UNITED STATES
SECURITIES AND EXCHANGE COMMISSION
Washington, D.C. 20549
FORM N-CSR
CERTIFIED SHAREHOLDER REPORT OF REGISTERED MANAGEMENT INVESTMENT COMPANIES
Investment Company Act file number 811-22969
PALMER SQUARE OPPORTUNISTIC INCOME FUND
(Exact name of registrant as specified in charter)
1900 Shawnee Mission Parkway Suite 315
Mission Woods, KS 66205
(Address of principal executive offices) (Zip code)
Scott Betz
Chief Compliance Officer
1900 Shawnee Mission Parkway Suite 315
Mission Woods, KS 66205
(Name and address of agent for service)
(816) 994-3200
Registrant's telephone number, including area code
Date of fiscal year end: July 31
Date of reporting period: July 31, 2020
Item 1. Report to Stockholders.
The registrant’s annual report transmitted to shareholders pursuant to Rule 30e-1 under the Investment Company Act of 1940, as amended (the “Investment Company Act”), is as follows:

Palmer Square Opportunistic Income Fund
(PSOIX)
ANNUAL REPORT
JULY 31, 2020
Beginning on January 1, 2021, as permitted by regulations adopted by the Securities and Exchange Commission, paper copies of the Fund’s shareholder reports like this one will no longer be sent by mail, unless you specifically request paper copies of the reports from the Fund if you hold your shares directly with the Fund, or from your financial intermediary, such as a broker-dealer or bank, if you hold your shares through a financial intermediary. Instead, the reports will be made available on a website, and you will be notified by mail each time a report is posted and provided with a website link to access the report.
If you already elected to receive shareholder reports electronically, you will not be affected by this change and you need not take any action. If you hold your shares directly with the Fund, you may elect to receive shareholder reports and other communications from the Fund electronically by contacting the Fund at (866) 933-9033 or, if you hold your shares through a financial intermediary, contacting your financial intermediary.
You may elect to receive all future reports in paper free of charge. If you hold your shares directly with the Fund, you can inform the Fund that you wish to continue receiving paper copies of your shareholder reports at (866) 933-9033 or, if you hold your shares through a financial intermediary, contacting your financial intermediary. Your election to receive reports in paper will apply to all of the funds you hold directly or through your financial intermediary, as applicable. |
Palmer Square Opportunistic Income Fund
Table of Contents
| Letter to Shareholders | 1 |
| Fund Performance | 11 |
| Schedule of Investments | 12 |
| Statement of Assets and Liabilities | 32 |
| Statement of Operations | 33 |
| Statements of Changes of Net Assets | 34 |
| Financial Highlights | 35 |
| Notes to Financial Statements | 36 |
| Report of Independent Registered Public Accounting Firm | 50 |
| Supplemental Information | 51 |
| Expense Example | 53 |
This report and the financial statements contained herein are provided for the general information of the shareholders of the Palmer Square Opportunistic Income Fund. This report is not authorized for distribution to prospective investors in the Fund unless preceded or accompanied by an effective prospectus.
www.palmersquarefunds.com

Palmer Square Opportunistic Income Fund (PSOIX)
July 2020
Fund Refresher
As a refresher, the Palmer Square Opportunistic Income Fund (“PSOIX” or the “Fund”) seeks to not only capture a high level of current income, but also long-term capital appreciation by investing with a flexible mandate to find the best relative value opportunities across corporate credit and structured credit.
Portfolio Snapshot
Please refer to the table below for a portfolio snapshot by quarter.
| 6/30/2019 | 9/30/2019 | 12/31/2019 | 3/31/2020 | 7/31/2020 | |
| Interest Rate Duration* | 0.12 yrs | 0.23 yrs | 0.32 yrs | 0.34 yrs | 0.79 yrs |
| Spread Duration | 3.67 yrs | 3.52 yrs | 3.52 yrs | 3.66 yrs | 3.69 yrs |
| Credit Spread | 521 | 614 | 626 | 1,101 | 725 |
| Weighted Average Price | $97.2 | $95.0 | $96.4 | $74.9 | $91.5 |
| Yield to Expected Call* | 7.03% | 7.58% | 7.95% | 11.63% | 7.54% |
| Yield to Maturity | 7.05% | 7.24% | 7.72% | 10.05% | 6.96% |
| Current Yield | 7.33% | 7.35% | 7.40% | 8.50% | 5.90% |
| Beta vs. S&P 500 | 0.23 | 0.22 | 0.22 | 0.24 | 0.55 |
| Beta vs. Bloomberg Barclays U.S. Aggregate Bond Index | -0.18 | -0.23 | -0.26 | 0.16 | 0.35 |
Past performance does not guarantee future results. *Please see Notes and Disclosure for definitions.
Summary Themes: V-Shaped Recovery in Asset Prices; Portfolio Rotations; Pockets of Relative Value Remain in High Yield BBs, CLO AAAs and Tier 1 CLO Mezz with Overcollateralization (“OC”)* Cushions
Theme I. V-Shaped Recovery in Asset Prices
| » | What a difference 3 months make. The 2nd quarter of 2020 was almost a mirror opposite of the 1st quarter, breaking records on many fronts. While the fundamental recovery in growth, jobs and earnings is likely to be more “Swoosh-Shaped” taking several months or quarters to fully recover to pre-COVID levels, the recovery in most asset prices has certainly been “V-Shaped”. Investment grade (“IG”) bonds returned 9.0% in Q2 (best since Q2 2009), High Yield (“HY”) bonds returned 10.2% (best since Q1 2009), bank loans returned 9.7%, the S&P 500 Index was up 20.5% (best quarter since 1975) and the Nasdaq is now at +12.7% for the year and has been breaking new highs. The 2nd quarter also broke records for IG bond issuance, with over $1.17 trillion of gross issuance. This is 2 times the amount issued in first half of 2019 and already 7% higher than all of 2019. |
| * | Please see Notes and Disclosure for definitions |
Palmer Square Capital Management LLC 1900 Shawnee Mission Parkway, Suite 315, Mission Woods, KS 66205 www.palmersquarefunds.com
1
| Index Return Summary | Q1 2020 | Q2 2020 | 1H 2020 |
| IG Bonds | -3.6% | 9.0% | 5.0% |
| HY Bonds | -12.7% | 10.2% | -3.8% |
| Bank Loans | -13.2% | 9.7% | -4.8% |
| S&P 500 | -19.6% | 20.5% | -3.1% |
| Nasdaq | -13.9% | 30.9% | 12.7% |
Please see Notes and Disclosure for definitions of these indices.
| » | A lot has been written/discussed on whether this snap back in risk is justified given the severity of the economic destruction caused by COVID-19 and the ensuing shutdowns as well as the fact that the virus does not yet seemed to be “under control”. Clearly, the enormous policy response from governments and central banks explains a lot of this move. Indeed, governments globally have introduced over $19 trillion in fiscal and monetary stimulus already and continue to message to the market they can do more if necessary. But relying on the proverbial “Fed Put” is not a sustainable investment strategy, and that is especially true in the credit markets. |
Theme II. Portfolio Rotations
| » | The 2nd quarter was one of the busiest quarters ever for the Fund. Strategically, we had cut risk overall in January/February and early March which allowed us to take advantage of the volatility. Our exposure to CLO BBB-B decreased from 79% in December 2019 to 71% in February 2020 to 59% in mid-March 2020. In late March and early April, we began adding exposure to severely discounted HY BB and CLO BBBs taking exposure up by 6.0% and 1.0%, respectively. We also began buying IG bonds (added 4% exposure) that were still trading at significantly wide spreads, with a focus on so-called “fallen angels”, or bonds downgraded from the Investment Grade market to the High Yield market. |
| » | In May we continued to add risk in several areas. We increased CLO BBB and CLO BB exposure by 2.4% and 4.4%, respectively, as CLO mezzanine debt had lagged the rally in corporate credit at that point. |
| » | Credit spreads continued to rally into June at which point we began to take profit on various IG bond positions that had rallied back to, or even through in some cases, pre-COVID levels. In late June we began rotating out of tight-trading BBB bonds and into BB HY bonds which continue to screen as relatively attractive to BBBs as well as historical average levels. On the structured side, we took profit in June as well, selling some CLO BBB/BB risk up 10-20pts and rotating part of this exposure back into CLO AAAs which didn’t rally as much as other credit asset classes. |
| » | Overall, the Fund took full advantage of the rally in credit, net adding significant risk in April/May but then taking profit and building back up dry powder* in late June after spreads, for some sub-classes of credit, have retraced* back to pre-COVID levels. |
Theme III. Pockets of Relative Value Remain in High Yield BBs, CLO AAAs and Tier 1 CLO Mezz with OC Cushions
| » | Despite the rally, we still see pockets of value in certain parts of the market. One way to compare the relative value of various credit asset classes is to compare how much they have retraced from the price lows / spread wides. The idea is that some asset classes have shown a tendency to recover more quickly than others (adjusted for risk) due to technical factors such as fund flows, investor limitations, the size of the asset class, etc. IG bonds have retraced 81% of the spread widening while HY BB bonds have only retraced 61%. Likewise, CLO AAA spreads have only retraced 63% as well, less than bank loans and IG bonds. As such, as we enter the 3rd quarter we see relative value in both HY BB bonds and CLO AAA tranches, both of which are trading well wide of 10-year average spread levels and even more wide of pre-COVID levels. And while we don’t necessarily expect spreads to get back to pre-COVID levels anytime soon, we do expect HY BBs and CLO AAA spreads to outperform other credit sub-classes in the near-to-medium term. We have been able to source HY BB bonds from issuers with little to no COVID impact at spreads 400-500bps range that were trading in the 150-200bps range pre-COVID. Similarly, we have also be accumulating CLO AAA tranches in the $97-98 price range with yields in the 2-2.5% range. While CLO BBB and BB have retraced 76% and 70% of their spread widening, we believe they still offer good value at current levels given their structural protection (more on that below) and discount prices. |
| * | Please see Notes and Disclosure for definitions. |
Palmer Square Capital Management LLC 1900 Shawnee Mission Parkway, Suite 315, Mission Woods, KS 66205 www.palmersquarefunds.com
2
| » | Also, when comparing CLO BBB and BB to their corporate counterparts1, both look relatively wide on a historical basis. Table 1 below compares CLO BBB to Corporate BBB spreads. The average spread differential over the past 5 years has been 225-250bps, and it currently sits at 282bps. A positive spread differential implies the first asset is cheaper than the second on a relative spread basis. This is in the 70th percentile in terms of cheapness vs Corporate BBBs over that past 5 years per our analysis. |
| CLO BB spreads look even cheaper when comparing to High Yield. As seen in table 2 below, CLO BB spreads are currently 319bps wider than High Yield, which is in the 90th percentile in terms of cheapness vs High Yield over that past 5 years (please note Palmer Square reviewed the spread differentials over the last 5 years in determining the percentile as of 6/30/2020 was in the X percentile of all spread differential values over this 5 year time period.) |
Table 1- CLO BBB Spread vs Bloomberg Barclays BBB Corp Spread
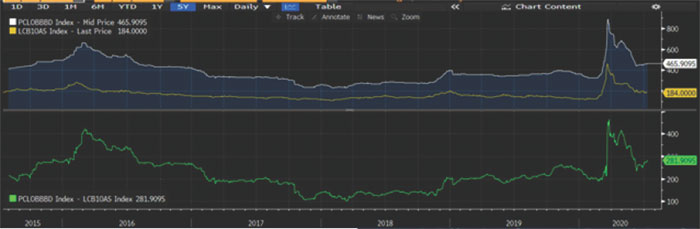
Source: Bloomberg, Palmer Square CLO Indices
Table 2- CLO BB spread vs Bloomberg Barclays HY Spread
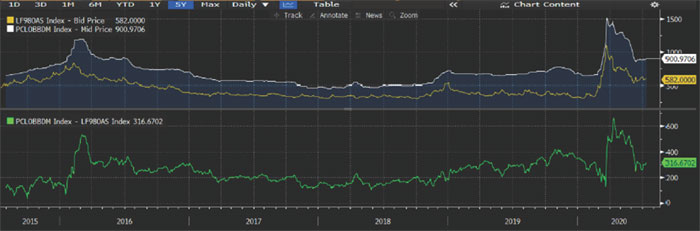
Source: Bloomberg, Palmer Square CLO Indices
| 1 | CLOs are comprised of bank loans, which are backed by the assets of a company. Corporate bonds are backed by the issuer of a company. |
Palmer Square Capital Management LLC 1900 Shawnee Mission Parkway, Suite 315, Mission Woods, KS 66205 www.palmersquarefunds.com
3
| Allocation | 7/31/2020 Price | Potential Pull to Par ($)* | Potential Pull to Par (%)* | Yield to Expected Call* | |
| CLO AAA | 3% | $98.02 | $1.98 | 2.02% | 1.83% |
| CLO A | 2% | $95.26 | $4.74 | 4.98% | 3.16% |
| CLO BBB | 25% | $93.18 | $6.82 | 7.32% | 5.28% |
| CLO BB | 33% | $86.26 | $13.74 | 15.93% | 10.06% |
| CLO B | 4% | $70.83 | $29.17 | 41.18% | 17.30% |
Source: Palmer Square as of 7/31/2020. *Please see Notes and Disclosure for definitions.
Palmer Square’s opportunistic strategies are focused heavily on the above. We believe we have positioned the strategies for considerable upside at these levels. As mentioned, we went into March with a higher quality positioning and sought to upgrade our portfolios even more during the distress. As we sit today, we are elated to be able to speak to investors about the value inherent in our portfolios.
Summary on Allocation / Attribution as of 7/31/2020
9/30/2019 Allocation | 12/31/2019 Allocation | 3/31/2020 Allocation | 7/31/2020 Allocation | 8/1/2019 to 7/31/2020 Gross Attribution | |
| CLO Debt | 78% | 79% | 73% | 66% | -1.91% |
| Bank Loans | 8% | 10% | 11% | 8% | -1.22% |
| High Yield Credit | 9% | 6% | 7% | 17% | 1.86% |
| Sub Notes | 3% | 4% | 4% | 3% | -1.23% |
| Credit Index Options | 0% | 0% | 4% | 0% | 0.00% |
| IG Corp Debt | 1% | 1% | 0% | 2% | 0.58% |
Please note the allocation above is on a gross exposure basis as a percent of NAV and does not include cash and/or hedges. Gross attribution does not include hedges, expenses and fees if applicable. Investment return and principal value will fluctuate, so that an investor’s shares, when redeemed, may be worth more or less than their original cost. Current performance may be lower or higher than the performance information quoted. Attribution refers to the process of measuring returns generated by various sources.
Performance Summary
The Fund returned -3.36% (net of fees) for the fiscal year-ending 7/31/2020.
Fund Performance Net of Fees as of 7/31/2020 (inception 8/29/2014*)
| YTD 2020 | 2019 | 2018 | 2017 | 2016 | 2015 | 2014* | |
PSOIX | -5.65% | 7.61% | -0.47% | 11.04% | 12.10% | -5.32% | -0.76% |
Fund Performance Net of Fees as of 7/31/2020 (inception 8/29/2014)
1 Year | 3 Years | 5 Years | Since Inception Annualized | |
| PSOIX | -3.36% | 1.40% | 2.63% | 2.86% |
Annual Expense Ratio: Net 1.86%. The Fund’s advisor has contractually agreed to waive or reduce its management fees and/or reimburse expenses of the Fund to ensure that total annual Fund operating expenses (excluding taxes, leverage interest, brokerage commissions, dividend and interest expenses on short sales, acquired fund fees and expenses, expenses incurred in connection with any merger or reorganization, and extraordinary expenses such as litigation expenses) do not exceed 1.50% of the Fund’s average daily net assets. This agreement is in effect until December 1, 2020, and it may be terminated before that date only by the Fund’s Board of Trustees. The Fund’s advisor is permitted to seek reimbursement from the Fund, subject to certain limitations, of fees waived or payments made to the Fund for a period ending three full fiscal years after the date of the waiver or payment. The performance data quoted represents past performance and that past performance does not guarantee future results. Investment return and principal value will fluctuate, so that an investor’s shares, when redeemed, may be worth more or less than their original cost. Current performance may be lower or higher than the performance information quoted. To obtain performance information current to the most recent month-end please call 866-933-9033.
Palmer Square Capital Management LLC 1900 Shawnee Mission Parkway, Suite 315, Mission Woods, KS 66205 www.palmersquarefunds.com
4
CLO Market Update and Opportunity
We certainly believe that pricing in CLOs is not reflective of value. As we lay-out below, we believe current pricing is representative of an opportunity to initiate or add to an existing allocation to this space.
| I. | How does Palmer Square Analyze the Downside Risk Taken When Analyzing CLOs? We analyze risk in many ways, but here are the main two: |
| 1. | Rigorous loan by loan analysis of the underlying CLO pool: as a refresher, it is helpful to provide some context for the Palmer Square team and approach. We have an 18-person senior investment team focused on analyzing industries and the respective companies within those industries. As our investors know, Palmer Square has a research bias for higher quality, larger and more liquid loans. Typically, 50% or so of the loans we own are also public companies as we believe that also provides an informational advantage as we often have daily news to factor into our decision-making. We also have a preference for certain industry weights and have been underweight cyclical industries for a significant period of time (said differently, we have favored more recession resistant industries such as healthcare, software, tech, financial services, etc.). |
| ● | When we look to invest capital into CLO debt, we focus on finding CLO debt that has an underlying loan pool and structure similar to the risk we put forth ourselves when we buy loans directly and structure our Palmer Square-issued CLOs. We can quickly assess if a particular BB-rated CLO debt opportunity has in its underlying loan pool bank loans that didn’t meet our underwriting bar or loans that are too small and illiquid or loans that are in industries which we view as unfavorable. We seek high quality when we buy loans directly and of course, when we obtain loan exposure indirectly due to owning CLO debt. We believe being an issuer of and investor in CLOs is a significant competitive advantage when selecting relative value in CLOs. |
| ● | In addition to the full financial modeling and fundamental credit work performed by our team on a loan-by-loan basis, we also generally added other harsh scenarios to the mix in March to understand COVID-19’s impact under various conditions. Below, are two examples of the type of loans we sought exposure to directly and through our CLOs: |
Bausch Healthcare (BHC)1:
| * | Bausch Healthcare is a global pharmaceutical company that also owns the Bausch & Lomb eyecare brand |
| * | BHC is one of the stronger credits in the leveraged Healthcare space: in 2019 it generated $1.5bn of cash from operations and repaid $900m of debt |
| * | Bausch has no debt maturities until 2022, $1.0bn of revolver capacity and $750m of cash |
| * | Bausch recently issued a press release confirming that they have ample inventories to withstand any disruptions and, to date, their manufacturing and supply chains remain intact |
| * | Although the company has a fair amount of leverage (6.8x), leverage through the first lien debt is only 2.8x |
| 1 | As of 6/30/2020, these two companies were not held directly by the Fund. This is not indicative of any holding of the Fund, but is illustrative of the type of analysis Palmer Square employs. |
Palmer Square Capital Management LLC 1900 Shawnee Mission Parkway, Suite 315, Mission Woods, KS 66205 www.palmersquarefunds.com
5
| * | We like Bausch’s Term Loan B: |
| - | $3.9bn outstanding |
| - | Rated BB (Moody’s) |
| - | The coupon is L + 300bps, with a June, 2025 maturity |
Davita (DVA)1:
| * | Davita is the largest provider of kidney dialysis clinics in the U.S. |
| * | DVA’s patients have End Stage Renal Disease (ESRD) and require dialysis treatments three times a week – it is a life critical process |
| * | Therefore it is highly unlikely that Davita will see much, if any, volume/revenue impact from this COVID-19 scare |
| * | In addition, DVA has a conservative balance sheet that would be able to absorb any financial disruption: |
| - | First Lien leverage is only 1.65x |
| - | Total leverage is 3.0x |
| - | Their stated leverage target is a range of 3.0x – 3.5x |
| - | The company has $750m of cash on the balance sheet plus a $1bn undrawn revolver |
| * | Davita’s Term Loan B: |
| - | $2.7bn outstanding |
| - | Rated BBB- (Moody’s) |
| - | The coupon is L + 175bps, with a July, 2024 maturity |
| 2. | Stressing the CLO Structure itself: in addition to stressing individual loans as highlighted above, we also spend considerable time running stress tests on the CLO structure. What does that mean? If you own a CLO BB-rated bond, you run stress on the underlying loan portfolio and overall CLO structure. Let’s look at two examples below: a BBB-rated CLO piece of debt and a BB-rated CLO piece of debt. How much would the underlying loan pool need to suffer in order to provide us with either $1 in principal writedown (i.e., receiving $99 back rather than $100 or par) or a 0% yield on our investment? |
| ● | It would take a 13.1% Constant Default Rate (CDR)2 (66.3% total default) for approximately 9yrs straight to break a BBB and 9% CDR (51.98% total default) to break a BB. |
| » | This analysis assumes 10% of the pool pre-pays each year, that loan defaults result in a $0.60 on the dollar recovery, and that these prepayment and recovery proceeds are re-invested in loans priced at $90 / 350 bps spread levels. |
| ● | Ultimately, this generally implies that well more than half of the industries in the economy suffer a disastrous fate for an extended period of time (i.e., years of suffering; not quarters of suffering). This disastrous a scenario makes 2008 look like a bull market. |
Please note that the below analysis assumes you “ONLY” get back $99 not par. Well, if you are buying a BB-rated CLO at $65 or a BBB-rated CLO at $75, that is still a very strong IRR potential, provided the issue does not default. Regardless, we don’t believe that the below scenarios are realistic. In 2008-2013, there was an approximate total default of 18 percent. In 1999-2003, there was an approximate total default of 23 percent. This analysis illustrates the strength of the underlying fundamentals of both a BB and BBB-rated because we believe it would take approximately 2.85x the 1999-2004 and 3.6x the 2008-2013 stress (cumulative defaults of the underlying loan pool) for either bond and to not return full par.
| 1 | As of 6/30/2020, these two companies were not held directly by the Fund. This is not indicative of any holding of the Fund, but is illustrative of the type of analysis Palmer Square employs. 2The constant default rate (CDR) refers to the percentage of mortgages within a pool of loans for which the mortgagors have fallen more than 90 days behind. The CDR is a measure used to analyze losses within mortgage-backed securities. |
Palmer Square Capital Management LLC 1900 Shawnee Mission Parkway, Suite 315, Mission Woods, KS 66205 www.palmersquarefunds.com
6
| BBB Breakeven Analysis | ||
| Metric | $1 Prin. Writedown | 0% Yield |
| CDR | 13.10% | 14.95% |
| CPR | 10% | 10% |
| Recovery | $0.60 | $0.60 |
| Reinvest $ | $90 | $90 |
| Reinvest Spread | 350 bps | 350 bps |
| Total Default % | 66.30% | 73.41% |
| Total Loss % | 26.53% | 29.37% |
| BB Breakeven Analysis | ||
| Metric | $1 Prin. Writedown | 0% Yield |
| CDR | 9.00% | 10.51% |
| CPR | 10% | 10% |
| Recovery | $0.60 | $0.60 |
| Reinvest $ | $90 | $90 |
| Reinvest Spread | 350 bps | 350 bps |
| Total Default % | 51.98% | 59.16% |
| Total Loss % | 20.79% | 23.66% |
Source: Bloomberg, Palmer Square, as of 3/27/2020. Based on historical metrics of a 2018-vintage CLO. Past performance does not guarantee future results. “CDR is cumulative default rate. “CPR” is constant prepayment rate. “Recovery” is amount recovered on a dollar basis on a defaulted loan. “Reinvest $” and “Reinvest Spread” reflect the dollar price and spread at which loss proceeds are reinvested. “Total Default %” represents the total amount of loans in the pool that experienced a default over the life of the bond. “Total Loss” represents the total principal loss on the pool. This is not indicative of any holding of the fund, but is illustrative of the type of analysis Palmer Square employs.
Finally, we wanted to insert S&P data on historical CLO defaults. Of note, not only has the CLO industry experienced very few defaults, over 80% of the defaults that have occurred were from 2003 or earlier issued vintage CLOs.
| U.S. CLO Tranche Defaults By Original Rating (as of Year-end 2018) | ||||||
| CLO 1.0 (issued 1994-2009) | CLO 2.0 (issued 2009-present) | Total (CLO 1.0 + CLO 2.0) | ||||
| Original Rating | Tranches rated | Tranches defaulted | Tranches rated | Tranches defaulted | Tranches rated | Tranches defaulted |
| AAA | 1,540 | 0 | 1,801 | 0 | 3,341 | 0 |
| AA | 616 | 1 | 1,388 | 0 | 2,004 | 1 |
| A | 790 | 5 | 1,179 | 0 | 1,969 | 5 |
| BBB | 783 | 9 | 1,007 | 0 | 1,790 | 9 |
| BB | 565 | 20 | 903 | 0 | 1,468 | 20 |
| B | 28 | 3 | 294 | 0 | 322 | 3 |
| Total | 4,322 | 38 | 6,572 | 0 | 10,894 | 38 |
Source: S&P
| II. | CLO Debt – How is the Fund positioned and Can Loan Downgrades Adversely Affect our Holdings? |
Moody’s, S&P, and Fitch have all been incredibly active. Of those debt securities put on watch (nearly 30% of all BBB and BB-rated), below is a summary of what was put on watch versus what the Fund may own.
| Rating | On Watch | PSOIX Owns | % Owned |
| AAA | 0 | 0 | 0.0% |
| AA | 7 | 0 | 0.0% |
| A | 75 | 0 | 0.0% |
| BBB | 425 | 14 | 3.3% |
| BB | 643 | 15 | 2.3% |
| B | 326 | 5 | 1.5% |
| Total | 1476 | 34 | 2.3% |
Source: Moody’s/S&P/Fitch as of 6/25/2020.
Palmer Square Capital Management LLC 1900 Shawnee Mission Parkway, Suite 315, Mission Woods, KS 66205 www.palmersquarefunds.com
7
Downgrades have started to trickle in. There have been 288 total tranche downgrades since 2015 (115 this year), the Fund does not own any of them.
| Rating | Downgrade | PSOIX Owns | % Owned |
| AAA | 0 | 0 | 0.0% |
| AA | 2 | 0 | 0.0% |
| A | 30 | 0 | 0.0% |
| BBB | 37 | 0 | 0.0% |
| BB | 101 | 0 | 0.0% |
| B | 118 | 0 | 0.0% |
| Total | 288 | 0 | 0.0% |
Source: Moody’s/S&P/Fitch as of 6/25/2020.
Summary
Given the portfolio positioning, we are confident in the outlook moving forward. We believe our portfolio is embedded with strong catalysts that will not only drive potential returns, but will also help mitigate volatility. More specifically, the portfolio has high current yield and the potential to generate price appreciation, and finally the portfolio has been providing low
interest rate and relatively low spread duration*.
Please do not hesitate to contact us at investorrelations@palmersquarecap.com or 816-994-3200 should you desire more information. We would also be happy to set up a call and/or meeting at your convenience.
| * | Please see Notes and Disclosure for definitions. |
Palmer Square Capital Management LLC 1900 Shawnee Mission Parkway, Suite 315, Mission Woods, KS 66205 www.palmersquarefunds.com
8
Notes and Disclosure
This overview is for informational and comparative purposes only and does not constitute an offer to sell or a solicitation of an offer to buy any interests in the Palmer Square Opportunistic Income Fund, the (“Fund”), and/or any other securities, or to provide any other advisory services. Any offer to invest in the funds will be made pursuant to the Fund’s prospectus, which will contain material information not contained herein and to which prospective investors are directed. Before investing, you should carefully read such materials in their entirety. This overview is not intended to replace such materials, and any information herein should not be relied upon for the purposes of investing in the Funds or for any other purpose. This overview is a summary and does not purport to be complete.
The Palmer Square Opportunistic Income Fund is a closed-end fund.
Interest Rate Duration measures a portfolio’s sensitivity to changes in interest rates. Spread Duration measures the sensitivity of a bond price based on basis point changes of more than 100. Yield To Call is the yield of a bond or note if you were to buy and hold the security until the call date. Yield To Maturity is the rate of return anticipated on a bond if held until the end of its lifetime. Current Yield is annual income divided by price paid. Beta describes an investment’s volatility in relation to that of the stock or bond market as a whole. For example, the S&P 500 is typically considered to be “the equity market” and it has a beta of 1.0. Yield to Expected Call is a Yield to Call metric that assumes callable bonds are not called on their call date, but at some later date prior to maturity. Yield to Expected Call considers contractual terms in a bond’s indenture or other similar governing document. A bond may be called before or after this date, which has the potential to increase or decrease the Yield to Expected Call calculation. All else equal, when a bond’s price is below par, Yield to Expected Call is a more conservative yield metric than Yield to Call. If a bond is not callable, Yield to Expected Call calculates the bond’s Yield to Maturity. Overcollateralization (OC) is the provision of collateral that is worth more than enough to cover potential losses in cases of default. Dry Powder is an informal term that refers to highly liquid securities, cash reserves and any other security that can be converted to cash right away. % Retrace refers to % Recovery back to pre-COVID-19 levels. Credit Spreads are often a good barometer of economic health - widening (bearish sentiment) and narrowing (bullish sentiment). Under the Term Asset-Backed Loan Facility (TALF), the Federal Reserve will lend on a non-recourse basis to holders of certain (eligible) AAA-rated ABS backed by newly and recently originated consumer and small business loans. The Bloomberg Barclays US Corporate Bond Index (IG Bonds) measures the investment grade, fixed-rate, taxable corporate bond market. The Bloomberg Barclays US Corporate High Yield Bond Index (HY Bonds) measures the USD-denominated, high yield, fixed-rate corporate bond market. Credit Suisse Leveraged Loan Index (Bank Loans) tracks the investable market of the U.S. dollar denominated leveraged loan market. The S&P 500 Index or the Standard & Poor’s 500 Index is a market-capitalization-weighted index of the 500 largest U.S. publicly traded companies. NASDAQ is a computerized stock trading network that allows brokers to access price quotations for stocks being traded electronically or sold on the floor of a stock exchange.
The allocation and credit quality distribution figures shown are used for illustrative purposes only. Palmer Square does not guarantee to execute that allocation and credit quality distribution. Allocation and exposures information, as well as other referenced categorizations, reflect classifications determined by Palmer Square as well as certain Palmer Square assumptions based on estimated portfolio characteristic information. Allocation and credit quality distribution figures may not sum to 100%. Ratings listed herein are assigned by Standard & Poor’s (S&P) and Moody’s Investor Service (Moody’s). Credit quality ratings are measured on a scale with S&P’s credit quality ratings ranging from AAA (highest) to D (lowest) and Moody’s credit quality ratings ranging from Aaa (highest) to C (lowest). We use the higher of the two ratings. Credit ratings listed are subject to change. Please contact Palmer Square for more information.
Market opportunities and/or yields shown are for illustration purposes only and are subject to change without notice. Palmer Square does not represent that these or any other strategy/opportunity will prove to be profitable or that the Fund’s investment objective will be met.
This material represents an assessment of the market environment at a specific point in time, is subject to change without notice, and should not be relied upon by the reader as research or investment advice. With regard to sources of information, certain of the economic and market information contained herein has been obtained from published sources and/or prepared by third parties. While such sources are believed to be reliable, Palmer Square or their employees or representatives do not assume any responsibility for the accuracy of such information. Palmer Square is under no obligation to verify its accuracy.
The Bloomberg Barclays U.S. Aggregate Bond Index is an unmanaged index of publicly issued investment grade corporate, US Treasury and government agency securities with remaining maturities of one to three years. The S&P 500 Index is a market-value weighted index provided by Standard & Poor’s comprised of 500 stocks chosen for market size and industry group representation. JPMorgan Liquid Loan Index - is a market-weighted index that measures the performance of the most liquid issues in the investment grade, dollar-denominated corporate bond market. ICE BAML High Yield Index - tracks the performance of non-investment-grade corporate bonds. Unlike mutual funds, indices are not managed and do not incur fees or expenses. It is not possible to invest directly in an index.
Palmer Square Capital Management LLC 1900 Shawnee Mission Parkway, Suite 315, Mission Woods, KS 66205 www.palmersquarefunds.com
9
Notes and Disclosure cont’d
The performance presented here is past performance and not indicative of future returns. Different types of investments involve varying degrees of risk and there can be no assurance that any specific investment will be profitable. Please note that the performance of the funds may not be comparable to the performance of any index shown. Palmer Square has not verified, and is under no obligation to verify, the accuracy of these returns. Past performance does not guarantee future results.
The risks of an investment in a collateralized debt obligation depend largely on the type of the collateral securities and the class of the debt obligation in which the Fund invests. Collateralized debt obligations are generally subject to credit, interest rate, valuation, prepayment and extension risks. These securities are also subject to risk of default on the underlying asset, particularly during periods of economic downturn. Defaults, downgrades, or perceived declines in creditworthiness of an issuer or guarantor of a debt security held by the Fund, or a counterparty to a financial contract with the Fund, can affect the value of the Fund’s portfolio. Credit loss can vary depending on subordinated securities and non-subordinated securities. If interest rates fall, an issuer may exercise its right to prepay their securities. If this happens, the Fund will not benefit from the rise in market price, and will reinvest prepayment proceeds at a later time. The Fund may lose any premium it paid on the security. If interest rates rise, repayments of fixed income securities may occur more slowly than anticipated by the market which may result in driving the prices of these securities down. The Fund is “non-diversified,” meaning the Fund may invest a larger percentage of its assets in the securities of a smaller number of issuers than a diversified fund. Investment in securities of a limited number of issuers exposes the Fund to greater market risk and potential losses than if its assets were diversified among the securities of a greater number of issuers. Foreign investments present additional risk due to currency fluctuations, economic and political factors, government regulations, differences in accounting standards and other factors. Investments in emerging markets involve even greater risks. High yield securities, commonly referred to as “junk bonds,” are rated below investment grade by at least one of Moody’s, S&P or Fitch (or if unrated, determined by the Fund’s advisor to be of comparable credit quality high yield securities). The Fund is new and has a limited history of operations.
The Palmer Square Opportunistic Income Fund is distributed by Foreside Fund Services LLC.
Palmer Square Capital Management LLC (“Palmer Square”) is an SEC registered investment adviser with its principal place of business in the State of Kansas. Registration of an investment adviser does not imply a certain level of skill or training. Palmer Square and its representatives are in compliance with the current registration and notice filing requirements imposed upon registered investment advisers by those states in which Palmer Square maintains clients. Palmer Square may only transact business in those states in which it is notice filed, or qualifies for an exemption or exclusion from notice filing requirements. Any subsequent, direct communication by Palmer Square with a prospective client shall be conducted by a representative that is either registered or qualifies for an exemption or exclusion from registration in the state where the prospective client resides. For additional information about Palmer Square, including fees and services, send for our disclosure statement as set forth on Form ADV using the contact information herein or refer to the Investment Adviser Public Disclosure web site (www.adviserinfo.sec.gov). Please read the disclosure statement carefully before you invest or send money.
Palmer Square Capital Management LLC 1900 Shawnee Mission Parkway, Suite 315, Mission Woods, KS 66205 www.palmersquarefunds.com
10
Palmer Square Opportunistic Income Fund
FUND PERFORMANCE at July 31, 2020 (Unaudited)

This graph compares a hypothetical $250,000 investment in the Fund’s shares, made at its inception, with a similar investment in the Bloomberg Barclays US Aggregate Bond Index. Results include the reinvestment of all dividends and capital gains.
The Bloomberg Barclays US Aggregate Bond Index is an unmanaged index of publicly issued investment grade corporate, US Treasury and government agency securities with remaining maturities of one to three years. The index does not reflect expenses, fees or sales charge, which would lower performance. The index is unmanaged and it is not possible to invest in an index.
| Average Annual Total Return as of July 31, 2020 | 1 Year | 5 Years | Since Inception | Inception Date |
| Palmer Square Opportunistic Income Fund | -3.36% | 2.63% | 2.86% | 8/29/14 |
| Bloomberg Barclays US Aggregate Bond Index | 10.12% | 4.47% | 4.06% | 8/29/14 |
The performance data quoted here represents past performance and past performance is not a guarantee of future results. Investment return and principal value will fluctuate so that an investor's shares, when redeemed, may be worth more or less than their original cost. Current performance may be lower or higher than the performance information quoted. The most recent month end performance may be obtained by calling (866) 933-9033.
Expense ratio for the Fund was 1.86%, which were the amounts stated in the current prospectus dated April 30, 2020. For the Fund’s current one year expense ratios, please refer to the Financial Highlights Section of this report. The Advisor has contractually agreed to waive or reduce its fee and/or to absorb other operating expenses (excluding taxes, leverage interest, brokerage commissions, dividend and interest expenses on short sales, acquired fund fees and expenses, expenses incurred in connection with any merger or reorganization, and extraordinary expenses such as litigation expenses) do not exceed 1.50% of the Fund’s average daily net assets. In the absence of such waivers, the Fund’s returns would be lower. This agreement is in effect until December 1, 2020, and it may be terminated before that date only by the Fund’s Board of Trustees.
Returns reflect the reinvestment of distributions made by the Fund, if any. The graph and the performance table above do not reflect the deduction of taxes that a shareholder would pay on Fund distributions or the redemption of Fund shares.
11
Palmer Square Opportunistic Income Fund
SCHEDULE OF INVESTMENTS
As of July 31, 2020
Principal | Value | |||||||
| BANK LOANS — 7.8% | ||||||||
| $ | 250,000 | Alphabet Holding Co., Inc. 7.911% (3-Month USD Libor+775 basis points), 8/15/20251,2,3 | $ | 231,750 | ||||
| 259,350 | Alterra Mountain Co. 5.500% (1-Month USD Libor+450 basis points), 8/1/20261,2,3 | 258,702 | ||||||
| Ancestry.com Operations, Inc. | ||||||||
| 298,480 | 4.750% (1-Month USD Libor+375 basis points), 10/19/20231,2,3 | 294,003 | ||||||
| 298,490 | 4.420% (3-Month USD Libor+425 basis points), 8/27/20261,2,3 | 290,592 | ||||||
| 511,284 | Avaya, Inc. 4.425% (3-Month USD Libor+425 basis points), 12/15/20241,2,3 | 484,953 | ||||||
| 249,359 | Bass Pro Group LLC 6.072% (3-Month USD Libor+500 basis points), 9/25/20241,2,3 | 248,638 | ||||||
| 689,340 | BCP Raptor LLC 5.250% (3-Month USD Libor+425 basis points), 6/30/20241,2,3 | 531,940 | ||||||
| CCS-CMGC Holdings, Inc. | ||||||||
| 270,875 | 7.544% (3-Month USD Libor+550 basis points), 10/1/20251,2,3 | 251,575 | ||||||
| 150,000 | 9.261% (3-Month USD Libor+900 basis points), 10/1/20261,2,3 | 139,500 | ||||||
| 395,801 | Covia Holdings Corp. 5.387% (3-Month USD Libor+375 basis points), 6/1/20251,2,3 | 249,190 | ||||||
| 298,500 | CTOS LLC 4.426% (1-Month USD Libor+425 basis points), 4/18/20251,2,3 | 296,448 | ||||||
| 498,750 | Delek U.S. Holdings, Inc. 6.500% (1-Month USD Libor+550 basis points), 3/30/20251,2,3 | 487,528 | ||||||
| 117,779 | Ditech Holding Corp. 8.499% (3-Month USD Libor+600 basis points), 6/30/20221,3 | 27,678 | ||||||
| 485,317 | Dynasty Acquisition Co., Inc. 3.808% (1-Month USD Libor+350 basis points), 4/8/20261,2,3 | 391,894 | ||||||
| 450,000 | Exact Holding North America, Inc. 9.000% (3-Month USD Libor+800 basis points), 9/29/20251,2,3 | 377,437 | ||||||
| 350,000 | Flexential Intermediate Corp. 7.587% (3-Month USD Libor+725 basis points), 8/1/20251,2,3 | 158,158 | ||||||
| 598,458 | Idera, Inc. 4.308% (3-Month USD Libor+450 basis points), 6/29/20241,2,3 | 590,229 | ||||||
| 397,954 | Infoblox, Inc. 4.661% (3-Month USD Libor+450 basis points), 11/7/20231,2,3 | 399,200 | ||||||
| 689,340 | Inmar, Inc. 5.072% (3-Month USD Libor+400 basis points), 5/1/20241,2,3 | 640,800 | ||||||
| 584,160 | Isagenix International LLC 6.750% (3-Month USD Libor+575 basis points), 6/14/20251,2,3 | 235,124 | ||||||
| 595,443 | Janus International Group LLC 4.822% (1-Month USD Libor+375 basis points), 2/15/20251,2,3 | 576,091 | ||||||
| 271,537 | Kestrel Acquisition LLC 5.250% (3-Month USD Libor+425 basis points), 6/30/20251,2,3 | 241,780 | ||||||
12
Palmer Square Opportunistic Income Fund
SCHEDULE OF INVESTMENTS - Continued
As of July 31, 2020
Principal | Value | |||||||
| BANK LOANS (Continued) | ||||||||
| Lightstone Holdco LLC | ||||||||
| $ | 473,305 | 4.750% (3-Month USD Libor+375 basis points), 1/30/20241,2,3 | $ | 404,295 | ||||
| 26,695 | 4.750% (3-Month USD Libor+375 basis points), 1/30/20241,2,3 | 22,803 | ||||||
| 508,686 | Limetree Bay Terminals LLC 5.000% (3-Month USD Libor+400 basis points), 2/15/20241,2,3,4,5,6 | 467,991 | ||||||
| 498,731 | McAfee LLC 5.555% (3-Month USD Libor+375 basis points), 9/29/20241,2,3 | 494,853 | ||||||
| 641,875 | Minotaur Acquisition, Inc. 5.174% (3-Month USD Libor+500 basis points), 3/29/20261,2,3 | 605,770 | ||||||
| 536,250 | MMM Holdings LLC 6.750% (1-Month USD Libor+575 basis points), 11/6/20261,2,3,6 | 524,184 | ||||||
| Murray Energy Corp. | ||||||||
| 307,554 | 13.000% (1-Month USD Libor+1,100 basis points), 9/14/20201,3 | 232,203 | ||||||
| 296,201 | 9.354% (1-Month USD Libor+725 basis points), 10/17/20221,3 | 8,145 | ||||||
| 399,917 | NeuStar, Inc. 9.072% (3-Month USD Libor+800 basis points), 8/8/20251,2,3 | 310,935 | ||||||
| 497,500 | Option Care Health, Inc. 4.661% (1-Month USD Libor+450 basis points), 8/6/20261,2,3 | 496,358 | ||||||
| 547,269 | Petco Animal Supplies, Inc. 4.250% (3-Month USD Libor+325 basis points), 1/26/20231,2,3 | 460,390 | ||||||
| 487,500 | Playtika Holding Corp. 7.072% (1-Month USD Libor+600 basis points), 12/10/20241,2,3 | 492,794 | ||||||
| 100,000 | Prairie ECI Acquiror LP 7.366% (3-Month USD Libor+475 basis points), 3/11/20261,2,3 | 90,759 | ||||||
| 325,000 | Quest Software U.S. Holdings, Inc. 10.027% (3-Month USD Libor+825 basis points), 5/18/20261,2,3 | 294,937 | ||||||
| 400,000 | Renaissance Holdings Corp. 7.161% (3-Month USD Libor+700 basis points), 5/29/20261,2,3 | 371,200 | ||||||
| 597,249 | Sabert Corp. 5.500% (1-Month USD Libor+450 basis points), 12/10/20261,2,3 | 594,015 | ||||||
| 295,000 | Samsonite IP Holdings Sarl 5.500% (1-Month USD Libor+450 basis points), 4/25/20251,2,3,6 | 288,916 | ||||||
| 347,301 | Serta Simmons Bedding LLC 3.500% (3-Month USD Libor+350 basis points), 11/8/20231,2,3 | 89,604 | ||||||
| 260,923 | Standard Aero Ltd. 3.808% (1-Month USD Libor+350 basis points), 4/8/20261,2,3,6 | 210,696 | ||||||
| 448,875 | Surgery Center Holdings, Inc. 9.000% (1-Month USD Libor+800 basis points), 8/31/20241,2,3 | 455,833 | ||||||
| 398,972 | TecoStar Holdings, Inc. 4.250% (3-Month USD Libor+325 basis points), 5/1/20241,2,3 | 383,013 | ||||||
| 393,551 | U.S. Silica Co. 5.000% (3-Month USD Libor+400 basis points), 5/1/20251,3 | 303,689 | ||||||
13
Palmer Square Opportunistic Income Fund
SCHEDULE OF INVESTMENTS - Continued
As of July 31, 2020
Principal | Value | |||||||
| BANK LOANS (Continued) | ||||||||
| $ | 893,250 | WaterBridge Midstream Operating LLC 6.750% (3-Month USD Libor+575 basis points), 6/21/20261,2,3 | $ | 749,772 | ||||
| 728,824 | Windstream Services LLC 6.250% (3-Month USD Libor+200 basis points), 4/24/20211,3 | 434,379 | ||||||
| 522,998 | Zelis Payments Buyer, Inc. 4.911% (1-Month USD Libor+475 basis points), 9/30/20261,2,3 | 522,719 | ||||||
| Total Bank Loans | ||||||||
| (Cost $18,716,096) | 16,713,463 | |||||||
| BONDS — 86.4% | ||||||||
| ASSET-BACKED SECURITIES — 67.3% | ||||||||
| 1,000,000 | AIMCO CLO Ltd. Series 2019-10A, Class E, 6.808% (3-Month USD Libor+655 basis points), 7/22/20322,3,7 | 897,709 | ||||||
| AIMCO CLO Series | ||||||||
| 5,000,000 | Series 2015-AA, Class SUB, 0.000%, 1/15/20282,7,8 | 1,637,388 | ||||||
| 1,000,000 | Series 2015-AA, Class DR, 2.725% (3-Month USD Libor+245 basis points), 1/15/20282,3,7 | 935,308 | ||||||
| 750,000 | Series 2015-AA, Class FR, 7.275% (3-Month USD Libor+700 basis points), 1/15/20282,3,7 | 543,216 | ||||||
| Annisa CLO Ltd. | ||||||||
| 1,000,000 | Series 2016-2A, Class DR, 3.272% (3-Month USD Libor+300 basis points), 7/20/20312,3,7 | 943,726 | ||||||
| 2,000,000 | Series 2016-2A, Class ER, 6.272% (3-Month USD Libor+600 basis points), 7/20/20312,3,7 | 1,753,943 | ||||||
| Apidos CLO | ||||||||
| 1,500,000 | Series 2015-21A, Class DR, 5.472% (3-Month USD Libor+520 basis points), 7/18/20272,3,7 | 1,179,595 | ||||||
| 750,000 | Series 2017-26A, Class C, 3.972% (3-Month USD Libor+370 basis points), 7/18/20292,3,7 | 705,684 | ||||||
| 650,000 | Series 2016-24A, Class DR, 6.072% (3-Month USD Libor+580 basis points), 10/20/20302,3,7 | 523,215 | ||||||
| 1,000,000 | Series 2016-24A, Class ER, 8.127% (3-Month USD Libor+785.5 basis points), 10/20/20302,3,7 | 615,709 | ||||||
| 1,000,000 | Series 2018-18A, Class E, 5.958% (3-Month USD Libor+570 basis points), 10/22/20302,3,7 | 805,155 | ||||||
| 925,000 | Series 2017-28A, Class D, 5.772% (3-Month USD Libor+550 basis points), 1/20/20312,3,7 | 743,361 | ||||||
| 2,000,000 | Series 2013-12A, Class DR, 2.875% (3-Month USD Libor+260 basis points), 4/15/20312,3,7 | 1,756,564 | ||||||
| 400,000 | Series 2019-31A, Class D, 3.925% (3-Month USD Libor+365 basis points), 4/15/20312,3,7 | 377,434 | ||||||
| 1,750,000 | Series 2013-12A, Class ER, 5.675% (3-Month USD Libor+540 basis points), 4/15/20312,3,7 | 1,392,817 | ||||||
14
Palmer Square Opportunistic Income Fund
SCHEDULE OF INVESTMENTS - Continued
As of July 31, 2020
Principal | Value | |||||||
| BONDS (Continued) | ||||||||
| ASSET-BACKED SECURITIES (Continued) | ||||||||
| $ | 1,000,000 | Series 2019-31A, Class E, 7.025% (3-Month USD Libor+675 basis points), 4/15/20312,3,7 | $ | 903,656 | ||||
| 1,000,000 | Series 2015-22A, Class CR, 3.222% (3-Month USD Libor+295 basis points), 4/20/20312,3,7 | 940,000 | ||||||
| 500,000 | Series 2013-15A, Class ERR, 5.972% (3-Month USD Libor+570 basis points), 4/20/20312,3,7 | 408,716 | ||||||
| 1,000,000 | Series 2015-22A, Class DR, 7.022% (3-Month USD Libor+675 basis points), 4/20/20312,3,7 | 911,991 | ||||||
| 1,250,000 | Series 2015-22A, Class ER, 8.922% (3-Month USD Libor+865 basis points), 4/20/20312,3,7 | 979,631 | ||||||
| 1,500,000 | Series 2015-20A, Class SUB, 0.000%, 7/16/20312,7,8 | 608,628 | ||||||
| 750,000 | Series 2015-20A, Class DR, 5.971% (3-Month USD Libor+570 basis points), 7/16/20312,3,7 | 620,264 | ||||||
| 1,000,000 | Ares CLO Ltd. Series 2015-2A, Class ER, 7.123% (3-Month USD Libor+685 basis points), 4/17/20332,3,7 | 905,000 | ||||||
| 1,166,667 | Atrium Series 15A, Class D, 3.256% (3-Month USD Libor+300 basis points), 1/23/20312,3,7 | 1,089,185 | ||||||
| Bardot CLO Ltd. | ||||||||
| 750,000 | Series 2019-2A, Class D, 4.058% (3-Month USD Libor+380 basis points), 10/22/20322,3,7 | 743,413 | ||||||
| 1,000,000 | Series 2019-2A, Class E, 7.208% (3-Month USD Libor+695 basis points), 10/22/20322,3,7 | 908,439 | ||||||
| Barings CLO Ltd. | ||||||||
| 1,750,000 | Series 2013-IA, Class CR, 1.772% (3-Month USD Libor+150 basis points), 1/20/20282,3,7 | 1,676,476 | ||||||
| 1,450,000 | Series 2013-IA, Class DR, 2.822% (3-Month USD Libor+255 basis points), 1/20/20282,3,7 | 1,346,325 | ||||||
| 1,750,000 | Series 2017-1A, Class E, 6.272% (3-Month USD Libor+600 basis points), 7/18/20292,3,7 | 1,578,621 | ||||||
| 750,000 | Series 2017-1A, Class F, 7.722% (3-Month USD Libor+745 basis points), 7/18/20292,3,7 | 555,040 | ||||||
| 1,000,000 | Barings CLO Ltd. Series 2019-1A, Class E, 6.955% (3-Month USD Libor+668 basis points), 4/15/20312,3,7 | 910,387 | ||||||
| Benefit Street Partners CLO Ltd. | ||||||||
| 1,250,000 | Series 2014-IVA, Class CRR, 4.072% (3-Month USD Libor+380 basis points), 1/20/20292,3,7 | 1,158,797 | ||||||
| 2,000,000 | Series 2017-11A, Class E, 7.475% (3-Month USD Libor+720 basis points), 4/15/20292,3,7 | 1,319,585 | ||||||
15
Palmer Square Opportunistic Income Fund
SCHEDULE OF INVESTMENTS - Continued
As of July 31, 2020
Principal | Value | |||||||
| BONDS (Continued) | ||||||||
| ASSET-BACKED SECURITIES (Continued) | ||||||||
| $ | 805,000 | Series 2013-IIA, Class CR, 3.975% (3-Month USD Libor+370 basis points), 7/15/20292,3,7 | $ | 728,192 | ||||
| 750,000 | Series 2018-5BA, Class C, 3.202% (3-Month USD Libor+293 basis points), 4/20/20312,3,7 | 652,213 | ||||||
| 1,250,000 | Series 2018-14A, Class E, 5.622% (3-Month USD Libor+535 basis points), 4/20/20312,3,7 | 955,519 | ||||||
| 1,000,000 | Series 2018-5BA, Class D, 6.222% (3-Month USD Libor+595 basis points), 4/20/20312,3,7 | 759,970 | ||||||
| 1,600,000 | Series 2016-9A, Class ER, 5.972% (3-Month USD Libor+570 basis points), 7/20/20312,3,7 | 1,209,746 | ||||||
| 1,000,000 | Series 2019-17A, Class E, 6.875% (3-Month USD Libor+660 basis points), 7/15/20322,3,7 | 883,144 | ||||||
| 1,000,000 | BlueMountain CLO Ltd. Series 2019-25A, Class E, 6.975% (3-Month USD Libor+670 basis points), 7/15/20322,3,7 | 848,552 | ||||||
| 500,000 | Carbone CLO Ltd. Series 2017-1A, Class D, 6.172% (3-Month USD Libor+590 basis points), 1/20/20312,3,7 | 438,391 | ||||||
| 1,000,000 | Carlyle Global Market Strategies CLO Ltd. Series 2015-2A, Class CR, 2.495% (3-Month USD Libor+225 basis points), 4/27/20272,3,7 | 928,500 | ||||||
| 1,303,000 | Carlyle U.S. CLO Ltd. Series 2019-3A, Class D, 7.302% (3-Month USD Libor+703 basis points), 10/20/20322,3,7 | 1,177,354 | ||||||
| 1,250,000 | Catamaran CLO Ltd. Series 2013-1A, Class DR, 3.045% (3-Month USD Libor+280 basis points), 1/27/20282,3,7 | 1,087,554 | ||||||
| 1,250,000 | Cedar Funding Ltd. Series 2016-6A, Class DR, 3.272% (3-Month USD Libor+300 basis points), 10/20/20282,3,7 | 1,168,462 | ||||||
| 750,000 | Chenango Park CLO Ltd. Series 2018-1A, Class D, 6.075% (3-Month USD Libor+580 basis points), 4/15/20302,3,7 | 633,033 | ||||||
| CIFC Funding Ltd. | ||||||||
| 750,000 | Series 2015-3A, Class DR, 2.772% (3-Month USD Libor+250 basis points), 4/19/20292,3,7 | 678,908 | ||||||
| 750,000 | Series 2018-1A, Class D, 2.922% (3-Month USD Libor+265 basis points), 4/18/20312,3,7 | 687,374 | ||||||
| 500,000 | Series 2018-3A, Class E, 5.772% (3-Month USD Libor+550 basis points), 7/18/20312,3,7 | 427,047 | ||||||
| 750,000 | Series 2019-5A, Class D, 7.115% (3-Month USD Libor+684 basis points), 10/15/20322,3,7 | 687,667 | ||||||
16
Palmer Square Opportunistic Income Fund
SCHEDULE OF INVESTMENTS - Continued
As of July 31, 2020
Principal | Value | |||||||
| BONDS (Continued) | ||||||||
| ASSET-BACKED SECURITIES (Continued) | ||||||||
| $ | 2,000,000 | Cumberland Park CLO Ltd. Series 2015-2A, Class ER, 5.922% (3-Month USD Libor+565 basis points), 7/20/20282,3,7 | $ | 1,755,846 | ||||
| Dryden CLO Ltd. | ||||||||
| 1,265,000 | Series 2018-64A, Class F, 7.422% (3-Month USD Libor+715 basis points), 4/18/20312,3,7 | 818,969 | ||||||
| 2,000,000 | Series 2018-57A, Class A, 1.402% (3-Month USD Libor+101 basis points), 5/15/20312,3,7 | 1,957,707 | ||||||
| 995,000 | Series 2018-57A, Class D, 2.942% (3-Month USD Libor+255 basis points), 5/15/20312,3,7 | 883,920 | ||||||
| 330,000 | Series 2018-57A, Class E, 5.592% (3-Month USD Libor+520 basis points), 5/15/20312,3,7 | 269,838 | ||||||
| 550,000 | Series 2020-77A, Class D1, 5.514% (3-Month USD Libor+514 basis points), 5/20/20312,3,7 | 550,503 | ||||||
| 1,500,000 | Series 2018-58A, Class A1, 1.273% (3-Month USD Libor+100 basis points), 7/17/20312,3,7 | 1,464,422 | ||||||
| 1,000,000 | Series 2018-70A, Class E, 6.321% (3-Month USD Libor+605 basis points), 1/16/20322,3,7 | 896,410 | ||||||
| 250,000 | Series 2019-72A, Class E, 7.192% (3-Month USD Libor+680 basis points), 5/15/20322,3,7 | 230,652 | ||||||
| 500,000 | Series 2020-78A, Class D, 4.267% (3-Month USD Libor+300 basis points), 4/17/20332,3,7 | 454,178 | ||||||
| Dryden Senior Loan Fund | ||||||||
| 1,750,000 | Series 2012-25A, Class DRR, 3.275% (3-Month USD Libor+300 basis points), 10/15/20272,3,7 | 1,636,584 | ||||||
| 7,000,000 | Series 2014-33X, Class SUBR, 0.000%, 4/15/20292,8 | 2,335,814 | ||||||
| 1,000,000 | Series 2017-54A, Class E, 6.472% (3-Month USD Libor+620 basis points), 10/19/20292,3,7 | 868,283 | ||||||
| 1,125,000 | Series 2015-38A, Class ER, 5.875% (3-Month USD Libor+560 basis points), 7/15/20302,3,7 | 909,188 | ||||||
| 1,775,000 | Series 2017-50A, Class E, 6.535% (3-Month USD Libor+626 basis points), 7/15/20302,3,7 | 1,572,693 | ||||||
| 500,000 | Series 2016-45A, Class DR, 3.425% (3-Month USD Libor+315 basis points), 10/15/20302,3,7 | 472,170 | ||||||
| 500,000 | Series 2016-45A, Class ER, 6.125% (3-Month USD Libor+585 basis points), 10/15/20302,3,7 | 423,095 | ||||||
| 1,500,000 | Series 2015-41A, Class ER, 5.575% (3-Month USD Libor+530 basis points), 4/15/20312,3,7 | 1,193,708 | ||||||
| Eaton Vance CLO Ltd. | ||||||||
| 1,075,000 | Series 2015-1A, Class DR, 2.772% (3-Month USD Libor+250 basis points), 1/20/20302,3,7 | 969,012 | ||||||
17
Palmer Square Opportunistic Income Fund
SCHEDULE OF INVESTMENTS - Continued
As of July 31, 2020
Principal | Value | |||||||
| BONDS (Continued) | ||||||||
| ASSET-BACKED SECURITIES (Continued) | ||||||||
| $ | 850,000 | Series 2015-1A, Class ER, 5.872% (3-Month USD Libor+560 basis points), 1/20/20302,3,7 | $ | 725,377 | ||||
| 750,000 | Series 2014-1RA, Class D, 3.325% (3-Month USD Libor+305 basis points), 7/15/20302,3,7 | 697,424 | ||||||
| 500,000 | Series 2014-1RA, Class E, 5.975% (3-Month USD Libor+570 basis points), 7/15/20302,3,7 | 418,609 | ||||||
| 750,000 | Series 2018-1A, Class D, 3.475% (3-Month USD Libor+320 basis points), 10/15/20302,3,7 | 719,285 | ||||||
| 1,000,000 | Series 2019-1A, Class E, 7.025% (3-Month USD Libor+675 basis points), 4/15/20312,3,7 | 919,237 | ||||||
| Flatiron CLO Ltd. | ||||||||
| 1,500,000 | Series 2015-1A, Class E, 4.975% (3-Month USD Libor+470 basis points), 4/15/20272,3,7 | 1,327,718 | ||||||
| 1,500,000 | Series 2017-1A, Class SUB, 0.000%, 5/15/20302,7,8 | 802,500 | ||||||
| 500,000 | Galaxy CLO Ltd. Series 2017-24A, Class E, 5.775% (3-Month USD Libor+550 basis points), 1/15/20312,3,7 | 421,111 | ||||||
| 1,500,000 | Goldentree Loan Opportunities Ltd. Series 2016-12A, Class ER, 5.671% (3-Month USD Libor+540 basis points), 7/21/20302,3,7 | 1,279,281 | ||||||
| 1,451,000 | GoldenTree Loan Opportunities Ltd. Series 2014-9A, Class ER2, 5.930% (3-Month USD Libor+566 basis points), 10/29/20292,3,7 | 1,208,470 | ||||||
| Highbridge Loan Management Ltd. | ||||||||
| 1,250,000 | Series 7A-2015, Class DR, 2.792% (3-Month USD Libor+240 basis points), 3/15/20272,3,7 | 1,117,946 | ||||||
| 1,000,000 | Series 7A-2015, Class FR, 6.992% (3-Month USD Libor+660 basis points), 3/15/20272,3,7 | 684,503 | ||||||
| 850,000 | Series 3A-2014, Class CR, 3.872% (3-Month USD Libor+360 basis points), 7/18/20292,3,7 | 794,725 | ||||||
| 500,000 | Series 5A-2015, Class DRR, 3.425% (3-Month USD Libor+315 basis points), 10/15/20302,3,7 | 447,587 | ||||||
| 1,250,000 | Series 5A-2015, Class ERR, 6.275% (3-Month USD Libor+600 basis points), 10/15/20302,3,7 | 1,016,935 | ||||||
| 750,000 | Series 6A-2015, Class BR, 2.291% (3-Month USD Libor+175 basis points), 2/5/20312,3,7 | 697,835 | ||||||
| 500,000 | HPS Loan Management Ltd. Series 8A-2016, Class ER, 5.772% (3-Month USD Libor+550 basis points), 7/20/20302,3,7 | 414,684 | ||||||
| 600,000 | LCM Ltd. Series 28A, Class E, 6.022% (3-Month USD Libor+575 basis points), 10/20/20302,3,7 | 473,526 | ||||||
18
Palmer Square Opportunistic Income Fund
SCHEDULE OF INVESTMENTS - Continued
As of July 31, 2020
Principal | Value | |||||||
| BONDS (Continued) | ||||||||
| ASSET-BACKED SECURITIES (Continued) | ||||||||
| $ | 500,000 | Limerock CLO LLC Series 2014-3A, Class D, 5.422% (3-Month USD Libor+515 basis points), 10/20/20262,3,7 | $ | 391,987 | ||||
| Madison Park Funding Ltd. | ||||||||
| 500,000 | Series 2015-16A, Class C, 3.972% (3-Month USD Libor+370 basis points), 4/20/20262,3,7 | 488,599 | ||||||
| 1,250,000 | Series 2015-19A, Class CR, 2.408% (3-Month USD Libor+215 basis points), 1/22/20282,3,7 | 1,154,589 | ||||||
| 1,460,000 | Series 2015-19A, Class DR, 4.608% (3-Month USD Libor+435 basis points), 1/22/20282,3,7 | 1,238,481 | ||||||
| 250,000 | Series 2018-27A, Class C, 2.872% (3-Month USD Libor+260 basis points), 4/20/20302,3,7 | 223,303 | ||||||
| 1,000,000 | Series 2016-21A, Class C2R, 5.995% (3-Month USD Libor+572 basis points), 10/15/20322,3,7 | 993,135 | ||||||
| Magnetite Ltd. | ||||||||
| 1,500,000 | Series 2015-16A, Class DR, 2.422% (3-Month USD Libor+215 basis points), 1/18/20282,3,7 | 1,393,531 | ||||||
| 500,000 | Series 2015-16A, Class ER, 5.272% (3-Month USD Libor+500 basis points), 1/18/20282,3,7 | 434,470 | ||||||
| 250,000 | Series 2019-22A, Class D, 3.925% (3-Month USD Libor+365 basis points), 4/15/20312,3,7 | 243,263 | ||||||
| 500,000 | Series 2019-22A, Class E, 7.025% (3-Month USD Libor+675 basis points), 4/15/20312,3,7 | 459,438 | ||||||
| 1,000,000 | Series 2016-17A, Class DR, 3.172% (3-Month USD Libor+290 basis points), 7/20/20312,3,7 | 945,314 | ||||||
| 250,000 | Series 2015-12A, Class DR, 3.275% (3-Month USD Libor+300 basis points), 10/15/20312,3,7 | 236,857 | ||||||
| 500,000 | Series 2015-12A, Class ER, 5.955% (3-Month USD Libor+568 basis points), 10/15/20312,3,7 | 423,611 | ||||||
| 1,500,000 | Series 2015-14RA, Class F, 8.202% (3-Month USD Libor+793 basis points), 10/18/20312,3,7 | 1,158,706 | ||||||
| 625,000 | Series 2019-24A, Class E, 7.225% (3-Month USD Libor+695 basis points), 1/15/20332,3,7 | 579,287 | ||||||
| 1,000,000 | Mariner CLO Ltd. Series 2019-1A, Class D, 4.118% (3-Month USD Libor+385 basis points), 4/30/20322,3,7 | 967,710 | ||||||
| 1,500,000 | Mountain View CLO LLC Series 2016-1A, Class DR, 3.968% (3-Month USD Libor+370 basis points), 4/14/20332,3,7 | 1,352,411 | ||||||
| Mountain View CLO Ltd. | ||||||||
| 1,000,000 | Series 2015-10A, Class E, 5.116% (3-Month USD Libor+485 basis points), 10/13/20272,3,7 | 764,693 | ||||||
19
Palmer Square Opportunistic Income Fund
SCHEDULE OF INVESTMENTS - Continued
As of July 31, 2020
Principal | Value | |||||||
| BONDS (Continued) | ||||||||
| ASSET-BACKED SECURITIES (Continued) | ||||||||
| $ | 1,300,000 | Series 2019-2A, Class D, 4.645% (3-Month USD Libor+437 basis points), 1/15/20332,3,7 | $ | 1,273,995 | ||||
| Neuberger Berman CLO Ltd. | ||||||||
| 4,000,000 | Series 2015-20A, Class SUB, 0.000%, 1/15/20282,7,8 | 1,381,438 | ||||||
| 1,500,000 | Series 2017-16SA, Class D, 2.775% (3-Month USD Libor+250 basis points), 1/15/20282,3,7 | 1,420,255 | ||||||
| 550,000 | Series 2015-20A, Class FR, 7.725% (3-Month USD Libor+745 basis points), 1/15/20282,3,7 | 374,440 | ||||||
| 325,000 | Series 2016-22A, Class DR, 3.373% (3-Month USD Libor+310 basis points), 10/17/20302,3,7 | 299,129 | ||||||
| 1,000,000 | Series 2016-22A, Class ER, 6.333% (3-Month USD Libor+606 basis points), 10/17/20302,3,7 | 857,207 | ||||||
| 350,000 | Series 2014-18A, Class CR2, 3.271% (3-Month USD Libor+300 basis points), 10/21/20302,3,7 | 311,735 | ||||||
| 2,000,000 | Series 2014-18A, Class DR2, 6.191% (3-Month USD Libor+592 basis points), 10/21/20302,3,7 | 1,605,076 | ||||||
| Neuberger Berman Loan Advisers CLO Ltd. | ||||||||
| 916,000 | Series 2018-27A, Class E, 5.475% (3-Month USD Libor+520 basis points), 1/15/20302,3,7 | 767,356 | ||||||
| 1,000,000 | Series 2017-24A, Class E, 6.292% (3-Month USD Libor+602 basis points), 4/19/20302,3,7 | 892,955 | ||||||
| 1,000,000 | Series 2017-26A, Class E, 6.172% (3-Month USD Libor+590 basis points), 10/18/20302,3,7 | 890,907 | ||||||
| 1,250,000 | Series 2018-30A, Class E, 7.022% (3-Month USD Libor+675 basis points), 1/20/20312,3,7 | 1,173,474 | ||||||
| 1,000,000 | Series 2020-37A, Class E, 7.219% (3-Month USD Libor+705 basis points), 7/20/20312,3,7 | 953,197 | ||||||
| 1,250,000 | Series 2018-29A, Class E, 5.872% (3-Month USD Libor+560 basis points), 10/19/20312,3,7 | 1,062,324 | ||||||
| 1,250,000 | Series 2019-32A, Class E, 6.972% (3-Month USD Libor+670 basis points), 1/19/20322,3,7 | 1,170,606 | ||||||
| 778,045 | Series 2019-35A, Class D, 3.972% (3-Month USD Libor+370 basis points), 1/19/20332,3,7 | 740,592 | ||||||
| Newark BSL CLO Ltd. | ||||||||
| 1,000,000 | Series 2016-1A, Class BR, 2.245% (3-Month USD Libor+200 basis points), 12/21/20292,3,7 | 964,597 | ||||||
| 1,000,000 | Series 2016-1A, Class CR, 3.245% (3-Month USD Libor+300 basis points), 12/21/20292,3,7 | 932,548 | ||||||
| 500,000 | Series 2017-1A, Class A1, 1.515% (3-Month USD Libor+127 basis points), 7/25/20302,3,7 | 492,731 | ||||||
20
Palmer Square Opportunistic Income Fund
SCHEDULE OF INVESTMENTS - Continued
As of July 31, 2020
Principal | Value | |||||||
| BONDS (Continued) | ||||||||
| ASSET-BACKED SECURITIES (Continued) | ||||||||
| OCP CLO Ltd. | ||||||||
| $ | 1,350,000 | Series 2017-13A, Class D, 6.905% (3-Month USD Libor+663 basis points), 7/15/20302,3,7 | $ | 1,245,555 | ||||
| 500,000 | Series 2019-17A, Class E, 6.932% (3-Month USD Libor+666 basis points), 7/20/20322,3,7 | 449,664 | ||||||
| Octagon Investment Partners Ltd. | ||||||||
| 500,000 | Series 2014-1A, Class E, 5.125% (3-Month USD Libor+485 basis points), 4/15/20262,3,7 | 442,935 | ||||||
| 575,000 | Series 2015-1A, Class DR, 2.825% (3-Month USD Libor+255 basis points), 7/15/20272,3,7 | 534,830 | ||||||
| 500,000 | Series 2017-1A, Class E, 6.572% (3-Month USD Libor+630 basis points), 7/20/20302,3,7 | 463,421 | ||||||
| 500,000 | Series 2019-1A, Class A, 1.572% (3-Month USD Libor+130 basis points), 7/20/20322,3,7 | 493,957 | ||||||
| 1,000,000 | OHA Credit Funding Ltd. Series 2019-2A, Class E, 5.771% (3-Month USD Libor+550 basis points), 4/21/20312,3,7 | 837,918 | ||||||
| Regatta Funding Ltd. | ||||||||
| 1,000,000 | Series 2017-1A, Class E, 6.373% (3-Month USD Libor+610 basis points), 10/17/20302,3,7 | 887,590 | ||||||
| 1,500,000 | Series 2018-4A, Class D, 6.745% (3-Month USD Libor+650 basis points), 10/25/20312,3,7 | 1,271,925 | ||||||
| 1,000,000 | Series 2019-2A, Class D, 4.175% (3-Month USD Libor+390 basis points), 1/15/20332,3,7 | 978,305 | ||||||
| 1,150,000 | Riserva CLO Ltd. Series 2016-3A, Class DR, 3.722% (3-Month USD Libor+345 basis points), 10/18/20282,3,7 | 1,110,526 | ||||||
| Rockford Tower CLO Ltd. | ||||||||
| 1,000,000 | Series 2017-1A, Class E, 5.675% (3-Month USD Libor+540 basis points), 4/15/20292,3,7 | 828,589 | ||||||
| 500,000 | Series 2017-3A, Class D, 2.922% (3-Month USD Libor+265 basis points), 10/20/20302,3,7 | 457,683 | ||||||
| 500,000 | Series 2018-1A, Class D, 3.377% (3-Month USD Libor+300 basis points), 5/20/20312,3,7 | 458,953 | ||||||
| 1,300,000 | Series 2019-1A, Class E, 6.632% (3-Month USD Libor+636 basis points), 4/20/20322,3,7 | 1,137,737 | ||||||
| TCI-Flatiron CLO Ltd. | ||||||||
| 750,000 | Series 2017-1A, Class D, 3.136% (3-Month USD Libor+275 basis points), 11/18/20302,3,7 | 686,754 | ||||||
| 750,000 | Series 2018-1A, Class D, 3.970% (3-Month USD Libor+370 basis points), 1/29/20322,3,7 | 733,430 | ||||||
21
Palmer Square Opportunistic Income Fund
SCHEDULE OF INVESTMENTS - Continued
As of July 31, 2020
Principal | Value | |||||||
| BONDS (Continued) | ||||||||
| ASSET-BACKED SECURITIES (Continued) | ||||||||
| $ | 1,000,000 | Series 2018-1A, Class E, 6.870% (3-Month USD Libor+660 basis points), 1/29/20322,3,7 | $ | 913,847 | ||||
| 1,000,000 | TCI-Symphony CLO Ltd. Series 2016-1A, Class DR, 3.266% (3-Month USD Libor+300 basis points), 10/13/20292,3,7 | 905,667 | ||||||
| 700,000 | Thayer Park CLO Ltd. Series 2017-1A, Class D, 6.372% (3-Month USD Libor+610 basis points), 4/20/20292,3,7 | 597,089 | ||||||
| 500,000 | Treman Park CLO Ltd. Series 2015-1A, Class DRR, 2.922% (3-Month USD Libor+265 basis points), 10/20/20282,3,7 | 473,968 | ||||||
| 1,000,000 | Upland CLO Ltd. Series 2016-1A, Class CR, 3.172% (3-Month USD Libor+290 basis points), 4/20/20312,3,7 | 906,086 | ||||||
| Voya CLO Ltd. | ||||||||
| 750,000 | Series 2014-3A, Class CR, 2.895% (3-Month USD Libor+265 basis points), 7/25/20262,3,7 | 699,158 | ||||||
| 750,000 | Series 2015-1A, Class CR, 2.622% (3-Month USD Libor+235 basis points), 1/18/20292,3,7 | 663,438 | ||||||
| 500,000 | Series 2017-2A, Class D, 6.295% (3-Month USD Libor+602 basis points), 6/7/20302,3,7 | 421,199 | ||||||
| 500,000 | Series 2013-1A, Class CR, 3.225% (3-Month USD Libor+295 basis points), 10/15/20302,3,7 | 441,649 | ||||||
| 880,000 | Series 2016-1A, Class DR, 5.522% (3-Month USD Libor+525 basis points), 1/20/20312,3,7 | 699,709 | ||||||
| 1,000,000 | Series 2018-1A, Class C, 2.872% (3-Month USD Libor+260 basis points), 4/19/20312,3,7 | 889,387 | ||||||
| 1,000,000 | Series 2018-1A, Class D, 5.472% (3-Month USD Libor+520 basis points), 4/19/20312,3,7 | 816,765 | ||||||
| 500,000 | Series 2018-2A, Class E, 5.525% (3-Month USD Libor+525 basis points), 7/15/20312,3,7 | 408,331 | ||||||
| 795,000 | Series 2018-2A, Class F, 7.565% (3-Month USD Libor+729 basis points), 7/15/20312,3,7 | 586,785 | ||||||
| 650,000 | Series 2018-3A, Class D, 3.275% (3-Month USD Libor+300 basis points), 10/15/20312,3,7 | 588,972 | ||||||
| 1,500,000 | Series 2018-4A, Class E, 6.575% (3-Month USD Libor+630 basis points), 1/15/20322,3,7 | 1,367,484 | ||||||
| 250,000 | Webster Park CLO Ltd. Series 2015-1A, Class DR, 5.772% (3-Month USD Libor+550 basis points), 7/20/20302,3,7 | 210,437 | ||||||
| 500,000 | Westcott Park CLO Ltd. Series 2016-1A, Class ER, 6.672% (3-Month USD Libor+640 basis points), 7/20/20282,3,7 | 451,074 | ||||||
22
Palmer Square Opportunistic Income Fund
SCHEDULE OF INVESTMENTS - Continued
As of July 31, 2020
Principal | Value | |||||||
| BONDS (Continued) | ||||||||
| ASSET-BACKED SECURITIES (Continued) | ||||||||
| York CLO Ltd. | ||||||||
| $ | 1,225,000 | Series 2016-1A, Class ER, 6.672% (3-Month USD Libor+640 basis points), 10/20/20292,3,7 | $ | 1,078,478 | ||||
| 500,000 | Series 2014-1A, Class DRR, 3.268% (3-Month USD Libor+301 basis points), 10/22/20292,3,7 | 466,633 | ||||||
| 1,500,000 | Series 2015-1A, Class AR, 1.408% (3-Month USD Libor+115 basis points), 1/22/20312,3,7 | 1,473,395 | ||||||
| 750,000 | Series 2018-1A, Class D, 3.608% (3-Month USD Libor+335 basis points), 10/22/20312,3,7 | 726,356 | ||||||
| 1,000,000 | Series 2018-1A, Class E, 6.268% (3-Month USD Libor+601 basis points), 10/22/20312,3,7 | 866,953 | ||||||
| 1,250,000 | Series 2019-1A, Class D, 4.258% (3-Month USD Libor+400 basis points), 7/22/20322,3,7 | 1,243,986 | ||||||
| 500,000 | Series 2019-1A, Class E, 7.318% (3-Month USD Libor+706 basis points), 7/22/20322,3,7 | 462,683 | ||||||
| 750,000 | Series 2019-2A, Class D, 4.058% (3-Month USD Libor+380 basis points), 1/22/20332,3,7 | 745,155 | ||||||
| 500,000 | Series 2019-2A, Class E, 7.198% (3-Month USD Libor+694 basis points), 1/22/20332,3,7 | 457,848 | ||||||
| Total Asset-Backed Securities | ||||||||
| (Cost $154,686,187) | 143,752,600 | |||||||
| COMMERCIAL MORTGAGE-BACKED SECURITIES — 1.8% | ||||||||
| 2,000,000 | AIMCO CLO Series Series 2015-AA, Class ER, 5.475% (3-Month USD Libor+520 basis points), 1/15/20282,3,7 | 1,742,885 | ||||||
| 1,437,000 | Benefit Street Partners CLO Ltd. Series 2015-VIA, Class CR, 3.722% (3-Month USD Libor+345 basis points), 10/18/20292,3,7 | 1,301,938 | ||||||
| 800,000 | Neuberger Berman Loan Advisers CLO Ltd. Series 2017-25A, Class D, 3.522% (3-Month USD Libor+325 basis points), 10/18/20292,3,7 | 756,590 | ||||||
| Total Commercial Mortgage-Backed Securities | ||||||||
| (Cost $4,160,376) | 3,801,413 | |||||||
| CORPORATE — 17.3% | ||||||||
| BASIC MATERIALS — 0.9% | ||||||||
| 118,000 | Kraton Polymers LLC / Kraton Polymers Capital Corp. 7.000%, 4/15/20252,7 | 122,544 | ||||||
| 68,000 | Neon Holdings, Inc. 10.125%, 4/1/20262,7 | 69,360 | ||||||
| 500,000 | Novelis Corp. 4.750%, 1/30/20302,7 | 522,693 | ||||||
23
Palmer Square Opportunistic Income Fund
SCHEDULE OF INVESTMENTS - Continued
As of July 31, 2020
Principal | Value | |||||||
| BONDS (Continued) | ||||||||
| CORPORATE (Continued) | ||||||||
| BASIC MATERIALS (Continued) | ||||||||
| $ | 650,000 | Olin Corp. 5.625%, 8/1/20292 | $ | 624,881 | ||||
| 500,000 | Tronox, Inc. 6.500%, 5/1/20252,7 | 532,812 | ||||||
| 1,872,290 | ||||||||
| COMMUNICATIONS — 2.4% | ||||||||
| 650,000 | CCO Holdings LLC / CCO Holdings Capital Corp. 5.375%, 6/1/20292,7 | 712,491 | ||||||
| 650,000 | CenturyLink, Inc. 4.000%, 2/15/20272,7 | 679,776 | ||||||
| 650,000 | LCPR Senior Secured Financing DAC 6.750%, 10/15/20272,6,7 | 703,137 | ||||||
| 650,000 | Match Group Holdings II LLC 4.625%, 6/1/20282,7 | 687,931 | ||||||
| 210,000 | Univision Communications, Inc. 6.625%, 6/1/20272,7 | 211,151 | ||||||
| 500,000 | UPC Holding B.V. 5.500%, 1/15/20282,6,7 | 508,658 | ||||||
| ViaSat, Inc. | ||||||||
| 750,000 | 5.625%, 9/15/20252,7 | 757,579 | ||||||
| 165,000 | 6.500%, 7/15/20282,7 | 169,759 | ||||||
| Virgin Media Secured Finance PLC | ||||||||
| 577,000 | 5.500%, 5/15/20292,6,7 | 629,847 | ||||||
| 45,000 | 4.500%, 8/15/20302,6,7 | 47,993 | ||||||
| 5,108,322 | ||||||||
| CONSUMER, CYCLICAL — 3.9% | ||||||||
| 440,000 | Abercrombie & Fitch Management Co. 8.750%, 7/15/20252,7 | 440,000 | ||||||
| 210,000 | American Builders & Contractors Supply Co., Inc. 4.000%, 1/15/20282,7 | 218,755 | ||||||
| 300,000 | Aramark Services, Inc. 5.000%, 2/1/20282,7 | 302,368 | ||||||
| 40,000 | Burlington Coat Factory Warehouse Corp. 6.250%, 4/15/20252,7 | 42,875 | ||||||
| 500,000 | Cinemark USA, Inc. 5.125%, 12/15/20222 | 436,757 | ||||||
| 500,000 | Core & Main LP 6.125%, 8/15/20252,7 | 516,290 | ||||||
| 335,000 | Dana, Inc. 5.625%, 6/15/20282 | 352,298 | ||||||
24
Palmer Square Opportunistic Income Fund
SCHEDULE OF INVESTMENTS - Continued
As of July 31, 2020
Principal | Value | |||||||
| BONDS (Continued) | ||||||||
| CORPORATE (Continued) | ||||||||
| CONSUMER, CYCLICAL (Continued) | ||||||||
| $ | 400,000 | Downstream Development Authority of the Quapaw Tribe of Oklahoma 10.500%, 2/15/20232,7,9 | $ | 319,458 | ||||
| Ford Motor Co. | ||||||||
| 590,000 | 9.000%, 4/22/20252 | 695,911 | ||||||
| 150,000 | 9.625%, 4/22/20302 | 199,259 | ||||||
| 255,000 | International Game Technology PLC 5.250%, 1/15/20292,6,7 | 260,966 | ||||||
| 205,000 | IRB Holding Corp. 7.000%, 6/15/20252,7 | 223,322 | ||||||
| 105,000 | L Brands, Inc. 6.875%, 7/1/20252,7 | 113,241 | ||||||
| 400,000 | Lions Gate Capital Holdings LLC 6.375%, 2/1/20242,7 | 405,010 | ||||||
| 80,000 | Macy's, Inc. 8.375%, 6/15/20252,7 | 83,877 | ||||||
| 650,000 | Michaels Stores, Inc. 8.000%, 7/15/20272,7 | 610,226 | ||||||
| 500,000 | Nordstrom, Inc. 8.750%, 5/15/20252,7 | 547,791 | ||||||
| Sally Holdings LLC / Sally Capital, Inc. | ||||||||
| 155,000 | 8.750%, 4/30/20252,7 | 175,441 | ||||||
| 550,000 | 5.625%, 12/1/20252 | 565,469 | ||||||
| 650,000 | Scientific Games International, Inc. 7.250%, 11/15/20292,7 | 595,848 | ||||||
| 85,000 | Taylor Morrison Communities, Inc. 5.125%, 8/1/20302,7 | 93,288 | ||||||
| 365,000 | Vail Resorts, Inc. 6.250%, 5/15/20252,7 | 393,744 | ||||||
| 200,000 | Wyndham Hotels & Resorts, Inc. 5.375%, 4/15/20262,7 | 204,581 | ||||||
| ZF North America Capital, Inc. | ||||||||
| 250,000 | 4.500%, 4/29/20227 | 262,188 | ||||||
| 250,000 | 4.750%, 4/29/20257 | 264,688 | ||||||
| 8,323,651 | ||||||||
| CONSUMER, NON-CYCLICAL — 2.4% | ||||||||
| 500,000 | AdaptHealth LLC 6.125%, 8/1/20282,7 | 522,325 | ||||||
| 650,000 | ASGN, Inc. 4.625%, 5/15/20282,7 | 665,723 | ||||||
25
Palmer Square Opportunistic Income Fund
SCHEDULE OF INVESTMENTS - Continued
As of July 31, 2020
| Principal Amount | Value | |||||||
| BONDS (Continued) | ||||||||
| CORPORATE (Continued) | ||||||||
| CONSUMER, NON-CYCLICAL (Continued) | ||||||||
| $ | 650,000 | DaVita, Inc. 4.625%, 6/1/20302,7 | $ | 692,039 | ||||
| Endo Dac / Endo Finance LLC / Endo Finco, Inc. | ||||||||
| 500,000 | 9.500%, 7/31/20272,6,7 | 540,000 | ||||||
| 169,000 | 6.000%, 6/30/20282,6,7 | 129,032 | ||||||
| 550,000 | GEMS MENASA Cayman Ltd. / GEMS Education Delaware LLC 7.125%, 7/31/20262,6 | 536,250 | ||||||
| 40,000 | Ortho-Clinical Diagnostics, Inc. / Ortho-Clinical Diagnostics S.A. 7.375%, 6/1/20252,7 | 42,675 | ||||||
| 66,000 | Par Pharmaceutical, Inc. 7.500%, 4/1/20272,7 | 70,286 | ||||||
| 300,000 | Radiology Partners, Inc. 9.250%, 2/1/20282,7 | 302,250 | ||||||
| 700,000 | RegionalCare Hospital Partners Holdings, Inc. / LifePoint Health, Inc. 9.750%, 12/1/20262,7 | 779,348 | ||||||
| 225,000 | Tenet Healthcare Corp. 6.875%, 11/15/2031 | 215,676 | ||||||
| 400,000 | U.S. Renal Care, Inc. 10.625%, 7/15/20272,7 | 427,174 | ||||||
| 310,000 | United Rentals, Inc. 3.875%, 2/15/20312 | 310,000 | ||||||
| 5,232,778 | ||||||||
| ENERGY — 1.2% | ||||||||
| CSI Compressco LP / CSI Compressco Finance, Inc. | ||||||||
| 75,000 | 7.500%, 4/1/20252,7 | 64,283 | ||||||
| 235,000 | 10.000%, 4/1/20262,7 | 145,700 | ||||||
| 471,000 | DCP Midstream Operating LP 5.125%, 5/15/20292 | 474,914 | ||||||
| 150,000 | Denbury Resources, Inc. 6.375%, 8/15/20212,9,10 | 3,750 | ||||||
| 300,000 | Murray Energy Corp. 11.250%, 4/15/20212,7,9,10 | 191 | ||||||
| 225,000 | Nabors Industries, Inc. 5.750%, 2/1/20252 | 89,695 | ||||||
| 500,000 | Occidental Petroleum Corp. 2.700%, 8/15/2022 | 483,602 | ||||||
| 450,000 | Peabody Energy Corp. 6.375%, 3/31/20252,7,9 | 226,406 | ||||||
| 700,000 | Sabine Pass Liquefaction LLC 4.200%, 3/15/20282 | 770,863 | ||||||
26
Palmer Square Opportunistic Income Fund
SCHEDULE OF INVESTMENTS - Continued
As of July 31, 2020
Principal | Value | |||||||
| BONDS (Continued) | ||||||||
| CORPORATE (Continued) | ||||||||
| ENERGY (Continued) | ||||||||
| $ | 400,000 | Tallgrass Energy Partners LP / Tallgrass Energy Finance Corp. 6.000%, 3/1/20272,7 | $ | 364,400 | ||||
| 2,623,804 | ||||||||
| FINANCIAL — 1.0% | ||||||||
| 500,000 | Brookfield Property REIT, Inc. / BPR Cumulus LLC / BPR Nimbus LLC / GGSI Sellco LL 5.750%, 5/15/20262,7 | 414,615 | ||||||
| 530,000 | Compass Group Diversified Holdings LLC 8.000%, 5/1/20262,7 | 561,037 | ||||||
| 235,000 | Diversified Healthcare Trust 9.750%, 6/15/20252 | 259,701 | ||||||
| Iron Mountain, Inc. | ||||||||
| 165,000 | 5.000%, 7/15/20282,7 | 170,983 | ||||||
| 485,000 | 5.250%, 7/15/20302,7 | 509,553 | ||||||
| 225,000 | NFP Corp. 6.875%, 8/15/20282,7 | 226,406 | ||||||
| 55,000 | Realogy Group LLC / Realogy Co.-Issuer Corp. 7.625%, 6/15/20252,7 | 57,804 | ||||||
| 2,200,099 | ||||||||
| INDUSTRIAL — 3.3% | ||||||||
| 650,000 | Amsted Industries, Inc. 4.625%, 5/15/20302,7 | 664,625 | ||||||
| 550,000 | Builders FirstSource, Inc. 5.000%, 3/1/20302,7 | 578,130 | ||||||
| 300,000 | Flex Ltd. 3.750%, 2/1/20262,6 | 327,824 | ||||||
| 350,000 | Forterra Finance LLC / FRTA Finance Corp. 6.500%, 7/15/20252,7 | 372,750 | ||||||
| 404,000 | Hillenbrand, Inc. 5.750%, 6/15/20252 | 435,057 | ||||||
| 510,000 | Howmet Aerospace, Inc. 5.125%, 10/1/20242 | 542,224 | ||||||
| 650,000 | JELD-WEN, Inc. 6.250%, 5/15/20252,7 | 698,750 | ||||||
| 500,000 | Owens-Brockway Glass Container, Inc. 6.625%, 5/13/20272,7 | 542,187 | ||||||
| 500,000 | Plastipak Holdings, Inc. 6.250%, 10/15/20252,7 | 500,937 | ||||||
| 400,000 | PowerTeam Services LLC 9.033%, 12/4/20252,7 | 425,450 | ||||||
27
Palmer Square Opportunistic Income Fund
SCHEDULE OF INVESTMENTS - Continued
As of July 31, 2020
Principal | Value | |||||||
| BONDS (Continued) | ||||||||
| CORPORATE (Continued) | ||||||||
| INDUSTRIAL (Continued) | ||||||||
| Standard Industries, Inc. | ||||||||
| $ | 450,000 | 6.000%, 10/15/20252,7 | $ | 470,059 | ||||
| 170,000 | 4.375%, 7/15/20302,7 | 183,861 | ||||||
| 500,000 | Summit Materials LLC / Summit Materials Finance Corp. 6.500%, 3/15/20272,7 | 552,590 | ||||||
| 400,000 | Trident TPI Holdings, Inc. 9.250%, 8/1/20242,7 | 425,712 | ||||||
| WESCO Distribution, Inc. | ||||||||
| 120,000 | 7.125%, 6/15/20252,7 | 131,846 | ||||||
| 160,000 | 7.250%, 6/15/20282,7 | 175,025 | ||||||
| 7,027,027 | ||||||||
| TECHNOLOGY — 1.9% | ||||||||
| 400,000 | BY Crown Parent LLC 7.375%, 10/15/20242,7 | 406,958 | ||||||
| 505,000 | BY Crown Parent LLC / BY Bond Finance, Inc. 4.250%, 1/31/20262,7 | 525,351 | ||||||
| 365,000 | Dell International LLC / EMC Corp. 4.900%, 10/1/20262,7 | 411,063 | ||||||
| 335,000 | Diebold Nixdorf, Inc. 9.375%, 7/15/20252,7 | 356,038 | ||||||
| 330,000 | Dun & Bradstreet Corp. 10.250%, 2/15/20272,7 | 375,456 | ||||||
| 500,000 | Everi Payments, Inc. 7.500%, 12/15/20252,7 | 486,823 | ||||||
| 230,000 | Exela Intermediate LLC / Exela Finance, Inc. 10.000%, 7/15/20232,7,9 | 58,581 | ||||||
| 250,000 | MagnaChip Semiconductor Corp. 6.625%, 7/15/20212 | 249,094 | ||||||
| 500,000 | MTS Systems Corp. 5.750%, 8/15/20272,7 | 488,505 | ||||||
| 650,000 | Science Applications International Corp. 4.875%, 4/1/20282,7 | 681,993 | ||||||
| 4,039,862 | ||||||||
| UTILITIES — 0.3% | ||||||||
| Calpine Corp. | ||||||||
| 170,000 | 4.625%, 2/1/20292,7 | 172,122 | ||||||
| 85,000 | 5.000%, 2/1/20312,7 | 87,327 | ||||||
| Talen Energy Supply LLC | ||||||||
| 350,000 | 6.500%, 6/1/20252,9 | 235,776 | ||||||
28
Palmer Square Opportunistic Income Fund
SCHEDULE OF INVESTMENTS - Continued
As of July 31, 2020
Principal | Value | |||||||
| BONDS (Continued) | ||||||||
| CORPORATE (Continued) | ||||||||
| UTILITIES (Continued) | ||||||||
| $ | 133,000 | 10.500%, 1/15/20262,7 | $ | 103,448 | ||||
| 598,673 | ||||||||
| Total Corporate | ||||||||
| (Cost $35,797,074) | 37,026,506 | |||||||
| Total Bonds | ||||||||
| (Cost $194,643,637) | 184,580,519 | |||||||
Number | ||||||||
| COMMON STOCKS — 0.0% | ||||||||
| ENERGY — 0.0% | ||||||||
| 12,991 | Pacific Drilling S.A.*,6 | 5,842 | ||||||
| TECHNOLOGY — 0.0% | ||||||||
| 17,360 | Exela Technologies, Inc.* | 8,859 | ||||||
| Total Common Stocks | ||||||||
| (Cost $304,593) | 14,701 | |||||||
| SHORT-TERM INVESTMENTS — 4.1% | ||||||||
| 231,406 | Fidelity Investments Money Market Funds - Treasury Portfolio - Class I, 0.06%9,11 | 231,406 | ||||||
| 8,411,592 | Federated Treasury Obligations Fund - Institutional Class, 0.09%11 | 8,411,592 | ||||||
| Total Short-Term Investments | ||||||||
| (Cost $8,642,998) | 8,642,998 | |||||||
| TOTAL INVESTMENTS — 98.3% | ||||||||
| (Cost $222,307,324) | 209,951,681 | |||||||
| Other Assets in Excess of Liabilities — 1.7% | 3,582,985 | |||||||
| TOTAL NET ASSETS — 100.0% | $ | 213,534,666 | ||||||
29
Palmer Square Opportunistic Income Fund
SCHEDULE OF INVESTMENTS - Continued
As of July 31, 2020
Principal | Value | |||||||
| SECURITIES SOLD SHORT — (0.5)% | ||||||||
| BONDS — (0.5)% | ||||||||
| CORPORATE — (0.5)% | ||||||||
| ENERGY — (0.5)% | ||||||||
| $ | (1,000,000 | ) | Continental Resources, Inc. 4.500%, 4/15/20232 | $ | (1,000,670 | ) | ||
| Total Corporate | ||||||||
| (Proceeds $990,028) | (1,000,670 | ) | ||||||
| Total Bonds | ||||||||
| (Proceeds $990,028) | (1,000,670 | ) | ||||||
| Total Securities Sold Short | ||||||||
| (Proceeds $990,028) | $ | (1,000,670 | ) | |||||
| * | Non-income producing security. |
| 1 | Bank loans generally pay interest at rates which are periodically determined by reference to a base lending rate plus a premium. All loans carry a variable rate of interest. These base lending rates are generally (i) the Prime Rate offered by one or more major United States banks, (ii) the lending rate offered by one or more European banks such as the London Interbank Offered Rate ("LIBOR") or (iii) the Certificate of Deposit rate. Bank Loans, while exempt from registration, under the Securities Act of 1933, contain certain restrictions on resale and cannot be sold publicly. Floating rate bank loans often require prepayments from excess cash flow or permit the borrower to repay at its election. The degree to which borrowers repay, whether as a contractual requirement or at their election, cannot be predicted with accuracy. |
| 2 | Callable. |
| 3 | Floating rate security. |
| 4 | All or a portion of the loan is unfunded. |
| 5 | Denotes investments purchased on a when-issued or delayed delivery basis. |
| 6 | Foreign security denominated in U.S. Dollars. |
| 7 | Security exempt from registration under Rule 144A of the Securities Act of 1933. These securities are restricted and may be resold in transactions exempt from registration normally to qualified institutional buyers. The total value of these securities is $174,435,704 which represents 81.69% of Net Assets. |
| 8 | Variable rate security. |
| 9 | All or a portion of this security is segregated as collateral for securities sold short. The market value of the securities pledged as collateral was $955,771, which represents 0.45% of total net assets of the Fund. |
| 10 | Security is in default. |
| 11 | The rate is the annualized seven-day yield at period end. |
See accompanying Notes to Financial Statements.
30
Palmer Square Opportunistic Income Fund
SUMMARY OF INVESTMENTS
As of July 31, 2020
| Security Type/Sector | Percent of Total Net Assets |
| Bonds | |
| Asset-Backed Securities | 67.3% |
| Corporate | 17.3% |
| Commercial Mortgage-Backed Securities | 1.8% |
| Total Bonds | 86.4% |
| Bank Loans | 7.8% |
| Common Stocks | |
| Technology | 0.0% |
| Energy | 0.0% |
| Total Common Stocks | 0.0% |
| Short-Term Investments | 4.1% |
| Total Investments | 98.3% |
| Other Assets in Excess of Liabilities | 1.7% |
| Total Net Assets | 100.0% |
See accompanying Notes to Financial Statements.
31
| Palmer Square Opportunistic Income Fund |
| STATEMENT OF ASSETS AND LIABILITIES |
| As of July 31, 2020 |
| Assets: | ||||
| Investments, at value (cost $222,307,324) | $ | 209,951,681 | ||
| Foreign currency, at value (cost $1,248) | 1,297 | |||
| Cash | 38,841 | |||
| Cash held at broker for securities sold short and swap contracts | 1,063,194 | |||
| Receivables: | ||||
| Investment securities sold | 4,325,386 | |||
| Fund shares sold | 75,695 | |||
| Interest | 961,844 | |||
| Prepaid expenses | 12,791 | |||
| Total assets | 216,430,729 | |||
| Liabilities: | ||||
| Securities sold short, at value (proceeds $990,028) | 1,000,670 | |||
| Payables: | ||||
| Investment securities purchased | 1,557,225 | |||
| Advisory fees | 184,313 | |||
| Shareholder servicing fees (Note 6) | 19,487 | |||
| Fund accounting and administration fees | 41,432 | |||
| Transfer agent fees and expenses | 25,408 | |||
| Custody fees | 3,730 | |||
| Auditing fees | 18,850 | |||
| Interest on securities sold short | 13,975 | |||
| Trustees' fees and expenses | 11,279 | |||
| Legal fees | 3,034 | |||
| Accrued other expenses | 16,660 | |||
| Total liabilities | 2,896,063 | |||
| Net Assets | $ | 213,534,666 | ||
| Components of Net Assets: | ||||
| Paid-in capital (par value of $0.01 per share with an unlimited number of shares authorized) | $ | 228,840,191 | ||
| Total accumulated deficit | (15,305,525 | ) | ||
| Net Assets | $ | 213,534,666 | ||
| Maximum Offering Price per Share: | ||||
| Net assets applicable to shares outstanding | $ | 213,534,666 | ||
| Shares of beneficial interest issued and outstanding | 12,692,698 | |||
| Redemption price per share | $ | 16.82 | ||
See accompanying Notes to Financial Statements.
32
| Palmer Square Opportunistic Income Fund |
| STATEMENT OF OPERATIONS |
| For the Year Ended July 31, 2020 |
| Investment Income: | ||||
| Interest | $ | 15,410,383 | ||
| Dividends | 719 | |||
| Total investment income | 15,411,102 | |||
| Expenses: | ||||
| Advisory fees | 1,852,559 | |||
| Shareholder servicing fees (Note 6) | 160,243 | |||
| Fund accounting and administration fees | 210,950 | |||
| Transfer agent fees and expenses | 95,745 | |||
| Custody fees | 19,025 | |||
| Interest on securities sold short | 346,690 | |||
| Legal fees | 98,451 | |||
| Trustees' fees and expenses | 60,415 | |||
| Registration fees | 35,733 | |||
| Miscellaneous | 35,323 | |||
| Shareholder reporting fees | 34,516 | |||
| Auditing fees | 19,224 | |||
| Insurance fees | 18,105 | |||
| Commitment fees (Note 11) | 7,745 | |||
| Total expenses | 2,994,724 | |||
| Advisory fees recovered | 140,679 | |||
| Fees paid indirectly (Note 3) | (2,129 | ) | ||
| Net expenses | 3,133,274 | |||
| Net investment income | 12,277,828 | |||
| Realized and Unrealized Gain (Loss): | ||||
| Net realized gain (loss) on: | ||||
| Investments | (4,491,528 | ) | ||
| Purchased options contracts | 165,298 | |||
| Securities sold short | 1,108,193 | |||
| Swaptions contracts | (24,057 | ) | ||
| Swap contracts | 871,237 | |||
| Foreign currency transactions | (64 | ) | ||
| Net realized loss | (2,370,921 | ) | ||
| Net change in unrealized appreciation/depreciation on: | ||||
| Investments | (9,169,871 | ) | ||
| Purchased options contracts | 144,384 | |||
| Securities sold short | 39,273 | |||
| Swap contracts | 1,857 | |||
| Foreign currency translations | 78 | |||
| Net change in unrealized appreciation/depreciation | (8,984,279 | ) | ||
| Net realized and unrealized loss on investments, purchased options contracts, securities sold short, swaptions contracts, swap contracts, and foreign currency | (11,355,200 | ) | ||
| Net Increase in Net Assets from Operations | $ | 922,628 |
See accompanying Notes to Financial Statements.
33
| Palmer Square Opportunistic Income Fund |
| STATEMENTS OF CHANGES IN NET ASSETS |
| For the | For the | ||||||||||
| Year Ended | Year Ended | ||||||||||
| July 31, 2020 | July 31, 2019 | ||||||||||
| Increase (Decrease) in Net Assets from: | |||||||||||
| Operations: | |||||||||||
| Net investment income | $ | 12,277,828 | $ | 8,452,692 | |||||||
| Net realized loss on investments, purchased options contracts, securities sold short, swaptions contracts, swap contracts and foreign currency | (2,370,921 | ) | (1,857,089 | ) | |||||||
| Net change in unrealized appreciation/depreciation on investments, purchased options contracts, securities sold short, swaptions contracts, swap contracts, and foreign currency | (8,984,279 | ) | (3,227,576 | ) | |||||||
| Net increase in net assets resulting from operations | 922,628 | 3,368,027 | |||||||||
| Distributions to Shareholders: | |||||||||||
| Total distributions to shareholders | (12,134,286 | ) | (9,285,989 | ) | |||||||
| Capital Transactions: | |||||||||||
| Net proceeds from shares sold | 83,975,265 | 77,035,325 | |||||||||
| Reinvestment of distributions | 3,843,109 | 2,597,923 | |||||||||
| Cost of shares redeemed | (46,667,344 | ) | (23,716,143 | ) | |||||||
| Net increase in net assets from capital transactions | 41,151,030 | 55,917,105 | |||||||||
| Total increase in net assets | 29,939,372 | 49,999,143 | |||||||||
| Net Assets: | |||||||||||
| Beginning of period | 183,595,294 | 133,596,151 | |||||||||
| End of period | $ | 213,534,666 | $ | 183,595,294 | |||||||
| Capital Share Transactions: | |||||||||||
| Shares sold | 5,315,426 | 4,078,708 | |||||||||
| Shares reinvested | 232,998 | 139,534 | |||||||||
| Shares redeemed | (2,706,676 | ) | (1,247,996 | ) | |||||||
| Net increase in capital share transactions | 2,841,748 | 2,970,246 | |||||||||
See accompanying Notes to Financial Statements.
34
| Palmer Square Opportunistic Income Fund |
| FINANCIAL HIGHLIGHTS |
| Per share operating performance. |
| For a capital share outstanding throughout each period. |
| For the Year Ended July 31, | ||||||||||||||||||||
| 2020 | 2019 | 2018 | 2017 | 2016 | ||||||||||||||||
| Net asset value, beginning of period | $ | 18.64 | $ | 19.42 | $ | 19.28 | $ | 17.76 | $ | 20.06 | ||||||||||
| Income from Investment Operations: | ||||||||||||||||||||
| Net investment income1 | 1.14 | 1.09 | 1.04 | 1.16 | 1.12 | |||||||||||||||
| Net realized and unrealized gain (loss) | (1.82 | ) | (0.66 | ) | (0.02 | ) | 1.52 | (2.29 | ) | |||||||||||
| Total from investment operations | (0.68 | ) | 0.43 | 1.02 | 2.68 | (1.17 | ) | |||||||||||||
| Less Distributions: | ||||||||||||||||||||
| From net investment income | (1.14 | ) | (1.01 | ) | (0.88 | ) | (1.17 | ) | (1.10 | ) | ||||||||||
| From net realized gains | - | (0.20 | ) | - | - | (0.03 | ) | |||||||||||||
| Total distributions | (1.14 | ) | (1.21 | ) | (0.88 | ) | (1.17 | ) | (1.13 | ) | ||||||||||
| Net increase from payments by affiliates 1 | - | - | - | 0.01 | 5 | - | ||||||||||||||
| Net asset value, end of period | $ | 16.82 | $ | 18.64 | $ | 19.42 | $ | 19.28 | $ | 17.76 | ||||||||||
| Total return2 | (3.36 | )% | 2.36 | % | 5.40 | % | 15.56 | %4 | (5.50 | )% | ||||||||||
| Ratios and Supplemental Data: | ||||||||||||||||||||
| Net assets, end of period (in thousands) | $ | 213,535 | $ | 183,595 | $ | 133,596 | $ | 95,872 | $ | 70,021 | ||||||||||
| Ratio of expenses to average net assets (including brokerage expense, interest expense and interest on securities sold short): | ||||||||||||||||||||
| Before fees waived/recovered3 | 1.62 | % | 1.81 | % | 1.72 | % | 1.80 | % | 1.93 | % | ||||||||||
| After fees waived/recovered3 | 1.69 | % | 1.85 | % | 1.58 | % | 1.53 | % | 1.50 | % | ||||||||||
| Ratio of net investment income to average net assets (including brokerage expense, interest expense and interest on securities sold short): | ||||||||||||||||||||
| Before fees waived/recovered | 6.70 | % | 5.78 | % | 5.19 | % | 5.89 | % | 5.97 | % | ||||||||||
| After fees waived/recovered | 6.63 | % | 5.74 | % | 5.33 | % | 6.16 | % | 6.40 | % | ||||||||||
| Portfolio turnover rate | 153 | % | 136 | % | 168 | % | 109 | % | 74 | % | ||||||||||
| 1 | Based on average shares outstanding for the period. |
| 2 | Total returns would have been lower/higher had expenses not been waived/recovered by the Advisor. Returns shown do not reflect the deduction of taxes that a shareholder would pay on Fund distributions or the redemption of Fund shares. |
| 3 | If brokerage expense, interest expense and interest on securities sold short had been excluded, the expense ratios would have been lowered by 0.19%, 0.35%, 0.08%, 0.03% and 0.00%, for the years ended July 31, 2020, 2019, 2018, 2017 and 2016, respectively. |
| 4 | Payment from affiliates had a positive 0.04% impact to total return. |
| 5 | The Advisor reimbursed the Fund $32,147 for fee reimbursements for certain trades. |
See accompanying Notes to Financial Statements.
35
Palmer Square Opportunistic Income Fund
NOTES TO FINANCIAL STATEMENTS
July 31, 2020
Note 1 – Organization
The Palmer Square Opportunistic Income Fund (the “Fund”) was organized as a Delaware statutory trust (the “Trust”) on May 1, 2014, and is registered as a non-diversified, closed-end management investment company under the Investment Company Act of 1940, as amended. Shares of the Fund are being offered on a continuous basis (the “Shares”). The Fund commenced operations on August 29, 2014. The Fund had no operations prior to August 29, 2014 other than those relating to its organization and the sale of 5,000 shares of beneficial interest in the Fund at $20.00 per share to the Fund’s advisor, Palmer Square Capital Management LLC.
The Fund has an “interval fund” structure pursuant to which the Fund, subject to applicable law, has adopted a fundamental investment policy to make quarterly offers to repurchase between 5% and 25% of its outstanding Shares at net asset value (“NAV”). Subject to the approval of the Fund’s Board of Trustees, the Fund will seek to conduct such quarterly repurchase offers typically for 10% of the Fund’s outstanding Shares at NAV. In connection with any repurchase offer, the Fund may offer to repurchase only the minimum amount of 5% of its outstanding Shares. Repurchases may be oversubscribed, preventing shareholders from selling some or all of their tendered Shares back to the Fund. The Fund’s Shares are not listed on any securities exchange and there is no secondary trading market for its Shares.
The Fund’s investment objective is to seek a high level of current income. As a secondary objective, the Fund seeks long-term capital appreciation.
The Fund is an investment company and accordingly follows the investment company accounting and reporting guidance of the Financial Accounting Standards Board (FASB) Accounting Standard Codification Topic 946 “Financial Services—Investment Companies”.
Note 2 – Accounting Policies
The following is a summary of the significant accounting policies consistently followed by the Fund in the preparation of its financial statements. The preparation of financial statements in conformity with accounting principles generally accepted in the United States of America (“GAAP”) requires management to make estimates and assumptions that affect the reported amounts and disclosures in the financial statements. Actual results could differ from these estimates.
(a) Valuation of Investments
The Fund values equity securities at the last reported sale price on the principal exchange or in the principal over the counter (“OTC”) market in which such securities are traded, as of the close of regular trading on the NYSE on the day the securities are being valued or, if the last-quoted sales price is not readily available, the securities will be valued at the last bid or the mean between the last available bid and ask price. Securities traded on the NASDAQ are valued at the NASDAQ Official Closing Price (“NOCP”). Pricing services generally value debt securities assuming orderly transactions of an institutional round lot size, but such securities may be held or transactions may be conducted in such securities in smaller, odd lot sizes. Odd lots often trade at lower prices than institutional round lots. Investments in open-end investment companies are valued at the daily closing net asset value of the respective investment company. Debt securities are valued by utilizing a price supplied by independent pricing service providers. The independent pricing service providers may use various valuation methodologies including matrix pricing and other analytical pricing models as well as market transactions and dealer quotations. These models generally consider such factors as yields or prices of bonds of comparable quality, type of issue, coupon, maturity, ratings and general market conditions. If a price is not readily available for a portfolio security, the security will be valued at fair value (the amount which the Fund might reasonably expect to receive for the security upon its current sale) as determined in good faith by the Fund’s advisor, subject to review and approval by the Valuation Committee, pursuant to procedures adopted by the Board of Trustees. The actions of the Valuation Committee are subsequently reviewed by the Board at its next regularly scheduled board meeting. The Valuation Committee meets as needed. The Valuation Committee is comprised of all the Trustees, but action may be taken by any one of the Trustees.
36
Palmer Square Opportunistic Income Fund
NOTES TO FINANCIAL STATEMENTS - Continued
July 31, 2020
(b) Investment Transactions, Investment Income and Expenses
Investment transactions are accounted for on the trade date. Realized gains and losses on investments are determined on the identified cost basis. Dividend income is recorded net of applicable withholding taxes on the ex-dividend date and interest income is recorded on an accrual basis. Withholding taxes on foreign dividends, if applicable, are paid (a portion of which may be reclaimable) or provided for in accordance with the applicable country’s tax rules and rates and are disclosed in the Statement of Operations. Withholding tax reclaims are filed in certain countries to recover a portion of the amounts previously withheld. The Fund records a reclaim receivable based on a number of factors, including a jurisdiction’s legal obligation to pay reclaims as well as payment history and market convention. Discounts on debt securities are accreted or amortized to interest income over the lives of the respective securities using the effective interest method. Premiums for callable debt securities are amortized to the earliest call date, if the call price was less than the purchase price. If the call price was not at par and the security was not called, the security is amortized to the next call price and date. Expenses incurred by the Trust with respect to more than one fund are allocated in proportion to the net assets of each fund except where allocation of direct expenses to each Fund or an alternative allocation method can be more appropriately made.
Income from securitization vehicles and equity investments in the equity class securities of CLO vehicles (typically income notes or subordinated notes) is recorded using the effective interest method in accordance with the provisions of ASC 325-40, Beneficial Interests in Securitized Financial Assets, based upon a calculation of the effective yield to the expected redemption date based on an estimate of future cash flows, including those CLO equity investments that have not made their inaugural distribution for the relevant period end. The Fund monitors the expected residual payments, and the effective yield is determined and updated quarterly, or as required. Accordingly, investment income recognized on CLO equity securities in the GAAP statement of operations differs from both the tax-basis investment income and from the cash distributions actually received by the Fund during the period.
In conjunction with the use of futures contracts and swap contracts, the Fund may be required to maintain collateral in various forms. At July 31, 2020, such collateral is denoted in the Fund’s Statement of Assets and Liabilities. Also in conjunction with the use of futures contracts or swap contracts, the Fund, when appropriate, utilizes a segregated margin deposit account with the counterparty. At July 31, 2020, these segregated margin deposit accounts are denoted in the Fund’s Statement of Assets and Liabilities.
(c) Asset-Backed Securities
Asset-backed securities include pools of mortgages, loans, receivables or other assets. Payment of principal and interest may be largely dependent upon the cash flows generated by the assets backing the securities, and, in certain cases, supported by letters of credit, surety bonds, or other credit enhancements. The value of asset-backed securities may also be affected by the creditworthiness of the servicing agent for the pool, the originator of the loans or receivables, or the financial institution(s) providing the credit support. In addition, asset-backed securities are not backed by any governmental agency.
Collateralized Debt Obligations (“CDOs”) include Collateralized Bond Obligations (“CBOs”), Collateralized Loan Obligations (“CLOs”) and other similarly structured securities. CBOs and CLOs are types of asset backed securities. A CBO is a trust which is backed by a diversified pool of high risk, below investment grade fixed income securities. A CLO is a trust typically collateralized by a pool of loans, which may include, among others, domestic and foreign senior secured loans, senior unsecured loans, and subordinate corporate loans, including loans that may be rated below investment grade or equivalent unrated loans. The risks of an investment in a CDO depend largely on the type of the collateral securities and the class of the CDO in which a Fund invests. CDOs carry additional risks including, but not limited to, (i) the possibility that distributions from collateral securities will not be adequate to make interest or other payments, (ii) the collateral may decline in value or default, (iii) a Fund may invest in CDOs that are subordinate to other classes, and (iv) the complex structure of the security may not be fully understood at the time of investment and may produce disputes with the issuer or unexpected investment results.
37
Palmer Square Opportunistic Income Fund
NOTES TO FINANCIAL STATEMENTS - Continued
July 31, 2020
(d) Mortgage-Backed Securities
The Fund may invest in mortgage-backed securities ("MBS"), representing direct or indirect interests in pools of underlying residential or commercial mortgage loans that are secured by real property. These securities provide investors with payments consisting of both principal and interest as the mortgages in the underlying mortgage pools are paid.
The timely payment of principal and interest (but not the market value) on MBS issued or guaranteed by Ginnie Mae (formally known as the Government National Mortgage Association or GNMA) is backed by Ginnie Mae and the full faith and credit of the US government. Obligations issued by Fannie Mae (formally known as the Federal National Mortgage Association or FNMA) and Freddie Mac (formally known as the Federal Home Loan Mortgage Corporation or FHLMC) are historically supported only by the credit of the issuer, but currently are guaranteed by the US government in connection with such agencies being placed temporarily into conservatorship by the US government.
Some MBS are sponsored or issued by private entities. Payments of principal and interest (but not the market value) of such private MBS may be supported by pools of residential or commercial mortgage loans or other MBS that are guaranteed, directly or indirectly, by the US government or one of its agencies or instrumentalities, or they may be issued without any government guarantee of the underlying mortgage assets but may contain some form of non-government credit enhancement.
Collateralized mortgage obligations ("CMO") are a type of MBS. A CMO is a debt security that may be collateralized by whole mortgage loans or mortgage pass-through securities. The mortgage loans or mortgage pass-through securities are divided into classes or tranches with each class having its own characteristics. Investors typically receive payments out of the interest and principal on the underlying mortgages. The portions of these payments that investors receive, as well as the priority of their rights to receive payments, are determined by the specific terms of the CMO class.
The yield characteristics of MBS differ from those of traditional debt securities. Among the major differences are that interest and principal payments are made more frequently, usually monthly, and that principal may be prepaid at any time because the underlying mortgage loans or other obligations generally may be prepaid at any time. Prepayments on a pool of mortgage loans are influenced by a variety of economic, geographic, social and other factors. Generally, prepayments on fixed-rate mortgage loans will increase during a period of falling interest rates and decrease during a period of rising interest rates. Certain classes of CMOs and other MBS are structured in a manner that makes them extremely sensitive to changes in prepayment rates.
(e) Swap Agreements and Swaptions
The Fund may enter into credit default swap agreements for investment purposes. A credit default swap agreement may have as reference obligations one or more securities that are not currently held by the Fund. The Fund may be either the buyer or seller in the transaction. Credit default swaps may also be structured based on the debt of a basket of issuers, rather than a single issuer, and may be customized with respect to the default event that triggers purchase or other factors. As a seller, the Fund would generally receive an upfront payment or a fixed rate of income throughout the term of the swap, which typically is between six months and three years, provided that there is no credit event. If a credit event occurs, generally the seller must pay the buyer the full face amount of deliverable obligations of the reference obligations that may have little or no value. The notional value will be used to segregate liquid assets for selling protection on credit default swaps. If the Fund were a buyer and no credit event occurs, the Fund would recover nothing if the swap is held through its termination date. However, if a credit event occurs, the buyer may elect to receive the full notional value of the swap in exchange for an equal face amount of deliverable obligations of the reference obligation that may have little or no value. The use of swap agreements by the Fund entails certain risks, which may be different from, or possibly greater than, the risks associated with investing directly in the securities and other investments that are the referenced asset for the swap agreement. Swaps are highly specialized instruments that require investment techniques, risk analyses, and tax planning different from those associated with stocks, bonds, and other traditional investments. The use of a swap requires an understanding not only of the referenced asset, reference rate, or index, but also of the swap itself, without the benefit of observing the performance of the swap under all the possible market conditions. Because some swap agreements have a leverage component, adverse changes in the value or level of the underlying asset, reference rate, or index can result in a loss substantially greater than the amount invested in the swap itself. Certain swaps have the potential for unlimited loss, regardless of the size of the initial investment.
38
Palmer Square Opportunistic Income Fund
NOTES TO FINANCIAL STATEMENTS - Continued
July 31, 2020
The Fund may also purchase credit default swap contracts in order to hedge against the risk of default of the debt of a particular issuer or basket of issuers, in which case the Fund would function as the counterparty referenced in the preceding paragraph. This would involve the risk that the investment may expire worthless and would only generate income in the event of an actual default by the issuer(s) of the underlying obligation(s) (or, as applicable, a credit downgrade or other indication of financial instability). It would also involve the risk that the seller may fail to satisfy its payment obligations to the Fund in the event of a default. The purchase of credit default swaps involves costs, which will reduce the Fund's return.
The Fund may enter into total return swap contracts for investment purposes. Total return swaps are contracts in which one party agrees to make periodic payments based on the change in market value of the underlying assets, which may include a specified security, basket of securities or security indexes during the specified period, in return for periodic payments based on a fixed or variable interest rate of the total return from other underlying assets. Total return swap agreements may be used to obtain exposure to a security or market without owning or taking physical custody of such security or market, including in cases in which there may be disadvantages associated with direct ownership of a particular security. In a typical total return equity swap, payments made by the Fund or the counterparty are based on the total return of a particular reference asset or assets (such as an equity security, a combination of such securities, or an index). That is, one party agrees to pay another party the return on a stock, basket of stocks, or stock index in return for a specified interest rate. By entering into an equity index swap, for example, the index receiver can gain exposure to stocks making up the index of securities without actually purchasing those stocks. Total return swaps involve not only the risk associated with the investment in the underlying securities, but also the risk of the counterparty not fulfilling its obligations under the agreement.
An option on a swap agreement, or a “swaption,” is a contract that gives a counterparty the right (but not the obligation) to enter into a new swap agreement or to shorten, extend, cancel or otherwise modify an existing swap agreement, at some designated future time on specified terms. In return, the purchaser pays a “premium” to the seller of the contract. The seller of the contract receives the premium and bears the risk of unfavorable changes on the underlying swap. The Fund may write (sell) and purchase put and call swaptions. The Fund may also enter into swaptions on either an asset-based or liability-based basis, depending on whether the Fund is hedging its assets or its liabilities. The Fund may write (sell) and purchase put and call swaptions to the same extent it may make use of standard options on securities or other instruments. The Fund may enter into these transactions primarily to preserve a return or spread on a particular investment or portion of its holdings, as a duration management technique, to protect against an increase in the price of securities the Fund anticipates purchasing at a later date, or for any other purposes, such as for speculation to increase returns. Swaptions are generally subject to the same risks involved in the Fund’s use of options.
39
Palmer Square Opportunistic Income Fund
NOTES TO FINANCIAL STATEMENTS - Continued
July 31, 2020
Depending on the terms of the particular option agreement, the Fund will generally incur a greater degree of risk when it writes a swaption than it will incur when it purchases a swaption. When the Fund purchases a swaption, it risks losing only the amount of the premium it has paid should it decide to let the option expire unexercised. However, when the Fund writes a swaption, upon exercise of the option the Fund will become obligated according to the terms of the underlying agreement. The Fund did not enter into any transactions in written swaptions contracts for the year ended July 31, 2020.
(f) Options Contracts
The Fund may write or purchase options contracts primarily to enhance the Fund’s returns or reduce volatility. In addition, the Fund may utilize options in an attempt to generate gains from options premiums or to reduce overall portfolio risk. When the Fund writes or purchases an option, an amount equal to the premium received or paid by the Fund is recorded as a liability or an asset and is subsequently adjusted to the current market value of the option written or purchased. Premiums received or paid from writing or purchasing options which expire unexercised are treated by the Fund on the expiration date as realized gains or losses. The difference between the premium and the amount paid or received on effecting a closing purchase or sale transaction, including brokerage commissions, is also treated as a realized gain or loss. If an option is exercised, the premium paid or received is added to the cost of the purchase or proceeds from the sale in determining whether the Fund has realized a gain or a loss on investment transactions. The Fund, as a writer of an option, may have no control over whether the underlying securities may be sold (call) or purchased (put) and as a result bears the market risk of an unfavorable change in the price of the security underlying the written option.
(g) Futures Contracts
The Fund may use interest rate, foreign currency, index and other futures contracts. A futures contract provides for the future sale by one party and purchase by another party of a specified quantity of the security or other financial instrument at a specified price and time. A futures contract on an index is an agreement pursuant to which two parties agree to take or make delivery of an amount of cash equal to the difference between the value of the index at the close of the last trading day of the contract and the price at which the index contract originally was written. Although the value of an index might be a function of the value of certain specified securities, physical delivery of these securities is not always made.
A futures contract held by the Fund is valued daily at the official settlement price of the exchange on which it is traded. Each day the Fund pays or receives cash, called "variation margin", equal to the daily change in value of the futures contract. This process is known as "marking to market". Variation margin does not represent a borrowing or loan by the Fund but is instead a settlement between the Fund and the broker of the amount one would owe the other if the futures contract expired. In computing daily net asset value, the Fund will mark to market its open futures positions. The Fund also is required to deposit and to maintain margin with respect to put and call options on futures contracts written by it. Such margin deposits will vary depending on the nature of the underlying futures contract (and the related initial margin requirements), the current market value of the option and other futures positions held by the Fund. Although some futures contracts call for making or taking delivery of the underlying securities, generally these obligations are closed out prior to delivery by offsetting purchases or sales of matching futures contracts (involving the same exchange, underlying security or index and delivery month). If an offsetting purchase price is less than the original sale price, the Fund realizes a capital gain, or if it is more, the Fund realizes a capital loss. Conversely, if an offsetting sale price is more than the original purchase price, the Fund realizes a capital gain, or if it is less, the Fund realizes a capital loss. The transaction costs also must be included in these calculations.
40
Palmer Square Opportunistic Income Fund
NOTES TO FINANCIAL STATEMENTS - Continued
July 31, 2020
(h) Short Sales
Short sales are transactions under which the Fund sells a security it does not own in anticipation of a decline in the value of that security. To complete such a transaction, the Fund must borrow the security to make delivery to the buyer. The Fund then is obligated to replace the security borrowed by purchasing the security at market price at the time of replacement. The price at such time may be more or less than the price at which the security was sold by the Fund. When a security is sold short a decrease in the value of the security will be recognized as a gain and an increase in the value of the security will be recognized as a loss, which is potentially limitless. Until the security is replaced, the Fund is required to pay the lender amounts equal to dividend or interest that accrue during the period of the loan which is recorded as an expense. To borrow the security, the Fund also may be required to pay a premium or an interest fee, which are recorded as interest expense. Cash or securities are segregated for the broker to meet the necessary margin requirements. The Fund is subject to the risk that it may not always be able to close out a short position at a particular time or at an acceptable price.
(i) Forward Foreign Currency Exchange Contracts
The Fund may utilize forward foreign currency exchange contracts (“forward contracts”) under which it is obligated to exchange currencies on specified future dates at specified rates, and are subject to the translations of foreign exchange rates fluctuations. All contracts are “marked-to-market” daily and any resulting unrealized gains or losses are recorded as unrealized appreciation or depreciation on foreign currency translations. The Fund records realized gains or losses at the time the forward contract is settled. Counterparties to these forward contracts are major U.S. financial institutions.
(j) Bank Loans
The Fund may purchase participations in commercial loans. Such investments may be secured or unsecured. Loan participations typically represent direct participation, together with other parties, in a loan to a corporate borrower, and generally are offered by banks or other financial institutions or lending syndicates. The Fund may participate in such syndications, or can buy part of a loan, becoming a part lender. When purchasing indebtedness and loan participations, the Fund assumes the credit risk associated with the corporate borrower and may assume the credit risk associated with an interposed bank or other financial intermediary. The indebtedness and loan participations in which the Fund intends to invest may not be rated by any nationally recognized rating service.
Bank loans may be structured to include both term loans, which are generally fully funded at the time of investment and unfunded loan commitments, which are contractual obligations for future funding. Unfunded loan commitments may include revolving credit facilities, which may obligate the Fund to supply additional cash to the borrower on demand, representing a potential financial obligation by the Fund in the future. The Fund may receive a commitment fee based on the undrawn portion of the underlying line of credit portion of a senior floating rate interest. Commitment fees are processed as a reduction in cost.
In addition, the Fund may enter into, or acquire participations in, delayed funding loans and revolving credit facilities. Delayed funding loans and revolving credit facilities are borrowing arrangements in which the lender agrees to make loans up to a maximum amount upon demand by the borrower during a specified term. A revolving credit facility differs from a delayed funding loan in that as the borrower repays the loan, an amount equal to the repayment may be borrowed again during the term of the revolving credit facility. Delayed funding loans and revolving credit facilities usually provide for floating or variable rates of interest. These commitments may have the effect of requiring the Fund to increase its investment in a company at a time when it might not otherwise decide to do so (including at a time when the company's financial condition makes it unlikely that such amounts will be repaid). To the extent that the Fund is committed to advance additional funds, it will at all-times segregate or "earmark" liquid assets, in an amount sufficient to meet such commitments.
41
Palmer Square Opportunistic Income Fund
NOTES TO FINANCIAL STATEMENTS - Continued
July 31, 2020
(k) Federal Income Taxes
The Fund intends to comply with the requirements of Subchapter M of the Internal Revenue Code applicable to regulated investment companies and to distribute substantially all of its net investment income and any net realized gains to its shareholders. Therefore, no provision is made for federal income or excise taxes. Due to the timing of dividend distributions and the differences in accounting for income and realized gains and losses for financial statement and federal income tax purposes, the fiscal year in which amounts are distributed may differ from the year in which the income and realized gains and losses are recorded by the Fund.
Accounting for Uncertainty in Income Taxes (the “Income Tax Statement”) requires an evaluation of tax positions taken (or expected to be taken) in the course of preparing a Fund’s tax returns to determine whether these positions meet a “more-likely-than-not” standard that, based on the technical merits, have a more than fifty percent likelihood of being sustained by a taxing authority upon examination. A tax position that meets the “more-likely-than-not” recognition threshold is measured to determine the amount of benefit to recognize in the financial statements. The Fund recognizes interest and penalties, if any, related to unrecognized tax benefits as income tax expense in the Statement of Operations.
The Income Tax Statement requires management of the Fund to analyze tax positions taken in the prior three open tax years, if any, and tax positions expected to be taken in the Fund’s current tax year, as defined by the IRS statute of limitations for all major jurisdictions, including federal tax authorities and certain state tax authorities. As of and during the years ended July 31, 2017-2020, the Fund did not have a liability for any unrecognized tax benefits. The Fund has no examination in progress and is not aware of any tax positions for which it is reasonably possible that the total amounts of unrecognized tax benefits will significantly change in the next twelve months.
(l) Distributions to Shareholders
The Fund will make quarterly distributions of net investment income and capital gains, if any, at least annually. Distributions to shareholders are recorded on the ex-dividend date. The amount and timing of distributions are determined in accordance with federal income tax regulations, which may differ from GAAP.
The character of distributions made during the year from net investment income or net realized gains may differ from the characterization for federal income tax purposes due to differences in the recognition of income, expense and gain (loss) items for financial statement and tax purposes.
(m) Counterparty Risks
The Fund may be exposed to counterparty risk on institution or other entity with which the Fund has unsettled or open transactions. Although the Fund expects to enter into transactions only with counterparties believed by the Advisor or relevant Sub-Advisor to be creditworthy, there can be no assurance that a counterparty will not default and that the Fund will not sustain a loss on a transaction as a result. The Fund is subject to the risk that issuers of the instruments in which it invests and trades may default on their obligations, and that certain events may occur that have an immediate and significant adverse effect on the value of those instruments.
The Fund is subject to various Master Agreements, which govern the terms of certain transactions with select counterparties. The Master Agreements reduce the counterparty risk associated with relevant transactions by specifying credit protection mechanisms and providing standardization that improves legal certainty. Master Agreements can also help limit counterparty risk by specifying collateral posting arrangements at pre-arranged exposure levels. Under the Master Agreement, collateral is routinely transferred if the total net exposure to certain transactions (net of existing collateral already in place) governed under the relevant master agreement with a counterparty in a given account exceeds a specified threshold.
42
Palmer Square Opportunistic Income Fund
NOTES TO FINANCIAL STATEMENTS - Continued
July 31, 2020
The Master Repurchase Agreement governs transactions between the Fund and the counterparty. The Master Repurchase Agreement maintains provisions for, among other things, initiation, income payments, events of default, and maintenance of collateral for Repurchase Agreements.
International Swaps and Derivatives Association, Inc. Master Agreements (“ISDA Master Agreements”) govern OTC financial derivative transactions entered into by the Fund and those counterparties. The ISDA Master Agreements maintain provisions for general obligations, representations, agreements, collateral and events of default or termination. Events of termination include conditions that may entitle counterparties to elect to terminate early and cause settlement of all outstanding transactions under the applicable ISDA Master Agreement.
Note 3 – Investment Advisory and Other Agreements
The Fund entered into an Investment Advisory Agreement (the “Agreement”) with Palmer Square Capital Management LLC (the “Advisor”). Under the terms of the Agreement, the Fund pays a monthly investment advisory fee to the Advisor at the annual rate of 1.00% of the Fund’s average daily net assets.
The Advisor has contractually agreed to waive or reduce its fee and/or to absorb other operating expenses to ensure that total annual Fund operating expenses (excluding taxes, leverage interest, brokerage commissions, dividend and interest expenses on short sales, acquired fund fees and expenses, expenses incurred in connection with any merger or reorganization, and extraordinary expenses such as litigation expenses) do not exceed 1.50% of the Fund’s average daily net assets. This agreement is in effect until December 1, 2020, and it may be terminated before that date only by the Fund’s Board of Trustees.
For the year ended July 31, 2020, the Advisor recovered advisory fees previously waived totaling $140,679. The Fund’s advisor is permitted to seek reimbursement from the Fund, subject to certain limitations, of fees waived or payments made to the Fund for a period ending three full fiscal years after the date of the waiver or payment. This reimbursement may be requested from the Fund if the reimbursement will not cause the Fund’s annual expense ratio to exceed the lesser of (a) the expense limitation amount in effect at the time such fees were waived or payments made, or (b) the expense limitation amount in effect at the time of the reimbursement. At July 31, 2020, the amount of these potentially recoverable expenses was $146,289. The Advisor may recapture all or a portion of this amount no later than July 31, 2021.
UMB Fund Services, Inc. (“UMBFS”) serves as the Fund’s fund accountant, transfer agent and co-administrator; and Mutual Fund Administration, LLC (“MFAC”) serves as the Fund’s other co-administrator. UMB Bank, n.a., an affiliate of UMBFS, serves as the Fund’s custodian. The Fund’s fees incurred for fund accounting, fund administration, transfer agency and custody services for the year ended July 31, 2020, are reported on the Statement of Operations.
Foreside Fund Services, LLC (“Distributor”) serves as the Fund’s distributor (the “Distributor”). The Distributor does not receive compensation from the Fund for its distribution services; the Advisor pays the Distributor a fee for its distribution-related services.
The Fund has a fee arrangement with its custodian, UMB Bank, n.a., which provides for custody fees to be reduced by earning credits based on cash balances left on deposit with the custodian. For the year ended July 31, 2020, the total fees reduced by earning credits were $2,129. Such amount is shown as a reduction of expenses, "Fees paid indirectly", on the Statement of Operations.
Certain trustees and officers of the Trust are employees of the Advisor and its affiliate. The Fund does not compensate trustees and officers affiliated with the Fund’s Advisor.
43
Palmer Square Opportunistic Income Fund
NOTES TO FINANCIAL STATEMENTS - Continued
July 31, 2020
Note 4 – Federal Income Taxes
At July 31, 2020, the cost of securities on a tax basis and gross unrealized appreciation and depreciation on investments for federal income tax purposes were as follows:
| Cost of investments | $ | 221,664,479 | ||
| Gross unrealized appreciation | $ | 7,469,847 | ||
| Gross unrealized depreciation | (20,183,315 | ) | ||
| Net unrealized depreciation on investments | $ | (12,713,468 | ) |
The difference between cost amounts for financial statement and federal income tax purposes is due primarily to timing differences in recognizing certain gains and losses in security transactions.
GAAP requires that certain components of net assets be reclassified between financial and tax reporting. These reclassifications have no effect on net assets or net asset value per share. For the year ended July 31, 2020, permanent differences in book and tax accounting have been reclassified to paid-in capital and total accumulated deficit as follows:
| Increase (Decrease) | |
| Paid-in Capital | Total Accumulated Deficit |
| $1,106 | $(1,106) |
As of July 31, 2020, the components of accumulated earnings (deficit) on a tax basis were as follows:
| Undistributed ordinary income | $ | 1,146,940 | ||
| Undistributed long-term capital gains | - | |||
| Accumulated earnings | 1,146,940 | |||
| Accumulated capital and other losses | (3,739,046 | ) | ||
| Unrealized depreciation on securities sold short | (10,642 | ) | ||
| Unrealized depreciation on investments | (12,702,826 | ) | ||
| Unrealized appreciation on foreign currency | 49 | |||
| Total accumulated deficit | $ | (15,305,525 | ) |
The tax character of distributions paid during the fiscal years ended July 31, 2020 and July 31, 2019 were as follows:
| 2020 | 2019 | |||||||
| Distributions paid from: | ||||||||
| Ordinary income | $ | 12,134,286 | $ | 9,011,994 | ||||
| Net long-term capital gains | - | 273,995 | ||||||
| Total taxable distributions | 12,134,286 | 9,285,989 | ||||||
| Total distributions paid | $ | 12,134,286 | $ | 9,285,989 | ||||
44
Palmer Square Opportunistic Income Fund
NOTES TO FINANCIAL STATEMENTS - Continued
July 31, 2020
As of July 31, 2020, the Fund had a short-term capital loss carryover of $344,214 and a long-term capital loss carryforward of $3,394,832. To the extent that the fund may realize future net capital gains, those gains will be offset by any of its unused capital loss carryforward. Future capital loss carryover utilization in any given year may be subject to Internal Revenue Code limitations.
Note 5 – Investment Transactions
For the year ended July 31, 2020, purchases and sales of investments, excluding short-term investments, futures contracts, options contracts, swaption contracts and swap contracts, were $278,454,778 and $245,613,562, respectively. Proceeds from securities sold short and cover short securities were $27,357,132 and $34,920,388, respectively, for the same period.
Note 6 – Shareholder Servicing Plan
The Fund has adopted a Shareholder Servicing Plan to pay a fee at an annual rate of up to 0.25% of average daily net assets of shares serviced by shareholder servicing agents who provide administrative and support services to their customers.
For the year ended July 31, 2020, shareholder servicing fees incurred are disclosed on the Statement of Operations.
Note 7 – Indemnifications
In the normal course of business, the Fund enters into contracts that contain a variety of representations which provide general indemnifications. The Fund’s maximum exposure under these arrangements is unknown, as this would involve future claims that may be made against the Fund that have not yet occurred. However, the Fund expects the risk of loss to be remote.
Note 8 – Fair Value Measurements and Disclosure
Fair Value Measurements and Disclosures defines fair value, establishes a framework for measuring fair value in accordance with GAAP, and expands disclosure about fair value measurements. It also provides guidance on determining when there has been a significant decrease in the volume and level of activity for an asset or a liability, when a transaction is not orderly, and how that information must be incorporated into a fair value measurement.
Under Fair Value Measurements and Disclosures, various inputs are used in determining the value of the Fund’s investments. These inputs are summarized into three broad Levels as described below:
| ● | Level 1 – Unadjusted quoted prices in active markets for identical assets or liabilities that the Fund has the ability to access. |
| ● | Level 2 – Observable inputs other than quoted prices included in Level 1 that are observable for the asset or liability, either directly or indirectly. These inputs may include quoted prices for the identical instrument on an inactive market, prices for similar instruments, interest rates, prepayment speeds, credit risk, yield curves, default rates and similar data. |
| ● | Level 3 – Unobservable inputs for the asset or liability, to the extent relevant observable inputs are not available, representing the Fund’s own assumptions about the assumptions a market participant would use in valuing the asset or liability, and would be based on the best information available. |
45
Palmer Square Opportunistic Income Fund
NOTES TO FINANCIAL STATEMENTS - Continued
July 31, 2020
The availability of observable inputs can vary from security to security and is affected by a wide variety of factors, including for example, the type of security, whether the security is new and not yet established in the marketplace, the liquidity of markets, and other characteristics particular to the security. To the extent that valuation is based on models or inputs that are less observable or unobservable in the market, the determination of fair value requires more judgment. Accordingly, the degree of judgment exercised in determining fair value is greatest for instruments categorized in Level 3.
The inputs used to measure fair value may fall into different Levels of the fair value hierarchy. In such cases, for disclosure purposes, the Level in the fair value hierarchy within which the fair value measurement falls in its entirety, is determined based on the lowest Level input that is significant to the fair value measurement in its entirety.
The inputs or methodology used for valuing securities are not an indication of the risk associated with investing in those securities. The following is a summary of the inputs used, as of July 31, 2020, in valuing the Fund’s assets carried at fair value:
| Level 1 | Level 2 | Level 3** | Total | |||||||||||||
| Assets | ||||||||||||||||
| Investments | ||||||||||||||||
| Bank Loans | $ | - | $ | 16,713,463 | $ | - | $ | 16,713,463 | ||||||||
| Bonds | ||||||||||||||||
| Asset-Backed Securities | - | 143,752,600 | - | 143,752,600 | ||||||||||||
| Commercial Mortgage-Backed Securities | - | 3,801,413 | - | 3,801,413 | ||||||||||||
| Corporate* | - | 37,026,506 | - | 37,026,506 | ||||||||||||
| Common Stock* | 14,701 | - | - | 14,701 | ||||||||||||
| Short-Term Investments | 8,642,998 | - | - | 8,642,998 | ||||||||||||
| Total Investments | $ | 8,657,699 | $ | 201,293,982 | $ | - | $ | 209,951,681 | ||||||||
Liabilities | ||||||||||||||||
| Securities Sold Short | ||||||||||||||||
| Bonds | ||||||||||||||||
| Corporate* | $ | - | $ | 1,000,670 | $ | - | $ | 1,000,670 | ||||||||
| Total Securities Sold Short | $ | - | $ | 1,000,670 | $ | - | $ | 1,000,670 | ||||||||
| * | All corporate bonds held in the Fund are Level 2 securities and all common stocks held in the Fund are Level 1 securities. For a detailed break-out by major industry classification, please refer to the Schedule of Investments. |
| ** | The Fund did not hold any Level 3 securities at period end. |
Note 9 – Derivatives and Hedging Disclosures
Derivatives and Hedging requires enhanced disclosures about the Fund’s derivative and hedging activities, including how such activities are accounted for and their effects on the Fund’s financial position, performance and cash flows.
46
Palmer Square Opportunistic Income Fund
NOTES TO FINANCIAL STATEMENTS - Continued
July 31, 2020
The effects of derivative instruments on the Statement of Operations for the year ended July 31, 2020 are as follows:
| Derivatives not designated as hedging instruments | ||||||||||||||||
Credit Contracts | Equity Contracts | Interest Rate Contracts | Total | |||||||||||||
| Realized Gain (Loss) on Derivatives | ||||||||||||||||
| Purchased options contracts | $ | - | $ | 165,298 | $ | - | $ | 165,298 | ||||||||
| Swap contracts | 871,237 | - | - | 871,237 | ||||||||||||
| Swaptions contracts | (24,057 | ) | - | - | (24,057 | ) | ||||||||||
| $ | 847,180 | $ | 165,298 | $ | - | $ | 1,012,478 | |||||||||
Credit Contracts | Equity Contracts | Interest Rate Contracts | Total | |||||||||||||
| Net Change in Unrealized Appreciation/Depreciation on Derivatives | ||||||||||||||||
| Purchased options contracts | $ | - | $ | 144,384 | $ | - | $ | 144,384 | ||||||||
| Swap contracts | 1,857 | - | - | 1,857 | ||||||||||||
| $ | 1,857 | $ | 144,384 | $ | - | $ | 146,241 | |||||||||
The notional amount is included on the Schedule of Investments. The quarterly average volumes of derivative instruments as of July 31, 2020 are as follows:
| Derivatives not designated as hedging instruments | ||||||||
| Credit contracts | Credit default swap contracts | Notional amount | $ | 1,286,000 | ||||
| Credit contracts | Swaptions Contracts | Notional amount | 1,800,000 | |||||
| Equity contracts | Purchased options contracts | Notional amount | 14,145,380 | |||||
Note 10 - Disclosures about Offsetting Assets and Liabilities
Disclosures about Offsetting Assets and Liabilities requires an entity to disclose information about offsetting and related arrangements to enable users of its financial statements to understand the effect of those arrangements on its financial position. The guidance requires retrospective application for all comparative periods presented.
A Fund mitigates credit risk with respect to OTC derivative counterparties through credit support annexes included with ISDA Master Agreements or other Master Netting Agreements which are the standard contracts governing most derivative transactions between the Fund and each of its counterparties. These agreements allow the Fund and each counterparty to offset certain derivative financial instruments’ payables and/or receivables against each other and/or with collateral, which is generally held by the Fund’s custodian. The amount of collateral moved to/from applicable counterparties is based upon minimum transfer amounts specified in the agreement. To the extent amounts due to the Fund from its counterparties are not fully collateralized contractually or otherwise, the Fund bears the risk of loss from counterparty non-performance.
The Fund did not hold any swap contracts as of July 31, 2020.
47
Palmer Square Opportunistic Income Fund
NOTES TO FINANCIAL STATEMENTS - Continued
July 31, 2020
Note 11 – Line of Credit
The Fund together with other funds managed by the Advisor (together “Palmer Square Funds”) has entered into a Senior Secured Revolving Credit Facility (“Facility”) of $25,000,000 with UMB Bank, n.a. The Fund is permitted to borrow up to the lesser of the available credit line amount or an amount up to 10% of the adjusted net assets of the Fund. The purpose of the Facility is to finance temporarily the repurchase or redemption of shares of each fund. Borrowings under this agreement bear interest at the one-month London Interbank Offered Rate (LIBOR) plus 1.75%. As compensation for holding the lending commitment available, the Palmer Square Funds are charged a commitment fee on the average daily unused balance of the Facility at the rate of 0.20% per annum. The commitment fees for the year ended July 31, 2020 are disclosed in the Statement of Operations. The Fund did not borrow under the line of credit agreement during the year ended July 31, 2020.
Note 12 – Capital Stock
The Fund is authorized as a Delaware statutory trust to issue an unlimited number of Shares. The minimum initial investment in the Fund by any investor is $100,000. However, there is no initial or subsequent investment minimums for accounts maintained by financial institutions (such as registered investment advisers and trusts) for the benefit of their clients who purchase shares through investment programs such as (1) fee-based advisory programs; (2) employee benefit plans (e.g., 401(k) or 457(b) retirement plans; (3) mutual fund platforms; and (4) consulting firms. In addition, there is no initial or subsequent investment minimum for Trustees or officers of the Fund, directors, officers and employees of Palmer Square Capital Management, LLC (the “Adviser”) or Foreside Fund Services, LLC (the “Distributor”) or any of their affiliates. Minimum investment amounts may be waived in the discretion of the Fund or the Adviser. The Distributor is not required to sell any specific number or dollar amount of the Fund’s shares, but will use commercially reasonable efforts to sell the shares.
A substantial portion of the Fund’s investments will be illiquid. For this reason, the Fund is structured as a closed-end interval fund, which means that the Shareholders will not have the right to redeem their Shares on a daily basis. In addition, the Fund does not expect any trading market to develop for the Shares. As a result, if investors decide to invest in the Fund, they will have very limited opportunity to sell their Shares. For each repurchase offer the Board will set an amount between 5% and 25% of the Fund’s Shares based on relevant factors, including the liquidity of the Fund’s positions and the Shareholders’ desire for liquidity. A Shareholder whose Shares (or a portion thereof) are repurchased by the Fund will not be entitled to a return of any sales charge that was charged in connection with the Shareholder’s purchase of the Shares.
Pursuant to Rule 23c-3 under the Investment Company Act, on a quarterly basis, the Fund offers to repurchase at NAV outstanding shares of the Fund. The results of the repurchase offers conducted for the year ended July 31, 2020 are as follows:
Commencement Date | Repurchase Request Deadline | Repurchase Pricing date | Net Asset Value as of Repurchase Offer Date | Shares Repurchased | Amount Repurchased | Percentage of Outstanding Shares Repurchased |
| July 10, 2019 | July 31, 2019 | August 9, 2019 | $18.60 | 245,572.331 | $4,567,645.36 | 2.49% |
| October 11, 2019 | November 11, 2019 | November 11, 2019 | $17.80 | 809,072.195 | $14,401,485.07 | 7.78% |
| January 13, 2020 | February 7, 2020 | February 7, 2020 | $18.90 | 779,724.175 | $14,736,786.91 | 7.41% |
| April 15, 2020 | May 8, 2020 | May 8, 2020 | $14.86 | 872,589.122 | $12,966.674.35 | 6.85% |
48
Palmer Square Opportunistic Income Fund
NOTES TO FINANCIAL STATEMENTS - Continued
July 31, 2020
Note 13 – Unfunded Commitments
The Fund may enter into unfunded loan commitments. Unfunded loan commitments may be partially or wholly unfunded. During the contractual period, the Fund is obliged to provide funding to the borrower upon demand. Unfunded loan commitments are fair valued in accordance with the valuation policy described in Note 2(a) and unrealized appreciation or depreciation, if any, is recorded on the Statement of Assets and Liabilities. As of July 31, 2020 the total unfunded amount was 0.2% of the Fund’s net assets.
As of July 31, 2020, the Funds had the following unfunded loan commitments outstanding:
| Loan | Principal | Cost | Value | Unrealized Appreciation/ (Depreciation) | ||||||||||||
| Limetree Bay Terminals LLC | $ | 508,686 | $ | 431,111 | $ | 467,991 | $ | 36,880 | ||||||||
Note 14 – COVID-19 Risks
In early 2020, an outbreak of a novel strain of coronavirus (COVID-19) emerged globally. This coronavirus has resulted in closing international borders, enhanced health screenings, healthcare service preparation and delivery, quarantines, cancellations, disruptions to supply chains and customer activity, as well as general public concern and uncertainty. The impact of this outbreak has negatively affected the worldwide economy, as well as the economies of individual countries, the financial health of individual companies and the market in general in significant and unforeseen ways. The future impact of COVID-19 is currently unknown, and it may exacerbate other risks that apply to the Fund, including political, social and economic risks. Any such impact could adversely affect the Fund’s performance, the performance of the securities in which the Fund invests and may lead to losses on your investment in the Fund. The ultimate impact of COVID-19 on the financial performance of the Fund’s investments is not reasonably estimable at this time.
Note 15 – Events Subsequent to the Fiscal Period End
The Fund has adopted financial reporting rules regarding subsequent events which require an entity to recognize in the financial statements the effects of all subsequent events that provide additional evidence about conditions that existed at the date of the balance sheet. There were no events or transactions that occurred during this period that materially impacted the amounts or disclosures in the Fund’s financial statements.
49
REPORT OF INDEPENDENT REGISTERED PUBLIC ACCOUNTING FIRM
To the Board of Trustees and the Shareholders of the Palmer Square Opportunistic Income Fund
Opinion on the Financial Statements
We have audited the accompanying statement of assets and liabilities of the Palmer Square Opportunistic Income Fund (the “Fund”), including the schedule of investments, as of July 31, 2020, the related statement of operations for the year then ended, the statements of changes in net assets for each of the two years in the period then ended, financial highlights for each of the five years in the period then ended, and the related notes (collectively referred to as the “financial statements”). In our opinion, the financial statements present fairly, in all material respects, the financial position of the Fund as of July 31, 2020, the results of its operations for the year then ended, the changes in its net assets for each of the two years in the period then ended, and the financial highlights for each of the five years in the period then ended, in conformity with accounting principles generally accepted in the United States of America.
Basis for Opinion
These financial statements are the responsibility of the Fund’s management. Our responsibility is to express an opinion on the Fund’s financial statements based on our audits. We are a public accounting firm registered with the Public Company Accounting Oversight Board (United States) (“PCAOB”) and are required to be independent with respect to the Fund in accordance with the U.S. federal securities laws and the applicable rules and regulations of the Securities and Exchange Commission and the PCAOB. We have served as the auditor of the Fund since 2014.
We conducted our audits in accordance with the standards of the PCAOB. Those standards require that we plan and perform the audit to obtain reasonable assurance about whether the financial statements are free of material misstatement, whether due to error or fraud. The Fund is not required to have, nor were we engaged to perform, an audit of its internal control over financial reporting. As part of our audits we are required to obtain an understanding of internal control over financial reporting, but not for the purpose of expressing an opinion on the effectiveness of the Fund’s internal control over financial reporting. Accordingly, we express no such opinion.
Our audits included performing procedures to assess the risks of material misstatement of the financial statements, whether due to error or fraud, and performing procedures that respond to those risks. Such procedures included examining, on a test basis, evidence regarding the amounts and disclosures in the financial statements. Our audits also included evaluating the accounting principles used and significant estimates made by management, as well as evaluating the overall presentation of the financial statements. Our procedures included confirmation of securities owned as of July 31, 2020 by correspondence with the custodian, agent banks, and brokers or by other appropriate auditing procedures where replies were not received. We believe that our audits provide a reasonable basis for our opinion.
| TAIT, WELLER & BAKER LLP | ||
| Philadelphia, Pennsylvania | ||
| September 29, 2020 |
50
Palmer Square Opportunistic Income Fund
SUPPLEMENTAL INFORMATION (Unaudited)
Trustees and Officers Information
Additional information about the Trustees is included in the Fund’s Statement of Additional Information which is available, without charge, upon request by calling (866) 933-9033. The Trustees and officers of the Fund and their principal occupations during the past five years are as follows:
Name, Address, Year of Birth and Position(s) held with Trust | Term of Office; Length of Time Served | Principal Occupation During the Past Five Years and Other Affiliations | Number of Portfolios in the Fund Complex Overseen by Trustee | Other Directorships Held by Trustee During the Past Five Years |
| Independent Trustees: | ||||
Megan Leigh Webber, CPA (born 1975) Trustee and Chairperson of the Board
| Indefinite; Trustee since August 2014; Chairperson since February 2019 | Financial Reporting Manager, The Anschutz Corporation (2000 - present). Supervising Audit Senior, KPMG, LLP (1997 - 2000). | 1 | Palmer Square Capital BDC Inc. (November 2019 to present); Montage Managers Trust, a registered investment company (ceased operations in 2017 – (included 1 portfolio). |
James Neville Jr. (born 1964) Trustee | Indefinite; Since August 2014 | Portfolio Manager, Great Plains Principal Trading (January 2012 - present). Proprietary Trader (1987 - 2011). | 1 | Palmer Square Capital BDC Inc. (November 2019 to present); Montage Managers Trust, a registered investment company (ceased operations in 2017 – (included 1 portfolio). |
51
Palmer Square Opportunistic Income Fund
SUPPLEMENTAL INFORMATION (Unaudited) – Continued
Name, Address, Year of Birth and Position(s) held with Trust | Term of Office; Length of Time Served | Principal Occupation During the Past Five Years and Other Affiliations | Number of Portfolios in the Fund Complex Overseen by Trustee | Other Directorships Held by Trustee During the Past Five Years |
| Officers of the Trust: | ||||
Jeffrey Fox (born 1975) President and Treasurer | Indefinite; President since April 2020 and Treasurer since March 2017 | President (March 2020 – present) and Managing Director (April 2013 – present), Palmer Square Capital Management LLC.
| N/A | N/A |
Scott Betz (born 1977) Chief Compliance Officer | Indefinite; Since April 2018 | Chief Operating Officer and Chief Compliance Officer, Palmer Square Capital Management, LLC (March 2018-present). Chief Operating Officer, Scout Investments, (December 2010-March 2018). Chief Compliance Officer, Scout Investments (May 2016-January 2018). | N/A | N/A |
Stacy Brice (born 1980) Secretary | Indefinite; Since November 2019 | Vice President of Compliance and Legal Counsel, Palmer Square Capital Management, LLC (August 2019 – present). Deputy Chief Compliance Officer, LibreMax Capital (January 2017 – May 2019), and Senior Compliance Officer LibreMax Capital (September 2015 – January 2017). Compliance Officer, Glade Brook Capital Partners, LLC (March 2012 – September 2015). | N/A | N/A |
The address for the Trustees and officers is 1900 Shawnee Mission Parkway, Suite 315, Mission Woods, KS 66205.
52
Palmer Square Opportunistic Income Fund
EXPENSE EXAMPLE
For the Six Months Ended July 31, 2020 (Unaudited)
Expense Example
As a shareholder of the Fund, you incur two types of costs: (1) transaction costs, and (2) ongoing costs, including management fees, distribution fees and other Fund expenses. The examples below are intended to help you understand your ongoing costs (in dollars) of investing in the Fund and to compare these costs with the ongoing costs of investing in other mutual funds.
These examples are based on an investment of $1,000 invested at the beginning of the period and held for the entire period from February 1, 2020 to July 31, 2020.
Actual Expenses
The information in the row titled “Actual Performance” of the table below provides actual account values and actual expenses. You may use the information in these columns, together with the amount you invested, to estimate the expenses that you paid over the period. Simply divide your account value by $1,000 (for example, an $8,600 account value divided by $1,000 = 8.6), then multiply the result by the number in the appropriate row under the column titled “Expenses Paid During Period” to estimate the expenses you paid on your account during this period.
Hypothetical Example for Comparison Purposes
The information in the row titled “Hypothetical (5% annual return before expenses)” of the table below provides hypothetical account values and hypothetical expenses based on the Fund’s actual expense ratios and an assumed rate of return of 5% per year before expenses, which is not the Fund’s actual return. The hypothetical account values and expenses may not be used to estimate the actual ending account balance or expenses you paid for the period. You may use this information to compare the ongoing costs of investing in the Fund and other funds. To do so, compare these 5% hypothetical examples with the 5% hypothetical examples that appear in the shareholder reports of the other funds.
Please note that the expenses shown in the table are meant to highlight your ongoing costs only and do not reflect any transaction costs, such as sales charges (load) or contingent deferred sales charges. Therefore, the information in the row titled “Hypothetical (5% annual return before expenses)” is useful in comparing ongoing costs only, and will not help you determine the relative total costs of owning different funds. In addition, if these transactional costs were included, your costs would have been higher.
Beginning Account Value | Ending Account Value | Expenses Paid During Period* | |
| 2/1/20 | 7/31/20 | 2/1/20 – 7/31/20 | |
| Actual Performance | $1,000.00 | $923.00 | $7.82 |
| Hypothetical (5% annual return before expenses) | $1,000.00 | $1,016.73 | $8.20 |
| * | Expenses are equal to the Fund’s annualized expense ratio of 1.63% multiplied by the average account value over the period, multiplied by 182/366 (to reflect the six month period). The expense ratios reflect a recovery of previously waived fees. Assumes all dividends and distributions were reinvested. |
53
This page is intentionally left blank
This page is intentionally left blank
This page is intentionally left blank
Palmer Square Opportunistic Income Fund
Investment Advisor
Palmer Square Capital Management LLC
1900 Shawnee Mission Parkway, Suite 315
Mission Woods, Kansas 66205
Independent Registered Public Accounting Firm
Tait, Weller & Baker LLP
Two Liberty Place
50 South 16th Street, Suite 2900
Philadelphia, Pennsylvania 19102
Custodian
UMB Bank, n.a.
928 Grand Boulevard, 5th Floor
Kansas City, Missouri 64106
Fund Co-Administrator
Mutual Fund Administration, LLC
2220 East Route 66, Suite 226
Glendora, California 91740
Fund Co-Administrator, Transfer Agent and Fund Accountant
UMB Fund Services, Inc.
235 West Galena Street
Milwaukee, Wisconsin 53212
Distributor
Foreside Fund Services, LLC
Three Canal Plaza, Suite 100
Portland, Maine 04101
www.foreside.com
FUND INFORMATION
| TICKER | CUSIP | |
| Palmer Square Opportunistic Income Fund | PSOIX | 611776 105 |
Privacy Principles of the Palmer Square Opportunistic Income Fund for Shareholders
The Fund is committed to maintaining the privacy of its shareholders and to safeguarding its non-public personal information. The following information is provided to help you understand what personal information the Fund collects, how we protect that information and why, in certain cases, we may share information with select other parties.
Generally, the Fund does not receive any non-public personal information relating to its shareholders, although certain non-public personal information of its shareholders may become available to the Fund. The Fund does not disclose any non-public personal information about its shareholders or former shareholders to anyone, except as permitted by law or as is necessary in order to service shareholder accounts (for example, to a transfer agent or third party administrator).
This report is sent to shareholders of the Palmer Square Opportunistic Income Fund for their information. It is not a Prospectus, circular or representation intended for use in the purchase or sale of shares of the Fund or of any securities mentioned in this report.
Proxy Voting
The Fund’s proxy voting policies and procedures, as well as information regarding how the Fund voted proxies for portfolio securities, if applicable, during the most recent 12-month period ended June 30, are available, without charge and upon request by calling (866) 933-9033 or on the SEC’s website at www.sec.gov.
Fund Portfolio Holdings
The Fund files a complete schedule of its portfolio holdings with the SEC for the first and third quarters of each fiscal year on Form N-PORT within 60 days of the end of such fiscal quarter. Shareholders may obtain the Fund’s Form N-PORT on the SEC’s website at www.sec.gov.
Prior to its use of Form N-PORT, the Fund filed its complete schedule of portfolio holdings with the SEC on Form N-Q, which is available online at www.sec.gov.
Householding
The Fund will mail only one copy of shareholder documents, including prospectuses, annual and semi-annual reports and proxy statements, to shareholders with multiple accounts at the same address. This practice is commonly called “householding” and is intended to reduce expenses and eliminate duplicate mailings of shareholder documents. Mailings of your shareholder documents may be householded indefinitely unless you instruct us otherwise. If you do not want the mailing of these documents to be combined with those other members of your household, please call the Fund at (866) 933-9033.
Palmer Square Opportunistic Income Fund
P.O. Box 2175
Milwaukee, WI 53201
Toll Free: (866) 933-9033
Item 2. Code of Ethics.
The registrant has adopted a code of ethics that applies to the registrant’s principal executive officer and principal financial officer. The registrant has not made any amendments to its code of ethics during the period covered by this report. The registrant has not granted any waivers from any provisions of the code of ethics during the period covered by this report.
The registrant undertakes to provide to any person without charge, upon request, a copy of its code of ethics by mail when they call the registrant at 1-866-933-9033.
Item 3. Audit Committee Financial Expert.
The Board of Trustees of the Registrant has determined that the Registrant does not have an audit committee financial expert serving on its audit committee. The audit committee is composed of the Registrant’s two independent Trustees, each of whom possesses extensive industry experience, but none of whom has all of the technical attributes identified in Instruction 2(b) to Item 3 of Form N-CSR to qualify as an “audit committee financial expert.” The Board of Trustees believes that the audit committee has sufficient knowledge and experience to meet its obligations as the audit committee of the Registrant. In addition, the Board of Trustees notes that the audit committee has the authority to retain any experts necessary to carry out its duties.
Item 4. Principal Accountant Fees and Services.
The registrant has engaged its principal accountant to perform audit services, audit-related services, tax services and other services during the past two fiscal years. "Audit services" refer to performing an audit of the registrant's annual financial statements or services that are normally provided by the accountant in connection with statutory and regulatory filings or engagements for those fiscal years. "Audit-related services" refer to the assurance and related services by the principal accountant that are reasonably related to the performance of the audit. "Tax services" refer to professional services rendered by the principal accountant for tax compliance, tax advice, and tax planning. There were no "other services" provided by the principal accountant. The following table details the aggregate fees billed or expected to be billed for each of the last two fiscal years for audit fees, audit-related fees, tax fees and other fees by the principal accountant.
| FYE 7/31/2020 | FYE 7/31/2019 | |
| Audit Fees | $16,150 | $16,000 |
| Audit-Related Fees | N/A | N/A |
| Tax Fees | $2,700 | $2,650 |
| All Other Fees | N/A | N/A |
The audit committee has adopted pre-approval policies and procedures that require the audit committee to pre-approve all audit and non-audit services of the registrant, including services provided to any entity affiliated with the registrant.
The percentage of fees billed by Tait Weller applicable to non-audit services pursuant to waiver of pre-approval requirement were as follows:
| FYE 7/31/2020 | FYE 7/31/2019 | |
| Audit-Related Fees | 0% | 0% |
| Tax Fees | 0% | 0% |
| All Other Fees | 0% | 0% |
All of the principal accountant's hours spent on auditing the registrant's financial statements were attributed to work performed by full-time permanent employees of the principal accountant.
The following table indicates the non-audit fees billed or expected to be billed by the registrant's accountant for services to the registrant and to the registrant's investment adviser (and any other controlling entity, etc.—not sub-adviser) for the last two years. The audit committee of the Board of Trustees has considered whether the provision of non-audit services that were rendered to the registrant's investment adviser is compatible with maintaining the principal accountant's independence and has concluded that the provision of such non-audit services by the accountant has not compromised the accountant's independence.
| Non-Audit Related Fees | FYE 7/31/2020 | FYE 7/31/2019 |
| Registrant | N/A | N/A |
| Registrant’s Investment Advisor | N/A | N/A |
Item 5. Audit Committee of Listed Registrants.
(a)Not applicable to registrants who are not listed issuers (as defined in Rule 10A-3 under the Securities Exchange Act of 1934).
(b) Not applicable.
Item 6. Schedule of Investments.
(a) Schedule of Investments is included as part of the report to shareholders filed under Item 1 of this Form.
(b) Not Applicable.
Item 7. Disclosure of Proxy Voting Policies and Procedures for Closed-End Management Investment Companies.
In accordance with Rules 30b1-4 (new) & 206(4)-6 (new) & 204-2 (amended) of the Investment Advisers Act of 1940, Palmer Square Capital Management LLC (“Palmer Square”) is providing all clients with a summary of its proxy voting procedures.
| ● | Upon opening an account with Palmer Square, clients are given the option to delegate proxy-voting discretion to Palmer Square by completing the appropriate documents. Palmer Square will only exercise proxy-voting discretion over client shares in the instances where clients give Palmer Square discretionary authority to vote on their behalf. |
| ● | It is Palmer Square’s policy to vote client shares primarily in conformity with Glass Lewis & Co. recommendations, in order to limit conflict of interest issues between Palmer Square and its clients. Glass Lewis & Co. and Palmer Square retain a record of all recommendations. |
| ● | Glass Lewis & Co. is a neutral third party that issues recommendations based upon its own internal guidelines. |
| ● | Palmer Square may vote client shares inconsistent with Glass Lewis & Co. recommendations if Palmer Square believes it is in the best interest of its clients. In such a case, Palmer Square will have on file a written disclosure detailing why they believe Glass Lewis & Co.’s recommendation was not in the client’s best interest. |
| ● | In situations where there is a conflict of interest in the voting of proxies due to business or personal relationships that Palmer Square maintains with persons having an interest in the outcome of certain votes, Palmer Square will take appropriate steps to ensure that its proxy voting decisions are made in the best interest of its clients. |
| ● | Palmer Square votes client shares via ProxyEdge, an electronic voting platform provided by Broadridge Financial Solutions, Inc. Additionally, ProxyEdge retains a record of proxy votes for each client. |
| ● | Annually, Palmer Square will file Form N-PX with the SEC, which will contain each fund’s complete proxy voting record. |
| ● | Palmer Square’s Compliance Department will periodically review all proxy votes to ensure consistency with its procedures. |
| ● | Upon request, clients can receive a copy of Palmer Square’s proxy voting procedures and Glass Lewis & Co.’s proxy voting guidelines. |
| ● | These procedures are currently in effect. |
Item 8. Portfolio Managers of Closed-End Management Investment Companies.
(a)(1) Information presented is as of September 1, 2019
Angie K. Long, Taylor R. Moore and Christopher D. Long are jointly and primarily responsible for the day to day management of the Fund and have managed the Fund since it commenced operations on August 29, 2014.
Christopher D. Long. Mr. Long is the President and founder of the Advisor and is responsible for the Advisor’s alternative investments business and credit business, managing both the firm’s investment activities and operations as well as defining its investment policy. Mr. Long was a Managing Director and Investment Committee Member at Prairie Capital Management, LLC (“Prairie”) from 2006 to 2009, where he was one of the team members responsible for the firm’s proprietary alternative investment products. Prior to joining Prairie, Mr. Long was at various New York City-based firms including Sandell Asset Management, Corp. (“Sandell”), a multi-billion multi-strategy hedge fund, where he, as a Research Analyst, invested in both equity and debt securities from 2005 to 2006. Prior to Sandell, he worked at Morgan Stanley in the Credit Derivatives and Distressed Securities Group as an Associate, focusing on the firm’s proprietary investments during the summer of 2004. Before Morgan Stanley, Mr. Long worked at TH Lee Putnam Ventures, a $1.1 billion private equity fund sponsored by Thomas H. Lee Partners and Putnam Investments, from 1999 to 2003. In that role, he was a member of the investment team investing over $200 million of capital and served as a director and board observer at certain companies in which the fund invested. Mr. Long started his career at JPMorgan & Co. in Leveraged Finance and Mergers & Acquisitions (FIG Group), advising corporations and private equity firms on investment banking and capital markets, from 1997 through 1999. Mr. Long received an MBA from the Harvard Business School in 2005, and an undergraduate degree in Economics, cum laude, from Princeton University in 1997.
Angie K. Long, CFA. Ms. Long has been the Chief Investment Officer of the Advisor since February 2011. She is a member of the Advisor’s Investment Committee and has key responsibilities for all investment-related activities with a particular focus on portfolio construction and risk management. Prior to joining Palmer Square, Ms. Long worked for JPMorgan Chase & Co. in New York from 1998 to 2011. There, she held a variety of management and trading roles, including Deputy Head of Credit Trading for North America, Head of High Yield Trading, and Head of Credit Derivatives Trading. She has been a trader within many products and strategies including high yield bonds, high yield credit derivatives, distressed debt, capital structure arbitrage and structured credit. Among other career achievements, Ms. Long is credited with creating the High Yield Debt Index, the first liquid credit trading index. She was named a managing director of JPMorgan Chase & Co. at age 29. She was responsible for building JPMorgan’s High Yield Credit Derivatives business and Credit Options business. Ms. Long holds the Series 7, 63, 4, 55, and 24 securities licenses. She received an AB degree in Economics from Princeton University in 1997 and is a CFA® charterholder.
Taylor R. Moore, CFA. Prior to joining Palmer Square, Taylor worked at JPMorgan Chase & Co. in New York and Delaware. Taylor was an integral part of the firm’s North American foreign exchange business serving as Associate Product Controller. In particular, Taylor played a key role in all financial operations and management of JPMorgan’s Forward and Spot foreign exchange trading desks. He began his career at JPMorgan as part of the firm’s Corporate Development Program, a two year selective leadership development program. Prior to JPMorgan Chase & Co., Taylor worked at Frontier Investment Bank, a boutique investment bank based out of Kansas City. He is also a CFA ® charterholder.
(a)(2) The following tables show information regarding accounts (other than the Fund) managed by each named portfolio manager as of July 31, 2020:
| With Advisory Fee based on Performance | ||||||||||||||||
| Type of Accounts | Number of Accounts | Total Assets | Number of Accounts | Total Assets | ||||||||||||
| Christopher D. Long | ||||||||||||||||
| Registered Investment Companies: | 2 | $ | 666,690,000 | 0 | $ | 0 | ||||||||||
| Other pooled investment vehicles: | 35 | $ | 10,589,510 | 14 | $ | 4,247,870 | ||||||||||
| Other accounts: | 73 | $ | 913,360,000 | 0 | $ | 0 | ||||||||||
| Angie K. Long, CFA | ||||||||||||||||
| Registered Investment Companies: | 2 | $ | 666,690,000 | 0 | $ | 0 | ||||||||||
| Other pooled investment vehicles: | 35 | $ | 10,589,510 | 14 | $ | 4,247,870 | ||||||||||
| Other accounts: | 43 | $ | 902,380,000 | 0 | $ | 0 | ||||||||||
| Taylor R. Moore, CFA | ||||||||||||||||
| Registered Investment Companies: | 0 | $ | 0 | 0 | $ | 0 | ||||||||||
| Other pooled investment vehicles: | 3 | $ | 459,570,000 | 3 | $ | 459,570,000 | ||||||||||
| Other accounts: | 19 | $ | 589,250,000 | 0 | $ | 0 | ||||||||||
Portfolio Manager Potential Material Conflicts of Interest
It is possible that conflicts of interest may arise in connection with the portfolio managers' management of the Fund's investments on the one hand and the investments of other accounts or vehicles for which the portfolio managers are responsible on the other. For example, a portfolio manager may have conflicts of interest in allocating management time, resources and investment opportunities among the Fund and the other accounts or vehicles the portfolio manager advises. In addition, due to differences in the investment strategies or restrictions among the Fund and the other accounts, a portfolio manager may take action with respect to another account that differs from the action taken with respect to the Fund. In some cases, another account managed by a portfolio manager may provide more revenue to the Advisor. While this may appear to create additional conflicts of interest for the portfolio manager in the allocation of management time, resources and investment opportunities, the Advisor strives to ensure that portfolio managers endeavor to exercise their discretion in a manner that is equitable to all interested persons. In this regard, in the absence of specific account-related impediments, it is the policy of the Advisor to allocate investment ideas pro rata to all accounts with the same primary investment objective.
The goal of the Advisor is to provide high quality investment services to all of its clients, while meeting its fiduciary obligation to treat all clients fairly. The Advisor have adopted and implemented policies and procedures, including brokerage and trade allocation policies and procedures that it believes address the conflicts associated with managing multiple accounts for multiple clients.
(a)(3) Portfolio Managers’ Compensation as of July 31, 2020.
The portfolio managers receive a fixed base salary. Each portfolio manager is an equity owner of the firm and shares in the firm’s profits. The portfolio managers’ compensation arrangements are not determined on the basis of specific funds or accounts managed.
(a)(4) Beneficial Ownership of Securities as of July 31, 2020.
| Portfolio Manager | Dollar Range of Equity Securities of the Fund Beneficially Owned |
| Angie K. Long, CFA | None |
| Christopher D. Long | None |
| Taylor R. Moore | None |
(b) Not applicable.
Item 9. Purchases of Equity Securities by Closed-End Management Investment Company and Affiliated Purchasers.
Not applicable.
Item 10. Submission of Matters to a Vote of Security Holders.
There have been no material changes to the procedures by which shareholders may recommend nominees to the registrant’s board of trustees.
Item 11. Controls and Procedures.
| (a) | The Registrant’s President and Treasurer have reviewed the Registrant's disclosure controls and procedures (as defined in Rule 30a-3(c) under the Investment Company Act of 1940 (the “Act”)) as of a date within 90 days of the filing of this report, as required by Rule 30a-3(b) under the Act and Rules 13a-15(b) or 15d-15(b) under the Securities Exchange Act of 1934. Based on their review, such officers have concluded that the disclosure controls and procedures are effective in ensuring that information required to be disclosed in this report is appropriately recorded, processed, summarized and reported and made known to them by others within the Registrant and by the Registrant’s service provider. |
| (b) | There were no changes in the Registrant's internal control over financial reporting (as defined in Rule 30a-3(d) under the Act) that occurred during the second fiscal quarter of the period covered by this report that has materially affected, or is reasonably likely to materially affect, the Registrant's internal control over financial reporting. |
Item 12. Disclosure of Securities Lending Activities for Closed-End Management Investment Companies.
The registrant did not have any Securities Lending Activities during the period covered by the report.
Item 13. Exhibits.
| (1) | Any code of ethics or amendment thereto, that is subject of the disclosure required by Item 2, to the extent that the registrant intends to satisfy Item 2 requirements through filing an exhibit. Incorporated by reference to the Registrant’s Form N-CSR filed October 9, 2015. |
(a)
(2) Certifications pursuant to Section 302 of the Sarbanes-Oxley Act of 2002. Filed herewith.
(3) Any written solicitation to purchase securities under Rule 23c-1 under the Act sent or given during the period covered by the report by or on behalf of the registrant to 10 or more persons. Not applicable.
| (b) | Certification pursuant to Section 906 of the Sarbanes-Oxley Act of 2002. Furnished herewith. |
SIGNATURES
Pursuant to the requirements of the Securities Exchange Act of 1934 and the Investment Company Act of 1940, the registrant has duly caused this report to be signed on its behalf by the undersigned, thereunto duly authorized.
| (Registrant) | Palmer Square Opportunistic Income Fund | ||
| By (Signature and Title) | /s/ Jeffrey D. Fox | ||
| Jeffrey D. Fox, President and Treasurer | |||
| Date | 10/9/20 |
Pursuant to the requirements of the Securities Exchange Act of 1934 and the Investment Company Act of 1940, this report has been signed below by the following persons on behalf of the registrant and in the capacities and on the dates indicated.
| By (Signature and Title) | /s/ Jeffrey D. Fox | ||
| Jeffrey D. Fox, President and Treasurer | |||
| Date | 10/9/20 |