As filed with the Securities and Exchange Commission on 11/04/2022
UNITED STATES
SECURITIES AND EXCHANGE COMMISSION
Washington, D.C. 20549
FORM N-CSR
CERTIFIED SHAREHOLDER REPORT OF REGISTERED
MANAGEMENT INVESTMENT COMPANIES
811-23011
Investment Company Act file number
The RBB FUND TRUST
(Exact name of registrant as specified in charter)
615 East Michigan Street
Milwaukee, WI 53202
(Address of principal executive offices) (Zip code)
Steven Plump, President
c/o U.S. Bank Global Fund Services
615 East Michigan Street
Milwaukee, WI 53202
(Name and address of agent for service)
(609) 731-6256
Registrant's telephone number, including area code
Date of fiscal year end: August 31
Date of reporting period: August 31, 2022
Item 1. Reports to Stockholders.

ANNUAL REPORT
August 31, 2022
PENN CAPITAL FLOATING RATE INCOME FUND
PENN CAPITAL MID CAP CORE FUND
PENN CAPITAL OPPORTUNISTIC HIGH INCOME FUND
PENN CAPITAL SHORT DURATION HIGH INCOME FUND
PENN CAPITAL SPECIAL SITUATIONS SMALL CAP EQUITY FUND
Each a series of The RBB Fund Trust (formerly, PENN Capital Funds Trust)
TABLE OF CONTENTS
Advisor’s Letter to Shareholders | 1 | |
Fund Summary | 6 | |
Disclosure of Fund Expenses | 11 | |
Fund | Schedule of Investments | |
Penn Capital Floating Rate Income Fund | 13 | |
Penn Capital Mid Cap Core Fund | 19 | |
Penn Capital Opportunistic High Income Fund | 22 | |
Penn Capital Short Duration High Income Fund | 28 | |
Penn Capital Special Situations Small Cap Equity Fund | 32 | |
Statements of Assets and Liabilities | 35 | |
Statements of Operations | 36 | |
Statements of Changes in Net Assets | 38 | |
Financial Highlights | 40 | |
Notes to the Financial Statements | 44 | |
Additional Information | 58 | |
Report of Independent Registered Public Accounting Firm | 62 | |
Trustees and Officers | 63 | |
Privacy Policy | 68 | |
[THIS PAGE INTENTIONALLY LEFT BLANK.]
THE RBB FUND TRUST (FORMERLY, PENN CAPITAL FUNDS TRUST)
Advisor’s Letter to Shareholders (Unaudited)
Dear Penn Capital Funds Shareholder:
Our investment strategies incorporate Penn Capital’s Complete Capital Structure Analysis®, an in-depth high yield (“HY”) and equity research philosophy used to identify a company’s optimal capital structure. Our investment professionals are capital structure generalists, meaning they are responsible for understanding the entire capital structure of the companies they follow. By following this philosophy, we believe that integrating credit and equity research allows us to construct a more comprehensive investment mosaic. Participating in both credit and equity markets, along with this integrated research process, provides Penn Capital’s investment team with what we believe is an informational advantage. Finding inefficiencies in the market can be challenging, but we remain committed to the pursuit of strong investment returns on behalf of our shareholders.
The following pages review the current market environment and provide additional insight into our funds and their performance over the past fiscal year beginning September 1, 2021 and ended August 31, 2022. Once again, I would like to thank you for your confidence in investing with us.
Overview
Over the past year, capital markets have been navigating a bumpy transition from focusing on the dramatic and immediate impacts of the COVID-19 pandemic, to assessing its long-term ramifications for the global economy and the ways that we live and work every day. The robust fiscal and monetary response to the pandemic supported the economy as activity slowed and people isolated themselves. In retrospect, massive government stimulus combined with the surprising resilience of consumers and businesses drove a faster than expected snapback in growth and increased asset price valuations. Surging consumer demand for goods (given a lack of experiential options) occurred just as global supply chains were hamstrung by COVID-19 outbreaks/restrictions and shortages for labor, raw materials, and components. This drove rapid inflation that has proved to be far more than “transitory” in nature. In 2022, the Federal Reserve has shifted their focus from supporting growth and employment to fighting inflation. Between March and August, the Federal Funds target rate was raised by 2.25%, with market expectations it will close 2022 over 4.00%.
Higher interest rates are a headwind to all risk assets including high yield corporate debt and small to mid-cap equities. Premium valuation, high growth sectors like Health Care and Information Technology have been the most challenged. Commodity-focused companies outperformed the overall market, as their products had pricing power in an inflationary environment. Credit product losses have been a function of higher interest rates, with long duration (low coupon, long maturity bonds) lagging the overall market. Despite significant equity market volatility, high yield credit spreads (risk premium for lower rated debt) have been mostly range bound during the past year. The Federal Reserve rate cycle is raising the total cost of borrowing for companies in our universe when they seek capital. Companies are reluctant to refinance debt at higher interest rates and new issuance has been muted.
As the Federal Reserve continues to raise interest rates, economic growth will slow. High yield credit spreads will be a key indica tor to determine if raising interest rates to combat inflation will ultimately lead to a recession. Shrinking high yield credit spreads is a signal to position portfolios opportunistically, while rising high yield credit spreads is a signal to position portfolios defensively. If a recession occurs, high yield credit spreads can bottom prior to the equity market providing a strong signal to reposition for recovery. During the Global Financial Crisis, the high yield credit spread hit its widest point in November 2008, while the equity market reached its low in March 2009, which provided a large opportunity for our strategy. These relationships drive Penn Capital’s investing philosophy as we navigate into the future.
Performance
The following paragraphs provide more detailed information on the performance of our funds for the fiscal year September 1, 2021 through August 31, 2022, as well as selected holdings.
Penn Capital Floating Rate Income Fund
For the fiscal year ended August 31, 2022, the Penn Capital Floating Rate Income Fund (the “Floating Rate Income Fund”)generated a -1.48% return versus +0.89% for its benchmark, the Credit Suisse Institutional Leveraged Loan Index over the same period.1
(1) | Prior to May 31, 2022, the Floating Rate Income Fund’s primary benchmark was the S&P/LSTA BB Loan Index. |
1
The portfolio benefited from an overweight to the Energy sector as well as solid security selection within Exploration and Production bonds and loans. The portfolio also benefited from gains in both the Industrial Services and Products sectors. Throughout the fiscal year, the Floating Rate Income Fund remained relatively defensively positioned, with minimal exposure to lower- rated CCC securities. This conservative positioning also helped improve performance.
Offsetting these gains was weak performance in the Consumer Discretionary Products, Retail, Media and Technology sectors. In Consumer Discretionary Products and Retail, declines in loans from former COVID winners like Bob’s Discount Furniture, JoAnn Fabrics and Weber were all large contributors to the Floating Rate Income Fund’s underperformance. All three companies experienced downdrafts in their loan prices due to earnings issues related to supply chain log-jams, cost inflation and changing consumer purchasing patterns. In Media and Technology, Dish, Rackspace and Avaya loan declines were also large contributors to the Floating Rate Income Fund’s underperformance. Growing investor trepidation about the large strategic decisions each of these businesses must soon make, combined with declining earnings in the secularly-challenged portions of their operations, drove loan prices for these businesses lower. Finally, the Floating Rate Income Fund’s exposure to mid- and longer-duration fixed rate bonds also hurt performance during the fiscal year, as increases in U.S. Treasury rates drove bond prices lower and caused bond performance to lag that of floating rate loans.
Penn Capital Short Duration High Income Fund
For the fiscal year ended August 31, 2022, the Penn Capital Short Duration High Income Fund (the “Short Duration Fund”) generated a -3.05 % return, outperforming its benchmark, ICE BofA 1-3 Year BB-Rated US Cash Pay High Yield Index, which returned - 3.80% over the same period. The Short Duration Fund maintains an average portfolio maturity of three years or less and excludes CCC-rated bonds. The portfolio will typically underperform the broad short duration market, which includes CCC-rated bonds, during low quality rallies (like 2021), and outperform during low quality selloffs (like 2020).
The portfolio benefitted from an overweight to and good security selection within COVID “re-opening plays”, such as within real estate investment trusts (“REITs”) and the Recreation & Travel and Gaming sectors, mainly via higher-coupon secured paper, including Norwegian Cruise Line Holdings and MGM Resorts International. Additionally, the portfolio benefitted from strong security selection within commodity-oriented industries, such as those in the Chemicals, Metals & Mining and Energy sectors. Strong security selection within the Auto Parts and Aerospace/Defense sectors also contributed to the portfolio, as did an underweight to the Banking sector.
The largest detractor from performance was security selection within the Packaging sector, where the Crown Cork & Seal Co Inc. 7.375% 2026 notes were weaker with higher interest rates, despite being a high quality credit with a non-callable bond structure. Also, structural underweights to Ford (Automotive and Auto Loans sectors) and Sprint (Telecommunications sector) were detractors. As the ICE BofA 1-3 Year BB-Rated US Cash Pay High Yield Index is unconstrained, the Ford and Sprint weightings were over 10%; whereas our portfolio limit on issuer holdings is 5%.
Yield-curve positioning was a net contributor, as the portfolio’s 0–1 year maturity “off-index” allocation more than offset an allocation to the 3-5 year maturity, which underperformed given rising rates. Additionally, off-index credit quality positioning contributed value as the portfolio’s single-B quality bonds allocation outperformed.
During the fiscal year, “off-index” asset allocation contributed value as the Short Duration High Income Fund’s loan allocation performance more than offset weakness from its convertible bond allocation. The fund held an average weighting of 6.3% in bank loan securities via exposure from a combination of individual bank loan holdings and investment in the Penn Capital Floating Rate Income Fund. The allocation to convertible bonds averaged a weighting of less than 1%.
Penn Capital Opportunistic High Income Fund
For the fiscal year ended August 31, 2022, the Penn Capital Opportunistic High Income Fund (the “Opportunistic High Income Fund”) generated a -10.31% return, outperforming its benchmark, the ICE BofA US High Yield Constrained Index, which returned -10.43% over the same period.
The portfolio benefitted from an overweight to and good security selection within the Energy sector, particularly the Exploration & Production sector, as well as an underweight to and strong security selection within the Pharmaceuticals sector. The portfolio avoided significant drawdowns in both Endo (opioids) and Bausch Health (patent challenge). Additionally, the portfolio benefitted from strong security selection within the Financial Services, Retail and Consumer Products sectors.
2
The largest detractor to performance was security selection within the Healthcare Facilities sector, where Community Health Systems, a hospital chain, struggled with higher labor costs. Also, “return-to-work” credits Pitney Bowes and Staples, within the Services sector, underperformed. Longer-dated paper within the Metals & Mining sector, and also an overweight to the Real Estate and Housing-related credit investments underperformed with higher rates.
Yield curve positioning was a slight detractor, as the underweighting of the portfolio’s 0-3 year maturity allocation, more than offset an underweight to the poorly performing 10+ year allocation. Conversely, credit quality positioning contributed value via an underweight to BB-rated bonds, overweight to single-B rated bonds and neutral to CCC-rated bonds.
During the fiscal year, “off-index” asset allocation contributed value as the Opportunistic High Income Fund’s loan allocation performance more than offset weakness from its convertible bond allocation. The fund held an average weighting of 7% in bank loan securities via exposure from a combination of individual bank loan holdings and investment in the Penn Capital Floating Rate Income Fund. The allocation to convertible bonds averaged a weighting of 3.8%.
Penn Capital Mid Cap Core Fund
For the fiscal year ended August 31, 2022, the Penn Capital Mid Cap Core Fund (the “Mid Cap Core Fund”) generated a -17.45 return, slightly underperforming the -16.38% return of its benchmark, the Bloomberg US 2500 Index2 over the same period. Best performing sectors during the period were the Healthcare and the Materials sectors. Within the Healthcare sector, a radiopharmaceutical company launched a highly successful contrast for the detection of prostate cancer. Drug companies that generate strong cash flows from marketed products provided returns in a challenging market. In the Materials sector, a nitrogen producer raised prices and profitability due to a globally advantaged cost structure in the United States. The sectors that hindered performance during the period were Financials and Consumer Discretionary. In the Financial Services sector, a digital marketing company for financial products experienced weakened demand due to rising interest rates. In the Consumer Discretionary sector, retailers lapped tough 2021 comparisons as sales slowed due to 2021 stimulus payments and rising inflation in 2022.
Penn Capital Special Situations Small Cap Equity Fund
For the fiscal year ended August 31, 2022, the Penn Capital Special Situations Small Cap Equity Fund (the “Special Situations Fund”) generated a -14.39% return, outperforming the -17.49% return of its benchmark, the Bloomberg US 2000 Index3, over the same period. Top contributors in the period were the Health Care, Energy, and Materials sectors. Within Health Care, a maker of diagnostic medical imaging products is experiencing surging demand for its new imaging agent for detection of prostate cancer. In the Energy sector, an exploration and production company benefitted from rising commodity prices while its low leverage and robust free-cash-flow will fund accelerating returns to shareholders through dividends and share repurchase. Within Materials, a producer of lithium compounds is capitalizing on growing demand for electric vehicle batteries and a highly favorable pricing environment. The top detractors in the period were the Industrials, Utilities, and Financials sectors. In the Industrials sector, a provider of online recruitment services underperformed due to macro headwinds and investor concerns regarding rising customer acquisition costs and competitive intensity. Underperformance in Utilities stemmed from the allocation effect, as the strategy was underweight the traditionally defensive group and it outperformed amid a risk-off market. Within Financials, a Texas based bank unveiled a strategic plan to establish a broker-dealer/investment bank, which will necessitate significant near-term investments that will weigh on margins and returns.
Past performance is not predictive of future performance. Investment return and principal value will fluctuate so that your shares, when redeemed, may be worth more or less than the original cost. Current performance may be lower or higher than that shown. To obtain performance current to the most recent month-end please call 844-302 PENN (7366) or visit www.penncapitalfunds.com.
(2) | Prior to May 31, 2022, the Mid Cap Core Fund’s primary benchmark was the Russell 2500® Index. |
(3) | Prior to May 31, 2022, the Special Situations Small Cap Equity Fund’s primary benchmark was the Russell 2000® Index. |
3
Conclusion
We would like to take this opportunity to thank our shareholders for entrusting their investments with our firm. We do not take your faith in us for granted. Our team remains committed to focusing our efforts on behalf of our shareholders, and we value your continued confidence in our vision. We believe the Penn Capital Funds offer a product line-up that embodies our investment philosophy and dedicated research-driven process.
Looking Forward
This report contains performance data and financial information. Please keep in mind that all securities markets, as well as mutual fund prices, fluctuate in value. If you would like more frequent updates, http://www.penncapitalfunds.com provides daily NAV, monthly performance figures, portfolio holdings, and other valuable information. We encourage you to visit penncapitalfunds.com, through which you may access your account, buy and sell sha res, and find other helpful tools.
At Penn Capital Funds, we believe that active management continues to serve as a critical element of investing in HY debt securities and equity securities of smaller and mid-sized companies. Although challenges remain, and markets may continue to be uneven, we are confident that investors with a well-diversified portfolio and a patient, long-term outlook should be well positioned for the years ahead.
We thank you for investing with us and look forward to continuing to serve your investment needs.
Sincerely,

Kirsten Hocker
President
Penn Capital Management Company, LLC
4
Past performance is no guarantee of future results. Unusually favorable market conditions and high returns may not be sustainable or repeated in the future.
This letter reflects Penn Capital’s analysis and opinions as of the most recent fiscal period. The information is not a complete analysis of any market, country, industry, security, or fund and should not be considered as a recommendation to buy, sell or hold any specific security or securities. Portfolio holdings are subject to change at any time. Please see the Schedules of Investments provided in this report for the complete listing of each Fund’s holdings.
All investments involve risk, including possible loss of principal, and there is no guarantee the Funds will achieve their investment objectives. Investments made in small and mid-capitalization companies may be more volatile and less liquid due to limited resources or product lines and more sensitive to economic factors. Investments in ETFs are subject to the same risks as the underlying securities in which the ETF invests as well as entails higher expenses than if invested into the underlying ETF directly. Investments in foreign securities and ADRs involve certain risks such as currency volatility, political and social instability and reduced market liquidity. As interest rates rise the value of bond prices will decline. Credit risk refers to the loss in the value of a security based on a default in the payment of principle and/or interest of the security, or the perception of the market of such default. High-yield bonds have a higher risk of default or other adverse credit events but have the potential to pay higher earnings over investment grade bonds. The value of convertible securities tends to decline as interest rates rise and, because of the conversion feature, tends to vary with fluctuations in the market value of the underlying securities. Bank loans in which the Fund may invest have similar risks to below investment grade fixed income securities. In the event of the insolvency of an agent bank, a loan could be subject to settlement risk as well as the risk of interruptions in the administrative duties performed in the day to day administration of the loan.
Index Definitions
The ICE BofA US High Yield Constrained Index contains all securities in the ICE BofA US High Yield Index but caps issuer exposure at 2%.
The ICE BofA 1-3 Year BB-Rated US Cash Pay High Yield Index is a subset of the ICE BofA US Cash Pay High Yield Index, which tracks the performance of non-investment-grade corporate bonds with a remaining term to final maturity less than three years and rated BB.
The S&P/LSTA BB Ratings Loan Index is a market value-weighted index designed to measure the performance of the US leveraged loan market and is comprised of loans whose rating is BB+, BB, BB-.
The Credit Suisse Institutional Leveraged Loan Index is a sub-index of the Credit Suisse Leveraged Loan Index. The Credit Suisse Leveraged Loan Index is designed to mirror the investable universe of the $US-denominated leveraged loan market. The Credit Suisse Institutional Leveraged Loan Index is designed to more closely reflect the investment criteria of institutional investors by sampling a lower volatility component of the market.
The Bloomberg US 2000 Index is a float market cap weighted benchmark of the lower 2,000 in capitalization of the Bloomberg 3000 Index.
The Bloomberg US 2500 Index is a float market cap weighted benchmark of the lower 2,500 in capitalization of the Bloomberg 3000 Index.
The Russell 2000® Index measures the performance of the small-cap segment of the U.S. equity universe. The Russell 2000 is a subset of the Russell 3000® Index representing approximately 10% of the total market capitalization of that index. It includes approximately 2000 of the smallest securities based on a combination of their market cap and current index membership. The Russell 2000 Index is constructed to provide a comprehensive and unbiased small-cap opportunity barometer and is completely reconstituted annually to ensure larger stocks do not distort the performance and characteristics of the true small-cap opportunity set.
The Russell 2500™ Index is composed of the bottom 500 stocks in the Russell 1000® Index and all the stocks in the Russell 2000® Index. The Russell 2500™Index return reflect adjustments for income dividends and capital gains distributions reinvested as of the ex-dividend dates.
An investment cannot be made directly in an index.
Foreside Fund Services, LLC Distributor
5
PENN CAPITAL FLOATING RATE INCOME FUND
Fund Summary (UNAUDITED)
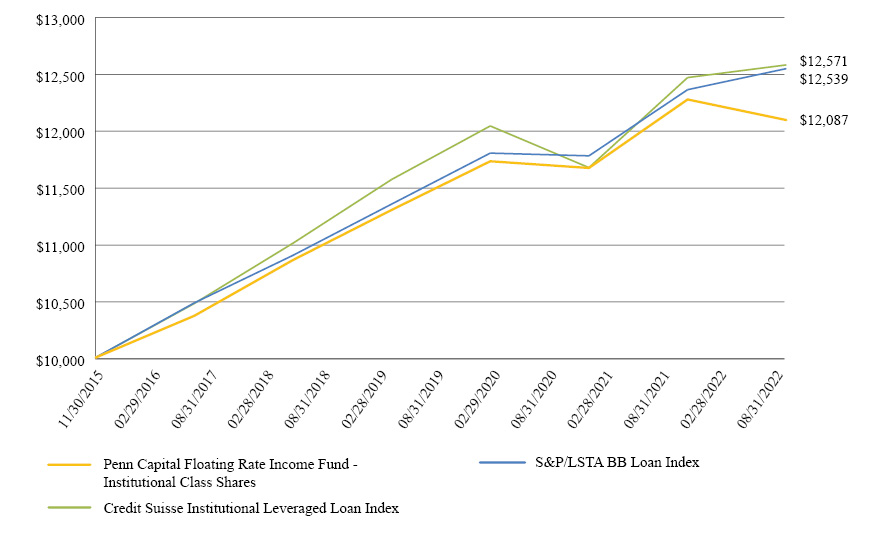
This chart assumes a hypothetical initial gross investment of $10,000 made on November 30, 2015, inception of the Institutional Class shares. Returns shown in the chart and table include the reinvestment of all dividends, but do not reflect the deduction of taxes that a shareholder would pay on Fund distributions or the redemption of Fund shares. In the absence of fee waivers and reimbursements, when they are necessary to keep expenses at the expense cap, total return would be reduced. Past performance is not predictive of future performance. Investment return and principal value will fluctuate so that your shares, when redeemed, may be worth more or less than the original cost. Current performance may be lower or higher than that shown. To obtain performance current to the most recent month-end please call 844-302 PENN (7366) or visit www.penncapitalfunds.com. Index returns do not reflect the effects of fees, transaction costs or expenses. It is not possible to invest directly in an index.
Average Annual Total Returns for the Periods Ended August 31, 2022 | One Year | Three Years | Five Years | Since |
Penn Capital Floating Rate Income Fund | ||||
Institutional Class Shares | -1.48% | 1.02% | 2.17% | 2.85% |
Credit Suisse Institutional Leveraged Loan Index(2) | 0.89% | 1.46% | 2.70% | 3.45% |
S&P/LSTA BB Loan Index | 1.50% | 2.05% | 2.84% | 3.41%(3) |
(1) | Inception date is 11/30/15. |
(2) | Effective May 31, 2022, the Fund changed its primary benchmark from the S&P/LTSA BB Loan Index to the Credit Suisse Institutional Leveraged Loan Index to better reflect the securities in which the Fund invests. |
(3) | The return shown for the S&P/LSTA BB Loan Index is from the inception date of the Institutional Class shares. |
Gross Expense Ratio: 1.16%, Net Expense Ratio: 0.64%, per the most recent Prospectus dated October 31, 2021, as supplemented May 31, 2022 and August 29, 2022.
The Advisor has contractually agreed to waive management fees and/or pay certain Fund expenses through at least April 1, 2023.
6
PENN CAPITAL MID CAP CORE FUND
FUND SUMMARY (UNAUDITED)

This chart assumes a hypothetical initial gross investment of $10,000 made on November 30, 2015, inception of the Institutional Class shares. Returns shown in the chart and table include the reinvestment of all dividends, but do not reflect the deduction of taxes that a shareholder would pay on Fund distributions or the redemption of Fund shares. In the absence of fee waivers and reimbursements, when they are necessary to keep expenses at the expense cap, total return would be reduced. Past performance is not predictive of future performance. Investment return and principal value will fluctuate so that your shares, when redeemed, may be worth more or less than the original cost. Current performance may be lower or higher than that shown. To obtain performance current to the most recent month-end please call 844-302 PENN (7366) or visit www.penncapitalfunds.com. Index returns do not reflect the effects of fees, transaction costs or expenses. It is not possible to invest directly in an index.
Average Annual Total Returns for the Periods Ended August 31, 2022 | One Year | Three Years | Five Years | Since |
Penn Capital Mid Cap Core Fund | ||||
Institutional Class Shares | -17.45% | 4.21% | 7.05% | 7.52% |
Bloomberg US 2500 Index(2) | -16.38% | 9.50% | 8.23% | 8.98% |
Russell 2500® Index | -15.54% | 9.57% | 8.54% | 9.13%(3) |
(1) | Inception date is 11/30/15. |
(2) | Effective May 31, 2022, the Fund changed its primary benchmark from the Russell 2500® Index to the Bloomberg 2500 Index to better reflect the securities in which the Fund invests. |
(3) | The return shown for the Russell 2500® Index is from the inception date of the Institutional Class shares. |
Gross Expense Ratio: 1.70%, Net Expense Ratio: 1.06%, per the most recent Prospectus dated October 31, 2021, as supplemented May 31, 2022 and August 29, 2022..
The Advisor has contractually agreed to waive management fees and/or pay certain Fund expenses through at least April 1, 2023.
7
PENN CAPITAL OPPORTUNISTIC HIGH INCOME FUND
FUND SUMMARY (UNAUDITED)

This chart assumes a hypothetical initial gross investment of $10,000 made on November 30, 2015, inception of the Institutional Class shares. Returns shown in the chart and table include the reinvestment of all dividends, but do not reflect the deduction of taxes that a shareholder would pay on Fund distributions or the redemption of Fund shares. In the absence of fee waivers and reimbursements, when they are necessary to keep expenses at the expense cap, total return would be reduced. Past performance is not predictive of future performance. Investment return and principal value will fluctuate so that your shares, when redeemed, may be worth more or less than the original cost. Current performance may be lower or higher than that shown. To obtain performance current to the most recent month-end please call 844-302 PENN (7366) or visit www.penncapitalfunds.com. Index returns do not reflect the effects of fees, transaction costs or expenses. It is not possible to invest directly in an index.
Average Annual Total Returns for the Periods Ended August 31, 2022 | One Year | Three Years | Five Years | Since |
Penn Capital Opportunistic High Income Fund | ||||
Institutional Class Shares | -10.31% | 0.14% | 1.75% | 3.85% |
ICE BofA US High Yield Constrained Index | -10.43% | 0.77% | 2.41% | 4.75%(2) |
50% ICE BofA High Yield Constrained Index -50% S&P/LSTA BB Loan Index | -4.55% | 1.46% | 2.66% | 4.11%(3) |
(1) | Inception date is 11/30/15. |
(2) | The return shown for the ICE BofA US High Yield Constrained Index is from the inception date of the Institutional Class shares. |
(3) | The return for the 50% ICE BofA High Yield Constrained Index -50% S&P/LSTA BB Loan Index is from the inception date of the Institutional Class shares. |
Gross Expense Ratio: 1.65%, Net Expense Ratio: 0.72%, per the most recent Prospectus dated October 31, 2021, as supplemented August 29, 2022.
The Advisor has contractually agreed to waive management fees and/or pay certain Fund expenses through at least April 1, 2023.
8
PENN CAPITAL SHORT DURATION HIGH INCOME FUND
FUND SUMMARY (UNAUDITED)
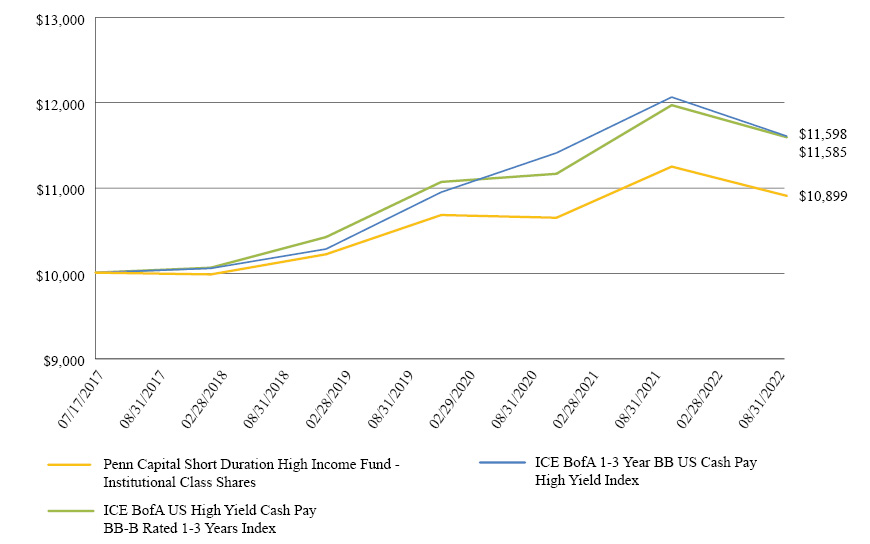
This chart assumes a hypothetical initial gross investment of $10,000 made on July 17, 2017, inception of the Institutional Class shares. Returns shown in the chart and table include the reinvestment of all dividends, but do not reflect the deduction of taxes that a shareholder would pay on Fund distributions or the redemption of Fund shares. In the absence of fee waivers and reimbursements, when they are necessary to keep expenses at the expense cap, total return would be reduced. Past performance is not predictive of future performance. Current performance may be lower or higher than that shown. To obtain performance current to the most recent month-end please call 844-302 PENN (7366) or visit www.penncapitalfunds.com. Investment return and principal value will fluctuate so that your shares, when redeemed, may be worth more or less than the original cost. Index returns do not reflect the effects of fees, transaction costs or expenses. It is not possible to invest directly in an index.
Average Annual Total Returns for the Periods Ended August 31, 2022 | One Year | Three Years | Five Years | Since |
Penn Capital Short Duration High Income Fund | ||||
Institutional Class Shares | -3.05% | 0.70% | 1.78% | 1.69% |
ICE BofA 1-3 Year BB-Rated US Cash Pay High Yield Index | -3.80% | 1.96% | 2.91% | 2.94%(2) |
ICE BofA US High Yield Cash Pay BB-B Rated 1-3 Years Index | -3.15% | 1.55% | 2.87% | 2.91%(3) |
(1) | Inception date is 7/17/17. |
(2) | The return shown for the ICE BofA. 1-3 Year BB-Rated US Cash Pay High Yield Index is from the inception date of the Institutional Class shares. |
(3) | The return shown for the ICE BofA US High Yield Cash Pay BB-B Rated 1-3 Years Index is from the inception date of the Institutional Class shares. The ICE BofA US High Yield Cash Pay BB-B Rated 1-3 Years Imdex is comprised of bonds within the ICE BofA High Yield Index whose ratings are at or between B1 through BB3, with maturities between 1 and 3 years. |
Gross Expense Ratio: 1.01%, Net Expense Ratio: 0.54%, per the most recent Prospectus dated October 31, 2021, as supplemented August 29, 2022..
The Advisor has contractually agreed to waive management fees and/or pay certain Fund expenses through at least April 1, 2023.
9
PENN CAPITAL SPECIAL SITUATIONS SMALL CAP EQUITY FUND
FUND SUMMARY (UNAUDITED)

This chart assumes a hypothetical initial gross investment of $10,000 made on December 17, 2015, inception of the Institutional Class shares. Returns shown in the chart and table include the reinvestment of all dividends, but do not reflect the deduction of taxes that a shareholder would pay on Fund distributions or the redemption of Fund shares. In the absence of fee waivers and reimbursements, when they are necessary to keep expenses at the expense cap, total return would be reduced. Past performance is not predictive of future performance. Investment return and principal value will fluctuate so that your shares, when redeemed, may be worth more or less than the original cost. Current performance may be lower or higher than that shown. To obtain performance current to the most recent month-end please call 844-302 PENN (7366) or visit www.penncapitalfunds.com. Index returns do not reflect the effects of fees, transaction costs or expenses. It is not possible to invest directly in an index.
Average Annual Total Returns for the Periods Ended August 31, 2022 | One Year | Three Years | Five Years | Since |
Penn Capital Special Situations Small Cap Equity Fund | ||||
Institutional Class Shares | -14.39% | 18.83% | 12.37% | 12.41% |
Bloomberg US 2000 Index(2) | -17.49% | 10.75% | 7.88% | 8.72% |
Russell 2000® Index | -17.88% | 8.59% | 6.95% | 8.93%(3) |
(1) | Inception date is 12/17/15. |
(2) | Effective May 31, 2022, the Fund changed its primary benchmark from the Russell 2000® Index to the Bloomberg US 2000 Index to better reflect the securities in which the Fund invests. |
(3) | The return shown for the Russell 2000® Index is from the inception date of the Institutional Class shares. |
Gross Expense Ratio: 1.71%, Net Expense Ratio: 1.09%, per the most recent Prospectus dated October 31, 2021, as supplemented May 31, 2022 and August 29, 2022..
The Advisor has contractually agreed to waive management fees and/or pay certain Fund expenses through at least April 1, 2023.
10
THE RBB FUND TRUST (FORMERLY, PENN CAPITAL FUNDS TRUST)
Disclosure of Fund Expenses (Unaudited)
FOR THE PERIOD FROM MARCH 1, 2022 TO AUGUST 31, 2022
Cost in Dollars of a $1,000 Investment
The examples below are intended to describe the fees and expenses borne by shareholders during the six-month period from March 1, 2022 to August 31, 2022, and the impact of those costs on your investment.
Example
As a shareholder of a Fund, you incur two types of costs: (1) transaction costs and (2) ongoing costs, including management fees and other Fund expenses. This example is intended to help you understand your ongoing costs (in dollars) of investing in a Fund and to compare these costs with the ongoing costs of investing in other mutual funds. These examples are based on an investment of $1,000 made at the beginning of the six-month period and held for the entire period from March 1, 2022 to August 31, 2022.
These examples illustrate your Fund’s ongoing costs in two ways:
Actual Expenses
The second and third data columns in the table below provide information about actual account values and actual expenses. You may use the information in these columns, together with the amount you invested, to estimate the expenses that you paid during the six-month period ended August 31, 2022. Simply divide your account value by $1,000 (for example, an $8,600 account value divided by $1,000 = 8.6), then multiply the result by the number under the heading entitled Expenses Paid During Period to estimate the expenses you paid on your account during this period.
Hypothetical Examples for Comparison Purposes
The fourth and fifth data columns in the table below provide information about hypothetical account values and hypothetical expenses based on each Fund’s actual expense ratio and an assumed rate of return of 5% per year before expenses, which is not a Fund’s actual return. The hypothetical account values and expenses may not be used to estimate the actual ending account balances or expenses you paid for the six-month period shown. You may use this information to compare the ongoing costs of investing in a Fund with the ongoing costs of investing in other funds. To do so, compare these 5% hypothetical examples with the 5% hypothetical examples that appear in the shareholder reports of the other funds.
Please note that the expenses shown in the table are meant to highlight your ongoing costs only and do not reflect any transactional costs, such as redemption fees. Therefore, the fourth and fifth data columns of the table are useful in comparing ongoing costs only and will not help you determine the relative total costs of owning different funds. In addition, if these transactional costs were included, your costs would have been higher.
11
Beginning | Ending | Expenses Paid | Annualized | Actual Six-Month | |
Penn Capital Floating Rate Income Fund(1) | |||||
Actual | $ 1,000.00 | $ 984.60 | $ 3.20 | 0.64% | -1.54% |
Hypothetical (5% return before expenses) | 1,000.00 | 1,021.98 | 3.26 | 0.64% | N/A |
Penn Capital Mid Cap Core Fund(1) | |||||
Actual | $ 1,000.00 | $ 850.70 | $ 4.94 | 1.06% | -14.93% |
Hypothetical (5% return before expenses) | 1,000.00 | 1,019.86 | 5.40 | 1.06% | N/A |
Penn Capital Opportunistic High Income Fund(1) | |||||
Actual | $ 1,000.00 | $ 922.00 | $ 3.49 | 0.72% | -7.80% |
Hypothetical (5% return before expenses) | 1,000.00 | 1,021.58 | 3.67 | 0.72% | N/A |
Penn Capital Short Duration High Income Fund | |||||
Actual | $ 1,000.00 | $ 979.80 | $ 2.69 | 0.54% | -2.02% |
Hypothetical (5% return before expenses) | 1,000.00 | 1,022.48 | 2.75 | 0.54% | N/A |
Penn Capital Special Situations Small Cap Equity Fund(1) | |||||
Actual | $ 1,000.00 | $ 858.40 | $ 5.11 | 1.09% | -14.16% |
Hypothetical (5% return before expenses) | 1,000.00 | 1,019.71 | 5.55 | 1.09% | N/A |
(1) | Information is for Institutional Class shares. |
(2) | Expenses are equal to each Fund’s annualized expense ratio, net of waivers and excluding acquired fund fees and expenses, if any, multiplied by the average account value over the period, multiplied by the number of days (184) in the most recent fiscal half-year, then divided by 365 to reflect the one-half year period. |
(3) | Ratios reflect expenses waived by the Funds’ investment adviser. Without these waivers, each Fund’s expenses would have been higher and the ending account values would have been lower. |
12
THE RBB FUND TRUST (FORMERLY, PENN CAPITAL FUNDS TRUST)
Penn Capital Floating Rate Income Fund
SCHEDULE OF INVESTMENTS
AUGUST 31, 2022
Principal | Value | |||||||
Bank Loans: 83.4%(a)(b) | ||||||||
Advertising & Marketing: 0.6% | ||||||||
Terrier Media Buyer, Inc., 5.166% (1 Month US LIBOR + 3.500%), 12/17/26 | $ | 195,030 | $ | 188,935 | ||||
Apparel & Textile Products: 3.1% | ||||||||
Calceus Acquisition, Inc., 7.075% (1 Month US LIBOR + 5.500%), 3/31/25 | 368,043 | 327,558 | ||||||
Canada Goose, Inc., 4.506% (1 Month US LIBOR + 3.500%), 10/7/27 | 346,251 | 338,785 | ||||||
Crocs, Inc., 4.030% (TSFR1M + 3.500%), 2/20/29 | 299,250 | 287,654 | ||||||
| 953,997 | ||||||||
Asset Management: 3.7% | ||||||||
Fiserv Investment Solutions, Inc., 5.455% (1 Month US LIBOR + 4.000%), 2/26/27 | 196,000 | 188,650 | ||||||
Hightower Holding LLC, 5.098% (1 Month US LIBOR + 4.000%), 4/21/28 | 198,500 | 192,297 | ||||||
Nexus Buyer LLC, 5.416% (1 Month US LIBOR + 3.750%), 10/30/26 | 243,750 | 236,335 | ||||||
Russell Investments US Institutional Holdco, Inc., 5.000%, 5/30/25 | ||||||||
(6 Month US LIBOR + 3.500%) | 138,702 | 130,988 | ||||||
(6 Month US LIBOR + 3.500%) | 59,620 | 56,303 | ||||||
The Edelman Financial Engines Center LLC, 5.166% (1 Month US LIBOR + 3.750%), 4/7/28 | 192,803 | 184,678 | ||||||
Victory Capital Holdings, Inc., 3.219% (1 Month US LIBOR + 2.250%), 7/1/26 | 158,792 | 154,823 | ||||||
| 1,144,074 | ||||||||
Cable & Satellite: 3.3% | ||||||||
Cogeco Communications USA II LP, 3.666% (1 Month US LIBOR + 2.000%), 8/9/24 | 240,430 | 234,821 | ||||||
CSC Holdings LLC, 4.249% (1 Month US LIBOR + 2.250%), 7/17/25 | 237,469 | 229,604 | ||||||
DirecTV Financing LLC, 7.372% (1 Month US LIBOR + 5.000%), 8/2/27 | 329,595 | 314,680 | ||||||
Ziggo Financing Partnership, 4.891% (1 Month US LIBOR + 2.500%), 4/17/28 | 250,000 | 241,095 | ||||||
| 1,020,200 | ||||||||
Principal | Value | |||||||
Chemicals: 4.0% | ||||||||
Avient Corp. T/L B (07/22), 3.750%, 9/30/29(d) | $ | 250,000 | $ | 248,750 | ||||
Diamond BC BV, 3.514%, 10/31/28 | ||||||||
(3 Month US LIBOR + 2.750%) | 248,125 | 238,716 | ||||||
(1 Month US LIBOR + 2.750%) | 625 | 601 | ||||||
Gemini HDPE LLC, 4.240% (1 Month US LIBOR + 3.000%), 12/31/27 | 187,337 | 183,684 | ||||||
Lummus Technology Holdings V LLC, 5.872% (1 Month US LIBOR + 3.500%), 6/30/27 | 187,482 | 180,647 | ||||||
Schweitzer-Mauduit International, Inc., 5.438% (1 Month US LIBOR + 4.000%), 1/27/28 | 198,000 | 188,100 | ||||||
Trinseo Materials Operating SCA, 4.166%, 5/15/28 | ||||||||
(1 Month US LIBOR + 2.500%) | 163,152 | 156,626 | ||||||
(1 Month US LIBOR + 2.500%) | 34,848 | 33,454 | ||||||
| 1,230,578 | ||||||||
Commercial Support Services: 4.2% | ||||||||
Covanta Holding Corp., 4.872% (1 Month US LIBOR + 2.500%), 12/29/28 | 330,272 | 322,980 | ||||||
Covanta Holding Corp., 4.166% (1 Month US LIBOR + 2.500%), 12/29/28 | 24,800 | 24,252 | ||||||
GFL Environmental, Inc., 4.239% (1 Month US LIBOR + 3.000%), 5/30/25 | 197,000 | 195,686 | ||||||
Prime Security Services T/L, 4.463% (1 Month US LIBOR + 2.750%), 9/23/26 | 278,713 | 271,876 | ||||||
R1 RCM T/L B, 4.525%, 5/12/29 | 300,000 | 294,939 | ||||||
TruGreen Limited Parternship T/L, 5.666% (1 Month US LIBOR + 4.000%), 10/29/27 | 197,000 | 188,628 | ||||||
| 1,298,361 | ||||||||
Construction Materials Manufacturing: 1.2% | ||||||||
Quikrete Holdings, Inc., 4.997% (1 Month US LIBOR + 2.625%), 11/15/23 | 376,875 | 362,331 | ||||||
Containers & Packaging Manufacturing: 2.6% | ||||||||
Graham Packaging Co., Inc., 5.372% (1 Month US LIBOR + 3.000%), 8/4/27 | 193,483 | 188,646 | ||||||
Pactiv Evergreen Group Holdings, Inc., 5.166%, 9/20/28 | ||||||||
(1 Month US LIBOR + 3.500%) | 40,327 | 39,175 | ||||||
The Accompanying Footnotes are an Integral Part of these Financial Statements
13
THE RBB FUND TRUST (FORMERLY, PENN CAPITAL FUNDS TRUST)
Penn Capital Floating Rate Income Fund
SCHEDULE OF INVESTMENTS
AUGUST 31, 2022
Principal | Value | |||||||
(1 Month US LIBOR + 3.500%) | $ | 183,178 | $ | 177,945 | ||||
(1 Month US LIBOR + 3.500%) | 24,620 | 23,916 | ||||||
Pactiv Evergreen Group Holdings, Inc., 4.916%, 2/5/26 | ||||||||
(1 Month US LIBOR + 3.250%) | 27,841 | 27,122 | ||||||
(1 Month US LIBOR + 3.250%) | 45,603 | 44,425 | ||||||
(1 Month US LIBOR + 3.250%) | 123,556 | 120,364 | ||||||
Sabert Corp., 6.875% (1 Month US LIBOR + 4.500%), 11/26/26 | 180,111 | 177,410 | ||||||
| 799,003 | ||||||||
E-Commerce Discretionary: 0.6% | ||||||||
CNT Holdings I Corp., 5.368% (1 Month US LIBOR + 3.750%), 10/16/27 | 197,500 | 192,738 | ||||||
Electric Utilities: 0.6% | ||||||||
Vistra Operations Co. LLC, 3.906%, 12/15/25 | ||||||||
(1 Month US LIBOR + 1.750%) | 38,519 | 37,706 | ||||||
(1 Month US LIBOR + 1.750%) | 156,003 | 152,714 | ||||||
| 190,420 | ||||||||
Engineering & Construction: 1.2% | ||||||||
Centuri Group, Inc., 4.081%, 9/29/28 | ||||||||
(1 Month US LIBOR + 2.500%) | 500 | 487 | ||||||
(3 Month US LIBOR + 2.500%) | 176,166 | 171,487 | ||||||
Pike Corp., 4.670% (1 Month US LIBOR + 3.000%), 1/21/28 | 196,575 | 191,938 | ||||||
| 363,912 | ||||||||
Entertainment Content: 1.8% | ||||||||
Alchemy Copyrights LLC, 4.713% (1 Month US LIBOR + 3.000%), 8/5/27 | 176,857 | 174,204 | ||||||
Playtika Holding Corp., 5.122% (1 Month US LIBOR + 2.750%), 3/13/28 | 197,500 | 192,934 | ||||||
Univision Communications, Inc., 6.254% (TSFR1M + 4.250%), 6/9/29 | 200,000 | 196,000 | ||||||
| 563,138 | ||||||||
Food Production: 3.3% | ||||||||
Chobani LLC, 5.166% (1 Month US LIBOR + 3.500%), 10/20/27(d) | 296,500 | 284,086 | ||||||
Froneri US, Inc., 4.622%, 1/29/27 | ||||||||
(1 Month US LIBOR + 2.250%) | 134,704 | 129,596 | ||||||
(1 Month US LIBOR + 2.250%) | 61,296 | 58,972 | ||||||
Principal | Value | |||||||
HLF Financing Sarl LLC, 4.166% (1 Month US LIBOR + 2.500%), 8/8/25 | $ | 220,625 | $ | 214,145 | ||||
Whole Earth Brands, Inc., 6.125% (1 Month US LIBOR + 4.500%), 2/2/28 | 346,744 | 322,472 | ||||||
| 1,009,271 | ||||||||
Health Care Facilities & Services: 4.9% | ||||||||
ADMI Corp., 5.747% (1 Month US LIBOR + 3.250%), 12/23/27 | 346,744 | 318,942 | ||||||
Cambrex Corp., 5.927% (1 Month US LIBOR + 3.500%), 12/4/26 | 239,209 | 231,959 | ||||||
FC Compassus LLC, 7.127% (1 Month US LIBOR + 4.250%), 12/31/26 | 195,030 | 175,527 | ||||||
Option Care Health, Inc., 5.122% (1 Month US LIBOR + 2.750%), 11/30/28 | 298,500 | 294,957 | ||||||
PetVet Care Centers LLC, 4.416% (1 Month US LIBOR + 2.750%), 2/28/25 | 312,931 | 300,022 | ||||||
Select Medical Corp., 4.170% (6 Month US LIBOR + 2.500%), 3/6/24 | 212,163 | 207,190 | ||||||
| 1,528,597 | ||||||||
Home & Office Products Manufactering: 0.8% | ||||||||
Weber-Stephen Products LLC, 4.916% (1 Month US LIBOR + 3.250%), 11/30/27 | 310,863 | 263,235 | ||||||
Housing: 0.6% | ||||||||
Foundation Building Materials, Inc., 4.489%, 1/31/28 | ||||||||
(3 Month US LIBOR + 3.250%) | 202,438 | 192,568 | ||||||
(1 Month US LIBOR + 3.250%) | 513 | 488 | ||||||
| 193,056 | ||||||||
Industrial Intermediate Products: 0.6% | ||||||||
Gates Global LLC, 4.166% (1 Month US LIBOR + 2.750%), 3/31/27 | 197,805 | 193,623 | ||||||
Insurance: 1.2% | ||||||||
Asurion LLC, 5.622% (1 Month US LIBOR + 3.250%), 12/23/26 | 197,000 | 180,115 | ||||||
HUB International Ltd., 4.214%, 4/18/25 | ||||||||
(2 Month US LIBOR + 3.000%) | 511 | 500 | ||||||
(3 Month US LIBOR + 3.000%) | 195,688 | 191,367 | ||||||
| 371,982 | ||||||||
The Accompanying Footnotes are an Integral Part of these Financial Statements
14
THE RBB FUND TRUST (FORMERLY, PENN CAPITAL FUNDS TRUST)
Penn Capital Floating Rate Income Fund
SCHEDULE OF INVESTMENTS
AUGUST 31, 2022
Principal | Value | |||||||
Internet Media & Services: 4.9% | ||||||||
Arches Buyer, Inc., 5.622% (1 Month US LIBOR + 3.250%), 12/6/27 | $ | 296,000 | $ | 279,042 | ||||
Buzz Merger Sub Ltd., 5.096% (1 Month US LIBOR + 2.750%), 1/22/27 | 244,375 | 237,655 | ||||||
Endurance International Group Holdings, Inc., 5.291% (1 Month US LIBOR + 3.500%), 2/10/28 | 202,950 | 189,886 | ||||||
Go Daddy Operating Co. LLC, 3.416%, 2/15/24 | ||||||||
(1 Month US LIBOR + 1.750%) | 73,346 | 72,561 | ||||||
(1 Month US LIBOR + 1.750%) | 238,572 | 236,017 | ||||||
Match Group Holdings II LLC, 3.194% (1 Month US LIBOR + 1.750%), 2/7/27 | 200,000 | 194,000 | ||||||
Shutterfly, Inc., 7.250% (1 Month US LIBOR + 5.000%), 9/25/26 | 405,900 | 305,610 | ||||||
| 1,514,771 | ||||||||
Leisure Facilities & Services: 7.2% | ||||||||
Alterra Mountain Co., 5.872% (1 Month US LIBOR + 3.500%), 8/17/28 | 239,441 | 232,557 | ||||||
Caesars Resort Collection LLC, 5.872% (1 Month US LIBOR + 3.500%), 7/21/25 | 112,611 | 111,541 | ||||||
Carnival Corp., 3.750% (1 Month US LIBOR + 3.000%), 6/30/25 | 246,851 | 234,664 | ||||||
Century Casinos T/L (03/22), 7.625%, 3/23/29 | 249,375 | 238,777 | ||||||
Dave & Buster’s, Inc., 7.427% (TSFR1M + 5.000%), 6/22/29 | 300,000 | 292,749 | ||||||
Hilton Grand Vacations LLC, 5.372% (1 Month US LIBOR + 3.000%), 7/31/28 | 248,125 | 242,336 | ||||||
IRB Holding Corp., 5.122% (1 Month US LIBOR + 2.750%), 2/5/25 | 241,309 | 235,981 | ||||||
IRB Holding Corp., 5.437% (SOFR + 3.000%), 12/15/27 | 197,000 | 190,310 | ||||||
Scientific Games Holdings LP, 4.175% (TSFR1M + 3.500%), 2/3/29 | 250,000 | 240,452 | ||||||
Scientific Games International, Inc., 5.044% (TSFR1M + 3.000%), 4/6/29 | 250,000 | 245,625 | ||||||
| 2,264,992 | ||||||||
Machinery Manufacturing: 1.4% | ||||||||
ASP Blade Holdings, Inc., 6.372% (1 Month US LIBOR + 4.000%), 12/31/28 | 248,824 | 231,762 | ||||||
Principal | Value | |||||||
EWT Holdings III Corp., 4.188% (1 Month US LIBOR + 2.500%), 3/10/28 | $ | 198,000 | $ | 195,277 | ||||
| 427,039 | ||||||||
Oil & Gas Producers: 3.1% | ||||||||
AL GCX Holdings (Arclight) T/L B, 5.916% (TSFR1M + 3.750%), 4/20/29 | 300,000 | 296,157 | ||||||
CQP Holdco LP, 6.000% (1 Month US LIBOR + 3.750%), 6/5/28 | 247,500 | 242,364 | ||||||
Freeport LNG Investments LLLP, 4.563% (1 Month US LIBOR + 3.500%), 11/17/28 | 246,674 | 236,329 | ||||||
GIP II Blue Holding LP, 5.506% (1 Month US LIBOR + 4.500%), 9/22/28 | 201,022 | 198,760 | ||||||
| 973,610 | ||||||||
Oil & Gas Services & Equipment: 1.4% | ||||||||
ChampionX T/L B1 (05/22) (Apergy), 5.080%, 5/14/29 | 300,000 | 298,500 | ||||||
Keane Group Holdings LLC, 5.938% (US LIBOR + 3.750%), 6/30/25(d) | 130,000 | 126,263 | ||||||
| 424,763 | ||||||||
Pharmaceuticals: 0.8% | ||||||||
Agiliti Health, Inc., 4.500%, 10/18/25 | ||||||||
(1 Month US LIBOR + 2.750%) | 243,073 | 236,996 | ||||||
(1 Month US LIBOR + 2.750%) | 630 | 614 | ||||||
| 237,610 | ||||||||
Publishing & Broadcasting: 2.8% | ||||||||
Clear Channel Outdoor Holdings, Inc., 6.306% (1 Month US LIBOR + 3.500%), 8/7/26 | 342,869 | 316,821 | ||||||
Cumulus Media New Holdings, Inc., 4.750% (1 Month US LIBOR + 3.750%), 3/30/26 | 145,298 | 139,486 | ||||||
The E.W. Scripps Co., 4.935% (1 Month US LIBOR + 2.563%), 5/1/26 | 242,152 | 237,461 | ||||||
The E.W. Scripps Co., 5.122% (1 Month US LIBOR + 3.000%), 1/7/28 | 165,750 | 163,174 | ||||||
| 856,942 | ||||||||
Retail - Consumer Discretionary: 5.4% | ||||||||
Great Outdoors Group T/L (Bass Pro) LLC, 6.122% (1 Month US LIBOR + 3.750%), 3/31/28 | 347,375 | 335,564 | ||||||
Jo-Ann Stores LLC, 5.964% (1 Month US LIBOR + 4.750%), 7/7/28 | 247,500 | 160,051 | ||||||
The Accompanying Footnotes are an Integral Part of these Financial Statements
15
THE RBB FUND TRUST (FORMERLY, PENN CAPITAL FUNDS TRUST)
Penn Capital Floating Rate Income Fund
SCHEDULE OF INVESTMENTS
AUGUST 31, 2022
Principal | Value | |||||||
LBM Acquisition LLC, 5.416% (1 Month US LIBOR + 3.750%), 12/17/27(d) | $ | 211,705 | $ | 192,704 | ||||
PetSmart, Inc., 4.500% (1 Month LIBOR USD + 3.750%), 2/11/28 | 198,000 | 193,050 | ||||||
Savers, Inc., 6.506% (1 Month US LIBOR + 5.750%), 4/6/27 | 198,500 | 194,034 | ||||||
Staples, Inc., 5.786% (1 Month US LIBOR + 4.500%), 9/12/24 | 307,569 | 290,173 | ||||||
White Cap Buyer LLC, 5.275% (1 Month US LIBOR + 4.000%), 10/8/27 | 345,386 | 333,063 | ||||||
| 1,698,639 | ||||||||
Semiconductors: 0.9% | ||||||||
II-VI, Inc., 5.123% (1 Month US LIBOR + 2.750%), 12/1/28(d) | 300,000 | 293,124 | ||||||
Software: 6.4% | ||||||||
Azalea TopCo, Inc., 4.739% (1 Month US LIBOR + 3.500%), 7/27/26 | 291,750 | 279,059 | ||||||
McAfee Corp., 6.407% (TSFR1M + 4.000%), 2/2/29 | 300,000 | 283,875 | ||||||
Proofpoint, Inc., 4.825% (1 Month US LIBOR + 3.250%), 6/9/28 | 199,000 | 191,189 | ||||||
Rackspace Technology Global, Inc., 4.160%, 2/15/28 | ||||||||
(3 Month US LIBOR + 2.750%) | 346,242 | 278,677 | ||||||
(1 Month US LIBOR + 2.750%) | 879 | 707 | ||||||
UKG, Inc., 5.535% (1 Month US LIBOR + 3.250%), 5/4/26 | 297,014 | 287,308 | ||||||
Waystar Technologies, Inc., 6.372% (1 Month US LIBOR + 4.000%), 10/31/26(d) | 347,364 | 339,402 | ||||||
Xperi Holding Corp., 5.166% (1 Month US LIBOR + 3.500%), 6/1/25 | 350,604 | 342,936 | ||||||
| 2,003,153 | ||||||||
Specialty Finance: 0.7% | ||||||||
TransUnion LLC, 3.416% (1 Month US LIBOR + 1.750%), 11/13/26 | 237,411 | 232,070 | ||||||
Specialty Retail: 1.3% | ||||||||
BDF Acquisition Corp., 7.622% (1 Month US LIBOR + 5.250%), 8/14/23 | 437,200 | 397,441 | ||||||
Technology Hardware: 0.8% | ||||||||
Maxar Technologies, Inc., 6.677% (TSFR1M + 4.250%), 6/29/29 | 250,000 | 239,625 | ||||||
Principal | Value | |||||||
Technology Services: 2.6% | ||||||||
NAB Holdings T/L, 5.204% (SOFR + 3.000%), 11/17/28 | $ | 348,250 | $ | 335,988 | ||||
Paysafe Holdings US Corp., 4.416% (1 Month US LIBOR + 2.750%), 4/30/25 | 248,120 | 231,372 | ||||||
Sabre GLBL Inc. T/L 8/22, 7.285%, 6/30/28(d) | 250,000 | 240,625 | ||||||
| 807,985 | ||||||||
Telecommnications: 3.2% | ||||||||
Altice France SA, 6.905% (1 Month US LIBOR + 4.000%), 7/13/26 | 235,023 | 227,267 | ||||||
Cincinnati Bell, Inc., 5.677% (SOFR + 3.250%), 12/29/28 | 348,250 | 340,488 | ||||||
Gogo Intermediate Holdings LLC, 4.989% (1 Month US LIBOR + 3.750%), 4/28/28 | 198,000 | 193,751 | ||||||
Lumen Technologies, Inc., 4.622% (1 Month US LIBOR + 2.250%), 3/15/27 | 243,750 | 229,125 | ||||||
| 990,631 | ||||||||
Transportation & Logistics: 1.3% | ||||||||
American Airlines, Inc., 7.460% (1 Month US LIBOR + 4.750%), 4/20/28 | 200,000 | 196,584 | ||||||
SkyMiles IP Ltd., 4.813% (1 Month US LIBOR + 3.750%), 10/20/27 | 200,000 | 202,392 | ||||||
| 398,976 | ||||||||
Wholesale - Consumer Discretionary: 0.9% | ||||||||
Dealer Tire LLC, 5.916%, 12/12/25 | ||||||||
(1 Month US LIBOR + 4.250%) | 100,551 | 99,646 | ||||||
(1 Month US LIBOR + 4.250%) | 170,559 | 169,024 | ||||||
| 268,670 | ||||||||
Total Bank Loans (cost $26,861,925) | 25,897,492 | |||||||
Corporate Bonds: 12.5% | ||||||||
Aerospace & Defense: 0.5% | ||||||||
TransDigm, Inc., 8.000%, 12/15/25(c) | 160,000 | 163,872 | ||||||
Cable & Satellite: 0.4% | ||||||||
Dish DBS Corp., 5.875%, 11/15/24 | 150,000 | 135,750 | ||||||
Containers & Packaging Manufacturing: 0.6% | ||||||||
Matthews International Corp., 5.250%, 12/1/25(c) | 200,000 | 182,110 | ||||||
The Accompanying Footnotes are an Integral Part of these Financial Statements
16
THE RBB FUND TRUST (FORMERLY, PENN CAPITAL FUNDS TRUST)
Penn Capital Floating Rate Income Fund
SCHEDULE OF INVESTMENTS
AUGUST 31, 2022
Principal | Value | |||||||
Entertainment Content: 0.6% | ||||||||
Univision Communications, Inc., 5.125%, 2/15/25(c) | $ | 195,000 | $ | 188,355 | ||||
Gas & Water Utilities: 0.4% | ||||||||
Rockpoint Gas Storage Canada Ltd., 7.000%, 3/31/23(c) | 138,000 | 136,620 | ||||||
Leisure Facilities & Services: 2.4% | ||||||||
Arrow Bidco LLC, 9.500%, 3/15/24(c) | 115,000 | 114,716 | ||||||
Carnival Corp., 10.500%, 2/1/26(c) | 385,000 | 396,548 | ||||||
International Game Technology PLC, 6.500%, 2/15/25(c) | 200,000 | 198,500 | ||||||
| 709,764 | ||||||||
Oil & Gas Producers: 1.5% | ||||||||
Matador Resources Co., 5.875%, 9/15/26 | 150,000 | 146,828 | ||||||
New Fortress Energy Inc., 6.5% 9/30/26(c) | 188,000 | 170,523 | ||||||
SM Energy Co. 5.625% 06/01/25 | 150,000 | 145,875 | ||||||
| 463,226 | ||||||||
Oil & Gas Services & Equipment: 1.0% | ||||||||
Oceaneering International, Inc., 4.650%, 11/15/24 | 200,000 | 186,584 | ||||||
Weatherford International Ltd., 11.000%, 12/1/24(c) | 124,000 | 125,897 | ||||||
| 312,481 | ||||||||
Home & Office Products Manufacturing: 0.5% | ||||||||
CD&R Smokey Buyer, Inc., 6.750%, 7/15/25(c) | 165,000 | 153,450 | ||||||
Publishing & Broadcasting: 0.4% | ||||||||
Cumulus Media New Holdings, Inc., 6.750%, 7/1/26(c) | 155,000 | 138,647 | ||||||
Real Estate Investment Trusts (REITs): 1.0% | ||||||||
VICI Properties LP / VICI Note Co, Inc., 4.625%, 6/15/25(c) | 150,000 | 145,194 | ||||||
XHR LP, 6.375%, 8/15/25(c) | 160,000 | 155,289 | ||||||
| 300,483 | ||||||||
Specialty Finance: 0.9% | ||||||||
Fortress Transportation and Infrastructure Investors LLC, 6.500%, 10/1/25(c) | 122,000 | 113,662 | ||||||
Principal | Value | |||||||
Starwood Property Trust, Inc., 3.750%, 12/31/24(c) | $ | 190,000 | $ | 177,043 | ||||
| 290,705 | ||||||||
Technology Services: 0.5% | ||||||||
Sabre GLBL, Inc., 9.250%, 4/15/25(c) | 165,000 | 162,573 | ||||||
Tobacco & Cannabis: 0.4% | ||||||||
Turning Point Brands, Inc., 5.625%, 2/15/26(c) | 145,000 | 128,663 | ||||||
Transportation & Logistics: 1.0% | ||||||||
Allegiant Travel Co., 7.250%, 8/15/27(c) | 300,000 | 297,969 | ||||||
Wholesale - Consumer Staples: 0.4% | ||||||||
KeHE Distributors LLC, 8.625%, 10/15/26(c) | 109,000 | 110,363 | ||||||
Total Corporate Bonds (cost $4,049,588) | 3,875,031 | |||||||
Number of | ||||||||
Short-Term Investments: 6.7% | ||||||||
U.S. Bank Money Market Deposit Account, 1.00%(e) | 2,085,171 | 2,085,171 | ||||||
Total Short-Term Investments: (cost $2,085,171) | 2,085,171 | |||||||
Total Investments - 102.6% (cost $32,996,684) | 31,857,694 | |||||||
Liabilities in Excess of Other Assets (2.6)% | (808,878 | ) | ||||||
Net Assets: 100.0% | $ | 31,048,816 | ||||||
Percentages are stated as a percent of net assets.
(a) | Bank Loans typically have rates of interest which are redetermined either daily, monthly, quarterly or semi-annually by reference to a base lending rate, plus a premium. These base lending rates are primarily the London Interbank Offered Rate (“LIBOR”) and secondarily, the prime rate offered by one or more major United States banks (the “Prime Rate”) and the certificate of deposit (“CD”) rate or other base lending rates used by commercial lenders. |
(b) | Senior floating-rate loans (Senior Loans) often require prepayments from excess cash flows or permit the borrowers to repay at their election. The degree to which borrowers repay, whether as a contractual requirement or at their election, cannot be predicted with accuracy. As a result, the actual remaining maturity may be substantially less than the stated maturities shown. However, Senior Loans will typically have an expected average life of approximately two to four years. |
The Accompanying Footnotes are an Integral Part of these Financial Statements
17
THE RBB FUND TRUST (FORMERLY, PENN CAPITAL FUNDS TRUST)
Penn Capital Floating Rate Income Fund
SCHEDULE OF INVESTMENTS
AUGUST 31, 2022
(c) | Securities purchased pursuant to Rule 144A of the Securities Act of 1933, as amended, and may be sold only to dealers in that program or other “qualified institutional buyers.” As of August 31, 2022, the value of these investments was $3,259,994, or 10.5% of total net assets. |
(d) | All or a portion of this loan is unfunded - See note. |
(e) | The rate shown is as of August 31, 2022. |
Country Exposure (as a percentage of total investments) | |
United States | 97.4% |
Panama | 1.2% |
United Kingdom | 0.6% |
Canada | 0.4% |
Bermuda | 0.4% |
Asset Type (as a percentage of total investments) (Unaudited) |

The Accompanying Footnotes are an Integral Part of these Financial Statements
18
THE RBB FUND TRUST (FORMERLY, PENN CAPITAL FUNDS TRUST)
Penn Capital Mid Cap Core Fund
SCHEDULE OF INVESTMENTS
AUGUST 31, 2022
Number of | Value | |||||||
Common Stocks: 88.1% | ||||||||
Aerospace & Defense: 1.3% | ||||||||
Mercury Systems, Inc.* | 3,318 | $ | 159,695 | |||||
Air Freight & Logistics: 1.8% | ||||||||
GXO Logistics, Inc.* | 2,494 | 110,684 | ||||||
XPO Logistics, Inc.* | 2,251 | 117,997 | ||||||
| 228,681 | ||||||||
Banks: 8.1% | ||||||||
Pinnacle Financial Partners, Inc. | 3,623 | 292,412 | ||||||
Seacoast Banking Corp of Florida | 8,137 | 262,988 | ||||||
Texas Capital Bancshares, Inc.* | 4,385 | 258,846 | ||||||
Western Alliance Bancorp | 2,980 | 228,626 | ||||||
| 1,042,872 | ||||||||
Biotechnology: 4.9% | ||||||||
BioMarin Pharmaceutical, Inc.* | 1,921 | 171,353 | ||||||
Halozyme Therapeutics, Inc.* | 4,702 | 191,513 | ||||||
United Therapeutics Corp.* | 1,124 | 254,721 | ||||||
| 617,587 | ||||||||
Building Products: 1.6% | ||||||||
Lennox International, Inc. | 849 | 203,862 | ||||||
Chemicals: 5.3% | ||||||||
CF Industries Holdings, Inc. | 2,304 | 238,372 | ||||||
Livent Corp.* | 7,080 | 227,834 | ||||||
Olin Corp. | 3,735 | 204,155 | ||||||
| 670,361 | ||||||||
Construction Materials: 1.9% | ||||||||
Martin Marietta Materials, Inc. | 701 | 243,745 | ||||||
Consumer Finance: 1.1% | ||||||||
OneMain Holdings, Inc. | 4,169 | 145,623 | ||||||
Electrical Equipment: 1.8% | ||||||||
nVent Electric PLC | 7,063 | 232,796 | ||||||
Food & Staples Retailing: 0.8% | ||||||||
Performance Food Group Co.* | 1,918 | 95,862 | ||||||
Health Care Equipment & Supplies: 3.6% | ||||||||
CONMED Corp. | 2,313 | 204,862 | ||||||
Lantheus Holdings, Inc.* | 3,116 | 245,541 | ||||||
| 450,403 | ||||||||
Number of | Value | |||||||
Hotels, Restaurants & Leisure: 4.6% | ||||||||
MGM Resorts International | $ | 5,054 | $ | 164,963 | ||||
Planet Fitness, Inc. - Class A* | 3,439 | 232,992 | ||||||
Vail Resorts, Inc. | 807 | 181,317 | ||||||
| 579,272 | ||||||||
Independent Power and Renewable Electricity Producers: 2.3% | ||||||||
Vistra Corp. | 11,748 | 290,763 | ||||||
Insurance: 7.0% | ||||||||
Arch Capital Group Ltd.* | 6,709 | 306,736 | ||||||
Axis Capital Holdings Ltd. | 4,361 | 231,787 | ||||||
Lincoln National Corp. | 2,591 | 119,341 | ||||||
Primerica, Inc. | 1,794 | 227,390 | ||||||
| 885,254 | ||||||||
Interactive Media & Services: 0.7% | ||||||||
IAC, Inc.* | 1,340 | 86,122 | ||||||
IT Services: 1.8% | ||||||||
GoDaddy, Inc. - Class A* | 2,984 | 226,247 | ||||||
Life Sciences Tools & Services: 1.9% | ||||||||
Avantor, Inc.* | 9,505 | 236,770 | ||||||
Machinery: 1.8% | ||||||||
Chart Industries, Inc.* | 1,198 | 232,244 | ||||||
Marine: 2.4% | ||||||||
Kirby Corp.* | 4,476 | 300,161 | ||||||
Media: 3.6% | ||||||||
Fox Corp. - Class B | 6,757 | 213,656 | ||||||
Liberty Media Corp.-Liberty SiriusXM - Class A* | 5,877 | 244,131 | ||||||
| 457,787 | ||||||||
Metals & Mining: 3.4% | ||||||||
Constellium SE* | 13,786 | 183,629 | ||||||
Steel Dynamics, Inc. | 3,033 | 244,824 | ||||||
| 428,453 | ||||||||
Oil, Gas & Consumable Fuels: 5.5% | ||||||||
Chesapeake Energy Corp. | 3,212 | 322,774 | ||||||
Diamondback Energy, Inc. | 2,847 | 379,448 | ||||||
| 702,222 | ||||||||
The Accompanying Footnotes are an Integral Part of these Financial Statements
19
THE RBB FUND TRUST (FORMERLY, PENN CAPITAL FUNDS TRUST)
Penn Capital Mid Cap Core Fund
SCHEDULE OF INVESTMENTS
AUGUST 31, 2022
Number of | Value | |||||||
Pharmaceuticals: 2.8% | ||||||||
Catalent, Inc.* | 2,118 | $ | 186,384 | |||||
Perrigo Co Plc | 4,344 | 162,552 | ||||||
| 348,936 | ||||||||
Professional Services: 1.5% | ||||||||
TransUnion | 2,587 | 191,102 | ||||||
Real Estate Management & Development: 1.4% | ||||||||
Kennedy-Wilson Holdings, Inc. | 10,197 | 179,059 | ||||||
Semiconductors & Semiconductor Equipment: 5.5% | ||||||||
Allegro MicroSystems, Inc.* | 10,441 | 243,484 | ||||||
Kulicke & Soffa Industries, Inc. | 4,504 | 189,348 | ||||||
Skyworks Solutions, Inc. | 973 | 95,889 | ||||||
Teradyne, Inc. | 1,975 | 167,164 | ||||||
| 695,885 | ||||||||
Software: 2.6% | ||||||||
RingCentral, Inc. - Class A* | 2,738 | 117,844 | ||||||
Tyler Technologies, Inc.* | 577 | 214,361 | ||||||
| 332,205 | ||||||||
Specialty Retail: 3.4% | ||||||||
Burlington Stores, Inc.* | 975 | 136,685 | ||||||
Five Below, Inc.* | 1,310 | 167,523 | ||||||
Floor & Decor Holdings, Inc. - Class A* | 1,492 | 121,389 | ||||||
| 425,597 | ||||||||
Technology Hardware, Storage & Peripherals: 1.2% | ||||||||
Western Digital Corp.* | 3,715 | 156,996 | ||||||
Trading Companies & Distributors: 2.5% | ||||||||
H&E Equipment Services, Inc. | 4,886 | 154,691 | ||||||
United Rentals, Inc.* | 549 | 160,330 | ||||||
| 315,021 | ||||||||
Total Common Stocks (cost $8,779,943) | 11,161,583 | |||||||
Equity Real Estate Investment Trusts (REITs): 7.4% | ||||||||
Apartment Income REIT Corp. | 6,051 | 247,183 | ||||||
Healthcare Realty Trust, Inc. | 10,493 | 255,190 | ||||||
Pebblebrook Hotel Trust | 9,650 | 170,033 | ||||||
VICI Properties, Inc. | 7,942 | 262,007 | ||||||
| 934,413 | ||||||||
Total REITs (cost $925,013) | 934,413 | |||||||
Number of | Value | |||||||
Short-Term Investments 4.9% | ||||||||
U.S. Bank Money Market Deposit Account, 1.00%(b) | 626,258 | $ | 626,258 | |||||
Total Short-Term Investments (cost $626,258) | 626,258 | |||||||
Total Investments - 100.4% (cost $10,331,214) | 12,722,254 | |||||||
Liabilities in Excess of Other Assets (0.4)% | (45,044 | ) | ||||||
Net Assets: 100.0% | $ | 12,677,210 | ||||||
Percentages are stated as a percent of net assets.
* | Non-income producing security. |
(a) | The rate shown is as of August 31, 2022. |
The Accompanying Footnotes are an Integral Part of these Financial Statements
20
THE RBB FUND TRUST (FORMERLY, PENN CAPITAL FUNDS TRUST)
Penn Capital Mid Cap Core Fund
SCHEDULE OF INVESTMENTS
AUGUST 31, 2022
Country Exposure (as a percentage of total investments) | |
United States | 91.3% |
Bermuda | 4.2% |
Ireland | 3.1% |
France | 1.4% |
Asset Type (as a percentage of total investments) (Unaudited) |

The industry classifications presented in this report, present the Global Industry Classification Standard (GICS®). GICS® was developed by and/or is the exclusive property of MSCI, Inc. and Standard & Poor Financial Services LLC (“S&P”). GICS® is a service mark of MSCI and S&P and has been licensed for use by U.S. Bank Global Fund Services.
The Accompanying Footnotes are an Integral Part of these Financial Statements
21
THE RBB FUND TRUST (FORMERLY, PENN CAPITAL FUNDS TRUST)
Penn Capital Opportunistic High Income Fund
SCHEDULE OF INVESTMENTS
AUGUST 31, 2022
Principal | Value | |||||||
Convertible Bonds: 3.1% | ||||||||
Cable & Satellite TV: 0.9% | ||||||||
DISH Network Corp., 3.375%, 8/15/26 | $ | 245,000 | $ | 176,293 | ||||
Consumer/Commercial/Lease Financing: 0.4% | ||||||||
Block, Inc., 0.250%, 11/1/27 | 85,000 | 65,628 | ||||||
Food - Wholesale: 0.5% | ||||||||
Herbalife Nutrition Ltd., 2.625%, 3/15/24 | 90,000 | 82,890 | ||||||
Internet: 0.4% | ||||||||
Spotify USA, Inc., 0.000%, 3/15/26 | 85,000 | 69,275 | ||||||
Pharmaceuticals: 0.5% | ||||||||
Tilray Brands, Inc., 5.000%, 10/1/23 | 100,000 | 97,135 | ||||||
Software/Services: 0.4% | ||||||||
RingCentral, Inc., 0.000%, 3/15/26 | 95,000 | 74,290 | ||||||
Total Convertible Bonds (cost $632,354) | 565,511 | |||||||
Corporate Bonds: 85.6% | ||||||||
Advertising: 1.4% | ||||||||
Clear Channel Outdoor Holdings, Inc., 5.125%, 8/15/27(a) | 50,000 | 44,781 | ||||||
Clear Channel Outdoor Holdings, Inc., 7.500%, 6/1/29(a) | 115,000 | 92,457 | ||||||
Stagwell Global LLC, 5.625%, 8/15/29(a) | 135,000 | 114,487 | ||||||
| 251,725 | ||||||||
Aerospace/Defense: 1.3% | ||||||||
Bombardier, Inc., 7.500%, 3/15/25(a) | 95,000 | 92,923 | ||||||
Maxar Technologies, Inc., 7.750%, 6/15/27(a) | 65,000 | 64,512 | ||||||
Triumph Group, Inc., 7.750%, 8/15/25 | 90,000 | 75,796 | ||||||
| 233,231 | ||||||||
Air Transportation: 2.3% | ||||||||
American Airlines, Inc., 5.750%, 4/20/29(a) | 145,000 | 130,897 | ||||||
American Airlines, Inc., 11.750%, 7/15/25(a) | 80,000 | 88,401 | ||||||
United Airlines, Inc., 4.625%, 4/15/29(a) | 90,000 | 78,975 | ||||||
Principal | Value | |||||||
VistaJet Malta Finance PLC / XO Management Holding, Inc., 6.375%, 2/1/30(a) | $ | 60,000 | $ | 51,600 | ||||
VistaJet Malta Finance PLC / XO Management Holding, Inc., 7.875%, 5/1/27(a) | 70,000 | 64,575 | ||||||
| 414,448 | ||||||||
Auto Parts & Equipment: 1.4% | ||||||||
American Axle & Manufacturing, Inc., 6.875%, 7/1/28 | 85,000 | 80,715 | ||||||
American Axle & Manufacturing, Inc., 5.000%, 10/1/29 | 50,000 | 42,104 | ||||||
The Goodyear Tire & Rubber Co., 5.000%, 7/15/29 | 20,000 | 17,929 | ||||||
The Goodyear Tire & Rubber Co., 5.250%, 7/15/31 | 65,000 | 56,020 | ||||||
The Goodyear Tire & Rubber Co., 7.000%, 3/15/28 | 55,000 | 56,017 | ||||||
| 252,785 | ||||||||
Automakers: 1.2% | ||||||||
Ford Motor Co., 6.625%, 10/1/28 | 215,000 | 220,310 | ||||||
Brokerage: 0.5% | ||||||||
StoneX Group, Inc., 8.625%, 6/15/25(a) | 95,000 | 96,662 | ||||||
Building & Construction: 2.6% | ||||||||
Ashton Woods USA LLC, 4.625%, 8/1/29(a) | 95,000 | 74,558 | ||||||
Ashton Woods USA LLC / Ashton Woods Finance Co., 4.625%, 4/1/30(a) | 95,000 | 74,943 | ||||||
Brookfield Residential Properties, Inc., 5.000%, 6/15/29(a) | 85,000 | 67,618 | ||||||
Great Lakes Dredge & Dock Corp., 5.250%, 6/1/29(a) | 100,000 | 85,293 | ||||||
Pike Corp., 5.500%, 9/1/28(a) | 100,000 | 82,671 | ||||||
Taylor Morrison Communities, Inc., 5.125%, 8/1/30(a) | 90,000 | 77,228 | ||||||
| 462,311 | ||||||||
Building Materials: 0.7% | ||||||||
Eco Material Technologies, Inc., 7.875%, 1/31/27(a) | 140,000 | 130,564 | ||||||
Cable & Satellite TV: 3.5% | ||||||||
CCO Holdings LLC, 4.500%, 8/15/30(a) | 135,000 | 113,532 | ||||||
The Accompanying Footnotes are an Integral Part of these Financial Statements
22
THE RBB FUND TRUST (FORMERLY, PENN CAPITAL FUNDS TRUST)
PENN CAPITAL OPPORTUNISTIC HIGH INCOME FUND
SCHEDULE OF INVESTMENTS
AUGUST 31, 2022
Principal | Value | |||||||
CSC Holdings LLC, 7.500%, 4/1/28(a) | $ | 200,000 | $ | 177,778 | ||||
CSC Holdings LLC, 6.500%, 2/1/29(a) | 200,000 | 184,047 | ||||||
DIRECTV Holdings LLC, 5.875%, 8/15/27(a) | 105,000 | 96,075 | ||||||
DISH DBS Corp., 5.250%, 12/1/26(a) | 75,000 | 61,922 | ||||||
| 633,354 | ||||||||
Chemicals: 2.2% | ||||||||
Avient Corp., 7.125%, 8/1/30(a) | 70,000 | 69,120 | ||||||
Chemours Co/The, 5.750%, 11/15/28(a) | 55,000 | 49,225 | ||||||
Olin Corp., 5.625%, 8/1/29 | 190,000 | 181,026 | ||||||
Venator Finance Sarl, 5.750%, 7/15/25(a) | 125,000 | 91,875 | ||||||
| 391,246 | ||||||||
Consumer/Commercial/Lease Financing: 2.7% | ||||||||
Enova International, Inc., 8.500%, 9/15/25(a) | 125,000 | 116,607 | ||||||
Fortress Transportation and Infrastructure Investors LLC, 9.750%, 8/1/27(a) | 45,000 | 45,109 | ||||||
Fortress Transportation and Infrastructure Investors LLC, 5.500%, 5/1/28(a) | 65,000 | 55,306 | ||||||
Global Aircraft Leasing Co. Ltd., 7.250% Cash or 7.000% PIK, 9/15/24(a) | 130,000 | 105,173 | ||||||
Navient Corp., 6.750%, 6/25/25 | 95,000 | 91,675 | ||||||
Navient Corp., 4.875%, 3/15/28 | 60,000 | 48,992 | ||||||
OneMain Finance Corp., 6.625%, 1/15/28 | 25,000 | 22,857 | ||||||
| 485,719 | ||||||||
Department Stores: 1.7% | ||||||||
Macy’s Retail Holdings LLC, 5.875%, 4/1/29(a) | 105,000 | 90,878 | ||||||
Neiman Marcus Group LLC, 7.125%, 4/1/26(a) | 225,000 | 210,503 | ||||||
| 301,381 | ||||||||
Diversified Capital Goods: 0.6% | ||||||||
Madison IAQ LLC, 5.875%, 6/30/29(a) | 130,000 | 106,943 | ||||||
Electric - Generation: 1.5% | ||||||||
Leeward Renewable Energy Operations LLC, 4.250%, 7/1/29(a) | 70,000 | 57,700 | ||||||
Principal | Value | |||||||
Sunnova Energy Corp., 5.875%, 9/1/26(a) | $ | 95,000 | $ | 87,638 | ||||
Vistra Corp., 8.000% (5 Year CMT Rate + 6.930%), 4/15/27(a) | 130,000 | 124,475 | ||||||
| 269,813 | ||||||||
Energy - Exploration & Production: 6.9% | ||||||||
Antero Resources Corp., 7.625%, 2/1/29(a) | 90,000 | 91,547 | ||||||
Callon Petroleum Co., 8.250%, 7/15/25 | 120,000 | 118,500 | ||||||
Comstock Resources, Inc., 6.750%, 3/1/29(a) | 145,000 | 138,399 | ||||||
Comstock Resources, Inc., 5.875%, 1/15/30(a) | 145,000 | 132,662 | ||||||
Earthstone Energy Holdings LLC, 8.000%, 4/15/27(a) | 95,000 | 92,566 | ||||||
Hilcorp Energy I LP, 6.250%, 11/1/28(a) | 125,000 | 118,117 | ||||||
Northern Oil and Gas, Inc., 8.125%, 3/1/28(a) | 135,000 | 129,600 | ||||||
Occidental Petroleum Corp., 6.625%, 9/1/30 | 110,000 | 117,513 | ||||||
Occidental Petroleum Corp., 6.125%, 1/1/31 | 90,000 | 93,533 | ||||||
Penn Virginia Holdings LLC, 9.250%, 8/15/26(a) | 130,000 | 127,634 | ||||||
SM Energy Co., 6.750%, 9/15/26 | 65,000 | 63,924 | ||||||
SM Energy Co., 6.500%, 7/15/28 | 35,000 | 33,705 | ||||||
| 1,257,700 | ||||||||
Food - Wholesale: 2.0% | ||||||||
BellRing Brands, Inc., 7.000%, 3/15/30(a) | 140,000 | 133,699 | ||||||
HLF Financing Sarl LLC, 4.875%, 6/1/29(a) | 55,000 | 43,404 | ||||||
KeHE Distributors LLC, 8.625%, 10/15/26(a) | 96,000 | 97,200 | ||||||
Simmons Foods, Inc., 4.625%, 3/1/29(a) | 105,000 | 92,870 | ||||||
| 367,173 | ||||||||
Food & Drug Retailers: 1.1% | ||||||||
Rite Aid Corp., 8.000%, 11/15/26(a) | 100,000 | 81,500 | ||||||
SEG Holding LLC, 5.625%, 10/15/28(a) | 120,000 | 108,487 | ||||||
| 189,987 | ||||||||
Forestry/Paper: 0.4% | ||||||||
Mercer International, Inc., 5.125%, 2/1/29 | 90,000 | 78,575 | ||||||
The Accompanying Footnotes are an Integral Part of these Financial Statements
23
THE RBB FUND TRUST (FORMERLY, PENN CAPITAL FUNDS TRUST)
PENN CAPITAL OPPORTUNISTIC HIGH INCOME FUND
SCHEDULE OF INVESTMENTS
AUGUST 31, 2022
Principal | Value | |||||||
Gaming: 2.2% | ||||||||
Affinity Gaming, 6.875%, 12/15/27(a) | $ | 65,000 | $ | 56,445 | ||||
Boyd Gaming Corp., 4.750%, 12/1/27 | 140,000 | 130,686 | ||||||
CCM Merger, Inc., 6.375%, 5/1/26(a) | 65,000 | 61,085 | ||||||
Scientific Games Holdings LP/Scientific Games US FinCo, Inc., 6.625%, 3/1/30(a) | 100,000 | 88,930 | ||||||
Station Casinos LLC, 4.625%, 12/1/31(a) | 80,000 | 66,841 | ||||||
| 403,987 | ||||||||
Gas Distribution: 5.1% | ||||||||
Antero Midstream Partners LP, 5.375%, 6/15/29(a) | 95,000 | 87,106 | ||||||
Blue Racer Midstream LLC, 6.625%, 7/15/26(a) | 40,000 | 37,864 | ||||||
Blue Racer Midstream LLC, 7.625%, 12/15/25(a) | 40,000 | 39,800 | ||||||
Cheniere Energy, Inc., 4.625%, 10/15/28 | 95,000 | 91,538 | ||||||
Crestwood Midstream Partners LP, 6.000%, 2/1/29(a) | 90,000 | 83,138 | ||||||
DCP Midstream Operating LP, 5.125%, 5/15/29 | 95,000 | 92,597 | ||||||
EnLink Midstream Partners LP, 5.050%, 4/1/45 | 125,000 | 90,055 | ||||||
EnLink Midstream LLC, 6.500%, 9/1/30(a) | 55,000 | 54,725 | ||||||
EQM Midstream Partners LP, 7.500%, 6/1/27(a) | 95,000 | 93,940 | ||||||
New Fortress Energy, Inc., 6.750%, 9/15/25(a) | 125,000 | 120,919 | ||||||
New Fortress Energy, Inc., 6.500%, 9/30/26(a) | 60,000 | 56,841 | ||||||
Solaris Midstream Holdings LLC, 7.625%, 4/1/26(a) | 77,000 | 75,172 | ||||||
| 923,695 | ||||||||
Health Facilities: 2.8% | ||||||||
CHS/Community Health Systems, Inc., 6.875%, 4/1/28(a) | 165,000 | 85,962 | ||||||
CHS/Community Health Systems, Inc., 6.000%, 1/15/29(a) | 105,000 | 86,180 | ||||||
Option Care Health, Inc., 4.375%, 10/31/29(a) | 85,000 | 74,755 | ||||||
Surgery Center Holdings, Inc., 6.750%, 7/1/25(a) | 65,000 | 62,712 | ||||||
Tenet Healthcare Corp., 6.125%, 10/1/28(a) | 65,000 | 59,637 | ||||||
Principal | Value | |||||||
Tenet Healthcare Corp., 4.375%, 1/15/30(a) | $ | 100,000 | $ | 87,500 | ||||
Tenet Healthcare Corp., 6.125%, 6/15/30(a) | 40,000 | 38,404 | ||||||
| 495,150 | ||||||||
Health Services: 1.8% | ||||||||
DaVita, Inc., 4.625%, 6/1/30(a) | 165,000 | 132,831 | ||||||
Modivcare, Inc., 5.875%, 11/15/25(a) | 110,000 | 103,429 | ||||||
Pediatrix Medical Group, Inc., 5.375%, 2/15/30(a) | 100,000 | 85,247 | ||||||
| 321,507 | ||||||||
Hotels: 0.6% | ||||||||
Hilton Grand Vacations LLC, 5.000%, 6/1/29(a) | 75,000 | 66,361 | ||||||
Hilton Grand Vacations LLC, 4.875%, 7/1/31(a) | 45,000 | 37,148 | ||||||
| 103,509 | ||||||||
Investments & Miscellaneous Financial Services: 0.6% | ||||||||
Icahn Enterprises LP, 5.250%, 5/15/27 | 65,000 | 59,134 | ||||||
Icahn Enterprises LP, 4.375%, 2/1/29 | 55,000 | 46,779 | ||||||
| 105,913 | ||||||||
Machinery: 1.0% | ||||||||
Titan International, Inc., 7.000%, 4/30/28 | 190,000 | 180,500 | ||||||
Managed Care: 1.2% | ||||||||
Centene Corp., 4.625%, 12/15/29 | 230,000 | 216,669 | ||||||
Media - Diversified: 1.0% | ||||||||
News Corp., 3.875%, 5/15/29(a) | 135,000 | 117,450 | ||||||
Urban One, Inc., 7.375%, 2/1/28(a) | 70,000 | 62,825 | ||||||
| 180,275 | ||||||||
Media Content: 2.8% | ||||||||
Beasley Mezzanine Holdings LLC, 8.625%, 2/1/26(a) | 105,000 | 81,900 | ||||||
Cumulus Media New Holdings, Inc., 6.750%, 7/1/26(a) | 96,000 | 85,872 | ||||||
Gray Television, Inc., 4.750%, 10/15/30(a) | 115,000 | 94,760 | ||||||
Scripps Escrow II, Inc., 5.375%, 1/15/31(a) | 125,000 | 103,437 | ||||||
Scripps Escrow, Inc., 5.875%, 7/15/27(a) | 50,000 | 45,249 | ||||||
Univision Communications, Inc., 6.625%, 6/1/27(a) | 90,000 | 86,852 | ||||||
| 498,070 | ||||||||
The Accompanying Footnotes are an Integral Part of these Financial Statements
24
THE RBB FUND TRUST (FORMERLY, PENN CAPITAL FUNDS TRUST)
PENN CAPITAL OPPORTUNISTIC HIGH INCOME FUND
SCHEDULE OF INVESTMENTS
AUGUST 31, 2022
Principal | Value | |||||||
Medical Products: 1.5% | ||||||||
AdaptHealth LLC, 6.125%, 8/1/28(a) | $ | 155,000 | $ | 142,613 | ||||
Medline Borrower LP, Inc., 3.875%, 4/1/29(a) | 140,000 | 118,650 | ||||||
| 261,263 | ||||||||
Metals/Mining Excluding Steel: 2.2% | ||||||||
FMG Resources August 2006 Pty Ltd., 6.125%, 4/15/32(a) | 70,000 | 64,694 | ||||||
Freeport-McMoRan, Inc., 4.625%, 8/1/30 | 95,000 | 87,945 | ||||||
Hudbay Minerals, Inc., 4.500%, 4/1/26(a) | 155,000 | 140,662 | ||||||
Taseko Mines Ltd., 7.000%, 2/15/26(a) | 120,000 | 98,965 | ||||||
| 392,266 | ||||||||
Oil Field Equipment & Services: 2.3% | ||||||||
Exterran Energy Solutions LP / EES Finance Corp., 8.125%, 5/1/25 | 70,000 | 68,124 | ||||||
Nabors Industries, Inc., 5.750%, 2/1/25 | 95,000 | 87,574 | ||||||
Oceaneering International, Inc., 4.650%, 11/15/24 | 70,000 | 65,305 | ||||||
USA Compression Partners LP / USA Compression Finance Corp., 6.875%, 4/1/26 | 65,000 | 60,960 | ||||||
Weatherford International Ltd., 11.000%, 12/1/24(a) | 14,000 | 14,214 | ||||||
Weatherford International Ltd., 8.625%, 4/30/30(a) | 140,000 | 126,542 | ||||||
| 422,719 | ||||||||
Packaging: 1.0% | ||||||||
FXI Holdings, Inc., 12.250%, 11/15/26(a) | 60,000 | 50,025 | ||||||
FXI Holdings, Inc., 7.875%, 11/1/24(a) | 90,000 | 74,722 | ||||||
Pactiv LLC, 7.950%, 12/15/25 | 60,000 | 55,850 | ||||||
| 180,597 | ||||||||
Personal & Household Products: 0.9% | ||||||||
CD&R Smokey Buyer, Inc., 6.750%, 7/15/25(a) | 95,000 | 88,350 | ||||||
Energizer Holdings, Inc., 6.500%, 12/31/27(a) | 70,000 | 65,119 | ||||||
| 153,469 | ||||||||
Pharmaceuticals: 0.2% | ||||||||
Bausch Health Cos, Inc., 6.125%, 2/1/27(a) | 50,000 | 37,000 | ||||||
Principal | Value | |||||||
Printing & Publishing: 0.4% | ||||||||
Gannett Holdings LLC, 6.000%, 11/1/26(a) | $ | 100,000 | $ | 78,000 | ||||
Real Estate Development & Management: 1.7% | ||||||||
Hunt Cos, Inc., 5.250%, 4/15/29(a) | 100,000 | 84,500 | ||||||
Kennedy-Wilson, Inc., 4.750%, 2/1/30 | 90,000 | 72,567 | ||||||
Realogy Group LLC, 5.750%, 1/15/29(a) | 140,000 | 109,686 | ||||||
Realogy Group LLC / Realogy Co-Issuer Corp., 5.250%, 4/15/30(a) | 50,000 | 37,598 | ||||||
| 304,351 | ||||||||
Real Estate Investment Trusts (REITs): 2.8% | ||||||||
HAT Holdings I LLC, 3.375%, 6/15/26(a) | 100,000 | 86,779 | ||||||
Iron Mountain, Inc., 5.250%, 3/15/28(a) | 50,000 | 45,875 | ||||||
Iron Mountain, Inc., 4.875%, 9/15/29(a) | 125,000 | 108,403 | ||||||
Rithm Capital Corp., 6.250%, 10/15/25(a) | 95,000 | 84,271 | ||||||
Service Properties Trust, 5.250%, 2/15/26 | 35,000 | 29,788 | ||||||
Service Properties Trust, 4.350%, 10/1/24 | 110,000 | 98,399 | ||||||
Service Properties Trust, 7.500%, 9/15/25 | 50,000 | 47,983 | ||||||
| 501,498 | ||||||||
Recreation & Travel: 2.7% | ||||||||
Carnival Corp., 10.500%, 2/1/26(a) | 40,000 | 41,200 | ||||||
Carnival Corp., 7.625%, 3/1/26(a) | 155,000 | 131,959 | ||||||
Carnival Corp., 4.000%, 8/1/28(a) | 85,000 | 70,868 | ||||||
Life Time, Inc., 8.000%, 4/15/26(a) | 90,000 | 79,446 | ||||||
SeaWorld Parks & Entertainment, Inc., 8.750%, 5/1/25(a) | 50,000 | 51,681 | ||||||
SeaWorld Parks & Entertainment, Inc., 5.250%, 8/15/29(a) | 130,000 | 113,240 | ||||||
| 488,394 | ||||||||
Restuarants: 0.4% | ||||||||
Papa John’s International, Inc., 3.875%, 9/15/29(a) | 75,000 | 64,125 | ||||||
Software/Services: 0.5% | ||||||||
Unisys Corp., 6.875%, 11/1/27(a) | 105,000 | 87,602 | ||||||
The Accompanying Footnotes are an Integral Part of these Financial Statements
25
THE RBB FUND TRUST (FORMERLY, PENN CAPITAL FUNDS TRUST)
PENN CAPITAL OPPORTUNISTIC HIGH INCOME FUND
SCHEDULE OF INVESTMENTS
AUGUST 31, 2022
Principal | Value | |||||||
Specialty Retail: 2.1% | ||||||||
Bath & Body Works, Inc., 9.375%, 7/1/25(a) | $ | 18,000 | $ | 19,042 | ||||
Bath & Body Works, Inc., 6.625%, 10/1/30(a) | 95,000 | 86,304 | ||||||
Crocs, Inc., 4.250%, 3/15/29(a) | 130,000 | 106,133 | ||||||
Kontoor Brands, Inc., 4.125%, 11/15/29(a) | 65,000 | 55,435 | ||||||
Shutterfly, Inc., 8.500%, 10/1/26(a) | 140,000 | 104,547 | ||||||
| 371,461 | ||||||||
Steel Producers/Products: 1.5% | ||||||||
Carpenter Technology Corp., 7.625%, 3/15/30 | 85,000 | 83,769 | ||||||
Cleveland-Cliffs, Inc., 4.625%, 3/1/29(a) | 70,000 | 62,141 | ||||||
Commercial Metals Co., 3.875%, 2/15/31 | 70,000 | 58,101 | ||||||
Commercial Metals Co., 4.375%, 3/15/32 | 80,000 | 68,079 | ||||||
| 272,090 | ||||||||
Support - Services: 6.8% | ||||||||
Arrow Bidco LLC, 9.500%, 3/15/24(a) | 95,000 | 94,765 | ||||||
H&E Equipment Services, Inc., 3.875%, 12/15/28(a) | 110,000 | 92,937 | ||||||
Pitney Bowes, Inc., 7.250%, 3/15/29(a) | 95,000 | 64,657 | ||||||
Sabre GLBL, Inc., 9.250%, 4/15/25(a) | 170,000 | 167,499 | ||||||
Sabre GLBL, Inc., 7.375%, 9/1/25(a) | 50,000 | 47,370 | ||||||
Specialty Building Products Holdings LLC / SBP Finance Corp., 6.375%, 9/30/26(a) | 105,000 | 94,587 | ||||||
SRS Distribution, Inc., 6.125%, 7/1/29(a) | 100,000 | 82,959 | ||||||
Staples, Inc., 7.500%, 4/15/26(a) | 115,000 | 97,182 | ||||||
Staples, Inc., 10.750%, 4/15/27(a) | 110,000 | 80,850 | ||||||
The ADT Security Corp., 4.125%, 8/1/29(a) | 65,000 | 55,817 | ||||||
The ADT Security Corp., 4.875%, 7/15/32(a) | 45,000 | 37,645 | ||||||
The Hertz Corp., 4.625%, 12/1/26(a) | 105,000 | 89,934 | ||||||
The Hertz Corp., 5.000%, 12/1/29(a) | 50,000 | 40,219 | ||||||
United Rentals North America, Inc., 5.250%, 1/15/30 | 140,000 | 132,440 | ||||||
White Cap Buyer LLC, 6.875%, 10/15/28(a) | 80,000 | 70,091 | ||||||
| 1,248,952 | ||||||||
Principal | Value | |||||||
Tech Hardware & Equipment: 0.8% | ||||||||
CommScope, Inc., 4.750%, 9/1/29(a) | $ | 35,000 | $ | 29,783 | ||||
Dell, Inc., 6.500%, 4/15/38 | 120,000 | 120,564 | ||||||
| 150,347 | ||||||||
Telecom - Satellite: 0.4% | ||||||||
Telesat Canada / Telesat LLC, 5.625%, 12/6/26(a) | 125,000 | 72,874 | ||||||
Telecom - Wireless: 0.6% | ||||||||
United States Cellular Corp., 6.700%, 12/15/33 | 115,000 | 111,970 | ||||||
Telecom - Wireline Integrated & Services: 1.6% | ||||||||
Cogent Communications Group, Inc., 7.000%, 6/15/27(a) | 70,000 | 66,898 | ||||||
Frontier Communications Holdings LLC, 5.000%, 5/1/28(a) | 50,000 | 43,823 | ||||||
Frontier Communications Holdings LLC, 6.000%, 1/15/30(a) | 55,000 | 45,321 | ||||||
Lumen Technologies, Inc., 5.625%, 4/1/25 | 130,000 | 126,089 | ||||||
| 282,131 | ||||||||
Theaters & Entertainment: 0.5% | ||||||||
Cinemark USA, Inc., 5.875%, 3/15/26(a) | 100,000 | 88,720 | ||||||
Tobacco: 0.9% | ||||||||
Turning Point Brands, Inc., 5.625%, 2/15/26(a) | 50,000 | 44,367 | ||||||
Vector Group Ltd., 5.750%, 2/1/29(a) | 105,000 | 91,014 | ||||||
| 135,381 | ||||||||
Transport Infrastructure/Services: 0.7% | ||||||||
XPO CNW, Inc., 6.700%, 5/1/34 | 130,000 | 125,571 | ||||||
Total Corporate Bonds (cost $17,223,827) | 15,403,983 | |||||||
Bank Loans: 0.3%(b)(c) | ||||||||
Specialty Retail: 0.3% | ||||||||
BDF Acquisition Corp., 7.622% (1 Month US LIBOR + 5.250%), 8/14/23 | 65,867 | 59,877 | ||||||
Total Bank Loans (cost $65,851) | 59,877 | |||||||
The Accompanying Footnotes are an Integral Part of these Financial Statements
26
THE RBB FUND TRUST (FORMERLY, PENN CAPITAL FUNDS TRUST)
PENN CAPITAL OPPORTUNISTIC HIGH INCOME FUND
SCHEDULE OF INVESTMENTS
AUGUST 31, 2022
Number of | Value | |
Real Estate Investment Trusts (REITs): 0.5% | ||
Pebblebrook Hotel Trust | 4,225 | $ 91,852 |
Total REITS (cost $108,087) | 91,852 | |
Mutual Funds: 8.1% | ||
Penn Capital Floating Rate Income Fund - Institutional Class (d) | 158,977 | 1,460,996 |
Total Mutual Funds (cost $1,539,143) | 1,460,996 | |
Short-Term Investments: 0.9% | ||
U.S. Bank Money Market Deposit Account, 1.00%(e) | 157,540 | 157,540 |
Total Short-Term Investments (cost $157,540) | 157,540 | |
Total Investments - 98.5% (cost $19,726,802) | 17,739,759 | |
Other Assets and Liabilities 1.5% | 261,912 | |
Net Assets: 100.0% | $ 18,001,671 | |
Percentages are stated as a percent of net assets.
(a) | Securities purchased pursuant to Rule 144A of the Securities Act of 1933, as amended, and may be sold only to dealers in that program or other “qualified institutional buyers.” As of August 31, 2022, the value of these investments was $11,595,756, or 64.4% of total net assets. |
(b) | Bank Loans typically have rates of interest which are redetermined either daily, monthly, quarterly or semi-annually by reference to a base lending rate, plus a premium. These base lending rates are primarily the London Interbank Offered Rate (“LIBOR”) and secondarily, the prime rate offered by one or more major United States banks (the “Prime Rate”) and the certificate of deposit (“CD”) rate or other base lending rates used by commercial lenders. |
(c) | Senior floating-rate loans (Senior Loans) often require prepayments from excess cash flows or permit the borrowers to repay at their election. The degree to which borrowers repay, whether as a contractual requirement or at their election, cannot be predicted with accuracy. As a result, the actual remaining maturity may be substantially less than the stated maturities shown. However, Senior Loans will typically have an expected average life of approximately two to four years. |
(d) | Affiliated company - See note. |
(e) | The rate shown is as of August 31, 2022. |
Country Exposure (as a percentage of total investments) | |
United States | 91.5% |
Canada | 2.9% |
Cayman Islands | 1.8% |
Panama | 1.4% |
Bermuda | 0.8% |
Malta | 0.7% |
Luxembourg | 0.5% |
Australia | 0.4% |
Asset Type (as a percentage of total investments) (Unaudited) |

The Accompanying Footnotes are an Integral Part of these Financial Statements
27
THE RBB FUND TRUST (FORMERLY, PENN CAPITAL FUNDS TRUST)
Penn Capital Short Duration High Income Fund
SCHEDULE OF INVESTMENTS
AUGUST 31, 2022
Principal | Value | |||||||
Convertible Bonds: 0.9% | ||||||||
Cable & Satellite TV: 0.9% | ||||||||
DISH Network Corp., 2.375%, 3/15/24 | $ | 340,000 | $ | 306,850 | ||||
Total Convertible Bonds (cost $333,873) | 306,850 | |||||||
Corporate Bonds: 86.9% | ||||||||
Advertising: 0.6% | ||||||||
TripAdvisor, Inc., 7.000%, 7/15/25(a) | 210,000 | 206,239 | ||||||
Aerospace/Defense: 3.3% | ||||||||
Howmet Aerospace, Inc., 6.875%, 5/1/25 | 497,000 | 510,379 | ||||||
Spirit AeroSystens, Inc., 5.500%, 1/15/25(a) | 195,000 | 190,929 | ||||||
TransDigm, Inc., 8.000%, 12/15/25(a) | 210,000 | 215,082 | ||||||
Triumph Group, Inc., 8.875%, 6/1/24(a) | 204,000 | 206,550 | ||||||
| 1,122,940 | ||||||||
Air Transportation: 2.1% | ||||||||
Allegiant Travel Co., 8.500%, 2/5/24(a) | 249,000 | 251,490 | ||||||
American Airlines, Inc., 11.750%, 7/15/25(a) | 90,000 | 99,450 | ||||||
Delta Air Lines, Inc., 7.000%, 5/1/25(a) | 203,000 | 210,159 | ||||||
Spirit Loyalty Cayman Ltd., 8.000%, 9/20/25(a) | 135,000 | 137,115 | ||||||
| 698,214 | ||||||||
Auto Loans: 1.5% | ||||||||
Ford Motor Credit Co. LLC, 5.584%, 3/18/24 | 500,000 | 497,600 | ||||||
Auto Parts & Equipment: 0.6% | ||||||||
The Goodyear Tire & Rubber Co., 9.500%, 5/31/25 | 195,000 | 203,771 | ||||||
Automakers: 0.4% | ||||||||
Jaguar Land Rover Automotive PLC, 5.625%, 2/1/23(a) | 150,000 | 146,319 | ||||||
Building & Construction: 1.2% | ||||||||
Meritage Homes Corp., 6.000%, 6/1/25 | 175,000 | 174,862 | ||||||
TRI Pointe Group Inc / TRI Pointe Homes, Inc., 5.875%, 6/15/24 | 230,000 | 227,024 | ||||||
| 401,886 | ||||||||
Cable & Satellite TV: 1.2% | ||||||||
CSC Holdings LLC, 5.250%, 6/1/24 | 219,000 | 213,525 | ||||||
CSC Holdings LLC, 5.875%, 9/15/22 | 200,000 | 199,750 | ||||||
| 413,275 | ||||||||
Chemicals: 3.9% | ||||||||
Avient Corp., 5.750%, 5/15/25(a) | 185,000 | 182,451 | ||||||
Compass Minerals International, Inc., 4.875%, 7/15/24(a) | 420,000 | 397,974 | ||||||
Koppers, Inc., 6.000%, 2/15/25(a) | 125,000 | 117,288 | ||||||
NOVA Chemicals Corp., 4.875%, 6/1/24(a) | 405,000 | 387,007 | ||||||
OCI NV, 4.625%, 10/15/25(a) | 240,000 | 231,612 | ||||||
| 1,316,332 | ||||||||
Consumer/Commercial/Lease Financing: 6.7% | ||||||||
Fortress Transportation and Infrastructure Investors LLC, 6.500%, 10/1/25(a) | 182,000 | 169,562 | ||||||
Navient Corp., 7.250%, 9/25/23 | 123,000 | 123,207 | ||||||
Navient Corp., 6.125%, 3/25/24 | 920,000 | 897,603 | ||||||
OneMain Finance Corp., 5.625%, 3/15/23 | 266,000 | 263,629 | ||||||
OneMain Finance Corp., 6.125%, 3/15/24 | 700,000 | 683,476 | ||||||
SLM Corp., 4.200%, 10/29/25 | 155,000 | 142,126 | ||||||
| 2,279,603 | ||||||||
Department Stores: 0.5% | ||||||||
Neiman Marcus Group LLC, 7.125%, 4/1/26(a) | 195,000 | 182,436 | ||||||
Diversified Capital Goods: 0.6% | ||||||||
Stevens Holding Co, Inc., 6.125%, 10/1/26(a) | 200,000 | 198,500 | ||||||
Electric-Generation: 0.6% | ||||||||
NextEra Energy Operating Partners LP, 4.250%, 7/15/24(a) | 200,000 | 192,703 | ||||||
Energy - Exploration & Production: 4.2% | ||||||||
EQT Corp., 6.125%, 2/1/25 | 190,000 | 195,267 | ||||||
Laredo Petroleum, Inc., 9.500%, 1/15/25 | 100,000 | 100,363 | ||||||
Occidental Petroleum Corp., 6.950%, 7/1/24 | 963,000 | 1,005,179 | ||||||
Range Resources Corp., 5.000%, 3/15/23 | 116,000 | 115,863 | ||||||
| 1,416,672 | ||||||||
The Accompanying Footnotes are an Integral Part of these Financial Statements
28
THE RBB FUND TRUST (FORMERLY, PENN CAPITAL FUNDS TRUST)
PENN CAPITAL SHORT DURATION HIGH INCOME FUND
SCHEDULE OF INVESTMENTS
AUGUST 31, 2022
| �� | Principal | Value | ||||||
Food - Wholesale: 1.1% | ||||||||
HLF Financing Sarl LLC, 7.875%, 9/1/25(a) | $ | 266,000 | $ | 256,136 | ||||
KeHE Distributors LLC, 8.625%, 10/15/26(a) | 132,000 | 133,650 | ||||||
| 389,786 | ||||||||
Forestry/Paper: 0.6% | ||||||||
Clearwater Paper Corp., 5.375%, 2/1/25(a) | 205,000 | 203,206 | ||||||
Gaming: 1.5% | ||||||||
Caesars Entertainment, Inc., 6.250%, 7/1/25(a) | 255,000 | 248,984 | ||||||
International Game Technology PLC, 6.500%, 2/15/25(a) | 275,000 | 272,937 | ||||||
| 521,921 | ||||||||
Gas Distribution: 3.2% | ||||||||
Blue Racer Midstream LLC, 7.625%, 12/15/25(a) | 195,000 | 194,025 | ||||||
Buckeye Partners LP, 4.350%, 10/15/24 | 310,000 | 297,817 | ||||||
DCP Midstream Operating LP, 5.375%, 7/15/25 | 195,000 | 195,487 | ||||||
Rockpoint Gas Storage Canada Ltd., 7.000%, 3/31/23(a) | 216,000 | 213,840 | ||||||
Western Midstream Operating LP, 3.350%, 2/1/25 | 190,000 | 179,259 | ||||||
| 1,080,428 | ||||||||
Health Facilities: 1.6% | ||||||||
HCA, Inc., 5.375%, 2/1/25 | 355,000 | 358,373 | ||||||
Tenet Healthcare Corp., 4.625%, 7/15/24 | 99,000 | 96,942 | ||||||
Tenet Healthcare Corp., 4.625%, 9/1/24(a) | 100,000 | 97,186 | ||||||
| 552,501 | ||||||||
Hotels: 3.5% | ||||||||
Marriott Ownership Resorts, Inc., 6.125%, 9/15/25(a) | 125,000 | 124,584 | ||||||
Park Intermediate Holdings LLC, 7.500%, 6/1/25(a) | 192,000 | 193,709 | ||||||
Travel + Leisure Co., 5.650%, 4/1/24 | 425,000 | 420,984 | ||||||
Travel + Leisure Co., 6.600%, 10/1/25 | 250,000 | 251,743 | ||||||
Travel + Leisure Co., 6.625%, 7/31/26(a) | 200,000 | 193,814 | ||||||
| 1,184,834 | ||||||||
Investments & Miscellaneous Financial Services: 2.6% | ||||||||
Icahn Enterprises LP, 6.250%, 5/15/26 | 268,000 | 256,914 | ||||||
Icahn Enterprises LP, 4.750%, 9/15/24 | 430,000 | 409,051 | ||||||
Oppenheimer Holdings, Inc., 5.500%, 10/1/25 | 220,000 | 219,043 | ||||||
| 885,008 | ||||||||
Machinery: 0.5% | ||||||||
Hillenbrand, Inc., 5.750%, 6/15/25 | 180,000 | 180,236 | ||||||
Media Content: 2.3% | ||||||||
AMC Networks, Inc., 5.000%, 4/1/24 | 273,000 | 266,175 | ||||||
Univision Communications, Inc., 5.125%, 2/15/25(a) | 515,000 | 497,451 | ||||||
| 763,626 | ||||||||
Monoline Insurance: 2.4% | ||||||||
NMI Holdings, Inc., 7.375%, 6/1/25(a) | 375,000 | 378,840 | ||||||
Radian Group, Inc., 4.500%, 10/1/24 | 440,000 | 420,473 | ||||||
| 799,313 | ||||||||
Multi-Line Insurance: 0.6% | ||||||||
Enact Holdings, Inc., 6.500%, 8/15/25(a) | 210,000 | 200,550 | ||||||
Non-Electric Utilities: 0.5% | ||||||||
AmeriGas Partners LP, 5.625%, 5/20/24 | 165,000 | 162,961 | ||||||
Oil Field Equipment & Services: 1.2% | ||||||||
Exterran Energy Solutions LP / EES Finance Corp., 8.125%, 5/1/25 | 100,000 | 97,320 | ||||||
TechnipFMC PLC, 6.500%, 2/1/26(a) | 137,000 | 134,518 | ||||||
Oceaneering International, Inc., 4.650%, 11/15/24 | 171,000 | 159,529 | ||||||
| 391,367 | ||||||||
Oil Refining & Marketing: 0.6% | ||||||||
Methanex Corp., 4.250%, 12/1/24 | 195,000 | 189,150 | ||||||
Packaging: 3.8% | ||||||||
Ball Corp., 5.250%, 7/1/25 | 80,000 | 79,801 | ||||||
Crown Cork & Seal Co., Inc., 7.375%, 12/15/26 | 473,000 | 494,285 | ||||||
FXI Holdings, Inc., 7.875%, 11/1/24(a) | 125,000 | 103,781 | ||||||
Owens-Brockway Glass Container, Inc., 5.875%, 8/15/23(a) | 327,000 | 325,071 | ||||||
Owens-Brockway Glass Container, Inc., 5.375%, 1/15/25(a) | 205,000 | 190,678 | ||||||
Pactiv LLC, 7.950%, 12/15/25 | 90,000 | 83,774 | ||||||
| 1,277,390 | ||||||||
The Accompanying Footnotes are an Integral Part of these Financial Statements
29
THE RBB FUND TRUST (FORMERLY, PENN CAPITAL FUNDS TRUST)
PENN CAPITAL SHORT DURATION HIGH INCOME FUND
SCHEDULE OF INVESTMENTS
AUGUST 31, 2022
Principal | Value | |||||||
Personal & Household Products: 1.0% | ||||||||
CD&R Smokey Buyer, Inc., 6.750%, 7/15/25(a) | $ | 160,000 | $ | 148,800 | ||||
Spectrum Brands, Inc., 5.750%, 7/15/25 | 195,000 | 190,255 | ||||||
| 339,055 | ||||||||
Pharmaceuticals: 3.0% | ||||||||
Elanco Animal Health, Inc., 5.772%, 8/28/23 | 200,000 | 199,660 | ||||||
Owens & Minor, Inc., 4.375%, 12/15/24 | 625,000 | 607,189 | ||||||
Teva Pharmaceutical Finance Netherlands III BV, 6.000%, 4/15/24 | 200,000 | 194,276 | ||||||
| 1,001,125 | ||||||||
Real Estate Development & Management: 1.7% | ||||||||
Newmark Group, Inc., 6.125%, 11/15/23 | 385,000 | 385,016 | ||||||
Realogy Group LLC, 4.875%, 6/1/23(a) | 180,000 | 178,927 | ||||||
| 563,943 | ||||||||
Real Estate Investment Trusts (REITs): 6.1% | ||||||||
HAT Holdings I LLC, 6.000%, 4/15/25(a) | 265,000 | 256,771 | ||||||
iStar, Inc., 4.750%, 10/1/24 | 220,000 | 220,086 | ||||||
Service Properties Trust, 4.500%, 6/15/23 | 465,000 | 455,788 | ||||||
Service Properties Trust, 7.500%, 9/15/25 | 155,000 | 148,747 | ||||||
Starwood Property Trust, Inc., 5.500%, 11/1/23(a) | 310,000 | 308,537 | ||||||
Starwood Property Trust, Inc., 3.750%, 12/31/24(a) | 150,000 | 139,771 | ||||||
VICI Properties LP / VICI Note Co, Inc., 5.625%, 5/1/24(a) | 455,000 | 455,683 | ||||||
XHR LP, 6.375%, 8/15/25(a) | 100,000 | 97,056 | ||||||
| 2,082,439 | ||||||||
Recreation & Travel: 4.3% | ||||||||
Carnival Corp., 10.500%, 2/1/26(a) | 155,000 | 159,649 | ||||||
Royal Caribbean Cruises Ltd., 5.250%, 11/15/22 | 120,000 | 120,116 | ||||||
Royal Caribbean Cruises Ltd., 10.875%, 6/1/23(a) | 600,000 | 610,878 | ||||||
SeaWorld Parks & Entertainment, Inc., 8.750%, 5/1/25(a) | 205,000 | 211,893 | ||||||
Six Flags Entertainment Corp., 4.875%, 7/31/24(a) | 210,000 | 201,486 | ||||||
Vail Resorts, Inc., 6.250%, 5/15/25(a) | 165,000 | 165,157 | ||||||
| 1,469,179 | ||||||||
Restaurants: 1.1% | ||||||||
Brinker International, Inc., 3.875%, 5/15/23 | 220,000 | 216,150 | ||||||
Dave & Buster’s, Inc., 7.625%, 11/1/25(a) | 155,000 | 155,962 | ||||||
| 372,112 | ||||||||
Software/Services: 0.5% | ||||||||
NortonLifeLock, Inc., 5.000%, 4/15/25(a) | 170,000 | 167,790 | ||||||
Specialty Retail: 3.6% | ||||||||
Abercrombie & Fitch Management Co., 8.750%, 7/15/25(a) | 175,000 | 170,868 | ||||||
Bath & Body Works, Inc., 9.375%, 7/1/25(a) | 193,000 | 204,174 | ||||||
G-III Apparel Group Ltd., 7.875%, 8/15/25(a) | 215,000 | 212,147 | ||||||
Hanesbrands, Inc., 4.625%, 5/15/24(a) | 215,000 | 207,097 | ||||||
Michael Kors USA, Inc., 4.250%, 11/1/24(a) | 200,000 | 196,000 | ||||||
QVC, Inc., 4.850%, 4/1/24 | 115,000 | 110,639 | ||||||
QVC, Inc., 4.450%, 2/15/25 | 130,000 | 119,582 | ||||||
| 1,220,507 | ||||||||
Support - Services: 4.3% | ||||||||
Arrow Bidco LLC, 9.500%, 3/15/24(a) | 176,000 | 175,566 | ||||||
Matthews International Corp., 5.250%, 12/1/25(a) | 243,000 | 221,264 | ||||||
Pitney Bowes, Inc., 4.625%, 3/15/24 | 165,000 | 153,755 | ||||||
Prime Security Services Borrower LLC, 5.250%, 4/15/24(a) | 417,000 | 413,104 | ||||||
Sabre GLBL, Inc., 9.250%, 4/15/25(a) | 220,000 | 216,764 | ||||||
WESCO Distribution, Inc., 7.125%, 6/15/25(a) | 313,000 | 313,056 | ||||||
| 1,493,509 | ||||||||
Tech Hardware & Equipment: 0.2% | ||||||||
Xerox Corp., 3.800%, 5/15/24 | 40,000 | 38,400 | ||||||
Xerox Corp., 4.625%, 3/15/23 | 20,000 | 19,879 | ||||||
| 58,279 | ||||||||
Telecom - Satellite: 1.1% | ||||||||
Hughes Satellite Systems Corp., 6.625%, 8/1/26 | 380,000 | 359,575 | ||||||
Telecom - Wireless: 2.3% | ||||||||
Sprint Corp., 7.625%, 2/15/25 | 740,000 | 774,225 | ||||||
The Accompanying Footnotes are an Integral Part of these Financial Statements
30
THE RBB FUND TRUST (FORMERLY, PENN CAPITAL FUNDS TRUST)
PENN CAPITAL SHORT DURATION HIGH INCOME FUND
SCHEDULE OF INVESTMENTS
AUGUST 31, 2022
Principal | Value | |||||||
Telecom - Wireline Integrated & Services: 3.0% | ||||||||
Lumen Technologies, Inc., 7.500%, 4/1/24 | $ | 200,000 | $ | 201,360 | ||||
Quebecor Media, Inc., 5.750%, 1/15/23 | 161,000 | 161,003 | ||||||
Qwest Corp., 7.250%, 9/15/25 | 630,000 | 652,217 | ||||||
| 1,014,580 | ||||||||
Theaters & Entertainment: 0.6% | ||||||||
Cinemark USA, Inc., 8.750%, 5/1/25(a) | 90,000 | 92,308 | ||||||
Live Nation Entertainment, Inc., 4.875%, 11/1/24(a) | 105,000 | 101,588 | ||||||
| 193,896 | ||||||||
Tobacco & Cannabis: 0.3% | ||||||||
Turning Point Brands, Inc., 5.625%, 2/15/26(a) | 124,000 | 110,029 | ||||||
Transport Infrastructure/Services: 0.4% | ||||||||
XPO Logistics, Inc., 6.250%, 5/1/25(a) | 147,000 | 148,713 | ||||||
Total Corporate Bonds (cost $30,913,788) | 29,427,723 | |||||||
Number of | ||||||||
Mutual Funds: 7.5% | ||||||||
Penn Capital Floating Rate Income Fund - Institutional Class (b) | 277,659 | 2,551,689 | ||||||
Total Mutual Funds (cost $2,714,060) | 2,551,689 | |||||||
Short-Term Investments: 3.5% | ||||||||
U.S. Bank Money Market Deposit Account, 1.00%(c) | 1,199,693 | 1,199,693 | ||||||
Total Short-Term Investments (cost $1,199,693) | 1,199,693 | |||||||
Total Investments - 98.8% (cost $35,161,414) | 33,485,955 | |||||||
Other Assets and Liabilities 1.2% | 418,568 | |||||||
Net Assets: 100.0% | $ | 33,904,523 | ||||||
Percentages are stated as a percent of net assets.
(a) | Securities purchased pursuant to Rule 144A of the Securities Act of 1933, as amended, and may be sold only to dealers in that program or other “qualified institutional buyers.” As of August 31, 2022, the value of these investments was $13,726,864, or 40.5% of total net assets. |
(b) | Affiliated company. |
(c) | The rate shown is as of August 31, 2022. |
Country Exposure (as a percentage of total investments) | |
United States | 90.3% |
Canada | 2.8% |
Liberia | 2.2% |
United Kingdom | 1.7% |
Netherlands | 1.3% |
Cayman Islands | 1.2% |
Panama | 0.5% |
Asset Type (as a percentage of total investments) (Unaudited) |

The Accompanying Footnotes are an Integral Part of these Financial Statements
31
THE RBB FUND TRUST (FORMERLY, PENN CAPITAL FUNDS TRUST)
Penn Capital Special Situations Small Cap Equity Fund
SCHEDULE OF INVESTMENTS
AUGUST 31, 2022
Number of | Value | |||||||
Common Stocks: 94.0% | ||||||||
Aerospace & Defense: 3.0% | ||||||||
Spirit AeroSystems Holdings, Inc. - Class A | 10,004 | $ | 301,120 | |||||
Triumph Group, Inc.* | 15,544 | 201,917 | ||||||
| 503,037 | ||||||||
Air Freight & Logistics: 1.0% | ||||||||
GXO Logistics, Inc.* | 3,789 | 168,156 | ||||||
Auto Components: 1.8% | ||||||||
American Axle & Manufacturing Holdings, Inc.* | 28,231 | 292,191 | ||||||
Banks: 10.7% | ||||||||
Ameris Bancorp | 5,675 | 264,909 | ||||||
FB Financial Corp. | 6,646 | 263,315 | ||||||
First BanCorp | 22,977 | 328,571 | ||||||
Metropolitan Bank Holding Corp.* | 2,477 | 177,328 | ||||||
Pinnacle Financial Partners, Inc. | 2,760 | 222,760 | ||||||
Seacoast Banking Corp of Florida | 7,089 | 229,116 | ||||||
South State Corp. | 3,802 | 296,708 | ||||||
| 1,782,707 | ||||||||
Biotechnology: 1.3% | ||||||||
Halozyme Therapeutics, Inc.* | 5,482 | 223,282 | ||||||
Capital Markets: 1.1% | ||||||||
Focus Financial Partners, Inc. - Class A* | 4,439 | 173,787 | ||||||
Chemicals: 3.0% | ||||||||
Avient Corp. | 5,218 | 228,705 | ||||||
Livent Corp.* | 8,263 | 265,903 | ||||||
| 494,608 | ||||||||
Commercial Services & Supplies: 3.1% | ||||||||
Steelcase, Inc. - Class A | 24,779 | 277,029 | ||||||
Viad Corp.* | 6,233 | 237,976 | ||||||
| 515,005 | ||||||||
Containers & Packaging: 1.2% | ||||||||
O-I Glass, Inc.* | 15,147 | 197,062 | ||||||
Electronic Equipment, Instruments & Components: 0.5% | ||||||||
Ouster, Inc.* | 55,197 | 82,796 | ||||||
Energy Equipment & Services: 5.6% | ||||||||
ChampionX Corp. | 7,533 | 164,295 | ||||||
Patterson-UTI Energy, Inc. | 20,626 | 307,327 | ||||||
Weatherford International PLC* | 16,576 | 466,449 | ||||||
| 938,071 | ||||||||
Food & Staples Retailing: 1.8% | ||||||||
Performance Food Group Co.* | 6,133 | 306,527 | ||||||
Health Care Equipment & Supplies: 6.1% | ||||||||
Alphatec Holdings, Inc.* | 26,205 | 198,896 | ||||||
Artivion, Inc.* | 9,102 | 201,700 | ||||||
CONMED Corp. | 2,134 | 189,009 | ||||||
Globus Medical, Inc. - Class A* | 2,923 | 173,012 | ||||||
Lantheus Holdings, Inc.* | 3,210 | 252,948 | ||||||
| 1,015,565 | ||||||||
Health Care Providers & Services: 5.9% | ||||||||
Acadia Healthcare Co., Inc.* | 3,095 | 253,573 | ||||||
ModivCare, Inc.* | 1,734 | 187,827 | ||||||
Option Care Health, Inc.* | 8,525 | 263,934 | ||||||
R1 RCM, Inc.* | 12,333 | 269,476 | ||||||
| 974,810 | ||||||||
Hotels, Restaurants & Leisure: 10.2% | ||||||||
Bloomin’ Brands, Inc. | 9,693 | 195,992 | ||||||
Boyd Gaming Corp. | 3,511 | 191,104 | ||||||
Golden Entertainment, Inc.* | 9,084 | 347,554 | ||||||
Papa John’s International, Inc. | 1,821 | 147,191 | ||||||
Penn National Gaming, Inc.* | 7,765 | 242,501 | ||||||
Planet Fitness, Inc. - Class A* | 3,603 | 244,103 | ||||||
SeaWorld Entertainment, Inc.* | 6,510 | 327,128 | ||||||
| 1,695,573 | ||||||||
IT Services: 1.4% | ||||||||
Sabre Corp.* | 33,159 | 238,413 | ||||||
Life Sciences Tools & Services: 0.9% | ||||||||
Medpace Holdings, Inc.* | 983 | 145,101 | ||||||
Machinery: 3.2% | ||||||||
Chart Industries, Inc.* | 1,745 | 338,286 | ||||||
Hillman Solutions Corp.* | 22,660 | 190,117 | ||||||
| 528,403 | ||||||||
Marine: 1.3% | ||||||||
Kirby Corp.* | 3,141 | 210,635 | ||||||
The Accompanying Footnotes are an Integral Part of these Financial Statements
32
THE RBB FUND TRUST (FORMERLY, PENN CAPITAL FUNDS TRUST)
PENN CAPITAL SPECIAL SITUATIONS SMALL CAP EQUITY FUND
SCHEDULE OF INVESTMENTS
AUGUST 31, 2022
Number of | Value | |||||||
Media: 7.0% | ||||||||
Clear Channel Outdoor Holdings, Inc.* | 101,533 | $ | 162,453 | |||||
EW Scripps Co. - Class A* | 18,368 | 274,601 | ||||||
Gray Television, Inc. | 18,389 | 351,230 | ||||||
Nexstar Media Group, Inc. - Class A | 1,950 | 373,074 | ||||||
| 1,161,358 | ||||||||
Metals & Mining: 2.4% | ||||||||
Carpenter Technology Corp. | 6,212 | 211,022 | ||||||
Kaiser Aluminum Corp. | 2,503 | 179,615 | ||||||
| 390,637 | ||||||||
Oil, Gas & Consumable Fuels: 6.8% | ||||||||
California Resources Corp. | 5,937 | 296,613 | ||||||
Earthstone Energy, Inc.* | 19,150 | 291,080 | ||||||
Northern Oil and Gas, Inc. | 9,059 | 286,627 | ||||||
Talos Energy, Inc.* | 12,551 | 260,182 | ||||||
| 1,134,502 | ||||||||
Pharmaceuticals: 0.7% | ||||||||
Harmony Biosciences Holdings, Inc.* | 2,811 | 123,431 | ||||||
Professional Services: 0.7% | ||||||||
Upwork, Inc.* | 6,322 | 110,003 | ||||||
Semiconductors & Semiconductor Equipment: 4.1% | ||||||||
Kulicke & Soffa Industries, Inc. | 5,260 | 221,130 | ||||||
Rambus, Inc.* | 10,821 | 279,074 | ||||||
Silicon Motion Technology Corp. ADR | 2,401 | 185,141 | ||||||
| 685,345 | ||||||||
Software: 1.2% | ||||||||
Rapid7, Inc.* | 3,399 | 195,443 | ||||||
Specialty Retail: 1.7% | ||||||||
Caleres, Inc. | 3,384 | 86,360 | ||||||
Five Below, Inc.* | 1,493 | 190,925 | ||||||
| 277,285 | ||||||||
Technology Hardware, Storage & Peripherals: 1.6% | ||||||||
Pure Storage, Inc. - Class A* | 9,053 | 262,265 | ||||||
Trading Companies & Distributors: 3.6% | ||||||||
H&E Equipment Services, Inc. | 9,693 | 306,880 | ||||||
NOW, Inc.* | 24,554 | 297,595 | ||||||
| 604,475 | ||||||||
Wireless Telecommunication Services: 1.1% | ||||||||
Gogo, Inc.* | 12,040 | 178,914 | ||||||
Total Common Stocks (cost $14,088,865) | 15,609,387 | |||||||
Equity Real Estate Investment Trusts (REITs): 3.8% | ||||||||
Essential Properties Realty Trust, Inc. | 9,184 | 207,926 | ||||||
Pebblebrook Hotel Trust | 8,404 | 148,078 | ||||||
Ryman Hospitality Properties, Inc.* | 3,326 | 273,464 | ||||||
| 629,468 | ||||||||
Total REITS (cost $610,666) | 629,468 | |||||||
Short-Term Investments: 2.3% | ||||||||
U.S. Bank Money Market Deposit Account, 1.00%(a) | 387,831 | 387,831 | ||||||
Total Short-Term Investments (cost $387,831) | 387,831 | |||||||
Total Investments - 100.1% (cost $15,087,362) | 16,626,686 | |||||||
Liabilities in Excess of Other Assets (0.1)% | (10,207 | ) | ||||||
Net Assets: 100.0% | $ | 16,616,479 | ||||||
Percentages are stated as a percent of net assets.
* | Non-income producing security. |
(a) | The rate shown is as of August 31, 2022. |
ADR - American Depositary Receipt |
The Accompanying Footnotes are an Integral Part of these Financial Statements
33
THE RBB FUND TRUST (FORMERLY, PENN CAPITAL FUNDS TRUST)
PENN CAPITAL SPECIAL SITUATIONS SMALL CAP EQUITY FUND
SCHEDULE OF INVESTMENTS
AUGUST 31, 2022
Country Exposure (as a percentage of total investments) | |
United States | 94.1% |
Ireland | 2.8% |
Puerto Rico | 2.0% |
Cayman Islands | 1.1% |
Asset Type (as a percentage of total investments) (Unaudited) |

The industry classifications presented in this report, present the Global Industry Classification Standard (GICS®). GICS® was developed by and/or is the exclusive property of MSCI, Inc. and Standard & Poor Financial Services LLC (“S&P”). GICS® is a service mark of MSCI and S&P and has been licensed for use by U.S. Bank Global Fund Services.
The Accompanying Footnotes are an Integral Part of these Financial Statements
34
THE RBB FUND TRUST (FORMERLY, PENN CAPITAL FUNDS TRUST)
Statements of Assets and Liabilities
AUGUST 31, 2022
Assets | Penn Capital | Penn Capital | Penn Capital | Penn Capital | Penn Capital | |||||||||||||||
Investments, at fair value (1) | ||||||||||||||||||||
Unaffiliated issuers | $ | 31,857,694 | $ | 12,722,254 | $ | 16,278,763 | $ | 30,934,266 | $ | 16,626,686 | ||||||||||
Affiliated mutual fund (see Note 7) | — | — | 1,460,996 | 2,551,689 | — | |||||||||||||||
Receivables: | ||||||||||||||||||||
Advisor reimbursement due | 6,940 | — | 4,678 | — | — | |||||||||||||||
Dividends and interest | 192,366 | 15,185 | 316,485 | 500,821 | 8,348 | |||||||||||||||
Investments sold | 386,927 | 108,424 | — | — | 15,327 | |||||||||||||||
Other assets | 14,461 | — | 5,681 | 32,781 | 6,344 | |||||||||||||||
Total assets | 32,458,388 | 12,845,863 | 18,066,603 | 34,019,557 | 16,656,705 | |||||||||||||||
Liabilities | ||||||||||||||||||||
Payables: | ||||||||||||||||||||
Due to custodian | 47,677 | — | — | — | — | |||||||||||||||
Investments purchased | 1,235,577 | 134,074 | — | — | — | |||||||||||||||
Fund shares redeemed | 19,645 | — | 9,370 | 56,273 | — | |||||||||||||||
Distribution payable | 68,720 | — | 18,985 | 12,625 | — | |||||||||||||||
Investment advisory fees | — | 4,664 | — | — | 7,756 | |||||||||||||||
Accrued expenses: | ||||||||||||||||||||
Professional fees | 18,873 | 17,629 | 17,505 | 18,990 | 18,757 | |||||||||||||||
Administration fees | 9,727 | 10,308 | 12,399 | 16,138 | 7,444 | |||||||||||||||
Other accrued expenses | 9,353 | 1,978 | 6,673 | 11,008 | 6,269 | |||||||||||||||
Total liabilities | 1,409,572 | 168,653 | 64,932 | 115,034 | 40,226 | |||||||||||||||
Net assets | $ | 31,048,816 | $ | 12,677,210 | $ | 18,001,671 | $ | 33,904,523 | $ | 16,616,479 | ||||||||||
Composition of Net Assets | ||||||||||||||||||||
Paid-in capital | $ | 35,654,600 | $ | 10,305,075 | $ | 21,040,603 | $ | 37,509,935 | $ | 14,913,467 | ||||||||||
Total distributable earnings/accumulated loss | (4,605,784 | ) | 2,372,135 | (3,038,932 | ) | (3,605,412 | ) | 1,703,012 | ||||||||||||
Net assets | $ | 31,048,816 | $ | 12,677,210 | $ | 18,001,671 | $ | 33,904,523 | $ | 16,616,479 | ||||||||||
Institutional Class | ||||||||||||||||||||
Net assets applicable to outstanding shares | $ | 31,048,816 | $ | 12,677,210 | $ | 18,001,671 | $ | 33,904,523 | $ | 16,616,479 | ||||||||||
Shares of beneficial interest outstanding, no par value, unlimited authorization | 3,377,543 | 1,020,914 | 2,118,386 | 3,704,405 | 1,218,250 | |||||||||||||||
Net asset value per share outstanding | $ | 9.19 | $ | 12.42 | $ | 8.50 | $ | 9.15 | $ | 13.64 | ||||||||||
(1) | Investment in securities at cost
|
Unaffiliated issuers | $ | 32,996,684 | $ | 10,331,214 | $ | 18,187,659 | $ | 32,447,354 | $ | 15,087,362 | ||||||||||
Affiliated mutual fund (see Note 8) | — | — | 1,539,143 | 2,714,060 | — |
The Accompanying Footnotes are an Integral Part of these Financial Statements
35
THE RBB FUND TRUST (FORMERLY, PENN CAPITAL FUNDS TRUST)
Statements of Operations
FISCAL YEAR ENDED AUGUST 31, 2022
Investment Income (Loss) | Penn Capital | Penn Capital | Penn Capital | Penn Capital | Penn Capital | |||||||||||||||
Income | ||||||||||||||||||||
Dividends | ||||||||||||||||||||
Unaffiliated dividends | $ | — | $ | 202,675 | $ | — | $ | — | $ | 122,867 | ||||||||||
Short-term capital gain distribution from affiliated mutual fund | — | — | 47,283 | 91,637 | — | |||||||||||||||
Interest and fees | 1,399,322 | 1,012 | 1,036,949 | 1,329,304 | 601 | |||||||||||||||
Total income | 1,399,322 | 203,687 | 1,084,232 | 1,420,941 | 123,468 | |||||||||||||||
Expenses | ||||||||||||||||||||
Advisory fees | 176,950 | 152,310 | 132,076 | 179,785 | 156,858 | |||||||||||||||
Administration and accounting fees | 100,770 | 36,464 | 75,763 | 91,037 | 34,681 | |||||||||||||||
Registration and filing fees | 22,151 | 21,486 | 21,184 | 17,325 | 21,486 | |||||||||||||||
Legal fees | 21,152 | 24,480 | 21,757 | 22,682 | 24,476 | |||||||||||||||
Service Fees | 10,141 | 2,071 | — | 6,603 | 5,881 | |||||||||||||||
Transfer agent fees | 7,713 | 4,554 | 6,811 | 10,134 | 3,953 | |||||||||||||||
Custodian fees | 6,332 | 2,193 | 2,883 | 2,312 | 4,157 | |||||||||||||||
Printing and shareholder reporting fees | 6,147 | 6,823 | 5,856 | 13,760 | 7,354 | |||||||||||||||
Officer fees | 1,527 | 1,521 | 1,523 | 1,535 | 1,518 | |||||||||||||||
Director fees | 548 | 426 | 428 | 599 | 422 | |||||||||||||||
Interest Expenses | — | 170 | — | 15 | 199 | |||||||||||||||
Other expenses | 2,565 | — | 3,677 | 3,958 | — | |||||||||||||||
Total expenses | 355,996 | 252,498 | 271,958 | 349,745 | 260,985 | |||||||||||||||
Expense waiver and reimbursement from Advisor | (150,091 | ) | (72,939 | ) | (133,924 | ) | (133,986 | ) | (80,812 | ) | ||||||||||
Net expenses | 205,905 | 179,559 | 138,034 | 215,759 | 180,173 | |||||||||||||||
Net investment income (loss) | 1,193,417 | 24,128 | 946,198 | 1,205,182 | (56,705 | ) | ||||||||||||||
Realized and Unrealized Gain | ||||||||||||||||||||
Net realized gain (loss) on investments | ||||||||||||||||||||
Unaffiliated issuers | (436,635 | ) | 396,672 | (454,505 | ) | (99,367 | ) | 617,231 | ||||||||||||
Net change in unrealized appreciation (depreciation) | ||||||||||||||||||||
Unaffiliated issuers | (1,270,641 | ) | (3,534,958 | ) | (2,526,950 | ) | (2,275,545 | ) | (3,000,682 | ) | ||||||||||
Affiliated Mutual Fund (See Note 7) | — | — | (78,147 | ) | (134,564 | ) | — | |||||||||||||
Net realized and unrealized gain (loss) on investments | (1,707,276 | ) | (3,138,286 | ) | (3,059,602 | ) | (2,509,476 | ) | (2,383,451 | ) | ||||||||||
Net increase (decrease) in net assets resulting from operations | $ | (513,859 | ) | $ | (3,114,158 | ) | $ | (2,113,404 | ) | $ | (1,304,294 | ) | $ | (2,440,156 | ) | |||||
Net of foreign taxes withheld | $ | — | $ | — | $ | — | $ | — | $ | 1,005 | ||||||||||
The Accompanying Footnotes are an Integral Part of these Financial Statements
36
[THIS PAGE INTENTIONALLY LEFT BLANK.]
THE RBB FUND TRUST (FORMERLY, PENN CAPITAL FUNDS TRUST)
Statements of Changes in Net Assets
Penn Capital Floating Rate Income Fund | Penn Capital Mid Cap Core Fund | |||||||||||||||||||||||
Increase (Decrease) in Net Assets | Fiscal Year | Fiscal Period | Fiscal Year | Fiscal Year | Fiscal Period | Fiscal Year | ||||||||||||||||||
Operations | ||||||||||||||||||||||||
Net investment income (loss) | $ | 1,193,417 | $ | 163,899 | $ | 1,128,984 | $ | 24,128 | $ | (9,065 | ) | $ | 53,376 | |||||||||||
Net realized gain (loss) on investments: | ||||||||||||||||||||||||
Unaffiliated issuers | (436,635 | ) | (17,851 | ) | 230,733 | 396,672 | 485,294 | 2,734,210 | ||||||||||||||||
Net change in unrealized appreciation (depreciation) | (1,270,641 | ) | (69,256 | ) | 1,247,840 | (3,534,958 | ) | (468,266 | ) | 3,642,695 | ||||||||||||||
Net increase (decrease) in net assets resulting from operations | (513,859 | ) | 76,792 | 2,607,557 | (3,114,158 | ) | 7,963 | 6,430,281 | ||||||||||||||||
Dividends and distributions to shareholders | ||||||||||||||||||||||||
Net dividends and distributions from net investment income and realized gain - Institutional Class | (1,186,709 | ) | (162,263 | ) | (1,132,139 | ) | (2,002,649 | ) | — | (1,241 | ) | |||||||||||||
Total dividends and distributions to shareholders | (1,186,709 | ) | (162,263 | ) | (1,132,139 | ) | (2,002,649 | ) | — | (1,241 | ) | |||||||||||||
Capital share transactions | ||||||||||||||||||||||||
Net proceeds from sale of shares | 3,540,917 | 991,623 | 1,047,183 | 344,227 | 28,349 | 761,046 | ||||||||||||||||||
Dividends and distributions reinvested | 718,527 | 92,597 | 782,402 | 1,592,243 | — | 1,238 | ||||||||||||||||||
Cost of shares redeemed** | (2,702,846 | ) | (491,776 | ) | (8,169,914 | ) | (3,002,147 | ) | (1,148,821 | ) | (3,185,190 | ) | ||||||||||||
Net increase (decrease) in net assets resulting from capital share transactions | 1,556,598 | 592,444 | (6,340,329 | ) | (1,065,677 | ) | (1,120,472 | ) | (2,422,906 | ) | ||||||||||||||
Net increase (decrease) in net assets | (143,970 | ) | 506,973 | (4,864,911 | ) | (6,182,484 | ) | (1,112,509 | ) | 4,006,134 | ||||||||||||||
Net Assets | ||||||||||||||||||||||||
Beginning of period | 31,192,786 | 30,685,813 | 35,550,724 | 18,859,694 | 19,972,203 | 15,966,069 | ||||||||||||||||||
End of period | $ | 31,048,816 | $ | 31,192,786 | $ | 30,685,813 | $ | 12,677,210 | $ | 18,859,694 | $ | 19,972,203 | ||||||||||||
The Accompanying Footnotes are an Integral Part of these Financial Statements
38
THE RBB FUND TRUST (FORMERLY, PENN CAPITAL FUNDS TRUST)
Statements of Changes in Net Assets
Penn Capital Opportunistic High Income Fund | Penn Capital Short Duration High Income Fund | Penn Capital Special Situations Small Cap Equity Fund | |||||||||||||||||||||||||||||||||
Fiscal Year | Fiscal Period | Fiscal Year | Fiscal Year | Fiscal Period | Fiscal Year | Fiscal Year | Fiscal Period | Fiscal Year | |||||||||||||||||||||||||||
| $ | 946,198 | $ | 153,322 | $ | 1,051,849 | $ | 1,205,182 | $ | 209,362 | $ | 1,640,318 | $ | (56,705 | ) | $ | (12,786 | ) | $ | (2,414 | ) | |||||||||||||||
| (454,505 | ) | 137,452 | 1,153,263 | (99,367 | ) | 93,746 | 807,835 | 617,231 | 338,177 | 3,817,804 | |||||||||||||||||||||||||
| (2,605,097 | ) | (206,077 | ) | 1,056,483 | (2,410,109 | ) | (126,700 | ) | 1,088,068 | (3,000,682 | ) | (463,507 | ) | 4,502,499 | |||||||||||||||||||||
| (2,113,404 | ) | 84,697 | 3,261,595 | (1,304,294 | ) | 176,408 | 3,536,221 | (2,440,156 | ) | (138,116 | ) | 8,317,889 | |||||||||||||||||||||||
| (943,646 | ) | (156,147 | ) | (1,055,682 | ) | (1,192,175 | ) | (213,906 | ) | (1,641,797 | ) | (3,352,825 | ) | — | — | ||||||||||||||||||||
| (943,646 | ) | (156,147 | ) | (1,055,682 | ) | (1,192,175 | ) | (213,906 | ) | (1,641,797 | ) | (3,352,825 | ) | — | — | ||||||||||||||||||||
| 2,179,258 | 2,753 | 1,355,922 | 2,759,420 | 4,619,400 | 3,314,698 | 5,556,932 | 312,961 | 2,775,232 | |||||||||||||||||||||||||||
| 747,008 | 120,747 | 1,034,753 | 1,063,957 | 190,157 | 1,493,984 | 2,834,632 | — | — | |||||||||||||||||||||||||||
| (826,310 | ) | (1,192,655 | ) | (2,316,469 | ) | (11,293,367 | ) | (1,081,292 | ) | (10,984,422 | ) | (2,875,898 | ) | (203,662 | ) | (1,415,714 | ) | ||||||||||||||||||
| 2,099,956 | (1,069,155 | ) | 74,206 | (7,469,990 | ) | 3,728,265 | (6,175,740 | ) | 5,515,666 | 109,299 | 1,359,518 | ||||||||||||||||||||||||
| (957,094 | ) | (1,140,605 | ) | 2,280,119 | (9,966,459 | ) | 3,690,767 | (4,281,316 | ) | (277,315 | ) | (28,817 | ) | 9,677,407 | |||||||||||||||||||||
| 18,958,765 | 20,099,370 | 17,819,251 | 43,870,982 | 40,180,215 | 44,461,531 | 16,893,794 | 16,922,611 | 7,245,204 | |||||||||||||||||||||||||||
| $ | 18,001,671 | $ | 18,958,765 | $ | 20,099,370 | $ | 33,904,523 | $ | 43,870,982 | $ | 40,180,215 | $ | 16,616,479 | $ | 16,893,794 | $ | 16,922,611 | ||||||||||||||||||
The Accompanying Footnotes are an Integral Part of these Financial Statements
39
THE RBB FUND TRUST (FORMERLY, PENN CAPITAL FUNDS TRUST)
Financial Highlights
Per Common | ||||||||||||||||||||||||||||
Income from | Distributions | |||||||||||||||||||||||||||
Net asset | Net | Net | Total from | Dividends | Distributions | Total | ||||||||||||||||||||||
Penn Capital Floating Rate Income Fund | ||||||||||||||||||||||||||||
Institutional Class | ||||||||||||||||||||||||||||
9/1/21 to 8/31/22 | $ | 9.68 | 0.35 | (0.49 | ) | (0.14 | ) | (0.35 | ) | — | (0.35 | ) | ||||||||||||||||
7/1/21 to 8/31/21(e) | $ | 9.70 | 0.05 | (0.02 | ) | 0.03 | (0.05 | ) | — | (0.05 | ) | |||||||||||||||||
7/1/20 to 6/30/21 | $ | 9.30 | 0.33 | 0.40 | 0.73 | (0.33 | ) | — | (0.33 | ) | ||||||||||||||||||
7/1/19 to 6/30/20 | $ | 9.97 | 0.42 | (0.67 | ) | 0.25 | (g) | (0.42 | ) | — | (0.42 | ) | ||||||||||||||||
7/1/18 to 6/30/19 | $ | 10.09 | 0.48 | (0.09 | ) | 0.39 | (g) | (0.51 | ) | — | (0.51 | ) | ||||||||||||||||
7/1/17 to 6/30/18 | $ | 10.21 | 0.43 | (0.06 | ) | 0.37 | (0.43 | ) | (0.06 | ) | (0.49 | ) | ||||||||||||||||
Penn Capital Mid Cap Core Fund | ||||||||||||||||||||||||||||
Institutional Class | ||||||||||||||||||||||||||||
9/1/21 to 8/31/22 | $ | 16.79 | 0.02 | (2.62 | ) | (2.60 | ) | (0.05 | ) | (1.72 | ) | (1.77 | ) | |||||||||||||||
7/1/21 to 8/31/21(e) | $ | 16.76 | (0.01 | ) | 0.04 | 0.03 | — | — | — | |||||||||||||||||||
7/1/20 to 6/30/21 | $ | 11.49 | 0.03 | 5.24 | 5.27 | (0.00 | )(i) | — | (0.00 | )(i) | ||||||||||||||||||
7/1/19 to 6/30/20 | $ | 12.68 | — | (i) | (0.60 | ) | (0.60 | ) | — | (0.59 | ) | (0.59 | ) | |||||||||||||||
7/1/18 to 6/30/19 | $ | 13.55 | (0.01 | ) | 0.37 | 0.36 | (g) | — | (1.23 | ) | (1.23 | ) | ||||||||||||||||
7/1/17 to 6/30/18 | $ | 11.73 | (0.04 | ) | 2.07 | 2.03 | — | (0.21 | ) | (0.21 | ) | |||||||||||||||||
Penn Capital Opportunisitic High Income Fund | ||||||||||||||||||||||||||||
Institutional Class | ||||||||||||||||||||||||||||
9/1/21 to 8/31/22 | $ | 9.96 | 0.46 | (1.46 | ) | (1.00 | ) | (0.46 | ) | — | (0.46 | ) | ||||||||||||||||
7/1/21 to 8/31/21(e) | $ | 10.00 | 0.08 | (0.04 | ) | 0.04 | (0.08 | ) | — | (0.08 | ) | |||||||||||||||||
7/1/20 to 6/30/21 | $ | 8.88 | 0.54 | 1.12 | 1.66 | (0.54 | ) | — | (0.54 | ) | ||||||||||||||||||
7/1/19 to 6/30/20 | $ | 9.99 | 0.53 | (1.10 | ) | (0.57 | )(g) | (0.54 | ) | — | (0.54 | ) | ||||||||||||||||
7/1/18 to 6/30/19 | $ | 10.06 | 0.59 | (0.02 | ) | 0.57 | (g) | (0.61 | ) | (0.03 | ) | (0.64 | ) | |||||||||||||||
7/1/17 to 6/30/18 | $ | 10.52 | 0.61 | (0.22 | ) | 0.39 | (g) | (0.63 | ) | (0.22 | ) | (0.85 | ) | |||||||||||||||
Penn Capital Short Duration High Income Fund | ||||||||||||||||||||||||||||
Institutional Class | ||||||||||||||||||||||||||||
9/1/21 to 8/31/22 | $ | 9.73 | 0.29 | (0.58 | ) | (0.29 | ) | (0.29 | ) | — | (0.29 | ) | ||||||||||||||||
7/1/21 to 8/31/21(e) | $ | 9.74 | 0.05 | (0.01 | ) | 0.04 | (0.05 | ) | — | (0.05 | ) | |||||||||||||||||
7/1/20 to 6/30/21 | $ | 9.33 | 0.36 | 0.41 | 0.77 | (0.36 | ) | — | (0.36 | ) | ||||||||||||||||||
7/1/19 to 6/30/20 | $ | 9.93 | 0.37 | (0.59 | ) | (0.22 | ) | (0.38 | ) | — | (0.38 | ) | ||||||||||||||||
7/1/18 to 6/30/19 | $ | 9.85 | 0.35 | 0.10 | 0.45 | (g) | (0.37 | ) | — | (0.37 | ) | |||||||||||||||||
7/17/17(f) to 6/30/18 | $ | 10.00 | 0.27 | (0.17 | ) | 0.10 | (0.25 | ) | — | (0.25 | ) | |||||||||||||||||
(a) | Information presented related to a share outstanding for the entire period. |
(b) | Annualized for periods less than one full year. |
(c) | Portfolio turnover is calculated on the basis of the Fund as a whole without distinguishing between the classes of shares issued. |
(d) | Not annualized. |
(e) | The Funds changed their fiscal year end to August 31. |
(f) | Commencement of operations. |
(g) | Total from investment operations per share includes redemption fees of less than $0.01 per share. |
(h) | Expense waiver of 0.64% was implemented on August 1, 2017. |
(i) | Amount is less than $0.005 per share. |
The Accompanying Footnotes are an Integral Part of these Financial Statements
40
THE RBB FUND TRUST (FORMERLY, PENN CAPITAL FUNDS TRUST)
Financial Highlights
Per Common | Supplemental | ||||||||||||||||||||||||||||||
Net asset | Total | Net assets, | Ratio of | Ratio of | Ratio of net | Ratio of net | Portfolio | ||||||||||||||||||||||||
| $ | 9.19 | (1.48 | )% | $ | 31,049 | 0.64 | % | 1.11 | % | 3.71 | % | 3.24 | % | 49 | % | ||||||||||||||||
| $ | 9.68 | 0.32 | % | $ | 31,193 | 0.64 | % | 1.16 | % | 3.13 | % | 2.61 | % | 3 | % | ||||||||||||||||
| $ | 9.70 | 7.95 | % | $ | 30,685 | 0.64 | % | 1.52 | % | 3.41 | % | 2.53 | % | 46 | % | ||||||||||||||||
| $ | 9.30 | (2.57 | )% | $ | 35,551 | 0.64 | % | 1.37 | % | 4.33 | % | 3.60 | % | 93 | % | ||||||||||||||||
| $ | 9.97 | 4.04 | % | $ | 37,485 | 0.64 | % | 1.43 | % | 4.89 | % | 4.10 | % | 57 | % | ||||||||||||||||
| $ | 10.09 | 3.71 | % | $ | 31,729 | 0.65 | %(h) | 1.64 | % | 4.31 | %(h) | 3.32 | % | 65 | % | ||||||||||||||||
| $ | 12.42 | (17.45 | )% | $ | 12,677 | 1.06 | % | 1.49 | % | 0.14 | % | (0.29 | )% | 38 | % | ||||||||||||||||
| $ | 16.79 | 0.18 | % | $ | 18,860 | 1.06 | % | 1.70 | % | (0.28 | )% | (0.92 | )% | 3 | % | ||||||||||||||||
| $ | 16.76 | 45.88 | % | $ | 19,972 | 1.06 | % | 2.19 | % | 0.30 | % | (0.83 | )% | 59 | % | ||||||||||||||||
| $ | 11.49 | (5.23 | )% | $ | 15,966 | 1.06 | % | 2.14 | % | (0.04 | )% | (1.12 | )% | 57 | % | ||||||||||||||||
| $ | 12.68 | 3.64 | % | $ | 14,363 | 1.06 | % | 2.20 | % | (0.11 | )% | (1.25 | )% | 40 | % | ||||||||||||||||
| $ | 13.55 | 17.41 | % | $ | 14,910 | 1.06 | % | 2.38 | % | (0.34 | )% | (1.66 | )% | 64 | % | ||||||||||||||||
| $ | 8.50 | (10.31 | )% | $ | 18,002 | 0.72 | % | 1.42 | % | 4.94 | % | 4.24 | % | 71 | % | ||||||||||||||||
| $ | 9.96 | 0.43 | % | $ | 18,959 | 0.72 | % | 1.65 | % | 4.69 | % | 3.76 | % | 18 | % | ||||||||||||||||
| $ | 10.00 | 19.08 | % | $ | 20,099 | 0.72 | % | 2.08 | % | 5.27 | % | 4.21 | % | 156 | % | ||||||||||||||||
| $ | 8.88 | (5.86 | )% | $ | 17,819 | 0.72 | % | 2.08 | % | 5.66 | % | 4.30 | % | 149 | % | ||||||||||||||||
| $ | 9.99 | 5.83 | % | $ | 15,236 | 0.72 | % | 2.26 | % | 5.90 | % | 4.36 | % | 85 | % | ||||||||||||||||
| $ | 10.06 | 3.81 | % | $ | 13,814 | 0.72 | % | 2.80 | % | 5.89 | % | 3.81 | % | 66 | % | ||||||||||||||||
| $ | 9.15 | (3.05 | )% | $ | 33,905 | 0.54 | % | 0.88 | % | 3.02 | % | 2.68 | % | 54 | % | ||||||||||||||||
| $ | 9.73 | 0.41 | % | $ | 43,871 | 0.54 | % | 0.99 | % | 2.97 | % | 2.52 | % | 11 | % | ||||||||||||||||
| $ | 9.74 | 11.96 | % | $ | 40,180 | 0.54 | % | 1.16 | % | 3.77 | % | 3.15 | % | 104 | % | ||||||||||||||||
| $ | 9.33 | (2.33 | )% | $ | 44,462 | 0.54 | % | 1.15 | % | 3.87 | % | 3.26 | % | 113 | % | ||||||||||||||||
| $ | 9.93 | 4.65 | % | $ | 34,924 | 0.54 | % | 1.44 | % | 3.75 | % | 2.85 | % | 48 | % | ||||||||||||||||
| $ | 9.85 | 1.03 | % | $ | 12,436 | 0.54 | % | 2.70 | % | 3.08 | % | 0.92 | % | 39 | % | ||||||||||||||||
The Accompanying Footnotes are an Integral Part of these Financial Statements
41
THE RBB FUND TRUST (FORMERLY, PENN CAPITAL FUNDS TRUST)
Financial Highlights
Per Common | ||||||||||||||||||||||||||||
Income from | Distributions | |||||||||||||||||||||||||||
Net asset | Net | Net | Total from | Dividends | Distributions | Total | ||||||||||||||||||||||
Penn Capital Special Situations Small Cap Equity Fund | ||||||||||||||||||||||||||||
Institutional Class | ||||||||||||||||||||||||||||
9/1/21 to 8/31/22 | $ | 19.62 | (0.05 | ) | (2.12 | ) | (2.17 | ) | — | (3.81 | ) | (3.81 | ) | |||||||||||||||
7/1/21 to 8/31/21(e) | $ | 19.79 | (0.01 | ) | (0.16 | ) | (0.17 | ) | — | — | — | |||||||||||||||||
7/1/20 to 6/30/21 | $ | 9.33 | (0.01 | ) | 10.47 | 10.46 | — | — | — | |||||||||||||||||||
7/1/19 to 6/30/20 | $ | 10.67 | (0.03 | ) | (1.31 | ) | (1.34 | ) | — | — | — | |||||||||||||||||
7/1/18 to 6/30/19 | $ | 12.59 | (0.05 | ) | (0.98 | ) | (1.03 | )(f) | — | (0.89 | ) | (0.89 | ) | |||||||||||||||
7/1/17 to 6/30/18 | $ | 11.71 | (0.08 | ) | 2.36 | 2.28 | (f) | — | (1.40 | ) | (1.40 | ) | ||||||||||||||||
(a) | Information presented related to a share outstanding for the entire period. |
(b) | Annualized for periods less than one full year. |
(c) | Portfolio turnover is calculated on the basis of the Fund as a whole without distinguishing between the classes of shares issued. |
(d) | Not annualized. |
(e) | The Funds changed their fiscal year end to August 31. |
(f) | Total from investment operations per share includes redemption fees of less than $0.01 per share. |
(g) | Expense waiver of 0.64% was implemented on August 1, 2017. |
(h) | Amount is less than $0.005 per share. |
The Accompanying Footnotes are an Integral Part of these Financial Statements
42
THE RBB FUND TRUST (FORMERLY, PENN CAPITAL FUNDS TRUST)
Financial Highlights
Per Common | Supplemental | ||||||||||||||||||||||||||||||
Net asset | Total | Net assets, | Ratio of | Ratio of | Ratio of net | Ratio of net | Portfolio | ||||||||||||||||||||||||
| $ | 13.64 | (14.39 | )% | $ | 16,616 | 1.09 | % | 1.58 | % | (0.34 | )% | (0.83 | )% | 87 | % | ||||||||||||||||
| $ | 19.62 | (0.86 | )% | $ | 16,894 | 1.09 | % | 1.71 | % | (0.46 | )% | (1.08 | )% | 11 | % | ||||||||||||||||
| $ | 19.79 | 112.11 | % | $ | 16,923 | 1.09 | % | 2.97 | % | (0.02 | )% | (1.90 | )% | 132 | % | ||||||||||||||||
| $ | 9.33 | (12.56 | )% | $ | 7,245 | 1.09 | % | 3.09 | % | (0.42 | )% | (2.42 | )% | 115 | % | ||||||||||||||||
| $ | 10.67 | (7.91 | )% | $ | 10,198 | 1.09 | % | 2.38 | % | (0.35 | )% | (1.64 | )% | 97 | % | ||||||||||||||||
| $ | 12.59 | 20.31 | % | $ | 21,289 | 1.09 | % | 2.09 | % | (0.64 | )% | (1.64 | )% | 105 | % | ||||||||||||||||
The Accompanying Footnotes are an Integral Part of these Financial Statements
43
THE RBB FUND TRUST (FORMERLY, PENN CAPITAL FUNDS TRUST)
Notes to the Financial Statements
AUGUST 31, 2022
1. Organization
The RBB Fund Trust, (formerly PENN Capital Funds Trust) (the “Trust” or the “Company”) was organized as a Delaware statutory trust on August 29, 2014, and is registered under the Investment Company Act of 1940 (the “1940 Act”), as amended, as an open-end management investment company. The Trust consists of five series that are available for investment: the Penn Capital Floating Rate Income Fund, the Penn Capital Mid Cap Core Fund, the Penn Capital Opportunistic High Income Fund, the Penn Capital Short Duration High Income Fund, and the Penn Capital Special Situations Small Cap Equity Fund (collectively referred to as the “Funds” and each individually referred to as a “Fund”). Two other series, the Penn Capital Micro Cap Equity Fund and the Penn Capital Enterprise Value Small Cap Equity Fund, are not currently offered. The Funds follow the Financial Accounting Standards Board (“FASB”) Accounting Standard Codification Topic 946 “Financial Services - Investment Companies”.
The Penn Capital Floating Rate Income Fund’s investment objective is to seek to provide current income. The Penn Capital Floating Rate Income Fund commenced operations on November 30, 2015.
The Penn Capital Opportunistic High Income Fund’s investment objective is to seek to provide total return through interest income and capital appreciation. The Penn Capital Opportunistic High Income Fund commenced operations on November 30, 2015.
The Penn Capital Short Duration High Income Fund’s investment objective is to seek to provide a high level of current income. The Penn Capital Short Duration High Income Fund commenced operations on July 17, 2017.
The Penn Capital Mid Cap Core Fund and the Penn Capital Special Situations Small Cap Equity Fund’s investment objective is to seek to provide capital appreciation. The Penn Capital Mid Cap Core Fund commenced operations on November 30, 2015. The Penn Capital Special Situations Small Cap Equity Fund commenced operations on December 17, 2015.
Each Fund’s investment objective is non-fundamental, and may be changed by the Trust’s Board of Trustees (the “Board” or “Trustees”) without shareholder approval. Unless otherwise noted, all of the other investment policies and strategies described in the Prospectus or hereafter are nonfundamental. The Penn Capital Management Company, LLC (the “Advisor” or “Penn Capital”) serves as the investment advisor to the Funds.
The Trust offers Institutional Class shares for the Penn Capital Floating Rate Income Fund, the Penn Capital Mid Cap Core Fund, the Penn Capital Opportunistic High Income Fund, the Penn Capital Special Situations Small Cap Equity Fund and the Penn Capital Short Duration High Income Fund. The Trust has also registered two other series, each with one class: the Penn Capital Micro Cap Equity Fund and the Penn Capital Enterprise Value Small Cap Equity Fund: Institutional Class. Institutional Class shares do not have a front-end or back-end sales charge. The Penn Capital Micro Cap Equity Fund and Penn Capital Enterprise Value Small Cap Fund have not commenced operations as of August 31, 2022.
The end of the reporting period for the Funds is August 31, 2022, and the period covered by these Notes to Financial Statements is the fiscal year ended August 31, 2022 (the “current fiscal period”).
2. Significant Accounting Policies
The following is a summary of significant accounting policies consistently followed by the Funds in the preparation of their financial statements. The financial statements have been prepared in conformity with accounting principles generally accepted in the United States of America (“GAAP”).
A. Investment Valuation
The Funds use the following valuation methods to determine fair value as either fair value for investments for which market quotations are available, or if not available, the fair value, as determined in good faith pursuant to such policies and procedures as may be approved by the Trust’s Board from time to time. The valuation of the portfolio investments of the Funds currently includes the following processes:
Portfolio securities listed on a national or foreign securities exchange, except those listed on the NASDAQ® Stock Market and Small CapSM exchanges (“NASDAQ®”), for which market quotations are available, are valued at the official closing price of such exchange on each business day (defined as days on which the Funds are open for business (“Business Day”)). Portfolio securities traded on the NASDAQ® will be valued at the NASDAQ® Official Closing Price on each Business Day. If there is no such reported sale on an exchange or NASDAQ®, the portfolio security will be valued at the most recent quoted bid price. Price information on listed securities is taken from the exchange where the security is primarily traded.
44
THE RBB FUND TRUST (FORMERLY, PENN CAPITAL FUNDS TRUST)
NOTES TO THE FINANCIAL STATEMENTS
AUGUST 31, 2022
Other assets and securities for which no quotations are readily available (such as for certain restricted or unlisted securities and private placements) or that may not be reliably priced (such as in the case of trade suspensions or halts, price movement limits set by certain foreign markets, and thinly traded or illiquid securities) will be valued in good faith at fair value using procedures and methods approved by the Board. Under the procedures adopted by the Board, the Board has delegated day-to-day responsibility for fair value determinations to a Valuation Committee comprised of representatives from the Advisor.
A Fund’s portfolio holdings may also consist of shares of other investment companies in which the Fund invests. The value of each such investment company will be its net asset value (“NAV”) at the time the Fund’s shares are priced. Each investment company calculates its NAV based on the current market value for its portfolio holdings. Each investment company values securities and other instruments in a manner as described in that investment company’s prospectus. The investment company’s prospectus explains the circumstances under which the company will use fair value pricing and the effects of using fair value pricing.
Because a Fund may invest in foreign securities, the Fund’s NAV may change on days when a shareholder will not be able to purchase or redeem Fund shares because foreign markets are open at times and on days when U.S. markets are not. Investments quoted in foreign currencies will be valued daily in U.S. dollars on the basis of the foreign currency exchange rates prevailing at the time such valuation is determined. Foreign currency exchange rates are generally determined as of the close of the New York Stock Exchange (“NYSE”) (generally 4:00 p.m. Eastern time). If an event that could materially affect the value of the Fund’s foreign securities has occurred between the time the securities were last traded and the time that the Fund calculates its NAV, the closing price of the Fund’s securities may no longer reflect their market value at the time the Fund calculates its NAV. In such a case, the Fund may use fair value methods to value such securities.
Fixed income securities shall be valued at the evaluated bid price supplied by the Fund’s pricing agent based on broker-dealer supplied valuations and other criteria, or directly by independent brokers when the pricing agent does not provide a price or the Valuation Committee does not believe that the pricing agent price reflects the current market value. If a price of a position is sought using independent brokers, the Advisor shall seek to obtain an evaluation bid price from at least two independent brokers who are knowledgeable about the position. The price of the position would be deemed to be an average of such bid prices. In the absence of sufficient broker dealer quotes, securities shall be valued at fair value pursuant to procedures adopted by the Board.
Bank loans are not listed on any securities exchange or board of trade. They are typically bought and sold by institutional investors in individually negotiated private transactions that function in many respects like an over-the-counter secondary market. This market generally has fewer trades and less liquidity than the secondary market for other types of securities. Some bank loans have few or no trades, or trade infrequently, and information regarding a specific bank loan may not be widely available or may be incomplete. Except as otherwise specified, bank loan securities shall be valued at the evaluated bid prices supplied by the Fund’s pricing agent based on broker-dealer supplied valuations and other criteria, such as, issuer details, interest rates, yield curves, prepayment speeds, credit risks/spreads, default rates and quoted prices for similar assets, or directly by independent brokers when the pricing agent does not provide a price or the Valuation Committee does not believe that the pricing agent price reflects the current market value. If a price of a position is sought using independent brokers, the Advisor shall seek to obtain a bid price from at least two independent brokers who are knowledgeable about the position. The price of the position would be deemed to be an average of such bid prices. In the absence of sufficient broker dealer quotes, securities shall be valued at fair value pursuant to procedures adopted by the Board.
Occasionally, reliable market quotations are not readily available (such as for certain restricted or unlisted securities and private placements) or securities and other assets may not be reliably priced (such as in the case of trade suspensions or halts, price movement limits set by certain foreign markets, and thinly traded or illiquid securities), or there may be events affecting the value of foreign securities or other securities held by the Funds that occur when regular trading on foreign or other exchanges is closed, but before trading on the NYSE is closed. Fair value determinations are then made in good faith in accordance with procedures adopted by the Board. Under the procedures adopted by the Board, the Board has delegated the responsibility for making fair value determinations to a Valuation Committee, subject to the Board’s oversight. Generally, the fair value of a portfolio security or other asset shall be the amount that the owner of the security or asset might reasonably expect to receive upon its current sale. A three-tier hierarchy is utilized to maximize the use of observable market data and minimize the use of unobservable inputs and to establish classification of fair value measurements for disclosure purposes. Inputs may be observable or unobservable and refer broadly to the assumptions that market participants would use in pricing the asset or liability, including assumptions about risk. Observable inputs are inputs that reflect the assumptions market participants would use in pricing the asset or liability and are developed based on market data obtained from sources independent of the reporting entity. Unobservable inputs are inputs that reflect the reporting
45
THE RBB FUND TRUST (FORMERLY, PENN CAPITAL FUNDS TRUST)
NOTES TO THE FINANCIAL STATEMENTS
AUGUST 31, 2022
entity’s own assumptions about the assumptions market participants would use in pricing the asset or liability and are developed based on the best information available under the circumstances. The three-tier hierarchy of inputs is summarized in the three broad levels listed below.
Level 1 — Prices are determined using quoted prices in active markets for identical securities.
Level 2 — Prices are determined using other significant observable inputs (including quoted prices for similar securities, interest rates, prepayment speeds, credit risk, etc.).
Level 3 — Prices are determined using significant unobservable inputs (including the Funds’ own assumptions in determining the fair value of investments).
The availability of observable inputs can vary from security to security and is affected by a wide variety of factors, including, for example, the type of security, whether the security is new and not yet established in the marketplace, the liquidity of markets, and other characteristics particular to the security. To the extent that valuation is based on models or inputs that are less observable or unobservable in the market, the determination of fair value requires more judgment. Accordingly, the degree of judgment exercised in determining fair value is greatest for instruments categorized in Level 3.
The inputs used to measure fair value may fall into different levels of the fair value hierarchy. In such cases, for disclosure purposes, the level in the fair value hierarchy within which the fair value measurement falls in its entirety is determined based on the lowest level input that is significant to the fair value measurement in its entirety.
The following table summarizes the inputs used as of the end of the reporting period, in valuing each Fund’s investments:
Description | ||||||||||||||||
Penn Capital Floating Rate Income Fund | Level 1 | Level 2 | Level 3 | Total | ||||||||||||
Investments in Securities(a) | ||||||||||||||||
Bank Loans | $ | — | $ | 25,897,492 | $ | — | $ | 25,897,492 | ||||||||
Corporate Bonds | — | 3,875,031 | — | 3,875,031 | ||||||||||||
Short-Term Investments | 2,085,171 | — | — | 2,085,171 | ||||||||||||
Total Investments in Securities | $ | 2,085,171 | $ | 29,772,523 | $ | — | $ | 31,857,694 | ||||||||
Penn Capital Mid Cap Core Fund | Level 1 | Level 2 | Level 3 | Total | ||||||||||||
Investments in Securities(a) | ||||||||||||||||
Common Stocks | $ | 11,161,583 | $ | — | $ | — | $ | 11,161,583 | ||||||||
Equity Real Estate Investment Trusts (REITs) | 934,413 | — | — | 934,413 | ||||||||||||
Short-Term Investments | 626,258 | — | — | 626,258 | ||||||||||||
Total Investments in Securities | $ | 12,722,254 | $ | — | $ | — | $ | 12,722,254 | ||||||||
Penn Capital Opportunistic High Income Fund | Level 1 | Level 2 | Level 3 | Total | ||||||||||||
Investments in Securities(a) | ||||||||||||||||
Convertible Bonds | $ | — | $ | 565,511 | $ | — | $ | 565,511 | ||||||||
Corporate Bonds | — | 15,403,983 | — | 15,403,983 | ||||||||||||
Bank Loans | — | 59,877 | — | 59,877 | ||||||||||||
Real Estate Investment Trusts (REITs) | 91,852 | — | — | 91,852 | ||||||||||||
Mutual Funds | 1,460,996 | — | — | 1,460,996 | ||||||||||||
Short-Term Investments | 157,540 | — | — | 157,540 | ||||||||||||
Total Investments in Securities | $ | 1,710,388 | $ | 16,029,371 | $ | — | $ | 17,739,759 | ||||||||
46
THE RBB FUND TRUST (FORMERLY, PENN CAPITAL FUNDS TRUST)
NOTES TO THE FINANCIAL STATEMENTS
AUGUST 31, 2022
Penn Capital Short Duration High Income Fund | Level 1 | Level 2 | Level 3 | Total | ||||||||||||
Investments in Securities(a) | ||||||||||||||||
Convertible Bonds | $ | — | $ | 306,850 | $ | — | $ | 306,850 | ||||||||
Corporate Bonds | — | 29,427,723 | — | 29,427,723 | ||||||||||||
Mutual Funds | 2,551,689 | — | — | 2,551,689 | ||||||||||||
Short-Term Investments | 1,199,693 | — | — | 1,199,693 | ||||||||||||
Total Investments in Securities | $ | 3,751,382 | $ | 29,734,573 | $ | — | $ | 33,485,955 | ||||||||
Penn Capital Special Situations Small Cap Equity Fund | Level 1 | Level 2 | Level 3 | Total | ||||||||||||
Investments in Securities(a) | ||||||||||||||||
Common Stocks | $ | 15,609,387 | — | — | $ | 15,609,387 | ||||||||||
Real Estate Investment Trusts (REITs) | 629,468 | — | — | 629,468 | ||||||||||||
Short-Term Investments | 387,831 | — | — | 387,831 | ||||||||||||
Total Investments in Securities | $ | 16,626,686 | $ | — | $ | — | $ | 16,626,686 | ||||||||
(a) | All other industry classifications are identified in the Schedule of Investments for the Fund. |
During the current fiscal period, the Funds had no significant Level 3 transfers.
B. Investment Transactions and Related Investment Income
Investment transactions are accounted for on a trade-date basis. Interest income is recorded on the accrual basis, including the amortization of premiums and accretion of discounts on bonds held using the yield-to-maturity method. Dividend income is recognized on ex-dividend date.
Realized gains and losses on investment transactions and unrealized appreciation and depreciation of investments are reported for financial statement and federal income tax purposes on the identified cost method.
C. Expenses
Certain expenses are shared with The RBB Fund, Inc. (“RBB”), an affiliated fund. Expenses incurred on behalf of a specific class, fund or fund family of the Trust or RBB are charged directly to the class, fund or fund family (in proportion to net assets). Expenses incurred for all of the funds (such as trustee or professional fees) are charged to all funds in proportion to their average net assets of the Trust and RBB, or in such other manner as the Board deems fair or equitable.
D. Use of Estimates
The preparation of the financial statements in conformity with GAAP requires management to make estimates and assumptions that affect the reported amounts of assets and liabilities and disclosure of contingent assets and liabilities at the date of the financial statements and the reported amounts of increases and decreases in net assets from operations during the reporting year. Actual results could differ from those estimates.
E. Dividends and Distributions
Dividends and distributions to Shareholders are recorded on the ex-date. The Penn Capital Floating Rate Income Fund, Penn Capital Opportunistic High Income Fund and the Penn Capital Short Duration High Income Fund declare and distribute their net investment income, if any, monthly and make distributions of their net realized capital gains, if any, at least annually, usually in December. The Penn Capital Mid Cap Core Fund and the Penn Capital Special Situations Small Cap Equity Fund declare and distribute their net investment income, if any, annually and make distributions of net realized capital gains, if any, at least annually, usually in December.
47
THE RBB FUND TRUST (FORMERLY, PENN CAPITAL FUNDS TRUST)
NOTES TO THE FINANCIAL STATEMENTS
AUGUST 31, 2022
The character of distributions made during the period from net investment income or net realized gains may differ from its ultimate characterization for federal income tax purposes. In addition, due to the timing of dividend distributions, the fiscal period in which the amounts are distributed may differ from the period that income or realized gains (losses) were recorded by each Fund.
F. Federal Income Taxes
Each Fund intends to qualify as a regulated investment company under Subchapter M of the Internal Revenue Code of 1986, as amended. If so qualified, the Funds will not be subject to federal income tax to the extent they distribute all of their net investment income and capital gains to shareholders. Therefore, no federal income tax provision is required.
The Funds evaluate tax positions taken or expected to be taken in the course of preparing their tax returns to determine whether it is more-likely-than-not (i.e., greater than 50%) that each tax position will be sustained upon examination by a taxing authority based on the technical merits of the position. Tax positions not deemed to meet the more-likely-than-not threshold are recorded as a tax benefit or expense in the current year. The Funds did not record any tax provision in the current period and have no provision for taxes in the financial statements. However, management’s conclusions regarding tax positions taken may be subject to review and adjustment at a later date based on factors including, but not limited to, examination by tax authorities (i.e., the last three open tax year ends, as applicable) and on-going analysis of and changes to tax laws, regulations and interpretations thereof.
G. Indemnifications
Under the Trust’s organizational documents, its officers and Trustees are indemnified against certain liabilities arising out of the performance of their duties to the Trust and each Fund. In addition, in the normal course of business, the Trust may enter into contracts that provide general indemnification to other parties. The Trust’s maximum exposure under these arrangements is unknown, as this would involve future claims that may be made against the Trust that have not yet occurred, and may not occur. However, the Trust has not had prior claims or losses pursuant to these contracts and considers the risk of loss to be remote.
3. Agreements and Related Party Transactions
Investment Advisory Agreement
The Trust has entered into an investment advisory agreement with the Advisor. Under the terms of the agreement, each Fund pays the Advisor a fee, payable at the end of each month, at an annual rate, set forth in the table below, of the respective Fund’s average daily net assets.
Penn Capital Floating Rate Income Fund | 0.55% |
Penn Capital Mid Cap Core Fund | 0.90% |
Penn Capital Opportunistic High Income Fund | 0.69% |
Penn Capital Short Duration High Income Fund | 0.45% |
Penn Capital Special Situations Small Cap Equity Fund | 0.95% |
With respect to each Fund other than the Penn Capital Opportunistic High Income Fund and the Penn Capital Short Duration High Income Fund, the Advisor has contractually agreed to waive its fees and/or pay Fund expenses so that the Funds’ total annual operating expenses (excluding any acquired fund fees and expenses, taxes, interest, brokerage fees, certain insurance costs, and extraordinary and other non-routine expenses) do not exceed the amounts shown below as a percentage of each Fund’s average daily net assets. With respect to the Penn Capital Opportunistic High Income Fund and the Penn Capital Short Duration High Income Fund, the Advisor has contractually agreed to waive its fees and/or pay Fund expenses so that the Fund’s total annual operating expenses (including any acquired fund fees and expenses incurred by the Fund as a result of its investments in other investment companies managed by the Advisor, but excluding any acquired fund fees and expenses incurred by the Fund as a result of its investments in unaffiliated investment companies, taxes, interest, brokerage fees, certain insurance costs, and extraordinary and
48
THE RBB FUND TRUST (FORMERLY, PENN CAPITAL FUNDS TRUST)
NOTES TO THE FINANCIAL STATEMENTS
AUGUST 31, 2022
other non-routine expenses) do not exceed the amounts shown below as a percentage of each Fund’s average daily net assets. The expense limitation agreement will remain in place through April 1, 2023. Thereafter, the expense limitation agreement for the Funds will be reviewed annually by the Advisor and the Board.
Institutional | |
Penn Capital Floating Rate Income Fund | 0.64% |
Penn Capital Mid Cap Core Fund | 1.06% |
Penn Capital Opportunistic High Income Fund | 0.72% |
Penn Capital Short Duration High Income Fund | 0.54% |
Penn Capital Special Situations Small Cap Equity Fund | 1.09% |
Any waived or reimbursed expenses by the Advisor to the Funds excluding any waivers related to acquired fund fees and expenses incurred by the Funds as a result of its investments in other investment companies managed by the Advisor, are subject to repayment by a Fund in the three years following the date the fees were waived or the expenses were paid, provided that the respective Fund is able to make the repayment without exceeding the Fund’s expense limitation in place when the fees were waived or expenses paid. The Advisor’s waived fees and paid expenses that are subject to potential recoupment are as follows:
Fiscal Period Incurred | Amount | Amount | Amount | Year of | ||||||||||||
Penn Capital Floating Rate Income Fund | ||||||||||||||||
June 30, 2020 | $ | 308,125 | $ | — | $ | 308,125 | 2023 | |||||||||
June 30, 2021 | 291,062 | — | 291,062 | 2024 | ||||||||||||
August 31, 2021(1) | 27,409 | — | 27,409 | 2024 | ||||||||||||
August 31, 2022 | 150,091 | — | 150,091 | 2025 | ||||||||||||
Total | $ | 776,687 | $ | — | $ | 776,687 | ||||||||||
Penn Capital Mid Cap Core Fund | ||||||||||||||||
June 30, 2020 | $ | 169,526 | $ | — | $ | 169,526 | 2023 | |||||||||
June 30, 2021 | 198,611 | — | 198,611 | 2024 | ||||||||||||
August 31, 2021(1) | 20,634 | — | 20,634 | 2024 | ||||||||||||
August 31, 2022 | 72,939 | — | 72,939 | 2025 | ||||||||||||
Total | $ | 461,710 | $ | — | $ | 461,710 | ||||||||||
Penn Capital Opportunistic High Income Fund | ||||||||||||||||
June 30, 2020 | $ | 241,623 | (2) | $ | — | $ | 221,552 | 2023 | ||||||||
June 30, 2021 | 256,142 | (2) | — | 253,063 | 2024 | |||||||||||
August 31, 2021(1) | 30,361 | — | 30,361 | 2024 | ||||||||||||
August 31, 2022 | 133,924 | (2) | — | 126,522 | 2025 | |||||||||||
Total | $ | 662,050 | $ | — | $ | 631,498 | ||||||||||
49
THE RBB FUND TRUST (FORMERLY, PENN CAPITAL FUNDS TRUST)
NOTES TO THE FINANCIAL STATEMENTS
AUGUST 31, 2022
Fiscal Period Incurred | Amount | Amount | Amount | Year of | ||||||||||||
Penn Capital Short Duration High Income Fund | ||||||||||||||||
June 30, 2020 | $ | 258,497 | (2) | $ | — | $ | 251,625 | 2023 | ||||||||
June 30, 2021 | 271,231 | (2) | — | 265,384 | 2024 | |||||||||||
August 31, 2021(1) | 33,215 | (2) | — | 31,724 | 2024 | |||||||||||
August 31, 2022 | 133,986 | (2) | — | 118,474 | 2025 | |||||||||||
Total | $ | 696,929 | $ | — | $ | 667,207 | ||||||||||
Penn Capital Special Situations Small Cap Equity Fund | ||||||||||||||||
June 30, 2020 | $ | 175,626 | $ | — | $ | 175,626 | 2023 | |||||||||
June 30, 2021 | 222,981 | — | 222,981 | 2024 | ||||||||||||
August 31, 2021(1) | 17,080 | — | 17,080 | 2024 | ||||||||||||
August 31, 2022 | 80,812 | — | 80,812 | 2025 | ||||||||||||
Total | $ | 496,499 | $ | — | $ | 496,499 | ||||||||||
(1) | Period from July 1, 2021 through August 31, 2021. |
(2) | Includes fees waived that are not subject to potential recoupment. |
Distribution Agreement
Foreside Fund Services, LLC is the Trust’s distributor and principal underwriter (the “Distributor”).
Agreements with the Administrator, Transfer Agent, and Custodian
U.S. Bancorp Fund Services, LLC (“Fund Services”), doing business as U.S. Bank Global Fund Services, serves as the Funds’ administrator. For providing administrative and accounting services, Fund Services is entitled to receive a monthly fee, subject to certain minimum and out of pocket expenses.
Fund Services serves as the Funds’ transfer and dividend disbursing agent. For providing transfer agent services, Fund Services is entitled to receive a monthly fee, subject to certain minimum and out of pocket expenses.
U.S. Bank, N.A. (the “Custodian”) provides certain custodial services to the Funds. The Custodian is entitled to receive a monthly fee, subject to certain minimum and out of pocket expenses.
Shareholder Servicing Plan
The Trust has adopted a Shareholder Servicing Plan on behalf of each Fund’s Institutional Class. Under the plan, each Class can pay for non-distribution related shareholder support services (‘‘service fees’’) in an amount up to 0.15% of its average daily net assets. The amount actually incurred by the Institutional Class shares for fiscal period on an annualized basis was 0.03% for the Penn Capital Floating Rate Income Fund, 0.00% for the Penn Capital Mid Cap Core Fund, 0.01% for the Penn Capital Opportunistic High Income Fund, 0.02% for the Penn Capital Short Duration High Income Fund and 0.03% for the Penn Capital Special Situations Small Cap Equity Fund.
Other Related Party Transactions
The Advisor and its affiliates have made investments in the Funds and accordingly, as shareholders of the Funds, pay a proportionate share of the Funds’ investment advisory fees and other expenses identified in the Funds’ Prospectus.
50
THE RBB FUND TRUST (FORMERLY, PENN CAPITAL FUNDS TRUST)
NOTES TO THE FINANCIAL STATEMENTS
AUGUST 31, 2022
4. Federal Tax Information
It is each Fund’s intention to continue to qualify as a regulated investment company under Subchapter M of the Internal Revenue Code and distribute all of its taxable income. Accordingly, no provision for federal income taxes is required in the financial statements.
The amount and character of income and capital gain distributions to be paid, if any, are determined in accordance with federal income tax regulations, which may differ from GAAP. These differences are primarily due to differences in the timing of recognition of gains or losses on investments. Permanent book and tax basis differences, if any, may result in reclassifications to distributable earnings and additional paid-in capital.
The following information is provided on a tax basis as of August 31, 2022:
Penn Capital | Penn Capital | Penn Capital | Penn Capital | Penn Capital | ||||||||||||||||
Cost of investments | $ | 32,996,687 | $ | 19,726,802 | $ | 15,201,404 | $ | 10,372,192 | $ | 35,164,630 | ||||||||||
Gross unrealized appreciation | 65,329 | 22,023 | 2,729,733 | 3,024,679 | 12,730 | |||||||||||||||
Gross unrealized (depreciation) | (1,204,322 | ) | (2,009,066 | ) | (1,304,451 | ) | (674,617 | ) | (1,691,405 | ) | ||||||||||
Net unrealized appreciation (depreciation) | (1,138,993 | ) | (1,987,043 | ) | 1,425,282 | 2,350,062 | (1,678,675 | ) | ||||||||||||
Undistributed ordinary income | 77,740 | 21,557 | — | 15,705 | 27,854 | |||||||||||||||
Undistributed long-term capital gains | — | — | 277,730 | 45,435 | — | |||||||||||||||
Total distributable earnings | 77,740 | 21,557 | 277,730 | 61,140 | 27,854 | |||||||||||||||
Other accumulated losses | (3,544,531 | ) | (1,073,446 | ) | — | (39,067 | ) | (1,954,591 | ) | |||||||||||
Total accumulated earnings (losses) | $ | (4,605,784 | ) | $ | (3,038,932 | ) | $ | 1,703,012 | $ | 2,372,135 | $ | (3,605,412 | ) | |||||||
Net investment income and net realized gains and losses for federal income tax purposes may differ from that reported on the financial statements because of permanent book-to-tax differences. GAAP requires that permanent differences between financial reporting and tax reporting be reclassified between various components of net assets.
These differences are primarily due to net operating losses. On the Statement of Assets and Liabilities, the following adjustments were made:
Distributable | Paid-In Capital | |||||||
Penn Capital Floating Rate Income Fund | $ | 1 | $ | (1 | ) | |||
Penn Capital Special Situations Small Cap Equity Fund | 56,705 | (56,705 | ) | |||||
51
THE RBB FUND TRUST (FORMERLY, PENN CAPITAL FUNDS TRUST)
NOTES TO THE FINANCIAL STATEMENTS
AUGUST 31, 2022
The Funds intend to utilize capital loss carryforwards to offset future realized gains. Capital loss carryforwards available for federal income tax purposes are as follows:
Capital Loss | Short-Term | Long-Term | ||||||||||
Penn Capital Floating Rate Income Fund | unlimited | $ | 2,219,186 | $ | 1,256,625 | |||||||
Penn Capital Opportunistic High Income Fund | unlimited | 664,563 | 389,898 | |||||||||
Penn Capital Short Duration High Income Fund | unlimited | 1,941,966 | — | |||||||||
A regulated investment company may elect for any taxable year to treat any portion of the qualified late year loss as arising on the first day of the next taxable year. Qualified late year losses are certain capital and ordinary losses which occur during the portion of the taxable year subsequent to October 31 and December 31, respectively. For the fiscal period ended August 31, 2022, the Penn Capital Mid Cap Core Fund deferred Post October losses of $39,067.
The character of distributions for tax purposes paid during the fiscal period ended August 31, 2022, is as follows:
Ordinary | Long-Term | |||||||
Penn Capital Floating Rate Income Fund | $ | 1,186,709 | $ | — | ||||
Penn Capital Opportunistic High Income Fund | 943,646 | — | ||||||
Penn Capital Short Duration High Income Fund | 1,192,175 | — | ||||||
Penn Capital Mid Cap Core Fund | 162,152 | 1,840,497 | ||||||
Penn Capital Special Situations Small Cap Equity Fund | 1,940,765 | 1,412,060 | ||||||
The character of distributions for tax purposes paid during the fiscal year ended August 31, 2021, is as follows:
Ordinary | Long-Term | |||||||
Penn Capital Floating Rate Income Fund | $ | 162,263 | $ | — | ||||
Penn Capital Opportunistic High Income Fund | 156,147 | — | ||||||
Penn Capital Short Duration High Income Fund | 213,906 | — | ||||||
The character of distributions for tax purposes paid during the fiscal year ended June 30, 2021, is as follows:
Ordinary | Long-Term | |||||||
Penn Capital Floating Rate Income Fund | $ | 1,132,139 | $ | — | ||||
Penn Capital Mid Cap Core Fund | 1,241 | — | ||||||
Penn Capital Opportunistic High Income Fund | 1,055,682 | — | ||||||
Penn Capital Short Duration High Income Fund | 1,641,797 | — | ||||||
52
THE RBB FUND TRUST (FORMERLY, PENN CAPITAL FUNDS TRUST)
NOTES TO THE FINANCIAL STATEMENTS
AUGUST 31, 2022
5. Trustee and Officer Compensation
The Trustees of the Company receive an annual retainer and meeting fees for meetings attended. An employee of Vigilant Compliance, LLC serves as Chief Compliance Officer of the Company and served as President of the Company until August 2022. Vigilant Compliance, LLC is compensated for the services provided to the Company. Employees of the Trust serve as President, Chief Financial Officer, Chief Operating Officer, Secretary and Director of Marketing & Business Development of the Company. They are compensated for services provided. Certain employees of U.S. Bancorp Fund Services, LLC serve as officers of the Trust. They are not compensated by the Funds or the Trust. For Trustee and Officer compensation amounts, please refer to the Statement of Operations.
6. Investment Transactions
During the current fiscal period, the aggregate cost of security purchases and the proceeds from security sales, other than short-term investments, were as follows:
Non-U.S. Government | U.S. Government | |||||||||||||||
Purchases | Sales | Purchases | Sales | |||||||||||||
Penn Capital Floating Rate Income Fund | $ | 17,466,385 | $ | 14,992,760 | $ | — | $ | — | ||||||||
Penn Capital Mid Cap Core Fund | 6,239,688 | 9,589,991 | — | — | ||||||||||||
Penn Capital Opportunistic High Income Fund | 15,573,332 | 13,260,698 | — | — | ||||||||||||
Penn Capital Short Duration High Income Fund | 20,631,709 | 26,548,650 | — | — | ||||||||||||
Penn Capital Special Situations Small Cap Equity Fund | 16,141,538 | 14,155,420 | — | — | ||||||||||||
7. Capital Share Transactions
Penn Capital | Penn Capital | Penn Capital | Penn Capital | Penn Capital | ||||||||||||||||
Institutional Class Shares | ||||||||||||||||||||
Shares sold | 365,625 | 23,407 | 223,358 | 291,558 | 365,338 | |||||||||||||||
Shares issued in reinvestment of dividends | 76,570 | 103,654 | 81,510 | 112,883 | 172,318 | |||||||||||||||
Shares redeemed | (287,736 | ) | (229,458 | ) | (89,599 | ) | (1,208,629 | ) | (180,614 | ) | ||||||||||
Net increase (decrease) | 154,459 | (102,397 | ) | 215,269 | (804,188 | ) | 357,042 | |||||||||||||
53
THE RBB FUND TRUST (FORMERLY, PENN CAPITAL FUNDS TRUST)
NOTES TO THE FINANCIAL STATEMENTS
AUGUST 31, 2022
8. Transactions with Affiliates
The following issuers are affiliated with the Funds; that is, the Adviser had control of 5% or more of the outstanding voting securities during the period from September 1, 2021 through August 31, 2022. As defined in Section (2)(a)(3) of the Investment Company Act of 1940; such issuers are:
September 1, 2021 | Additions | Reductions | ||||||||||||||||||||||
Issuer Name | Share | Cost | Share | Cost | Share | Cost | ||||||||||||||||||
Penn Capital Opportunistic High Income Fund | ||||||||||||||||||||||||
Penn Capital Floating Rate Income Fund | — | $ | — | 158,977 | $ | 1,539,143 | — | $ | — | |||||||||||||||
| $ | — | $ | 1,539,143 | $ | — | |||||||||||||||||||
Penn Capital Short Duration High Income Fund | ||||||||||||||||||||||||
Penn Capital Floating Rate Income Fund | 176,071 | $ | 1,732,173 | 101,588 | $ | 981,887 | — | $ | — | |||||||||||||||
| $ | 1,732,173 | $ | 981,887 | $ | — | |||||||||||||||||||
August 31, 2022 | August 31, 2022 | |||||||||||||||||||||||||||
Issuer Name | Share | Dividend | Capital Gain | Unrealized | Realized | Value | Cost | |||||||||||||||||||||
Penn Capital Opportunistic High Income Fund | ||||||||||||||||||||||||||||
Penn Capital Floating Rate Income Fund | 158,977 | $ | 47,283 | $ | — | $ | (78,147 | ) | $ | — | $ | 1,460,996 | $ | 1,539,143 | ||||||||||||||
| $ | 47,283 | $ | — | $ | (78,147 | ) | $ | — | $ | 1,460,996 | $ | 1,539,143 | ||||||||||||||||
Penn Capital Short Duration High Income Fund | ||||||||||||||||||||||||||||
Penn Capital Floating Rate Income Fund | 277,659 | $ | 91,637 | $ | — | $ | (134,564 | ) | $ | — | $ | 2,551,689 | $ | 2,714,060 | ||||||||||||||
| $ | 91,637 | $ | — | $ | (134,564 | ) | $ | — | $ | 2,551,689 | $ | 2,714,060 | ||||||||||||||||
9. Credit Risk, LIBOR and Asset Concentration
Small- and mid-capitalization companies may not have the size, resources and other assets of large capitalization companies. As a result, the securities of small- and mid-capitalization companies may be subject to greater market risks and fluctuations in value than large capitalization companies or may not correspond to changes in the stock market in general. In addition, small- and mid-capitalization companies may be particularly affected by interest rate increases, as they may find it more difficult to borrow money to continue or expand operations, or may have difficulty in repaying any loans.
54
THE RBB FUND TRUST (FORMERLY, PENN CAPITAL FUNDS TRUST)
NOTES TO THE FINANCIAL STATEMENTS
AUGUST 31, 2022
High yield securities and unrated securities of similar credit quality have speculative characteristics and involve greater volatility of price and yield, greater of liquidity risk, and generally reflect a greater possibility of an adverse change in financial condition that could affect an issuer’s ability to honor its obligations.
There are a number of risks associated with an investment in bank loans, including credit risk, interest rate risk, liquidity risk and prepayment risk. Lack of an active trading market, restrictions on resale, irregular trading activity, wide bid/ask spreads and extended trade settlement periods may impair the Fund’s ability to sell bank loans within its desired time frame or at an acceptable price and its ability to accurately value existing and prospective investments. Extended trade settlement periods may result in cash not being immediately available to the Fund. As a result of such illiquidity, the Fund may have to sell other investments or engage in borrowing transactions to raise cash to meet its obligations.
A Fund may invest in certain instruments that rely in some fashion upon London Interbank Offered Rate (“LIBOR”). LIBOR is an average interest rate, determined by the ICE Benchmark Administration, that banks charge one another for the use of short-term money. The United Kingdom’s Financial Conduct Authority, which regulates LIBOR, announced plans to phase out the use of LIBOR by the end of 2021. The FCA and ICE Benchmark Administrator have since announced that most LIBOR settings will no longer be published after December 31, 2021 and a majority of U.S. dollar LIBOR settings will cease publication after June 30, 2023. The U.S. Federal Reserve, based on the recommendations of the New York Federal Reserve’s Alternative Reference Rate Committee (comprised of major derivative market participants and their regulators), has begun publishing SOFR that is intended to replace U.S. dollar LIBOR. Proposals for alternative reference rates for other currencies have also been announced or have already begun publication. Uncertainty related to the liquidity impact of the change in rates, and how to appropriately adjust these rates at the time of transition, poses risks for the Funds. The effect of any changes to, or discontinuation of, LIBOR on the Funds will depend on, among other things, (1) existing fallback or termination provisions in individual contracts and (2) whether, how, and when industry participants develop and adopt new reference rates and fallbacks for both legacy and new instruments and contracts. The expected discontinuation of LIBOR could have a significant impact on the financial markets in general and may also present heightened risk to market participants, including public companies, investment advisers, investment companies, and broker-dealers. The risks associated with this discontinuation and transition will be exacerbated if the work necessary to effect an orderly transition to an alternative reference rate is not completed in a timely manner. Accordingly, it is difficult to predict the full impact of the transition away from LIBOR on the Funds until new reference rates and fallbacks for both legacy and new instruments and contracts are commercially accepted and market practices become settled.
10. Line of Credit
The Funds have a $10,000,000 uncommitted, unsecured, umbrella 364-day line of credit, for temporary purposes, including to meet redemption requests. The interest rate as of August 31, 2022 was 5.5%. During the current fiscal period, the Penn Capital Floating Rate Income Fund and the Penn Capital Opportunistic High Income Fund did not use the credit line.
During the current fiscal period, line of credit activity for the Penn Capital Mid Cap Core Fund, the Penn Capital Special Situations Small Cap Equity Fund, and the Penn Capital Short Duration High Income Fund was as follows:
Fund | Average | Amount | Interest | Maximum | ||||||||||||
Penn Capital Mid Cap Core Fund | $ | 3,652 | $ | — | $ | 171 | $ | 1,163,000 | ||||||||
Penn Capital Special Situations Small Cap Equity Fund | $ | 3,816 | $ | — | $ | 133 | $ | 368,000 | ||||||||
Penn Capital Short Duration High Income Fund | $ | 466 | $ | — | $ | 15 | $ | 170,000 | ||||||||
11. Recent Accounting Pronouncements and Regulatory Updates
In October 2020, the Securities and Exchange Commission (“SEC”) adopted new regulations governing the use of derivatives by registered investment companies (“Rule 18f-4”). Rule 18f-4 imposes limits on the amount of derivatives a Fund can enter into, eliminates the asset segregation framework previously used by funds to comply with Section 18 of the 1940 Act, and requires funds whose use of derivatives is greater than a limited specified amount to establish and maintain a comprehensive derivatives risk management program
55
THE RBB FUND TRUST (FORMERLY, PENN CAPITAL FUNDS TRUST)
NOTES TO THE FINANCIAL STATEMENTS
AUGUST 31, 2022
and appoint a derivatives risk manager. The Funds are required to comply with Rule 18f-4 and have adopted procedures for investing in derivatives and other transactions in compliance with Rule 18f-4. Rule 18f-4 may require the Funds to observe more stringent requirements than were previously imposed by the 1940 Act, which could adversely affect the ability of the Funds to engage in certain derivatives transactions and/or increase the costs of such derivatives transactions, which could adversely affect the Funds’ performance and increase costs related to the Funds’ use of derivatives.
In December 2020, the Securities and Exchange Commission (“SEC”) adopted a new rule providing a framework for fund valuation practices (“Rule 2a-5”). Rule 2a-5 establishes requirements for determining fair value in good faith for purposes of the 1940 Act. Rule 2a-5 will permit fund boards to designate certain parties to perform fair value determinations, subject to board oversight and certain other conditions. Rule 2a-5 also defines when market quotations are “readily available” for purposes of the 1940 Act and the threshold for determining whether a fund must fair value a security. In connection with Rule 2a-5, the SEC also adopted related recordkeeping requirements and is rescinding previously issued guidance, including with respect to the role of a board in determining fair value and the accounting and auditing of fund investments. The Funds will be required to comply with the rules by September 8, 2022. Effective September 8, 2022 and pursuant to the requirements of Rule 2a-5, the Board designated the Adviser as its valuation designee to perform fair value determinations and approved new valuation procedures for the Funds.
12. Concentration Risks
The Advisor and its employees collectively have beneficial ownership, either directly or indirectly, of more than 20% of each of the Funds as of August 31, 2022. In addition to the Advisor, one or more individual investors own more than 10% of the Penn Capital Special Situations Small Cap Equity Fund and the Penn Capital Mid Cap Core Fund as of August 31, 2022. To the extent multiple investors in the Funds rely on the advice of a common investment advisor the Funds may have the risk of a concentrated investor base.
13. COVID-19
The global outbreak of COVID-19 (commonly referred to as “coronavirus”) has disrupted economic markets and the prolonged economic impact is uncertain. Although vaccines for COVID-19 are available, the ultimate economic fallout from the pandemic, and the long-term impact on economies, markets, industries and individual issuers, are not known. The operational and financial performance of the issuers of securities in which the Funds invest depends on future developments, including the duration and spread of the outbreak and the pace of recovery which may vary from market to market, and such uncertainty may in turn adversely affect the value and liquidity of the Funds’ investments, impair the Funds’ ability to satisfy redemption requests, and negatively impact the Funds’ performance.
14. Ukraine-Russia Conflict Risk
In February 2022, Russia commenced a military attack on Ukraine. The outbreak of hostilities between the two countries and the threat of wider-spread hostilities could have a severe adverse effect on the region and global economies, including significant negative impacts on the markets for certain securities and commodities, such as oil and natural gas. In addition, sanctions imposed on Russia by the United States and other countries, and any sanctions imposed in the future, could have a significant adverse impact on the Russian economy and related markets. The price and liquidity of investments may fluctuate widely as a result of the conflict and related events. How long the armed conflict and related events will last cannot be predicted. These tensions and any related events could have a significant impact on Fund performance and the value of Fund investments, even beyond any direct exposure the Funds may have to issuers located in these countries.
56
THE RBB FUND TRUST (FORMERLY, PENN CAPITAL FUNDS TRUST)
NOTES TO THE FINANCIAL STATEMENTS
AUGUST 31, 2022
15. Unfunded Commitments
The Funds may enter into unfunded loan commitments. Unfunded loan commitments may be partially or wholly funded. During the contractual period, the Funds are obliged to provide funding to the borrower upon demand. Unfunded loan commitments are fair valued in accordance with the valuation policy described in Note 2(a) and unrealized appreciation or depreciation, if any, is recorded on the Statements of Assets and Liabilities. As of August 31, 2022, the total unfunded amount was 5.6% of the Penn Capital Floating Rate Income Fund’s net assets.
As of the end of the reporting period, the Penn Capital Floating Rate Income Fund had the following unfunded loan commitments outstanding:
Loan | Principal | Cost | Value | Unrealized | ||||||||||||
AVIENT CORPORATION T/L B (07/22) | $ | 250,000 | $ | 242,519 | $ | 248,750 | $ | 6,231 | ||||||||
CHOBANI (10/20) T/L | 100,000 | 92,519 | 95,813 | 3,294 | ||||||||||||
II-VI T/L B (11/21) | 300,000 | 290,269 | 293,124 | 2,855 | ||||||||||||
KEANE GROUP T/L | 130,000 | 129,838 | 126,263 | (3,575 | ) | |||||||||||
LBM T/L B | 38,889 | 38,519 | 35,401 | (3,118 | ) | |||||||||||
NAVICURE T/L B (9/19) | 200,000 | 197,519 | 195,416 | (2,103 | ) | |||||||||||
SABRE GLBL T/L 8/22 | 250,000 | 244,394 | 240,625 | (3,769 | ) | |||||||||||
16. Subsequent Events
Management has evaluated the impact of all subsequent events on the Funds through the date the financial statements were issued and has determined that there were no significant events requiring recognition or disclosure in the financial statements.
57
THE RBB FUND TRUST (FORMERLY, PENN CAPITAL FUNDS TRUST)
Additional Information
AUGUST 31, 2022 (UNAUDITED)
Shareholder Notification of Federal Tax Status
For the fiscal period ended August 31, 2022, certain dividends paid by the Funds may be reported as qualified dividend income and may be eligible for taxation at capital gain rates. The percentage of dividends declared from ordinary income designated as qualified dividend income was as follows:
Penn Capital Floating Rate Income Fund | 0.00% |
Penn Capital Mid Cap Core Fund. | 57.66% |
Penn Capital Opportunistic High Income Fund | 0.00% |
Penn Capital Short Duration High Income Fund | 0.00% |
Penn Capital Special Situations Small Cap Equity Fund | 39.93% |
For corporate shareholders, the percentage of ordinary income distributions qualifying for the corporate dividends received deduction for the fiscal period ended August 31, 2022 was as follows:
Penn Capital Floating Rate Income Fund | 0.00% |
Penn Capital Mid Cap Core Fund | 55.83% |
Penn Capital Opportunistic High Income Fund | 0.00% |
Penn Capital Short Duration High Income Fund | 0.00% |
Penn Capital Special Situations Small Cap Equity Fund. | 31.66% |
The percentage of taxable ordinary income distributions designated as short-term capital gain distributions under Internal Revenue Section 871(k)(2)(c) for the fiscal period ended August 31, 2022 was as follows:
Penn Capital Floating Rate Income Fund | 0.00% |
Penn Capital Mid Cap Core Fund | 62.65% |
Penn Capital Opportunistic High Income Fund | 0.00% |
Penn Capital Short Duration High Income Fund | 0.00% |
Penn Capital Special Situations Small Cap Equity Fund. | 100.00% |
Proxy Voting Policies
A description of the policies and procedures that each Fund uses to determine how to vote proxies relating to portfolio securities owned by that Fund is available: (1) without charge, upon request, by calling 844-302-7366; (2) in the Statement of Additional Information on the Trust’s website www.penncapitalfunds.com; and (3) on the SEC’s website at www.sec.gov. Information about how the Funds voted proxies relating to portfolio securities during the most recent 12 month period ended June 30, 2021 may be obtained (1) without charge, upon request, by calling 844-302-7366 and (2) on the SEC’s website at www.sec.gov.
Form N-PORT
Each Fund will file its complete schedule of portfolio holdings with the SEC for the first and third quarters of each fiscal year on Part F of Form N-PORT. The Funds’ Part F of Form N-PORT will be available on the EDGAR database on the SEC’s website at www.sec.gov.
Householding
In an effort to decrease costs, the Funds intend to reduce the number of duplicate prospectuses, annual and semi-annual reports, proxy statements and other similar documents you receive by sending only one copy of each to those addresses shared by two or more accounts and to shareholders that the transfer agent reasonably believes are from the same family or household. Once implemented, if you would like to discontinue householding for your accounts, please call (844) 302-7366 to request individual copies of these documents. The transfer agent will begin sending individual copies thirty days after receiving your request to stop householding. This policy does not apply to account statements.
58
THE RBB FUND TRUST (FORMERLY, PENN CAPITAL FUNDS TRUST)
Additional Information
AUGUST 31, 2022 (UNAUDITED)
Approval of Investment Advisory Agreement
As required by the 1940 Act, the Board, including all of the Trustees who are not “interested persons” of the Trust, as that term is defined in the 1940 Act (the “Independent Trustees”), considered the renewal of the investment advisory agreement between Penn Capital and the Trust (the “Investment Advisory Agreement”) on behalf of the Penn Capital Floating Rate Income Fund, Penn Capital Short Duration High Income Fund, Penn Capital Opportunistic High Income Fund, Penn Capital Mid Cap Core Fund, and Penn Capital Special Situations Small Cap Equity Fund, (for this section only, each a “Fund” and collectively the “Funds”), at a meeting of the Board held on May 11-12, 2022 (the “Meeting”). At the Meeting, the Board, including all of the Independent Trustees, approved the Investment Advisory Agreement for an additional one-year term. The Board’s decision to approve the Investment Advisory Agreement reflects the exercise of its business judgment to continue the existing arrangement. In approving the Investment Advisory Agreement, the Board considered information provided by Penn Capital with the assistance and advice of counsel to the Independent Trustees and the Trust.
In considering the renewal and approval of the Investment Advisory Agreement between the Trust and Penn Capital, with respect to the Funds, the Trustees took into account all the materials provided prior to and during the Meeting and at other meetings throughout the past year, the presentations made during the Meeting, and the discussions held during the Meeting. Among other things, the Trustees considered (i) the nature, extent, and quality of Penn Capital’s services provided to the Funds; (ii) descriptions of the experience and qualifications of Penn Capital personnel providing those services; (iii) Penn Capital’s investment philosophies and processes; (iv) Penn Capital’s assets under management and client descriptions; (v) Penn Capital’s soft dollar commission and trade allocation policies, including information on the types of research and services obtained in connection with soft dollar commissions; (vi) Penn Capital’s current advisory fee arrangements with the Trust and other similarly managed clients; (vii) Penn Capital’s compliance procedures; (viii) Penn Capital’s financial information, insurance coverage and profitability analysis related to providing advisory services to the Funds; (ix) the extent to which economies of scale are relevant to the Funds; (x) report prepared by Broadridge/Lipper comparing each Fund’s management fees and total expense ratio to those each Fund’s respective Lipper Group and comparing the performance of each Fund to the performance of each Fund’s respective Lipper Group; and (xi) a report comparing the performance of each Fund to the performance of its benchmark.
As part of their review, the Trustees considered the nature, extent and quality of the services provided by Penn Capital. The Trustees concluded that Penn Capital had substantial resources to provide services to the Funds and that Penn Capital’s services had been acceptable.
The Trustees also considered the investment performance of the Funds. Information on the Funds’ investment performance was provided for the one-, three-, five-, and since inception periods ended March 31, 2022, as applicable. The Trustees considered the Funds’ investment performance in light of their investment objectives and investment strategies. The Trustees concluded that the investment performance of each of the Funds as compared to their respective benchmarks and Lipper Groups was acceptable.
In reaching this conclusion, the Trustees noted that the Penn Capital Floating Rate Income Fund underperformed its benchmark (S&P/LSTA BB Loan Index) for the year-to-date, one-year, three-year, five-year, and since-inception periods ended March 31, 2022. The Trustees also noted that the Penn Capital Floating Rate Income Fund ranked in the 5th quintile in its Lipper Performance Group for the one-year, two-year, three-year, four-year and five-year periods ended December 31, 2021.
The Trustees noted that the Penn Capital Short Duration High Income Fund outperformed its primary benchmark (ICE BofAML 1-3 Year BB-Rated US Cash Pay High Yield Index) for the year-to-date and one-year periods ended March 31, 2022, and underperformed its benchmark for the three-year and since-inception periods ended March 31, 2022. The Trustees noted that the Penn Capital Short Duration High Income Fund’s performance ranked in the 3rd quintile in its Lipper Performance Group for the one-year period ended December 31, 2021, and ranked in the 5th quintile for the two-year, three-year, and since-inception periods ended December 31, 2021.
The Trustees noted that the Penn Capital Opportunistic High Income Fund outperformed its primary benchmark (ICE BofAML High Yield Constrained Index) for the year-to-date and one-year periods ended March 31, 2022, and underperformed its benchmark for the three-year, five-year, and since-inception periods ended March 31, 2022. The Trustees noted that the Penn Capital Opportunistic High Income Fund’s performance ranked in the 2nd quintile in its Lipper Performance Group for the one-year and four-year periods ended December 31, 2021, and ranked in the 3rd quintile for the two-year period ended December 31, 2021.
59
THE RBB FUND TRUST (FORMERLY, PENN CAPITAL FUNDS TRUST)
Additional Information
AUGUST 31, 2022 (UNAUDITED)
Next, the Trustees also reviewed the performance of the Penn Capital Mid Cap Core Fund, noting that the Fund had outperformed its benchmark (Russell 2500 Index) for the year-to-date and one-year periods ended March 31, 2022, and underperformed its benchmark for the three-year, five-year, and since-inception periods ended March 31, 2022.. The Trustees noted that the Penn Capital Mid Cap Core Fund ranked in the 2nd quintile in its Lipper Performance Group for the four-year and five-year periods ended December 31, 2021, and ranked in the 4th quintile for the two-year and three-year periods ended December 31, 2021.
Finally, the Trustees reviewed the performance of the Penn Capital Special Situations Small Cap Equity Fund, which outperformed its benchmark (Russell 2000 Index) for the year-to-date, one-year, three-year, five-year, and since-inception periods ended March 31, 2022. The Trustees noted that the Penn Capital Special Situations Small Cap Equity Fund ranked in the 1st quintile in its Lipper Performance Group for the one-year, two-year, three-year, four-year, and five-year periods ended December 31, 2021.
The Board also considered the advisory fee rates payable by the Funds under the Investment Advisory Agreement. In this regard, information on the fees paid by the Funds and the Funds’ total operating expense ratios (before and after fee waivers and expense reimbursements) were compared to similar information for mutual funds advised by other, unaffiliated investment advisory firms. The Trustees noted that Penn Capital had contractually agreed to waive management fees and reimburse expenses through at least April 1, 2023 for the Funds to limit total annual operating expenses to agreed upon levels for each Fund.
The Trustees noted that the Penn Capital Floating Rate Income Fund’s actual advisor fees ranked in the 1st quintile of its Lipper Expense Group, and that the total expenses of the Fund ranked in the 2nd quintile of its Lipper Expense Group.
The Trustees noted that the Penn Capital Short Duration High Income Fund’s actual advisor fees and total expenses ranked in the 1st quintile of its Lipper Expense Group.
The Trustees noted that the Penn Capital Opportunistic High Income Fund’s actual advisor fees ranked in the 1st quintile of its Lipper Expense Group, and that the total expenses of the Fund ranked in the 2nd quintile of its Lipper Expense Group.
The Trustees noted that the Penn Capital Mid Cap Core Fund’s actual advisor fees ranked in the 1st quintile of its Lipper Expense Group, and that the total expenses of the Fund ranked in the 5th quintile of its Lipper Expense Group.
The Trustees noted that the Penn Capital Special Situations Small Cap Equity Fund’s actual advisor fees ranked in the 1st quintile of its Lipper Expense Group, and that the total expenses of the Fund ranked in the 5th quintile of its Lipper Expense Group.
After reviewing the information regarding the Funds’ costs, profitability and economies of scale, and after considering Penn Capital’s services, the Trustees concluded that the investment advisory fees paid by the Funds were fair and reasonable and that the Investment Advisory Agreement should be approved and continued for an additional one-year period ending August 16, 2023.
Liquidity Risk Management Program
The Trust has adopted and implemented a Liquidity Risk Management Program (the “Trust Program”) as required by rule 22e-4 under the 1940 Act. In accordance with the Trust Program, the Adviser has adopted and implemented a liquidity risk management program (the “Adviser Program” and together with the Trust Program, the “Programs”) on behalf of the Funds. The Programs seek to assess, manage and review each Fund’s Liquidity Risk. “Liquidity Risk” is defined as the risk that a Fund could not meet requests to redeem shares issued by the Fund without significant dilution of remaining investors’ interest in the Fund.
The Board has appointed Vigilant Compliance, LLC (“Vigilant”) as the program administrator for the Trust Program and Liquidity Risk Management Committee of the Adviser as the program administrator for the Adviser Program. The process of monitoring and determining the liquidity of each Fund’s investments is supported by one or more third-party vendors.
At meetings held during the current fiscal period, the Board and its Regulatory Oversight Committee received and reviewed a written report (the “Report”) of Vigilant and the Adviser concerning the operation of the Programs for the period from October 1, 2021 to December 31, 2021 (the “Period”). The Report summarized the operation of the Programs and the information and factors considered by Vigilant and the Adviser in reviewing the adequacy and effectiveness of the implementation of the Programs with respect to each Fund. Such information and factors included, among other things: (i) the methodology used to classify the liquidity of each Fund’s portfolio investments and the Adviser’s assessment that each Fund’s strategy remained appropriate for an open-end mutual fund; (ii) analyses of each Fund’s trading environment and reasonably anticipated trading size; (iii) that each Fund (excluding Penn Capital Floating Rate Income Fund) held primarily highly liquid assets (investments that the Fund anticipates can
60
THE RBB FUND TRUST (FORMERLY, PENN CAPITAL FUNDS TRUST)
Additional Information
AUGUST 31, 2022 (UNAUDITED)
be converted to cash within 3 business days or less in current market conditions without significantly changing their market value); (iv) that the Funds (excluding Penn Capital Defensive Floating Rate Fund) did not require the establishment of a highly liquid investment minimum and the methodology for that determination; (v) the Penn Capital Defensive Floating Rate Fund complied with its designated highly liquid investment minimum; (vi) confirmation that the Funds did not breach the 15% maximum illiquid security threshold (investments that cannot be sold or disposed of in seven days or less in current market conditions without the sale of the investment significantly changing the market value of the investment) during the Period and the procedures for monitoring compliance with the limit; (vii) that the processes, technologies and third-party vendors used to assess, manage, and/or periodically review each Fund’s Liquidity Risk functioned appropriately during the Period; and (viii) that the Programs operated adequately during the Period. The Report also indicated that there were no material changes made to the Programs during the Period.
Based on the review, the Report concluded that the Programs were being implemented effectively and reasonably designed to assess and manage Liquidity Risk in each Fund’s portfolio.
There can be no assurance that the Trust Program or the Adviser Program will achieve its objectives under all circumstances in the future.
Please refer to the Funds’ prospectus for more information regarding a Fund’s exposure to liquidity risk and other risks to which it may be subject.
61
THE RBB FUND TRUST (FORMERLY, PENN CAPITAL FUNDS TRUST)
Report of Independent Registered Public Accounting Firm
To the Shareholders and Trustees of
RBB Fund Trust
Opinion on the Financial Statements
We have audited the accompanying statements of assets and liabilities of the Penn Capital Floating Rate Income Fund, the Penn Capital Mid Cap Core Fund, the Penn Capital Opportunistic High Income Fund, the Penn Capital Short Duration High Income Fund, and the Penn Capital Special Situations Small Cap Equity Fund (the “Funds”), each a series of RBB Fund Trust (the “Trust”) (formerly Penn Capital Funds Trust), including the schedules of investments, as of August 31, 2022, the related statements of operations, the statements of changes in net assets, and financial highlights for the year then ended, for the two month period ended August 31, 2021 and for the year ended June 30, 2021, and the related notes (collectively referred to as the “financial statements”). In our opinion, the financial statements present fairly, in all material respects, the financial position of the Funds as of August 31, 2022, the results of their operations, the changes in their net assets, and their financial highlights for the year then ended, the two month period ended August 31, 2021 and for the year ended June 30, 2021, in conformity with accounting principles generally accepted in the United States of America.
The financial highlights for each of the three years in the period ended June 30, 2020, except for Penn Capital Short Duration High Income Fund in which the financial highlights for each of the two years in the period ended June 30, 2020 and the period from July 17, 2017 (commencement of operations) though June 30, 2018 have been audited by other auditors, whose report dated August 28, 2020 expressed unqualified opinions on such financial highlights.
Basis for Opinion
These financial statements are the responsibility of the Funds’ management. Our responsibility is to express an opinion on the Funds’ financial statements based on our audits. We are a public accounting firm registered with the Public Company Accounting Oversight Board (United States) (“PCAOB”) and are required to be independent with respect to the Funds in accordance with the U.S. federal securities laws and the applicable rules and regulations of the Securities and Exchange Commission and the PCAOB. We have served as the auditor of one or more of the funds in the Trust since 2021.
We conducted our audits in accordance with the standards of the PCAOB. Those standards require that we plan and perform the audits to obtain reasonable assurance about whether the financial statements are free of material misstatement, whether due to error or fraud. The Funds are not required to have, nor were we engaged to perform, an audit of the Funds’ internal control over financial reporting. As part of our audits we are required to obtain an understanding of internal control over financial reporting, but not for the purpose of expressing an opinion on the effectiveness of the Funds’ internal control over financial reporting. Accordingly, we express no such opinion.
Our audits included performing procedures to assess the risks of material misstatement of the financial statements, whether due to error or fraud, and performing procedures that respond to those risks. Such procedures included examining, on a test basis, evidence regarding the amounts and disclosures in the financial statements. Our audits also included evaluating the accounting principles used and significant estimates made by management, as well as evaluating the overall presentation of the financial statements. Our procedures included confirmation of securities owned as of August 31, 2022 by correspondence with the custodian and brokers; when replies were not received from brokers, we performed other auditing procedures. We believe that our audits provide a reasonable basis for our opinion.

TAIT, WELLER & BAKER LLP
Philadelphia, Pennsylvania
October 28, 2022
62
THE RBB FUND TRUST (FORMERLY, PENN CAPITAL FUNDS TRUST)
Trustees and Officers (UNAUDITED)
The business and affairs of the Trust are managed under the direction of the Trust’s Board. The Trustees and executive officers of the Trust, their ages, business addresses and principal occupations during the past five years are set forth below.
Name, Address and Age | Position(s) | Term of | Principal Occupations | Other Directorships | Number of |
Independent Trustees | |||||
Julian A. Brodsky | Trustee | June 2021 to present | From 1969 to 2011, Director and Vice Chairman, Comcast Corporation (cable television and communications). | AMDOCS Limited (service provider to telecommunications companies). | 55 |
Gregory P. Chandler | Trustee | June 2021 to present | Since 2020, Chief Financial Officer, Herspiegel Consulting LLC (life sciences consulting services); 2020, Chief Financial Officer, Avocado Systems Inc. (cyber security software provider); from 2009 - 2020, Chief Financial Officer, Emtec, Inc. (information technology consulting/services). | FS Energy and Power Fund (business development company); Wilmington Funds (12 portfolios) (registered investment company); Emtec, Inc. (until December 2019); FS Investment Corporation (business development company) (until December 2018). | 55 |
Lisa A. Dolly Age: 56 | Director | October 2021 to present | From July 2019-December 2019, Chairman, Pershing LLC (broker dealer, clearing and custody firm); January 2016-June 2019, Chief Executive Officer, Pershing, LLC. | Allfunds Group PLC (United Kingdom wealthtech and fund distribution provider); Securities Industry and Financial Markets Association (trade association for broker dealers, investment banks and asset managers); Hightower Advisors (wealth management firm). | 55 |
63
THE RBB FUND TRUST (FORMERLY, PENN CAPITAL FUNDS TRUST)
TRUSTEES AND OFFICERS (UNAUDITED)
Name, Address and Age | Position(s) held with the Trust | Term of | Principal Occupations During the Past Five Years | Other Directorships During the Past 5 Years | Number of Portfolios |
Independent Trustees (continued) | |||||
Nicholas A. Giordano | Trustee | June 2021 to present | Since 1997, Consultant, financial services organizations. | IntriCon Corporation (biomedical device manufacturer); Wilmington Funds (12 portfolios) (registered investment company); Independence Blue Cross (healthcare insurance) (until March 2021); Kalmar Pooled Investment Trust (registered investment company) (until September 2017). | 55 |
Arnold M. Reichman | Trustee | June 2021 to present | Retired. | EIP Investment Trust (registered investment company) (until August 2022). | 55 |
Brian T. Shea | Trustee | June 2021 to present | From 2014-2017, Chief Executive Officer, BNY Mellon Investment Services (fund services, global custodian and securities clearing firm); from 1983- 2014, Chief Executive Officer and various positions, Pershing LLC (broker dealer, clearing and custody firm). | Fidelity National Information Services, Inc. (financial services technology company); Ameriprise Financial, Inc. (financial services company); WisdomTree Investments, Inc. (asset management company) (until March 2019). | 55 |
Robert A. Straniere | Trustee | June 2021 to present | Since 2009, Administrative Law Judge, New York City; since 1980, Founding Partner, Straniere Law Group (law firm). | None. | 55 |
Interested Trustee2 | |||||
Robert Sablowsky | Trustee | June 2021 to present | Since 2002, Senior Director – Investments and, prior thereto, Executive Vice President, of Oppenheimer & Co., Inc. (a registered broker-dealer). | None. | 55 |
64
THE RBB FUND TRUST (FORMERLY, PENN CAPITAL FUNDS TRUST)
Trustees and Officers (UNAUDITED)
Name, Address and Age | Position(s) held with the Trust | Term of | Principal Occupations During the Past Five Years | Other Directorships During the Past 5 Years | Number of Portfolios |
Officers | |||||
Steven Plump 615 East Michigan Street Milwaukee, WI 53202 Age: 63 | President | August 2022 to present | From 2011 to 2021, Executive Vice President, PIMCO Investments LLC. | N/A | N/A |
Salvatore Faia, JD, CPA, CFE Vigilant Compliance, LLC Age: 59 | Chief Compliance Officer | June 2021 to present | Since 2021, Chief Compliance Officer of The RBB Fund Trust (formerly, Penn Capital Funds Trust); Since 2004, President, Vigilant Compliance, LLC (investment management services company); since 2005, Independent Trustee of EIP Investment Trust (registered investment company); Since 2004, Chief Compliance Officer of the RBB Fund, Inc.; President of The RBB Fund, Inc. from 2009 to 2022; President of The RBB Fund Trust from 2021 to 2022. | N/A | N/A |
James G. Shaw | Chief Financial Officer and Secretary
Chief Operating Officer | June 2021 to present
August 2022 to present | Chief Financial Officer and Secretary of The RBB Fund, Inc. (since 2016); Chief Operating Officer of The RBB Fund, Inc. (since 2022); from 2005 to 2016, Assistant Treasurer of The RBB Fund, Inc.; from 1995 to 2016, Senior Director and Vice President of BNY Mellon Investment Servicing (US) Inc. (financial services company). | N/A | N/A |
Craig A. Urciuoli | Director of Marketing & Business Development | June 2021 to present | Director of Marketing & Business Development of The RBB Fund, Inc. (since 2019) and The RBB Fund Trust (formerly, Penn Capital Funds Trust) (since 2021); from 2000-2019, Managing Director, Third Avenue Management LLC (investment advisory firm). | N/A | N/A |
65
THE RBB FUND TRUST (FORMERLY, PENN CAPITAL FUNDS TRUST)
TRUSTEES AND OFFICERS (UNAUDITED)
Name, Address and Age | Position(s) held with the Trust | Term of | Principal Occupations During the Past Five Years | Other Directorships During the Past 5 Years | Number of Portfolios |
Officers (continued) | |||||
Jennifer Witt Milwaukee, WI 53202 Age: 39 | Assistant Treasurer | June 2021 to present | Since 2020, Vice President, U.S. Bank Global Fund Services (fund administrative services firm); from 2016 to 2020, Assistant Vice President, U.S. Bank Global Fund Services; from 2007 to 2016, Supervisor, Nuveen Investments (registered investment company). | N/A | N/A |
Edward Paz 615 East Michigan Street Milwaukee, WI 53202 Age: 51 | Assistant Secretary | June 2021 to present | Since 2007, Vice President and Counsel, U.S. Bancorp Fund Services, LLC (fund administrative services firm). | N/A | N/A |
Michael P. Malloy One Logan Square Ste. 2000 Philadelphia, PA 19103 Age: 63 | Assistant Secretary | June 2021 to present | Since 1993, Partner, Faegre Drinker Biddle & Reath LLP (law firm). | N/A | N/A |
Jillian L. Bosmann One Logan Square Ste. 2000 Philadelphia, PA 19103 Age: 43 | Assistant Secretary | June 2021 to present | Since 2017, Partner, Faegre Drinker Biddle & Reath LLP (law firm). | N/A | N/A |
* | Each Trustee oversees 55 portfolios of the fund complex, consisting of the series in the Trust and the RBB Fund, Inc. (48 portfolios). |
1 | Subject to the Trust’s Retirement Policy, each Trustee may continue to serve as a Trustee until the last day of the calendar year in which the applicable Trustee attains age 75 or until his or her successor is elected and qualified or his or her death, resignation or removal. The Board reserves the right to waive the requirements of the Policy with respect to an individual Trustee. The Board has approved waivers of the policy with respect to Messrs. Brodsky, Carnall, Giordano, Sablowsky and Straniere. Each officer holds office at the pleasure of the Board until the next special meeting of the Trust or until his or her successor is duly elected and qualified, or until he or she dies, resigns or is removed. |
2 | Mr. Sablowsky is considered an “interested person” of the Trust as that term is defined in the 1940 Act and is referred to as an “Interested Trustee.” Mr. Sablowsky is considered an “Interested Trustee” of the Trust by virtue of his position as an employee of Oppenheimer & Co., Inc., a registered broker-dealer that may execute portfolio transactions for the Funds or other accounts managed by the Advisor. |
66
THE RBB FUND TRUST (FORMERLY, PENN CAPITAL FUNDS TRUST)
TRUSTEES AND OFFICERS (UNAUDITED)
Trustee Experience, Qualifications, Attributes and/or Skills
The information above includes each Trustee’s principal occupations during the last five years. Each Trustee possesses extensive additional experience, skills and attributes relevant to his qualifications to serve as a Trustee. The cumulative background of each Trustee led to the conclusion that each Trustee should serve as a Trustee of the Company. Mr. Brodsky has over 40 years of senior executive-level management experience in the cable television and communications industry. Mr. Chandler has demonstrated leadership and management abilities as evidenced by his senior executive level positions in the investment technology consulting/services and investment banking/brokerage industries, and also serves on various boards. Ms. Dolly has over three decades of experience in the financial services industry, and she has demonstrated her leadership and management abilities by serving in numerous senior executive-level positions. Mr. Giordano has years of experience as a consultant to financial services organizations and also serves on the boards of other registered investment companies. Mr. Reichman brings decades of investment management experience to the Board, in addition to senior executive-level management experience. Mr. Sablowsky has demonstrated leadership and management abilities as evidenced by his senior executive-level positions in the financial services industry. Mr. Shea has demonstrated leadership and management abilities as evidenced by his senior executive-level positions in the brokerage, clearing, and investment services industry, including service on the boards of industry regulatory organizations and a university. Mr. Straniere has been a practicing attorney for over 30 years and has served on the boards of an asset management company and another registered investment company.
67
THE RBB FUND TRUST (FORMERLY, PENN CAPITAL FUNDS TRUST)
Privacy Policy
FACTS | WHAT DO THE PENN CAPITAL FUNDS DO WITH YOUR PERSONAL INFORMATION? | ||
Why? | Financial companies choose how they share your personal information. Federal law gives consumers the right to limit some but not all sharing. Federal law also requires us to tell you how we collect, share, and protect your personal information. Please read this notice carefully to understand what we do. | ||
What? | The types of personal information we collect and share depend on the product or service you have with us. The information can include: ● Social Security number ● Account balances and account transactions ● Assets and transaction history When you are no longer our client, we continue to share your information as described in this notice. | ||
How? | All financial companies need to share clients’ personal information to run the everyday business. In the section below, we list the reasons financial companies can share their clients’ personal information; the reasons PENN chooses to share; and whether you can limit this sharing. | ||
Reasons we can share your personal information | Does Penn share? | Can you limit | |
For everyday business purposes - | Yes | No | |
For marketing purposes - | No | No | |
For joint marketing with other financial companies | No | No | |
For affiliates’ everyday business purposes - | Yes | No | |
For affiliates’ everyday business purposes - | No | No | |
For nonaffiliates to market to you | No | No | |
Questions? | Call 215-302-1500 or go to www.penncapital.com |
68
THE RBB FUND TRUST (FORMERLY, PENN CAPITAL FUNDS TRUST)
PRIVACY POLICY
What we do | |
Who is providing this notice? | Penn Capital Management Company, Inc. and its affiliates (“Penn”) |
What we do | |
How does Penn protect my personal information? | To protect your personal information from unauthorized access and use, we use security measures that comply with federal law. These measures include computer and secured files and buildings. |
How does Penn collect my personal information? | We collect your personal information, for example, when you ● Open an account or deposit money ● Provide information on client questionnaires |
Why can’t I limit all sharing? | Federal law gives you the right to limit only ● sharing for affiliates everyday business purposes - information about your creditworthiness ● affiliates from using your information to market to you ● sharing for nonaffiliates to market to you State laws and individual companies may give you additional rights to limit sharing. |
Definitions | |
Affiliates | Companies related by common ownership or control. They can be financial or nonfinancial companies ● PENN Capital Funds Group LLC ● PENN Capital Funds Trust ● Penn Capital Management Company, Inc. |
Nonaffiliates | Companies not related by common ownership or control. They can be financial or nonfinancial companies ● Penn does not share information with nonaffiliates |
Joint marketing | A formal agreement between non affiliated companies that together market financial products or services to you. ● Penn does not have joint marketing partners |
Other important information | |
This notice replaces all previous notices of our consumer privacy policy, and may be amended from time to time. Penn will inform you of updates or changes as required by law. | |
69
[THIS PAGE INTENTIONALLY LEFT BLANK.]
[THIS PAGE INTENTIONALLY LEFT BLANK.]
Investment Advisor
Penn Capital Management Company, LLC
Navy Yard Corporate Center
1200 Intrepid Avenue, Suite 400
Philadelphia, Pennsylvania 19112
Legal Counsel
Faegre Drinker Biddle & Reath LLP
One Logan Square, Suite 2000
Philadelphia, PA 19103
Independent Registered Public Accounting Firm
Tait, Weller & Baker LLP
50 South 16th Street, Suite 2900
Philadelphia, PA 19102
Custodian
U.S. Bank N.A.
1555 N. Rivercenter Drive, Suite 302
Milwaukee, WI 53212
Distributor
Foreside Fund Services, LLC
Three Canal Plaza
Portland, ME 04101
Administrator, Transfer Agent
and Dividend Disbursing Agent
U.S. Bancorp Fund Services, LLC
doing business as U.S. Bank Global Fund Services
615 East Michigan Street
Milwaukee, WI 53202
Shareholder/Investor Information
1.844.302.PENN (7366)
www.penncapitalfunds.com
BEFORE INVESTING YOU SHOULD CAREFULLY CONSIDER THE FUNDS’ INVESTMENT OBJECTIVES, RISKS, CHARGES AND EXPENSES. THIS AND OTHER RELEVANT INFORMATION CAN BE FOUND IN THE PROSPECTUS AND STATEMENT OF ADDITIONAL INFORMATION, COPIES OF WHICH MAY BE OBTAINED BY CALLING (844) 302-PENN (7366) OR BY VISITING WWW.PENNCAPITALFUNDS.COM. PLEASE READ THE PROSPECTUS CAREFULLY BEFORE YOU INVEST.
PENN-AR22
Item 2. Code of Ethics.
The registrant has adopted a code of ethics that applies to the registrant's principal executive officer and principal financial officer. The registrant has not made any substantive amendments to its code of ethics during the period covered by this report. The registrant has not granted any waivers from any provisions of the code of ethics during the period covered by this report. A copy of the registrant's Code of Ethics is filed herewith.
Item 3. Audit Committee Financial Expert.
The registrant's board of directors has determined that the registrant has at least one audit committee financial expert serving on its audit committee. Julian A. Brodsky, Gregory P. Chandler and Nicholas A. Giordano are the registrant's audit committee financial experts and each of them is "independent."
Item 4. Principal Accountant Fees and Services.
Audit Fees
| (a) | The aggregate fees billed for each of the last two fiscal years for professional services rendered by the principal accountant for the audit of the registrant's annual financial statements or services that are normally provided by the accountant in connection with statutory and regulatory filings or engagements for those fiscal years were: |
| Fiscal Year 2022 | Fiscal Year 2021 | |
| Tait, Weller & Baker | $77,500 | $115,000 |
| Aggregate Fees | $77,500 | $115,000 |
Audit-Related Fees
| (b) | The aggregate fees billed in each of the last two fiscal years for assurance and related services by the principal accountant that are reasonably related to the performance of the audit of the registrant's financial statements and are not reported under paragraph (a) of this Item were related to review of the semi-annual reports and N-1A filings for Ernst & Young LLP and review of semi-annual reports for Tait, Weller & Baker and were as follows: |
| Fiscal Year 2022 | Fiscal Year 2021 | |
| Tait, Weller & Baker | $2,500 | $0 |
| Aggregate Fees | $2,500 | $0 |
Tax Fees
| (c) | The aggregate fees billed in each of the last two fiscal years for professional services rendered by the principal accountant for tax compliance, tax advice, and tax planning were related to federal and state tax return review and excise distribution review and were as follows: |
| Fiscal Year 2022 | Fiscal Year 2021 | |
| Tait, Weller & Baker | $15,000 | $30,000 |
| Aggregate Fees | $19,950 | $17,300 |
All Other Fees
| (d) | The aggregate fees billed in each of the last two fiscal years for products and services provided by the principal accountant, other than the services reported in paragraphs (a) through (c) of this Item were: |
| Fiscal Year 2022 | Fiscal Year 2021 | |
| Tait, Weller & Baker | $0 | $0 |
| Aggregate Fees | $0 | $0 |
(e)(1) Pre-Approval of Audit and Permitted Non-Audit Services
| 1. | Pre-Approval Requirements of the Company. The Committee shall pre-approve all auditing services and permissible non-audit services (e.g., tax services) to be provided to the Company by the Auditor, including the fees associated with those services. |
| 2. | Pre-Approval Requirements of Affiliates. Additionally, the Committee shall pre-approve any engagement of the Auditor to provide non-audit services to an investment adviser of a Portfolio or to any affiliate of such investment adviser that provides ongoing services to the Company, if the engagement relates directly to the operations and financial reporting of the Company. |
| 3. | Delegation. The Committee may delegate to the Chairman of the Committee, or if the Chairman is not available, one or more of its members, the authority to grant pre-approvals. The decisions of any member to whom authority is delegated shall be presented to the full Committee at its next scheduled meeting. |
| 4. | Prohibited Services. The Committee shall confirm with the Auditor that the Auditor is not performing contemporaneously with the Company's audit any prohibited non-audit services for the Company, any investment adviser of a Portfolio, or any affiliates of the Company or such investment advisers. The Auditor is responsible for informing the Committee of whether it believes that a particular service is permissible or prohibited pursuant to applicable regulations and standards. |
| (e)(2) | The percentage of services described in each of paragraphs (b) through (d) of this Item that were approved by the audit committee pursuant to paragraph (c)(7)(i)(C) of Rule 2-01 of Regulation S-X are as follows: |
(b) Not applicable.
(c) Not applicable.
(d) Not applicable.
| (f) | The percentage of hours expended on the principal accountant's engagement to audit the registrant's financial statements for the most recent fiscal year that were attributed to work performed by persons other than the principal accountant's full-time, permanent employees was less than 50%. |
| (g) | The aggregate non-audit fees billed by the registrant's accountant for services rendered to the registrant, and rendered to the registrant's investment adviser (not including any sub-adviser whose role is primarily portfolio management and is subcontracted with or overseen by another investment adviser), and any entity controlling, controlled by, or under common control with the adviser that provides ongoing services to the registrant for each of the last two fiscal years of the registrant were: |
| Fiscal Year 2022 | Fiscal Year 2021 | |
| Tait, Weller & Baker | $17,500 | $30,000 |
| Aggregate Fees | $17,500 | $30,000 |
| (h) | Not applicable. |
| (i) | Not applicable. |
| (j) | Not applicable. |
Item 5. Audit Committee of Listed Registrants.
Not applicable.
Item 6. Investments.
| (a) | The registrant's Schedule of Investments is included as part of the report to shareholders filed under Item 1 of this Form. |
| (b) | Not applicable. |
Item 7. Disclosure of Proxy Voting Policies and Procedures for Closed-End Management Investment Companies.
Not applicable.
Item 8. Portfolio Managers of Closed-End Management Investment Companies.
Not applicable.
Item 9. Purchases of Equity Securities by Closed-End Management Investment Company and Affiliated Purchasers.
Not applicable.
Item 10. Submission of Matters to a Vote of Security Holders.
There have been no material changes to the procedures by which the shareholders may recommend nominees to the registrant's board of directors, where those changes were implemented after the registrant last provided disclosure in response to the requirements of Item 407(c)(2)(iv) of Regulation S-K (17 CFR 229.407) (as required by Item 22(b)(15) of Schedule 14A (17 CFR 240.14a-101)), or this Item.
Item 11. Controls and Procedures.
| (a) | The Registrant's Principal Executive and Principal Financial Officers have reviewed the Registrant's disclosure controls and procedures (as defined in Rule 30a-3(c) under the Investment Company Act of 1940 (the "Act")) as of a date within 90 days of the filing of this report, as required by Rule 30a-3(b) under the Act and Rules 13a-15(b) or 15d-15(b) under the Securities Exchange Act of 1934. Based on their review, such officers have concluded that the disclosure controls and procedures are effective in ensuring that information required to be disclosed in this report is appropriately recorded, processed, summarized and reported and made known to them by others within the Registrant and by the Registrant's service provider. |
| (b) | There were no changes in the Registrant's internal control over financial reporting (as defined in Rule 30a-3(d) under the Act) that occurred during the period covered by this report that has materially affected, or is reasonably likely to materially affect, the Registrant's internal control over financial reporting. |
Item 12. Disclosure of Securities Lending Activities for Closed-End Management Investment Companies
Not applicable.
Item 13. Exhibits.
(a)(3) Not applicable.
(a)(4) Certifications pursuant to Section 906 of the Sarbanes-Oxley Act of 2002. Furnished herewith
SIGNATURES
Pursuant to the requirements of the Securities Exchange Act of 1934 and the Investment Company Act of 1940, the registrant has duly caused this report to be signed on its behalf by the undersigned, thereunto duly authorized.
| (Registrant) | The RBB Fund Trust | ||
| By (Signature and Title)* | /s/ Steven Plump | ||
| Steven Plump, President | |||
| (principal executive officer) | |||
| Date | 11/2/2022 |
Pursuant to the requirements of the Securities Exchange Act of 1934 and the Investment Company Act of 1940, this report has been signed below by the following persons on behalf of the registrant and in the capacities and on the dates indicated.
| By (Signature and Title)* | /s/ Steven Plump | ||
| Steven Plump, President | |||
| (principal executive officer) | |||
| Date | 11/2/2022 | ||
| By (Signature and Title)* | /s/ James Shaw | ||
| James Shaw, Chief Financial Officer | |||
| (principal financial officer) | |||
| Date | 11/2/2022 |
| * | Print the name and title of each signing officer under his or her signature. |