As filed with the Securities and Exchange Commission on December 28, 2017
UNITED STATES
SECURITIES AND EXCHANGE COMMISSION
Washington, D.C. 20549
FORM N-CSR
CERTIFIED SHAREHOLDER REPORT OF REGISTERED
MANAGEMENT INVESTMENT COMPANIES
Investment Company Act file number 811-23108
Amplify ETF Trust
(Exact name of registrant as specified in charter)
310 South Hale Street
Wheaton, IL 60187
(Address of principal executive offices) (Zip code)
Christian Magoon
Amplify ETF Trust
310 South Hale Street
Wheaton, IL 60187
(Name and address of agent for service)
With copies to:
Morrison C. Warren, Esq.
Chapman and Cutler LLP
111 West Monroe Street
Chicago, IL 60603
(855)-267-3837
Registrant's telephone number, including area code
Date of fiscal year end: October 31
Date of reporting period: October 31, 2017
Item 1. Reports to Stockholders.

AMPLIFY ETF TRUST
Amplify Online Retail ETF IBUY
Amplify YieldShares Senior Loan and Income ETF YESR
Amplify YieldShares CWP Dividend & Option Income ETF DIVO
Amplify YieldShares Oil Hedged MLP Income ETF AMLX
|
ANNUAL REPORT
October 31, 2017
Amplify ETF Trust
Table of Contents
MARKET PERFORMANCE | 2 |
FUND PERFORMANCE | 3 |
SCHEDULES OF INVESTMENTS | 7 |
STATEMENTS OF ASSETS AND LIABILITIES | 13 |
STATEMENTS OF OPERATIONS | 14 |
STATEMENTS OF CHANGES IN NET ASSETS | 15 |
FINANCIAL HIGHLIGHTS | 19 |
NOTES TO THE FINANCIAL STATEMENTS | 23 |
REPORT OF INDEPENDENT REGISTERED PUBLIC ACCOUNTING FIRM | 41 |
BOARD CONSIDERATIONS REGARDING APPROVAL OF INVESTMENT MANAGEMENT AGREEMENT AND SUB-ADVISORY AGREEMENT | 42 |
DISCLOSURE OF FUND EXPENSES | 45 |
TRUSTEES AND OFFICERS OF THE TRUST | 47 |
NOTICE TO SHAREHOLDERS | 49 |
SUPPLEMENTAL INFORMATION | 50 |
PRIVACY POLICY | 51 |
Amplify ETF Trust (the “Trust”) files its complete schedule of fund holdings with the Securities and Exchange Commission (the “Commission”) for the first and third quarters of each fiscal year on Form N-Q within sixty days after the end of the period. The Trust’s Form N-Qs are available on the Commission’s website at www.sec.gov, and may be reviewed and copied at the Commission’s Public Reference Room in Washington, DC. Information on the operation of the Public Reference Room may be obtained by calling 1-800-SEC-0330.
A description of the policies and procedures that Amplify Investments, LLC (the “Adviser”) uses to determine how to vote proxies relating to portfolio securities, as well as information relating to how a fund voted proxies relating to portfolio securities during the most recent 12-month period ended June 30, is available (i) without charge, upon request, by calling 1-855-267-3837 and (ii) on the Commission’s website at www.sec.gov.
1
Amplify ETF Trust
Market Performance
October 31, 2017 (Unaudited)
From the beginning of 2017 through the end of November 2017, US stock investors have been treated to a series of new record highs and very low volatility. The Dow Jones Industrial Average, the S&P 500 and the NASDAQ 100 had gained between 17-29% through the first 11 months of the year. There are many potential drivers behind this rally, including decreased regulation, potential tax reform, improving US economic data, a restrained Federal Reserve keeping interest rates relatively low, and more attractive corporate earnings. Still, many wonder if the stock market gains in 2017 thus far should in fact be so robust given the geopolitical tensions with countries including North Korea, the contentiousness between Democrats and Republicans, and the continued investigations surrounding Russian interference in the US elections. Time will tell if these risks turn into drivers of increased stock market volatility or even sell-offs. Thus far the markets have been able to shrug off these concerns. “Bull markets climb a wall of worry,” is an old market saying, but at what point could that climb be so high that worry eventually resets the level or pace of that climb?
Taking a closer look at the broad-based S&P 500 shows that some sectors of the US equity market were clearly preferred over others in 2017. Leading the pack by a wide margin was the Technology sector gaining around 30% through November. The business growth numbers the Technology sector reported throughout 2017 both attracted investors and led to about a 13% outperformance of the S&P 500. The “FANG” stocks – Facebook, Amazon, Netflix and Google (Alphabet) – were the most powerful drivers of the Technology sector rally as the FANG acronym became a household name. In a distant second place was the Healthcare sector gaining 19% and managing to outperform the S&P 500 through November. Fueled in part by the Obamacare health insurance mandate as well as older US demographics, this sector continued to report solid financial results. Finally, a close third to Healthcare was the Materials sector, which gained just under 19% in the similar time period. An improving US economy and the underlying demand for materials fueling that growth powered these companies forward.
It was such a stellar year for the S&P 500 and equity investors that just one market sector finished in the red and that was Energy. Energy stocks were down about 9% on the year, cooling off after a strong performance in 2016. Oil prices were down about 20% through midyear, which put pressure on oil company profits and hurt equity returns. Since that mid-June oil price low however, oil prices are up over 30%; yet the S&P Energy sector has rallied less than 10% off its mid year low. That weak rally kept Energy as the only S&P 500 sector in the red for the year.
Through the end of November, 2017 has been a fruitful year for investors in broad-based US equities and a remarkable year for those overweight in technology stocks. While the year has yielded above average stock market returns, it is important to note that economic numbers in the US and around the world seem to be still improving. In addition, it appears a major US tax reform bill will pass, which would be favorable to US based companies. Yet despite these positives, major legislative, geopolitical and legal risks abound going into 2018. Will US equity investors continue to shrug these risks off like they did for most of 2017? Time will tell.
Investing involves risk. Principal loss is possible.
One cannot invest directly in an index.
Past performance does not guarantee future results. Index performance is not indicative of fund performance. To obtain fund performance call 855-267-3837 or visit http://AmplifyETFs.com/.
Fund holdings are subject to change and should not be considered a recommendation to buy or sell any security. Please see schedule of investments section in this report for a full listing of the Fund’s holdings.
Dow Jones Industrial Average: It is a price-weighted average of 30 significant stocks traded on the New York Stock Exchange (NYSE) and the NASDAQ.
S&P 500 Index: The S&P 500 is a market value weighted index and one of the common benchmarks for the U.S. stock market.
Nasdaq 100: An index composed of the 100 largest, most actively traded U.S companies listed on the Nasdaq stock exchange.
Amplify ETFs are distributed by Quasar Distributors LLC.
2
Amplify ETF Trust
Amplify Online Retail ETF
Fund Performance
October 31, 2017 (Unaudited)
Growth of a $10,000 Investment
(at Net Asset Value)
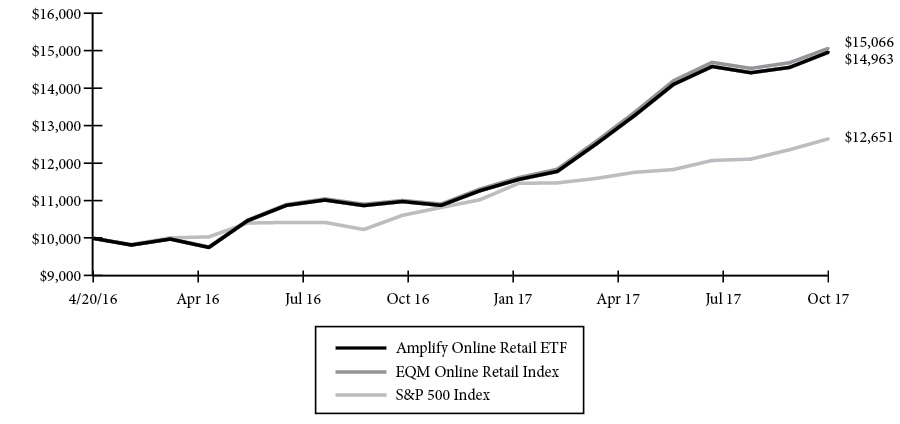
ANNUALIZED RETURNS | ||||
One Year | Inception to Date (a) | |||
Net Asset Value | Market Price | Net Asset Value | Market Price | |
Amplify Online Retail ETF | 37.64% | 37.66% | 30.04% | 30.34% |
EQM Online Retail Index | 38.13% | 38.13% | 30.62% | 30.62% |
S&P 500 Index | 23.63% | 23.63% | 16.56% | 16.56% |
(a) | Fund commenced operations on April 20, 2016. |
The performance data quoted herein represents past performance and the return and value of an investment in the Fund will fluctuate so that shares, when redeemed or sold in the market, may be worth more or less than their original cost. Past performance is no guarantee of future performance and should not be considered as a representation of the future results of the Fund. The Fund’s performance assumes the reinvestment of all dividends and all capital gains. Index returns assume reinvestment of dividends and, unlike a Fund’s returns, do not reflect any fees or expenses. If such fees and expenses were included in the index returns, the performance would have been lower. Please note that one cannot invest directly in an unmanaged index.
There are no assurances that the Fund will meet its stated objectives.
The Fund’s holdings and allocations are subject to change and should not be considered recommendations to buy individual securities.
Returns shown do not reflect the deduction of taxes that a shareholder would pay on Fund distributions or the redemption of Fund shares.
3
Amplify ETF Trust
Amplify YieldShares Senior Loan and Income ETF
Fund Performance
October 31, 2017 (Unaudited)
Growth of a $10,000 Investment
(at Net Asset Value)

ANNUALIZED RETURNS | ||||
One Year | Inception to Date (a) | |||
Net Asset Value | Market Price | Net Asset Value | Market Price | |
Amplify YieldShares Senior Loan and Income ETF | 14.37% | 14.69% | 12.27% | 12.80% |
Prime Senior Loan and Income CEF Index/Prime 5 US Dividend ETF Index (b) | 15.37% | 15.37% | 14.81% | 14.81% |
S&P/LSTA U.S. Leveraged Loan 100 Index | 4.42% | 4.42% | 5.00% | 5.00% |
(a) | Fund commenced operations on September 21, 2016. |
(b) | Effective August 29, 2017, the Fund’s investment objective changed to track the performance, before fees and expenses, of the Prime Senior Loan and Income CEF Index. Prior to August 29, 2017, the Fund’s investment objective was to track the performance, before fees and expenses, of the Prime 5 US Dividend ETF Index. Performance shown for periods beginning August 29, 2017 is that of the Prime Senior Loan and Income CEF Index and performance shown for periods prior to August 29, 2017 is that of the Prime 5 US Dividend ETF Index. |
The performance data quoted herein represents past performance and the return and value of an investment in the Fund will fluctuate so that shares, when redeemed or sold in the market, may be worth more or less than their original cost. Past performance is no guarantee of future performance and should not be considered as a representation of the future results of the Fund. The Fund’s performance assumes the reinvestment of all dividends and all capital gains. Index returns assume reinvestment of dividends and, unlike a Fund’s returns, do not reflect any fees or expenses. If such fees and expenses were included in the index returns, the performance would have been lower. Please note that one cannot invest directly in an unmanaged index.
There are no assurances that the Fund will meet its stated objectives.
The Fund’s holdings and allocations are subject to change and should not be considered recommendations to buy individual securities.
Returns shown do not reflect the deduction of taxes that a shareholder would pay on Fund distributions or the redemption of Fund shares
4
Amplify ETF Trust
Amplify YieldShares CWP Dividend & Option Income ETF
Fund Performance
October 31, 2017 (Unaudited)
Growth of a $10,000 Investment
(at Net Asset Value)
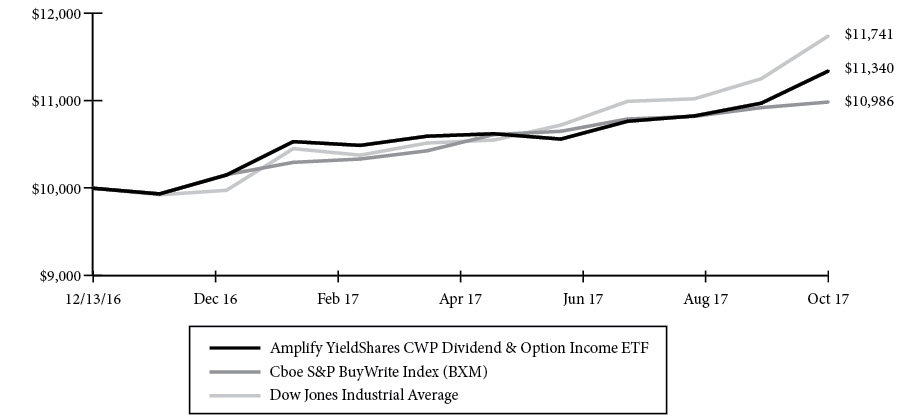
TOTAL RETURN FOR THE | ||
Inception to Date (a) | ||
Net Asset Value | Market Price | |
Amplify YieldShares CWP Dividend & Option Income ETF | 13.40% | 13.80% |
CBOE S&P 500 BuyWrite Index | 9.86% | 9.86% |
Dow Jones Industrial Average | 17.41% | 17.41% |
(a) | Fund commenced operations on December 14, 2016. |
The performance data quoted herein represents past performance and the return and value of an investment in the Fund will fluctuate so that shares, when redeemed or sold in the market, may be worth more or less than their original cost. Past performance is no guarantee of future performance and should not be considered as a representation of the future results of the Fund. The Fund’s performance assumes the reinvestment of all dividends and all capital gains. Index returns assume reinvestment of dividends and, unlike a Fund’s returns, do not reflect any fees or expenses. If such fees and expenses were included in the index returns, the performance would have been lower. Please note that one cannot invest directly in an unmanaged index.
There are no assurances that the Fund will meet its stated objectives.
The Fund’s holdings and allocations are subject to change and should not be considered recommendations to buy individual securities.
Returns shown do not reflect the deduction of taxes that a shareholder would pay on Fund distributions or the redemption of Fund shares.
5
Amplify ETF Trust
Amplify YieldShares Oil Hedged MLP Income ETF
Fund Performance
October 31, 2017 (Unaudited)
Growth of a $10,000 Investment
(at Net Asset Value)
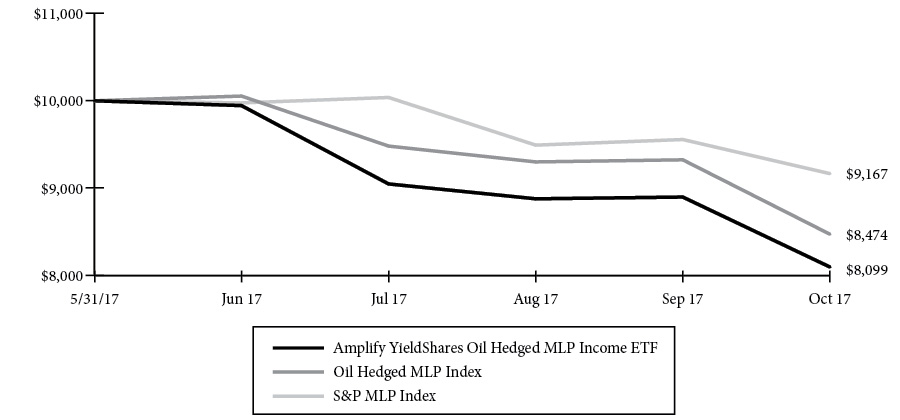
TOTAL RETURN FOR THE | ||
Inception to Date (a) | ||
Net Asset Value | Market Price | |
Amplify YieldShares Oil Hedged MLP Income ETF | -19.01% | -18.69% |
Oil Hedged MLP Index | -15.26% | -15.26% |
S&P MLP Index | -8.33% | -8.33% |
(a) | Fund commenced operations on June 1, 2017. |
The performance data quoted herein represents past performance and the return and value of an investment in the Fund will fluctuate so that shares, when redeemed or sold in the market, may be worth more or less than their original cost. Past performance is no guarantee of future performance and should not be considered as a representation of the future results of the Fund. The Fund’s performance assumes the reinvestment of all dividends and all capital gains. Index returns assume reinvestment of dividends and, unlike a Fund’s returns, do not reflect any fees or expenses. If such fees and expenses were included in the index returns, the performance would have been lower. Please note that one cannot invest directly in an unmanaged index.
There are no assurances that the Fund will meet its stated objectives.
The Fund’s holdings and allocations are subject to change and should not be considered recommendations to buy individual securities.
Returns shown do not reflect the deduction of taxes that a shareholder would pay on Fund distributions or the redemption of Fund shares.
6
Amplify ETF Trust
Amplify Online Retail ETF
Schedule of Investments
October 31, 2017
| Description | Shares | Value | ||||||
| COMMON STOCKS — 99.9% | ||||||||
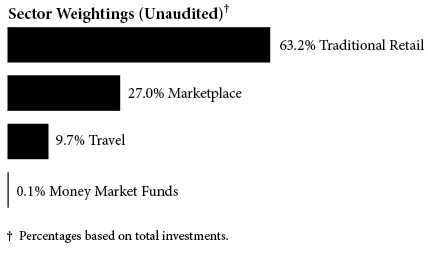
| Marketplace — 27.0% | ||||||||
Alibaba Group Holding Ltd. - ADR (a) | 11,881 | $ | 2,196,678 | |||||
Copart, Inc. (a) | 96,989 | 3,519,731 | ||||||
Etsy, Inc. (a) | 280,194 | 4,679,240 | ||||||
GrubHub, Inc. (a) | 65,919 | 4,022,377 | ||||||
IAC/InterActiveCorp (a) | 30,710 | 3,963,126 | ||||||
Just Eat PLC (a) | 192,970 | 1,999,078 | ||||||
| MercadoLibre, Inc. | 5,951 | 1,430,085 | ||||||
PayPal Holdings, Inc. (a) | 59,967 | 4,351,206 | ||||||
| Rakuten, Inc. | 136,900 | 1,455,627 | ||||||
Shopify, Inc. (a) | 17,120 | 1,703,269 | ||||||
| 29,320,417 | ||||||||
| Traditional Retail — 63.2% | ||||||||
1-800-Flowers.com, Inc. (a) | 285,071 | 2,679,667 | ||||||
Amazon.com, Inc. (a) | 3,130 | 3,459,526 | ||||||
| ASKUL Corp. | 47,100 | 1,263,401 | ||||||
ASOS PLC (a) | 18,482 | 1,398,429 | ||||||
Carvana Co. (a) | 337,216 | 4,781,723 | ||||||
Cimpress NV (a) | 17,365 | 1,895,216 | ||||||
Ebay, Inc. (a) | 88,276 | 3,322,709 | ||||||
FTD Companies, Inc. (a) | 149,120 | 1,610,496 | ||||||
| HSN, Inc. | 83,121 | 3,133,662 | ||||||
JD.com, Inc. - ADR (a) | 39,757 | 1,491,683 | ||||||
Lands' End, Inc. (a) | 123,260 | 1,343,534 | ||||||
Liberty Interactive QVC Group - Series A (a) | 139,794 | 3,176,120 | ||||||
Netflix, Inc. (a) | 19,045 | 3,741,009 | ||||||
| Nutrisystem, Inc. | 58,867 | 2,940,407 | ||||||
Overstock.com, Inc. (a) | 172,206 | 7,904,255 | ||||||
| PetMed Express, Inc. | 124,992 | 4,419,717 | ||||||
Shutterfly, Inc. (a) | 57,089 | 2,437,700 | ||||||
Stamps.com, Inc. (a) | 26,642 | 5,978,465 | ||||||
| Start Today Co. Ltd. | 62,500 | 1,698,474 | ||||||
Vipshop Holdings Ltd. - ADR (a) | 102,659 | 811,006 | ||||||
Wayfair, Inc. (a) | 60,842 | 4,252,856 | ||||||
Yoox Net-A-Porter Group SpA (a) | 53,611 | 2,004,605 | ||||||
Zalando SE (a)(b) | 32,365 | 1,619,419 | ||||||
zooplus AG (a) | 7,469 | 1,238,482 | ||||||
| 68,602,561 | ||||||||
| Travel — 9.7% | ||||||||
Ctrip.com International Ltd. - ADR (a) | 27,241 | 1,304,571 | ||||||
| Expedia, Inc. | 21,427 | 2,671,090 | ||||||
MakeMyTrip Ltd. (a) | 37,667 | 1,028,309 | ||||||
Priceline Group, Inc. (a) | 1,585 | 3,030,457 | ||||||
TripAdvisor, Inc. (a) | 66,044 | 2,476,650 | ||||||
| 10,511,077 | ||||||||
| Total Common Stocks | ||||||||
| (Cost $97,404,317) | 108,434,055 | |||||||
| MONEY MARKET FUNDS — 0.1% | ||||||||
STIT-Government & Agency Portfolio - Institutional Class - 0.95% (c) | 99,212 | 99,212 | ||||||
| Total Money Market Funds | ||||||||
| (Cost $99,212) | 99,212 | |||||||
| Total Investments — 100.0% | ||||||||
| (Cost $97,503,529) | $ | 108,533,267 | ||||||
Percentages are based on Net Assets of $108,482,117.
ADR - American Depositary Receipt
(a) | Non-income producing security. |
(b) | Security exempt from registration under Rule 144(a) and Regulation S under the Securities Act of 1933. Such seccurities are treated as liquid securities, according to the Funds’ liquidity guidelines. At October 31, 2017, the value of these securities amounted to $1,619,419 or 1.5% of net assets. |
(c) | Seven-day yield as of October 31, 2017. |
The accompanying notes are an integral part of the financial statements.
7
Amplify ETF Trust
Amplify YieldShares Senior Loan and Income ETF
Schedule of Investments
October 31, 2017

| Description | Shares | Value | ||||||
| INVESTMENT COMPANIES — 99.9% | ||||||||
| Apollo Senior Floating Rate Fund, Inc. | 3,251 | $ | 54,227 | |||||
| Avenue Income Credit Strategies Fund | 7,263 | 106,185 | ||||||
| BlackRock Floating Rate Income Strategies Fund, Inc. | 4,137 | 59,200 | ||||||
| BlackRock Floating Rate Income Trust | 2,303 | 32,956 | ||||||
| Blackstone / GSO Senior Floating Rate Term Fund | 2,421 | 41,956 | ||||||
| Blackstone/GSO Long-Short Credit Income Fund | 4,996 | 80,985 | ||||||
| Eaton Vance Floating-Rate Income Plus Fund | 2,863 | 47,125 | ||||||
| Eaton Vance Floating-Rate Income Trust | 3,249 | 47,078 | ||||||
| Eaton Vance Senior Floating-Rate Trust | 3,690 | 53,690 | ||||||
| Eaton Vance Senior Income Trust | 7,904 | 51,850 | ||||||
| First Trust Senior Floating Rate Income Fund II | 5,023 | 66,002 | ||||||
| Invesco Dynamic Credit Opportunities Fund | 8,290 | 98,568 | ||||||
| Invesco Senior Income Trust | 12,946 | 57,351 | ||||||
| Nuveen Credit Strategies Income Fund | 12,572 | 104,976 | ||||||
| Nuveen Floating Rate Income Fund | 4,276 | 49,730 | ||||||
| Nuveen Floating Rate Income Opportunity Fund | 5,395 | 61,773 | ||||||
| Nuveen Senior Income Fund | 7,523 | 51,006 | ||||||
| Nuveen Short Duration Credit Opportunities Fund | 3,344 | 58,754 | ||||||
| Pioneer Floating Rate Trust | 5,554 | 66,815 | ||||||
| THL Credit Senior Loan Fund | 3,225 | 55,470 | ||||||
| Voya Prime Rate Trust | 13,490 | 69,204 | ||||||
| Western Asset Corporate Loan Fund, Inc. | 5,447 | 58,827 | ||||||
| Total Investment Companies | ||||||||
| (Cost $1,378,630) | 1,373,728 | |||||||
| MONEY MARKET FUNDS — 0.5% | ||||||||
STIT-Government & Agency Portfolio - Institutional Class - 0.95% (a) | 6,525 | $ | 6,525 | |||||
| Total Money Market Funds | ||||||||
| (Cost $6,525) | 6,525 | |||||||
| Total Investments — 100.4% | ||||||||
| (Cost $1,385,155) | $ | 1,380,253 | ||||||
Percentages are based on Net Assets of $1,374,884.
(a) | Seven-day yield as of October 31, 2017. |
The accompanying notes are an integral part of the financial statements.
8
Amplify ETF Trust
Amplify YieldShares CWP Dividend & Option Income ETF
Schedule of Investments
October 31, 2017
| Description | Shares | Value | ||||||
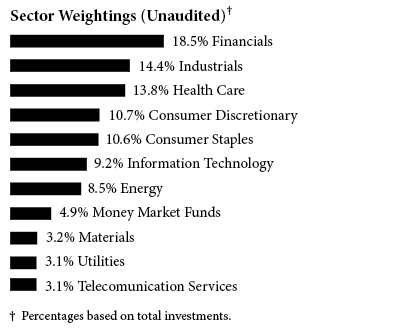
| COMMON STOCKS — 89.7% | ||||||||
| Consumer Discretionary — 10.1% | ||||||||
| McDonald's Corp. | 3,371 | $ | 562,653 | |||||
| The Home Depot, Inc. | 3,310 | 548,732 | ||||||
| 1,111,385 | ||||||||
| Consumer Staples — 10.0% | ||||||||
| Coca-Cola Co. | 7,200 | 331,056 | ||||||
| Procter & Gamble Co. | 3,470 | 299,600 | ||||||
Wal-Mart Stores, Inc. (a) | 5,380 | 469,728 | ||||||
| 1,100,384 | ||||||||
| Energy — 8.1% | ||||||||
| Chevron Corp. | 4,660 | 540,047 | ||||||
| Valero Energy Corp. | 4,400 | 347,116 | ||||||
| 887,163 | ||||||||
| Financials — 17.4% | ||||||||
| American Express Co. | 5,905 | 564,046 | ||||||
| CME Group, Inc. | 2,400 | 329,208 | ||||||
| Goldman Sachs Group, Inc. | 2,080 | 504,358 | ||||||
JPMorgan Chase & Co. (a) | 5,200 | 523,172 | ||||||
| 1,920,784 | ||||||||
| Health Care — 13.0% | ||||||||
| Johnson & Johnson | 3,870 | 539,517 | ||||||
| Medtronic PLC | 3,915 | 315,236 | ||||||
| UnitedHealth Group, Inc. | 2,760 | 580,207 | ||||||
| 1,434,960 | ||||||||
| Industrials — 13.6% | ||||||||
| Boeing Co. | 2,135 | 550,787 | ||||||
| Caterpillar, Inc. | 4,500 | 611,100 | ||||||
| United Technologies Corp. | 2,755 | 329,939 | ||||||
| 1,491,826 | ||||||||
| Information Technology — 8.7% | ||||||||
Apple, Inc. (a) | 3,600 | 608,544 | ||||||
| Visa, Inc. | 3,200 | 351,936 | ||||||
| 960,480 | ||||||||
| Materials — 3.0% | ||||||||
| DowDuPont, Inc. | 4,615 | 333,711 | ||||||
| Telecommunication Services — 2.9% | ||||||||
| Verizon Communications, Inc. | 6,750 | 323,122 | ||||||
| Utilities — 2.9% | ||||||||
| Dominion Energy, Inc. | 3,920 | 318,069 | ||||||
| Total Common Stocks | ||||||||
| (Cost $9,091,474) | 9,881,884 | |||||||
| MONEY MARKET FUNDS — 4.6% | ||||||||
STIT-Government & Agency Portfolio - Institutional Class - 0.95% (b) | 509,159 | 509,159 | ||||||
| Total Money Market Funds | ||||||||
| (Cost $509,159) | 509,159 | |||||||
| Total Investments — 94.3% | ||||||||
| (Cost $9,600,633) | $ | 10,391,043 | ||||||
Percentages are based on Net Assets of $11,016,158.
(a) | All or a portion of this security is held as collateral for the options written. At October 31, 2017, the value of these securities amounted to $1,601,444 or 14.5% of net assets. |
(b) | Seven-day yield as of October 31, 2017. |
The Global Industry Classification Standard (GICS®) was developed by and/or is the exclusive property of MSCI, Inc. and Standard & Poor’s Financial Services LLC (“S&P”). GICS® is a service mark of MSCI, Inc. and S&P and has been licensed for use by the Fund’s Administrator, U.S. Bancorp Fund Services, LLC.
The accompanying notes are an integral part of the financial statements.
9
Amplify ETF Trust
Amplify YieldShares CWP Dividend & Option Income ETF
Schedule of Options Written
October 31, 2017
| Description | Contracts | Notional Amount | Value | |||||||||
Call Options Written (a) — (0.20)% | ||||||||||||
| Apple, Inc., Expires 11/03/2017, Exercise Price $167.50 | 36 | (608,544 | ) | $ | (16,830 | ) | ||||||
| JPMorgan Chase & Co., Expires 11/17/2017, Exercise Price $105.00 | 52 | (523,172 | ) | (1,144 | ) | |||||||
| Wal-Mart Stores, Inc., Expires 11/17/2017, Exercise Price $90.00 | 53 | (462,743 | ) | (3,789 | ) | |||||||
| Total Call Options Written | ||||||||||||
| (Premiums Received $3,868) | $ | (21,763 | ) | |||||||||
(a) | Exchange Traded |
The accompanying notes are an integral part of the financial statements.
10
Amplify ETF Trust
Amplify YieldShares Oil Hedged MLP Income ETF
Schedule of Investments
October 31, 2017
| Description | Shares | Value | ||||||
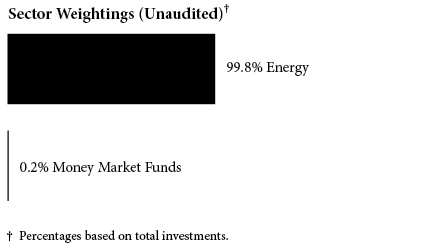
| MASTER LIMITED PARTNERSHIPS AND RELATED COMPANIES — 96.4% | ||||||||
| Energy — 96.4% | ||||||||
| Andeavor Logistics LP | 3,555 | $ | 160,601 | |||||
| Buckeye Partners LP | 1,566 | 83,170 | ||||||
| Cheniere Energy Partners LP | 3,204 | 89,680 | ||||||
| DCP Midstream LP | 2,790 | 92,293 | ||||||
Enbridge Energy Management LLC (a) | 6,051 | 87,140 | ||||||
| Enbridge Energy Partners LP | 5,745 | 86,635 | ||||||
| Energy Transfer Equity LP | 4,914 | 87,223 | ||||||
| Energy Transfer Partners LP | 4,707 | 81,949 | ||||||
| EnLink Midstream Partners LP | 5,448 | 83,409 | ||||||
| Genesis Energy LP | 3,264 | 76,018 | ||||||
| MPLX LP | 2,565 | 90,442 | ||||||
| NGL Energy Partners LP | 10,041 | 116,978 | ||||||
| NuStar Energy LP | 2,175 | 72,427 | ||||||
| Plains All American Pipeline LP | 4,032 | 80,519 | ||||||
| Plains GP Holdings LP | 3,867 | 78,887 | ||||||
| Tallgrass Energy Partners LP | 1,890 | 82,480 | ||||||
| TC PipeLines LP | 1,707 | 90,966 | ||||||
| Viper Energy Partners LP | 5,175 | 101,430 | ||||||
| Western Gas Partners LP | 1,731 | 82,898 | ||||||
| Total Master Limited Partnerships and Related Companies | ||||||||
| (Cost $1,840,204) | 1,725,145 | |||||||
| MONEY MARKET FUNDS — 0.2% | ||||||||
STIT-Government & Agency Portfolio - Institutional Class - 0.95% (b) | 3,443 | 3,443 | ||||||
| Total Money Market Funds | ||||||||
| (Cost $3,443) | 3,443 | |||||||
| Total Investments — 96.6% | ||||||||
| (Cost $1,843,647) | $ | 1,728,588 | ||||||
Percentages are based on Net Assets of $1,788,961.
(a) | Non-income producing security. |
(b) | Seven-day yield as of October 31, 2017. |
The Global Industry Classification Standard (GICS®) was developed by and/or is the exclusive property of MSCI, Inc. and Standard & Poor’s Financial Services LLC (“S&P”). GICS® is a service mark of MSCI, Inc. and S&P and has been licensed for use by the Fund’s Administrator, U.S. Bancorp Fund Services, LLC.
The accompanying notes are an integral part of the financial statements.
11
Amplify ETF Trust
Amplify YieldShares Oil Hedged MLP Income ETF
Schedule of Open Futures Contracts
October 31, 2017
Number of Contracts | Description | Expiration | Notional | Value | Unrealized |
(13) | WTI Crude Future | December | $ (706,940) | $ (2,990) | $ (40,262) |
The accompanying notes are an integral part of the financial statements.
12
Amplify ETF Trust
Statements of Assets and Liabilities
October 31, 2017
| Amplify Online Retail ETF | Amplify YieldShares Senior Loan and Income ETF | Amplify YieldShares CWP Dividend & Option Income ETF | Amplify YieldShares Oil Hedged MLP Income ETF | |||||||||||||
| Assets: | ||||||||||||||||
| Investments at Cost | $ | 97,503,529 | $ | 1,385,155 | $ | 9,600,633 | $ | 1,843,647 | ||||||||
| Investments at Fair Value | $ | 108,533,267 | $ | 1,380,253 | $ | 10,391,043 | $ | 1,728,588 | ||||||||
| Cash | — | — | 682,409 | — | ||||||||||||
| Deposit at Broker for Futures | — | — | — | 56,832 | ||||||||||||
| Receivable for Investments Sold | — | — | 621,468 | — | ||||||||||||
| Dividends, Distributions from Master Limited Partnerships and Interest Receivable | 6,252 | 2,247 | 15,369 | 7,916 | ||||||||||||
Total Assets | 108,539,519 | 1,382,500 | 11,710,289 | 1,793,336 | ||||||||||||
| Liabilities: | ||||||||||||||||
| Options Written, at Value (Premiums Received $0, $0, $3,868 and $0, respectively) | — | — | 21,763 | — | ||||||||||||
| Payable for Distributions to Shareholders | — | 7,086 | — | — | ||||||||||||
| Payable for Investments Purchased | — | — | 663,597 | — | ||||||||||||
| Variation Margin Payable | — | — | — | 2,990 | ||||||||||||
| Advisory Fees Payable | 57,402 | 530 | 8,771 | 1,385 | ||||||||||||
Total Liabilities | 57,402 | 7,616 | 694,131 | 4,375 | ||||||||||||
| Net Assets | $ | 108,482,117 | $ | 1,374,884 | $ | 11,016,158 | $ | 1,788,961 | ||||||||
| Net Assets Consist of: | ||||||||||||||||
| Paid-in Capital ($0.01 par value) | $ | 29,000 | $ | 500 | $ | 4,000 | $ | 1,500 | ||||||||
| Additional Paid-in Capital | 98,173,859 | 1,126,685 | 10,261,705 | 2,192,095 | ||||||||||||
| Undistributed (Accumulated) Net Investment Income (Loss), net of deferred tax benefit (expense) | (165,050 | ) | — | — | (6,757 | ) | ||||||||||
| Accumulated Net Realized Gain (Loss) on Investments, net of deferred tax benefit (expense) | (585,356 | ) | 252,601 | (22,062 | ) | (242,556 | ) | |||||||||
| Net Unrealized Appreciation (Depreciation), net of deferred tax benefit (expense) on: | ||||||||||||||||
| Investments | 11,029,664 | (4,902 | ) | 790,410 | (115,059 | ) | ||||||||||
| Options Written | — | — | (17,895 | ) | — | |||||||||||
| Futures Contracts | — | — | — | (40,262 | ) | |||||||||||
Net Assets | $ | 108,482,117 | $ | 1,374,884 | $ | 11,016,158 | $ | 1,788,961 | ||||||||
| Outstanding Shares of Beneficial Interest (unlimited authorized - $0.01 par value) | 2,900,000 | 50,000 | 400,000 | 150,000 | ||||||||||||
| Net Asset Value, Offering and Redemption Price per Share | $ | 37.41 | $ | 27.50 | $ | 27.54 | $ | 11.93 | ||||||||
The accompanying notes are an integral part of the financial statements.
13
Amplify ETF Trust
Statements of Operations
For the Year/Period Ended October 31, 2017
| Amplify Online Retail ETF | Amplify YieldShares Senior Loan and Income ETF | Amplify | Amplify | |||||||||||||
| Investment Income: | ||||||||||||||||
| Dividend income from common stock (Net of Foreign Withholding Tax of $1,050, $0, $0 and $0, respectively) | $ | 110,604 | $ | 62,252 | $ | 173,369 | $ | — | ||||||||
| Distributions received from master limited partnerships | — | — | — | 46,130 | ||||||||||||
| Less: return of capital on distributions received from master limited partnerships | — | — | — | (46,130 | ) | |||||||||||
| Interest Income | 836 | 31 | 3,834 | 84 | ||||||||||||
Total Investment Income | 111,440 | 62,283 | 177,203 | 84 | ||||||||||||
| Expenses: | ||||||||||||||||
| Advisory Fees | 268,232 | 8,818 | 64,478 | 6,841 | ||||||||||||
Total Expenses | 268,232 | 8,818 | 64,478 | 6,841 | ||||||||||||
| Advisory Fees Waived | — | (1,717 | ) | — | — | |||||||||||
Net Expenses | 268,232 | 7,101 | 64,478 | 6,841 | ||||||||||||
Net Investment Income (Loss) | (156,792 | ) | 55,182 | 112,725 | (6,757 | ) | ||||||||||
Current and deferred tax benefit (expense) (c) | — | — | — | — | ||||||||||||
| Net Investment Income (Loss), Net of Taxes | (156,792 | ) | 55,182 | 112,725 | (6,757 | ) | ||||||||||
| Realized and Unrealized Gain (Loss): | ||||||||||||||||
| Net Realized Gain (Loss) on: | ||||||||||||||||
| Payment from Affiliate | 5,163 | — | — | — | ||||||||||||
| Investments | (589,606 | ) | 271,568 | 43,324 | 20,840 | |||||||||||
| Foreign Currency | (7,736 | ) | — | — | — | |||||||||||
| Options Written | — | — | 26,708 | — | ||||||||||||
| Futures Contracts | — | — | — | (263,396 | ) | |||||||||||
Current and deferred tax benefit (expense) (c) | — | — | — | — | ||||||||||||
| Net Change in Unrealized Appreciation (Depreciation) on: | ||||||||||||||||
| Investments | 10,660,526 | (4,335 | ) | — | (115,059 | ) | ||||||||||
| Foreign Currency | 146,457 | — | — | — | ||||||||||||
| Options Written | — | — | 790,410 | — | ||||||||||||
| Futures Contracts | — | — | (17,895 | ) | (40,262 | ) | ||||||||||
Current and deferred tax benefit (expense) (c) | — | — | — | — | ||||||||||||
Net Realized and Unrealized Gain (Loss) | 10,214,804 | 267,233 | 842,547 | (397,877 | ) | |||||||||||
Net Increase (Decrease) in Net Assets Resulting from Operations | $ | 10,058,012 | $ | 322,415 | $ | 955,272 | $ | (404,634 | ) | |||||||
(a) | Fund commenced operations on December 14, 2016. |
(b) | Fund commenced operations on June 1, 2017. |
(c) | Any tax benefit (expense) in Amplify Oil Hedged MLP Income ETF was fully offset by a 100% valuation allowance recorded as of October 31, 2017. |
The accompanying notes are an integral part of the financial statements.
14
Amplify ETF Trust
Statements of Changes in Net Assets
| Amplify Online Retail ETF | ||||||||
| Year Ended October 31, 2017 | Period Ended October 31, 2016(a) | |||||||
| Operations: | ||||||||
| Net Investment Loss | $ | (156,792 | ) | $ | (4,705 | ) | ||
| Net Realized Loss on Investments and Foreign Currency | (592,179 | ) | (2,391 | ) | ||||
| Net Change in Unrealized Appreciation on Investments and Foreign Currency | 10,806,983 | 222,681 | ||||||
Net Increase in Net Assets Resulting from Operations | 10,058,012 | 215,585 | ||||||
| Capital Share Transactions: | ||||||||
| Subscriptions | 94,347,495 | 3,861,025 | ||||||
Increase in Net Assets from Capital Share Transactions | 94,347,495 | 3,861,025 | ||||||
| Total Increase in Net Assets | 104,405,507 | 4,076,610 | ||||||
| Net Assets: | ||||||||
| Beginning of Period | 4,076,610 | — | ||||||
| End of Period | $ | 108,482,117 | $ | 4,076,610 | ||||
| Undistributed (Accumulated) Net Investment Loss | $ | (165,050 | ) | $ | (4,833 | ) | ||
| Share Transactions: | ||||||||
| Subscriptions | 2,750,000 | 150,000 | ||||||
Net Increase in Shares Outstanding from Share Transactions | 2,750,000 | 150,000 | ||||||
(a) | The Fund commenced operations on April 20, 2016. |
The accompanying notes are an integral part of the financial statements.
15
Amplify ETF Trust
Statements of Changes in Net Assets
| Amplify YieldShares Senior Loan and Income ETF | ||||||||
| Year Ended October 31, 2017 | Period Ended October 31, 2016(a) | |||||||
| Operations: | ||||||||
| Net Investment Income | $ | 55,182 | $ | 5,576 | ||||
| Net Realized Gain (Loss) on Investments | 271,568 | (18,883 | ) | |||||
| Net Change in Unrealized Appreciation (Depreciation) on Investments | (4,335 | ) | (567 | ) | ||||
Net Increase (Decrease) in Net Assets Resulting from Operations | 322,415 | (13,874 | ) | |||||
| Distributions to Shareholders: | ||||||||
| From Net Investment Income | (60,842 | ) | — | |||||
| Total Distributions | (60,842 | ) | — | |||||
| Capital Share Transactions: | ||||||||
| Subscriptions | — | 2,500,000 | ||||||
| Redemptions | (1,372,815 | ) | — | |||||
Increase (Decrease) in Net Assets from Capital Share Transactions | (1,372,815 | ) | 2,500,000 | |||||
Total Increase (Decrease) in Net Assets | (1,111,242 | ) | 2,486,126 | |||||
| Net Assets: | ||||||||
| Beginning of Period | 2,486,126 | — | ||||||
| End of Period | $ | 1,374,884 | $ | 2,486,126 | ||||
| Undistributed (Accumulated) Net Investment Income (Loss) | $ | — | $ | 5,576 | ||||
| Share Transactions: | ||||||||
| Subscriptions | — | 100,000 | ||||||
| Redemptions | (50,000 | ) | — | |||||
Net Increase (Decrease) in Shares Outstanding from Share Transactions | (50,000 | ) | 100,000 | |||||
(a) | The Fund commenced operations on September 21, 2016. |
The accompanying notes are an integral part of the financial statements.
16
Amplify ETF Trust
Statement of Changes in Net Assets
| Amplify YieldShares CWP Dividend & Option Income ETF | ||||
Period Ended October 31, | ||||
| Operations: | ||||
| Net Investment Income | $ | 112,725 | ||
| Net Realized Gain on Investments and Options Written | 70,032 | |||
| Net Change in Unrealized Appreciation on Investments and Options Written | 772,515 | |||
Net Increase in Net Assets Resulting from Operations | 955,272 | |||
| Distributions to Shareholders: | ||||
| From Net Investment Income | (204,819 | ) | ||
| From Return of Capital | (72,145 | ) | ||
| Total Distributions | (276,964 | ) | ||
| Capital Share Transactions: | ||||
| Subscriptions | 10,337,850 | |||
Increase in Net Assets from Capital Share Transactions | 10,337,850 | |||
Total Increase in Net Assets | 11,016,158 | |||
| Net Assets: | ||||
| Beginning of Period | — | |||
| End of Period | $ | 11,016,158 | ||
| Undistributed (Accumulated) Net Investment Income (Loss) | $ | — | ||
| Share Transactions: | ||||
| Subscriptions | 400,000 | |||
Net Increase in Shares Outstanding from Share Transactions | 400,000 | |||
(a) | The Fund commenced operations on December 14, 2016. |
The accompanying notes are an integral part of the financial statements.
17
Amplify ETF Trust
Statement of Changes in Net Assets
| Amplify YieldShares Oil Hedged MLP Income ETF | ||||
Period Ended October 31, | ||||
| Operations: | ||||
| Net Investment Loss, net of deferred tax benefit (expense) | $ | (6,757 | ) | |
| Net Realized Loss on Investments and futures contracts, net of deferred tax benefit (expense) | (242,556 | ) | ||
| Net Change in Unrealized Depreciation on Investments and Futures Contracts, net of deferred tax benefit (expense) | (155,321 | ) | ||
Net Decrease in Net Assets Resulting from Operations | (404,634 | ) | ||
| Distributions to Shareholders: | ||||
| From Return of Capital | (36,120 | ) | ||
| Total Distributions | (36,120 | ) | ||
| Capital Share Transactions: | ||||
| Subscriptions | 2,229,715 | |||
Increase in Net Assets from Capital Share Transactions | 2,229,715 | |||
Total Increase in Net Assets | 1,788,961 | |||
| Net Assets: | ||||
| Beginning of Period | — | |||
| End of Period | $ | 1,788,961 | ||
| Undistributed (Accumulated) Net Investment Loss | $ | (6,757 | ) | |
| Share Transactions: | ||||
| Subscriptions | 150,000 | |||
Net Increase in Shares Outstanding from Share Transactions | 150,000 | |||
(a) | The Fund commenced operations on June 1, 2017. |
The accompanying notes are an integral part of the financial statements.
18
Amplify ETF Trust
Amplify Online Retail ETF
Financial Highlights
| Year Ended October 31, 2017 | Period Ended | |||||||
Net Asset Value, Beginning of Year/Period | $ | 27.18 | $ | 25.00 | ||||
| Income (Loss) from Investment Operations: | ||||||||
Net Investment Loss (b) | (0.13 | ) | (0.05 | ) | ||||
| Net Realized and Unrealized Gain | 10.36 | (c) | 2.23 | |||||
| Total from Investment Operations | 10.23 | 2.18 | ||||||
Net Asset Value, End of Year/Period | $ | 37.41 | $ | 27.18 | ||||
Total Return on Net Asset Value (d) | 37.64 | %(e) | 8.71 | %(f) | ||||
| Supplemental Data: | ||||||||
| Net Assets, End of Year/Period (000's) | $ | 108,482 | $ | 4,077 | ||||
| Ratio of Expenses to Average Net Assets | 0.65 | % | 0.65 | %(g) | ||||
| Ratio of Net Investment Loss to Average Net Assets | -0.38 | % | -0.34 | %(g) | ||||
Portfolio Turnover (h) | 11 | % | 8 | %(f) | ||||
(a) | The Fund commenced operations on April 20, 2016. |
(b) | Calculated based on average shares outstanding during the period. |
(c) | Includes less than $0.01 gain per share derived from a payment from affiliate. See Note 4. |
(d) | Total Return on Net Asset Value is based on the change in net asset value (“NAV”) of a share during the period and assumes reinvestment of dividends and distributions at NAV. Total Return on Net Asset Value is for the period indicated and has not been annualized. The return shown does not reflect the deduction of taxes that a shareholder would pay on fund distributions or redemption of fund shares. |
(e) | Before payment from affiliate for the loss resulting from a trade error, the total return for the year would have been 37.63%. See Note 4. |
(f) | Not Annualized. |
(g) | Annualized. |
(h) | Excludes the impact of in-kind transactions. |
The accompanying notes are an integral part of the financial statements.
19
Amplify ETF Trust
Amplify YieldShares Senior Loan and Income ETF
Financial Highlights
| Year Ended October 31, 2017 | Period Ended October 31, | |||||||
Net Asset Value, Beginning of Year/Period | $ | 24.86 | $ | 25.00 | ||||
| Income (Loss) from Investment Operations: | ||||||||
Net Investment Income (b) (c) | 0.76 | 0.06 | ||||||
| Net Realized and Unrealized Gain (Loss) | 2.80 | (0.20 | ) | |||||
| Total from Investment Operations | 3.56 | (0.14 | ) | |||||
| Distributions to Shareholders | ||||||||
| Net Investment Income | (0.92 | ) | — | |||||
| Total from Distributions | (0.92 | ) | — | |||||
Net Asset Value, End of Year/Period | $ | 27.50 | $ | 24.86 | ||||
Total Return on Net Asset Value (d) | 14.37 | % | -0.55 | %(e) | ||||
| Supplemental Data: | ||||||||
| Net Assets, End of Year/Period (000's) | $ | 1,375 | $ | 2,486 | ||||
Ratio of Expenses to Average Net Assets (Before Advisory Fees Waived) (f) | 0.45 | % | 0.45 | %(g) | ||||
Ratio of Expenses to Average Net Assets (After Advisory Fees Waived) (f) | 0.36 | % | 0.35 | %(g) | ||||
Ratio of Net Investment Income to Average Net Assets (c) | 2.82 | % | 2.03 | %(g) | ||||
Portfolio Turnover (h) | 167 | % | 59 | %(e) | ||||
(a) | The Fund commenced operations on September 21, 2016. |
(b) | Calculated based on average shares outstanding during the period. |
(c) | Recognition of net investment income by the Fund is affected by the timing of the declaration of dividends by the underlying investment companies in which the Fund invests. The ratio does not include net investment income of the investment companies in which the Fund invests. |
(d) | Total Return on Net Asset Value is based on the change in net asset value (“NAV”) of a share during the period and assumes reinvestment of dividends and distributions at NAV. Total Return on Net Asset Value is for the period indicated and has not been annualized. The return shown does not reflect the deduction of taxes that a shareholder would pay on fund distributions or redemption of fund shares. |
(e) | Not Annualized. |
(f) | These ratios exclude the impact of expenses of the underlying security holdings as represented in the Schedule of Investments. |
(g) | Annualized. |
(h) | Excludes the impact of in-kind transactions. |
The accompanying notes are an integral part of the financial statements.
20
Amplify ETF Trust
Amplify YieldShares CWP Dividend & Option Income ETF
Financial Highlights
Period Ended October 31, | ||||
Net Asset Value, Beginning of Period | $ | 25.00 | ||
| Income (Loss) from Investment Operations: | ||||
Net Investment Income (b) | 0.39 | |||
| Net Realized and Unrealized Gain | 2.92 | |||
| Total from Investment Operations | 3.31 | |||
| Distributions to Shareholders | ||||
| Net Investment Income | (0.57 | ) | ||
| Return of Capital | (0.20 | ) | ||
| Total from Distributions | (0.77 | ) | ||
Net Asset Value, End of Period | $ | 27.54 | ||
Total Return on Net Asset Value (c) | 13.40 | %(d) | ||
| Supplemental Data: | ||||
| Net Assets, End of Period (000's) | $ | 11,016 | ||
| Ratio of Expenses to Average Net Assets | 0.95 | %(e) | ||
| Ratio of Net Investment Income (Loss) to Average Net Assets | 1.67 | %(e) | ||
Portfolio Turnover (f) | 187 | %(d) | ||
(a) | The Fund commenced operations on December 14, 2016. |
(b) | Calculated based on average shares outstanding during the period. |
(c) | Total Return on Net Asset Value is based on the change in net asset value (“NAV”) of a share during the period and assumes reinvestment of dividends and distributions at NAV. Total Return on Net Asset Value is for the period indicated and has not been annualized. The return shown does not reflect the deduction of taxes that a shareholder would pay on fund distributions or redemption of fund shares. |
(d) | Not Annualized. |
(e) | Annualized. |
(f) | Excludes the impact of in-kind transactions. |
The accompanying notes are an integral part of the financial statements.
21
Amplify ETF Trust
Amplify YieldShares Oil Hedged MLP Income ETF
Financial Highlights
Period Ended October 31, | ||||
Net Asset Value, Beginning of Period | $ | 15.00 | ||
| Income (Loss) from Investment Operations: | ||||
Net Investment Loss (b) | (0.05 | ) | ||
| Net Realized and Unrealized Loss | (2.78 | ) | ||
| Total from Investment Operations | (2.83 | ) | ||
| Distributions to Shareholders | ||||
| Return of Capital | (0.24 | ) | ||
| Total from Distributions | (0.24 | ) | ||
Net Asset Value, End of Period | $ | 11.93 | ||
Total Return on Net Asset Value (c) | -19.01 | %(d) | ||
| Supplemental Data: | ||||
| Net Assets, End of Period (000's) | $ | 1,789 | ||
| Ratio of Expenses to Average Net Assets (including net deferred income tax benefit (expense)) | 0.85 | %(e) | ||
| Ratio of Net Investment Loss to Average Net Assets (including net deferred income tax benefit (expense)) | -0.84 | %(e) | ||
Portfolio Turnover (f) | 39 | %(d) | ||
(a) | The Fund commenced operations on June 1, 2017. |
(b) | Calculated based on average shares outstanding during the period. |
(c) | Total Return on Net Asset Value is based on the change in net asset value (“NAV”) of a share during the period and assumes reinvestment of dividends and distributions at NAV. Total Return on Net Asset Value is for the period indicated and has not been annualized. The return shown does not reflect the deduction of taxes that a shareholder would pay on fund distributions or redemption of fund shares. |
(d) | Not Annualized. |
(e) | Annualized. |
(f) | Excludes the impact of in-kind transactions. |
The accompanying notes are an integral part of the financial statements.
22
Amplify ETF Trust
Notes to the Financial Statements
October 31, 2017
1. | ORGANIZATION |
Amplify ETF Trust (the “Trust”) was organized as a Massachusetts business trust on January 6, 2015, and is authorized to issue an unlimited number of shares in one or more series of funds. The Trust is an open-end management investment company, registered under the Investment Company Act of 1940, as amended (the “1940 Act”). The Trust consists of four non-diversified funds, Amplify Online Retail ETF, Amplify YieldShares Senior Loan and Income ETF (formerly known as Amplify YieldShares Prime 5 Dividend ETF), Amplify YieldShares CWP Dividend & Option Income ETF and Amplify YieldShares Oil Hedged MLP Income ETF (the “Funds”). Each Fund represents a beneficial interest in a separate portfolio of securities and other assets, with their own investment objectives and policies.
The investment objective of Amplify Online Retail ETF is to seek investment results that generally correspond (before fees and expenses) to the price and yield of the EQM Online Retail Index. Amplify Online Retail ETF commenced operations on April 20, 2016. The investment objective of Amplify YieldShares Senior Loan and Income ETF (a fund of funds) is to seek investment results that generally correspond (before fees and expenses) to the price and yield of the Prime Senior Loan and Income CEF Index. Amplify YieldShares Senior Loan & Income ETF commenced operations on September 21, 2016. The investment objective of Amplify YieldShares CWP Dividend & Option Income ETF is to seek to provide current income as its primary objective and capital appreciation as its secondary objective. Amplify YieldShares CWP Dividend & Option Income ETF commenced operations on December 14, 2016. The investment objective of Amplify YieldShares Oil Hedged MLP Income ETF is to seek to provide a high level of current income as its primary objective and to provide returns from energy master limited partnerships with a view toward reduced volatility as its secondary objective. Amplify YieldShares Oil Hedged MLP Income ETF commenced operations on June 1, 2017.
Amplify Online Retail ETF lists and principally trade its shares on The Nasdaq Stock Market® LLC (“Nasdaq”) and Amplify YieldShares Senior Loan and Income ETF, Amplify YieldShares CWP Dividend & Option Income ETF and Amplify YieldShares Oil Hedged MLP Income ETF lists and is principally trade their shares on the Cboe BZX Exchange, Inc. (each an “Exchange” and collectively, the “Exchanges”). Shares of the Funds trade on the Exchanges at market prices that may be below, at, or above the Funds’ net asset value (“NAV”). The Funds will issue and redeem shares on a continuous basis at NAV only in large blocks of shares, typically 50,000 shares, called “Creation Units.” Creation Units will be issued and redeemed principally in-kind for securities included in a specified universe. Once created, shares generally will trade in the secondary market at market prices that change throughout the day in amounts less than a Creation Unit. Except when aggregated in Creation Units, shares are not redeemable securities of a Fund. Shares of a Fund may only be purchased or redeemed by certain financial institutions (“Authorized Participants”). An Authorized Participant is either (i) a broker-dealer or other participant in the clearing process through the Continuous Net Settlement System of the National Securities Clearing Corporation or (ii) a DTC participant and, in each case, must have executed a Participant Agreement with Quasar Distributors, LLC (“the Distributor”). Most retail investors will not qualify as Authorized Participants or have the resources to buy and sell whole Creation Units. Therefore, they will be unable to purchase or redeem the shares directly from the Funds. Rather, most retail investors will purchase shares in the secondary market with the assistance of a broker and will be subject to customary brokerage commissions or fees.
Each Fund currently offers one class of shares, which has no front end sales load, no deferred sales charge, and no redemption fee. A purchase or redemption (i.e. creation or redemption) transaction fee of $500 is imposed for the transfer and other transaction costs associated with the purchase or redemption of Creation Units for Amplify Online Retail ETF and Amplify YieldShares CWP Dividend & Option Income ETF. A purchase or redemption transaction fee of $250 is imposed for Amplify YieldShares Senior Loan and Income ETF and Amplify YieldShares Oil Hedged MLP Income ETF. The Funds may issue an unlimited number of shares of beneficial interest, with par value of $0.01 per share. All shares of the Funds have equal rights and privileges.
2. | SIGNIFICANT ACCOUNTING POLICIES |
The Funds are investment companies and accordingly follow the investment company accounting and reporting guidance of the Financial Accounting Standards Board (“FASB”) Accounting Standards Codification (“ASC”) Topic 946 Financial Services – Investment Companies.
The following is a summary of significant accounting policies consistently followed by the Funds in the preparation of their financial statements. These policies are in conformity with accounting principles generally accepted in the United States of America (“U.S. GAAP”).
23
Amplify ETF Trust
Notes to the Financial Statements
October 31, 2017 (Continued)
SECURITY VALUATION
In accordance with the authoritative guidance on fair value measurements and disclosure under U.S. GAAP, the Funds disclose fair value of their investments in a hierarchy that prioritizes the inputs to valuation techniques used to measure fair value. The objective of a fair value measurement is to determine the price that would be received to sell an asset or paid to transfer a liability in an orderly transaction between market participants at the measurement date (an exit price). Accordingly, the fair value hierarchy gives the highest priority to quoted prices (unadjusted) in active markets for identical assets or liabilities (Level 1) and the lowest priority to unobservable inputs (Level 3). The following describes the levels of the fair value hierarchy:
Level 1 – Unadjusted quoted prices in active markets for identical, unrestricted assets or liabilities that the Funds have the ability to access at the measurement date;
Level 2 – Quoted prices which are not active, or inputs that are observable (either directly or indirectly) for substantially the full term of the asset or liability; and
Level 3 – Prices, inputs or exotic modeling techniques which are both significant to the fair value measurement and unobservable (supported by little or no market activity)
The valuation techniques used by the Funds to measure fair value for the period ended October 31, 2017 maximized the use of observable inputs and minimized the use of unobservable inputs.
For the period ended October 31, 2017, there have been no significant changes to the Funds’ fair valuation methodologies. It is the Funds’ policy to recognize transfers into or out of all levels at the end of the reporting period.
Common stocks, preferred stock, and other equity securities listed on any national or foreign exchange (excluding Nasdaq) and the London Stock Exchange Alternative Investment Market (“AIM”) will be valued at the last price on the exchange on which they are principally traded or, for NASDAQ and AIM securities, the official closing price. Securities traded on more than one securities exchange are valued at the last sale price or official closing price, as applicable, at the close of the exchange representing the principal market for such securities. Redeemable securities issued by open-end investment companies shall be valued at the investment company’s applicable NAV, with the exception of exchange-traded open-end investment companies which are priced as equity securities. Exchange-traded options will be valued at the current mean price where such contracts are principally traded. Futures contracts will be valued at the settlement price. Securities traded in the over-the-counter market are valued at the mean of the bid and the asked price, if available, and otherwise at their closing bid price.
If no quotation is available from either a pricing service, or one or more brokers or if the pricing committee has reason to question the reliability or accuracy of a quotation supplied, securities are valued at fair value as determined in good faith by the pricing committee, pursuant to procedures established under the general supervision and responsibility of the Fund’s Board of Trustees (the “Board”).
The following is a summary of the fair valuations according to the inputs used to value the Funds’ investments as of October 31, 2017:
| Category | Amplify Online Retail ETF | Amplify YieldShares Senior Loan and Income ETF | Amplify YieldShares CWP Dividend & Option Income ETF | Amplify YieldShares Oil Hedged MLP Income ETF | ||||||||||||
| Investments in Securities | ||||||||||||||||
| Assets | ||||||||||||||||
| Level 1 | ||||||||||||||||
| Common Stocks | $ | 108,434,055 | $ | — | $ | 9,881,884 | $ | — | ||||||||
| Investment Companies | — | 1,373,728 | — | — | ||||||||||||
| Master Limited Partnerships and Related Companies | — | — | — | 1,725,145 | ||||||||||||
| Money Market Funds | 99,212 | 6,525 | 509,159 | 3,443 | ||||||||||||
| Total Level 1 | 108,533,267 | 1,380,253 | 10,391,043 | 1,728,588 | ||||||||||||
24
Amplify ETF Trust
Notes to the Financial Statements
October 31, 2017 (Continued)
| Category | Amplify Online Retail ETF | Amplify YieldShares Senior Loan and Income ETF | Amplify YieldShares CWP Dividend & Option Income ETF | Amplify YieldShares Oil Hedged MLP Income ETF | ||||||||||||
| Level 2 | $ | — | $ | — | $ | — | $ | — | ||||||||
| Total Level 2 | — | — | — | — | ||||||||||||
| Level 3 | $ | — | $ | — | $ | — | $ | — | ||||||||
| Total Level 3 | — | — | — | — | ||||||||||||
| Total | $ | 108,533,267 | $ | 1,380,253 | $ | 10,391,043 | $ | 1,728,588 | ||||||||
Other Financial Instruments (a) | ||||||||||||||||
| Liabilities | ||||||||||||||||
| Level 1 | ||||||||||||||||
| Options Written | $ | — | $ | — | $ | 21,763 | $ | — | ||||||||
| Futures Contracts | — | — | — | 40,262 | ||||||||||||
| Total Level 1 | — | — | 21,763 | 40,262 | ||||||||||||
| Level 2 | — | — | — | — | ||||||||||||
| Total Level 2 | — | — | — | — | ||||||||||||
| Level 3 | — | — | — | — | ||||||||||||
| Total Level 3 | — | — | — | — | ||||||||||||
| Total | $ | — | $ | — | $ | 21,763 | $ | 40,262 | ||||||||
See the Schedules of Investments for further disaggregation of investment categories.
There were no transfers into or out of any Levels nor any Level 3 investments held during the year/period ended October 31, 2017.
(a) | Other Financial Instruments are derivative instruments not reflected in the Schedules of Investments. Such as options written, which are reflected at value, and futures contracts, which are reflected at unrealized depreciation. |
OPTION WRITING
The Amplify YieldShares CWP Dividend & Option Income ETF will employ an option strategy in which it will write U.S. exchange-traded covered call options on equity securities in the portfolio in order to seek additional income (in the form of premiums on the options) and selective repurchase of such options. A call option written (sold) by the Fund will give the holder (buyer) the right to buy a certain equity security at a predetermined strike price from the Fund. A premium is the income received by an investor who sells or writes an option contract to another party. The Fund seeks to lower risk and enhance total return by tactically selling short-term call options on some, or all, of the equity securities in the portfolio. Specifically, the Fund seeks to provide gross income of approximately 2-3% from dividend income and 2-4% from option premium, plus the potential for capital appreciation. Unlike a systematic covered call program, the Fund is not obligated to continuously cover each individual equity position. When one of the underlying stocks demonstrates strength or an increase in implied volatility, the Fund identifies that opportunity and sells call options tactically, rather than keeping all positions covered and limiting potential upside.
When the Fund writes an option, an amount equal to the premium received by the Fund is recorded as a liability and is subsequently adjusted to the current fair value of the option written. Premiums received from writing options that expire unexercised are treated by the Fund on the expiration date as realized gains from options written. The difference between the premium and the amount paid on effecting a closing purchase transaction, including brokerage commissions, is also treated as a realized gain, or, if the premium is less than the amount paid for the closing purchase transaction, as a realized loss. If a call option is exercised, the premium is added to the proceeds from the sale of the underlying security in determining whether the Fund has realized a gain or loss. The Fund, as a writer of an option, bears the market risk of an unfavorable change in the price of the security underlying the written option.
25
Amplify ETF Trust
Notes to the Financial Statements
October 31, 2017 (Continued)
FUTURES CONTRACTS
The Amplify YieldShares Oil Hedged MLP Income ETF may use futures contracts to seek to enhance return, to hedge some of the risks of its investments in securities, as a substitute for a position in the underlying asset, to reduce transaction costs, to maintain full market exposure (which means to adjust the characteristics of their investments to more closely approximate those of the markets in which it invests), to manage cash flows, to limit exposure to losses due to changes to non-U.S. currency exchange rates or to preserve capital. The Fund selectively hedges these positions to limit the correlation of its performance to the price of West Texas Intermediate Crude Oil (“WTI Crude Oil”). WTI Crude Oil, also known as Texas light sweet, is a grade of crude oil used as a benchmark in oil futures contracts pricing.
The Fund uses a benchmark, the Oil Hedged MLP Index (the “Benchmark”), which is developed, maintained and sponsored by ETP Ventures LLC (“ETP Ventures”). The Benchmark reflects the performance of long positions in master limited partnerships (“MLPs”) and a short exposure in WTI Crude Oil futures. To be “long” means to hold or be exposed to a security or instrument with the expectation that its value will increase over time. To be “short” means to sell or be exposed to a security or instrument with the expectation that it will fall in value. The Fund believes that MLPs have moved in the same direction as the price of WTI Crude Oil and that significant declines in the price of WTI Crude Oil can directly impact the price of the MLPs’ securities even though MLP earnings may have little exposure to the prices of WTI Crude Oil in the short term. The Benchmark seeks to reduce the volatility of maintaining its long positions in MLPs by strategically shorting WTI Crude Oil futures by up to 100% of the value of the Fund’s portfolio. Both constant and variable hedging elements are designed to provide market-neutral exposure to the MLPs in the Fund’s portfolio and are set to predetermined roll schedules for nearest and next-nearest futures contracts. The Benchmark maintains a continuous short on WTI Crude Oil futures equivalent on 40% of the net notional value of the long MLP holdings. A variable hedge element of 0% to 60% of the net notional value of the long MLP holdings is based upon a proprietary algorithmic methodology developed by ETP Ventures. The Fund will purchase or sell futures contracts in accordance with the Commodity Futures Trading Commission (“CFTC”) regulations.
The value of derivative instruments on the Statements of Assets and Liabilities for Amplify YieldShares CWP Dividend & Option Income ETF and Amplify YieldShares Oil Hedged MLP Income ETF as of October 31, 2017 is as follows:
Statement of Assets and Liabilities - Values of Derivative Instruments as of October 31, 2017
Amplify YieldShares CWP Dividend & Option Income ETF
Liability Derivatives | ||
Derivatives | Location | Value |
Equity Contracts - Options | Options written, at value | $ 21,763 |
The effect of Derivative Instruments on the Statement of Operations for the period ended October 31, 2017
Amount of Realized Gain on Derivatives Recognized in Income | Change in Unrealized Depreciation on Derivatives Recognized in Income | |||
Derivatives | Options Written | Derivatives | Options Written | |
Equity Contracts | $ 26,708 | Equity Contracts | $ (17,895) | |
Amplify YieldShares Oil Hedged Income ETF
Liability Derivatives | ||
Derivatives | Location | Value |
Commodity Contracts - Futures | Variation Margin Payable | $ 2,990 |
26
Amplify ETF Trust
Notes to the Financial Statements
October 31, 2017 (Continued)
The effect of Derivative Instruments on the Statement of Operations for the period ended October 31, 2017
Amount of Realized Gain on Derivatives Recognized in Income | Change in Unrealized Depreciation on Recognized in Income | |||
Derivatives | Futures | Derivatives | Futures | |
Commodity Contracts | $ (263,396) | Commodity Contracts | $ (40,262) | |
The average monthly value of options written during the period ended October 31, 2017 was $(7,126). The average monthly notional value of short futures during the period ended October 31, 2017 was $(1,431,212).
OFFSETTING ASSETS AND LIABILITIES
The Amplify YieldShares CWP Dividend & Option Income ETF and the Amplify YieldShares Oil Hedged Income ETF are subject to various Master Netting Arrangements, which govern the terms of certain transactions with select counterparties. The Master Netting Arrangements allow the Funds to close out and net their total exposure to a counterparty in the event of a default with respect to all the transactions governed under a single agreement with a counterparty. The Master Netting Arrangements also specify collateral posting arrangements at pre-arranged exposure levels. Under the Master Netting Arrangements, collateral is routinely transferred if the total net exposure to certain transactions (net of existing collateral already in place) governed under the relevant Master Netting Arrangement with a counterparty in a given account exceeds a specified threshold depending on the counterparty and type of Master Netting Arrangement.
The following is a summary of the Assets and Liabilities subject to offsetting in the Amplify YieldShares CWP Dividend & Option Income ETF and Amplify YieldShares Oil Hedged Income ETF as of October 31, 2017:
| Liabilities | Gross Amounts not offset in the Statements of Assets and Liabilities | |||||||||||||||||||||||
| Description / Counterparty | Gross Amounts of Recognized Liabilities | Gross Amounts Offset in the Statements of Assets and Liabilities | Net Amounts Presented in the Statements of Assets and Liabilities | Financial Instruments | Collateral Pledged | Net Amount | ||||||||||||||||||
| Amplify YieldShares CWP Dividend & Option Income ETF | ||||||||||||||||||||||||
| Options Written | ||||||||||||||||||||||||
Bank of America Merrill Lynch | $ | 21,763 | $ | — | $ | 21,763 | $ | 21,763 | $ | — | $ | — | ||||||||||||
| Amplify YieldShares Oil Hedged Income ETF | ||||||||||||||||||||||||
| Futures Contracts | ||||||||||||||||||||||||
| RBC Capital Markets, LLC | $ | 2,990 | $ | — | $ | 2,990 | $ | — | $ | 2,990 | $ | — | ||||||||||||
In some instances, the collateral amounts disclosed in the tables were adjusted due to the requirement to limit the collateral amounts to avoid the effect of overcollateralization. Actual collateral received/pledged may be more than the amounts disclosed herein.
SHARE VALUATION
The NAV per share of the Funds is calculated by dividing the sum of the value of the securities held by the Funds, plus cash and other assets, minus all liabilities (including estimated accrued expenses) by the total number of shares outstanding for each Fund, rounded to the nearest cent. The Funds’ shares will not be priced on the days on which the New York Stock Exchange (“NYSE”) is closed for trading. The offering and redemption price per share for the Funds is equal to the Funds’ NAV.
27
Amplify ETF Trust
Notes to the Financial Statements
October 31, 2017 (Continued)
USE OF ESTIMATES
The preparation of financial statements in conformity with U.S. GAAP requires management to make estimates and assumptions that affect the reported assets and liabilities and disclosure of contingent assets and liabilities at the date of the financial statement, as well as the reported amounts of revenues and expenses during the period. Actual results could differ from those estimates.
FOREIGN CURRENCY TRANSLATION
The books and records of the Funds are maintained in U.S. dollars. Investment securities and other assets and liabilities denominated in a foreign currency are translated into U.S. dollars on the date of valuation. Purchases and sales of investment securities, income and expenses are translated into U.S. dollars at the relevant rates of exchange prevailing on the respective dates of such transactions. The Funds do not isolate that portion of realized or unrealized gains and losses resulting from changes in the foreign exchange rate from fluctuations arising from changes in the market prices of the securities. These gains and losses are included in net realized and unrealized gains (loss) on investments on the Statements of Operations. Net realized and unrealized gains and losses on foreign currency transactions represent net foreign exchange gains or losses from foreign currency exchange contracts, disposition of foreign currencies, currency gains or losses realized between trade and settlement dates on securities transactions and the difference between the amount of the investment income and foreign withholding taxes recorded on the Funds’ books and the U.S. dollar equivalent amounts actually received or paid.
SECURITY TRANSACTIONS AND INVESTMENT INCOME
Security transactions are accounted for on trade date. Costs used in determining realized gains and losses on the sale of investment securities are based on specific identification. Dividend income is recorded on the ex-dividend date. Interest income is recognized on the accrual basis. Withholding taxes on foreign dividends have been provided for in accordance with the Funds’ understanding of the applicable country’s tax rules and rates.
Distributions received from the investments in closed-end funds (“CEFs”) are recorded as ordinary income, net realized capital gain or return of capital based on information reported by the CEFs and management’s estimates of such amounts based on historical information. These estimates are adjusted with the tax returns after the actual source of distributions has been disclosed by the CEF and may differ from the estimated amounts.
Distributions received from MLPs are generally comprised of ordinary income and return of capital from MLPs. For financial statement purposes, Amplify YieldShares Oil Hedged MLP Income ETF (“AMLX”) uses return of capital and income estimates to allocate the dividend income. Such estimates are based on historical information available from each MLP and other industry sources. These estimates may subsequently be revised based on information received from energy trusts or MLPs after their tax reporting periods are concluded, as the actual character of these distributions is not known until after the fiscal year end of AMLX.
DIVIDENDS AND DISTRIBUTIONS TO SHAREHOLDERS
Dividends from net investment income, if any, will be declared and paid at least annually by the Funds. The Funds distributes their net realized capital gains, if any, to shareholders annually. All distributions are recorded on the ex-dividend date.
Due to the tax treatment of the Amplify YieldShares Oil Hedged Income ETF’s allocations and distributions from MLPs, the Advisor expects that a significant portion of the Amplify YieldShares Oil Hedged Income ETF’s distributions to shareholders will typically be treated as return of capital to shareholders for U.S. federal income tax purposes (i.e., as distributions in excess of the the Amplify YieldShares Oil Hedged Income ETF’s current and accumulated earnings and profits as described below). However, no assurance can be given in this regard; just as the the Amplify YieldShares Oil Hedged Income ETF’s corporate income tax liability can fluctuate materially from year to year, the extent to which the the Amplify YieldShares Oil Hedged Income ETF is able to make return-of-capital distributions also can vary materially from year to year depending on a number of different factors, including the composition of the the Amplify YieldShares Oil Hedged Income ETF’s portfolio, the level of allocations of net income and other tax items for the Amplify YieldShares Oil Hedged Income ETF from its underlying MLP investments during a particular taxable year, the length of time the Amplify YieldShares Oil Hedged Income ETF has owned the MLP equity securities in its portfolio, and the extent to which the Amplify YieldShares Oil Hedged Income ETF disposes of MLP equity securities during a particular year, including, if necessary, to meet Fund shareholder redemption
28
Amplify ETF Trust
Notes to the Financial Statements
October 31, 2017 (Continued)
requests. The Amplify YieldShares Oil Hedged Income ETF records its pro rata share of income (loss) and capital gains (losses), to the extent of distributions it has received, allocated from the underlying partnerships and accordingly adjusts the cost basis of the underlying partnerships for return of capital.
The amount and character of income and capital gain distributions to be paid, if any, are determined in accordance with income tax regulations, which may differ from U.S. GAAP. As a result, net investment income (loss) and net realized gain (loss) on investments and foreign currency for a reporting period may differ significantly from distributions during such period. These book/tax differences may be temporary or permanent. To the extent these differences are permanent in nature, they are charged or credited to undistributed (accumulated) net investment income (loss), accumulated net realized gain (loss) on investments or paid-in capital, as appropriate, in the period that the differences arise.
GUARANTEES AND INDEMNIFICATIONS
In the normal course of business, the Funds enter into contracts with service providers that contain general indemnification clauses. The Funds’ maximum exposure under these arrangements is unknown, as this would involve future claims that may be made against the Funds that have not yet occurred. However, based on experience, the Funds expect risk of loss to be remote.
ORGANIZATIONAL AND OFFERING COSTS
All organizational costs incurred to establish the Funds were paid by Amplify Investments, LLC (the “Adviser”) and are not subject to reimbursement.
3. | AGREEMENTS |
Amplify Investments, LLC (the “Adviser”) serves as investment adviser to the Funds. Pursuant to an Investment Management Agreement (the “Management Agreement”) between the Trust, on behalf of the Funds, and the Adviser, the Adviser provides investment advice to the Funds and oversees the day-to-day operations of the Funds, subject to the direction and control of the Board and the officers of the Trust. Under the Management Agreement, the Funds will pay the following investment advisory fees to the Adviser as compensation for the services rendered, facilities furnished, and expenses paid by it, including the cost of transfer agency, custody, fund administration, legal, audit and other service and license fees, but excluding interest, taxes, brokerage commissions, and other expenses connected with the execution of portfolio transactions, distribution and service fees payable pursuant to a Rule 12b-1 Plan, if any, and extraordinary expenses.
Fund | Annual Rate of Average Daily Net Assets |
Amplify Online Retail ETF | 0.65% |
Amplify YieldShares Senior Loan and Income ETF | 0.45% |
Amplify YieldShares CWP Dividend & Option Income ETF | 0.95% |
Amplify YieldShares Oil Hedged MLP Income ETF | 0.85% |
Prior to August 29, 2017, pursuant to a contractual agreement between the Trust, on behalf of Amplify YieldShares Senior Loan and Income ETF and the Adviser, the management fees paid to the Adviser were reduced by 0.10%. For the period ended October 31, 2017, the Adviser’s management fee was reduced by $1,717. The Adviser is not eligible to recoup this amount.
The Adviser has overall responsibility for overseeing the investment of the Funds’ assets, managing the Funds’ business affairs and providing certain clerical, bookkeeping and other administrative services for the Trust. Penserra Capital Management, LLC serves as the sub-adviser (“Penserra”) to the Amplify Online Retail ETF, Amplify YieldShares Senior Loan and Income ETF and Amplify YieldShares Oil Hedged MLP Income ETF. Penserra and Capital Wealth Planning, LLC (“CWP”) serves as the sub advisers to the Amplify YieldShares CWP Dividend & Option Income ETF (Penserra, together with CWP, the “Sub-Advisers,” and each, a “Sub-Adviser”). The Sub-Adviser
29
Amplify ETF Trust
Notes to the Financial Statements
October 31, 2017 (Continued)
has responsibility for selecting and continuously monitoring the Fund’s investments. Sub-Advisory fees earned by Penserra and CWP are paid for by the Adviser. For the period ended October 31, 2017, the Funds paid Penserra Securities, LLC, an affiliate of Penserra, $17,737 for brokerage commissions.
U.S. Bancorp Fund Services, LLC (“USBFS” or the “Administrator”) acts as the Funds’ Administrator and, in that capacity, performs various administrative and accounting services for the Funds. The Administrator prepares various federal and state regulatory filings, reports and returns for the Funds, including regulatory compliance monitoring and financial reporting; prepares reports and materials to be supplied to the Board; monitors the activities of the Funds’ custodian, transfer agent and accountant. USBFS also serves as the transfer agent and fund accountant to the Funds.
U.S. Bank N.A., an affiliate of USBFS, serves as the Funds’ custodian.
The Distributor acts as the Funds’ principal underwriter in a continuous public offering of the Funds’ shares. The Distributor is an affiliate of the Administrator.
Certain officers and two Trustees of the Trust are also officers or employees of the Adviser or its affiliates. They receive no fees for serving as officers or Trustees of the Trust.
4. | INVESTMENT TRANSACTIONS |
For the year/period ended October 31, 2017, the purchases and sales of investments in securities, excluding in-kind transactions and short-term securities were:
| Fund | Purchases | Sales | ||||||
| Amplify Online Retail ETF | $ | 9,024,236 | $ | 4,777,347 | ||||
| Amplify YieldShares Senior Loan and Income ETF | 3,277,122 | 3,281,321 | ||||||
| Amplify YieldShares CWP Dividend & Option Income ETF | 13,617,156 | 14,086,667 | ||||||
| Amplify YieldShares Oil Hedged MLP Income ETF | 689,701 | 799,322 | ||||||
For the year/period ended October 31, 2017, in-kind transactions associated with creations and redemptions were:
| Fund | Purchases | Sales | ||||||
| Amplify Online Retail ETF | $ | 89,896,932 | $ | — | ||||
| Amplify YieldShares Senior Loan and Income ETF | — | 1,366,976 | ||||||
| Amplify YieldShares CWP Dividend & Option Income ETF | 9,617,787 | — | ||||||
| Amplify YieldShares Oil Hedged MLP Income ETF | 1,975,115 | — | ||||||
There were no purchases or sales of long-term U.S. Government securities by the Funds.
During the year ended October 31, 2017, Amplify Online Retail ETF had a trade error where a foreign exchange transaction was placed using the incorrect currency. This resulted in a loss to the Fund of $5,163, of which a portion was subsequently reimbursed to the Fund by an affiliate.
30
Amplify ETF Trust
Notes to the Financial Statements
October 31, 2017 (Continued)
| 5. | FEDERAL INCOME TAXES |
As of and during the year/period ended October 31, 2017, the Funds did not have any tax positions that did not meet the “more-likely-than-not” threshold of being sustained by the applicable tax authority. As of and during the year/period ended October 31, 2017, the Funds did not have liabilities for any unrecognized tax benefits. The Funds recognize interest and penalties, if any, related to unrecognized tax benefits on uncertain tax positons as income tax expense in the Statements of Operations. During the year/period ended October 31, 2017, the Funds did not incur any interest or penalties.
Amplify Online Retail ETF, Amplify YieldShares Senior Loan and Income ETF and Amplify YieldShares CWP Dividend & Option Income ETF
There were no distributions during the period ended October 31, 2016. The tax composition of distributions paid during the year/period ended October 31, 2017 for the Funds was as follows:
| Ordinary Income | Capital Gains | Return of Capital | ||||||||||
| Amplify Online Retail ETF | $ | — | $ | — | $ | — | ||||||
| Amplify YieldShares Senior Loan and Income ETF | 60,842 | — | — | |||||||||
| Amplify YieldShares CWP Dividend & Option Income ETF | 204,819 | — | 72,145 | |||||||||
The Funds, except Amplify YieldShares Oil Hedged MLP Income ETF, intend to meet the requirements of Subchapter M of the Internal Revenue Code applicable to regulated investment companies and will distribute substantially all taxable income and capital gains to shareholders. Therefore, no federal income or excise tax provision has been made.
The cost basis of investments for federal income tax purposes as of October 31, 2017 was as follows:
| Amplify Online Retail ETF | Amplify YieldShares Senior Loan and Income ETF | Amplify YieldShares CWP Dividend & Option Income ETF | ||||||||||
| Tax cost of investments | $ | 97,579,853 | $ | 1,385,155 | $ | 9,622,031 | ||||||
| Gross tax unrealized appreciation | 17,934,031 | 7,818 | 816,073 | |||||||||
| Gross tax unrealized depreciation | (6,980,617 | ) | (12,720 | ) | (47,061 | ) | ||||||
| Net tax unrealized appreciation (depreciation) | 10,953,414 | (4,902 | ) | 769,012 | ||||||||
| Undistributed ordinary income | — | 259,687 | — | |||||||||
| Undistributed long-term gain | — | — | — | |||||||||
| Total distributable earnings | — | 259,687 | — | |||||||||
| Other accumulated (loss) | (674,156 | ) | (7,086 | ) | (18,559 | ) | ||||||
| Total accumulated gain | $ | 10,279,258 | $ | 247,699 | $ | 750,453 | ||||||
The difference between book and tax-basis cost is primarily attributable to the deferral on wash sales.
At October 31, 2017, the Funds deferred, on a tax basis, late year ordinary losses of:
| Late Year Ordinary Loss Deferral | ||||
| Amplify Online Retail ETF | $ | (165,050 | ) | |
| Amplify YieldShares Senior Loan and Income ETF | — | |||
| Amplify YieldShares CWP Dividend & Option Income ETF | — | |||
31
Amplify ETF Trust
Notes to the Financial Statements
October 31, 2017 (Continued)
At October 31, 2017, the Funds had the following capital loss carryforwards:
| Short-Term | Expires | |||||
| Amplify Online Retail ETF | $ | (509,032 | ) | Unlimited | ||
| Amplify YieldShares Senior Loan and Income ETF | — | N/A | ||||
| Amplify YieldShares CWP Dividend & Option Income ETF | — | N/A | ||||
Additionally, U.S. GAAP require that certain components of net assets relating to permanent differences be reclassified between financial and tax reporting. These reclassifications have no effect on net assets or NAV per share. The permanent differences primarily relate to distributions from foreign currency gain/loss, re-designation of distributions, net operating losses and gains from passive foreign investment companies. For the year/period ended October 31, 2017, the following table shows the reclassifications made:
| Undistributed (Accumulated) Net Investment Income (Loss) | Accumulated Net Realized Gain (Loss) | Paid-In Capital | ||||||||||
| Amplify Online Retail ETF | $ | (3,425 | ) | $ | 9,086 | $ | (5,661 | ) | ||||
| Amplify YieldShares Senior Loan and Income ETF | 84 | (84 | ) | — | ||||||||
| Amplify YieldShares CWP Dividend & Option Income ETF | 92,094 | (92,094 | ) | — | ||||||||
Amplify YieldShares Oil Hedged MLP Income ETF
Amplify YieldShares Oil Hedged MLP Income ETF is treated as a regular corporation, or “C” corporation for U.S. federal income tax purposes. Because the Amplify Yield Shares Oil Hedged MP Income ETF is treated as a “C” corporation, it will not be taxed as a regulated investment company (“RIC”) under Subchapter M of the Code, and therefore, is not required to comply with the diversification requirements applicable to RICs.
The tax composition of distributions paid during the period ended October 31, 2017 for the Fund was as follows:
| Ordinary Income | Return of Capital | |||||||
| Amplify YieldShares Oil Hedged MLP Income ETF | $ | — | $ | 36,120 | ||||
The Amplify YieldShares Oil Hedged MLP Income ETF is subject to federal and state income tax on its taxable income. Currently, the maximum marginal regular federal income tax rate for a corporation is 35%. The federal income tax rate for corporations may change to 21% pending future legislation, which may have a material impact on future financial statements. A change in federal income tax rate is recorded on the date of enactment. Management estimates that the effect to the Fund’s deferred tax asset on the date of enactment would be offset by a corresponding change in valuation allowance. The Fund may be subject to a 20% federal alternative minimum tax on its federal alternative minimum taxable income to the extent that its alternative minimum tax exceeds its respective regular federal income tax. The Amplify YieldShares Oil Hedged MLP Income ETF invests in assets in MLPs, which generally are treated as partnerships for federal income tax purposes. As a limited partner in MLPs, the Fund includes its allocable share of each MLP’s taxable income in computing its own taxable income. Due to the nature of the Fund’s investments, the Fund may be required to file income tax returns in several states.
In calculating the Amplify YieldShares Oil Hedged Income ETF’s daily net asset value, the Fund will account for its deferred tax liability and/or asset balances. The Fund will accrue, in accordance with U.S. GAAP, a deferred income tax liability or benefit balance at the current effective U.S. federal income tax rate plus an estimated state income tax rate for its future tax liability or benefit associated with the capital appreciation or depreciation of its investments and for any net operating gains or losses.
32
Amplify ETF Trust
Notes to the Financial Statements
October 31, 2017 (Continued)
Deferred income taxes reflect the net tax effect of temporary differences between the carrying amount of assets and liabilities for financial reporting and tax purposes. A valuation allowance is recognized if, based on the weight of available evidence, it is more likely than not that some portion or all of a deferred income tax asset will not be realized. From time to time, as new information becomes available, the Fund will modify its estimates or assumption regarding the deferred tax liabilities or assets. As of October 31, 2017, the Amplify YieldShares Oil Hedged MLP Income ETF did not record a deferred tax asset or liability.
| Deferred Tax Assets: | ||||
| Net Operating Loss Carry-Forwards | $ | 1,515 | ||
| State NOL Carry-Forward | 103 | |||
| Capital Loss Carry-Forward (Tax-Basis) | 104,749 | |||
| Unrealized Losses | 44,858 | |||
| Total Deferred Tax Assets (Before Valuation Allowance) | 151,225 | |||
| Valuation Allowance | (151,225 | ) | ||
| Total Net Deferred Tax Asset/Liability | $ | — | ||
The net operating loss carryforward and capital loss carryforward are available to offset future taxable income. The Fund has the following net operating loss and capital loss amounts:
Fiscal Year Ended Net Operating Loss | Amount | Expiration |
October 31, 2017 | $ 4,329 | October 31, 2037 |
Fiscal Year Ended Capital Loss | Amount | Expiration |
October 31, 2017 | $ 280,278 | October 31, 2022 |
For corporations, capital losses can only be used to offset capital gains and cannot be used to offset ordinary income. The capital loss may be carried forward for five years and, accordingly, would expire as of October 31, 2022. The net operating loss can be carried forward for 20 years and, accordingly, would expire as of October 31, 2037.
For the Amplify YieldShares Oil Hedged MLP Income ETF, total income taxes have been computed by applying the federal statutory income tax rate of 35% plus a blended state income tax rate. The Fund applied this effective rate to net ordinary income, realized gains on investments and unrealized gains on investments before taxes in computing its total income taxes.
| Amount | Rate | |||||||
| Total Tax (Benefit) Expense | ||||||||
| Tax (Benefit) Expense at Statutory Rates | $ | (141,622 | ) | (35.00 | %) | |||
| State Income Tax Expense, Net of Federal Benefit | (9,602 | ) | (2.37 | %) | ||||
| Change in Valuation Allowance | 151,224 | 37.73 | % | |||||
Total Tax Expense | $ | — | — | |||||
At October 31, 2017, the tax cost basis of investments, gross unrealized appreciation and depreciations of investments for federal income tax purposes were as follows:
| Tax cost of investments | $ | 1,848,616 | ||
| Gross unrealized appreciation | 31,316 | |||
| Gross unrealized depreciation | (151,344 | ) | ||
| Net unrealized appreciation (depreciation) | $ | (120,028 | ) |
33
Amplify ETF Trust
Notes to the Financial Statements
October 31, 2017 (Continued)
6. | RECENT ACCOUNTING PRONOUNCEMENTS |
On December 14, 2016, the FASB issued Accounting Standards Update (“ASU”) 2016-19, Technical Corrections and Improvements that made technical changes to various sections of the ASC, including Topic 820, Fair Value Measurement. The changes to Topic 820 are intended to clarify the difference between a valuation approach and a valuation technique. A reporting entity should disclose, for Level 2 and Level 3 fair value measurements, a change in either or both a valuation approach and a valuation technique and the reason(s) for the change. The changes to Topic 820 are effective for fiscal years, and interim periods within those fiscal years, beginning after December 15, 2016. At this time, management is evaluating the implications of this ASU and its impact on the financial statements.
In March 2017, the FASB issued ASU No. 2017-08, Receivables—Nonrefundable Fees and Other Costs (Subtopic 310-20): Premium Amortization on Purchased Callable Debt Securities. The amendments in the ASU shorten the amortization period for certain callable debt securities, held at a premium, to be amortized to the earliest call date. The ASU does not require an accounting change for securities held at a discount; which continues to be amortized to maturity. The ASU is effective for fiscal years and interim periods within those fiscal years beginning after December 15, 2018. Management is currently evaluating the impact, if any, of applying this provision.
7. | PRINCIPAL RISKS |
ACTIVE MARKET RISK
Although the Funds intend to principally trade the shares on the Exchange, there can be no assurance that an active trading market for the shares will develop or be maintained. Shares may trade on the Exchange at market prices that may be below, at or above the Funds’ NAV.
ADR AND GDR RISK
ADRs and global depositary receipts (“GDRs”) may be subject to certain of the risks associated with direct investments in the securities of foreign companies, such as currency, political, economic and market risks, because their values depend on the performance of the non-dollar denominated underlying foreign securities. Certain countries may limit the ability to convert ADRs into the underlying foreign securities and vice versa, which may cause the securities of the foreign company to trade at a discount or premium to the market price of the related ADR. ADRs may be purchased through “sponsored” or “unsponsored” facilities. A depositary may establish an unsponsored facility without participation by the issuer of the deposited security. Unsponsored receipts may involve higher expenses and may be less liquid. GDRs can involve currency risk since, unlike ADRs, they may not be U.S. dollar-denominated. Because the Funds’ NAV is determined in U.S. dollars, the NAV of the Funds could decline if the currency of the non-U.S. market in which the Funds invest depreciates against the U.S. dollar, even if the value of the Funds’ holdings, measured in the foreign currency, increases.
ALTERNATIVE MINIMUM TAX
As a corporation for tax purposes, the Fund’s earnings and profits will be calculated using (i) straight-line depreciation rather than a percentage depletion method and (ii) drilling costs and exploration and development costs are amortized over a five-year and ten-year period, respectively. Because of the differences in the manner in which earnings and profits and taxable income are calculated, the Fund may make distributions out of earnings and profits, treated as dividends, in years in which the Funds has no taxable income. In addition, in calculating the Fund’s alternative minimum taxable income, the certain percentage depletion deductions and intangible drilling costs may be treated as items of tax preference. Items of tax preference increase alternative minimum taxable income and increase the likelihood that the Fund may be subject to alternative minimum tax.
AUTHORIZED PARTICIPANT CONCENTRATION RISK
Only an authorized participants may engage in creation or redemption transactions directly with the Funds. The Funds has a limited number of institutions that act as authorized participants. To the extent that these institutions exit the business or are unable to proceed with creation and/or redemption orders with respect to the Funds and no other authorized participant is able to step forward to create or redeem, in either of these cases, Fund shares may trade at a discount to the Funds’ net asset value and possibly face delisting.
34
Amplify ETF Trust
Notes to the Financial Statements
October 31, 2017 (Continued)
BORROWING AND LEVERAGE RISK
When the Funds borrows money, they must pay interest and other fees, which will reduce the Funds’ returns if such costs exceed the returns on the portfolio securities purchased or retained with such borrowings. Any such borrowings are intended to be temporary. However, under certain market conditions, including periods of low demand or decreased liquidity, such borrowings might be outstanding for longer periods of time. As prescribed by the 1940 Act, the Funds will be required to maintain specified asset coverage of at least 300% with respect to any bank borrowing immediately following such borrowing. The Funds may be required to dispose of assets on unfavorable terms if market fluctuations or other factors reduce the Funds’ asset coverage to less than the prescribed amount.
CASH TRANSACTIONS RISK
Unlike many exchange-traded funds, the Fund expects to effect a portion of redemptions for cash, rather than in kind. Because the Fund may effect redemptions for cash, rather than in kind distributions, it may be required to sell portfolio securities in order to obtain the cash needed to distribute redemption proceeds. Such cash transactions may have to be carried out over several days if the securities market is relatively illiquid and may involve considerable brokerage fees. These brokerage fees, which will be higher than if the Fund redeemed its Shares in kind, will be passed on in the form of redemption transaction fees. In addition, these factors may result in wider spreads between the bid and the offered prices of the Shares than for shares of more conventional exchange-traded funds. Such cash transactions may therefore have an adverse effect on the Fund’s performance.
COVERED CALL RISK
Covered call risk is the risk that the Fund will forgo, during the option’s life, the opportunity to profit from increases in the market value of the security covering the call option above the sum of the premium and the strike price of the call, but has retained the risk of loss should the price of the underlying security decline. In addition, as the Fund writes covered calls over more of its portfolio, its ability to benefit from capital appreciation becomes more limited. The writer of an option has no control over the time when it may be required to fulfill its obligation as a writer of the option. Once an option writer has received an exercise notice, it cannot effect a closing purchase transaction in order to terminate its obligation under the option and must deliver the underlying security at the exercise price.
CONSUMER DISCRETIONARY COMPANIES RISK
These companies manufacture products and provide discretionary services directly to the consumer, and the success of these companies is tied closely to the performance of the overall domestic and international economy, interest rates, competition and consumer confidence. Success depends heavily on disposable household income and consumer spending. Changes in demographics and consumer tastes can also affect the demand for, and success of, consumer discretionary products in the marketplace.
CORRELATION RISK
Correlation risk is the risk that there might be an imperfect correlation, or even no correlation, between price movements of a derivative instrument and price movements of investments being hedged. When a derivative transaction is used to completely hedge another position, changes in the market value of the combined position (the derivative instrument plus the position being hedged) result from an imperfect correlation between the price movements of the two instruments. With a perfect hedge, the value of the combined position remains unchanged with any change in the price of the underlying asset. With an imperfect hedge, the value of the derivative instrument and its hedge are not perfectly correlated. For example, if the value of a derivative instrument used in a short hedge (such as writing a call option, buying a put option or selling a futures contract) increased by less than the decline in value of the hedged investments, the hedge would not be perfectly correlated. This might occur due to factors unrelated to the value of the investments being hedged, such as speculative or other pressures on the markets in which these instruments are traded. The effectiveness of hedges using instruments on indices will depend, in part, on the degree of correlation between price movements in the index and the price movements in the investments being hedged.
35
Amplify ETF Trust
Notes to the Financial Statements
October 31, 2017 (Continued)
CYBER SECURITY RISK
As the use of Internet technology has become more prevalent in the course of business, the Funds have become more susceptible to potential operational risks through breaches in cyber security. A breach in cyber security refers to both intentional and unintentional events that may cause the Funds to lose proprietary information, suffer data corruption or lose operational capacity. Such events could cause the Funds to incur regulatory penalties, reputational damage, additional compliance costs associated with corrective measures and/or financial loss. Cyber security breaches may involve unauthorized access to the Funds’ digital information systems through “hacking” or malicious software coding, but may also result from outside attacks such as denial-of-service attacks through efforts to make network services unavailable to intended users. In addition, cyber security breaches of the Funds’ third party service providers, such as its administrator, transfer agent, custodian, or sub-advisor, as applicable, or issuers in which the Funds invest, can also subject the Funds to many of the same risks associated with direct cyber security breaches. The Funds have established risk management systems designed to reduce the risks associated with cyber security. However, there is no guarantee that such efforts will succeed, especially because the Funds do not directly control the cyber security systems of issuers or third party service providers.
ENERGY COMPANIES RISK
As a company engaged in natural resource activities such as the exploration, development, mining, production, processing, refining, transportation, storage and marketing of mineral or natural resources, an MLP may be directly affected by energy commodity prices, especially those companies that own the underlying energy commodity. A decrease in the production or availability of natural gas, natural gas liquids, crude oil, coal or other energy commodities or a decrease in the volume of such commodities available for transportation, processing, storage or distribution may adversely impact the financial performance of energy companies. Energy companies are subject to significant federal, state and local government regulation in virtually every aspect of their operations, including how facilities are constructed, maintained and operated, environmental and safety controls, and the prices they may charge for products and services. Various governmental authorities have the power to enforce compliance with these regulations and the permits issued under them and violators are subject to administrative, civil and criminal penalties, including civil fines, injunctions or both. Stricter laws, regulations or enforcement policies could be enacted in the future which would likely increase compliance costs and may adversely affect the financial performance of energy companies. Natural disasters and/or extreme weather, such as hurricanes in the Gulf of Mexico, also may impact energy companies. Additional risks associated with the industry served by energy companies include, but are not limited to, sustained reduced demand for crude oil, rising interest rates which could result in a higher cost of capital, threats of attack by terrorists or other non-state actors, and geopolitical issues such as war and the unpredictable nature of hostile or unstable governments.
EQUITY SECURITIES RISK
The value of shares of the Funds will fluctuate with changes in the value of these equity securities. Equity securities prices fluctuate for several reasons, including changes in investors’ perceptions of the financial condition of an issuer or the general condition of the relevant stock market, such as the current market volatility, or when political or economic events affecting the issuers occur.
FLUCTUATION OF NAV RISK
The NAV of the Funds’ shares will generally fluctuate with changes in the market value of the Funds’ holdings. The market prices of shares will generally fluctuate in accordance with changes in NAV as well as the relative supply of and demand for shares on the Exchange.
FOREIGN INVESTMENT RISK
Securities issued by foreign companies present risks beyond those of securities of U.S. issuers. Risks of investing in the securities of foreign companies include: different accounting standards; expropriation, nationalization or other adverse political or economic developments; currency devaluation, blockages or transfer restrictions; changes in foreign currency exchange rates; taxes; restrictions on foreign investments and exchange of securities; and less government supervision and regulation of issuers in foreign countries. Prices of foreign securities also may be more volatile.
36
Amplify ETF Trust
Notes to the Financial Statements
October 31, 2017 (Continued)
FUTURES RISK
The successful use of short positions on futures contracts with respect to the Oil Hedging Strategy depends upon the Sub-Adviser’s skill and experience with respect to such instruments and are subject to special risk considerations, including: imperfect correlation between the change in market value of the instruments held by the Fund and the price of the futures contract; possible lack of a liquid secondary market for its position on a futures contract and the resulting inability to close a short position on a futures contract when desired; losses caused by unanticipated market movement, which are potentially unlimited; the Sub-Adviser’s inability to correctly predict the direction of securities prices, interest rates, currency exchange rates and other economic factors; the possibility that a counterparty will default in the performance of its obligations; the possibility that the Fund may have insufficient cash and have to sell securities from its portfolio to meet the daily variation margin requirements at a time when it may be disadvantageous to do so; the possibility that a failure to close a position may result in delivery of an illiquid commodity to the Fund or that rapid selling to avoid delivery may result in unfavorable execution prices; and possible inefficiencies that are created by the need to “roll contracts” (i.e., sell out of a contract that is nearing delivery or settlement in favor of a contract with a delivery or settlement date that is further into the future).
If the Sub-Adviser applies a hedge in the Fund’s portfolio at an inappropriate time or judges market movements incorrectly, futures strategies may lower the Fund’s return.
FUND OF FUND RISK
Because the Amplify YieldShares Senior Loan and Income ETF is a fund of funds, its investment performance largely depends on the investment performance of the closed end funds (“CEFs”) in which it invests. An investment in the Fund is subject to the risks associated with the CEFs that comprise the Index. The Fund will pay indirectly a proportional share of the fees and expenses of the CEFs in which it invests, including their investment advisory and administration fees, in addition to its own fees and expenses. In addition, at times certain segments of the market represented by constituent CEFs may be out of favor and underperform other segments.
GEOGRAPHIC REGION RISK
The Fund invests primarily in securities of companies headquarterd or incorporated in the United States and Canada. An investment in a particular geographic region may be particularly susceptible to changes in the political, diplomatic and economic conditions of that region or any new regulatory requirements of the region. Accordingly, an investment in the Fund may be more volatile than an investment diversified across several geographic regions.
INDEX RISK
The Funds are not actively managed. The Funds invest in securities included in or representative of its Index regardless of their investment merit. Unlike many investment companies, the Funds do not utilize an investing strategy that seeks returns in excess of the Index. Therefore, it would not necessarily buy or sell a security unless that security is added or removed, respectively, from the Index, even if that security generally is underperforming.
INDUSTRY CONCENTRATION RISK
In following its methodology, the Index from time to time may be concentrated to a significant degree in securities of issuers located in a single industry or sector. To the extent that the Index concentrates in the securities of issuers in a particular industry or sector, the Funds will also concentrate its investments to approximately the same extent. By concentrating its investments in an industry or sector, the Funds may face more risks than if it were diversified broadly over numerous industries or sectors.
INFORMATION TECHNOLOGY COMPANIES RISK
Information technology companies are generally subject to rapidly changing technologies, short product life cycles, fierce competition, aggressive pricing and reduced profit margins, the loss of patent, copyright and trademark protections, cyclical market patterns, evolving industry standards, and frequent new product introductions. Information technology companies may be smaller and less experienced
37
Amplify ETF Trust
Notes to the Financial Statements
October 31, 2017 (Continued)
companies, with limited product lines, markets or financial resources and fewer experienced management or marketing personnel. Information technology company stocks, especially those which are internet related, have experienced extreme price and volume fluctuations that are often unrelated to their operating performance.
INTEREST RATE RISK
As yield-based investments, MLPs carry interest rate risk and may underperform in rising interest rate enviroments. Additionally, when investors have heightened fears about the economy, the risk spread between MLPs and competing investment options can widen, which may have an adverse effect on the stock price of MLPs. Rising interest rates may increase the potential cost of MLPs financing projects or cost of operations and may affect the demand for MLP investments, either of which may result in lower performance by or distributions from the Fund’s MLP investments.
INTERNET COMPANIES RISK
Internet companies are subject to rapid changes in technology, worldwide competition, rapid obsolescence of products and services, loss of patent protections, cyclical market patterns, evolving industry standards, frequent new product introductions and the considerable risk of owning small capitalization companies that have recently begun operations. In addition, the stocks of many internet companies have exceptionally high price-to-earnings ratios with little or no earnings histories. Many internet companies have experienced extreme price and volume fluctuations that often have been unrelated to their operating performance.
MANAGEMENT RISK
The Fund is subject to management risk because it is an actively managed portfolio. The Sub-Adviser will apply techniques and risk analyses in making investment decision for the Fund, but there can be no guarantee that the Fund will meet its investment objectives.
MARKET CAPITALIZATION RISK
The Index may comprise large, mid and small capitalization stocks. The Index and therefore the Funds will comprise large, mid and small capitalization stocks to the same extent. As a result, the Funds may be exposed to additional risk associated with mid and small capitalization companies. Increased exposure to mid and/or small capitalization companies may cause the Funds to be more vulnerable to adverse general market or economic developments because such securities may be less liquid and subject to greater price volatility than those of larger, more established companies. Such companies may have limited product lines, markets or financial resources, and they may be dependent on a limited management group. In addition, they may be more vulnerable to adverse general market or economic developments.
Generally, the Fund considers a large capitalization stock to have a market capitalization exceeding $10 billion, a mid-capitalization stock to have a market capitalization range of $2 billion to $10 billion, and a small capitalization stock to have a market capitalization range of $300 million to $2 billion. Increased exposure to mid and/or small capitalization companies may cause the Fund to be more vulnerable to adverse general market or economic developments because such securities may be less liquid and subject to greater price volatility than those of larger, more established companies. Such companies may have limited product lines, markets or financial resources, and they may be dependent on a limited management group. In addition, they may be more vulnerable to adverse general market or economic developments.
MARKET MAKER RISK
Market-making third parties may be required to provide liquidity, which would reduce the value of the Fund. If the Fund has lower average daily trading volumes, it may rely on a small number of third-party market makers to provide a market for the purchase and sale of Shares. Any trading halt or other problem relating to the trading activity of these market makers could result in a dramatic change in the spread between the Fund’s net asset value and the price at which the Shares are trading on the Exchange which could result in a decrease in value of the Shares.
38
Amplify ETF Trust
Notes to the Financial Statements
October 31, 2017 (Continued)
MARKET RISK
Market risk is the risk that a particular security owned by the Funds or shares of the Funds in general may fall in value. Securities are subject to market fluctuations caused by such factors as economic, political, regulatory or market developments, changes in interest rates and perceived trends in securities prices. Overall security values could decline generally or could underperform other investments.
MLP RISK
An investment in MLP units involves risks which differ from an investment in common stock of a corporation. Holders of MLP units have limited control and voting rights on matters affecting the partnership. In addition, there are certain tax risks associated with an investment in MLP units and conflicts of interest may exist between common unit holders and the general partner, including those arising from incentive distribution payments. In addition, there is the risk that a MLP could be, contrary to its intention, taxed as a corporation, resulting in decreased returns from such MLP.
NEW FUND RISK
The Funds currently have fewer assets than larger funds, and like other relatively new funds, large inflows and outflows may impact the Funds’ market exposure for limited periods of time. This impact may be positive or negative, depending on the direction of market movement during the period affected. Also, during the initial invest-up period, the Funds may depart from its principal investment strategies and invest a larger amount or all of its assets in cash equivalents, or it may hold cash.
NON-CORRELATION RISK
The Funds’ return may not match the return of the Index for a number of reasons. Although the Funds currently intend to seek to fully replicate the Index, the Funds may use a representative sampling approach, which may cause the Funds not to be as well-correlated with the return of the Index as would be the case if the Funds purchased all of the securities in the Index in the proportions represented in the Index. In addition, the performance of the Funds and the Index may vary due to asset valuation differences and differences between the Funds’ portfolio and the Index resulting from legal restrictions, cost or liquidity constraints.
NON-DIVERSIFICATION RISK
Because the Funds are non-diversified and can invest a greater portion of its assets in securities of individual issuers than a diversified fund, changes in the market value of a single investment could cause greater fluctuations in share price than would occur in a diversified fund. This may increase the Funds’ volatility and cause the performance of a relatively small number of issuers to have a greater impact on the Funds’ performance.
ONLINE RETAIL RISK
Companies that operate in the online marketplace, retail and travel segments are subject to fluctuating consumer demand. Unlike traditional brick and mortar retailers, online marketplaces and retailers must assume shipping costs or pass such costs to consumers. Consumer access to price information for the same or similar products may cause companies that operate in the online marketplace, retail and travel segments to reduce profit margins in order to compete. Profit margins in the travel industry are particularly sensitive to seasonal demand, fuel costs and consumer perception of various risks associated with travel to various destinations. Due to the nature of their business models, companies that operate in the online marketplace, retail and travel segments may also be subject to heightened cybersecurity risk, including the risk of theft or damage to vital hardware, software and information systems. The loss or public dissemination of sensitive customer information or other proprietary data may negatively affect the financial performance of such companies to a greater extent than traditional brick and mortar retailers. As a result of such companies being web-based and the fact that they process, store, and transmit large amounts of data, including personal information, for their customers, failure to prevent or mitigate data loss or other security breaches, including breaches of vendors’ technology and systems, could expose companies that operate in the online marketplace, retail and travel segments or their customers to a risk of loss or misuse of such information, adversely affect their operating results, result in litigation or potential liability, and otherwise harm their businesses.
39
Amplify ETF Trust
Notes to the Financial Statements
October 31, 2017 (Continued)
POOLED INVESTMENT VEHICLE RISK
The Fund may invest in shares of other pooled investment vehicles, including exchange-traded funds (“ETFs” and exchange-traded notes (“ETNs”). Shareholders bear both their proportionate share of the Fund’s expenses and similar expenses of the underlying pooled investment vehicle. Pooled investment vehicles that invest in commodities are subject to the risks associated with direct investments in those commodities. The price and movement of a pooled investment vehicle designed to track an index may not track the index and may result in a loss. Certain pooled investment vehicles traded on exchanges may be thinly traded and experience large spreads between the “ask” price quoted by a seller and the “bid” price offered by a buyer. Certain pooled investment vehicles may also not have the protections applicable to other types of investments under federal securities or commodities laws and may be subject to counterparty or credit risk.
PORTFOLIO TURNOVER RISK
The Fund will engage in active trading, which may result in a turnover of the Fund’s portfolio to be greater than 100% annually. The Fund’s strategy may result in the Fund paying higher levels of transaction costs and generating greater tax liabilities for shareholders. Frequent portfolio turnover may negatively affect the Fund’s performance.
RISK THAT RETURNS OF CAPITAL DISTRIBUTIONS FROM THE FUND REDUCE THE TAX BASIS OF SHARES
A portion of the Fund’s distributions are expected to be treated as a return of capital for tax purposes. Returns of capital distribution are not taxable income to you but reduce your tax basis in your Shares. Such a reduction in tax basis will result in larger taxable gains and/or lower tax losses on a subsequent sale of Shares. Shareholders who periodically receive the payment of dividends or other distributions consisting of a return of capital may be under the impression that they are receiving net profits from the Fund when, in fact, they are not. You should not assume that the source of the distributions is from the net profits of the Fund. If returns of capital exceed your tax basis, you will recognize gain as if you had sold the Shares.
8. | SUBSEQUENT EVENTS |
The Funds have evaluated the need for additional disclosures and/or adjustments resulting from subsequent events through the date the financial statements were issued. The evaluation did not result in any subsequent events that necessitated disclosure and/or adjustments other than the following:
The Federal income tax rate for corporations is expected to change to 21% for taxable years beginning after December 31, 2017, which may have a material impact on future financial statements. A change in federal income tax rate is recorded on the date of enactment. Management estimates that the effect to the Amplify YieldShares Oil Hedged MLP Income ETF’s deferred tax asset on the date of enactment would be offset by a corresponding change in valuation allowance.
40
Amplify ETF Trust
Report of Independent Registered Public Accounting Firm
To the Shareholders of Amplify Online Retail ETF, Amplify YieldShares Senior Loan and Income ETF (formerly Amplify YieldShares Prime 5 Dividend Income ETF), Amplify YieldShares CWP Dividend & Option Income ETF, and Amplify YieldShares Oil Hedged MLP Income ETF and Board of Trustees of Amplify ETF Trust
We have audited the accompanying statements of assets and liabilities, including the schedules of investments, options written, and open futures contracts, of Amplify ETF Trust comprising Amplify Online Retail ETF, Amplify YieldShares Senior Loan and Income ETF, Amplify YieldShares CWP Dividend & Option Income ETF, and Amplify YieldShares Oil Hedged MLP Income ETF (the “Funds”) as of October 31, 2017, and the related statements of operations for the year then ended, and the statements of changes in net assets and the financial highlights for each of the two periods in the period then ended for Amplify Online Retail ETF and Amplify YieldShares Senior Loan and Income ETF, the related statements of operations and changes in net assets and financial highlights for the period December 14, 2016 (commencement of operations) through October 31, 2017 for Amplify YieldShares CWP Dividend & Option Income ETF, and the related statements of operations and changes in net assets and financial highlights for the period June 1, 2017 (commencement of operations) through October 31, 2017 for Amplify YieldShares Oil Hedged MLP Income ETF. These financial statements and financial highlights are the responsibility of the Funds’ management. Our responsibility is to express an opinion on these financial statements and financial highlights based on our audits.
We conducted our audits in accordance with the standards of the Public Company Accounting Oversight Board (United States). Those standards require that we plan and perform the audit to obtain reasonable assurance about whether the financial statements and financial highlights are free of material misstatement. An audit includes examining, on a test basis, evidence supporting the amounts and disclosures in the financial statements. Our procedures included confirmation of securities owned as of October 31, 2017, by correspondence with the custodian and brokers. An audit also includes assessing the accounting principles used and significant estimates made by management, as well as evaluating the overall financial statement presentation. We believe that our audits provide a reasonable basis for our opinion.
In our opinion, the financial statements and financial highlights referred to above present fairly, in all material respects, the financial position of the Funds as of October 31, 2017, the results of their operations, the changes in their net assets, and their financial highlights for the periods indicated above, in conformity with accounting principles generally accepted in the United States of America.

COHEN & COMPANY, LTD.
Cleveland, Ohio
December 20, 2017
41
Amplify ETF Trust
Board Considerations Regarding Approval of Investment Management Agreement
and Sub-Advisory Agreement
October 31, 2017 (Unaudited)
Amplify YieldShares Oil Hedged MLP Income ETF
Pursuant to Section 15(c) of the Investment Company Act of 1940 (the “1940 Act”), at a meeting held on June 22, 2016, the Board of Trustees (the “Board”) of Amplify ETF Trust (the “Trust”) considered the approval of the following agreements (collectively, the “Agreements”): 1) an Investment Management Agreement between Amplify Investments LLC (the “Adviser”) and the Trust, on behalf of the Amplify YieldShares Oil Hedged MLP ETF (the “Fund”) and 2) an Investment Sub-Advisory Agreement between the Adviser and Penserra Capital Management LLC (the “Sub-Adviser”), on behalf of the Fund.
After their initial two-year terms, the Agreements must be approved: (i) by the vote of the Trustees or by a vote of the shareholders of the Fund; and (ii) by the vote of a majority of the Trustees who are not parties to the Agreements or “interested persons” of any party thereto, as defined in the 1940 Act (the “Independent Trustees”), cast in person at a meeting called for the purpose of voting on such approval. Each year after the initial two-year term, the Board will call and hold a meeting to decide whether to renew the Agreements for an additional one-year term. In preparation for such meetings, the Board requests and reviews a wide variety of information from the Adviser and the Sub-Adviser.
Prior to the meeting held on March 14, 2017, the Board, including the Independent Trustees, reviewed written materials from the Adviser and the Sub-Adviser regarding, among other things: (i) the nature, extent and quality of the services to be provided to fund shareholders by the Adviser and the Sub-Adviser; (ii) the Adviser and the Sub-Adviser’s costs and profits expected to be realized in providing their services, including any fall-out benefits expected to be enjoyed by the Adviser and the Sub-Adviser; and (iii) the existence, or anticipated existence, of economies of scale.
Prior to and at the meeting held on March 14, 2017, representatives from the Adviser and the Sub-Adviser, along with other service providers of the Fund, presented additional oral and written information to help the Board evaluate the Adviser and the Sub-Adviser’s fees and other aspects of the Agreements. Among other things, representatives from the Adviser and the Sub-Adviser provided overviews of their advisory businesses, including investment personnel and investment processes. The representatives also discussed the rationale for launching the Fund, the Fund’s fees and fee structures of comparable investment companies. The Board then discussed the written materials that it received before the meeting and the Adviser and Sub-Adviser’s oral presentations and any other information that the Board received at the meeting, and deliberated on the approval of the Agreements in light of this information. In its deliberations, the Board did not identify any single piece of information discussed below that was all-important, controlling or determinative of its decision.
Nature, Extent and Quality of Services. In evaluating the nature, extent and quality of the Adviser’s services, the Trustees considered information concerning the functions to be performed by the Adviser and the Sub-Adviser and the personnel and resources of the Adviser and Sub-Adviser, including the investment management team that will be responsible for the day-to-day management of the Fund and the portfolio manager responsible for investing the portfolio of the Fund. The Trustees also considered that the Adviser secured a license with respect to the index that the Fund sought to track, the Oil Hedged MLP Index, and considered the performance history of the index. The Trustees considered statements by the Adviser and Sub-Adviser regarding its respective financial condition, that each was financially stable and could support its performance of the services under its Agreement. The Trustees also considered the services to be provided by the Adviser in its oversight of the Fund’s service providers.
Based on their review, the Trustees concluded that the nature, extent and quality of the services to be provided by the Adviser and Sub-Adviser to the Fund under the respective Agreement were expected to be appropriate and reasonable.
Fees, Expenses and Profitability. The Trustees discussed the information provided by the Adviser on the Fund’s proposed investment management fee of 0.85%, as compared to information provided by the Adviser on other similar products. The Trustees also considered that the Adviser and Sub-Adviser did not manage any similar accounts. The Trustees noted that the proposed annual investment management fee to be charged to the Fund was a unitary fee, and that the Adviser has agreed to pay all other expenses of the Fund, including fees payable to the Sub-Adviser, except brokerage commissions and other expenses connected with the execution of portfolio transactions, taxes, interest, distribution and service fees payable pursuant to a 12b-1 Plan, if any, and extraordinary expenses. The Board concluded that the unitary investment management fee to be charged to the Fund is reasonable and appropriate in light of the services expected to be provided by the Adviser and Sub-Adviser. In conjunction with their review of the unitary investment management fee, the Trustees considered information provided by the Adviser on its costs to be incurred in connection with the proposed Agreement and its
42
Amplify ETF Trust
Board Considerations Regarding Approval of Investment Management Agreement
and Sub-Advisory Agreement
October 31, 2017 (Unaudited) (Continued)
estimated profitability, and noted the Adviser’s statement that it would not likely be profitable in its first year of operating the Fund and that any profitability would not be excessive. The Trustees concluded that the estimated profits to be realized by the Adviser with respect to the Fund appeared to be reasonable.
Economies of Scale and Whether the Fee Level Reflects These Economies of Scale. The Trustees considered the information provided by the Adviser as to the extent to which economies of scale may be realized as the Fund grows and whether the fee level reflects economies of scale for the benefit of shareholders. The Trustees noted that any reduction in fixed costs associated with the management of the Fund would be enjoyed by the Adviser and Sub-Adviser, but that a unitary fee provides a level of certainty in expenses for the Fund. The Trustees considered whether the proposed advisory fee rate for the Fund is reasonable in relation to the projected asset size of the Fund. The Trustees noted the Adviser’s views on its expectations for growth, noting that, initially, the Adviser did not anticipate any material economies of scale. The Trustees concluded that the flat investment management fee was reasonable and appropriate.
The Trustees noted that the Adviser and Sub-Adviser had not identified any further benefits that it would derive from its relationship with the Fund, and had noted that it will not, initially, have any soft dollar arrangements.
Based on all of the information considered and the conclusions reached, the Board, including the Independent Trustees, determined to approve the Agreement for the Fund.
Amplify Online Retail ETF
Pursuant to Section 15(c) of the Investment Company Act of 1940 (the “1940 Act”), at a meeting held on November 5, 2015, the Board of Trustees (the “Board”) of Amplify ETF Trust (the “Trust”) considered the approval of, and approved, the following agreements (collectively, the “Agreements”): 1) an Investment Management Agreement between Amplify Investments LLC (the “Adviser”) and the Trust, on behalf of the Amplify Online Retail ETF (the “Fund”) and 2) an Investment Sub-Advisory Agreement between the Adviser and Penserra Capital Management LLC (the “Sub-Adviser”), on behalf of the Fund (collectively, the “Agreements”).
After their initial two-year terms, the Agreements must be approved: (i) by the vote of the Trustees or by a vote of the shareholders of the Fund; and (ii) by the vote of a majority of the Trustees who are not parties to the Agreements or “interested persons” of any party thereto, as defined in the 1940 Act (the “Independent Trustees”), cast in person at a meeting called for the purpose of voting on such approval. Each year after the initial two-year term, the Board will call and hold a meeting to decide whether to renew the Agreements for an additional one-year term. In preparation for such meetings, the Board requests and reviews a wide variety of information from the Adviser and the Sub-Adviser. Thus, a meeting was held on September 12, 2017 to discuss and review the Agreements with respect to the Fund
Prior to the meeting held on September 12, 2017, the Board, including the Independent Trustees, reviewed written materials from the Adviser and the Sub-Adviser regarding, among other things: (i) the nature, extent and quality of the services to be provided to fund shareholders by the Adviser and the Sub-Adviser; (ii) the Adviser and the Sub-Adviser’s costs and profits expected to be realized in providing their services, including any fall-out benefits expected to be enjoyed by the Adviser and the Sub-Adviser; and (iii) the existence, or anticipated existence, of economies of scale.
Prior to and at the meeting held on September 12, 2017, representatives from the Adviser and the Sub-Adviser, along with other service providers of the Fund, presented additional oral and written information to help the Board evaluate the Adviser and the Sub-Adviser’s fees and other aspects of the Agreements. Among other things, representatives from the Adviser and the Sub-Adviser provided overviews of their advisory businesses, including investment personnel and investment processes. The representatives also discussed the rationale for launching the Fund, the Fund’s fees and fee structures of comparable investment companies. The Board then discussed the written materials that it received before the meeting and the Adviser and Sub-Adviser’s oral presentations and any other information that the Board received at the meeting, and deliberated on the approval of the Agreements in light of this information. In its deliberations, the Board did not identify any single piece of information discussed below that was all-important, controlling or determinative of its decision.
43
Amplify ETF Trust
Board Considerations Regarding Approval of Investment Management Agreement
and Sub-Advisory Agreement
October 31, 2017 (Unaudited) (Continued)
Nature, Extent and Quality of Services. In evaluating the nature, extent and quality of the Adviser’s services, the Trustees considered information concerning the functions to be performed by the Adviser and the Sub-Adviser and the personnel and resources of the Adviser and Sub-Adviser, including the investment management team that will be responsible for the ay-to-day management of the Fund and the portfolio manager responsible for investing the portfolio of the Fund. The Trustees also considered that the Adviser secured a license with respect to the index that the Fund sought to track, the Oil Hedged MLP Index, and considered the performance history of the index. The Trustees considered statements by the Adviser and Sub-Adviser regarding its respective financial condition, that each was financially stable and could support its performance of the services under its Agreement. The Trustees also considered the services to be provided by the Adviser in its oversight of the Fund’s service providers.
Based on their review, the Trustees concluded that the nature, extent and quality of the services to be provided by the Adviser and Sub-Adviser to the Fund under the respective Agreement were expected to be appropriate and reasonable.
Fees, Expenses and Profitability. The Trustees discussed the information provided by the Adviser on the Fund’s proposed investment management fee of 0.65% as compared to information provided by the Adviser on other similar products. The Trustees also considered that the Adviser and Sub-Adviser had managed this account to the Board’s satisfaction over the course of the previous two years. The Trustees noted that the proposed annual investment management fee to be charged to the Fund was a unitary fee, and that the Adviser has agreed to pay all other expenses of the Fund, including fees payable to the Sub-Adviser, except brokerage commissions and other expenses connected with the execution of portfolio transactions, taxes, interest, distribution and service fees payable pursuant to a 12b-1 Plan, if any, and extraordinary expenses. The Board concluded that the unitary investment management fee to be charged to the Fund is reasonable and appropriate in light of the services expected to be provided by the Adviser and Sub-Adviser. In conjunction with their review of the unitary investment management fee, the Trustees considered information provided by the Adviser on its costs to be incurred in connection with the proposed Agreement and its estimated profitability, and noted the Adviser’s statement that it would not likely be profitable in its first year of operating the Fund and that any profitability would not be excessive. The Trustees concluded that the estimated profits to be realized by the Adviser with respect to the Fund appeared to be reasonable.
Economies of Scale and Whether the Fee Level Reflects These Economies of Scale. The Trustees considered the information provided by the Adviser as to the extent to which economies of scale may be realized as the Fund grows and whether the fee level reflects economies of scale for the benefit of shareholders. The Trustees noted that any reduction in fixed costs associated with the management of the Fund would be enjoyed by the Adviser and Sub-Adviser, but that a unitary fee provides a level of certainty in expenses for the Fund. The Trustees considered whether the proposed advisory fee rate for the Fund is reasonable in relation to the projected asset size of the Fund. The Trustees noted the Adviser’s views on its expectations for growth, noting that, initially, the Adviser did not anticipate any material economies of scale. The Trustees concluded that the flat investment management fee was reasonable and appropriate.
The Trustees noted that the Adviser and Sub-Adviser had not identified any further benefits that it would derive from its relationship with the Fund, and had noted that it will not, initially, have any soft dollar arrangements.
Based on all of the information considered and the conclusions reached, the Board, including the Independent Trustees, determined to approve the Agreements for the Fund.
44
Amplify ETF Trust
Disclosure of Fund Expenses
October 31, 2017 (Unaudited)
All Exchange Traded Funds (“ETF”) have operating expenses. As a shareholder of an ETF, your investment is affected by these ongoing costs, which include (among others) costs for ETF management, administrative services, brokerage fees and shareholder reports like this one. It is important for you to understand the impact of these costs on your investment returns.
Operating expenses such as these are deducted from an ETF’s gross income and directly reduce its final investment return. These expenses are expressed as a percentage of the ETF’s average net assets; this percentage is known as the ETF’s expense ratio.
The following examples use the expense ratio and are intended to help you understand the ongoing costs (in dollars) of investing in your fund and to compare these costs with those of other funds. The examples are based on investment of $1,000 made at the beginning of the period shown and held for the periods shown below.
The table below illustrates your fund’s costs in two ways:
ACTUAL FUND RETURN
This section helps you to estimate the actual expenses after fee waivers that your fund incurred over the period shown. “Expenses Paid During Period” shows the actual dollar expense cost incurred by a $1,000 investment in the Fund, and the “Ending Account Value” number is derived from deducting that expense cost from the Fund’s gross investment return.
You can use this information, together with the actual amount you invested in the Fund, to estimate the expenses you paid during the period. Simply divide your actual account value by $1,000 to arrive at a ratio (for example, an $8,600 account value divided by $1,000 = 8.6), then multiply that ratio by the number shown for your fund under “Expenses Paid During Period.”
HYPOTHETICAL 5% RETURN
This section helps you compare your fund’s costs with those of other funds. It assumes that the Fund had an annual 5% return before expenses during the year, but that the “Annualized Expense Ratio” for the period is unchanged. This example is useful in making comparisons because the Commission requires all funds to make this 5% calculation. You can assess your fund’s comparative cost by comparing the hypothetical result of your fund under “Expenses Paid During Period” with those that appear in the same charts in the shareholder reports for other funds.
NOTE: Because the return is set at 5% for comparison purposes – NOT your fund’s actual return – the account values shown may not apply to your specific investment.
Fund | Beginning Account Value | Ending | Annualized Expense Ratios | Expenses Paid During Period(a) |
Amplify Online Retail ETF | ||||
Actual Fund Return | $ 1,000.00 | $ 1,196.10 | 0.65% | $3.60 |
Hypothetical 5% Return | $ 1,000.00 | $ 1,021.93 | 0.65% | $3.31 |
Amplify YieldShares Senior Loan and Income ETF | ||||
Actual Fund Return | $ 1,000.00 | $ 1,022.80 | 0.45% | $2.29 |
Hypothetical 5% Return | $ 1,000.00 | $ 1022.94 | 0.45% | $2.29 |
Amplify YieldShares CWP Dividend & Option Income ETF | ||||
Actual Fund Return | $ 1,000.00 | $ 1,070.30 | 0.95% | $4.96 |
Hypothetical 5% Return | $ 1,000.00 | $ 1,020.42 | 0.95% | $4.84 |
45
Amplify ETF Trust
Disclosure of Fund Expenses
October 31, 2017 (Unaudited) (Continued)
Fund | Beginning Account Value | Ending | Annualized Expense Ratios | Expenses Paid During Period |
Amplify YieldShares Oil Hedged MLP Income ETF | ||||
Actual Fund Return | $ 1,000.00 | $ 809.90 | 0.85% | $3.20(c) |
Hypothetical 5% Return | $ 1,000.00 | $ 1,020.92 | 0.85% | $4.33(d) |
(a) | The dollar amounts shown as expenses paid during the period are equal to the Fund’s annualized expense ratio multiplied by the average account value during the period, multiplied by 184/365 (to reflect the one-half year period). |
(b) | Fund Commencement |
(c) | The dollar amount shown as expenses paid during the period for the Amplify YieldShares Oil Hedged MLP Income ETF is multiplied by 152/365, which is the number of days since inception divided by the number of days in the year. |
(d) | The dollar amount shown as expenses paid during the period for the Amplify YieldShares Oil Hedged MLP Income ETF is multiplied by 184/365 (to reflect the one-half year period). |
46
Amplify ETF Trust
Trustees and Officers of the Trust
October 31, 2017 (Unaudited)
The following chart lists Trustees and Officers as of October 31, 2017.
Set forth below are the names, ages, addresses, position with the Trust, term of office and length of time served, the principal occupations during the past five years, number of portfolios in fund complex overseen by the trustees, and other directorships outside the fund complex of each of the persons currently serving as Trustees and Officers of the Trust. The Funds’ Statement of Additional Information (“SAI”) includes additional information about the Trustees and Officers. The SAI may be obtained without charge by calling 1-855-267-3837. Furthermore, you can obtain the SAI by accessing the Commissions website at www.sec.gov or by accessing the Funds’ website at www.amplifyetfs.com.
Name, Address, and Age | Position(s) Held with the Trust | Term of Office and Length of Time Served (1) | Principal Occupation(s) During Past 5 Years | Number of Portfolios in Fund Complex Overseen By Trustee | Other Directorships held by Trustee |
Interested Trustee | |||||
Christian Magoon (2) c/o Amplify Investments LLC 310 S. Hale Street Wheaton, IL 60187 Y.O.B.: 1974 | Chairman of the Board of Trustees; Chief Executive Officer and President | Indefinite term Since inception | Chief Executive Officer, Magoon Capital (2010 – present); Chief Executive Officer, YieldShares, LLC (2013 – present); Chief Executive Officer, President of Amplify Invesments (2015 – present) | 4 | None |
John Phillips (3) c/o Amplify Investments LLC 310 S. Hale Street Wheaton, IL 60187 Y.O.B.: 1958 | Secretary | Indefinite term Since inception | Chief Operation Officer and Head of Product Development, Amplify Investments (2015 – present); Managing Director, White, Weld & Co. (2007 – 2015) | 4 | N/A |
Independent Trustees | |||||
Michael DiSanto c/o Amplify Investments LLC 310 S. Hale Street Wheaton, IL 60187 Y.O.B.: 1979 | Trustee | Indefinite term Since inception | Attorney, City of Naperville, Illinois (2007 – present); member, Elder board of the Compass Church, (2013 – present); adjuct professor, Aurora University (2012) | 4 | None |
Rick Powers c/o Amplify Investments LLC 310 S. Hale Street Wheaton, IL 60187 Y.O.B.: 1957 | Trustee | Indefinite term Since inception | Deputy Commissioner, Transportation, State of Indiana (2014 – present); Director, Code Enforcement, City of Indianapolis, Indiana (2001 – 2014) | 4 | None |
Mark Tucker c/o Amplify Investments LLC 310 S. Hale Street Wheaton, IL 60187 Y.O.B.: 1963 | Trustee | Indefinite term Since inception | Sole member, Aspen Equity Partners, LLC (2009 – present); New Liberty Popcorn, LLC (2015 – present) | 4 | None |
47
Amplify ETF Trust
Trustees and Officers of the Trust
October 31, 2017 (Unaudited) (Continued)
Name, Address, and Age | Position(s) Held with the Trust | Term of Office and Length of Time Served | Principal Occupation(s) During Past 5 Years | Other Directorships |
Officers | ||||
Ed Keiley c/o Amplify Investments LLC 310 S. Hale Street Wheaton, IL 60187 Y.O.B.: 1965 | Chief Compliance Officer | Indefinite term Since inception | Chief Compliance Officer, Amplify Investments (2016 – present); Trader Compliance, Inc. (2003 – present) | N/A |
Bradley H. Bailey c/o Amplify Investments LLC 310 S. Hale Street Wheaton, IL 60187 Y.O.B.: 1967 | Chief Financial Officer | Indefinite term 2016 | Chief Financial Officer, Amplify Investments (2016 – present); Chief Financial Officer, Copia Capital LLC (2014 – 2016); Chief Financial Officer, Central Square Management LLC (2011 – 2014) | N/A |
(1) | Each Trustee shall serve until the next meeting of shareholders called for the purpose of considering the election or re-election of such Trustee, unless such Trustee dies, retires, resigns or is removed pursuant to the Trustees Declaration of Trust. |
(2) | Mr. Magoon is deemed an “interested person” of the Trust due to his position as Chief Executive Officer and President of Amplify Investments and the Trust. |
(3) | Mr. Phillips is deemed an “interested person” of the Trust due to his position as Chief Operating Officer of Amplify Investments and Secretary of the Trust. |
48
Amplify ETF Trust
Additional Information
October 31, 2017 (Unaudited)
Qualified Dividend Income/Dividends Received Deduction
For the fiscal year/period ended October 31, 2017, certain dividends paid by the Funds may be subject to a maximum tax rate of 15%, as provided for by the Jobs and Growth Tax Relief Reconciliation Act of 2003.
The percentage of dividends declared from ordinary income designated as qualified dividend income was as follows:
| Amplify Online Retail ETF | 0.00 | % | ||
| Amplify YieldShares Senior Loan and Income ETF | 21.86 | % | ||
| Amplify YieldShares CWP Dividend & Option Income ETF | 77.40 | % |
For corporate shareholders, the percent of ordinary income distributions qualifying for the corporate dividends received deduction for the fiscal year/period ended October 31, 2017 was as follows:
| Amplify Online Retail ETF | 0.00 | % | ||
| Amplify YieldShares Senior Loan and Income ETF | 12.96 | % | ||
| Amplify YieldShares CWP Dividend & Option Income ETF | 77.42 | % |
Short Term Capital Gains
The percentage of taxable ordinary income distributions that are designated as short-term capital gain distributions under Internal Revenue Section 871(k)(2)(C) for each fund were as follows:
| Amplify Online Retail ETF | 0.00 | % | ||
| Amplify YieldShares Senior Loan and Income ETF | 0.00 | % | ||
| Amplify YieldShares CWP Dividend & Option Income ETF | 33.25 | % |
49
Amplify ETF Trust
Supplemental Information
October 31, 2017 (Unaudited)
DISTRIBUTION OF PREMIUMS AND DISCOUNTS
NAV is the price per share at which the Fund issues and redeems shares. It is calculated in accordance with the standard formula for valuing mutual fund shares. The “Market Price” of the Fund generally is determined using the composite closing price each day. The Fund’s Market Price may be at, above or below its NAV. The NAV of the Fund will fluctuate with changes in the market value of the Fund’s holdings. The Market Price of the Fund will fluctuate in accordance with changes in its NAV, as well as market supply and demand.
Premiums or discounts are the differences (expressed as a percentage) between the NAV and Market Price of the Fund on a given day, generally at the time NAV is calculated. A premium is the amount that the Fund is trading above the reported NAV, expressed as a percentage of the NAV. A discount is the amount that the Fund is trading below the reported NAV, expressed as a percentage of the NAV.
Further information regarding premiums and discounts is available, without charge, on the Fund’s website at www.amplifyetfs.com.
DELIVERY OF SHAREHOLDER DOCUMENTS—HOUSEHOLDING
Householding is an option available to certain investors of the Fund. Householding is a method of delivery, based on the preference of the individual investor, in which a single copy of certain shareholder documents can be delivered to investors who share the same address, even if their accounts are registered under different names. Householding for the Fund is available through certain broker-dealers. If you are interested in enrolling in householding and receiving a single copy of the prospectus and other shareholder documents, please contact your broker-dealer. If you currently are enrolled in householding and wish to change your householding status, please contact your broker-dealer.
50
Amplify ETF Trust
Privacy Policy
October 31, 2017 (Unaudited)
AMPLIFY ETFS AND AMPLIFY AFFILIATES PRIVACY POLICY
Amplify recognizes the importance of protecting your personal and financial information when you visit our websites (each a “Website” and together “Websites”). This Policy is designed to help you understand the information collection practices on all Websites owned or operated by or on behalf of companies within the Amplify group of companies, including: Amplify Investments, LLC, Amplify Development, LLC, and Amplify Securities, LLC. We are committed to:
(a) protecting the personal information you provide to us;
(b) telling you how we use the information we gather about you; and
(c) ensuring that you know why we intend to disclose your personal information.
CHANGES TO THIS PRIVACY POLICY
This Privacy Policy is dated January 1, 2016. Amplify reserves the right to amend this Privacy Policy at any time without notice, by updating this posting, in which case the date of the Policy will be revised. The current version of this Policy can be accessed from the link on the www.amplifyetfs.com homepage.
INFORMATION COLLECTION AND USE
Personally Identifiable Information: The personally identifiable information you submit to our Websites is used to service your interest and to improve our services to you and/or to provide you with information on Amplify products and services. The types of personal information that may be collected at our Websites include: name, address, email address and telephone number. We will not sell, share or rent your personally identifiable information to others in contravention of this Privacy Policy.
Additionally, if the Website is a password protected site, then (a) once you submit your password and enter, the Website will recognize who you are and will collect all information that you submit, including all electronic instructions (including all transaction information), and (b) any information collected about you from the Website may be associated with other identifying information that we have about you.
Aggregate Information: We generally record certain usage information, such as the number and frequency of visitors to our Websites. This information may include the websites that you access immediately before and after your visit to our Websites, the Internet browser you are using and your IP address. If we use such data at all it will be on an aggregate basis, and we will not disclose to third parties any information that could be used to identify you personally.
Service Providers: We may use internal or external service providers to operate our Websites and employ other persons to perform work on our behalf, such as sending postal mail and e-mail. These persons may have access to the personally identifiable information you submit through the Websites, but only for the purpose of performing their duties. These personnel may not use your personally identifiable information for any other purpose.
Compliance with Laws: We do not automatically collect personally identifiable information from visitors to our Websites, except to the extent we are required to do so pursuant to some statute or regulation applicable to us. We will not provide any personally identifiable information to any other persons, except if we are required to make disclosures by any law, any government or private parties in connection with a lawsuit, subpoena, investigation or similar proceeding.
E-mail and Marketing: Amplify does not sell its customers’ e-mail addresses, nor will we provide your personal information to third parties for their marketing purposes. Amplify will not send you e-mail messages without first receiving your permission, unless it relates to servicing your account or unless you have consented to receiving electronic delivery of fund documents as part of our E-Delivery service. It is our policy to include instructions for unsubscribing from these permission-based programs. We recommend that you do not send us any individual personal information via non secure methods of correspondence, including via public electronic communication channels, such as Internet e-mail, which are generally not secure.
51
Amplify ETF Trust
Privacy Policy
October 31, 2017 (Unaudited) (Continued)
Business Transfers: If the business, stock or assets of Amplify are acquired or merged with another business entity, we will share all or some of your information with this entity to continue to provide our service to you. You will receive notice of such an event and the new entity will inform you of any changes to the practices in this Privacy Policy. If the new entity wishes to make additional use of your information, you may decline such use at such time.
Disclosure to Third Parties: The personal information you provide to us will only be disclosed to third parties if we have your permission, or as set out in this Privacy Policy. We may disclose details about the general use of our Websites to third parties – for example, to demonstrate patterns of use to advertisers and other business partners. Information we pass on for this purpose will not include any personal information by which you may be identified. We endeavor to prevent unauthorized disclosures of your personal information by third parties but we are not responsible for any unauthorized disclosures or other breaches of security or for the actions of others if the information was passed to them with your authority or with the authority of anyone other than us or our group companies.
COOKIES
What are Cookies?
Cookies are small text files that are stored in your computer’s memory and hard drive when you visit certain web pages. They are used to enable websites to function or to provide information to the owners of a website.
Why Do We Use Cookies?
Cookies help us to provide customized services and information. We use cookies on all our Websites to tell us, in general terms, how and when pages in our Websites are visited, what our users’ technology preferences are – such as what type of video player they use – and whether our Websites are functioning properly.
If you are using one of our password-protected sites, then the website may use cookies or other technology to help us authenticate you, store and recognize your configuration and user attributes, facilitate your navigation of the website and customize its content so that the information made available is likely to be of more interest to you.
In broad terms, we use cookies on our Websites for the following purposes:
● | Analytical purposes: Analytical cookies allow us to recognize measure and track visitors to our Websites. This helps us to improve and develop the way our Websites work, for example, by determining whether site visitors can find information easily, or by identifying the aspects of websites that are of the most interest to them. |
● | Usage preferences: Some of the cookies on our Websites are activated when visitors to our sites make a choice about their usage of the site. Our Websites then ‘remember’ the settings preferences of the user concerned. This allows us to tailor aspects of our sites to the individual user. |
● | Terms and conditions: We use cookies on our Websites to record when a site visitor has seen a policy, such as this one, or provided consent, such as consent to the terms and conditions on our Websites. This helps to improve the user’s experience of the site – for example, it avoids a user from repeatedly being asked to consent to the same terms. |
● | Session management: The software that runs our websites uses cookies for technical purposes needed by the internal workings of our servers. For instance, we use cookies to distribute requests among multiple servers, authenticate users and determine what features of the site they can access, verify the origin of requests, keep track of information about a user’s session and determine which options or pages to display in order for the site to function. |
● | Functional purposes: Functional purpose cookies store information that is needed by our applications to process and operate. For example, where transactions or requests within an application involve multiple workflow stages, cookies are used to store the information from each stage temporarily, in order to facilitate completion of the overall transaction or request. |
52
Amplify ETF Trust
Privacy Policy
October 31, 2017 (Unaudited) (Continued)
Further Information About Cookies
If you would like to find out more about cookies in general and how to manage them, please visit www.allaboutcookies.org.
THIRD PARTY WEBSITES
Amplify disclaims responsibility for the privacy policies and customer information practices of third party internet websites hyperlinked from our Website or this Privacy Policy.
SECURITY
Amplify protects your personal information when you transact business on our Website by requiring the use of a browser software program that supports industry standard SSL encryption with 128-bit key lengths. The “128-bit” designation refers to the length of the key used to encrypt the data being transmitted, with a longer key representing a higher level of security.
CONTACT US
We welcome inquiries or comments about our Privacy Policy and any queries or concerns about Amplify ETFs at support@amplifyetfs.com or 1-855-267-3837.
53
Investment Adviser:
Amplify Investments, LLC
310 S. Hale Street
Wheaton, IL 60187
Investment Sub-Adviser:
Penserra Capital Management, LLC
4 Orinda Way, Suite 100-A
Orinda, CA 94563
Legal Counsel:
Chapman and Cutler LLP
111 West Monroe Street
Chicago, IL 60603
Independent Registered Public Accounting Firm:
Cohen & Company, Ltd.
1350 Euclid Avenue, Suite 800
Cleveland, OH 44115
Distributor:
Quasar Distributors, LLC
777 East Wisconsin Avenue, 6th Floor
Milwaukee, WI 53202
Administrator:
U.S. Bancorp Fund Services, LLC
777 East Wisconsin Avenue
Milwaukee, WI 53202
Transfer Agent:
U.S. Bancorp Fund Services, LLC
615 East Michigan Street
Milwaukee, WI 53202
Custodian:
U.S. Bank National Association
1555 North RiverCenter Drive, Suite 302
Milwaukee, WI 53212
This information must be preceded or accompanied by a current prospectus for the Funds.
Item 2. Code of Ethics.
The registrant has adopted a code of ethics that applies to the registrant’s principal executive officer and principal financial officer. The registrant has not made any amendments to its code of ethics during the period covered by this report. The registrant has not granted any waivers from any provisions of the code of ethics during the period covered by this report. A copy of the registrant’s Code of Ethics is filed herewith.
Item 3. Audit Committee Financial Expert.
The registrant’s board of trustees has determined that there is at least one audit committee financial expert serving on its audit committee. Mark Tucker is the “audit committee financial expert” and is considered to be “independent” as each term is defined in Item 3 of Form N-CSR.
Item 4. Principal Accountant Fees and Services.
The registrant has engaged its principal accountant to perform audit services, audit-related services, tax services and other services during the past two fiscal years. “Audit services” refer to performing an audit of the registrant's annual financial statements or services that are normally provided by the accountant in connection with statutory and regulatory filings or engagements for those fiscal years. “Audit-related services” refer to the assurance and related services by the principal accountant that are reasonably related to the performance of the audit. “Tax services” refer to professional services rendered by the principal accountant for tax compliance, tax advice, and tax planning. There were no “Other services” provided by the principal accountant. The following table details the aggregate fees billed or expected to be billed for each of the last two fiscal years for audit fees, audit-related fees, tax fees and other fees by the principal accountant.
| FYE 10/31/2017 | FYE 10/31/2016 | |
| Audit Fees | $72,500 | $28,500 |
| Audit-Related Fees | $0 | $0 |
| Tax Fees | $21,500 | $6,000 |
| All Other Fees | N/A | N/A |
The audit committee has adopted pre-approval policies and procedures that require the audit committee to pre-approve all audit and non-audit services of the registrant, including services provided to any entity affiliated with the registrant.
The percentage of fees billed by Cohen & Company, Ltd. applicable to non-audit services pursuant to waiver of pre-approval requirement were as follows:
| FYE 10/31/2017 | FYE 10/31/2016 | |
| Audit-Related Fees | 0% | 0% |
| Tax Fees | 0% | 0% |
| All Other Fees | 0% | 0% |
1
All of the principal accountant’s hours spent on auditing the registrant’s financial statements were attributed to work performed by full-time permanent employees of the principal accountant. (If more than 50 percent of the accountant’s hours were spent to audit the registrant's financial statements for the most recent fiscal year, state how many hours were attributed to work performed by persons other than the principal accountant's full-time, permanent employees.)
The following table indicates the non-audit fees billed or expected to be billed by the registrant’s accountant for services to the registrant and to the registrant’s investment adviser (and any other controlling entity, etc.—not sub-adviser) for the last two years. The audit committee of the board of trustees/directors has considered whether the provision of non-audit services that were rendered to the registrant's investment adviser is compatible with maintaining the principal accountant's independence and has concluded that the provision of such non-audit services by the accountant has not compromised the accountant’s independence.
| Non-Audit Related Fees | FYE 10/31/2017 | FYE 10/31/2016 |
| Registrant | $21,500 | $6,000 |
| Registrant’s Investment Adviser | $0 | $0 |
Item 5. Audit Committee of Listed Registrants.
The registrant is an issuer as defined in Rule 10A-3 under the Securities Exchange Act of 1934, (the "Act") and has a separately-designated standing audit committee established in accordance with Section 3(a)(58)(A) of the Act. The independent members of the committee are as follows: Mark Tucker, Michael DiSanto and Rick Powers.
Item 6. Investments.
| (a) | Schedule of Investments is included as part of the report to shareholders filed under Item 1 of this Form. |
Item 7. Disclosure of Proxy Voting Policies and Procedures for Closed-End Management Investment Companies.
Not applicable to open-end investment companies.
Item 8. Portfolio Managers of Closed-End Management Investment Companies.
Not applicable to open-end investment companies.
Item 9. Purchases of Equity Securities by Closed-End Management Investment Company and Affiliated Purchasers.
Not applicable to open-end investment companies.
Item 10. Submission of Matters to a Vote of Security Holders.
There have been no material changes to the procedures by which shareholders may recommend nominees to the registrant’s board of trustees.
2
Item 11. Controls and Procedures.
| (a) | The Registrant’s principal executive and principal financial officers have reviewed the Registrant's disclosure controls and procedures (as defined in Rule 30a-3(c) under the Investment Company Act of 1940 (the “Act”)) as of a date within 90 days of the filing of this report, as required by Rule 30a-3(b) under the Act and Rules 13a-15(b) or 15d-15(b) under the Securities Exchange Act of 1934. Based on their review, such officers have concluded that the disclosure controls and procedures are effective in ensuring that information required to be disclosed in this report is appropriately recorded, processed, summarized and reported and made known to them by others within the Registrant and by the Registrant’s service provider. |
| (b) | There were no changes in the Registrant's internal control over financial reporting (as defined in Rule 30a-3(d) under the Act) that occurred during the last fiscal quarter of the period covered by this report that has materially affected, or is reasonably likely to materially affect, the Registrant's internal control over financial reporting. |
Item 12. Exhibits.
| (a) | (1) Any code of ethics or amendment thereto, that is the subject of the disclosure required by Item 2, to the extent that the registrant intends to satisfy Item 2 requirements through filing an exhibit. Not Applicable. |
(2) A separate certification for each principal executive and principal financial officer pursuant to Section 302 of the Sarbanes-Oxley Act of 2002. Filed herewith.
(3) Any written solicitation to purchase securities under Rule 23c-1 under the Act sent or given during the period covered by the report by or on behalf of the registrant to 10 or more persons. Not applicable to open-end investment companies.
| (b) | Certifications pursuant to Section 906 of the Sarbanes-Oxley Act of 2002. Furnished herewith. |
3
SIGNATURES
Pursuant to the requirements of the Securities Exchange Act of 1934 and the Investment Company Act of 1940, the registrant has duly caused this report to be signed on its behalf by the undersigned, thereunto duly authorized.
| (Registrant) | Amplify ETF Trust | |
| By (Signature and Title) | /s/ Christian Magoon | |
| Christian Magoon, | ||
| President and Chief Executive Officer | ||
| Date | 12/21/17 |
Pursuant to the requirements of the Securities Exchange Act of 1934 and the Investment Company Act of 1940, this report has been signed below by the following persons on behalf of the registrant and in the capacities and on the dates indicated.
| By (Signature and Title) | /s/ Christian Magoon | |
| Christian Magoon, | ||
| President and Chief Executive Officer | ||
| Date | 12/21/17 | |
| By (Signature and Title) | /s/ Bradley H. Bailey | |
| Bradley H. Bailey, | ||
| Chief Financial Officer | ||
| Date | 12/21/17 |
4