Table of Contents
UNITED STATES
SECURITIES AND EXCHANGE COMMISSION
Washington, D.C. 20549
FORM N-CSR
CERTIFIED SHAREHOLDER REPORT OF REGISTERED
MANAGEMENT INVESTMENT COMPANIES
Investment Company Act file number 811-23096
Legg Mason ETF Investment Trust
(Exact name of registrant as specified in charter)
620 Eighth Avenue, 47th Floor, New York, NY 10018
(Address of principal executive offices) (Zip code)
Marc A. De Oliveira
Franklin Templeton
100 First Stamford Place
Stamford, CT 06902
(Name and address of agent for service)
Registrant’s telephone number, including area code: 1-877-721-1926
Date of fiscal year end: March 31
Date of reporting period: September 30, 2022
Table of Contents
| ITEM 1. | REPORT TO STOCKHOLDERS. |
The Semi-Annual Report to Stockholders is filed herewith.
Table of Contents

| Semi-Annual Report | September 30, 2022 |
Western Asset ETFs
Western Asset Short Duration Income ETF
Western Asset Total Return ETF

| INVESTMENT PRODUCTS: NOT FDIC INSURED • NO BANK GUARANTEE • MAY LOSE VALUE |
Table of Contents
| II | Western Asset ETFs |
Table of Contents

Dear Shareholder,
We are pleased to provide the semi-annual report of Western Asset Short Duration Income ETF and Western Asset Total Return ETF for the six-month reporting period ended September 30, 2022. Please read on for each Fund’s performance information during the Funds’ reporting period.
As always, we remain committed to providing you with excellent service and a full spectrum of investment choices. We also remain committed to supplementing the support you receive from your financial advisor. One way we accomplish this is through our website, www.franklintempleton.com. Here you can gain immediate access to market and investment information, including:
| • | Fund net asset value and market price, |
| • | Market insights and commentaries from our portfolio managers, and |
| • | A host of educational resources. |
We look forward to helping you meet your financial goals.
Sincerely,

Patrick O’Connor
President and Chief Executive Officer - Investment Management President
October 31, 2022
| Western Asset ETFs | III |
Table of Contents
Western Asset Short Duration Income ETF
Western Asset Short Duration Income ETF seeks current income.
Performance review
For the six months ended September 30, 2022, Western Asset Short Duration Income ETF generated a -4.98% return on a net asset value (“NAV”)i basis and -5.13% based on its market priceii per share.
The performance table shows the Fund’s total return for the six months ended September 30, 2022 based on its NAV and market price. The Fund’s broad-based market index, the Bloomberg U.S. Corporate 1 – 5 Year Indexiii, returned -3.85% over the same timeframe. The Lipper Short Investment Grade Debt Funds Category Averageiv returned-2.91%for the same period Please note that Lipper performance returns are based on each fund’s NAV.
| Performance Snapshot as of September 30, 2022 (unaudited) | ||||
| 6 months | ||||
| Western Asset Short Duration Income ETF: | ||||
$23.08 (NAV) | -4.98 | %*† | ||
$23.11 (Market Price) | -5.13 | %*‡ | ||
| Bloomberg U.S. Corporate 1-5 Year Index | -3.85 | % | ||
| Lipper Short Investment Grade Debt Funds Category Average | -2.91 | % | ||
The performance shown represents past performance. Past performance is no guarantee of future results and current performance may be higher or lower than the performance shown above. Principal value and investment returns will fluctuate so shares, when sold, may be worth more or less than their original cost. Performance data current to the most recent month-end is available at www.franklintempleton.com.
Investors buy and sell shares of an exchange-traded fund (“ETF”) at market price (not NAV) in the secondary market throughout the trading day. These shares are not individually available for direct purchase from or direct redemption to the ETF. Market price returns are typically based upon the official closing price of the Fund’s shares. These returns do not represent investors’ returns had they traded shares at other times. Performance figures for periods shorter than one year represent cumulative figures and are not annualized.
Information showing the Fund’s net asset value, market price, premiums and discounts, and bid-ask spreads for various time periods is available by visiting the Fund’s website at www.franklintempleton.com.
As of the Fund’s current prospectus dated July 29, 2022, the gross total annual fund operating expense ratio for the Fund was 0.29%.
* Total returns are based on changes in NAV or market price, respectively. Returns reflect the deduction of all Fund expenses. Returns do not reflect the deduction of brokerage commissions or taxes that investors pay on distributions or the sale of shares.
† Total return assumes the reinvestment of all distributions, including returns of capital, if any, at NAV.
‡ Total return assumes the reinvestment of all distributions, including returns of capital, if any, at market price, which typically is based upon the official closing price of the Fund’s shares.
Looking for additional information?
The Fund’s daily NAV is available online at www.franklintempleton.com. The Fund is traded under the symbol “WINC” and its closing market price is available on most financial websites. In a continuing effort to provide information concerning the Fund, shareholders may call 1-877-721-1926 (toll free), Monday through Friday from 8:00 a.m. to 5:30 p.m. Eastern time, for the Fund’s current NAV, market price and other information.
RISKS: Fixed income securities involve interest rate, credit, inflation and reinvestment risks; and possible loss of principal. As interest rates rise, the value of fixed income securities falls. High yield securities include greater price volatility, illiquidity, and possibility of default. International investments are subject to special risks, including currency fluctuations, social, economic and political uncertainties, which could increase volatility. These risks are magnified in emerging markets. Emerging market countries tend to have economic, political and legal systems that are less developed and are less stable than those of more developed countries. Derivatives, such as options and futures, can be illiquid, may disproportionately increase losses, and have a potentially large impact on fund performance. The use of leverage may increase volatility and possibility of loss. Potential active and frequent trading may result in higher transaction costs and increased investor liability. Asset-backed, mortgage-backed or mortgage related securities are subject to prepayment and extension risks. Active management and diversification do not ensure gains or protect against market declines. Please see the Fund’s prospectus for a more complete discussion of these and other risks and the Fund’s investment strategies.
| IV | Western Asset ETFs |
Table of Contents
Western Asset Total Return ETF
Western Asset Total Return ETF seeks to maximize total return, consistent with prudent investment management and liquidity needs.
Performance review
For the six months ended September 30, 2022, Western Asset Total Return ETF generated a -13.21% return on a NAV basis and -14.41% based on its market price per share.
The performance table shows the Fund’s total return for the six months ended September 30, 2022 based on its NAV and market price. The Fund’s broad-based market index, the Bloomberg U.S. Aggregate Indexv, returned -9.22% over the same time frame. The Lipper Core Plus Bond Funds Category Averagevi returned -10.08% for the same period. Please note that Lipper performance returns are based on each fund’s NAV.
| Performance Snapshot as of September 30, 2022 (unaudited) | ||||
| 6 months | ||||
| Western Asset Total Return ETF: | ||||
$19.52 (NAV) | -13.21 | %*† | ||
$19.37 (Market Price) | -14.41 | %*‡ | ||
| Bloomberg U.S. Aggregate Index | -9.22 | % | ||
| Lipper Core Plus Bond Funds Category Average | -10.08 | % | ||
The performance shown represents past performance. Past performance is no guarantee of future results and current performance may be higher or lower than the performance shown above. Principal value and investment returns will fluctuate so shares, when sold, may be worth more or less than their original cost. Performance data current to the most recent month-end is available at www.franklintempleton.com.
Investors buy and sell shares of an ETF at market price (not NAV) in the secondary market throughout the trading day. These shares are not individually available for direct purchase from or direct redemption to the ETF. Market price returns are typically based upon the official closing price of the Fund’s shares. These returns do not represent investors’ returns had they traded shares at other times. Performance figures for periods shorter than one year represent cumulative figures and are not annualized.
Information showing the Fund’s net asset value, market price, premiums and discounts, and bid-ask spreads for various time periods is available by visiting the Fund’s website at www.franklintempleton.com.
As of the Fund’s current prospectus dated July 29, 2022, the gross total annual fund operating expense ratio for the Fund was 0.49%.
The management agreement between Legg Mason ETF Investment Trust (the "Trust”) on behalf of the Fund and Legg Mason Partners Fund Advisor, LLC (the “manager” or “LMPFA”) (the “Management Agreement”) provides that LMPFA will pay all operating expenses of the Fund, other than interest expenses, taxes, brokerage expenses, future 12b-1 fees (if any), acquired fund fees and expenses, extra ordinary expenses and the management fee payable to LMPFA under the Management Agreement. LMPFA will also pay all subadvisory fees of the Fund. The manager has agreed to waive and/or reimburse management fees so that the ratio of total annual fund operating expenses will not exceed 0.45% (subject to the same exclusions as the Management Agreement). This arrangement cannot be terminated prior to July 31, 2023 without the Board of Trustees’ consent.
* Total returns are based on changes in NAV or market price, respectively. Returns reflect the deduction of all Fund expenses. Returns do not reflect the deduction of brokerage commissions or taxes that investors pay on distributions or the sale of shares.
† Total return assumes the reinvestment of all distributions, including returns of capital, if any, at NAV.
‡ Total return assumes the reinvestment of all distributions, including returns of capital, if any, at market price, which typically is based upon the official closing price of the Fund’s shares.
Looking for additional information?
The Fund’s daily NAV is available online at www.franklintempleton.com. The Fund is traded under the symbol “WBND” and its closing market price is available on most financial websites. In a continuing effort to provide information concerning the Fund, shareholders may call 1-877-721-1926 (toll free), Monday through Friday from 8:00 a.m. to 5:30 p.m. Eastern Time, for the Fund’s current NAV, market price and other information.
RISKS: Fixed income securities involve interest rate, credit, inflation and reinvestment risks. As interest rates rise, the value of fixed income securities falls. High yield securities include greater price volatility, illiquidity, and possibility of default. International investments are subject to special risks, including currency fluctuations, social, economic, and political uncertainties, which could increase volatility. These risks are magnified in emerging markets. Emerging market countries tend to have economic, political and legal systems that are less developed and are less stable than those of more developed countries Derivatives, such as options and futures, can be illiquid, may disproportionately increase losses, and have a potentially large impact on Fund performance. The use of leverage may increase volatility and possibility of loss. Potential active and frequent trading may result in higher transaction costs and increased investor liability. Asset-backed, mortgage-backed, or mortgage-related securities are
| Western Asset ETFs | V |
Table of Contents
Performance review (cont’d)
subject to prepayment and extension risks. Active management and diversification do not ensure gains or protect against market declines. Please see the Fund’s prospectus for a more complete discussion of these and other risks and the Fund’s investment strategies.
As always, thank you for your confidence in our stewardship of your assets.
Sincerely,
Patrick O’Connor
President and Chief Executive Officer — Investment Management President
October 31, 2022
All investments are subject to risk including the possible loss of principal. Past performance is no guarantee of future results. All index performance reflects no deduction for fees, expenses or taxes. Please note that an investor cannot invest directly in an index.
| i | Net Asset Value (“NAV”) is calculated by subtracting total liabilities from total assets and dividing the results by the number of shares outstanding. |
| ii | Market price is determined by supply and demand. It is the price at which an investor purchases or sells shares of the Fund. The Market price may differ from the Fund’s NAV. |
| iii | The Bloomberg U.S. Corporate 1-5 Year Index is an unmanaged index that measures the performance of the investment-grade, fixed-rate, taxable 1-5 year maturity corporate bond market. It includes U.S. dollar-denominated securities publicly issued by U.S. and non-U.S. industrial, utility and financial issuers. Investors cannot invest directly in an index and unmanaged index returns do not reflect any fees, expenses or sales charges. |
| iv | Lipper, Inc., a wholly-owned subsidiary of Refinitiv, provides independent insight on global collective investments. Returns are based on the six-month period ended September 30, 2022, including the reinvestment of all distributions, including returns of capital, if any, calculated among the 376 funds in the Fund’s Lipper category. |
| v | The Bloomberg U.S. Aggregate Index is a broad-based bond index comprised of government, corporate, mortgage- and asset-backed issues, rated investment grade or higher, and having at least one year to maturity. |
| vi | Lipper, Inc., a wholly-owned subsidiary of Refinitiv, provides independent insight on global collective investments. Returns are based on the six-month period ended September 30, 2022, including the reinvestment of all distributions, including returns of capital, if any, calculated among the 318 funds in the Fund’s Lipper category. |
| VI | Western Asset ETFs |
Table of Contents
Western Asset Short Duration Income ETF Investment Breakdown† (%) as a percent of total investments
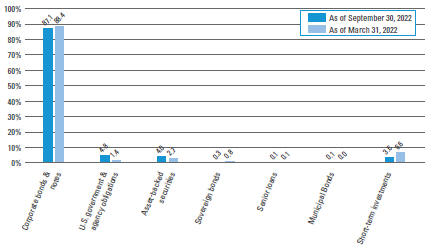
| † | The bar graph above represents the composition of the Fund’s investments as of September 30, 2022 and March 31, 2022 and does not include derivatives, such as futures contracts and swap contracts. The Fund is actively managed. As a result, the composition of the Fund’s investments is subject to change at any time. |
| Western Asset ETFs 2022 Semi-Annual Report | 1 |
Table of Contents
Funds at a glance (unaudited) (cont’d)
Western Asset Total Return ETF Investment Breakdown† (%) as a percent of total investments
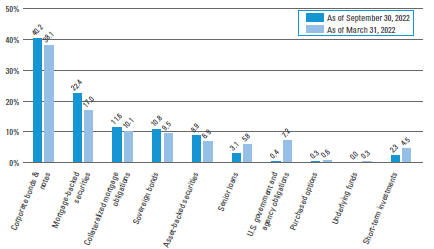
| † | The bar graph above represents the composition of the Fund’s investments as of September 30, 2022 and March 31, 2022 and does not include derivatives, such as written options, futures contracts, forward foreign currency contracts and swap contracts. The Fund is actively managed. As a result, the composition of the Fund’s investments is subject to change at any time. |
| 2 | Western Asset ETFs 2022 Semi-Annual Report |
Table of Contents
Western Asset Short Duration Income ETF
Example
As a shareholder of the Fund, you may incur two types of costs: (1) transaction costs, such as brokerage commissions paid on purchases and sales of Fund shares; and (2) ongoing costs, including management fees; and other Fund expenses. This example is intended to help you understand your ongoing costs (in dollars) of investing in the Fund and to compare these costs with the ongoing costs of investing in other funds.
This example is based on an investment of $1,000 invested on April 1, 2022 and held for the six months ended September 30, 2022.
Actual expenses
The table below titled “Based on actual total return” provides information about actual account values and actual expenses. You may use the information provided in this table, together with the amount you invested, to estimate the expenses that you paid over the period. To estimate the expenses you paid on your account, divide your ending account value by $1,000 (for example, an $8,600 ending account value divided by $1,000 = 8.6), then multiply the result by the number under the heading entitled “Expenses Paid During the Period”.
Hypothetical example for comparison purposes
The table below titled “Based on hypothetical total return” providesinformationabouthypotheticalaccountvaluesandhypothetical expenses based on the actual expense ratio and an assumed rate of return of 5.00% per year before expenses, which is not the Fund’s actual return. The hypothetical account values and expenses may not be used to estimate the actual ending account balance or expenses you paid for the period. You may use the information provided in this table to compare the ongoing costs of investing in the Fund and other funds. To do so, compare the 5.00% hypothetical example relating to the Fund with the 5.00% hypothetical examples that appear in the shareholder reports of the other funds.
Please note that the expenses shown in the table below are meant to highlight your ongoing costs only and do not reflect any transactional costs, such as brokerage commissions paid on purchases and sales of Fund shares. Therefore, the table is useful in comparing ongoing costs only, and will not help you determine the relative total costs of owning different funds. In addition, if these transaction costs were included, your costs would have been higher.
| Based on actual total return1 | Based on hypothetical total return1 | |||||||||||||||||||||||||||||||||||||||||||||||||
Actual Total Return2 | Beginning Value | Ending Account Value | Annualized Expense Ratio | Expenses Paid During the Period3 | Hypothetical Annualized Total Return | Beginning Account Value | Ending Account Value | Annualized Expense Ratio | Expenses Paid During the Period3 | |||||||||||||||||||||||||||||||||||||||||
| -4.98% | $ | 1,000.00 | $ | 950.20 | 0.29 | % | $ | 1.42 | 5.00 | % | $1,000.00 | $ | 1,023.61 | 0.29 | % | $ | 1.47 | |||||||||||||||||||||||||||||||||
| 1 | For the six months ended September 30, 2022. |
| 2 | Assumes the reinvestment of all distributions, including returns of capital, if any, at net asset value. Total return is not annualized, as it may not be representative of the total return for the year. Performance figures may reflect fee waivers and/or expense reimbursements. In the absence of fee waivers and/or expense reimbursements, the total return would have been lower. Past performance is no guarantee of future results. |
| 3 | Expenses (net of fee waivers and/or expense reimbursements) are equal to the Fund’s annualized expense ratio multiplied by the average account value over the period, multiplied by the number of days in the most recent fiscal half-year (183), then divided by 365. |
| Western Asset ETFs 2022 Semi-Annual Report | 3 |
Table of Contents
Funds expenses (unaudited) (cont’d)
Western Asset Total Return ETF
Example
As a shareholder of the Fund, you may incur two types of costs: (1) transaction costs, such as brokerage commissions paid on purchases and sales of Fund shares; and (2) ongoing costs, including management fees; and other Fund expenses. This example is intended to help you understand your ongoing costs (in dollars) of investing in the Fund and to compare these costs with the ongoing costs of investing in other funds.
This example is based on an investment of $1,000 invested on April 1, 2022 and held for the six months ended September 30, 2022.
Actual expenses
The table below titled “Based on actual total return” provides information about actual account values and actual expenses. You may use the information provided in this table, together with the amount you invested, to estimate the expenses that you paid over the period. To estimate the expenses you paid on your account, divide your ending account value by $1,000 (for example, an $8,600 ending account value divided by $1,000 = 8.6), then multiply the result by the number under the heading entitled “Expenses Paid During the Period”.
Hypothetical example for comparison purposes
The table below titled “Based on hypothetical total return” providesinformationabouthypotheticalaccountvaluesandhypothetical expenses based on the actual expense ratio and an assumed rate of return of 5.00% per year before expenses, which is not the Fund’s actual return. The hypothetical account values and expenses may not be used to estimate the actual ending account balance or expenses you paid for the period. You may use the information provided in this table to compare the ongoing costs of investing in the Fund and other funds. To do so, compare the 5.00% hypothetical example relating to the Fund with the 5.00% hypothetical examples that appear in the shareholder reports of the other funds.
Please note that the expenses shown in the table below are meant to highlight your ongoing costs only and do not reflect any transactional costs, such as brokerage commissions paid on purchases and sales of Fund shares. Therefore, the table is useful in comparing ongoing costs only, and will not help you determine the relative total costs of owning different funds. In addition, if these transaction costs were included, your costs would have been higher.
| Based on actual total return1 | Based on hypothetical total return1 | |||||||||||||||||||||||||||||||||||||||||||||||||
Actual Total Return2 | Beginning Account | Ending Account Value | Annualized Expense Ratio | Expenses Paid During the Period3 | Hypothetical Annualized | Beginning Value | Ending Account Value | Annualized Expense Ratio | Expenses Paid During the Period3 | |||||||||||||||||||||||||||||||||||||||||
| -13.21% | $ | 1,000.00 | $ | 867.90 | 0.45 | % | $ | 2.11 | 5.00 | % | $1,000.00 | $ | 1,022.81 | 0.45 | % | $ | 2.28 | |||||||||||||||||||||||||||||||||
| 1 | For the six months ended September 30, 2022. |
| 2 | Assumes the reinvestment of all distributions, including returns of capital, if any, at net asset value. Total return is not annualized, as it may not be representative of the total return for the year. Performance figures may reflect fee waivers and/or expense reimbursements. In the absence of fee waivers and/or expense reimbursements, the total return would have been lower. Past performance is no guarantee of future results. |
| 3 | Expenses (net of fee waivers and/or expense reimbursements) are equal to the Fund’s annualized expense ratio multiplied by the average account value over the period, multiplied by the number of days in the most recent fiscal half-year (183), then divided by 365. |
| 4 | Western Asset ETFs 2022 Semi-Annual Report |
Table of Contents
Schedules of investments (unaudited)
September 30, 2022
Western Asset Short Duration Income ETF
(Percentages shown based on Fund net assets)
| Security | Rate | Maturity Date | Face Amount | Value | ||||||||||||
| Corporate Bonds & Notes — 85.8% | ||||||||||||||||
| Communication Services — 8.2% | ||||||||||||||||
Diversified Telecommunication Services — 2.4% | ||||||||||||||||
AT&T Inc., Senior Notes | 4.250 | % | 3/1/27 | $ | 50,000 | $ | 47,984 | |||||||||
AT&T Inc., Senior Notes | 1.650 | % | 2/1/28 | 20,000 | 16,436 | |||||||||||
NTT Finance Corp., Senior Notes | 1.162 | % | 4/3/26 | 200,000 | 174,701 | (a) | ||||||||||
NTT Finance Corp., Senior Notes | 4.372 | % | 7/27/27 | 200,000 | 193,985 | (a) | ||||||||||
Verizon Communications Inc., Senior Notes | 2.550 | % | 3/21/31 | 190,000 | 151,701 | |||||||||||
Total Diversified Telecommunication Services | 584,807 | |||||||||||||||
Entertainment — 0.5% | ||||||||||||||||
Warnermedia Holdings Inc., Senior Notes | 3.755 | % | 3/15/27 | 130,000 | 116,311 | (a) | ||||||||||
Warnermedia Holdings Inc., Senior Notes | 5.050 | % | 3/15/42 | 20,000 | 14,965 | (a) | ||||||||||
Total Entertainment | 131,276 | |||||||||||||||
Interactive Media & Services — 0.4% | ||||||||||||||||
Alphabet Inc., Senior Notes | 1.100 | % | 8/15/30 | 80,000 | 61,851 | |||||||||||
Meta Platforms Inc., Senior Notes | 3.850 | % | 8/15/32 | 30,000 | 26,374 | (a) | ||||||||||
Total Interactive Media & Services | 88,225 | |||||||||||||||
Media — 4.2% | ||||||||||||||||
Charter Communications Operating LLC/Charter Communications Operating Capital Corp., Senior Secured Notes | 4.908 | % | 7/23/25 | 50,000 | 48,758 | |||||||||||
Charter Communications Operating LLC/Charter Communications Operating Capital Corp., Senior Secured Notes | 5.050 | % | 3/30/29 | 210,000 | 193,288 | |||||||||||
Charter Communications Operating LLC/Charter Communications Operating Capital Corp., Senior Secured Notes | 4.400 | % | 4/1/33 | 30,000 | 24,842 | |||||||||||
Comcast Corp., Senior Notes | 3.400 | % | 4/1/30 | 120,000 | 105,542 | |||||||||||
Fox Corp., Senior Notes | 4.030 | % | 1/25/24 | 40,000 | 39,506 | |||||||||||
Time Warner Entertainment Co. LP, Senior Secured Notes | 8.375 | % | 3/15/23 | 600,000 | 608,334 | |||||||||||
Total Media | 1,020,270 | |||||||||||||||
Wireless Telecommunication Services — 0.7% | ||||||||||||||||
T-Mobile USA Inc., Senior Notes | 3.500 | % | 4/15/25 | 20,000 | 19,115 | |||||||||||
T-Mobile USA Inc., Senior Notes | 2.050 | % | 2/15/28 | 120,000 | 99,577 | |||||||||||
T-Mobile USA Inc., Senior Notes | 2.250 | % | 11/15/31 | 50,000 | 37,681 | |||||||||||
Total Wireless Telecommunication Services | 156,373 | |||||||||||||||
Total Communication Services | 1,980,951 | |||||||||||||||
| Consumer Discretionary — 10.2% | ||||||||||||||||
Auto Components — 0.8% | ||||||||||||||||
ZF North America Capital Inc., Senior Notes | 4.750 | % | 4/29/25 | 200,000 | 181,936 | (a) | ||||||||||
Automobiles — 3.8% | ||||||||||||||||
Ford Motor Credit Co. LLC, Senior Notes | 3.350 | % | 11/1/22 | 200,000 | 199,718 | |||||||||||
Ford Motor Credit Co. LLC, Senior Notes | 2.700 | % | 8/10/26 | 200,000 | 165,878 | |||||||||||
General Motors Co., Senior Notes | 6.125 | % | 10/1/25 | 280,000 | 280,121 | |||||||||||
General Motors Co., Senior Notes | 5.600 | % | 10/15/32 | 20,000 | 17,853 | |||||||||||
Hyundai Capital America, Senior Notes | 0.800 | % | 1/8/24 | 70,000 | 65,853 | (a) | ||||||||||
Nissan Motor Co. Ltd., Senior Notes | 3.043 | % | 9/15/23 | 200,000 | 194,432 | (a) | ||||||||||
Total Automobiles | 923,855 | |||||||||||||||
Hotels, Restaurants & Leisure — 3.9% | ||||||||||||||||
Genting New York LLC/GENNY Capital Inc., Senior Notes | 3.300 | % | 2/15/26 | 200,000 | 170,838 | (a) | ||||||||||
See Notes to Financial Statements.
| Western Asset ETFs 2022 Semi-Annual Report | 5 |
Table of Contents
Schedules of investments (unaudited) (cont’d)
September 30, 2022
Western Asset Short Duration Income ETF
(Percentages shown based on Fund net assets)
| Security | Rate | Maturity Date | Face Amount | Value | ||||||||||||
Hotels, Restaurants & Leisure — continued | ||||||||||||||||
Las Vegas Sands Corp., Senior Notes | 3.200 | % | 8/8/24 | $ | 50,000 | $ | 47,133 | |||||||||
Las Vegas Sands Corp., Senior Notes | 2.900 | % | 6/25/25 | 300,000 | 269,055 | |||||||||||
Marriott International Inc., Senior Notes | 3.600 | % | 4/15/24 | 140,000 | 136,693 | |||||||||||
Sands China Ltd., Senior Notes | 5.900 | % | 8/8/28 | 200,000 | 168,102 | |||||||||||
Wynn Macau Ltd., Senior Notes | 4.875 | % | 10/1/24 | 200,000 | 160,610 | (a) | ||||||||||
Total Hotels, Restaurants & Leisure | 952,431 | |||||||||||||||
Household Durables — 0.5% | ||||||||||||||||
DR Horton Inc., Senior Notes | 2.500 | % | 10/15/24 | 110,000 | 104,600 | |||||||||||
MDC Holdings Inc., Senior Notes | 2.500 | % | 1/15/31 | 10,000 | 6,683 | |||||||||||
Total Household Durables | 111,283 | |||||||||||||||
Internet & Direct Marketing Retail — 0.5% | ||||||||||||||||
Amazon.com Inc., Senior Notes | 1.200 | % | 6/3/27 | 150,000 | 128,099 | |||||||||||
Multiline Retail — 0.3% | ||||||||||||||||
Dollar Tree Inc., Senior Notes | 4.000 | % | 5/15/25 | 50,000 | 48,443 | |||||||||||
Nordstrom Inc., Senior Notes | 2.300 | % | 4/8/24 | 20,000 | 18,600 | |||||||||||
Total Multiline Retail | 67,043 | |||||||||||||||
Specialty Retail — 0.4% | ||||||||||||||||
Lowe’s Cos. Inc., Senior Notes | 1.300 | % | 4/15/28 | 130,000 | 104,939 | |||||||||||
Total Consumer Discretionary | 2,469,586 | |||||||||||||||
| Consumer Staples — 2.6% | ||||||||||||||||
Beverages — 0.5% | ||||||||||||||||
Anheuser-Busch InBev Worldwide Inc., Senior Notes (3 mo. USD LIBOR + 0.740%) | 3.163 | % | 1/12/24 | 100,000 | 99,810 | (b) | ||||||||||
PepsiCo Inc., Senior Notes | 3.900 | % | 7/18/32 | 20,000 | 18,488 | |||||||||||
Total Beverages | 118,298 | |||||||||||||||
Food & Staples Retailing — 0.0%†† | ||||||||||||||||
Costco Wholesale Corp., Senior Notes | 1.375 | % | 6/20/27 | 10,000 | 8,630 | |||||||||||
Food Products — 0.1% | ||||||||||||||||
Hershey Co., Senior Notes | 1.700 | % | 6/1/30 | 10,000 | 7,909 | |||||||||||
Mondelez International Inc., Senior Notes | 1.500 | % | 2/4/31 | 20,000 | 14,680 | |||||||||||
Total Food Products | 22,589 | |||||||||||||||
Household Products — 0.1% | ||||||||||||||||
Clorox Co., Senior Notes | 1.800 | % | 5/15/30 | 10,000 | 7,715 | |||||||||||
Kimberly-Clark Corp., Senior Notes | 1.050 | % | 9/15/27 | 10,000 | 8,404 | |||||||||||
Total Household Products | 16,119 | |||||||||||||||
Tobacco — 1.9% | ||||||||||||||||
Altria Group Inc., Senior Notes | 2.625 | % | 9/16/26 | 120,000 | 107,704 | |||||||||||
Altria Group Inc., Senior Notes | 4.800 | % | 2/14/29 | 80,000 | 73,846 | |||||||||||
BAT International Finance PLC, Senior Notes | 1.668 | % | 3/25/26 | 160,000 | 138,306 | |||||||||||
Cargill Inc., Senior Notes | 0.750 | % | 2/2/26 | 170,000 | 148,327 | (a) | ||||||||||
Total Tobacco | 468,183 | |||||||||||||||
Total Consumer Staples | 633,819 | |||||||||||||||
| Energy — 14.8% | ||||||||||||||||
Oil, Gas & Consumable Fuels — 14.8% | ||||||||||||||||
Cimarex Energy Co., Senior Notes | 4.375 | % | 3/15/29 | 20,000 | 16,133 | |||||||||||
Continental Resources Inc., Senior Notes | 4.500 | % | 4/15/23 | 140,000 | 139,299 | |||||||||||
See Notes to Financial Statements.
| 6 | Western Asset ETFs 2022 Semi-Annual Report |
Table of Contents
Western Asset Short Duration Income ETF
(Percentages shown based on Fund net assets)
| Security | Rate | Maturity Date | Face Amount | Value | ||||||||||||
Oil, Gas & Consumable Fuels — continued | ||||||||||||||||
Continental Resources Inc., Senior Notes | 3.800 | % | 6/1/24 | $ | 60,000 | $ | 58,240 | |||||||||
Continental Resources Inc., Senior Notes | 2.268 | % | 11/15/26 | 100,000 | 85,336 | (a) | ||||||||||
Coterra Energy Inc., Senior Notes | 3.900 | % | 5/15/27 | 110,000 | 101,930 | (a) | ||||||||||
Coterra Energy Inc., Senior Notes | 4.375 | % | 3/15/29 | 80,000 | 73,955 | (a) | ||||||||||
DCP Midstream Operating LP, Senior Notes | 3.250 | % | 2/15/32 | 40,000 | 31,621 | |||||||||||
Devon Energy Corp., Senior Notes | 5.850 | % | 12/15/25 | 60,000 | 60,521 | |||||||||||
Devon Energy Corp., Senior Notes | 5.250 | % | 10/15/27 | 106,000 | 106,202 | |||||||||||
Devon Energy Corp., Senior Notes | 5.875 | % | 6/15/28 | 12,000 | 11,979 | |||||||||||
Devon Energy Corp., Senior Notes | 4.500 | % | 1/15/30 | 220,000 | 200,246 | |||||||||||
Devon OEI Operating LLC, Senior Notes | 7.500 | % | 9/15/27 | 20,000 | 21,351 | |||||||||||
Diamondback Energy Inc., Senior Notes | 3.250 | % | 12/1/26 | 150,000 | 138,335 | |||||||||||
Ecopetrol SA, Senior Notes | 5.875 | % | 9/18/23 | 180,000 | 178,612 | |||||||||||
Ecopetrol SA, Senior Notes | 4.625 | % | 11/2/31 | 40,000 | 28,000 | |||||||||||
El Paso Natural Gas Co. LLC, Senior Notes | 7.500 | % | 11/15/26 | 60,000 | 63,794 | |||||||||||
Energy Transfer LP, Senior Notes | 4.200 | % | 9/15/23 | 20,000 | 19,785 | |||||||||||
Energy Transfer LP, Senior Notes | 4.050 | % | 3/15/25 | 470,000 | 450,685 | |||||||||||
Energy Transfer LP, Senior Notes | 2.900 | % | 5/15/25 | 80,000 | 74,568 | |||||||||||
Enterprise Products Operating LLC, Senior Notes | 3.950 | % | 2/15/27 | 40,000 | 38,052 | |||||||||||
Enterprise Products Operating LLC, Senior Notes | 2.800 | % | 1/31/30 | 70,000 | 58,456 | |||||||||||
Enterprise Products Operating LLC, Senior Notes (5.375% to 2/15/28 then 3 mo. USD LIBOR + 2.570%) | 5.375 | % | 2/15/78 | 130,000 | 97,632 | (b) | ||||||||||
EOG Resources Inc., Senior Notes | 4.375 | % | 4/15/30 | 30,000 | 28,569 | |||||||||||
EQT Corp., Senior Notes | 5.678 | % | 10/1/25 | 20,000 | 19,877 | |||||||||||
EQT Corp., Senior Notes | 3.125 | % | 5/15/26 | 110,000 | 100,178 | (a) | ||||||||||
EQT Corp., Senior Notes | 3.900 | % | 10/1/27 | 10,000 | 9,100 | |||||||||||
Exxon Mobil Corp., Senior Notes | 3.482 | % | 3/19/30 | 40,000 | 36,323 | |||||||||||
Florida Gas Transmission Co. LLC, Senior Notes | 2.300 | % | 10/1/31 | 70,000 | 52,790 | (a) | ||||||||||
Kinder Morgan Energy Partners LP, Senior Notes | 7.300 | % | 8/15/33 | 10,000 | 10,400 | |||||||||||
MEG Energy Corp., Senior Notes | 7.125 | % | 2/1/27 | 70,000 | 71,050 | (a) | ||||||||||
MPLX LP, Senior Notes | 1.750 | % | 3/1/26 | 150,000 | 131,247 | |||||||||||
Northwest Pipeline LLC, Senior Notes | 7.125 | % | 12/1/25 | 20,000 | 20,629 | |||||||||||
Occidental Petroleum Corp., Senior Notes | 6.950 | % | 7/1/24 | 10,000 | 10,275 | |||||||||||
Parsley Energy LLC/Parsley Finance Corp., Senior Notes | 5.625 | % | 10/15/27 | 20,000 | 20,560 | (a) | ||||||||||
Parsley Energy LLC/Parsley Finance Corp., Senior Notes | 4.125 | % | 2/15/28 | 10,000 | 9,090 | (a) | ||||||||||
Pioneer Natural Resources Co., Senior Notes | 0.550 | % | 5/15/23 | 100,000 | 97,576 | |||||||||||
Southern Natural Gas Co. LLC, Senior Notes | 0.625 | % | 4/28/23 | 20,000 | 19,452 | (a) | ||||||||||
Southwestern Energy Co., Senior Notes | 4.750 | % | 2/1/32 | 10,000 | 8,381 | |||||||||||
Targa Resources Corp., Senior Notes | 5.200 | % | 7/1/27 | 50,000 | 48,099 | |||||||||||
Targa Resources Corp., Senior Notes | 4.200 | % | 2/1/33 | 60,000 | 49,968 | |||||||||||
Tennessee Gas Pipeline Co. LLC, Senior Notes | 7.000 | % | 10/15/28 | 50,000 | 51,360 | |||||||||||
Tennessee Gas Pipeline Co. LLC, Senior Notes | 2.900 | % | 3/1/30 | 60,000 | 49,113 | (a) | ||||||||||
Transcontinental Gas Pipe Line Co. LLC, Senior Notes | 3.250 | % | 5/15/30 | 40,000 | 33,817 | |||||||||||
Western Midstream Operating LP, Senior Notes | 3.350 | % | 2/1/25 | 80,000 | 74,576 | |||||||||||
Western Midstream Operating LP, Senior Notes | 3.950 | % | 6/1/25 | 50,000 | 47,000 | |||||||||||
Williams Cos. Inc., Senior Notes | 3.700 | % | 1/15/23 | 530,000 | 529,616 | |||||||||||
Total Energy | 3,583,778 | |||||||||||||||
See Notes to Financial Statements.
| Western Asset ETFs 2022 Semi-Annual Report | 7 |
Table of Contents
Schedules of investments (unaudited) (cont’d)
September 30, 2022
Western Asset Short Duration Income ETF
(Percentages shown based on Fund net assets)
| Security | Rate | Maturity Date | Face Amount | Value | ||||||||||||
| Financials — 28.3% | ||||||||||||||||
Banks — 15.5% | ||||||||||||||||
Banco Santander SA, Senior Notes (4.175% to 3/24/27 then 1 year Treasury Constant Maturity Rate + 2.000%) | 4.175 | % | 3/24/28 | 200,000 | $ | 180,224 | (b) | |||||||||
Bank of America Corp., Senior Notes (1.530% to 12/6/24 then SOFR + 0.650%) | 1.530 | % | 12/6/25 | 20,000 | 18,294 | (b) | ||||||||||
Bank of America Corp., Senior Notes (1.734% to 7/22/26 then SOFR + 0.960%) | 1.734 | % | 7/22/27 | 410,000 | 351,751 | (b) | ||||||||||
Bank of America Corp., Senior Notes (2.299% to 7/21/31 then SOFR + 1.220%) | 2.299 | % | 7/21/32 | 30,000 | 22,420 | (b) | ||||||||||
Bank of America Corp., Senior Notes (2.572% to 10/20/31 then SOFR + 1.210%) | 2.572 | % | 10/20/32 | 100,000 | 76,483 | (b) | ||||||||||
Bank of America Corp., Senior Notes (2.592% to 4/29/30 then SOFR + 2.150%) | 2.592 | % | 4/29/31 | 130,000 | 103,098 | (b) | ||||||||||
Bank of America Corp., Senior Notes (2.972% to 2/4/32 then SOFR + 1.330%) | 2.972 | % | 2/4/33 | 250,000 | 195,438 | (b) | ||||||||||
BNP Paribas SA, Junior Subordinated Notes (7.750% to 8/16/29 then 5 year Treasury Constant Maturity Rate + 4.899%) | 7.750 | % | 8/16/29 | 200,000 | 184,560 | (a)(b)(c) | ||||||||||
BNP Paribas SA, Senior Notes (1.675% to 6/30/26 then SOFR + 0.912%) | 1.675 | % | 6/30/27 | 400,000 | 338,358 | (a)(b) | ||||||||||
Citigroup Inc., Senior Notes (0.981% to 5/1/24 then SOFR + 0.669%) | 0.981 | % | 5/1/25 | 20,000 | 18,531 | (b) | ||||||||||
Citigroup Inc., Senior Notes (1.281% to 11/3/24 then SOFR + 0.528%) | 1.281 | % | 11/3/25 | 80,000 | 73,079 | (b) | ||||||||||
Citigroup Inc., Senior Notes (1.462% to 6/9/26 then SOFR + 0.770%) | 1.462 | % | 6/9/27 | 360,000 | 306,504 | (b) | ||||||||||
Citigroup Inc., Senior Notes (3.057% to 1/25/32 then SOFR + 1.351%) | 3.057 | % | 1/25/33 | 140,000 | 110,255 | (b) | ||||||||||
Citigroup Inc., Subordinated Notes | 5.500 | % | 9/13/25 | 20,000 | 19,969 | |||||||||||
Danske Bank A/S, Senior Notes (0.976% to 9/10/24 then 1 year Treasury Constant Maturity Rate + 0.550%) | 0.976 | % | 9/10/25 | 200,000 | 181,102 | (a)(b) | ||||||||||
Danske Bank A/S, Senior Notes (3.244% to 12/20/24 then 3 mo. USD LIBOR + 1.591%) | 3.244 | % | 12/20/25 | 200,000 | 185,927 | (a)(b) | ||||||||||
HSBC Holdings PLC, Senior Notes (0.976% to 5/24/24 then SOFR + 0.708%) | 0.976 | % | 5/24/25 | 200,000 | 183,750 | (b) | ||||||||||
HSBC Holdings PLC, Subordinated Notes | 7.625 | % | 5/17/32 | 10,000 | 10,504 | |||||||||||
HSBC Holdings PLC, Subordinated Notes (4.762% to 3/29/32 then SOFR + 2.530%) | 4.762 | % | 3/29/33 | 200,000 | 164,155 | (b) | ||||||||||
Intesa Sanpaolo SpA, Senior Notes | 3.375 | % | 1/12/23 | 210,000 | 208,828 | (a) | ||||||||||
JPMorgan Chase & Co., Senior Notes (1.578% to 4/22/26 then SOFR + 0.885%) | 1.578 | % | 4/22/27 | 330,000 | 284,891 | (b) | ||||||||||
JPMorgan Chase & Co., Senior Notes (2.522% to 4/22/30 then SOFR + 2.040%) | 2.522 | % | 4/22/31 | 10,000 | 7,905 | (b) | ||||||||||
JPMorgan Chase & Co., Senior Notes (2.545% to 11/8/31 then SOFR + 1.180%) | 2.545 | % | 11/8/32 | 170,000 | 128,999 | (b) | ||||||||||
JPMorgan Chase & Co., Senior Notes (2.963% to 1/25/32 then SOFR + 1.260%) | 2.963 | % | 1/25/33 | 90,000 | 70,748 | (b) | ||||||||||
JPMorgan Chase & Co., Subordinated Notes (2.956% to 5/13/30 then SOFR + 2.515%) | 2.956 | % | 5/13/31 | 120,000 | 95,051 | (b) | ||||||||||
Wells Fargo & Co., Senior Notes | 3.000 | % | 10/23/26 | 200,000 | 181,278 | |||||||||||
Wells Fargo & Co., Senior Notes (3.350% to 3/2/32 then SOFR + 1.500%) | 3.350 | % | 3/2/33 | 80,000 | 64,877 | (b) | ||||||||||
Total Banks | 3,766,979 | |||||||||||||||
Capital Markets — 9.0% | ||||||||||||||||
Charles Schwab Corp., Senior Notes | 1.150 | % | 5/13/26 | 210,000 | 183,705 | |||||||||||
Credit Suisse Group AG, Junior Subordinated Notes (9.750% to 12/23/27 then 5 year Treasury Constant Maturity Rate + 6.383%) | 9.750 | % | 6/23/27 | 200,000 | 196,176 | (a)(b)(c) | ||||||||||
Credit Suisse Group AG, Senior Notes (2.193% to 6/5/25 then SOFR + 2.044%) | 2.193 | % | 6/5/26 | 280,000 | 243,457 | (a)(b) | ||||||||||
Daimler Trucks Finance North America LLC, Senior Notes | 3.650 | % | 4/7/27 | 240,000 | 219,566 | (a) | ||||||||||
Goldman Sachs Group Inc., Senior Notes (0.855% to 2/12/25 then SOFR + 0.609%) | 0.855 | % | 2/12/26 | 40,000 | 35,688 | (b) | ||||||||||
Goldman Sachs Group Inc., Senior Notes (1.093% to 12/9/25 then SOFR + 0.789%) | 1.093 | % | 12/9/26 | 220,000 | 189,844 | (b) | ||||||||||
Goldman Sachs Group Inc., Senior Notes (1.948% to 10/21/26 then SOFR + 0.913%) | 1.948 | % | 10/21/27 | 100,000 | 85,516 | (b) | ||||||||||
Goldman Sachs Group Inc., Senior Notes (3.102% to 2/24/32 then SOFR + 1.410%) | 3.102 | % | 2/24/33 | 200,000 | 158,851 | (b) | ||||||||||
Goldman Sachs Group Inc., Senior Notes (3.615% to 3/15/27 then SOFR + 1.846%) | 3.615 | % | 3/15/28 | 10,000 | 9,101 | (b) | ||||||||||
Goldman Sachs Group Inc., Subordinated Notes | 4.250 | % | 10/21/25 | 30,000 | 28,956 | |||||||||||
See Notes to Financial Statements.
| 8 | Western Asset ETFs 2022 Semi-Annual Report |
Table of Contents
Western Asset Short Duration Income ETF
(Percentages shown based on Fund net assets)
| Security | Rate | Maturity Date | Face Amount | Value | ||||||||||||
Capital Markets — continued | ||||||||||||||||
Intercontinental Exchange Inc., Senior Notes | 4.600 | % | 3/15/33 | $ | 30,000 | $ | 27,947 | |||||||||
Mercedes-Benz Finance North America LLC, Senior Notes | 1.450 | % | 3/2/26 | 150,000 | 131,800 | (a) | ||||||||||
Morgan Stanley, Senior Notes (0.985% to 12/10/25 then SOFR + 0.720%) | 0.985 | % | 12/10/26 | 40,000 | 34,491 | (b) | ||||||||||
Morgan Stanley, Senior Notes (1.512% to 7/20/26 then SOFR + 0.858%) | 1.512 | % | 7/20/27 | 20,000 | 17,034 | (b) | ||||||||||
Morgan Stanley, Senior Notes (1.593% to 5/4/26 then SOFR + 0.879%) | 1.593 | % | 5/4/27 | 270,000 | 233,303 | (b) | ||||||||||
Morgan Stanley, Senior Notes (2.188% to 4/28/25 then SOFR + 1.990%) | 2.188 | % | 4/28/26 | 130,000 | 119,246 | (b) | ||||||||||
Morgan Stanley, Senior Notes (2.511% to 10/20/31 then SOFR + 1.200%) | 2.511 | % | 10/20/32 | 100,000 | 76,423 | (b) | ||||||||||
Morgan Stanley, Senior Notes (2.699% to 1/22/30 then SOFR + 1.143%) | 2.699 | % | 1/22/31 | 20,000 | 16,215 | (b) | ||||||||||
UBS AG, Senior Notes | 1.250 | % | 6/1/26 | 200,000 | 172,393 | (a) | ||||||||||
Total Capital Markets | 2,179,712 | |||||||||||||||
Diversified Financial Services — 1.7% | ||||||||||||||||
AerCap Ireland Capital DAC/AerCap Global Aviation Trust, Senior Notes | 2.450 | % | 10/29/26 | 300,000 | 253,082 | |||||||||||
AerCap Ireland Capital DAC/AerCap Global Aviation Trust, Senior Notes | 3.300 | % | 1/30/32 | 200,000 | 150,414 | |||||||||||
Element Fleet Management Corp., Senior Notes | 1.600 | % | 4/6/24 | 10,000 | 9,410 | (a) | ||||||||||
Global Aircraft Leasing Co. Ltd., Senior Notes (6.500% Cash or 7.250% PIK) | 6.500 | % | 9/15/24 | 2,307 | 1,736 | (a)(d) | ||||||||||
Total Diversified Financial Services | 414,642 | |||||||||||||||
Insurance — 2.0% | ||||||||||||||||
American International Group Inc., Senior Notes | 2.500 | % | 6/30/25 | 150,000 | 139,951 | |||||||||||
AmFam Holdings Inc., Senior Notes | 2.805 | % | 3/11/31 | 150,000 | 116,460 | (a) | ||||||||||
GA Global Funding Trust, Secured Notes | 1.000 | % | 4/8/24 | 20,000 | 18,595 | (a) | ||||||||||
New York Life Global Funding, Senior Secured Notes | 0.950 | % | 6/24/25 | 60,000 | 53,756 | (a) | ||||||||||
Prudential Financial Inc., Senior Notes | 1.500 | % | 3/10/26 | 10,000 | 8,943 | |||||||||||
Reliance Standard Life Global Funding II, Secured Notes | 2.500 | % | 10/30/24 | 100,000 | 94,309 | (a) | ||||||||||
Reliance Standard Life Global Funding II, Secured Notes | 2.750 | % | 1/21/27 | 50,000 | 44,866 | (a) | ||||||||||
Total Insurance | 476,880 | |||||||||||||||
Thrifts & Mortgage Finance — 0.1% | ||||||||||||||||
Rocket Mortgage LLC/Rocket Mortgage Co-Issuer Inc., Senior Notes | 2.875 | % | 10/15/26 | 20,000 | 16,400 | (a) | ||||||||||
Total Financials | 6,854,613 | |||||||||||||||
| Health Care — 4.2% | ||||||||||||||||
Biotechnology — 0.8% | ||||||||||||||||
AbbVie Inc., Senior Notes | 2.600 | % | 11/21/24 | 40,000 | 38,065 | |||||||||||
AbbVie Inc., Senior Notes | 2.950 | % | 11/21/26 | 170,000 | 155,747 | |||||||||||
Total Biotechnology | 193,812 | |||||||||||||||
Health Care Equipment & Supplies — 0.1% | ||||||||||||||||
Becton Dickinson and Co., Senior Notes | 3.363 | % | 6/6/24 | 32,000 | 31,097 | |||||||||||
Health Care Providers & Services — 2.9% | ||||||||||||||||
Bon Secours Mercy Health Inc., Secured Notes | 3.464 | % | 6/1/30 | 10,000 | 8,782 | |||||||||||
Centene Corp., Senior Notes | 4.625 | % | 12/15/29 | 30,000 | 26,958 | |||||||||||
Centene Corp., Senior Notes | 3.375 | % | 2/15/30 | 130,000 | 106,275 | |||||||||||
Cigna Corp., Senior Notes | 4.125 | % | 11/15/25 | 50,000 | 48,561 | |||||||||||
Cigna Corp., Senior Notes | 2.400 | % | 3/15/30 | 150,000 | 122,162 | |||||||||||
CommonSpirit Health, Senior Secured Notes | 2.782 | % | 10/1/30 | 10,000 | 7,981 | |||||||||||
CSL Finance PLC, Senior Notes | 3.850 | % | 4/27/27 | 30,000 | 28,392 | (a) | ||||||||||
CSL Finance PLC, Senior Notes | 4.050 | % | 4/27/29 | 40,000 | 36,843 | (a) | ||||||||||
CVS Health Corp., Senior Notes | 2.625 | % | 8/15/24 | 20,000 | 19,186 | |||||||||||
CVS Health Corp., Senior Notes | 2.875 | % | 6/1/26 | 40,000 | 37,032 | |||||||||||
See Notes to Financial Statements.
| Western Asset ETFs 2022 Semi-Annual Report | 9 |
Table of Contents
Schedules of investments (unaudited) (cont’d)
September 30, 2022
Western Asset Short Duration Income ETF
(Percentages shown based on Fund net assets)
| Security | Rate | Maturity Date | Face Amount | Value | ||||||||||||
Health Care Providers & Services — continued | ||||||||||||||||
CVS Health Corp., Senior Notes | 1.300 | % | 8/21/27 | 110,000 | $ | 91,644 | ||||||||||
Elevance Health Inc., Senior Notes | 4.100 | % | 5/15/32 | 20,000 | 18,064 | |||||||||||
UnitedHealth Group Inc., Senior Notes | 1.150 | % | 5/15/26 | 90,000 | 79,648 | |||||||||||
UnitedHealth Group Inc., Senior Notes | 3.700 | % | 5/15/27 | 80,000 | 76,108 | |||||||||||
Total Health Care Providers & Services | 707,636 | |||||||||||||||
Pharmaceuticals — 0.4% | ||||||||||||||||
Astrazeneca Finance LLC, Senior Notes | 1.200 | % | 5/28/26 | 40,000 | 35,048 | |||||||||||
Merck & Co. Inc., Senior Notes | 1.900 | % | 12/10/28 | 70,000 | 58,716 | |||||||||||
Total Pharmaceuticals | 93,764 | |||||||||||||||
Total Health Care | 1,026,309 | |||||||||||||||
| Industrials — 7.2% | ||||||||||||||||
Aerospace & Defense — 1.6% | ||||||||||||||||
Boeing Co., Senior Notes | 4.875 | % | 5/1/25 | 50,000 | 48,785 | |||||||||||
Boeing Co., Senior Notes | 2.196 | % | 2/4/26 | 390,000 | 346,101 | |||||||||||
Total Aerospace & Defense | 394,886 | |||||||||||||||
Airlines — 1.8% | ||||||||||||||||
Air Canada Pass-Through Trust | 5.000 | % | 12/15/23 | 39,600 | 38,504 | (a) | ||||||||||
American Airlines Group Inc. Pass-Through Trust | 4.950 | % | 2/15/25 | 30,930 | 28,123 | |||||||||||
American Airlines Inc./AAdvantage Loyalty IP Ltd., Senior Secured Notes | 5.500 | % | 4/20/26 | 60,000 | 56,350 | (a) | ||||||||||
Delta Air Lines Inc./SkyMiles IP Ltd., Senior Secured Notes | 4.500 | % | 10/20/25 | 210,000 | 203,838 | (a) | ||||||||||
Delta Air Lines Inc./SkyMiles IP Ltd., Senior Secured Notes | 4.750 | % | 10/20/28 | 40,000 | 37,254 | (a) | ||||||||||
United Airlines Pass-Through Trust | 4.875 | % | 1/15/26 | 63,680 | 59,476 | |||||||||||
US Airways Pass-Through Trust | 3.950 | % | 11/15/25 | 9,525 | 8,443 | |||||||||||
Total Airlines | 431,988 | |||||||||||||||
Commercial Services & Supplies — 0.3% | ||||||||||||||||
Waste Connections Inc., Senior Notes | 4.200 | % | 1/15/33 | 80,000 | 72,477 | |||||||||||
Industrial Conglomerates — 0.2% | ||||||||||||||||
Honeywell International Inc., Senior Notes | 1.950 | % | 6/1/30 | 50,000 | 40,848 | |||||||||||
Professional Services — 0.1% | ||||||||||||||||
Equifax Inc., Senior Notes | 2.350 | % | 9/15/31 | 30,000 | 22,539 | |||||||||||
Road & Rail — 0.4% | ||||||||||||||||
Canadian Pacific Railway Co., Senior Notes | 1.750 | % | 12/2/26 | 110,000 | 96,319 | |||||||||||
Trading Companies & Distributors — 2.8% | ||||||||||||||||
Air Lease Corp., Senior Notes | 3.000 | % | 9/15/23 | 140,000 | 136,565 | |||||||||||
Air Lease Corp., Senior Notes | 0.700 | % | 2/15/24 | 220,000 | 205,540 | |||||||||||
Aviation Capital Group LLC, Senior Notes | 4.125 | % | 8/1/25 | 370,000 | 338,475 | (a) | ||||||||||
Total Trading Companies & Distributors | 680,580 | |||||||||||||||
Total Industrials | 1,739,637 | |||||||||||||||
| Information Technology — 4.1% | ||||||||||||||||
Electronic Equipment, Instruments & Components — 0.6% | ||||||||||||||||
TD SYNNEX Corp., Senior Notes | 1.250 | % | 8/9/24 | 100,000 | 91,949 | |||||||||||
Vontier Corp., Senior Notes | 1.800 | % | 4/1/26 | 60,000 | 51,004 | |||||||||||
Total Electronic Equipment, Instruments & Components | 142,953 | |||||||||||||||
IT Services — 0.8% | ||||||||||||||||
Mastercard Inc., Senior Notes | 3.300 | % | 3/26/27 | 130,000 | 122,106 | |||||||||||
See Notes to Financial Statements.
| 10 | Western Asset ETFs 2022 Semi-Annual Report |
Table of Contents
Western Asset Short Duration Income ETF
(Percentages shown based on Fund net assets)
| Security | Rate | Maturity Date | Face Amount | Value | ||||||||||||
IT Services — continued | ||||||||||||||||
PayPal Holdings Inc., Senior Notes | 2.300 | % | 6/1/30 | $ | 80,000 | $ | 65,081 | |||||||||
S&P Global Inc., Senior Notes | 1.250 | % | 8/15/30 | 10,000 | 7,487 | |||||||||||
Total IT Services | 194,674 | |||||||||||||||
Semiconductors & Semiconductor Equipment — 0.5% | ||||||||||||||||
Broadcom Inc., Senior Notes | 3.150 | % | 11/15/25 | 10,000 | 9,386 | |||||||||||
KLA Corp., Senior Notes | 4.650 | % | 7/15/32 | 20,000 | 19,201 | |||||||||||
Lam Research corp., Senior Notes | 1.900 | % | 6/15/30 | 70,000 | 55,468 | |||||||||||
QUALCOMM Inc., Senior Notes | 4.250 | % | 5/20/32 | 20,000 | 18,874 | |||||||||||
Texas Instruments Inc., Senior Notes | 3.650 | % | 8/16/32 | 30,000 | 27,162 | |||||||||||
Total Semiconductors & Semiconductor Equipment | 130,091 | |||||||||||||||
Software — 1.6% | ||||||||||||||||
Adobe Inc., Senior Notes | 2.300 | % | 2/1/30 | 110,000 | 91,385 | |||||||||||
Fortinet Inc., Senior Notes | 1.000 | % | 3/15/26 | 130,000 | 111,864 | |||||||||||
Salesforce Inc., Senior Notes | 1.500 | % | 7/15/28 | 140,000 | 117,535 | |||||||||||
Workday Inc., Senior Notes | 3.800 | % | 4/1/32 | 80,000 | 69,438 | |||||||||||
Total Software | 390,222 | |||||||||||||||
Technology Hardware, Storage & Peripherals — 0.6% | ||||||||||||||||
Apple Inc., Senior Notes | 1.400 | % | 8/5/28 | 160,000 | 133,249 | |||||||||||
Total Information Technology | 991,189 | |||||||||||||||
| Materials — 3.0% | ||||||||||||||||
Containers & Packaging — 0.0%†† | ||||||||||||||||
Graphic Packaging International LLC, Senior Secured Notes | 1.512 | % | 4/15/26 | 10,000 | 8,747 | (a) | ||||||||||
Metals & Mining — 2.9% | ||||||||||||||||
Anglo American Capital PLC, Senior Notes | 3.625 | % | 9/11/24 | 200,000 | 193,405 | (a) | ||||||||||
Freeport-McMoRan Inc., Senior Notes | 4.375 | % | 8/1/28 | 150,000 | 135,069 | |||||||||||
Glencore Finance Canada Ltd., Senior Notes | 4.250 | % | 10/25/22 | 120,000 | 119,936 | (a) | ||||||||||
Glencore Funding LLC, Senior Notes | 1.625 | % | 9/1/25 | 190,000 | 170,971 | (a) | ||||||||||
Yamana Gold Inc., Senior Notes | 4.625 | % | 12/15/27 | 70,000 | 63,720 | |||||||||||
Yamana Gold Inc., Senior Notes | 2.630 | % | 8/15/31 | 10,000 | 7,396 | |||||||||||
Total Metals & Mining | 690,497 | |||||||||||||||
Paper & Forest Products — 0.1% | ||||||||||||||||
Suzano Austria GmbH, Senior Notes | 3.125 | % | 1/15/32 | 30,000 | 21,591 | |||||||||||
Total Materials | 720,835 | |||||||||||||||
| Real Estate — 1.6% | ||||||||||||||||
Equity Real Estate Investment Trusts (REITs) — 1.6% | ||||||||||||||||
Alexandria Real Estate Equities Inc., Senior Notes | 2.000 | % | 5/18/32 | 10,000 | 7,348 | |||||||||||
Diversified Healthcare Trust, Senior Notes | 4.750 | % | 5/1/24 | 20,000 | 17,238 | |||||||||||
Extra Space Storage LP, Senior Notes | 3.900 | % | 4/1/29 | 20,000 | 17,807 | |||||||||||
Kimco Realty Corp., Senior Notes | 2.250 | % | 12/1/31 | 60,000 | 45,007 | |||||||||||
Simon Property Group LP, Senior Notes | 3.500 | % | 9/1/25 | 20,000 | 19,096 | |||||||||||
VICI Properties LP, Senior Notes | 4.750 | % | 2/15/28 | 100,000 | 91,951 | |||||||||||
WEA Finance LLC/Westfield UK & Europe Finance PLC, Senior Notes | 3.750 | % | 9/17/24 | 200,000 | 188,930 | (a) | ||||||||||
Welltower Inc., Senior Notes | 3.850 | % | 6/15/32 | 20,000 | 17,091 | |||||||||||
Total Real Estate | 404,468 | |||||||||||||||
See Notes to Financial Statements.
| Western Asset ETFs 2022 Semi-Annual Report | 11 |
Table of Contents
Schedules of investments (unaudited) (cont’d)
September 30, 2022
Western Asset Short Duration Income ETF
(Percentages shown based on Fund net assets)
| Security | Rate | Maturity Date | Face Amount | Value | ||||||||||||
| Utilities — 1.6% | ||||||||||||||||
Electric Utilities — 1.6% | ||||||||||||||||
DTE Electric Co., First Mortgage | 2.625 | % | 3/1/31 | $ | 30,000 | $ | 24,959 | |||||||||
Duke Energy Ohio Inc., First Mortgage | 2.125 | % | 6/1/30 | 10,000 | 7,979 | |||||||||||
Edison International, Senior Notes | 4.950 | % | 4/15/25 | �� | 160,000 | 156,755 | ||||||||||
NRG Energy Inc., Senior Secured Notes | 2.450 | % | 12/2/27 | 160,000 | 130,984 | (a) | ||||||||||
Ohio Edison Co., Senior Notes | 5.500 | % | 1/15/33 | 20,000 | 19,713 | (a) | ||||||||||
Pacific Gas and Electric Co., First Mortgage Bonds | 2.100 | % | 8/1/27 | 30,000 | 24,251 | |||||||||||
Pacific Gas and Electric Co., First Mortgage Bonds | 3.000 | % | 6/15/28 | 20,000 | 16,479 | |||||||||||
Toledo Edison Co. | 2.650 | % | 5/1/28 | 8,000 | 6,917 | (a) | ||||||||||
Total Utilities | 388,037 | |||||||||||||||
Total Corporate Bonds & Notes (Cost — $23,104,673) | 20,793,222 | |||||||||||||||
| U.S. Government & Agency Obligations — 4.8% | ||||||||||||||||
U.S. Government Obligations — 4.8% | ||||||||||||||||
U.S. Treasury Bonds | 3.250 | % | 5/15/42 | 80,000 | 71,000 | |||||||||||
U.S. Treasury Bonds | 3.375 | % | 8/15/42 | 20,000 | 18,115 | |||||||||||
U.S. Treasury Bonds | 2.250 | % | 2/15/52 | 10,000 | 7,266 | |||||||||||
U.S. Treasury Bonds | 2.875 | % | 5/15/52 | 20,000 | 16,772 | |||||||||||
U.S. Treasury Notes | 2.750 | % | 7/31/27 | 400,000 | 376,656 | |||||||||||
U.S. Treasury Notes | 2.750 | % | 8/15/32 | 730,000 | 667,494 | |||||||||||
Total U.S. Government & Agency Obligations (Cost — $1,214,637) | 1,157,303 | |||||||||||||||
| Asset-Backed Securities — 3.9% | ||||||||||||||||
ABPCI Direct Lending Fund LLC, 2020-9A A1R (3 mo. USD LIBOR + 1.400%) | 4.169 | % | 11/18/31 | 270,000 | 262,861 | (a)(b) | ||||||||||
AGL CLO Ltd., 2020-6A AR (3 mo. USD LIBOR + 1.200%) | 3.910 | % | 7/20/34 | 100,000 | 97,334 | (a)(b) | ||||||||||
CIFC Funding Ltd., 2021-4A A (3 mo. USD LIBOR + 1.050%) | 3.562 | % | 7/15/33 | 110,000 | 107,003 | (a)(b) | ||||||||||
Halcyon Loan Advisors Funding Ltd., 2017-2A A2 (3 mo. USD LIBOR + 1.700%) | 4.440 | % | 1/17/30 | 250,000 | 242,709 | (a)(b) | ||||||||||
Navient Private Education Refi Loan Trust, 2020-DA A | 1.690 | % | 5/15/69 | 34,529 | 31,196 | (a) | ||||||||||
Neuberger Berman Loan Advisers CLO Ltd., 2021-42A A (3 mo. USD LIBOR + 1.100%) | 3.840 | % | 7/16/35 | 210,000 | 203,526 | (a)(b) | ||||||||||
Total Asset-Backed Securities (Cost — $972,886) | 944,629 | |||||||||||||||
| Sovereign Bonds — 0.3% | ||||||||||||||||
Argentina — 0.1% | ||||||||||||||||
Argentine Republic Government International Bond, Senior Notes | 1.000 | % | 7/9/29 | 4,718 | 901 | |||||||||||
Argentine Republic Government International Bond, Senior Notes, Step bond (0.500%to 7/9/23 then 0.750%) | 0.500 | % | 7/9/30 | 135,800 | 27,090 | |||||||||||
Total Argentina | 27,991 | |||||||||||||||
Peru — 0.2% | ||||||||||||||||
Peruvian Government International Bond, Senior Notes | 2.783 | % | 1/23/31 | 60,000 | 47,507 | |||||||||||
Total Sovereign Bonds (Cost — $141,853) | 75,498 | |||||||||||||||
| Senior Loans — 0.1% | ||||||||||||||||
| Energy — 0.1% | ||||||||||||||||
Oil, Gas & Consumable Fuels — 0.1% | ||||||||||||||||
Southwestern Energy Co., Initial Term Loan (3 mo. Term SOFR + 2.500%) | 6.203 | % | 6/22/27 | 19,850 | 19,527 | (b)(e)(f) | ||||||||||
| Industrials — 0.0%†† | ||||||||||||||||
Airlines — 0.0%†† | ||||||||||||||||
Delta Air Lines Inc., Initial Term Loan (3 mo. USD LIBOR + 3.750%) | 6.460 | % | 10/20/27 | 10,000 | 10,008 | (b)(e)(f) | ||||||||||
Total Senior Loans (Cost — $29,731) | 29,535 | |||||||||||||||
See Notes to Financial Statements.
| 12 | Western Asset ETFs 2022 Semi-Annual Report |
Table of Contents
Western Asset Short Duration Income ETF
(Percentages shown based on Fund net assets)
| Security | Rate | Maturity Date | Face Amount | Value | ||||||||||||
| Municipal Bonds — 0.1% | ||||||||||||||||
California — 0.1% | ||||||||||||||||
Regents of the University of California, CA, Medical Center Pooled Revenue, Taxable Bonds, Series Q (Cost — $30,000) | 4.132 | % | 5/15/32 | $ | 30,000 | $ | 27,363 | |||||||||
Total Investments before Short-Term Investments (Cost — $25,493,780) | 23,027,550 | |||||||||||||||
| Shares | ||||||||||||||||
| Short-Term Investments — 3.5% | ||||||||||||||||
BNY Mellon Cash Reserve Fund (Cost — $851,572) | 1.350 | % | 851,572 | 851,572 | ||||||||||||
Total Investments — 98.5% (Cost — $26,345,352) | 23,879,122 | |||||||||||||||
Other Assets in Excess of Liabilities — 1.5% | 354,959 | |||||||||||||||
Total Net Assets — 100.0% | $ | 24,234,081 | ||||||||||||||
| †† | Represents less than 0.1%. |
| (a) | Security is exempt from registration under Rule 144A of the Securities Act of 1933. This security may be resold in transactions that are exempt from registration, normally to qualified institutional buyers. This security has been deemed liquid pursuant to guidelines approved by the Board of Trustees. |
| (b) | Variable rate security. Interest rate disclosed is as of the most recent information available. Certain variable rate securities are not based on a published reference rate and spread but are determined by the issuer or agent and are based on current market conditions. These securities do not indicate a reference rate and spread in their description above. |
| (c) | Security has no maturity date. The date shown represents the next call date. |
| (d) | Payment-in-kind security for which the issuer has the option at each interest payment date of making interest payments in cash or additional securities. |
| (e) | Interest rates disclosed represent the effective rates on senior loans. Ranges in interest rates are attributable to multiple contracts under the same loan. |
| (f) | Senior loans may be considered restricted in that the Fund ordinarily is contractually obligated to receive approval from the agent bank and/or borrower prior to the disposition of a senior loan. |
Abbreviation(s) used in this schedule: | ||
| CLO | — Collateralized Loan Obligation | |
| LIBOR | — London Interbank Offered Rate | |
| PIK | — Payment-In-Kind | |
| SOFR | — Secured Overnight Financing Rate | |
| USD | — United States Dollar | |
At September 30, 2022, the Fund had the following open futures contracts:
| Number of Contracts | Expiration Date | Notional Amount | Market Value | Unrealized Appreciation (Depreciation) | ||||||||||||||||
| Contracts to Buy: | ||||||||||||||||||||
| U.S. Treasury 2-Year Notes | 6 | 12/22 | $ | 1,244,866 | $ | 1,232,344 | $ | (12,522) | ||||||||||||
| U.S. Treasury 5-Year Notes | 122 | 12/22 | 13,590,164 | 13,115,953 | (474,211) | |||||||||||||||
| (486,733) | ||||||||||||||||||||
| Contracts to Sell: | ||||||||||||||||||||
| U.S. Treasury 10-Year Notes | 77 | 12/22 | 9,078,350 | 8,628,812 | 449,538 | |||||||||||||||
| U.S. Treasury Long-Term Bonds | 9 | 12/22 | 1,235,211 | 1,137,656 | 97,555 | |||||||||||||||
| U.S. Treasury Ultra 10-Year Notes | 6 | 12/22 | 757,316 | 710,907 | 46,409 | |||||||||||||||
| U.S. Treasury Ultra Long-Term Bonds | 1 | 12/22 | 149,767 | 137,000 | 12,767 | |||||||||||||||
| 606,269 | ||||||||||||||||||||
| Net unrealized appreciation on open futures contracts |
| $ | 119,536 | |||||||||||||||||
See Notes to Financial Statements.
| Western Asset ETFs 2022 Semi-Annual Report | 13 |
Table of Contents
Schedules of investments (unaudited) (cont’d)
September 30, 2022
Western Asset Short Duration Income ETF
At September 30, 2022, the Fund had the following open swap contracts:
| CENTRALLY CLEARED CREDIT DEFAULT SWAPS ON CREDIT INDICES — BUY PROTECTION1 | ||||||||||||||||||||||
| Reference Entity | Notional Amount2 | Termination Date | Periodic Payments Made by the Fund† | Market Value3 | Upfront Premiums Paid (Received) | Unrealized Appreciation | ||||||||||||||||
| MARKIT CDX.NA.HY.38 Index | $ | 366,300 | 6/20/27 | 5.000% quarterly | $ | 8,292 | $ | 2,175 | $ | 6,117 | ||||||||||||
| MARKIT CDX.NA.IG.38 Index | 1,010,000 | 6/20/27 | 1.000% quarterly | (255) | (6,596) | 6,341 | ||||||||||||||||
| Total | $ | 1,376,300 | $ | 8,037 | $ | (4,421) | $ | 12,458 | ||||||||||||||
| 1 | If the Fund is a buyer of protection and a credit event occurs, as defined under the terms of that particular swap agreement, the Fund will either (i) receive from the seller of protection an amount equal to the notional amount of the swap and deliver the referenced obligation or the underlying securities comprising the referenced index or (ii) receive a net settlement amount in the form of cash or securities equal to the notional amount of the swap less the recovery value of the referenced obligation or the underlying securities comprising the referenced index. |
| 2 | The maximum potential amount the Fund could be required to pay as a seller of credit protection or receive as a buyer of credit protection if a credit event occurs as defined under the terms of that particular swap agreement. |
| 3 | The quoted market prices and resulting values for credit default swap agreements on asset-backed securities and credit indices serve as an indicator of the current status of the payment/performance risk and represent the likelihood of an expected loss (or profit) for the credit derivative had the notional amount of the swap agreement been closed/sold as of the period end. Decreasing market values (sell protection) or increasing market values (buy protection) when compared to the notional amount of the swap, represent a deterioration of the referenced entity’s credit soundness and a greater likelihood or risk of default or other credit event occurring as defined under the terms of the agreement. |
| † | Percentage shown is an annual percentage rate. |
See Notes to Financial Statements.
| 14 | Western Asset ETFs 2022 Semi-Annual Report |
Table of Contents
Western Asset Total Return ETF
(Percentages shown based on Fund net assets)
| Security | Rate | Maturity Date | Face Amount† | Value | ||||||||||||
| Corporate Bonds & Notes — 41.3% | ||||||||||||||||
| Communication Services — 5.1% | ||||||||||||||||
Diversified Telecommunication Services — 1.6% | ||||||||||||||||
AT&T Inc., Senior Notes | 1.650 | % | 2/1/28 | 40,000 | $ | 32,872 | ||||||||||
AT&T Inc., Senior Notes | 2.550 | % | 12/1/33 | 20,000 | 14,807 | |||||||||||
AT&T Inc., Senior Notes | 5.350 | % | 9/1/40 | 20,000 | 18,048 | |||||||||||
AT&T Inc., Senior Notes | 5.550 | % | 8/15/41 | 10,000 | 9,268 | |||||||||||
AT&T Inc., Senior Notes | 4.350 | % | 6/15/45 | 19,000 | 14,684 | |||||||||||
AT&T Inc., Senior Notes | 3.500 | % | 9/15/53 | 50,000 | 33,317 | |||||||||||
AT&T Inc., Senior Notes | 3.550 | % | 9/15/55 | 37,000 | 24,303 | |||||||||||
AT&T Inc., Senior Notes | 3.650 | % | 9/15/59 | 20,000 | 12,958 | |||||||||||
Verizon Communications Inc., Senior Notes | 2.100 | % | 3/22/28 | 40,000 | 33,768 | |||||||||||
Verizon Communications Inc., Senior Notes | 3.150 | % | 3/22/30 | 40,000 | 34,023 | |||||||||||
Verizon Communications Inc., Senior Notes | 1.750 | % | 1/20/31 | 60,000 | 44,998 | |||||||||||
Verizon Communications Inc., Senior Notes | 2.550 | % | 3/21/31 | 60,000 | 47,906 | |||||||||||
Verizon Communications Inc., Senior Notes | 2.355 | % | 3/15/32 | 94,000 | 72,082 | |||||||||||
Verizon Communications Inc., Senior Notes | 4.500 | % | 8/10/33 | 160,000 | 144,108 | |||||||||||
Verizon Communications Inc., Senior Notes | 5.250 | % | 3/16/37 | 30,000 | 28,017 | |||||||||||
Verizon Communications Inc., Senior Notes | 3.400 | % | 3/22/41 | 10,000 | 7,301 | |||||||||||
Total Diversified Telecommunication Services | 572,460 | |||||||||||||||
Entertainment — 0.5% | ||||||||||||||||
Warnermedia Holdings Inc., Senior Notes | 3.755 | % | 3/15/27 | 20,000 | 17,894 | (a) | ||||||||||
Warnermedia Holdings Inc., Senior Notes | 4.054 | % | 3/15/29 | 10,000 | 8,637 | (a) | ||||||||||
Warnermedia Holdings Inc., Senior Notes | 4.279 | % | 3/15/32 | 70,000 | 57,588 | (a) | ||||||||||
Warnermedia Holdings Inc., Senior Notes | 5.050 | % | 3/15/42 | 10,000 | 7,482 | (a) | ||||||||||
Warnermedia Holdings Inc., Senior Notes | 5.141 | % | 3/15/52 | 90,000 | 65,414 | (a) | ||||||||||
Total Entertainment | 157,015 | |||||||||||||||
Interactive Media & Services — 0.1% | ||||||||||||||||
Alphabet Inc., Senior Notes | 1.100 | % | 8/15/30 | 20,000 | 15,463 | |||||||||||
Media — 2.0% | ||||||||||||||||
CCO Holdings LLC/CCO Holdings Capital Corp., Senior Notes | 4.500 | % | 8/15/30 | 10,000 | 7,909 | (a) | ||||||||||
CCO Holdings LLC/CCO Holdings Capital Corp., Senior Notes | 4.250 | % | 2/1/31 | 218,000 | 167,215 | (a) | ||||||||||
Charter Communications Operating LLC/Charter Communications Operating Capital Corp., Senior Secured Notes | 4.908 | % | 7/23/25 | 40,000 | 39,006 | |||||||||||
Charter Communications Operating LLC/Charter Communications Operating Capital Corp., Senior Secured Notes | 5.050 | % | 3/30/29 | 50,000 | 46,021 | |||||||||||
Charter Communications Operating LLC/Charter Communications Operating Capital Corp., Senior Secured Notes | 2.800 | % | 4/1/31 | 70,000 | 52,916 | |||||||||||
Charter Communications Operating LLC/Charter Communications Operating Capital Corp., Senior Secured Notes | 5.375 | % | 4/1/38 | 80,000 | 64,824 | |||||||||||
Charter Communications Operating LLC/Charter Communications Operating Capital Corp., Senior Secured Notes | 3.500 | % | 3/1/42 | 40,000 | 25,381 | |||||||||||
Charter Communications Operating LLC/Charter Communications Operating Capital Corp., Senior Secured Notes | 4.800 | % | 3/1/50 | 10,000 | 7,214 | |||||||||||
Comcast Corp., Senior Notes | 3.150 | % | 3/1/26 | 20,000 | 18,841 | |||||||||||
Comcast Corp., Senior Notes | 3.300 | % | 4/1/27 | 50,000 | 46,378 | |||||||||||
Comcast Corp., Senior Notes | 4.250 | % | 10/15/30 | 40,000 | 37,035 | |||||||||||
Comcast Corp., Senior Notes | 3.750 | % | 4/1/40 | 20,000 | 15,722 | |||||||||||
See Notes to Financial Statements.
| Western Asset ETFs 2022 Semi-Annual Report | 15 |
Table of Contents
Schedules of investments (unaudited) (cont’d)
September 30, 2022
Western Asset Total Return ETF
(Percentages shown based on Fund net assets)
| Security | Rate | Maturity Date | Face Amount† | Value | ||||||||||||
Media — continued | ||||||||||||||||
Comcast Corp., Senior Notes | 4.000 | % | 8/15/47 | 10,000 | $ | 7,736 | ||||||||||
Comcast Corp., Senior Notes | 3.969 | % | 11/1/47 | 20,000 | 15,292 | |||||||||||
Comcast Corp., Senior Notes | 3.450 | % | 2/1/50 | 10,000 | 6,983 | |||||||||||
Comcast Corp., Senior Notes | 2.800 | % | 1/15/51 | 70,000 | 42,878 | |||||||||||
DISH DBS Corp., Senior Notes | 5.875 | % | 11/15/24 | 120,000 | 107,100 | |||||||||||
Time Warner Cable LLC, Senior Secured Notes | 6.550 | % | 5/1/37 | 10,000 | 9,023 | |||||||||||
Total Media | 717,474 | |||||||||||||||
Wireless Telecommunication Services — 0.9% | ||||||||||||||||
T-Mobile USA Inc., Senior Notes | 3.500 | % | 4/15/25 | 50,000 | 47,788 | |||||||||||
T-Mobile USA Inc., Senior Notes | 2.250 | % | 2/15/26 | 10,000 | 8,948 | |||||||||||
T-Mobile USA Inc., Senior Notes | 3.750 | % | 4/15/27 | 10,000 | 9,228 | |||||||||||
T-Mobile USA Inc., Senior Notes | 3.875 | % | 4/15/30 | 30,000 | 26,611 | |||||||||||
T-Mobile USA Inc., Senior Notes | 2.550 | % | 2/15/31 | 40,000 | 31,692 | |||||||||||
Vmed O2 UK Financing I PLC, Senior Secured Notes | 4.750 | % | 7/15/31 | 200,000 | 154,299 | (a) | ||||||||||
Vodafone Group PLC, Senior Notes | 4.375 | % | 5/30/28 | 50,000 | 47,033 | |||||||||||
Total Wireless Telecommunication Services | 325,599 | |||||||||||||||
Total Communication Services | 1,788,011 | |||||||||||||||
| Consumer Discretionary — 4.9% | ||||||||||||||||
Automobiles — 1.6% | ||||||||||||||||
Ford Motor Co., Senior Notes | 3.250 | % | 2/12/32 | 130,000 | 93,643 | |||||||||||
Ford Motor Co., Senior Notes | 6.100 | % | 8/19/32 | 20,000 | 17,632 | |||||||||||
Ford Motor Credit Co. LLC, Senior Notes | 4.000 | % | 11/13/30 | 200,000 | 156,000 | |||||||||||
General Motors Co., Senior Notes | 5.400 | % | 10/2/23 | 20,000 | 20,002 | |||||||||||
General Motors Co., Senior Notes | 6.125 | % | 10/1/25 | 40,000 | 40,017 | |||||||||||
General Motors Co., Senior Notes | 5.950 | % | 4/1/49 | 10,000 | 8,341 | |||||||||||
General Motors Financial Co. Inc., Senior Notes | 3.100 | % | 1/12/32 | 20,000 | 15,085 | |||||||||||
Nissan Motor Co. Ltd., Senior Notes | 4.345 | % | 9/17/27 | 240,000 | 206,877 | (a) | ||||||||||
Total Automobiles | 557,597 | |||||||||||||||
Hotels, Restaurants & Leisure — 1.9% | ||||||||||||||||
Las Vegas Sands Corp., Senior Notes | 3.200 | % | 8/8/24 | 40,000 | 37,707 | |||||||||||
Las Vegas Sands Corp., Senior Notes | 2.900 | % | 6/25/25 | 80,000 | 71,748 | |||||||||||
McDonald’s Corp., Senior Notes | 3.500 | % | 3/1/27 | 10,000 | 9,470 | |||||||||||
McDonald’s Corp., Senior Notes | 3.800 | % | 4/1/28 | 20,000 | 18,786 | |||||||||||
McDonald’s Corp., Senior Notes | 4.450 | % | 9/1/48 | 70,000 | 58,385 | |||||||||||
NCL Corp. Ltd., Senior Notes | 5.875 | % | 3/15/26 | 130,000 | 98,896 | (a) | ||||||||||
Sands China Ltd., Senior Notes | 5.625 | % | 8/8/25 | 200,000 | 181,186 | |||||||||||
Sands China Ltd., Senior Notes | 2.800 | % | 3/8/27 | 200,000 | 158,914 | |||||||||||
VOC Escrow Ltd., Senior Secured Notes | 5.000 | % | 2/15/28 | 20,000 | 16,267 | (a) | ||||||||||
Total Hotels, Restaurants & Leisure | 651,359 | |||||||||||||||
Household Durables — 0.1% | ||||||||||||||||
Lennar Corp., Senior Notes | 4.500 | % | 4/30/24 | 20,000 | 19,628 | |||||||||||
MDC Holdings Inc., Senior Notes | 6.000 | % | 1/15/43 | 10,000 | 7,504 | |||||||||||
Total Household Durables | 27,132 | |||||||||||||||
Internet & Direct Marketing Retail — 1.1% | ||||||||||||||||
Amazon.com Inc., Senior Notes | 3.450 | % | 4/13/29 | 30,000 | 27,740 | |||||||||||
Amazon.com Inc., Senior Notes | 1.500 | % | 6/3/30 | 10,000 | 7,889 | |||||||||||
See Notes to Financial Statements.
| 16 | Western Asset ETFs 2022 Semi-Annual Report |
Table of Contents
Western Asset Total Return ETF
(Percentages shown based on Fund net assets)
| Maturity | Face | |||||||||||||||
| Security | Rate | Date | Amount† | Value | ||||||||||||
Internet & Direct Marketing Retail — continued | ||||||||||||||||
Amazon.com Inc., Senior Notes | 3.600 | % | 4/13/32 | 10,000 | $ | 9,093 | ||||||||||
Amazon.com Inc., Senior Notes | 3.875 | % | 8/22/37 | 70,000 | 60,847 | |||||||||||
Amazon.com Inc., Senior Notes | 4.050 | % | 8/22/47 | 60,000 | 50,668 | |||||||||||
Amazon.com Inc., Senior Notes | 3.100 | % | 5/12/51 | 30,000 | 21,002 | |||||||||||
Prosus NV, Senior Notes | 3.832 | % | 2/8/51 | 400,000 | 221,970 | (a) | ||||||||||
Total Internet & Direct Marketing Retail | 399,209 | |||||||||||||||
Multiline Retail — 0.0%†† | ||||||||||||||||
Target Corp., Senior Notes | 2.250 | % | 4/15/25 | 10,000 | 9,431 | |||||||||||
Specialty Retail — 0.1% | ||||||||||||||||
Home Depot Inc., Senior Notes | 2.700 | % | 4/15/30 | 10,000 | 8,541 | |||||||||||
Home Depot Inc., Senior Notes | 3.350 | % | 4/15/50 | 40,000 | 28,670 | |||||||||||
Total Specialty Retail | 37,211 | |||||||||||||||
Textiles, Apparel & Luxury Goods — 0.1% | ||||||||||||||||
NIKE Inc., Senior Notes | 2.750 | % | 3/27/27 | 30,000 | 27,567 | |||||||||||
Total Consumer Discretionary | 1,709,506 | |||||||||||||||
| Consumer Staples — 2.0% | ||||||||||||||||
Beverages — 0.6% | ||||||||||||||||
Anheuser-Busch Cos. LLC/Anheuser-Busch InBev Worldwide Inc., Senior Notes | 3.650 | % | 2/1/26 | 30,000 | 28,817 | |||||||||||
Anheuser-Busch InBev Worldwide Inc., Senior Notes | 4.750 | % | 1/23/29 | 10,000 | 9,742 | |||||||||||
Anheuser-Busch InBev Worldwide Inc., Senior Notes | 4.600 | % | 4/15/48 | 10,000 | 8,281 | |||||||||||
Anheuser-Busch InBev Worldwide Inc., Senior Notes | 4.439 | % | 10/6/48 | 30,000 | 24,337 | |||||||||||
Anheuser-Busch InBev Worldwide Inc., Senior Notes | 5.550 | % | 1/23/49 | 10,000 | 9,405 | |||||||||||
Anheuser-Busch InBev Worldwide Inc., Senior Notes | 4.500 | % | 6/1/50 | 20,000 | 16,481 | |||||||||||
Coca-Cola Co., Senior Notes | 3.375 | % | 3/25/27 | 20,000 | 19,081 | |||||||||||
Constellation Brands Inc., Senior Notes | 4.350 | % | 5/9/27 | 30,000 | 28,776 | |||||||||||
PepsiCo Inc., Senior Notes | 2.625 | % | 3/19/27 | 60,000 | 55,056 | |||||||||||
Total Beverages | 199,976 | |||||||||||||||
Food & Staples Retailing — 0.0%†† | ||||||||||||||||
Walmart Inc., Senior Notes | 1.800 | % | 9/22/31 | 10,000 | 7,945 | |||||||||||
Food Products — 0.4% | ||||||||||||||||
Hershey Co., Senior Notes | 0.900 | % | 6/1/25 | 10,000 | 9,076 | |||||||||||
Kraft Heinz Foods Co., Senior Notes | 4.375 | % | 6/1/46 | 40,000 | 31,096 | |||||||||||
Kraft Heinz Foods Co., Senior Notes | 4.875 | % | 10/1/49 | 30,000 | 24,726 | |||||||||||
Mars Inc., Senior Notes | 2.700 | % | 4/1/25 | 20,000 | 19,020 | (a) | ||||||||||
Mars Inc., Senior Notes | 3.200 | % | 4/1/30 | 30,000 | 26,490 | (a) | ||||||||||
Mars Inc., Senior Notes | 3.200 | % | 4/1/30 | 10,000 | 8,830 | (b) | ||||||||||
Mondelez International Inc., Senior Notes | 1.500 | % | 5/4/25 | 30,000 | 27,420 | |||||||||||
Total Food Products | 146,658 | |||||||||||||||
Tobacco — 1.0% | ||||||||||||||||
Altria Group Inc., Senior Notes | 5.375 | % | 1/31/44 | 10,000 | 8,096 | |||||||||||
Altria Group Inc., Senior Notes | 3.875 | % | 9/16/46 | 30,000 | 18,969 | |||||||||||
Altria Group Inc., Senior Notes | 5.950 | % | 2/14/49 | 110,000 | 91,077 | |||||||||||
Altria Group Inc., Senior Notes | 6.200 | % | 2/14/59 | 4,000 | 3,472 | |||||||||||
BAT Capital Corp., Senior Notes | 3.557 | % | 8/15/27 | 40,000 | 35,127 | |||||||||||
BAT Capital Corp., Senior Notes | 3.734 | % | 9/25/40 | 30,000 | 19,221 | |||||||||||
See Notes to Financial Statements.
| Western Asset ETFs 2022 Semi-Annual Report | 17 |
Table of Contents
Schedules of investments (unaudited) (cont’d)
September 30, 2022
Western Asset Total Return ETF
(Percentages shown based on Fund net assets)
| Security | Rate | Maturity Date | Face Amount† | Value | ||||||||||||
Tobacco — continued | ||||||||||||||||
BAT Capital Corp., Senior Notes | 4.540 | % | 8/15/47 | 40,000 | $ | 26,502 | ||||||||||
Philip Morris International Inc., Senior Notes | 2.500 | % | 11/2/22 | 140,000 | 139,692 | |||||||||||
Total Tobacco | 342,156 | |||||||||||||||
Total Consumer Staples | 696,735 | |||||||||||||||
| Energy — 6.4% | ||||||||||||||||
Energy Equipment & Services — 0.0%†† | ||||||||||||||||
Halliburton Co., Senior Notes | 3.800 | % | 11/15/25 | 2,000 | 1,926 | |||||||||||
Oil, Gas & Consumable Fuels — 6.4% | ||||||||||||||||
BP Capital Markets America Inc., Senior Notes | 3.937 | % | 9/21/28 | 40,000 | 37,057 | |||||||||||
BP Capital Markets America Inc., Senior Notes | 3.633 | % | 4/6/30 | 30,000 | 26,952 | |||||||||||
Cameron LNG LLC, Senior Secured Notes | 2.902 | % | 7/15/31 | 30,000 | 24,710 | (a) | ||||||||||
Cameron LNG LLC, Senior Secured Notes | 3.302 | % | 1/15/35 | 60,000 | 47,190 | (a) | ||||||||||
Cheniere Energy Inc., Senior Notes | 4.625 | % | 10/15/28 | 30,000 | 27,520 | |||||||||||
Cheniere Energy Partners LP, Senior Notes | 3.250 | % | 1/31/32 | 10,000 | 7,679 | |||||||||||
Chevron Corp., Senior Notes | 1.554 | % | 5/11/25 | 30,000 | 27,718 | |||||||||||
Chevron Corp., Senior Notes | 2.236 | % | 5/11/30 | 20,000 | 16,708 | |||||||||||
Continental Resources Inc., Senior Notes | 4.500 | % | 4/15/23 | 20,000 | 19,900 | |||||||||||
Continental Resources Inc., Senior Notes | 2.268 | % | 11/15/26 | 20,000 | 17,067 | (a) | ||||||||||
Continental Resources Inc., Senior Notes | 5.750 | % | 1/15/31 | 20,000 | 18,077 | (a) | ||||||||||
Continental Resources Inc., Senior Notes | 4.900 | % | 6/1/44 | 30,000 | 21,404 | |||||||||||
Coterra Energy Inc., Senior Notes | 3.900 | % | 5/15/27 | 70,000 | 64,864 | (a) | ||||||||||
Coterra Energy Inc., Senior Notes | 4.375 | % | 3/15/29 | 70,000 | 64,711 | (a) | ||||||||||
Devon Energy Corp., Senior Notes | 5.850 | % | 12/15/25 | 110,000 | 110,955 | |||||||||||
Devon Energy Corp., Senior Notes | 5.000 | % | 6/15/45 | 90,000 | 74,892 | |||||||||||
Diamondback Energy Inc., Senior Notes | 3.500 | % | 12/1/29 | 20,000 | 17,263 | |||||||||||
Ecopetrol SA, Senior Notes | 5.875 | % | 5/28/45 | 140,000 | 84,757 | |||||||||||
Energy Transfer LP, Junior Subordinated Notes (6.250% to 2/15/23 then 3 mo. USD LIBOR + 4.028%) | 6.250 | % | 2/15/23 | 10,000 | 8,200 | (c)(d) | ||||||||||
Energy Transfer LP, Junior Subordinated Notes (6.500% to 11/15/26 then 5 year Treasury Constant Maturity Rate + 5.694%) | 6.500 | % | 11/15/26 | 20,000 | 17,422 | (c)(d) | ||||||||||
Energy Transfer LP, Junior Subordinated Notes (6.750% to 5/15/25 then 5 year Treasury Constant Maturity Rate + 5.134%) | 6.750 | % | 5/15/25 | 10,000 | 8,640 | (c)(d) | ||||||||||
Energy Transfer LP, Junior Subordinated Notes (7.125% to 5/15/30 then 5 year Treasury Constant Maturity Rate + 5.306%) | 7.125 | % | 5/15/30 | 30,000 | 24,646 | (c)(d) | ||||||||||
Energy Transfer LP, Senior Notes | 2.900 | % | 5/15/25 | 60,000 | 55,926 | |||||||||||
Energy Transfer LP, Senior Notes | 4.950 | % | 6/15/28 | 10,000 | 9,314 | |||||||||||
Energy Transfer LP, Senior Notes | 5.250 | % | 4/15/29 | 10,000 | 9,405 | |||||||||||
Energy Transfer LP, Senior Notes | 3.750 | % | 5/15/30 | 20,000 | 16,935 | |||||||||||
Energy Transfer LP, Senior Notes | 6.250 | % | 4/15/49 | 60,000 | 53,228 | |||||||||||
Enterprise Products Operating LLC, Senior Notes | 4.150 | % | 10/16/28 | 50,000 | 46,486 | |||||||||||
Enterprise Products Operating LLC, Senior Notes | 2.800 | % | 1/31/30 | 30,000 | 25,053 | |||||||||||
Enterprise Products Operating LLC, Senior Notes | 3.700 | % | 1/31/51 | 80,000 | 56,252 | |||||||||||
Enterprise Products Operating LLC, Senior Notes (5.375% to 2/15/28 then 3 mo. USD LIBOR + 2.570%) | 5.375 | % | 2/15/78 | 10,000 | 7,510 | (d) | ||||||||||
EOG Resources Inc., Senior Notes | 4.375 | % | 4/15/30 | 10,000 | 9,523 | |||||||||||
EOG Resources Inc., Senior Notes | 3.900 | % | 4/1/35 | 40,000 | 34,189 | |||||||||||
See Notes to Financial Statements.
| 18 | Western Asset ETFs 2022 Semi-Annual Report |
Table of Contents
Western Asset Total Return ETF
(Percentages shown based on Fund net assets)
| Security | Rate | Maturity Date | Face Amount† | Value | ||||||||||||
Oil, Gas & Consumable Fuels — continued | ||||||||||||||||
EOG Resources Inc., Senior Notes | 4.950 | % | 4/15/50 | 10,000 | $ | 9,303 | ||||||||||
EQM Midstream Partners LP, Senior Notes | 6.000 | % | 7/1/25 | 70,000 | 64,724 | (a) | ||||||||||
EQT Corp., Senior Notes | 3.900 | % | 10/1/27 | 55,000 | 50,050 | |||||||||||
EQT Corp., Senior Notes | 5.000 | % | 1/15/29 | 20,000 | 18,661 | |||||||||||
EQT Corp., Senior Notes | 3.625 | % | 5/15/31 | 40,000 | 33,347 | (a) | ||||||||||
Exxon Mobil Corp., Senior Notes | 2.992 | % | 3/19/25 | 30,000 | 28,774 | |||||||||||
Exxon Mobil Corp., Senior Notes | 3.482 | % | 3/19/30 | 40,000 | 36,323 | |||||||||||
Exxon Mobil Corp., Senior Notes | 3.452 | % | 4/15/51 | 30,000 | 22,339 | |||||||||||
Kinder Morgan Inc., Senior Notes | 4.300 | % | 3/1/28 | 10,000 | 9,358 | |||||||||||
Kinder Morgan Inc., Senior Notes | 5.050 | % | 2/15/46 | 20,000 | 16,336 | |||||||||||
Kinder Morgan Inc., Senior Notes | 5.200 | % | 3/1/48 | 40,000 | 33,428 | |||||||||||
MPLX LP, Senior Notes | 4.875 | % | 6/1/25 | 20,000 | 19,599 | |||||||||||
MPLX LP, Senior Notes | 4.800 | % | 2/15/29 | 40,000 | 37,222 | |||||||||||
MPLX LP, Senior Notes | 4.500 | % | 4/15/38 | 20,000 | 16,099 | |||||||||||
MPLX LP, Senior Notes | 5.500 | % | 2/15/49 | 10,000 | 8,487 | |||||||||||
Occidental Petroleum Corp., Senior Notes | 6.600 | % | 3/15/46 | 110,000 | 113,300 | |||||||||||
Occidental Petroleum Corp., Senior Notes | 4.200 | % | 3/15/48 | 60,000 | 47,951 | |||||||||||
Parsley Energy LLC/Parsley Finance Corp., Senior Notes | 4.125 | % | 2/15/28 | 10,000 | 9,090 | (a) | ||||||||||
Petrobras Global Finance BV, Senior Notes | 5.750 | % | 2/1/29 | 130,000 | 121,582 | |||||||||||
Pioneer Natural Resources Co., Senior Notes | 2.150 | % | 1/15/31 | 30,000 | 23,109 | |||||||||||
Shell International Finance BV, Senior Notes | 4.375 | % | 5/11/45 | 40,000 | 33,616 | |||||||||||
Southwestern Energy Co., Senior Notes | 5.375 | % | 3/15/30 | 10,000 | 9,010 | |||||||||||
Southwestern Energy Co., Senior Notes | 4.750 | % | 2/1/32 | 10,000 | 8,381 | |||||||||||
Targa Resources Corp., Senior Notes | 5.200 | % | 7/1/27 | 10,000 | 9,620 | |||||||||||
Targa Resources Partners LP/Targa Resources Partners Finance Corp., Senior Notes | 5.000 | % | 1/15/28 | 10,000 | 9,250 | |||||||||||
Targa Resources Partners LP/Targa Resources Partners Finance Corp., Senior Notes | 6.875 | % | 1/15/29 | 20,000 | 19,644 | |||||||||||
Targa Resources Partners LP/Targa Resources Partners Finance Corp., Senior Notes | 4.875 | % | 2/1/31 | 50,000 | 43,000 | |||||||||||
Tennessee Gas Pipeline Co. LLC, Senior Notes | 2.900 | % | 3/1/30 | 10,000 | 8,186 | (a) | ||||||||||
Transcontinental Gas Pipe Line Co. LLC, Senior Notes | 7.850 | % | 2/1/26 | 70,000 | 74,348 | |||||||||||
Western Midstream Operating LP, Senior Notes | 3.350 | % | 2/1/25 | 10,000 | 9,322 | |||||||||||
Western Midstream Operating LP, Senior Notes | 4.500 | % | 3/1/28 | 10,000 | 9,050 | |||||||||||
Western Midstream Operating LP, Senior Notes | 4.300 | % | 2/1/30 | 30,000 | 25,658 | |||||||||||
Western Midstream Operating LP, Senior Notes | 5.500 | % | 8/15/48 | 60,000 | 48,525 | |||||||||||
Western Midstream Operating LP, Senior Notes (3 mo. USD LIBOR + 1.100%) | 3.555 | % | 1/13/23 | 10,000 | 9,926 | (d) | ||||||||||
Williams Cos. Inc., Senior Notes | 7.750 | % | 6/15/31 | 80,000 | 86,838 | |||||||||||
Williams Cos. Inc., Senior Notes | 8.750 | % | 3/15/32 | 40,000 | 46,557 | |||||||||||
Total Oil, Gas & Consumable Fuels | 2,262,166 | |||||||||||||||
Total Energy | 2,264,092 | |||||||||||||||
| Financials — 12.2% | ||||||||||||||||
Banks — 8.7% | ||||||||||||||||
Bank of America Corp., Senior Notes | 5.000 | % | 1/21/44 | 50,000 | 43,201 | |||||||||||
See Notes to Financial Statements.
| Western Asset ETFs 2022 Semi-Annual Report | 19 |
Table of Contents
Schedules of investments (unaudited) (cont’d)
September 30, 2022
Western Asset Total Return ETF
(Percentages shown based on Fund net assets)
| Security | Rate | Maturity Date | Face Amount† | Value | ||||||||||||
Banks — continued | ||||||||||||||||
Bank of America Corp., Senior Notes (2.572% to 10/20/31 then SOFR + 1.210%) | 2.572 | % | 10/20/32 | 50,000 | $ | 38,241 | (d) | |||||||||
Bank of America Corp., Senior Notes (2.687% to 4/22/31 then SOFR + 1.320%) | 2.687 | % | 4/22/32 | 260,000 | 202,991 | (d) | ||||||||||
Bank of America Corp., Senior Notes (2.972% to 2/4/32 then SOFR + 1.330%) | 2.972 | % | 2/4/33 | 60,000 | 46,905 | (d) | ||||||||||
Bank of America Corp., Senior Notes (4.376% to 4/27/27 then SOFR + 1.580%) | 4.376 | % | 4/27/28 | 40,000 | 37,481 | (d) | ||||||||||
Bank of America Corp., Subordinated Notes | 4.200 | % | 8/26/24 | 80,000 | 78,689 | |||||||||||
Bank of Montreal, Senior Notes | 1.850 | % | 5/1/25 | 30,000 | 27,601 | |||||||||||
Bank of Nova Scotia, Subordinated Notes (4.588% to 5/4/32 then 5 year Treasury Constant Maturity Rate + 2.050%) | 4.588 | % | 5/4/37 | 50,000 | 41,922 | (d) | ||||||||||
BNP Paribas SA, Senior Notes (5.198% to 1/10/29 then 3 mo. USD LIBOR + 2.567%) | 5.198 | % | 1/10/30 | 200,000 | 184,635 | (a)(d) | ||||||||||
Canadian Imperial Bank of Commerce, Senior Notes | 0.950 | % | 6/23/23 | 30,000 | 29,176 | |||||||||||
Citigroup Inc., Senior Notes | 8.125 | % | 7/15/39 | 120,000 | 141,831 | |||||||||||
Citigroup Inc., Senior Notes (1.678% to 5/15/23 then SOFR + 1.667%) | 1.678 | % | 5/15/24 | 50,000 | 48,927 | (d) | ||||||||||
Citigroup Inc., Senior Notes (2.520% to 11/3/31 then SOFR + 1.177%) | 2.520 | % | 11/3/32 | 70,000 | 53,042 | (d) | ||||||||||
Citigroup Inc., Senior Notes (3.785% to 3/17/32 then SOFR + 1.939%) | 3.785 | % | 3/17/33 | 20,000 | 16,765 | (d) | ||||||||||
Citigroup Inc., Senior Notes (3.980% to 3/20/29 then 3 mo. USD LIBOR + 1.338%) | 3.980 | % | 3/20/30 | 60,000 | 53,243 | (d) | ||||||||||
Citigroup Inc., Senior Notes (4.412% to 3/31/30 then SOFR + 3.914%) | 4.412 | % | 3/31/31 | 40,000 | 35,885 | (d) | ||||||||||
Citigroup Inc., Senior Notes (4.658% to 5/24/27 then SOFR + 1.887%) | 4.658 | % | 5/24/28 | 30,000 | 28,509 | (d) | ||||||||||
Citigroup Inc., Senior Notes (4.910% to 5/24/32 then SOFR + 2.086%) | 4.910 | % | 5/24/33 | 20,000 | 18,400 | (d) | ||||||||||
Citigroup Inc., Subordinated Notes | 5.500 | % | 9/13/25 | 60,000 | 59,907 | |||||||||||
Cooperatieve Rabobank UA, Senior Notes (1.339% to 6/24/25 then 1 year Treasury Constant Maturity Rate + 1.000%) | 1.339 | % | 6/24/26 | 250,000 | 221,558 | (a)(d) | ||||||||||
Danske Bank A/S, Senior Notes (3.773% to 3/28/24 then 1 year Treasury Constant Maturity Rate + 1.450%) | 3.773 | % | 3/28/25 | 250,000 | 240,419 | (a)(d) | ||||||||||
HSBC Holdings PLC, Senior Notes (2.099% to 6/4/25 then SOFR + 1.929%) | 2.099 | % | 6/4/26 | 200,000 | 179,094 | (d) | ||||||||||
Intesa Sanpaolo SpA, Senior Notes | 3.375 | % | 1/12/23 | 200,000 | 198,884 | (a) | ||||||||||
JPMorgan Chase & Co., Senior Notes (2.083% to 4/22/25 then SOFR + 1.850%) | 2.083 | % | 4/22/26 | 30,000 | 27,333 | (d) | ||||||||||
JPMorgan Chase & Co., Senior Notes (2.545% to 11/8/31 then SOFR + 1.180%) | 2.545 | % | 11/8/32 | 80,000 | 60,705 | (d) | ||||||||||
JPMorgan Chase & Co., Senior Notes (2.580% to 4/22/31 then SOFR + 1.250%) | 2.580 | % | 4/22/32 | 50,000 | 38,758 | (d) | ||||||||||
JPMorgan Chase & Co., Senior Notes (2.739% to 10/15/29 then SOFR + 1.510%) | 2.739 | % | 10/15/30 | 40,000 | 32,524 | (d) | ||||||||||
JPMorgan Chase & Co., Senior Notes (4.023% to 12/5/23 then 3 mo. USD LIBOR + 1.000%) | 4.023 | % | 12/5/24 | 10,000 | 9,840 | (d) | ||||||||||
JPMorgan Chase & Co., Senior Notes (4.452% to 12/5/28 then 3 mo. USD LIBOR + 1.330%) | 4.452 | % | 12/5/29 | 60,000 | 54,915 | (d) | ||||||||||
JPMorgan Chase & Co., Subordinated Notes | 4.950 | % | 6/1/45 | 30,000 | 25,025 | |||||||||||
Lloyds Banking Group PLC, Senior Notes | 4.375 | % | 3/22/28 | 200,000 | 181,814 | |||||||||||
Royal Bank of Canada, Senior Notes | 1.150 | % | 6/10/25 | 20,000 | 18,048 | |||||||||||
Toronto-Dominion Bank, Senior Notes | 0.750 | % | 6/12/23 | 30,000 | 29,180 | |||||||||||
Toronto-Dominion Bank, Senior Notes | 1.150 | % | 6/12/25 | 20,000 | 17,974 | |||||||||||
See Notes to Financial Statements.
| 20 | Western Asset ETFs 2022 Semi-Annual Report |
Table of Contents
Western Asset Total Return ETF
(Percentages shown based on Fund net assets)
| Security | Rate | Maturity Date | Face Amount† | Value | ||||||||||||
Banks — continued | ||||||||||||||||
US Bancorp, Senior Notes | 1.450 | % | 5/12/25 | 40,000 | $ | 36,718 | ||||||||||
Wells Fargo & Co., Senior Notes | 3.000 | % | 10/23/26 | 50,000 | 45,320 | |||||||||||
Wells Fargo & Co., Senior Notes | 4.150 | % | 1/24/29 | 50,000 | 45,990 | |||||||||||
Wells Fargo & Co., Senior Notes (1.654% to 6/2/23 then SOFR + 1.600%) | 1.654 | % | 6/2/24 | 20,000 | 19,530 | (d) | ||||||||||
Wells Fargo & Co., Senior Notes (2.188% to 4/30/25 then SOFR + 2.000%) | 2.188 | % | 4/30/26 | 30,000 | 27,398 | (d) | ||||||||||
Wells Fargo & Co., Senior Notes (3.350% to 3/2/32 then SOFR + 1.500%) | 3.350 | % | 3/2/33 | 30,000 | 24,329 | (d) | ||||||||||
Wells Fargo & Co., Senior Notes (3.584% to 5/22/27 then 3 mo. USD LIBOR + 1.310%) | 3.584 | % | 5/22/28 | 100,000 | 90,445 | (d) | ||||||||||
Wells Fargo & Co., Senior Notes (5.013% to 4/4/50 then SOFR + 4.502%) | 5.013 | % | 4/4/51 | 220,000 | 189,898 | (d) | ||||||||||
Wells Fargo & Co., Subordinated Notes | 4.750 | % | 12/7/46 | 50,000 | 39,984 | |||||||||||
Total Banks | 3,043,034 | |||||||||||||||
Capital Markets — 2.5% | ||||||||||||||||
Bank of New York Mellon Corp., Senior Notes | 1.600 | % | 4/24/25 | 10,000 | 9,236 | |||||||||||
Credit Suisse Group AG, Senior Notes (2.193% to 6/5/25 then SOFR + 2.044%) | 2.193 | % | 6/5/26 | 250,000 | 217,372 | (a)(d) | ||||||||||
Goldman Sachs Group Inc., Senior Notes | 3.850 | % | 7/8/24 | 80,000 | 78,183 | |||||||||||
Goldman Sachs Group Inc., Senior Notes | 3.500 | % | 4/1/25 | 40,000 | 38,208 | |||||||||||
Goldman Sachs Group Inc., Senior Notes (2.650% to 10/21/31 then SOFR + 1.264%) | 2.650 | % | 10/21/32 | 180,000 | 137,964 | (d) | ||||||||||
Goldman Sachs Group Inc., Senior Notes (3.615% to 3/15/27 then SOFR + 1.846%) | 3.615 | % | 3/15/28 | 20,000 | 18,201 | (d) | ||||||||||
Goldman Sachs Group Inc., Senior Notes (4.223% to 5/1/28 then 3 mo. USD LIBOR + 1.301%) | 4.223 | % | 5/1/29 | 10,000 | 9,089 | (d) | ||||||||||
Goldman Sachs Group Inc., Subordinated Notes | 5.150 | % | 5/22/45 | 40,000 | 33,378 | |||||||||||
Morgan Stanley, Senior Notes (2.188% to 4/28/25 then SOFR + 1.990%) | 2.188 | % | 4/28/26 | 40,000 | 36,691 | (d) | ||||||||||
Morgan Stanley, Senior Notes (2.511% to 10/20/31 then SOFR + 1.200%) | 2.511 | % | 10/20/32 | 80,000 | 61,138 | (d) | ||||||||||
Morgan Stanley, Senior Notes (4.431% to 1/23/29 then 3 mo. USD LIBOR + 1.628%) | 4.431 | % | 1/23/30 | 50,000 | 45,963 | (d) | ||||||||||
Morgan Stanley, Subordinated Notes (2.484% to 9/16/31 then SOFR + 1.360%) | 2.484 | % | 9/16/36 | 30,000 | 21,499 | (d) | ||||||||||
UBS Group AG, Junior Subordinated Notes (7.000% to 1/31/24 then USD 5 year ICE Swap Rate + 4.344%) | 7.000 | % | 1/31/24 | 200,000 | 189,240 | (a)(c)(d) | ||||||||||
Total Capital Markets | 896,162 | |||||||||||||||
Consumer Finance — 0.1% | ||||||||||||||||
American Express Co., Senior Notes | 4.050 | % | 5/3/29 | 50,000 | 46,018 | |||||||||||
Diversified Financial Services — 0.7% | ||||||||||||||||
AerCap Ireland Capital DAC/AerCap Global Aviation Trust, Senior Notes | 2.450 | % | 10/29/26 | 200,000 | 168,721 | |||||||||||
Park Aerospace Holdings Ltd., Senior Notes | 5.500 | % | 2/15/24 | 70,000 | 68,523 | (a) | ||||||||||
Total Diversified Financial Services | 237,244 | |||||||||||||||
Insurance — 0.2% | ||||||||||||||||
Berkshire Hathaway Finance Corp., Senior Notes | 4.250 | % | 1/15/49 | 30,000 | 24,932 | |||||||||||
Guardian Life Global Funding, Secured Notes | 1.100 | % | 6/23/25 | 20,000 | 17,964 | (a) | ||||||||||
New York Life Global Funding, Senior Secured Notes | 0.950 | % | 6/24/25 | 40,000 | 35,837 | (a) | ||||||||||
Total Insurance | 78,733 | |||||||||||||||
Total Financials | 4,301,191 | |||||||||||||||
See Notes to Financial Statements.
| Western Asset ETFs 2022 Semi-Annual Report | 21 |
Table of Contents
Schedules of investments (unaudited) (cont’d)
September 30, 2022
Western Asset Total Return ETF
(Percentages shown based on Fund net assets)
| Security | Rate | Maturity Date | Face Amount† | Value | ||||||||||||
| Health Care — 3.3% | ||||||||||||||||
Biotechnology — 0.8% | ||||||||||||||||
AbbVie Inc., Senior Notes | 3.750 | % | 11/14/23 | 10,000 | $ | 9,888 | ||||||||||
AbbVie Inc., Senior Notes | 2.600 | % | 11/21/24 | 90,000 | 85,646 | |||||||||||
AbbVie Inc., Senior Notes | 3.200 | % | 11/21/29 | 80,000 | 70,038 | |||||||||||
AbbVie Inc., Senior Notes | 4.750 | % | 3/15/45 | 60,000 | 51,507 | |||||||||||
AbbVie Inc., Senior Notes | 4.875 | % | 11/14/48 | 10,000 | 8,793 | |||||||||||
AbbVie Inc., Senior Notes | 4.250 | % | 11/21/49 | 20,000 | 16,055 | |||||||||||
Gilead Sciences Inc., Senior Notes | 3.650 | % | 3/1/26 | 20,000 | 19,011 | |||||||||||
Total Biotechnology | 260,938 | |||||||||||||||
Health Care Equipment & Supplies — 0.1% | ||||||||||||||||
Abbott Laboratories, Senior Notes | 3.750 | % | 11/30/26 | 20,000 | 19,397 | |||||||||||
Health Care Providers & Services — 1.3% | ||||||||||||||||
Cigna Corp., Senior Notes | 3.750 | % | 7/15/23 | 4,000 | 3,971 | |||||||||||
Cigna Corp., Senior Notes | 4.125 | % | 11/15/25 | 30,000 | 29,136 | |||||||||||
Cigna Corp., Senior Notes | 4.375 | % | 10/15/28 | 10,000 | 9,442 | |||||||||||
Cigna Corp., Senior Notes | 4.900 | % | 12/15/48 | 20,000 | 17,270 | |||||||||||
CVS Health Corp., Senior Notes | 3.625 | % | 4/1/27 | 10,000 | 9,353 | |||||||||||
CVS Health Corp., Senior Notes | 1.875 | % | 2/28/31 | 10,000 | 7,617 | |||||||||||
CVS Health Corp., Senior Notes | 2.125 | % | 9/15/31 | 20,000 | 15,410 | |||||||||||
CVS Health Corp., Senior Notes | 2.700 | % | 8/21/40 | 80,000 | 52,514 | |||||||||||
CVS Health Corp., Senior Notes | 5.050 | % | 3/25/48 | 20,000 | 17,613 | |||||||||||
Elevance Health Inc., Senior Notes | 3.650 | % | 12/1/27 | 40,000 | 37,252 | |||||||||||
Elevance Health Inc., Senior Notes | 4.550 | % | 5/15/52 | 10,000 | 8,436 | |||||||||||
HCA Inc., Senior Notes | 5.625 | % | 9/1/28 | 40,000 | 38,117 | |||||||||||
HCA Inc., Senior Notes | 3.500 | % | 9/1/30 | 50,000 | 41,286 | |||||||||||
Humana Inc., Senior Notes | 4.500 | % | 4/1/25 | 10,000 | 9,857 | |||||||||||
Humana Inc., Senior Notes | 3.125 | % | 8/15/29 | 40,000 | 34,613 | |||||||||||
Humana Inc., Senior Notes | 2.150 | % | 2/3/32 | 10,000 | 7,599 | |||||||||||
UnitedHealth Group Inc., Senior Notes | 3.875 | % | 12/15/28 | 20,000 | 18,749 | |||||||||||
UnitedHealth Group Inc., Senior Notes | 4.000 | % | 5/15/29 | 30,000 | 27,952 | |||||||||||
UnitedHealth Group Inc., Senior Notes | 2.000 | % | 5/15/30 | 10,000 | 8,044 | |||||||||||
UnitedHealth Group Inc., Senior Notes | 2.300 | % | 5/15/31 | 10,000 | 8,045 | |||||||||||
UnitedHealth Group Inc., Senior Notes | 4.200 | % | 5/15/32 | 20,000 | 18,575 | |||||||||||
UnitedHealth Group Inc., Senior Notes | 5.700 | % | 10/15/40 | 10,000 | 10,052 | |||||||||||
UnitedHealth Group Inc., Senior Notes | 2.900 | % | 5/15/50 | 40,000 | 26,272 | |||||||||||
UnitedHealth Group Inc., Senior Notes | 3.250 | % | 5/15/51 | 20,000 | 13,878 | |||||||||||
Total Health Care Providers & Services | 471,053 | |||||||||||||||
Pharmaceuticals — 1.1% | ||||||||||||||||
Bristol-Myers Squibb Co., Senior Notes | 3.400 | % | 7/26/29 | 24,000 | 21,762 | |||||||||||
Bristol-Myers Squibb Co., Senior Notes | 4.250 | % | 10/26/49 | 20,000 | 16,725 | |||||||||||
Johnson & Johnson, Senior Notes | 0.950 | % | 9/1/27 | 10,000 | 8,463 | |||||||||||
Johnson & Johnson, Senior Notes | 3.625 | % | 3/3/37 | 30,000 | 25,937 | |||||||||||
Merck & Co. Inc., Senior Notes | 1.450 | % | 6/24/30 | 30,000 | 23,460 | |||||||||||
Merck & Co. Inc., Senior Notes | 2.750 | % | 12/10/51 | 20,000 | 13,026 | |||||||||||
Pfizer Inc., Senior Notes | 0.800 | % | 5/28/25 | 20,000 | 18,161 | |||||||||||
See Notes to Financial Statements.
| 22 | Western Asset ETFs 2022 Semi-Annual Report |
Table of Contents
Western Asset Total Return ETF
(Percentages shown based on Fund net assets)
| Security | Rate | Maturity Date | Face Amount† | Value | ||||||||||||
Pharmaceuticals — continued | ||||||||||||||||
Teva Pharmaceutical Finance Co. BV, Senior Notes | 2.950 | % | 12/18/22 | 70,000 | $ | 69,400 | ||||||||||
Teva Pharmaceutical Finance Netherlands III BV, Senior Notes | 3.150 | % | 10/1/26 | 240,000 | 196,920 | |||||||||||
Total Pharmaceuticals | 393,854 | |||||||||||||||
Total Health Care | 1,145,242 | |||||||||||||||
| Industrials — 3.3% | ||||||||||||||||
Aerospace & Defense — 1.5% | ||||||||||||||||
Boeing Co., Senior Notes | 1.433 | % | 2/4/24 | 10,000 | 9,500 | |||||||||||
Boeing Co., Senior Notes | 4.875 | % | 5/1/25 | 50,000 | 48,785 | |||||||||||
Boeing Co., Senior Notes | 2.196 | % | 2/4/26 | 70,000 | 62,121 | |||||||||||
Boeing Co., Senior Notes | 3.200 | % | 3/1/29 | 50,000 | 41,747 | |||||||||||
Boeing Co., Senior Notes | 5.150 | % | 5/1/30 | 20,000 | 18,501 | |||||||||||
Boeing Co., Senior Notes | 3.250 | % | 2/1/35 | 100,000 | 70,625 | |||||||||||
Boeing Co., Senior Notes | 3.550 | % | 3/1/38 | 10,000 | 6,850 | |||||||||||
Boeing Co., Senior Notes | 5.705 | % | 5/1/40 | 10,000 | 8,735 | |||||||||||
Boeing Co., Senior Notes | 5.805 | % | 5/1/50 | 20,000 | 17,380 | |||||||||||
Boeing Co., Senior Notes | 5.930 | % | 5/1/60 | 30,000 | 25,662 | |||||||||||
L3Harris Technologies Inc., Senior Notes | 4.854 | % | 4/27/35 | 20,000 | 18,055 | |||||||||||
Lockheed Martin Corp., Senior Notes | 3.900 | % | 6/15/32 | 30,000 | 27,791 | |||||||||||
Lockheed Martin Corp., Senior Notes | 4.150 | % | 6/15/53 | 30,000 | 25,075 | |||||||||||
Northrop Grumman Corp., Senior Notes | 3.250 | % | 1/15/28 | 60,000 | 54,594 | |||||||||||
Northrop Grumman Corp., Senior Notes | 5.250 | % | 5/1/50 | 30,000 | 28,627 | |||||||||||
Raytheon Technologies Corp., Senior Notes | 2.250 | % | 7/1/30 | 70,000 | 56,571 | |||||||||||
Total Aerospace & Defense | 520,619 | |||||||||||||||
Airlines — 1.1% | ||||||||||||||||
Delta Air Lines Inc., Senior Secured Notes | 7.000 | % | 5/1/25 | 140,000 | 140,903 | (a) | ||||||||||
Delta Air Lines Inc./SkyMiles IP Ltd., Senior Secured Notes | 4.750 | % | 10/20/28 | 70,000 | 65,195 | (a) | ||||||||||
Hawaiian Brand Intellectual Property Ltd./HawaiianMiles Loyalty Ltd., Senior Secured Notes | 5.750 | % | 1/20/26 | 10,000 | 8,820 | (a) | ||||||||||
Mileage Plus Holdings LLC/Mileage Plus Intellectual Property Assets Ltd., Senior Secured Notes | 6.500 | % | 6/20/27 | 38,000 | 37,194 | (a) | ||||||||||
Spirit Loyalty Cayman Ltd./Spirit IP Cayman Ltd., Senior Secured Notes | 8.000 | % | 9/20/25 | 22,000 | 22,128 | (a) | ||||||||||
United Airlines Inc., Senior Secured Notes | 4.375 | % | 4/15/26 | 30,000 | 26,775 | (a) | ||||||||||
United Airlines Inc., Senior Secured Notes | 4.625 | % | 4/15/29 | 120,000 | 99,293 | (a) | ||||||||||
Total Airlines | 400,308 | |||||||||||||||
Building Products — 0.0%†† | ||||||||||||||||
Carrier Global Corp., Senior Notes | 2.722 | % | 2/15/30 | 10,000 | 8,254 | |||||||||||
Commercial Services & Supplies — 0.1% | ||||||||||||||||
Cintas Corp. No 2, Senior Notes | 4.000 | % | 5/1/32 | 20,000 | 18,353 | |||||||||||
Electrical Equipment — 0.0%†† | ||||||||||||||||
Vertiv Group Corp., Senior Secured Notes | 4.125 | % | 11/15/28 | 10,000 | 8,050 | (a) | ||||||||||
Industrial Conglomerates — 0.1% | ||||||||||||||||
3M Co., Senior Notes | 3.050 | % | 4/15/30 | 20,000 | 17,002 | |||||||||||
3M Co., Senior Notes | 3.700 | % | 4/15/50 | 40,000 | 29,087 | |||||||||||
General Electric Co., Senior Notes | 6.750 | % | 3/15/32 | 6,000 | 6,483 | |||||||||||
Total Industrial Conglomerates | 52,572 | |||||||||||||||
See Notes to Financial Statements.
| Western Asset ETFs 2022 Semi-Annual Report | 23 |
Table of Contents
Schedules of investments (unaudited) (cont’d)
September 30, 2022
Western Asset Total Return ETF
(Percentages shown based on Fund net assets)
| Security | Rate | Maturity Date | Face Amount† | Value | ||||||||||||
Machinery — 0.1% | ||||||||||||||||
Otis Worldwide Corp., Senior Notes | 2.056 | % | 4/5/25 | 20,000 | $ | 18,500 | ||||||||||
Road & Rail — 0.3% | ||||||||||||||||
Canadian Pacific Railway Co., Senior Notes | 3.000 | % | 12/2/41 | 20,000 | 14,165 | |||||||||||
Canadian Pacific Railway Co., Senior Notes | 3.100 | % | 12/2/51 | 10,000 | 6,564 | |||||||||||
Union Pacific Corp., Senior Notes | 2.150 | % | 2/5/27 | 10,000 | 8,925 | |||||||||||
Union Pacific Corp., Senior Notes | 2.891 | % | 4/6/36 | 30,000 | 22,860 | |||||||||||
Union Pacific Corp., Senior Notes | 3.839 | % | 3/20/60 | 30,000 | 22,276 | |||||||||||
Union Pacific Corp., Senior Notes | 3.750 | % | 2/5/70 | 20,000 | 13,980 | |||||||||||
Total Road & Rail | 88,770 | |||||||||||||||
Trading Companies & Distributors — 0.1% | ||||||||||||||||
Air Lease Corp., Senior Notes | 3.375 | % | 7/1/25 | 30,000 | 27,952 | |||||||||||
H&E Equipment Services Inc., Senior Notes | 3.875 | % | 12/15/28 | 10,000 | 7,850 | (a) | ||||||||||
Total Trading Companies & Distributors | 35,802 | |||||||||||||||
Total Industrials | 1,151,228 | |||||||||||||||
| Information Technology — 1.6% | ||||||||||||||||
IT Services — 0.2% | ||||||||||||||||
PayPal Holdings Inc., Senior Notes | 2.300 | % | 6/1/30 | 40,000 | 32,540 | |||||||||||
Visa Inc., Senior Notes | 2.700 | % | 4/15/40 | 15,000 | 10,844 | |||||||||||
Visa Inc., Senior Notes | 4.300 | % | 12/14/45 | 40,000 | 34,842 | |||||||||||
Total IT Services | 78,226 | |||||||||||||||
Semiconductors & Semiconductor Equipment — 0.5% | ||||||||||||||||
Broadcom Inc., Senior Notes | 3.137 | % | 11/15/35 | 110,000 | 77,077 | (a) | ||||||||||
Intel Corp., Senior Notes | 1.600 | % | 8/12/28 | 30,000 | 24,758 | |||||||||||
Intel Corp., Senior Notes | 4.750 | % | 3/25/50 | 10,000 | 8,641 | |||||||||||
Intel Corp., Senior Notes | 3.050 | % | 8/12/51 | 10,000 | 6,420 | |||||||||||
NVIDIA Corp., Senior Notes | 3.500 | % | 4/1/40 | 50,000 | 38,839 | |||||||||||
NXP BV/NXP Funding LLC/NXP USA Inc., Senior Notes | 2.700 | % | 5/1/25 | 30,000 | 27,817 | |||||||||||
Total Semiconductors & Semiconductor Equipment | 183,552 | |||||||||||||||
Software — 0.7% | ||||||||||||||||
Microsoft Corp., Senior Notes | 3.300 | % | 2/6/27 | 100,000 | 95,292 | |||||||||||
Oracle Corp., Senior Notes | 1.650 | % | 3/25/26 | 50,000 | 43,810 | |||||||||||
Oracle Corp., Senior Notes | 2.875 | % | 3/25/31 | 70,000 | 55,206 | |||||||||||
Salesforce Inc., Senior Notes | 1.500 | % | 7/15/28 | 20,000 | 16,791 | |||||||||||
Workday Inc., Senior Notes | 3.700 | % | 4/1/29 | 30,000 | 26,906 | |||||||||||
Workday Inc., Senior Notes | 3.800 | % | 4/1/32 | 20,000 | 17,360 | |||||||||||
Total Software | 255,365 | |||||||||||||||
Technology Hardware, Storage & Peripherals — 0.2% | ||||||||||||||||
Apple Inc., Senior Notes | 2.450 | % | 8/4/26 | 60,000 | 55,325 | |||||||||||
Total Information Technology | 572,468 | |||||||||||||||
| Materials — 2.0% | ||||||||||||||||
Chemicals — 0.4% | ||||||||||||||||
Orbia Advance Corp. SAB de CV, Senior Notes | 2.875 | % | 5/11/31 | 200,000 | 145,500 | (a) | ||||||||||
Metals & Mining — 1.1% | ||||||||||||||||
Anglo American Capital PLC, Senior Notes | 4.000 | % | 9/11/27 | 200,000 | 182,914 | (a) | ||||||||||
Barrick North America Finance LLC, Senior Notes | 5.750 | % | 5/1/43 | 20,000 | 18,818 | |||||||||||
See Notes to Financial Statements.
| 24 | Western Asset ETFs 2022 Semi-Annual Report |
Table of Contents
Western Asset Total Return ETF
(Percentages shown based on Fund net assets)
| Security | Rate | Maturity Date | Face Amount† | Value | ||||||||||||
Metals & Mining — continued | ||||||||||||||||
BHP Billiton Finance USA Ltd., Senior Notes | 5.000 | % | 9/30/43 | 20,000 | $ | 18,956 | ||||||||||
Freeport-McMoRan Inc., Senior Notes | 4.625 | % | 8/1/30 | 20,000 | 17,525 | |||||||||||
Freeport-McMoRan Inc., Senior Notes | 5.450 | % | 3/15/43 | 75,000 | 62,572 | |||||||||||
Glencore Funding LLC, Senior Notes | 4.125 | % | 3/12/24 | 10,000 | 9,826 | (a) | ||||||||||
Glencore Funding LLC, Senior Notes | 4.000 | % | 3/27/27 | 50,000 | 46,574 | (a) | ||||||||||
Glencore Funding LLC, Senior Notes | 3.875 | % | 10/27/27 | 30,000 | 27,286 | (a) | ||||||||||
Total Metals & Mining | 384,471 | |||||||||||||||
Paper & Forest Products — 0.5% | ||||||||||||||||
Suzano Austria GmbH, Senior Notes | 3.750 | % | 1/15/31 | 10,000 | 7,835 | |||||||||||
Suzano Austria GmbH, Senior Notes | 3.125 | % | 1/15/32 | 210,000 | 151,137 | |||||||||||
Total Paper & Forest Products | 158,972 | |||||||||||||||
Total Materials | 688,943 | |||||||||||||||
| Utilities — 0.5% | ||||||||||||||||
Electric Utilities — 0.5% | ||||||||||||||||
American Transmission Systems Inc., Senior Notes | 2.650 | % | 1/15/32 | 210,000 | 164,856 | (a) | ||||||||||
Duke Energy Ohio Inc., Secured Bonds | 3.650 | % | 2/1/29 | 20,000 | 18,276 | |||||||||||
Total Utilities | 183,132 | |||||||||||||||
Total Corporate Bonds & Notes (Cost — $17,238,487) | 14,500,548 | |||||||||||||||
| Mortgage-Backed Securities — 23.0% | ||||||||||||||||
FHLMC — 2.9% | ||||||||||||||||
Federal Home Loan Mortgage Corp. (FHLMC) | 3.500 | % | 1/1/38-5/1/50 | 226,966 | 208,741 | |||||||||||
Federal Home Loan Mortgage Corp. (FHLMC) | 1.500 | % | 10/1/41 | 37,126 | 29,677 | |||||||||||
Federal Home Loan Mortgage Corp. (FHLMC) | 4.500 | % | 5/1/47-7/1/49 | 78,531 | 76,093 | |||||||||||
Federal Home Loan Mortgage Corp. (FHLMC) | 4.000 | % | 3/1/48-7/1/49 | 336,926 | 318,214 | |||||||||||
Federal Home Loan Mortgage Corp. (FHLMC) | 5.000 | % | 11/1/49 | 105,225 | 103,736 | |||||||||||
Federal Home Loan Mortgage Corp. (FHLMC) | 2.500 | % | 1/1/51 | 0 | 0 | (e) | ||||||||||
Federal Home Loan Mortgage Corp. (FHLMC) | 2.000 | % | 2/1/51 | 0 | 0 | (e) | ||||||||||
Federal Home Loan Mortgage Corp. (FHLMC) (12 mo. USD LIBOR + 1.619%) | 2.873 | % | 11/1/47 | 63,456 | 61,136 | (d) | ||||||||||
Federal Home Loan Mortgage Corp. (FHLMC) (12 mo. USD LIBOR + 1.621%) | 3.083 | % | 2/1/50 | 77,386 | 74,383 | (d) | ||||||||||
Federal Home Loan Mortgage Corp. (FHLMC) (12 mo. USD LIBOR + 1.628%) | 3.008 | % | 11/1/48 | 143,452 | 136,221 | (d) | ||||||||||
Total FHLMC | 1,008,201 | |||||||||||||||
FNMA — 14.8% | ||||||||||||||||
Federal National Mortgage Association (FNMA) | 3.160 | % | 5/1/29 | 9,559 | 8,821 | |||||||||||
Federal National Mortgage Association (FNMA) | 2.930 | % | 6/1/30 | 19,145 | 17,368 | |||||||||||
Federal National Mortgage Association (FNMA) | 2.149 | % | 2/1/32 | 19,937 | 16,462 | (d) | ||||||||||
Federal National Mortgage Association (FNMA) | 3.500 | % | | 12/1/34- 8/1/50 | 550,714 | 504,904 | ||||||||||
Federal National Mortgage Association (FNMA) | 2.790 | % | 1/1/35 | 49,367 | 42,156 | (d) | ||||||||||
Federal National Mortgage Association (FNMA) | 3.000 | % | 7/1/35-5/1/51 | 688,844 | 624,378 | |||||||||||
Federal National Mortgage Association (FNMA) | 2.500 | % | 9/1/36-7/1/61 | 608,041 | 516,489 | |||||||||||
See Notes to Financial Statements.
| Western Asset ETFs 2022 Semi-Annual Report | 25 |
Table of Contents
Schedules of investments (unaudited) (cont’d)
September 30, 2022
Western Asset Total Return ETF
(Percentages shown based on Fund net assets)
| Security | Rate | Maturity Date | Face Amount† | Value | ||||||||||||
FNMA — continued | ||||||||||||||||
Federal National Mortgage Association (FNMA) | 2.000 | % | 3/1/41-10/1/41 | 220,207 | $ | 184,458 | ||||||||||
Federal National Mortgage Association (FNMA) | 6.000 | % | 7/1/41 | 33,044 | 34,732 | |||||||||||
Federal National Mortgage Association (FNMA) | 4.500 | % | 2/1/48-1/1/59 | 68,776 | 66,562 | |||||||||||
Federal National Mortgage Association (FNMA) | 4.000 | % | 9/1/48-1/1/49 | 418,860 | 396,275 | |||||||||||
Federal National Mortgage Association (FNMA) | 2.500 | % | 10/1/50-6/1/51 | 0 | 0 | (e) | ||||||||||
Federal National Mortgage Association (FNMA) | 2.000 | % | 10/1/51 | 1,300,000 | 971,344 | (f) | ||||||||||
Federal National Mortgage Association (FNMA) | 2.500 | % | 10/1/51 | 1,200,000 | 922,689 | (f) | ||||||||||
Federal National Mortgage Association (FNMA) | 3.000 | % | 10/1/51 | 600,000 | 435,098 | (f) | ||||||||||
Federal National Mortgage Association (FNMA) | 3.500 | % | 10/1/51 | 200,000 | 89,992 | (f) | ||||||||||
Federal National Mortgage Association (FNMA) | 4.500 | % | 10/1/51 | 400,000 | 381,031 | (f) | ||||||||||
Total FNMA | 5,212,759 | |||||||||||||||
GNMA — 5.3% | ||||||||||||||||
Government National Mortgage Association (GNMA) | 3.000 | % | 10/15/42 | 47,757 | 42,819 | |||||||||||
Government National Mortgage Association (GNMA) II | 3.500 | % | 2/20/46-1/20/50 | 340,507 | 313,915 | |||||||||||
Government National Mortgage Association (GNMA) II | 3.000 | % | 11/20/46-2/20/50 | 522,647 | 463,026 | |||||||||||
Government National Mortgage Association (GNMA) II | 4.500 | % | 4/20/48-4/20/50 | 185,024 | 179,490 | |||||||||||
Government National Mortgage Association (GNMA) II | 5.000 | % | 11/20/48 | 27,110 | 26,720 | |||||||||||
Government National Mortgage Association (GNMA) II | 4.000 | % | 4/20/50 | 38,086 | 36,580 | |||||||||||
Government National Mortgage Association (GNMA) II | 2.500 | % | 9/20/51 | 90,816 | 78,327 | |||||||||||
Government National Mortgage Association (GNMA) II | 2.500 | % | 10/1/51 | 300,000 | 257,736 | (f) | ||||||||||
Government National Mortgage Association (GNMA) II | 3.000 | % | 10/1/51 | 200,000 | 88,363 | (f) | ||||||||||
Government National Mortgage Association (GNMA) II | 3.500 | % | 10/1/51 | 200,000 | 181,899 | (f) | ||||||||||
Government National Mortgage Association (GNMA) II | 4.000 | % | 10/1/51 | 200,000 | 186,758 | (f) | ||||||||||
Total GNMA | 1,855,633 | |||||||||||||||
Total Mortgage-Backed Securities (Cost — $8,892,682) |
| 8,076,593 | ||||||||||||||
| Collateralized Mortgage Obligations(g) — 11.9% | ||||||||||||||||
Alternative Loan Trust, 2005-81 A1 (1 mo. USD LIBOR + 0.560%) | 3.644 | % | 2/25/37 | 137,934 | 113,832 | (d) | ||||||||||
BWAY Mortgage Trust, 2015-1740 E | 4.806 | % | 1/10/35 | 500,000 | 412,227 | (a)(d) | ||||||||||
BX Commercial Mortgage Trust, 2019-IMC F (1 mo. USD LIBOR + 2.900%) | 5.718 | % | 4/15/34 | 300,000 | 279,510 | (a)(d) | ||||||||||
CSMC Trust, 2019-UVIL A | 3.160 | % | 12/15/41 | 260,000 | 215,063 | (a) | ||||||||||
CSMC Trust, 2021-NQM6 A3 | 1.585 | % | 7/25/66 | 203,953 | 159,481 | (a)(d) | ||||||||||
Deephaven Residential Mortgage Trust, 2022-1 A2 | 2.961 | % | 1/25/67 | 240,000 | 189,170 | (a)(d) | ||||||||||
Federal Home Loan Mortgage Corp. (FHLMC) REMIC, 5010 IK, IO | 2.500 | % | 9/25/50 | 70,570 | 10,494 | |||||||||||
Federal Home Loan Mortgage Corp. (FHLMC) REMIC, 5010 JI, IO | 2.500 | % | 9/25/50 | 83,342 | 13,019 | |||||||||||
Federal Home Loan Mortgage Corp. (FHLMC) REMIC, 5018 MI, IO | 2.000 | % | 10/25/50 | 87,615 | 11,999 | |||||||||||
Federal Home Loan Mortgage Corp. (FHLMC) REMIC, 5140 NI, IO | 2.500 | % | 5/25/49 | 93,740 | 12,951 | |||||||||||
Federal Home Loan Mortgage Corp. (FHLMC) REMIC, Structured Agency Credit Risk Debt Notes, 2022-DNA3 M1A (30 Day Average SOFR + 2.000%) | 4.281 | % | 4/25/42 | 97,421 | 96,448 | (a)(d) | ||||||||||
See Notes to Financial Statements.
| 26 | Western Asset ETFs 2022 Semi-Annual Report |
Table of Contents
Western Asset Total Return ETF
(Percentages shown based on Fund net assets)
| Security | Rate | Maturity Date | Face Amount† | Value | ||||||||||||
| Collateralized Mortgage Obligations (g) — continued | ||||||||||||||||
Federal National Mortgage Association (FNMA) — CAS, 2022-R07 1M1 (30 Day Average SOFR + 2.950%) | 5.255 | % | 6/25/42 | 103,173 | $ | 103,181 | (a)(d) | |||||||||
Federal National Mortgage Association (FNMA) — CAS, 2014-C01 M2 (1 mo. USD LIBOR + 4.400%) | 7.484 | % | 1/25/24 | 42,209 | 42,787 | (d) | ||||||||||
Federal National Mortgage Association (FNMA) — CAS, 2014-C02 1M2 (1 mo. USD LIBOR + 2.600%) | 5.684 | % | 5/25/24 | 89,722 | 89,536 | (d) | ||||||||||
Federal National Mortgage Association (FNMA) — CAS, 2015-C03 1M2 (1 mo. USD LIBOR + 5.000%) | 8.084 | % | 7/25/25 | 18,478 | 18,845 | (a)(d) | ||||||||||
Federal National Mortgage Association (FNMA) — CAS, 2018-C01 1B1 (1 mo. USD LIBOR + 3.550%) | 6.634 | % | 7/25/30 | 230,000 | 229,137 | (a)(d) | ||||||||||
Federal National Mortgage Association (FNMA) — CAS, 2018-C03 1B1 (1 mo. USD LIBOR + 3.750%) | 6.834 | % | 10/25/30 | 320,000 | 316,215 | (a)(d) | ||||||||||
Federal National Mortgage Association (FNMA) — CAS, 2019-R07 1M2 (1 mo. USD LIBOR + 2.100%) | 5.184 | % | 10/25/39 | 37,333 | 37,128 | (a)(d) | ||||||||||
Federal National Mortgage Association (FNMA) ACES, 2018-M9 APT2 | 3.218 | % | 4/25/28 | 93,653 | 87,479 | (d) | ||||||||||
Federal National Mortgage Association (FNMA) REMIC, 2020-74 EI, IO | 2.500 | % | 10/25/50 | 79,791 | 13,589 | |||||||||||
Federal National Mortgage Association (FNMA) REMIC, 2020-89 DI, IO | 2.500 | % | 12/25/50 | 238,444 | 35,265 | |||||||||||
Federal National Mortgage Association (FNMA) REMIC, 2021-1 IG, IO | 2.500 | % | 2/25/51 | 175,312 | 29,741 | |||||||||||
Government National Mortgage Association (GNMA), 2013-50 IO, IO | 0.066 | % | 10/16/48 | 5,618,223 | 12,075 | (d) | ||||||||||
Government National Mortgage Association (GNMA), 2014-17 AM | 3.537 | % | 6/16/48 | 49,885 | 48,020 | (d) | ||||||||||
Government National Mortgage Association (GNMA), 2016-14 H | 2.850 | % | 3/16/57 | 279,456 | 247,142 | |||||||||||
Government National Mortgage Association (GNMA), 2020-103 AD | 1.450 | % | 1/16/63 | 60,030 | 48,533 | |||||||||||
Government National Mortgage Association (GNMA), 2020-123 NI, IO | 2.500 | % | 8/20/50 | 82,016 | 11,341 | |||||||||||
Government National Mortgage Association (GNMA), 2020-160 YI, IO | 2.500 | % | 10/20/50 | 172,422 | 23,475 | |||||||||||
Government National Mortgage Association (GNMA), 2020-181 WI, IO | 2.000 | % | 12/20/50 | 409,541 | 45,572 | |||||||||||
Government National Mortgage Association (GNMA), 2020-H13 FM (1 mo. USD LIBOR + 0.400%) | 2.757 | % | 8/20/70 | 180,576 | 178,850 | (d) | ||||||||||
Government National Mortgage Association (GNMA), 2022-3 IO, IO | 0.640 | % | 2/16/61 | 98,788 | 5,479 | (d) | ||||||||||
Government National Mortgage Association (GNMA), 2022-63 LM | 3.500 | % | 10/20/50 | 100,000 | 85,456 | |||||||||||
GS Mortgage Securities Corp. II, 2018-SRP5 C (1 mo. USD LIBOR + 4.250%) | 7.068 | % | 9/15/31 | 367,589 | 143,357 | (a)(d) | ||||||||||
Impac CMB Trust, 2005-7 A1 (1 mo. USD LIBOR + 0.520%) | 3.604 | % | 11/25/35 | 134,145 | 119,924 | (d) | ||||||||||
IndyMac INDX Mortgage Loan Trust, 2005-AR10 A1 (1 mo. USD LIBOR + 0.520%) | 3.604 | % | 6/25/35 | 172,160 | 139,453 | (d) | ||||||||||
JPMorgan Chase Commercial Mortgage Securities Trust, 2019-BKWD D (1 mo. USD LIBOR + 1.850%) | 4.918 | % | 9/15/29 | 400,000 | 382,858 | (a)(d) | ||||||||||
LAQ Mortgage Trust, 2022-LAQ A (1 mo. Term SOFR + 1.724%) | 4.646 | % | 3/15/39 | 75,244 | 72,984 | (a)(d) | ||||||||||
WaMu Mortgage Pass-Through Certificates Trust, 2005-AR8 2A1A (1 mo. USD LIBOR + 0.580%) | 3.664 | % | 7/25/45 | 47,492 | 43,912 | (d) | ||||||||||
Wells Fargo Commercial Mortgage Trust, 2017-C41 B | 4.188 | % | 11/15/50 | 70,000 | 61,861 | (d) | ||||||||||
Total Collateralized Mortgage Obligations (Cost — $4,906,156) |
| 4,187,389 | ||||||||||||||
| Sovereign Bonds — 11.1% | ||||||||||||||||
Argentina — 0.1% | ||||||||||||||||
Argentine Republic Government International Bond, Senior Notes | 1.000 | % | 7/9/29 | 4,443 | 849 | |||||||||||
Argentine Republic Government International Bond, Senior Notes, Step bond (0.500% to 7/9/23 then 0.750%) | 0.500 | % | 7/9/30 | 145,500 | 29,024 | |||||||||||
Total Argentina | 29,873 | |||||||||||||||
See Notes to Financial Statements.
| Western Asset ETFs 2022 Semi-Annual Report | 27 |
Table of Contents
Schedules of investments (unaudited) (cont’d)
September 30, 2022
Western Asset Total Return ETF
(Percentages shown based on Fund net assets)
| Security | Rate | Maturity Date | Face Amount† | Value | ||||||||||||
Brazil — 1.7% | ||||||||||||||||
Brazil Notas do Tesouro Nacional Serie F, Notes | 10.000 | % | 1/1/27 | 1,964,000 | BRL | $ | 342,498 | |||||||||
Brazilian Government International Bond, Senior Notes | 5.000 | % | 1/27/45 | 350,000 | 254,004 | |||||||||||
Total Brazil | 596,502 | |||||||||||||||
Colombia — 0.6% | ||||||||||||||||
Colombia Government International Bond, Senior Notes | 5.000 | % | 6/15/45 | 330,000 | 199,748 | |||||||||||
Indonesia — 2.7% | ||||||||||||||||
Indonesia Treasury Bond | 6.500 | % | 2/15/31 | 14,190,000,000 | IDR | 880,791 | ||||||||||
Indonesia Treasury Bond | 6.375 | % | 4/15/32 | 959,000,000 | IDR | 58,546 | ||||||||||
Indonesia Treasury Bond | 7.500 | % | 6/15/35 | 330,000,000 | IDR | 21,671 | ||||||||||
Total Indonesia | 961,008 | |||||||||||||||
Kenya — 0.4% | ||||||||||||||||
Republic of Kenya Government International Bond, Senior Notes | 6.300 | % | 1/23/34 | 200,000 | 122,000 | (a) | ||||||||||
Mexico — 3.5% | ||||||||||||||||
Mexican Bonos, Senior Notes | 7.750 | % | 11/13/42 | 24,380,000 | MXN | 1,005,500 | ||||||||||
Mexico Government International Bond, Senior Notes | 4.750 | % | 3/8/44 | 300,000 | 229,884 | |||||||||||
Total Mexico | 1,235,384 | |||||||||||||||
Peru — 0.2% | ||||||||||||||||
Peruvian Government International Bond, Senior Notes | 2.783 | % | 1/23/31 | 90,000 | 71,261 | |||||||||||
Russia — 1.3% | ||||||||||||||||
Russian Federal Bond — OFZ | 6.000 | % | 10/6/27 | 9,460,000 | RUB | 48,751 | *(h) | |||||||||
Russian Federal Bond — OFZ | 7.650 | % | 4/10/30 | 77,880,000 | RUB | 401,345 | *(h) | |||||||||
Russian Federal Bond — OFZ | 7.250 | % | 5/10/34 | 240,000 | RUB | 1,237 | *(h) | |||||||||
Total Russia | 451,333 | |||||||||||||||
South Africa — 0.6% | ||||||||||||||||
Republic of South Africa Government Bond, Senior Notes | 6.250 | % | 3/31/36 | 6,310,000 | ZAR | 222,838 | ||||||||||
Total Sovereign Bonds (Cost — $5,641,936) | 3,889,947 | |||||||||||||||
| Asset-Backed Securities — 9.1% | ||||||||||||||||
Allegany Park CLO Ltd., 2019-1A CR (3 mo. Term SOFR + 2.050%) | 4.527 | % | 1/20/35 | 250,000 | 233,768 | (a)(d) | ||||||||||
ECMC Group Student Loan Trust, 2020-2A A (1 mo. USD LIBOR + 1.150%) | 4.234 | % | 11/25/69 | 143,952 | 141,738 | (a)(d) | ||||||||||
Grippen Park CLO Ltd., 2017-1A E (3 mo. USD LIBOR + 5.700%) | 8.410 | % | 1/20/30 | 250,000 | 206,256 | (a)(d) | ||||||||||
Halsey Point CLO Ltd., 2019-1A E (3 mo. USD LIBOR + 7.700%) | 10.410 | % | 1/20/33 | 300,000 | 261,316 | (a)(d) | ||||||||||
Hildene Community Funding CDO Ltd., 2015-1A ARR | 2.600 | % | 11/1/35 | 130,000 | 113,425 | (a) | ||||||||||
Loanpal Solar Loan Ltd., 2021-2GS A | 2.220 | % | 3/20/48 | 241,454 | 192,053 | (a) | ||||||||||
Marathon CLO Ltd., 2019-2A BA (3 mo. USD LIBOR + 3.300%) | 6.010 | % | 1/20/33 | 250,000 | 242,453 | (a)(d) | ||||||||||
MF1 LLC, 2022-FL10 A (1 mo. Term SOFR + 2.635%) | 5.659 | % | 9/17/37 | 100,000 | 99,168 | (a)(d) | ||||||||||
Morgan Stanley ABS Capital Inc. Trust, 2004-NC7 M1 (1 mo. USD LIBOR + 0.855%) | 3.939 | % | 7/25/34 | 63,416 | 59,279 | (d) | ||||||||||
Morgan Stanley ABS Capital Inc. Trust, 2004-NC8 M1 (1 mo. USD LIBOR + 0.915%) | 3.999 | % | 9/25/34 | 158,594 | 147,776 | (d) | ||||||||||
NADG NNN Operating LP, 2019-1 A | 3.368 | % | 12/28/49 | 147,937 | 137,905 | (a) | ||||||||||
Nelnet Student Loan Trust, 2013-1A A (1 mo. USD LIBOR + 0.600%) | 3.684 | % | 6/25/41 | 47,782 | 46,947 | (a)(d) | ||||||||||
Sierra Timeshare Receivables Funding LLC, 2021-2A A | 1.350 | % | 9/20/38 | 130,702 | 121,411 | (a) | ||||||||||
SMB Private Education Loan Trust, 2018-C A2A | 3.630 | % | 11/15/35 | 62,625 | 60,225 | (a) | ||||||||||
SMB Private Education Loan Trust, 2018-C A2B (1 mo. USD LIBOR + 0.750%) | 3.568 | % | 11/15/35 | 131,566 | 129,683 | (a)(d) | ||||||||||
SMB Private Education Loan Trust, 2019-B A2B (1 mo. USD LIBOR + 1.000%) | 3.818 | % | 6/15/37 | 62,244 | 61,313 | (a)(d) | ||||||||||
See Notes to Financial Statements.
| 28 | Western Asset ETFs 2022 Semi-Annual Report |
Table of Contents
Western Asset Total Return ETF
(Percentages shown based on Fund net assets)
| Security | Rate | Maturity Date | Face Amount† | Value | ||||||||||||
| Asset-Backed Securities — continued | ||||||||||||||||
Structured Asset Investment Loan Trust, 2005-HE1 M2 (1 mo. USD LIBOR + 0.720%) | 3.804 | % | 7/25/35 | 215,519 | $ | 206,369 | (d) | |||||||||
TICP CLO Ltd., 2018-IIA C (3 mo. USD LIBOR + 2.950%) | 5.660 | % | 4/20/28 | 250,000 | 234,565 | (a)(d) | ||||||||||
Trinitas CLO Ltd., 2020-14A C (3 mo. USD LIBOR + 3.000%) | 5.783 | % | 1/25/34 | 300,000 | 279,030 | (a)(d) | ||||||||||
United States Small Business Administration, 2019-20D 1 | 2.980 | % | 4/1/39 | 22,657 | 20,948 | |||||||||||
Wellfleet CLO Ltd., 2017-3A C (3 mo. USD LIBOR + 2.750%) | 5.490 | % | 1/17/31 | 250,000 | 216,408 | (a)(d) | ||||||||||
Total Asset-Backed Securities (Cost — $3,481,545) |
| 3,212,036 | ||||||||||||||
| Senior Loans — 3.2% | ||||||||||||||||
| Communication Services — 0.6% | ||||||||||||||||
Diversified Telecommunication Services — 0.1% | ||||||||||||||||
Zayo Group Holdings Inc., Initial Dollar Term Loan (1 mo. USD LIBOR + 3.000%) | 6.115 | % | 3/9/27 | 41,621 | 34,655 | (d)(i)(j) | ||||||||||
Media — 0.5% | ||||||||||||||||
Charter Communications Operating LLC, Term Loan B2 (1 mo. USD LIBOR + 1.750%) | 4.870 | % | 2/1/27 | 38,898 | 37,374 | (d)(i)(j) | ||||||||||
Nexstar Broadcasting Inc., Term Loan B4 (1 mo. USD LIBOR + 2.500%) | 5.615 | % | 9/18/26 | 55,417 | 54,566 | (d)(i)(j) | ||||||||||
Virgin Media Bristol LLC, Term Loan Facility N (1 mo. USD LIBOR + 2.500%) | 5.318 | % | 1/31/28 | 50,000 | 47,639 | (d)(i)(j) | ||||||||||
Virgin Media Bristol LLC, Term Loan Facility Q (1 mo. USD LIBOR + 3.250%) | 6.068 | % | 1/31/29 | 20,000 | 19,325 | (d)(i)(j) | ||||||||||
Total Media | 158,904 | |||||||||||||||
Total Communication Services | 193,559 | |||||||||||||||
| Consumer Discretionary — 0.4% | ||||||||||||||||
Hotels, Restaurants & Leisure — 0.3% | ||||||||||||||||
Caesars Resort Collection LLC, Term Loan B1 (1 mo. USD LIBOR + 3.500%) | 6.615 | % | 7/21/25 | 50,538 | 49,722 | (d)(i)(j) | ||||||||||
Hilton Worldwide Finance LLC, Refinance Term Loan B2 (1 mo. USD LIBOR + 1.750%) | 4.809 | % | 6/22/26 | 50,000 | 48,292 | (d)(i)(j) | ||||||||||
Total Hotels, Restaurants & Leisure | 98,014 | |||||||||||||||
Specialty Retail — 0.1% | ||||||||||||||||
Harbor Freight Tools USA Inc., 2021 Refinancing Term Loan (1 mo. USD LIBOR + 2.750%) | 5.865 | % | 10/19/27 | 55,930 | 50,476 | (d)(i)(j)(k) | ||||||||||
Total Consumer Discretionary | 148,490 | |||||||||||||||
| Consumer Staples — 0.2% | ||||||||||||||||
Food & Staples Retailing — 0.1% | ||||||||||||||||
Froneri U.S. Inc., Term Loan Facility B2 (1 mo. USD LIBOR + 2.250%) | 5.365 | % | 1/29/27 | 48,875 | 46,028 | (d)(i)(j) | ||||||||||
Household Products — 0.1% | ||||||||||||||||
Energizer Holdings Inc., Term Loan (1 mo. USD LIBOR + 2.250%) | 5.313 | % | 12/22/27 | 18,208 | 17,365 | (d)(i)(j) | ||||||||||
Total Consumer Staples | 63,393 | |||||||||||||||
| Energy — 0.1% | ||||||||||||||||
Oil, Gas & Consumable Fuels — 0.1% | ||||||||||||||||
Pilot Travel Centers LLC, Initial Term Loan B (1 mo. Term SOFR + 2.100%) | 5.134 | % | 8/4/28 | 48,653 | 46,473 | (d)(i)(j) | ||||||||||
| Financials — 0.8% | ||||||||||||||||
Diversified Financial Services — 0.6% | ||||||||||||||||
Castlelake Aviation One Designated Activity Co., Initial Term Loan (3 mo. USD LIBOR + 2.750%) | 6.043 | % | 10/22/26 | 69,052 | 66,621 | (d)(i)(j) | ||||||||||
Citadel Securities LP, 2021 Term Loan (1 mo. Term SOFR + 2.614%) | 5.649 | % | 2/2/28 | 56,724 | 55,007 | (d)(i)(j) | ||||||||||
See Notes to Financial Statements.
| Western Asset ETFs 2022 Semi-Annual Report | 29 |
Table of Contents
Schedules of investments (unaudited) (cont’d)
September 30, 2022
Western Asset Total Return ETF
(Percentages shown based on Fund net assets)
| Security | Rate | Maturity Date | Face Amount† | Value | ||||||||||||
Diversified Financial Services — continued | ||||||||||||||||
Deerfield Dakota Holding LLC, First Lien Initial Dollar Term Loan (1 mo. Term SOFR + 3.750%) | 6.784 | % | 4/9/27 | 57,525 | $ | 54,169 | (d)(i)(j) | |||||||||
UFC Holdings LLC, Term Loan B3 (6 mo. USD LIBOR + 2.750%) | 5.520 | % | 4/29/26 | 51,170 | 49,081 | (d)(i)(j) | ||||||||||
Total Diversified Financial Services | 224,878 | |||||||||||||||
Insurance — 0.0%†† | ||||||||||||||||
Asurion LLC, New Term Loan B10 (3 mo. Term SOFR + 4.100%) | 7.134 | % | 8/21/28 | 10,394 | 8,831 | (d)(i)(j) | ||||||||||
Mortgage Real Estate Investment Trusts (REITs) — 0.2% |
| |||||||||||||||
Apollo Commercial Real Estate Finance Inc., Initial Term Loan (1 mo. USD LIBOR + 2.750%) | 5.865 | % | 5/15/26 | 56,133 | 52,485 | (d)(i)(j)(l) | ||||||||||
Total Financials | 286,194 | |||||||||||||||
| Health Care — 0.4% | ||||||||||||||||
Health Care Providers & Services — 0.4% | ||||||||||||||||
Global Medical Response Inc., 2020 Term Loan (1 mo. USD LIBOR + 4.250%) | 7.378 | % | 10/2/25 | 88,425 | 76,443 | (d)(i)(j) | ||||||||||
Sterigenics-Nordion Holdings LLC, Term Loan (1 mo. USD LIBOR + 2.750%) | 5.865 | % | 12/11/26 | 50,000 | 43,750 | (d)(i)(j) | ||||||||||
Total Health Care | 120,193 | |||||||||||||||
| Industrials — 0.5% | ||||||||||||||||
Airlines — 0.2% | ||||||||||||||||
Air Canada, Term Loan (3 mo. USD LIBOR + 3.500%) | 6.421 | % | 8/11/28 | 39,900 | 37,870 | (d)(i)(j) | ||||||||||
Delta Air Lines Inc., Initial Term Loan (3 mo. USD LIBOR + 3.750%) | 6.460 | % | 10/20/27 | 50,000 | 50,039 | (d)(i)(j) | ||||||||||
Total Airlines | 87,909 | |||||||||||||||
Commercial Services & Supplies — 0.3% | ||||||||||||||||
Ali Group North America Co., Initial Term Loan B (1 mo. Term SOFR + 2.114%) | 5.149 | % | 7/30/29 | 45,445 | 43,717 | (d)(i)(j) | ||||||||||
Mister Car Wash Holdings Inc., First Lien Initial Term Loan (1 mo. USD LIBOR + 3.000%) | 6.115 | % | 5/14/26 | 51,586 | 49,680 | (d)(i)(j) | ||||||||||
Total Commercial Services & Supplies | 93,397 | |||||||||||||||
Total Industrials | 181,306 | |||||||||||||||
| Information Technology — 0.2% | ||||||||||||||||
Electronic Equipment, Instruments & Components — 0.1% |
| |||||||||||||||
II-VI Inc., Term Loan B (1 mo. USD LIBOR + 2.750%) | 5.878 | % | 7/2/29 | 50,000 | 48,334 | (d)(i)(j) | ||||||||||
Software — 0.1% | ||||||||||||||||
Cloudera Inc., Term Loan (1 mo. USD LIBOR + 3.750%) | 6.865 | % | 10/8/28 | 39,799 | 34,824 | (d)(i)(j)(l) | ||||||||||
Total Information Technology | 83,158 | |||||||||||||||
Total Senior Loans (Cost — $1,184,113) |
| 1,122,766 | ||||||||||||||
| U.S. Government & Agency Obligations — 0.4% | ||||||||||||||||
U.S. Government Obligations — 0.4% | ||||||||||||||||
U.S. Treasury Bonds | 3.625 | % | 8/15/43 | 30,000 | 27,974 | |||||||||||
U.S. Treasury Bonds | 3.000 | % | 8/15/52 | 150,000 | 129,445 | |||||||||||
Total U.S. Government & Agency Obligations (Cost — $167,224) |
| 157,419 | ||||||||||||||
Expiration Date | Contracts | Notional Amount† | ||||||||||||||
| Purchased Options — 0.3% | ||||||||||||||||
| Exchange-Traded Purchased Options — 0.3% | ||||||||||||||||
90-Day Eurodollar Futures, Call @ $97.00 | 12/19/22 | 20 | 50,000 | 875 | ||||||||||||
90-Day Eurodollar Futures, Call @ $98.63 | 12/19/22 | 117 | 292,500 | 1,462 | ||||||||||||
See Notes to Financial Statements.
| 30 | Western Asset ETFs 2022 Semi-Annual Report |
Table of Contents
Western Asset Total Return ETF
(Percentages shown based on Fund net assets)
| Security | Expiration Date | Contracts | Notional Amount† | Value | ||||||||||||||||
| Exchange-Traded Purchased Options — continued |
| |||||||||||||||||||
SOFR 1-Year Mid-Curve Futures, Call @ $95.75 |
| 12/16/22 | 78 | 195,000 | $ | 68,738 | ||||||||||||||
SOFR 1-Year Mid-Curve Futures, Call @ $96.50 |
| 12/16/22 | 30 | 75,000 | 7,688 | |||||||||||||||
U.S. Treasury 5-Year Notes Futures, Call @ $108.50 |
| 10/21/22 | 35 | 35,000 | 11,210 | |||||||||||||||
U.S. Treasury 5-Year Notes Futures, Call @ $111.50 |
| 10/21/22 | 6 | 6,000 | 188 | |||||||||||||||
U.S. Treasury 10-Year Notes Futures, Call @ $112.50 |
| 10/21/22 | 12 | 12,000 | 10,688 | |||||||||||||||
U.S. Treasury 10-Year Notes Futures, Call @ $116.50 |
| 10/21/22 | 12 | 12,000 | 1,313 | |||||||||||||||
Total Exchange-Traded Purchased Options (Cost — $177,018) |
| 102,162 | ||||||||||||||||||
| Counterparty | ||||||||||||||||||||
| OTC Purchased Options — 0.0%†† |
| |||||||||||||||||||
U.S. Dollar/Japanese Yen , Put @ 131.55 JPY | | Goldman Sachs Group Inc. | | 10/5/22 | 332,975 | 332,975 | 2 | |||||||||||||
U.S. Dollar/Australian Dollar, Put @ 0.69 AUD | | Goldman Sachs Group Inc. | | 11/17/22 | 794,000 | 794,000 | 1,955 | |||||||||||||
U.S. Dollar/Canadian Dollar, Put @ 1.27 CAD | | Morgan Stanley & Co. Inc. | | 10/7/22 | 127,000 | 127,000 | 0 | (e) | ||||||||||||
U.S. Dollar/Canadian Dollar, Put @ 1.27 CAD | Citibank N.A. | 10/11/22 | 185,000 | 185,000 | 0 | (e) | ||||||||||||||
U.S. Dollar/Canadian Dollar, Put @ 1.27 CAD | Citibank N.A. | 10/11/22 | 62,000 | 62,000 | 0 | (e) | ||||||||||||||
U.S. Dollar/Canadian Dollar, Put @ 1.27 CAD | Citibank N.A. | 10/11/22 | 62,000 | 62,000 | 0 | (e) | ||||||||||||||
U.S. Dollar/Canadian Dollar, Put @ 1.27 CAD | | Goldman Sachs Group Inc. | | 10/14/22 | 186,000 | 186,000 | 0 | (e) | ||||||||||||
U.S. Dollar/Euro, Put @ 1.02 EUR | | Goldman Sachs Group Inc. | | 11/17/22 | 794,000 | 794,000 | 3,942 | |||||||||||||
U.S. Dollar/Japanese Yen, Put @ 131.39 JPY | Citibank N.A. | 10/6/22 | 99,064 | 99,064 | 2 | |||||||||||||||
U.S. Dollar/Japanese Yen, Put @ 131.50 JPY | | Goldman Sachs Group Inc. | | 10/6/22 | 110,697 | 110,697 | 2 | |||||||||||||
Total OTC Purchased Options (Cost — $29,994) |
| 5,903 | ||||||||||||||||||
Total Purchased Options (Cost — $207,012) |
| 108,065 | ||||||||||||||||||
Total Investments before Short-Term Investments (Cost — $41,719,155) |
| 35,254,763 | ||||||||||||||||||
| Rate | Shares | |||||||||||||||||||
| Short-Term Investments — 2.3% | ||||||||||||||||||||
BNY Mellon Cash Reserve Fund (Cost — $809,047) |
| 1.350% | 809,047 | 809,047 | ||||||||||||||||
Total Investments — 102.6% (Cost — $42,528,202) |
| 36,063,810 | ||||||||||||||||||
Liabilities in Excess of Other Assets — (2.6)% |
| (925,020 | ) | |||||||||||||||||
Total Net Assets — 100.0% | $ | 35,138,790 | ||||||||||||||||||
See Notes to Financial Statements.
| Western Asset ETFs 2022 Semi-Annual Report | 31 |
Table of Contents
Schedules of investments (unaudited) (cont’d)
September 30, 2022
Western Asset Total Return ETF
| † | Face amount/notional amount denominated in U.S. dollars, unless otherwise noted. |
| †† | Represents less than 0.1%. |
| * | Non-income producing security. |
| (a) | Security is exempt from registration under Rule 144A of the Securities Act of 1933. This security may be resold in transactions that are exempt from registration, normally to qualified institutional buyers. This security has been deemed liquid pursuant to guidelines approved by the Board of Trustees. |
| (b) | Security is exempt from registration under Regulation S of the Securities Act of 1933. Regulation S applies to securities offerings that are made outside of the United States and do not involve direct selling efforts in the United States. This security has been deemed liquid pursuant to guidelines approved by the Board of Trustees. |
| (c) | Security has no maturity date. The date shown represents the next call date. |
| (d) | Variable rate security. Interest rate disclosed is as of the most recent information available. Certain variable rate securities are not based on a published reference rate and spread but are determined by the issuer or agent and are based on current market conditions. These securities do not indicate a reference rate and spread in their description above. |
| (e) | Value is less than $1. |
| (f) | This security is traded on a to-be-announced (“TBA”) basis. At September 30, 2022, the Fund held TBA securities with a total cost of $3,719,972. |
| (g) | Collateralized mortgage obligations are secured by an underlying pool of mortgages or mortgage pass-through certificates that are structured to direct payments on underlying collateral to different series or classes of the obligations. The interest rate may change positively or inversely in relation to one or more interest rates, financial indices or other financial indicators and may be subject to an upper and/or lower limit. |
| (h) | The coupon payment on this security is currently in default as of September 30, 2022. |
| (i) | Interest rates disclosed represent the effective rates on senior loans. Ranges in interest rates are attributable to multiple contracts under the same loan. |
| (j) | Senior loans may be considered restricted in that the Fund ordinarily is contractually obligated to receive approval from the agent bank and/or borrower prior to the disposition of a senior loan. |
| (k) | All or a portion of this loan is unfunded as of September 30, 2022. The interest rate for fully unfunded term loans is to be determined. |
| (l) | Security is valued using significant unobservable inputs (Note 1). |
Abbreviation(s) used in this schedule: | ||
| ACES | — Alternative Credit Enhancement Securities | |
| AUD | — Australian Dollar | |
| BRL | — Brazilian Real | |
| CAD | — Canadian Dollar | |
| CAS | — Connecticut Avenue Securities | |
| CDO | — Collateralized Debt Obligation | |
| CLO | — Collateralized Loan Obligation | |
| EUR | — Euro | |
| ICE | — Intercontinental Exchange | |
| IDR | — Indonesian Rupiah | |
| IO | — Interest Only | |
| JPY | — Japanese Yen | |
| LIBOR | — London Interbank Offered Rate | |
| MXN | — Mexican Peso | |
| OFZ | — Obligatsyi Federal’novo Zaima (Russian Federal Loan Obligation) | |
| REMIC | — Real Estate Mortgage Investment Conduit | |
| RUB | — Russian Ruble | |
| SOFR | — Secured Overnight Financing Rate | |
| USD | — United States Dollar | |
| ZAR | — South African Rand | |
At September 30, 2022, the Fund had the following written options contracts:
| Exchange-Traded Written Options |
| |||||||||||||||||||
| Security | Expiration Date | Strike Price | Contracts | Notional Amount† | Value | |||||||||||||||
| 3-Month SOFR Futures , Call | 12/15/23 | $ | 96.50 | 52 | 130,000 | $ | (56,225) | |||||||||||||
| 3-Month SOFR Futures , Call | 12/15/23 | 96.63 | 36 | 90,000 | (35,775) | |||||||||||||||
| 3-Month SOFR Futures , Call | 6/16/23 | 97.25 | 28 | 70,000 | (6,650) | |||||||||||||||
| 3-Month SOFR Futures , Call | 9/15/23 | 98.25 | 71 | 177,500 | (13,312) | |||||||||||||||
| 3-Month SOFR Futures , Call | 9/15/23 | 98.75 | 215 | 537,500 | (26,875) | |||||||||||||||
See Notes to Financial Statements.
| 32 | Western Asset ETFs 2022 Semi-Annual Report |
Table of Contents
Western Asset Total Return ETF
| Security | Expiration Date | Strike Price | Contracts | Notional Amount† | Value | |||||||||||||||
| 90-Day Eurodollar Futures, Call | 12/19/22 | $ | 96.50 | 24 | 60,000 | $ | (1,500) | |||||||||||||
| 90-Day Eurodollar Futures, Call | 12/19/22 | 97.50 | 81 | 202,500 | (3,038) | |||||||||||||||
| 90-Day Eurodollar Futures, Call | 12/19/22 | 98.00 | 81 | 202,500 | (2,025) | |||||||||||||||
| 90-Day Eurodollar Futures, Call | 12/19/22 | 98.13 | 47 | 117,500 | (881) | |||||||||||||||
| 90-Day Eurodollar Futures, Call | 12/19/22 | 98.38 | 70 | 175,000 | (1,313) | |||||||||||||||
| 90-Day Eurodollar Futures, Call | 12/19/22 | 98.88 | 214 | 535,000 | (1,338) | |||||||||||||||
| 90-Day Eurodollar Futures, Call | 6/20/23 | 97.13 | 37 | 92,500 | (7,863) | |||||||||||||||
| 90-Day Eurodollar Futures, Call | 6/20/23 | 97.50 | 44 | 110,000 | (6,600) | |||||||||||||||
| 90-Day Eurodollar Futures, Put | 12/19/22 | 98.13 | 47 | 117,500 | (330,762) | |||||||||||||||
| 90-Day Eurodollar Futures, Put | 12/19/22 | 98.38 | 117 | 292,500 | (896,512) | |||||||||||||||
| U.S. Treasury 5-Year Notes Futures, Call | 11/25/22 | 108.75 | 23 | 23,000 | (12,758) | |||||||||||||||
| U.S. Treasury 10-Year Notes Futures, Call | 10/21/22 | 119.00 | 21 | 21,000 | (984) | |||||||||||||||
| U.S. Treasury 10-Year Notes Futures, Call | 11/25/22 | 115.50 | 24 | 24,000 | (12,000) | |||||||||||||||
| U.S. Treasury 10-Year Notes Futures, Call | 11/25/22 | 119.50 | 24 | 24,000 | (3,000) | |||||||||||||||
| U.S. Treasury 10-Year Notes Futures, Put | 10/21/22 | 113.50 | 98 | 98,000 | (192,937) | |||||||||||||||
| Total Exchange-Traded Written Options (Premiums received — $600,427) |
| $ | (1,612,348) | |||||||||||||||||
| OTC Written Options |
| |||||||||||||||||||||
| Counterparty | ||||||||||||||||||||||
| U.S. Dollar/British Pound, Put | JPMorgan Chase & Co. | 10/24/22 | 1.20 | GBP | 122,767 | 122,767 | $ | (175) | ||||||||||||||
| U.S. Dollar/British Pound, Put | Citibank N.A. | 10/27/22 | 1.21 | GBP | 117,313 | 117,313 | (162) | |||||||||||||||
| U.S. Dollar/British Pound, Put | Goldman Sachs Group Inc. | 12/22/22 | 1.08 | GBP | 51,000 | 51,000 | (2,876) | |||||||||||||||
| U.S. Dollar/British Pound, Put | JPMorgan Chase & Co. | 12/22/22 | 1.08 | GBP | 52,000 | 52,000 | (3,201) | |||||||||||||||
| U.S. Dollar/British Pound, Put | Morgan Stanley & Co. Inc. | 12/22/22 | 1.12 | GBP | 119,000 | 119,000 | (4,011) | |||||||||||||||
| Total OTC Written Options (Premiums received — $8,622) |
| $ | (10,425) | |||||||||||||||||||
| Total Written Options (Premiums received — $609,049) |
| $ | (1,622,773) | |||||||||||||||||||
| †Notional | amount denominated in U.S. dollars, unless otherwise noted. |
Abbreviation(s) used in this schedule: | ||
| GBP | — British Pound | |
| SOFR | — Secured Overnight Financing Rate | |
At September 30, 2022, the Fund had the following open futures contracts:
Number of Contracts | Expiration Date | Notional Amount | Market Value | Unrealized Appreciation (Depreciation) | ||||||||||||||||
| Contracts to Buy: |
| |||||||||||||||||||
| 3-Month Euribor | 12 | 12/22 | $ | 2,920,125 | $ | 2,872,971 | $ | (47,154) | ||||||||||||
| 3-Month SOFR | 2 | 6/23 | 482,804 | 478,075 | (4,729) | |||||||||||||||
| 3-Month SOFR | 18 | 9/23 | 4,332,188 | 4,305,600 | (26,588) | |||||||||||||||
| 3-Month SOFR | 15 | 12/24 | 3,634,744 | 3,611,813 | (22,931) | |||||||||||||||
| 90-Day Eurodollar | 5 | 3/23 | 1,188,405 | 1,191,187 | 2,782 | |||||||||||||||
| 90-Day Eurodollar | 8 | 6/23 | 1,931,263 | 1,906,700 | (24,563) | |||||||||||||||
| Australian 10-Year Bonds | 5 | 12/22 | �� | 387,260 | 376,500 | (10,760) | ||||||||||||||
| Euro-Bobl | 2 | 12/22 | 240,169 | 234,626 | (5,543) | |||||||||||||||
| Euro-OAT | 2 | 12/22 | 270,888 | 258,863 | (12,025) | |||||||||||||||
| U.S. Treasury 5-Year Notes | 157 | 12/22 | 17,266,364 | 16,878,727 | (387,637) | |||||||||||||||
| U.S. Treasury Long-Term Bonds | 59 | 12/22 | 8,065,624 | 7,457,968 | (607,656) | |||||||||||||||
| U.S. Treasury Ultra Long-Term Bonds | 28 | 12/22 | 4,069,018 | 3,836,000 | (233,018) | |||||||||||||||
| (1,379,822) | ||||||||||||||||||||
See Notes to Financial Statements.
| Western Asset ETFs 2022 Semi-Annual Report | 33 |
Table of Contents
Schedules of investments (unaudited) (cont’d)
September 30, 2022
Western Asset Total Return ETF
Number of Contracts | Expiration Date | Notional Amount | Market Value | Unrealized Appreciation (Depreciation) | ||||||||||||||||
| Contracts to Sell: | ||||||||||||||||||||
| 3-Month SOFR | 30 | 12/23 | $ | 7,214,870 | $ | 7,182,749 | $ | 32,121 | ||||||||||||
| 90-Day Eurodollar | 110 | 12/22 | 26,360,206 | 26,210,249 | 149,957 | |||||||||||||||
| 90-Day Eurodollar | 26 | 3/25 | 6,361,833 | 6,247,800 | 114,033 | |||||||||||||||
| Euro-Bund | 2 | 12/22 | 283,022 | 271,344 | 11,678 | |||||||||||||||
| U.S. Treasury 2-Year Notes | 111 | 12/22 | 23,134,028 | 22,798,360 | 335,668 | |||||||||||||||
| U.S. Treasury 10-Year Notes | 109 | 12/22 | 12,690,504 | 12,214,813 | 475,691 | |||||||||||||||
| U.S. Treasury Ultra 10-Year Notes | 9 | 12/22 | 1,134,174 | 1,066,359 | 67,815 | |||||||||||||||
| 1,186,963 | ||||||||||||||||||||
| Net unrealized depreciation on open futures contracts |
| $ | (192,859) | |||||||||||||||||
Abbreviation(s) used in this table: | ||
| Bobl | — Bundesobligation | |
| OAT | — Obligations Assimilables du Trésor (French Treasury Bonds) | |
| SOFR | — Secured Overnight Financing Rate | |
At September 30, 2022, the Fund had the following open forward foreign currency contracts:
Currency Purchased | Currency Sold | Counterparty | Settlement Date | Unrealized Appreciation (Depreciation) | ||||||||||||||||
| USD | 102,112 | JPY | 13,776,996 | Goldman Sachs Group Inc. | 10/7/22 | $ | 6,867 | |||||||||||||
| USD | 29,059 | JPY | 3,918,343 | Citibank N.A. | 10/11/22 | 1,960 | ||||||||||||||
| USD | 33,209 | JPY | 4,478,247 | Goldman Sachs Group Inc. | 10/11/22 | 2,238 | ||||||||||||||
| USD | 54,548 | CAD | 69,620 | Morgan Stanley & Co. Inc. | 10/11/22 | 3,882 | ||||||||||||||
| USD | 25,419 | CAD | 32,430 | Citibank N.A. | 10/12/22 | 1,819 | ||||||||||||||
| USD | 27,279 | CAD | 34,760 | Citibank N.A. | 10/12/22 | 1,983 | ||||||||||||||
| USD | 79,544 | CAD | 101,570 | Citibank N.A. | 10/12/22 | 5,626 | ||||||||||||||
| USD | 79,688 | CAD | 102,000 | Goldman Sachs Group Inc. | 10/17/22 | 5,459 | ||||||||||||||
| EUR | 292,106 | USD | 296,116 | BNP Paribas SA | 10/18/22 | (9,589) | ||||||||||||||
| JPY | 125,936,635 | USD | 930,880 | BNP Paribas SA | 10/18/22 | (59,321) | ||||||||||||||
| AUD | 1,065,823 | USD | 730,184 | Citibank N.A. | 10/18/22 | (44,762) | ||||||||||||||
| CAD | 100,000 | USD | 77,025 | Citibank N.A. | 10/18/22 | (4,252) | ||||||||||||||
| CAD | 310,000 | USD | 238,778 | Citibank N.A. | 10/18/22 | (13,181) | ||||||||||||||
| CAD | 763,878 | USD | 590,196 | Citibank N.A. | 10/18/22 | (34,296) | ||||||||||||||
| EUR | 254,623 | NOK | 2,633,611 | Citibank N.A. | 10/18/22 | 8,051 | ||||||||||||||
| NZD | 263,516 | USD | 161,668 | Citibank N.A. | 10/18/22 | (12,603) | ||||||||||||||
| USD | 174,807 | CNH | 1,170,000 | Citibank N.A. | 10/18/22 | 10,651 | ||||||||||||||
| USD | 608 | IDR | 9,150,000 | Citibank N.A. | 10/18/22 | 7 | ||||||||||||||
| USD | 182,313 | IDR | 2,748,179,481 | Citibank N.A. | 10/18/22 | 1,941 | ||||||||||||||
| USD | 227,085 | IDR | 3,431,020,000 | Citibank N.A. | 10/18/22 | 1,896 | ||||||||||||||
| COP | 508,148,260 | USD | 114,994 | Goldman Sachs Group Inc. | 10/18/22 | (4,794) | ||||||||||||||
| GBP | 80,672 | USD | 97,248 | Goldman Sachs Group Inc. | 10/18/22 | (7,158) | ||||||||||||||
| JPY | 8,000,000 | USD | 59,651 | Goldman Sachs Group Inc. | 10/18/22 | (4,286) | ||||||||||||||
| USD | 144,367 | CAD | 191,889 | Goldman Sachs Group Inc. | 10/18/22 | 4,723 | ||||||||||||||
| USD | 54,544 | GBP | 50,613 | Goldman Sachs Group Inc. | 10/18/22 | (1,978) | ||||||||||||||
| USD | 60,212 | GBP | 56,000 | Goldman Sachs Group Inc. | 10/18/22 | (2,326) | ||||||||||||||
| USD | 185,814 | JPY | 26,847,199 | Goldman Sachs Group Inc. | 10/18/22 | 15 | ||||||||||||||
| CNH | 146,459 | USD | 21,293 | JPMorgan Chase & Co. | 10/18/22 | (744) | ||||||||||||||
| CNH | 994,991 | USD | 139,667 | JPMorgan Chase & Co. | 10/18/22 | (66) | ||||||||||||||
| IDR | 2,913,134,424 | USD | 191,691 | JPMorgan Chase & Co. | 10/18/22 | (494) | ||||||||||||||
| IDR | 5,971,650,000 | USD | 393,649 | JPMorgan Chase & Co. | 10/18/22 | (1,711) | ||||||||||||||
| INR | 22,717,824 | USD | 284,684 | JPMorgan Chase & Co. | 10/18/22 | (5,957) | ||||||||||||||
| USD | 43,499 | AUD | 62,852 | JPMorgan Chase & Co. | 10/18/22 | 3,080 | ||||||||||||||
See Notes to Financial Statements.
| 34 | Western Asset ETFs 2022 Semi-Annual Report |
Table of Contents
Western Asset Total Return ETF
Currency Purchased | Currency Sold | Counterparty | Settlement Date | Unrealized Appreciation (Depreciation) | ||||||||||||||||
| USD | 155,148 | AUD | 240,078 | JPMorgan Chase & Co. | 10/18/22 | $ | 756 | |||||||||||||
| USD | 195,710 | AUD | 291,182 | JPMorgan Chase & Co. | 10/18/22 | 8,454 | ||||||||||||||
| USD | 107,019 | CAD | 146,904 | JPMorgan Chase & Co. | 10/18/22 | 113 | ||||||||||||||
| USD | 89,720 | CNH | 600,000 | JPMorgan Chase & Co. | 10/18/22 | 5,537 | ||||||||||||||
| USD | 140,440 | CNH | 941,600 | JPMorgan Chase & Co. | 10/18/22 | 8,329 | ||||||||||||||
| USD | 6,754 | IDR | 101,370,000 | JPMorgan Chase & Co. | 10/18/22 | 100 | ||||||||||||||
| USD | 15,516 | IDR | 232,970,000 | JPMorgan Chase & Co. | 10/18/22 | 225 | ||||||||||||||
| USD | 22,511 | IDR | 337,670,000 | JPMorgan Chase & Co. | 10/18/22 | 349 | ||||||||||||||
| USD | 25,012 | IDR | 375,480,000 | JPMorgan Chase & Co. | 10/18/22 | 368 | ||||||||||||||
| USD | 31,106 | IDR | 466,970,000 | JPMorgan Chase & Co. | 10/18/22 | 458 | ||||||||||||||
| USD | 75,037 | IDR | 1,126,490,000 | JPMorgan Chase & Co. | 10/18/22 | �� | 1,102 | |||||||||||||
| USD | 239,721 | IDR | 3,594,100,000 | JPMorgan Chase & Co. | 10/18/22 | 3,829 | ||||||||||||||
| USD | 15,554 | INR | 1,249,490 | JPMorgan Chase & Co. | 10/18/22 | 224 | ||||||||||||||
| USD | 65,666 | INR | 5,379,989 | JPMorgan Chase & Co. | 10/18/22 | (342) | ||||||||||||||
| CNH | 640,150 | USD | 89,146 | Morgan Stanley & Co. Inc. | 10/18/22 | 670 | ||||||||||||||
| EUR | 68,689 | NOK | 712,060 | Morgan Stanley & Co. Inc. | 10/18/22 | 2,025 | ||||||||||||||
| MXN | 1,931,851 | USD | 96,015 | Morgan Stanley & Co. Inc. | 10/18/22 | (264) | ||||||||||||||
| MXN | 8,397,626 | USD | 411,814 | Morgan Stanley & Co. Inc. | 10/18/22 | 4,409 | ||||||||||||||
| NOK | 5,642,000 | USD | 559,578 | Morgan Stanley & Co. Inc. | 10/18/22 | (41,765) | ||||||||||||||
| USD | 30,286 | CAD | 40,000 | Morgan Stanley & Co. Inc. | 10/18/22 | 1,177 | ||||||||||||||
| USD | 44,014 | CAD | 57,288 | Morgan Stanley & Co. Inc. | 10/18/22 | 2,323 | ||||||||||||||
| USD | 36,665 | EUR | 36,564 | Morgan Stanley & Co. Inc. | 10/18/22 | 799 | ||||||||||||||
| USD | 197,040 | INR | 16,088,345 | Morgan Stanley & Co. Inc. | 10/18/22 | (349) | ||||||||||||||
| USD | 51,128 | JPY | 6,984,386 | Morgan Stanley & Co. Inc. | 10/18/22 | 2,792 | ||||||||||||||
| USD | 688,772 | MXN | 14,409,790 | Morgan Stanley & Co. Inc. | 10/18/22 | (25,441) | ||||||||||||||
| USD | 1,073,765 | MXN | 22,490,000 | Morgan Stanley & Co. Inc. | 10/18/22 | (40,939) | ||||||||||||||
| USD | 16,612 | NOK | 161,445 | Morgan Stanley & Co. Inc. | 10/18/22 | 1,795 | ||||||||||||||
| USD | 37,372 | NZD | 65,995 | Morgan Stanley & Co. Inc. | 10/18/22 | 40 | ||||||||||||||
| CNH | 930,000 | USD | 129,131 | Morgan Stanley & Co. Inc. | 10/18/22 | 1,353 | ||||||||||||||
| GBP | 28,000 | USD | 30,310 | Goldman Sachs Group Inc. | 12/28/22 | 990 | ||||||||||||||
| USD | 53,260 | GBP | 48,000 | Goldman Sachs Group Inc. | 12/28/22 | (397) | ||||||||||||||
| GBP | 28,000 | USD | 30,106 | JPMorgan Chase & Co. | 12/28/22 | 1,195 | ||||||||||||||
| GBP | 51,896 | USD | 57,525 | Morgan Stanley & Co. Inc. | 12/28/22 | 488 | ||||||||||||||
| USD | 4,417 | GBP | 4,000 | Morgan Stanley & Co. Inc. | 12/28/22 | (55) | ||||||||||||||
| USD | 140,013 | CNH | 994,991 | JPMorgan Chase & Co. | 1/18/23 | 57 | ||||||||||||||
| USD | 391,455 | IDR | 5,971,650,000 | JPMorgan Chase & Co. | 1/18/23 | 748 | ||||||||||||||
| INR | 16,088,345 | USD | 195,052 | Morgan Stanley & Co. Inc. | 1/18/23 | 762 | ||||||||||||||
| USD | 129,472 | CNH | 930,000 | Morgan Stanley & Co. Inc. | 1/18/23 | (1,342) | ||||||||||||||
| Total | $ | (206,747) | ||||||||||||||||||
Abbreviation(s) used in this table: | ||
| AUD | — Australian Dollar | |
| CAD | — Canadian Dollar | |
| CNH | — Chinese Offshore Yuan | |
| COP | — Colombian Peso | |
| EUR | — Euro | |
| GBP | — British Pound | |
| IDR | — Indonesian Rupiah | |
| INR | — Indian Rupee | |
| JPY | — Japanese Yen | |
| MXN | — Mexican Peso | |
| NOK | — Norwegian Krone | |
See Notes to Financial Statements.
| Western Asset ETFs 2022 Semi-Annual Report | 35 |
Table of Contents
Schedules of investments (unaudited) (cont’d)
September 30, 2022
Western Asset Total Return ETF
| NZD | — New Zealand Dollar | |
| USD | — United States Dollar | |
At September 30, 2022, the Fund had the following open swap contracts:
| CENTRALLY CLEARED INTEREST RATE SWAPS | ||||||||||||||||||||
| Notional Amount | Termination Date | Payments the Fund† | Payments Received by | Upfront Premiums Paid (Received) | Unrealized Appreciation (Depreciation) | |||||||||||||||
| $ | 1,520,000 | 11/18/23 | 3.970%** | CPURNSA** | $ | (9,049) | $ | 51,061 | ||||||||||||
| 4,138,000 | 6/4/24 | 3-Month LIBOR quarterly | 0.820% semi-annually | — | (147,570) | |||||||||||||||
| 16,958,000 | 7/11/24 | Daily SOFR annually | 1.323% annually | (610,665) | (227,663) | |||||||||||||||
| 7,460,000 | 8/10/25 | Daily SOFR annually | 2.725% annually | (4,133) | (166,965) | |||||||||||||||
| 5,420,000 | 9/17/26 | CPURNSA** | 2.723%** | 18,149 | (269,844) | |||||||||||||||
| 1,520,000 | 11/18/26 | CPURNSA** | 3.370%** | 20,795 | (39,275) | |||||||||||||||
| 2,310,000 | 11/20/26 | 1.52% annually | Daily SOFR annually | (3,776) | 140,808 | |||||||||||||||
| 890,000 | 3/4/27 | Daily SOFR annually | 1.550% annually | (1,341) | (81,310) | |||||||||||||||
| 8,311,000 | 3/16/27 | Daily SOFR annually | 3.550% annually | (93,049) | (9,011) | |||||||||||||||
| 5,089,000 | 4/30/29 | 3.270% annually | Daily SOFR annually | (5,485) | 131,987 | |||||||||||||||
| 583,000 | 3/18/32 | 2.000% annually | Daily SOFR annually | 4,470 | 68,935 | |||||||||||||||
| 2,370,000 | 5/15/32 | 3.220% annually | Daily SOFR annually | (9,264) | 73,447 | |||||||||||||||
| 1,530,000 | 7/11/32 | 1.800% annually | Daily SOFR annually | — | 220,938 | |||||||||||||||
| 1,647,000 | 8/10/33 | 2.480% annually | Daily SOFR annually | — | 134,249 | |||||||||||||||
| 1,566,000 | 2/15/48 | 2.600% annually | Daily SOFR annually | 107,470 | 47,490 | |||||||||||||||
| 139,000 | 2/15/48 | 3.050% annually | Daily SOFR annually | 4,283 | (973) | |||||||||||||||
| 780,000 | 7/11/52 | 1.780% annually | Daily SOFR annually | — | 190,231 | |||||||||||||||
| Total | $ | 62,231,000 | $ | (581,595) | $ | 116,535 | ||||||||||||||
| OTC CREDIT DEFAULT SWAPS ON CORPORATE ISSUES — SELL PROTECTION1 | ||||||||||||||||||||||||
Swap Counterparty (Reference Entity) | Notional Amount2 | Termination Date | Implied Credit Spread at September 30, | Periodic Payments Received by the Fund† | Market Value | Upfront Premiums Paid | Unrealized Depreciation | |||||||||||||||||
| BNP Paribas SA (Volkswagen International Finance NV, 0.875%, due 1/16/23) | 530,000 | EUR | 12/20/24 | 1.381% | 1.000% quarterly | $ | (4,229) | $ | 6,734 | $ | (10,963) | |||||||||||||
See Notes to Financial Statements.
| 36 | Western Asset ETFs 2022 Semi-Annual Report |
Table of Contents
Western Asset Total Return ETF
| OTC CREDIT DEFAULT SWAPS ON CORPORATE ISSUES — BUY PROTECTION4 | ||||||||||||||||||||||||
| Swap Counterparty (Reference Entity) | Notional Amount2 | Termination Date | Implied Credit Spread at | Periodic the Fund† | Market Value | Upfront Premiums Paid (Received) | Unrealized Appreciation | |||||||||||||||||
| BNP Paribas SA (Daimler AG, 1.400%, due 1/12/24 | 530,000 | EUR | 12/20/24 | 0.870% | 1.000% quarterly | $ | (1,456) | $ | (5,691) | $ | 4,235 | |||||||||||||
| CENTRALLY CLEARED CREDIT DEFAULT SWAPS ON CREDIT INDICES — SELL PROTECTION1 | ||||||||||||||||||||||
| Reference Entity | Notional Amount2 | Termination Date | Periodic Payments Received by the Fund† | Market Value5 | Upfront Premiums Paid (Received) | Unrealized Depreciation | ||||||||||||||||
| MARKIT CDX.NA.IG.38 Index | $ | 1,598,000 | 6/20/32 | 1.000% quarterly | $ | (38,777) | $ | (9,300) | $ | (29,477) | ||||||||||||
| MARKIT CDX.NA.IG.39 Index | 8,170,000 | 12/20/27 | 1.000% quarterly | (28,043) | (13,933) | (14,110) | ||||||||||||||||
| Total | $ | 9,768,000 | $ | (66,820) | $ | (23,233) | $ | (43,587) | ||||||||||||||
| CENTRALLY CLEARED CREDIT DEFAULT SWAPS ON CREDIT INDICES — BUY PROTECTION4 | ||||||||||||||||||||||
| Reference Entity | Notional Amount2 | Termination Date | Periodic the Fund† | Market Value5 | Upfront Premiums Paid (Received) | Unrealized Appreciation | ||||||||||||||||
| MARKIT CDX.NA.HY.39 Index | $ | 1,047,000 | 12/20/27 | 5.000% quarterly | $ | 42,968 | $ | 42,825 | $ | 143 | ||||||||||||
| 1 | If the Fund is a seller of protection and a credit event occurs, as defined under the terms of that particular swap agreement, the Fund will either (i) pay to the buyer of protection an amount equal to the notional amount of the swap and take delivery of the referenced obligation or underlying securities comprising the referenced index or (ii) pay a net settlement amount in the form of cash or securities equal to the notional amount of the swap less the recovery value of the referenced obligation or underlying securities comprising the referenced index. |
| 2 | The maximum potential amount the Fund could be required to pay as a seller of credit protection or receive as a buyer of credit protection if a credit event occurs as defined under the terms of that particular swap agreement. |
| 3 | Implied credit spreads, utilized in determining the market value of credit default swap agreements on corporate or sovereign issues as of period end, serve as an indicator of the current status of the payment/performance risk and represent the likelihood or risk of default for the credit derivative. The implied credit spread of a particular referenced entity reflects the cost of buying/selling protection and may include upfront payments required to be made to enter into the agreement. Wider credit spreads represent a deterioration of the referenced entity’s credit soundness and a greater likelihood or risk of default or other credit event occurring as defined under the terms of the agreement. A credit spread identified as “Defaulted” indicates a credit event has occurred for the referenced entity or obligation. |
| 4 | If the Fund is a buyer of protection and a credit event occurs, as defined under the terms of that particular swap agreement, the Fund will either (i) receive from the seller of protection an amount equal to the notional amount of the swap and deliver the referenced obligation or the underlying securities comprising the referenced index or (ii) receive a net settlement amount in the form of cash or securities equal to the notional amount of the swap less the recovery value of the referenced obligation or the underlying securities comprising the referenced index. |
| 5 | The quoted market prices and resulting values for credit default swap agreements on asset-backed securities and credit indices serve as an indicator of the current status of the payment/performance risk and represent the likelihood of an expected loss (or profit) for the credit derivative had the notional amount of the swap agreement been closed/sold as of the period end. Decreasing market values (sell protection) or increasing market values (buy protection) when compared to the notional amount of the swap, represent a deterioration of the referenced entity’s credit soundness and a greater likelihood or risk of default or other credit event occurring as defined under the terms of the agreement. |
| † | Percentage shown is an annual percentage rate. |
| ** | One time payment made at termination date. |
Abbreviation(s) used in this table: | ||
| CPURNSA | — U.S. CPI Urban Consumers NSA Index | |
| EUR | — Euro | |
| LIBOR | — London Interbank Offered Rate | |
| SOFR | — Secured Overnight Financing Rate | |
See Notes to Financial Statements.
| Western Asset ETFs 2022 Semi-Annual Report | 37 |
Table of Contents
Statements of assets and liabilities (unaudited)
September 30, 2022
Western Asset Short Duration Income ETF | Western Asset Total Return ETF | |||||||
| Assets: | ||||||||
Investments, at value (Cost — $26,345,352 and $42,528,202, respectively) | $ | 23,879,122 | $ | 36,063,810 | ||||
Foreign currency, at value (Cost — $0 and $322,087, respectively) | — | 322,342 | ||||||
Interest receivable | 184,066 | 346,860 | ||||||
Deposits with brokers for open futures contracts and exchange-traded options | 135,670 | 1,949,048 | ||||||
Receivable from brokers — net variation margin on centrally cleared swap contracts | 53,613 | — | ||||||
Receivable from brokers — net variation margin on open futures contracts | 7,313 | 57,392 | ||||||
Deposits with brokers for centrally cleared swap contracts | — | 616,190 | ||||||
Foreign currency collateral for open futures contracts and exchange-traded options, at value (Cost — $0 and 205,534, respectively) | — | 198,323 | ||||||
Receivable for securities sold | — | 1,647,465 | ||||||
Unrealized appreciation on forward foreign currency contracts | — | 111,665 | ||||||
Total Assets | 24,259,784 | 41,313,095 | ||||||
| Liabilities: | ||||||||
Payable for securities purchased | 20,000 | 4,149,113 | ||||||
Investment management fee payable | 5,703 | 18,174 | ||||||
Due to custodian | — | 57,392 | ||||||
OTC swaps, at value (paid — $0 and 1,043, respectively) | — | 5,685 | ||||||
Payable to brokers — net variation margin on centrally cleared swap contracts | — | 2,756 | ||||||
Unrealized depreciation on forward foreign currency contracts | — | 318,412 | ||||||
Written options, at value (premiums received — $0 and 609,049, respectively) | — | 1,622,773 | ||||||
Total Liabilities | 25,703 | 6,174,305 | ||||||
| Total Net Assets | $ | 24,234,081 | $ | 35,138,790 | ||||
| Net Assets: | ||||||||
Par value (Note 5) | $ | 11 | $ | 18 | ||||
Paid-in capital in excess of par value | 28,476,349 | 66,533,491 | ||||||
Total distributable earnings (loss) | (4,242,279) | (31,394,719) | ||||||
| Total Net Assets | $ | 24,234,081 | $ | 35,138,790 | ||||
| Shares Outstanding | 1,050,000 | 1,800,000 | ||||||
| Net Asset Value | $23.08 | $19.52 | ||||||
See Notes to Financial Statements.
| 38 | Western Asset ETFs 2022 Semi-Annual Report |
Table of Contents
Statements of operations (unaudited)
For the Six Months Ended September 30, 2022
Western Asset Short Duration Income ETF | Western Asset Total Return ETF | |||||||
| Investment Income: | ||||||||
Dividends | — | $ | 3,723 | |||||
Interest | $ | 377,038 | 1,367,445 | |||||
Less: Foreign taxes withheld | — | (5,958) | ||||||
Interest | $ | 377,038 | 1,365,210 | |||||
| Expenses: | ||||||||
Investment management fee (Note 2) | 39,857 | 168,166 | ||||||
Total Expenses | 39,857 | 168,166 | ||||||
Less: Fee waivers and/or expense reimbursements (Note 2) | — | (13,728) | ||||||
Net Expenses | 39,857 | 154,438 | ||||||
| Net Investment Income | 337,181 | 1,210,772 | ||||||
Realized and Unrealized Gain (Loss) on Investments, Futures Contracts, Written Options, Swap Contracts, Forward Foreign Currency Contracts and Foreign Currency Transactions (Notes 1, 3 and 4): |
| |||||||
Net Realized Gain (Loss) From: | ||||||||
Investment transactions | (1,312,538) | (11,908,673) | ||||||
Futures contracts | 276,436 | (5,174,913) | ||||||
Written options | — | 877,962 | ||||||
Swap contracts | 1,827 | (1,579,100) | ||||||
Forward foreign currency contracts | — | (814,843) | ||||||
Foreign currency transactions | — | (28,918) | ||||||
Net Realized Loss | (1,034,275) | (18,628,485) | ||||||
Change in Net Unrealized Appreciation (Depreciation) From: | ||||||||
Investments | (905,991) | 2,226,301 | ||||||
Futures contracts | 90,232 | 2,816,252 | ||||||
Written options | — | 599,416 | ||||||
Swap contracts | 12,458 | 1,338,403 | ||||||
Forward foreign currency contracts | — | 84,871 | ||||||
Foreign currencies | — | (71,600) | ||||||
Change in Net Unrealized Appreciation (Depreciation) | (803,301) | 6,993,643 | ||||||
| Net Loss on Investments, Futures Contracts, Written Options, Swap Contracts, Forward Foreign Currency Contracts and Foreign Currency Transactions | (1,837,576) | (11,634,842) | ||||||
| Decrease in Net Assets From Operations | $ | (1,500,395) | $ | (10,424,070) | ||||
See Notes to Financial Statements.
| Western Asset ETFs 2022 Semi-Annual Report | 39 |
Table of Contents
Statements of changes in net assets
Western Asset Short Duration Income ETF
For the Six Months Ended September 30, 2022 (unaudited), the Period Ended March 31, 2022 and the Year Ended July 31, 2021 | 2022 | 2022† | 2021 | |||||||||
| Operations: | ||||||||||||
Net investment income | $ | 337,181 | $ | 273,530 | $ | 226,134 | ||||||
Net realized gain (loss) | (1,034,275) | (203,949) | 170,730 | |||||||||
Change in net unrealized appreciation (depreciation) | (803,301) | (1,736,892) | 101,187 | |||||||||
Increase (Decrease) in Net Assets From Operations | (1,500,395) | (1,667,311) | 498,051 | |||||||||
| Distributions to Shareholders From (Note 1): | ||||||||||||
Total distributable earnings | (333,389) | (248,387) | (239,911) | |||||||||
Decrease in Net Assets From Distributions to Shareholders | (333,389) | (248,387) | (239,911) | |||||||||
| Fund Share Transactions (Note 5): | ||||||||||||
Net proceeds from sale of shares (50,000, 700,000 and 450,000 shares issued, respectively) | 1,177,196 | 17,829,137 | 11,830,154 | |||||||||
Cost of shares repurchased (450,000, 0 and 0 shares repurchased, respectively) | (10,765,605) | — | — | |||||||||
Increase (Decrease) in Net Assets From Fund Share Transactions | (9,588,409) | 17,829,137 | 11,830,154 | |||||||||
Increase (Decrease) in Net Assets | (11,422,193) | 15,913,439 | 12,088,294 | |||||||||
| Net Assets: | ||||||||||||
Beginning of period | 35,656,274 | 19,742,835 | 7,654,541 | |||||||||
End of period | $ | 24,234,081 | $ | 35,656,274 | $ | 19,742,835 | ||||||
| † | For the period August 1, 2021 through March 31, 2022. |
See Notes to Financial Statements.
| 40 | Western Asset ETFs 2022 Semi-Annual Report |
Table of Contents
Western Asset Total Return ETF
For the Six Months Ended September 30, 2022 (unaudited), the Period Ended March 31, 2022 and the Year Ended July 31, 2021 | 2022 | 2022† | 2021 | |||||||||
| Operations: | ||||||||||||
Net investment income | $ | 1,210,772 | $ | 757,220 | $ | 3,121,836 | ||||||
Net realized loss | (18,628,485) | (2,751,350) | (754,616) | |||||||||
Change in net unrealized appreciation (depreciation) | 6,993,643 | (13,278,068) | (6,750,555) | |||||||||
Decrease in Net Assets From Operations | (10,424,070) | (15,272,198) | (4,383,335) | |||||||||
| Distributions to Shareholders From (Note 1): | ||||||||||||
Total distributable earnings | (1,220,253) | (627,413) | (5,351,211) | |||||||||
Decrease in Net Assets From Distributions to Shareholders | (1,220,253) | (627,413) | (5,351,211) | |||||||||
| Fund Share Transactions (Note 5): | ||||||||||||
Net proceeds from sale of shares (50,000, 300,000 and 550,000 shares issued, respectively) | 1,128,226 | 6,990,864 | 15,044,884 | |||||||||
Cost of shares repurchased (3,200,000, 100,000 and 800,000 shares repurchased, respectively) | (67,620,789) | (2,382,634) | (21,685,482) | |||||||||
Increase (Decrease) in Net Assets From Fund Share Transactions | (66,492,563) | 4,608,230 | (6,640,598) | |||||||||
Decrease in Net Assets | (78,136,886) | (11,291,381) | (16,375,144) | |||||||||
| Net Assets: | ||||||||||||
Beginning of period | 113,275,676 | 124,567,057 | 140,942,201 | |||||||||
End of period | $ | 35,138,790 | $ | 113,275,676 | $ | 124,567,057 | ||||||
| † | For the period January 1, 2022 through March 31, 2022. |
See Notes to Financial Statements.
| Western Asset ETFs 2022 Semi-Annual Report | 41 |
Table of Contents
Western Asset Short Duration Income ETF
| For a share of beneficial interest outstanding throughout each year ended March 31, unless otherwise noted: | ||||||||||||||||||||
| 20221,2 | 20222,3 | 20212,4 | 20202,4 | 20192,5 | ||||||||||||||||
| Net asset value, beginning of period | $24.59 | $26.32 | $25.52 | $25.80 | $25.00 | |||||||||||||||
| Income (loss) from operations: | ||||||||||||||||||||
Net investment income | 0.30 | 0.29 | 0.63 | 0.97 | 0.48 | |||||||||||||||
Net realized and unrealized gain (loss) | (1.52) | (1.74) | 0.90 | (0.10) | 6 | 0.72 | ||||||||||||||
Total income (loss) from operations | (1.22) | (1.45) | 1.53 | 0.87 | 1.20 | |||||||||||||||
| Less distributions from: | ||||||||||||||||||||
Net investment income | (0.29) | (0.28) | (0.73) | (1.04) | (0.40) | |||||||||||||||
Net realized gains | — | — | — | (0.11) | — | |||||||||||||||
Total distributions | (0.29) | (0.28) | (0.73) | (1.15) | (0.40) | |||||||||||||||
| Net asset value, end of period | $23.08 | $24.59 | $26.32 | $25.52 | $25.80 | |||||||||||||||
Total return, based on NAV7 | (4.98) | % | (5.55) | % | 6.06 | % | 3.52 | % | 4.82 | % | ||||||||||
| Net assets, end of period (000s) | $24,234 | $35,656 | $19,743 | $7,655 | $25,801 | |||||||||||||||
| Ratios to average net assets: | ||||||||||||||||||||
Gross expenses | 0.29 | %8 | 0.29 | %8 | 0.29 | % | 0.29 | % | 0.29 | %8 | ||||||||||
Net expenses | 0.29 | 8 | 0.29 | 8 | 0.29 | 0.29 | 0.29 | 8 | ||||||||||||
Net investment income | 2.45 | 8 | 1.69 | 8 | 2.42 | 3.85 | 3.99 | 8 | ||||||||||||
| Portfolio turnover rate9 | 24 | % | 28 | % | 65 | % | 72 | % | 54 | % | ||||||||||
| 1 | For the six months ended September 30, 2022 (unaudited). |
| 2 | Per share amounts have been calculated using the average shares method. |
| 3 | For the period August 1, 2021 through March 31, 2022. |
| 4 | For the year ended July 31. |
| 5 | For the period February 7, 2019 (inception date) to July 31, 2019. |
| 6 | Calculation of the net loss per share (both realized and unrealized) does not correlate to the aggregate realized and unrealized loss presented in the Statement of Operations due to the timing of sales and repurchases of Fund Shares in relation to fluctuating market values of the investments of the Fund. |
| 7 | Performance figures may reflect fee waivers and/or expense reimbursements. In the absence of fee waivers and/or expense reimbursements, the total return would have been lower. The total return calculation assumes that distributions are reinvested at NAV. Past performance is no guarantee of future results. Total returns for periods of less than one year are not annualized. |
| 8 | Annualized. |
| 9 | Portfolio turnover excludes the value of portfolio securities received or delivered as a result of in-kind fund share transactions. |
See Notes to Financial Statements.
| 42 | Western Asset ETFs 2022 Semi-Annual Report |
Table of Contents
Western Asset Total Return ETF
| For a share of beneficial interest outstanding throughout each year ended March 31, unless otherwise noted: | ||||||||||||||||||||||||
| 20221,2 | 20222,3 | 20212,4 | 20202,4 | 20192,4 | 20182,5 | |||||||||||||||||||
| Net asset value, beginning of period | $ | 22.88 | $ | 26.22 | $ | 28.19 | $ | 26.88 | $ | 25.16 | $ | 25.00 | ||||||||||||
| Income (loss) from operations: | ||||||||||||||||||||||||
Net investment income | 0.38 | 0.16 | 0.66 | 0.61 | 0.82 | 0.20 | ||||||||||||||||||
Net realized and unrealized gain (loss) | (3.37) | (3.37) | (1.49) | 2.07 | 2.45 | 0.10 | ||||||||||||||||||
Total income (loss) from operations | (2.99) | (3.21) | (0.83) | 2.68 | 3.27 | 0.30 | ||||||||||||||||||
| Less distributions from: | ||||||||||||||||||||||||
Net investment income | (0.37) | (0.13) | (0.87) | (0.84) | (0.90) | (0.14) | ||||||||||||||||||
Net realized gains | — | — | (0.27) | (0.53) | (0.65) | — | ||||||||||||||||||
Total distributions | (0.37) | (0.13) | (1.14) | (1.37) | (1.55) | (0.14) | ||||||||||||||||||
| Net asset value, end of period | $ | 19.52 | $ | 22.88 | $ | 26.22 | $ | 28.19 | $ | 26.88 | $ | 25.16 | ||||||||||||
Total return, based on NAV6 | (13.21) | % | (12.28) | % | (2.98) | % | 10.12 | % | 13.19 | % | 1.19 | % | ||||||||||||
| Net assets, end of period (000s) | $ | 35,139 | $ | 113,276 | $ | 124,567 | $ | 140,942 | $ | 107,525 | $ | 25,162 | ||||||||||||
| Ratios to average net assets: | ||||||||||||||||||||||||
Gross expenses7 | 0.49 | %8 | 0.49 | %8 | 0.49 | % | 0.49 | % | 0.49 | % | 0.49 | %8 | ||||||||||||
Net expenses7,9 | 0.45 | 8 | 0.45 | 8 | 0.45 | 0.45 | 0.45 | 0.45 | 8 | |||||||||||||||
Net investment income | 3.53 | 8 | 2.62 | 8 | 2.43 | 2.19 | 3.09 | 3.33 | 8 | |||||||||||||||
| Portfolio turnover rate10 | 21 | % | 10 | % | 65 | % | 115 | % | 80 | % | 18 | % | ||||||||||||
| 1 | For the six months ended September 30, 2022 (unaudited). |
| 2 | Per share amounts have been calculated using the average shares method. |
| 3 | For the period January 1, 2022 through March 31, 2022. |
| 4 | For the Year Ended December 31. |
| 5 | For the period October 3, 2018 (inception date) to December 31, 2018. |
| 6 | Performance figures may reflect fee waivers and/or expense reimbursements. In the absence of fee waivers and/or expense reimbursements, the total return would have been lower. The total return calculation assumes that distributions are reinvested at NAV. Past performance is no guarantee of future results. Total returns for periods of less than one year are not annualized. |
| 7 | As a result of an expense limitation arrangement, the ratio of total annual fund operating expenses, other than interest expenses, taxes, brokerage expenses, future 12b-1 fees (if any), acquired fund fees and expenses, extraordinary expenses and the management fee payable to LMPFA under the investment management agreement, to the average net assets did not exceed 0.45%. This expense limitation arrangement cannot be terminated prior to July 31, 2023 without the Board of Trustees’ consent. |
| 8 | Annualized. |
| 9 | Reflects fee waivers and/or expense reimbursements. |
| 10 | Excluding mortgage dollar rolls transactions. If mortgage dollar roll transactions had been included, the portfolio turnover rate would have been 35% for the six months ended September 30, 2022, 16% for the period ended March 31, 2022 and 103%, 193%, 285% and 97% for the years ended December 31, 2021, 2020, 2019 and the period ended December 31, 2018, respectively. |
See Notes to Financial Statements.
| Western Asset ETFs 2022 Semi-Annual Report | 43 |
Table of Contents
Notes to financial statements (unaudited)
1. Organization and significant accounting policies
Western Asset Short Duration Income ETF (“Short Duration Income ETF”) and Western Asset Total Return ETF (“Total Return ETF” ) ( the “Funds”) are separate diversified investment series of Legg Mason ETF Investment Trust (the “Trust”). The Trust, a Maryland statutory trust, is registered under the Investment Company Act of 1940, as amended (the “1940 Act”), as an open-end management investment company.
The Funds are actively managed exchange-traded funds (“ETFs”). ETFs are funds that trade like other publicly-traded securities. Unlike shares of a mutual fund, which can be bought from and redeemed by the issuing fund by all shareholders at a price based on net asset value (“NAV”), shares of the Funds may be directly purchased from and redeemed by the Funds at NAV solely by certain large institutional investors who have entered into agreements with the Funds’ distributor (“Authorized Participants”). Also unlike shares of a mutual fund, shares of the Funds are listed on a national securities exchange and trade in the secondary market at market prices that change throughout the day.
Shares of the Funds are listed and traded at market prices on NASDAQ. The market price for a Fund’s shares may be different from a Fund’s NAV. The Funds issue and redeem shares at NAV only in blocks of a specified number of shares or multiples thereof (“Creation Units”). Only Authorized Participants may purchase or redeem Creation Units directly with the Funds at NAV. Creation Units generally are issued and redeemed in cash. However, Creation Units may also be issued and redeemed partially in-kind for a basket of securities and partially in cash. Except when aggregated in Creation Units, shares of the Funds are not redeemable securities. Shareholders who are not Authorized Participants may not redeem shares directly from the Funds at NAV.
The following are significant accounting policies consistently followed by the Funds and are in conformity with U.S. generally accepted accounting principles (“GAAP”). Estimates and assumptions are required to be made regarding assets, liabilities and changes in net assets resulting from operations when financial statements are prepared. Changes in the economic environment, financial markets and any other parameters used in determining these estimates could cause actual results to differ. Subsequent events have been evaluated through the date the financial statements were issued.
(a) Investment valuation. The valuations for fixed income securities (which may include, but are not limited to, corporate, government, municipal, mortgage-backed, collateralized mortgage obligations and asset-backed securities) and certain derivative instruments are typically the prices supplied by independent third party pricing services, which may use market prices or broker/dealer quotations or a variety of valuation techniques and methodologies. The independent third party pricing services typically use inputs that are observable such as issuer details, interest rates, yield curves, prepayment speeds, credit risks/spreads, default rates and quoted prices for similar securities. Investments in open-end funds are valued at the closing net asset value per share of each fund on the day of valuation. Futures contracts are valued daily at the settlement price established by the board of trade or exchange on which they are traded. Equity securities for which market quotations are available are valued at the last reported sales price or official closing price on the primary market or exchange on which they trade. When the Funds hold securities or other assets that are denominated in a foreign currency, the Funds will normally use the currency exchange rates, generally determined as of 4:00 p.m. (London Time). If independent third party pricing services are unable to supply prices for a portfolio investment, or if the prices supplied are deemed by the manager to be unreliable, the market price may be determined by the manager using quotations from one or more broker/dealers or at the transaction price if the security has recently been purchased and no value has yet been obtained from a pricing service or pricing broker. When reliable prices are not readily available, such as when the value of a security has been significantly affected by events after the close of the exchange or market on which the security is principally traded, but before each Fund calculates its net asset value, the Funds value these securities as determined in accordance with procedures approved by the Funds’ Board of Trustees.
Pursuant to policies adopted by the Board of Trustees, the Funds’ manager has been designated as the valuation designee and is responsible for the oversight of the daily valuation process. The Funds’ manager is assisted by the Global Fund Valuation Committee (the “Valuation Committee”). The Valuation Committee is responsible for making fair value determinations, evaluating the effectiveness of the Funds’ pricing policies, and reporting to the Funds’ manager and the Board of Trustees. When determining the reliability of third party pricing information for investments owned by the Funds, the Valuation Committee, among other things, conducts due diligence reviews of pricing vendors, monitors the daily change in prices and reviews transactions among market participants.
The Valuation Committee will consider pricing methodologies it deems relevant and appropriate when making fair value determinations. Examples of possible methodologies include, but are not limited to, multiple of earnings; discount from market of a similar freely traded security; discounted cash-flow analysis; book value or a multiple thereof; risk premium/yield
| 44 | Western Asset ETFs 2022 Semi-Annual Report |
Table of Contents
analysis; yield to maturity; and/or fundamental investment analysis. The Valuation Committee will also consider factors it deems relevant and appropriate in light of the facts and circumstances. Examples of possible factors include, but are not limited to, the type of security; the issuer’s financial statements; the purchase price of the security; the discount from market value of unrestricted securities of the same class at the time of purchase; analysts’ research and observations from financial institutions; information regarding any transactions or offers with respect to the security; the existence of merger proposals or tender offers affecting the security; the price and extent of public trading in similar securities of the issuer or comparable companies; and the existence of a shelf registration for restricted securities.
For each portfolio security that has been fair valued pursuant to the policies adopted by the Board of Trustees, the fair value price is compared against the last available and next available market quotations. The Valuation Committee reviews the results of such back testing monthly and fair valuation occurrences are reported to the Board of Trustees quarterly.
The Funds use valuation techniques to measure fair value that are consistent with the market approach and/or income approach, depending on the type of security and the particular circumstance. The market approach uses prices and other relevant information generated by market transactions involving identical or comparable securities. The income approach uses valuation techniques to discount estimated future cash flows to present value.
GAAP establishes a disclosure hierarchy that categorizes the inputs to valuation techniques used to value assets and liabilities at measurement date. These inputs are summarized in the three broad levels listed below:
| • | Level 1 — unadjusted quoted prices in active markets for identical investments |
| • | Level 2 — other significant observable inputs (including quoted prices for similar investments, interest rates, prepayment speeds, credit risk, etc.) |
| • | Level 3 — significant unobservable inputs (including the Funds’ own assumptions in determining the fair value of investments) |
The inputs or methodologies used to value securities are not necessarily an indication of the risk associated with investing in those securities.
The following is a summary of the inputs used in valuing the Funds’ assets and liabilities carried at fair value:
Short Duration Income ETF
| ASSETS | ||||||||||||||||
| Description | Quoted Prices (Level 1) | Other Significant Observable Inputs (Level 2) | Significant Inputs (Level 3) | Total | ||||||||||||
| Long-Term Investments†: | ||||||||||||||||
Corporate Bonds & Notes | — | $ | 20,793,222 | — | $ | 20,793,222 | ||||||||||
U.S. Government & Agency Obligations | — | 1,157,303 | — | 1,157,303 | ||||||||||||
Asset-Backed Securities | — | 944,629 | — | 944,629 | ||||||||||||
Sovereign Bonds | — | 75,498 | — | 75,498 | ||||||||||||
Senior Loans | — | 29,535 | — | 29,535 | ||||||||||||
Municipal Bonds | — | 27,363 | — | 27,363 | ||||||||||||
| Total Long-Term Investments | — | 23,027,550 | — | 23,027,550 | ||||||||||||
| Short-Term Investments† | — | 851,572 | — | 851,572 | ||||||||||||
| Total Investments | — | $ | 23,879,122 | — | $ | 23,879,122 | ||||||||||
| Other Financial Instruments: | ||||||||||||||||
Futures Contracts†† | $ | 606,269 | — | — | $ | 606,269 | ||||||||||
Centrally Cleared Credit Default Swaps on Credit Indices — Buy Protection†† | — | $ | 12,458 | — | 12,458 | |||||||||||
| Total Other Financial Instruments | $ | 606,269 | $ | 12,458 | — | $ | 618,727 | |||||||||
| Total | $ | 606,269 | $ | 23,891,580 | — | $ | 24,497,849 | |||||||||
| Western Asset ETFs 2022 Semi-Annual Report | 45 |
Table of Contents
Notes to financial statements (unaudited) (cont’d)
| LIABILITIES | ||||||||||||||||
| Description | Quoted Prices (Level 1) | Other Significant Observable Inputs (Level 2) | Significant Unobservable Inputs (Level 3) | Total | ||||||||||||
| Other Financial Instruments: | ||||||||||||||||
Futures Contracts†† | $ | 486,733 | — | — | $ | 486,733 | ||||||||||
| † | See Schedule of Investments for additional detailed categorizations. |
| †† | Reflects the unrealized appreciation (depreciation) of the instruments. |
Total Return ETF
| ASSETS | ||||||||||||||||
| Description | Quoted Prices (Level 1) | Other Significant (Level 2) | Significant Unobservable (Level 3) | Total | ||||||||||||
| Long-Term Investments†: | ||||||||||||||||
Corporate Bonds & Notes | — | $ | 14,500,548 | — | $ | 14,500,548 | ||||||||||
Mortgage-Backed Securities | — | 8,076,593 | — | 8,076,593 | ||||||||||||
Collateralized Mortgage Obligations | — | 4,187,389 | — | 4,187,389 | ||||||||||||
Sovereign Bonds | — | 3,889,947 | — | 3,889,947 | ||||||||||||
Asset-Backed Securities | — | 3,212,036 | — | 3,212,036 | ||||||||||||
Senior Loans: | ||||||||||||||||
Financials | — | 233,709 | $ | 52,485 | 286,194 | |||||||||||
Information Technology | — | 48,334 | 34,824 | 83,158 | ||||||||||||
Other Senior Loans | — | 753,414 | — | 753,414 | ||||||||||||
U.S. Government & Agency Obligations | — | 157,419 | — | 157,419 | ||||||||||||
Purchased Options: | ||||||||||||||||
Exchange-Traded Purchased Options | $ | 102,162 | — | — | 102,162 | |||||||||||
OTC Purchased Options | — | 5,903 | — | 5,903 | ||||||||||||
| Total Long-Term Investments | 102,162 | 35,065,292 | 87,309 | 35,254,763 | ||||||||||||
| Short-Term Investments† | — | 809,047 | — | 809,047 | ||||||||||||
| Total Investments | $ | 102,162 | $ | 35,874,339 | $ | 87,309 | $ | 36,063,810 | ||||||||
| Other Financial Instruments: | ||||||||||||||||
Futures Contracts†† | $ | 1,189,745 | — | — | $ | 1,189,745 | ||||||||||
Forward Foreign Currency Contracts†† | — | $ | 111,665 | — | 111,665 | |||||||||||
Centrally Cleared Interest Rate Swaps†† | — | 1,059,146 | — | 1,059,146 | ||||||||||||
Centrally Cleared Credit Default Swaps on Credit Indices — Buy Protection†† | — | 143 | — | 143 | ||||||||||||
| Total Other Financial Instruments | $ | 1,189,745 | $ | 1,170,954 | — | $ | 2,360,699 | |||||||||
| Total | $ | 1,291,907 | $ | 37,045,293 | $ | 87,309 | $ | 38,424,509 | ||||||||
| 46 | Western Asset ETFs 2022 Semi-Annual Report |
Table of Contents
| LIABILITIES | ||||||||||||||||
| Description | Quoted Prices (Level 1) | Other Significant (Level 2) | Significant Inputs (Level 3) | Total | ||||||||||||
| Other Financial Instruments: | ||||||||||||||||
Written Options: | ||||||||||||||||
Exchange-Traded Written Options | $ | 1,612,348 | — | — | $ | 1,612,348 | ||||||||||
OTC Written Options | — | $ | 10,425 | — | 10,425 | |||||||||||
Futures Contracts†† | 1,382,604 | — | — | 1,382,604 | ||||||||||||
Forward Foreign Currency Contracts†† | — | 318,412 | — | 318,412 | ||||||||||||
Centrally Cleared Interest Rate Swaps†† | — | 942,611 | — | 942,611 | ||||||||||||
OTC Credit Default Swaps on Corporate Issues — Sell Protection‡ | — | 4,229 | — | 4,229 | ||||||||||||
OTC Credit Default Swaps on Corporate Issues — Buy Protection‡ | — | 1,456 | — | 1,456 | ||||||||||||
Centrally Cleared Credit Default Swaps on Credit Indices — Sell Protection†† | — | 43,587 | — | 43,587 | ||||||||||||
| Total | $ | 2,994,952 | $ | 1,320,720 | — | $ | 4,315,672 | |||||||||
| † | See Schedule of Investments for additional detailed categorizations. |
| †† | Reflects the unrealized appreciation (depreciation) of the instruments. |
| ‡ | Value includes any premium paid or received with respect to swap contracts. |
(b) Purchased options. When the Funds purchase an option, an amount equal to the premium paid by the Funds is recorded as an investment on the Statement of Assets and Liabilities, the value of which is marked-to-market to reflect the current market value of the option purchased. If the purchased option expires, the Funds realize a loss equal to the amount of premium paid. When an instrument is purchased or sold through the exercise of an option, the related premium paid is added to the basis of the instrument acquired or deducted from the proceeds of the instrument sold. The risk associated with purchasing put and call options is limited to the premium paid.
(c) Written options. When the Funds write an option, an amount equal to the premium received by the Funds is recorded as a liability, the value of which is marked-to-market daily to reflect the current market value of the option written. If the option expires, the premium received is recorded as a realized gain. When a written call option is exercised, the difference between the premium received plus the option exercise price and the Funds’ basis in the underlying security (in the case of a covered written call option), or the cost to purchase the underlying security (in the case of an uncovered written call option), including brokerage commission, is recognized as a realized gain or loss. When a written put option is exercised, the amount of the premium received is subtracted from the cost of the security purchased by the Funds from the exercise of the written put option to form the Funds’ basis in the underlying security purchased. The writer or buyer of an option traded on an exchange can liquidate the position before the exercise of the option by entering into a closing transaction. The cost of a closing transaction is deducted from the original premium received resulting in a realized gain or loss to the Funds. The risk in writing a covered call option is that the Funds may forego the opportunity of profit if the market price of the underlying security increases and the option is exercised. The risk in writing a put option is that the Funds may incur a loss if the market price of the underlying security decreases and the option is exercised.
The risk in writing an uncovered call option is that the Funds are exposed to the risk of loss if the market price of the underlying security increases. In addition, there is the risk that the Funds may not be able to enter into a closing transaction because of an illiquid secondary market.
(d) Options on futures contracts. An option on a futures contract gives the purchaser the right, in return for the premium paid, to assume a position in the underlying futures contract at the specified option exercise price at any time prior to the expiration date of the option. Upon exercise of an option, the delivery of the futures position by the writer of the option to the holder of the option will be accompanied by delivery of the accumulated balance in the writer’s futures margin account that represents the amount by which the market price of the futures contract exceeds (in the case of a call) or is less than (in the case of a put) the exercise price of the option on the futures contract. The potential for loss related to the purchase of an option on a futures contract is limited to the premium paid for the option plus transaction costs. Because the value of the option is fixed at the point of purchase, there are no daily cash payments by the purchaser to reflect changes in the value of the underlying contract; however, the value of the option changes daily and that change would be reflected in the net asset value of the Funds. The potential for loss related to writing call options is unlimited. The potential for loss related to writing put options is limited only by the aggregate strike price of the put option less the premium received.
| Western Asset ETFs 2022 Semi-Annual Report | 47 |
Table of Contents
Notes to financial statements (unaudited) (cont’d)
(e) Futures contracts. The Funds use futures contracts generally to gain exposure to, or hedge against, changes in certain asset classes or in an attempt to increase the Funds returns. A futures contract represents a commitment for the future purchase or sale of an asset at a specified price on a specified date.
Upon entering into a futures contract, the Funds are required to deposit cash or securities with a broker in an amount equal to a certain percentage of the contract amount. This is known as the ‘‘initial margin’’ and subsequent payments (‘‘variation margin’’) are made or received by the Funds each day, depending on the daily fluctuation in the value of the contract. For certain futures, including foreign denominated futures, variation margin is not settled daily, but is recorded as a net variation margin payable or receivable. The daily changes in contract value are recorded as unrealized appreciation or depreciation in the Statements of Operations and the Funds recognize a realized gain or loss when the contract is closed.
Futures contracts involve, to varying degrees, risk of loss in excess of the amounts reflected in the financial statements. In addition, there is the risk that the Funds may not be able to enter into a closing transaction because of an illiquid secondary market.
(f) Forward foreign currency contracts. The Funds enter into a forward foreign currency contract to hedge exposure of bond positions or in an attempt to increase the Total Return ETF’s return. A forward foreign currency contract is an agreement between two parties to buy and sell a currency at a set price with delivery and settlement at a future date. The contract is marked-to-market daily and the change in value is recorded by the Funds as an unrealized gain or loss. When a forward foreign currency contract is closed, through either delivery or offset by entering into another forward foreign currency contract, the Funds recognize a realized gain or loss equal to the difference between the value of the contract at the time it was opened and the value of the contract at the time it is closed.
Non-deliverable forward foreign currency exchange contracts are settled with the counterparty in cash without the delivery of foreign currency.
Forward foreign currency contracts involve elements of market risk in excess of the amounts reflected on the Statements of Assets and Liabilities. The Funds bear the risk of an unfavorable change in the foreign exchange rate underlying the forward foreign currency contract. Risks may also arise upon entering into these contracts from the potential inability of the counterparties to meet the terms of their contracts.
(g) Swap agreements. The Funds invest in swaps for the purpose of managing its exposure to interest rate, credit or market risk, or for other purposes. The use of swaps involves risks that are different from those associated with other portfolio transactions. Swap agreements are privately negotiated in the over-the-counter market and may be entered into as a bilateral contract (“OTC Swaps”) or centrally cleared (“Centrally Cleared Swaps”). Unlike Centrally Cleared Swaps, the Funds have credit exposure to the counterparties of OTC Swaps.
In a Centrally Cleared Swap, immediately following execution of the swap, the swap agreement is submitted to a clearinghouse or central counterparty (the “CCP”) and the CCP becomes the ultimate counterparty of the swap agreement. The Funds are required to interface with the CCP through a broker, acting in an agency capacity. All payments are settled with the CCP through the broker. Upon entering into a Centrally Cleared Swap, the Funds are required to deposit initial margin with the broker in the form of cash or securities.
Swap contracts are marked-to-market daily and changes in value are recorded as unrealized appreciation (depreciation). The daily change in valuation of Centrally Cleared Swaps, if any, is recorded as a net receivable or payable for variation margin on the Statements of Assets and Liabilities. Gains or losses are realized upon termination of the swap agreement. Collateral, in the form of restricted cash or securities, may be required to be held in segregated accounts with the Fund’s custodian in compliance with the terms of the swap contracts. Securities posted as collateral for swap contracts are identified in the Schedule of Investments and restricted cash, if any, is identified on the Statements of Assets and Liabilities. Risks may exceed amounts recorded in the Statements of Assets and Liabilities. These risks include changes in the returns of the underlying instruments, failure of the counterparties to perform under the contracts’ terms, and the possible lack of liquidity with respect to the swap agreements.
OTC Swap payments received or made at the beginning of the measurement period are reflected as a premium or deposit, respectively, on the Statements of Assets and Liabilities. These upfront payments are amortized over the life of the swap and are recognized as realized gain or loss in the Statements of Operations. Net periodic payments received or paid by the Funds are recognized as a realized gain or loss in the Statements of Operations.
| 48 | Western Asset ETFs 2022 Semi-Annual Report |
Table of Contents
The Funds’ maximum exposure in the event of a defined credit event on a credit default swap to sell protection is the notional amount. As of September 30, 2022, the total notional value of all credit default swaps to sell protection was EUR 530,000 and $9,768,000 for the Total Return ETF. These amounts would be offset by the value of the swap’s reference entity, upfront premiums received on the swap and any amounts received from the settlement of a credit default swap where the Total Return ETF bought protection for the same referenced entity. As of September 30, 2022, the Short Duration Income ETF did not hold any credit default swaps to sell protection.
For average notional amounts of swaps held during the six months ended September 30, 2022, see Note 4.
Credit default swaps
The Funds enter into credit default swap (“CDS”) contracts for investment purposes, to manage its credit risk or to add leverage. CDS agreements involve one party making a stream of payments to another party in exchange for the right to receive a specified return in the event of a default by a third party, typically corporate or sovereign issuers, on a specified obligation, or in the event of a write-down, principal shortfall, interest shortfall or default of all or part of the referenced entities comprising a credit index. The Funds may use a CDS to provide protection against defaults of the issuers (i.e., to reduce risk where the Funds have exposure to an issuer) or to take an active long or short position with respect to the likelihood of a particular issuer’s default. As a seller of protection, the Funds generally receives an upfront payment or a stream of payments throughout the term of the swap provided that there is no credit event. If the Funds are a seller of protection and a credit event occurs, as defined under the terms of that particular swap agreement, the maximum potential amount of future payments (undiscounted) that the Funds could be required to make under a CDS agreement would be an amount equal to the notional amount of the agreement. These amounts of potential payments will be partially offset by any recovery of values from the respective referenced obligations. As a seller of protection, the Funds effectively adds leverage to its portfolio because, in addition to its total net assets, the Funds are subject to investment exposure on the notional amount of the swap. As a buyer of protection, the Funds generally receives an amount up to the notional value of the swap if a credit event occurs.
Implied spreads are the theoretical prices a lender receives for credit default protection. When spreads rise, market perceived credit risk rises and when spreads fall, market perceived credit risk falls. The implied credit spread of a particular referenced entity reflects the cost of buying/selling protection and may include upfront payments required to enter into the agreement. Wider credit spreads and decreasing market values, when compared to the notional amount of the swap, represent a deterioration of the referenced entity’s credit soundness and a greater likelihood or risk of default or other credit event occurring as defined under the terms of the agreement. Credit spreads utilized in determining the period end market value of CDS agreements on corporate or sovereign issues are disclosed in the Schedules of Investments and serve as an indicator of the current status of the payment/performance risk and represent the likelihood or risk of default for credit derivatives. For CDS agreements on asset-backed securities and credit indices, the quoted market prices and resulting values, particularly in relation to the notional amount of the contract as well as the annual payment rate, serve as an indication of the current status of the payment/performance risk.
The Funds’ maximum risk of loss from counterparty risk, as the protection buyer, is the fair value of the contract (this risk is mitigated by the posting of collateral by the counterparty to the Funds to cover the Funds’ exposure to the counterparty). As the protection seller, the Funds’ maximum risk is the notional amount of the contract. CDS are considered to have credit risk-related contingent features since they require payment by the protection seller to the protection buyer upon the occurrence of a defined credit event.
Entering into a CDS agreement involves, to varying degrees, elements of credit, market and documentation risk in excess of the related amounts recognized on the Statements of Assets and Liabilities. Such risks involve the possibility that there will be no liquid market for these agreements, that the counterparty to the agreement may default on its obligation to perform or disagree as to the meaning of the contractual terms in the agreement, and that there will be unfavorable changes in net interest rates.
Interest rate swaps
The Funds enter into interest rate swap contracts to manage its exposure to interest rate risk. Interest rate swaps are agreements between two parties to exchange cash flows based on a notional principal amount. The Funds may elect to pay a fixed rate and receive a floating rate, or receive a fixed rate and pay a floating rate, on a notional principal amount. Interest rate swaps are marked-to-market daily based upon quotations from market makers and the change, if any, is recorded as an unrealized appreciation or depreciation in the Statements of Operations. When a swap contract is terminated early, the Funds record a realized gain or loss equal to the difference between the original cost and the settlement amount of the closing transaction.
| Western Asset ETFs 2022 Semi-Annual Report | 49 |
Table of Contents
Notes to financial statements (unaudited) (cont’d)
The risks of interest rate swaps include changes in market conditions that will affect the value of the contract or changes in the present value of the future cash flow streams and the possible inability of the counterparty to fulfill its obligations under the agreement. The Funds maximum risk of loss from counterparty credit risk is the discounted net value of the cash flows to be received from the counterparty over the contract’s remaining life, to the extent that amount is positive. This risk is mitigated by the posting of collateral by the counterparty to the Funds to cover the Fund’s exposure to the counterparty.
(h) Swaptions. The Funds may purchase or write swaption contracts to manage exposure to fluctuations in interest rates or to enhance yield. The Funds may also purchase and write swaption contracts to manage exposure to an underlying instrument. Swaption contracts written by the Funds represent an option that gives the purchaser the right, but not the obligation, to enter into a previously agreed upon swap contract at a future date. Swaption contracts purchased by the Funds represent an option that gives the Funds the right, but not the obligation, to enter into a previously agreed upon swap contract at a future date.
When the Funds write a swaption, an amount equal to the premium received by the Funds is recorded as a liability, the value of which is marked-to-market daily to reflect the current market value of the swaption written. If the swaption expires, the Funds realize a gain equal to the amount of the premium received.
When the Funds purchase a swaption, an amount equal to the premium paid by the Funds is recorded as an investment on the Statement of Assets and Liabilities, the value of which is marked-to-market daily to reflect the current market value of the swaption purchased. If the swaption expires, the Funds realize a loss equal to the amount of the premium paid.
Swaptions are marked-to-market daily based upon quotations from market makers. Changes in the value of the swaption are reported as unrealized gains or losses in the Statements of Operations.
(i) Loan participations. The Funds may invest in loans arranged through private negotiation between one or more financial institutions. The Funds investment in any such loan may be in the form of a participation in or an assignment of the loan. In connection with purchasing participations, the Funds generally will have no right to enforce compliance by the borrower with the terms of the loan agreement related to the loan, or any rights of off-set against the borrower and the Funds may not benefit directly from any collateral supporting the loan in which it has purchased the participation.
The Funds assumes the credit risk of the borrower, the lender that is selling the participation and any other persons interpositioned between the Funds and the borrower. In the event of the insolvency of the lender selling the participation, the Funds may be treated as a general creditor of the lender and may not benefit from any off-set between the lender and the borrower.
(j) Unfunded loan commitments. The Funds may enter into certain credit agreements where all or a portion of the total amount committed may be unfunded. The Funds are obligated to fund these commitments at the borrower’s discretion. The commitments are disclosed in the accompanying Schedule of Investments. At September 30, 2022, the Funds had sufficient cash and/or securities to cover these commitments.
(k) Stripped securities. The Funds may invest in ‘‘Stripped Securities,’’ a term used collectively for components, or strips, of fixed income securities. Stripped Securities can be principal only securities (“PO”), which are debt obligations that have been stripped of unmatured interest coupons, or interest only securities (“IO”), which are unmatured interest coupons that have been stripped from debt obligations. The market value of Stripped Securities will fluctuate in response to changes in economic conditions, rates of pre-payment, interest rates and the market’s perception of the securities. However, fluctuations in response to interest rates may be greater in Stripped Securities than for debt obligations of comparable maturities that pay interest currently. The amount of fluctuation may increase with a longer period of maturity.
The yield to maturity on IO’s is sensitive to the rate of principal repayments (including prepayments) on the related underlying debt obligation and principal payments may have a material effect on yield to maturity. If the underlying debt obligation experiences greater than anticipated prepayments of principal, the Funds may not fully recoup its initial investment in IO’s.
(l) Securities traded on a when-issued and delayed delivery basis. The Funds may trade securities on a when-issued or delayed delivery basis. In when-issued and delayed delivery transactions, the securities are purchased or sold by the Funds with payment and delivery taking place in the future in order to secure what is considered to be an advantageous price and yield to the Funds at the time of entering into the transaction.
Purchasing such securities involves risk of loss if the value of the securities declines prior to settlement. These securities are subject to market fluctuations and their current value is determined in the same manner as for other securities.
| 50 | Western Asset ETFs 2022 Semi-Annual Report |
Table of Contents
(m) Securities traded on a to-be-announced basis. The Funds may trade securities on a to-be-announced (“TBA”) basis. In a TBA transaction, the Funds commits to purchasing or selling securities which have not yet been issued by the issuer and for which specific information, such as the face amount, maturity date and underlying pool of investments in U.S. government agency mortgage pass-through securities, is not announced. Securities purchased on a TBA basis are not settled until they are delivered to the Funds. Beginning on the date the Funds enters into a TBA transaction, cash, U.S. government securities or other liquid high-grade debt obligations are segregated in an amount equal in value to the purchase price of the TBA security. These securities are subject to market fluctuations and their current value is determined in the same manner as for other securities.
(n) Mortgage dollar rolls. The Funds may enter into mortgage dollar rolls in which the Funds sells mortgage-backed securities for delivery in the current month, realizing a gain or loss, and simultaneously entering into contracts to repurchase substantially similar (same type, coupon and maturity) securities to settle on a specified future date.
The Funds executes its mortgage dollar rolls entirely in the TBA market, whereby the Funds makes a forward commitment to purchase a security and, instead of accepting delivery, the position is offset by a sale of the security with a simultaneous agreement to repurchase at a future date. The Funds accounts for mortgage dollar rolls as purchases and sales.
The risk of entering into mortgage dollar rolls is that the market value of the securities the Funds is obligated to repurchase under the agreement may decline below the repurchase price. In the event the buyer of securities under a mortgage dollar roll files for bankruptcy or becomes insolvent, the Fund’s use of the proceeds of the mortgage dollar roll may be restricted pending a determination by the counterparty, or its trustee or receiver, whether to enforce the Fund’s obligation to repurchase the securities.
(o) Inflation-indexed bonds. Inflation-indexed bonds are fixed income securities whose principal value or interest rate is periodically adjusted according to the rate of inflation for the Funds. As the index measuring inflation changes, the principal value or interest rate of inflation-indexed bonds will be adjusted accordingly. Inflation adjustments to the principal amount of inflation-indexed bonds are reflected as an increase or decrease to investment income on the Statements of Operations. Repayment of the original bond principal upon maturity (as adjusted for inflation) is guaranteed in the case of U.S. Treasury inflation-indexed bonds. For bonds that do not provide a similar guarantee, the adjusted principal value of the bond repaid at maturity may be less than the original principal.
(p) Foreign currency translation. Investment securities and other assets and liabilities denominated in foreign currencies are translated into U.S. dollar amounts based upon prevailing exchange rates on the date of valuation. Purchases and sales of investment securities and income and expense items denominated in foreign currencies are translated into U.S. dollar amounts based upon prevailing exchange rates on the respective dates of such transactions.
The Funds do not isolate that portion of the results of operations resulting from fluctuations in foreign exchange rates on investments from the fluctuations arising from changes in market prices of securities held. Such fluctuations are included with the net realized and unrealized gain or loss on investments.
Net realized foreign exchange gains or losses arise from sales of foreign currencies, including gains and losses on forward foreign currency contracts, currency gains or losses realized between the trade and settlement dates on securities transactions, and the difference between the amounts of dividends, interest, and foreign withholding taxes recorded on each Funds’ books and the U.S. dollar equivalent of the amounts actually received or paid. Net unrealized foreign exchange gains and losses arise from changes in the values of assets and liabilities, other than investments in securities, on the date of valuation, resulting from changes in exchange rates.
Foreign security and currency transactions may involve certain considerations and risks not typically associated with those of U.S. dollar denominated transactions as a result of, among other factors, the possibility of lower levels of governmental supervision and regulation of foreign securities markets and the possibility of political or economic instability.
(q) Credit and market risk. The Funds invest in high-yield and emerging market instruments that are subject to certain credit and market risks. The yields of high-yield and emerging market debt obligations reflect, among other things, perceived credit and market risks. The Funds’ investments in securities rated below investment grade typically involve risks not associated with higher rated securities including, among others, greater risk related to timely and ultimate payment of interest and principal, greater market price volatility and less liquid secondary market trading. The consequences of political, social, economic or diplomatic changes may have disruptive effects on the market prices of investments held by the Funds. The Funds’ investments in non-U.S. dollar denominated securities may also result in foreign currency losses caused by devaluations and exchange rate fluctuations.
| Western Asset ETFs 2022 Semi-Annual Report | 51 |
Table of Contents
Notes to financial statements (unaudited) (cont’d)
Investments in securities that are collateralized by real estate mortgages are subject to certain credit and liquidity risks. When market conditions result in an increase in default rates of the underlying mortgages and the foreclosure values of underlying real estate properties are materially below the outstanding amount of these underlying mortgages, collection of the full amount of accrued interest and principal on these investments may be doubtful. Such market conditions may significantly impair the value and liquidity of these investments and may result in a lack of correlation between their credit ratings and values.
(r) Foreign investment risks. The Funds’ investments in foreign securities may involve risks not present in domestic investments. Since securities may be denominated in foreign currencies, may require settlement in foreign currencies or may pay interest or dividends in foreign currencies, changes in the relationship of these foreign currencies to the U.S. dollar can significantly affect the value of the investments and earnings of the Funds. Foreign investments may also subject the Funds to foreign government exchange restrictions, expropriation, taxation or other political, social or economic developments, all of which affect the market and/or credit risk of the investments.
(s) Counterparty risk and credit-risk-related contingent features of derivative instruments. The Funds may invest in certain securities or engage in other transactions where the Funds is exposed to counterparty credit risk in addition to broader market risks. The Funds may invest in securities of issuers, which may also be considered counterparties as trading partners in other transactions. This may increase the risk of loss in the event of default or bankruptcy by the counterparty or if the counterparty otherwise fails to meet its contractual obligations. The Funds’ subadviser attempts to mitigate counterparty risk by (i) periodically assessing the creditworthiness of its trading partners, (ii) monitoring and/or limiting the amount of its net exposure to each individual counterparty based on its assessment and (iii) requiring collateral from the counterparty for certain transactions. Market events and changes in overall economic conditions may impact the assessment of such counterparty risk by the subadviser. In addition, declines in the values of underlying collateral received may expose the Funds to increased risk of loss.
With exchange traded and centrally cleared derivatives, there is less counterparty risk to the Funds since the exchange or clearinghouse, as counterparty to such instruments, guarantees against a possible default. The clearinghouse stands between the buyer and the seller of the contract; therefore, the credit risk is limited to failure of the clearinghouse. While offset rights may exist under applicable law, the Funds do not have a contractual right of offset against a clearing broker or clearinghouse in the event of a default of the clearing broker or clearinghouse.
The Funds have entered into master agreements, such as an International Swaps and Derivatives Association, Inc. Master Agreement (“ISDA Master Agreement”) or similar agreement, with certain of its derivative counterparties that govern over-the-counter (“OTC”) derivatives and provide for general obligations, representations, agreements, collateral posting terms, netting provisions in the event of default or termination and credit related contingent features. The credit related contingent features include, but are not limited to, a percentage decrease in the Fund net assets or net asset value per share over a specified period of time. If these credit related contingent features were triggered, the derivatives counterparty could terminate the positions and demand payment or require additional collateral.
Under an ISDA Master Agreement, the Funds may, under certain circumstances, offset with the counterparty certain derivative financial instruments’ payables and/or receivables with collateral held and/or posted and create one single net payment. However, absent an event of default by the counterparty or a termination of the agreement, the terms of the ISDA Master Agreements do not result in an offset of reported amounts of financial assets and financial liabilities in the Statements of Assets and Liabilities across transactions between the Funds and the applicable counterparty. The enforceability of the right to offset may vary by jurisdiction.
Collateral requirements differ by type of derivative. Collateral or margin requirements are set by the broker or exchange clearinghouse for exchange traded derivatives while collateral terms are contract specific for OTC traded derivatives. Cash collateral that has been pledged to cover obligations of the Funds under derivative contracts, if any, will be reported separately in the Statement of Assets and Liabilities. Securities pledged as collateral, if any, for the same purpose are noted in the Schedules of Investments.
As of September 30, 2022, Total Return ETF held OTC written options, OTC swap contracts and forward foreign currency contracts with credit related contingent features which had a net liability- position of $334,522. If a contingent feature would have been triggered, the Total Return ETF would have been required to pay this amount to its derivatives counterparties. The Short Duration Income ETF did not have any open OTC derivative transactions with credit related contingent features in a net liability position.
| 52 | Western Asset ETFs 2022 Semi-Annual Report |
Table of Contents
(t) Security transactions and investment income. Security transactions are accounted for on a trade date basis. Interest income (including interest income from payment-in-kind securities), adjusted for amortization of premium and accretion of discount, is recorded on the accrual basis. Paydown gains and losses on mortgage- and asset-backed securities are recorded as adjustments to interest income. Dividend income is recorded on the ex-dividend date for dividends received in cash and/or securities. The cost of investments sold is determined by use of the specific identification method. To the extent any issuer defaults or a credit event occurs that impacts the issuer, the Funds may halt any additional interest income accruals and consider the realizability of interest accrued up to the date of default or credit event.
(u) Distributions to shareholders. Distributions from net investment income of the Funds, if any, are declared and paid monthly. Distributions of net realized gains, if any, are declared at least annually. Distributions to shareholders of the Funds are recorded on the ex-dividend date and are determined in accordance with income tax regulations, which may differ from GAAP.
(v) Federal and other taxes. It is the Funds’ policy to comply with the federal income and excise tax requirements of the Internal Revenue Code of 1986 (the “Code”), as amended, applicable to regulated investment companies. Accordingly, the Funds intend to distribute their taxable income and net realized gains, if any, to shareholders in accordance with timing requirements imposed by the Code. Therefore, no federal or state income tax provision is required in the Funds’ financial statements.
Management has analyzed the Funds’ tax positions taken on income tax returns for all open tax years and has concluded that as of March 31, 2022, no provision for income tax is required in the Funds’ financial statements. The Funds’ federal and state income and federal excise tax returns for tax years for which the applicable statutes of limitations have not expired are subject to examination by the Internal Revenue Service and state departments of revenue.
Under the applicable foreign tax laws, a withholding tax may be imposed on interest, dividends and capital gains at various rates.
(w) Reclassification. GAAP requires that certain components of net assets be reclassified to reflect permanent differences between financial and tax reporting. These reclassifications have no effect on net assets or net asset value per share.
2. Investment management agreement and other transactions with affiliates
Legg Mason Partners Fund Advisor, LLC (“LMPFA”) is each Fund’s investment manager. Western Asset Management Company, LLC (“Western Asset”), is each Fund’s subadviser and Western Asset Management Company Pte. Ltd. in Singapore (“Western Asset Singapore”), Western Asset Management Company Ltd in Japan (“Western Asset Japan”) and Western Asset Management Company Limited in London (“Western Asset London”) are each Fund’s subadvisers. LMPFA, Western Asset, Western Asset Singapore, Western Asset Japan and Western Asset London are indirect, wholly-owned subsidiaries of Franklin Resources, Inc. (“Franklin Resources”).
LMPFA provides administrative and certain oversight services to the Funds. LMPFA delegates to the subadviser the day-to-day portfolio management of the Funds. Each Fund is responsible for paying interest expenses, taxes, brokerage expenses, future 12b-1 fees (if any), acquired fund fees and expenses, extraordinary expenses and the management fee payable to LMPFA under the investment management agreement.
Under the investment management agreement and subject to the general supervision of the Funds’ Board of Trustees, LMPFA as to each Fund provides or causes to be furnished all investment management, supervisory, administrative and other services reasonably necessary for the operation of the Fund, including certain distribution services (provided pursuant to a separate distribution agreement) and investment advisory services (provided pursuant to separate subadvisory agreements) under a unitary fee structure.
Each Fund pays an investment management fee, calculated daily and paid monthly, at an annual rate of the Fund’s average daily net assets as follows:
| Annualized Fee Rate | ||||
| Western Asset Short Duration Income ETF | 0.29 | % | ||
| Western Asset Total Return ETF | 0.49 | % | ||
LMPFA has agreed to waive fees and/or reimburse investment manager fees, so that the ratio of total annual operating expenses will not exceed 0.45% of Total Return ETF’s average daily net assets (subject to the same exclusions as the
| Western Asset ETFs 2022 Semi-Annual Report | 53 |
Table of Contents
Notes to financial statements (unaudited) (cont’d)
investment management agreement). This arrangement cannot be terminated prior to July 31, 2023 without the Board of Trustees’ consent.
During the September 30, 2022, fees waived and/or expenses reimbursed amounted to $13,728 for Total Return ETF.
As compensation for its subadvisory services, LMPFA as to each Fund pays Western Asset monthly 70% of the management fee paid by a Fund to LMPFA, net of (i) all fees and expenses incurred as to the Fund by LMPFA under the investment management agreement (including without limitation any subadvisory fee paid to another subadviser to the Fund) and (ii) expense waivers, if any, and reimbursements. Western Asset pays Western Asset Singapore, Western Asset Japan and Western Asset London a monthly subadvisory fee in an amount equal to 100% of the management fee paid to Western Asset on the assets that Western Asset allocates to each such non-U.S. subadviser to manage.
Franklin Distributors, LLC (“Franklin Distributors”) serves as the distributor of Creation Units for the Funds on an agency basis. Franklin Distributors is an indirect, wholly-owned broker-dealer subsidiary of Franklin Resources.
The Funds’ Board of Trustees has adopted a Rule 12b-1 shareholder services and distribution plan and under that plan, each Fund is authorized to pay service and/or distribution fees calculated at an annual rate of up to 0.25% of its average daily net assets. No service and/or distribution fees are currently paid by the Funds, and there are no current plans to impose these fees.
All officers and one Trustee of the Trust are employees of Franklin Resources or its affiliates and do not receive compensation from the Trust.
3. Investments
During the six months ended September 30, 2022, the aggregate cost of purchases and proceeds from sales of investments (excluding in-kind transactions and short-term investments) and U.S. Government & Agency Obligations were as follows:
| Western Asset Short Duration Income ETF | ||||||||
| Investments | U.S. Government & Agency Obligations | |||||||
| Purchases | $ | 4,489,002 | $ | 1,793,634 | ||||
| Sales | 13,168,502 | 1,067,556 | ||||||
| Western Asset Total Return ETF | ||||||||
| Investments | U.S. Government & Agency Obligations | |||||||
| Purchases | $ | 3,745,043 | $ | 19,175,753 | ||||
| Sales | 49,073,708 | 39,779,329 | ||||||
During the six months ended September 30, 2022, there were no in-kind transactions (Note 5).
At September 30, 2022, the aggregate cost of investments and the aggregate gross unrealized appreciation and depreciation of investments for federal income tax purposes were as follows:
| Short Duration Income ETF | ||||||||||||||||
Cost/Premiums Paid (Received) | Gross Unrealized Appreciation | Gross Unrealized | Net Unrealized | |||||||||||||
| Securities | $ | 26,345,352 | $ | 11,566 | $ | (2,477,796) | $ | (2,466,230) | ||||||||
| Futures contracts | — | 606,269 | (486,733) | 119,536 | ||||||||||||
| Swap contracts | (4,421) | 12,458 | — | 12,458 | ||||||||||||
| 54 | Western Asset ETFs 2022 Semi-Annual Report |
Table of Contents
| Total Return ETF | ||||||||||||||||
Cost/ Paid | Gross Unrealized Appreciation | Gross Unrealized Depreciation | Net Unrealized Appreciation (Depreciation) | |||||||||||||
| Securities | $ | 42,528,202 | $ | 69,332 | $ | (6,533,724) | $ | (6,464,392) | ||||||||
| Written options | (609,049) | 261,871 | (1,275,595) | (1,013,724) | ||||||||||||
| Futures contracts | — | 1,189,745 | (1,382,604) | (192,859) | ||||||||||||
| Forward foreign currency contracts | — | 111,665 | (318,412) | (206,747) | ||||||||||||
| Swap contracts | (560,960) | 1,063,524 | (997,161) | 66,363 | ||||||||||||
4. Derivative instruments and hedging activities
Below is a table, grouped by derivative type, that provides information about the fair value and the location of derivatives within the Statements of Assets and Liabilities at September 30, 2022.
Western Asset Short Duration Income ETF
| ASSET DERIVATIVES1 | ||||||||||||
Interest Rate Risk | Credit Risk | Total | ||||||||||
| Futures contracts2 | $ | 606,269 | — | $ | 606,269 | |||||||
| Centrally cleared swap contracts3 | — | $ | 12,458 | 12,458 | ||||||||
| Total | $ | 606,269 | $ | 12,458 | $ | 618,727 | ||||||
| LIABILITY DERIVATIVES1 | ||||||||||||
| Interest Rate Risk | ||||||||||||
| Futures contracts2 | $ | 486,733 | ||||||||||
| 1 | Generally, the balance sheet location for asset derivatives is receivables/net unrealized appreciation and for liability derivatives is payables/net unrealized depreciation. |
| 2 | Includes cumulative unrealized appreciation (depreciation) of futures contracts as reported in the Schedule of Investments. Only net variation margin is reported within the receivables and/or payables on the Statements of Assets and Liabilities. |
| 3 | Includes cumulative unrealized appreciation (depreciation) of centrally cleared swap contracts as reported in the Schedule of Investments. Only net variation margin is reported within the receivables and/or payables on the Statements of Assets and Liabilities. |
The following tables provide information about the effect of derivatives and hedging activities on the Fund’s Statement of Operations for the six months ended September 30, 2022. The first table provides additional detail about the amounts and sources of gains (losses) realized on derivatives during the period. The second table provides additional information about the change in net unrealized appreciation (depreciation) resulting from the Fund’s derivatives and hedging activities during the period.
| AMOUNT OF NET REALIZED GAIN (LOSS) ON DERIVATIVES RECOGNIZED | ||||||||||||
Interest Rate Risk | Credit Risk | Total | ||||||||||
| Futures contracts | $ | 276,436 | — | $ | 276,436 | |||||||
| Swap contracts | — | $ | 1,827 | 1,827 | ||||||||
| Total | $ | 276,436 | $ | 1,827 | $ | 278,263 | ||||||
| Western Asset ETFs 2022 Semi-Annual Report | 55 |
Table of Contents
Notes to financial statements (unaudited) (cont’d)
| CHANGE IN NET UNREALIZED APPRECIATION (DEPRECIATION) ON DERIVATIVES RECOGNIZED | ||||||||||||
Interest Rate Risk | Credit Risk | Total | ||||||||||
| Futures contracts | $ | 90,232 | — | $ | 90,232 | |||||||
| Swap contracts | — | $ | 12,458 | 12,458 | ||||||||
| Total | $ | 90,232 | $12,458 | $ | 102,690 | |||||||
During the six months ended September 30, 2022, the volume of derivative activity for the Fund was as follows:
Average Market Value | ||||
| Futures contracts (to buy) | $ | 16,112,472 | ||
| Futures contracts (to sell) | 11,886,406 | |||
Average Notional Balance | ||||
| Credit default swap contracts (buy protection) | $ | 326,086 | ||
| Credit default swap contracts (sell protection) | 897,714 | |||
| 56 | Western Asset ETFs 2022 Semi-Annual Report |
Table of Contents
Below is a table, grouped by derivative type, that provides information about the fair value and the location of derivatives within the Statements of Assets and Liabilities at September 30, 2022.
Western Asset Total Return ETF
| ASSET DERIVATIVES1 | ||||||||||||||||
Interest Rate Risk | Foreign Exchange Risk | Credit Risk | Total | |||||||||||||
| Purchased options2 | $ | 102,162 | $ | 5,903 | — | $ | 108,065 | |||||||||
| Futures contracts3 | 1,189,745 | — | — | 1,189,745 | ||||||||||||
| Forward foreign currency contracts | — | 111,665 | — | 111,665 | ||||||||||||
| Centrally cleared swap contracts4 | 1,059,146 | — | $ | 143 | 1,059,289 | |||||||||||
| Total | $ | 2,351,053 | $ | 117,568 | $ | 143 | $ | 2,468,764 | ||||||||
| LIABILITY DERIVATIVES1 | ||||||||||||||||
Interest Rate Risk | Foreign Exchange Risk | Credit Risk | Total | |||||||||||||
| Written options | $ | 1,612,348 | $ | 10,425 | — | $ | 1,622,773 | |||||||||
| Futures contracts3 | 1,382,604 | — | — | 1,382,604 | ||||||||||||
| Forward foreign currency contracts | — | 318,412 | — | 318,412 | ||||||||||||
| OTC swap contracts5 | — | — | $ | 5,685 | 5,685 | |||||||||||
| Centrally cleared swap contracts4 | 942,611 | — | 43,587 | 986,198 | ||||||||||||
| Total | $ | 3,937,563 | $ | 328,837 | $ | 49,272 | $ | 4,315,672 | ||||||||
| 1 | Generally, the balance sheet location for asset derivatives is receivables/net unrealized appreciation and for liability derivatives is payables/net unrealized depreciation. |
| 2 | Market value of purchased options is reported in Investments at value in the Statements of Assets and Liabilities. |
| 3 | Includes cumulative unrealized appreciation (depreciation) of futures contracts as reported in the Schedule of Investments. Only net variation margin is reported within the receivables and/or payables on the Statements of Assets and Liabilities. |
| 4 | Includes cumulative unrealized appreciation (depreciation) of centrally cleared swap contracts as reported in the Schedule of Investments. Only net variation margin is reported within the receivables and/or payables on the Statements of Assets and Liabilities. |
| 5 | Values include premiums paid (received) on swap contracts which are shown separately in the Statements of Assets and Liabilities. |
The following tables provide information about the effect of derivatives and hedging activities on the Fund’s Statement of Operations for the six months ended September 30, 2022. The first table provides additional detail about the amounts and sources of gains (losses) realized on derivatives during the period. The second table provides additional information about the change in net unrealized appreciation (depreciation) resulting from the Fund’s derivatives and hedging activities during the period.
| AMOUNT OF NET REALIZED GAIN (LOSS) ON DERIVATIVES RECOGNIZED | ||||||||||||||||
Interest Rate Risk | Foreign Exchange Risk | Credit Risk | Total | |||||||||||||
| Purchased options1 | $ | (1,177,989) | $ | (7,137) | — | $ | (1,185,126) | |||||||||
| Futures contracts | (5,174,913) | — | — | (5,174,913) | ||||||||||||
| Written options | 859,834 | 18,128 | — | 877,962 | ||||||||||||
| Swap contracts | (1,515,908) | — | $ | (63,192) | (1,579,100) | |||||||||||
| Forward foreign currency contracts | — | (814,843) | — | (814,843) | ||||||||||||
| Total | $ | (7,008,976) | $ | (803,852) | $ | (63,192) | $ | (7,876,020) | ||||||||
| 1 | Net realized gain (loss) from purchased options is reported in Net Realized Gain (Loss) From Investment transactions in the Statement of Operations. |
| Western Asset ETFs 2022 Semi-Annual Report | 57 |
Table of Contents
Notes to financial statements (unaudited) (cont’d)
| CHANGE IN NET UNREALIZED APPRECIATION (DEPRECIATION) ON DERIVATIVES RECOGNIZED | ||||||||||||||||
| Interest Rate Risk | Foreign Exchange Risk | Credit Risk | Total | |||||||||||||
| Purchased options1 | $ | (116,306) | $ | (21,226) | — | $ | (137,532) | |||||||||
| Futures contracts | 2,816,252 | — | — | 2,816,252 | ||||||||||||
| Written options | 583,015 | 16,401 | — | 599,416 | ||||||||||||
| Swap contracts | 1,409,988 | — | $ | (71,585) | 1,338,403 | |||||||||||
| Forward foreign currency contracts | — | 84,871 | — | 84,871 | ||||||||||||
| Total | $ | 4,692,949 | $ | 80,046 | $ | (71,585) | $ | 4,701,410 | ||||||||
| 1 | The change in net unrealized appreciation (depreciation) from purchased options is reported in the Change in Net Unrealized Appreciation (Depreciation) From Investments in the Statement of Operations. |
During the six months ended September 30, 2022, the volume of derivative activity for the Fund was as follows:
Average Market Value | ||||
| Purchased options | $ | 417,667 | ||
| Written options | 1,799,003 | |||
| Futures contracts (to buy) | 138,243,798 | |||
| Futures contracts (to sell) | 98,110,907 | |||
| Forward foreign currency contracts (to buy) | 2,291,102,068 | |||
| Forward foreign currency contracts (to sell) | 8,203,165,199 | |||
Average Notional Balance | ||||
| Interest rate swap contracts | $ | 79,977,857 | ||
| Credit default swap contracts (buy protection) | 1,300,084 | |||
| Credit default swap contracts (sell protection) | 11,738,339 | |||
The following table presents the Fund’s OTC derivative assets and liabilities by counterparty net of amounts available for offset under an ISDA Master Agreement and net of the related collateral pledged (received) by the Fund as of September 30, 2022.
| Counterparty | Gross Assets Subject to Master Agreements1 | Gross Liabilities Agreements1 | Net Assets Agreements | Collateral (Received)2 | Net Amount3,4 | |||||||||||||||
| BNP Paribas SA | — | $ | (74,595) | $ | (74,595) | — | $ | (74,595) | ||||||||||||
| Citibank N.A. | $ | 33,936 | (109,256) | (75,320) | — | (75,320) | ||||||||||||||
| Goldman Sachs Group Inc. | 22,251 | (23,815) | (1,564) | — | (1,564) | |||||||||||||||
| JPMorgan Chase & Co. | 38,866 | (12,690) | 26,176 | — | 26,176 | |||||||||||||||
| Morgan Stanley & Co. Inc. | 22,515 | (114,166) | (91,651) | — | (91,651) | |||||||||||||||
| Total | $ | 117,568 | $ | (334,522) | $ | (216,954) | — | $ | (216,954) | |||||||||||
| 1 | Absent an event of default or early termination, derivative assets and liabilities are presented gross and not offset in the Statement of Assets and Liabilities. |
| 2 | Gross amounts are not offset in the Statement of Assets and Liabilities. |
| 3 | Net amount may also include forward foreign currency exchange contracts that are not required to be collateralized. |
| 4 | Represents the net amount receivable (payable) from (to) the counterparty in the event of default. |
5. Fund share transactions
At September 30, 2022, the Trust had an unlimited number of shares of beneficial interest authorized with a par value of $0.00001 per share. Each Funds’ shares are issued and redeemed by the Funds only in Creation Units or Creation Unit aggregations, where 50,000 shares of each Fund constitute a Creation Unit. Such transactions are generally on a cash basis. However, Creation Units may also be issued and redeemed partially in-kind for a basket of securities and partially in cash. Transactions in capital shares of the Funds are disclosed in detail in the Statements of Changes in Net Assets. Authorized Participants are subject to standard creation and redemption transaction fees to offset transfer and other transaction costs associated with the issuance and redemption of Creation Units. Creations and redemptions for cash (when cash creations and redemptions are available or specified) may be subject to an additional variable fee.
| 58 | Western Asset ETFs 2022 Semi-Annual Report |
Table of Contents
6. Redemption facility
On February 4, 2022, the Funds, together with other U.S. registered and foreign investment funds (collectively, the “Borrowers”) managed by Franklin Resources or its affiliates, became a borrower in a joint syndicated senior unsecured credit facility totaling $2.675 billion (the “Global Credit Facility”). The Global Credit Facility provides a source of funds to the Borrowers for temporary and emergency purposes, including the ability to meet future unanticipated or unusually large redemption requests. Unless renewed, the Global Credit Facility will terminate on February 3, 2023.
Under the terms of the Global Credit Facility, the Funds shall, in addition to interest charged on any borrowings made by the Funds and other costs incurred by the Funds, pay its share of fees and expenses incurred in connection with the implementation and maintenance of the Global Credit Facility, based upon its relative share of the aggregate net assets of all the Borrowers, including an annual commitment fee of 0.15% based upon the unused portion of the Global Credit Facility. These fees are reflected in the Statements of Operations. The Funds did not utilize the Global Credit Facility during the six months ended September 30, 2022.
7. Deferred capital losses
As of March 31, 2022, Short Duration Income ETF and Total Return ETF had deferred capital losses of $890,097 and $9,333,578, respectively, which have no expiration date, that will be available to offset future taxable capital gains.
8. Concentration of risk
Russia’s military invasion of Ukraine in February 2022, the resulting responses by the United States and other countries, and the potential for wider conflict could increase volatility and uncertainty in the financial markets and adversely affect regional and global economies. The United States and other countries have imposed broad-ranging economic sanctions on Russia and certain Russian individuals, banking entities and corporations as a response to its invasion of Ukraine. The United States and other countries have also imposed economic sanctions on Belarus and may impose sanctions on other countries that support Russia’s military invasion. These sanctions, as well as any other economic consequences related to the invasion, such as additional sanctions, boycotts or changes in consumer or purchaser preferences or cyberattacks on governments, companies or individuals, may further decrease the value and liquidity of certain Russian securities and securities of issuers in other countries that are subject to economic sanctions related to the invasion. To the extent that a Fund has exposure to Russian investments or investments in countries affected by the invasion, the Fund’s ability to price, buy, sell, receive or deliver such investments was impaired. The Fund could determine at any time that certain of the most affected securities have little or no value. In addition, any exposure that the Fund may have to counterparties in Russia or in countries affected by the invasion could negatively impact the Fund’s portfolio. The extent and duration of Russia’s military actions and the repercussions of such actions (including any retaliatory actions or countermeasures that may be taken by those subject to sanctions) are impossible to predict, but could result in significant market disruptions, including in the oil and natural gas markets, and may negatively affect global supply chains, inflation and global growth. These and any related events could significantly impact the Fund’s performance and the value of an investment in the Fund, even beyond any direct exposure the Fund may have to Russian issuers or issuers in other countries affected by the invasion. At March 31, 2022, the Western Asset Total Return ETF had 1.28% of its net assets invested in securities with significant economic risk or exposure to Russia. Beginning on February 28, 2022, the Moscow Exchange, where Russian equity securities are traded, closed for an extended holiday. The VC applied a discount for lack of marketability to all impacted securities.
9. Geopolitical risk
On February 24, 2022, Russia engaged in military actions in the sovereign territory of Ukraine. The current political and financial uncertainty surrounding Russia and Ukraine may increase market volatility and the economic risk of investing in securities in these countries and may also cause uncertainty for the global economy and broader financial markets. The ultimate fallout and long-term impact from these events are not known. The Funds will continue to assess the impact on valuations and liquidity and will take any potential actions needed in accordance with procedures approved by the Board of Trustees.
10. Recent accounting pronouncement
In March 2020, the Financial Accounting Standards Board (FASB) issued Accounting Standards Update (ASU) No. 2020-04, Reference Rate Reform (Topic 848) – Facilitation of the Effects of Reference Rate Reform on Financial Reporting. In January 2021, the FASB issued ASU No. 2021-01, with further amendments to Topic 848. The amendments in the ASUs provide optional temporary accounting recognition and financial reporting relief from the effect of certain types of contract
| Western Asset ETFs 2022 Semi-Annual Report | 59 |
Table of Contents
Notes to financial statements (unaudited) (cont’d)
modifications due to the planned discontinuation of the LIBOR and other interbank-offered based reference rates as of the end of 2021 and 2023. The ASUs are effective for certain reference rate-related contract modifications that occur during the period March 12, 2020 through December 31, 2022. Management has reviewed the requirements and believes the adoption of these ASUs will not have a material impact on the financial statements.
11. Other matters
The outbreak of the respiratory illness COVID-19 (commonly referred to as “coronavirus”) has continued to rapidly spread around the world, causing considerable uncertainty for the global economy and financial markets. The ultimate economic fallout from the pandemic, and the long-term impact on economies, markets, industries and individual issuers, are not known. The COVID-19 pandemic could adversely affect the value and liquidity of the Funds’ investments, impair the Funds’ ability to satisfy redemption requests, and negatively impact the Funds’ performance. In addition, the outbreak of COVID-19, and measures taken to mitigate its effects, could result in disruptions to the services provided to a Fund by its service providers.
* * *
The Funds’ investments, payment obligations, and financing terms may be based on floating rates, such as the London Interbank Offered Rate, or “LIBOR,” which is the offered rate for short-term Eurodollar deposits between major international banks. Plans are underway to phase out the use of LIBOR by the end of 2021. In December 2020, the ICE Benchmark Administration, the administrator of LIBOR, announced that it had commenced a consultation to determine whether to extend publication of certain U.S. dollar LIBOR settings (overnight and one-, three-, six-and twelve-month U.S. dollar LIBOR) to the end of June 2023. There remains uncertainty regarding the nature of any replacement rate and the impact of the transition from LIBOR on the Fund’s transactions and the financial markets generally. As such, the potential effect of a transition away from LIBOR on the Fund or the Funds’ investments cannot yet be determined.
| 60 | Western Asset ETFs 2022 Semi-Annual Report |
Table of Contents
Board approval of management and subadvisory agreements (unaudited)
At a meeting held on May 25, 2022 (Meeting), the Board of Trustees (Board) of the Legg Mason ETF Investment Trust (Trust), including a majority of the trustees who are not “interested persons” as defined in the Investment Company Act of 1940 (Independent Trustees), reviewed and approved the continuance of (i) the investment management agreement between Legg Mason Partners Fund Advisor, LLC (LMPFA) and the Trust, on behalf of each Fund; (ii) the investment sub-advisory agreement between LMPFA and Western Asset Management Company, LLC (Western Asset LLC), an affiliate of LMPFA, on behalf of each Fund; (iii) the investment sub-advisory agreement between LMPFA and Western Asset Management Company Limited (Western Asset Limited), an affiliate of LMPFA, on behalf of each Fund; (iv) the investment sub-advisory agreement between LMPFA and Western Asset Management Company Pte. Ltd. (Western Asset Pte. Ltd.), an affiliate of LMPFA, on behalf of each Fund; and (v) the investment sub-advisory agreement between LMPFA and Western Asset Management Company Ltd (Western Asset Ltd), an affiliate of LMPFA, on behalf of each Fund (each a Management Agreement) for an additional one-year period. The Independent Trustees received advice from and met separately with Independent Trustee counsel in considering whether to approve the continuation of each Management Agreement. Although the Management Agreements for the Funds were considered at the same Board meeting, the Board considered the information provided to it about the Funds together and with respect to each Fund separately as the Board deemed appropriate. LMPFA, Western Asset LLC, Western Asset Limited, Western Asset Pte. Ltd. and Western Asset Ltd are each referred to herein as a Manager.
In considering the continuation of each Management Agreement, the Board reviewed and considered information provided by each Manager at the Meeting and throughout the year at meetings of the Board and its committees. The Board also reviewed and considered information provided in response to a detailed set of requests for information submitted to each Manager by Independent Trustee counsel on behalf of the Independent Trustees in connection with the annual contract renewal process. In addition, prior to the Meeting, the Independent Trustees held a virtual contract renewal meeting at which the Independent Trustees conferred amongst themselves and Independent Trustee counsel about contract renewal matters and, subsequently, requested additional information from management that the Independent Trustees reviewed and considered at the Meeting. The Board reviewed and considered all of the factors it deemed relevant in approving the continuance of each Management Agreement, including, but not limited to: (i) the nature, extent and quality of the services provided by each Manager; (ii) the investment performance of each Fund, (iii) the costs of the services provided and profits realized by each Manager and its affiliates from the relationship with each Fund; (iv) the extent to which economies of scale are realized as each Fund grows; and (v) whether fee levels reflect these economies of scale for the benefit of Fund investors.
In approving the continuance of each Management Agreement, the Board, including a majority of the Independent Trustees, determined that the terms of each Management Agreement are fair and reasonable and that the continuance of such Management Agreement is in the best interests of the applicable Fund and its shareholders. While attention was given to all information furnished, the following discusses some primary factors relevant to the Board’s determination.
Nature, Extent and Quality of Services
The Board reviewed and considered information regarding the nature, extent and quality of investment management services provided by each Manager and its affiliates to the Funds and their shareholders. This information included, among other things, the qualifications, background and experience of the senior management and investment personnel of each Manager; the structure of investment personnel compensation; oversight of third-party service providers; investment performance reports and related financial information for each Fund; reports on expenses; legal and compliance matters; risk controls; pricing and other services provided by each Manager and its affiliates; and management fees charged by each Manager and its affiliates to US funds and other accounts, including management’s explanation of differences among accounts where relevant. The Board acknowledged the ongoing integration of the Legg Mason family of funds into the Franklin Templeton (FT) family of funds, and developing strategies to address areas of heightened concern in the registered fund industry, including various regulatory initiatives and recent geopolitical concerns.
The Board also reviewed and considered the benefits provided to Fund shareholders of investing in a fund that is part of the FT family of funds. The Board noted the financial position of Franklin Resources, Inc. (FRI), the Managers’ parent, and its commitment to the registered fund business as evidenced by its continued introduction of new funds, reassessment of the fund offerings in response to the market environment and project initiatives and capital investments relating to the services provided to the Funds by the FT organization. The Board specifically noted FT’s commitment to being a global leader in stewardship and sustainability and the recent addition of a senior executive focused on environmental, social and governance and climate control initiatives.
| Western Asset ETFs | 61 |
Table of Contents
Board approval of management and subadvisory agreements (unaudited) (cont’d)
Following consideration of such information, the Board was satisfied with the nature, extent and quality of services provided by each Manager and its affiliates to the Funds and their shareholders.
Fund Performance
The Board reviewed and considered the performance results of each Fund for various time periods ended February 28, 2022. The Board considered the performance returns for each Fund in comparison to the performance returns of registered funds deemed comparable to the Fund included in a universe (Performance Universe) selected by Broadridge Financial Solutions, Inc. (Broadridge), an independent provider of investment company data. The Board received a description of the methodology used by Broadridge to select the registered funds included in a Performance Universe. The Board also reviewed and considered Fund performance reports provided and discussions that occurred with portfolio managers at Board meetings throughout the year. The Board noted its ongoing discussions with management about the performance of the Funds to date, particularly as compared to peers, the importance of performance to asset growth and growth of market share, and the performance of the Funds in periods of volatility. In addition, the Board acknowledged information provided regarding management’s strategy behind the overall product line up, the sources of asset growth, the nature of management’s research, potential use of innovative data and technology, and investments in marketing and distribution. Finally, the Board noted management’s high level of client engagement and the strength of its compliance program. A summary of each Fund’s performance results is below.
Western Asset Short Duration Income ETF — The Performance Universe for the Fund included the Fund and all retail and institutional short investment-grade debt funds and exchange-traded funds. The Fund commenced operations on February 7, 2019, and thus has been in operation for less than five years. The Board noted that the Fund’s annualized total return for the one-year period was below the median and in the fifth quintile (worst) of its Performance Universe, but for the three year-period was above the median of and ranked first out of 340 funds in its Performance Universe. The Board concluded that the Fund’s performance was satisfactory.
Western Asset Total Return ETF — The Performance Universe for the Fund included the Fund and all retail and institutional core plus bond funds and exchange-traded funds. The Fund commenced operations on October 3, 2018, and thus has been in operation for less than five years. The Board noted that the Fund’s annualized total return for the one- and three-year periods was below the median of its Performance Universe. The Board discussed this performance with management and management explained that the Fund’s relative underperformance in comparison to its Performance Universe over the one-year reporting period was largely due to the Fund’s interest rate positioning, noting that the Fund was generally overweight duration relative to peers during an environment of increasing interest rates. Management further explained the steps the portfolio management team was taking in an effort to improve the Fund’s peer rankings. Based on the foregoing, the Board concluded that the Fund’s Management Agreement should be continued for an additional one-year period, and that management’s efforts should continue to be closely monitored.
Comparative Fees and Expenses
The Board reviewed and considered information regarding each Fund’s actual total expense ratio, noting that each Fund pays a Unified Fee (as defined below). The Board considered the actual total expense ratio and, separately, the contractual management fee rate, without the effect of fee waivers, if any (Management Rate) of each Fund in comparison to the median expense ratio and median Management Rate, respectively, of other exchange-traded funds deemed comparable to and with a similar expense structure to the Fund selected by Broadridge (Expense Group). Broadridge fee and expense data is based upon information taken from each fund’s most recent annual or semi-annual report, which reflects historical asset levels that may be quite different from those currently existing, particularly in a period of market volatility. While recognizing such inherent limitation and the fact that expense ratios and Management Rates generally increase as assets decline and decrease as assets grow, the Board believed the independent analysis conducted by Broadridge to be an appropriate measure of comparative fees and expenses. The Broadridge Management Rate includes administrative charges. The Board received a description of the methodology used by Broadridge to select the exchange-traded funds included in an Expense Group.
Western Asset Short Duration Income ETF — The Expense Group for the Fund was comprised of actively managed exchange-traded funds, which included the Fund and seven other short investment-grade debt funds. The Board noted that the Management Rate and actual total expense ratio for the Fund were below the medians of its Expense Group. The Board further noted that the Fund has a unified management fee (Unified Fee) and that pursuant to the Unified Fee arrangement the Manager pays
| 62 | Western Asset ETFs |
Table of Contents
for all operating expenses of the Fund, except interest expenses, taxes, brokerage expenses, future Rule 12b-1 fees (if any), acquired fund fees and expenses, extraordinary expenses and the management fee (Unified Fee Arrangement). The Board also noted that each of Western Asset LLC, Western Asset Limited, Western Asset Pte. Ltd. and Western Asset Ltd is paid by LMPFA out of the Unified Fee LMPFA receives from the Fund and that the allocation of the fee between LMPFA and each of Western Asset LLC, Western Asset Limited, Western Asset Pte. Ltd. and Western Asset Ltd reflected the services provided by each to the Fund. After consideration of the above, the Board concluded that the Management Rate charged to the Fund and the sub-advisory fee paid to each of Western Asset LLC, Western Asset Limited, Western Asset Pte. Ltd. and Western Asset Ltd are reasonable.
Western Asset Total Return ETF — The Expense Group for the Fund was comprised of actively managed exchange-traded funds, which included the Fund and five other core plus bond funds. The Board noted that the Management Rate for the Fund and its actual total expense ratio were above the medians of its Expense Group. The Board also noted that the Fund’s actual total expense ratio reflected an expense cap on operating expenses. The Board further noted that the Fund has a Unified Fee and the terms of the Unified Fee Arrangement. The Board also noted that each of Western Asset LLC, Western Asset Limited, Western Asset Pte. Ltd. and Western Asset Ltd is paid by LMPFA out of the Unified Fee LMPFA receives from the Fund and that the allocation of the fee between LMPFA and each of Western Asset LLC, Western Asset Limited, Western Asset Pte. Ltd. and Western Asset Ltd reflected the services provided by each to the Fund. After consideration of the above, the Board concluded that the Management Rate charged to the Fund and the sub-advisory fee paid to each of Western Asset LLC, Western Asset Limited, Western Asset Pte. Ltd. and Western Asset Ltd are reasonable.
Profitability
The Board reviewed and considered information regarding the profits realized by each Manager and its affiliates in connection with the operation of each Fund. In this respect, the Board considered the Fund profitability analysis that addresses the overall profitability of FT’s US fund business, as well as its profits in providing investment management and other services to each of the individual funds during the 12-month period ended September 30, 2021, being the most recent fiscal year-end for FRI. The Board noted that although management continually makes refinements to its methodologies used in calculating profitability in response to organizational and product-related changes, the overall methodology has remained consistent with that used in the Funds’ profitability report presentations from prior years. The Board also noted that PricewaterhouseCoopers LLP, auditor to FRI and certain FT funds, has been engaged to periodically review and assess the allocation methodologies to be used solely by the Funds’ Board with respect to the profitability analysis.
The Board noted management’s belief that costs incurred in establishing the infrastructure necessary for the type of fund operations conducted by each Manager and its affiliates may not be fully reflected in the expenses allocated to each Fund in determining its profitability, as well as the fact that the level of profits, to a certain extent, reflected operational cost savings and efficiencies initiated by management. As part of this evaluation, the Board considered management’s outsourcing of certain operations, which effort has required considerable up-front expenditures but, over the long run, is expected to result in greater efficiencies. The Board also noted management’s expenditures in improving shareholder services provided to the Funds, as well as the need to implement systems and meet additional regulatory and compliance requirements resulting from recent US Securities and Exchange Commission and other regulatory requirements.
The Board also considered the extent to which each Manager and its affiliates might derive ancillary benefits from fund operations, including potential benefits resulting from personnel and systems enhancements necessitated by fund growth, as well as increased leverage with service providers and counterparties. Based upon its consideration of all these factors, the Board concluded that the level of profits realized by each Manager and its affiliates from providing services to each Fund was not excessive in view of the nature, extent and quality of services provided to each Fund.
Economies of Scale
The Board reviewed and considered the extent to which each Manager may realize economies of scale, if any, as each Fund grows larger and whether each Fund’s management fee structure reflects any economies of scale for the benefit of shareholders. The Board considered that each Fund would likely experience benefits from the Unified Fee at the Fund’s projected asset levels because of LMPFA’s contractual requirement to bear most of the Fund’s ordinary operating expenses. The Board noted that, under the Unified Fee, it is not anticipated that any of the Funds will generate significant, if any, profit for LMPFA and/or its affiliates for some time. The Board considered management’s view that any analyses of potential
| Western Asset ETFs | 63 |
Table of Contents
Board approval of management and subadvisory agreements (unaudited) (cont’d)
economies of scale in managing a particular fund are inherently limited in light of the joint and common costs and investments each Manager incurs across the FT family of funds as a whole. The Board noted that, as of December 31, 2021, the Funds’ net assets were less than $130 million. The Board recognized that there would not likely be any economies of scale for a Fund until the Fund’s assets grow.
Conclusion
Based on its review, consideration and evaluation of all factors it believed relevant, including the above-described factors and conclusions, the Board unanimously approved the continuation of each Management Agreement for an additional one-year period.
| 64 | Western Asset ETFs |
Table of Contents
Statement regarding liquidity risk management program (unaudited)
Each Fund has adopted and implemented a written Liquidity Risk Management Program (the “LRMP”) as required by Rule 22e-4 under the Investment Company Act of 1940 (the “Liquidity Rule”). The LRMP for the Franklin Templeton and Legg Mason Funds is designed to assess and manage each Fund’s liquidity risk, which is defined as the risk that the Fund could not meet requests to redeem shares issued by the Fund without significant dilution of remaining investors’ interests in the Fund. In accordance with the Liquidity Rule, the LRMP includes policies and procedures that provide for: (1) assessment, management, and review (no less frequently than annually) of each Fund’s liquidity risk; (2) classification of each Fund’s portfolio holdings into one of four liquidity categories (Highly Liquid, Moderately Liquid, Less Liquid, and Illiquid); (3) for Funds that do not primarily hold assets that are Highly Liquid, establishing and maintaining a minimum percentage of the Fund’s net assets in Highly Liquid investments (called a “Highly Liquid Investment Minimum” or “HLIM”); and (4) prohibiting the Fund’s acquisition of Illiquid investments that would result in the Fund holding more than 15% of its net assets in Illiquid assets. The LRMP also requires reporting to the Securities and Exchange Commission (“SEC”) (on a non-public basis) and to the Board if the Fund’s holdings of Illiquid assets exceed 15% of the Fund’s net assets. Funds with HLIMs must have procedures for addressing HLIM shortfalls, including reporting to the Board and, with respect to HLIM shortfalls lasting more than seven consecutive calendar days, reporting to the SEC (on a non-public basis).
The Director of Liquidity Risk within the Investment Risk Management Group (the “IRMG”) is the appointed Administrator of the LRMP. The IRMG maintains the Investment Liquidity Committee (the “ILC”) to provide oversight and administration of policies and procedures governing liquidity risk management for Franklin Templeton and Legg Mason products and portfolios. The ILC includes representatives from Franklin Templeton’s Risk, Trading, Global Compliance, Legal, Investment Compliance, Investment Operations, Valuation Committee, Product Management and Global Product Strategy.
In assessing and managing each Fund’s liquidity risk, the ILC considers, as relevant, a variety of factors, including the Fund’s investment strategy and the liquidity of its portfolio investments during both normal and reasonably foreseeable stressed conditions; its short and long-term cash flow projections; and its cash holdings and access to other funding sources including the Funds’ interfund lending facility and line of credit. Classification of the Fund’s portfolio holdings in the four liquidity categories is based on the number of days it is reasonably expected to take to convert the investment to cash (for Highly Liquid and Moderately Liquid holdings) or sell or dispose of the investment (for Less Liquid and Illiquid investments), in current market conditions without significantly changing the investment’s market value.
Each Fund primarily holds liquid assets that are defined under the Liquidity Rule as “Highly Liquid Investments,” and therefore is not required to establish an HLIM. Highly Liquid Investments are defined as cash and any investment reasonably expected to be convertible to cash in current market conditions in three business days or less without the conversion to cash significantly changing the market value of the investment.
At meetings of the Funds’ Board of Trustees/Directors held in May 2022, the Program Administrator provided a written report to the Board addressing the adequacy and effectiveness of the program for the year ended December 31, 2021. The Program Administrator report concluded that (i.) the LRMP, as adopted and implemented, remains reasonably designed to assess and manage each Fund’s liquidity risk; (ii.) the LRMP, including the Highly Liquid Investment Minimum (“HLIM”) where applicable, was implemented and operated effectively to achieve the goal of assessing and managing each Fund’s liquidity risk; and (iii.) each Fund was able to meet requests for redemption without significant dilution of remaining investors’ interests in the Fund.
| Western Asset ETFs | 65 |
Table of Contents
Western Asset ETFs
Trustees
Rohit Bhagat
Deborah D. McWhinney
Anantha K. Pradeep
Jennifer M. Johnson
Chair
Investment manager
Legg Mason Partners Fund Advisor, LLC
Subadvisers
Western Asset Management Company, LLC
Western Asset Management Company Limited Western Asset Management Company Ltd.
Western Asset Management Company Pte. Ltd.
Custodian
The Bank of New York Mellon
Transfer agent
The Bank of New York Mellon
240 Greenwich Street
New York, NY 10286
Independent registered public accounting firm
PricewaterhouseCoopers LLP
Baltimore, MD
Western Asset ETFs
Western Asset Short Duration Income ETF
Western Asset Total Return ETF
The Funds are separate investment series of Legg Mason ETF Investment Trust, a Maryland statutory trust.
Western Asset ETFs
Legg Mason Funds
620 Eighth Avenue, 47th Floor
New York, NY 10018
The Funds file their complete schedule of portfolio holdings with the Securities and Exchange Commission (“SEC”) for the first and third quarters of each fiscal year as an exhibit to their reports on Form N-PORT. The Funds’ Forms N-PORT are available on the SEC’s website at www.sec.gov. To obtain information on Form N-PORT, shareholders can call the Funds at 1-877-721-1926.
Information on how the Funds voted proxies relating to portfolio securities during the prior 12-month period ended June 30th of each year and a description of the policies and procedures that the Funds use to determine how to vote proxies related to portfolio transactions are available (1) without charge, upon request, by calling the Funds at 1-877-721-1926, (2) at www.franklintempleton.com and (3) on the SEC’s website at www.sec.gov.
This report is submitted for the general information of the shareholders of Western Asset Short Duration Income ETF and Western Asset Total Return ETF. This report is not authorized for distribution to prospective investors in the Funds unless preceded or accompanied by a current prospectus.
Investors should consider each Fund’s investment objectives, risks, charges and expenses carefully before investing. Each prospectus contains this and other important information about the Funds. Please read the prospectuses carefully before investing.
www.franklintempleton.com
© 2022 Franklin Distributors, LLC, Member FINRA/SIPC. All rights reserved.
Table of Contents
www.franklintempleton.com
© 2022 Franklin Distributors, LLC, Member FINRA/SIPC. All rights reserved.
WAETF S 11/22 SR22-4537
Table of Contents
| ITEM 2. | CODE OF ETHICS. | |
| Not applicable. | ||
| ITEM 3. | AUDIT COMMITTEE FINANCIAL EXPERT. | |
| Not applicable. | ||
| ITEM 4. | PRINCIPAL ACCOUNTANT FEES AND SERVICES. | |
| Not applicable. | ||
| ITEM 5. | AUDIT COMMITTEE OF LISTED REGISTRANTS. | |
| Not applicable. | ||
| ITEM 6. | SCHEDULE OF INVESTMENTS. | |
| Included herein under Item 1. | ||
| ITEM 7. | DISCLOSURE OF PROXY VOTING POLICIES AND PROCEDURES FOR CLOSED-END MANAGEMENT INVESTMENT COMPANIES. | |
| Not applicable. | ||
| ITEM 8. | PORTFOLIO MANAGERS OF CLOSED-END MANAGEMENT INVESTMENT COMPANIES. | |
| Not applicable. | ||
| ITEM 9. | PURCHASES OF EQUITY SECURITIES BY CLOSED-END MANAGEMENT INVESTMENT COMPANY AND AFFILIATED PURCHASERS. | |
| Not applicable. | ||
| ITEM 10. | SUBMISSION OF MATTERS TO A VOTE OF SECURITY HOLDERS. | |
| Not applicable. | ||
| ITEM 11. | CONTROLS AND PROCEDURES. | |
(a) The registrant’s principal executive officer and principal financial officer have concluded that the registrant’s disclosure controls and procedures (as defined in Rule 30a- 3(c) under the Investment Company Act of 1940, as amended (the “1940 Act”)) are effective as of a date within 90 days of the filing date of this report that includes the disclosure required by this paragraph, based on their evaluation of the disclosure controls and procedures required by Rule 30a-3(b) under the 1940 Act and 15d-15(b) under the Securities Exchange Act of 1934. | ||
(b) There were no changes in the registrant’s internal control over financial reporting (as defined in Rule 30a-3(d) under the 1940 Act) that occurred during the second fiscal quarter of the period covered by this report that have materially affected, or are likely to materially affect the registrant’s internal control over financial reporting. | ||
| ITEM 12. | DISCLOSURE OF SECURITIES LENDING ACTIVITIES FOR CLOSED-END MANAGEMENT INVESTMENT COMPANIES. | |
| Not applicable. | ||
Table of Contents
| ITEM 13. | EXHIBITS. | |
| (a) (1) Code of Ethics attached hereto. | ||
| Exhibit 99.CODE ETH | ||
| (a) (2) Certifications pursuant to section 302 of the Sarbanes-Oxley Act of 2002 attached hereto. | ||
| Exhibit 99.CERT | ||
| (b) Certifications pursuant to Section 906 of the Sarbanes-Oxley Act of 2002 attached hereto. | ||
| Exhibit 99.906CERT | ||
Table of Contents
SIGNATURES
Pursuant to the requirements of the Securities Exchange Act of 1934 and the Investment Company Act of 1940, the registrant has duly caused this Report to be signed on its behalf by the undersigned, there unto duly authorized.
Legg Mason ETF Investment Trust
| By: | /s/ Matthew T. Hinkle | |
| Matthew T. Hinkle | ||
| Chief Executive Officer | ||
| Date: | November 23, 2022 | |
Pursuant to the requirements of the Securities Exchange Act of 1934 and the Investment Company Act of 1940, this report has been signed below by the following persons on behalf of the registrant and in the capacities and on the dates indicated.
| By: | /s/ Matthew T. Hinkle | |
| Matthew T. Hinkle | ||
| Chief Executive Officer | ||
| Date: | November 23, 2022 | |
| By: | /s/ Vivek Pai | |
| Vivek Pai | ||
| Principal Financial Officer | ||
| Date: | November 23, 2022 | |