UNITED STATES
SECURITIES AND EXCHANGE COMMISSION
Washington, D.C. 20549
SECURITIES AND EXCHANGE COMMISSION
Washington, D.C. 20549
FORM N-CSR
CERTIFIED SHAREHOLDER REPORT OF REGISTERED
MANAGEMENT INVESTMENT COMPANIES
Investment Company Act file number 811-23084
Series Portfolios Trust
(Exact name of registrant as specified in charter)
(Exact name of registrant as specified in charter)
615 East Michigan Street
Milwaukee, WI 53202
(Address of principal executive offices) (Zip code)
(Address of principal executive offices) (Zip code)
Ryan Roell, President
Series Portfolios Trust
c/o U.S. Bancorp Fund Services, LLC
777 East Wisconsin Ave, 5th Fl
Milwaukee, WI 53202
(Name and address of agent for service)
(Name and address of agent for service)
(414) 516-1709
Registrant's telephone number, including area code
Date of fiscal year end: October 31, 2022
Date of reporting period: October 31, 2022
Item 1. Report to Stockholders.
| (a) |
Weiss Alternative Multi-Strategy Fund
Class K – weisx
Investor Class – weizx
Annual Report
October 31, 2022
WEISS ALTERNATIVE MULTI-STRATEGY FUND
Dear Shareholders:
The Weiss Alternative Multi-Strategy Fund (the “Fund” or “WEISX”) was launched on December 1, 2015 in response to investors’ search for a daily liquid, actively managed, multi-alternative strategy. The Fund seeks to provide returns with moderate volatility, lower drawdowns, and reduced correlation to the overall performance of bond and equity markets. The Fund employs a risk-controlled approach to liquid and diversified strategies. The Fund seeks to generate its return from three sources:
| (1) | Core Market Neutral: Employs approximately 20 industry-focused, differentiated strategies and aims to generate performance through security price dispersion instead of market direction. | |
| (2) | Growth: A pro-cyclical strategy typically offering exposure to the US equity markets. | |
| (3) | Defensive: Income-generating strategy created to provide high liquidity and capital preservation, typically offering exposure to US treasuries and corporate credit. |
In the trailing 3-month period (Aug 01, 2022 – Oct 31, 2022), WEISX returned -7.57% net of fees while its benchmark, the Bloomberg US Corporate Bond Index returned -8.98%.
Overall portfolio annualized volatility for the trailing 3 months was 14.42%.
For the trailing 1-year, WEISX returned -18.99% net on 11.76% volatility. Over the same time-period, the Bloomberg U.S. Corporate Bond Index benchmark returned -19.57% on 8.50% volatility.
In the trailing 3-month period, the Core Market Neutral strategy returned 2.63% gross, the Growth strategy returned -5.13% gross, and the Defensive strategy returned -9.68% gross. The current month end gross exposure weights across the three strategies are as follows: Core Market Neutral 47.48%, Defensive 37.14%, and Growth 15.37%.
WEISX illustrated its effort to minimize volatility and mitigate downside risk during periods of increased financial market instability. The Core Market Neutral strategy continued to contribute a return stream with low levels of correlation to other asset classes which complemented the pro-cyclical Growth sleeve and the Defensive sleeve.
Sincerely,
/s/ Weiss Portfolio Managers
1
WEISS ALTERNATIVE MULTI-STRATEGY FUND
Performance data quoted represents past performance; past performance does not guarantee future results.
The Bloomberg U.S. Corporate Bond Index measures the investment grade, fixed-rate, taxable corporate bond market. It includes USD denominated securities publicly issued by U.S. and non-U.S. industrial, utility and financial issuers.
Gross performance is shown for illustrative purposes only and does not reflect the fees and expenses of an investment in the Fund.
Volatility/Standard Deviation is defined as a quantity calculated to indicate the extent of deviation for a group as a whole.
Correlation is a statistical measure of the degree to which the movements of two variables (stock/option/convertible prices or returns) are related.
Opinions expressed are subject to change at any time, are not guaranteed and should not be considered investment advice.
Diversification does not assure a profit nor protect against loss in a declining market.
Mutual fund investing involves risk. Principal loss is possible. Derivatives involve special risks including correlation, counterparty, liquidity, operational, accounting and tax risks. These risks, in certain cases, may be greater than the risks presented by more traditional investments. The Fund may also use options and future contracts, which have the risks of unlimited losses of the underlying holdings due to unanticipated market movements and failure to correctly predict the direction of securities prices, interest rates and currency exchange rates. The investment in options is not suitable for all investors. The Fund invests in foreign securities which involve greater volatility and political, economic and currency risks and differences in accounting methods. These risks are greater in emerging markets. Investment by the Fund in lower-rated and non-rated securities presents a greater risk of loss to principal and interest than higher-rated securities. The Fund may use leverage which may exaggerate the effect of any increase or decrease in the value of portfolio securities or the Net Asset Value (“NAV”) of the Fund, and money borrowed will be subject to interest costs. Small- and Medium-capitalization companies tend to have limited liquidity and greater price volatility than large-capitalization companies. Investing in ETFs are subject to additional risks that do not apply to conventional mutual funds, including the risks that the market price of the shares may trade at a discount to its NAV, an active secondary trading market may not develop or be maintained, or trading may be halted by the exchange in which they trade, which may impact the Fund’s ability to sell its shares. The Fund may make short sales of securities, which involves the risk that losses may exceed the original amount invested.
Must be preceded or accompanied by a prospectus.
The Weiss Alternative Multi-Strategy Fund is distributed by Quasar Distributors, LLC.
2
WEISS ALTERNATIVE MULTI-STRATEGY FUND
Value of $20,000 Investment (Unaudited)
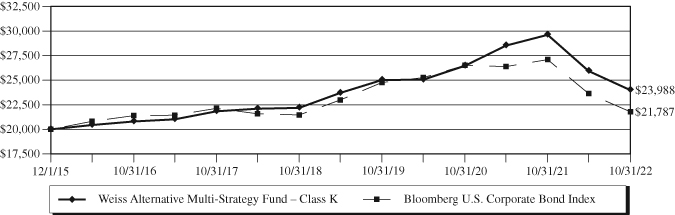
The chart assumes an initial investment of $20,000. Performance reflects waivers of fees and operating expenses in effect. In the absence of such waivers, total return would be reduced. Past performance is not predictive of future performance. Investment return and principal value will fluctuate, so that your shares, when redeemed, may be worth more or less than their original cost. Performance assumes the reinvestment of capital gains and income distributions. The performance does not reflect the deduction of taxes that a shareholder would pay on Fund distributions or the redemption of Fund shares. Current performance of the Fund may be lower or higher than the performance quoted. Performance data current to the most recent month end may be obtained by visiting www.weissfunds.com or calling 1-866-530-2690.
Rates of Return (%) – As of October 31, 2022
One Year | Five Year | Since Inception(1)(2) | |
| Class K | -18.99% | 1.90% | 2.66% |
Bloomberg U.S. Corporate Bond Index(3) | -19.57% | -0.32% | 1.24% |
| Investor Class | -19.26% | 1.54% | 2.15% |
Bloomberg U.S. Corporate Bond Index(3) | -19.57% | -0.32% | 0.43% |
(1) | Inception Date of Class K was December 1, 2015. |
(2) | Inception Date of Investor Class was February 28, 2017. |
(3) | The Bloomberg Barclays U.S. Corporate Bond Index measures the investment grade, fixed-rate, taxable corporate bond market. It includes USD-denominated securities publicly issued by U.S. and non-U.S. industrial, utility and financial issuers. The securities that comprise the Bloomberg U.S. Corporate Bond Index may differ substantially from the securities in the Fund’s portfolio. It is not possible to directly invest in an index. |
The returns reflect the actual performance for each period and do not include the impact of trades executed on the last business day of the period that were recorded on the first business day of the next period.
3
WEISS ALTERNATIVE MULTI-STRATEGY FUND
The Fund’s gross expense ratio is 3.59% and the net expense ratio is 2.92% (as of the most recent prospectus dated February 28, 2022). The expense ratios stated here may differ from that of the expense ratios provided in the Fund’s financial highlights herewithin due to the timing of financial information and the inclusion of acquired fund fees and expenses (“AFFE”) in the prospectus only. The Fund’s investment advisor has contractually agreed to waive a portion or all of its management fees and reimburse Fund expenses (excluding Rule 12b-1 fees, shareholder servicing fees, acquired fund fees and expenses, front-end or contingent deferred sales loads, swap fees and expenses, dividends and interest on short positions, taxes, leverage interest, brokerage fees (including commissions, mark-ups and mark-downs), annual account fees for margin accounts, expenses incurred in connection with any merger or reorganization, or extraordinary expenses such as litigation) in order to limit the Total Annual Fund Operating Expenses to 1.50% of the average daily net assets of the Fund or by the Fund’s investment advisor through at least February 28, 2023. The advisor may request recoupment of previously waived fees and reimbursed expenses from the Fund for three years from the date they were waived or reimbursed, provided that after payment of the recoupment, the Total Annual Fund Operating Expenses do not exceed the lesser of the Expense Cap: (i) in effect at the time of the waiver or reimbursement; or (ii) in effect at the time of recoupment.
4
WEISS ALTERNATIVE MULTI-STRATEGY FUND
Expense Example (Unaudited)
October 31, 2022
As a shareholder of the Fund, you incur two types of costs: (1) transaction costs, and (2) ongoing costs, including management fees and other Fund specific expenses. The expense example is intended to help the shareholder understand ongoing costs (in dollars) of investing in the Fund and to compare these costs with the ongoing costs of investing in other mutual funds. The example is based on an investment of $1,000 invested at the beginning of the period and held for the most recent six-month period.
The Actual Expenses comparison provides information about actual account values and actual expenses. A shareholder may use the information in this line, together with the amount invested, to estimate the expenses paid over the period. A shareholder may divide his/her account value by $1,000 (e.g., an $8,600 account value divided by $1,000 = 8.6), then multiply the result by the number in the first line under the heading entitled “Expenses Paid During Period” to estimate the expenses paid on his/her account during this period.
The Hypothetical Example for Comparison Purposes provides information about hypothetical account values and hypothetical expenses based on each Fund’s actual expense ratio and an assumed rate of return of 5% per year before expenses, which is not the Fund’s actual return. The hypothetical account values and expenses may not be used to estimate the actual ending account balance or expenses paid for the period. A shareholder may use this information to compare the ongoing costs of investing in the Fund and other funds. To do so, a shareholder would compare this 5% hypothetical example with the 5% hypothetical examples that appear in the shareholder reports of other funds.
The expenses shown in the table are meant to highlight your ongoing costs only and do not reflect any transactional costs, such as sales charges (loads), redemptions fees or exchange fees. Therefore, the Hypothetical Example for Comparisons Purposes is useful in comparing ongoing costs only and will not help to determine the relevant total costs of owning different funds. In addition, if these transactional costs were included, shareholder costs would have been higher.
| Expenses Paid | ||||
| Annualized Net | Beginning | Ending | During Period(1) | |
| Expense Ratio | Account Value | Account Value | (05/01/2022 to | |
(10/31/2022) | (05/01/2022) | (10/31/2022) | 10/31/2022) | |
Class K Actual(2)(3) | 2.79% | $1,000.00 | $ 925.30 | $13.54 |
| Class K Hypothetical | ||||
(5% annual return before expenses)(4) | 2.79% | $1,000.00 | $1,011.14 | $14.14 |
Investor Class Actual(2)(3) | 3.14% | $1,000.00 | $ 923.00 | $15.22 |
| Investor Class Hypothetical | ||||
(5% annual return before expenses)(4) | 3.14% | $1,000.00 | $1,009.38 | $15.90 |
(1) | Expenses are equal to the Fund’s annualized expense ratio for the period multiplied by the average account value over the period, multiplied by 184/365 to reflect its six-month period. |
(2) | Based on the actual returns for the period from May 1, 2022 through October 31, 2022, of -7.47% and -7.70% for Class K and Investor Class, respectively. |
(3) | Excluding dividends on short positions and borrowing expense, your actual cost of investing in Class K and Investor Class would be $7.28 and $8.97, respectively. |
(4) | Excluding dividends on short positions and borrowing expense, your hypothetical cost of investing in Class K and Investor Class would be $7.63 and $9.40, respectively. |
5
WEISS ALTERNATIVE MULTI-STRATEGY FUND
Allocation of Portfolio (Unaudited)
October 31, 2022
LONG INVESTMENTS(1)(2)

(1) | Data expressed as a percentage of common stocks, exchange traded funds, contingent value rights, escrow notes, warrants, purchased options, money market fund, long swap contracts, and long futures contracts as of October 31, 2022. Data expressed excludes securities sold short, written options, short swap contracts, short futures contracts and other assets in excess of liabilities. Please refer to the Schedule of Investments, Schedule of Written Options, Schedule of Open Swap Contracts, and Schedule of Open Futures Contracts for more details on the Fund’s individual holdings. |
(2) | The value of option, swap, forward currency contracts and futures contracts are expressed as notional and not market value. |
6
WEISS ALTERNATIVE MULTI-STRATEGY FUND
Allocation of Portfolio (Unaudited)
October 31, 2022
SHORT INVESTMENTS(3)(4)

(3) | Data expressed as a percentage of short common stocks, short exchange traded funds, written options, and short swap contracts, as of October 31, 2022. Data expressed excludes long investments, long swap contracts, long futures contracts and other assets in excess of liabilities. Please refer to the Schedule of Investments, Schedule of Written Options and Schedule of Open Swap Contracts for more details on the Fund’s individual holdings. |
(4) | The value of option and swap contracts are expressed as notional and not market value. |
7
WEISS ALTERNATIVE MULTI-STRATEGY FUND
Schedule of Investments
October 31, 2022
| Shares | Value | |||||||
| COMMON STOCKS – 37.81% | ||||||||
| Aerospace & Defense – 0.17% | ||||||||
The Boeing Company (a) | 272 | $ | 38,763 | |||||
Bombardier, Inc., Class B (a)(b) | 7,499 | 220,233 | ||||||
General Dynamics Corporation | 382 | 95,424 | ||||||
TransDigm Group, Inc. | 127 | 73,121 | ||||||
427,541 | ||||||||
| Air Freight & Logistics – 0.60% | ||||||||
Atlas Air Worldwide Holdings, Inc. (a) | 7 | 708 | ||||||
C.H. Robinson Worldwide, Inc. | 136 | 13,290 | ||||||
DSV A/S (b) | 514 | 69,456 | ||||||
FedEx Corporation | 4,738 | 759,407 | ||||||
Forward Air Corporation | 5,511 | 583,449 | ||||||
GXO Logistics, Inc. (a) | 2,839 | 103,737 | ||||||
1,530,047 | ||||||||
| Airlines – 0.44% | ||||||||
Allegiant Travel Company (a) | 1,103 | 82,780 | ||||||
Copa Holdings S.A., Class A (a)(b) | 1,751 | 131,728 | ||||||
Delta Air Lines, Inc. (a) | 1,605 | 54,458 | ||||||
Southwest Airlines Company (a) | 11,466 | 416,789 | ||||||
United Airlines Holdings, Inc. (a) | 9,787 | 421,624 | ||||||
1,107,379 | ||||||||
| Auto Components – 0.16% | ||||||||
Aptiv plc (a)(b) | 1,646 | 149,901 | ||||||
Autoliv, Inc. | 1,057 | 84,930 | ||||||
Luminar Technologies, Inc. (a) | 13,324 | 107,791 | ||||||
Tenneco, Inc., Class A (a) | 3,275 | 64,518 | ||||||
407,140 | ||||||||
| Automobiles – 0.37% | ||||||||
Daimler AG (b) | 1,356 | 78,487 | ||||||
General Motors Company | 21,340 | 837,595 | ||||||
Tesla Motors, Inc. (a) | 157 | 35,724 | ||||||
951,806 | ||||||||
| Banks – 2.11% | ||||||||
Bank of America Corporation | 5,386 | 194,111 | ||||||
Banner Corporation | 2,354 | 175,962 | ||||||
BOK Financial Corporation | 1,146 | 126,278 | ||||||
Cadence Bank | 4,486 | 124,038 | ||||||
Citizens Financial Group, Inc. | 8,751 | 357,916 | ||||||
Columbia Banking System, Inc. | 5,487 | 183,650 | ||||||
The accompanying notes are an integral part of these financial statements.
8
WEISS ALTERNATIVE MULTI-STRATEGY FUND
Schedule of Investments – Continued
October 31, 2022
| Shares | Value | |||||||
| Banks – 2.11% (Continued) | ||||||||
Fifth Third Bancorporation | 6,826 | $ | 243,620 | |||||
First Horizon National Corporation | 23,655 | 579,784 | ||||||
FNB Corporation | 4,120 | 59,534 | ||||||
Hancock Holding Company | 1,075 | 60,060 | ||||||
KeyCorporation | 17,062 | 304,898 | ||||||
M&T Bank Corporation | 2,528 | 425,639 | ||||||
Old National Bancorp | 9,212 | 180,187 | ||||||
Pinnacle Financial Partners, Inc. | 2,992 | 248,306 | ||||||
Renasant Corporation | 1,633 | 65,924 | ||||||
Signature Bank | 1,877 | 297,561 | ||||||
Synovus Financial Corporation | 5,985 | 238,502 | ||||||
Texas Capital Bancshares, Inc. (a) | 6,036 | 362,160 | ||||||
Umpqua Holdings Corporation | 2,162 | 42,981 | ||||||
Webster Financial Corporation | 4,411 | 239,341 | ||||||
Wells Fargo & Company | 10,453 | 480,733 | ||||||
Wintrust Financial Corporation | 3,945 | 369,331 | ||||||
5,360,516 | ||||||||
| Beverages – 0.22% | ||||||||
Celsius Holdings, Inc. (a) | 407 | 37,070 | ||||||
Constellation Brands, Inc., Class A | 740 | 182,839 | ||||||
Monster Beverage Corporation (a) | 1,508 | 141,330 | ||||||
PepsiCo, Inc. | 1,035 | 187,935 | ||||||
549,174 | ||||||||
| Biotechnology – 0.72% | ||||||||
AbbVie, Inc. | 1,510 | 221,064 | ||||||
Albireo Pharma, Inc. (a) | 958 | 19,658 | ||||||
Aldeyra Therapeutics, Inc. (a) | 2,013 | 10,991 | ||||||
Alnylam Pharmaceuticals, Inc. (a) | 290 | 60,105 | ||||||
Altimmune, Inc. (a) | 870 | 10,910 | ||||||
Amgen, Inc. | 399 | 107,870 | ||||||
Apellis Pharmaceuticals, Inc. (a) | 315 | 19,054 | ||||||
Argenx S.E. – ADR (a)(b) | 393 | 152,457 | ||||||
Aurinia Pharmaceuticals, Inc. – ADR (a)(b) | 475 | 3,862 | ||||||
Autolus Therapeutics plc – ADR (a)(b) | 353 | 1,006 | ||||||
BeiGene Ltd. – ADR (a)(b) | 163 | 27,529 | ||||||
BELLUS Health, Inc. (a)(b) | 801 | 7,417 | ||||||
Biogen, Inc. (a) | 410 | 116,210 | ||||||
BioMarin Pharmaceutical, Inc. (a) | 1,209 | 104,736 | ||||||
BioNTech SE – ADR (b) | 106 | 14,590 | ||||||
Dynavax Technologies Corporation (a) | 385 | 4,408 | ||||||
The accompanying notes are an integral part of these financial statements.
9
WEISS ALTERNATIVE MULTI-STRATEGY FUND
Schedule of Investments – Continued
October 31, 2022
| Shares | Value | |||||||
| Biotechnology – 0.72% (Continued) | ||||||||
Eiger BioPharmaceuticals, Inc. (a) | 2,649 | $ | 13,536 | |||||
Exact Sciences Corporation (a) | 1,608 | 55,926 | ||||||
Exelixis, Inc. (a) | 2,454 | 40,687 | ||||||
FibroGen, Inc. (a) | 69 | 1,123 | ||||||
Gilead Sciences, Inc. | 1,551 | 121,691 | ||||||
Heron Therapeutics, Inc. (a) | 4,377 | 16,851 | ||||||
Horizon Therapeutics plc (a)(b) | 390 | 24,305 | ||||||
Incyte Corporation (a) | 625 | 46,463 | ||||||
Insmed, Inc. (a) | 3,293 | 57,035 | ||||||
Karyopharm Therapeutics, Inc. (a) | 655 | 3,118 | ||||||
Merus N.V. (a)(b) | 282 | 5,781 | ||||||
Moderna, Inc. (a) | 477 | 71,707 | ||||||
Natera, Inc. (a) | 271 | 12,726 | ||||||
Prometheus Biosciences, Inc. (a) | 28 | 1,471 | ||||||
Regeneron Pharmaceuticals, Inc. (a) | 27 | 20,216 | ||||||
Rigel Pharmaceuticals, Inc. (a) | 4,095 | 2,984 | ||||||
Sage Therapeutics, Inc. (a) | 95 | 3,578 | ||||||
Seagen, Inc. (a) | 1,310 | 166,580 | ||||||
Travere Therapeutics, Inc. (a) | 2,992 | 64,867 | ||||||
United Therapeutics Corporation (a) | 133 | 30,660 | ||||||
Vertex Pharmaceuticals, Inc. (a) | 514 | 160,368 | ||||||
Viridian Therapeutics, Inc. (a) | 1,861 | 37,034 | ||||||
1,840,574 | ||||||||
| Building Products – 0.07% | ||||||||
Fortune Brands Home & Security, Inc. | 415 | 25,033 | ||||||
Johnson Controls International plc (b) | 795 | 45,983 | ||||||
Lennox International, Inc. | 113 | 26,393 | ||||||
Trane Technologies plc (b) | 511 | 81,571 | ||||||
178,980 | ||||||||
| Capital Markets – 0.83% | ||||||||
Affiliated Managers Group, Inc. | 1,479 | 183,633 | ||||||
The Bank New York Mellon Corporation | 7,208 | 303,529 | ||||||
Blue Owl Capital, Inc. | 17,707 | 177,424 | ||||||
The Carlyle Group, Inc. | 6,410 | 181,275 | ||||||
Cowen, Inc., Class A | 2,215 | 85,543 | ||||||
The Goldman Sachs Group, Inc. | 1,047 | 360,702 | ||||||
Interactive Brokers Group, Inc., Class A | 2,267 | 181,700 | ||||||
Robinhood Markets, Inc. (a) | 23,113 | 269,960 | ||||||
State Street Corporation | 4,873 | 360,602 | ||||||
2,104,368 | ||||||||
The accompanying notes are an integral part of these financial statements.
10
WEISS ALTERNATIVE MULTI-STRATEGY FUND
Schedule of Investments – Continued
October 31, 2022
| Shares | Value | |||||||
| Chemicals – 0.19% | ||||||||
Albemarle Corporation | 159 | $ | 44,499 | |||||
CVR Partners LP | 1,172 | 141,812 | ||||||
DuPont de Nemours, Inc. | 2,326 | 133,047 | ||||||
Nutrien Ltd. (b) | 1,070 | 90,415 | ||||||
The Sherwin-Williams Company | 271 | 60,983 | ||||||
Shin-Etsu Chemical Company Ltd. (b) | 118 | 12,264 | ||||||
483,020 | ||||||||
| Commercial Services & Supplies – 0.41% | ||||||||
ACV Auctions, Inc., Class A (a) | 38,557 | 351,640 | ||||||
Driven Brands Holdings, Inc. (a) | 1,630 | 52,127 | ||||||
GFL Environmental, Inc. (b) | 1,625 | 43,859 | ||||||
IAA, Inc. (a) | 15,589 | 591,291 | ||||||
1,038,917 | ||||||||
| Communications Equipment – 1.86% | ||||||||
ADTRAN Holdings, Inc. | 23,536 | 528,619 | ||||||
Arista Networks, Inc. (a) | 511 | 61,759 | ||||||
Calix, Inc. (a) | 2,730 | 201,037 | ||||||
Ciena Corporation (a) | 21,318 | 1,021,132 | ||||||
Cisco Systems, Inc. | 6,992 | 317,647 | ||||||
CommScope Holding Company, Inc. (a) | 136,548 | 1,807,896 | ||||||
F5, Inc. (a)(g) | 1,223 | 174,779 | ||||||
Sierra Wireless, Inc. (a)(b) | 902 | 26,771 | ||||||
Telefonaktiebolaget LM Ericsson – ADR (b) | 105,906 | 589,896 | ||||||
4,729,536 | ||||||||
| Construction & Engineering – 0.09% | ||||||||
MasTec, Inc. (a) | 925 | 71,299 | ||||||
Quanta Services, Inc. | 424 | 60,225 | ||||||
WillScot Mobile Mini Holdings Corporation (a) | 2,432 | 103,433 | ||||||
234,957 | ||||||||
| Construction Materials – 0.06% | ||||||||
Cemex SAB de CV – ADR (a)(b) | 33,854 | 130,677 | ||||||
Vulcan Materials Company | 219 | 35,850 | ||||||
166,527 | ||||||||
| Consumer Finance – 0.36% | ||||||||
American Express Company | 2,048 | 304,025 | ||||||
Discover Financial Services | 4,034 | 421,392 | ||||||
Encore Capital Group, Inc. (a) | 1,215 | 61,868 | ||||||
PRA Group, Inc. (a) | 1,892 | 63,382 | ||||||
SoFi Technologies, Inc. (a) | 10,988 | 59,775 | ||||||
910,442 | ||||||||
The accompanying notes are an integral part of these financial statements.
11
WEISS ALTERNATIVE MULTI-STRATEGY FUND
Schedule of Investments – Continued
October 31, 2022
| Shares | Value | |||||||
| Containers & Packaging – 0.30% | ||||||||
Ardagh Metal Packaging S.A. (b) | 136,194 | $ | 604,701 | |||||
Avery Dennison Corporation | 318 | 53,917 | ||||||
Graphic Packaging Holding Company | 4,137 | 94,986 | ||||||
753,604 | ||||||||
| Diversified Consumer Services – 0.07% | ||||||||
Duolingo, Inc. (a) | 282 | 23,079 | ||||||
European Wax Center, Inc., Class A | 583 | 8,384 | ||||||
New Oriental Education & Technology Group, Inc. – ADR (a)(b) | 5,956 | 141,395 | ||||||
172,858 | ||||||||
| Diversified Financial Services – 0.12% | ||||||||
Apollo Global Management, Inc. | 5,509 | 304,978 | ||||||
| Diversified Telecommunication Services – 0.01% | ||||||||
AT&T, Inc. | 777 | 14,165 | ||||||
| Electric Utilities – 0.02% | ||||||||
NextEra Energy, Inc. | 511 | 39,602 | ||||||
| Electrical Equipment – 0.39% | ||||||||
AMETEK, Inc. | 1,440 | 186,711 | ||||||
Eaton Corporation plc (b) | 1,473 | 221,053 | ||||||
Emerson Electric Company | 3,400 | 294,440 | ||||||
Enovix Corporation (a) | 1,017 | 19,191 | ||||||
Hubbell, Inc. | 185 | 43,934 | ||||||
nVent Electric plc (b) | 614 | 22,411 | ||||||
Regal Rexnord Corporation | 78 | 9,870 | ||||||
Rockwell Automation, Inc. | 421 | 107,481 | ||||||
Vertiv Holdings Company | 5,152 | 73,725 | ||||||
978,816 | ||||||||
| Electronic Equipment, Instruments & Components – 0.41% | ||||||||
Coherent Corporation (a) | 13,687 | 460,020 | ||||||
Fabrinet (a)(b) | 1,996 | 228,343 | ||||||
Hitachi Ltd. (b) | 429 | 19,465 | ||||||
Rogers Corporation (a) | 398 | 93,661 | ||||||
Teledyne Technologies, Inc. (a) | 626 | 249,136 | ||||||
1,050,625 | ||||||||
The accompanying notes are an integral part of these financial statements.
12
WEISS ALTERNATIVE MULTI-STRATEGY FUND
Schedule of Investments – Continued
October 31, 2022
| Shares | Value | |||||||
| Energy Equipment & Services – 0.54% | ||||||||
ChampionX Corporation | 11,257 | $ | 322,175 | |||||
Core Laboratories N.V. (b) | 111 | 2,160 | ||||||
Halliburton Company | 3,767 | 137,194 | ||||||
NexTier Oilfield Solutions, Inc. (a) | 8,190 | 82,555 | ||||||
TechnipFMC plc (a)(b) | 24,388 | 258,269 | ||||||
Tenaris SA – ADR (b) | 12,372 | 388,728 | ||||||
TGS ASA (b) | 4,441 | 60,464 | ||||||
Transocean Ltd. (a)(b) | 30,326 | 111,600 | ||||||
1,363,145 | ||||||||
| Entertainment – 0.47% | ||||||||
Activision Blizzard, Inc. | 2,398 | 174,575 | ||||||
Electronic Arts, Inc. | 144 | 18,138 | ||||||
Netflix, Inc. (a)(g) | 1,033 | 301,512 | ||||||
Take-Two Interactive Software, Inc. (a) | 1,730 | 204,970 | ||||||
The Walt Disney Company (a) | 491 | 52,311 | ||||||
Warner Brothers Discovery, Inc. (a) | 4,286 | 55,718 | ||||||
Warner Music Group Corporation, Class A | 2,943 | 76,577 | ||||||
World Wrestling Entertainment, Inc., Class A | 4,007 | 316,112 | ||||||
1,199,913 | ||||||||
| Food & Staples Retailing – 0.21% | ||||||||
Albertsons Companies, Inc., Class A | 4,365 | 89,526 | ||||||
Performance Food Group Company (a) | 899 | 46,784 | ||||||
US Foods Holding Corporation (a) | 5,132 | 152,728 | ||||||
Walgreens Boots Alliance, Inc. | 3,367 | 122,895 | ||||||
Wal-Mart Stores, Inc. | 844 | 120,127 | ||||||
532,060 | ||||||||
| Food Products – 1.12% | ||||||||
Bunge Ltd. (b) | 3,313 | 326,993 | ||||||
Conagra Brands, Inc. | 13,093 | 480,513 | ||||||
The Hershey Company | 1,288 | 307,536 | ||||||
Hostess Brands, Inc. (a) | 7,674 | 203,207 | ||||||
Ingredion, Inc. | 1,982 | 176,636 | ||||||
The J.M. Smucker Company | 1,223 | 184,257 | ||||||
Kellogg Company | 3,003 | 230,690 | ||||||
The Kraft Heinz Company | 1,710 | 65,784 | ||||||
Mondelez International, Inc., Class A | 1,837 | 112,939 | ||||||
Pilgrim’s Pride Corporation (a) | 2,921 | 67,329 | ||||||
Post Holdings, Inc. (a) | 2,036 | 184,095 | ||||||
The Simply Good Foods Company (a) | 3,864 | 147,991 | ||||||
The accompanying notes are an integral part of these financial statements.
13
WEISS ALTERNATIVE MULTI-STRATEGY FUND
Schedule of Investments – Continued
October 31, 2022
| Shares | Value | |||||||
| Food Products – 1.12% (Continued) | ||||||||
Sovos Brands, Inc. (a) | 5,100 | $ | 70,686 | |||||
TreeHouse Foods, Inc. (a) | 2,678 | 134,543 | ||||||
Utz Brands, Inc. | 8,565 | 138,839 | ||||||
2,832,038 | ||||||||
| Health Care Equipment & Supplies – 0.73% | ||||||||
Abbott Laboratories | 2,468 | 244,184 | ||||||
ABIOMED, Inc. (a) | 368 | 92,765 | ||||||
Baxter International, Inc. | 1,851 | 100,602 | ||||||
Boston Scientific Corporation (a) | 7,408 | 319,359 | ||||||
Cardiovascular Systems, Inc. (a) | 249 | 3,596 | ||||||
CVRx, Inc. (a) | 1,303 | 13,134 | ||||||
DexCom, Inc. (a) | 1,847 | 223,081 | ||||||
Edwards Lifesciences Corporation (a) | 1,612 | 116,757 | ||||||
Haemonetics Corporation (a) | 682 | 57,936 | ||||||
Inari Medical, Inc. (a) | 536 | 41,234 | ||||||
Inmode Ltd. (a)(b) | 776 | 26,632 | ||||||
Inspire Medical Systems, Inc. (a) | 54 | 10,527 | ||||||
Insulet Corporation (a) | 207 | 53,574 | ||||||
Intuitive Surgical, Inc. (a) | 465 | 114,609 | ||||||
Outset Medical, Inc. (a) | 1,010 | 15,695 | ||||||
Penumbra, Inc. (a) | 724 | 124,144 | ||||||
Shockwave Medical, Inc. (a) | 45 | 13,192 | ||||||
STAAR Surgical Company (a) | 271 | 19,206 | ||||||
Stryker Corporation | 376 | 86,194 | ||||||
Tandem Diabetes Care, Inc. (a) | 603 | 33,858 | ||||||
Teleflex, Inc. | 246 | 52,782 | ||||||
Zimmer Biomet Holdings, Inc. | 842 | 95,441 | ||||||
1,858,502 | ||||||||
| Health Care Providers & Services – 0.92% | ||||||||
1Life Healthcare, Inc. (a)(g) | 14,423 | 246,633 | ||||||
Acadia Healthcare Company, Inc. (a) | 591 | 48,048 | ||||||
Amedisys, Inc. (a) | 352 | 34,352 | ||||||
AMN Healthcare Services, Inc. (a) | 437 | 54,843 | ||||||
Anthem, Inc. | 274 | 149,815 | ||||||
Cano Health, Inc. (a) | 2,513 | 8,997 | ||||||
Cardinal Health, Inc. | 800 | 60,720 | ||||||
Centene Corporation (a) | 88 | 7,491 | ||||||
Chemed Corporation | 73 | 34,082 | ||||||
Cigna Corporation | 850 | 274,601 | ||||||
CVS Health Corporation | 322 | 30,493 | ||||||
The accompanying notes are an integral part of these financial statements.
14
WEISS ALTERNATIVE MULTI-STRATEGY FUND
Schedule of Investments – Continued
October 31, 2022
| Shares | Value | |||||||
| Health Care Providers & Services – 0.92% (Continued) | ||||||||
Encompass Health Corporation | 2,134 | $ | 116,175 | |||||
Enhabit, Inc. (a) | 2,654 | 32,963 | ||||||
Fresenius SE & Co KGaA (b) | 1,503 | 34,589 | ||||||
Guardant Health, Inc. (a) | 37 | 1,831 | ||||||
HealthEquity, Inc. (a) | 1,427 | 111,178 | ||||||
Humana, Inc. | 281 | 156,820 | ||||||
Laboratory Corporation of America Holdings | 728 | 161,514 | ||||||
McKesson Corporation | 346 | 134,722 | ||||||
Molina Healthcare, Inc. (a) | 577 | 207,062 | ||||||
Oak Street Health, Inc. (a) | 56 | 1,133 | ||||||
Option Care Health, Inc. (a) | 4,017 | 121,554 | ||||||
The Pennant Group, Inc. (a) | 354 | 4,358 | ||||||
Privia Health Group, Inc. (a) | 377 | 12,622 | ||||||
Quest Diagnostics, Inc. | 190 | 27,294 | ||||||
Signify Health, Inc., Class A (a) | 5,450 | 159,304 | ||||||
Surgery Partners, Inc. (a) | 232 | 6,308 | ||||||
Tenet Healthcare Corporation (a) | 1,228 | 54,474 | ||||||
Universal Health Services, Inc., Class B | 462 | 53,532 | ||||||
2,347,508 | ||||||||
| Health Care Technology – 0.02% | ||||||||
Evolent Health, Inc., Class A (a) | 1,087 | 34,578 | ||||||
Veeva Systems, Inc. (a) | 77 | 12,931 | ||||||
47,509 | ||||||||
| Hotels, Restaurants & Leisure – 2.23% | ||||||||
Airbnb, Inc., Class A (a) | 327 | 34,960 | ||||||
BJ’s Restaurants, Inc. (a) | 3,066 | 100,718 | ||||||
Booking Holdings, Inc. (a) | 58 | 108,430 | ||||||
Boyd Gaming Corporation | 9,627 | 556,056 | ||||||
Carnival Corporation (a)(b) | 18,206 | 164,946 | ||||||
Darden Restaurants, Inc. | 2,171 | 310,757 | ||||||
Domino’s Pizza, Inc. | 241 | 80,070 | ||||||
DraftKings, Inc., Class A (a)(g) | 2,374 | 37,509 | ||||||
Hilton Worldwide Holdings, Inc. (g) | 6,252 | 845,646 | ||||||
Hyatt Hotels Corporation, Class A (a) | 3,082 | 290,355 | ||||||
International Game Technology plc (b) | 640 | 12,832 | ||||||
Jack in the Box, Inc. | 1,988 | 175,401 | ||||||
Las Vegas Sands Corporation (a)(g) | 19,144 | 727,663 | ||||||
Marriott International, Inc., Class A | 203 | 32,502 | ||||||
Marriott Vacations Worldwide Corporation | 104 | 15,367 | ||||||
McDonald’s Corporation (g) | 29 | 7,907 | ||||||
The accompanying notes are an integral part of these financial statements.
15
WEISS ALTERNATIVE MULTI-STRATEGY FUND
Schedule of Investments – Continued
October 31, 2022
| Shares | Value | |||||||
| Hotels, Restaurants & Leisure – 2.23% (Continued) | ||||||||
Melco Crown Entertainment Ltd. – ADR (a)(b)(g) | 17,764 | $ | 97,169 | |||||
MGM Resorts International | 3,276 | 116,527 | ||||||
Norwegian Cruise Line Holdings Ltd. (a)(b) | 15,252 | 257,606 | ||||||
Planet Fitness, Inc., Class A (a) | 1,477 | 96,714 | ||||||
Restaurant Brands International, Inc. (b) | 3,495 | 207,533 | ||||||
Royal Caribbean Cruises Ltd. (a)(b)(g) | 13,433 | 717,054 | ||||||
Sweetgreen, Inc., Class A (a) | 4,641 | 86,323 | ||||||
Travel + Leisure Company | 583 | 22,142 | ||||||
Vail Resorts, Inc. | 655 | 143,530 | ||||||
Wyndham Hotels & Resorts, Inc. | 506 | 38,421 | ||||||
Wynn Resorts Ltd. (a)(g) | 4,654 | 297,391 | ||||||
Yum! Brands, Inc. | 674 | 79,700 | ||||||
5,661,229 | ||||||||
| Household Durables – 0.03% | ||||||||
Meritage Homes Corporation (a) | 517 | 39,375 | ||||||
Sony Group Corporation (b) | 176 | 11,868 | ||||||
TopBuild Corporation (a) | 163 | 27,733 | ||||||
78,976 | ||||||||
| Household Products – 0.28% | ||||||||
The Clorox Company | 698 | 101,936 | ||||||
The Procter & Gamble Company | 4,491 | 604,803 | ||||||
706,739 | ||||||||
| Industrial Conglomerates – 0.51% | ||||||||
General Electric Company | 6,188 | 481,488 | ||||||
Honeywell International, Inc. | 896 | 182,802 | ||||||
Roper Technologies, Inc. | 1,294 | 536,415 | ||||||
Siemens AG, Reg (b) | 855 | 93,374 | ||||||
1,294,079 | ||||||||
| Insurance – 0.09% | ||||||||
International General Insurance Holdings Ltd. (b) | 29,450 | 223,525 | ||||||
Syncora Holdings Ltd. – ADR (a)(b)(f) | 2,808 | 110 | ||||||
223,635 | ||||||||
| Interactive Media & Services – 0.27% | ||||||||
Alphabet, Inc., Class A (a) | 3,185 | 301,014 | ||||||
Alphabet, Inc., Class C (a) | 1 | 95 | ||||||
Bambuser AB (a)(b) | 20,591 | 8,137 | ||||||
IAC, Inc. (a) | 1,339 | 65,183 | ||||||
Match Group, Inc. (a) | 293 | 12,658 | ||||||
The accompanying notes are an integral part of these financial statements.
16
WEISS ALTERNATIVE MULTI-STRATEGY FUND
Schedule of Investments – Continued
October 31, 2022
| Shares | Value | |||||||
| Interactive Media & Services – 0.27% (Continued) | ||||||||
Meta Platforms, Inc., Class A (a)(g) | 1,372 | $ | 127,816 | |||||
Pinterest, Inc. (a) | 984 | 24,206 | ||||||
Vimeo, Inc. (a) | 23,709 | 90,094 | ||||||
ZoomInfo Technologies, Inc. (a) | 1,034 | 46,044 | ||||||
675,247 | ||||||||
| Internet & Direct Marketing Retail – 0.26% | ||||||||
Amazon.com, Inc. (a)(g) | 5,458 | 559,117 | ||||||
Expedia Group, Inc. (a) | 387 | 36,173 | ||||||
Xometry, Inc., Class A (a) | 1,200 | 72,072 | ||||||
667,362 | ||||||||
| Internet Software & Services – 0.05% | ||||||||
Criteo S.A. – ADR (a)(b) | 4,733 | 120,691 | ||||||
| IT Services – 0.77% | ||||||||
Akamai Technologies, Inc. (a) | 1,098 | 96,986 | ||||||
Cloudflare, Inc., Class A (a)(g) | 1,018 | 57,334 | ||||||
DXC Technology Company (a) | 2,925 | 84,094 | ||||||
EPAM Systems, Inc. (a) | 1,410 | 493,500 | ||||||
Evo Payments, Inc. (a) | 1,646 | 55,454 | ||||||
Fujitsu Ltd. (b) | 142 | 16,338 | ||||||
GoDaddy, Inc., Class A (a) | 1,548 | 124,459 | ||||||
LiveRamp Holdings, Inc. (a) | 21,957 | 403,131 | ||||||
MoneyGram International, Inc. (a) | 4,176 | 44,224 | ||||||
Okta, Inc. (a) | 979 | 54,942 | ||||||
PayPal Holdings, Inc. (a) | 1,780 | 148,772 | ||||||
Shopify, Inc., Class A (a)(b) | 431 | 14,753 | ||||||
Snowflake, Inc., Class A (a) | 108 | 17,312 | ||||||
Squarespace, Inc., Class A (a) | 1,866 | 41,444 | ||||||
Switch, Inc., Class A | 6,523 | 222,108 | ||||||
Toast, Inc., Class A (a) | 1,335 | 29,490 | ||||||
Twilio, Inc., Class A (a) | 630 | 46,853 | ||||||
1,951,194 | ||||||||
| Leisure Products – 0.06% | ||||||||
Old PSG Wind-Down Ltd. (a)(b)(f) | 2,127 | 202 | ||||||
Peloton Interactive, Inc., Class A (a)(g) | 2,907 | 24,419 | ||||||
Topgolf Callaway Brands Corporation (a) | 6,333 | 118,554 | ||||||
143,175 | ||||||||
| Life Sciences Tools & Services – 0.29% | ||||||||
Avantor, Inc. (a) | 4,460 | 89,958 | ||||||
Bio-Rad Laboratories, Inc., Class A (a) | 152 | 53,460 | ||||||
The accompanying notes are an integral part of these financial statements.
17
WEISS ALTERNATIVE MULTI-STRATEGY FUND
Schedule of Investments – Continued
October 31, 2022
| Shares | Value | |||||||
| Life Sciences Tools & Services – 0.29% (Continued) | ||||||||
Bruker Corporation | 1,100 | $ | 68,024 | |||||
Charles River Laboratories International, Inc. (a) | 901 | 191,237 | ||||||
IQVIA Holdings, Inc. (a) | 391 | 81,981 | ||||||
Pacific Biosciences of California, Inc. (a) | 1,054 | 8,896 | ||||||
Qiagen N.V. (a)(b) | 4,066 | 177,115 | ||||||
Repligen Corporation (a) | 188 | 34,308 | ||||||
SomaLogic, Inc. (a) | 9,757 | 33,857 | ||||||
Standard BioTools, Inc. (a) | 218 | 257 | ||||||
739,093 | ||||||||
| Machinery – 0.54% | ||||||||
Caterpillar, Inc. | 880 | 190,485 | ||||||
Cummins, Inc. | 185 | 45,234 | ||||||
Deere & Company | 230 | 91,039 | ||||||
Flowserve Corporation | 6,512 | 186,764 | ||||||
Fortive Corporation | 290 | 18,531 | ||||||
Ingersoll Rand, Inc. | 2,127 | 107,414 | ||||||
Komatsu Ltd. (b) | 814 | 15,946 | ||||||
Nikola Corporation (a)(g) | 22,500 | 85,275 | ||||||
PACCAR, Inc. | 569 | 55,096 | ||||||
Parker-Hannifin Corporation | 61 | 17,728 | ||||||
Proto Labs, Inc. (a) | 3,739 | 142,792 | ||||||
The Timken Company | 830 | 59,171 | ||||||
Trinity Industries, Inc. | 12,896 | 367,923 | ||||||
1,383,398 | ||||||||
| Marine – 0.11% | ||||||||
Kirby Corporation (a) | 3,449 | 240,568 | ||||||
Star Bulk Carriers Corporation (b) | 1,700 | 29,614 | ||||||
270,182 | ||||||||
| Media – 0.37% | ||||||||
comScore, Inc. (a) | 245,605 | 297,182 | ||||||
DISH Network Corporation, Class A (a) | 840 | 12,524 | ||||||
Fox Corporation | 322 | 9,296 | ||||||
The Interpublic Group of Companies, Inc. | 7,317 | 217,974 | ||||||
Liberty Media Corp-Liberty SiriusXM, Class A (a) | 1,057 | 44,859 | ||||||
Nexstar Media Group, Inc., Class A | 808 | 138,410 | ||||||
Shaw Communications, Inc., Class B (a)(b) | 923 | 23,706 | ||||||
Shaw Communications, Inc., Class B (b) | 2,705 | 69,492 | ||||||
TEGNA, Inc. | 2,665 | 55,645 | ||||||
The Trade Desk, Inc., Class A (a) | 1,472 | 78,369 | ||||||
947,457 | ||||||||
The accompanying notes are an integral part of these financial statements.
18
WEISS ALTERNATIVE MULTI-STRATEGY FUND
Schedule of Investments – Continued
October 31, 2022
| Shares | Value | |||||||
| Metals & Mining – 0.59% | ||||||||
Agnico Eagle Mines Ltd. (b) | 1,615 | $ | 70,996 | |||||
Alcoa Corporation | 2,045 | 79,816 | ||||||
Capstone Copper Corporation (a)(b) | 14,098 | 32,701 | ||||||
Carpenter Technology Corporation | 9,186 | 343,556 | ||||||
Champion Iron Ltd. (a)(b) – Canadian Stock Exchange | 1 | 3 | ||||||
Champion Iron Ltd. (b) – Australian Stock Exchange | 13,072 | 39,320 | ||||||
Cleveland-Cliffs, Inc. (a) | 24 | 312 | ||||||
ERO Copper Corporation (a)(b) | 4,409 | 50,195 | ||||||
Filo Mining Corporation (a)(b) | 8,848 | 105,993 | ||||||
Ivanhoe Mines Ltd., Class A (a)(b) | 19,330 | 134,083 | ||||||
Lynas Rare Earths Ltd. (a)(b) | 5,518 | 29,432 | ||||||
Mineral Resources Ltd. (b) | 2,845 | 133,379 | ||||||
NGEx Minerals Ltd. (a)(b) | 15,099 | 26,599 | ||||||
Nucor Corporation | 437 | 57,413 | ||||||
Patriot Battery Metals, Inc. (a)(b) | 9,831 | 36,586 | ||||||
Sigma Lithium Corporation (a)(b) | 5,132 | 183,418 | ||||||
Teck Resources Ltd., Class B (b) | 3,369 | 102,552 | ||||||
Turquoise Hill Resources Ltd. (a)(b) | 2,823 | 79,355 | ||||||
Zacapa Resources Ltd. (a)(b) | 1,762 | 194 | ||||||
1,505,903 | ||||||||
| Multiline Retail – 0.10% | ||||||||
Dollar General Corporation | 802 | 204,550 | ||||||
Kohl’s Corporation | 1,337 | 40,043 | ||||||
244,593 | ||||||||
| Multi-Utilities – 0.02% | ||||||||
RWE AG (b) | 1,215 | 46,772 | ||||||
| Oil, Gas & Consumable Fuels – 3.30% | ||||||||
Alliance Resource Partners LP | 13,033 | 316,441 | ||||||
Antero Resources Corporation (a) | 10,499 | 384,893 | ||||||
Cameco Corporation (b) | 4,778 | 113,334 | ||||||
Chesapeake Energy Corporation | 3,361 | 343,729 | ||||||
Chevron Corporation | 1,795 | 324,715 | ||||||
Chord Energy Corporation | 1,262 | 193,200 | ||||||
ConocoPhillips | 5,639 | 711,022 | ||||||
Devon Energy Corporation | 6,545 | 506,256 | ||||||
Diamondback Energy, Inc. | 2,945 | 462,689 | ||||||
EOG Resources, Inc. | 3,442 | 469,902 | ||||||
EQT Corporation | 1,127 | 47,154 | ||||||
Exxon Mobil Corporation | 3,944 | 437,035 | ||||||
Magnolia Oil & Gas Corporation, Class A | 3,959 | 101,667 | ||||||
The accompanying notes are an integral part of these financial statements.
19
WEISS ALTERNATIVE MULTI-STRATEGY FUND
Schedule of Investments – Continued
October 31, 2022
| Shares | Value | |||||||
| Oil, Gas & Consumable Fuels – 3.30% (Continued) | ||||||||
Marathon Oil Corporation | 14,280 | $ | 434,826 | |||||
Marathon Petroleum Corporation | 1,199 | 136,230 | ||||||
Matador Resources Company | 5,162 | 343,015 | ||||||
Murphy Oil Corporation | 8,427 | 408,794 | ||||||
Northern Oil and Gas, Inc. | 9,479 | 323,613 | ||||||
Occidental Petroleum Corporation | 5,478 | 397,703 | ||||||
PBF Energy, Inc., Class A (a) | 5,509 | 243,773 | ||||||
PDC Energy, Inc. | 1,706 | 123,071 | ||||||
Petroleo Brasileiro SA – ADR (b) | 11,105 | 142,366 | ||||||
Phillips 66 | 922 | 96,155 | ||||||
Pioneer Natural Resources Company | 1,572 | 403,077 | ||||||
Range Resources Corporation | 11,762 | 334,982 | ||||||
SM Energy Company | 5,792 | 260,524 | ||||||
Southwestern Energy Company (a) | 45,703 | 316,722 | ||||||
Valero Energy Corporation | 24 | 3,013 | ||||||
8,379,901 | ||||||||
| Paper & Forest Products – 0.03% | ||||||||
Resolute Forest Products, Inc. (a) | 941 | 19,582 | ||||||
Stella-Jones, Inc. (b) | 1,765 | 53,157 | ||||||
72,739 | ||||||||
| Personal Products – 0.15% | ||||||||
e.l.f. Beauty, Inc. (a) | 4,391 | 189,955 | ||||||
Unilever plc (b) | 4,363 | 199,137 | ||||||
389,092 | ||||||||
| Pharmaceuticals – 0.59% | ||||||||
AstraZeneca plc – ADR | 2,884 | 169,608 | ||||||
Bausch Health Companies, Inc. (a)(b) | 451 | 2,932 | ||||||
Bayer AG (b) | 3,946 | 207,485 | ||||||
Bristol Myers-Squibb Company | 51 | 3,951 | ||||||
Catalent, Inc. (a) | 28 | 1,840 | ||||||
Elanco Animal Health, Inc. (a) | 1,015 | 13,388 | ||||||
Eli Lilly & Company (g) | 940 | 340,365 | ||||||
GSK plc – ADR (b) | 126 | 4,179 | ||||||
Intra-Cellular Therapies, Inc. (a) | 516 | 23,566 | ||||||
Jazz Pharmaceuticals plc (a)(b) | 906 | 130,274 | ||||||
Merck & Company, Inc. (g) | 2,028 | 205,234 | ||||||
Merck KGaA (b) | 277 | 45,141 | ||||||
Pfizer, Inc. | 1,168 | 54,370 | ||||||
Relmada Therapeutics, Inc. (a) | 3,071 | 19,624 | ||||||
Royalty Pharma plc, Class A (b) | 935 | 39,569 | ||||||
The accompanying notes are an integral part of these financial statements.
20
WEISS ALTERNATIVE MULTI-STRATEGY FUND
Schedule of Investments – Continued
October 31, 2022
| Shares | Value | |||||||
| Pharmaceuticals – 0.59% (Continued) | ||||||||
Sanofi – ADR (b) | 97 | $ | 4,193 | |||||
Teva Pharmaceutical Industries Ltd. – ADR (a)(b) | 6,966 | 62,137 | ||||||
Viatris, Inc. | 5,288 | 53,567 | ||||||
Zoetis, Inc. | 716 | 107,958 | ||||||
1,489,381 | ||||||||
| Professional Services – 0.02% | ||||||||
KBR, Inc. | 952 | 47,381 | ||||||
| Real Estate Investment Trusts (REITs) – 5.55% | ||||||||
Acadia Realty Trust | 27,169 | 379,551 | ||||||
American Homes 4 Rent, Class A | 15,605 | 498,424 | ||||||
Americold Realty Trust | 12,267 | 297,475 | ||||||
AvalonBay Communities, Inc. | 3,388 | 593,307 | ||||||
Boston Properties, Inc. | 13,123 | 954,042 | ||||||
Brixmor Property Group, Inc. | 34,206 | 728,930 | ||||||
Broadstone Net Lease, Inc. | 16,756 | 287,198 | ||||||
Cousins Properties, Inc. | 26,805 | 636,887 | ||||||
CubeSmart | 14,207 | 594,847 | ||||||
Douglas Emmett, Inc. | 14,333 | 252,117 | ||||||
EastGroup Properties, Inc. | 748 | 117,204 | ||||||
Equity LifeStyle Properties, Inc. | 3,671 | 234,797 | ||||||
Essential Properties Realty Trust, Inc. | 43,570 | 937,626 | ||||||
Federal Realty Investment Trust | 1,471 | 145,600 | ||||||
Healthpeak Properties, Inc. | 27,718 | 657,748 | ||||||
Highwoods Properties, Inc. | 26,045 | 735,250 | ||||||
Lexington Realty Trust | 707 | 6,844 | ||||||
National Retail Properties, Inc. | 17,678 | 743,006 | ||||||
Paramount Group, Inc. | 2,115 | 13,684 | ||||||
Prologis, Inc. | 3,024 | 334,908 | ||||||
Public Storage | 904 | 280,014 | ||||||
Regency Centers Corporation | 9,313 | 563,530 | ||||||
Retail Opportunity Investments Corporation | 13,491 | 195,350 | ||||||
Rexford Industrial Realty, Inc. | 5,873 | 324,659 | ||||||
Sabra Health Care REIT, Inc. | 60,435 | 825,542 | ||||||
Spirit Realty Capital, Inc. | 4,650 | 180,560 | ||||||
STORE Capital Corporation | 13,556 | 431,081 | ||||||
UDR, Inc. | 14,786 | 587,891 | ||||||
Ventas, Inc. | 28,602 | 1,119,196 | ||||||
VICI Properties, Inc. | 2,631 | 84,245 | ||||||
Washington Real Estate Investment Trust | 17,502 | 334,113 | ||||||
14,075,626 | ||||||||
The accompanying notes are an integral part of these financial statements.
21
WEISS ALTERNATIVE MULTI-STRATEGY FUND
Schedule of Investments – Continued
October 31, 2022
| Shares | Value | |||||||
| Road & Rail – 0.49% | ||||||||
ArcBest Corporation | 109 | $ | 8,658 | |||||
Canadian Pacific Railway Ltd. (b) | 3,005 | 223,842 | ||||||
CSX Corporation | 11,721 | 340,612 | ||||||
FTAI Infrastructure, Inc. (a) | 557 | 1,532 | ||||||
Heartland Express, Inc. | 402 | 5,982 | ||||||
J.B. Hunt Transport Services, Inc. | 1,629 | 278,673 | ||||||
Lyft, Inc., Class A (a) | 2,260 | 33,086 | ||||||
Norfolk Southern Corporation | 68 | 15,509 | ||||||
TFI International, Inc. – ADR | 82 | 7,464 | ||||||
Uber Technologies, Inc. (a) | 344 | 9,140 | ||||||
Union Pacific Corporation | 1,084 | 213,700 | ||||||
XPO Logistics, Inc. (a) | 1,870 | 96,754 | ||||||
1,234,952 | ||||||||
| Semiconductors & Semiconductor Equipment – 1.65% | ||||||||
Advanced Micro Devices, Inc. (a) | 13,462 | 808,528 | ||||||
Ambarella, Inc. (a)(b) | 2,928 | 160,250 | ||||||
ASML Holding N.V. (b) | 317 | 149,757 | ||||||
Broadcom, Inc. | 66 | 31,028 | ||||||
Lam Research Corporation | 200 | 80,956 | ||||||
MACOM Technology Solutions Holdings, Inc. (a) | 4,713 | 272,741 | ||||||
Marvell Technology, Inc. | 13,065 | 518,419 | ||||||
Micron Technology, Inc. | 5,099 | 275,856 | ||||||
Monolithic Power Systems, Inc. | 248 | 84,184 | ||||||
NVIDIA Corporation | 144 | 19,436 | ||||||
NXP Semiconductors N.V. (b)(g) | 286 | 41,779 | ||||||
ON Semiconductor Corporation (a) | 1,309 | 80,412 | ||||||
QUALCOMM, Inc. (g) | 11,273 | 1,326,381 | ||||||
Silicon Laboratories, Inc. (a) | 648 | 74,468 | ||||||
Synaptics, Inc. (a) | 684 | 60,602 | ||||||
Taiwan Semiconductor Manufacturing Company Ltd. – ADR (b) | 266 | 16,372 | ||||||
Texas Instruments, Inc. (g) | 820 | 131,717 | ||||||
Ultra Clean Holdings, Inc. (a) | 2,049 | 63,744 | ||||||
4,196,630 | ||||||||
| Software – 3.81% | ||||||||
8x8, Inc. (a) | 10,200 | 43,146 | ||||||
Adobe, Inc. (a) | 954 | 303,849 | ||||||
Alteryx, Inc., Class A (a)(g) | 1,600 | 77,968 | ||||||
Asana, Inc., Class A (a)(g) | 2,670 | 55,002 | ||||||
Atlassian Corporation, Class A (a) | 669 | 135,626 | ||||||
Autodesk, Inc. (a) | 380 | 81,434 | ||||||
Bill.com Holdings, Inc. (a) | 803 | 107,088 | ||||||
The accompanying notes are an integral part of these financial statements.
22
WEISS ALTERNATIVE MULTI-STRATEGY FUND
Schedule of Investments – Continued
October 31, 2022
| Shares | Value | |||||||
| Software – 3.81% (Continued) | ||||||||
Braze, Inc., Class A (a) | 2,544 | $ | 75,328 | |||||
BTRS Holdings, Inc. (a) | 6,357 | 60,010 | ||||||
Cadence Design Systems, Inc. (a) | 442 | 66,914 | ||||||
Cipher Mining, Inc. (a) | 54,078 | 54,619 | ||||||
Confluent, Inc., Class A (a) | 3,412 | 91,715 | ||||||
Crowdstrike Holdings, Inc., Class A (a) | 569 | 91,723 | ||||||
CyberArk Software Ltd. (a)(b) | 2,945 | 462,100 | ||||||
Datadog, Inc., Class A (a) | 1,189 | 95,726 | ||||||
The Descartes Systems Group, Inc. (a)(b) | 109 | 7,529 | ||||||
Domo, Inc., Class B (a) | 12,047 | 212,870 | ||||||
Dynatrace, Inc. (a)(g) | 1,763 | 62,128 | ||||||
Elastic N.V. (a)(b) | 953 | 60,944 | ||||||
Everbridge, Inc. (a) | 1,065 | 33,366 | ||||||
Five9, Inc. (a) | 850 | 51,221 | ||||||
ForgeRock, Inc., Class A (a) | 5,267 | 118,824 | ||||||
Freshworks, Inc., Class A (a) | 2,720 | 36,965 | ||||||
Gitlab, Inc., Class A (a) | 1,620 | 78,505 | ||||||
HubSpot, Inc. (a) | 401 | 118,921 | ||||||
Intuit, Inc. | 1,690 | 722,475 | ||||||
KnowBe4, Inc., Class A (a) | 2,848 | 70,004 | ||||||
Manhattan Associates, Inc. (a) | 985 | 119,845 | ||||||
Microsoft Corporation | 2,135 | 495,598 | ||||||
Momentive Global, Inc. (a) | 9,388 | 72,851 | ||||||
Monday.com Ltd. (a)(b) | 939 | 100,417 | ||||||
New Relic, Inc. (a) | 1,323 | 78,375 | ||||||
Nice Ltd. – ADR (a)(b) | 241 | 45,763 | ||||||
Nutanix, Inc., Class A (a)(g) | 7,569 | 207,391 | ||||||
Oracle Corporation | 16,361 | 1,277,303 | ||||||
Palo Alto Networks, Inc. (a) | 3,972 | 681,555 | ||||||
Paycom Software, Inc. (a) | 535 | 185,110 | ||||||
Paylocity Holding Corporation (a) | 611 | 141,624 | ||||||
Q2 Holdings, Inc. (a) | 2,176 | 67,543 | ||||||
Qualtrics International, Inc., Class A (a) | 3,658 | 43,786 | ||||||
RingCentral, Inc., Class A (a)(g) | 1,367 | 48,556 | ||||||
Riskfield Ltd., Class A (a)(b) | 20,601 | 91,674 | ||||||
Salesforce.com, Inc. (a) | 1,343 | 218,358 | ||||||
SentinelOne, Inc., Class A (a) | 8,293 | 189,412 | ||||||
ServiceNow, Inc. (a)(g) | 994 | 418,216 | ||||||
Smartsheet, Inc., Class A (a) | 922 | 32,196 | ||||||
Splunk, Inc. (a) | 372 | 30,917 | ||||||
Sumo Logic, Inc. (a) | 17,196 | 132,581 | ||||||
Synopsys, Inc. (a) | 402 | 117,605 | ||||||
The accompanying notes are an integral part of these financial statements.
23
WEISS ALTERNATIVE MULTI-STRATEGY FUND
Schedule of Investments – Continued
October 31, 2022
| Shares | Value | |||||||
| Software – 3.81% (Continued) | ||||||||
Tenable Holdings, Inc. (a) | 3,415 | $ | 138,786 | |||||
Varonis Systems, Inc. (a) | 4,849 | 129,808 | ||||||
Verint Systems, Inc. (a) | 1,735 | 61,471 | ||||||
VMware, Inc., Class A | 729 | 82,034 | ||||||
Workday, Inc., Class A (a) | 2,039 | 317,717 | ||||||
Workiva, Inc. (a) | 534 | 41,551 | ||||||
Zendesk, Inc. (a) | 7,264 | 557,076 | ||||||
Zscaler, Inc. (a) | 1,151 | 177,369 | ||||||
9,678,488 | ||||||||
| Special Purpose Acquisition Companies – 0.01% | ||||||||
Aequi Acquisition Corporation, Class A (a) | 1,800 | 18,072 | ||||||
| Specialty Retail – 0.39% | ||||||||
Advance Auto Parts, Inc. | 269 | 51,088 | ||||||
AutoZone, Inc. (a) | 34 | 86,118 | ||||||
Best Buy Company, Inc. | 411 | 28,117 | ||||||
Dick’s Sporting Goods, Inc. | 215 | 24,458 | ||||||
The Home Depot, Inc. | 541 | 160,206 | ||||||
Lithia Motors, Inc. | 1,824 | 361,426 | ||||||
Lowe’s Companies, Inc. | 198 | 38,600 | ||||||
The TJX Companies, Inc. | 3,275 | 236,128 | ||||||
986,141 | ||||||||
| Technology Hardware, Storage & Peripherals – 0.41% | ||||||||
Apple, Inc. | 2,446 | 375,070 | ||||||
NetApp, Inc. | 861 | 59,641 | ||||||
Pure Storage, Inc., Class A (a) | 19,279 | 594,950 | ||||||
1,029,661 | ||||||||
| Textiles, Apparel & Luxury Goods – 0.09% | ||||||||
Lululemon Athletica, Inc. (a) | 158 | 51,989 | ||||||
Tapestry, Inc. | 5,440 | 172,339 | ||||||
224,328 | ||||||||
| Thrifts & Mortgage Finance – 0.19% | ||||||||
Mr. Cooper Group, Inc. (a) | 9,364 | 369,784 | ||||||
PennyMac Financial Services, Inc. | 2,344 | 124,982 | ||||||
494,766 | ||||||||
| Tobacco – 0.03% | ||||||||
Swedish Match AB (b) | 6,341 | 65,217 | ||||||
The accompanying notes are an integral part of these financial statements.
24
WEISS ALTERNATIVE MULTI-STRATEGY FUND
Schedule of Investments – Continued
October 31, 2022
| Shares | Value | |||||||
| Trading Companies & Distributors – 0.43% | ||||||||
Air Lease Corporation | 475 | $ | 16,763 | |||||
Ferguson plc (b) | 1,526 | 166,731 | ||||||
Fortress Transportation and Infrastructure Investors LLC, Class A | 26,144 | 454,383 | ||||||
MRC Global, Inc. (a) | 14,314 | 143,569 | ||||||
Russel Metals, Inc. (a)(b) | 272 | 5,634 | ||||||
United Rentals, Inc. (a) | 538 | 169,852 | ||||||
W.W. Grainger, Inc. | 49 | 28,633 | ||||||
WESCO International, Inc. (a) | 842 | 116,002 | ||||||
1,101,567 | ||||||||
| Wireless Communication Services – 0.00% | ||||||||
NII Holdings, Inc. (a)(b)(f) | 6,235 | 2,182 | ||||||
| Wireless Telecommunication Services – 0.11% | ||||||||
T-Mobile U.S., Inc. (a)(g) | 1,879 | 284,781 | ||||||
| Total Common Stocks | ||||||||
| (Cost $95,627,812) | 95,946,877 | |||||||
| EXCHANGE TRADED FUNDS – 17.89% | ||||||||
Direxion Daily MSCI Brazil Bull 2X Shares (g) | 2,600 | 224,562 | ||||||
Invesco S&P 500 Equal Weight ETF | 4,897 | 683,425 | ||||||
iShares 20+ Year Treasury Bond ETF | 6,747 | 648,454 | ||||||
iShares iBoxx $Investment Grade Corporate Bond ETF (d) | 193,300 | 19,590,955 | ||||||
iShares iBoxx High Yield Corporate Bond ETF (d) | 292,100 | 21,448,903 | ||||||
iShares MSCI Brazil ETF | 4,118 | 134,535 | ||||||
iShares Russell 2000 ETF | 2,311 | 423,676 | ||||||
iShares U.S. Home Construction ETF | 1,987 | 111,828 | ||||||
ProShares Ultra VIX Short-Term Futures ETF (a)(g) | 25,715 | 252,264 | ||||||
ProShares UltraPro QQQ (g) | 3,200 | 67,040 | ||||||
ProShares UltraShort 20+ Year Treasury (a) | 146 | 5,253 | ||||||
ProShares VIX Short-Term Futures ETF (a) | 10,344 | 147,816 | ||||||
SPDR S&P 500 ETF Trust (g) | 3,834 | 1,480,729 | ||||||
SPDR S&P Homebuilders ETF | 244 | 14,235 | ||||||
SPDR S&P Oil & Gas Exploration & Production ETF | 243 | 36,764 | ||||||
Sprott Physical Gold Trust (a) | 2,601 | 32,799 | ||||||
United States Oil Fund LP (a) | 717 | 51,287 | ||||||
Utilities Select Sector SPDR Fund | 459 | 30,652 | ||||||
| Total Exchange Traded Funds | ||||||||
| (Cost $55,663,018) | 45,385,177 | |||||||
The accompanying notes are an integral part of these financial statements.
25
WEISS ALTERNATIVE MULTI-STRATEGY FUND
Schedule of Investments – Continued
October 31, 2022
| Shares | Value | |||||||
| CONTINGENT VALUE RIGHT – 0.00% | ||||||||
Kinross Gold Corporation (a)(b)(f) | 835 | $ | — | |||||
| Total Contingent Value Right | ||||||||
| (Cost $—) | — | |||||||
| ESCROW NOTES – 0.01% | ||||||||
Altaba, Inc. (a)(f) | 5,796 | 21,735 | ||||||
| Total Escrow Notes | ||||||||
| (Cost $19,909) | 21,735 | |||||||
| WARRANTS – 0.01% | ||||||||
| Biotechnology – 0.00% | ||||||||
Zealand Pharma A/S (a)(b)(f) | ||||||||
Exercise Price: $12.00, 11/24/2023 | 1,688 | — | ||||||
| Insurance – 0.01% | ||||||||
International General Insurance Holdings Ltd. (a)(b) | ||||||||
Exercise Price: $25.00, 3/17/2025 | 29,450 | 19,290 | ||||||
| Health Care Technology – 0.00% | ||||||||
Multiplan Corporation | ||||||||
Exercise Price: $11.50, 2/13/2025 | 515 | 99 | ||||||
| Health Care Providers & Services – 0.00% | ||||||||
Sema4 Holdings Corporation (a) | ||||||||
Exercise Price: $11.50, 7/22/2026 | 25,818 | 3,875 | ||||||
| Special Purpose Acquisition Companies – 0.00% | ||||||||
Aequi Acquisition Corporation, Class A (a) | ||||||||
Exercise Price: $27.00, 11/30/2027 | 600 | 12 | ||||||
| Total Warrants | ||||||||
| (Cost $120,013) | 23,276 | |||||||
| Notional | ||||||||||||
| PURCHASED OPTIONS – 0.06% | Contracts (c) | Amount | ||||||||||
| Purchased Call Options (a) – 0.04% | ||||||||||||
ADT, Inc. | ||||||||||||
Expiration: November 2022, Exercise Price: $12.00 | 666 | $ | 563,436 | 1,665 | ||||||||
Alcoa Corporation | ||||||||||||
Expiration: November 2022, Exercise Price: $44.00 | 19 | 74,157 | 1,453 | |||||||||
Expiration: March 2023, Exercise Price: $55.00 | 6 | 23,418 | 1,101 | |||||||||
Alteryx, Inc. | ||||||||||||
Expiration: January 2023, Exercise Price: $65.00 | 9 | 43,857 | 1,035 | |||||||||
The accompanying notes are an integral part of these financial statements.
26
WEISS ALTERNATIVE MULTI-STRATEGY FUND
Schedule of Investments – Continued
October 31, 2022
| Notional | ||||||||||||
| Contracts (c) | Amount | Value | ||||||||||
| Purchased Call Options (a) – 0.04% (Continued) | ||||||||||||
Beyond Meat, Inc. (g) | ||||||||||||
Expiration: November 2022, Exercise Price: $17.50 | 27 | $ | 42,390 | $ | 2,808 | |||||||
CVS Health Corporation | ||||||||||||
Expiration: November 2022, Exercise Price: $95.00 | 20 | 189,400 | 4,070 | |||||||||
DraftKings, Inc. (g) | ||||||||||||
Expiration: November 2022, Exercise Price: $17.50 | 33 | 52,140 | 2,359 | |||||||||
Dynatrace, Inc. (g) | ||||||||||||
Expiration: February 2023, Exercise Price: $35.00 | 5 | 17,620 | 2,350 | |||||||||
GSK plc | ||||||||||||
Expiration: November 2022, Exercise Price: $33.00 | 27 | 89,559 | 2,902 | |||||||||
Expiration: November 2022, Exercise Price: $35.00 | 22 | 72,974 | 715 | |||||||||
Humana, Inc. | ||||||||||||
Expiration: November 2022, Exercise Price: $550.00 | 2 | 111,616 | 3,210 | |||||||||
iShares 20+ Year Treasury Bond ETF | ||||||||||||
Expiration: January 2023, Exercise Price: $114.00 | 5 | 48,055 | 173 | |||||||||
iShares China Large-Cap ETF | ||||||||||||
Expiration: December 2022, Exercise Price: $29.00 | 54 | 113,130 | 108 | |||||||||
iShares iBoxx $Investment Grade Corporate Bond ETF | ||||||||||||
Expiration: November 2022, Exercise Price: $105.00 | 27 | 273,645 | 513 | |||||||||
Las Vegas Sands Corporation (g) | ||||||||||||
Expiration: December 2022, Exercise Price: $38.00 | 36 | 136,836 | 11,340 | |||||||||
Li-Cycle Holdings Corporation | ||||||||||||
Expiration: January 2023, Exercise Price: $10.00 | 9 | 5,364 | 90 | |||||||||
Medtronic plc | ||||||||||||
Expiration: November 2022, Exercise Price: $85.00 | 7 | 61,138 | 2,712 | |||||||||
Melco Resorts & Entertainment Ltd. | ||||||||||||
Expiration: January 2023, Exercise Price: $8.00 | 31 | 16,957 | 930 | |||||||||
Meta Platforms, Inc. (g) | ||||||||||||
Expiration: December 2022, Exercise Price: $175.00 | 9 | 83,844 | 54 | |||||||||
NOV, Inc. | ||||||||||||
Expiration: November 2022, Exercise Price: $25.00 | 136 | 304,640 | 4,080 | |||||||||
Nutanix, Inc. (g) | ||||||||||||
Expiration: January 2023, Exercise Price: $15.00 | 14 | 38,360 | 17,570 | |||||||||
Peloton Interactive, Inc. (g) | ||||||||||||
Expiration: March 2023, Exercise Price: $10.00 | 27 | 22,680 | 4,199 | |||||||||
RingCentral, Inc. (g) | ||||||||||||
Expiration: December 2022, Exercise Price: $50.00 | 8 | 28,416 | 500 | |||||||||
Royal Caribbean Cruises Ltd. | ||||||||||||
Expiration: December 2022, Exercise Price: $50.00 | 13 | 69,394 | 9,393 | |||||||||
Sanofi | ||||||||||||
Expiration: November 2022, Exercise Price: $42.00 | 9 | 38,907 | 1,800 | |||||||||
The accompanying notes are an integral part of these financial statements.
27
WEISS ALTERNATIVE MULTI-STRATEGY FUND
Schedule of Investments – Continued
October 31, 2022
| Notional | ||||||||||||
| Contracts (c) | Amount | Value | ||||||||||
| Purchased Call Options (a) – 0.04% (Continued) | ||||||||||||
SPDR S&P 500 ETF Trust | ||||||||||||
Expiration: November 2022, Exercise Price: $380.00 | 4 | $ | 154,484 | $ | 5,268 | |||||||
Expiration: December 2022, Exercise Price: $450.00 | 24 | 926,904 | 756 | |||||||||
Tenet Healthcare Corporation | ||||||||||||
Expiration: November 2022, Exercise Price: $45.00 | 2 | 8,872 | 380 | |||||||||
T-Mobile US, Inc. | ||||||||||||
Expiration: November 2022, Exercise Price: $140.00 | 4 | 60,624 | 5,030 | |||||||||
Transocean Ltd. | ||||||||||||
Expiration: January 2023, Exercise Price: $5.00 | 96 | 35,328 | 1,824 | |||||||||
Warner Brothers Discovery, Inc. | ||||||||||||
Expiration: November 2022, Exercise Price: $17.50 | 32 | 41,600 | 112 | |||||||||
Wynn Resorts Ltd. (g) | ||||||||||||
Expiration: November 2022, Exercise Price: $65.00 | 21 | 134,190 | 7,245 | |||||||||
| Total Purchased Call Options | ||||||||||||
| (Cost $93,234) | 97,745 | |||||||||||
| Purchased Put Options (a) – 0.02% | ||||||||||||
Aurinia Pharmaceuticals, Inc. | ||||||||||||
Expiration: November 2022, Exercise Price: $5.00 | 2 | 1,626 | 11 | |||||||||
Corsair Gaming, Inc. | ||||||||||||
Expiration: November 2022, Exercise Price: $12.50 | 27 | 37,260 | 1,039 | |||||||||
Edwards Lifesciences Corporation (g) | ||||||||||||
Expiration: November 2022, Exercise Price: $83.00 | 1 | 7,243 | 1,065 | |||||||||
Eli Lilly & Company (g) | ||||||||||||
Expiration: November 2022, Exercise Price: $345.00 | 1 | 36,209 | 605 | |||||||||
Health Care Select Sector SPDR Fund | ||||||||||||
Expiration: November 2022, Exercise Price: $130.00 | 14 | 185,850 | 672 | |||||||||
Horizon therapeutics plc (g) | ||||||||||||
Expiration: November 2022, Exercise Price: $60.00 | 1 | 6,232 | 203 | |||||||||
Johnson & Johnson | ||||||||||||
Expiration: November 2022, Exercise Price: $170.00 | 21 | 365,337 | 819 | |||||||||
PBF Energy, Inc. (g) | ||||||||||||
Expiration: November 2022, Exercise Price: $42.00 | 7 | 30,975 | 1,260 | |||||||||
SPDR S&P 500 ETF Trust (g) | ||||||||||||
Expiration: November 2022, Exercise Price: $370.00 | 21 | 811,041 | 9,692 | |||||||||
SPDR S&P Oil & Gas Exploration & Production ETF | ||||||||||||
Expiration: November 2022, Exercise Price: $138.00 | 122 | 1,845,738 | 20,008 | |||||||||
Steel Dynamics, Inc. | ||||||||||||
Expiration: November 2022, Exercise Price: $90.00 | 14 | 131,670 | 3,220 | |||||||||
Stryker Corporation (g) | ||||||||||||
Expiration: November 2022, Exercise Price: $225.00 | 1 | 22,924 | 600 | |||||||||
The accompanying notes are an integral part of these financial statements.
28
WEISS ALTERNATIVE MULTI-STRATEGY FUND
Schedule of Investments – Continued
October 31, 2022
| Notional | ||||||||||||
| Contracts (c) | Amount | Value | ||||||||||
| Purchased Put Options (a) – 0.02% (Continued) | ||||||||||||
TechnipFMC plc | ||||||||||||
Expiration: November 2022, Exercise Price: $10.00 | 133 | $ | 140,847 | $ | 3,657 | |||||||
UnitedHealth Group, Inc. (g) | ||||||||||||
Expiration: November 2022, Exercise Price: $485.00 | 2 | 111,030 | 19 | |||||||||
Expiration: November 2022, Exercise Price: $520.00 | 14 | 777,210 | 497 | |||||||||
Vertex Pharmaceuticals, Inc. (g) | ||||||||||||
Expiration: November 2022, Exercise Price: $285.00 | 1 | 31,200 | 143 | |||||||||
| Total Purchased Put Options | ||||||||||||
| (Cost $138,018) | 43,510 | |||||||||||
| Total Purchased Options | ||||||||||||
| (Cost $231,252) | 141,255 | |||||||||||
| Shares | ||||||||
| MONEY MARKET FUND – 28.67% | ||||||||
Fidelity Investments Money Market Funds Government | ||||||||
Portfolio, Class I, 2.87% (d)(e) | 72,738,939 | 72,738,939 | ||||||
| Total Money Market Fund | ||||||||
| (Cost $72,738,939) | 72,738,939 | |||||||
| Total Investments | ||||||||
| (Cost $224,400,943) – 84.45% | 214,257,259 | |||||||
| Other Assets In Excess Of Liabilities – 15.55% (d) | 39,469,310 | |||||||
| Net Assets – 100.00% | $ | 253,726,569 | ||||||
| (a) | Non-income producing security. |
| (b) | Foreign security. |
| (c) | 100 shares per contract. |
| (d) | All or a portion of the assets have been committed as collateral for open securities sold short, written option contracts, swap contacts, and futures contracts. The total value of assets committed as collateral as of October 31, 2022 is $144,630,894. |
| (e) | The rate quoted is the annualized seven-day effective yield as of October 31, 2022. |
| (f) | Level 3 security. See Note 2 in the Notes to Financial Statements. |
| (g) | Held in connection with a written option contract. See Schedule of Written Options for more details. |
ADR – American Depository Receipt
ETF – Exchange Traded Fund
plc – Public Limited Company
Reg – Registered
The Global Industry Classification Standard (GICS®) was developed by and/or is the exclusive property of MSCI, Inc. and Standard & Poor Financial Services LLC (“S&P”). GICS is a service mark of MSCI and S&P and has been licensed for use by U.S. Bancorp Fund Services, LLC, doing business as U.S. Bank Global Fund Services (“Fund Services”).
The accompanying notes are an integral part of these financial statements.
29
WEISS ALTERNATIVE MULTI-STRATEGY FUND
Schedule of Securities Sold Short
October 31, 2022
| Shares | Value | |||||||
| SHORT COMMON STOCKS (a) – (22.23)% | ||||||||
| Aerospace & Defense – (0.10)% | ||||||||
AeroVironment, Inc. | (332 | ) | $ | (30,378 | ) | |||
The Boeing Company | (544 | ) | (77,525 | ) | ||||
L3Harris Technologies, Inc. | (544 | ) | (134,080 | ) | ||||
Lockheed Martin Corporation | (16 | ) | (7,787 | ) | ||||
(249,770 | ) | |||||||
| Air Freight & Logistics – (0.29)% | ||||||||
Atlas Air Worldwide Holdings, Inc. | (1,265 | ) | (127,942 | ) | ||||
FedEx Corporation | (40 | ) | (6,411 | ) | ||||
Hub Group, Inc., Class A | (1,059 | ) | (82,178 | ) | ||||
United Parcel Service, Inc., Class B | (3,094 | ) | (519,080 | ) | ||||
(735,611 | ) | |||||||
| Airlines – (0.18)% | ||||||||
American Airlines Group, Inc. | (29,753 | ) | (421,898 | ) | ||||
JetBlue Airways Corporation | (5,473 | ) | (44,003 | ) | ||||
(465,901 | ) | |||||||
| Auto Components – (0.01)% | ||||||||
QuantumScape Corporation | (4,128 | ) | (34,386 | ) | ||||
| Automobiles – (0.33)% | ||||||||
Ford Motor Company | (40,812 | ) | (545,656 | ) | ||||
Rivian Automotive, Inc., Class A | (1,625 | ) | (56,826 | ) | ||||
Stellantis N.V. (b) | (5,448 | ) | (73,657 | ) | ||||
Tesla Motors, Inc. | (555 | ) | (126,285 | ) | ||||
Winnebago Industries, Inc. | (437 | ) | (26,085 | ) | ||||
(828,509 | ) | |||||||
| Banks – (1.51)% | ||||||||
Ameris Bancorp | (1,657 | ) | (85,352 | ) | ||||
Bank OZK | (5,675 | ) | (243,912 | ) | ||||
BankUnited, Inc. | (4,899 | ) | (176,119 | ) | ||||
Citigroup, Inc. | (7,915 | ) | (362,982 | ) | ||||
Columbia Banking System, Inc. | (1,285 | ) | (43,009 | ) | ||||
East West Bancorp, Inc. | (3,412 | ) | (244,197 | ) | ||||
First Citizens BancShares, Inc., Class A | (203 | ) | (166,890 | ) | ||||
First Hawaiian, Inc. | (2,344 | ) | (59,960 | ) | ||||
First Republic Bank | (1,062 | ) | (127,546 | ) | ||||
Hilltop Holdings, Inc. | (6,003 | ) | (173,787 | ) | ||||
Huntington Bancshares, Inc. | (20,128 | ) | (305,543 | ) | ||||
The accompanying notes are an integral part of these financial statements.
30
WEISS ALTERNATIVE MULTI-STRATEGY FUND
Schedule of Securities Sold Short – Continued
October 31, 2022
| Shares | Value | |||||||
| Banks – (1.51)% (Continued) | ||||||||
The PNC Financial Services Group, Inc. | (2,598 | ) | $ | (420,434 | ) | |||
Prosperity Bancshares, Inc. | (1,700 | ) | (121,669 | ) | ||||
Regions Financial Corporation | (10,880 | ) | (238,816 | ) | ||||
Simmons First National Corporation, Class A | (4,157 | ) | (99,228 | ) | ||||
SVB Financial Group | (2,084 | ) | (481,321 | ) | ||||
Truist Financial Corporation | (8,233 | ) | (368,756 | ) | ||||
Zions Bancorporation NA | (2,312 | ) | (120,085 | ) | ||||
(3,839,606 | ) | |||||||
| Beverages – (0.47)% | ||||||||
Anheuser-Busch InBev SA – ADR | (4,349 | ) | (217,885 | ) | ||||
The Boston Beer Company, Inc., Class A | (157 | ) | (58,607 | ) | ||||
Brown-Forman Corporation, Class B | (3,065 | ) | (208,420 | ) | ||||
The Coca-Cola Company | (6,591 | ) | (394,471 | ) | ||||
Keurig Dr. Pepper, Inc. | (1,632 | ) | (63,387 | ) | ||||
Molson Coors Brewing Company, Class B | (1,253 | ) | (63,189 | ) | ||||
National Beverage Corporation | (3,857 | ) | (182,899 | ) | ||||
(1,188,858 | ) | |||||||
| Biotechnology – (0.28)% | ||||||||
ADC Therapeutics S.A. (b) | (216 | ) | (959 | ) | ||||
Arcturus Therapeutics Holdings, Inc. | (399 | ) | (7,062 | ) | ||||
Arcus Biosciences, Inc. | (333 | ) | (8,485 | ) | ||||
Avidity Biosciences, Inc. | (459 | ) | (6,555 | ) | ||||
Beam Therapeutics, Inc. | (266 | ) | (11,720 | ) | ||||
Caribou Biosciences, Inc. | (929 | ) | (9,049 | ) | ||||
Compass Pathways plc – ADR | (1,281 | ) | (13,502 | ) | ||||
Design Therapeutics, Inc. | (535 | ) | (8,357 | ) | ||||
Editas Medicine, Inc. | (1,067 | ) | (13,391 | ) | ||||
Erasca, Inc. | (1,912 | ) | (15,621 | ) | ||||
Graphite Bio, Inc. | (514 | ) | (1,804 | ) | ||||
ImmunoGen, Inc. | (2,419 | ) | (14,369 | ) | ||||
Ionis Pharmaceuticals, Inc. | (268 | ) | (11,846 | ) | ||||
iTeos Therapeutics, Inc. | (388 | ) | (7,558 | ) | ||||
Kodiak Sciences, Inc. | (1,465 | ) | (10,519 | ) | ||||
Krystal Biotech, Inc. | (215 | ) | (16,448 | ) | ||||
Moderna, Inc. | (1,664 | ) | (250,149 | ) | ||||
Natera, Inc. | (296 | ) | (13,900 | ) | ||||
Neurocrine Biosciences, Inc. | (250 | ) | (28,780 | ) | ||||
Nkarta, Inc. | (534 | ) | (6,734 | ) | ||||
Novavax, Inc. | (898 | ) | (19,998 | ) | ||||
Praxis Precision Medicines, Inc. | (123 | ) | (242 | ) | ||||
The accompanying notes are an integral part of these financial statements.
31
WEISS ALTERNATIVE MULTI-STRATEGY FUND
Schedule of Securities Sold Short – Continued
October 31, 2022
| Shares | Value | |||||||
| Biotechnology – (0.28)% (Continued) | ||||||||
Protagonist Therapeutics, Inc. | (383 | ) | $ | (3,102 | ) | |||
Recursion Pharmaceuticals, Inc., Class A | (800 | ) | (8,440 | ) | ||||
Regeneron Pharmaceuticals, Inc. | (275 | ) | (205,906 | ) | ||||
Rocket Pharmaceuticals, Inc. | (546 | ) | (10,188 | ) | ||||
Scholar Rock Holding Corporation | (395 | ) | (3,855 | ) | ||||
SQZ Biotechnologies Company | (206 | ) | (587 | ) | ||||
Stoke Therapeutics, Inc. | (510 | ) | (7,574 | ) | ||||
(716,700 | ) | |||||||
| Building Products – (0.12)% | ||||||||
Allegion plc (b) | (967 | ) | (101,313 | ) | ||||
Builders FirstSource, Inc. | (218 | ) | (13,442 | ) | ||||
Carrier Global Corporation | (591 | ) | (23,498 | ) | ||||
JELD-WEN Holding, Inc. | (3,052 | ) | (32,382 | ) | ||||
Masco Corporation | (601 | ) | (27,808 | ) | ||||
Owens Corning | (1,248 | ) | (106,841 | ) | ||||
(305,284 | ) | |||||||
| Capital Markets – (1.00)% | ||||||||
BlackRock, Inc. | (566 | ) | (365,585 | ) | ||||
Blackstone, Inc. | (3,264 | ) | (297,481 | ) | ||||
EQT AB (b) | (930 | ) | (18,302 | ) | ||||
Federated Investors, Inc., Class B | (1,768 | ) | (61,438 | ) | ||||
Janus Henderson Group plc (b) | (13,609 | ) | (309,877 | ) | ||||
KKR & Company, Inc. | (2,425 | ) | (117,928 | ) | ||||
Moelis & Company | (3,630 | ) | (154,130 | ) | ||||
Morgan Stanley | (3,732 | ) | (306,658 | ) | ||||
Northern Trust Corporation | (3,536 | ) | (298,262 | ) | ||||
Raymond James Financial, Inc. | (1,017 | ) | (120,148 | ) | ||||
SEI Investments Company | (3,351 | ) | (181,959 | ) | ||||
T. Rowe Price Group, Inc. | (2,843 | ) | (301,813 | ) | ||||
(2,533,581 | ) | |||||||
| Chemicals – (0.12)% | ||||||||
Albemarle Corporation | (136 | ) | (38,062 | ) | ||||
Corteva, Inc. | (725 | ) | (47,372 | ) | ||||
Dow, Inc. | (1,038 | ) | (48,516 | ) | ||||
The Mosaic Company | (2,146 | ) | (115,348 | ) | ||||
The Scotts Miracle-Gro Company | (563 | ) | (25,847 | ) | ||||
The Sherwin-Williams Company | (82 | ) | (18,452 | ) | ||||
(293,597 | ) | |||||||
The accompanying notes are an integral part of these financial statements.
32
WEISS ALTERNATIVE MULTI-STRATEGY FUND
Schedule of Securities Sold Short – Continued
October 31, 2022
| Shares | Value | |||||||
| Commercial Services & Supplies – (0.17)% | ||||||||
Clean Harbors, Inc. | (108 | ) | $ | (13,226 | ) | |||
KAR Auction Services, Inc. | (3,267 | ) | (47,470 | ) | ||||
Ritchie Brothers Auctioneers, Inc. (b) | (829 | ) | (54,159 | ) | ||||
Tetra Tech, Inc. | (1,147 | ) | (162,048 | ) | ||||
Waste Connections, Inc. (b) | (461 | ) | (60,811 | ) | ||||
Waste Management, Inc. | (620 | ) | (98,189 | ) | ||||
(435,903 | ) | |||||||
| Communications Equipment – (0.03)% | ||||||||
Lumentum Holdings, Inc. | (1,061 | ) | (78,991 | ) | ||||
| Construction & Engineering – (0.11)% | ||||||||
AECOM | (3,797 | ) | (285,838 | ) | ||||
| Consumer Finance – (0.41)% | ||||||||
Ally Financial, Inc. | (13,153 | ) | (362,497 | ) | ||||
Capital One Financial Corporation | (3,968 | ) | (420,687 | ) | ||||
OneMain Holdings, Inc. | (3,262 | ) | (125,783 | ) | ||||
Synchrony Financial | (3,416 | ) | (121,473 | ) | ||||
(1,030,440 | ) | |||||||
| Containers & Packaging – (0.17)% | ||||||||
Ball Corporation | (3,778 | ) | (186,595 | ) | ||||
Crown Holdings, Inc. | (2,926 | ) | (200,694 | ) | ||||
Greif, Inc., Class A | (597 | ) | (39,527 | ) | ||||
(426,816 | ) | |||||||
| Distributors – (0.09)% | ||||||||
Genuine Parts Company | (1,087 | ) | (193,334 | ) | ||||
Pool Corporation | (78 | ) | (23,730 | ) | ||||
(217,064 | ) | |||||||
| Diversified Consumer Services – (0.22)% | ||||||||
ADT, Inc. | (66,600 | ) | (563,436 | ) | ||||
| Diversified Telecommunication Services – (0.15)% | ||||||||
AT&T, Inc. | (11,367 | ) | (207,220 | ) | ||||
Lumen Technologies, Inc. | (7,410 | ) | (54,538 | ) | ||||
Verizon Communications, Inc. | (3,287 | ) | (122,835 | ) | ||||
(384,593 | ) | |||||||
The accompanying notes are an integral part of these financial statements.
33
WEISS ALTERNATIVE MULTI-STRATEGY FUND
Schedule of Securities Sold Short – Continued
October 31, 2022
| Shares | Value | |||||||
| Electrical Equipment – (0.05)% | ||||||||
Acuity Brands, Inc. | (567 | ) | $ | (104,084 | ) | |||
Regal Rexnord Corporation | (215 | ) | (27,206 | ) | ||||
(131,290 | ) | |||||||
| Electronic Equipment, Instruments & Components – (0.11)% | ||||||||
Corning, Inc. | (8,190 | ) | (263,472 | ) | ||||
Zebra Technologies Corporation, Class A | (24 | ) | (6,797 | ) | ||||
(270,269 | ) | |||||||
| Energy Equipment & Services – (0.36)% | ||||||||
Baker Hughes Company | (8,600 | ) | (237,876 | ) | ||||
NOV, Inc. | (12,468 | ) | (279,283 | ) | ||||
ProPetro Holding Corporation | (84 | ) | (995 | ) | ||||
Schlumberger N.V. Ltd. (b) | (7,637 | ) | (397,353 | ) | ||||
(915,507 | ) | |||||||
| Entertainment – (0.10)% | ||||||||
Endeavor Group Holdings, Inc., Class A | (3,283 | ) | (71,701 | ) | ||||
Liberty Media Corp-Liberty Formula One, Class C | (1,043 | ) | (60,212 | ) | ||||
Live Nation Entertainment, Inc. | (276 | ) | (21,972 | ) | ||||
ROBLOX Corporation, Class A | (1,153 | ) | (51,585 | ) | ||||
Roku, Inc. | (836 | ) | (46,431 | ) | ||||
(251,901 | ) | |||||||
| Food & Staples Retailing – (0.17)% | ||||||||
Casey’s General Stores, Inc. | (509 | ) | (118,449 | ) | ||||
Costco Wholesale Corporation | (218 | ) | (109,327 | ) | ||||
The Kroger Company | (2,000 | ) | (94,580 | ) | ||||
Sysco Corporation | (1,199 | ) | (103,785 | ) | ||||
(426,141 | ) | |||||||
| Food Products – (0.97)% | ||||||||
Archer-Daniels-Midland Company | (759 | ) | (73,608 | ) | ||||
B&G Foods, Inc. | (3,385 | ) | (55,446 | ) | ||||
Campbell Soup Company | (6,836 | ) | (361,693 | ) | ||||
Flowers Foods, Inc. | (11,689 | ) | (335,591 | ) | ||||
General Mills, Inc. | (6,759 | ) | (551,399 | ) | ||||
The Hain Celestial Group, Inc. | (2,105 | ) | (39,385 | ) | ||||
Hormel Foods Corporation | (605 | ) | (28,102 | ) | ||||
Kellogg Company | (351 | ) | (26,964 | ) | ||||
McCormick & Company, Inc. | (5,119 | ) | (402,558 | ) | ||||
Mondelez International, Inc., Class A | (2,823 | ) | (173,558 | ) | ||||
Nestle SA (b) | (1,556 | ) | (169,384 | ) | ||||
Tyson Foods, Inc., Class A | (3,624 | ) | (247,700 | ) | ||||
(2,465,388 | ) | |||||||
The accompanying notes are an integral part of these financial statements.
34
WEISS ALTERNATIVE MULTI-STRATEGY FUND
Schedule of Securities Sold Short – Continued
October 31, 2022
| Shares | Value | |||||||
| Health Care Equipment & Supplies – (0.25)% | ||||||||
Align Technology, Inc. | (306 | ) | $ | (59,456 | ) | |||
Baxter International, Inc. | (131 | ) | (7,120 | ) | ||||
Becton, Dickinson and Company | (521 | ) | (122,940 | ) | ||||
Danaher Corporation | (433 | ) | (108,973 | ) | ||||
Enovis Corporation | (1,389 | ) | (68,686 | ) | ||||
IDEXX Laboratories, Inc. | (39 | ) | (14,028 | ) | ||||
Lantheus Holdings, Inc. | (98 | ) | (7,251 | ) | ||||
Medtronic plc (b) | (2,463 | ) | (215,118 | ) | ||||
Straumann Holding AG (b) | (363 | ) | (34,547 | ) | ||||
(638,119 | ) | |||||||
| Health Care Providers & Services – (0.70)% | ||||||||
1Life Healthcare, Inc. | (36 | ) | (616 | ) | ||||
Alignment Healthcare, Inc. | (1,969 | ) | (26,070 | ) | ||||
AmerisourceBergen Corporation | (861 | ) | (135,366 | ) | ||||
Centene Corporation | (3,170 | ) | (269,862 | ) | ||||
CVS Health Corporation | (1,188 | ) | (112,504 | ) | ||||
DaVita, Inc. | (1,131 | ) | (82,574 | ) | ||||
Fresenius Medical Care AG & Co KGaA (b) | (997 | ) | (27,578 | ) | ||||
HCA Holdings, Inc. | (792 | ) | (172,236 | ) | ||||
LHC Group, Inc. | (1,004 | ) | (167,768 | ) | ||||
Oak Street Health, Inc. | (645 | ) | (13,048 | ) | ||||
Owens & Minor, Inc. | (777 | ) | (13,209 | ) | ||||
Quest Diagnostics, Inc. | (1,036 | ) | (148,821 | ) | ||||
R1 RCM, Inc. | (3,343 | ) | (59,037 | ) | ||||
UnitedHealth Group, Inc. | (985 | ) | (546,823 | ) | ||||
(1,775,512 | ) | |||||||
| Health Care Technology – (0.02)% | ||||||||
Certara, Inc. | (665 | ) | (8,133 | ) | ||||
Doximity, Inc., Class A | (806 | ) | (21,335 | ) | ||||
Schrodinger, Inc. | (547 | ) | (13,112 | ) | ||||
Teladoc Health, Inc. | (419 | ) | (12,419 | ) | ||||
(54,999 | ) | |||||||
| Hotels, Restaurants & Leisure – (0.92)% | ||||||||
Accor SA (b) | (4,855 | ) | (116,333 | ) | ||||
Bally’s Corporation | (4,770 | ) | (107,516 | ) | ||||
Bloomin’ Brands, Inc. | (4,232 | ) | (101,610 | ) | ||||
Carnival Corporation (b) | (31,747 | ) | (287,628 | ) | ||||
Chipotle Mexican Grill, Inc. | (46 | ) | (68,923 | ) | ||||
Choice Hotels International, Inc. | (2,152 | ) | (279,416 | ) | ||||
The accompanying notes are an integral part of these financial statements.
35
WEISS ALTERNATIVE MULTI-STRATEGY FUND
Schedule of Securities Sold Short – Continued
October 31, 2022
| Shares | Value | |||||||
| Hotels, Restaurants & Leisure – (0.92)% (Continued) | ||||||||
Cracker Barrel Old Country Store, Inc. | (1,290 | ) | $ | (147,344 | ) | |||
Darden Restaurants, Inc. | (834 | ) | (119,379 | ) | ||||
Dine Brands Global, Inc. | (85 | ) | (6,128 | ) | ||||
Domino’s Pizza, Inc. | (263 | ) | (87,379 | ) | ||||
Life Time Group Holdings, Inc. | (1,018 | ) | (10,679 | ) | ||||
Marriott International, Inc., Class A | (1,278 | ) | (204,621 | ) | ||||
McDonald’s Corporation | (685 | ) | (186,772 | ) | ||||
Melco Crown Entertainment Ltd. – ADR (b) | (6,796 | ) | (37,174 | ) | ||||
Papa John’s International, Inc. | (363 | ) | (26,365 | ) | ||||
Penn National Gaming, Inc. | (7,860 | ) | (260,166 | ) | ||||
Ruth’s Hospitality Group, Inc. | (2,918 | ) | (60,636 | ) | ||||
SeaWorld Entertainment, Inc. | (1,432 | ) | (83,285 | ) | ||||
Starbucks Corporation | (524 | ) | (45,373 | ) | ||||
The Wendy’s Company | (4,006 | ) | (83,245 | ) | ||||
(2,319,972 | ) | |||||||
| Household Durables – (0.05)% | ||||||||
Lennar Corporation, Class A | (187 | ) | (15,091 | ) | ||||
Mohawk Industries, Inc. | (132 | ) | (12,507 | ) | ||||
Newell Brands, Inc. | (2,252 | ) | (31,100 | ) | ||||
PulteGroup, Inc. | (379 | ) | (15,156 | ) | ||||
Taylor Morrison Home Corporation | (1,353 | ) | (35,638 | ) | ||||
Whirlpool Corporation | (103 | ) | (14,239 | ) | ||||
(123,731 | ) | |||||||
| Household Products – (0.14)% | ||||||||
Church & Dwight Company, Inc. | (1,813 | ) | (134,398 | ) | ||||
Kimberly-Clark Corporation | (1,792 | ) | (223,032 | ) | ||||
(357,430 | ) | |||||||
| Industrial Conglomerates – (0.07)% | ||||||||
3M Company | (1,484 | ) | (186,672 | ) | ||||
| Insurance – (0.05)% | ||||||||
First American Financial Corporation | (2,431 | ) | (122,522 | ) | ||||
Oscar Health, Inc., Class A | (3,128 | ) | (11,667 | ) | ||||
(134,189 | ) | |||||||
| Interactive Media & Services – (0.06)% | ||||||||
Bumble, Inc., Class A | (3,353 | ) | (85,166 | ) | ||||
Match Group, Inc. | (1,165 | ) | (50,328 | ) | ||||
Nextdoor Holdings, Inc. | (6,106 | ) | (16,547 | ) | ||||
(152,041 | ) | |||||||
The accompanying notes are an integral part of these financial statements.
36
WEISS ALTERNATIVE MULTI-STRATEGY FUND
Schedule of Securities Sold Short – Continued
October 31, 2022
| Shares | Value | |||||||
| Internet & Direct Marketing Retail – (0.03)% | ||||||||
DoorDash, Inc., Class A | (632 | ) | $ | (27,511 | ) | |||
eBay, Inc. | (934 | ) | (37,211 | ) | ||||
Fiverr International Ltd. (b) | (434 | ) | (13,432 | ) | ||||
(78,154 | ) | |||||||
| Internet Software & Services – 0.00% | ||||||||
Coupa Software, Inc. | (19 | ) | (1,011 | ) | ||||
| IT Services – (0.15)% | ||||||||
Block, Inc. | (447 | ) | (26,851 | ) | ||||
International Business Machines Corporation | (1,086 | ) | (150,183 | ) | ||||
MongoDB, Inc. | (267 | ) | (48,869 | ) | ||||
Shift4 Payments, Inc., Class A | (690 | ) | (31,719 | ) | ||||
Snowflake, Inc., Class A | (762 | ) | (122,149 | ) | ||||
(379,771 | ) | |||||||
| Leisure Products – (0.01)% | ||||||||
Brunswick Corporation | (343 | ) | (24,240 | ) | ||||
| Life Sciences Tools & Services – (0.22)% | ||||||||
Adaptive Biotechnologies Corporation | (1,325 | ) | (10,309 | ) | ||||
Agilent Technologies, Inc. | (662 | ) | (91,588 | ) | ||||
ICON plc (b) | (836 | ) | (165,394 | ) | ||||
Illumina, Inc. | (296 | ) | (67,731 | ) | ||||
Medpace Holdings, Inc. | (68 | ) | (15,095 | ) | ||||
Olink Holding AB – ADR (b) | (843 | ) | (15,452 | ) | ||||
PerkinElmer, Inc. | (602 | ) | (80,415 | ) | ||||
Quanterix Corporation | (989 | ) | (10,948 | ) | ||||
Thermo Fisher Scientific, Inc. | (135 | ) | (69,386 | ) | ||||
Seer, Inc. | (538 | ) | (4,213 | ) | ||||
Syneos Health, Inc. | (678 | ) | (34,158 | ) | ||||
(564,689 | ) | |||||||
| Machinery – (0.68)% | ||||||||
AGCO Corporation | (90 | ) | (11,175 | ) | ||||
Allison Transmission Holdings, Inc. | (251 | ) | (10,605 | ) | ||||
Chart Industries, Inc. | (958 | ) | (213,519 | ) | ||||
Cummins, Inc. | (244 | ) | (59,660 | ) | ||||
Daifuku Company Ltd. (b) | (139 | ) | (6,363 | ) | ||||
Dover Corporation | (779 | ) | (101,808 | ) | ||||
Flowserve Corporation | (46 | ) | (1,319 | ) | ||||
Gates Industrial Corporation plc (b) | (5,551 | ) | (61,894 | ) | ||||
The accompanying notes are an integral part of these financial statements.
37
WEISS ALTERNATIVE MULTI-STRATEGY FUND
Schedule of Securities Sold Short – Continued
October 31, 2022
| Shares | Value | |||||||
| Machinery – (0.68)% (Continued) | ||||||||
IDEX Corporation | (311 | ) | $ | (69,138 | ) | |||
Illinois Tool Works, Inc. | (1,394 | ) | (297,661 | ) | ||||
Kennametal, Inc. | (2,445 | ) | (65,306 | ) | ||||
Kubota Corporation (b) | (265 | ) | (3,697 | ) | ||||
Lincoln Electric Holdings, Inc. | (819 | ) | (116,298 | ) | ||||
Makita Corporation (b) | (342 | ) | (6,250 | ) | ||||
Otis Worldwide Corporation | (1,605 | ) | (113,377 | ) | ||||
PACCAR, Inc. | (1,173 | ) | (113,582 | ) | ||||
Parker-Hannifin Corporation | (82 | ) | (23,831 | ) | ||||
Pentair plc (b) | (795 | ) | (34,145 | ) | ||||
RBC Bearings, Inc. | (323 | ) | (81,890 | ) | ||||
Snap-on, Inc. | (607 | ) | (134,784 | ) | ||||
Stanley Black & Decker, Inc. | (845 | ) | (66,324 | ) | ||||
The Toro Company | (732 | ) | (77,175 | ) | ||||
Xylem, Inc. | (634 | ) | (64,941 | ) | ||||
(1,734,742 | ) | |||||||
| Marine – (0.04)% | ||||||||
AP Moller – Maersk A/S, Class B (b) | (24 | ) | (50,140 | ) | ||||
Kuehne + Nagel International AG (b) | (190 | ) | (40,445 | ) | ||||
(90,585 | ) | |||||||
| Media – (0.35)% | ||||||||
Charter Communications, Inc., Class A | (1,168 | ) | (429,380 | ) | ||||
Comcast Corporation, Class A | (1,418 | ) | (45,007 | ) | ||||
The New York Times Company, Class A | (2,722 | ) | (78,829 | ) | ||||
Omnicom Group, Inc. | (3,031 | ) | (220,505 | ) | ||||
Paramount Global, Class B | (5,740 | ) | (105,157 | ) | ||||
(878,878 | ) | |||||||
| Metals & Mining – (1.13)% | ||||||||
Alumina Ltd. (b) | (63,272 | ) | (54,683 | ) | ||||
BHP Group Ltd. – ADR (b) | (12,985 | ) | (620,943 | ) | ||||
First Quantum Minerals Ltd. (b) | (3,276 | ) | (57,784 | ) | ||||
Fortescue Metals Group Ltd. (b) | (10,745 | ) | (101,229 | ) | ||||
Freeport-McMoRan, Inc. | (9,178 | ) | (290,851 | ) | ||||
Hudbay Minerals, Inc. (b) | (6,303 | ) | (23,951 | ) | ||||
Hudbay Minerals, Inc. (b) | (8,050 | ) | (30,549 | ) | ||||
Lundin Mining Corporation (b) | (8,571 | ) | (44,920 | ) | ||||
Nucor Corporation | (3,216 | ) | (422,518 | ) | ||||
Rio Tinto plc – ADR (b) | (10,179 | ) | (543,050 | ) | ||||
Sayona Mining Ltd. (b) | (243,900 | ) | (36,637 | ) | ||||
The accompanying notes are an integral part of these financial statements.
38
WEISS ALTERNATIVE MULTI-STRATEGY FUND
Schedule of Securities Sold Short – Continued
October 31, 2022
| Shares | Value | |||||||
| Metals & Mining – (1.13)% (Continued) | ||||||||
South32 Ltd. (b) | (24,480 | ) | $ | (56,164 | ) | |||
Southern Copper Corporation | (2,259 | ) | (106,105 | ) | ||||
Standard Lithium Ltd. (b) | (6,655 | ) | (27,618 | ) | ||||
Steel Dynamics, Inc. | (4,730 | ) | (444,857 | ) | ||||
(2,861,859 | ) | |||||||
| Multiline Retail – (0.17)% | ||||||||
Dollar General Corporation | (668 | ) | (170,373 | ) | ||||
Dollar Tree, Inc. | (573 | ) | (90,821 | ) | ||||
Ollie’s Bargain Outlet Holdings, Inc. | (1,863 | ) | (104,328 | ) | ||||
Target Corporation | (336 | ) | (55,188 | ) | ||||
(420,710 | ) | |||||||
| Oil, Gas & Consumable Fuels – (1.74)% | ||||||||
APA Corporation | (6,392 | ) | (290,580 | ) | ||||
BP plc – ADR | (4,465 | ) | (148,595 | ) | ||||
Canadian Natural Resources Ltd. (b) | (5,888 | ) | (352,927 | ) | ||||
Cenovus Energy, Inc. (b) | (12,076 | ) | (243,935 | ) | ||||
CNX Resources Corporation | (20,398 | ) | (342,890 | ) | ||||
Comstock Resources, Inc. | (9,784 | ) | (183,744 | ) | ||||
Continental Resources, Inc. | (2,206 | ) | (163,178 | ) | ||||
Coterra Energy, Inc. | (5,739 | ) | (178,655 | ) | ||||
Delek U.S. Holdings, Inc. | (110 | ) | (3,263 | ) | ||||
EQT Corporation | (5,368 | ) | (224,597 | ) | ||||
Equinor ASA – ADR (b) | (9,014 | ) | (327,028 | ) | ||||
Hess Corporation | (2,222 | ) | (313,480 | ) | ||||
HF Sinclair Corporation | (779 | ) | (47,651 | ) | ||||
Laredo Petroleum, Inc. | (2,355 | ) | (152,251 | ) | ||||
Ovintiv, Inc. | (5,823 | ) | (294,935 | ) | ||||
Shell plc – ADR (b) | (7,277 | ) | (404,820 | ) | ||||
Suncor Energy, Inc. (b) | (9,495 | ) | (326,533 | ) | ||||
TotalEnergies SE – ADR (b) | (7,058 | ) | (386,567 | ) | ||||
Woodside Energy Group Ltd. – ADR (b) | (923 | ) | (21,386 | ) | ||||
(4,407,015 | ) | |||||||
| Personal Products – (0.14)% | ||||||||
Beiersdorf AG (b) | (133 | ) | (12,767 | ) | ||||
Edgewell Personal Care Company | (6,133 | ) | (240,352 | ) | ||||
The Estee Lauder Companies, Inc., Class A | (509 | ) | (102,049 | ) | ||||
(355,168 | ) | |||||||
The accompanying notes are an integral part of these financial statements.
39
WEISS ALTERNATIVE MULTI-STRATEGY FUND
Schedule of Securities Sold Short – Continued
October 31, 2022
| Shares | Value | |||||||
| Pharmaceuticals – (0.48)% | ||||||||
Athira Pharma, Inc. | (128 | ) | $ | (424 | ) | |||
Bristol Myers-Squibb Company | (523 | ) | (40,517 | ) | ||||
Catalent, Inc. | (336 | ) | (22,085 | ) | ||||
GSK plc – ADR (b) | (2,968 | ) | (98,449 | ) | ||||
H. Lundbeck A/S (b) | (20,475 | ) | (76,611 | ) | ||||
Johnson & Johnson | (861 | ) | (149,788 | ) | ||||
Nektar Therapeutics | (364 | ) | (1,369 | ) | ||||
Novartis AG – ADR (b) | (1,059 | ) | (85,917 | ) | ||||
Novartis AG (b) | (896 | ) | (72,478 | ) | ||||
Novo Nordisk A/S – ADR (b) | (474 | ) | (51,590 | ) | ||||
Novo Nordisk A/S (b) | (405 | ) | (44,036 | ) | ||||
Organon & Company | (2,607 | ) | (68,251 | ) | ||||
Perrigo Company plc (b) | (878 | ) | (35,366 | ) | ||||
Pfizer, Inc. | (3,747 | ) | (174,423 | ) | ||||
Roche Holding AG (b) | (408 | ) | (135,374 | ) | ||||
Royalty Pharma plc, Class A (b) | (2,132 | ) | (90,226 | ) | ||||
Sanofi – ADR (b) | (1,496 | ) | (64,672 | ) | ||||
(1,211,576 | ) | |||||||
| Professional Services – (0.10)% | ||||||||
Booz Allen Hamilton Holding Corporation | (1,037 | ) | (112,877 | ) | ||||
Exponent, Inc. | (888 | ) | (84,591 | ) | ||||
FTI Consulting, Inc. | (409 | ) | (63,653 | ) | ||||
(261,121 | ) | |||||||
| Real Estate Investment Trusts (REITs) – (5.33)% | ||||||||
Agree Realty Corporation | (6,787 | ) | (466,267 | ) | ||||
Apartment Income REIT Corporation | (4,646 | ) | (178,546 | ) | ||||
Camden Property Trust | (3,665 | ) | (423,491 | ) | ||||
CareTrust REIT, Inc. | (12,216 | ) | (228,195 | ) | ||||
Corporate Office Properties Trust | (51,216 | ) | (1,364,906 | ) | ||||
Equity Residential | (1,456 | ) | (91,757 | ) | ||||
Essex Property Trust, Inc. | (2,071 | ) | (460,259 | ) | ||||
Extra Space Storage, Inc. | (2,665 | ) | (472,878 | ) | ||||
First Industrial Realty Trust, Inc. | (12,316 | ) | (586,611 | ) | ||||
Four Corners Property Trust, Inc. | (9,662 | ) | (247,540 | ) | ||||
Healthcare Realty Trust, Inc. | (32,876 | ) | (668,369 | ) | ||||
Invitation Homes, Inc. | (13,423 | ) | (425,375 | ) | ||||
Kilroy Realty Corporation | (22,155 | ) | (946,905 | ) | ||||
Kimco Realty Corporation | (18,007 | ) | (384,990 | ) | ||||
Kite Realty Group Trust | (42,985 | ) | (844,225 | ) | ||||
Life Storage, Inc. | (2,250 | ) | (248,873 | ) | ||||
LTC Properties, Inc. | (3,548 | ) | (137,201 | ) | ||||
The accompanying notes are an integral part of these financial statements.
40
WEISS ALTERNATIVE MULTI-STRATEGY FUND
Schedule of Securities Sold Short – Continued
October 31, 2022
| Shares | Value | |||||||
| Real Estate Investment Trusts (REITs) – (5.33)% (Continued) | ||||||||
Mid-America Apartment Communities, Inc. | (3,076 | ) | $ | (484,316 | ) | |||
National Storage Affiliates Trust | (4,014 | ) | (171,237 | ) | ||||
NETSTREIT Corporation | (2,913 | ) | (54,823 | ) | ||||
Omega Healthcare Investors, Inc. | (16,207 | ) | (515,059 | ) | ||||
Park Hotels & Resorts, Inc. | (1,957 | ) | (25,598 | ) | ||||
Pebblebrook Hotel Trust | (8,250 | ) | (132,330 | ) | ||||
Phillips Edison & Company, Inc. | (17,709 | ) | (533,749 | ) | ||||
Physicians Realty Trust | (12,048 | ) | (181,443 | ) | ||||
Rayonier, Inc. | (3,054 | ) | (102,920 | ) | ||||
Realty Income Corporation | (19,658 | ) | (1,224,104 | ) | ||||
Simon Property Group, Inc. | (853 | ) | (92,960 | ) | ||||
Sun Communities, Inc. | (3,179 | ) | (428,688 | ) | ||||
Urban Edge Properties | (20,776 | ) | (293,357 | ) | ||||
Vornado Realty Trust | (18,861 | ) | (444,931 | ) | ||||
Welltower, Inc. | (10,553 | ) | (644,155 | ) | ||||
(13,506,058 | ) | |||||||
| Real Estate Management & Development – (0.01)% | ||||||||
Compass, Inc., Class A | (3,450 | ) | (9,108 | ) | ||||
Zillow Group, Inc., Class C | (737 | ) | (22,744 | ) | ||||
(31,852 | ) | |||||||
| Road & Rail – (0.39)% | ||||||||
Canadian National Railway Company (b) | (326 | ) | (38,611 | ) | ||||
Covenant Logistics Group, Inc. | (1,829 | ) | (69,209 | ) | ||||
Knight-Swift Transportation Holdings, Inc. | (5,903 | ) | (283,521 | ) | ||||
Landstar System, Inc. | (954 | ) | (149,034 | ) | ||||
Old Dominion Freight Line, Inc. | (730 | ) | (200,458 | ) | ||||
Saia, Inc. | (82 | ) | (16,307 | ) | ||||
Schneider National, Inc., Class B | (4,607 | ) | (102,460 | ) | ||||
Uber Technologies, Inc. | (484 | ) | (12,860 | ) | ||||
Werner Enterprises, Inc. | (3,130 | ) | (122,696 | ) | ||||
(995,156 | ) | |||||||
| Semiconductors & Semiconductor Equipment – (0.67)% | ||||||||
Applied Materials, Inc. | (2,808 | ) | (247,918 | ) | ||||
Intel Corporation | (159 | ) | (4,520 | ) | ||||
Lam Research Corporation | (819 | ) | (331,515 | ) | ||||
NVIDIA Corporation | (1,400 | ) | (188,958 | ) | ||||
Teradyne, Inc. | (479 | ) | (38,967 | ) | ||||
Texas Instruments, Inc. | (4,234 | ) | (680,107 | ) | ||||
Tower Semiconductor Ltd. – ADR | (5,020 | ) | (214,655 | ) | ||||
(1,706,640 | ) | |||||||
The accompanying notes are an integral part of these financial statements.
41
WEISS ALTERNATIVE MULTI-STRATEGY FUND
Schedule of Securities Sold Short – Continued
October 31, 2022
| Shares | Value | |||||||
| Software – (0.19)% | ||||||||
Blackline, Inc. | (157 | ) | $ | (8,792 | ) | |||
Ceridian HCM Holding, Inc. | (197 | ) | (13,039 | ) | ||||
Check Point Software Technologies Ltd. – ADR | (273 | ) | (35,280 | ) | ||||
Dassault Systemes SE (b) | (249 | ) | (8,346 | ) | ||||
DocuSign, Inc. | (492 | ) | (23,764 | ) | ||||
HashiCorp, Inc., Class A | (1,063 | ) | (32,666 | ) | ||||
JFrog Ltd. – ADR | (497 | ) | (12,624 | ) | ||||
Palantir Technologies, Inc., Class A | (4,154 | ) | (36,514 | ) | ||||
Pegasystems, Inc. | (262 | ) | (9,749 | ) | ||||
Qualys, Inc. | (1,640 | ) | (233,798 | ) | ||||
UiPath, Inc. | (3,079 | ) | (38,949 | ) | ||||
Unity Software, Inc. | (1,318 | ) | (38,881 | ) | ||||
(492,402 | ) | |||||||
| Specialty Retail – (0.29)% | ||||||||
AutoNation, Inc. | (65 | ) | (6,910 | ) | ||||
Best Buy Company, Inc. | (110 | ) | (7,525 | ) | ||||
Burlington Stores, Inc. | (1,126 | ) | (160,973 | ) | ||||
CarMax, Inc. | (5,079 | ) | (320,028 | ) | ||||
Carvana Company | (2,351 | ) | (31,809 | ) | ||||
Foot Locker, Inc. | (2,490 | ) | (78,933 | ) | ||||
Lithia Motors, Inc. | (39 | ) | (7,728 | ) | ||||
Lowe’s Companies, Inc. | (336 | ) | (65,503 | ) | ||||
RH | (266 | ) | (67,545 | ) | ||||
(746,954 | ) | |||||||
| Technology Hardware, Storage & Peripherals – (0.12)% | ||||||||
Corsair Gaming, Inc. | (3,859 | ) | (53,254 | ) | ||||
Dell Technologies, Inc., Class C | (796 | ) | (30,566 | ) | ||||
Hewlett Packard Enterprise Company | (4,991 | ) | (71,222 | ) | ||||
HP, Inc. | (5,063 | ) | (139,840 | ) | ||||
(294,882 | ) | |||||||
| Textiles, Apparel & Luxury Goods – (0.01)% | ||||||||
NIKE, Inc., Class B | (225 | ) | (20,853 | ) | ||||
Thrifts & Mortgage Finance – (0.12)% | ||||||||
New York Community Bancorp, Inc. | (19,584 | ) | (182,327 | ) | ||||
Rocket Companies, Inc., Class A | (18,029 | ) | (124,400 | ) | ||||
(306,727 | ) | |||||||
| Trading Companies & Distributors – (0.08)% | ||||||||
Fastenal Company | (1,272 | ) | (61,476 | ) | ||||
GATX Corporation | (402 | ) | (42,093 | ) | ||||
The accompanying notes are an integral part of these financial statements.
42
WEISS ALTERNATIVE MULTI-STRATEGY FUND
Schedule of Securities Sold Short – Continued
October 31, 2022
| Shares | Value | |||||||
| Trading Companies & Distributors – (0.08)% (Continued) | ||||||||
MSC Industrial Direct Company, Inc. | (240 | ) | $ | (19,915 | ) | |||
Triton International Ltd. – ADR | (804 | ) | (48,795 | ) | ||||
Watsco, Inc. | (102 | ) | (27,638 | ) | ||||
(199,917 | ) | |||||||
| Wireless Telecommunication Services – 0.00% | ||||||||
SoftBank Group Corporation (b) | (105 | ) | (4,507 | ) | ||||
| Total Short Common Stocks | ||||||||
| (Proceeds $(55,638,271)) | (56,393,512 | ) | ||||||
| SHORT EXCHANGE TRADED FUNDS – (10.43)% | ||||||||
ARK Genomic Revolution ETF | (732 | ) | (24,712 | ) | ||||
ARK Innovation ETF | (10,185 | ) | (389,882 | ) | ||||
Communication Services Select Sector SPDR Fund | (8,275 | ) | (398,938 | ) | ||||
Consumer Discretionary Select Sector SPDR Fund | (2,295 | ) | (330,549 | ) | ||||
Consumer Staples Select Sector SPDR Fund | (7,011 | ) | (509,980 | ) | ||||
Energy Select Sector SPDR Fund | (3,777 | ) | (339,930 | ) | ||||
Financial Select Sector SPDR Fund | (138 | ) | (4,689 | ) | ||||
First Trust NASDAQ Cybersecurity ETF | (12,375 | ) | (516,161 | ) | ||||
Health Care Select Sector SPDR Fund | (5,539 | ) | (735,302 | ) | ||||
Industrial Select Sector SPDR Fund | (3,989 | ) | (376,362 | ) | ||||
Invesco QQQ Trust Series 1 | (21,219 | ) | (5,897,821 | ) | ||||
Invesco Solar ETF | (2,067 | ) | (147,336 | ) | ||||
iShares China Large-Cap ETF | (7,479 | ) | (156,685 | ) | ||||
iShares Core DAX UCITS ETF | (1,231 | ) | (135,934 | ) | ||||
iShares Core EURO STOXX 50 UCITS ETF | (1,995 | ) | (71,564 | ) | ||||
iShares MSCI Eurozone ETF | (6,221 | ) | (219,041 | ) | ||||
iShares MSCI Germany Index Fund ETF | (5,067 | ) | (110,562 | ) | ||||
iShares Nasdaq Biotechnology ETF | (1,146 | ) | (147,364 | ) | ||||
iShares North American Tech-Software ETF | (10,013 | ) | (2,679,479 | ) | ||||
iShares Russell 1000 Growth ETF | (3,099 | ) | (689,775 | ) | ||||
iShares Russell 2000 ETF | (8,090 | ) | (1,483,140 | ) | ||||
iShares Russell 2000 Growth ETF | (1,307 | ) | (295,722 | ) | ||||
iShares Russell 3000 ETF | (350 | ) | (78,368 | ) | ||||
iShares Transportation Average ETF | (1,670 | ) | (354,842 | ) | ||||
iShares U.S. Technology ETF | (11,429 | ) | (873,061 | ) | ||||
KraneShares CSI China Internet ETF | (5,157 | ) | (99,014 | ) | ||||
Material Select Sector SPDR | (1,509 | ) | (111,787 | ) | ||||
SPDR S&P 500 ETF Trust | (15,984 | ) | (6,173,181 | ) | ||||
SPDR S&P Biotech ETF | (1,789 | ) | (146,966 | ) | ||||
SPDR S&P Homebuilders ETF | (2,166 | ) | (126,364 | ) | ||||
The accompanying notes are an integral part of these financial statements.
43
WEISS ALTERNATIVE MULTI-STRATEGY FUND
Schedule of Securities Sold Short – Continued
October 31, 2022
| Shares | Value | |||||||
| SHORT EXCHANGE TRADED FUNDS – (10.43)% (Continued) | ||||||||
SPDR S&P Metals & Mining ETF | (7,353 | ) | $ | (356,621 | ) | |||
SPDR S&P MidCap 400 ETF Trust | (348 | ) | (154,432 | ) | ||||
SPDR S&P Oil & Gas Exploration & Production ETF | (5,328 | ) | (806,073 | ) | ||||
SPDR S&P Regional Banking ETF | (522 | ) | (33,382 | ) | ||||
SPDR S&P Retail ETF | (1,105 | ) | (69,339 | ) | ||||
Technology Select Sector SPDR Fund | (1,202 | ) | (153,700 | ) | ||||
U.S. Global Jets ETF | (9,959 | ) | (176,673 | ) | ||||
Utilities Select Sector SPDR Fund | (869 | ) | (58,032 | ) | ||||
VanEck Vectors Gold Miners ETF | (4,822 | ) | (116,500 | ) | ||||
VanEck Vectors Semiconductor ETF | (3,196 | ) | (604,747 | ) | ||||
Vanguard REIT ETF | (3,890 | ) | (322,792 | ) | ||||
| Total Short Exchange Traded Funds | ||||||||
| (Proceeds $(26,683,733)) | (26,476,802 | ) | ||||||
| Total Securities Sold Short – (32.66)% | ||||||||
| (Proceeds $(82,322,004)) | $ | (82,870,314 | ) | |||||
| (a) | Securities sold short are not owned by the Fund and cannot produce income. |
| (b) | Foreign security. |
ADR – American Depository Receipt
plc – Public Limited Company
The accompanying notes are an integral part of these financial statements.
44
WEISS ALTERNATIVE MULTI-STRATEGY FUND
Schedule of Written Options
October 31, 2022
| Contracts (a) | Notional Amount | Value | ||||||||||
| WRITTEN CALL OPTIONS | ||||||||||||
1Life Healthcare, Inc. | ||||||||||||
Expiration: January 2023, Exercise Price: $17.50 | (11 | ) | $ | (18,810 | ) | $ | (55 | ) | ||||
Alteryx, Inc. | ||||||||||||
Expiration: January 2023, Exercise Price: $80.00 | (9 | ) | (43,857 | ) | (247 | ) | ||||||
Amazon.com, Inc. | ||||||||||||
Expiration: December 2022, Exercise Price: $80.00 | (27 | ) | (276,588 | ) | (63,450 | ) | ||||||
Expiration: December 2022, Exercise Price: $85.00 | (14 | ) | (143,416 | ) | (26,530 | ) | ||||||
Asana, Inc. | ||||||||||||
Expiration: November 2022, Exercise Price: $30.00 | (4 | ) | (8,240 | ) | (40 | ) | ||||||
Beyond Meat, Inc. | ||||||||||||
Expiration: November 2022, Exercise Price: $12.50 | (27 | ) | (42,390 | ) | (9,585 | ) | ||||||
Charter Communications, Inc. | ||||||||||||
Expiration: December 2022, Exercise Price: $250.00 | (6 | ) | (220,572 | ) | (71,760 | ) | ||||||
Cloudflare, Inc. | ||||||||||||
Expiration: November 2022, Exercise Price: $55.00 | (4 | ) | (22,528 | ) | (2,570 | ) | ||||||
Direxion Daily MSCI Brazil Bull 2X Shares | ||||||||||||
Expiration: November 2022, Exercise Price: $65.00 | (9 | ) | (77,733 | ) | (19,800 | ) | ||||||
Expiration: December 2022, Exercise Price: $70.00 | (17 | ) | (146,829 | ) | (34,425 | ) | ||||||
DraftKings, Inc. | ||||||||||||
Expiration: November 2022, Exercise Price: $20.00 | (33 | ) | (52,140 | ) | (825 | ) | ||||||
Dynatrace, Inc. | ||||||||||||
Expiration: February 2023, Exercise Price: $45.00 | (5 | ) | (17,620 | ) | (675 | ) | ||||||
Eli Lilly & Company | ||||||||||||
Expiration: November 2022, Exercise Price: $380.00 | (1 | ) | (36,209 | ) | (529 | ) | ||||||
F5, Inc. | ||||||||||||
Expiration: November 2022, Exercise Price: $140.00 | (3 | ) | (42,873 | ) | (2,070 | ) | ||||||
Hilton Worldwide Holdings, Inc. | ||||||||||||
Expiration: November 2022, Exercise Price: $100.00 | (14 | ) | (189,364 | ) | (49,770 | ) | ||||||
Invesco QQQ Trust Series 1 | ||||||||||||
Expiration: December 2022, Exercise Price: $210.00 | (14 | ) | (389,130 | ) | (97,370 | ) | ||||||
Expiration: December 2022, Exercise Price: $215.00 | (14 | ) | (389,130 | ) | (90,566 | ) | ||||||
Expiration: December 2022, Exercise Price: $220.00 | (14 | ) | (389,130 | ) | (83,818 | ) | ||||||
Expiration: December 2022, Exercise Price: $255.00 | (14 | ) | (389,130 | ) | (39,739 | ) | ||||||
Las Vegas Sands Corporation | ||||||||||||
Expiration: December 2022, Exercise Price: $46.00 | (36 | ) | (136,836 | ) | (2,538 | ) | ||||||
McDonald’s Corporation | ||||||||||||
Expiration: November 2022, Exercise Price: $260.00 | (3 | ) | (81,798 | ) | (4,357 | ) | ||||||
Melco Resorts & Entertainment Ltd. (b) | ||||||||||||
Expiration: January 2023, Exercise Price: $13.00 | (31 | ) | (16,957 | ) | (155 | ) | ||||||
Merck & Company Inc. | ||||||||||||
Expiration: November 2022, Exercise Price: $102.00 | (1 | ) | (10,120 | ) | (175 | ) | ||||||
The accompanying notes are an integral part of these financial statements.
45
WEISS ALTERNATIVE MULTI-STRATEGY FUND
Schedule of Written Options – Continued
October 31, 2022
| Contracts (a) | Notional Amount | Value | ||||||||||
| WRITTEN CALL OPTIONS (Continued) | ||||||||||||
Meta Platforms, Inc. | ||||||||||||
Expiration: November 2022, Exercise Price: $100.00 | (3 | ) | $ | (27,948 | ) | $ | (175 | ) | ||||
Expiration: December 2022, Exercise Price: $200.00 | (9 | ) | (83,844 | ) | (32 | ) | ||||||
Netflix, Inc. | ||||||||||||
Expiration: November 2022, Exercise Price: $285.00 | (2 | ) | (58,376 | ) | (3,460 | ) | ||||||
Nikola Corporation | ||||||||||||
Expiration: November 2022, Exercise Price: $3.00 | (25 | ) | (9,475 | ) | (2,300 | ) | ||||||
Expiration: November 2022, Exercise Price: $4.00 | (147 | ) | (55,713 | ) | (4,410 | ) | ||||||
Nutanix, Inc. | ||||||||||||
Expiration: January 2023, Exercise Price: $20.00 | (14 | ) | (38,360 | ) | (11,130 | ) | ||||||
NXP Semiconductors N.V. (b) | ||||||||||||
Expiration: November 2022, Exercise Price: $150.00 | (3 | ) | (43,824 | ) | (930 | ) | ||||||
Peloton Interactive, Inc. | ||||||||||||
Expiration: January 2024, Exercise Price: $17.50 | (27 | ) | (22,680 | ) | (3,564 | ) | ||||||
ProShares Ultra VIX Short-Term Futures ETF | ||||||||||||
Expiration: November 2022, Exercise Price: $10.00 | (12 | ) | (11,772 | ) | (840 | ) | ||||||
Expiration: November 2022, Exercise Price: $11.00 | (45 | ) | (44,145 | ) | (1,935 | ) | ||||||
Expiration: November 2022, Exercise Price: $13.00 | (22 | ) | (21,582 | ) | (506 | ) | ||||||
Expiration: November 2022, Exercise Price: $14.00 | (45 | ) | (44,145 | ) | (922 | ) | ||||||
Expiration: November 2022, Exercise Price: $17.00 | (90 | ) | (88,290 | ) | (1,260 | ) | ||||||
Expiration: December 2022, Exercise Price: $6.00 | (17 | ) | (16,677 | ) | (6,588 | ) | ||||||
Expiration: December 2022, Exercise Price: $7.00 | (42 | ) | (41,202 | ) | (12,201 | ) | ||||||
Expiration: December 2022, Exercise Price: $8.00 | (42 | ) | (41,202 | ) | (9,051 | ) | ||||||
Expiration: December 2022, Exercise Price: $9.00 | (16 | ) | (15,696 | ) | (2,536 | ) | ||||||
Expiration: December 2022, Exercise Price: $10.00 | (63 | ) | (61,803 | ) | (7,560 | ) | ||||||
Expiration: December 2022, Exercise Price: $11.00 | (22 | ) | (21,582 | ) | (2,079 | ) | ||||||
Expiration: December 2022, Exercise Price: $15.00 | (38 | ) | (37,278 | ) | (1,824 | ) | ||||||
Expiration: December 2022, Exercise Price: $16.00 | (38 | ) | (37,278 | ) | (1,558 | ) | ||||||
Expiration: December 2022, Exercise Price: $25.00 | (114 | ) | (111,834 | ) | (2,622 | ) | ||||||
Expiration: December 2022, Exercise Price: $30.00 | (45 | ) | (44,145 | ) | (923 | ) | ||||||
Expiration: December 2022, Exercise Price: $39.00 | (45 | ) | (44,145 | ) | (810 | ) | ||||||
ProShares UltraPro QQQ | ||||||||||||
Expiration: December 2022, Exercise Price: $30.00 | (32 | ) | (67,040 | ) | (1,280 | ) | ||||||
QUALCOMM, Inc. | ||||||||||||
Expiration: November 2022, Exercise Price: $120.00 | (3 | ) | (35,298 | ) | (1,568 | ) | ||||||
Expiration: December 2022, Exercise Price: $90.00 | (14 | ) | (164,724 | ) | (40,530 | ) | ||||||
RingCentral, Inc. | ||||||||||||
Expiration: December 2022, Exercise Price: $75.00 | (8 | ) | (28,416 | ) | (200 | ) | ||||||
Royal Caribbean Cruises Ltd. (b) | ||||||||||||
Expiration: December 2022, Exercise Price: $60.00 | (13 | ) | (69,394 | ) | (3,523 | ) | ||||||
The accompanying notes are an integral part of these financial statements.
46
WEISS ALTERNATIVE MULTI-STRATEGY FUND
Schedule of Written Options – Continued
October 31, 2022
| Contracts (a) | Notional Amount | Value | ||||||||||
| WRITTEN CALL OPTIONS (Continued) | ||||||||||||
ServiceNow, Inc. | ||||||||||||
Expiration: November 2022, Exercise Price: $410.00 | (3 | ) | $ | (126,222 | ) | $ | (7,470 | ) | ||||
SPDR S&P 500 ETF Trust | ||||||||||||
Expiration: November 2022, Exercise Price: $390.00 | (4 | ) | (154,484 | ) | (3,060 | ) | ||||||
Texas Instruments, Inc. | ||||||||||||
Expiration: November 2022, Exercise Price: $160.00 | (6 | ) | (96,378 | ) | (3,210 | ) | ||||||
T-Mobile US, Inc. | ||||||||||||
Expiration: November 2022, Exercise Price: $160.00 | (4 | ) | (60,624 | ) | (328 | ) | ||||||
Wynn Resorts Ltd. | ||||||||||||
Expiration: November 2022, Exercise Price: $75.00 | (21 | ) | (134,190 | ) | (1,481 | ) | ||||||
(742,915 | ) | |||||||||||
| WRITTEN PUT OPTIONS | ||||||||||||
ADT, Inc. | ||||||||||||
Expiration: November 2022, Exercise Price: $12.00 | (666 | ) | (563,436 | ) | (239,760 | ) | ||||||
Alteryx, Inc. | ||||||||||||
Expiration: January 2023, Exercise Price: $60.00 | (9 | ) | (43,857 | ) | (11,475 | ) | ||||||
Amazon.com, Inc. | ||||||||||||
Expiration: December 2022, Exercise Price: $155.00 | (7 | ) | (71,708 | ) | (36,820 | ) | ||||||
Beyond Meat, Inc. | ||||||||||||
Expiration: November 2022, Exercise Price: $17.50 | (27 | ) | (42,390 | ) | (8,910 | ) | ||||||
Charter Communications, Inc. | ||||||||||||
Expiration: November 2022, Exercise Price: $350.00 | (2 | ) | (73,524 | ) | (1,560 | ) | ||||||
Expiration: December 2022, Exercise Price: $460.00 | (6 | ) | (220,572 | ) | (55,890 | ) | ||||||
CVS Health Corporation | ||||||||||||
Expiration: November 2022, Exercise Price: $80.00 | (1 | ) | (9,470 | ) | (15 | ) | ||||||
Dynatrace, Inc. | ||||||||||||
Expiration: February 2023, Exercise Price: $25.00 | (5 | ) | (17,620 | ) | (437 | ) | ||||||
Edwards Lifesciences Corporation | ||||||||||||
Expiration: November 2022, Exercise Price: $79.00 | (1 | ) | (7,243 | ) | (695 | ) | ||||||
Horizon Therapeutics plc (b) | ||||||||||||
Expiration: November 2022, Exercise Price: $55.00 | (2 | ) | (12,464 | ) | (184 | ) | ||||||
Intel Corporation | ||||||||||||
Expiration: November 2022, Exercise Price: $28.50 | (27 | ) | (76,761 | ) | (3,321 | ) | ||||||
Invesco QQQ Trust Series 1 | ||||||||||||
Expiration: November 2022, Exercise Price: $305.00 | (11 | ) | (305,745 | ) | (30,212 | ) | ||||||
Expiration: November 2022, Exercise Price: $310.00 | (39 | ) | (1,084,005 | ) | (125,424 | ) | ||||||
Expiration: November 2022, Exercise Price: $315.00 | (35 | ) | (972,825 | ) | (129,640 | ) | ||||||
iShares 20+ Year Treasury Bond ETF | ||||||||||||
Expiration: January 2023, Exercise Price: $100.00 | (5 | ) | (48,055 | ) | (3,200 | ) | ||||||
The Kraft Heinz Company | ||||||||||||
Expiration: November 2022, Exercise Price: $30.00 | (82 | ) | (315,454 | ) | (205 | ) | ||||||
The accompanying notes are an integral part of these financial statements.
47
WEISS ALTERNATIVE MULTI-STRATEGY FUND
Schedule of Written Options – Continued
October 31, 2022
| Contracts (a) | Notional Amount | Value | ||||||||||
| WRITTEN PUT OPTIONS (Continued) | ||||||||||||
Nutanix, Inc. | ||||||||||||
Expiration: January 2023, Exercise Price: $12.50 | (14 | ) | $ | (38,360 | ) | $ | (315 | ) | ||||
PBF Energy, Inc. | ||||||||||||
Expiration: November 2022, Exercise Price: $36.00 | (27 | ) | (119,475 | ) | (1,148 | ) | ||||||
Pfizer, Inc. | ||||||||||||
Expiration: November 2022, Exercise Price: $46.00 | (2 | ) | (9,310 | ) | (242 | ) | ||||||
QUALCOMM, Inc. | ||||||||||||
Expiration: December 2022, Exercise Price: $160.00 | (14 | ) | (164,724 | ) | (59,885 | ) | ||||||
RingCentral, Inc. | ||||||||||||
Expiration: December 2022, Exercise Price: $45.00 | (8 | ) | (28,416 | ) | (8,400 | ) | ||||||
Salesforce, Inc. | ||||||||||||
Expiration: November 2022, Exercise Price: $150.00 | (3 | ) | (48,777 | ) | (546 | ) | ||||||
SPDR S&P 500 ETF Trust | ||||||||||||
Expiration: November 2022, Exercise Price: $360.00 | (21 | ) | (811,041 | ) | (5,544 | ) | ||||||
Splunk, Inc. | ||||||||||||
Expiration: January 2023, Exercise Price: $75.00 | (3 | ) | (24,933 | ) | (1,560 | ) | ||||||
Stryker Corporation | ||||||||||||
Expiration: November 2022, Exercise Price: $215.00 | (3 | ) | (68,772 | ) | (930 | ) | ||||||
United Therapeutics Corporation | ||||||||||||
Expiration: November 2022, Exercise Price: $190.00 | (1 | ) | (23,053 | ) | (185 | ) | ||||||
UnitedHealth Group, Inc. | ||||||||||||
Expiration: November 2022, Exercise Price: $510.00 | (14 | ) | (777,210 | ) | (217 | ) | ||||||
Vertex Pharmaceuticals, Inc. | ||||||||||||
Expiration: November 2022, Exercise Price: $275.00 | (1 | ) | (31,200 | ) | (150 | ) | ||||||
Warner Brothers Discovery, Inc. | ||||||||||||
Expiration: November 2022, Exercise Price: $15.00 | (32 | ) | (41,600 | ) | (6,944 | ) | ||||||
(733,814 | ) | |||||||||||
| TOTAL WRITTEN OPTIONS | ||||||||||||
| (Premiums received $1,883,277) | $ | (1,476,729 | ) | |||||||||
| (a) | 100 shares per contract. |
| (b) | Foreign security. |
ETF – Exchange Traded Fund
The accompanying notes are an integral part of these financial statements.
48
WEISS ALTERNATIVE MULTI-STRATEGY FUND
Schedule of Swap Contracts
October 31, 2022
| Value of | ||||||||||||||||||||||||||
| Pay/Receive | Number of | Unrealized | ||||||||||||||||||||||||
| Counter- | Maturity | Financing | Financing | Payment | Shares/ | Notional | Upfront | Appreciation | ||||||||||||||||||
| party | Security | Date | Rate | Rate | Frequency | Units | Amount | Payment | (Depreciation)* | |||||||||||||||||
| LONG EQUITY SWAP CONTRACTS | ||||||||||||||||||||||||||
Morgan | Airbus S.E. | 7/9/24 | Pay | 1.340% | Monthly | 1,212 | $ | 131,143 | $ | — | $ | 10,455 | ||||||||||||||
Stanley | (0.600% + Euro | |||||||||||||||||||||||||
| Overnight | ||||||||||||||||||||||||||
| Index Average) | ||||||||||||||||||||||||||
Morgan | Airbus S.E. | 5/15/24 | Pay | 1.340% | Monthly | 3,253 | 351,987 | — | 18,923 | |||||||||||||||||
Stanley | (0.600% + Euro | |||||||||||||||||||||||||
| Overnight | ||||||||||||||||||||||||||
| Index Average) | ||||||||||||||||||||||||||
Morgan | AstraZeneca plc | 6/10/24 | Pay | 2.790% | Monthly | 337 | 39,541 | — | 1,590 | |||||||||||||||||
Stanley | (0.600% + Sterling | |||||||||||||||||||||||||
| Overnight | ||||||||||||||||||||||||||
| Index Average) | ||||||||||||||||||||||||||
Morgan | China Solar | 3/27/24 | Pay | 3.580% | Monthly | 12,564 | 155,514 | — | (16,250 | ) | ||||||||||||||||
Stanley | (0.500% + U.S. | |||||||||||||||||||||||||
| Federal Funds | ||||||||||||||||||||||||||
| Effective Rate) | ||||||||||||||||||||||||||
Morgan | Flutter | 8/6/24 | Pay | 2.790% | Monthly | 1,068 | 141,554 | — | 13,880 | |||||||||||||||||
Stanley | Entertainment plc | (0.600% + Sterling) | ||||||||||||||||||||||||
| Overnight | ||||||||||||||||||||||||||
| Index Average) | ||||||||||||||||||||||||||
Morgan | Flutter | 1/6/23 | Pay | 2.790% | Monthly | 72 | 9,543 | — | 1,307 | |||||||||||||||||
Stanley | Entertainment plc | (0.600% + Sterling) | ||||||||||||||||||||||||
| Overnight | ||||||||||||||||||||||||||
| Index Average) | ||||||||||||||||||||||||||
Morgan | Glencore plc | 6/19/23 | Pay | 2.790% | Monthly | 64,542 | 370,025 | — | 19,864 | |||||||||||||||||
Stanley | (0.600% + Sterling | |||||||||||||||||||||||||
| Overnight | ||||||||||||||||||||||||||
| Index Average) | ||||||||||||||||||||||||||
Morgan | Growth Basket | 8/7/24 | Pay | 3.580% | Monthly | 436 | 195,825 | — | (10,686 | ) | ||||||||||||||||
Stanley | (0.500% + U.S. | |||||||||||||||||||||||||
| Federal Funds | ||||||||||||||||||||||||||
| Effective Rate) | ||||||||||||||||||||||||||
Morgan | Growth Vs. | 5/14/24 | Pay | 0.850% | Monthly | 2,960 | 330,454 | — | (11,818 | ) | ||||||||||||||||
Stanley | Value Basket | Fixed Rate | ||||||||||||||||||||||||
Morgan | GSK plc | 6/10/24 | Pay | 2.790% | Monthly | 8,727 | 142,958 | — | 9,744 | |||||||||||||||||
Stanley | (0.600% + Sterling | |||||||||||||||||||||||||
| Overnight | ||||||||||||||||||||||||||
| Index Average) | ||||||||||||||||||||||||||
Morgan | Haleon plc | 6/10/24 | Pay | 2.790% | Monthly | 35,517 | 108,912 | — | 472 | |||||||||||||||||
Stanley | (0.600% + Sterling | |||||||||||||||||||||||||
| Overnight | ||||||||||||||||||||||||||
| Index Average) | ||||||||||||||||||||||||||
The accompanying notes are an integral part of these financial statements.
49
WEISS ALTERNATIVE MULTI-STRATEGY FUND
Schedule of Swap Contracts – Continued
October 31, 2022
| Value of | ||||||||||||||||||||||||||
| Pay/Receive | Number of | Unrealized | ||||||||||||||||||||||||
| Counter- | Maturity | Financing | Financing | Payment | Shares/ | Notional | Upfront | Appreciation | ||||||||||||||||||
| party | Security | Date | Rate | Rate | Frequency | Units | Amount | Payment | (Depreciation)* | |||||||||||||||||
| LONG EQUITY SWAP CONTRACTS (Continued) | ||||||||||||||||||||||||||
| Morgan | Imperial | 3/6/24 | Pay | 2.790% | Monthly | 2,629 | 64,040 | $ | — | $ | 5,600 | |||||||||||||||
| Stanley | Brands plc | (0.600% + Sterling | ||||||||||||||||||||||||
| Overnight | ||||||||||||||||||||||||||
| Index Average) | ||||||||||||||||||||||||||
| Morgan | iShares iBoxx | 1/4/23 | Pay | 2.780% | Monthly | 320,100 | 32,442,135 | — | (6,709,380 | ) | ||||||||||||||||
| Stanley | $Investment | ((0.300)% + U.S. | ||||||||||||||||||||||||
| Grade Corporate | Federal Funds | |||||||||||||||||||||||||
| Bond ETF | Effective Rate) | |||||||||||||||||||||||||
| Morgan | iShares iBoxx | 1/4/23 | Pay | 1.780% | Monthly | 462,200 | 33,939,346 | — | (4,116,714 | ) | ||||||||||||||||
| Stanley | High Yield | ((1.300)% + U.S. | ||||||||||||||||||||||||
| Corporate | Federal Funds | |||||||||||||||||||||||||
| Bond ETF | Effective Rate) | |||||||||||||||||||||||||
| Morgan | John Wood | 5/8/24 | Pay | 2.790% | Monthly | 82,559 | 132,745 | — | (54,363 | ) | ||||||||||||||||
| Stanley | Group plc | (0.600% + Sterling | ||||||||||||||||||||||||
| Overnight | ||||||||||||||||||||||||||
| Index Average) | ||||||||||||||||||||||||||
| Morgan | Sanofi | 6/5/24 | Pay | 1.340% | Monthly | 1,596 | 137,348 | — | 9,605 | |||||||||||||||||
| Stanley | (0.600% + Euro | |||||||||||||||||||||||||
| Overnight | ||||||||||||||||||||||||||
| Index Average) | ||||||||||||||||||||||||||
| Morgan | U.S. Sector- | 12/14/23 | Pay | 0.850% | Monthly | 255 | 19,411 | — | (351 | ) | ||||||||||||||||
| Stanley | Neutral | Fixed Rate | ||||||||||||||||||||||||
| Quality Basket | ||||||||||||||||||||||||||
| Morgan | U.S. Value | 10/28/24 | Pay | 0.850% | Monthly | 706 | 38,521 | — | (1,181 | ) | ||||||||||||||||
| Stanley | Basket | Fixed Rate | ||||||||||||||||||||||||
| Morgan | Vallourec S.A. | 10/16/24 | Pay | 1.340% | Monthly | 11,573 | 123,133 | — | 2,233 | |||||||||||||||||
| Stanley | (0.600% + Euro | |||||||||||||||||||||||||
| Overnight | ||||||||||||||||||||||||||
| Index Average) | ||||||||||||||||||||||||||
| SHORT EQUITY SWAP CONTRACTS | ||||||||||||||||||||||||||
| Morgan | Antofagast plc | 5/7/24 | Pay | 1.690% | Monthly | (84 | ) | (1,132 | ) | — | 2 | |||||||||||||||
| Stanley | ((0.500)% + Sterling | |||||||||||||||||||||||||
| Overnight | ||||||||||||||||||||||||||
| Index Average) | ||||||||||||||||||||||||||
| Morgan | Antofagasta plc | 6/19/23 | Pay | 1.690% | Monthly | (11,327 | ) | (152,636 | ) | — | 15,060 | |||||||||||||||
| Stanley | ((0.500)% + Sterling | |||||||||||||||||||||||||
| Overnight | ||||||||||||||||||||||||||
| Index Average) | ||||||||||||||||||||||||||
| Morgan | Crowd Basket | 6/28/24 | Pay | 2.580% | ||||||||||||||||||||||
| Stanley | ((0.500)% + U.S. | Monthly | (7,305 | ) | (813,631 | ) | — | 86,645 | ||||||||||||||||||
| Federal Funds | ||||||||||||||||||||||||||
| Effective Rate) | ||||||||||||||||||||||||||
The accompanying notes are an integral part of these financial statements.
50
WEISS ALTERNATIVE MULTI-STRATEGY FUND
Schedule of Swap Contracts – Continued
October 31, 2022
| Value of | ||||||||||||||||||||||||||
Pay/Receive | Number of | Unrealized | ||||||||||||||||||||||||
| Counter- | Maturity | Financing | Financing | Payment | Shares/ | Notional | Upfront | Appreciation | ||||||||||||||||||
| party | Security | Date | Rate | Rate | Frequency | Units | Amount | Payment | (Depreciation)* | |||||||||||||||||
| SHORT EQUITY SWAP CONTRACTS (Continued) | ||||||||||||||||||||||||||
Morgan | Cyclical Vs. | 4/29/24 | Receive | (0.850)% | Monthly | (547 | ) | (56,133 | ) | $ | — | $ | (49 | ) | ||||||||||||
Stanley | Defensive Basket | Fixed Rate | ||||||||||||||||||||||||
Morgan | Cyclicals Vs. | 1/25/24 | Receive | (0.850)% | Monthly | (26 | ) | (2,668 | ) | — | (106 | ) | ||||||||||||||
Stanley | Defensive Basket | Fixed Rate | ||||||||||||||||||||||||
Morgan | Danone S.A. | 11/28/22 | Pay | 0.240% | Monthly | (848 | ) | (42,145 | ) | — | (2,312 | ) | ||||||||||||||
Stanley | ((0.500)% + Euro | |||||||||||||||||||||||||
| Overnight | ||||||||||||||||||||||||||
| Index Average) | ||||||||||||||||||||||||||
Morgan | Debt Expiry | 2/2/23 | Pay | 2.660% | Monthly | (5,540 | ) | (485,969 | ) | — | (12,337 | ) | ||||||||||||||
Stanley | Basket | ((0.420)% + U.S. | ||||||||||||||||||||||||
| Federal Funds | ||||||||||||||||||||||||||
| Effective Rate) | ||||||||||||||||||||||||||
Morgan | European | 2/2/23 | Pay | 2.780% | ||||||||||||||||||||||
Stanley | Exposure Basket | ((0.300)% + U.S. | Monthly | (4,815 | ) | (361,992 | ) | — | 34,216 | |||||||||||||||||
| Federal Funds | ||||||||||||||||||||||||||
| Effective Rate) | ||||||||||||||||||||||||||
Morgan | High Beta | 3/22/23 | Pay | 2.680% | Monthly | (478 | ) | (30,874 | ) | — | (2,451 | ) | ||||||||||||||
Stanley | Cyclicals Basket | ((0.400)% + U.S. | ||||||||||||||||||||||||
| Federal Funds | ||||||||||||||||||||||||||
| Effective Rate) | ||||||||||||||||||||||||||
Morgan | High Yield | 3/22/23 | Pay | 2.710% | Monthly | (670 | ) | (33,527 | ) | — | (3,680 | ) | ||||||||||||||
Stanley | Debt Sensitivity | ((0.370)% + U.S. | ||||||||||||||||||||||||
ex-Energy Basket | Federal Funds | |||||||||||||||||||||||||
| Effective Rate) | ||||||||||||||||||||||||||
Morgan | Infotech Basket | 6/28/24 | Pay | 2.630% | Monthly | (1,631 | ) | (230,852 | ) | — | 9,394 | |||||||||||||||
Stanley | ((0.450)% + U.S. | |||||||||||||||||||||||||
| Federal Funds | ||||||||||||||||||||||||||
| Effective Rate) | ||||||||||||||||||||||||||
Morgan | Infotech Basket | 2/2/23 | Pay | 2.630% | Monthly | (3,379 | ) | (478,264 | ) | — | (23,682 | ) | ||||||||||||||
Stanley | ((0.450)% + U.S. | |||||||||||||||||||||||||
| Federal Funds | ||||||||||||||||||||||||||
| Effective Rate) | ||||||||||||||||||||||||||
Morgan | Media Basket | 6/28/24 | Pay | 2.680% | Monthly | (3,921 | ) | (205,343 | ) | — | 18,514 | |||||||||||||||
Stanley | ((0.400)% + U.S. | |||||||||||||||||||||||||
| Federal Funds | ||||||||||||||||||||||||||
| Effective Rate) | ||||||||||||||||||||||||||
Morgan | MSGWTRN3_P | 11/21/23 | Pay | 2.830% | Monthly | (2,726 | ) | (283,150 | ) | — | (6,046 | ) | ||||||||||||||
Stanley | ((0.250)% + U.S. | |||||||||||||||||||||||||
| Federal Funds | ||||||||||||||||||||||||||
| Effective Rate) | ||||||||||||||||||||||||||
Morgan | MSGWTRN3_R | 3/22/23 | Pay | 2.830% | Monthly | (274 | ) | (28,460 | ) | — | (669 | ) | ||||||||||||||
Stanley | ((0.250)% + U.S. | |||||||||||||||||||||||||
| Federal Funds | ||||||||||||||||||||||||||
| Effective Rate) | ||||||||||||||||||||||||||
The accompanying notes are an integral part of these financial statements.
51
WEISS ALTERNATIVE MULTI-STRATEGY FUND
Schedule of Swap Contracts – Continued
October 31, 2022
| Value of | ||||||||||||||||||||||||||
Pay/Receive | Number of | Unrealized | ||||||||||||||||||||||||
| Counter- | Maturity | Financing | Financing | Payment | Shares/ | Notional | Upfront | Appreciation | ||||||||||||||||||
| party | Security | Date | Rate | Rate | Frequency | Units | Amount | Payment | (Depreciation)* | |||||||||||||||||
| SHORT EQUITY SWAP CONTRACTS (Continued) | ||||||||||||||||||||||||||
Morgan | MSGWXSD | 2/2/23 | Pay | 2.730% | Monthly | (9,540 | ) | (1,476,697 | ) | $ | — | $ | (21,044 | ) | ||||||||||||
Stanley | ((0.350)% + U.S. | |||||||||||||||||||||||||
| Federal Funds | ||||||||||||||||||||||||||
| Effective Rate) | ||||||||||||||||||||||||||
Morgan | MSW06501 | 1/5/23 | Receive | (0.460)% | Monthly | (5,418 | ) | (35,272 | ) | — | 2,443 | |||||||||||||||
Stanley | Basket | ((0.400)% + Bank | ||||||||||||||||||||||||
| of Japan Estimated | ||||||||||||||||||||||||||
| Unsecured | ||||||||||||||||||||||||||
| Overnight | ||||||||||||||||||||||||||
| Call Rate) | ||||||||||||||||||||||||||
Morgan | QQQE | 2/2/23 | Pay | 2.710% | Monthly | (15,607 | ) | (1,232,797 | ) | — | 54,606 | |||||||||||||||
Stanley | MSGWQQQE | ((0.370)% + U.S. | ||||||||||||||||||||||||
Basket | Federal Funds | |||||||||||||||||||||||||
| Effective Rate) | ||||||||||||||||||||||||||
Morgan | QQQE | 11/1/23 | Pay | 2.710% | Monthly | (1,850 | ) | (146,132 | ) | — | 22,901 | |||||||||||||||
Stanley | MSGWQQQE | ((0.370)% + U.S. | ||||||||||||||||||||||||
Basket | Federal Funds | |||||||||||||||||||||||||
| Effective Rate) | ||||||||||||||||||||||||||
Morgan | Rio Tinto plc | 5/8/24 | Pay | 1.690% | Monthly | (1,060 | ) | (55,397 | ) | — | 2,918 | |||||||||||||||
Stanley | ((0.500)% + Sterling | |||||||||||||||||||||||||
| Overnight | ||||||||||||||||||||||||||
| Index Average) | ||||||||||||||||||||||||||
Morgan | Rio Tinto plc | 6/19/23 | Pay | 1.690% | Monthly | (1,679 | ) | (87,747 | ) | — | 5,530 | |||||||||||||||
Stanley | ((0.500)% + Sterling | |||||||||||||||||||||||||
| Overnight | ||||||||||||||||||||||||||
| Index Average) | ||||||||||||||||||||||||||
Morgan | SAAS Basket | 2/2/23 | Pay | 2.780% | Monthly | (809 | ) | (301,676 | ) | — | 1,274 | |||||||||||||||
Stanley | ((0.300)% + U.S. | |||||||||||||||||||||||||
| Federal Funds | ||||||||||||||||||||||||||
| Effective Rate) | ||||||||||||||||||||||||||
Morgan | Software Basket | 6/27/24 | Pay | 2.680% | Monthly | (9,945 | ) | (1,080,922 | ) | — | 105,187 | |||||||||||||||
Stanley | ((0.400)% + U.S. | |||||||||||||||||||||||||
| Federal Funds | ||||||||||||||||||||||||||
| Effective Rate) | ||||||||||||||||||||||||||
Morgan | Technology | 2/2/23 | Pay | 2.770% | Monthly | (10,784 | ) | (613,933 | ) | — | 9,838 | |||||||||||||||
Stanley | Hardware Basket | ((0.310)% + U.S. | ||||||||||||||||||||||||
| Federal Funds | ||||||||||||||||||||||||||
| Effective Rate) | ||||||||||||||||||||||||||
Morgan | U.S. Growth | 4/2/24 | Pay | 2.380% | Monthly | (2,528 | ) | (474,358 | ) | — | 58,770 | |||||||||||||||
Stanley | Long Basket | ((0.700)% + U.S. | ||||||||||||||||||||||||
| Federal Funds | ||||||||||||||||||||||||||
| Effective Rate) | ||||||||||||||||||||||||||
The accompanying notes are an integral part of these financial statements.
52
WEISS ALTERNATIVE MULTI-STRATEGY FUND
Schedule of Swap Contracts – Continued
October 31, 2022
| Value of | ||||||||||||||||||||||||||
| Pay/Receive | Number of | Unrealized | ||||||||||||||||||||||||
| Counter- | Maturity | Financing | Financing | Payment | Shares/ | Notional | Upfront | Appreciation | ||||||||||||||||||
| party | Security | Date | Rate | Rate | Frequency | Units | Amount | Payment | (Depreciation)* | |||||||||||||||||
| SHORT EQUITY SWAP CONTRACTS (Continued) | ||||||||||||||||||||||||||
Morgan | U.S. Momentum | 4/26/24 | Receive | (0.900)% | Monthly | (1,341 | ) | (208,278 | ) | $ | — | $ | (2,164 | ) | ||||||||||||
Stanley | Basket | Fixed Rate | ||||||||||||||||||||||||
Morgan | U.S. Realized | 1/26/24 | Receive | (0.750)% | Monthly | (13 | ) | (1,286 | ) | — | 144 | |||||||||||||||
Stanley | Volatility Basket | Fixed Rate | ||||||||||||||||||||||||
Morgan | U.S. Value | 4/3/24 | Pay | 2.820% | Monthly | (1,072 | ) | (150,125 | ) | — | (5,247 | ) | ||||||||||||||
Stanley | Long Basket | ((0.260)% + U.S. | ||||||||||||||||||||||||
| Federal Funds | ||||||||||||||||||||||||||
| Effective Rate) | ||||||||||||||||||||||||||
Morgan | Unprofitable | 6/27/24 | Pay | 2.560% | Monthly | (2,134 | ) | (74,519 | ) | — | 3,993 | |||||||||||||||
Stanley | Technology | ((0.520)% + U.S. | ||||||||||||||||||||||||
Company Basket | Federal Funds | |||||||||||||||||||||||||
| Effective Rate) | ||||||||||||||||||||||||||
Morgan | Unprofitable | 2/2/23 | Pay | 2.560% | Monthly | (6,024 | ) | (210,358 | ) | — | (6,629 | ) | ||||||||||||||
Stanley | Technology | ((0.520)% + U.S. | ||||||||||||||||||||||||
Company Basket | Federal Funds | |||||||||||||||||||||||||
| Effective Rate) | ||||||||||||||||||||||||||
Morgan | Woodside | 11/16/22 | Pay | 1.690% | Monthly | (243 | ) | (5,656 | ) | — | (5,461 | ) | ||||||||||||||
Stanley | Petroleum Ltd. | ((0.500)% + Sterling | ||||||||||||||||||||||||
| Overnight | ||||||||||||||||||||||||||
| Index Average) | ||||||||||||||||||||||||||
$ | (10,487,512 | ) | ||||||||||||||||||||||||
plc – Public Limited Company
| * | Based on the net swap value held at each counterparty, unrealized appreciation is a receivable and unrealized depreciation is a payable. |
The accompanying notes are an integral part of these financial statements.
53
WEISS ALTERNATIVE MULTI-STRATEGY FUND
Schedule of Open Forward Currency Contracts*
October 31, 2022
| Unrealized | ||||||||||||||||
| Settlement | Currency to | Value | Currency to | Value | Appreciation | |||||||||||
| Date | be Delivered | (USD) | be Received | (USD) | (Depreciation)** | |||||||||||
| 11/30/22 | CNY 1,076,577 | 147,768 | USD 150,347 | 150,347 | $ | 2,579 | ||||||||||
147,768 | 150,347 | 2,579 | ||||||||||||||
| CNY – | Chinese Yuan |
| * | Morgan Stanley is the counterparty for all open forward currency contracts held by the Fund as of October 31, 2022. |
| ** | Unrealized appreciation is a receivable and unrealized depreciation is a payable. |
The accompanying notes are an integral part of these financial statements.
54
WEISS ALTERNATIVE MULTI-STRATEGY FUND
Schedule of Open Futures Contracts
October 31, 2022
| Value and | |||||||||||||||
| Number of | Unrealized | ||||||||||||||
| Contracts | Notional | Appreciation | |||||||||||||
| Expiration Date | Description | Purchased | Amount | (Depreciation) | |||||||||||
| LONG FUTURES CONTRACTS | |||||||||||||||
| 12/20/22 | CBT Long-Term U.S. Treasury Bond | 20 | $ | 2,026,087 | $ | (308,590 | ) | ||||||||
| 12/20/22 | CBT Ultra Long-Term U.S. Treasury Bond | 168 | 13,170,142 | (3,679,775 | ) | ||||||||||
| 12/20/22 | CBT 10-Year U.S. Treasury Bond | 229 | 21,623,313 | (1,487,810 | ) | ||||||||||
| 12/16/22 | E-Mini Russell 2000 | 329 | 30,481,850 | 293,757 | |||||||||||
| 12/16/22 | E-Mini S&P 500 | 214 | 41,548,100 | (571,806 | ) | ||||||||||
| 12/28/22 | 100 Ounce Gold Futures | 102 | 16,735,140 | (960,286 | ) | ||||||||||
$ | (6,714,510 | ) | |||||||||||||
The accompanying notes are an integral part of these financial statements.
55
WEISS ALTERNATIVE MULTI-STRATEGY FUND
Statement of Assets and Liabilities
October 31, 2022
| ASSETS: | ||||
Investments, at value (Cost $224,400,943) | $ | 214,257,259 | ||
Cash(1) | 15,600,315 | |||
Foreign currency, at value (Cost $6,174,027) | 6,164,752 | |||
Deposits at broker for securities sold short and written options | 88,134,430 | |||
Receivable for investments sold | 30,236,817 | |||
Collateral for swap contracts | 24,208,000 | |||
Deposits for futures | 6,775,226 | |||
Dividends and interest receivable | 434,509 | |||
Receivable for fund shares sold | 105,849 | |||
Receivable for forward currency contracts | 2,579 | |||
Prepaid expenses and other receivables | 15,740 | |||
Total assets | 385,935,476 | |||
| LIABILITIES: | ||||
Securities sold short, at value (proceeds of $82,322,004) | 82,870,314 | |||
Written option contracts, at value (premiums received $1,883,277) | 1,476,729 | |||
Payable for swap contracts, net | 10,487,512 | |||
Payable to broker-foreign currency, at value (Proceeds $3,596,839) | 3,613,903 | |||
Payable for investments purchased | 29,568,363 | |||
Payable for fund shares redeemed | 2,969,100 | |||
Variation margin | 712,596 | |||
Payable to Adviser | 234,534 | |||
Payable for custodian fees | 63,060 | |||
Payable for fund administration and fund accounting fees | 54,961 | |||
Dividends and interest payable for securities sold short | 50,177 | |||
Payable for transfer agent fees and expenses | 15,545 | |||
Payable for swap interest and dividends, net | 9,412 | |||
Payable for compliance fees | 2,292 | |||
Distribution and shareholder servicing fees payable | 537 | |||
Accrued expenses and other liabilities | 79,872 | |||
Total liabilities | 132,208,907 | |||
| NET ASSETS | $ | 253,726,569 | ||
| NET ASSETS CONSISTS OF: | ||||
Paid-in capital | $ | 309,303,571 | ||
Total accumulated losses | (55,577,002 | ) | ||
Total net assets | $ | 253,726,569 | ||
| Class K | Investor | |||||||
| Shares | Class Shares | |||||||
Net assets | $ | 251,477,192 | $ | 2,249,377 | ||||
Shares issued and outstanding(2) | 29,838,534 | 271,752 | ||||||
Net asset value, offering, and redemption price per share | $ | 8.43 | $ | 8.28 | ||||
(1) | Includes restricted cash of $15,500,000. |
(2) | Unlimited shares authorized without par value. |
The accompanying notes are an integral part of these financial statements.
56
WEISS ALTERNATIVE MULTI-STRATEGY FUND
Statement of Operations
For the Year Ended October 31, 2022
| INVESTMENT INCOME: | ||||
Dividend income on long positions (net of foreign withholding taxes of $29,701 respectively) | $ | 3,911,360 | ||
Interest income, including broker interest on short positions | 2,069,000 | |||
Total investment income | 5,980,360 | |||
| EXPENSES: | ||||
Investment advisory fees (See Note 3) | 4,038,029 | |||
Dividends on securities sold short | 2,092,755 | |||
Borrowing expense on securities sold short | 1,157,724 | |||
Fund administration and fund accounting fees (See Note 3) | 336,587 | |||
Custodian fees (See Note 3) | 159,589 | |||
Transfer agent fees (See Note 3) | 102,563 | |||
Federal and state registration fees | 64,880 | |||
Audit fees | 55,000 | |||
Legal fees | 33,842 | |||
Distribution fees – Investor Class (See Note 3) | 18,714 | |||
Reports to shareholders | 18,008 | |||
Compliance fees (See Note 3) | 14,998 | |||
Trustees’ fees (See Note 3) | 12,469 | |||
Shareholder servicing fees – Investor Class (See Note 5) | 7,486 | |||
Other | 16,208 | |||
Total expense before reimbursement | 8,128,852 | |||
Less: Expense reimbursement by Adviser (see Note 3) | (814,144 | ) | ||
Net expenses | 7,314,708 | |||
| NET INVESTMENT LOSS | (1,334,348 | ) | ||
| REALIZED AND UNREALIZED GAIN (LOSS) ON INVESTMENTS: | ||||
Realized gain (loss) on: | ||||
| Investments | (18,630,777 | ) | ||
| Securities sold short | 15,297,188 | |||
| Written option contracts expired or closed | 880,833 | |||
| Swap contracts | 2,893,717 | |||
| Future contracts | (27,142,788 | ) | ||
| Forward currency contracts | 12,867 | |||
| Foreign currency translation | (175,906 | ) | ||
| Net realized loss | (26,864,866 | ) | ||
Change in unrealized appreciation (depreciation) on: | ||||
| Investments | (14,339,845 | ) | ||
| Securities sold short | 1,542,504 | |||
| Written option contracts | 396,125 | |||
| Swap contracts | (10,338,342 | ) | ||
| Future contracts | (7,061,158 | ) | ||
| Forward currency contracts | 2,579 | |||
| Foreign currency translation | (45,200 | ) | ||
| Net change in unrealized depreciation (appreciation) | (29,843,337 | ) | ||
| Net realized and change in unrealized loss on investments | (56,708,203 | ) | ||
| NET DECREASE IN NET ASSETS RESULTING FROM OPERATIONS | $ | (58,042,551 | ) | |
The accompanying notes are an integral part of these financial statements.
57
WEISS ALTERNATIVE MULTI-STRATEGY FUND
Statements of Changes in Net Assets
| Year Ended | Year Ended | |||||||
| October 31, 2022 | October 31, 2021 | |||||||
| OPERATIONS: | ||||||||
Net investment loss | $ | (1,334,348 | ) | $ | (1,371,640 | ) | ||
Net realized gain (loss) on investments, securities sold short, | ||||||||
written option contracts expired or closed, swap contracts, futures | ||||||||
contracts, forward currency contracts, and foreign currency transactions | (26,864,866 | ) | 16,369,749 | |||||
Change in unrealized appreciation (depreciation) on investments, | ||||||||
securities sold short, written option contracts, swap contracts, futures | ||||||||
contracts, forward currency contracts and foreign currency translation | (29,843,337 | ) | 1,132,923 | |||||
Net increase (decrease) in net assets resulting from operations | (58,042,551 | ) | 16,131,032 | |||||
| DISTRIBUTIONS TO SHAREHOLDERS: | ||||||||
| Class K | (15,007,578 | ) | (6,974,185 | ) | ||||
| Investor Class | (709,286 | ) | (457,953 | ) | ||||
Total distributions to shareholders | (15,716,864 | ) | (7,432,138 | ) | ||||
| CAPITAL SHARE TRANSACTIONS: | ||||||||
Net increase in net assets resulting from capital share transactions(1) | 96,793,567 | 124,223,633 | ||||||
| NET INCREASE IN NET ASSETS | 23,034,152 | 132,922,527 | ||||||
| NET ASSETS: | ||||||||
Beginning of year | 230,692,417 | 97,769,890 | ||||||
End of year | $ | 253,726,569 | $ | 230,692,417 | ||||
(1) | A summary of capital share transactions is as follows: |
SHARE TRANSACTIONS:
| For the Year Ended | For the Year Ended | |||||||||||||||||
| October 31, 2022 | October 31, 2021 | |||||||||||||||||
| Shares | Amount | Shares | Amount | |||||||||||||||
Class K: | ||||||||||||||||||
| Issued | 21,436,992 | $ | 207,598,738 | 14,836,798 | $ | 158,993,848 | ||||||||||||
| Issued to holders in | ||||||||||||||||||
| reinvestment of dividends | 1,434,757 | 14,835,381 | 666,111 | 6,974,185 | ||||||||||||||
| Redeemed | (13,061,945 | ) | (121,379,526 | ) | (4,085,024 | ) | (44,414,756 | ) | ||||||||||
| Net increase in Class K | 9,809,804 | $ | 101,054,593 | 11,417,885 | $ | 121,553,277 | ||||||||||||
Investor Class: | ||||||||||||||||||
| Issued | 434,793 | $ | 4,492,482 | 308,532 | $ | 3,280,142 | ||||||||||||
| Issued to holders in | ||||||||||||||||||
| reinvestment of dividends | 69,674 | 709,286 | 44,204 | 457,954 | ||||||||||||||
| Redeemed | (1,044,210 | ) | (9,462,794 | ) | (100,390 | ) | (1,067,740 | ) | ||||||||||
| Net decrease in Investor Class | (539,743 | ) | (4,261,026 | ) | 252,346 | 2,670,356 | ||||||||||||
Net increase in shares outstanding | 9,270,061 | $ | 96,793,567 | 11,670,231 | $ | 124,223,633 | ||||||||||||
The accompanying notes are an integral part of these financial statements.
58
WEISS ALTERNATIVE MULTI-STRATEGY FUND
Financial Highlights
| Year Ended | Year Ended | Year Ended | Year Ended | Year Ended | ||||||||||||||||
| October 31, | October 31, | October 31, | October 31, | October 31, | ||||||||||||||||
| 2022 | 2021 | 2020 | 2019 | 2018 | ||||||||||||||||
| Class K | ||||||||||||||||||||
PER SHARE DATA(1): | ||||||||||||||||||||
Net asset value, beginning of year | $ | 11.08 | $ | 10.67 | $ | 11.25 | $ | 10.44 | $ | 10.45 | ||||||||||
INVESTMENT OPERATIONS: | ||||||||||||||||||||
Net investment income (loss)(2) | (0.05 | ) | (0.08 | ) | (0.02 | ) | 0.08 | 0.01 | ||||||||||||
| Net realized and unrealized | ||||||||||||||||||||
| gain (loss) on investments | (1.92 | ) | 1.30 | 0.62 | 1.18 | 0.17 | ||||||||||||||
| Total from investment operations | (1.97 | ) | 1.22 | 0.60 | 1.26 | 0.18 | ||||||||||||||
LESS DISTRIBUTIONS FROM: | ||||||||||||||||||||
| Net investment income | — | (0.02 | ) | (0.11 | ) | (0.21 | ) | — | ||||||||||||
| Net realized gains | (0.68 | ) | (0.79 | ) | (1.07 | ) | (0.24 | ) | (0.19 | ) | ||||||||||
| Total distributions | (0.68 | ) | (0.81 | ) | (1.18 | ) | (0.45 | ) | (0.19 | ) | ||||||||||
Redemption fees | — | — | — | — | 0.00 | (3) | ||||||||||||||
Net asset value, end of year | $ | 8.43 | $ | 11.08 | $ | 10.67 | $ | 11.25 | $ | 10.44 | ||||||||||
| TOTAL RETURN | -18.99 | % | 11.88 | % | 5.79 | % | 12.76 | % | 1.61 | % | ||||||||||
| SUPPLEMENTAL DATA AND RATIOS: | ||||||||||||||||||||
Net assets, end of year (in thousands) | $ | 251,477 | $ | 221,827 | $ | 91,865 | $ | 89,627 | $ | 81,498 | ||||||||||
Ratio of gross expenses to average net assets: | ||||||||||||||||||||
Before expense reimbursement(4) | 3.01 | % | 3.46 | % | 4.07 | % | 3.95 | % | 4.25 | % | ||||||||||
After expense reimbursement(4) | 2.71 | % | 2.79 | % | 3.05 | % | 3.16 | % | 3.27 | % | ||||||||||
Ratio of dividends, interest, and borrowing expense | ||||||||||||||||||||
on securities sold short to average net assets | 1.21 | % | 1.29 | % | 1.55 | % | 1.66 | % | 1.77 | % | ||||||||||
Ratio of operating expenses to average net | ||||||||||||||||||||
assets excluding dividends, interest, and | ||||||||||||||||||||
borrowing expense on securities sold short(4) | 1.50 | % | 1.50 | % | 1.50 | % | 1.50 | % | 1.50 | % | ||||||||||
Ratio of net investment income (loss) | ||||||||||||||||||||
to average net assets(4) | (0.49 | )% | (0.77 | )% | (0.24 | )% | 0.78 | % | 0.11 | % | ||||||||||
Portfolio turnover rate(5) | 734 | % | 576 | % | 738 | % | 585 | % | 700 | % | ||||||||||
| (1) | For a Class K share outstanding for the entire year. |
| (2) | Calculated based on average shares outstanding during the year. |
| (3) | Amount per share is less than $0.005. |
| (4) | These ratios exclude the impact of expenses of the underlying exchange-traded funds as represented in the Schedule of Investments. Recognition of net investment income by the Fund is affected by the timing of the declaration of dividends by the underlying exchange-traded funds in which the Fund invests. |
| (5) | The portfolio turnover disclosed is for the Fund as a whole. The numerator for the portfolio turnover rate includes the lesser of purchases or sales (excluding short-term investments, short-term options, swap contracts, futures contracts and short positions). The denominator includes the average fair value of long positions throughout the years ended. |
The accompanying notes are an integral part of these financial statements.
59
WEISS ALTERNATIVE MULTI-STRATEGY FUND
Financial Highlights
| Year Ended | Year Ended | Year Ended | Year Ended | Year Ended | ||||||||||||||||
| October 31, | October 31, | October 31, | October 31, | October 31, | ||||||||||||||||
| 2022 | 2021 | 2020 | 2019 | 2018 | ||||||||||||||||
| Investor Class | ||||||||||||||||||||
PER SHARE DATA(1): | ||||||||||||||||||||
Net asset value, beginning of year | $ | 10.92 | $ | 10.56 | $ | 11.16 | $ | 10.38 | $ | 10.44 | ||||||||||
INVESTMENT OPERATIONS: | ||||||||||||||||||||
Net investment income (loss)(2) | (0.08 | ) | (0.12 | ) | (0.06 | ) | 0.05 | (0.02 | ) | |||||||||||
| Net realized and unrealized | ||||||||||||||||||||
gain (loss) on investments(3) | (1.88 | ) | 1.28 | 0.61 | 1.18 | 0.15 | ||||||||||||||
| Total from investment operations | (1.96 | ) | 1.16 | 0.55 | 1.23 | 0.13 | ||||||||||||||
LESS DISTRIBUTIONS FROM: | ||||||||||||||||||||
| Net investment income | — | (0.01 | ) | (0.08 | ) | (0.21 | ) | — | ||||||||||||
| Net realized gains | (0.68 | ) | (0.79 | ) | (1.07 | ) | (0.24 | ) | (0.19 | ) | ||||||||||
| Total distributions | (0.68 | ) | (0.80 | ) | (1.15 | ) | (0.45 | ) | (0.19 | ) | ||||||||||
Redemption fees | — | — | 0.00 | (4) | 0.00 | (4) | 0.00 | (4) | ||||||||||||
Net asset value, end of year | $ | 8.28 | $ | 10.92 | $ | 10.56 | $ | 11.16 | $ | 10.38 | ||||||||||
| TOTAL RETURN | -19.26 | % | 11.43 | % | 5.48 | % | 12.36 | % | 1.22 | % | ||||||||||
SUPPLEMENTAL DATA AND RATIOS: | ||||||||||||||||||||
Net assets, end of year (in thousands) | $ | 2,249 | $ | 8,865 | $ | 5,905 | $ | 5,487 | $ | 4,128 | ||||||||||
Ratio of gross expenses to average net assets: | ||||||||||||||||||||
Before expense reimbursement(5) | 3.36 | % | 3.80 | % | 4.42 | % | 4.30 | % | 4.60 | % | ||||||||||
After expense reimbursement(5) | 3.06 | % | 3.14 | % | 3.40 | % | 3.51 | % | 3.62 | % | ||||||||||
Ratio of dividends, interest, and borrowing expense | ||||||||||||||||||||
on securities sold short to average net assets | 1.21 | % | 1.29 | % | 1.55 | % | 1.66 | % | 1.77 | % | ||||||||||
Ratio of operating expenses to average net assets | ||||||||||||||||||||
excluding dividends, interest, and borrowing | ||||||||||||||||||||
expense on securities sold short(5) | 1.85 | % | 1.85 | % | 1.85 | % | 1.85 | % | 1.85 | % | ||||||||||
Ratio of net investment income (loss) | ||||||||||||||||||||
to average net assets(5) | (0.84 | )% | (1.11 | )% | (0.59 | )% | 0.43 | % | (0.24 | )% | ||||||||||
Portfolio turnover rate(6) | �� | 734 | % | 576 | % | 738 | % | 585 | % | 700 | % | |||||||||
| (1) | For an Investor Class share outstanding for the entire year. |
| (2) | Calculated based on average shares outstanding during the year. |
| (3) | Realized and unrealized gains and losses per share in this caption are balancing amounts necessary to reconcile the change in net asset value per share for the years, and may not reconcile with the aggregate gains and losses in the Statement of Operations due to share transactions for the year. |
| (4) | Amount per share is less than $0.005. |
| (5) | These ratios exclude the impact of expenses of the underlying exchange traded funds as represented in the Schedule of Investments. Recognition of net investment income by the Fund is affected by the timing of the declaration of dividends by the underlying exchange traded funds in which the Fund invests. |
| (6) | The portfolio turnover disclosed is for the Fund as a whole. The numerator for the portfolio turnover rate includes the lesser of purchases or sales (excluding short-term investments, short-term options, swap contracts, futures contracts and short positions). The denominator includes the average fair value of long positions throughout the years end. |
The accompanying notes are an integral part of these financial statements.
60
WEISS ALTERNATIVE MULTI-STRATEGY FUND
Notes to the Financial Statements
October 31, 2022
1. ORGANIZATION
Series Portfolios Trust (the “Trust”) was organized as a Delaware statutory trust under a Declaration of Trust dated July 27, 2015. The Trust is registered under the Investment Company Act of 1940, as amended (the “1940 Act”), as an open-end management investment company. The Weiss Alternative Multi-Strategy Fund (the “Fund”) is a diversified series with its own investment objectives and policies within the Trust. The Fund’s investment adviser, Weiss Multi-Strategy Advisers LLC (the “Adviser”), is responsible for investment advisory services, day-to-day management of the Fund’s assets, as well as compliance, sales, marketing and operation services to the Fund. The primary investment objective of the Fund is to provide returns with moderate volatility and reduced correlation to the bond and equity markets. The Fund commenced operations on December 1, 2015. The Fund is an investment company and accordingly follows the investment company accounting and reporting guidance of the Financial Accounting Standards Board (“FASB”) Accounting Standards Codification (the “Codification”) Topic 946 Financial Services – Investment Companies. The Fund does not hold itself out as related to any other series of the Trust for purposes of investment and investor services, nor does it share the same investment adviser with any other series of the Trust.
The Fund offers four share classes, Class A, Class I, Class K and Investor Class. Effective March 31, 2017, the Fund ceased offering Class I. As of October 31, 2022, Class A and Class I shares are not available for purchase. Class K and Investor Class shares have no front-end sales load, no deferred sales charge, and a 1.00% redemption fee prior to November 22, 2019. Investor Class shares are subject to a 0.25% distribution fee (12b-1) and a shareholder servicing fee of up to 0.10% of average daily net assets. Class K shares are not subject to a distribution fee or a shareholder servicing fee.
The Fund may issue an unlimited number of shares of beneficial interest, with no par value. All shares of the Fund have equal rights and privileges except with respect to distribution fees and voting rights on matters affecting a single share class.
2. SIGNIFICANT ACCOUNTING POLICIES
The following is a summary of significant accounting policies consistently followed by the Fund in the preparation of its financial statements. These policies are in conformity with generally accepted accounting principles in the United States of America (“GAAP”).
A. Investment Valuation – The following is a summary of the Fund’s pricing procedures. It is intended to be a general discussion and may not necessarily reflect all the pricing procedures followed by the Fund. Equity securities, including common stocks, preferred stocks, and real estate investment trusts (“REITS”) that are traded on a national securities exchange, except those listed on the Nasdaq Global Market®, Nasdaq Global Select Market® and the Nasdaq Capital Market® exchanges (collectively “Nasdaq”), are valued at the last reported sale price on that exchange on which the security is principally traded. Securities traded on Nasdaq will be valued at the Nasdaq Official Closing Price (“NOCP”). If, on a particular day, an exchange traded or Nasdaq security does not trade, then the mean between the most recent quoted bid and asked prices will be used. All equity securities that are not traded on a listed exchange are valued at the last sale price in the over-the-counter (“OTC”) market. If a non-exchanged traded equity security does not trade on a particular day, then the mean between the last quoted closing bid and asked price will be used. To the extent these securities are actively traded and valuation adjustments are not applied, they are categorized in Level 1 of the fair value hierarchy.
61
WEISS ALTERNATIVE MULTI-STRATEGY FUND
Notes to the Financial Statements – Continued
October 31, 2022
Fixed income securities, including short-term debt instruments having a maturity less than 60 days, are valued at the evaluated mean price supplied by an approved independent third-party pricing service (“Pricing Service”). These securities are categorized in Level 2 of the fair value hierarchy.
In the case of foreign securities, the occurrence of events after the close of foreign markets, but prior to the time the Fund’s NAV is calculated will result in an adjustment to the trading prices of foreign securities when foreign markets open on the following business day. The Fund will value foreign securities at fair value, taking into account such events in calculating the NAV. In such cases, use of fair valuation can reduce an investor’s ability to seek profit by estimating the Fund’s NAV in advance of the time the NAV is calculated. These securities are categorized in Level 2 of the fair value hierarchy.
Exchange traded funds and closed-end funds are valued at the last reported sale price on the exchange on which the security is principally traded. If, on a particular day, an exchange-traded fund does not trade, then the mean between the most recent quoted bid and asked prices will be used. To the extent these securities are actively traded and valuation adjustments are not applied, they are categorized in Level 1 of the fair value hierarchy.
Investments in registered open-end investment companies (including money market funds), other than exchange-traded funds, are typically valued at their reported NAV per share. To the extent these securities are valued at their NAV per share, they are categorized in Level 1 of the fair value hierarchy.
Forward currency contracts maturing in two or fewer days are valued at the spot rate. Forward currency contracts maturing in three days or more are valued at the midpoint prices calculated by U.S. Bancorp Fund Services, LLC, doing business as U.S. Bank Global Fund Services (“Fund Services” or the “Administrator”) using an “interpolation” methodology that incorporates foreign-exchange prices obtained from an approved pricing service for standard forward-settlement periods, such as one month, three months, six months and one year. These securities are categorized in Level 2 of the fair value hierarchy.
Exchange traded options and Flexible Exchange® options (“FLEX options”) are valued at the composite mean price, which calculates the mean of the highest bid price and lowest ask price across the exchanges where the option is principally traded. If the composite mean price is not available, the last sale or settlement price maybe be used. For non-exchange traded options, models such as Black-Scholes can be used to value the options. On the last trading day prior to expiration, expiring options may be priced at intrinsic value. These securities are categorized in Level 2 of the fair value hierarchy.
Futures contracts are valued at the settlement price on the exchange on which they are principally traded. The settlement price is the average of the prices at which a futures contract trades immediately before the close of trading for the day. Equity swap contract prices are determined by using the same methods used to price the underlying security. These securities are categorized in Level 1 or Level 2 of the fair value hierarchy.
The Board of Trustees (the “Board”) has adopted a pricing and valuation policy for use by the Fund and its Valuation Designee (as defined below) in calculating the Fund’s NAV. Pursuant to Rule 2a-5 under the 1940 Act, the Fund has designated the Adviser as its “Valuation Designee” to perform all of the fair value determinations as well as to perform all of the responsibilities that may be performed by the Valuation Designee in accordance with Rule 2a-5. The Valuation Designee is authorized to make all necessary determinations of the fair values of the portfolio securities and other assets for which market quotations are not readily available or if it is deemed that the prices obtained from brokers and dealers or independent pricing services are unreliable.
62
WEISS ALTERNATIVE MULTI-STRATEGY FUND
Notes to the Financial Statements – Continued
October 31, 2022
The Fund has adopted authoritative fair value accounting standards which establish an authoritative definition of fair value and set out a hierarchy for measuring fair value. These standards require additional disclosures about the various inputs and valuation techniques used to develop the measurements of fair value, a discussion in changes in valuation techniques and related inputs during the period and expanded disclosure of valuation levels for major security types. These inputs are summarized in the three broad levels listed below:
| Level 1 – | Unadjusted quoted prices in active markets for identical assets or liabilities that the Fund has the ability to access. |
| Level 2 – | Observable inputs other than quoted prices included in Level 1 that are observable for the asset or liability, either directly or indirectly. These inputs may include quoted prices for the identical instrument on an inactive market, prices for similar instruments, interest rates, prepayment speeds, credit risk, yield curves, default rates and similar data. |
| Level 3 – | Unobservable inputs for the asset or liability, to the extent relevant observable inputs are not available, representing the Fund’s own assumptions about the assumptions a market participant would use in valuing the asset or liability, and would be based on the best information available. |
The inputs or methodology used for valuing securities are not an indication of the risk associated with investing in those securities.
The following table is a summary of the inputs used to value the Fund’s securities by level within the fair value hierarchy as of October 31, 2022:
| Level 1 | Level 2 | Level 3 | Total | |||||||||||||
| Assets | ||||||||||||||||
Investments at Fair Value | ||||||||||||||||
Common Stocks | ||||||||||||||||
Aerospace & Defense | $ | 427,541 | $ | — | $ | — | $ | 427,541 | ||||||||
Air Freight & Logistics | 1,460,591 | 69,456 | — | 1,530,047 | ||||||||||||
Airlines | 1,107,379 | — | — | 1,107,379 | ||||||||||||
Auto Components | 407,140 | — | — | 407,140 | ||||||||||||
Automobiles | 873,319 | 78,487 | — | 951,806 | ||||||||||||
Banks | 5,360,516 | — | — | 5,360,516 | ||||||||||||
Beverages | 549,174 | — | — | 549,174 | ||||||||||||
Biotechnology | 1,840,574 | — | — | 1,840,574 | ||||||||||||
Building Products | 178,980 | — | — | 178,980 | ||||||||||||
Capital Markets | 2,104,368 | — | — | 2,104,368 | ||||||||||||
Chemicals | 470,756 | 12,264 | — | 483,020 | ||||||||||||
Commercial Services & Supplies | 1,038,917 | — | — | 1,038,917 | ||||||||||||
Communications Equipment | 4,729,536 | — | — | 4,729,536 | ||||||||||||
Construction & Engineering | 234,957 | — | — | 234,957 | ||||||||||||
Construction Materials | 166,527 | — | — | 166,527 | ||||||||||||
Consumer Finance | 910,442 | — | — | 910,442 | ||||||||||||
Containers & Packaging | 753,604 | — | — | 753,604 | ||||||||||||
Diversified Consumer Services | 172,858 | — | — | 172,858 | ||||||||||||
Diversified Financial Services | 304,978 | — | — | 304,978 | ||||||||||||
63
WEISS ALTERNATIVE MULTI-STRATEGY FUND
Notes to the Financial Statements – Continued
October 31, 2022
| Level 1 | Level 2 | Level 3 | Total | |||||||||||||
| Assets – Continued | ||||||||||||||||
Investments at Fair Value – Continued | ||||||||||||||||
Diversified Telecommunication Services | $ | 14,165 | $ | — | $ | — | $ | 14,165 | ||||||||
Electric Utilities | 39,602 | — | — | 39,602 | ||||||||||||
Electrical Equipment | 978,816 | — | — | 978,816 | ||||||||||||
Electronic Equipment, | ||||||||||||||||
Instruments & Components | 1,031,160 | 19,465 | — | 1,050,625 | ||||||||||||
Energy Equipment & Services | 1,302,681 | 60,464 | — | 1,363,145 | ||||||||||||
Entertainment | 1,199,913 | — | — | 1,199,913 | ||||||||||||
Food & Staples Retailing | 532,060 | — | — | 532,060 | ||||||||||||
Food Products | 2,832,038 | — | — | 2,832,038 | ||||||||||||
Health Care Equipment & Supplies | 1,858,502 | — | — | 1,858,502 | ||||||||||||
Health Care Providers & Services | 2,312,919 | 34,589 | — | 2,347,508 | ||||||||||||
Health Care Technology | 47,509 | — | — | 47,509 | ||||||||||||
Hotels, Restaurants & Leisure | 5,661,229 | — | — | 5,661,229 | ||||||||||||
Household Durables | 67,108 | 11,868 | — | 78,976 | ||||||||||||
Household Products | 706,739 | — | — | 706,739 | ||||||||||||
Industrial Conglomerates | 1,200,705 | 93,374 | — | 1,294,079 | ||||||||||||
Insurance | 223,525 | — | 110 | 223,635 | ||||||||||||
Interactive Media & Services | 667,110 | 8,137 | — | 675,247 | ||||||||||||
Internet & Direct Marketing Retail | 667,362 | — | — | 667,362 | ||||||||||||
Internet Software & Services | 120,691 | — | — | 120,691 | ||||||||||||
IT Services | 1,934,856 | 16,338 | — | 1,951,194 | ||||||||||||
Leisure Products | 142,973 | — | 202 | 143,175 | ||||||||||||
Life Sciences Tools & Services | 739,093 | — | — | 739,093 | ||||||||||||
Machinery | 1,367,452 | 15,946 | — | 1,383,398 | ||||||||||||
Marine | 270,182 | — | — | 270,182 | ||||||||||||
Media | 947,457 | — | — | 947,457 | ||||||||||||
Metals & Mining | 1,303,772 | 202,131 | — | 1,505,903 | ||||||||||||
Multiline Retail | 244,593 | — | — | 244,593 | ||||||||||||
Multi-Utilities | — | 46,772 | — | 46,772 | ||||||||||||
Oil, Gas & Consumable Fuels | 8,379,901 | — | — | 8,379,901 | ||||||||||||
Paper & Forest Products | 72,739 | — | — | 72,739 | ||||||||||||
Personal Products | 189,955 | 199,137 | — | 389,092 | ||||||||||||
Pharmaceuticals | 1,236,755 | 252,626 | — | 1,489,381 | ||||||||||||
Professional Services | 47,381 | — | — | 47,381 | ||||||||||||
Real Estate Investment Trusts (REITs) | 14,075,626 | — | — | 14,075,626 | ||||||||||||
Road & Rail | 1,234,952 | — | — | 1,234,952 | ||||||||||||
Semiconductors & Semiconductor Equipment | 4,196,630 | — | — | 4,196,630 | ||||||||||||
Software | 9,678,488 | — | — | 9,678,488 | ||||||||||||
Special Purpose Acquisition Companies | 18,072 | — | — | 18,072 | ||||||||||||
Specialty Retail | 986,141 | — | — | 986,141 | ||||||||||||
Technology Hardware, Storage & Peripherals | 1,029,661 | — | — | 1,029,661 | ||||||||||||
Textiles, Apparel & Luxury Goods | 224,328 | — | — | 224,328 | ||||||||||||
64
WEISS ALTERNATIVE MULTI-STRATEGY FUND
Notes to the Financial Statements – Continued
October 31, 2022
| Level 1 | Level 2 | Level 3 | Total | |||||||||||||
| Assets – Continued | ||||||||||||||||
Investments at Fair Value – Continued | ||||||||||||||||
Thrifts & Mortgage Finance | $ | 494,766 | $ | — | $ | — | $ | 494,766 | ||||||||
Tobacco | — | 65,217 | — | 65,217 | ||||||||||||
Trading Companies & Distributors | 1,101,567 | — | — | 1,101,567 | ||||||||||||
Wireless Communication Services | — | — | 2,182 | 2,182 | ||||||||||||
Wireless Telecommunication Services | 284,781 | — | — | 284,781 | ||||||||||||
Total Common Stocks | 94,758,112 | 1,186,271 | 2,494 | 95,946,877 | ||||||||||||
Exchange Traded Funds | 45,385,177 | — | — | 45,385,177 | ||||||||||||
Contingent Value Right | — | — | — | (2) | — | |||||||||||
Escrow Notes | — | — | 21,735 | 21,735 | ||||||||||||
Warrants | 23,177 | 99 | — | (2) | 23,276 | |||||||||||
Purchased Options | 2,899 | 138,356 | — | 141,255 | ||||||||||||
Money Market Fund | 72,738,939 | — | — | 72,738,939 | ||||||||||||
Other Instruments | ||||||||||||||||
Forward Contracts(1) | — | 2,579 | — | 2,579 | ||||||||||||
$ | 212,908,304 | $ | 1,327,305 | $ | 24,229 | $ | 214,259,838 | |||||||||
| Liabilities | ||||||||||||||||
Investments at Fair Value | ||||||||||||||||
Common Stocks | ||||||||||||||||
Aerospace & Defense | $ | (249,770 | ) | $ — | $ | — | $ | (249,770 | ) | |||||||
Air Freight & Logistics | (735,611 | ) | — | — | (735,611 | ) | ||||||||||
Airlines | (465,901 | ) | — | — | (465,901 | ) | ||||||||||
Auto Components | (34,386 | ) | — | — | (34,386 | ) | ||||||||||
Automobiles | (828,509 | ) | — | — | (828,509 | ) | ||||||||||
Banks | (3,839,606 | ) | — | — | (3,839,606 | ) | ||||||||||
Beverages | (1,188,858 | ) | — | — | (1,188,858 | ) | ||||||||||
Biotechnology | (716,700 | ) | — | — | (716,700 | ) | ||||||||||
Building Products | (305,284 | ) | — | — | (305,284 | ) | ||||||||||
Capital Markets | (2,515,279 | ) | (18,302 | ) | — | (2,533,581 | ) | |||||||||
Chemicals | (293,597 | ) | — | — | (293,597 | ) | ||||||||||
Commercial Services & Supplies | (435,903 | ) | — | — | (435,903 | ) | ||||||||||
Communications Equipment | (78,991 | ) | — | — | (78,991 | ) | ||||||||||
Construction & Engineering | (285,838 | ) | — | — | (285,838 | ) | ||||||||||
Consumer Finance | (1,030,440 | ) | — | — | (1,030,440 | ) | ||||||||||
Containers & Packaging | (426,816 | ) | — | — | (426,816 | ) | ||||||||||
Distributors | (217,064 | ) | — | — | (217,064 | ) | ||||||||||
Diversified Consumer Services | (563,436 | ) | — | — | (563,436 | ) | ||||||||||
Diversified Telecommunication Services | (384,593 | ) | — | — | (384,593 | ) | ||||||||||
Electrical Equipment | (131,290 | ) | — | — | (131,290 | ) | ||||||||||
Electronic Equipment, Instruments & Components | (270,269 | ) | — | — | (270,269 | ) | ||||||||||
Energy Equipment & Services | (915,507 | ) | — | — | (915,507 | ) | ||||||||||
65
WEISS ALTERNATIVE MULTI-STRATEGY FUND
Notes to the Financial Statements – Continued
October 31, 2022
| Level 1 | Level 2 | Level 3 | Total | |||||||||||||
| Liabilities – Continued | ||||||||||||||||
Investments at Fair Value – Continued | ||||||||||||||||
Entertainment | $ | (251,901 | ) | $ | — | $ | — | $ | (251,901 | ) | ||||||
Food & Staples Retailing | (426,141 | ) | — | — | (426,141 | ) | ||||||||||
Food Products | (2,296,004 | ) | (169,384 | ) | — | (2,465,388 | ) | |||||||||
Health Care Equipment & Supplies | (603,572 | ) | (34,547 | ) | — | (638,119 | ) | |||||||||
Health Care Providers & Services | (1,747,934 | ) | (27,578 | ) | — | (1,775,512 | ) | |||||||||
Health Care Technology | (54,999 | ) | — | — | (54,999 | ) | ||||||||||
Hotels, Restaurants & Leisure | (2,203,639 | ) | (116,333 | ) | — | (2,319,972 | ) | |||||||||
Household Durables | (123,731 | ) | — | — | (123,731 | ) | ||||||||||
Household Products | (357,430 | ) | — | — | (357,430 | ) | ||||||||||
Industrial Conglomerates | (186,672 | ) | — | — | (186,672 | ) | ||||||||||
Insurance | (134,189 | ) | — | — | (134,189 | ) | ||||||||||
Interactive Media & Services | (152,041 | ) | — | — | (152,041 | ) | ||||||||||
Internet & Direct Marketing Retail | (78,154 | ) | — | — | (78,154 | ) | ||||||||||
Internet Software & Services | (1,011 | ) | — | — | (1,011 | ) | ||||||||||
IT Services | (379,771 | ) | — | — | (379,771 | ) | ||||||||||
Leisure Products | (24,240 | ) | — | — | (24,240 | ) | ||||||||||
Life Sciences Tools & Services | (564,689 | ) | — | — | (564,689 | ) | ||||||||||
Machinery | (1,718,432 | ) | (16,310 | ) | — | (1,734,742 | ) | |||||||||
Marine | — | (90,585 | ) | — | (90,585 | ) | ||||||||||
Media | (878,878 | ) | — | — | (878,878 | ) | ||||||||||
Metals & Mining | (2,613,146 | ) | (248,713 | ) | — | (2,861,859 | ) | |||||||||
Multiline Retail | (420,710 | ) | — | — | (420,710 | ) | ||||||||||
Oil, Gas & Consumable Fuels | (4,407,015 | ) | — | — | (4,407,015 | ) | ||||||||||
Personal Products | (342,401 | ) | (12,767 | ) | — | (355,168 | ) | |||||||||
Pharmaceuticals | (883,077 | ) | (328,499 | ) | — | (1,211,576 | ) | |||||||||
Professional Services | (261,121 | ) | — | — | (261,121 | ) | ||||||||||
Real Estate Investment Trusts (REITs) | (13,506,058 | ) | — | — | (13,506,058 | ) | ||||||||||
Real Estate Management & Development | (31,852 | ) | — | — | (31,852 | ) | ||||||||||
Road & Rail | (995,156 | ) | — | — | (995,156 | ) | ||||||||||
Semiconductors & Semiconductor Equipment | (1,706,640 | ) | — | — | (1,706,640 | ) | ||||||||||
Software | (484,056 | ) | (8,346 | ) | — | (492,402 | ) | |||||||||
Specialty Retail | (746,954 | ) | — | — | (746,954 | ) | ||||||||||
Technology Hardware, Storage & Peripherals | (294,882 | ) | — | — | (294,882 | ) | ||||||||||
Textiles, Apparel & Luxury Goods | (20,853 | ) | — | — | (20,853 | ) | ||||||||||
Thrifts & Mortgage Finance | (306,727 | ) | — | — | (306,727 | ) | ||||||||||
Trading Companies & Distributors | (199,917 | ) | — | — | (199,917 | ) | ||||||||||
Wireless Telecommunication Services | (4,507 | ) | — | — | (4,507 | ) | ||||||||||
Total Common Stock | (55,322,148 | ) | (1,071,364 | ) | — | (56,393,512 | ) | |||||||||
Exchange Traded Funds | (26,269,304 | ) | (207,498 | ) | — | (26,476,802 | ) | |||||||||
66
WEISS ALTERNATIVE MULTI-STRATEGY FUND
Notes to the Financial Statements – Continued
October 31, 2022
| Level 1 | Level 2 | Level 3 | Total | |||||||||||||
Other Instruments | ||||||||||||||||
Written Options | $ | (3,655 | ) | $ | (1,473,074 | ) | $ | — | $ | (1,476,729 | ) | |||||
Futures Contracts(1) | — | (6,714,510 | ) | — | (6,714,510 | ) | ||||||||||
Swap Contracts(1) | — | (10,487,512 | ) | — | (10,487,512 | ) | ||||||||||
$ | (81,590,600 | ) | $ | (19,958,465 | ) | $ | — | $ | (101,549,065 | ) | ||||||
(1) | Swap contracts, future contracts and forward currency exchange contracts are valued at the net unrealized appreciation (depreciation) on the instrument as presented on the Schedules of Open Swap, Open Futures and Open Forward Currency contracts. |
(2) | Amount less than $0.50. |
For the period ended October 31, 2022, there were no transfers into or out of Level 3 securities.
B. Securities Sold Short – The Fund sells securities or currencies short for economic hedging purposes or any other investment purpose. For financial statement purposes, an amount equal to the settlement amount is initially included in the Statement of Assets and Liabilities as an asset and an equivalent liability. The amount of the liability is subsequently priced to reflect the current value of the short position. Subsequent fluctuations in the market prices of securities or currencies sold, but not yet purchased, may require purchasing the securities or currencies at prices which may differ from the fair value reflected on the Statement of Assets and Liabilities. Short sale transactions result in off balance sheet risk because the ultimate obligation may exceed the related amounts shown in the Statement of Assets and Liabilities. The Fund will incur losses if the price of the security increases between the date of the short sale and the date on which the Fund purchases the securities to replace the borrowed securities. The Fund’s losses on short sales are potentially unlimited because there is no upward limit on the price a borrowed security could attain.
The Fund is liable for any dividends and interest payable on securities while those securities are sold short. Until the security is replaced, the Fund is required to pay to the lender any income earned, which is recorded as an expense by the Fund. The Fund’s policy is to segregate liquid assets in an amount equal to the fair value of securities sold short (not including proceeds received), which is reflected in the Schedule of Investments. These assets are required to be adjusted daily to reflect changes in the value of the securities or currencies sold short.
C. Transactions with Brokers – The Fund’s deposits at brokers for securities sold short are with one securities dealer. The Fund does not require the brokers to maintain collateral in support of the receivables from the brokers for proceeds on securities sold short. The Fund is required by the brokers to maintain collateral at the brokers or in a segregated account at the Fund’s custodian for securities sold short. The Fund may maintain cash deposits at brokers beyond the receivables for short sales.
The Fund’s written options contracts’, equity swap contracts’, forward currency contracts’ and futures contracts cash deposits are monitored daily by the Adviser and counterparty. Cash deposits beyond the short sale proceeds by the Fund are presented as deposits at brokers on the Statement of Assets and Liabilities. The Fund’s securities sold short and written option contracts are traded through the same account at Morgan Stanley and the deposits associated with these investments are not able to be determined by security or contract type. These transactions may involve market risk in excess of the amounts receivable or payable reflected on the Statement of Assets and Liabilities.
D. Written Option Contracts – The Fund is subject to equity price risk in the normal course of pursuing its investment objectives. The Fund writes (sells) put or call options for hedging purposes, volatility management purposes, or otherwise to gain, or reduce, long or short exposure to one or more asset classes or issuers. When a
67
WEISS ALTERNATIVE MULTI-STRATEGY FUND
Notes to the Financial Statements – Continued
October 31, 2022
Fund writes (sells) an option, an amount equal to the premium received by the Fund is included in the Statement of Assets and Liabilities as an asset and an equivalent liability. The amount of the liability is subsequently priced daily to reflect the current value of the option written. Refer to Note 2 A. for a pricing description. By writing an option, a Fund may become obligated during the term of the option to deliver or purchase the securities underlying the option at the exercise price if the option is exercised. These contracts may involve market risk in excess of the amounts receivable or payable reflected on the Statement of Assets and Liabilities. Refer to Note 2 R. for further derivative disclosures, and Note 2 P. for further counterparty risk disclosure.
When an option expires on its stipulated expiration date or the Fund enters into a closing purchase transaction, the Fund realizes gains or losses if the cost of the closing purchase transaction differs from the premium received when the option was sold without regard to any unrealized appreciation or depreciation on the underlying security, and the liability related to such option is eliminated. When a written call option is exercised, the premium originally received decreases the cost basis of the security and the Fund realizes gains or losses from the sale of the underlying security. When a written put option is exercised, the cost of the security acquired is decreased by the premium received for the put.
E. Purchased Option Contracts – The Fund is subject to equity price risk in the normal course of pursuing its investment objectives. The Fund purchases put or call options for hedging purposes, volatility management purposes, or otherwise to gain, or reduce, long or short exposure to one or more asset classes or issuers. When the Fund purchases an option contract, an amount equal to the premiums paid is included in the Statement of Assets and Liabilities Investments at value as an investment, and is subsequently priced daily to reflect the value of the purchased option contract. Refer to Note 2 A. for a pricing description. Refer to Note 2 R. for further derivative disclosures, and Note 2 P. for further counterparty risk disclosure.
F. Flex Options – The Fund principally uses options to hedge exposure to underlying positions given projected increases in volatility or to crystalize price gains or losses in individual securities. FLEX Options are customized option contracts available through the CBOE that are guaranteed for settlement by The Options Clearing Corporation (“OCC” or the “Clearinghouse”). FLEX Options provide investors with the ability to customize exercise prices and expiration dates, while achieving price discovery in competitive, transparent auctions markets and avoiding the counterparty exposure of over-the-counter (“OTC”) options positions. The Fund bears the risk that the Clearinghouse will be unable or unwilling to perform its obligations under the FLEX Options contracts.
G. Forward Currency Contracts – The Fund is subject to foreign currency rate risk in the normal course of pursuing its investment objectives. Forward foreign currency exchange contracts are entered into to gain or reduce exposure to foreign currencies (foreign currency exchange risk). A forward foreign currency exchange contract is an agreement between two parties to buy or sell a currency at a set exchange rate on a specified date. These contracts help to manage the overall exposure to the currencies in which some of the investments held by the Fund are denominated and in some cases, may be used to obtain exposure to a particular market. The Fund may enter into forward contracts for foreign currency hedging purposes, volatility management purposes or otherwise to gain, or reduce, long or short exposure to one or more asset classes or issuers. The Fund may enter into forward currency exchange contracts obligating the Fund to deliver and receive a currency at a specified future date. Forward contracts are valued daily, and unrealized appreciation or depreciation is recorded daily as the difference between the contract exchange rate and the closing forward rate applied to the face amount of the contract. Refer to Note 2 A. for a pricing description. A realized gain or loss is recorded at the time the forward contract expires. Credit risk may arise as a result of the failure of the counterparty to comply with the terms of the contract. Refer to Note 2 P. for further counterparty risk disclosure.
68
WEISS ALTERNATIVE MULTI-STRATEGY FUND
Notes to the Financial Statements – Continued
October 31, 2022
The use of forward currency exchange contracts does not eliminate fluctuations in the underlying prices of the Fund’s investment securities. The use of forward currency exchange contracts involves the risk that anticipated currency movements will not be accurately predicted. A forward currency exchange contract would limit the risk of loss due to a decline in the value of a particular currency; however, it would also limit any potential gain that might result should the value of the currency increase instead of decrease. These contracts may involve market risk in excess of the amounts receivable or payable reflected on the Statement of Assets and Liabilities. Refer to Note 2 R. for further derivative disclosures.
H. Futures Contracts – The Fund may enter into futures contracts traded on domestic and international exchanges, including stock index and fixed income futures contracts. The Fund principally uses futures for attractive liquidity offered in portfolio construction and management than available using equity and fixed income exchange traded funds. Upon entering into a contract, the Fund deposits and maintains as collateral such initial margin as required by the exchange on which the transaction is affected. Pursuant to the contract, the Fund agrees to receive from or pay to the broker an amount of cash equal to the daily fluctuation in value of the contract (with the exception of futures contracts traded on the London Metal Exchange (“LME”)). Such receipts or payments are known as variation margin and are recorded by the Fund as unrealized gains and losses. When the contract is closed, the Fund records a realized gain or loss equal to the difference between the value of the contract at the time it was opened and the value at the time it was closed. The variation margin on LME futures contracts do not settle daily, but rather settle at their respective maturity dates. The risks inherent in the use of futures contracts include adverse changes in the value of such instruments. Refer to Note 2 A. for a pricing description. Refer to Note 2 R. for further derivative disclosures, and Note 2 P. for further counterparty risk disclosure.
I. Equity Swap Contracts – The Fund is subject to equity price risk and interest rate risk in the normal course of pursuing its investment objectives. During the year ended October 31, 2022, the Fund entered into both long and short equity swap contracts. Swap contracts are entered into to manage exposure to issuers, markets and securities. A long equity swap contract entitles the Fund to receive from the counterparty any appreciation and dividends paid on an individual security, while obligating the Fund to pay the counterparty any depreciation on the security as well as interest on the notional amount of the contract generally at a rate equal to the Euro OverNight Index Average (“EONIA”) or the Sterling OverNight Index Average (“SONIA”), Bank of Japan Estimate Unsecured Overnight Call Rate (“TONAR”) or the Federal Funds Rate (“FED”) (plus an additional rate. Please see the Schedule of Open Swap for details on a contract by contract basis). A short equity swap contract obligates the Fund to pay the counterparty any appreciation and dividends paid on an individual security, while entitling the Fund to receive from the counterparty any depreciation on the security, and to pay to or receive from the counterparty interest on the notional value of the contract generally at a rate equal to EONIA, SONIA, TONAR or FED (plus an additional rate. Please see the Schedule of Open Swap Contracts for details on a contract by contract basis).
Fluctuations in the value of an open contract are recorded daily as net unrealized appreciation or depreciation. The Fund will realize gains or losses upon termination or reset of the contract. Either party, under certain conditions, may terminate the contract prior to the contract’s expiration date. Refer to Note 2 A. for a pricing description. Credit risk may arise as a result of the failure of the counterparty to comply with the terms of the contract. Refer to Note 2 P. for further counterparty risk disclosure. Additionally, risk may arise from unanticipated movements in interest rates or in the value of the underlying securities. These contracts may involve market risk in excess of the amounts receivable or payable reflected on the Statement of Assets and Liabilities. Refer to Note 2 R. for further derivative disclosures.
69
WEISS ALTERNATIVE MULTI-STRATEGY FUND
Notes to the Financial Statements – Continued
October 31, 2022
J. Foreign Securities and Currency Translation – Investment securities and other assets and liabilities denominated in foreign currencies are translated into U.S. dollar amounts at the date of valuation. Purchases and sales of investment securities and income and expense items denominated in foreign currencies are translated into U.S. dollar amounts on the respective dates of such transactions. The Fund does not isolate the portion of the results of operations from changes in foreign exchange rates on investments from the fluctuations arising from changes in market prices of securities held. Reported net realized foreign exchange gains or losses arise from sales of foreign currencies, and the difference between the amounts of dividends, interest, and foreign withholding taxes recorded on the Fund’s books and the U.S. dollar equivalent of the amounts actually received or paid. Net unrealized foreign exchange gains and losses arise from changes in the fair values of assets and liabilities, other than investments in securities at fiscal year-end, resulting from changes in exchange rates.
Investments in foreign securities entail certain risks. There may be a possibility of nationalization or expropriation of assets, confiscatory taxation, political or financial instability, and diplomatic developments that could affect the value of the Fund’s investments in certain foreign countries. Since foreign securities normally are denominated and traded in foreign currencies, the value of the Fund’s assets may be affected favorably or unfavorably by currency exchange rates, currency exchange control regulations, foreign withholding taxes, and restrictions or prohibitions on the repatriation of foreign currencies. There may be less information publicly available about a foreign issuer than about a U.S. issuer, and foreign issuers are not generally subject to accounting, auditing, and financial reporting standards and practices comparable to those in the United States. The securities of some foreign issuers are less liquid and at times more volatile than securities of comparable U.S. issuers.
K. Cash and Cash Equivalents – The Fund considers highly liquid short-term fixed income investments purchased with an original maturity of less than three months to be cash equivalents. Cash equivalents are included in short-term investments on the Schedule of Investments as well as in investments on the Statement of Assets and Liabilities.
L. Guarantees and Indemnifications – In the normal course of business, the Fund enters into contracts with service providers that contain general indemnification clauses. The Fund’s maximum exposure under these arrangements is unknown, as this would involve future claims that may be made against the Fund that have not yet occurred.
M. Security Transactions, Income and Expenses – The Fund follows industry practice and records security transactions on the trade date. Realized gains and losses on sales of securities are calculated on the basis of identified cost. Dividend income and expense is recorded on the ex-dividend date and interest income and expense is recorded on an accrual basis. Withholding taxes on foreign dividends have been provided for in accordance with the Fund’s understanding of the applicable country’s tax rules and regulations. Discounts and premiums on securities purchased are amortized over the expected life of the respective securities. Interest income is accounted for on the accrual basis and includes amortization of premiums and accretion of discounts on the effective interest method.
N. Allocation of Income, Expenses and Gains/Losses – Income, expenses (other than those deemed attributable to a specific share class), and gains and losses of the Fund are allocated daily to each class of shares based upon the ratio of net assets represented by each class as a percentage of the net assets of the Fund. Expenses deemed directly attributable to a class of shares are recorded by the specific class. Most Fund expenses are allocated by class based on relative net assets. 12b-1 fees are expensed at 0.25% of average daily net assets of Investor Class shares (See Note 5). Shareholder servicing fees are expensed at an annual rate of up to 0.10% of average daily net assets of Investor Class shares (See Note 5). Trust Expenses associated with a specific fund in the Trust are charged to that fund. Common Trust expenses are typically allocated evenly between the funds of the Trust, or by other equitable means.
70
WEISS ALTERNATIVE MULTI-STRATEGY FUND
Notes to the Financial Statements – Continued
October 31, 2022
O. Share Valuation – The NAV per share of the Fund is calculated by dividing the sum of the value of the securities held by the Fund, plus cash and other assets, minus all liabilities (including estimated accrued expenses) by the total number of shares outstanding for the Fund, rounded to the nearest cent. The Fund’s shares will not be priced on days which the New York Stock Exchange (“NYSE”) is closed for trading.
P. Counterparty Risk – The Fund helps manage counterparty credit risk by entering into agreements only with counterparties the Adviser believes have the financial resources to honor its obligations. The Adviser considers the credit worthiness of each counterparty to a contract in evaluating potential credit risk. The counterparty risk for forward currency exchange contracts to the Fund includes the amount of any net unrealized appreciation on the contract. The counterparty risk for equity swaps contracts to the Fund includes the risk of loss of the full amount of any net unrealized appreciation on the contract, along with dividends receivable on long equity contracts and interest receivable on short equity contracts. Written and purchased options and futures contracts sold on an exchange do not expose the Fund to counterparty risk; the exchange’s clearinghouse guarantees the options and futures against counterparty nonperformance. Over-the-counter options counterparty risk includes the risk of loss of the full amount of any net unrealized appreciation.
Q. Use of Estimates – The preparation of financial statements in conformity with GAAP requires management to make estimates and assumptions that affect the reported amounts of assets and liabilities and disclosure of contingent assets and liabilities at the date of the financial statements and the reported amounts of revenues and expenses during the reporting period. Actual results could differ from those estimates.
R. Derivatives – The Fund may utilize derivative instruments such as options, swaps, futures, forward currency exchange contracts and other instruments with similar characteristics to the extent that they are consistent with the Fund’s respective investment objectives and limitations. The use of these instruments may involve additional investment risks, including the possibility of illiquid markets or imperfect correlation between the value of the instruments and the underlying securities. Derivatives also may create leverage which will amplify the effect of their performance on the Fund and may produce significant losses. Refer to Note 7 for further derivative disclosure.
The Fund employs a risk optimized allocation strategy by investing in (1) an actively managed, diversified, market neutral multi-strategy portfolio that includes equity securities, debt securities, and/or derivatives (the “Core Market Neutral Component”), (2) a long-only “growth” overlay of equity securities (the “Growth Component”), and (3) a long-only “defensive” overlay of debt securities (the “Defensive Component”). To implement its strategy, the Fund may also use derivatives, such as swaps and futures on indexes, in the Growth and Defensive Components. The Fund’s Growth and Defensive Components consist only of securities purchased with the objective of seeking an increase in the underlying prices of such securities. The Fund’s Growth Component will, under normal circumstances, consist of domestically traded large- and midcap equity securities that aim to approximately track price performance in the overall stock market. The portion of the Fund’s overall portfolio comprised of debt securities, which are held in the Defensive and Core Market Neutral Components, will, under normal market conditions, have a weighted average maturity that exceeds 9 years and will consist primarily of investment-grade debt securities with an average credit rating in excess of “A” by Standard & Poor’s, or an equivalent quality rating from another Nationally Recognized Statistical Rating Organization. The Fund may also invest in below-investment grade debt securities (also referred to as high yield debt securities or “junk” bonds).
The Fund’s Core Market Neutral Component consists of a combination of “long” securities purchased that seek to benefit from an increase in the underlying prices of such securities and “short” securities sold that seek to benefit from a decrease in the underlying prices of such securities. The Fund’s Core Market Neutral Component may be characterized by sector focus, geographic definition, quantitative method, event orientation or some other
71
WEISS ALTERNATIVE MULTI-STRATEGY FUND
Notes to the Financial Statements – Continued
October 31, 2022
dominant characteristic. The strategies employed and the allocation among them will vary over time. The common attribute of these strategies is a long/short investment approach whereby various securities or instruments are held long and others are sold short. The Adviser, therefore, applies moderate leverage (i.e., borrowed capital to increase investment exposure) to the Core Market Neutral Component in an effort to enhance absolute returns. In addition, in order to take advantage of certain opportunities in the securities markets, the Fund may engage in active and frequent trading with respect to the Core Market Neutral Component.
The Adviser seeks to allocate assets to each of the three components based on the Adviser’s assessment of each component’s expected contribution to the Fund’s overall portfolio risk. The Adviser utilizes the historical price return and volatility (among other proprietary measures) of each component in order to estimate a component’s risk contribution. Although there is no requirement to invest a specific percentage of the Fund’s assets in a particular component, it is generally expected that a larger percentage of the Fund’s assets will be allocated to low risk asset classes (i.e., those that comprise the bond or Defensive Component) than to higher risk asset classes (i.e., those that comprise the equity or Growth Component). Given that the Adviser seeks to allocate assets to each individual component according to its risk contribution (as measured by its historical price return and volatility), the Fund’s allocation of assets to the Core Market Neutral, Growth and Defensive Components can fluctuate widely.
The equity securities that comprise the Fund’s Growth Component may at any time include positions in U.S. common, preferred or convertible securities of large- or mid- capitalization issuers; securities of other investment companies, including exchange-traded funds (“ETFs”); depositary receipts, including American Depositary Receipts (“ADRs”), and derivatives, such as swaps and futures on indexes. The equity securities that comprise the Fund’s Core Market Neutral Component may at any time include positions in U.S. or non-U.S. common, preferred or convertible securities of any market capitalization throughout the world, including emerging markets countries; securities of other investment companies, including ETFs; and depositary receipts, including ADRs. The debt securities that comprise the Fund’s Defensive Component and Core Market Neutral Component may include corporate debt securities, bonds (including inflation-indexed bonds), notes or other debentures, U.S. Government and foreign government securities, high yield or junk bonds, ETFs, and derivatives, such as swaps and futures on indexes. In addition, the Core Market Neutral Component may invest in derivative instruments, including swaps, interest rate swaps, options or index options (e.g., calls and puts may be purchased or written), futures contracts, and forward contracts. The Fund’s derivative instruments are used for several purposes, including to create investment leverage; as a substitute for securities, interest rates, currencies and commodities; and/or to hedge against market movements.
The Fund has adopted authoritative standards regarding disclosure about derivatives and hedging activities and how they affect the Fund’s Statement of Assets and Liabilities and Statement of Operations. For the year ended October 31, 2022, the Fund’s average derivative volume is described below:
| Monthly Average | Monthly Average | |||||||
| Quantity | Notional Value | |||||||
| Purchased Option Contracts | 1,548 | $ | 7,039,521 | |||||
| Written Option Contracts | 1,945 | 8,356,351 | ||||||
| Long Total Return Swap Contracts | 932,270 | 49,372,945 | ||||||
| Short Total Return Swap Contracts | 195,266 | 8,262,507 | ||||||
| Long Futures Contracts | 1,025 | 132,511,877 | ||||||
| Long Forward Contracts | 621,668 | 326,469 | ||||||
| Short Forward Contracts | 1,910,600 | 225,823 | ||||||
72
WEISS ALTERNATIVE MULTI-STRATEGY FUND
Notes to the Financial Statements – Continued
October 31, 2022
Statement of Assets and Liabilities
The effect of derivative instruments on the Statement of Assets and Liabilities as of October 31, 2022.
| Statement of Assets and | Fair Value | ||||||||
Liabilities Location | Assets | Liabilities | |||||||
Purchased Option Contracts | |||||||||
Equity | Investments, at value | $ | 141,255 | $ | — | ||||
Written Option Contracts | |||||||||
Equity | Written option contracts, at value | — | 1,476,729 | ||||||
Swap Contracts | |||||||||
Equity | Payable for swap contracts, net | — | 10,487,512 | ||||||
Forward Currency Contracts | Receivable for forward | ||||||||
currency exchange contracts | 2,579 | — | |||||||
Futures Contracts | |||||||||
Commodity | Variation margin for futures contracts | — | 41,820 | ||||||
Equity | Variation margin for futures contracts | — | 279,245 | ||||||
Interest rate | Variation margin for futures contracts | — | 391,531 | ||||||
Total Futures Contracts | — | 712,596 | |||||||
$ | 143,834 | $ | 12,676,837 | ||||||
Statement of Operations
The effect of derivative instruments on the Statements of Operations for the year ended October 31, 2022:
| Net Realized Gain (Loss) on Derivatives | ||||||||||||||||||||||||||
| Forward | ||||||||||||||||||||||||||
| Purchased | Written | Currency | ||||||||||||||||||||||||
| Option | Option | Swap | Futures | Exchange | ||||||||||||||||||||||
Derivatives | Contracts* | Contracts | Contracts | Contracts | Contracts | Total | ||||||||||||||||||||
| Equity Contracts | $ | (811,328 | ) | $ | 880,833 | $ | 2,893,717 | $ | (10,249,872 | ) | $ | — | $ | (7,286,650 | ) | |||||||||||
| Commodity Contracts | — | — | — | (2,498,507 | ) | — | (2,498,507 | ) | ||||||||||||||||||
| Interest Rate Contracts | — | — | — | (14,394,409 | ) | — | (14,394,409 | ) | ||||||||||||||||||
| Foreign Exchange Contracts | — | — | — | — | 12,867 | 12,867 | ||||||||||||||||||||
| Total | $ | (811,328 | ) | $ | 880,833 | $ | 2,893,717 | $ | (27,142,788 | ) | $ | 12,867 | $ | (24,166,699 | ) | |||||||||||
| Net Change in Unrealized Appreciation (Depreciation) on Derivatives | ||||||||||||||||||||||||||
| Forward | ||||||||||||||||||||||||||
| Purchased | Written | Currency | ||||||||||||||||||||||||
| Option | Option | Swap | Futures | Exchange | ||||||||||||||||||||||
Derivatives | Contracts** | Contracts | Contracts | Contracts | Contracts | Total | ||||||||||||||||||||
| Equity Contracts | $ | (57,258 | ) | $ | 396,125 | $ | (10,338,342 | ) | $ | (1,700,407 | ) | $ | — | $ | (11,699,882 | ) | ||||||||||
| Commodity Contracts | — | — | — | (960,286 | ) | — | (960,286 | ) | ||||||||||||||||||
| Interest Rate Contracts | — | — | — | (4,400,465 | ) | — | (4,400,465 | ) | ||||||||||||||||||
| Foreign Exchange Contracts | — | — | — | — | 2,579 | 2,579 | ||||||||||||||||||||
| Total | $ | (57,258 | ) | $ | 396,125 | $ | (10,338,342 | ) | $ | (7,061,158 | ) | $ | 2,579 | $ | (17,058,054 | ) | ||||||||||
| * | The amounts disclosed are included in the realized gain (loss) on investments. | |
| ** | The amounts disclosed are included in the change in unrealized appreciation (depreciation) on investments. |
73
WEISS ALTERNATIVE MULTI-STRATEGY FUND
Notes to the Financial Statements – Continued
October 31, 2022
3. RELATED PARTY TRANSACTIONS
The Trust has an agreement with the Adviser to furnish investment advisory services to the Fund. Pursuant to an Investment Advisory Agreement between the Trust and the Adviser, the Adviser is entitled to receive, on a monthly basis, an annual advisory fee equal to 1.50% of the Fund’s average daily net assets.
The Fund’s Adviser has contractually agreed in an Operating Expense Limitation Agreement to reduce its management fees and/or absorb expenses of the Fund to ensure that total annual operating expenses after fee waiver and/or expense reimbursement (excluding 12b-1 fees – Class A and Investor Class (see Note 5), shareholder servicing fees – Class A, Class I and Investor Class (see Note 5), any acquired fund fees and expenses, front-end or contingent deferred loads, redemption fees, swap fees and expenses, dividends and interest on short positions, taxes, leverage interest, brokerage fees (including commissions, mark-ups and mark-downs), annual account fees for margin accounts, expenses incurred in connection with any merger or reorganization and extraordinary expenses such as litigation) do not exceed 1.50% of the Fund’s average daily net assets. As of October 31, 2022, Class A shares and Class I shares are not available. The Adviser may request recoupment of previously waived fees and reimbursed Fund expenses from the Fund for three years from the date they were waived or reimbursed, provide that, after payment of the recoupment, the Total Annual Fund Operating Expenses do no exceed the lesser of the Expense Cap: (i) in effect at the time of the waiver or reimbursement; or (ii) in effect at the time of recoupment. The Operating Expense Limitation Agreement is intended to be continual in nature and cannot be terminated within one year after the effective date of the Fund’s prospectus and subject thereafter to termination at any time upon 60 days written notice and approval by the Board or the Advisor, with consent of the Board. Waived fees and reimbursed expenses subject to potential recovery during the fiscal year of expiration are as follows:
Expiration | Amount | |||
November 2022 to October 2023 | $ | 969,449 | ||
November 2023 to October 2024 | 1,165,912 | |||
November 2024 to October 2025 | 814,144 | |||
Fund Services acts as the Fund’s Administrator, transfer agent, and fund accountant. U.S. Bank N.A. (the “Custodian”) serves as the custodian to the Fund. The Custodian is an affiliate of the Administrator. The Administrator performs various administrative and accounting services for the Fund. The Administrator prepares various federal and state regulatory filings, reports and returns for the Fund; prepares reports and materials to be supplied to the Trustees; monitors the activities of the Fund’s custodian; coordinates the payment of the Fund’s expenses and reviews the Fund’s expense accruals. The officers of the Trust, including the Chief Compliance Officer, are employees of the Administrator. A trustee of the Trust is an officer of the Administrator. As compensation for its services, the Administrator is entitled to a monthly fee at an annual rate based upon the average daily net assets of the Fund, subject to annual minimums. Fees paid by the Fund for administration and accounting, transfer agency, custody and compliance services for the year ended October 31, 2022, are disclosed in the Statement of Operations.
Quasar Distributors, LLC, is the Fund’s distributor (the “Distributor”). The Distributor is not affiliated with the Adviser, Fund Services, or its affiliated companies.
4. TAX FOOTNOTE
Federal Income Taxes – The Fund intends to comply with the requirements of Subchapter M of the Internal Revenue Code of 1986, as amended, necessary to qualify as a regulated investment company and distributes substantially all net taxable investment income and net realized gains to shareholders in a manner which results in no tax cost to the Fund. Therefore, no federal income or excise tax provision is required. As of and during the year ended October 31, 2022, the Fund did not have any tax positions that did not meet the “more-likely-than-not”
74
WEISS ALTERNATIVE MULTI-STRATEGY FUND
Notes to the Financial Statements – Continued
October 31, 2022
threshold of being sustained by the applicable tax authority and did not have liabilities for any unrecognized tax benefits. The Fund recognizes interest and penalties, if any, related to unrecognized tax benefits on uncertain tax positions as income tax expense in the Statement of Operations. The Fund is not subject to examination by taxing authorities for the tax years prior to October 31, 2019.
As of October 31, 2022, the components of accumulated earnings (losses) on a tax basis were as follows:
| Tax cost of investments* | $ | 132,866,706 | ||
| Gross unrealized appreciation | $ | 7,674,430 | ||
| Gross unrealized depreciation | (30,407,552 | ) | ||
| Net unrealized depreciation | (22,733,122 | ) | ||
| Undistributed ordinary income | — | |||
| Undistributed long-term capital gain | — | |||
| Other accumulated losses | (32,843,880 | ) | ||
| Total accumulated losses | $ | (55,577,002 | ) |
| * | Represents cost for federal income tax purposes and differs from the cost for financial reporting purposes due to partnership adjustments, wash sales, derivatives and constructive sales. |
As of October 31, 2022, the Fund had short-term capital loss carryovers of $5,237,928 and long-term carryovers of $25,774,297 which will be permitted to be carried over for an unlimited period of time. A regulated investment company may elect for any taxable year to treat any portion of any qualified late year loss as arising on the first day of the next taxable year. Qualified late year losses are certain ordinary losses which occur during the portion of the Fund’s taxable period subsequent to December 31, respectively. For the taxable year ended October 31, 2022, the Fund does not plan to defer any qualified late year losses.
Distributions to Shareholders – The Fund distributes substantially all net investment income, if any, and net realized capital gains, if any, annually. Distributions to shareholders are recorded on the ex-dividend date. The treatment for financial reporting purposes of distributions made to shareholders during the year from net investment income or net realized capital gains may differ from their treatment for federal income tax purposes. These differences are caused primarily by differences in the timing of the recognition of certain components of income, expense or realized capital gain for federal income tax purposes. Where such differences are permanent in nature, GAAP requires that they be reclassified in the components of the net assets based on their ultimate characterization for federal income tax purposes. Any such reclassifications will have no effect on net assets, results of operations or net asset values per share of the Fund. For the year ended October 31, 2022 the following table shows the reclassifications made:
| Total | |||
| Distributable | |||
Earnings | Paid-in Capital | ||
| $9,473,109 | $(9,473,109) |
Adjustments to the amounts shown in the table were due to net operating losses and partnership adjustments.
75
WEISS ALTERNATIVE MULTI-STRATEGY FUND
Notes to the Financial Statements – Continued
October 31, 2022
The tax character of distributions paid for the year ended October 31, 2022 and the year ended October 31, 2021, respectively, were as follows:
| Ordinary Income* | Long-Term Capital Gain | Total | ||||||||||
| 2022 | $ | 12,810,319 | $ | 2,906,545 | $ | 15,716,864 | ||||||
| 2021 | 7,432,138 | — | 7,432,138 | |||||||||
| * | For federal income tax purposes, distributions of short-term capital gains are treated as ordinary income distributions. |
5. DISTRIBUTION & SHAREHOLDER SERVICING FEES
The Fund has adopted a Distribution Plan pursuant to Rule 12b-1 (the “Plan”) for Class A and the Investor Class. The Plan permits the Fund to pay for distribution and related expenses at an annual rate of 0.25% average daily net assets of Class A and the Investor Class. Amounts paid under the Plan are paid to the Distributor to compensate it for costs of the services it provides to Class A and Investor Class shares of the Fund and the expenses it bears in the distribution of the Fund’s Class A and Investor Class shares, including overhead and telephone expenses; printing and distribution of prospectuses and reports used in connection with the offering of the Fund’s Investor class shares to prospective investors; and preparation, printing, payments to intermediaries and distribution of sales literature and advertising materials.
Under the Plan, the Trustees will be furnished quarterly with information detailing the amount of expenses paid under the Plan and the purposes for which payments were made. The Plan may be terminated at any time by vote of a majority of the Trustees of the Trust who are not interested persons. Continuation of the Plan is considered by such Trustees no less frequently than annually. As of October 31, 2022, Class A shares were not available. For the year ended October 31, 2022, the Investor Class incurred expenses of $18,714 pursuant to the Plan.
In addition, pursuant to a Shareholder Service Plan (the “Shareholder Servicing Plan”) adopted by the Trust on behalf of the Fund, the Advisor is authorized to engage financial institutions, securities dealers and other industry professionals (“Shareholder Servicing Agent”) to provide personal shareholder services relating to the servicing and maintenance of shareholder accounts not otherwise provided to the Fund. Payments made pursuant to the Shareholder Servicing Plan shall not exceed 0.10% of the average daily net asset value of Class A, Class I and the Investor Class of the Fund’s shares. For the year ended October 31, 2022, the Investor Class incurred expenses of $7,486 to the plan. As of October 31, 2022, Class A and Class I shares were not available for purchase.
Payments made under the Shareholder Servicing Plan shall be used to compensate Shareholder Servicing Agents for providing general shareholder liaison services, including, but not limited to: (i) answering inquiries from shareholders regarding account status and history, the manner in which purchases and redemptions of the Fund shares may be effected, and other matters pertaining to the Fund; (ii) assisting shareholders in designating and changing dividend options, account designations and addresses; (iii) arranging for wiring of funds and transmitting and receiving funds in connection with orders to purchase or redeem Fund shares; (iv) verifying and guaranteeing shareholder signatures in connection with orders to purchase or redeem Fund shares; (v) providing such other similar services related to the maintenance of shareholder accounts; and (vi) providing necessary personnel and facilities to conduct the activities described above.
Distributions and shareholder servicing fees are not subject to the Operating Expense Limitation Agreement to reduce management fees and/or absorb Fund expenses by the Adviser. Distribution and shareholder servicing fees will increase the expenses beyond the Operating Expense Limitation Agreement rate of 1.50% for Class A, Class I and Investor Class.
76
WEISS ALTERNATIVE MULTI-STRATEGY FUND
Notes to the Financial Statements – Continued
October 31, 2022
6. INVESTMENT TRANSACTIONS
The aggregate purchases and sales, excluding short-term investments, by the Fund for the year ended October 31, 2022, were as follows:
| Purchases | Sales | |||||||
| U.S. Government | $ | — | $ | — | ||||
| Other | 1,256,667,711 | 1,222,145,625 | ||||||
7. OFFSETTING ASSETS AND LIABILITIES
The Fund is subject to various Master Netting Arrangements, which govern the terms of certain transactions with select counterparties. The Master Netting Arrangements allow the Fund to close out and net its total exposure to a counterparty in the event of a default with respect to all the transactions governed under a single agreement with a counterparty. The Master Netting Arrangements also specify collateral posting arrangements at pre-arranged exposure levels. Under the Master Netting Arrangements, collateral is routinely transferred if the total net exposure to certain transactions (net of existing collateral already in place) governed under the relevant Master Netting Arrangement with a counterparty in a given account exceeds a specified threshold depending on the counterparty and the type of Master Netting Arrangement. Morgan Stanley is the prime broker for exchange traded derivatives and the counterparty for swaps and forward currency contracts.
| Gross | Gross Amounts not | |||||||||||||||||||||||||
| Gross | Amounts | Net Amounts | offset in the Statement | |||||||||||||||||||||||
| Amounts of | Offset in the | Presented in | of Assets and Liabilities | |||||||||||||||||||||||
| Recognized | Statement of | the Statement | Collateral | |||||||||||||||||||||||
| Assets/ | Assets and | of Assets | Financial | Received/ | Net | |||||||||||||||||||||
| Liabilities | Liabilities | and Liabilities | Instruments | Pledged* | Amount | |||||||||||||||||||||
| Assets: | ||||||||||||||||||||||||||
| Description | ||||||||||||||||||||||||||
Forward Currency Contracts | $ | 2,579 | $ | — | $ | 2,579 | $ | — | $ | — | $ | 2,579 | ||||||||||||||
Future Contracts | 23,030 | 23,030 | — | — | — | — | ||||||||||||||||||||
Swap Contracts | 525,092 | 525,092 | — | — | — | — | ||||||||||||||||||||
$ | 550,701 | $ | 548,122 | $ | 2,579 | $ | — | $ | — | $ | 2,579 | |||||||||||||||
| Liabilities: | ||||||||||||||||||||||||||
| Description | ||||||||||||||||||||||||||
Forward Currency Contracts | $ | — | $ | — | $ | — | $ | — | $ | — | $ | — | ||||||||||||||
Future Contracts | 735,626 | 23,030 | 712,596 | — | 712,596 | — | ||||||||||||||||||||
Swap Contracts | 11,012,604 | 525,092 | 10,487,512 | — | 10,487,512 | — | ||||||||||||||||||||
Written Option Contracts | 1,476,729 | — | 1,476,729 | — | 1,476,729 | — | ||||||||||||||||||||
$ | 13,224,959 | $ | 548,122 | $ | 12,676,837 | $ | — | $ | 12,676,837 | $ | — | |||||||||||||||
| * | In some instances, the actual collateral pledged/received may be more than amount shown. |
77
WEISS ALTERNATIVE MULTI-STRATEGY FUND
Notes to the Financial Statements – Continued
October 31, 2022
8. BENEFICIAL OWNERSHIP
The beneficial ownership, either directly or indirectly, of more than 25% of the voting securities of a fund creates a presumption of control of the fund, under Section 2(a)(9) of the Investment Company Act of 1940. As of October 31, 2022, National Financial Services and Charles Schwab, for the benefit of their customers, owned 37.45% and 29.81% of the outstanding shares of the Fund.
9. RECENT MARKET EVENTS RISK
U.S. and international markets have experienced significant periods of volatility in recent years and months due to a number of economic, political and global macro factors including the impact of COVID-19 as a global pandemic, which has resulted in a public health crisis, disruptions to business operations and supply chains, stress on the global healthcare system, growth concerns in the U.S. and overseas, staffing shortages and the inability to meet consumer demand, and widespread concern and uncertainty. The global recovery from COVID-19 is proceeding at slower than expected rates due to the emergence of variant strains and may last for an extended period of time. Continuing uncertainties regarding interest rates, rising inflation, political events, rising government debt in the U.S. and trade tensions also contribute to market volatility. As a result of continuing political tensions and armed conflicts, including the war between Ukraine and Russia, the U.S. and the European Union imposed sanctions on certain Russian individuals and companies, including certain financial institutions, and have limited certain exports and imports to and from Russia. The war has contributed to recent market volatility and may continue to do so.
10. SUBSEQUENT EVENTS
On December 20, 2022, the Fund’s Class K shares declared an income distribution of $0.00108259 payable on December 21, 2022, to shareholders of record on December 20, 2022.
Management has evaluated events and transactions for potential recognition or disclosure through the date the financial statements were issued and there are no additional subsequent events to report that would have a material impact on the Fund’s financial statements and the notes to the financial statements.
78
WEISS ALTERNATIVE MULTI-STRATEGY FUND
Report of Independent Registered Public Accounting Firm
To the Shareholders of Weiss Alternative Multi-Strategy Fund and
Board of Trustees of Series Portfolios Trust
Opinion on the Financial Statements
We have audited the accompanying statement of assets and liabilities, including the schedules of investments, securities sold short, written options, swap contracts, open forward currency contracts, and open futures contracts, of Weiss Alternative Multi-Strategy Fund (the “Fund”), a series of Series Portfolios Trust, as of October 31, 2022, the related statement of operations for the year then ended, the statements of changes in net assets for each of the two years in the period then ended, the related notes, and the financial highlights for each of the five years in the period then ended (collectively referred to as the “financial statements”). In our opinion, the financial statements present fairly, in all material respects, the financial position of the Fund as of October 31, 2022, the results of its operations for the year then ended, the changes in net assets for each of the two years in the period then ended, and the financial highlights for each of the five years in the period then ended, in conformity with accounting principles generally accepted in the United States of America.
Basis for Opinion
These financial statements are the responsibility of the Fund’s management. Our responsibility is to express an opinion on the Fund’s financial statements based on our audits. We are a public accounting firm registered with the Public Company Accounting Oversight Board (United States) (“PCAOB”) and are required to be independent with respect to the fund in accordance with the U.S. federal securities laws and the applicable rules and regulations of the Securities and Exchange Commission and the PCAOB.
We conducted our audits in accordance with the standards of the PCAOB. Those standards require that we plan and perform the audit to obtain reasonable assurance about whether the financial statements are free of material misstatement whether due to error or fraud.
Our audits included performing procedures to assess the risks of material misstatement of the financial statements, whether due to error or fraud, and performing procedures that respond to those risks. Such procedures included examining, on a test basis, evidence regarding the amounts and disclosures in the financial statements. Our procedures included confirmation of securities owned as of October 31, 2022, by correspondence with the custodian and brokers; when replies were not received from brokers, we performed other auditing procedures. Our audits also included evaluating the accounting principles used and significant estimates made by management, as well as evaluating the overall presentation of the financial statements. We believe that our audits provide a reasonable basis for our opinion.
We have served as the Fund’s auditor since 2015.

COHEN & COMPANY, LTD.
Milwaukee, Wisconsin
December 30, 2022
79
WEISS ALTERNATIVE MULTI-STRATEGY FUND
Board Consideration of Investment Advisory Agreement (Unaudited)
October 31, 2022
Under Section 15 of the Investment Company Act of 1940 (the “1940 Act”), the Board of Trustees (the “Board” or the “Trustees”) of Series Portfolios Trust (the “Trust”), including a majority of the Trustees who have no direct or indirect interest in the investment advisory agreement and who are not “interested persons” of the Trust, as defined in the 1940 Act (the “Independent Trustees”), must determine annually whether to approve the continuation of the Trust’s investment advisory agreements.
At a meeting held on July 28, 2022 (the “Meeting”), the Board, including the Independent Trustees, considered and approved the continuance of the advisory agreement (the “Advisory Agreement”) between the Trust, on behalf of the Weiss Alternative Multi-Strategy Fund (the “Fund”), and Weiss Multi-Strategy Advisors, LLC (“Weiss”), for an additional one-year term. At the Meeting, the Board considered the factors and reached the conclusions described below in reviewing and approving Weiss to continue serving as the Fund’s investment adviser for another year.
In connection with the annual review process and in advance of the Meeting, Weiss provided information to the Board in response to requests submitted to it by U.S. Bank Global Fund Services (“Fund Services”), the Fund’s administrator, on behalf of the Board, to facilitate the Board’s evaluation of the terms of the Advisory Agreement. The information furnished by Weiss included materials describing, among other matters: (i) the nature, extent, and quality of the services provided by Weiss, including Weiss’ portfolio managers and other personnel, and the investment practices and techniques used by Weiss in managing the Fund; (ii) the historical investment performance of the Fund; (iii) the management fees payable by the Fund to Weiss and the Fund’s overall fees and operating expenses compared with those of a peer group of mutual funds; (iv) Weiss’ profitability and economies of scale; and (v) other ancillary or “fall-out” benefits Weiss and/or its affiliates, if any, may receive based on Weiss’s relationship with the Fund. In addition to the Meeting, the Board met on June 28, 2022 with Fund Services and counsel to discuss the materials that had been furnished by Weiss in response to the information requests. The Board also considered information furnished to the Board at its meetings periodically over the course of the year. At these meetings, representatives of Weiss furnished quarterly reports and other information to the Board regarding the performance of the Fund, the services provided to the Fund by Weiss, and compliance and operational matters related to the Fund and Weiss.
In considering and approving the Advisory Agreement for another year, the Board considered the information it deemed relevant, including but not limited to the information discussed below. The Board considered not only the specific information presented in connection with the Meeting, but also the knowledge gained over time through previous interactions with Weiss. The Board did not identify any particular information or consideration that was all-important or controlling, and each individual Trustee may have attributed different weights to various factors. The Independent Trustees were assisted in their evaluation of the Advisory Agreement by independent legal counsel, from whom they received separate legal advice and with whom they met separately from management and the Interested Trustee on several occasions. The following summarizes a number of relevant, but not necessarily all, factors considered by the Board in approving the continuation of the Advisory Agreement.
NATURE, EXTENT AND QUALITY OF SERVICES TO BE PROVIDED TO THE FUND
The Board considered the nature, extent and quality of services provided to the Fund by Weiss under the Advisory Agreement. This information included, among other things, the qualifications, background, tenure and responsibilities of each of the portfolio managers who are primarily responsible for the day-to-day portfolio management of the Fund. It also included information about Weiss’ investment process and investment strategy for the Fund, the approach to security selection and the overall positioning of the Fund’s portfolio. The Board noted that Weiss had been managing the Fund’s portfolio since its inception.
80
WEISS ALTERNATIVE MULTI-STRATEGY FUND
Board Consideration of Investment Advisory Agreement (Unaudited) – Continued
October 31, 2022
The Board evaluated the ability of Weiss, based on attributes such as its financial condition, resources and reputation, to attract and retain qualified investment professionals, including research, advisory and supervisory personnel. The Board further considered Weiss’ compliance program and its compliance record since the inception of the Fund.
Based on the above factors, as well as those discussed below, the Board concluded, within the context of its full deliberations, that Weiss is capable of continuing to provide services of the nature, extent and quality contemplated by the terms of the Advisory Agreement.
INVESTMENT PERFORMANCE
The Board considered the Fund’s investment performance information as of June 30, 2022 as compared to its benchmark index, the Bloomberg Barclays U.S. Corporate Bond Index, and noted that the Fund’s Class K and Investor Class shares outperformed the index for the three-year, five-year and since inception periods ended June 30, 2022, but underperformed the index for the year-to-date and one-year periods ended June 30, 2022. Additionally, the Board considered the Fund’s investment performance as compared to a performance universe of peer funds compiled by Broadridge Financial Solutions (“Broadridge”), an independent provider of investment company data, based on Morningstar fund classifications (the “Performance Universe”). The Trustees considered that the performance data provided by Broadridge included, among other things, performance comparisons for the one-year, two-year, three-year, four-year, and five-year periods ended March 31, 2022. The Trustees noted that the Fund’s Class K shares outperformed the Performance Universe average and median for the three-year, four-year, and five-year periods, outperformed the Performance Universe average but matched the Performance Universe median for the two-year period, and underperformed the Performance Universe average and median for the one-year period. The Board also considered that, in connection with its meetings held during the course of the prior year, the Board received and considered reports regarding the Fund’s performance over various time periods.
After considering the investment performance information described above, the Trustees concluded that the performance results achieved by Weiss for the Fund were satisfactory given market conditions. Although past performance is not a guarantee or indication of future results, the Trustees further concluded that they continue to have confidence in Weiss’s overall capabilities to manage the Fund.
FEES AND EXPENSES
The Board reviewed and considered the contractual investment management fee rate payable by the Fund to Weiss for investment management services (the “Management Fee Rate”). Among other information reviewed by the Board was a comparison of the Management Fee Rate of the Fund with those of other funds in an expense group (the “Expense Group”), as determined by Broadridge, based on Morningstar fund classifications. The Board noted that the Management Fee Rate was higher than the Expense Group average and median.
The Board received and evaluated information about the nature and extent of responsibilities and duties, as well as the entrepreneurial and other risks, assumed by Weiss. The Board also noted that Weiss reported that it does not manage any accounts using the same or similar strategy as that applied to the Fund.
Based on its consideration of the factors and information it deemed relevant, including those described here, the Board determined that the Management Fee Rate was reasonable in light of the services expected to be covered, and those currently being covered, by the Advisory Agreement.
81
WEISS ALTERNATIVE MULTI-STRATEGY FUND
Board Consideration of Investment Advisory Agreement (Unaudited) – Continued
October 31, 2022
The Board received and considered information regarding the Fund’s net operating expense ratios and its various components, including management fees, administrative fees, custodian and other non-management fees, Rule 12b-1 fees and non-Rule 12b-1 service fees and fee waiver and expense reimbursement arrangements. The Board recognized that Weiss had entered into an expense limitation agreement (the “Expense Limitation Agreement”) to limit the total annual fund operating expenses of each class of the Fund (excluding Rule 12b-1 fees, shareholder servicing fees, redemption fees, swap fees and expenses, dividends and interest on short positions, taxes, leverage interest, brokerage fees (including commissions, mark-ups and mark-downs), annual account fees for margin accounts, expenses incurred in connection with any merger or reorganization, or extraordinary expenses such as litigation). The Board considered the net operating expense ratios in comparison to the average and median ratios of the Expense Group. The Board noted that the Fund’s net expense ratio for Class K was higher than both the average and median of the Expense Group. The Board acknowledged that Weiss absorbs all expenses incurred by the Fund above its management fee, excepting any expenses not covered under the Expense Limitation Agreement. The Board received a description of the methodology and screening criteria used by Broadridge to determine the mutual funds and share classes in the Expense Group. While the Board recognized that comparisons between the Fund and Expense Peer Group may be imprecise, the comparative, independently-selected information provided by Broadridge assisted the Board in evaluating the reasonableness of the Fund’s Management Fee Rate and net expense ratio.
Based on its consideration of the factors and information it deemed relevant, including the features of the Fund as described above, the Board concluded that the expense structure of the Fund supported the continuation of the Advisory Agreement.
PROFITABILITY AND ECONOMIES OF SCALE
The Board requested and received a report on Weiss’ revenue and expenses resulting from services provided to the Fund pursuant to the Advisory Agreement for the twelve months ended March 31, 2022. The Board noted that Weiss has subsidized the Fund’s operations since inception and has not yet recouped those subsidies. The Board further observed that Weiss’s profit from sponsoring the Fund had not been, and currently was not, excessive.
With respect to economies of scale, the Board reviewed the Fund’s operating history and noted that the Fund had experienced growth since it commenced operations. The Board then considered information regarding whether and the extent to which economies of scale may be realized as the Fund’s assets grow and whether the Fund’s fee structure reflects these economies of scale for the benefit of for shareholders. The Board considered that the Expense Limitation Agreement limits costs to shareholders and provides a means of sharing potential economies of scale with the Fund’s shareholders. The Board noted that it would have an opportunity to consider economies of scale in the context of future contract renewals as Weiss continues to expand its operations and the Fund grows.
ANCILLARY BENEFITS DERIVED FROM THE RELATIONSHIP WITH THE FUND
The Board received and considered information regarding ancillary or “fall-out” benefits to Weiss and/or its affiliates, if any, as a result of Weiss’s relationship with the Fund. Ancillary benefits could include, among others, benefits attributable to research credits generated by Fund portfolio transactions. In this regard, the Board considered that Weiss confirmed it had benefited firm-wide from research credits generated by Fund portfolio transactions over the past twelve months. Ancillary benefits could also include benefits potentially derived from an increase in Weiss’ business as a result of its relationship with the Fund (such as the ability to market to
82
WEISS ALTERNATIVE MULTI-STRATEGY FUND
Board Consideration of Investment Advisory Agreement (Unaudited) – Continued
October 31, 2022
shareholders other potential financial products and services offered by Weiss, or to operate other products and services that follow investment strategies similar to those of the Fund). Based on its consideration of the factors and information it deemed relevant, including those described here, the Board did not find that any ancillary benefits received by Weiss and/or its affiliates, if any, were unreasonable.
CONCLUSIONS
In considering the renewal of the Advisory Agreement, the Trustees did not identify any one factor as all-important, but rather considered these factors collectively in light of the Fund’s surrounding circumstances. After considering the above-described factors and based on its deliberations and its evaluation of the information described above, the Board unanimously approved the Advisory Agreement for an additional one-year term.
83
WEISS ALTERNATIVE MULTI-STRATEGY FUND
Statement Regarding the Fund’s Liquidity Risk Management Program (Unaudited)
October 31, 2022
In accordance with Rule 22e-4 under the Investment Company Act of 1940, as amended, Series Portfolios Trust (the “Trust”) has adopted and implemented a liquidity risk management program (the “Trust Program”). As required under the Trust Program, Weiss Multi-Strategy Advisers, LLC (the “Adviser”), the investment adviser to the Weiss Alternative Balanced Risk Fund (the “Fund”), a series of the Trust, has adopted and implemented a liquidity risk management program tailored specifically to the Fund (the “Adviser Program”). The Adviser Program seeks to promote effective liquidity risk management for the Fund and to protect Fund shareholders from dilution of their interests. The Board of Trustees (the “Board”) of the Trust has approved the Adviser as the administrator for the Adviser Program (the “Program Administrator”). The Program Administrator has further delegated administration of the Adviser Program to its Liquidity Risk Management Committee. The Program Administrator is required to provide a written annual report to the Board and the Trust’s chief compliance officer regarding the adequacy and effectiveness of the Adviser Program, including the operation of the Fund’s highly liquid investment minimum, if applicable, and any material changes to the Adviser Program.
On July 28, 2022, the Board reviewed the Program Administrator’s written annual report for the period June 1, 2021 through May 31, 2022 (the “Report”). The Report provided an assessment of the Fund’s liquidity risk: the risk that the Fund could not meet requests to redeem shares issued by the Fund without significant dilution of the remaining investors’ interests in the Fund. The Adviser Program assesses liquidity risk under both normal and reasonably foreseeable stressed market conditions. The Program Administrator has retained ICE Data Services, Inc., a third-party vendor, to provide portfolio investment classification services, and the Report noted that the Fund primarily held investments that were classified as highly liquid during the review period. The Report noted that the Fund’s portfolio is expected to continue to primarily hold highly liquid investments and the determination that the Fund be designated as a “primarily highly liquid fund” (as defined in Rule 22e-4) remains appropriate and the Fund can therefore continue to rely on the exclusion in Rule 22e-4 from the requirements to determine and review a highly liquid investment minimum for the Fund and to adopt policies and procedures for responding to a highly liquid investment minimum shortfall. The Report noted that there were no breaches of the Fund’s restriction on holding illiquid investments exceeding 15% of its net assets during the review period. The Report confirmed that the Fund’s investment strategy was appropriate for an open-end management investment company. The Report also indicated that no material changes had been made to the Adviser Program during the review period.
The Program Administrator determined that the Fund is reasonably likely to be able to meet redemption requests without adversely affecting non-redeeming Fund shareholders through significant dilution. The Program Administrator concluded that the Adviser Program was adequately designed and effectively implemented during the review period.
84
WEISS ALTERNATIVE MULTI-STRATEGY FUND
Additional Information (Unaudited)
October 31, 2022
TRUSTEES AND EXECUTIVE OFFICERS
The Board oversees the management and operations of the Trust. The Board, in turn, elects the officers of the Trust, who are responsible for the day-to-day operations of the Trust and its separate series. The current Trustees and officers of the Trust, their year of birth, positions with the Trust, terms of office with the Trust and length of time served, principal occupations during the past five years and other directorships are set forth in the table below. Unless noted otherwise, the principal business address of each Trustee is c/o U.S. Bank Global Fund Services, 615 East Michigan Street, Milwaukee, Wisconsin 53202.
| Number of | |||||
| Portfolios | |||||
| in Fund | Other | ||||
| Positions | Term of Office | Complex(2) | Directorships | ||
| Name and | with | and Length of | Principal Occupations | Overseen | Held During |
Year of Birth | the Trust | Time Served | During Past Five Years | by Trustees | Past Five Years |
Independent Trustees of the Trust(1) | |||||
Koji Felton | Trustee | Indefinite Term; | Retired | 1 | Independent |
(born 1961) | Since | Trustee, Listed | |||
September | Funds Trust | ||||
2015. | (52 portfolios) | ||||
(Since 2019). | |||||
Debra McGinty-Poteet | Trustee | Indefinite Term; | Retired. | 1 | Independent |
(born 1956) | Since | Trustee, F/m | |||
September | Funds Trust | ||||
2015. | (3 portfolios) | ||||
(Since May | |||||
2015). | |||||
Daniel B. Willey | Trustee | Indefinite Term; | Retired. Chief Compliance | 1 | None |
(born 1955) | Since | Officer, United Nations | |||
September | Joint Staff Pension | ||||
2015. | Fund (2009 – 2017). | ||||
| Interested Trustee | |||||
Elaine E. Richards(3) | Chair, | Indefinite Term; | Senior Vice President, | 1 | None |
(born 1968) | Trustee | Since | U.S. Bank Global Fund | ||
July | Services (since 2007). | ||||
2021. | |||||
| Officers of the Trust | |||||
Ryan L. Roell | President and | Indefinite Term; | Vice President, | Not | Not |
(born 1973) | Principal | Since | U.S. Bank Global Fund | Applicable | Applicable |
Executive | July | Services (since 2005). | |||
Officer | 2019. | ||||
Cullen O. Small | Vice | Indefinite Term; | Vice President, | Not | Not |
(born 1987) | President, | Since | U.S. Bank Global | Applicable | Applicable |
Treasurer and | January | Fund Services | |||
Principal | 2019. | (since 2010). | |||
Financial | |||||
Officer | |||||
85
WEISS ALTERNATIVE MULTI-STRATEGY FUND
Additional Information (Unaudited) – Continued
October 31, 2022
| Number of | |||||
| Portfolios | |||||
| in Fund | Other | ||||
| Positions | Term of Office | Complex(2) | Directorships | ||
| Name and | with | and Length of | Principal Occupations | Overseen | Held During |
Year of Birth | the Trust | Time Served | During Past Five Years | by Trustees | Past Five Years |
Donna Barrette | Vice | Indefinite Term; | Senior Vice President | Not | Not |
(born 1966) | President, | Since | and Compliance Officer, | Applicable | Applicable |
Chief | November | U.S. Bank Global Fund | |||
Compliance | 2019. | Services (since 2004). | |||
Officer and | |||||
Anti-Money | |||||
Laundering | |||||
Officer | |||||
Adam W. Smith | Secretary | Indefinite Term; | Vice President, | Not | Not |
(born 1981) | Since | U.S. Bank Global | Applicable | Applicable | |
June | Fund Services | ||||
2019. | (since 2012). | ||||
Richard E. Grange | Assistant | Indefinite Term; | Officer, U.S. Bank | Not | Not |
(born 1982) | Treasurer | Since | Global Fund | Applicable | Applicable |
October | Services (since 2015). | ||||
2022. |
| (1) | The Trustees of the Trust who are not “interested persons” of the Trust as defined by the 1940 Act (“Independent Trustees”). |
| (2) | As of the date of October 31, 2022, the Trust was comprised of 12 portfolios (including the Fund) managed by unaffiliated investment advisors. The term “Fund Complex” applies only to the Fund. The Fund does not hold itself out as related to any other series within the Trust for investment purposes, nor does it share the same investment adviser with any other series within the Trust. |
| (3) | Ms. Richards, as a result of her employment with U.S. Bank Global Fund Services, which acts as transfer agent, administrator, and fund accountant to the Trust, is considered to be an “interested person” of the Trust, as defined by the 1940 Act. |
86
WEISS ALTERNATIVE MULTI-STRATEGY FUND
Additional Information (Unaudited) – Continued
October 31, 2022
AVAILABILITY OF FUND PORTFOLIO INFORMATION
The Fund files complete schedules of portfolio holdings with the SEC for the first and third quarters of each fiscal year on Part F of Form N-PORT, which is available on the SEC’s website at www.sec.gov. The Fund’s Part F of Form N-PORT may be reviewed and copied at the SEC’s Public Reference Room in Washington, D.C. For information on the Public Reference Room call 1-800-SEC-0330. In addition, the Fund’s Part F of Form N-PORT is available without charge upon request by calling 1-866-530-2690.
AVAILABILITY OF PROXY VOTING INFORMATION
A description of the Fund’s Proxy Voting Policies and Procedures is available without charge, upon request, by calling 1-866-530-2690. Information regarding how the Fund voted proxies relating to portfolio securities during the most recent period ended June 30, is available (1) without charge, upon request, by calling 1-866-530-2690, or (2) on the SEC’s website at www.sec.gov.
QUALIFIED DIVIDEND INCOME/DIVIDENDS RECEIVED DEDUCTION
For the year ended October 31, 2022, certain dividends paid by the Fund may be reported as qualified dividend income (QDI) and maybe eligible for taxation at capital gains rates. The percentage of dividends declared from ordinary income designated as qualified dividend income was 4.05%.
For corporate shareholders, the percent of ordinary income distributions qualifying for the corporate dividends received deduction for the year ended October 31, 2022 was 3.40%.
87
WEISS ALTERNATIVE MULTI-STRATEGY FUND
Privacy Notice (Unaudited)
The Fund collects non-public information about you from the following sources:
| • | Information we receive about you on applications or other forms; | |
| • | Information you give us orally; and/or | |
| • | Information about your transactions with us or others |
We do not disclose any non-public personal information about our customers or former customers without the customer’s authorization, except as permitted by law. We may share information with affiliated and unaffiliated third parties with whom we have contracts for servicing the Fund. We will provide unaffiliated third parties with only the information necessary to carry out their assigned responsibilities. We maintain physical, electronic and procedural safeguards to guard your personal information and require third parties to treat your personal information with the same high degree of confidentiality.
In the event that you hold shares of the Fund through a financial intermediary, including, but not limited to, a broker-dealer, bank, or trust company, the privacy policy of your financial intermediary would govern how your non-public personal information would be shared with unaffiliated third parties.
88
(This Page Intentionally Left Blank.)
INVESTMENT ADVISER
Weiss Multi-Strategy Advisers LLC
320 Park Avenue, 20th Floor
New York, NY 10022
DISTRIBUTOR
Quasar Distributors, LLC
111 East Kilbourn Avenue, Suite 2200
Milwaukee, WI 53202
CUSTODIAN
U.S. Bank N.A.
1555 North Rivercenter Drive, Suite 302
Milwaukee, WI 53212
ADMINISTRATOR, FUND ACCOUNTANT
AND TRANSFER AGENT
U.S. Bancorp Fund Services, LLC
615 East Michigan Street
Milwaukee, WI 53202
INDEPENDENT REGISTERED PUBLIC ACCOUNTING FIRM
Cohen & Company, Ltd.
342 North Water Street, Suite 830
Milwaukee, WI 53202
LEGAL COUNSEL
Goodwin Procter LLP
1900 N Street NW
Washington, DC 20036
This report should be accompanied or preceded by a prospectus.
The Fund’s Statement of Additional Information contains additional information about the
Fund’s trustees and is available without charge upon request by calling 1-866-530-2690.
| (b) | Not applicable. |
Item 2. Code of Ethics.
The registrant has adopted a code of ethics that applies to the registrant’s principal executive officer and principal financial officer. The registrant has not made any substantive amendments to its code of ethics during the period covered by this report. The registrant has not granted any waivers from any provisions of the code of ethics during the period covered by this report.
File: A copy of the registrant’s Code of Ethics is filed herewith.
Item 3. Audit Committee Financial Expert.
The registrant’s board of trustees has determined that there is at least one audit committee financial expert serving on its audit committee. Debra McGinty-Poteet is the “audit committee financial expert” and is considered to be “independent” as each term is defined in Item 3 of Form N‑CSR.
Item 4. Principal Accountant Fees and Services.
The registrant has engaged its principal accountant to perform audit services, audit-related services, tax services and other services during the past fiscal year. “Audit services” refer to performing an audit of the registrant's annual financial statements or services that are normally provided by the accountant in connection with statutory and regulatory filings or engagements for the past fiscal year. “Audit-related services” refer to the assurance and related services by the principal accountant that are reasonably related to the performance of the audit. “Tax services” refer to professional services rendered by the principal accountant for tax compliance, tax advice, and tax planning; including reviewing the Fund’s tax returns and distribution calculations. There were no “other services” provided by the principal accountant. For the fiscal years ended October 31, 2022, and October 31, 2021, the Fund’s principal accountant was Cohen & Company, Ltd. The following table details the aggregate fees billed or expected to be billed for the last fiscal year for audit fees, audit-related fees, tax fees and other fees by the principal accountant.
| FYE 10/31/2022 | FYE 10/31/2021 | |
Audit Fees | $46,000 | $46,000 |
Audit-Related Fees | $0 | $0 |
Tax Fees | $7,000 | $7,000 |
All Other Fees | $0 | $0 |
The audit committee has adopted pre-approval policies and procedures that require the audit committee to pre‑approve all audit and non‑audit services of the registrant, including services provided to any entity affiliated with the registrant.
The percentage of fees billed by Cohen & Company, Ltd. applicable to non-audit services pursuant to waiver of pre-approval requirement were as follows:
| FYE 10/31/2022 | FYE 10/31/2021 | |
Audit-Related Fees | 0% | 0% |
Tax Fees | 0% | 0% |
All Other Fees | 0% | 0% |
All of the principal accountant’s hours spent on auditing the registrant’s financial statements were attributed to work performed by full‑time permanent employees of the principal accountant.
The following table indicates the non-audit fees billed or expected to be billed by the registrant’s accountant for services to the registrant and to the registrant’s investment adviser (and any other controlling entity, etc.—not sub-adviser) for the last fiscal year. The audit committee of the board of trustees has considered whether the provision of non-audit services that were rendered to the registrant's investment adviser is compatible with maintaining the principal accountant's independence and has concluded that the provision of such non-audit services by the accountant has not compromised the accountant’s independence.
Non-Audit Related Fees | FYE 10/31/2022 | FYE 10/31/2021 |
Registrant | $0 | $0 |
Registrant’s Investment Adviser | $0 | $0 |
The registrant has not been identified by the U.S. Securities and Exchange Commission as having filed an annual report issued by a registered public accounting firm branch or office that is located in a foreign jurisdiction where the Public Company Accounting Oversight Board is unable to inspect or completely investigate because of a position taken by an authority in that jurisdiction.
The registrant is not a foreign issuer.
Item 5. Audit Committee of Listed Registrants.
Not applicable to registrants who are not listed issuers (as defined in Rule 10A-3 under the Securities Exchange Act of 1934).
(b) Not applicable.
Item 6. Investments.
| (a) | Schedule of Investments is included as part of the report to shareholders filed under Item 1 of this Form. |
| (b) | Not applicable. |
Item 7. Disclosure of Proxy Voting Policies and Procedures for Closed-End Management Investment Companies.
Not applicable to open-end investment companies.
Item 8. Portfolio Managers of Closed-End Management Investment Companies.
Not applicable to open-end investment companies.
Item 9. Purchases of Equity Securities by Closed‑End Management Investment Company and Affiliated Purchasers.
Not applicable to open-end investment companies.
Item 10. Submission of Matters to a Vote of Security Holders.
There have been no material changes to the procedures by which shareholders may recommend nominees to the registrant’s board of trustees.
Item 11. Controls and Procedures.
| (a) | The Registrant’s President and Treasurer have reviewed the Registrant's disclosure controls and procedures (as defined in Rule 30a-3(c) under the Investment Company Act of 1940 (the “Act”)) as of a date within 90 days of the filing of this report, as required by Rule 30a-3(b) under the Act and Rules 13a-15(b) or 15d‑15(b) under the Securities Exchange Act of 1934. Based on their review, such officers have concluded that the disclosure controls and procedures are effective in ensuring that information required to be disclosed in this report is appropriately recorded, processed, summarized and reported and made known to them by others within the Registrant and by the Registrant’s service provider. |
| (b) | There were no changes in the Registrant's internal control over financial reporting (as defined in Rule 30a-3(d) under the Act) that occurred during the period covered by this report that has materially affected, or is reasonably likely to materially affect, the Registrant's internal control over financial reporting. |
Item 12. Disclosure of Securities Lending Activities for Closed-End management Investment Companies.
Not applicable to open-end investment companies.
Item 13. Exhibits.
(3) Any written solicitation to purchase securities under Rule 23c‑1 under the Act sent or given during the period covered by the report by or on behalf of the registrant to 10 or more persons. Not applicable to open-end investment companies.
(4) Change in the registrant’s independent public accountant. There was no change in the registrant’s independent public accountant for the period covered by this report.
SIGNATURES
Pursuant to the requirements of the Securities Exchange Act of 1934 and the Investment Company Act of 1940, the registrant has duly caused this report to be signed on its behalf by the undersigned, thereunto duly authorized.
(Registrant) Series Portfolios Trust
By (Signature and Title) /s/ Ryan Roell
Ryan Roell, President
Date January 6, 2023
Pursuant to the requirements of the Securities Exchange Act of 1934 and the Investment Company Act of 1940, this report has been signed below by the following persons on behalf of the registrant and in the capacities and on the dates indicated.
By (Signature and Title) /s/ Ryan Roell
Ryan Roell, President
Date January 6, 2023
By (Signature and Title) /s/ Cullen Small
Cullen Small, Treasurer
Date January 6, 2023