Table of Contents
UNITED STATES
SECURITIES AND EXCHANGE COMMISSION
Washington, D.C. 20549
FORM N-CSR
CERTIFIED SHAREHOLDER REPORT OF REGISTERED
MANAGEMENT INVESTMENT COMPANIES
Investment Company Act file number: 811-23117
JPMorgan Trust IV
(Exact name of registrant as specified in charter)
277 Park Avenue
New York, NY 10172
(Address of principal executive offices) (Zip code)
Gregory S. Samuels
277 Park Avenue
New York, NY 10172
(Name and Address of Agent for Service)
Registrant’s telephone number, including area code: (800) 480-4111
Date of fiscal year end: June 30
Date of reporting period: July 1, 2019 through June 30, 2020
Form N-CSR is to be used by management investment companies to file reports with the Commission not later than 10 days after the transmission to stockholders of any report that is required to be transmitted to stockholders under Rule 30e-1 under the Investment Company Act of 1940 (17 CFR 270.30e-1). The Commission may use the information provided on Form N-CSR in its regulatory, disclosure review, inspection, and policymaking roles.
A registrant is required to disclose the information specified by Form N-CSR, and the Commission will make this information public. A registrant is not required to respond to the collection of information contained in Form N-CSR unless the Form displays a currently valid Office of Management and Budget (“OMB”) control number. Please direct comments concerning the accuracy of the information collection burden estimate and any suggestions for reducing the burden to Secretary, Securities and Exchange Commission, 450 Fifth Street, NW, Washington, DC 20549-0609. The OMB has reviewed this collection of information under the clearance requirements of 44 U.S.C. Section 3507.
Table of Contents
ITEM 1. REPORTS TO STOCKHOLDERS.
The following is a copy of the report transmitted to shareholders pursuant to Rule 30e-1 under the Investment Company Act of 1940 (17 CFR 270.30e-1).
Table of Contents
Annual Report
J.P. Morgan Large Cap Funds
June 30, 2020
JPMorgan Equity Focus Fund
JPMorgan Equity Income Fund
JPMorgan Equity Premium Income Fund
JPMorgan Growth and Income Fund
JPMorgan Hedged Equity Fund
JPMorgan Large Cap Growth Fund
JPMorgan Large Cap Value Fund
JPMorgan U.S. Equity Fund
JPMorgan U.S. Large Cap Core Plus Fund
JPMorgan U.S. Research Enhanced Equity Fund
Beginning on January 1, 2021, as permitted by regulations adopted by the Securities and Exchange Commission, paper copies of the Funds’ annual and semi-annual shareholder reports will no longer be sent by mail, unless you specifically request paper copies of the reports. Instead, the reports will be made available on the Funds’ website www.jpmorganfunds.com and you will be notified by mail each time a report is posted and provided with a website to access the report. If you already elected to receive shareholder reports electronically, you will not be affected by this change and you need not take any action.
You may elect to receive shareholder reports and other communications from the Funds electronically anytime by contacting your financial intermediary (such as a broker dealer, bank, or retirement plan) or, if you are a direct investor, by going to www.jpmorganfunds.com/edelivery.
You may elect to receive paper copies of all future reports free of charge. Contact your financial intermediary or, if you invest directly with the Funds, email us at funds.website.support@jpmorganfunds.com or call 1-800-480-4111. Your election to receive paper reports will apply to all funds held within your account(s).

Table of Contents
| Letter to Shareholders | 1 | |||
| Market Overview | 2 | |||
Fund Commentaries: | ||||
| 3 | ||||
| 5 | ||||
| 7 | ||||
| 10 | ||||
| 12 | ||||
| 15 | ||||
| 17 | ||||
| 19 | ||||
| 21 | ||||
| 24 | ||||
| Schedules of Portfolio Investments | 26 | |||
| Financial Statements | 58 | |||
| Financial Highlights | 84 | |||
| Notes to Financial Statements | 104 | |||
| Report of Independent Registered Public Accounting Firm | 123 | |||
| Trustees | 124 | |||
| Officers | 127 | |||
| Schedule of Shareholder Expenses | 128 | |||
| Liquidity Risk Management Program | 133 | |||
| Tax Letter | 134 | |||
| Privacy Policy — Located at the back of this Annual Report | ||||
Investments in a Fund are not deposits or obligations of, or guaranteed or endorsed by, any bank and are not insured or guaranteed by the FDIC, the Federal Reserve Board or any other government agency. You could lose money if you sell when a Fund’s share price is lower than when you invested.
Past performance is no guarantee of future performance. The general market views expressed in this report are opinions based on market and other conditions through the end of the reporting period and are subject to change without notice. These views are not intended to predict the future performance of a Fund or the securities markets. References to specific securities and their issuers are for illustrative purposes only and are not intended to be, and should not be interpreted as, recommendations to purchase or sell such securities. Such views are not meant as investment advice and may not be relied on as an indication of trading intent on behalf of any Fund.
Prospective investors should refer to the Funds’ prospectuses for a discussion of the Funds’ investment objectives, strategies and risks. Call J.P. Morgan Funds Service Center at 1-800-480-4111 for a prospectus containing more complete information about a Fund, including management fees and other expenses. Please read it carefully before investing.
Table of Contents
JULY 28, 2020 (Unaudited)
Dear Shareholders,
While every epoch holds challenges and opportunities, the current year has brought unprecedented challenges that impacted communities both globally and locally. J.P. Morgan Asset Management has directly confronted the challenges of this year, with sensitivity, urgency and a clear vision, serving our shareholders, clients and communities with unwavering commitment.
 |
“J.P. Morgan Asset Management has directly confronted the challenges of this year, with sensitivity, urgency and a clear vision, serving our shareholders, clients and communities with unwavering commitment.” |
The advent of the COVID-19 pandemic and the ensuing closure of large parts of global, national and local economies also brought severe stress to financial markets. Daily market volatility spiked and yields on U.S. Treasury bonds fell to record lows in March 2020 and by the end of the first quarter of 2020, the value of the S&P 500 Index had declined by 20%. However, the U.S. Federal Reserve, along with other leading central banks, slashed interest rates and unleashed a range of initiatives to seek to ensure liquidity and stability in financial markets. From their lows on March 23, 2020 to the end of the reporting period, the S&P 500 and the Bloomberg Barclays U.S.
Aggregate Index rebounded by 39.3% and 5.0%, respectively, amid accommodative central bank policies, government stimulus programs and global efforts to halt the spread of COVID-19.
Many have faced significant challenges throughout the past year, whether related to the COVID-19 pandemic or the recent acts of racism and discrimination around the world. JPMorgan Chase & Co. has recommitted its firm stance against any form of racism, discrimination, or social injustice. As Brian Lamb, Global Head of Diversity & Inclusion for JPMorgan Chase & Co., recently said, “We are working across the entire firm — being intentional to strengthen our inclusive environment where our employees, customers and partners feel welcomed and valued in the communities where we do business.” To learn more, please visit JPMorgan Chase & Co.’s Diversity & Inclusion web site.
On behalf of J.P. Morgan Asset Management, thank you for entrusting us to manage your assets. Should you have any questions, please visit www.jpmorganfunds.com or contact the J.P. Morgan Funds Service Center at 1-800-480-4111.
Sincerely yours,

Andrea L. Lisher
Head of Americas, Client
J.P. Morgan Asset Management
| JUNE 30, 2020 | J.P. MORGAN LARGE CAP FUNDS | 1 | ||||||
Table of Contents
J.P. Morgan Large Cap Funds
TWELVE MONTHS ENDED JUNE 30, 2020 (Unaudited)
While U.S. equity markets generally outperformed other financial markets in the second half of 2019, global prices for a broad range of assets fell sharply in the first quarter of 2020 as large sectors of global, national and local economies shut down in response to the COVID-19 pandemic. However, equity markets rebounded somewhat in the final three months of the reporting period as stimulus programs from leading central banks and governments took hold and countries in Asia and Europe showed progress in halting the spread of virus.
In late July 2019, the U.S. Federal Reserve (the “Fed”) cut interest rates for the first time in more than a decade as U.S. economic growth showed signs of slowing, even as U.S. unemployment remained at historically low levels. The central bank followed with two more interest rate cuts in September and October 2019. In response to lower rates and improved or stable economic data, equity prices in the U.S. generally rose in the final months of 2019.
Further support for U.S. equity markets came from a “Phase One” trade agreement between the U.S. and China that reduced existing tariffs and headed off the implementation of new tariffs scheduled to take effect December 15, 2019. U.S. investor sentiment remained positive through January 2020 and weathered a brief flare up in military tension between the U.S. and Iran.
While the S&P 500 reached six new closing highs in February — the last one on February 19 – the final weeks of the month were marked by a broad sell-off of assets and a sharp rise in financial market volatility in reaction to the spread of COVID-19 and the expected economic damage to follow. In early March 2020, the World Health Organization declared COVID-19 a pandemic and as businesses, schools and other institutions across the country began to close, U.S. weekly unemployment claims reached record highs. By the end of the first quarter of the 2020, the S&P 500 had declined by 20%.
A U.S. government stimulus package, valued at 10% of U.S. gross domestic product, and the Fed’s decision to slash interest rates further and restart its quantitative easing asset purchasing program — along with a range of other stimulus programs — provided support for U.S. and global equity markets in the following months. As economies in Asia and Europe, as well as parts of the U.S., began to reopen in the second quarter of 2020, global prices both for equity and fixed income assets rose. Within U.S. equity markets, large cap stocks generally outperformed mid cap and small cap stocks and growth stocks outperformed value stocks during the reporting period.
| 2 | J.P. MORGAN LARGE CAP FUNDS | JUNE 30, 2020 | ||||
Table of Contents
FUND COMMENTARY
TWELVE MONTHS ENDED JUNE 30, 2020 (Unaudited)
| REPORTING PERIOD RETURN: | ||||
| Fund (Class I Shares)* | 6.12% | |||
| S&P 500 Index | 7.51% | |||
| Net Assets as of 6/30/2020 (In Thousands) | $ | 85,054 | ||
INVESTMENT OBJECTIVE**
The JPMorgan Equity Focus Fund (the “Fund”) seeks long term capital appreciation.
WHAT WERE THE MAIN DRIVERS OF THE FUND’S PERFORMANCE?
The Fund’s Class I Shares underperformed the S&P 500 Index (the “Benchmark”) for the twelve months ended June 30, 2020. The Fund’s overweight position and security selection in the financials sector and its security selection in the real estate sector were leading detractors from performance relative to the Benchmark, while the Fund’s security selection and overweight position in the consumer discretionary sector and its security selection in the health care sector were leading contributors to relative performance.
Leading individual detractors from relative performance included the Fund’s overweight positions in Loews Inc., Delta Air Lines Inc. and Capital One Financial Corp. Shares of Loews, a holding company operating in the energy, insurance and hotels sectors, fell after the company reported a loss for the first quarter of 2020. Shares of Delta Air Lines, a passenger airline, fell as global air travel was restricted in response to the COVID-19 pandemic. Shares of Capital One Financial, a credit card and financial services company, fell after the company reported a loss and lower-than-expected revenue for the first quarter of 2020.
Leading individual contributors to relative performance included the Fund’s out-of-Benchmark position in Tesla, Inc. and its overweight positions in DexCom Inc. and Microsoft Corp. Shares of Tesla, a producer of electric vehicles and energy storage systems, rose amid a faster-than-expected schedule for production of its Model Y vehicles and efficient production output from its Shanghai factory. Shares of DexCom, a medical device manufacturer, rose after the company reported better-than-expected earnings and revenue for several consecutive quarters. Shares of Microsoft, an information technology company, rose amid general investor demand for large cap technology stocks during the reporting period.
HOW WAS THE FUND POSITIONED?
The Fund’s portfolio managers employed a bottom-up fundamental approach to stock selection. As a result of this approach to stock selection, the Fund’s largest positions were in the information technology and financials sectors and the Fund’s
smallest positions were in the consumer staples and utilities sectors.
| TOP TEN EQUITY HOLDINGS OF THE PORTFOLIO*** | ||||||||
| 1. | Microsoft Corp. | 6.7 | % | |||||
| 2. | Amazon.com, Inc. | 5.8 | ||||||
| 3. | Apple, Inc | 4.7 | ||||||
| 4. | Loews Corp. | 3.8 | ||||||
| 5. | Berkshire Hathaway, Inc., Class B | 3.5 | ||||||
| 6. | UnitedHealth Group, Inc. | 3.5 | ||||||
| 7. | Home Depot, Inc. (The) | 3.5 | ||||||
| 8. | Alphabet, Inc., Class C | 3.5 | ||||||
| 9. | Bank of America Corp. | 3.3 | ||||||
| 10. | Mastercard, Inc., Class A | 2.9 | ||||||
PORTFOLIO COMPOSITION BY SECTOR*** | ||||
Information Technology | 24.7 | % | ||
Financials | 19.4 | |||
Consumer Discretionary | 15.4 | |||
Health Care | 12.3 | |||
Materials | 5.5 | |||
Communication Services | 5.0 | |||
Real Estate | 4.0 | |||
Energy | 3.1 | |||
Industrials | 3.0 | |||
Utilities | 2.1 | |||
Consumer Staples | 1.7 | |||
Short-Term Investments | 3.8 | |||
| * | The return shown is based on net asset values calculated for shareholder transactions and may differ from the return shown in the financial highlights, which reflects adjustments made to the net asset values in accordance with accounting principles generally accepted in the United States of America. |
| ** | The adviser seeks to achieve the Fund’s objective. There can be no guarantee it will be achieved. |
| *** | Percentages indicated are based on total investments as of June 30, 2020. The Fund’s portfolio composition is subject to change. |
| JUNE 30, 2020 | J.P. MORGAN LARGE CAP FUNDS | 3 | ||||||
Table of Contents
JPMorgan Equity Focus Fund
FUND COMMENTARY
TWELVE MONTHS ENDED JUNE 30, 2020 (Unaudited) (continued)
AVERAGE ANNUAL TOTAL RETURNS AS OF JUNE 30, 2020 | ||||||||||||||
| INCEPTION DATE OF CLASS | 1 YEAR | 5 YEAR | SINCE INCEPTION | |||||||||||
CLASS A SHARES | July 29, 2011 | |||||||||||||
With Sales Charge* | 0.31 | % | 9.00 | % | 11.39 | % | ||||||||
Without Sales Charge | 5.87 | 10.18 | 12.06 | |||||||||||
CLASS C SHARES | July 29, 2011 | |||||||||||||
With CDSC** | 4.30 | 9.63 | 11.50 | |||||||||||
Without CDSC | 5.30 | 9.63 | 11.50 | |||||||||||
CLASS I SHARES | July 29, 2011 | 6.12 | 10.46 | 12.34 | ||||||||||
CLASS R6 SHARES | October 1, 2018 | 6.39 | 10.56 | 12.40 | ||||||||||
| * | Sales Charge for Class A Shares is 5.25%. |
| ** | Assumes a 1% CDSC (contingent deferred sales charge) for the one year period and 0% CDSC thereafter. |
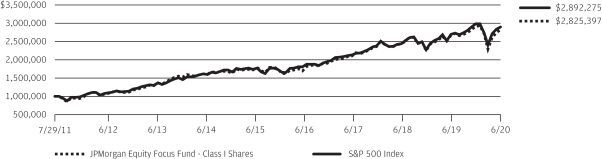
LIFE OF FUND PERFORMANCE (7/29/11 TO 6/30/20)
The performance quoted is past performance and is not a guarantee of future results. Mutual funds are subject to certain market risks. Investment returns and principal value of an investment will fluctuate so that an investor’s shares, when redeemed, may be worth more or less than their original cost. Current performance may be higher or lower than the performance data shown. For up-to-date, month-end performance information please call 1-800-480-4111.
The Fund commenced operations on July 29, 2011.
Returns for Class R6 Shares prior to their inception date are based on the performance of Class I Shares. The actual returns of Class R6 Shares would have been different than those shown because Class R6 Shares have different expenses than Class I Shares.
The graph illustrates comparative performance for $1,000,000 invested in Class I Shares of the JPMorgan Equity Focus Fund and the S&P 500 Index from July 29, 2011 to June 30, 2020. The performance of the Fund assumes reinvestment of all dividends and capital gain distributions, if any, and does not include a sales charge. The performance of the S&P 500 Index does not reflect the deduction of expenses or a sales charge associated with a mutual fund and has been adjusted to reflect reinvestment of all dividends and capital gain
distributions of securities included in the benchmark, if applicable. The S&P 500 Index is an unmanaged index generally representative of the performance of large companies in the U.S. stock market. Investors cannot invest directly in an index.
Class I Shares have a $1,000,000 minimum initial investment.
Subsequent to the inception date of the Fund and through July 31, 2013, the Fund did not experience any shareholder activity. If such shareholder activity had occurred, the Fund’s performance may have been impacted.
Fund performance may reflect the waiver of the Fund’s fees and reimbursement of expenses for certain periods since the applicable inception date. Without these waivers and reimbursements, performance would have been lower. Also, performance shown in this section does not reflect the deduction of taxes that a shareholder would pay on Fund distributions or on gains resulting from redemptions of Fund shares.
The returns shown are based on net asset values calculated for shareholder transactions and may differ from the returns shown in the financial highlights, which reflect adjustments made to the net asset values in accordance with accounting principles generally accepted in the United States of America.
| 4 | J.P. MORGAN LARGE CAP FUNDS | JUNE 30, 2020 | ||||
Table of Contents
FUND COMMENTARY
TWELVE MONTHS ENDED JUNE 30, 2020 (Unaudited)
| REPORTING PERIOD RETURN: | ||||
| Fund (Class I Shares)* | (6.06)% | |||
| Russell 1000 Value Index | (8.84)% | |||
| Net Assets as of 6/30/2020 (In Thousands) | $ | 29,554,937 | ||
INVESTMENT OBJECTIVE**
The JPMorgan Equity Income Fund (the “Fund”) seeks capital appreciation and current income.
WHAT WERE THE MAIN DRIVERS OF THE FUND’S PERFORMANCE?
The Fund’s Class I Shares outperformed the Russell 1000 Value Index (the “Benchmark”) for the twelve months ended June 30, 2020. The Fund’s security selection and overweight position in the information technology and energy sectors were leading contributors to performance relative to the Benchmark, while the Fund’s security selection in the real estate and consumer staples sectors was a leading detractor from relative performance.
Leading individual contributors to relative performance included the Fund’s out-of-Benchmark positions in Apple Inc. and Microsoft Corp. and its overweight position in BlackRock Inc. Shares of Apple and Microsoft, both of which are information technology companies, rose amid general investor demand for large cap technology stocks during the reporting period. Shares of BlackRock, a financial services provider, rose after the company reported better-than-expected revenue for the first quarter of 2020.
Leading individual detractors from relative performance included the Fund’s overweight positions in Discover Financial Services, Simon Property Group Inc. and Prudential Financial Inc. Shares of Discover Financial Services, a banking and credit card company, fell amid a sharp decline in consumer spending in response to the COVID-19 pandemic. Shares of Simon Property Group, a real estate investment trust operating in the retail property sector, fell as retail businesses closed in response to the COVID-19 pandemic. Shares of Prudential Financial, a financial services provider, fell after the company reported lower-than-expected earnings and revenue for the first quarter of 2020.
HOW WAS THE FUND POSITIONED?
The Fund’s portfolio managers’ focus remained on stock selection, as they believed that quality companies trading at attractive valuations have the greatest potential to outperform in the long term. As the Fund aimed to purchase stocks with above average dividend yields, the research process was designed to identify companies with predictable and durable
business models deemed capable of generating sustainable free cash flow.
| TOP TEN EQUITY HOLDINGS OF THE PORTFOLIO*** | ||||||||
| 1. | Bank of America Corp. | 2.5 | % | |||||
| 2. | Bristol-Myers Squibb Co | 2.5 | ||||||
| 3. | Johnson & Johnson | 2.4 | ||||||
| 4. | Comcast Corp., Class A | 2.4 | ||||||
| 5. | Microsoft Corp. | 2.4 | ||||||
| 6. | BlackRock, Inc. | 2.3 | ||||||
| 7. | Texas Instruments, Inc. | 2.2 | ||||||
| 8. | CME Group, Inc. | 2.2 | ||||||
| 9. | Home Depot, Inc. (The) | 2.1 | ||||||
| 10. | UnitedHealth Group, Inc. | 1.9 | ||||||
PORTFOLIO COMPOSITION BY SECTOR*** | ||||
Financials | 22.6 | % | ||
Health Care | 15.0 | |||
Industrials | 12.6 | |||
Information Technology | 11.9 | |||
Consumer Staples | 9.6 | |||
Consumer Discretionary | 6.1 | |||
Utilities | 5.5 | |||
Communication Services | 4.3 | |||
Energy | 4.0 | |||
Materials | 2.8 | |||
Real Estate | 2.6 | |||
Short-Term Investments | 3.0 | |||
| * | The return shown is based on net asset values calculated for shareholder transactions and may differ from the return shown in the financial highlights, which reflects adjustments made to the net asset values in accordance with accounting principles generally accepted in the United States of America. |
| ** | The adviser seeks to achieve the Fund’s objective. There can be no guarantee it will be achieved. |
| *** | Percentages indicated are based on total investments as of June 30, 2020. The Fund’s portfolio composition is subject to change. |
| JUNE 30, 2020 | J.P. MORGAN LARGE CAP FUNDS | 5 | ||||||
Table of Contents
JPMorgan Equity Income Fund
FUND COMMENTARY
TWELVE MONTHS ENDED JUNE 30, 2020 (Unaudited) (continued)
AVERAGE ANNUAL TOTAL RETURNS AS OF JUNE 30, 2020 | ||||||||||||||
| INCEPTION DATE OF CLASS | 1 YEAR | 5 YEAR | 10 YEAR | |||||||||||
CLASS A SHARES | February 18, 1992 | |||||||||||||
With Sales Charge* | (11.28 | )% | 5.31 | % | 11.01 | % | ||||||||
Without Sales Charge | (6.36 | ) | 6.45 | 11.60 | ||||||||||
CLASS C SHARES | November 4, 1997 | |||||||||||||
With CDSC** | (7.83 | ) | 5.93 | 11.05 | ||||||||||
Without CDSC | (6.83 | ) | 5.93 | 11.05 | ||||||||||
CLASS I SHARES | July 2, 1987 | (6.06 | ) | 6.73 | 11.88 | |||||||||
CLASS R2 SHARES | February 28, 2011 | (6.57 | ) | 6.18 | 11.32 | |||||||||
CLASS R3 SHARES | September 9, 2016 | (6.29 | ) | 6.46 | 11.61 | |||||||||
CLASS R4 SHARES | September 9, 2016 | (6.07 | ) | 6.73 | 11.88 | |||||||||
CLASS R5 SHARES | February 28, 2011 | (5.98 | ) | 6.91 | 12.07 | |||||||||
CLASS R6 SHARES | January 31, 2012 | (5.83 | ) | 7.00 | 12.14 | |||||||||
| * | Sales Charge for Class A Shares is 5.25%. |
| ** | Assumes a 1% CDSC (contingent deferred sales charge) for the one year period and 0% CDSC thereafter. |
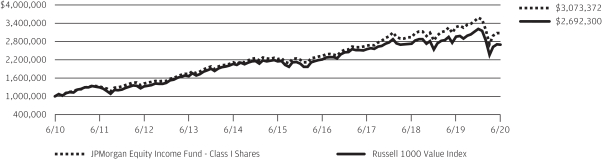
TEN YEAR PERFORMANCE (6/30/10 TO 6/30/20)
The performance quoted is past performance and is not a guarantee of future results. Mutual funds are subject to certain market risks. Investment returns and principal value of an investment will fluctuate so that an investor’s shares, when redeemed, may be worth more or less than their original cost. Current performance may be higher or lower than the performance data shown. For up-to-date month-end performance information please call 1-800-480-4111.
Returns for Class R2, Class R4, and Class R5 Shares prior to their inception dates are based on the performance of Class I Shares. With respect to Class R2 Shares, prior class performance has been adjusted to reflect the differences in expenses between classes. The actual returns for Class R4 Shares would have been similar to those shown because Class R4 Shares had similar expenses to Class I Shares. The actual returns for Class R5 Shares would have been different than those shown because Class R5 Shares have different expenses than Class I Shares.
Returns for Class R3 Shares prior to their inception date are based on the performance of Class A Shares. The actual returns for Class R3 Shares would have been similar than those shown because Class R3 Shares currently have the same expenses as Class A Shares.
Returns for Class R6 Shares prior to their inception date are based on the performance of Class R5 Shares and, prior to February 28, 2011, Class I Shares. The actual returns for Class R6 Shares would have been different than those shown because Class R6 Shares have different expenses than Class R5 and Class I Shares.
The graph illustrates comparative performance for $1,000,000 invested in Class I Shares of the JPMorgan Equity Income Fund and the Russell 1000 Value Index from June 30, 2010 to June 30, 2020. The performance of the Fund assumes reinvestment of all dividends and capital gain distributions, if any, and does not include a sales charge. The performance of the Russell 1000 Value Index does not reflect the deduction of expenses or a sales charge associated with a mutual fund and has been adjusted to reflect reinvestment of all dividends and capital gain distributions of the securities included in the benchmark, if applicable. The Russell 1000 Value Index is an unmanaged index which measures the performance of those Russell 1000 companies with lower price-to-book ratios and lower forecasted growth values. Investors cannot invest directly in an index.
Class I Shares have a $1,000,000 minimum initial investment.
Fund performance may reflect the waiver of the Fund’s fees and reimbursement of expenses for certain periods. Without these waivers and reimbursements, performance would have been lower. Also, performance shown in this section does not reflect the deduction of taxes that a shareholder would pay on Fund distributions or on gains resulting from redemptions of Fund shares.
The returns shown are based on net asset values calculated for shareholder transactions and may differ from the returns shown in the financial highlights, which reflect adjustments made to the net asset values in accordance with accounting principles generally accepted in the United States of America.
| 6 | J.P. MORGAN LARGE CAP FUNDS | JUNE 30, 2020 | ||||
Table of Contents
JPMorgan Equity Premium Income Fund
FUND COMMENTARY
TWELVE MONTHS ENDED JUNE 30, 2020 (Unaudited)
| REPORTING PERIOD RETURN: | ||||
| Fund (Class I Shares)* | (3.50)% | |||
S&P 500 Index | 7.51% | |||
ICE BofAML 3-Month U.S. Treasury Bill Index | 1.63% | |||
Net Assets as of 6/30/2020 (In Thousands) | $191,730 | |||
INVESTMENT OBJECTIVE**
The JPMorgan Equity Premium Income Fund (the “Fund”) seeks current income while maintaining prospects for capital appreciation.
WHAT WERE THE MAIN DRIVERS OF THE FUND’S PERFORMANCE?
The Fund’s Class I Shares underperformed both the S&P 500 Index (the “Benchmark”) and the ICE BofAML 3-Month U.S. Treasury Bill Index for the twelve months ended June 30, 2020. The Fund’s underweight position and security selection in the information technology sector and its overweight position in the utilities sector were leading detractors from performance relative to the Benchmark, while the Fund’s security selection and underweight position in the energy sector and its security selection in the health care sector were leading contributors to relative performance.
Leading individual detractors from performance relative to the Benchmark included the Fund’s underweight positions in Apple Inc. and Amazon.com Inc. and its overweight position in Automatic Data Processing Inc. Shares of Apple, a maker of mobile devices, computers, software and relative services, rose amid better-than-expected earnings growth and positive investor sentiment over the company’s planned launch of new products and upgrades. Shares of Amazon.com, a provider of online retail products and services, rose amid investor expectations that the company would benefit from at-home quarantines in
response to the COVID-19 pandemic, as well as investor demand for large cap technology sector stocks. Shares of Automatic Data Processing, a provider of payroll and other business services, fell amid significant disruption in the U.S. labor market in response to the COVID-19 pandemic.
Leading individual contributors to the Fund’s performance included its overweight position in Eli Lilly Inc. and its underweight positions in Cisco Systems Inc. and Boeing Co. Shares of Eli Lilly, a pharmaceutical manufacturer, rose after the company reported better-than-expected earnings and revenue for the first quarter of 2020. Shares of Cisco Systems, a provider of internet networking products and services that was not held in the Fund, fell in the first half of the reporting period following two consecutive quarters of weaker-than-expected revenue growth. Shares of Boeing, an aircraft and aerospace manufacturer, fell amid investor concerns about the future of its 737 Max aircraft as well as a sharp decline in airline traffic in response to the COVID-19 pandemic.
HOW WAS THE FUND POSITIONED?
The Fund seeks to generate income through a combination of selling options and investing in large cap stocks and delivering monthly income from associated option premiums and stock dividends. The Fund’s portfolio managers employed a proprietary research process designed to identify what they believed were overvalued and undervalued stocks with attractive risk/return characteristics.
| JUNE 30, 2020 | J.P. MORGAN LARGE CAP FUNDS | 7 | ||||||
Table of Contents
JPMorgan Equity Premium Income Fund
FUND COMMENTARY
TWELVE MONTHS ENDED JUNE 30, 2020 (Unaudited) (continued)
| TOP TEN EQUITY HOLDINGS OF THE PORTFOLIO*** | ||||||||
| 1. | Barclays Bank plc, ELN, 68.00%, 7/17/2020, (linked to S&P 500 Index) | 4.0 | % | |||||
| 2. | BNP Paribas, ELN, 72.67%, 7/31/2020, (linked to S&P 500 Index) | 3.4 | ||||||
| 3. | BMO Capital Markets Corp., ELN, 70.97%, 7/10/2020, (linked to S&P 500 Index) | 3.0 | ||||||
| 4. | Toronto-Dominion Bank (The), ELN, 78.20%, 8/7/2020, (linked to S&P 500 Index) | 2.7 | ||||||
| 5. | Royal Bank of Canada, ELN, 81.10%, 7/24/2020, (linked to S&P 500 Index) | 2.4 | ||||||
| 6. | Amazon.com, Inc. | 1.5 | ||||||
| 7. | Microsoft Corp. | 1.5 | ||||||
| 8. | Accenture plc, Class A | 1.5 | ||||||
| 9. | AbbVie, Inc. | 1.4 | ||||||
| 10. | Eli Lilly and Co. | 1.4 | ||||||
PORTFOLIO COMPOSITION BY SECTOR*** | ||||
Equity-Linked Notes | 15.5 | % | ||
Information Technology | 12.5 | |||
Health Care | 11.6 | |||
Consumer Staples | 11.5 | |||
Financials | 9.3 | |||
Industrials | 8.6 | |||
Utilities | 7.5 | |||
Consumer Discretionary | 7.1 | |||
Communication Services | 6.9 | |||
Materials | 2.6 | |||
Real Estate | 2.2 | |||
Exchange-Traded Fund | 1.0 | |||
Energy | 0.7 | |||
Short-Term Investments | 3.0 | |||
| * | The return shown is based on net asset values calculated for shareholder transactions and may differ from the return shown in the financial highlights, which reflects adjustments made to the net asset values in accordance with accounting principles generally accepted in the United States of America. |
| ** | The adviser seeks to achieve the Fund’s objective. There can be no guarantee it will be achieved. |
| *** | Percentages indicated are based on total investments as of June 30, 2020. The Fund’s portfolio composition is subject to change. |
| 8 | J.P. MORGAN LARGE CAP FUNDS | JUNE 30, 2020 | ||||
Table of Contents
AVERAGE ANNUAL TOTAL RETURNS AS OF JUNE 30, 2020 | ||||
| INCEPTION DATE OF CLASS | 1 YEAR | SINCE INCEPTION | ||||||||
CLASS A SHARES | August 31, 2018 | |||||||||
With Sales Charge* | (8.84 | )% | (1.83 | )% | ||||||
Without Sales Charge | (3.77 | ) | 1.10 | |||||||
CLASS C SHARES | August 31, 2018 | |||||||||
With CDSC** | (5.26 | ) | 0.55 | |||||||
Without CDSC | (4.26 | ) | 0.55 | |||||||
CLASS I SHARES | August 31, 2018 | (3.50 | ) | 1.32 | ||||||
CLASS R5 SHARES | August 31, 2018 | (3.35 | ) | 1.48 | ||||||
CLASS R6 SHARES | August 31, 2018 | (3.33 | ) | 1.53 | ||||||
| * | Sales Charge for Class A Shares is 5.25%. |
| ** | Assumes a 1% CDSC (contingent deferred sales charge) for the one year period and 0% CDSC thereafter. |
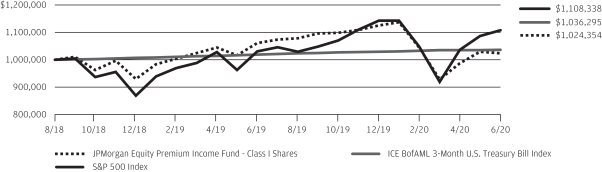
LIFE OF FUND PERFORMANCE (8/31/18 to 6/30/20)
The performance quoted is past performance and is not a guarantee of future results. Mutual funds are subject to certain market risks. Investment returns and principal value of an investment will fluctuate so that an investor’s shares, when redeemed, may be worth more or less than their original cost. Current performance may be higher or lower than the performance data shown. For up-to-date month-end performance information please call 1-800-480-4111.
The Fund commenced operations on August 31, 2018.
The graph illustrates comparative performance for $1,000,000 invested in Class I Shares of the JPMorgan Equity Premium Income Fund, the S&P 500 Index and the ICE BofAML 3-Month U.S. Treasury Bill Index from August 31, 2018 to June 30, 2020. The performance of the Fund assumes reinvestment of all dividends and capital gain distributions, if any, and does not include a sales charge. The performance of the S&P 500 Index and the ICE BofAML 3-Month U.S. Treasury Bill Index does not reflect the deduction of expenses or a sales charge associated with a mutual fund and approximates the minimum possible dividend reinvestment of the securities included in the benchmarks, if applicable. These expenses are not identical to the expenses incurred by the Fund. The S&P 500 Index is an unmanaged index generally representative of the performance of large companies in the U.S. stock market. The ICE BofAML 3-Month U.S. Treasury Bill Index is comprised of a single issue purchased at the
beginning of the month and held for a full month. Each month the ICE BofAML 3-Month U.S. Treasury Bill Index is rebalanced and the issue selected is the outstanding Treasury Bill that matures closest to, but not beyond, 3 months from the rebalancing date. Investors cannot invest directly in an index.
Class I Shares have a $1,000,000 minimum initial investment.
Subsequent to the inception date of the Fund and through April 7, 2019, the Fund did not experience any shareholder activity. If such shareholder activity had occurred, the Fund’s performance may have been impacted.
Fund performance may reflect the waiver of the Fund’s fees and reimbursement of expenses for certain periods since the applicable inception date. Without these waivers and reimbursements, performance would have been lower. Also, performance shown in this section does not reflect the deduction of taxes that a shareholder would pay on Fund distributions or on gains resulting from redemptions of Fund shares.
The returns shown are based on net asset values calculated for shareholder transactions and may differ from the returns shown in the financial highlights, which reflect adjustments made to the net asset values in accordance with accounting principles generally accepted in the United States of America.
| JUNE 30, 2020 | J.P. MORGAN LARGE CAP FUNDS | 9 | ||||||
Table of Contents
JPMorgan Growth and Income Fund
FUND COMMENTARY
TWELVE MONTHS ENDED JUNE 30, 2020 (Unaudited)
| REPORTING PERIOD RETURN: | ||||
| Fund (Class A Shares, without a sales charge)* | (5.10)% | |||
| Russell 1000 Value Index | (8.84)% | |||
| Net Assets as of 6/30/2020 (In Thousands) | $ | 726,854 | ||
INVESTMENT OBJECTIVE**
The JPMorgan Growth and Income Fund (the “Fund”) seeks to provide capital growth over the long term and to earn income from dividends.
WHAT WERE THE MAIN DRIVERS OF THE FUND’S PERFORMANCE?
The Fund’s Class A Shares, without a sales charge, outperformed the Russell 1000 Value Index (the “Benchmark”) for the twelve months ended June 30, 2020. The Fund’s security selection and overweight position in the information technology sector and its security selection in the consumer discretionary sector were leading contributors to performance relative to the Benchmark, while the Fund’s security selection in the consumer staples and real estate and sectors was a leading detractor from relative performance.
Leading individual contributors to relative performance included the Fund’s out-of-Benchmark positions in Apple Inc. and Microsoft Corp. and its overweight position in BlackRock Inc. Shares of Apple and Microsoft, both of which are information technology companies, rose amid general investor demand for large cap technology stocks during the reporting period. Shares of BlackRock, a financial services provider, rose after the company reported better-than-expected revenue for the first quarter of 2020.
Leading individual detractors from relative performance included the Fund’s overweight positions in Discover Financial Services, Ventas Inc. and Simon Property Group Inc. Shares of Discover Financial Services, a banking and credit card company, fell amid a sharp decline in consumer spending in response to the COVID-19 pandemic. Shares of Ventas, a real estate investment trust operating in the senior housing and health care sector, fell amid investor concerns about the impact of the COVID-19 pandemic on the company’s line of business. Shares of Simon Property Group, a real estate investment trust operating in the retail sector, fell as consumers moved to online shopping in response to the COVID-19 pandemic.
HOW WAS THE FUND POSITIONED?
The Fund’s portfolio managers focused on stock selection and aimed to invest in undervalued companies with durable franchises, strong management and the ability to grow their intrinsic value per share. The portfolio managers employed a bottom-up approach to security selection and fundamental research.
| TOP TEN EQUITY HOLDINGS OF THE PORTFOLIO*** | ||||||||
| 1. | Microsoft Corp. | 3.1 | % | |||||
| 2. | Bank of America Corp. | 2.6 | ||||||
| 3. | BlackRock, Inc. | 2.4 | ||||||
| 4. | Morgan Stanley | 2.4 | ||||||
| 5. | Bristol-Myers Squibb Co. | 2.3 | ||||||
| 6. | Johnson & Johnson | 2.1 | ||||||
| 7. | Home Depot, Inc. (The) | 2.0 | ||||||
| 8. | Texas Instruments, Inc. | 2.0 | ||||||
| 9. | Alphabet, Inc., Class C | 2.0 | ||||||
| 10. | Berkshire Hathaway, Inc., Class B | 2.0 | ||||||
PORTFOLIO COMPOSITION BY SECTOR*** | ||||
| Financials | 24.6 | % | ||
| Health Care | 15.6 | |||
| Industrials | 12.5 | |||
| Information Technology | 11.2 | |||
| Consumer Discretionary | 8.3 | |||
| Communication Services | 6.2 | |||
| Consumer Staples | 5.9 | |||
| Energy | 4.6 | |||
| Utilities | 4.4 | |||
| Materials | 1.8 | |||
| Real Estate | 1.4 | |||
| Short-Term Investments | 3.5 | |||
| * | The return shown is based on net asset values calculated for shareholder transactions and may differ from the return shown in the financial highlights, which reflects adjustments made to the net asset values in accordance with accounting principles generally accepted in the United States of America. |
| ** | The adviser seeks to achieve the Fund’s objective. There can be no guarantee it will be achieved. |
| *** | Percentages indicated are based on total investments as of June 30, 2020. The Fund’s portfolio composition is subject to change. |
| 10 | J.P. MORGAN LARGE CAP FUNDS | JUNE 30, 2020 | ||||
Table of Contents
AVERAGE ANNUAL TOTAL RETURNS AS OF JUNE 30, 2020 | ||||||||||||||
| INCEPTION DATE OF CLASS | 1 YEAR | 5 YEAR | 10 YEAR | |||||||||||
CLASS A SHARES | September 23, 1987 | |||||||||||||
With Sales Charge* | (10.08 | )% | 4.78 | % | 10.80 | % | ||||||||
Without Sales Charge | (5.10 | ) | 5.91 | 11.40 | ||||||||||
CLASS C SHARES | January 2, 1998 | |||||||||||||
With CDSC** | (6.57 | ) | 5.39 | 10.84 | ||||||||||
Without CDSC | (5.57 | ) | 5.39 | 10.84 | ||||||||||
CLASS I SHARES | January 25, 1996 | (4.85 | ) | 6.18 | 11.69 | |||||||||
CLASS R2 SHARES | November 2, 2015 | (5.32 | ) | 5.67 | 11.28 | |||||||||
CLASS R3 SHARES | July 31, 2017 | (5.10 | ) | 5.92 | 11.41 | |||||||||
CLASS R4 SHARES | July 31, 2017 | (4.88 | ) | 6.18 | 11.69 | |||||||||
CLASS R5 SHARES | November 2, 2015 | (4.72 | ) | 6.35 | 11.78 | |||||||||
CLASS R6 SHARES | November 2, 2015 | (4.62 | ) | 6.43 | 11.82 | |||||||||
| * | Sales Charge for Class A Shares is 5.25%. |
| ** | Assumes a 1% CDSC (contingent deferred sales charge) for the one year period and 0% CDSC thereafter. |
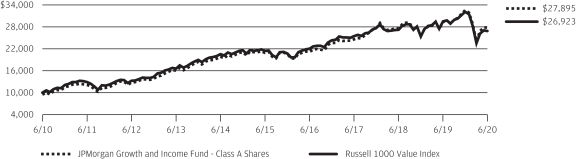
TEN YEAR PERFORMANCE (6/30/10 TO 6/30/20)
The performance quoted is past performance and is not a guarantee of future results. Mutual funds are subject to certain market risks. Investment returns and principal value of an investment will fluctuate so that an investor’s shares, when redeemed, may be worth more or less than their original cost. Current performance may be higher or lower than the performance data shown. For up-to-date month-end performance information please call 1-800-480-4111.
Returns for Class R2 Shares prior to their inception date are based on the performance of Class A Shares. The actual returns of Class R2 Shares would have been lower than those shown because Class R2 Shares have higher expenses than Class A Shares.
Returns for Class R3 Shares prior to their inception date are based on the performance of the Class A Shares. The actual returns of Class R3 Shares would have been similar to those shown because Class R3 Shares have similar expenses to Class A Shares.
Returns for Class R4 Shares prior to their inception date are based on the performance of the Class I Shares. The actual returns of Class R4 Shares would have been similar to those shown because Class R4 Shares have similar expenses to Class I Shares.
Returns for Class R5 and Class R6 Shares prior to their inception date are based on the performance of Class I Shares. The actual returns of Class R5 and Class R6 Shares would have been different than those shown because Class R5 and Class R6 Shares have different expenses than Class I Shares.
The graph illustrates comparative performance for $10,000 invested in Class A Shares of the JPMorgan Growth and Income Fund and the Russell 1000 Value Index from June 30, 2010 to June 30, 2020. The performance of the Fund assumes reinvestment of all dividends and capital gain distributions, if any, and includes a sales charge. The performance of the Russell 1000 Value Index does not reflect the deduction of expenses or a sales charge associated with a mutual fund and has been adjusted to reflect reinvestment of all dividends and capital gain distributions of the securities included in the benchmarks, if applicable. The Russell 1000 Value Index is an unmanaged index, which measures the performance of those Russell 1000 companies with lower price-to-book ratios and lower forecasted growth values. Investors cannot invest directly in an index.
Class A Shares have a $1,000 minimum initial investment and carry a 5.25% sales charge.
Fund performance may reflect the waiver of the Fund’s fees and reimbursement of expenses for certain periods. Without these waivers and reimbursements, performance would have been lower. Also, performance shown in this section does not reflect the deduction of taxes that a shareholder would pay on Fund distributions or on gains resulting from redemptions of Fund shares.
The returns shown are based on net asset values calculated for shareholder transactions and may differ from the returns shown in the financial highlights, which reflect adjustments made to the net asset values in accordance with accounting principles generally accepted in the United States of America.
| JUNE 30, 2020 | J.P. MORGAN LARGE CAP FUNDS | 11 | ||||||
Table of Contents
FUND COMMENTARY
TWELVE MONTHS ENDED JUNE 30, 2020 (Unaudited)
| REPORTING PERIOD RETURN: | ||||
| Fund (Class I Shares)* | 9.30% | |||
| S&P 500 Index | 7.51% | |||
| Net Assets as of 6/30/2020 (In Thousands) | $ | 8,741,592 | ||
INVESTMENT OBJECTIVE**
The JPMorgan Hedged Equity Fund (the “Fund”) seeks to provide capital appreciation.
WHAT WERE THE MAIN DRIVERS OF THE FUND’S PERFORMANCE?
The Fund’s Class I Shares outperformed the S&P 500 Index (the “Benchmark”) for the twelve months ended June 30, 2020. The Fund’s options hedge allowed the Fund to generally perform as designed, delivering returns with less volatility than the Benchmark during the reporting period. The Fund captured 120% of the Benchmark’s total return with about 50% of the Benchmark’s volatility during the twelve month reporting period.
The Fund’s security selection in the technology and pharmaceutical/medical technology sectors was a leading contributor to performance relative to the Benchmark, while the Fund’s security selection in the insurance and basic materials sectors was a leading detractor from relative performance.
Leading individual contributors to relative performance included the Fund’s overweight position in PayPal Inc. and its underweight positions in Disney Co. and Boeing Co. Shares of PayPal, a provider of digital payment services, rose amid investor expectations the company’s businesses would benefit from at-home quarantines in response to the COVID-19 pandemic. Shares of Disney, a media and entertainment provider, fell as the company closed its resorts and withheld the release of new films in response to the COVID-19 pandemic. Shares of Boeing, an aircraft and aerospace manufacturer, fell amid
investor concerns about the future of its 737 Max aircraft as well as a sharp decline in airline traffic in response to the COVID-19 pandemic.
Leading individual detractors from relative performance included the Fund’s overweight positions in Discovery Inc., Automatic Data Processing Inc. and Analog Devices Inc.
Shares of Discovery, a media company, fell after the company reported lower-than-expected earnings for the first quarter of 2020. Shares of Automatic Data Processing, a provider of payroll and other business services, fell amid significant disruption in the U.S. labor market in response to the COVID-19 pandemic. Shares of Analog Devices, an integrated circuits manufacturer, fell after the company withdrew its earnings forecast amid uncertainty about the impact of the COVID-19 pandemic.
HOW WAS THE FUND POSITIONED?
The Fund used an enhanced index strategy that invests primarily in common stocks of large capitalization U.S. companies, while systematically purchasing and selling exchange-traded
index put options and selling exchange-traded index call options. The option overlay is known as a “Put/Spread Collar” strategy. The combination of the diversified portfolio of equity securities, downside protection from index put options and income from index call options provided the Fund with a portion of the returns associated with equity market investments while exposing the Fund to less risk than traditional long-only equity strategies.
| 12 | J.P. MORGAN LARGE CAP FUNDS | JUNE 30, 2020 | ||||
Table of Contents
| TOP TEN EQUITY HOLDINGS OF THE PORTFOLIO*** | ||||||||
| 1. | Microsoft Corp. | 6.5 | % | |||||
| 2. | Apple, Inc. | 5.9 | ||||||
| 3. | Amazon.com, Inc. | 4.6 | ||||||
| 4. | S&P 500 Index 9/30/2020 at USD 2,930.00, European Style | 3.3 | ||||||
| 5. | Facebook, Inc., Class A | 1.9 | ||||||
| 6. | Mastercard, Inc., Class A | 1.7 | ||||||
| 7. | Alphabet, Inc., Class A | 1.7 | ||||||
| 8. | Alphabet, Inc., Class C | 1.5 | ||||||
| 9. | Procter & Gamble Co. (The) | 1.4 | ||||||
| 10. | Berkshire Hathaway, Inc., Class B | 1.4 | ||||||
PORTFOLIO COMPOSITION BY SECTOR*** | ||||
| Information Technology | 25.8 | % | ||
| Health Care | 13.4 | |||
| Consumer Discretionary | 10.9 | |||
| Communication Services | 10.1 | |||
| Financials | 9.5 | |||
| Industrials | 7.1 | |||
| Consumer Staples | 5.6 | |||
| Put Options Purchased | 3.3 | |||
| Utilities | 2.8 | |||
| Energy | 2.6 | |||
| Materials | 2.2 | |||
| Real Estate | 1.7 | |||
| Short-Term Investments | 5.0 | |||
| * | The return shown is based on net asset values calculated for shareholder transactions and may differ from the return shown in the financial highlights, which reflects adjustments made to the net asset values in accordance with accounting principles generally accepted in the United States of America. |
| ** | The adviser seeks to achieve the Fund’s objective. There can be no guarantee it will be achieved. |
| *** | Percentages indicated are based on total investments as of June 30, 2020. The Fund’s portfolio composition is subject to change. |
| JUNE 30, 2020 | J.P. MORGAN LARGE CAP FUNDS | 13 | ||||||
Table of Contents
JPMorgan Hedged Equity Fund
FUND COMMENTARY
TWELVE MONTHS ENDED JUNE 30, 2020 (Unaudited) (continued)
AVERAGE ANNUAL TOTAL RETURNS AS OF JUNE 30, 2020 | ||||||||||||||
| INCEPTION DATE OF CLASS | 1 YEAR | 5 YEAR | SINCE INCEPTION | |||||||||||
CLASS A SHARES | December 13, 2013 | |||||||||||||
With Sales Charge* | 3.31 | % | 5.71 | % | 6.13 | % | ||||||||
Without Sales Charge | 9.03 | 6.85 | 7.01 | |||||||||||
CLASS C SHARES | December 13, 2013 | |||||||||||||
With CDSC** | 7.44 | 6.32 | 6.47 | |||||||||||
Without CDSC | 8.44 | 6.32 | 6.47 | |||||||||||
CLASS I SHARES | December 13, 2013 | 9.30 | 7.13 | 7.27 | ||||||||||
CLASS R5 SHARES | December 13, 2013 | 9.44 | 7.31 | 7.47 | ||||||||||
CLASS R6 SHARES | December 13, 2013 | 9.60 | 7.39 | 7.54 | ||||||||||
| * | Sales Charge for Class A Shares is 5.25%. |
| ** | Assumes a 1% CDSC (contingent deferred sales charge) for the one year period and 0% CDSC thereafter. |
LIFE OF FUND PERFORMANCE (12/13/13 TO 6/30/20)
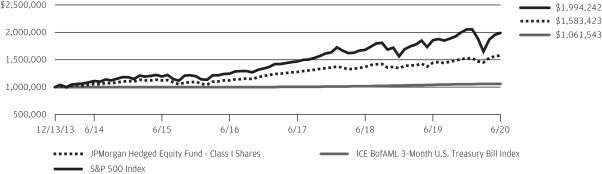
The performance quoted is past performance and is not a guarantee of future results. Mutual funds are subject to certain market risks. Investment returns and principal value of an investment will fluctuate so that an investor’s shares, when redeemed, may be worth more or less than their original cost. Current performance may be higher or lower than the performance data shown. For up-to-date month-end performance information please call 1-800-480-4111.
The Fund commenced operations on December 13, 2013.
The graph illustrates comparative performance for $1,000,000 invested in Class I Shares of the JPMorgan Hedged Equity Fund, the S&P 500 Index and the ICE BofAML 3-Month U.S. Treasury Bill Index from December 13, 2013 to June 30, 2020. The performance of the Fund assumes reinvestment of all dividends and capital gain distributions, if any, and does not include a sales charge. The performance of the S&P 500 Index and the ICE BofAML 3-Month U.S. Treasury Bill Index does not reflect the deduction of expenses or a sales charge associated with a mutual fund and approximates the minimum possible dividend reinvestment of the securities included in the benchmarks, if applicable. The S&P 500 Index is an unmanaged index generally representative of the performance of large companies in the U.S. stock market. The ICE BofAML 3-Month U.S. Treasury Bill Index is comprised of a single issue purchased at the
beginning of the month and held for a full month. Each month the ICE BofAML 3-Month U.S. Treasury Bill Index is rebalanced and the issue selected is the outstanding Treasury Bill that matures closest to, but not beyond, 3 months from the rebalancing date. Investors cannot invest directly in an index.
Class I Shares have a $1,000,000 minimum initial investment.
Subsequent to the inception date of the Fund and through May 30, 2014, the Fund did not experience any shareholder activity. If such shareholder activity had occurred, the Fund’s performance may have been impacted.
Fund performance may reflect the waiver of the Fund’s fees and reimbursement of expenses for certain periods since the applicable inception date. Without these waivers and reimbursements, performance would have been lower. Also, performance shown in this section does not reflect the deduction of taxes that a shareholder would pay on Fund distributions or on gains resulting from redemptions of Fund shares.
The returns shown are based on net asset values calculated for shareholder transactions and may differ from the returns shown in the financial highlights, which reflect adjustments made to the net asset values in accordance with accounting principles generally accepted in the United States of America.
| 14 | J.P. MORGAN LARGE CAP FUNDS | JUNE 30, 2020 | ||||
Table of Contents
JPMorgan Large Cap Growth Fund
FUND COMMENTARY
TWELVE MONTHS ENDED JUNE 30, 2020 (Unaudited)
| REPORTING PERIOD RETURN: | ||||
| Fund (Class I Shares)* | 30.40% | |||
| Russell 1000 Growth Index | 23.28% | |||
| Net Assets as of 6/30/2020 (In Thousands) | $ | 23,265,166 | ||
INVESTMENT OBJECTIVE**
The JPMorgan Large Cap Growth Fund (the “Fund”) seeks long-term capital appreciation.
WHAT WERE THE MAIN DRIVERS OF THE FUND’S PERFORMANCE?
The Fund’s Class I Shares outperformed the Russell 1000 Growth Index (the “Benchmark”) for the twelve months ended June 30, 2020. The Fund’s security selection and overweight position in the consumer discretionary sector and its security selection in the health care sectors were leading contributors to performance relative to the Benchmark, while the Fund’s security selection in the industrials sector was the sole sector detractor from relative performance.
Leading individual contributors to relative performance included the Fund’s overweight positions in Tesla, Inc., DexCom Inc. and its out-of-Benchmark position in Shopify Inc. Shares of Tesla, a producer of electric vehicles and energy storage systems, rose amid a faster-than-expected schedule for production of its Model Y vehicles and efficient production output from its Shanghai factory. Shares of DexCom, a medical device manufacturer, rose after the company reported better-than-expected earnings and revenue for several consecutive quarters and the company was included in the S&P 500 Index in May 2020. Shares of Shopify, an electronic commerce platform provider not held in the Benchmark, rose after the company reported better-than-expected earnings for the first quarter of 2020 and formed a sales partnership with Walmart Inc.
Leading individual detractors from relative performance included the Fund’s underweight positions in Apple Inc. and Amazon.com Inc., and its underweight position in Exact Sciences Inc. Shares of Apple, a maker of mobile devices, computers, software and relative services, rose amid better-than-expected earnings growth and positive investor sentiment over the company’s planned launch of new products and upgrades. Shares of Amazon.com, a provider of online retail products and services, rose amid investor expectations that the company would benefit from at-home quarantines in response to the COVID-19 pandemic, as well as investor demand for large cap technology sector stocks. Shares of Exact Sciences, a medical diagnostics provider, fell after the company reported lower-than-expected sales of its colon cancer screening test.
HOW WAS THE FUND POSITIONED?
The Fund’s portfolio managers utilized a bottom-up approach to stock selection, rigorously researching individual companies in an effort to construct portfolios of stocks that have strong fundamentals and positive price momentum. The Fund’s portfolio managers sought to invest in companies with attractive fundamentals that, in their view, possessed the potential to significantly exceed expectations for a prolonged period of time.
| TOP TEN EQUITY HOLDINGS OF THE PORTFOLIO*** | ||||||||
| 1. | Apple, Inc. | 6.6 | % | |||||
| 2. | Microsoft Corp. | 5.7 | ||||||
| 3. | Tesla, Inc. | 5.4 | ||||||
| 4. | Amazon.com, Inc. | 5.0 | ||||||
| 5. | Alphabet, Inc., Class C | 3.2 | ||||||
| 6. | PayPal Holdings, Inc. | 2.7 | ||||||
| 7. | Facebook, Inc., Class A | 2.5 | ||||||
| 8. | NVIDIA Corp. | 2.5 | ||||||
| 9. | Mastercard, Inc., Class A | 2.3 | ||||||
| 10. | DexCom, Inc. | 2.3 | ||||||
PORTFOLIO COMPOSITION BY SECTOR*** | ||||
| Information Technology | 32.6 | % | ||
| Consumer Discretionary | 21.0 | |||
| Health Care | 13.8 | |||
| Communication Services | 8.6 | |||
| Financials | 5.3 | |||
| Industrials | 4.5 | |||
| Materials | 2.0 | |||
| Consumer Staples | 1.6 | |||
| Real Estate | 1.0 | |||
| Energy | 0.3 | |||
| Short-Term Investments | 9.3 | |||
| * | The return shown is based on net asset values calculated for shareholder transactions and may differ from the return shown in the financial highlights, which reflects adjustments made to the net asset values in accordance with accounting principles generally accepted in the United States of America. |
| ** | The adviser seeks to achieve the Fund’s objective. There can be no guarantee it will be achieved. |
| *** | Percentages indicated are based on total investments as of June 30, 2020. The Fund’s portfolio composition is subject to change. |
| JUNE 30, 2020 | J.P. MORGAN LARGE CAP FUNDS | 15 | ||||||
Table of Contents
JPMorgan Large Cap Growth Fund
FUND COMMENTARY
TWELVE MONTHS ENDED JUNE 30, 2020 (Unaudited) (continued)
AVERAGE ANNUAL TOTAL RETURNS AS OF JUNE 30, 2020 | ||||||||||||||
| INCEPTION DATE OF CLASS | 1 YEAR | 5 YEAR | 10 YEAR | |||||||||||
CLASS A SHARES | February 22, 1994 | |||||||||||||
With Sales Charge* | 23.26 | % | 16.51 | % | 17.68 | % | ||||||||
Without Sales Charge | 30.09 | 17.77 | 18.31 | |||||||||||
CLASS C SHARES | November 4, 1997 | |||||||||||||
With CDSC** | 28.42 | 17.18 | 17.71 | |||||||||||
Without CDSC | 29.42 | 17.18 | 17.71 | |||||||||||
CLASS I SHARES | February 28, 1992 | 30.40 | 18.01 | 18.53 | ||||||||||
CLASS R2 SHARES | November 3, 2008 | 29.76 | 17.46 | 18.01 | ||||||||||
CLASS R3 SHARES | September 9, 2016 | 30.09 | 17.73 | 18.29 | ||||||||||
CLASS R4 SHARES | September 9, 2016 | 30.40 | 18.01 | 18.53 | ||||||||||
CLASS R5 SHARES | April 14, 2009 | 30.59 | 18.21 | 18.76 | ||||||||||
CLASS R6 SHARES | November 30, 2010 | 30.75 | 18.33 | 18.85 | ||||||||||
| * | Sales Charge for Class A Shares is 5.25%. |
| ** | Assumes a 1% CDSC (contingent deferred sales charge) for the one year period and 0% CDSC thereafter. |
TEN YEAR PERFORMANCE (6/30/10 TO 6/30/20)
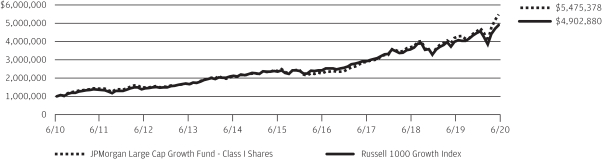
The performance quoted is past performance and is not a guarantee of future results. Mutual funds are subject to certain market risks. Investment returns and principal value of an investment will fluctuate so that an investor’s shares, when redeemed, may be worth more or less than their original cost. Current performance may be higher or lower than the performance data shown. For up-to-date month-end performance information please call 1-800-480-4111.
Returns for Class R3 and Class R4 Shares prior to their inception dates are based on the performance of Class I Shares. With respect to Class R3 Shares, prior class performance has been adjusted to reflect the differences in expenses between classes. The actual returns for Class R4 Shares would have been similar to those shown because Class R4 Shares had similar expenses to Class I Shares.
Returns for Class R6 Shares prior to their inception date are based on the performance of Class R5 Shares. The actual returns for Class R6 Shares would have been different than those shown because Class R6 Shares have different expenses than Class R5 and Class I Shares.
The graph illustrates comparative performance for $1,000,000 invested in Class I Shares of the JPMorgan Large Cap Growth Fund and the Russell 1000 Growth Index from June 30, 2010 to June 30, 2020. The performance of the
Fund assumes reinvestment of all dividends and capital gain distributions, if any, and does not include a sales charge. The performance of the Russell 1000 Growth Index does not reflect the deduction of expenses or a sales charge associated with a mutual fund and has been adjusted to reflect reinvestment of all dividends and capital gain distributions of the securities included in the benchmark, if applicable. The Russell 1000 Growth Index is an unmanaged index which measures the performance of those Russell 1000 companies with higher price-to-book ratios and higher forecasted growth values. Investors cannot invest directly in an index.
Class I Shares have a $1,000,000 minimum initial investment.
Fund performance may reflect the waiver of the Fund’s fees and reimbursement of expenses for certain periods. Without these waivers and reimbursements, performance would have been lower. Also, performance shown in this section does not reflect the deduction of taxes that a shareholder would pay on Fund distributions or on gains resulting from redemptions of Fund shares.
The returns shown are based on net asset values calculated for shareholder transactions and may differ from the returns shown in the financial highlights, which reflect adjustments made to the net asset values in accordance with accounting principles generally accepted in the United States of America.
| 16 | J.P. MORGAN LARGE CAP FUNDS | JUNE 30, 2020 | ||||
Table of Contents
FUND COMMENTARY
TWELVE MONTHS ENDED JUNE 30, 2020 (Unaudited)
| Reporting Period Return: | ||||
| Fund (Class I Shares)* | (8.35)% | |||
| Russell 1000 Value Index | (8.84)% | |||
| Net Assets as of 6/30/2020 (In Thousands) | $ | 1,259,997 | ||
INVESTMENT OBJECTIVE**
The JPMorgan Large Cap Value Fund (the “Fund”) seeks capital appreciation with the incidental goal of achieving current income by investing primarily in equity securities.
WHAT WERE THE MAIN DRIVERS OF THE FUND’S PERFORMANCE?
The Fund’s Class I Shares outperformed the Russell 1000 Value Index (the “Benchmark”) for the twelve months ended June 30, 2020. The Fund’s security selection in the retail sector and its security selection and overweight position in the basic materials sector were leading contributors to performance relative to the Benchmark, while the Fund’s overweight position and security selection in the consumer cyclical and real estate investment trusts sectors were leading detractors from relative performance.
Leading individual contributors to relative performance included the Fund’s overweight positions in Morgan Stanley and FMC Corp. and its out-of-Benchmark position in Lowe’s Cos. Shares of Morgan Stanley, a financial services provider, rose amid investor expectations that it would maintain dividend payments to shareholders. Shares of FMC, a diversified chemicals manufacturer, rose after the company reported better-than-expected earnings for the first quarter of 2020 and raised its forecast for 2020. Shares of Lowe’s, a retailer of home improvement products, rose amid increased consumer spending on home improvement during at-home quarantines.
Leading individual detractors from relative performance included the Fund’s overweight positions in Wells Fargo & Co., Norwegian Cruise Line Holdings Ltd. and Ventas Inc. Shares of Wells Fargo, a banking and financial services company, fell amid investor expectations that it would cut its dividends and report lower-than-expected earnings in 2020. Shares of Norwegian Cruise Lines Holdings, an operator of cruise ships, fell as its business shut down in response to the COVID-19 pandemic. Shares of Ventas, a real estate investment trust operating in the senior housing and health care sector, fell amid investor concerns about the impact of the COVID-19 pandemic on the company’s line of business.
HOW WAS THE FUND POSITIONED?
The Fund’s portfolio manager combined a bottom-up fundamental approach to security selection with a systematic
valuation process. Overall, the Fund’s portfolio manager looked to take advantage of mispriced stocks that he believed appeared attractive relative to their fair value.
| TOP TEN EQUITY HOLDINGS OF THE PORTFOLIO*** | ||||||||
| 1. | Comcast Corp., Class A | 3.8 | % | |||||
| 2. | FMC Corp. | 3.8 | ||||||
| 3. | Citigroup, Inc. | 3.2 | ||||||
| 4. | Wells Fargo & Co. | 2.9 | ||||||
| 5. | Bank of America Corp. | 2.7 | ||||||
| 6. | Morgan Stanley | 2.7 | ||||||
| 7. | ON Semiconductor Corp. | 2.5 | ||||||
| 8. | General Motors Co. | 2.5 | ||||||
| 9. | Lamb Weston Holdings, Inc. | 2.4 | ||||||
| 10. | Bristol-Myers Squibb Co. | 2.4 | ||||||
PORTFOLIO COMPOSITION BY SECTOR*** | ||||
| Financials | 17.5 | % | ||
| Health Care | 13.6 | |||
| Industrials | 12.5 | |||
| Consumer Discretionary | 10.7 | |||
| Materials | 9.9 | |||
| Real Estate | 7.1 | |||
| Energy | 6.3 | |||
| Information Technology | 5.8 | |||
| Consumer Staples | 5.7 | |||
| Communication Services | 4.9 | |||
| Utilities | 0.5 | |||
| Short-Term Investments | 5.5 | |||
| * | The return shown is based on net asset values calculated for shareholder transactions and may differ from the return shown in the financial highlights, which reflects adjustments made to the net asset values in accordance with accounting principles generally accepted in the United States of America. |
| ** | The adviser seeks to achieve the Fund’s objective. There can be no guarantee it will be achieved. |
| *** | Percentages indicated are based on total investments as of June 30, 2020. The Fund’s portfolio composition is subject to change. |
| JUNE 30, 2020 | J.P. MORGAN LARGE CAP FUNDS | 17 | ||||||
Table of Contents
JPMorgan Large Cap Value Fund
FUND COMMENTARY
TWELVE MONTHS ENDED JUNE 30, 2020 (Unaudited) (continued)
AVERAGE ANNUAL TOTAL RETURNS AS OF JUNE 30, 2020 | ||||||||||||||
| INCEPTION DATE OF CLASS | 1 YEAR | 5 YEAR | 10 YEAR | |||||||||||
CLASS A SHARES | February 18, 1992 | |||||||||||||
With Sales Charge* | (13.45 | )% | 3.14 | % | 9.43 | % | ||||||||
Without Sales Charge | (8.66 | ) | 4.25 | 10.02 | ||||||||||
CLASS C SHARES | March 22, 1999 | |||||||||||||
With CDSC** | (10.04 | ) | 3.73 | 9.47 | ||||||||||
Without CDSC | (9.04 | ) | 3.73 | 9.47 | ||||||||||
CLASS I SHARES | March 1, 1991 | (8.35 | ) | 4.48 | 10.22 | |||||||||
CLASS R2 SHARES | November 3, 2008 | (8.83 | ) | 3.98 | 9.75 | |||||||||
CLASS R3 SHARES | October 1, 2018 | (8.59 | ) | 4.26 | 10.03 | |||||||||
CLASS R4 SHARES | October 1, 2018 | (8.34 | ) | 4.48 | 10.22 | |||||||||
CLASS R5 SHARES | May 15, 2006 | (8.26 | ) | 4.64 | 10.43 | |||||||||
CLASS R6 SHARES | November 30, 2010 | (8.14 | ) | 4.73 | 10.49 | |||||||||
| * | Sales Charge for Class A Shares is 5.25%. |
| ** | Assumes a 1% CDSC (contingent deferred sales charge) for the one year period and 0% CDSC thereafter. |
TEN YEAR PERFORMANCE (6/30/10 TO 6/30/20)
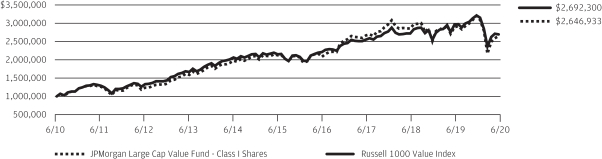
The performance quoted is past performance and is not a guarantee of future results. Mutual funds are subject to certain market risks. Investment returns and principal value of an investment will fluctuate so that an investor’s shares, when redeemed, may be worth more or less than their original cost. Current performance may be higher or lower than the performance data shown. For up-to-date month-end performance information please call 1-800-480-4111.
Returns for Class R3 Shares prior to their inception date are based on the performance of Class A Shares. The actual returns of Class R3 Shares would have been similar to those shown because Class R3 Shares have similar expenses to Class A Shares.
Returns for Class R4 Shares prior to their inception date are based on the performance of Class I Shares. The actual returns for Class R4 Shares would have been similar to those shown because Class R4 Shares have similar expenses than Class I Shares.
Returns for Class R6 Shares prior to their inception date are based on the per- formance of Class R5 Shares. The actual returns for Class R6 Shares would have been different than those shown because Class R6 Shares have different expenses than Class R5 Shares.
The graph illustrates comparative performance for $1,000,000 invested in Class I Shares of the JPMorgan Large Cap Value Fund and the Russell 1000
Value Index from June 30, 2010 to June 30, 2020. The performance of the Fund assumes reinvestment of all dividends and capital gain distributions, if any, and does not include a sales charge. The performance of the Russell 1000 Value Index does not reflect the deduction of expenses or a sales charge associated with a mutual fund and has been adjusted to reflect reinvestment of all dividends and capital gain distributions of the securities included in the benchmark, if applicable. The Russell 1000 Value Index is an unmanaged index which measures the performance of those Russell 1000 companies with lower price-to-book ratios and lower forecasted growth values. Investors cannot invest directly in an index.
Class I Shares have a $1,000,000 minimum initial investment.
Fund performance may reflect the waiver of the Fund’s fees and reimbursement of expenses for certain periods. Without these waivers and reimbursements, performance would have been lower. Also, performance shown in this section does not reflect the deduction of taxes that a shareholder would pay on Fund distributions or on gains resulting from redemptions of Fund shares.
The returns shown are based on net asset values calculated for shareholder transactions and may differ from the returns shown in the financial highlights, which reflect adjustments made to the net asset values in accordance with accounting principles generally accepted in the United States of America.
| 18 | J.P. MORGAN LARGE CAP FUNDS | JUNE 30, 2020 | ||||
Table of Contents
FUND COMMENTARY
TWELVE MONTHS ENDED JUNE 30, 2020 (Unaudited)
| REPORTING PERIOD RETURN: | ||||
| Fund (Class L Shares)* | 13.03% | |||
| S&P 500 Index | 7.51% | |||
| Net Assets as of 6/30/2020 (In Thousands) | $ | 14,938,762 | ||
INVESTMENT OBJECTIVE**
The JPMorgan U.S. Equity Fund (the “Fund”) seeks to provide high total return from a portfolio of selected equity securities.
WHAT WERE THE MAIN DRIVERS OF THE FUND’S PERFORMANCE?
The Fund’s Class L Shares outperformed the S&P 500 Index (the “Benchmark”) for the twelve months ended June 30, 2020. The Fund’s security selection in the industrial cyclical sector and its security selection and overweight position in the media sector were leading contributors to performance relative to the Benchmark, while the Fund’s security selection in the retail and consumer cyclical sectors was a leading detractor from relative performance.
Leading individual contributors to relative performance included the Fund’s overweight positions in Prologis Inc. and Charter Communications Inc. and its underweight position in Cisco Systems Inc. Shares of Prologis, a real estate investment trust operating in the warehousing and logistics sector, rose amid increase demand for inventory storage and after the company reported better-than-expected earnings for the first quarter of 2020. Shares of Charter Communications, a provider of broadband communications, rose on the consumer trend toward non-cable TV content, which accelerated with at-home quarantines in response to the COVID-19. Shares of Cisco Systems, a provider of internet networking products and services that was not held in the Fund, fell in the first half of the reporting period following two consecutive quarters of weaker-than-expected revenue growth.
Leading individual detractors from relative performance included the Fund’s overweight positions in Royal Caribbean Cruises Ltd., Boston Scientific Corp. and Analog Devices Inc. Shares of Royal Caribbean Cruises, a cruise ship operator, fell as its business shut down in response to the COVID-19 pandemic. Shares of Boston Scientific, a medical devices manufacturer, fell after the company reported lower-than-expected earnings and revenue for the first quarter of 2020. Shares of Analog Devices, a manufacturer of integrated circuits, fell after the company reported lower-than-expected earnings and revenue for its fiscal fourth quarter of 2019.
HOW WAS THE FUND POSITIONED?
The Fund’s portfolio managers employed a bottom-up fundamental approach to stock selection, researching companies to determine what they believed to be their underlying value and potential for future earnings growth.
| TOP TEN EQUITY HOLDINGS OF THE PORTFOLIO*** | ||||||||
| 1. | Microsoft Corp. | 7.5 | % | |||||
| 2. | Amazon.com, Inc. | 5.9 | ||||||
| 3. | Alphabet, Inc., Class A | 4.6 | ||||||
| 4. | Apple, Inc. | 4.4 | ||||||
| 5. | Mastercard, Inc., Class A | 4.3 | ||||||
| 6. | Verizon Communications, Inc. | 2.8 | ||||||
| 7. | Prologis, Inc. | 2.7 | ||||||
| 8. | AbbVie, Inc. | 2.7 | ||||||
| 9. | Norfolk Southern Corp. | 2.5 | ||||||
| 10. | Eaton Corp. plc | 2.4 | ||||||
PORTFOLIO COMPOSITION BY SECTOR*** | ||||
Information Technology | 31.3 | % | ||
Health Care | 15.1 | |||
Consumer Discretionary | 11.9 | |||
Communication Services | 11.5 | |||
Financials | 8.1 | |||
Industrials | 8.0 | |||
Utilities | 3.7 | |||
Consumer Staples | 3.6 | |||
Real Estate | 2.7 | |||
Materials | 2.4 | |||
Energy | 1.3 | |||
Short-Term Investments | 0.4 | |||
| * | The return shown is based on net asset values calculated for shareholder transactions and may differ from the return shown in the financial highlights, which reflects adjustments made to the net asset values in accordance with accounting principles generally accepted in the United States of America. |
| ** | The adviser seeks to achieve the Fund’s objective. There can be no guarantee it will be achieved. |
| *** | Percentages indicated are based on total investments as of June 30, 2020. The Fund’s portfolio composition is subject to change. |
| JUNE 30, 2020 | J.P. MORGAN LARGE CAP FUNDS | 19 | ||||||
Table of Contents
JPMorgan U.S. Equity Fund
FUND COMMENTARY
TWELVE MONTHS ENDED JUNE 30, 2020 (Unaudited) (continued)
AVERAGE ANNUAL TOTAL RETURNS AS OF JUNE 30, 2020 | ||||||||||||||
| INCEPTION DATE OF CLASS | 1 YEAR | 5 YEAR | 10 YEAR | |||||||||||
CLASS A SHARES | September 10, 2001 | |||||||||||||
With Sales Charge* | 6.67 | % | 9.33 | % | 13.28 | % | ||||||||
Without Sales Charge | 12.59 | 10.52 | 13.90 | |||||||||||
CLASS C SHARES | September 10, 2001 | |||||||||||||
With CDSC** | 11.01 | 9.96 | 13.32 | |||||||||||
Without CDSC | 12.01 | 9.96 | 13.32 | |||||||||||
CLASS I SHARES | September 10, 2001 | 12.82 | 10.74 | 14.11 | ||||||||||
CLASS L SHARES | September 17, 1993 | 13.03 | 10.91 | 14.28 | ||||||||||
CLASS R2 SHARES | November 3, 2008 | 12.29 | 10.22 | 13.60 | ||||||||||
CLASS R3 SHARES | September 9, 2016 | 12.57 | 10.49 | 13.88 | ||||||||||
CLASS R4 SHARES | September 9, 2016 | 12.84 | 10.74 | 14.11 | ||||||||||
CLASS R5 SHARES | May 15, 2006 | 13.04 | 10.94 | 14.33 | ||||||||||
CLASS R6 SHARES | November 30, 2010 | 13.13 | 11.02 | 14.41 | ||||||||||
| * | Sales Charge for Class A Shares is 5.25%. |
| ** | Assumes a 1% CDSC (contingent deferred sales charge) for the one year period and 0% CDSC thereafter. |
TEN YEAR PERFORMANCE (6/30/10 TO 6/30/20)
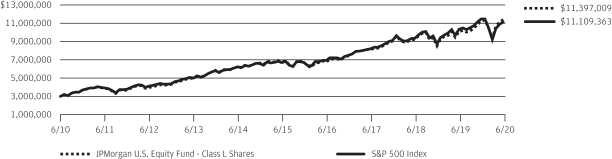
The performance quoted is past performance and is not a guarantee of future results. Mutual funds are subject to certain market risks. Investment returns and principal value of an investment will fluctuate so that an investor’s shares, when redeemed, may be worth more or less than their original cost. Current performance may be higher or lower than the performance data shown. For up-to-date month-end performance information please call 1-800-480-4111.
Returns for Class R3 Shares prior to their inception dates are based on the performance of Class A Shares. The actual returns of Class R3 Shares would have been similar to those shown because Class R3 Shares have similar expenses to Class A Shares.
Returns for Class R4 Shares prior to their inception date are based on the performance of Class I Shares. The actual returns for Class R4 Shares would have been similar to those shown because Class R4 Shares have similar expenses than Class I Shares.
Returns for Class R6 Shares prior to their inception date are based on the performance of Class R5 Shares. The actual returns for Class R6 Shares would have been different than those shown because Class R6 Shares have different expenses than Class R5 Shares.
The graph illustrates comparative performance for $3,000,000 invested in Class L Shares of the JPMorgan U.S. Equity Fund and the S&P 500 Index from
June 30, 2010 to June 30, 2020. The performance of the Fund assumes reinvestment of all dividends and capital gain distributions, if any, and does not include a sales charge. The performance of the S&P 500 Index does not reflect the deduction of expenses or a sales charge associated with a mutual fund and has been adjusted to reflect reinvestment of all dividends and capital gain distributions of the securities included in the benchmark, if applicable. The S&P 500 Index is an unmanaged index generally representative of the performance of large companies in the U.S. stock market. Investors cannot invest directly in an index.
Class L Shares have a $3,000,000 minimum initial investment.
Fund performance may reflect the waiver of the Fund’s fees and reimbursement of expenses for certain periods. Without these waivers and reimbursements, performance would have been lower. Also, performance shown in this section does not reflect the deduction of taxes that a shareholder would pay on Fund distributions or on gains resulting from redemptions of Fund shares.
The returns shown are based on net asset values calculated for shareholder transactions and may differ from the returns shown in the financial highlights, which reflect adjustments made to the net asset values in accordance with accounting principles generally accepted in the United States of America.
| 20 | J.P. MORGAN LARGE CAP FUNDS | JUNE 30, 2020 | ||||
Table of Contents
JPMorgan U.S. Large Cap Core Plus Fund
FUND COMMENTARY
TWELVE MONTHS ENDED JUNE 30, 2020 (Unaudited)
| REPORTING PERIOD RETURN: | ||||
| Fund (Class I Shares)* | 11.93% | |||
| S&P 500 Index | 7.51% | |||
| Net Assets as of 6/30/2020 (In Thousands) | $ | 3,050,306 | ||
INVESTMENT OBJECTIVE**
The JPMorgan U.S. Large Cap Core Plus Fund (the “Fund”) seeks to provide a high total return from a portfolio of selected equity securities.
WHAT WERE THE MAIN DRIVERS OF THE FUND’S PERFORMANCE?
The Fund’s Class I Shares outperformed the S&P 500 Index (the “Benchmark”) for the twelve months ended June 30, 2020. The Fund’s security selection in the media sector and the semiconductors & hardware sector was a leading contributor to performance relative to the Benchmark, while the Fund’s security selection in the consumer stable and basic materials sectors was a leading detractor from relative performance.
Leading individual contributors to relative performance included the Fund’s overweight position in PayPal Inc. and its underweight positions in Cisco Systems Inc. and Disney Co. Shares of PayPal, a provider of digital payment services, rose amid investor expectations the company’s businesses would benefit from at-home quarantines in response to the COVID-19 pandemic. Shares of Cisco Systems, a provider of internet networking products and services that was not held in the Fund, fell in the first half of the reporting period following two consecutive quarters of weaker-than-expected revenue growth. Shares of Disney, a media and entertainment provider, fell as the company closed its resorts and withheld the release of new films in response to the COVID-19 pandemic.
Leading individual detractors from relative performance included the Fund’s overweight position in DuPont Inc. and Diamondback Energy Inc. and its underweight position in Apple
Inc. Shares of DuPont, a chemicals and materials manufacturer, fell after the company reported a decline in profit and sales for the third and fourth quarters of 2019 and forecast lower-than-expected results for 2020. Shares of Diamondback Energy, a petroleum and natural gas producer operating in U.S. shale formations, fell as global oil prices fell sharply in the second half of the reporting period. Shares of Apple, a maker of mobile devices, computers, software and relative services, rose amid better-than-expected earnings growth and positive investor sentiment over the company’s planned launch of new products and upgrades.
HOW WAS THE FUND POSITIONED?
The Fund’s portfolio managers employed a bottom-up fundamental approach to stock selection, researching companies to determine their underlying value and potential for future earnings growth. Overall, the Fund’s portfolio managers aimed to take advantage of mispriced stocks that appeared attractive relative to fair value for long positions, and looked for overvalued stocks in which to take short positions. The long-to-short exposure ratio at the end of the reporting period was 129% to 29%.
| * | The return shown is based on net asset values calculated for shareholder transactions and may differ from the return shown in the financial highlights, which reflects adjustments made to the net asset values in accordance with accounting principles generally accepted in the United States of America. |
| ** | The adviser seeks to achieve the Fund’s objective. There can be no guarantee it will be achieved. |
| JUNE 30, 2020 | J.P. MORGAN LARGE CAP FUNDS | 21 | ||||||
Table of Contents
JPMorgan U.S. Large Cap Core Plus Fund
FUND COMMENTARY
TWELVE MONTHS ENDED JUNE 30, 2020 (Unaudited) (continued)
| TOP TEN LONG POSITIONS OF THE PORTFOLIO* | ||||||||
| 1. | Microsoft Corp. | 5.8 | % | |||||
| 2. | Amazon.com, Inc. | 4.8 | ||||||
| 3. | Apple, Inc. | 4.8 | ||||||
| 4. | PayPal Holdings, Inc. | 2.2 | ||||||
| 5. | Mastercard, Inc., Class A | 2.0 | ||||||
| 6. | Alphabet, Inc., Class A | 2.0 | ||||||
| 7. | AbbVie, Inc. | 1.6 | ||||||
| 8. | Procter & Gamble Co. (The) | 1.4 | ||||||
| 9. | NextEra Energy, Inc. | 1.4 | ||||||
| 10. | ASML Holding NV (Registered), NYRS (Netherlands) | 1.4 | ||||||
| TOP TEN SHORT POSITIONS OF THE PORTFOLIO** | ||||||||
| 1. | Cisco Systems, Inc. | 2.7 | % | |||||
| 2. | Clorox Co. (The) | 2.5 | ||||||
| 3. | Spotify Technology SA | 2.5 | ||||||
| 4. | Juniper Networks, Inc. | 1.8 | ||||||
| 5. | Walt Disney Co. (The) | 1.8 | ||||||
| 6. | NetApp, Inc. | 1.8 | ||||||
| 7. | Gilead Sciences, Inc. | 1.7 | ||||||
| 8. | Kroger Co. (The) | 1.7 | ||||||
| 9. | Western Union Co. (The) | 1.6 | ||||||
| 10. | 3M Co. | 1.6 | ||||||
LONG POSITION PORTFOLIO COMPOSITION BY SECTOR* | ||||||
Information Technology | 29.8 | % | ||||
Health Care | 13.4 | |||||
Consumer Discretionary | 12.6 | |||||
Communication Services | 9.3 | |||||
Industrials | 9.2 | |||||
Financials | 7.1 | |||||
Consumer Staples | 4.5 | |||||
Real Estate | 3.5 | |||||
Energy | 3.4 | |||||
Materials | 3.3 | |||||
Utilities | 3.0 | |||||
Short-Term Investments | 0.9 | |||||
SHORT POSITION PORTFOLIO COMPOSITION BY SECTOR** | ||||
Information Technology | 16.0 | % | ||
Industrials | 15.8 | |||
Communication Services | 11.9 | |||
Health Care | 10.3 | |||
Energy | 8.7 | |||
Financials | 8.5 | |||
Real Estate | 7.6 | |||
Consumer Staples | 6.9 | |||
Materials | 5.8 | |||
Consumer Discretionary | 4.6 | |||
Utilities | 3.9 | |||
| * | Percentages indicated are based on total long investments as of June 30, 2020 The Fund’s portfolio composition is subject to change. |
| ** | Percentages indicated are based on total short investments as of June 30, 2020. The Fund’s portfolio composition is subject to change. |
| 22 | J.P. MORGAN LARGE CAP FUNDS | JUNE 30, 2020 | ||||
Table of Contents
AVERAGE ANNUAL TOTAL RETURNS AS OF JUNE 30, 2020 | ||||||||||||||
| INCEPTION DATE OF CLASS | 1 YEAR | 5 YEAR | 10 YEAR | |||||||||||
CLASS A SHARES | November 1, 2005 | |||||||||||||
With Sales Charge* | 5.82 | % | 8.24 | % | 12.65 | % | ||||||||
Without Sales Charge | 11.66 | 9.41 | 13.27 | |||||||||||
CLASS C SHARES | November 1, 2005 | |||||||||||||
With CDSC** | 10.11 | 8.87 | 12.70 | |||||||||||
Without CDSC | 11.11 | 8.87 | 12.70 | |||||||||||
CLASS I SHARES | November 1, 2005 | 11.93 | 9.69 | 13.55 | ||||||||||
CLASS R2 SHARES | November 3, 2008 | 11.32 | 9.09 | 12.95 | ||||||||||
CLASS R5 SHARES | May 15, 2006 | 12.04 | 9.82 | 13.74 | ||||||||||
CLASS R6 SHARES | November 1, 2017 | 12.10 | 9.88 | 13.76 | ||||||||||
| * | Sales Charge for Class A Shares is 5.25%. |
| ** | Assumes a 1% CDSC (contingent deferred sales charge) for the one year period and 0% CDSC thereafter. |
TEN YEAR PERFORMANCE (6/30/10 TO 6/30/20)
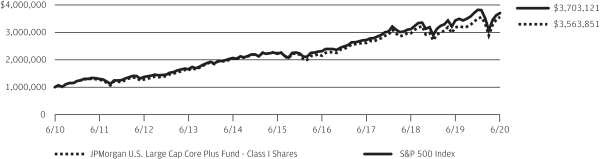
The performance quoted is past performance and is not a guarantee of future results. Mutual funds are subject to certain market risks. Investment returns and principal value of an investment will fluctuate so that an investor’s shares, when redeemed, may be worth more or less than their original cost. Current performance may be higher or lower than the performance data shown. For up-to-date month-end performance information please call 1-800-480-4111.
Returns for Class R6 Shares prior to its inception date are based on the performance of Class R5 Shares. The actual returns of Class R6 Shares would have been different than those shown because Class R6 Shares have different expenses than Class R5 Shares.
The graph illustrates comparative performance for $1,000,000 invested in Class I Shares of the JPMorgan U.S. Large Cap Core Plus Fund and the S&P 500 Index from June 30, 2010 to June 30, 2020. The performance of the Fund assumes reinvestment of all dividends and capital gain distributions, if any, and does not include a sales charge. The performance of the S&P 500 Index does not reflect the deduction of expenses or a sales charge associated with a
mutual fund and has been adjusted to reflect reinvestment of all dividends and capital gain distributions of the securities included in the benchmark, if applicable. The S&P 500 Index is an unmanaged index generally representative of the performance of large companies in the U.S. stock market. Investors cannot directly invest in an index.
Class I Shares have a $1,000,000 minimum initial investment.
Fund performance may reflect the waiver of the Fund’s fees and reimbursement of expenses for certain periods. Without these waivers and reimbursements, performance would have been lower. Also, performance shown in this section does not reflect the deduction of taxes that a shareholder would pay on Fund distributions or on gains resulting from redemptions of Fund shares.
The returns shown are based on net asset values calculated for shareholder transactions and may differ from the returns shown in the financial highlights, which reflect adjustments made to the net asset values in accordance with accounting principles generally accepted in the United States of America.
| JUNE 30, 2020 | J.P. MORGAN LARGE CAP FUNDS | 23 | ||||||
Table of Contents
JPMorgan U.S. Research Enhanced Equity Fund
FUND COMMENTARY
TWELVE MONTHS ENDED JUNE 30, 2020 (Unaudited)
| REPORTING PERIOD RETURN: | ||||
| Fund (Class L Shares)* | 9.32% | |||
| S&P 500 Index | 7.51% | |||
| Net Assets as of 6/30/2020 (In Thousands) | $ | 4,364,764 | ||
INVESTMENT OBJECTIVE**
The JPMorgan U.S. Research Enhanced Equity Fund (the “Fund”) seeks to provide a consistently high total return from a broadly diversified portfolio of equity securities with risk characteristics similar to the S&P 500 Index (the “Benchmark”).
WHAT WERE THE MAIN DRIVERS OF THE FUND’S PERFORMANCE?
The Fund’s Class L Shares outperformed the Benchmark for the twelve months ended June 30, 2020. The Fund’s security selection in the technology and pharmaceutical/medical technology sectors was a leading contributor to performance relative to the Benchmark, while the Fund’s security selection in the insurance and basic materials sectors was a leading detractor from relative performance.
Leading individual contributors to relative performance included the Fund’s overweight position in PayPal Holdings Inc. and its underweight positions in Disney Co. and Boeing Co. Shares of PayPal, a provider of digital payment services, rose amid investor expectations the company’s businesses would benefit from at-home quarantines in response to the COVID-19 pandemic. Shares of Disney, a media and entertainment provider, fell as the company closed its resorts and withheld the release of new films in response to the COVID-19 pandemic. Shares of Boeing, an aircraft and aerospace manufacturer, fell amid investor concerns about the future of its 737 Max aircraft as well as a sharp decline in airline traffic in response to the COVID-19 pandemic
Leading individual detractors from relative performance included the Fund’s overweight positions in Discovery Inc., Automatic Data Processing Inc. and Analog Devices Inc. Shares of Discovery, a media company, fell after the company reported lower-than-expected earnings for the first quarter of 2020. Shares of Automatic Data Processing, a provider of payroll and other business services, fell amid significant disruption in the U.S. labor market in response to the COVID-19 pandemic. Shares of Analog Devices, an integrated circuits manufacturer, fell after the company withdrew its earnings forecast amid uncertainty about the impact of the COVID-19 pandemic.
HOW WAS THE FUND POSITIONED?
The Fund’s portfolio managers attempted to construct the portfolio so that stock selection was the principal source of potential excess return. The Fund’s portfolio managers sought investment opportunities in companies that they believed were attractive based on valuation and strong fundamentals.
| TOP TEN EQUITY HOLDINGS OF THE PORTFOLIO*** | ||||||||
| 1. | Microsoft Corp. | 6.9 | % | |||||
| 2. | Apple, Inc. | 6.3 | ||||||
| 3. | Amazon.com, Inc. | 4.9 | ||||||
| 4. | Facebook, Inc., Class A | 2.1 | ||||||
| 5. | Mastercard, Inc., Class A | 1.8 | ||||||
| 6. | Alphabet, Inc., Class A | 1.8 | ||||||
| 7. | Alphabet, Inc., Class C | 1.6 | ||||||
| 8. | Procter & Gamble Co. (The) | 1.5 | ||||||
| 9. | Berkshire Hathaway, Inc., Class | 1.5 | ||||||
| 10. | PayPal Holdings, Inc. | 1.4 | ||||||
PORTFOLIO COMPOSITION BY SECTOR*** | ||||||
Information Technology | 27.4 | % | ||||
Health Care | 14.2 | |||||
Consumer Discretionary | 11.6 | |||||
Communication Services | 10.8 | |||||
Financials | 10.1 | |||||
Industrials | 7.5 | |||||
Consumer Staples | 5.9 | |||||
Utilities | 2.9 | |||||
Energy | 2.8 | |||||
Materials | 2.4 | |||||
Real Estate | 1.9 | |||||
Short-Term Investments | 2.5 | |||||
| * | The return shown is based on net asset values calculated for shareholder transactions and may differ from the return shown in the financial highlights, which reflects adjustments made to the net asset values in accordance with accounting principles generally accepted in the United States of America. |
| ** | The adviser seeks to achieve the Fund’s objective. There can be no guarantee it will be achieved. |
| *** | Percentages indicated are based on total investments as of June 30, 2020 The Fund’s portfolio composition is subject to change. |
| 24 | J.P. MORGAN LARGE CAP FUNDS | JUNE 30, 2020 | ||||
Table of Contents
AVERAGE ANNUAL TOTAL RETURNS AS OF JUNE 30, 2020 | ||||||||||||||
| INCEPTION DATE OF CLASS | 1 YEAR | 5 YEAR | 10 YEAR | |||||||||||
CLASS A SHARES | September 28, 2001 | |||||||||||||
With Sales Charge* | 3.34 | % | 7.68 | % | 12.72 | % | ||||||||
Without Sales Charge | 9.08 | 8.85 | 13.33 | |||||||||||
CLASS I SHARES | September 10, 2001 | 9.38 | 9.13 | 13.61 | ||||||||||
CLASS L SHARES | January 3, 1997 | 9.32 | 9.15 | 13.71 | ||||||||||
CLASS R6 SHARES | March 24, 2003 | 9.47 | 9.27 | 13.83 | ||||||||||
| * | Sales Charge for Class A Shares is 5.25%. |
TEN YEAR PERFORMANCE (6/30/10 TO 6/30/20)
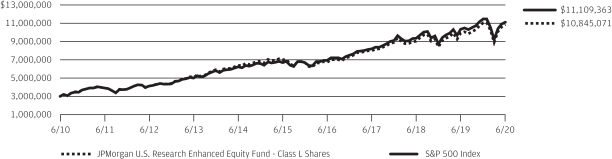
The performance quoted is past performance and is not a guarantee of future results. Mutual funds are subject to certain market risks. Investment returns and principal value of an investment will fluctuate so that an investor’s shares, when redeemed, may be worth more or less than their original cost. Current performance may be higher or lower than the performance data shown. For up-to-date month-end performance information please call 1-800-480-4111.
The graph illustrates comparative performance for $3,000,000 invested in Class L Shares of the JPMorgan U.S. Research Enhanced Equity Fund and the S&P 500 Index from June 30, 2010 to June 30, 2020. The performance of the Fund assumes reinvestment of all dividends and capital gain distributions, if any, and does not include a sales charge. The performance of the S&P 500 Index does not reflect the deduction of expenses or a sales charge associated with a mutual fund and has been adjusted to reflect reinvestment of all dividends and capital gain distributions of the securities included in the benchmark,
if applicable. The S&P 500 Index is an unmanaged index generally representative of the performance of large companies in the U.S. stock market. Investors cannot invest directly in an index.
Class L Shares have a $3,000,000 minimum initial investment.
Fund performance may reflect the waiver of the Fund’s fees and reimbursement of expenses for certain periods. Without these waivers and reimbursements, performance would have been lower. Also, performance shown in this section does not reflect the deduction of taxes that a shareholder would pay on Fund distributions or on gains resulting from redemptions of Fund shares.
The returns shown are based on net asset values calculated for shareholder transactions and may differ from the returns shown in the financial highlights, which reflect adjustments made to the net asset values in accordance with accounting principles generally accepted in the United States of America.
| JUNE 30, 2020 | J.P. MORGAN LARGE CAP FUNDS | 25 | ||||||
Table of Contents
JPMorgan Equity Focus Fund
SCHEDULE OF PORTFOLIO INVESTMENTS
AS OF JUNE 30, 2020
| INVESTMENTS | SHARES (000) | VALUE ($000) | ||||||
Common Stocks — 96.3% |
| |||||||
Airlines — 1.3% |
| |||||||
Southwest Airlines Co. | 32 | 1,084 | ||||||
|
| |||||||
Automobiles — 2.6% |
| |||||||
Tesla, Inc. * | 2 | 2,170 | ||||||
|
| |||||||
Banks — 3.3% |
| |||||||
Bank of America Corp. | 119 | 2,829 | ||||||
|
| |||||||
Biotechnology — 6.2% |
| |||||||
AbbVie, Inc. | 22 | 2,124 | ||||||
Amgen, Inc. | 9 | 2,170 | ||||||
Regeneron Pharmaceuticals, Inc. * | 2 | 998 | ||||||
|
| |||||||
| 5,292 | ||||||||
|
| |||||||
Capital Markets — 6.3% |
| |||||||
Charles Schwab Corp. (The) | 62 | 2,087 | ||||||
S&P Global, Inc. | 4 | 1,347 | ||||||
T. Rowe Price Group, Inc. | 16 | 1,940 | ||||||
|
| |||||||
| 5,374 | ||||||||
|
| |||||||
Construction Materials — 2.7% |
| |||||||
Martin Marietta Materials, Inc. | 11 | 2,306 | ||||||
|
| |||||||
Consumer Finance — 2.4% |
| |||||||
Capital One Financial Corp. | 33 | 2,073 | ||||||
|
| |||||||
Containers & Packaging — 2.8% |
| |||||||
Ball Corp. | 12 | 818 | ||||||
Packaging Corp. of America | 15 | 1,527 | ||||||
|
| |||||||
| 2,345 | ||||||||
|
| |||||||
Diversified Financial Services — 3.5% |
| |||||||
Berkshire Hathaway, Inc., Class B * | 17 | 3,015 | ||||||
|
| |||||||
Electric Utilities — 2.1% |
| |||||||
Xcel Energy, Inc. | 29 | 1,815 | ||||||
|
| |||||||
Electronic Equipment, Instruments & Components — 1.2% |
| |||||||
Zebra Technologies Corp., Class A * | 4 | 1,007 | ||||||
|
| |||||||
Equity Real Estate Investment Trusts (REITs) — 4.0% |
| |||||||
Federal Realty Investment Trust | 19 | 1,594 | ||||||
Public Storage | 9 | 1,770 | ||||||
|
| |||||||
| 3,364 | ||||||||
|
| |||||||
Food & Staples Retailing — 1.7% |
| |||||||
Walgreens Boots Alliance, Inc. | 35 | 1,477 | ||||||
|
| |||||||
Health Care Equipment & Supplies — 2.5% |
| |||||||
DexCom, Inc. * | 2 | 885 | ||||||
Intuitive Surgical, Inc. * | 2 | 1,256 | ||||||
|
| |||||||
| 2,141 | ||||||||
|
| |||||||
| INVESTMENTS | SHARES (000) | VALUE ($000) | ||||||
Health Care Providers & Services — 3.5% |
| |||||||
UnitedHealth Group, Inc. | 10 | 3,012 | ||||||
|
| |||||||
Insurance — 3.8% |
| |||||||
Loews Corp. | 95 | 3,262 | ||||||
|
| |||||||
Interactive Media & Services — 3.5% |
| |||||||
Alphabet, Inc., Class C * | 2 | 2,950 | ||||||
|
| |||||||
Internet & Direct Marketing Retail — 7.5% |
| |||||||
Amazon.com, Inc. * | 2 | 4,919 | ||||||
Booking Holdings, Inc. * | 1 | 1,438 | ||||||
|
| |||||||
| 6,357 | ||||||||
|
| |||||||
IT Services — 6.5% |
| |||||||
Global Payments, Inc. | 7 | 1,247 | ||||||
Mastercard, Inc., Class A | 8 | 2,457 | ||||||
PayPal Holdings, Inc. * | 10 | 1,797 | ||||||
|
| |||||||
| 5,501 | ||||||||
|
| |||||||
Machinery — 1.7% |
| |||||||
Stanley Black & Decker, Inc. | 11 | 1,488 | ||||||
|
| |||||||
Media — 1.6% |
| |||||||
DISH Network Corp., Class A * | 39 | 1,341 | ||||||
|
| |||||||
Oil, Gas & Consumable Fuels — 3.1% |
| |||||||
Kinder Morgan, Inc. | 96 | 1,451 | ||||||
Marathon Petroleum Corp. | 31 | 1,145 | ||||||
|
| |||||||
| 2,596 | ||||||||
|
| |||||||
Semiconductors & Semiconductor Equipment — 3.7% |
| |||||||
Advanced Micro Devices, Inc. * | 26 | 1,390 | ||||||
QUALCOMM, Inc. | 20 | 1,790 | ||||||
|
| |||||||
| 3,180 | ||||||||
|
| |||||||
Software — 8.7% |
| |||||||
Microsoft Corp. | 28 | 5,701 | ||||||
Synopsys, Inc. * | 8 | 1,621 | ||||||
|
| |||||||
| 7,322 | ||||||||
|
| |||||||
Specialty Retail — 5.4% |
| |||||||
AutoZone, Inc. * | 1 | 1,594 | ||||||
Home Depot, Inc. (The) | 12 | 2,983 | ||||||
|
| |||||||
| 4,577 | ||||||||
|
| |||||||
Technology Hardware, Storage & Peripherals — 4.7% |
| |||||||
Apple, Inc. | 11 | 4,011 | ||||||
|
| |||||||
Total Common Stocks | 81,889 | |||||||
|
| |||||||
SEE NOTES TO FINANCIAL STATEMENTS.
| 26 | J.P. MORGAN LARGE CAP FUNDS | JUNE 30, 2020 | ||||
Table of Contents
| INVESTMENTS | SHARES (000) | VALUE ($000) | ||||||
Short-Term Investments — 3.8% |
| |||||||
Investment Companies — 3.8% |
| |||||||
JPMorgan Prime Money Market Fund Class IM Shares, 0.47% (a) (b) | 3,213 | 3,216 | ||||||
|
| |||||||
Total Investments — 100.1% | 85,105 | |||||||
Liabilities in Excess of | (51 | ) | ||||||
|
| |||||||
NET ASSETS — 100.0% | 85,054 | |||||||
|
| |||||||
Percentages indicated are based on net assets.
| (a) | Investment in an affiliated fund, which is registered under the Investment Company Act of 1940, as amended, and is advised by J.P. Morgan Investment Management Inc. | |
| (b) | The rate shown is the current yield as of June 30, 2020. | |
| * | Non-income producing security. |
SEE NOTES TO FINANCIAL STATEMENTS.
| JUNE 30, 2020 | J.P. MORGAN LARGE CAP FUNDS | 27 | ||||||
Table of Contents
JPMorgan Equity Income Fund
SCHEDULE OF PORTFOLIO INVESTMENTS
AS OF JUNE 30, 2020
| INVESTMENTS | SHARES (000) | VALUE ($000) | ||||||
Common Stocks — 97.0% |
| |||||||
Aerospace & Defense — 3.0% |
| |||||||
General Dynamics Corp. | 3,265 | 488,023 | ||||||
Raytheon Technologies Corp. | 6,440 | 396,848 | ||||||
|
| |||||||
| 884,871 | ||||||||
|
| |||||||
Banks — 6.6% |
| |||||||
Bank of America Corp. | 31,161 | 740,063 | ||||||
Cullen/Frost Bankers, Inc. | 1,134 | 84,705 | ||||||
M&T Bank Corp. | 484 | 50,278 | ||||||
PNC Financial Services Group, Inc. (The) | 5,201 | 547,221 | ||||||
Truist Financial Corp. | 7,301 | 274,163 | ||||||
US Bancorp | 7,069 | 260,268 | ||||||
|
| |||||||
| 1,956,698 | ||||||||
|
| |||||||
Beverages — 2.0% |
| |||||||
Coca-Cola Co. (The) | 4,068 | 181,764 | ||||||
PepsiCo, Inc. | 3,020 | 399,457 | ||||||
|
| |||||||
| 581,221 | ||||||||
|
| |||||||
Biotechnology — 0.6% |
| |||||||
Amgen, Inc. | 748 | 176,428 | ||||||
|
| |||||||
Building Products — 0.4% |
| |||||||
Trane Technologies plc | 1,388 | 123,510 | ||||||
|
| |||||||
Capital Markets — 7.8% |
| |||||||
BlackRock, Inc. | 1,240 | 674,539 | ||||||
Charles Schwab Corp. (The) | 3,157 | 106,513 | ||||||
CME Group, Inc. | 3,948 | 641,660 | ||||||
Morgan Stanley | 10,549 | 509,503 | ||||||
Northern Trust Corp. | 1,794 | 142,354 | ||||||
T. Rowe Price Group, Inc. | 2,186 | 270,032 | ||||||
|
| |||||||
| 2,344,601 | ||||||||
|
| |||||||
Chemicals — 2.8% |
| |||||||
Air Products and Chemicals, Inc. | 1,930 | 465,921 | ||||||
PPG Industries, Inc. | 3,503 | 371,545 | ||||||
|
| |||||||
| 837,466 | ||||||||
|
| |||||||
Commercial Services & Supplies — 0.8% |
| |||||||
Republic Services, Inc. | 2,904 | 238,296 | ||||||
|
| |||||||
Consumer Finance — 1.8% |
| |||||||
American Express Co. | 3,629 | 345,472 | ||||||
Capital One Financial Corp. | 2,827 | 176,927 | ||||||
|
| |||||||
| 522,399 | ||||||||
|
| |||||||
Diversified Telecommunication Services — 1.9% |
| |||||||
Verizon Communications, Inc. | 9,945 | 548,282 | ||||||
|
| |||||||
Electric Utilities — 3.7% |
| |||||||
Entergy Corp. | 1,824 | 171,113 | ||||||
| INVESTMENTS | SHARES (000) | VALUE ($000) | ||||||
Electric Utilities — continued |
| |||||||
NextEra Energy, Inc. | 2,249 | 540,038 | ||||||
Xcel Energy, Inc. | 5,973 | 373,301 | ||||||
|
| |||||||
| 1,084,452 | ||||||||
|
| |||||||
Electrical Equipment — 1.2% |
| |||||||
Eaton Corp. plc | 4,154 | 363,355 | ||||||
|
| |||||||
Equity Real Estate Investment Trusts (REITs) — 2.6% |
| |||||||
Alexandria Real Estate Equities, Inc. | 734 | 119,026 | ||||||
AvalonBay Communities, Inc. | 1,335 | 206,473 | ||||||
Boston Properties, Inc. | 1,006 | 90,881 | ||||||
Prologis, Inc. | 659 | 61,544 | ||||||
Realty Income Corp. | 931 | 55,400 | ||||||
Simon Property Group, Inc. | 420 | 28,695 | ||||||
Ventas, Inc. | 2,578 | 94,394 | ||||||
Vornado Realty Trust | 3,013 | 115,113 | ||||||
|
| |||||||
| 771,526 | ||||||||
|
| |||||||
Food & Staples Retailing — 1.8% |
| |||||||
Sysco Corp. | 2,349 | 128,371 | ||||||
Walmart, Inc. | 3,365 | 403,035 | ||||||
|
| |||||||
| 531,406 | ||||||||
|
| |||||||
Food Products — 1.6% |
| |||||||
Mondelez International, Inc., Class A | 9,246 | 472,756 | ||||||
|
| |||||||
Health Care Equipment & Supplies — 3.2% |
| |||||||
Abbott Laboratories | 710 | 64,919 | ||||||
Becton Dickinson and Co. | 1,394 | 333,589 | ||||||
Medtronic plc | 5,820 | 533,681 | ||||||
|
| |||||||
| 932,189 | ||||||||
|
| |||||||
Health Care Providers & Services — 3.5% |
| |||||||
AmerisourceBergen Corp. | 2,181 | 219,770 | ||||||
CVS Health Corp. | 3,747 | 243,438 | ||||||
UnitedHealth Group, Inc. | 1,930 | 569,373 | ||||||
|
| |||||||
| 1,032,581 | ||||||||
|
| |||||||
Hotels, Restaurants & Leisure — 1.8% |
| |||||||
McDonald’s Corp. | 2,486 | 458,635 | ||||||
Starbucks Corp. | 1,058 | 77,856 | ||||||
|
| |||||||
| 536,491 | ||||||||
|
| |||||||
Household Products — 1.7% |
| |||||||
Procter & Gamble Co. (The) | 4,268 | 510,348 | ||||||
|
| |||||||
Industrial Conglomerates — 0.6% |
| |||||||
Honeywell International, Inc. | 1,218 | 176,109 | ||||||
|
| |||||||
Insurance — 6.3% |
| |||||||
Arthur J Gallagher & Co. | 2,934 | 286,021 | ||||||
SEE NOTES TO FINANCIAL STATEMENTS.
| 28 | J.P. MORGAN LARGE CAP FUNDS | JUNE 30, 2020 | ||||
Table of Contents
| INVESTMENTS | SHARES (000) | VALUE ($000) | ||||||
Common Stocks — continued |
| |||||||
Insurance — continued |
| |||||||
Chubb Ltd. | 1,881 | 238,229 | ||||||
Hartford Financial Services Group, Inc. (The) | 5,701 | 219,758 | ||||||
Marsh & McLennan Cos., Inc. | 2,236 | 240,081 | ||||||
MetLife, Inc. | 6,797 | 248,235 | ||||||
Progressive Corp. (The) | 3,506 | 280,904 | ||||||
Prudential Financial, Inc. | 2,780 | 169,278 | ||||||
Travelers Cos., Inc. (The) | 1,479 | 168,625 | ||||||
|
| |||||||
| 1,851,131 | ||||||||
|
| |||||||
IT Services — 3.8% |
| |||||||
Accenture plc, Class A | 988 | 212,127 | ||||||
Automatic Data Processing, Inc. | 1,864 | 277,577 | ||||||
Fidelity National Information Services, Inc. | 3,007 | 403,271 | ||||||
International Business Machines Corp. | 1,926 | 232,573 | ||||||
|
| |||||||
| 1,125,548 | ||||||||
|
| |||||||
Leisure Products — 0.8% |
| |||||||
Hasbro, Inc. | 3,021 | 226,411 | ||||||
|
| |||||||
Machinery — 5.4% |
| |||||||
Deere & Co. | 2,123 | 333,668 | ||||||
Dover Corp. | 5,119 | 494,326 | ||||||
Illinois Tool Works, Inc. | 772 | 135,067 | ||||||
Otis Worldwide Corp. | 1,492 | 84,828 | ||||||
Parker-Hannifin Corp. | 2,178 | 399,138 | ||||||
Stanley Black & Decker, Inc. | 1,097 | 152,918 | ||||||
|
| |||||||
| 1,599,945 | ||||||||
|
| |||||||
Media — 2.4% |
| |||||||
Comcast Corp., Class A | 18,311 | 713,777 | ||||||
|
| |||||||
Multi-Utilities — 1.8% |
| |||||||
CMS Energy Corp. | 5,011 | 292,756 | ||||||
DTE Energy Co. | 585 | 62,927 | ||||||
Public Service Enterprise Group, Inc. | 3,703 | 182,048 | ||||||
|
| |||||||
| 537,731 | ||||||||
|
| |||||||
Oil, Gas & Consumable Fuels — 4.0% |
| |||||||
Chevron Corp. | 6,375 | 568,885 | ||||||
ConocoPhillips | 11,798 | 495,748 | ||||||
Valero Energy Corp. | 2,055 | 120,867 | ||||||
|
| |||||||
| 1,185,500 | ||||||||
|
| |||||||
Pharmaceuticals — 7.7% |
| |||||||
Bristol-Myers Squibb Co. | 12,551 | 737,972 | ||||||
Eli Lilly and Co. | 2,122 | 348,468 | ||||||
Johnson & Johnson | 5,125 | 720,689 | ||||||
Merck & Co., Inc. | 3,456 | 267,220 | ||||||
Pfizer, Inc. | 6,748 | 220,648 | ||||||
|
| |||||||
| 2,294,997 | ||||||||
|
| |||||||
| INVESTMENTS | SHARES (000) | VALUE ($000) | ||||||
Road & Rail — 1.2% |
| |||||||
Norfolk Southern Corp. | 1,945 | 341,526 | ||||||
|
| |||||||
Semiconductors & Semiconductor Equipment — 4.1% |
| |||||||
Analog Devices, Inc. | 4,634 | 568,308 | ||||||
Texas Instruments, Inc. | 5,155 | 654,512 | ||||||
|
| |||||||
| 1,222,820 | ||||||||
|
| |||||||
Software — 2.4% |
| |||||||
Microsoft Corp. | 3,470 | 706,236 | ||||||
|
| |||||||
Specialty Retail — 3.1% |
| |||||||
Best Buy Co., Inc. | 1,210 | 105,636 | ||||||
Home Depot, Inc. (The) | 2,482 | 621,784 | ||||||
TJX Cos., Inc. (The) | 3,557 | 179,831 | ||||||
|
| |||||||
| 907,251 | ||||||||
|
| |||||||
Technology Hardware, Storage & Peripherals — 1.6% |
| |||||||
Apple, Inc. | 1,267 | 462,101 | ||||||
|
| |||||||
Textiles, Apparel & Luxury Goods — 0.5% |
| |||||||
VF Corp. | 2,459 | 149,850 | ||||||
|
| |||||||
Tobacco — 2.5% |
| |||||||
Altria Group, Inc. | 6,477 | 254,216 | ||||||
Philip Morris International, Inc. | 6,815 | 477,445 | ||||||
|
| |||||||
| 731,661 | ||||||||
|
| |||||||
Total Common Stocks | 28,681,470 | |||||||
|
| |||||||
Short-Term Investments — 3.0% |
| |||||||
Investment Companies — 3.0% |
| |||||||
JPMorgan Prime Money Market Fund Class IM Shares, 0.47% (a) (b) | 882,220 | 883,014 | ||||||
|
| |||||||
Total Investments — 100.0% | 29,564,484 | |||||||
Liabilities in Excess of | (9,547 | ) | ||||||
|
| |||||||
NET ASSETS — 100.0% | 29,554,937 | |||||||
|
| |||||||
Percentages indicated are based on net assets.
| (a) | Investment in an affiliated fund, which is registered under the Investment Company Act of 1940, as amended, and is advised by J.P. Morgan Investment Management Inc. | |
| (b) | The rate shown is the current yield as of June 30, 2020. | |
| (c) | Amount rounds to less than 0.1% of net assets. |
SEE NOTES TO FINANCIAL STATEMENTS.
| JUNE 30, 2020 | J.P. MORGAN LARGE CAP FUNDS | 29 | ||||||
Table of Contents
JPMorgan Equity Premium Income Fund
SCHEDULE OF PORTFOLIO INVESTMENTS
AS OF JUNE 30, 2020
| INVESTMENTS | SHARES (000) | VALUE ($000) | ||||||
Common Stocks — 81.7% |
| |||||||
Aerospace & Defense — 2.1% |
| |||||||
General Dynamics Corp. | 6 | 867 | ||||||
Northrop Grumman Corp. | 7 | 2,300 | ||||||
Raytheon Technologies Corp. | 14 | 835 | ||||||
|
| |||||||
| 4,002 | ||||||||
|
| |||||||
Beverages — 2.6% |
| |||||||
Coca-Cola Co. (The) | 34 | 1,512 | ||||||
Constellation Brands, Inc., Class A | 5 | 830 | ||||||
PepsiCo, Inc. | 20 | 2,580 | ||||||
|
| |||||||
| 4,922 | ||||||||
|
| |||||||
Biotechnology — 2.6% |
| |||||||
AbbVie, Inc. | 29 | 2,803 | ||||||
Alexion Pharmaceuticals, Inc. * | 8 | 914 | ||||||
Regeneron Pharmaceuticals, Inc. * | 2 | 1,204 | ||||||
|
| |||||||
| 4,921 | ||||||||
|
| |||||||
Building Products — 0.8% |
| |||||||
Trane Technologies plc | 18 | 1,570 | ||||||
|
| |||||||
Capital Markets — 3.0% |
| |||||||
BlackRock, Inc. | 1 | 704 | ||||||
CME Group, Inc. | 12 | 2,001 | ||||||
Intercontinental Exchange, Inc. | 25 | 2,267 | ||||||
S&P Global, Inc. | 2 | 771 | ||||||
|
| |||||||
| 5,743 | ||||||||
|
| |||||||
Chemicals — 1.1% |
| |||||||
Air Products and Chemicals, Inc. | 3 | 829 | ||||||
Linde plc (United Kingdom) | 6 | 1,244 | ||||||
|
| |||||||
| 2,073 | ||||||||
|
| |||||||
Commercial Services & Supplies — 0.9% |
| |||||||
Waste Management, Inc. | 16 | 1,691 | ||||||
|
| |||||||
Consumer Finance — 0.4% |
| |||||||
American Express Co. | 8 | 748 | ||||||
|
| |||||||
Containers & Packaging — 1.2% |
| |||||||
Silgan Holdings, Inc. | 74 | 2,388 | ||||||
|
| |||||||
Diversified Financial Services — 1.1% |
| |||||||
Berkshire Hathaway, Inc., Class B * | 12 | 2,133 | ||||||
|
| |||||||
Diversified Telecommunication Services — 1.2% |
| |||||||
Verizon Communications, Inc. | 41 | 2,237 | ||||||
|
| |||||||
Electric Utilities — 5.4% |
| |||||||
American Electric Power Co., Inc. | 18 | 1,407 | ||||||
Duke Energy Corp. | 18 | 1,445 | ||||||
Entergy Corp. | 21 | 2,000 | ||||||
Evergy, Inc. | 12 | 718 | ||||||
| INVESTMENTS | SHARES (000) | VALUE ($000) | ||||||
Electric Utilities — continued |
| |||||||
NextEra Energy, Inc. | 10 | 2,448 | ||||||
Xcel Energy, Inc. | 40 | 2,505 | ||||||
|
| |||||||
| 10,523 | ||||||||
|
| |||||||
Electrical Equipment — 0.6% |
| |||||||
Eaton Corp. plc | 13 | 1,163 | ||||||
|
| |||||||
Entertainment — 0.8% |
| |||||||
Netflix, Inc. * | 3 | 1,545 | ||||||
|
| |||||||
Equity Real Estate Investment Trusts (REITs) — 2.2% |
| |||||||
Equinix, Inc. | 3 | 2,058 | ||||||
Equity LifeStyle Properties, Inc. | 9 | 534 | ||||||
Prologis, Inc. | 9 | 809 | ||||||
Sun Communities, Inc. | 6 | 810 | ||||||
|
| |||||||
| 4,211 | ||||||||
|
| |||||||
Food & Staples Retailing — 2.3% |
| |||||||
Costco Wholesale Corp. | 8 | 2,358 | ||||||
Kroger Co. (The) | 23 | 789 | ||||||
Walmart, Inc. | 11 | 1,337 | ||||||
|
| |||||||
| 4,484 | ||||||||
|
| |||||||
Food Products — 2.9% |
| |||||||
Conagra Brands, Inc. | 26 | 923 | ||||||
General Mills, Inc. | 15 | 954 | ||||||
Hershey Co. (The) | 9 | 1,160 | ||||||
Mondelez International, Inc., Class A | 49 | 2,506 | ||||||
|
| |||||||
| 5,543 | ||||||||
|
| |||||||
Health Care Equipment & Supplies — 1.3% |
| |||||||
Baxter International, Inc. | 21 | 1,801 | ||||||
Medtronic plc | 7 | 652 | ||||||
|
| |||||||
| 2,453 | ||||||||
|
| |||||||
Health Care Providers & Services — 0.8% |
| |||||||
McKesson Corp. | 4 | 611 | ||||||
UnitedHealth Group, Inc. | 3 | 964 | ||||||
|
| |||||||
| 1,575 | ||||||||
|
| |||||||
Hotels, Restaurants & Leisure — 0.5% |
| |||||||
McDonald’s Corp. | 5 | 1,005 | ||||||
|
| |||||||
Household Products — 2.6% |
| |||||||
Kimberly-Clark Corp. | 17 | 2,378 | ||||||
Procter & Gamble Co. (The) | 21 | 2,517 | ||||||
|
| |||||||
| 4,895 | ||||||||
|
| |||||||
Industrial Conglomerates — 1.4% |
| |||||||
Honeywell International, Inc. | 18 | 2,614 | ||||||
|
| |||||||
SEE NOTES TO FINANCIAL STATEMENTS.
| 30 | J.P. MORGAN LARGE CAP FUNDS | JUNE 30, 2020 | ||||
Table of Contents
| INVESTMENTS | SHARES (000) | VALUE ($000) | ||||||
Common Stocks — continued |
| |||||||
Insurance — 4.8% |
| |||||||
Allstate Corp. (The) | 24 | 2,320 | ||||||
Aon plc, Class A | 9 | 1,647 | ||||||
Chubb Ltd. | 16 | 2,053 | ||||||
Marsh & McLennan Cos., Inc. | 6 | 591 | ||||||
Progressive Corp. (The) | 31 | 2,448 | ||||||
RenaissanceRe Holdings Ltd. (Bermuda) | 2 | 411 | ||||||
|
| |||||||
| 9,470 | ||||||||
|
| |||||||
Interactive Media & Services — 2.2% |
| |||||||
Alphabet, Inc., Class A * | 2 | 2,688 | ||||||
Facebook, Inc., Class A * | 7 | 1,515 | ||||||
|
| |||||||
| 4,203 | ||||||||
|
| |||||||
Internet & Direct Marketing Retail — 1.5% |
| |||||||
Amazon.com, Inc. * | 1 | 2,908 | ||||||
|
| |||||||
IT Services — 7.0% |
| |||||||
Accenture plc, Class A | 13 | 2,895 | ||||||
Automatic Data Processing, Inc. | 11 | 1,594 | ||||||
Jack Henry & Associates, Inc. | 14 | 2,578 | ||||||
Leidos Holdings, Inc. | 16 | 1,454 | ||||||
Mastercard, Inc., Class A | 9 | 2,516 | ||||||
PayPal Holdings, Inc. * | 7 | 1,133 | ||||||
Visa, Inc., Class A | 7 | 1,350 | ||||||
|
| |||||||
| 13,520 | ||||||||
|
| |||||||
Life Sciences Tools & Services — 0.9% |
| |||||||
Thermo Fisher Scientific, Inc. | 5 | 1,639 | ||||||
|
| |||||||
Machinery — 1.6% |
| |||||||
Cummins, Inc. | 6 | 982 | ||||||
Deere & Co. | 3 | 433 | ||||||
PACCAR, Inc. | 22 | 1,679 | ||||||
|
| |||||||
| 3,094 | ||||||||
|
| |||||||
Media — 2.0% |
| |||||||
Charter Communications, Inc., Class A * | 5 | 2,394 | ||||||
Comcast Corp., Class A | 36 | 1,413 | ||||||
|
| |||||||
| 3,807 | ||||||||
|
| |||||||
Metals & Mining — 0.3% |
| |||||||
Newmont Corp. | 9 | 572 | ||||||
|
| |||||||
Multiline Retail — 1.9% |
| |||||||
Dollar Tree, Inc. * | 15 | 1,385 | ||||||
Target Corp. | 19 | 2,279 | ||||||
|
| |||||||
| 3,664 | ||||||||
|
| |||||||
| INVESTMENTS | SHARES (000) | VALUE ($000) | ||||||
Multi-Utilities — 2.1% |
| |||||||
CMS Energy Corp. | 40 | 2,364 | ||||||
Sempra Energy | 14 | 1,622 | ||||||
|
| |||||||
| 3,986 | ||||||||
|
| |||||||
Oil, Gas & Consumable Fuels — 0.7% |
| |||||||
Chevron Corp. | 7 | 590 | ||||||
Kinder Morgan, Inc. | 49 | 748 | ||||||
|
| |||||||
| 1,338 | ||||||||
|
| |||||||
Pharmaceuticals — 6.2% |
| |||||||
Bristol-Myers Squibb Co. | 41 | 2,436 | ||||||
Eli Lilly and Co. | 16 | 2,695 | ||||||
Johnson & Johnson | 17 | 2,421 | ||||||
Merck & Co., Inc. | 31 | 2,383 | ||||||
Pfizer, Inc. | 64 | 2,082 | ||||||
|
| |||||||
| 12,017 | ||||||||
|
| |||||||
Road & Rail — 1.4% |
| |||||||
Norfolk Southern Corp. | 6 | 1,037 | ||||||
Old Dominion Freight Line, Inc. | 10 | 1,622 | ||||||
|
| |||||||
| 2,659 | ||||||||
|
| |||||||
Semiconductors & Semiconductor Equipment — 0.8% |
| |||||||
Texas Instruments, Inc. | 11 | 1,450 | ||||||
|
| |||||||
Software — 3.5% |
| |||||||
Intuit, Inc. | 8 | 2,460 | ||||||
Microsoft Corp. | 14 | 2,900 | ||||||
salesforce.com, Inc. * | 7 | 1,341 | ||||||
|
| |||||||
| 6,701 | ||||||||
|
| |||||||
Specialty Retail — 2.8% |
| |||||||
AutoZone, Inc. * | 2 | 1,863 | ||||||
Home Depot, Inc. (The) | 7 | 1,821 | ||||||
Ross Stores, Inc. | 5 | 401 | ||||||
TJX Cos., Inc. (The) | 25 | 1,277 | ||||||
|
| |||||||
| 5,362 | ||||||||
|
| |||||||
Technology Hardware, Storage & Peripherals — 1.4% |
| |||||||
Apple, Inc. | 7 | 2,692 | ||||||
|
| |||||||
Textiles, Apparel & Luxury Goods — 0.5% |
| |||||||
NIKE, Inc., Class B | 10 | 980 | ||||||
|
| |||||||
Tobacco — 1.4% |
| |||||||
Altria Group, Inc. | 31 | 1,211 | ||||||
Philip Morris International, Inc. | 20 | 1,410 | ||||||
|
| |||||||
| 2,621 | ||||||||
|
| |||||||
SEE NOTES TO FINANCIAL STATEMENTS.
| JUNE 30, 2020 | J.P. MORGAN LARGE CAP FUNDS | 31 | ||||||
Table of Contents
JPMorgan Equity Premium Income Fund
SCHEDULE OF PORTFOLIO INVESTMENTS
AS OF JUNE 30, 2020 (continued)
| INVESTMENTS | SHARES (000) | VALUE ($000) | ||||||
Common Stocks — continued |
| |||||||
Wireless Telecommunication Services — 0.9% |
| |||||||
T-Mobile US, Inc. * | 16 | 1,642 | ||||||
|
| |||||||
Total Common Stocks | 156,764 | |||||||
|
| |||||||
PRINCIPAL ($000) | ||||||||
Equity Linked Notes — 15.8% |
| |||||||
Barclays Bank plc, ELN, 68.00%, 7/17/2020, (linked to S&P 500 Index) (a) | 2 | 7,849 | ||||||
BMO Capital Markets Corp., ELN, 70.97%, 7/10/2020, (linked to S&P 500 Index) (a) | 2 | 5,924 | ||||||
BNP Paribas, ELN, 72.67%, 7/31/2020, (linked to S&P 500 Index) (a) | 2 | 6,578 | ||||||
Royal Bank of Canada, ELN, 81.10%, 7/24/2020, (linked to S&P 500 Index) (a) | 1 | 4,701 | ||||||
Toronto-Dominion Bank (The), ELN, 78.20%, 8/7/2020, (linked to S&P 500 Index) (a) | 2 | 5,199 | ||||||
|
| |||||||
Total Equity Linked Notes | 30,251 | |||||||
|
| |||||||
| SHARES (000) | ||||||||
Exchange-Traded Funds — 1.0% |
| |||||||
International Equity — 1.0% |
| |||||||
iShares Edge MSCI Min Vol USA ETF | 31 | 1,866 | ||||||
|
| |||||||
| NO. OF RIGHTS (000) | ||||||||
Rights — 0.0% (b) |
| |||||||
Wireless Telecommunication Services — 0.0% (b) |
| |||||||
T-Mobile US, Inc., expiring 7/27/2020 * | 15 | 3 | ||||||
|
| |||||||
| SHARES (000) | ||||||||
Short-Term Investments — 3.1% |
| |||||||
Investment Companies — 3.1% |
| |||||||
JPMorgan Prime Money Market Fund Class IM Shares, 0.47% (c) (d) | 5,893 | 5,899 | ||||||
|
| |||||||
Total Investments — 101.6% | 194,783 | |||||||
Liabilities in Excess of | (3,053 | ) | ||||||
|
| |||||||
NET ASSETS — 100.0% | 191,730 | |||||||
|
| |||||||
Percentages indicated are based on net assets.
Abbreviations
| ELN | Equity-Linked Note | |
| ETF | Exchange-Traded Fund | |
| (a) | Securities exempt from registration under Rule 144A or Section 4 (a)(2), of the Securities Act of 1933, as amended. | |
| (b) | Amount rounds to less than 0.1% of net assets. | |
| (c) | Investment in an affiliated fund, which is registered under the Investment Company Act of 1940, as amended, and is advised by J.P. Morgan Investment Management Inc. | |
| (d) | The rate shown is the current yield as of June 30, 2020. | |
| * | Non-income producing security. | |
SEE NOTES TO FINANCIAL STATEMENTS.
| 32 | J.P. MORGAN LARGE CAP FUNDS | JUNE 30, 2020 | ||||
Table of Contents
JPMorgan Growth and Income Fund
SCHEDULE OF PORTFOLIO INVESTMENTS
AS OF JUNE 30, 2020
| INVESTMENTS | SHARES (000) | VALUE ($000) | ||||||
Common Stocks — 96.4% |
| |||||||
Aerospace & Defense — 3.3% |
| |||||||
General Dynamics Corp. | 61 | 9,087 | ||||||
Northrop Grumman Corp. | 16 | 4,981 | ||||||
Raytheon Technologies Corp. | 157 | 9,649 | ||||||
|
| |||||||
| 23,717 | ||||||||
|
| |||||||
Banks — 8.7% |
| |||||||
Bank of America Corp. | 800 | 19,002 | ||||||
Citigroup, Inc. | 164 | 8,363 | ||||||
Citizens Financial Group, Inc. | 137 | 3,468 | ||||||
Cullen/Frost Bankers, Inc. | 38 | 2,817 | ||||||
M&T Bank Corp. | 38 | 3,972 | ||||||
PNC Financial Services Group, Inc. (The) | 74 | 7,743 | ||||||
Truist Financial Corp. | 322 | 12,105 | ||||||
US Bancorp | 149 | 5,482 | ||||||
|
| |||||||
| 62,952 | ||||||||
|
| |||||||
Beverages — 0.7% |
| |||||||
PepsiCo, Inc. | 37 | 4,867 | ||||||
|
| |||||||
Biotechnology — 2.1% |
| |||||||
AbbVie, Inc. | 112 | 11,026 | ||||||
Amgen, Inc. | 18 | 4,245 | ||||||
|
| |||||||
| 15,271 | ||||||||
|
| |||||||
Building Products — 0.6% |
| |||||||
Trane Technologies plc | 51 | 4,574 | ||||||
|
| |||||||
Capital Markets — 8.3% |
| |||||||
BlackRock, Inc. | 33 | 17,791 | ||||||
Charles Schwab Corp. (The) | 118 | 3,968 | ||||||
Goldman Sachs Group, Inc. (The) | 46 | 9,110 | ||||||
Morgan Stanley | 363 | 17,533 | ||||||
T. Rowe Price Group, Inc. | 94 | 11,584 | ||||||
|
| |||||||
| 59,986 | ||||||||
|
| |||||||
Chemicals — 1.4% |
| |||||||
Air Products and Chemicals, Inc. | 27 | 6,544 | ||||||
Axalta Coating Systems Ltd. * | 176 | 3,964 | ||||||
|
| |||||||
| 10,508 | ||||||||
|
| |||||||
Commercial Services & Supplies — 0.6% |
| |||||||
Republic Services, Inc. | 55 | 4,472 | ||||||
|
| |||||||
Consumer Finance — 1.6% |
| |||||||
American Express Co. | 71 | 6,740 | ||||||
Capital One Financial Corp. | 75 | 4,701 | ||||||
|
| |||||||
| 11,441 | ||||||||
|
| |||||||
Containers & Packaging — 0.4% |
| |||||||
Ball Corp. | 42 | 2,905 | ||||||
|
| |||||||
| INVESTMENTS | SHARES (000) | VALUE ($000) | ||||||
Diversified Financial Services — 2.0% |
| |||||||
Berkshire Hathaway, Inc., Class B * | 81 | 14,441 | ||||||
|
| |||||||
Diversified Telecommunication Services — 1.1% |
| |||||||
Verizon Communications, Inc. | 151 | 8,304 | ||||||
|
| |||||||
Electric Utilities — 2.4% |
| |||||||
Entergy Corp. | 46 | 4,306 | ||||||
NextEra Energy, Inc. | 31 | 7,325 | ||||||
Xcel Energy, Inc. | 90 | 5,606 | ||||||
|
| |||||||
| 17,237 | ||||||||
|
| |||||||
Electrical Equipment — 0.9% |
| |||||||
Eaton Corp. plc | 78 | 6,788 | ||||||
|
| |||||||
Entertainment — 0.7% |
| |||||||
Walt Disney Co. (The) | 46 | 5,129 | ||||||
|
| |||||||
Equity Real Estate Investment Trusts (REITs) — 1.4% |
| |||||||
AvalonBay Communities, Inc. | 25 | 3,866 | ||||||
Ventas, Inc. | 91 | 3,329 | ||||||
Vornado Realty Trust | 81 | 3,099 | ||||||
|
| |||||||
| 10,294 | ||||||||
|
| |||||||
Food & Staples Retailing — 1.0% |
| |||||||
Walmart, Inc. | 63 | 7,522 | ||||||
|
| |||||||
Food Products — 1.1% |
| |||||||
Mondelez International, Inc., Class A | 150 | 7,675 | ||||||
|
| |||||||
Health Care Equipment & Supplies — 2.7% |
| |||||||
Becton Dickinson and Co. | 39 | 9,403 | ||||||
Medtronic plc | 114 | 10,454 | ||||||
|
| |||||||
| 19,857 | ||||||||
|
| |||||||
Health Care Providers & Services — 3.8% |
| |||||||
Anthem, Inc. | 14 | 3,603 | ||||||
Cigna Corp. | 44 | 8,304 | ||||||
Humana, Inc. | 11 | 4,071 | ||||||
UnitedHealth Group, Inc. | 41 | 12,004 | ||||||
|
| |||||||
| 27,982 | ||||||||
|
| |||||||
Hotels, Restaurants & Leisure — 1.0% |
| |||||||
McDonald’s Corp. | 39 | 7,176 | ||||||
|
| |||||||
Household Durables — 0.5% |
| |||||||
Newell Brands, Inc. | 213 | 3,375 | ||||||
|
| |||||||
Household Products — 1.3% |
| |||||||
Colgate-Palmolive Co. | 129 | 9,473 | ||||||
|
| |||||||
Industrial Conglomerates — 0.7% |
| |||||||
Honeywell International, Inc. | 37 | 5,408 | ||||||
|
| |||||||
SEE NOTES TO FINANCIAL STATEMENTS.
| JUNE 30, 2020 | J.P. MORGAN LARGE CAP FUNDS | 33 | ||||||
Table of Contents
JPMorgan Growth and Income Fund
SCHEDULE OF PORTFOLIO INVESTMENTS
AS OF JUNE 30, 2020 (continued)
| INVESTMENTS | SHARES (000) | VALUE ($000) | ||||||
Common Stocks — continued |
| |||||||
Insurance — 4.2% |
| |||||||
Chubb Ltd. | 61 | 7,732 | ||||||
Hartford Financial Services Group, Inc. (The) | 187 | 7,213 | ||||||
Loews Corp. | 84 | 2,880 | ||||||
Marsh & McLennan Cos., Inc. | 41 | 4,424 | ||||||
MetLife, Inc. | 138 | 5,051 | ||||||
Prudential Financial, Inc. | 49 | 2,978 | ||||||
|
| |||||||
| 30,278 | ||||||||
|
| |||||||
Interactive Media & Services — 2.0% |
| |||||||
Alphabet, Inc., Class C * | 10 | 14,601 | ||||||
|
| |||||||
Internet & Direct Marketing Retail — 0.6% |
| |||||||
Booking Holdings, Inc. * | 1 | 2,070 | ||||||
Expedia Group, Inc. | 30 | 2,433 | ||||||
|
| |||||||
| 4,503 | ||||||||
|
| |||||||
IT Services — 1.8% |
| |||||||
Fidelity National Information Services, Inc. | 55 | 7,415 | ||||||
International Business Machines Corp. | 47 | 5,616 | ||||||
|
| |||||||
| 13,031 | ||||||||
|
| |||||||
Machinery — 4.4% |
| |||||||
Dover Corp. | 106 | 10,204 | ||||||
IDEX Corp. | 26 | 4,093 | ||||||
Otis Worldwide Corp. | 53 | 3,028 | ||||||
Parker-Hannifin Corp. | 61 | 11,199 | ||||||
Stanley Black & Decker, Inc. | 25 | 3,526 | ||||||
|
| |||||||
| 32,050 | ||||||||
|
| |||||||
Media — 2.3% |
| |||||||
Comcast Corp., Class A | 352 | 13,702 | ||||||
Discovery, Inc., Class A * | 153 | 3,226 | ||||||
|
| |||||||
| 16,928 | ||||||||
|
| |||||||
Multi-Utilities — 2.0% |
| |||||||
CMS Energy Corp. | 199 | 11,632 | ||||||
Public Service Enterprise Group, Inc. | 59 | 2,920 | ||||||
|
| |||||||
| 14,552 | ||||||||
|
| |||||||
Oil, Gas & Consumable Fuels — 4.6% |
| |||||||
Chevron Corp. | 138 | 12,270 | ||||||
ConocoPhillips | 198 | 8,306 | ||||||
EOG Resources, Inc. | 107 | 5,408 | ||||||
Phillips 66 | 28 | 1,999 | ||||||
Pioneer Natural Resources Co. | 15 | 1,485 | ||||||
Valero Energy Corp. | 62 | 3,664 | ||||||
|
| |||||||
| 33,132 | ||||||||
|
| |||||||
| INVESTMENTS | SHARES (000) | VALUE ($000) | ||||||
Pharmaceuticals — 6.9% |
| |||||||
Bristol-Myers Squibb Co. | 289 | 16,988 | ||||||
Eli Lilly and Co. | 35 | 5,739 | ||||||
Johnson & Johnson | 110 | 15,455 | ||||||
Merck & Co., Inc. | 83 | 6,385 | ||||||
Pfizer, Inc. | 166 | 5,441 | ||||||
|
| |||||||
| 50,008 | ||||||||
|
| |||||||
Road & Rail — 1.5% |
| |||||||
CSX Corp. | 54 | 3,766 | ||||||
Kansas City Southern | 47 | 7,046 | ||||||
|
| |||||||
| 10,812 | ||||||||
|
| |||||||
Semiconductors & Semiconductor Equipment — 4.4% |
| |||||||
Analog Devices, Inc. | 107 | 13,098 | ||||||
NXP Semiconductors NV (Netherlands) | 37 | 4,185 | ||||||
Texas Instruments, Inc. | 115 | 14,614 | ||||||
|
| |||||||
| 31,897 | ||||||||
|
| |||||||
Software — 3.1% |
| |||||||
Microsoft Corp. | 112 | 22,875 | ||||||
|
| |||||||
Specialty Retail — 5.1% |
| |||||||
AutoZone, Inc. * | 8 | 8,923 | ||||||
Home Depot, Inc. (The) | 59 | 14,731 | ||||||
Lowe’s Cos., Inc. | 52 | 6,972 | ||||||
TJX Cos., Inc. (The) | 124 | 6,259 | ||||||
|
| |||||||
| 36,885 | ||||||||
|
| |||||||
Technology Hardware, Storage & Peripherals — 1.8% |
| |||||||
Apple, Inc. | 36 | 13,297 | ||||||
|
| |||||||
Textiles, Apparel & Luxury Goods — 1.2% |
| |||||||
NIKE, Inc., Class B | 89 | 8,707 | ||||||
|
| |||||||
Tobacco — 1.8% |
| |||||||
Altria Group, Inc. | 102 | 3,996 | ||||||
Philip Morris International, Inc. | 129 | 9,051 | ||||||
|
| |||||||
| 13,047 | ||||||||
|
| |||||||
Trading Companies & Distributors — 0.4% |
| |||||||
Watsco, Inc. | 18 | 3,234 | ||||||
|
| |||||||
Total Common Stocks | 701,191 | |||||||
|
| |||||||
SEE NOTES TO FINANCIAL STATEMENTS.
| 34 | J.P. MORGAN LARGE CAP FUNDS | JUNE 30, 2020 | ||||
Table of Contents
| INVESTMENTS | SHARES (000) | VALUE ($000) | ||||||
Short-Term Investments — 3.5% |
| |||||||
Investment Companies — 3.5% |
| |||||||
JPMorgan Prime Money Market Fund Class IM Shares, 0.47% (a) (b) | 25,211 | 25,234 | ||||||
|
| |||||||
Total Investments — 99.9% | 726,425 | |||||||
Other Assets Less Liabilities — 0.1% | 429 | |||||||
|
| |||||||
NET ASSETS — 100.0% | 726,854 | |||||||
|
| |||||||
Percentages indicated are based on net assets.
| (a) | Investment in an affiliated fund, which is registered under the Investment Company Act of 1940, as amended, and is advised by J.P. Morgan Investment Management Inc. | |
| (b) | The rate shown is the current yield as of June 30, 2020. | |
| * | Non-income producing security. |
SEE NOTES TO FINANCIAL STATEMENTS.
| JUNE 30, 2020 | J.P. MORGAN LARGE CAP FUNDS | 35 | ||||||
Table of Contents
JPMorgan Hedged Equity Fund
SCHEDULE OF PORTFOLIO INVESTMENTS
AS OF JUNE 30, 2020
| INVESTMENTS | SHARES (000) | VALUE ($000) | ||||||
Common Stocks — 95.4% |
| |||||||
Aerospace & Defense — 1.2% |
| |||||||
General Dynamics Corp. (a) | 171 | 25,527 | ||||||
Northrop Grumman Corp. | 116 | 35,692 | ||||||
Raytheon Technologies Corp. | 727 | 44,787 | ||||||
|
| |||||||
| 106,006 | ||||||||
|
| |||||||
Airlines — 0.3% |
| |||||||
Delta Air Lines, Inc. | 309 | 8,665 | ||||||
Southwest Airlines Co. | 400 | 13,686 | ||||||
|
| |||||||
| 22,351 | ||||||||
|
| |||||||
Auto Components — 0.1% |
| |||||||
Magna International, Inc. (Canada) | 293 | 13,064 | ||||||
|
| |||||||
Automobiles — 0.2% |
| |||||||
General Motors Co. | 568 | 14,359 | ||||||
|
| |||||||
Banks — 3.0% |
| |||||||
Bank of America Corp. (a) | 1,895 | 45,002 | ||||||
Citigroup, Inc. | 1,933 | 98,771 | ||||||
Citizens Financial Group, Inc. | 705 | 17,798 | ||||||
KeyCorp | 2,414 | 29,400 | ||||||
Regions Financial Corp. | 1,862 | 20,711 | ||||||
Truist Financial Corp. | 161 | 6,044 | ||||||
Wells Fargo & Co. | 1,881 | 48,154 | ||||||
|
| |||||||
| 265,880 | ||||||||
|
| |||||||
Beverages — 1.1% |
| |||||||
Coca-Cola Co. (The) (a) | 1,272 | 56,821 | ||||||
Constellation Brands, Inc., Class A | 246 | 43,016 | ||||||
|
| |||||||
| 99,837 | ||||||||
|
| |||||||
Biotechnology — 2.8% |
| |||||||
AbbVie, Inc. | 1,072 | 105,254 | ||||||
Alexion Pharmaceuticals, Inc. * | 237 | 26,619 | ||||||
Amgen, Inc. (a) | 64 | 15,004 | ||||||
Biogen, Inc. * (a) | 88 | 23,576 | ||||||
Gilead Sciences, Inc. | 41 | 3,120 | ||||||
Regeneron Pharmaceuticals, Inc. * | 62 | 38,611 | ||||||
Vertex Pharmaceuticals, Inc. * | 111 | 32,124 | ||||||
|
| |||||||
| 244,308 | ||||||||
|
| |||||||
Building Products — 0.8% |
| |||||||
Carrier Global Corp. | 829 | 18,425 | ||||||
Masco Corp. | 557 | 27,955 | ||||||
Trane Technologies plc | 251 | 22,315 | ||||||
|
| |||||||
| 68,695 | ||||||||
|
| |||||||
Capital Markets — 2.9% |
| |||||||
BlackRock, Inc. | 64 | 34,897 | ||||||
Charles Schwab Corp. (The) | 459 | 15,502 | ||||||
| INVESTMENTS | SHARES (000) | VALUE ($000) | ||||||
Capital Markets — continued |
| |||||||
CME Group, Inc. | 124 | 20,148 | ||||||
Goldman Sachs Group, Inc. (The) | 107 | 21,091 | ||||||
MarketAxess Holdings, Inc. | 25 | 12,418 | ||||||
Morgan Stanley | 1,126 | 54,383 | ||||||
MSCI, Inc. | 36 | 11,876 | ||||||
S&P Global, Inc. | 166 | 54,569 | ||||||
State Street Corp. | 347 | 22,058 | ||||||
T. Rowe Price Group, Inc. | 66 | 8,156 | ||||||
|
| |||||||
| 255,098 | ||||||||
|
| |||||||
Chemicals — 1.6% |
| |||||||
Air Products and Chemicals, Inc. | 70 | 17,021 | ||||||
Celanese Corp. | 223 | 19,249 | ||||||
Dow, Inc. | 431 | 17,561 | ||||||
DuPont de Nemours, Inc. | 254 | 13,492 | ||||||
Eastman Chemical Co. | 481 | 33,470 | ||||||
Linde plc (United Kingdom) | 123 | 26,028 | ||||||
LyondellBasell Industries NV, Class A | 163 | 10,704 | ||||||
|
| |||||||
| 137,525 | ||||||||
|
| |||||||
Commercial Services & Supplies — 0.1% |
| |||||||
Cintas Corp. (a) | 34 | 9,092 | ||||||
|
| |||||||
Communications Equipment — 0.4% |
| |||||||
Cisco Systems, Inc. | 603 | 28,131 | ||||||
Motorola Solutions, Inc. | 32 | 4,462 | ||||||
|
| |||||||
| 32,593 | ||||||||
|
| |||||||
Consumer Finance — 0.6% |
| |||||||
American Express Co. (a) | 320 | 30,468 | ||||||
Capital One Financial Corp. | 293 | 18,354 | ||||||
|
| |||||||
| 48,822 | ||||||||
|
| |||||||
Containers & Packaging — 0.5% |
| |||||||
Avery Dennison Corp. | 160 | 18,297 | ||||||
Crown Holdings, Inc. * (a) | 234 | 15,250 | ||||||
Packaging Corp. of America | 64 | 6,395 | ||||||
Westrock Co. | 284 | 8,021 | ||||||
|
| |||||||
| 47,963 | ||||||||
|
| |||||||
Diversified Consumer Services — 0.0% (b) |
| |||||||
H&R Block, Inc. | 128 | 1,822 | ||||||
|
| |||||||
Diversified Financial Services — 1.5% |
| |||||||
Berkshire Hathaway, Inc., Class B * (a) | 706 | 126,061 | ||||||
Voya Financial, Inc. | 31 | 1,455 | ||||||
|
| |||||||
| 127,516 | ||||||||
|
| |||||||
Diversified Telecommunication Services — 1.1% |
| |||||||
Verizon Communications, Inc. (a) | 1,813 | 99,925 | ||||||
|
| |||||||
SEE NOTES TO FINANCIAL STATEMENTS.
| 36 | J.P. MORGAN LARGE CAP FUNDS | JUNE 30, 2020 | ||||
Table of Contents
| INVESTMENTS | SHARES (000) | VALUE ($000) | ||||||
Common Stocks — continued |
| |||||||
Electric Utilities — 2.3% |
| |||||||
Duke Energy Corp. | 230 | 18,345 | ||||||
Entergy Corp. | 482 | 45,228 | ||||||
FirstEnergy Corp. | 542 | 21,024 | ||||||
NextEra Energy, Inc. (a) | 355 | 85,268 | ||||||
Southern Co. (The) | 278 | 14,423 | ||||||
Xcel Energy, Inc. (a) | 239 | 14,950 | ||||||
|
| |||||||
| 199,238 | ||||||||
|
| |||||||
Electrical Equipment — 0.9% |
| |||||||
Eaton Corp. plc | 637 | 55,725 | ||||||
Emerson Electric Co. | 342 | 21,238 | ||||||
|
| |||||||
| 76,963 | ||||||||
|
| |||||||
Electronic Equipment, Instruments & Components — 0.1% |
| |||||||
TE Connectivity Ltd. | 112 | 9,159 | ||||||
|
| |||||||
Entertainment — 1.2% |
| |||||||
Electronic Arts, Inc. * | 57 | 7,518 | ||||||
Netflix, Inc. * (a) | 217 | 98,767 | ||||||
|
| |||||||
| 106,285 | ||||||||
|
| |||||||
Equity Real Estate Investment Trusts (REITs) — 1.8% |
| |||||||
Equinix, Inc. | 65 | 45,367 | ||||||
Equity LifeStyle Properties, Inc. | 134 | 8,371 | ||||||
Equity Residential | 355 | 20,875 | ||||||
Mid-America Apartment Communities, Inc. | 144 | 16,490 | ||||||
Prologis, Inc. | 483 | 45,046 | ||||||
Realty Income Corp. | 69 | 4,085 | ||||||
Sun Communities, Inc. | 44 | 5,973 | ||||||
UDR, Inc. | 95 | 3,566 | ||||||
Ventas, Inc. | 253 | 9,268 | ||||||
|
| |||||||
| 159,041 | ||||||||
|
| |||||||
Food & Staples Retailing — 0.8% |
| |||||||
Costco Wholesale Corp. | 202 | 61,183 | ||||||
Kroger Co. (The) | 374 | 12,670 | ||||||
|
| |||||||
| 73,853 | ||||||||
|
| |||||||
Food Products — 0.7% |
| |||||||
Conagra Brands, Inc. | 161 | 5,648 | ||||||
Mondelez International, Inc., Class A (a) | 1,029 | 52,635 | ||||||
|
| |||||||
| 58,283 | ||||||||
|
| |||||||
Health Care Equipment & Supplies — 2.8% |
| |||||||
ABIOMED, Inc. * | 14 | 3,498 | ||||||
Baxter International, Inc. | 509 | 43,796 | ||||||
Becton Dickinson and Co. | 20 | 4,734 | ||||||
Boston Scientific Corp. * (a) | 688 | 24,143 | ||||||
| INVESTMENTS | SHARES (000) | VALUE ($000) | ||||||
Health Care Equipment & Supplies — continued |
| |||||||
DexCom, Inc. * | 22 | 9,083 | ||||||
Edwards Lifesciences Corp. * | 142 | 9,825 | ||||||
Intuitive Surgical, Inc. * (a) | 26 | 14,671 | ||||||
Medtronic plc (a) | 939 | 86,074 | ||||||
Zimmer Biomet Holdings, Inc. (a) | 423 | 50,477 | ||||||
|
| |||||||
| 246,301 | ||||||||
|
| |||||||
Health Care Providers & Services — 2.9% |
| |||||||
Anthem, Inc. (a) | 114 | 30,030 | ||||||
Cigna Corp. (a) | 252 | 47,319 | ||||||
DaVita, Inc. * | 122 | 9,685 | ||||||
McKesson Corp. | 319 | 49,011 | ||||||
UnitedHealth Group, Inc. (a) | 385 | 113,508 | ||||||
|
| |||||||
| 249,553 | ||||||||
|
| |||||||
Hotels, Restaurants & Leisure — 0.5% |
| |||||||
Hilton Worldwide Holdings, Inc. | 247 | 18,113 | ||||||
Yum! Brands, Inc. | 280 | 24,358 | ||||||
|
| |||||||
| 42,471 | ||||||||
|
| |||||||
Household Durables — 0.3% |
| |||||||
Lennar Corp., Class A | 483 | 29,781 | ||||||
|
| |||||||
Household Products — 1.9% |
| |||||||
Kimberly-Clark Corp. | 274 | 38,746 | ||||||
Procter & Gamble Co. (The) (a) | 1,059 | 126,608 | ||||||
|
| |||||||
| 165,354 | ||||||||
|
| |||||||
Industrial Conglomerates — 1.0% |
| |||||||
Honeywell International, Inc. (a) | 617 | 89,206 | ||||||
|
| |||||||
Insurance — 1.9% |
| |||||||
Allstate Corp. (The) (a) | 497 | 48,197 | ||||||
American International Group, Inc. | 282 | 8,794 | ||||||
Aon plc, Class A | 141 | 27,070 | ||||||
Arch Capital Group Ltd. * | 141 | 4,041 | ||||||
Everest Re Group Ltd. | 14 | 2,932 | ||||||
Hartford Financial Services Group, Inc. (The) | 253 | 9,736 | ||||||
Marsh & McLennan Cos., Inc. | 166 | 17,783 | ||||||
MetLife, Inc. | 103 | 3,771 | ||||||
Progressive Corp. (The) | 523 | 41,930 | ||||||
|
| |||||||
| 164,254 | ||||||||
|
| |||||||
Interactive Media & Services — 5.4% |
| |||||||
Alphabet, Inc., Class A * (a) | 109 | 154,685 | ||||||
Alphabet, Inc., Class C * (a) | 97 | 137,530 | ||||||
Facebook, Inc., Class A * (a) | 780 | 177,002 | ||||||
|
| |||||||
| 469,217 | ||||||||
|
| |||||||
SEE NOTES TO FINANCIAL STATEMENTS.
| JUNE 30, 2020 | J.P. MORGAN LARGE CAP FUNDS | 37 | ||||||
Table of Contents
JPMorgan Hedged Equity Fund
SCHEDULE OF PORTFOLIO INVESTMENTS
AS OF JUNE 30, 2020 (continued)
| INVESTMENTS | SHARES (000) | VALUE ($000) | ||||||
Common Stocks — continued |
| |||||||
Internet & Direct Marketing Retail — 5.2% |
| |||||||
Amazon.com, Inc. * (a) | 153 | 421,496 | ||||||
Booking Holdings, Inc. * (a) | 22 | 35,366 | ||||||
|
| |||||||
| 456,862 | ||||||||
|
| |||||||
IT Services — 6.3% |
| |||||||
Accenture plc, Class A | 285 | 61,137 | ||||||
Automatic Data Processing, Inc. (a) | 298 | 44,325 | ||||||
FleetCor Technologies, Inc. * | 28 | 7,020 | ||||||
International Business Machines Corp. | 430 | 51,889 | ||||||
Leidos Holdings, Inc. | 309 | 28,978 | ||||||
Mastercard, Inc., Class A (a) | 526 | 155,545 | ||||||
PayPal Holdings, Inc. * (a) | 690 | 120,174 | ||||||
Visa, Inc., Class A (a) | 404 | 78,072 | ||||||
|
| |||||||
| 547,140 | ||||||||
|
| |||||||
Life Sciences Tools & Services — 1.3% |
| |||||||
Illumina, Inc. * | 47 | 17,567 | ||||||
Thermo Fisher Scientific, Inc. (a) | 270 | 97,994 | ||||||
|
| |||||||
| 115,561 | ||||||||
|
| |||||||
Machinery — 1.7% |
| |||||||
Cummins, Inc. (a) | 230 | 39,774 | ||||||
Deere & Co. | 140 | 22,074 | ||||||
Parker-Hannifin Corp. | 217 | 39,683 | ||||||
Snap-on, Inc. | 75 | 10,436 | ||||||
Stanley Black & Decker, Inc. | 238 | 33,129 | ||||||
|
| |||||||
| 145,096 | ||||||||
|
| |||||||
Media — 2.2% |
| |||||||
Altice USA, Inc., Class A * (a) | 340 | 7,655 | ||||||
Charter Communications, Inc., Class A * (a) | 168 | 85,877 | ||||||
Comcast Corp., Class A (a) | 1,867 | 72,765 | ||||||
Discovery, Inc., Class A * | 694 | 14,634 | ||||||
Discovery, Inc., Class C * | 757 | 14,588 | ||||||
|
| |||||||
| 195,519 | ||||||||
|
| |||||||
Metals & Mining — 0.2% |
| |||||||
Newmont Corp. | 257 | 15,880 | ||||||
|
| |||||||
Multiline Retail — 0.7% |
| |||||||
Dollar Tree, Inc. * | 187 | 17,311 | ||||||
Target Corp. | 363 | 43,498 | ||||||
|
| |||||||
| 60,809 | ||||||||
|
| |||||||
Multi-Utilities — 0.6% |
| |||||||
CenterPoint Energy, Inc. | 362 | 6,756 | ||||||
CMS Energy Corp. | 363 | 21,201 | ||||||
DTE Energy Co. | 128 | 13,769 | ||||||
Sempra Energy | 90 | 10,499 | ||||||
|
| |||||||
| 52,225 | ||||||||
|
| |||||||
| INVESTMENTS | SHARES (000) | VALUE ($000) | ||||||
Oil, Gas & Consumable Fuels — 2.8% |
| |||||||
Cabot Oil & Gas Corp. | 154 | 2,654 | ||||||
Cheniere Energy, Inc. * | 197 | 9,528 | ||||||
Chevron Corp. (a) | 836 | 74,552 | ||||||
Diamondback Energy, Inc. | 279 | 11,658 | ||||||
EOG Resources, Inc. (a) | 755 | 38,258 | ||||||
Exxon Mobil Corp. (a) | 381 | 17,043 | ||||||
Marathon Petroleum Corp. (a) | 265 | 9,921 | ||||||
ONEOK, Inc. | 370 | 12,284 | ||||||
Phillips 66 | 319 | 22,969 | ||||||
Pioneer Natural Resources Co. (a) | 351 | 34,296 | ||||||
Williams Cos., Inc. (The) | 393 | 7,472 | ||||||
|
| |||||||
| 240,635 | ||||||||
|
| |||||||
Pharmaceuticals — 4.1% |
| |||||||
Bristol-Myers Squibb Co. (a) | 1,431 | 84,161 | ||||||
Eli Lilly and Co. (a) | 491 | 80,661 | ||||||
Johnson & Johnson (a) | 563 | 79,180 | ||||||
Merck & Co., Inc. (a) | 1,321 | 102,127 | ||||||
Pfizer, Inc. | 474 | 15,491 | ||||||
|
| |||||||
| 361,620 | ||||||||
|
| |||||||
Professional Services — 0.1% |
| |||||||
Verisk Analytics, Inc. | 53 | 9,010 | ||||||
|
| |||||||
Road & Rail — 1.3% |
| |||||||
CSX Corp. | 458 | 31,921 | ||||||
Kansas City Southern | 43 | 6,348 | ||||||
Lyft, Inc., Class A * | 148 | 4,896 | ||||||
Norfolk Southern Corp. (a) | 359 | 63,011 | ||||||
Union Pacific Corp. (a) | 64 | 10,844 | ||||||
|
| |||||||
| 117,020 | ||||||||
|
| |||||||
Semiconductors & Semiconductor Equipment — 4.9% |
| |||||||
Advanced Micro Devices, Inc. * (a) | 357 | 18,792 | ||||||
Analog Devices, Inc. (a) | 531 | 65,137 | ||||||
Applied Materials, Inc. | 220 | 13,271 | ||||||
Intel Corp. | 317 | 18,980 | ||||||
Lam Research Corp. | 142 | 46,091 | ||||||
Microchip Technology, Inc. | 174 | 18,277 | ||||||
Micron Technology, Inc. * | 473 | 24,394 | ||||||
NVIDIA Corp. (a) | 166 | 62,897 | ||||||
NXP Semiconductors NV (Netherlands) | 323 | 36,834 | ||||||
Qorvo, Inc. * | 194 | 21,406 | ||||||
QUALCOMM, Inc. | 202 | 18,400 | ||||||
Texas Instruments, Inc. (a) | 668 | 84,822 | ||||||
|
| |||||||
| 429,301 | ||||||||
|
| |||||||
SEE NOTES TO FINANCIAL STATEMENTS.
| 38 | J.P. MORGAN LARGE CAP FUNDS | JUNE 30, 2020 | ||||
Table of Contents
| INVESTMENTS | SHARES (000) | VALUE ($000) | ||||||
Common Stocks — continued |
| |||||||
Software — 8.8% |
| |||||||
Fortinet, Inc. * | 46 | 6,349 | ||||||
Intuit, Inc. | 229 | 67,956 | ||||||
Microsoft Corp. (a) | 2,901 | 590,359 | ||||||
salesforce.com, Inc. * (a) | 481 | 90,108 | ||||||
Workday, Inc., Class A * | 73 | 13,613 | ||||||
|
| |||||||
| 768,385 | ||||||||
|
| |||||||
Specialty Retail — 3.5% |
| |||||||
AutoZone, Inc. * (a) | 35 | 39,763 | ||||||
Best Buy Co., Inc. (a) | 535 | 46,718 | ||||||
Home Depot, Inc. (The) (a) | 367 | 91,973 | ||||||
Lowe’s Cos., Inc. (a) | 543 | 73,413 | ||||||
Ross Stores, Inc. (a) | 255 | 21,718 | ||||||
TJX Cos., Inc. (The) | 691 | 34,960 | ||||||
|
| |||||||
| 308,545 | ||||||||
|
| |||||||
Technology Hardware, Storage & Peripherals — 6.4% |
| |||||||
Apple, Inc. (a) | 1,474 | 537,797 | ||||||
HP, Inc. | 1,088 | 18,960 | ||||||
|
| |||||||
| 556,757 | ||||||||
|
| |||||||
Textiles, Apparel & Luxury Goods — 0.7% |
| |||||||
Carter’s, Inc. | 51 | 4,082 | ||||||
NIKE, Inc., Class B | 495 | 48,486 | ||||||
Ralph Lauren Corp. | 115 | 8,343 | ||||||
|
| |||||||
| 60,911 | ||||||||
|
| |||||||
Tobacco — 1.3% |
| |||||||
Altria Group, Inc. (a) | 1,266 | 49,704 | ||||||
Philip Morris International, Inc. | 888 | 62,185 | ||||||
|
| |||||||
| 111,889 | ||||||||
|
| |||||||
Wireless Telecommunication Services — 0.6% |
| |||||||
T-Mobile US, Inc. * | 501 | 52,176 | ||||||
|
| |||||||
Total Common Stocks | 8,339,156 | |||||||
|
| |||||||
| INVESTMENTS | NO. OF CONTRACTS | VALUE ($000) | ||||||
Options Purchased — 3.4% |
| |||||||
Put Options Purchased — 3.4% |
| |||||||
Index Funds — 3.4% | ||||||||
S&P 500 Index | 27,545 | 298,312 | ||||||
|
| |||||||
Total Options Purchased | 298,312 | |||||||
|
| |||||||
| NO. OF RIGHTS (000) | ||||||||
Rights — 0.0% (b) |
| |||||||
Wireless Telecommunication Services — 0.0% (b) |
| |||||||
T-Mobile US, Inc., expiring 7/27/2020 * | 481 | 81 | ||||||
|
| |||||||
| SHARES (000) | ||||||||
Short-Term Investments — 5.2% |
| |||||||
Investment Companies — 5.2% |
| |||||||
JPMorgan U.S. Government Money Market Fund Class Institutional Shares, 0.06% (c) (d) | 456,381 | 456,381 | ||||||
|
| |||||||
Total Investments — 104.0% | 9,093,930 | |||||||
Liabilities in Excess of |
| (352,338 | ) | |||||
|
| |||||||
NET ASSETS — 100.0% | 8,741,592 | |||||||
|
| |||||||
Percentages indicated are based on net assets.
Abbreviations
| USD | United States Dollar | |
| (a) | All or a portion of the security is segregated for options written. | |
| (b) | Amount rounds to less than 0.1% of net assets. | |
| (c) | Investment in an affiliated fund, which is registered under the Investment Company Act of 1940, as amended, and is advised by J.P. Morgan Investment Management Inc. | |
| (d) | The rate shown is the current yield as of June 30, 2020. | |
| * | Non-income producing security. | |
| Futures contracts outstanding as of June 30, 2020 (amounts in thousands, except number of contracts): | ||||||||||||||||||||
| DESCRIPTION | NUMBER OF CONTRACTS | EXPIRATION DATE | TRADING CURRENCY | NOTIONAL AMOUNT ($) | VALUE AND UNREALIZED APPRECIATION (DEPRECIATION) ($) | |||||||||||||||
Long Contracts |
| |||||||||||||||||||
S&P 500 E-Mini Index | 1,049 | 09/2020 | USD | 161,769 | 1,680 | |||||||||||||||
|
| |||||||||||||||||||
Abbreviations
| USD | United States Dollar |
SEE NOTES TO FINANCIAL STATEMENTS.
| JUNE 30, 2020 | J.P. MORGAN LARGE CAP FUNDS | 39 | ||||||
Table of Contents
JPMorgan Hedged Equity Fund
SCHEDULE OF PORTFOLIO INVESTMENTS
AS OF JUNE 30, 2020 (continued)
| Written Call Options Contracts as of June 30, 2020 (amounts in thousands, except number of contracts): | ||||||||||||||||||||||
| DESCRIPTION | COUNTERPARTY | NUMBER OF CONTRACTS | NOTIONAL AMOUNT | EXERCISE PRICE | EXPIRATION DATE | VALUE ($) | ||||||||||||||||
| S&P 500 Index | Exchange-Traded | 27,545 | USD 8,539,749 | USD 3,230.00 | 9/30/2020 | (219,672 | ) | |||||||||||||||
|
| |||||||||||||||||||||
| Written Put Options Contracts as of June 30, 2020 (amounts in thousands, except number of contracts): | ||||||||||||||||||||||
| DESCRIPTION | COUNTERPARTY | NUMBER OF CONTRACTS | NOTIONAL AMOUNT | EXERCISE PRICE | EXPIRATION DATE | VALUE ($) | ||||||||||||||||
| S&P 500 Index | Exchange-Traded | 27,545 | USD 8,539,749 | USD 2,465.00 | 9/30/2020 | (85,527 | ) | |||||||||||||||
|
| |||||||||||||||||||||
| Total Written Options Contracts (Premiums Received $300,626) | (305,199 | ) | ||||||||||||||||||||
|
| |||||||||||||||||||||
Abbreviations
| USD | United States Dollar |
SEE NOTES TO FINANCIAL STATEMENTS.
| 40 | J.P. MORGAN LARGE CAP FUNDS | JUNE 30, 2020 | ||||
Table of Contents
JPMorgan Large Cap Growth Fund
SCHEDULE OF PORTFOLIO INVESTMENTS
AS OF JUNE 30, 2020
| INVESTMENTS | SHARES (000) | VALUE ($000) | ||||||
Common Stocks — 95.2% |
| |||||||
Aerospace & Defense — 0.2% |
| |||||||
TransDigm Group, Inc. | 94 | 41,641 | ||||||
|
| |||||||
Automobiles — 5.7% |
| |||||||
Tesla, Inc. * (a) | 1,222 | 1,319,852 | ||||||
|
| |||||||
Beverages — 1.2% |
| |||||||
Monster Beverage Corp. * | 4,118 | 285,477 | ||||||
|
| |||||||
Biotechnology — 7.9% |
| |||||||
Alnylam Pharmaceuticals, Inc. * (a) | 483 | 71,493 | ||||||
Amgen, Inc. | 1,415 | 333,671 | ||||||
Biogen, Inc. * | 309 | 82,673 | ||||||
BioMarin Pharmaceutical, Inc.* | 1,784 | 220,032 | ||||||
Exact Sciences Corp. * (a) | 1,610 | 139,991 | ||||||
Moderna, Inc. * (a) | 1,107 | 71,106 | ||||||
Regeneron Pharmaceuticals, Inc.* | 636 | 396,578 | ||||||
Sarepta Therapeutics, Inc. * (a) | 962 | 154,279 | ||||||
Seattle Genetics, Inc. * (a) | 2,230 | 378,939 | ||||||
|
| |||||||
| 1,848,762 | ||||||||
|
| |||||||
Capital Markets — 5.6% |
| |||||||
Blackstone Group, Inc. (The), Class A (a) | 3,179 | 180,094 | ||||||
Charles Schwab Corp. (The) | 4,975 | 167,847 | ||||||
MarketAxess Holdings, Inc. | 979 | 490,149 | ||||||
Morgan Stanley (a) | 1,483 | 71,605 | ||||||
MSCI, Inc. | 313 | 104,386 | ||||||
S&P Global, Inc. (a) | 873 | 287,702 | ||||||
|
| |||||||
| 1,301,783 | ||||||||
|
| |||||||
Chemicals — 2.1% |
| |||||||
Air Products and Chemicals, Inc. | 1,115 | 269,131 | ||||||
Sherwin-Williams Co. (The) | 389 | 224,495 | ||||||
|
| |||||||
| 493,626 | ||||||||
|
| |||||||
Communications Equipment — 0.3% |
| |||||||
Arista Networks, Inc. * (a) | 285 | 59,796 | ||||||
|
| |||||||
Electrical Equipment — 1.7% |
| |||||||
Rockwell Automation, Inc. (a) | 1,852 | 394,519 | ||||||
|
| |||||||
Electronic Equipment, Instruments & Components — 0.6% |
| |||||||
Amphenol Corp., Class A | 1,401 | 134,230 | ||||||
|
| |||||||
Entertainment — 1.3% |
| |||||||
Netflix, Inc. * | 670 | 304,786 | ||||||
|
| |||||||
Equity Real Estate Investment Trusts (REITs) — 1.0% |
| |||||||
Equinix, Inc. (a) | 327 | 229,757 | ||||||
|
| |||||||
Health Care Equipment & Supplies — 3.8% |
| |||||||
ABIOMED, Inc. * | 343 | 82,807 | ||||||
| INVESTMENTS | SHARES (000) | VALUE ($000) | ||||||
Health Care Equipment & Supplies — continued | ||||||||
DexCom, Inc. * (a) | 1,357 | 550,087 | ||||||
Intuitive Surgical, Inc. * | 459 | 261,367 | ||||||
|
| |||||||
| 894,261 | ||||||||
|
| |||||||
Health Care Providers & Services — 0.5% |
| |||||||
McKesson Corp. | 685 | 105,139 | ||||||
|
| |||||||
Health Care Technology — 0.7% |
| |||||||
Veeva Systems, Inc., Class A* | 687 | 161,000 | ||||||
|
| |||||||
Hotels, Restaurants & Leisure — 3.4% |
| |||||||
Chipotle Mexican Grill, Inc. * (a) | 470 | 494,399 | ||||||
Las Vegas Sands Corp. | 1,995 | 90,852 | ||||||
Starbucks Corp. (a) | 2,809 | 206,736 | ||||||
|
| |||||||
| 791,987 | ||||||||
|
| |||||||
Industrial Conglomerates — 0.9% |
| |||||||
Roper Technologies, Inc. (a) | 525 | 203,875 | ||||||
|
| |||||||
Interactive Media & Services — 7.7% |
| |||||||
Alphabet, Inc., Class C * | 548 | 774,746 | ||||||
Facebook, Inc., Class A * | 2,732 | 620,429 | ||||||
Match Group, Inc. * (a) | 2,297 | 245,926 | ||||||
Snap, Inc., Class A * (a) | 5,862 | 137,694 | ||||||
Twitter, Inc. * | 376 | 11,213 | ||||||
|
| |||||||
| 1,790,008 | ||||||||
|
| |||||||
Internet & Direct Marketing Retail — 9.9% |
| |||||||
Alibaba Group Holding Ltd., ADR (China) * | 992 | 213,888 | ||||||
Amazon.com, Inc. * | 443 | 1,222,448 | ||||||
Booking Holdings, Inc. * | 165 | 263,373 | ||||||
Grubhub, Inc. * (a) | 1,101 | 77,414 | ||||||
MercadoLibre, Inc. (Argentina) * | 451 | 444,587 | ||||||
Wayfair, Inc., Class A * (a) | 411 | 81,277 | ||||||
|
| |||||||
| 2,302,987 | ||||||||
|
| |||||||
IT Services — 6.7% |
| |||||||
FleetCor Technologies, Inc. * | 316 | 79,383 | ||||||
Mastercard, Inc., Class A | 1,939 | 573,362 | ||||||
PayPal Holdings, Inc. * | 3,844 | 669,714 | ||||||
Shopify, Inc., Class A (Canada) * | 172 | 163,073 | ||||||
Square, Inc., Class A * (a) | 723 | 75,840 | ||||||
|
| |||||||
| 1,561,372 | ||||||||
|
| |||||||
Life Sciences Tools & Services — 1.5% |
| |||||||
Illumina, Inc. * | 320 | 118,429 | ||||||
Thermo Fisher Scientific, Inc. | 640 | 231,847 | ||||||
|
| |||||||
| 350,276 | ||||||||
|
| |||||||
SEE NOTES TO FINANCIAL STATEMENTS.
| JUNE 30, 2020 | J.P. MORGAN LARGE CAP FUNDS | 41 | ||||||
Table of Contents
JPMorgan Large Cap Growth Fund
SCHEDULE OF PORTFOLIO INVESTMENTS
AS OF JUNE 30, 2020 (continued)
| INVESTMENTS | SHARES (000) | VALUE ($000) | ||||||
Common Stocks — continued |
| |||||||
Oil, Gas & Consumable Fuels — 0.3% |
| |||||||
Phillips 66 | 1,052 | 75,610 | ||||||
|
| |||||||
Personal Products — 0.4% |
| |||||||
Estee Lauder Cos., Inc. (The), Class A | 499 | 94,076 | ||||||
|
| |||||||
Professional Services — 0.7% |
| |||||||
CoStar Group, Inc. * | 215 | 152,865 | ||||||
|
| |||||||
Road & Rail — 1.3% |
| |||||||
Lyft, Inc., Class A * (a) | 3,470 | 114,553 | ||||||
Norfolk Southern Corp. | 1,122 | 196,972 | ||||||
|
| |||||||
| 311,525 | ||||||||
|
| |||||||
Semiconductors & Semiconductor Equipment — 9.2% |
| |||||||
Advanced Micro Devices, Inc. * | 8,849 | 465,556 | ||||||
ASML Holding NV (Registered), NYRS (Netherlands) (a) | 985 | 362,399 | ||||||
Lam Research Corp. | 640 | 207,111 | ||||||
NVIDIA Corp. | 1,601 | 608,224 | ||||||
QUALCOMM, Inc. | 1,684 | 153,607 | ||||||
Texas Instruments, Inc. | 2,743 | 348,253 | ||||||
|
| |||||||
| 2,145,150 | ||||||||
|
| |||||||
Software — 10.6% |
| |||||||
Atlassian Corp. plc, Class A * | 862 | 155,411 | ||||||
Microsoft Corp. | 6,845 | 1,393,005 | ||||||
ServiceNow, Inc. * | 594 | 240,464 | ||||||
SS&C Technologies Holdings, Inc. | 1,988 | 112,254 | ||||||
Synopsys, Inc. * | 1,865 | 363,596 | ||||||
Trade Desk, Inc. (The), Class A * (a) | 474 | 192,681 | ||||||
|
| |||||||
| 2,457,411 | ||||||||
|
| |||||||
Specialty Retail — 1.9% |
| |||||||
Home Depot, Inc. (The) | 1,458 | 365,153 | ||||||
Ross Stores, Inc. | 835 | 71,182 | ||||||
|
| |||||||
| 436,335 | ||||||||
|
| |||||||
Technology Hardware, Storage & Peripherals — 6.9% |
| |||||||
Apple, Inc. (a) | 4,406 | 1,607,205 | ||||||
|
| |||||||
Textiles, Apparel & Luxury Goods — 1.2% |
| |||||||
Lululemon Athletica, Inc. * | 921 | 287,330 | ||||||
|
| |||||||
Total Common Stocks | 22,142,641 | |||||||
|
| |||||||
Short-Term Investments — 9.8% |
| |||||||
Investment Companies — 4.7% |
| |||||||
JPMorgan Prime Money Market Fund Class IM Shares, 0.47% (b) (c) | 1,083,387 | 1,084,362 | ||||||
|
| |||||||
| INVESTMENTS | SHARES (000) | VALUE ($000) | ||||||
Investment of Cash Collateral from Securities Loaned — 5.1% |
| |||||||
JPMorgan Securities Lending Money Market Fund Agency SL Class Shares, 0.51% (b) (c) | 1,102,458 | 1,102,899 | ||||||
JPMorgan U.S. Government Money Market Fund Class IM Shares, 0.14% (b) (c) | 96,805 | 96,805 | ||||||
|
| |||||||
Total Investment of Cash Collateral from Securities Loaned | 1,199,704 | |||||||
|
| |||||||
Total Short-Term Investments | 2,284,066 | |||||||
|
| |||||||
Total Investments — 105.0% | 24,426,707 | |||||||
Liabilities in Excess of | (1,161,541 | ) | ||||||
|
| |||||||
NET ASSETS — 100.0% | 23,265,166 | |||||||
|
| |||||||
Percentages indicated are based on net assets.
Abbreviations
| ADR | American Depositary Receipt | |
| NYRS | New York Registry Shares | |
| (a) | The security or a portion of this security is on loan at June 30, 2020. The total value of securities on loan at June 30, 2020 is approximately $1,215,560,000. | |
| (b) | Investment in an affiliated fund, which is registered under the Investment Company Act of 1940, as amended, and is advised by J.P. Morgan Investment Management Inc. | |
| (c) | The rate shown is the current yield as of June 30, 2020. | |
| * | Non-income producing security. | |
SEE NOTES TO FINANCIAL STATEMENTS.
| 42 | J.P. MORGAN LARGE CAP FUNDS | JUNE 30, 2020 | ||||
Table of Contents
JPMorgan Large Cap Value Fund
SCHEDULE OF PORTFOLIO INVESTMENTS
AS OF JUNE 30, 2020
| INVESTMENTS | SHARES (000) | VALUE ($000) | ||||||
Common Stocks — 98.7% |
| |||||||
Aerospace & Defense — 3.1% |
| |||||||
General Dynamics Corp. | 82 | 12,316 | ||||||
Howmet Aerospace, Inc. | 549 | 8,700 | ||||||
Raytheon Technologies Corp. | 175 | 10,777 | ||||||
Spirit AeroSystems Holdings, Inc., Class A (a) | 321 | 7,685 | ||||||
|
| |||||||
| 39,478 | ||||||||
|
| |||||||
Airlines — 0.5% |
| |||||||
Southwest Airlines Co. | 203 | 6,928 | ||||||
|
| |||||||
Auto Components — 1.9% |
| |||||||
Aptiv plc | 66 | 5,135 | ||||||
Autoliv, Inc. (Sweden) (a) | 298 | 19,224 | ||||||
|
| |||||||
| 24,359 | ||||||||
|
| |||||||
Automobiles — 3.0% |
| |||||||
Ford Motor Co. | 806 | 4,903 | ||||||
General Motors Co. | 1,288 | 32,597 | ||||||
|
| |||||||
| 37,500 | ||||||||
|
| |||||||
Banks — 10.8% |
| |||||||
Bank of America Corp. | 1,508 | 35,813 | ||||||
Citigroup, Inc. | 829 | 42,375 | ||||||
Citizens Financial Group, Inc. (a) | 279 | 7,029 | ||||||
East West Bancorp, Inc. | 153 | 5,548 | ||||||
Regions Financial Corp. (a) | 571 | 6,351 | ||||||
Wells Fargo & Co. | 1,492 | 38,200 | ||||||
|
| |||||||
| 135,316 | ||||||||
|
| |||||||
Biotechnology — 2.5% |
| |||||||
AbbVie, Inc. | 65 | 6,382 | ||||||
Alexion Pharmaceuticals, Inc. * | 159 | 17,879 | ||||||
Biogen, Inc. * | 28 | 7,545 | ||||||
|
| |||||||
| 31,806 | ||||||||
|
| |||||||
Building Products — 4.0% |
| |||||||
Carrier Global Corp. | 419 | 9,312 | ||||||
Owens Corning | 453 | 25,277 | ||||||
Trane Technologies plc | 176 | 15,678 | ||||||
|
| |||||||
| 50,267 | ||||||||
|
| |||||||
Capital Markets — 3.2% |
| |||||||
Invesco Ltd. | 466 | 5,012 | ||||||
Morgan Stanley | 735 | 35,476 | ||||||
|
| |||||||
| 40,488 | ||||||||
|
| |||||||
Chemicals — 9.6% |
| |||||||
Celanese Corp. | 209 | 18,002 | ||||||
CF Industries Holdings, Inc. | 296 | 8,327 | ||||||
DuPont de Nemours, Inc. | 424 | 22,543 | ||||||
| INVESTMENTS | SHARES (000) | VALUE ($000) | ||||||
Chemicals — continued |
| |||||||
Eastman Chemical Co. | 223 | 15,551 | ||||||
FMC Corp. | 503 | 50,060 | ||||||
Westlake Chemical Corp. (a) | 120 | 6,443 | ||||||
|
| |||||||
| 120,926 | ||||||||
|
| |||||||
Containers & Packaging — 0.5% |
| |||||||
International Paper Co. (a) | 177 | 6,232 | ||||||
|
| |||||||
Electric Utilities — 0.5% |
| |||||||
Entergy Corp. | 72 | 6,736 | ||||||
|
| |||||||
Electrical Equipment — 0.5% |
| |||||||
Sensata Technologies Holding plc * | 168 | 6,243 | ||||||
|
| |||||||
Equity Real Estate Investment Trusts (REITs) — 5.8% |
| |||||||
Realty Income Corp. | 230 | 13,709 | ||||||
Ventas, Inc. | 704 | 25,784 | ||||||
VEREIT, Inc. | 1,206 | 7,751 | ||||||
Weingarten Realty Investors | 697 | 13,196 | ||||||
Welltower, Inc. | 246 | 12,715 | ||||||
|
| |||||||
| 73,155 | ||||||||
|
| |||||||
Food & Staples Retailing — 2.5% |
| |||||||
US Foods Holding Corp. * | 1,582 | 31,205 | ||||||
|
| |||||||
Food Products — 2.6% |
| |||||||
Lamb Weston Holdings, Inc. (a) | 505 | 32,265 | ||||||
|
| |||||||
Health Care Equipment & Supplies — 1.4% |
| |||||||
Zimmer Biomet Holdings, Inc. | 148 | 17,618 | ||||||
|
| |||||||
Health Care Providers & Services — 5.8% |
| |||||||
Anthem, Inc. | 64 | 16,778 | ||||||
Cigna Corp. | 137 | 25,689 | ||||||
CVS Health Corp. | 179 | 11,630 | ||||||
McKesson Corp. | 121 | 18,579 | ||||||
|
| |||||||
| 72,676 | ||||||||
|
| |||||||
Hotels, Restaurants & Leisure — 2.2% |
| |||||||
Darden Restaurants, Inc. (a) | 260 | 19,715 | ||||||
InterContinental Hotels Group plc, ADR (United Kingdom) (a) | 172 | 7,608 | ||||||
|
| |||||||
| 27,323 | ||||||||
|
| |||||||
Household Durables — 0.8% |
| |||||||
Whirlpool Corp. (a) | 82 | 10,634 | ||||||
|
| |||||||
Insurance — 4.3% |
| |||||||
American International Group, Inc. | 432 | 13,454 | ||||||
Chubb Ltd. | 117 | 14,803 | ||||||
Hartford Financial Services Group, Inc. (The) | 236 | 9,082 | ||||||
MetLife, Inc. | 225 | 8,224 | ||||||
SEE NOTES TO FINANCIAL STATEMENTS.
| JUNE 30, 2020 | J.P. MORGAN LARGE CAP FUNDS | 43 | ||||||
Table of Contents
JPMorgan Large Cap Value Fund
SCHEDULE OF PORTFOLIO INVESTMENTS
AS OF JUNE 30, 2020 (continued)
| INVESTMENTS | SHARES (000) | VALUE ($000) | ||||||
Common Stocks — continued |
| |||||||
Insurance — continued |
| |||||||
Prudential Financial, Inc. | 143 | 8,678 | ||||||
|
| |||||||
| 54,241 | ||||||||
|
| |||||||
Internet & Direct Marketing Retail — 0.4% |
| |||||||
Booking Holdings, Inc. * | 3 | 5,095 | ||||||
|
| |||||||
IT Services — 1.8% |
| |||||||
WEX, Inc. * | 137 | 22,672 | ||||||
|
| |||||||
Machinery — 2.5% |
| |||||||
AGCO Corp. | 234 | 12,995 | ||||||
Snap-on, Inc. (a) | 54 | 7,493 | ||||||
Stanley Black & Decker, Inc. | 77 | 10,704 | ||||||
|
| |||||||
| 31,192 | ||||||||
|
| |||||||
Media — 4.4% |
| |||||||
Comcast Corp., Class A | 1,289 | 50,238 | ||||||
Discovery, Inc., Class A * (a) | 232 | 4,895 | ||||||
|
| |||||||
| 55,133 | ||||||||
|
| |||||||
Metals & Mining — 0.3% |
| |||||||
Alcoa Corp. * (a) | 284 | 3,192 | ||||||
|
| |||||||
Oil, Gas & Consumable Fuels — 6.6% |
| |||||||
Chevron Corp. | 69 | 6,157 | ||||||
Diamondback Energy, Inc. | 322 | 13,458 | ||||||
EOG Resources, Inc. | 476 | 24,093 | ||||||
Parsley Energy, Inc., Class A | 1,611 | 17,209 | ||||||
Pioneer Natural Resources Co. | 232 | 22,637 | ||||||
|
| |||||||
| 83,554 | ||||||||
|
| |||||||
Pharmaceuticals — 4.4% |
| |||||||
Bristol-Myers Squibb Co. | 534 | 31,423 | ||||||
Elanco Animal Health, Inc. * (a) | 267 | 5,727 | ||||||
Merck & Co., Inc. | 239 | 18,513 | ||||||
|
| |||||||
| 55,663 | ||||||||
|
| |||||||
Real Estate Management & Development — 1.6% |
| |||||||
CBRE Group, Inc., Class A * | 167 | 7,565 | ||||||
Cushman & Wakefield plc * (a) | 1,002 | 12,481 | ||||||
|
| |||||||
| 20,046 | ||||||||
|
| |||||||
Road & Rail — 2.4% |
| |||||||
Lyft, Inc., Class A * (a) | 348 | 11,478 | ||||||
Norfolk Southern Corp. | 106 | 18,592 | ||||||
|
| |||||||
| 30,070 | ||||||||
|
| |||||||
Semiconductors & Semiconductor Equipment — 4.3% |
| |||||||
Microchip Technology, Inc. (a) | 134 | 14,080 | ||||||
NXP Semiconductors NV (Netherlands) | 63 | 7,139 | ||||||
ON Semiconductor Corp. * (a) | 1,673 | 33,163 | ||||||
|
| |||||||
| 54,382 | ||||||||
|
| |||||||
| INVESTMENTS | SHARES (000) | VALUE ($000) | ||||||
Specialty Retail — 2.7% |
| |||||||
AutoNation, Inc. * (a) | 296 | 11,116 | ||||||
Best Buy Co., Inc. (a) | 189 | 16,520 | ||||||
Lowe’s Cos., Inc. | 48 | 6,432 | ||||||
|
| |||||||
| 34,068 | ||||||||
|
| |||||||
Textiles, Apparel & Luxury Goods — 0.1% |
| |||||||
Levi Strauss & Co., Class A (a) | 138 | 1,848 | ||||||
|
| |||||||
Tobacco — 0.9% |
| |||||||
Philip Morris International, Inc. | 169 | 11,812 | ||||||
|
| |||||||
Wireless Telecommunication Services — 0.8% |
| |||||||
T-Mobile US, Inc. * | 96 | 9,946 | ||||||
|
| |||||||
Total Common Stocks | 1,244,069 | |||||||
|
| |||||||
| NO. OF RIGHTS (000) | ||||||||
Rights — 0.1% |
| |||||||
Pharmaceuticals — 0.1% |
| |||||||
Bristol-Myers Squibb Co., CVR, expiring 12/31/2020 * | 214 | 767 | ||||||
|
| |||||||
Wireless Telecommunication Services — 0.0% (b) |
| |||||||
T-Mobile US, Inc., expiring 7/27/2020 * | 96 | 16 | ||||||
|
| |||||||
Total Rights | 783 | |||||||
|
| |||||||
| SHARES (000) | ||||||||
Short-Term Investments — 5.8% |
| |||||||
Investment Companies — 1.0% |
| |||||||
JPMorgan Prime Money Market Fund Class IM Shares, 0.47% (c) (d) | 12,558 | 12,570 | ||||||
|
| |||||||
Investment of Cash Collateral from Securities Loaned — 4.8% |
| |||||||
JPMorgan Securities Lending Money Market Fund Agency SL Class Shares, 0.51% (c) (d) | 51,684 | 51,705 | ||||||
JPMorgan U.S. Government Money Market Fund Class IM Shares, 0.14% (c) (d) | 8,693 | 8,692 | ||||||
|
| |||||||
Total Investment of Cash Collateral from Securities Loaned | 60,397 | |||||||
|
| |||||||
Total Short-Term Investments | 72,967 | |||||||
|
| |||||||
Total Investments — 104.6% | 1,317,819 | |||||||
Liabilities in Excess of | (57,822 | ) | ||||||
|
| |||||||
NET ASSETS — 100.0% | 1,259,997 | |||||||
|
| |||||||
Percentages indicated are based on net assets.
SEE NOTES TO FINANCIAL STATEMENTS.
| 44 | J.P. MORGAN LARGE CAP FUNDS | JUNE 30, 2020 | ||||
Table of Contents
Abbreviations
| ADR | American Depositary Receipt | |
| CVR | Contingent Value Rights | |
| (a) | The security or a portion of this security is on loan at June 30, 2020. The total value of securities on loan at June 30, 2020 is approximately $59,241,000. | |
| (b) | Amount rounds to less than 0.1% of net assets. | |
| (c) | Investment in an affiliated fund, which is registered under the Investment Company Act of 1940, as amended, and is advised by J.P. Morgan Investment Management Inc. | |
| (d) | The rate shown is the current yield as of June 30, 2020. | |
| * | Non-income producing security. | |
SEE NOTES TO FINANCIAL STATEMENTS.
| JUNE 30, 2020 | J.P. MORGAN LARGE CAP FUNDS | 45 | ||||||
Table of Contents
JPMorgan U.S. Equity Fund
SCHEDULE OF PORTFOLIO INVESTMENTS
AS OF JUNE 30, 2020
| INVESTMENTS | SHARES (000) | VALUE ($000) | ||||||
Common Stocks — 100.0% |
| |||||||
Aerospace & Defense — 2.3% |
| |||||||
Northrop Grumman Corp. | 1,104 | 339,268 | ||||||
|
| |||||||
Banks — 4.1% |
| |||||||
Huntington Bancshares, Inc. | 11,284 | 101,951 | ||||||
KeyCorp | 9,110 | 110,966 | ||||||
SVB Financial Group * | 643 | 138,481 | ||||||
Truist Financial Corp. | 7,102 | 266,685 | ||||||
|
| |||||||
| 618,083 | ||||||||
|
| |||||||
Beverages — 3.6% |
| |||||||
Coca-Cola Co. (The) | 4,107 | 183,511 | ||||||
Constellation Brands, Inc., Class A | 2,003 | 350,479 | ||||||
|
| |||||||
| 533,990 | ||||||||
|
| |||||||
Biotechnology — 3.1% |
| |||||||
AbbVie, Inc. | 4,178 | 410,194 | ||||||
Biogen, Inc. * | 206 | 55,001 | ||||||
|
| |||||||
| 465,195 | ||||||||
|
| |||||||
Capital Markets — 2.0% |
| |||||||
Ameriprise Financial, Inc. | 975 | 146,226 | ||||||
Morgan Stanley | 3,268 | 157,865 | ||||||
|
| |||||||
| 304,091 | ||||||||
|
| |||||||
Chemicals — 1.2% |
| |||||||
Eastman Chemical Co. | 2,505 | 174,443 | ||||||
|
| |||||||
Containers & Packaging — 1.3% |
| |||||||
Crown Holdings, Inc. * | 2,966 | 193,179 | ||||||
|
| |||||||
Diversified Telecommunication Services — 2.8% |
| |||||||
Verizon Communications, Inc. | 7,626 | 420,396 | ||||||
|
| |||||||
Electric Utilities — 3.7% |
| |||||||
NextEra Energy, Inc. | 1,479 | 355,091 | ||||||
Xcel Energy, Inc. (a) | 3,184 | 199,021 | ||||||
|
| |||||||
| 554,112 | ||||||||
|
| |||||||
Electrical Equipment — 2.5% |
| |||||||
Eaton Corp. plc | 4,197 | 367,131 | ||||||
|
| |||||||
Entertainment — 1.8% |
| |||||||
Netflix, Inc. * | 590 | 268,620 | ||||||
|
| |||||||
Equity Real Estate Investment Trusts (REITs) — 2.7% |
| |||||||
Prologis, Inc. | 4,401 | 410,725 | ||||||
|
| |||||||
Health Care Equipment & Supplies — 4.2% |
| |||||||
Baxter International, Inc. | 2,038 | 175,500 | ||||||
Boston Scientific Corp. * | 9,456 | 332,013 | ||||||
Intuitive Surgical, Inc. * (a) | 212 | 120,801 | ||||||
|
| |||||||
| 628,314 | ||||||||
|
| |||||||
| INVESTMENTS | SHARES (000) | VALUE ($000) | ||||||
Health Care Providers & Services — 4.9% |
| |||||||
Cigna Corp. | 1,519 | 284,989 | ||||||
Quest Diagnostics, Inc. | 1,481 | 168,810 | ||||||
UnitedHealth Group, Inc. | 954 | 281,244 | ||||||
|
| |||||||
| 735,043 | ||||||||
|
| |||||||
Hotels, Restaurants & Leisure — 3.1% |
| |||||||
McDonald’s Corp. | 1,652 | 304,747 | ||||||
Yum! Brands, Inc. | 1,891 | 164,317 | ||||||
|
| |||||||
| 469,064 | ||||||||
|
| |||||||
Insurance — 1.9% |
| |||||||
Chubb Ltd. | 1,182 | 149,641 | ||||||
Progressive Corp. (The) | 1,722 | 137,984 | ||||||
|
| |||||||
| 287,625 | ||||||||
|
| |||||||
Interactive Media & Services — 5.4% |
| |||||||
Alphabet, Inc., Class A * | 484 | 686,454 | ||||||
Facebook, Inc., Class A * | 561 | 127,403 | ||||||
|
| |||||||
| 813,857 | ||||||||
|
| |||||||
Internet & Direct Marketing Retail — 5.9% |
| |||||||
Amazon.com, Inc. * | 322 | 887,187 | ||||||
|
| |||||||
IT Services — 7.9% |
| |||||||
Booz Allen Hamilton Holding Corp. (a) | 1,028 | 79,947 | ||||||
FleetCor Technologies, Inc. * | 812 | 204,362 | ||||||
Leidos Holdings, Inc. | 2,604 | 243,924 | ||||||
Mastercard, Inc., Class A | 2,182 | 645,343 | ||||||
|
| |||||||
| 1,173,576 | ||||||||
|
| |||||||
Machinery — 0.8% |
| |||||||
Stanley Black & Decker, Inc. (a) | 822 | 114,595 | ||||||
|
| |||||||
Media — 1.5% |
| |||||||
Altice USA, Inc., Class A * | 4,306 | 97,064 | ||||||
Charter Communications, Inc., Class A * (a) | 246 | 125,645 | ||||||
|
| |||||||
| 222,709 | ||||||||
|
| |||||||
Oil, Gas & Consumable Fuels — 1.3% |
| |||||||
Diamondback Energy, Inc. | 1,206 | 50,456 | ||||||
Pioneer Natural Resources Co. (a) | 1,499 | 146,467 | ||||||
|
| |||||||
| 196,923 | ||||||||
|
| |||||||
Pharmaceuticals — 2.9% |
| |||||||
Bristol-Myers Squibb Co. | 3,670 | 215,812 | ||||||
Eli Lilly and Co. | 1,324 | 217,343 | ||||||
|
| |||||||
| 433,155 | ||||||||
|
| |||||||
Road & Rail — 2.5% |
| |||||||
Norfolk Southern Corp. | 2,157 | 378,751 | ||||||
|
| |||||||
SEE NOTES TO FINANCIAL STATEMENTS.
| 46 | J.P. MORGAN LARGE CAP FUNDS | JUNE 30, 2020 | ||||
Table of Contents
| INVESTMENTS | SHARES (000) | VALUE ($000) | ||||||
Common Stocks — continued |
| |||||||
Semiconductors & Semiconductor Equipment — 9.3% |
| |||||||
Advanced Micro Devices, Inc. * | 1,488 | 78,272 | ||||||
Analog Devices, Inc. | 1,985 | 243,446 | ||||||
ASML Holding NV (Registered), NYRS (Netherlands) | 754 | 277,467 | ||||||
NXP Semiconductors NV (Netherlands) | 1,571 | 179,176 | ||||||
Taiwan Semiconductor Manufacturing Co. Ltd., ADR (Taiwan) | 5,058 | 287,146 | ||||||
Texas Instruments, Inc. | 2,423 | 307,619 | ||||||
|
| |||||||
| 1,373,126 | ||||||||
|
| |||||||
Software — 10.0% |
| |||||||
Microsoft Corp. | 5,542 | 1,127,756 | ||||||
salesforce.com, Inc. * | 1,901 | 356,199 | ||||||
|
| |||||||
| 1,483,955 | ||||||||
|
| |||||||
Specialty Retail — 2.9% |
| |||||||
O’Reilly Automotive, Inc. * | 732 | 308,813 | ||||||
Ross Stores, Inc. | 1,420 | 121,082 | ||||||
|
| |||||||
| 429,895 | ||||||||
|
| |||||||
Technology Hardware, Storage & Peripherals — 4.4% |
| |||||||
Apple, Inc. | 1,821 | 664,203 | ||||||
|
| |||||||
Total Common Stocks | 14,941,211 | |||||||
|
| |||||||
Short-Term Investments — 0.4% |
| |||||||
Investment Companies — 0.3% |
| |||||||
JPMorgan Prime Money Market Fund Class IM Shares, 0.47% (b) (c)(Cost $41,341) | 41,304 | 41,341 | ||||||
|
| |||||||
Investment of Cash Collateral from Securities Loaned — 0.1% |
| |||||||
JPMorgan Securities Lending Money Market Fund Agency SL Class Shares, 0.51% (b) (c) | 1,073 | 1,074 | ||||||
JPMorgan U.S. Government Money Market Fund Class IM Shares, 0.14% (b) (c) | 12,605 | 12,605 | ||||||
|
| |||||||
Total Investment of Cash Collateral from Securities Loaned | 13,679 | |||||||
|
| |||||||
Total Short-Term Investments | 55,020 | |||||||
|
| |||||||
Total Investments — 100.4% | 14,996,231 | |||||||
Liabilities in Excess of | (57,469 | ) | ||||||
|
| |||||||
NET ASSETS — 100.0% | 14,938,762 | |||||||
|
| |||||||
Percentages indicated are based on net assets.
Abbreviations
| ADR | American Depositary Receipt | |
| NYRS | New York Registry Shares | |
| (a) | The security or a portion of this security is on loan at June 30, 2020. The total value of securities on loan at June 30, 2020 is approximately $13,372,000. | |
| (b) | Investment in an affiliated fund, which is registered under the Investment Company Act of 1940, as amended, and is advised by J.P. Morgan Investment Management Inc. | |
| (c) | The rate shown is the current yield as of June 30, 2020. | |
| * | Non-income producing security. | |
SEE NOTES TO FINANCIAL STATEMENTS.
| JUNE 30, 2020 | J.P. MORGAN LARGE CAP FUNDS | 47 | ||||||
Table of Contents
JPMorgan U.S. Large Cap Core Plus Fund
SCHEDULE OF PORTFOLIO INVESTMENTS
AS OF JUNE 30, 2020
| INVESTMENTS | SHARES (000) | VALUE ($000) | ||||||
Long Positions — 129.5% |
| |||||||
Common Stocks — 128.3% |
| |||||||
Aerospace & Defense — 2.3% |
| |||||||
Northrop Grumman Corp. (a) | 131 | 40,267 | ||||||
Raytheon Technologies Corp. | 490 | 30,211 | ||||||
|
| |||||||
| 70,478 | ||||||||
|
| |||||||
Auto Components — 0.6% |
| |||||||
Aptiv plc | 56 | 4,340 | ||||||
BorgWarner, Inc. | 150 | 5,302 | ||||||
Magna International, Inc. (Canada) | 189 | 8,416 | ||||||
|
| |||||||
| 18,058 | ||||||||
|
| |||||||
Banks — 3.4% |
| |||||||
Bank of America Corp. (a) | 1,210 | 28,736 | ||||||
Citigroup, Inc. | 873 | 44,598 | ||||||
First Republic Bank | 122 | 12,958 | ||||||
SVB Financial Group * | 59 | 12,616 | ||||||
Truist Financial Corp. | 127 | 4,779 | ||||||
|
| |||||||
| 103,687 | ||||||||
|
| |||||||
Beverages — 1.8% |
| |||||||
Coca-Cola Co. (The) (a) | 628 | 28,037 | ||||||
PepsiCo, Inc. (a) | 203 | 26,893 | ||||||
|
| |||||||
| 54,930 | ||||||||
|
| |||||||
Biotechnology — 4.0% |
| |||||||
AbbVie, Inc. | 641 | 62,946 | ||||||
Alexion Pharmaceuticals, Inc. * | 114 | 12,812 | ||||||
Amgen, Inc. | 35 | 8,371 | ||||||
Biogen, Inc. * | 48 | 12,862 | ||||||
Regeneron Pharmaceuticals, Inc. * | 18 | 11,219 | ||||||
Vertex Pharmaceuticals, Inc. * | 53 | 15,282 | ||||||
|
| |||||||
| 123,492 | ||||||||
|
| |||||||
Building Products — 1.7% |
| |||||||
Carrier Global Corp. | 317 | 7,034 | ||||||
Masco Corp. | 259 | 12,982 | ||||||
Trane Technologies plc | 368 | 32,705 | ||||||
| 52,721 | ||||||||
|
| |||||||
Capital Markets — 3.1% |
| |||||||
BlackRock, Inc. (a) | 52 | 28,262 | ||||||
Morgan Stanley (a) | 1,037 | 50,109 | ||||||
State Street Corp. | 239 | 15,201 | ||||||
|
| |||||||
| 93,572 | ||||||||
|
| |||||||
Chemicals — 4.3% |
| |||||||
Air Products and Chemicals, Inc. | 141 | 34,038 | ||||||
Celanese Corp. | 169 | 14,565 | ||||||
DuPont de Nemours, Inc. | 58 | 3,071 | ||||||
| INVESTMENTS | SHARES (000) | VALUE ($000) | ||||||
Chemicals — continued |
| |||||||
Eastman Chemical Co. | 145 | 10,085 | ||||||
FMC Corp. | 248 | 24,738 | ||||||
Linde plc (United Kingdom) | 207 | 43,812 | ||||||
|
| |||||||
| 130,309 | ||||||||
|
| |||||||
Commercial Services & Supplies — 0.2% |
| |||||||
Waste Management, Inc. | 59 | 6,280 | ||||||
|
| |||||||
Consumer Finance — 0.8% |
| |||||||
American Express Co. | 257 | 24,452 | ||||||
|
| |||||||
Diversified Financial Services — 0.4% |
| |||||||
Voya Financial, Inc. | 281 | 13,093 | ||||||
|
| |||||||
Diversified Telecommunication Services — 0.5% |
| |||||||
Verizon Communications, Inc. | 293 | 16,163 | ||||||
|
| |||||||
Electric Utilities — 3.7% |
| |||||||
Entergy Corp. | 180 | 16,870 | ||||||
Evergy, Inc. | 175 | 10,403 | ||||||
FirstEnergy Corp. | 130 | 5,026 | ||||||
NextEra Energy, Inc. (a) | 228 | 54,652 | ||||||
Xcel Energy, Inc. | 416 | 26,015 | ||||||
|
| |||||||
| 112,966 | ||||||||
|
| |||||||
Electrical Equipment — 0.9% |
| |||||||
AMETEK, Inc. | 77 | 6,864 | ||||||
Eaton Corp. plc | 210 | 18,381 | ||||||
Sensata Technologies Holding plc * | 75 | 2,776 | ||||||
|
| |||||||
| 28,021 | ||||||||
|
| |||||||
Electronic Equipment, Instruments & Components — 0.2% |
| |||||||
TE Connectivity Ltd. | 67 | 5,451 | ||||||
|
| |||||||
Energy Equipment & Services — 0.2% |
| |||||||
Baker Hughes Co. | 327 | 5,029 | ||||||
|
| |||||||
Entertainment — 2.0% |
| |||||||
Electronic Arts, Inc. * | 86 | 11,422 | ||||||
Netflix, Inc. * (a) | 87 | 39,789 | ||||||
Warner Music Group Corp., Class A * | 334 | 9,862 | ||||||
|
| |||||||
| 61,073 | ||||||||
|
| |||||||
Equity Real Estate Investment Trusts (REITs) — 4.6% |
| |||||||
Brixmor Property Group, Inc. | 485 | 6,224 | ||||||
Equinix, Inc. | 31 | 22,022 | ||||||
Equity LifeStyle Properties, Inc. | 193 | 12,042 | ||||||
JBG SMITH Properties | 68 | 2,010 | ||||||
Prologis, Inc. | 404 | 37,715 | ||||||
Realty Income Corp. | 129 | 7,669 | ||||||
SBA Communications Corp. | 81 | 24,085 | ||||||
Ventas, Inc. | 582 | 21,310 | ||||||
SEE NOTES TO FINANCIAL STATEMENTS.
| 48 | J.P. MORGAN LARGE CAP FUNDS | JUNE 30, 2020 | ||||
Table of Contents
| INVESTMENTS | SHARES (000) | VALUE ($000) | ||||||
Long Positions — continued |
| |||||||
Common Stocks — continued |
| |||||||
Equity Real Estate Investment Trusts (REITs) — continued |
| |||||||
WP Carey, Inc. | 89 | 6,007 | ||||||
|
| |||||||
| 139,084 | ||||||||
|
| |||||||
Food & Staples Retailing — 0.6% |
| |||||||
Albertsons Cos., Inc., Class A * | 457 | 7,199 | ||||||
Costco Wholesale Corp. | 37 | 11,232 | ||||||
|
| |||||||
| 18,431 | ||||||||
|
| |||||||
Food Products — 0.7% |
| |||||||
Conagra Brands, Inc. | 139 | 4,902 | ||||||
Mondelez International, Inc., Class A (a) | 335 | 17,135 | ||||||
|
| |||||||
| 22,037 | ||||||||
|
| |||||||
Health Care Equipment & Supplies — 3.4% |
| |||||||
Baxter International, Inc. | 256 | 22,025 | ||||||
Boston Scientific Corp. * (a) | 936 | 32,880 | ||||||
Medtronic plc | 108 | 9,946 | ||||||
Zimmer Biomet Holdings, Inc. (a) | 326 | 38,947 | ||||||
|
| |||||||
| 103,798 | ||||||||
|
| |||||||
Health Care Providers & Services — 4.0% |
| |||||||
Cigna Corp. (a) | 281 | 52,702 | ||||||
HCA Healthcare, Inc. | 32 | 3,125 | ||||||
McKesson Corp. | 168 | 25,844 | ||||||
UnitedHealth Group, Inc. (a) | 140 | 41,421 | ||||||
|
| |||||||
| 123,092 | ||||||||
|
| |||||||
Hotels, Restaurants & Leisure — 1.7% |
| |||||||
Las Vegas Sands Corp. | 311 | 14,150 | ||||||
McDonald’s Corp. | 56 | 10,280 | ||||||
Yum! Brands, Inc. | 330 | 28,710 | ||||||
|
| |||||||
| 53,140 | ||||||||
|
| |||||||
Household Durables — 0.5% |
| |||||||
Lennar Corp., Class A | 271 | 16,674 | ||||||
|
| |||||||
Household Products — 1.9% |
| |||||||
Kimberly-Clark Corp. | 22 | 3,097 | ||||||
Procter & Gamble Co. (The) | 469 | 56,088 | ||||||
|
| |||||||
| 59,185 | ||||||||
|
| |||||||
Industrial Conglomerates — 1.3% |
| |||||||
Honeywell International, Inc. (a) | 279 | 40,341 | ||||||
|
| |||||||
Insurance — 1.4% |
| |||||||
Arthur J Gallagher & Co. | 121 | 11,795 | ||||||
Chubb Ltd. | 134 | 17,005 | ||||||
Progressive Corp. (The) | 189 | 15,166 | ||||||
|
| |||||||
| 43,966 | ||||||||
|
| |||||||
| INVESTMENTS | SHARES (000) | VALUE ($000) | ||||||
Interactive Media & Services — 5.7% |
| |||||||
Alphabet, Inc., Class A * (a) | 56 | 79,970 | ||||||
Alphabet, Inc., Class C * (a) | 29 | 40,613 | ||||||
Facebook, Inc., Class A * (a) | 235 | 53,376 | ||||||
|
| |||||||
| 173,959 | ||||||||
|
| |||||||
Internet & Direct Marketing Retail — 6.8% |
| |||||||
Amazon.com, Inc. * (a) | 69 | 190,557 | ||||||
Booking Holdings, Inc. * | 10 | 15,984 | ||||||
|
| |||||||
| 206,541 | ||||||||
|
| |||||||
IT Services — 11.1% |
| |||||||
Automatic Data Processing, Inc. (a) | 177 | 26,425 | ||||||
Booz Allen Hamilton Holding Corp. | 75 | 5,850 | ||||||
Fidelity National Information Services, Inc. | 326 | 43,671 | ||||||
Fiserv, Inc. * (a) | 284 | 27,757 | ||||||
Leidos Holdings, Inc. | 363 | 34,005 | ||||||
Mastercard, Inc., Class A (a) | 273 | 80,638 | ||||||
PayPal Holdings, Inc. * | 498 | 86,813 | ||||||
WEX, Inc. * | 202 | 33,278 | ||||||
|
| |||||||
| 338,437 | ||||||||
|
| |||||||
Life Sciences Tools & Services — 1.7% |
| |||||||
Thermo Fisher Scientific, Inc. | 146 | 52,851 | ||||||
|
| |||||||
Machinery — 1.9% |
| |||||||
Parker-Hannifin Corp. | 129 | 23,623 | ||||||
Snap-on, Inc. | 36 | 4,955 | ||||||
Stanley Black & Decker, Inc. | 218 | 30,319 | ||||||
|
| |||||||
| 58,897 | ||||||||
|
| |||||||
Media — 2.7% |
| |||||||
Charter Communications, Inc., Class A * (a) | 62 | 31,674 | ||||||
Comcast Corp., Class A (a) | 773 | 30,141 | ||||||
Discovery, Inc., Class A * | 819 | 17,277 | ||||||
Discovery, Inc., Class C * | 227 | 4,376 | ||||||
|
| |||||||
| 83,468 | ||||||||
|
| |||||||
Multiline Retail — 0.5% |
| |||||||
Dollar Tree, Inc. * | 149 | 13,796 | ||||||
|
| |||||||
Multi-Utilities — 0.2% |
| |||||||
CenterPoint Energy, Inc. | 252 | 4,706 | ||||||
|
| |||||||
Oil, Gas & Consumable Fuels — 4.3% |
| |||||||
Cheniere Energy, Inc. * | 104 | 5,005 | ||||||
Chevron Corp. | 222 | 19,805 | ||||||
ConocoPhillips | 409 | 17,190 | ||||||
Diamondback Energy, Inc. | 572 | 23,938 | ||||||
Marathon Petroleum Corp. (a) | 221 | 8,243 | ||||||
Parsley Energy, Inc., Class A | 509 | 5,432 | ||||||
SEE NOTES TO FINANCIAL STATEMENTS.
| JUNE 30, 2020 | J.P. MORGAN LARGE CAP FUNDS | 49 | ||||||
Table of Contents
JPMorgan U.S. Large Cap Core Plus Fund
SCHEDULE OF PORTFOLIO INVESTMENTS
AS OF JUNE 30, 2020 (continued)
| INVESTMENTS | SHARES (000) | VALUE ($000) | ||||||
Long Positions — continued |
| |||||||
Common Stocks — continued |
| |||||||
Oil, Gas & Consumable Fuels — continued |
| |||||||
Phillips 66 | 101 | 7,294 | ||||||
Pioneer Natural Resources Co. (a) | 214 | 20,935 | ||||||
TC Energy Corp. (Canada) | 207 | 8,887 | ||||||
Williams Cos., Inc. (The) | 745 | 14,174 | ||||||
|
| |||||||
| 130,903 | ||||||||
|
| |||||||
Pharmaceuticals — 4.1% |
| |||||||
Bristol-Myers Squibb Co. (a) | 693 | 40,720 | ||||||
Elanco Animal Health, Inc. * | 135 | 2,890 | ||||||
Eli Lilly and Co. | 243 | 39,973 | ||||||
Johnson & Johnson | 114 | 15,968 | ||||||
Merck & Co., Inc. | 323 | 24,963 | ||||||
|
| |||||||
| 124,514 | ||||||||
|
| |||||||
Road & Rail — 3.5% |
| |||||||
CSX Corp. | 228 | 15,915 | ||||||
Kansas City Southern | 21 | 3,073 | ||||||
Lyft, Inc., Class A * | 508 | 16,778 | ||||||
Norfolk Southern Corp. (a) | 280 | 49,171 | ||||||
Union Pacific Corp. (a) | 123 | 20,722 | ||||||
|
| |||||||
| 105,659 | ||||||||
|
| |||||||
Semiconductors & Semiconductor Equipment — 9.4% |
| |||||||
Advanced Micro Devices, Inc. * | 126 | 6,619 | ||||||
Analog Devices, Inc. (a) | 274 | 33,602 | ||||||
ASML Holding NV (Registered), NYRS (Netherlands) | 148 | 54,448 | ||||||
KLA Corp. | 36 | 7,094 | ||||||
Lam Research Corp. | 81 | 26,079 | ||||||
Micron Technology, Inc. * | 147 | 7,595 | ||||||
NVIDIA Corp. (a) | 74 | 27,947 | ||||||
NXP Semiconductors NV (Netherlands) | 344 | 39,240 | ||||||
ON Semiconductor Corp. * | 258 | 5,122 | ||||||
Qorvo, Inc. * | 69 | 7,634 | ||||||
Skyworks Solutions, Inc. | 16 | 2,105 | ||||||
Taiwan Semiconductor Manufacturing Co. Ltd., ADR (Taiwan) | 528 | 29,953 | ||||||
Texas Instruments, Inc. (a) | 279 | 35,442 | ||||||
Xilinx, Inc. | 39 | 3,867 | ||||||
|
| |||||||
| 286,747 | ||||||||
|
| |||||||
Software — 11.8% |
| |||||||
Ceridian HCM Holding, Inc. * | 169 | 13,405 | ||||||
Intuit, Inc. | 40 | 11,919 | ||||||
Microsoft Corp. (a) | 1,124 | 228,802 | ||||||
Paylocity Holding Corp. * | 146 | 21,295 | ||||||
salesforce.com, Inc. * (a) | 259 | 48,471 | ||||||
| INVESTMENTS | SHARES (000) | VALUE ($000) | ||||||
Software — continued |
| |||||||
ServiceNow, Inc. * | 31 | 12,365 | ||||||
Workday, Inc., Class A * | 109 | 20,441 | ||||||
|
| |||||||
| 356,698 | ||||||||
|
| |||||||
Specialty Retail — 5.9% |
| |||||||
AutoZone, Inc. * (a) | 13 | 14,535 | ||||||
Best Buy Co., Inc. | 195 | 17,004 | ||||||
Home Depot, Inc. (The) (a) | 171 | 42,888 | ||||||
Lowe’s Cos., Inc. | 364 | 49,165 | ||||||
O’Reilly Automotive, Inc. * | 100 | 42,068 | ||||||
TJX Cos., Inc. (The) | 265 | 13,410 | ||||||
|
| |||||||
| 179,070 | ||||||||
|
| |||||||
Technology Hardware, Storage & Peripherals — 6.2% |
| |||||||
Apple, Inc. (a) | 517 | 188,420 | ||||||
|
| |||||||
Textiles, Apparel & Luxury Goods — 0.4% |
| |||||||
NIKE, Inc., Class B | 128 | 12,501 | ||||||
|
| |||||||
Tobacco — 0.8% |
| |||||||
Altria Group, Inc. | 310 | 12,166 | ||||||
Philip Morris International, Inc. | 159 | 11,165 | ||||||
|
| |||||||
| 23,331 | ||||||||
|
| |||||||
Wireless Telecommunication Services — 1.1% |
| |||||||
T-Mobile US, Inc. * | 325 | 33,895 | ||||||
|
| |||||||
Total Common Stocks | 3,913,916 | |||||||
|
| |||||||
| NO. OF RIGHTS (000) | ||||||||
Rights — 0.0% (b) |
| |||||||
Wireless Telecommunication Services — 0.0% (b) |
| |||||||
T-Mobile US, Inc., expiring 7/27/2020 * | — | (c) | — | (c) | ||||
|
| |||||||
| SHARES (000) | ||||||||
Short-Term Investments — 1.2% |
| |||||||
Investment Companies — 1.2% |
| |||||||
JPMorgan Prime Money Market Fund Class IM Shares, 0.47% (d) (e) | 35,630 | 35,661 | ||||||
|
| |||||||
Total Long Positions | 3,949,577 | |||||||
|
| |||||||
Short Positions — (29.3)% |
| |||||||
Common Stocks — (29.3)% |
| |||||||
Aerospace & Defense — (0.7)% | ||||||||
Boeing Co. (The) | (30 | ) | (5,545 | ) | ||||
HEICO Corp. | (50 | ) | (4,963 | ) | ||||
SEE NOTES TO FINANCIAL STATEMENTS.
| 50 | J.P. MORGAN LARGE CAP FUNDS | JUNE 30, 2020 | ||||
Table of Contents
| INVESTMENTS | SHARES (000) | VALUE ($000) | ||||||
Short Positions — continued |
| |||||||
Common Stocks — continued |
| |||||||
Aerospace & Defense — continued | ||||||||
Huntington Ingalls Industries, Inc. | (18 | ) | (3,195 | ) | ||||
Lockheed Martin Corp. | (12 | ) | (4,337 | ) | ||||
TransDigm Group, Inc. | (8 | ) | (3,421 | ) | ||||
|
| |||||||
| (21,461 | ) | |||||||
|
| |||||||
Air Freight & Logistics — (0.5)% |
| |||||||
CH Robinson Worldwide, Inc. | (117 | ) | (9,247 | ) | ||||
Expeditors International of Washington, Inc. | (78 | ) | (5,946 | ) | ||||
|
| |||||||
| (15,193 | ) | |||||||
|
| |||||||
Automobiles — (0.2)% |
| |||||||
Ford Motor Co. | (964 | ) | (5,860 | ) | ||||
|
| |||||||
Banks — (1.0)% |
| |||||||
BancorpSouth Bank | (139 | ) | (3,170 | ) | ||||
Bank of Hawaii Corp. | (62 | ) | (3,834 | ) | ||||
Commerce Bancshares, Inc. | (165 | ) | (9,818 | ) | ||||
M&T Bank Corp. | (61 | ) | (6,357 | ) | ||||
Old National Bancorp | (174 | ) | (2,399 | ) | ||||
People’s United Financial, Inc. | (407 | ) | (4,705 | ) | ||||
|
| |||||||
| (30,283 | ) | |||||||
|
| |||||||
Biotechnology — (0.5)% |
| |||||||
Gilead Sciences, Inc. | (203 | ) | (15,589 | ) | ||||
|
| |||||||
Building Products — (0.5)% |
| |||||||
Fortune Brands Home & Security, Inc. | (74 | ) | (4,711 | ) | ||||
Johnson Controls International plc | (208 | ) | (7,086 | ) | ||||
Lennox International, Inc. | (16 | ) | (3,616 | ) | ||||
|
| |||||||
| (15,413 | ) | |||||||
|
| |||||||
Capital Markets — (0.7)% |
| |||||||
Franklin Resources, Inc. | (256 | ) | (5,360 | ) | ||||
Nasdaq, Inc. | (73 | ) | (8,705 | ) | ||||
Northern Trust Corp. | (85 | ) | (6,765 | ) | ||||
|
| |||||||
| (20,830 | ) | |||||||
|
| |||||||
Chemicals — (0.4)% |
| |||||||
Albemarle Corp. | (148 | ) | (11,389 | ) | ||||
RPM International, Inc. | (20 | ) | (1,479 | ) | ||||
|
| |||||||
| (12,868 | ) | |||||||
|
| |||||||
Commercial Services & Supplies — (0.1)% |
| |||||||
Republic Services, Inc. | (35 | ) | (2,883 | ) | ||||
|
| |||||||
Communications Equipment — (1.3)% |
| |||||||
Cisco Systems, Inc. | (518 | ) | (24,180 | ) | ||||
Juniper Networks, Inc. | (700 | ) | (16,004 | ) | ||||
|
| |||||||
| (40,184 | ) | |||||||
|
| |||||||
| INVESTMENTS | SHARES (000) | VALUE ($000) | ||||||
Construction Materials — (0.3)% |
| |||||||
Martin Marietta Materials, Inc. | (14 | ) | (2,848 | ) | ||||
Vulcan Materials Co. | (50 | ) | (5,747 | ) | ||||
|
| |||||||
| (8,595 | ) | |||||||
|
| |||||||
Consumer Finance — (0.1)% |
| |||||||
Capital One Financial Corp. | (48 | ) | (2,979 | ) | ||||
|
| |||||||
Containers & Packaging — (1.0)% |
| |||||||
AptarGroup, Inc. | (27 | ) | (2,971 | ) | ||||
Avery Dennison Corp. | (53 | ) | (6,037 | ) | ||||
Ball Corp. | (55 | ) | (3,788 | ) | ||||
International Paper Co. | (257 | ) | (9,050 | ) | ||||
Sealed Air Corp. | (39 | ) | (1,270 | ) | ||||
Sonoco Products Co. | (144 | ) | (7,532 | ) | ||||
|
| |||||||
| (30,648 | ) | |||||||
|
| |||||||
Diversified Telecommunication Services — (0.6)% |
| |||||||
AT&T, Inc. | (465 | ) | (14,062 | ) | ||||
CenturyLink, Inc. | (432 | ) | (4,332 | ) | ||||
|
| |||||||
| (18,394 | ) | |||||||
|
| |||||||
Electric Utilities — (0.5)% |
| |||||||
Exelon Corp. | (163 | ) | (5,927 | ) | ||||
Southern Co. (The) | (190 | ) | (9,827 | ) | ||||
|
| |||||||
| (15,754 | ) | |||||||
|
| |||||||
Electrical Equipment — (0.4)% |
| |||||||
Acuity Brands, Inc. | (77 | ) | (7,419 | ) | ||||
Hubbell, Inc. | (29 | ) | (3,586 | ) | ||||
|
| |||||||
| (11,005 | ) | |||||||
|
| |||||||
Electronic Equipment, Instruments & Components — (0.2)% |
| |||||||
Cognex Corp. | (106 | ) | (6,326 | ) | ||||
|
| |||||||
Energy Equipment & Services — (0.6)% |
| |||||||
Halliburton Co. | (845 | ) | (10,967 | ) | ||||
Schlumberger Ltd. | (390 | ) | (7,165 | ) | ||||
|
| |||||||
| (18,132 | ) | |||||||
|
| |||||||
Entertainment — (1.7)% |
| |||||||
Activision Blizzard, Inc. | (76 | ) | (5,754 | ) | ||||
Spotify Technology SA * | (87 | ) | (22,388 | ) | ||||
Take-Two Interactive Software, Inc. * | (52 | ) | (7,220 | ) | ||||
Walt Disney Co. (The) | (143 | ) | (15,991 | ) | ||||
|
| |||||||
| (51,353 | ) | |||||||
|
| |||||||
Equity Real Estate Investment Trusts (REITs) — (2.2)% |
| |||||||
Crown Castle International Corp. | (38 | ) | (6,291 | ) | ||||
Digital Realty Trust, Inc. | (62 | ) | (8,770 | ) | ||||
Duke Realty Corp. | (85 | ) | (3,025 | ) | ||||
SEE NOTES TO FINANCIAL STATEMENTS.
| JUNE 30, 2020 | J.P. MORGAN LARGE CAP FUNDS | 51 | ||||||
Table of Contents
JPMorgan U.S. Large Cap Core Plus Fund
SCHEDULE OF PORTFOLIO INVESTMENTS
AS OF JUNE 30, 2020 (continued)
| INVESTMENTS | SHARES (000) | VALUE ($000) | ||||||
Short Positions — continued |
| |||||||
Common Stocks — continued |
| |||||||
Equity Real Estate Investment Trusts (REITs) — continued |
| |||||||
Equity Residential | (46 | ) | (2,693 | ) | ||||
Extra Space Storage, Inc. | (89 | ) | (8,258 | ) | ||||
Iron Mountain, Inc. | (379 | ) | (9,894 | ) | ||||
National Retail Properties, Inc. | (158 | ) | (5,604 | ) | ||||
Public Storage | (31 | ) | (5,880 | ) | ||||
Simon Property Group, Inc. | (187 | ) | (12,815 | ) | ||||
Vornado Realty Trust | (135 | ) | (5,155 | ) | ||||
|
| |||||||
| (68,385 | ) | |||||||
|
| |||||||
Food & Staples Retailing — (0.6)% |
| |||||||
Kroger Co. (The) | (436 | ) | (14,773 | ) | ||||
Sysco Corp. | (51 | ) | (2,813 | ) | ||||
|
| |||||||
| (17,586 | ) | |||||||
|
| |||||||
Food Products — (0.7)% |
| |||||||
Campbell Soup Co. | (206 | ) | (10,203 | ) | ||||
General Mills, Inc. | (68 | ) | (4,180 | ) | ||||
Hershey Co. (The) | (23 | ) | (2,996 | ) | ||||
Kellogg Co. | (40 | ) | (2,627 | ) | ||||
|
| |||||||
| (20,006 | ) | |||||||
|
| |||||||
Health Care Equipment & Supplies — (0.7)% |
| |||||||
Abbott Laboratories | (118 | ) | (10,764 | ) | ||||
Dentsply Sirona, Inc. | (33 | ) | (1,457 | ) | ||||
Stryker Corp. | (40 | ) | (7,180 | ) | ||||
Varian Medical Systems, Inc. * | (24 | ) | (2,974 | ) | ||||
|
| |||||||
| (22,375 | ) | |||||||
|
| |||||||
Health Care Providers & Services — (0.7)% |
| |||||||
AmerisourceBergen Corp. | (74 | ) | (7,478 | ) | ||||
Cardinal Health, Inc. | (56 | ) | (2,935 | ) | ||||
Henry Schein, Inc. * | (175 | ) | (10,200 | ) | ||||
|
| |||||||
| (20,613 | ) | |||||||
|
| |||||||
Health Care Technology — (0.3)% |
| |||||||
Cerner Corp. | (129 | ) | (8,843 | ) | ||||
|
| |||||||
Hotels, Restaurants & Leisure — (0.5)% |
| |||||||
Chipotle Mexican Grill, Inc. * | (5 | ) | (4,978 | ) | ||||
Starbucks Corp. | (145 | ) | (10,688 | ) | ||||
|
| |||||||
| (15,666 | ) | |||||||
|
| |||||||
Household Products — (0.7)% |
| |||||||
Clorox Co. (The) | (102 | ) | (22,483 | ) | ||||
|
| |||||||
Industrial Conglomerates — (0.7)% |
| |||||||
3M Co. | (91 | ) | (14,130 | ) | ||||
General Electric Co. | (1,176 | ) | (8,030 | ) | ||||
|
| |||||||
| (22,160 | ) | |||||||
|
| |||||||
| INVESTMENTS | SHARES (000) | VALUE ($000) | ||||||
Insurance — (0.7)% |
| |||||||
Allstate Corp. (The) | (84 | ) | (8,186 | ) | ||||
Aon plc, Class A | (25 | ) | (4,725 | ) | ||||
Axis Capital Holdings Ltd. | (41 | ) | (1,668 | ) | ||||
Globe Life, Inc. | (12 | ) | (918 | ) | ||||
Principal Financial Group, Inc. | (75 | ) | (3,114 | ) | ||||
Travelers Cos., Inc. (The) | (32 | ) | (3,612 | ) | ||||
|
| |||||||
| (22,223 | ) | |||||||
|
| |||||||
Interactive Media & Services — (0.3)% |
| |||||||
Twitter, Inc. * | (329 | ) | (9,793 | ) | ||||
|
| |||||||
IT Services — (1.3)% |
| |||||||
Accenture plc, Class A | (15 | ) | (3,128 | ) | ||||
Alliance Data Systems Corp. | (39 | ) | (1,740 | ) | ||||
Jack Henry & Associates, Inc. | (43 | ) | (7,943 | ) | ||||
Paychex, Inc. | (145 | ) | (10,996 | ) | ||||
Western Union Co. (The) | (676 | ) | (14,607 | ) | ||||
|
| |||||||
| (38,414 | ) | |||||||
|
| |||||||
Life Sciences Tools & Services — (0.7)% |
| |||||||
Agilent Technologies, Inc. | (102 | ) | (9,013 | ) | ||||
Mettler-Toledo International, Inc. * | (4 | ) | (3,576 | ) | ||||
Waters Corp. * | (50 | ) | (9,088 | ) | ||||
|
| |||||||
| (21,677 | ) | |||||||
|
| |||||||
Machinery — (0.9)% |
| |||||||
Caterpillar, Inc. | (79 | ) | (9,999 | ) | ||||
Donaldson Co., Inc. | (63 | ) | (2,928 | ) | ||||
Illinois Tool Works, Inc. | (70 | ) | (12,313 | ) | ||||
PACCAR, Inc. | (42 | ) | (3,156 | ) | ||||
|
| |||||||
| (28,396 | ) | |||||||
|
| |||||||
Media — (0.9)% |
| |||||||
AMC Networks, Inc., Class A * | (58 | ) | (1,352 | ) | ||||
Fox Corp., Class A | (104 | ) | (2,777 | ) | ||||
Interpublic Group of Cos., Inc. (The) | (158 | ) | (2,715 | ) | ||||
Omnicom Group, Inc. | (168 | ) | (9,187 | ) | ||||
Sirius XM Holdings, Inc. | (1,554 | ) | (9,125 | ) | ||||
ViacomCBS, Inc. | (92 | ) | (2,145 | ) | ||||
|
| |||||||
| (27,301 | ) | |||||||
|
| |||||||
Multiline Retail — (0.4)% |
| |||||||
Kohl’s Corp. | (192 | ) | (3,978 | ) | ||||
Macy’s, Inc. | (880 | ) | (6,055 | ) | ||||
Nordstrom, Inc. | (196 | ) | (3,038 | ) | ||||
|
| |||||||
| (13,071 | ) | |||||||
|
| |||||||
Multi-Utilities — (0.6)% |
| |||||||
Consolidated Edison, Inc. | (162 | ) | (11,689 | ) | ||||
SEE NOTES TO FINANCIAL STATEMENTS.
| 52 | J.P. MORGAN LARGE CAP FUNDS | JUNE 30, 2020 | ||||
Table of Contents
| INVESTMENTS | SHARES (000) | VALUE ($000) | ||||||
Short Positions — continued |
| |||||||
Common Stocks — continued |
| |||||||
Multi-Utilities — continued |
| |||||||
NiSource, Inc. | (131 | ) | (2,974 | ) | ||||
Public Service Enterprise Group, Inc. | (65 | ) | (3,210 | ) | ||||
|
| |||||||
| (17,873 | ) | |||||||
|
| |||||||
Oil, Gas & Consumable Fuels — (2.0)% |
| |||||||
Apache Corp. | (317 | ) | (4,280 | ) | ||||
Devon Energy Corp. | (198 | ) | (2,245 | ) | ||||
Enbridge, Inc. (Canada) | (305 | ) | (9,284 | ) | ||||
Exxon Mobil Corp. | (222 | ) | (9,929 | ) | ||||
Hess Corp. | (163 | ) | (8,469 | ) | ||||
HollyFrontier Corp. | (142 | ) | (4,144 | ) | ||||
Marathon Oil Corp. | (666 | ) | (4,078 | ) | ||||
Noble Energy, Inc. | (246 | ) | (2,204 | ) | ||||
Occidental Petroleum Corp. | (730 | ) | (13,354 | ) | ||||
Valero Energy Corp. | (36 | ) | (2,105 | ) | ||||
|
| |||||||
| (60,092 | ) | |||||||
|
| |||||||
Personal Products — 0.0% (b) |
| |||||||
Coty, Inc., Class A | (301 | ) | (1,345 | ) | ||||
|
| |||||||
Pharmaceuticals — (0.1)% |
| |||||||
Pfizer, Inc. | (92 | ) | (3,021 | ) | ||||
|
| |||||||
Professional Services — (0.4)% |
| |||||||
Robert Half International, Inc. | (226 | ) | (11,942 | ) | ||||
|
| |||||||
Road & Rail — (0.3)% |
| |||||||
JB Hunt Transport Services, Inc. | (67 | ) | (8,063 | ) | ||||
Werner Enterprises, Inc. | (35 | ) | (1,533 | ) | ||||
|
| |||||||
| (9,596 | ) | |||||||
|
| |||||||
Semiconductors & Semiconductor Equipment — (0.3)% |
| |||||||
Broadcom, Inc. | (11 | ) | (3,340 | ) | ||||
Intel Corp. | (95 | ) | (5,660 | ) | ||||
|
| |||||||
| (9,000 | ) | |||||||
|
| |||||||
Software — (0.5)% |
| |||||||
Adobe, Inc. * | (15 | ) | (6,733 | ) | ||||
Splunk, Inc. * | (39 | ) | (7,831 | ) | ||||
|
| |||||||
| (14,564 | ) | |||||||
|
| |||||||
| INVESTMENTS | SHARES (000) | VALUE ($000) | ||||||
Specialty Retail — (0.1)% |
| |||||||
Bed Bath & Beyond, Inc. | (186 | ) | (1,971 | ) | ||||
|
| |||||||
Technology Hardware, Storage & Peripherals — (1.1)% |
| |||||||
Hewlett Packard Enterprise Co. | (156 | ) | (1,518 | ) | ||||
HP, Inc. | (268 | ) | (4,668 | ) | ||||
NetApp, Inc. | (354 | ) | (15,702 | ) | ||||
Seagate Technology plc | (108 | ) | (5,208 | ) | ||||
Western Digital Corp. | (119 | ) | (5,261 | ) | ||||
Xerox Holdings Corp. | (157 | ) | (2,403 | ) | ||||
|
| |||||||
| (34,760 | ) | |||||||
|
| |||||||
Textiles, Apparel & Luxury Goods — (0.2)% |
| |||||||
Hanesbrands, Inc. | (431 | ) | (4,868 | ) | ||||
|
| |||||||
Trading Companies & Distributors — (0.1)% |
| |||||||
Fastenal Co. | (81 | ) | (3,454 | ) | ||||
|
| |||||||
Total Common Stocks | (895,228 | ) | ||||||
|
| |||||||
Total Short Positions | (895,228 | ) | ||||||
|
| |||||||
Total Investments — 100.2% | 3,054,349 | |||||||
Liabilities in Excess of | (4,043 | ) | ||||||
|
| |||||||
NET ASSETS — 100.0% | 3,050,306 | |||||||
|
| |||||||
Percentages indicated are based on net assets.
Abbreviations
| ADR | American Depositary Receipt | |
| NYRS | New York Registry Shares | |
| (a) | All or a portion of this security is segregated as collateral for short sales. The total value of securities segregated as collateral is approximately $1,215,707,000. | |
| (b) | Amount rounds to less than 0.1% of net assets. | |
| (c) | Amount rounds to less than one thousand. | |
| (d) | Investment in an affiliated fund, which is registered under the Investment Company Act of 1940, as amended, and is advised by J.P. Morgan Investment Management Inc. | |
| (e) | The rate shown is the current yield as of June 30, 2020. | |
| * | Non-income producing security. | |
| Futures contracts outstanding as of June 30, 2020 (amounts in thousands, except number of contracts): | ||||||||||||||||||||
| DESCRIPTION | NUMBER OF CONTRACTS | EXPIRATION DATE | TRADING CURRENCY | NOTIONAL AMOUNT ($) | VALUE AND UNREALIZED APPRECIATION (DEPRECIATION) ($) | |||||||||||||||
Long Contracts | ||||||||||||||||||||
S&P 500 E-Mini Index | 14 | 09/2020 | USD | 2,159 | (24 | ) | ||||||||||||||
|
| |||||||||||||||||||
Abbreviations
| USD | United States Dollar |
SEE NOTES TO FINANCIAL STATEMENTS.
| JUNE 30, 2020 | J.P. MORGAN LARGE CAP FUNDS | 53 | ||||||
Table of Contents
JPMorgan U.S. Research Enhanced Equity Fund
SCHEDULE OF PORTFOLIO INVESTMENTS
AS OF JUNE 30, 2020
| INVESTMENTS | SHARES (000) | VALUE ($000) | ||||||
Common Stocks — 98.8% |
| |||||||
Aerospace & Defense — 1.3% |
| |||||||
General Dynamics Corp. | 88 | 13,193 | ||||||
Northrop Grumman Corp. | 60 | 18,446 | ||||||
Raytheon Technologies Corp. | 376 | 23,146 | ||||||
|
| |||||||
| 54,785 | ||||||||
|
| |||||||
Airlines — 0.3% |
| |||||||
Delta Air Lines, Inc. | 160 | 4,478 | ||||||
Southwest Airlines Co. | 207 | 7,073 | ||||||
|
| |||||||
| 11,551 | ||||||||
|
| |||||||
Auto Components — 0.2% |
| |||||||
Magna International, Inc. (Canada) | 152 | 6,752 | ||||||
|
| |||||||
Automobiles — 0.2% |
| |||||||
General Motors Co. | 293 | 7,421 | ||||||
|
| |||||||
Banks — 3.1% |
| |||||||
Bank of America Corp. | 979 | 23,257 | ||||||
Citigroup, Inc. | 999 | 51,047 | ||||||
Citizens Financial Group, Inc. | 364 | 9,198 | ||||||
KeyCorp | 1,247 | 15,194 | ||||||
Regions Financial Corp. | 963 | 10,703 | ||||||
Truist Financial Corp. | 83 | 3,124 | ||||||
Wells Fargo & Co. | 972 | 24,886 | ||||||
|
| |||||||
| 137,409 | ||||||||
|
| |||||||
Beverages — 1.2% |
| |||||||
Coca-Cola Co. (The) | 657 | 29,365 | ||||||
Constellation Brands, Inc., Class A | 127 | 22,231 | ||||||
|
| |||||||
| 51,596 | ||||||||
|
| |||||||
Biotechnology — 2.9% |
| |||||||
AbbVie, Inc. | 554 | 54,396 | ||||||
Alexion Pharmaceuticals, Inc. * | 123 | 13,757 | ||||||
Amgen, Inc. | 33 | 7,754 | ||||||
Biogen, Inc. * | 46 | 12,184 | ||||||
Gilead Sciences, Inc. | 21 | 1,613 | ||||||
Regeneron Pharmaceuticals, Inc. * | 32 | 19,954 | ||||||
Vertex Pharmaceuticals, Inc. * | 57 | 16,602 | ||||||
|
| |||||||
| 126,260 | ||||||||
|
| |||||||
Building Products — 0.8% |
| |||||||
Carrier Global Corp. | 429 | 9,522 | ||||||
Masco Corp. | 288 | 14,447 | ||||||
Trane Technologies plc | 130 | 11,533 | ||||||
|
| |||||||
| 35,502 | ||||||||
|
| |||||||
Capital Markets — 3.0% |
| |||||||
BlackRock, Inc. | 33 | 18,035 | ||||||
Charles Schwab Corp. (The) | 237 | 8,012 | ||||||
| INVESTMENTS | SHARES (000) | VALUE ($000) | ||||||
Capital Markets — continued |
| |||||||
CME Group, Inc. | 64 | 10,412 | ||||||
Goldman Sachs Group, Inc. (The) | 55 | 10,900 | ||||||
MarketAxess Holdings, Inc. | 13 | 6,418 | ||||||
Morgan Stanley | 582 | 28,106 | ||||||
MSCI, Inc. | 18 | 6,137 | ||||||
S&P Global, Inc. | 86 | 28,202 | ||||||
State Street Corp. | 179 | 11,400 | ||||||
T. Rowe Price Group, Inc. | 34 | 4,215 | ||||||
|
| |||||||
| 131,837 | ||||||||
|
| |||||||
Chemicals — 1.6% |
| |||||||
Air Products and Chemicals, Inc. | 36 | 8,797 | ||||||
Celanese Corp. | 115 | 9,948 | ||||||
Dow, Inc. | 223 | 9,075 | ||||||
DuPont de Nemours, Inc. | 131 | 6,973 | ||||||
Eastman Chemical Co. | 248 | 17,298 | ||||||
Linde plc (United Kingdom) | 63 | 13,451 | ||||||
LyondellBasell Industries NV, Class A | 84 | 5,532 | ||||||
|
| |||||||
| 71,074 | ||||||||
|
| |||||||
Commercial Services & Supplies — 0.1% |
| |||||||
Cintas Corp. | 18 | 4,699 | ||||||
|
| |||||||
Communications Equipment — 0.4% |
| |||||||
Cisco Systems, Inc. | 312 | 14,538 | ||||||
Motorola Solutions, Inc. | 16 | 2,306 | ||||||
|
| |||||||
| 16,844 | ||||||||
|
| |||||||
Consumer Finance — 0.6% |
| |||||||
American Express Co. | 165 | 15,746 | ||||||
Capital One Financial Corp. | 152 | 9,486 | ||||||
|
| |||||||
| 25,232 | ||||||||
|
| |||||||
Containers & Packaging — 0.6% |
| |||||||
Avery Dennison Corp. | 83 | 9,457 | ||||||
Crown Holdings, Inc. * | 121 | 7,881 | ||||||
Packaging Corp. of America | 33 | 3,305 | ||||||
Westrock Co. | 147 | 4,145 | ||||||
|
| |||||||
| 24,788 | ||||||||
|
| |||||||
Diversified Consumer Services — 0.0% (a) |
| |||||||
H&R Block, Inc. | 66 | 942 | ||||||
|
| |||||||
Diversified Financial Services — 1.5% |
| |||||||
Berkshire Hathaway, Inc., Class B * | 365 | 65,149 | ||||||
Voya Financial, Inc. | 16 | 752 | ||||||
|
| |||||||
| 65,901 | ||||||||
|
| |||||||
Diversified Telecommunication Services — 1.2% |
| |||||||
Verizon Communications, Inc. | 937 | 51,642 | ||||||
|
| |||||||
SEE NOTES TO FINANCIAL STATEMENTS.
| 54 | J.P. MORGAN LARGE CAP FUNDS | JUNE 30, 2020 | ||||
Table of Contents
| INVESTMENTS | SHARES (000) | VALUE ($000) | ||||||
Common Stocks — continued |
| |||||||
Electric Utilities — 2.4% |
| |||||||
Duke Energy Corp. | 119 | 9,481 | ||||||
Entergy Corp. | 249 | 23,374 | ||||||
FirstEnergy Corp. | 276 | 10,706 | ||||||
NextEra Energy, Inc. | 183 | 44,067 | ||||||
Southern Co. (The) | 144 | 7,454 | ||||||
Xcel Energy, Inc. | 124 | 7,726 | ||||||
|
| |||||||
| 102,808 | ||||||||
|
| |||||||
Electrical Equipment — 0.9% |
| |||||||
Eaton Corp. plc | 329 | 28,799 | ||||||
Emerson Electric Co. | 177 | 10,976 | ||||||
|
| |||||||
| 39,775 | ||||||||
|
| |||||||
Electronic Equipment, Instruments & Components — 0.1% |
| |||||||
TE Connectivity Ltd. | 58 | 4,733 | ||||||
|
| |||||||
Entertainment — 1.3% |
| |||||||
Electronic Arts, Inc. * | 29 | 3,885 | ||||||
Netflix, Inc. * | 112 | 51,044 | ||||||
|
| |||||||
| 54,929 | ||||||||
|
| |||||||
Equity Real Estate Investment Trusts (REITs) — 1.9% |
| |||||||
Equinix, Inc. | 33 | 23,447 | ||||||
Equity LifeStyle Properties, Inc. | 69 | 4,326 | ||||||
Equity Residential | 183 | 10,788 | ||||||
Mid-America Apartment Communities, Inc. | 74 | 8,522 | ||||||
Prologis, Inc. | 249 | 23,280 | ||||||
Realty Income Corp. | 35 | 2,111 | ||||||
Sun Communities, Inc. | 23 | 3,087 | ||||||
UDR, Inc. | 49 | 1,843 | ||||||
Ventas, Inc. | 131 | 4,790 | ||||||
|
| |||||||
| 82,194 | ||||||||
|
| |||||||
Food & Staples Retailing — 0.9% |
| |||||||
Costco Wholesale Corp. | 104 | 31,620 | ||||||
Kroger Co. (The) | 193 | 6,548 | ||||||
|
| |||||||
| 38,168 | ||||||||
|
| |||||||
Food Products — 0.7% |
| |||||||
Conagra Brands, Inc. | 83 | 2,919 | ||||||
Mondelez International, Inc., Class A | 532 | 27,202 | ||||||
|
| |||||||
| 30,121 | ||||||||
|
| |||||||
Health Care Equipment & Supplies — 2.9% |
| |||||||
ABIOMED, Inc. * | 7 | 1,808 | ||||||
Baxter International, Inc. | 263 | 22,634 | ||||||
Becton Dickinson and Co. | 10 | 2,447 | ||||||
Boston Scientific Corp. * | 355 | 12,477 | ||||||
DexCom, Inc. * | 12 | 4,695 | ||||||
| INVESTMENTS | SHARES (000) | VALUE ($000) | ||||||
Health Care Equipment & Supplies — continued |
| |||||||
Edwards Lifesciences Corp. * | 73 | 5,078 | ||||||
Intuitive Surgical, Inc. * | 13 | 7,582 | ||||||
Medtronic plc | 485 | 44,482 | ||||||
Zimmer Biomet Holdings, Inc. | 219 | 26,087 | ||||||
|
| |||||||
| 127,290 | ||||||||
|
| |||||||
Health Care Providers & Services — 3.0% |
| |||||||
Anthem, Inc. | 59 | 15,520 | ||||||
Cigna Corp. | 130 | 24,455 | ||||||
DaVita, Inc. * | 63 | 5,005 | ||||||
McKesson Corp. | 165 | 25,329 | ||||||
UnitedHealth Group, Inc. | 199 | 58,662 | ||||||
|
| |||||||
| 128,971 | ||||||||
|
| |||||||
Hotels, Restaurants & Leisure — 0.5% |
| |||||||
Hilton Worldwide Holdings, Inc. | 127 | 9,361 | ||||||
Yum! Brands, Inc. | 145 | 12,589 | ||||||
|
| |||||||
| 21,950 | ||||||||
|
| |||||||
Household Durables — 0.4% |
| |||||||
Lennar Corp., Class A | 250 | 15,391 | ||||||
|
| |||||||
Household Products — 2.0% |
| |||||||
Kimberly-Clark Corp. | 142 | 20,024 | ||||||
Procter & Gamble Co. (The) | 547 | 65,432 | ||||||
|
| |||||||
| 85,456 | ||||||||
|
| |||||||
Industrial Conglomerates — 1.1% |
| |||||||
Honeywell International, Inc. | 319 | 46,102 | ||||||
|
| |||||||
Insurance — 1.9% |
| |||||||
Allstate Corp. (The) | 257 | 24,908 | ||||||
American International Group, Inc. | 146 | 4,545 | ||||||
Aon plc, Class A | 73 | 13,990 | ||||||
Arch Capital Group Ltd. * | 73 | 2,089 | ||||||
Everest Re Group Ltd. | 7 | 1,515 | ||||||
Hartford Financial Services Group, Inc. (The) | 131 | 5,032 | ||||||
Marsh & McLennan Cos., Inc. | 86 | 9,190 | ||||||
MetLife, Inc. | 53 | 1,949 | ||||||
Progressive Corp. (The) | 270 | 21,669 | ||||||
|
| |||||||
| 84,887 | ||||||||
|
| |||||||
Interactive Media & Services — 5.6% |
| |||||||
Alphabet, Inc., Class A * | 56 | 79,943 | ||||||
Alphabet, Inc., Class C * | 50 | 71,076 | ||||||
Facebook, Inc., Class A * | 403 | 91,475 | ||||||
|
| |||||||
| 242,494 | ||||||||
|
| |||||||
SEE NOTES TO FINANCIAL STATEMENTS.
| JUNE 30, 2020 | J.P. MORGAN LARGE CAP FUNDS | 55 | ||||||
Table of Contents
JPMorgan U.S. Research Enhanced Equity Fund
SCHEDULE OF PORTFOLIO INVESTMENTS
AS OF JUNE 30, 2020 (continued)
| INVESTMENTS | SHARES (000) | VALUE ($000) | ||||||
Common Stocks — continued |
| |||||||
Internet & Direct Marketing Retail — 5.4% |
| |||||||
Amazon.com, Inc. * | 79 | 217,834 | ||||||
Booking Holdings, Inc. * | 11 | 18,277 | ||||||
|
| |||||||
| 236,111 | ||||||||
|
| |||||||
IT Services — 6.4% |
| |||||||
Accenture plc, Class A | 147 | 31,596 | ||||||
Automatic Data Processing, Inc. | 154 | 22,907 | ||||||
FleetCor Technologies, Inc. * | 14 | 3,628 | ||||||
International Business Machines Corp. | 222 | 26,816 | ||||||
Leidos Holdings, Inc. | 160 | 14,976 | ||||||
Mastercard, Inc., Class A | 272 | 80,388 | ||||||
PayPal Holdings, Inc. * | 356 | 62,107 | ||||||
Visa, Inc., Class A | 209 | 40,348 | ||||||
|
| |||||||
| 282,766 | ||||||||
|
| |||||||
Life Sciences Tools & Services — 1.4% |
| |||||||
Illumina, Inc. * | 25 | 9,079 | ||||||
Thermo Fisher Scientific, Inc. | 140 | 50,644 | ||||||
|
| |||||||
| 59,723 | ||||||||
|
| |||||||
Machinery — 1.7% |
| |||||||
Cummins, Inc. | 119 | 20,557 | ||||||
Deere & Co. | 73 | 11,408 | ||||||
Parker-Hannifin Corp. | 112 | 20,508 | ||||||
Snap-on, Inc. | 39 | 5,393 | ||||||
Stanley Black & Decker, Inc. | 123 | 17,121 | ||||||
|
| |||||||
| 74,987 | ||||||||
|
| |||||||
Media — 2.3% |
| |||||||
Altice USA, Inc., Class A * | 176 | 3,956 | ||||||
Charter Communications, Inc., Class A * | 87 | 44,383 | ||||||
Comcast Corp., Class A | 965 | 37,605 | ||||||
Discovery, Inc., Class A * | 358 | 7,563 | ||||||
Discovery, Inc., Class C * | 391 | 7,539 | ||||||
|
| |||||||
| 101,046 | ||||||||
|
| |||||||
Metals & Mining — 0.2% |
| |||||||
Newmont Corp. | 133 | 8,207 | ||||||
|
| |||||||
Multiline Retail — 0.7% |
| |||||||
Dollar Tree, Inc. * | 97 | 8,946 | ||||||
Target Corp. | 187 | 22,480 | ||||||
|
| |||||||
| 31,426 | ||||||||
|
| |||||||
Multi-Utilities — 0.6% |
| |||||||
CenterPoint Energy, Inc. | 187 | 3,491 | ||||||
CMS Energy Corp. | 188 | 10,957 | ||||||
DTE Energy Co. | 66 | 7,116 | ||||||
Sempra Energy | 46 | 5,426 | ||||||
|
| |||||||
| 26,990 | ||||||||
|
| |||||||
| INVESTMENTS | SHARES (000) | VALUE ($000) | ||||||
Oil, Gas & Consumable Fuels — 2.8% |
| |||||||
Cabot Oil & Gas Corp. | 80 | 1,372 | ||||||
Cheniere Energy, Inc. * | 102 | 4,924 | ||||||
Chevron Corp. | 432 | 38,530 | ||||||
Diamondback Energy, Inc. | 144 | 6,025 | ||||||
EOG Resources, Inc. | 390 | 19,772 | ||||||
Exxon Mobil Corp. | 197 | 8,808 | ||||||
Marathon Petroleum Corp. | 137 | 5,127 | ||||||
ONEOK, Inc. | 191 | 6,348 | ||||||
Phillips 66 | 165 | 11,870 | ||||||
Pioneer Natural Resources Co. | 181 | 17,724 | ||||||
Williams Cos., Inc. (The) | 203 | 3,862 | ||||||
|
| |||||||
| 124,362 | ||||||||
|
| |||||||
Pharmaceuticals — 4.3% |
| |||||||
Bristol-Myers Squibb Co. | 740 | 43,495 | ||||||
Eli Lilly and Co. | 254 | 41,686 | ||||||
Johnson & Johnson | 291 | 40,921 | ||||||
Merck & Co., Inc. | 683 | 52,780 | ||||||
Pfizer, Inc. | 245 | 8,006 | ||||||
|
| |||||||
| 186,888 | ||||||||
|
| |||||||
Professional Services — 0.1% |
| |||||||
Verisk Analytics, Inc. | 27 | 4,656 | ||||||
|
| |||||||
Road & Rail — 1.4% |
| |||||||
CSX Corp. | 237 | 16,498 | ||||||
Kansas City Southern | 22 | 3,280 | ||||||
Lyft, Inc., Class A * | 77 | 2,530 | ||||||
Norfolk Southern Corp. | 185 | 32,565 | ||||||
Union Pacific Corp. | 33 | 5,604 | ||||||
|
| |||||||
| 60,477 | ||||||||
|
| |||||||
Semiconductors & Semiconductor Equipment — 5.1% |
| |||||||
Advanced Micro Devices, Inc. * | 185 | 9,712 | ||||||
Analog Devices, Inc. | 274 | 33,664 | ||||||
Applied Materials, Inc. | 113 | 6,859 | ||||||
Intel Corp. | 164 | 9,809 | ||||||
Lam Research Corp. | 74 | 23,821 | ||||||
Microchip Technology, Inc. | 90 | 9,445 | ||||||
Micron Technology, Inc. * | 245 | 12,607 | ||||||
NVIDIA Corp. | 86 | 32,505 | ||||||
NXP Semiconductors NV (Netherlands) | 167 | 19,036 | ||||||
Qorvo, Inc. * | 100 | 11,063 | ||||||
QUALCOMM, Inc. | 104 | 9,509 | ||||||
Texas Instruments, Inc. | 345 | 43,836 | ||||||
|
| |||||||
| 221,866 | ||||||||
|
| |||||||
SEE NOTES TO FINANCIAL STATEMENTS.
| 56 | J.P. MORGAN LARGE CAP FUNDS | JUNE 30, 2020 | ||||
Table of Contents
| INVESTMENTS | SHARES (000) | VALUE ($000) | ||||||
Common Stocks — continued |
| |||||||
Software — 9.0% |
| |||||||
Fortinet, Inc. * | 24 | 3,281 | ||||||
Intuit, Inc. | 119 | 35,120 | ||||||
Microsoft Corp. | 1,499 | 305,101 | ||||||
salesforce.com, Inc. * | 249 | 46,569 | ||||||
Workday, Inc., Class A * | 38 | 7,035 | ||||||
|
| |||||||
| 397,106 | ||||||||
|
| |||||||
Specialty Retail — 3.7% |
| |||||||
AutoZone, Inc. * | 18 | 20,550 | ||||||
Best Buy Co., Inc. | 277 | 24,144 | ||||||
Home Depot, Inc. (The) | 190 | 47,534 | ||||||
Lowe’s Cos., Inc. | 281 | 37,940 | ||||||
Ross Stores, Inc. | 132 | 11,224 | ||||||
TJX Cos., Inc. (The) | 357 | 18,067 | ||||||
|
| |||||||
| 159,459 | ||||||||
|
| |||||||
Technology Hardware, Storage & Peripherals — 6.5% |
| |||||||
Apple, Inc. | 762 | 277,937 | ||||||
HP, Inc. | 562 | 9,798 | ||||||
|
| |||||||
| 287,735 | ||||||||
|
| |||||||
Textiles, Apparel & Luxury Goods — 0.7% |
| |||||||
Carter’s, Inc. | 26 | 2,109 | ||||||
NIKE, Inc., Class B | 256 | 25,058 | ||||||
Ralph Lauren Corp. | 59 | 4,312 | ||||||
|
| |||||||
| 31,479 | ||||||||
|
| |||||||
Tobacco — 1.3% |
| |||||||
Altria Group, Inc. | 654 | 25,687 | ||||||
Philip Morris International, Inc. | 459 | 32,138 | ||||||
|
| |||||||
| 57,825 | ||||||||
|
| |||||||
| INVESTMENTS | SHARES (000) | VALUE ($000) | ||||||
Wireless Telecommunication Services — 0.6% |
| |||||||
T-Mobile US, Inc. * | 259 | 26,967 | ||||||
|
| |||||||
Total Common Stocks | 4,309,580 | |||||||
|
| |||||||
| NO. OF RIGHTS (000) | ||||||||
Rights — 0.0% (a) |
| |||||||
Wireless Telecommunication Services — 0.0% (a) |
| |||||||
T-Mobile US, Inc., expiring 7/27/2020 * | 232 | 39 | ||||||
|
| |||||||
| SHARES (000) | ||||||||
Short-Term Investments — 2.5% |
| |||||||
Investment Companies — 2.5% |
| |||||||
JPMorgan Prime Money Market Fund Class IM Shares, 0.47% (b) (c) | 110,045 | 110,144 | ||||||
|
| |||||||
Total Investments — 101.3% | 4,419,763 | |||||||
Liabilities in Excess of | (54,999 | ) | ||||||
|
| |||||||
NET ASSETS — 100.0% | 4,364,764 | |||||||
|
| |||||||
Percentages indicated are based on net assets.
| (a) | Amount rounds to less than 0.1% of net assets. | |
| (b) | Investment in an affiliated fund, which is registered under the Investment Company Act of 1940, as amended, and is advised by J.P. Morgan Investment Management Inc. | |
| (c) | The rate shown is the current yield as of June 30, 2020. | |
| * | Non-income producing security. |
| Futures contracts outstanding as of June 30, 2020 (amounts in thousands, except number of contracts): | ||||||||||||||||||||
| DESCRIPTION | NUMBER OF CONTRACTS | EXPIRATION DATE | TRADING CURRENCY | NOTIONAL AMOUNT ($) | VALUE AND UNREALIZED APPRECIATION (DEPRECIATION) ($) | |||||||||||||||
Long Contracts | ||||||||||||||||||||
S&P 500 E-Mini Index | 328 | 09/2020 | USD | 50,582 | 992 | |||||||||||||||
|
| |||||||||||||||||||
Abbreviations
| USD | United States Dollar |
SEE NOTES TO FINANCIAL STATEMENTS.
| JUNE 30, 2020 | J.P. MORGAN LARGE CAP FUNDS | 57 | ||||||
Table of Contents
STATEMENTS OF ASSETS AND LIABILITIES
AS OF JUNE 30, 2020
(Amounts in thousands, except per share amounts)
JPMorgan | JPMorgan Equity Income Fund | JPMorgan Equity Premium Income Fund | ||||||||||
ASSETS: |
| |||||||||||
Investments in non-affiliates, at value | $ | 81,889 | $ | 28,681,470 | $ | 188,884 | ||||||
Investments in affiliates, at value | 3,216 | 883,014 | 5,899 | |||||||||
Cash | 1 | 361 | 2 | |||||||||
Receivables: | ||||||||||||
Investment securities sold | — | — | 10,701 | |||||||||
Fund shares sold | 40 | 42,691 | 193 | |||||||||
Interest and dividends from non-affiliates | 44 | 51,541 | 1,298 | |||||||||
Dividends from affiliates | — | (a) | 11 | — | (a) | |||||||
Securities lending income (See Note 2.B.) | — | (a) | — | — | ||||||||
Other assets | — | 168 | — | |||||||||
|
|
|
|
|
| |||||||
Total Assets | 85,190 | 29,659,256 | 206,977 | |||||||||
|
|
|
|
|
| |||||||
LIABILITIES: | ||||||||||||
Payables: | ||||||||||||
Distributions | — | — | 10 | |||||||||
Investment securities purchased | — | 50,059 | 14,200 | |||||||||
Fund shares redeemed | 10 | 37,478 | 906 | |||||||||
Accrued liabilities: | ||||||||||||
Investment advisory fees | 8 | 9,709 | 9 | |||||||||
Administration fees | — | 1,242 | — | |||||||||
Distribution fees | 3 | 1,597 | 5 | |||||||||
Service fees | 12 | 3,357 | 37 | |||||||||
Custodian and accounting fees | 9 | 173 | 12 | |||||||||
Trustees’ and Chief Compliance Officer’s fees | — | (a) | 2 | — | (a) | |||||||
Audit fees | 27 | 27 | 45 | |||||||||
Printing and mailing costs | 52 | 569 | 4 | |||||||||
Registration fees | 9 | — | 16 | |||||||||
Other | 6 | 106 | 3 | |||||||||
|
|
|
|
|
| |||||||
Total Liabilities | 136 | 104,319 | 15,247 | |||||||||
|
|
|
|
|
| |||||||
Net Assets | $ | 85,054 | $ | 29,554,937 | $ | 191,730 | ||||||
|
|
|
|
|
| |||||||
| (a) | Amount rounds to less than one thousand. |
SEE NOTES TO FINANCIAL STATEMENTS.
| 58 | J.P. MORGAN LARGE CAP FUNDS | JUNE 30, 2020 | ||||
Table of Contents
JPMorgan | JPMorgan Income Fund | JPMorgan Equity Premium Income Fund | ||||||||||
NET ASSETS: |
| |||||||||||
Paid-in-Capital | $ | 55,297 | $ | 26,551,129 | $ | 216,611 | ||||||
Total distributable earnings (loss) | 29,757 | 3,003,808 | (24,881 | ) | ||||||||
|
|
|
|
|
| |||||||
Total Net Assets | $ | 85,054 | $ | 29,554,937 | $ | 191,730 | ||||||
|
|
|
|
|
| |||||||
Net Assets: | ||||||||||||
Class A | $ | 5,723 | $ | 3,234,850 | $ | 12,904 | ||||||
Class C | 3,147 | 1,350,402 | 4,710 | |||||||||
Class I | 52,303 | 10,727,252 | 173,409 | |||||||||
Class R2 | — | 72,182 | — | |||||||||
Class R3 | — | 170,246 | — | |||||||||
Class R4 | — | 106,277 | — | |||||||||
Class R5 | — | 1,230,147 | 21 | |||||||||
Class R6 | 23,881 | 12,663,581 | 686 | |||||||||
|
|
|
|
|
| |||||||
Total | $ | 85,054 | $ | 29,554,937 | $ | 191,730 | ||||||
|
|
|
|
|
| |||||||
Outstanding units of beneficial interest (shares) ($0.0001 par value; unlimited number of shares authorized): | ||||||||||||
Class A | 213 | 199,425 | 996 | |||||||||
Class C | 123 | 85,030 | 363 | |||||||||
Class I | 1,910 | 649,396 | 13,378 | |||||||||
Class R2 | — | 4,472 | — | |||||||||
Class R3 | — | 10,504 | — | |||||||||
Class R4 | — | 6,438 | — | |||||||||
Class R5 | — | 74,412 | 2 | |||||||||
Class R6 | 877 | 766,658 | 53 | |||||||||
Net Asset Value (a): | ||||||||||||
Class A — Redemption price per share | $ | 26.88 | $ | 16.22 | $ | 12.96 | ||||||
Class C — Offering price per share (b) | 25.63 | 15.88 | 12.96 | |||||||||
Class I — Offering and redemption price per share | 27.38 | 16.52 | 12.96 | |||||||||
Class R2 — Offering and redemption price per share | — | 16.14 | — | |||||||||
Class R3 — Offering and redemption price per share | — | 16.21 | — | |||||||||
Class R4 — Offering and redemption price per share | — | 16.51 | — | |||||||||
Class R5 — Offering and redemption price per share | — | 16.53 | 12.96 | |||||||||
Class R6 — Offering and redemption price per share | 27.25 | 16.52 | 12.96 | |||||||||
Class A maximum sales charge | 5.25 | % | 5.25 | % | 5.25 | % | ||||||
Class A maximum public offering price per share | $ | 28.37 | $ | 17.12 | $ | 13.68 | ||||||
|
|
|
|
|
| |||||||
Cost of investments in non-affiliates | $ | 58,592 | $ | 24,776,423 | $ | 181,141 | ||||||
Cost of investments in affiliates | 3,215 | 882,345 | 5,899 | |||||||||
| (a) | Per share amounts may not recalculate due to rounding of net assets and/or shares outstanding. |
| (b) | Redemption price for Class C Shares varies based upon length of time the shares are held. |
SEE NOTES TO FINANCIAL STATEMENTS.
| JUNE 30, 2020 | J.P. MORGAN LARGE CAP FUNDS | 59 | ||||||
Table of Contents
STATEMENTS OF ASSETS AND LIABILITIES
AS OF JUNE 30, 2020 (continued)
(Amounts in thousands, except per share amounts)
JPMorgan | JPMorgan Equity Fund | JPMorgan Large Cap Growth Fund | ||||||||||
ASSETS: |
| |||||||||||
Investments in non-affiliates, at value | $ | 701,191 | $ | 8,339,237 | $ | 22,142,641 | ||||||
Investments in affiliates, at value | 25,234 | 456,381 | 1,084,362 | |||||||||
Investment of cash collateral received from securities loaned, at value (See Note 2.B.) | — | — | 1,199,704 | |||||||||
Options purchased, at value | — | 298,312 | — | |||||||||
Cash | 10 | 125 | 389 | |||||||||
Deposits at broker for futures contracts | — | 21,442 | — | |||||||||
Receivables: | ||||||||||||
Investment securities sold | — | 1,438,064 | 36,470 | |||||||||
Fund shares sold | 458 | 357,447 | 40,303 | |||||||||
Dividends from non-affiliates | 893 | 9,461 | 2,875 | |||||||||
Dividends from affiliates | — | (a) | 13 | 14 | ||||||||
Securities lending income (See Note 2.B.) | — | — | 2,105 | |||||||||
Variation margin on futures contracts | — | 3,458 | — | |||||||||
Other assets | — | 31 | 138 | |||||||||
|
|
|
|
|
| |||||||
Total Assets | 727,786 | 10,923,971 | 24,509,001 | |||||||||
|
|
|
|
|
| |||||||
LIABILITIES: |
| |||||||||||
Payables: | ||||||||||||
Investment securities purchased | — | 1,867,528 | — | |||||||||
Collateral received on securities loaned (See Note 2.B.) | — | — | 1,199,704 | |||||||||
Fund shares redeemed | 337 | 5,598 | 32,745 | |||||||||
Outstanding options written, at fair value | — | 305,199 | — | |||||||||
Accrued liabilities: | ||||||||||||
Investment advisory fees | 207 | 1,587 | 7,064 | |||||||||
Administration fees | 25 | 472 | 411 | |||||||||
Distribution fees | 121 | 246 | 1,146 | |||||||||
Service fees | 109 | 1,457 | 2,278 | |||||||||
Custodian and accounting fees | 17 | 139 | 103 | |||||||||
Trustees’ and Chief Compliance Officer’s fees | — | (a) | — | (a) | 1 | |||||||
Audit fees | 26 | 42 | 28 | |||||||||
Printing and mailing costs | 18 | 90 | 286 | |||||||||
Registration fees | 32 | — | — | |||||||||
Other | 40 | 21 | 69 | |||||||||
|
|
|
|
|
| |||||||
Total Liabilities | 932 | 2,182,379 | 1,243,835 | |||||||||
|
|
|
|
|
| |||||||
Net Assets | $ | 726,854 | $ | 8,741,592 | $ | 23,265,166 | ||||||
|
|
|
|
|
| |||||||
| (a) | Amount rounds to less than one thousand. |
SEE NOTES TO FINANCIAL STATEMENTS.
| 60 | J.P. MORGAN LARGE CAP FUNDS | JUNE 30, 2020 | ||||
Table of Contents
JPMorgan | JPMorgan Hedged Equity Fund | JPMorgan Large Cap Growth Fund | ||||||||||
NET ASSETS: |
| |||||||||||
Paid-in-Capital | $ | 561,690 | $ | 7,976,458 | $ | 12,152,998 | ||||||
Total distributable earnings (loss) | 165,164 | 765,134 | 11,112,168 | |||||||||
|
|
|
|
|
| |||||||
Total Net Assets | $ | 726,854 | $ | 8,741,592 | $ | 23,265,166 | ||||||
|
|
|
|
|
| |||||||
Net Assets: |
| |||||||||||
Class A | $ | 497,399 | $ | 473,314 | $ | 3,280,463 | ||||||
Class C | 26,487 | 246,741 | 701,820 | |||||||||
Class I | 135,234 | 7,167,488 | 7,058,308 | |||||||||
Class R2 | 1,126 | — | 118,628 | |||||||||
Class R3 | 398 | — | 90,107 | |||||||||
Class R4 | 1,159 | — | 64,792 | |||||||||
Class R5 | 83 | 2,964 | 781,380 | |||||||||
Class R6 | 64,968 | 851,085 | 11,169,668 | |||||||||
|
|
|
|
|
| |||||||
Total | $ | 726,854 | $ | 8,741,592 | $ | 23,265,166 | ||||||
|
|
|
|
|
| |||||||
Outstanding units of beneficial interest (shares) | ||||||||||||
($0.0001 par value; unlimited number of shares authorized): | ||||||||||||
Class A | 10,903 | 21,684 | 68,286 | |||||||||
Class C | 652 | 11,372 | 19,807 | |||||||||
Class I | 2,798 | 327,324 | 144,303 | |||||||||
Class R2 | 24 | — | 2,584 | |||||||||
Class R3 | 8 | — | 1,864 | |||||||||
Class R4 | 24 | — | 1,326 | |||||||||
Class R5 | 2 | 135 | 15,564 | |||||||||
Class R6 | 1,334 | 38,781 | 220,494 | |||||||||
Net Asset Value (a): | ||||||||||||
Class A — Redemption price per share | $ | 45.62 | $ | 21.83 | $ | 48.04 | ||||||
Class C — Offering price per share (b) | 40.63 | 21.70 | 35.43 | |||||||||
Class I — Offering and redemption price per share | 48.34 | 21.90 | 48.91 | |||||||||
Class R2 — Offering and redemption price per share | 45.72 | — | 45.90 | |||||||||
Class R3 — Offering and redemption price per share | 48.25 | — | 48.34 | |||||||||
Class R4 — Offering and redemption price per share | 48.31 | — | 48.84 | |||||||||
Class R5 — Offering and redemption price per share | 48.69 | 21.93 | 50.20 | |||||||||
Class R6 — Offering and redemption price per share | 48.70 | 21.95 | 50.66 | |||||||||
Class A maximum sales charge | 5.25 | % | 5.25 | % | 5.25 | % | ||||||
Class A maximum public offering price per share | $ | 48.15 | $ | 23.04 | $ | 50.70 | ||||||
|
|
|
|
|
| |||||||
Cost of investments in non-affiliates | $ | 534,823 | $ | 6,839,268 | $ | 11,896,273 | ||||||
Cost of investments in affiliates | 25,216 | 456,381 | 1,083,765 | |||||||||
Cost of options purchased | — | 309,275 | — | |||||||||
Investment securities on loan, at value (See Note 2.B.) | — | — | 1,215,560 | |||||||||
Cost of investment of cash collateral (See Note 2.B.) | — | — | 1,199,665 | |||||||||
Premiums received from options written | — | 300,626 | — | |||||||||
| (a) | Per share amounts may not recalculate due to rounding of net assets and/or shares outstanding. |
| (b) | Redemption price for Class C Shares varies based upon length of time the shares are held. |
SEE NOTES TO FINANCIAL STATEMENTS.
| JUNE 30, 2020 | J.P. MORGAN LARGE CAP FUNDS | 61 | ||||||
Table of Contents
STATEMENTS OF ASSETS AND LIABILITIES
AS OF JUNE 30, 2020 (continued)
(Amounts in thousands, except per share amounts)
| JPMorgan Large Cap Value Fund | JPMorgan U.S. Equity Fund | JPMorgan U.S. Large Cap Core Plus Fund | JPMorgan U.S. Research Enhanced Equity Fund | |||||||||||||
ASSETS: |
| |||||||||||||||
Investments in non-affiliates, at value | $ | 1,244,852 | $ | 14,941,211 | $ | 3,913,916 | $ | 4,309,619 | ||||||||
Investments in affiliates, at value | 12,570 | 41,341 | 35,661 | 110,144 | ||||||||||||
Investment of cash collateral received from securities loaned, at value (See Note 2.B.) | 60,397 | 13,679 | — | — | ||||||||||||
Cash | 6 | 47 | 23 | 44 | ||||||||||||
Deposits at broker for futures contracts | — | — | 368 | 9,236 | ||||||||||||
Receivables: | ||||||||||||||||
Investment securities sold | 2,020 | 65,587 | 39,484 | 10,105 | ||||||||||||
Fund shares sold | 676 | 12,528 | 697 | 3,431 | ||||||||||||
Interest and dividends from non-affiliates | 2,084 | 11,462 | 3,941 | 4,541 | ||||||||||||
Dividends from affiliates | — | (a) | 1 | — | (a) | 1 | ||||||||||
Tax reclaims | — | — | 6 | 6 | ||||||||||||
Securities lending income (See Note 2.B.) | 26 | 24 | — | — | ||||||||||||
Variation margin on futures contracts | — | — | 26 | 871 | ||||||||||||
|
|
|
|
|
|
|
| |||||||||
Total Assets | 1,322,631 | 15,085,880 | 3,994,122 | 4,447,998 | ||||||||||||
|
|
|
|
|
|
|
| |||||||||
LIABILITIES: |
| |||||||||||||||
Payables: | ||||||||||||||||
Securities sold short, at value | — | — | 895,228 | — | ||||||||||||
Dividend expense to non-affiliates on securities sold short | — | — | 1,071 | — | ||||||||||||
Investment securities purchased | 239 | 90,961 | 42,579 | 76,348 | ||||||||||||
Collateral received on securities loaned (See Note 2.B.) | 60,397 | 13,679 | — | — | ||||||||||||
Fund shares redeemed | 1,254 | 34,853 | 2,343 | 5,629 | ||||||||||||
Accrued liabilities: | ||||||||||||||||
Investment advisory fees | 375 | 4,634 | 1,570 | 714 | ||||||||||||
Administration fees | 48 | 658 | 146 | 155 | ||||||||||||
Distribution fees | 66 | 665 | 117 | 37 | ||||||||||||
Service fees | 78 | 881 | 308 | 62 | ||||||||||||
Custodian and accounting fees | 19 | 122 | 109 | 37 | ||||||||||||
Trustees’ and Chief Compliance Officer’s fees | — | (a) | 1 | — | (a) | 1 | ||||||||||
Audit fees | 27 | 28 | 38 | 29 | ||||||||||||
Printing and mailing costs | 78 | 536 | 172 | 154 | ||||||||||||
Registration fees | 35 | 28 | 96 | 38 | ||||||||||||
Other | 18 | 72 | 39 | 30 | ||||||||||||
|
|
|
|
|
|
|
| |||||||||
Total Liabilities | 62,634 | 147,118 | 943,816 | 83,234 | ||||||||||||
|
|
|
|
|
|
|
| |||||||||
Net Assets | $ | 1,259,997 | $ | 14,938,762 | $ | 3,050,306 | $ | 4,364,764 | ||||||||
|
|
|
|
|
|
|
| |||||||||
| (a) | Amount rounds to less than one thousand. |
SEE NOTES TO FINANCIAL STATEMENTS.
| 62 | J.P. MORGAN LARGE CAP FUNDS | JUNE 30, 2020 | ||||
Table of Contents
| JPMorgan Large Cap Value Fund | JPMorgan U.S. Equity Fund | JPMorgan Plus Fund | JPMorgan U.S. Research Enhanced Equity Fund | |||||||||||||
NET ASSETS: |
| |||||||||||||||
Paid-in-Capital | $ | 1,337,326 | $ | 10,151,899 | $ | 1,092,254 | $ | 3,003,808 | ||||||||
Total distributable earnings (loss) | (77,329 | ) | 4,786,863 | 1,958,052 | 1,360,956 | |||||||||||
|
|
|
|
|
|
|
| |||||||||
Total Net Assets | $ | 1,259,997 | $ | 14,938,762 | $ | 3,050,306 | $ | 4,364,764 | ||||||||
|
|
|
|
|
|
|
| |||||||||
Net Assets: |
| |||||||||||||||
Class A | $ | 119,402 | $ | 1,869,111 | $ | 267,701 | $ | 183,005 | ||||||||
Class C | 33,769 | 274,741 | 59,105 | — | ||||||||||||
Class I | 262,414 | 1,038,998 | 2,189,079 | 204,193 | ||||||||||||
Class L | — | 1,309,531 | — | 391,894 | ||||||||||||
Class R2 | 17,777 | 216,689 | 4,560 | — | ||||||||||||
Class R3 | 18 | 117,991 | — | — | ||||||||||||
Class R4 | 11,823 | 21,651 | — | — | ||||||||||||
Class R5 | 18,535 | 817,671 | 38,447 | — | ||||||||||||
Class R6 | 796,259 | 9,272,379 | 491,414 | 3,585,672 | ||||||||||||
|
|
|
|
|
|
|
| |||||||||
Total | $ | 1,259,997 | $ | 14,938,762 | $ | 3,050,306 | $ | 4,364,764 | ||||||||
|
|
|
|
|
|
|
| |||||||||
Outstanding units of beneficial interest (shares) | ||||||||||||||||
($0.0001 par value; unlimited number of shares authorized): | ||||||||||||||||
Class A | 9,384 | 115,270 | 10,891 | 6,893 | ||||||||||||
Class C | 2,775 | 17,611 | 2,607 | — | ||||||||||||
Class I | 21,012 | 63,841 | 87,406 | 7,606 | ||||||||||||
Class L | — | 80,324 | — | 14,625 | ||||||||||||
Class R2 | 1,410 | 13,508 | 194 | — | ||||||||||||
Class R3 | 1 | 7,305 | — | — | ||||||||||||
Class R4 | 929 | 1,332 | — | — | ||||||||||||
Class R5 | 1,469 | 50,136 | 1,526 | — | ||||||||||||
Class R6 | 63,531 | 567,326 | 19,515 | 133,743 | ||||||||||||
Net Asset Value (a): | ||||||||||||||||
Class A — Redemption price per share | $ | 12.72 | $ | 16.22 | $ | 24.58 | $ | 26.55 | ||||||||
Class C — Offering price per share (b) | 12.17 | 15.60 | 22.67 | — | ||||||||||||
Class I — Offering and redemption price per share | 12.49 | 16.27 | 25.04 | 26.85 | ||||||||||||
Class L — Offering and redemption price per share | — | 16.30 | — | 26.80 | ||||||||||||
Class R2 — Offering and redemption price per share | 12.61 | 16.04 | 23.54 | — | ||||||||||||
Class R3 — Offering and redemption price per share | 12.48 | 16.15 | — | — | ||||||||||||
Class R4 — Offering and redemption price per share | 12.73 | 16.25 | — | — | ||||||||||||
Class R5 — Offering and redemption price per share | 12.62 | 16.31 | 25.20 | — | ||||||||||||
Class R6 — Offering and redemption price per share | 12.53 | 16.34 | 25.18 | 26.81 | ||||||||||||
Class A maximum sales charge | 5.25 | % | 5.25 | % | 5.25 | % | 5.25 | % | ||||||||
Class A maximum public offering price per share | $ | 13.42 | $ | 17.12 | $ | 25.94 | $ | 28.02 | ||||||||
|
|
|
|
|
|
|
| |||||||||
Cost of investments in non-affiliates | $ | 1,245,090 | $ | 10,549,672 | $ | 2,450,303 | $ | 2,977,518 | ||||||||
Cost of investments in affiliates | 12,570 | 41,341 | 35,657 | 110,137 | ||||||||||||
Investment securities on loan, at value (See Note 2.B.) | 59,241 | 13,372 | — | — | ||||||||||||
Cost of investment of cash collateral (See Note 2.B.) | 60,398 | 13,679 | — | — | ||||||||||||
Proceeds from securities sold short | — | — | 963,436 | — | ||||||||||||
| (a) | Per share amounts may not recalculate due to rounding of net assets and/or shares outstanding. |
| (b) | Redemption price for Class C Shares varies based upon length of time the shares are held. |
SEE NOTES TO FINANCIAL STATEMENTS.
| JUNE 30, 2020 | J.P. MORGAN LARGE CAP FUNDS | 63 | ||||||
Table of Contents
STATEMENTS OF OPERATIONS
FOR THE YEAR ENDED JUNE 30, 2020
(Amounts in thousands)
| JPMorgan Equity Focus Fund | JPMorgan Equity Income Fund | JPMorgan Equity Premium Income Fund | ||||||||||
INVESTMENT INCOME: | ||||||||||||
Interest income from non-affiliates | $ | — | (a) | $ | 9 | $ | 11,943 | |||||
Interest income from affiliates | — | (a) | — | — | ||||||||
Dividend income from non-affiliates | 1,544 | 779,142 | 2,277 | |||||||||
Dividend income from affiliates | 35 | 15,227 | 25 | |||||||||
Income from securities lending (net) (See Note 2.B.) | — | (a) | — | — | ||||||||
|
|
|
|
|
| |||||||
Total investment income | 1,579 | 794,378 | 14,245 | |||||||||
|
|
|
|
|
| |||||||
EXPENSES: |
| |||||||||||
Investment advisory fees | 491 | 112,524 | 293 | |||||||||
Administration fees | 72 | 14,360 | 88 | |||||||||
Distribution fees: | ||||||||||||
Class A | 14 | 8,521 | 15 | |||||||||
Class C | 24 | 10,928 | 17 | |||||||||
Class R2 | — | 433 | — | |||||||||
Class R3 | — | 407 | — | |||||||||
Service fees: | ||||||||||||
Class A | 14 | 8,521 | 15 | |||||||||
Class C | 8 | 3,643 | 6 | |||||||||
Class I | 155 | 25,616 | 271 | |||||||||
Class R2 | — | 216 | — | |||||||||
Class R3 | — | 407 | — | |||||||||
Class R4 | — | 231 | — | |||||||||
Class R5 | — | 1,423 | — | (a) | ||||||||
Custodian and accounting fees | 23 | 738 | 45 | |||||||||
Interest expense to affiliates | — | (a) | 1 | 2 | ||||||||
Professional fees | 55 | 347 | 97 | |||||||||
Trustees’ and Chief Compliance Officer’s fees | 26 | 126 | 26 | |||||||||
Printing and mailing costs | 40 | 1,631 | 22 | |||||||||
Registration and filing fees | 76 | 1,005 | 176 | |||||||||
Transfer agency fees (See Note 2.J.) | 5 | 864 | 2 | |||||||||
Offering costs (See Note 2.H.) | — | — | 5 | |||||||||
Other | 9 | 359 | 10 | |||||||||
|
|
|
|
|
| |||||||
Total expenses | 1,012 | 192,301 | 1,090 | |||||||||
|
|
|
|
|
| |||||||
Less fees waived | (223 | ) | (1,353 | ) | (299 | ) | ||||||
Less expense reimbursements | — | — | (58 | ) | ||||||||
|
|
|
|
|
| |||||||
Net expenses | 789 | 190,948 | 733 | |||||||||
|
|
|
|
|
| |||||||
Net investment income (loss) | 790 | 603,430 | 13,512 | |||||||||
|
|
|
|
|
| |||||||
REALIZED/UNREALIZED GAINS (LOSSES): | ||||||||||||
Net realized gain (loss) on transactions from: |
| |||||||||||
Investments in non-affiliates | 11,965 | (525,415 | ) | (29,238 | ) | |||||||
Investments in affiliates | (2 | ) | 164 | — | (a) | |||||||
|
|
|
|
|
| |||||||
Net realized gain (loss) | 11,963 | (525,251 | ) | (29,238 | ) | |||||||
|
|
|
|
|
| |||||||
Change in net unrealized appreciation/depreciation on: |
| |||||||||||
Investments in non-affiliates | (8,471 | ) | (2,031,491 | ) | 4,460 | |||||||
Investments in affiliates | 1 | 588 | — | (a) | ||||||||
|
|
|
|
|
| |||||||
Change in net unrealized appreciation/depreciation | (8,470 | ) | (2,030,903 | ) | 4,460 | |||||||
|
|
|
|
|
| |||||||
Net realized/unrealized gains (losses) | 3,493 | (2,556,154 | ) | (24,778 | ) | |||||||
|
|
|
|
|
| |||||||
Change in net assets resulting from operations | $ | 4,283 | $ | (1,952,724 | ) | $ | (11,266 | ) | ||||
|
|
|
|
|
| |||||||
| (a) | Amount rounds to less than one thousand. |
SEE NOTES TO FINANCIAL STATEMENTS.
| 64 | J.P. MORGAN LARGE CAP FUNDS | JUNE 30, 2020 | ||||
Table of Contents
JPMorgan | JPMorgan Hedged Equity Fund | JPMorgan Large Cap Growth Fund | ||||||||||
INVESTMENT INCOME: | ||||||||||||
Interest income from non-affiliates | $ | — | (a) | $ | 58 | $ | 12 | |||||
Interest income from affiliates | — | (a) | — | — | (a) | |||||||
Dividend income from non-affiliates | 17,415 | 131,924 | 143,212 | |||||||||
Dividend income from affiliates | 287 | 1,628 | 8,356 | |||||||||
Non-cash dividend income from non-affiliates | — | 9,811 | — | |||||||||
Income from securities lending (net) (See Note 2.B.) | — | (a) | — | 9,815 | ||||||||
|
|
|
|
|
| |||||||
Total investment income | 17,702 | 143,421 | 161,395 | |||||||||
|
|
|
|
|
| |||||||
EXPENSES: |
| |||||||||||
Investment advisory fees | 2,780 | 16,376 | 80,645 | |||||||||
Administration fees | 521 | 4,913 | 11,495 | |||||||||
Distribution fees: | ||||||||||||
Class A | 1,278 | 1,037 | 6,695 | |||||||||
Class C | 207 | 1,468 | 4,137 | |||||||||
Class R2 | 3 | — | 604 | |||||||||
Class R3 | — | (a) | — | 165 | ||||||||
Service fees: | ||||||||||||
Class A | 1,278 | 1,037 | 6,695 | |||||||||
Class C | 69 | 489 | 1,379 | |||||||||
Class I | 258 | 13,347 | 12,683 | |||||||||
Class R2 | 1 | — | 302 | |||||||||
Class R3 | — | (a) | — | 165 | ||||||||
Class R4 | 1 | — | 68 | |||||||||
Class R5 | — | (a) | 2 | 713 | ||||||||
Custodian and accounting fees | 41 | 354 | 442 | |||||||||
Interest expense to affiliates | — | 7 | 4 | |||||||||
Professional fees | 60 | 147 | 240 | |||||||||
Trustees’ and Chief Compliance Officer’s fees | 28 | 48 | 88 | |||||||||
Printing and mailing costs | 51 | 391 | 709 | |||||||||
Registration and filing fees | 125 | 471 | 577 | |||||||||
Transfer agency fees (See Note 2.J.) | 193 | 125 | 524 | |||||||||
Other | 21 | 103 | 230 | |||||||||
|
|
|
|
|
| |||||||
Total expenses | 6,915 | 40,315 | 128,560 | |||||||||
|
|
|
|
|
| |||||||
Less fees waived | (780 | ) | (366 | ) | (17,465 | ) | ||||||
Less expense reimbursements | (8 | ) | (7 | ) | (17 | ) | ||||||
|
|
|
|
|
| |||||||
Net expenses | 6,127 | 39,942 | 111,078 | |||||||||
|
|
|
|
|
| |||||||
Net investment income (loss) | 11,575 | 103,479 | 50,317 | |||||||||
|
|
|
|
|
| |||||||
REALIZED/UNREALIZED GAINS (LOSSES): | ||||||||||||
Net realized gain (loss) on transactions from: |
| |||||||||||
Investments in non-affiliates | 1,993 | (329,388 | ) | 1,883,710 | ||||||||
Investments in affiliates | (1 | ) | — | 125 | ||||||||
Options purchased | — | 401,900 | — | |||||||||
Futures contracts | — | 14,045 | — | |||||||||
Options written | — | (556,447 | ) | — | ||||||||
|
|
|
|
|
| |||||||
Net realized gain (loss) | 1,992 | (469,890 | ) | 1,883,835 | ||||||||
|
|
|
|
|
| |||||||
Change in net unrealized appreciation/depreciation on: |
| |||||||||||
Investments in non-affiliates | (46,648 | ) | 914,381 | 3,286,356 | ||||||||
Investments in affiliates | 17 | — | 592 | |||||||||
Options purchased | — | (9,352 | ) | — | ||||||||
Futures contracts | — | 441 | — | |||||||||
Options written | — | (3,226 | ) | — | ||||||||
|
|
|
|
|
| |||||||
Change in net unrealized appreciation/depreciation | (46,631 | ) | 902,244 | 3,286,948 | ||||||||
|
|
|
|
|
| |||||||
Net realized/unrealized gains (losses) | (44,639 | ) | 432,354 | 5,170,783 | ||||||||
|
|
|
|
|
| |||||||
Change in net assets resulting from operations | $ | (33,064 | ) | $ | 535,833 | $ | 5,221,100 | |||||
|
|
|
|
|
| |||||||
| (a) | Amount rounds to less than one thousand. |
SEE NOTES TO FINANCIAL STATEMENTS.
| JUNE 30, 2020 | J.P. MORGAN LARGE CAP FUNDS | 65 | ||||||
Table of Contents
STATEMENTS OF OPERATIONS
FOR THE YEAR ENDED JUNE 30, 2020 (continued)
(Amounts in thousands)
| JPMorgan Large Cap Value Fund | JPMorgan U.S. Equity Fund | JPMorgan U.S. Large Cap Core Plus Fund | JPMorgan U.S. Research Enhanced Equity Fund | |||||||||||||
INVESTMENT INCOME: |
| |||||||||||||||
Interest income from non-affiliates | $ | 1 | $ | 43 | $ | 32 | $ | 29 | ||||||||
Interest income from affiliates | — | — | (a) | 2 | — | (a) | ||||||||||
Dividend income from non-affiliates | 32,140 | 237,219 | 86,340 | 86,166 | ||||||||||||
Dividend income from affiliates | 480 | 2,292 | 988 | 793 | ||||||||||||
Non-cash dividend income from non-affiliates | — | — | — | 4,720 | ||||||||||||
Income from securities lending (net) (See Note 2.B.) | 105 | 201 | — | — | ||||||||||||
|
|
|
|
|
|
|
| |||||||||
Total investment income | 32,726 | 239,755 | 87,362 | 91,708 | ||||||||||||
|
|
|
|
|
|
|
| |||||||||
EXPENSES: |
| |||||||||||||||
Investment advisory fees | 5,752 | 58,661 | 27,650 | 11,230 | ||||||||||||
Administration fees | 1,079 | 9,861 | 3,159 | 3,369 | ||||||||||||
Distribution fees: | ||||||||||||||||
Class A | 551 | 4,221 | 1,161 | 472 | ||||||||||||
Class C | 340 | 2,074 | 629 | — | ||||||||||||
Class R2 | 100 | 1,136 | 25 | — | ||||||||||||
Class R3 | — | (a) | 283 | — | — | |||||||||||
Service fees: | ||||||||||||||||
Class A | 551 | 4,221 | 1,161 | 472 | ||||||||||||
Class C | 113 | 691 | 210 | — | ||||||||||||
Class I | 662 | 2,555 | 7,354 | 526 | ||||||||||||
Class L | — | 1,423 | — | 401 | ||||||||||||
Class R2 | 50 | 568 | 12 | — | ||||||||||||
Class R3 | — | (a) | 283 | — | — | |||||||||||
Class R4 | 32 | 55 | — | — | ||||||||||||
Class R5 | 26 | 812 | 83 | — | ||||||||||||
Custodian and accounting fees | 56 | 428 | 268 | 142 | ||||||||||||
Interest expense to affiliates | — | 2 | 7 | — | (a) | |||||||||||
Professional fees | 68 | 217 | 120 | 112 | ||||||||||||
Trustees’ and Chief Compliance Officer’s fees | 31 | 79 | 42 | 43 | ||||||||||||
Printing and mailing costs | 103 | 466 | 112 | 52 | ||||||||||||
Registration and filing fees | 166 | 280 | 191 | 96 | ||||||||||||
Transfer agency fees (See Note 2.J.) | 110 | 388 | 109 | 75 | ||||||||||||
Dividend expense to non-affiliates on securities sold short | — | — | 28,761 | — | ||||||||||||
Interest expense to non-affiliates on securities sold short | — | — | 5,979 | — | ||||||||||||
Other | 25 | 214 | 71 | 77 | ||||||||||||
|
|
|
|
|
|
|
| |||||||||
Total expenses | 9,815 | 88,918 | 77,104 | 17,067 | ||||||||||||
|
|
|
|
|
|
|
| |||||||||
Less fees waived | (1,106 | ) | (6,033 | ) | (5,804 | ) | (4,578 | ) | ||||||||
Less expense reimbursements | (18 | ) | (86 | ) | (3 | ) | (34 | ) | ||||||||
|
|
|
|
|
|
|
| |||||||||
Net expenses | 8,691 | 82,799 | 71,297 | 12,455 | ||||||||||||
|
|
|
|
|
|
|
| |||||||||
Net investment income (loss) | 24,035 | 156,956 | 16,065 | 79,253 | ||||||||||||
|
|
|
|
|
|
|
| |||||||||
REALIZED/UNREALIZED GAINS (LOSSES): | ||||||||||||||||
Net realized gain (loss) on transactions from: |
| |||||||||||||||
Investments in non-affiliates | (22,839 | ) | 1,059,829 | 1,393,660 | 808,278 | |||||||||||
Investments in affiliates | 17 | (3 | ) | 26 | (11 | ) | ||||||||||
Futures contracts | — | 14,270 | (11,552 | ) | 878 | |||||||||||
Securities sold short | — | — | 79,467 | — | ||||||||||||
|
|
|
|
|
|
|
| |||||||||
Net realized gain (loss) | (22,822 | ) | 1,074,096 | 1,461,601 | 809,145 | |||||||||||
|
|
|
|
|
|
|
| |||||||||
Change in net unrealized appreciation/depreciation on: |
| |||||||||||||||
Investments in non-affiliates | (109,303 | ) | 589,057 | (1,035,662 | ) | (499,924 | ) | |||||||||
Investments in affiliates | (2 | ) | (10 | ) | 2 | 3 | ||||||||||
Futures contracts | — | (142 | ) | 132 | 356 | |||||||||||
Securities sold short | — | — | (9,577 | ) | — | |||||||||||
|
|
|
|
|
|
|
| |||||||||
Change in net unrealized appreciation/depreciation | (109,305 | ) | 588,905 | (1,045,105 | ) | (499,565 | ) | |||||||||
|
|
|
|
|
|
|
| |||||||||
Net realized/unrealized gains (losses) | (132,127 | ) | 1,663,001 | 416,496 | 309,580 | |||||||||||
|
|
|
|
|
|
|
| |||||||||
Change in net assets resulting from operations | $ | (108,092 | ) | $ | 1,819,957 | $ | 432,561 | $ | 388,833 | |||||||
|
|
|
|
|
|
|
| |||||||||
| (a) | Amount rounds to less than one thousand. |
SEE NOTES TO FINANCIAL STATEMENTS.
| 66 | J.P. MORGAN LARGE CAP FUNDS | JUNE 30, 2020 | ||||
Table of Contents
STATEMENTS OF CHANGES IN NET ASSETS
FOR THE PERIODS INDICATED
(Amounts in thousands)
| JPMorgan Equity Focus Fund | JPMorgan Equity Income Fund | |||||||||||||||
| Year Ended June 30, 2020 | Year Ended June 30, 2019 | Year Ended June 30, 2020 | Year Ended June 30, 2019 | |||||||||||||
CHANGE IN NET ASSETS RESULTING FROM OPERATIONS: |
| |||||||||||||||
Net investment income (loss) | $ | 790 | $ | 1,021 | $ | 603,430 | $ | 417,629 | ||||||||
Net realized gain (loss) | 11,963 | 25,683 | (525,251 | ) | 261,966 | |||||||||||
Change in net unrealized appreciation/depreciation | (8,470 | ) | (16,976 | ) | (2,030,903 | ) | 1,549,963 | |||||||||
|
|
|
|
|
|
|
| |||||||||
Change in net assets resulting from operations | 4,283 | 9,728 | (1,952,724 | ) | 2,229,558 | |||||||||||
|
|
|
|
|
|
|
| |||||||||
DISTRIBUTIONS TO SHAREHOLDERS: | ||||||||||||||||
Class A | (962 | ) | (681 | ) | (100,496 | ) | (140,305 | ) | ||||||||
Class C | (540 | ) | (399 | ) | (36,790 | ) | (57,794 | ) | ||||||||
Class I | (10,258 | ) | (14,230 | ) | (324,790 | ) | (356,669 | ) | ||||||||
Class R2 | — | — | (2,344 | ) | (3,859 | ) | ||||||||||
Class R3 | — | — | (4,859 | ) | (5,148 | ) | ||||||||||
Class R4 | — | — | (2,895 | ) | (1,500 | ) | ||||||||||
Class R5 | — | — | (46,903 | ) | (59,529 | ) | ||||||||||
Class R6 (a) | (4,735 | ) | (2 | ) | (394,174 | ) | (310,524 | ) | ||||||||
|
|
|
|
|
|
|
| |||||||||
Total distributions to shareholders | (16,495 | ) | (15,312 | ) | (913,251 | ) | (935,328 | ) | ||||||||
|
|
|
|
|
|
|
| |||||||||
CAPITAL TRANSACTIONS: |
| |||||||||||||||
Change in net assets resulting from capital transactions | (9,562 | ) | (140,958 | ) | 8,758,465 | 5,113,722 | ||||||||||
|
|
|
|
|
|
|
| |||||||||
NET ASSETS: |
| |||||||||||||||
Change in net assets | (21,774 | ) | (146,542 | ) | 5,892,490 | 6,407,952 | ||||||||||
Beginning of period | 106,828 | 253,370 | 23,662,447 | 17,254,495 | ||||||||||||
|
|
|
|
|
|
|
| |||||||||
End of period | $ | 85,054 | $ | 106,828 | $ | 29,554,937 | $ | 23,662,447 | ||||||||
|
|
|
|
|
|
|
| |||||||||
| (a) | Commencement of offering of class of shares effective October 1, 2018 for JPMorgan Equity Focus Fund. |
SEE NOTES TO FINANCIAL STATEMENTS.
| JUNE 30, 2020 | J.P. MORGAN LARGE CAP FUNDS | 67 | ||||||
Table of Contents
STATEMENTS OF CHANGES IN NET ASSETS
FOR THE PERIODS INDICATED (continued)
(Amounts in thousands)
| JPMorgan Equity Premium Income Fund | JPMorgan Growth and Income Fund | |||||||||||||||
| Year Ended June 30, 2020 | Period Ended June 30, 2019 (a) | Year Ended June 30, 2020 | Year Ended June 30, 2019 | |||||||||||||
CHANGE IN NET ASSETS RESULTING FROM OPERATIONS: |
| |||||||||||||||
Net investment income (loss) | $ | 13,512 | $ | 3,239 | $ | 11,575 | $ | 11,130 | ||||||||
Net realized gain (loss) | (29,238 | ) | (3,432 | ) | 1,992 | 16,767 | ||||||||||
Change in net unrealized appreciation/depreciation | 4,460 | 3,283 | (46,631 | ) | 12,931 | |||||||||||
|
|
|
|
|
|
|
| |||||||||
Change in net assets resulting from operations | (11,266 | ) | 3,090 | (33,064 | ) | 40,828 | ||||||||||
|
|
|
|
|
|
|
| |||||||||
DISTRIBUTIONS TO SHAREHOLDERS: | ||||||||||||||||
Class A | (857 | ) | (2 | ) | (19,342 | ) | (28,923 | ) | ||||||||
Class C | (258 | ) | (1 | ) | (1,019 | ) | (1,489 | ) | ||||||||
Class I | (12,367 | ) | (3,249 | ) | (3,705 | ) | (5,085 | ) | ||||||||
Class R2 | — | — | (16 | ) | (6 | ) | ||||||||||
Class R3 | — | — | (2 | ) | (1 | ) | ||||||||||
Class R4 | — | — | (12 | ) | (1 | ) | ||||||||||
Class R5 | (2 | ) | (1 | ) | (3 | ) | (3 | ) | ||||||||
Class R6 | (39 | ) | (1 | ) | (2,189 | ) | (2,303 | ) | ||||||||
|
|
|
|
|
|
|
| |||||||||
Total distributions to shareholders | (13,523 | ) | (3,254 | ) | (26,288 | ) | (37,811 | ) | ||||||||
|
|
|
|
|
|
|
| |||||||||
CAPITAL TRANSACTIONS: |
| |||||||||||||||
Change in net assets resulting from capital transactions | 162,286 | 54,397 | 133,703 | 38,723 | ||||||||||||
|
|
|
|
|
|
|
| |||||||||
NET ASSETS: |
| |||||||||||||||
Change in net assets | 137,497 | 54,233 | 74,351 | 41,740 | ||||||||||||
Beginning of period | 54,233 | — | 652,503 | 610,763 | ||||||||||||
|
|
|
|
|
|
|
| |||||||||
End of period | $ | 191,730 | $ | 54,233 | $ | 726,854 | $ | 652,503 | ||||||||
|
|
|
|
|
|
|
| |||||||||
| (a) | Commencement of operations was August 31, 2018. |
SEE NOTES TO FINANCIAL STATEMENTS.
| 68 | J.P. MORGAN LARGE CAP FUNDS | JUNE 30, 2020 | ||||
Table of Contents
| JPMorgan Hedged Equity Fund | JPMorgan Large Cap Growth Fund | |||||||||||||||
| Year Ended June 30, 2020 | Year Ended June 30, 2019 | Year Ended June 30, 2020 | Year Ended June 30, 2019 | |||||||||||||
CHANGE IN NET ASSETS RESULTING FROM OPERATIONS: |
| |||||||||||||||
Net investment income (loss) | $ | 103,479 | $ | 44,889 | $ | 50,317 | $ | 9,977 | ||||||||
Net realized gain (loss) | (469,890 | ) | (199,259 | ) | 1,883,835 | 2,059,616 | ||||||||||
Change in net unrealized appreciation/depreciation | 902,244 | 377,249 | 3,286,948 | (142,274 | ) | |||||||||||
|
|
|
|
|
|
|
| |||||||||
Change in net assets resulting from operations | 535,833 | 222,879 | 5,221,100 | 1,927,319 | ||||||||||||
|
|
|
|
|
|
|
| |||||||||
DISTRIBUTIONS TO SHAREHOLDERS: | ||||||||||||||||
Class A | (3,986 | ) | (2,575 | ) | (307,305 | ) | (290,662 | ) | ||||||||
Class C | (836 | ) | (707 | ) | (82,111 | ) | (80,926 | ) | ||||||||
Class I | (62,588 | ) | (36,679 | ) | (568,389 | ) | (537,464 | ) | ||||||||
Class R2 | — | — | (16,104 | ) | (19,576 | ) | ||||||||||
Class R3 | — | — | (7,619 | ) | (2,356 | ) | ||||||||||
Class R4 | — | — | (2,550 | ) | (823 | ) | ||||||||||
Class R5 | (32 | ) | (7 | ) | (83,447 | ) | (94,352 | ) | ||||||||
Class R6 | (8,633 | ) | (3,472 | ) | (964,234 | ) | (744,597 | ) | ||||||||
|
|
|
|
|
|
|
| |||||||||
Total distributions to shareholders | (76,075 | ) | (43,440 | ) | (2,031,759 | ) | (1,770,756 | ) | ||||||||
|
|
|
|
|
|
|
| |||||||||
CAPITAL TRANSACTIONS: |
| |||||||||||||||
Change in net assets resulting from capital transactions | 3,226,028 | 2,447,975 | 4,163,215 | 1,405,460 | ||||||||||||
|
|
|
|
|
|
|
| |||||||||
NET ASSETS: |
| |||||||||||||||
Change in net assets | 3,685,786 | 2,627,414 | 7,352,556 | 1,562,023 | ||||||||||||
Beginning of period | 5,055,806 | 2,428,392 | 15,912,610 | 14,350,587 | ||||||||||||
|
|
|
|
|
|
|
| |||||||||
End of period | $ | 8,741,592 | $ | 5,055,806 | $ | 23,265,166 | $ | 15,912,610 | ||||||||
|
|
|
|
|
|
|
| |||||||||
SEE NOTES TO FINANCIAL STATEMENTS.
| JUNE 30, 2020 | J.P. MORGAN LARGE CAP FUNDS | 69 | ||||||
Table of Contents
STATEMENTS OF CHANGES IN NET ASSETS
FOR THE PERIODS INDICATED (continued)
(Amounts in thousands)
| JPMorgan Large Cap Value Fund | JPMorgan U.S. Equity Fund | |||||||||||||||
| Year Ended June 30, 2020 | Year Ended June 30, 2019 | Year Ended June 30, 2020 | Year Ended June 30, 2019 | |||||||||||||
CHANGE IN NET ASSETS RESULTING FROM OPERATIONS: |
| |||||||||||||||
Net investment income (loss) | $ | 24,035 | $ | 24,256 | $ | 156,956 | $ | 163,804 | ||||||||
Net realized gain (loss) | (22,822 | ) | (38,069 | ) | 1,074,096 | 1,320,157 | ||||||||||
Change in net unrealized appreciation/depreciation | (109,305 | ) | 29,360 | 588,905 | (180,336 | ) | ||||||||||
|
|
|
|
|
|
|
| |||||||||
Change in net assets resulting from operations | (108,092 | ) | 15,547 | 1,819,957 | 1,303,625 | |||||||||||
|
|
|
|
|
|
|
| |||||||||
DISTRIBUTIONS TO SHAREHOLDERS: | ||||||||||||||||
Class A | (2,660 | ) | (14,350 | ) | (161,648 | ) | (145,610 | ) | ||||||||
Class C | (354 | ) | (4,699 | ) | (26,242 | ) | (34,523 | ) | ||||||||
Class I | (4,022 | ) | (26,304 | ) | (97,817 | ) | (176,401 | ) | ||||||||
Class L | — | — | (142,043 | ) | (197,302 | ) | ||||||||||
Class R2 | (207 | ) | (1,479 | ) | (21,799 | ) | (28,317 | ) | ||||||||
Class R3 (a) | — | (b) | (1 | ) | (11,145 | ) | (10,133 | ) | ||||||||
Class R4 (a) | (193 | ) | (93 | ) | (2,149 | ) | (1,931 | ) | ||||||||
Class R5 | (425 | ) | (2,258 | ) | (80,738 | ) | (104,750 | ) | ||||||||
Class R6 | (15,475 | ) | (70,128 | ) | (925,117 | ) | (936,749 | ) | ||||||||
|
|
|
|
|
|
|
| |||||||||
Total distributions to shareholders | (23,336 | ) | (119,312 | ) | (1,468,698 | ) | (1,635,716 | ) | ||||||||
|
|
|
|
|
|
|
| |||||||||
CAPITAL TRANSACTIONS: |
| |||||||||||||||
Change in net assets resulting from capital transactions | (19,703 | ) | (137,459 | ) | 286,006 | (424,509 | ) | |||||||||
|
|
|
|
|
|
|
| |||||||||
NET ASSETS: |
| |||||||||||||||
Change in net assets | (151,131 | ) | (241,224 | ) | 637,265 | (756,600 | ) | |||||||||
Beginning of period | 1,411,128 | 1,652,352 | 14,301,497 | 15,058,097 | ||||||||||||
|
|
|
|
|
|
|
| |||||||||
End of period | $ | 1,259,997 | $ | 1,411,128 | $ | 14,938,762 | $ | 14,301,497 | ||||||||
|
|
|
|
|
|
|
| |||||||||
| (a) | Commencement of offering of class of shares effective October 1, 2018 for JPMorgan Large Cap Value Fund. |
| (b) | Amount rounds to less than one thousand. |
SEE NOTES TO FINANCIAL STATEMENTS.
| 70 | J.P. MORGAN LARGE CAP FUNDS | JUNE 30, 2020 | ||||
Table of Contents
| JPMorgan U.S. Large Cap Core Plus Fund | JPMorgan U.S. Research Enhanced Equity Fund | |||||||||||||||
| Year Ended June 30, 2020 | Year Ended June 30, 2019 | Year Ended June 30, 2020 | Year Ended June 30, 2019 | |||||||||||||
CHANGE IN NET ASSETS RESULTING FROM OPERATIONS: |
| |||||||||||||||
Net investment income (loss) | $ | 16,065 | $ | 33,620 | $ | 79,253 | $ | 100,475 | ||||||||
Net realized gain (loss) | 1,461,601 | 962,925 | 809,145 | 517,266 | ||||||||||||
Change in net unrealized appreciation/depreciation | (1,045,105 | ) | (561,494 | ) | (499,565 | ) | (24,892 | ) | ||||||||
|
|
|
|
|
|
|
| |||||||||
Change in net assets resulting from operations | 432,561 | 435,051 | 388,833 | 592,849 | ||||||||||||
|
|
|
|
|
|
|
| |||||||||
DISTRIBUTIONS TO SHAREHOLDERS: | ||||||||||||||||
Class A | (110,686 | ) | (96,383 | ) | (21,842 | ) | (27,920 | ) | ||||||||
Class C | (22,436 | ) | (20,837 | ) | — | — | ||||||||||
Class I | (858,499 | ) | (784,212 | ) | (23,849 | ) | (27,285 | ) | ||||||||
Class L | — | — | (45,099 | ) | (51,150 | ) | ||||||||||
Class R2 | (1,126 | ) | (839 | ) | — | — | ||||||||||
Class R5 | (20,316 | ) | (16,031 | ) | — | — | ||||||||||
Class R6 | (161,893 | ) | (193,852 | ) | (463,809 | ) | (633,551 | ) | ||||||||
|
|
|
|
|
|
|
| |||||||||
Total distributions to shareholders | (1,174,956 | ) | (1,112,154 | ) | (554,599 | ) | (739,906 | ) | ||||||||
|
|
|
|
|
|
|
| |||||||||
CAPITAL TRANSACTIONS: |
| |||||||||||||||
Change in net assets resulting from capital transactions | (2,626,307 | ) | (1,932,512 | ) | (1,284,816 | ) | (774,687 | ) | ||||||||
|
|
|
|
|
|
|
| |||||||||
NET ASSETS: |
| |||||||||||||||
Change in net assets | (3,368,702 | ) | (2,609,615 | ) | (1,450,582 | ) | (921,744 | ) | ||||||||
Beginning of period | 6,419,008 | 9,028,623 | 5,815,346 | 6,737,090 | ||||||||||||
|
|
|
|
|
|
|
| |||||||||
End of period | $ | 3,050,306 | $ | 6,419,008 | $ | 4,364,764 | $ | 5,815,346 | ||||||||
|
|
|
|
|
|
|
| |||||||||
SEE NOTES TO FINANCIAL STATEMENTS.
| JUNE 30, 2020 | J.P. MORGAN LARGE CAP FUNDS | 71 | ||||||
Table of Contents
STATEMENTS OF CHANGES IN NET ASSETS
FOR THE PERIODS INDICATED (continued)
(Amounts in thousands)
| JPMorgan Equity Focus Fund | JPMorgan Equity Income Fund | |||||||||||||||
| Year Ended June 30, 2020 | Year Ended June 30, 2019 | Year Ended June 30, 2020 | Year Ended June 30, 2019 | |||||||||||||
CAPITAL TRANSACTIONS: | ||||||||||||||||
Class A | ||||||||||||||||
Proceeds from shares issued | $ | 2,181 | $ | 2,435 | $ | 1,164,544 | $ | 755,202 | ||||||||
Distributions reinvested | 962 | 681 | 95,360 | 133,800 | ||||||||||||
Cost of shares redeemed | (2,204 | ) | (1,458 | ) | (977,172 | ) | (824,132 | ) | ||||||||
|
|
|
|
|
|
|
| |||||||||
Change in net assets resulting from Class A capital transactions | $ | 939 | $ | 1,658 | $ | 282,732 | $ | 64,870 | ||||||||
|
|
|
|
|
|
|
| |||||||||
Class C | ||||||||||||||||
Proceeds from shares issued | $ | 409 | $ | 529 | $ | 366,152 | $ | 284,340 | ||||||||
Distributions reinvested | 540 | 399 | 32,079 | 51,095 | ||||||||||||
Cost of shares redeemed | (490 | ) | (688 | ) | (334,932 | ) | (286,413 | ) | ||||||||
|
|
|
|
|
|
|
| |||||||||
Change in net assets resulting from Class C capital transactions | $ | 459 | $ | 240 | $ | 63,299 | $ | 49,022 | ||||||||
|
|
|
|
|
|
|
| |||||||||
Class I | ||||||||||||||||
Proceeds from shares issued | $ | 4,205 | $ | 23,367 | $ | 5,501,467 | $ | 3,482,287 | ||||||||
Distributions reinvested | 10,183 | 14,130 | 291,290 | 318,091 | ||||||||||||
Cost of shares redeemed | (30,218 | ) | (198,184 | ) | (3,044,873 | ) | (1,602,290 | ) | ||||||||
|
|
|
|
|
|
|
| |||||||||
Change in net assets resulting from Class I capital transactions | $ | (15,830 | ) | $ | (160,687 | ) | $ | 2,747,884 | $ | 2,198,088 | ||||||
|
|
|
|
|
|
|
| |||||||||
Class R2 | ||||||||||||||||
Proceeds from shares issued | $ | — | $ | — | $ | 23,230 | $ | 30,350 | ||||||||
Distributions reinvested | — | — | 2,243 | 3,484 | ||||||||||||
Cost of shares redeemed | — | — | (40,287 | ) | (25,985 | ) | ||||||||||
|
|
|
|
|
|
|
| |||||||||
Change in net assets resulting from Class R2 capital transactions | $ | — | $ | — | $ | (14,814 | ) | $ | 7,849 | |||||||
|
|
|
|
|
|
|
| |||||||||
Class R3 | ||||||||||||||||
Proceeds from shares issued | $ | — | $ | — | $ | 92,006 | $ | 64,756 | ||||||||
Distributions reinvested | — | — | 4,162 | 4,644 | ||||||||||||
Cost of shares redeemed | — | — | (46,297 | ) | (30,072 | ) | ||||||||||
|
|
|
|
|
|
|
| |||||||||
Change in net assets resulting from Class R3 capital transactions | $ | — | $ | — | $ | 49,871 | $ | 39,328 | ||||||||
|
|
|
|
|
|
|
| |||||||||
Class R4 | ||||||||||||||||
Proceeds from shares issued | $ | — | $ | — | $ | 71,534 | $ | 57,970 | ||||||||
Distributions reinvested | — | — | 2,895 | 1,500 | ||||||||||||
Cost of shares redeemed | — | — | (23,816 | ) | (20,302 | ) | ||||||||||
|
|
|
|
|
|
|
| |||||||||
Change in net assets resulting from Class R4 capital transactions | $ | — | $ | — | $ | 50,613 | $ | 39,168 | ||||||||
|
|
|
|
|
|
|
| |||||||||
Class R5 | ||||||||||||||||
Proceeds from shares issued | $ | — | $ | — | $ | 478,990 | $ | 460,008 | ||||||||
Distributions reinvested | — | — | 44,948 | 55,745 | ||||||||||||
Cost of shares redeemed | — | — | (593,726 | ) | (273,526 | ) | ||||||||||
|
|
|
|
|
|
|
| |||||||||
Change in net assets resulting from Class R5 capital transactions | $ | — | $ | — | $ | (69,788 | ) | $ | 242,227 | |||||||
|
|
|
|
|
|
|
| |||||||||
Class R6 (a) | ||||||||||||||||
Proceeds from shares issued | $ | 7,519 | $ | 40,177 | $ | 7,465,340 | $ | 3,362,596 | ||||||||
Subscriptions in-kind (See Note 9) | — | — | 48,418 | — | ||||||||||||
Distributions reinvested | 4,735 | 2 | 377,452 | 292,441 | ||||||||||||
Cost of shares redeemed | (7,384 | ) | (22,348 | ) | (2,242,542 | ) | (1,127,173 | ) | ||||||||
Redemptions in-kind (See Note 8) | — | — | — | (54,694 | ) | |||||||||||
|
|
|
|
|
|
|
| |||||||||
Change in net assets resulting from Class R6 capital transactions | $ | 4,870 | $ | 17,831 | $ | 5,648,668 | $ | 2,473,170 | ||||||||
|
|
|
|
|
|
|
| |||||||||
Total change in net assets resulting from capital transactions | $ | (9,562 | ) | $ | (140,958 | ) | $ | 8,758,465 | $ | 5,113,722 | ||||||
|
|
|
|
|
|
|
| |||||||||
| (a) | Commencement of offering of class of shares effective October 1, 2018 for JPMorgan Equity Focus Fund. |
SEE NOTES TO FINANCIAL STATEMENTS.
| 72 | J.P. MORGAN LARGE CAP FUNDS | JUNE 30, 2020 | ||||
Table of Contents
| JPMorgan Equity Focus Fund | JPMorgan Equity Income Fund | |||||||||||||||
| Year Ended June 30, 2020 | Year Ended June 30, 2019 | Year Ended June 30, 2020 | Year Ended June 30, 2019 | |||||||||||||
SHARE TRANSACTIONS: |
| |||||||||||||||
Class A |
| |||||||||||||||
Issued | 79 | 81 | 67,608 | 44,333 | ||||||||||||
Reinvested | 35 | 25 | 5,373 | 8,045 | ||||||||||||
Redeemed | (84 | ) | (51 | ) | (57,395 | ) | (48,297 | ) | ||||||||
|
|
|
|
|
|
|
| |||||||||
Change in Class A Shares | 30 | 55 | 15,586 | 4,081 | ||||||||||||
|
|
|
|
|
|
|
| |||||||||
Class C |
| |||||||||||||||
Issued | 17 | 18 | 21,351 | 17,076 | ||||||||||||
Reinvested | 21 | 15 | 1,838 | 3,143 | ||||||||||||
Redeemed | (21 | ) | (25 | ) | (20,307 | ) | (17,081 | ) | ||||||||
|
|
|
|
|
|
|
| |||||||||
Change in Class C Shares | 17 | 8 | 2,882 | 3,138 | ||||||||||||
|
|
|
|
|
|
|
| |||||||||
Class I |
| |||||||||||||||
Issued | 143 | 726 | 317,929 | 201,387 | ||||||||||||
Reinvested | 366 | 511 | 16,183 | 18,776 | ||||||||||||
Redeemed | (1,079 | ) | (6,421 | ) | (181,493 | ) | (93,029 | ) | ||||||||
|
|
|
|
|
|
|
| |||||||||
Change in Class I Shares | (570 | ) | (5,184 | ) | 152,619 | 127,134 | ||||||||||
|
|
|
|
|
|
|
| |||||||||
Class R2 |
| |||||||||||||||
Issued | — | — | 1,382 | 1,779 | ||||||||||||
Reinvested | — | — | 126 | 211 | ||||||||||||
Redeemed | — | — | (2,304 | ) | (1,521 | ) | ||||||||||
|
|
|
|
|
|
|
| |||||||||
Change in Class R2 Shares | — | — | (796 | ) | 469 | |||||||||||
|
|
|
|
|
|
|
| |||||||||
Class R3 |
| |||||||||||||||
Issued | — | — | 5,236 | 3,784 | ||||||||||||
Reinvested | — | — | 235 | 280 | ||||||||||||
Redeemed | — | — | (2,666 | ) | (1,796 | ) | ||||||||||
|
|
|
|
|
|
|
| |||||||||
Change in Class R3 Shares | — | — | 2,805 | 2,268 | ||||||||||||
|
|
|
|
|
|
|
| |||||||||
Class R4 |
| |||||||||||||||
Issued | — | — | 3,947 | 3,364 | ||||||||||||
Reinvested | — | — | 162 | 88 | ||||||||||||
Redeemed | — | — | (1,344 | ) | (1,151 | ) | ||||||||||
|
|
|
|
|
|
|
| |||||||||
Change in Class R4 Shares | — | — | 2,765 | 2,301 | ||||||||||||
|
|
|
|
|
|
|
| |||||||||
Class R5 |
| |||||||||||||||
Issued | — | — | 26,787 | 26,643 | ||||||||||||
Reinvested | — | — | 2,489 | 3,283 | ||||||||||||
Redeemed | — | — | (33,212 | ) | (15,716 | ) | ||||||||||
|
|
|
|
|
|
|
| |||||||||
Change in Class R5 Shares | — | — | (3,936 | ) | 14,210 | |||||||||||
|
|
|
|
|
|
|
| |||||||||
Class R6 (a) |
| |||||||||||||||
Issued | 264 | 1,490 | 418,476 | 192,820 | ||||||||||||
Subscriptions in-kind (See Note 9) | — | — | 2,637 | — | ||||||||||||
Reinvested | 170 | — | (b) | 21,032 | 17,229 | |||||||||||
Redeemed | (290 | ) | (757 | ) | (128,412 | ) | (64,768 | ) | ||||||||
Redemptions in-kind (See Note 8) | — | — | — | (3,151 | ) | |||||||||||
|
|
|
|
|
|
|
| |||||||||
Change in Class R6 Shares | 144 | 733 | 313,733 | 142,130 | ||||||||||||
|
|
|
|
|
|
|
| |||||||||
| (a) | Commencement of offering of class of shares effective October 1, 2018 for JPMorgan Equity Focus Fund. |
| (b) | Amount rounds to less than one thousand |
SEE NOTES TO FINANCIAL STATEMENTS.
| JUNE 30, 2020 | J.P. MORGAN LARGE CAP FUNDS | 73 | ||||||
Table of Contents
STATEMENTS OF CHANGES IN NET ASSETS
FOR THE PERIODS INDICATED (continued)
(Amounts in thousands)
| JPMorgan Equity Premium Income Fund | JPMorgan Growth and Income Fund | |||||||||||||||
| Year Ended June 30, 2020 | Period Ended June 30, 2019 (a) | Year Ended June 30, 2020 | Year Ended June 30, 2019 | |||||||||||||
CAPITAL TRANSACTIONS: | ||||||||||||||||
Class A | ||||||||||||||||
Proceeds from shares issued | $ | 25,022 | $ | 123 | $ | 103,634 | $ | 48,540 | ||||||||
Distributions reinvested | 852 | 2 | 18,821 | 28,106 | ||||||||||||
Cost of shares redeemed | (11,252 | ) | — | (b) | (69,860 | ) | (63,999 | ) | ||||||||
|
|
|
|
|
|
|
| |||||||||
Change in net assets resulting from Class A capital transactions | $ | 14,622 | $ | 125 | $ | 52,595 | $ | 12,647 | ||||||||
|
|
|
|
|
|
|
| |||||||||
Class C | ||||||||||||||||
Proceeds from shares issued | $ | 5,247 | $ | 20 | $ | 9,193 | $ | 8,554 | ||||||||
Distributions reinvested | 254 | 1 | 848 | 1,282 | ||||||||||||
Cost of shares redeemed | (238 | ) | — | (6,721 | ) | (6,924 | ) | |||||||||
|
|
|
|
|
|
|
| |||||||||
Change in net assets resulting from Class C capital transactions | $ | 5,263 | $ | 21 | $ | 3,320 | $ | 2,912 | ||||||||
|
|
|
|
|
|
|
| |||||||||
Class I | ||||||||||||||||
Proceeds from shares issued | $ | 165,512 | $ | 51,120 | $ | 75,806 | $ | 37,640 | ||||||||
Distributions reinvested | 12,358 | 3,248 | 3,345 | 4,589 | ||||||||||||
Cost of shares redeemed | (36,261 | ) | (159 | ) | (33,791 | ) | (26,157 | ) | ||||||||
|
|
|
|
|
|
|
| |||||||||
Change in net assets resulting from Class I capital transactions | $ | 141,609 | $ | 54,209 | $ | 45,360 | $ | 16,072 | ||||||||
|
|
|
|
|
|
|
| |||||||||
Class R2 | ||||||||||||||||
Proceeds from shares issued | $ | — | $ | — | $ | 1,202 | $ | 66 | ||||||||
Distributions reinvested | — | — | 16 | 6 | ||||||||||||
Cost of shares redeemed | — | — | (111 | ) | (3 | ) | ||||||||||
|
|
|
|
|
|
|
| |||||||||
Change in net assets resulting from Class R2 capital transactions | $ | — | $ | — | $ | 1,107 | $ | 69 | ||||||||
|
|
|
|
|
|
|
| |||||||||
Class R3 | ||||||||||||||||
Proceeds from shares issued | $ | — | $ | — | $ | 400 | $ | — | ||||||||
Distributions reinvested | — | — | 2 | 1 | ||||||||||||
Cost of shares redeemed | — | — | — | (b) | — | |||||||||||
|
|
|
|
|
|
|
| |||||||||
Change in net assets resulting from Class R3 capital transactions | $ | — | $ | — | $ | 402 | $ | 1 | ||||||||
|
|
|
|
|
|
|
| |||||||||
Class R4 | ||||||||||||||||
Proceeds from shares issued | $ | — | $ | — | $ | 1,340 | $ | — | ||||||||
Distributions reinvested | — | — | 12 | 1 | ||||||||||||
Cost of shares redeemed | — | — | (38 | ) | — | |||||||||||
|
|
|
|
|
|
|
| |||||||||
Change in net assets resulting from Class R4 capital transactions | $ | — | $ | — | $ | 1,314 | $ | 1 | ||||||||
|
|
|
|
|
|
|
| |||||||||
Class R5 | ||||||||||||||||
Proceeds from shares issued | $ | — | $ | 20 | $ | 71 | $ | 30 | ||||||||
Distributions reinvested | 2 | 1 | 3 | 3 | ||||||||||||
Cost of shares redeemed | — | — | (55 | ) | (3 | ) | ||||||||||
|
|
|
|
|
|
|
| |||||||||
Change in net assets resulting from Class R5 capital transactions | $ | 2 | $ | 21 | $ | 19 | $ | 30 | ||||||||
|
|
|
|
|
|
|
| |||||||||
Class R6 | ||||||||||||||||
Proceeds from shares issued | $ | 939 | $ | 20 | $ | 48,377 | $ | 12,212 | ||||||||
Distributions reinvested | 25 | 1 | 2,097 | 2,197 | ||||||||||||
Cost of shares redeemed | (174 | ) | — | (20,888 | ) | (7,418 | ) | |||||||||
|
|
|
|
|
|
|
| |||||||||
Change in net assets resulting from Class R6 capital transactions | $ | 790 | $ | 21 | $ | 29,586 | $ | 6,991 | ||||||||
|
|
|
|
|
|
|
| |||||||||
Total change in net assets resulting from capital transactions | $ | 162,286 | $ | 54,397 | $ | 133,703 | $ | 38,723 | ||||||||
|
|
|
|
|
|
|
| |||||||||
| (a) | Commencement of operations was August 31, 2018. |
| (b) | Amount rounds to less than one thousand. |
SEE NOTES TO FINANCIAL STATEMENTS.
| 74 | J.P. MORGAN LARGE CAP FUNDS | JUNE 30, 2020 | ||||
Table of Contents
| JPMorgan Equity Premium Income Fund | JPMorgan Growth and Income Fund | |||||||||||||||
| Year Ended June 30, 2020 | Period Ended June 30, 2019 (a) | Year Ended June 30, 2020 | Year Ended June 30, 2019 | |||||||||||||
SHARE TRANSACTIONS: |
| |||||||||||||||
Class A |
| |||||||||||||||
Issued | 1,779 | 8 | 2,118 | 987 | ||||||||||||
Reinvested | 66 | — | (b) | 373 | 606 | |||||||||||
Redeemed | (857 | ) | — | (b) | (1,432 | ) | (1,316 | ) | ||||||||
|
|
|
|
|
|
|
| |||||||||
Change in Class A Shares | 988 | 8 | 1,059 | 277 | ||||||||||||
|
|
|
|
|
|
|
| |||||||||
Class C |
| |||||||||||||||
Issued | 362 | 1 | 209 | 198 | ||||||||||||
Reinvested | 19 | — | (b) | 19 | 31 | |||||||||||
Redeemed | (19 | ) | — | (160 | ) | (158 | ) | |||||||||
|
|
|
|
|
|
|
| |||||||||
Change in Class C Shares | 362 | 1 | 68 | 71 | ||||||||||||
|
|
|
|
|
|
|
| |||||||||
Class I |
| |||||||||||||||
Issued | 11,688 | 3,410 | 1,616 | 736 | ||||||||||||
Reinvested | 917 | 225 | 64 | 93 | ||||||||||||
Redeemed | (2,849 | ) | (11 | ) | (675 | ) | (519 | ) | ||||||||
|
|
|
|
|
|
|
| |||||||||
Change in Class I Shares | 9,756 | 3,624 | 1,005 | 310 | ||||||||||||
|
|
|
|
|
|
|
| |||||||||
Class R2 |
| |||||||||||||||
Issued | — | — | 24 | 1 | ||||||||||||
Reinvested | — | — | — | (b) | — | (b) | ||||||||||
Redeemed | — | — | (2 | ) | — | (b) | ||||||||||
|
|
|
|
|
|
|
| |||||||||
Change in Class R2 Shares | — | — | 22 | 1 | ||||||||||||
|
|
|
|
|
|
|
| |||||||||
Class R3 |
| |||||||||||||||
Issued | — | — | 7 | — | ||||||||||||
Reinvested | — | — | — | (b) | 1 | |||||||||||
Redeemed | — | — | — | (b) | — | |||||||||||
|
|
|
|
|
|
|
| |||||||||
Change in Class R3 Shares | — | — | 7 | 1 | ||||||||||||
|
|
|
|
|
|
|
| |||||||||
Class R4 |
| |||||||||||||||
Issued | — | — | 24 | — | ||||||||||||
Reinvested | — | — | — | (b) | 1 | |||||||||||
Redeemed | — | — | (1 | ) | — | |||||||||||
|
|
|
|
|
|
|
| |||||||||
Change in Class R4 Shares | — | — | 23 | 1 | ||||||||||||
|
|
|
|
|
|
|
| |||||||||
Class R5 |
| |||||||||||||||
Issued | — | 1 | 2 | — | (b) | |||||||||||
Reinvested | 1 | — | (b) | — | (b) | — | (b) | |||||||||
Redeemed | — | — | (1 | ) | — | (b) | ||||||||||
|
|
|
|
|
|
|
| |||||||||
Change in Class R5 Shares | 1 | 1 | 1 | — | (b) | |||||||||||
|
|
|
|
|
|
|
| |||||||||
Class R6 |
| |||||||||||||||
Issued | 64 | 1 | 915 | 235 | ||||||||||||
Reinvested | 2 | — | (b) | 39 | 44 | |||||||||||
Redeemed | (14 | ) | — | (395 | ) | (144 | ) | |||||||||
|
|
|
|
|
|
|
| |||||||||
Change in Class R6 Shares | 52 | 1 | 559 | 135 | ||||||||||||
|
|
|
|
|
|
|
| |||||||||
| (a) | Commencement of operations was August 31, 2018. |
| (b) | Amount rounds to less than one thousand. |
SEE NOTES TO FINANCIAL STATEMENTS.
| JUNE 30, 2020 | J.P. MORGAN LARGE CAP FUNDS | 75 | ||||||
Table of Contents
STATEMENTS OF CHANGES IN NET ASSETS
FOR THE PERIODS INDICATED (continued)
(Amounts in thousands)
| JPMorgan Hedged Equity Fund | JPMorgan Large Cap Growth Fund | |||||||||||||||
| Year Ended June 30, 2020 | Year Ended June 30, 2019 | Year Ended June 30, 2020 | Year Ended June 30, 2019 | |||||||||||||
CAPITAL TRANSACTIONS: | ||||||||||||||||
Class A | ||||||||||||||||
Proceeds from shares issued | $ | 495,566 | $ | 200,515 | $ | 1,093,424 | $ | 565,602 | ||||||||
Distributions reinvested | 3,972 | 2,559 | 290,772 | 268,247 | ||||||||||||
Cost of shares redeemed | (348,671 | ) | (196,149 | ) | (1,019,134 | ) | (848,901 | ) | ||||||||
|
|
|
|
|
|
|
| |||||||||
Change in net assets resulting from Class A capital transactions | $ | 150,867 | $ | 6,925 | $ | 365,062 | $ | (15,052 | ) | |||||||
|
|
|
|
|
|
|
| |||||||||
Class C | ||||||||||||||||
Proceeds from shares issued | $ | 128,940 | $ | 98,773 | $ | 194,307 | $ | 101,496 | ||||||||
Distributions reinvested | 835 | 705 | 64,738 | 64,190 | ||||||||||||
Cost of shares redeemed | (56,070 | ) | (27,734 | ) | (147,910 | ) | (162,510 | ) | ||||||||
|
|
|
|
|
|
|
| |||||||||
Change in net assets resulting from Class C capital transactions | $ | 73,705 | $ | 71,744 | $ | 111,135 | $ | 3,176 | ||||||||
|
|
|
|
|
|
|
| |||||||||
Class I | ||||||||||||||||
Proceeds from shares issued | $ | 5,474,198 | $ | 3,264,704 | $ | 2,721,471 | $ | 1,278,824 | ||||||||
Distributions reinvested | 59,927 | 34,623 | 522,530 | 499,924 | ||||||||||||
Cost of shares redeemed | (2,956,713 | ) | (1,180,493 | ) | (1,843,411 | ) | (1,526,803 | ) | ||||||||
|
|
|
|
|
|
|
| |||||||||
Change in net assets resulting from Class I capital transactions | $ | 2,577,412 | $ | 2,118,834 | $ | 1,400,590 | $ | 251,945 | ||||||||
|
|
|
|
|
|
|
| |||||||||
Class R2 | ||||||||||||||||
Proceeds from shares issued | $ | — | $ | — | $ | 36,135 | $ | 52,974 | ||||||||
Distributions reinvested | — | — | 13,984 | 15,016 | ||||||||||||
Cost of shares redeemed | — | — | (83,183 | ) | (85,360 | ) | ||||||||||
|
|
|
|
|
|
|
| |||||||||
Change in net assets resulting from Class R2 capital transactions | $ | — | $ | — | $ | (33,064 | ) | $ | (17,370 | ) | ||||||
|
|
|
|
|
|
|
| |||||||||
Class R3 | ||||||||||||||||
Proceeds from shares issued | $ | — | $ | — | $ | 51,615 | $ | 41,442 | ||||||||
Distributions reinvested | — | — | 4,020 | 1,370 | ||||||||||||
Cost of shares redeemed | — | — | (23,556 | ) | (5,767 | ) | ||||||||||
|
|
|
|
|
|
|
| |||||||||
Change in net assets resulting from Class R3 capital transactions | $ | — | $ | — | $ | 32,079 | $ | 37,045 | ||||||||
|
|
|
|
|
|
|
| |||||||||
Class R4 | ||||||||||||||||
Proceeds from shares issued | $ | — | $ | — | $ | 49,115 | $ | 5,495 | ||||||||
Distributions reinvested | — | — | 2,550 | 823 | ||||||||||||
Cost of shares redeemed | — | — | (6,458 | ) | (1,898 | ) | ||||||||||
|
|
|
|
|
|
|
| |||||||||
Change in net assets resulting from Class R4 capital transactions | $ | — | $ | — | $ | 45,207 | $ | 4,420 | ||||||||
|
|
|
|
|
|
|
| |||||||||
Class R5 | ||||||||||||||||
Proceeds from shares issued | $ | 1,405 | $ | 1,826 | $ | 172,183 | $ | 171,763 | ||||||||
Distributions reinvested | 32 | 7 | 78,312 | 89,822 | ||||||||||||
Cost of shares redeemed | (550 | ) | (105 | ) | (278,117 | ) | (351,362 | ) | ||||||||
|
|
|
|
|
|
|
| |||||||||
Change in net assets resulting from Class R5 capital transactions | $ | 887 | $ | 1,728 | $ | (27,622 | ) | $ | (89,777 | ) | ||||||
|
|
|
|
|
|
|
| |||||||||
Class R6 | ||||||||||||||||
Proceeds from shares issued | $ | 755,421 | $ | 295,474 | $ | 3,367,122 | $ | 1,840,965 | ||||||||
Distributions reinvested | 3,351 | 978 | 931,375 | 723,675 | ||||||||||||
Cost of shares redeemed | (335,615 | ) | (47,708 | ) | (2,028,669 | ) | (1,333,567 | ) | ||||||||
|
|
|
|
|
|
|
| |||||||||
Change in net assets resulting from Class R6 capital transactions | $ | 423,157 | $ | 248,744 | $ | 2,269,828 | $ | 1,231,073 | ||||||||
|
|
|
|
|
|
|
| |||||||||
Total change in net assets resulting from capital transactions | $ | 3,226,028 | $ | 2,447,975 | $ | 4,163,215 | $ | 1,405,460 | ||||||||
|
|
|
|
|
|
|
| |||||||||
SEE NOTES TO FINANCIAL STATEMENTS.
| 76 | J.P. MORGAN LARGE CAP FUNDS | JUNE 30, 2020 | ||||
Table of Contents
| JPMorgan Hedged Equity Fund | JPMorgan Large Cap Growth Fund | |||||||||||||||
| Year Ended June 30, 2020 | Year Ended June 30, 2019 | Year Ended June 30, 2020 | Year Ended June 30, 2019 | |||||||||||||
SHARE TRANSACTIONS: |
| |||||||||||||||
Class A |
| |||||||||||||||
Issued | 23,862 | 10,234 | 26,425 | 14,213 | ||||||||||||
Reinvested | 190 | 131 | 7,477 | 7,726 | ||||||||||||
Redeemed | (17,011 | ) | (10,028 | ) | (24,532 | ) | (21,501 | ) | ||||||||
|
|
|
|
|
|
|
| |||||||||
Change in Class A Shares | 7,041 | 337 | 9,370 | 438 | ||||||||||||
|
|
|
|
|
|
|
| |||||||||
Class C |
| |||||||||||||||
Issued | 6,200 | 5,092 | 6,347 | 3,322 | ||||||||||||
Reinvested | 40 | 37 | 2,250 | 2,388 | ||||||||||||
Redeemed | (2,757 | ) | (1,432 | ) | (4,817 | ) | (5,303 | ) | ||||||||
|
|
|
|
|
|
|
| |||||||||
Change in Class C Shares | 3,483 | 3,697 | 3,780 | 407 | ||||||||||||
|
|
|
|
|
|
|
| |||||||||
Class I |
| |||||||||||||||
Issued | 261,714 | 166,589 | 64,836 | 31,957 | ||||||||||||
Reinvested | 2,858 | 1,758 | 13,208 | 14,219 | ||||||||||||
Redeemed | (145,069 | ) | (60,565 | ) | (44,234 | ) | (38,672 | ) | ||||||||
|
|
|
|
|
|
|
| |||||||||
Change in Class I Shares | 119,503 | 107,782 | 33,810 | 7,504 | ||||||||||||
|
|
|
|
|
|
|
| |||||||||
Class R2 |
| |||||||||||||||
Issued | — | — | 906 | 1,393 | ||||||||||||
Reinvested | — | — | 376 | 449 | ||||||||||||
Redeemed | �� | — | (2,121 | ) | (2,227 | ) | ||||||||||
|
|
|
|
|
|
|
| |||||||||
Change in Class R2 Shares | — | — | (839 | ) | (385 | ) | ||||||||||
|
|
|
|
|
|
|
| |||||||||
Class R3 |
| |||||||||||||||
Issued | — | — | 1,251 | 1,026 | ||||||||||||
Reinvested | — | — | 103 | 39 | ||||||||||||
Redeemed | — | — | (568 | ) | (148 | ) | ||||||||||
|
|
|
|
|
|
|
| |||||||||
Change in Class R3 Shares | — | — | 786 | 917 | ||||||||||||
|
|
|
|
|
|
|
| |||||||||
Class R4 |
| |||||||||||||||
Issued | — | — | 1,166 | 139 | ||||||||||||
Reinvested | — | — | 64 | 23 | ||||||||||||
Redeemed | — | — | (157 | ) | (47 | ) | ||||||||||
|
|
|
|
|
|
|
| |||||||||
Change in Class R4 Shares | — | — | 1,073 | 115 | ||||||||||||
|
|
|
|
|
|
|
| |||||||||
Class R5 |
| |||||||||||||||
Issued | 66 | 92 | 3,989 | 4,109 | ||||||||||||
Reinvested | 2 | — | (a) | 1,927 | 2,499 | |||||||||||
Redeemed | (26 | ) | (5 | ) | (6,525 | ) | (8,504 | ) | ||||||||
|
|
|
|
|
|
|
| |||||||||
Change in Class R5 Shares | 42 | 87 | (609 | ) | (1,896 | ) | ||||||||||
|
|
|
|
|
|
|
| |||||||||
Class R6 |
| |||||||||||||||
Issued | 36,462 | 15,045 | 77,205 | 44,475 | ||||||||||||
Reinvested | 159 | 49 | 22,702 | 19,983 | ||||||||||||
Redeemed | (16,768 | ) | (2,420 | ) | (47,053 | ) | (32,490 | ) | ||||||||
|
|
|
|
|
|
|
| |||||||||
Change in Class R6 Shares | 19,853 | 12,674 | 52,854 | 31,968 | ||||||||||||
|
|
|
|
|
|
|
| |||||||||
| (a) | Amount rounds to less than one thousand. |
SEE NOTES TO FINANCIAL STATEMENTS.
| JUNE 30, 2020 | J.P. MORGAN LARGE CAP FUNDS | 77 | ||||||
Table of Contents
STATEMENTS OF CHANGES IN NET ASSETS
FOR THE PERIODS INDICATED (continued)
(Amounts in thousands)
| JPMorgan Large Cap Value Fund | JPMorgan U.S. Equity Fund | |||||||||||||||
| Year Ended June 30, 2020 | Year Ended June 30, 2019 | Year Ended June 30, 2020 | Year Ended June 30, 2019 | |||||||||||||
CAPITAL TRANSACTIONS: | ||||||||||||||||
Class A | ||||||||||||||||
Proceeds from shares issued | $ | 138,275 | $ | 38,199 | $ | 715,588 | $ | 668,701 | ||||||||
Distributions reinvested | 2,618 | 13,929 | 154,154 | 132,720 | ||||||||||||
Cost of shares redeemed | (156,095 | ) | (120,946 | ) | (605,447 | ) | (561,909 | ) | ||||||||
|
|
|
|
|
|
|
| |||||||||
Change in net assets resulting from Class A capital transactions | $ | (15,202 | ) | $ | (68,818 | ) | $ | 264,295 | $ | 239,512 | ||||||
|
|
|
|
|
|
|
| |||||||||
Class C | ||||||||||||||||
Proceeds from shares issued | $ | 3,402 | $ | 12,245 | $ | 40,488 | $ | 47,501 | ||||||||
Distributions reinvested | 344 | 4,589 | 24,891 | 32,837 | ||||||||||||
Cost of shares redeemed | (20,436 | ) | (26,332 | ) | (84,646 | ) | (81,416 | ) | ||||||||
|
|
|
|
|
|
|
| |||||||||
Change in net assets resulting from Class C capital transactions | $ | (16,690 | ) | $ | (9,498 | ) | $ | (19,267 | ) | $ | (1,078 | ) | ||||
|
|
|
|
|
|
|
| |||||||||
Class I | ||||||||||||||||
Proceeds from shares issued | $ | 187,035 | $ | 180,351 | $ | 295,219 | $ | 408,617 | ||||||||
Distributions reinvested | 4,008 | 26,175 | 94,363 | 171,208 | ||||||||||||
Cost of shares redeemed | (206,607 | ) | (258,184 | ) | (492,924 | ) | (922,817 | ) | ||||||||
|
|
|
|
|
|
|
| |||||||||
Change in net assets resulting from Class I capital transactions | $ | (15,564 | ) | $ | (51,658 | ) | $ | (103,342 | ) | $ | (342,992 | ) | ||||
|
|
|
|
|
|
|
| |||||||||
Class L | ||||||||||||||||
Proceeds from shares issued | $ | — | $ | — | $ | 269,061 | $ | 340,083 | ||||||||
Distributions reinvested | — | — | 124,874 | 166,869 | ||||||||||||
Cost of shares redeemed | — | — | (663,087 | ) | (575,141 | ) | ||||||||||
|
|
|
|
|
|
|
| |||||||||
Change in net assets resulting from Class L capital transactions | $ | — | $ | — | $ | (269,152 | ) | $ | (68,189 | ) | ||||||
|
|
|
|
|
|
|
| |||||||||
Class R2 | ||||||||||||||||
Proceeds from shares issued | $ | 4,111 | $ | 9,456 | $ | 28,578 | $ | 31,183 | ||||||||
Distributions reinvested | 196 | 1,316 | 21,162 | 26,663 | ||||||||||||
Cost of shares redeemed | (6,217 | ) | (4,971 | ) | (82,008 | ) | (72,348 | ) | ||||||||
|
|
|
|
|
|
|
| |||||||||
Change in net assets resulting from Class R2 capital transactions | $ | (1,910 | ) | $ | 5,801 | $ | (32,268 | ) | $ | (14,502 | ) | |||||
|
|
|
|
|
|
|
| |||||||||
Class R3 (a) | ||||||||||||||||
Proceeds from shares issued | $ | — | (b) | $ | 20 | $ | 27,510 | $ | 53,558 | |||||||
Distributions reinvested | — | (b) | 1 | 10,063 | 9,047 | |||||||||||
Cost of shares redeemed | — | (b) | — | (33,612 | ) | (9,993 | ) | |||||||||
|
|
|
|
|
|
|
| |||||||||
Change in net assets resulting from Class R3 capital transactions | $ | — | (b) | $ | 21 | $ | 3,961 | $ | 52,612 | |||||||
|
|
|
|
|
|
|
| |||||||||
Class R4 (a) | ||||||||||||||||
Proceeds from shares issued | $ | 1,815 | $ | 13,825 | $ | 4,496 | $ | 17,146 | ||||||||
Distributions reinvested | 192 | 93 | 2,149 | 1,931 | ||||||||||||
Cost of shares redeemed | (3,474 | ) | (1,201 | ) | (8,139 | ) | (6,325 | ) | ||||||||
|
|
|
|
|
|
|
| |||||||||
Change in net assets resulting from Class R4 capital transactions | $ | (1,467 | ) | $ | 12,717 | $ | (1,494 | ) | $ | 12,752 | ||||||
|
|
|
|
|
|
|
| |||||||||
Class R5 | ||||||||||||||||
Proceeds from shares issued | $ | 7,109 | $ | 20,278 | $ | 78,859 | $ | 73,209 | ||||||||
Distributions reinvested | 420 | 2,241 | 73,591 | 94,444 | ||||||||||||
Cost of shares redeemed | (17,058 | ) | (13,694 | ) | (194,808 | ) | (236,756 | ) | ||||||||
|
|
|
|
|
|
|
| |||||||||
Change in net assets resulting from Class R5 capital transactions | $ | (9,529 | ) | $ | 8,825 | $ | (42,358 | ) | $ | (69,103 | ) | |||||
|
|
|
|
|
|
|
| |||||||||
Class R6 | ||||||||||||||||
Proceeds from shares issued | $ | 166,602 | $ | 325,810 | $ | 1,785,782 | $ | 1,335,233 | ||||||||
Subscriptions in-kind (See Note 9) | — | — | 45,414 | — | ||||||||||||
Distributions reinvested | 15,432 | 69,882 | 919,240 | 934,866 | ||||||||||||
Cost of shares redeemed | (141,375 | ) | (430,541 | ) | (2,264,805 | ) | (2,503,620 | ) | ||||||||
|
|
|
|
|
|
|
| |||||||||
Change in net assets resulting from Class R6 capital transactions | $ | 40,659 | $ | (34,849 | ) | $ | 485,631 | $ | (233,521 | ) | ||||||
|
|
|
|
|
|
|
| |||||||||
Total change in net assets resulting from capital transactions | $ | (19,703 | ) | $ | (137,459 | ) | $ | 286,006 | $ | (424,509 | ) | |||||
|
|
|
|
|
|
|
| |||||||||
| (a) | Commencement of offering of class of shares effective October 1, 2018 for JPMorgan Large Cap Value Fund. |
| (b) | Amount rounds to less than one thousand. |
SEE NOTES TO FINANCIAL STATEMENTS.
| 78 | J.P. MORGAN LARGE CAP FUNDS | JUNE 30, 2020 | ||||
Table of Contents
| JPMorgan Large Cap Value Fund | JPMorgan U.S. Equity Fund | |||||||||||||||
| Year Ended June 30, 2020 | Year Ended June 30, 2019 | Year Ended June 30, 2020 | Year Ended June 30, 2019 | |||||||||||||
SHARE TRANSACTIONS: |
| |||||||||||||||
Class A |
| |||||||||||||||
Issued | 10,104 | 2,636 | 46,733 | 43,450 | ||||||||||||
Reinvested | 196 | 1,057 | 9,829 | 9,250 | ||||||||||||
Redeemed | (11,819 | ) | (8,443 | ) | (39,445 | ) | (35,922 | ) | ||||||||
|
|
|
|
|
|
|
| |||||||||
Change in Class A Shares | (1,519 | ) | (4,750 | ) | 17,117 | 16,778 | ||||||||||
|
|
|
|
|
|
|
| |||||||||
Class C |
| |||||||||||||||
Issued | 262 | 893 | 2,740 | 3,118 | ||||||||||||
Reinvested | 26 | 365 | 1,647 | 2,381 | ||||||||||||
Redeemed | (1,590 | ) | (1,966 | ) | (5,697 | ) | (5,483 | ) | ||||||||
|
|
|
|
|
|
|
| |||||||||
Change in Class C Shares | (1,302 | ) | (708 | ) | (1,310 | ) | 16 | |||||||||
|
|
|
|
|
|
|
| |||||||||
Class I |
| |||||||||||||||
Issued | 14,482 | 12,677 | 18,972 | 26,279 | ||||||||||||
Reinvested | 306 | 2,016 | 5,999 | 11,895 | ||||||||||||
Redeemed | (15,555 | ) | (18,372 | ) | (31,630 | ) | (59,810 | ) | ||||||||
|
|
|
|
|
|
|
| |||||||||
Change in Class I Shares | (767 | ) | (3,679 | ) | (6,659 | ) | (21,636 | ) | ||||||||
|
|
|
|
|
|
|
| |||||||||
Class L |
| |||||||||||||||
Issued | — | — | 17,663 | 21,487 | ||||||||||||
Reinvested | — | — | 7,922 | 11,566 | ||||||||||||
Redeemed | — | — | (42,694 | ) | (37,224 | ) | ||||||||||
|
|
|
|
|
|
|
| |||||||||
Change in Class L Shares | — | — | (17,109 | ) | (4,171 | ) | ||||||||||
|
|
|
|
|
|
|
| |||||||||
Class R2 |
| |||||||||||||||
Issued | 326 | 652 | 1,874 | 2,018 | ||||||||||||
Reinvested | 15 | 101 | 1,363 | 1,883 | ||||||||||||
Redeemed | (468 | ) | (353 | ) | (5,292 | ) | (4,597 | ) | ||||||||
|
|
|
|
|
|
|
| |||||||||
Change in Class R2 Shares | (127 | ) | 400 | (2,055 | ) | (696 | ) | |||||||||
|
|
|
|
|
|
|
| |||||||||
Class R3 (a) |
| |||||||||||||||
Issued | — | (b) | 1 | 1,723 | 3,354 | |||||||||||
Reinvested | — | (b) | — | (b) | 644 | 633 | ||||||||||
Redeemed | — | (b) | — | (2,144 | ) | (643 | ) | |||||||||
|
|
|
|
|
|
|
| |||||||||
Change in Class R3 Shares | — | (b) | 1 | 223 | 3,344 | |||||||||||
|
|
|
|
|
|
|
| |||||||||
Class R4 (a) |
| |||||||||||||||
Issued | 134 | 1,113 | 290 | 1,067 | ||||||||||||
Reinvested | 14 | 7 | 137 | 134 | ||||||||||||
Redeemed | (250 | ) | (89 | ) | (534 | ) | (400 | ) | ||||||||
|
|
|
|
|
|
|
| |||||||||
Change in Class R4 Shares | (102 | ) | 1,031 | (107 | ) | 801 | ||||||||||
|
|
|
|
|
|
|
| |||||||||
Class R5 |
| |||||||||||||||
Issued | 542 | 1,415 | 5,056 | 4,699 | ||||||||||||
Reinvested | 32 | 170 | 4,669 | 6,538 | ||||||||||||
Redeemed | (1,286 | ) | (950 | ) | (12,468 | ) | (15,115 | ) | ||||||||
|
|
|
|
|
|
|
| |||||||||
Change in Class R5 Shares | (712 | ) | 635 | (2,743 | ) | (3,878 | ) | |||||||||
|
|
|
|
|
|
|
| |||||||||
Class R6 |
| |||||||||||||||
Issued | 12,775 | 22,094 | 113,479 | 85,926 | ||||||||||||
Subscriptions in-kind (See Note 9) | — | — | 2,771 | — | ||||||||||||
Reinvested | 1,189 | 5,350 | 58,213 | 64,491 | ||||||||||||
Redeemed | (10,425 | ) | (29,764 | ) | (143,075 | ) | (154,015 | ) | ||||||||
|
|
|
|
|
|
|
| |||||||||
Change in Class R6 Shares | 3,539 | (2,320 | ) | 31,388 | (3,598 | ) | ||||||||||
|
|
|
|
|
|
|
| |||||||||
| (a) | Commencement of offering of class of shares effective October 1, 2018 for JPMorgan Large Cap Value Fund. |
| (b) | Amount rounds to less than one thousand. |
SEE NOTES TO FINANCIAL STATEMENTS.
| JUNE 30, 2020 | J.P. MORGAN LARGE CAP FUNDS | 79 | ||||||
Table of Contents
STATEMENTS OF CHANGES IN NET ASSETS
FOR THE PERIODS INDICATED (continued)
(Amounts in thousands)
| JPMorgan U.S. Large Cap Core Plus Fund | JPMorgan U.S. Research Enhanced Equity Fund | |||||||||||||||
| Year Ended June 30, 2020 | Year Ended June 30, 2019 | Year Ended June 30, 2020 | Year Ended June 30, 2019 | |||||||||||||
CAPITAL TRANSACTIONS: | ||||||||||||||||
Class A | ||||||||||||||||
Proceeds from shares issued | $ | 82,531 | $ | 135,379 | $ | 56,324 | $ | 34,397 | ||||||||
Distributions reinvested | 107,818 | 94,468 | 21,732 | 27,797 | ||||||||||||
Cost of shares redeemed | (536,310 | ) | (275,160 | ) | (97,073 | ) | (123,985 | ) | ||||||||
|
|
|
|
|
|
|
| |||||||||
Change in net assets resulting from Class A capital transactions | $ | (345,961 | ) | $ | (45,313 | ) | $ | (19,017 | ) | $ | (61,791 | ) | ||||
|
|
|
|
|
|
|
| |||||||||
Class C | ||||||||||||||||
Proceeds from shares issued | $ | 7,465 | $ | 12,993 | $ | — | $ | — | ||||||||
Distributions reinvested | 19,111 | 17,995 | — | — | ||||||||||||
Cost of shares redeemed | (60,945 | ) | (67,277 | ) | — | — | ||||||||||
|
|
|
|
|
|
|
| |||||||||
Change in net assets resulting from Class C capital transactions | $ | (34,369 | ) | $ | (36,289 | ) | $ | — | $ | — | ||||||
|
|
|
|
|
|
|
| |||||||||
Class I | ||||||||||||||||
Proceeds from shares issued | $ | 542,564 | $ | 888,442 | $ | 49,261 | $ | 56,824 | ||||||||
Distributions reinvested | 811,087 | 739,627 | 23,349 | 26,614 | ||||||||||||
Cost of shares redeemed | (3,344,154 | ) | (2,590,860 | ) | (94,822 | ) | (115,409 | ) | ||||||||
|
|
|
|
|
|
|
| |||||||||
Change in net assets resulting from Class I capital transactions | $ | (1,990,503 | ) | $ | (962,791 | ) | $ | (22,212 | ) | $ | (31,971 | ) | ||||
|
|
|
|
|
|
|
| |||||||||
Class L | ||||||||||||||||
Proceeds from shares issued | $ | — | $ | — | $ | 76,268 | $ | 60,334 | ||||||||
Distributions reinvested | — | — | 26,507 | 32,173 | ||||||||||||
Cost of shares redeemed | — | — | (125,628 | ) | (138,095 | ) | ||||||||||
|
|
|
|
|
|
|
| |||||||||
Change in net assets resulting from Class L capital transactions | $ | — | $ | — | $ | (22,853 | ) | $ | (45,588 | ) | ||||||
|
|
|
|
|
|
|
| |||||||||
Class R2 | ||||||||||||||||
Proceeds from shares issued | $ | 1,116 | $ | 946 | $ | — | $ | — | ||||||||
Distributions reinvested | 808 | 532 | — | — | ||||||||||||
Cost of shares redeemed | (1,967 | ) | (2,235 | ) | — | — | ||||||||||
|
|
|
|
|
|
|
| |||||||||
Change in net assets resulting from Class R2 capital transactions | $ | (43 | ) | $ | (757 | ) | $ | — | $ | — | ||||||
|
|
|
|
|
|
|
| |||||||||
Class R5 | ||||||||||||||||
Proceeds from shares issued | $ | 15,058 | $ | 22,201 | $ | — | $ | — | ||||||||
Distributions reinvested | 20,259 | 15,977 | — | — | ||||||||||||
Cost of shares redeemed | (84,259 | ) | (57,731 | ) | — | — | ||||||||||
|
|
|
|
|
|
|
| |||||||||
Change in net assets resulting from Class R5 capital transactions | $ | (48,942 | ) | $ | (19,553 | ) | $ | — | $ | — | ||||||
|
|
|
|
|
|
|
| |||||||||
Class R6 | ||||||||||||||||
Proceeds from shares issued | $ | 91,207 | $ | 38,738 | $ | 898,953 | $ | 253,929 | ||||||||
Distributions reinvested | 113,531 | 166,828 | 462,987 | 633,410 | ||||||||||||
Cost of shares redeemed | (411,227 | ) | (1,073,375 | ) | (1,245,965 | ) | (1,522,676 | ) | ||||||||
Redemptions in-kind (See Note 8) | — | — | (1,336,709 | ) | — | |||||||||||
|
|
|
|
|
|
|
| |||||||||
Change in net assets resulting from Class R6 capital transactions | $ | (206,489 | ) | $ | (867,809 | ) | $ | (1,220,734 | ) | $ | (635,337 | ) | ||||
|
|
|
|
|
|
|
| |||||||||
Total change in net assets resulting from capital transactions | $ | (2,626,307 | ) | $ | (1,932,512 | ) | $ | (1,284,816 | ) | $ | (774,687 | ) | ||||
|
|
|
|
|
|
|
| |||||||||
SEE NOTES TO FINANCIAL STATEMENTS.
| 80 | J.P. MORGAN LARGE CAP FUNDS | JUNE 30, 2020 | ||||
Table of Contents
| JPMorgan U.S. Large Cap Core Plus Fund | JPMorgan U.S. Research Enhanced Equity Fund | |||||||||||||||
| Year Ended June 30, 2020 | Year Ended June 30, 2019 | Year Ended June 30, 2020 | Year Ended June 30, 2019 | |||||||||||||
SHARE TRANSACTIONS: |
| |||||||||||||||
Class A |
| |||||||||||||||
Issued | 3,532 | 4,895 | 2,164 | 1,253 | ||||||||||||
Reinvested | 4,576 | 3,825 | 890 | 1,116 | ||||||||||||
Redeemed | (21,865 | ) | (9,740 | ) | (3,751 | ) | (4,605 | ) | ||||||||
|
|
|
|
|
|
|
| |||||||||
Change in Class A Shares | (13,757 | ) | (1,020 | ) | (697 | ) | (2,236 | ) | ||||||||
|
|
|
|
|
|
|
| |||||||||
Class C |
| |||||||||||||||
Issued | 340 | 506 | — | — | ||||||||||||
Reinvested | 873 | 773 | — | — | ||||||||||||
Redeemed | (2,792 | ) | (2,631 | ) | — | — | ||||||||||
|
|
|
|
|
|
|
| |||||||||
Change in Class C Shares | (1,579 | ) | (1,352 | ) | — | — | ||||||||||
|
|
|
|
|
|
|
| |||||||||
Class I |
| |||||||||||||||
Issued | 22,659 | 31,989 | 1,907 | 2,021 | ||||||||||||
Reinvested | 33,851 | 29,468 | 945 | 1,056 | ||||||||||||
Redeemed | (138,788 | ) | (93,992 | ) | (3,638 | ) | (4,084 | ) | ||||||||
|
|
|
|
|
|
|
| |||||||||
Change in Class I Shares | (82,278 | ) | (32,535 | ) | (786 | ) | (1,007 | ) | ||||||||
|
|
|
|
|
|
|
| |||||||||
Class L |
| |||||||||||||||
Issued | — | — | 3,031 | 2,291 | ||||||||||||
Reinvested | — | — | 1,075 | 1,280 | ||||||||||||
Redeemed | — | — | (4,779 | ) | (4,963 | ) | ||||||||||
|
|
|
|
|
|
|
| |||||||||
Change in Class L Shares | — | — | (673 | ) | (1,392 | ) | ||||||||||
|
|
|
|
|
|
|
| |||||||||
Class R2 |
| |||||||||||||||
Issued | 49 | 36 | — | — | ||||||||||||
Reinvested | 36 | 22 | — | — | ||||||||||||
Redeemed | (90 | ) | (82 | ) | — | — | ||||||||||
|
|
|
|
|
|
|
| |||||||||
Change in Class R2 Shares | (5 | ) | (24 | ) | — | — | ||||||||||
|
|
|
|
|
|
|
| |||||||||
Class R5 |
| |||||||||||||||
Issued | 639 | 840 | — | — | ||||||||||||
Reinvested | 840 | 633 | — | — | ||||||||||||
Redeemed | (3,482 | ) | (2,058 | ) | — | — | ||||||||||
|
|
|
|
|
|
|
| |||||||||
Change in Class R5 Shares | (2,003 | ) | (585 | ) | — | — | ||||||||||
|
|
|
|
|
|
|
| |||||||||
Class R6 |
| |||||||||||||||
Issued | 3,578 | 1,425 | 35,010 | 9,239 | ||||||||||||
Reinvested | 4,714 | 6,614 | 18,774 | 25,157 | ||||||||||||
Redeemed | (16,836 | ) | (38,577 | ) | (46,532 | ) | (54,997 | ) | ||||||||
Redemptions in-kind (See Note 8) | — | — | (52,834 | ) | — | |||||||||||
|
|
|
|
|
|
|
| |||||||||
Change in Class R6 Shares | (8,544 | ) | (30,538 | ) | (45,582 | ) | (20,601 | ) | ||||||||
|
|
|
|
|
|
|
| |||||||||
SEE NOTES TO FINANCIAL STATEMENTS.
| JUNE 30, 2020 | J.P. MORGAN LARGE CAP FUNDS | 81 | ||||||
Table of Contents
STATEMENT OF CASH FLOWS
FOR THE YEAR ENDED JUNE 30, 2020
(Amounts in thousands)
JPMorgan U.S. | ||||
INCREASE (DECREASE) IN CASH | ||||
Cash flows provided (used) by operating activities: | ||||
Net increase in net assets resulting from operations | $ | 432,561 | ||
Adjustments to reconcile net increase/decrease in net assets resulting from | ||||
operations to net cash provided (used) by operating activities: | ||||
Purchases of investment securities | (4,437,015 | ) | ||
Proceeds from disposition of investment securities | 8,696,129 | |||
Covers of investment securities sold short | (2,603,850 | ) | ||
Proceeds from investment securities sold short | 2,100,141 | |||
Purchases of short-term investments — affiliates, net | 42,453 | |||
Change in unrealized (appreciation)/depreciation on investments in non-affiliates | 1,035,662 | |||
Change in unrealized (appreciation)/depreciation on investments in affiliates | (2 | ) | ||
Change in unrealized (appreciation)/depreciation on investment securities sold short | 9,577 | |||
Net realized (gain)/loss on investments in non-affiliates | (1,393,660 | ) | ||
Net realized (gain)/loss on investments in affiliates | (26 | ) | ||
Net realized (gain)/loss on securities sold short | (79,467 | ) | ||
Decrease in interest and dividends receivable from non-affiliates | 5,040 | |||
Decrease in dividends receivable from affiliates | 5 | |||
Increase in tax reclaims receivable | (6 | ) | ||
Decrease in variation margin receivable | 143 | |||
Decrease in dividend expense to non-affiliates on securities sold short | (1,782 | ) | ||
Decrease in interest expense to non-affiliates on securities sold short | (674 | ) | ||
Decrease in investment advisory fees payable | (1,904 | ) | ||
Decrease in administration fees payable | (79 | ) | ||
Decrease in distribution fees payable | (92 | ) | ||
Decrease in service fees payable | (385 | ) | ||
Decrease in custodian and accounting fees payable | (26 | ) | ||
Increase in audit fees payable | 5 | |||
Decrease in printing and mailing cost payable | (61 | ) | ||
Increase in registration fees payable | 96 | |||
Decrease in other accrued expenses payable | (68 | ) | ||
|
| |||
Net cash provided (used) by operating activities | 3,802,715 | |||
|
| |||
Cash flows provided (used) by financing activities: | ||||
Proceeds from shares issued | 742,052 | |||
Payment for shares redeemed | (4,444,274 | ) | ||
Cash distributions paid to shareholders (net of reinvestments of approximately $1,072,614,000) | (102,342 | ) | ||
|
| |||
Net cash provided (used) by financing activities | (3,804,564 | ) | ||
|
| |||
Cash: | ||||
Net increase (decrease) in unrestricted and restricted cash and deposits at broker | (1,849 | ) | ||
Restricted and unrestricted cash and deposits at broker at beginning of period | 2,240 | |||
|
| |||
Restricted and unrestricted cash and deposits at broker at end of period | $ | 391 | ||
|
| |||
Supplemental disclosure of cash flow information:
For the year ended June 30, 2020 the Fund paid approximately $6,660,000 in interest expense for securities sold short.
For purposes of reporting the Statement of Cash Flows, the Fund considers all cash accounts that are not subject to withdrawal restrictions or penalties to be cash equivalents.
Reconciliation of restricted and unrestricted cash and foreign currency at the end of period to the Statement of Assets and Liabilities:
| June 30, 2019 | June 30, 2020 | |||||||
Cash | $ | 408 | $ | 23 | ||||
Deposits at broker: | ||||||||
Futures contracts | 1,832 | 368 | ||||||
|
|
|
| |||||
| $ | 2,240 | $ | 391 | |||||
|
|
|
| |||||
SEE NOTES TO FINANCIAL STATEMENTS.
| 82 | J.P. MORGAN LARGE CAP FUNDS | JUNE 30, 2020 | ||||
Table of Contents
THIS PAGE IS INTENTIONALLY LEFT BLANK
| JUNE 30, 2020 | J.P. MORGAN LARGE CAP FUNDS | 83 | ||||||
Table of Contents
FOR THE PERIODS INDICATED
| Per share operating performance | |||||||||||||||||||||||||||
| Investment operations | Distributions | |||||||||||||||||||||||||||
| Net asset value, beginning of period | Net investment income (loss) (b) | Net realized and unrealized gains (losses) on investments | Total from investment operations | Net investment income | Net realized gain | Total distributions | ||||||||||||||||||||||
JPMorgan Equity Focus Fund | ||||||||||||||||||||||||||||
Class A | ||||||||||||||||||||||||||||
Year Ended June 30, 2020 | $ | 30.15 | $ | 0.15 | $ | 1.68 | $ | 1.83 | $ | (0.12 | ) | $ | (4.98 | ) | $ | (5.10 | ) | |||||||||||
Year Ended June 30, 2019 | 31.83 | 0.13 | 2.32 | 2.45 | (0.41 | ) | (3.72 | ) | (4.13 | ) | ||||||||||||||||||
Year Ended June 30, 2018 | 29.09 | 0.08 | 4.23 | 4.31 | (0.01 | ) | (1.56 | ) | (1.57 | ) | ||||||||||||||||||
Year Ended June 30, 2017 | 23.73 | (0.01 | ) | 5.70 | 5.69 | (0.01 | ) | (0.32 | ) | (0.33 | ) | |||||||||||||||||
Year Ended June 30, 2016 | 24.78 | (0.01 | ) | (0.38 | ) | (0.39 | ) | — | (f) | (0.66 | ) | (0.66 | ) | |||||||||||||||
Class C | ||||||||||||||||||||||||||||
Year Ended June 30, 2020 | 29.01 | 0.01 | 1.60 | 1.61 | (0.01 | ) | (4.98 | ) | (4.99 | ) | ||||||||||||||||||
Year Ended June 30, 2019 | 30.75 | (0.03 | ) | 2.25 | 2.22 | (0.24 | ) | (3.72 | ) | (3.96 | ) | |||||||||||||||||
Year Ended June 30, 2018 | 28.28 | (0.08 | ) | 4.11 | 4.03 | — | (1.56 | ) | (1.56 | ) | ||||||||||||||||||
Year Ended June 30, 2017 | 23.18 | (0.14 | ) | 5.56 | 5.42 | — | (0.32 | ) | (0.32 | ) | ||||||||||||||||||
Year Ended June 30, 2016 | 24.34 | (0.13 | ) | (0.37 | ) | (0.50 | ) | — | (0.66 | ) | (0.66 | ) | ||||||||||||||||
Class I | ||||||||||||||||||||||||||||
Year Ended June 30, 2020 | 30.60 | 0.23 | 1.70 | 1.93 | (0.17 | ) | (4.98 | ) | (5.15 | ) | ||||||||||||||||||
Year Ended June 30, 2019 | 32.13 | 0.18 | 2.38 | 2.56 | (0.37 | ) | (3.72 | ) | (4.09 | ) | ||||||||||||||||||
Year Ended June 30, 2018 | 29.34 | 0.16 | 4.27 | 4.43 | (0.08 | ) | (1.56 | ) | (1.64 | ) | ||||||||||||||||||
Year Ended June 30, 2017 | 23.92 | 0.06 | 5.75 | 5.81 | (0.07 | ) | (0.32 | ) | (0.39 | ) | ||||||||||||||||||
Year Ended June 30, 2016 | 24.95 | 0.06 | (0.39 | ) | (0.33 | ) | (0.04 | ) | (0.66 | ) | (0.70 | ) | ||||||||||||||||
Class R6 | ||||||||||||||||||||||||||||
Year Ended June 30, 2020 | 30.48 | 0.30 | 1.69 | 1.99 | (0.24 | ) | (4.98 | ) | (5.22 | ) | ||||||||||||||||||
October 1, 2018 (g) through June 30, 2019 | 34.55 | 0.23 | (0.05 | ) | 0.18 | (0.53 | ) | (3.72 | ) | (4.25 | ) | |||||||||||||||||
| (a) | Annualized for periods less than one year, unless otherwise noted. |
| (b) | Calculated based upon average shares outstanding. |
| (c) | Not annualized for periods less than one year. |
| (d) | Includes adjustments in accordance with accounting principles generally accepted in the United States of America and as such, the net asset values for financial reporting purposes and the returns based upon those net asset values may differ from the net asset values and returns for shareholder transactions. |
| (e) | Includes earnings credits and interest expense, if applicable, each of which is less than 0.005% unless otherwise noted. |
| (f) | Amount rounds to less than $0.005. |
| (g) | Commencement of offering of class of shares. |
SEE NOTES TO FINANCIAL STATEMENTS.
| 84 | J.P. MORGAN LARGE CAP FUNDS | JUNE 30, 2020 | ||||
Table of Contents
| Ratios/Supplemental data | |||||||||||||||||||||||||
| Ratios to average net assets (a) | ||||||||||||||||||||||||||
| Net asset value, end of period | Total return (excludes sales charge) (c)(d) | Net assets, end of period (000’s) | Net expenses (e) | Net income | Expenses without waivers, | Portfolio turnover rate (c) | ||||||||||||||||||||
| $ | 26.88 | 5.87 | % | $ | 5,723 | 1.10 | % | 0.55 | % | 1.34 | % | 44 | % | |||||||||||||
| 30.15 | 9.22 | 5,511 | 1.09 | 0.42 | 1.41 | 45 | ||||||||||||||||||||
| 31.83 | 15.02 | 4,077 | 1.11 | 0.26 | 1.31 | 34 | ||||||||||||||||||||
| 29.09 | 24.09 | 3,362 | 1.17 | (0.02 | ) | 1.37 | 84 | |||||||||||||||||||
| 23.73 | (1.60 | ) | 1,937 | 1.24 | (0.03 | ) | 1.55 | 45 | ||||||||||||||||||
| 25.63 | 5.30 | 3,147 | 1.60 | 0.05 | 1.84 | 44 | ||||||||||||||||||||
| 29.01 | 8.67 | 3,084 | 1.59 | (0.09 | ) | 1.89 | 45 | |||||||||||||||||||
| 30.75 | 14.45 | 3,017 | 1.61 | (0.26 | ) | 1.80 | 34 | |||||||||||||||||||
| 28.28 | 23.49 | 3,331 | 1.66 | (0.51 | ) | 1.86 | 84 | |||||||||||||||||||
| 23.18 | (2.10 | ) | 1,268 | 1.74 | (0.54 | ) | 1.96 | 45 | ||||||||||||||||||
| 27.38 | 6.12 | 52,303 | 0.85 | 0.79 | 1.08 | 44 | ||||||||||||||||||||
| 30.60 | 9.50 | 75,887 | 0.84 | 0.57 | 1.08 | 45 | ||||||||||||||||||||
| 32.13 | 15.31 | 246,276 | 0.86 | 0.52 | 1.03 | 34 | ||||||||||||||||||||
| 29.34 | 24.43 | 180,151 | 0.92 | 0.23 | 1.10 | 84 | ||||||||||||||||||||
| 23.92 | (1.37 | ) | 136,284 | 0.99 | 0.24 | 1.11 | 45 | |||||||||||||||||||
| 27.25 | 6.39 | 23,881 | 0.60 | 1.06 | 0.83 | 44 | ||||||||||||||||||||
| 30.48 | 2.03 | 22,346 | 0.59 | 1.08 | 0.95 | 45 | ||||||||||||||||||||
SEE NOTES TO FINANCIAL STATEMENTS.
| JUNE 30, 2020 | J.P. MORGAN LARGE CAP FUNDS | 85 | ||||||
Table of Contents
FINANCIAL HIGHLIGHTS
FOR THE PERIODS INDICATED (continued)
| Per share operating performance | |||||||||||||||||||||||||||
| Investment operations | Distributions | |||||||||||||||||||||||||||
| Net asset value, beginning of period | Net investment income (loss) (b) | Net realized and unrealized gains (losses) on investments | Total from investment operations | Net investment income | Net realized gain | Total distributions | ||||||||||||||||||||||
JPMorgan Equity Income Fund | ||||||||||||||||||||||||||||
Class A | ||||||||||||||||||||||||||||
Year Ended June 30, 2020 | $ | 17.83 | $ | 0.32 | $ | (1.42 | ) | $ | (1.10) | $ | (0.32 | ) | $ | (0.19 | ) | $ | (0.51 | ) | ||||||||||
Year Ended June 30, 2019 | 16.82 | 0.32 | 1.48 | 1.80 | (0.33 | ) | (0.46 | ) | (0.79 | ) | ||||||||||||||||||
Year Ended June 30, 2018 | 15.67 | 0.26 | 1.29 | 1.55 | (0.25 | ) | (0.15 | ) | (0.40 | ) | ||||||||||||||||||
Year Ended June 30, 2017 | 14.01 | 0.24 | 1.75 | 1.99 | (0.24 | ) | (0.09 | ) | (0.33 | ) | ||||||||||||||||||
Year Ended June 30, 2016 | 13.77 | 0.25 | 0.35 | 0.60 | (0.25 | ) | (0.11 | ) | (0.36 | ) | ||||||||||||||||||
Class C | ||||||||||||||||||||||||||||
Year Ended June 30, 2020 | 17.47 | 0.23 | (1.39 | ) | (1.16 | ) | (0.24 | ) | (0.19 | ) | (0.43 | ) | ||||||||||||||||
Year Ended June 30, 2019 | 16.50 | 0.23 | 1.46 | 1.69 | (0.26 | ) | (0.46 | ) | (0.72 | ) | ||||||||||||||||||
Year Ended June 30, 2018 | 15.41 | 0.17 | 1.26 | 1.43 | (0.19 | ) | (0.15 | ) | (0.34 | ) | ||||||||||||||||||
Year Ended June 30, 2017 | 13.80 | 0.16 | 1.72 | 1.88 | (0.18 | ) | (0.09 | ) | (0.27 | ) | ||||||||||||||||||
Year Ended June 30, 2016 | 13.58 | 0.18 | 0.35 | 0.53 | (0.20 | ) | (0.11 | ) | (0.31 | ) | ||||||||||||||||||
Class I | ||||||||||||||||||||||||||||
Year Ended June 30, 2020 | 18.14 | 0.37 | (1.43 | ) | (1.06 | ) | (0.37 | ) | (0.19 | ) | (0.56 | ) | ||||||||||||||||
Year Ended June 30, 2019 | 17.10 | 0.37 | 1.51 | 1.88 | (0.38 | ) | (0.46 | ) | (0.84 | ) | ||||||||||||||||||
Year Ended June 30, 2018 | 15.92 | 0.31 | 1.31 | 1.62 | (0.29 | ) | (0.15 | ) | (0.44 | ) | ||||||||||||||||||
Year Ended June 30, 2017 | 14.23 | 0.28 | 1.77 | 2.05 | (0.27 | ) | (0.09 | ) | (0.36 | ) | ||||||||||||||||||
Year Ended June 30, 2016 | 13.97 | 0.28 | 0.37 | 0.65 | (0.28 | ) | (0.11 | ) | (0.39 | ) | ||||||||||||||||||
Class R2 | ||||||||||||||||||||||||||||
Year Ended June 30, 2020 | 17.74 | 0.27 | (1.40 | ) | (1.13 | ) | (0.28 | ) | (0.19 | ) | (0.47 | ) | ||||||||||||||||
Year Ended June 30, 2019 | 16.74 | 0.28 | 1.47 | 1.75 | (0.29 | ) | (0.46 | ) | (0.75 | ) | ||||||||||||||||||
Year Ended June 30, 2018 | 15.62 | 0.21 | 1.28 | 1.49 | (0.22 | ) | (0.15 | ) | (0.37 | ) | ||||||||||||||||||
Year Ended June 30, 2017 | 13.97 | 0.20 | 1.75 | 1.95 | (0.21 | ) | (0.09 | ) | (0.30 | ) | ||||||||||||||||||
Year Ended June 30, 2016 | 13.74 | 0.21 | 0.35 | 0.56 | (0.22 | ) | (0.11 | ) | (0.33 | ) | ||||||||||||||||||
Class R3 | ||||||||||||||||||||||||||||
Year Ended June 30, 2020 | 17.81 | 0.32 | (1.41 | ) | (1.09 | ) | (0.32 | ) | (0.19 | ) | (0.51 | ) | ||||||||||||||||
Year Ended June 30, 2019 | 16.80 | 0.32 | 1.49 | 1.81 | (0.34 | ) | (0.46 | ) | (0.80 | ) | ||||||||||||||||||
Year Ended June 30, 2018 | 15.66 | 0.27 | 1.27 | 1.54 | (0.25 | ) | (0.15 | ) | (0.40 | ) | ||||||||||||||||||
September 9, 2016 (f) through June 30, 2017 | 14.06 | 0.19 | 1.71 | 1.90 | (0.21 | ) | (0.09 | ) | (0.30 | ) | ||||||||||||||||||
Class R4 | ||||||||||||||||||||||||||||
Year Ended June 30, 2020 | 18.13 | 0.37 | (1.43 | ) | (1.06 | ) | (0.37 | ) | (0.19 | ) | (0.56 | ) | ||||||||||||||||
Year Ended June 30, 2019 | 17.09 | 0.36 | 1.52 | 1.88 | (0.38 | ) | (0.46 | ) | (0.84 | ) | ||||||||||||||||||
Year Ended June 30, 2018 | 15.92 | 0.32 | 1.29 | 1.61 | (0.29 | ) | (0.15 | ) | (0.44 | ) | ||||||||||||||||||
September 9, 2016 (f) through June 30, 2017 | 14.28 | 0.29 | 1.67 | 1.96 | (0.23 | ) | (0.09 | ) | (0.32 | ) | ||||||||||||||||||
Class R5 | ||||||||||||||||||||||||||||
Year Ended June 30, 2020 | 18.16 | 0.40 | (1.45 | ) | (1.05 | ) | (0.39 | ) | (0.19 | ) | (0.58 | ) | ||||||||||||||||
Year Ended June 30, 2019 | 17.11 | 0.40 | 1.51 | 1.91 | (0.40 | ) | (0.46 | ) | (0.86 | ) | ||||||||||||||||||
Year Ended June 30, 2018 | 15.93 | 0.34 | 1.30 | 1.64 | (0.31 | ) | (0.15 | ) | (0.46 | ) | ||||||||||||||||||
Year Ended June 30, 2017 | 14.23 | 0.31 | 1.78 | 2.09 | (0.30 | ) | (0.09 | ) | (0.39 | ) | ||||||||||||||||||
Year Ended June 30, 2016 | 13.98 | 0.31 | 0.35 | 0.66 | (0.30 | ) | (0.11 | ) | (0.41 | ) | ||||||||||||||||||
Class R6 | ||||||||||||||||||||||||||||
Year Ended June 30, 2020 | 18.14 | 0.42 | (1.44 | ) | (1.02 | ) | (0.41 | ) | (0.19 | ) | (0.60 | ) | ||||||||||||||||
Year Ended June 30, 2019 | 17.10 | 0.42 | 1.50 | 1.92 | (0.42 | ) | (0.46 | ) | (0.88 | ) | ||||||||||||||||||
Year Ended June 30, 2018 | 15.92 | 0.35 | 1.31 | 1.66 | (0.33 | ) | (0.15 | ) | (0.48 | ) | ||||||||||||||||||
Year Ended June 30, 2017 | 14.22 | 0.32 | 1.78 | 2.10 | (0.31 | ) | (0.09 | ) | (0.40 | ) | ||||||||||||||||||
Year Ended June 30, 2016 | 13.97 | 0.33 | 0.34 | 0.67 | (0.31 | ) | (0.11 | ) | (0.42 | ) | ||||||||||||||||||
| (a) | Annualized for periods less than one year, unless otherwise noted. |
| (b) | Calculated based upon average shares outstanding. |
| (c) | Not annualized for periods less than one year. |
| (d) | Includes adjustments in accordance with accounting principles generally accepted in the United States of America and as such, the net asset values for financial reporting purposes and the returns based upon those net asset values may differ from the net asset values and returns for shareholder transactions. |
| (e) | Includes earnings credits and interest expense, if applicable, each of which is less than 0.005% unless otherwise noted. |
| (f) | Commencement of offering of class of shares. |
SEE NOTES TO FINANCIAL STATEMENTS.
| 86 | J.P. MORGAN LARGE CAP FUNDS | JUNE 30, 2020 | ||||
Table of Contents
| Ratios/Supplemental data | |||||||||||||||||||||||||
| Ratios to average net assets (a) | ||||||||||||||||||||||||||
| Net asset value, end of period | Total return (excludes sales charge) (c)(d) | Net assets, end of period (000’s) | Net expenses (e) | Net income | Expenses without waivers, reimbursements and | Portfolio | ||||||||||||||||||||
| $ | 16.22 | (6.36 | )% | $ | 3,234,850 | 0.98 | % | 1.83 | % | 0.98 | % | 22 | % | |||||||||||||
| 17.83 | 11.17 | 3,277,249 | 0.99 | 1.90 | 1.00 | 23 | ||||||||||||||||||||
| 16.82 | 9.94 | 3,022,879 | 1.00 | 1.55 | 1.01 | 20 | ||||||||||||||||||||
| 15.67 | 14.34 | 3,176,361 | 1.04 | 1.59 | 1.08 | 14 | ||||||||||||||||||||
| 14.01 | 4.45 | 3,370,383 | 1.04 | 1.83 | 1.11 | 20 | ||||||||||||||||||||
| 15.88 | (6.83 | ) | 1,350,402 | 1.47 | 1.34 | 1.47 | 22 | |||||||||||||||||||
| 17.47 | 10.66 | 1,434,793 | 1.48 | 1.39 | 1.49 | 23 | ||||||||||||||||||||
| 16.50 | 9.35 | 1,303,731 | 1.50 | 1.05 | 1.50 | 20 | ||||||||||||||||||||
| 15.41 | 13.74 | 1,385,115 | 1.54 | 1.09 | 1.55 | 14 | ||||||||||||||||||||
| 13.80 | 4.01 | 1,304,007 | 1.54 | 1.33 | 1.58 | 20 | ||||||||||||||||||||
| 16.52 | (6.06 | ) | 10,727,252 | 0.71 | 2.11 | 0.72 | 22 | |||||||||||||||||||
| 18.14 | 11.45 | 9,013,293 | 0.73 | 2.12 | 0.74 | 23 | ||||||||||||||||||||
| 17.10 | 10.22 | 6,320,979 | 0.74 | 1.81 | 0.75 | 20 | ||||||||||||||||||||
| 15.92 | 14.57 | 6,542,906 | 0.78 | 1.84 | 0.79 | 14 | ||||||||||||||||||||
| 14.23 | 4.75 | 4,679,200 | 0.79 | 2.07 | 0.81 | 20 | ||||||||||||||||||||
| 16.14 | (6.57 | ) | 72,182 | 1.23 | 1.56 | 1.23 | 22 | |||||||||||||||||||
| 17.74 | 10.90 | 93,453 | 1.24 | 1.64 | 1.25 | 23 | ||||||||||||||||||||
| 16.74 | 9.59 | 80,330 | 1.26 | 1.29 | 1.26 | 20 | ||||||||||||||||||||
| 15.62 | 14.08 | 87,437 | 1.29 | 1.34 | 1.39 | 14 | ||||||||||||||||||||
| 13.97 | 4.20 | 77,230 | 1.29 | 1.59 | 1.45 | 20 | ||||||||||||||||||||
| 16.21 | (6.29 | ) | 170,246 | 0.97 | 1.86 | 0.97 | 22 | |||||||||||||||||||
| 17.81 | 11.20 | 137,142 | 0.98 | 1.87 | 0.99 | 23 | ||||||||||||||||||||
| 16.80 | 9.90 | 91,267 | 0.99 | 1.61 | 0.99 | 20 | ||||||||||||||||||||
| 15.66 | 13.62 | 25,209 | 1.03 | 1.55 | 1.05 | 14 | ||||||||||||||||||||
| 16.51 | (6.07 | ) | 106,277 | 0.72 | 2.12 | 0.72 | 22 | |||||||||||||||||||
| 18.13 | 11.46 | 66,602 | 0.73 | 2.08 | 0.74 | 23 | ||||||||||||||||||||
| 17.09 | 10.18 | 23,451 | 0.74 | 1.90 | 0.75 | 20 | ||||||||||||||||||||
| 15.92 | 13.85 | 1,340 | 0.78 | 2.28 | 0.83 | 14 | ||||||||||||||||||||
| 16.53 | (5.98 | ) | 1,230,147 | 0.56 | 2.24 | 0.57 | 22 | |||||||||||||||||||
| 18.16 | 11.67 | 1,422,483 | 0.58 | 2.29 | 0.59 | 23 | ||||||||||||||||||||
| 17.11 | 10.38 | 1,097,476 | 0.59 | 1.98 | 0.60 | 20 | ||||||||||||||||||||
| 15.93 | 14.84 | 912,746 | 0.58 | 2.05 | 0.63 | 14 | ||||||||||||||||||||
| 14.23 | 4.89 | 722,424 | 0.59 | 2.28 | 0.64 | 20 | ||||||||||||||||||||
| 16.52 | (5.83 | ) | 12,663,581 | 0.46 | 2.38 | 0.47 | 22 | |||||||||||||||||||
| 18.14 | 11.72 | 8,217,432 | 0.48 | 2.38 | 0.49 | 23 | ||||||||||||||||||||
| 17.10 | 10.49 | 5,314,382 | 0.49 | 2.08 | 0.50 | 20 | ||||||||||||||||||||
| 15.92 | 14.95 | 2,821,798 | 0.50 | 2.13 | 0.50 | 14 | ||||||||||||||||||||
| 14.22 | 4.98 | 1,913,077 | 0.50 | 2.43 | 0.50 | 20 | ||||||||||||||||||||
SEE NOTES TO FINANCIAL STATEMENTS.
| JUNE 30, 2020 | J.P. MORGAN LARGE CAP FUNDS | 87 | ||||||
Table of Contents
FINANCIAL HIGHLIGHTS
FOR THE PERIODS INDICATED (continued)
| Per share operating performance | |||||||||||||||||||
| Investment operations | Distributions | |||||||||||||||||||
| Net asset value, beginning of period | Net investment income (loss) (b) | Net realized gains (losses) on | Total from investment operations | Net investment income | ||||||||||||||||
JPMorgan Equity Premium Income Fund | ||||||||||||||||||||
Class A | ||||||||||||||||||||
Year Ended June 30, 2020 | $ | 14.92 | $ | 1.88 | $ | (2.42 | ) | $ | (0.54 | ) | $ | (1.42 | ) | |||||||
August 31, 2018 (f) through June 30, 2019 | 15.00 | 0.95 | (0.11 | ) | 0.84 | (0.92 | ) | |||||||||||||
Class C | ||||||||||||||||||||
Year Ended June 30, 2020 | 14.92 | 1.61 | (2.22 | ) | (0.61 | ) | (1.35 | ) | ||||||||||||
August 31, 2018 (f) through June 30, 2019 | 15.00 | 0.85 | (0.07 | ) | 0.78 | (0.86 | ) | |||||||||||||
Class I | ||||||||||||||||||||
Year Ended June 30, 2020 | 14.92 | 1.59 | (2.10 | ) | (0.51 | ) | (1.45 | ) | ||||||||||||
August 31, 2018 (f) through June 30, 2019 | 15.00 | 0.94 | (0.07 | ) | 0.87 | (0.95 | ) | |||||||||||||
Class R5 | ||||||||||||||||||||
Year Ended June 30, 2020 | 14.92 | 1.48 | (1.96 | ) | (0.48 | ) | (1.48 | ) | ||||||||||||
August 31, 2018 (f) through June 30, 2019 | 15.00 | 0.96 | (0.08 | ) | 0.88 | (0.96 | ) | |||||||||||||
Class R6 | ||||||||||||||||||||
Year Ended June 30, 2020 | 14.92 | 1.83 | (2.30 | ) | (0.47 | ) | (1.49 | ) | ||||||||||||
August 31, 2018 (f) through June 30, 2019 | 15.00 | 0.97 | (0.07 | ) | 0.90 | (0.98 | ) | |||||||||||||
| (a) | Annualized for periods less than one year, unless otherwise noted. |
| (b) | Calculated based upon average shares outstanding. |
| (c) | Not annualized for periods less than one year. |
| (d) | Includes adjustments in accordance with accounting principles generally accepted in the United States of America and as such, the net asset values for financial reporting purposes and the returns based upon those net asset values may differ from the net asset values and returns for shareholder transactions. |
| (e) | Includes earnings credits and interest expense, if applicable, each of which is less than 0.005% unless otherwise noted. |
| (f) | Commencement of operations. |
| (g) | Certain non-recurring expenses incurred by the Fund were not annualized for the period indicated. |
SEE NOTES TO FINANCIAL STATEMENTS.
| 88 | J.P. MORGAN LARGE CAP FUNDS | JUNE 30, 2020 | ||||
Table of Contents
| Ratios/Supplemental data | |||||||||||||||||||||||||
| Ratios to average net assets (a) | ||||||||||||||||||||||||||
| Net asset value, end of period | Total return (excludes sales charge) (c)(d) | Net assets, end of period (000’s) | Net expenses (e) | Net income | Expenses without waivers, reimbursements and | Portfolio turnover rate (c) | ||||||||||||||||||||
| $ | 12.96 | (3.78 | )% | $ | 12,904 | 0.85 | % | 14.21 | % | 1.11 | % | 236 | % | |||||||||||||
| 14.92 | 5.95 | 125 | 0.85 | (g) | 7.90 | (g) | 1.80 | (g) | 43 | |||||||||||||||||
| 12.96 | (4.26 | ) | 4,710 | 1.35 | 11.77 | 1.61 | 236 | |||||||||||||||||||
| 14.92 | 5.50 | 21 | 1.35 | (g) | 7.14 | (g) | 2.26 | (g) | 43 | |||||||||||||||||
| 12.96 | (3.57 | ) | 173,409 | 0.60 | 11.40 | 0.91 | 236 | |||||||||||||||||||
| 14.92 | 6.15 | 54,045 | 0.60 | (g) | 7.89 | (g) | 1.13 | (g) | 43 | |||||||||||||||||
| 12.96 | (3.43 | ) | 21 | 0.45 | 10.37 | 0.83 | 236 | |||||||||||||||||||
| 14.92 | 6.28 | 21 | 0.45 | (g) | 8.04 | (g) | 1.36 | (g) | 43 | |||||||||||||||||
| 12.96 | (3.33 | ) | 686 | 0.35 | 13.60 | 0.59 | 236 | |||||||||||||||||||
| 14.92 | 6.37 | 21 | 0.35 | (g) | 8.14 | (g) | 1.26 | (g) | 43 | |||||||||||||||||
SEE NOTES TO FINANCIAL STATEMENTS.
| JUNE 30, 2020 | J.P. MORGAN LARGE CAP FUNDS | 89 | ||||||
Table of Contents
FINANCIAL HIGHLIGHTS
FOR THE PERIODS INDICATED (continued)
| Per share operating performance | |||||||||||||||||||||||||||
| Investment operations | Distributions | |||||||||||||||||||||||||||
| Net asset value, beginning of period | Net investment income (loss) (b) | Net realized (losses) on | Total from investment operations | Net investment income | Net realized gain | Total distributions | ||||||||||||||||||||||
JPMorgan Growth and Income Fund |
| |||||||||||||||||||||||||||
Class A | ||||||||||||||||||||||||||||
Year Ended June 30, 2020 | $ | 49.84 | $ | 0.79 | $ | (3.18 | ) | $ | (2.39 | ) | $ | (0.76 | ) | $ | (1.07 | ) | $ | (1.83 | ) | |||||||||
Year Ended June 30, 2019 | 49.77 | 0.85 | 2.21 | 3.06 | (0.85 | ) | (2.14 | ) | (2.99 | ) | ||||||||||||||||||
Year Ended June 30, 2018 | 46.85 | 0.64 | 4.98 | 5.62 | (0.62 | ) | (2.08 | ) | (2.70 | ) | ||||||||||||||||||
Year Ended June 30, 2017 | 42.75 | 0.57 | 6.31 | 6.88 | (0.57 | ) | (2.21 | ) | (2.78 | ) | ||||||||||||||||||
Year Ended June 30, 2016 | 45.46 | 0.59 | (0.27 | ) | 0.32 | (0.55 | ) | (2.48 | ) | (3.03 | ) | |||||||||||||||||
Class C | ||||||||||||||||||||||||||||
Year Ended June 30, 2020 | 44.59 | 0.48 | (2.81 | ) | (2.33 | ) | (0.56 | ) | (1.07 | ) | (1.63 | ) | ||||||||||||||||
Year Ended June 30, 2019 | 44.91 | 0.53 | 1.98 | 2.51 | (0.69 | ) | (2.14 | ) | (2.83 | ) | ||||||||||||||||||
Year Ended June 30, 2018 | 42.54 | 0.35 | 4.51 | 4.86 | (0.41 | ) | (2.08 | ) | (2.49 | ) | ||||||||||||||||||
Year Ended June 30, 2017 | 39.07 | 0.31 | 5.76 | 6.07 | (0.39 | ) | (2.21 | ) | (2.60 | ) | ||||||||||||||||||
Year Ended June 30, 2016 | 41.83 | 0.35 | (0.25 | ) | 0.10 | (0.38 | ) | (2.48 | ) | (2.86 | ) | |||||||||||||||||
Class I | ||||||||||||||||||||||||||||
Year Ended June 30, 2020 | 52.69 | 0.96 | (3.36 | ) | (2.40 | ) | (0.88 | ) | (1.07 | ) | (1.95 | ) | ||||||||||||||||
Year Ended June 30, 2019 | 52.41 | 1.00 | 2.36 | 3.36 | (0.94 | ) | (2.14 | ) | (3.08 | ) | ||||||||||||||||||
Year Ended June 30, 2018 | 49.21 | 0.81 | 5.21 | 6.02 | (0.74 | ) | (2.08 | ) | (2.82 | ) | ||||||||||||||||||
Year Ended June 30, 2017 | 44.77 | 0.72 | 6.62 | 7.34 | (0.69 | ) | (2.21 | ) | (2.90 | ) | ||||||||||||||||||
Year Ended June 30, 2016 | 47.45 | 0.73 | (0.27 | ) | 0.46 | (0.66 | ) | (2.48 | ) | (3.14 | ) | |||||||||||||||||
Class R2 | ||||||||||||||||||||||||||||
Year Ended June 30, 2020 | 50.01 | 0.69 | (3.19 | ) | (2.50 | ) | (0.72 | ) | (1.07 | ) | (1.79 | ) | ||||||||||||||||
Year Ended June 30, 2019 | 49.98 | 0.63 | 2.31 | 2.94 | (0.77 | ) | (2.14 | ) | (2.91 | ) | ||||||||||||||||||
Year Ended June 30, 2018 | 47.06 | 0.53 | 4.99 | 5.52 | (0.52 | ) | (2.08 | ) | (2.60 | ) | ||||||||||||||||||
Year Ended June 30, 2017 | 42.94 | 0.46 | 6.33 | 6.79 | (0.46 | ) | (2.21 | ) | (2.67 | ) | ||||||||||||||||||
November 2, 2015 (f) through June 30, 2016 | 45.92 | 0.40 | (0.70 | ) | (0.30 | ) | (0.20 | ) | (2.48 | ) | (2.68 | ) | ||||||||||||||||
Class R3 | ||||||||||||||||||||||||||||
Year Ended June 30, 2020 | 52.66 | 0.75 | (3.29 | ) | (2.54 | ) | (0.80 | ) | (1.07 | ) | (1.87 | ) | ||||||||||||||||
Year Ended June 30, 2019 | 52.41 | 0.89 | 2.33 | 3.22 | (0.83 | ) | (2.14 | ) | (2.97 | ) | ||||||||||||||||||
July 31, 2017 (f) through June 30, 2018 | 49.99 | 0.68 | 4.46 | 5.14 | (0.64 | ) | (2.08 | ) | (2.72 | ) | ||||||||||||||||||
Class R4 | ||||||||||||||||||||||||||||
Year Ended June 30, 2020 | 52.69 | 1.04 | (3.46 | ) | (2.42 | ) | (0.89 | ) | (1.07 | ) | (1.96 | ) | ||||||||||||||||
Year Ended June 30, 2019 | 52.41 | 1.02 | 2.34 | 3.36 | (0.94 | ) | (2.14 | ) | (3.08 | ) | ||||||||||||||||||
July 31, 2017 (f) through June 30, 2018 | 49.99 | 0.79 | 4.46 | 5.25 | (0.75 | ) | (2.08 | ) | (2.83 | ) | ||||||||||||||||||
Class R5 | ||||||||||||||||||||||||||||
Year Ended June 30, 2020 | 53.06 | 1.04 | (3.39 | ) | (2.35 | ) | (0.95 | ) | (1.07 | ) | (2.02 | ) | ||||||||||||||||
Year Ended June 30, 2019 | 52.74 | 1.09 | 2.38 | 3.47 | (1.01 | ) | (2.14 | ) | (3.15 | ) | ||||||||||||||||||
Year Ended June 30, 2018 | 49.50 | 0.91 | 5.23 | 6.14 | (0.82 | ) | (2.08 | ) | (2.90 | ) | ||||||||||||||||||
Year Ended June 30, 2017 | 45.01 | 0.83 | 6.65 | 7.48 | (0.78 | ) | (2.21 | ) | (2.99 | ) | ||||||||||||||||||
November 2, 2015 (f) through June 30, 2016 | 47.95 | 0.62 | (0.73 | ) | (0.11 | ) | (0.35 | ) | (2.48 | ) | (2.83 | ) | ||||||||||||||||
Class R6 | ||||||||||||||||||||||||||||
Year Ended June 30, 2020 | 53.08 | 1.11 | (3.42 | ) | (2.31 | ) | (1.00 | ) | (1.07 | ) | (2.07 | ) | ||||||||||||||||
Year Ended June 30, 2019 | 52.75 | 1.16 | 2.36 | 3.52 | (1.05 | ) | (2.14 | ) | (3.19 | ) | ||||||||||||||||||
Year Ended June 30, 2018 | 49.50 | 1.04 | 5.16 | 6.20 | (0.87 | ) | (2.08 | ) | (2.95 | ) | ||||||||||||||||||
Year Ended June 30, 2017 | 45.01 | 0.81 | 6.69 | 7.50 | (0.80 | ) | (2.21 | ) | (3.01 | ) | ||||||||||||||||||
November 2, 2015 (f) through June 30, 2016 | 47.95 | 0.63 | (0.72 | ) | (0.09 | ) | (0.37 | ) | (2.48 | ) | (2.85 | ) | ||||||||||||||||
| (a) | Annualized for periods less than one year, unless otherwise noted. |
| (b) | Calculated based upon average shares outstanding. |
| (c) | Not annualized for periods less than one year. |
| (d) | Includes adjustments in accordance with accounting principles generally accepted in the United States of America and as such, the net asset values for financial reporting purposes and the returns based upon those net asset values may differ from the net asset values and returns for shareholder transactions. |
| (e) | Includes earnings credits and interest expense, if applicable, each of which is less than 0.005% unless otherwise noted. |
| (f) | Commencement of offering of class of shares. |
SEE NOTES TO FINANCIAL STATEMENTS.
| 90 | J.P. MORGAN LARGE CAP FUNDS | JUNE 30, 2020 | ||||
Table of Contents
| Ratios/Supplemental data | |||||||||||||||||||||||||
| Ratios to average net assets (a) | ||||||||||||||||||||||||||
| Net asset value, end of period | Total return (excludes sales charge) (c)(d) | Net assets, end of period (000’s) | Net expenses (e) | Net income | Expenses without waivers, reimbursements and earnings credits | Portfolio turnover rate (c) | ||||||||||||||||||||
| $ | 45.62 | (5.11 | )% | $ | 497,399 | 0.94 | % | 1.61 | % | 1.06 | % | 22 | % | |||||||||||||
| 49.84 | 6.68 | 490,597 | 0.93 | 1.73 | 1.06 | 26 | ||||||||||||||||||||
| 49.77 | 12.04 | 476,090 | 0.97 | 1.29 | 1.08 | 32 | ||||||||||||||||||||
| 46.85 | 16.34 | 445,078 | 1.03 | 1.26 | 1.10 | 28 | ||||||||||||||||||||
| 42.75 | 1.02 | 422,151 | 1.06 | 1.38 | 1.13 | 39 | ||||||||||||||||||||
| 40.63 | (5.57 | ) | 26,487 | 1.44 | 1.11 | 1.53 | 22 | |||||||||||||||||||
| 44.59 | 6.15 | 26,032 | 1.43 | 1.21 | 1.54 | 26 | ||||||||||||||||||||
| 44.91 | 11.45 | 23,034 | 1.47 | 0.77 | 1.55 | 32 | ||||||||||||||||||||
| 42.54 | 15.76 | 28,290 | 1.53 | 0.76 | 1.59 | 28 | ||||||||||||||||||||
| 39.07 | 0.54 | 25,541 | 1.56 | 0.89 | 1.62 | 39 | ||||||||||||||||||||
| 48.34 | (4.85 | ) | 135,234 | 0.69 | 1.88 | 0.78 | 22 | |||||||||||||||||||
| 52.69 | 6.94 | 94,500 | 0.68 | 1.93 | 0.79 | 26 | ||||||||||||||||||||
| 52.41 | 12.29 | 77,737 | 0.72 | 1.55 | 0.79 | 32 | ||||||||||||||||||||
| 49.21 | 16.64 | 64,148 | 0.78 | 1.50 | 0.83 | 28 | ||||||||||||||||||||
| 44.77 | 1.28 | 40,068 | 0.81 | 1.64 | 0.86 | 39 | ||||||||||||||||||||
| 45.72 | (5.34 | ) | 1,126 | 1.19 | 1.46 | 1.98 | 22 | |||||||||||||||||||
| 50.01 | 6.41 | 108 | 1.18 | 1.30 | 2.77 | 26 | ||||||||||||||||||||
| 49.98 | 11.76 | 41 | 1.21 | 1.06 | 1.49 | 32 | ||||||||||||||||||||
| 47.06 | 16.04 | 23 | 1.28 | 1.01 | 2.06 | 28 | ||||||||||||||||||||
| 42.94 | (0.40 | ) | 20 | 1.28 | 1.44 | 3.72 | 39 | |||||||||||||||||||
| 48.25 | (5.10 | ) | 398 | 0.94 | 1.50 | 1.03 | 22 | |||||||||||||||||||
| 52.66 | 6.66 | 24 | 0.93 | 1.73 | 1.84 | 26 | ||||||||||||||||||||
| 52.41 | 10.33 | 22 | 0.94 | 1.42 | 1.12 | 32 | ||||||||||||||||||||
| 48.31 | (4.88 | ) | 1,159 | 0.69 | 2.15 | 0.77 | 22 | |||||||||||||||||||
| 52.69 | 6.94 | 24 | 0.68 | 1.98 | 1.60 | 26 | ||||||||||||||||||||
| 52.41 | 10.56 | 22 | 0.71 | 1.64 | 0.87 | 32 | ||||||||||||||||||||
| 48.69 | (4.72 | ) | 83 | 0.54 | 2.02 | 5.20 | 22 | |||||||||||||||||||
| 53.06 | 7.10 | 74 | 0.53 | 2.10 | 1.01 | 26 | ||||||||||||||||||||
| 52.74 | 12.48 | 43 | 0.55 | 1.72 | 0.80 | 32 | ||||||||||||||||||||
| 49.50 | 16.88 | 37 | 0.59 | 1.72 | 1.23 | 28 | ||||||||||||||||||||
| 45.01 | 0.05 | 20 | 0.59 | 2.14 | 3.02 | 39 | ||||||||||||||||||||
| 48.70 | (4.64 | ) | 64,968 | 0.44 | 2.14 | 0.53 | 22 | |||||||||||||||||||
| 53.08 | 7.21 | 41,144 | 0.43 | 2.22 | 0.53 | 26 | ||||||||||||||||||||
| 52.75 | 12.59 | 33,774 | 0.44 | 1.95 | 0.52 | 32 | ||||||||||||||||||||
| 49.50 | 16.94 | 2,129 | 0.53 | 1.66 | 0.55 | 28 | ||||||||||||||||||||
| 45.01 | 0.08 | 20 | 0.53 | 2.19 | 2.96 | 39 | ||||||||||||||||||||
SEE NOTES TO FINANCIAL STATEMENTS.
| JUNE 30, 2020 | J.P. MORGAN LARGE CAP FUNDS | 91 | ||||||
Table of Contents
FINANCIAL HIGHLIGHTS
FOR THE PERIODS INDICATED (continued)
| Per share operating performance | |||||||||||||||||||
| Investment operations | Distributions | |||||||||||||||||||
| Net asset value, beginning of period | Net investment income (loss) (a) | Net realized gains (losses) on | Total from investment operations | Net investment income | ||||||||||||||||
JPMorgan Hedged Equity Fund | ||||||||||||||||||||
Class A | ||||||||||||||||||||
Year Ended June 30, 2020 | $ | 20.23 | $ | 0.28 | $ | 1.51 | $ | 1.79 | $ | (0.19 | ) | |||||||||
Year Ended June 30, 2019 | 19.43 | 0.20 | 0.79 | 0.99 | (0.19 | ) | ||||||||||||||
Year Ended June 30, 2018 | 18.24 | 0.18 | 1.15 | 1.33 | (0.14 | ) | ||||||||||||||
Year Ended June 30, 2017 | 16.23 | 0.19 | 2.01 | 2.20 | (0.19 | ) | ||||||||||||||
Year Ended June 30, 2016 | 16.47 | 0.20 | (0.28 | ) | (0.08 | ) | (0.16 | ) | ||||||||||||
Class C | ||||||||||||||||||||
Year Ended June 30, 2020 | 20.10 | 0.17 | 1.52 | 1.69 | (0.09 | ) | ||||||||||||||
Year Ended June 30, 2019 | 19.33 | 0.11 | 0.77 | 0.88 | (0.11 | ) | ||||||||||||||
Year Ended June 30, 2018 | 18.16 | 0.08 | 1.15 | 1.23 | (0.06 | ) | ||||||||||||||
Year Ended June 30, 2017 | 16.17 | 0.10 | 2.01 | 2.11 | (0.12 | ) | ||||||||||||||
Year Ended June 30, 2016 | 16.43 | 0.13 | (0.29 | ) | (0.16 | ) | (0.10 | ) | ||||||||||||
Class I | ||||||||||||||||||||
Year Ended June 30, 2020 | 20.28 | 0.33 | 1.53 | 1.86 | (0.24 | ) | ||||||||||||||
Year Ended June 30, 2019 | 19.47 | 0.26 | 0.78 | 1.04 | (0.23 | ) | ||||||||||||||
Year Ended June 30, 2018 | 18.27 | 0.23 | 1.16 | 1.39 | (0.19 | ) | ||||||||||||||
Year Ended June 30, 2017 | 16.26 | 0.23 | 2.01 | 2.24 | (0.23 | ) | ||||||||||||||
Year Ended June 30, 2016 | 16.50 | 0.25 | (0.28 | ) | (0.03 | ) | (0.21 | ) | ||||||||||||
Class R5 | ||||||||||||||||||||
Year Ended June 30, 2020 | 20.32 | 0.36 | 1.52 | 1.88 | (0.27 | ) | ||||||||||||||
Year Ended June 30, 2019 | 19.50 | 0.29 | 0.79 | 1.08 | (0.26 | ) | ||||||||||||||
Year Ended June 30, 2018 | 18.30 | 0.26 | 1.16 | 1.42 | (0.22 | ) | ||||||||||||||
Year Ended June 30, 2017 | 16.28 | 0.26 | 2.02 | 2.28 | (0.26 | ) | ||||||||||||||
Year Ended June 30, 2016 | 16.51 | 0.24 | (0.24 | ) | — | (d) | (0.23 | ) | ||||||||||||
Class R6 | ||||||||||||||||||||
Year Ended June 30, 2020 | 20.32 | 0.39 | 1.53 | 1.92 | (0.29 | ) | ||||||||||||||
Year Ended June 30, 2019 | 19.49 | 0.31 | 0.79 | 1.10 | (0.27 | ) | ||||||||||||||
Year Ended June 30, 2018 | 18.29 | 0.27 | 1.16 | 1.43 | (0.23 | ) | ||||||||||||||
Year Ended June 30, 2017 | 16.28 | 0.25 | 2.03 | 2.28 | (0.27 | ) | ||||||||||||||
Year Ended June 30, 2016 | 16.52 | 0.27 | (0.27 | ) | — | (d) | (0.24 | ) | ||||||||||||
| (a) | Calculated based upon average shares outstanding. |
| (b) | Includes adjustments in accordance with accounting principles generally accepted in the United States of America and as such, the net asset values for financial reporting purposes and the returns based upon those net asset values may differ from the net asset values and returns for shareholder transactions. |
| (c) | Includes earnings credits and interest expense, if applicable, each of which is less than 0.005% unless otherwise noted. |
| (d) | Amount rounds to less than $0.005. |
SEE NOTES TO FINANCIAL STATEMENTS.
| 92 | J.P. MORGAN LARGE CAP FUNDS | JUNE 30, 2020 | ||||
Table of Contents
| Ratios/Supplemental data | |||||||||||||||||||||||||
| Ratios to average net assets | ||||||||||||||||||||||||||
| Net asset value, end of period | Total return (excludes sales charge) (b) | Net assets, end of period (000’s) | Net expenses (c) | Net income | Expenses without waivers, reimbursements and earnings credits | Portfolio turnover rate | ||||||||||||||||||||
| $ | 21.83 | 8.89 | % | $ | 473,314 | 0.85 | % | 1.35 | % | 0.86 | % | 68 | % | |||||||||||||
| 20.23 | 5.12 | 296,242 | 0.85 | 1.02 | 0.87 | 48 | ||||||||||||||||||||
| 19.43 | 7.33 | 277,898 | 0.84 | 0.92 | 0.87 | 44 | ||||||||||||||||||||
| 18.24 | 13.60 | 133,789 | 0.84 | 1.06 | 1.05 | 31 | ||||||||||||||||||||
| 16.23 | (0.43 | ) | 71,417 | 0.85 | 1.27 | 1.11 | 57 | |||||||||||||||||||
| 21.70 | 8.40 | 246,741 | 1.35 | 0.84 | 1.36 | 68 | ||||||||||||||||||||
| 20.10 | 4.60 | 158,602 | 1.35 | 0.55 | 1.37 | 48 | ||||||||||||||||||||
| 19.33 | 6.79 | 81,030 | 1.34 | 0.42 | 1.38 | 44 | ||||||||||||||||||||
| 18.16 | 13.07 | 29,168 | 1.34 | 0.55 | 1.45 | 31 | ||||||||||||||||||||
| 16.17 | (0.95 | ) | 9,867 | 1.35 | 0.80 | 1.52 | 57 | |||||||||||||||||||
| 21.90 | 9.21 | 7,167,488 | 0.59 | 1.59 | 0.60 | 68 | ||||||||||||||||||||
| 20.28 | 5.39 | 4,214,453 | 0.60 | 1.30 | 0.61 | 48 | ||||||||||||||||||||
| 19.47 | 7.63 | 1,947,444 | 0.59 | 1.17 | 0.62 | 44 | ||||||||||||||||||||
| 18.27 | 13.86 | 597,013 | 0.59 | 1.30 | 0.69 | 31 | ||||||||||||||||||||
| 16.26 | (0.17 | ) | 158,820 | 0.60 | 1.54 | 0.74 | 57 | |||||||||||||||||||
| 21.93 | 9.30 | 2,964 | 0.45 | 1.74 | 0.59 | 68 | ||||||||||||||||||||
| 20.32 | 5.57 | 1,893 | 0.45 | 1.46 | 0.95 | 48 | ||||||||||||||||||||
| 19.50 | 7.81 | 123 | 0.39 | 1.37 | 0.67 | 44 | ||||||||||||||||||||
| 18.30 | 14.10 | 37 | 0.40 | 1.51 | 1.08 | 31 | ||||||||||||||||||||
| 16.28 | 0.07 | 25 | 0.40 | 1.49 | 2.16 | 57 | ||||||||||||||||||||
| 21.95 | 9.50 | 851,085 | 0.35 | 1.87 | 0.35 | 68 | ||||||||||||||||||||
| 20.32 | 5.69 | 384,616 | 0.35 | 1.56 | 0.37 | 48 | ||||||||||||||||||||
| 19.49 | 7.87 | 121,897 | 0.34 | 1.42 | 0.42 | 44 | ||||||||||||||||||||
| 18.29 | 14.09 | 3,289 | 0.34 | 1.41 | 0.42 | 31 | ||||||||||||||||||||
| 16.28 | 0.07 | 74 | 0.35 | 1.66 | 1.40 | 57 | ||||||||||||||||||||
SEE NOTES TO FINANCIAL STATEMENTS.
| JUNE 30, 2020 | J.P. MORGAN LARGE CAP FUNDS | 93 | ||||||
Table of Contents
FINANCIAL HIGHLIGHTS
FOR THE PERIODS INDICATED (continued)
| Per share operating performance | |||||||||||||||||||||||||||
| Investment operations | Distributions | |||||||||||||||||||||||||||
| Net asset value, beginning of period | Net investment income (loss) (b) | Net realized and unrealized gains (losses) on investments | Total from investment operations | Net investment income | Net realized gain | Total distributions | ||||||||||||||||||||||
JPMorgan Large Cap Growth Fund |
| |||||||||||||||||||||||||||
Class A | ||||||||||||||||||||||||||||
Year Ended June 30, 2020 | $ | 41.87 | $ | (0.01 | ) | $ | 11.39 | $ | 11.38 | $ | — | $ | (5.21 | ) | $ | (5.21 | ) | |||||||||||
Year Ended June 30, 2019 | 42.44 | (0.09 | ) | 4.80 | 4.71 | — | (5.28 | ) | (5.28 | ) | ||||||||||||||||||
Year Ended June 30, 2018 | 38.23 | (0.10 | ) | 9.92 | 9.82 | — | (5.61 | ) | (5.61 | ) | ||||||||||||||||||
Year Ended June 30, 2017 | 32.93 | (0.07 | ) | 8.51 | 8.44 | — | (3.14 | ) | (3.14 | ) | ||||||||||||||||||
Year Ended June 30, 2016 | 36.82 | (0.06 | ) | (2.23 | ) | (2.29 | ) | — | (1.60 | ) | (1.60 | ) | ||||||||||||||||
Class C | ||||||||||||||||||||||||||||
Year Ended June 30, 2020 | 32.33 | (0.17 | ) | 8.48 | 8.31 | — | (5.21 | ) | (5.21 | ) | ||||||||||||||||||
Year Ended June 30, 2019 | 34.20 | (0.23 | ) | 3.64 | 3.41 | — | (5.28 | ) | (5.28 | ) | ||||||||||||||||||
Year Ended June 30, 2018 | 31.95 | (0.25 | ) | 8.11 | 7.86 | — | (5.61 | ) | (5.61 | ) | ||||||||||||||||||
Year Ended June 30, 2017 | 28.15 | (0.20 | ) | 7.14 | 6.94 | — | (3.14 | ) | (3.14 | ) | ||||||||||||||||||
Year Ended June 30, 2016 | 31.86 | (0.20 | ) | (1.91 | ) | (2.11 | ) | — | (1.60 | ) | (1.60 | ) | ||||||||||||||||
Class I | ||||||||||||||||||||||||||||
Year Ended June 30, 2020 | 42.46 | 0.09 | 11.59 | 11.68 | (0.02 | ) | (5.21 | ) | (5.23 | ) | ||||||||||||||||||
Year Ended June 30, 2019 | 42.86 | 0.01 | 4.87 | 4.88 | — | (5.28 | ) | (5.28 | ) | |||||||||||||||||||
Year Ended June 30, 2018 | 38.47 | (0.01 | ) | 10.01 | 10.00 | — | (5.61 | ) | (5.61 | ) | ||||||||||||||||||
Year Ended June 30, 2017 | 33.08 | (0.02 | ) | 8.55 | 8.53 | — | (3.14 | ) | (3.14 | ) | ||||||||||||||||||
Year Ended June 30, 2016 | 36.92 | (0.01 | ) | (2.23 | ) | (2.24 | ) | — | (1.60 | ) | (1.60 | ) | ||||||||||||||||
Class R2 | ||||||||||||||||||||||||||||
Year Ended June 30, 2020 | 40.32 | (0.11 | ) | 10.90 | 10.79 | — | (5.21 | ) | (5.21 | ) | ||||||||||||||||||
Year Ended June 30, 2019 | 41.17 | (0.18 | ) | 4.61 | 4.43 | — | (5.28 | ) | (5.28 | ) | ||||||||||||||||||
Year Ended June 30, 2018 | 37.33 | (0.20 | ) | 9.65 | 9.45 | — | (5.61 | ) | (5.61 | ) | ||||||||||||||||||
Year Ended June 30, 2017 | 32.31 | (0.16 | ) | 8.32 | 8.16 | — | (3.14 | ) | (3.14 | ) | ||||||||||||||||||
Year Ended June 30, 2016 | 36.24 | (0.15 | ) | (2.18 | ) | (2.33 | ) | — | (1.60 | ) | (1.60 | ) | ||||||||||||||||
Class R3 | ||||||||||||||||||||||||||||
Year Ended June 30, 2020 | 42.10 | (0.01 | ) | 11.46 | 11.45 | — | (5.21 | ) | (5.21 | ) | ||||||||||||||||||
Year Ended June 30, 2019 | 42.64 | (0.08 | ) | 4.82 | 4.74 | — | (5.28 | ) | (5.28 | ) | ||||||||||||||||||
Year Ended June 30, 2018 | 38.39 | (0.08 | ) | 9.94 | 9.86 | — | (5.61 | ) | (5.61 | ) | ||||||||||||||||||
September 9, 2016 (f) through June 30, 2017 | 33.97 | (0.06 | ) | 7.62 | 7.56 | — | (3.14 | ) | (3.14 | ) | ||||||||||||||||||
Class R4 | ||||||||||||||||||||||||||||
Year Ended June 30, 2020 | 42.45 | 0.08 | 11.58 | 11.66 | (0.06 | ) | (5.21 | ) | (5.27 | ) | ||||||||||||||||||
Year Ended June 30, 2019 | 42.85 | 0.01 | 4.87 | 4.88 | — | (5.28 | ) | (5.28 | ) | |||||||||||||||||||
Year Ended June 30, 2018 | 38.47 | 0.01 | 9.98 | 9.99 | — | (5.61 | ) | (5.61 | ) | |||||||||||||||||||
September 9, 2016 (f) through June 30, 2017 | 33.97 | 0.04 | 7.60 | 7.64 | — | (3.14 | ) | (3.14 | ) | |||||||||||||||||||
Class R5 | ||||||||||||||||||||||||||||
Year Ended June 30, 2020 | 43.44 | 0.16 | 11.88 | 12.04 | (0.07 | ) | (5.21 | ) | (5.28 | ) | ||||||||||||||||||
Year Ended June 30, 2019 | 43.65 | 0.07 | 5.00 | 5.07 | — | (5.28 | ) | (5.28 | ) | |||||||||||||||||||
Year Ended June 30, 2018 | 39.04 | 0.06 | 10.16 | 10.22 | — | (5.61 | ) | (5.61 | ) | |||||||||||||||||||
Year Ended June 30, 2017 | 33.46 | 0.05 | 8.67 | 8.72 | — | (3.14 | ) | (3.14 | ) | |||||||||||||||||||
Year Ended June 30, 2016 | 37.25 | 0.06 | (2.25 | ) | (2.19 | ) | — | (1.60 | ) | (1.60 | ) | |||||||||||||||||
Class R6 | ||||||||||||||||||||||||||||
Year Ended June 30, 2020 | 43.78 | 0.21 | 11.99 | 12.20 | (0.11 | ) | (5.21 | ) | (5.32 | ) | ||||||||||||||||||
Year Ended June 30, 2019 | 43.95 | 0.11 | 5.03 | 5.14 | (0.03 | ) | (5.28 | ) | (5.31 | ) | ||||||||||||||||||
Year Ended June 30, 2018 | 39.23 | 0.10 | 10.23 | 10.33 | — | (5.61 | ) | (5.61 | ) | |||||||||||||||||||
Year Ended June 30, 2017 | 33.58 | 0.09 | 8.70 | 8.79 | — | (3.14 | ) | (3.14 | ) | |||||||||||||||||||
Year Ended June 30, 2016 | 37.34 | 0.10 | (2.26 | ) | (2.16 | ) | — | (1.60 | ) | (1.60 | ) | |||||||||||||||||
| (a) | Annualized for periods less than one year, unless otherwise noted. |
| (b) | Calculated based upon average shares outstanding. |
| (c) | Not annualized for periods less than one year. |
| (d) | Includes adjustments in accordance with accounting principles generally accepted in the United States of America and as such, the net asset values for financial reporting purposes and the returns based upon those net asset values may differ from the net asset values and returns for shareholder transactions. |
| (e) | Includes earnings credits and interest expense, if applicable, each of which is less than 0.005% unless otherwise noted. |
| (f) | Commencement of offering of class of shares. |
SEE NOTES TO FINANCIAL STATEMENTS.
| 94 | J.P. MORGAN LARGE CAP FUNDS | JUNE 30, 2020 | ||||
Table of Contents
| Ratios/Supplemental data | |||||||||||||||||||||||||
| Ratios to average net assets (a) | ||||||||||||||||||||||||||
| Net asset value, end of period | Total return (excludes sales charge) (c)(d) | Net assets, period (000’s) | Net expenses (e) | Net income | Expenses without waivers, reimbursements and earnings credits | Portfolio turnover rate (c) | ||||||||||||||||||||
| $ | 48.04 | 30.09 | % | $ | 3,280,463 | 0.94 | % | (0.03 | )% | 1.04 | % | 47 | % | |||||||||||||
| 41.87 | 13.67 | 2,466,910 | 0.93 | (0.23 | ) | 1.10 | 50 | |||||||||||||||||||
| 42.44 | 28.45 | 2,481,816 | 0.97 | (0.25 | ) | 1.11 | 24 | |||||||||||||||||||
| 38.23 | 27.50 | 2,462,957 | 1.05 | (0.19 | ) | 1.25 | 22 | |||||||||||||||||||
| 32.93 | (6.45 | ) | 4,251,242 | 1.04 | (0.17 | ) | 1.27 | 43 | ||||||||||||||||||
| 35.43 | 29.42 | 701,820 | 1.44 | (0.53 | ) | 1.54 | 47 | |||||||||||||||||||
| 32.33 | 13.11 | 518,116 | 1.43 | (0.73 | ) | 1.59 | 50 | |||||||||||||||||||
| 34.20 | 27.83 | 534,199 | 1.47 | (0.75 | ) | 1.60 | 24 | |||||||||||||||||||
| 31.95 | 26.79 | 487,702 | 1.55 | (0.69 | ) | 1.67 | 22 | |||||||||||||||||||
| 28.15 | (6.90 | ) | 559,238 | 1.55 | (0.67 | ) | 1.69 | 43 | ||||||||||||||||||
| 48.91 | 30.40 | 7,058,308 | 0.69 | 0.22 | 0.78 | 47 | ||||||||||||||||||||
| 42.46 | 13.95 | 4,691,515 | 0.68 | 0.02 | 0.84 | 50 | ||||||||||||||||||||
| 42.86 | 28.77 | 4,413,908 | 0.74 | (0.03 | ) | 0.85 | 24 | |||||||||||||||||||
| 38.47 | 27.65 | 4,771,428 | 0.89 | (0.05 | ) | 0.90 | 22 | |||||||||||||||||||
| 33.08 | (6.29 | ) | 4,161,010 | 0.89 | (0.04 | ) | 0.93 | 43 | ||||||||||||||||||
| 45.90 | 29.76 | 118,628 | 1.19 | (0.27 | ) | 1.29 | 47 | |||||||||||||||||||
| 40.32 | 13.39 | 138,030 | 1.18 | (0.47 | ) | 1.34 | 50 | |||||||||||||||||||
| 41.17 | 28.11 | 156,775 | 1.24 | (0.52 | ) | 1.35 | 24 | |||||||||||||||||||
| 37.33 | 27.14 | 147,902 | 1.31 | (0.46 | ) | 1.47 | 22 | |||||||||||||||||||
| 32.31 | (6.67 | ) | 192,560 | 1.30 | (0.43 | ) | 1.55 | 43 | ||||||||||||||||||
| 48.34 | 30.09 | 90,107 | 0.94 | (0.02 | ) | 1.03 | 47 | |||||||||||||||||||
| 42.10 | 13.68 | 45,376 | 0.93 | (0.21 | ) | 1.08 | 50 | |||||||||||||||||||
| 42.64 | 28.43 | 6,865 | 0.96 | (0.21 | ) | 1.10 | 24 | |||||||||||||||||||
| 38.39 | 24.05 | 992 | 1.12 | (0.20 | ) | 1.20 | 22 | |||||||||||||||||||
| 48.84 | 30.40 | 64,792 | 0.69 | 0.19 | 0.78 | 47 | ||||||||||||||||||||
| 42.45 | 13.96 | 10,740 | 0.68 | 0.02 | 0.83 | 50 | ||||||||||||||||||||
| 42.85 | 28.74 | 5,930 | 0.73 | 0.02 | 0.85 | 24 | ||||||||||||||||||||
| 38.47 | 24.31 | 440 | 0.89 | 0.12 | 1.07 | 22 | ||||||||||||||||||||
| 50.20 | 30.59 | 781,380 | 0.54 | 0.38 | 0.63 | 47 | ||||||||||||||||||||
| 43.44 | 14.15 | 702,536 | 0.53 | 0.17 | 0.69 | 50 | ||||||||||||||||||||
| 43.65 | 28.93 | 788,766 | 0.59 | 0.14 | 0.70 | 24 | ||||||||||||||||||||
| 39.04 | 27.92 | 799,190 | 0.70 | 0.15 | 0.72 | 22 | ||||||||||||||||||||
| 33.46 | (6.10 | ) | 1,209,521 | 0.69 | 0.17 | 0.73 | 43 | |||||||||||||||||||
| 50.66 | 30.75 | 11,169,668 | 0.44 | 0.47 | 0.53 | 47 | ||||||||||||||||||||
| 43.78 | 14.23 | 7,339,387 | 0.43 | 0.27 | 0.58 | 50 | ||||||||||||||||||||
| 43.95 | 29.08 | 5,962,328 | 0.48 | 0.24 | 0.60 | 24 | ||||||||||||||||||||
| 39.23 | 28.03 | 3,606,093 | 0.60 | 0.25 | 0.60 | 22 | ||||||||||||||||||||
| 33.58 | (6.00 | ) | 3,330,565 | 0.60 | 0.28 | 0.60 | 43 | |||||||||||||||||||
SEE NOTES TO FINANCIAL STATEMENTS.
| JUNE 30, 2020 | J.P. MORGAN LARGE CAP FUNDS | 95 | ||||||
Table of Contents
FINANCIAL HIGHLIGHTS
FOR THE PERIODS INDICATED (continued)
| Per share operating performance | |||||||||||||||||||||||||||
| Investment operations | Distributions | |||||||||||||||||||||||||||
| Net asset value, beginning of period | Net investment income (loss) (b) | Net realized and unrealized gains (losses) on investments | Total from investment operations | Net investment income | Net realized gain | Total distributions | ||||||||||||||||||||||
JPMorgan Large Cap Value Fund |
| |||||||||||||||||||||||||||
Class A |
| |||||||||||||||||||||||||||
Year Ended June 30, 2020 | $ | 14.11 | $ | 0.18 | $ | (1.40 | ) | $ | (1.22 | ) | $ | (0.17 | ) | $ | — | $ | (0.17 | ) | ||||||||||
Year Ended June 30, 2019 | 15.11 | 0.17 | (0.09 | ) | 0.08 | (0.17 | ) | (0.91 | ) | (1.08 | ) | |||||||||||||||||
Year Ended June 30, 2018 | 15.48 | 0.15 | 0.89 | 1.04 | (0.13 | ) | (1.28 | ) | (1.41 | ) | ||||||||||||||||||
Year Ended June 30, 2017 | 12.71 | 0.15 | 3.42 | 3.57 | (0.14 | ) | (0.66 | ) | (0.80 | ) | ||||||||||||||||||
Year Ended June 30, 2016 | 15.02 | 0.17 | (0.59 | ) | (0.42 | ) | (0.16 | ) | (1.73 | ) | (1.89 | ) | ||||||||||||||||
Class C | ||||||||||||||||||||||||||||
Year Ended June 30, 2020 | 13.49 | 0.11 | (1.32 | ) | (1.21 | ) | (0.11 | ) | — | (0.11 | ) | |||||||||||||||||
Year Ended June 30, 2019 | 14.51 | 0.10 | (0.10 | ) | — | (f) | (0.11 | ) | (0.91 | ) | (1.02 | ) | ||||||||||||||||
Year Ended June 30, 2018 | 14.93 | 0.06 | 0.86 | 0.92 | (0.06 | ) | (1.28 | ) | (1.34 | ) | ||||||||||||||||||
Year Ended June 30, 2017 | 12.30 | 0.07 | 3.30 | 3.37 | (0.08 | ) | (0.66 | ) | (0.74 | ) | ||||||||||||||||||
Year Ended June 30, 2016 | 14.60 | 0.10 | (0.58 | ) | (0.48 | ) | (0.09 | ) | (1.73 | ) | (1.82 | ) | ||||||||||||||||
Class I | ||||||||||||||||||||||||||||
Year Ended June 30, 2020 | 13.85 | 0.21 | (1.36 | ) | (1.15 | ) | (0.21 | ) | — | (0.21 | ) | |||||||||||||||||
Year Ended June 30, 2019 | 14.85 | 0.20 | (0.09 | ) | 0.11 | (0.20 | ) | (0.91 | ) | (1.11 | ) | |||||||||||||||||
Year Ended June 30, 2018 | 15.24 | 0.18 | 0.87 | 1.05 | (0.16 | ) | (1.28 | ) | (1.44 | ) | ||||||||||||||||||
Year Ended June 30, 2017 | 12.53 | 0.17 | 3.37 | 3.54 | (0.17 | ) | (0.66 | ) | (0.83 | ) | ||||||||||||||||||
Year Ended June 30, 2016 | 14.79 | 0.15 | (0.54 | ) | (0.39 | ) | (0.14 | ) | (1.73 | ) | (1.87 | ) | ||||||||||||||||
Class R2 | ||||||||||||||||||||||||||||
Year Ended June 30, 2020 | 13.98 | 0.15 | (1.38 | ) | (1.23 | ) | (0.14 | ) | — | (0.14 | ) | |||||||||||||||||
Year Ended June 30, 2019 | 14.99 | 0.14 | (0.10 | ) | 0.04 | (0.14 | ) | (0.91 | ) | (1.05 | ) | |||||||||||||||||
Year Ended June 30, 2018 | 15.39 | 0.11 | 0.86 | 0.97 | (0.09 | ) | (1.28 | ) | (1.37 | ) | ||||||||||||||||||
Year Ended June 30, 2017 | 12.64 | 0.10 | 3.41 | 3.51 | (0.10 | ) | (0.66 | ) | (0.76 | ) | ||||||||||||||||||
Year Ended June 30, 2016 | 14.96 | 0.14 | (0.60 | ) | (0.46 | ) | (0.13 | ) | (1.73 | ) | (1.86 | ) | ||||||||||||||||
Class R3 | ||||||||||||||||||||||||||||
Year Ended June 30, 2020 | 13.84 | 0.18 | (1.36 | ) | (1.18 | ) | (0.18 | ) | — | (0.18 | ) | |||||||||||||||||
October 1, 2018 (g) through June 30, 2019 | 15.63 | 0.13 | (0.88 | ) | (0.75 | ) | (0.13 | ) | (0.91 | ) | (1.04 | ) | ||||||||||||||||
Class R4 | ||||||||||||||||||||||||||||
Year Ended June 30, 2020 | 14.11 | 0.22 | (1.39 | ) | (1.17 | ) | (0.21 | ) | — | (0.21 | ) | |||||||||||||||||
October 1, 2018 (g) through June 30, 2019 | 15.90 | 0.16 | (0.89 | ) | (0.73 | ) | (0.15 | ) | (0.91 | ) | (1.06 | ) | ||||||||||||||||
Class R5 | ||||||||||||||||||||||||||||
Year Ended June 30, 2020 | 14.00 | 0.24 | (1.39 | ) | (1.15 | ) | (0.23 | ) | — | (0.23 | ) | |||||||||||||||||
Year Ended June 30, 2019 | 14.99 | 0.23 | (0.09 | ) | 0.14 | (0.22 | ) | (0.91 | ) | (1.13 | ) | |||||||||||||||||
Year Ended June 30, 2018 | 15.37 | 0.21 | 0.88 | 1.09 | (0.19 | ) | (1.28 | ) | (1.47 | ) | ||||||||||||||||||
Year Ended June 30, 2017 | 12.63 | 0.20 | 3.39 | 3.59 | (0.19 | ) | (0.66 | ) | (0.85 | ) | ||||||||||||||||||
Year Ended June 30, 2016 | 14.93 | 0.21 | (0.58 | ) | (0.37 | ) | (0.20 | ) | (1.73 | ) | (1.93 | ) | ||||||||||||||||
Class R6 | ||||||||||||||||||||||||||||
Year Ended June 30, 2020 | 13.90 | 0.25 | (1.37 | ) | (1.12 | ) | (0.25 | ) | — | (0.25 | ) | |||||||||||||||||
Year Ended June 30, 2019 | 14.90 | 0.24 | (0.10 | ) | 0.14 | (0.23 | ) | (0.91 | ) | (1.14 | ) | |||||||||||||||||
Year Ended June 30, 2018 | 15.28 | 0.22 | 0.88 | 1.10 | (0.20 | ) | (1.28 | ) | (1.48 | ) | ||||||||||||||||||
Year Ended June 30, 2017 | 12.56 | 0.20 | 3.38 | 3.58 | (0.20 | ) | (0.66 | ) | (0.86 | ) | ||||||||||||||||||
Year Ended June 30, 2016 | 14.86 | 0.24 | (0.60 | ) | (0.36 | ) | (0.21 | ) | (1.73 | ) | (1.94 | ) | ||||||||||||||||
| (a) | Annualized for periods less than one year, unless otherwise noted. |
| (b) | Calculated based upon average shares outstanding. |
| (c) | Not annualized for periods less than one year. |
| (d) | Includes adjustments in accordance with accounting principles generally accepted in the United States of America and as such, the net asset values for financial reporting purposes and the returns based upon those net asset values may differ from the net asset values and returns for shareholder transactions. |
| (e) | Includes earnings credits and interest expense, if applicable, each of which is less than 0.005% unless otherwise noted. |
| (f) | Amount rounds to less than $0.005. |
| (g) | Commencement of offering of class of shares. |
SEE NOTES TO FINANCIAL STATEMENTS.
| 96 | J.P. MORGAN LARGE CAP FUNDS | JUNE 30, 2020 | ||||
Table of Contents
| Ratios/Supplemental data | |||||||||||||||||||||||||
| Ratios to average net assets (a) | ||||||||||||||||||||||||||
| Net asset value, end of period | Total return (excludes sales charge) (c)(d) | Net assets, end of period (000’s) | Net expenses (e) | Net income | Expenses without waivers, reimbursements and earnings credits | Portfolio turnover rate (c) | ||||||||||||||||||||
| $ | 12.72 | (8.66 | )% | $ | 119,402 | 0.93 | % | 1.33 | % | 1.04 | % | 177 | % | |||||||||||||
| 14.11 | 1.07 | 153,809 | 0.93 | 1.19 | 1.04 | 162 | ||||||||||||||||||||
| 15.11 | 6.52 | 236,470 | 0.93 | 0.92 | 1.04 | 130 | ||||||||||||||||||||
| 15.48 | 28.47 | 215,017 | 0.92 | 1.01 | 1.08 | 145 | ||||||||||||||||||||
| 12.71 | (2.51 | ) | 96,373 | 0.93 | 1.27 | 1.12 | 219 | |||||||||||||||||||
| 12.17 | (9.04 | ) | 33,769 | 1.44 | 0.81 | 1.52 | 177 | |||||||||||||||||||
| 13.49 | 0.57 | 55,009 | 1.44 | 0.70 | 1.52 | 162 | ||||||||||||||||||||
| 14.51 | 5.94 | 69,445 | 1.44 | 0.42 | 1.52 | 130 | ||||||||||||||||||||
| 14.93 | 27.72 | 48,028 | 1.44 | 0.50 | 1.57 | 145 | ||||||||||||||||||||
| 12.30 | (2.98 | ) | 17,041 | 1.45 | 0.75 | 1.62 | 219 | |||||||||||||||||||
| 12.49 | (8.35 | ) | 262,414 | 0.69 | 1.57 | 0.76 | 177 | |||||||||||||||||||
| 13.85 | 1.31 | 301,663 | 0.69 | 1.44 | 0.77 | 162 | ||||||||||||||||||||
| 14.85 | 6.74 | 378,058 | 0.70 | 1.19 | 0.77 | 130 | ||||||||||||||||||||
| 15.24 | 28.61 | 161,494 | 0.79 | 1.15 | 0.80 | 145 | ||||||||||||||||||||
| 12.53 | (2.34 | ) | 23,373 | 0.77 | 1.07 | 0.77 | 219 | |||||||||||||||||||
| 12.61 | (8.83 | ) | 17,777 | 1.19 | 1.09 | 1.28 | 177 | |||||||||||||||||||
| 13.98 | 0.83 | 21,489 | 1.19 | 0.97 | 1.29 | 162 | ||||||||||||||||||||
| 14.99 | 6.14 | 17,046 | 1.21 | 0.68 | 1.30 | 130 | ||||||||||||||||||||
| 15.39 | 28.11 | 6,775 | 1.23 | 0.71 | 1.43 | 145 | ||||||||||||||||||||
| 12.64 | (2.78 | ) | 3,462 | 1.20 | 1.05 | 1.57 | 219 | |||||||||||||||||||
| 12.48 | (8.59 | ) | 18 | 0.94 | 1.36 | 2.24 | 177 | |||||||||||||||||||
| 13.84 | (4.25 | ) | 19 | 0.94 | 1.28 | 1.17 | 162 | |||||||||||||||||||
| 12.73 | (8.34 | ) | 11,823 | 0.69 | 1.60 | 0.76 | 177 | |||||||||||||||||||
| 14.11 | (4.05 | ) | 14,545 | 0.68 | 1.51 | 0.77 | 162 | |||||||||||||||||||
| 12.62 | (8.26 | ) | 18,535 | 0.54 | 1.72 | 0.62 | 177 | |||||||||||||||||||
| 14.00 | 1.50 | 30,522 | 0.54 | 1.61 | 0.63 | 162 | ||||||||||||||||||||
| 14.99 | 6.90 | 23,166 | 0.55 | 1.33 | 0.63 | 130 | ||||||||||||||||||||
| 15.37 | 28.82 | 10,218 | 0.59 | 1.35 | 0.62 | 145 | ||||||||||||||||||||
| 12.63 | (2.15 | ) | 4,155 | 0.59 | 1.52 | 0.60 | 219 | |||||||||||||||||||
| 12.53 | (8.14 | ) | 796,259 | 0.44 | 1.86 | 0.51 | 177 | |||||||||||||||||||
| 13.90 | 1.52 | 834,072 | 0.44 | 1.70 | 0.52 | 162 | ||||||||||||||||||||
| 14.90 | 7.04 | 928,167 | 0.46 | 1.41 | 0.52 | 130 | ||||||||||||||||||||
| 15.28 | 28.90 | 610,732 | 0.51 | 1.43 | 0.52 | 145 | ||||||||||||||||||||
| 12.56 | (2.06 | ) | 565,542 | 0.51 | 1.90 | 0.52 | 219 | |||||||||||||||||||
SEE NOTES TO FINANCIAL STATEMENTS.
| JUNE 30, 2020 | J.P. MORGAN LARGE CAP FUNDS | 97 | ||||||
Table of Contents
FINANCIAL HIGHLIGHTS
FOR THE PERIODS INDICATED (continued)
| Per share operating performance | |||||||||||||||||||||||||||
| Investment operations | Distributions | |||||||||||||||||||||||||||
| Net asset value, beginning of period | Net investment income (loss) (b) | Net realized and unrealized gains (losses) on investments | Total from investment operations | Net investment | Net realized | Total distributions | ||||||||||||||||||||||
JPMorgan U.S. Equity Fund | ||||||||||||||||||||||||||||
Class A | ||||||||||||||||||||||||||||
Year Ended June 30, 2020 | $ | 15.86 | $ | 0.11 | $ | 1.82 | $ | 1.93 | $ | (0.11 | ) | $ | (1.46 | ) | $ | (1.57 | ) | |||||||||||
Year Ended June 30, 2019 | 16.48 | 0.12 | 1.17 | 1.29 | (0.12 | ) | (1.79 | ) | (1.91 | ) | ||||||||||||||||||
Year Ended June 30, 2018 | 15.80 | 0.11 | 1.94 | 2.05 | (0.11 | ) | (1.26 | ) | (1.37 | ) | ||||||||||||||||||
Year Ended June 30, 2017 | 13.76 | 0.11 | 2.57 | 2.68 | (0.11 | ) | (0.53 | ) | (0.64 | ) | ||||||||||||||||||
Year Ended June 30, 2016 | 14.75 | 0.12 | (0.30 | ) | (0.18 | ) | (0.11 | ) | (0.70 | ) | (0.81 | ) | ||||||||||||||||
Class C | ||||||||||||||||||||||||||||
Year Ended June 30, 2020 | 15.31 | 0.03 | 1.75 | 1.78 | (0.03 | ) | (1.46 | ) | (1.49 | ) | ||||||||||||||||||
Year Ended June 30, 2019 | 15.99 | 0.04 | 1.13 | 1.17 | (0.06 | ) | (1.79 | ) | (1.85 | ) | ||||||||||||||||||
Year Ended June 30, 2018 | 15.37 | 0.03 | 1.89 | 1.92 | (0.04 | ) | (1.26 | ) | (1.30 | ) | ||||||||||||||||||
Year Ended June 30, 2017 | 13.41 | 0.04 | 2.49 | 2.53 | (0.04 | ) | (0.53 | ) | (0.57 | ) | ||||||||||||||||||
Year Ended June 30, 2016 | 14.40 | 0.05 | (0.30 | ) | (0.25 | ) | (0.04 | ) | (0.70 | ) | (0.74 | ) | ||||||||||||||||
Class I | ||||||||||||||||||||||||||||
Year Ended June 30, 2020 | 15.91 | 0.15 | 1.82 | 1.97 | (0.15 | ) | (1.46 | ) | (1.61 | ) | ||||||||||||||||||
Year Ended June 30, 2019 | 16.51 | 0.16 | 1.18 | 1.34 | (0.15 | ) | (1.79 | ) | (1.94 | ) | ||||||||||||||||||
Year Ended June 30, 2018 | 15.83 | 0.15 | 1.94 | 2.09 | (0.15 | ) | (1.26 | ) | (1.41 | ) | ||||||||||||||||||
Year Ended June 30, 2017 | 13.79 | 0.14 | 2.57 | 2.71 | (0.14 | ) | (0.53 | ) | (0.67 | ) | ||||||||||||||||||
Year Ended June 30, 2016 | 14.78 | 0.13 | (0.29 | ) | (0.16 | ) | (0.13 | ) | (0.70 | ) | (0.83 | ) | ||||||||||||||||
Class L | ||||||||||||||||||||||||||||
Year Ended June 30, 2020 | 15.93 | 0.17 | 1.83 | 2.00 | (0.17 | ) | (1.46 | ) | (1.63 | ) | ||||||||||||||||||
Year Ended June 30, 2019 | 16.53 | 0.18 | 1.18 | 1.36 | (0.17 | ) | (1.79 | ) | (1.96 | ) | ||||||||||||||||||
Year Ended June 30, 2018 | 15.85 | 0.17 | 1.94 | 2.11 | (0.17 | ) | (1.26 | ) | (1.43 | ) | ||||||||||||||||||
Year Ended June 30, 2017 | 13.80 | 0.16 | 2.58 | 2.74 | (0.16 | ) | (0.53 | ) | (0.69 | ) | ||||||||||||||||||
Year Ended June 30, 2016 | 14.79 | 0.16 | (0.30 | ) | (0.14 | ) | (0.15 | ) | (0.70 | ) | (0.85 | ) | ||||||||||||||||
Class R2 | ||||||||||||||||||||||||||||
Year Ended June 30, 2020 | 15.70 | 0.07 | 1.80 | 1.87 | (0.07 | ) | (1.46 | ) | (1.53 | ) | ||||||||||||||||||
Year Ended June 30, 2019 | 16.34 | 0.08 | 1.16 | 1.24 | (0.09 | ) | (1.79 | ) | (1.88 | ) | ||||||||||||||||||
Year Ended June 30, 2018 | 15.68 | 0.07 | 1.92 | 1.99 | (0.07 | ) | (1.26 | ) | (1.33 | ) | ||||||||||||||||||
Year Ended June 30, 2017 | 13.66 | 0.07 | 2.55 | 2.62 | (0.07 | ) | (0.53 | ) | (0.60 | ) | ||||||||||||||||||
Year Ended June 30, 2016 | 14.66 | 0.08 | (0.31 | ) | (0.23 | ) | (0.07 | ) | (0.70 | ) | (0.77 | ) | ||||||||||||||||
Class R3 | ||||||||||||||||||||||||||||
Year Ended June 30, 2020 | 15.80 | 0.11 | 1.81 | 1.92 | (0.11 | ) | (1.46 | ) | (1.57 | ) | ||||||||||||||||||
Year Ended June 30, 2019 | 16.43 | 0.12 | 1.16 | 1.28 | (0.12 | ) | (1.79 | ) | (1.91 | ) | ||||||||||||||||||
Year Ended June 30, 2018 | 15.76 | 0.11 | 1.93 | 2.04 | (0.11 | ) | (1.26 | ) | (1.37 | ) | ||||||||||||||||||
September 9, 2016 (f) through June 30, 2017 | 14.11 | 0.08 | 2.24 | 2.32 | (0.14 | ) | (0.53 | ) | (0.67 | ) | ||||||||||||||||||
Class R4 | ||||||||||||||||||||||||||||
Year Ended June 30, 2020 | 15.89 | 0.15 | 1.82 | 1.97 | (0.15 | ) | (1.46 | ) | (1.61 | ) | ||||||||||||||||||
Year Ended June 30, 2019 | 16.50 | 0.17 | 1.16 | 1.33 | (0.15 | ) | (1.79 | ) | (1.94 | ) | ||||||||||||||||||
Year Ended June 30, 2018 | 15.82 | 0.16 | 1.93 | 2.09 | (0.15 | ) | (1.26 | ) | (1.41 | ) | ||||||||||||||||||
September 9, 2016 (f) through June 30, 2017 | 14.15 | 0.13 | 2.22 | 2.35 | (0.15 | ) | (0.53 | ) | (0.68 | ) | ||||||||||||||||||
Class R5 | ||||||||||||||||||||||||||||
Year Ended June 30, 2020 | 15.94 | 0.17 | 1.83 | 2.00 | (0.17 | ) | (1.46 | ) | (1.63 | ) | ||||||||||||||||||
Year Ended June 30, 2019 | 16.54 | 0.19 | 1.17 | 1.36 | (0.17 | ) | (1.79 | ) | (1.96 | ) | ||||||||||||||||||
Year Ended June 30, 2018 | 15.85 | 0.18 | 1.95 | 2.13 | (0.18 | ) | (1.26 | ) | (1.44 | ) | ||||||||||||||||||
Year Ended June 30, 2017 | 13.81 | 0.17 | 2.57 | 2.74 | (0.17 | ) | (0.53 | ) | (0.70 | ) | ||||||||||||||||||
Year Ended June 30, 2016 | 14.80 | 0.18 | (0.31 | ) | (0.13 | ) | (0.16 | ) | (0.70 | ) | (0.86 | ) | ||||||||||||||||
Class R6 | ||||||||||||||||||||||||||||
Year Ended June 30, 2020 | 15.97 | 0.19 | 1.83 | 2.02 | (0.19 | ) | (1.46 | ) | (1.65 | ) | ||||||||||||||||||
Year Ended June 30, 2019 | 16.56 | 0.20 | 1.19 | 1.39 | (0.19 | ) | (1.79 | ) | (1.98 | ) | ||||||||||||||||||
Year Ended June 30, 2018 | 15.87 | 0.19 | 1.95 | 2.14 | (0.19 | ) | (1.26 | ) | (1.45 | ) | ||||||||||||||||||
Year Ended June 30, 2017 | 13.82 | 0.18 | 2.58 | 2.76 | (0.18 | ) | (0.53 | ) | (0.71 | ) | ||||||||||||||||||
Year Ended June 30, 2016 | 14.82 | 0.18 | (0.31 | ) | (0.13 | ) | (0.17 | ) | (0.70 | ) | (0.87 | ) | ||||||||||||||||
| (a) | Annualized for periods less than one year, unless otherwise noted. |
| (b) | Calculated based upon average shares outstanding. |
| (c) | Not annualized for periods less than one year. |
| (d) | Includes adjustments in accordance with accounting principles generally accepted in the United States of America and as such, the net asset values for financial reporting purposes and the returns based upon those net asset values may differ from the net asset values and returns for shareholder transactions. |
| (e) | Includes earnings credits and interest expense, if applicable, each of which is less than 0.005% unless otherwise noted. |
| (f) | Commencement of offering of class of shares. |
SEE NOTES TO FINANCIAL STATEMENTS.
| 98 | J.P. MORGAN LARGE CAP FUNDS | JUNE 30, 2020 | ||||
Table of Contents
| Ratios/Supplemental data | |||||||||||||||||||||||||
| Ratios to average net assets (a) | ||||||||||||||||||||||||||
Net asset value, end of | Total return (excludes sales charge) (c)(d) | Net assets, end of period (000’s) | Net expenses (e) | Net income | Expenses without waivers, reimbursements and earnings credits | Portfolio turnover rate (c) | ||||||||||||||||||||
| $ | 16.22 | 12.59 | % | $ | 1,869,111 | 0.94 | % | 0.70 | % | 0.99 | % | 84 | % | |||||||||||||
| 15.86 | 9.18 | 1,556,392 | 0.94 | 0.76 | 0.99 | 91 | ||||||||||||||||||||
| 16.48 | 13.20 | 1,340,858 | 0.94 | 0.69 | 1.01 | 97 | ||||||||||||||||||||
| 15.80 | 19.86 | 1,371,821 | 0.94 | 0.75 | 1.10 | 86 | ||||||||||||||||||||
| 13.76 | (1.15 | ) | 1,446,878 | 0.94 | 0.85 | 1.14 | 83 | |||||||||||||||||||
| 15.60 | 12.01 | 274,741 | 1.44 | 0.19 | 1.49 | 84 | ||||||||||||||||||||
| 15.31 | 8.63 | 289,675 | 1.44 | 0.27 | 1.49 | 91 | ||||||||||||||||||||
| 15.99 | 12.66 | 302,297 | 1.44 | 0.19 | 1.50 | 97 | ||||||||||||||||||||
| 15.37 | 19.23 | 318,369 | 1.44 | 0.25 | 1.55 | 86 | ||||||||||||||||||||
| 13.41 | (1.66 | ) | 294,744 | 1.44 | 0.35 | 1.59 | 83 | |||||||||||||||||||
| 16.27 | 12.82 | 1,038,998 | 0.69 | 0.94 | 0.73 | 84 | ||||||||||||||||||||
| 15.91 | 9.47 | 1,121,609 | 0.69 | 1.03 | 0.74 | 91 | ||||||||||||||||||||
| 16.51 | 13.44 | 1,521,535 | 0.71 | 0.92 | 0.75 | 97 | ||||||||||||||||||||
| 15.83 | 20.05 | 1,287,300 | 0.76 | 0.93 | 0.81 | 86 | ||||||||||||||||||||
| 13.79 | (1.00 | ) | 1,066,145 | 0.76 | 0.94 | 0.81 | 83 | |||||||||||||||||||
| 16.30 | 13.03 | 1,309,531 | 0.55 | 1.08 | 0.59 | 84 | ||||||||||||||||||||
| 15.93 | 9.60 | 1,552,520 | 0.55 | 1.16 | 0.60 | 91 | ||||||||||||||||||||
| 16.53 | 13.56 | 1,679,995 | 0.57 | 1.05 | 0.60 | 97 | ||||||||||||||||||||
| 15.85 | 20.27 | 3,391,256 | 0.61 | 1.07 | 0.67 | 86 | ||||||||||||||||||||
| 13.80 | (0.83 | ) | 3,704,104 | 0.61 | 1.18 | 0.68 | 83 | |||||||||||||||||||
| 16.04 | 12.29 | 216,689 | 1.19 | 0.44 | 1.23 | 84 | ||||||||||||||||||||
| 15.70 | 8.89 | 244,356 | 1.19 | 0.52 | 1.24 | 91 | ||||||||||||||||||||
| 16.34 | 12.88 | 265,675 | 1.21 | 0.42 | 1.25 | 97 | ||||||||||||||||||||
| 15.68 | 19.58 | 260,589 | 1.20 | 0.48 | 1.40 | 86 | ||||||||||||||||||||
| 13.66 | (1.47 | ) | 205,224 | 1.19 | 0.60 | 1.48 | 83 | |||||||||||||||||||
| 16.15 | 12.57 | 117,991 | 0.94 | 0.70 | 0.98 | 84 | ||||||||||||||||||||
| 15.80 | 9.14 | 111,902 | 0.94 | 0.79 | 0.99 | 91 | ||||||||||||||||||||
| 16.43 | 13.18 | 61,413 | 0.95 | 0.69 | 1.00 | 97 | ||||||||||||||||||||
| 15.76 | 16.83 | 25,050 | 1.00 | 0.67 | 1.03 | 86 | ||||||||||||||||||||
| 16.25 | 12.84 | 21,651 | 0.69 | 0.95 | 0.73 | 84 | ||||||||||||||||||||
| 15.89 | 9.44 | 22,870 | 0.69 | 1.08 | 0.75 | 91 | ||||||||||||||||||||
| 16.50 | 13.48 | 10,531 | 0.70 | 0.94 | 0.75 | 97 | ||||||||||||||||||||
| 15.82 | 16.99 | 1,030 | 0.75 | 1.03 | 0.81 | 86 | ||||||||||||||||||||
| 16.31 | 13.04 | 817,671 | 0.54 | 1.09 | 0.58 | 84 | ||||||||||||||||||||
| 15.94 | 9.60 | 842,888 | 0.54 | 1.17 | 0.59 | 91 | ||||||||||||||||||||
| 16.54 | 13.66 | 938,744 | 0.54 | 1.08 | 0.60 | 97 | ||||||||||||||||||||
| 15.85 | 20.24 | 890,105 | 0.56 | 1.12 | 0.62 | 86 | ||||||||||||||||||||
| 13.81 | (0.77 | ) | 910,033 | 0.56 | 1.27 | 0.63 | 83 | |||||||||||||||||||
| 16.34 | 13.13 | 9,272,379 | 0.44 | 1.20 | 0.48 | 84 | ||||||||||||||||||||
| 15.97 | 9.74 | 8,559,285 | 0.44 | 1.27 | 0.49 | 91 | ||||||||||||||||||||
| 16.56 | 13.75 | 8,937,049 | 0.46 | 1.17 | 0.50 | 97 | ||||||||||||||||||||
| 15.87 | 20.37 | 6,751,473 | 0.50 | 1.19 | 0.50 | 86 | ||||||||||||||||||||
| 13.82 | (0.78 | ) | 4,755,359 | 0.50 | 1.33 | 0.50 | 83 | |||||||||||||||||||
SEE NOTES TO FINANCIAL STATEMENTS.
| JUNE 30, 2020 | J.P. MORGAN LARGE CAP FUNDS | 99 | ||||||
Table of Contents
FINANCIAL HIGHLIGHTS
FOR THE PERIODS INDICATED (continued)
| Per share operating performance | |||||||||||||||||||||||||||
| Investment operations | Distributions | |||||||||||||||||||||||||||
| Net asset value, beginning of period | Net investment income (loss) (b) | Net realized gains | Total from investment operations | Net investment income | Net realized gain | Total distributions | ||||||||||||||||||||||
JPMorgan U.S. Large Cap Core Plus Fund | ||||||||||||||||||||||||||||
Class A | ||||||||||||||||||||||||||||
Year Ended June 30, 2020 | $ | 27.51 | $ | 0.04 | $ | 2.65 | $ | 2.69 | $ | (0.03 | ) | $ | (5.59 | ) | $ | (5.62 | ) | |||||||||||
Year Ended June 30, 2019 | 30.10 | 0.05 | 1.53 | 1.58 | (0.05 | ) | (4.12 | ) | (4.17 | ) | ||||||||||||||||||
Year Ended June 30, 2018 | 30.35 | — | (g) | 3.87 | 3.87 | — | (4.12 | ) | (4.12 | ) | ||||||||||||||||||
Year Ended June 30, 2017 | 26.06 | — | (g) | 5.54 | 5.54 | (0.01 | ) | (1.24 | ) | (1.25 | ) | |||||||||||||||||
Year Ended June 30, 2016 | 29.81 | 0.04 | (1.37 | ) | (1.33 | ) | — | (g) | (2.42 | ) | (2.42 | ) | ||||||||||||||||
Class C | ||||||||||||||||||||||||||||
Year Ended June 30, 2020 | 25.88 | (0.08 | ) | 2.46 | 2.38 | — | (5.59 | ) | (5.59 | ) | ||||||||||||||||||
Year Ended June 30, 2019 | 28.65 | (0.08 | ) | 1.43 | 1.35 | — | (4.12 | ) | (4.12 | ) | ||||||||||||||||||
Year Ended June 30, 2018 | 29.21 | (0.15 | ) | 3.71 | 3.56 | — | (4.12 | ) | (4.12 | ) | ||||||||||||||||||
Year Ended June 30, 2017 | 25.23 | (0.14 | ) | 5.36 | 5.22 | — | (1.24 | ) | (1.24 | ) | ||||||||||||||||||
Year Ended June 30, 2016 | 29.07 | (0.10 | ) | (1.32 | ) | (1.42 | ) | — | (2.42 | ) | (2.42 | ) | ||||||||||||||||
Class I | ||||||||||||||||||||||||||||
Year Ended June 30, 2020 | 27.94 | 0.10 | 2.69 | 2.79 | (0.10 | ) | (5.59 | ) | (5.69 | ) | ||||||||||||||||||
Year Ended June 30, 2019 | 30.51 | 0.13 | 1.54 | 1.67 | (0.12 | ) | (4.12 | ) | (4.24 | ) | ||||||||||||||||||
Year Ended June 30, 2018 | 30.66 | 0.08 | 3.92 | 4.00 | (0.03 | ) | (4.12 | ) | (4.15 | ) | ||||||||||||||||||
Year Ended June 30, 2017 | 26.32 | 0.08 | 5.59 | 5.67 | (0.09 | ) | (1.24 | ) | (1.33 | ) | ||||||||||||||||||
Year Ended June 30, 2016 | 30.07 | 0.10 | (1.37 | ) | (1.27 | ) | (0.06 | ) | (2.42 | ) | (2.48 | ) | ||||||||||||||||
Class R2 | ||||||||||||||||||||||||||||
Year Ended June 30, 2020 | 26.62 | (0.04 | ) | 2.55 | 2.51 | — | (5.59 | ) | (5.59 | ) | ||||||||||||||||||
Year Ended June 30, 2019 | 29.31 | (0.04 | ) | 1.47 | 1.43 | — | (4.12 | ) | (4.12 | ) | ||||||||||||||||||
Year Ended June 30, 2018 | 29.74 | (0.09 | ) | 3.78 | 3.69 | — | (4.12 | ) | (4.12 | ) | ||||||||||||||||||
Year Ended June 30, 2017 | 25.61 | (0.07 | ) | 5.44 | 5.37 | — | (1.24 | ) | (1.24 | ) | ||||||||||||||||||
Year Ended June 30, 2016 | 29.40 | (0.03 | ) | (1.34 | ) | (1.37 | ) | — | (2.42 | ) | (2.42 | ) | ||||||||||||||||
Class R5 | ||||||||||||||||||||||||||||
Year Ended June 30, 2020 | 28.08 | 0.11 | 2.71 | 2.82 | (0.11 | ) | (5.59 | ) | (5.70 | ) | ||||||||||||||||||
Year Ended June 30, 2019 | 30.65 | 0.14 | 1.55 | 1.69 | (0.14 | ) | (4.12 | ) | (4.26 | ) | ||||||||||||||||||
Year Ended June 30, 2018 | 30.81 | 0.11 | 3.93 | 4.04 | (0.08 | ) | (4.12 | ) | (4.20 | ) | ||||||||||||||||||
Year Ended June 30, 2017 | 26.44 | 0.13 | 5.62 | 5.75 | (0.14 | ) | (1.24 | ) | (1.38 | ) | ||||||||||||||||||
Year Ended June 30, 2016 | 30.21 | 0.18 | (1.40 | ) | (1.22 | ) | (0.13 | ) | (2.42 | ) | (2.55 | ) | ||||||||||||||||
Class R6 | ||||||||||||||||||||||||||||
Year Ended June 30, 2020 | 28.07 | 0.14 | 2.70 | 2.84 | (0.14 | ) | (5.59 | ) | (5.73 | ) | ||||||||||||||||||
Year Ended June 30, 2019 | 30.63 | 0.17 | 1.56 | 1.73 | (0.17 | ) | (4.12 | ) | (4.29 | ) | ||||||||||||||||||
November 1, 2017 (i) through June 30, 2018 | 32.99 | 0.09 | 1.79 | 1.88 | (0.12 | ) | (4.12 | ) | (4.24 | ) | ||||||||||||||||||
| (a) | Annualized for periods less than one year, unless otherwise noted. |
| (b) | Calculated based upon average shares outstanding. |
| (c) | Not annualized for periods less than one year. |
| (d) | Includes adjustments in accordance with accounting principles generally accepted in the United States of America and as such, the net asset values for financial reporting purposes and the returns based upon those net asset values may differ from the net asset values and returns for shareholder transactions. |
| (e) | Includes earnings credits and interest expense, if applicable, each of which is less than 0.005% unless otherwise noted. |
| (f) | The net expenses and expenses without waivers, reimbursements and earnings credits (excluding dividend and interest expense for securities sold short) for Class A are 1.10% and 1.26% for the year ended June 30, 2020, 1.09% and 1.34% for the year ended June 30, 2019, 1.15% and 1.40% for the year ended June 30, 2018, 1.25% and 1.43% for the year ended June 30, 2017 and 1.26% and 1.49% for the year ended June 30, 2016; for Class C are 1.60% and 1.76% for the year ended June 30, 2020, 1.60% and 1.85% for the year ended June 30, 2019, 1.65% and 1.90% for the year ended June 30, 2018, 1.75% and 1.94% for the year ended June 30, 2017 and 1.76% and 2.00% for the year ended June 30, 2016; for Class I are 0.85% and 1.01% for the year ended June 30, 2020, 0.85% and 1.09% for the year ended June 30, 2019, 0.90% and 1.15% for the year ended June 30, 2018, 0.98% and 1.16% for the year ended June 30, 2017 and 1.00% and 1.21% for the year ended June 30, 2016; for Class R2 are 1.45% and 1.52% for the year ended June 30, 2020, 1.45% and 1.63% for the year ended June 30, 2019, 1.47% and 1.67% for the year ended June 30, 2018, 1.50% and 1.76% for the year ended June 30, 2017 and 1.51% and 1.84% for the year ended June 30, 2016; for Class R5 are 0.80% and 0.85% for the year ended June 30, 2020, 0.80% and 0.94% for the year ended June 30, 2019, 0.79% and 1.00% for the year ended June 30, 2018, 0.80% and 0.96% for the year ended June 30, 2017 and 0.80% and 0.97% for the year ended June 30, 2016; for Class R6 are 0.70% and 0.75% for the year ended June 30, 2020, 0.70% and 0.85% for the year ended June 30, 2019 and 0.70% and 0.90% for the period ended June 30, 2018, respectively. |
| (g) | Amount rounds to less than $0.005. |
| (h) | Amount rounds to less than 0.005%. |
| (i) | Commencement of offering of class of shares. |
SEE NOTES TO FINANCIAL STATEMENTS.
| 100 | J.P. MORGAN LARGE CAP FUNDS | JUNE 30, 2020 | ||||
Table of Contents
| Ratios/Supplemental data | |||||||||||||||||||||||||||||
| Ratios to average net assets (a) | ||||||||||||||||||||||||||||||
| Net asset value, end of period | Total return (excludes sales charge) (c)(d) | Net assets, period (000’s) | Net expenses dividend and interest expense for securities sold short) (e)(f) | Net income | Expenses without waivers, reimbursements and earnings credits (including dividend and interest expense for securities sold short) (f) | Portfolio turnover rate (excluding securities sold short) (c) | Portfolio turnover rate (including securities sold short) (c) | |||||||||||||||||||||||
| $ | 24.58 | 11.66 | % | $ | 267,701 | 1.92 | % | 0.19 | % | 2.08 | % | 85 | % | 134 | % | |||||||||||||||
| 27.51 | 6.84 | 678,071 | 1.91 | 0.22 | 2.16 | 98 | 148 | |||||||||||||||||||||||
| 30.10 | 13.16 | 772,656 | 2.01 | 0.01 | 2.26 | 110 | 161 | |||||||||||||||||||||||
| 30.35 | 21.64 | 791,067 | 2.20 | 0.00 | (h) | 2.39 | 94 | 131 | ||||||||||||||||||||||
| 26.06 | (4.52 | ) | 890,217 | 2.21 | 0.14 | 2.44 | 88 | 127 | ||||||||||||||||||||||
| 22.67 | 11.11 | 59,105 | 2.42 | (0.32 | ) | 2.58 | 85 | 134 | ||||||||||||||||||||||
| 25.88 | 6.31 | 108,332 | 2.42 | (0.29 | ) | 2.67 | 98 | 148 | ||||||||||||||||||||||
| 28.65 | 12.58 | 158,677 | 2.50 | (0.50 | ) | 2.75 | 110 | 161 | ||||||||||||||||||||||
| 29.21 | 21.05 | 201,031 | 2.70 | (0.50 | ) | 2.89 | 94 | 131 | ||||||||||||||||||||||
| 25.23 | (4.98 | ) | 212,879 | 2.71 | (0.37 | ) | 2.95 | 88 | 127 | |||||||||||||||||||||
| 25.04 | 11.93 | 2,189,079 | 1.67 | 0.40 | 1.83 | 85 | 134 | |||||||||||||||||||||||
| 27.94 | 7.11 | 4,740,691 | 1.67 | 0.46 | 1.91 | 98 | 148 | |||||||||||||||||||||||
| 30.51 | 13.46 | 6,169,553 | 1.75 | 0.27 | 2.00 | 110 | 161 | |||||||||||||||||||||||
| 30.66 | 21.95 | 8,075,047 | 1.94 | 0.27 | 2.12 | 94 | 131 | |||||||||||||||||||||||
| 26.32 | (4.28 | ) | 8,175,603 | 1.95 | 0.38 | 2.16 | 88 | 127 | ||||||||||||||||||||||
| 23.54 | 11.32 | 4,560 | 2.27 | (0.13 | ) | 2.34 | 85 | 134 | ||||||||||||||||||||||
| 26.62 | 6.45 | 5,304 | 2.27 | (0.14 | ) | 2.45 | 98 | 148 | ||||||||||||||||||||||
| 29.31 | 12.81 | 6,528 | 2.31 | (0.30 | ) | 2.52 | 110 | 161 | ||||||||||||||||||||||
| 29.74 | 21.33 | 6,207 | 2.45 | (0.24 | ) | 2.71 | 94 | 131 | ||||||||||||||||||||||
| 25.61 | (4.74 | ) | 5,987 | 2.46 | (0.11 | ) | 2.79 | 88 | 127 | |||||||||||||||||||||
| 25.20 | 11.99 | 38,447 | 1.62 | 0.46 | 1.67 | 85 | 134 | |||||||||||||||||||||||
| 28.08 | 7.14 | 99,113 | 1.62 | 0.51 | 1.76 | 98 | 148 | |||||||||||||||||||||||
| 30.65 | 13.57 | 126,084 | 1.65 | 0.37 | 1.85 | 110 | 161 | |||||||||||||||||||||||
| 30.81 | 22.18 | 168,526 | 1.76 | 0.47 | 1.92 | 94 | 131 | |||||||||||||||||||||||
| 26.44 | (4.07 | ) | 591,379 | 1.75 | 0.73 | 1.92 | 88 | 127 | ||||||||||||||||||||||
| 25.18 | 12.10 | 491,414 | 1.52 | 0.58 | 1.57 | 85 | 134 | |||||||||||||||||||||||
| 28.07 | 7.30 | 787,497 | 1.52 | 0.59 | 1.67 | 98 | 148 | |||||||||||||||||||||||
| 30.63 | 6.10 | 1,795,125 | 1.54 | 0.44 | 1.74 | 110 | 161 | |||||||||||||||||||||||
SEE NOTES TO FINANCIAL STATEMENTS.
| JUNE 30, 2020 | J.P. MORGAN LARGE CAP FUNDS | 101 | ||||||
Table of Contents
FINANCIAL HIGHLIGHTS
FOR THE PERIODS INDICATED (continued)
| Per share operating performance | |||||||||||||||||||||||||||||||
| Investment operations | Distributions | |||||||||||||||||||||||||||||||
| Net asset value, beginning of period | Net investment income (loss) (a) | Net realized and unrealized gains (losses) on investments | Total from investment operations | Net investment income | Net realized gain | Return of capital | Total distributions | |||||||||||||||||||||||||
JPMorgan U.S. Research Enhanced Equity Fund | ||||||||||||||||||||||||||||||||
Class A | ||||||||||||||||||||||||||||||||
Year Ended June 30, 2020 | $ | 27.38 | $ | 0.38 | $ | 1.80 | $ | 2.18 | $ | (0.31 | ) | $ | (2.70 | ) | $ | — | $ | (3.01 | ) | |||||||||||||
Year Ended June 30, 2019 | 28.37 | 0.34 | 1.96 | 2.30 | (0.36 | ) | (2.93 | ) | — | (3.29 | ) | |||||||||||||||||||||
Year Ended June 30, 2018 | 25.40 | 0.31 | 2.96 | 3.27 | (0.30 | ) | — | — | (0.30 | ) | ||||||||||||||||||||||
Year Ended June 30, 2017 | 21.74 | 0.28 | 3.72 | 4.00 | (0.32 | ) | — | (0.02 | ) | (0.34 | ) | |||||||||||||||||||||
Year Ended June 30, 2016 | 23.99 | 0.26 | (1.32 | ) | (1.06 | ) | (0.22 | ) | (0.97 | ) | — | (1.19 | ) | |||||||||||||||||||
Class I | ||||||||||||||||||||||||||||||||
Year Ended June 30, 2020 | 27.65 | 0.45 | 1.83 | 2.28 | (0.38 | ) | (2.70 | ) | — | (3.08 | ) | |||||||||||||||||||||
Year Ended June 30, 2019 | 28.61 | 0.41 | 1.98 | 2.39 | (0.42 | ) | (2.93 | ) | — | (3.35 | ) | |||||||||||||||||||||
Year Ended June 30, 2018 | 25.62 | 0.39 | 2.98 | 3.37 | (0.38 | ) | — | — | (0.38 | ) | ||||||||||||||||||||||
Year Ended June 30, 2017 | 21.92 | 0.35 | 3.76 | 4.11 | (0.39 | ) | — | (0.02 | ) | (0.41 | ) | |||||||||||||||||||||
Year Ended June 30, 2016 | 24.18 | 0.32 | (1.34 | ) | (1.02 | ) | (0.27 | ) | (0.97 | ) | — | (1.24 | ) | |||||||||||||||||||
Class L | ||||||||||||||||||||||||||||||||
Year Ended June 30, 2020 | 27.61 | 0.45 | 1.82 | 2.27 | (0.38 | ) | (2.70 | ) | — | (3.08 | ) | |||||||||||||||||||||
Year Ended June 30, 2019 | 28.57 | 0.41 | 1.97 | 2.38 | (0.41 | ) | (2.93 | ) | — | (3.34 | ) | |||||||||||||||||||||
Year Ended June 30, 2018 | 25.58 | 0.38 | 2.98 | 3.36 | (0.37 | ) | — | — | (0.37 | ) | ||||||||||||||||||||||
Year Ended June 30, 2017 | 21.89 | 0.35 | 3.75 | 4.10 | (0.39 | ) | — | (0.02 | ) | (0.41 | ) | |||||||||||||||||||||
Year Ended June 30, 2016 | 24.15 | 0.35 | (1.33 | ) | (0.98 | ) | (0.31 | ) | (0.97 | ) | — | (1.28 | ) | |||||||||||||||||||
Class R6 | ||||||||||||||||||||||||||||||||
Year Ended June 30, 2020 | 27.62 | 0.48 | 1.81 | 2.29 | (0.40 | ) | (2.70 | ) | — | (3.10 | ) | |||||||||||||||||||||
Year Ended June 30, 2019 | 28.57 | 0.44 | 1.98 | 2.42 | (0.44 | ) | (2.93 | ) | — | (3.37 | ) | |||||||||||||||||||||
Year Ended June 30, 2018 | 25.59 | 0.41 | 2.97 | 3.38 | (0.40 | ) | — | — | (0.40 | ) | ||||||||||||||||||||||
Year Ended June 30, 2017 | 21.90 | 0.38 | 3.75 | 4.13 | (0.42 | ) | — | (0.02 | ) | (0.44 | ) | |||||||||||||||||||||
Year Ended June 30, 2016 | 24.16 | 0.37 | (1.33 | ) | (0.96 | ) | (0.33 | ) | (0.97 | ) | — | (1.30 | ) | |||||||||||||||||||
| (a) | Calculated based upon average shares outstanding. |
| (b) | Includes adjustments in accordance with accounting principles generally accepted in the United States of America and as such, the net asset values for financial reporting purposes and the returns based upon those net asset values may differ from the net asset values and returns for shareholder transactions. |
| (c) | Includes earnings credits and interest expense, if applicable, each of which is less than 0.005% unless otherwise noted. |
SEE NOTES TO FINANCIAL STATEMENTS.
| 102 | J.P. MORGAN LARGE CAP FUNDS | JUNE 30, 2020 | ||||
Table of Contents
| Ratios/Supplemental data | |||||||||||||||||||||||||
| Ratios to average net assets | ||||||||||||||||||||||||||
| Net asset value, end of period | Total return (excludes sales charge) (b) | Net assets, end of period (000’s) | Net expenses (c) | Net investment income (loss) | Expenses | Portfolio turnover rate | ||||||||||||||||||||
| $ | 26.55 | 9.08 | % | $ | 183,005 | 0.60 | % | 1.45 | % | 0.85 | % | 59 | % | |||||||||||||
| 27.38 | 9.39 | 207,809 | 0.60 | 1.24 | 0.85 | 42 | ||||||||||||||||||||
| 28.37 | 12.92 | 278,766 | 0.60 | 1.13 | 0.85 | 45 | ||||||||||||||||||||
| 25.40 | 18.52 | 422,719 | 0.69 | 1.19 | �� | 0.96 | 40 | |||||||||||||||||||
| 21.74 | (4.30 | ) | 497,934 | 0.85 | 1.20 | 1.02 | 122 | |||||||||||||||||||
| 26.85 | 9.38 | 204,193 | 0.35 | 1.70 | 0.59 | 59 | ||||||||||||||||||||
| 27.65 | 9.65 | 232,077 | 0.35 | 1.50 | 0.59 | 42 | ||||||||||||||||||||
| 28.61 | 13.19 | 268,898 | 0.35 | 1.39 | 0.60 | 45 | ||||||||||||||||||||
| 25.62 | 18.85 | 285,141 | 0.43 | 1.45 | 0.69 | 40 | ||||||||||||||||||||
| 21.92 | (4.08 | ) | 260,494 | 0.60 | 1.45 | 0.69 | 122 | |||||||||||||||||||
| 26.80 | 9.36 | 391,894 | 0.35 | 1.70 | 0.44 | 59 | ||||||||||||||||||||
| 27.61 | 9.66 | 422,351 | 0.35 | 1.50 | 0.44 | 42 | ||||||||||||||||||||
| 28.57 | 13.20 | 476,809 | 0.35 | 1.38 | 0.44 | 45 | ||||||||||||||||||||
| 25.58 | 18.86 | 835,535 | 0.40 | 1.47 | 0.49 | 40 | ||||||||||||||||||||
| 21.89 | (3.94 | ) | 824,559 | 0.45 | 1.59 | 0.50 | 122 | |||||||||||||||||||
| 26.81 | 9.47 | 3,585,672 | 0.25 | 1.79 | 0.34 | 59 | ||||||||||||||||||||
| 27.62 | 9.78 | 4,953,109 | 0.25 | 1.60 | 0.34 | 42 | ||||||||||||||||||||
| 28.57 | 13.28 | 5,712,617 | 0.25 | 1.50 | 0.34 | 45 | ||||||||||||||||||||
| 25.59 | 19.00 | 5,863,138 | 0.28 | 1.60 | 0.34 | 40 | ||||||||||||||||||||
| 21.90 | (3.83 | ) | 6,638,591 | 0.34 | 1.69 | 0.35 | 122 | |||||||||||||||||||
SEE NOTES TO FINANCIAL STATEMENTS.
| JUNE 30, 2020 | J.P. MORGAN LARGE CAP FUNDS | 103 | ||||||
Table of Contents
AS OF JUNE 30, 2020
1. Organization
JPMorgan Trust I (“JPM I”), JPMorgan Trust II (“JPM II”) and JPMorgan Trust IV (“JPM IV”) (collectively, the “Trusts”) were formed on November 12, 2004 for JPM I and JPM II and November 11, 2015 for JPM IV, as Delaware statutory trusts, pursuant to Declarations of Trust dated November 5, 2004 and November 11, 2015, respectively, and are registered under the Investment Company Act of 1940, as amended (the “1940 Act”), as open-end management investment companies.
The following are 10 separate funds of the Trusts (each, a “Fund” and collectively, the “Funds”) covered by this report:
| Classes Offered | Trust | Diversification Classification | ||||
| JPMorgan Equity Focus Fund | Class A, Class C, Class I and Class R6(1) | JPM I | Diversified(5) | |||
| JPMorgan Equity Income Fund | Class A, Class C, Class I, Class R2, Class R3, Class R4, Class R5 and Class R6 | JPM II | Diversified | |||
| JPMorgan Equity Premium Income Fund(2) | Class A, Class C, Class I, Class R5 and Class R6 | JPM IV | Diversified | |||
| JPMorgan Growth and Income Fund | Class A, Class C, Class I, Class R2, Class R3, Class R4, Class R5 and Class R6 | JPM I | Diversified | |||
| JPMorgan Hedged Equity Fund | Class A, Class C, Class I, Class R5 and Class R6 | JPM I | Diversified | |||
| JPMorgan Large Cap Growth Fund | Class A, Class C, Class I, Class R2, Class R3, Class R4, Class R5 and Class R6 | JPM II | Diversified | |||
| JPMorgan Large Cap Value Fund | Class A, Class C, Class I, Class R2, Class R3(3), Class R4(3), Class R5 and Class R6 | JPM II | Diversified | |||
| JPMorgan U.S. Equity Fund | Class A, Class C, Class I, Class L, Class R2, Class R3, Class R4, Class R5 and Class R6 | JPM I | Diversified | |||
| JPMorgan U.S. Large Cap Core Plus Fund | Class A, Class C, Class I, Class R2, Class R5 and Class R6 | JPM I | Diversified | |||
| JPMorgan U.S. Research Enhanced Equity Fund | Class A(4), Class I, Class L(6) and Class R6 | JPM I | Diversified |
| (1) | Class R6 commenced operations on October 1, 2018 for JPMorgan Equity Focus Fund. |
| (2) | Equity Premium Income Fund commenced operations on August 31, 2018. |
| (3) | Class R3 and Class R4 commenced operations on October 1, 2018 for JPMorgan Large Cap Value Fund. |
| (4) | Class A Shares are publicly offered on a limited basis for JPMorgan U.S. Research Enhanced Equity Fund. |
| (5) | Effective February 12, 2020, JPMorgan Equity Focus Fund is classified as a diversified fund. |
| (6) | On July 6, 2020, the Funds’ Class L Shares will be converted into Class I Shares. Additionally, on July 6, 2020, the Class L Shares were no longer offered. |
The investment objective of JPMorgan Equity Focus Fund (“Equity Focus Fund”) and JPMorgan Large Cap Growth Fund (“Large Cap Growth Fund”) is to seek long-term capital appreciation.
The investment objective of JPMorgan Equity Income Fund (“Equity Income Fund”) is to seek capital appreciation and current income.
The investment objective of JPMorgan Equity Premium Income Fund (“Equity Premium Income Fund”) is to seek current income while maintaining prospects for capital appreciation.
The investment objective of JPMorgan Growth and Income Fund (“Growth and Income Fund”) is to seek to provide capital growth over the long-term and to earn income from dividends.
The investment objective of JPMorgan Hedged Equity Fund (“Hedged Equity Fund”) is to seek to provide capital appreciation.
The investment objective of JPMorgan Large Cap Value Fund (“Large Cap Value Fund”) is to seek capital appreciation with the incidental goal of achieving current income by investing primarily in equity securities.
The investment objective of JPMorgan U.S. Equity Fund (“U.S. Equity Fund”) is to seek to provide high total return from a portfolio of selected equity securities.
The investment objective of JPMorgan U.S. Large Cap Core Plus Fund (“U.S. Large Cap Core Plus Fund”) is to seek to provide a high total return from a portfolio of selected equity securities.
The investment objective of JPMorgan U.S. Research Enhanced Equity Fund (“U.S. Research Enhanced Equity Fund”) is to seek to provide a consistently high total return from a broadly diversified portfolio of equity securities with risk characteristics similar to the Standard and Poor’s 500 Composite Stock Price Index.
| 104 | J.P. MORGAN LARGE CAP FUNDS | JUNE 30, 2020 | ||||
Table of Contents
Class L Shares for U.S. Equity Fund and Class A and Class L Shares for U.S. Research Enhanced Equity Fund are publicly offered on a limited basis. Investors are not eligible to purchase Class L Shares of the Funds unless they meet certain requirements as described in Funds’ prospectuses.
Class A Shares generally provide for a front-end sales charge while Class C Shares provide for a contingent deferred sales charge (“CDSC”). No sales charges are assessed with respect to Class I, Class L, Class R2, Class R3, Class R4, Class R5 and Class R6 Shares. Certain Class A Shares, for which front-end sales charges have been waived, may be subject to a CDSC as described in the Funds’ prospectuses. Class C Shares automatically convert to Class A Shares after ten years. All classes of shares have equal rights to earnings, assets and voting privileges, except that each class may bear different transfer agency, distribution and service fees and each class has exclusive voting rights with respect to its distribution plan and shareholder servicing agreements.
Class A Shares for the U.S. Research Enhanced Equity Fund are publicly offered on a limited basis. Investors are not eligible to purchase shares of the Fund unless they meet certain requirements as described in the Fund’s prospectus.
J.P. Morgan Investment Management Inc. (“JPMIM”), an indirect, wholly-owned subsidiary of JPMorgan Chase & Co. (“JPMorgan”), acts as Adviser (the “Adviser”) and Administrator (the “Administrator”) to the Funds.
2. Significant Accounting Policies
The following is a summary of significant accounting policies followed by the Funds in the preparation of their financial statements. The Funds are investment companies and, accordingly , follow the investment company accounting and reporting guidance of the Financial Accounting Standards Board (“FASB”) Accounting Standards Codification Topic 946 — Investment Companies, which is part of U.S. generally accepted accounting principles (“GAAP”). The preparation of financial statements in conformity with GAAP requires management to make estimates and assumptions that affect (i) the reported amounts of assets and liabilities, (ii) disclosure of contingent assets and liabilities at the date of the financial statements, and (iii) the reported amounts of increases and decreases in net assets from operations during the reporting period. Actual results could differ from those estimates.
A. Valuation of Investments — Investments are valued in accordance with GAAP and the Funds’ valuation policies set forth by, and under the supervision and responsibility of, the Boards of Trustees of the Trusts (the “Boards”), which established the following approach to valuation, as described more fully below: (i) investments for which market quotations are readily available shall be valued at their market value and (ii) all other investments for which market quotations are not readily available shall be valued at their fair value as determined in good faith by the Boards.
The Administrator has established the J.P. Morgan Asset Management Americas Valuation Committee (“AVC”) to assist the Boards with the oversight and monitoring of the valuation of the Funds’ investments. The Administrator implements the valuation policies of the Funds’ investments, as directed by the Boards. The AVC oversees and carries out the policies for the valuation of investments held in the Funds. This includes monitoring the appropriateness of fair values based on results of ongoing valuation oversight including, but not limited to, consideration of macro or security specific events, market events, and pricing vendor and broker due diligence. The Administrator is responsible for discussing and assessing the potential impacts to the fair values on an ongoing basis, and at least on a quarterly basis, with the AVC and the Boards.
Equities and other exchange-traded instruments are valued at the last sale price or official market closing price on the primary exchange on which the instrument is traded before the net asset values (“NAV”) of the Funds are calculated on a valuation date.
Investments in open-end investment companies (“Underlying Funds”) are valued at each Underlying Fund’s NAV per share as of the report date.
Futures contracts and options are generally valued on the basis of available market quotations.
Valuations reflected in this report are as of the report date. As a result, changes in valuation due to market events and/or issuer-related events after the report date and prior to issuance of the report are not reflected herein.
The various inputs that are used in determining the valuation of the Funds’ investments are summarized into the three broad levels listed below.
| • | Level 1 — Unadjusted inputs using quoted prices in active markets for identical investments. |
| • | Level 2 — Other significant observable inputs including, but not limited to, quoted prices for similar investments, inputs other than quoted prices that are observable for investments (such as interest rates, prepayment speeds, credit risk, etc.) or other market corroborated inputs. |
| • | Level 3 — Significant inputs based on the best information available in the circumstances, to the extent observable inputs are not available (including the Funds’ assumptions in determining the fair value of investments). |
A financial instrument’s level within the fair value hierarchy is based on the lowest level of any input, both individually and in the aggregate, that is significant to the fair value measurement. The inputs or methodology used for valuing instruments are not necessarily an indication of the risk associated with investing in those instruments.
| JUNE 30, 2020 | J.P. MORGAN LARGE CAP FUNDS | 105 | ||||||
Table of Contents
NOTES TO FINANCIAL STATEMENTS
AS OF JUNE 30, 2020 (continued)
The following tables represent each valuation input as presented on the Schedules of Portfolio Investments (“SOIs”) (amounts in thousands):
| Equity Focus Fund | ||||||||||||||||
| Level 1 Quoted prices | Level 2 Other significant observable inputs | Level 3 Significant unobservable inputs | Total | |||||||||||||
Total Investments in Securities (a) | $ | 85,105 | $ | — | $ | — | $ | 85,105 | ||||||||
|
|
|
|
|
|
|
| |||||||||
| Equity Income Fund | ||||||||||||||||
| Level 1 Quoted prices | Level 2 Other significant observable inputs | Level 3 Significant unobservable inputs | Total | |||||||||||||
Total Investments in Securities (a) | $ | 29,564,484 | $ | — | $ | — | $ | 29,564,484 | ||||||||
|
|
|
|
|
|
|
| |||||||||
| Equity Premium Income Fund |
| |||||||||||||||
| Level 1 Quoted prices | Level 2 Other significant observable inputs | Level 3 Significant unobservable inputs | Total | |||||||||||||
Investments in Securities |
| |||||||||||||||
Common Stocks | $ | 156,764 | $ | — | $ | — | $ | 156,764 | ||||||||
Equity Linked Notes | — | 30,251 | — | 30,251 | ||||||||||||
Exchange-Traded Funds | 1,866 | — | — | 1,866 | ||||||||||||
Rights | 3 | — | — | 3 | ||||||||||||
Short-Term Investments |
| |||||||||||||||
Investment Companies | 5,899 | — | — | 5,899 | ||||||||||||
|
|
|
|
|
|
|
| |||||||||
Total Investments in Securities | $ | 164,532 | $ | 30,251 | $ | — | $ | 194,783 | ||||||||
|
|
|
|
|
|
|
| |||||||||
| Growth and Income Fund |
| |||||||||||||||
| Level 1 Quoted prices | Level 2 Other significant observable inputs | Level 3 Significant unobservable inputs | Total | |||||||||||||
Total Investments in Securities (a) | $ | 726,425 | $ | — | $ | — | $ | 726,425 | ||||||||
|
|
|
|
|
|
|
| |||||||||
| Hedged Equity Fund |
| |||||||||||||||
| Level 1 Quoted prices | Level 2 Other significant observable inputs | Level 3 Significant unobservable inputs | Total | |||||||||||||
Total Investments in Securities (a) | $ | 9,093,930 | $ | — | $ | — | $ | 9,093,930 | ||||||||
|
|
|
|
|
|
|
| |||||||||
Appreciation in Other Financial Instruments |
| |||||||||||||||
Futures Contracts (a) | $ | 1,680 | $ | — | $ | — | $ | 1,680 | ||||||||
|
|
|
|
|
|
|
| |||||||||
Depreciation in Other Financial Instruments |
| |||||||||||||||
Options Written | ||||||||||||||||
Call Options Written | $ | (219,672 | ) | $ | — | $ | — | $ | (219,672 | ) | ||||||
Put Options Written | (85,527 | ) | — | — | (85,527 | ) | ||||||||||
|
|
|
|
|
|
|
| |||||||||
Total Depreciation in Other Financial Instruments | $ | (305,199 | ) | $ | — | $ | — | $ | (305,199 | ) | ||||||
|
|
|
|
|
|
|
| |||||||||
| Large Cap Growth Fund |
| |||||||||||||||
| Level 1 Quoted prices | Level 2 Other significant observable inputs | Level 3 Significant unobservable inputs | Total | |||||||||||||
Total Investments in Securities (a) | $ | 24,426,707 | $ | — | $ | — | $ | 24,426,707 | ||||||||
|
|
|
|
|
|
|
| |||||||||
| 106 | J.P. MORGAN LARGE CAP FUNDS | JUNE 30, 2020 | ||||
Table of Contents
| Large Cap Value Fund |
| |||||||||||||||
| Level 1 Quoted prices | Level 2 Other significant observable inputs | Level 3 Significant unobservable inputs | Total | |||||||||||||
Total Investments in Securities (a) | $ | 1,317,819 | $ | — | $ | — | $ | 1,317,819 | ||||||||
|
|
|
|
|
|
|
| |||||||||
| U.S. Equity Fund |
| |||||||||||||||
| Level 1 Quoted prices | Level 2 Other significant observable inputs | Level 3 Significant unobservable inputs | Total | |||||||||||||
Total Investments in Securities (a) | $ | 14,996,231 | $ | — | $ | — | $ | 14,996,231 | ||||||||
|
|
|
|
|
|
|
| |||||||||
| U.S. Large Cap Core Plus Fund |
| |||||||||||||||
| Level 1 Quoted prices | Level 2 Other significant observable inputs | Level 3 Significant unobservable inputs | Total | |||||||||||||
Total Investments in Securities (a) | $ | 3,949,577 | $ | — | $ | — | $ | 3,949,577 | ||||||||
|
|
|
|
|
|
|
| |||||||||
Total Liabilities for Securities Sold Short (a) | $ | (895,228 | ) | $ | — | $ | — | $ | (895,228 | ) | ||||||
|
|
|
|
|
|
|
| |||||||||
Depreciation in Other Financial Instruments |
| |||||||||||||||
Futures Contracts (a) | $ | (24 | ) | $ | — | $ | — | $ | (24 | ) | ||||||
|
|
|
|
|
|
|
| |||||||||
| U.S. Research Enhanced Equity Fund |
| |||||||||||||||
| Level 1 Quoted prices | Level 2 Other significant observable inputs | Level 3 Significant unobservable inputs | Total | |||||||||||||
Total Investments in Securities (a) | $ | 4,419,763 | $ | — | $ | — | $ | 4,419,763 | ||||||||
|
|
|
|
|
|
|
| |||||||||
Appreciation in Other Financial Instruments |
| |||||||||||||||
Futures Contracts (a) | $ | 992 | $ | — | $ | — | $ | 992 | ||||||||
|
|
|
|
|
|
|
| |||||||||
| (a) | Please refer to the SOIs for specifics of portfolio holdings. |
B. Securities Lending — The Funds are authorized to engage in securities lending in order to generate additional income. The Funds are able to lend to approved borrowers. Citibank N.A. (“Citibank”) serves as lending agent for the Funds, pursuant to a Securities Lending Agency Agreement (the “Securities Lending Agency Agreement”). Securities loaned are collateralized by cash equal to at least 100% of the market value plus accrued interest on the securities lent, which is invested in the Class IM Shares of the JPMorgan U.S. Government Money Market Fund and the Agency SL Class Shares of the JPMorgan Securities Lending Money Market Fund. The Funds retain loan fees and the interest on cash collateral investments but are required to pay the borrower a rebate for the use of cash collateral. In cases where the lent security is of high value to borrowers, there may be a negative rebate (i.e., a net payment from the borrower to the Funds). Upon termination of a loan, the Funds are required to return to the borrower an amount equal to the cash collateral, plus any rebate owed to the borrowers. The remaining maturities of the securities lending transactions are considered overnight and continuous. Loans are subject to termination by the Funds or the borrower at any time.
The net income earned on the securities lending (after payment of rebates and Citibank’s fee) is included on the Statements of Operations as Income from securities lending (net). The Funds also receive payments from the borrower during the period of the loan, equivalent to dividends and interest earned on the securities loaned, which are recorded as Dividend or Interest income, respectively, on the Statements of Operations.
Under the Securities Lending Agency Agreement, Citibank marks to market the loaned securities on a daily basis. In the event the cash received from the borrower is less than 102% of the value of the loaned securities (105% for loans of non-U.S. securities), Citibank requests additional cash from the borrower so as to maintain a collateralization level of at least 102% of the value of the loaned securities plus accrued interest (105% for loans of non-U.S. securities), subject to certain de minimis amounts.
The value of securities out on loan is recorded as an asset on the Statements of Assets and Liabilities. The value of the cash collateral received is recorded as a liability on the Statements of Assets and Liabilities and details of collateral investments are disclosed on the SOIs.
The Funds bear the risk of loss associated with the collateral investments and are not entitled to additional collateral from the borrower to cover any such losses. To the extent that the value of the collateral investments declines below the amount owed to a borrower, the Funds may incur losses that exceed the amount they earned on lending the security. Upon termination of a loan, the Funds may use leverage (borrow money) to repay the borrower for cash collateral posted if the Adviser does not believe that it is prudent to sell the collateral investments to fund the payment of this liability. Securities lending activity is subject to master netting arrangements.
| JUNE 30, 2020 | J.P. MORGAN LARGE CAP FUNDS | 107 | ||||||
Table of Contents
NOTES TO FINANCIAL STATEMENTS
AS OF JUNE 30, 2020 (continued)
The following table presents for each lending Fund, the value of the securities on loan with Citibank, net of amounts available for offset under the master netting arrangements and any related collateral received or posted by the Funds as of June 30, 2020 (amounts in thousands).
| Investment Securities on Loan, at value, Presented on the Statements of Assets and Liabilities | Cash Collateral Posted by Borrower* | Net Amount Due to Counterparty (not less than zero) | ||||||||||
Large Cap Growth Fund | $ | 1,215,560 | $ | (1,199,704 | )** | $ | 15,856 | |||||
Large Cap Value Fund | 59,241 | (59,241 | ) | — | ||||||||
U.S. Equity Fund | 13,372 | (13,372 | ) | — | ||||||||
| * | Collateral posted reflects the value of securities on loan and does not include any additional amounts received from the borrower. |
| ** | Subsequent to June 30, 2020, additional collateral was received from borrowers. |
Securities lending also involves counterparty risks, including the risk that the loaned securities may not be returned in a timely manner or at all. Subject to certain conditions, Citibank has agreed to indemnify the Funds from losses resulting from a borrower’s failure to return a loaned security.
JPMIM voluntarily waived management fees investment advisory fees charged to the Funds to reduce the impact of the cash collateral investment in the JPMorgan U.S. Government Money Market Fund from 0.15% to 0.06%. For the year ended June 30, 2020, JPMIM waived fees associated with the Funds’ investment in the JPMorgan U.S. Government Money Market Fund as follows (amounts in thousands):
Equity Focus Fund | $ | — | (a) | |
Growth and Income Fund | — | (a) | ||
Large Cap Growth Fund | 65 | |||
Large Cap Value Fund | 4 | |||
U.S. Equity Fund | 8 |
| (a) | Amount rounds to less than one thousand. |
The above waiver is included in the determination of earnings on cash collateral investment and in the calculation of Citibank’s compensation and is included in the Statements of Operations as Income from securities lending (net).
Equity Focus Fund and Growth and Income Fund did not have any securities out on loan at June 30, 2020. Equity Income Fund, Equity Premium Income Fund, Hedged Equity Fund, U.S. Large Cap Core Plus Fund and U.S. Research Enhanced Equity Fund did not lend out any securities during the year ended June 30, 2020.
C. Investment Transactions with Affiliates — The Funds invested in Underlying Funds which are advised by the Adviser. An issuer which is under common control with a Fund may be considered an affiliate. For the purposes of the financial statements, the Funds assume the issuers listed in the tables below to be affiliated issuers. Underlying Funds’ distributions may be reinvested into the Underlying Funds. Reinvestment amounts are included in the purchase cost amounts in the tables below. Amounts in the tables below are in thousands.
| Equity Focus Fund |
| |||||||||||||||||||||||||||||||||||
| For the year ended June 30, 2020 | ||||||||||||||||||||||||||||||||||||
| Security Description | Value at June 30, 2019 | Purchases at Cost | Proceeds from Sales | Net Realized Gain (Loss) | Change in Unrealized Appreciation/ (Depreciation) | Value at June 30, 2020 | Shares at June 30, 2020 | Dividend Income | Capital Gain Distributions | |||||||||||||||||||||||||||
JPMorgan Prime Money Market Fund Class IM Shares, 0.47% (a)(b) | $ | 2,779 | $ | 32,183 | $ | 31,745 | $ | (2 | ) | $ | 1 | $ | 3,216 | 3,213 | $ | 35 | $ | — | ||||||||||||||||||
JPMorgan U.S. Government Money Market Fund Class IM Shares (a) | — | 18,414 | 18,414 | — | — | — | — | 1 | * | — | ||||||||||||||||||||||||||
|
|
|
|
|
|
|
|
|
|
|
|
|
|
|
| |||||||||||||||||||||
Total | $ | 2,779 | $ | 50,597 | $ | 50,159 | $ | (2 | ) | $ | 1 | $ | 3,216 | $ | 36 | $ | — | |||||||||||||||||||
|
|
|
|
|
|
|
|
|
|
|
|
|
|
|
| |||||||||||||||||||||
| 108 | J.P. MORGAN LARGE CAP FUNDS | JUNE 30, 2020 | ||||
Table of Contents
| Equity Income Fund |
| |||||||||||||||||||||||||||||||||||
| For the year ended June 30, 2020 | ||||||||||||||||||||||||||||||||||||
| Security Description | Value at June 30, 2019 | Purchases at Cost | Proceeds from Sales | Net Realized Gain (Loss) | Change in Unrealized Appreciation/ (Depreciation) | Value at June 30, 2020 | Shares at June 30, 2020 | Dividend Income | Capital Gain Distributions | |||||||||||||||||||||||||||
JPMorgan Prime Money Market Fund Class IM Shares, 0.47% (a)(b) | $ | 1,052,315 | $ | 11,186,437 | $ | 11,356,490 | $ | 164 | $ | 588 | $ | 883,014 | 882,220 | $ | 15,227 | $ | — | |||||||||||||||||||
|
|
|
|
|
|
|
|
|
|
|
|
|
|
|
| |||||||||||||||||||||
| Equity Premium Income Fund |
| |||||||||||||||||||||||||||||||||||
| For the year ended June 30, 2020 | ||||||||||||||||||||||||||||||||||||
| Security Description | Value at June 30, 2019 | Purchases at Cost | Proceeds from Sales | Net Realized Gain (Loss) | Change in Unrealized Appreciation/ (Depreciation) | Value at June 30, 2020 | Shares at June 30, 2020 | Dividend Income | Capital Gain Distributions | |||||||||||||||||||||||||||
JPMorgan Prime Money Market Fund Class IM Shares, 0.47% (a)(b) | $ | — | $ | 235,098 | $ | 229,199 | $ | — | (c) | $ | — | (c) | $ | 5,899 | 5,893 | $ | 25 | $ | — | |||||||||||||||||
|
|
|
|
|
|
|
|
|
|
|
|
|
|
|
| |||||||||||||||||||||
| Growth and Income Fund |
| |||||||||||||||||||||||||||||||||||
| For the year ended June 30, 2020 | ||||||||||||||||||||||||||||||||||||
| Security Description | Value at June 30, 2019 | Purchases at Cost | Proceeds from Sales | Net Realized Gain (Loss) | Change in Unrealized Appreciation/ (Depreciation) | Value at June 30, 2020 | Shares at June 30, 2020 | Dividend Income | Capital Gain Distributions | |||||||||||||||||||||||||||
JPMorgan Prime Money Market Fund Class IM Shares, 0.47% (a)(b) | $ | 20,398 | $ | 188,034 | $ | 183,214 | $ | (1 | ) | $ | 17 | $ | 25,234 | 25,211 | $ | 287 | $ | — | ||||||||||||||||||
JPMorgan U.S. Government Money Market Fund Class IM Shares (a) | — | 5,048 | 5,048 | — | — | — | — | — | *(c) | — | ||||||||||||||||||||||||||
|
|
|
|
|
|
|
|
|
|
|
|
|
|
|
| |||||||||||||||||||||
Total | $ | 20,398 | $ | 193,082 | $ | 188,262 | $ | (1 | ) | $ | 17 | $ | 25,234 | $ | 287 | $ | — | |||||||||||||||||||
|
|
|
|
|
|
|
|
|
|
|
|
|
|
|
| |||||||||||||||||||||
| Hedged Equity Fund |
| |||||||||||||||||||||||||||||||||||
| For the year ended June 30, 2020 | ||||||||||||||||||||||||||||||||||||
| Security Description | Value at June 30, 2019 | Purchases at Cost | Proceeds from Sales | Net Realized Gain (Loss) | Change in Unrealized Appreciation/ (Depreciation) | Value at June 30, 2020 | Shares at June 30, 2020 | Dividend Income | Capital Gain Distributions | |||||||||||||||||||||||||||
JPMorgan U.S. Government Money Market Fund Class Institutional Shares, 0.06% (a)(b) | $ | 232,451 | $ | 4,012,643 | $ | 3,788,713 | $ | — | $ | — | $ | 456,381 | 456,381 | $ | 1,628 | $ | — | |||||||||||||||||||
|
|
|
|
|
|
|
|
|
|
|
|
|
|
|
| |||||||||||||||||||||
| JUNE 30, 2020 | J.P. MORGAN LARGE CAP FUNDS | 109 | ||||||
Table of Contents
NOTES TO FINANCIAL STATEMENTS
AS OF JUNE 30, 2020 (continued)
| Large Cap Growth Fund |
| |||||||||||||||||||||||||||||||||||
| For the year ended June 30, 2020 | ||||||||||||||||||||||||||||||||||||
| Security Description | Value at June 30, 2019 | Purchases at Cost | Proceeds from Sales | Net Realized Gain (Loss) | Change in Unrealized Appreciation/ (Depreciation) | Value at June 30, 2020 | Shares at June 30, 2020 | Dividend Income | Capital Gain Distributions | |||||||||||||||||||||||||||
JPMorgan Prime Money Market Fund Class IM Shares, 0.47% (a)(b) | $ | 177,684 | $ | 7,186,540 | $ | 6,280,577 | $ | 125 | $ | 590 | $ | 1,084,362 | 1,083,387 | $ | 8,356 | $ | — | |||||||||||||||||||
JPMorgan Securities Lending Money Market Fund Agency SL Class Shares, 0.51% (a)(b) | 406,108 | 4,166,500 | 3,469,999 | 288 | * | 2 | 1,102,899 | 1,102,458 | 8,541 | * | — | |||||||||||||||||||||||||
JPMorgan U.S. Government Money Market Fund Class IM Shares, 0.14% (a)(b) | 96,965 | 2,481,334 | 2,481,494 | — | — | 96,805 | 96,805 | 1,063 | * | — | ||||||||||||||||||||||||||
|
|
|
|
|
|
|
|
|
|
|
|
|
|
|
| |||||||||||||||||||||
Total | $ | 680,757 | $ | 13,834,374 | $ | 12,232,070 | $ | 413 | $ | 592 | $ | 2,284,066 | $ | 17,960 | $ | — | ||||||||||||||||||||
|
|
|
|
|
|
|
|
|
|
|
|
|
|
|
| |||||||||||||||||||||
| Large Cap Value Fund |
| |||||||||||||||||||||||||||||||||||
| For the year ended June 30, 2020 | ||||||||||||||||||||||||||||||||||||
| Security Description | Value at June 30, 2019 | Purchases at Cost | Proceeds from Sales | Net Realized Gain (Loss) | Change in Unrealized Appreciation/ (Depreciation) | Value at June 30, 2020 | Shares at June 30, 2020 | Dividend Income | Capital Gain Distributions | |||||||||||||||||||||||||||
JPMorgan Prime Money Market Fund Class IM Shares, 0.47% (a)(b) | $ | 11,520 | $ | 965,730 | $ | 964,695 | $ | 17 | $ | (2 | ) | $ | 12,570 | 12,558 | $ | 480 | $ | — | ||||||||||||||||||
JPMorgan Securities Lending Money Market Fund Agency SL Class Shares, 0.51% (a)(b) | — | 270,200 | 218,500 | 5 | * | — | 51,705 | 51,684 | 166 | * | — | |||||||||||||||||||||||||
JPMorgan U.S. Government Money Market Fund Class IM Shares, 0.14% (a)(b) | — | 266,260 | 257,568 | — | — | 8,692 | 8,693 | 77 | * | — | ||||||||||||||||||||||||||
|
|
|
|
|
|
|
|
|
|
|
|
|
|
|
| |||||||||||||||||||||
Total | $ | 11,520 | $ | 1,502,190 | $ | 1,440,763 | $ | 22 | $ | (2 | ) | $ | 72,967 | $ | 723 | $ | — | |||||||||||||||||||
|
|
|
|
|
|
|
|
|
|
|
|
|
|
|
| |||||||||||||||||||||
| U.S. Equity Fund |
| |||||||||||||||||||||||||||||||||||
| For the year ended June 30, 2020 | ||||||||||||||||||||||||||||||||||||
| Security Description | Value at June 30, 2019 | Purchases at Cost | Proceeds from Sales | Net Realized Gain (Loss) | Change in Unrealized Appreciation/ (Depreciation) | Value at June 30, 2020 | Shares at June 30, 2020 | Dividend Income | Capital Gain Distributions | |||||||||||||||||||||||||||
JPMorgan Prime Money Market Fund Class IM Shares, 0.47% (a)(b) | $ | 88,792 | $ | 6,761,851 | $ | 6,809,290 | $ | (3 | ) | $ | (9 | ) | $ | 41,341 | 41,304 | $ | 2,292 | $ | — | |||||||||||||||||
JPMorgan Securities Lending Money Market Fund Agency SL Class Shares, 0.51% (a)(b) | 13,017 | 1,194,300 | 1,206,299 | 57 | * | (1 | ) | 1,074 | 1,073 | 658 | * | — | ||||||||||||||||||||||||
JPMorgan U.S. Government Money Market Fund Class IM Shares, 0.14% (a)(b) | 3,902 | 574,106 | 565,403 | — | — | 12,605 | 12,605 | 142 | * | — | ||||||||||||||||||||||||||
|
|
|
|
|
|
|
|
|
|
|
|
|
|
|
| |||||||||||||||||||||
Total | $ | 105,711 | $ | 8,530,257 | $ | 8,580,992 | $ | 54 | $ | (10 | ) | $ | 55,020 | $ | 3,092 | $ | — | |||||||||||||||||||
|
|
|
|
|
|
|
|
|
|
|
|
|
|
|
| |||||||||||||||||||||
| 110 | J.P. MORGAN LARGE CAP FUNDS | JUNE 30, 2020 | ||||
Table of Contents
| U.S. Large Cap Core Plus Fund |
| |||||||||||||||||||||||||||||||||||
| For the year ended June 30, 2020 | ||||||||||||||||||||||||||||||||||||
| Security Description | Value at June 30, 2019 | Purchases at Cost | Proceeds from Sales | Net Realized Gain (Loss) | Change in Unrealized Appreciation/ (Depreciation) | Value at June 30, 2020 | Shares at June 30, 2020 | Dividend Income | Capital Gain Distributions | |||||||||||||||||||||||||||
JPMorgan Prime Money Market Fund Class IM Shares, 0.47% (a)(b) | $ | 78,086 | $ | 3,523,730 | $ | 3,566,183 | $ | 26 | $ | 2 | $ | 35,661 | 35,630 | $ | 988 | $ | — | |||||||||||||||||||
|
|
|
|
|
|
|
|
|
|
|
|
|
|
|
| |||||||||||||||||||||
| U.S. Research Enhanced Equity Fund |
| |||||||||||||||||||||||||||||||||||
| For the year ended June 30, 2020 | ||||||||||||||||||||||||||||||||||||
| Security Description | Value at June 30, 2019 | Purchases at Cost | Proceeds from Sales | Net Realized Gain (Loss) | Change in Unrealized Appreciation/ (Depreciation) | Value at June 30, 2020 | Shares at June 30, 2020 | Dividend Income | Capital Gain Distributions | |||||||||||||||||||||||||||
JPMorgan Prime Money Market Fund Class IM Shares, 0.47% (a)(b) | $ | 39,677 | $ | 1,462,388 | $ | 1,391,913 | $ | (11 | ) | $ | 3 | $ | 110,144 | 110,045 | $ | 793 | $ | — | ||||||||||||||||||
|
|
|
|
|
|
|
|
|
|
|
|
|
|
|
| |||||||||||||||||||||
| (a) | Investment in an affiliated fund, which is registered under the Investment Company Act of 1940, as amended, and is advised by J.P. Morgan Investment Management Inc. |
| (b) | The rate shown is the current yield as of June 30, 2020. |
| (c) | Amount rounds to less than one thousand. |
| * | Amount is included on the Statements of Operations as Income from securities lending (net) (after payments of rebates and Citibank’s fee). |
D. Futures Contracts — Hedged Equity Fund, U.S. Equity Fund, U.S. Large Cap Core Plus Fund and U.S. Research Enhanced Equity Fund used index futures contracts to gain or reduce exposure to the stock market, maintain liquidity or minimize transaction costs. The Funds also purchased futures contracts to invest incoming cash in the market or sold futures in response to cash outflows, thereby simulating an invested position in the underlying index while maintaining a cash balance for liquidity.
Futures contracts provide for the delayed delivery of the underlying instrument at a fixed price or are settled for a cash amount based on the change in the value of the underlying instrument at a specific date in the future. Upon entering into a futures contract, the Funds are required to deposit with the broker, cash or securities in an amount equal to a certain percentage of the contract amount, which is referred to as the initial margin deposit. Subsequent payments, referred to as variation margin, are made or received by the Funds periodically and are based on changes in the market value of open futures contracts. Changes in the market value of open futures contracts are recorded as Change in net unrealized appreciation/depreciation on the Statements of Operations. Realized gains or losses, representing the difference between the value of the contract at the time it was opened and the value at the time it was closed, are reported on the Statements of Operations at the closing or expiration of the futures contract. Securities deposited as initial margin are designated on the SOIs, while cash deposited, which is considered restricted, is recorded on the Statements of Assets and Liabilities. A receivable from and/or a payable to brokers for the daily variation margin is also recorded on the Statements of Assets and Liabilities.
The use of futures contracts exposes the Funds to equity price risk. The Funds may be subject to the risk that the change in the value of the futures contract may not correlate perfectly with the underlying instrument. Use of long futures contracts subjects the Funds to risk of loss in excess of the amounts shown on the Statements of Assets and Liabilities, up to the notional amount of the futures contracts. Use of short futures contracts subjects the Funds to unlimited risk of loss. The Funds may enter into futures contracts only on exchanges or boards of trade. The exchange or board of trade acts as the counterparty to each futures transaction; therefore, the Funds’ credit risk is limited to failure of the exchange or board of trade. Under some circumstances, futures exchanges may establish daily limits on the amount that the price of a futures contract can vary from the previous day’s settlement price, which could effectively prevent liquidation of positions.
The table below discloses the volume of the Funds’ futures contracts activity during the year ended June 30, 2020 (amounts in thousands):
| Hedged Equity Fund | U.S. Equity Fund | U.S. Large Cap Core Plus Fund | U.S. Research Enhanced Equity Fund | |||||||||||||
Futures Contracts — Equity: | ||||||||||||||||
Average Notional Balance Long | $ | 109,146 | $ | 43,267 | (a) | $ | 17,019 | $ | 50,779 | |||||||
Ending Notional Balance Long | 161,769 | — | 2,159 | 50,582 | ||||||||||||
| (a) | For the period July 1, 2019 through May 31, 2020. |
| JUNE 30, 2020 | J.P. MORGAN LARGE CAP FUNDS | 111 | ||||||
Table of Contents
NOTES TO FINANCIAL STATEMENTS
AS OF JUNE 30, 2020 (continued)
The Funds’ futures contracts are not subject to master netting arrangements (the right to close out all transactions traded with a counterparty and net amounts owed or due across transactions).
E. Options — Hedged Equity Fund purchased and sold (“wrote”) put and call options on indices to manage and hedge equity risk within its portfolio. A purchaser of a put option has the right, but not the obligation, to sell the underlying instrument at an agreed upon price (“strike price”) to the option seller. A purchaser of a call option has the right, but not the obligation, to purchase the underlying instrument at the strike price from the option seller.
Options Purchased — Premiums paid by the Fund for options purchased are included on the Statements of Assets and Liabilities as Options purchased. The option is adjusted daily to reflect the current market value of the option and the change is recorded as Change in net unrealized appreciation/depreciation on options purchased on the Statements of Operations. If the option is allowed to expire, the Fund will lose the entire premium it paid and record a loss for the premium amount. Premiums paid for options purchased which are exercised or closed are added to the amounts paid or will offset against the proceeds on the underlying investment transaction to determine the realized gain (loss) or cost basis of the underlying investment.
Options Written — Premiums received by the Fund for options written are included on the Statements of Assets and Liabilities as a liability. The amount of the liability is adjusted daily to reflect the current market value of the option written and the change in market value is recorded as Change in net unrealized appreciation/depreciation of options written on the Statements of Operations. Premiums received from options written that expire are treated as realized gains. If a written option is closed, the Fund records a realized gain or loss on options written based on whether the cost of the closing transaction exceeds the premium received. If a call option is exercised by the option buyer, the premium received by the Fund is added to the proceeds from the sale of the underlying security to the option buyer and compared to the cost of the closing transaction to determine whether there has been a realized gain or loss. If a put option is exercised by an option buyer, the premium received by the option seller reduces the cost basis of the purchased security.
The Fund pledges collateral to the counterparty in the form of securities for options written. Securities designated as collateral are denoted on the SOI.
Written uncovered call options subject the Fund to unlimited risk of loss. Written covered call options limit the upside potential of a security above the strike price. Written put options subject the Fund to risk of loss if the value of the security declines below the exercise price minus the put premium.
The Fund is not subject to credit risk on options written as the counterparty has already performed its obligation by paying the premium at the inception of the contract.
The Fund’s exchange-traded option contracts are not subject to master netting arrangements (the right to close out all transactions traded with a counterparty and net amounts owed or due across transactions).
The Fund may be required to post or receive collateral for over-the-counter options. Cash collateral posted by the Fund is considered restricted.
The table below discloses the volume of the Fund’s options contracts activity during the year ended June 30, 2020:
Exchange-Traded Options: | ||||
Average Number of Contracts Purchased | 22,110 | |||
Average Number of Contracts Written | 44,220 | |||
Ending Number of Contracts Purchased | 27,545 | |||
Ending Number of Contracts Written | 55,090 |
F. Equity-Linked Notes — The Equity Premium Income Fund invested in Equity-Linked Notes (“ELNs”). These are hybrid instruments which combine both debt and equity characteristics into a single note form. ELNs’ values are linked to the performance of an underlying index. ELNs are unsecured debt obligations of an issuer and may not be publicly listed or traded on an exchange. ELNs are valued daily, under procedures adopted by the Board of JPM IV, based on values provided by an approved pricing source. These notes have a coupon which is accrued and recorded as interest income on the Statements of Operations. Changes in the market value of ELNs are recorded as Change in net unrealized appreciation or depreciation on the Statements of Operations. The Fund realizes a gain or loss when an ELN is sold or matures which is recorded as Net realized gain (loss) on transactions from investments in non-affiliates on the Statements of Operations.
As of June 30, 2020, the Fund had outstanding ELNs as listed on the SOI.
G. Short Sales — The U.S. Large Cap Core Plus Fund engages in short sales as part of its normal investment activities. In a short sale, the Fund sells securities it does not own in anticipation of a decline in the market value of those securities. In order to deliver securities to the purchaser, the Fund borrows securities from a broker. To close out a short position, the Fund delivers the same securities to the broker.
The Fund is required to pledge cash or securities to the broker as collateral for the securities sold short. Collateral requirements are calculated daily based on the current market value of the short positions. Cash collateral deposited with the broker is recorded as Deposits at broker for securities sold short, while cash collateral deposited at the Fund’s custodian for the benefit of the broker is recorded as Restricted cash for securities sold short on the Statements of Assets and Liabilities. Securities segregated as collateral are denoted on the SOI. The Fund may receive or pay the net of the following amounts: (i) a portion of the income from the investment of cash collateral; (ii) the broker’s fee on the borrowed securities (calculated daily based upon the market value of each borrowed security and a variable rate that is dependent on availability of the security); and (iii) a
| 112 | J.P. MORGAN LARGE CAP FUNDS | JUNE 30, 2020 | ||||
Table of Contents
financing charge for the difference between the market value of the short position and cash collateral deposited with the broker. The net amounts of income or fees are included as Interest income or Interest expense on securities sold short on the Statements of Operations.
The Fund is obligated to pay the broker dividends declared on short positions when a position is open on the record date. Dividends on short positions are reported on ex-dividend date on the Statements of Operations as Dividend expense on securities sold short. Liabilities for securities sold short are reported at market value on the Statements of Assets and Liabilities and the change in market value is recorded as Change in net unrealized appreciation (depreciation) on the Statements of Operations. Short sale transactions may result in unlimited losses as the security’s price increases and the short position loses value. There is no upward limit on the price a borrowed security could attain. The Fund is also subject to risk of loss if the broker were to fail to perform its obligations under the contractual terms.
The Fund will record a realized loss if the price of the borrowed security increases between the date of the short sale and the date on which the Fund replaces the borrowed security. The Fund will record a realized gain if the price of the borrowed security declines between those dates.
As of June 30, 2020, the Fund had outstanding short sales as listed on the SOI.
H. Offering and Organizational Costs — Total offering costs of approximately $27,000 incurred in connection with the offering of shares of the Equity Premium Income Fund are amortized on a straight line basis over 12 months from the date the Fund commenced operations. Costs paid in connection with the organization of the Fund, if any, are recorded as an expense at the time the Fund commenced operations. For the year ended June 30, 2020, total offering costs amortized were approximately $5,000.
I. Security Transactions and Investment Income — Investment transactions are accounted for on the trade date (the date the order to buy or sell is executed). Securities gains and losses are calculated on a specifically identified cost basis. Interest income is determined on the basis of coupon interest accrued using the effective interest method, which adjusts for amortization of premiums and accretion of discounts. Dividend income net of foreign taxes withheld, if any, is recorded on the ex-dividend date or when a Fund first learns of the dividend.
To the extent such information is publicly available, the Funds record distributions received in excess of income earned from underlying investments as a reduction of cost of investments and/or realized gain. Such amounts are based on estimates if actual amounts are not available and actual amounts of income, realized gain and return of capital may differ from the estimated amounts. The Funds adjust the estimated amounts of the components of distributions (and consequently their net investment income) as necessary, once the issuers provide information about the actual composition of the distributions.
J. Allocation of Income and Expenses — Expenses directly attributable to a Fund are charged directly to that Fund, while the expenses attributable to more than one fund of the Trusts are allocated among the applicable funds. Investment income, realized and unrealized gains and losses and expenses, other than class-specific expenses, are allocated daily to each class of shares based upon the proportion of net assets of each class at the beginning of each day.
Transfer agency fees are class-specific expenses. The amount of the transfer agency fees charged to each share class of the Funds for the year ended June 30, 2020 are as follows (amounts in thousands):
| Class A | Class C | Class I | Class L | Class R2 | Class R3 | Class R4 | Class R5 | Class R6 | Total | |||||||||||||||||||||||||||||||
Equity Focus Fund | ||||||||||||||||||||||||||||||||||||||||
Transfer agency fees | $ | 1 | $ | — | (a) | $ | 3 | n/a | n/a | n/a | n/a | n/a | $ | 1 | $ | 5 | ||||||||||||||||||||||||
Equity Income Fund | ||||||||||||||||||||||||||||||||||||||||
Transfer agency fees | 424 | 79 | 129 | n/a | $ | 11 | $ | 5 | $ | 3 | $ | 26 | 187 | 864 | ||||||||||||||||||||||||||
Equity Premium Income Fund | ||||||||||||||||||||||||||||||||||||||||
Transfer agency fees | 1 | — | (a) | 1 | n/a | n/a | n/a | n/a | — | (a) | — | (a) | 2 | |||||||||||||||||||||||||||
Growth and Income Fund | ||||||||||||||||||||||||||||||||||||||||
Transfer agency fees | 176 | 2 | 6 | n/a | 4 | — | (a) | — | (a) | 4 | 1 | 193 | ||||||||||||||||||||||||||||
Hedged Equity Fund | ||||||||||||||||||||||||||||||||||||||||
Transfer agency fees | 34 | 13 | 58 | n/a | n/a | n/a | n/a | 3 | 17 | 125 | ||||||||||||||||||||||||||||||
Large Cap Growth Fund | ||||||||||||||||||||||||||||||||||||||||
Transfer agency fees | 312 | 22 | 73 | n/a | 8 | 2 | 1 | 14 | 92 | 524 | ||||||||||||||||||||||||||||||
Large Cap Value Fund | ||||||||||||||||||||||||||||||||||||||||
Transfer agency fees | 68 | 3 | 7 | n/a | 4 | — | (a) | — | (a) | 2 | 26 | 110 | ||||||||||||||||||||||||||||
U.S. Equity Fund | ||||||||||||||||||||||||||||||||||||||||
Transfer agency fees | 98 | 13 | 33 | $ | 139 | 6 | 3 | — | (a) | 10 | 86 | 388 | ||||||||||||||||||||||||||||
U.S. Large Cap Core Plus Fund | ||||||||||||||||||||||||||||||||||||||||
Transfer agency fees | 41 | 7 | 55 | n/a | 1 | n/a | n/a | — | (a) | 5 | 109 | |||||||||||||||||||||||||||||
U.S. Research Enhanced Equity Fund | ||||||||||||||||||||||||||||||||||||||||
Transfer agency fees | 21 | n/a | 6 | 14 | n/a | n/a | n/a | n/a | 34 | 75 | ||||||||||||||||||||||||||||||
| (a) | Amount rounds to less than one thousand. |
| JUNE 30, 2020 | J.P. MORGAN LARGE CAP FUNDS | 113 | ||||||
Table of Contents
NOTES TO FINANCIAL STATEMENTS
AS OF JUNE 30, 2020 (continued)
K. Federal Income Taxes — Each Fund is treated as a separate taxable entity for Federal income tax purposes. Each Fund’s policy is to comply with the provisions of the Internal Revenue Code (the “Code”) applicable to regulated investment companies and to distribute to shareholders all of its distributable net investment income and net realized capital gains on investments. Accordingly, no provision for Federal income tax is necessary. Management has reviewed the Funds’ tax positions for all open tax years and has determined that as of June 30, 2020, no liability for Federal income tax is required in the Funds’ financial statements for net unrecognized tax benefits. However, management’s conclusions may be subject to future review based on changes in, or the interpretation of, the accounting standards or tax laws and regulations. Each Fund’s Federal tax returns for the prior three fiscal years remain subject to examination by the Internal Revenue Service.
L. Distributions to Shareholders — Distributions from net investment income, if any, are generally declared and paid quarterly, except for Equity Focus Fund, Large Cap Growth Fund and U.S. Large Cap Core Plus Fund, for which distributions are generally declared and paid annually, and Equity Income Fund and Equity Premium Income Fund, for which distributions are generally declared and paid monthly. Distributions are declared separately for each class. No class has preferential dividend rights; differences in per share rates are due to differences in separate class expenses. Net realized capital gains, if any, are distributed by each Fund at least annually. The amount of distributions from net investment income and net realized capital gains is determined in accordance with Federal income tax regulations, which may differ from GAAP. To the extent these “book/tax” differences are permanent in nature (i.e., that they result from other than timing of recognition — “temporary differences”), such amounts are reclassified within the capital accounts based on their Federal tax basis treatment.
The following amounts were reclassified within the capital accounts (amounts in thousands):
| Paid-in-Capital | Accumulated undistributed (distributions in excess of) net investment income | Accumulated net realized gains (losses) | ||||||||||
Equity Focus Fund | $ | 1,688 | $ | (41 | ) | $ | (1,647 | ) | ||||
Equity Income Fund | (1,369 | ) | (366 | ) | 1,735 | |||||||
Equity Premium Income Fund | (57 | ) | (7 | ) | 64 | |||||||
Growth and Income Fund | — | (46 | ) | 46 | ||||||||
Hedged Equity Fund | — | (2,562 | ) | 2,562 | ||||||||
Large Cap Growth Fund | 133,929 | (4,345 | ) | (129,584 | ) | |||||||
Large Cap Value Fund | — | (552 | ) | 552 | ||||||||
U.S. Equity Fund | 85,025 | (5,849 | ) | (79,176 | ) | |||||||
U.S. Large Cap Core Plus Fund | 237,550 | (370 | ) | (237,180 | ) | |||||||
U.S. Research Enhanced Equity Fund | 529,741 | (2,676 | ) | (527,065 | ) | |||||||
The reclassifications for the Funds relate primarily to non-taxable dividends, redemptions in-kind and tax equalization.
3. Fees and Other Transactions with Affiliates
A. Investment Advisory Fee — Pursuant to an Investment Advisory Agreement, the Adviser manages the investments of each Fund and for such services is paid a fee. The investment advisory fee is accrued daily and paid monthly based on each Fund’s average daily net assets. The annual rate for each Fund is as follows:
Equity Focus Fund | 0.50 | %(1) | ||
Equity Income Fund | 0.40 | |||
Equity Premium Income Fund | 0.25 | |||
Growth and Income Fund | 0.40 | |||
Hedged Equity Fund | 0.25 | |||
Large Cap Growth Fund | 0.45 | (1) | ||
Large Cap Value Fund | 0.40 | |||
U.S. Equity Fund | 0.40 | |||
U.S. Large Cap Core Plus Fund | 0.65 | (1) | ||
U.S. Research Enhanced Equity Fund | 0.25 |
| (1) | Prior to August 1, 2019, the investment advisory fee for Equity Focus Fund, Large Cap Growth Fund and U.S. Large Cap Core Plus Fund was accrued daily and paid monthly at an annual rate of 0.60%, 0.50% and 0.70%, respectively, of each Fund’s daily net assets. |
The Adviser waived investment advisory fees and/or reimbursed expenses as outlined in Note 3.F.
B. Administration Fee — Pursuant to Administration Agreements, the Administrator provides certain administration services to each Fund. In consideration of these services, the Administrator receives a fee accrued daily and paid monthly at an annual rate of 0.075% of the first $10 billion of each Fund’s respective average daily net assets, plus 0.050% of each Fund’s respective average daily net assets between $10 billion and
| 114 | J.P. MORGAN LARGE CAP FUNDS | JUNE 30, 2020 | ||||
Table of Contents
$20 billion, plus 0.025% of each Fund’s respective average daily net assets between $20 billion and $25 billion, plus 0.01% of each Fund’s respective average daily net assets in excess of $25 billion. For the year ended June 30, 2020, the effective annualized rate for Equity Focus Fund, Equity Income Fund, Equity Premium Income Fund, Growth and Income Fund, Hedged Equity Fund, Large Cap Growth Fund, Large Cap Value Fund, U.S. Equity Fund, U.S. Large Cap Core Plus Fund and U.S. Research Enhanced Equity Fund was 0.08%, 0.05%, 0.08%, 0.08%, 0.08%, 0.06%, 0.08%, 0.07%, 0.08% and 0.08%, respectively, of each Fund’s average daily net assets, notwithstanding any fee waivers and/or expense reimbursements.
The Administrator waived administration fees as outlined in Note 3.F.
JPMorgan Chase Bank, N.A. (“JPMCB”), a wholly-owned subsidiary of JPMorgan, serves as the Funds’ sub-administrator (the “Sub-administrator”). For its services as Sub-administrator, JPMCB receives a portion of the fees payable to the Administrator.
C. Distribution Fees — Pursuant to a Distribution Agreement, JPMorgan Distribution Services, Inc. (“JPMDS”), an indirect, wholly-owned subsidiary of JPMorgan, serves as each Funds’ principal underwriter and promotes and arranges for the sale of each Fund’s shares.
The Boards have adopted a Distribution Plan (the “Distribution Plan”) for Class A, Class C, Class R2 and Class R3 Shares of the Funds, as applicable, pursuant to Rule 12b-1 under the 1940 Act. The Class I, Class L, Class R4, Class R5 and Class R6 Shares of the Funds do not charge a distribution fee. The Distribution Plan provides that each Fund shall pay, with respect to the applicable share classes, distribution fees, including payments to JPMDS, at annual rates of the average daily net assets as shown in the table below:
| Class A | Class C | Class R2 | Class R3 | |||||||||||||
Equity Focus Fund | 0.25 | % | 0.75 | % | n/a | n/a | ||||||||||
Equity Income Fund | 0.25 | 0.75 | 0.50 | % | 0.25 | % | ||||||||||
Equity Premium Income Fund | 0.25 | 0.75 | n/a | n/a | ||||||||||||
Growth and Income Fund | 0.25 | 0.75 | 0.50 | 0.25 | ||||||||||||
Hedged Equity Fund | 0.25 | 0.75 | n/a | n/a | ||||||||||||
Large Cap Growth Fund | 0.25 | 0.75 | 0.50 | 0.25 | ||||||||||||
Large Cap Value Fund | 0.25 | 0.75 | 0.50 | 0.25 | ||||||||||||
U.S. Equity Fund | 0.25 | 0.75 | 0.50 | 0.25 | ||||||||||||
U.S. Large Cap Core Plus Fund | 0.25 | 0.75 | 0.50 | n/a | ||||||||||||
U.S. Research Enhanced Equity Fund | 0.25 | n/a | n/a | n/a | ||||||||||||
In addition, JPMDS is entitled to receive the front-end sales charges from purchases of Class A Shares and the CDSC from redemptions of Class C Shares and certain Class A Shares for which front-end sales charges have been waived. For the year ended June 30, 2020, JPMDS retained the following (amounts in thousands):
| Front-End Sales Charge | CDSC | |||||||
Equity Focus Fund | $ | 3 | $ | — | ||||
Equity Income Fund | 831 | 9 | ||||||
Equity Premium Income Fund | 9 | — | ||||||
Growth and Income Fund | 20 | — | (a) | |||||
Hedged Equity Fund | 224 | 6 | ||||||
Large Cap Growth Fund | 584 | 1 | ||||||
Large Cap Value Fund | 6 | — | (a) | |||||
U.S. Equity Fund | 86 | 1 | ||||||
U.S. Large Cap Core Plus Fund | 10 | — | ||||||
U.S. Research Enhanced Equity Fund | — | (a) | — | (a) | ||||
| (a) | Amount rounds to less than one thousand. |
D. Service Fees — The Trusts, on behalf of the Funds, have entered into Shareholder Servicing Agreements with JPMDS under which JPMDS provides certain support services to fund shareholders. For performing these services, JPMDS receives a fee with respect to all share classes, except for
| JUNE 30, 2020 | J.P. MORGAN LARGE CAP FUNDS | 115 | ||||||
Table of Contents
NOTES TO FINANCIAL STATEMENTS
AS OF JUNE 30, 2020 (continued)
Class R6 Shares which do not charge a service fee, that is accrued daily and paid monthly equal to a percentage of the average daily net assets as shown in the table below:
| Class A | Class C | Class I | Class L | Class R2 | Class R3 | Class R4 | Class R5 | |||||||||||||||||||||||||
Equity Focus Fund | 0.25 | % | 0.25 | % | 0.25 | % | n/a | n/a | n/a | n/a | n/a | |||||||||||||||||||||
Equity Income Fund | 0.25 | 0.25 | 0.25 | n/a | 0.25 | % | 0.25 | % | 0.25 | % | 0.10 | % | ||||||||||||||||||||
Equity Premium Income Fund | 0.25 | 0.25 | 0.25 | n/a | n/a | n/a | n/a | 0.10 | ||||||||||||||||||||||||
Growth and Income Fund | 0.25 | 0.25 | 0.25 | n/a | 0.25 | 0.25 | 0.25 | 0.10 | ||||||||||||||||||||||||
Hedged Equity Fund | 0.25 | 0.25 | 0.25 | n/a | n/a | n/a | n/a | 0.10 | ||||||||||||||||||||||||
Large Cap Growth Fund | 0.25 | 0.25 | 0.25 | n/a | 0.25 | 0.25 | 0.25 | 0.10 | ||||||||||||||||||||||||
Large Cap Value Fund | 0.25 | 0.25 | 0.25 | n/a | 0.25 | 0.25 | 0.25 | 0.10 | ||||||||||||||||||||||||
U.S. Equity Fund | 0.25 | 0.25 | 0.25 | 0.10 | % | 0.25 | 0.25 | 0.25 | 0.10 | |||||||||||||||||||||||
U.S. Large Cap Core Plus Fund | 0.25 | 0.25 | 0.25 | n/a | 0.25 | n/a | n/a | 0.10 | ||||||||||||||||||||||||
U.S. Research Enhanced Equity Fund | 0.25 | n/a | 0.25 | 0.10 | n/a | n/a | n/a | n/a | ||||||||||||||||||||||||
JPMDS has entered into shareholder services contracts with affiliated and unaffiliated financial intermediaries who provide shareholder services and other related services to their clients or customers who invest in the Funds. Pursuant to such contracts, JPMDS will pay all or a portion of such fees earned to financial intermediaries for performing such services.
JPMDS waived service fees as outlined in Note 3.F.
E. Custodian and Accounting Fees — JPMCB provides portfolio custody and accounting services to the Funds. For performing these services, the Funds pay JPMCB transaction and asset-based fees that vary according to the number of transactions and positions, plus out-of-pocket expenses. The amounts paid directly to JPMCB by the Funds for custody and accounting services are included in Custodian and accounting fees on the Statements of Operations.
Interest income earned on cash balances at the custodian, if any, is included in Interest income from affiliates on the Statements of Operations.
Interest expense paid to the custodian related to cash overdrafts, if any, is included in Interest expense to affiliates on the Statements of Operations.
F. Waivers and Reimbursements — The Adviser, Administrator and/or JPMDS have contractually agreed to waive fees and/or reimburse the Funds to the extent that total annual operating expenses (excluding acquired fund fees and expenses other than certain money market fund fees as described below, dividend and interest expenses related to short sales, interest, taxes, expenses related to litigation and potential litigation, expenses related to trustee elections and extraordinary expenses) exceed the percentages of the Funds’ respective average daily net assets as shown in the table below:
| Class A | Class C | Class I | Class L | Class R2 | Class R3 | Class R4 | Class R5 | Class R6 | ||||||||||||||||||||||||||||
Equity Focus Fund | 1.10 | % | 1.60 | % | 0.85 | % | n/a | n/a | n/a | n/a | n/a | 0.60 | % | |||||||||||||||||||||||
Equity Income Fund | n/a | (1) | n/a | (1) | n/a | (1) | n/a | n/a | (1) | n/a | (1) | n/a | (1) | n/a | (1) | n/a | (1) | |||||||||||||||||||
Equity Premium Income Fund | 0.85 | 1.35 | 0.60 | n/a | n/a | n/a | n/a | 0.45 | % | 0.35 | ||||||||||||||||||||||||||
Growth and Income Fund | 0.94 | 1.44 | 0.69 | n/a | 1.19 | % | 0.94 | % | 0.69 | % | 0.54 | 0.44 | ||||||||||||||||||||||||
Hedged Equity Fund | 0.85 | 1.35 | 0.60 | n/a | n/a | n/a | n/a | 0.45 | 0.35 | |||||||||||||||||||||||||||
Large Cap Growth Fund | 0.94 | 1.44 | 0.69 | n/a | 1.19 | 0.94 | 0.69 | 0.54 | 0.44 | |||||||||||||||||||||||||||
Large Cap Value Fund | 0.93 | 1.44 | 0.69 | n/a | 1.19 | 0.94 | 0.69 | 0.54 | 0.44 | |||||||||||||||||||||||||||
U.S. Equity Fund | 0.94 | 1.44 | 0.69 | 0.61 | % | 1.19 | 0.94 | 0.69 | 0.54 | 0.44 | ||||||||||||||||||||||||||
U.S. Large Cap Core Plus Fund | 1.10 | 1.60 | 0.85 | n/a | 1.45 | n/a | n/a | 0.80 | 0.70 | |||||||||||||||||||||||||||
U.S. Research Enhanced Equity Fund | 0.60 | n/a | 0.35 | n/a | (2) | n/a | n/a | n/a | n/a | 0.25 | ||||||||||||||||||||||||||
| (1) | Effective November 1, 2019, the contractual expense limitation for Class A, Class C, Class I, Class R2, Class R3, Class R4, Class R5 and Class R6 Shares expired. Prior to November 1, 2019, the contractual expense limitation was 1.04%, 1.54%, 0.79%, 1.29%, 1.04%, 0.79%, 0.59% and 0.54% for Class A, Class C, Class I, Class R2, Class R3, Class R4, Class R5 and Class R6 Shares, respectively. |
| (2) | Effective November 1, 2019, the contractual expense limitation for Class L Shares expired. Prior to November 1, 2019, the contractual expense limitation was 0.45% for Class L Shares. |
Except as noted above, the expense limitation agreements were in effect for the year ended June 30, 2020 and the contractual expense limitation percentages in the table above are in place until at least October 31, 2020.
| 116 | J.P. MORGAN LARGE CAP FUNDS | JUNE 30, 2020 | ||||
Table of Contents
For the year ended June 30, 2020, the Funds’ service providers waived fees and/or reimbursed expenses for each of the Funds as follows (amounts in thousands). None of these parties expect the Funds to repay any such waived fees and reimbursed expenses in future years.
| Contractual Waivers | ||||||||||||||||||||
| Investment Advisory Fees | Administration Fees | Service Fees | Total | Contractual Reimbursements | ||||||||||||||||
Equity Focus Fund | $ | 144 | $ | 72 | $ | 4 | $ | 220 | $ | — | ||||||||||
Equity Income Fund | 26 | — | — | 26 | — | |||||||||||||||
Equity Premium Income Fund | 207 | 86 | 2 | 295 | 58 | |||||||||||||||
Growth and Income Fund | 342 | 228 | 184 | 754 | 8 | |||||||||||||||
Hedged Equity Fund | 34 | 23 | 38 | 95 | 7 | |||||||||||||||
Large Cap Growth Fund | 9,855 | 6,561 | 349 | 16,765 | 17 | |||||||||||||||
Large Cap Value Fund | 580 | 386 | 100 | 1,066 | 18 | |||||||||||||||
U.S. Equity Fund | 3,402 | 2,262 | 163 | 5,827 | 86 | |||||||||||||||
U.S. Large Cap Core Plus Fund | 1,285 | 856 | 3,583 | 5,724 | 3 | |||||||||||||||
U.S. Research Enhanced Equity Fund | 2,331 | 1,553 | 627 | 4,511 | 34 | |||||||||||||||
| (a) | Amount rounds to less than one thousand. |
Additionally, the Funds may invest in one or more money market funds advised by the Adviser (affiliated money market funds). The Adviser, Administrator and/or JPMDS, as shareholder servicing agent, have contractually agreed to waive fees and/or reimburse expenses in an amount sufficient to offset the respective net fees each collects from the affiliated money market fund on the applicable Fund’s investment in such affiliated money market fund, except for investments of securities lending cash collateral. None of these parties expect the Funds to repay any such waived fees and reimbursed expenses in future years.
The amounts of waivers resulting from investments in these money market funds for the year ended June 30, 2020 were as follows (amounts in thousands):
Equity Focus Fund | $ | 3 | ||
Equity Income Fund | 1,327 | |||
Equity Premium Income Fund | 4 | |||
Growth and Income Fund | 26 | |||
Hedged Equity Fund | 271 | |||
Large Cap Growth Fund | 700 | |||
Large Cap Value Fund | 40 | |||
U.S. Equity Fund | 206 | |||
U.S. Large Cap Core Plus Fund | 80 | |||
U.S. Research Enhanced Equity Fund | 67 |
G. Other — Certain officers of the Trusts are affiliated with the Adviser, the Administrator and JPMDS. Such officers, with the exception of the Chief Compliance Officer, receive no compensation from the Funds for serving in their respective roles.
The Boards designated and appointed a Chief Compliance Officer to the Funds pursuant to Rule 38a-1 under the 1940 Act. Each Fund, along with affiliated funds, makes reimbursement payments, on a pro-rata basis, to the Administrator for a portion of the fees associated with the office of the Chief Compliance Officer. Such fees are included in Trustees’ and Chief Compliance Officer’s fees on the Statements of Operations.
The Trusts adopted a Trustee Deferred Compensation Plan (the “Plan”) which allows the independent Trustees to defer the receipt of all or a portion of compensation related to performance of their duties as Trustees. The deferred fees are invested in various J.P. Morgan Funds until distribution in accordance with the Plan.
During the year ended June 30, 2020, the Equity Focus Fund, Hedged Equity Fund, Large Cap Value Fund, U.S. Equity Fund, U.S. Large Cap Core Plus Fund and U.S. Research Enhanced Equity Fund purchased securities from an underwriting syndicate in which the principal underwriter or members of the syndicate were affiliated with the Adviser.
The Securities and Exchange Commission (“SEC”) has granted an exemptive order permitting the Funds to engage in principal transactions with J.P. Morgan Securities, Inc., an affiliated broker, involving taxable money market instruments, subject to certain conditions.
| JUNE 30, 2020 | J.P. MORGAN LARGE CAP FUNDS | 117 | ||||||
Table of Contents
NOTES TO FINANCIAL STATEMENTS
AS OF JUNE 30, 2020 (continued)
4. Investment Transactions
During the year ended June 30, 2020, purchases and sales of investments (excluding short-term investments and transfers in-kind) were as follows (amounts in thousands):
| Purchases (excluding U.S. Government) | Sales (excluding U.S. Government) | Securities Sold Short | Covers on Securities Sold Short | |||||||||||||
Equity Focus Fund | $ | 40,702 | $ | 66,276 | $ | — | $ | — | ||||||||
Equity Income Fund | 14,541,363 | 5,952,474 | — | — | ||||||||||||
Equity Premium Income Fund | 391,071 | 243,402 | — | — | ||||||||||||
Growth and Income Fund | 256,073 | 147,831 | — | — | ||||||||||||
Hedged Equity Fund | 7,197,964 | 4,440,015 | — | — | ||||||||||||
Large Cap Growth Fund | 9,150,109 | 8,029,538 | — | — | ||||||||||||
Large Cap Value Fund | 2,467,558 | 2,480,523 | — | — | ||||||||||||
U.S. Equity Fund | 12,158,581 | 13,148,030 | — | — | ||||||||||||
U.S. Large Cap Core Plus Fund | 4,437,561 | 8,676,822 | 2,085,919 | 2,568,414 | ||||||||||||
U.S. Research Enhanced Equity Fund | 2,620,610 | 3,083,207 | — | — | ||||||||||||
During the year ended June 30, 2020, there were no purchases or sales of U.S. Government securities.
5. Federal Income Tax Matters
For Federal income tax purposes, the estimated cost and unrealized appreciation (depreciation) in value of investments held at June 30, 2020 were as follows (amounts in thousands):
| Aggregate Cost | Gross Unrealized Appreciation | Gross Unrealized Depreciation | Net Unrealized Appreciation (Depreciation) | |||||||||||||
Equity Focus Fund | $ | 63,787 | $ | 23,839 | $ | 2,521 | $ | 21,318 | ||||||||
Equity Income Fund | 25,738,640 | 5,105,328 | 1,279,484 | 3,825,844 | ||||||||||||
Equity Premium Income Fund | 190,402 | 9,560 | 5,179 | 4,381 | ||||||||||||
Growth and Income Fund | 563,252 | 186,206 | 23,033 | 163,173 | ||||||||||||
Hedged Equity Fund | 7,681,671 | 1,342,625 | 233,885 | 1,108,740 | ||||||||||||
Large Cap Growth Fund | 14,247,264 | 10,312,516 | 133,073 | 10,179,443 | ||||||||||||
Large Cap Value Fund | 1,336,577 | 96,559 | 115,317 | (18,758 | ) | |||||||||||
U.S. Equity Fund | 10,890,347 | 4,265,729 | 159,845 | 4,105,884 | ||||||||||||
U.S. Large Cap Core Plus Fund* | 1,665,830 | 1,498,392 | 109,897 | 1,388,495 | ||||||||||||
U.S. Research Enhanced Equity Fund | 3,129,584 | 1,405,463 | 114,292 | 1,291,171 | ||||||||||||
| * | The tax cost includes the proceeds from short sales which may result in a net negative cost. |
For the Funds, the difference between book and tax basis appreciation (depreciation) on investments is primarily attributed to wash sale loss deferrals, mark to market of options contracts and non-taxable dividends.
The tax character of distributions paid during the year ended June 30, 2020 was as follows (amounts in thousands):
| Ordinary Income* | Net Long-Term Capital Gains | Total Distributions Paid | ||||||||||
Equity Focus Fund | $ | 1,840 | $ | 14,655 | $ | 16,495 | ||||||
Equity Income Fund | 604,025 | 309,226 | 913,251 | |||||||||
Equity Premium Income Fund | 13,523 | — | 13,523 | |||||||||
Growth and Income Fund | 12,810 | 13,478 | 26,288 | |||||||||
Hedged Equity Fund | 76,075 | — | 76,075 | |||||||||
Large Cap Growth Fund | 25,755 | 2,006,004 | 2,031,759 | |||||||||
Large Cap Value Fund | 23,336 | — | 23,336 | |||||||||
U.S. Equity Fund | 156,829 | 1,311,869 | 1,468,698 | |||||||||
U.S. Large Cap Core Plus Fund | 20,011 | 1,154,945 | 1,174,956 | |||||||||
U.S. Research Enhanced Equity Fund | 70,897 | 483,702 | 554,599 | |||||||||
| * | Short-term gain distributions are treated as ordinary income for income tax purposes. |
| 118 | J.P. MORGAN LARGE CAP FUNDS | JUNE 30, 2020 | ||||
Table of Contents
The tax character of distributions paid during the year ended June 30, 2019 was as follows (amounts in thousands):
| Ordinary Income* | Net Long-Term Capital Gains | Total Distributions Paid | ||||||||||
Equity Focus Fund | $ | 1,517 | $ | 13,795 | $ | 15,312 | ||||||
Equity Income Fund | 429,818 | 505,510 | 935,328 | |||||||||
Equity Premium Income Fund | 3,254 | — | 3,254 | |||||||||
Growth and Income Fund | 12,960 | 24,851 | 37,811 | |||||||||
Hedged Equity Fund | 43,440 | — | 43,440 | |||||||||
Large Cap Growth Fund | 5,415 | 1,765,341 | 1,770,756 | |||||||||
Large Cap Value Fund | 69,943 | 49,369 | 119,312 | |||||||||
U.S. Equity Fund | 493,090 | 1,142,626 | 1,635,716 | |||||||||
U.S. Large Cap Core Plus Fund | 34,942 | 1,077,212 | 1,112,154 | |||||||||
U.S. Research Enhanced Equity Fund | 99,784 | 640,122 | 739,906 | |||||||||
| * | Short-term gain distributions are treated as ordinary income for income tax purposes. |
As of June 30, 2020, the estimated components of net assets (excluding paid-in-capital) on a tax basis were as follows (amounts in thousands):
| Current Distributable Ordinary Income | Current Distributable Long-Term Capital Gain (Tax Basis Capital Loss Carryover) | Unrealized Appreciation (Depreciation) | ||||||||||
Equity Focus Fund | $ | 1,000 | $ | 7,466 | $ | 21,318 | ||||||
Equity Income Fund | — | — | 3,825,844 | |||||||||
Equity Premium Income Fund | — | (4,187 | ) | 4,381 | ||||||||
Growth and Income Fund | 793 | 7,677 | 163,173 | |||||||||
Hedged Equity Fund | 26,480 | (272,280 | ) | 1,108,740 | ||||||||
Large Cap Growth Fund | 25,426 | 976,336 | 10,179,443 | |||||||||
Large Cap Value Fund | 1,422 | (24,093 | ) | (18,758 | ) | |||||||
U.S. Equity Fund | 26,301 | 654,859 | 4,105,884 | |||||||||
U.S. Large Cap Core Plus Fund | 48,650 | 521,841 | 1,387,712 | |||||||||
U.S. Research Enhanced Equity Fund | 12,968 | 91,777 | 1,291,171 | |||||||||
For the Funds, the cumulative timing differences primarily consist of mark to market of options contracts, post-October capital loss deferrals, non-taxable dividends and wash sale loss deferrals.
As of June 30, 2020, the following Funds had net capital loss carryforwards (amounts in thousands):
| Capital Loss Carryforward Character | ||||||||
| Short-Term | Long-Term | |||||||
Equity Premium Income Fund | $ | 4,187 | $ | — | ||||
Hedged Equity Fund | 114,389 | 157,891 | ||||||
Large Cap Value Fund | 24,093 | — | ||||||
Net capital losses incurred after October 31, and within the taxable year are deemed to arise on the first business day of the Funds’ next taxable year. For the year ended June 30, 2020, the following Funds deferred to July 1, 2020 the following net capital losses of (amounts in thousands):
| Net Capital Losses (Gains) | ||||||||
| Short-Term | Long-Term | |||||||
Equity Income Fund | $ | 491,217 | $ | 330,688 | ||||
Equity Premium Income Fund | 25,154 | (102 | ) | |||||
Growth and Income Fund | 6,424 | — | ||||||
Hedged Equity Fund | 57,540 | 40,233 | ||||||
Large Cap Growth Fund | 68,836 | — | ||||||
Large Cap Value Fund | 49,514 | (13,663 | ) | |||||
U.S. Research Enhanced Equity Fund | 34,878 | — | ||||||
| JUNE 30, 2020 | J.P. MORGAN LARGE CAP FUNDS | 119 | ||||||
Table of Contents
NOTES TO FINANCIAL STATEMENTS
AS OF JUNE 30, 2020 (continued)
6. Borrowings
The Funds rely upon an exemptive order granted by the SEC (the “Order”) permitting the establishment and operation of an Interfund Lending Facility (the “Facility”). The Facility allows the Funds to directly lend and borrow money to or from any other fund relying upon the Order at rates beneficial to both the borrowing and lending funds. Advances under the Facility are taken primarily for temporary or emergency purposes, including the meeting of redemption requests that otherwise might require the untimely disposition of securities, and are subject to each Fund’s borrowing restrictions. The Interfund loan rate is determined, as specified in the Order, by averaging the current repurchase agreement rate and the current bank loan rate. The Order was granted to JPM II and may be relied upon by the Funds because the Funds and the series of JPM II are all investment companies in the same “group of investment companies” (as defined in Section 12(d)(1)(G) of the 1940 Act).
The Funds had no borrowings outstanding from another fund during the year ended June 30, 2020.
The Trusts and JPMCB have entered into a financing arrangement. Under this arrangement, JPMCB provides an unsecured, uncommitted credit facility in the aggregate amount of $100 million to certain of the J.P. Morgan Funds, including the Funds. Advances under the arrangement are taken primarily for temporary or emergency purposes, including the meeting of redemption requests that otherwise might require the untimely disposition of securities, and are subject to each Fund’s borrowing restrictions. Interest on borrowings is payable at a rate determined by JPMCB at the time of borrowing. This agreement has been extended until November 2, 2020.
The Funds had no borrowings outstanding from the unsecured, uncommitted credit facility during the year ended June 30, 2020.
The Trusts, along with certain other trusts for J.P. Morgan Funds (“Borrowers”), have entered into a joint syndicated senior unsecured revolving credit facility totaling $1.5 billion (“Credit Facility”) with various lenders and The Bank of New York Mellon, as administrative agent for the lenders. This Credit Facility provides a source of funds to the Borrowers for temporary and emergency purposes, including the meeting of redemption requests that otherwise might require the untimely disposition of securities. Under the terms of the Credit Facility, a borrowing fund must have a minimum of $25,000,000 in adjusted net asset value and not exceed certain adjusted net asset coverage ratios prior to and during the time in which any borrowings are outstanding. If a fund does not comply with the aforementioned requirements, the fund must remediate within three business days with respect to the $25,000,000 minimum adjusted net asset value or within one business day with respect to certain asset coverage ratios or the administrative agent at the request of, or with the consent of, the lenders may terminate the Credit Facility and declare any outstanding borrowings to be due and payable immediately.
Interest associated with any borrowing under the Credit Facility is charged to the borrowing fund at a rate of interest equal to 1.00%, which has increased to 1.25% pursuant to the amendment referenced below, plus the greater of the federal funds effective rate or one month London InterBank Offered Rate (“LIBOR”). The annual commitment fee to maintain the Credit Facility is 0.15% and is incurred on the unused portion of the Credit Facility and is allocated to all participating funds pro rata based on their respective net assets. Effective August 11, 2020, this agreement has been amended and restated for a term of 364 days, unless extended, and to include the change to the interest rate charged for borrowing from the Credit Facility to 1.25%, as noted above, and an upfront fee of 0.075% of the Credit Facility to be charged and paid by all participating funds of the Credit Facility.
The Funds had no borrowings outstanding from the Credit Facility at June 30, 2020. Average borrowings from the Credit Facility during the year ended June 30, 2020 were as follows (amounts in thousands, except number of days outstanding):
| Average Borrowings | Average Interest Rate Paid | Number of Days Outstanding | Interest Paid | |||||||||||||
Hedged Equity Fund | $ | 94,500 | 1.95 | % | 2 | $ | 10 | |||||||||
7. Risks, Concentrations and Indemnifications
In the normal course of business, the Funds enter into contracts that contain a variety of representations which provide general indemnifications. Each Fund’s maximum exposure under these arrangements is unknown. The amount of exposure would depend on future claims that may be brought against each Fund. However, based on experience, the Funds expect the risk of loss to be remote.
| 120 | J.P. MORGAN LARGE CAP FUNDS | JUNE 30, 2020 | ||||
Table of Contents
As of June 30, 2020, the Funds had individual shareholder and/or omnibus accounts which owned more than 10% of the respective Fund’s outstanding shares as follows:
| Number of individual shareholder and/or Affiliated Omnibus Accounts | % of the Fund | Number of individual shareholder and/or Non-Affiliated Omnibus Accounts | % of the Fund | |||||||||||||
Equity Focus Fund | 1 | 64.5 | % | 1 | 21.1 | % | ||||||||||
Equity Income Fund | 1 | 10.3 | 2 | 25.9 | ||||||||||||
Equity Premium Income Fund | 1 | 19.1 | 3 | 54.1 | ||||||||||||
Growth and Income Fund | 1 | 15.7 | 1 | 17.9 | ||||||||||||
Hedged Equity Fund | — | — | 2 | 29.3 | ||||||||||||
Large Cap Growth Fund | — | — | 1 | 19.7 | ||||||||||||
Large Cap Value Fund | 2 | 30.4 | 1 | 10.4 | ||||||||||||
U.S. Equity Fund | — | — | 1 | 14.4 | ||||||||||||
U.S. Large Cap Core Plus Fund | 1 | 23.1 | 1 | 32.1 | ||||||||||||
U.S. Research Enhanced Equity Fund | 1 | 10.3 | 1 | 14.7 | ||||||||||||
As of June 30, 2020, J.P. Morgan Investor Funds and JPMorgan SmartRetirement Funds, which are affiliated funds of funds, owned in the aggregate, shares representing more than 10% of the net assets of the following Funds:
| J.P. Morgan Investor Funds | JPMorgan SmartRetirement Funds | |||||||
Large Cap Value Fund | 42.5 | % | n/a | |||||
U.S. Equity Fund | n/a | 28.0 | % | |||||
U.S. Research Enhanced Equity Fund | 14.9 | 38.9 | ||||||
Significant shareholder transactions by these shareholders may impact the Funds’ performance and liquidity.
The Equity Premium Income Fund’s investments in ELNs entail varying degrees of risks. The Equity Premium Income Fund is subject to loss of their full principal amount. In addition, the ELNs are subject to a stated maximum return which may limit the payment at maturity. The Equity Premium Income Fund may also be exposed to additional risks associated with structured notes including: counterparty credit risk related to the issuer’s ability to make payment at maturity; liquidity risk related to a lack of liquid market for these notes, preventing the funds from trading or selling the notes easily; and a greater degree of market risk than other types of debt securities because the investor bears the risk associated with the underlying financial instruments.
LIBOR is intended to represent the rate at which contributing banks may obtain short-term borrowings from each other in the London interbank market. The regulatory authority that oversees financial services firms and financial markets in the U.K. has announced that, after the end of 2021, it would no longer persuade or compel contributing banks to make rate submissions for purposes of determining the LIBOR rate. As a result, it is possible that commencing in 2022, LIBOR may no longer be available or no longer deemed an appropriate reference rate upon which to determine the interest rate on or impacting certain loans, notes, derivatives and other instruments or investments comprising some or all of a Fund’s portfolio. In light of this eventuality, public and private sector industry initiatives are currently underway to identify new or alternative reference rates to be used in place of LIBOR. There is no assurance that the composition or characteristics of any such alternative reference rate will be similar to or produce the same value or economic equivalence as LIBOR or that it will have the same volume or liquidity as did LIBOR prior to its discontinuance or unavailability, which may affect the value or liquidity or return on certain investments of a Fund and result in costs incurred in connection with closing out positions and entering into new trades. These risks may also apply with respect to changes in connection with other interbank offering rates (e.g., Euribor) and a wide range of other index levels, rates and values that are treated as “benchmarks” and are the subject of recent regulatory reform.
The Funds are subject to infectious disease epidemics/pandemics risk. Recently, the worldwide outbreak of COVID-19, a novel coronavirus disease, has negatively affected economies, markets and individual companies throughout the world. The effects of this COVID-19 pandemic to public health, and business and market conditions, including exchange trading suspensions and closures may continue to have a significant negative impact on the performance of a Fund’s investments, increase a Fund’s volatility, exacerbate other pre-existing political, social and economic risks to the Funds and negatively impact broad segments of businesses and populations. The Funds’ operations may be interrupted as a result, which may have a significant negative impact on investment performance. In addition, governments, their regulatory agencies, or self-regulatory organizations may take actions in response to the pandemic that affect the instruments in which the Funds invest, or the issuers of such instruments, in ways that could also have a significant negative impact on a Fund’s investment performance. The full impact of this COVID-19 pandemic, or other future epidemics/pandemics, is currently unknown.
| JUNE 30, 2020 | J.P. MORGAN LARGE CAP FUNDS | 121 | ||||||
Table of Contents
NOTES TO FINANCIAL STATEMENTS
AS OF JUNE 30, 2020 (continued)
8. Redemptions in-kind
On February 28, 2019, certain shareholders sold Class R6 Shares of Equity Income Fund. The portfolio securities were delivered primarily by means of a redemption in-kind in exchange for shares of the Fund. Cash and portfolio securities were transferred as detailed below (amounts in thousands):
| Value | Realized Gains (Losses) | Type | ||||||||||
Equity Income Fund | $ | 54,694 | * | $ | 27,965 | Redemption in-kind | ||||||
| * | This amount includes cash of approximately $2,919,000 associated with the redemption in-kind. |
On October 18, 2019, certain shareholders sold Class R6 Shares of U.S. Research Enhanced Equity Fund. The portfolio securities were delivered primarily by means of a redemption in-kind in exchange for shares of the Fund. Cash and portfolio securities were transferred as detailed below (amounts in thousands):
| Value | Realized Gains (Losses) | Type | ||||||||||
U.S. Research Enhanced Equity Fund | $ | 1,336,709 | * | $ | 545,813 | Redemption in-kind | ||||||
| * | This amount includes cash of approximately $17,300,000 associated with the redemption in-kind. |
9. Subscription in-kind
On July 29, 2019, certain shareholders purchased Class R6 Shares of U.S. Equity Fund. The portfolio securities were received primarily by means of a subscription in-kind in exchange for shares of the Fund. Portfolio securities were transferred as detailed below (amounts in thousands):
| Value | Type | |||||||
U.S. Equity Fund | $ | 45,414 | Subscription in-kind | |||||
On February 26, 2020, certain shareholders purchased Class R6 Shares of Equity Income Fund. The portfolio securities were received primarily by means of a subscription in-kind in exchange for shares of the Fund. Portfolio securities were transferred as detailed below (amounts in thousands):
| Value | Type | |||||
Equity Income Fund | $48,418* | Subscription in-kind | ||||
| * | This amount includes cash of approximately $230,000 associated with the subscription in-kind. |
10. Subsequent Events
On August 11, 2020 the Board of Trustees of JPM I approved the following changes for the Growth and Income Fund, which are expected to become effective on or about November 1, 2020: (i) a change to the Fund’s name to JPMorgan U.S. Value Fund; (ii) a change to the Fund’s investment objective so the new objective will be “the Fund seeks to provide capital growth over the long-term”; and (iii) a change to the Fund’s 80% investment policy so that, under normal circumstances, at least 80% of the Fund’s Assets (net assets plus the amount of any borrowings for investment purposes) will be invested in common stocks issued by U.S companies.
On August 11, 2020, the contractual expense limitations for all share classes of the Funds, excluding Equity Income Fund and Class L Shares of the U.S. Equity Fund, were extended until at least October 31, 2021.
| 122 | J.P. MORGAN LARGE CAP FUNDS | JUNE 30, 2020 | ||||
Table of Contents
REPORT OF INDEPENDENT REGISTERED PUBLIC ACCOUNTING FIRM
To the Board of Trustees of JPMorgan Trust I, JPMorgan Trust II and JPMorgan Trust IV and Shareholders of JPMorgan Equity Focus Fund, JPMorgan Equity Income Fund, JPMorgan Equity Premium Income Fund, JPMorgan Growth and Income Fund, JPMorgan Hedged Equity Fund, JPMorgan Large Cap Growth Fund, JPMorgan Large Cap Value Fund, JPMorgan U.S. Equity Fund, JPMorgan U.S. Large Cap Core Plus Fund and JPMorgan U.S. Research Enhanced Equity Fund
Opinions on the Financial Statements
We have audited the accompanying statements of assets and liabilities, including the schedules of portfolio investments, of JPMorgan Equity Focus Fund, JPMorgan Growth and Income Fund, JPMorgan Hedged Equity Fund, JPMorgan U.S. Equity Fund, JPMorgan U.S. Research Enhanced Equity Fund and JPMorgan U.S. Large Cap Core Plus Fund (six of the funds constituting JPMorgan Trust I), JPMorgan Equity Income Fund, JPMorgan Large Cap Growth Fund and JPMorgan Large Cap Value Fund (three of the funds constituting JPMorgan Trust II) and JPMorgan Equity Premium Income Fund (one of the funds constituting JPMorgan Trust IV) (hereafter collectively referred to as the “Funds”) as of June 30, 2020, the related statements of operations and the statement of cash flows for JPMorgan U.S. Large Cap Core Plus Fund for the year ended June 30, 2020 and the statements of changes in net assets and the financial highlights for each of the periods indicated in the table below, including the related notes (collectively referred to as the “financial statements”). In our opinion, the financial statements present fairly, in all material respects, the financial position of each of the Funds as of June 30, 2020, the results of each of their operations and its cash flows for JPMorgan U.S. Large Cap Core Plus Fund for the year then ended and the changes in each of their net assets and each of the financial highlights for each of the periods indicated in the table below, in conformity with accounting principles generally accepted in the United States of America.
JPMorgan Equity Focus Fund JPMorgan Growth and Income Fund JPMorgan Hedged Equity Fund JPMorgan U.S. Equity Fund JPMorgan U.S. Research Enhanced Equity Fund JPMorgan Equity Income Fund JPMorgan Large Cap Growth Fund JPMorgan Large Cap Value Fund JPMorgan U.S. Large Cap Core Plus Fund | Statements of changes in net assets for each of the two years in the period ended June 30, 2020 and the financial highlights for each of the periods indicated therein | |
JPMorgan Equity Premium Income Fund | Statement of changes in net assets for the year ended June 30, 2020, and the period August 31, 2018 (commencement of operations) through June 30, 2019 and the financial highlights for the year ended June 30, 2020, and the period August 31, 2018 (commencement of operations) through June 30, 2019 |
Basis for Opinions
These financial statements are the responsibility of the Funds’ management. Our responsibility is to express an opinion on the Funds’ financial statements based on our audits. We are a public accounting firm registered with the Public Company Accounting Oversight Board (United States) (PCAOB) and are required to be independent with respect to the Funds in accordance with the U.S. federal securities laws and the applicable rules and regulations of the Securities and Exchange Commission and the PCAOB.
We conducted our audits of these financial statements in accordance with the standards of the PCAOB. Those standards require that we plan and perform the audit to obtain reasonable assurance about whether the financial statements are free of material misstatement, whether due to error or fraud.
Our audits included performing procedures to assess the risks of material misstatement of the financial statements, whether due to error or fraud, and performing procedures that respond to those risks. Such procedures included examining, on a test basis, evidence regarding the amounts and disclosures in the financial statements. Our audits also included evaluating the accounting principles used and significant estimates made by management, as well as evaluating the overall presentation of the financial statements. Our procedures included confirmation of securities owned as of June 30, 2020 by correspondence with the custodian, transfer agent and brokers; when replies were not received from brokers, we performed other auditing procedures. We believe that our audits provide a reasonable basis for our opinions.
/s/ PricewaterhouseCoopers LLP
New York, New York
August 24, 2020
We have served as the auditor of one or more investment companies in the JPMorgan Funds complex since 1993.
| JUNE 30, 2020 | J.P. MORGAN LARGE CAP FUNDS | 123 | ||||||
Table of Contents
(Unaudited)
The Funds’ Statement of Additional Information includes additional information about the Funds’ Trustees and is available, without charge, upon request by calling 1-800-480-4111 or on the J.P. Morgan Funds’ website at www.jpmorganfunds.com.
Name (Year of Birth); Positions With the Funds (1) | Principal Occupation During Past 5 Years | Number of Funds in Fund Complex Overseen by Trustee (2) | Other Directorships Held During the Past 5 Years | |||
Independent Trustees | ||||||
| John F. Finn (1947); Chairman since 2020; Trustee of Trusts since 2005; Trustee of heritage One Group Mutual Funds since 1998. | Chairman, Gardner, Inc. (supply chain management company serving industrial and consumer markets) (serving in various roles 1974-present). | 126 | Director, Greif, Inc. (GEF) (industrial package products and services) (2007-present); Trustee, Columbus Association for the Performing Arts (1988-present); Director, Cardinal Health, Inc. (CAH) (1994-2014). | |||
| Stephen P. Fisher (1959); Trustee of Trusts since 2018. | Retired; Chairman and Chief Executive Officer, NYLIFE Distributors LLC (registered broker-dealer) (serving in various roles 2008-2013); Chairman, NYLIM Service Company LLC (transfer agent) (2008-2017); New York Life Investment Management LLC (registered investment adviser) (serving in various roles 2005-2017); Chairman, IndexIQ Advisors LLC (registered investment adviser for ETFs) (2014-2017); President, MainStay VP Funds Trust (2007-2017), MainStay DefinedTerm Municipal Opportunities Fund (2011-2017) and MainStay Funds Trust (2007-2017) (registered investment companies). | 126 | Honors Program Advisory Board Member, The Zicklin School of Business, Baruch College, The City University of New York (2017-present). | |||
| Kathleen M. Gallagher (1958); Trustee of the Trusts since 2018. | Retired; Chief Investment Officer — Benefit Plans, Ford Motor Company (serving in various roles 1985-2016). | 126 | Non-Executive Director, Legal & General Investment Management (Holdings) (2018-present); Non-Executive Director, Legal & General Investment Management America (financial services and insurance) (2017-present); Advisory Board Member, Fiduciary Solutions, State Street Global Advisors (2017-present); Member, Client Advisory Council, Financial Engines, LLC (registered investment adviser) (2011-2016); Director, Ford Pension Funds Investment Management Ltd. (2007-2016). | |||
| Dennis P. Harrington* (1950); Trustee of Trusts since 2017. | Retired; Partner, Deloitte LLP (accounting firm) (serving in various roles 1984-2012). | 126 | None | |||
| Frankie D. Hughes (1952); Trustee of Trusts since 2008. | President, Ashland Hughes Properties (property management) (2014-present); President and Chief Investment Officer, Hughes Capital Management, Inc. (fixed income asset management) (1993-2014). | 126 | None | |||
| 124 | J.P. MORGAN LARGE CAP FUNDS | JUNE 30, 2020 | ||||
Table of Contents
Name (Year of Birth); Positions With the Funds (1) | Principal Occupation During Past 5 Years | Number of Funds in Fund Complex Overseen by Trustee (2) | Other Directorships Held During the Past 5 Years | |||
Independent Trustees (continued) | ||||||
Raymond Kanner** (1953); Trustee of Trusts since 2017. | Retired; Managing Director & Chief Investment Officer, IBM Retirement Funds (2007-2016). | 126 | Advisory Board Member, Penso Advisors LLC (2020-present); Advisory Board Member, Los Angeles Capital (2018-present); Advisory Board Member, State Street Global Advisors Fiduciary Solutions Board (2017-present); Acting Executive Director, Committee on Investment of Employee Benefit Assets (CIEBA) (2016-2017); Advisory Board Member, Betterment for Business (robo advisor) (2016-2017); Advisory Board Member, BlueStar Indexes (index creator) (2013-2017); Director, Emerging Markets Growth Fund (registered investment company) (1997-2016); Member, Russell Index Client Advisory Board (2001-2015). | |||
| Peter C. Marshall (1942); Trustee of Trusts since 2005; Trustee of heritage One Group Mutual Funds since 1985. | Self-employed business consultant (2002-present). | 126 | None | |||
| Mary E. Martinez (1960); Trustee of Trusts since 2013. | Associate, Special Properties, a Christie’s International Real Estate Affiliate (2010-present); Managing Director, Bank of America (Asset Management) (2007-2008); Chief Operating Officer, U.S. Trust Asset Management, U.S. Trust Company (asset management) (2003-2007); President, Excelsior Funds (registered investment companies) (2004-2005). | 126 | None | |||
| Marilyn McCoy (1948); Trustee of Trusts since 2005; Trustee of heritage One Group Mutual Funds since 1999. | Vice President of Administration and Planning, Northwestern University (1985-present). | 126 | None | |||
| Mitchell M. Merin (1953); Trustee of Trusts since 2013. | Retired; President and Chief Operating Officer, Morgan Stanley Investment Management, Member Morgan Stanley & Co. Management Committee (serving in various roles 1981-2006). | 126 | Director, Sun Life Financial (SLF) (financial services and insurance) (2007-2013). | |||
| Dr. Robert A. Oden, Jr. (1946); Trustee of Trusts since 2005; Trustee of heritage One Group Mutual Funds since 1997. | Retired; President, Carleton College (2002-2010); President, Kenyon College (1995-2002). | 126 | Trustee and Vice Chair, Trout Unlimited (2017-present); Trustee, American Museum of Fly Fishing (2013-present); Vice Chair, Dartmouth-Hitchcock Medical Center (2011-present); Trustee, American University in Cairo (1999-2014). | |||
| Marian U. Pardo*** (1946); Trustee of Trusts since 2013. | Managing Director and Founder, Virtual Capital Management LLC (investment consulting) (2007-present); Managing Director, Credit Suisse Asset Management (portfolio manager) (2003-2006). | 126 | President and Member, Board of Governors, Columbus Citizens Foundation (not-for-profit supporting philanthropic and cultural programs) (2006-present). | |||
| JUNE 30, 2020 | J.P. MORGAN LARGE CAP FUNDS | 125 | ||||||
Table of Contents
TRUSTEES
(Unaudited) (continued)
| (1) | The Trustees serve for an indefinite term, subject to the Trusts’ current retirement policy, which is age 78 for all Trustees. |
| (2) | A Fund Complex means two or more registered investment companies that hold themselves out to investors as related companies for purposes of investment and investor services or have a common investment adviser or have an investment adviser that is an affiliated person of the investment adviser of any of the other registered investment companies. The J.P. Morgan Funds Complex for which the Boards of Trustees serve currently includes ten registered investment companies (126 funds). |
| * | Two family members of Mr. Harrington are partner and managing director, respectively, of the Funds’ independent registered public accounting firm. Such firm has represented to the Boards that those family members are not involved in the audit of the Funds’ financial statements and do not provide other services to the Funds. The Boards have concluded that such association does not interfere with Mr. Harrington’s exercise of independent judgment as an Independent Trustee. |
| ** | A family member of Mr. Kanner is employed by JPMorgan Chase Bank, which is affiliated with JPMIM and JPMDS. In that capacity, this employee provides services to various JPMorgan affiliates including JPMIM and JPMDS and for which JPMIM and JPMDS bear some portion of the expense thereof. |
| *** | In connection with prior employment with JPMorgan Chase, Ms. Pardo was the recipient of non-qualified pension plan payments from JPMorgan Chase in the amount of approximately $2,055 per month, which she irrevocably waived effective January 1, 2013, and deferred compensation payments from JPMorgan Chase in the amount of approximately $7,294 per year, which ended in January 2013. In addition, Ms. Pardo receives payments from a fully-funded qualified plan, which is not an obligation of JPMorgan Chase. |
The contact address for each of the Trustees is 277 Park Avenue, New York, NY 10172.
| 126 | J.P. MORGAN LARGE CAP FUNDS | JUNE 30, 2020 | ||||
Table of Contents
(Unaudited)
Name (Year of Birth), Positions Held with the Trusts (Since) | Principal Occupations During Past 5 Years | |
| Brian S. Shlissel (1964), President and Principal Executive Officer (2016) | Managing Director and Chief Administrative Officer for J.P. Morgan pooled vehicles, J.P. Morgan Investment Management Inc. (formerly JPMorgan Funds Management, Inc.) (from 2014 to present); Managing Director and Head of Mutual Fund Services, Allianz Global Investors; President and Chief Executive Officer, Allianz Global Investors Mutual Funds and PIMCO Closed-End Funds (from 1999 to 2014). | |
Timothy J. Clemens (1975), Treasurer and Principal Financial Officer (2018)* | Executive Director, J.P. Morgan Investment Management Inc. (formerly JPMorgan Funds Management, Inc.) since February 2016; Vice President, JPMorgan Funds Management, Inc. from October 2013 to January 2016. | |
| Gregory S. Samuels (1980), Secretary (2019) (formerly Assistant Secretary since 2010)* | Executive Director and Assistant General Counsel, JPMorgan Chase since February 2014; formerly Vice President and Assistant General Counsel, JPMorgan Chase from 2010 to February 2014. | |
| Stephen M. Ungerman (1953), Chief Compliance Officer (2005) | Managing Director, JPMorgan Chase & Co.; Mr. Ungerman has been with JPMorgan Chase & Co. since 2000. | |
Elizabeth A. Davin (1964), Assistant Secretary (2005)** | Executive Director and Assistant General Counsel, JPMorgan Chase since February 2012; formerly Vice President and Assistant General Counsel, JPMorgan Chase from 2005 to February 2012; Senior Counsel, JPMorgan Chase (formerly Bank One Corporation) from 2004 to 2005. | |
| Jessica K. Ditullio (1962), Assistant Secretary (2005)** | Executive Director and Assistant General Counsel, JPMorgan Chase. Ms. Ditullio has been with JPMorgan Chase (formerly Bank One Corporation) since 1990. | |
Anthony Geron (1971), Assistant Secretary (2018)* | Vice President and Assistant General Counsel, JPMorgan Chase since September 2018; Lead Director and Counsel, AXA Equitable Life Insurance Company from 2015 to 2018 and Senior Director and Counsel, AXA Equitable Life Insurance Company from 2014 to 2015. | |
| Carmine Lekstutis (1980), Assistant Secretary (2011)* | Executive Director and Assistant General Counsel, JPMorgan Chase since February 2015; formerly Vice President and Assistant General Counsel, JPMorgan Chase from 2011 to February 2015. | |
| Keri E. Riemer (1976), Assistant Secretary (2019)* | Executive Director and Assistant General Counsel, JPMorgan Chase since February 2019; Counsel, Seward & Kissel LLP (law firm) (2016-2019); Associate, Seward & Kissel LLP (2011-2016). | |
Zachary E. Vonnegut-Gabovitch (1986), Assistant Secretary (2017)* | Vice President and Assistant General Counsel, JPMorgan Chase since September 2016; Associate, Morgan, Lewis & Bockius (law firm) from 2012 to 2016. | |
Michael M. D’Ambrosio (1969), Assistant Treasurer (2012) | Managing Director, J.P. Morgan Investment Management Inc. (formerly JPMorgan Funds Management, Inc.) since May 2014; formerly Executive Director, JPMorgan Funds Management, Inc. from 2012 to May 2014. | |
Aleksandr Fleytekh (1972), Assistant Treasurer (2019)* | Vice President, J.P. Morgan Investment Management Inc. (formerly JPMorgan Funds Management, Inc.) since February 2012. | |
Shannon Gaines (1977), Assistant Treasurer (2018)** | Vice President, J.P. Morgan Investment Management Inc. (formerly JPMorgan Funds Management, Inc.) since January 2014. | |
Jeffrey D. House (1972), Assistant Treasurer (2017)** | Vice President, J.P. Morgan Investment Management Inc. (formerly JPMorgan Funds Management, Inc.) since July 2006. | |
Lauren A. Paino (1973), Assistant Treasurer (2014)* | Executive Director, J.P. Morgan Investment Management Inc. (formerly JPMorgan Funds Management, Inc.) since August 2013. | |
| Joseph Parascondola (1963), Assistant Treasurer (2011)* | Executive Director, J.P. Morgan Investment Management, Inc. since February 2020, formerly Vice President, J.P. Morgan Investment Management Inc. (formerly JPMorgan Funds Management, Inc.) from August 2006 to January 2020. | |
Gillian I. Sands (1969), Assistant Treasurer (2012)* | Vice President, J.P. Morgan Investment Management Inc. (formerly JPMorgan Funds Management, Inc.) since September 2012. | |
The contact address for each of the officers, unless otherwise noted, is 277 Park Avenue, New York, NY 10172.
| * | The contact address for the officer is 4 New York Plaza, New York, NY 10004. |
| ** | The contact address for the officer is 1111 Polaris Parkway, Columbus, OH 43240. |
| JUNE 30, 2020 | J.P. MORGAN LARGE CAP FUNDS | 127 | ||||||
Table of Contents
SCHEDULE OF SHAREHOLDER EXPENSES
(Unaudited)
Hypothetical $1,000 Investment
As a shareholder of the Funds, you incur two types of costs: (1) transaction costs, including sales charges (loads) on purchase payments and (2) ongoing costs, including investment advisory fees, administration fees, distribution fees and other Fund expenses. The examples below are intended to help you understand your ongoing costs (in dollars) of investing in the Funds and to compare these ongoing costs with the ongoing costs of investing in other mutual funds. The examples assume that you had a $1,000 investment in each Class at the beginning of the reporting period, January 1, 2020, and continued to hold your shares at the end of the reporting period, June 30, 2020.
Actual Expenses
For each Class of each Fund in the table below, the first line provides information about actual account values and actual expenses. You may use the information in this line, together with the amount you invested, to estimate the expenses that you paid over the period. Simply divide your account value by $1,000 (for example, an $8,600 account value divided by $1,000 = 8.6), then multiply the result by the number in the first line of each Class under the heading titled “Expenses Paid During the Period” to estimate the expenses you paid on your account during this period.
Hypothetical Example for Comparison Purposes
The second line of each Class in the table below provides information about hypothetical account values and hypothetical expenses based on the Class’ actual expense ratio and an assumed rate of return of 5% per year before expenses, which is not the Class’ actual return. The hypothetical account values and expenses may not be used to estimate the actual ending account balance or expenses you paid for the period. You may use this information to compare the ongoing costs of investing in the Class of the Fund and other funds. To do so, compare this 5% hypothetical example with the 5% hypothetical examples that appear in the shareholder reports of the other funds. Please note that the expenses shown in the table are meant to highlight your ongoing costs only and do not reflect any transaction costs, such as sales charges (loads) or redemption fees. Therefore, the second line for each Class in the table is useful in comparing ongoing costs only, and will not help you determine the relative total costs of owning different funds. In addition, if these transaction costs were included, your costs would have been higher. The examples also assume all dividends and distributions have been reinvested.
| Beginning Account Value January 1, 2020 | Ending Account Value June 30, 2020 | Expenses Paid During the Period* | Annualized Expense Ratio | |||||||||||||
JPMorgan Equity Focus Fund | ||||||||||||||||
Class A | ||||||||||||||||
Actual | $ | 1,000.00 | $ | 968.60 | $ | 5.38 | 1.10 | % | ||||||||
Hypothetical | 1,000.00 | 1,019.39 | 5.52 | 1.10 | ||||||||||||
Class C | ||||||||||||||||
Actual | 1,000.00 | 966.10 | 7.82 | 1.60 | ||||||||||||
Hypothetical | 1,000.00 | 1,016.91 | 8.02 | 1.60 | ||||||||||||
Class I | ||||||||||||||||
Actual | 1,000.00 | 969.50 | 4.16 | 0.85 | ||||||||||||
Hypothetical | 1,000.00 | 1,020.64 | 4.27 | 0.85 | ||||||||||||
Class R6 | ||||||||||||||||
Actual | 1,000.00 | 971.10 | 2.94 | 0.60 | ||||||||||||
Hypothetical | 1,000.00 | 1,021.88 | 3.02 | 0.60 | ||||||||||||
JPMorgan Equity Income Fund | ||||||||||||||||
Class A | ||||||||||||||||
Actual | 1,000.00 | 858.00 | 4.48 | 0.97 | ||||||||||||
Hypothetical | 1,000.00 | 1,020.04 | 4.87 | 0.97 | ||||||||||||
Class C | ||||||||||||||||
Actual | 1,000.00 | 856.00 | 6.78 | 1.47 | ||||||||||||
Hypothetical | 1,000.00 | 1,017.55 | 7.37 | 1.47 | ||||||||||||
Class I | ||||||||||||||||
Actual | 1,000.00 | 859.00 | 3.28 | 0.71 | ||||||||||||
Hypothetical | 1,000.00 | 1,021.33 | 3.57 | 0.71 | ||||||||||||
Class R2 | ||||||||||||||||
Actual | 1,000.00 | 857.20 | 5.63 | 1.22 | ||||||||||||
Hypothetical | 1,000.00 | 1,018.80 | 6.12 | 1.22 | ||||||||||||
Class R3 | ||||||||||||||||
Actual | 1,000.00 | 858.40 | 4.48 | 0.97 | ||||||||||||
Hypothetical | 1,000.00 | 1,020.04 | 4.87 | 0.97 | ||||||||||||
| 128 | J.P. MORGAN LARGE CAP FUNDS | JUNE 30, 2020 | ||||
Table of Contents
| Beginning Account Value January 1, 2020 | Ending Account Value June 30, 2020 | Expenses Paid During the Period* | Annualized Expense Ratio | |||||||||||||
JPMorgan Equity Income Fund (continued) | ||||||||||||||||
Class R4 | ||||||||||||||||
Actual | $ | 1,000.00 | $ | 859.40 | $ | 3.28 | 0.71 | % | ||||||||
Hypothetical | 1,000.00 | 1,021.33 | 3.57 | 0.71 | ||||||||||||
Class R5 | ||||||||||||||||
Actual | 1,000.00 | 859.70 | 2.59 | 0.56 | ||||||||||||
Hypothetical | 1,000.00 | 1,022.08 | 2.82 | 0.56 | ||||||||||||
Class R6 | ||||||||||||||||
Actual | 1,000.00 | 860.10 | 2.13 | 0.46 | ||||||||||||
Hypothetical | 1,000.00 | 1,022.58 | 2.31 | 0.46 | ||||||||||||
JPMorgan Equity Premium Income Fund | ||||||||||||||||
Class A | ||||||||||||||||
Actual | 1,000.00 | 908.30 | 4.03 | 0.85 | ||||||||||||
Hypothetical | 1,000.00 | 1,020.64 | 4.27 | 0.85 | ||||||||||||
Class C | ||||||||||||||||
Actual | 1,000.00 | 906.10 | 6.40 | 1.35 | ||||||||||||
Hypothetical | 1,000.00 | 1,018.15 | 6.77 | 1.35 | ||||||||||||
Class I | ||||||||||||||||
Actual | 1,000.00 | 909.40 | 2.85 | 0.60 | ||||||||||||
Hypothetical | 1,000.00 | 1,021.88 | 3.02 | 0.60 | ||||||||||||
Class R5 | ||||||||||||||||
Actual | 1,000.00 | 910.10 | 2.14 | 0.45 | ||||||||||||
Hypothetical | 1,000.00 | 1,022.63 | 2.26 | 0.45 | ||||||||||||
Class R6 | ||||||||||||||||
Actual | 1,000.00 | 910.50 | 1.66 | 0.35 | ||||||||||||
Hypothetical | 1,000.00 | 1,023.12 | 1.76 | 0.35 | ||||||||||||
JPMorgan Growth and Income Fund | ||||||||||||||||
Class A | ||||||||||||||||
Actual | 1,000.00 | 854.70 | 4.33 | 0.94 | ||||||||||||
Hypothetical | 1,000.00 | 1,020.19 | 4.72 | 0.94 | ||||||||||||
Class C | ||||||||||||||||
Actual | 1,000.00 | 852.70 | 6.63 | 1.44 | ||||||||||||
Hypothetical | 1,000.00 | 1,017.70 | 7.22 | 1.44 | ||||||||||||
Class I | ||||||||||||||||
Actual | 1,000.00 | 855.90 | 3.18 | 0.69 | ||||||||||||
Hypothetical | 1,000.00 | 1,021.43 | 3.47 | 0.69 | ||||||||||||
Class R2 | ||||||||||||||||
Actual | 1,000.00 | 853.80 | 5.48 | 1.19 | ||||||||||||
Hypothetical | 1,000.00 | 1,018.95 | 5.97 | 1.19 | ||||||||||||
Class R3 | ||||||||||||||||
Actual | 1,000.00 | 854.80 | 4.33 | 0.94 | ||||||||||||
Hypothetical | 1,000.00 | 1,020.19 | 4.72 | 0.94 | ||||||||||||
Class R4 | ||||||||||||||||
Actual | 1,000.00 | 855.80 | 3.18 | 0.69 | ||||||||||||
Hypothetical | 1,000.00 | 1,021.43 | 3.47 | 0.69 | ||||||||||||
Class R5 | ||||||||||||||||
Actual | 1,000.00 | 856.50 | 2.49 | 0.54 | ||||||||||||
Hypothetical | 1,000.00 | 1,022.18 | 2.72 | 0.54 | ||||||||||||
Class R6 | ||||||||||||||||
Actual | 1,000.00 | 856.90 | 2.03 | 0.44 | ||||||||||||
Hypothetical | 1,000.00 | 1,022.68 | 2.21 | 0.44 | ||||||||||||
JPMorgan Hedged Equity Fund | ||||||||||||||||
Class A | ||||||||||||||||
Actual | 1,000.00 | 1,034.30 | 4.30 | 0.85 | ||||||||||||
Hypothetical | 1,000.00 | 1,020.64 | 4.27 | 0.85 | ||||||||||||
| JUNE 30, 2020 | J.P. MORGAN LARGE CAP FUNDS | 129 | ||||||
Table of Contents
SCHEDULE OF SHAREHOLDER EXPENSES
(Unaudited) (continued)
Hypothetical $1,000 Investment
| Beginning Account Value January 1, 2020 | Ending Account Value June 30, 2020 | Expenses Paid During the Period* | Annualized Expense Ratio | |||||||||||||
JPMorgan Hedged Equity Fund (continued) | ||||||||||||||||
Class C | ||||||||||||||||
Actual | $ | 1,000.00 | $ | 1,031.90 | $ | 6.82 | 1.35 | % | ||||||||
Hypothetical | 1,000.00 | 1,018.15 | 6.77 | 1.35 | ||||||||||||
Class I | ||||||||||||||||
Actual | 1,000.00 | 1,035.90 | 2.99 | 0.59 | ||||||||||||
Hypothetical | 1,000.00 | 1,021.93 | 2.97 | 0.59 | ||||||||||||
Class R5 | ||||||||||||||||
Actual | 1,000.00 | 1,036.20 | 2.28 | 0.45 | ||||||||||||
Hypothetical | 1,000.00 | 1,022.63 | 2.26 | 0.45 | ||||||||||||
Class R6 | ||||||||||||||||
Actual | 1,000.00 | 1,037.60 | 1.77 | 0.35 | ||||||||||||
Hypothetical | 1,000.00 | 1,023.12 | 1.76 | 0.35 | ||||||||||||
JPMorgan Large Cap Growth Fund | ||||||||||||||||
Class A | ||||||||||||||||
Actual | 1,000.00 | 1,202.20 | 5.09 | 0.93 | ||||||||||||
Hypothetical | 1,000.00 | 1,020.24 | 4.67 | 0.93 | ||||||||||||
Class C | ||||||||||||||||
Actual | 1,000.00 | 1,199.00 | 7.82 | 1.43 | ||||||||||||
Hypothetical | 1,000.00 | 1,017.75 | 7.17 | 1.43 | ||||||||||||
Class I | ||||||||||||||||
Actual | 1,000.00 | 1,203.80 | 3.73 | 0.68 | ||||||||||||
Hypothetical | 1,000.00 | 1,021.48 | 3.42 | 0.68 | ||||||||||||
Class R2 | ||||||||||||||||
Actual | 1,000.00 | 1,200.60 | 6.46 | 1.18 | ||||||||||||
Hypothetical | 1,000.00 | 1,019.00 | 5.92 | 1.18 | ||||||||||||
Class R3 | ||||||||||||||||
Actual | 1,000.00 | 1,202.20 | 5.09 | 0.93 | ||||||||||||
Hypothetical | 1,000.00 | 1,020.24 | 4.67 | 0.93 | ||||||||||||
Class R4 | ||||||||||||||||
Actual | 1,000.00 | 1,203.50 | 3.73 | 0.68 | ||||||||||||
Hypothetical | 1,000.00 | 1,021.48 | 3.42 | 0.68 | ||||||||||||
Class R5 | ||||||||||||||||
Actual | 1,000.00 | 1,204.70 | 2.91 | 0.53 | ||||||||||||
Hypothetical | 1,000.00 | 1,022.23 | 2.66 | 0.53 | ||||||||||||
Class R6 | ||||||||||||||||
Actual | 1,000.00 | 1,205.30 | 2.36 | 0.43 | ||||||||||||
Hypothetical | 1,000.00 | 1,022.73 | 2.16 | 0.43 | ||||||||||||
JPMorgan Large Cap Value Fund | ||||||||||||||||
Class A | ||||||||||||||||
Actual | 1,000.00 | 825.90 | 4.22 | 0.93 | ||||||||||||
Hypothetical | 1,000.00 | 1,020.24 | 4.67 | 0.93 | ||||||||||||
Class C | ||||||||||||||||
Actual | 1,000.00 | 824.20 | 6.53 | 1.44 | ||||||||||||
Hypothetical | 1,000.00 | 1,017.70 | 7.22 | 1.44 | ||||||||||||
Class I | ||||||||||||||||
Actual | 1,000.00 | 827.30 | 3.13 | 0.69 | ||||||||||||
Hypothetical | 1,000.00 | 1,021.43 | 3.47 | 0.69 | ||||||||||||
Class R2 | ||||||||||||||||
Actual | 1,000.00 | 825.20 | 5.40 | 1.19 | ||||||||||||
Hypothetical | 1,000.00 | 1,018.95 | 5.97 | 1.19 | ||||||||||||
Class R3 | ||||||||||||||||
Actual | 1,000.00 | 826.00 | 4.27 | 0.94 | ||||||||||||
Hypothetical | 1,000.00 | 1,020.19 | 4.72 | 0.94 | ||||||||||||
| 130 | J.P. MORGAN LARGE CAP FUNDS | JUNE 30, 2020 | ||||
Table of Contents
| Beginning Account Value January 1, 2020 | Ending Account Value June 30, 2020 | Expenses Paid During the Period* | Annualized Expense Ratio | |||||||||||||
JPMorgan Large Cap Value Fund (continued) | ||||||||||||||||
Class R4 | ||||||||||||||||
Actual | $ | 1,000.00 | $ | 827.20 | $ | 3.13 | 0.69 | % | ||||||||
Hypothetical | 1,000.00 | 1,021.43 | 3.47 | 0.69 | ||||||||||||
Class R5 | ||||||||||||||||
Actual | 1,000.00 | 827.80 | 2.45 | 0.54 | ||||||||||||
Hypothetical | 1,000.00 | 1,022.18 | 2.72 | 0.54 | ||||||||||||
Class R6 | ||||||||||||||||
Actual | 1,000.00 | 827.80 | 2.00 | 0.44 | ||||||||||||
Hypothetical | 1,000.00 | 1,022.68 | 2.21 | 0.44 | ||||||||||||
JPMorgan U.S. Equity Fund | ||||||||||||||||
Class A | ||||||||||||||||
Actual | 1,000.00 | 1,014.20 | 4.71 | 0.94 | ||||||||||||
Hypothetical | 1,000.00 | 1,020.19 | 4.72 | 0.94 | ||||||||||||
Class C | ||||||||||||||||
Actual | 1,000.00 | 1,011.40 | 7.20 | 1.44 | ||||||||||||
Hypothetical | 1,000.00 | 1,017.70 | 7.22 | 1.44 | ||||||||||||
Class I | ||||||||||||||||
Actual | 1,000.00 | 1,014.90 | 3.46 | 0.69 | ||||||||||||
Hypothetical | 1,000.00 | 1,021.43 | 3.47 | 0.69 | ||||||||||||
Class L | ||||||||||||||||
Actual | 1,000.00 | 1,015.60 | 2.76 | 0.55 | ||||||||||||
Hypothetical | 1,000.00 | 1,022.13 | 2.77 | 0.55 | ||||||||||||
Class R2 | ||||||||||||||||
Actual | 1,000.00 | 1,013.00 | 5.96 | 1.19 | ||||||||||||
Hypothetical | 1,000.00 | 1,018.95 | 5.97 | 1.19 | ||||||||||||
Class R3 | ||||||||||||||||
Actual | 1,000.00 | 1,013.60 | 4.71 | 0.94 | ||||||||||||
Hypothetical | 1,000.00 | 1,020.19 | 4.72 | 0.94 | ||||||||||||
Class R4 | ||||||||||||||||
Actual | 1,000.00 | 1,015.50 | 3.46 | 0.69 | ||||||||||||
Hypothetical | 1,000.00 | 1,021.43 | 3.47 | 0.69 | ||||||||||||
Class R5 | ||||||||||||||||
Actual | 1,000.00 | 1,016.30 | 2.71 | 0.54 | ||||||||||||
Hypothetical | 1,000.00 | 1,022.18 | 2.72 | 0.54 | ||||||||||||
Class R6 | ||||||||||||||||
Actual | 1,000.00 | 1,016.20 | 2.21 | 0.44 | ||||||||||||
Hypothetical | 1,000.00 | 1,022.68 | 2.21 | 0.44 | ||||||||||||
JPMorgan U.S. Large Cap Core Plus Fund | ||||||||||||||||
Class A | ||||||||||||||||
Actual | 1,000.00 | 1,012.80 | 9.97 | 1.99 | ||||||||||||
Hypothetical | 1,000.00 | 1,014.95 | 9.98 | 1.99 | ||||||||||||
Class C | ||||||||||||||||
Actual | 1,000.00 | 1,010.30 | 12.46 | 2.49 | ||||||||||||
Hypothetical | 1,000.00 | 1,012.47 | 12.47 | 2.49 | ||||||||||||
Class I | ||||||||||||||||
Actual | 1,000.00 | 1,013.80 | 8.68 | 1.73 | ||||||||||||
Hypothetical | 1,000.00 | 1,016.25 | 8.69 | 1.73 | ||||||||||||
Class R2 | ||||||||||||||||
Actual | 1,000.00 | 1,011.20 | 11.71 | 2.34 | ||||||||||||
Hypothetical | 1,000.00 | 1,013.21 | 11.73 | 2.34 | ||||||||||||
Class R5 | ||||||||||||||||
Actual | 1,000.00 | 1,014.10 | 8.48 | 1.69 | ||||||||||||
Hypothetical | 1,000.00 | 1,016.45 | 8.49 | 1.69 | ||||||||||||
| JUNE 30, 2020 | J.P. MORGAN LARGE CAP FUNDS | 131 | ||||||
Table of Contents
SCHEDULE OF SHAREHOLDER EXPENSES
(Unaudited) (continued)
Hypothetical $1,000 Investment
| Beginning Account Value January 1, 2020 | Ending Account Value June 30, 2020 | Expenses Paid During the Period* | Annualized Expense Ratio | |||||||||||||
JPMorgan U.S. Large Cap Core Plus Fund (continued) | ||||||||||||||||
Class R6 | ||||||||||||||||
Actual | $ | 1,000.00 | $ | 1,014.90 | $ | 7.98 | 1.59 | % | ||||||||
Hypothetical | 1,000.00 | 1,016.94 | 7.99 | 1.59 | ||||||||||||
JPMorgan U.S. Research Enhanced Equity Fund | ||||||||||||||||
Class A | ||||||||||||||||
Actual | 1,000.00 | 981.50 | 2.96 | 0.60 | ||||||||||||
Hypothetical | 1,000.00 | 1,021.88 | 3.02 | 0.60 | ||||||||||||
Class I | ||||||||||||||||
Actual | 1,000.00 | 983.00 | 1.73 | 0.35 | ||||||||||||
Hypothetical | 1,000.00 | 1,023.12 | 1.76 | 0.35 | ||||||||||||
Class L | ||||||||||||||||
Actual | 1,000.00 | 983.00 | 1.73 | 0.35 | ||||||||||||
Hypothetical | 1,000.00 | 1,023.12 | 1.76 | 0.35 | ||||||||||||
Class R6 | ||||||||||||||||
Actual | 1,000.00 | 983.20 | 1.23 | 0.25 | ||||||||||||
Hypothetical | 1,000.00 | 1,023.62 | 1.26 | 0.25 | ||||||||||||
| * | Expenses are equal to each Class’ respective annualized expense ratio, multiplied by the average account value over the period, multiplied by 182/366 (to reflect the one-half year period). |
| 132 | J.P. MORGAN LARGE CAP FUNDS | JUNE 30, 2020 | ||||
Table of Contents
LIQUIDITY RISK MANAGEMENT PROGRAM
(Unaudited)
Each of the Funds has adopted the J.P. Morgan Funds Liquidity Risk Management Program (the “Program”) under Rule 22e-4 under the 1940 Act (the “Liquidity Rule”). The Program seeks to assess, manage and review each Fund’s Liquidity Risk. “Liquidity Risk” is defined as the risk that a fund could not meet requests to redeem shares issued by the fund without significant dilution of remaining investors’ interests in the fund. Among other things, the Liquidity Rule requires that a written report be provided to the Boards of Trustees (the “Board”) on an annual basis that addresses the operation of the Program and assesses the adequacy and effectiveness of its implementation, including the operation of any Highly Liquidity Investment Minimum (“HLIM”) established for a Fund and any material changes to the Program.
The Board has appointed J.P. Morgan Asset Management’s Liquidity Risk Forum to be the program administrator for the Program (the “Program Administrator”). On February 11, 2020, the Board of Trustees reviewed the Program Administrator’s initial written report (the “Report”) concerning the operation of the Program for the period from December 1, 2018 through December 31, 2019 (the “Program Reporting Period”). The Report addressed the operation of the Program and assessed its adequacy and effectiveness of implementation, including, where applicable, the operation of a Fund’s HLIM. There were no material changes to the Program during the Program Reporting Period.
The Report summarized the operation of the Program and the information and factors considered by the Program
Administrator in assessing whether the Program has been adequately and effectively implemented with respect to each Fund. Such information and factors included, among other things: (1) the liquidity risk framework used to assess, manage, and periodically review each Fund’s Liquidity Risk and the results of this assessment; (2) the methodology and inputs for classifying each of the Fund’s investments into one of four liquidity categories that reflect an estimate of their liquidity under current market conditions; (3) whether a Fund invested primarily in “Highly Liquid Investments” (as defined under the Liquidity Rule), whether an HLIM should be established for a Fund (and, for Funds that have adopted an HLIM, whether the HLIM continues to be appropriate or whether a Fund has invested below its HLIM) and the procedures for monitoring for this limit; (4) whether a Fund invested more than 15% of its assets in “Illiquid Investments” (as defined under the Liquidity Rule) and the procedures for monitoring for this limit; and (5) specific liquidity events arising during the Program Reporting Period, including the impact on Fund liquidity caused by extended non-U.S. market closures.
Based on this review, the Report concluded that: (1) the Program continues to be reasonably designed to effectively assess and manage each Fund’s Liquidity Risk; and (2) the Program has been adequately and effectively implemented with respect to each Fund during the Program Reporting Period.
| JUNE 30, 2020 | J.P. MORGAN LARGE CAP FUNDS | 133 | ||||||
Table of Contents
(Unaudited)
Certain tax information for the J.P. Morgan Funds is required to be provided to shareholders based upon the Funds’ income and distributions for the taxable year ended June 30, 2020. The information and distributions reported in this letter may differ from the information and taxable distributions reported to the shareholders for the calendar year ending December 31, 2020. The information necessary to complete your income tax returns for the calendar year ending December 31, 2020 will be provided under separate cover.
Dividends Received Deduction (DRD)
Each Fund listed below had the following percentage, or maximum allowable percentage, of ordinary income distributions eligible for the dividends received deduction for corporate shareholders for the fiscal year ended June 30, 2020:
| Dividends Received Deduction | ||||
JPMorgan Equity Focus Fund | 72.59 | % | ||
JPMorgan Equity Income Fund | 100.00 | |||
JPMorgan Equity Premium Income Fund | 13.70 | |||
JPMorgan Growth and Income Fund | 100.00 | |||
JPMorgan Hedged Equity Fund | 100.00 | |||
JPMorgan Large Cap Growth Fund | 100.00 | |||
JPMorgan Large Cap Value Fund | 100.00 | |||
JPMorgan U.S. Equity Fund | 100.00 | |||
JPMorgan U.S. Large Cap Core Plus Fund | 100.00 | |||
JPMorgan U.S. Research Enhanced Equity Fund | 100.00 | |||
Long-Term Capital Gain
Each Fund listed below distributed the following amount, or maximum allowable amount, of long-term capital gain dividends for the fiscal year ended June 30, 2020 (amounts in thousands):
| Long-Term Capital Gain Distribution | ||||
JPMorgan Equity Focus Fund | $ | 16,179 | ||
JPMorgan Equity Income Fund | 309,226 | |||
JPMorgan Growth and Income Fund | 13,478 | |||
JPMorgan Large Cap Growth Fund | 2,139,934 | |||
JPMorgan U.S. Equity Fund | 1,385,904 | |||
JPMorgan U.S. Large Cap Core Plus Fund | 1,386,459 | |||
JPMorgan U.S. Research Enhanced Equity Fund | 483,702 | |||
Qualified Dividend Income (QDI)
Each Fund listed below had the following amount, or maximum allowable amount, of ordinary income distributions treated as qualified dividends for the fiscal year ended June 30, 2020 (amounts in thousands):
| Qualified Dividend Income | ||||
JPMorgan Equity Focus Fund | $ | 1,339 | ||
JPMorgan Equity Income Fund | 604,025 | |||
JPMorgan Equity Premium Income Fund | 1,990 | |||
JPMorgan Growth and Income Fund | 12,810 | |||
JPMorgan Hedged Equity Fund | 76,075 | |||
JPMorgan Large Cap Growth Fund | 25,755 | |||
JPMorgan Large Cap Value Fund | 23,336 | |||
JPMorgan U.S. Equity Fund | 156,829 | |||
JPMorgan U.S. Large Cap Core Plus Fund | 20,011 | |||
JPMorgan U.S. Research Enhanced Equity Fund | 70,897 | |||
Section 199A Income
The Fund listed below had the following amount, or maximum allowable amount, of ordinary income distributions treated as 199A dividends for the fiscal year ended June 30, 2020.
JPMorgan Equity Focus Fund | $ | 145 |
| 134 | J.P. MORGAN LARGE CAP FUNDS | JUNE 30, 2020 | ||||
Table of Contents

Rev. January 2011
| FACTS | WHAT DOES J.P. MORGAN FUNDS DO WITH YOUR PERSONAL INFORMATION? | |
| Why? | Financial companies choose how they share your personal information. Federal law gives consumers the right to limit some but not all sharing. Federal law also requires us to tell you how we collect, share, and protect your personal information. Please read this notice carefully to understand what we do. |
| What? | The types of personal information we collect and share depend on the product or service you have with us. This information can include:
◾ Social Security number and account balances
◾ transaction history and account transactions
◾ checking account information and wire transfer instructions
When you are no longer our customer, we continue to share your information as described in this notice. |
| How? | All financial companies need to share customers’ personal information to run their everyday business. In the section below, we list the reasons financial companies can share their customers’ personal information; the reasons J.P. Morgan Funds chooses to share; and whether you can limit this sharing. |
| Reasons we can share your personal information | Does J.P. Morgan Funds share? | Can you limit this sharing? | ||
For our everyday business purposes — such as to process your transactions, maintain your account(s), respond to court orders and legal investigations, or report to credit bureaus | Yes | No | ||
For marketing purposes — to offer our products and services to you | Yes | No | ||
| For joint marketing with other financial companies | No | We don’t share | ||
For our affiliates’ everyday business purposes — information about your transactions and experiences | No | We don’t share | ||
For our affiliates’ everyday business purposes — information about your creditworthiness | No | We don’t share | ||
| For nonaffiliates to market to you | No | We don’t share | ||
| Questions? | Call 1-800-480-4111 or go to www.jpmorganfunds.com | |

Table of Contents
Page 2 | ||
| Who we are | ||
| Who is providing this notice? | J.P. Morgan Funds | |
| What we do | ||
| How does J.P. Morgan Funds protect my personal information? | To protect your personal information from unauthorized access and use, we use security measures that comply with federal law. These measures include computer safeguards and secured files and buildings. We authorize our employees to access your information only when they need it to do their work and we require companies that work for us to protect your information. | |
How does J.P. Morgan Funds collect my personal information? | We collect your personal information, for example, when you:
◾ open an account or provide contact information
◾ give us your account information or pay us by check
◾ make a wire transfer
We also collect your personal information from others, such as credit bureaus, affiliates and other companies. | |
| Why can’t I limit all sharing? | Federal law gives you the right to limit only
◾ sharing for affiliates’ everyday business purposes – information about your creditworthiness
◾ affiliates from using your information to market to you
◾ sharing for nonaffiliates to market to you
State laws and individual companies may give you additional rights to limit sharing. | |
| Definitions | ||
| Affiliates | Companies related by common ownership or control. They can be financial and nonfinancial companies.
◾ J.P. Morgan Funds does not share with our affiliates. | |
| Nonaffiliates | Companies not related by common ownership or control. They can be financial and nonfinancial companies.
◾ J.P. Morgan Funds does not share with nonaffiliates so they can market to you. | |
| Joint Marketing | A formal agreement between nonaffiliated financial companies that together market financial products or services to you.
◾ J.P. Morgan Funds doesn’t jointly market. | |
Table of Contents
J.P. Morgan Funds are distributed by JPMorgan Distribution Services, Inc., which is an affiliate of JPMorgan Chase & Co. Affiliates of JPMorgan Chase & Co. receive fees for providing various services to the funds.
Contact JPMorgan Distribution Services, Inc. at 1-800-480-4111 for a fund prospectus. You can also visit us at www.jpmorganfunds.com. Investors should carefully consider the investment objectives and risk as well as charges and expenses of the mutual fund before investing. The prospectus contains this and other information about the mutual fund. Read the prospectus carefully before investing.
Investors may obtain information about the Securities Investor Protection Corporation (SIPC), including the SIPC brochure, by visiting www.sipc.org or by calling SIPC at 202-371-8300.
Each Fund files a complete schedule of its fund holdings for the first and third quarters of its fiscal year with the SEC as an exhibit to its report on Form N-PORT. The Funds’ Form N-PORT reports are available on the SEC’s website at http://www.sec.gov. Each Fund’s quarterly holdings can be found by visiting the J.P. Morgan Funds’ website at www.jpmorganfunds.com.
A description of each Fund’s policies and procedures with respect to the disclosure of each Fund’s holdings is available in the prospectuses and Statement of Additional Information.
A copy of proxy policies and procedures is available without charge upon request by calling 1-800-480-4111 and on the Funds’ website at www.jpmorganfunds.com. A description of such policies and procedures is on the SEC’s website at www.sec.gov. The Trustees have delegated the authority to vote proxies for securities owned by the Funds to the Adviser. A copy of the Funds’ voting record for the most recent 12-month period ended June 30 is available on the SEC’s website at www.sec.gov or at the Funds’ website at www.jpmorganfunds.com no later than August 31 of each year. The Funds’ proxy voting record will include, among other things, a brief description of the matter voted on for each fund security, and will state how each vote was cast, for example, for or against the proposal.

Table of Contents

J.P. Morgan Asset Management is the brand name for the asset management business of JPMorgan Chase & Co. and its affiliates worldwide.
| © JPMorgan Chase & Co., 2020. All rights reserved. June 2020. | AN-LCE-620 |
Table of Contents
Annual Report
J.P. Morgan Funds
June 30, 2020
JPMorgan SmartSpendingSM 2015 Fund
(formerly known as JPMorgan SmartSpendingSM 2050 Fund)
Beginning on January 1, 2021, as permitted by regulations adopted by the Securities and Exchange Commission, paper copies of the Fund’s annual and semi-annual shareholder reports will no longer be sent by mail, unless you specifically request paper copies of the reports. Instead, the reports will be made available on the Fund’s website www.jpmorganfunds.com and you will be notified by mail each time a report is posted and provided with a website to access the report. If you already elected to receive shareholder reports electronically, you will not be affected by this change and you need not take any action.
You may elect to receive shareholder reports and other communications from the Fund electronically anytime by contacting your financial intermediary (such as a broker dealer, bank, or retirement plan) or, if you are a direct investor, by going to www.jpmorganfunds.com/edelivery.
You may elect to receive paper copies of all future reports free of charge. Contact your financial intermediary or, if you invest directly with the Fund, email us at funds.website.support@jpmorganfunds.com or call 1-800-480-4111. Your election to receive paper reports will apply to all funds held within your account(s).

Table of Contents
Investments in the Fund are not deposits or obligations of, or guaranteed or endorsed by, any bank and are not insured or guaranteed by the FDIC, the Federal Reserve Board or any other government agency. You could lose money if you sell when the Fund’s share price is lower than when you invested.
Past performance is no guarantee of future performance. The general market views expressed in this report are opinions based on market and other conditions through the end of the reporting period and are subject to change without notice. These views are not intended to predict the future performance of the Fund or the securities markets. References to specific securities and their issuers are for illustrative purposes only and are not intended to be, and should not be interpreted as, recommendations to purchase or sell such securities. Such views are not meant as investment advice and may not be relied on as an indication of trading intent on behalf of the Fund.
Prospective investors should refer to the Fund’s prospectuses for a discussion of the Fund’s investment objective, strategies and risks. Call J.P. Morgan Funds Service Center at 1-800-480-4111 for a prospectus containing more complete information about the Fund, including management fees and other expenses. Please read it carefully before investing.
Table of Contents
JULY 28, 2020 (Unaudited)
Dear Shareholders,
While every epoch holds challenges and opportunities, the current year has brought unprecedented challenges that impacted communities both globally and locally. J.P. Morgan Asset Management has directly confronted the challenges of this year, with sensitivity, urgency and a clear vision, serving our shareholders, clients and communities with unwavering commitment.
 |
“J.P. Morgan Asset Management has directly confronted the challenges of this year, with sensitivity, urgency and a clear vision, serving our shareholders, clients and communities with unwavering commitment.” |
The advent of the COVID-19 pandemic and the ensuing closure of large parts of global, national and local economies also brought severe stress to financial markets. Daily market volatility spiked and yields on U.S. Treasury bonds fell to record lows in March 2020 and by the end of the first quarter of 2020, the value of the S&P 500 Index had declined by 20%. However, the U.S. Federal Reserve, along with other leading central banks, slashed interest rates and unleashed a range of initiatives to seek to ensure liquidity and stability in financial markets. From their lows on March 23, 2020 to the end of the reporting period, the S&P 500 and the Bloomberg Barclays U.S.
Aggregate Index rebounded by 39.3% and 5.0%, respectively, amid accommodative central bank policies, government stimulus programs and global efforts to halt the spread of COVID-19.
Many have faced significant challenges throughout the past year, whether related to the COVID-19 pandemic or the recent acts of racism and discrimination around the world. JPMorgan Chase & Co. has recommitted its firm stance against any form of racism, discrimination, or social injustice. As Brian Lamb, Global Head of Diversity & Inclusion for JPMorgan Chase & Co., recently said, “We are working across the entire firm — being intentional to strengthen our inclusive environment where our employees, customers and partners feel welcomed and valued in the communities where we do business.” To learn more, please visit JPMorgan Chase & Co.’s Diversity & Inclusion web site.
On behalf of J.P. Morgan Asset Management, thank you for entrusting us to manage your assets. Should you have any questions, please visit www.jpmorganfunds.com or contact the J.P. Morgan Funds Service Center at 1-800-480-4111.
Sincerely yours,

Andrea L. Lisher
Head of Americas, Client
J.P. Morgan Asset Management
| JUNE 30, 2020 | J.P. MORGAN FUNDS | 1 | ||||||
Table of Contents
JPMorgan SmartSpendingSM 2015 Fund
(formerly known as JPMorgan SmartSpendingSM 2050 Fund)
TWELVE MONTHS ENDED JUNE 30, 2020 (Unaudited)
| REPORTING PERIOD RETURN: | ||||
| Fund (Class I Shares)* | (2.06)% | |||
| Bloomberg Barclays U.S. Aggregate Index | 8.74% | |||
| MSCI World Index (net of foreign withholding taxes) | 2.84% | |||
| JPMorgan SmartSpending Composite Benchmark | 6.91% | |||
| Net Assets as of 6/30/2020 | $28,358,530 | |||
INVESTMENT OBJECTIVE**
The JPMorgan SmartSpending 2015 Fund (the “Fund”) seeks to provide total return consisting of current income and some capital appreciation.
HOW DID THE MARKET PERFORM?
While U.S. equity markets generally outperformed other financial markets in the second half of 2019, global prices for a broad range of assets fell sharply in the first quarter of 2020 as large sectors of global, national and local economies shut down in response to the COVID-19 pandemic. However, equity markets rebounded somewhat in the final three months of the reporting period as stimulus from leading central banks and governments took hold and countries in Asia and Europe showed progress in halting the spread of virus.
In late July 2019, the U.S. Federal Reserve (the “Fed”) cut interest rates for the first time in more than a decade as U.S. economic growth showed signs of slowing, even as U.S. unemployment remained at historically low levels. The central bank followed with two more interest rate cuts in September and October 2019. In response to lower rates and improved or stable economic data, equity prices in the U.S. generally rose in the final months of 2019.
Further support for U.S. equity markets came from a “Phase One” trade agreement between the U.S. and China that reduced existing tariffs and headed off the implementation of new tariffs scheduled to take effect December 15, 2019. U.S. investor sentiment remained positive through January 2020 and weathered a brief flare up in military tension between the U.S. and Iran.
While the S&P 500 reached six new closing highs in February — the last one on February 19 – the final weeks of the month were marked by a broad sell-off of assets and a sharp rise in financial market volatility in reaction to the spread of COVID-19 and the expected economic damage to follow. In early March 2020, the World Health Organization declared COVID-19 a pandemic and as businesses, schools and other institutions across the country began to close, U.S. weekly unemployment claims reached record highs. By the end of the first quarter of 2020, the S&P 500 had declined by 20%.
A U.S. government stimulus package, valued at 10% of U.S. gross domestic product, and the Fed’s decision to slash interest rates further and restart its quantitative easing asset purchasing program — along with a range of other stimulus programs — provided support for equity markets in the following months. As economies in Asia and Europe, as well as parts of the U.S., began to reopen in the second quarter of 2020, global prices both for equity and fixed income assets rose. Within U.S. equity markets, large cap stock generally outperformed mid cap and small cap stocks and growth stocks outperformed value stocks during the reporting period.
WHAT WERE THE MAIN DRIVERS OF THE PORTFOLIO’S PERFORMANCE?
The Fund’s Class I Shares underperformed the Bloomberg Barclays U.S. Aggregate Index (the “Benchmark”) and the MSCI World Index (net of foreign withholding taxes) for the twelve months ended June 30, 2020. The Fund also underperformed the JPMorgan SmartSpending Composite Benchmark (the “Composite Benchmark”), which consists of 40% MSCI World Index (net of foreign withholding taxes) and 60% Bloomberg Barclays U.S. Aggregate Index, over the same period.
Relative to the Benchmark, which does not include equity securities, the Fund’s allocation to global equity markets was a leading detractor to performance, mostly due to the outperformance of core fixed income and U.S. Treasury bonds relative to equity during the reporting period, particularly in the first quarter of 2020.
Relative to the MSCI World Index, which includes exposure primarily to developed market equities, the Fund’s more broadly diversified equity exposure, including to emerging markets equity, detracted from performance.
Relative to the Composite Benchmark, the Fund’s defensive positioning through reduced exposure to global equity and its increased allocation to fixed income and cash throughout late 2019 and subsequent increase in allocations to equity and high yield bonds (also known as “junk bonds”) in the beginning of January 2020 detracted from performance.
| 2 | J.P. MORGAN FUNDS | JUNE 30, 2020 | ||||
Table of Contents
HOW WAS THE PORTFOLIO POSITIONED?
The Fund invested in underlying J.P. Morgan Funds and third party exchange-traded funds to implement the Fund managers’ asset allocation decisions. The Fund’s portfolio managers used futures contracts in general to implement tactical asset allocations. The Fund’s portfolio managers used a systematic screening and selection process to choose the underlying funds in their construction of the Fund’s portfolio. Relative to its Composite Benchmark, the Fund invested in a broader range of asset classes.
PORTFOLIO COMPOSITION BY ASSET CLASS*** | ||||
| Fixed Income | 61.4 | % | ||
| U.S. Equity | 18.7 | |||
| International Equity | 13.4 | |||
| Short-Term Investments | 3.2 | |||
| U.S. Treasury Obligations | 2.2 | |||
| Alternative Assets | 1.1 | |||
| * | The return shown is based on net asset values calculated for shareholder transactions and may differ from the return shown in the financial highlights, which reflects adjustments made to the net asset values in accordance with accounting principles generally accepted in the United States of America. |
| ** | The adviser seeks to achieve the Fund’s objective. There can be no guarantee it will be achieved. |
| *** | Percentages indicated are based on total investments as of June 30, 2020. The Fund’s portfolio composition is subject to change. |
| JUNE 30, 2020 | J.P. MORGAN FUNDS | 3 | ||||||
Table of Contents
JPMorgan SmartSpendingSM 2015 Fund
(formerly known as JPMorgan SmartSpendingSM 2050 Fund)
FUND COMMENTARY
TWELVE MONTHS ENDED JUNE 30, 2020 (Unaudited) (continued)
AVERAGE ANNUAL TOTAL RETURNS AS OF JUNE 30, 2020 | ||||||||||
| INCEPTION DATE OF CLASS | 1 YEAR | SINCE INCEPTION | ||||||||
CLASS A SHARES | December 30, 2016 | |||||||||
With Sales Charge* | (6.68 | )% | 2.10 | % | ||||||
Without Sales Charge | (2.29 | ) | 3.46 | |||||||
CLASS I SHARES | December 30, 2016 | (2.06 | ) | 3.72 | ||||||
CLASS R2 SHARES | December 30, 2016 | (2.68 | ) | 3.05 | ||||||
CLASS R3 SHARES | December 30, 2016 | (2.45 | ) | 3.30 | ||||||
CLASS R4 SHARES | December 30, 2016 | (2.14 | ) | 3.58 | ||||||
CLASS R5 SHARES | December 30, 2016 | (2.00 | ) | 3.73 | ||||||
CLASS R6 SHARES | December 30, 2016 | (1.91 | ) | 3.84 | ||||||
| * | Sales Charge for Class A Shares is 4.50%. |
LIFE OF FUND PERFORMANCE (12/30/16 to 6/30/20)
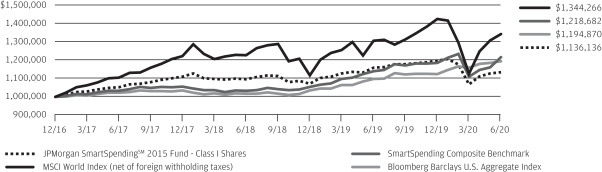
The performance quoted is past performance and is not a guarantee of future results. Mutual funds are subject to certain market risks. Investment returns and principal value of an investment will fluctuate so that an investor’s shares, when redeemed, may be worth more or less than their original cost. Current performance may be higher or lower than the performance data shown. For up-to-date month-end performance information please call 1-800-480-4111.
The Fund commenced operations on December 30, 2016.
The graph illustrates comparative performance for $1,000,000 invested in Class I Shares of the JPMorgan SmartSpendingSM 2015 Fund, the MSCI World Index (net of foreign withholding taxes), the Bloomberg Barclays U.S. Aggregate Index and the SmartSpending Composite Benchmark from December 30, 2016 to June 30, 2020. The performance of the Fund may reflect the waiver of the Fund’s fees and reimbursement of expenses for certain periods since the inception date. Without these waivers and reimbursements, performance would have been lower. Also, performance shown in this section does not reflect the deduction of taxes that a shareholder would pay on Fund distributions or redemptions of Fund shares. The Bloomberg Barclays U.S. Aggregate Index is an unmanaged index representing SEC-registered taxable and dollar denominated securities. It covers the U.S. investment grade fixed rate bond market,
with index components for government and corporate securities, mortgage pass-through, and asset-backed securities. The MSCI World Index (net of foreign withholding taxes) is a broad measure of the performance of developed countries’ equity markets. The JPMorgan SmartSpending Composite Benchmark is a composite benchmark of unmanaged indexes that includes 40% MSCI World Index (net of foreign withholding taxes) and 60% Bloomberg Barclays U.S. Aggregate Index. Investors cannot invest directly in an index.
Class I Shares have a $1,000,000 minimum initial investment.
Fund performance may reflect the waiver of the Fund’s fees and reimbursement of expenses for certain periods since the inception date. Without these waivers and reimbursements, performance would have been lower. Also, performance shown in this section does not reflect the deduction of taxes that a shareholder would pay on Fund distributions or on gains resulting from redemptions of Fund shares.
The returns shown are based on net asset values calculated for shareholder transactions and may differ from the returns shown in the financial highlights, which reflect adjustments made to the net asset values in accordance with accounting principles generally accepted in the United States of America.
| 4 | J.P. MORGAN FUNDS | JUNE 30, 2020 | ||||
Table of Contents
JPMorgan SmartSpendingSM 2015 Fund
(formerly known as JPMorgan SmartSpendingSM 2050 Fund)
SCHEDULE OF PORTFOLIO INVESTMENTS
AS OF JUNE 30, 2020
| INVESTMENTS | SHARES | VALUE($) | ||||||
Investment Companies — 57.7% | ||||||||
Fixed Income — 42.6% | ||||||||
JPMorgan Core Bond Fund Class R6 Shares (a) | 275,442 | 3,409,976 | ||||||
JPMorgan Corporate Bond Fund Class R6 Shares (a) | 136,800 | 1,462,391 | ||||||
JPMorgan Emerging Markets Strategic Debt Fund Class R6 Shares (a) | 15,932 | 121,720 | ||||||
JPMorgan High Yield Fund Class R6 Shares (a) | 133,887 | 884,996 | ||||||
JPMorgan Income Fund Class R6 Shares (a) | 123,815 | 1,120,525 | ||||||
JPMorgan Inflation Managed Bond Fund Class R6 Shares (a) | 202,536 | 2,110,428 | ||||||
JPMorgan Managed Income Fund Class L Shares (a) | 2,008 | 20,178 | ||||||
JPMorgan Short Duration Core Plus Fund Class R6 Shares (a) | 305,328 | 2,961,681 | ||||||
|
| |||||||
Total Fixed Income | 12,091,895 | |||||||
|
| |||||||
U.S. Equity — 15.1% | ||||||||
JPMorgan Equity Index Fund Class R6 Shares (a) | 90,664 | 4,280,252 | ||||||
|
| |||||||
Total Investment Companies | 16,372,147 | |||||||
|
| |||||||
Exchange-Traded Funds — 37.3% | ||||||||
Alternative Assets — 1.1% | ||||||||
JPMorgan BetaBuilders MSCI US REIT ETF (a) | 4,443 | 316,920 | ||||||
|
| |||||||
Fixed Income — 19.0% | ||||||||
JPMorgan U.S. Aggregate Bond ETF (a) | 192,855 | 5,396,083 | ||||||
|
| |||||||
International Equity — 13.5% | ||||||||
iShares Core MSCI Emerging Markets ETF | 22,051 | 1,049,628 | ||||||
JPMorgan BetaBuilders International Equity ETF (a) | 60,191 | 2,774,203 | ||||||
|
| |||||||
Total International Equity | 3,823,831 | |||||||
|
| |||||||
U.S. Equity — 3.7% | ||||||||
iShares Russell 2000 ETF | 2,697 | 386,156 | ||||||
iShares Russell Mid-Cap ETF | 12,176 | 652,634 | ||||||
|
| |||||||
Total U.S. Equity | 1,038,790 | |||||||
|
| |||||||
Total Exchange-Traded Funds (Cost $10,558,560) | 10,575,624 | |||||||
|
| |||||||
| PRINCIPAL AMOUNT($) | ||||||||
U.S. Treasury Obligations — 2.2% | ||||||||
U.S. Treasury Notes 2.50%, 1/31/2021(b) | 616,000 | 624,373 | ||||||
|
| |||||||
| INVESTMENTS | SHARES | VALUE($) | ||||||
Short-Term Investments — 3.2% | ||||||||
Investment Companies — 3.2% | ||||||||
JPMorgan U.S. Government Money Market Fund Class IM Shares, 0.14% (a)(c) | 898,593 | 898,593 | ||||||
|
| |||||||
Total Investments — 100.4% |
| 28,470,737 | ||||||
Liabilities in Excess of Other Assets — (0.4)% |
| (112,207 | ) | |||||
|
| |||||||
NET ASSETS — 100.0% |
| 28,358,530 | ||||||
|
| |||||||
Percentages indicated are based on net assets.
Abbreviations
| ETF | Exchange-Traded Fund | |
| REIT | Real Estate Investment Trust | |
| (a) | Investment in an affiliated fund, which is registered under the Investment Company Act of 1940, as amended, and is advised by J.P. Morgan Investment Management Inc. | |
| (b) | All or a portion of this security is deposited with the broker as initial margin for futures contracts. | |
| (c) | The rate shown is the current yield as of June 30, 2020. | |
Detailed information about investment portfolios of the underlying funds and ETFs can be found in shareholder reports filed with the Securities and Exchange Commission (SEC) by each such underlying fund semi-annually on Form N-CSR and in portfolio holdings filed quarterly on Form N-PORT, and are available for download from both the SEC’s as well as the respective underlying fund’s website. Detailed information about underlying J.P. Morgan Funds can also be found at www.jpmorganfunds.com or by calling 1-800-480-4111.
SEE NOTES TO FINANCIAL STATEMENTS.
| JUNE 30, 2020 | J.P. MORGAN FUNDS | 5 | ||||||
Table of Contents
JPMorgan SmartSpendingSM 2015 Fund
(formerly known as JPMorgan SmartSpendingSM 2050 Fund)
SCHEDULE OF PORTFOLIO INVESTMENTS
AS OF JUNE 30, 2020 (continued)
| Futures contracts outstanding as of June 30, 2020: | ||||||||||||||||||||
| DESCRIPTION | NUMBER OF CONTRACTS | EXPIRATION DATE | TRADING CURRENCY | NOTIONAL AMOUNT ($) | VALUE AND UNREALIZED APPRECIATION (DEPRECIATION) ($) | |||||||||||||||
Long Contracts |
| |||||||||||||||||||
Australia 10 Year Bond | 6 | 09/2020 | AUD | 616,073 | 5,297 | |||||||||||||||
Canada 10 Year Bond | 10 | 09/2020 | CAD | 1,132,882 | 1,859 | |||||||||||||||
MSCI Emerging Markets E-Mini Index | 9 | 09/2020 | USD | 442,980 | 11,616 | |||||||||||||||
Russell 2000 E-Mini Index | 3 | 09/2020 | USD | 215,445 | 8,476 | |||||||||||||||
U.S. Treasury 10 Year Note | 27 | 09/2020 | USD | 3,756,797 | 13,232 | |||||||||||||||
|
| |||||||||||||||||||
| 40,480 | ||||||||||||||||||||
|
| |||||||||||||||||||
Short Contracts |
| |||||||||||||||||||
Euro-Bund | (3 | ) | 09/2020 | EUR | (593,781 | ) | (8,756 | ) | ||||||||||||
FTSE 100 Index | (10 | ) | 09/2020 | GBP | (760,555 | ) | (13,851 | ) | ||||||||||||
Long Gilt | (2 | ) | 09/2020 | GBP | (340,678 | ) | (4,785 | ) | ||||||||||||
S&P 500 E-Mini Index | (7 | ) | 09/2020 | USD | (1,079,488 | ) | (21,214 | ) | ||||||||||||
|
| |||||||||||||||||||
| (48,606 | ) | |||||||||||||||||||
|
| |||||||||||||||||||
| (8,126 | ) | |||||||||||||||||||
|
| |||||||||||||||||||
Abbreviations
| AUD | Australian Dollar | |
| CAD | Canadian Dollar | |
| EUR | Euro | |
| FTSE | Financial Times and the London Stock Exchange | |
| GBP | British Pound | |
| MSCI | Morgan Stanley Capital International | |
| USD | United States Dollar |
SEE NOTES TO FINANCIAL STATEMENTS.
| 6 | J.P. MORGAN FUNDS | JUNE 30, 2020 | ||||
Table of Contents
THIS PAGE IS INTENTIONALLY LEFT BLANK
| JUNE 30, 2020 | J.P. MORGAN FUNDS | 7 | ||||||
Table of Contents
STATEMENTS OF ASSETS AND LIABILITIES
AS OF JUNE 30, 2020
| JPMorgan SmartSpendingSM 2015 Fund (formerly known as JPMorgan SmartSpendingSM 2050 Fund) | ||||
ASSETS: | ||||
Investments in non-affiliates, at value | $ | 2,712,791 | ||
Investments in affiliates, at value | 25,757,946 | |||
Receivables: | ||||
Interest from non-affiliates | 6,431 | |||
Dividends from affiliates | 4,950 | |||
Variation margin on futures contracts | 48,413 | |||
Due from Adviser | 23,188 | |||
Other assets | 7,686 | |||
|
| |||
Total Assets | 28,561,405 | |||
|
| |||
LIABILITIES: | ||||
Payables: | ||||
Due to custodian | 4,857 | |||
Fund shares redeemed | 136,803 | |||
Accrued liabilities: | ||||
Distribution fees | 23 | |||
Service fees | 4,613 | |||
Custodian and accounting fees | 7,943 | |||
Printing and mailing costs | 27,263 | |||
Audit fees | 17,426 | |||
Other | 3,947 | |||
|
| |||
Total Liabilities | 202,875 | |||
|
| |||
Net Assets | $ | 28,358,530 | ||
|
| |||
SEE NOTES TO FINANCIAL STATEMENTS.
| 8 | J.P. MORGAN FUNDS | JUNE 30, 2020 | ||||
Table of Contents
| JPMorgan SmartSpendingSM 2015 Fund (formerly known as JPMorgan SmartSpendingSM 2050 Fund) | ||||
NET ASSETS: | ||||
Paid-in-Capital | $ | 28,741,953 | ||
Total distributable earnings (loss) | (383,423 | ) | ||
|
| |||
Total Net Assets | $ | 28,358,530 | ||
|
| |||
Net Assets: | ||||
Class A | $ | 23,610 | ||
Class I | 28,222,134 | |||
Class R2 | 22,220 | |||
Class R3 | 22,415 | |||
Class R4 | 22,612 | |||
Class R5 | 22,729 | |||
Class R6 | 22,810 | |||
|
| |||
Total | $ | 28,358,530 | ||
|
| |||
Outstanding units of beneficial interest (shares) | ||||
($0.0001 par value; unlimited number of shares authorized): | ||||
Class A | 1,602 | |||
Class I | 1,912,729 | |||
Class R2 | 1,511 | |||
Class R3 | 1,522 | |||
Class R4 | 1,533 | |||
Class R5 | 1,540 | |||
Class R6 | 1,545 | |||
Net Asset Value (a): | ||||
Class A — Redemption price per share | $ | 14.73 | ||
Class I — Offering and redemption price per share | 14.75 | |||
Class R2 — Offering and redemption price per share | 14.70 | |||
Class R3 — Offering and redemption price per share | 14.72 | |||
Class R4 — Offering and redemption price per share | 14.75 | |||
Class R5 — Offering and redemption price per share | 14.76 | |||
Class R6 — Offering and redemption price per share | 14.77 | |||
Class A maximum sales charge | 4.50 | % | ||
Class A maximum public offering price per share | $ | 15.42 | ||
|
| |||
Cost of investments in non-affiliates | $ | 2,796,356 | ||
Cost of investments in affiliates | 25,307,326 | |||
| (a) | Per share amounts may not recalculate due to rounding of net assets and/or shares outstanding. |
SEE NOTES TO FINANCIAL STATEMENTS.
| JUNE 30, 2020 | J.P. MORGAN FUNDS | 9 | ||||||
Table of Contents
STATEMENTS OF OPERATIONS
FOR THE YEAR ENDED JUNE 30, 2020
| JPMorgan SmartSpendingSM 2015 Fund (formerly known as JPMorgan SmartSpendingSM 2050 Fund) | ||||
INVESTMENT INCOME: | ||||
Interest income from non-affiliates | $ | 8,618 | ||
Dividend income from non-affiliates | 91,404 | |||
Dividend income from affiliates | 701,960 | |||
|
| |||
Total investment income | 801,982 | |||
|
| |||
EXPENSES: | ||||
Investment advisory fees | 95,381 | |||
Administration fees | 22,442 | |||
Distribution fees: | ||||
Class A | 61 | |||
Class R2 | 114 | |||
Class R3 | 57 | |||
Service fees: | ||||
Class A | 61 | |||
Class I | 74,457 | |||
Class R2 | 57 | |||
Class R3 | 57 | |||
Class R4 | 57 | |||
Class R5 | 23 | |||
Custodian and accounting fees | 24,327 | |||
Interest expense to affiliates | 105 | |||
Professional fees | 39,079 | |||
Trustees’ and Chief Compliance Officer’s fees | 25,163 | |||
Printing and mailing costs | 29,705 | |||
Registration and filing fees | 98,335 | |||
Transfer agency fees (See Note 2.G.) | 2,262 | |||
Other | 10,689 | |||
|
| |||
Total expenses | 422,432 | |||
|
| |||
Less fees waived | (153,947 | ) | ||
Less expense reimbursements | (201,642 | ) | ||
|
| |||
Net expenses | 66,843 | |||
|
| |||
Net investment income (loss) | 735,139 | |||
|
| |||
REALIZED/UNREALIZED GAINS (LOSSES): | ||||
Net realized gain (loss) on transactions from: | ||||
Investments in non-affiliates | 153,453 | |||
Investments in affiliates | 444,341 | |||
Futures contracts | (1,065,816 | ) | ||
Foreign currency transactions | 5,159 | |||
|
| |||
Net realized gain (loss) | (462,863 | ) | ||
|
| |||
Distributions of capital gains received from investment company affiliates | 119,711 | |||
|
| |||
Change in net unrealized appreciation/depreciation on: | ||||
Investments in non-affiliates | (390,113 | ) | ||
Investments in affiliates | (535,066 | ) | ||
Futures contracts | (48,746 | ) | ||
Foreign currency translations | (5,266 | ) | ||
|
| |||
Change in net unrealized appreciation/depreciation | (979,191 | ) | ||
|
| |||
Net realized/unrealized gains (losses) | (1,322,343 | ) | ||
|
| |||
Change in net assets resulting from operations | $ | (587,204 | ) | |
|
| |||
SEE NOTES TO FINANCIAL STATEMENTS.
| 10 | J.P. MORGAN FUNDS | JUNE 30, 2020 | ||||
Table of Contents
STATEMENTS OF CHANGES IN NET ASSETS
FOR THE PERIODS INDICATED
| JPMorgan SmartSpendingSM 2015 Fund (formerly known as JPMorgan SmartSpendingSM 2050 Fund) | ||||||||
| Year Ended June 30, 2020 | Year Ended June 30, 2019 | |||||||
CHANGE IN NET ASSETS RESULTING FROM OPERATIONS: | ||||||||
Net investment income (loss) | $ | 735,139 | $ | 837,094 | ||||
Net realized gain (loss) | (462,863 | ) | 245,435 | |||||
Distributions of capital gains received from investment company affiliates | 119,711 | 196,507 | ||||||
Change in net unrealized appreciation/depreciation | (979,191 | ) | 392,689 | |||||
|
|
|
| |||||
Change in net assets resulting from operations | (587,204 | ) | 1,671,725 | |||||
|
|
|
| |||||
DISTRIBUTIONS TO SHAREHOLDERS: | ||||||||
Class A | (1,407 | ) | (975 | ) | ||||
Class I | (1,812,109 | ) | (1,387,928 | ) | ||||
Class R2 | (1,245 | ) | (889 | ) | ||||
Class R3 | (1,309 | ) | (941 | ) | ||||
Class R4 | (1,372 | ) | (993 | ) | ||||
Class R5 | (1,410 | ) | (1,025 | ) | ||||
Class R6 | (1,436 | ) | (1,046 | ) | ||||
|
|
|
| |||||
Total distributions to shareholders | (1,820,288 | ) | (1,393,797 | ) | ||||
|
|
|
| |||||
CAPITAL TRANSACTIONS: | ||||||||
Change in net assets resulting from capital transactions | 217,011 | (182,975 | ) | |||||
|
|
|
| |||||
NET ASSETS: | ||||||||
Change in net assets | (2,190,481 | ) | 94,953 | |||||
Beginning of period | 30,549,011 | 30,454,058 | ||||||
|
|
|
| |||||
End of period | $ | 28,358,530 | $ | 30,549,011 | ||||
|
|
|
| |||||
SEE NOTES TO FINANCIAL STATEMENTS.
| JUNE 30, 2020 | J.P. MORGAN FUNDS | 11 | ||||||
Table of Contents
STATEMENTS OF CHANGES IN NET ASSETS
FOR THE PERIODS INDICATED (continued)
| JPMorgan SmartSpendingSM 2015 Fund (formerly known as JPMorgan SmartSpendingSM 2050 Fund) | ||||||||
| Year Ended June 30, 2020 | Year Ended June 30, 2019 | |||||||
CAPITAL TRANSACTIONS: | ||||||||
Class A | ||||||||
Proceeds from shares issued | $ | 1,101 | $ | — | ||||
Distributions reinvested | 1,407 | 975 | ||||||
|
|
|
| |||||
Change in net assets resulting from Class A capital transactions | $ | 2,508 | $ | 975 | ||||
|
|
|
| |||||
Class I | ||||||||
Proceeds from shares issued | $ | 6,500 | $ | — | ||||
Distributions reinvested | 1,812,109 | 1,387,928 | ||||||
Cost of shares redeemed | (1,610,878 | ) | (1,576,772 | ) | ||||
|
|
|
| |||||
Change in net assets resulting from Class I capital transactions | $ | 207,731 | $ | (188,844 | ) | |||
|
|
|
| |||||
Class R2 | ||||||||
Distributions reinvested | $ | 1,245 | $ | 889 | ||||
|
|
|
| |||||
Change in net assets resulting from Class R2 capital transactions | $ | 1,245 | $ | 889 | ||||
|
|
|
| |||||
Class R3 | ||||||||
Distributions reinvested | $ | 1,309 | $ | 941 | ||||
|
|
|
| |||||
Change in net assets resulting from Class R3 capital transactions | $ | 1,309 | $ | 941 | ||||
|
|
|
| |||||
Class R4 | ||||||||
Distributions reinvested | $ | 1,372 | $ | 993 | ||||
|
|
|
| |||||
Change in net assets resulting from Class R4 capital transactions | $ | 1,372 | $ | 993 | ||||
|
|
|
| |||||
Class R5 | ||||||||
Distributions reinvested | $ | 1,410 | $ | 1,025 | ||||
|
|
|
| |||||
Change in net assets resulting from Class R5 capital transactions | $ | 1,410 | $ | 1,025 | ||||
|
|
|
| |||||
Class R6 | ||||||||
Distributions reinvested | $ | 1,436 | $ | 1,046 | ||||
|
|
|
| |||||
Change in net assets resulting from Class R6 capital transactions | $ | 1,436 | $ | 1,046 | ||||
|
|
|
| |||||
Total change in net assets resulting from capital transactions | $ | 217,011 | $ | (182,975 | ) | |||
|
|
|
| |||||
SEE NOTES TO FINANCIAL STATEMENTS.
| 12 | J.P. MORGAN FUNDS | JUNE 30, 2020 | ||||
Table of Contents
| JPMorgan SmartSpendingSM 2015 Fund (formerly known as JPMorgan SmartSpendingSM 2050 Fund) | ||||||||
| Year Ended June 30, 2020 | Year Ended June 30, 2019 | |||||||
SHARE TRANSACTIONS: | ||||||||
Class A | ||||||||
Issued | 68 | — | ||||||
Reinvested | 90 | 65 | ||||||
|
|
|
| |||||
Change in Class A Shares | 158 | 65 | ||||||
|
|
|
| |||||
Class I | ||||||||
Issued | 405 | — | ||||||
Reinvested | 114,909 | 92,616 | ||||||
Redeemed | (104,569 | ) | (100,751 | ) | ||||
|
|
|
| |||||
Change in Class I Shares | 10,745 | (8,135 | ) | |||||
|
|
|
| |||||
Class R2 | ||||||||
Reinvested | 79 | 59 | ||||||
|
|
|
| |||||
Change in Class R2 Shares | 79 | 59 | ||||||
|
|
|
| |||||
Class R3 | ||||||||
Reinvested | 83 | 63 | ||||||
|
|
|
| |||||
Change in Class R3 Shares | 83 | 63 | ||||||
|
|
|
| |||||
Class R4 | ||||||||
Reinvested | 87 | 66 | ||||||
|
|
|
| |||||
Change in Class R4 Shares | 87 | 66 | ||||||
|
|
|
| |||||
Class R5 | ||||||||
Reinvested | 89 | 69 | ||||||
|
|
|
| |||||
Change in Class R5 Shares | 89 | 69 | ||||||
|
|
|
| |||||
Class R6 | ||||||||
Reinvested | 91 | 70 | ||||||
|
|
|
| |||||
Change in Class R6 Shares | 91 | 70 | ||||||
|
|
|
| |||||
SEE NOTES TO FINANCIAL STATEMENTS.
| JUNE 30, 2020 | J.P. MORGAN FUNDS | 13 | ||||||
Table of Contents
FOR THE PERIODS INDICATED
| Per share operating performance | ||||||||||||||||||||||||||||
| Investment operations | Distributions | |||||||||||||||||||||||||||
| Net asset value, beginning of period | Net investment income (loss) (b)(c) | Net realized and unrealized gains (losses) on investments | Total from investment operations | Net investment income | Net realized gain | Total distributions | ||||||||||||||||||||||
JPMorgan SmartSpendingSM 2015 Fund (formerly known as JPMorgan SmartSpendingSM 2050 Fund) |
| |||||||||||||||||||||||||||
Class A | ||||||||||||||||||||||||||||
Year Ended June 30, 2020 | $ | 15.97 | $ | 0.34 | $ | (0.66 | ) | $ | (0.32 | ) | $ | (0.42 | ) | $ | (0.50 | ) | $ | (0.92 | ) | |||||||||
Year Ended June 30, 2019 | 15.86 | 0.39 | 0.42 | 0.81 | (0.39 | ) | (0.31 | ) | (0.70 | ) | ||||||||||||||||||
Year Ended June 30, 2018 | 15.66 | 0.35 | 0.26 | 0.61 | (0.24 | ) | (0.17 | ) | (0.41 | ) | ||||||||||||||||||
December 30, 2016 (h) through June 30, 2017 | 15.00 | 0.14 | 0.64 | 0.78 | (0.12 | ) | — | (0.12 | ) | |||||||||||||||||||
Class I | ||||||||||||||||||||||||||||
Year Ended June 30, 2020 | 15.99 | 0.38 | (0.67 | ) | (0.29 | ) | (0.45 | ) | (0.50 | ) | (0.95 | ) | ||||||||||||||||
Year Ended June 30, 2019 | 15.87 | 0.44 | 0.42 | 0.86 | (0.43 | ) | (0.31 | ) | (0.74 | ) | ||||||||||||||||||
Year Ended June 30, 2018 | 15.66 | 0.39 | 0.25 | 0.64 | (0.26 | ) | (0.17 | ) | (0.43 | ) | ||||||||||||||||||
December 30, 2016 (h) through June 30, 2017 | 15.00 | 0.16 | 0.64 | 0.80 | (0.14 | ) | — | (0.14 | ) | |||||||||||||||||||
Class R2 | ||||||||||||||||||||||||||||
Year Ended June 30, 2020 | 15.94 | 0.28 | (0.67 | ) | (0.39 | ) | (0.35 | ) | (0.50 | ) | (0.85 | ) | ||||||||||||||||
Year Ended June 30, 2019 | 15.83 | 0.33 | 0.42 | 0.75 | (0.33 | ) | (0.31 | ) | (0.64 | ) | ||||||||||||||||||
Year Ended June 30, 2018 | 15.66 | 0.29 | 0.25 | 0.54 | (0.20 | ) | (0.17 | ) | (0.37 | ) | ||||||||||||||||||
December 30, 2016 (h) through June 30, 2017 | 15.00 | 0.11 | 0.64 | 0.75 | (0.09 | ) | — | (0.09 | ) | |||||||||||||||||||
Class R3 | ||||||||||||||||||||||||||||
Year Ended June 30, 2020 | 15.96 | 0.32 | (0.67 | ) | (0.35 | ) | (0.39 | ) | (0.50 | ) | (0.89 | ) | ||||||||||||||||
Year Ended June 30, 2019 | 15.85 | 0.37 | 0.42 | 0.79 | (0.37 | ) | (0.31 | ) | (0.68 | ) | ||||||||||||||||||
Year Ended June 30, 2018 | 15.66 | 0.33 | 0.25 | 0.58 | (0.22 | ) | (0.17 | ) | (0.39 | ) | ||||||||||||||||||
December 30, 2016 (h) through June 30, 2017 | 15.00 | 0.13 | 0.64 | 0.77 | (0.11 | ) | — | (0.11 | ) | |||||||||||||||||||
Class R4 | ||||||||||||||||||||||||||||
Year Ended June 30, 2020 | 15.98 | 0.36 | (0.66 | ) | (0.30 | ) | (0.43 | ) | (0.50 | ) | (0.93 | ) | ||||||||||||||||
Year Ended June 30, 2019 | 15.86 | 0.41 | 0.43 | 0.84 | (0.41 | ) | (0.31 | ) | (0.72 | ) | ||||||||||||||||||
Year Ended June 30, 2018 | 15.66 | 0.37 | 0.25 | 0.62 | (0.25 | ) | (0.17 | ) | (0.42 | ) | ||||||||||||||||||
December 30, 2016 (h) through June 30, 2017 | 15.00 | 0.15 | 0.64 | 0.79 | (0.13 | ) | — | (0.13 | ) | |||||||||||||||||||
Class R5 | ||||||||||||||||||||||||||||
Year Ended June 30, 2020 | 15.99 | 0.38 | (0.66 | ) | (0.28 | ) | (0.45 | ) | (0.50 | ) | (0.95 | ) | ||||||||||||||||
Year Ended June 30, 2019 | 15.87 | 0.44 | 0.42 | 0.86 | (0.43 | ) | (0.31 | ) | (0.74 | ) | ||||||||||||||||||
Year Ended June 30, 2018 | 15.66 | 0.39 | 0.25 | 0.64 | (0.26 | ) | (0.17 | ) | (0.43 | ) | ||||||||||||||||||
December 30, 2016 (h) through June 30, 2017 | 15.00 | 0.16 | 0.64 | 0.80 | (0.14 | ) | — | (0.14 | ) | |||||||||||||||||||
Class R6 | ||||||||||||||||||||||||||||
Year Ended June 30, 2020 | 16.00 | 0.40 | (0.66 | ) | (0.26 | ) | (0.47 | ) | (0.50 | ) | (0.97 | ) | ||||||||||||||||
Year Ended June 30, 2019 | 15.88 | 0.45 | 0.42 | 0.87 | (0.44 | ) | (0.31 | ) | (0.75 | ) | ||||||||||||||||||
Year Ended June 30, 2018 | 15.66 | 0.41 | 0.25 | 0.66 | (0.27 | ) | (0.17 | ) | (0.44 | ) | ||||||||||||||||||
December 30, 2016 (h) through June 30, 2017 | 15.00 | 0.17 | 0.64 | 0.81 | (0.15 | ) | — | (0.15 | ) | |||||||||||||||||||
| (a) | Annualized for periods less than one year, unless otherwise noted. |
| (b) | Net investment income (loss) is affected by the timing of distributions from Underlying Funds. |
| (c) | Calculated based upon average shares outstanding. |
| (d) | Not annualized for periods less than one year. |
| (e) | Includes adjustments in accordance with accounting principles generally accepted in the United States of America and as such, the net asset values for financial reporting purposes and the returns based upon those net asset values may differ from the net asset values and returns for shareholder transactions. |
| (f) | Does not include expenses of Underlying Funds. |
| (g) | Certain non-recurring expenses incurred by the Fund were not annualized for the period indicated. |
| (h) | Commencement of operations. |
SEE NOTES TO FINANCIAL STATEMENTS.
| 14 | J.P. MORGAN FUNDS | JUNE 30, 2020 | ||||
Table of Contents
| Ratios/Supplemental data | |||||||||||||||||||||||||
| Ratios to average net assets (a) | ||||||||||||||||||||||||||
value, end of period | Total return (excludes sales charge) (d)(e) | Net assets, end of period | Net expenses (f) | Net investment income (loss) (b) | Expenses without waivers, reimbursements and earnings credits (f) | Portfolio turnover rate (d) | ||||||||||||||||||||
| $ | 14.73 | (2.29 | )% | $ | 23,610 | 0.48 | % | 2.21 | % | 1.83 | % | 125 | % | |||||||||||||
| 15.97 | 5.45 | 23,058 | 0.43 | 2.51 | 1.71 | 50 | ||||||||||||||||||||
| 15.86 | 3.90 | 21,866 | 0.43 | (g) | 2.21 | (g) | 1.70 | (g) | 30 | |||||||||||||||||
| 15.66 | 5.23 | 21,050 | 0.45 | (g) | 1.85 | (g) | 3.76 | (g) | 8 | |||||||||||||||||
| 14.75 | (2.06 | ) | 28,222,134 | 0.22 | 2.46 | 1.41 | 125 | |||||||||||||||||||
| 15.99 | 5.75 | 30,410,614 | 0.19 | 2.79 | 1.44 | 50 | ||||||||||||||||||||
| 15.87 | 4.12 | 30,322,835 | 0.19 | (g) | 2.46 | (g) | 1.36 | (g) | 30 | |||||||||||||||||
| 15.66 | 5.36 | 30,794,263 | 0.19 | (g) | 2.09 | (g) | 1.26 | (g) | 8 | |||||||||||||||||
| 14.70 | (2.68 | ) | 22,220 | 0.85 | 1.83 | 2.08 | 125 | |||||||||||||||||||
| 15.94 | 5.05 | 22,822 | 0.85 | 2.13 | 1.97 | 50 | ||||||||||||||||||||
| 15.83 | 3.46 | 21,731 | 0.85 | (g) | 1.80 | (g) | 2.00 | (g) | 30 | |||||||||||||||||
| 15.66 | 5.02 | 21,009 | 0.84 | (g) | 1.44 | (g) | 4.09 | (g) | 8 | |||||||||||||||||
| 14.72 | (2.45 | ) | 22,415 | 0.60 | 2.08 | 4.58 | 125 | |||||||||||||||||||
| 15.96 | 5.29 | 22,964 | 0.60 | 2.38 | 1.72 | 50 | ||||||||||||||||||||
| 15.85 | 3.74 | 21,813 | 0.60 | (g) | 2.05 | (g) | 1.75 | (g) | 30 | |||||||||||||||||
| 15.66 | 5.15 | 21,035 | 0.59 | (g) | 1.69 | (g) | 3.82 | (g) | 8 | |||||||||||||||||
| 14.75 | (2.14 | ) | 22,612 | 0.35 | 2.33 | 3.05 | 125 | |||||||||||||||||||
| 15.98 | 5.60 | 23,108 | 0.35 | 2.63 | 1.47 | 50 | ||||||||||||||||||||
| 15.86 | 3.96 | 21,895 | 0.35 | (g) | 2.30 | (g) | 1.50 | (g) | 30 | |||||||||||||||||
| 15.66 | 5.27 | 21,060 | 0.35 | (g) | 1.94 | (g) | 3.57 | (g) | 8 | |||||||||||||||||
| 14.76 | (2.00 | ) | 22,729 | 0.20 | 2.48 | 5.06 | 125 | |||||||||||||||||||
| 15.99 | 5.74 | 23,193 | 0.20 | 2.78 | 1.32 | 50 | ||||||||||||||||||||
| 15.87 | 4.11 | 21,942 | 0.21 | (g) | 2.44 | (g) | 1.36 | (g) | 30 | |||||||||||||||||
| 15.66 | 5.35 | 21,076 | 0.20 | (g) | 2.09 | (g) | 3.43 | (g) | 8 | |||||||||||||||||
| 14.77 | (1.91 | ) | 22,810 | 0.10 | 2.58 | 1.21 | 125 | |||||||||||||||||||
| 16.00 | 5.84 | 23,252 | 0.10 | 2.88 | 1.23 | 50 | ||||||||||||||||||||
| 15.88 | 4.24 | 21,976 | 0.10 | (g) | 2.55 | (g) | 1.25 | (g) | 30 | |||||||||||||||||
| 15.66 | 5.40 | 21,086 | 0.10 | (g) | 2.19 | (g) | 3.33 | (g) | 8 | |||||||||||||||||
SEE NOTES TO FINANCIAL STATEMENTS.
| JUNE 30, 2020 | J.P. MORGAN FUNDS | 15 | ||||||
Table of Contents
AS OF JUNE 30, 2020
1. Organization
JPMorgan Trust IV (the “Trust”) was formed on November 11, 2015, as a Delaware statutory trust, pursuant to a Declaration of Trust dated November 11, 2015 and is registered under the Investment Company Act of 1940, as amended (the “1940 Act”), as an open-end management investment company.
The following is a separate fund of the Trust (the “Fund”) covered by this report:
| Classes Offered | Diversification Classification | |||
| JPMorgan SmartSpendingSM 2015 Fund(1) | Class A, Class I, Class R2, Class R3, Class R4, Class R5 and Class R6 | Diversified |
| (1) | Effective May 1, 2020, JPMorgan SmartSpendingSM 2050 Fund changed its name to JPMorgan SmartSpendingSM 2015 Fund. |
The investment objective of the Fund is to seek to provide total return consisting of current income and some capital appreciation.
The Fund commenced operations on December 30, 2016.
Class A Shares generally provide for a front-end sales charge. No sales charges are assessed with respect to Class I, Class R2, Class R3, Class R4, Class R5 and Class R6 Shares. Certain Class A Shares, for which front-end sales charges have been waived, may be subject to a CDSC as described in the Fund’s prospectus. All classes of shares have equal rights as to earnings, assets and voting privileges, except that each class may bear different transfer agency, distribution and service fees and each class has exclusive voting rights with respect to its distribution plan and shareholder servicing agreements.
J.P. Morgan Investment Management Inc. (“JPMIM”), an indirect, wholly-owned subsidiary of JPMorgan Chase & Co. (“JPMorgan”), acts as Adviser (the “Adviser”) and Administrator (the “Administrator”) to the Fund.
2. Significant Accounting Policies
The following is a summary of significant accounting policies followed by the Fund in the preparation of its financial statements. The Fund is an investment company and, accordingly, follows the investment company accounting and reporting guidance of the Financial Accounting Standards Board (“FASB”) Accounting Standards Codification Topic 946 — Investment Companies, which is part of U.S. generally accepted accounting principles (“GAAP”). The preparation of financial statements in conformity with GAAP requires management to make estimates and assumptions that affect (i) the reported amounts of assets and liabilities, (ii) disclosure of contingent assets and liabilities at the date of the financial statements, and (iii) the reported amounts of increases and decreases in net assets from operations during the reporting period. Actual results could differ from those estimates.
A. Valuation of Investments — Investments are valued in accordance with GAAP and the Fund’s valuation policies set forth by, and under the supervision and responsibility of, the Board of Trustees (the “Board”), which established the following approach to valuation, as described more fully below: (i) investments for which market quotations are readily available shall be valued at their market value and (ii) all other investments for which market quotations are not readily available shall be valued at their fair value as determined in good faith by the Board.
The Administrator has established the J.P. Morgan Asset Management Americas Valuation Committee (“AVC”) to assist the Board with the oversight and monitoring of the valuation of the Fund’s investments. The Administrator implements the valuation policies of the Fund’s investments, as directed by the Board. The AVC oversees and carries out the policies for the valuation of investments held in the Fund. This includes monitoring the appropriateness of fair values based on results of ongoing valuation oversight including, but not limited to, consideration of macro or security specific events, market events, and pricing vendor and broker due diligence. The Administrator is responsible for discussing and assessing the potential impacts to the fair values on an ongoing basis, and, at least on a quarterly basis, with the AVC and the Board.
Fixed income instruments are valued based on prices received from Pricing Services. The Pricing Services use multiple valuation techniques to determine the valuation of fixed income instruments. In instances where sufficient market activity exists, the Pricing Services may utilize a market-based approach through which trades or quotes from market makers are used to determine the valuation of these instruments. In instances where sufficient market activity may not exist, the Pricing Services also utilize proprietary valuation models which may consider market transactions in comparable securities and the various relationships between securities in determining fair value and/or market characteristics in order to estimate the relevant cash flows, which are then discounted to calculate the fair values.
Equities and other exchange-traded instruments are valued at the last sale price or official market closing price on the primary exchange on which the instrument is traded before the net asset values (“NAV”) of the Fund are calculated on a valuation date. Certain foreign equity instruments, as well as certain derivatives with foreign equity reference obligations, are valued by applying international fair value factors provided by approved affiliated and unaffiliated pricing vendors or third party broker-dealers (collectively referred to as “Pricing Services”). The factors seek to adjust the local closing price for movements of local markets post-closing, but prior to the time the NAVs are calculated.
Investments in open-end investment companies excluding exchange-traded funds (“ETFs”) (“Underlying Funds”) are valued at each Underlying Fund’s NAV per share as of the report date.
Futures contracts are generally valued on the basis of available market quotations.
| 16 | J.P. MORGAN FUNDS | JUNE 30, 2020 | ||||
Table of Contents
Valuations reflected in this report are as of the report date. As a result, changes in valuation due to market events and/or issuer-related events after the report date and prior to issuance of the report are not reflected herein.
The various inputs that are used in determining the valuation of the Fund’s investments are summarized into the three broad levels listed below.
| • | Level 1 — Unadjusted inputs using quoted prices in active markets for identical investments. |
| • | Level 2 — Other significant observable inputs including, but not limited to, quoted prices for similar investments, inputs other than quoted prices that are observable for investments (such as interest rates, prepayment speeds, credit risk, etc.) or other market corroborated inputs. |
| • | Level 3 — Significant inputs based on the best information available in the circumstances, to the extent observable inputs are not available (including the Fund’s assumptions in determining the fair value of investments). |
A financial instrument’s level within the fair value hierarchy is based on the lowest level of any input, both individually and in the aggregate, that is significant to the fair value measurement. The inputs or methodology used for valuing instruments are not necessarily an indication of the risk associated with investing in those instruments.
The following table represents each valuation input as presented on the Schedule of Portfolio Investments (“SOI”):
| Level 1 Quoted prices | Level 2 Other significant observable inputs | Level 3 Significant | Total | |||||||||||||
Investments in Securities | ||||||||||||||||
Exchange-Traded Funds | $ | 10,575,624 | $ | — | $ | — | $ | 10,575,624 | ||||||||
Investment Companies | 16,372,147 | — | — | 16,372,147 | ||||||||||||
U.S. Treasury Obligations | — | 624,373 | — | 624,373 | ||||||||||||
Short-Term Investments | ||||||||||||||||
Investment Companies | 898,593 | — | — | 898,593 | ||||||||||||
|
|
|
|
|
|
|
| |||||||||
Total Investments in Securities | $ | 27,846,364 | $ | 624,373 | $ | — | $ | 28,470,737 | ||||||||
|
|
|
|
|
|
|
| |||||||||
Appreciation in Other Financial Instruments |
| |||||||||||||||
Futures Contracts | $ | 40,480 | $ | — | $ | — | $ | 40,480 | ||||||||
|
|
|
|
|
|
|
| |||||||||
Depreciation in Other Financial Instruments |
| |||||||||||||||
Futures Contracts | $ | (34,755 | ) | $ | (13,851 | ) | $ | — | $ | (48,606 | ) | |||||
|
|
|
|
|
|
|
| |||||||||
B. Investment Transactions with Affiliates — The Fund invested in Underlying Funds and ETFs which are advised by the Adviser. An issuer which is under common control with the Fund may be considered an affiliate. For the purposes of the financial statements, the Fund assumes the issuers listed in the table below to be affiliated issuers. Underlying Funds’ and ETFs’ distributions may be reinvested into the Underlying Funds and ETFs. Reinvestment amounts are included in the purchase cost amounts in the table below.
| For the year ended June 30, 2020 | ||||||||||||||||||||||||||||||||||||
| Security Description | Value at 2019 | Purchases at Cost | Proceeds from Sales | Net Realized Gain (Loss) | Change in Unrealized Appreciation/ (Depreciation) | Value at 2020 | Shares at June 30, 2020 | Dividend Income | Capital Gain Distributions | |||||||||||||||||||||||||||
JPMorgan BetaBuilders International Equity ETF (a) | $ | — | $ | 2,798,731 | $ | — | $ | — | $ | (24,528 | ) | $ | 2,774,203 | 60,191 | $ | 702 | $ | — | ||||||||||||||||||
JPMorgan BetaBuilders MSCI US REIT ETF (a) | — | 854,719 | 418,375 | (71,424 | ) | (48,000 | ) | 316,920 | 4,443 | 11,723 | 533 | |||||||||||||||||||||||||
JPMorgan Core Bond Fund Class R6 Shares (a) | 6,289,086 | 2,297,561 | 5,434,499 | 245,825 | 12,003 | 3,409,976 | 275,442 | 139,753 | 30,006 | |||||||||||||||||||||||||||
JPMorgan Core Plus Bond Fund Class R6 Shares (a) | 4,243,740 | 72,140 | 4,412,490 | 177,110 | (80,500 | ) | — | — | 23,624 | — | ||||||||||||||||||||||||||
JPMorgan Corporate Bond Fund Class R6 Shares (a) | — | 1,407,818 | — | — | 54,573 | 1,462,391 | 136,800 | 6,966 | — | |||||||||||||||||||||||||||
JPMorgan Emerging Markets Equity Fund Class R6 Shares (a) | — | 1,043,654 | 1,022,383 | (21,271 | ) | — | — | — | 6,433 | — | ||||||||||||||||||||||||||
JPMorgan Emerging Markets Strategic Debt Fund Class R6 Shares (a) | 1,019,980 | 124,462 | 880,439 | (105,512 | ) | (36,771 | ) | 121,720 | 15,932 | 42,251 | — | |||||||||||||||||||||||||
JPMorgan Equity Income Fund Class R6 Shares (a) | — | 1,067,753 | 1,118,384 | 50,631 | — | — | — | 8,055 | 9,225 | |||||||||||||||||||||||||||
JPMorgan Equity Index Fund Class R6 Shares (a) | 1,813,340 | 3,724,438 | 1,210,040 | 76,228 | (123,714 | ) | 4,280,252 | 90,664 | 59,688 | 2,569 | ||||||||||||||||||||||||||
| JUNE 30, 2020 | J.P. MORGAN FUNDS | 17 | ||||||
Table of Contents
NOTES TO FINANCIAL STATEMENTS
AS OF JUNE 30, 2020 (continued)
| For the year ended June 30, 2020 | ||||||||||||||||||||||||||||||||||||
| Security Description | Value at 2019 | Purchases at Cost | Proceeds from Sales | Net Realized Gain (Loss) | Change in Unrealized Appreciation/ (Depreciation) | Value at 2020 | Shares at June 30, 2020 | Dividend Income | Capital Gain Distributions | |||||||||||||||||||||||||||
JPMorgan Growth Advantage Fund Class R6 Shares* (a) | $ | 574,999 | $ | — | $ | 571,572 | $ | 166,251 | $ | (169,678 | ) | $ | — | — | $ | — | $ | — | ||||||||||||||||||
JPMorgan High Yield Fund Class R6 Shares (a) | 2,768,070 | 374,014 | 2,030,546 | (185,656 | ) | (40,886 | ) | 884,996 | 133,887 | 99,525 | — | |||||||||||||||||||||||||
JPMorgan Income Fund Class R6 Shares (a) | 1,227,608 | 1,285,848 | 1,226,214 | (106,612 | ) | (60,105 | ) | 1,120,525 | 123,815 | 91,851 | 538 | |||||||||||||||||||||||||
JPMorgan Inflation Managed Bond Fund Class R6 Shares (a) | — | 2,332,517 | 227,630 | (6,962 | ) | 12,503 | 2,110,428 | 202,536 | 18,239 | — | ||||||||||||||||||||||||||
JPMorgan International Research Enhanced Equity Fund Class R6 Shares (a) | 1,069,700 | 388,509 | 1,451,853 | 96,513 | (102,869 | ) | — | — | 37,213 | — | ||||||||||||||||||||||||||
JPMorgan Managed Income Fund Class L Shares (a) | 3,517,759 | 1,150,898 | 4,638,465 | 4,747 | (14,761 | ) | 20,178 | 2,008 | 40,955 | 1,851 | ||||||||||||||||||||||||||
JPMorgan Short Duration Core Plus Fund Class R6 Shares (a) | — | 3,674,825 | 731,692 | (4,946 | ) | 23,494 | 2,961,681 | 305,328 | 65,551 | — | ||||||||||||||||||||||||||
JPMorgan U.S. Aggregate Bond ETF (a) | — | 6,169,103 | 955,196 | 6,323 | 175,853 | 5,396,083 | 192,855 | 38,365 | — | |||||||||||||||||||||||||||
JPMorgan U.S. Equity Fund Class R6 Shares (a) | 938,414 | 271,615 | 1,235,971 | 93,583 | (67,641 | ) | — | — | 5,556 | 74,989 | ||||||||||||||||||||||||||
JPMorgan U.S. Government Money Market Fund Class IM Shares, 0.14% (a)(b) | 393,354 | 11,240,807 | 10,735,568 | — | — | 898,593 | 898,593 | 5,510 | — | |||||||||||||||||||||||||||
JPMorgan Value Advantage Fund Class R6 Shares (a) | 545,423 | — | 530,897 | 29,513 | (44,039 | ) | — | — | — | — | ||||||||||||||||||||||||||
|
|
|
|
|
|
|
|
|
|
|
|
|
|
|
| |||||||||||||||||||||
Total | $ | 24,401,473 | $ | 40,279,412 | $ | 38,832,214 | $ | 444,341 | $ | (535,066 | ) | $ | 25,757,946 | $ | 701,960 | $ | 119,711 | |||||||||||||||||||
|
|
|
|
|
|
|
|
|
|
|
|
|
|
|
| |||||||||||||||||||||
| (a) | Investment in an affiliated fund, which is registered under the Investment Company Act of 1940, as amended, and is advised by J.P. Morgan Investment Management Inc. |
| (b) | The rate shown is the current yield as of June 30, 2020. |
| * | Non-income producing security |
C. Foreign Currency Translation — The books and records of the Fund are maintained in U.S. dollars. Foreign currency amounts are translated into U.S. dollars at the prevailing exchange rates of such currencies against the U.S. dollar. The market value of investment securities and other assets and liabilities are translated at the exchange rate as of the valuation date. Purchases and sales of investment securities, income and expenses are translated at the exchange rate prevailing on the respective dates of such transactions.
The Fund does not isolate the effect of changes in foreign exchange rates from changes in market prices on securities held. Accordingly, such changes are included within Change in net unrealized appreciation/depreciation on investments on the Statement of Operations.
Reported realized foreign currency gains and losses arise from the disposition of foreign currency, currency gains or losses realized between the trade and settlement dates on securities transactions, and the difference between the amounts of dividends, interest and foreign withholding taxes recorded on the Fund’s books on the transaction date and the U.S. dollar equivalent of the amounts actually received or paid. These reported realized foreign currency gains and losses are included in Net realized gain (loss) on foreign currency transactions on the Statement of Operations. Unrealized foreign currency gains and losses arise from changes (due to changes in exchange rates) in the value of foreign currency and other assets and liabilities denominated in foreign currencies, which are held at period end are included in Change in net unrealized appreciation/depreciation on foreign currency translations on the Statement of Operations.
D. Futures Contracts — The Fund used treasury and index futures contracts to gain exposure to or to overweight or underweight allocations among various sectors or markets, maintain liquidity or minimize transaction costs. The Fund also purchased futures contracts to invest incoming cash in the market or sells futures in response to cash outflows, thereby simulating an invested position in the underlying index while maintaining a cash balance for liquidity.
Futures contracts provide for the delayed delivery of the underlying instrument at a fixed price or are settled for a cash amount based on the change in the value of the underlying instrument at a specific date in the future. Upon entering into a futures contract, the Fund is required to
| 18 | J.P. MORGAN FUNDS | JUNE 30, 2020 | ||||
Table of Contents
deposit with the broker, cash or securities in an amount equal to a certain percentage of the contract amount, which is referred to as the initial margin deposit. Subsequent payments, referred to as variation margin, are made or received by the Fund periodically and are based on changes in the market value of open futures contracts. Changes in the market value of open futures contracts are recorded as Change in net unrealized appreciation/depreciation on the Statement of Operations. Realized gains or losses, representing the difference between the value of the contract at the time it was opened and the value at the time it was closed, are reported on the Statement of Operations at the closing or expiration of the futures contract. Securities deposited as initial margin are designated on the SOI, while cash deposited, which is considered restricted, is recorded on the Statement of Assets and Liabilities. A receivable from and/or a payable to brokers for the daily variation margin is also recorded on the Statement of Assets and Liabilities.
The use of futures contracts exposes the Fund to equity price and interest rate risks. The Fund may be subject to the risk that the change in the value of the futures contract may not correlate perfectly with the underlying instrument. Use of long futures contracts subjects the Fund to risk of loss in excess of the amounts shown on the Statement of Assets and Liabilities, up to the notional amount of the futures contracts. Use of short futures contracts subjects the Fund to unlimited risk of loss. The Fund may enter into futures contracts only on exchanges or boards of trade. The exchange or board of trade acts as the counterparty to each futures transaction; therefore, the Fund’s credit risk is limited to failure of the exchange or board of trade. Under some circumstances, futures exchanges may establish daily limits on the amount that the price of a futures contract can vary from the previous day’s settlement price, which could effectively prevent liquidation of positions.
The table below discloses the volume of the Fund’s futures contracts activity during the year ended June 30, 2020:
| Average Notional Balance | Ending Notional Balance | |||||||
Long Futures Contracts: | ||||||||
Equity | $ | 830,284 | $ | 658,425 | ||||
Interest Rate | 3,673,285 | 5,505,752 | ||||||
Short Futures Contracts: | ||||||||
Equity | 1,983,983 | 1,840,043 | ||||||
Interest Rate | 787,778 | 934,459 | ||||||
The Fund’s futures contracts are not subject to master netting arrangements (the right to close out all transactions traded with a counterparty and net amounts owed or due across transactions).
E. Summary of Derivatives Information — The following table presents the value of derivatives held as of June 30, 2020 by their primary underlying risk exposure and respective location on the Statement of Assets and Liabilities:
| Derivative Contracts | Statement of Assets and Liabilities Location | |||||
| Gross Assets: | Futures Contracts (a) | |||||
Equity contracts | Receivables, Net Assets — Unrealized Appreciation | $ | 20,092 | |||
Interest rate contracts | Receivables, Net Assets — Unrealized Appreciation | 20,388 | ||||
|
| |||||
Total | $ | 40,480 | ||||
|
| |||||
Gross Liabilities: | ||||||
Equity contracts | Payables, Net Assets — Unrealized Depreciation | $ | (35,065 | ) | ||
Interest rate contracts | Payables, Net Assets — Unrealized Depreciation | (13,541 | ) | |||
|
| |||||
Total | $ | (48,606 | ) | |||
|
| |||||
| (a) | This amount represents the cumulative appreciation (depreciation) of futures contracts as reported on the SOI. The Statement of Assets and Liabilities only reflect the current day variation margin receivable/payable from/to brokers. |
The following tables present the effect of derivatives on the Statement of Operations for the year ended June 30, 2020 by primary underlying risk exposure:
| Amount of Realized Gain (Loss) on Derivatives Recognized on the Statement of Operations | ||||
| Derivative Contracts | Futures Contracts | |||
Equity contracts | $ | (1,265,855 | ) | |
Interest rate contracts | 200,039 | |||
|
| |||
Total | $ | (1,065,816 | ) | |
|
| |||
| JUNE 30, 2020 | J.P. MORGAN FUNDS | 19 | ||||||
Table of Contents
NOTES TO FINANCIAL STATEMENTS
AS OF JUNE 30, 2020 (continued)
| Amount of Change in Unrealized Appreciation (Depreciation) on Derivatives Recognized on the Statement of Operations | ||||
| Derivative Contracts | Futures Contracts | |||
Equity contracts | $ | (7,672 | ) | |
Interest rate contracts | (41,074 | ) | ||
|
| |||
Total | $ | (48,746 | ) | |
|
| |||
The Fund’s derivatives contracts held at June 30, 2020 are not accounted for as hedging instruments under GAAP.
F. Security Transactions and Investment Income — Investment transactions are accounted for on the trade date (the date the order to buy or sell is executed). Securities gains and losses are calculated on a specifically identified cost basis. Interest income is determined on the basis of coupon interest accrued using the effective interest method, which adjusts for amortization of premiums and accretion of discounts. Distributions of net investment income and realized capital gains from the Underlying Funds and ETFs, if any, are recorded on the ex-dividend date.
G. Allocation of Income and Expenses — Expenses directly attributable to a fund are charged directly to the fund, while the expenses attributable to more than one fund of the Trust are allocated among the applicable funds. Investment income, realized and unrealized gains and losses and expenses, other than class-specific expenses, are allocated daily to each class of shares based upon the proportion of net assets of each class at the beginning of each day.
Transfer agency fees are class-specific expenses. The amount of the transfer agency fees charged to each share class of the Fund for the year ended June 30, 2020 are as follows:
| Class A | Class I | Class R2 | Class R3 | Class R4 | Class R5 | Class R6 | Total | |||||||||||||||||||||||||
Transfer agency fees | $ | 40 | $ | 236 | $ | 40 | $ | 671 | $ | 380 | $ | 883 | $ | 12 | $ | 2,262 | ||||||||||||||||
The Fund invests in Underlying Funds and ETFs and, as a result, bears a portion of the expenses incurred by these Underlying Funds and ETFs. These expenses are not reflected in the expenses shown on the Statement of Operations and are not included in the ratios to average net assets shown on the Financial Highlights. Certain expenses of affiliated Underlying Funds and ETFs are waived as described in Note 3.F.
H. Federal Income Taxes — The Fund is treated as a separate taxable entity for Federal income tax purposes. The Fund’s policy is to comply with the provisions of the Internal Revenue Code (the “Code”) applicable to regulated investment companies and to distribute to shareholders all of its distributable net investment income and net realized capital gains on investments. Accordingly, no provision for Federal income tax is necessary. Management has reviewed the Fund’s tax positions for all open tax years and has determined that as of June 30, 2020, no liability for Federal income tax is required in the Fund’s financial statements for net unrecognized tax benefits. However, management’s conclusions may be subject to future review based on changes in, or the interpretation of, the accounting standards or tax laws and regulations. The Fund’s Federal tax returns for the prior three fiscal years remain subject to examination by the Internal Revenue Service.
I. Distributions to Shareholders — Distributions from net investment income are generally declared and paid annually and are declared separately for each class. No class has preferential dividend rights; differences in per share rates are due to differences in separate class expenses. Net realized capital gains, if any, are distributed at least annually. The amount of distributions from net investment income and net realized capital gains is determined in accordance with Federal income tax regulations, which may differ from GAAP. To the extent these “book/tax” differences are permanent in nature (i.e., that they result from other than timing of recognition — “temporary differences”), such amounts are reclassified within the capital accounts based on their Federal tax basis treatment.
The following amounts were reclassified within the capital accounts:
| Paid-in-Capital | Accumulated undistributed (distributions in excess of) net investment income | Accumulated net realized gains (losses) | ||||||||||
| $ | (1 | ) | $ | 18,282 | $ | (18,281 | ) | |||||
The reclassifications for the Fund relate primarily to foreign currency gains or losses.
3. Fees and Other Transactions with Affiliates
A. Investment Advisory Fee — Pursuant to an Investment Advisory Agreement, the Adviser supervises the investments of the Fund and for such services is paid a fee. The fee is accrued daily and paid monthly at an annual rate of 0.25% of the Fund’s average daily net assets. Prior to March 1, 2020, the investment advisory fee was accrued daily and paid monthly at an annual rate of 0.35% of the Fund’s average daily net assets.
The Adviser waived investment advisory fees and/or reimbursed expenses as outlined in Note 3.F.
B. Administration Fee — Pursuant to an Administration Agreement, the Administrator provides certain administration services to the Fund. In consideration of these services, the Administrator receives a fee accrued daily and paid monthly at an annual rate of 0.075% of the first $10 billion of
| 20 | J.P. MORGAN FUNDS | JUNE 30, 2020 | ||||
Table of Contents
the Fund’s average daily net assets, plus 0.050% of the Fund’s average daily net assets between $10 billion and $20 billion, plus 0.025% of the Fund’s average daily net assets between $20 billion and $25 billion, plus 0.01% of the Fund’s average daily net assets in excess of $25 billion. For the year ended June 30, 2020, the effective rate was 0.08% of the Fund’s average daily net assets, notwithstanding any fee waivers and/or expense reimbursements.
The Administrator waived administration fees as outlined in Note 3.F.
JPMorgan Chase Bank, N.A. (“JPMCB”), a wholly-owned subsidiary of JPMorgan, serves as the Fund’s sub-administrator (the “Sub-administrator”). For its services as Sub-administrator, JPMCB receives a portion of the fees payable to the Administrator.
C. Distribution Fees — Pursuant to a Distribution Agreement, JPMorgan Distribution Services, Inc. (“JPMDS”), an indirect, wholly-owned subsidiary of JPMorgan, serves as the Trust’s principal underwriter and promotes and arranges for the sale of the Fund’s shares.
The Board has adopted a Distribution Plan (the “Distribution Plan”) for Class A, Class R2 and Class R3 Shares of the Fund in accordance with Rule 12b-1 under the 1940 Act. Class I, Class R4, Class R5 and Class R6 do not charge a distribution fee. The Distribution Plan provides that the Fund shall pay distribution fees, including payments to JPMDS, at annual rates of 0.25%, 0.50% and 0.25% of the average daily net assets of Class A, Class R2 and Class R3 Shares, respectively.
In addition, JPMDS is entitled to receive the front-end sales charges from purchases of Class A Shares and the CDSC from redemptions of certain Class A Shares for which front-end sales charges have been waived. For the year ended June 30, 2020, JPMDS did not retain any front-end sales charges or CDSC.
D. Service Fees — The Trust, on behalf of the Fund, has entered into a Shareholder Servicing Agreement with JPMDS under which JPMDS provides certain support services to fund shareholders. For performing these services, JPMDS receives a fee, except for Class R6 Shares which do not charge a service fee, that is accrued daily and paid monthly equal to a percentage of the average daily net assets as shown in the table below:
| Class A | Class I | Class R2 | Class R3 | Class R4 | Class R5 | |||||||||||||||||||
| 0.25 | % | 0.25 | % | 0.25 | % | 0.25 | % | 0.25 | % | 0.10 | % | |||||||||||||
JPMDS has entered into shareholder services contracts with affiliated and unaffiliated financial intermediaries who provide shareholder services and other related services to their clients or customers who invest in the Fund under which JPMDS will pay all or a portion of such fees earned to financial intermediaries for performing such services.
JPMDS waived service fees as outlined in Note 3.F.
E. Custodian and Accounting Fees — JPMCB provides portfolio custody and accounting services to the Fund. For performing these services, the Fund pays JPMCB transaction and asset-based fees that vary according to the number of transactions and positions, plus out-of-pocket expenses. The amounts paid directly to JPMCB by the Fund for custody and accounting services are included in Custodian and accounting fees on the Statement of Operations.
Interest income earned on cash balances at the custodian, if any, is included in Interest income from affiliates on the Statement of Operations.
Interest expense paid to the custodian related to cash overdrafts, if any, is included in Interest expense to affiliates on the Statement of Operations.
F. Waivers and Reimbursements — The Adviser, Administrator and JPMDS have contractually agreed to waive fees and/or reimburse expenses to the extent that total annual operating expenses of the Fund, Underlying Funds and ETFs (excluding dividend and interest expenses related to short sales, interest, taxes, expenses related to litigation and potential litigation, expenses related to trustee elections and extraordinary expenses incurred by the Fund and any Underlying Fund and ETFs and acquired fund fees incurred by an Underlying Fund and ETFs) exceed the percentages of the Fund’s average daily net assets as shown in the table below:
| Class A | Class I | Class R2(1) | Class R3(1) | Class R4(1) | Class R5(1) | Class R6(1) | ||||||||||||||||||||||
| 0.74 | % | 0.49 | % | 1.04 | % | 0.79 | % | 0.54 | % | 0.39 | % | 0.29 | % | |||||||||||||||
| (1) | Prior to March 1, 2020, the contractual expense limitations for Class R2 Shares, Class R3 Shares, Class R4 Shares, Class R5 Shares and Class R6 Shares were 1.15%, 0.90%, 0.65%, 0.50% and 0.40%, respectively. The contractual expense percentages in the table above are in place until at least October 31, 2020. |
The expense limitation agreement was in effect for the year ended June 30, 2020 and is in place until at least October 31, 2020.
For the year ended June 30, 2020, the Fund’s service providers waived fees and/or reimbursed expenses for the Fund as follows. None of these parties expect the Fund to repay any such waived fees and reimbursed expenses in future years.
| Contractual Waivers | ||||||||||||||||||||
| Investment Advisory Fees | Administration Fees | Service Fees | Total | Contractual Reimbursement | ||||||||||||||||
| $ | 95,381 | $ | 22,442 | $ | 36,124 | $ | 153,947 | $ | 201,642 | |||||||||||
| JUNE 30, 2020 | J.P. MORGAN FUNDS | 21 | ||||||
Table of Contents
NOTES TO FINANCIAL STATEMENTS
AS OF JUNE 30, 2020 (continued)
The Underlying Funds and ETFs may impose separate advisory and servicing fees. To avoid charging a servicing fee at an effective rate above 0.25% for Class A, Class I, Class R2, Class R3 and Class R4 Shares and above 0.10% for Class R5 Shares, JPMDS may waive servicing fees with respect to the Fund in an amount equal to the weighted average pro-rata amount of servicing fees charged by the affiliated Underlying Funds and ETFs. These waivers may be in addition to any waivers required to meet the Fund’s contractual expense limitations, but will not exceed the Fund’s servicing fees.
G. Other — Certain officers of the Trust are affiliated with the Adviser, the Administrator and JPMDS. Such officers, with the exception of the Chief Compliance Officer, receive no compensation from the Fund for serving in their respective roles.
The Board designated and appointed a Chief Compliance Officer to the Fund pursuant to Rule 38a-1 under the 1940 Act. The Fund, along with affiliated funds, makes reimbursement payments, on a pro-rata basis, to the Administrator for a portion of the fees associated with the office of the Chief Compliance Officer. Such fees are included in Trustees’ and Chief Compliance Officer’s fees on the Statement of Operations.
The Trust adopted a Trustee Deferred Compensation Plan (the “Plan”) which allows the independent Trustees to defer the receipt of all or a portion of compensation related to performance of their duties as Trustees. The deferred fees are invested in various J.P. Morgan Funds until distribution in accordance with the Plan.
The Securities and Exchange Commission (“SEC”) has granted an exemptive order permitting the Fund to invest in certain financial instruments in addition to Underlying Funds and securities.
4. Investment Transactions
During the year ended June 30, 2020, purchases and sales of investments (excluding short-term investments) were as follows:
| Purchases (excluding U.S. Government) | Sales (excluding U.S. Government) | Purchases of U.S. | Sales of U.S. | |||||||||||||
| $ | 36,108,618 | $ | 38,638,614 | $ | 408,713 | $ | 483,610 | |||||||||
5. Federal Income Tax Matters
For Federal income tax purposes, the estimated cost and unrealized appreciation (depreciation) in value of investments held at June 30, 2020 were as follows:
| Aggregate Cost | Gross Unrealized Appreciation | Gross Unrealized Depreciation | Net Unrealized Appreciation (Depreciation) | |||||||||||||
| $ | 28,205,811 | $ | 598,883 | $ | 342,083 | $ | 256,800 | |||||||||
The difference between book and tax basis appreciation (depreciation) on investments is primarily attributed to wash sale loss deferrals and mark to market of futures contracts.
The tax character of distributions paid during the year ended June 30, 2020 was as follows:
| Ordinary Income* | Net Long-Term Capital Gains | Total Distributions Paid | ||||||||||
| $ | 945,981 | $ | 874,307 | $ | 1,820,288 | |||||||
| * | Short-term gain distributions are treated as ordinary income for income tax purposes. |
The tax character of distributions paid during the year ended June 30, 2019 was as follows:
| Ordinary Income* | Net Long-Term Capital Gains | Total Distributions Paid | ||||||||||
| $ | 1,078,615 | $ | 315,182 | $ | 1,393,797 | |||||||
| * | Short-term gain distributions are treated as ordinary income for income tax purposes. |
As of June 30, 2020, the estimated components of net assets (excluding paid-in-capital) on a tax basis were as follows:
| Current Distributable Ordinary Income | Current Distributable Long-Term Capital Gain (Tax Basis Capital Loss Carryover) | Unrealized Appreciation (Depreciation) | ||||||||||
| $ | 288,748 | $ | — | $ | 236,470 | |||||||
| 22 | J.P. MORGAN FUNDS | JUNE 30, 2020 | ||||
Table of Contents
The cumulative timing differences primarily consist of mark to market of futures contracts, post-October capital loss deferrals, straddle loss deferrals, trustee deferred compensation and wash sale loss deferrals.
At June 30, 2020, the Fund did not have any net capital loss carryforwards.
Net capital losses incurred after October 31, and within the taxable year are deemed to arise on the first business day of the Fund’s next taxable year. For the year ended June 30, 2020 the Fund deferred to July 1, 2020 the following net capital losses of:
| Net Capital Losses (Gains) | ||||||||
Short-Term | Long-Term | |||||||
| $ | 944,065 | $ | (56,793 | ) | ||||
6. Borrowings
The Fund relies upon an exemptive order granted by the SEC (the “Order”) permitting the establishment and operation of an Interfund Lending Facility (the “Facility”). The Facility allows the Fund to directly lend and borrow money to or from any other fund relying upon the Order at rates beneficial to both the borrowing and lending funds. Advances under the Facility are taken primarily for temporary or emergency purposes, including the meeting of redemption requests that otherwise might require the untimely disposition of securities, and are subject to the Fund’s borrowing restrictions. The Interfund loan rate is determined, as specified in the Order, by averaging the current repurchase agreement rate and the current bank loan rate. The Order was granted to JPMorgan Trust II and may be relied upon by the Fund because the Fund and the series of JPMorgan Trust II are both investment companies in the same “group of investment companies” (as defined in Section 12(d)(1)(G) of the 1940 Act).
The Fund had no borrowings outstanding from another fund during the year ended June 30, 2020.
The Trust and JPMCB have entered into a financing arrangement. Under this arrangement, JPMCB provides an unsecured, uncommitted credit facility in the aggregate amount of $100 million to certain of the J.P. Morgan Funds, including the Fund. Advances under the arrangement are taken primarily for temporary or emergency purposes, including the meeting of redemption requests that otherwise might require the untimely disposition of securities, and are subject to the Fund’s borrowing restrictions. Interest on borrowings is payable at a rate determined by JPMCB at the time of borrowing. This agreement has been extended until November 2, 2020.
The Fund had no borrowings outstanding from the unsecured, uncommitted credit facility during the year ended June 30, 2020.
The Trust, along with certain other trusts for J.P. Morgan Funds (“Borrowers”), has entered into a joint syndicated senior unsecured revolving credit facility totaling $1.5 billion (“Credit Facility”) with various lenders and The Bank of New York Mellon, as administrative agent for the lenders. Effective August 14, 2018, the Fund was added to the Credit facility. This Credit Facility provides a source of funds to the Borrowers for temporary and emergency purposes, including the meeting of redemption requests that otherwise might require the untimely disposition of securities. Under the terms of the Credit Facility, a borrowing fund must have a minimum of $25,000,000 in adjusted net asset value and not exceed certain adjusted net asset coverage ratios prior to and during the time in which any borrowings are outstanding. If a fund does not comply with the aforementioned requirements, the fund must remediate within three business days with respect to the $25,000,000 minimum adjusted net asset value or within one business day with respect to certain asset coverage ratios or the administrative agent at the request of, or with the consent of, the lenders may terminate the Credit Facility and declare any outstanding borrowings to be due and payable immediately.
Interest associated with any borrowing under the Credit Facility is charged to the borrowing fund at a rate of interest equal to 1.00%, which has increased to 1.25% pursuant to the amendment referenced below, plus the greater of the federal funds effective rate or one month London InterBank Offered Rate (“LIBOR”). The annual commitment fee to maintain the Credit Facility is 0.15% and is incurred on the unused portion of the Credit Facility and is allocated to all participating funds pro rata based on their respective net assets. Effective August 11, 2020, this agreement has been amended and restated for a term of 364 days, unless extended, and to include the change to the interest rate charged for borrowing from the Credit Facility to 1.25%, as noted above, and an upfront fee of 0.075% of the Credit Facility to be charged and paid by all participating funds in the Credit Facility.
The Fund did not utilize the Credit Facility during the year ended June 30, 2020.
7. Risks, Concentrations and Indemnifications
In the normal course of business, the Fund enters into contracts that contain a variety of representations which provide general indemnifications. The Fund’s maximum exposure under these arrangements is unknown. The amount of exposure would depend on future claims that may be brought against the Fund. However, based on experience, the Fund expects the risk of loss to be remote.
As of June 30, 2020, all of the Fund’s shares were held by the Adviser.
Because of the Fund’s investments in the Underlying Funds and ETFs, the Fund indirectly pays a portion of the expenses incurred by the Underlying Funds and ETFs. As a result, the cost of investing in the Fund may be higher than the cost of investing in a mutual fund that invests directly in Individual securities and financial instruments. The Fund is also subject to certain risks related to the Underlying Funds’ and ETFs’ investments in securities and financial instruments such as equity securities, foreign and emerging markets securities and real estate securities. These securities are subject to risks specific to their structure, sector or market.
| JUNE 30, 2020 | J.P. MORGAN FUNDS | 23 | ||||||
Table of Contents
NOTES TO FINANCIAL STATEMENTS
AS OF JUNE 30, 2020 (continued)
The Fund invests in ETFs. ETFs are pooled investment vehicles whose ownership interests are purchased and sold on a securities exchange. ETFs may be structured as investment companies, depositary receipts or other pooled investment vehicles and may be passively or actively managed. Passively managed ETFs generally seek to track the performance of a particular market index, including broad-based market indexes, as well as indexes relating to particular sectors, markets, regions or industries. Actively managed ETFs do not seek to track the performance of a particular market index. The price movement of an index-based ETF may not track the underlying index and may result in a loss. In addition, ETFs may trade at a price below or above their NAV (also known as a discount or premium, respectively).
In addition, the Underlying Funds and ETFs may use derivative instruments in connection with their individual investment strategies including futures contracts, forward foreign currency exchange contracts, options, swaps and other derivatives, which are also subject to specific risks related to their structure, sector or market and may be riskier than investments in other types of securities.
Derivatives may be riskier than other types of investments because they may be more sensitive to changes in economic and market conditions and could result in losses that significantly exceed the Fund’s original investment. Many derivatives create leverage thereby causing the Fund to be more volatile than they would have been if they had not used derivatives. Derivatives also expose the Fund to counterparty risk (the risk that the derivative counterparty will not fulfill its contractual obligations), including credit risk of the derivative counterparty. The possible lack of a liquid secondary market for derivatives and the resulting inability of the Fund to sell or otherwise close a derivatives position could expose the Fund to losses.
Specific risks and concentrations present in the Underlying Funds and ETFs are disclosed within their individual financial statements and registration statements, as appropriate.
LIBOR is intended to represent the rate at which contributing banks may obtain short-term borrowings from each other in the London interbank market. The regulatory authority that oversees financial services firms and financial markets in the U.K. has announced that, after the end of 2021, it would no longer persuade or compel contributing banks to make rate submissions for purposes of determining the LIBOR rate. As a result, it is possible that commencing in 2022, LIBOR may no longer be available or no longer deemed an appropriate reference rate upon which to determine the interest rate on or impacting certain loans, notes, derivatives and other instruments or investments comprising some or all of the Fund’s portfolio. In light of this eventuality, public and private sector industry initiatives are currently underway to identify new or alternative reference rates to be used in place of LIBOR. There is no assurance that the composition or characteristics of any such alternative reference rate will be similar to or produce the same value or economic equivalence as LIBOR or that it will have the same volume or liquidity as did LIBOR prior to its discontinuance or unavailability, which may affect the value or liquidity or return on certain investments of the Fund and result in costs incurred in connection with closing out positions and entering into new trades. These risks may also apply with respect to changes in connection with other interbank offering rates (e.g., Euribor) and a wide range of other index levels, rates and values that are treated as “benchmarks” and are the subject of recent regulatory reform.
The Fund is subject to infectious disease epidemics/pandemics risk. Recently, the worldwide outbreak of COVID-19, a novel coronavirus disease, has negatively affected economies, markets and individual companies throughout the world. The effects of this COVID-19 pandemic to public health, and business and market conditions, including exchange trading suspensions and closures may continue to have a significant negative impact on the performance of the Fund’s investments, increase the Fund’s volatility, exacerbate other pre-existing political, social and economic risks to the Fund and negatively impact broad segments of businesses and populations. The Fund’s operations may be interrupted as a result, which may have a significant negative impact on investment performance. In addition, governments, their regulatory agencies, or self-regulatory organizations may take actions in response to the pandemic that affect the instruments in which the Fund invests, or the issuers of such instruments, in ways that could also have a significant negative impact on the Fund’s investment performance. The full impact of this COVID-19 pandemic, or other future epidemics/pandemics, is currently unknown.
8. Subsequent Event
On August 11, 2020, the Board approved changes to the investment advisory fee and the expense limitation agreement for the Fund. Effective November 1, 2020, the investment advisory fee for the Fund will be reduced from 0.25% to 0.15% and the contractual expense limitation will decrease to 0.69%, 0.44%, 0.94%, 0.69%, 0.44%, 0.29% and 0.19% for Class A, Class I, Class R2, Class R3, Class R4, Class R5 and Class R6 Shares, respectively, and will be in place until at least October 31, 2021.
| 24 | J.P. MORGAN FUNDS | JUNE 30, 2020 | ||||
Table of Contents
REPORT OF INDEPENDENT REGISTERED PUBLIC ACCOUNTING FIRM
To the Board of Trustees of JPMorgan Trust IV and Shareholders of JPMorgan SmartSpendingSM 2015 Fund
Opinion on the Financial Statements
We have audited the accompanying statement of assets and liabilities, including the schedule of portfolio investments, of JPMorgan SmartSpending 2015 Fund (formerly known as JPMorgan SmartSpending 2050 Fund) (one of the funds constituting JPMorgan Trust IV, referred to hereafter as the “Fund’’) as of June 30, 2020, the related statement of operations for the year ended June 30, 2020, the statement of changes in net assets for each of the two years in the period ended June 30, 2020, including the related notes, and the financial highlights for each of the three years in the period ended June 30, 2020 and for the period December 30, 2016 (commencement of operations) through June 30, 2017 (collectively referred to as the “financial statements”). In our opinion, the financial statements present fairly, in all material respects, the financial position of the Fund as of June 30, 2020, the results of its operations for the year then ended, the changes in its net assets for each of the two years in the period ended June 30, 2020 and the financial highlights for each of the three years in the period ended June 30, 2020 and for the period December 30, 2016 (commencement of operations) through June 30, 2017 in conformity with accounting principles generally accepted in the United States of America.
Basis for Opinion
These financial statements are the responsibility of the Fund’s management. Our responsibility is to express an opinion on the Fund’s financial statements based on our audits. We are a public accounting firm registered with the Public Company Accounting Oversight Board (United States) (PCAOB) and are required to be independent with respect to the Fund in accordance with the U.S. federal securities laws and the applicable rules and regulations of the Securities and Exchange Commission and the PCAOB.
We conducted our audits of these financial statements in accordance with the standards of the PCAOB. Those standards require that we plan and perform the audit to obtain reasonable assurance about whether the financial statements are free of material misstatement, whether due to error or fraud.
Our audits included performing procedures to assess the risks of material misstatement of the financial statements, whether due to error or fraud, and performing procedures that respond to those risks. Such procedures included examining, on a test basis, evidence regarding the amounts and disclosures in the financial statements. Our audits also included evaluating the accounting principles used and significant estimates made by management, as well as evaluating the overall presentation of the financial statements. Our procedures included confirmation of securities owned as of June 30, 2020 by correspondence with the custodian, transfer agent and brokers; when replies were not received from brokers, we performed other auditing procedures. We believe that our audits provide a reasonable basis for our opinion.
/s/ PricewaterhouseCoopers LLP
New York, New York
August 24, 2020
We have served as the auditor of one or more investment companies in the JPMorgan Funds complex since 1993.
| JUNE 30, 2020 | J.P. MORGAN FUNDS | 25 | ||||||
Table of Contents
(Unaudited)
The Fund’s Statement of Additional Information includes additional information about the Fund’s Trustees and is available, without charge, upon request by calling 1-800-480-4111 or on the J.P. Morgan Funds’ website at www.jpmorganfunds.com.
Name (Year of Birth); Positions With the Fund (1) | Principal Occupation During Past 5 Years | Number of Funds in Fund Complex Overseen by Trustee (2) | Other Directorships Held During the Past 5 Years | |||
Independent Trustees | ||||||
| John F. Finn (1947); Chairman since 2020; Trustee of Trust since 2005; Trustee of heritage One Group Mutual Funds since 1998. | Chairman, Gardner, Inc. (supply chain management company serving industrial and consumer markets) (serving in various roles 1974-present). | 126 | Director, Greif, Inc. (GEF) (industrial package products and services) (2007-present); Trustee, Columbus Association for the Performing Arts (1988-present); Director, Cardinal Health, Inc. (CAH) (1994-2014). | |||
| Stephen P. Fisher (1959); Trustee of Trust since 2018. | Retired; Chairman and Chief Executive Officer, NYLIFE Distributors LLC (registered broker-dealer) (serving in various roles 2008-2013); Chairman, NYLIM Service Company LLC (transfer agent) (2008-2017); New York Life Investment Management LLC (registered investment adviser) (serving in various roles 2005-2017); Chairman, IndexIQ Advisors LLC (registered investment adviser for ETFs) (2014-2017); President, MainStay VP Funds Trust (2007-2017), MainStay DefinedTerm Municipal Opportunities Fund (2011-2017) and MainStay Funds Trust (2007-2017) (registered investment companies). | 126 | Honors Program Advisory Board Member, The Zicklin School of Business, Baruch College, The City University of New York (2017-present). | |||
| Kathleen M. Gallagher (1958); Trustee of Trust since 2018. | Retired; Chief Investment Officer — Benefit Plans, Ford Motor Company (serving in various roles 1985-2016). | 126 | Non-Executive Director, Legal & General Investment Management (Holdings) (2018-present); Non-Executive Director, Legal & General Investment Management America (financial services and insurance) (2017-present); Advisory Board Member, Fiduciary Solutions, State Street Global Advisors (2017-present); Member, Client Advisory Council, Financial Engines, LLC (registered investment adviser) (2011-2016); Director, Ford Pension Funds Investment Management Ltd. (2007-2016). | |||
| Dennis P. Harrington* (1950); Trustee of Trust since 2017. | Retired; Partner, Deloitte LLP (accounting firm) (serving in various roles 1984-2012). | 126 | None | |||
| Frankie D. Hughes (1952); Trustee of Trust since 2008. | President, Ashland Hughes Properties (property management) (2014-present); President and Chief Investment Officer, Hughes Capital Management, Inc. (fixed income asset management) (1993-2014). | 126 | None | |||
| 26 | J.P. MORGAN FUNDS | JUNE 30, 2020 | ||||
Table of Contents
Name (Year of Birth); Positions With the Fund (1) | Principal Occupation During Past 5 Years | Number of Funds in Fund Complex Overseen by Trustee (2) | Other Directorships Held During the Past 5 Years | |||
Independent Trustees (continued) | ||||||
Raymond Kanner** (1953); Trustee of Trust since 2017. | Retired; Managing Director & Chief Investment Officer, IBM Retirement Funds (2007-2016). | 126 | Advisory Board Member, Penso Advisors LLC (2020-present); Advisory Board Member, Los Angeles Capital (2018-present); Advisory Board Member, State Street Global Advisors Fiduciary Solutions Board (2017-present); Acting Executive Director, Committee on Investment of Employee Benefit Assets (CIEBA) (2016-2017); Advisory Board Member, Betterment for Business (robo advisor) (2016-2017); Advisory Board Member, BlueStar Indexes (index creator) (2013-2017); Director, Emerging Markets Growth Fund (registered investment company) (1997-2016); Member, Russell Index Client Advisory Board (2001-2015). | |||
| Peter C. Marshall (1942); Trustee of Trust since 2005; Trustee of heritage One Group Mutual Funds since 1985. | Self-employed business consultant (2002-present). | 126 | None | |||
| Mary E. Martinez (1960); Trustee of Trust since 2013. | Associate, Special Properties, a Christie’s International Real Estate Affiliate (2010-present); Managing Director, Bank of America (Asset Management) (2007-2008); Chief Operating Officer, U.S. Trust Asset Management, U.S. Trust Company (asset management) (2003-2007); President, Excelsior Funds (registered investment companies) (2004-2005). | 126 | None | |||
| Marilyn McCoy (1948); Trustee of Trust since 2005; Trustee of heritage One Group Mutual Funds since 1999. | Vice President of Administration and Planning, Northwestern University (1985-present). | 126 | None | |||
| Mitchell M. Merin (1953); Trustee of Trust since 2013. | Retired; President and Chief Operating Officer, Morgan Stanley Investment Management, Member Morgan Stanley & Co. Management Committee (serving in various roles 1981-2006). | 126 | Director, Sun Life Financial (SLF) (financial services and insurance) (2007-2013). | |||
| Dr. Robert A. Oden, Jr. (1946); Trustee of Trust since 2005; Trustee of heritage One Group Mutual Funds since 1997. | Retired; President, Carleton College (2002-2010); President, Kenyon College (1995-2002). | 126 | Trustee and Vice Chair, Trout Unlimited (2017-present); Trustee, American Museum of Fly Fishing (2013-present); Vice Chair, Dartmouth-Hitchcock Medical Center (2011-present); Trustee, American University in Cairo (1999-2014). | |||
| Marian U. Pardo*** (1946); Trustee of Trust since 2013. | Managing Director and Founder, Virtual Capital Management LLC (investment consulting) (2007-present); Managing Director, Credit Suisse Asset Management (portfolio manager) (2003-2006). | 126 | President and Member, Board of Governors, Columbus Citizens Foundation (not-for-profit supporting philanthropic and cultural programs) (2006-present). | |||
| JUNE 30, 2020 | J.P. MORGAN FUNDS | 27 | ||||||
Table of Contents
TRUSTEES
(Unaudited) (continued)
| (1) | The Trustees serve for an indefinite term, subject to the Trust’s current retirement policy, which is age 78 for all Trustees. |
| (2) | A Fund Complex means two or more registered investment companies that hold themselves out to investors as related companies for purposes of investment and investor services or have a common investment adviser or have an investment adviser that is an affiliated person of the investment adviser of any of the other registered investment companies. The J.P. Morgan Funds Complex for which the Board of Trustees serves currently includes ten registered investment companies (126 funds). |
| * | Two family members of Mr. Harrington are partner and managing director, respectively, of the Fund’s independent registered public accounting firm. Such firm has represented to the Board that those family members are not involved in the audit of the Fund’s financial statements and do not provide other services to the Fund. The Board has concluded that such association does not interfere with Mr. Harrington’s exercise of independent judgment as an Independent Trustee. |
| ** | A family member of Mr. Kanner is employed by JPMorgan Chase Bank, which is affiliated with JPMIM and JPMDS. In that capacity, this employee provides services to various JPMorgan affiliates including JPMIM and JPMDS and for which JPMIM and JPMDS bear some portion of the expense thereof. |
| *** | In connection with prior employment with JPMorgan Chase, Ms. Pardo was the recipient of non-qualified pension plan payments from JPMorgan Chase in the amount of approximately $2,055 per month, which she irrevocably waived effective January 1, 2013, and deferred compensation payments from JPMorgan Chase in the amount of approximately $7,294 per year, which ended in January 2013. In addition, Ms. Pardo receives payments from a fully-funded qualified plan, which is not an obligation of JPMorgan Chase. |
The contact address for each of the Trustees is 277 Park Avenue, New York, NY 10172.
| 28 | J.P. MORGAN FUNDS | JUNE 30, 2020 | ||||
Table of Contents
(Unaudited)
Name (Year of Birth), Positions Held with the Trust (Since) | Principal Occupations During Past 5 Years | |
| Brian S. Shlissel (1964), President and Principal Executive Officer (2016) | Managing Director and Chief Administrative Officer for J.P. Morgan pooled vehicles, J.P. Morgan Investment Management Inc. (formerly JPMorgan Funds Management, Inc.) (from 2014 to present); Managing Director and Head of Mutual Fund Services, Allianz Global Investors; President and Chief Executive Officer, Allianz Global Investors Mutual Funds and PIMCO Closed-End Funds (from 1999 to 2014). | |
Timothy J. Clemens (1975), Treasurer and Principal Financial Officer (2018)* | Executive Director, J.P. Morgan Investment Management Inc. (formerly JPMorgan Funds Management, Inc.) since February 2016; Vice President, JPMorgan Funds Management, Inc. from October 2013 to January 2016. | |
Gregory S. Samuels (1980), | Executive Director and Assistant General Counsel, JPMorgan Chase since February 2014; formerly Vice President and Assistant General Counsel, JPMorgan Chase from 2010 to February 2014. | |
| Stephen M. Ungerman (1953), Chief Compliance Officer (2005) | Managing Director, JPMorgan Chase & Co.; Mr. Ungerman has been with JPMorgan Chase & Co. since 2000. | |
Elizabeth A. Davin (1964), Assistant Secretary (2005)** | Executive Director and Assistant General Counsel, JPMorgan Chase since February 2012; formerly Vice President and Assistant General Counsel, JPMorgan Chase from 2005 to February 2012; Senior Counsel, JPMorgan Chase (formerly Bank One Corporation) from 2004 to 2005. | |
| Jessica K. Ditullio (1962), Assistant Secretary (2005)** | Executive Director and Assistant General Counsel, JPMorgan Chase. Ms. Ditullio has been with JPMorgan Chase (formerly Bank One Corporation) since 1990. | |
Anthony Geron (1971), Assistant Secretary (2018)* | Vice President and Assistant General Counsel, JPMorgan Chase since September 2018; Lead Director and Counsel, AXA Equitable Life Insurance Company from 2015 to 2018 and Senior Director and Counsel, AXA Equitable Life Insurance Company from 2014 to 2015. | |
| Carmine Lekstutis (1980), Assistant Secretary (2011)* | Executive Director and Assistant General Counsel, JPMorgan Chase since February 2015; formerly Vice President and Assistant General Counsel, JPMorgan Chase from 2011 to February 2015. | |
| Keri E. Riemer (1976), Assistant Secretary (2019)* | Executive Director and Assistant General Counsel, JPMorgan Chase since February 2019; Counsel, Seward & Kissel LLP (law firm) (2016-2019); Associate, Seward & Kissel LLP (2011-2016). | |
Zachary E. Vonnegut-Gabovitch (1986), Assistant Secretary (2017)* | Vice President and Assistant General Counsel, JPMorgan Chase since September 2016; Associate, Morgan, Lewis & Bockius (law firm) from 2012 to 2016. | |
Michael M. D’Ambrosio (1969), Assistant Treasurer (2012) | Managing Director, J.P. Morgan Investment Management Inc. (formerly JPMorgan Funds Management, Inc.) since May 2014; formerly Executive Director, JPMorgan Funds Management, Inc. from 2012 to May 2014. | |
Aleksandr Fleytekh (1972), Assistant Treasurer (2019)* | Vice President, J.P. Morgan Investment Management Inc. (formerly JPMorgan Funds Management, Inc.) since February 2012. | |
Shannon Gaines (1977), Assistant Treasurer (2018)** | Vice President, J.P. Morgan Investment Management Inc. (formerly JPMorgan Funds Management, Inc.) since January 2014. | |
Jeffrey D. House (1972), Assistant Treasurer (2017)** | Vice President, J.P. Morgan Investment Management Inc. (formerly JPMorgan Funds Management, Inc.) since July 2006. | |
Lauren A. Paino (1973), Assistant Treasurer (2014)* | Executive Director, J.P. Morgan Investment Management Inc. (formerly JPMorgan Funds Management, Inc.) since August 2013. | |
| Joseph Parascondola (1963), Assistant Treasurer (2011)* | Executive Director, J.P. Morgan Investment Management, Inc. since February 2020, formerly Vice President, J.P. Morgan Investment Management Inc. (formerly JPMorgan Funds Management, Inc.) from August 2006 to January 2020. | |
Gillian I. Sands (1969), Assistant Treasurer (2012)* | Vice President, J.P. Morgan Investment Management Inc. (formerly JPMorgan Funds Management, Inc.) since September 2012. | |
The contact address for each of the officers, unless otherwise noted, is 277 Park Avenue, New York, NY 10172.
| * | The contact address for the officer is 4 New York Plaza, New York, NY 10004. |
| ** | The contact address for the officer is 1111 Polaris Parkway, Columbus, OH 43240. |
| JUNE 30, 2020 | J.P. MORGAN FUNDS | 29 | ||||||
Table of Contents
SCHEDULE OF SHAREHOLDER EXPENSES
(Unaudited)
Hypothetical $1,000 Investment
As a shareholder of the Fund, you incur two types of costs: (1) transaction costs, including sales charges (loads) on purchase payments and (2) ongoing costs, including investment advisory fees, administration fees, distribution fees and other Fund expenses. The examples below are intended to help you understand your ongoing costs (in dollars) of investing in the Fund (not including expenses of the Underlying Funds and ETFs) and to compare these ongoing costs with the ongoing costs of investing in other mutual funds. The examples assume that you had a $1,000 investment in each Class at the beginning of the reporting period, January 1, 2020, and continued to hold your shares at the end of the reporting period, June 30, 2020.
Actual Expenses
For each Class of the Fund in the table below, the first line provides information about actual account values and actual expenses. You may use the information in this line, together with the amount you invested, to estimate the expenses that you paid over the period. Simply divide your account value by $1,000 (for example, an $8,600 account value divided by $1,000 = 8.6), then multiply the result by the number in the first line of each Class under the heading titled “Expenses Paid During the Period” to estimate the expenses you paid on your account during this period.
Hypothetical Example for Comparison Purposes
The second line of each Class in the table below provides information about hypothetical account values and hypothetical expenses based on the Class’ actual expense ratio and an assumed rate of return of 5% per year before expenses, which is not the Class’ actual return. The hypothetical account values and expenses may not be used to estimate the actual ending account balance or expenses you paid for the period. You may use this information to compare the ongoing costs of investing in the Class of the Fund and other funds. To do so, compare this 5% hypothetical example with the 5% hypothetical examples that appear in the shareholder reports of the other funds. Please note that the expenses shown in the table are meant to highlight your ongoing costs only and do not reflect any transaction costs, such as sales charges (loads) or redemption fees, and expenses of the Underlying Funds and ETFs. Therefore, the second line for each Class in the table is useful in comparing ongoing costs only, and will not help you determine the relative total costs of owning different funds. In addition, if these transaction costs were included, your costs would have been higher. The examples also assume all dividends and distributions have been reinvested.
| Beginning Account Value January 1, 2020 | Ending Account Value June 30, 2020 | Expenses Paid During the Period* | Annualized Ratio | |||||||||||||
JPMorgan SmartSpendingSM 2015 Fund | ||||||||||||||||
Class A | ||||||||||||||||
Actual | $ | 1,000.00 | $ | 946.10 | $ | 2.47 | 0.51 | % | ||||||||
Hypothetical | 1,000.00 | 1,022.33 | 2.56 | 0.51 | ||||||||||||
Class I | ||||||||||||||||
Actual | 1,000.00 | 947.30 | 1.26 | 0.26 | ||||||||||||
Hypothetical | 1,000.00 | 1,023.57 | 1.31 | 0.26 | ||||||||||||
Class R2 | ||||||||||||||||
Actual | 1,000.00 | 944.70 | 4.11 | 0.85 | ||||||||||||
Hypothetical | 1,000.00 | 1,020.64 | 4.27 | 0.85 | ||||||||||||
Class R3 | ||||||||||||||||
Actual | 1,000.00 | 946.00 | 2.90 | 0.60 | ||||||||||||
Hypothetical | 1,000.00 | 1,021.88 | 3.02 | 0.60 | ||||||||||||
Class R4 | ||||||||||||||||
Actual | 1,000.00 | 947.30 | 1.69 | 0.35 | ||||||||||||
Hypothetical | 1,000.00 | 1,023.12 | 1.76 | 0.35 | ||||||||||||
Class R5 | ||||||||||||||||
Actual | 1,000.00 | 948.00 | 1.02 | 0.21 | ||||||||||||
Hypothetical | 1,000.00 | 1,023.82 | 1.06 | 0.21 | ||||||||||||
Class R6 | ||||||||||||||||
Actual | 1,000.00 | 948.60 | 0.48 | 0.10 | ||||||||||||
Hypothetical | 1,000.00 | 1,024.37 | 0.50 | 0.10 | ||||||||||||
| * | Expenses are equal to each Class’ respective annualized expense ratio, multiplied by the average account value over the period, multiplied by 182/366 (to reflect the one-half year period). |
| 30 | J.P. MORGAN FUNDS | JUNE 30, 2020 | ||||
Table of Contents
LIQUIDITY RISK MANAGEMENT PROGRAM
(Unaudited)
The Fund has adopted the J.P. Morgan Funds Liquidity Risk Management Program (the “Program”) under Rule 22e-4 under the 1940 Act (the “Liquidity Rule”). The Program seeks to assess, manage and review the Fund’s Liquidity Risk. “Liquidity Risk” is defined as the risk that a fund could not meet requests to redeem shares issued by the fund without significant dilution of remaining investors’ interests in the fund. Among other things, the Liquidity Rule requires that a written report be provided to the Board of Trustees (the “Board”) on an annual basis that addresses the operation of the Program and assesses the adequacy and effectiveness of its implementation, including the operation of any Highly Liquidity Investment Minimum (“HLIM”) established for a J.P. Morgan Fund and any material changes to the Program.
The Board has appointed J.P. Morgan Asset Management’s Liquidity Risk Forum to be the program administrator for the Program (the “Program Administrator”). On February 11, 2020, the Board of Trustees reviewed the Program Administrator’s initial written report (the “Report”) concerning the operation of the Program for the period from December 1, 2018 through December 31, 2019 (the “Program Reporting Period”). The Report addressed the operation of the Program and assessed its adequacy and effectiveness of implementation, including, where applicable, the operation of a J.P. Morgan Fund’s HLIM. There were no material changes to the Program during the Program Reporting Period.
The Report summarized the operation of the Program and the information and factors considered by the Program Administrator in assessing whether the Program has been adequately and effectively implemented with respect to the Fund. Such information and factors included, among other things: (1) the liquidity risk framework used to assess, manage, and periodically review the Fund’s Liquidity Risk and the results of this assessment; (2) the methodology and inputs for classifying the Fund’s investments into one of four liquidity categories that reflect an estimate of their liquidity under current market conditions; (3) whether the Fund invested primarily in “Highly Liquid Investments” (as defined under the Liquidity Rule), whether an HLIM should be established for the Fund (and, for J.P. Morgan Funds that have adopted an HLIM, whether the HLIM continues to be appropriate or whether the Fund has invested below its HLIM) and the procedures for monitoring for this limit; (4) whether the Fund invested more than 15% of its assets in “Illiquid Investments” (as defined under the Liquidity Rule) and the procedures for monitoring for this limit; and (5) specific liquidity events arising during the Program Reporting Period, including the impact on Fund liquidity caused by extended non-U.S. market closures.
Based on this review, the Report concluded that: (1) the Program continues to be reasonably designed to effectively assess and manage the Fund’s Liquidity Risk; and (2) the Program has been adequately and effectively implemented with respect to the Fund during the Program Reporting Period.
| JUNE 30, 2020 | J.P. MORGAN FUNDS | 31 | ||||||
Table of Contents
(Unaudited)
Certain tax information for the J.P. Morgan Funds is required to be provided to shareholders based upon the Fund’s income and distributions for the taxable year ended June 30, 2020. The information and distributions reported in this letter may differ from the information and taxable distributions reported to the shareholders for the calendar year ending December 31, 2020. The information necessary to complete your income tax returns for the calendar year ending December 31, 2020 will be provided under separate cover.
Dividends Received Deduction (DRD)
The Fund had 5.35%, or maximum allowable percentage, of ordinary income distributions eligible for the dividends received deduction for corporate shareholders for the fiscal year ended June 30, 2020.
Long-Term Capital Gain
The Fund distributed $874,307, or maximum allowable amount, of long-term capital gain dividends for the fiscal year ended June 30, 2020.
Qualified Dividend Income (QDI)
The Fund had $153,421, or maximum allowable amount, of ordinary income distributions treated as qualified dividends for the fiscal year ended June 30, 2020.
| 32 | J.P. MORGAN FUNDS | JUNE 30, 2020 | ||||
Table of Contents

| FACTS | WHAT DOES J.P. MORGAN FUNDS DO WITH YOUR PERSONAL INFORMATION? | |
| Why? | Financial companies choose how they share your personal information. Federal law gives consumers the right to limit some but not all sharing. Federal law also requires us to tell you how we collect, share, and protect your personal information. Please read this notice carefully to understand what we do. |
| What? | The types of personal information we collect and share depend on the product or service you have with us. This information can include:
◾ Social Security number and account balances
◾ transaction history and account transactions
◾ checking account information and wire transfer instructions
When you are no longer our customer, we continue to share your information as described in this notice. |
| How? | All financial companies need to share customers’ personal information to run their everyday business. In the section below, we list the reasons financial companies can share their customers’ personal information; the reasons J.P. Morgan Funds chooses to share; and whether you can limit this sharing. |
| Reasons we can share your personal information | Does J.P. Morgan Funds share? | Can you limit this sharing? | ||
For our everyday business purposes — such as to process your transactions, maintain your account(s), respond to court orders and legal investigations, or report to credit bureaus | Yes | No | ||
For marketing purposes — to offer our products and services to you | Yes | No | ||
| For joint marketing with other financial companies | No | We don’t share | ||
For our affiliates’ everyday business purposes — information about your transactions and experiences | No | We don’t share | ||
For our affiliates’ everyday business purposes — information about your creditworthiness | No | We don’t share | ||
| For nonaffiliates to market to you | No | We don’t share | ||
| Questions? | Call 1-800-480-4111 or go to www.jpmorganfunds.com | |

Table of Contents
Page 2 | ||
| Who we are | ||
| Who is providing this notice? | J.P. Morgan Funds | |
| What we do | ||
| How does J.P. Morgan Funds protect my personal information? | To protect your personal information from unauthorized access and use, we use security measures that comply with federal law. These measures include computer safeguards and secured files and buildings. We authorize our employees to access your information only when they need it to do their work and we require companies that work for us to protect your information. | |
How does J.P. Morgan Funds collect my personal information? | We collect your personal information, for example, when you:
◾ open an account or provide contact information
◾ give us your account information or pay us by check
◾ make a wire transfer
We also collect your personal information from others, such as credit bureaus, affiliates and other companies. | |
| Why can’t I limit all sharing? | Federal law gives you the right to limit only
◾ sharing for affiliates’ everyday business purposes – information about your creditworthiness
◾ affiliates from using your information to market to you
◾ sharing for nonaffiliates to market to you
State laws and individual companies may give you additional rights to limit sharing. | |
| Definitions | ||
| Affiliates | Companies related by common ownership or control. They can be financial and nonfinancial companies.
◾ J.P. Morgan Funds does not share with our affiliates. | |
| Nonaffiliates | Companies not related by common ownership or control. They can be financial and nonfinancial companies.
◾ J.P. Morgan Funds does not share with nonaffiliates so they can market to you. | |
| Joint Marketing | A formal agreement between nonaffiliated financial companies that together market financial products or services to you.
◾ J.P. Morgan Funds doesn’t jointly market. | |
Table of Contents
J.P. Morgan Funds are distributed by JPMorgan Distribution Services, Inc., which is an affiliate of JPMorgan Chase & Co. Affiliates of JPMorgan Chase & Co. receive fees for providing various services to the funds.
Contact JPMorgan Distribution Services, Inc. at 1-800-480-4111 for a fund prospectus. You can also visit us at www.jpmorganfunds.com. Investors should carefully consider the investment objectives and risk as well as charges and expenses of the mutual fund before investing. The prospectus contains this and other information about the mutual fund. Read the prospectus carefully before investing.
Investors may obtain information about the Securities Investor Protection Corporation (SIPC), including the SIPC brochure, by visiting www.sipc.org or by calling SIPC at 202-371-8300.
The Fund files a complete schedule of its fund holdings for the first and third quarters of its fiscal year with the SEC as an exhibit to its report on Form N-PORT. The Fund’s Form N-PORT reports are available on the SEC’s website at http://www.sec.gov. The Fund’s quarterly holdings can be found by visiting the J.P. Morgan Funds’ website at www.jpmorganfunds.com.
A description of the Fund’s policies and procedures with respect to the disclosure of the Fund’s holdings is available in the prospectuses and Statement of Additional Information.
A copy of proxy policies and procedures is available without charge upon request by calling 1-800-480-4111 and on the Fund’s website at www.jpmorganfunds.com. A description of such policies and procedures is on the SEC’s website at www.sec.gov. The Trustees have delegated the authority to vote proxies for securities owned by the Fund to the Adviser. A copy of the Fund’s voting record for the most recent 12-month period ended June 30 is available on the SEC’s website at www.sec.gov or at the Fund’s website at www.jpmorganfunds.com no later than August 31 of each year. The Fund’s proxy voting record will include, among other things, a brief description of the matter voted on for each fund security, and will state how each vote was cast, for example, for or against the proposal.
Table of Contents

J.P. Morgan Asset Management is the brand name for the asset management businesses of JPMorgan Chase & Co. and its affiliates worldwide.
| © JPMorgan Chase & Co., 2020. All rights reserved. June 2020. | AN-SS2015-620 |
Table of Contents
ITEM 2. CODE OF ETHICS.
Disclose whether, as of the end of the period covered by the report, the registrant has adopted a code of ethics that applies to the registrant’s principal executive officer, principal financial officer, principal accounting officer or controller, or persons performing similar functions, regardless of whether these individuals are employed by the registrant or a third party. If the registrant has not adopted such a code of ethics, explain why it has not done so.
The registrant must briefly describe the nature of any amendment, during the period covered by the report, to a provision of its code of ethics that applies to the registrant’s principal executive officer, principal financial officer, principal accounting officer or controller, or persons performing similar functions, regardless of whether these individuals are employed by the registrant or a third party, and that relates to any element of the code of ethics definition enumerated in paragraph (b) of this Item. The registrant must file a copy of any such amendment as an exhibit pursuant to Item 13(a)(1), unless the registrant has elected to satisfy paragraph (f) of this Item by positing its code of ethics on its website pursuant to paragraph (f)(2) of this Item, or by undertaking to provide its code of ethics to any person without charge, upon request, pursuant to paragraph (f)(3) of this Item.
If the registrant has, during the period covered by the report, granted a waiver, including an implicit waiver, from a provision of the code of ethics that applies to the registrant’s principal executive officer, principal financial officer, principal accounting officer or controller, or persons performing similar functions, regardless of whether these individuals are employed by the registrant or third party, that relates to one or more items set forth in paragraph (b) of this Item, the registrant must briefly describe the nature of the waiver, the name of the person to whom the waiver was granted, and the date of the waiver.
The Registrant has adopted a code of ethics that applies to the Registrant’s principal executive officer and principal financial officer. There were no amendments to the code of ethics or waivers granted with respect to the code of ethics in the period covered by the report.
ITEM 3. AUDIT COMMITTEE FINANCIAL EXPERT.
(a) (1) Disclose that the registrant’s board of directors has determined that the registrant either:
(i) Has at least one audit committee financial expert serving on its audit committee; or
(ii) Does not have an audit committee financial expert serving on its audit committee.
The Registrant’s Board of Trustees has determined that the Registrant has at least one audit committee financial expert serving on its audit committee. The Securities and Exchange Commission has stated that the designation or identification of a person as an audit committee financial expert pursuant to this Item 3 of Form N-CSR does not impose on such person any duties, obligations or liabilities that are greater than the duties, obligations and liabilities imposed on such person as a member of the Audit Committee and the Board of Trustees in the absence of such designation or identification.
(2) If the registrant provides the disclosure required by paragraph (a)(1)(i) of this Item, it must disclose the name of the audit committee financial expert and whether that person is “independent.” In order to be considered “independent” for purposes of this Item, a member of an audit committee may not, other than in his or her capacity as a member of the audit committee, the board of directors, or any other board committee:
(i) Accept directly or indirectly any consulting, advisory, or other compensatory fee from the issuer; or
(ii) Be an “interested person” of the investment company as defined in Section 2(a)(19) of the Act (15 U.S.C. 80a-2(a)(19)).
The audit committee financial expert is Dennis P. Harrington. He is not an “interested person” of the Registrant and is also “independent” as defined by the U.S. Securities and Exchange Commission for purposes of audit committee financial expert determinations.
(3) If the registrant provides the disclosure required by paragraph (a)(1)(ii) of this Item, it must explain why it does not have an audit committee financial expert.
Not applicable.
Table of Contents
ITEM 4. PRINCIPAL ACCOUNTANT FEES AND SERVICES.
(a) Disclose, under the caption Audit Fees, the aggregate fees billed for each of the last two fiscal years for professional services rendered by the principal accountant for the audit of the registrant’s annual financial statements or services that are normally provided by the accountant in connection with statutory and regulatory filings or engagements for those fiscal years.
AUDIT FEES
2020 – $126,963
2019 – $125,734
(b) Disclose, under the caption Audit-Related Fees, the aggregate fees billed in each of the last two fiscal years for assurance and related services by the principal accountant that are reasonably related to the performance of the audit of the registrant’s financial statements and are not reported under paragraph (a) of this Item. Registrants shall describe the nature of the services comprising the fees disclosed under this category.
AUDIT-RELATED FEES
2020 – $17,820
2019 – $17,820
Audit-related fees consists of semi-annual financial statement reviews and security count procedures performed as required under Rule 17f-2 of the Investment Company Act of 1940 during the Registrant’s fiscal year.
(c) Disclose, under the caption Tax Fees, the aggregate fees billed in each of the last two fiscal years for professional services rendered by the principal accountant for tax compliance, tax advice, and tax planning. Registrants shall describe the nature of the services comprising the fees disclosed under this category.
TAX FEES
2020 – $41,569
2019 – $40,118
The tax fees consist of fees billed in connection with preparing the federal regulated investment company income tax returns for the Registrant for the tax years ended June 30, 2020 and 2019, respectively.
For the last fiscal year, no tax fees were required to be approved pursuant to paragraph (c)(7)(ii) of Rule 2-01 of Regulation S-X.
(d) Disclose, under the caption All Other Fees, the aggregate fees billed in each of the last two fiscal years for products and services provided by the principal accountant, other than the services reported in paragraphs (a) through (c) of this Item. Registrants shall describe the nature of the services comprising the fees disclosed under this category.
ALL OTHER FEES
2020 – Not applicable
2019 – Not applicable
(e) (1) Disclose the audit committee’s pre-approval policies and procedures described in paragraph (c)(7) of Rule 2-01 of Regulation S-X.
Pursuant to the Registrant’s Audit Committee Charter and written policies and procedures for the pre-approval of audit and non-audit services (the “Pre-approval Policy”), the Audit Committee pre-approves all audit and non-audit services performed by the Registrant’s independent public registered accounting firm for the Registrant. In addition, the Audit Committee pre-approves the auditor’s engagement for non-audit services with the Registrant’s investment adviser (not including a sub-adviser whose role is primarily portfolio management and is sub-contracted or overseen by another investment adviser) and any Service Affiliate in accordance with paragraph (c)(7)(ii) of Rule 2-01 of Regulation S-X, if the engagement relates directly to the operations and financial reporting of the Registrant. Proposed services may be pre-approved either 1) without consideration of specific case-by-case services or 2) require the specific pre-approval of the Audit Committee. Therefore, initially the Pre-approval Policy listed a number of audit and non-audit services that have been approved by the Audit Committee, or which were not subject to pre-approval under the transition provisions of Sarbanes-Oxley Act of 2002 (the
Table of Contents
“Pre-approval List”). The Audit Committee annually reviews and pre-approves the services included on the Pre-approval List that may be provided by the independent public registered accounting firm without obtaining additional specific pre-approval of individual services from the Audit Committee. The Audit Committee adds to, or subtracts from, the list of general pre-approved services from time to time, based on subsequent determinations. All other audit and non-audit services not on the Pre-approval List must be specifically pre-approved by the Audit Committee.
One or more members of the Audit Committee may be appointed as the Committee’s delegate for the purposes of considering whether to approve such services. Any pre-approvals granted by the delegate will be reported, for informational purposes only, to the Audit Committee at its next scheduled meeting. The Audit Committee’s responsibilities to pre-approve services performed by the independent public registered accounting firm are not delegated to management.
(2) Disclose the percentage of services described in each of paragraphs (b) through (d) of this Item that were approved by the audit committee pursuant to paragraph (c)(7)(i)(C) of Rule 2-01 of Regulation S-X.
2020 – 0.0%
2019 – 0.0%
(f) If greater than 50 percent, disclose the percentage of hours expended on the principal accountant’s engagement to audit the registrant’s financial statements for the most recent fiscal year that were attributed to work performed by persons other than the principal accountant’s full-time, permanent employees.
Not applicable – Less than 50%.
(g) Disclose the aggregate non-audit fees billed by the registrant’s accountant for services rendered to the registrant, and rendered to the registrant’s investment adviser (not including any sub-adviser whose role is primarily portfolio management and is subcontracted with or overseen by another investment adviser), and any entity controlling, controlled by, or under common control with the adviser that provides ongoing services to the registrant for each of the last two fiscal years of the registrant.
The aggregate non-audit fees billed by the independent registered public accounting firm for services rendered to the Registrant, and rendered to Service Affiliates, for the last two calendar year ends were:
2019 – $24.8 million
2018 – $30.3 million
(h) Disclose whether the registrant’s audit committee of the board of directors has considered whether the provision of non-audit services that were rendered to the registrant’s investment adviser (not including any subadviser whose role is primarily portfolio management and is subcontracted with or overseen by another investment adviser), and any entity controlling, controlled by, or under common control with the investment adviser that provides ongoing services to the registrant that were not pre-approved pursuant to paragraph (c)(7)(ii) of Rule 2-01 of Regulation S-X is compatible with maintaining the principal accountant’s independence.
The Registrant’s Audit Committee has considered whether the provision of the non-audit services that were rendered to Service Affiliates that were not pre-approved (not requiring pre-approval) is compatible with maintaining the independent public registered accounting firm’s independence. All services provided by the independent public registered accounting firm to the Registrant or to Service Affiliates that were required to be pre-approved were pre-approved as required.
ITEM 5. AUDIT COMMITTEE OF LISTED REGISTRANTS.
(a) If the registrant is a listed issuer as defined in Rule 10A-3 under the Exchange Act (17CFR 240.10A-3), state whether or not the registrant has a separately-designated standing audit committee established in accordance with Section 3(a)(58)(A) of the Exchange Act (15 U.S.C. 78c(a)(58)(A)). If the registrant has such a committee, however designated, identify each committee member. If the entire board of directors is acting as the registrant’s audit committee as specified in Section 3(a)(58)(B) of the Exchange Act (15 U.S.C. 78c(a)(58)(B)), so state.
(b) If applicable, provide the disclosure required by Rule 10A-3(d) under the Exchange Act (17CFR 240.10A-3(d)) regarding an exemption from the listing standards for all audit committees.
Not applicable.
Table of Contents
ITEM 6. INVESTMENTS.
File Schedule I – Investments in securities of unaffiliated issuers as of the close of the reporting period as set forth in Section 210.12-12 of Regulation S-X, unless the schedule is included as part of the report to shareholders filed under Item 1 of this Form.
Included in Item 1.
ITEM 7. DISCLOSURE OF PROXY VOTING POLICIES AND PROCEDURES FOR CLOSED-END MANAGEMENT INVESTMENT COMPANIES.
Not applicable.
ITEM 8. PORTFOLIO MANAGERS OF CLOSED-END MANAGEMENT INVESTMENT COMPANIES.
Not applicable.
ITEM 9. PURCHASE OF EQUITY SECURITIES BY CLOSED-END MANAGEMENT INVESTMENT COMPANY AND AFFILIATED PURCHASERS.
Not applicable.
ITEM 10. SUBMISSION OF MATTERS TO A VOTE OF SECURITY HOLDERS.
Describe any material changes to the procedures by which shareholders may recommend nominees to the registrant’s board of directors, where those changes were implemented after the registrant last provided disclosure in response to the requirements of Item 7(d)(2)(ii)(G) of Schedule 14A (17 CFR 240.14a-101), or this Item.
No material changes to report.
ITEM 11. CONTROLS AND PROCEDURES.
(a) Disclose the conclusions of the registrant’s principal executive and principal financial officers, or persons performing similar functions, regarding the effectiveness of the registrant’s disclosure controls and procedures (as defined in Rule 30a-3(c) under the Act (17 CFR 270.30a-3(c))) as of a date within 90 days of the filing date of the report that includes the disclosure required by this paragraph, based on the evaluation of these controls and procedures required by Rule 30a-3(b) under the Act (17 CFR 270.30a-3(b)) and Rules 13a-15(b) or 15d-15(b) under the Exchange Act (17 CFR 240.13a-15(b) or 240.15d-15(b)).
The Registrant’s principal executive and principal financial officers have concluded, based on their evaluation of the Registrant’s disclosure controls and procedures as of a date within 90 days of the filing date of this report, that the Registrant’s disclosure controls and procedures are reasonably designed to ensure that information required to be disclosed by the Registrant on Form N-CSR is recorded, processed, summarized and reported within the required time periods and that information required to be disclosed by the Registrant in the reports that it files or submits on Form N-CSR is accumulated and communicated to the Registrant’s management, including its principal executive and principal financial officers, as appropriate to allow timely decisions regarding required disclosure.
(b) Disclose any change in the registrant’s internal control over financial reporting (as defined in Rule 30a-3(d) under the Act (17 CFR 270.30a-3(d)) that occurred during the registrant’s second fiscal quarter of the period covered by this report that has materially affected, or is reasonably likely to materially affect, the registrant’s internal control over financial reporting.
There were no changes in the Registrant’s internal control over financial reporting that occurred during the last fiscal quarter covered by this report that have materially affected, or are reasonably likely to materially affect, the Registrant’s internal control over financial reporting.
Table of Contents
ITEM 12. DISCLOSURE OF SECURITIES LENDING ACTIVITIES FOR CLOSED-END MANAGEMENT INVESTMENT COMPANIES.
Not applicable.
ITEM 13. EXHIBITS.
(a) File the exhibits listed below as part of this Form. Letter or number the exhibits in the sequence indicated.
(1) Any code of ethics, or amendment thereto, that is the subject of the disclosure required by Item 2, to the extent that the registrant intends to satisfy the Item 2 requirements through filing of an exhibit.
(2) A separate certification for each principal executive officer and principal financial officer of the registrant as required by Rule 30a-2(a) under the Act (17 CFR 270.30a-2).
(3) Any written solicitation to purchase securities under Rule 23c-1 under the Act (17 CFR 270.23c-1) sent or given during the period covered by the report by or on behalf of the registrant to 10 or more persons.
Not applicable.
(b) A separate or combined certification for each principal executive officer and principal officer of the registrant as required by Rule 30a-2(b) under the Act of 1940.
Table of Contents
SIGNATURES
Pursuant to the requirements of the Securities Exchange Act of 1934 and the Investment Company Act of 1940, the registrant has duly caused this report to be signed on its behalf by the undersigned, thereunto duly authorized.
| JPMorgan Trust IV | ||
| By: | /s/ Brian S. Shlissel | |
| Brian S. Shlissel | ||
| President and Principal Executive Officer | ||
| August 31, 2020 | ||
Pursuant to the requirements of the Securities Exchange Act of 1934 and the Investment Company Act of 1940, this report has been signed below by the following persons on behalf of the registrant and in the capacities and on the dates indicated.
| By: | /s/ Brian S. Shlissel | |
| Brian S. Shlissel | ||
| President and Principal Executive Officer | ||
| August 31, 2020 |
| By: | /s/ Timothy J. Clemens | |
| Timothy J. Clemens | ||
| Treasurer and Principal Financial Officer | ||
| August 31, 2020 |