Exhibit (C)(8)(D)
|
November 2, 2015
Strictly Private and Confidential
Advisory Report on the Reorganization of Enersis S.A.
Prepared for the Enersis S.A. Board of Directors
|
Important information
This document has been prepared by IM Trust consultants financial S.A. (hereinafter “IM Trust”) at the request of the Board of Directors of Enersis S.A. (‘Enersis’, “ENI” or the “Company”) for the exclusive and private use of the company and its Board of Directors.
The recommendations and conclusions of this document constitute the best opinion of IM Trust regarding the Reorganization of Enersis at the time of issuance of this document, considering the methodologies used for this purpose and the information that was available. This document’s conclusions may vary if additional or other background information were available. IM Trust shall be under no obligation to report such variations nor when the opinions or information contained in the document are modified.
For the preparation of the present document, IM Trust has been based solely on information provided by Enersis and public information, for which IM Trust has assumed, without independent verification, its complete and total integrity and accuracy. In this way, IM Trust assumes no responsibility with regard to the information reviewed by the conclusions arising out of any error, inaccuracy, and/or falsity of such information.
Likewise, the conclusions of the document may be based on assumptions that may be subject to significant uncertainties and economic and market contingencies, such as flows, projections, estimates, and interpretations, the occurrence of which can be difficult to predict and many of which could even be beyond the reach of Enersis, so there is no certainty at all about the degree of fulfillment of such assumptions. Under no circumstances may the use or incorporation of such flows, projections or estimates be considered as a representation, warranty, or prediction by IM Trust regarding their occurrence, nor of the assumptions that underlie them.
Strictly Private and Confidential 2
|
Contents
1. Executive summary 4
2. Background and scope of the evaluation 19
3. Description of the Reorganization 23
4. General Considerations and analytical scheme 35
5. Considerations of the business model 39
6. Impact of the Reorganization on the Market Value of Enersis 44 i. Holding Discount Considerations 44 ii. Liquidity Considerations 55 iii. Risk rating considerations 60 iv. Summary 64
7. Cash flow impacts from the reorganization in the value of Enersis 66 i. Impacts on EBITDA 66 ii. Tax impacts 70 iii. Transaction Costs (one-off) 73 iv. Summary 75
8. Estimate of relative holdings in the merger in ENI Americas 77 i. Relative holdings according to discounted cash flow appraisal 79 ii. Relative holdings according to multiples appraisal and market capitalization 86 iii. Relative holdings adjusted by cost disproportionality of the Reorganization 91 iv. Summary 93
9. Answers to questions made by members of the Board of Directors of Enersis 99 10. Attachments 103
Strictly Private and Confidential 3
|
EXECUTIVE SUMMARY 1
Strictly Private and Confidential 4
|
Background Information on the Reorganization
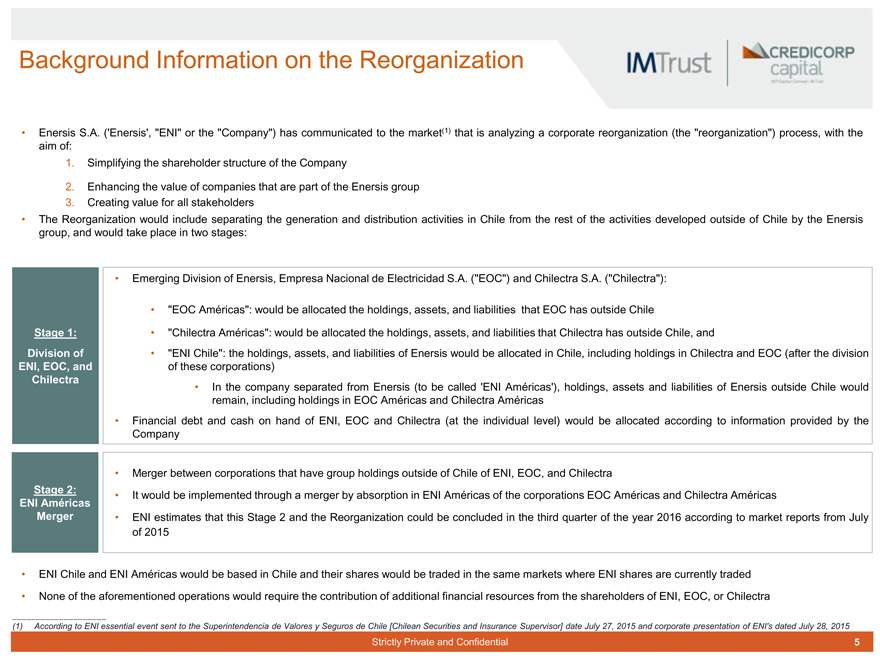
Enersis S.A. (‘Enersis’, “ENI” or the “Company”) has communicated to the market(1) that is analyzing a corporate reorganization (the “reorganization”) process, with the aim of:
1. Simplifying the shareholder structure of the Company
2. Enhancing the value of companies that are part of the Enersis group
3. Creating value for all stakeholders
The Reorganization would include separating the generation and distribution activities in Chile from the rest of the activities developed outside of Chile by the Enersis group, and would take place in two stages:
Emerging Division of Enersis, Empresa Nacional de Electricidad S.A. (“EOC”) and Chilectra S.A. (“Chilectra”):
“EOC Américas”: would be allocated the holdings, assets, and liabilities that EOC has outside Chile
“Chilectra Américas”: would be allocated the holdings, assets, and liabilities that Chilectra has outside Chile, and
“ENI Chile”: the holdings, assets, and liabilities of Enersis would be allocated in Chile, including holdings in Chilectra and EOC (after the division of these corporations)
In the company separated from Enersis (to be called ‘ENI Américas’), holdings, assets and liabilities of Enersis outside Chile would remain, including holdings in EOC Américas and Chilectra Américas
Financial debt and cash on hand of ENI, EOC and Chilectra (at the individual level) would be allocated according to information provided by the Company
Merger between corporations that have group holdings outside of Chile of ENI, EOC, and Chilectra
It would be implemented through a merger by absorption in ENI Américas of the corporations EOC Américas and Chilectra Américas
ENI estimates that this Stage 2 and the Reorganization could be concluded in the third quarter of the year 2016 according to market reports from July of 2015
Stage 1: Division of ENI, EOC, and Chilectra
Stage 2: ENI Américas Merger
ENI Chile and ENI Américas would be based in Chile and their shares would be traded in the same markets where ENI shares are currently traded
None of the aforementioned operations would require the contribution of additional financial resources from the shareholders of ENI, EOC, or Chilectra
(1) According to ENI essential event sent to the Superintendencia de Valores y Seguros de Chile [Chilean Securities and Insurance Supervisor] date July 27, 2015 and corporate presentation of ENI’s dated July 28, 2015
Strictly Private and Confidential 5
|
Scope of the report
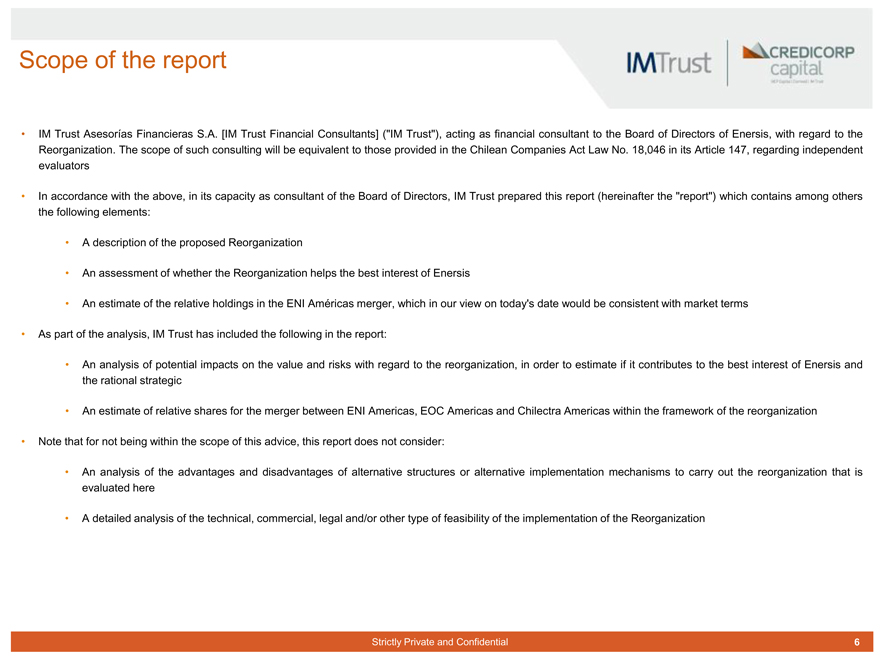
IM Trust Asesorías Financieras S.A. [IM Trust Financial Consultants] (“IM Trust”), acting as financial consultant to the Board of Directors of Enersis, with regard to the Reorganization. The scope of such consulting will be equivalent to those provided in the Chilean Companies Act Law No. 18,046 in its Article 147, regarding independent evaluators
In accordance with the above, in its capacity as consultant of the Board of Directors, IM Trust prepared this report (hereinafter the “report”) which contains among others the following elements:
A description of the proposed Reorganization
An assessment of whether the Reorganization helps the best interest of Enersis
An estimate of the relative holdings in the ENI Américas merger, which in our view on today’s date would be consistent with market terms
As part of the analysis, IM Trust has included the following in the report:
An analysis of potential impacts on the value and risks with regard to the reorganization, in order to estimate if it contributes to the best interest of Enersis and the rational strategic
An estimate of relative shares for the merger between ENI Americas, EOC Americas and Chilectra Americas within the framework of the reorganization
Note that for not being within the scope of this advice, this report does not consider:
An analysis of the advantages and disadvantages of alternative structures or alternative implementation mechanisms to carry out the reorganization that is evaluated here
A detailed analysis of the technical, commercial, legal and/or other type of feasibility of the implementation of the Reorganization
Strictly Private and Confidential 6
|
Structure of the Reorganization
I
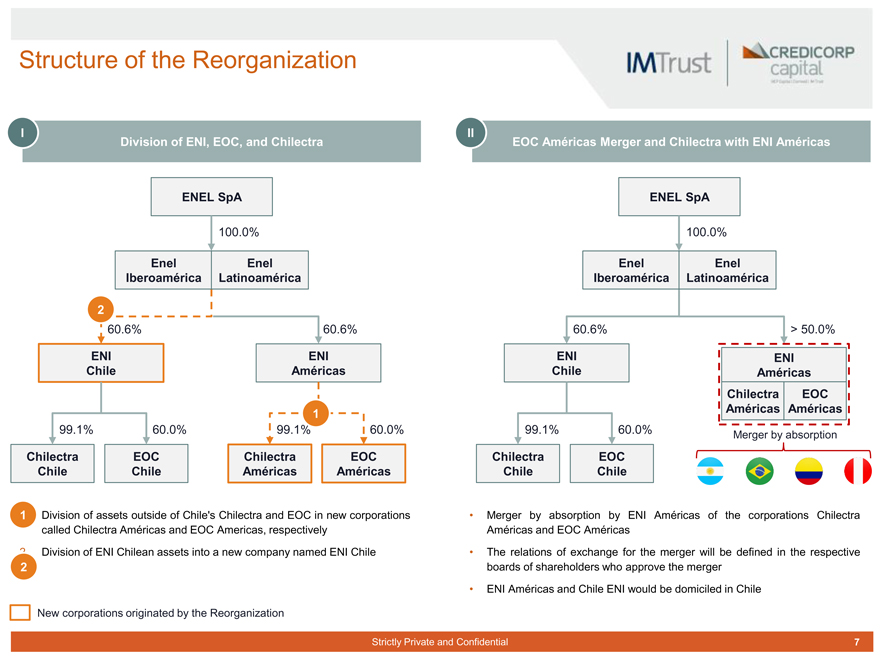
Division of ENI, EOC, and Chilectra
ENEL SpA
100.0%
Enel Iberoamérica
Enel Latinoamérica
2
60.6% 60.6%
ENI Chile ENI Américas
1
99.1% 60.0% 99.1% 60.0%
Chilectra EOC Chilectra EOC Chile Chile Américas Américas
1. Division of assets outside of Chile’s Chilectra and EOC in new corporations called Chilectra Américas and EOC Americas, respectively
2. Division of ENI Chilean assets into a new company named ENI Chile
2
New corporations originated by the Reorganization
II
EOC Américas Merger and Chilectra with ENI Américas
ENEL SpA
100.0%
Enel Iberoamérica Enel Latinoamérica
60.6% > 50.0%
ENI Chile ENI Américas EOC
Américas Chilectra Américas
99.1% 60.0% Merger by absorption
Chilectra EOC Chile Chile
Merger by absorption by ENI Américas of the corporations Chilectra Américas and EOC Américas
The relations of exchange for the merger will be defined in the respective boards of shareholders who approve the merger
ENI Américas and Chile ENI would be domiciled in Chile
Strictly Private and Confidential 7
|
Assessment Framework
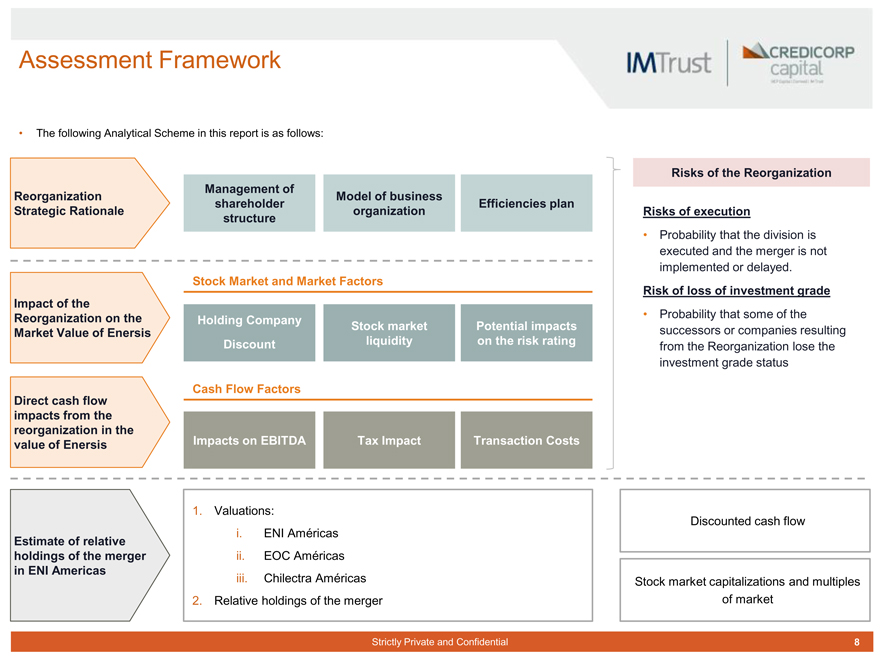
The following Analytical Scheme in this report is as follows:
Reorganization Strategic Rationale Management of shareholder structure Model of business organizationEfficiencies plan
Impact of the Reorganization on the Market Value of Enersis Stock Market and Market Factors Holding Company Discount Stock market liquidity
Potential impacts on the risk rating
Direct cash flow impacts from the reorganization in the value of Enersis Cash Flow Factors Impacts on EBITDA Tax ImpactTransaction Costs
Risks of the Reorganization
Risks of execution
Probability that the division is executed and the merger is not implemented or delayed.
Risk of loss of investment grade
Probability that some of the successors or companies resulting from the Reorganization lose the investment grade status
Estimate of relative holdings of the merger in ENI Americas
1. Valuations:
i. ENI Américas
ii. EOC Américas
iii. Chilectra Américas
2. Relative holdings of the merger
Discounted cash flow
Stock market capitalizations and multiples of market
Strictly Private and Confidential 8
|
Reorganization Strategic Rationale
1
Management of shareholder structure
2
Integrated organizational model by geographic area
3
Efficiencies plan
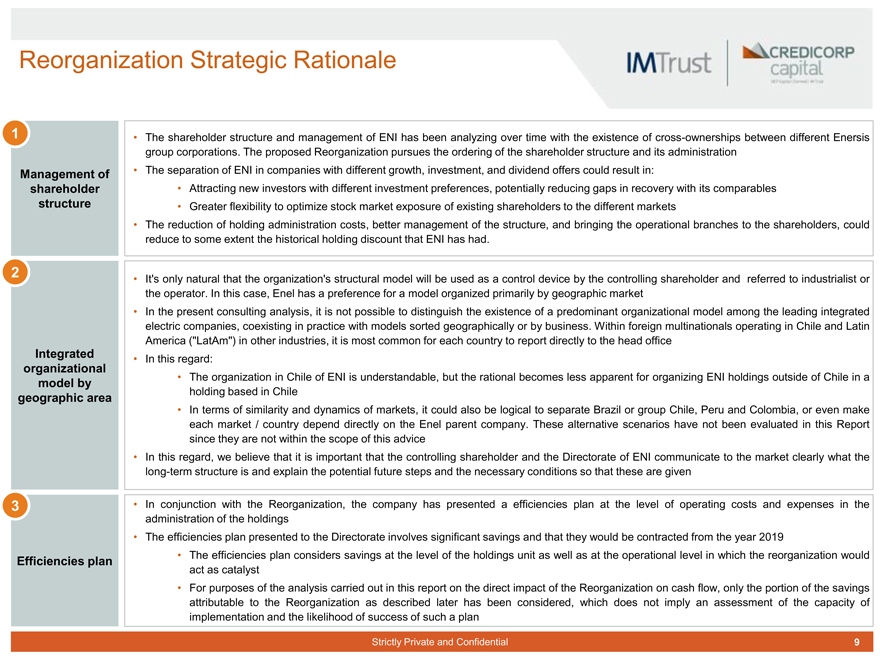
The shareholder structure and management of ENI has been analyzing over time with the existence of cross-ownerships between different Enersis group corporations. The proposed Reorganization pursues the ordering of the shareholder structure and its administration
The separation of ENI in companies with different growth, investment, and dividend offers could result in:
Attracting new investors with different investment preferences, potentially reducing gaps in recovery with its comparables
Greater flexibility to optimize stock market exposure of existing shareholders to the different markets
The reduction of holding administration costs, better management of the structure, and bringing the operational branches to the shareholders, could reduce to some extent the historical holding discount that ENI has had.
It’s only natural that the organization’s structural model will be used as a control device by the controlling shareholder and referred to industrialist or the operator. In this case, Enel has a preference for a model organized primarily by geographic market
In the present consulting analysis, it is not possible to distinguish the existence of a predominant organizational model among the leading integrated electric companies, coexisting in practice with models sorted geographically or by business. Within foreign multinationals operating in Chile and Latin America (“LatAm”) in other industries, it is most common for each country to report directly to the head office
In this regard:
The organization in Chile of ENI is understandable, but the rational becomes less apparent for organizing ENI holdings outside of Chile in a holding based in Chile
In terms of similarity and dynamics of markets, it could also be logical to separate Brazil or group Chile, Peru and Colombia, or even make each market / country depend directly on the Enel parent company. These alternative scenarios have not been evaluated in this Report since they are not within the scope of this advice
In this regard, we believe that it is important that the controlling shareholder and the Directorate of ENI communicate to the market clearly what the long-term structure is and explain the potential future steps and the necessary conditions so that these are given
In conjunction with the Reorganization, the company has presented a efficiencies plan at the level of operating costs and expenses in the administration of the holdings
The efficiencies plan presented to the Directorate involves significant savings and that they would be contracted from the year 2019
The efficiencies plan considers savings at the level of the holdings unit as well as at the operational level in which the reorganization would act as catalyst
For purposes of the analysis carried out in this report on the direct impact of the Reorganization on cash flow, only the portion of the savings attributable to the Reorganization as described later has been considered, which does not imply an assessment of the capacity of implementation and the likelihood of success of such a plan
Strictly Private and Confidential 9
|
Potential impact of the reorganization in the market value of Enersis
1 Holding Discount Considerations
2 Liquidity Considerations
3 Considerations regarding the impacts on the risk rating
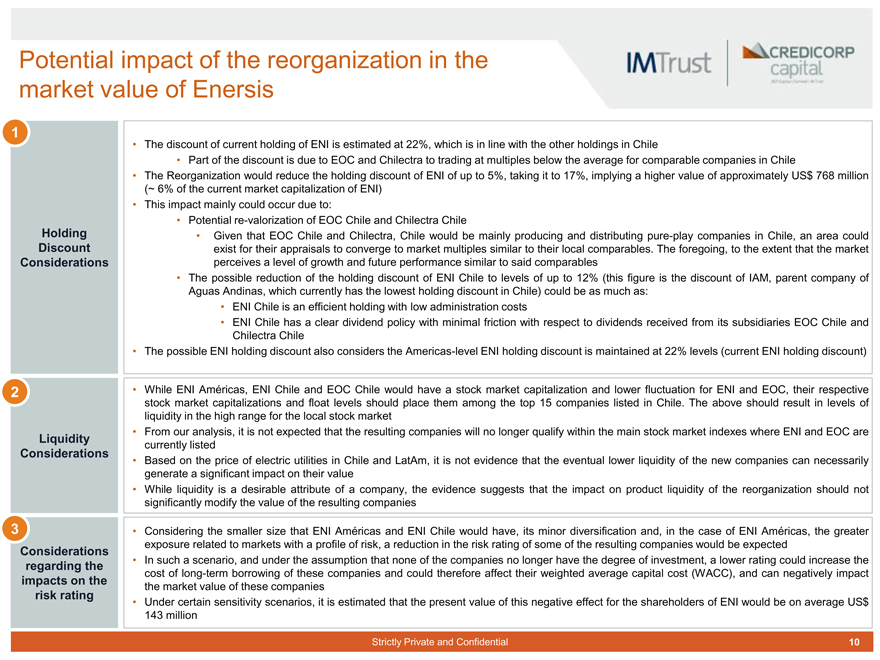
The discount of current holding of ENI is estimated at 22%, which is in line with the other holdings in Chile
Part of the discount is due to EOC and Chilectra to trading at multiples below the average for comparable companies in Chile
The Reorganization would reduce the holding discount of ENI of up to 5%, taking it to 17%, implying a higher value of approximately US$ 768 million
(~ 6% of the current market capitalization of ENI) This impact mainly could occur due to:
Potential re-valorization of EOC Chile and Chilectra Chile
Given that EOC Chile and Chilectra, Chile would be mainly producing and distributing pure-play companies in Chile, an area could exist for their appraisals to converge to market multiples similar to their local comparables. The foregoing, to the extent that the market perceives a level of growth and future performance similar to said comparables
The possible reduction of the holding discount of ENI Chile to levels of up to 12% (this figure is the discount of IAM, parent company of Aguas Andinas, which currently has the lowest holding discount in Chile) could be as much as:
ENI Chile is an efficient holding with low administration costs
ENI Chile has a clear dividend policy with minimal friction with respect to dividends received from its subsidiaries EOC Chile and Chilectra Chile The possible ENI holding discount also considers the Americas-level ENI holding discount is maintained at 22% levels (current ENI holding discount)
While ENI Américas, ENI Chile and EOC Chile would have a stock market capitalization and lower fluctuation for ENI and EOC, their respective stock market capitalizations and float levels should place them among the top 15 companies listed in Chile. The above should result in levels of liquidity in the high range for the local stock market From our analysis, it is not expected that the resulting companies will no longer qualify within the main stock market indexes where ENI and EOC are currently listed Based on the price of electric utilities in Chile and LatAm, it is not evidence that the eventual lower liquidity of the new companies can necessarily generate a significant impact on their value While liquidity is a desirable attribute of a company, the evidence suggests that the impact on product liquidity of the reorganization should not significantly modify the value of the resulting companies
Considering the smaller size that ENI Américas and ENI Chile would have, its minor diversification and, in the case of ENI Américas, the greater exposure related to markets with a profile of risk, a reduction in the risk rating of some of the resulting companies would be expected In such a scenario, and under the assumption that none of the companies no longer have the degree of investment, a lower rating could increase the cost of long-term borrowing of these companies and could therefore affect their weighted average capital cost (WACC), and can negatively impact the market value of these companies Under certain sensitivity scenarios, it is estimated that the present value of this negative effect for the shareholders of ENI would be on average US$ 143 million
Strictly Private and Confidential 10
|
Potential impacts of market value for the shareholders of ENI
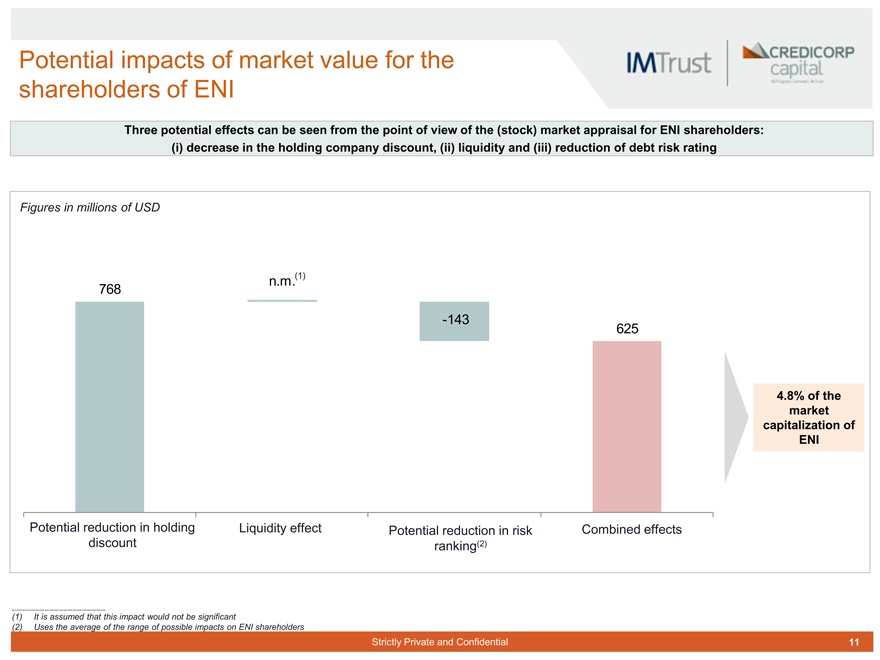
Three potential effects can be seen from the point of view of the (stock) market appraisal for ENI shareholders: (i) decrease in the holding company discount, (ii) liquidity and (iii) reduction of debt risk rating
Figures in millions of USD
n.m.(1) 768
-143
625
4.8% of the market capitalization of ENI
Potential reduction in holding Liquidity effect Potential reduction in risk Combined effects discount ranking(2)
(1) It is assumed that this impact would not be significant
(2) Uses the average of the range of possible impacts on ENI shareholders
Strictly Private and Confidential 11
|
Potential impact on the value of ENI by direct impacts of the Reorganization in its cash flows
1
Impacts on EBITDA
2
Tax impacts
3
Transaction Costs
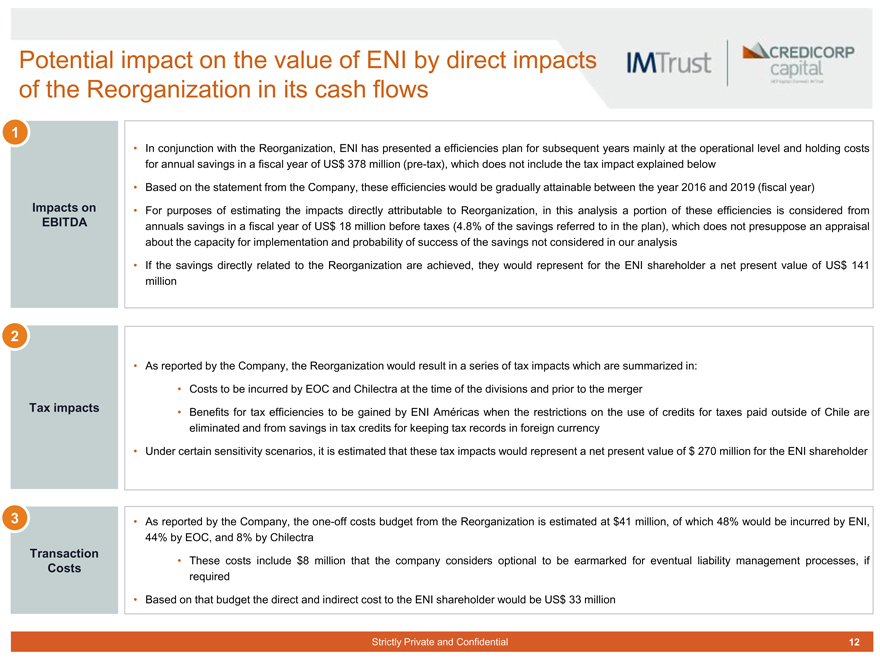
In conjunction with the Reorganization, ENI has presented a efficiencies plan for subsequent years mainly at the operational level and holding costs for annual savings in a fiscal year of US$ 378 million (pre-tax), which does not include the tax impact explained below
Based on the statement from the Company, these efficiencies would be gradually attainable between the year 2016 and 2019 (fiscal year)
For purposes of estimating the impacts directly attributable to Reorganization, in this analysis a portion of these efficiencies is considered from annuals savings in a fiscal year of US$ 18 million before taxes (4.8% of the savings referred to in the plan), which does not presuppose an appraisal about the capacity for implementation and probability of success of the savings not considered in our analysis
If the savings directly related to the Reorganization are achieved, they would represent for the ENI shareholder a net present value of US$ 141 million
As reported by the Company, the Reorganization would result in a series of tax impacts which are summarized in:
Costs to be incurred by EOC and Chilectra at the time of the divisions and prior to the merger
Benefits for tax efficiencies to be gained by ENI Américas when the restrictions on the use of credits for taxes paid outside of Chile are eliminated and from savings in tax credits for keeping tax records in foreign currency
Under certain sensitivity scenarios, it is estimated that these tax impacts would represent a net present value of $ 270 million for the ENI shareholder
As reported by the Company, the one-off costs budget from the Reorganization is estimated at $41 million, of which 48% would be incurred by ENI, 44% by EOC, and 8% by Chilectra
These costs include $8 million that the company considers optional to be earmarked for eventual liability management processes, if required
Based on that budget the direct and indirect cost to the ENI shareholder would be US$ 33 million
Strictly Private and Confidential 12
|
Potential impacts on cash flow for the shareholders of ENI
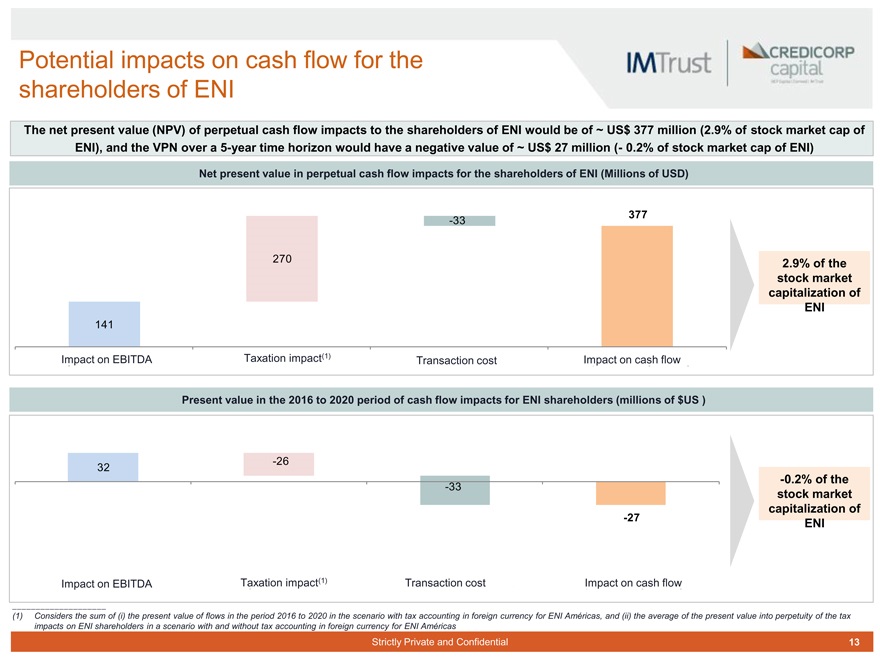
The net present value (NPV) of perpetual cash flow impacts to the shareholders of ENI would be of ~ US$ 377 million (2.9% of stock market cap of ENI), and the VPN over a 5-year time horizon would have a negative value of ~ US$ 27 million (- 0.2% of stock market cap of ENI)
Net present value in perpetual cash flow impacts for the shareholders of ENI (Millions of USD)
377
-33
270 2.9% of the stock market capitalization of ENI
141
Impact on EBITDA Taxation impact(1) Transaction cost
Impact on cash flow
2.9% of the stock market capitalization of ENI
Present value in the 2016 to 2020 period of cash flow impacts for ENI shareholders (millions of $US )
-0.2% of the stock market capitalization of ENI
-26 32
-33
-27
Impact on EBITDA Taxation impact(1) Transaction cost
(1) Considers the sum of (i) the present value of flows in the period 2016 to 2020 in the scenario with tax accounting in foreign currency for ENI Américas, and (ii) the average of the present value into perpetuity of the tax impacts on ENI shareholders in a scenario with and without tax accounting in foreign currency for ENI Américas
Strictly Private and Confidential 13
|
Main risks of the Reorganization
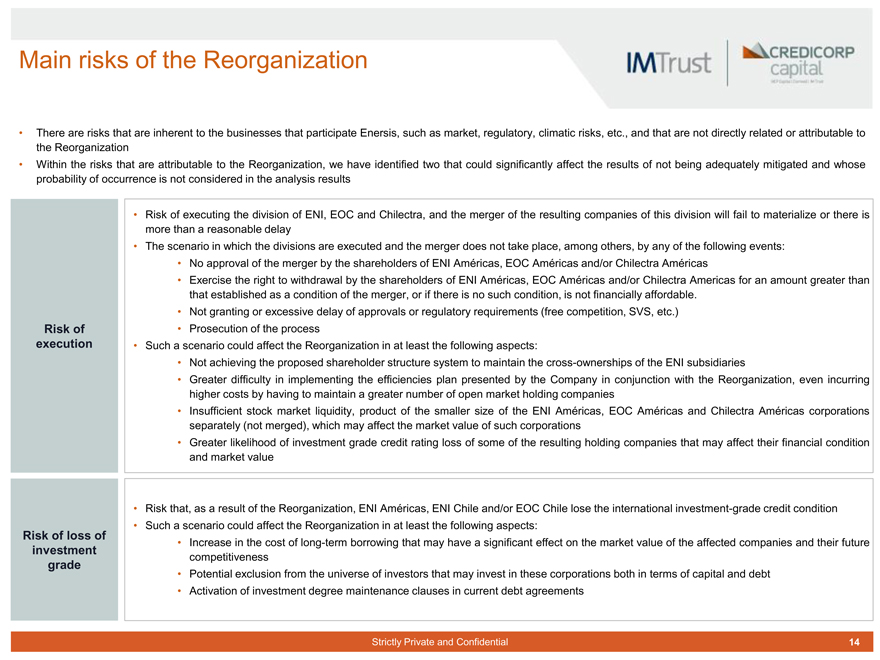
There are risks that are inherent to the businesses that participate Enersis, such as market, regulatory, climatic risks, etc., and that are not directly related or attributable to the Reorganization
Within the risks that are attributable to the Reorganization, we have identified two that could significantly affect the results of not being adequately mitigated and whose probability of occurrence is not considered in the analysis results
Risk of execution
Risk of executing the division of ENI, EOC and Chilectra, and the merger of the resulting companies of this division will fail to materialize or there is more than a reasonable delay
The scenario in which the divisions are executed and the merger does not take place, among others, by any of the following events:
No approval of the merger by the shareholders of ENI Américas, EOC Américas and/or Chilectra Américas
Exercise the right to withdrawal by the shareholders of ENI Américas, EOC Américas and/or Chilectra Americas for an amount greater than that established as a condition of the merger, or if there is no such condition, is not financially affordable.
Not granting or excessive delay of approvals or regulatory requirements (free competition, SVS, etc.)
Prosecution of the process
Such a scenario could affect the Reorganization in at least the following aspects:
Not achieving the proposed shareholder structure system to maintain the cross-ownerships of the ENI subsidiaries
Greater difficulty in implementing the efficiencies plan presented by the Company in conjunction with the Reorganization, even incurring higher costs by having to maintain a greater number of open market holding companies
Insufficient stock market liquidity, product of the smaller size of the ENI Américas, EOC Américas and Chilectra Américas corporations separately (not merged), which may affect the market value of such corporations
Greater likelihood of investment grade credit rating loss of some of the resulting holding companies that may affect their financial condition and market value
Risk of loss of investment grade
Risk that, as a result of the Reorganization, ENI Américas, ENI Chile and/or EOC Chile lose the international investment-grade credit condition Such a scenario could affect the Reorganization in at least the following aspects:
Increase in the cost of long-term borrowing that may have a significant effect on the market value of the affected companies and their future competitiveness
Potential exclusion from the universe of investors that may invest in these corporations both in terms of capital and debt
Activation of investment degree maintenance clauses in current debt agreements
Strictly Private and Confidential 14
|
Methodology for the estimate of relative holdings in the merger in ENI Americas
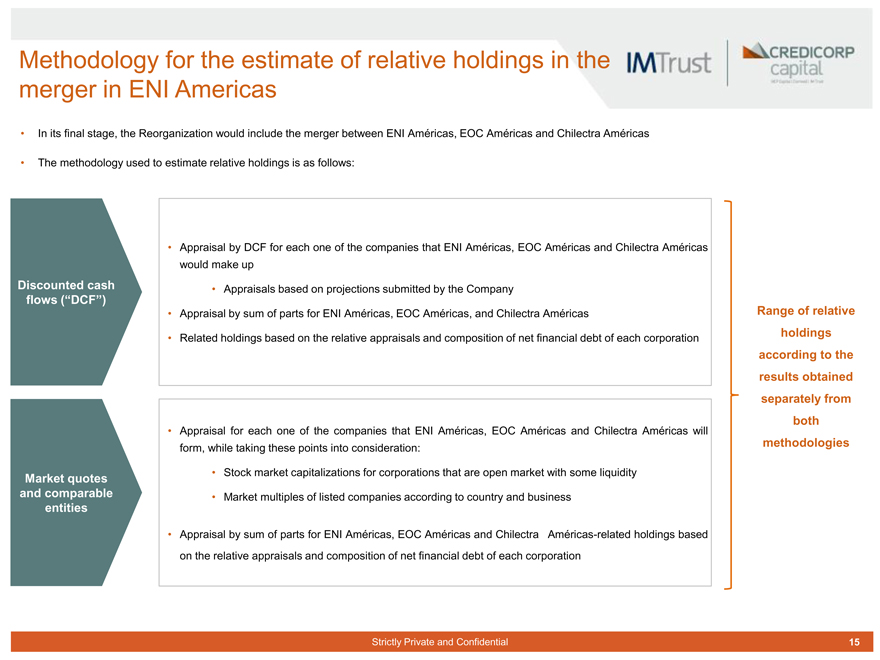
In its final stage, the Reorganization would include the merger between ENI Américas, EOC Américas and Chilectra Américas
The methodology used to estimate relative holdings is as follows:
Discounted cash flows (“DCF”)
Appraisal by DCF for each one of the companies that ENI Américas, EOC Américas and Chilectra Américas would make up
Appraisals based on projections submitted by the Company
Appraisal by sum of parts for ENI Américas, EOC Américas, and Chilectra Américas
Related holdings based on the relative appraisals and composition of net financial debt of each corporation
Market quotes and comparable entities
Appraisal for each one of the companies that ENI Américas, EOC Américas and Chilectra Américas will form, while taking these points into consideration:
Stock market capitalizations for corporations that are open market with some liquidity
Market multiples of listed companies according to country and business
Appraisal by sum of parts for ENI Américas, EOC Américas and Chilectra Américas-related holdings based on the relative appraisals and composition of net financial debt of each corporation
Range of relative holdings according to the results obtained separately from both methodologies
Strictly Private and Confidential 15
|
Range of relative holdings in the merger of ENI Americas
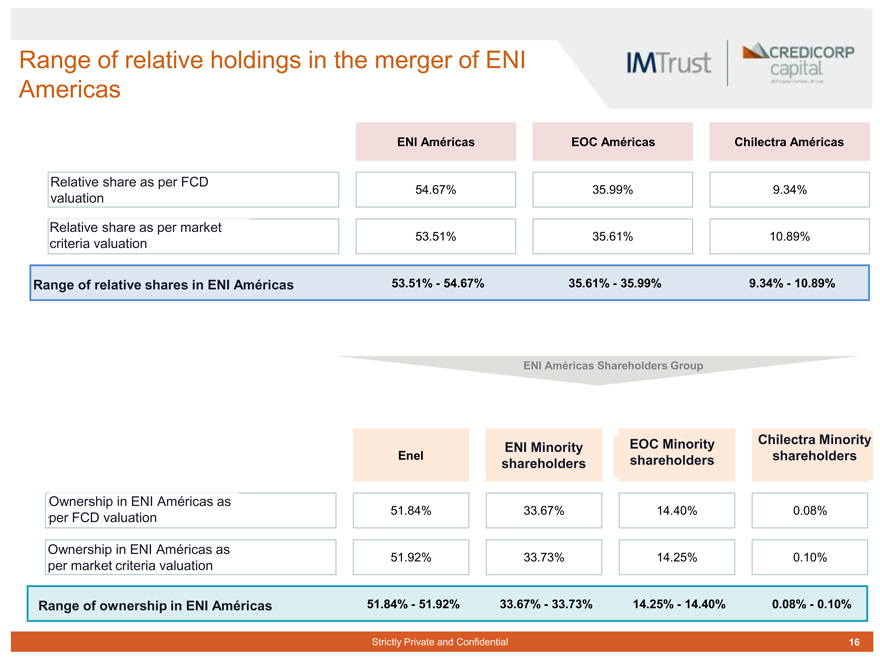
ENI Américas EOC AméricasChilectra Américas
Relative share as per FCD valuation 54.67% 35.99%9.34%
Relative share as per market criteria valuation 53.51% 35.61%10.89%
Range of relative shares in ENI Américas 53.51% - 54.67% 35.61% - 35.99%9.34% - 10.89%
ENI Américas Shareholders Group
Enel ENI Minority shareholdersEOC Minority shareholdersChilectra Minority shareholders
Ownership in ENI Américas as per FCD valuation 51.84% 33.67%14.40%0.08%
Ownership in ENI Américas as per market criteria valuation 51.92% 33.73%14.25%0.10%
Range of ownership in ENI Américas 51.84% - 51.92% 33.67% - 33.73%14.25% - 14.40%0.08% - 0.10%
Strictly Private and Confidential 16
|
Conclusions (1/2)
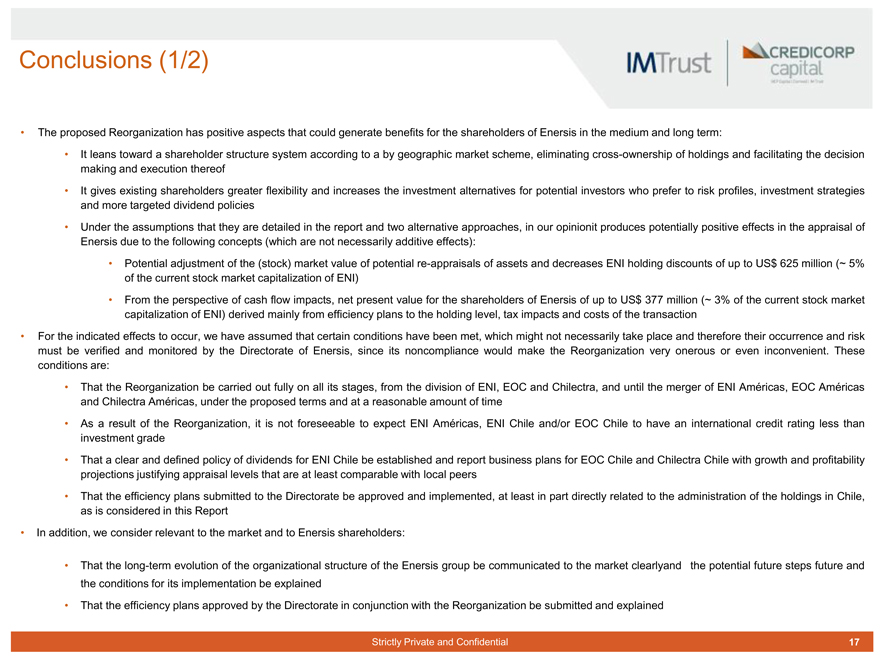
The proposed Reorganization has positive aspects that could generate benefits for the shareholders of Enersis in the medium and long term:
It leans toward a shareholder structure system according to a by geographic market scheme, eliminating cross-ownership of holdings and facilitating the decision making and execution thereof
It gives existing shareholders greater flexibility and increases the investment alternatives for potential investors who prefer to risk profiles, investment strategies and more targeted dividend policies
Under the assumptions that they are detailed in the report and two alternative approaches, in our opinionit produces potentially positive effects in the appraisal of Enersis due to the following concepts (which are not necessarily additive effects):
Potential adjustment of the (stock) market value of potential re-appraisals of assets and decreases ENI holding discounts of up to US$ 625 million (~ 5% of the current stock market capitalization of ENI)
From the perspective of cash flow impacts, net present value for the shareholders of Enersis of up to US$ 377 million (~ 3% of the current stock market capitalization of ENI) derived mainly from efficiency plans to the holding level, tax impacts and costs of the transaction
For the indicated effects to occur, we have assumed that certain conditions have been met, which might not necessarily take place and therefore their occurrence and risk must be verified and monitored by the Directorate of Enersis, since its noncompliance would make the Reorganization very onerous or even inconvenient. These conditions are:
That the Reorganization be carried out fully on all its stages, from the division of ENI, EOC and Chilectra, and until the merger of ENI Américas, EOC Américas and Chilectra Américas, under the proposed terms and at a reasonable amount of time
As a result of the Reorganization, it is not foreseeable to expect ENI Américas, ENI Chile and/or EOC Chile to have an international credit rating less than investment grade
That a clear and defined policy of dividends for ENI Chile be established and report business plans for EOC Chile and Chilectra Chile with growth and profitability projections justifying appraisal levels that are at least comparable with local peers
That the efficiency plans submitted to the Directorate be approved and implemented, at least in part directly related to the administration of the holdings in Chile, as is considered in this Report
In addition, we consider relevant to the market and to Enersis shareholders:
That the long-term evolution of the organizational structure of the Enersis group be communicated to the market clearly and the potential future steps future and the conditions for its implementation be explained
That the efficiency plans approved by the Directorate in conjunction with the Reorganization be submitted and explained
Strictly Private and Confidential 17
|
Conclusions (2/2)
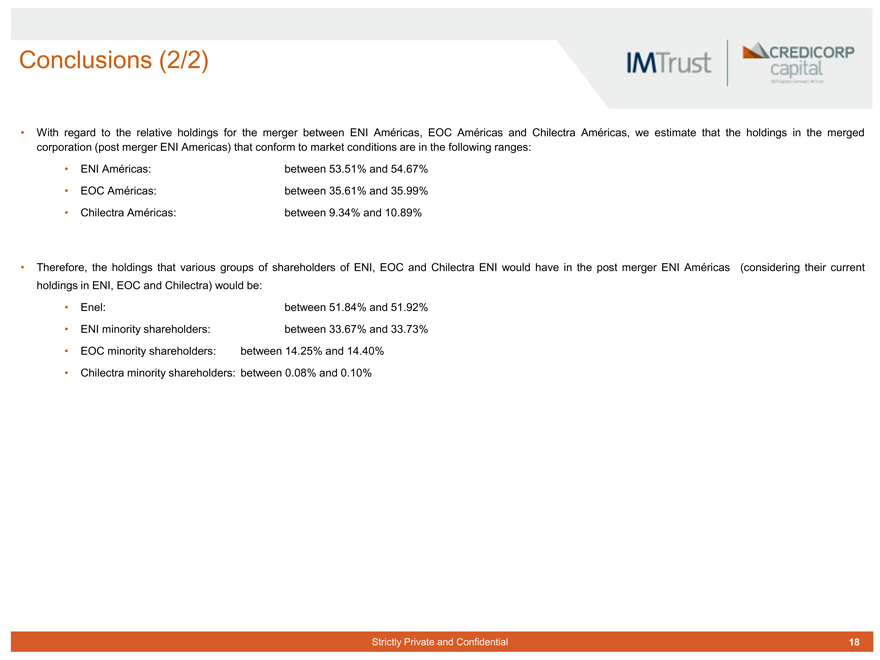
With regard to the relative holdings for the merger between ENI Américas, EOC Américas and Chilectra Américas, we estimate that the holdings in the merged corporation (post merger ENI Americas) that conform to market conditions are in the following ranges:
ENI Américas: between 53.51% and 54.67%
EOC Américas: between 35.61% and 35.99%
Chilectra Américas: between 9.34% and 10.89%
Therefore, the holdings that various groups of shareholders of ENI, EOC and Chilectra ENI would have in the post merger ENI Américas (considering their current holdings in ENI, EOC and Chilectra) would be:
Enel: between 51.84% and 51.92%
ENI minority shareholders: between 33.67% and 33.73%
EOC minority shareholders: between 14.25% and 14.40%
Chilectra minority shareholders: between 0.08% and 0.10%
Strictly Private and Confidential 18
|
BACKGROUND AND SCOPE OF THE EVALUATION 2
Strictly Private and Confidential 19
|
Background Information on the Reorganization (1/2)
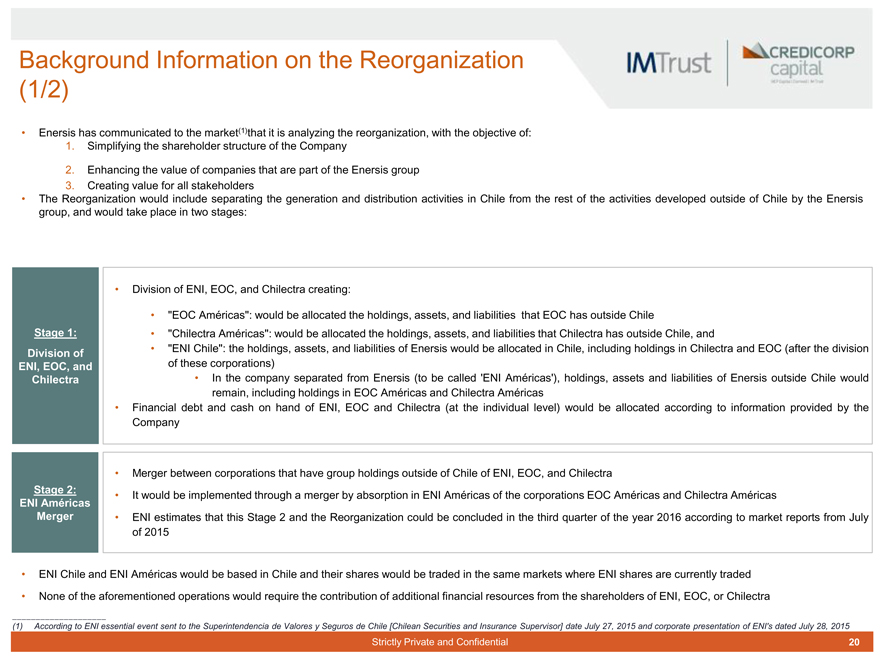
Enersis has communicated to the market(1) that it is analyzing the reorganization, with the objective of:
1. Simplifying the shareholder structure of the Company
2. Enhancing the value of companies that are part of the Enersis group
3. Creating value for all stakeholders
The Reorganization would include separating the generation and distribution activities in Chile from the rest of the activities developed outside of Chile by the Enersis group, and would take place in two stages:
Stage 1: Division of ENI, EOC, and Chilectra
Division of ENI, EOC, and Chilectra creating:
“EOC Américas”: would be allocated the holdings, assets, and liabilities that EOC has outside Chile
“Chilectra Américas”: would be allocated the holdings, assets, and liabilities that Chilectra has outside Chile, and
“ENI Chile”: the holdings, assets, and liabilities of Enersis would be allocated in Chile, including holdings in Chilectra and EOC (after the division of these corporations)
In the company separated from Enersis (to be called ‘ENI Américas’), holdings, assets and liabilities of Enersis outside Chile would remain, including holdings in EOC Américas and Chilectra Américas Financial debt and cash on hand of ENI, EOC and Chilectra (at the individual level) would be allocated according to information provided by the Company
Stage 2: ENI Américas Merger
Merger between corporations that have group holdings outside of Chile of ENI, EOC, and Chilectra
It would be implemented through a merger by absorption in ENI Américas of the corporations EOC Américas and Chilectra Américas
ENI estimates that this Stage 2 and the Reorganization could be concluded in the third quarter of the year 2016 according to market reports from July of 2015
ENI Chile and ENI Américas would be based in Chile and their shares would be traded in the same markets where ENI shares are currently traded
None of the aforementioned operations would require the contribution of additional financial resources from the shareholders of ENI, EOC, or Chilectra
(1) According to ENI essential event sent to the Superintendencia de Valores y Seguros de Chile [Chilean Securities and Insurance Supervisor] date July 27, 2015 and corporate presentation of ENI’s dated July 28, 2015
Strictly Private and Confidential 20
|
Background Information on the Reorganization (2/2)
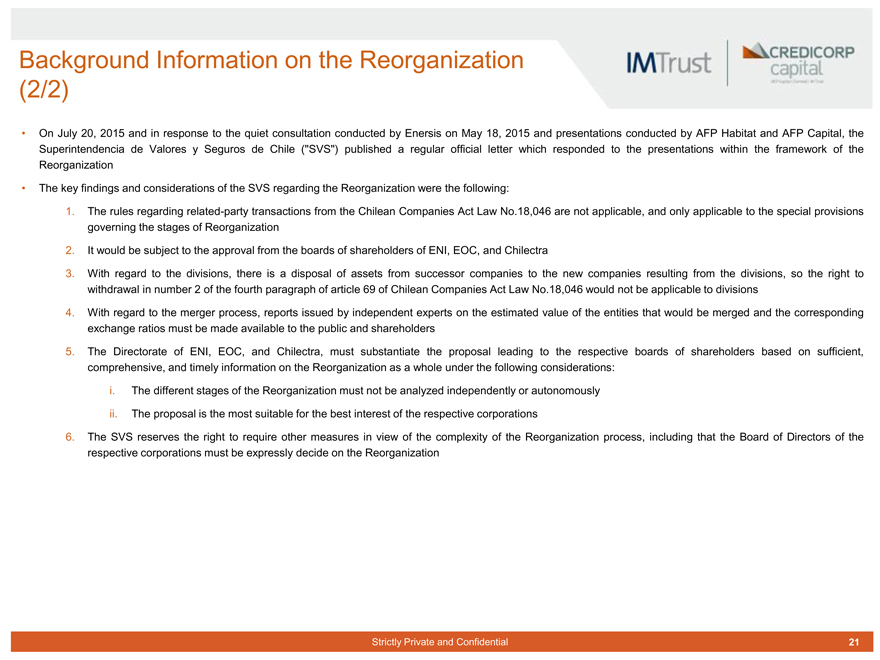
On July 20, 2015 and in response to the quiet consultation conducted by Enersis on May 18, 2015 and presentations conducted by AFP Habitat and AFP Capital, the Superintendencia de Valores y Seguros de Chile (“SVS”) published a regular official letter which responded to the presentations within the framework of the Reorganization
The key findings and considerations of the SVS regarding the Reorganization were the following:
1. The rules regarding related-party transactions from the Chilean Companies Act Law No.18,046 are not applicable, and only applicable to the special provisions governing the stages of Reorganization
2. It would be subject to the approval from the boards of shareholders of ENI, EOC, and Chilectra
3. With regard to the divisions, there is a disposal of assets from successor companies to the new companies resulting from the divisions, so the right to withdrawal in number 2 of the fourth paragraph of article 69 of Chilean Companies Act Law No.18,046 would not be applicable to divisions
4. With regard to the merger process, reports issued by independent experts on the estimated value of the entities that would be merged and the corresponding exchange ratios must be made available to the public and shareholders
5. The Directorate of ENI, EOC, and Chilectra, must substantiate the proposal leading to the respective boards of shareholders based on sufficient, comprehensive, and timely information on the Reorganization as a whole under the following considerations:
i. The different stages of the Reorganization must not be analyzed independently or autonomously
ii. The proposal is the most suitable for the best interest of the respective corporations
6. The SVS reserves the right to require other measures in view of the complexity of the Reorganization process, including that the Board of Directors of the respective corporations must be expressly decide on the Reorganization
Strictly Private and Confidential 21
|
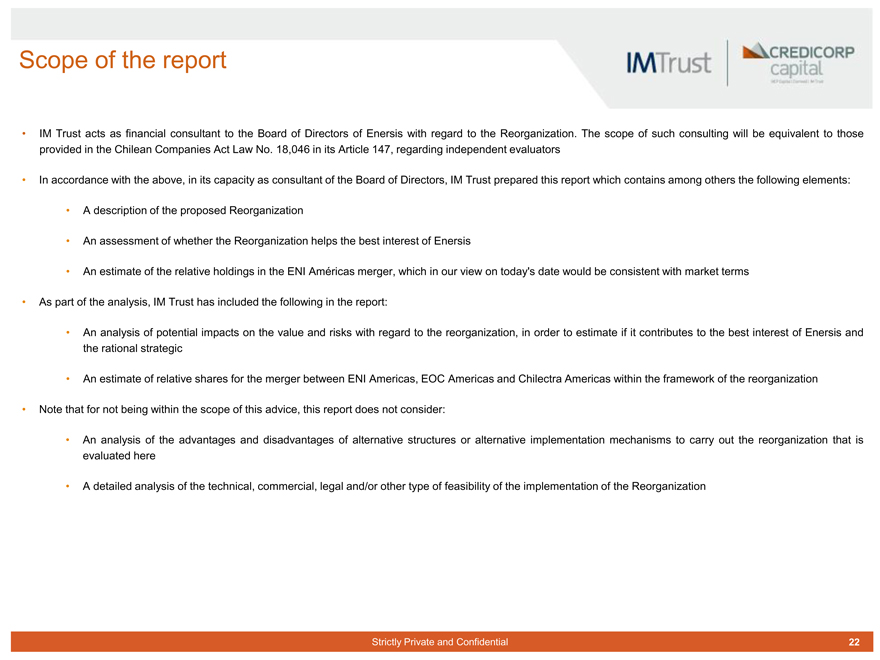
Scope of the report
IM Trust acts as financial consultant to the Board of Directors of Enersis with regard to the Reorganization. The scope of such consulting will be equivalent to those provided in the Chilean Companies Act Law No. 18,046 in its Article 147, regarding independent evaluators
In accordance with the above, in its capacity as consultant of the Board of Directors, IM Trust prepared this report which contains among others the following elements:
A description of the proposed Reorganization
An assessment of whether the Reorganization helps the best interest of Enersis
An estimate of the relative holdings in the ENI Américas merger, which in our view on today’s date would be consistent with market terms As part of the analysis, IM Trust has included the following in the report:
An analysis of potential impacts on the value and risks with regard to the reorganization, in order to estimate if it contributes to the best interest of Enersis and the rational strategic
An estimate of relative shares for the merger between ENI Americas, EOC Americas and Chilectra Americas within the framework of the reorganization Note that for not being within the scope of this advice, this report does not consider:
An analysis of the advantages and disadvantages of alternative structures or alternative implementation mechanisms to carry out the reorganization that is evaluated here
A detailed analysis of the technical, commercial, legal and/or other type of feasibility of the implementation of the Reorganization
Strictly Private and Confidential 22
|

DESCRIPTION OF THE REORGANIZATION 3
Strictly Private and Confidential 23
|
Structure of the Reorganization
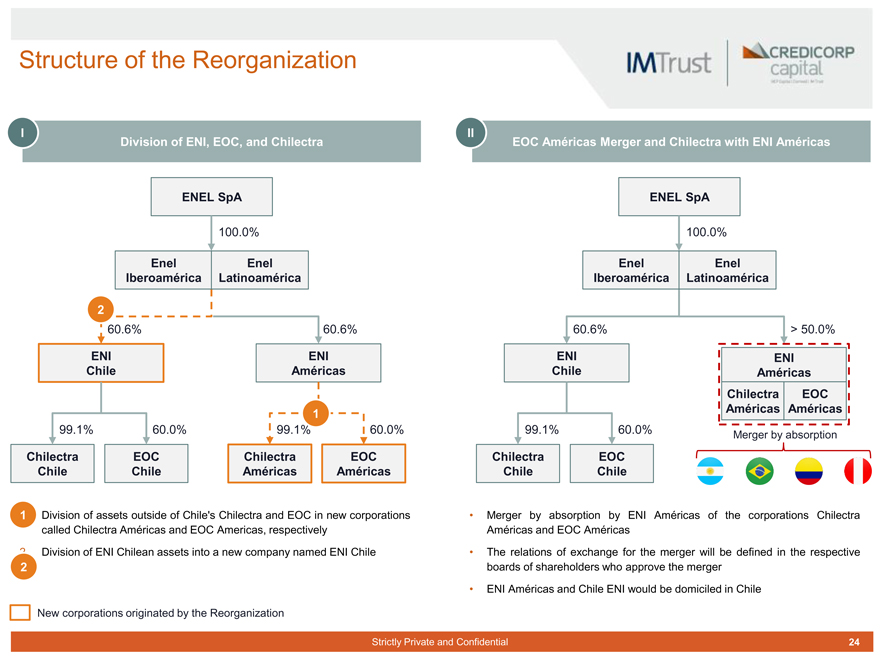
1 Division of ENI, EOC, and Chilectra
ENEL SpA
100.0%
Enel Iberoamérica Enel Latinoamérica
2
60.6% 60.6%
ENI Chile ENI Américas
1
99.1% 60.0% 99.1% 60.0%
Chilectra Chile EOC Chile Chilectra Américas EOC Américas
1 Division of assets outside of Chile’s Chilectra and EOC in new corporations called Chilectra Américas and EOC Americas, respectively
2 Division of ENI Chilean assets into a new company named ENI Chile
New corporations originated by the Reorganization
II EOC Américas Merger and Chilectra with ENI Américas
ENEL SpA
100.0%
Enel Iberoamérica Enel Latinoamérica
60.6% > 50.0%
ENI Chile ENI Américas Chilectra
Américas EOC Américas
99.1% 60.0% Merger by absorption
Chilectra Chile EOC Chile
Merger by absorption by ENI Américas of the corporations Chilectra Américas and EOC Américas
The relations of exchange for the merger will be defined in the respective boards of shareholders who approve the merger
ENI Américas and Chile ENI would be domiciled in Chile
Strictly Private and Confidential 24
|
Current Shareholder Structure of Enersis
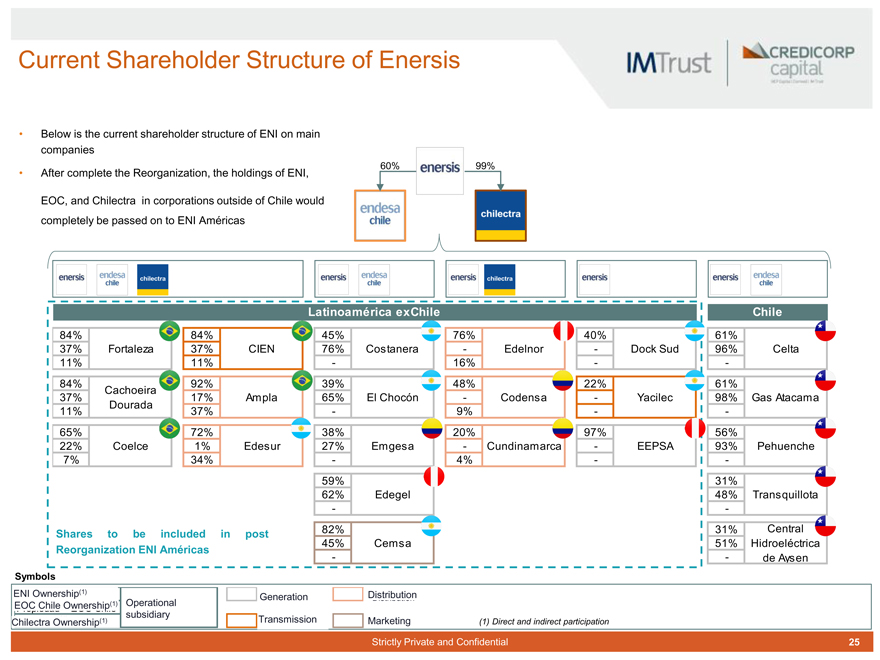
Below is the current shareholder structure of ENI on main companies
60% 99%
After complete the Reorganization, the holdings of ENI, EOC, and Chilectra in corporations outside of Chile would completely be passed on to ENI Américas
Latinoamérica exChile Chile
84% 84% 45% 76% 40% 61%
37% Fortaleza 37% CIEN 76% Costanera - Edelnor - Dock Sud 96% Celta 11% 11% - 16% - 84% 92% 39% 48% 22% 61% Cachoeira 37% 17% Ampla 65% El Chocón - Codensa - Yacilec 98% Gas Atacama Dourada 11% 37% - 9% - 65% 72% 38% 20% 97% 56% 22% Coelce 1% Edesur 27% Emgesa - Cundinamarca - EEPSA 93% Pehuenche
7% 34% - 4% - 59% 31%
62% Edegel 48% Transquillota
- 82% 31% Central Shares to be included in post 45% Cemsa 51% Hidroeléctrica
Reorganization ENI Américas - de Aysen
Symbols ENI Ownership (1) (1) Propiedad ENI Generation Generatio Distribution Distribution EOC Chile(1) Ownership(1) Operational
Propiedad EOC Chile subsidiary
(1) Transmission Other
Chilectra Propiedad Ownership Chilectra (1) Transmissi Marketing (1) Direct and indirect participation
Strictly Private and Confidential 25
|
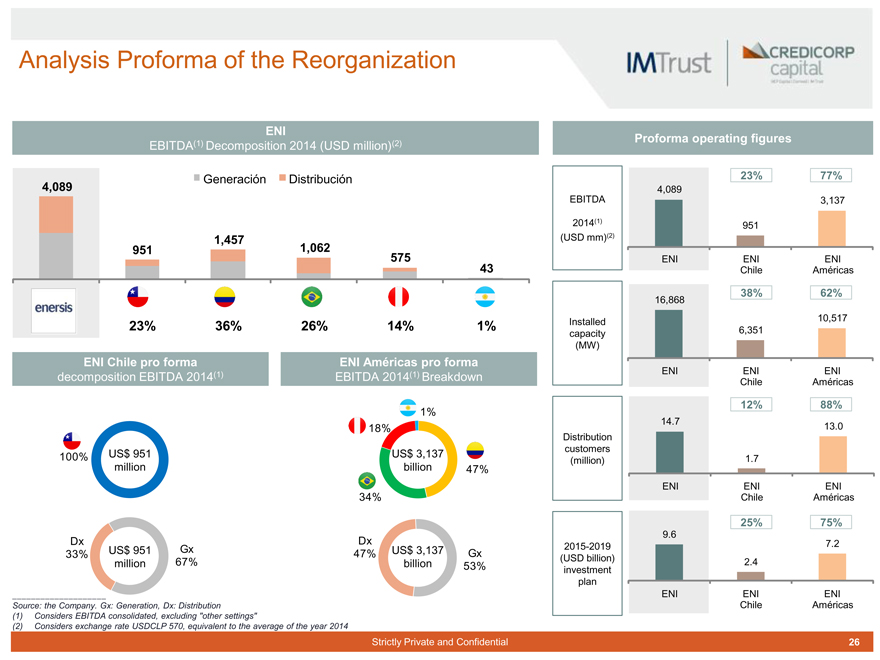
Analysis Proforma of the Reorganization
ENI
EBITDA(1) Decomposition 2014 (USD million)(2)
Generación Distribución
4,089
1,457
951 1,062
575 43
23% 36% 26% 14% 1%
ENI Chile pro forma ENI Américas pro forma decomposition EBITDA 2014(1) EBITDA 2014(1) Breakdown
1% 18%
100% US$ 951 US$ 3,137 million billion 47%
34%
Dx Dx
US$ 951 Gx 47% US$ 3,137 Gx 33% million 67% billion 53%
Source: the Company. Gx: Generation, Dx: Distribution
(1) Considers EBITDA consolidated, excluding “other settings”
(2) Considers exchange rate USDCLP 570, equivalent to the average of the year 2014
Strictly Private and Confidential
Proforma operating figures
23% 77%
4,089
EBITDA 3,137 2014(1) 951 (USD mm)(2)
ENI ENI ENI Chile Américas
38% 62%
16,868
Installed 10,517 capacity 6,351 (MW)
ENI ENI ENI Chile Américas
12% 88%
14.7
13.0 Distribution customers (million) 1.7
ENI ENI ENI Chile Américas
25% 75%
9.6 7.2 2015-2019 (USD billion) 2.4 investment plan ENI ENI ENI
Chile Américas
26
|
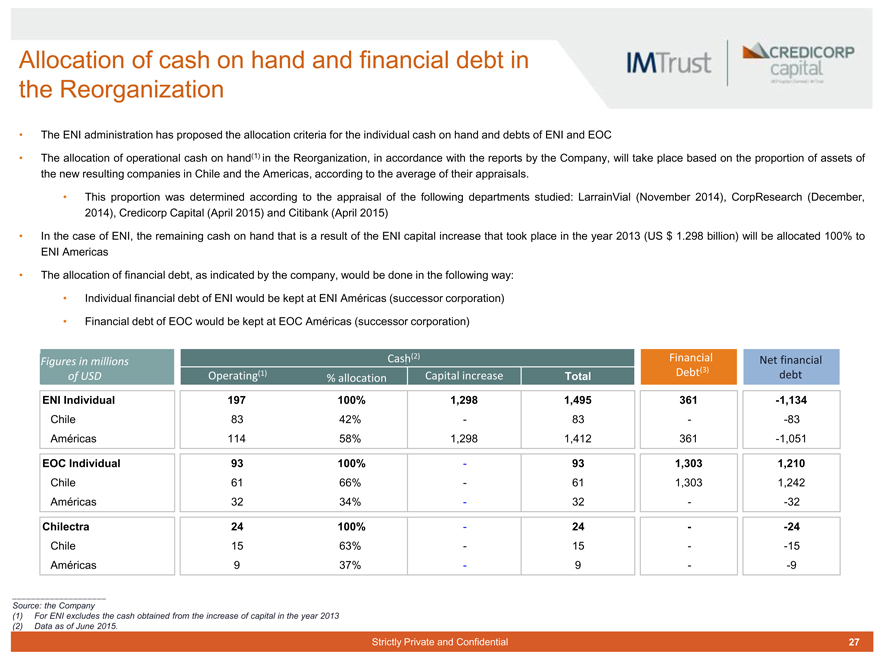
Allocation of cash on hand and financial debt in the Reorganization
The ENI administration has proposed the allocation criteria for the individual cash on hand and debts of ENI and EOC
(1)
The allocation of operational cash on hand(1) in the Reorganization, in accordance with the reports by the Company, will take place based on the proportion of assets of the new resulting companies in Chile and the Americas, according to the average of their appraisals.
This proportion was determined according to the appraisal of the following departments studied: LarrainVial (November 2014), CorpResearch (December, 2014), Credicorp Capital (April 2015) and Citibank (April 2015)
In the case of ENI, the remaining cash on hand that is a result of the ENI capital increase that took place in the year 2013 (US $ 1.298 billion) will be allocated 100% to ENI Americas
The allocation of financial debt, as indicated by the company, would be done in the following way:
Individual financial debt of ENI would be kept at ENI Américas (successor corporation)
Financial debt of EOC would be kept at EOC Américas (successor corporation)
Figures in millions of USD Operating(1) %%asignaallocationióCashCaja(2)(2)Capital increaseTotalFinancial Debt(3)Net financial debt
ENI Individual 197 100%1,2981,495361-1,134
Chile 83 42%-83--83
Américas 114 58%1,2981,412361-1,051
EOC Individual 93 100%-931,3031,210
Chile 61 66%-611,3031,242
Américas 32 34%-32--32
Chilectra 24 100%-24--24
Chile 15 63%-15--15
Américas 9 37%-9--9
Source: the Company
(1) For ENI excludes the cash obtained from the increase of capital in the year 2013 (2) Data as of June 2015.
Strictly Private and Confidential 27
|
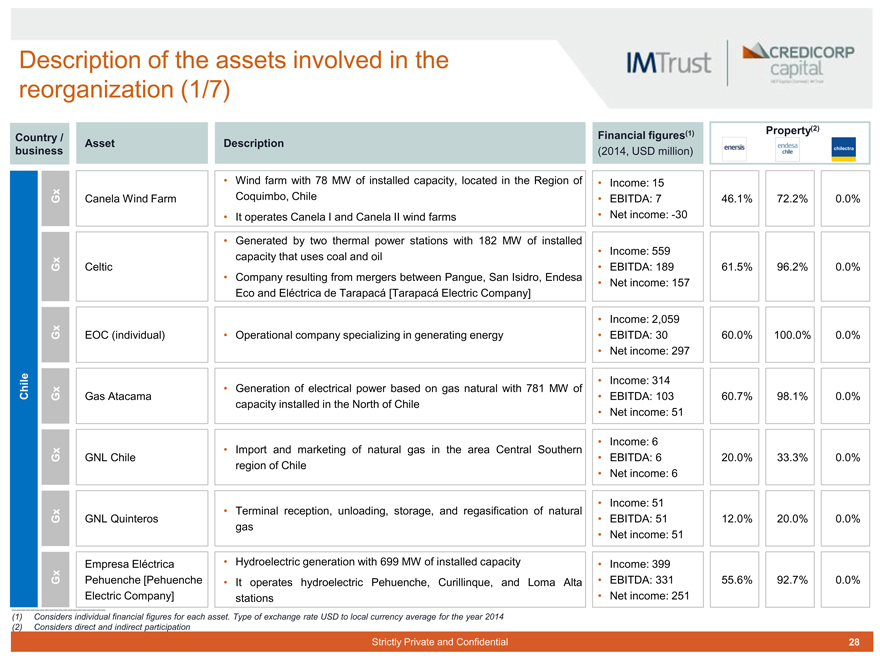
Description of the assets involved in the
reorganization (1/7)
Country / business Asset Description
Gx Canela Wind FarmWind farm with 78 MW of installed capacity, located in the Region of Coquimbo, Chile It operates Canela I and Canela II wind farms Generated by two thermal power stations with 182 MW of installed capacity that uses coal and oil
Gx CelticCompany resulting from mergers between Pangue, San Isidro, Endesa Eco and Eléctrica de Tarapacá [Tarapacá Electric Company]
Gx EOC (individual)Operational company specializing in generating energy
Chile Gx Gas AtacamaGeneration of electrical power based on gas natural with 781 MW of capacity installed in the North of Chile
Gx GNL ChileImport and marketing of natural gas in the area Central Southern region of Chile
Gx GNL QuinterosTerminal reception, unloading, storage, and regasification of natural gas
Gx Empresa Eléctrica Pehuenche [Pehuenche Electric Company]Hydroelectric generation with 699 MW of installed capacity It operates hydroelectric Pehuenche, Curillinque, and Loma Alta stations
Financial figures(1) Property(2)
(2014, USD million)
Income: 15
EBITDA: 7 46.1%72.2%0.0%
Net income: -30
Income: 559
EBITDA: 189 61.5%96.2%0.0%
Net income: 157
Income: 2,059
EBITDA: 30 60.0%100.0%0.0%
Net income: 297
Income: 314
EBITDA: 103 60.7%98.1%0.0%
Net income: 51
Income: 6
EBITDA: 6 20.0%33.3%0.0%
Net income: 6
Income: 51
EBITDA: 51 12.0%20.0%0.0%
Net income: 51
Income: 399
EBITDA: 331 55.6%92.7%0.0%
Net income: 251
(1) Considers individual financial figures for each asset. Type of exchange rate USD to local currency average for the year 2014 (2) Considers direct and indirect participation
Strictly Private and Confidential 28
|
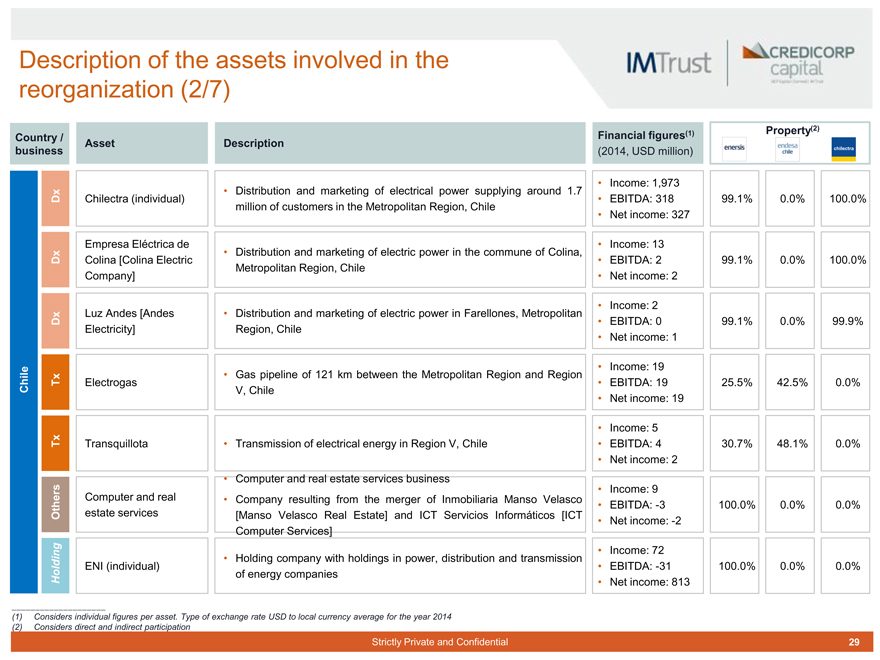
Description of the assets involved in the reorganization (2/7)
Country / business Asset Description
Dx Chilectra (individual)Distribution and marketing of electrical power supplying around 1.7 million of customers in the Metropolitan Region, Chile
Dx Empresa Eléctrica de Colina [Colina Electric Company]Distribution and marketing of electric power in the commune of Colina, Metropolitan Region, Chile
Dx Luz Andes [Andes Electricity]Distribution and marketing of electric power in Farellones, Metropolitan Region, Chile
Chile Tx ElectrogasGas pipeline of 121 km between the Metropolitan Region and Region V, Chile
Tx Transquillota Computer and realTransmission of electrical energy in Region V, Chile Computer and real estate services business Company resulting from the merger of Inmobiliaria Manso Velasco
Others Holding estate services ENI (individual)[Manso Velasco Real Estate] and ICT Servicios Informáticos [ICT Computer Services] Holding company with holdings in power, distribution and transmission of energy companies
Financial figures(1) Property(2)
(2014, USD million)
Income: 1,973
EBITDA: 318 99.1%0.0%100.0%
Net income: 327
Income: 13
EBITDA: 2 99.1%0.0%100.0%
Net income: 2
Income: 2
EBITDA: 0 99.1%0.0%99.9%
Net income: 1
Income: 19
EBITDA: 19 25.5%42.5%0.0%
Net income: 19
Income: 5
EBITDA: 4 30.7%48.1%0.0%
Net income: 2
Income: 9
EBITDA: -3 100.0%0.0%0.0%
Net income: -2
Income: 72
EBITDA: -31 100.0%0.0%0.0%
Net income: 813
(1) Considers individual figures per asset. Type of exchange rate USD to local currency average for the year 2014 (2) Considers direct and indirect participation
Strictly Private and Confidential 29
|
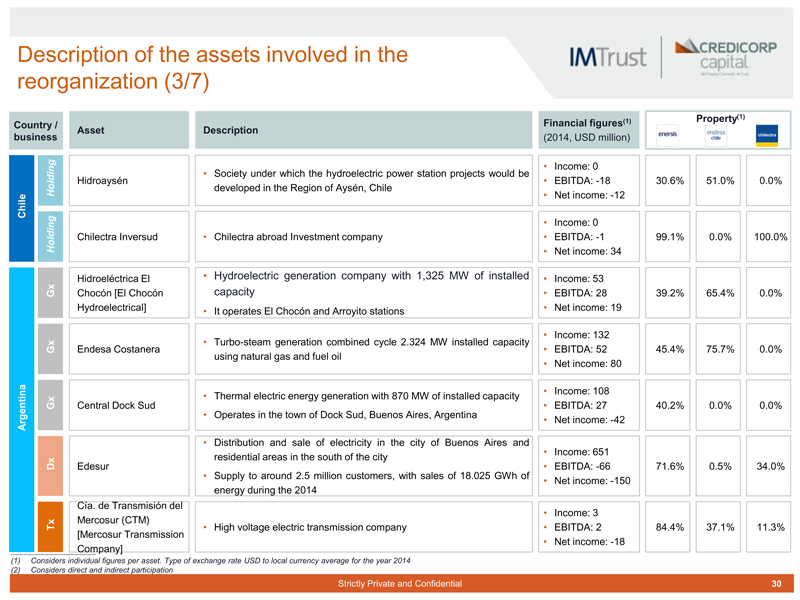
Description of the assets involved in the reorganization (3/7)
Country /
Asset Description business
Holding Hidroaysén Society under which the hydroelectric power station projects would be developed in the Region of Aysén, Chile
Chile Holding Chilectra Inversud Chilectra abroad Investment company
Gx Hidroeléctrica El Chocón [El Chocón Hydroelectrical] Hydroelectric generation company with 1,325 MW of installed capacity It operates El Chocón and Arroyito stations
Gx Endesa Costanera Turbo-steam generation combined cycle 2.324 MW installed capacity using natural gas and fuel oil
Gx Central Dock Sud Thermal electric energy generation with 870 MW of installed capacity
Argentina Operates in the town of Dock Sud, Buenos Aires, Argentina Distribution and sale of electricity in the city of Buenos Aires and residential areas in the south of the city
Dx Edesur Supply to around 2.5 million customers, with sales of 18.025 GWh of energy during the 2014
Tx Cía. de Transmisión del Mercosur (CTM) [Mercosur Transmission Company] High voltage electric transmission company
(1) (2) Considers individual figures per asset. Type of exchange rate USD to local currency average for the year 2014 Considers direct and indirect participation
Strictly Private and Confidential
Financial figures(1) Property(1)
(2014, USD million)
Income: 0
EBITDA: -18 30.6%51.0%0.0%
Net income: -12
Income: 0
EBITDA: -1 99.1%0.0%100.0%
Net income: 34
Income: 53
EBITDA: 28 39.2%65.4%0.0%
Net income: 19
Income: 132
EBITDA: 52 45.4%75.7%0.0%
Net income: 80
Income: 108
EBITDA: 27 40.2%0.0%0.0%
Net income: -42
Income: 651
EBITDA: -66 71.6%0.5%34.0%
Net income: -150
Income: 3
EBITDA: 2 84.4%37.1%11.3%
Net income: -18
30
|
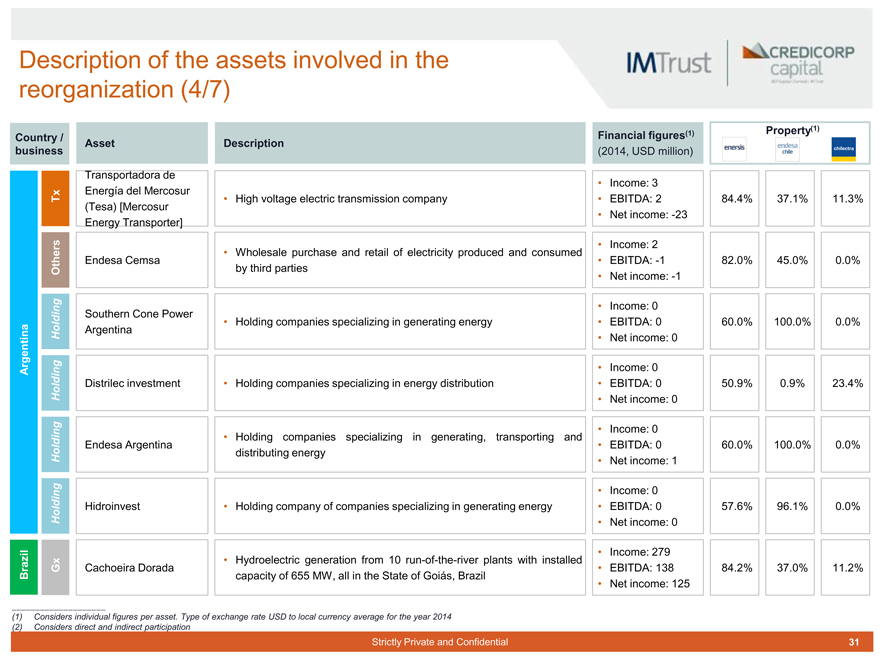
Description of the assets involved in the reorganization (4/7)
Country / business Asset Description
Tx Transportadora de Energía del Mercosur (Tesa) [Mercosur Energy Transporter] High voltage electric transmission company
Others Endesa Cemsa Wholesale purchase and retail of electricity produced and consumed by third parties
Holding Southern Cone Power Argentina Holding companies specializing in generating energy
Argentina Holding Distrilec investment Holding companies specializing in energy distribution
Holding Endesa Argentina Holding companies specializing in generating, transporting and distributing energy
Holding Hidroinvest Holding company of companies specializing in generating energy
Gx Brazil Cachoeira Dorada Hydroelectric generation from 10 run-of-the-river plants with installed capacity of 655 MW, all in the State of Goiás, Brazil
Financial figures(1) Property(1)
(2014, USD million)
Income: 3
EBITDA: 2 84.4%37.1%11.3%
Net income: -23
Income: 2
EBITDA: -1 82.0%45.0%0.0%
Net income: -1
Income: 0
EBITDA: 0 60.0%100.0%0.0%
Net income: 0
Income: 0
EBITDA: 0 50.9%0.9%23.4%
Net income: 0
Income: 0
EBITDA: 0 60.0%100.0%0.0%
Net income: 1
Income: 0
EBITDA: 0 57.6%96.1%0.0%
Net income: 0
Income: 279
EBITDA: 138 84.2%37.0%11.2%
Net income: 125
(1) Considers individual figures per asset. Type of exchange rate USD to local currency average for the year 2014 (2) Considers direct and indirect participation
Strictly Private and Confidential 31
|
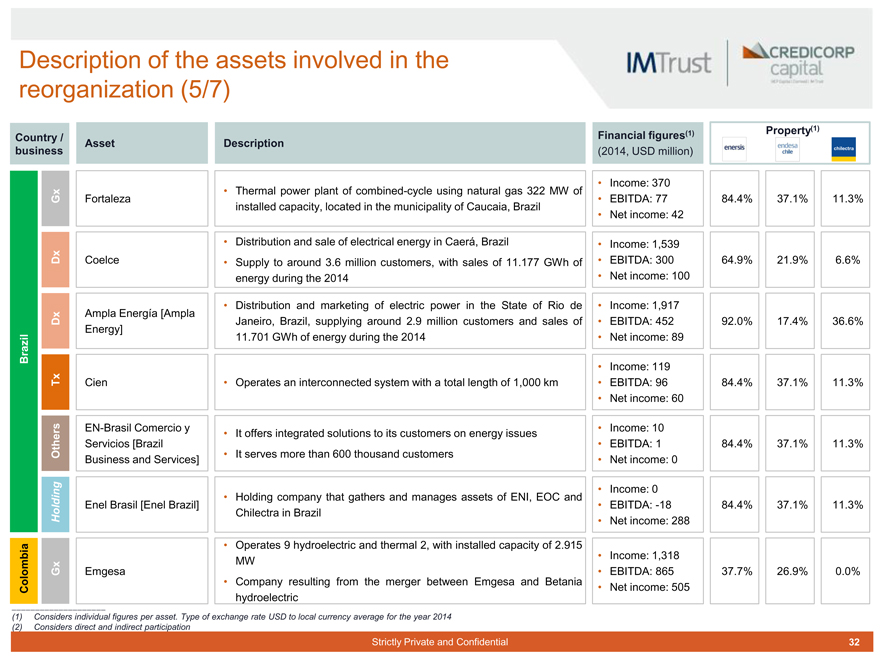
Description of the assets involved in the reorganization (5/7)
Country / business Asset Description
Gx Fortaleza Thermal power plant of combined-cycle using natural gas 322 MW of installed capacity, located in the municipality of Caucaia, Brazil
Dx Coelce Distribution and sale of electrical energy in Caerá, Brazil Supply to around 3.6 million customers, with sales of 11.177 GWh of energy during the 2014
Dx Ampla Energía [Ampla Energy] Distribution and marketing of electric power in the State of Rio de Janeiro, Brazil, supplying around 2.9 million customers and sales of 11.701 GWh of energy during the 2014
Brazil Tx Cien Operates an interconnected system with a total length of 1,000 km
Others EN-Brasil Comercio y Servicios [Brazil Business and Services] It offers integrated solutions to its customers on energy issues It serves more than 600 thousand customers
Holding company that gathers and manages assets of ENI, EOC and
Holding Enel Brasil [Enel Brazil] Chilectra in Brazil Operates 9 hydroelectric and thermal 2, with installed capacity of 2.915 MW
Gx Colombia Emgesa Company resulting from the merger between Emgesa and Betania hydroelectric
Financial figures(1) Property(1)
(2014, USD million)
Income: 370
EBITDA: 77 84.4%37.1%11.3%
Net income: 42
Income: 1,539
EBITDA: 300 64.9%21.9%6.6%
Net income: 100
Income: 1,917
EBITDA: 452 92.0%17.4%36.6%
Net income: 89
Income: 119
EBITDA: 96 84.4%37.1%11.3%
Net income: 60
Income: 10
EBITDA: 1 84.4%37.1%11.3%
Net income: 0
Income: 0
EBITDA: -18 84.4%37.1%11.3%
Net income: 288
Income: 1,318
EBITDA: 865 37.7%26.9%0.0%
Net income: 505
(1) Considers individual figures per asset. Type of exchange rate USD to local currency average for the year 2014 (2) Considers direct and indirect participation
Strictly Private and Confidential 32
|
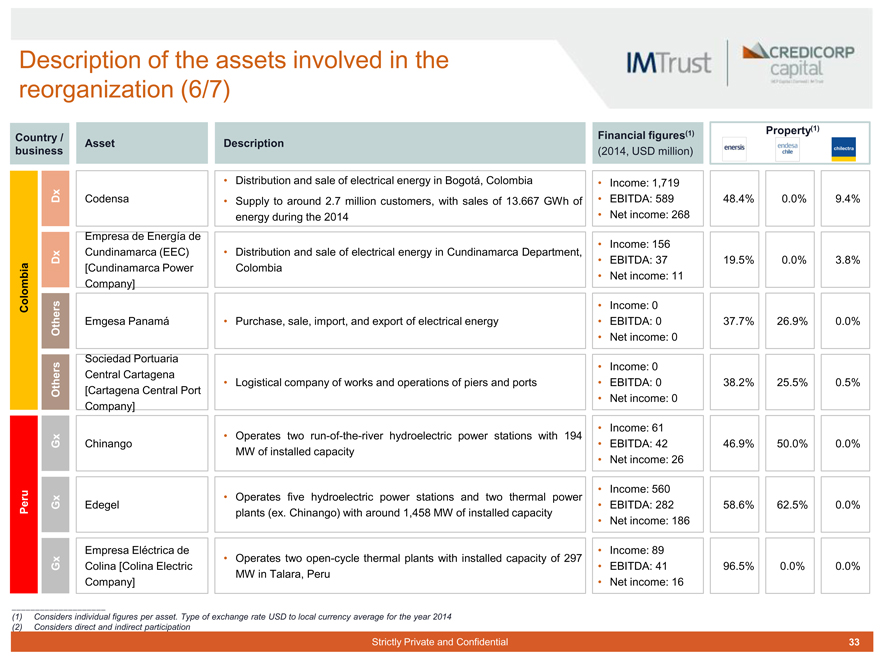
Description of the assets involved in the reorganization (6/7)
Country / business Asset Description
Dx Codensa Distribution and sale of electrical energy in Bogotá, Colombia Supply to around 2.7 million customers, with sales of 13.667 GWh of energy during the 2014
Colombia Dx Empresa de Energía de Cundinamarca (EEC) [Cundinamarca Power Company] Distribution and sale of electrical energy in Cundinamarca Department, Colombia
Others Emgesa Panamá Purchase, sale, import, and export of electrical energy
Others Sociedad Portuaria Central Cartagena [Cartagena Central Port Company] Logistical company of works and operations of piers and ports
Gx Chinango Operates two run-of-the-river hydroelectric power stations with 194 MW of installed capacity
Peru Gx Edegel Operates five hydroelectric power stations and two thermal power plants (ex. Chinango) with around 1,458 MW of installed capacity
Gx Empresa Eléctrica de Colina [Colina Electric Company] Operates two open-cycle thermal plants with installed capacity of 297 MW in Talara, Peru
Financial figures(1) Property(1)
(2014, USD million)
Income: 1,719
EBITDA: 589 48.4%0.0%9.4%
Net income: 268
Income: 156
EBITDA: 37 19.5%0.0%3.8%
Net income: 11
Income: 0
EBITDA: 0 37.7%26.9%0.0%
Net income: 0
Income: 0
EBITDA: 0 38.2%25.5%0.5%
Net income: 0
Income: 61
EBITDA: 42 46.9%50.0%0.0%
Net income: 26
Income: 560
EBITDA: 282 58.6%62.5%0.0%
Net income: 186
Income: 89
EBITDA: 41 96.5%0.0%0.0%
Net income: 16
(1) Considers individual figures per asset. Type of exchange rate USD to local currency average for the year 2014 (2) Considers direct and indirect participation
Strictly Private and Confidential 33
|
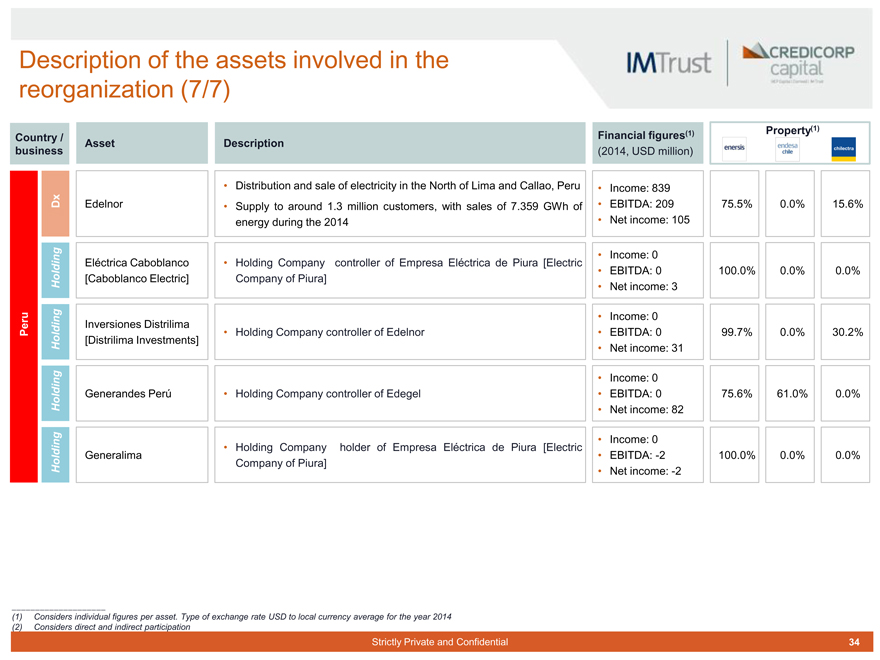
Description of the assets involved in the reorganization (7/7)
Country / business Asset DescriptionFinancial figures(1) (2014, USD million)Property(1)
Dx Edelnor Distribution and sale of electricity in the North of Lima and Callao, Peru Supply to around 1.3 million customers, with sales of 7.359 GWh of energy during the 2014 Income: 839 EBITDA: 209 Net income: 10575.5%0.0%15.6%
Holding Eléctrica Caboblanco [Caboblanco Electric] Holding Company controller of Empresa Eléctrica de Piura [Electric Company of Piura] Income: 0 EBITDA: 0 Net income: 3100.0%0.0%0.0%
Peru Holding Inversiones Distrilima [Distrilima Investments] Holding Company controller of Edelnor Income: 0 EBITDA: 0 Net income: 3199.7%0.0%30.2%
Holding Generandes Perú Holding Company controller of Edegel Income: 0 EBITDA: 0 Net income: 8275.6%61.0%0.0%
Holding Generalima Holding Company holder of Empresa Eléctrica de Piura [Electric Company of Piura] Income: 0 EBITDA: -2 Net income: -2100.0%0.0%0.0%
(1) Considers individual figures per asset. Type of exchange rate USD to local currency average for the year 2014 (2) Considers direct and indirect participation
Strictly Private and Confidential 34
|
GENERAL CONSIDERATIONS AND ANALYTICAL
SCHEME 4
Strictly Private and Confidential 35
|
Information used
1. The company enabled a virtual data room through which the following was delivered:
Presentations made to the Directorate by the administration of ENI with respect to reorganization
Presentations made by the administration of ENI with regard to the operations that it maintains through their subsidiaries in the different markets
Historical financial information for the periods December 2013, December 2014 and June 2015 for each of the companies involved in the Reorganization
Protected financial information for the period 2015-2020 for each of the companies involved in the reorganization, which:
- They were updated during October 2015 according to the business plans of each asset and the market conditions in the respective countries
- They were sent to IM Trust on October 17, 2015
- They are the same ones delivered to the various ENI, EOC, and Chilectra appraisers within the framework of the Reorganization
- They were approved by the company’s management and known by the Board of Directors of ENI
Information and estimates on the impact of the Reorganization: tax effects, efficiencies plan, the transaction costs and criteria for allocation of cash on hand and debt
2. Meetings with the administration and technical equipment of ENI
Working meetings were held with the administration of the Company
IM Trust asked questions to ENI, which were answered through the data room, along with other questions made by other appraisers of ENI in the framework of the Reorganization
3. Public information is available on the market: financial and market information services, analyst reports, etc.
It should be noted that:
ENI, EOC, and Chilectra are open companies in the Santiago Stock Exchange and, in addition, ENI and EOC are listed in the New York Stock Exchange (NYSE), and therefore these companies are supervised by national and international regulatory bodies, including the SVS, the Securities and Exchange Commission (SEC) and other local regulatory agencies in the countries where it operates
The analysis carried out by IM Trust did not contemplate a due diligence of ENI, EOC, Chilectra or societies involved in the Reorganization. With regard to accounting, legal, tax, and regulatory issues, the Company was requested its best estimate, opinion, or projection regarding the impact of the Reorganization. These estimates, opinions, or projections have not been independently verified by experts different from those that attended the Company in the formulation of the responses and have not been verified independently by IM Trust
Strictly Private and Confidential 36
|
General considerations used in the report
According to information made available by Enersis and the views contained in the replies provided by Enersis IM Trust, with regard to the Reorganization we have assumed the following:
It is permitted by Chilean legislation and the other countries where ENI, EOC, and Chilectra operates (Brazil, Colombia, Peru, and Argentina) and it does not violate any rule in any jurisdiction applicable to ENI, EOC, and Chilectra
It does not cause regulatory, environmental effects, or adverse competition for ENI, EOC and/or Chilectra, its subsidiaries and/or successors and/or those arising on the occasion of the Reorganization
It does affect or violate agreements with associates, providers, clients or any counterpart of ENI, EOC and/or Chilectra, its subsidiaries and/or successors and/or those arising on the occasion of the Reorganization
It does not involve accounting or tax effects which could negatively impact the results of ENI, EOC and/or Chilectra, its subsidiaries and/or successor companies and/or those arising on the occasion of the reorganization beyond those considered in the present report on the basis of the information provided by the company
It does create not new contingencies for ENI, EOC and/or Chilectra, its subsidiaries and/or successors and/or those arising on the occasion of the Reorganization
It does not affect or violate agreements in credit or creditor contracts of ENI, EOC, Chilectra and/or their subsidiaries that originate material effects in the results of any of these corporations, among which are breach, cross-default, or cross-acceleration events, and/or increases of financial costs
It is not incurred in liability management processes which mean material costs for ENI, EOC, and/or Chilectra, its subsidiaries and/or successor companies and/or arising on the occasion of the reorganization, beyond those considered in the present report on the basis of the information provided by the company
In terms of its stages, it is carried out in it entirety from the division of ENI, EOC and Chilectra, and until the merger of ENI Américas, EOC Américas and Chilectra Américas, under the proposed terms and at a reasonable amount of time
This analysis does not include a scenario in which once the division of ENI, EOC and Chilectra has taken place, the merger in ENI Americas is not completed in the time and manner as planned by Enersis
As a result of the Reorganization, ENI Américas, ENI Chile, and/or EOC Chile will not have an international credit rating below investment grade by any of the following risk classifiers: Moody’s, Standard & Poor’s and/or Fitch Ratings
Divided, successor and merged corporations are still listed and traded in the same markets and stock exchanges where ENI, EOC, and Chilectra are listed and traded, as appropriate
None of the operations involved or that arise due to the Reorganization would require the contribution of additional financial resources from the shareholders of ENI, EOC, and/or Chilectra
The fact that the Reorganization is carried out or does not affect the commitment of Endesa, S.A. and Enel S.p.A., to maintain Enersis and Endesa, S.A. (or the successor company(ies) or those arising from it), except for Enel Green Power S.p.A.(1), as a unique vehicle for investment in South America.
If the Reorganization does not take place, the current situation at Enersis would be maintained in terms of the consolidation, management, and political and economic rights of the holdings involved in the Reorganization
(1) This commitment was established by the Enersis shareholders on December 20, 2012
Strictly Private and Confidential 37
|

Assessment Framework
The following Analytical Scheme in this report is as follows:
Reorganization Strategic Rationale Management of shareholder structure Model of business organizationEfficiencies plan
Impact of the Reorganization on the Market Value of Enersis Stock Market and Market Factors Holding Company Discount Stock market liquidity
Potential impacts on the risk rating
Direct cash flow impacts from the reorganization in the value of Enersis Cash Flow Factors Impacts on EBITDA Tax ImpactTransaction Costs
Risks of the Reorganization
Risks of execution
Probability that the division is executed and the merger is not implemented or delayed.
Risk of loss of investment grade
Probability that some of the successors or companies resulting from the Reorganization lose the investment grade status
Discounted cash flow
Stock market capitalizations and multiples of market
Estimate of relative holdings of the merger in ENI Americas
1. Valuations: i. ENI Américas ii. EOC Américas iii. Chilectra Américas
2. Relative holdings of the merger
Strictly Private and Confidential 38
|
CONSIDERATIONS OF THE BUSINESS MODEL 5
Strictly Private and Confidential 39
|
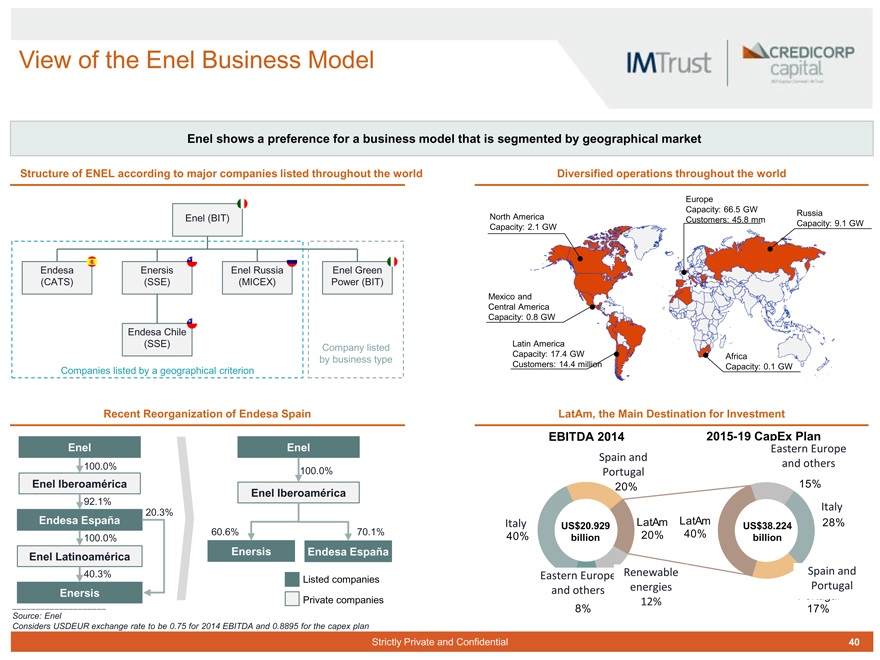
View of the Enel Business Model
Enel shows a preference for a business model that is segmented by geographical market
Structure of ENEL according to major companies listed throughout the world
Enersis (SSE)
Enel (BIT)
Endesa (CATS)
Enel Russia (MICEX)
Enel Green Power (BIT)
Company listed by business type
Companies listed by a geographical criterion
Endesa Chile (SSE)
Diversified operations throughout the world
Africa
Capacity: 0.1 GW
Latin America Capacity: 17.4 GW Customers: 14.4 million
Mexico and Central America Capacity: 0.8 GW
North America Capacity: 2.1 GW
Europe
Capacity: 66.5 GW Customers: 45.8 mm
Russia
Capacity: 9.1 GW
Recent Reorganization of Endesa Spain
Enel
100.0%
Enel Iberoamérica
92.1%
20.3%
Endesa España
100.0%
Enel Latinoamérica
40.3%
Enersis
Enel
100.0%
Enel Iberoamérica
60.6% 70.1%
Enersis Endesa España
Listed companies
Private companies
LatAm, the Main Destination for Investment
Italy
40%
Eastern Europe Renewable and others energies 12%
8%
15%
Italy
28%
Spain and Portugal
17%
US$38.224 billion
LatAm LatAm 20% 40%
Spain and Portugal
20%
EBITDA 2014
2015-19 CapEx Plan
Eastern Europe and others
Source: Enel
Considers USDEUR exchange rate to be 0.75 for 2014 EBITDA and 0.8895 for the capex plan
Strictly Private and Confidential 40
|
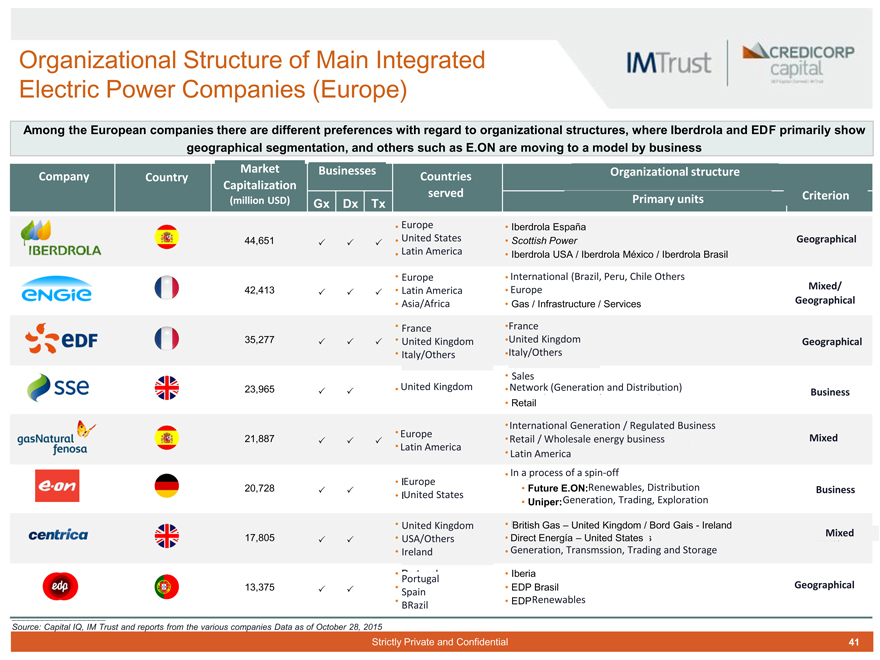
Organizational Structure of Main Integrated Electric Power Companies (Europe)
Among the European companies there are different preferences with regard to organizational structures, where Iberdrola and EDF primarily show geographical segmentation, and others such as E.ON are moving to a model by business
Company Country Market Capitalization (million USD)Businesses Gx Dx TxCountries servedOrganizational structure Primary unitsCriterion
44,651 Europe United States Latin America Iberdrola España Scottish Power Iberdrola USA / Iberdrola México / Iberdrola BrasilGeographical
42,413 Europe Latin America Asia/Africa International (Brazil, Peru, Chile Others Europe Gas / Infrastructure / ServicesMixed/ Geographical
35,277 France United Kingdom Italy/Others France United Kingdom Italy/OthersGeographical
23,965 United Kingdom VSalesntas NetworkRedes (Generación(Generationy Distribución)and Distribution) RetailBusiness
21,887 Europe Latin America InternationalGener ción IntGenerationrnacional / NRegulatedocios ReguladosBusiness RetailNegocios/ Wholesaleminoristas/mayoristasenergy businessde energía LatinL inoaAmericaé ica InEnaprprocessceso deof aspin-offspin-offMixed
20,728 Europe United States Future E.ON:Renewables,Renov les, Distributionis ibución Uniper:Generation, Trading, ExplorationBusiness
17,805 United Kingdom USA/Others Ireland Britishr Gas -–ReinoUnitedUnidoKingdom/ Bord/ BordGaisGais- Irlanda- Ireland Directt EnergíaEne í –- EstadosUnited StatesUnidos Generation, Transmssion, Trading and StorageMixed
13,375 Spain Portugal BRazil Iberia EDP Brasil EDPRenewablesGeographical
Source: Capital IQ, IM Trust and reports from the various companies Data as of October 28, 2015
Strictly Private and Confidential 41
|
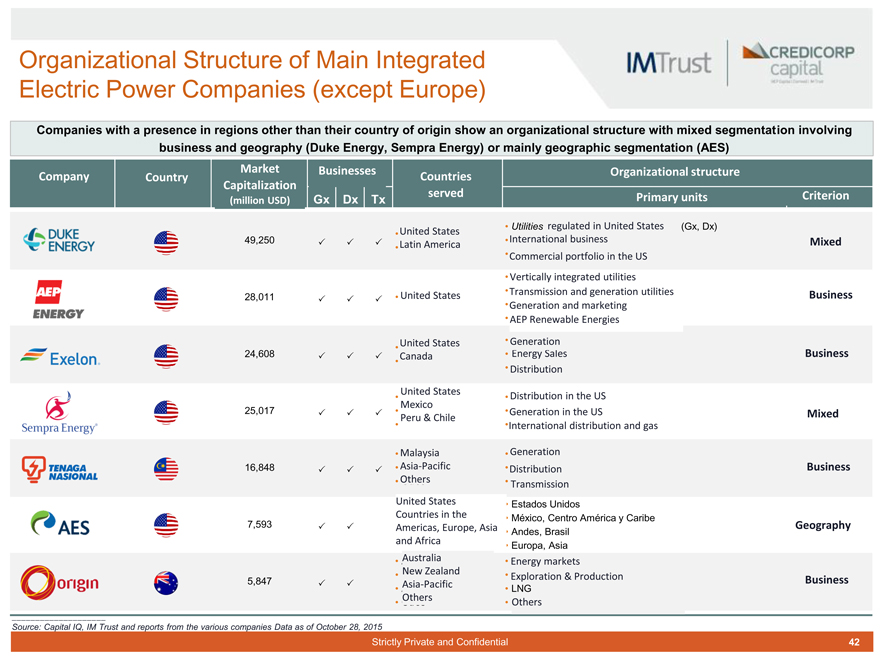
Organizational Structure of Main Integrated Electric Power Companies (except Europe)
Companies with a presence in regions other than their country of origin show an organizational structure with mixed segmentation involving business and geography (Duke Energy, Sempra Energy) or mainly geographic segmentation (AES)
Company Country Market Capitalization (million USD) Businesses Gx Dx TxCountries served Organizational structure Primary units Criterion
49,250 United States Latin America Utilities regulatedreguladasinenUnitedEs a osStatesUnidos (Gx, Dx) International business Commercial portfolio in the USMixed
28,011 United States Vertically integrated utilities Transmission and generation utilities Generation and marketing AEP Renewable EnergiesBusiness
24,608 United States Canada Generation Energy Sales Distribution Business
25,017 United States Mexico Peru & Chile Distribution in the US Generation in the US International distribution and gas Mixed
16,848 Malaysia Asia-Pacific Others Generation Distribution Transmission Business
7,593 United States Countries in the Americas, Europe, Asia and Africa Estados Unidos México, Centro América y Caribe Andes, Brasil Europa, AsiaGeography
5,847 Australia New Zealand Asia-Pacific Others Energy markets Explorationxplor ción & Productionción LNG Others Business
Source: Capital IQ, IM Trust and reports from the various companies Data as of October 28, 2015
Strictly Private and Confidential 42
|
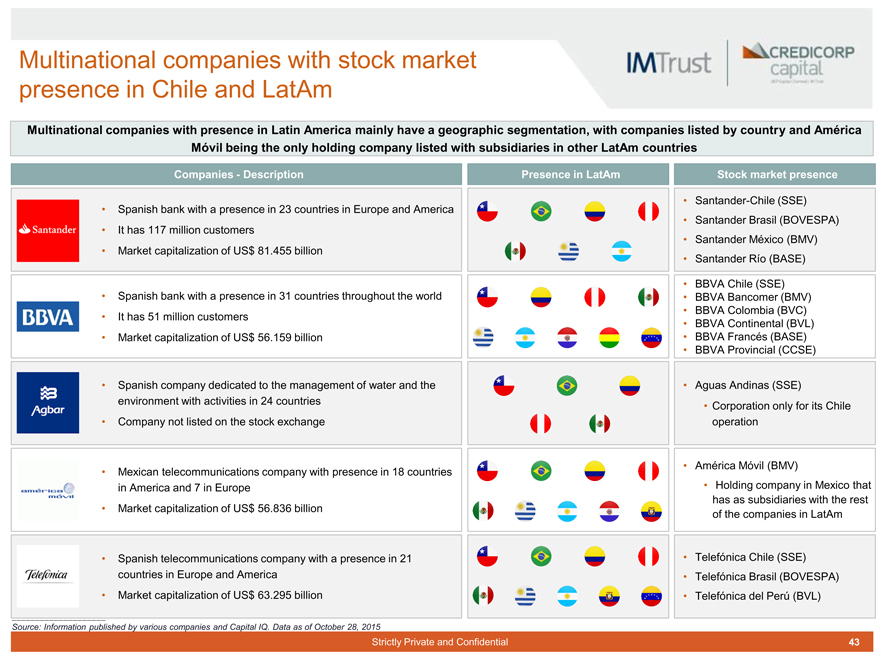
Multinational companies with stock market presence in Chile and LatAm
Multinational companies with presence in Latin America mainly have a geographic segmentation, with companies listed by country and América Móvil being the only holding company listed with subsidiaries in other LatAm countries
Companies - Description
Spanish bank with a presence in 23 countries in Europe and America
It has 117 million customers
Market capitalization of US$ 81.455 billion
Spanish bank with a presence in 31 countries throughout the world
It has 51 million customers
Market capitalization of US$ 56.159 billion
Spanish company dedicated to the management of water and the environment with activities in 24 countries
Company not listed on the stock exchange
Mexican telecommunications company with presence in 18 countries in America and 7 in Europe
Market capitalization of US$ 56.836 billion
Spanish telecommunications company with a presence in 21 countries in Europe and America
Market capitalization of US$ 63.295 billion
Presence in LatAm
Stock market presence
Santander-Chile (SSE)
Santander Brasil (BOVESPA)
Santander México (BMV)
Santander Río (BASE)
BBVA Chile (SSE)
BBVA Bancomer (BMV)
BBVA Colombia (BVC)
BBVA Continental (BVL)
BBVA Francés (BASE)
BBVA Provincial (CCSE)
Aguas Andinas (SSE)
Corporation only for its Chile operation
América Móvil (BMV)
Holding company in Mexico that has as subsidiaries with the rest of the companies in LatAm
Telefónica Chile (SSE)
Telefónica Brasil (BOVESPA)
Telefónica del Perú (BVL)
Source: Information published by various companies and Capital IQ. Data as of October 28, 2015
Strictly Private and Confidential 43
|
IMPACT OF THE REORGANIZATION ON THE
MARKET VALUE OF ENERSIS 6 i. Holding Discount Considerations
Strictly Private and Confidential 44
|
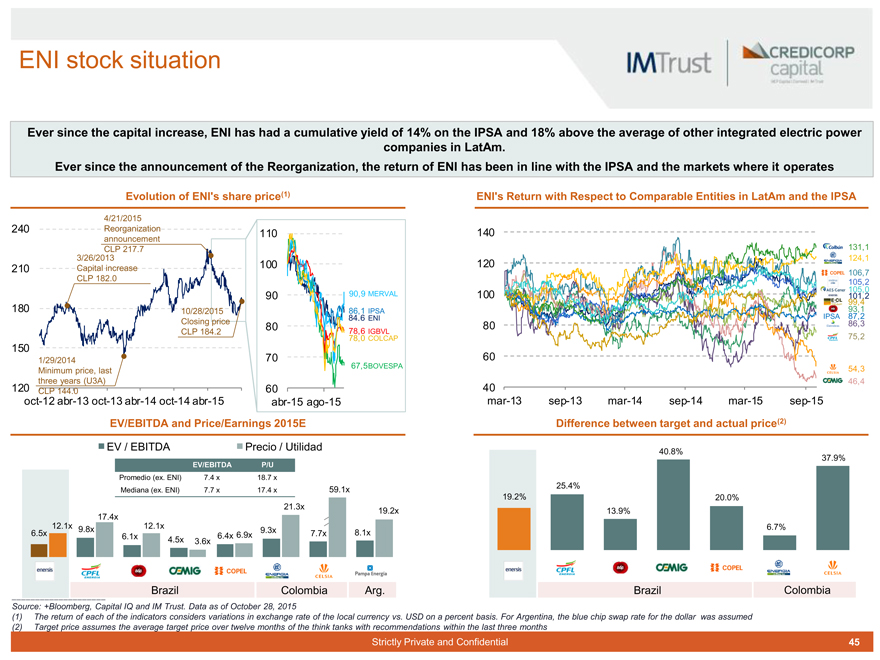
ENI stock situation
Ever since the capital increase, ENI has had a cumulative yield of 14% on the IPSA and 18% above the average of other integrated electric power companies in LatAm.
Ever since the announcement of the Reorganization, the return of ENI has been in line with the IPSA and the markets where it operates
Evolution of ENI’s share price(1)
4/21/2015
240 Reorganization 110 announcement CLP 217.7 3/26/2013 210 Capital increase 100 CLP 182.0
90 90,9 MERVAL
180 10/28/2015 86,1 IPSA Closing price 80 84,6 ENI
CLP 184.2 78,6 78,0 COLCAP IGBVL
150 70
1/29/2014
67,5BOVESPA
Minimum price, last three years (U3A)
120 CLP 144.0 60
oct-12 abr-13 oct-13 abr-14 oct-14 abr-15 abr-15 ago-15
ENI’s Return with Respect to Comparable Entities in LatAm and the IPSA
140
131,1 124,1
120
106,7
105,0 105,2 100 101,2 93,1 99,4
IPSA 86,3 87,2
80
75,2
60
54,3
46,4
40 mar-13 sep-13 mar-14 sep-14 mar-15 sep-15
EV/EBITDA and Price/Earnings 2015E
EV / EBITDA Precio / Utilidad
EV/EBITDA P/U
Promedio (ex. ENI) 7.4 x 18.7 x
Mediana (ex. ENI) 7.7 x 17.4 x 59.1x
21.3x
19.2x 17.4x 12.1x 9.8x 12.1x 6.5x 9.3x 7.7x 8.1x 6.1x 6.4x 6.9x 4.5x 3.6x
Brazil Colombia Arg.
Difference between target and actual price(2)
40.8%
37.9%
25.4%
19.2% 20.0% 13.9%
6.7%
Brazil Colombia
Source: +Bloomberg, Capital IQ and IM Trust. Data as of October 28, 2015
(1) The return of each of the indicators considers variations in exchange rate of the local currency vs. USD on a percent basis. For Argentina, the blue chip swap rate for the dollar was assumed (2) Target price assumes the average target price over twelve months of the think tanks with recommendations within the last three months
Strictly Private and Confidential 45
|
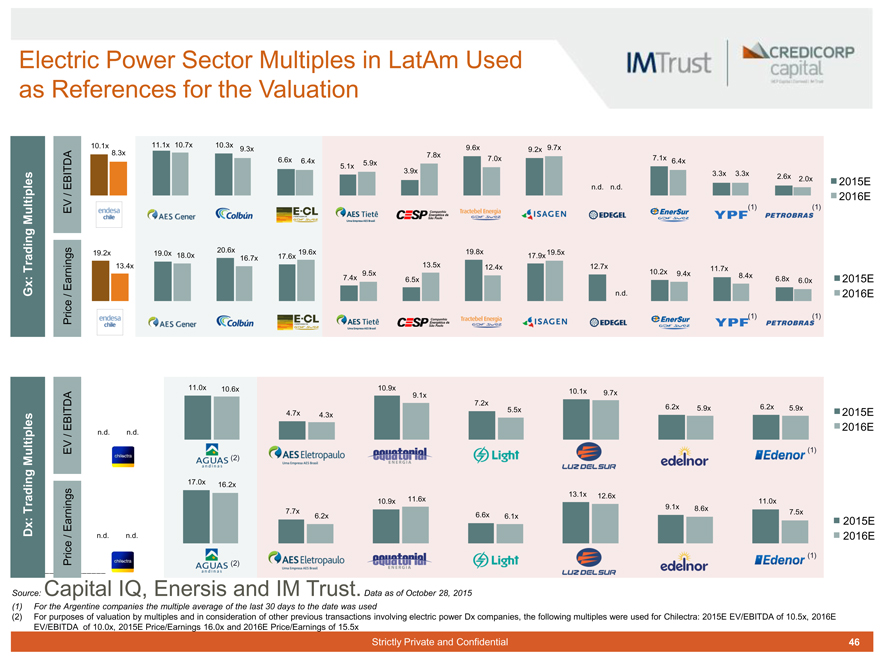
Electric Power Sector Multiples in LatAm Used as References for the Valuation
10.1x 11.1x 10.7x 10.3x 9.6x 9.7x
9.3x 9.2x
8.3x 7.8x
6.6x 6.4x 7.0x 7.1x 6.4x
5.1x 5.9x
3.9x 3.3x 3.3x
2.6x 2.0x
2015E
EBITDA n.d. n.d.
/ 2016E
Multiples EV (1) (1)
19.2x 20.6x 19.6x 19.8x 19.5x 19.0x 18.0x 17.6x 17.9x 16.7x 13.5x
Trading 13.4x 12.4x 12.7x 10.2x 11.7x
9.5x 9.4x 8.4x
Earnings 7.4x 6.5x 6.8x 6.0x 2015E
Gx: / n.d. 2016E
Price (1) (1)
11.0x 10.6x 10.9x
10.1x 9.7x
9.1x
7.2x
4.7x 5.5x 6.2x 5.9x 6.2x 5.9x
4.3x 2015E
EBITDA 2016E
n.d. n.d.
/
EV (1)
Multiples (2)
17.0x 16.2x
13.1x 12.6x
10.9x 11.6x 11.0x
9.1x 8.6x
Trading 7.7x 7.5x
6.2x 6.6x 6.1x
Earnings 2015E
Dx: / n.d. n.d. 2016E (1)
Price (2)
Source: Capital IQ, Enersis and IM Trust. Data as of October 28, 2015 (1) For the Argentine companies the multiple average of the last 30 days to the date was used
(2) For purposes of valuation by multiples and in consideration of other previous transactions involving electric power Dx companies, the following multiples were used for Chilectra: 2015E EV/EBITDA of 10.5x, 2016E EV/EBITDA of 10.0x, 2015E Price/Earnings 16.0x and 2016E Price/Earnings of 15.5x
Strictly Private and Confidential 46
|
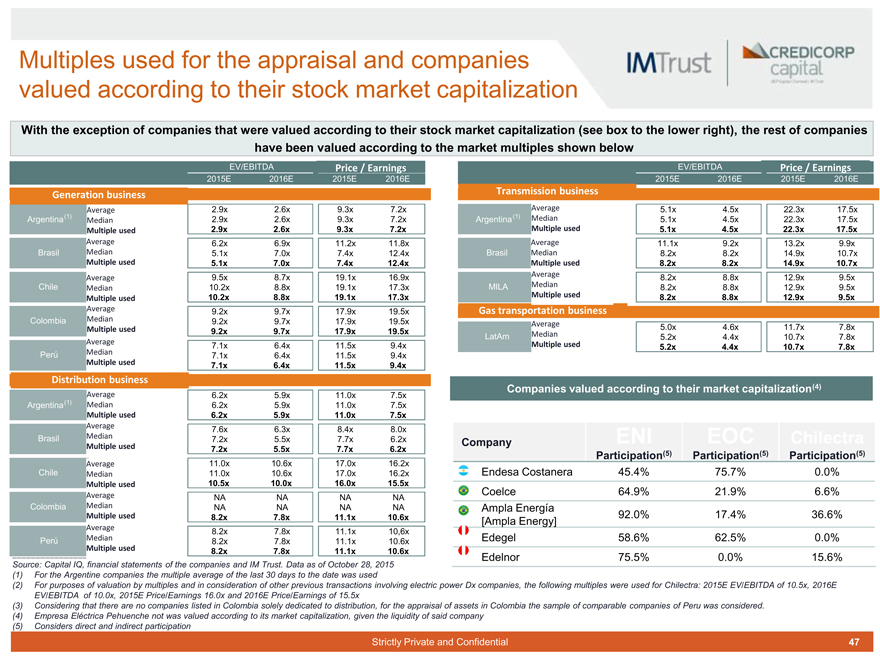
Multiples used for the appraisal and companies valued according to their stock market capitalization
With the exception of companies that were valued according to their stock market capitalization (see box to the lower right), the rest of companies have been valued according to the market multiples shown below
EV/EBITDAPricePr cio/Utilidad/ Earnings
2015E2016E2015E2016E
Generation business
Average 2.9x2.6x9.3x7.2x
Argentina(1) Median 2.9x2.6x9.3x7.2x
Multiple used 2.9x2.6x9.3x7.2x
Average 6.2x6.9x11.2x11.8x
Brasil Median 5.1x7.0x7.4x12.4x
Multiple used 5.1x7.0x7.4x12.4x
Average 9.5x8.7x19.1x16.9x
Chile Median 10.2x8.8x19.1x17.3x
Multiple used 10.2x8.8x19.1x17.3x
Average 9.2x9.7x17.9x19.5x
Colombia Median 9.2x9.7x17.9x19.5x
Multiple used 9.2x9.7x17.9x19.5x
Average 7.1x6.4x11.5x9.4x
Perú Median 7.1x6.4x11.5x9.4x
Multiple used 7.1x6.4x11.5x9.4x
Distribution business
Average 6.2x5.9x11.0x7.5x
Argentina(1) Median 6.2x5.9x11.0x7.5x
Multiple used 6.2x5.9x11.0x7.5x
Average 7.6x6.3x8.4x8.0x
Brasil Median 7.2x5.5x7.7x6.2x
Multiple used 7.2x5.5x7.7x6.2x
Average 11.0x10.6x17.0x16.2x
Chile Median 11.0x10.6x17.0x16.2x
Multiple used 10.5x10.0x16.0x15.5x
Average NANANANA
Colombia Median NANANANA
Multiple used 8.2x7.8x11.1x10.6x
Average 8.2x7.8x11.1x10,6x
Perú Median 8.2x7.8x11.1x10.6x
Multiple used 8.2x7.8x11.1x10.6x
EV/EBITDAPricePrecio/Utilidad/ Earnings
2015E2016E2015E2016E
Transmission business
Average 5.1x4.5x22.3x17.5x
Argentina(1) Median 5.1x4.5x22.3x17.5x
Multiple used 5.1x4.5x22.3x17.5x
Average 11.1x9.2x13.2x9.9x
Brasil Median 8.2x8.2x14.9x10.7x
Multiple used 8.2x8.2x14.9x10.7x
Average 8.2x8.8x12.9x9.5x
MILA Median 8.2x8.8x12.9x9.5x
Multiple used 8.2x8.8x12.9x9.5x
NegocioGasttransportationa s rte de gasbusiness
Average 5.0x4.6x11.7x7.8x
LatAm Median 5.2x4.4x10.7x7.8x
Multiple used 5.2x4.4x10.7x7.8x
Companies valued according to their market capitalization(4)
Company ENIEOCChilectra
Participation(5) Participation(5)Participation(5)
Endesa Costanera 45.4% 75.7%0.0%
Coelce 64.9%21.9%6.6%
Ampla Energía
[Ampla Energy] 92.0% 17.4%36.6%
Edegel 58.6%62.5%0.0%
Edelnor 75.5%0.0%15.6%
Source: Capital IQ, financial statements of the companies and IM Trust. Data as of October 28, 2015 (1) For the Argentine companies the multiple average of the last 30 days to the date was used
(2) For purposes of valuation by multiples and in consideration of other previous transactions involving electric power Dx companies, the following multiples were used for Chilectra: 2015E EV/EBITDA of 10.5x, 2016E EV/EBITDA of 10.0x, 2015E Price/Earnings 16.0x and 2016E Price/Earnings of 15.5x (3) Considering that there are no companies listed in Colombia solely dedicated to distribution, for the appraisal of assets in Colombia the sample of comparable companies of Peru was considered.
(4) Empresa Eléctrica Pehuenche not was valued according to its market capitalization, given the liquidity of said company (5) Considers direct and indirect participation
Strictly Private and Confidential 47
|
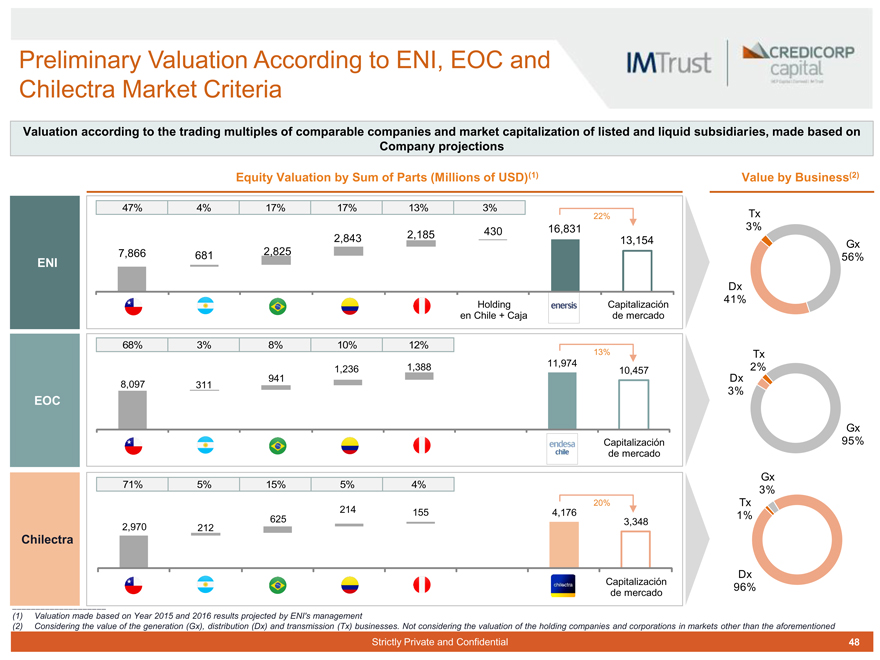
Preliminary Valuation According to ENI, EOC and Chilectra Market Criteria
Valuation according to the trading multiples of comparable companies and market capitalization of listed and liquid subsidiaries, made based on Company projections
Equity Valuation by Sum of Parts (Millions of USD)(1) Value by Business(2)
47% 4% 17% 17% 13% 3%
22% Tx
16,831 3% 2,185 430 2,843 13,154
Gx 7,866 681 2,825 56%
ENI
Dx 41%
Holding Capitalización en Chile + Caja de mercado
68% 3% 8% 10% 12%
13% Tx
1,388 11,974 2% 1,236 10,457 Dx 941 8,097 311
EOC 3%
Gx
Capitalización 95% de mercado
Gx
71% 5% 15% 5% 4%
3%
20% Tx
214 155 4,176
625 1% 3,348 2,970 212
Chilectra
Dx
Capitalización
96% de mercado
(1) Valuation made based on Year 2015 and 2016 results projected by ENI’s management
(2) Considering the value of the generation (Gx), distribution (Dx) and transmission (Tx) businesses. Not considering the valuation of the holding companies and corporations in markets other than the aforementioned
Strictly Private and Confidential 48
|
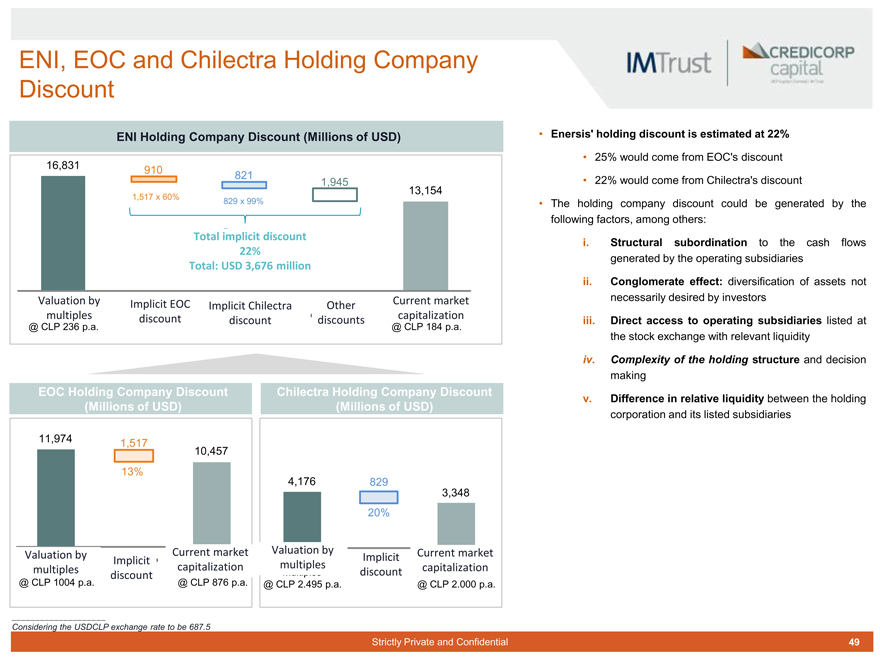
ENI, EOC and Chilectra Holding Company Discount
Enersis’ holding discount is estimated at 22%
25% would come from EOC’s discount
22% would come from Chilectra’s discount
The holding company discount could be generated by the following factors, among others:
i. Structural subordination to the cash flows generated by the operating subsidiaries
ii. Conglomerate effect: diversification of assets not necessarily desired by investors
iii. Direct access to operating subsidiaries listed at the stock exchange with relevant liquidity
iv. Complexity of the holding structure and decision making
v. Difference in relative liquidity between the holding corporation and its listed subsidiaries
ENI Holding Company Discount (Millions of USD)
16,831 910 821
1,945
13,154
1,517 x 60%
829 x 99%
Total implicit discount 22% Total: USD 3,676 million
Valuation by Implicit EOC Current market Implicit Chilectra Other multiples discount capitalization discount discounts
@ CLP 236 p.a. @ CLP 184 p.a.
EOC Holding Company Discount Chilectra Holding Company Discount (Millions of USD) (Millions of USD)
11,974 1,517
10,457
13% 4,176
829
3,348 20%
Current market Valuation by Current market Valuation by Implicit Implicit multiples multiples capitalization capitalization discount discount
@ CLP 1004 p.a. @ CLP 876 p.a. @ CLP 2.495 p.a. @ CLP 2.000 p.a.
Considering the USDCLP exchange rate to be 687.5
Strictly Private and Confidential 49
|
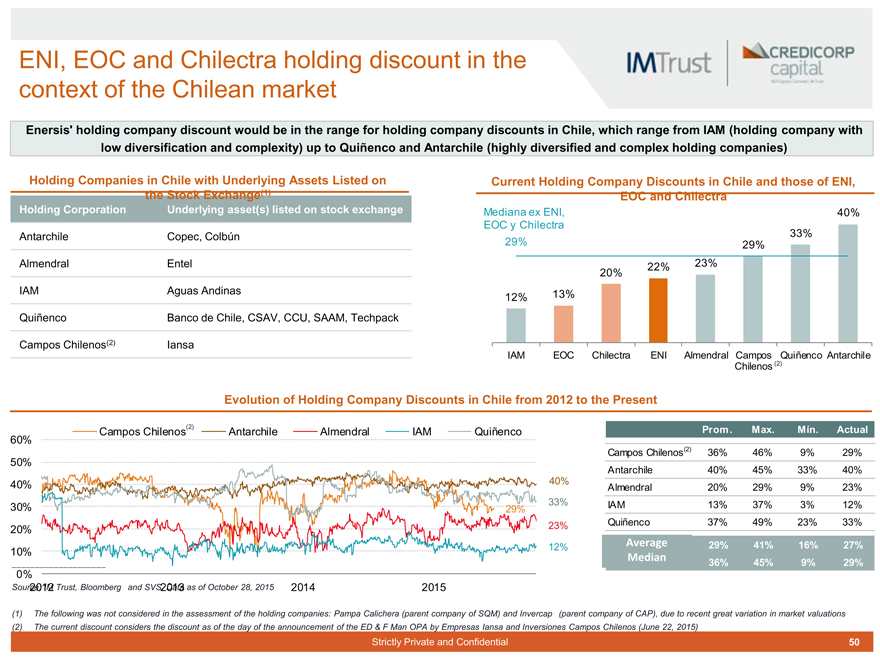
ENI, EOC and Chilectra holding discount in the context of the Chilean market
Enersis’ holding company discount would be in the range for holding company discounts in Chile, which range from IAM (holding company with low diversification and complexity) up to Quiñenco and Antarchile (highly diversified and complex holding companies)
Holding Companies in Chile with Underlying Assets Listed on
the Stock Exchange(1)
Holding Corporation Underlying asset(s) listed on stock exchange
Antarchile Copec, Colbún
Almendral Entel
IAM Aguas Andinas
Quiñenco Banco de Chile, CSAV, CCU, SAAM, Techpack
Campos Chilenos(2) Iansa
Current Holding Company Discounts in Chile and those of ENI, EOC and Chilectra
Mediana ex ENI, 40% EOC y Chilectra 33% 29% 29% 20% 22% 23% 12% 13%
IAM EOC Chilectra ENI Almendral Campos Quiñenco Antarchile Chilenos (2)
Evolution of Holding Company Discounts in Chile from 2012 to the Present
Campos Chilenos(2) Antarchile Almendral IAM Quiñenco 60%
50%
40% 40%
33%
30% 29%
20% 23% 10% 12%
0%
Source: 2012 IM Trust, Bloomberg and SVS. 2013 Data as of October 28, 2015 2014 2015
Prom . Max.Mín.Actual
Campos Chilenos(2) 36% 46%9%29%
Antarchile 40% 45%33%40%
Almendral 20% 29%9%23%
IAM 13% 37%3%12%
Quiñenco 37% 49%23%33%
Average 29% 41%16%27%
Median 36% 45%9%29%
(1) The following was not considered in the assessment of the holding companies: Pampa Calichera (parent company of SQM) and Invercap (parent company of CAP), due to recent great variation in market valuations (2) The current discount considers the discount as of the day of the announcement of the ED & F Man OPA by Empresas Iansa and Inversiones Campos Chilenos (June 22, 2015)
Strictly Private and Confidential 50
|
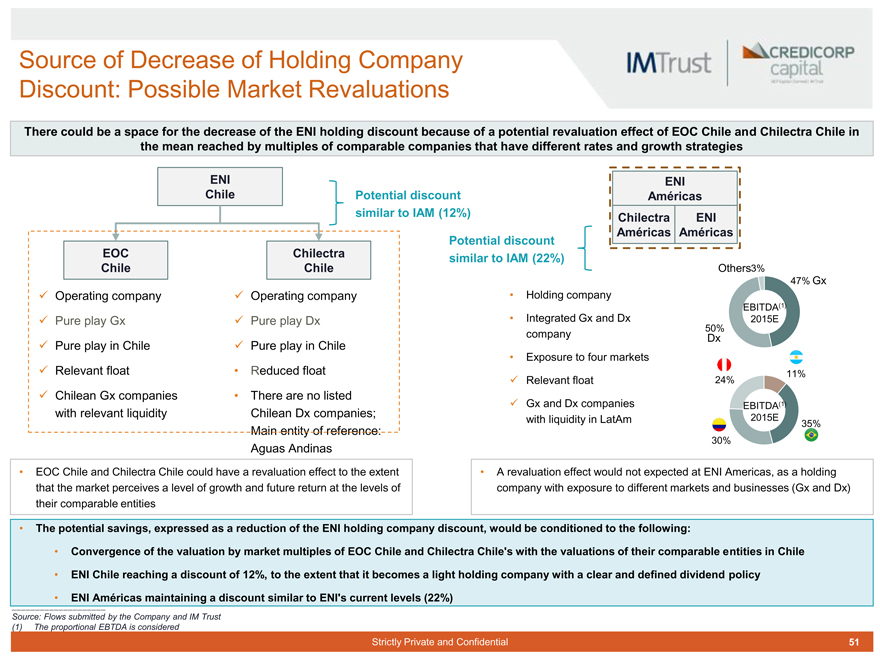
Source of Decrease of Holding Company Discount: Possible Market Revaluations
There could be a space for the decrease of the ENI holding discount because of a potential revaluation effect of EOC Chile and Chilectra Chile in the mean reached by multiples of comparable companies that have different rates and growth strategies
EOC Chile
??Operating company
??Pure play Gx ??Pure play in Chile ??Relevant float
??Chilean Gx companies with relevant liquidity
Others3%
47% Gx
EBITDA(1) 2015E
50%
Dx
11% 24%
EBITDA(1) 2015E
35% 30%
Holding company
Integrated Gx and Dx company
Exposure to four markets
Relevant float
Gx and Dx companies with liquidity in LatAm
ENI Américas Chilectra ENI Américas Américas
Potential discount similar to IAM (22%)
Potential discount similar to IAM (12%)
ENI Chile
Chilectra Chile
??Operating company
??Pure play Dx
??Pure play in Chile
Reduced float
There are no listed Chilean Dx companies; Main entity of reference: Aguas Andinas
EOC Chile and Chilectra Chile could have a revaluation effect to the extent
that the market perceives a level of growth and future return at the levels of
their comparable entities
A revaluation effect would not expected at ENI Americas, as a holding company with exposure to different markets and businesses (Gx and Dx)
The potential savings, expressed as a reduction of the ENI holding company discount, would be conditioned to the following:
Convergence of the valuation by market multiples of EOC Chile and Chilectra Chile’s with the valuations of their comparable entities in Chile
ENI Chile reaching a discount of 12%, to the extent that it becomes a light holding company with a clear and defined dividend policy
ENI Américas maintaining a discount similar to ENI’s current levels (22%)
Source: Flows submitted by the Company and IM Trust (1) The proportional EBTDA is considered
Strictly Private and Confidential 51
|
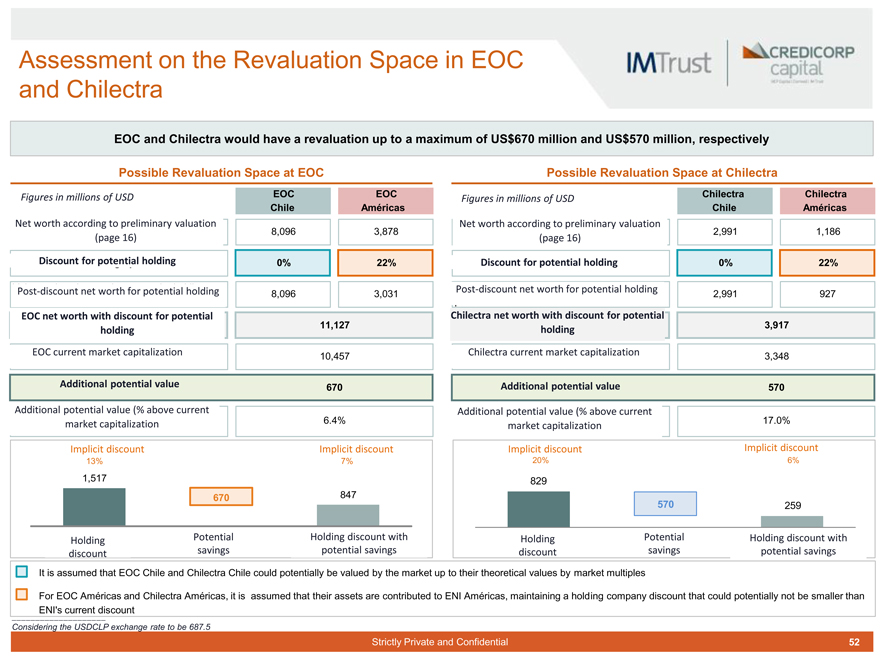
Assessment on the Revaluation Space in EOC and Chilectra
EOC and Chilectra would have a revaluation up to a maximum of US$670 million and US$570 million, respectively
Possible Revaluation Space at EOC Possible Revaluation Space at Chilectra
Figures in millions of USD EOC EOC
Chile Américas
Net worth according to preliminary valuation 8,096 3,878 (page 16)
Descuent Discount de for holding potential potencial holding 0% 22%
Post-discount net worth for potential holding 8,096 3,031
EOC net worth with discount for potential 11,127 holding
EOC current market capitalization 10,457
Additional potential value 670
Additional potential value (% above current market capitalization 6.4%
Chilectra Chilectra
Figures in millions of USD Chile Américas
Net worth according to preliminary valuation
2,991 1,186
(page 16)
Descuent Discount de for holding potential potencial holding 0% 22%
Post-discount net worth for potential holding
2,991 927
Chilectra net worth with discount for potential
3,917 holding
Chilectra current market capitalization 3,348
Additional potential value 570
Additional potential value (% above current 17.0% market capitalization
Descuento Implicit implícito discount Descuento Implicit discount implícito 13% 7%
1,517
670 847
Holding Potential Holding discount with discount savings potential savings
Descuento Implicit discount implícito Implicit Descuento discount implícito 20% 6%
829
570 259
Holding Potential Holding discount with discount savings potential savings
It is assumed that EOC Chile and Chilectra Chile could potentially be valued by the market up to their theoretical values by market multiples
For EOC Américas and Chilectra Américas, it is assumed that their assets are contributed to ENI Américas, maintaining a holding company discount that could potentially not be smaller than ENI’s current discount
Considering the USDCLP exchange rate to be 687.5
Strictly Private and Confidential 52
|
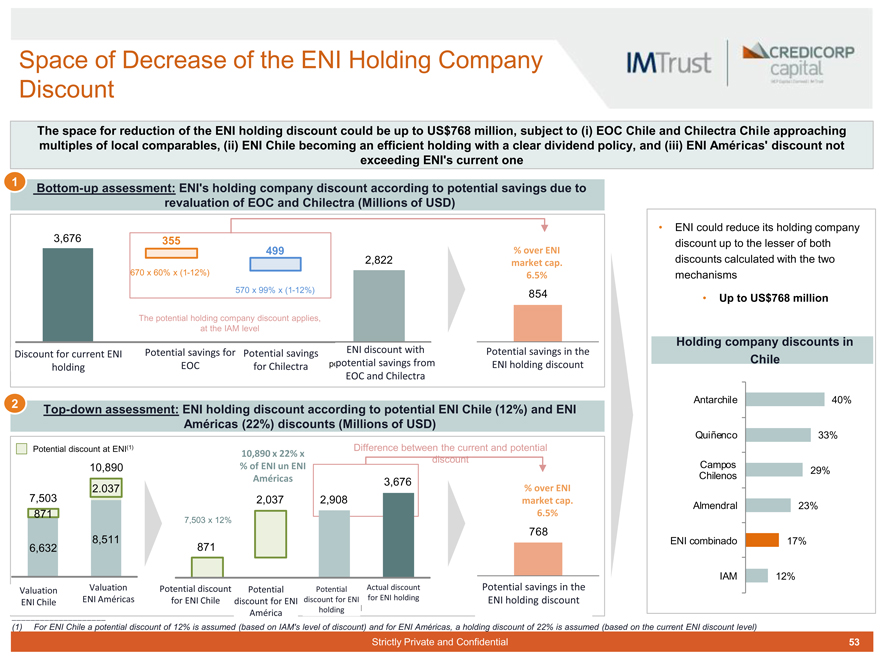
Space of Decrease of the ENI Holding Company Discount
The space for reduction of the ENI holding discount could be up to US$768 million, subject to (i) EOC Chile and Chilectra Chile approaching multiples of local comparables, (ii) ENI Chile becoming an efficient holding with a clear dividend policy, and (iii) ENI Américas’ discount not exceeding ENI’s current one 1 Bottom-up assessment: ENI’s holding company discount according to potential savings due to revaluation of EOC and Chilectra (Millions of USD)
3,676 355
499 % over ENI 2,822 market cap.
670 x 60% x (1-12%) 6.5% 570 x 99% x (1-12%) 854
The potential holding company discount applies, at the IAM level
Potential savings for Potential savings ENI discount with Potential savings in the Discount for current ENI potential savings from holding EOC for Chilectra p ENI holding discount EOC and Chilectra
2
Top-down assessment: ENI holding discount according to potential ENI Chile (12%) and ENI Américas (22%) discounts (Millions of USD)
Potential discount at ENI(1) 10,890 x 22% x Difference between the current and potential discount
10,890 % of ENI un ENI
Américas 3,676
2.037 % over ENI
7,503 2,037 2,908 market cap.
871 6.5%
7,503 x 12%
768 8,511 6,632 871
Valuation Valuation Potential discount Potential Potential Actual discount Potential savings in the ENI Américas for ENI Chile discount for ENI discount for ENI for ENI holding ENI holding discount ENI Chile holding
ENI could reduce its holding company discount up to the lesser of both discounts calculated with the two mechanisms
Up to US$768 million
Holding company discounts in Chile
Antarchile 40%
Quiñenco 33%
Campos
29% Chilenos
Almendral 23% ENI combinado 17% IAM 12%
(1) For ENI Chile a potential discount of 12% is assumed (based on IAM’s level of discount) and for ENI Américas, a holding discount of 22% is assumed (based on the current ENI discount level)
Strictly Private and Confidential 53
|
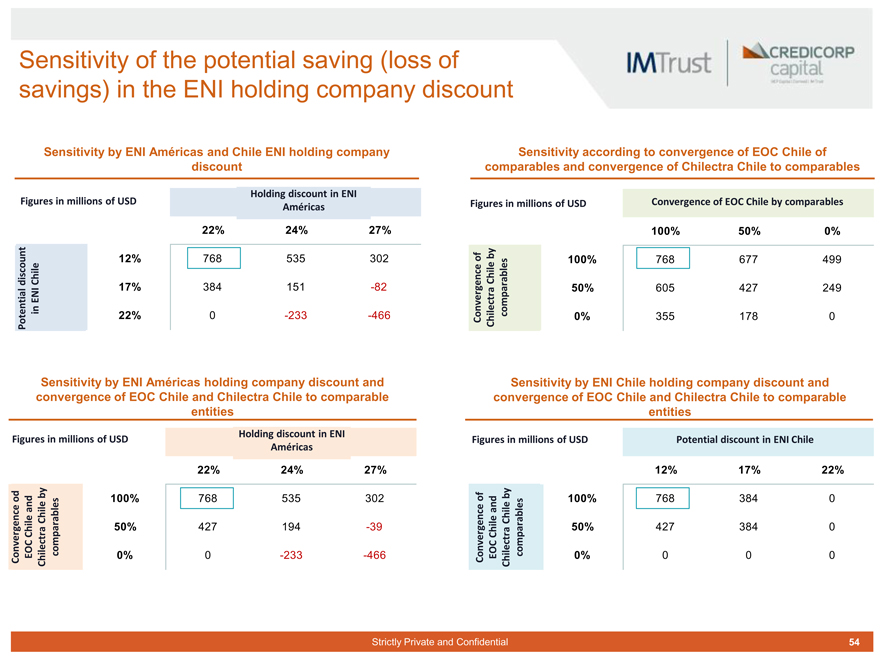
Sensitivity of the potential saving (loss of savings) in the ENI holding company discount
Sensitivity by ENI Américas and Chile ENI holding company discount
Holding discount in ENI Figures in millions of USD
Américas
22% 24% 27%
discount Chile 12% 768 535 302
ENI 17% 384 151 -82 in Potential 22% 0 -233 -466
Sensitivity according to convergence of EOC Chile of comparables and convergence of Chilectra Chile to comparables
Figures in millions of USD Convergence of EOC Chile by comparables
100% 50% 0%
of by
Chile 100% 768 677 499 comparables 50% 605 427 249 Convergence Chilectra 0% 355 178 0
Sensitivity by ENI Américas holding company discount and convergence of EOC Chile and Chilectra Chile to comparable entities
Holding discount in ENI Figures in millions of USD Américas
22% 24% 27%
by od 100% 768 535 302 and Chile Chile 50% 427 194 -39 ergence EOC comparables Conv Chilectra 0% 0 -233 -466
Sensitivity by ENI Chile holding company discount and convergence of EOC Chile and Chilectra Chile to comparable entities
Figures in millions of USD Potential discount in ENI Chile
12% 17% 22%
of by and 100% 768 384 0
Chile
Chile 50% 427 384 0 comparables Convergence EOC Chilectra 0% 0 0 0
Strictly Private and Confidential 54
|
IMPACT OF THE REORGANIZATION ON THE
MARKET VALUE OF ENERSIS
ii. Liquidity Considerations
Strictly Private and Confidential 55
|
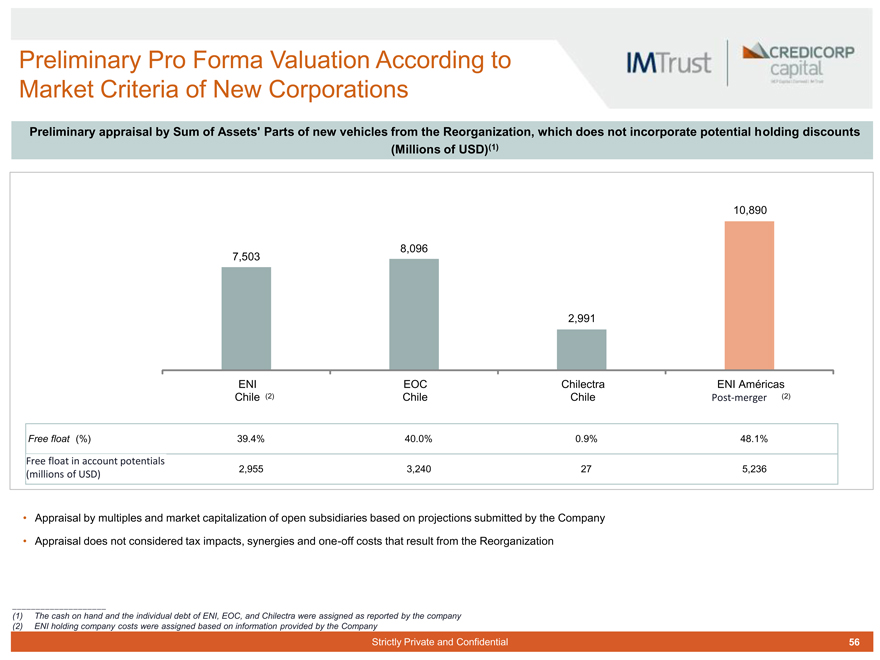
Preliminary Pro Forma Valuation According to Market Criteria of New Corporations
Preliminary appraisal by Sum of Assets’ Parts of new vehicles from the Reorganization, which does not incorporate potential holding discounts (Millions of USD)(1)
10,890
8,096 7,503
2,991
ENI EOC Chilectra ENI Américas Chile (2) Chile Chile Post-merger (2)
Free float (%) 39.4% 40.0% 0.9% 48.1%
Free float in account potentials 2,955 3,240 27 5,236 (millions of USD)
Appraisal by multiples and market capitalization of open subsidiaries based on projections submitted by the Company
Appraisal does not considered tax impacts, synergies and one-off costs that result from the Reorganization
(1) The cash on hand and the individual debt of ENI, EOC, and Chilectra were assigned as reported by the company (2) ENI holding company costs were assigned based on information provided by the Company
Strictly Private and Confidential 56
|
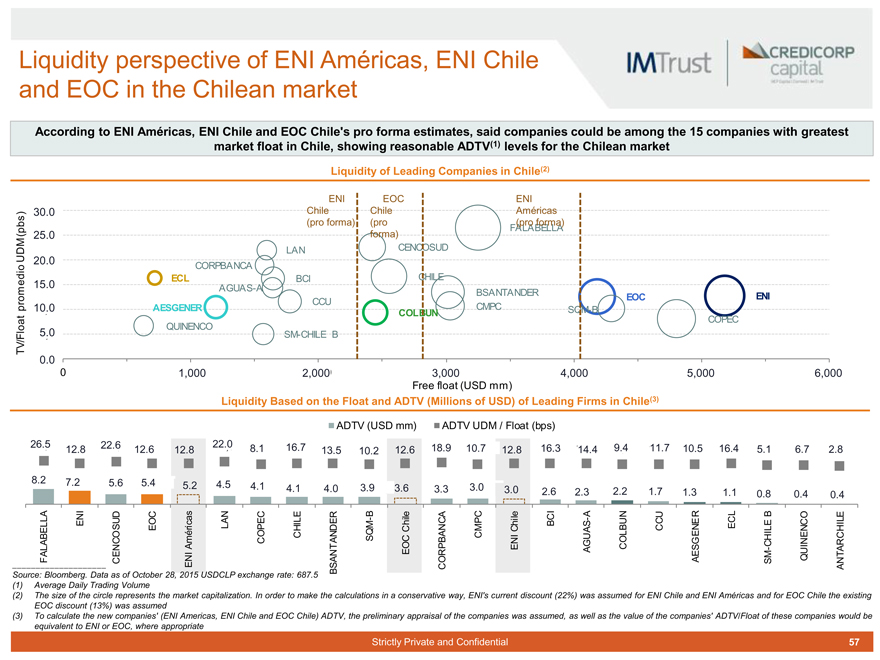
Liquidity perspective of ENI Américas, ENI Chile and EOC in the Chilean market
According to ENI Américas, ENI Chile and EOC Chile’s pro forma estimates, said companies could be among the 15 companies with greatest market float in Chile, showing reasonable ADTV(1) levels for the Chilean market
Liquidity of Leading Companies in Chile(2)
ENI EOC ENI 30. ,0 Chile Chile Américas s) b (pro forma) (pro (pro forma)
FALABELLA
(p forma)
25. ,0
M CENCOSUD UD LAN
20. ,0 io CORPBANCA d ECL BCI CHILE me 15. ,0 AGUAS-A
BSANTANDER ENI o EOC r CCU p 10. ,0 AESGENER CMPC SQM-B t COLBUN COPEC a QUINENCO
TV/Flo 5. ,0 SM-CHILE B
0. ,0
0 1,000 . 0 2,000 2.000 3,000 . 4,000 . 5,000 5. 6,000 6.
Free float (USD mm)
Liquidity Based on the Float and ADTV (Millions of USD) of Leading Firms in Chile(3)
ADTV (USD mm) ADTV UDM / Float (bps)
26. 26,5 5 12,8 22. 2,6 6 12,6 12,8 22. 22,0 0 8.1 16.,7 13,5 , 18.,9 10.7 12,8 16. ,3 14,4 9.4 11. ,7 10.5 16. 16,4 4
12.8 12.6 12.8 8,1 13.5 10. ,2 12.6 , 12.8 14.4 9,4 0,5 5. 5,1 1 6.,7 2. 2,8 8
8.2 8,2 7.2 7,2
5.6 , 5.4 5,4 5,2 5.2 4.5 , 4.1 4,1 4,1 4,0 3,9 3,6 3.0
4.1 4.0 3.9 3.6 3.3 , , 3. 3,0 0 2. 2,6 6 2. 2,3 3 2. 2,2 2 1. 1,7 7 1,3 ,
1.3 1.1 0. 0,8 8 0.4 0,4 0.4 0,4
I E B e A N R B E i l LA EN UD as ic AN ER—h CA ile BCI S—ECL L EL S EOC r L HIL C MPC Ch BU CCU ILE HI
O C C I UA L ENCO mé COPEC AND SQM BAN O H
G C I N RC A T EN C SGENE—A
EOC RP A
ALAB ENC AE M QU T F C O S
ENI BSAN C AN Source: Bloomberg. Data as of October 28, 2015 USDCLP exchange rate: 687.5 (1) Average Daily Trading Volume
(2) The size of the circle represents the market capitalization. In order to make the calculations in a conservative way, ENI’s current discount (22%) was assumed for ENI Chile and ENI Américas and for EOC Chile the existing EOC discount (13%) was assumed (3) To calculate the new companies’ (ENI Americas, ENI Chile and EOC Chile) ADTV, the preliminary appraisal of the companies was assumed, as well as the value of the companies’ ADTV/Float of these companies would be equivalent to ENI or EOC, where appropriate
Strictly Private and Confidential 57
|
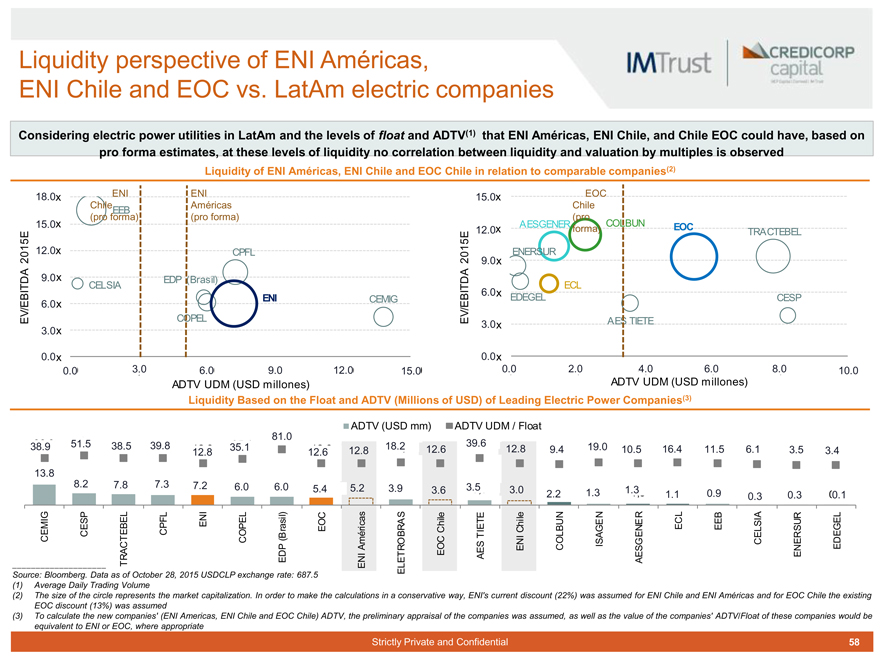
Liquidity perspective of ENI Américas,
ENI Chile and EOC vs. LatAm electric companies
Considering electric power utilities in LatAm and the levels of float and ADTV(1) that ENI Américas, ENI Chile, and Chile EOC could have, based on pro forma estimates, at these levels of liquidity no correlation between liquidity and valuation by multiples is observed
Liquidity of ENI Américas, ENI Chile and EOC Chile in relation to comparable companies(2)
18. ,0x ENI ENI 15. ,0x EOC Chile Américas Chile
EEB
(pro forma) (pro forma) (pro
15. ,0x AESGENER COLBUN EOC
12. ,0x forma) TRACTEBEL 2015E 12. ,0x CPFL 2015E ENERSUR
9. ,0x A , x
9.0 EDP (Brasil)
TD CELSIA ECL
6. ,0x
ENI CEMIG EDEGEL CESP
EBI / 6. ,0x
EV COPEL EV/EBITDA AES TIETE
3. ,0x
3. ,0x
0. ,0x 0. ,0x
0.,0 3. ,0 6.,0 9. ,0 12. ,0 15. ,0 0. 0,0 0 2. 2,0 0 4. ,0 6. 6,0 0 8.,0 0 10. ,0
ADTV UDM (USD millones) ADTV UDM (USD millones)
Liquidity Based on the Float and ADTV (Millions of USD) of Leading Electric Power Companies(3)
, ADTV (USD mm) ADTV UDM / Float
81.0
38,9 51.5 51,5 38,5 39,8 35,1 39.6 39,6
38.9 38.5 39.8 12,8 35.1 12,6 12,8 18. 18,2 2 12. 12,6 6 12. 12,8 8 9.,4 4 19.0 ,0 10.5 10,5 16.4 16,4 11.5 11,5 6.1 6,1 3.5
12.8 12.6 12.8 , 3. 3,4 4 13. ,8 8,2 8.2 7.8 7,8 7.3 , 7.2 7,2 6.0 , 5,9 6.0 5,4 5,2 3.5 5.4 5.2 3.9 3,9 3.6 , 3,5 3.0 3,0 2,2 1.3 2.2 1.3 1,3 1,3 1. 1,1 1 0. 0,9 9 0. 0,3 3 0. 0,3 3 0,1 0.1
G P L S E N L IA R L I S FL E OC as A T ile E ER E M P ENI ic h EC S
E E r R Chile C N EEB L G C C é TIE AG RSU E
CE COP (Brasil) m OBS IS CE E D A R OC ENI COLBUN SGE N E
EDPI T E A E E E TRACTEBEL E A
EN E L Source: Bloomberg. Data as of October 28, 2015 USDCLP exchange rate: 687.5 (1) Average Daily Trading Volume
(2) The size of the circle represents the market capitalization. In order to make the calculations in a conservative way, ENI’s current discount (22%) was assumed for ENI Chile and ENI Américas and for EOC Chile the existing EOC discount (13%) was assumed (3) To calculate the new companies’ (ENI Americas, ENI Chile and EOC Chile) ADTV, the preliminary appraisal of the companies was assumed, as well as the value of the companies’ ADTV/Float of these companies would be equivalent to ENI or EOC, where appropriate
Strictly Private and Confidential 58
|
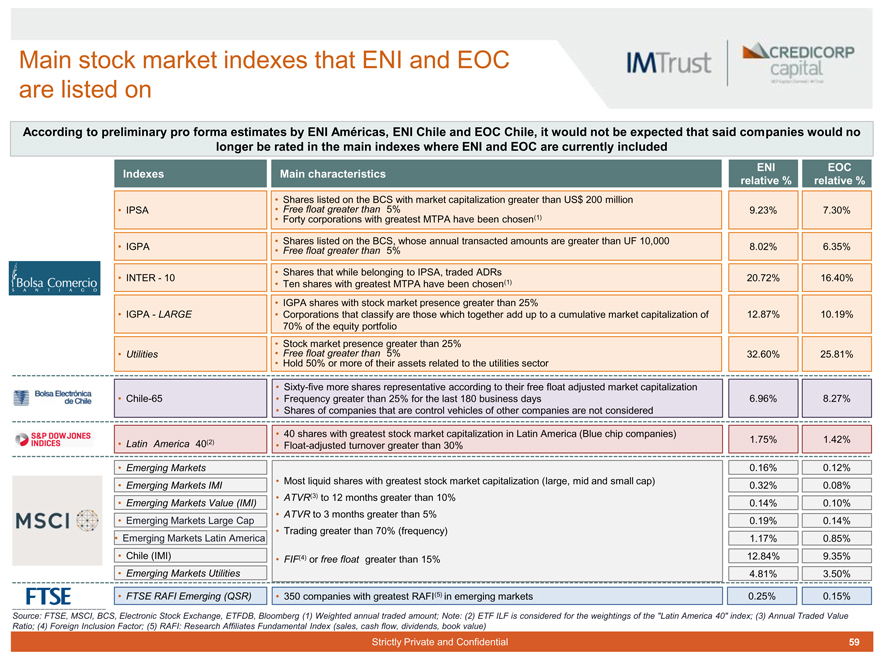
Main stock market indexes that ENI and EOC are listed on
According to preliminary pro forma estimates by ENI Américas, ENI Chile and EOC Chile, it would not be expected that said companies would no longer be rated in the main indexes where ENI and EOC are currently included
ENI EOC Indexes Main characteristics relative % relative %
Shares listed on the BCS with market capitalization greater than US$ 200 million
IPSA Free float greater than 5% 9.23% 7.30%
Forty corporations with greatest MTPA have been chosen(1)
Shares listed on the BCS, whose annual transacted amounts are greater than UF 10,000
IGPA Free float greater than 5% 8.02% 6.35%
Shares that while belonging to IPSA, traded ADRs
INTER—10 20.72% 16.40%
Ten shares with greatest MTPA have been chosen(1)
IGPA shares with stock market presence greater than 25%
IGPA—LARGE Corporations that classify are those which together add up to a cumulative market capitalization of 12.87% 10.19% 70% of the equity portfolio
Stock market presence greater than 25%
Utilities Free float greater than 5% 32.60% 25.81%
Hold 50% or more of their assets related to the utilities sector
Sixty-five more shares representative according to their free float adjusted market capitalization
Chile-65 Frequency greater than 25% for the last 180 business days 6.96% 8.27%
Shares of companies that are control vehicles of other companies are not considered
40 shares with greatest stock market capitalization in Latin America (Blue chip companies)
(2) 1.75% 1.42%
Latin America 40 Float-adjusted turnover greater than 30%
Emerging Markets 0.16% 0.12%
Most liquid shares with greatest stock market capitalization (large, mid and small cap)
Emerging Markets IMI 0.32% 0.08%
Emerging Markets Value (IMI) ATVR(3) to 12 months greater than 10% 0.14% 0.10%
ATVR to 3 months greater than 5%
Emerging Markets Large Cap 0.19% 0.14%
Trading greater than 70% (frequency)
Emerging Markets Latin America 1.17% 0.85%
Chile (IMI) FIF(4) or free float greater than 15% 12.84% 9.35%
Emerging Markets Utilities 4.81% 3.50%
FTSE RAFI Emerging (QSR) 350 companies with greatest RAFI(5) in emerging markets 0.25% 0.15%
Source: FTSE, MSCI, BCS, Electronic Stock Exchange, ETFDB, Bloomberg (1) Weighted annual traded amount; Note: (2) ETF ILF is considered for the weightings of the “Latin America 40” index; (3) Annual Traded Value Ratio; (4) Foreign Inclusion Factor; (5) RAFI: Research Affiliates Fundamental Index (sales, cash flow, dividends, book value)
Strictly Private and Confidential 59
|
IMPACT OF THE REORGANIZATION ON THE MARKET
VALUE OF ENERSIS
iii. Risk rating considerations
Strictly Private and Confidential 60
|
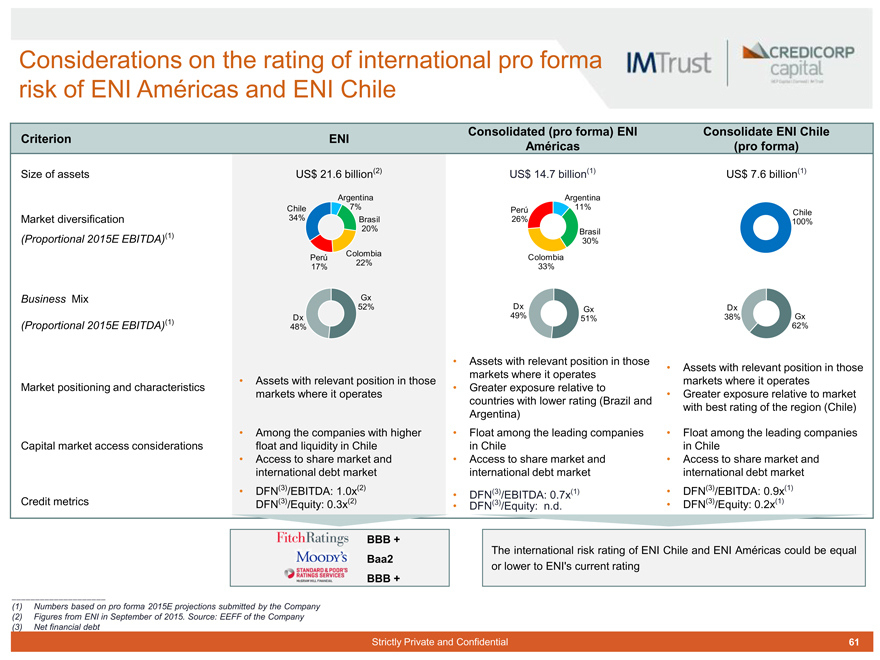
Considerations on the rating of international pro forma risk of ENI Américas and ENI Chile
Consolidated (pro forma) ENI Consolidate ENI Chile Criterion ENI
Américas (pro forma)
Size of assets US$ 21.6 billion(2) US$ 14.7 billion(1) US$ 7.6 billion(1)
Argentina Argentina Chile 7% Perú 11%
Chile
Market diversification 34% Brasil 26%
20% 100% Brasil
(Proportional 2015E EBITDA)(1)
30% Colombia Perú Colombia 22% 17% 33%
Business Mix Gx
52% Dx Gx Dx
(1) Dx 49% 51% 38% Gx
(Proportional 2015E EBITDA) 48% 62%
Assets with relevant position in those
Assets with relevant position in those markets where it operates
Assets with relevant position in those markets where it operates Market positioning and characteristics Greater exposure relative to markets where it operates Greater exposure relative to market countries with lower rating (Brazil and with best rating of the region (Chile) Argentina)
Among the companies with higher Float among the leading companies Float among the leading companies Capital market access considerations float and liquidity in Chile in Chile in Chile
Access to share market and Access to share market and Access to share market and international debt market international debt market international debt market
(3) (2) (3) (1)
DFN /EBITDA: 1.0x DFN(3)/EBITDA: 0.7x(1) DFN /EBITDA: 0.9x Credit metrics DFN(3)/Equity: 0.3x(2) DFN(3)/Equity: n.d. DFN(3)/Equity: 0.2x(1)
BBB +
The international risk rating of ENI Chile and ENI Américas could be equal
Baa2 or lower to ENI’s current rating
BBB +
(1) Numbers based on pro forma 2015E projections submitted by the Company (2) Figures from ENI in September of 2015. Source: EEFF of the Company (3) Net financial debt
Strictly Private and Confidential 61
|
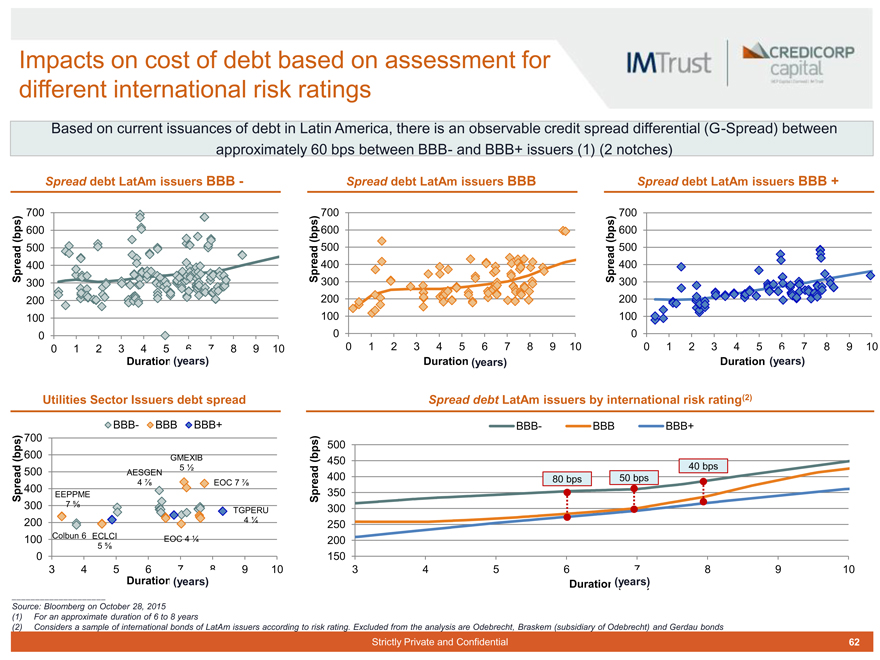
Impacts on cost of debt based on assessment for different international risk ratings
Based on current issuances of debt in Latin America, there is an observable credit spread differential (G-Spread) between approximately 60 bps between BBB- and BBB+ issuers (1) (2 notches)
Spread debt LatAm issuers BBB - Spread debt LatAm issuers BBB Spread debt LatAm issuers BBB +
700 700 700
) ) ) (bps 600 (bps 600 (bps 600 ad 500 d 500 d 500 ea 400 a 400 400 Spre 300 Spr 300 Spre 300 200 200 200 100 100 100
0 0 0
0 1 2 3 4 5 6 7 8 9 10 0 1 2 3 4 5 6 7 8 9 10 0 1 2 3 4 5 6 7 8 9 10
Duration (years) Duration (years) Duration (years)
Utilities Sector Issuers debt spread Spread debt LatAm issuers by international risk rating(2)
BBB- BBB BBB+ BBB- BBB BBB+ 700 s) 600 500
(bps) GMEXIB (bp 450
5 1/2 40 bps ad 500 AESGEN
400 80 bps 50 bps
4 7/8 EOC 7 7/8
400 350
Spre EEPPME Spread
300 7 5/8 300
TGPERU
200 4 1/4 250
100 Colbun 6 ECLCI EOC 4 1/4 200
5 5/8
0 150
3 4 5 6 7 8 9 10 3 4 5 6 7 8 9 10
Duration (years) Duration(years)
Source: Bloomberg on October 28, 2015
(1) For an approximate duration of 6 to 8 years
(2) Considers a sample of international bonds of LatAm issuers according to risk rating. Excluded from the analysis are Odebrecht, Braskem (subsidiary of Odebrecht) and Gerdau bonds
Strictly Private and Confidential 62
|
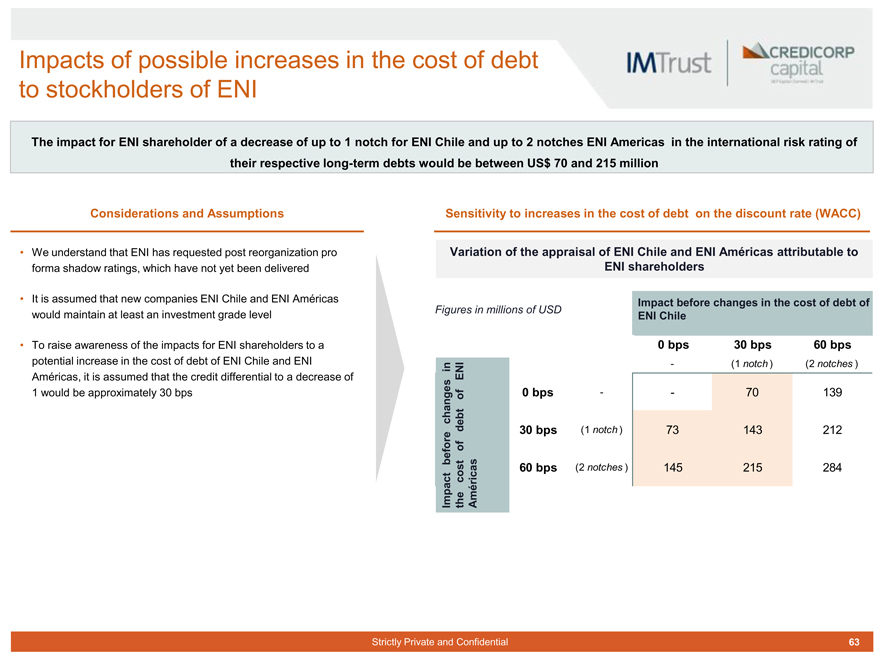
Impacts of possible increases in the cost of debt to stockholders of ENI
The impact for ENI shareholder of a decrease of up to 1 notch for ENI Chile and up to 2 notches ENI Americas in the international risk rating of their respective long-term debts would be between US$ 70 and 215 million
Considerations and Assumptions
We understand that ENI has requested post reorganization pro forma shadow ratings, which have not yet been delivered
It is assumed that new companies ENI Chile and ENI Américas would maintain at least an investment grade level
To raise awareness of the impacts for ENI shareholders to a potential increase in the cost of debt of ENI Chile and ENI Américas, it is assumed that the credit differential to a decrease of 1 would be approximately 30 bps
Sensitivity to increases in the cost of debt on the discount rate (WACC)
Variation of the appraisal of ENI Chile and ENI Américas attributable to ENI shareholders
Impact before changes in the cost of debt of
Figures in millions of USD
ENI Chile
0 bps 30 bps 60 bps in - (1 notch ) (2 notches )
ENI of 0 bps - 70 139 changes debt 30 bps (1 notch ) 73 143 212 of before
60 bps (2 notches ) 145 215 284 cost Impact Américas the
Strictly Private and Confidential 63
|
IMPACT OF THE REORGANIZATION ON THE MARKET
VALUE OF ENERSIS iv. Summary
Strictly Private and Confidential 64
|
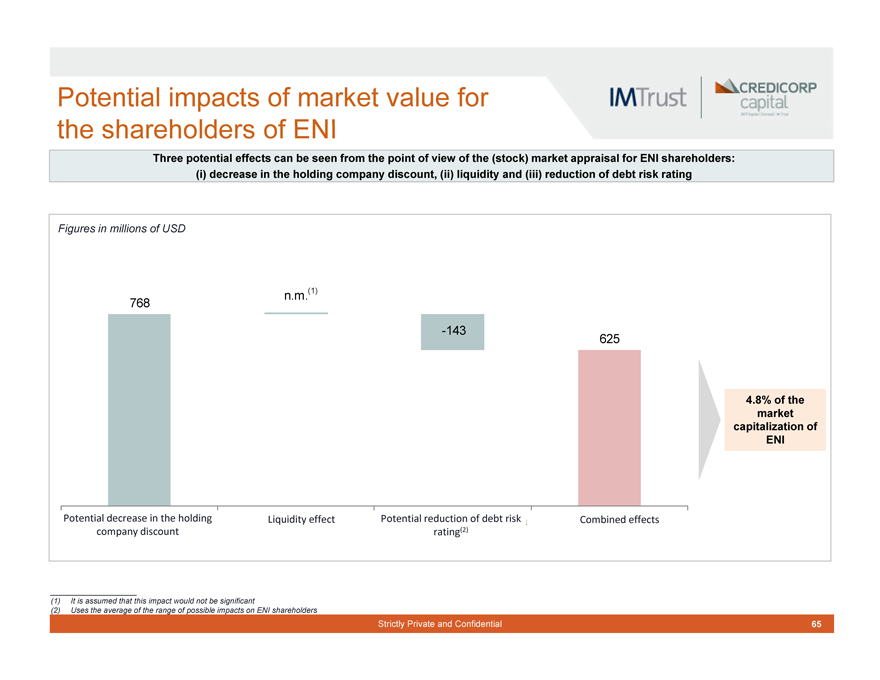
Potential impacts of market value for the shareholders of ENI
Three potential effects can be seen from the point of view of the (stock) market appraisal for ENI shareholders: (i) decrease in the holding company discount, (ii) liquidity and (iii) reduction of debt risk rating
Figures in millions of USD
n.m.(1) 768
-143
625
Potential decrease in the holding company discount Liquidity effect Potential reduction of debt risk rating(2)Combined effects
4.8% of the market capitalization of ENI
(1) It is assumed that this impact would not be significant
(2) Uses the average of the range of possible impacts on ENI shareholders
Strictly Private and Confidential 65
|
Cash flow impacts from the reorganization in the value of Enersis 7 i. Impacts on EBITDA
Strictly Private and Confidential 66
|

Assumption regarding efficiencies directly attributable to the Reorganization
Direct efficiencies product of the Reorganization (Millions of USD)(1) Considerations and Assumptions
ENI Chile ENI Américas In conjunction with the Reorganization, ENI has presented an efficiencies plan for the following years, which does not include the tax impacts: (Values estimated by the Company before taxes)
Efficiencies in operating costs
Operating costs
895 2,220 Efficiencies in staff & services (S & S) expensesl expenses
We understand that these efficiencies may be achievable in the year 2019
Holding regime
Companies’ S & S The estimation of this plan of efficiencies does not presuppose an assessment
Expenses
99 44 of the capacity of implementation and likelihood of success of such a plan
However, for the purposes of estimating the impacts in EBITDA directly attributable to the Reorganization, the following are considered:
Operators’ S & S
Expenses 00 380 The cost savings associated with the Elimination of redundant operations in EOC Chile and Chilectra Chile
Cost savings of staff & services for ENI Chile and ENI Américas Cash pooling Holding Company
- and FE 150
An annual savings before tax of US$ 18 million
Total (fiscal year) is expected from efficiencies directly
9,914 2,794 attributable to the Reorganization
Estimated efficiency / efficiency considered
Source: the Company
(1) Comparison of data of the year 2019 with regard to data of the year 2015 (2014 base and homogeneous exchange rate)
Strictly Private and Confidential 67
|
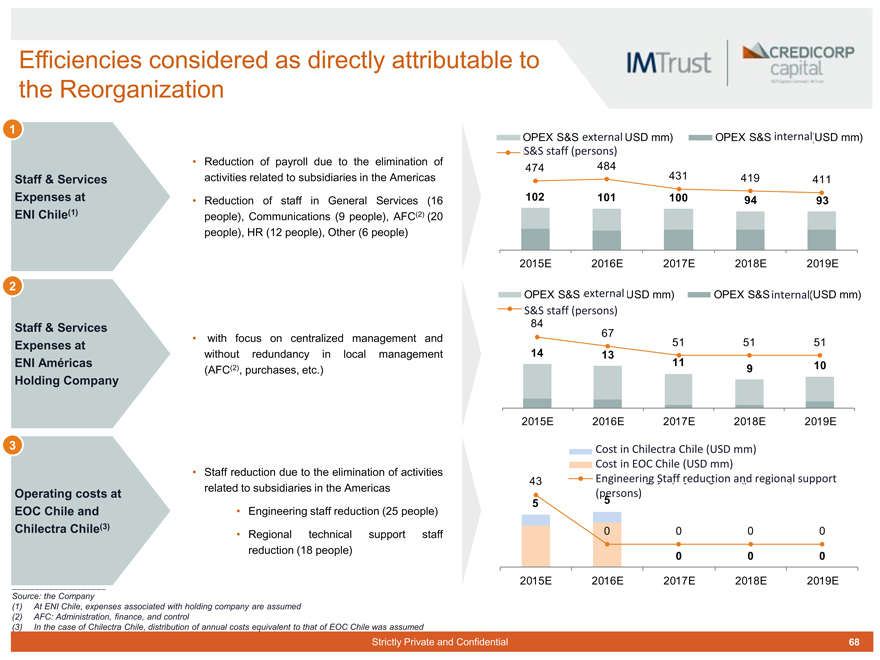
Efficiencies considered as directly attributable to the Reorganization
1
OPEX S&S external o (USD mm) OPEX S&S internal(USD mm)
S&S staff (persons)
Reduction of payroll due to the elimination of 484 474
Staff & Services activities related to subsidiaries in the Americas 431 419 411 Expenses at Reduction of staff in General Services (16 102 101 100 94 93 ENI Chile(1) people), Communications (9 people), AFC(2) (20 people), HR (12 people), Other (6 people)
2015E 2016E 2017E 2018E 2019E
2
OPEX S&S external(USD mm) OPEX S&S internal(USD mm)
S&S staff (persons)
Staff & Services 84 67
with focus on centralized management and 51 51 51
Expenses at
ENI Américas without redundancy in local management 14 13 11
(AFC(2), purchases, etc.) 9 10
Holding Company
2015E 2016E 2017E 2018E 2019E
3 Cost in Chilectra Chile (USD mm) Cost in EOC Chile (USD mm)
Staff reduction due to the elimination of activities related to subsidiaries in the Americas 43 Engineering Staff reduction and regional support
Operating costs at (persons)
5 5
EOC Chile and Engineering staff reduction (25 people)
Chilectra Chile(3) 0 0 0 0
Regional technical support staff reduction (18 people)
0 0 0
2015E 2016E 2017E 2018E 2019E
Source: the Company
(1) At ENI Chile, expenses associated with holding company are assumed (2) AFC: Administration, finance, and control
(3) In the case of Chilectra Chile, distribution of annual costs equivalent to that of EOC Chile was assumed
Strictly Private and Confidential 68
|
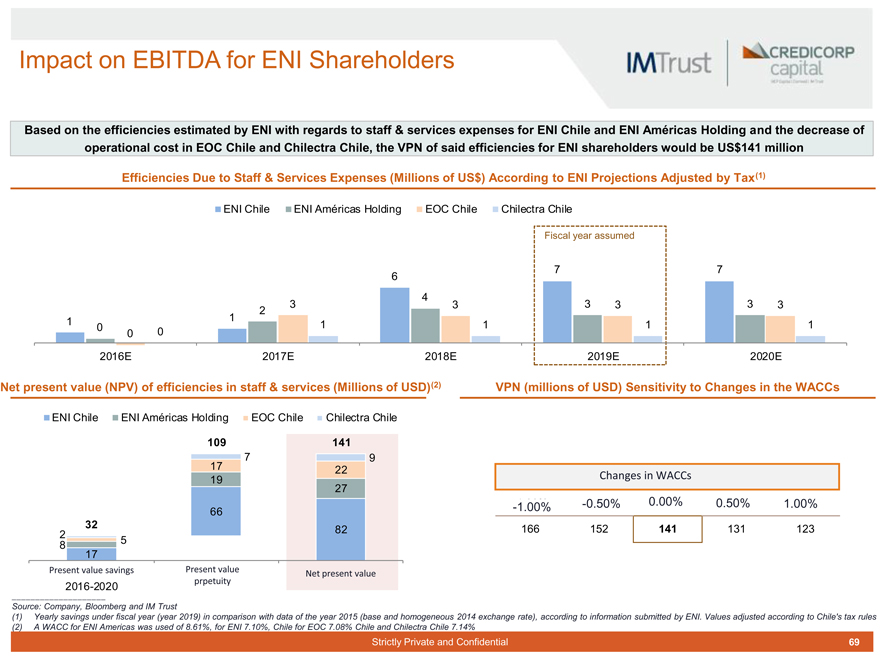
Impact on EBITDA for ENI Shareholders
Based on the efficiencies estimated by ENI with regards to staff & services expenses for ENI Chile and ENI Américas Holding and the decrease of operational cost in EOC Chile and Chilectra Chile, the VPN of said efficiencies for ENI shareholders would be US$141 million
Efficiencies Due to Staff & Services Expenses (Millions of US$) According to ENI Projections Adjusted by Tax(1)
ENI Chile ENI Américas Holding EOC Chile Chilectra Chile
Fiscal year assumed
7 7 6 4
3 3 3 3 3 3 2
1 1
0 1 1 1 1
0 0
2016E 2017E 2018E 2019E 2020E
Net present value (NPV) of efficiencies in staff & services (Millions of USD)(2) VPN (millions of USD) Sensitivity to Changes in the WACCs
ENI Chile ENI Américas Holding EOC Chile Chilectra Chile
109 141
17 7 9 22
19 Changes in WACCs
27
-0.50% 0.00% 0.50% 1.00% 66 -1.00%
32 166 152 141 131 123 82 2 5
8 17
Present value savings Present value prpetuity Net present value
2016-2020
Source: Company, Bloomberg and IM Trust
(1) Yearly savings under fiscal year (year 2019) in comparison with data of the year 2015 (base and homogeneous 2014 exchange rate), according to information submitted by ENI. Values adjusted according to Chile’s tax rules (2) A WACC for ENI Americas was used of 8.61%, for ENI 7.10%, Chile for EOC 7.08% Chile and Chilectra Chile 7.14%
Strictly Private and Confidential 69
|
Cash flow impacts from the reorganization in the value of Enersis ii. Tax impacts
Strictly Private and Confidential 70
|
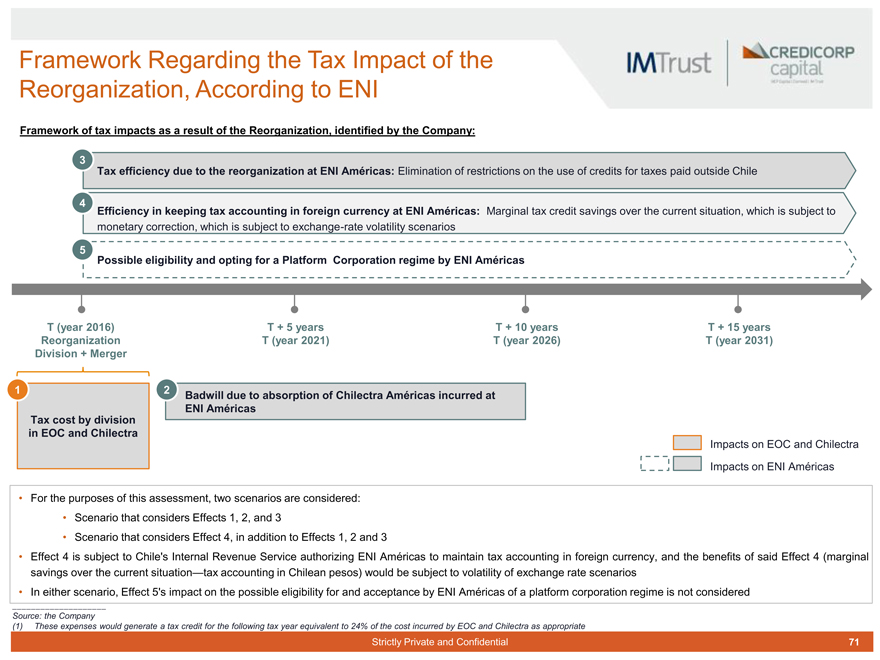
Framework Regarding the Tax Impact of the Reorganization, According to ENI
Framework of tax impacts as a result of the Reorganization, identified by the Company:
3
Tax efficiency due to the reorganization at ENI Américas: Elimination of restrictions on the use of credits for taxes paid outside Chile
4
Efficiency in keeping tax accounting in foreign currency at ENI Américas: Marginal tax credit savings over the current situation, which is subject to monetary correction, which is subject to exchange-rate volatility scenarios
5 Possible eligibility and opting for a Platform Corporation regime by ENI Américas
T (year 2016) T + 5 years T + 10 years T + 15 years Reorganization T (year 2021) T (year 2026) T (year 2031) Division + Merger
1 2
Badwill due to absorption of Chilectra Américas incurred at ENI Américas Tax cost by division in EOC and Chilectra
Impacts on EOC and Chilectra
Impacts on ENI Américas
For the purposes of this assessment, two scenarios are considered:
Scenario that considers Effects 1, 2, and 3
Scenario that considers Effect 4, in addition to Effects 1, 2 and 3
Effect 4 is subject to Chile’s Internal Revenue Service authorizing ENI Américas to maintain tax accounting in foreign currency, and the benefits of said Effect 4 (marginal savings over the current situation - tax accounting in Chilean pesos) would be subject to volatility of exchange rate scenarios
In either scenario, Effect 5’s impact on the possible eligibility for and acceptance by ENI Américas of a platform corporation regime is not considered
Source: the Company
(1) These expenses would generate a tax credit for the following tax year equivalent to 24% of the cost incurred by EOC and Chilectra as appropriate
Strictly Private and Confidential 71
|
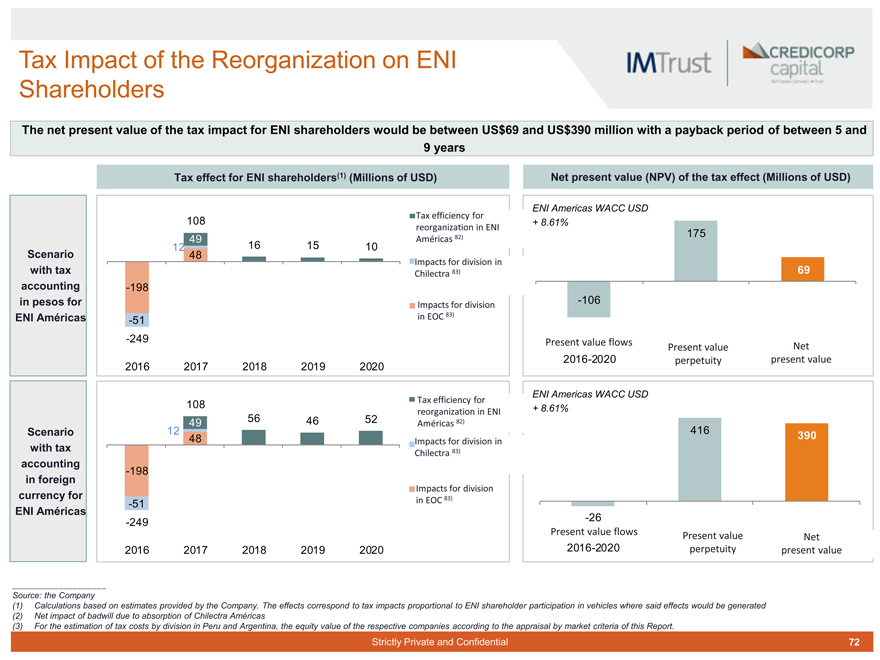
Tax Impact of the Reorganization on ENI Shareholders
The net present value of the tax impact for ENI shareholders would be between US$69 and US$390 million with a payback period of between 5 and 9 years
Tax effect for ENI shareholders(1) (Millions of USD) Net present value (NPV) of the tax effect (Millions of USD)
Tax efficiency for ENI Americas WACC USD
108 + 8.61% reorganization in ENI
82) 175
49 Américas
Scenario 12 48 16 15 10
Impacts for division in with tax Chilectra 83) 69 accounting -198 in pesos for -106
Impacts for division
ENI Américas in EOC 83)
-51
-249 Present value flows
Present value Net 2016-2020 perpetuity present value
2016 2017 2018 2019 2020
ENI Americas WACC USD
108 Tax efficiency for + 8.61% reorganization in ENI
49 56 46 52 82)
Américas
Scenario 12 416
48 390
Impacts for division in with tax 83)
Chilectra accounting
-198 in foreign
Impacts for division currency for 83)
-51 in EOC
ENI Américas
-249 -26
Present value flows Present value
Net 2016 2017 2018 2019 2020 2016-2020 perpetuity present value
Source: the Company
(1) Calculations based on estimates provided by the Company. The effects correspond to tax impacts proportional to ENI shareholder participation in vehicles where said effects would be generated (2) Net impact of badwill due to absorption of Chilectra Américas (3) For the estimation of tax costs by division in Peru and Argentina, the equity value of the respective companies according to the appraisal by market criteria of this Report.
Strictly Private and Confidential 72
|
Cash flow impacts from the reorganization in the value of Enersis iii. Transaction Costs (one-off)
Strictly Private and Confidential 73
|
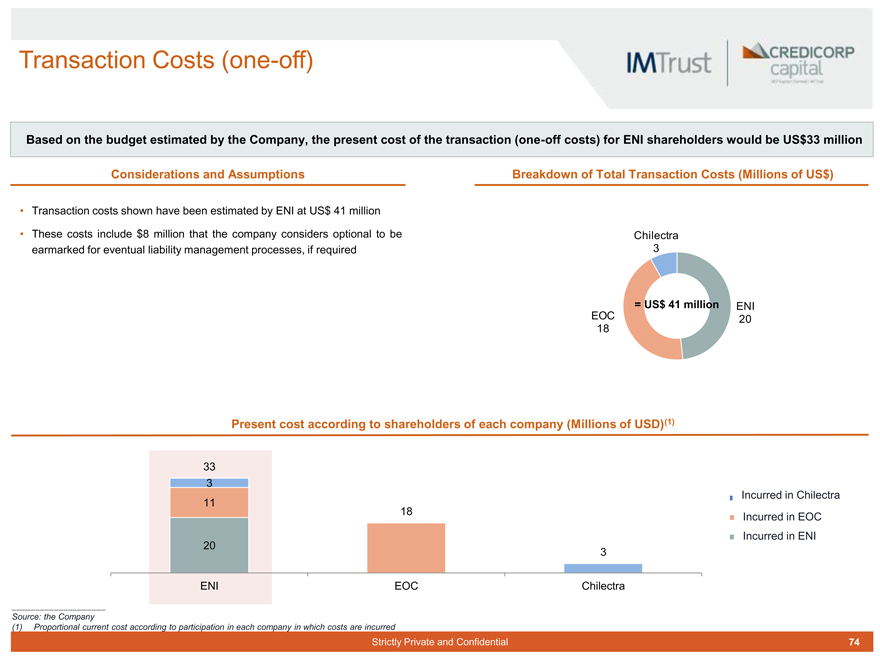
Transaction Costs (one-off)
Based on the budget estimated by the Company, the present cost of the transaction (one-off costs) for ENI shareholders would be US$33 million
Considerations and Assumptions Breakdown of Total Transaction Costs (Millions of US$)
Transaction costs shown have been estimated by ENI at US$ 41 million
These costs include $8 million that the company considers optional to be Chilectra earmarked for eventual liability management processes, if required 3
= US$ 41 million ENI
EOC 20 18
Present cost according to shareholders of each company (Millions of USD)(1)
33 3
Incurred in Chilectra 11 18 Incurred in EOC
20 Incurred in ENI
3
ENI EOC Chilectra
Source: the Company
(1) Proportional current cost according to participation in each company in which costs are incurred
Strictly Private and Confidential 74
|
Cash flow impacts from the reorganization in the value of Enersis iv. Summary
Strictly Private and Confidential 75
|
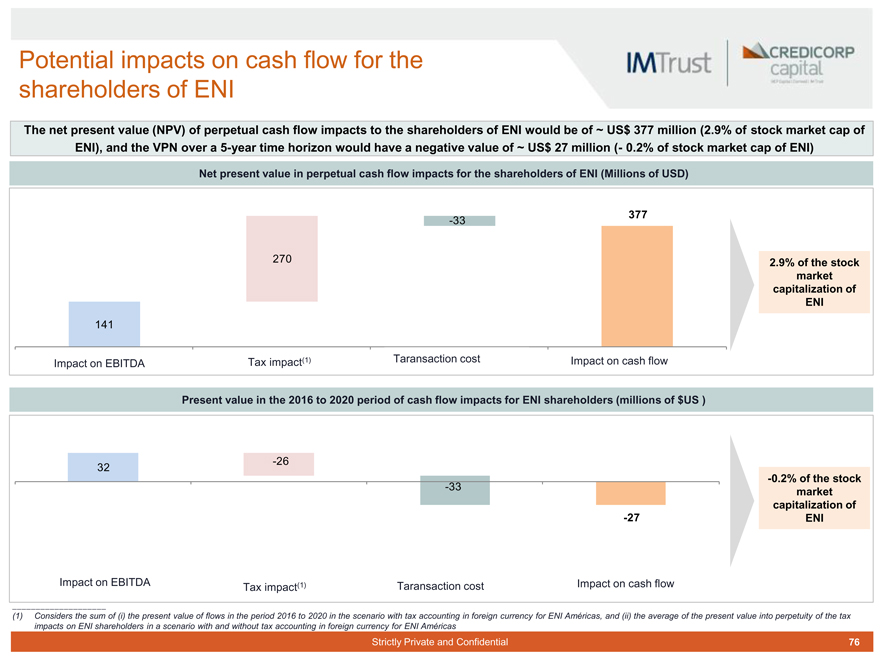
Potential impacts on cash flow for the shareholders of ENI
The net present value (NPV) of perpetual cash flow impacts to the shareholders of ENI would be of ~ US$ 377 million (2.9% of stock market cap of ENI), and the VPN over a 5-year time horizon would have a negative value of ~ US$ 27 million (- 0.2% of stock market cap of ENI)
Net present value in perpetual cash flow impacts for the shareholders of ENI (Millions of USD)
377
-33
270 2.9% of the stock market capitalization of ENI
141
Impact on EBITDA Tax impact(1) Taransaction cost Impact on cash flow
Present value in the 2016 to 2020 period of cash flow impacts for ENI shareholders (millions of $US )
-26 32
-0.2% of the stock
-33 market capitalization of -27 ENI
Impact on EBITDA (1) Taransaction cost Impact on cash flow Tax impact
(1) Considers the sum of (i) the present value of flows in the period 2016 to 2020 in the scenario with tax accounting in foreign currency for ENI Américas, and (ii) the average of the present value into perpetuity of the tax impacts on ENI shareholders in a scenario with and without tax accounting in foreign currency for ENI Américas
Strictly Private and Confidential 76
|
IMTrust CREDICORP
capital
ESTIMATE OF RELATIVE HOLDINGS IN THE
MERGER IN ENI AMERICAS
8
Strictly Private and Confidential
77
|

Methodology for the estimate of relative holdings in the merger in ENI Americas
IMTrust CREDICORP
capital
In its final stage, the Reorganization would include the merger between ENI Américas, EOC Américas and Chilectra Américas
The methodology used to estimate relative holdings is as follows:
Discounted cash flows (“DCF”)
Appraisal by DCF for each one of the companies that ENI Américas, EOC Américas and Chilectra Américas would make up
Appraisals based on projections submitted by the Company
Appraisal by sum of parts for ENI Américas, EOC Américas, and Chilectra Américas
Related holdings based on the relative appraisals and composition of net financial debt of each corporation
Market quotes and comparable entities
Appraisal for each one of the companies that ENI Américas, EOC Américas and Chilectra Américas will form, while taking these points into consideration:
Stock market capitalizations for corporations that are open market with some liquidity
Market multiples of listed companies according to country and business
Appraisal by sum of parts for ENI Américas, EOC Américas and Chilectra Américas-related holdings based on the relative appraisals and composition of net financial debt of each corporation
Range of relative holdings according to the results obtained separately from both methodologies
Strictly Private and Confidential
78
|
IMTrust CREDICORP
capital
ESTIMATE OF RELATIVE HOLDINGS IN THE
MERGER IN ENI AMERICAS i. Relative holdings according to discounted cash flow appraisal
Strictly Private and Confidential
79
|
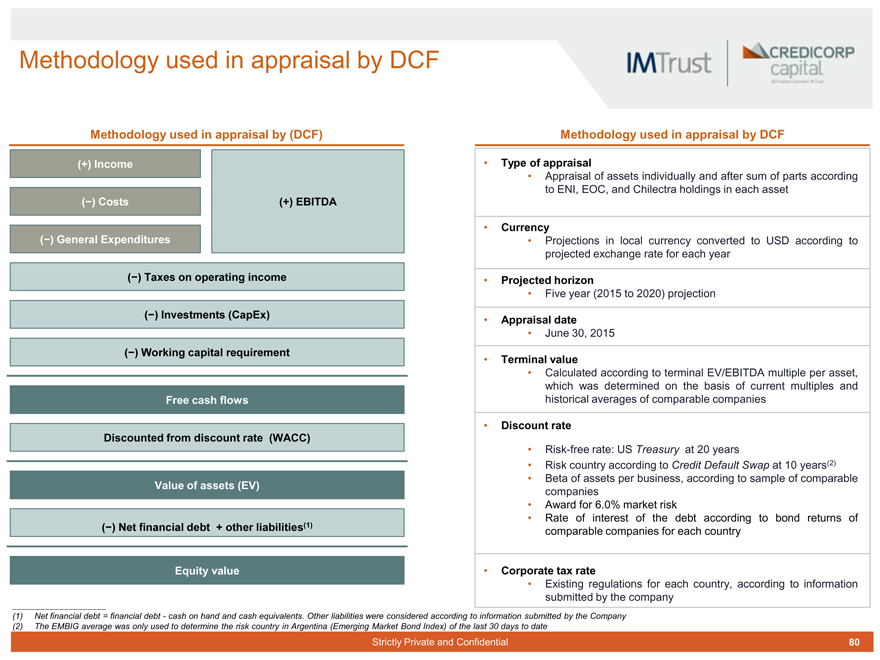
Methodology used in appraisal by DCF
IMTrust CREDICORP
capital
Methodology used in appraisal by (DCF)
(+) Income
(-) Costs
(-) General Expenditures
(+) EBITDA
(-) Taxes on operating income (-) Investments (CapEx) (-) Working capital requirement
Free cash flows
Discounted from discount rate (WACC)
Value of assets (EV)
(-) Net financial debt + other liabilities(1)
Equity value
Methodology used in appraisal by DCF
Type of appraisal
Appraisal of assets individually and after sum of parts according to ENI, EOC, and Chilectra holdings in each asset
Currency
Projections in local currency converted to USD according to projected exchange rate for each year
Projected horizon
Five year (2015 to 2020) projection
Appraisal date
June 30, 2015
Terminal value
Calculated according to terminal EV/EBITDA multiple per asset, which was determined on the basis of current multiples and historical averages of comparable companies
Discount rate
Risk-free rate: US Treasury at 20 years
Risk country according to Credit Default Swap at 10 years(2)
Beta of assets per business, according to sample of comparable companies
Award for 6.0% market risk
Rate of interest of the debt according to bond returns of comparable companies for each country
Corporate tax rate
Existing regulations for each country, according to information submitted by the company
(1) Net financial debt = financial debt - cash on hand and cash equivalents. Other liabilities were considered according to information submitted by the Company (2) The EMBIG average was only used to determine the risk country in Argentina (Emerging Market Bond Index) of the last 30 days to date
Strictly Private and Confidential
80
|
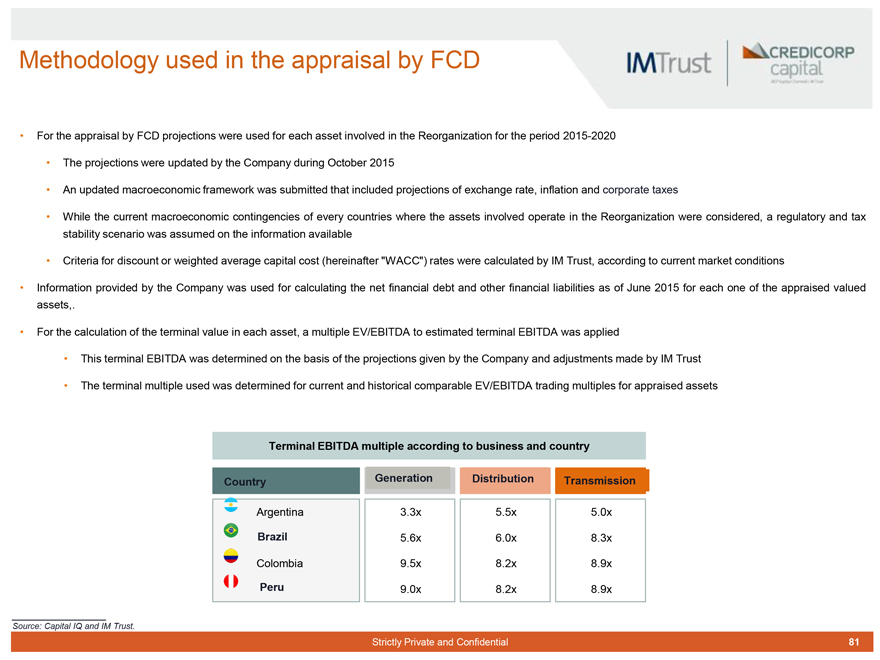
Methodology used in the appraisal by FCD
IMTrust CREDICORP
capital
For the appraisal by FCD projections were used for each asset involved in the Reorganization for the period 2015-2020
The projections were updated by the Company during October 2015
An updated macroeconomic framework was submitted that included projections of exchange rate, inflation and corporate taxes
While the current macroeconomic contingencies of every countries where the assets involved operate in the Reorganization were considered, a regulatory and tax stability scenario was assumed on the information available
Criteria for discount or weighted average capital cost (hereinafter “WACC”) rates were calculated by IM Trust, according to current market conditions
Information provided by the Company was used for calculating the net financial debt and other financial liabilities as of June 2015 for each one of the appraised valued assets,.
For the calculation of the terminal value in each asset, a multiple EV/EBITDA to estimated terminal EBITDA was applied
This terminal EBITDA was determined on the basis of the projections given by the Company and adjustments made by IM Trust
The terminal multiple used was determined for current and historical comparable EV/EBITDA trading multiples for appraised assets
Terminal EBITDA multiple according to business and country
Country
Argentina
Brazil
Colombia
Peru
Generation
3.3x 5.6x 9.5x 9.0x
Distribution
5.5x 6.0x 8.2x 8.2x
Transmission
5.0x 8.3x 8.9x 8.9x
Source: Capital IQ and IM Trust.
Strictly Private and Confidential
81
|
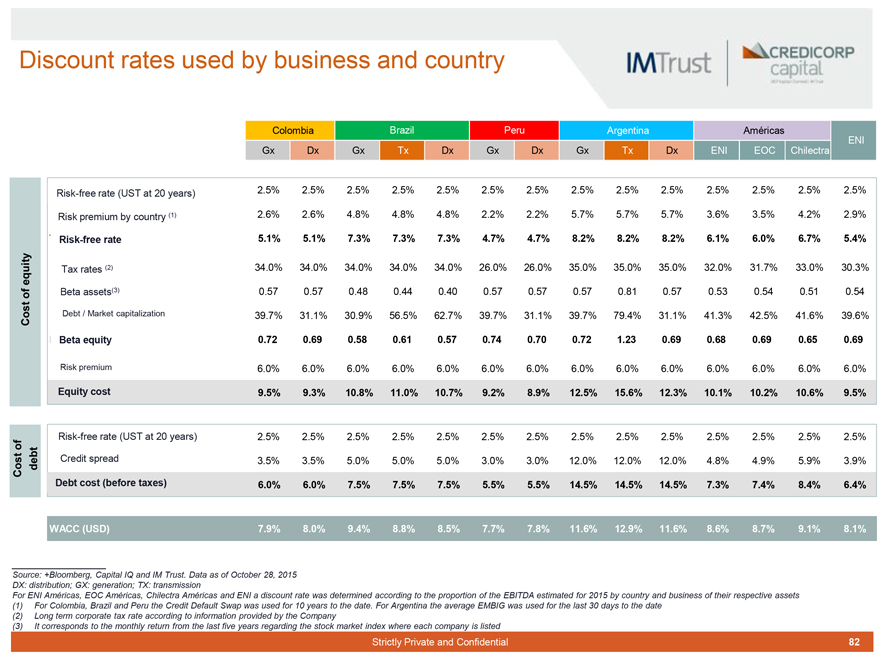
Discount rates used by business and country
IMTrust CREDICORP
capital
Cost of equity
Colombia Brazil Peru Argentina Américas
ENI
Gx Dx Gx Tx Dx Gx Dx Gx Tx Dx ENI EOC Chilectra
Risk-free rate (UST at 20 years) 2.5% 2.5% 2.5% 2.5% 2.5% 2.5% 2.5% 2.5% 2.5% 2.5% 2.5% 2.5% 2.5% 2.5%
Risk premium by country (1) 2.6% 2.6% 4.8% 4.8% 4.8% 2.2% 2.2% 5.7% 5.7% 5.7% 3.6% 3.5% 4.2% 2.9%
Risk-free rate 5.1% 5.1% 7.3% 7.3% 7.3% 4.7% 4.7% 8.2% 8.2% 8.2% 6.1% 6.0% 6.7% 5.4%
Tax rates (2) 34.0% 34.0% 34.0% 34.0% 34.0% 26.0% 26.0% 35.0% 35.0% 35.0% 32.0% 31.7% 33.0% 30.3%
Beta assets(3) 0.57 0.57 0.48 0.44 0.40 0.57 0.57 0.57 0.81 0.57 0.53 0.54 0.51 0.54
Debt / Market capitalization 39.7% 31.1% 30.9% 56.5% 62.7% 39.7% 31.1% 39.7% 79.4% 31.1% 41.3% 42.5% 41.6% 39.6%
Beta equity 0.72 0.69 0.58 0.61 0.57 0.74 0.70 0.72 1.23 0.69 0.68 0.69 0.65 0.69
Risk premium 6.0% 6.0% 6.0% 6.0% 6.0% 6.0% 6.0% 6.0% 6.0% 6.0% 6.0% 6.0% 6.0% 6.0%
Equity cost 9.5% 9.3% 10.8% 11.0% 10.7% 9.2% 8.9% 12.5% 15.6% 12.3% 10.1% 10.2% 10.6% 9.5%
Cost of debt
Risk-free rate (UST at 20 years) 2.5% 2.5% 2.5% 2.5% 2.5% 2.5% 2.5% 2.5% 2.5% 2.5% 2.5% 2.5% 2.5% 2.5%
Credit spread 3.5% 3.5% 5.0% 5.0% 5.0% 3.0% 3.0% 12.0% 12.0% 12.0% 4.8% 4.9% 5.9% 3.9%
Debt cost (before taxes) 6.0% 6.0% 7.5% 7.5% 7.5% 5.5% 5.5% 14.5% 14.5% 14.5% 7.3% 7.4% 8.4% 6.4%
WACC (USD) 7.9% 8.0% 9.4% 8.8% 8.5% 7.7% 7.8% 11.6% 12.9% 11.6% 8.6% 8.7% 9.1% 8.1%
Source: +Bloomberg, Capital IQ and IM Trust. Data as of October 28, 2015
DX: distribution; GX: generation; TX: transmission
For ENI Américas, EOC Américas, Chilectra Américas and ENI a discount rate was determined according to the proportion of the EBITDA estimated for 2015 by country and business of their respective assets
(1) For Colombia, Brazil and Peru the Credit Default Swap was used for 10 years to the date. For Argentina the average EMBIG was used for the last 30 days to the date
(2) Long term corporate tax rate according to information provided by the Company
(3) It corresponds to the monthly return from the last five years regarding the stock market index where each company is listed
Strictly Private and Confidential
82
|
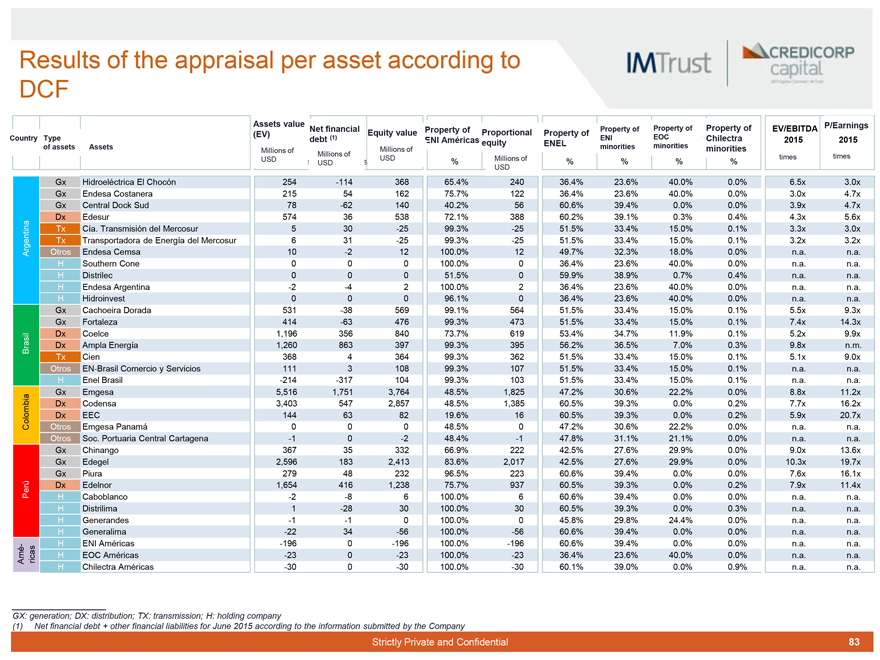
Results of the appraisal per asset according to DCF
IMTrust CREDICORP
capital
Country Type of assets Assets Assets value (EV) Net financial debt (1) Equity value Property of ENI Américas Proportional equity Property of ENEL Property of ENI minorities Property of EOC minorities Property of Chilectra minorities EV/EBITDA 2015 P/Earnings 2015
Millions of USD Millions of USD Millions of USD % Millions of USD % % % % times times
Gx Hidroeléctrica El Chocón 254 -114 368 65.4% 240 36.4% 23.6% 40.0% 0.0% 6.5x 3.0x
Gx Endesa Costanera 215 54 162 75.7% 122 36.4% 23.6% 40.0% 0.0% 3.0x 4.7x
Gx Central Dock Sud 78 -62 140 40.2% 56 60.6% 39.4% 0.0% 0.0% 3.9x 4.7x
Dx Edesur 574 36 538 72.1% 388 60.2% 39.1% 0.3% 0.4% 4.3x 5.6x
Tx Cía. Transmisión del Mercosur 5 30 -25 99.3% -25 51.5% 33.4% 15.0% 0.1% 3.3x 3.0x
Tx Transportadora de Energía del Mercosur 6 31 -25 99.3% -25 51.5% 33.4% 15.0% 0.1% 3.2x 3.2x
Argentina Otros Endesa Cemsa 10 -2 12 100.0% 12 49.7% 32.3% 18.0% 0.0% n.a. n.a.
H Southern Cone 0 0 0 100.0% 0 36.4% 23.6% 40.0% 0.0% n.a. n.a.
H Distrilec 0 0 0 51.5% 0 59.9% 38.9% 0.7% 0.4% n.a. n.a.
H Endesa Argentina -2 -4 2 100.0% 2 36.4% 23.6% 40.0% 0.0% n.a. n.a.
H Hidroinvest 0 0 0 96.1% 0 36.4% 23.6% 40.0% 0.0% n.a. n.a.
Gx Cachoeira Dorada 531 -38 569 99.1% 564 51.5% 33.4% 15.0% 0.1% 5.5x 9.3x
Gx Fortaleza 414 -63 476 99.3% 473 51.5% 33.4% 15.0% 0.1% 7.4x 14.3x
Dx Coelce 1,196 356 840 73.7% 619 53.4% 34.7% 11.9% 0.1% 5.2x 9.9x
Brasil Dx Ampla Energía 1,260 863 397 99.3% 395 56.2% 36.5% 7.0% 0.3% 9.8x n.m.
Tx Cien 368 4 364 99.3% 362 51.5% 33.4% 15.0% 0.1% 5.1x 9.0x
Otros EN-Brasil Comercio y Servicios 111 3 108 99.3% 107 51.5% 33.4% 15.0% 0.1% n.a. n.a.
H Enel Brasil -214 -317 104 99.3% 103 51.5% 33.4% 15.0% 0.1% n.a. n.a.
Gx Emgesa 5,516 1,751 3,764 48.5% 1,825 47.2% 30.6% 22.2% 0.0% 8.8x 11.2x
Dx Codensa 3,403 547 2,857 48.5% 1,385 60.5% 39.3% 0.0% 0.2% 7.7x 16.2x
Dx EEC 144 63 82 19.6% 16 60.5% 39.3% 0.0% 0.2% 5.9x 20.7x
Colombia Otros Emgesa Panamá 0 0 0 48.5% 0 47.2% 30.6% 22.2% 0.0% n.a. n.a.
Otros Soc. Portuaria Central Cartagena -1 0 -2 48.4% -1 47.8% 31.1% 21.1% 0.0% n.a. n.a.
Gx Chinango 367 35 332 66.9% 222 42.5% 27.6% 29.9% 0.0% 9.0x 13.6x
Gx Edegel 2,596 183 2,413 83.6% 2,017 42.5% 27.6% 29.9% 0.0% 10.3x 19.7x
Gx Piura 279 48 232 96.5% 223 60.6% 39.4% 0.0% 0.0% 7.6x 16.1x
Perú Dx Edelnor 1,654 416 1,238 75.7% 937 60.5% 39.3% 0.0% 0.2% 7.9x 11.4x
H Caboblanco -2 -8 6 100.0% 6 60.6% 39.4% 0.0% 0.0% n.a. n.a.
H Distrilima 1 -28 30 100.0% 30 60.5% 39.3% 0.0% 0.3% n.a. n.a.
H Generandes -1 -1 0 100.0% 0 45.8% 29.8% 24.4% 0.0% n.a. n.a.
H Generalima -22 34 -56 100.0% -56 60.6% 39.4% 0.0% 0.0% n.a. n.a.
H ENI Américas -196 0 -196 100.0% -196 60.6% 39.4% 0.0% 0.0% n.a. n.a.
Amé-ricas H EOC Américas -23 0 -23 100.0% -23 36.4% 23.6% 40.0% 0.0% n.a. n.a.
H Chilectra Américas -30 0 -30 100.0% -30 60.1% 39.0% 0.0% 0.9% n.a. n.a.
GX: generation; DX: distribution; TX: transmission; H: holding company
(1) Net financial debt + other financial liabilities for June 2015 according to the information submitted by the Company
Strictly Private and Confidential
83
|
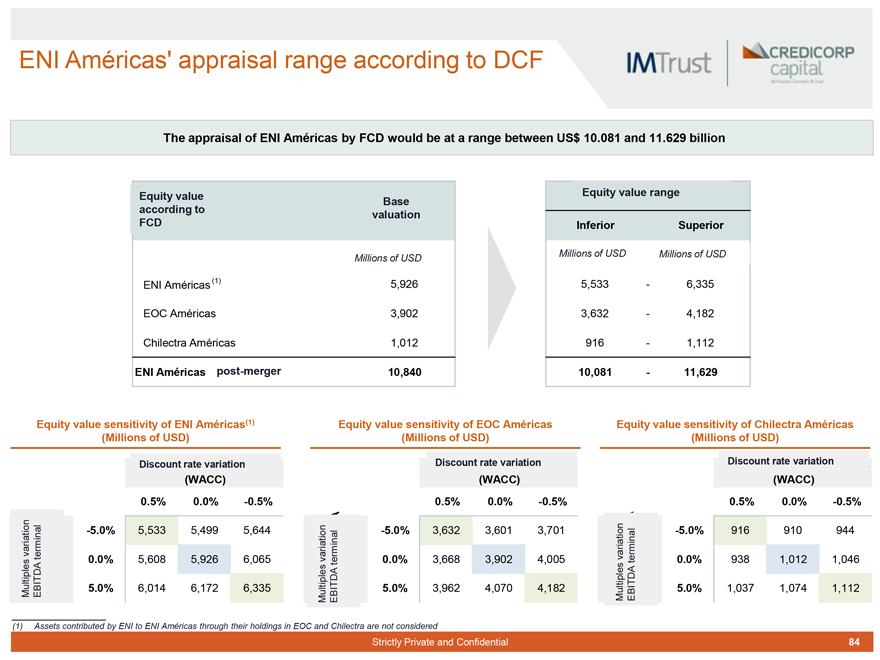
ENI Américas’ appraisal range according to DCF
IMTrust CREDICORP
capital
The appraisal of ENI Américas by FCD would be at a range between US$ 10.081 and 11.629 billion
Equity value according to FCD Base valuation
Millions of USD
ENI Américas (1) 5,926
EOC Américas 3,902
Chilectra Américas 1,012
ENI Américas post-merger 10,840
Equity value range
Inferior Superior
Millions of USD Millions of USD
5,533 - 6,335
3,632 - 4,182
916 - 1,112
10,081 - 11,629
Equity value sensitivity of ENI Américas(1) (Millions of USD)
Equity value sensitivity of EOC Américas (Millions of USD)
Equity value sensitivity of Chilectra Américas (Millions of USD)
variation terminal
Multiples EBITDA
Discount rate variation
(WACC)
0.5% 0.0% -0.5%
-5.0% 5,533 5,499 5,644
0.0% 5,608 5,926 6,065
5.0% 6,014 6,172 6,335
variation terminal
Multiples EBITDA
Discount rate variation
(WACC)
0.5% 0.0% -0.5%
-5.0% 3,632 3,601 3,701
0.0% 3,668 3,902 4,005
5.0% 3,962 4,070 4,182
variation terminal
Multiples EBITDA
Discount rate variation
(WACC)
0.5% 0.0% -0.5%
-5.0% 916 910 944
0.0% 938 1,012 1,046
5.0% 1,037 1,074 1,112
(1) Assets contributed by ENI to ENI Américas through their holdings in EOC and Chilectra are not considered
Strictly Private and Confidential
84
|
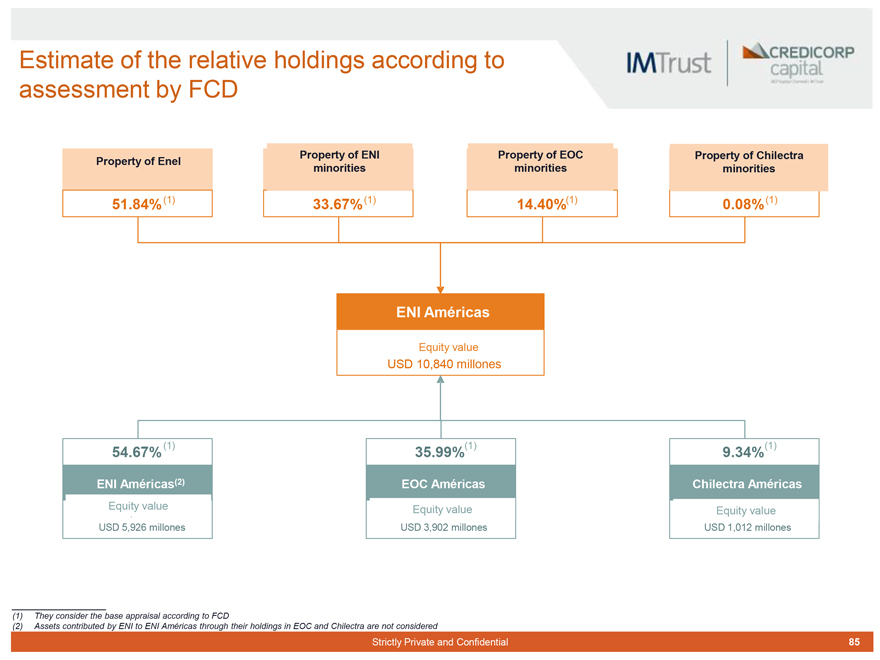
Estimate of the relative holdings according to assessment by FCD
IMTrust CREDICORP
capital
Property of Enel
Property of ENI minorities
Property of EOC minorities
Property of Chilectra minorities
51.84% (1)
33.67% (1)
14.40%(1)
0.08% (1)
ENI Américas
Equity value
USD 10,840 millones
54.67% (1)
ENI Américas (2)
Equity value
USD 5,926 millones
35.99% (1)
EOC Américas
Equity value
USD 3,902 millones
9.34% (1)
Chilectra Américas
Equity value
USD 1,012 millones
(1) They consider the base appraisal according to FCD
(2) Assets contributed by ENI to ENI Américas through their holdings in EOC and Chilectra are not considered
Strictly Private and Confidential
85
|
IMTrust CREDICORP
capital
ESTIMATE OF RELATIVE HOLDINGS IN THE
MERGER IN ENI AMERICAS ii. Relative holdings according to multiples appraisal and market capitalization
Strictly Private and Confidential
86
|
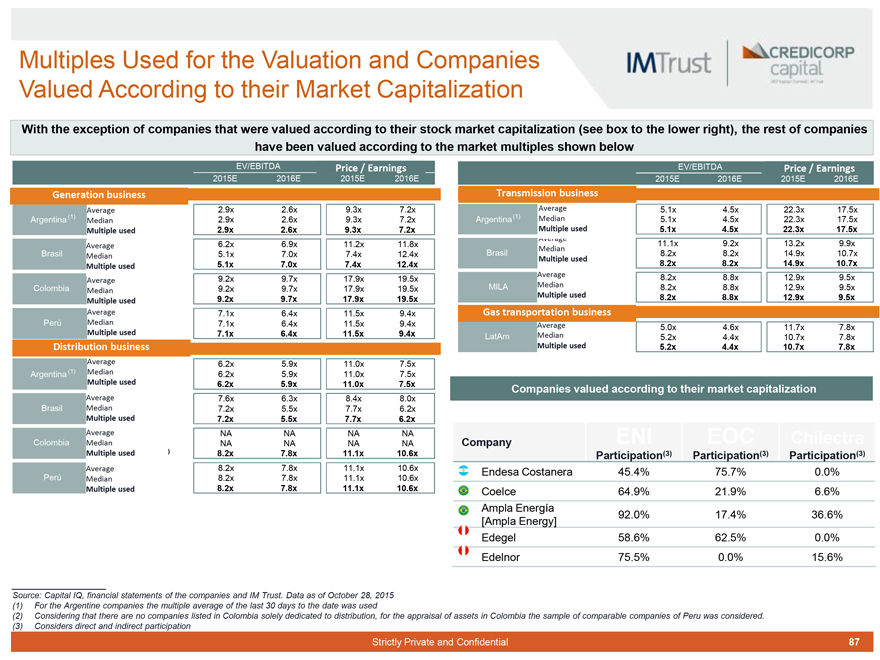
Multiples Used for the Valuation and Companies Valued According to their Market Capitalization
IMTrust CREDICORP
capital
With the exception of companies that were valued according to their stock market capitalization (see box to the lower right), the rest of companies have been valued according to the market multiples shown below
EV/EBITDA Price / Earnings
2015E 2016E 2015E 2016E
Generation business
Average 2.9x 2.6x 9.3x 7.2x
Argentina(1) Median 2.9x 2.6x 9.3x 7.2x
Multiple used 2.9x 2.6x 9.3x 7.2x
Average 6.2x 6.9x 11.2x 11.8x
Brasil Median 5.1x 7.0x 7.4x 12.4x
Multiple used 5.1x 7.0x 7.4x 12.4x
Average 9.2x 9.7x 17.9x 19.5x
Colombia Median 9.2x 9.7x 17.9x 19.5x
Multiple used 9.2x 9.7x 17.9x 19.5x
Average 7.1x 6.4x 11.5x 9.4x
Perú Median 7.1x 6.4x 11.5x 9.4x
Multiple used 7.1x 6.4x 11.5x 9.4x
Distribution business
Average 6.2x 5.9x 11.0x 7.5x
Argentina (1) Median 6.2x 5.9x 11.0x 7.5x
Multiple used 6.2x 5.9x 11.0x 7.5x
Average 7.6x 6.3x 8.4x 8.0x
Brasil Median 7.2x 5.5x 7.7x 6.2x
Multiple used 7.2x 5.5x 7.7x 6.2x
Average NA NA NA NA
Colombia Median NA NA NA NA
Multiple used ) 8.2x 7.8x 11.1x 10.6x
Average 8.2x 7.8x 11.1x 10.6x
Perú Median 8.2x 7.8x 11.1x 10.6x
Multiple used 8.2x 7.8x 11.1x 10.6x
EV/EBITDA Price / Earnings
2015E 2016E 2015E 2016E
Transmission business
Average 5.1x 4.5x 22.3x 17.5x
Argentina(1) Median 5.1x 4.5x 22.3x 17.5x
Multiple used 5.1x 4.5x 22.3x 17.5x
Average 11.1x 9.2x 13.2x 9.9x
Median
Brasil 8.2x 8.2x 14.9x 10.7x
Multiple used 8.2x 8.2x 14.9x 10.7x
Average 8.2x 8.8x 12.9x 9.5x
MILA Median 8.2x 8.8x 12.9x 9.5x
Multiple used 8.2x 8.8x 12.9x 9.5x
Gas transportation business
Average 5.0x 4.6x 11.7x 7.8x
LatAm Median 5.2x 4.4x 10.7x 7.8x
Multiple used 5.2x 4.4x 10.7x 7.8x
Companies valued according to their market capitalization
Company ENI EOC Chilectra
Participation(3) Participation(3) Participation(3)
Endesa Costanera 45.4% 75.7% 0.0%
Coelce 64.9% 21.9% 6.6%
Ampla Energía
[Ampla Energy] 92.0% 17.4% 36.6%
Edegel 58.6% 62.5% 0.0%
Edelnor 75.5% 0.0% 15.6%
Source: Capital IQ, financial statements of the companies and IM Trust. Data as of October 28, 2015
(1) For the Argentine companies the multiple average of the last 30 days to the date was used
(2) Considering that there are no companies listed in Colombia solely dedicated to distribution, for the appraisal of assets in Colombia the sample of comparable companies of Peru was considered.
(3) Considers direct and indirect participation
Strictly Private and Confidential
87
|
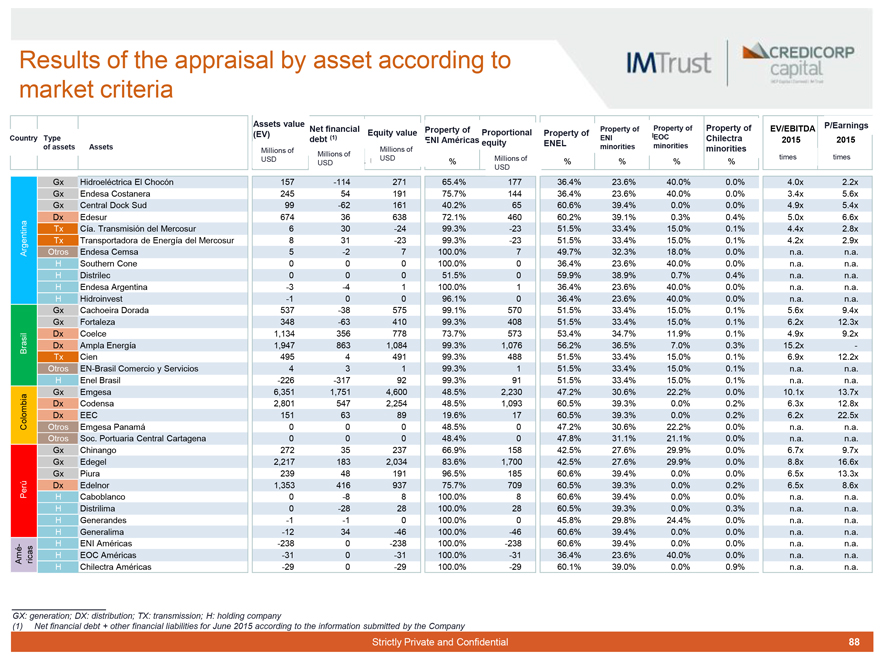
Results of the appraisal by asset according to market criteria
IMTrust CREDICORP
capital
Country Type of assets Assets Assets value (EV) Net financial debt (1) Equity value Property of ENI Américas Proportional equity Property of ENEL Property of ENI minorities Property of EOC minorities Property of Chilectra minorities EV/EBITDA 2015 P/Earnings 2015
Millions of USD Millions of USD Millions of USD % Millions of USD % % % % times times
Gx Hidroeléctrica El Chocón 157 -114 271 65.4% 177 36.4% 23.6% 40.0% 0.0% 4.0x 2.2x
Gx Endesa Costanera 245 54 191 75.7% 144 36.4% 23.6% 40.0% 0.0% 3.4x 5.6x
Gx Central Dock Sud 99 -62 161 40.2% 65 60.6% 39.4% 0.0% 0.0% 4.9x 5.4x
Dx Edesur 674 36 638 72.1% 460 60.2% 39.1% 0.3% 0.4% 5.0x 6.6x
Tx Cía. Transmisión del Mercosur 6 30 -24 99.3% -23 51.5% 33.4% 15.0% 0.1% 4.4x 2.8x
Tx Transportadora de Energía del Mercosur 8 31 -23 99.3% -23 51.5% 33.4% 15.0% 0.1% 4.2x 2.9x
Argentina Otros Endesa Cemsa 5 -2 7 100.0% 7 49.7% 32.3% 18.0% 0.0% n.a. n.a.
H Southern Cone 0 0 0 100.0% 0 36.4% 23.6% 40.0% 0.0% n.a. n.a.
H Distrilec 0 0 0 51.5% 0 59.9% 38.9% 0.7% 0.4% n.a. n.a.
H Endesa Argentina -3 -4 1 100.0% 1 36.4% 23.6% 40.0% 0.0% n.a. n.a.
H Hidroinvest -1 0 0 96.1% 0 36.4% 23.6% 40.0% 0.0% n.a. n.a.
Gx Cachoeira Dorada 537 -38 575 99.1% 570 51.5% 33.4% 15.0% 0.1% 5.6x 9.4x
Gx Fortaleza 348 -63 410 99.3% 408 51.5% 33.4% 15.0% 0.1% 6.2x 12.3x
Dx Coelce 1,134 356 778 73.7% 573 53.4% 34.7% 11.9% 0.1% 4.9x 9.2x
Brasil Dx Ampla Energía 1,947 863 1,084 99.3% 1,076 56.2% 36.5% 7.0% 0.3% 15.2x -
Tx Cien 495 4 491 99.3% 488 51.5% 33.4% 15.0% 0.1% 6.9x 12.2x
Otros EN-Brasil Comercio y Servicios 4 3 1 99.3% 1 51.5% 33.4% 15.0% 0.1% n.a. n.a.
H Enel Brasil -226 -317 92 99.3% 91 51.5% 33.4% 15.0% 0.1% n.a. n.a.
Gx Emgesa 6,351 1,751 4,600 48.5% 2,230 47.2% 30.6% 22.2% 0.0% 10.1x 13.7x
Dx Codensa 2,801 547 2,254 48.5% 1,093 60.5% 39.3% 0.0% 0.2% 6.3x 12.8x
Dx EEC 151 63 89 19.6% 17 60.5% 39.3% 0.0% 0.2% 6.2x 22.5x
Colombia Otros Emgesa Panamá 0 0 0 48.5% 0 47.2% 30.6% 22.2% 0.0% n.a. n.a.
Otros Soc. Portuaria Central Cartagena 0 0 0 48.4% 0 47.8% 31.1% 21.1% 0.0% n.a. n.a.
Gx Chinango 272 35 237 66.9% 158 42.5% 27.6% 29.9% 0.0% 6.7x 9.7x
Gx Edegel 2,217 183 2,034 83.6% 1,700 42.5% 27.6% 29.9% 0.0% 8.8x 16.6x
Gx Piura 239 48 191 96.5% 185 60.6% 39.4% 0.0% 0.0% 6.5x 13.3x
Perú Dx Edelnor 1,353 416 937 75.7% 709 60.5% 39.3% 0.0% 0.2% 6.5x 8.6x
H Caboblanco 0 -8 8 100.0% 8 60.6% 39.4% 0.0% 0.0% n.a. n.a.
H Distrilima 0 -28 28 100.0% 28 60.5% 39.3% 0.0% 0.3% n.a. n.a.
H Generandes -1 -1 0 100.0% 0 45.8% 29.8% 24.4% 0.0% n.a. n.a.
H Generalima -12 34 -46 100.0% -46 60.6% 39.4% 0.0% 0.0% n.a. n.a.
H ENI Américas -238 0 -238 100.0% -238 60.6% 39.4% 0.0% 0.0% n.a. n.a.
Américas H EOC Américas -31 0 -31 100.0% -31 36.4% 23.6% 40.0% 0.0% n.a. n.a.
H Chilectra Américas -29 0 -29 100.0% -29 60.1% 39.0% 0.0% 0.9% n.a. n.a.
GX: generation; DX: distribution; TX: transmission; H: holding company
(1) Net financial debt + other financial liabilities for June 2015 according to the information submitted by the Company
Strictly Private and Confidential
88
|
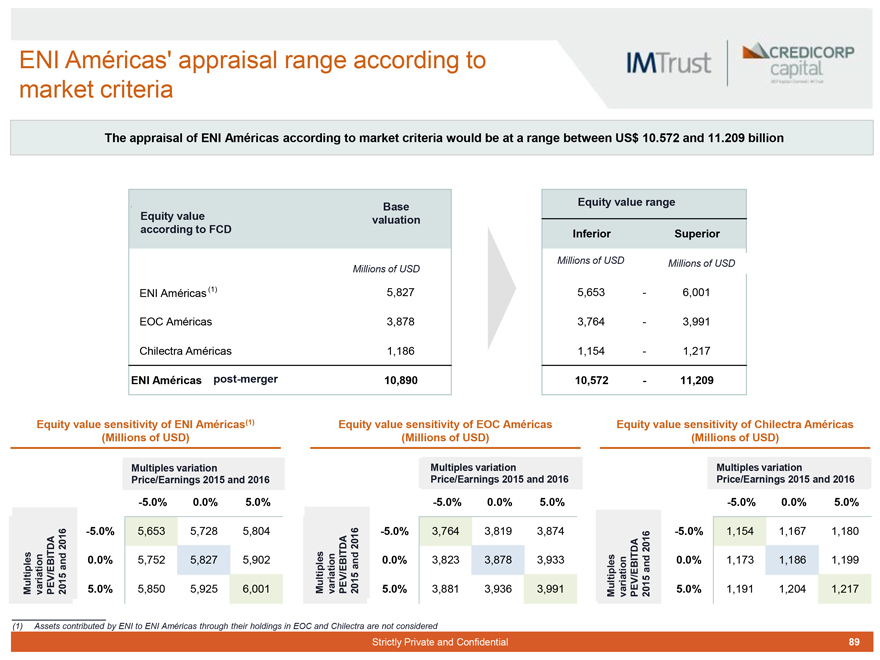
ENI Américas’ appraisal range according to market criteria
IMTrust CREDICORP
capital
The appraisal of ENI Américas according to market criteria would be at a range between US$ 10.572 and 11.209 billion
Base valuation
Equity value
according to FCD
Millions of USD
ENI Américas(1) 5,827
EOC Américas 3,878
Chilectra Américas 1,186
ENI Américas post-merger 10,890
Equity value range
Inferior Superior
Millions of USD Millions of USD
5,653 - 6,001
3,764 - 3,991
1,154 - 1,217
10,572 - 11,209
Equity value sensitivity of ENI Américas(1) (Millions of USD)
Equity value sensitivity of EOC Américas (Millions of USD)
Equity value sensitivity of Chilectra Américas (Millions of USD)
Multiples variation
PEV/EBITDA 2015 and 2016
Multiples variation
Price/Earnings 2015 and 2016
-5.0% 0.0% 5.0%
-5.0% 5,653 5,728 5,804
0.0% 5,752 5,827 5,902
5.0% 5,850 5,925 6,001
Multiples variation
PEV/EBITDA 2015 and 2016
Multiples variation
Price/Earnings 2015 and 2016
-5.0% 0.0% 5.0%
-5.0% 3,764 3,819 3,874
0.0% 3,823 3,878 3,933
5.0% 3,881 3,936 3,991
Multiples variation
PEV/EBITDA 2015 and 2016
Multiples variation
Price/Earnings 2015 and 2016
-5.0% 0.0% 5.0%
-5.0% 1,154 1,167 1,180
0.0% 1,173 1,186 1,199
5.0% 1,191 1,204 1,217
(1) Assets contributed by ENI to ENI Américas through their holdings in EOC and Chilectra are not considered
Strictly Private and Confidential
89
|
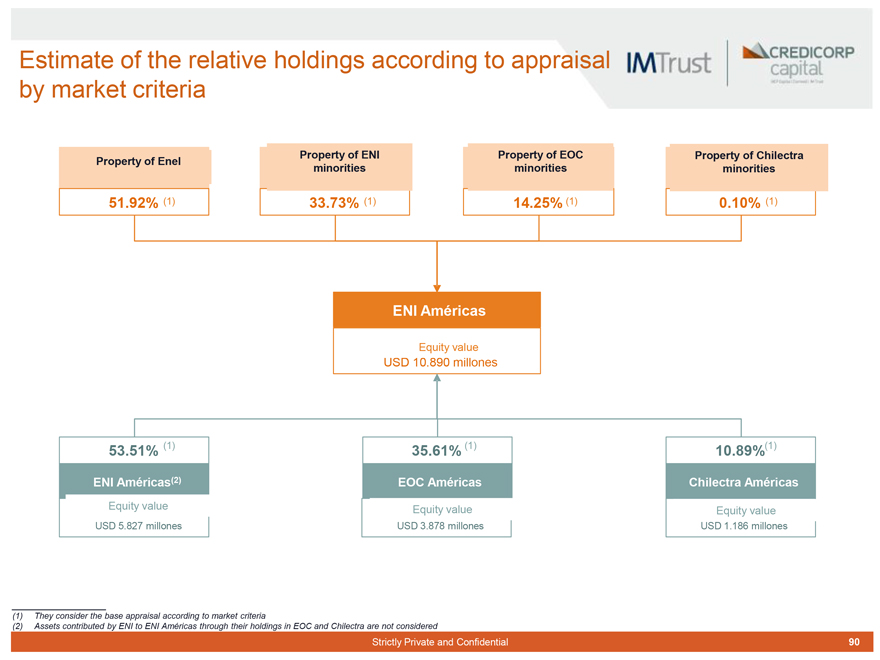
Estimate of the relative holdings according to appraisal by market criteria
IMTrust CREDICORP
capital
Property of Enel
51.92% (1)
Property of ENI minorities
33.73% (1)
Property of EOC minorities
14.25% (1)
Property of Chilectra minorities
0.10% (1)
ENI Américas
Equity value
USD 10.890 millones
53.51% (1)
ENI Américas(2)
Equity value
USD 5.827 millones
35.61% (1)
EOC Américas
Equity value
USD 3.878 millones
10.89%(1)
Chilectra Américas
Equity value
USD 1.186 millones
(1) They consider the base appraisal according to market criteria
(2) Assets contributed by ENI to ENI Américas through their holdings in EOC and Chilectra are not considered
Strictly Private and Confidential
90
|
IMTrust CREDICORP
capital
ESTIMATE OF RELATIVE HOLDINGS IN THE MERGER IN ENI AMERICAS
iii. Relative holdings adjusted by cost disproportionality of the Reorganization
Strictly Private and Confidential
91
|
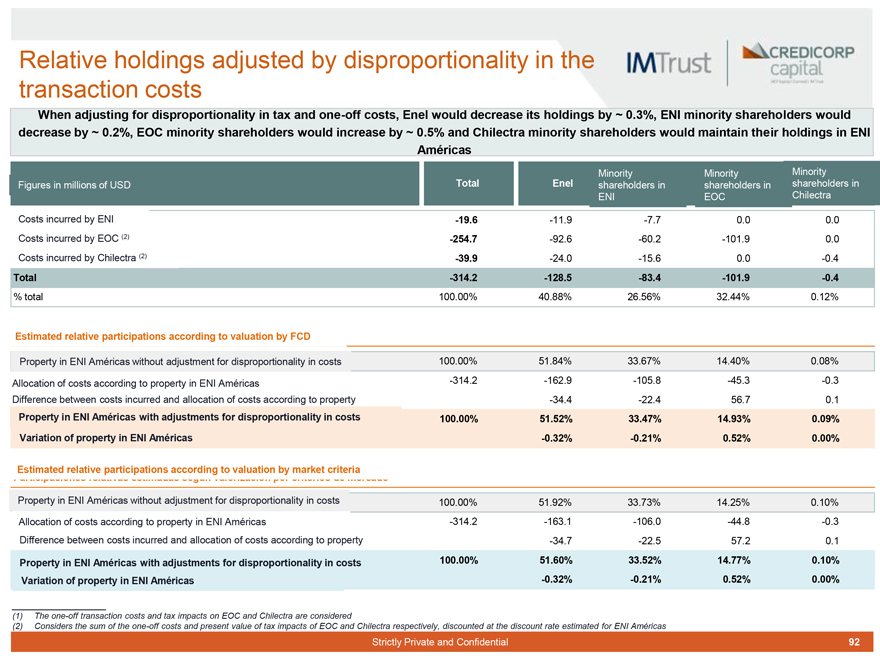
Relative holdings adjusted by disproportionality in the transaction costs
IMTrust CREDICORP
capital
When adjusting for disproportionality in tax and one-off costs, Enel would decrease its holdings by ~ 0.3%, ENI minority shareholders would decrease by ~ 0.2%, EOC minority shareholders would increase by ~ 0.5% and Chilectra minority shareholders would maintain their holdings in ENI Américas
Minority Minority Minority
Figures in millions of USD Total Enel shareholders in ENI shareholders in EOC shareholders in Chilectra
Costs incurred by ENI -19.6 -11.9 -7.7 0.0 0.0
Costs incurred by EOC (2) -254.7 -92.6 -60.2 -101.9 0.0
Costs incurred by Chilectra (2) -39.9 -24.0 -15.6 0.0 -0.4
Total -314.2 -128.5 -83.4 -101.9 -0.4
% total 100.00% 40.88% 26.56% 32.44% 0.12%
Estimated relative participations according to valuation by FCD
Property in ENI Américas without adjustment for disproportionality in costs 100.00% 51.84% 33.67% 14.40% 0.08%
Allocation of costs according to property in ENI Américas -314.2 -162.9 -105.8 -45.3 -0.3
Difference between costs incurred and allocation of costs according to property -34.4 -22.4 56.7 0.1
Property in ENI Américas with adjustments for disproportionality in costs 100.00% 51.52% 33.47% 14.93% 0.09%
Variation of property in ENI Américas -0.32% -0.21% 0.52% 0.00%
Estimated relative participations according to valuation by market criteria
Property in ENI Américas without adjustment for disproportionality in costs 100.00% 51.92% 33.73% 14.25% 0.10%
Allocation of costs according to property in ENI Américas -314.2 -163.1 -106.0 -44.8 -0.3
Difference between costs incurred and allocation of costs according to property -34.7 -22.5 57.2 0.1
Property in ENI Américas with adjustments for disproportionality in costs 100.00% 51.60% 33.52% 14.77% 0.10%
Variation of property in ENI Américas -0.32% -0.21% 0.52% 0.00%
(1) The one-off transaction costs and tax impacts on EOC and Chilectra are considered
(2) Considers the sum of the one-off costs and present value of tax impacts of EOC and Chilectra respectively, discounted at the discount rate estimated for ENI Américas
Strictly Private and Confidential
92
|
IMTrust
CREDICORP capital
ESTIMATE OF RELATIVE HOLDINGS IN THE
MERGER IN ENI AMERICAS
iv. Summary
Strictly Private and Confidential 93
|
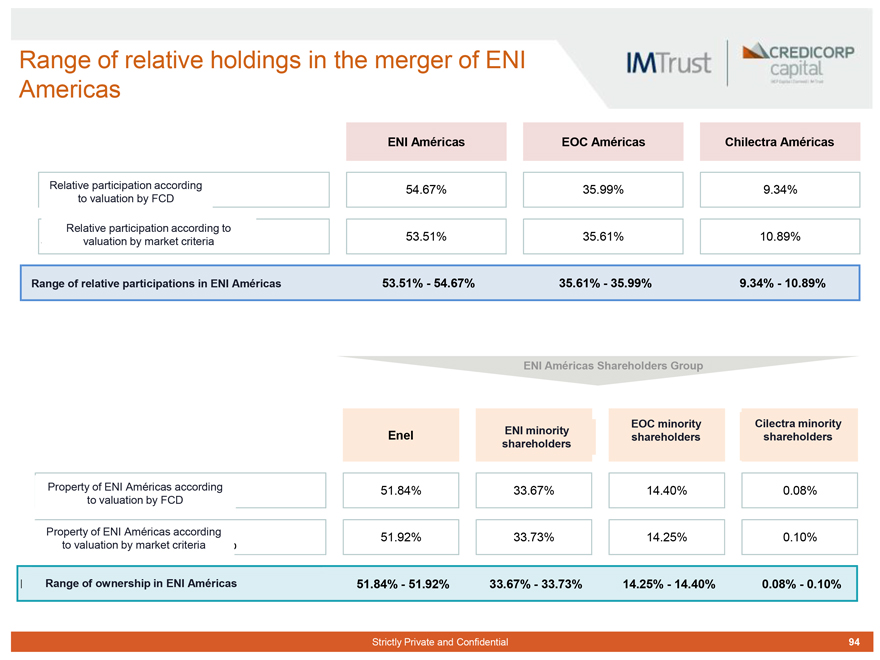
IMTrust
CREDICORP capital
Range of relative holdings in the merger of ENI Americas
ENI Américas EOC Américas Chilectra Américas
Relative participation according to valuation by FCD
54.67%
35.99%
9.34%
Relative participation according to valuation by market criteria )
53.51%
35.61%
10.89%
Range of relative participations in ENI Américas
53.51% - 54.67%
35.61% - 35.99%
9.34% - 10.89%
ENI Américas Shareholders Group
Enel
ENI minority shareholders
EOC minority shareholders
Cilectra minority shareholders
Property of ENI Américas according to valuation by FCD
51.84%
33.67%
14.40%
0.08%
Property of ENI Américas according to valuation by market criteria
51.92%
33.73%
14.25%
0.10%
Range of ownership in ENI Américas
51.84% - 51.92%
33.67% - 33.73%
14.25% - 14.40%
0.08% - 0.10%
Strictly Private and Confidential 94
|
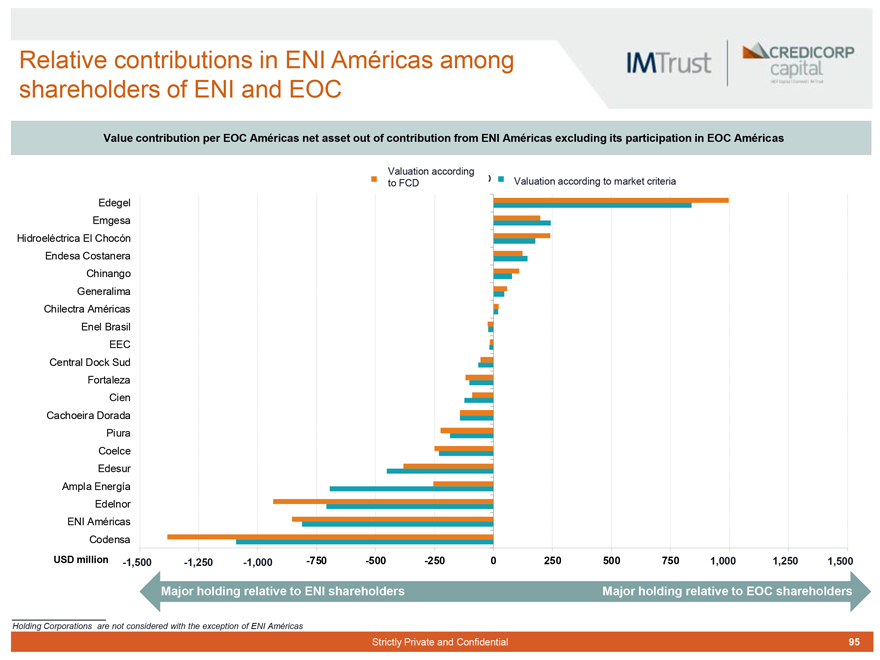
IMTrust
CREDICORP capital
Relative contributions in ENI Américas among shareholders of ENI and EOC
Value contribution per EOC Américas net asset out of contribution from ENI Américas excluding its participation in EOC Américas
Valuation according to FCD ) Valuation according to market criteria
Edegel
Emgesa
Hidroeléctrica El Chocón
Endesa Costanera
Chinango
Generalima
Chilectra Américas
Enel Brasil
EEC
Central Dock Sud
Fortaleza
Cien
Cachoeira Dorada
Piura
Coelce
Edesur
Ampla Energía
Edelnor
ENI Américas
Codensa
USD million -1,500
-1,250 . -1,000 . -750 -500 -250 0 250 500 750 1,000 1,250 1,500
Major holding relative to ENI shareholders Major holding relative to EOC shareholders
Holding Corporations are not considered with the exception of ENI Américas
Strictly Private and Confidential 95
|

IMTrust
CREDICORP capital
ANSWERS TO QUESTIONS MADE BY MEMBERS OF THE BOARD OF DIRECTORS OF ENERSIS
9
Strictly Private and Confidential 96
|
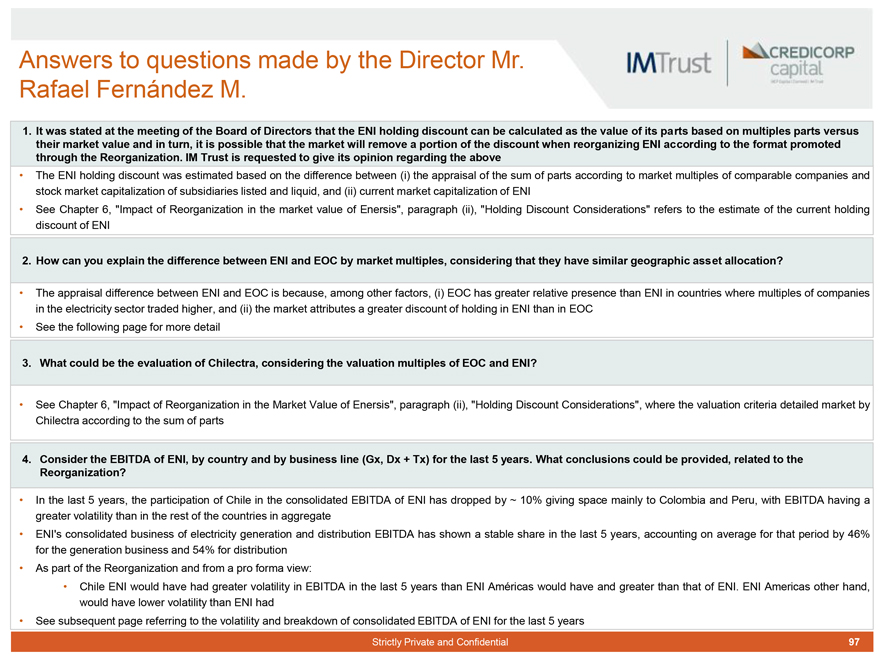
IMTrust
CREDICORP capital
Answers to questions made by the Director Mr. Rafael Fernández M.
1. It was stated at the meeting of the Board of Directors that the ENI holding discount can be calculated as the value of its parts based on multiples parts versus their market value and in turn, it is possible that the market will remove a portion of the discount when reorganizing ENI according to the format promoted through the Reorganization. IM Trust is requested to give its opinion regarding the above
• The ENI holding discount was estimated based on the difference between (i) the appraisal of the sum of parts according to market multiples of comparable companies and stock market capitalization of subsidiaries listed and liquid, and (ii) current market capitalization of ENI
• See Chapter 6, “Impact of Reorganization in the market value of Enersis”, paragraph (ii), “Holding Discount Considerations” refers to the estimate of the current holding discount of ENI
2. How can you explain the difference between ENI and EOC by market multiples, considering that they have similar geographic asset allocation?
• The appraisal difference between ENI and EOC is because, among other factors, (i) EOC has greater relative presence than ENI in countries where multiples of companies in the electricity sector traded higher, and (ii) the market attributes a greater discount of holding in ENI than in EOC
• See the following page for more detail
3. What could be the evaluation of Chilectra, considering the valuation multiples of EOC and ENI?
• See Chapter 6, “Impact of Reorganization in the Market Value of Enersis”, paragraph (ii), “Holding Discount Considerations”, where the valuation criteria detailed market by Chilectra according to the sum of parts
4. Consider the EBITDA of ENI, by country and by business line (Gx, Dx + Tx) for the last 5 years. What conclusions could be provided, related to the Reorganization?
• In the last 5 years, the participation of Chile in the consolidated EBITDA of ENI has dropped by ~ 10% giving space mainly to Colombia and Peru, with EBITDA having a greater volatility than in the rest of the countries in aggregate
• ENI’s consolidated business of electricity generation and distribution EBITDA has shown a stable share in the last 5 years, accounting on average for that period by 46% for the generation business and 54% for distribution
• As part of the Reorganization and from a pro forma view:
• Chile ENI would have had greater volatility in EBITDA in the last 5 years than ENI Américas would have and greater than that of ENI. ENI Americas other hand, would have lower volatility than ENI had
• See subsequent page referring to the volatility and breakdown of consolidated EBITDA of ENI for the last 5 years
Strictly Private and Confidential 97
|
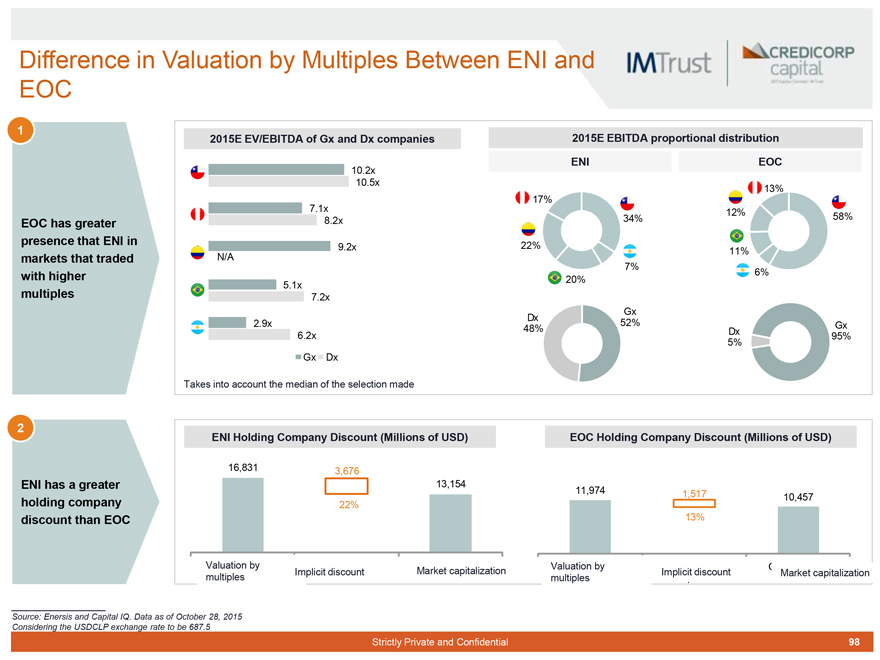
IMTrust
CREDICORP capital
Difference in Valuation by Multiples Between ENI and EOC
1
EOC has greater presence that ENI in markets that traded with higher multiples
2015E EV/EBITDA of Gx and Dx companies
2015E EBITDA proportional distribution
ENI
EOC
10.2x
10.5x
13%
17%
7.1x
12%
8.2x
34%
58%
9.2x
22%
11%
N/A
7%
6%
5.1x
20%
7.2x
Dx
Gx
2.9x
52%
Gx
48%
Dx
6.2x
95%
5%
Gx Dx
Takes into account the median of the selection made
2
ENI has a greater holding company discount than EOC
ENI Holding Company Discount (Millions of USD) EOC Holding Company Discount (Millions of USD)
16,831 3,676
13,154
11,974
1,517 10,457
22%
13%
Valuation by multiples Implicit discount Market capitalization Valuation by Implicit discount multiples Market capitalization
Source: Enersis and Capital IQ. Data as of October 28, 2015 Considering the USDCLP exchange rate to be 687.5
Strictly Private and Confidential
98
|
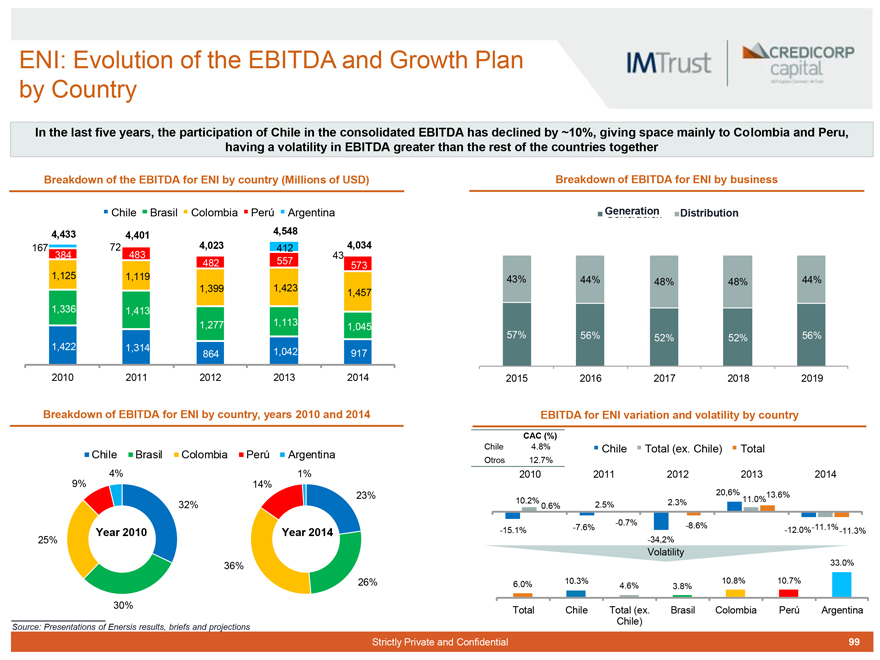
IMTrust
CREDICORP capital
ENI: Evolution of the EBITDA and Growth Plan by Country
In the last five years, the participation of Chile in the consolidated EBITDA has declined by ~10%, giving space mainly to Colombia and Peru, having a volatility in EBITDA greater than the rest of the countries together
Breakdown of the EBITDA for ENI by country (Millions of USD)
Chile Brasil Colombia Perú Argentina
4,433 4,401 4,548
167 72 4,023 412 4,034
384 483 43
482 557 573
1,125 1,119
1,399 1,423 1,457
1,336 1,413
1,277 1,113 1,045
1,422 1,314 864 1,042 917
2010 2011 2012 2013 2014
Breakdown of EBITDA for ENI by business
Generation Distribution
43% 44% 48% 48% 44%
57% 56% 52% 52% 56%
2015 2016 2017 2018 2019
Breakdown of EBITDA for ENI by country, years 2010 and 2014
Chile Brasil Colombia Perú Argentina
4% 1%
9% 14%
23%
32%
Year 2010 Year 2014
25%
36%
26%
30%
Source: Presentations of Enersis results, briefs and projections
EBITDA for ENI variation and volatility by country
CAC (%)
Chile 4.8%
Otros 12.7%
Chile Total (ex. Chile) Total
2010 2011 2012 2013 2014
20,6% 13.6%
10.2% 0.6% 2.5% 2.3% 11.0%
-7.6% -0.7% -8.6% -11.1%
-15.1% -12.0% -11.3%
-34,2%
Volatility
33.0%
6.0% 10.3% 4.6% 3.8% 10.8% 10.7%
Total Chile Total (ex. Brasil Colombia Perú Argentina
Chile)
Strictly Private and Confidential
99
|
IMTrust
CREDICORP capital
ATTACHMENTS
11
Strictly Private and Confidential
100
|
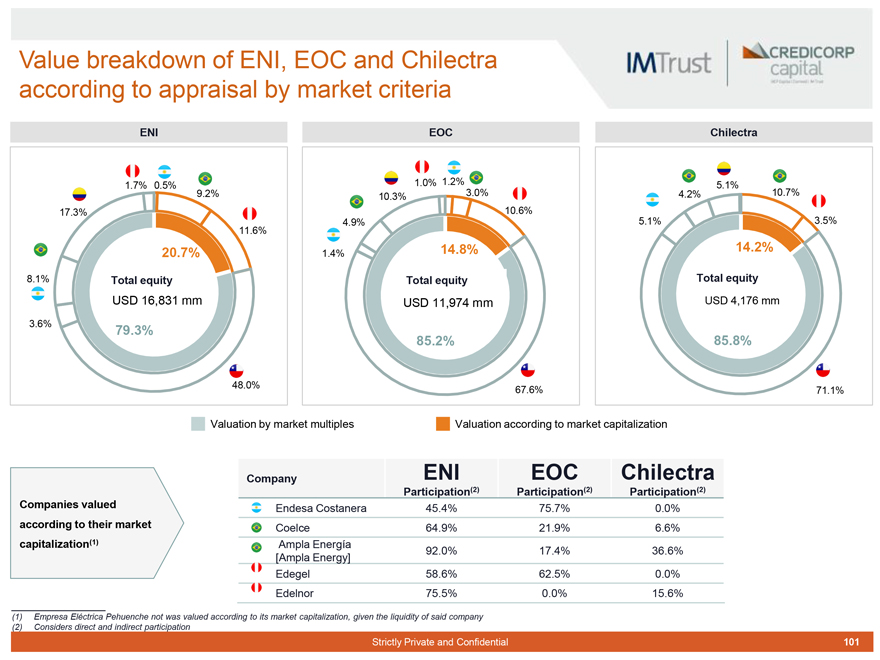
IMTrust
CREDICORP capital
Value breakdown of ENI, EOC and Chilectra according to appraisal by market criteria
ENI
1.7% 0.5%
9.2%
17.3%
11.6%
20.7%
8.1% Total equity
USD 16,831 mm
3.6% 79.3%
48.0%
EOC
1.0% 1.2%
10.3% 3.0%
10.6%
4.9%
1.4% 14.8%
Total equity
USD 11,974 mm
85.2%
67.6%
Chilectra
5.1%
4.2% 10.7%
5.1% 3.5%
14.2%
Total equity
USD 4,176 mm
85.8%
71.1%
Valuation by market multiples Valuation according to market capitalization
Companies valued according to their market capitalization(1)
Company ENI EOC Chilectra
Participation(2) Participation(2) Participation(2)
Endesa Costanera 45.4% 75.7% 0.0%
Coelce 64.9% 21.9% 6.6%
Ampla Energía
[Ampla Energy] 92.0% 17.4% 36.6%
Edegel 58.6% 62.5% 0.0%
Edelnor 75.5% 0.0% 15.6%
(1) Empresa Eléctrica Pehuenche not was valued according to its market capitalization, given the liquidity of said company
(2) Considers direct and indirect participation
Strictly Private and Confidential
101
|
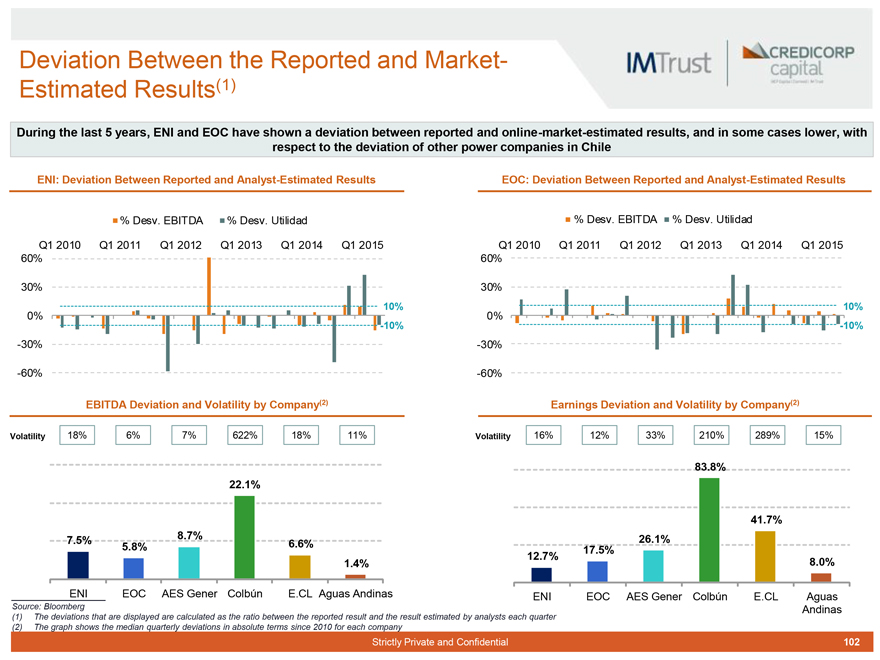
IMTrust
CREDICORP capital
Deviation Between the Reported and Market-Estimated Results(1)
During the last 5 years, ENI and EOC have shown a deviation between reported and online-market-estimated results, and in some cases lower, with respect to the deviation of other power companies in Chile
ENI: Deviation Between Reported and Analyst-Estimated Results
% Desv. EBITDA % Desv. Utilidad
Q1 2010 Q1 2011 Q1 2012 Q1 2013 Q1 2014 Q1 2015
60%
30%
10%
0%
-10%
-30%
-60%
EOC: Deviation Between Reported and Analyst-Estimated Results
% Desv. EBITDA % Desv. Utilidad
Q1 2010 Q1 2011 Q1 2012 Q1 2013 Q1 2014 Q1 2015
60%
30%
10%
0%
-10%
-30%
-60%
EBITDA Deviation and Volatility by Company(2)
Volatility 18% 6% 7% 622% 18% 11%
22.1%
8.7%
7.5% 5.8% 6.6%
1.4%
ENI EOC AES Gener Colbún E.CL Aguas Andinas
Earnings Deviation and Volatility by Company(2)
Volatility 16% 12% 33% 210% 289% 15%
83.8%
41.7%
26.1%
17.5%
12.7% 8.0%
ENI EOC AES Gener Colbún E.CL Aguas
Andinas
Source: Bloomberg
(1) The deviations that are displayed are calculated as the ratio between the reported result and the result estimated by analysts each quarter (2) The graph shows the median quarterly deviations in absolute terms since 2010 for each company
Strictly Private and Confidential 102
|
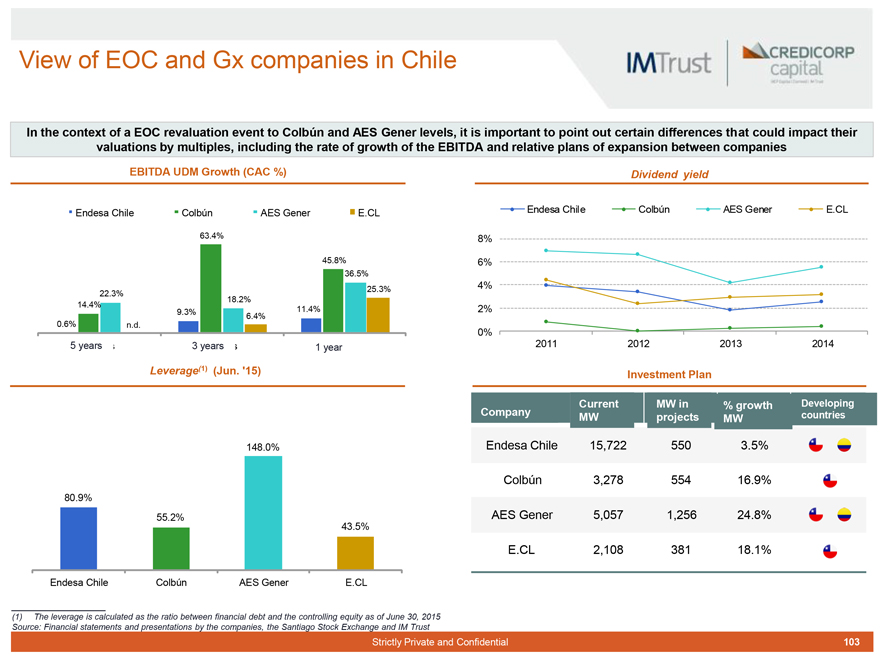
IMTrust
CREDICORP capital
View of EOC and Gx companies in Chile
In the context of a EOC revaluation event to Colbún and AES Gener levels, it is important to point out certain differences that could impact their valuations by multiples, including the rate of growth of the EBITDA and relative plans of expansion between companies
EBITDA UDM Growth (CAC %)
Endesa Chile Colbún AES Gener E.CL
63.4%
45.8%
36.5%
22.3% 25.3%
18.2%
14.4% 9.3% 11.4%
6.4%
0.6% n.d.
5 years 3 years 1 year
Dividend yield
Endesa Chile Colbún AES Gener E.CL
8% 6% 4% 2% 0%
2011 2012 2013 2014
Leverage(1) (Jun. ‘15)
148.0%
80.9%
55.2%
43.5%
Endesa Chile Colbún AES Gener E.CL
Investment Plan
Company Current MW MW in projects % growth MW Developing countries
Endesa Chile 15,722 550 3.5%
Colbún 3,278 554 16.9%
AES Gener 5,057 1,256 24.8%
E.CL 2,108 381 18.1%
(1) The leverage is calculated as the ratio between financial debt and the controlling equity as of June 30, 2015 Source: Financial statements and presentations by the companies, the Santiago Stock Exchange and IM Trust
Strictly Private and Confidential 103
|
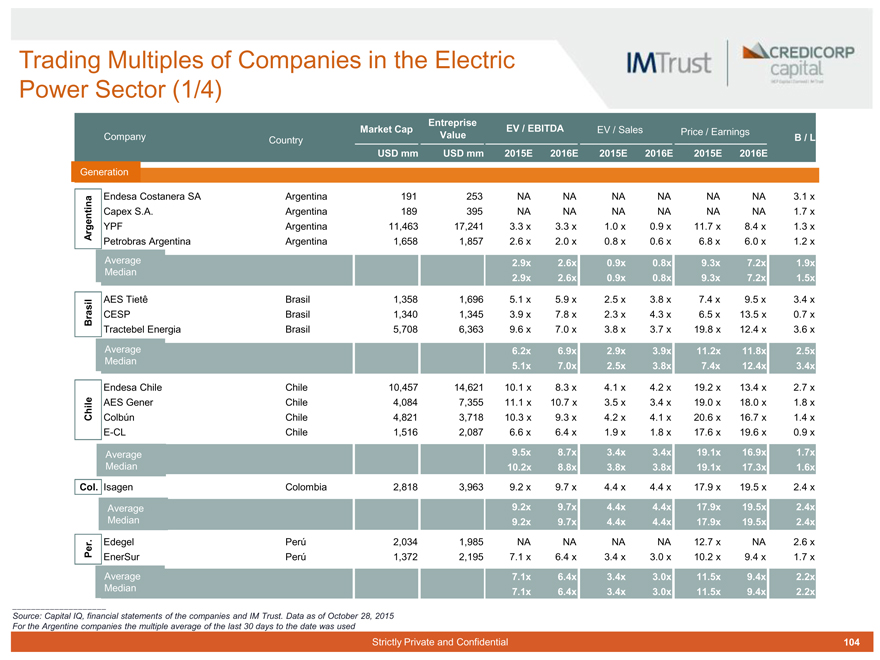
IMTrust
CREDICORP capital
Trading Multiples of Companies in the Electric Power Sector (1/4)
Market Cap Entreprise EV / EBITDA EV / Sales Price / Earnings
Company Country USD mm Value USD mm 2015E 2016E 2015E 2016E 2015E 2016E B / L
Generation
Endesa Costanera SA Argentina 191 253 NA NA NA NA NA NA 3.1 x
Capex S.A. Argentina 189 395 NA NA NA NA NA NA 1.7 x
Argentina YPF Argentina 11,463 17,241 3.3 x 3.3 x 1.0 x 0.9 x 11.7 x 8.4 x 1.3 x
Petrobras Argentina Argentina 1,658 1,857 2.6 x 2.0 x 0.8 x 0.6 x 6.8 x 6.0 x 1.2 x
Average 2.9x 2.6x 0.9x 0.8x 9.3x 7.2x 1.9x
Median 2.9x 2.6x 0.9x 0.8x 9.3x 7.2x 1.5x
AES Tietê Brasil 1,358 1,696 5.1 x 5.9 x 2.5 x 3.8 x 7.4 x 9.5 x 3.4 x
Brasil CESP Brasil 1,340 1,345 3.9 x 7.8 x 2.3 x 4.3 x 6.5 x 13.5 x 0.7 x
Tractebel Energia Brasil 5,708 6,363 9.6 x 7.0 x 3.8 x 3.7 x 19.8 x 12.4 x 3.6 x
Average 6.2x 6.9x 2.9x 3.9x 11.2x 11.8x 2.5x
Median 5.1x 7.0x 2.5x 3.8x 7.4x 12.4x 3.4x
Endesa Chile Chile 10,457 14,621 10.1 x 8.3 x 4.1 x 4.2 x 19.2 x 13.4 x 2.7 x
AES Gener Chile 4,084 7,355 11.1 x 10.7 x 3.5 x 3.4 x 19.0 x 18.0 x 1.8 x
Chile Colbún Chile 4,821 3,718 10.3 x 9.3 x 4.2 x 4.1 x 20.6 x 16.7 x 1.4 x
E-CL Chile 1,516 2,087 6.6 x 6.4 x 1.9 x 1.8 x 17.6 x 19.6 x 0.9 x
Average 9.5x 8.7x 3.4x 3.4x 19.1x 16.9x 1.7x
Median 10.2x 8.8x 3.8x 3.8x 19.1x 17.3x 1.6x
Col. Isagen Colombia 2,818 3,963 9.2 x 9.7 x 4.4 x 4.4 x 17.9 x 19.5 x 2.4 x
Average 9.2x 9.7x 4.4x 4.4x 17.9x 19.5x 2.4x
Median 9.2x 9.7x 4.4x 4.4x 17.9x 19.5x 2.4x
Edegel Perú 2,034 1,985 NA NA NA NA 12.7 x NA 2.6 x
Per. EnerSur Perú 1,372 2,195 7.1 x 6.4 x 3.4 x 3.0 x 10.2 x 9.4 x 1.7 x
Average 7.1x 6.4x 3.4x 3.0x 11.5x 9.4x 2.2x
Median 7.1x 6.4x 3.4x 3.0x 11.5x 9.4x 2.2x
Source: Capital IQ, financial statements of the companies and IM Trust. Data as of October 28, 2015 For the Argentine companies the multiple average of the last 30 days to the date was used
Strictly Private and Confidential 104
|

IMTrust
CREDICORP capital
Trading Multiples of Companies in the Electric Power Sector (2/4)
Market Cap Entreprise EV / EBITDA EV / Sales Price / Earnings
Company Country USD mm Value USD mm 2015E 2016E 2015E 2016E 2015E 2016E B / L
Distribution
Arg. Edenor Argentina 1,265 1,413 6.2 x 5.9 x 3.7 x 1.7 x 11.0 x 7.5 x 10.5 x
Average 6.2x 5.9x 3.7x 1.7x 11.0x 7.5x 10.5x
Median 6.2x 5.9x 3.7x 1.7x 11.0x 7.5x 10.5x
Ampla Brasil 1,084 1,664 NA NA NA NA NA NA 1.6 x
Companhia Energética do Ceará - Coelce Brasil 778 1,074 NA NA NA NA NA NA 1.6 x
Brasil Eletropaulo Brasil 420 973 4.7 x 4.3 x 0.4 x 0.4 x 7.7 x 6.2 x 0.6 x
Equatorial Energia S.A. Brasil 1,780 2,355 10.9 x 9.1 x 1.7 x 1.6 x 10.9 x 11.6 x 2.0 x
Light SA Brasil 652 2,521 7.2 x 5.5 x 0.9 x 1.0 x 6.6 x 6.1 x 0.7 x
Average 7.6x 6.3x 1.0x 1.0x 8.4x 8.0x 1.3x
Median 7.2x 5.5x 0.9x 1.0x 7.7x 6.2x 1.6x
Ch. Chilectra S.A. Chile 3,348 3,337 NA NA NA NA NA NA NA
Aguas Andinas S.A. Chile 3,146 4,352 11.0 x 10.6 x 6.7 x 6.5 x 17.0 x 16.2 x 3.6 x
Average 11.0x 10.6x 6.7x 6.5x 17.0x 16.2x 3.6x
Median 11.0x 10.6x 6.7x 6.5x 17.0x 16.2x 3.6x
Col. Promigas S.A. E.S.P. Colombia 1,959 2,825 NA NA NA NA NA NA 2.4 x
Average NA NA NA NA NA NA 2.4x
Median NA NA NA NA NA NA 2.4x
Luz del Sur S.A.A. Perú 1,444 1,886 10.1 x 9.7 x 2.3 x 2.1 x 13.1 x 12.6 x 2.6 x
Per. Emp. Distribucion Electrica De Lima Norte Perú 937 1,324 6.2 x 5.9 x 1.6 x 1.6 x 9.1 x 8.6 x 2.1 x
Average 8.2x 7.8x 2.0x 1.8x 11.1x 10.6x 2.4x
Median 8.2x 7.8x 2.0x 1.8x 11.1x 10.6x 2.4x
Source: Capital IQ, financial statements of the companies and IM Trust. Data as of October 28, 2015 For the Argentine companies the multiple average of the last 30 days to the date was used
Considering that there are no companies listed in Colombia solely dedicated to distribution, for the appraisal of assets in Colombia the sample of comparable companies of Peru was considered.
Strictly Private and Confidential 105
|
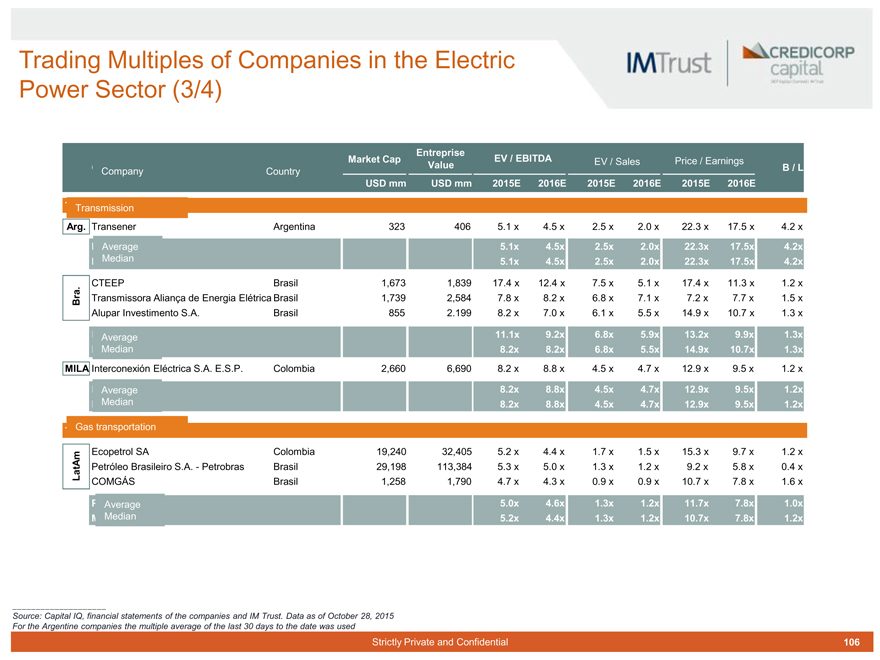
IMTrust
CREDICORP capital
Trading Multiples of Companies in the Electric Power Sector (3/4)
Market Cap Entreprise EV / EBITDA EV / Sales Price / Earnings
Company Country USD mm Value USD mm 2015E 2016E 2015E 2016E 2015E 2016E B / L
Transmission
Arg. Transener Argentina 323 406 5.1 x 4.5 x 2.5 x 2.0 x 22.3 x 17.5 x 4.2 x
Average 5.1x 4.5x 2.5x 2.0x 22.3x 17.5x 4.2x
Median 5.1x 4.5x 2.5x 2.0x 22.3x 17.5x 4.2x
CTEEP Brasil 1,673 1,839 17.4 x 12.4 x 7.5 x 5.1 x 17.4 x 11.3 x 1.2 x
Bra. Transmissora Aliança de Energia Elétrica Brasil 1,739 2,584 7.8 x 8.2 x 6.8 x 7.1 x 7.2 x 7.7 x 1.5 x
Alupar Investimento S.A. Brasil 855 2.199 8.2 x 7.0 x 6.1 x 5.5 x 14.9 x 10.7 x 1.3 x
Average 11.1x 9.2x 6.8x 5.9x 13.2x 9.9x 1.3x
Median 8.2x 8.2x 6.8x 5.5x 14.9x 10.7x 1.3x
MILA Interconexión Eléctrica S.A. E.S.P. Colombia 2,660 6,690 8.2 x 8.8 x 4.5 x 4.7 x 12.9 x 9.5 x 1.2 x
Average 8.2x 8.8x 4.5x 4.7x 12.9x 9.5x 1.2x
Median 8.2x 8.8x 4.5x 4.7x 12.9x 9.5x 1.2x
Gas transportation
Ecopetrol SA Colombia 19,240 32,405 5.2 x 4.4 x 1.7 x 1.5 x 15.3 x 9.7 x 1.2 x
LatAm Petróleo Brasileiro S.A. - Petrobras Brasil 29,198 113,384 5.3 x 5.0 x 1.3 x 1.2 x 9.2 x 5.8 x 0.4 x
COMGÁS Brasil 1,258 1,790 4.7 x 4.3 x 0.9 x 0.9 x 10.7 x 7.8 x 1.6 x
P Average 5.0x 4.6x 1.3x 1.2x 11.7x 7.8x 1.0x
Median 5.2x 4.4x 1.3x 1.2x 10.7x 7.8x 1.2x
Source: Capital IQ, financial statements of the companies and IM Trust. Data as of October 28, 2015 For the Argentine companies the multiple average of the last 30 days to the date was used
Strictly Private and Confidential 106
|
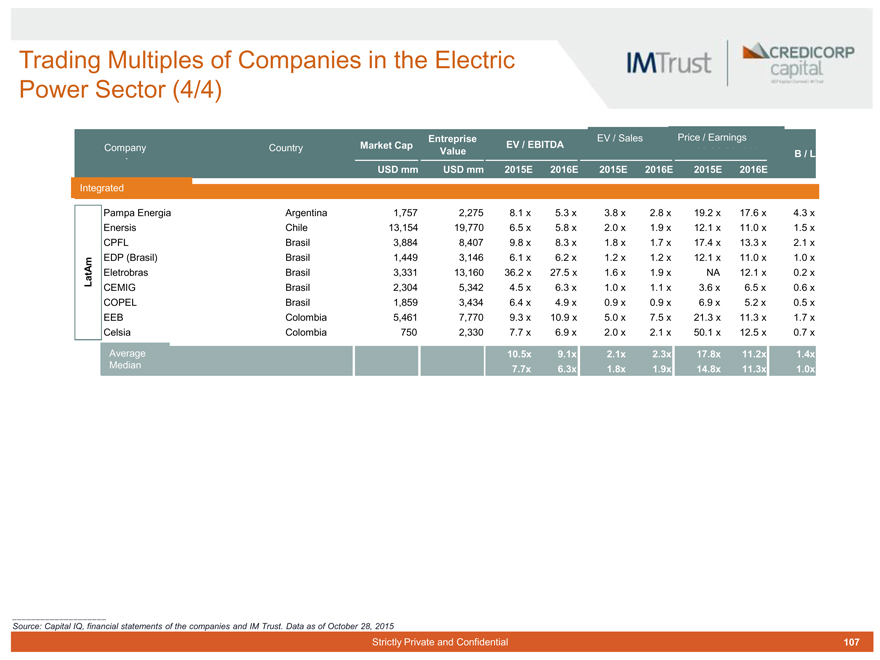
IMTrust
CREDICORP capital
Trading Multiples of Companies in the Electric Power Sector (4/4)
Company Country Market Cap Entreprise EV / EBITDA EV / Sales Price / Earnings
USD mm Value USD mm 2015E 2016E 2015E 2016E 2015E 2016E B / L
Integrated
Pampa Energia Argentina 1,757 2,275 8.1 x 5.3 x 3.8 x 2.8 x 19.2 x 17.6 x 4.3 x
Enersis Chile 13,154 19,770 6.5 x 5.8 x 2.0 x 1.9 x 12.1 x 11.0 x 1.5 x
CPFL Brasil 3,884 8,407 9.8 x 8.3 x 1.8 x 1.7 x 17.4 x 13.3 x 2.1 x
EDP (Brasil) Brasil 1,449 3,146 6.1 x 6.2 x 1.2 x 1.2 x 12.1 x 11.0 x 1.0 x
LatAm Eletrobras Brasil 3,331 13,160 36.2 x 27.5 x 1.6 x 1.9 x NA 12.1 x 0.2 x
CEMIG Brasil 2,304 5,342 4.5 x 6.3 x 1.0 x 1.1 x 3.6 x 6.5 x 0.6 x
COPEL Brasil 1,859 3,434 6.4 x 4.9 x 0.9 x 0.9 x 6.9 x 5.2 x 0.5 x
EEB Colombia 5,461 7,770 9.3 x 10.9 x 5.0 x 7.5 x 21.3 x 11.3 x 1.7 x
Celsia Colombia 750 2,330 7.7 x 6.9 x 2.0 x 2.1 x 50.1 x 12.5 x 0.7 x
Average 10.5x 9.1x 2.1x 2.3x 17.8x 11.2x 1.4x
Median 7.7x 6.3x 1.8x 1.9x 14.8x 11.3x 1.0x
Source: Capital IQ, financial statements of the companies and IM Trust. Data as of October 28, 2015
Strictly Private and Confidential 107
|

IMTrust
CREDICORP capital
BCP Capital | Correval | IM Trust
Santiago Office
Avenida Apoquindo 3721, Piso 9
Las Condes
7550177
Chile
+56 (2) 2450 1600