UNITED STATES
SECURITIES AND EXCHANGE COMMISSION
Washington, D.C. 20549
FORM N-CSR
CERTIFIED SHAREHOLDER REPORT OF REGISTERED
MANAGEMENT INVESTMENT COMPANIES
Investment Company Act file number811-23248
Tortoise Essential Assets Income Term Fund
(Exact name of registrant as specified in charter)
11550 Ash Street, Suite 300, Leawood, KS 66211
(Address of principal executive offices) (Zip code)
P. Bradley Adams
Diane Bono
11550 Ash Street, Suite 300, Leawood, KS 66211
(Name and address of agent for service)
913-981-1020
Registrant's telephone number, including area code
Date of fiscal year end:November 30
Date of reporting period:November 30, 2019
Item 1. Report to Stockholders.
Annual Report| November 30, 2019
2019 Annual Report
Closed-End Funds
| Tortoise |
| 2019 Annual Report to Stockholders |
This combined report provides you with a comprehensive review of our funds that span essential assets.
| Table of contents | ||||||
| Closed-end Fund Comparison | 1 | TEAF: Fund Focus | 20 | |||
| Letter to Stockholders | 2 | Financial Statements | 24 | |||
| TYG: | Fund Focus | 5 | Notes to Financial Statements | 62 | ||
| NTG: | Fund Focus | 8 | Report of Independent Registered | |||
| TTP: | Fund Focus | 11 | Public Accounting Firm | 82 | ||
| NDP: | Fund Focus | 14 | Company Officers and Directors | 83 | ||
| TPZ: | Fund Focus | 17 | Additional Information | 85 | ||
| TTP and TPZ distribution policies |
Tortoise Pipeline & Energy Fund, Inc. (“TTP”) and Tortoise Power and Energy Infrastructure Fund, Inc. (“TPZ”) are relying on exemptive relief permitting them to make long-term capital gain distributions throughout the year. Each of TTP and TPZ, with approval of its Board of Directors (the “Board”), has adopted a distribution policy (the “Policy”) with the purpose of distributing over the course of each year, through periodic distributions as nearly equal as practicable and any required special distributions, an amount closely approximating the total taxable income of TTP and TPZ during such year and, if so determined by the Board, all or a portion of the return of capital paid by portfolio companies to TTP and TPZ during such year. In accordance with its Policy, TTP distributes a fixed amount per common share, currently $0.285, each quarter to its common shareholders. Prior to August 2019, the quarterly distribution rate was $0.4075. TPZ distributes a fixed amount per common share, currently $0.125, each month to its common shareholders. These amounts are subject to change from time to time at the discretion of the Board. Although the level of distributions is independent of TTP’s and TPZ’s performance, TTP and TPZ expect such distributions to correlate with its performance over time. Each quarterly and monthly distribution to shareholders is expected to be at the fixed amount established by the Board, except for extraordinary distributions in light of TTP’s and TPZ’s performance for the entire calendar year and to enable TTP and TPZ to comply with the distribution requirements imposed by the Internal Revenue Code. The Board may amend, suspend or terminate the Policy without prior notice to shareholders if it deems such action to be in the best interests of TTP, TPZ and their respective shareholders. For example, the Board might take such action if the Policy had the effect of shrinking TTP’s or TPZ’s assets to a level that was determined to be detrimental to TTP or TPZ shareholders. The suspension or termination of the Policy could have the effect of creating a trading discount (if TTP’s or TPZ’s stock is trading at or above net asset value), widening an existing trading discount, or decreasing an existing premium. You should not draw any conclusions about TTP’s or TPZ’s investment performance from the amount of the distribution or from the terms of TTP’s or TPZ’s distribution policy. Each of TTP and TPZ estimates that it has distributed more than its income and net realized capital gains; therefore, a portion of your distribution may be a return of capital. A return of capital may occur, for example, when some or all of the money that you invested in TTP or TPZ is paid back to you. A return of capital distribution does not necessarily reflect TTP’s or TPZ’s investment performance and should not be confused with “yield” or “income.” The amounts and sources of distributions reported are only estimates and are not being provided for tax reporting purposes. The actual amounts and sources of the amounts for tax reporting purposes will depend upon TTP’s and TPZ’s investment experience during the remainder of their fiscal year and may be subject to changes based on tax regulations. TTP and TPZ will send you a Form 1099-DIV for the calendar year that will tell you how to report these distributions for federal income tax purposes.
| Tortoise |
| 2019 Annual Report| November 30, 2019 |
Closed-end Fund Comparison | |||||||||||
| Name/Ticker | Primary focus | Structure | Total assets ($ millions)1 | Portfolio mix by asset type2 | Portfolio mix by structure2 | ||||||
 | Tortoise Energy NYSE: TYG | Midstream | C-corp | $1,826.5 | 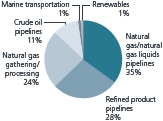 |  | |||||
Tortoise Midstream NYSE: NTG | Natural gas | C-corp | $1,266.8 | 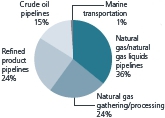 |  | ||||||
Tortoise Pipeline NYSE: TTP | North | Regulated | $209.1 | 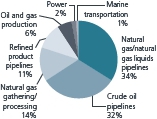 |  | ||||||
 | Tortoise Energy NYSE: NDP | North | Regulated | $99.4 | 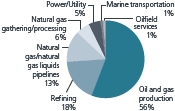 |  | |||||
 | Tortoise Power and NYSE: TPZ | Power | Regulated | $184.8 | 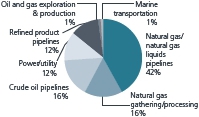 | 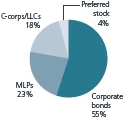 | |||||
 | Tortoise Essential NYSE: TEAF | Essential | Regulated | $289.5 | 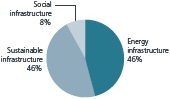 |  | |||||
| 1 | As of 12/31/2019 |
| 2 | As of 11/30/2019 |
| (unaudited) | |
| Tortoise | 1 |
| Tortoise |
| 2019 Annual Report to closed-end fund stockholders |
Dear stockholder,
With our emphasis on essential assets, we focus on the trends and opportunities occurring across the sectors. One of our biggest focuses is on the energy evolution that is underway globally. Energy demand is growing worldwide, particularly from electrification in emerging countries. This increasing demand needs to be met with lower-carbon supply in order to decrease global carbon emissions. For this to happen, natural gas and renewables must take market share from coal for electricity generation. Additionally, U.S. midstream energy is playing a big role, exporting cheap and lower carbon energy to the rest of the world, increasing the need for critical infrastructure to support these exports. In the social infrastructure sector, we are encouraged by the role charter schools are playing in the school choice movement and are mindful of where senior living construction projects are most needed.
Energy Infrastructure
The broader energy sector, as represented by the S&P Energy Select Sector®Index, finished the fourth fiscal quarter ending November 30, 2019 in positive territory, returning 3.3%, bringing fiscal year 2019 performance to -7.7%. Oil markets experienced significant volatility during the period. Prices were caught in a tug-of-war between escalating tensions in the Middle East culminating in significant, but temporary supply outages, mixed signals from U.S.-China trade negotiations impacting demand growth.
Upstream
The Tortoise North American Oil and Gas Producers IndexSMreturned -1.3% in the fourth fiscal quarter, bringing fiscal year performance to -22.7%. Crude oil prices, represented by West Texas Intermediate (WTI), began the fiscal quarter at $53.94 per barrel and peaked at $62.90 on Sept. 16, 2019 following the attacks on Saudi oil infrastructure. Prices troughed quickly thereafter at $52.45 on Oct. 3, 2019 on Saudi claims of minimal disruption to production and the potential for a U.S.-Iran deal before ending the fiscal year at $58.11.
U.S. crude oil production growth is expected to broadly moderate in 2020 as compared to the rapid growth over the past two years. Specifically, U.S. crude oil production is projected to average 12.3 million barrels per day (MMbbl/d) in 2019 and 13.2 MMbbl/d in 20201. U.S. producers are facing increased pressure from investors to exhibit capital discipline and reign in production growth in favor of higher free cash flow generation and return of capital to shareholders. Nonetheless, with multiple years of tremendous production growth, propelled by the U.S. shale revolution, the U.S. transitioned into a net exporter of oil and petroleum products for the first time in recent history. The U.S. became a net exporter of oil and petroleum products in September 2019 with net exports projected to grow in 2020 and beyond1. Rising U.S. energy exports of liquids and natural gas are expected to positively affect the U.S. trade deficit and will ultimately help reduce global CO2emissions, along with renewables, as they take market share from coal.
Following the end of the fiscal year, the Organization of Petroleum Exporting Countries (OPEC) and their Non-OPEC partners (OPEC+) announced in December a clear goal of establishing a floor for crude oil prices through the seasonally weaker first quarter of 2020. OPEC+ members agreed to an incremental 0.5 MMbbl/d cut to the existing agreement taking the official cut to 1.7 MMbbl/d for 1Q20. In addition, Saudi Arabia agreed to continue its over-complianceof 0.4 MMbbl/d implying a new commitment level of cutting 2.1 MMbbl/d. Saudi Arabia is focused on stabilizing of crude oil prices following the recent Saudi Aramco initial public offering. While the deal was not extended, OPEC+ did set a date for an extraordinary meeting to be held in early March 2020 to determine the need for additional cuts. Emphasis will likely be placed upon improved compliance from various OPEC members with poor historical compliance (Iraq, Nigeria, and UAE). With trade tensions easing and the global economy not showing any signs of a true slowdown, oil demand growth is currently expected to improve in 2020, which should bring worldwide supply and demand into better balance.
Natural gas demand has remained robust supported by record levels of domestic power burn, increased exports to Mexico and record liquefied natural gas (LNG) exports driven by the startup of three new liquefaction and export facilities (Elba Island, Cameron LNG, Freeport LNG). However, surging natural gas supply more than offset strong demand, resulting in an elevated pace of inventory builds and pricing pressure through much of the period. Natural gas prices, represented by Henry Hub, opened the fiscal quarter at $2.39 per million British thermal units, hit a low of $2.08 on Oct. 18, and then peaked at $2.87 in November, due to colder than average weather in the midwest, before ending the fiscal year back down to $2.46.
Persistently low natural gas prices have prompted natural gas producers to reign in capex budgets and drilling programs in 2020. While natural gas production is expected to continue growing, the pace of supply growth is set to slow measurably, with production expected to average 91.8 billion cubic feet per day (Bcf/d) in 2019 and 93.8 Bcf/d in 20202. The backdrop of slowing production growth and strong domestic and export demand paints a picture of improving natural gas fundamentals in the future. The second wave of LNG export facilities, led by final investment decisions (FIDs) made to Exxon’s Golden Pass and Venture Global’s Calcasieu Pass LNG export facilities in 2019, will provide another meaningful catalyst for natural gas export demand growth from 2022 to 2025.
Midstream
Midstream energy performance lagged broader energy in the fourth fiscal quarter with the Tortoise North American Pipeline IndexSMreturning -2.6% and the Tortoise MLP Index®returning -8.9%, bringing fiscal year performance to 5.9% and -7.0%, respectively. The sharp contrast in midstream index performance is due to midstream companies structured as C-Corporations outperforming those structured as MLPs. C-Corporations benefitted from several items versus MLPs, including: stronger corporate governance, broad market index inclusion for some companies, lack of K-1s, and a more certain corporate structure. Contributing to broad midstream underperformance for the fiscal quarter were concerns regarding a slowdown in U.S. production growth, political rhetoric regarding proposed fracking bans from Democratic Presidential candidates and tax loss selling. Gathering and processing companies in particular suffered following lower natural gas and natural gas liquids (NGL) pricing and the ‘going concern’ language introduced into Chesapeake Energy’s (CHK) quarterly filing. These items drove negative sentiment and raised questions related to producer financial health, counterparty risk and exposure to drilling slowdowns. However, the U.S. has seen tremendous production growth in recent years and we believe a more moderate pace of growth is healthy for the midstream sector through the reduction in growth capital expenditures and reduced risk of takeaway capacity overbuild.
| (unaudited) | |
| 2 | Tortoise |
| 2019 Annual Report| November 30, 2019 |
DCP Midstream LP (DCP) became the latest MLP to announce the elimination of its incentive distribution rights (IDRs) in the fourth fiscal quarter. As the era of simplification comes to a close, the results have advanced the midstream sector in our view and accomplished widespread cost of capital and corporate governance improvements. Looking forward, the midstream sector continues to evolve. There has been an industry-wide shift to higher distribution coverage and self-funding the equity portion of capital expenditure programs. With the expected moderation in U.S. production growth, midstream companies are now shifting focus toward executing on delivering value through the return of capital to shareholders in the form of debt reduction, sustainable yields and distribution growth, and potential stock buybacks. A particular emphasis on the generation of free cash flow yields comparable to other S&P 500 sectors continues to emerge, achieved through the sale of non-core assets and the reduction of growth capital expenditures.
Interest in publicly traded midstream companies and assets, from both public and private entities, has remained elevated, highlighting their strategic value and attractive valuations. Recently announced or closed transactions include Energy Transfer’s (ET) acquisition of SemGroup Corporation (SEMG), DTE Energy’s (DTE) acquisition of a natural gas gathering system in the Haynesville Shale and Pembina Pipeline Corporation’s (PPL CN) acquisition of Kinder Morgan Canada and the Cochin pipeline.
Downstream
Refinery utilization has remained challenged in 2019 due to heavy spring and fall turnarounds in preparation for the International Maritime Organization’s Jan. 1, 2020 implementation of sulfur reduction regulations on the shipping industry (IMO 2020), unplanned refinery outages, as well as the closure of Philadelphia Energy Solutions’ 350 Mbbl/d Philadelphia refinery, the largest refining complex on the east coast. IMO 2020 has positioned U.S. refiners to take advantage of higher distillate pricing and more heavily discounted medium-heavy sour crude oils as they have more flexibility than international refiners to use a wide range of crude oil feedstocks. We expected that U.S. refinery utilization and throughput will exhibit strong growth as refiners attempt to capture margin upside driven by IMO 2020.
Incremental NGL supply from completed Permian takeaway projects and overall liquids production growth surpassed current levels of domestic NGL demand, primarily from petrochemical facilities, resulting in price pressure. We expect that moderating northeast liquids production growth and increased demand from petrochemical projects coming online in late 2019 and early 2020 will begin to draw down inventories.
Capital Markets
Capital markets activity increased during the fourth fiscal quarter with MLPs and other pipeline companies raising approximately $10.8 billion in total capital, with nearly all of the issuance in debt. This brings the total capital raised for the fiscal year to approximately $36.4 billion, slightly lower than the previous fiscal year. As expected, alternative options for capital and self-funding projects have continued to trend higher.
Merger and acquisition activity among MLPs and other pipeline companies in the last fiscal quarter of the year was largely driven by Energy Transfer’s acquisition of SemGroup Corporation, which at$5.1 billion made up nearly all of the merger and acquisition activity in the quarter. This brought the fiscal year’s announced transactions to $26.6 billion. This is significantly below the previous year when many large simplification transactions were announced. This fiscal year’s activity was driven by three large transactions. In addition to Energy Transfer’s acquisition of SemGroup Corporation, MPLX purchased Andeavor Logistics for approximately $13.5 billion and Pembina Pipeline Corporation purchased two businesses from Kinder Morgan for approximately $4.4 billion combined.
Sustainable infrastructure
Solar
The solar industry is set to install 13 gigawatts (GWs) of capacity in the U.S. in 2019, the second highest annual installation on record. Much of the activity has been concentrated in the southwest and southeast, with Florida and Texas ranking behind California in year-to-date installations. Signed solar PPA prices range from $18-35 megawatts/hour, putting solar on par with new gas generation and competitive with the operating costs of existing coal plants. Costs continue to decline, as evidenced by the 12% decline year-over-year in Q3 2019 to $0.95/watt for utility-scale projects3. On the policy front, the investment tax credit (ITC) is set to phase down for projects beginning construction at the end of 2019. We continue to monitor efforts to extend the ITC as we enter 2020, but do not view an extension as necessary given anticipated continued cost declines.
Wind
Wind installations totaled 1,927 megawatts (MWs) in the third calendar quarter of 2019, reaching a total installed capacity of more than 100,000 MW across the U.S. with an additional 46,500 MW of capacity currently under construction or in advanced development. Nineteen states now have more than 1,000 MW under construction or advanced development. Texas hosts 19% of the total development pipeline, followed by Wyoming (11%), Oklahoma (7%), Iowa, (6%), and Virginia (6%). It is also important to have offtake agreements in place. Currently, 44% of capacity in the pipeline has a Power Purchase Agreement (PPA) in place, while 28% is utility-owned and 6% has a hedge contract4. New developments are largely being driven by corporate customers who have signed 64% of capacity contracted in the third quarter. Turbine technology continues to improve with 22% of new turbines installed year to date rated between 3.4 MW and 3.6 MW in size4.
Social Infrastructure
Education
As campaigns for 2020 elections have intensified, school choice in general, and charter schools specifically, have received increased media attention. In this politically charged atmosphere, it is worth noting that a recent national poll indicated that a significant majority of voters support some form of school of choice (69%) with the overwhelming majority of african-american voters indicating it is an “important priority.” In some faster-growing states, a number of school district superintendents have acknowledged they would be unable to meet increasing enrollment without the growth of charter public schools.
| (unaudited) | |
| Tortoise | 3 |
The market for publicly issued tax-exempt bonds for charter public schools, a proxy for the overall demand and the primary vehicle for charter school facility finance, was exceptionally strong in 2019. Par value of these bonds exceeded $3 billion, including more than $500 million of higher risk, single-investor projects. Chartering laws across the nation do not require school districts or municipalities to provide school buildings for charters, making access to facilities one of the greatest challenges faced by charter school leaders. With less than 10% of charter schools having ever accessed the public tax-exempt bond market, and resistance to purchasing bonds for early-stage charter schools by large, high-yield bond funds, Tortoise believes the unmet demand for private, single-investor capital for charter school facilities to be at least as large as today’s public market for charter school bonds. Tortoise will continue to seek out high-quality and high potential charter schools and selectively invest.
Senior Living
According to the National Investment Center for Seniors Housing and Care (NIC), which is particularly focused on for-profit communities, the national market occupancy for senior housing increased slightly to 88.0% in the third quarter, after falling to 87.7% in the second quarter, its lowest level in eight years.
Occupancy at non-profit communities has presented a different picture. As of the third quarter, not-for-profit senior living occupancy was nearly 7% higher than the for-profit space and the third quarter represented the highest occupancy levels for not-for-profit providers since 2007.
Regardless of its status as a for-profit or non-profit senior living provider, the local variation between market supply/demand seems to be widening while national construction continues to slow. We believe this should help markets with oversupply over the long term.
We remain bullish in the senior living space, with demographic trends in our favor. NIC estimates that 881,000 additional units of senior housing inventory will be needed to serve seniors between 2019 and 2030. If you consider the typical senior living facility size of approximately 100 units, that equates to 8,810 projects.
Project Finance
Demand for energy-related projects within the project finance sector has remained strong as efforts continue to de-carbonize power generation and fuel production throughout the U.S. In particular, there have been several positive renewable natural gas (RNG) updates. In July 2019, the Coalition for Renewable Natural Gas announced that the North American RNG industry had surpassed the 100-facility milestone. This equates to growth of nearly 150% over the past five years, from the 41 projects built between 1982 and 2014 and more than 50 additional projects under construction or in development. This evidences a strengthening of support for landfill gas and anaerobic digester projects that produce RNG. Demand for recycling projects is also growing as circular-economy efforts gain momentum in the areas of landfill avoidance and waste repurposing.
We continue to rely on our deep expertise in each of these areas, as well as our vast respective networks, to seek out opportunities where significant demand and barriers to entry exist and we can be a strategic provider of capital.
Concluding thoughts
We expect plenty of opportunities in essential assets in 2020. We believe there are catalyst driving the social infrastructure sector with the aging population driving housing demand and school of choice being a key driver for charter schools. We are also optimistic across the energy sector where we expect supply and demand will find better balance and companies will shine a brighter light on their cash flow as they return it to shareholders. Our long-term outlook is built around worldwide electricity demand doubling by 2050. In our view, natural gas and renewables need to replace coal in power generation. This is the fastest and most economical way to lower global CO2emissions and improve living standards for people around the globe.
The S&P Energy Select Sector®Index is a capitalization-weighted index of S&P 500®Index companies in the energy sector involved in the development or production of energy products. The Tortoise North American Oil and Gas Producers IndexSMis a float-adjusted, capitalization-weighted index of North American energy companies engaged primarily in the production of crude oil, condensate, natural gas or natural gas liquids (NGLs). The Tortoise North American Pipeline IndexSMis a float adjusted, capitalization-weighted index of energy pipeline companies domiciled in the United States and Canada. The Tortoise MLP Index®is a float-adjusted, capitalization-weighted index of energy master limited partnerships.
The Tortoise indices are the exclusive property of Tortoise Index Solutions, LLC, which has contracted with S&P Opco, LLC (a subsidiary of S&P Dow Jones Indices LLC) to calculate and maintain the Tortoise MLP Index®, Tortoise North American Pipeline IndexSMand Tortoise North American Oil and Gas Producers IndexSM(the “Indices”). The Indices are not sponsored by S&P Dow Jones Indices or its affiliates or its third party licensors (collectively, “S&P Dow Jones Indices LLC”). S&P Dow Jones Indices will not be liable for any errors or omission in calculating the Indices. “Calculated by S&P Dow Jones Indices” and its related stylized mark(s) are service marks of S&P Dow Jones Indices and have been licensed for use by Tortoise Index Solutions, LLC and its affiliates.S&P®is a registered trademark of Standard & Poor’s Financial Services LLC (“SPFS”), and Dow Jones®is a registered trademark of Dow Jones Trademark Holdings LLC (“Dow Jones”).
It is not possible to invest directly in an index.
Performance data quoted represent past performance; past performance does not guarantee future results. Like any other stock, total return and market value will fluctuate so that an investment, when sold, may be worth more or less than its original cost.
| 1 | Energy Information Administration, Short-Term Outlook, December 2019 |
| 2 | BTU Analytics |
| 3 | Wood MacKenzie, power and renewables, December 2019 |
| 4 | AWEA July-September 2019 |
| (unaudited) | |
| 4 | Tortoise |
| 2019 Annual Report| November 30, 2019 |
| Tortoise |
| Energy Infrastructure Corp. (TYG) |
Fund description
TYG seeks a high level of total return with an emphasis on current distributions paid to stockholders. TYG invests primarily in equity securities of master limited partnerships (MLPs) and their affiliates that transport, gather, process or store natural gas, natural gas liquids (NGLs), crude oil and refined petroleum products.
Fund performance review
Midstream energy performance lagged broader energy for the fourth fiscal quarter, but outperformed for the fiscal year. A combination of concerns regarding a slowdown in U.S. production growth, political rhetoric regarding proposed frack bans from Democratic candidates, and tax loss selling largely contributed to midstream underperformance for the fiscal quarter. Coverage and leverage has improved for many midstream companies. The average coverage ratio for the fund’s portfolio companies was 1.40x in 3Q2019 while average leverage was 3.80x. Since the fund’s inception, it has paid out more than $35 in cumulative distributions to stockholders. The fund’s market-based and NAV-based returns for the fiscal year ending November 30, 2019 were -15.5% and -16.4%, respectively (including the reinvestment of distributions). Comparatively, the Tortoise MLP Index®returned -7.0% for the same period.
| 2019 fiscal year highlights | ||
| Distributions paid per share (fiscal year 2019) | $2.6200 | |
| Distribution paid per share (4th quarter 2019) | $0.6550 | |
| Distribution rate (as of 11/30/2019) | 15.6% | |
| Quarter-over-quarter distribution increase | 0.0% | |
| Year-over-year distribution increase | 0.0% | |
| Cumulative distributions paid per share to stockholders since inception in February 2004 | $35.7025 | |
| Market-based total return | (15.5)% | |
| NAV-based total return | (16.4)% | |
| Premium (discount) to NAV (as of 11/30/2019) | (2.8)% |
Key asset performance drivers
| Top five contributors | Company type | Performance driver | ||
| Buckeye Partners, L.P. | Midstream refined product pipeline MLP | Acquired at a premium | ||
| MTP Energy KMAA LLC – Private | Midstream natural gas | The underlying company was acquired for a premium | ||
| Phillips 66 Partners LP | Midstream refined product pipeline MLP | Eliminated incentive distribution rights (IDRs) leading to a lower cost of capital | ||
| Western Gas Partners LP | Midstream gathering and processing MLP | Clarity on Colorado drilling legislation and close of LP/GP merger | ||
| NuStar Energy L.P. | Refined products pipelines MLP | Strong volume growth from Permian and outlook for St. James and Corpus Christi assets | ||
| Bottom five contributors | Company type | Performance driver | ||
| EQM Midstream Partners, LP | Midstream natural gas/natural gas liquids pipeline MLP | Uncertainty around Mountain Valley Pipeline project combined with potential for slowing drilling activity in the Marcellus | ||
| Antero Midstream Corporation | Midstream gathering and processing company | Concerns around potential recontracting of gathering and process contracts and financial health of parent company Antero Resources (AR) as natural gas prices moved lower | ||
| Western Midstream Partners, LP | Midstream gathering and processing MLP | Carrying out strategic review | ||
| EnLink Midstream, LLC | Midstream gathering and processing company | Concern around producers slowing drilling activity in Oklahoma | ||
| MPLX LP | Refined products pipeline MLP | Continued uncertainty regarding organizational structure and parental support combined with north east natural G&P exposure |
Unlike the fund return, index return is pre-expenses and taxes.
Performance data quoted represent past performance; past performance does not guarantee future results. Like any other stock, total return and market value will fluctuate so that an investment, when sold, may be worth more or less than its original cost. Portfolio composition is subject to change due to ongoing management of the fund. References to specific securities or sectors should not be construed as a recommendation by the fund or its adviser. See Schedule of Investments for portfolio weighting at the end of the fiscal quarter.
| (unaudited) | |
| Tortoise | 5 |
| Tortoise |
| Energy Infrastructure Corp. (TYG)(continued) |
Fund structure and distribution policy
The fund is structured as a corporation and is subject to federal and state income tax on its taxable income. The fund has adopted a distribution policy in which the Board of Directors considers many factors in determining distributions to stockholders. Over the long term, the fund expects to distribute substantially all of its distributable cash flow (DCF) to holders of common stock. The fund’s Board of Directors reviews the distribution rate quarterly, and may adjust the quarterly distribution throughout the year. Although the level of distributions is independent of the funds’ performance in the short term, the fund expects such distributions to correlate with its performance over time.
Distributable cash flow and distributions
DCF is distributions received from investments less expenses. The total distributions received from investments include the amount received as cash distributions from investments, paid-in-kind distributions, and dividend and interest payments. Income also includes the premiums received from sales of covered call options, net of amounts paid to buy back out-of-the-money options. The total expenses include current or anticipated operating expenses, leverage costs and current income taxes. Current income taxes include taxes paid on net investment income, in addition to foreign taxes, if any. Taxes incurred from realized gains on the sale of investments, expected tax benefits and deferred taxes are not included in DCF.
Income from investments increased approximately 3.3% as compared to 3rd quarter 2019 primarily due to increased distribution rates on investments within the fund’s portfolio. Operating expenses, consisting primarily of fund advisory fees, decreased approximately 9.7% during the quarter due to lower asset-based fees. Overall leverage costs decreased approximately 3.9% as compared to 3rd quarter 2019 primarily due to leverage utilization during the quarter. As a result of the changes in income and expenses, DCF increased approximately 7.1% as compared to 3rd quarter 2019. The fund paid a quarterly distribution of $0.655 per share, which was equal to the distribution paid in the prior quarter and 4th quarter 2018. The fund has paid cumulative distributions to stockholders of $35.7025 per share since its inception in Feb. 2004.
The Key Financial Data table discloses the calculation of DCF and should be read in conjunction with this discussion. The difference between distributions received from investments in the DCF calculation and total investment income as reported in the Statement of Operations, is reconciled as follows: the Statement of Operations, in conformity with U.S. generally accepted accounting principles (GAAP), recognizes distribution income from MLPs and other investments on their ex-dates, whereas the DCF calculation may reflect distribution income on their pay dates; GAAP recognizes that a significant portion of the cash distributions received from MLPs and other investments are characterized as a return of capital and therefore excluded from investment income, whereas the DCF calculation includes the return of capital (net of any distributions deemed to be return of principal); and distributions received from investments in the DCF calculation include the value of dividends paid-in-kind (additional stock or MLP units), whereas such amounts may not be included as income for GAAP purposes and includes distributions related to direct investments when the purchase price is reduced in lieu of receiving cash distributions. Net premiums onoptions written (premiums received less amounts paid to buy back out-of-the-money options) with expiration dates during the fiscal quarter are included in the DCF calculation, whereas GAAP recognizes the net effect of options written as realized and unrealized gains (losses). Income for DCF purposes is reduced by amortizing the cost of certain investments that may not have a residual value after a known time period and by distributions received from investments deemed to be return of principal. The treatment of expenses in the DCF calculation also differs from what is reported in the Statement of Operations. In addition to the total operating expenses, including fee waiver, as disclosed in the Statement of Operations, the DCF calculation reflects interest expense, realized and unrealized gains (losses) on interest rate swap settlements, distributions to preferred stockholders, other recurring leverage expenses, as well as taxes paid on net investment income.
“Net Investment Income (Loss), before Income Taxes” on the Statement of Operations is adjusted as follows to reconcile to DCF for YTD and 4th quarter 2019 (in thousands):
| YTD 2019 | 4th Qtr 2019 | |||||||
| Net Investment Loss, | ||||||||
| before Income Taxes | $ | (18,708 | ) | $ | (4,719 | ) | ||
| Adjustments to reconcile to DCF: | ||||||||
| Distributions characterized as | ||||||||
| return of capital, net | 149,182 | 38,218 | ||||||
| Other | 1,655 | 729 | ||||||
| DCF | $ | 132,129 | $ | 34,228 | ||||
Leverage
The fund’s leverage utilization decreased $65.0 million during 4th quarter 2019 and represented 37.1% of total assets at November 30, 2019. The fund has maintained compliance with its applicable coverage ratios. At year-end, including the impact of interest rate swaps, approximately 79% of the leverage cost was fixed, the weighted-average maturity was 3.3 years and the weighted-average annual rate on leverage was 3.66%. During the quarter, Series CC notes, with a notional amount of $15,000,000 and a fixed rate of 3.48% were paid in full upon maturity. These rates will vary in the future as a result of changing floating rates, utilization of the fund’s credit facilities and as leverage and swaps mature or are redeemed.
Income taxes
During 4th quarter 2019, the fund’s deferred tax liability decreased by $39.4 million to $116.5 million, primarily as a result of a decrease in value of its investment portfolio. The fund had net realized losses of $6.5 million during the quarter. To the extent that the fund has taxable income, it will owe federal and state income taxes. Tax payments can be funded from investment earnings, fund assets, or borrowings.
Please see the Financial Statements and Notes to Financial Statements for additional detail regarding critical accounting policies, results of operations, leverage, taxes and other important fund information.
For further information regarding the calculation of distributable cash flow and distributions to stockholders, as well as a discussion of the tax impact on distributions and results and recent tax reform, please visit www.tortoiseadvisors.com.
| (unaudited) | |
| 6 | Tortoise |
| 2019 Annual Report| November 30, 2019 |
| TYG Key Financial Data (supplemental unaudited information) |
| (dollar amounts in thousands unless otherwise indicated) |
The information presented below regarding Distributable Cash Flow and Selected Financial Information is supplemental non-GAAP financial information, which the fund believes is meaningful to understanding operating performance. The Distributable Cash Flow Ratios include the functional equivalent of EBITDA for non-investment companies, and the fund believes they are an important supplemental measure of performance and promote comparisons from period-to-period. This information is supplemental, is not inclusive of required financial disclosures (e.g. Total Expense Ratio), and should be read in conjunction with the full financial statements.
| Year Ended November 30, | 2018 | 2019 | |||||||||||||||||||||||||||||||||
| 2018 | 2019 | Q4(1) | Q1(1) | Q2(1) | Q3(1) | Q4(1) | |||||||||||||||||||||||||||||
| Total Income from Investments | |||||||||||||||||||||||||||||||||||
| Distributions and dividends | |||||||||||||||||||||||||||||||||||
| from investments | $ | 177,860 | $ | 174,696 | $ | 44,214 | $ | 43,148 | $ | 44,564 | $ | 42,910 | $ | 44,074 | |||||||||||||||||||||
| Dividends paid in kind | 2,752 | 801 | 113 | 115 | 117 | 269 | 300 | ||||||||||||||||||||||||||||
| Interest earned on corporate bonds | — | 467 | — | — | — | 119 | 348 | ||||||||||||||||||||||||||||
| Premiums on options written | 1,274 | 3,267 | 1,258 | 793 | 1,092 | 668 | 714 | ||||||||||||||||||||||||||||
| Total from investments | 181,886 | 179,231 | 45,585 | 44,056 | 45,773 | 43,966 | 45,436 | ||||||||||||||||||||||||||||
| Operating Expenses Before Leverage | |||||||||||||||||||||||||||||||||||
| Costs and Current Taxes | |||||||||||||||||||||||||||||||||||
| Advisory fees, net of fees waived | 21,466 | 19,522 | 5,392 | 4,849 | 5,215 | 4,979 | 4,479 | ||||||||||||||||||||||||||||
| Other operating expenses | 1,741 | 1,624 | 438 | 415 | 420 | 407 | 382 | ||||||||||||||||||||||||||||
| 23,207 | 21,146 | 5,830 | 5,264 | 5,635 | 5,386 | 4,861 | |||||||||||||||||||||||||||||
| Distributable cash flow before | |||||||||||||||||||||||||||||||||||
| leverage costs and current taxes | 158,679 | 158,085 | 39,755 | 38,792 | 40,138 | 38,580 | 40,575 | ||||||||||||||||||||||||||||
| Leverage costs(2) | 26,088 | 25,956 | 6,561 | 6,365 | 6,637 | 6,607 | 6,347 | ||||||||||||||||||||||||||||
| Current income tax expense(3) | — | — | — | — | — | — | — | ||||||||||||||||||||||||||||
| Distributable Cash Flow(4) | $ | 132,591 | $ | 132,129 | $ | 33,194 | $ | 32,427 | $ | 33,501 | $ | 31,973 | $ | 34,228 | |||||||||||||||||||||
| Net realized gain (loss), net of | |||||||||||||||||||||||||||||||||||
| income taxes, for the period | $ | 42,565 | $ | 29,053 | $ | (45,158 | ) | $ | (10,210 | ) | $ | 10,905 | $ | 34,895 | $ | (6,537 | ) | ||||||||||||||||||
| As a percent of average total assets(5) | |||||||||||||||||||||||||||||||||||
| Total from investments | 7.75 | % | 8.55 | % | 7.91 | % | 8.61 | % | 8.42 | % | 8.38 | % | 9.71 | % | |||||||||||||||||||||
| Operating expenses before | |||||||||||||||||||||||||||||||||||
| leverage costs and current taxes | 1.01 | % | 1.03 | % | 1.01 | % | 1.03 | % | 1.04 | % | 1.03 | % | 1.04 | % | |||||||||||||||||||||
| Distributable cash flow before | |||||||||||||||||||||||||||||||||||
| leverage costs and current taxes | 6.74 | % | 7.52 | % | 6.90 | % | 7.58 | % | 7.38 | % | 7.35 | % | 8.67 | % | |||||||||||||||||||||
| As a percent of average net assets(5) | |||||||||||||||||||||||||||||||||||
| Total from investments | 12.81 | % | 14.51 | % | 12.90 | % | 14.36 | % | 14.01 | % | 14.41 | % | 17.12 | % | |||||||||||||||||||||
| Operating expenses before | |||||||||||||||||||||||||||||||||||
| leverage costs and current taxes | 1.67 | % | 1.76 | % | 1.65 | % | 1.72 | % | 1.72 | % | 1.77 | % | 1.83 | % | |||||||||||||||||||||
| Leverage costs and current taxes | 1.88 | % | 2.16 | % | 1.86 | % | 2.08 | % | 2.03 | % | 2.17 | % | 2.39 | % | |||||||||||||||||||||
| Distributable cash flow | 9.26 | % | 10.59 | % | 9.39 | % | 10.56 | % | 10.26 | % | 10.47 | % | 12.90 | % | |||||||||||||||||||||
| Selected Financial Information | |||||||||||||||||||||||||||||||||||
| Distributions paid on common stock | $ | 138,298 | $ | 140,588 | $ | 35,131 | $ | 35,131 | $ | 35,131 | $ | 35,131 | $ | 35,195 | |||||||||||||||||||||
| Distributions paid on common stock | |||||||||||||||||||||||||||||||||||
| per share | 2.6200 | 2.6200 | 0.6550 | 0.6550 | 0.6550 | 0.6550 | 0.6550 | ||||||||||||||||||||||||||||
| Total assets, end of period(6) | 2,136,339 | 1,680,775 | 2,136,339 | 2,129,174 | 2,110,273 | 1,951,035 | 1,680,775 | ||||||||||||||||||||||||||||
| Average total assets during period(6)(7) | 2,293,998 | 2,044,102 | 2,311,256 | 2,074,901 | 2,157,919 | 2,080,591 | 1,876,534 | ||||||||||||||||||||||||||||
| Leverage(8) | 652,100 | 623,900 | 652,100 | 679,100 | 683,700 | 688,900 | 623,900 | ||||||||||||||||||||||||||||
| Leverage as a percent of total assets | 30.5 | % | 37.1 | % | 30.5 | % | 31.9 | % | 32.4 | % | 35.3 | % | 37.1 | % | |||||||||||||||||||||
| Net unrealized depreciation, | |||||||||||||||||||||||||||||||||||
| end of period | (338,892 | ) | (543,310 | ) | (338,892 | ) | (302,159 | ) | (300,530 | ) | (421,920 | ) | (543,310 | ) | |||||||||||||||||||||
| Net assets, end of period | 1,260,300 | 930,286 | 1,260,300 | 1,245,766 | 1,220,946 | 1,097,489 | 930,286 | ||||||||||||||||||||||||||||
| Average net assets during period(9) | 1,388,683 | 1,203,943 | 1,417,581 | 1,243,981 | 1,296,336 | 1,210,078 | 1,064,735 | ||||||||||||||||||||||||||||
| Net asset value per common share | 23.50 | 17.31 | 23.50 | 23.23 | 22.76 | 20.43 | 17.31 | ||||||||||||||||||||||||||||
| Market value per share | 22.59 | 16.82 | 22.59 | 22.91 | 21.90 | 20.39 | 16.82 | ||||||||||||||||||||||||||||
| Shares outstanding (000’s) | 53,635 | 53,732 | 53,635 | 53,635 | 53,635 | 53,732 | 53,732 | ||||||||||||||||||||||||||||
| (1) | Q1 is the period from December through February. Q2 is the period from March through May. Q3 is the period from June through August. Q4 is the period from September through November. |
| (2) | Leverage costs include interest expense, distributions to preferred stockholders, interest rate swap expenses and other recurring leverage expenses. |
| (3) | Includes taxes paid on net investment income and foreign taxes, if any. Taxes related to realized gains are excluded from the calculation of Distributable Cash Flow (“DCF”). |
| (4) | “Net investment income (loss), before income taxes” on the Statement of Operations is adjusted as follows to reconcile to DCF: increased by the return of capital on distributions, the dividends paid in stock and increased liquidation value, the premium on dividends paid in kind, the net premiums on options written and amortization of debt issuance costs; and decreased by realized and unrealized gains (losses) on interest rate swap settlements, distributions received that are excluded for DCF purposes and amortization on certain investments. |
| (5) | Annualized for periods less than one full year. |
| (6) | Includes deferred issuance and offering costs on senior notes and preferred stock. |
| (7) | Computed by averaging month-end values within each period. |
| (8) | Leverage consists of senior notes, preferred stock and outstanding borrowings under credit facilities. |
| (9) | Computed by averaging daily net assets within each period. |
| Tortoise | 7 |
| Tortoise |
| Midstream Energy Fund, Inc. (NTG) |
Fund description
NTG seeks to provide stockholders with a high level of total return with an emphasis on current distributions. NTG invests primarily in midstream energy equities that own and operate a network of pipeline and energy related logistical infrastructure assets with an emphasis on those that transport, gather, process and store natural gas and natural gas liquids (NGLs). NTG targets midstream energy equities, including MLPs benefiting from U.S. natural gas production and consumption expansion, with minimal direct commodity exposure.
Fund performance review
Midstream energy performance lagged broader energy for the fourth fiscal quarter, but outperformed for the fiscal year. A combination of concerns regarding a slowdown in U.S. production growth, political rhetoric regarding proposed frack bans from Democratic candidates, and tax loss selling largely contributed to midstream underperformance for the fiscal quarter. Coverage and leverage has improved for many midstream companies. The average coverage ratio for the fund’s portfolio companies was 1.42x in 3Q2019 while average leverage was 3.82x.
The fund’s market-based and NAV-based returns for the fiscal year ending November 30, 2019 were -17.6% and -16.6%, respectively (including the reinvestment of distributions). Comparatively, the Tortoise MLP Index®returned -7.0% for the same period.
| 2019 fiscal year highlights | ||
| Distributions paid per share (fiscal year 2019) | $1.6900 | |
| Distributions paid per share (4th quarter 2019) | $0.4225 | |
| Distribution rate (as of 11/30/2019) | 17.1% | |
| Quarter-over-quarter distribution increase | 0.0% | |
| Year-over-year distribution increase | 0.0% | |
| Cumulative distributions paid per share to | ||
| stockholders since inception in July 2010 | $15.4600 | |
| Market-based total return | (17.6)% | |
| NAV-based total return | (16.6)% | |
| Premium (discount) to NAV (as of 11/30/2019) | (6.4)% |
Key asset performance drivers
| Top five contributors | Company type | Performance driver | ||
| Buckeye Partners, L.P. | Midstream refined product pipeline MLP | Acquired at a premium | ||
| Western Gas Partners LP | Midstream gathering and processing MLP | Clarity on Colorado drilling legislation and close of LP/GP merger | ||
| NuStar Energy L.P. | Refined products pipelines MLP | Strong volume growth from Permian and outlook for St. James and Corpus Christi assets | ||
| ONEOK, Inc. | Midstream natural gas/natural gas liquids pipeline company | Continued execution of backlog of infrastructure projects with high returns | ||
| Phillips 66 Partners LP | Midstream refined product pipeline MLP | Eliminated incentive distribution rights (IDRs) leading to a lower cost of capital | ||
| Bottom five contributors | Company type | Performance driver | ||
| EQM Midstream Partners, LP | Midstream natural gas/natural gas liquids pipeline MLP | Uncertainty around Mountain Valley Pipeline project combined with potential for slowing drilling activity in the Marcellus | ||
| Western Midstream Partners, LP | Midstream gathering and processing MLP | Carrying out strategic review | ||
| Antero Midstream Corporation | Midstream gathering and processing company | Concerns around potential recontracting of gathering and process contracts and financial health of parent company Antero Resources (AR) as natural gas prices moved lower | ||
| EnLink Midstream, LLC | Midstream gathering and processing company | Concern around producers slowing drilling activity in Oklahoma | ||
| MPLX LP | Refined products pipeline MLP | Continued uncertainty regarding organizational structure and parental support combined with north east natural G&P exposure |
Unlike the fund return, index return is pre-expenses and taxes.
Performance data quoted represent past performance; past performance does not guarantee future results. Like any other stock, total return and market value will fluctuate so that an investment, when sold, may be worth more or less than its original cost. Portfolio composition is subject to change due to ongoing management of the fund. References to specific securities or sectors should not be construed as a recommendation by the fund or its adviser. See Schedule of Investments for portfolio weighting at the end of the fiscal quarter.
| (unaudited) | |
| 8 | Tortoise |
| 2019 Annual Report| November 30, 2019 |
Fund structure and distribution policy
The fund is structured as a corporation and is subject to federal and state income tax on its taxable income. The fund has adopted a distribution policy in which the Board of Directors considers many factors in determining distributions to stockholders. Over the long term, the fund expects to distribute substantially all of its distributable cash flow (DCF) to holders of common stock. The fund’s Board of Directors reviews the distribution rate quarterly, and may adjust the quarterly distribution throughout the year. Although the level of distributions is independent of the funds’ performance in the short term, the fund expects such distributions to correlate with its performance over time.
Distributable cash flow and distributions
DCF is distributions received from investments less expenses. The total distributions received from investments include the amount received as cash distributions from MLPs, paid-in-kind distributions, and dividend and interest payments. Income also includes the premiums received from sales of covered call options, net of amounts paid to buy back out-of-the-money options. The total expenses include current or anticipated operating expenses, leverage costs and current income taxes. Current income taxes include taxes paid on net investment income in addition to foreign taxes, if any. Taxes incurred from realized gains on the sale of investments, expected tax benefits and deferred taxes are not included in DCF.
Income from investments increased approximately 0.8% as compared to 3rd quarter 2019 primarily due to increased distribution rates on investments within the fund’s portfolio. Operating expenses, consisting primarily of fund advisory fees, decreased approximately 10.2% during the quarter due to lower asset-based fees. Leverage costs decreased approximately 4.5% as compared to 3rd quarter 2019 primarily due to lower leverage utilization during the quarter. As a result of the changes in income and expenses, DCF increased approximately 3.7% as compared to 3rd quarter 2019. The fund paid a quarterly distribution of $0.4225 per share, which was equal to the distribution paid in the prior quarter and 4th quarter 2018. The fund has paid cumulative distributions to stockholders of $15.46 per share since its inception in July 2010.
The Key Financial Data table discloses the calculation of DCF and should be read in conjunction with this discussion. The difference between distributions received from investments in the DCF calculation and total investment income as reported in the Statement of Operations, is reconciled as follows: the Statement of Operations, in conformity with U.S. generally accepted accounting principles (GAAP), recognizes distribution income from MLPs, common stock and other investments on their ex-dates, whereas the DCF calculation may reflect distribution income on their pay dates; GAAP recognizes that a significant portion of the cash distributions received from MLPs, common stock and other investments are characterized as a return of capital and therefore excluded from investment income, whereas the DCF calculation includes the return of capital; and distributions received from investments in the DCF calculation include the value of dividends paid-in-kind (additional stock or MLP units), whereas such amounts may not be included as income for GAAP purposes, and includes distributions related to direct investments when the purchase price is reduced in lieu ofreceiving cash distributions. Net premiums on options written (premiums received less amounts paid to buy back out-of-the-money options) with expiration dates during the fiscal quarter are included in the DCF calculation, whereas GAAP recognizes the net effect of options written as realized and unrealized gains (losses). The treatment of expenses in the DCF calculation also differs from what is reported in the Statement of Operations. In addition to the total operating expenses, including fee waiver, as disclosed in the Statement of Operations, the DCF calculation reflects interest expense, distributions to preferred stockholders, other recurring leverage expenses, as well as taxes paid on net investment income.
“Net Investment Income (Loss), before Income Taxes” on the Statement of Operations is adjusted as follows to reconcile to DCF for YTD and 4th quarter 2019 (in thousands):
| YTD 2019 | 4th Qtr 2019 | |||||||
| Net Investment Loss, | ||||||||
| before Income Taxes | $ | (21,284 | ) | $ | (4,564 | ) | ||
| Adjustments to reconcile to DCF: | ||||||||
| Distributions characterized | ||||||||
| as return of capital | 112,443 | 27,870 | ||||||
| Other | 3,833 | 1,075 | ||||||
| DCF | $ | 94,992 | $ | 24,381 | ||||
Leverage
The fund’s leverage utilization decreased by $65.5 million during 4th quarter 2019 and represented 39.8% of total assets at November 30, 2019. The fund has maintained compliance with its applicable coverage ratios. At year-end, approximately 84% of the leverage cost was fixed, the weighted-average maturity was 3.3 years and the weighted-average annual rate on leverage was 3.84%. During the quarter, Series K notes, with a notional amount of $35,000,000 and a floating rate based on 3-month LIBOR plus 1.30% were paid in full upon maturity. These rates will vary in the future as a result of changing floating rates, utilization of the fund’s credit facility and as leverage matures or is redeemed.
Income taxes
During 4th quarter 2019, the fund’s deferred tax liability decreased by $28.3 million to $27.9 million, primarily as a result of the decrease in value of its investment portfolio. The fund had net realized losses of $8.6 million during the quarter. As of November 30, 2019, the fund had net operating losses of $1.3 million and capital loss carryforwards of $26.9 million for federal income tax purposes.To the extent that the fund has taxable income in the future that is not offset by net operating losses, it will owe federal and state income taxes. Tax payments can be funded from investment earnings, fund assets, or borrowings.
Please see the Financial Statements and Notes to Financial Statements for additional detail regarding critical accounting policies, results of operations, leverage, taxes and other important fund information.
For further information regarding the calculation of distributable cash flow and distributions to stockholders, as well as a discussion of the tax impact on distributions and results and recent tax reform, please visit www.tortoiseadvisors.com.
| (unaudited) | |
| Tortoise | 9 |
| NTG Key Financial Data (supplemental unaudited information) |
| (dollar amounts in thousands unless otherwise indicated) |
The information presented below regarding Distributable Cash Flow and Selected Financial Information is supplemental non-GAAP financial information, which the fund believes is meaningful to understanding operating performance. The Distributable Cash Flow Ratios include the functional equivalent of EBITDA for non-investment companies, and the fund believes they are an important supplemental measure of performance and promote comparisons from period-to-period. This information is supplemental, is not inclusive of required financial disclosures (e.g. Total Expense Ratio), and should be read in conjunction with the full financial statements.
| Year Ended November 30, | 2018 | 2019 | |||||||||||||||||||||||||||||||||
| 2018 | 2019 | Q4(1) | Q1(1) | Q2(1) | Q3(1) | Q4(1) | |||||||||||||||||||||||||||||
| Total Income from Investments | |||||||||||||||||||||||||||||||||||
| Distributions and dividends | |||||||||||||||||||||||||||||||||||
| from investments | $ | 115,952 | $ | 125,782 | $ | 31,874 | $ | 31,399 | $ | 31,824 | $ | 31,244 | $ | 31,315 | |||||||||||||||||||||
| Dividends paid in kind | 1,879 | 518 | 68 | 69 | 70 | 179 | 200 | ||||||||||||||||||||||||||||
| Interest earned on corporate bonds | 315 | — | — | — | 85 | 230 | |||||||||||||||||||||||||||||
| Premiums on options written | 1,254 | 3,300 | 1,254 | 542 | 890 | 927 | 941 | ||||||||||||||||||||||||||||
| Total from investments | 119,085 | 129,915 | 33,196 | 32,010 | 32,784 | 32,435 | 32,686 | ||||||||||||||||||||||||||||
| Operating Expenses Before Leverage | |||||||||||||||||||||||||||||||||||
| Costs and Current Taxes | |||||||||||||||||||||||||||||||||||
| Advisory fees, net of fees waived | 12,863 | 13,531 | 3,264 | 3,145 | 3,715 | 3,526 | 3,145 | ||||||||||||||||||||||||||||
| Other operating expenses | 1,319 | 1,271 | 352 | 334 | 324 | 312 | 301 | ||||||||||||||||||||||||||||
| 14,182 | 14,802 | 3,616 | 3,479 | 4,039 | 3,838 | 3,446 | |||||||||||||||||||||||||||||
| Distributable cash flow before | |||||||||||||||||||||||||||||||||||
| leverage costs and current taxes | 104,903 | 115,113 | 29,580 | 28,531 | 28,745 | 28,597 | 29,240 | ||||||||||||||||||||||||||||
| Leverage costs(2) | 17,304 | 20,121 | 4,749 | 4,999 | 5,175 | 5,088 | 4,859 | ||||||||||||||||||||||||||||
| Current income tax expense(3) | — | — | — | — | — | — | — | ||||||||||||||||||||||||||||
| Distributable Cash Flow(4) | $ | 87,599 | $ | 94,992 | $ | 24,831 | $ | 23,532 | $ | 23,570 | $ | 23,509 | $ | 24,381 | |||||||||||||||||||||
| Net realized gain (loss), net of | |||||||||||||||||||||||||||||||||||
| income taxes, for the period | $ | 46,530 | $ | (35,176 | ) | $ | (4,243 | ) | $ | (29,889 | ) | $ | (6,278 | ) | $ | 9,631 | $ | (8,640 | ) | ||||||||||||||||
| As a percent of average total assets(5) | |||||||||||||||||||||||||||||||||||
| Total from investments | 8.11 | % | 8.69 | % | 8.38 | % | 8.81 | % | 8.46 | % | 8.73 | % | 9.96 | % | |||||||||||||||||||||
| Operating expenses before | |||||||||||||||||||||||||||||||||||
| leverage costs and current taxes | 0.99 | % | 1.02 | % | 0.91 | % | 0.96 | % | 1.04 | % | 1.03 | % | 1.05 | % | |||||||||||||||||||||
| Distributable cash flow before | |||||||||||||||||||||||||||||||||||
| leverage costs and current taxes | 7.12 | % | 7.67 | % | 7.47 | % | 7.85 | % | 7.42 | % | 7.70 | % | 8.91 | % | |||||||||||||||||||||
| As a percent of average net assets(5) | |||||||||||||||||||||||||||||||||||
| Total from investments | 13.07 | % | 14.43 | % | 13.08 | % | 14.36 | % | 13.79 | % | 14.70 | % | 17.18 | % | |||||||||||||||||||||
| Operating expenses before | |||||||||||||||||||||||||||||||||||
| leverage costs and current taxes | 1.60 | % | 1.70 | % | 1.42 | % | 1.56 | % | 1.70 | % | 1.74 | % | 1.81 | % | |||||||||||||||||||||
| Leverage costs and current taxes | 1.95 | % | 2.31 | % | 1.87 | % | 2.24 | % | 2.18 | % | 2.31 | % | 2.55 | % | |||||||||||||||||||||
| Distributable cash flow | 9.52 | % | 10.42 | % | 9.79 | % | 10.56 | % | 9.91 | % | 10.65 | % | 12.82 | % | |||||||||||||||||||||
| Selected Financial Information | |||||||||||||||||||||||||||||||||||
| Distributions paid on common stock | $ | 86,693 | $ | 106,822 | $ | 26,705 | $ | 26,706 | $ | 26,705 | $ | 26,706 | $ | 26,705 | |||||||||||||||||||||
| Distributions paid on common stock | |||||||||||||||||||||||||||||||||||
| per share | 1.6900 | 1.6900 | 0.4225 | 0.4225 | 0.4225 | 0.4225 | 0.4225 | ||||||||||||||||||||||||||||
| Total assets, end of period(6) | 1,506,745 | 1,163,500 | 1,506,745 | 1,508,643 | 1,498,278 | 1,380,446 | 1,163,500 | ||||||||||||||||||||||||||||
| Average total assets during period(6)(7) | 1,429,518 | 1,447,092 | 1,588,197 | 1,472,955 | 1,536,794 | 1,473,596 | 1,316,053 | ||||||||||||||||||||||||||||
| Leverage(8) | 517,100 | 462,600 | 517,100 | 522,600 | 527,300 | 528,100 | 462,600 | ||||||||||||||||||||||||||||
| Leverage as a percent of total assets | 34.3 | % | 39.8 | % | 34.3 | % | 34.6 | % | 35.2 | % | 38.3 | % | 39.8 | % | |||||||||||||||||||||
| Net unrealized appreciation (depreciation), | |||||||||||||||||||||||||||||||||||
| end of period | 23,424 | (64,329 | ) | 23,424 | 75,853 | 93,595 | 15,163 | (64,329 | ) | ||||||||||||||||||||||||||
| Net assets, end of period | 915,033 | 667,708 | 915,033 | 905,859 | 886,270 | 786,294 | 667,708 | ||||||||||||||||||||||||||||
| Average net assets during period(9) | 887,014 | 871,496 | 1,018,337 | 903,917 | 943,080 | 875,555 | 762,956 | ||||||||||||||||||||||||||||
| Net asset value per common share | 14.48 | 10.56 | 14.48 | 14.33 | 14.02 | 12.44 | 10.56 | ||||||||||||||||||||||||||||
| Market value per common share | 13.72 | 9.88 | 13.72 | 13.66 | 13.21 | 12.03 | 9.88 | ||||||||||||||||||||||||||||
| Shares outstanding (000’s) | 63,208 | 63,208 | 63,208 | 63,208 | 63,208 | 63,208 | 63,208 | ||||||||||||||||||||||||||||
| (1) | Q1 is the period from December through February. Q2 is the period from March through May. Q3 is the period from June through August. Q4 is the period from September through November. |
| (2) | Leverage costs include interest expense, distributions to preferred stockholders and other recurring leverage expenses. |
| (3) | Includes taxes paid on net investment income and foreign taxes, if any. Taxes related to realized gains are excluded from the calculation of Distributable Cash Flow (“DCF”). |
| (4) | “Net investment income (loss), before income taxes” on the Statement of Operations is adjusted as follows to reconcile to DCF: increased by the return of capital on distributions, the dividends paid in stock and increased liquidation value, the premium on dividends paid in kind and amortization of debt issuance costs. |
| (5) | Annualized for periods less than one full year. |
| (6) | Includes deferred issuance and offering costs on senior notes and preferred stock. |
| (7) | Computed by averaging month-end values within each period. |
| (8) | Leverage consists of senior notes, preferred stock and outstanding borrowings under the credit facility. |
| (9) | Computed by averaging daily net assets within each period. |
| 10 | Tortoise |
| 2019 Annual Report| November 30, 2019 |
| Tortoise |
| Pipeline & Energy Fund, Inc. (TTP) |
Fund description
TTP seeks a high level of total return with an emphasis on current distributions paid to stockholders. TTP invests primarily in equity securities of North American pipeline companies that transport natural gas, natural gas liquids (NGLs), crude oil and refined products and, to a lesser extent, in other energy infrastructure companies.
Fund performance review
Midstream energy performance lagged broader energy for the fourth fiscal quarter, but outperformed for the fiscal year. A combination of concerns regarding a slowdown in U.S. production growth, political rhetoric regarding proposed frack bans from Democratic candidates, and tax loss selling largely contributed to midstream underperformance for the fiscal quarter. The fund’s market-based and NAV-based returns for the fiscal year ending November 30, 2019 were -11.1% and -12.0%, respectively (including the reinvestment of distributions). Comparatively, the Tortoise North American Pipeline IndexSMreturned 5.9% for the same period.
| 2019 fiscal year highlights | ||
| Distributions paid per share (fiscal year 2019) | $1.3850 | |
| Distributions paid per share (4th quarter 2019) | $0.2850 | |
| Distribution rate (as of 11/30/2019) | 9.9% | |
| Quarter-over-quarter distribution increase (decrease) | (0.0)% | |
| Year-over-year distribution increase (decrease) | (30.1)% | |
| Cumulative distributions paid per share to | ||
| stockholders since inception in October 2011 | $13.1125 | |
| Market-based total return | (11.1)% | |
| NAV-based total return | (12.0)% | |
| Premium (discount) to NAV (as of 11/30/2019) | (11.2)% | |
Please refer to the inside front cover of the report for important information about the fund’s distribution policy
The fund’s covered call strategy, which focuses on independent energy companies that are key pipeline transporters, enabled the fund to generate current income. The notional amount of the fund’s covered calls averaged approximately 6% of total assets, and their out-of-the-money percentage at the time written averaged approximately 9% during the fiscal quarter.
Key asset performance drivers
| Top five contributors | Company type | Performance driver | ||
| Enbridge Inc. | Midstream crude oil pipeline company | Visible dividend growth of 5-7% in 2020+ | ||
| ONEOK, Inc. | Midstream natural gas/natural gas liquids pipeline company | Continued execution of backlog of infrastructure projects with high returns | ||
| Buckeye Partners, L.P. | Midstream refined product pipeline MLP | Acquired at a premium | ||
| NuStar Energy L.P. | Refined products pipelines MLP | Strong volume growth from Permian and outlook for St. James and Corpus Christi assets | ||
| Inter Pipeline Ltd. | Midstream crude oil | Bid to acquire the company | ||
| pipeline company | in corporate transaction | |||
| Bottom five contributors | Company type | Performance driver | ||
| Antero Midstream Corporation | Midstream gathering and processing company | Concerns around potential recontracting of gathering and process contracts and financial health of parent company Antero Resources (AR) as natural gas prices moved lower | ||
| EnLink Midstream, LLC | Midstream gathering and processing company | Concern around producers slowing drilling activity in Oklahoma | ||
| Equitrans Midstream Corporation | Midstream natural gas/natural gas liquids pipeline company | Uncertainty around Mountain Valley Pipeline project | ||
| Plains GP Holdings, L.P. | Midstream crude oil pipeline company | Uncertain crude oil production growth from Permian in 2020 leading to concerns to potential of over build | ||
| MPLX LP | Refined products pipeline MLP | Continued uncertainty regarding organizational structure and parental support combined with north east natural G&P exposure |
Unlike the fund return, index return is pre-expenses.
Performance data quoted represent past performance; past performance does not guarantee future results. Like any other stock, total return and market value will fluctuate so that an investment, when sold, may be worth more or less than its original cost. Portfolio composition is subject to change due to ongoing management of the fund. References to specific securities or sectors should not be construed as a recommendation by the fund or its adviser. See Schedule of Investments for portfolio weighting at the end of the fiscal quarter.
| (unaudited) | |
| Tortoise | 11 |
| Tortoise |
| Pipeline & Energy Fund, Inc. (TTP) (continued) |
Fund structure and distribution policy
The fund is structured to qualify as a Regulated Investment Company (RIC) allowing it to pass-through to shareholders income and capital gains earned, thus avoiding double-taxation. To qualify as a RIC, the fund must meet specific income, diversification and distribution requirements. Regarding income, at least 90 percent of the fund’s gross income must be from dividends, interest and capital gains. The fund must meet quarterly diversification requirements including the requirement that at least 50 percent of the assets be in cash, cash equivalents or other securities with each single issuer of other securities not greater than 5 percent of total assets. No more than 25 percent of total assets can be invested in any one issuer other than government securities or other RIC’s. The fund must also distribute at least 90 percent of its investment company income. RIC’s are also subject to excise tax rules which require RIC’s to distribute approximately 98 percent of net income and net capital gains to avoid a 4 percent excise tax.
The fund has adopted a distribution policy which is included on the inside front cover of this report. To summarize, the fund intends to distribute an amount closely approximating the total taxable income for the year and, if so determined by the Board, distribute all or a portion of the return of capital paid by portfolio companies during the year. The fund may designate a portion of its distributions as capital gains and may also distribute additional capital gains in the last calendar quarter of the year to meet annual excise distribution requirements. The fund distributes a fixed amount per common share, currently $0.285, each quarter to its common shareholders. This amount is subject to change from time to time at the discretion of the Board. Although the level of distributions is independent of the funds’ performance in the short term, the fund expects such distributions to correlate with its performance over time.
Distributable cash flow and distributions
Distributable cash flow (DCF) is income from investments less expenses. Income from investments includes the amount received as cash or paid-in-kind distributions from common stock, master limited partnerships (MLPs), affiliates of MLPs, and pipeline and other energy companies in which the fund invests, and dividend payments on short-term investments. Income also includes the premiums received from sales of covered call options, net of amounts paid to buy back out-of-the-money options. The total expenses include current or anticipated operating expenses and leverage costs.
Income from investments decreased approximately 10.0% as compared to 3rd quarter 2019, primarily due to lower premiums from covered call options. Operating expenses, consisting primarily of fund advisory fees, decreased approximately 8.2% during the quarter, primarily due to lower asset-based fees. Leverage costs decreased 2.7% as compared to 3rd quarter 2019 primarily as a result of a decrease in interest rates during the quarter. As a result of the changes in income and expenses, DCF decreased approximately 11.6% as compared to 3rd quarter 2019. In addition, the fund had net realized losses on investments of $1.5 million during 4th quarter 2019. The fund paid a quarterly distribution of $0.285 per share, which was equal to the distribution paid in the prior quarter and a decrease of 30% from the 4th quarter 2018. The fund has paid cumulative distributions to stockholders of $13.1125 per share since its inception in October 2011.
The Key Financial Data table discloses the calculation of DCF and should be read in conjunction with this discussion. The difference between income from investments in the DCF calculation and total investment income as reported in the Statement of Operations, is reconciled as follows: (1) the Statement of Operations, in conformity with U.S. generally accepted accounting principles (GAAP), recognizes distributions and dividend income from MLPs, common stock and other investments on their ex-dates, whereas the DCF calculation may reflect distributions and dividend income on their pay dates; (2) GAAP recognizes that a significant portion of the cash distributions received from MLPs, common stock and other investments are characterized as a return of capital and therefore excluded from investment income, whereas the DCF calculation includes the return of capital; (3) income from investments in the DCF calculation includes the value of dividends paid-in-kind (additional stock or units), whereas such amounts may not be included as income for GAAP purposes; and (4) net premiums on options written (premiums received less amounts paid to buy back out-of-the-money options) with expiration dates during the fiscal quarter are included in the DCF calculation, whereas GAAP recognizes the net effect of options written as realized and unrealized gains (losses).
“Net Investment Income (Loss)” on the Statement of Operations is adjusted as follows to reconcile to DCF for YTD and 4th quarter 2019 (in thousands):
| YTD 2019 | 4th Qtr 2019 | |||||||
| Net Investment Loss | $ | (1,236 | ) | $ | (71 | ) | ||
| Adjustments to reconcile to DCF: | ||||||||
| Net premiums on options written | 3,623 | 484 | ||||||
| Distributions characterized | ||||||||
| as return of capital | 11,183 | 2,671 | ||||||
| Other | 261 | 69 | ||||||
| DCF | $ | 13,831 | $ | 3,153 | ||||
Leverage
The fund’s leverage utilization increased by $0.3 million during 4th quarter 2019 and represented 32.1% of total assets at November 30, 2019. The fund has maintained compliance with its applicable coverage ratios. At year-end, approximately 71% of the leverage cost was fixed, the weighted-average maturity was 2.9 years and the weighted-average annual rate on leverage was 3.82%. These rates will vary in the future as a result of changing floating rates, utilization of the fund’s credit facility and as leverage matures or is redeemed.
Please see the Financial Statements and Notes to Financial Statements for additional detail regarding critical accounting policies, results of operations, leverage and other important fund information.
For further information regarding the calculation of distributable cash flow and distributions to stockholders, as well as a discussion of the tax impact on distributions, please visit www.tortoiseadvisors.com.
| (unaudited) | |
| 12 | Tortoise |
| 2019 Annual Report| November 30, 2019 |
| TTP Key Financial Data (supplemental unaudited information) |
| (dollar amounts in thousands unless otherwise indicated) |
The information presented below regarding Distributable Cash Flow and Selected Financial Information is supplemental non-GAAP financial information, which the fund believes is meaningful to understanding operating performance. The Distributable Cash Flow Ratios include the functional equivalent of EBITDA for non-investment companies, and the fund believes they are an important supplemental measure of performance and promote comparisons from period-to-period. This information is supplemental, is not inclusive of required financial disclosures (e.g. Total Expense Ratio), and should be read in conjunction with the full financial statements.
| Year Ended November 30, | 2018 | 2019 | |||||||||||||||||||||||||||||||||
| 2018 | 2019 | Q4(1) | Q1(1) | Q2(1) | Q3(1) | Q4(1) | |||||||||||||||||||||||||||||
| Total Income from Investments | |||||||||||||||||||||||||||||||||||
| Dividends and distributions | |||||||||||||||||||||||||||||||||||
| from investments, net of | |||||||||||||||||||||||||||||||||||
| foreign taxes withheld | $ | 14,738 | $ | 15,444 | $ | 3,649 | $ | 3,617 | $ | 4,032 | $ | 3,905 | $ | 3,890 | |||||||||||||||||||||
| Dividends paid in kind | 1,796 | 237 | 422 | 53 | 54 | 62 | 68 | ||||||||||||||||||||||||||||
| Net premiums on options written | 4,808 | 3,622 | 1,154 | 1,133 | 1,039 | 967 | 483 | ||||||||||||||||||||||||||||
| Total from investments | 21,342 | 19,303 | 5,225 | 4,803 | 5,125 | 4,934 | 4,441 | ||||||||||||||||||||||||||||
| Operating Expenses Before | |||||||||||||||||||||||||||||||||||
| Leverage Costs | |||||||||||||||||||||||||||||||||||
| Advisory fees, net of fees waived | 2,845 | 2,414 | 696 | 606 | 643 | 602 | 563 | ||||||||||||||||||||||||||||
| Other operating expenses | 605 | 549 | 147 | 146 | 149 | 138 | 116 | ||||||||||||||||||||||||||||
| 3,450 | 2,963 | 843 | 752 | 792 | 740 | 679 | |||||||||||||||||||||||||||||
| Distributable cash flow before | |||||||||||||||||||||||||||||||||||
| leverage costs | 17,892 | 16,340 | 4,382 | 4,051 | 4,333 | 4,194 | 3,762 | ||||||||||||||||||||||||||||
| Leverage costs(2) | 2,582 | 2,509 | 668 | 641 | 633 | 626 | 609 | ||||||||||||||||||||||||||||
| Distributable Cash Flow(3) | $ | 15,310 | $ | 13,831 | $ | 3,714 | $ | 3,410 | $ | 3,700 | $ | 3,568 | $ | 3,153 | |||||||||||||||||||||
| Net realized loss on investments | |||||||||||||||||||||||||||||||||||
| and foreign currency translation, | |||||||||||||||||||||||||||||||||||
| for the period | $ | (356 | ) | $ | (16,707 | ) | $ | (596 | ) | $ | (6,959 | ) | $ | (5,479 | ) | $ | (2,745 | ) | $ | (1,524 | ) | ||||||||||||||
| As a percent of average total assets(4) | |||||||||||||||||||||||||||||||||||
| Total from investments | 8.29 | % | 8.82 | % | 8.29 | % | 8.73 | % | 8.84 | % | 8.96 | % | 8.74 | % | |||||||||||||||||||||
| Operating expenses before | |||||||||||||||||||||||||||||||||||
| leverage costs | 1.34 | % | 1.35 | % | 1.34 | % | 1.37 | % | 1.37 | % | 1.34 | % | 1.34 | % | |||||||||||||||||||||
| Distributable cash flow before | |||||||||||||||||||||||||||||||||||
| leverage costs | 6.95 | % | 7.47 | % | 6.95 | % | 7.36 | % | 7.47 | % | 7.62 | % | 7.40 | % | |||||||||||||||||||||
| As a percent of average net assets(4) | |||||||||||||||||||||||||||||||||||
| Total from investments | 11.32 | % | 12.29 | % | 11.43 | % | 12.16 | % | 11.97 | % | 12.63 | % | 12.46 | % | |||||||||||||||||||||
| Operating expenses before | |||||||||||||||||||||||||||||||||||
| leverage costs | 1.83 | % | 1.89 | % | 1.84 | % | 1.90 | % | 1.85 | % | 1.89 | % | 1.91 | % | |||||||||||||||||||||
| Leverage costs | 1.37 | % | 1.60 | % | 1.46 | % | 1.62 | % | 1.48 | % | 1.60 | % | 1.71 | % | |||||||||||||||||||||
| Distributable cash flow | 8.12 | % | 8.80 | % | 8.13 | % | 8.64 | % | 8.64 | % | 9.14 | % | 8.84 | % | |||||||||||||||||||||
| Selected Financial Information | |||||||||||||||||||||||||||||||||||
| Distributions paid on common stock | $ | 16,327 | $ | 13,873 | $ | 4,082 | $ | 4,082 | $ | 4,081 | $ | 2,855 | $ | 2,855 | |||||||||||||||||||||
| Distributions paid on common stock | |||||||||||||||||||||||||||||||||||
| per share | 1.6300 | 1.3850 | 0.4075 | 0.4075 | 0.4075 | 0.2850 | 0.2850 | ||||||||||||||||||||||||||||
| Total assets, end of period(5) | 235,259 | 192,751 | 235,259 | 227,676 | 222,673 | 207,072 | 192,751 | ||||||||||||||||||||||||||||
| Average total assets during period(5)(6) | 257,585 | 218,949 | 252,876 | 223,114 | 229,950 | 218,436 | 203,852 | ||||||||||||||||||||||||||||
| Leverage(7) | 69,800 | 61,800 | 69,800 | 61,800 | 63,100 | 61,500 | 61,800 | ||||||||||||||||||||||||||||
| Leverage as a percent of total assets | 29.7 | % | 32.1 | % | 29.7 | % | 27.1 | % | 28.3 | % | 29.7 | % | 32.1 | % | |||||||||||||||||||||
| Net unrealized depreciation, | |||||||||||||||||||||||||||||||||||
| end of period | (34,897 | ) | (37,569 | ) | (34,897 | ) | (23,375 | ) | (19,404 | ) | (28,190 | ) | (37,569 | ) | |||||||||||||||||||||
| Net assets, end of period | 163,202 | 129,887 | 163,202 | 163,313 | 157,061 | 143,463 | 129,887 | ||||||||||||||||||||||||||||
| Average net assets during period(8) | 188,518 | 157,017 | 183,386 | 160,184 | 169,837 | 155,032 | 142,932 | ||||||||||||||||||||||||||||
| Net asset value per common share | 16.29 | 12.97 | 16.29 | 16.30 | 15.68 | 14.32 | 12.97 | ||||||||||||||||||||||||||||
| Market value per common share | 14.33 | 11.52 | 14.33 | 14.63 | 14.02 | 12.84 | 11.52 | ||||||||||||||||||||||||||||
| Shares outstanding (000’s) | 10,016 | 10,016 | 10,016 | 10,016 | 10,016 | 10,016 | 10,016 | ||||||||||||||||||||||||||||
| (1) | Q1 is the period from December through February. Q2 is the period from March through May. Q3 is the period from June through August. Q4 is the period from September through November. |
| (2) | Leverage costs include interest expense, distributions to preferred stockholders and other recurring leverage expenses. |
| (3) | “Net investment income (loss)” on the Statement of Operations is adjusted as follows to reconcile to Distributable Cash Flow (“DCF”): increased by net premiums on options written, the return of capital on distributions, the dividends paid in stock and increased liquidation value, the premium on dividends paid in kind and amortization of debt issuance costs. |
| (4) | Annualized for periods less than one full year. |
| (5) | Includes deferred issuance and offering costs on senior notes and preferred stock. |
| (6) | Computed by averaging month-end values within each period. |
| (7) | Leverage consists of senior notes, preferred stock and outstanding borrowings under the revolving credit facility. |
| (8) | Computed by averaging daily net assets within each period. |
| Tortoise | 13 |
| Tortoise |
| Energy Independence Fund, Inc. (NDP) |
Fund description
NDP seeks a high level of total return with an emphasis on current distributions paid to stockholders. NDP invests primarily in equity securities of upstream North American energy companies that engage in the exploration and production of crude oil, condensate, natural gas and natural gas liquids that generally have a significant presence in North American oil and gas fields, including shale reservoirs.
Fund performance review
Oil markets experienced significant volatility during the period. Prices were caught in a tug-of-war between escalating tensions in the Middle East culminating in significant but temporary supply outages, mixed signals from U.S.-China trade negotiations impacting demand growth. The fund’s market-based and NAV-based returns for the fiscal year ending November 30, 2019 were -52.4% and -45.4%, respectively (including the reinvestment of distributions). Comparatively, the Tortoise North American Oil and Gas Producers IndexSMreturned -22.7% for the same period.
| 2019 fiscal year highlights | ||
| Distributions paid per share (fiscal year 2019) | $1.0750 | |
| Distributions paid per share (4th quarter 2019) | $0.1000 | |
| Distribution rate (as of 11/30/2019) | 11.0% | |
| Quarter-over-quarter distribution increase (decrease) | (0.0)% | |
| Year-over-year distribution increase (decrease) | (77.1)% | |
| Cumulative distributions paid per share to | ||
| stockholders since inception in July 2012 | $12.0125 | |
| Market-based total return | (52.4)% | |
| NAV-based total return | (45.4)% | |
| Premium (discount) to NAV (as of 11/30/2019) | (12.9)% |
The fund utilizes a covered call strategy, which seeks to generate income while reducing overall volatility. The premium income generated from this strategy helped to lower NAV volatility during the quarter. The notional amount of the fund’s covered calls averaged approximately 70% of total assets and their out-of-the-money percentage at the time written averaged approximately 14% during the fiscal quarter.
Key asset performance drivers
| Top five contributors | Company type | Performance driver | ||
| Anadarko Petroleum Corp. | Upstream oil and natural gas producer | Occidental Petroleum offered premium to acquire all of the outstanding shares | ||
| Marathon Petroleum Corporation | Downstream refiner | Generated significant free cash flow to pay dividend and buyback shares as well as announced spin-off of retail gasoline business | ||
| Valero Energy Corporation | Downstream refiner | Increased exports and IMO exposure and margin capture leading to improved earnings outlook | ||
| NextEra Energy, Inc. | Integrated infrastructure | Highly visible growth from renewable buildout | ||
| Buckeye Partners, L.P. | Midstream refined product pipeline MLP | Acquired at a premium | ||
| Bottom five contributors | Company type | Performance driver | ||
| Range Resources Corporation | Upstream natural gas producer | Declining natural gas prices resulting in weaker earnings and a lower growth outlook | ||
| Antero Resources Corporation | Upstream oil and natural gas producer | Declining natural gas prices resulting in weaker earnings and a lower growth outlook | ||
| EQTCorporation | Upstream natural gas producer | Declining natural gas prices resulting in weaker earnings and a lower growth outlook | ||
| Concho Resources Inc. | Upstream liquids producer | Unexpected operational challenge tied to well spacing raised concerns about future growth | ||
| Cabot Oil & Gas Corporation | Upstream natural gas producer | Declining natural gas prices resulting in weaker earnings and a lower growth outlook |
Unlike the fund return, index return is pre-expenses.
Performance data quoted represent past performance: past performance does not guarantee future results. Like any other stock, total return and market value will fluctuate so that an investment, when sold, may be worth more or less than its original cost. Portfolio composition is subject to change due to ongoing management of the fund. References to specific securities or sectors should not be construed as a recommendation by the fund or its adviser. See Schedule of Investments for portfolio weighting at the end of the fiscal quarter.
| (unaudited) | |
| 14 | Tortoise |
| 2019 Annual Report| November 30, 2019 |
Fund structure and distribution policy
The fund is structured to qualify as a Regulated Investment Company (RIC) allowing it to pass-through to shareholders income and capital gains earned, thus avoiding double-taxation. To qualify as a RIC, the fund must meet specific income, diversification and distribution requirements. Regarding income, at least 90 percent of the fund’s gross income must be from dividends, interest and capital gains. The fund must meet quarterly diversification requirements including the requirement that at least 50 percent of the assets be in cash, cash equivalents or other securities with each single issuer of other securities not greater than 5 percent of total assets. No more than 25 percent of total assets can be invested in any one issuer other than government securities or other RIC’s. The fund must also distribute at least 90 percent of its investment company income. RIC’s are also subject to excise tax rules which require RIC’s to distribute approximately 98 percent of net income and net capital gains to avoid a 4 percent excise tax.
The fund has adopted a distribution policy which intends to distribute an amount closely approximating the total taxable income for the year and, if so determined by the Board, distribute all or a portion of the return of capital paid by portfolio companies during the year. The fund may designate a portion of its distributions as capital gains and may also distribute additional capital gains in the last calendar quarter of the year to meet annual excise distribution requirements. Distribution amounts are subject to change from time to time at the discretion of the Board. Although the level of distributions is independent of the funds’ performance in the short term, the fund expects such distributions to correlate with its performance over time.
Distributable cash flow and distributions
Distributable cash flow (DCF) is income from investments less expenses. Income from investments includes the amount received as cash or paid-in-kind distributions from investments and dividend payments on short-term investments. Income also includes the premiums received from sales of covered call options, net of amounts paid to buy back out-of-the-money options. The total expenses include current or anticipated operating expenses and leverage costs.
Income from investments decreased approximately 54.5% as compared to 3rd quarter 2019, primarily due to decreased premiums received on written covered call options. Operating expenses, consisting primarily of fund advisory fees, decreased approximately 15.1% during the quarter due primarily to lower asset-based fees. Total leverage costs decreased approximately 26.0% as compared to 3rd quarter 2019, due to lower leverage utilization and interest rates during the quarter. As a result of the changes in income and expenses, DCF decreased by approximately 59.6% as compared to 3rd quarter 2019. In addition, the fund had net realized losses on investments of $2.3 million during 4th quarter 2019.
The fund paid a distribution of $0.10 per share during 4th quarter 2019, which was equal to the distribution paid in the prior quarter and a decrease of 77% from 4th quarter 2018. The fund has paid cumulative distributions to stockholders of $12.0125 per share since its inception in July 2012.
The Key Financial Data table discloses the calculation of DCF and should be read in conjunction with this discussion. The difference between income from investments in the DCF calculation and total investment income as reported in the Statement of Operations, is reconciled as follows: (1) the Statement of Operations, in conformity with U.S. generally accepted accounting principles (GAAP), recognizes distributions and dividend income from MLPs, common stock and other investments on their ex-dates, whereas the DCF calculation may reflect distributions and dividend income on their pay dates; (2) GAAP recognizes that a significant portion of the cash distributions received from MLPs, common stock and other investments are characterized as a return of capital and therefore excluded from investment income, whereas the DCF calculation includes the return of capital; (3) income from investments in the DCF calculation includes the value of dividends paid-in-kind (additional stock or units), whereas such amounts may not be included as income for GAAP purposes; and (4) net premiums on options written (premiums received less amounts paid to buy back out-of-the-money options) with expiration dates during fiscal quarter are included in the DCF calculation, whereas GAAP recognizes the net effect of options written as realized and unrealized gains (losses).
“Net Investment Income (Loss)” on the Statement of Operations is adjusted as follows to reconcile to DCF for YTD and 4th quarter 2019 (in thousands):
| YTD 2019 | 4th Qtr 2019 | ||||||
| Net Investment Income (loss) | $ | (1,491 | ) | $ | 66 | ||
| Adjustments to reconcile to DCF: | |||||||
| Net premiums on options written | 17,101 | 1,771 | |||||
| Distributions characterized | |||||||
| as return of capital | 1,323 | 146 | |||||
| DCF | $ | 16,933 | $ | 1,983 | |||
Leverage
The fund’s leverage utilization decreased $2.2 million as compared to 3rd quarter 2019. The fund utilizes all floating rate leverage that had an interest rate of 2.70% and represented 29.9% of total assets at year-end. The fund has maintained compliance with its applicable coverage ratios. The interest rate on the fund’s leverage will vary in the future along with changing floating rates.
Please see the Financial Statements and Notes to Financial Statements for additional detail regarding critical accounting policies, results of operations, leverage and other important fund information.
For further information regarding the calculation of distributable cash flow and distributions to stockholders, as well as a discussion of the tax impact on distributions, please visit www.tortoiseadvisors.com.
| (unaudited) | |
| Tortoise | 15 |
| NDP Key Financial Data (supplemental unaudited information) |
| (dollar amounts in thousands unless otherwise indicated) |
The information presented below regarding Distributable Cash Flow and Selected Financial Information is supplemental non-GAAP financial information, which the fund believes is meaningful to understanding operating performance. The Distributable Cash Flow Ratios include the functional equivalent of EBITDA for non-investment companies, and the fund believes they are an important supplemental measure of performance and promote comparisons from period-to-period. This information is supplemental, is not inclusive of required financial disclosures (e.g. Total Expense Ratio), and should be read in conjunction with the full financial statements.
| Year Ended November 30, | 2018 | 2019 | |||||||||||||||||||||||||||||||||
| 2018 | 2019 | Q4(1) | Q1(1) | Q2(1) | Q3(1) | Q4(1) | |||||||||||||||||||||||||||||
| Total Income from Investments | |||||||||||||||||||||||||||||||||||
| Distributions and dividends | |||||||||||||||||||||||||||||||||||
| from investments, net of | |||||||||||||||||||||||||||||||||||
| foreign taxes withheld | $ | 5,122 | $ | 2,971 | $ | 1,167 | $ | 1,250 | $ | 394 | $ | 538 | $ | 789 | |||||||||||||||||||||
| Dividends paid in stock | 796 | — | 152 | — | — | — | — | ||||||||||||||||||||||||||||
| Net premiums on options written | 24,820 | 17,101 | 6,400 | 4,966 | 5,279 | 5,085 | 1,771 | ||||||||||||||||||||||||||||
| Total from investments | 30,738 | 20,072 | 7,719 | 6,216 | 5,673 | 5,623 | 2,560 | ||||||||||||||||||||||||||||
| Operating Expenses Before | |||||||||||||||||||||||||||||||||||
| Leverage Costs | |||||||||||||||||||||||||||||||||||
| Advisory fees, net of fees waived | 2,639 | 1,434 | 613 | 437 | 421 | 315 | 261 | ||||||||||||||||||||||||||||
| Other operating expenses | 566 | 476 | 134 | 133 | 133 | 110 | 100 | ||||||||||||||||||||||||||||
| 3,205 | 1,910 | 747 | 570 | 554 | 425 | 361 | |||||||||||||||||||||||||||||
| Distributable cash flow before | |||||||||||||||||||||||||||||||||||
| leverage costs | 27,533 | 18,162 | 6,972 | 5,646 | 5,119 | 5,198 | 2,199 | ||||||||||||||||||||||||||||
| Leverage costs(2) | 1,759 | 1,229 | 486 | 371 | 350 | 292 | 216 | ||||||||||||||||||||||||||||
| Distributable Cash Flow(3) | $ | 25,774 | $ | 16,933 | $ | 6,486 | $ | 5,275 | $ | 4,769 | $ | 4,906 | $ | 1,983 | |||||||||||||||||||||
| Net realized loss on investments | |||||||||||||||||||||||||||||||||||
| and foreign currency translation, | |||||||||||||||||||||||||||||||||||
| for the period | $ | (6,693 | ) | $ | (88,310 | ) | $ | (2,031 | ) | $ | (37,544 | ) | $ | (17,350 | ) | $ | (31,152 | ) | $ | (2,264 | ) | ||||||||||||||
| As a percent of average total assets(4) | |||||||||||||||||||||||||||||||||||
| Total from investments | 12.72 | % | 15.22 | % | 13.91 | % | 15.48 | % | 15.12 | % | 19.20 | % | 10.92 | % | |||||||||||||||||||||
| Operating expenses before | |||||||||||||||||||||||||||||||||||
| leverage costs | 1.33 | % | 1.45 | % | 1.35 | % | 1.42 | % | 1.48 | % | 1.45 | % | 1.54 | % | |||||||||||||||||||||
| Distributable cash flow before | |||||||||||||||||||||||||||||||||||
| leverage costs | 11.39 | % | 13.77 | % | 12.56 | % | 14.06 | % | 13.64 | % | 17.75 | % | 9.38 | % | |||||||||||||||||||||
| As a percent of average net assets(4) | |||||||||||||||||||||||||||||||||||
| Total from investments | 17.42 | % | 21.32 | % | 19.29 | % | 21.38 | % | 20.05 | % | 28.01 | % | 15.34 | % | |||||||||||||||||||||
| Operating expenses before | |||||||||||||||||||||||||||||||||||
| leverage costs | 1.82 | % | 2.03 | % | 1.87 | % | 1.96 | % | 1.96 | % | 2.12 | % | 2.16 | % | |||||||||||||||||||||
| Leverage costs | 1.00 | % | 1.31 | % | 1.21 | % | 1.28 | % | 1.24 | % | 1.45 | % | 1.29 | % | |||||||||||||||||||||
| Distributable cash flow | 14.60 | % | 17.98 | % | 16.21 | % | 18.14 | % | 16.85 | % | 24.44 | % | 11.89 | % | |||||||||||||||||||||
| Selected Financial Information | |||||||||||||||||||||||||||||||||||
| Distributions paid on common stock | $ | 25,587 | $ | 15,829 | $ | 6,414 | $ | 6,430 | $ | 6,445 | $ | 1,477 | $ | 1,477 | |||||||||||||||||||||
| Distributions paid on common stock | |||||||||||||||||||||||||||||||||||
| per share | 1.7500 | 1.0750 | 0.4375 | 0.4375 | 0.4375 | 0.1000 | 0.1000 | ||||||||||||||||||||||||||||
| Total assets, end of period | 191,285 | 88,684 | 191,285 | 156,648 | 123,229 | 95,078 | 88,684 | ||||||||||||||||||||||||||||
| Average total assets during period(5) | 241,656 | 131,848 | 222,541 | 162,807 | 148,821 | 116,182 | 94,064 | ||||||||||||||||||||||||||||
| Leverage(6) | 57,100 | 26,500 | 57,100 | 42,400 | 34,600 | 28,700 | 26,500 | ||||||||||||||||||||||||||||
| Leverage as a percent of total assets | 29.9 | % | 29.9 | % | 29.9 | % | 27.1 | % | 28.1 | % | 30.2 | % | 29.9 | % | |||||||||||||||||||||
| Net unrealized depreciation, | |||||||||||||||||||||||||||||||||||
| end of period | (50,328 | ) | (21,026 | ) | (50,328 | ) | (28,074 | ) | (27,092 | ) | (21,503 | ) | (21,026 | ) | |||||||||||||||||||||
| Net assets, end of period | 132,488 | 61,550 | 132,488 | 111,490 | 87,720 | 65,322 | 61,550 | ||||||||||||||||||||||||||||
| Average net assets during period(7) | 176,481 | 94,144 | 160,534 | 117,918 | 112,274 | 79,655 | 66,948 | ||||||||||||||||||||||||||||
| Net asset value per common share | 9.02 | 4.17 | 9.02 | 7.57 | 5.94 | 4.42 | 4.17 | ||||||||||||||||||||||||||||
| Market value per common share | 9.00 | 3.63 | 9.00 | 8.08 | 7.40 | 3.99 | 3.63 | ||||||||||||||||||||||||||||
| Shares outstanding (000’s) | 14,696 | 14,768 | 14,696 | 14,733 | 14,768 | 14,768 | 14,768 | ||||||||||||||||||||||||||||
| (1) | Q1 is the period from December through February. Q2 is the period from March through May. Q3 is the period from June through August. Q4 is the period from September through November. |
| (2) | Leverage costs include interest expense and other recurring leverage expenses. |
| (3) | “Net investment income (loss)” on the Statement of Operations is adjusted as follows to reconcile to Distributable Cash Flow (“DCF”): increased by net premiums on options written, the return of capital on distributions the distributions paid in stock and the premium on dividends paid in kind. |
| (4) | Annualized for periods less than one full year. |
| (5) | Computed by averaging month-end values within each period. |
| (6) | Leverage consists of outstanding borrowings under the revolving credit facility. |
| (7) | Computed by averaging daily net assets within each period. |
| 16 | Tortoise |
| 2019 Annual Report| November 30, 2019 |
| Tortoise |
| Power and Energy Infrastructure Fund, Inc. (TPZ) |
Fund description
TPZ seeks to provide a high level of current income to stockholders, with a secondary objective of capital appreciation. TPZ seeks to invest primarily in fixed income and dividend-paying equity securities of power and energy infrastructure companies that provide stable and defensive characteristics throughout economic cycles.
Fund performance review
Midstream energy performance lagged broader energy for the fourth fiscal quarter, but outperformed for the fiscal year. A combination of concerns regarding a slowdown in U.S. production growth, political rhetoric regarding proposed frack bans from Democratic candidates, and tax loss selling largely contributed to midstream underperformance for the fiscal quarter. The fund’s market-based and NAV-based returns for the fiscal year ending November 30, 2019 were -1.4% and -2.6%, respectively (including the reinvestment of distributions). Comparatively, the TPZ Benchmark Composite* returned 9.4% for the same period. The fund’s fixed income holdings outperformed its equity holdings on a total return basis.
| 2019 fiscal year highlights | ||
| Distributions paid per share (fiscal year 2019) | $1.5000 | |
| Monthly distribution paid per share (4th quarter 2019) | $0.1250 | |
| Distribution rate (as of 11/30/2019) | 9.6% | |
| Quarter-over-quarter distribution increase | 0.0% | |
| Year-over-year distribution increase | 0.0% | |
| Cumulative distribution to stockholders | ||
| since inception in July 2009 | $16.7750 | |
| Market-based total return | (1.4)% | |
| NAV-based total return | (2.6)% | |
| Premium (discount) to NAV (as of 11/30/2019) | (12.0)% |
* The TPZ Benchmark Composite includes the BofA Merrill Lynch U.S. Energy Index (CIEN), the BofA Merrill Lynch U.S. Electricity Index (CUEL) and the Tortoise MLP Index®(TMLP).It is comprised of a blend of 70% fixed income and 30% equity securities issued by companies in the power and energy infrastructure sectors.
Please refer to the inside front cover of the report for important information about the fund’s distribution policy.
Key asset performance drivers
| Top five contributors | Company type | Performance driver | ||
| Enbridge Inc. (fixed income) | Midstream crude oil pipeline company | Successful efforts to reduce leverage | ||
| Enbridge Inc. | Midstream crude oil pipeline company | Visible dividend growth of 5-7% in 2020+ | ||
| TransCanada Corporation (fixed income) | Midstream natural gas/natural gas liquids pipeline company | Regulated business model and defensive fixed income security | ||
| Buckeye Partners, L.P. | Midstream refined product pipeline MLP | Acquired at a premium | ||
| SemGroup Corp. (fixed income) | Midstream crude oil pipeline company | Acquired by an investment grade company | ||
| Bottom five contributors | Company type | Performance driver | ||
| Antero Midstream Corporation | Midstream gathering and processing company | Concerns around potential recontracting of gathering and process contracts and financial health of parent company Antero Resources (AR) as natural gas prices moved lower | ||
| Western Midstream Partners, LP | Midstream gathering and processing MLP | Carrying out strategic review | ||
| EnLink Midstream, LLC | Midstream gathering and processing company | Concern around producers slowing drilling activity in Oklahoma | ||
| MPLX LP | Refined products pipeline MLP | Continued uncertainty regarding organizational structure and parental support combined with north east natural G&P exposure | ||
| Equitrans Midstream Corporation | Midstream natural gas/natural gas liquids pipeline company | Uncertainty around Mountain Valley Pipeline project |
Unlike the fund return, index return is pre-expenses.
Performance data quoted represent past performance; past performance does not guarantee future results. Like any other stock, total return and market value will fluctuate so that an investment, when sold, may be worth more or less than its original cost. Portfolio composition is subject to change due to ongoing management of the fund. References to specific securities or sectors should not be construed as a recommendation by the fund or its adviser. See Schedule of Investments for portfolio weighting at the end of the fiscal quarter.
| (unaudited) | |
| Tortoise | 17 |
| Tortoise |
| Power and Energy Infrastructure Fund, Inc. (TPZ)(continued) |
Fund structure and distribution policy
The fund is structured to qualify as a Regulated Investment Company (RIC) allowing it to pass-through to shareholders income and capital gains earned, thus avoiding double-taxation. To qualify as a RIC, the fund must meet specific income, diversification and distribution requirements. Regarding income, at least 90 percent of the fund gross income must be from dividends, interest and capital gains. The fund must meet quarterly diversification requirements including the requirement that at least 50 percent of the assets be in cash, cash equivalents or other securities with each single issuer of other securities not greater than 5 percent of total assets. No more than 25 percent of total assets can be invested in any one issuer other than government securities or other RIC’s. The fund must also distribute at least 90 percent of its investment company income. RIC’s are also subject to excise tax rules which require RIC’s to distribute approximately 98 percent of net income and net capital gains to avoid a 4 percent excise tax.
The fund has adopted a distribution policy which is included on the inside front cover of this report. To summarize, the fund intends to distribute an amount closely approximating the total taxable income for the year and, if so determined by the Board, distribute all or a portion of the return of capital paid by portfolio companies during the year. The fund may designate a portion of its distributions as capital gains and may also distribute additional capital gains in the last calendar quarter of the year to meet annual excise distribution requirements. The fund distributes a fixed amount per common share, currently $0.125, each month to its common shareholders. This amount is subject to change from time to time at the discretion of the Board. Although the level of distributions is independent of the funds’ performance in the short term, the fund expects such distributions to correlate with its performance over time.
Distributable cash flow and distributions
Distributable cash flow (DCF) is income from investments less expenses. Income from investments includes the accrued interest from corporate bonds, cash distributions and paid-in-kind distributions from master limited partnerships (MLPs) and other equity investments and dividends earned from short-term investments. The total expenses include current or anticipated operating expenses and leverage costs.
Income from investments increased approximately 1.0% as compared to 3rd quarter 2019 due primarily to trading activity within the fund’s portfolio. Operating expenses, consisting primarily of fund advisory fees, decreased approximately 7.4% during the quarter due primarily to lower asset-based fees. Total leverage costs decreased approximately 6.8% as compared to 3rd quarter 2019, primarily due to lower leverage utilization and interest rates during the quarter. As a result of the changes in income and expenses, DCF increased approximately 4.5% as compared to 3rd quarter 2019. In addition, the fund had net realized gains on investments of $4.3 million during 4th quarter 2019.
The fund paid monthly distributions of $0.125 per share during 4th quarter 2019, which was unchanged over the prior quarter and 4th quarter 2018. The fund’s Board of Directors has declared monthly distributions of $0.125 per share to be paid during 1st quarter 2020. The fund has paid cumulative distributions to stockholders of $16.775 per share since its inception in July 2009.
The Key Financial Data table discloses the calculation of DCF and should be read in conjunction with this discussion. The difference between income from investments in the DCF calculation and total investment income as reported in the Statement of Operations, is reconciled as follows: (1) U.S. generally accepted accounting principles (GAAP), recognizes distribution income from MLPs, common stock and other investments on their ex-dates, whereas the DCF calculation may reflect distribution income on their pay dates; (2) GAAP recognizes that a significant portion of the cash distributions received from MLPs, common stock and other investments are characterized as a return of capital and therefore excluded from investment income, whereas the DCF calculation includes the return of capital; (3) income from investments in the DCF calculation includes the value of dividends paid-in-kind (additional stock or units), whereas such amounts may not be included as income for GAAP purposes; and (4) amortization of premium or discount for all securities is calculated using the yield to worst methodology for GAAP purposes while yield to call is used in calculating amortization for long-dated hybrid securities in the DCF calculation. The treatment of expenses in the DCF calculation also differs from what is reported in the Statement of Operations. In addition to the total operating expenses, including fee waiver, as disclosed in the Statement of Operations, the DCF calculation reflects interest expense and realized and unrealized gains (losses) on interest rate swap settlements as leverage costs.
“Net Investment Income (Loss)” on the Statement of Operations is adjusted as follows to reconcile to DCF for YTD and 4th quarter 2019 (in thousands):
| YTD 2019 | 4th Qtr 2019 | |||||
| Net Investment Income | $ | 2,722 | $ | 747 | ||
| Adjustments to reconcile to DCF: | ||||||
| Distributions characterized | ||||||
| as return of capital | 6,296 | 1,624 | ||||
| Other | 240 | 53 | ||||
| DCF | $ | 9,258 | $ | 2,424 | ||
Leverage
The fund’s leverage utilization decreased $2.0 million as compared to 3rd quarter 2019 and represented 30.4% of total assets at November 30, 2019. The fund has maintained compliance with its applicable coverage ratios. At year-end, including the impact of interest rate swaps, approximately 61% of the leverage cost was fixed, the weighted-average maturity was 2.4 years and the weighted-average annual rate on leverage was 2.81%. These rates will vary in the future as a result of changing floating rates and as swaps mature or are redeemed.
Please see the Financial Statements and Notes to Financial Statements for additional detail regarding critical accounting policies, results of operations, leverage and other important fund information.
For further information regarding the calculation of distributable cash flow and distributions to stockholders, as well as a discussion of the tax impact on distributions, please visit www.tortoiseadvisors.com.
| (unaudited) | |
| 18 | Tortoise |
| 2019 Annual Report| November 30, 2019 |
| TPZ Key Financial Data (supplemental unaudited information) |
| (dollar amounts in thousands unless otherwise indicated) |
The information presented below regarding Distributable Cash Flow and Selected Financial Information is supplemental non-GAAP financial information, which the fund believes is meaningful to understanding operating performance. The Distributable Cash Flow Ratios include the functional equivalent of EBITDA for non-investment companies, and the fund believes they are an important supplemental measure of performance and promote comparisons from period-to-period. This information is supplemental, is not inclusive of required financial disclosures (e.g. Total Expense Ratio), and should be read in conjunction with the full financial statements.
| Year Ended November 30, | 2018 | 2019 | |||||||||||||||||||||||||||||
| 2018 | 2019 | Q4(1) | Q1(1) | Q2(1) | Q3(1) | Q4(1) | |||||||||||||||||||||||||
| Total Income from Investments | |||||||||||||||||||||||||||||||
| Interest earned on corporate bonds | $ | 5,440 | $ | 5,437 | $ | 1,369 | $ | 1,357 | $ | 1,381 | $ | 1,368 | $ | 1,331 | |||||||||||||||||
| Distributions and dividends | |||||||||||||||||||||||||||||||
| from investments, net of | |||||||||||||||||||||||||||||||
| foreign taxes withheld | 6,747 | 7,632 | 1,654 | 1,841 | 1,909 | 1,907 | 1,975 | ||||||||||||||||||||||||
| Dividends paid in kind | 1,233 | 175 | 284 | 39 | 40 | 47 | 49 | ||||||||||||||||||||||||
| Total from investments | 13,420 | 13,244 | 3,307 | 3,237 | 3,330 | 3,322 | 3,355 | ||||||||||||||||||||||||
| Operating Expenses Before | |||||||||||||||||||||||||||||||
| Leverage Costs | |||||||||||||||||||||||||||||||
| Advisory fees | 1,898 | 1,825 | 473 | 447 | 476 | 462 | 440 | ||||||||||||||||||||||||
| Other operating expenses | 546 | 521 | 137 | 140 | 141 | 131 | 109 | ||||||||||||||||||||||||
| 2,444 | 2,346 | 610 | 587 | 617 | 593 | 549 | |||||||||||||||||||||||||
| Distributable cash flow before | |||||||||||||||||||||||||||||||
| leverage costs | 10,976 | 10,898 | 2,697 | 2,650 | 2,713 | 2,729 | 2,806 | ||||||||||||||||||||||||
| Leverage costs(2) | 1,394 | 1,640 | 373 | 413 | 435 | 410 | 382 | ||||||||||||||||||||||||
| Distributable Cash Flow(3) | $ | 9,582 | $ | 9,258 | $ | 2,324 | $ | 2,237 | $ | 2,278 | $ | 2,319 | $ | 2,424 | |||||||||||||||||
| Net realized gain (loss) on | |||||||||||||||||||||||||||||||
| investments and foreign currency | |||||||||||||||||||||||||||||||
| translation, for the period | $ | 8,973 | $ | 4,740 | $ | 3,996 | $ | (520 | ) | $ | 878 | $ | 94 | $ | 4,288 | ||||||||||||||||
| As a percent of average total assets(4) | |||||||||||||||||||||||||||||||
| Total from investments | 6.72 | % | 6.89 | % | 6.55 | % | 6.85 | % | 6.66 | % | 6.78 | % | 7.23 | % | |||||||||||||||||
| Operating expenses before | |||||||||||||||||||||||||||||||
| leverage costs | 1.22 | % | 1.22 | % | 1.21 | % | 1.24 | % | 1.23 | % | 1.21 | % | 1.18 | % | |||||||||||||||||
| Distributable cash flow before | |||||||||||||||||||||||||||||||
| leverage costs | 5.50 | % | 5.67 | % | 5.34 | % | 5.61 | % | 5.43 | % | 5.57 | % | 6.05 | % | |||||||||||||||||
| As a percent of average net assets(4) | |||||||||||||||||||||||||||||||
| Total from investments | 9.09 | % | 9.62 | % | 8.93 | % | 9.54 | % | 9.20 | % | 9.53 | % | 10.25 | % | |||||||||||||||||
| Operating expenses before | |||||||||||||||||||||||||||||||
| leverage costs | 1.66 | % | 1.70 | % | 1.65 | % | 1.73 | % | 1.70 | % | 1.70 | % | 1.68 | % | |||||||||||||||||
| Leverage costs | 0.94 | % | 1.19 | % | 1.01 | % | 1.22 | % | 1.20 | % | 1.18 | % | 1.17 | % | |||||||||||||||||
| Distributable cash flow | 6.49 | % | 6.73 | % | 6.27 | % | 6.59 | % | 6.30 | % | 6.65 | % | 7.40 | % | |||||||||||||||||
| Selected Financial Information | |||||||||||||||||||||||||||||||
| Distributions paid on common stock | $ | 10,427 | $ | 10,427 | $ | 2,607 | $ | 2,607 | $ | 2,607 | $ | 2,606 | $ | 2,607 | |||||||||||||||||
| Distributions paid on common stock | |||||||||||||||||||||||||||||||
| per share | 1.5000 | 1.5000 | 0.3750 | 0.3750 | 0.3750 | 0.3750 | 0.3750 | ||||||||||||||||||||||||
| Total assets, end of period | 191,906 | 177,843 | 191,906 | 195,308 | 197,731 | 190,032 | 177,843 | ||||||||||||||||||||||||
| Average total assets during period(5) | 199,749 | 192,260 | 200,269 | 191,512 | 198,360 | 194,528 | 186,087 | ||||||||||||||||||||||||
| Leverage(6) | 53,400 | 54,100 | 53,400 | 53,800 | 56,600 | 56,100 | 54,100 | ||||||||||||||||||||||||
| Leverage as a percent of total assets | 27.8 | % | 30.4 | % | 27.8 | % | 27.5 | % | 28.6 | % | 29.5 | % | 30.4 | % | |||||||||||||||||
| Net unrealized appreciation (depreciation), | |||||||||||||||||||||||||||||||
| end of period | 3,956 | (7,471 | ) | 3,956 | 9,850 | 9,939 | 5,062 | (7,471 | ) | ||||||||||||||||||||||
| Net assets, end of period | 137,325 | 123,015 | 137,325 | 140,763 | 139,785 | 133,107 | 123,015 | ||||||||||||||||||||||||
| Average net assets during period(7) | 147,616 | 137,701 | 146,848 | 137,573 | 143,596 | 138,251 | 131,313 | ||||||||||||||||||||||||
| Net asset value per common share | 19.76 | 17.70 | 19.76 | 20.25 | 20.11 | 19.15 | 17.70 | ||||||||||||||||||||||||
| Market value per common share | 17.17 | 15.57 | 17.17 | 17.97 | 18.25 | 18.17 | 15.57 | ||||||||||||||||||||||||
| Shares outstanding (000’s) | 6,951 | 6,951 | 6,951 | 6,951 | 6,951 | 6,951 | 6,951 | ||||||||||||||||||||||||
| (1) | Q1 is the period from December through February. Q2 is the period from March through May. Q3 is the period from June through August. Q4 is the period from September through November. |
| (2) | Leverage costs include interest expense, interest rate swap expenses and other recurring leverage expenses. |
| (3) | “Net investment income (loss)” on the Statement of Operations is adjusted as follows to reconcile to Distributable Cash Flow (“DCF”): increased by the return of capital on distributions, the dividends paid in stock and increased liquidation value and the premium on dividends paid in kind; and decreased by realized and unrealized gains (losses) on interest rate swap settlements. |
| (4) | Annualized for periods less than one full year. |
| (5) | Computed by averaging month-end values within each period. |
| (6) | Leverage consists of outstanding borrowings under the revolving credit facility. |
| (7) | Computed by averaging daily net assets within each period. |
| Tortoise | 19 |
| Tortoise |
| Essential Assets Income Term Fund (TEAF) |
Fund description
TEAF seeks to provide a high level of total return with an emphasis on current distributions. TEAF provides investors access to a combination of public and direct investments in essential assets that are making an impact on clients and communities.
Fund performance
We are pleased with the performance of much of the fund’s portfolio; however continue to be frustrated with the volatility in the energy infrastructure allocation of the portfolio, which negatively impacted NAV during the last fiscal quarter. We continue to manage TEAF with a long-term focus and continue to believe the energy infrastructure companies in the fund will benefit from growing natural gas demand over the long and medium term and we have seen a strong rebound in early fiscal 2020. We continue to have conviction that TEAF’s investment strategy, investments in public and direct investments across social infrastructure, sustainable infrastructure and energy infrastructure, offers investors attractive total return potential while providing stable current income.
We continue to progress in transitioning the portfolio to the targeted allocation of 60% direct investments. As of Nov. 30, 2019, TEAF’s total direct investment commitments were approximately $87 million or 32% of the portfolio. Additionally, we are very pleased to have completed the fund’s allocation to direct sustainable infrastructure investments. The direct investment pipeline remains robust.
Public Energy Infrastructure
| ● | Energy infrastructure equities remained an underperformer during the fourth fiscal quarter, despite generally constructive 3Q earnings reports in October and November. |
| ● | Natural gas prices rebounded early in the fiscal quarter, but ultimately did not sustain the rally as growing natural gas supply has outpaced demand. |
| ● | Gathering and processing companies in the natural gas sector were the main performance detractors in the energy infrastructure sleeve as a result of the weaker natural gas prices and concerns around volume growth in 2020. |
| ● | Valuation of energy infrastructure companies are at all-time lows entering 2020 and we maintain conviction that the medium and long-term fundamentals of the group will drive cash flow higher in subsequent years. |
| ● | We continue to believe that equities will perform better as free cash flow generation in the sector is will inflect significantly higher in 2020 / 2021. |
Private Energy Infrastructure
| ● | TEAF funded a private investment in Mexico Pacific Limited, an LNG export facility on the pacific coast of Mexico, during the fiscal quarter. The facility is under development and expected to export 12 million tons per annum of U.S. shale gas to Asia. |
| ● | TEAF closed a private investment in public equity transaction (PIPE) during the fiscal quarter. The fund purchased $5.5 million of Noble Midstream Partners (NBLX) units. The investment was used by NBLX in a simplification transaction in which NBLX acquired 100% of its outstanding incentive distribution rights and all of Noble Energy’s (NBL) remaining midstream interests. |
| (unaudited) | |
| 20 | Tortoise |
| 2019 Annual Report| November 30, 2019 |
Public Sustainable Infrastructure
| ● | The fund’s global listed sustainable infrastructure securities performed extremely well during the fiscal quarter. |
| ● | An overweight position in UK utilities contributed to the strong performance. These securities outperformed ahead of the UK general elections as the risk of a Labour victory, which had weighed on sector over the past three years due to the party’s nationalization plan, faded away in the polls. |
| ● | Additionally, renewable-focused securities performed well, supported by continued value creation in the renewable value chain. Overall, investors seeking yield and exposure to clean electricity generators continued to value these assets at higher multiples. |
Private Sustainable Infrastructure
| ● | TEAF did not make any additional private sustainable infrastructure investments during the quarter as the fund previously reached its target allocation in private sustainable deals. |
| ● | To date, the fund has invested approximately $44 million in three entities. |
Social Infrastructure
| ● | TEAF completed a debt investment in The Cottages of Perry Hall during the fiscal quarter. The senior living facility is located in Parkville, MD, just outside of Baltimore and has 64 units. Since undergoing a management change in early 2018, the facility has recently reached 100% occupancy following renovations and a new operational plan. |
| ● | TEAF completed a debt investment in a private school in Fort Pierce, FL, during the fiscal quarter. The school, St. James Christian Academy, is using the proceeds to acquire and renovate one of the facilities it is currently leasing. The investment is expected to allow the school to increase enrollment from 700 students to more than 1,000 students within three years. |
| 2019 fiscal year highlights (since fund inception 3/26/2019) | ||
| Distributions paid per share (fiscal year 2019) | $0.7595 | |
| Distributions paid per share (4th quarter 2019) | $0.3255 | |
| Distribution rate (as of 11/30/2019) | 8.3% | |
| Quarter-over-quarter distribution increase | 0.0% | |
| Year-over-year distribution increase | 0.0% | |
| Cumulative distributions paid per share to stockholders since inception in March 2019 | $0.7595 | |
| Market-based total return | (18.5)% | |
| NAV-based total return | (8.0)% | |
| Premium (discount) to NAV (as of 11/30/2019) | (11.4)% |
Performance data quoted represent past performance; past performance does not guarantee future results. Like any other stock, total return and market value will fluctuate so that an investment, when sold, may be worth more or less than its original cost. Portfolio composition is subject to change due to ongoing management of the fund. References to specific securities or sectors should not be construed as a recommendation by the fund or its adviser. See Schedule of Investments for portfolio weighting at the end of the fiscal quarter.
| (unaudited) | |
| Tortoise | 21 |
| Tortoise |
| Essential Assets Income Term Fund (TEAF)(continued) |
Fund structure and distribution policy
The fund is structured to qualify as a Regulated Investment Company (RIC) allowing it to pass-through to shareholders income and capital gains earned, thus avoiding double-taxation. To qualify as a RIC, the fund must meet specific income, diversification and distribution requirements. Regarding income, at least 90 percent of the fund gross income must be from dividends, interest and capital gains. The fund must meet quarterly diversification requirements including the requirement that at least 50 percent of the assets be in cash, cash equivalents or other securities with each single issuer of other securities not greater than 5 percent of total assets. No more than 25 percent of total assets can be invested in any one issuer other than government securities or other RIC’s. The fund must also distribute at least 90 percent of its investment company income. RIC’s are also subject to excise tax rules which require RIC’s to distribute approximately 98 percent of net income and net capital gains to avoid a 4 percent excise tax.
The fund has adopted a distribution policy which intends to distribute an amount closely approximating the total taxable income for the year and, if so determined by the Board, distribute all or a portion of the return of capital paid by portfolio companies during the year. The fund may designate a portion of its distributions as capital gains and may also distribute additional capital gains in the last calendar quarter of the year to meet annual excise distribution requirements. Distribution amounts are subject to change from time to time at the discretion of the Board. Although the level of distributions is independent of the funds’ performance in the short term, the fund expects such distributions to correlate with its performance over time.
Distributable cash flow and distributions
DCF is income from investments less expenses. Income from investments includes the accrued interest from bonds, the amount received as cash or paid-in-kind distributions from investments and dividend payments on short-term investments. Income also includes the premiums received from sales of covered call options, net of amounts paid to buy back out-of-the-money options. The total expenses include current or anticipated operating expenses and leverage costs.
Income from investments decreased approximately 16.9% as compared to 3rd quarter 2019 due primarily to the impact of distribution timing differences quarter over quarter. Operating expenses, consisting primarily of fund advisory fees, increased slightly during the quarter. Total leverage costs decreased approximately 9.1% as compared to 3rd quarter 2019, primarily due to lower interest rates during the quarter. As a result of the changes in income and expenses, DCF decreased approximately 20.7% as compared to 3rd quarter 2019. In addition, the fund had net realized losses on investments of $9.2 million during 4th quarter 2019.
The fund paid monthly distributions of $0.1085 per share during 4th quarter 2019. The fund’s Board of Directors has declared monthly distributions of $0.1085 per share to be paid during1st quarter 2020. The fund has paid cumulative distributions to stockholders of $0.7595 per share since its inception in March 2019.
The Key Financial Data table discloses the calculation of DCF and should be read in conjunction with this discussion. The difference between income from investments in the DCF calculation and total investment income as reported in the Statement of Operations, is reconciled as follows: the Statement of Operations, in conformity with U.S. generally accepted accounting principles (GAAP), recognizes distributions and dividend income from MLPs, common stock and other investments on their ex-dates, whereas the DCF calculation may reflect distributions and dividend income on their pay dates; GAAP recognizes that a significant portion of the cash distributions received from MLPs, common stock and other investments are characterized as a return of capital and therefore excluded from investment income, whereas the DCF calculation includes the return of capital; income from investments in the DCF calculation includes the value of dividends paid-in-kind (additional stock or units), whereas such amounts may not be included as income for GAAP purposes. Net premiums on options written (premiums received less amounts paid to buy back out-of-the-money options) with expiration dates during fiscal quarter are included in the DCF calculation, whereas GAAP recognizes the net effect of options written as realized and unrealized gains (losses). The treatment of expenses in the DCF calculation also differs from what is reported in the Statement of Operations. Transaction costs related to acquiring certain investments in affiliated entities are included in cost basis of the investment for DCF purposes and amortized over a period of time.
“Net Investment Income (Loss)” on the Statement of Operations is adjusted as follows to reconcile to DCF for YTD 2019 and 4th quarter 2019 (in thousands):
| YTD 2019 | 4th Qtr 2019 | |||||
| Net Investment Income, | ||||||
| before Income Taxes | $ | 3,725 | $ | 172 | ||
| Adjustments to reconcile to DCF: | ||||||
| Distributions characterized | ||||||
| as return of capital | 3,965 | 1,400 | ||||
| Net premiums on options written | 5,368 | 1,762 | ||||
| Other | 649 | 649 | ||||
| DCF | $ | 13,707 | $ | 3,983 | ||
Leverage
The fund’s leverage utilization was relatively unchanged as compared to 3rd quarter 2019. The fund utilizes all floating rate leverage that had an interest rate of 2.50% and represented 11.8% of total assets at year-end. The fund has maintained compliance with its applicable coverage ratios. The interest rate on the fund’s leverage will vary in the future along with changing floating rates.
Please see the Financial Statements and Notes to Financial Statements for additional detail regarding critical accounting policies, results of operations, leverage and other important fund information.
For further information regarding the calculation of distributable cash flow and distributions to stockholders, as well as a discussion of the tax impact on distributions, please visit www.tortoiseadvisors.com.
| (unaudited) | |
| 22 | Tortoise |
| 2019 Annual Report| November 30, 2019 |
| TEAF Key Financial Data (supplemental unaudited information) |
| (dollar amounts in thousands unless otherwise indicated) |
The information presented below regarding Distributable Cash Flow and Selected Financial Information is supplemental non-GAAP financial information, which the fund believes is meaningful to understanding operating performance. The Distributable Cash Flow Ratios include the functional equivalent of EBITDA for non-investment companies, and the fund believes they are an important supplemental measure of performance and promote comparisons from period-to-period. This information is supplemental, is not inclusive of required financial disclosures (e.g. Total Expense Ratio), and should be read in conjunction with the full financial statements.
| Period from | ||||||||||||||||||||
| March 29, 2019(1) | ||||||||||||||||||||
| through | 2019 | |||||||||||||||||||
| November 30, 2019 | Q2(2) | Q3(2) | Q4(2) | |||||||||||||||||
| Total Income from Investments | ||||||||||||||||||||
| Interest earned on bonds and notes | $ | 3,109 | $ | 548 | $ | 1,164 | $ | 1,397 | ||||||||||||
| Distributions and dividends from investments, | ||||||||||||||||||||
| net of foreign taxes withheld | 9,616 | 3,805 | 3,576 | 2,235 | ||||||||||||||||
| Distributions paid in kind | 206 | — | 62 | 144 | ||||||||||||||||
| Net premiums on options written | 3,965 | 1,137 | 1,428 | 1,400 | ||||||||||||||||
| Total from investments | 16,896 | 5,490 | 6,230 | 5,176 | ||||||||||||||||
| Operating Expenses Before Leverage Costs | ||||||||||||||||||||
| Advisory fees | 2,099 | 546 | 792 | 761 | ||||||||||||||||
| Other operating expenses | 470 | 102 | 165 | 203 | ||||||||||||||||
| 2,569 | 648 | 957 | 964 | |||||||||||||||||
| Distributable cash flow before leverage costs | 14,327 | 4,842 | 5,273 | 4,212 | ||||||||||||||||
| Leverage costs(3) | 620 | 139 | 252 | 229 | ||||||||||||||||
| Distributable Cash Flow(4) | $ | 13,707 | $ | 4,703 | $ | 5,021 | $ | 3,983 | ||||||||||||
| Net realized loss on investments and foreign | ||||||||||||||||||||
| currency translation, for the period | $ | (12,936 | ) | $ | (71 | ) | $ | (3,168 | ) | $ | (9,697 | ) | ||||||||
| As a percent of average total assets(5) | ||||||||||||||||||||
| Total from investments | 8.89 | % | 11.25 | % | 8.65 | % | 7.46 | % | ||||||||||||
| Operating expenses before leverage costs | 1.35 | % | 1.33 | % | 1.33 | % | 1.39 | % | ||||||||||||
| Distributable cash flow before leverage costs | 7.54 | % | 9.92 | % | 7.32 | % | 6.07 | % | ||||||||||||
| As a percent of average net assets(5) | ||||||||||||||||||||
| Total from investments | 9.90 | % | 12.01 | % | 9.73 | % | 8.49 | % | ||||||||||||
| Operating expenses before leverage costs | 1.51 | % | 1.42 | % | 1.50 | % | 1.58 | % | ||||||||||||
| Leverage costs | 0.36 | % | 0.30 | % | 0.39 | % | 0.38 | % | ||||||||||||
| Distributable cash flow | 8.03 | % | 10.29 | % | 7.84 | % | 6.53 | % | ||||||||||||
| Selected Financial Information | ||||||||||||||||||||
| Distributions paid on common stock | $ | 10,247 | $ | 1,464 | $ | 4,391 | $ | 4,392 | ||||||||||||
| Distributions paid on common stock per share | 0.7595 | 0.1085 | 0.3255 | 0.3255 | ||||||||||||||||
| Total assets, end of period | 271,915 | 288,040 | 276,736 | 271,915 | ||||||||||||||||
| Average total assets during period(6) | 280,814 | 278,413 | 285,731 | 278,477 | ||||||||||||||||
| Leverage(7) | 32,000 | 31,500 | 31,500 | 32,000 | ||||||||||||||||
| Leverage as a percent of total assets | 11.8 | % | 10.9 | % | 11.4 | % | 11.8 | % | ||||||||||||
| Net unrealized depreciation, end of period | (15,821 | ) | (15,131 | ) | (22,549 | ) | (15,821 | ) | ||||||||||||
| Net assets, end of period | 237,461 | 255,534 | 243,882 | 237,461 | ||||||||||||||||
| Average net assets during period(8) | 252,217 | 260,772 | 253,916 | 244,483 | ||||||||||||||||
| Net asset value per common share | 17.60 | 18.94 | 18.08 | 17.60 | ||||||||||||||||
| Market value per common share | 15.60 | 18.45 | 16.25 | 15.60 | ||||||||||||||||
| Shares outstanding (000’s) | 13,491 | 13,491 | 13,491 | 13,491 | ||||||||||||||||
| (1) | Commencement of operations. |
| (2) | Q2 represents the period from March 29, 2019 (commencement of operations) through May 31, 2019. Q3 represents the period from June through August. Q4 represents the period from September through November. |
| (3) | Leverage costs include interest expense and other recurring leverage expenses. |
| (4) | “Net investment income (loss)” on the Statement of Operations is adjusted as follows to reconcile to Distributable Cash Flow (“DCF”): increased by the return of capital on distributions and the net premiums on options written and decreased by amortization on certain investments. |
| (5) | Annualized. |
| (6) | Computed by averaging month-end values within each period. |
| (7) | Leverage consists of outstanding borrowings under the margin loan facility. |
| (8) | Computed by averaging daily net assets within each period. |
| Tortoise | 23 |
| TYG Consolidated Schedule of Investments |
| November 30, 2019 |
| Shares | Fair Value | ||||
| Master Limited Partnerships — 126.4%(1) | |||||
| Crude Oil Pipelines — 18.2%(1) | |||||
| United States — 18.2%(1) | |||||
| BP Midstream Partners LP | 248,258 | $ | 3,624,567 | ||
| Genesis Energy L.P. | 621,847 | 11,821,312 | |||
| PBF Logistics LP | 856,856 | 17,522,705 | |||
| Plains All American Pipeline, L.P. | 4,497,553 | 78,257,422 | |||
| Shell Midstream Partners, L.P. | 2,940,946 | 57,818,998 | |||
| 169,045,004 | |||||
| Natural Gas/Natural Gas Liquids Pipelines — 38.4%(1) | |||||
| United States — 38.4%(1) | |||||
| Cheniere Energy Partners LP | 300,314 | 11,673,205 | |||
| DCP Midstream, LP | 2,268,264 | 47,883,053 | |||
| Energy Transfer LP(2) | 13,261,563 | 156,619,059 | |||
| Enterprise Products Partners L.P. | 5,353,209 | 140,896,461 | |||
| 357,071,778 | |||||
| Natural Gas Gathering/Processing — 22.4%(1) | |||||
| United States — 22.4%(1) | |||||
| CNX Midstream Partners LP | 2,621,599 | 38,013,186 | |||
| Enable Midstream Partners LP | 2,023,704 | 18,597,840 | |||
| EQM Midstream Partners, LP | 2,612,476 | 60,531,069 | |||
| Hess Midstream Partners LP | 647,635 | 13,244,136 | |||
| Noble Midstream Partners LP(3) | 432,663 | 8,406,642 | |||
| Western Midstream Partners, LP | 3,939,053 | 69,839,410 | |||
| 208,632,283 | |||||
| Other — 0.5%(1) | |||||
| United States — 0.5%(1) | |||||
| Westlake Chemical Partners LP | 206,837 | 4,589,713 | |||
| Refined Product Pipelines — 46.9%(1) | |||||
| United States — 46.9%(1) | |||||
| Holly Energy Partners, L.P. | 2,356,962 | 52,701,670 | |||
| Magellan Midstream Partners, L.P. | 2,112,028 | 123,490,277 | |||
| MPLX LP | 5,177,155 | 122,439,716 | |||
| NuStar Energy L.P.(4) | 2,518,020 | 71,058,524 | |||
| Phillips 66 Partners LP | 1,193,614 | 66,520,108 | |||
| 436,210,295 | |||||
| Total Master Limited Partnerships | |||||
| (Cost $1,246,716,130) | 1,175,549,073 | ||||
| Common Stock — 37.5%(1) | |||||
| Crude Oil Pipelines — 1.5%(1) | |||||
| Canada — 1.5%(1) | |||||
| Enbridge Inc. | 353,090 | 13,417,420 | |||
| Marine Transportation — 1.6%(1) | |||||
| Monaco — 1.6%(1) | |||||
| GasLog Partners LP | 1,039,959 | 15,131,403 | |||
| Natural Gas Gathering/Processing — 17.9%(1) | |||||
| United States — 17.9%(1) | |||||
| Antero Midstream Corporation | 6,010,622 | 27,528,649 | |||
| EnLink Midstream, LLC | 4,396,866 | 20,885,114 | |||
| Rattler Midstream LP | 3,643 | 57,960 | |||
| Targa Resources Corp. | 1,766,097 | 64,515,523 | |||
| The Williams Companies, Inc. | 2,359,522 | 53,608,340 | |||
| 166,595,586 | |||||
| Natural Gas/Natural Gas Liquids Pipelines — 16.5%(1) | |||||
| United States — 16.5%(1) | |||||
| Kinder Morgan Inc. | 2,224,608 | 43,624,563 | |||
| ONEOK, Inc.(4) | 907,868 | 64,504,021 | |||
| Tallgrass Energy, LP | 2,532,731 | 45,361,212 | |||
| 153,489,796 | |||||
| Total Common Stock | |||||
| (Cost $432,533,338) | 348,634,205 | ||||
| Preferred Stock — 11.4%(1) | |||||
| Crude Oil Pipelines — 0.8%(1) | |||||
| United States — 0.8%(1) | |||||
| SemGroup Corporation, 7.000%(3)(5)(6) | 6,277 | 6,948,972 | |||
| Natural Gas/Natural Gas Liquids Pipelines — 8.1%(1) | |||||
| United States — 8.1%(1) | |||||
| Altus Midstream Company | |||||
| Preferred(3)(5)(7) | 10,072 | 10,421,842 | |||
| Crestwood Equity Partners LP, 9.25% | 7,126,640 | 65,422,555 | |||
| 75,844,397 | |||||
| Natural Gas Gathering/Processing — 2.5%(1) | |||||
| United States — 2.5%(1) | |||||
| Targa Resources Corp., 9.500%(3)(5) | 21,758 | 23,242,766 | |||
| Total Preferred Stock | |||||
| (Cost $102,238,517) | 106,036,135 | ||||
| See accompanying Notes to Financial Statements. | |
| 24 | Tortoise |
| 2019 Annual Report| November 30, 2019 |
| TYG Consolidated Schedule of Investments (continued) |
| November 30, 2019 |
| Principal Amount/ Shares | Fair Value | ||||||
| Corporate Bonds — 2.2%(1) | |||||||
| Refined Product Pipelines — 2.2%(1) | |||||||
| United States — 2.2%(1) | |||||||
| Buckeye Partners, | |||||||
| 5.600%, 10/15/2044 | $ | 3,000,000 | $ | 2,514,676 | |||
| Buckeye Partners, | |||||||
| 5.850%, 11/15/2043 | 21,000,000 | 17,928,501 | |||||
| 20,443,177 | |||||||
| Total Corporate Bonds | |||||||
| (Cost $20,600,197) | 20,443,177 | ||||||
| Private Investments — 1.5%(1) | |||||||
| Renewables — 1.5%(1) | |||||||
| United States — 1.5%(1) | |||||||
| TK NYS Solar Holdco, LLC(3)(5)(8)(9) | |||||||
| (Cost $53,481,470) | N/A | 14,093,091 | |||||
| Short-Term Investment — 0.0%(1) | |||||||
| United States Investment Company — 0.0%(1) | |||||||
| Invesco Government & Agency Portfolio — Institutional Class, | |||||||
| 1.53%(10)(Cost $221,598) | 221,598 | 221,598 | |||||
| Total Investments — 179.0%(1) | |||||||
| (Cost $1,855,791,250) | 1,664,977,279 | ||||||
| Interest Rate Swap Contracts — (0.0)%(1) | |||||||
| $10,000,000 notional — net unrealized depreciation(11) | (161,840 | ) | |||||
| Total Value of Options Written | |||||||
| (Premiums received $127,576)(12)— (0.0)%(1) | (63,728 | ) | |||||
| Other Assets and Liabilities — 0.6%(1) | 5,905,971 | ||||||
| Deferred Tax Liability — (12.5)%(1) | (116,472,157 | ) | |||||
| Credit Facility Borrowings — (10.1)%(1) | (93,900,000 | ) | |||||
| Senior Notes — (39.2)%(1) | (365,000,000 | ) | |||||
| Mandatory Redeemable Preferred Stock | |||||||
| at Liquidation Value — (17.8)%(1) | (165,000,000 | ) | |||||
| Total Net Assets Applicable to | |||||||
| Common Stockholders — 100.0%(1) | $ | 930,285,525 | |||||
| (1) | Calculated as a percentage of net assets applicable to common stockholders. |
| (2) | A portion of the security is segregated as collateral for the unrealized depreciation of interest rate swap contracts of $161,840. |
| (3) | Restricted securities have a total fair value of $63,113,313, which represents 6.8% of net assets. See Note 6 to the financial statements for further disclosure. |
| (4) | All or a portion of the security represents cover for outstanding call option contracts written. |
| (5) | Securities have been valued by using significant unobservable inputs in accordance with fair value procedures and are categorized as level 3 investments, as more fully described in Note 2 to the financial statements. |
| (6) | Security distributions are paid-in-kind. Cash value of the 7.0% coupon is added to the liquidation preference of the preferred stock. |
| (7) | Security distributions are paid-in-kind. Cash value of the 7.0% coupon is paid in the form of additional shares. |
| (8) | Deemed to be an affiliate of the fund. |
| (9) | See Affiliated Company Transactions Note 7 and Basis For Consolidation Note 13 to the financial statements for further disclosure. |
| (10) | Rate indicated is the current yield as of November 30, 2019. |
| (11) | See Schedule of Interest Rate Swap Contracts and Note 12 to the financial statements for further disclosure. |
| (12) | See Schedule of Options Written and Note 12 to the financial statements for further disclosure. |
| See accompanying Notes to Financial Statements. | |
| Tortoise | 25 |
| NTG Schedule of Investments |
| November 30, 2019 |
| Shares | Fair Value | ||||
| Master Limited Partnerships — 123.7%(1) | |||||
| Crude Oil Pipelines — 22.9%(1) | |||||
| United States — 22.9%(1) | |||||
| BP Midstream Partners LP | 885,663 | $ | 12,930,680 | ||
| Delek Logistics Partners, LP | 481,177 | 15,455,405 | |||
| Genesis Energy L.P. | 447,697 | 8,510,720 | |||
| PBF Logistics LP | 1,043,763 | 21,344,953 | |||
| Plains All American Pipeline, L.P. | 3,010,839 | 52,388,599 | |||
| Shell Midstream Partners, L.P. | 2,164,800 | 42,559,968 | |||
| 153,190,325 | |||||
| Natural Gas/Natural Gas Liquids Pipelines — 37.9%(1) | |||||
| United States — 37.9%(1) | |||||
| Cheniere Energy Partners LP | 217,634 | 8,459,434 | |||
| DCP Midstream, LP | 1,693,902 | 35,758,271 | |||
| Energy Transfer LP | 9,403,483 | 111,055,134 | |||
| Enterprise Products Partners L.P. | 3,723,147 | 97,993,229 | |||
| 253,266,068 | |||||
| Natural Gas Gathering/Processing — 22.3%(1) | |||||
| United States — 22.3%(1) | |||||
| CNX Midstream Partners, LP | 2,374,388 | 34,428,626 | |||
| Enable Midstream Partners LP | 2,192,047 | 20,144,912 | |||
| EQM Midstream Partners, LP | 1,843,746 | 42,719,595 | |||
| Hess Midstream Partners LP | 429,313 | 8,779,451 | |||
| Noble Midstream Partners LP | 238,293 | 4,968,409 | |||
| Noble Midstream Partners LP(2) | 302,100 | 5,869,803 | |||
| Western Midstream Partners, LP | 1,791,794 | 31,768,508 | |||
| 148,679,304 | |||||
| Refined Product Pipelines — 39.9%(1) | |||||
| United States — 39.9%(1) | |||||
| Holly Energy Partners, L.P. | 1,640,761 | 36,687,416 | |||
| Magellan Midstream Partners, L.P. | 953,724 | 55,764,242 | |||
| MPLX LP | 3,818,007 | 90,295,865 | |||
| NuStar Energy L.P.(3) | 1,619,666 | 45,706,974 | |||
| Phillips 66 Partners LP | 676,333 | 37,692,038 | |||
| 266,146,535 | |||||
| Other — 0.7%(1) | |||||
| United States — 0.7%(1) | |||||
| Westlake Chemical Partners LP | 212,224 | 4,709,251 | |||
| Total Master Limited Partnerships | |||||
| (Cost $905,758,462) | 825,991,483 | ||||
| Common Stock — 37.2%(1) | |||||
| Crude Oil Pipelines — 1.7%(1) | |||||
| Canada — 1.7%(1) | |||||
| Enbridge Inc. | 295,200 | 11,217,600 | |||
| Marine Transportation — 1.5%(1) | |||||
| Monaco — 1.5%(1) | |||||
| GasLog Partners, LP | 713,490 | 10,381,279 | |||
| Natural Gas Gathering/Processing — 18.2%(1) | |||||
| United States — 18.2%(1) | |||||
| Antero Midstream Corporation | 4,392,612 | 20,118,163 | |||
| EnLink Midstream, LLC | 3,180,848 | 15,109,028 | |||
| Rattler Midstream LP | 2,771 | 44,087 | |||
| Targa Resources Corp. | 1,145,479 | 41,844,348 | |||
| The Williams Companies, Inc. | 1,951,699 | 44,342,601 | |||
| 121,458,227 | |||||
| Natural Gas/Natural Gas Liquids Pipelines — 15.8%(1) | |||||
| United States — 15.8%(1) | |||||
| Kinder Morgan Inc. | 1,407,434 | 27,599,781 | |||
| ONEOK, Inc.(3) | 543,433 | 38,610,915 | |||
| Tallgrass Energy, LP | 2,199,921 | 39,400,585 | |||
| 105,611,281 | |||||
| Total Common Stock | |||||
| (Cost $313,416,148) | 248,668,387 | ||||
| Preferred Stock — 10.5%(1) | |||||
| Crude Oil Pipelines — 0.6%(1) | |||||
| United States — 0.6%(1) | |||||
| SemGroup Corporation, 7.000%(2)(4)(5) | 3,763 | 4,165,840 | |||
| Natural Gas Gathering/Processing — 2.0%(1) | |||||
| United States — 2.0%(1) | |||||
| Targa Resources Corp., 9.500%(2)(4) | 12,252 | 13,088,076 | |||
| Natural Gas/Natural Gas Liquids Pipelines — 7.9%(1) | |||||
| United States — 7.9%(1) | |||||
| Altus Midstream Company Preferred(2)(4)(6) | 7,202 | 7,451,871 | |||
| Crestwood Equity Partners LP, 9.25% | 4,898,611 | 44,969,249 | |||
| 52,421,120 | |||||
| Total Preferred Stock | |||||
| (Cost $67,525,396) | 69,675,036 | ||||
| See accompanying Notes to Financial Statements. | |
| 26 | Tortoise |
| 2019 Annual Report| November 30, 2019 |
| NTG Schedule of Investments (continued) |
| November 30, 2019 |
| �� | Principal Amount/ Shares | Fair Value | |||||
| Corporate Bonds — 2.0%(1) | |||||||
| Refined Product Pipelines — 2.0%(1) | |||||||
| United States — 2.0%(1) | |||||||
| Buckeye Partners, | |||||||
| 5.600%, 10/15/2044 | $ | 5,000,000 | $ | 4,191,127 | |||
| Buckeye Partners, | |||||||
| 5.850%, 11/15/2043 | 10,950,000 | 9,348,433 | |||||
| 13,539,560 | |||||||
| Total Corporate Bonds | |||||||
| (Cost $13,577,852) | 13,539,560 | ||||||
| Short-Term Investment — 0.1%(1) | |||||||
| United States Investment Company — 0.1%(1) | |||||||
| First American Government Obligations Fund, | |||||||
| 1.56%(7)(Cost $300,953) | 300,953 | 300,953 | |||||
| Total Investments — 173.5%(1) | |||||||
| (Cost $1,300,578,811) | 1,158,175,419 | ||||||
| Total Value of Options Written | |||||||
| (Premiums received $115,174)(8)— (0.0)%(1) | (45,245 | ) | |||||
| Other Assets and Liabilities — 0.0%(1) | 70,482 | ||||||
| Deferred Tax Liability — (4.2)%(1) | (27,892,485 | ) | |||||
| Credit Facility Borrowings — (8.0)%(1) | (53,600,000 | ) | |||||
| Senior Notes — (41.5)%(1) | (277,000,000 | ) | |||||
| Mandatory Redeemable Preferred Stock | |||||||
| at Liquidation Value — (19.8)%(1) | (132,000,000 | ) | |||||
| Total Net Assets Applicable to | |||||||
| Common Stockholders — 100.0%(1) | $ | 667,708,171 | |||||
| (1) | Calculated as a percentage of net assets applicable to common stockholders. |
| (2) | Restricted securities have a total fair value of $30,575,590, which represents 4.6% of net assets. See Note 6 to the financial statements for further disclosure. |
| (3) | All or a portion of the security represents cover for outstanding call option contracts written. |
| (4) | Securities have been valued by using significant unobservable inputs in accordance with fair value procedures and are categorized as level 3 investments, as more fully described in Note 2 to the financial statements. |
| (5) | Security distributions are paid-in-kind. Cash value of the 7.0% coupon is added to the liquidation preference of the preferred stock. |
| (6) | Security distributions are paid-in-kind. Cash value of the 7.0% coupon is paid in the form of additional shares. |
| (7) | Rate indicated is the current yield as of November 30, 2019. |
| (8) | See Schedule of Options Written and Note 12 to the financial statements for further disclosure. |
| See accompanying Notes to Financial Statements. | |
| Tortoise | 27 |
| TTP Schedule of Investments |
| November 30, 2019 |
| Shares | Fair Value | ||||
| Common Stock — 104.6%(1) | |||||
| Marine Transportation — 1.3%(1) | |||||
| Monaco — 1.3%(1) | |||||
| GasLog Partners LP | 111,052 | $ | 1,615,807 | ||
| Crude Oil Pipelines — 40.5%(1) | |||||
| Canada — 26.2%(1) | |||||
| Gibson Energy Inc | 188,122 | 3,534,988 | |||
| Enbridge Inc. | 488,750 | 18,572,500 | |||
| Inter Pipeline Ltd. | 324,250 | 5,370,398 | |||
| Pembina Pipeline Corporation | 187,888 | 6,560,450 | |||
| United States — 14.3%(1) | |||||
| Plains GP Holdings, L.P. | 870,553 | 15,208,561 | |||
| SemGroup Corporation | 222,097 | 3,413,631 | |||
| 52,660,528 | |||||
| Natural Gas Gathering/Processing — 15.7%(1) | |||||
| United States — 15.7%(1) | |||||
| Antero Midstream Corporation | 671,725 | 3,076,500 | |||
| EnLink Midstream, LLC | 662,363 | 3,146,224 | |||
| Equitrans Midstream Corporation | 397,483 | 3,962,906 | |||
| Rattler Midstream LP | 13 | 207 | |||
| Targa Resources Corp. | 280,249 | 10,237,496 | |||
| 20,423,333 | |||||
| Natural Gas/Natural Gas Liquids Pipelines — 37.3%(1) | |||||
| Canada — 7.0%(1) | |||||
| Keyera Corp. | 82,825 | 2,020,898 | |||
| TC Energy Corporation | 137,605 | 7,008,223 | |||
| United States — 30.3%(1) | |||||
| Kinder Morgan Inc. | 303,779 | 5,957,105 | |||
| ONEOK, Inc. | 226,372 | 16,083,731 | |||
| Tallgrass Energy LP | 456,220 | 8,170,900 | |||
| The Williams Companies, Inc. | 402,880 | 9,153,434 | |||
| 48,394,291 | |||||
| Oil and Gas Production — 8.8%(1) | |||||
| United States — 8.8%(1) | |||||
| Cabot Oil & Gas Corporation(2) | 75,600 | 1,205,064 | |||
| Cimarex Energy Co.(2) | 13,200 | 606,804 | |||
| Concho Resources Inc.(2) | 8,400 | 609,504 | |||
| Continental Resources, Inc.(2) | 19,700 | 608,336 | |||
| Diamondback Energy, Inc.(2) | 6,400 | 494,976 | |||
| EOG Resources, Inc.(2) | 15,500 | 1,098,950 | |||
| EQT Corporation(2) | 50,400 | 439,992 | |||
| Noble Energy, Inc.(2) | 57,400 | 1,191,624 | |||
| Parsley Energy, Inc.(2) | 37,500 | 561,750 | |||
| Pioneer Natural Resources Company(2) | 9,900 | 1,265,616 | |||
| Viper Energy Partners LP(2) | 89,600 | 2,125,312 | |||
| WPX Energy, Inc.(2)(3) | 120,700 | 1,187,688 | |||
| 11,395,616 | |||||
| Power — 1.0%(1) | |||||
| United States — 1.0%(1) | |||||
| NextEra Energy Partners, LP | 25,349 | 1,346,792 | |||
| Total Common Stock | |||||
| (Cost $169,549,566) | 135,836,367 | ||||
| Master Limited Partnerships — 36.0%(1) | |||||
| Crude Oil Pipelines — 4.3%(1) | |||||
| United States — 4.3%(1) | |||||
| BP Midstream Partners LP | 33,891 | 494,809 | |||
| Genesis Energy L.P. | 46,531 | 884,554 | |||
| PBF Logistics LP | 78,278 | 1,600,785 | |||
| Shell Midstream Partners, L.P. | 132,089 | 2,596,870 | |||
| 5,577,018 | |||||
| Natural Gas/Natural Gas Liquids Pipelines — 13.1%(1) | |||||
| United States — 13.1%(1) | |||||
| DCP Midstream, LP | 89,185 | 1,882,695 | |||
| Energy Transfer LP | 958,093 | 11,315,078 | |||
| Enterprise Products Partners L.P. | 145,209 | 3,821,901 | |||
| 17,019,674 | |||||
| Natural Gas Gathering/Processing — 2.9%(1) | |||||
| United States — 2.9%(1) | |||||
| CNX Midstream Partners LP | 60,605 | 878,773 | |||
| EQM Midstream Partners, LP | 16,045 | 371,763 | |||
| Noble Midstream Partners LP(4) | 24,065 | 467,583 | |||
| Western Midstream Partners, LP | 114,429 | 2,028,826 | |||
| 3,746,945 | |||||
| Other — 0.2%(1) | |||||
| United States — 0.2%(1) | |||||
| Westlake Chemical Partners LP | 11,004 | 244,179 | |||
| Refined Product Pipelines — 15.5%(1) | |||||
| United States — 15.5%(1) | |||||
| Holly Energy Partners, L.P. | 162,052 | 3,623,483 | |||
| Magellan Midstream Partners, L.P. | 57,108 | 3,339,105 | |||
| MPLX LP | 265,910 | 6,288,771 | |||
| NuStar Energy L.P. | 135,021 | 3,810,293 | |||
| Phillips 66 Partners LP | 56,933 | 3,172,876 | |||
| 20,234,528 | |||||
| Total Master Limited Partnerships | |||||
| (Cost $52,089,151) | 46,822,344 | ||||
| See accompanying Notes to Financial Statements. | |
| 28 | Tortoise |
| 2019 Annual Report| November 30, 2019 |
| TTP Schedule of Investments (continued) |
| November 30, 2019 |
| Shares | Fair Value | |||||
| Preferred Stock — 7.2%(1) | ||||||
| Crude Oil Pipelines — 2.5%(1) | ||||||
| United States — 2.5%(1) | ||||||
| SemGroup Corporation., 7.000%(4)(5)(6) | 2,877 | $ | 3,184,991 | |||
| Natural Gas/Natural Gas Liquids Pipelines — 0.4%(1) | ||||||
| United States — 0.4%(1) | ||||||
| Altus Midstream Company, 7.000%(4)(5)(7) | 535 | 553,634 | ||||
| Natural Gas Gathering/Processing — 1.7%(1) | ||||||
| United States — 1.7%(1) | ||||||
| Targa Resources Corp., 9.500%(4)(5) | 2,108 | 2,251,850 | ||||
| Power — 2.6%(1) | ||||||
| United States — 2.6%(1) | ||||||
| Sempra Energy, 6.000%, 01/15/2021 | 28,811 | 3,397,105 | ||||
| Total Preferred Stock | ||||||
| (Cost $8,118,326) | 9,387,580 | |||||
| Short-Term Investment — 0.2%(1) | ||||||
| United States Investment Company — 0.2%(1) | ||||||
| Invesco Government & Agency Portfolio — Institutional Class, | ||||||
| 1.53%(8)(Cost $236,602) | 236,602 | 236,602 | ||||
| Total Investments — 148.0%(1) | ||||||
| (Cost $229,993,645) | 192,282,893 | |||||
| Total Value of Options Written | ||||||
| (Premiums received $225,578)(9)— (0.0)%(1) | (83,438 | ) | ||||
| Other Assets and Liabilities — (0.4)%(1) | (512,894 | ) | ||||
| Credit Facility Borrowings — (9.1)%(1) | (11,800,000 | ) | ||||
| Senior Notes — (26.2)%(1) | (34,000,000 | ) | ||||
| Mandatory Redeemable Preferred Stock | ||||||
| at Liquidation Value — (12.3)%(1) | (16,000,000 | ) | ||||
| Total Net Assets Applicable to | ||||||
| Common Stockholders — 100.0%(1) | $ | 129,886,561 | ||||
| (1) | Calculated as a percentage of net assets applicable to common stockholders. |
| (2) | All or a portion of the security represents cover for outstanding call option contracts written. |
| (3) | Non-income producing security. |
| (4) | Restricted securities have a total fair value of $6,458,058, which represents 5.0% of net assets. See Note 6 to the financial statements for further disclosure. |
| (5) | Securities have been valued by using significant unobservable inputs in accordance with fair value procedures and are categorized as level 3 investments, as more fully described in Note 2 to the financial statements. |
| (6) | Security distributions are paid-in-kind. Cash value of the 7.0% coupon is added to the liquidation preference of the preferred stock. |
| (7) | Security distributions are paid-in-kind. Cash value of the 7.0% coupon is paid in the form of additional shares. |
| (8) | Rate indicated is the current yield as of November 30, 2019. |
| (9) | See Schedule of Options Written and Note 12 to the financial statements for further disclosure. |
| See accompanying Notes to Financial Statements. | |
| Tortoise | 29 |
| NDP Schedule of Investments (unaudited) |
| November 30, 2019 |
| Shares | Fair Value | |||||
| Common Stock — 130.7%(1) | ||||||
| Marine Transportation — 2.2%(1) | ||||||
| Monaco — 2.2%(1) | ||||||
| GasLog Partners LP | 91,843 | $ | 1,336,316 | |||
| Natural Gas/Natural Gas Liquids Pipelines — 10.7%(1) | ||||||
| United States — 10.7%(1) | ||||||
| Cheniere Energy, Inc.(2) | 64,300 | 3,892,722 | ||||
| The Williams Companies, Inc. | 117,774 | 2,675,825 | ||||
| 6,568,547 | ||||||
| Natural Gas Gathering/Processing — 3.9%(1) | ||||||
| United States — 3.9%(1) | ||||||
| Equitrans Midstream Corporation | 188,304 | 1,877,391 | ||||
| Targa Resources Corp. | 14,000 | 511,420 | ||||
| 2,388,811 | ||||||
| Oil and Gas Production — 79.6%(1) | ||||||
| United States — 79.6%(1) | ||||||
| Cabot Oil & Gas Corporation | 293,600 | 4,679,984 | ||||
| Cimarex Energy Co.(3) | 57,500 | 2,643,275 | ||||
| Concho Resources Inc.(3) | 67,300 | 4,883,288 | ||||
| Continental Resources, Inc.(3) | 95,600 | 2,952,128 | ||||
| Diamondback Energy, Inc.(3) | 64,400 | 4,980,696 | ||||
| EOG Resources, Inc.(3) | 74,000 | 5,246,600 | ||||
| EQT Corporation(3) | 263,000 | 2,295,990 | ||||
| Marathon Oil Corporation(3) | 263,300 | 3,067,445 | ||||
| Noble Energy, Inc.(3) | 177,600 | 3,686,976 | ||||
| Parsley Energy, Inc.(3) | 267,800 | 4,011,644 | ||||
| Pioneer Natural Resources Company(3) | 38,800 | 4,960,192 | ||||
| Range Resources Corporation(3) | 691,000 | 2,411,590 | ||||
| WPX Energy, Inc.(2)(3) | 325,100 | 3,198,984 | ||||
| 49,018,792 | ||||||
| Oilfield Services — 1.1%(1) | ||||||
| United States — 1.1%(1) | ||||||
| Chart Industries, Inc.(2) | 12,417 | 685,418 | ||||
| Power/Utility — 6.7%(1) | ||||||
| United States — 6.7%(1) | ||||||
| NextEra Energy, Inc. | 17,700 | 4,138,614 | ||||
| Refining — 26.5%(1) | ||||||
| United States — 26.5%(1) | ||||||
| Delek US Holdings, Inc.(3) | 117,700 | 4,038,287 | ||||
| Marathon Petroleum Corporation(3) | 124,900 | 7,573,936 | ||||
| Valero Energy Corporation(3) | 49,200 | 4,698,108 | ||||
| 16,310,331 | ||||||
| Total Common Stock | ||||||
| (Cost $101,644,511) | 80,446,829 | |||||
| Master Limited Partnerships — 9.0%(1) | ||||||
| Natural Gas/Natural Gas Liquids Pipelines — 7.9%(1) | ||||||
| United States — 7.9%(1) | ||||||
| Energy Transfer LP | 274,437 | 3,241,101 | ||||
| Enterprise Products Partners L.P. | 60,652 | 1,596,361 | ||||
| 4,837,462 | ||||||
| Natural Gas Gathering/Processing — 1.1%(1) | ||||||
| United States — 1.1%(1) | ||||||
| Noble Midstream Partners LP(4) | 37,208 | 722,952 | ||||
| Total Master Limited Partnerships | ||||||
| (Cost $6,188,272) | 5,560,414 | |||||
| Preferred Stock — 3.5%(1) | ||||||
| Natural Gas Gathering/Processing — 3.5%(1) | ||||||
| United States — 3.5%(1) | ||||||
| Targa Resources Corp., 9.500%(4)(5) | ||||||
| (Cost $1,688,542) | 1,997 | 2,133,275 | ||||
| Short-Term Investment — 0.5%(1) | ||||||
| United States Investment Company — 0.5%(1) | ||||||
| Invesco Government & Agency Portfolio — Institutional Class, | ||||||
| 1.53%(6)(Cost $299,161) | 299,161 | 299,161 | ||||
| Total Investments — 143.7%(1) | ||||||
| (Cost $109,820,486) | 88,439,679 | |||||
| Total Value of Options Written | ||||||
| (Premiums received $534,008)(7)— (0.3)%(1) | (179,348 | ) | ||||
| Other Assets and Liabilities — (0.3)%(1) | (209,996 | ) | ||||
| Credit Facility Borrowings — (43.1)%(1) | (26,500,000 | ) | ||||
| Total Net Assets Applicable to | ||||||
| Common Stockholders — 100.0%(1) | $ | 61,550,335 | ||||
| (1) | Calculated as a percentage of net assets applicable to common stockholders. |
| (2) | Non-income producing security. |
| (3) | All or a portion of the security represents cover for outstanding call option contracts written. |
| (4) | Restricted securities have a total fair value of $2,856,227, which represents 4.6% of net assets. See Note 6 to the financial statements for further disclosure. |
| (5) | Securities have been valued by using significant unobservable inputs in accordance with fair value procedures and are categorized as level 3 investments, as more fully described in Note 2 to the financial statements. |
| (6) | Rate indicated is the current yield as of November 30, 2019. |
| (7) | See Schedule of Options Written and Note 12 to the financial statements for further disclosure. |
| See accompanying Notes to Financial Statements. | |
| 30 | Tortoise |
| 2019 Annual Report| November 30, 2019 |
| TPZ Schedule of Investments |
| November 30, 2019 |
| Principal Amount | Fair Value | |||||
| Corporate Bonds — 78.7%(1) | ||||||
| Crude Oil Pipelines — 12.1%(1) | ||||||
| Canada — 7.0%(1) | ||||||
| Enbridge Inc., | ||||||
| 5.500%, 07/15/2077 | $ | 8,500,000 | $ | 8,712,500 | ||
| United States — 5.1%(1) | ||||||
| SemGroup Corp., | ||||||
| 6.375%, 03/15/2025 | 6,000,000 | 6,255,000 | ||||
| 14,967,500 | ||||||
| Natural Gas/Natural Gas Liquids Pipelines — 40.9%(1) | ||||||
| Canada — 6.8%(1) | ||||||
| TransCanada Corporation, | ||||||
| 5.625%, 05/20/2075 | 7,000,000 | 7,311,220 | ||||
| TransCanada Corporation, | ||||||
| 5.300%, 03/15/2077 | 1,000,000 | 1,021,860 | ||||
| United States — 34.1%(1) | ||||||
| Antero Midstream Partners LP, | ||||||
| 5.750%, 03/01/2027 | 2,000,000 | 1,580,000 | ||||
| Cheniere Corp., | ||||||
| 7.000%, 06/30/2024 | 4,000,000 | 4,589,360 | ||||
| Cheniere Corp., | ||||||
| 5.875%, 03/31/2025 | 2,000,000 | 2,235,400 | ||||
| Kinder Morgan, Inc., | ||||||
| 6.500%, 09/15/2020 | 4,000,000 | 4,134,680 | ||||
| Florida Gas Transmission Co., LLC, | ||||||
| 5.450%, 07/15/2020(2) | 1,500,000 | 1,529,010 | ||||
| NGPL PipeCo LLC, | ||||||
| 4.875%, 08/15/2027(2) | 2,000,000 | 2,119,517 | ||||
| ONEOK, Inc., | ||||||
| 4.250%, 02/01/2022 | 4,500,000 | 4,667,097 | ||||
| ONEOK, Inc., | ||||||
| 7.500%, 09/01/2023 | 2,000,000 | 2,336,000 | ||||
| Rockies Express Pipeline LLC, | ||||||
| 4.950%, 07/15/2029(2) | 3,000,000 | 2,890,545 | ||||
| Ruby Pipeline, LLC, | ||||||
| 6.000%, 04/01/2022(2) | 1,102,273 | 1,140,775 | ||||
| Southern Star Central Corp., | ||||||
| 5.125%, 07/15/2022(2) | 3,000,000 | 3,030,000 | ||||
| Tallgrass Energy LP, | ||||||
| 5.500%, 01/15/2028(2) | 3,250,000 | 3,006,315 | ||||
| The Williams Companies, Inc., | ||||||
| 7.875%, 09/01/2021 | 5,000,000 | 5,463,531 | ||||
| The Williams Companies, Inc., | ||||||
| 4.550%, 06/24/2024 | 3,000,000 | 3,211,480 | ||||
| 50,266,790 | ||||||
| Natural Gas Gathering/Processing — 9.0%(1) | ||||||
| United States — 9.0%(1) | ||||||
| Blue Racer Midstream, LLC, | ||||||
| 6.625%, 07/15/2026(2) | 5,900,000 | 5,103,500 | ||||
| EnLink Midstream LLC, | ||||||
| 5.375%, 06/01/2029 | 2,000,000 | 1,694,400 | ||||
| Hess Corporation, | ||||||
| 5.625%, 02/15/2026(2) | 4,160,000 | 4,326,400 | ||||
| 11,124,300 | ||||||
| Oil and Gas Production — 2.3%(1) | ||||||
| United States — 2.3%(1) | ||||||
| Ascent Resources Utica Holdings, LLC, | ||||||
| 10.000%, 04/01/2022(2) | 1,302,000 | 1,249,920 | ||||
| Ascent Resources Utica Holdings, LLC, | ||||||
| 7.000%, 11/01/2026 | 2,000,000 | 1,540,000 | ||||
| 2,789,920 | ||||||
| Power/Utility — 13.0%(1) | ||||||
| United States — 13.0%(1) | ||||||
| The AES Corporation, | ||||||
| 5.500%, 04/15/2025 | 4,000,000 | 4,144,800 | ||||
| Duquesne Light Holdings, Inc., | ||||||
| 6.400%, 09/15/2020(2) | 3,000,000 | 3,090,538 | ||||
| Duquesne Light Holdings, Inc., | ||||||
| 5.900%, 12/01/2021(2) | 2,000,000 | 2,127,572 | ||||
| NextEra Energy, Inc., | ||||||
| 4.800%, 12/01/2077 | 4,500,000 | 4,584,186 | ||||
| NV Energy Inc., | ||||||
| 6.250%, 11/15/2020 | 1,000,000 | 1,039,556 | ||||
| Pattern Energy Group Inc., | ||||||
| 5.875%, 02/01/2024(2) | 1,000,000 | 1,030,000 | ||||
| 16,016,652 | ||||||
| Refined Product Pipelines — 1.4%(1) | ||||||
| United States — 1.4%(1) | ||||||
| Buckeye Partners, | ||||||
| 5.850%, 11/15/2043 | 2,000,000 | 1,707,476 | ||||
| Total Corporate Bonds | ||||||
| (Cost $95,495,122) | 96,872,638 | |||||
| See accompanying Notes to Financial Statements. | |
| Tortoise | 31 |
| TPZ Schedule of Investments (continued) |
| November 30, 2019 |
| Shares | Fair Value | ||||
| Master Limited Partnerships — 32.8%(1) | |||||
| Crude Oil Pipelines — 3.1%(1) | |||||
| United States — 3.1%(1) | |||||
| BP Midstream Partners LP | 25,000 | $ | 365,000 | ||
| PBF Logistics LP | 85,868 | 1,756,001 | |||
| Shell Midstream Partners, L.P. | 89,044 | 1,750,605 | |||
| 3,871,606 | |||||
| Natural Gas/Natural Gas Liquids Pipelines — 10.6%(1) | |||||
| United States — 10.6%(1) | |||||
| DCP Midstream, LP | 96,758 | 2,042,561 | |||
| Energy Transfer LP | 717,787 | 8,477,065 | |||
| Enterprise Products Partners L.P. | 98,682 | 2,597,310 | |||
| 13,116,936 | |||||
| Natural Gas Gathering/Processing — 3.5%(1) | |||||
| United States — 3.5%(1) | |||||
| CNX Midstream Partners, LP | 47,302 | 685,879 | |||
| EQM Midstream Partners, LP | 8,010 | 185,592 | |||
| Noble Midstream Partners LP(2) | 21,975 | 426,974 | |||
| Western Midstream Partners, LP | 166,907 | 2,959,261 | |||
| 4,257,706 | |||||
| Other — 0.2%(1) | |||||
| United States — 0.2%(1) | |||||
| Westlake Chemical Partners LP | 9,289 | 206,123 | |||
| Refined Product Pipelines — 15.4%(1) | |||||
| United States — 15.4%(1) | |||||
| Holly Energy Partners, L.P. | 136,327 | 3,048,272 | |||
| Magellan Midstream Partners, L.P. | 56,119 | 3,281,278 | |||
| MPLX LP(3) | 312,118 | 7,381,592 | |||
| NuStar Energy L.P. | 102,338 | 2,887,978 | |||
| Phillips 66 Partners LP | 41,654 | 2,321,377 | |||
| 18,920,497 | |||||
| Total Master Limited Partnerships | |||||
| (Cost $44,187,560) | 40,372,868 | ||||
| Common Stock — 25.6%(1) | |||||
| Crude Oil Pipelines — 6.2%(1) | |||||
| United States — 6.2%(1) | |||||
| Enbridge Inc. | 47,888 | 1,819,744 | |||
| Plains GP Holdings, L.P. | 331,453 | 5,790,484 | |||
| 7,610,228 | |||||
| Marine Transportation — 1.0%(1) | |||||
| Monaco — 1.0%(1) | |||||
| GasLog Partners LP | 86,675 | 1,261,121 | |||
| Natural Gas/Natural Gas Liquids Pipelines — 7.8%(1) | |||||
| United States — 7.8%(1) | |||||
| ONEOK, Inc. | 69,117 | 4,910,763 | |||
| Tallgrass Energy LP | 264,052 | 4,729,171 | |||
| 9,639,934 | |||||
| Natural Gas Gathering/Processing — 8.8%(1) | |||||
| United States — 8.8%(1) | |||||
| Antero Midstream Corporation | 444,931 | 2,037,784 | |||
| EnLink Midstream, LLC | 259,598 | 1,233,091 | |||
| Equitrans Midstream Corporation | 145,093 | 1,446,577 | |||
| Targa Resources Corp. | 166,023 | 6,064,820 | |||
| 10,782,272 | |||||
| Power — 1.8%(1) | |||||
| United States — 1.8%(1) | |||||
| DTE Energy Company | 17,229 | 2,152,591 | |||
| Total Common Stock | |||||
| (Cost $37,437,512) | 31,446,146 | ||||
| See accompanying Notes to Financial Statements. | |
| 32 | Tortoise |
| 2019 Annual Report| November 30, 2019 |
| TPZ Schedule of Investments (continued) |
| November 30, 2019 |
| Shares | Fair Value | |||||
| Preferred Stock — 5.8%(1) | ||||||
| Crude Oil Pipelines — 1.9%(1) | ||||||
| United States — 1.9%(1) | ||||||
| SemGroup Corporation, 7.000%(2)(4)(5) | 2,120 | $ | 2,346,952 | |||
| Natural Gas Gathering/Processing — 1.5%(1) | ||||||
| United States — 1.5%(1) | ||||||
| Targa Resources Corp., 9.500%(2)(4) | 1,685 | 1,799,984 | ||||
| Natural Gas Liquids Pipelines — 0.4%(1) | ||||||
| United States — 0.4%(1) | ||||||
| Altus Midstream Company, 7.000%(2)(4)(6) | 467 | 482,845 | ||||
| Power — 2.0%(1) | ||||||
| United States — 2.0%(1) | ||||||
| Sempra Energy, | ||||||
| 6.000%, 01/15/2021 | 21,189 | 2,498,395 | ||||
| Total Preferred Stock | ||||||
| (Cost $6,161,716) | 7,128,176 | |||||
| Short-Term Investment — 0.2%(1) | ||||||
| United States Investment Company — 0.2%(1) | ||||||
| Invesco Government & Agency Portfolio — Institutional Class, | ||||||
| 1.53%(7)(Cost $244,583) | 244,583 | 244,583 | ||||
| Total Investments — 143.1%(1) | ||||||
| (Cost $183,526,493) | 176,064,411 | |||||
| Interest Rate Swap Contracts — 0.0%(1) | ||||||
| $3,000,000 notional — net unrealized depreciation(8) | (8,589 | ) | ||||
| Other Assets and Liabilities — 0.9%(1) | 1,059,108 | |||||
| Credit Facility Borrowings — (44.0)%(1) | (54,100,000 | ) | ||||
| Total Net Assets Applicable to | ||||||
| Common Stockholders — 100.0%(1) | $ | 123,014,930 | ||||
| (1) | Calculated as a percentage of net assets applicable to common stockholders. |
| (2) | Restricted securities have a total fair value of $35,700,847 which represents 29.0% of net assets. See Note 6 to the financial statements for further disclosure. |
| (3) | A portion of the security is segregated as collateral for the unrealized depreciation of interest rate swap contracts of $8,589. |
| (4) | Securities have been valued by using significant unobservable inputs in accordance with fair value procedures and are categorized as level 3 investments, as more fully described in Note 2 to the financial statements. |
| (5) | Security distributions are paid-in-kind. Cash value of the 7.0% coupon is added to the liquidation preference of the preferred stock. |
| (6) | Security distributions are paid-in-kind. Cash value of the 7.0% coupon is paid in the form of additional shares. |
| (7) | Rate indicated is the current yield as of November 30, 2019. |
| (8) | See Schedule of Interest Rate Swap Contracts and Note 12 to the financial statements for further disclosure. |
| See accompanying Notes to Financial Statements. | |
| Tortoise | 33 |
| TEAF Consolidated Schedule of Investments |
| November 30, 2019 |
| Shares | Fair Value | ||||
| Common Stock — 45.2%(1) | |||||
| Natural Gas/Natural Gas Liquids Pipelines — 8.2%(1) | |||||
| Italy — 1.7%(1) | |||||
| Snam SpA(2) | 823,467 | $ | 4,093,700 | ||
| United States — 6.5%(1) | |||||
| Cheniere Energy Inc.(2)(3) | 82,600 | 5,000,604 | |||
| ONEOK, Inc.(4) | 46,732 | 3,320,309 | |||
| Tallgrass Energy LP(2) | 325,146 | 5,823,365 | |||
| The Williams Companies, Inc.(4) | 53,628 | 1,218,428 | |||
| 19,456,406 | |||||
| Natural Gas Gathering/Processing — 3.6%(1) | |||||
| United States — 3.6%(1) | |||||
| Targa Resources Corp.(2) | 232,101 | 8,478,650 | |||
| Oil and Gas Production — 5.3%(1) | |||||
| United States — 5.3%(1) | |||||
| Cabot Oil & Gas Corporation(2) | 211,800 | 3,376,092 | |||
| Cimarex Energy Co.(2) | 44,100 | 2,027,277 | |||
| EQT Corporation(2) | 273,300 | 2,385,909 | |||
| Noble Energy, Inc.(2) | 230,500 | 4,785,180 | |||
| 12,574,458 | |||||
| Other — 1.1%(1) | |||||
| Australia — 1.1%(1) | |||||
| Spark Infrastructure Group | 1,734,851 | 2,546,385 | |||
| Power — 18.5%(1) | |||||
| Australia — 0.7%(1) | |||||
| APA Group | 235,760 | 1,754,143 | |||
| Canada — 1.4%(1) | |||||
| Algonquin Power & Utilities Corp | 233,452 | 3,274,268 | |||
| France — 2.0%(1) | |||||
| Engie SA | 310,111 | 4,906,506 | |||
| Italy — 2.3%(1) | |||||
| Enel SpA(2) | 741,420 | 5,600,616 | |||
| Portugal — 3.9%(1) | |||||
| EDP — Energias de Portugal SA | 1,330,915 | 5,381,671 | |||
| REN — Redes Energeticas Nacionais | |||||
| SGPS SA | 1,237,890 | 3,778,005 | |||
| Spain — 1.4%(1) | |||||
| Iberdrola SA | 344,100 | 3,384,851 | |||
| United States — 2.0%(1) | |||||
| Covanta Holding Corp(4) | 316,092 | 4,649,713 | |||
| United Kingdom — 4.8%(1) | |||||
| National Grid PLC(2) | 524,577 | 6,036,007 | |||
| SSE PLC(2) | 311,504 | 5,237,257 | |||
| 44,003,037 | |||||
| Renewables — 6.0%(1) | |||||
| Canada — 3.5%(1) | |||||
| Innergex Renewable Energy Inc | 295,054 | 3,805,070 | |||
| TransAlta Renewables Inc | 389,060 | 4,402,298 | |||
| United States — 2.5%(1) | |||||
| Pattern Energy Group Inc A(4) | 160,244 | 4,409,915 | |||
| TerraForm Power Inc(5)(6) | 105,909 | 1,642,649 | |||
| 14,259,932 | |||||
| Water Infrastructure — 2.5%(1) | |||||
| France — 0.6%(1) | |||||
| Suez | 94,620 | 1,400,623 | |||
| United Kingdom — 1.9%(1) | |||||
| Pennon Group PLC | 292,218 | 3,446,662 | |||
| Pentair PLC(2) | 23,375 | 1,036,681 | |||
| 5,883,966 | |||||
| Total Common Stock | |||||
| (Cost $112,039,913) | 107,202,834 | ||||
| Master Limited Partnerships — 18.9%(1) | |||||
| Natural Gas/Natural Gas Liquids Pipelines — 7.6%(1) | |||||
| United States — 7.6%(1) | |||||
| DCP Midstream, LP(4) | 134,027 | 2,829,310 | |||
| Energy Transfer LP(4) | 574,030 | 6,779,294 | |||
| Enterprise Products Partners L.P.(4) | 321,504 | 8,461,985 | |||
| 18,070,589 | |||||
| Natural Gas Gathering/Processing — 6.3%(1) | |||||
| United States — 6.3%(1) | |||||
| EQM Midstream Partners, LP(4) | 199,732 | 4,627,790 | |||
| Noble Midstream Partners LP(4) | 110,620 | 2,306,427 | |||
| Noble Midstream Partners LP(7) | 265,040 | 5,149,727 | |||
| Western Midstream Partners, LP(4) | 157,122 | 2,785,773 | |||
| 14,869,717 | |||||
| Other — 2.5%(1) | |||||
| United States — 2.5%(1) | |||||
| Enviva Partners LP(4) | 175,439 | 6,063,172 | |||
| Renewables — 2.5%(1) | |||||
| Canada — 2.5%(1) | |||||
| Brookfield Renewable Partners LP(4) | 125,345 | 5,846,854 | |||
| Total Master Limited Partnerships | |||||
| (Cost $52,916,846) | 44,850,332 | ||||
| See accompanying Notes to Financial Statements. | |
| 34 | Tortoise |
| 2019 Annual Report| November 30, 2019 |
| TEAF Consolidated Schedule of Investments (continued) |
| November 30, 2019 |
| Principal | ||||||
| Amount | Fair Value | |||||
| Corporate Bonds — 13.5%(1) | ||||||
| Crude Oil Pipelines — 2.9%(1) | ||||||
| Canada — 2.9%(1) | ||||||
| Enbridge Inc, | ||||||
| 6.250%, 03/01/2078(4) | $ | 4,000,000 | $ | 4,290,000 | ||
| Genesis Energy LP / Genesis | ||||||
| Energy Finance Corp, | ||||||
| 6.250%, 05/15/2026(4) | 3,000,000 | 2,615,415 | ||||
| 6,905,415 | ||||||
| Healthcare — 2.3%(1) | ||||||
| United States — 2.3%(1) | ||||||
| Grace Commons Property, | ||||||
| 15.000%, 10/31/2021(7) | 1,825,000 | 1,825,000 | ||||
| Grace Commons Property, | ||||||
| 8.000%, 10/31/2021(7) | 3,650,000 | 3,650,000 | ||||
| 5,475,000 | ||||||
| Natural Gas/Natural Gas Liquids Pipelines — 1.7%(1) | ||||||
| Canada — 1.7%(1) | ||||||
| TransCanada Corporation, | ||||||
| 5.300%, 03/15/2077(4) | 4,000,000 | 4,087,440 | ||||
| Natural Gas Gathering/Processing — 2.3%(1) | ||||||
| United States — 2.3%(1) | ||||||
| Antero Midstream Partners LP, | ||||||
| 5.750%, 01/15/2028(4)(7) | 3,750,000 | 2,896,875 | ||||
| Blue Racer Midstream, LLC, | ||||||
| 6.625%, 07/15/2026(4)(7) | 3,000,000 | 2,595,000 | ||||
| 5,491,875 | ||||||
| Oil and Gas Production — 3.3%(1) | ||||||
| United States — 3.3%(1) | ||||||
| Ascent Resources Utica Holdings, LLC, | ||||||
| 7.000%, 11/01/2026(4) | 3,500,000 | 2,695,000 | ||||
| Southwestern Energy Co, | ||||||
| 7.750%, 10/01/2027(4) | 3,000,000 | 2,606,250 | ||||
| Southwestern Energy Co, | ||||||
| 7.500%, 04/01/2026(4) | 3,000,000 | 2,628,750 | ||||
| 7,930,000 | ||||||
| Senior Living — 1.0%(1) | ||||||
| United States — 1.0%(1) | ||||||
| Realco Perry Hall, | ||||||
| 10.000%, 10/01/2024(7) | 2,280,000 | 2,279,850 | ||||
| Total Corporate Bonds | ||||||
| (Cost $33,575,781) | 32,169,580 | |||||
| Principal | ||||||
| Amount/Shares | ||||||
| Preferred Bonds — 4.9%(1) | ||||||
| Natural Gas Gathering/Processing — 0.6%(1) | ||||||
| United States — 0.6%(1) | ||||||
| EnLink Midstream Partners LP, | ||||||
| 6.000%, Perpetuity | $ | 3,000,000 | 1,500,000 | |||
| Natural Gas/Natural Gas Liquids Pipelines — 4.3%(1) | ||||||
| United States — 4.3%(1) | ||||||
| DCP Midstream LP, | ||||||
| 7.375% Perpetuity(4) | 5,000,000 | 4,775,000 | ||||
| Energy Transfer Operating LP, | ||||||
| 6.250%, Perpetuity(4) | 6,000,000 | 5,400,000 | ||||
| 10,175,000 | ||||||
| Total Preferred Bonds | ||||||
| (Cost $13,149,496) | 11,675,000 | |||||
| Term Loan — 0.3%(1) | ||||||
| Education — 0.3%(1) | ||||||
| United States — 0.3%(1) | ||||||
| The Village Charter School, Inc., | ||||||
| 10.000%, 12/15/2021 | ||||||
| (Cost $800,000) | 800,000 | 800,000 | ||||
| Preferred Stock — 6.1%(1) | ||||||
| Natural Gas/Natural Gas Liquids Pipelines — 2.4%(1) | ||||||
| United States — 2.4%(1) | ||||||
| Crestwood Equity Partners LP, 9.25%(4) | 161,120 | 1,479,082 | ||||
| Altus Midstream Company | ||||||
| Preferred(7)(8)(9) | 4,148 | 4,291,720 | ||||
| 5,770,802 | ||||||
| Natural Gas Gathering/Processing — 1.8%(1) | ||||||
| United States — 1.8%(1) | ||||||
| Targa Resources Corp., 9.500%(7)(8) | 4,000 | 4,272,960 | ||||
| Power/Utility — 1.3%(1) | ||||||
| United States — 1.3%(1) | ||||||
| Aqua America Inc., | ||||||
| 6.000%, 04/30/2022 | 50,000 | 2,975,500 | ||||
| Renewables — 0.6%(1) | ||||||
| United States — 0.6%(1) | ||||||
| NextEra Energy Partners LP | 29,410 | 1,460,207 | ||||
| Total Preferred Stock | ||||||
| (Cost $13,881,284) | 14,479,469 | |||||
| See accompanying Notes to Financial Statements. | |
| Tortoise | 35 |
| TEAF Consolidated Schedule of Investments (continued) |
| November 30, 2019 |
| Principal | |||||||
| Amount/Shares | Fair Value | ||||||
| Private Investments — 17.2%(1) | |||||||
| Natural Gas/Natural Gas Liquids Pipelines — 0.8%(1) | |||||||
| Mexico — 0.8%(1) | |||||||
| Mexico Pacific Limited LLC | |||||||
| Series A(7)(8) | 88,889 | $ | 2,000,000 | ||||
| Renewables — 16.4%(1) | |||||||
| United States — 16.4%(1) | |||||||
| Renewable Holdco, LLC(7)(8)(10) | N/A | 12,497,810 | |||||
| Renewable Holdco I, LLC(7)(8)(10) | N/A | 25,400,059 | |||||
| Renewable Holdco II, LLC(7)(8)(10) | N/A | 987,905 | |||||
| 38,885,774 | |||||||
| Total Private Investments | |||||||
| (Cost $41,278,372) | 40,885,774 | ||||||
| Municipal Bonds — 5.4%(1) | |||||||
| Florida — 0.3%(1) | |||||||
| Florida Development Finance Corp, | |||||||
| 10.000%, 07/01/2025 | 445,000 | 445,036 | |||||
| (Obligor: Athenian Academy, | |||||||
| Inc. — Series B) | |||||||
| Public Finance Authority Educational | |||||||
| Facility Revenue, | |||||||
| 12.000%, 10/01/2029 | 185,000 | 183,539 | |||||
| (Obligor: St. James Christian | |||||||
| Academy, Inc.) | |||||||
| 628,575 | |||||||
| Pennsylvania — 1.3%(1) | |||||||
| Philadelphia Authority for Industrial | |||||||
| Development, | |||||||
| 10.000%, 06/15/2030 | 3,135,000 | 3,161,679 | |||||
| (Obligor: MaST Community | |||||||
| Charter School III) | |||||||
| Wisconsin — 3.8%(1) | |||||||
| Public Finance Authority, | |||||||
| 9.000%, 06/01/2029 | 8,925,000 | 8,954,096 | |||||
| (Obligor: Vonore Fiber Products) | |||||||
| �� | |||||||
| Total Municipal Bonds | |||||||
| (Cost $12,690,000) | 12,744,350 | ||||||
| Construction Note — 1.5%(1) | |||||||
| Renewables — 1.5%(1) | |||||||
| Bermuda — 1.5%(1) | |||||||
| Saturn Solar Bermuda 1 Ltd., | |||||||
| 6.000%, 02/28/2020 | |||||||
| (Cost $3,770,670)(7)(8) | 3,510,000 | 3,516,669 | |||||
| Short-Term Investment — 0.2%(1) | |||||||
| United States Investment Company — 0.2%(1) | |||||||
| First American Government Obligations Fund, | |||||||
| 1.56%(11)(Cost $410,126) | 410,126 | 410,126 | |||||
| Total Investments — 113.2%(1) | |||||||
| (Cost $284,512,488) | 268,734,134 | ||||||
| Total Value of Options Written | |||||||
| (Premiums received $570,114)(12)— (0.1)%(1) | (288,066 | ) | |||||
| Forward Currency Contracts — (0.2)%(1) | |||||||
| $7,357,919 notional — net unrealized depreciation(6) | (320,491 | ) | |||||
| Deferred Tax Asset — 0.2%(1) | 418,970 | ||||||
| Other Assets and Liabilities — 0.4%(1) | 916,131 | ||||||
| Credit Facility Borrowings — (13.5)%(1) | (32,000,000 | ) | |||||
| Total Net Assets Applicable to | |||||||
| Common Stockholders — 100.0%(1) | $ | 237,460,678 | |||||
| (1) | Calculated as a percentage of net assets applicable to common stockholders. |
| (2) | All or a portion of the security represents cover for outstanding call option contracts written. |
| (3) | Non-income producing security. |
| (4) | All or a portion of the security is segregated as collateral for the margin borrowing facility. See Note 11 to the financial statements for further disclosure. |
| (5) | All or a portion of the security is segregated as collateral for forward currency contracts. |
| (6) | See Schedule of Forward Currency Contracts and Note 12 to the financial statements for further disclosure. |
| (7) | Restricted securities have a total fair value of $71,363,575 which represents 30.1% of net assets. See Note 7 to the financial statements for further disclosure. |
| (8) | Securities have been valued by using significant unobservable inputs in accordance with fair value procedures and are categorized as level 3 investments, as more fully described in Note 2 to the financial statements. |
| (9) | Security distributions are paid-in-kind. Cash value of the 7.0% coupon is paid in the form of additional shares. |
| (10) | Deemed to be an affiliate of the fund. See Notes 7 and 13 to the financial statements for further disclosure. |
| (11) | Rate indicated is the current yield as of November 30, 2019. |
| (12) | See Schedule of Options Written and Note 12 to the financial statements for further disclosure. |
| See accompanying Notes to Financial Statements. | |
| 36 | Tortoise |
| 2019 Annual Report| November 30, 2019 |
| Schedule of Interest Rate Swap Contracts |
| November 30, 2019 |
| TYG | |||||||||||||
| Fixed Rate | Floating Rate | ||||||||||||
| Maturity | Notional | Paid by | Received by | Unrealized | |||||||||
| Counterparty | Date | Amount | TYG | TYG | Depreciation | ||||||||
| The Bank of Nova Scotia | 09/02/2021 | $ | 10,000,000 | 2.381% | 1-month U.S. Dollar LIBOR | $ | (161,840 | ) | |||||
| TPZ | |||||||||||||
| Fixed Rate | Floating Rate | ||||||||||||
| Maturity | Notional | Paid by | Received by | Unrealized | |||||||||
| Counterparty | Date | Amount | TPZ | TPZ | Depreciation | ||||||||
| Wells Fargo Bank, N.A. | 08/06/2020 | $ | 3,000,000 | 2.180% | 3-month U.S. Dollar LIBOR | $ | (8,589 | ) | |||||
Schedule of Forward Currency Contracts
November 30, 2019
| TEAF | Contract Amount | |||||||||
| Unrealized | ||||||||||
| Counterparty | Settlement Date | Purchases (000’s) | Sales (000’s) | Depreciation | ||||||
| Morgan Stanley & Co. LLC | 12/16/19 | USD 7,358 | GBP 5,687 | $ | (320,491 | ) | ||||
USD = U.S. Dollars
GBP = British Pounds
| See accompanying Notes to Financial Statements. | |
| Tortoise | 37 |
| Schedule of Options Written |
| November 30, 2019 |
| TYG | ||||||||||||||
| Call Options Written | Expiration Date | Strike Price | Contracts | Notional Value | Fair Value | |||||||||
| NuStar Energy LP | December 2019 | $ | 29.00 | 1,450 | $ | 4,205,000 | $ | (1,853 | ) | |||||
| ONEOK, Inc. | December 2019 | 73.50 | 1,125 | 8,268,750 | (39,375 | ) | ||||||||
| ONEOK, Inc. | December 2019 | 74.00 | 1,125 | 8,325,000 | (22,500 | ) | ||||||||
| Total Value of Call Options Written(Premiums received $127,576) | $ | 20,798,750 | $ | (63,728 | ) | |||||||||
| NTG | ||||||||||||||
| Call Options Written | Expiration Date | Strike Price | Contracts | Notional Value | Fair Value | |||||||||
| NuStar Energy LP | December 2019 | $ | 29.00 | 2,050 | $ | 5,945,000 | $ | (2,620 | ) | |||||
| ONEOK, Inc. | December 2019 | 73.50 | 775 | 5,696,250 | (27,125 | ) | ||||||||
| ONEOK, Inc. | December 2019 | 74.00 | 775 | 5,735,000 | (15,500 | ) | ||||||||
| Total Value of Call Options Written(Premiums received $115,174) | $ | 17,376,250 | $ | (45,245 | ) | |||||||||
| TTP | ||||||||||||||
| Call Options Written | Expiration Date | Strike Price | Contracts | Notional Value | Fair Value | |||||||||
| Cabot Oil & Gas Corporation | December 2019 | $ | 19.15 | 756 | $ | 1,447,740 | $ | (429 | ) | |||||
| Cimarex Energy Co. | December 2019 | 49.30 | 132 | 650,760 | (11,207 | ) | ||||||||
| Concho Resources Inc. | December 2019 | 77.75 | 84 | 653,100 | (7,986 | ) | ||||||||
| Continental Resources, Inc. | December 2019 | 33.65 | 197 | 662,905 | (8,882 | ) | ||||||||
| Diamondback Energy, Inc. | December 2019 | 85.00 | 64 | 544,000 | (4,160 | ) | ||||||||
| EOG Resources, Inc. | December 2019 | 78.50 | 155 | 1,216,750 | (5,873 | ) | ||||||||
| EQT Corporation | December 2019 | 10.90 | 504 | 549,360 | (3,834 | ) | ||||||||
| Noble Energy, Inc. | December 2019 | 22.10 | 574 | 1,268,540 | (17,173 | ) | ||||||||
| Parsley Energy, Inc. | December 2019 | 17.20 | 375 | 645,000 | (2,774 | ) | ||||||||
| Pioneer Natural Resources Company | December 2019 | 142.00 | 99 | 1,405,800 | (6,088 | ) | ||||||||
| Viper Energy Partners LP | December 2019 | 26.70 | 896 | 2,392,320 | (2,962 | ) | ||||||||
| WPX Energy, Inc. | December 2019 | 11.00 | 1,207 | 1,327,700 | (12,070 | ) | ||||||||
| Total Value of Call Options Written(Premiums received $225,578) | $ | 12,763,975 | $ | (83,438 | ) | |||||||||
| NDP | ||||||||||||||
| Call Options Written | Expiration Date | Strike Price | Contracts | Notional Value | Fair Value | |||||||||
| Cimarex Energy Co. | December 2019 | $ | 54.00 | 575 | $ | 3,105,000 | $ | (11,067 | ) | |||||
| Concho Resources Inc. | December 2019 | 83.00 | 673 | 5,585,900 | (19,565 | ) | ||||||||
| Continental Resources, Inc. | December 2019 | 35.50 | 956 | 3,393,800 | (18,322 | ) | ||||||||
| Delek US Holdings, Inc. | December 2019 | 40.00 | 1,177 | 4,708,000 | (17,655 | ) | ||||||||
| Diamondback Energy, Inc. | December 2019 | 90.00 | 644 | 5,796,000 | (14,168 | ) | ||||||||
| EOG Resources, Inc. | December 2019 | 85.00 | 740 | 6,290,000 | (4,810 | ) | ||||||||
| EQT Corporation | December 2019 | 12.00 | 2,630 | 3,156,000 | (7,890 | ) | ||||||||
| Marathon Petroleum Corporation | December 2019 | 70.85 | 1,249 | 8,849,165 | (2,840 | ) | ||||||||
| Noble Energy, Inc. | December 2019 | 24.55 | 1,776 | 4,360,080 | (5,087 | ) | ||||||||
| Parsley Energy, Inc. | December 2019 | 18.30 | 2,678 | 4,900,740 | (6,160 | ) | ||||||||
| Pioneer Natural Resources Company | December 2019 | 153.00 | 388 | 5,936,400 | (6,496 | ) | ||||||||
| Range Resources Corporation | December 2019 | 4.35 | 6,910 | 3,005,850 | (53,475 | ) | ||||||||
| Valero Energy Corporation | December 2019 | 110.00 | 492 | 5,412,000 | (984 | ) | ||||||||
| WPX Energy, Inc. | December 2019 | 11.60 | 3,251 | 3,771,160 | (10,829 | ) | ||||||||
| Total Value of Call Options Written(Premiums received $534,008) | $ | 68,270,095 | $ | (179,348 | ) | |||||||||
| See accompanying Notes to Financial Statements. | |
| 38 | Tortoise |
| 2019 Annual Report| November 30, 2019 |
| Schedule of Options Written (continued) |
| November 30, 2019 |
| TEAF | ||||||||||||||
| Call Options Written | Expiration Date | Strike Price | Contracts | Notional Value | Fair Value | |||||||||
| USD | ||||||||||||||
| Cabot Oil & Gas Corporation | December 2019 | $ | 19.00 | 2,118 | $ | 4,024,200 | $ | (10,590 | ) | |||||
| Cheniere Energy Inc. | December 2019 | 66.00 | 826 | 5,451,600 | (11,462 | ) | ||||||||
| Cimarex Energy Co. | December 2019 | 50.45 | 441 | 2,224,845 | (26,593 | ) | ||||||||
| EQT Corporation | December 2019 | 11.00 | 2,733 | 3,006,300 | (27,330 | ) | ||||||||
| Noble Energy, Inc. | December 2019 | 21.40 | 2,305 | 4,932,700 | (118,819 | ) | ||||||||
| Pentair PLC | December 2019 | 45.00 | 233 | 1,048,500 | (11,650 | ) | ||||||||
| Tallgrass Energy LP | December 2019 | 19.50 | 1,626 | 3,170,700 | (173 | ) | ||||||||
| Tallgrass Energy LP | December 2019 | 20.00 | 1,625 | 3,250,000 | (20,313 | ) | ||||||||
| Targa Resources Corp. | December 2019 | 42.00 | 2,321 | 9,748,200 | (11,605 | ) | ||||||||
| Euro | ||||||||||||||
| Enel SpA | December 2019 | 7.10 | 1,482 | 5,796,653 | (13,798 | ) | ||||||||
| Snam SpA | December 2019 | 4.80 | 700 | 3,702,031 | (2,160 | ) | ||||||||
| GBP | ||||||||||||||
| National Grid PLC | December 2019 | 9.50 | 524 | 6,438,012 | (27,107 | ) | ||||||||
| SSE PLC | December 2019 | 14.00 | 250 | 4,526,525 | (6,466 | ) | ||||||||
| Total Value of Call Options Written(Premiums received $570,114) | $ | 57,320,266 | $ | (288,066 | ) | |||||||||
| See accompanying Notes to Financial Statements. | |
| Tortoise | 39 |
| Statements of Assets & Liabilities |
| November 30, 2019 |
| Tortoise Energy | Tortoise | |||||
| Infrastructure | Midstream Energy | |||||
| Corp.(1) | Fund, Inc. | |||||
| Assets | ||||||
| Investments in unaffiliated securities at fair value(2) | $ | 1,650,884,188 | $ | 1,158,175,419 | ||
| Investments in affiliated securities at fair value(3) | 14,093,091 | — | ||||
| Cash | — | — | ||||
| Receivable for Adviser fee waiver | — | — | ||||
| Receivable for investments sold | 2,344,925 | 2,291,436 | ||||
| Receivable for premiums on options written | — | — | ||||
| Unrealized appreciation of interest rate swap contracts, net | — | — | ||||
| Unrealized appreciation of forward currency contracts | — | — | ||||
| Dividends, distributions and interest receivable from investments | 626,441 | 395,119 | ||||
| Tax reclaims receivable | — | — | ||||
| Escrow receivable | 814,669 | — | ||||
| Current tax asset | 11,138,214 | 2,319,733 | ||||
| Deferred tax asset | — | — | ||||
| Prepaid expenses and other assets | 843,210 | 317,842 | ||||
| Total assets | 1,680,744,738 | 1,163,499,549 | ||||
| Liabilities | ||||||
| Call options written, at fair value(4) | 63,728 | 45,245 | ||||
| Payable to Adviser | 2,933,283 | 2,054,385 | ||||
| Accrued directors’ fees and expenses | 45,305 | 39,133 | ||||
| Payable for investments purchased | — | — | ||||
| Accrued expenses and other liabilities | 8,186,415 | 3,822,708 | ||||
| Unrealized depreciation of interest rate swap contracts | 161,840 | — | ||||
| Unrealized depreciation of forward currency contracts | — | — | ||||
| Current tax liability | — | — | ||||
| Deferred tax liability | 116,472,157 | 27,892,485 | ||||
| Credit facility borrowings | 93,900,000 | 53,600,000 | ||||
| Senior notes, net(5) | 364,563,653 | 276,743,681 | ||||
| Mandatory redeemable preferred stock, net(6) | 164,132,832 | 131,593,741 | ||||
| Total liabilities | 750,459,213 | 495,791,378 | ||||
| Net assets applicable to common stockholders | $ | 930,285,525 | $ | 667,708,171 | ||
| Net Assets Applicable to Common Stockholders Consist of: | ||||||
| Capital stock, $0.001 par value per share | $ | 53,732 | $ | 63,208 | ||
| Additional paid-in capital | 697,107,449 | 594,868,375 | ||||
| Total distributable earnings (loss) | 233,124,344 | 72,776,588 | ||||
| Net assets applicable to common stockholders | $ | 930,285,525 | $ | 667,708,171 | ||
| Capital shares: | ||||||
| Authorized | 100,000,000 | 100,000,000 | ||||
| Outstanding | 53,732,462 | 63,208,377 | ||||
| Net Asset Value per common share outstanding (net assets applicable | ||||||
| to common stock, divided by common shares outstanding) | $ | 17.31 | $ | 10.56 | ||
| (1) Consolidated Statement of Assets and Liabilities (See Note 13 to the financial statements for further disclosure) | ||||||
| (2) Investments in unaffiliated securities at cost | $ | 1,802,309,780 | $ | 1,300,578,811 | ||
| (3) Investments in affiliated securities at cost | $ | 53,481,470 | $ | — | ||
| (4) Call options written, premiums received | $ | 127,576 | $ | 115,174 | ||
| (5) Deferred debt issuance and offering costs | $ | 436,347 | $ | 256,319 | ||
| (6) Deferred offering costs | $ | 867,168 | $ | 406,259 | ||
| See accompanying Notes to Financial Statements. | |
| 40 | Tortoise |
| 2019 Annual Report| November 30, 2019 |
| Tortoise Power | Tortoise | ||||||||||||||
| Tortoise Pipeline | Tortoise Energy | and Energy | Essential Assets | ||||||||||||
| & Energy | Independence | Infrastructure | Income Term | ||||||||||||
| Fund, Inc. | Fund, Inc. | Fund, Inc. | Fund(1) | ||||||||||||
| $ | 192,282,893 | $ | 88,439,679 | $ | 176,064,411 | $ | 229,848,360 | ||||||||
| — | — | — | 38,885,774 | ||||||||||||
| — | — | 12,623 | 378,442 | ||||||||||||
| — | — | — | 115,403 | ||||||||||||
| — | — | — | — | ||||||||||||
| — | — | — | 66,735 | ||||||||||||
| — | — | — | — | ||||||||||||
| — | — | — | — | ||||||||||||
| 373,815 | 234,463 | 1,747,971 | 1,945,556 | ||||||||||||
| — | — | 12,238 | 252,481 | ||||||||||||
| — | — | — | — | ||||||||||||
| — | — | — | — | ||||||||||||
| — | — | — | 418,970 | ||||||||||||
| 94,510 | 9,623 | 5,902 | 3,621 | ||||||||||||
| 192,751,218 | 88,683,765 | 177,843,145 | 271,915,342 | ||||||||||||
| 83,438 | 179,348 | — | 288,066 | ||||||||||||
| 371,545 | 172,903 | 291,919 | 623,176 | ||||||||||||
| 30,433 | 29,217 | 28,808 | 13,999 | ||||||||||||
| — | — | — | 940,861 | ||||||||||||
| 733,193 | 251,962 | 398,899 | 268,071 | ||||||||||||
| — | — | 8,589 | — | ||||||||||||
| — | — | — | 320,491 | ||||||||||||
| — | — | — | — | ||||||||||||
| — | — | — | — | ||||||||||||
| 11,800,000 | 26,500,000 | 54,100,000 | 32,000,000 | ||||||||||||
| 33,924,324 | — | — | — | ||||||||||||
| 15,921,724 | — | — | — | ||||||||||||
| 62,864,657 | 27,133,430 | 54,828,215 | 34,454,664 | ||||||||||||
| $ | 129,886,561 | $ | 61,550,335 | $ | 123,014,930 | $ | 237,460,678 | ||||||||
| $ | 10,016 | $ | 14,768 | $ | 6,951 | $ | 13,491 | ||||||||
| 191,472,216 | 222,592,683 | 128,276,550 | 264,108,245 | ||||||||||||
| (61,595,671 | ) | (161,057,116 | ) | (5,268,571 | ) | (26,661,058 | ) | ||||||||
| $ | 129,886,561 | $ | 61,550,335 | $ | 123,014,930 | $ | 237,460,678 | ||||||||
| 100,000,000 | 100,000,000 | 100,000,000 | 100,000,000 | ||||||||||||
| 10,016,413 | 14,767,968 | 6,951,333 | 13,491,127 | ||||||||||||
| $ | 12.97 | $ | 4.17 | $ | 17.70 | $ | 17.60 | ||||||||
| $ | 229,993,645 | $ | 109,820,486 | $ | 183,526,493 | $ | 245,234,116 | ||||||||
| $ | — | $ | — | $ | — | $ | 39,278,372 | ||||||||
| $ | 225,578 | $ | 534,008 | $ | — | $ | 570,114 | ||||||||
| $ | 75,676 | $ | — | $ | — | $ | — | ||||||||
| $ | 78,276 | $ | — | $ | — | $ | — | ||||||||
| See accompanying Notes to Financial Statements. | |
| Tortoise | 41 |
| Statements of Operations |
| Year Ended November 30, 2019 |
| Tortoise Energy | Tortoise | |||||||
| Infrastructure | Midstream Energy | |||||||
| Corp.(1) | Fund, Inc. | |||||||
| Investment Income | ||||||||
| Distributions from master limited partnerships | $ | 130,392,247 | $ | 94,386,005 | ||||
| Dividends and distributions from common stock | 34,543,506 | 26,085,341 | ||||||
| Dividends and distributions from preferred stock | 8,413,848 | 5,535,169 | ||||||
| Dividends and distributions from electronically traded funds | — | — | ||||||
| Dividends and distributions from private investments | 22,940,960 | — | ||||||
| Dividends and distributions from affiliated private investments | 1,275,000 | — | ||||||
| Less return of capital on distributions(3) | (171,298,472 | ) | (112,442,509 | ) | ||||
| Less foreign taxes withheld | — | — | ||||||
| Net dividends and distributions from investments | 26,267,089 | 13,564,006 | ||||||
| Interest income | 469,219 | 315,417 | ||||||
| Dividends from money market mutual funds | 8,567 | 8,219 | ||||||
| Other income | 1,533,755 | — | ||||||
| Total Investment Income | 28,278,630 | 13,887,642 | ||||||
| Operating Expenses | ||||||||
| Advisory fees | 19,538,388 | 13,834,487 | ||||||
| Administrator fees | 490,158 | 455,324 | ||||||
| Professional fees | 357,321 | 245,783 | ||||||
| Directors’ fees | 177,421 | 151,304 | ||||||
| Stockholder communication expenses | 178,776 | 117,156 | ||||||
| Custodian fees and expenses | 98,597 | 70,840 | ||||||
| Fund accounting fees | 86,852 | 78,685 | ||||||
| Registration fees | 56,117 | 62,208 | ||||||
| Stock transfer agent fees | 13,810 | 16,245 | ||||||
| Franchise fees | 3,851 | — | ||||||
| Other operating expenses | 160,842 | 74,076 | ||||||
| Total Operating Expenses | 21,162,133 | 15,106,108 | ||||||
| Leverage Expenses | ||||||||
| Interest expense | 18,248,673 | 14,648,210 | ||||||
| Distributions to mandatory redeemable preferred stockholders | 6,919,999 | 5,363,166 | ||||||
| Amortization of debt issuance costs | 411,988 | 248,432 | ||||||
| Other leverage expenses | 259,967 | 109,732 | ||||||
| Total Leverage Expenses | 25,840,627 | 20,369,540 | ||||||
| Total Expenses | 47,002,760 | 35,475,648 | ||||||
| Less fees waived by Adviser (Note 4) | (16,438 | ) | (303,806 | ) | ||||
| Net Expenses | 46,986,322 | 35,171,842 | ||||||
| Net Investment Income (Loss), before Income Taxes | (18,707,692 | ) | (21,284,200 | ) | ||||
| Deferred tax benefit | 2,663,518 | 3,734,259 | ||||||
| Net Investment Income (Loss) | (16,044,174 | ) | (17,549,941 | ) | ||||
| Realized and Unrealized Loss on Investments and Foreign Currency | ||||||||
| Net realized gain (loss) on investments in unaffiliated securities | 24,387,636 | (54,660,742 | ) | |||||
| Net realized gain on options | 2,750,775 | 8,594,292 | ||||||
| Net realized gain (loss) on interest rate swap settlements | (2,359 | ) | — | |||||
| Net realized gain on currency futures | — | — | ||||||
| Net realized loss on foreign currency and translation | ||||||||
| of other assets and liabilities denominated in foreign currency | — | — | ||||||
| Net realized gain (loss), before income taxes | 27,136,052 | (46,066,450 | ) | |||||
| Current tax (expense) benefit | (7,034,755 | ) | 1,510,530 | |||||
| Deferred tax benefit | 8,951,409 | 9,380,105 | ||||||
| Income tax benefit | 1,916,654 | 10,890,635 | ||||||
| Net realized gain (loss) | 29,052,706 | (35,175,815 | ) | |||||
| Net unrealized appreciation (depreciation) of investments in unaffiliated securities | (258,391,633 | ) | (115,293,614 | ) | ||||
| Net unrealized depreciation of investments in affiliated securities | (7,723,442 | ) | — | |||||
| Net unrealized appreciation (depreciation) of options | 492,115 | 372,847 | ||||||
| Net unrealized depreciation of interest rate swap contracts | (270,723 | ) | — | |||||
| Net unrealized depreciation of forward currency contracts | — | — | ||||||
| Net unrealized appreciation (depreciation) of other assets and liabilities due to foreign currency translation | — | — | ||||||
| Net unrealized appreciation (depreciation), before income taxes | (265,893,683 | ) | (114,920,767 | ) | ||||
| Deferred tax benefit | 61,475,443 | 27,168,584 | ||||||
| Net unrealized appreciation (depreciation) | (204,418,240 | ) | (87,752,183 | ) | ||||
| Net Realized and Unrealized Loss | (175,365,534 | ) | (122,927,998 | ) | ||||
| Net Decrease in Net Assets Applicable to Common Stockholders Resulting from Operations | $ | (191,409,708 | ) | $ | (140,477,939 | ) | ||
| (1) | Consolidated Statement of Operations (See Note 13 to the financial statements for further disclosure). |
| (2) | Fund commenced operations on March 29, 2019. |
| (3) | Return of Capital may be in excess of current year distributions due to prior year adjustments. See Note 2 to the financial statements for further disclosure. |
| See accompanying Notes to Financial Statements. | |
| 42 | Tortoise |
| 2019 Annual Report| November 30, 2019 |
| Tortoise Power | Tortoise | ||||||||||||||
| Tortoise Pipeline | Tortoise Energy | and Energy | Essential Assets | ||||||||||||
| & Energy | Independence | Infrastructure | Income Term | ||||||||||||
| Fund, Inc. | Fund, Inc. | Fund, Inc. | Fund(1)(2) | ||||||||||||
| $ | 4,700,481 | $ | 894,357 | $ | 3,938,977 | $ | 3,447,268 | ||||||||
| 10,688,017 | 1,878,202 | 3,306,166 | 5,572,247 | ||||||||||||
| 452,273 | 189,715 | 432,395 | 402,731 | ||||||||||||
| — | — | — | 895,305 | ||||||||||||
| — | — | — | — | ||||||||||||
| — | — | — | — | ||||||||||||
| (11,183,449 | ) | (1,323,155 | ) | (6,296,634 | ) | (5,367,751 | ) | ||||||||
| (386,869 | ) | (5,332 | ) | (35,735 | ) | (332,376 | ) | ||||||||
| 4,270,453 | 1,633,787 | 1,345,169 | 4,617,424 | ||||||||||||
| — | — | 5,437,274 | 3,058,746 | ||||||||||||
| 7,716 | 14,915 | 5,595 | 105,128 | ||||||||||||
| — | — | — | 50,003 | ||||||||||||
| 4,278,169 | 1,648,702 | 6,788,038 | 7,831,301 | ||||||||||||
| 2,414,233 | 1,434,710 | 1,825,179 | 2,576,335 | ||||||||||||
| 100,697 | 65,046 | 89,317 | 73,222 | ||||||||||||
| 150,455 | 145,226 | 151,267 | 1,151,532 | ||||||||||||
| 110,633 | 106,271 | 105,153 | 34,111 | ||||||||||||
| 54,909 | 36,597 | 76,975 | 21,773 | ||||||||||||
| 15,564 | 14,232 | 10,654 | 29,733 | ||||||||||||
| 45,560 | 37,636 | 29,016 | 23,509 | ||||||||||||
| 24,490 | 24,867 | 24,490 | 27,574 | ||||||||||||
| 12,414 | 12,326 | 14,151 | 11,526 | ||||||||||||
| — | — | — | — | ||||||||||||
| 34,238 | 33,124 | 19,818 | 13,943 | ||||||||||||
| 2,963,193 | 1,910,035 | 2,346,020 | 3,963,258 | ||||||||||||
| 1,752,914 | 1,229,415 | 1,719,941 | 619,731 | ||||||||||||
| 735,543 | — | — | — | ||||||||||||
| 41,426 | — | — | — | ||||||||||||
| 20,835 | — | — | — | ||||||||||||
| 2,550,718 | 1,229,415 | 1,719,941 | 619,731 | ||||||||||||
| 5,513,911 | 3,139,450 | 4,065,961 | 4,582,989 | ||||||||||||
| — | — | — | (477,099 | ) | |||||||||||
| 5,513,911 | 3,139,450 | 4,065,961 | 4,105,890 | ||||||||||||
| (1,235,742 | ) | (1,490,748 | ) | 2,722,077 | 3,725,411 | ||||||||||
| — | — | — | 418,970 | ||||||||||||
| (1,235,742 | ) | (1,490,748 | ) | 2,722,077 | 4,144,381 | ||||||||||
| (16,705,273 | ) | (88,309,962 | ) | 4,740,042 | (12,799,162 | ) | |||||||||
| 1,171,832 | 4,861,669 | — | 1,998,935 | ||||||||||||
| — | — | 81,937 | — | ||||||||||||
| — | — | — | 497,766 | ||||||||||||
| (1,227 | ) | — | (149 | ) | (136,366 | ) | |||||||||
| (15,534,668 | ) | (83,448,293 | ) | 4,821,830 | (10,438,827 | ) | |||||||||
| — | — | — | — | ||||||||||||
| — | — | — | — | ||||||||||||
| — | — | — | — | ||||||||||||
| (15,534,668 | ) | (83,448,293 | ) | 4,821,830 | (10,438,827 | ) | |||||||||
| (2,501,617 | ) | 30,519,391 | (11,289,186 | ) | (15,385,756 | ) | |||||||||
| — | — | — | (392,598 | ) | |||||||||||
| (170,855 | ) | (1,217,322 | ) | — | 282,048 | ||||||||||
| — | — | (137,219 | ) | — | |||||||||||
| — | — | — | (320,491 | ) | |||||||||||
| 484 | — | — | (4,108 | ) | |||||||||||
| (2,671,988 | ) | 29,302,069 | (11,426,405 | ) | (15,820,905 | ) | |||||||||
| — | — | — | — | ||||||||||||
| (2,671,988 | ) | 29,302,069 | (11,426,405 | ) | (15,820,905 | ) | |||||||||
| (18,206,656 | ) | (54,146,224 | ) | (6,604,575 | ) | (26,259,732 | ) | ||||||||
| $ | (19,442,398 | ) | $ | (55,636,972 | ) | $ | (3,882,498 | ) | $ | (22,115,351 | ) | ||||
| See accompanying Notes to Financial Statements. | |
| Tortoise | 43 |
| Statements of Changes in Net Assets |
| Tortoise Energy Infrastructure Corp.(1) | Tortoise Midstream Energy Fund, Inc. | |||||||||||||||
| Year Ended | Year Ended | Year Ended | Year Ended | |||||||||||||
| November 30, | November 30, | November 30, | November 30, | |||||||||||||
| 2019 | 2018 | 2019 | 2018 | |||||||||||||
| Operations | ||||||||||||||||
| Net investment income (loss) | $ | (16,044,174 | ) | $ | (25,739,125 | ) | $ | (17,549,941 | ) | $ | (22,743,508 | ) | ||||
| Net realized gain (loss) | 29,052,706 | 42,564,712 | (35,175,815 | ) | 46,530,162 | |||||||||||
| Net unrealized appreciation (depreciation) | (204,418,240 | ) | 79,528,704 | (87,752,183 | ) | (946,809 | ) | |||||||||
| Net increase (decrease) in net assets | ||||||||||||||||
| applicable to common stockholders resulting | ||||||||||||||||
| from operations | (191,409,708 | ) | 96,354,291 | (140,477,939 | ) | 22,839,845 | ||||||||||
| Distributions to Common Stockholders | ||||||||||||||||
| From distributable earnings | — | — | — | — | ||||||||||||
| From return of capital | (140,587,568 | ) | (138,297,758 | ) | (106,822,149 | ) | (86,693,300 | ) | ||||||||
| Total distributions to common stockholders | (140,587,568 | ) | (138,297,758 | ) | (106,822,149 | ) | (86,693,300 | ) | ||||||||
| Capital Stock Transactions | ||||||||||||||||
| Proceeds from issuance of common shares | ||||||||||||||||
| through offerings | — | 114,529,368 | — | 230,973,008 | ||||||||||||
| Underwriting discounts and offering expenses | ||||||||||||||||
| associated with the issuance of common stock | (6,953 | ) | (349,970 | ) | (24,715 | ) | (8,891,735 | ) | ||||||||
| Issuance of common shares from reinvestment | ||||||||||||||||
| of distributions to stockholders | 1,990,050 | 6,535,303 | — | 2,720,036 | ||||||||||||
| Net increase (decrease) in net assets applicable | ||||||||||||||||
| to common stockholders from capital stock | ||||||||||||||||
| transactions | 1,983,097 | 120,714,701 | (24,715 | ) | 224,801,309 | |||||||||||
| Total increase (decrease) in net assets applicable | ||||||||||||||||
| to common stockholders | (330,014,179 | ) | 78,771,234 | (247,324,803 | ) | 160,947,854 | ||||||||||
| Net Assets | ||||||||||||||||
| Beginning of period | 1,260,299,704 | 1,181,528,470 | 915,032,974 | 754,085,120 | ||||||||||||
| End of period | $ | 930,285,525 | $ | 1,260,299,704 | $ | 667,708,171 | $ | 915,032,974 | ||||||||
| Transactions in common shares | ||||||||||||||||
| Shares outstanding at beginning of period | 53,635,054 | 49,379,408 | 63,208,377 | 47,246,780 | ||||||||||||
| Shares issued through offerings | — | 4,013,693 | — | 15,802,094 | ||||||||||||
| Shares issued through reinvestment of distributions | 97,408 | 241,953 | — | 159,503 | ||||||||||||
| Shares outstanding at end of period | 53,732,462 | 53,635,054 | 63,208,377 | 63,208,377 | ||||||||||||
| (1) | Consolidated Statement of Changes in Net Assets (See Note 13 to the financial statements for further disclosure). |
| (2) | Commencement of operations. |
| See accompanying Notes to Financial Statements. | |
| 44 | Tortoise |
| 2019 Annual Report| November 30, 2019 |
| Tortoise | |||||||||||||||||||||||||||
| Essential Assets | |||||||||||||||||||||||||||
| Tortoise Power and Energy | Income Term | ||||||||||||||||||||||||||
| Tortoise Pipeline & Energy Fund, Inc. | Tortoise Energy Independence Fund, Inc. | Infrastructure Fund, Inc. | Fund(1) | ||||||||||||||||||||||||
| Period from | |||||||||||||||||||||||||||
| Year Ended | Year Ended | Year Ended | Year Ended | Year Ended | Year Ended | March 29, 2019(2) | |||||||||||||||||||||
| November 30, | November 30, | November 30, | November 30, | November 30, | November 30, | through | |||||||||||||||||||||
| 2019 | 2018 | 2019 | 2018 | 2019 | 2018 | November 30, 2019 | |||||||||||||||||||||
| $ | (1,235,742 | ) | $ | (1,506,036 | ) | $ | (1,490,748 | ) | $ | (4,228,300 | ) | $ | 2,722,077 | $ | 1,683,994 | $ | 4,144,381 | ||||||||||
| (15,534,668 | ) | (374,310 | ) | (83,448,293 | ) | 3,657,227 | 4,821,830 | 9,007,176 | (10,438,827 | ) | |||||||||||||||||
| (2,671,988 | ) | (7,108,381 | ) | 29,302,069 | (30,476,293 | ) | (11,426,405 | ) | (11,182,556 | ) | (15,820,905 | ) | |||||||||||||||
| (19,442,398 | ) | (8,988,727 | ) | (55,636,972 | ) | (31,047,366 | ) | (3,882,498 | ) | (491,386 | ) | (22,115,351 | ) | ||||||||||||||
| — | (428,639 | ) | — | — | (9,729,252 | ) | (10,427,000 | ) | (4,545,707 | ) | |||||||||||||||||
| (13,872,732 | ) | (15,898,114 | ) | (15,828,822 | ) | (25,586,654 | ) | (697,748 | ) | — | (5,700,804 | ) | |||||||||||||||
| (13,872,732 | ) | (16,326,753 | ) | (15,828,822 | ) | (25,586,654 | ) | (10,427,000 | ) | (10,427,000 | ) | (10,246,511 | ) | ||||||||||||||
| — | — | — | — | — | — | 269,722,540 | |||||||||||||||||||||
| — | — | — | — | — | — | — | |||||||||||||||||||||
| — | — | 527,895 | 1,233,701 | — | — | — | |||||||||||||||||||||
| — | — | 527,895 | 1,233,701 | — | — | 269,722,540 | |||||||||||||||||||||
| (33,315,130 | ) | (25,315,480 | ) | (70,937,899 | ) | (55,400,319 | ) | (14,309,498 | ) | (10,918,386 | ) | 237,360,678 | |||||||||||||||
| 163,201,691 | 188,517,171 | 132,488,234 | 187,888,553 | 137,324,428 | 148,242,814 | 100,000 | |||||||||||||||||||||
| $ | 129,886,561 | $ | 163,201,691 | $ | 61,550,335 | $ | 132,488,234 | $ | 123,014,930 | $ | 137,324,428 | $ | 237,460,678 | ||||||||||||||
| 10,016,413 | 10,016,413 | 14,696,260 | 14,583,662 | 6,951,333 | 6,951,333 | 5,000 | |||||||||||||||||||||
| — | — | — | — | — | — | 13,486,127 | |||||||||||||||||||||
| — | — | 71,708 | 112,598 | — | — | — | |||||||||||||||||||||
| 10,016,413 | 10,016,413 | 14,767,968 | 14,696,260 | 6,951,333 | 6,951,333 | 13,491,127 | |||||||||||||||||||||
| See accompanying Notes to Financial Statements. | |
| Tortoise | 45 |
| Statements of Cash Flows |
| Year Ended November 30, 2019 |
| Tortoise Energy | Tortoise | |||||||
| Infrastructure | Midstream Energy | |||||||
| Corp.(1) | Fund, Inc. | |||||||
| Cash Flows From Operating Activities | ||||||||
| Dividends, distributions and interest received from investments | $ | 197,824,408 | $ | 126,164,545 | ||||
| Purchases of long-term investments | (553,887,426 | ) | (420,452,581 | ) | ||||
| Proceeds from sales of long-term investments | 568,893,979 | 488,691,140 | ||||||
| Sales (purchases) of short-term investments, net | 10,646 | 102 | ||||||
| Proceeds from litigation settlement | 40,328 | — | ||||||
| Proceeds from funds held in escrow | 880,420 | — | ||||||
| Proceeds from income tax refund | 1,533,755 | — | ||||||
| Call options written, net | 2,146,927 | 2,775,777 | ||||||
| Proceeds (payments) on interest rate swap contracts, net | (2,359 | ) | — | |||||
| Proceeds on forward currency contracts, net | — | — | ||||||
| Other income received | — | — | ||||||
| Interest received on securities sold, net | — | — | ||||||
| Interest expense paid | (18,421,159 | ) | (14,951,385 | ) | ||||
| Distributions to mandatory redeemable preferred stockholders | (6,919,999 | ) | (5,365,848 | ) | ||||
| Other leverage expenses paid | (323,213 | ) | (203,861 | ) | ||||
| Income taxes paid | (3,293,390 | ) | (341,518 | ) | ||||
| Operating expenses paid | (21,678,370 | ) | (14,888,342 | ) | ||||
| Net cash provided by (used in) operating activities | 166,804,547 | 161,428,029 | ||||||
| Cash Flows From Financing Activities | ||||||||
| Advances (payments) on credit facilities, net | (13,200,000 | ) | (19,500,000 | ) | ||||
| Issuance of mandatory redeemable preferred stock | — | — | ||||||
| Redemption of mandatory redeemable preferred stock | — | — | ||||||
| Maturity of senior notes | (15,000,000 | ) | (35,000,000 | ) | ||||
| Debt issuance costs | — | (81,156 | ) | |||||
| Issuance of common stock | — | — | ||||||
| Common stock issuance costs | (6,953 | ) | (24,715 | ) | ||||
| Distributions paid to common stockholders | (138,597,594 | ) | (106,822,158 | ) | ||||
| Net cash provided by (used in) financing activities | (166,804,547 | ) | (161,428,029 | ) | ||||
| Net change in cash | — | — | ||||||
| Cash — beginning of period | — | — | ||||||
| Cash — end of period | $ | — | $ | — | ||||
| (1) | Consolidated Statement of Cash Flows (See Note 13 to the financial statements for further disclosure). |
| (2) | Fund commenced operations on March 29, 2019. |
| See accompanying Notes to Financial Statements. | |
| 46 | Tortoise |
| 2019 Annual Report| November 30, 2019 |
| Tortoise Power | Tortoise | ||||||||||||||
| Tortoise Pipeline | Tortoise Energy | and Energy | Essential Assets | ||||||||||||
| & Energy | Independence | Infrastructure | Income Term | ||||||||||||
| Fund, Inc. | Fund, Inc. | Fund, Inc. | Fund(1)(2) | ||||||||||||
| $ | 15,674,685 | $ | 2,777,045 | $ | 13,170,803 | $ | 11,491,977 | ||||||||
| (47,371,626 | ) | (239,980,954 | ) | (48,457,500 | ) | (428,542,836 | ) | ||||||||
| 58,361,559 | 282,029,366 | 48,864,200 | 127,369,367 | ||||||||||||
| (18,738 | ) | 12,824 | 26,492 | (410,126 | ) | ||||||||||
| — | — | 3,563 | — | ||||||||||||
| — | — | — | — | ||||||||||||
| — | — | — | — | ||||||||||||
| 884,634 | 4,605,510 | — | 2,502,877 | ||||||||||||
| — | — | 81,937 | — | ||||||||||||
| — | — | — | 497,766 | ||||||||||||
| — | — | — | 50,003 | ||||||||||||
| — | — | 127,857 | (838,607 | ) | |||||||||||
| (1,747,038 | ) | (1,427,261 | ) | (1,745,252 | ) | (544,381 | ) | ||||||||
| (722,031 | ) | — | — | — | |||||||||||
| (22,000 | ) | — | — | — | |||||||||||
| — | — | — | — | ||||||||||||
| (3,023,632 | ) | (2,115,567 | ) | (2,332,477 | ) | (2,773,627 | ) | ||||||||
| 22,015,813 | 45,900,963 | 9,739,623 | (291,197,587 | ) | |||||||||||
| (8,000,000 | ) | (30,600,000 | ) | 700,000 | 32,000,000 | ||||||||||
| 16,000,000 | — | — | — | ||||||||||||
| (16,000,000 | ) | — | — | — | |||||||||||
| — | — | — | — | ||||||||||||
| (143,081 | ) | — | — | — | |||||||||||
| — | — | — | 269,822,540 | ||||||||||||
| — | — | — | — | ||||||||||||
| (13,872,732 | ) | (15,300,963 | ) | (10,427,000 | ) | (10,246,511 | ) | ||||||||
| (22,015,813 | ) | (45,900,963 | ) | (9,727,000 | ) | 291,576,029 | |||||||||
| — | — | 12,623 | 378,442 | ||||||||||||
| — | — | — | — | ||||||||||||
| $ | — | $ | — | $ | 12,623 | $ | 378,442 | ||||||||
| See accompanying Notes to Financial Statements. | |
| Tortoise | 47 |
| Statements of Cash Flows(continued) |
| Year Ended November 30, 2019 |
| Tortoise Energy | Tortoise | |||||||
| Infrastructure | Midstream Energy | |||||||
| Corp.(1) | Fund, Inc. | |||||||
| Reconciliation of net increase (decrease) in net assets applicable to common stockholders | ||||||||
| resulting from operations to net cash provided by (used in) operating activities | ||||||||
| Net increase (decrease) in net assets applicable to common stockholders resulting from operations | $ | (191,409,708 | ) | $ | (140,477,939 | ) | ||
| Adjustments to reconcile net increase (decrease) in net assets applicable to common stockholders | ||||||||
| resulting from operations to net cash provided by (used in) operating activities: | ||||||||
| Purchases of long-term investments | (530,643,243 | ) | (420,452,581 | ) | ||||
| Proceeds from sales of long-term investments | 571,238,904 | 490,982,576 | ||||||
| Sales (purchases) of short-term investments, net | 10,646 | 102 | ||||||
| Proceeds from litigation settlement | 40,328 | — | ||||||
| Proceeds from funds held in escrow | 880,420 | — | ||||||
| Call options written, net | 2,124,794 | 2,775,777 | ||||||
| Return of capital on distributions received | 171,298,472 | 112,442,509 | ||||||
| Deferred tax benefit | (73,090,370 | ) | (40,282,948 | ) | ||||
| Net unrealized (appreciation) depreciation | 265,893,683 | 114,920,767 | ||||||
| Amortization (accretion) of market premium (discount), net | (23,635 | ) | (15,915 | ) | ||||
| Net realized (gain) loss | (27,138,411 | ) | 46,066,450 | |||||
| Amortization of debt issuance costs | 411,988 | 248,432 | ||||||
| Changes in operating assets and liabilities: | ||||||||
| (Increase) decrease in dividends, distributions and interest receivable from investments | (195,304 | ) | (149,691 | ) | ||||
| (Increase) decrease in current tax asset | 3,741,365 | (1,852,048 | ) | |||||
| (Increase) decrease in receivable for investments sold | (2,344,925 | ) | (2,291,436 | ) | ||||
| Increase in receivable for premiums on options written | 22,133 | — | ||||||
| (Increase) decrease in prepaid expenses and other assets | (92,041 | ) | (143,582 | ) | ||||
| Increase (decrease) in payable for investments purchased | (23,244,183 | ) | — | |||||
| Increase (decrease) in payable to Adviser, net of fees waived | (596,405 | ) | (96,056 | ) | ||||
| Increase (decrease) in accrued expenses and other liabilities | (79,961 | ) | (246,388 | ) | ||||
| Total adjustments | 358,214,255 | 301,905,968 | ||||||
| Net cash provided by (used in) operating activities | $ | 166,804,547 | $ | 161,428,029 | ||||
| Non-Cash Financing Activities | ||||||||
| Reinvestment of distributions by common stockholders in additional common shares | $ | 1,990,050 | $ | — | ||||
| (1) | Consolidated Statement of Cash Flows (See Note 13 to the financial statements for further disclosure). |
| (2) | Fund commenced operations on March 29, 2019. |
| See accompanying Notes to Financial Statements | |
| 48 | Tortoise |
| 2019 Annual Report| November 30, 2019 |
| Tortoise Power | Tortoise | ||||||||||||||
| Tortoise Pipeline | Tortoise Energy | and Energy | Essential Assets | ||||||||||||
| & Energy | Independence | Infrastructure | Income Term | ||||||||||||
| Fund, Inc. | Fund, Inc. | Fund, Inc. | Fund(1)(2) | ||||||||||||
| $ | (19,442,398 | ) | $ | (55,636,972 | ) | $ | (3,882,498 | ) | $ | (22,115,351 | ) | ||||
| (46,433,952 | ) | (239,980,954 | ) | (48,010,222 | ) | (429,483,697 | ) | ||||||||
| 58,361,559 | 282,029,366 | 48,667,588 | 127,369,367 | ||||||||||||
| (18,738 | ) | 12,824 | 26,492 | (410,126 | ) | ||||||||||
| — | — | 3,563 | — | ||||||||||||
| — | — | — | — | ||||||||||||
| 884,634 | 4,605,510 | — | 2,569,612 | ||||||||||||
| 11,183,449 | 1,323,155 | 6,296,634 | 5,367,751 | ||||||||||||
| — | — | — | (418,970 | ) | |||||||||||
| 2,671,988 | (29,302,069 | ) | 11,426,405 | 15,820,905 | |||||||||||
| — | — | 347,363 | (161,276 | ) | |||||||||||
| 15,534,668 | 83,448,293 | (4,739,893 | ) | 10,936,593 | |||||||||||
| 41,426 | — | — | — | ||||||||||||
| 213,067 | (194,812 | ) | (133,375 | ) | (2,334,403 | ) | |||||||||
| — | — | — | — | ||||||||||||
| — | — | 196,612 | — | ||||||||||||
| — | — | — | (66,735 | ) | |||||||||||
| (5,130 | ) | 3,253 | 3,176 | (3,621 | ) | ||||||||||
| (937,674 | ) | — | (447,278 | ) | 940,861 | ||||||||||
| (84,875 | ) | (226,275 | ) | (21,341 | ) | 507,773 | |||||||||
| 47,789 | (180,356 | ) | 6,397 | 283,730 | |||||||||||
| 41,458,211 | 101,537,935 | 13,622,121 | (269,082,236 | ) | |||||||||||
| $ | 22,015,813 | $ | 45,900,963 | $ | 9,739,623 | $ | (291,197,587 | ) | |||||||
| $ | — | $ | 527,895 | $ | — | $ | — | ||||||||
| See accompanying Notes to Financial Statements. | |
| Tortoise | 49 |
| TYG Financial Highlights |
| Year Ended | Year Ended | Year Ended | Year Ended | Year Ended | |||||||||||||||||||||
| November 30, | November 30, | November 30, | November 30, | November 30, | |||||||||||||||||||||
| 2019 | 2018 | 2017 | 2016 | 2015 | |||||||||||||||||||||
| Per Common Share Data(1) | |||||||||||||||||||||||||
| Net Asset Value, beginning of year | $ | 23.50 | $ | 23.93 | $ | 28.83 | $ | 29.28 | $ | 49.34 | |||||||||||||||
| Income (Loss) from Investment Operations | |||||||||||||||||||||||||
| Net investment loss(2) | (0.30 | ) | (0.49 | ) | (0.65 | ) | (0.78 | ) | (0.62 | ) | |||||||||||||||
| Net realized and unrealized gain (loss)(2) | (3.27 | ) | 2.59 | (1.64 | ) | 2.94 | (16.85 | ) | |||||||||||||||||
| Total income (loss) from investment operations | (3.57 | ) | 2.10 | (2.29 | ) | 2.16 | (17.47 | ) | |||||||||||||||||
| Distributions to Common Stockholders | |||||||||||||||||||||||||
| From return of capital | (2.62 | ) | (2.62 | ) | (2.62 | ) | (2.62 | ) | (2.59 | ) | |||||||||||||||
| Capital Stock Transactions | |||||||||||||||||||||||||
| Premiums less underwriting discounts and offering | |||||||||||||||||||||||||
| costs on issuance of common stock(3) | (0.00 | ) | 0.09 | 0.01 | 0.01 | (0.00 | ) | ||||||||||||||||||
| Net Asset Value, end of year | $ | 17.31 | $ | 23.50 | $ | 23.93 | $ | 28.83 | $ | 29.28 | |||||||||||||||
| Per common share market value, end of year | $ | 16.82 | $ | 22.59 | $ | 25.86 | $ | 30.63 | $ | 26.57 | |||||||||||||||
| Total investment return based on market value(4) | (15.46 | ) | % | (3.42 | ) | % | (7.49 | ) | % | 26.21 | % | (37.86 | ) | % | |||||||||||
| Supplemental Data and Ratios | |||||||||||||||||||||||||
| Net assets applicable to common stockholders, | |||||||||||||||||||||||||
| end of year (000’s) | $ | 930,286 | $ | 1,260,300 | $ | 1,181,528 | $ | 1,412,274 | $ | 1,405,733 | |||||||||||||||
| Average net assets (000’s) | $ | 1,203,943 | $ | 1,388,683 | $ | 1,406,724 | $ | 1,345,764 | $ | 1,974,038 | |||||||||||||||
| Ratio of Expenses to Average Net Assets | |||||||||||||||||||||||||
| Advisory fees | 1.62 | % | 1.58 | % | 1.74 | % | 1.74 | % | 1.76 | % | |||||||||||||||
| Other operating expenses | 0.14 | 0.13 | 0.12 | 0.12 | 0.10 | ||||||||||||||||||||
| Total operating expenses, before fee waiver | 1.76 | 1.71 | 1.86 | 1.86 | 1.86 | ||||||||||||||||||||
| Fee waiver(5) | (0.00 | ) | (0.04 | ) | (0.00 | ) | (0.01 | ) | — | ||||||||||||||||
| Total operating expenses | 1.76 | 1.67 | 1.86 | 1.85 | 1.86 | ||||||||||||||||||||
| Leverage expenses | 2.15 | 1.87 | 1.78 | 2.29 | 1.75 | ||||||||||||||||||||
| Income tax expense (benefit)(6) | (5.49 | ) | (11.02 | ) | (5.28 | ) | 4.64 | (24.50 | ) | ||||||||||||||||
| Total expenses | (1.58 | ) | % | (7.48 | ) | % | (1.64 | ) | % | 8.78 | % | (20.89 | ) | % | |||||||||||
| See accompanying Notes to Financial Statements. | |
| 50 | Tortoise |
2019 Annual Report| November 30, 2019 |
| Year Ended | Year Ended | Year Ended | Year Ended | Year Ended | |||||||||||||||||||||
| November 30, | November 30, | November 30, | November 30, | November 30, | |||||||||||||||||||||
| 2019 | 2018 | 2017 | 2016 | 2015 | |||||||||||||||||||||
| Ratio of net investment loss to average net assets | |||||||||||||||||||||||||
| before fee waiver | (1.33 | ) | % | (1.89 | ) | % | (2.27 | ) | % | (2.83 | ) | % | (1.50 | ) | % | ||||||||||
| Ratio of net investment loss to average net assets | |||||||||||||||||||||||||
| after fee waiver | (1.33 | ) | % | (1.85 | ) | % | (2.27 | ) | % | (2.82 | ) | % | (1.50 | ) | % | ||||||||||
| Portfolio turnover rate | 26.35 | % | 17.96 | % | 20.38 | % | 24.23 | % | 12.94 | % | |||||||||||||||
| Credit facility borrowings, end of year (000’s) | $ | 93,900 | $ | 107,100 | $ | 112,700 | $ | 109,300 | $ | 66,000 | |||||||||||||||
| Senior notes, end of year (000’s) | $ | 365,000 | $ | 380,000 | $ | 412,500 | $ | 442,500 | $ | 545,000 | |||||||||||||||
| Preferred stock, end of year (000’s) | $ | 165,000 | $ | 165,000 | $ | 165,000 | $ | 165,000 | $ | 295,000 | |||||||||||||||
| Per common share amount of senior notes | |||||||||||||||||||||||||
| outstanding, end of year | $ | 6.79 | $ | 7.08 | $ | 8.35 | $ | 9.03 | $ | 11.35 | |||||||||||||||
| Per common share amount of net assets, | |||||||||||||||||||||||||
| excluding senior notes, end of year | $ | 24.10 | $ | 30.58 | $ | 32.28 | $ | 37.86 | $ | 40.63 | |||||||||||||||
| Asset coverage, per $1,000 of principal amount | |||||||||||||||||||||||||
| of senior notes and credit facility borrowings(7) | $ | 3,387 | $ | 3,926 | $ | 3,564 | $ | 3,858 | $ | 3,784 | |||||||||||||||
| Asset coverage ratio of senior notes and | |||||||||||||||||||||||||
| credit facility borrowings(7) | 339 | % | 393 | % | 356 | % | 386 | % | 378 | % | |||||||||||||||
| Asset coverage, per $10 liquidation value per share | |||||||||||||||||||||||||
| of mandatory redeemable preferred stock(8) | $ | 25 | $ | 29 | $ | 27 | $ | 30 | $ | 26 | |||||||||||||||
| Asset coverage ratio of preferred stock(8) | 249 | % | 293 | % | 271 | % | 297 | % | 255 | % | |||||||||||||||
| (1) | Information presented relates to a share of common stock outstanding for the entire year. |
| (2) | The per common share data for the years ended November 30, 2018, 2017, 2016, and 2015 do not reflect the change in estimate of investment income and return of capital, for the respective year. See Note 2C to the financial statements for further disclosure. |
| (3) | Represents underwriting and offering costs of less than $0.01 for the year ended November 30, 2019. Represents premium on shelf offerings of $0.10 per share, less the underwriting and offering costs of $0.01 per share, for the year ended November 30, 2018. Represents the premium on the shelf offerings of $0.01 per share, less the underwriting and offering costs of less than $0.01 per share for the year ended November 30, 2017. Represents the premium on the shelf offerings of $0.02 per share, less the underwriting and offering costs of less than $0.01 per share for the year ended November 30, 2016. Represents underwriting and offering costs of less than $0.01 per share for the year ended November 30, 2015. |
| (4) | Total investment return is calculated assuming a purchase of common stock at the beginning of the year and a sale at the closing price on the last day of the year reported (excluding brokerage commissions). The calculation also assumes reinvestment of distributions at actual prices pursuant to TYG’s dividend reinvestment plan. |
| (5) | Less than 0.01% for the year ended November 30, 2019 and the years ended November 30, 2017 and 2014. |
| (6) | For the year ended November 30, 2019, TYG accrued $73,090,370 for net deferred income tax benefit and $7,034,755 for current income tax expense. For the year ended November 30, 2018, TYG accrued $152,516,725 for net deferred income tax benefit, which included a deferred tax benefit of $125,271,378 due to the impact from the federal tax rate reduction related to the Tax Cuts and Jobs Act. For the year ended November 30, 2017, TYG accrued $35,365,364 for current income tax expense and $109,662,030 for net deferred income tax benefit. For the year ended November 30, 2016, TYG accrued $57,075,786 for current income tax expense and $5,303,392 for net deferred income tax expense. For the year ended November 30, 2015, TYG accrued $66,785,732 for net current income tax expense and $550,449,662 for net deferred income tax benefit. |
| (7) | Represents value of total assets less all liabilities and indebtedness not represented by senior notes, credit facility borrowings and preferred stock at the end of the year divided by senior notes and credit facility borrowings outstanding at the end of the year. |
| (8) | Represents value of total assets less all liabilities and indebtedness not represented by senior notes, credit facility borrowings and preferred stock at the end of the year divided by senior notes, credit facility borrowings and preferred stock outstanding at the end of the year. |
| See accompanying Notes to Financial Statements. | |
| Tortoise | 51 |
| NTG Financial Highlights |
| Year Ended | Year Ended | Year Ended | Year Ended | Year Ended | |||||||||||||||||||||
| November 30, | November 30, | November 30, | November 30, | November 30, | |||||||||||||||||||||
| 2019 | 2018 | 2017 | 2016 | 2015 | |||||||||||||||||||||
| Per Common Share Data(1) | |||||||||||||||||||||||||
| Net Asset Value, beginning of year | $ | 14.48 | $ | 15.96 | $ | 19.22 | $ | 18.65 | $ | 29.83 | |||||||||||||||
| Income (Loss) from Investment Operations | |||||||||||||||||||||||||
| Net investment loss(2) | (0.28 | ) | (0.43 | ) | (0.42 | ) | (0.46 | ) | (0.32 | ) | |||||||||||||||
| Net realized and unrealized gain (loss)(2) | (1.95 | ) | 1.36 | (1.15 | ) | 2.72 | (9.17 | ) | |||||||||||||||||
| Total income (loss) from investment operations | (2.23 | ) | 0.93 | (1.57 | ) | 2.26 | (9.49 | ) | |||||||||||||||||
| Distributions to Common Stockholders | |||||||||||||||||||||||||
| From return of capital | (1.69 | ) | (1.69 | ) | (1.69 | ) | (1.69 | ) | (1.69 | ) | |||||||||||||||
| Capital stock transactions | |||||||||||||||||||||||||
| Premiums less underwriting discounts and offering | |||||||||||||||||||||||||
| costs on issuance of common stock(3) | (0.00 | ) | (0.72 | ) | — | (0.00 | ) | (0.00 | ) | ||||||||||||||||
| Net Asset Value, end of year | $ | 10.56 | $ | 14.48 | $ | 15.96 | $ | 19.22 | $ | 18.65 | |||||||||||||||
| Per common share market value, end of year | $ | 9.88 | $ | 13.72 | $ | 15.90 | $ | 18.90 | $ | 16.18 | |||||||||||||||
| Total investment return based on market value(4) | (17.63 | ) | % | (4.10 | ) | % | (7.67 | ) | % | 27.99 | % | (37.08 | ) | % | |||||||||||
| Supplemental Data and Ratios | |||||||||||||||||||||||||
| Net assets applicable to common stockholders, | |||||||||||||||||||||||||
| end of year (000’s) | $ | 667,708 | $ | 915,033 | $ | 754,085 | $ | 904,866 | $ | 876,409 | |||||||||||||||
| Average net assets (000’s) | $ | 871,496 | $ | 887,014 | $ | 892,196 | $ | 862,527 | $ | 1,174,085 | |||||||||||||||
| Ratio of Expenses to Average Net Assets | |||||||||||||||||||||||||
| Advisory fees | 1.59 | % | 1.54 | % | 1.61 | % | 1.56 | % | 1.56 | % | |||||||||||||||
| Other operating expenses | 0.14 | 0.15 | 0.14 | 0.16 | 0.12 | ||||||||||||||||||||
| Total operating expenses, before fee waiver | 1.73 | 1.69 | 1.75 | 1.72 | 1.68 | ||||||||||||||||||||
| Fee waiver | (0.03 | ) | (0.09 | ) | — | (0.01 | ) | (0.09 | ) | ||||||||||||||||
| Total operating expenses | 1.70 | 1.60 | 1.75 | 1.71 | 1.59 | ||||||||||||||||||||
| Leverage expenses | 2.34 | 1.98 | 1.89 | 1.95 | 1.42 | ||||||||||||||||||||
| Income tax expense (benefit)(5) | (4.80 | ) | (6.09 | ) | (4.33 | ) | 7.25 | (21.92 | ) | ||||||||||||||||
| Total expenses | (0.76 | ) | % | (2.51 | ) | % | (0.69 | ) | % | 10.91 | % | (18.91 | ) | % | |||||||||||
| See accompanying Notes to Financial Statements. | |
| 52 | Tortoise |
2019 Annual Report| November 30, 2019 |
| Year Ended | Year Ended | Year Ended | Year Ended | Year Ended | |||||||||||||||||||||
| November 30, | November 30, | November 30, | November 30, | November 30, | |||||||||||||||||||||
| 2019 | 2018 | 2017 | 2016 | 2015 | |||||||||||||||||||||
| Ratio of net investment loss to average net assets | |||||||||||||||||||||||||
| before fee waiver | (2.05 | ) | % | (2.65 | ) | % | (2.22 | ) | % | (2.53 | ) | % | (1.36 | ) | % | ||||||||||
| Ratio of net investment loss to average net assets | |||||||||||||||||||||||||
| after fee waiver | (2.02 | ) | % | (2.56 | ) | % | (2.22 | ) | % | (2.52 | ) | % | (1.27 | ) | % | ||||||||||
| Portfolio turnover rate | 29.21 | % | 13.67 | % | 20.94 | % | 35.47 | % | 17.54 | % | |||||||||||||||
| Credit facility borrowings, end of year (000’s) | $ | 53,600 | $ | 73,100 | $ | 49,800 | $ | 46,800 | $ | 62,800 | |||||||||||||||
| Senior notes, end of year (000’s) | $ | 277,000 | $ | 312,000 | $ | 284,000 | $ | 284,000 | $ | 348,000 | |||||||||||||||
| Preferred stock, end of year (000’s) | $ | 132,000 | $ | 132,000 | $ | 110,000 | $ | 110,000 | $ | 90,000 | |||||||||||||||
| Per common share amount of senior notes | |||||||||||||||||||||||||
| outstanding, end of year | $ | 4.38 | $ | 4.94 | $ | 6.01 | $ | 6.03 | $ | 7.40 | |||||||||||||||
| Per common share amount of net assets, excluding | |||||||||||||||||||||||||
| senior notes, end of year | $ | 14.94 | $ | 19.42 | $ | 21.97 | $ | 25.25 | $ | 26.05 | |||||||||||||||
| Asset coverage, per $1,000 of principal amount | |||||||||||||||||||||||||
| of senior notes and credit facility borrowings(6) | $ | 3,419 | $ | 3,719 | $ | 3,589 | $ | 4,068 | $ | 3,353 | |||||||||||||||
| Asset coverage ratio of senior notes and credit | |||||||||||||||||||||||||
| facility borrowings(6) | 342 | % | 372 | % | 359 | % | 407 | % | 335 | % | |||||||||||||||
| Asset coverage, per $25 liquidation value per share | |||||||||||||||||||||||||
| of mandatory redeemable preferred stock(7) | $ | 61 | $ | 69 | $ | 67 | $ | 76 | $ | 69 | |||||||||||||||
| Asset coverage ratio of preferred stock(7) | 244 | % | 277 | % | 270 | % | 305 | % | 275 | % | |||||||||||||||
| (1) | Information presented relates to a share of common stock outstanding for the entire year. |
| (2) | The per common share data for the years ended November 30, 2018, 2017, 2016, and 2015 do not reflect the change in estimate of investment income and return of capital, for the respective year. See Note 2C to the financial statements for further disclosure. |
| (3) | Represents underwriting and offering costs of less than $0.01 for the year endingNovember 30, 2019. Represents the discounts on shares issued through rights offerings of $0.55, plus the underwriting and offering costs of $0.17 per share for the year ended November 30, 2018. Represents less than $0.01 per share for the years ended November 30, 2016 and 2015. |
| (4) | Total investment return is calculated assuming a purchase of common stock at the beginningof the year and a sale at the closing price on the last day of the year reported (excluding brokerage commissions). This calculation also assumes reinvestment of distributions at actual prices pursuant to NTG’s dividend reinvestment plan. |
| (5) | For the year ended November 30, 2019, NTG accrued $40,282,948 for net deferred income tax benefit and $1,510,530 for current tax benefit. For the year ended November 30, 2018, NTG accrued $54,197,357 for net deferred income tax benefit, which included a deferred tax benefit of $47,436,124 due to the impact from the federal tax rate reduction related to the Tax Cuts and Jobs Act. For the year ended November 30, 2017, NTG accrued $440,504 for current income tax expense and $39,035,257 for net deferred income tax benefit. For the year ended November 30, 2016, NTG accrued $1,891,670 for current income tax expense and $60,652,872 for net deferred income tax expense. For the year ended November 30, 2015, NTG accrued $200,550 for current income tax expense and $257,585,058 for net deferred income tax benefit. |
| (6) | Represents value of total assets less all liabilities and indebtedness not represented by senior notes, credit facility borrowings and preferred stock at the end of the year divided by senior notes and credit facility borrowings outstanding at the end of the year. |
| (7) | Represents value of total assets less all liabilities and indebtedness not represented by senior notes, credit facility borrowings and preferred stock at the end of the year divided by senior notes, credit facility borrowings and preferred stock outstanding at the end of the year. |
| See accompanying Notes to Financial Statements. | |
| Tortoise | 53 |
| TTP Financial Highlights |
| Year Ended | Year Ended | Year Ended | Year Ended | Year Ended | |||||||||||||||||||||
| November 30, | November 30, | November 30, | November 30, | November 30, | |||||||||||||||||||||
| 2019 | 2018 | 2017 | 2016 | 2015 | |||||||||||||||||||||
| Per Common Share Data(1) | |||||||||||||||||||||||||
| Net Asset Value, beginning of year | $ | 16.29 | $ | 18.82 | $ | 23.42 | $ | 19.71 | $ | 35.04 | |||||||||||||||
| Income (Loss) from Investment Operations | |||||||||||||||||||||||||
| Net investment income (loss)(2) | (0.12 | ) | (0.15 | ) | (0.05 | ) | 0.04 | 0.22 | |||||||||||||||||
| Net realized and unrealized gain (loss)(2) | (1.81 | ) | (0.75 | ) | (2.92 | ) | 5.30 | (13.60 | ) | ||||||||||||||||
| Total income (loss) from investment operations | (1.93 | ) | (0.90 | ) | (2.97 | ) | 5.34 | (13.38 | ) | ||||||||||||||||
| Distributions to Common Stockholders | |||||||||||||||||||||||||
| From net investment income | — | (0.04 | ) | (0.05 | ) | (0.38 | ) | (0.34 | ) | ||||||||||||||||
| From net realized gains from | |||||||||||||||||||||||||
| investment transactions | — | — | (0.25 | ) | (1.25 | ) | (1.61 | ) | |||||||||||||||||
| From return of capital | (1.39 | ) | (1.59 | ) | (1.33 | ) | — | — | |||||||||||||||||
| Total distributions to common stockholders | (1.39 | ) | (1.63 | ) | (1.63 | ) | (1.63 | ) | (1.95 | ) | |||||||||||||||
| Net Asset Value, end of year | $ | 12.97 | $ | 16.29 | $ | 18.82 | $ | 23.42 | $ | 19.71 | |||||||||||||||
| Per common share market value, end of year | $ | 11.52 | $ | 14.33 | $ | 17.01 | $ | 21.55 | $ | 17.47 | |||||||||||||||
| Total investment return based on market value(3) | (11.10 | ) | % | (7.03 | ) | % | (14.18 | ) | % | 34.89 | % | (41.19 | ) | % | |||||||||||
| Supplemental Data and Ratios | |||||||||||||||||||||||||
| Net assets applicable to common stockholders, | |||||||||||||||||||||||||
| end of year (000’s) | $ | 129,887 | $ | 163,202 | $ | 188,517 | $ | 234,539 | $ | 197,443 | |||||||||||||||
| Average net assets (000’s) | $ | 157,017 | $ | 188,518 | $ | 219,359 | $ | 192,888 | $ | 292,473 | |||||||||||||||
| Ratio of Expenses to Average Net Assets | |||||||||||||||||||||||||
| Advisory fees | 1.54 | % | 1.51 | % | 1.43 | % | 1.48 | % | 1.44 | % | |||||||||||||||
| Other operating expenses | 0.35 | 0.32 | 0.26 | 0.29 | 0.22 | ||||||||||||||||||||
| Total operating expenses, before fee waiver | 1.89 | 1.83 | 1.69 | 1.77 | 1.66 | ||||||||||||||||||||
| Fee waiver | — | — | (0.00 | ) | (0.07 | ) | (0.14 | ) | |||||||||||||||||
| Total operating expenses | 1.89 | 1.83 | 1.69 | 1.70 | 1.52 | ||||||||||||||||||||
| Leverage expenses | 1.62 | 1.40 | 1.06 | 1.23 | 0.93 | ||||||||||||||||||||
| Total expenses | 3.51 | % | 3.23 | % | 2.75 | % | 2.93 | % | 2.45 | % | |||||||||||||||
| See accompanying Notes to Financial Statements. | |
| 54 | Tortoise |
2019 Annual Report| November 30, 2019 |
| Year Ended | Year Ended | Year Ended | Year Ended | Year Ended | |||||||||||||||||||
| November 30, | November 30, | November 30, | November 30, | November 30, | |||||||||||||||||||
| 2019 | 2018 | 2017 | 2016 | 2015 | |||||||||||||||||||
| Ratio of net investment income (loss) to average | |||||||||||||||||||||||
| net assets before fee waiver | (0.79 | ) | % | (0.80 | ) | % | (0.21 | ) | % | 0.12 | % | 0.60 | % | ||||||||||
| Ratio of net investment income (loss) to average | |||||||||||||||||||||||
| net assets after fee waiver | (0.79 | ) | % | (0.80 | ) | % | (0.21 | ) | % | 0.19 | % | 0.74 | % | ||||||||||
| Portfolio turnover rate | 21.31 | % | 14.27 | % | 24.23 | % | 90.22 | % | 18.84 | % | |||||||||||||
| Credit facility borrowings, end of year (000’s) | $ | 11,800 | $ | 19,800 | $ | 19,300 | $ | 16,600 | $ | 16,900 | |||||||||||||
| Senior notes, end of year (000’s) | $ | 34,000 | $ | 34,000 | $ | 34,000 | $ | 34,000 | $ | 54,000 | |||||||||||||
| Preferred stock, end of year (000’s) | $ | 16,000 | $ | 16,000 | $ | 16,000 | $ | 16,000 | $ | 16,000 | |||||||||||||
| Per common share amount of senior notes | |||||||||||||||||||||||
| outstanding, end of year | $ | 3.39 | $ | 3.39 | $ | 3.39 | $ | 3.39 | $ | 5.39 | |||||||||||||
| Per common share amount of net assets, excluding | |||||||||||||||||||||||
| senior notes, end of year | $ | 16.36 | $ | 19.68 | $ | 22.21 | $ | 26.81 | $ | 25.10 | |||||||||||||
| Asset coverage, per $1,000 of principal amount | |||||||||||||||||||||||
| of senior notes and credit facility borrowings(4) | $ | 4,185 | $ | 4,331 | $ | 4,837 | $ | 5,951 | $ | 4,010 | |||||||||||||
| Asset coverage ratio of senior notes and credit | |||||||||||||||||||||||
| facility borrowings(4) | 419 | % | 433 | % | 484 | % | 595 | % | 401 | % | |||||||||||||
| Asset coverage, per $25 liquidation value per share | |||||||||||||||||||||||
| of mandatory redeemable preferred stock(5) | $ | 78 | $ | 83 | $ | 93 | $ | 113 | $ | 82 | |||||||||||||
| Asset coverage ratio of preferred stock(5) | 310 | % | 334 | % | 372 | % | 452 | % | 327 | % | |||||||||||||
| (1) | Information presented relates to a share of common stock outstanding for the entire year. |
| (2) | The per common share data for the years ended November 30, 2018, 2017, 2016, and 2015, do not reflect the change in estimate of investment income and return of capital, for the respective year. See Note 2C to the financial statements for further disclosure. |
| (3) | Total investment return is calculated assuming a purchase of common stock at the beginning of the year and a sale at the closing price on the last day of the year reported (excluding brokerage commissions). The calculation also assumes reinvestment of distributions at actual prices pursuant to TTP’s dividend reinvestment plan. |
| (4) | Represents value of total assets less all liabilities and indebtedness not represented by senior notes, credit facility borrowings and preferred stock at the end of the year divided by senior notes and credit facility borrowings outstanding at the end of the year. |
| (5) | Represents value of total assets less all liabilities and indebtedness not represented by senior notes, credit facility borrowings and preferred stock at the end of the year divided by senior notes, credit facility borrowings and preferred stock outstanding at the end of the year. |
| See accompanying Notes to Financial Statements. | |
| Tortoise | 55 |
| NDP Financial Highlights |
| Year Ended November 30, 2019 | Year Ended November 30, 2018 | Year Ended November 30, 2017 | Year Ended November 30, 2016 | Year Ended November 30, 2015 | |||||||||||||||||||||
| Per Common Share Data(1) | |||||||||||||||||||||||||
| Net Asset Value, beginning of year | $ | 9.02 | $ | 12.88 | $ | 16.95 | $ | 15.53 | $ | 22.76 | |||||||||||||||
| Income (Loss) from Investment Operations | |||||||||||||||||||||||||
| Net investment loss(2) | (0.10 | ) | (0.29 | ) | (0.20 | ) | (0.12 | ) | (0.10 | ) | |||||||||||||||
| Net realized and unrealized gain (loss)(2) | (3.67 | ) | (1.82 | ) | (2.12 | ) | 3.29 | (5.38 | ) | ||||||||||||||||
| Total income (loss) from investment operations | (3.77 | ) | (2.11 | ) | (2.32 | ) | 3.17 | (5.48 | ) | ||||||||||||||||
| Distributions to Common Stockholders | |||||||||||||||||||||||||
| From net investment income(3) | — | — | — | — | (0.00 | ) | |||||||||||||||||||
| From net realized gains from | |||||||||||||||||||||||||
| investment transactions | — | — | — | — | — | ||||||||||||||||||||
| From return of capital | (1.08 | ) | (1.75 | ) | (1.75 | ) | (1.75 | ) | (1.75 | ) | |||||||||||||||
| Total distributions to common stockholders | (1.08 | ) | (1.75 | ) | (1.75 | ) | (1.75 | ) | (1.75 | ) | |||||||||||||||
| Net Asset Value, end of year | $ | 4.17 | $ | 9.02 | $ | 12.88 | $ | 16.95 | $ | 15.53 | |||||||||||||||
| Per common share market value, end of year | $ | 3.63 | $ | 9.00 | $ | 12.39 | $ | 15.85 | $ | 13.18 | |||||||||||||||
| Total investment return based on market value(4) | (52.35 | ) | % | (15.10 | ) | % | (11.04 | ) | % | 36.27 | % | (31.05 | ) | % | |||||||||||
| Supplemental Data and Ratio | |||||||||||||||||||||||||
| Net assets applicable to common stockholders, | |||||||||||||||||||||||||
| end of year (000’s) | $ | 61,550 | $ | 132,488 | $ | 187,889 | $ | 246,088 | $ | 225,410 | |||||||||||||||
| Average net assets (000’s) | $ | 94,144 | $ | 176,481 | $ | 209,940 | $ | 212,528 | $ | 288,672 | |||||||||||||||
| Ratio of Expenses to Average Net Assets | |||||||||||||||||||||||||
| Advisory fees | 1.52 | % | 1.50 | % | 1.43 | % | 1.42 | % | 1.33 | % | |||||||||||||||
| Other operating expenses | 0.51 | 0.32 | 0.26 | 0.29 | 0.21 | ||||||||||||||||||||
| Total operating expenses, before fee waiver | 2.03 | 1.82 | 1.69 | 1.71 | 1.54 | ||||||||||||||||||||
| Fee waiver | — | — | (0.01 | ) | (0.13 | ) | (0.13 | ) | |||||||||||||||||
| Total operating expenses | 2.03 | 1.82 | 1.68 | 1.58 | 1.41 | ||||||||||||||||||||
| Leverage expenses | 1.30 | 0.99 | 0.56 | 0.37 | 0.21 | ||||||||||||||||||||
| Total expenses | 3.33 | % | 2.81 | % | 2.24 | % | 1.95 | % | 1.62 | % | |||||||||||||||
| See accompanying Notes to Financial Statements. | |
| 56 | Tortoise |
| 2019 Annual Report| November 30, 2019 |
| Year Ended November 30, 2019 | Year Ended November 30, 2018 | Year Ended November 30, 2017 | Year Ended November 30, 2016 | Year Ended November 30, 2015 | |||||||||||||||||||||
| Ratio of net investment loss to average net assets | |||||||||||||||||||||||||
| before fee waiver | (1.58 | ) | % | (2.40 | ) | % | (1.41 | ) | % | (0.98 | ) | % | (0.61 | ) | % | ||||||||||
| Ratio of net investment loss to average net assets | |||||||||||||||||||||||||
| after fee waiver | (1.58 | ) | % | (2.40 | ) | % | (1.40 | ) | % | (0.85 | ) | % | (0.48 | ) | % | ||||||||||
| Portfolio turnover rate | 182.52 | % | 143.77 | % | 64.88 | % | 47.03 | % | 15.63 | % | |||||||||||||||
| Credit facility borrowings, end of year (000’s) | $ | 26,500 | $ | 57,100 | $ | 64,500 | $ | 63,800 | $ | 61,800 | |||||||||||||||
| Asset coverage, per $1,000 of principal amount | |||||||||||||||||||||||||
| of credit facility borrowings(5) | $ | 3,323 | $ | 3,320 | $ | 3,913 | $ | 4,857 | $ | 4,647 | |||||||||||||||
| Asset coverage ratio of credit facility borrowings(5) | 332 | % | 332 | % | 391 | % | 486 | % | 465 | % | |||||||||||||||
| (1) | Information presented relates to a share of common stock outstanding for the entire year. |
| (2) | The per common share data for the years ended November 30, 2018, 2017, 2016, 2015 and 2014 do not reflect the change in estimate of investment income and return of capital, for the respective year. See Note 2C to the financial statements for further disclosure. |
| (3) | Less than $0.01 for the years ended November 30, 2015 and 2014. |
| (4) | Total investment return is calculated assuming a purchase of common stock at the beginning of the year and a sale at the closing price on the last day of the year reported (excluding brokerage commissions). The calculation also assumes reinvestment of distributions at actual prices pursuant to NDP’s dividend reinvestment plan. |
| (5) | Represents value of total assets less all liabilities and indebtedness not represented by credit facility borrowings at the end of the year divided by credit facility borrowings outstanding at the end of the year. |
| See accompanying Notes to Financial Statements. | |
| Tortoise | 57 |
| TPZ Financial Highlights |
| Year Ended November 30, 2019 | Year Ended November 30, 2018 | Year Ended November 30, 2017 | Year Ended November 30, 2016 | Year Ended November 30, 2015 | |||||||||||||||||||||
| Per Common Share Data(1) | |||||||||||||||||||||||||
| Net Asset Value, beginning of year | $ | 19.76 | $ | 21.33 | $ | 23.89 | $ | 21.23 | $ | 31.08 | |||||||||||||||
| Income (loss) from Investment Operations | |||||||||||||||||||||||||
| Net investment income(2) | 0.39 | 0.24 | 0.59 | 0.71 | 0.88 | ||||||||||||||||||||
| Net realized and unrealized gain (loss)(2) | (0.95 | ) | (0.31 | ) | (1.65 | ) | 3.49 | (7.87 | ) | ||||||||||||||||
| Total income (loss) from investment operations | (0.56 | ) | (0.07 | ) | (1.06 | ) | 4.20 | (6.99 | ) | ||||||||||||||||
| Distributions to Common Stockholders | |||||||||||||||||||||||||
| From net investment income | (1.40 | ) | (1.50 | ) | (1.04 | ) | (1.29 | ) | (0.91 | ) | |||||||||||||||
| From net realized gains from | |||||||||||||||||||||||||
| investment transactions | — | — | (0.36 | ) | (0.25 | ) | (1.95 | ) | |||||||||||||||||
| From return of capital | (0.10 | ) | — | (0.10 | ) | — | — | ||||||||||||||||||
| Total distributions to common stockholders | (1.50 | ) | (1.50 | ) | (1.50 | ) | (1.54 | ) | (2.86 | ) | |||||||||||||||
| Net Asset Value, end of year | $ | 17.70 | $ | 19.76 | $ | 21.33 | $ | 23.89 | $ | 21.23 | |||||||||||||||
| Per common share market value, end of year | $ | 15.57 | $ | 17.17 | $ | 19.94 | $ | 21.43 | $ | 18.53 | |||||||||||||||
| Total investment return based on market value(3) | (1.38 | ) | % | (6.82 | ) | % | (0.27 | ) | % | 25.57 | % | (22.54 | ) | % | |||||||||||
| Total investment return based on net asset value(4) | (2.59 | ) | % | 0.24 | % | (4.31 | ) | % | 22.18 | % | (23.19 | ) | % | ||||||||||||
| Supplemental Data and Ratios | |||||||||||||||||||||||||
| Net assets applicable to common stockholders, | |||||||||||||||||||||||||
| end of period (000’s) | $ | 123,015 | $ | 137,324 | $ | 148,243 | $ | 166,073 | $ | 147,563 | |||||||||||||||
| Average net assets (000’s) | $ | 137,701 | $ | 147,616 | $ | 162,708 | $ | 146,274 | $ | 187,752 | |||||||||||||||
| Ratio of Expenses to Average Net Assets | |||||||||||||||||||||||||
| Advisory fees | 1.32 | % | 1.29 | % | 1.25 | % | 1.27 | % | 1.20 | % | |||||||||||||||
| Other operating expenses | 0.38 | 0.37 | 0.31 | 0.39 | 0.31 | ||||||||||||||||||||
| Total operating expenses, before fee waiver | 1.70 | 1.66 | 1.56 | 1.66 | 1.51 | ||||||||||||||||||||
| Fee waiver | — | — | — | — | (0.01 | ) | |||||||||||||||||||
| Total operating expenses | 1.70 | 1.66 | 1.56 | 1.66 | 1.50 | ||||||||||||||||||||
| Leverage expenses | 1.25 | 0.98 | 0.59 | 0.44 | 0.26 | ||||||||||||||||||||
| Total expenses | 2.95 | % | 2.39 | % | 2.15 | % | 2.10 | % | 1.76 | % | |||||||||||||||
| See accompanying Notes to Financial Statements. | |
| 58 | Tortoise |
| 2019 Annual Report| November 30, 2019 |
| Year Ended November 30, 2019 | Year Ended November 30, 2018 | Year Ended November 30, 2017 | Year Ended November 30, 2016 | Year Ended November 30, 2015 | |||||||||||||||||||||
| Ratio of net investment income to average | |||||||||||||||||||||||||
| net assets before fee waiver | 1.98 | % | 1.14 | % | 2.51 | % | 3.39 | % | 3.25 | % | |||||||||||||||
| Ratio of net investment income to average | |||||||||||||||||||||||||
| net assets after fee waiver | 1.98 | % | 1.14 | % | 2.51 | % | 3.39 | % | 3.26 | % | |||||||||||||||
| Portfolio turnover rate(3) | 25.27 | % | 31.41 | % | 30.86 | % | 40.61 | % | 30.99 | % | |||||||||||||||
| Credit facility borrowings, end of period (000’s) | $ | 54,100 | $ | 53,400 | $ | 53,400 | $ | 50,600 | $ | 49,900 | |||||||||||||||
| Asset coverage, per $1,000 of principal amount | |||||||||||||||||||||||||
| of senior notes and credit facility borrowings(5) | $ | 3,274 | $ | 3,572 | $ | 3,776 | $ | 4,282 | $ | 3,957 | |||||||||||||||
| Asset coverage ratio of senior notes and credit | |||||||||||||||||||||||||
| facility borrowings(5) | 327 | % | 357 | % | 378 | % | 428 | % | 396 | % | |||||||||||||||
| (1) | Information presented relates to a share of common stock outstanding for the entire year. |
| (2) | The per common share data for the years ended November 30, 2018, 2017, 2016 and 2015 do not reflect the change in estimate of investment income and return of capital, for the respective year. See Note 2C to the financial statements for further disclosure. |
| (3) | Total investment return is calculated assuming a purchase of common stock at the beginning of the year and a sale at the closing price on the last day of the year reported (excluding brokerage commissions). The calculation also assumes reinvestment of distributions at actual prices pursuant to TPZ’s dividend reinvestment plan. |
| (4) | Total investment return is calculated assuming a purchase of common stock at the beginning of the year and a sale at net asset value on the last day of the year reported. The calculation also assumes reinvestment of distributions at actual prices pursuant to TPZ’s dividend reinvestment plan. |
| (5) | Represents value of total assets less all liabilities and indebtedness not represented by credit facility borrowings at the end of the year divided by credit facility borrowings outstanding at the end of the year. |
| See accompanying Notes to Financial Statements. | |
| Tortoise | 59 |
| TEAF Financial Highlights |
| Period from March 29, 2019(1) through November 30, 2019 | |||||
| Per Common Share Data(2) | |||||
| Net Asset Value, beginning of period | $ | 20.00 | |||
| Income (loss) from Investment Operations | |||||
| Net investment income | 0.31 | ||||
| Net realized and unrealized loss | (1.95 | ) | |||
| Total loss from investment operations | (1.64 | ) | |||
| Distributions to Common Stockholders | |||||
| From net investment income | (0.34 | ) | |||
| From net realized gains from investment transactions | — | ||||
| From return of capital | (0.42 | ) | |||
| Total distributions to common stockholders | (0.76 | ) | |||
| Net Asset Value, end of period | $ | 17.60 | |||
| Per common share market value, end of period | $ | 15.60 | |||
| Total investment return based on market value(3)(4) | (18.45 | ) | % | ||
| Supplemental Data and Ratios | |||||
| Net assets applicable to common stockholders, end of period (000’s) | $ | 237,461 | |||
| Average net assets (000’s) | $ | 252,217 | |||
| Ratio of Expenses to Average Net Assets(5) | |||||
| Advisory fees | 1.51 | % | |||
| Other operating expenses | 0.81 | ||||
| Total operating expenses, before fee waiver | 2.32 | ||||
| Fee waiver | (0.28 | ) | |||
| Total operating expenses | 2.04 | ||||
| Leverage expenses | 0.36 | ||||
| Income tax benefit(6) | (0.24 | ) | |||
| Total expenses | 2.16 | % | |||
| See accompanying Notes to Financial Statements. | |
| 60 | Tortoise |
| 2019 Annual Report| November 30, 2019 |
| Period from | ||||
| March 29, 2019(1) | ||||
| through | ||||
| November 30, 2019 | ||||
| Ratio of net investment income to average net assets before fee waiver(5) | 2.15 | % | ||
| Ratio of net investment income to average net assets after fee waiver(5) | 2.43 | % | ||
| Portfolio turnover rate(3) | 50.44 | % | ||
| Credit facility borrowings, end of period (000’s) | $ | 32,000 | ||
| Asset coverage, per $1,000 of principal amount of senior notes and credit facility borrowings(6) | $ | 8,421 | ||
| Asset coverage ratio of senior notes and credit facility borrowings(7) | 842 | % | ||
| (1) | Commencement of operations. |
| (2) | Information presented relates to a share of common stock outstanding for the entire period. |
| (3) | Not annualized. |
| (4) | Total investment return is calculated assuming a purchase of common stock at the beginning of the period and a sale at the closing price on the last day of the period reported (excluding brokerage commissions). The calculation also assumes reinvestment of distributions at actual prices pursuant to TEAF’s dividend reinvestment plan. |
| (5) | Annualized. |
| (6) | For the period ended November 30, 2019, TEAF accrued $418,970 for net deferred income tax benefit. |
| (7) | Represents value of total assets less all liabilities and indebtedness not represented by margin facility borrowings at the end of the period divided by margin facility borrowings outstanding at the end of the period. |
| See accompanying Notes to Financial Statements. | |
| Tortoise | 61 |
| Notes to Financial Statements |
| November 30, 2019 |
This report covers the following companies, each of which is listed on the New York Stock Exchange (“NYSE”): Tortoise Energy Infrastructure Corp. (“TYG”), Tortoise Midstream Energy Fund, Inc. (“NTG”) (formerly Tortoise MLP Fund, Inc.), Tortoise Pipeline & Energy Fund, Inc. (“TTP”), Tortoise Energy Independence Fund, Inc. (“NDP”), Tortoise Power and Energy Infrastructure Fund, Inc. (“TPZ”), and Tortoise Essential Assets Income Term Fund (“TEAF”). These companies are individually referred to as a “Fund” or by their respective NYSE symbols, or collectively as the “Funds”, and each is a non-diversified, closed-end management investment company under the Investment Company Act of 1940, as amended (the “1940 Act”). Each of TYG, NTG, TTP, NDP and TEAF has a primary investment objective to seek a high level of total return with an emphasis on current distributions. TPZ has a primary investment objective to provide a high level of current income, with a secondary objective of capital appreciation. TEAF commenced operations on March 29, 2019.
2. Significant Accounting Policies
The Funds follow accounting and reporting guidance applicable to investment companies under U.S. generally accepted accounting principles (“GAAP”).
A. Use of Estimates
The preparation of financial statements in conformity with GAAP requires management to make estimates and assumptions that affect the reported amount of assets and liabilities and disclosure of contingent assets and liabilities as of the date of the financial statements, and the amount of income and expenses during the period reported. Actual results could differ from those estimates.
B. Security Valuation
In general, and where applicable, the Funds use readily available market quotations based upon the last updated sales price from the principal market to determine fair value. The Funds primarily own securities that are listed on a securities exchange or are traded in the over-the-counter market. The Funds value those securities at their last sale price on that exchange or over-the-counter market on the valuation date. If the security is listed on more than one exchange, the Funds use the price from the exchange that it considers to be the principal exchange on which the security is traded. If there has been no sale on such exchange or over-the-counter market on such day, the security is valued at the mean between the last bid price and last ask price on such day. Securities listed on the NASDAQ are valued at the NASDAQ Official Closing Price, which may not necessarily represent the last sale price. These securities are categorized as Level 1 in the fair value hierarchy.
Restricted securities are subject to statutory or contractual restrictions on their public resale, which may make it more difficult to obtain a valuation and may limit a Fund’s ability to dispose of them. Investments in private placement securities and other securities for which market quotations are not readily available are valued in good faith by using fair value procedures. Such fair value procedures consider factors such as discounts to publicly traded issues, time until conversion date, securities with similar yields, quality, type of issue, coupon, duration and rating. If events occur that affect the value of a Fund’s portfolio securities before the net asset value has been calculated (a “significant event”), the portfolio securities so affected are generally priced using fair value procedures.
An equity security of a publicly traded company acquired in a private placement transaction without registration under the Securities Act of 1933, as amended (the “1933 Act”), is subject to restrictions on resale that can affect the security’s liquidity and fair value. If such a security is convertible into publicly traded common shares, the security generally will be valued at the common share market price adjusted by a percentage discount due to the restrictions and categorized as Level 2 in the fair value hierarchy. To the extent that such securities are convertible or otherwise become freely tradable within a time frame that may be reasonably determined, an amortization schedule may be used to determine the discount. If the security has characteristics that are dissimilar to the class of security that trades on the open market, the security will generally be valued and categorized as Level 3 in the fair value hierarchy.
Unobservable inputs are used to measure fair value to the extent that observable inputs are not available, thereby allowing for situations in which there is little, if any, market activity. Unobservable inputs reflect the Funds’ own beliefs about the assumptions that market participants would use in pricing the asset or liability (including assumptions about risk). Unobservable inputs are developed based on the best information available in the circumstances, which might include the Fund’s own data. The Fund’s own data are adjusted if information is reasonably available without undue cost and effort that indicates that market participants would use different assumptions. Due to the inherent uncertainty of valuations of such investments, the fair values may differ significantly from the values that would have been used had an active market existed.
Options (including options on futures contracts) and futures contracts shall be valued using readily available market quotations. Exchange-traded options are valued at the last reported sale price on any exchange on which they trade. If there are no sales reported on any exchange, exchange-traded options shall be valued at the mean between the last highest bid and last lowest asked prices obtained as of the closing of the exchanges on which the option is traded. Exchange-traded domestic futures contracts are valued at the last reported sale price on the Chicago Mercantile Exchange. Exchange-traded foreign futures contracts are valued at the last reported sale price on the primary foreign exchange on which they principally trade. The value of Flexible Exchange Options (FLEX Options) are determined (i) by an evaluated price as determined by a third-party valuation service; or (ii) by using a quotation provided by a broker-dealer.
The Funds generally value debt securities at evaluated prices obtained from an independent third-party valuation service that utilizes a pricing matrix based upon yield data for securities with similar characteristics, or based on a direct written broker-dealer quotation from a dealer who has made a market in the security. Debt securities with 60 days or less to maturity at time of purchase are valued on the basis of amortized cost, which approximates fair value. The securities are categorized as level 2 in the fair value hierarchy.
| 62 | Tortoise |
| 2019 Annual Report| November 30, 2019 |
| Notes to Financial Statements (continued) |
Various inputs are used in determining the fair value of the Funds’ investments and financial instruments. These inputs are summarized in the three broad levels listed below:
| Level 1 — quoted prices in active markets for identical investments |
| Level 2 — other significant observable inputs (including quoted prices for similar investments, market corroborated inputs, etc.) |
| Level 3 — significant unobservable inputs (including a Fund’s own assumptions in determining the fair value of investments) |
The inputs or methodologies used for valuing securities are not necessarily an indication of the risk associated with investing in those securities.
The following tables provide the fair value measurements of applicable assets and liabilities by level within the fair value hierarchy as of November 30, 2019. These assets and liabilities are measured on a recurring basis.
| TYG: | ||||||||||||
| Description | Level 1 | Level 2 | Level 3 | Total | ||||||||
| Assets | ||||||||||||
| Investments: | ||||||||||||
| Master Limited Partnerships(a) | $ | 1,167,142,431 | $ | 8,406,642 | $ | — | $ | 1,175,549,073 | ||||
| Common Stock(a) | 348,634,205 | — | — | 348,634,205 | ||||||||
| Preferred Stock(a) | 65,422,555 | — | 40,613,580 | 106,036,135 | ||||||||
| Corporate Bonds(a) | — | 20,443,177 | — | 20,443,177 | ||||||||
| Private Investment(a) | — | — | 14,093,091 | 14,093,091 | ||||||||
| Short-Term Investment(b) | 221,598 | — | — | 221,598 | ||||||||
| Total Assets | $ | 1,581,420,789 | $ | 28,849,819 | $ | 54,706,671 | $ | 1,664,977,279 | ||||
| Liabilities | ||||||||||||
| Interest Rate Swap Contracts | $ | — | $ | 161,840 | $ | — | $ | 161,840 | ||||
| Written Call Options | 61,875 | 1,853 | — | 63,728 | ||||||||
| Total Liabilities | $ | 61,875 | $ | 163,693 | $ | — | $ | 225,568 | ||||
| NTG: | ||||||||||||
| Description | Level 1 | Level 2 | Level 3 | Total | ||||||||
| Assets | ||||||||||||
| Investments: | ||||||||||||
| Master Limited Partnerships(a) | $ | 820,121,680 | $ | 5,869,803 | $ | — | $ | 825,991,483 | ||||
| Common Stock(a) | 248,668,387 | — | — | 248,668,387 | ||||||||
| Preferred Stock(a) | 44,969,249 | — | 24,705,787 | 69,675,036 | ||||||||
| Corporate Bonds(a) | — | 13,539,560 | — | 13,539,560 | ||||||||
| Short-Term Investment(b) | 300,953 | — | — | 300,953 | ||||||||
| Total Assets | $ | 1,114,060,269 | $ | 19,409,363 | $ | 24,705,787 | $ | 1,158,175,419 | ||||
| Liabilities | ||||||||||||
| Written Call Options | $ | 2,620 | $ | 42,625 | $ | — | $ | 45,245 | ||||
| TTP: | ||||||||||||
| Description | Level 1 | Level 2 | Level 3 | Total | ||||||||
| Assets | ||||||||||||
| Investments: | ||||||||||||
| Common Stock(a) | $ | 135,836,367 | $ | — | $ | — | $ | 135,836,367 | ||||
| Master Limited Partnerships(a) | 46,354,761 | 467,583 | — | 46,822,344 | ||||||||
| Preferred Stock(a) | 3,397,105 | — | 5,990,475 | 9,387,580 | ||||||||
| Short-Term Investment(b) | 236,602 | — | — | 236,602 | ||||||||
| Total Assets | $ | 185,824,835 | $ | 467,583 | $ | 5,990,475 | $ | 192,282,893 | ||||
| Liabilities | ||||||||||||
| Written Call Options | $ | 16,230 | $ | 67,208 | $ | — | $ | 83,438 | ||||
| Tortoise | 63 |
| Notes to Financial Statements (continued) |
| NDP: | ||||||||||||
| Description | Level 1 | Level 2 | Level 3 | Total | ||||||||
| Assets | ||||||||||||
| Investments: | ||||||||||||
| Common Stock(a) | $ | 80,446,829 | $ | — | $ | — | $ | 80,446,829 | ||||
| Master Limited Partnerships(a) | 4,837,462 | 722,952 | — | 5,560,414 | ||||||||
| Preferred Stock(a) | — | — | 2,133,275 | 2,133,275 | ||||||||
| Short-Term Investment(b) | 299,161 | — | — | 299,161 | ||||||||
| Total Assets | $ | 85,583,452 | $ | 722,952 | $ | 2,133,275 | $ | 88,439,679 | ||||
| Liabilities | ||||||||||||
| Written Call Options | $ | 51,604 | $ | 127,744 | $ | — | $ | 179,348 | ||||
| TPZ: | ||||||||||||
| Description | Level 1 | Level 2 | Level 3 | Total | ||||||||
| Assets | ||||||||||||
| Investments: | ||||||||||||
| Corporate Bonds(a) | $ | — | $ | 96,872,638 | $ | — | $ | 96,872,638 | ||||
| Master Limited Partnerships(a) | 39,945,894 | 426,974 | — | 40,372,868 | ||||||||
| Common Stock(a) | 31,446,146 | — | — | 31,446,146 | ||||||||
| Preferred Stock(a) | 2,498,395 | — | 4,629,781 | 7,128,176 | ||||||||
| Short-Term Investment(b) | 244,583 | — | — | 244,583 | ||||||||
| Total Assets | $ | 74,135,018 | $ | 97,299,612 | $ | 4,629,781 | $ | 176,064,411 | ||||
| Liabilities | ||||||||||||
| Interest Rate Swap Contracts | $ | — | $ | 8,589 | $ | — | $ | 8,589 | ||||
| TEAF: | ||||||||||||
| Description | Level 1 | Level 2 | Level 3 | Total | ||||||||
| Assets | ||||||||||||
| Investments: | ||||||||||||
| Common Stock(a) | $ | 107,202,834 | $ | — | $ | — | $ | 107,202,834 | ||||
| Master Limited Partnerships(a) | 39,700,605 | 5,149,727 | — | 44,850,332 | ||||||||
| Corporate Bonds(a) | — | 32,969,580 | — | 32,969,580 | ||||||||
| Preferred Bonds(a) | — | 11,675,000 | — | 11,675,000 | ||||||||
| Preferred Stock(a) | 5,914,789 | — | 8,564,680 | 14,479,469 | ||||||||
| Private Investments(a) | — | — | 40,885,774 | 40,885,774 | ||||||||
| Municipal Bonds(a) | — | 12,744,350 | — | 12,744,350 | ||||||||
| Construction Note(a) | — | — | 3,516,669 | 3,516,669 | ||||||||
| Short-Term Investment(b) | 410,126 | — | — | 410,126 | ||||||||
| Total Assets | $ | 153,228,354 | $ | 62,538,657 | $ | 52,967,123 | $ | 268,734,134 | ||||
| Liabilities | ||||||||||||
| Forward Currency Contracts | $ | — | $ | 320,491 | $ | — | $ | 320,491 | ||||
| Written Call Options | 87,451 | 200,615 | — | 288,066 | ||||||||
| Total Liabilities | $ | 87,451 | $ | 521,561 | $ | — | $ | 609,012 | ||||
| (a) | All other industry classifications are identified in the Schedule of Investments. |
| (b) | Short-term investment is a sweep investment for cash balances. |
| 64 | Tortoise |
| 2019 Annual Report| November 30, 2019 |
| Notes to Financial Statements (continued) |
The following tables present each Fund’s assets measured at fair value on a recurring basis using significant unobservable inputs (Level 3) for the period ended November 30, 2019:
| Preferred Stock | TYG | NTG | TTP | NDP | TPZ | TEAF | |||||||||||||||
| Balance — beginning of period | $ | 29,426,431 | $ | 16,777,343 | $ | 4,909,451 | $ | 2,178,123 | $ | 3,761,271 | $ | — | |||||||||
| Purchases | 10,071,748 | 7,201,545 | 535,036 | — | 466,625 | 8,447,551 | |||||||||||||||
| Return of capital | — | — | — | — | — | — | |||||||||||||||
| Sales | — | — | — | — | — | — | |||||||||||||||
| Total realized gain/loss | — | — | — | — | — | ||||||||||||||||
| Change in unrealized gain/loss | 1,115,401 | 726,899 | 545,988 | (44,848 | ) | 401,885 | 117,129 | ||||||||||||||
| Balance — end of period | $ | 40,613,580 | $ | 24,705,787 | $ | 5,990,475 | $ | 2,133,275 | $ | 4,629,781 | $ | 8,564,680 | |||||||||
| Private Investments | TYG | NTG | TTP | NDP | TPZ | TEAF | |||||||||||||||
| Balance — beginning of period | $ | 36,836,183 | $ | — | $ | — | $ | — | $ | — | $ | — | |||||||||
| Purchases | 4,108,065 | — | — | — | — | 41,278,372 | |||||||||||||||
| Return of capital | (22,546,884 | ) | — | — | — | — | — | ||||||||||||||
| Sales | — | — | — | — | — | — | |||||||||||||||
| Total realized gain/loss | 5,954,383 | — | — | — | — | — | |||||||||||||||
| Change in unrealized gain/loss | (10,258,656 | ) | — | — | — | — | (392,598 | ) | |||||||||||||
| Balance — end of period | $ | 14,093,091 | $ | — | $ | — | $ | — | $ | — | $ | 40,885,774 | |||||||||
| Construction Note | TYG | NTG | TTP | NDP | TPZ | TEAF | |||||||||||||||
| Balance — beginning of period | $ | — | $ | — | $ | — | $ | — | $ | — | $ | — | |||||||||
| Purchases | — | — | — | — | — | 3,770,670 | |||||||||||||||
| Return of capital | — | — | — | — | — | — | |||||||||||||||
| Sales | — | — | — | — | — | — | |||||||||||||||
| Total realized gain/loss | — | — | — | — | — | — | |||||||||||||||
| Change in unrealized gain/loss | — | — | — | — | — | (254,001 | ) | ||||||||||||||
| Balance — end of period | $ | — | $ | — | $ | — | $ | — | $ | — | $ | 3,516,669 | |||||||||
| TYG | NTG | TTP | NDP | TPZ | TEAF | ||||||||||||||||
| Change in unrealized | |||||||||||||||||||||
| gain/loss on investments | |||||||||||||||||||||
| still held at November 30, 2019 | $ | (7,623,288 | ) | $ | 726,898 | $ | 545,988 | $ | (44,848 | ) | $ | 401,885 | $ | (529,470 | ) | ||||||
TYG, NTG, TTP, NDP and TPZ own units of preferred stock of Targa Resources Corp. (“TRGP Pfd”) that were issued in a private placement transaction that closed on March 16, 2016. TEAF owns units of TRGP Pfd that were purchased in a private placement transaction that closed on November 18, 2019. The preferred stock provides the purchaser an option to convert into common stock after 12 years. In addition, the preferred stock can be repurchased by the issuer at a price of $1,100 per share after five years and $1,050 per share after six years.
TYG, NTG, TTP, and TPZ own units of preferred stock of SemGroup Corporation (“SEMG Pfd”) that were issued in a private placement transaction that closed on January 19, 2018. The preferred stock provides the purchaser an option to convert into common stock after 18 months at a price of $33.00 per share. In addition, the issuer can force conversion to common stock after 3 years at a price of $47.85 per share.
TYG, NTG, TTP, TPZ and TEAF own units of preferred stock of Altus Midstream Company (“ALTM Pfd”) that were issued in a private placement transaction that closed on June 12, 2019. The preferred stock carries a conversion option into common stock after the 7th anniversary of issuance (June 12, 2026) with a conversion rate determined as the quotient of Altus’ common unit price divided by a 6% discount to the prior 20-Day Volume Weighted Average Price (“VWAP”). Alternately, Altus can force conversion into common stock at a value determined by a minimum rate of return: before 5 years: greater of 1.3x Multiple on Invested Capital (“MOIC”) or 11.5% Internal Rate of Return (“IRR”), and after 5 years: greater of 1.3x MOIC or 13.75% IRR.
A combination of a lattice model and a takeout premium calculation is being utilized to determine fair value of the level 3 SEMG Pfd securities. On September 16, 2019 a definitive merger agreement was entered into between Energy Transfer LP (ET) and SemGroup Corporation (SEMG). The terms of the merger agreement indicate that upon closing of the merger the SEMG Pfd securities are to be redeemed at a 1% premium to the liquidation value of the shares. Fund management has analyzed the likelihood of the merger closing and determined that this outcome is highly likely. As such, an 80% weight has been applied to the takeout premium calculation and a 20% weight to the lattice model in order to determine fair value of the SEMG Pfd securities. The Funds estimate future volatility of the underlying common stock price and the discount rate to apply to expected future cash flows. Unobservable inputs used to determine the discount rate include an illiquidity spread due to the shares being issued in the private market and a seniority spread due to the purchased private preferred units being lower in the capital structure than the issuer’s public preferred stock. An increase (decrease) in the illiquidity spread or seniority spread would lead to a corresponding decrease (increase) in fair value of the preferred stock. An increase (decrease) in estimated future volatility would lead to a corresponding increase (decrease) in fair value of the preferred stock.
| Tortoise | 65 |
| Notes to Financial Statements (continued) |
A discounted cash flow model prepared by an independent third party is being utilized to determine fair value of the level 3 ALTM Pfd security. Unobservable inputs used to determine the discount rate include a debt discount rate that generally reflects the credit worthiness of the company. An increase (decrease) in the debt discount rate would lead to a corresponding decrease (increase) in fair value of the preferred stock.
A discounted cash flows model is being utilized to determine fair value of the construction note. Unobservable inputs used to determine the discount rate include a risk spread based on similar projects and an illiquidity spread due to the note being issued in the private market. An increase (decrease) in the risk spread or illiquidity spread would lead to a corresponding decrease (increase) in fair value of the note.
The following tables summarize the fair value and significant unobservable inputs that each Fund used to value its portfolio investments categorized as Level 3 as of November 30, 2019:
| Assets at Fair Value | TYG | NTG | TTP | NDP | TPZ | TEAF | ||||||||||||
| Construction Note | $ | — | $ | — | $ | — | $ | — | $ | — | $ | 3,516,669 | ||||||
| Preferred Stock | $ | 40,613,580 | $ | 24,705,787 | $ | 5,990,475 | $ | 2,133,275 | $ | 4,629,781 | $ | 8,564,680 | ||||||
| Private Investments | $ | 14,093,091 | $ | — | $ | — | $ | — | $ | — | $ | 40,885,774 | ||||||
| Assets at Fair Value | Valuation Technique | Unobservable Inputs | Input | |||||||||||||||
| Preferred Stock (ALTM Pfd) | Discounted cash flow model | Debt discount rate | 11.400% | |||||||||||||||
| Preferred Stock (TRGP Pfd) | Lattice model | Debt discount rate | 9.1000% | |||||||||||||||
| Preferred Stock (SEMG Pfd) | Lattice model | Illiquidity & seniority spread | 1.8618% | |||||||||||||||
| Private Investment (TK NYS Solar Holdco, LLC) | Discounted cash flow model | Post-contracted weighted average cost of capital | 8.5000% | |||||||||||||||
| Private Investment (Renewable Holdco, LLC) | Recent transaction | Purchase price | $6,852,642 | |||||||||||||||
| Private Investment (Renewable Holdco, LLC) | Discounted cash flow model | Post-contracted weighted average cost of capital | 8.5000% | |||||||||||||||
| Private Investment (Renewable Holdco I, LLC) | Discounted cash flow model | Post-contracted weighted average cost of capital | 7.5000% | |||||||||||||||
| Private Investment (Renewable Holdco II, LLC) | Discounted cash flow model | Post-contracted weighted average cost of capital | 8.5000% | |||||||||||||||
| Construction Note | Discounted cash flow model | Risk spread | 1.7500% | |||||||||||||||
| Construction Note | Discounted cash flow model | Illiquidity spread | 1.7255% | |||||||||||||||
C. Securities Transactions and Investment Income
Securities transactions are accounted for on the date the securities are purchased or sold (trade date). Realized gains and losses are reported on an identified cost basis. Interest income is recognized on the accrual basis, including amortization of premiums and accretion of discounts. Dividend income and distributions are recorded on the ex-dividend date. Distributions received from investments generally are comprised of ordinary income and return of capital. The Funds estimate the allocation of distributions between investment income and return of capital at the time such distributions are received based on historical information or regulatory filings. These estimates may subsequently be revised based on actual allocations received from the portfolio companies after their tax reporting periods are concluded, as the actual character of these distributions is not known until after the fiscal year-end of the Funds.
Subsequent to November 30, 2018, the Funds reallocated the amount of return of capital recognized for the period from December 1, 2017 through November 30, 2018 based on the 2018 tax reporting information received. The impact of this adjustment is as follows:
| Estimated | Revised | Increase/(Decrease) | ||||||||
| Return of Capital % | Return of Capital % | In Return of Capital | ||||||||
| TYG | 94% | 93% | $ | (3,266,424 | ) | |||||
| NTG | 95% | 95% | $ | (613,926 | ) | |||||
| TTP | 66% | 69% | $ | 403,245 | ||||||
| NDP | 77% | 80% | $ | 158,988 | ||||||
| TPZ | 89% | 89% | $ | 16,301 | ||||||
In addition, the Funds may be subject to withholding taxes on foreign-sourced income. The Funds accrue such taxes when the related income is earned.
D. Foreign Currency Translation
For foreign currency, investments in foreign securities, and other assets and liabilities denominated in a foreign currency, the Funds translate these amounts into U.S. dollars on the following basis: (i) market value of investment securities, assets and liabilities at the current rate of exchange on the valuation date, and (ii) purchases and sales of investment securities, income and expenses at the relevant rates of exchange on the respective dates of such transactions. The Funds do not isolate the portion of gains and losses on investments that is due to changes in the foreign exchange rates from that which is due to changes in market prices of securities.
| 66 | Tortoise |
| 2019 Annual Report| November 30, 2019 |
| Notes to Financial Statements (continued) |
Each of TYG and NTG, as corporations, are obligated to pay federal and state income tax on its taxable income. Currently, the federal income tax rate for corporations is 21%.
TTP, NDP and TPZ each qualify as a regulated investment company (“RIC”) under the Internal Revenue Code (“IRC”). TEAF intends to be treated and to qualify each year as a RIC under the IRC. As a result, TTP, NDP, TPZ and TEAF generally will not be subject to U.S. federal income tax on income and gains that they distribute each taxable year to stockholders if they meet certain minimum distribution requirements. However, TEAF’s taxable subsidiary, created to hold certain investments is generally subject to federal and state income taxes on its income. RICs are required to distribute substantially all of their income, in addition to meeting certain asset diversification requirements, and are subject to a 4% non-deductible U.S. federal excise tax on certain undistributed income unless the fund makes sufficient distributions to satisfy the excise tax avoidance requirement.
The Funds invest in master limited partnerships (“MLPs”), which generally are treated as partnerships for federal income tax purposes. As a limited partner in the MLPs, each Fund reports its allocable share of the MLP’s taxable income in computing its own taxable income. The Funds’ tax expense or benefit, if applicable, is included in the Statements of Operations based on the component of income or gains (losses) to which such expense or benefit relates. For TYG and NTG, deferred income taxes reflect the net tax effects of temporary differences between the carrying amounts of assets and liabilities for financial reporting purposes and the amounts used for income tax purposes. A valuation allowance is recognized if, based on the weight of available evidence, it is more likely than not that some portion or all of the deferred income tax asset will not be realized.
TYG — November 30, 2016 through 2019
NTG — November 30, 2013 through 2019
TTP, NDP and TPZ — November 30, 2016 through 2019
TEAF — November 30, 2019
F. Distributions to Stockholders
Distributions to common stockholders are recorded on the ex-dividend date. The Funds may not declare or pay distributions to its common stockholders if it does not meet asset coverage ratios required under the 1940 Act or the rating agency guidelines for its debt and preferred stock following such distribution. The amount of any distributions will be determined by the Board of Directors. The character of distributions to common stockholders made during the year may differ from their ultimate characterization for federal income tax purposes.
As RICs, TTP, NDP, TPZ and TEAF each intend to make cash distributions of its investment company taxable income and capital gains to common stockholders. In addition, on an annual basis, TTP, NDP, TPZ and TEAF each may distribute additional capital gains in the last calendar quarter if necessary to meet minimum distribution requirements and thus avoid being subject to excise taxes. Distributions paid to stockholders in excess of investment company taxable income and net realized gains will be treated as return of capital to stockholders.
Distributions to mandatory redeemable preferred (“MRP”) stockholders are accrued daily based on applicable distribution rates for each series and paid periodically according to the terms of the agreements. The Funds may not declare or pay distributions to its preferred stockholders if it does not meet a 200% asset coverage ratio for its debt or the rating agency basic maintenance amount for the debt following such distribution. The character of distributions to preferred stockholders made during the year may differ from their ultimate characterization for federal income tax purposes.
For tax purposes, distributions to stockholders for the year ended November 30, 2019 were characterized as follows:
| TYG | NTG | TTP | NDP | TPZ | TEAF | |||||||||||||
| Common | Preferred | Common | Preferred | Common | Preferred | Common | Common | Common | ||||||||||
| Qualified dividend income | 21% | 100% | — | — | — | 50% | — | 10% | 29% | |||||||||
| Ordinary dividend income | — | — | — | — | — | — | — | 64% | 15% | |||||||||
| Return of capital | 79% | — | 100% | 100% | 100% | 50% | 100% | 7% | 56% | |||||||||
| Long-term capital gain | — | — | — | — | — | — | — | 19% | — | |||||||||
* For Federal income tax purposes, distributions of short-term capital gains are included in qualified dividend income.
| Tortoise | 67 |
| Notes to Financial Statements (continued) |
Offering costs related to the issuance of common stock are charged to additional paid-in capital when the stock is issued. Debt issuance costs related to senior notes and MRP Stock are deferred and amortized over the period the debt or MRP Stock is outstanding.
TYG:
Offering costs (excluding underwriter discounts and commissions) of $6,953 related to the issuance of common stock were recorded to additional paid-in capital during the period ended November 30, 2019.
NTG:
Offering costs (excluding underwriter discounts and commissions) of $24,715 related to the issuance of common stock were recorded to additional paid-in capital during the period ended November 30, 2019. Deferred costs (excluding underwriter commissions) were reflected during the period ended November 30, 2019 for Series P Notes ($23,187), Series Q Notes ($17,391), Series R Notes ($15,072) and MRP G Shares ($25,506) that were issued in October 2018.
TTP:
Deferred costs (excluding underwriter commissions) were reflected during the period ended November 30, 2019 for Series H Notes ($49,830) and MRP B Shares ($93,251) that were issued in December 2018.
There were no offering or debt issuance costs recorded during the period ended November 30, 2019, for NDP, TPZ or TEAF.
H. Derivative Financial Instruments
The Funds have established policies and procedures for risk assessment and the approval, reporting and monitoring of derivative financial instrument activities. The Funds do not hold or issue derivative financial instruments for speculative purposes. All derivative financial instruments are recorded at fair value with changes in fair value during the reporting period, and amounts accrued under the agreements, included as unrealized gains or losses in the accompanying Statements of Operations. Derivative instruments that are subject to an enforceable master netting arrangement allow a Fund and the counterparty to the instrument to offset any exposure to the other party with amounts owed to the other party. The fair value of derivative financial instruments in a loss position are offset against the fair value of derivative financial instruments in a gain position, with the net fair value appropriately reflected as an asset or liability within the accompanying Statements of Assets & Liabilities.
TYG and TPZ use interest rate swap contracts in an attempt to manage interest rate risk. Cash settlements under the terms of the interest rate swap contracts and the termination of such contracts are recorded as realized gains or losses in the accompanying Statements of Operations.
TYG, NTG, TTP, NDP and TEAF seek to provide current income from gains earned through an option strategy that normally consists of writing (selling) call options on selected equity securities held in the portfolio (“covered calls”). The premium received on a written call option is initially recorded as a liability and subsequently adjusted to the then current fair value of the option written. Premiums received from writing call options that expire unexercised are recorded as a realized gain on the expiration date. Premiums received from writing call options that are exercised are added to the proceeds from the sale of the underlying security to calculate the realized gain (loss). If a written call option is repurchased prior to its exercise, the realized gain (loss) is the difference between the premium received and the amount paid to repurchase the option.
TEAF has entered into forward currency contracts, which represent agreements to exchange currencies on specific future dates at predetermined rates. TEAF uses forward currency contracts to manage exposure to changes in exchange rates. On a daily basis, TEAF’s investment adviser values forward currency contracts and records unrealized appreciation or depreciation for open forward currency contracts in the Statements of Assets & Liabilities. Realized gains or losses are recorded at the time the forward currency contracts are closed.
I. Indemnifications
Under each of the Funds’ organizational documents, its officers and directors are indemnified against certain liabilities arising out of the performance of their duties to the Funds. In addition, in the normal course of business, the Funds may enter into contracts that provide general indemnification to other parties. A Fund’s maximum exposure under these arrangements is unknown, as this would involve future claims that may be made against the Funds that have not yet occurred, and may not occur. However, the Funds have not had prior claims or losses pursuant to these contracts and expect the risk of loss to be remote.
J. Cash and Cash Equivalents
Cash and cash equivalents include short-term, liquid investments with an original maturity of three months or less and money market fund accounts.
K. Recent Accounting and Regulatory Updates
In August 2018, the FASB issued ASU No. 2018-13 (“ASU 2018-13”), Fair Value Measurement (Topic 820): Disclosure Framework which modifies the disclosure requirements on fair value measurements. ASU 2018-13 is effective for fiscal years, and interim periods within those fiscal years, beginning after December 15, 2019, early adoption is permitted. Management is currently evaluating this guidance to determine the impact on the financial statements.
| 68 | Tortoise |
| 2019 Annual Report| November 30, 2019 |
| Notes to Financial Statements (continued) |
TYG, NTG, TTP, NDP and TPZ concentrate their investments in the energy sector. TEAF concentrates its investments in issuers operating in essential asset sectors. Funds that primarily invest in a particular sector may experience greater volatility than companies investing in a broad range of industry sectors. A Fund may, for defensive purposes, temporarily invest all or a significant portion of its assets in investment grade securities, short-term debt securities and cash or cash equivalents. To the extent a Fund uses this strategy, it may not achieve its investment objective.
4. Agreements
TYG — 0.95% up to $2,500,000,000, 0.90% between $2,500,000,000 and $3,500,000,000, and 0.85% above $3,500,000,000.
NTG — 0.95%.
TTP — 1.10%.
NDP — 1.10%.
TPZ — 0.95%.
TEAF — 1.35%, less a fee waiver of 0.25% for one year following March 29, 2019.
In addition, the Adviser has contractually agreed to waive all fees due under the Investment Advisory Agreements for TYG and NTG related to the net proceeds received from the issuance of additional common stock under at-the-market equity programs for a six-month period following the date of issuance. NTG has agreed to similarly waive fees related to the proceeds received from a rights offering that occurred during July 2018.
U.S. Bancorp Fund Services, LLC d/b/a U.S. Bank Global Fund Services serves as each Fund’s administrator. Each Fund pays the administrator a monthly fee computed at an annual rate of 0.04% of the first $1,000,000,000 of the Fund’s Managed Assets, 0.01% on the next $500,000,000 of Managed Assets and 0.005% on the balance of the Fund’s Managed Assets.
U.S. Bank, N.A. serves as the Funds’ custodian. Each Fund pays the custodian a monthly fee computed at an annual rate of 0.004% of the Fund’s U.S. Dollar-denominated assets and 0.015% of the Fund’s Canadian Dollar-denominated assets, plus portfolio transaction fees.
5. Income Taxes
TYG and NTG:
Deferred income taxes reflect the net tax effect of temporary differences between the carrying amount of assets and liabilities for financial reporting and tax purposes. Components of TYG’s and NTG’s deferred tax assets and liabilities as of November 30, 2019 are as follows:
| TYG | NTG | |||||
| Deferred tax assets: | ||||||
| Net operating loss carryforwards | $ | — | $ | 431,954 | ||
| Capital loss carryforwards | — | 6,181,945 | ||||
| AMT credit | — | 1,412,445 | ||||
| Net unrealized loss on investment securities | 44,501,439 | 32,765,163 | ||||
| 44,501,439 | 40,791,507 | |||||
| Deferred tax liabilities: | ||||||
| Basis reduction of investments | 160,973,596 | 68,683,992 | ||||
| 160,973,596 | 68,683,992 | |||||
| Total net deferred tax liability | $ | 116,472,157 | $ | 27,892,485 | ||
At November 30, 2019, a valuation allowance on deferred tax assets was not deemed necessary because each of TYG and NTG believe it is more likely than not that there is an ability to realize its deferred tax assets through future taxable income. Any adjustments to TYG’s or NTG’s estimates of future taxable income will be made in the period such determination is made.
During the period ending November 30, 2019, TYG received approximately $5,665,000 in Investment Tax Credits which can be used to offset current federal tax liability, if any. Any unused credits will be carried forward and available to use against a future tax liability.
| Tortoise | 69 |
| Notes to Financial Statements (continued) |
| TYG | NTG | |||||||
| Application of statutory income tax rate | $ | (54,067,718 | ) | $ | (38,276,998 | ) | ||
| State income taxes, net of federal tax effect | (5,947,448 | ) | (3,681,883 | ) | ||||
| Permanent differences | 486,684 | 407,573 | ||||||
| Investment Tax Credit | (8,190,593 | ) | — | |||||
| Other | 1,663,460 | (242,170 | ) | |||||
| Total income tax expense (benefit) | $ | (66,055,615 | ) | $ | (41,793,478 | ) | ||
Total income taxes are being calculated by applying the federal rate plus a blended state income tax rate. During the year, each of TYG and NTG re-evaluated its blended state income tax rate, decreasing the overall rate from 23.41% to 23.31% and from 23.06% to 23.02%, respectively, due to anticipated state apportionment of income and gains.
For the period ended November 30, 2019, the components of income tax expense for TYG and NTG include the following:
| TYG | NTG | |||||||
| Current tax expense (benefit) | ||||||||
| Federal | $ | 4,573,865 | $ | (1,413,899 | ) | |||
| State | 2,460,890 | (96,631 | ) | |||||
| Total current tax expense (benefit) | 7,034,755 | (1,510,530 | ) | |||||
| Deferred tax expense (benefit) | ||||||||
| Federal | $ | (65,847,180 | ) | $ | (36,748,128 | ) | ||
| State (net of federal tax effect) | (7,243,190 | ) | (3,534,820 | ) | ||||
| Total deferred tax expense (benefit) | (73,090,370 | ) | (40,282,948 | ) | ||||
| Total income tax expense (benefit), net | $ | (66,055,615 | ) | $ | (41,793,478 | ) | ||
TYG acquired all of the net assets of Tortoise Energy Capital Corporation (“TYY”) and Tortoise North American Energy Corporation (“TYN”) on June 23, 2014 in a tax-free reorganization under Section 368(a)(1)(C) of the IRC. During the current year, TYG utilized the remaining net operating losses inherited in the acquisition. As of November 30, 2019, NTG had net operating losses for federal income tax purposes of approximately $1,295,792. The net operating losses may be carried forward for 20 years. If not utilized, these net operating losses will expire in the years ending November 30, 2033 through 2038.
As of November 30, 2019, NTG had capital loss carryforwards of approximately $26,900,000, which may be carried forward for 5 years. If not utilized, these capital losses will expire in the year ending November 30, 2024. The capital losses for the year ending November 30, 2019 have been estimated based on information currently available. As of November 30, 2019, NTG had $1,412,445 of AMT credits available, which may be utilized against future tax liabilities. AMT credit carryovers may be eligible for a partial refund in 2018, 2019 or 2020 and any remaining unused credit will be fully refundable in 2021. NTG is estimating an eligible refund in 2018 of approximately $1,400,000.
TTP, NDP, TPZ and TEAF:
It is the intention of TTP, NDP, TPZ and TEAF to qualify as RICs under Subchapter M of the IRC and distribute all of its taxable income. Accordingly, no provision for federal income taxes is required in the financial statements. However, TEAF’s taxable subsidiary created to make and hold certain investments is generally subject to federal and state income taxes on its income.
As of November 30, 2019, TEAF consolidated the balance of a deferred tax benefit of $418,970 related to the investment activities of its taxable subsidiary. The components of TEAF’s deferred tax asset are $336,149 and $82,821 federal and state, respectively. Total income taxes are computed by applying the federal statutory rate plus a blended state income tax rate totaling 26.17%.
At November 30, 2019, a valuation allowance on deferred tax assets was not deemed necessary because TEAF believes it is more likely than not that its able to realize its deferred tax assets through future taxable income. Any adjustments to TEAF’s estimates of future taxable income will be made in the period such determination is made.
| 70 | Tortoise |
| 2019 Annual Report| November 30, 2019 |
| Notes to Financial Statements (continued) |
| Application of Statutory Income tax rate | $ | (337,229 | ) | |
| State Income taxes, net of federal tax effect | (83,087 | ) | ||
| Permanent differences | 1,346 | |||
| Other | — | |||
| Total income tax expense (benefit) | $ | (418,970 | ) |
The amount and character of income and capital gain distributions to be paid, if any, are determined in accordance with federal income tax regulations, which may differ from U.S. generally accepted accounting principles. These differences are primarily due to return of capital distributions from underlying investments, wash sales, straddles, swaps, differences in the timing of recognition of gains or losses on investments and distributions in excess of current earnings. These reclassifications have no impact on net assets or results of operations. Permanent book and tax basis differences resulted in the following reclassifications:
| TTP | NDP | TPZ | TEAF | |||||||||||
| Distributable earnings (loss) | $ | 93,131 | $ | 1,181,619 | $ | 0 | $ | 0 | ||||||
| Additional paid-in capital | $ | (93,131 | ) | $ | (1,181,619 | ) | $ | 0 | $ | 0 | ||||
The tax character of distributions paid to stockholders for the years ending November 30, 2019 and November 30, 2018 was as follows:
| Year Ended November 30, 2019 | |||||||||||||||
| TTP | NDP | TPZ | TEAF(1) | ||||||||||||
| Common | Preferred | Common | Common | Common | |||||||||||
| Ordinary income(2) | $ | — | $ | 367,805 | $ | — | $ | 7,757,597 | $ | 4,545,707 | |||||
| Long-term capital gain | — | — | — | 1,971,655 | — | ||||||||||
| Return of capital | 13,872,732 | 367,738 | 15,828,822 | 697,748 | 5,700,804 | ||||||||||
| Total distributions | $ | 13,872,732 | $ | 735,543 | $ | 15,828,822 | $ | 10,427,000 | $ | 10,246,511 | |||||
| Year Ended November 30, 2018 | |||||||||||||||
| TTP | NDP | TPZ | |||||||||||||
| Common | Preferred | Common | Common | ||||||||||||
| Ordinary income(1) | $ | 428,639 | $ | 686,401 | $ | — | $ | 4,643,278 | |||||||
| Long-term capital gain | — | — | — | 5,783,722 | |||||||||||
| Return of capital | 15,898,114 | — | 25,586,654 | — | |||||||||||
| Total distributions | $ | 16,326,753 | $ | 686,401 | $ | 25,586,654 | $ | 10,427,000 | |||||||
| (1) | Period from March 29, 2019 (commencement of operations) through November 30, 2019. |
| (2) | For Federal income tax purposes, distributions of short-term capital gains are treated as ordinary income distributions. |
As of November 30, 2019, the components of accumulated earnings (deficit) on a tax basis were as follows:
| TTP | NDP | TPZ | TEAF | |||||||||||||
| Unrealized appreciation (depreciation) | $ | (40,841,708) | $ | (49,544,380) | $ | (5,257,348) | $ | (18,827,811) | ||||||||
| Capital loss carryforwards | (20,597,807) | (110,941,585) | — | (7,332,247) | ||||||||||||
| Undistributed ordinary income | — | — | — | |||||||||||||
| Other temporary differences | (156,156) | (1) | (571,151) | (2) | (11,223) | (501,000) | (3) | |||||||||
| Accumulated earnings (deficit) | $ | (61,595,671) | $ | (161,057,116) | $ | (5,268,571) | $ | (26,661,058) | ||||||||
| (1) | Primarily related to losses deferred under straddle regulations per IRC Sec. 1092 and dividends payable. |
| (2) | Primarily related to late year loss deferral. |
| (3) | Primarily related to expenses of TEAF’s taxable subsidiary and losses deferred under straddle regulations per IRC Sec. 1092. |
| Tortoise | 71 |
| Notes to Financial Statements (continued) |
In order to meet certain excise tax distribution requirements, TTP, NDP, TPZ, and TEAF are required to measure and distribute annually net capital gains realized during a twelve month period ending October 31 and net investment income earned during a twelve month period ending December 31. In connection with this, TTP, NDP, TPZ, and TEAF are permitted for tax purposes to defer into their next fiscal year qualified late year losses. Qualified late year ordinary losses are any net ordinary losses incurred between January 1 and the end of their fiscal year, November 30, 2019. For the taxable year ended November 30, 2019, TTP, TPZ, and TEAF do not plan to defer any losses. NDP plans to defer, on a tax basis, late year ordinary losses of approximately $571,000.
As of November 30, 2019, the aggregate cost of investments, aggregate gross unrealized appreciation and aggregate gross unrealized depreciation on a federal income tax basis were as follows:
| TYG | NTG | TTP | NDP | TPZ | TEAF | |||||||||||||||||||
| Tax cost of investments | $ | 1,196,632,882 | $ | 1,000,852,123 | $ | 219,880,738 | $ | 138,497,242 | $ | 177,136,445 | $ | 285,751,277 | ||||||||||||
| Gross unrealized appreciation | ||||||||||||||||||||||||
| of investments | $ | 615,751,458 | $ | 270,416,740 | $ | 19,116,140 | $ | 742,105 | $ | 12,592,500 | $ | 10,535,853 | ||||||||||||
| Gross unrealized depreciation | ||||||||||||||||||||||||
| of investments | (147,505,053 | ) | (113,023,515 | ) | (46,571,845 | ) | (50,445,008 | ) | (13,673,123 | ) | (27,524,704 | ) | ||||||||||||
| Net unrealized appreciation | ||||||||||||||||||||||||
| (depreciation) of investments | $ | 468,246,405 | $ | 157,393,225 | $ | (27,455,705 | ) | $ | (49,702,903 | ) | $ | (1,080,623 | ) | $ | (16,988,851 | ) | ||||||||
6. Restricted Securities
Certain of the Funds’ investments are restricted and are valued as determined in accordance with fair value procedures, as more fully described in Note 2. The following table shows the principal amount or shares, acquisition date(s), acquisition cost, fair value and the percent of net assets which the securities comprise at November 30, 2019.
| TYG: | |||||||||||||||||
| Fair Value | |||||||||||||||||
| as Percent | |||||||||||||||||
| Investment Security | Investment Type | Shares | Acquisition Date(s) | Acquisition Cost | Fair Value | of Net Assets | |||||||||||
| Altus Midstream Company, | |||||||||||||||||
| 7.000% | Preferred Stock | 10,072 | 6/12/19-11/14/19 | $ | 10,071,748 | $ | 10,421,842 | 1.1 | % | ||||||||
| Noble Midstream | Master Limited | ||||||||||||||||
| Partners LP | Partnerships | 432,663 | 11/21/19 | 8,956,124 | 8,406,642 | 0.9 | |||||||||||
| SemGroup Corporation, | |||||||||||||||||
| 7.000% | Preferred Stock | 6,277 | 01/19/18 | 6,277,000 | 6,948,972 | 0.8 | |||||||||||
| Targa Resources Corp., | |||||||||||||||||
| 9.500% | Preferred Stock | 21,758 | 03/16/16 | 19,265,393 | 23,242,766 | 2.5 | |||||||||||
| TK NYS Solar Holdco, LLC | Private Investment | N/A | 08/18/17-8/19/19 | 55,256,470 | 14,093,091 | 1.5 | |||||||||||
| $ | 99,826,735 | $ | 63,113,313 | 6.8 | % | ||||||||||||
| NTG: | |||||||||||||||||
| Fair Value | |||||||||||||||||
| as Percent | |||||||||||||||||
| Investment Security | Investment Type | Shares | Acquisition Date(s) | Acquisition Cost | Fair Value | of Net Assets | |||||||||||
| Altus Midstream Company, | |||||||||||||||||
| 7.000% | Preferred Stock | 7,202 | 6/12/19-11/14/19 | $ | 7,201,545 | $ | 7,451,871 | 1.1 | % | ||||||||
| Noble Midstream | Master Limited | ||||||||||||||||
| Partners LP | Partnerships | 302,100 | 11/21/19 | 6,253,470 | 5,869,803 | 0.9 | |||||||||||
| SemGroup Corporation, | |||||||||||||||||
| 7.000% | Preferred Stock | 3,763 | 01/19/18 | 3,763,000 | 4,165,840 | 0.6 | |||||||||||
| Targa Resources Corp., | |||||||||||||||||
| 9.500% | Preferred Stock | 12,252 | 03/16/16 | 10,848,405 | 13,088,076 | 2.0 | |||||||||||
| $ | 28,066,420 | $ | 30,575,590 | 4.6 | % | ||||||||||||
| 72 | Tortoise |
| 2019 Annual Report| November 30, 2019 |
| Notes to Financial Statements (continued) |
| TTP: | ||||||||||||||||||
| Fair Value | ||||||||||||||||||
| as Percent | ||||||||||||||||||
| Investment Security | Investment Type | Shares | Acquisition Date(s) | Acquisition Cost | Fair Value | of Net Assets | ||||||||||||
| Altus Midstream Company, | ||||||||||||||||||
| 7.000% | Preferred Stock | 535 | 06/12/19-11/14/19 | $ | 535,036 | $ | 553,634 | 0.4 | % | |||||||||
| Noble Midstream | Master Limited | |||||||||||||||||
| Partners LP | Partnerships | 24,065 | 11/21/19 | 498,146 | 467,583 | 0.4 | ||||||||||||
| SemGroup Corporation, | ||||||||||||||||||
| 7.000% | Preferred Stock | 2,877 | 01/19/18 | 2,877,000 | 3,184,991 | 2.5 | ||||||||||||
| Targa Resources Corp., | ||||||||||||||||||
| 9.500% | Preferred Stock | 2,108 | 03/16/16 | 1,866,506 | 2,251,850 | 1.7 | ||||||||||||
| $ | 5,776,688 | $ | 6,458,058 | 5.0 | % | |||||||||||||
| NDP: | ||||||||||||||||||
| Fair Value | ||||||||||||||||||
| as Percent | ||||||||||||||||||
| Investment Security | Investment Type | Shares | Acquisition Date | Acquisition Cost | Fair Value | of Net Assets | ||||||||||||
| Noble Midstream | Master Limited | |||||||||||||||||
| Partners LP | Partnerships | 37,208 | 11/21/19 | $ | 770,206 | $ | 722,952 | 1.1 | % | |||||||||
| Targa Resources Corp., | ||||||||||||||||||
| 9.500% | Preferred Stock | 1,997 | 03/16/16 | 1,768,223 | 2,133,275 | 3.5 | ||||||||||||
| $ | 2,538,429 | $ | 2,856,227 | 4.6 | % | |||||||||||||
| TPZ: | ||||||||||||||||||
| Fair Value | ||||||||||||||||||
| Principal | as Percent | |||||||||||||||||
| Investment Security | Investment Type | Amount/Shares | Acquisition Date(s) | Acquisition Cost | Fair Value | of Net Assets | ||||||||||||
| Ascent Resources Utica | ||||||||||||||||||
| Holdings, LLC, | ||||||||||||||||||
| 10.000%, 04/01/2022* | Corporate Bond | $ | 1,302,000 | 08/27/18 | $ | 1,445,220 | $ | 1,249,920 | 1.0 | % | ||||||||
| Blue Racer Midstream, LLC, | ||||||||||||||||||
| 6.625%, 07/15/2026* | Corporate Bond | $ | 5,900,000 | 6/18/18-02/05/19 | 5,936,250 | 5,103,500 | 4.2 | |||||||||||
| Duquesne Light Holdings, Inc., | ||||||||||||||||||
| 6.400%, 09/15/2020* | Corporate Bond | $ | 3,000,000 | 11/30/11 | 3,180,330 | 3,090,538 | 2.5 | |||||||||||
| Duquesne Light Holdings, Inc., | ||||||||||||||||||
| 5.900%, 12/01/2021* | Corporate Bond | $ | 2,000,000 | 11/18/11-12/05/11 | 2,074,420 | 2,127,572 | 1.7 | |||||||||||
| Florida Gas Transmission Co., LLC, | ||||||||||||||||||
| 5.450%, 07/15/2020* | Corporate Bond | $ | 1,500,000 | 07/08/10-01/04/11 | 1,551,220 | 1,529,010 | 1.3 | |||||||||||
| Hess Corporation, | ||||||||||||||||||
| 5.625%, 02/15/2026* | Corporate Bond | $ | 4,160,000 | 07/19/18-08/06/18 | 4,196,600 | 4,326,400 | 3.5 | |||||||||||
| NGPL PipeCo LLC, | ||||||||||||||||||
| 4.875%, 08/15/2027* | Corporate Bond | $ | 2,000,000 | 07/30/18 | 2,030,000 | 2,119,517 | 1.7 | |||||||||||
| Pattern Energy Group Inc., | ||||||||||||||||||
| 5.875%, 02/01/2024* | Corporate Bond | $ | 1,000,000 | 01/20/17-01/23/17 | 1,011,875 | 1,030,000 | 0.8 | |||||||||||
| Rockies Express Pipeline LLC, | ||||||||||||||||||
| 4.950%, 07/15/2029* | Corporate Bond | $ | 3,000,000 | 04/12/19 | 3,002,670 | 2,890,545 | 2.4 | |||||||||||
| Ruby Pipeline, LLC, | ||||||||||||||||||
| 6.000%, 04/01/2022* | Corporate Bond | $ | 1,102,273 | 09/17/12 | 1,273,409 | 1,140,775 | 0.9 | |||||||||||
| Southern Star Central Corp., | ||||||||||||||||||
| 5.125%, 07/15/2022* | Corporate Bond | $ | 3,000,000 | 06/17/14 | 3,041,250 | 3,030,000 | 2.5 | |||||||||||
| Tallgrass Energy LP, | ||||||||||||||||||
| 5.500%, 01/15/2028* | Corporate Bond | $ | 3,250,000 | 09/24/18-02/06/19 | 3,261,250 | 3,006,315 | 2.4 | |||||||||||
| Noble Midstream | Master Limited | |||||||||||||||||
| Partners LP | Partnerships | 21,975 | 11/21/19 | 454,883 | 426,974 | 0.3 | ||||||||||||
| Altus Midstream Company, | ||||||||||||||||||
| 7.000% | Preferred Stock | 467 | 06/12/19-11/14/19 | 466,625 | 482,845 | 0.4 | ||||||||||||
| SemGroup Corporation, | ||||||||||||||||||
| 7.000% | Preferred Stock | 2,120 | 01/19/18 | 2,120,000 | 2,346,952 | 1.9 | ||||||||||||
| Targa Resources Corp., | ||||||||||||||||||
| 9.500% | Preferred Stock | 1,685 | 03/16/16 | 1,424,734 | 1,799,984 | 1.5 | ||||||||||||
| $ | 36,470,736 | $ | 35,700,847 | 29.0 | % | |||||||||||||
| Tortoise | 73 |
| Notes to Financial Statements (continued) |
| TEAF: | ||||||||||||||||||
| Fair Value | ||||||||||||||||||
| Principal | as Percent | |||||||||||||||||
| Investment Security | Investment Type | Amount/Shares | Acquisition Date | Acquisition Cost | Fair Value | of Net Assets | ||||||||||||
| Antero Midstream Partners LP, | ||||||||||||||||||
| 5.750%, 01/15/2028* | Corporate Bond | $ | 3,750,000 | 10/31/19-11/19/19 | $ | 3,093,750 | $ | 2,896,875 | 1.2 | % | ||||||||
| Blue Racer Midstream, LLC, | ||||||||||||||||||
| 6.625%, 07/15/2026* | Corporate Bond | $ | 3,000,000 | 03/29/19 | 3,075,000 | 2,595,000 | 1.1 | |||||||||||
| Grace Commons Property, | ||||||||||||||||||
| 15.000%, 10/31/2021* | Corporate Bond | $ | 1,825,000 | 06/17/19 | 1,825,000 | 1,825,000 | 0.8 | |||||||||||
| Grace Commons Property, | ||||||||||||||||||
| 8.000%, 10/31/2021* | Corporate Bond | $ | 3,650,000 | 06/17/19 | 3,650,000 | 3,650,000 | 1.5 | |||||||||||
| Realco Perry Hall, | ||||||||||||||||||
| 10.000%, 10/01/2024* | Corporate Bond | $ | 2,280,000 | 10/01/19 | 2,280,000 | 2,279,850 | 1.0 | |||||||||||
| Saturn Solar Bermuda 1 Ltd., | ||||||||||||||||||
| 6.000%, 02/28/2020 | Construction Note | $ | 3,510,000 | 05/24/19-07/03/19 | 3,770,670 | 3,516,669 | 1.5 | |||||||||||
| Noble Midstream | Master Limited | |||||||||||||||||
| Partners LP | Partnerships | 265,040 | 11/21/19 | 5,486,328 | 5,149,727 | 2.2 | ||||||||||||
| Altus Midstream Company, | ||||||||||||||||||
| 7.000% | Preferred Stock | 4,148 | 06/12/19-11/14/19 | 4,147,551 | 4,291,720 | 1.8 | ||||||||||||
| Targa Resources Corp., | ||||||||||||||||||
| 9.500% | Preferred Stock | 4,000 | 11/18/19 | 4,300,000 | 4,272,960 | 1.8 | ||||||||||||
| Mexico Pacific Limited LLC Series A | Private Investment | 88,889 | 10/23/19 | 2,000,000 | 2,000,000 | 0.8 | ||||||||||||
| Renewable Holdco, LLC | Private Investment | N/A | 07/25/19-11/22/19 | 11,831,569 | 12,497,810 | 5.3 | ||||||||||||
| Renewable Holdco I, LLC | Private Investment | N/A | 09/09/19 | 26,526,217 | 25,400,059 | 10.7 | ||||||||||||
| Renewable Holdco II, LLC | Private Investment | N/A | 10/15/19-11/15/19 | 920,586 | 987,905 | 0.4 | ||||||||||||
| $ | 72,906,671 | $ | 71,363,575 | 30.1 | % | |||||||||||||
| * | Security is eligible for resale under Rule 144A under the 1933 Act. |
7. Affiliated Company Transactions
A summary of the transactions in affiliated companies during the period ended November 30, 2019 is as follows:
| TYG: | |||||||||||||||||||||||||||
| 11/30/19 | Net Change | ||||||||||||||||||||||||||
| 11/30/18 | Gross | Gross | Realized | Distributions | Share | 11/30/19 | in Unrealized | ||||||||||||||||||||
| Investment Security | Share Balance | Additions | Reductions | Gain/(Loss) | Received | Balance | Value | Depreciation | |||||||||||||||||||
| TK NYS Solar Holdco, LLC | N/A | $ | 4,108,065 | $ | — | $ | — | $ | 1,275,000 | N/A | $ | 14,093,091 | $ | 7,723,442 | |||||||||||||
| TEAF: | |||||||||||||||||||||||||||||
| Net Change | |||||||||||||||||||||||||||||
| 11/30/19 | in Unrealized | ||||||||||||||||||||||||||||
| 11/30/18 | Gross | Gross | Realized | Distributions | Share | 11/30/19 | Appreciation | ||||||||||||||||||||||
| Investment Security | Share Balance | Additions | Reductions | Gain/(Loss) | Received | Balance | Value | (Depreciation) | |||||||||||||||||||||
| Renewable Holdco, LLC | N/A | $ | 11,831,569 | $ | — | $ | — | $ | — | N/A | $ | 12,497,810 | $ | 666,241 | |||||||||||||||
| Renewable Holdco I, LLC | N/A | $ | 26,526,217 | $ | — | $ | — | $ | — | N/A | $ | 25,400,059 | $ | (1,126,158 | ) | ||||||||||||||
| Renewable Holdco II, LLC | N/A | $ | 920,586 | $ | — | $ | — | $ | — | N/A | $ | 987,905 | $ | 67,319 | |||||||||||||||
8. Investment Transactions
For the period ended November 30, 2019, the amount of security transactions (other than U.S. government securities and short-term investments), is as follows:
| TYG | NTG | TTP | NDP | TPZ | TEAF | |||||||||||||
| Purchases | $ | 530,643,243 | $ | 420,452,582 | $ | 46,433,952 | $ | 239,980,954 | $ | 48,010,222 | $ | 429,483,697 | ||||||
| Sales | $ | 571,238,904 | $ | 490,982,576 | $ | 58,361,559 | $ | 282,029,366 | $ | 48,667,588 | $ | 127,369,367 | ||||||
| 74 | Tortoise |
| 2019 Annual Report| November 30, 2019 |
| Notes to Financial Statements (continued) |
TYG, NTG and TTP each have issued private senior notes (collectively, the “Notes”), which are unsecured obligations and, upon liquidation, dissolution or winding up of a Fund, will rank: (1) senior to all of the Fund’s outstanding preferred shares, if any; (2) senior to all of the Fund’s outstanding common shares; (3) on parity with any unsecured creditors of the Fund and any unsecured senior securities representing indebtedness of the Fund and (4) junior to any secured creditors of the Fund. Holders of the Notes are entitled to receive periodic cash interest payments until maturity. The Notes are not listed on any exchange or automated quotation system.
The Notes are redeemable in certain circumstances at the option of a Fund, subject to payment of any applicable make-whole amounts or early redemption premiums. The Notes for a Fund are also subject to a mandatory redemption if the Fund fails to meet asset coverage ratios required under the 1940 Act or the rating agency guidelines if such failure is not waived or cured. At November 30, 2019, each of TYG, NTG and TTP were in compliance with asset coverage covenants and basic maintenance covenants for its senior notes.
Details of each Fund’s outstanding Notes, including estimated fair value, as of November 30, 2019 are included below. The estimated fair value of each series of fixed-rate Notes was calculated, for disclosure purposes, by discounting future cash flows by a rate equal to the current U.S. Treasury rate with an equivalent maturity date, plus either 1) the spread between the interest rate on recently issued debt and the U.S. Treasury rate with a similar maturity date or 2) if there has not been a recent debt issuance, the spread between the AAA corporate finance debt rate and the U.S. Treasury rate with an equivalent maturity date plus the spread between the fixed rates of the Notes and the AAA corporate finance debt rate. The estimated fair value of floating rate Notes approximates the carrying amount because the interest rate fluctuates with changes in interest rates available in the current market. The estimated fair values in the following tables are Level 2 valuations within the fair value hierarchy.
| TYG: | |||||||||||||
| Notional | Estimated | ||||||||||||
| Series | Maturity Date | Interest Rate | Payment Frequency | Amount | Fair Value | ||||||||
| Series J | December 19, 2019 | 3.30 | % | Semi-Annual | $ | 15,000,000 | $ | 15,228,290 | |||||
| Series Y | June 14, 2020 | 2.77 | % | Semi-Annual | 12,500,000 | 12,683,575 | |||||||
| Series LL | June 14, 2020 | 3.32 | %(1) | Quarterly | 20,000,000 | 20,000,000 | |||||||
| Series O | September 27, 2020 | 3.78 | % | Semi-Annual | 15,000,000 | 15,265,984 | |||||||
| Series Z | June 14, 2021 | 2.98 | % | Semi-Annual | 12,500,000 | 12,778,576 | |||||||
| Series R | January 22, 2022 | 3.77 | % | Semi-Annual | 25,000,000 | 26,033,370 | |||||||
| Series DD | September 27, 2022 | 4.21 | % | Semi-Annual | 13,000,000 | 13,726,540 | |||||||
| Series II | December 18, 2022 | 3.22 | % | Semi-Annual | 10,000,000 | 10,379,637 | |||||||
| Series K | December 19, 2022 | 3.87 | % | Semi-Annual | 10,000,000 | 10,597,347 | |||||||
| Series S | January 22, 2023 | 3.99 | % | Semi-Annual | 10,000,000 | 10,613,481 | |||||||
| Series P | September 27, 2023 | 4.39 | % | Semi-Annual | 12,000,000 | 12,947,380 | |||||||
| Series FF | November 20, 2023 | 4.16 | % | Semi-Annual | 10,000,000 | 10,662,874 | |||||||
| Series JJ | December 18, 2023 | 3.34 | % | Semi-Annual | 20,000,000 | 21,000,805 | |||||||
| Series T | January 22, 2024 | 4.16 | % | Semi-Annual | 25,000,000 | 27,065,186 | |||||||
| Series L | December 19, 2024 | 3.99 | % | Semi-Annual | 20,000,000 | 21,824,672 | |||||||
| Series AA | June 14, 2025 | 3.48 | % | Semi-Annual | 10,000,000 | 10,685,707 | |||||||
| Series MM | June 14, 2025 | 3.37 | %(2) | Quarterly | 30,000,000 | 30,000,000 | |||||||
| Series NN | June 14, 2025 | 3.20 | % | Semi-Annual | 30,000,000 | 31,589,815 | |||||||
| Series KK | December 18, 2025 | 3.53 | % | Semi-Annual | 10,000,000 | 10,743,424 | |||||||
| Series OO | April 9, 2026 | 3.27 | % | Semi-Annual | 30,000,000 | 31,487,912 | |||||||
| Series PP | September 25, 2027 | 3.33 | % | Semi-Annual | 25,000,000 | 26,536,337 | |||||||
| $ | 365,000,000 | $ | 381,850,912 | ||||||||||
| (1) | Floating rate resets each quarter based on 3-month LIBOR plus 1.20%. The current rate is effective for the period from September 16, 2019 through December 15, 2019. The weighted-average interest rate for the year ended November 30, 2019 was 3.69%. |
| (2) | Floating rate resets each quarter based on 3-month LIBOR plus 1.25%. The current rate is effective for the period from September 16, 2019 through December 15, 2019. The weighted-average interest rate for the year ended November 30, 2019 was 3.74%. |
| Tortoise | 75 |
| Notes to Financial Statements(continued) |
TYG’s Series CC Notes, with a notional amount of $15,000,000 and a fixed rate of 3.48%, matured and were paid in full on September 27, 2019.
| NTG: | |||||||||||||||||
| Notional | Estimated | ||||||||||||||||
| Series | Maturity Date | Interest Rate | Payment Frequency | Amount | Fair Value | ||||||||||||
| Series D | December 15, 2020 | 4.29 | % | Quarterly | $ | 112,000,000 | $ | 115,173,254 | |||||||||
| Series J | April 17, 2021 | 3.72 | % | Semi-Annual | 30,000,000 | 30,666,408 | |||||||||||
| Series L | April 17, 2021 | 3.45 | %(1) | Quarterly | 20,000,000 | 20,000,000 | |||||||||||
| Series M | April 17, 2021 | 3.06 | % | Semi-Annual | 10,000,000 | 10,124,850 | |||||||||||
| Series P | October 16, 2023 | 3.79 | % | Semi-Annual | 20,000,000 | 21,093,621 | |||||||||||
| Series N | December 13, 2024 | 3.18 | % | Semi-Annual | 32,000,000 | 33,597,724 | |||||||||||
| Series Q | October 16, 2025 | 3.97 | % | Semi-Annual | 15,000,000 | 16,290,155 | |||||||||||
| Series R | October 16, 2026 | 4.02 | % | Semi-Annual | 13,000,000 | 14,285,344 | |||||||||||
| Series O | December 13, 2027 | 3.47 | % | Semi-Annual | 25,000,000 | 27,078,518 | |||||||||||
| $ | 277,000,000 | $ | 288,309,874 | ||||||||||||||
| (1) | Floating rate resets each quarter based on 3-month LIBOR plus 1.45%. The current rate is effective for the period from October 17, 2019 through January 16, 2020. The weighted-average rate for the year ended November 30, 2019 was 3.92%. |
NTG’s Series K Notes, with a notional amount of $35,000,000 and a floating rate based on 3-month LIBOR plus 1.30%, matured and were paid in full on September 9, 2019.
| TTP: | |||||||||||||||||
| Notional | Estimated | ||||||||||||||||
| Series | Maturity Date | Interest Rate | Payment Frequency | Amount | Fair Value | ||||||||||||
| Series F | December 12, 2020 | 3.01 | % | Semi-Annual | $ | 6,000,000 | $ | 6,122,441 | |||||||||
| Series D | December 15, 2021 | 4.08 | % | Quarterly | 16,000,000 | 16,663,029 | |||||||||||
| Series G | December 12, 2022 | 3.18 | %(1) | Quarterly | 6,000,000 | 6,000,000 | |||||||||||
| Series H | December 13, 2024 | 3.97 | % | Semi-Annual | 6,000,000 | 6,544,054 | |||||||||||
| $ | 34,000,000 | $ | 35,329,524 | ||||||||||||||
| (1) | Floating rate resets each quarter based on 3-month LIBOR plus 1.05%. The current rate is effective for the period from September 12, 2019 through December 11, 2019. The weighted-average interest rate for the year ended November 30, 2019 was 3.54%. |
On December 13, 2018, TTP issued $6,000,000 Series H Senior Notes which carry a fixed interest rate of 3.97% and mature on December 13, 2024.
TTP’s Series C Notes, with a notional amount of $6,000,000 and a fixed rate of 3.49%, matured and were paid in full on December 13, 2018.
10. Mandatory Redeemable Preferred Stock
TYG, NTG and TTP each have issued and outstanding MRP Stock at November 30, 2019. The MRP Stock has rights determined by the Board of Directors. Except as otherwise indicated in the Funds’ Charter or Bylaws, or as otherwise required by law, the holders of MRP Stock have voting rights equal to the holders of common stock (one vote per MRP share) and will vote together with the holders of shares of common stock as a single class except on matters affecting only the holders of preferred stock or the holders of common stock. The 1940 Act requires that the holders of any preferred stock (including MRP Stock), voting separately as a single class, have the right to elect at least two directors at all times.
Under the 1940 Act, a fund may not declare dividends or make other distributions on shares of common stock or purchases of such shares if, at the time of the declaration, distribution or purchase, asset coverage with respect to the outstanding MRP Stock would be less than 200%. The MRP Stock is also subject to a mandatory redemption if a Fund fails to meet an asset coverage ratio of at least 225% as determined in accordance with the 1940 Act or a rating agency basic maintenance amount if such failure is not waived or cured. At November 30, 2019, each of TYG, NTG and TTP were in compliance with asset coverage covenants and basic maintenance covenants for its MRP Stock.
| 76 | Tortoise |
| 2019 Annual Report| November 30, 2019 |
| Notes to Financial Statements (continued) |
TYG:
TYG has 65,000,000 shares of preferred stock authorized and 16,500,000 shares of MRP Stock outstanding at November 30, 2019. TYG’s MRP Stock has a liquidation value of $10.00 per share plus any accumulated but unpaid distributions, whether or not declared. Holders of the MRP D Stock and MRP E Stock are entitled to receive cash interest payments semi-annually at a fixed rate until maturity. The TYG MRP Stock is not listed on any exchange or automated quotation system.
| Aggregate Liquidation | Estimated Fair | ||||||||||||||||||
| Series | Mandatory Redemption Date | Fixed Rate | Shares Outstanding | Preference | Value | ||||||||||||||
| Series D | December 17, 2021 | 4.01 | % | 8,500,000 | $ | 85,000,000 | $ | 88,177,703 | |||||||||||
| Series E | December 17, 2024 | 4.34 | % | 8,000,000 | 80,000,000 | 86,660,279 | |||||||||||||
| 16,500,000 | $ | 165,000,000 | $ | 174,837,982 | |||||||||||||||
TYG’s MRP Stock is redeemable in certain circumstances at the option of TYG, subject to payment of any applicable make-whole amounts.
NTG:
NTG has 10,000,000 shares of preferred stock authorized and 5,280,000 shares of MRP Stock outstanding at November 30, 2019. NTG’s MRP Stock has a liquidation value of $25.00 per share plus any accumulated but unpaid distributions, whether or not declared. Holders of NTG MRP Stock are entitled to receive cash interest payments each quarter at a fixed rate until maturity. The NTG MRP Stock is not listed on any exchange or automated quotation system.
| Aggregate Liquidation | Estimated Fair | ||||||||||||||||||||
| Series | Mandatory Redemption Date | Fixed Rate | Shares Outstanding | Preference | Value | ||||||||||||||||
| Series C | December 8, 2020 | 3.73 | % | 200,000 | $ | 5,000,000 | $ | 5,068,640 | |||||||||||||
| Series D | December 8, 2022 | 4.19 | % | 1,600,000 | 40,000,000 | 41,642,401 | |||||||||||||||
| Series G | October 16, 2023 | 4.39 | % | 880,000 | 22,000,000 | 23,175,487 | |||||||||||||||
| Series E | December 13, 2024 | 3.78 | % | 1,600,000 | 40,000,000 | 41,637,239 | |||||||||||||||
| Series F | December 13, 2027 | 4.07 | % | 1,000,000 | 25,000,000 | 26,811,831 | |||||||||||||||
| 5,280,000 | $ | 132,000,000 | $ | 138,335,598 | |||||||||||||||||
NTG’s MRP Stock is redeemable in certain circumstances at the option of NTG, subject to payment of any applicable make-whole amounts.
TTP:
TTP has 10,000,000 shares of preferred stock authorized and 640,000 shares of MRP Stock outstanding at November 30, 2019. On December 13, 2018, TTP issued 640,000 Series B Mandatory Redeemable Preferred Shares (aggregate liquidation preference $16,000,000) which carry a fixed interest rate of 4.57% and a mandatory redemption date of December 13, 2024. On December 13, 2018, TTP redeemed 640,000 shares (aggregate liquidation preference $16,000,000) of MRP A Stock. TTP’s MRP Stock has a liquidation value of $25.00 per share plus any accumulated but unpaid distributions, whether or not declared. Holders of TTP MRP Stock are entitled to receive cash interest payments each quarter at a fixed rate until maturity. The TTP MRP Stock is not listed on any exchange or automated quotation system.
| Aggregate Liquidation | Estimated Fair | ||||||||||||||||||||
| Series | Mandatory Redemption Date | Fixed Rate | Shares Outstanding | Preference | Value | ||||||||||||||||
| Series B | December 13, 2024 | 4.57 | % | 640,000 | $ | 16,000,000 | $ | 17,269,292 | |||||||||||||
TTP’s MRP Stock is redeemable in certain circumstances at the option of TTP, subject to payment of any applicable make-whole amounts.
| Tortoise | 77 |
| Notes to Financial Statements(continued) |
11. Credit Facilities
The following table shows key terms, average borrowing activity and interest rates for the period during which the facility was utilized during the period from December 1, 2018 through November 30, 2019 as well as the principal balance and interest rate in effect at November 30, 2019 for each of the Funds’ credit facilities:
| TYG | TYG | NTG | TTP | NDP | TPZ | TEAF | ||||||||
| Lending syndicate | The Bank | Bank of America, | The Bank | The Bank | The Bank | The Bank | ||||||||
| agent | U.S. Bank, N.A. | of Nova Scotia | N.A. | of Nova Scotia | of Nova Scotia | of Nova Scotia | of Nova Scotia | |||||||
| Unsecured, | Unsecured, | Unsecured, | Unsecured, | Secured, | Secured, | |||||||||
| revolving credit | revolving credit | revolving credit | revolving credit | revolving credit | revolving credit | Margin loan | ||||||||
| Type of facility | facility | facility | facility | facility | facility | facility | facility | |||||||
| Borrowing | ||||||||||||||
| capacity | $130,000,000 | $90,000,000 | $140,000,000 | $35,000,000 | $80,000,000 | $60,000,000 | $45,000,000 | |||||||
| 364-day rolling | 179-day rolling | 179-day rolling | ||||||||||||
| Maturity date | June 12, 2020 | June 22, 2020 | June 12, 2020 | evergreen | evergreen | evergreen | N/A | |||||||
| 1-month LIBOR | 1-month LIBOR | 1-month LIBOR | 1-month LIBOR | 1-month LIBOR | 1-month LIBOR | 1-month LIBOR | ||||||||
| Interest rate | plus 1.10% | plus 1.20% | plus 1.10% | plus 1.125% | plus 0.80% | plus 0.80% | plus 0.80% | |||||||
| Non-usage fee | 0.15%-0.25%(1) | 0.15%(2) | 0.15%-0.25%(3) | 0.15% | 0.20%(4) | 0.20%(5) | 0.20%(6) | |||||||
| For the period ended November 30, 2019: | ||||||||||||||
| Average principal | ||||||||||||||
| balance | $69,400,000 | $62,300,000 | $79,100,000 | $12,400,000 | $36,200,000 | $54,400,000 | $30,500,000 | |||||||
| Average | ||||||||||||||
| interest rate | 3.43% | 3.48% | 3.44% | 3.41% | 3.08% | 3.12% | 2.98% | |||||||
| As of November 30, 2019: | ||||||||||||||
| Principal balance | ||||||||||||||
| outstanding | $30,900,000 | $63,000,000 | $53,600,000 | $11,800,000 | $26,500,000 | $54,100,000(7) | $32,000,000 | |||||||
| Interest rate | 2.80% | 2.90% | 2.80% | 2.82% | 2.50% | 2.50% | 2.50% | |||||||
| (1) | Non-use fees are equal to a rate of 0.25% when the outstanding balance is below $65,000,000 and 0.15% when the outstanding balance is at least $65,000,000, but below $91,000,000. The outstanding balance will not be subject to the non-use fee when the amount outstanding is at least $91,000,000. |
| (2) | Non-usage fee is waived if the outstanding balance on the facility is at least $63,000,000. |
| (3) | Non-use fees are equal to a rate of 0.25% when the outstanding balance is below $70,000,000 and 0.15% when the outstanding balance is at least $70,000,000, but below $98,000,000. The outstanding balance will not be subject to the non-use fee when the amount outstanding is at least $98,000,000. |
| (4) | Non-usage fee is waived if the outstanding balance on the facility is at least $56,000,000. |
| (5) | Non-usage fee is waived if the outstanding balance on the facility is at least $42,000,000. |
| (6) | Non-usage fee is waived if the outstanding balance on the facility is at least $31,500,000. |
| (7) | TPZ’s credit facility allows for interest rates to be fixed on all or a portion of the outstanding balance. Amounts reflect activity on the credit facility for the period from December 1, 2018 through November 30, 2019 and include $15,000,000 of the outstanding principal balance that has a fixed rate of 3.03% through June 30, 2023 and $15,000,000 of the outstanding principal balance that has a fixed rate of 3.04% through June 30, 2024. |
On June 12, 2019, TYG entered into an amendment to its credit facility with U.S. Bank, N.A. that extends the credit facility through June 12, 2021. The terms of the amendment provide for an unsecured revolving credit facility of $130,000,000. During the extension, outstanding balances generally will accrue interest at a variable rate equal to one-month LIBOR plus 1.10 percent and unused portions of the credit facility will accrue a non-usage fee of 0.25 percent when the outstanding balance is below $65,000,000 and 0.15 percent when the balance is at least $65,000,000, but below $91,000,000. The non-usage fee is waived if the outstanding balance is at least $91,000,000.
On June 12, 2019, NTG entered into an amendment to its credit facility with U.S. Bank, N.A. that extends the credit facility through June 12, 2021. The terms of the amendment provide for an unsecured revolving credit facility of $120,000,000. During the extension, outstanding balances generally accrue interest at a variable rate equal to one-month LIBOR plus 1.10 percent and unused portions of the credit facility accrued a non-usage fee of 0.25 percent when the outstanding balance is below $60,000,000 and 0.15 percent when the balance is at least $60,000,000, but below $84,000,000. The non-usage fee was waived if the outstanding balance is at least $84,000,000.
On September 5, 2019, NTG entered into an amendment to its credit facility with U.S. Bank, N.A. that increased the borrowing capacity from $120,000,000 to $140,000,000. After the amendment, unused portions of the credit facility will accrue a non-usage fee of 0.25 percent when the outstanding balance is below $70,000,000 and 0.15 percent when the balance is at least $70,000,000, but below $98,000,000. The non-usage fee is waived if the outstanding balance is at least $98,000,000.
| 78 | Tortoise |
| 2019 Annual Report| November 30, 2019 |
| Notes to Financial Statements (continued) |
Under the terms of the credit and margin facilities, the Funds must maintain asset coverage required under the 1940 Act. If a Fund fails to maintain the required coverage, it may be required to repay a portion of an outstanding balance until the coverage requirement has been met. At November 30, 2019, each Fund was in compliance with facility terms.
12. Derivative Financial Instruments
The Funds have adopted the disclosure provisions of FASB Accounting Standard Codification 815, Derivatives and Hedging (“ASC 815”). ASC 815 requires enhanced disclosures about the Funds’ use of and accounting for derivative instruments and the effect of derivative instruments on the Funds’ results of operations and financial position. Tabular disclosure regarding derivative fair value and gain/loss by contract type (e.g., interest rate contracts, foreign exchange contracts, credit contracts, etc.) is required and derivatives accounted for as hedging instruments under ASC 815 must be disclosed separately from those that do not qualify for hedge accounting. Even though the Funds may use derivatives in an attempt to achieve an economic hedge, the Funds’ derivatives are not accounted for as hedging instruments under ASC 815 because investment companies account for their derivatives at fair value and record any changes in fair value in current period earnings.
Forward Currency Contracts
TEAF invests in derivative instruments for hedging or risk management purposes, and for short-term purposes such as maintaining market exposure pending investment of the proceeds of an offering or transitioning its portfolio between different asset classes. The Fund’s use of derivatives could enhance or decrease the cash available to the Fund for payment of distributions or interest, as the case may be. Derivatives can be illiquid, may disproportionately increase losses and have a potentially large negative impact on the Fund’s performance. Derivative transactions, including options on securities and securities indices and other transactions in which the Fund may engage (such as forward currency transactions, futures contracts and options thereon and total return swaps), may subject the Fund to increased risk of principal loss due to unexpected movements in stock prices, changes in stock volatility levels, interest rates and foreign currency exchange rates and imperfect correlations between the Fund’s securities holdings and indices upon which derivative transactions are based. The Fund also will be subject to credit risk with respect to the counterparties to any OTC derivatives contracts the Fund enters into.
Interest Rate Swap Contracts
TYG and TPZ have each entered into interest rate swap contracts in an attempt to protect it from increasing interest expense on its leverage resulting from increasing interest rates. A decline in interest rates may result in a decline in the value of the swap contracts, which may result in a decline in the net assets of TYG and TPZ. At the time the interest rate swap contracts reach their scheduled termination, there is a risk that TYG and TPZ will not be able to obtain a replacement transaction, or that the terms of the replacement would not be as favorable as on the expiring transaction. In addition, if TYG or TPZ is required to terminate any swap contract early due to a decline in net assets below a threshold amount ($450,000,000 for TYG and $60,000,000 for TPZ) or failing to maintain a required 300% asset coverage of the liquidation value of the outstanding debt, then TYG or TPZ could be required to make a payment to the extent of any net unrealized depreciation of the terminated swaps, in addition to redeeming all or some of its outstanding debt. TYG and TPZ each segregate a portion of its assets as collateral for the amount of any net liability of its interest rate swap contracts.
TYG and TPZ are exposed to credit risk on the interest rate swap contracts if the counterparty should fail to perform under the terms of the interest rate swap contracts. The amount of credit risk is limited to the net appreciation of the interest rate swap contracts, if any, as no collateral is pledged by the counterparty. In addition, if the counterparty to the interest rate swap contracts defaults, the Fund would incur a loss in the amount of the receivable and would not receive amounts due from the counterparty to offset the interest payments on the Fund’s leverage.
The average notional amount of all open swap agreements for TYG and TPZ for the period from December 1, 2018 through November 30, 2019 was $10,000,000 and $9,000,000, respectively.
The following table presents TYG’s and TPZ’s interest rate swap contracts, each of which is subject to a netting agreement, on a gross and a net basis at November 30, 2019:
| Gross Amounts Not Offset in the | ||||||||||||||||||||||||||||||
| Statement of Assets & Liabilities | ||||||||||||||||||||||||||||||
| Gross Amounts | Net Amounts of | |||||||||||||||||||||||||||||
| Gross Amounts | Offset in the | Assets Presented in | ||||||||||||||||||||||||||||
| of Recognized | Statements of | the Statements of | Financial | Cash Collateral | ||||||||||||||||||||||||||
| Description | Liabilities | Assets & Liabilities | Assets & Liabilities | Instruments | Received | Net Amount | ||||||||||||||||||||||||
| TYG: Interest Rate Swap Contracts | $ | 161,840 | $ | — | $ | 161,840 | $ | — | $ | — | $ | 161,840 | ||||||||||||||||||
| TPZ: Interest Rate Swap Contracts | $ | 8,589 | $ | — | $ | 8,589 | $ | — | $ | — | $ | 8,589 | ||||||||||||||||||
| Tortoise | 79 |
| Notes to Financial Statements (continued) |
| TYG | NTG | TTP | |||||||||||||||||||
| Number of | Number of | Number of | |||||||||||||||||||
| Contracts | Premium | Contracts | Premium | Contracts | Premium | ||||||||||||||||
| Options outstanding at November 30, 2018 | 39,884 | $ | 493,575 | 28,299 | $ | 350,544 | 5,539 | $ | 512,777 | ||||||||||||
| Options written | 127,944 | 2,910,661 | 137,554 | 3,138,000 | 70,574 | 3,448,088 | |||||||||||||||
| Options closed* | (6,216 | ) | (296,987 | ) | (5,261 | ) | (162,842 | ) | (60,552 | ) | (3,239,805 | ) | |||||||||
| Options exercised | (7,035 | ) | (296,572 | ) | (8,618 | ) | (350,202 | ) | (2,791 | ) | (158,948 | ) | |||||||||
| Options expired | (150,877 | ) | (2,683,101 | ) | (148,374 | ) | (2,860,326 | ) | (7,727 | ) | (336,534 | ) | |||||||||
| Options outstanding at November 30, 2019 | 3,700 | $ | 127,576 | 3,600 | $ | 115,174 | 5,043 | $ | 225,578 | ||||||||||||
| NDP | TEAF | ||||||||||||||||||||
| Number of | Number of | ||||||||||||||||||||
| Contracts | Premium | Contracts | Premium | ||||||||||||||||||
| Options outstanding at November 30, 2018 | 41,406 | $ | 2,406,989 | — | $ | — | |||||||||||||||
| Options written | 622,258 | 16,038,200 | 169,522 | 4,384,880 | |||||||||||||||||
| Options closed* | (458,871 | ) | (13,530,034 | ) | (105,296 | ) | (2,978,952 | ) | |||||||||||||
| Options exercised | (51,619 | ) | (1,848,228 | ) | (12,560 | ) | (340,205 | ) | |||||||||||||
| Options expired | (129,035 | ) | (2,532,919 | ) | (34,482 | ) | (495,609 | ) | |||||||||||||
| Options outstanding at November 30, 2019 | 24,139 | $ | 534,008 | 17,184 | $ | 570,114 | |||||||||||||||
*The aggregate cost of closing written option contracts was $489,005 for TYG, $12,021 for NTG, $2,404,506 for TTP, $9,584,462 for NDP, and $1,473,246, for TEAF, resulting in net realized gain (loss) of $(192,018), $150,821, $(32,970), $3,945,572 and $1,503,890 for TYG, NTG, TTP, NDP and TEAF, respectively.
The following table presents the types and fair value of derivatives by location as presented on the Statements of Assets & Liabilities at November 30, 2019:
| Assets/(Liabilities) | ||||||||||
| Derivatives not accounted for | ||||||||||
| as hedging instruments under ASC 815 | Location | Fair Value | ||||||||
| TYG: Interest rate swap contracts | Interest rate swap contracts | $ | (161,840 | ) | ||||||
| TYG: Written equity call options | Options written, at fair value | $ | (63,728 | ) | ||||||
| NTG: Written equity call options | Options written, at fair value | $ | (45,245 | ) | ||||||
| TTP: Written equity call options | Options written, at fair value | $ | (83,438 | ) | ||||||
| NDP: Written equity call options | Options written, at fair value | $ | (179,348 | ) | ||||||
| TPZ: Interest rate swap contracts | Interest rate swap contracts | $ | (8,589 | ) | ||||||
| TEAF: Forward currency contracts | Forward currency contracts | $ | (320,491 | ) | ||||||
| TEAF: Written equity call options | Options written, at fair value | $ | (288,066 | ) | ||||||
| The following table presents the effect of derivatives on the Statements of Operations for the period ended November 30, 2019: | ||||||||||
| Net Unrealized | ||||||||||
| Net Realized | Appreciation | |||||||||
| Derivatives not accounted for | Location of Gains (Losses) | Gain (Loss) on | (Depreciation) | |||||||
| as hedging instruments under ASC 815 | on Derivatives | Derivatives | of Derivatives | |||||||
| TYG: Interest rate swap contracts | Interest rate swaps | $ | (2,359 | ) | $ | (270,723 | ) | |||
| TYG: Written equity call options | Options | $ | 2,750,775 | $ | 492,115 | |||||
| NTG: Written equity call options | Options | $ | 8,594,292 | $ | 372,847 | |||||
| TTP: Written equity call options | Options | $ | 1,171,832 | $ | (170,855 | ) | ||||
| NDP: Written equity call options | Options | $ | 4,861,669 | $ | (1,217,322 | ) | ||||
| TPZ: Interest rate swap contracts | Interest rate swaps | $ | 81,937 | $ | (137,219 | ) | ||||
| TEAF: Forward foreign exchange contracts | Forward currency contracts | $ | 497,766 | $ | (320,491 | ) | ||||
| TEAF: Written equity call options | Options | $ | 1,998,935 | $ | 282,048 | |||||
| 80 | Tortoise |
| 2019 Annual Report| November 30, 2019 |
| Notes to Financial Statements (continued) |
As of November 30, 2019, TYG has committed a total of $55,256,470 of equity funding to Tortoise Holdco II, LLC, a wholly-owned investment of TYG. Tortoise Holdco II, LLC wholly owns TK NYS Solar Holdco, LLC, which owns and operates renewable energy assets. TK NYS Solar Holdco, LLC acquired the commercial and industrial solar portfolio between August 2017 and November 2019. Fair value of TK NYS Solar Holdco, LLC is net of tax benefits.
TYG’s consolidated schedule of investments includes the portfolio holdings of the Fund and its subsidiary, Tortoise Holdco II, LLC. All inter-company transactions and balances have been eliminated.
As of November 30, 2019, TEAF has committed $40,195,534 to TEAF Solar Holdco, LLC, a wholly-owned investment of TEAF. TEAF Solar Holdco, LLC wholly owns each of Renewable Holdco, LLC and Renewable Holdco I, LLC, which owns and operates renewable energy assets. TEAF Solar Holdco, LLC owns a majority partnership interest in Renewable Holdco II, LLC. Renewable Holdco, LLC and Renewable Holdco II, LLC’s acquisition of the commercial and industrial solar portfolio is ongoing. Renewable Holdco I, LLC acquired the commercial and industrial solar portfolio in September 2019.
As of November 30, 2019, TEAF has provided $3,770,670 to TEAF Solar Holdco I, LLC, a wholly-owned investment of TEAF. TEAF Solar Holdco I, LLC has committed to $6,667,100 of debt funding to Saturn Solar Bermuda 1, Ltd. through a construction note. Under the terms of the note TEAF Solar Holdco I, LLC receives cash payments monthly at an annual rate of 6%. As of November 30, 2019, $3,510,000 of the construction note had been funded.
TEAF’s consolidated schedule of investments includes the portfolio holdings of the Fund and its subsidiaries, TEAF Solar Holdco, LLC and TEAF Solar Holdco I, LLC. All inter-company transactions and balances have been eliminated.
14. Subsequent Events
TYG:
On December 4, 2019, TYG Series LL Notes with a notional amount of $20,000,000 and a floating interest rate based on 3-month LIBOR plus 1.20% were paid in full upon redemption.
TYG has performed an evaluation of subsequent events through the date the financial statements were issued and has determined that no additional items require recognition or disclosure.
NTG:
On December 4, 2019, NTG Series L Notes with a notional amount of $20,000,000 and a floating interest rate based on 3-month LIBOR plus 1.45% were paid in full upon redemption.
NTG has performed an evaluation of subsequent events through the date the financial statements were issued and has determined that no additional items require recognition or disclosure.
TTP:
TTP has performed an evaluation of subsequent events through the date the financial statements were issued and has determined that no items require recognition or disclosure.
NDP:
NDP has performed an evaluation of subsequent events through the date the financial statements were issued and has determined that no items require recognition or disclosure.
TPZ:
On December 31, 2019, TPZ paid a distribution in the amount of $0.125 per common share, for a total of $868,917. Of this total, the dividend reinvestment amounted to $10,693.
TPZ has performed an evaluation of subsequent events through the date the financial statements were issued and has determined that no additional items require recognition or disclosure.
TEAF:
On December 31, 2019, TEAF paid a distribution in the amount of $0.1085 per common share, for a total of $1,463,787. Of this total, the dividend reinvestment amounted to $109,905.
Effective January 1, 2020, the Adviser terminated its Investment Sub-Advisory Agreement with Tortoise Credit Strategies, LLC.
TEAF has performed an evaluation of subsequent events through the date the financial statements were issued and has determined that no additional items require recognition or disclosure.
| Tortoise | 81 |
| Report of Independent Registered Public Accounting Firm |
Tortoise Energy Infrastructure Corp.
Tortoise Midstream Energy Fund, Inc.
Tortoise Pipeline & Energy Fund, Inc.
Tortoise Energy Independence Fund, Inc.
Tortoise Power and Energy Infrastructure Fund, Inc.
Tortoise Essential Assets Income Term Fund
Opinion on the Financial Statements
We have audited the accompanying statements of assets and liabilities of Tortoise Energy Infrastructure Corp. (consolidated), Tortoise Midstream Energy Fund, Inc., Tortoise Pipeline & Energy Fund, Inc., Tortoise Energy Independence Fund, Inc., Tortoise Power and Energy Infrastructure Fund, Inc., and Tortoise Essential Assets Income Term Fund (consolidated) (the “Funds”), including the schedules of investments, as of November 30, 2019, and the related statements of operations and cash flows, the statements of changes in net assets, and the financial highlights for each of the periods indicated in the table below and the related notes (collectively referred to as the “financial statements”). In our opinion, the financial statements present fairly, in all material respects, the financial position of the Funds at November 30, 2019, the results of their operations, cash flows, changes in net assets and financial highlights for each of the periods indicated in the table below, in conformity with U.S. generally accepted accounting principles.
| Statement | Statement of | |||||
| Closed-End Funds | of operations | changes in net assets | Financial highlights | |||
| Tortoise Energy Infrastructure Corp. | For the year ended November 30, 2019 | For each of the two years in the period ended November 30, 2019 | For each of the five years in the period ended November 30, 2019 | |||
| Tortoise Midstream Energy Fund, Inc. | ||||||
| Tortoise Pipeline & Energy Fund, Inc. | ||||||
| Tortoise Energy Independence Fund, Inc. | ||||||
| Tortoise Power and Energy Infrastructure Fund, Inc. | ||||||
| Tortoise Essential Assets Income Term Fund | For the year ended November 30, 2019 | For the period from March 29, 2019 to November 30, 2019 | For the period from March 29, 2019 to November 30, 2019 |
Basis for Opinion
These financial statements are the responsibility of the Funds’ management. Our responsibility is to express an opinion on the Funds’ financial statements based on our audits. We are a public accounting firm registered with the Public Company Accounting Oversight Board (United States) (“PCAOB”) and are required to be independent with respect to the Funds in accordance with the U.S. federal securities laws and the applicable rules and regulations of the Securities and Exchange Commission and the PCAOB.
We conducted our audits in accordance with the standards of the PCAOB. Those standards require that we plan and perform the audit to obtain reasonable assurance about whether the financial statements are free of material misstatement, whether due to error or fraud. The Funds are not required to have, nor were we engaged to perform an audit of the Funds’ internal control over financial reporting. As part of our audits we are required to obtain an understanding of internal control over financial reporting but not for the purpose of expressing an opinion on the effectiveness of the Funds’ internal control over financial reporting. Accordingly, we express no such opinion.
Our audits included performing procedures to assess the risks of material misstatement of the financial statements, whether due to error or fraud, and performing procedures that respond to those risks. Such procedures included examining, on a test basis, evidence regarding the amounts and disclosures in the financial statements. Our procedures included confirmation of securities owned as of November 30, 2019, by correspondence with the custodian, counterparties, and brokers. Our audits also included evaluating the accounting principles used and significant estimates made by management, as well as evaluating the overall presentation of the financial statements. We believe that our audits provide a reasonable basis for our opinion.

Minneapolis, Minnesota
January 27, 2020
We have served as the auditor of one or more Tortoise investment companies since 2004.
| 82 | Tortoise |
| 2019 Annual Report| November 30, 2019 |
| Company Officers and Directors (unaudited) |
| November 30, 2019 |
| Number of | ||||||||
| Position(s) Held | Portfolios in | Other Public | ||||||
| With Company, Term | Fund Complex | Company | ||||||
| of Office and Length | Overseen | Directorships | ||||||
| Name and Age(1) | of Time Served(2) | Principal Occupation During Past Five Years | by Director(3) | Held | ||||
| Independent Directors | ||||||||
| Conrad S. Ciccotello (Born 1960) | Class I Director of TYG since 2003 and of NTG since 2010; Class II Director of NDP since 2012 and of TPZ since 2007; Class III Director of TTP since 2011; Class I Director of TEAF since 2019. | Professor and Director, Reiman School of Finance, University of Denver (faculty member since 2017); Professor and Chairman of the Department of Risk Management and Insurance, Robinson College of Business, Georgia State University (1999-2017); Director of Personal Financial Planning Program; Investment Consultant to the University System of Georgia for its defined contribution retirement plan; Formerly Faculty Member, Pennsylvania State University (1997-1999); Published a number of academic and professional journal articles on investment company performance and structure, with a focus on MLPs. | 7 | CorEnergy Infrastructure Trust, Inc.; Peachtree Alternative Strategies Fund | ||||
| Rand C. Berney (Born 1955) | Class I Director of TTP since 2014; Class II Director of each of TYG and NTG since 2014; Class III Director of each of NDP and TPZ since 2014; Class II Director of TEAF since 2019. | Executive-in-Residence and Professor for Professional Financial Planning Course and Professional Ethics Course, College of Business Administration, Kansas State University since 2012; Formerly Senior Vice President of Corporate Shared Services of ConocoPhillips from 2009 to 2012, Vice President and Controller of ConocoPhillips from 2002 to 2009, and Vice President and Controller of Phillips Petroleum Company from 1997 to 2002; Member of the Oklahoma Society of CPAs, the Financial Executive Institute, American Institute of Certified Public Accountants, the Institute of Internal Auditors and the Institute of Management Accountants. | 6 | None | ||||
| Jennifer Paquette (Born 1962) | Class I Director of TTP since 2018; Class II Director of each of TYG and NTG since 2018; Class III Director of each of NDP and TPZ since 2018; Class II Director of TEAF since 2019. | Retired in 2017; Previously Chief Investment Officer of the Public Employees’ Retirement Association of Colorado (“Colorado PERA”) from 2003 to 2017; Held various positions within Colorado PERA from 1999 to 2003 and 1995 to 1996; Formerly Vice-President Institutional Account Executive at Merrill Lynch, Pierce, Fenner & Smith from 1991 to 1994; Vice-President, Portfolio Manager and Analyst at Alliance Capital Management from 1987 to 1991; Portfolio Assistant and Assistant at Mitchell Hutchins Asset Management from 1985 to 1987. Chartered Financial Analyst (“CFA”) charterholder. | 6 | None | ||||
| Alexandra Herger (Born 1957) | Class I Director of each of NDP and TPZ since 2015; Class II Director of TTP since 2015; Class III Director of each of TYG and NTG since 2015; Class III Director of TEAF since 2019. | Retired in 2014; Previously interim vice president of exploration for Marathon Oil in 2014 prior to her retirement; Director of international exploration and new ventures for Marathon Oil from 2008 to 2014; Held various positions with Shell Exploration and Production Co. between 2002 and 2008; Member of the Society of Exploration Geophysicists, the American Association of Petroleum Geologists, the Houston Geological Society and the Southeast Asia Petroleum Exploration Society; Member of the 2010 Leadership Texas/Foundation for Women’s Resources since 2010; Director of Panoro Energy ASA, an international independent oil and gas company listed on the Oslo Stock Exchange. | 6 | None | ||||
| Interested Directors(4) | ||||||||
| H. Kevin Birzer (Born 1959) | Class I Director and Chairman of the Board of NDP since 2012 and of TPZ since 2007; Class II Director and Chairman of the Board of TTP since 2011; Class III Director and Chairman of the Board of TYG since 2003 and of NTG since 2010; Class III Director and Chairman of the Board of TEAF since 2019. | Chief Executive Officer of the Adviser; Managing Director of the Adviser and member of the Investment Committee of the Adviser since 2002; Director and Chairman of the Board of each of Tortoise Energy Capital Corporation (“TYY”) and Tortoise North American Energy Corporation (“TYN”) from its inception until its merger into TYG effective June 23, 2014; Director and Chairman of the Board of Tortoise Capital Resources Corporation (“TTO”), which changed its name to CorEnergy Infrastructure Trust, Inc. on December 3, 2012 (“CORR”), from its inception through November 30, 2011. CFA designation since 1988. | 6 | None |
| (1) | The address of each director and officer is 5100 W. 115th Place, Leawood, Kansas 66211. |
| (2) | Ending year of Director terms by Class are as follows: |
| TYG | NTG | TTP | NDP | TPZ | TEAF | ||||||||
| Class I | 2020 | 2020 | 2021 | 2022 | 2022 | 2020 | |||||||
| Class II | 2021 | 2021 | 2022 | 2020 | 2020 | 2021 | |||||||
| Class III | 2022 | 2022 | 2020 | 2021 | 2021 | 2022 |
| (3) | This number includes TYG, NTG, TTP, NDP, TPZ and TEAF. The Adviser serves as the investment adviser to TYG, NTG, TTP, NDP, TPZ and TEAF. For Mr. Ciccotello, this number also includes the Tortoise Tax-Advantaged Social Infrastructure Fund, Inc. (“TSIFX”), whose investment adviser was an affiliate of the Adviser until December 31, 2019. Effective January 1, 2020, the Adviser serves as the investment adviser to TSIFX. |
| (4) | As a result of their respective positions held with the Adviser or its affiliates, these individuals are considered “interested persons” within the meaning of the 1940 Act. |
| Tortoise | 83 |
| Company Officers and Directors (unaudited) (continued) |
| November 30, 2019 |
| Number of | ||||||||
| Position(s) Held | Portfolios in | Other Public | ||||||
| With Company, Term | Fund Complex | Company | ||||||
| of Office and Length | Overseen | Directorships | ||||||
| Name and Age(1) | of Time Served(2) | Principal Occupation During Past Five Years | by Director | Held | ||||
| Interested Officers(3) | ||||||||
| P. Bradley Adams (Born 1960) | Chief Executive Officer of each of TYG, NTG, TTP, NDP and TPZ since June 2015. Principal Financial Officer and Treasurer of each of TYG, NTG, TTP, NDP and TPZ since May 2017. Chief Executive Officer, Principal Financial Officer and Treasurer of TEAF since November 2018. | Managing Director of the Adviser since January 2013; Director of Financial Operations of the Adviser from 2005 to January 2013; Chief Financial Officer of NTG from 2010 to June 2015, of each of TYG and TPZ from May 2011 to June 2015, of each of TTP and NDP from its inception to June 2015, and of each of TYY and TYN from May 2011 to June 2014; Assistant Treasurer of each of the TYG, TYY and TYN from November 2005 to May 2011, of TPZ from its inception to May 2011, and of TTO from its inception to June 2012. | N/A | None | ||||
| Matthew G.P. Sallee (Born 1978) | President of TYG and NTG since June 2015. | Managing Director of the Adviser since January 2014; Portfolio Manager of the Adviser since July 2013; Senior Investment Analyst of the Adviser from June 2012 to July 2013; Investment Analyst of the Adviser from 2009 to June 2012; Research Analyst of the Adviser from 2005 to 2009. CFA designation since 2009. | N/A | None | ||||
| Brian A. Kessens (Born 1975) | President of TTP and TPZ since June 2015. | Managing Director of the Adviser since January 2015; Portfolio Manager of the Adviser since July 2013; Senior Investment Analyst of the Adviser from June 2012 to July 2013; Investment Analyst of the Adviser from 2008 to June 2012. CFA designation since 2006. | N/A | None | ||||
| Robert J. Thummel (Born 1972) | President of NDP since June 2015. | Managing Director of the Adviser since January 2014; Portfolio Manager of the Adviser since July 2013; Senior Investment Analyst of the Adviser from June 2012 to July 2013; Investment Analyst of the Adviser from 2004 to June 2012. Previously, the President of TYN from 2008 until its merger into TYG in June 2014. | N/A | None | ||||
| Nicholas S. Holmes (Born 1985) | President of TEAF since May 2019; Vice President of each of TYG and NTG since June 2015. | Managing Director of the Adviser since January 2020; Portfolio Manager of the Adviser since January 2019; Investment Analyst of the Adviser from January 2015 through December 2018; Research Analyst of the Adviser from January 2012 through December 2014 and Assistant Research Analyst from January 2010 through December 2011. CFA designation since 2013. | N/A | None | ||||
| Stephen Pang (Born 1981) | Vice President of TTP since May 2017. | Managing Director of the Adviser since January 2019; Portfolio Manager of the Adviser since January 2018; Director of the Adviser since January 2017; Investment Analyst of the Adviser from January 2015 to January 2017; CFA designation since 2016. | N/A | None | ||||
| Adam Peltzer (Born 1975) | Vice President of TPZ since May 2017. | Portfolio Manager of the Adviser since January 2020; Director and Investment Analyst of the Adviser from March 2015 through December 2019. CFA designation since 2009. | N/A | None | ||||
| Brett Jergens (Born 1978) | Vice President of NDP since June 2015. | Portfolio Manager of the Adviser since January 2018; Investment Analyst of the Adviser from December 2010 through December 2017; Research Analyst of the Adviser from June 2007 through December 2010. CFA designation since 2011. | N/A | None | ||||
| Shobana Gopal (Born 1962) | Vice President of each of TYG, NTG, TTP, NDP and TPZ since June 2015. Vice President of TEAF since November 2018. | Director, Tax of the Adviser since January 2013; Tax Analyst of the Adviser from September 2006 through December 2012. | N/A | None | ||||
| Diane Bono (Born 1958) | Secretary of each of TYG, NTG, TTP, NDP and TPZ since May 2013. Secretary of TEAF since November 2018. | Chief Compliance Officer of the Adviser since June 2006; Chief Compliance Officer of TYG since June 2006 and of each of NTG, TTP, NDP, TPZ and TEAF since its inception, and of each of TYY and TYN from June 2006 to June 2014; Secretary of each of TYY and TYN from May 2013 to June 2014. | N/A | None |
| (1) | The address of each director and officer is 5100 W. 115th Place, Leawood, Kansas 66211. |
| (2) | Officers are elected annually. |
| (3) | As a result of their respective positions held with the Adviser or its affiliates, these individuals are considered “interested persons” within the meaning of the 1940 Act. |
| 84 | Tortoise |
| 2019 Annual Report| November 30, 2019 |
| Additional Information (unaudited) |
For stockholders that do not have a November 30, 2019 tax year end, this notice is for information purposes only. For stockholders with a November 30, 2019 tax year end, please consult your tax advisor as to the pertinence of this notice. For the fiscal year ended November 30, 2019, each Fund is designating the following items with regard to distributions paid during the year.
| Common Distributions | ||||||||||||||||||||||||||||||
| Qualifying For | ||||||||||||||||||||||||||||||
| Return of Capital | Long-Term Capital | Ordinary Income | Qualifying | Corporate Dividends | ||||||||||||||||||||||||||
| Distributions | Gain Distributions(1) | Distributions | Total Distributions | Dividends(2) | Rec. Deduction(3) | |||||||||||||||||||||||||
| TTP | 100.00 | % | 0.00 | % | 0.00 | % | 100.00 | % | 0.00 | % | 0.00 | % | ||||||||||||||||||
| NDP | 100.00 | % | 0.00 | % | 0.00 | % | 100.00 | % | 0.00 | % | 0.00 | % | ||||||||||||||||||
| TPZ | 6.69 | % | 18.91 | % | 74.40 | % | 100.00 | % | 14.47 | % | 11.40 | % | ||||||||||||||||||
| TEAF | 55.64 | % | 0.00 | % | 44.36 | % | 100.00 | % | 65.69 | % | 16.51 | % | ||||||||||||||||||
| Preferred Distributions | ||||||||||||||||||||||||||||||
| Qualifying For | ||||||||||||||||||||||||||||||
| Return of Capital | Long-Term Capital | Ordinary Income | Qualifying | Corporate Dividends | ||||||||||||||||||||||||||
| Distributions | Gain Distributions(1) | Distributions | Total Distributions | Dividends(2) | Rec. Deduction(3) | |||||||||||||||||||||||||
| TTP | 50.00 | % | 0.00 | % | 50.00 | % | 100.00 | % | 100.00 | % | 100.00 | % | ||||||||||||||||||
| (1) | The Fund designates long-term capital gain distributions per IRC Code Sec. 852(b)(3)(C). The long-term capital gain tax rate is variable based on the taxpayer’s taxable income. |
| (2) | Represents the portion of Ordinary Income Distributions taxable at the capital gain tax rates if the stockholder meets holding period requirements. |
| (3) | Represents the portion of Ordinary Income Distributions which qualify for the “Corporate Dividends Received Deduction.” |
Director and Officer Compensation
The Funds do not compensate any of its directors who are “interested persons,” as defined in Section 2(a)(19) of the 1940 Act, nor any of its officers. For the period from December 1, 2018 through November 30, 2019, the aggregate compensation paid by the Funds to the independent directors was as follows:
| TYG | NTG | TTP | NDP | TPZ | TEAF | |||||
| $176,200 | $152,800 | $122,000 | $118,000 | $111,000 | $ 46,000 |
The Funds did not pay any special compensation to any of its directors or officers.
Forward-Looking Statements
This report contains “forward-looking statements” within the meaning of the 1933 Act and the Securities Exchange Act of 1934, as amended. By their nature, all forward-looking statements involve risks and uncertainties, and actual results could differ materially from those contemplated by the forward-looking statements. Several factors that could materially affect each Fund’s actual results are the performance of the portfolio of investments held by it, the conditions in the U.S. and international financial, petroleum and other markets, the price at which shares of each Fund will trade in the public markets and other factors discussed in filings with the Securities and Exchange Commission (SEC).
Proxy Voting Policies
A description of the policies and procedures that each Fund uses to determine how to vote proxies relating to portfolio securities owned by the Fund and information regarding how each Fund voted proxies relating to the portfolio of securities during the 12-month period ended June 30, 2019 are available to stockholders (i) without charge, upon request by calling the Adviser at (913) 981-1020 or toll-free at (866) 362-9331 and on or through the Adviser’s Web site at www.tortoiseadvisors.com; and (ii) on the SEC’s Web site at www.sec.gov.
Form N-Q
Each Fund files its complete schedule of portfolio holdings for the first and third quarters of each fiscal year with the SEC on Form N-Q or Part F of Form N-PORT (beginning with filings after March 31, 2019). Each Fund’s Form N-Q and Part F of Form N-PORT are available without charge upon request by calling the Adviser at (866) 362-9331 or by visiting the SEC’s Web site at www.sec.gov.
Each Fund’s Form N-Qs are also available through the Adviser’s Web site at www.tortoiseadvisors.com.
Statement of Additional Information
The Statement of Additional Information (“SAI”) includes additional information about each Fund’s directors and is available upon request without charge by calling the Adviser at (866) 362-9331 or by visiting the SEC’s Web site at www.sec.gov.
Certifications
Each Fund’s Chief Executive Officer has submitted to the New York Stock Exchange the annual CEO certification as required by Section 303A.12(a) of the NYSE Listed Company Manual.
Each Fund has filed with the SEC, as an exhibit to its most recently filed Form N-CSR, the certification of its Chief Executive Officer and Principal Financial Officer required by Section 302 of the Sarbanes-Oxley Act.
| Tortoise | 85 |
| Additional Information(unaudited) (continued) |
In order to conduct its business, each Fund collects and maintains certain nonpublic personal information about its stockholders of record with respect to their transactions in shares of each Fund’s securities. This information includes the stockholder’s address, tax identification or Social Security number, share balances, and distribution elections. We do not collect or maintain personal information about stockholders whose share balances of our securities are held in “street name” by a financial institution such as a bank or broker.
We do not disclose any nonpublic personal information about you, the Funds’ other stockholders or the Funds’ former stockholders to third parties unless necessary to process a transaction, service an account, or as otherwise permitted by law.
To protect your personal information internally, we restrict access to nonpublic personal information about the Funds’ stockholders to those employees who need to know that information to provide services to our stockholders. We also maintain certain other safeguards to protect your nonpublic personal information.
Repurchase Disclosure
Notice is hereby given in accordance with Section 23(c) of the 1940 Act, that each Fund may from time to time purchase shares of its common stock in the open market.
Automatic Dividend Reinvestment
Each of NTG, TTP, NDP, TPZ and TEAF have an Automatic Dividend Reinvestment Plan and TYG has an Automatic Dividend Reinvestment and Cash Purchase Plan (each, a “Plan”). Each Plan allows participating common stockholders to reinvest distributions, including dividends, capital gains and return of capital in additional shares of the Fund’s common stock and TYG’s Plan also allows registered holders of the TYG’s common stock to make optional cash investments, in accordance with TYG’s Plan, on a monthly basis.
If a stockholder’s shares are registered directly with the Fund or with a brokerage firm that participates in the Fund’s Plan, all distributions are automatically reinvested for stockholders by the Agent in additional shares of common stock of the Fund (unless a stockholder is ineligible or elects otherwise). Stockholders holding shares that participate in the Plan in a brokerage account may not be able to transfer the shares to another broker and continue to participate in the Plan. Stockholders who elect not to participate in the Plan will receive all distributions payable in cash paid by check mailed directly to the stockholder of record (or, if the shares are held in street or other nominee name, then to such nominee) by Computershare, as dividend paying agent. Distributions subject to tax (if any) are taxable whether or not shares are reinvested.
Any single investment pursuant to the cash purchase option under TYG’s Plan must be in an amount of at least $100 and may not exceed $5,000 per month unless a request for waiver has been granted. A request for waiver should be directed to TYG at 1-866-362-9331 and TYG has the sole discretion to grant any requested waiver. Optional cash investments may be delivered to the Agent by personal check, by automatic or electronic bank account transfer or by online access at www.computershare.com. TYG reserves the right to reject any purchase order. Stockholders who hold shares in street or other nominee name who want to participate in optional cash investments should contact their broker, bank or other nominee and follow their instructions. There is no obligation to make an optional cash investment at any time, and the amount of such investments may vary from time to time. Optional cash investments must be received by the Agent no later than two business days prior to the monthly investment date (the “payment date”) for purchase of common shares on the next succeeding purchase date under TYG’s Plan. Scheduled optional cash purchases may be cancelled or refunded upon a participant’s written request received by the Agent at least two business days prior to the purchase date. Participants will not be able to instruct the Agent to purchase common shares at a specific time or at a specific price.
If on the distribution payment date or, for TYG, the purchase date for optional cash investments, the net asset value per share of the common stock is equal to or less than the market price per share of common stock plus estimated brokerage commissions, the Fund will issue additional shares of common stock to participants. The number of shares will be determined by the greater of the net asset value per share or 95 percent of the market price. Otherwise, shares generally will be purchased on the open market by the Agent as soon as possible following the payment date or purchase date, but in no event later than 30 days after such date except as necessary to comply with applicable law. There are no brokerage charges with respect to shares issued directly by the Fund as a result of distributions payable either in shares or in cash or, for TYG, as a result of optional cash investments. However, each participant will pay a pro rata share of brokerage commissions incurred with respect to the Agent’s open-market purchases in connection with the reinvestment of distributions or optional cash investments. If a participant elects to have the Agent sell part or all of his or her common stock and remit the proceeds, such participant will be charged a transaction fee of $15.00 plus his or her pro rata share of brokerage commissions on the shares sold.
Participation is completely voluntary. Stockholders may elect not to participate in the Plan, and participation may be terminated or resumed at any time without penalty, by giving notice in writing, by telephone or Internet to Computershare, the Plan Agent, at the address set forth below. Such termination will be effective with respect to a particular distribution if notice is received prior to such record date.
Additional information about the Plan may be obtained by writing to Computershare Trust Company, N.A, P.O. Box 30170, College Station, TX 77842-3170. You may also contact Computershare by phone at (800) 426-5523 or visit their Web site at www.computershare.com.
| 86 | Tortoise |
| 2019 Annual Report| November 30, 2019 |
| Additional Information(unaudited) (continued) |
In approving the renewal of the respective Investment Advisory Agreement of each of TYG, NTG, TPZ, TTP and NDP in November 2019, the directors who are not “interested persons” (as defined in the Investment Company Act of 1940) of the fund (“Independent Directors”) requested and received extensive data and information from the Adviser concerning the fund and the services provided to it by the Adviser under the Investment Advisory Agreement, including information from independent, third-party sources, regarding the factors considered in their evaluation. Before the Independent Directors voted on approval of the Investment Advisory Agreement, the Independent Directors met with independent legal counsel during an executive session and discussed the agreement and related information.
Factors Considered for Each Fund
The Independent Directors considered and evaluated all the information provided by the Adviser. The Independent Directors did not identify any single factor as being all-important or controlling, and each Independent Director may have attributed different levels of importance to different factors. In deciding to renew the fund’s agreement, the Independent Directors’ decision was based on the following factors.
Nature, Extent and Quality of Services Provided.The Independent Directors considered information regarding the history, qualification and background of the Adviser and the individuals primarily responsible for the portfolio management of the fund. Additionally, the Independent Directors considered the quality and extent of the resources devoted to research and analysis of the fund’s actual and potential investments, including the research and decision-making processes utilized by the Adviser, as well as risk oversight and the methods adopted to seek to achieve compliance with the investment objectives, policies and restrictions of the fund, and meeting regulatory requirements. Further, the Independent Directors considered the quality and depth of the Adviser personnel (including the number and caliber of portfolio managers and research analysts involved and the size and experience of the investment, accounting, trading, client service and compliance teams dedicated to the fund), the continued addition of professionals at the Adviser to broaden its coverage efforts, and other Adviser resources and plans for growth, use of affiliates of the Adviser, and the particular expertise with respect to energy companies, MLP markets and financing (including private financing).
In addition to advisory services, the Independent Directors considered the quality of the administrative and other non-investment advisory services provided to the fund. The Adviser provides the fund with certain services (in addition to any such services provided to the fund by third parties) and officers and other personnel as are necessary for the operations of the fund. In particular, the Adviser provides the fund with the following administrative services including, among others: (i) preparing disclosure documents, such as periodic stockholder reports and the prospectus and the statement of additional information in connection with public offerings; (ii) communicating with analysts to support secondary market analysis of the fund; (iii) oversight of daily accounting and pricing; (iv) preparing periodic filings with regulators and stock exchanges; (v) overseeing and coordinating the activities of other service providers; (vi) organizing Board meetings and preparing the materials for such Board meetings; (vii) providing compliance support; (viii) furnishing analytical and other support to assist the Board in its consideration of strategic issues; (ix) the responsible handling of the leverage target; and (x) performing other administrative services for the operation of the fund, such as press releases, fact sheets, investor calls, leverage financing, tax reporting, tax management, fulfilling regulatory filing requirements and investor relations services.
The Independent Directors also reviewed information received from the Adviser and the fund’s Chief Compliance Officer (the “CCO”) regarding the compliance policies and procedures established pursuant to the 1940 Act and their applicability to the fund, including the fund’s Code of Ethics.
The Independent Directors concluded that the nature of the fund and the specialized expertise of the Adviser in the niche market of MLPs for each of TYG and NTG and the energy market for each of TTP, NDP and TPZ, as well as the nature, extent and quality of services provided by the Adviser to the fund, made it qualified to serve as the adviser. The Independent Directors recognized that the Adviser’s commitment to a long-term investment horizon correlated well to the investment strategy of the fund.
Investment Performance of the Fund and the Adviser, Costs of the Services To Be Provided and Profits To Be Realized by the Adviser and its Affiliates from the Relationship, and Fee Comparisons.The Independent Directors reviewed and evaluated information regarding the fund’s performance and the performance of other Adviser accounts (including other investment companies), and information regarding the nature of the markets during the performance period, with a particular focus on the MLP sector for each of TYG and NTG and on the energy sector for each of TTP, NDP and TPZ. The Independent Directors considered the fund’s investment performance against peer funds for the following periods: one year, three year, five year, ten year and since inception for TYG; one year, three year, five year, 10 year (where applicable) and since inception for each of NTG, TTP, NDP and TPZ, and for each of 2017, 2018 and year-to-date 2019 for each fund, as well as against specialized sector (including a custom composite of sector indices (“custom composite”) for each of TTP and TPZ) and more general market indices for the fiscal year-to-date, one year and since inception periods for the fund. The Independent Directors also considered senior management’s and portfolio managers’ analysis of the reasons for any over-performance or underperformance against its peers and/or sector market indices, as applicable. The Independent Directors noted that for the relevant
| Tortoise | 87 |
| Additional Information(unaudited) (continued) |
The Adviser provided detailed information concerning its cost of providing services to the fund, its profitability in managing the fund, its overall profitability, and its financial condition. The Independent Directors reviewed the methodology used to prepare this financial information. This financial information regarding the Adviser is considered in order to evaluate the Adviser’s financial condition, its ability to continue to provide services under the Investment Advisory Agreement, and the reasonableness of the current management fee, and was, to the extent possible, evaluated in comparison to other more specialized investment advisers.
The Independent Directors considered and evaluated information regarding fees charged to, and services provided to, other investment companies advised by the Adviser (including the impact of any fee waiver or reimbursement arrangements and any expense reimbursement arrangements), and fees charged to separate institutional accounts and other accounts managed by the Adviser. The information provided to the Independent Directors discussed the significant differences in scope of services provided to the fund and to the Adviser’s other non-closed-end fund clients. The Independent Directors considered the fee comparisons in light of the different services provided in managing these other types of clients. The Independent Directors considered and evaluated the information they received comparing the fund’s contractual annual management fee and overall expenses with a peer group of comparable closed-end funds with similar investment objectives and strategies, including other MLP or energy investment companies, as applicable depending on the fund, determined by the Adviser. Given the specialized universe of managers and funds fitting within the criteria for the peer group as well as a lack of reliable, consistent third party data, the Adviser did not believe that it would be beneficial to engage the services of an independent third-party to prepare the peer group analysis, and the Independent Directors concurred with this approach. The Adviser provided information on the methodology used for determining the peer group.
| 88 | Tortoise |
| 2019 Annual Report| November 30, 2019 |
| Additional Information(unaudited) (continued) |
Economies of Scale.The Independent Directors considered information from the Adviser concerning whether economies of scale would be realized as the fund grows, and whether fee levels reflect any economies of scale for the benefit of the fund’s stockholders. The Independent Directors concluded that economies of scale are difficult to measure and predict overall. Accordingly, the Independent Directors reviewed other information, such as year-over-year profitability of the Adviser generally, the profitability of its management of the fund, and the fees of competitive funds not managed by the Adviser over a range of asset sizes. The Independent Directors concluded the Adviser is appropriately sharing any economies of scale through its fee structure and through reinvestment in its business resources to provide stockholders additional content and services.
Collateral Benefits Derived by the Adviser.The Independent Directors reviewed information from the Adviser concerning collateral benefits it receives as a result of its relationship with the fund. They concluded that the Adviser generally does not directly use the fund’s or stockholder information to generate profits in other lines of business, and therefore does not derive any significant collateral benefits from them.
The Independent Directors did not, with respect to their deliberations concerning their approval of the continuation of the Investment Advisory Agreement, consider the benefits the Adviser may derive from relationships the Adviser may have with brokers through soft dollar arrangements because the Adviser does not employ any third party soft dollar arrangements in rendering its advisory services to the fund. The Adviser receives unsolicited research from some of the brokers with whom it places trades on behalf of clients, however, the Adviser has no arrangements or understandings with such brokers regarding receipt of research in return for commissions. The Adviser does not consider this research when selecting brokers to execute fund transactions and does not put a specific value on unsolicited research, nor attempt to estimate and allocate the relative costs or benefits among clients.
Conclusions of the Directors
The Independent Directors concluded that no single factor reviewed was determinative as the principal factor in whether to approve the Agreement. The process, as discussed above, describes only the most important factors, but not all of the matters, considered by the Independent Directors. On the basis of such information as the Independent Directors considered necessary to the exercise of its reasonable business judgment and its evaluation of all of the factors described above, and after discussion and as assisted by the advice of legal counsel that is independent of the Adviser, the Independent Directors determined that each factor, in the context of all of the other factors they considered, favored approval of the Agreement. The Independent Directors therefore unanimously concluded that the Investment Advisory Agreement between the fund and the Adviser is fair and reasonable in light of the services provided and should be renewed. It was noted that it was the judgment of the Independent Directors that approval of the Investment Advisory Agreement was in the best interests of the fund and its stockholders.
| Tortoise | 89 |
Office of the Company Board of Directors of H. Kevin Birzer, Chairman Rand C. Berney Conrad S. Ciccotello Alexandra Herger Jennifer Paquette | Administrator Custodian Transfer, Dividend Disbursing Legal Counsel Investor Relations Stock Symbols This report is for stockholder information. This is not a |
 |
5100 W. 115th Place |
Item 2. Code of Ethics.
The Registrant has adopted a code of ethics that applies to the Registrant’s Principal Executive Officer and its Principal Financial Officer. The Registrant has not made any amendments to this code of ethics during the period covered by this report. The Registrant has not granted any waivers from any provisions of this code of ethics during the period covered by this report.
Item 3. Audit Committee Financial Expert.
The Registrant’s Board of Directors has determined that there is at least one “audit committee financial expert” serving on its audit committee. Mr. Rand Berney is the “audit committee financial expert” and is considered to be “independent” as each term is defined in Item 3 of Form N-CSR.
Item 4. Principal Accountant Fees and Services.
The Registrant has engaged its principal accountant to perform audit services, audit-related services and tax services during the fiscal year since its initial public offering on March 26, 2019. “Audit services” refer to performing an audit of the Registrant's annual financial statements or services that are normally provided by the accountant in connection with statutory and regulatory filings or engagements for the most recent fiscal year. “Audit-related services” refer to the assurance and related services by the principal accountant that are reasonably related to the performance of the audit. “Tax services” refer to professional services rendered by the principal accountant for tax compliance (including preparation of tax returns), tax advice, and tax planning. The following table details the approximate amounts of aggregate fees billed to the Registrant for the fiscal period ended November 30, 2019 for audit fees, audit-related fees, tax fees and other fees by the principal accountant.
| FYE 11/30/2019 | ||
| Audit Fees | $93,000 | |
| Audit-Related Fees | — | |
| Tax Fees | $4,000 | |
| All Other Fees | — | |
| Aggregate Non-Audit Fees | — |
The audit committee has adopted pre-approval policies and procedures that require the audit committee to pre-approve (i) the selection of the Registrant’s independent registered public accounting firm, (ii) the engagement of the independent registered public accounting firm to provide any non-audit services to the Registrant, (iii) the engagement of the independent registered public accounting firm to provide any non-audit services to the Adviser or any entity controlling, controlled by, or under common control with the Adviser that provides ongoing services to the Registrant, if the engagement relates directly to the operations and financial reporting of the Registrant, and (iv) the fees and other compensation to be paid to the independent registered public accounting firm. The Chairman of the audit committee may grant the pre-approval of any engagement of the independent registered public accounting firm for non-audit services of less than $10,000, and such delegated pre-approvals will be presented to the full audit committee at its next meeting. Under certain limited circumstances, pre-approvals are not required under securities law regulations for certain non-audit services below certain de minimis thresholds. Since the adoption of these policies and procedures, the audit committee has pre-approved all audit and non-audit services provided to the Registrant by the principal accountant. None of these services provided by the principal accountant were approved by the audit committee pursuant to the de minimis exception under Rule 2.01(c)(7)(i)(C) or Rule 2.01(c)(7)(ii) of Regulation S-X. All of the principal accountant’s hours spent on auditing the Registrant’s financial statements were attributed to work performed by full-time permanent employees of the principal accountant.
In the Registrant’s partial fiscal year ended November 30, 2019, the Adviser was billed approximately $45,100 in fees for tax and other non-audit services provided to the Adviser. These non-audit services were not required to be preapproved by the Registrant’s audit committee. No entity controlling, controlled by, or under common control with the Adviser that provides ongoing services to the Registrant, has paid to, or been billed for fees by, the principal accountant for non-audit services rendered to the Adviser or such entity during the Registrant’s last two fiscal years. The audit committee has considered whether the principal accountant’s provision of services (other than audit services) to the Registrant, the Adviser or any entity controlling, controlled by, or under common control with the Adviser that provides services to the Registrant is compatible with maintaining the principal accountant’s independence in performing audit services.
Item 5. Audit Committee of Listed Registrants.
The Registrant has a separately-designated standing audit committee established in accordance with Section 3(a)(58)(A) of the Securities Exchange Act of 1934, and is comprised of Mr. Conrad S. Ciccotello, Mr. Rand C. Berney, Ms. Jennifer Paquette and Ms. Alexandra A. Herger.
Item 6. Investments.
(a) Schedule of Investments is included as part of the report to shareholders filed under Item 1.
(b) Not applicable.
Item 7. Disclosure of Proxy Voting Policies and Procedures for Closed-End Management Investment Companies.
Copies of the proxy voting policies and procedures of the Registrant and the Adviser are attached hereto as Exhibit 99.VOTEREG and Exhibit 99.VOTEADV, respectively.
Item 8. Portfolio Managers of Closed-End Management Investment Companies.
Unless otherwise indicated, information is presented as of November 30, 2019.
As of the date of this filing, portfolio managers of the Adviser and Subadviser are responsible for the day-to-day management of their respective sleeves of the Registrant’s overall investment portfolio.
Biographical information about each member of the portfolio management team as of the date of this filing is set forth below.
| Position(s) Held with | ||||
| Company and Length | ||||
| Name and Age* | of Time Served | Principal Occupation During Past Five Years | ||
| Brian A. Kessens | N/A | Managing Director of the Adviser since January 2015; Portfolio Manager of the Adviser since July 2013; Senior Investment Analyst of the Adviser from June 2012 to July 2013; Investment Analyst of the Adviser from 2008 to June 2012; President of TTP and TPZ since June 2015. CFA designation since 2006. |
| James R. Mick | N/A | Managing Director of the Adviser since January 2014 and a member of the Investment Committee of the Adviser since June 2015; Portfolio Manager of the Adviser since July 2013; Senior Investment Analyst of the Adviser from June 2012 to July 2013; Investment Analyst of the Adviser from 2011 to June 2012. Research analyst of the Adviser from 2006 to 2011. CFA designation since 2010. | ||
| Matthew G.P. Sallee | N/A | Managing Director of the Adviser since January 2014 and member of the Investment Committee of the Adviser since June 2015; Portfolio Manager of the Adviser since July 2013; Senior Investment Analyst of the Adviser from June 2012 to July 2013; Investment Analyst of the Adviser from 2009 to June 2012; Research Analyst of the Adviser from 2005 to 2009; President of TYG and NTG since June 2015. CFA designation since 2009. | ||
| Robert J. Thummel, Jr. | N/A | Managing Director of the Adviser since January 2014 and a member of the Investment Committee of the Adviser since June 2015; Portfolio Manager of the Adviser since July 2013; Senior Investment Analyst of the Adviser from June 2012 to July 2013; Investment Analyst of the Adviser from 2004 to June 2012; President of NDP since June 2015. | ||
| Stephen Pang | N/A | Managing Director of the Adviser since January 2019; Portfolio Manager of the Adviser since January 2018; Director of the Adviser since January 2017; Investment Analyst of the Adviser from January 2015 to January 2017; Vice President of TTP since May 2017. CFA designation since 2016. | ||
| Brett Jergens | N/A | Portfolio Manager of the Adviser since January 2018; Investment Analyst of the Adviser from December 2010 through December 2017; Research Analyst of the Adviser from June 2007 through December 2010; Vice President of NDP since June 2015. CFA designation since 2011. | ||
| Nicholas S. Holmes | President since May 2019 | Managing Director of the Adviser since January 2020; Portfolio Manager of the Adviser since January 2019; Investment Analyst of the Adviser from January 2015 through December 2018; Research Analyst of the Adviser from January 2012 through December 2014 and Assistant Research Analyst from January 2010 through December 2011; President of TEAF since May 2019 and Vice President of TYG and NTG since June 2015. CFA designation since 2013. | ||
| Adam Peltzer | N/A | Portfolio Manager of the Adviser since January 2020; Director and Investment Analyst of the Adviser from March 2015 through December 2019. Vice President of TPZ since May 2017. CFA designation since 2011. | ||
| Jeremy Goff | N/A | Managing Director of the Adviser and affiliate of the Adviser since January 2018; Director of the Adviser from January 2016 through December 2017; Vice President of the Adviser from January 2014 to December 2015; Associate of the Adviser from September 2011 December 2013. |
| David Sifford | N/A | Managing Director of the Adviser since January 2020; Managing Director of an affiliate of the Adviser from September 2018 through December 2019; Vice President of Education Investments at EPR Properties from May 2013 to August 2018. | ||
| Edward Russell | N/A | Managing Director of Adviser since 2014. | ||
| Jerry G. Polacek | N/A | Managing Director and Portfolio Manager of the Adviser since January 2018; Managing Partner of an affiliate of the Adviser from September 2016 through December 2017; Chief Executive Officer and Chief Investment Officer of Energy & Infrastructure Capital, LLC from March 2014 through July 2016. | ||
| Matthew S. Ordway | N/A | Managing Director and Portfolio Manager of the Adviser since January 2018; Partner of an affiliate of the Adviser from September 2016 through December 2017; Chief Financial Officer and Chief Operating Officer of Energy & Infrastructure Capital, LLC from March 2014 through July 2016. | ||
| Prashanth K. Prakash | N/A | Director of the Adviser since January 2018; Vice President of the Adviser from September 2016 through December 2017; Vice President of Energy & Infrastructure Capital, LLC from March 2014 through July 2016. | ||
| Matthew Breidert | N/A | Portfolio Manager of the Subadviser since November 2018; Partner and Senior Portfolio Manager of Ecofin Ltd. from May 2016 to November 2018; Portfolio Manager of Ecofin Ltd. from March 2008 to May 2016. | ||
| Jean-Hugues de Lamaze | N/A | Managing Director of the Subadviser since January 2020; Portfolio Manager of the Subadviser since November 2018; Partner and Senior Portfolio Manager of Ecofin from May 2016 to November 2018; Portfolio Manager of Ecofin from 2006 to May 2016. | ||
| Flavien Hias | N/A | Investment Analyst of the Subadviser since November 2018; Equity Analyst of Ecofin Ltd. from July 2017 to November 2018; Analyst at Berenberg from December 2015 to June 2017; Equity Analyst at Societe Generale from January 2014 to December 2015. | ||
| Maximilian Slee | N/A | Portfolio Manager of the Subadviser since November 2018; Analyst of Ecofin Ltd. from January 2010 to November 2018. | ||
| Michel Sznajer | N/A | Portfolio Manager of the Subadviser since November 2018; Portfolio Manager and Analyst of Ecofin Ltd. from October 2016 to November 2018; Partner of Silvaris Capital Management from May 2014 to June 2016. |
*The address of each portfolio manager is 5100 W. 115thPlace, Leawood, Kansas 66211.
The Adviser also serves as the investment adviser to TYG, NTG, TTP, NDP and TPZ.
The following table provides information about the other accounts managed on a day-to-day basis by each of the portfolio managers as of November 30, 2019:
| Number of | ||||||||
| Accounts | Total Assets of | |||||||
| Paying a | Accounts Paying | |||||||
| Number of | Total Assets of | Performance | a Performance | |||||
| Name of Manager | Accounts | Accounts | Fee | Fee | ||||
| Brian Kessens | ||||||||
| Registered investment companies | 9 | $7,129,030,561 | 0 | — | ||||
| Other pooled investment vehicles | 13 | $668,054,973 | 0 | — | ||||
| Other accounts | 779 | $5,511,288,244 | 1 | $171,074,952 | ||||
| James Mick | ||||||||
| Registered investment companies | 9 | $7,129,030,561 | 0 | — | ||||
| Other pooled investment vehicles | 13 | $668,054,973 | 0 | — | ||||
| Other accounts | 779 | $5,511,288,244 | 1 | $171,074,952 | ||||
| Matthew Sallee | ||||||||
| Registered investment companies | 9 | $7,129,030,561 | 0 | — | ||||
| Other pooled investment vehicles | 13 | $668,054,973 | 0 | — | ||||
| Other accounts | 779 | $5,511,288,244 | 1 | $171,074,952 | ||||
| Robert Thummel | ||||||||
| Registered investment companies | 9 | $7,129,030,561 | 0 | — | ||||
| Other pooled investment vehicles | 13 | $668,054,973 | 0 | — | ||||
| Other accounts | 779 | $5,511,288,244 | 1 | $171,074,952 | ||||
| Stephen Pang | ||||||||
| Registered investment companies | 9 | $7,129,030,561 | 0 | — | ||||
| Other pooled investment vehicles | 13 | $668,054,973 | 0 | — | ||||
| Other accounts | 779 | $5,511,288,244 | 1 | $171,074,952 | ||||
| Brett Jergens | ||||||||
| Registered investment companies | 9 | $7,129,030,561 | 0 | — | ||||
| Other pooled investment vehicles | 13 | $668,054,973 | 0 | — | ||||
| Other accounts | 779 | $5,511,288,244 | 1 | $171,074,952 | ||||
| Nick Holmes | ||||||||
| Registered investment companies | 9 | $7,129,030,561 | 0 | — | ||||
| Other pooled investment vehicles | 13 | $668,054,973 | 0 | — | ||||
| Other accounts | 779 | $5,511,288,244 | 1 | $171,074,952 | ||||
| Adam Peltzer | ||||||||
| Registered investment companies | 10 | $7,369,158,772 | 0 | — | ||||
| Other pooled investment vehicles | 15 | $752,934,957 | 0 | — | ||||
| Other accounts | 780 | $5,519,940,322 | 1 | $171,074,952 | ||||
| Jeremy Goff | ||||||||
| Registered investment companies | 1 | $240,128,211 | 0 | — | ||||
| Other pooled investment vehicles | 2 | $84,879,984 | 0 | — | ||||
| Other accounts | 1 | $8,652,078 | 0 | — | ||||
| David Sifford | ||||||||
| Registered investment companies | 1 | $240,128,211 | 0 | — | ||||
| Other pooled investment vehicles | 2 | $84,879,984 | 0 | — | ||||
| Other accounts | 1 | $8,652,078 | 0 | — | ||||
| Ed Russell | ||||||||
| Registered investment companies | — | $— | — | — | ||||
| Other pooled investment vehicles | — | $— | — | — | ||||
| Other accounts | — | $— | — | — |
| Jerry G. Polacek | ||||||||
| Registered investment companies | — | $— | — | — | ||||
| Other pooled investment vehicles | — | $— | — | — | ||||
| Other accounts | 1 | $8,751,122 | 0 | — | ||||
| Matthew S. Ordway | ||||||||
| Registered investment companies | — | $— | — | — | ||||
| Other pooled investment vehicles | — | $— | — | — | ||||
| Other accounts | 1 | $8,751,122 | 0 | — | ||||
| Prashanth K. Prakash | ||||||||
| Registered investment companies | — | $— | — | — | ||||
| Other pooled investment vehicles | — | $— | — | — | ||||
| Other accounts | 1 | $8,751,122 | 0 | — | ||||
| Matthew Breidert | ||||||||
| Registered investment companies | — | $— | — | — | ||||
| Other pooled investment vehicles | 2 | $129,293,830 | 2 | $53,835,344 | ||||
| Other accounts | — | $— | — | — | ||||
| Jean-Hugues de Lamaze | ||||||||
| Registered investment companies | 1 | $194,798,630 | — | — | ||||
| Other pooled investment vehicles | 1 | $6,549,654 | — | — | ||||
| Other accounts | — | $— | — | — | ||||
| Flavien Hias | ||||||||
| Registered investment companies | — | $— | — | — | ||||
| Other pooled investment vehicles | — | $— | — | — | ||||
| Other accounts | — | $— | — | — | ||||
| Maximilian Slee | ||||||||
| Registered investment companies | — | $— | — | — | ||||
| Other pooled investment vehicles | 2 | $98,359,302 | 2 | $56,858,540 | ||||
| Other accounts | — | $— | — | — | ||||
| Michel Sznajer | ||||||||
| Registered investment companies | — | $— | — | — | ||||
| Other pooled investment vehicles | 2 | $93,560,818 | 1 | $1,606,951 | ||||
| Other accounts | — | $— | — | — |
Material Conflicts of Interest
Conflicts of interest may arise from the fact that the Adviser, the Subadviser and their affiliates carry on substantial investment activities for other clients, in which the Registrant has no interest, some of which may have investment strategies similar to the Registrant. In addition, conflicts of interest may arise from the fact that a related person of the Adviser has an interest in a limited liability company client, similar to a general partner interest in a partnership, for which the Adviser also serves as manager. The Adviser or its affiliates may have financial incentives to favor certain of these accounts over the Registrant. For example, the Adviser or Subadviser may have an incentive to allocate potentially more favorable investment opportunities to other funds and clients that pay the Adviser an incentive or performance fee. Performance and incentive fees also create the incentive to allocate potentially riskier, but potentially better performing, investments to such funds and other clients in an effort to increase the incentive fee. The Adviser or Subadviser also may have an incentive to make investments in one fund, having the effect of increasing the value of a security in the same issuer held by another fund or client, which in turn, may result in an incentive fee being paid to the Adviser or Subadviser by that other fund or client. Any of the Adviser’s or its affiliates’ proprietary accounts or other customer accounts may compete with the Registrant for specific trades. The Adviser, the Subadviser or their affiliates may give advice and recommend securities to, or buy or sell securities for, other accounts and customers, which advice or securities recommended may differ from advice given to, or securities recommended or bought or sold for, the Registrant, even though their investment objectives may be the same as, or similar to, the Registrant’s objectives. The Adviser and the Subadviser have written allocation policies and procedures designed to address potential conflicts of interest. For instance, when two or more clients advised by the Adviser, the Subadviser or their affiliates seek to purchase or sell the same publicly traded securities, the securities actually purchased or sold will be allocated among the clients on a good faith equitable basis by the Adviser or the Subadviser in its discretion and in accordance with the clients’ various investment objectives and the Adviser’s or the Subadviser’s procedures. In some cases, this system may adversely affect the price or size of the position the Registrant may obtain or sell. In other cases, the Registrant’s ability to participate in volume transactions may produce better execution for it. When possible, the Adviser and the Subadviser combine all of the trade orders into one or more block orders, and each account participates at the average unit or share price obtained in a block order. When block orders are only partially filled, the Adviser and the Subadviser consider a number of factors in determining how allocations are made, with the overall goal to allocate in a manner so that accounts are not preferred or disadvantaged over time. The Adviser also has allocation policies for transactions involving private placement securities, which are designed to result in a fair and equitable participation in offerings or sales for each participating client.
The Adviser also serves as investment adviser for four other publicly traded management investment companies, all of which invest in the energy sector.
The Adviser and the Subadviser will evaluate a variety of factors in determining whether a particular investment opportunity or strategy is appropriate and feasible for the relevant account at a particular time, including, but not limited to, the following: (1) the nature of the investment opportunity taken in the context of the other investments at the time; (2) the liquidity of the investment relative to the needs of the particular entity or account; (3) the availability of the opportunity (i.e., size of obtainable position); (4) the transaction costs involved; and (5) the investment or regulatory limitations applicable to the particular entity or account. Because these considerations may differ when applied to the Registrant and relevant accounts under management in the context of any particular investment opportunity, the Registrant’s investment activities, on the one hand, and other managed accounts, on the other hand, may differ considerably from time to time. In addition, the Registrant’s fees and expenses will differ from those of the other managed accounts. Accordingly, stockholders should be aware that the Registrant’s future performance and the future performance of the other accounts of the Adviser may vary.
From time to time, the Adviser and the Subadviser may seed proprietary accounts for the purpose of evaluating a new investment strategy that eventually may be available to clients through one or more product structures. Such accounts also may serve the purpose of establishing a performance record for the strategy. The Adviser’s or Subadviser’s management of accounts with proprietary interests and nonproprietary client accounts may create an incentive to favor the proprietary accounts in the allocation of investment opportunities, and the timing and aggregation of investments. The Adviser’s and Subadviser’s proprietary seed accounts may include long-short strategies, and certain client strategies may permit short sales. A conflict of interest arises if a security is sold short at the same time as a long position, and continuously short selling in a security may adversely affect the stock price of the same security held long in client accounts. The Adviser and the Subadviser have adopted various policies to mitigate these conflicts, including policies that require the Adviser to avoid favoring any account, and that prohibit client and proprietary accounts from engaging in short sales with respect to individual stocks held long in client accounts. The Adviser’s policies also require transactions in proprietary accounts to be placed after client transactions.
Situations may occur when the Registrant could be disadvantaged because of the investment activities conducted by the Adviser, the Subadviser and their affiliates for their other accounts. Such situations may be based on, among other things, the following: (1) legal or internal restrictions on the combined size of positions that may be taken for the Registrant or the other accounts, thereby limiting the size of the Registrant’s position; (2) the difficulty of liquidating an investment for the Registrant or the other accounts where the market cannot absorb the sale of the combined position; or (3) limits on co-investing in negotiated transactions under the Investment Company Act of 1940.
The 1940 Act limits our ability to co-invest in negotiated private placements of securities with our affiliates, including other funds managed by the Adviser. We and our Adviser have received exemptive relief from the SEC that permits certain co-investment transactions. In this regard, our Adviser has the ability to allocate investment opportunities of certain negotiated transactions between us, other funds registered under the 1940 Act and other accounts managed by our Adviser pro rata based on available capital, up to the amount proposed to be invested by each. All accounts generally are required to participate on the same terms. Pursuant to the exemptive order, our Adviser will be required to provide the board of directors of each participating registered fund with certain information concerning the relevant investment. A majority (as defined in section 57(o) of the 1940 Act) of the directors eligible to consider the co-investment transaction of each participating registered fund must approve such registered fund’s participation in the co-investment transaction.
To the extent that the Adviser sources and structures private investments in publicly traded companies, certain employees of the Adviser may become aware of actions planned by such companies, such as acquisitions, which may not be announced to the public. It is possible that the Registrant could be precluded from investing in or selling securities of a company about which the Adviser has material, non-public information; however, it is the Adviser’s intention to ensure that any material, non-public information available to certain employees of the Adviser is not shared with the employees responsible for the purchase and sale of publicly traded securities or to confirm prior to receipt of any material non-public information that the information will shortly be made public. The Registrant’s investment opportunities also may be limited by affiliations of the Adviser, the Subadviser or their affiliates with essential asset companies.
The Adviser, the Subadviser and their principals, officers, employees, and affiliates may buy and sell securities or other investments for their own accounts and may have actual or potential conflicts of interest with respect to investments made on the Registrant’s behalf. As a result of differing trading and investment strategies or constraints, positions may be taken by principals, officers, employees, and affiliates of the Adviser or Subadviser that are the same as, different from, or made at a different time than positions taken for the Registrant. Further, the Adviser or Subadviser may at some time in the future, manage additional investment funds with the same investment objective as the Registrant’s.
Compensation
None of Messrs. Breidert, de Lamaze, Goff, Holmes, Jergens, Kessens, Mick, Ordway, Pang, Peltzer, Polacek, Prakash, Russell, Sallee, Slee, Sifford, Sznajer or Thummel receives any direct compensation from the Registrant or any other of the managed accounts reflected in the table above. All such accounts are managed by the Adviser or the Subadviser. Each of Messrs. Goff, Holmes, Jergens, Kessens, Mick, Ordway, Pang, Polacek, Prakash, Russell, Sallee, Sifford, and Thummel has an agreement with the Adviser. Messrs. Goff, Holmes, Jergens, Kessens, Mick, Ordway, Pang, Peltzer, Polacek, Prakash, Russell, Sallee, Sifford and Thummel each receives a base salary for the services he provides. Each of Messrs. Breidert, de Lamaze, Hias, Slee and Sznajer has an agreement with the Subadviser and receives a base salary from the Subadviser for the services he provides. All Portfolio Managers are also eligible for an annual cash bonus based on the Adviser’s or Subadviser’s earnings and the satisfaction of certain other conditions. Additional benefits received by the portfolio managers are normal and customary employee benefits generally available to all salaried employees of the Adviser or Subadviser, as applicable. Each of Messrs. Breidert, de Lamaze, Goff, Holmes, Jergens, Kessens, Mick, Ordway, Pang, Peltzer, Polacek, Prakash, Russell, Sallee, Slee, Sifford, Sznajer and Thummel owns an equity interest in Tortoise Investments, LLC that indirectly wholly owns the Adviser and the Subadviser, and each thus benefits from increases in the net income of the Adviser and the Subadviser.
Securities Owned in the Registrant by Portfolio Managers
The following table provides information about the dollar range of equity securities in the Registrant beneficially owned by each of the portfolio managers as of November 30, 2019:
| Aggregate Dollar Range of | ||
| Portfolio Manager | Holdings in the Registrant | |
| Brian Kessens | $10,001-$50,000 | |
| James Mick | None | |
| Matthew Sallee | $1-10,000 | |
| Robert Thummel | $10,001-$50,000 | |
| Stephen Pang | None | |
| Brett Jergens | None | |
| Nick Holmes | None | |
| Adam Peltzer | None | |
| Jeremy Goff | None | |
| David Sifford | None | |
| Ed Russell | $10,001-$50,000 | |
| Jerry G. Polacek | $10,001-$50,000 | |
| Matthew S. Ordway | $1-$10,000 | |
| Prashanth K. Prakash | None | |
| Matthew Breidert | $100,001-$500,000 | |
| Jean-Hugues de Lamaze | None | |
| Flavien Hias | None | |
| Maximilian Slee | None | |
| Michel Sznajer | None |
Item 9. Purchases of Equity Securities by Closed-End Management Investment Company and Affiliated Purchasers.
| Period | (a) Total Number of Shares (or Units) Purchased | (b) Average Price Paid per Share (or Unit) | (c) Total Number of Shares (or Units) Purchased as Part of Publicly Announced Plans or Programs | (d) Maximum Number (or Approximate Dollar Value) of Shares (or Units) that May Yet Be Purchased Under the Plans or Programs |
| Month #1 | 0 | 0 | 0 | 0 |
| 6/1/19-6/30/19 | ||||
| Month #2 | 0 | 0 | 0 | 0 |
| 7/1/19-7/31/19 | ||||
| Month #3 | 0 | 0 | 0 | 0 |
| 8/1/19-8/31/19 | ||||
| Month #4 | 0 | 0 | 0 | 0 |
| 9/1/19-9/30/19 | ||||
| Month #5 | 0 | 0 | 0 | 0 |
| 10/1/19-10/31/19 | ||||
| Month #6 | 0 | 0 | 0 | 0 |
| 11/1/19-11/30/19 | ||||
| Total | 0 | 0 | 0 | 0 |
Item 10. Submission of Matters to a Vote of Security Holders.
None.
Item 11. Controls and Procedures.
(a) The Registrant’s Chief Executive Officer, Principal Financial Officer and Treasurer has concluded that the Registrant's disclosure controls and procedures (as defined in Rule 30a-3(c) under the Investment Company Act of 1940 (the “1940 Act”)) are effective as of a date within 90 days of the filing date of this report, based on the evaluation of these controls and procedures required by Rule 30a-3(b) under the 1940 Act and Rules 13a-15(b) or 15d-15(b) under the Securities Exchange Act of 1934, as amended.
(b) There were no changes in the Registrant’s internal control over financial reporting (as defined in Rule 30a-3(d) under the 1940 Act) that occurred during the period covered by this report that have materially affected, or are reasonably likely to materially affect, the Registrant’s internal control over financial reporting.
Item 12. Disclosure of Securities Lending Activities For Closed-End Management Investment Companies.
The Registrant does not participate in securities lending activities.
Item 13. Exhibits.
(a)(1)Any code of ethics or amendment thereto, that is the subject of the disclosure required by Item 2, to the extent that the Registrant intends to satisfy Item 2 requirements through filing of an exhibit.Filed herewith.
(2)Certifications pursuant to Section 302 of the Sarbanes-Oxley Act of 2002.Filed herewith.
(3)Any written solicitation to purchase securities under Rule 23c-1 under the Act sent or given during the period covered by the report by or on behalf of the Registrant to 10 or more persons.None.
(b)Certification pursuant to Section 906 of the Sarbanes-Oxley Act of 2002.Furnished herewith.
SIGNATURES
Pursuant to the requirements of the Securities Exchange Act of 1934 and the Investment Company Act of 1940, the Registrant has duly caused this report to be signed on its behalf by the undersigned, thereunto duly authorized.
| (Registrant) | Tortoise Essential Assets Income Term Fund | |
| By (Signature and Title) | /s/ P. Bradley Adams | |
| P. Bradley Adams, Chief Executive Officer, Principal Financial Officer and Treasurer | ||
| Date February 5, 2020 | ||
Pursuant to the requirements of the Securities Exchange Act of 1934 and the Investment Company Act of 1940, this report has been signed below by the following persons on behalf of the Registrant and in the capacities and on the dates indicated. | ||
| By (Signature and Title) | /s/ P. Bradley Adams | |
| P. Bradley Adams, Chief Executive Officer, Principal Financial Officer and Treasurer | ||
| Date February 5, 2020 | ||