UNITED STATES
SECURITIES AND EXCHANGE COMMISSION
Washington, D.C. 20549
FORM N-CSR
CERTIFIED SHAREHOLDER REPORT OF REGISTERED
MANAGEMENT INVESTMENT COMPANIES
Investment Company Act file number 811-23248
Tortoise Essential Assets Income Term Fund
(Exact name of registrant as specified in charter)
5100 W 115th Place, Leawood, KS 66211
(Address of principal executive offices) (Zip code)
P. Bradley Adams
Diane Bono
5100 W 115th Place, Leawood, KS 66211
(Name and address of agent for service)
913-981-1020
Registrant's telephone number, including area code
Date of fiscal year end: November 30
Date of reporting period: November 30, 2020
Item 1. Report to Stockholders.
Annual Report | November 30, 2020
2020 Annual Report
Closed-End Funds
![]()
| Tortoise |
| 2020 Annual Report to Stockholders |
This combined report provides you with a comprehensive review of our funds that span essential assets.
| Table of contents | ||||||
| Closed-end Fund Comparison | 1 | TEAF: Fund Focus | 21 | |||
| Letter to Stockholders | 2 | Financial Statements | 25 | |||
| TYG: | Fund Focus | 6 | Notes to Financial Statements | 64 | ||
| NTG: | Fund Focus | 9 | Report of Independent Registered | |||
| TTP: | Fund Focus | 12 | Public Accounting Firm | 86 | ||
| NDP: | Fund Focus | 15 | Company Officers and Directors | 87 | ||
| TPZ: | Fund Focus | 18 | Additional Information | 89 | ||
| TTP and TPZ distribution policies |
Tortoise Pipeline & Energy Fund, Inc. (“TTP”) and Tortoise Power and Energy Infrastructure Fund, Inc. (“TPZ”) are relying on exemptive relief permitting them to make long-term capital gain distributions throughout the year. Each of TTP and TPZ, with approval of its Board of Directors (the “Board”), has adopted a distribution policy (the “Policy”) with the purpose of distributing over the course of each year, through periodic distributions as nearly equal as practicable and any required special distributions, an amount closely approximating the total taxable income of TTP and TPZ during such year and, if so determined by the Board, all or a portion of the return of capital paid by portfolio companies to TTP and TPZ during such year. In accordance with its Policy, TTP distributes a fixed amount per common share, currently $0.16, each quarter to its common shareholders. Prior to May 2020, the quarterly distribution rate was $0.285. TPZ distributes a fixed amount per common share, currently $0.05, each month to its common shareholders. Prior to June 2020, the monthly distribution rate was $0.125. These amounts are subject to change from time to time at the discretion of the Board. Although the level of distributions is independent of TTP’s and TPZ’s performance, TTP and TPZ expect such distributions to correlate with its performance over time. Each quarterly and monthly distribution to shareholders is expected to be at the fixed amount established by the Board, except for extraordinary distributions in light of TTP’s and TPZ’s performance for the entire calendar year and to enable TTP and TPZ to comply with the distribution requirements imposed by the Internal Revenue Code. The Board may amend, suspend or terminate the Policy without prior notice to shareholders if it deems such action to be in the best interests of TTP, TPZ and their respective shareholders. For example, the Board might take such action if the Policy had the effect of shrinking TTP’s or TPZ’s assets to a level that was determined to be detrimental to TTP or TPZ shareholders. The suspension or termination of the Policy could have the effect of creating a trading discount (if TTP’s or TPZ’s stock is trading at or above net asset value), widening an existing trading discount, or decreasing an existing premium. You should not draw any conclusions about TTP’s or TPZ’s investment performance from the amount of the distribution or from the terms of TTP’s or TPZ’s distribution policy. Each of TTP and TPZ estimates that it has distributed more than its income and net realized capital gains; therefore, a portion of your distribution may be a return of capital. A return of capital may occur, for example, when some or all of the money that you invested in TTP or TPZ is paid back to you. A return of capital distribution does not necessarily reflect TTP’s or TPZ’s investment performance and should not be confused with “yield” or “income.” The amounts and sources of distributions reported are only estimates and are not being provided for tax reporting purposes. The actual amounts and sources of the amounts for tax reporting purposes will depend upon TTP’s and TPZ’s investment experience during the remainder of their fiscal year and may be subject to changes based on tax regulations. TTP and TPZ will send you a Form 1099-DIV for the calendar year that will tell you how to report these distributions for federal income tax purposes.
Tortoise
| 2020 Annual Report | November 30, 2020 |
Closed-end Fund Comparison | |||||||||||
| Name/Ticker | Primary focus | Structure | Total assets ($ millions)1 | Portfolio mix by asset type2 | Portfolio mix by structure2 | ||||||
 | Tortoise Energy NYSE: TYG Inception: 2/2004 | Midstream MLPs | C-corp | $446.8 |  |  | |||||
Tortoise Midstream Inception: 7/2010 | Natural gas infrastructure MLPs | C-corp | $220.4 | 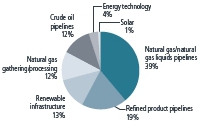 |  | ||||||
Tortoise Pipeline NYSE: TTP | North American pipeline companies | Regulated investment company | $68.5 |  |  | ||||||
 | Tortoise Energy Inception: 7/2012 | North American oil & gas producers | Regulated investment company | $34.1 |  |  | |||||
 | Tortoise Power NYSE: TPZ | Power & energy infrastructure companies (Fixed income & equity) | Regulated investment company | $115.8 |  |  | |||||
 | Tortoise Essential NYSE: TEAF Inception: | Essential assets | Regulated investment company | $249.9 |  |  | |||||
| 1 | As of 12/31/2020 |
| 2 | As of 11/30/2020 |
| (unaudited) | |
| Tortoise | 1 |
| Tortoise |
| 2020 Annual Report to closed-end fund stockholders |
Dear stockholder
The 2020 fiscal year, ending on November 30, 2020 was certainly like no other. The COVID-19 global pandemic affected every part of our lives and the essential assets in which Tortoise invests. Energy demand concerns and volatile commodity prices plagued the energy sector. Social impact projects in the education segment were greatly impacted by virtual learning, and senior living facilities literally shut down as they fought to keep residents safe. After a tumultuous year, all of these segments appear to be on their way to recovery with high hopes for 2021. The sustainable infrastructure sector, particularly renewable energy, had a strong year propelled even higher by anticipated Biden Administration energy policy. As we move into 2021, with COVID-19 vaccinations being administered throughout the world driving energy demand toward pre-COVID-19 levels and the push toward cleaner energy gaining momentum, we are optimistic that 2021 will be a strong year for investors in these essential assets sectors.
Energy and power infrastructure
The broader energy sector, as represented by the S&P Energy Select Sector® Index, finished the fourth fiscal quarter ending November 30, 2020 in positive territory, returning 4.9%, bringing fiscal year 2020 performance to -31.7%. Energy markets and prices experienced significant volatility throughout the fiscal year driven by the uncertainty around energy demand due to COVID-19, concerns over the massively oversupplied global oil market in April, and ultimately a recovery in the latter part of 2020. Looking ahead to 2021, all eyes are focused on energy demand and the subsequent rollout of COVID-19 vaccinations. Pfizer and Moderna’s November announcements of positive data regarding their vaccines for COVID-19 led to a stock market surge, with beaten down energy companies leading the charge, along with commodities such as crude oil. With the growing belief in vaccine success and visibility to significantly improved economic activity, 2021 energy demand growth could exceed anything ever seen on a year-over-year basis.
Following the price war between Saudi Arabia and Russia in early March, the Organization of Petroleum Exporting Countries (OPEC) and their Non-OPEC partners (OPEC+) announced deep production cuts with a clear goal of balancing the global crude oil market. The market dramatically shifted from an approximate 20 million barrels per day (b/d) surplus in April to an approximate 4 million b/d deficit in July, providing the path for market rebalancing. Overall adherence to the production cut agreement remained strong in the second half of 2020 leading to inventory draws. Entering 2021, the global crude oil market remains in deficit, supported by the OPEC+ crude oil production cut agreement, and expected inventory draws are expected to continue throughout 2021.
U.S. crude oil production declined in 2020 in response to the supply-demand imbalance resulting from the economic shutdowns and stay-at-home orders in March and April. This resulted in the first annual decline in U.S. production since 2016. Specifically, U.S. crude oil production fell from a record 12.9 million barrels per day (b/d) in November 2019 to 11.2 million b/d in November 20201. EIA forecasts that U.S. crude oil production will average 11.1 million b/d in 2021.
For U.S. producers, 2020 was a year of change. The COVID-19 pandemic accelerated producers’ capital discipline as investors focused on higher free cash flow generation and return of capital to shareholders. This free-cash-flow emphasis led to a host of M&A deals as E&P companies prioritized the importance of scale, diversity and strengthening balance sheets in a challenging oil price environment.
While oil dominated the headlines, natural gas continued to provide a cleaner burning source. As a result, we continue to see natural gas as a critical source of energy supply going forward. During the 2020 fiscal year, a reduction in natural gas demand caused by COVID-19 initially resulted in the convergence of global natural gas prices. However, in the final months of the year, LNG exports from the U.S. rapidly shot back up driven by increasing demand for natural gas in Asia and resulting in Asian gas prices trading at a premium relative to the U.S. Henry Hub prices. Domestically, the backdrop of slowing production growth and strong domestic and export demand paints a picture of improving natural gas fundamentals in the future. Rising U.S. energy exports of liquids and natural gas are expected to positively affect the U.S. trade deficit and to ultimately help reduce global CO2 emissions, along with renewables, as they take market share from coal.
Midstream energy outperformed broader energy in the fourth fiscal quarter and the fiscal year with the Tortoise North American Pipeline IndexSM returning 6.3% and the Tortoise MLP Index® returning 11.2%, bringing fiscal year performance to -15.8% and -23.6%, respectively. There were several contributors to midstream energy’s negative performance for the fiscal year including: negative energy sentiment following energy demand uncertainty, excess pipeline takeaway capacity related to the COVID-19 pandemic resulting in lower production, and political rhetoric focused on an energy transition to cleaner energy sources. Midstream companies structured as C-Corporations continued to benefit from several items versus MLPs, including: stronger corporate governance, broad market index inclusion for some companies, lack of K-1s, and a more certain corporate structure.
There were a couple of positive themes standing out for midstream businesses throughout the fiscal year. First, resiliency. Resilient cash flows confirm the essential nature of the assets that midstream businesses operate. Strong contractual obligations (take or pay contracts) and customer profiles (large, investment grade rated counterparties) helped midstream energy companies generate consistent cash flow from operations even in the low and volatile 2020 price environment. At the onset of the COVID-19 pandemic, we forecasted midstream EBITDA declining 5%-10% in 2020. However, heading into the final months of 2020, companies revised their forecasts higher and EBITDA is expected to only be down 4% for the year. Notably, companies with significant natural gas businesses and/or take or pay contracts reaffirmed guidance, whereas others with cash flows tied to wellhead volumes provided a wider range of outcomes.
| (unaudited) | |
| 2 | Tortoise |
| 2020 Annual Report | November 30, 2020 |
The other clear trend in earnings was virtually every midstream energy company transitioning to a capital allocation focused on positive free-cash-flow after dividends. This is a stark change made possible by declining capital expenditures for midstream projects and sale of non-core assets. We forecast growth capex to decline by approximately $16 billion YTD as midstream rationalizes project spending. This shift in spending has allowed the midstream sector to not only be free cash flow positive, but materially so, especially compared to other asset classes and the S&P 500. In 2021, we expect midstream companies to have $8 billion of free cash flow after distributions and by 2024 we expect $21 billion of free cash flow after distributions.
We believe midstream companies will more directly return cash flow to shareholders in the form of dividends, debt reduction and share buybacks. While continuing to pay out very high dividend yields, we are advocating for companies to utilize stock buybacks to create their own flows and help turn the tide on stock performance. The numbers show that this can be achieved while still reducing leverage in a meaningful way.
During the last few months of the fiscal year, the buyback announcements started coming in earnest. In early October, Targa Resources (TRGP) announced a $500 million stock buyback program. MPLX and Plains All American followed suit, announcing significant buyback programs for $1 billion and $500 million, respectively for the three largest during the quarter. In total, 10 midstream companies announced share buyback programs in 2020, including six during the fourth quarter. We believe the forthcoming free cash flow and share buyback themes can help drive sustainable outperformance for the midstream sector.
One of the key regulatory announcements of 2020 was the Army Corps of Engineers announcing it began work on an environmental impact statement for the Dakota Access Pipeline, something the district court requested for the better part of the year. Another requirement of the court was that the Corps determine a remedy for the fact that the pipeline no longer has a permit to cross Federal land. The Corps stated that it would require no immediate action and that it does not think the court has jurisdiction over the matter. We are closely monitoring Dakota Access Pipeline developments as the fate of the pipeline impacts several midstream companies. In other pipeline news, in July, the Supreme Court agreed to reinstate streamlined permitting for pipelines across the country, except for Keystone XL. This is positive for the most notable project under construction, the Mountain Valley Pipeline, Equitrans’ 300+ mile natural gas pipeline which is nearing completion after a series of several delays. Construction of the pipeline continues, and we expect for it to be in service within the next year.
While the 2020 presidential election created headline risks for the energy sector, we believe the consensus path forward for the Biden Administration will focus on getting Americans back to work with supportive policies versus policies aimed at opposing the oil and gas industry or destroying jobs. The predominant theme around Biden’s energy plan is to address climate change and create substantial job opportunities for Americans. The topic of climate change and related opportunities for the overall economy was one of the four pillars of the convention platform, integrated into an overall vision of revitalization of America. We expect market economics to dictate the trajectory of future energy supply and demand. Renewables and natural gas are more economic than coal in generating electricity and will likely continue to take share, while crude oil will likely remain the predominant fuel source in the transportation sector for the near future.
Finally, despite past comments early on during the campaign, we do not expect a ban on fracking. It is worth noting that under the Obama Administration, the ban on crude oil exports was lifted which was supportive of the energy industry. Ironically, regulatory pressures have the potential to tighten new supply, pushing oil and gas prices up, and making existing infrastructure more valuable.
2020 also ushered in continued questions about midstream energy’s role in an energy transition environment. During the fiscal year, there were three oil majors, Shell, Total SE and BP, that openly discussed a path forward around renewable energy. The European Union (EU) moved further towards renewables and 7 of the 10 largest economies stated their intention to have net-zero emissions by 2050. While the energy transition will take time to play out, midstream management teams openly discussed the role their companies could play in such a transition. Pipeline infrastructure, for example, could be repurposed to transport hydrogen. As the world continues to demand more energy and less carbon, we are encouraging midstream companies to view energy transition opportunistically.
Within the downstream portion of the energy value chain, the refining sector remained among the most challenged sectors in 2020 due to the COVID-19 pandemic. Refinery utilization has recovered from the depths of the economic contraction in March and April but remains below 2019 levels. Permanent refinery closures have and should continue to help balance the market from a supply and demand perspective. From a U.S. refined product standpoint, we believe gasoline and diesel will continue to inch towards pre-COVID levels during 2021 while a slower recovery should be expected in jet fuel. As U.S. energy demand recovers in 2021, U.S. refinery utilization and throughput should exhibit strong growth and return to more normalized levels.
Natural gas liquids, unlike the refining sector, has proved resilient despite challenges faced during the COVID-19 pandemic. Strength can be seen in LPGs (liquid petroleum gases) where demand is driven by global population growth and improvements in living standards in Asia, notably in China and India.
Sustainable infrastructure
Renewable energy
2020 started out strong for new renewables installation on the heels of a 2019 that itself was the second and third-strongest years ever for solar and wind, respectively. Like most of the economy, renewables then saw a COVID-driven decline bottom-out during the second quarter, but rebounded substantially in the following months. Utility solar in particular has been only minimally impacted by COVID-19 related construction delays. For solar, more than 19 giga watts (GW) of installations are expected for the full year of 2020 – making it the
| (unaudited) | |
| Tortoise | 3 |
most capacity installed in a single year in the U.S. and an increase of new growth of around 40% over 20192. Activity remains concentrated in the southwest and southeast, with Texas ahead of Florida and California in year-to-date installations2. According to the U.S. Energy Information Administration, wind installation is also expected to see a strong finish to the year with as much as 23 GW of new capacity coming on line in 2020.
The pandemic caused little to no slowdown in new project announcements as growth is expected to continue in the coming years with a backlog of more than 150 GW over the next five years. That includes major announcements we’ve seen this year from the likes of Amazon, Google, and Microsoft, among others, as well as from several individual states. This represents market share gain for renewables as, between them, wind and solar represent more than 70% of all U.S. electricity-generating capacity additions in 20202. This is not surprising, given that on a levelized cost of energy basis (LCOE) wind and utility-scale solar tend to be a cheaper option than building out any new fossil fuel powered options. Support from the incoming Biden Administration should serve to only provide further momentum to this trend.
Sustainable Project Finance
During 2020, the ongoing sustainability trend that is transforming the waste and energy sectors continued to foster strong growth in waste-to-energy and waste-to-value projects, with a potential for accelerated growth in coming years based on new project announcements.
Waste-to-energy may not be as recognized within the broad renewables sector when compared to more visible solutions such as wind, solar, and hydro. However, bioenergy and biofuel is nearly comparable in size at 44% of U.S. renewable energy consumption, versus 55% for wind, solar, and hydro combined, according to data released in the fourth quarter of 2020 by the U.S. Energy Information Administration. Within the waste-to-energy sector, the strongest growth continues to be within the renewable natural gas (RNG) and renewable diesel sectors as part of ongoing efforts to decarbonize electricity production and transportation fuels.
The number of RNG production facilities operating in the U.S. at year-end increased to 157, up 78% from 2019. In addition, there are 76 new projects under construction and another 79 projects in planning, which suggests continued strong growth in RNG production into 2021. During 2020, more than 20 new waste-to-energy projects were announced for the production of renewable diesel and sustainable aviation fuel (SAF), totaling approximately $4 billion in new project costs. Many of these projects are expected to begin construction during 2021 and 2022.
In the waste-to-value sector, 2020 was a promising year for plastic and food-waste recycling, including targeted corporate sustainability goals, the formation of new recycling alliances, and the development of new technologies for commercial scale-up. Regarding plastics, several new projects were announced for items with low recycling rates, such as polypropylene, polystyrene, and mixed-plastics. Several new projects involving the anaerobic digestion of food waste are also under construction or planned for 2021. These food waste recycling projects typically produce RNG and other value-added co-products, while diverting methane-producing organics from landfills, thereby reducing greenhouse gas emissions.
Social impact
Education
In early Spring, COVID-19 prompted most state and/or municipalities to issue full closure orders prohibiting in-person instruction for all K-12 public school students. As of December 15, 2020, only Washington, DC & Puerto Rico had full closure orders in effect. Four states (TX, FL, AK & IA) had full opening orders in effect that require full-time in-person be available to all K-12 students; seven states (CA, OR, NM, WV, NC, DE & HI) had partial closure orders in effect that prohibit in-person instruction for students in some regions or certain grade levels. For the remaining 39 states, the decisions to make full-time in-person instruction available are being made at the local level3. Many school districts saw their first enrollment declines in decades with families making the decision to transfer students to private schools or shift to home schooling.
In the fourth quarter of 2020, challenges associated with school re-openings, COVID testing and immunization planning and events surrounding the Presidential election shifted the attention of many charter school opponents. Many concerns about the potential for anti-charter school policies from the incoming Biden Administration have been alleviated by the announcement that Connecticut Education Commissioner Miguel Cardona would be the nominee to lead the US Department of Education. While it is highly unlikely that the results of 2020 local, state and national elections will significantly improve the political environment for charter schools, securing federal aid and addressing the tremendous educational inequity spotlighted throughout the pandemic will almost certainly be the primary political focus in K-12 education for the first quarter 2021.
In spite of the uncertainty created by the pandemic, 2020 was another record year for the charter school and K-12 private school bond market with more than 160 offerings and nearly $4 billion in new issuance. While attempts to return to full-time in-person instruction remain controversial in some parts of the country, parental demand for safe, high-quality school facilities has only increased. Overall, there has been no reduction to state and local funding for K-12 public schools during the current school year with many school districts implementing previously approved budgeted increases. While California has indicated that some charter school payment deferrals may be implemented, there are well established options in place to assist schools with any resulting cash flow challenges.
While the challenges in K-12 education in 2020 were unprecedented, the opportunity for investing in facilities for excellent schools has only increased. Relationships with bankers, financial advisors and developers continue to grow stronger as we are seen as one of the go-to solutions for schools that do not have the luxury of off-the-shelf facility financing. As our K-12 portfolio and market presence continues to grow, we believe our ability to find and finance outstanding schools that offer exceptional returns for our investors will continue to improve.
| (unaudited) | |
| 4 | Tortoise |
| 2020 Annual Report | November 30, 2020 |
Senior Living
There’s a common phrase floating around the senior living industry these days; light at the end of the tunnel. While 2020 was a trying year, many of our operators have begun inoculating residents and staff per the CDC’s recommendation that they be among the first recipients of the vaccine. As one can imagine, a vaccine has more than lifted the spirits in many of our communities. Given the salacious headlines and doomsday projections in March 2020, one might have expected senior living to be wiped off the map, but it hasn’t, thanks to the industry’s resilience and federal stimulus dollars.
Regarding the resilience of the senior living industry, the reality is that senior living is a high turnover model that’s enduring, and the average high acuity setting hasn’t seen many more deaths than a typical year. Statistically, through December 2020, nationwide occupancy for independent living and assisted living decreased to 83.5% and 77.7%, respectively. Occupancy has decreased for independent and assisted living, 6.2% and 7.5% since the pandemic began4. The rate of occupancy decline from month to month has been decelerating for both independent and assisted living, and primary markets have seen a higher rate of decline than the secondary markets that we typically invest in.
One reason the senior living industry has weathered the pandemic better than expected, is the Federal stimulus dollars which almost all of our borrowers had access to through the Payroll Protection Program (“PPP”) which provided for 2.5 months of average monthly payroll costs. Additionally, in late September, the Department of Health and Human Services announced that assisted living providers can receive 2% of annual revenue, plus a payment to account for revenue loss and expenses attributable to the pandemic. Applications were due November 6th and should provide timely aid to an industry on the front lines.
From a capital markets perspective, the senior living community has seen the lowest number of financings since the great financial crisis of 2007-08. As of October, $1.5 billion had been publicly issued for a tax-exempt market that normally issues over $4 billion a year5. The senior living capital markets were “frozen” until mid-summer when the first investment grade senior living deal priced. Since then, there has been a slow thaw of the senior living capital markets with a significant portion of banks and equity investors on the “sidelines”. With each passing day, more capital is returning to the space and deals across the spectrum of senior living are crossing the finish line once again. Simultaneously, vaccinations at our senior living communities have created a surge of capital market activity as groups vie for the “first mover’s advantage”.
On a positive note, the pandemic has strengthened the industry’s infectious disease policies and procedures which has brought lasting change for the better. For example, the industry has been remarkably slow to adopt telehealth; however, telehealth visits have gone from approximately 3% pre-COVID-19 to more than 50% currently. The dramatic positive shift was made possible by Congress passing bills in the spring of 2020 which now allow telehealth to be covered by Medicare.
Clearly it will not happen overnight, but we are cautiously optimistic the senior living community is poised to rebound to pre-COVID-19 levels in short order.
Concluding thoughts
We feel strongly that the future of energy will be driven by a combination of natural gas and renewables to meet growing energy demand while simultaneously reducing global CO2 emissions. There are many tailwinds driving the move to cleaner energy with the Biden Administration and the trends toward ESG investing. Although 2020 and the pandemic proved challenging in the education and senior living sectors, we anticipate more of a return to normal during 2021. We are positioning the funds to take advantage of these trends and have an optimistic outlook for 2021 and beyond.
The S&P Energy Select Sector® Index is a capitalization-weighted index of S&P 500® Index companies in the energy sector involved in the development or production of energy products. The Tortoise North American Oil and Gas Producers IndexSM is a float-adjusted, capitalization-weighted index of North American energy companies engaged primarily in the production of crude oil, condensate, natural gas or natural gas liquids (NGLs). The Tortoise North American Pipeline IndexSM is a float adjusted, capitalization-weighted index of energy pipeline companies domiciled in the United States and Canada. The Tortoise MLP Index® is a float-adjusted, capitalization-weighted index of energy master limited partnerships.
The Tortoise indices are the exclusive property of Tortoise Index Solutions, LLC, which has contracted with S&P Opco, LLC (a subsidiary of S&P Dow Jones Indices LLC) to calculate and maintain the Tortoise MLP Index®, Tortoise North American Pipeline IndexSM and Tortoise North American Oil and Gas Producers IndexSM (the “Indices”). The Indices are not sponsored by S&P Dow Jones Indices or its affiliates or its third party licensors (collectively, “S&P Dow Jones Indices LLC”). S&P Dow Jones Indices will not be liable for any errors or omission in calculating the Indices. “Calculated by S&P Dow Jones Indices” and its related stylized mark(s) are service marks of S&P Dow Jones Indices and have been licensed for use by Tortoise Index Solutions, LLC and its affiliates. S&P® is a registered trademark of Standard & Poor’s Financial Services LLC (“SPFS”), and Dow Jones® is a registered trademark of Dow Jones Trademark Holdings LLC (“Dow Jones”).
It is not possible to invest directly in an index.
Performance data quoted represent past performance; past performance does not guarantee future results. Like any other stock, total return and market value will fluctuate so that an investment, when sold, may be worth more or less than its original cost.
| 1. | Energy Information Administration, December 2020 STEO |
| 2. | Solar Market Insight Report, 2020 Q4 |
| 3. | CNN “Where Schools are Reopening in the U.S.”, December 15, 2020 |
| 4. | NIC |
| 5. | Ziegler |
| (unaudited) | |
| Tortoise | 5 |
| Tortoise |
| Energy Infrastructure Corp. (TYG) |
Fund description
TYG seeks a high level of total return with an emphasis on current distributions paid to stockholders. TYG invests primarily in equity securities of master limited partnerships (MLPs) and their affiliates that transport, gather, process or store natural gas, natural gas liquids (NGLs), crude oil and refined petroleum products.
Fund performance
There were several contributors to midstream energy’s negative performance for the fiscal year including volatile commodity prices and negative energy sentiment, energy demand concerns and excess takeaway capacity related to the COVID-19 pandemic, as well as political rhetoric and uncertainty related to the 2020 U.S. presidential election, regulatory concerns around pipeline permitting, and concerns around midstream’s role in the evolving energy transition. Beyond this, one positive theme stood out for midstream businesses throughout the fiscal year — resiliency. Resilient cash flows confirm the essential nature of the assets that midstream businesses operate. Strong contractual obligations (take or pay contracts) and customer profiles (large, investment grade rated counterparties) helped midstream energy companies generate consistent cash flow from operations even in the low and volatile 2020 price environment. The average leverage for the fund’s portfolio companies was 3.41x in the fourth fiscal quarter. Since the fund’s inception, it has paid out more than $144 in cumulative distributions to stockholders. Leverage drastically impacted the fund’s returns throughout the period. The fund’s use of leverage drove outperformance compared to the index during the strong fourth fiscal quarter with market-based and NAV-based returns of 17.8% and 12.4%, respectively (including the reinvestment of distributions). Conversely, the required deleveraging during the weak market earlier in the year magnified negative performance with 2020 fiscal year returns of -69.7% and -61.7%, respectively. The Tortoise MLP Index® returned 11.2% and -23.6% during the same periods, respectively.
| 2020 fiscal year summary | |||
| Distributions paid per share (fiscal year 2020) | $2.1800 | (1) | |
| Distributions paid per share (4th quarter 2020) | $0.3000 | ||
| Distribution rate (as of 11/30/2020) | 6.3% | ||
| Quarter-over-quarter distribution increase (decrease) | 0.0% | ||
| Year-over-year distribution increase (decrease) | (88.5)% | (1) | |
| Cumulative distributions paid per share to | |||
| stockholders since inception in February 2004 | $144.9900 | (1) | |
| Market-based total return | (69.7)% | ||
| NAV-based total return | (61.7)% | ||
| Premium (discount) to NAV (as of 11/30/2020) | (23.2)% |
| (1) | Includes impact of reverse stock split. |
Key asset performance drivers
| Top five contributors | Company type | Performance driver | ||
| Sunnova Energy International Inc. | Solar company | Positive solar growth fundamentals and lower financing costs | ||
| Targa Resources Corp. – Preferred Shares A | Midstream gathering and processing company | Convertible debt structure provided downside protection | ||
| DCP Midstream LP | Natural gas pipeline MLP | Strong operating performance and improved NGL price outlook | ||
| Sunnova Energy International Inc. – Convertible Notes 9.750% Due 4/30/2025 | Solar company | Positive solar growth fundamentals and lower financing costs | ||
| Altus Midstream Company Preferred | Natural gas pipeline company | Preferred structure outperformed equity midstream equity performance | ||
| Bottom five contributors | Company type | Performance driver | ||
| Energy Transfer LP | Natural gas pipeline MLP | Concern Dakota Access Pipeline operations may be halted due to potential need for Environmental Impact Statement | ||
| Targa Resources Corp. | Midstream gathering and processing company | Concern about prolonged slowdown in production growth | ||
| ONEOK, Inc. | Midstream natural gas/natural gas liquids pipeline company | Concern about declining crude oil volumes negatively impacting natural gas and natural gas liquids (NGL) | ||
| Plains All American Pipeline, L.P. | Midstream crude oil pipeline MLP | Concerns regarding excess capacity for Permian crude pipelines | ||
| Enterprise Products Partners L.P. | Midstream natural gas/natural gas liquids pipeline MLP | Concerns of lower U.S.and global energy demand due to slower than expected recovery |
Unlike the fund return, index return is pre-expenses and taxes.
Performance data quoted represent past performance; past performance does not guarantee future results. Like any other stock, total return and market value will fluctuate so that an investment, when sold, may be worth more or less than its original cost. Portfolio composition is subject to change due to ongoing management of the fund. References to specific securities or sectors should not be construed as a recommendation by the fund or its adviser. See Schedule of Investments for portfolio weighting at the end of the fiscal quarter.
| (unaudited) | |
| 6 | Tortoise |
| 2020 Annual Report | November 30, 2020 |
Fund structure and distribution policy
The fund is structured as a corporation and is subject to federal and state income tax on its taxable income. The fund has adopted a distribution policy in which the Board of Directors considers many factors in determining distributions to stockholders, including NAV performance and distributable cash flow (DCF). The fund’s Board of Directors reviews the distribution rate at least quarterly, and may adjust the quarterly distribution throughout the year. Although the level of distributions is independent of the funds’ performance in the short term, the fund expects such distributions to correlate with its performance over time.
Distributable cash flow and distributions
DCF is distributions received from investments less expenses. The total distributions received from investments include the amount received as cash distributions from investments, paid-in-kind distributions, and dividend and interest payments. Income also includes the premiums received from sales of covered call options, net of amounts paid to buy back out-of-the-money options. The total expenses include current or anticipated operating expenses, leverage costs and current income taxes. Current income taxes include taxes paid on net investment income, in addition to foreign taxes, if any. Taxes incurred from realized gains on the sale of investments, expected tax benefits and deferred taxes are not included in DCF.
Income from investments increased slightly as compared to 3rd quarter 2020. Operating expenses, consisting primarily of fund advisory fees, decreased approximately 5.7% during the quarter due mainly to lower asset-based fees. Overall leverage costs decreased approximately 3.1% as compared to 3rd quarter 2020 due primarily to lower interest rates during the period. As a result of the changes in income and expenses, DCF increased approximately 2.8% as compared to 3rd quarter 2020. The fund paid a quarterly distribution of $0.30 per share during the quarter, no change from the distribution paid from the prior quarter and a decrease of approximately 88.5% from the distribution paid in Q3 2019. The fund has paid cumulative distributions to stockholders of $144.99 per share since its inception in Feb. 2004.
The Key Financial Data table discloses the calculation of DCF and should be read in conjunction with this discussion. The difference between distributions received from investments in the DCF calculation and total investment income as reported in the Statement of Operations, is reconciled as follows: the Statement of Operations, in conformity with U.S. generally accepted accounting principles (GAAP), recognizes distribution income from MLPs and other investments on their ex-dates, whereas the DCF calculation may reflect distribution income on their pay dates; GAAP recognizes that a significant portion of the cash distributions received from MLPs and other investments are characterized as a return of capital and therefore excluded from investment income, whereas the DCF calculation includes the return of capital (net of any distributions deemed to be return of principal); and distributions received from investments in the DCF calculation include the value of dividends paid-in-kind (additional stock or MLP units), whereas such amounts may not be included as income for GAAP purposes and includes distributions related to direct investments when the purchase price is reduced in lieu of receiving cash distributions. Net premiums on options written (premiums received less amounts paid to buy back out-of-the-money options) with expiration dates during the fiscal quarter are included in the DCF calculation, whereas GAAP recognizes the net effect of options written as realized and unrealized gains (losses). Income for DCF purposes is reduced by amortizing the cost of certain investments that may not have a residual value after a known time period and by distributions received from investments deemed to be return of principal. The treatment of expenses in the DCF calculation also differs from what is reported in the Statement of Operations. In addition to the total operating expenses, including fee waiver, as disclosed in the Statement of Operations, the DCF calculation reflects interest expense, realized and unrealized gains (losses) on interest rate swap settlements, distributions to preferred stockholders, other recurring leverage expenses, as well as taxes paid on net investment income.
“Net Investment Income (Loss), before Income Taxes” on the Statement of Operations is adjusted as follows to reconcile to DCF for YTD and 4th quarter 2020 (in thousands):
| YTD 2020 | 4th Qtr 2020 | |||||||
| Net Investment Loss, | ||||||||
| before Income Taxes | $ | (15,465 | ) | $ | (2,805 | ) | ||
| Adjustments to reconcile to DCF: | ||||||||
| Distributions characterized as | ||||||||
| return of capital, net | 61,794 | 9,292 | ||||||
| Premiums on redemption of | ||||||||
| senior notes and MRP stock | 3,659 | — | ||||||
| Other | 652 | 441 | ||||||
| DCF | $ | 50,640 | $ | 6,928 | ||||
Leverage
The fund’s leverage utilization decreased $8.4 million during 4th quarter 2020 and represented 29.3% of total assets at November 30, 2020. At year-end, the fund was in compliance with applicable coverage ratios, 100% of the leverage cost was fixed, the weighted-average maturity was 2.8 years and the weighted-average annual rate on leverage was 3.84%. These rates will vary in the future as a result of changing floating rates, utilization of the fund’s credit facility and as leverage and swaps mature or are redeemed. During the quarter, $4.8 million of Senior Notes were paid in full upon maturity.
Income taxes
As of November 30, 2020, the fund’s deferred tax asset was zero. The fund had capital loss carryforwards of $572.0 million for federal income tax purposes, which can be used to offset prior or future capital gains. To the extent that the fund has taxable income, it will owe federal and state income taxes. Tax payments can be funded from investment earnings, fund assets, or borrowings.
Please see the Financial Statements and Notes to Financial Statements for additional detail regarding critical accounting policies, results of operations, leverage, taxes and other important fund information.
For further information regarding the calculation of distributable cash flow and distributions to stockholders, as well as a discussion of the tax impact on distributions, please visit www.tortoiseecofin.com.
| (unaudited) | |
| Tortoise | 7 |
| TYG Key Financial Data (supplemental unaudited information) |
| (dollar amounts in thousands unless otherwise indicated) |
The information presented below regarding Distributable Cash Flow and Selected Financial Information is supplemental non-GAAP financial information, which the fund believes is meaningful to understanding operating performance. The Distributable Cash Flow Ratios include the functional equivalent of EBITDA for non-investment companies, and the fund believes they are an important supplemental measure of performance and promote comparisons from period-to-period. This information is supplemental, is not inclusive of required financial disclosures (e.g. Total Expense Ratio), and should be read in conjunction with the full financial statements
| Year Ended November 30, | 2019 | 2020 | |||||||||||||||||||||||||||||||||
| 2019 | 2020 | Q4(1) | Q1(1) | Q2(1) | Q3(1) | Q4(1) | |||||||||||||||||||||||||||||
| Total Income from Investments | |||||||||||||||||||||||||||||||||||
| Distributions and dividends | |||||||||||||||||||||||||||||||||||
| from investments | $ | 174,696 | $ | 68,737 | $ | 44,074 | $ | 40,436 | $ | 10,138 | $ | 8,982 | $ | 9,181 | |||||||||||||||||||||
| Dividends paid in kind | 801 | 357 | 300 | 178 | 179 | — | — | ||||||||||||||||||||||||||||
| Interest earned on corporate bonds | 467 | 2,283 | 348 | 712 | 604 | 547 | 420 | ||||||||||||||||||||||||||||
| Premiums on options written | 3,267 | 250 | 714 | 250 | — | — | — | ||||||||||||||||||||||||||||
| Total from investments | 179,231 | 71,627 | 45,436 | 41,576 | 10,921 | 9,529 | 9,601 | ||||||||||||||||||||||||||||
| Operating Expenses Before Leverage | |||||||||||||||||||||||||||||||||||
| �� Costs and Current Taxes | |||||||||||||||||||||||||||||||||||
| Advisory fees | 19,522 | 7,259 | 4,479 | 4,143 | 1,373 | 923 | 820 | ||||||||||||||||||||||||||||
| Other operating expenses | 1,624 | 1,342 | 382 | 407 | 313 | 294 | 328 | ||||||||||||||||||||||||||||
| 21,146 | 8,601 | 4,861 | 4,550 | 1,686 | 1,217 | 1,148 | |||||||||||||||||||||||||||||
| Distributable cash flow before | |||||||||||||||||||||||||||||||||||
| leverage costs and current taxes | 158,085 | 63,026 | 40,575 | 37,026 | 9,235 | 8,312 | 8,453 | ||||||||||||||||||||||||||||
| Leverage costs(2) | 25,956 | 12,386 | 6,347 | 5,878 | 3,409 | 1,574 | 1,525 | ||||||||||||||||||||||||||||
| Current income tax expense(3) | — | — | — | — | — | — | — | ||||||||||||||||||||||||||||
| Distributable Cash Flow(4) | $ | 132,129 | $ | 50,640 | $ | 34,228 | $ | 31,148 | $ | 5,826 | $ | 6,738 | $ | 6,928 | |||||||||||||||||||||
| Net realized gain (loss), net of | |||||||||||||||||||||||||||||||||||
| income taxes, for the period | $ | 29,053 | $ | (632,460 | ) | $ | (6,537 | ) | $ | (17,195 | ) | $ | (572,057 | ) | $ | (34,087 | ) | $ | (9,121 | ) | |||||||||||||||
| As a percent of average total assets(5) | |||||||||||||||||||||||||||||||||||
| Total from investments | 8.55 | % | 8.11 | % | 9.71 | % | 10.04 | % | 5.58 | % | 8.02 | % | 8.95 | % | |||||||||||||||||||||
| Operating expenses before | |||||||||||||||||||||||||||||||||||
| leverage costs and current taxes | 1.03 | % | 1.01 | % | 1.04 | % | 1.10 | % | 0.86 | % | 1.02 | % | 1.07 | % | |||||||||||||||||||||
| Distributable cash flow before | |||||||||||||||||||||||||||||||||||
| leverage costs and current taxes | 7.52 | % | 7.10 | % | 8.67 | % | 8.94 | % | 4.72 | % | 7.00 | % | 7.88 | % | |||||||||||||||||||||
| As a percent of average net assets(5) | |||||||||||||||||||||||||||||||||||
| Total from investments | 14.51 | % | 14.67 | % | 17.12 | % | 16.87 | % | 14.35 | % | 12.31 | % | 13.97 | % | |||||||||||||||||||||
| Operating expenses before | |||||||||||||||||||||||||||||||||||
| leverage costs and current taxes | 1.76 | % | 1.84 | % | 1.83 | % | 1.85 | % | 2.22 | % | 1.57 | % | 1.67 | % | |||||||||||||||||||||
| Leverage costs and current taxes | 2.16 | % | 2.64 | % | 2.39 | % | 2.38 | % | 4.48 | % | 2.03 | % | 2.22 | % | |||||||||||||||||||||
| Distributable cash flow | 10.59 | % | 10.19 | % | 12.90 | % | 12.64 | % | 7.65 | % | 8.71 | % | 10.08 | % | |||||||||||||||||||||
| Selected Financial Information | |||||||||||||||||||||||||||||||||||
| Distributions paid on common stock | $ | 140,588 | $ | 28,912 | $ | 35,195 | $ | 21,224 | $ | — | $ | 3,979 | $ | 3,709 | |||||||||||||||||||||
| Distributions paid on common stock | |||||||||||||||||||||||||||||||||||
| per share(7) | 10.4800 | 2.1800 | 2.6200 | 1.5800 | — | 0.3000 | 0.3000 | ||||||||||||||||||||||||||||
| Total assets, end of period(6) | 1,680,775 | 455,839 | 1,680,775 | 1,416,246 | 508,235 | 450,671 | 455,839 | ||||||||||||||||||||||||||||
| Average total assets during period(6)(8) | 2,044,102 | 847,473 | 1,876,534 | 1,665,499 | 778,359 | 472,659 | 431,543 | ||||||||||||||||||||||||||||
| Leverage(9) | 623,900 | 133,427 | 623,900 | 565,300 | 129,100 | 125,067 | 133,427 | ||||||||||||||||||||||||||||
| Leverage as a percent of total assets | 37.1 | % | 29.3 | % | 37.1 | % | 39.9 | % | 25.4 | % | 27.8 | % | 29.3 | % | |||||||||||||||||||||
| Net unrealized depreciation, | |||||||||||||||||||||||||||||||||||
| end of period | (543,310 | ) | (473,357 | ) | (543,310 | ) | (662,820 | ) | (526,684 | ) | (513,439 | ) | (473,357 | ) | |||||||||||||||||||||
| Net assets, end of period | 930,286 | 305,628 | 930,286 | 769,227 | 334,413 | 294,394 | 305,628 | ||||||||||||||||||||||||||||
| Average net assets during period(10) | 1,203,943 | 468,705 | 1,064,735 | 991,440 | 302,755 | 307,880 | 276,337 | ||||||||||||||||||||||||||||
| Net asset value per common share(7) | 69.24 | 24.95 | 69.24 | 57.28 | 25.08 | 22.52 | 24.95 | ||||||||||||||||||||||||||||
| Market value per share(7) | 67.28 | 19.16 | 67.28 | 50.60 | 18.70 | 16.50 | 19.16 | ||||||||||||||||||||||||||||
| Shares outstanding (000’s) | 53,732 | 12,250 | 53,732 | 53,732 | 13,334 | 13,072 | 12,250 | ||||||||||||||||||||||||||||
| (1) | Q1 is the period from December through February. Q2 is the period from March through May. Q3 is the period from June through August. Q4 is the period from September through November. |
| (2) | Leverage costs include interest expense, distributions to preferred stockholders, interest rate swap expenses and other recurring leverage expenses. |
| (3) | Includes taxes paid on net investment income and foreign taxes, if any. Taxes related to realized gains are excluded from the calculation of Distributable Cash Flow (“DCF”). |
| (4) | “Net investment income (loss), before income taxes” on the Statement of Operations is adjusted as follows to reconcile to DCF: increased by the return of capital on distributions, the dividends paid in stock and increased liquidation value, the premium on dividends paid in kind, the net premiums on options written and amortization of debt issuance costs; and decreased by realized and unrealized gains (losses) on interest rate swap settlements, distributions received that are excluded for DCF purposes and amortization on certain investments. |
| (5) | Annualized for periods less than one year. |
| (6) | Includes deferred issuance and offering costs on senior notes and preferred stock. |
| (7) | Adjusted to reflect 1 for 4 reverse stock split effective May 1, 2020. |
| (8) | Computed by averaging month-end values within each period. |
| (9) | Leverage consists of senior notes, preferred stock and outstanding borrowings under credit facilities. |
| (10) | Computed by averaging daily net assets within each period. |
| 8 | Tortoise |
2020 Annual Report | November 30, 2020 |
| Tortoise |
| Midstream Energy Fund, Inc. (NTG) |
Fund description
NTG seeks to provide stockholders with a high level of total return with an emphasis on current distributions. NTG invests primarily in midstream energy equities that own and operate a network of pipeline and energy related logistical infrastructure assets with an emphasis on those that transport, gather, process and store natural gas and natural gas liquids (NGLs). NTG targets midstream energy equities, including MLPs benefiting from U.S. natural gas production and consumption expansion, with minimal direct commodity exposure.
Fund performance
There were several contributors to midstream energy’s negative performance for the fiscal year including volatile commodity prices and negative energy sentiment, energy demand concerns and excess takeaway capacity related to the COVID-19 pandemic as well as political rhetoric and uncertainty related to the 2020 U.S. presidential election, regulatory concerns around pipeline permitting, and concerns around midstream’s role in the evolving energy transition. Beyond this, one positive theme stood out for midstream businesses throughout the fiscal year — resiliency. Resilient cash flows confirm the essential nature of the assets that midstream businesses operate. Strong contractual obligations (take or pay contracts) and customer profiles (large, investment grade rated counterparties) helped midstream energy companies generate consistent cash flow from operations even in the low and volatile 2020 price environment. The average leverage for the fund’s portfolio companies was 3.35x in the fourth fiscal quarter. Leverage drastically impacted the fund’s performance throughout the period. The fund’s use of leverage drove outperformance compared to the index during the strong fiscal quarter with market-based and NAV-based returns of fiscal quarter ending November 30, 2020 were 17.6% and 13.9%, respectively (including the reinvestment of distributions). Conversely, the required deleveraging during the weak market earlier in the year magnified negative performance with 2020 fiscal year returns of -78.8% and -73.9%, respectively. The Tortoise MLP Index® returned 11.2% and -23.6% during the same periods, respectively.
| 2020 fiscal year summary | ||||
| Distributions paid per share (fiscal year 2020) | $ | 2.9700 | (1) | |
| Distributions paid per share (4th quarter 2020) | $ | 0.3100 | ||
| Distribution rate (as of 11/30/2020) | 6.4% | |||
| Quarter-over-quarter distribution increase (decrease) | 0.0% | |||
| Year-over-year distribution increase (decrease) | (92.7)% | (1) | ||
| Cumulative distributions paid per share to | ||||
| stockholders since inception in July 2010 | $ | 157.5700 | (1) | |
| Market-based total return | (78.8)% | |||
| NAV-based total return | (73.9)% | |||
| Premium (discount) to NAV (as of 11/30/2020) | (23.9)% |
| (1) | Includes impact of reverse stock split. |
Key asset performance drivers
| Top five contributors | Company type | Performance driver | ||
| MPLX LP | Refined products pipeline MLP | Protection from minimum volume commitments and business diversification with Northeast midstream business | ||
| Sunnova Energy International Inc. | Solar company | Positive solar growth fundamentals and lower financing costs | ||
| DCP Midstream LP | Natural gas pipeline MLP | Strong operating performance and improved natural gas liquids price outlook | ||
| Altus Midstream Company Preferred | Natural gas pipeline company | Preferred structure outperformed equity midstream equity performance | ||
| Targa Resources Corp. – Preferred Shares A | Midstream gathering and processing company | Convertible debt structure provided downside protection | ||
| Bottom five contributors | Company type | Performance driver | ||
| Energy Transfer LP | Natural gas pipeline MLP | Concern Dakota Access Pipeline operations may be halted due to potential need for Environmental Impact Statement | ||
| Targa Resources Corp. | Midstream gathering and processing company | Concern about prolonged slowdown in production growth | ||
| Enterprise Products Partners L.P. | Midstream natural gas/natural gas liquids pipeline MLP | Concerns of lower U.S. and global energy demand due to slower than expected recovery | ||
| Plains All American Pipeline, L.P. | Midstream crude oil pipeline MLP | Concerns regarding excess capacity for Permian crude pipelines | ||
| Phillips 66 Partners LP | Midstream refined product pipeline MLP | Concern Dakota Access Pipeline operations may be halted due to potential need for Environmental Impact Statement |
Unlike the fund return, index return is pre-expenses and taxes.
Performance data quoted represent past performance; past performance does not guarantee future results. Like any other stock, total return and market value will fluctuate so that an investment, when sold, may be worth more or less than its original cost. Portfolio composition is subject to change due to ongoing management of the fund. References to specific securities or sectors should not be construed as a recommendation by the fund or its adviser. See Schedule of Investments for portfolio weighting at the end of the fiscal quarter.
| (unaudited) | |
| Tortoise | 9 |
| Tortoise |
| Midstream Energy Fund, Inc. (NTG) (continued) |
Fund structure and distribution policy
The fund is structured as a corporation and is subject to federal and state income tax on its taxable income. The fund has adopted a distribution policy in which the Board of Directors considers many factors in determining distributions to stockholders, including NAV performance and distributable cash flow (DCF). The fund’s Board of Directors reviews the distribution rate at least quarterly, and may adjust the quarterly distribution throughout the year. Although the level of distributions is independent of the funds’ performance in the short term, the fund expects such distributions to correlate with its performance over time.
Distributable cash flow and distributions
DCF is distributions received from investments less expenses. The total distributions received from investments include the amount received as cash distributions from MLPs, paid-in-kind distributions, and dividend and interest payments. Income also includes the premiums received from sales of covered call options, net of amounts paid to buy back out-of-the-money options. The total expenses include current or anticipated operating expenses, leverage costs and current income taxes. Current income taxes include taxes paid on net investment income in addition to foreign taxes, if any. Taxes incurred from realized gains on the sale of investments, expected tax benefits and deferred taxes are not included in DCF.
Income from investments decreased approximately 9.1% as compared to 3rd quarter 2020 primarily due to lower distributions from investments within the fund’s portfolio. Operating expenses, consisting primarily of fund advisory fees, increased slightly during the quarter. Leverage costs decreased approximately 11% as compared to 3rd quarter 2020 due to lower interest rates during the quarter. As a result of the changes in income and expenses, DCF decreased approximately 11% as compared to 3rd quarter 2020. The fund paid a quarterly distribution of $0.31 per share during the quarter, no change from the distribution paid in the prior quarter and a decrease of approximately 93% from the distribution paid in Q4 2019. The fund has paid cumulative distributions to stockholders of $157.57 per share since its inception in July 2010.
The Key Financial Data table discloses the calculation of DCF and should be read in conjunction with this discussion. The difference between distributions received from investments in the DCF calculation and total investment income as reported in the Statement of Operations, is reconciled as follows: the Statement of Operations, in conformity with U.S. generally accepted accounting principles (GAAP), recognizes distribution income from MLPs, common stock and other investments on their ex-dates, whereas the DCF calculation may reflect distribution income on their pay dates; GAAP recognizes that a significant portion of the cash distributions received from MLPs, common stock and other investments are characterized as a return of capital and therefore excluded from investment income, whereas the DCF calculation includes the return of capital; and distributions received from investments in the DCF calculation include the value of dividends paid-in-kind (additional stock or MLP units), whereas such amounts may not be included as income for GAAP purposes, and includes distributions related to direct investments when the purchase price is reduced in lieu of receiving cash distributions. Net premiums on options written (premiums received less amounts paid to buy back out-of-the-money options) with expiration dates during the fiscal quarter are included in the DCF calculation, whereas GAAP recognizes the net effect of options written as realized and unrealized gains (losses). The treatment of expenses in the DCF calculation also differs from what is reported in the Statement of Operations. In addition to the total operating expenses, including fee waiver, as disclosed in the Statement of Operations, the DCF calculation reflects interest expense, distributions to preferred stockholders, other recurring leverage expenses, as well as taxes paid on net investment income.
“Net Investment Income (Loss), before Income Taxes” on the Statement of Operations is adjusted as follows to reconcile to DCF for YTD and 4th quarter 2020 (in thousands):
| YTD 2020 | 4th Qtr 2020 | |||||||
| Net Investment Loss, | ||||||||
| before Income Taxes | $ | (10,472 | ) | $ | (2,086 | ) | ||
| Adjustments to reconcile to DCF: | ||||||||
| Distributions characterized as | ||||||||
| return of capital (ROC) | 39,828 | 5,192 | ||||||
| Premiums on redemption of | ||||||||
| senior notes and MRP stock | 4,081 | — | ||||||
| Prior year ROC re-class | (1,606 | ) | — | |||||
| Other | 888 | 372 | ||||||
| DCF | $ | 32,719 | $ | 3,478 | ||||
Leverage
The fund’s leverage utilization increased approximately $17 million during 4th quarter 2020 and represented 30.0% of total assets at November 30, 2020. At year-end, the fund was in compliance with applicable coverage ratios, 100% of the leverage cost was fixed, the weighted-average maturity was 1.5 years and the weighted-average annual rate on leverage was 2.39%. These rates will vary in the future as a result of changing floating rates, utilization of the fund’s credit facility and as leverage matures or is redeemed. During the quarter, $22.9 million of Senior Notes were paid in full upon maturity.
Income taxes
As of November 30, 2020, the fund’s deferred tax asset was zero. The fund had capital loss carryforwards of $550.7 million for federal income tax purposes, which can be used to offset future capital gains. To the extent that the fund has taxable income, it will owe federal and state income taxes. Tax payments can be funded from investment earnings, fund assets, or borrowings.
Please see the Financial Statements and Notes to Financial Statements for additional detail regarding critical accounting policies, results of operations, leverage, taxes and other important fund information.
For further information regarding the calculation of distributable cash flow and distributions to stockholders, as well as a discussion of the tax impact on distributions, please visit www.tortoiseecofin.com.
| (unaudited) | |
| 10 | Tortoise |
2020 Annual Report | November 30, 2020 |
| NTG Key Financial Data (supplemental unaudited information) |
| (dollar amounts in thousands unless otherwise indicated) |
The information presented below regarding Distributable Cash Flow and Selected Financial Information is supplemental non-GAAP financial information, which the fund believes is meaningful to understanding operating performance. The Distributable Cash Flow Ratios include the functional equivalent of EBITDA for non-investment companies, and the fund believes they are an important supplemental measure of performance and promote comparisons from period-to-period. This information is supplemental, is not inclusive of required financial disclosures (e.g. Total Expense Ratio), and should be read in conjunction with the full financial statements.
| Year Ended November 30, | 2019 | 2020 | |||||||||||||||||||||||||||||||||
| 2019 | 2020 | Q4(1) | Q1(1) | Q2(1) | Q3(1) | Q4(1) | |||||||||||||||||||||||||||||
| Total Income from Investments | |||||||||||||||||||||||||||||||||||
| Distributions and dividends | |||||||||||||||||||||||||||||||||||
| from investments | $ | 125,782 | $ | 44,780 | $ | 31,315 | $ | 28,806 | $ | 6,309 | $ | 5,045 | $ | 4,620 | |||||||||||||||||||||
| Dividends paid in kind | 518 | 257 | 200 | 127 | 130 | — | — | ||||||||||||||||||||||||||||
| Interest earned on corporate bonds | 315 | 1,194 | 230 | 489 | 317 | 222 | 166 | ||||||||||||||||||||||||||||
| Premiums on options written | 3,300 | 216 | 941 | 216 | — | — | — | ||||||||||||||||||||||||||||
| Total from investments | 129,915 | 46,447 | 32,686 | 29,638 | 6,756 | 5,267 | 4,786 | ||||||||||||||||||||||||||||
| Operating Expenses Before Leverage | |||||||||||||||||||||||||||||||||||
| Costs and Current Taxes | |||||||||||||||||||||||||||||||||||
| Advisory fees, net of fees waived | 13,531 | 4,665 | 3,145 | 2,868 | 873 | 482 | 442 | ||||||||||||||||||||||||||||
| Other operating expenses | 1,271 | 944 | 301 | 321 | 156 | 207 | 260 | ||||||||||||||||||||||||||||
| 14,802 | 5,609 | 3,446 | 3,189 | 1,029 | 689 | 702 | |||||||||||||||||||||||||||||
| Distributable cash flow before | |||||||||||||||||||||||||||||||||||
| leverage costs and current taxes | 115,113 | 40,838 | 29,240 | 26,449 | 5,727 | 4,578 | 4,084 | ||||||||||||||||||||||||||||
| Leverage costs(2) | 20,121 | 8,119 | 4,859 | 4,428 | 2,402 | 683 | 606 | ||||||||||||||||||||||||||||
| Current income tax expense(3) | — | — | — | — | — | — | — | ||||||||||||||||||||||||||||
| Distributable Cash Flow(4) | $ | 94,992 | $ | 32,719 | $ | 24,381 | $ | 22,021 | $ | 3,325 | $ | 3,895 | $ | 3,478 | |||||||||||||||||||||
| Net realized gain (loss), net of | |||||||||||||||||||||||||||||||||||
| income taxes, for the period | $ | (35,176 | ) | $ | (561,915 | ) | $ | (8,640 | ) | $ | (6,917 | ) | $ | (518,170 | ) | $ | (28,505 | ) | $ | (8,323 | ) | ||||||||||||||
| As a percent of average total assets (5) | |||||||||||||||||||||||||||||||||||
| Total from investments | 8.69 | % | 8.59 | % | 9.96 | % | 10.37 | % | 5.77 | % | 9.32 | % | 9.29 | % | |||||||||||||||||||||
| Operating expenses before | |||||||||||||||||||||||||||||||||||
| leverage costs and current taxes | 1.02 | % | 1.08 | % | 1.05 | % | 1.12 | % | 0.88 | % | 1.22 | % | 1.36 | % | |||||||||||||||||||||
| Distributable cash flow before | |||||||||||||||||||||||||||||||||||
| leverage costs and current taxes | 7.67 | % | 7.51 | % | 8.91 | % | 9.25 | % | 4.89 | % | 8.10 | % | 7.93 | % | |||||||||||||||||||||
| As a percent of average net assets(5) | |||||||||||||||||||||||||||||||||||
| Total from investments | 14.43 | % | 15.49 | % | 17.18 | % | 16.80 | % | 16.18 | % | 13.90 | % | 14.47 | % | |||||||||||||||||||||
| Operating expenses before | |||||||||||||||||||||||||||||||||||
| leverage costs and current taxes | 1.70 | % | 1.94 | % | 1.81 | % | 1.81 | % | 2.46 | % | 1.82 | % | 2.12 | % | |||||||||||||||||||||
| Leverage costs and current taxes | 2.31 | % | 2.81 | % | 2.55 | % | 2.51 | % | 5.75 | % | 1.80 | % | 1.83 | % | |||||||||||||||||||||
| Distributable cash flow | 10.42 | % | 10.74 | % | 12.82 | % | 12.48 | % | 7.97 | % | 10.28 | % | 10.52 | % | |||||||||||||||||||||
| Selected Financial Information | |||||||||||||||||||||||||||||||||||
| Distributions paid on common stock | $ | 106,822 | $ | 18,638 | $ | 26,705 | $ | 14,854 | $ | — | $ | 1,952 | $ | 1,832 | |||||||||||||||||||||
| Distributions paid on common stock | |||||||||||||||||||||||||||||||||||
| per share(7) | 16.9000 | 2.9700 | 4.2250 | 2.3500 | — | 0.3100 | 0.3100 | ||||||||||||||||||||||||||||
| Total assets, end of period(6) | 1,163,500 | 226,449 | 1,163,500 | 964,276 | 239,673 | 212,560 | 226,449 | ||||||||||||||||||||||||||||
| Average total assets during period(6)(8) | 1,447,092 | 521,028 | 1,316,053 | 1,149,464 | 466,040 | 224,762 | 207,191 | ||||||||||||||||||||||||||||
| Leverage(9) | 462,600 | 68,021 | 462,600 | 409,500 | 50,900 | 50,900 | 68,021 | ||||||||||||||||||||||||||||
| Leverage as a percent of total assets | 39.8 | % | 30.0 | % | 39.8 | % | 42.5 | % | 21.2 | % | 23.9 | % | 30.0 | % | |||||||||||||||||||||
| Net unrealized appreciation | |||||||||||||||||||||||||||||||||||
| (depreciation), end of period | (64,329 | ) | 14,962 | (64,329 | ) | (157,875 | ) | (22,960 | ) | (11,035 | ) | 14,962 | |||||||||||||||||||||||
| Net assets, end of period | 667,708 | 149,407 | 667,708 | 549,293 | 162,369 | 141,403 | 149,407 | ||||||||||||||||||||||||||||
| Average net assets during period(10) | 871,496 | 289,147 | 762,956 | 709,609 | 166,096 | 150,772 | 132,986 | ||||||||||||||||||||||||||||
| Net asset value per common share(7) | 105.60 | 25.56 | 105.60 | 86.90 | 25.69 | 22.76 | 25.56 | ||||||||||||||||||||||||||||
| Market value per common share(7) | 98.80 | 19.46 | 98.80 | 78.00 | 20.95 | 16.79 | 19.46 | ||||||||||||||||||||||||||||
| Shares outstanding (000’s) | 63,208 | 5,846 | 63,208 | 63,208 | 6,321 | 6,214 | 5,846 | ||||||||||||||||||||||||||||
| (1) | Q1 is the period from December through February. Q2 is the period from March through May. Q3 is the period from June through August. Q4 is the period from September through November. |
| (2) | Leverage costs include interest expense, distributions to preferred stockholders and other recurring leverage expenses. |
| (3) | Includes taxes paid on net investment income and foreign taxes, if any. Taxes related to realized gains are excluded from the calculation of Distributable Cash Flow (“DCF”). |
| (4) | “Net investment income (loss), before income taxes” on the Statement of Operations is adjusted as follows to reconcile to DCF: increased by the return of capital on distributions, the dividends paid in stock and increased liquidation value, the premium on dividends paid in kind and amortization of debt issuance costs. |
| (5) | Annualized for periods less than one year. |
| (6) | Includes deferred issuance and offering costs on senior notes and preferred stock. |
| (7) | Adjusted to reflect 1 for 10 reverse stock split effective May 1, 2020. |
| (8) | Computed by averaging month-end values within each period. |
| (9) | Leverage consists of senior notes, preferred stock and outstanding borrowings under the credit facility. |
| (10) | Computed by averaging daily net assets within each period. |
| Tortoise | 11 |
| Tortoise |
| Pipeline & Energy Fund, Inc. (TTP) |
Fund description
TTP seeks a high level of total return with an emphasis on current distributions paid to stockholders. TTP invests primarily in equity securities of North American pipeline companies that transport natural gas, natural gas liquids (NGLs), crude oil and refined products and, to a lesser extent, in other energy infrastructure companies.
Fund performance
There were several contributors to midstream energy’s negative performance for the fiscal year including volatile commodity prices and negative energy sentiment, energy demand concerns and excess takeaway capacity related to the COVID-19 pandemic as well as political rhetoric and uncertainty related to the 2020 U.S. presidential election, regulatory concerns around pipeline permitting, and concerns around midstream’s role in the evolving energy transition. Beyond this, one positive theme stood out for midstream businesses throughout the fiscal year — resiliency. Resilient cash flows confirm the essential nature of the assets that midstream businesses operate. Strong contractual obligations (take or pay contracts) and customer profiles (large, investment grade rated counterparties) helped midstream energy companies generate consistent cash flow from operations even in the low and volatile 2020 price environment. Leverage impacted the fund’s performance throughout the period. The fund’s use of leverage drove outperformance compared to the index during the strong fiscal quarter with market-based and NAV-based returns of 8.4% and 6.9%, respectively (including the reinvestment of distributions). Conversely, the required deleveraging during the weak market earlier in the year magnified negative performance with 2020 fiscal year returns of -64.7% and -58.6%, respectively. The Tortoise North American Pipeline Index returned 6.3% and -15.8% during the same periods, respectively.
| 2020 fiscal year summary | ||||
| Distributions paid per share (fiscal year 2020) | $ | 1.6200 | (1) | |
| Distributions paid per share (4th quarter 2020) | $ | 0.1600 | ||
| Distribution rate (as of 11/30/2020) | 4.2% | |||
| Quarter-over-quarter distribution increase (decrease) | 0.0% | |||
| Year-over-year distribution increase (decrease) | (86.0)% | (1) | ||
| Cumulative distributions paid per share to | ||||
| stockholders since inception in October 2011 | $ | 54.0700 | (1) | |
| Market-based total return | (64.7)% | |||
| NAV-based total return | (58.6)% | |||
| Premium (discount) to NAV (as of 11/30/2020) | (24.1)% |
| (1) | Includes impact of reverse stock split. |
Please refer to the inside front cover of the report for important information about the fund’s distribution policy.
The fund utilizes a covered call strategy when appropriate, which seeks to generate income while reducing overall volatility. No covered calls were written during the quarter.
Key asset performance drivers
| Top five contributors | Company type | Performance driver | ||
| Tallgrass Energy LP | Midstream natural gas/natural gas liquids pipeline company | Acquisition by Blackstone | ||
| Semgroup Corp | Midstream crude oil pipeline company | Acquisition by Energy Transfer | ||
| Nextera Energy Partners LP | Downstream power company | Positive solar and wind growth fundamentals | ||
| Equitrans Midstream Corporation | Midstream gathering and processing company | Relatively steady natural gas outlook amid market volatility | ||
| Targa Resources Corp. – Preferred Shares A | Midstream gathering and processing company | Convertible debt structure provided downside protection | ||
| Bottom five contributors | Company type | Performance driver | ||
| ONEOK, Inc. | Midstream natural gas/natural gas liquids pipeline company | Concern about declining crude oil volumes negatively impacting natural gas and natural gas liquids (NGL) | ||
| Plains GP Holdings, L.P. | Midstream crude oil pipeline company | Reduced crude oil volume outlook | ||
| Targa Resources Corp. | Midstream gathering and processing company | Concern about prolonged slowdown in production growth | ||
| Energy Transfer LP | Midstream natural gas/natural gas liquids pipeline MLP | Concern Dakota Access Pipeline operations may be halted due to potential need for Environmental Impact Statement | ||
| Kinder Morgan Inc. | Midstream natural gas/natural gas liquids pipeline company | Slower improvement in refined product demand following COVID-19 than expected |
Unlike the fund return, index return is pre-expenses.
Performance data quoted represent past performance; past performance does not guarantee future results. Like any other stock, total return and market value will fluctuate so that an investment, when sold, may be worth more or less than its original cost. Portfolio composition is subject to change due to ongoing management of the fund. References to specific securities or sectors should not be construed as a recommendation by the fund or its adviser. See Schedule of Investments for portfolio weighting at the end of the fiscal quarter.
| (unaudited) | |
| 12 | Tortoise |
2020 Annual Report | November 30, 2020 |
Fund structure and distribution policy
The fund is structured to qualify as a Regulated Investment Company (RIC) allowing it to pass-through to shareholders income and capital gains earned, thus avoiding double-taxation. To qualify as a RIC, the fund must meet specific income, diversification and distribution requirements. Regarding income, at least 90 percent of the fund’s gross income must be from dividends, interest and capital gains. The fund must meet quarterly diversification requirements including the requirement that at least 50 percent of the assets be in cash, cash equivalents or other securities with each single issuer of other securities not greater than 5 percent of total assets. No more than 25 percent of total assets can be invested in any one issuer other than government securities or other RIC’s. The fund must also distribute at least 90 percent of its investment company income. RIC’s are also subject to excise tax rules which require RIC’s to distribute approximately 98 percent of net income and net capital gains to avoid a 4 percent excise tax.
The fund has adopted a distribution policy which is included on the inside front cover of this report. To summarize, the fund intends to distribute an amount closely approximating the total taxable income for the year and, if so determined by the Board, distribute all or a portion of the return of capital paid by portfolio companies during the year. The fund may designate a portion of its distributions as capital gains and may also distribute additional capital gains in the last calendar quarter of the year to meet annual excise distribution requirements. Distribution amounts are subject to change from time to time at the discretion of the Board. Although the level of distributions is independent of the funds’ performance in the short term, the fund expects such distributions to correlate with its performance over time.
Distributable cash flow and distributions
Distributable cash flow (DCF) is income from investments less expenses. Income from investments includes the amount received as cash or paid-in-kind distributions from common stock, master limited partnerships (MLPs), affiliates of MLPs, and pipeline and other energy companies in which the fund invests, and dividend payments on short-term investments. Income also includes the premiums received from sales of covered call options, net of amounts paid to buy back out-of-the-money options. The total expenses include current or anticipated operating expenses and leverage costs.
Income from investments decreased approximately 2.8% as compared to 3rd quarter 2020, primarily due to lower distributions from investments within the fund’s portfolio. Operating expenses, consisting primarily of fund advisory fees, increased approximately 14% during the quarter, primarily due to a one-time increase in operating expenses partially offset by lower asset-based fees. Leverage costs decreased approximately 11% as compared to 3rd quarter 2020 primarily due to reduced leverage utilization during the quarter. As a result of the changes in income and expenses, DCF decreased approximately 6.5% as compared to 3rd quarter 2020. The fund had net realized gains on investments of approximately $0.2 million during 4th quarter 2020. The fund paid a quarterly distribution of $0.16 per share, no change from the distribution paid in the prior quarter and a decrease of approximately 86% from 4th quarter 2020. The fund has paid cumulative distributions to stockholders of $54.07 per share since its inception in October 2011.
The Key Financial Data table discloses the calculation of DCF and should be read in conjunction with this discussion. The difference between income from investments in the DCF calculation and total investment income as reported in the Statement of Operations, is reconciled as follows: (1) the Statement of Operations, in conformity with U.S. generally accepted accounting principles (GAAP), recognizes distributions and dividend income from MLPs, common stock and other investments on their ex-dates, whereas the DCF calculation may reflect distributions and dividend income on their pay dates; (2) GAAP recognizes that a significant portion of the cash distributions received from MLPs, common stock and other investments are characterized as a return of capital and therefore excluded from investment income, whereas the DCF calculation includes the return of capital; (3) income from investments in the DCF calculation includes the value of dividends paid-in-kind (additional stock or units), whereas such amounts may not be included as income for GAAP purposes; and (4) net premiums on options written (premiums received less amounts paid to buy back out-of-the-money options) with expiration dates during the fiscal quarter are included in the DCF calculation, whereas GAAP recognizes the net effect of options written as realized and unrealized gains (losses).
“Net Investment Income (Loss)” on the Statement of Operations is adjusted as follows to reconcile to DCF for YTD and 4th quarter 2020 (in thousands):
| YTD 2020 | 4th Qtr 2020 | |||||||
| Net Investment Loss | $ | (679 | ) | $ | (564 | ) | ||
| Adjustments to reconcile to DCF: | ||||||||
| Net premiums on options written | 747 | — | ||||||
| Distributions characterized as | ||||||||
| return of capital (ROC) | 5,443 | 1,207 | ||||||
| Premiums on redemption of | ||||||||
| senior notes and MRP stock | 195 | — | ||||||
| Prior year ROC re-class | (580 | ) | — | |||||
| Other | 137 | 64 | ||||||
| DCF | $ | 5,263 | $ | 707 | ||||
Leverage
The fund’s leverage utilization decreased approximately $3.9 million during 4th quarter 2020 and represented 29.7% of total assets at November 30, 2020. At year-end, the fund was in compliance with applicable coverage ratios, 100% of the leverage cost was fixed, the weighted-average maturity was 2.5 years and the weighted-average annual rate on leverage was 4.94%. These rates will vary in the future as a result of changing floating rates, utilization of the fund’s credit facility and as leverage matures or is redeemed. During the quarter, $3.9 million of Senior Notes were paid in full upon maturity.
Please see the Financial Statements and Notes to Financial Statements for additional detail regarding critical accounting policies, results of operations, leverage and other important fund information.
For further information regarding the calculation of distributable cash flow and distributions to stockholders, as well as a discussion of the tax impact on distributions, please visit www.tortoiseecofin.com.
| (unaudited) | |
| Tortoise | 13 |
| TTP Key Financial Data (supplemental unaudited information) |
| (dollar amounts in thousands unless otherwise indicated) |
The information presented below regarding Distributable Cash Flow and Selected Financial Information is supplemental non-GAAP financial information, which the fund believes is meaningful to understanding operating performance. The Distributable Cash Flow Ratios include the functional equivalent of EBITDA for non-investment companies, and the fund believes they are an important supplemental measure of performance and promote comparisons from period-to-period. This information is supplemental, is not inclusive of required financial disclosures (e.g. Total Expense Ratio), and should be read in conjunction with the full financial statements.
| Year Ended November 30, | 2019 | 2020 | |||||||||||||||||||||||||||||||||
| 2019 | 2020 | Q4(1) | Q1(1) | Q2(1) | Q3(1) | Q4(1) | |||||||||||||||||||||||||||||
| Total Income from Investments | |||||||||||||||||||||||||||||||||||
| Dividends and distributions | |||||||||||||||||||||||||||||||||||
| from investments, net of | |||||||||||||||||||||||||||||||||||
| foreign taxes withheld | $ | 15,444 | $ | 7,763 | $ | 3,890 | $ | 3,744 | $ | 1,349 | $ | 1,357 | $ | 1,313 | |||||||||||||||||||||
| Dividends paid in kind | 237 | 19 | 68 | 9 | 10 | — | — | ||||||||||||||||||||||||||||
| Net premiums on options written | 3,622 | 747 | 483 | 539 | 208 | — | — | ||||||||||||||||||||||||||||
| Total from investments | 19,303 | 8,529 | 4,441 | 4,292 | 1,567 | 1,357 | 1,313 | ||||||||||||||||||||||||||||
| Operating Expenses Before | |||||||||||||||||||||||||||||||||||
| Leverage Costs | |||||||||||||||||||||||||||||||||||
| Advisory fees, net of fees waived | 2,414 | 1,171 | 563 | 548 | 235 | 202 | 186 | ||||||||||||||||||||||||||||
| Other operating expenses | 549 | 524 | 116 | 147 | 137 | 86 | 154 | ||||||||||||||||||||||||||||
| 2,963 | 1,695 | 679 | 695 | 372 | 288 | 340 | |||||||||||||||||||||||||||||
| Distributable cash flow before | |||||||||||||||||||||||||||||||||||
| leverage costs | 16,340 | 6,834 | 3,762 | 3,597 | 1,195 | 1,069 | 973 | ||||||||||||||||||||||||||||
| Leverage costs(2) | 2,509 | 1,571 | 609 | 585 | 409 | 311 | 266 | ||||||||||||||||||||||||||||
| Distributable Cash Flow(3) | $ | 13,831 | $ | 5,263 | $ | 3,153 | $ | 3,012 | $ | 786 | $ | 758 | $ | 707 | |||||||||||||||||||||
| Net realized gain (loss) on | |||||||||||||||||||||||||||||||||||
| investments and foreign currency | |||||||||||||||||||||||||||||||||||
| translation, for the period | $ | (16,707 | ) | $ | (95,821 | ) | $ | (1,524 | ) | $ | (5,807 | ) | $ | (86,692 | ) | $ | (3,517 | ) | $ | 195 | |||||||||||||||
| As a percent of average total assets(4) | |||||||||||||||||||||||||||||||||||
| Total from investments | 8.82 | % | 7.85 | % | 8.74 | % | 8.96 | % | 6.29 | % | 7.44 | % | 7.80 | % | |||||||||||||||||||||
| Operating expenses before | |||||||||||||||||||||||||||||||||||
| leverage costs | 1.35 | % | 1.56 | % | 1.34 | % | 1.45 | % | 1.49 | % | 1.58 | % | 2.02 | % | |||||||||||||||||||||
| Distributable cash flow before | |||||||||||||||||||||||||||||||||||
| leverage costs | 7.47 | % | 6.29 | % | 7.40 | % | 7.51 | % | 4.80 | % | 5.86 | % | 5.78 | % | |||||||||||||||||||||
| As a percent of average net assets(4) | |||||||||||||||||||||||||||||||||||
| Total from investments | 12.29 | % | 12.18 | % | 12.46 | % | 12.31 | % | 12.85 | % | 11.11 | % | 12.18 | % | |||||||||||||||||||||
| Operating expenses before | |||||||||||||||||||||||||||||||||||
| leverage costs | 1.89 | % | 2.42 | % | 1.91 | % | 1.99 | % | 3.05 | % | 2.36 | % | 3.15 | % | |||||||||||||||||||||
| Leverage costs | 1.60 | % | 2.24 | % | 1.71 | % | 1.68 | % | 3.35 | % | 2.55 | % | 2.47 | % | |||||||||||||||||||||
| Distributable cash flow | 8.80 | % | 7.52 | % | 8.84 | % | 8.64 | % | 6.45 | % | 6.20 | % | 6.56 | % | |||||||||||||||||||||
| Selected Financial Information | |||||||||||||||||||||||||||||||||||
| Distributions paid on common stock | $ | 13,873 | $ | 4,041 | $ | 2,855 | $ | 2,855 | $ | 401 | $ | 397 | $ | 388 | |||||||||||||||||||||
| Distributions paid on common stock | |||||||||||||||||||||||||||||||||||
| per share(5) | 5.5400 | 1.6200 | 1.1400 | 1.1400 | 0.1600 | 0.1600 | 0.1600 | ||||||||||||||||||||||||||||
| Total assets, end of period(6) | 192,751 | 69,207 | 192,751 | 169,680 | 75,700 | 71,579 | 69,207 | ||||||||||||||||||||||||||||
| Average total assets during period(6)(7) | 218,949 | 108,608 | 203,852 | 192,750 | 99,132 | 72,559 | 67,662 | ||||||||||||||||||||||||||||
| Leverage(8) | 61,800 | 20,557 | 61,800 | 58,000 | 24,500 | 24,500 | 20,557 | ||||||||||||||||||||||||||||
| Leverage as a percent of total assets | 32.1 | % | 29.7 | % | 32.1 | % | 34.2 | % | 32.4 | % | 34.2 | % | 29.7 | % | |||||||||||||||||||||
| Net unrealized depreciation, | |||||||||||||||||||||||||||||||||||
| end of period | (37,569 | ) | (17,638 | ) | (37,569 | ) | (48,038 | ) | (20,652 | ) | (20,791 | ) | (17,638 | ) | |||||||||||||||||||||
| Net assets, end of period | 129,887 | 48,108 | 129,887 | 110,707 | 50,721 | 46,636 | 48,108 | ||||||||||||||||||||||||||||
| Average net assets during period(9) | 157,017 | 70,052 | 142,932 | 140,195 | 48,522 | 48,608 | 43,353 | ||||||||||||||||||||||||||||
| Net asset value per common share(5) | 51.88 | 19.97 | 51.88 | 44.20 | 20.26 | 18.86 | 19.97 | ||||||||||||||||||||||||||||
| Market value per common share(5) | 46.08 | 15.15 | 46.08 | 39.44 | 16.98 | 14.11 | 15.15 | ||||||||||||||||||||||||||||
| Shares outstanding (000’s) | 10,016 | 2,409 | 10,016 | 10,016 | 2,504 | 2,473 | 2,409 | ||||||||||||||||||||||||||||
| (1) | Q1 is the period from December through February. Q2 is the period from March through May. Q3 is the period from June through August. Q4 is the period from September through November. |
| (2) | Leverage costs include interest expense, distributions to preferred stockholders and other recurring leverage expenses. |
| (3) | “Net investment income (loss)” on the Statement of Operations is adjusted as follows to reconcile to Distributable Cash Flow (“DCF”): increased by net premiums on options written, the return of capital on distributions, the dividends paid in stock and increased liquidation value, the premium on dividends paid in kind and amortization of debt issuance costs. |
| (4) | Annualized for periods less than one year. |
| (5) | Adjusted to reflect 1 for 4 reverse stock split effective May 1, 2020. |
| (6) | Includes deferred issuance and offering costs on senior notes and preferred stock. |
| (7) | Computed by averaging month-end values within each period. |
| (8) | Leverage consists of senior notes, preferred stock and outstanding borrowings under the revolving credit facility. |
| (9) | Computed by averaging daily net assets within each period. |
| 14 | Tortoise |
| 2020 Annual Report | November 30, 2020 |
| Tortoise |
| Energy Independence Fund, Inc. (NDP) |
Fund description
NDP seeks a high level of total return with an emphasis on current distributions paid to stockholders. NDP invests primarily in equity securities of upstream North American energy companies that engage in the exploration and production of crude oil, condensate, natural gas and natural gas liquids that generally have a significant presence in North American oil and gas fields, including shale reservoirs.
Fund performance
For U.S. producers, 2020 was a year of change. The COVID-19 pandemic accelerated producers’ capital discipline as investors focused on higher free cash flow generation and return of capital to shareholders. This free-cash-flow focus led to a host of M&A deals as E&P companies focused on the importance of scale, diversity and strengthening balance sheets in a challenging oil price environment. Following the price war between Saudi Arabia and Russia in early March, the Organization of Petroleum Exporting Countries (OPEC) and their Non-OPEC partners (OPEC+) announced deep production cuts with a clear goal of balancing the global crude oil market. The market dramatically shifted from an approximate 20 million barrels per day (b/d) surplus in April to an approximate 4 million b/d deficit in July, providing the path for market rebalancing. Overall adherence to the production cut agreement remained strong in the second half of 2020 leading to inventory draws. Entering 2021, the global crude market remains in deficit, supported by the OPEC+ crude oil production cut agreement, and inventory draws are expected to continue throughout 2021. The fund’s market-based and NAV-based returns for the fiscal quarter ending November 30, 2020 were 7.4% and 4.1%, respectively (including the reinvestment of distributions) bringing the 2020 fiscal year returns to -54.9% and -48.9%, respectively.
| 2020 fiscal year summary | ||||
| Distributions paid per share | $ | 0.8000 | (1) | |
| Distributions paid per share (4th quarter 2020) | None | |||
| Distribution rate (as of 11/30/2020) | 0.0% | |||
| Quarter-over-quarter distribution increase (decrease) | 0.0% | |||
| Year-over-year distribution increase (decrease) | (100.0)% | |||
| Cumulative distributions paid per share to | ||||
| stockholders since inception in July 2012 | $ | 96.9000 | (1) | |
| Market-based total return | (54.9)% | |||
| NAV-based total return | (48.9)% | |||
| Premium (discount) to NAV (as of 11/30/2020) | (23.1)% |
| (1) | Includes impact of reverse stock split. |
The fund utilizes a covered call strategy when appropriate, which seeks to generate income while reducing overall volatility. No covered calls were written during the quarter.
Key asset performance drivers
| Top five contributors | Company type | Performance driver | ||
| Chevron Corporation | Upstream oil and natural gas producing company | Strong balance sheet supporting attractive dividend sustained during period of low commodity prices | ||
| ConocoPhillips | Liquids producing company | Relatively low leverage amid volatile energy environment | ||
| EQT Corporation | Upstream natural gas producing company | Pure-play natural gas producers that benefitted from rising natural gas prices | ||
| Nextera Energy Inc. | Power/utility company | Increased guidance tied to renewable energy growth | ||
| TC Energy Corp | Natural gas pipeline company | Limited cash flow decline given limited commodity price exposure | ||
| Bottom five contributors | Company type | Performance driver | ||
| Marathon Petroleum Corp | Refining company | Concerns about global refined product (gasoline, diesel, and jet fuel) demand declines | ||
| Noble Energy Inc | Natural gas producing company | Lower crude oil prices negatively impacting cash flow | ||
| WPX Energy Inc | Oil and gas producing company | Lower crude oil prices negatively impacting cash flow | ||
| Parsley Energy, Inc. | Oil and gas producing company | Lower crude oil prices negatively impacting cash flow | ||
| Cimarex Energy Co | Oil and gas producing company | Lower crude oil prices negatively impacting cash flow | ||
Unlike the fund return, index return is pre-expenses.
Performance data quoted represent past performance: past performance does not guarantee future results. Like any other stock, total return and market value will fluctuate so that an investment, when sold, may be worth more or less than its original cost. Portfolio composition is subject to change due to ongoing management of the fund. References to specific securities or sectors should not be construed as a recommendation by the fund or its adviser. See Schedule of Investments for portfolio weighting at the end of the fiscal quarter.
| (unaudited) | |
| Tortoise | 15 |
| Tortoise |
| Energy Independence Fund, Inc. (NDP) (continued) |
Fund structure and distribution policy
The fund is structured to qualify as a Regulated Investment Company (RIC) allowing it to pass-through to shareholders income and capital gains earned, thus avoiding double-taxation. To qualify as a RIC, the fund must meet specific income, diversification and distribution requirements. Regarding income, at least 90 percent of the fund’s gross income must be from dividends, interest and capital gains. The fund must meet quarterly diversification requirements including the requirement that at least 50 percent of the assets be in cash, cash equivalents or other securities with each single issuer of other securities not greater than 5 percent of total assets. No more than 25 percent of total assets can be invested in any one issuer other than government securities or other RIC’s. The fund must also distribute at least 90 percent of its investment company income. RIC’s are also subject to excise tax rules which require RIC’s to distribute approximately 98 percent of net income and net capital gains to avoid a 4 percent excise tax.
The fund has adopted a distribution policy which intends to distribute an amount closely approximating the total taxable income for the year and, if so determined by the Board, distribute all or a portion of the return of capital paid by portfolio companies during the year. The fund may designate a portion of its distributions as capital gains and may also distribute additional capital gains in the last calendar quarter of the year to meet annual excise distribution requirements. Distribution amounts are subject to change from time to time at the discretion of the Board. Although the level of distributions is independent of the funds’ performance in the short term, the fund expects such distributions to correlate with its performance over time.
Distributable cash flow and distributions
Distributable cash flow (DCF) is income from investments less expenses. Income from investments includes the amount received as cash or paid-in-kind distributions from investments and dividend payments on short-term investments. Income also includes the premiums received from sales of covered call options, net of amounts paid to buy back out-of-the-money options. The total expenses include current or anticipated operating expenses and leverage costs.
Income from investments decreased approximately 5.5% as compared to 3rd quarter 2020, primarily due to lower distributions from investments within the fund’s portfolio. Operating expenses, consisting primarily of fund advisory fees, increased approximately 5.6% during the quarter, primarily due to a one-time increase in operating expenses partially offset by lower asset-based fees. Total leverage costs were substantially unchanged as compared to 3rd quarter 2020. As a result of the changes in income and expenses, DCF decreased by approximately 16% as compared to 3rd quarter 2020.
The fund announced the temporary suspension of distributions during the 2nd quarter and did not pay any distributions during the 4th quarter. The fund has paid cumulative distributions to stockholders of $96.90 per share since its inception in July 2012.
The Key Financial Data table discloses the calculation of DCF and should be read in conjunction with this discussion. The difference between income from investments in the DCF calculation and total investment income as reported in the Statement of Operations, is reconciled as follows: (1) the Statement of Operations, in conformity with U.S. generally accepted accounting principles (GAAP), recognizes distributions and dividend income from MLPs, common stock and other investments on their ex-dates, whereas the DCF calculation may reflect distributions and dividend income on their pay dates; (2) GAAP recognizes that a significant portion of the cash distributions received from MLPs, common stock and other investments are characterized as a return of capital and therefore excluded from investment income, whereas the DCF calculation includes the return of capital; (3) income from investments in the DCF calculation includes the value of dividends paid-in-kind (additional stock or units), whereas such amounts may not be included as income for GAAP purposes; and (4) net premiums on options written (premiums received less amounts paid to buy back out-of-the-money options) with expiration dates during fiscal quarter are included in the DCF calculation, whereas GAAP recognizes the net effect of options written as realized and unrealized gains (losses).
“Net Investment Income (Loss)” on the Statement of Operations is adjusted as follows to reconcile to DCF for YTD and 4th quarter 2020 (in thousands):
| YTD 2020 | 4th Qtr 2020 | |||||||
| Net Investment Income (loss) | $ | 12 | $ | (15 | ) | |||
| Adjustments to reconcile to DCF: | ||||||||
| Net premiums on options written | 1,734 | — | ||||||
| Distributions characterized as | ||||||||
| return of capital | 675 | 188 | ||||||
| Other | (11 | ) | (1 | ) | ||||
| DCF | $ | 2,410 | $ | 172 | ||||
Leverage
The fund’s leverage utilization increased $0.6 million as compared to 3rd quarter 2020. The fund utilizes all floating rate leverage that had an interest rate of 0.95% and represented 14.1% of total assets at year-end. During the period, the fund maintained compliance with its applicable coverage ratios. The interest rate on the fund’s leverage will vary in the future along with changing floating rates.
Please see the Financial Statements and Notes to Financial Statements for additional detail regarding critical accounting policies, results of operations, leverage and other important fund information.
For further information regarding the calculation of distributable cash flow and distributions to stockholders, as well as a discussion of the tax impact on distributions, please visit www.tortoiseecofin.com.
| (unaudited) | |
| 16 | Tortoise |
| 2020 Annual Report | November 30, 2020 |
| NDP Key Financial Data (supplemental unaudited information) |
| (dollar amounts in thousands unless otherwise indicated) |
The information presented below regarding Distributable Cash Flow and Selected Financial Information is supplemental non-GAAP financial information, which the fund believes is meaningful to understanding operating performance. The Distributable Cash Flow Ratios include the functional equivalent of EBITDA for non-investment companies, and the fund believes they are an important supplemental measure of performance and promote comparisons from period-to-period. This information is supplemental, is not inclusive of required financial disclosures (e.g. Total Expense Ratio), and should be read in conjunction with the full financial statements.
| Year Ended November 30, | 2019 | 2020 | |||||||||||||||||||||||||||||||||
| 2019 | 2020 | Q4(1) | Q1(1) | Q2(1) | Q3(1) | Q4(1) | |||||||||||||||||||||||||||||
| Total Income from Investments | |||||||||||||||||||||||||||||||||||
| Distributions and dividends | |||||||||||||||||||||||||||||||||||
| from investments, net of | |||||||||||||||||||||||||||||||||||
| foreign taxes withheld | $ | 2,971 | $ | 1,877 | $ | 789 | $ | 657 | $ | 448 | $ | 397 | $ | 375 | |||||||||||||||||||||
| Dividends paid in stock | — | — | — | — | — | — | — | ||||||||||||||||||||||||||||
| Net premiums on options written | 17,101 | 1,734 | 1,771 | 1,275 | 459 | — | — | ||||||||||||||||||||||||||||
| Total from investments | 20,072 | 3,611 | 2,560 | 1,932 | 907 | 397 | 375 | ||||||||||||||||||||||||||||
| Operating Expenses Before | |||||||||||||||||||||||||||||||||||
| Leverage Costs | |||||||||||||||||||||||||||||||||||
| Advisory fees, net of fees waived | 1,434 | 521 | 261 | 247 | 93 | 94 | 87 | ||||||||||||||||||||||||||||
| Other operating expenses | 476 | 437 | 100 | 128 | 124 | 84 | 101 | ||||||||||||||||||||||||||||
| 1,910 | 958 | 361 | 375 | 217 | 178 | 188 | |||||||||||||||||||||||||||||
| Distributable cash flow before | |||||||||||||||||||||||||||||||||||
| leverage costs | 18,162 | 2,653 | 2,199 | 1,557 | 690 | 219 | 187 | ||||||||||||||||||||||||||||
| Leverage costs(2) | 1,229 | 243 | 216 | 184 | 30 | 14 | 15 | ||||||||||||||||||||||||||||
| Distributable Cash Flow(3) | $ | 16,933 | $ | 2,410 | $ | 1,983 | $ | 1,373 | $ | 660 | $ | 205 | $ | 172 | |||||||||||||||||||||
| Net realized loss on investments | |||||||||||||||||||||||||||||||||||
| and foreign currency translation, | |||||||||||||||||||||||||||||||||||
| for the period | $ | (88,310 | ) | $ | (48,686 | ) | $ | (2,264 | ) | $ | (3,945 | ) | $ | (44,750 | ) | $ | (8 | ) | $ | 17 | |||||||||||||||
| As a percent of average total assets(4) | |||||||||||||||||||||||||||||||||||
| Total from investments | 15.22 | % | 7.46 | % | 10.92 | % | 9.16 | % | 8.97 | % | 4.74 | % | 4.66 | % | |||||||||||||||||||||
| Operating expenses before | |||||||||||||||||||||||||||||||||||
| leverage costs | 1.45 | % | 1.98 | % | 1.54 | % | 1.78 | % | 2.15 | % | 2.12 | % | 2.34 | % | |||||||||||||||||||||
| Distributable cash flow before | |||||||||||||||||||||||||||||||||||
| leverage costs | 13.77 | % | 5.48 | % | 9.38 | % | 7.38 | % | 6.82 | % | 2.62 | % | 2.32 | % | |||||||||||||||||||||
| As a percent of average net assets(4) | |||||||||||||||||||||||||||||||||||
| Total from investments | 21.32 | % | 9.74 | % | 15.34 | % | 12.10 | % | 13.19 | % | 5.33 | % | 5.55 | % | |||||||||||||||||||||
| Operating expenses before | |||||||||||||||||||||||||||||||||||
| leverage costs | 2.03 | % | 2.59 | % | 2.16 | % | 2.35 | % | 3.15 | % | 2.39 | % | 2.78 | % | |||||||||||||||||||||
| Leverage costs | 1.31 | % | 0.66 | % | 1.29 | % | 1.15 | % | 0.44 | % | 0.19 | % | 0.22 | % | |||||||||||||||||||||
| Distributable cash flow | 17.98 | % | 6.49 | % | 11.89 | % | 8.60 | % | 9.60 | % | 2.75 | % | 2.55 | % | |||||||||||||||||||||
| Selected Financial Information | |||||||||||||||||||||||||||||||||||
| Distributions paid on common stock | $ | 15,829 | $ | 1,477 | $ | 1,477 | $ | 1,477 | $ | — | $ | — | $ | — | |||||||||||||||||||||
| Distributions paid on common stock | |||||||||||||||||||||||||||||||||||
| per share(5) | 8.6000 | 0.8000 | 0.8000 | 0.8000 | — | — | — | ||||||||||||||||||||||||||||
| Total assets, end of period | 88,684 | 35,482 | 88,684 | 66,439 | 33,895 | 33,760 | 35,482 | ||||||||||||||||||||||||||||
| Average total assets during period(6) | 131,848 | 48,399 | 94,064 | 84,873 | 40,207 | 33,345 | 32,358 | ||||||||||||||||||||||||||||
| Leverage(7) | 26,500 | 5,000 | 26,500 | 20,400 | 4,100 | 4,400 | 5,000 | ||||||||||||||||||||||||||||
| Leverage as a percent of total assets | 29.9 | % | 14.1 | % | 29.9 | % | 30.7 | % | 12.1 | % | 13.0 | % | 14.1 | % | |||||||||||||||||||||
| Net unrealized depreciation, | |||||||||||||||||||||||||||||||||||
| end of period | (21,026 | ) | (3,569 | ) | (21,026 | ) | (32,908 | ) | (4,249 | ) | (4,737 | ) | (3,569 | ) | |||||||||||||||||||||
| Net assets, end of period | 61,550 | 30,307 | 61,550 | 45,253 | 29,566 | 29,137 | 30,307 | ||||||||||||||||||||||||||||
| Average net assets during period(8) | 94,144 | 37,057 | 66,948 | 64,239 | 27,364 | 29,658 | 27,155 | ||||||||||||||||||||||||||||
| Net asset value per common share(5) | 33.36 | 16.42 | 33.36 | 24.48 | 16.20 | 15.78 | 16.42 | ||||||||||||||||||||||||||||
| Market value per common share(5) | 29.04 | 12.63 | 29.04 | 21.76 | 12.01 | 11.76 | 12.63 | ||||||||||||||||||||||||||||
| Shares outstanding (000’s) | 14,768 | 1,846 | 14,768 | 14,768 | 1,846 | 1,846 | 1,846 | ||||||||||||||||||||||||||||
| (1) | Q1 is the period from December through February. Q2 is the period from March through May. Q3 is the period from June through August. Q4 is the period from September through November. |
| (2) | Leverage costs include interest expense and other recurring leverage expenses. |
| (3) | “Net investment income (loss)” on the Statement of Operations is adjusted as follows to reconcile to Distributable Cash Flow (“DCF”): increased by net premiums on options written, the return of capital on distributions the distributions paid in stock and the premium on dividends paid in kind. |
| (4) | Annualized for periods less than one year. |
| (5) | Adjusted to reflect 1 for 8 reverse stock split effective May 1, 2020. |
| (6) | Computed by averaging month-end values within each period. |
| (7) | Leverage consists of outstanding borrowings under the revolving credit facility. |
| (8) | Computed by averaging daily net assets within each period. |
| Tortoise | 17 |
| Tortoise |
| Power and Energy Infrastructure Fund, Inc. (TPZ) |
Fund description
TPZ seeks to provide a high level of current income to stockholders, with a secondary objective of capital appreciation. TPZ seeks to invest primarily in fixed income and dividend-paying equity securities of power and energy infrastructure companies that provide stable and defensive characteristics throughout economic cycles.
Fund performance
There were several contributors to midstream energy’s negative performance for the fiscal year including volatile commodity prices and negative energy sentiment, energy demand concerns and excess takeaway capacity related to the COVID-19 pandemic as well as political rhetoric and uncertainty related to the 2020 U.S. presidential election, regulatory concerns around pipeline permitting, and concerns around midstream’s role in the evolving energy transition. Beyond this, one positive theme stood out for midstream businesses throughout the fiscal year — resiliency. Resilient cash flows confirm the essential nature of the assets that midstream businesses operate. Strong contractual obligations (take or pay contracts) and customer profiles (large, investment grade rated counterparties) helped midstream energy companies generate consistent cash flow from operations even in the low and volatile 2020 price environment. Leverage impacted the fund’s performance throughout the period. The fund’s use of leverage drove outperformance compared to the index during the strong fiscal quarter with market-based and NAV-based returns of 9.9% and 7.9%, respectively (including the reinvestment of distributions). Conversely, the required deleveraging during the weak market earlier in the year magnified negative performance with 2020 fiscal year returns of -29.2% and -18.9%, respectively. The TPZ Benchmark Composite returned 5.3% and 1.5% during the same periods, respectively.
| 2020 fiscal year summary | |||
| Distributions paid per share (fiscal year 2020) | $ | 1.0500 | |
| Monthly distributions paid per share | $ | 0.0500 | |
| Distribution rate (as of 11/30/2020) | 6.0% | ||
| Quarter-over-quarter distribution increase (decrease) | 0.0% | ||
| Year-over-year distribution increase (decrease) | (60.0)% | ||
| Cumulative distribution to stockholders | |||
| since inception in July 2009 | $ | 17.8250 | |
| Market-based total return | (29.2)% | ||
| NAV-based total return | (18.9)% | ||
| Premium (discount) to NAV (as of 11/30/2020) | (23.2)% | ||
*The TPZ Benchmark Composite includes the BofA Merrill Lynch U.S. Energy Index (CIEN), the BofA Merrill Lynch U.S. Electricity Index (CUEL) and the Tortoise MLP Index® (TMLP). It is comprised of a blend of 70% fixed income and 30% equity securities issued by companies in the power and energy infrastructure sectors.
Please refer to the inside front cover of the report for important information about the fund’s distribution policy.
| Key asset performance drivers | ||||
| Top five contributors | Company type | Performance driver | ||
| Blue Racer Midstream, LLC, 6.625%, 07/15/2026 | Gathering and processing MLP company | Improved Marcellus shale natural gas and natural gas liquids outlook following lower production in other basins | ||
| Sunnova Energy International Inc. | Solar company | Positive solar growth fundamentals and lower financing costs | ||
| Ascent Resources Utica Holdings, LLC, 7.000%, 11/01/2026 | Oil and gas production company | Higher forecast for natural gas prices following lower associated natural gas prices | ||
| EnLink Midstream LLC, 5.375%, 06/01/2029 | Gathering and processing MLP | Improved commodity prices leading to stronger counterparties along with lower interest rate environment | ||
| Tallgrass Energy LP | Midstream natural gas/natural gas liquids pipeline company | Acquisition by Blackstone | ||
| Bottom five contributors | Company type | Performance driver | ||
| Energy Transfer LP | Midstream natural gas/natural gas liquids pipeline MLP | Concern Dakota Access Pipeline operations may be halted due to potential need for Environmental Impact Statement | ||
| Targa Resources Corp. | Gathering and processing company | Concern about prolonged slowdown in production growth | ||
| Plains GP Holdings, L.P. | Midstream crude oil pipeline company | Reduced crude oil volume outlook | ||
| TransCanada Corporation, 5.625%, 05/20/2075 | Natural gas pipeline company | Uncertainty about pipeline viability and interest rate level over long-term | ||
| ONEOK, Inc | Midstream natural gas/natural gas liquids pipeline company | Concern about declining crude oil volumes negatively impacting natural gas and natural gas liquids (NGL) volumes | ||
Unlike the fund return, index return is pre-expenses.
Performance data quoted represent past performance; past performance does not guarantee future results. Like any other stock, total return and market value will fluctuate so that an investment, when sold, may be worth more or less than its original cost. Portfolio composition is subject to change due to ongoing management of the fund. References to specific securities or sectors should not be construed as a recommendation by the fund or its adviser. See Schedule of Investments for portfolio weighting at the end of the fiscal quarter.
| (unaudited) | |
| 18 | Tortoise |
| 2020 Annual Report | November 30, 2020 |
Fund structure and distribution policy
The fund is structured to qualify as a Regulated Investment Company (RIC) allowing it to pass-through to shareholders income and capital gains earned, thus avoiding double-taxation. To qualify as a RIC, the fund must meet specific income, diversification and distribution requirements. Regarding income, at least 90 percent of the fund gross income must be from dividends, interest and capital gains. The fund must meet quarterly diversification requirements including the requirement that at least 50 percent of the assets be in cash, cash equivalents or other securities with each single issuer of other securities not greater than 5 percent of total assets. No more than 25 percent of total assets can be invested in any one issuer other than government securities or other RIC’s. The fund must also distribute at least 90 percent of its investment company income. RIC’s are also subject to excise tax rules which require RIC’s to distribute approximately 98 percent of net income and net capital gains to avoid a 4 percent excise tax.
The fund has adopted a distribution policy which is included on the inside front cover of this report. To summarize, the fund intends to distribute an amount closely approximating the total taxable income for the year and, if so determined by the Board, distribute all or a portion of the return of capital paid by portfolio companies during the year. The fund may designate a portion of its distributions as capital gains and may also distribute additional capital gains in the last calendar quarter of the year to meet annual excise distribution requirements. Distribution amounts are subject to change from time to time at the discretion of the Board. Although the level of distributions is independent of the funds’ performance in the short term, the fund expects such distributions to correlate with its performance over time.
Distributable cash flow and distributions
Distributable cash flow (DCF) is income from investments less expenses. Income from investments includes the accrued interest from corporate bonds, cash distributions and paid-in-kind distributions from master limited partnerships (MLPs) and other equity investments and dividends earned from short-term investments. The total expenses include current or anticipated operating expenses and leverage costs.
Income from investments decreased approximately 3.2% as compared to 3rd quarter 2020, primarily due to lower distributions from investments within the fund’s portfolio. Operating expenses, consisting primarily of fund advisory fees, increased slightly during the quarter. Total leverage costs decreased approximately 4.1% as compared to 3rd quarter 2020 due to lower interest rates during the quarter. As a result of the changes in income and expenses, DCF decreased approximately 4.4% as compared to 3rd quarter 2020. The fund had net realized gains on investments of approximately $0.5 million during 4th quarter 2020.
The fund paid monthly distributions of $0.05 per share during 4th quarter 2020, no change from the prior quarter and a decrease of approximately 60% from 4th quarter 2019. The fund’s Board of Directors has announced monthly distributions of $0.05 per share are expected to be paid during 1st quarter 20201. The fund has paid cumulative distributions to stockholders of $17.825 per share since its inception in July 2009.
The Key Financial Data table discloses the calculation of DCF and should be read in conjunction with this discussion. The difference between income from investments in the DCF calculation and total investment income as reported in the Statement of Operations, is reconciled as follows: (1) U.S. generally accepted accounting principles (GAAP), recognizes distribution income from MLPs, common stock and other investments on their ex-dates, whereas the DCF calculation may reflect distribution income on their pay dates; (2) GAAP recognizes that a significant portion of the cash distributions received from MLPs, common stock and other investments are characterized as a return of capital and therefore excluded from investment income, whereas the DCF calculation includes the return of capital; (3) income from investments in the DCF calculation includes the value of dividends paid-in-kind (additional stock or units), whereas such amounts may not be included as income for GAAP purposes; and (4) amortization of premium or discount for all securities is calculated using the yield to worst methodology for GAAP purposes while yield to call is used in calculating amortization for long-dated hybrid securities in the DCF calculation. The treatment of expenses in the DCF calculation also differs from what is reported in the Statement of Operations. In addition to the total operating expenses, including fee waiver, as disclosed in the Statement of Operations, the DCF calculation reflects interest expense and realized and unrealized gains (losses) on interest rate swap settlements as leverage costs.
“Net Investment Income (Loss)” on the Statement of Operations is adjusted as follows to reconcile to DCF for YTD and 4th quarter 2020 (in thousands):
| YTD 2020 | 4th Qtr 2020 | |||||
| Net Investment Income | $ | 2,431 | $ | 472 | ||
| Adjustments to reconcile to DCF: | ||||||
| Distributions characterized as | ||||||
| return of capital | 3,795 | 822 | ||||
| Other | 50 | — | ||||
| DCF | $ | 6,276 | $ | 1,294 | ||
Leverage
The fund’s leverage utilization increased $0.1 million as compared to 3rd quarter 2020 and represented 22.5% of total assets at November 30, 2020. During the period, the fund maintained compliance with its applicable coverage ratios. At year-end, including the impact of interest rate swaps, approximately 92% of the leverage cost was fixed, the weighted-average maturity was 3.0 years and the weighted-average annual rate on leverage was 3.16%. These rates will vary in the future as a result of changing floating rates and as swaps mature or are redeemed.
Please see the Financial Statements and Notes to Financial Statements for additional detail regarding critical accounting policies, results of operations, leverage and other important fund information.
For further information regarding the calculation of distributable cash flow and distributions to stockholders, as well as a discussion of the tax impact on distributions, please visit www.tortoiseecofin.com.
| (unaudited) | |
| Tortoise | 19 |
| TPZ Key Financial Data (supplemental unaudited information) |
| (dollar amounts in thousands unless otherwise indicated) |
The information presented below regarding Distributable Cash Flow and Selected Financial Information is supplemental non-GAAP financial information, which the fund believes is meaningful to understanding operating performance. The Distributable Cash Flow Ratios include the functional equivalent of EBITDA for non-investment companies, and the fund believes they are an important supplemental measure of performance and promote comparisons from period-to-period. This information is supplemental, is not inclusive of required financial disclosures (e.g. Total Expense Ratio), and should be read in conjunction with the full financial statements.
| Year Ended November 30, | 2019 | 2020 | |||||||||||||||||||||||||||||||||
| 2019 | 2020 | Q4(1) | Q1(1) | Q2(1) | Q3(1) | Q4(1) | |||||||||||||||||||||||||||||
| Total Income from Investments | |||||||||||||||||||||||||||||||||||
| Interest earned on corporate bonds | $ | 5,437 | $ | 4,366 | $ | 1,331 | $ | 1,311 | $ | 1,116 | $ | 1,013 | $ | 926 | |||||||||||||||||||||
| Distributions and dividends | |||||||||||||||||||||||||||||||||||
| from investments, net of | |||||||||||||||||||||||||||||||||||
| foreign taxes withheld | 7,632 | 4,578 | 1,975 | 1,924 | 800 | 914 | 940 | ||||||||||||||||||||||||||||
| Dividends paid in kind | 175 | 16 | 49 | 8 | 8 | — | — | ||||||||||||||||||||||||||||
| Total from investments | 13,244 | 8,960 | 3,355 | 3,243 | 1,924 | 1,927 | 1,866 | ||||||||||||||||||||||||||||
| Operating Expenses Before | |||||||||||||||||||||||||||||||||||
| Leverage Costs | |||||||||||||||||||||||||||||||||||
| Advisory fees | 1,825 | 1,196 | 440 | 426 | 251 | 261 | 258 | ||||||||||||||||||||||||||||
| Other operating expenses | 521 | 503 | 109 | 141 | 120 | 116 | 126 | ||||||||||||||||||||||||||||
| 2,346 | 1,699 | 549 | 567 | 371 | 377 | 384 | |||||||||||||||||||||||||||||
| Distributable cash flow before | |||||||||||||||||||||||||||||||||||
| leverage costs | 10,898 | 7,261 | 2,806 | 2,676 | 1,553 | 1,550 | 1,482 | ||||||||||||||||||||||||||||
| Leverage costs(2) | 1,640 | 985 | 382 | 367 | 234 | 196 | 188 | ||||||||||||||||||||||||||||
| Distributable Cash Flow(3) | $ | 9,258 | $ | 6,276 | $ | 2,424 | $ | 2,309 | $ | 1,319 | $ | 1,354 | $ | 1,294 | |||||||||||||||||||||
| Net realized gain (loss) on | |||||||||||||||||||||||||||||||||||
| investments and foreign currency | |||||||||||||||||||||||||||||||||||
| translation, for the period | $ | 4,740 | $ | (25,728 | ) | $ | 4,288 | $ | 1,376 | $ | (27,995 | ) | $ | 351 | $ | 540 | |||||||||||||||||||
| As a percent of average total assets(4) | |||||||||||||||||||||||||||||||||||
| Total from investments | 6.89 | % | 6.98 | % | 7.23 | % | 7.35 | % | 6.59 | % | 7.00 | % | 6.79 | % | |||||||||||||||||||||
| Operating expenses before | |||||||||||||||||||||||||||||||||||
| leverage costs | 1.22 | % | 1.32 | % | 1.18 | % | 1.28 | % | 1.27 | % | 1.37 | % | 1.40 | % | |||||||||||||||||||||
| Distributable cash flow before | |||||||||||||||||||||||||||||||||||
| leverage costs | 5.67 | % | 5.66 | % | 6.05 | % | 6.07 | % | 5.32 | % | 5.63 | % | 5.39 | % | |||||||||||||||||||||
| As a percent of average net assets(4) | |||||||||||||||||||||||||||||||||||
| Total from investments | 9.62 | % | 9.63 | % | 10.25 | % | 10.18 | % | 10.12 | % | 9.05 | % | 8.94 | % | |||||||||||||||||||||
| Operating expenses before | |||||||||||||||||||||||||||||||||||
| leverage costs | 1.70 | % | 1.83 | % | 1.68 | % | 1.78 | % | 1.95 | % | 1.77 | % | 1.84 | % | |||||||||||||||||||||
| Leverage costs | 1.19 | % | 1.06 | % | 1.17 | % | 1.15 | % | 1.23 | % | 0.92 | % | 0.90 | % | |||||||||||||||||||||
| Distributable cash flow | 6.73 | % | 6.74 | % | 7.40 | % | 7.25 | % | 6.94 | % | 6.36 | % | 6.20 | % | |||||||||||||||||||||
| Selected Financial Information | |||||||||||||||||||||||||||||||||||
| Distributions paid on common stock | $ | 10,427 | $ | 7,297 | $ | 2,607 | $ | 2,607 | $ | 2,607 | $ | 1,043 | $ | 1,040 | |||||||||||||||||||||
| Distributions paid on common stock | |||||||||||||||||||||||||||||||||||
| per share | 1.5000 | 1.0500 | 0.3750 | 0.3750 | 0.3750 | 0.1500 | 0.1500 | ||||||||||||||||||||||||||||
| Total assets, end of period | 177,843 | 116,212 | 177,843 | 165,718 | 109,703 | 111,838 | 116,212 | ||||||||||||||||||||||||||||
| Average total assets during period(5) | 192,260 | 128,284 | 186,087 | 177,506 | 116,136 | 109,506 | 110,592 | ||||||||||||||||||||||||||||
| Leverage(6) | 54,100 | 26,200 | 54,100 | 52,900 | 24,900 | 26,100 | 26,200 | ||||||||||||||||||||||||||||
| Leverage as a percent of total assets | 30.4 | % | 22.5 | % | 30.4 | % | 31.9 | % | 22.7 | % | 23.3 | % | 22.5 | % | |||||||||||||||||||||
| Net unrealized depreciation, | |||||||||||||||||||||||||||||||||||
| end of period | (7,471 | ) | (9,695 | ) | (7,471 | ) | (17,866 | ) | (15,664 | ) | (14,689 | ) | (9,695 | ) | |||||||||||||||||||||
| Net assets, end of period | 123,015 | 89,426 | 123,015 | 112,095 | 84,322 | 85,232 | 89,426 | ||||||||||||||||||||||||||||
| Average net assets during period(7) | 137,701 | 93,027 | 131,313 | 128,167 | 75,647 | 84,671 | 83,906 | ||||||||||||||||||||||||||||
| Net asset value per common share | 17.70 | 13.01 | 17.70 | 16.13 | 12.13 | 12.26 | 13.01 | ||||||||||||||||||||||||||||
| Market value per common share | 15.57 | 9.99 | 15.57 | 14.71 | 9.78 | 9.24 | 9.99 | ||||||||||||||||||||||||||||
| Shares outstanding (000’s) | 6,951 | 6,873 | 6,951 | 6,951 | 6,951 | 6,951 | 6,873 | ||||||||||||||||||||||||||||
| (1) | Q1 is the period from December through February. Q2 is the period from March through May. Q3 is the period from June through August. Q4 is the period from September through November. |
| (2) | Leverage costs include interest expense, interest rate swap expenses and other recurring leverage expenses. |
| (3) | “Net investment income (loss)” on the Statement of Operations is adjusted as follows to reconcile to Distributable Cash Flow (“DCF”): increased by the return of capital on distributions, the dividends paid in stock and increased liquidation value and the premium on dividends paid in kind; and decreased by realized and unrealized gains (losses) on interest rate swap settlements. |
| (4) | Annualized for periods less than one year. |
| (5) | Computed by averaging month-end values within each period. |
| (6) | Leverage consists of outstanding borrowings under the revolving credit facility. |
| (7) | Computed by averaging daily net assets within each period. |
| 20 | Tortoise |
| 2020 Annual Report | November 30, 2020 |
| Tortoise |
| Essential Assets Income Term Fund (TEAF) |
Fund description
TEAF seeks to provide a high level of total return with an emphasis on current distributions. TEAF provides investors access to a combination of public and direct investments in essential assets that are making an impact on clients and communities.
Fund performance
TEAF realized positive price appreciation in all sectors of the portfolio during fourth fiscal quarter. Integrated utilities and renewables companies in the portfolio continued strong performance during the period, benefitting from de-carbonization and ESG tailwinds. Additionally, energy infrastructure, which had been under pressure most of the year, rebounded strongly during the fourth fiscal quarter on the prospects of strengthening demand in 2021 as a result of COVID-19 vaccine announcements. Direct sustainable investments continued to perform well during the fiscal quarter. As a reminder, we currently have a mix of operating assets and assets under construction in the portfolio. Assets under construction are on-time and on-budget, and expected to enter service in late 2020 and early 2021.
We believe the portfolio is positioned well heading into 2021 to benefit from several key themes, including de-carbonization of global power generation, renewable infrastructure investment and growing demand for natural gas globally. We expect to see integrated utilities and renewables companies execute on their growing backlog of projects, driving solid cash flow growth in 2021. We also expect rebounding LNG exports and prices to increase natural gas demand year-over-year, which should benefit natural gas infrastructure companies in the portfolio.
We continue to progress on transitioning the portfolio to the targeted allocation of 60% direct investments. As of November 30, 2020, TEAF’s total direct investment commitments were approximately $117 million or approximately 48% of the portfolio. As previously mentioned, we have completed the fund’s allocation to direct sustainable and energy infrastructure investments. We expect to reach the targeted allocation for direct investments in the first half of 2021.
Public Energy Infrastructure
| ● | Public energy infrastructure equities performed well during the fourth fiscal quarter, driven by the expectation that global energy demand rebounds strongly in 2021 following positive COVID-19 vaccine announcements in November. |
| ● | Commodity prices (crude oil and global LNG) strengthened during the period, driving positive sentiment in the sector. We expect stronger LNG demand in 2021 to support volumes for natural gas infrastructure companies in 2021. |
| ● | We continue to see capital discipline from portfolio companies, which we expect to drive strong free cash flow generation in 2021. Increasing free cash flow and lower debt levels are expected to support valuation of the sector moving forward. |
Private Energy Infrastructure
| ● | TEAF participated in a Series A convertible preferred issuance by Enterprise Products Partners (EPD) during the fourth fiscal quarter. |
| – | EPD is a leading midstream infrastructure company in North America providing services to producers and consumers of natural gas, NGLs, crude oil, refined products and petrochemicals. |
| – | The preferred security pays a current coupon of 7.25%. |
| ● | Our private energy deals performed extremely well during the period, driven by strong tailwinds in the renewable energy sector. |
Public Sustainable Infrastructure
| ● | Public sustainable infrastructure equities had a strong fourth fiscal quarter driven primarily by the performance of renewable developers and operators. Canadian renewables companies performed extremely well during the period. |
| ● | The EU confirmed its target to reduce emissions 55% by 2030 (vs 1990), outlined further plans to boost renewables investment (with respect to offshore wind capacity) and the UK announced its Green Plan, including its interest in green hydrogen and a ban on the sale of traditional combustion engine cars by 2030 (5 years earlier than the last plan). |
| (unaudited) | |
| Tortoise | 21 |
| Tortoise |
| Essential Assets Income Term Fund (TEAF) (continued) |
| ● | Moreover, the anticipation of a Biden administration is generating hopes that his $2tn climate change investment program will further boost renewables growth prospects and accelerate the sector’s transformation. |
| ● | Finally, China announced its target to achieve net zero before 2060, a very important objective for a country that relies heavily on coal. On that basis, we look forward to the United Nation Climate Change Conference (COP-26) in November 2021 where we should expect to hear more commitments about de-carbonization. |
| ● | Aside from government actions, corporates have been active in announcing plans to migrate to net zero and green their supply chain. All these developments are positive and we expect growth to continue unabated in the sustainable infrastructure space. |
Private Sustainable Infrastructure
| ● | TEAF did not invest in any additional private sustainable infrastructure projects during the fourth fiscal quarter as the fund previously reached its target allocation. |
| ● | To date, the fund has invested approximately $52 million in three entities. |
| ● | Operating assets held at TEAF continued to operate as expected with cash flow generation profiles driven by long-term contracted cash flows. |
| ● | One of the solar projects in Massachusetts was placed into service in December 2020 and expect the second Massachusetts solar project to be online in first half of 2021. |
Social Infrastructure
| ● | TEAF completed a debt investment in Drumlin Reserve during the fourth fiscal quarter. Drumlin Reserve is an existing 154-unit senior living community located in Cottage Grove, Wisconsin. The community provides Independent Living, Assisted Living and Memory Care services and has held steady levels of occupancy despite COVID-19. TEAF invested in two tranches of debt, for a total of approximately $2.8 million. |
| |
| ● | TEAF completed a debt investment in PureCycle Technologies (PCT) during the fourth fiscal quarter. PCT will use the proceeds to fund the construction and operation of a plastics recycling facility in Iroton, Ohio. When complete, the project will use proprietary, non-chemical technology to recycle polypropylene from post-consumer plastics into an ultra-pure form. Currently, less than 2% of polypropylene is recycled per year due to limitations of current recycling methods. All of the annual offtake volume produced by the project has been contracted under long-term LOIs with large, well-known industry participants at premium pricing. PCT has entered into long-term agreements to secure more than 100% of the project’s required feedstock, most of which would otherwise end up in landfills. TEAF invested $9 million in the senior secured bonds. |
| 2020 fiscal year summary | ||
| Distributions paid per share (fiscal year 2020) | $1.1010 | |
| Monthly distributions paid per share | $0.0750 | |
| Distribution rate (as of 11/30/2020) | 6.9% | |
| Quarter-over-quarter distribution increase (decrease) | 0.0% | |
| Year-over-year distribution increase (decrease) | (30.9)% | |
| Cumulative distribution to stockholders | ||
| since inception in July 2009 | $1.8605 | |
| Market-based total return | (8.7)% | |
| NAV-based total return | (1.6)% | |
| Premium (discount) to NAV (as of 11/30/2020) | (17.7)% |
Performance data quoted represent past performance; past performance does not guarantee future results. Like any other stock, total return and market value will fluctuate so that an investment, when sold, may be worth more or less than its original cost. Portfolio composition is subject to change due to ongoing management of the fund. References to specific securities or sectors should not be construed as a recommendation by the fund or its adviser. See Schedule of Investments for portfolio weighting at the end of the fiscal quarter.
| (unaudited) | |
| 22 | Tortoise |
| 2020 Annual Report | November 30, 2020 |
Fund structure and distribution policy
The fund is structured to qualify as a Regulated Investment Company (RIC) allowing it to pass-through to shareholders income and capital gains earned, thus avoiding double-taxation. To qualify as a RIC, the fund must meet specific income, diversification and distribution requirements. Regarding income, at least 90 percent of the fund gross income must be from dividends, interest and capital gains. The fund must meet quarterly diversification requirements including the requirement that at least 50 percent of the assets be in cash, cash equivalents or other securities with each single issuer of other securities not greater than 5 percent of total assets. No more than 25 percent of total assets can be invested in any one issuer other than government securities or other RIC’s. The fund must also distribute at least 90 percent of its investment company income. RIC’s are also subject to excise tax rules which require RIC’s to distribute approximately 98 percent of net income and net capital gains to avoid a 4 percent excise tax.
The fund has adopted a distribution policy which intends to distribute an amount closely approximating the total taxable income for the year and, if so determined by the Board, distribute all or a portion of the return of capital paid by portfolio companies during the year. The fund may designate a portion of its distributions as capital gains and may also distribute additional capital gains in the last calendar quarter of the year to meet annual excise distribution requirements. Distribution amounts are subject to change from time to time at the discretion of the Board. Although the level of distributions is independent of the funds’ performance in the short term, the fund expects such distributions to correlate with its performance over time.
Distributable cash flow and distributions
DCF is income from investments less expenses. Income from investments includes the accrued interest from bonds, the amount received as cash or paid-in-kind distributions from investments and dividend payments on short-term investments. Income also includes the premiums received from sales of covered call options, net of amounts paid to buy back out-of-the-money options. The total expenses include current or anticipated operating expenses and leverage costs.
Income from investments increased approximately 11% as compared to 3rd quarter 2020, primarily due to an increase in premiums received from call options written. Operating expenses, consisting primarily of fund advisory fees, increased approximately 23% during the quarter, primarily due to a one-time increase in operating expenses partially offset by lower asset-based fees. Total leverage costs decreased approximately 8.3% as compared to 3rd quarter 2020, primarily due to lower interest rates during the quarter. As a result of the changes in income and expenses, DCF increased approximately 7.5% as compared to 3rd quarter 2020. The fund had net realized gains on investments of approximately $5.4 million during 4th quarter 2020.
The fund paid monthly distributions of $0.075 per share during 4th quarter 2020, no change from the prior quarter and a decrease of approximately 31% from 4th quarter 2019. The fund’s Board of Directors has declared monthly distributions of $0.075 per share to be paid during 1st quarter 2020. The fund has paid cumulative distributions to stockholders of $1.8605 per share since its inception in March 2019.
The Key Financial Data table discloses the calculation of DCF and should be read in conjunction with this discussion. The difference between distributions received from investments in the DCF calculation and total investment income as reported in the Statement of Operations, is reconciled as follows: the Statement of Operations, in conformity with U.S. generally accepted accounting principles (GAAP), recognizes distribution income from MLPs and other investments on their ex-dates, whereas the DCF calculation may reflect distribution income on their pay dates; GAAP recognizes that a significant portion of the cash distributions received from MLPs and other investments are characterized as a return of capital and therefore excluded from investment income, whereas the DCF calculation includes the return of capital (net of any distributions deemed to be return of principal); and distributions received from investments in the DCF calculation include the value of dividends paid-in-kind (additional stock or MLP units), whereas such amounts may not be included as income for GAAP purposes and includes distributions related to direct investments when the purchase price is reduced in lieu of receiving cash distributions. Net premiums on options written (premiums received less amounts paid to buy back out-of-the-money options) with expiration dates during the fiscal quarter are included in the DCF calculation, whereas GAAP recognizes the net effect of options written as realized and unrealized gains (losses). Income for DCF purposes is reduced by amortizing the cost of certain investments that may not have a residual value after a known time period and by distributions received from investments deemed to be return of principal.
“Net Investment Income (Loss)” on the Statement of Operations is adjusted as follows to reconcile to DCF for YTD and 4th quarter 2020 (in thousands):
| YTD 2020 | 4th Qtr 2020 | |||||
| Net Investment Income (Loss), | ||||||
| before income taxes | $ | 7,451 | $ | (3,644) | ||
| Adjustments to reconcile to DCF: | ||||||
| Distributions characterized as | ||||||
| return of capital | 9,880 | 6,559 | ||||
| Net premiums on options written | 3,125 | 967 | ||||
| Return of principal excluded | ||||||
| for DCF purposes | (5,194) | — | ||||
| Amortization on certain investments | (1,126) | (322) | ||||
| Other | (251) | (79) | ||||
| DCF | $ | 13,885 | $ | 3,481 | ||
Leverage
The fund’s leverage utilization increased $0.6 million as compared to 3rd quarter 2020. The fund utilizes all floating rate leverage that had an interest rate of 0.95% and represented 12.6% of total assets at year-end. During the period, the fund maintained compliance with its applicable coverage ratios. The interest rate on the fund’s leverage will vary in the future along with changing floating rates.
Please see the Financial Statements and Notes to Financial Statements for additional detail regarding critical accounting policies, results of operations, leverage and other important fund information.
For further information regarding the calculation of distributable cash flow and distributions to stockholders, as well as a discussion of the tax impact on distributions, please visit www.tortoiseecofin.com
| (unaudited) | |
| Tortoise | 23 |
| TEAF Key Financial Data (supplemental unaudited information) |
| (dollar amounts in thousands unless otherwise indicated) |
The information presented below regarding Distributable Cash Flow and Selected Financial Information is supplemental non-GAAP financial information, which the fund believes is meaningful to understanding operating performance. The Distributable Cash Flow Ratios include the functional equivalent of EBITDA for non-investment companies, and the fund believes they are an important supplemental measure of performance and promote comparisons from period-to-period. This information is supplemental, is not inclusive of required financial disclosures (e.g. Total Expense Ratio), and should be read in conjunction with the full financial statements.
| Period from | ||||||||||||||||||||||||||||||||||
| March 29, | ||||||||||||||||||||||||||||||||||
| 2019(1) | ||||||||||||||||||||||||||||||||||
| through | Year Ended | |||||||||||||||||||||||||||||||||
| November 30, | November 30, | 2019 | 2020 | |||||||||||||||||||||||||||||||
| 2019 | 2020 | Q4(1) | Q1(1) | Q2(1) | Q3(1) | Q4(1) | ||||||||||||||||||||||||||||
| Total Income from Investments | ||||||||||||||||||||||||||||||||||
| Interest earned on bonds and notes | $ | 3,109 | $ | 6,332 | $ | 1,397 | $ | 1,488 | $ | 1,571 | $ | 1,669 | $ | 1,604 | ||||||||||||||||||||
| Distributions and dividends | ||||||||||||||||||||||||||||||||||
| from investments, net of | ||||||||||||||||||||||||||||||||||
| foreign taxes withheld | 9,616 | 8,583 | 2,235 | 2,216 | 2,257 | 1,998 | 2,112 | |||||||||||||||||||||||||||
| Distributions paid in kind | 206 | 149 | 144 | 74 | 75 | — | — | |||||||||||||||||||||||||||
| Net premiums on options written | 3,965 | 3,125 | 1,400 | 1,217 | 372 | 569 | 967 | |||||||||||||||||||||||||||
| Total from investments | 16,896 | 18,189 | 5,176 | 4,995 | 4,275 | 4,236 | 4,683 | |||||||||||||||||||||||||||
| Operating Expenses Before | ||||||||||||||||||||||||||||||||||
| Leverage Costs | ||||||||||||||||||||||||||||||||||
| Advisory fees | 2,099 | 3,033 | 761 | 772 | 679 | 797 | 785 | |||||||||||||||||||||||||||
| Other operating expenses | 470 | 788 | 203 | 177 | 155 | 116 | 340 | |||||||||||||||||||||||||||
| 2,569 | 3,821 | 964 | 949 | 834 | 913 | 1,125 | ||||||||||||||||||||||||||||
| Distributable cash flow before | ||||||||||||||||||||||||||||||||||
| leverage costs | 14,327 | 14,368 | 4,212 | 4,046 | 3,441 | 3,323 | 3,558 | |||||||||||||||||||||||||||
| Leverage costs(2) | 620 | 483 | 229 | 222 | 100 | 84 | 77 | |||||||||||||||||||||||||||
| Distributable Cash Flow(3) | $ | 13,707 | $ | 13,885 | $ | 3,983 | $ | 3,824 | $ | 3,341 | $ | 3,239 | $ | 3,481 | ||||||||||||||||||||
| Net realized loss on investments | ||||||||||||||||||||||||||||||||||
| and foreign currency translation, | ||||||||||||||||||||||||||||||||||
| for the period | $ | (12,936 | ) | $ | (37,958 | ) | $ | (9,697 | ) | $ | (1,758 | ) | $ | (37,365 | ) | $ | (4,186 | ) | $ | 5,351 | ||||||||||||||
| As a percent of average total assets(4) | ||||||||||||||||||||||||||||||||||
| Total from investments | 8.89 | % | 11.06 | % | 7.46 | % | 7.24 | % | 7.57 | % | 7.18 | % | 8.00 | % | ||||||||||||||||||||
| Operating expenses before | ||||||||||||||||||||||||||||||||||
| leverage costs | 1.35 | % | 2.32 | % | 1.39 | % | 1.38 | % | 1.48 | % | 1.55 | % | 1.92 | % | ||||||||||||||||||||
| Distributable cash flow before | ||||||||||||||||||||||||||||||||||
| leverage costs | 7.54 | % | 8.74 | % | 6.07 | % | 5.86 | % | 6.09 | % | 5.63 | % | 6.08 | % | ||||||||||||||||||||
| As a percent of average net assets(4) | ||||||||||||||||||||||||||||||||||
| Total from investments | 9.90 | % | 12.80 | % | 8.49 | % | 8.13 | % | 9.18 | % | 8.26 | % | 9.22 | % | ||||||||||||||||||||
| Operating expenses before | ||||||||||||||||||||||||||||||||||
| leverage costs | 1.51 | % | 2.69 | % | 1.58 | % | 1.55 | % | 1.79 | % | 1.78 | % | 2.21 | % | ||||||||||||||||||||
| Leverage costs | 0.36 | % | 0.34 | % | 0.38 | % | 0.36 | % | 0.21 | % | 0.16 | % | 0.15 | % | ||||||||||||||||||||
| Distributable cash flow | 8.03 | % | 9.77 | % | 6.53 | % | 6.22 | % | 7.18 | % | 6.32 | % | 6.86 | % | ||||||||||||||||||||
| Selected Financial Information | ||||||||||||||||||||||||||||||||||
| Distributions paid on common stock | $ | 10,247 | $ | 14,854 | $ | 4,392 | $ | 4,391 | $ | 4,392 | $ | 3,036 | $ | 3,035 | ||||||||||||||||||||
| Distributions paid on common stock | ||||||||||||||||||||||||||||||||||
| per share | 0.7595 | 1.1010 | 0.3255 | 0.3255 | 0.3255 | 0.2250 | 0.2250 | |||||||||||||||||||||||||||
| Total assets, end of period | 271,915 | 246,112 | 271,915 | 264,801 | 234,072 | 237,689 | 246,112 | |||||||||||||||||||||||||||
| Average total assets during period(5) | 280,814 | 243,000 | 278,477 | 277,296 | 224,806 | 234,695 | 235,505 | |||||||||||||||||||||||||||
| Leverage(6) | 32,000 | 31,100 | 32,000 | 34,600 | 30,900 | 30,500 | 31,100 | |||||||||||||||||||||||||||
| Leverage as a percent of total assets | 11.8 | % | 12.6 | % | 11.8 | % | 13.1 | % | 13.2 | % | 12.8 | % | 12.6 | % | ||||||||||||||||||||
| Net unrealized appreciation | ||||||||||||||||||||||||||||||||||
| (depreciation), end of period | (15,821 | ) | 5,259 | (15,821 | ) | (19,861 | ) | (18,369 | ) | (3,411 | ) | 5,259 | ||||||||||||||||||||||
| Net assets, end of period | 237,461 | 213,825 | 237,461 | 228,885 | 196,262 | 206,277 | 213,825 | |||||||||||||||||||||||||||
| Average net assets during period(7) | 252,217 | 210,055 | 244,483 | 247,031 | 185,254 | 203,958 | 204,319 | |||||||||||||||||||||||||||
| Net asset value per common share | 17.60 | 15.85 | 17.60 | 16.97 | 14.55 | 15.29 | 15.85 | |||||||||||||||||||||||||||
| Market value per common share | 15.60 | 13.04 | 15.60 | 15.32 | 10.73 | 11.20 | 13.04 | |||||||||||||||||||||||||||
| Shares outstanding (000’s) | 13,491 | 13,491 | 13,491 | 13,491 | 13,491 | 13,491 | 13,491 | |||||||||||||||||||||||||||
| (1) | Q1 represents the period from December through February. Q2 represents the period from March through May. Q3 represents the period from June through August. Q4 represents the period from September through November. |
| (2) | Leverage costs include interest expense and other recurring leverage expenses. |
| (3) | “Net investment income (loss)” on the Statement of Operations is adjusted as follows to reconcile to Distributable Cash Flow (“DCF”): increased by the return of capital on distributions and the net premiums on options written and decreased by amortization on certain investments. |
| (4) | Annualized for periods less than one year. |
| (5) | Computed by averaging month-end values within each period. |
| (6) | Leverage consists of outstanding borrowings under the margin loan facility. |
| (7) | Computed by averaging daily net assets within each period. |
| 24 | Tortoises |
| 2020 Annual Report | November 30, 2020 |
| TYG Consolidated Schedule of Investments |
| November 30, 2020 |
| Shares/Units | Fair Value | ||||
| Master Limited Partnerships — 80.2%(1) | |||||
| Crude Oil Pipelines — 17.3%(1) | |||||
| United States — 17.3%(1) | |||||
| BP Midstream Partners LP | 588,860 | $ | 6,677,672 | ||
| NuStar Energy L.P. | 1,168,071 | 15,523,664 | |||
| Plains All American Pipeline, L.P. | 2,606,368 | 20,694,562 | |||
| Shell Midstream Partners, L.P. | 974,215 | 9,995,446 | |||
| 52,891,344 | |||||
| Natural Gas/Natural Gas Liquids Pipelines — 23.1%(1) | |||||
| United States — 23.1%(1) | |||||
| DCP Midstream, LP | 886,830 | 14,322,305 | |||
| Energy Transfer LP | 2,783,863 | 17,204,273 | |||
| Enterprise Products Partners L.P.(2) | 2,007,979 | 38,954,793 | |||
| 70,481,371 | |||||
| Natural Gas Gathering/Processing — 4.1%(1) | |||||
| United States — 4.1%(1) | |||||
| Western Midstream Partners, LP | 971,071 | 12,526,816 | |||
| Renewable Infrastructure — 6.8%(1) | |||||
| United States — 6.8%(1) | |||||
| Enviva Partners LP | 90,944 | 4,059,740 | |||
| Nextera Energy Partners LP | 264,253 | 16,772,138 | |||
| 20,831,878 | |||||
| Refined Product Pipelines — 28.9%(1) | |||||
| United States — 28.9%(1) | |||||
| Holly Energy Partners, L.P. | 365,340 | 4,946,704 | |||
| Magellan Midstream Partners, L.P. | 885,537 | 36,439,848 | |||
| MPLX LP | 1,652,635 | 34,771,440 | |||
| Phillips 66 Partners LP | 450,679 | 12,114,252 | |||
| 88,272,244 | |||||
| Total Master Limited Partnerships | |||||
| (Cost $317,428,809) | 245,003,653 | ||||
| Common Stock — 27.1%(1) | |||||
| Renewable Infrastructure — 3.9%(1) | |||||
| United States — 3.9%(1) | |||||
| Algonquin Power Utilities Corp. | 271,759 | 4,261,181 | |||
| Atlantica Sustainable | |||||
| Infrastructure PLC | 123,600 | 4,250,604 | |||
| Clearway Energy Inc. | 118,000 | 3,453,860 | |||
| 11,965,645 | |||||
| Natural Gas/Natural Gas Liquids Pipelines — 19.9%(1) | |||||
| United States — 19.9%(1) | |||||
| Kinder Morgan Inc. | 986,049 | 14,179,385 | |||
| ONEOK, Inc. | 480,237 | 17,226,101 | |||
| The Williams Companies, Inc. | 1,402,288 | 29,420,002 | |||
| 60,825,488 | |||||
| Natural Gas Gathering/Processing — 3.3%(1) | |||||
| United States — 3.3%(1) | |||||
| Equitrans Midstream Corp. | 1,241,828 | 10,133,318 | |||
| Total Common Stock | |||||
| (Cost $77,159,382) | 82,924,451 | ||||
| Preferred Stock — 12.3%(1) | |||||
| Natural Gas/Natural Gas Liquids Pipelines — 4.0%(1) | |||||
| United States — 4.0%(1) | |||||
| Altus Midstream Company, 7.000%(3)(4) | 10,427 | 12,180,492 | |||
| Natural Gas Gathering/Processing — 7.2%(1) | |||||
| United States — 7.2%(1) | |||||
| Targa Resources Corp., 9.500%(3)(4) | 21,758 | 21,888,112 | |||
| Renewable Infrastructure — 1.1%(1) | |||||
| United States — 1.1%(1) | |||||
| Nextera Energy Inc. | 72,016 | 3,523,743 | |||
| Total Preferred Stock | |||||
| (Cost $32,324,569) | 37,592,347 | ||||
| See accompanying Notes to Financial Statements. | |
| Tortoise | 25 |
| TYG Consolidated Schedule of Investments (continued) |
| November 30, 2020 |
| Shares/Units | Fair Value | |||||
| Corporate Bonds — 1.2%(1) | ||||||
| Refined Product Pipelines — 0.3%(1) | ||||||
| United States — 0.3%(1) | ||||||
| Buckeye Partners, | ||||||
| 6.375%, 01/22/2078 | 1,200,000 | $ | 816,000 | |||
| Natural Gas Gathering/Processing — 0.9%(1) | ||||||
| United States — 0.9%(1) | ||||||
| Enlink Midstream Partners, | ||||||
| 6.000%, Perpetual | 5,100,000 | 2,805,000 | ||||
| Total Corporate Bonds | ||||||
| (Cost $4,912,598) | 3,621,000 | |||||
| Convertible Note — 1.3%(1) | ||||||
| Solar — 1.3%(1) | ||||||
| Grand Cayman — 1.3%(1) | ||||||
| Sunnova Energy Intl Inc., | ||||||
| 9.750%, 04/30/2025(3)(4) | ||||||
| (Cost $1,307,000) | 1,307,000 | 3,954,420 | ||||
| Private Investment — 3.4%(1) | ||||||
| Renewable Infrastructure — 3.4%(1) | ||||||
| United States — 3.4%(1) | ||||||
| TK NYS Solar Holdco, LLC(3)(4)(5) | ||||||
| (Cost $52,206,469) | N/A | 10,365,844 | ||||
| Special Purpose Acquisition Company Units — 6.0%(1) | ||||||
| Energy Technology — 6.0%(1) | ||||||
| United States — 6.0%(1) | ||||||
| ArcLight Clean Transition Corp. | 170,608 | 1,770,911 | ||||
| Bluescape Opportunities | ||||||
| Acquisition Corp. | 175,338 | 1,756,887 | ||||
| Climate Change Crisis Real Impact | ||||||
| Acquisition Corp. | 170,003 | 1,800,332 | ||||
| Northern Genesis Acquisition Corp | 289,312 | 4,391,756 | ||||
| Star Peak Energy Transition Corp | 172,622 | 1,820,299 | ||||
| Peridot Acquisition Corp. | 162,009 | 1,676,793 | ||||
| Qell Acquisition Corp. | 113,805 | 1,358,832 | ||||
| Rice Acquisition Corp. | 174,753 | 1,810,441 | ||||
| Spartan Acquisition Corp. | 195,156 | 2,066,702 | ||||
| Total Special Purpose | ||||||
| Acquisition Company Units | ||||||
| (Cost $16,243,625) | 18,452,953 | |||||
| Short-Term Investment — 0.0%(1) | ||||||
| United States Investment Company — 0.0%(1) | ||||||
| Invesco Government & Agency Portfolio — Institutional Class, | ||||||
| 0.01%(6) (Cost $140,958) | 140,958 | 140,958 | ||||
| Total Investments — 131.6%(1) | ||||||
| (Cost $501,723,410) | 402,055,626 | |||||
| Interest Rate Swap Contracts — (0.1)%(1) | ||||||
| $10,000,000 notional — net unrealized depreciation(7) | (188,015 | ) | ||||
| Other Assets and Liabilities — 7.9%(1) | 23,986,566 | |||||
| Senior Notes — (28.8)%(1) | (87,926,667 | ) | ||||
| Mandatory Redeemable Preferred Stock | ||||||
| at Liquidation Value — (10.5)%(1) | (32,300,000 | ) | ||||
| Total Net Assets Applicable to | ||||||
| Common Stockholders — 100.0%(1) | $ | 305,627,510 | ||||
| (1) | Calculated as a percentage of net assets applicable to common stockholders. |
| (2) | A portion of the security is segregated as collateral for the unrealized depreciation of interest rate swap contracts of $188,015. |
| (3) | Restricted securities have a total fair value of $48,388,868, which represents 15.8% of net assets. See Note 6 to the financial statements for further disclosure. |
| (4) | Securities have been valued by using significant unobservable inputs in accordance with fair value procedures and are categorized as level 3 investments, as more fully described in Note 2 to the financial statements. |
| (5) | Deemed to be an affiliate of the fund. See Affiliated Company Transactions Note 7 and Basis For Consolidation Note 13 to the financial statements for further disclosure. |
| (6) | Rate indicated is the current yield as of November 30, 2020. |
| (7) | See Schedule of Interest Rate Swap Contracts and Note 12 to the financial statements for further disclosure. |
| See accompanying Notes to Financial Statements. | |
| 26 | Tortoise |
| 2020 Annual Report | November 30, 2020 |
| NTG Schedule of Investments |
| November 30, 2020 |
| Shares/Units | Fair Value | ||||
| Master Limited Partnerships — 86.1%(1) | |||||
| Crude Oil Pipelines — 17.4%(1) | |||||
| United States — 17.4%(1) | |||||
| BP Midstream Partners LP | 522,549 | $ | 5,925,706 | ||
| NuStar Energy L.P. | 277,490 | 3,687,842 | |||
| Plains All American Pipeline, L.P. | 1,452,139 | 11,529,984 | |||
| Shell Midstream Partners, L.P. | 478,987 | 4,914,407 | |||
| 26,057,939 | |||||
| Natural Gas/Natural Gas Liquids Pipelines — 26.3%(1) | |||||
| United States — 26.3%(1) | |||||
| DCP Midstream, LP | 525,160 | 8,481,334 | |||
| Energy Transfer LP | 1,462,141 | 9,036,031 | |||
| Enterprise Products Partners L.P. | 1,127,493 | 21,873,364 | |||
| 39,390,729 | |||||
| Natural Gas Gathering/Processing — 4.1%(1) | |||||
| United States — 4.1%(1) | |||||
| Western Midstream Partners, LP | 473,373 | 6,106,512 | |||
| Renewable Infrastructure — 8.8%(1) | |||||
| United States — 8.8%(1) | |||||
| Enviva Partners LP | 50,640 | 2,260,570 | |||
| Nextera Energy Partners LP | 172,099 | 10,923,124 | |||
| 13,183,694 | |||||
| Refined Product Pipelines — 29.4%(1) | |||||
| United States — 29.4%(1) | |||||
| Magellan Midstream Partners, L.P. | 502,672 | 20,684,953 | |||
| MPLX LP | 894,030 | 18,810,391 | |||
| Phillips 66 Partners LP | 164,252 | 4,415,094 | |||
| 43,910,438 | |||||
| Total Master Limited Partnerships | |||||
| (Cost $178,157,973) | 128,649,312 | ||||
| Common Stock — 39.4%(1) | |||||
| Natural Gas/Natural Gas Liquids Pipelines — 26.2%(1) | |||||
| United States — 26.2%(1) | |||||
| Kinder Morgan Inc. | 603,686 | 8,681,005 | |||
| ONEOK, Inc. | 304,533 | 10,923,599 | |||
| The Williams Companies, Inc. | 935,654 | 19,630,021 | |||
| 39,234,625 | |||||
| Natural Gas Gathering/Processing — 4.4%(1) | |||||
| United States — 4.4%(1) | |||||
| Equitrans Midstream Corp. | 707,241 | 5,771,089 | |||
| Hess Midstream Partners LP | 45,146 | 813,982 | |||
| 6,585,071 | |||||
| Renewable Infrastructure — 8.8%(1) | |||||
| United States — 8.8%(1) | |||||
| Algonquin Power Utilities Corp. | 356,300 | 5,586,784 | |||
| Atlantica Sustainable | |||||
| Infrastructure PLC | 162,050 | 5,572,900 | |||
| Clearway Energy Inc. | 66,778 | 1,954,592 | |||
| 13,114,276 | |||||
| Total Common Stock | |||||
| (Cost $53,922,989) | 58,933,972 | ||||
| See accompanying Notes to Financial Statements. | |
| Tortoise | 27 |
| NTG Schedule of Investments (continued) |
| November 30, 2020 |
| Shares/Units | Fair Value | |||||
| Preferred Stock — 15.4%(1) | ||||||
| Natural Gas Gathering/Processing — 8.3%(1) | ||||||
| United States — 8.3%(1) | ||||||
| Targa Resources Corp., 9.500% (2)(3) | 12,252 | $ | 12,325,266 | |||
| Natural Gas/Natural Gas Liquids Pipelines — 5.8%(1) | ||||||
| United States — 5.8%(1) | ||||||
| Altus Midstream Company, 7.000%(2)(3) | 7,456 | 8,709,349 | ||||
| Renewable Infrastructure — 1.3%(1) | ||||||
| United States — 1.3%(1) | ||||||
| Nextera Energy Inc. | 39,095 | 1,912,918 | ||||
| Total Preferred Stock | ||||||
| (Cost $19,715,371) | 22,947,533 | |||||
| Corporate Bond — 1.3%(1) | ||||||
| Natural Gas Gathering/Processing — 1.3%(1) | ||||||
| United States — 1.3%(1) | ||||||
| Enlink Midstream Partners, | ||||||
| 6.000%, Perpetual | ||||||
| (Cost $2,605,322) | 3,400,000 | 1,870,000 | ||||
| Convertible Note — 1.8%(1) | ||||||
| Solar — 1.8%(1) | ||||||
| Grand Cayman — 1.8%(1) | ||||||
| Sunnova Energy Intl Inc., | ||||||
| 9.75%, 04/30/2025(2)(3) | ||||||
| (Cost $910,000) | 910,000 | 2,753,269 | ||||
| Special Purpose Acquisition Company Units — 6.9%(1) | ||||||
| Energy Technology — 6.9%(1) | ||||||
| United States — 6.9%(1) | ||||||
| ArcLight Clean Transition Corp. | 94,940 | 985,477 | ||||
| Bluescape Opportunities | ||||||
| Acquisition Corp. | 98,145 | 983,413 | ||||
| Climate Change Crisis Real Impact | ||||||
| Acquisition Corp. | 95,043 | 1,006,505 | ||||
| Peridot Acquisition Corp. | 90,157 | 933,125 | ||||
| Qell Acquisition Corp. | 63,626 | 759,694 | ||||
| Rice Acquisition Corp. | 97,976 | 1,015,031 | ||||
| Spartan Acquisition Corp. | 109,199 | 1,156,417 | ||||
| Northern Genesis Acquisition Corp | 160,108 | 2,430,439 | ||||
| Star Peak Energy Transition Corp | 94,757 | 999,213 | ||||
| Total Special Purpose | ||||||
| Acquisition Company Units | ||||||
| (Cost $9,043,739) | 10,269,314 | |||||
| Short-Term Investment — 0.1%(1) | ||||||
| United States Investment Company — 0.1%(1) | ||||||
| First American Government Obligations Fund, | ||||||
| 0.05%(4) (Cost $97,036) | 97,036 | 97,036 | ||||
| Total Investments — 151.0%(1) | ||||||
| (Cost $264,452,430) | 225,520,436 | |||||
| Other Assets and Liabilities — (5.4%)(1) | (8,092,174 | ) | ||||
| Credit Facility Borrowings — (26.8)%(1) | (40,000,000 | ) | ||||
| Senior Notes — (10.3)%(1) | (15,320,855 | ) | ||||
| Mandatory Redeemable Preferred Stock | ||||||
| at Liquidation Value — (8.5)%(1) | (12,700,000 | ) | ||||
| Total Net Assets Applicable to | ||||||
| Common Stockholders — 100.0%(1) | $ | 149,407,407 | ||||
| (1) | Calculated as a percentage of net assets applicable to common stockholders. |
| (2) | Restricted securities have a total fair value of $23,787,884, which represents 15.9% of net assets. See Note 6 to the financial statements for further disclosure. |
| (3) | Securities have been valued by using significant unobservable inputs in accordance with fair value procedures and are categorized as level 3 investments, as more fully described in Note 2 to the financial statements. |
| (4) | Rate indicated is the current yield as of November 30, 2020. |
| See accompanying Notes to Financial Statements. | |
| 28 | Tortoise |
| 2020 Annual Report | November 30, 2020 |
| TTP Schedule of Investments |
| November 30, 2020 |
| Shares/Units | Fair Value | ||||
| Common Stock — 86.9%(1) | |||||
| Crude Oil Pipelines — 27.7%(1) | |||||
| Canada — 21.9%(1) | |||||
| Gibson Energy Inc | 50,815 | $ | 816,202 | ||
| Enbridge Inc. | 175,500 | 5,477,355 | |||
| Inter Pipeline Ltd. | 93,257 | 929,195 | |||
| Pembina Pipeline Corporation | 130,637 | 3,331,560 | |||
| United States — 5.8%(1) | |||||
| Plains GP Holdings, L.P. | 352,356 | 2,794,183 | |||
| 13,348,495 | |||||
| Renewable Infrastructure — 3.8%(1) | |||||
| United States — 3.8%(1) | |||||
| NextEra Energy Partners, LP | 29,030 | 1,842,534 | |||
| Natural Gas Gathering/Processing — 8.8%(1) | |||||
| United States — 8.8%(1) | |||||
| Equitrans Midstream Corporation | 307,343 | 2,507,919 | |||
| Hess Midstream LP | 78,784 | 1,420,476 | |||
| Rattler Midstream LP | 13 | 108 | |||
| Targa Resources Corp. | 11,747 | 276,055 | |||
| 4,204,558 | |||||
| Natural Gas/Natural Gas Liquids Pipelines — 46.6%(1) | |||||
| Canada — 13.0%(1) | |||||
| Keyera Corp. | 73,152 | 1,262,290 | |||
| TC Energy Corporation | 113,623 | 4,991,458 | |||
| United States — 33.6%(1) | |||||
| Kinder Morgan Inc. | 389,508 | 5,601,125 | |||
| ONEOK, Inc. | 108,842 | 3,904,163 | |||
| The Williams Companies, Inc. | 317,849 | 6,668,472 | |||
| 22,427,508 | |||||
| Total Common Stock | |||||
| (Cost $54,640,622) | 41,823,095 | ||||
| Master Limited Partnerships — 34.6%(1) | |||||
| Crude Oil Pipelines — 4.4%(1) | |||||
| United States — 4.4%(1) | |||||
| BP Midstream Partners LP | 14,840 | 168,286 | |||
| NuStar Energy L.P. | 32,670 | 434,184 | |||
| PBF Logistics LP | 24,710 | 230,544 | |||
| Shell Midstream Partners, L.P. | 124,825 | 1,280,705 | |||
| 2,113,719 | |||||
| Natural Gas/Natural Gas Liquids Pipelines — 12.0%(1) | |||||
| United States — 12.0%(1) | |||||
| DCP Midstream, LP | 39,058 | 630,787 | |||
| Energy Transfer LP | 317,787 | 1,963,924 | |||
| Enterprise Products Partners L.P. | 163,236 | 3,166,778 | |||
| 5,761,489 | |||||
| Natural Gas Gathering/Processing — 2.6%(1) | |||||
| United States — 2.6%(1) | |||||
| Noble Midstream Partners LP | 24,065 | 229,339 | |||
| Western Midstream Partners, LP | 79,732 | 1,028,543 | |||
| 1,257,882 | |||||
| Other — 0.2%(1) | |||||
| United States — 0.2%(1) | |||||
| Westlake Chemical Partners LP | 4,940 | 104,876 | |||
| Refined Product Pipelines — 15.4%(1) | |||||
| United States — 15.4%(1) | |||||
| Holly Energy Partners, L.P. | 41,962 | 568,165 | |||
| Magellan Midstream Partners, L.P. | 56,630 | 2,330,325 | |||
| MPLX LP | 160,097 | 3,368,441 | |||
| Phillips 66 Partners LP | 42,166 | 1,133,422 | |||
| 7,400,353 | |||||
| Total Master Limited Partnerships | |||||
| (Cost $22,297,918) | 16,638,319 | ||||
| See accompanying Notes to Financial Statements. | |
| Tortoise | 29 |
| TTP Schedule of Investments (continued) |
| November 30, 2020 |
| Shares/Units | Fair Value | |||||
| Preferred Stock — 11.9%(1) | ||||||
| Natural Gas/Natural Gas Liquids Pipelines — 1.4%(1) | ||||||
| United States — 1.4%(1) | ||||||
| Altus Midstream Company, 7.000%(2)(3) | 554 | $ | 647,057 | |||
| Natural Gas Gathering/Processing — 4.4%(1) | ||||||
| United States — 4.4%(1) | ||||||
| Targa Resources Corp., 9.500%(2)(3) | 2,108 | 2,120,606 | ||||
| Renewable Infrastructure — 6.1%(1) | ||||||
| United States — 6.1%(1) | ||||||
| Sempra Energy, 6.000%, 01/15/2021 | 28,811 | 2,954,856 | ||||
| Total Preferred Stock | ||||||
| (Cost $5,260,216) | 5,722,519 | |||||
| Special Purpose Acquisition Company Units — 6.6%(1) | ||||||
| Energy Technology — 6.6%(1) | ||||||
| United States — 6.6%(1) | ||||||
| ArcLight Clean Transition Corp. | 29,781 | 309,127 | ||||
| Bluescape Opportunities | ||||||
| Acquisition Corp. | 29,721 | 297,804 | ||||
| Climate Change Crisis Real Impact | ||||||
| Acquisition Corp. | 29,790 | 315,476 | ||||
| Northern Genesis Acquisition Corp | 48,873 | 741,892 | ||||
| Peridot Acquisition Corp. | 28,491 | 294,882 | ||||
| Qell Acquisition Corp. | 19,942 | 238,107 | ||||
| Rice Acquisition Corp. | 29,941 | 310,189 | ||||
| Spartan Acquisition Corp. | 32,365 | 342,745 | ||||
| Star Peak Energy Transition Corp | 29,302 | 308,990 | ||||
| Total Special Purpose | ||||||
| Acquisition Company Units | ||||||
| (Cost $2,783,386) | 3,159,212 | |||||
| Short-Term Investment — 3.2%(1) | ||||||
| United States Investment Company — 3.2%(1) | ||||||
| Invesco Government & Agency Portfolio — Institutional Class, | ||||||
| 0.01%(4) (Cost $1,565,040) | 1,565,040 | 1,565,040 | ||||
| Total Investments — 143.2%(1) | ||||||
| (Cost $86,547,182) | 68,908,185 | |||||
| Other Assets and Liabilities — (0.5)%(1) | (242,706 | ) | ||||
| Senior Notes — (30.0)%(1) | (14,457,143 | ) | ||||
| Mandatory Redeemable Preferred Stock | ||||||
| at Liquidation Value — (12.7)%(1) | �� | (6,100,000 | ) | |||
| Total Net Assets Applicable to | ||||||
| Common Stockholders — 100.0%(1) | $ | 48,108,336 | ||||
| (1) | Calculated as a percentage of net assets applicable to common stockholders. |
| (2) | Restricted securities have a total fair value of $2,767,663, which represents 5.8% of net assets. See Note 6 to the financial statements for further disclosure. |
| (3) | Securities have been valued by using significant unobservable inputs in accordance with fair value procedures and are categorized as level 3 investments, as more fully described in Note 2 to the financial statements. |
| (4) | Rate indicated is the current yield as of November 30, 2020. |
| See accompanying Notes to Financial Statements. | |
| 30 | Tortoise |
| 2020 Annual Report | November 30, 2020 |
| NDP Schedule of Investments |
| November 30, 2020 |
| Shares/Units | Fair Value | |||||
| Common Stock — 94.5%(1) | ||||||
| Crude Oil Pipelines — 4.9%(1) | ||||||
| Canada — 4.9%(1) | ||||||
| Enbridge Inc. | 47,200 | $ | 1,473,112 | |||
| Renewable Infrastructure — 6.8%(1) | ||||||
| United States — 6.8%(1) | ||||||
| NextEra Energy, Inc. | 15,200 | 1,118,568 | ||||
| Sempra Energy | 7,500 | 956,100 | ||||
| 2,074,668 | ||||||
| Natural Gas/Natural Gas Liquids Pipelines — 23.7%(1) | ||||||
| United States — 23.7%(1) | ||||||
| Cheniere Energy, Inc.(2) | 38,900 | 2,205,241 | ||||
| Kinder Morgan Inc. | 104,400 | 1,501,272 | ||||
| TC Energy Corporation | 28,748 | 1,262,900 | ||||
| The Williams Companies, Inc. | 105,500 | 2,213,390 | ||||
| 7,182,803 | ||||||
| Oil and Gas Production — 59.1%(1) | ||||||
| United States — 59.1%(1) | ||||||
| BP PLC | 39,283 | 768,375 | ||||
| Cabot Oil & Gas Corporation | 125,700 | 2,202,264 | ||||
| Chevron Corporation | 27,300 | 2,380,014 | ||||
| Concho Resources Inc. | 26,566 | 1,527,014 | ||||
| ConocoPhillips | 35,594 | 1,408,099 | ||||
| Diamondback Energy, Inc. | 39,717 | 1,587,091 | ||||
| EOG Resources, Inc. | 33,000 | 1,547,040 | ||||
| EQT Corporation(2) | 123,800 | 1,842,144 | ||||
| Parsley Energy, Inc. | 67,606 | 847,103 | ||||
| Pioneer Natural Resources Company | 18,700 | 1,880,846 | ||||
| Royal Dutch Shell PLC | 56,700 | 1,918,728 | ||||
| 17,908,718 | ||||||
| Total Common Stock | ||||||
| (Cost $31,270,760) | 28,639,301 | |||||
| Master Limited Partnerships — 9.7%(1) | ||||||
| Natural Gas/Natural Gas Liquids Pipelines — 6.9%(1) | ||||||
| United States — 6.9%(1) | ||||||
| Energy Transfer LP | 116,900 | 722,442 | ||||
| Enterprise Products Partners L.P. | 71,100 | 1,379,340 | ||||
| 2,101,782 | ||||||
| Natural Gas Gathering/Processing — 1.2%(1) | ||||||
| United States — 1.2%(1) | ||||||
| Noble Midstream Partners LP | 37,208 | 354,592 | ||||
| Refined Product Pipelines — 1.6%(1) | ||||||
| United States — 1.6%(1) | ||||||
| Magellan Midstream Partners, L.P. | 11,423 | 470,056 | ||||
| Total Master Limited Partnerships | ||||||
| (Cost $4,381,818) | 2,926,430 | |||||
| Preferred Stock — 6.6%(1) | ||||||
| Natural Gas Gathering/Processing — 6.6%(1) | ||||||
| United States — 6.6%(1) | ||||||
| Targa Resources Corp., 9.500%(3)(4) | ||||||
| (Cost $1,688,542) | 1,997 | 2,008,943 | ||||
| Special Purpose Acquisition Company Units — 5.4%(1) | ||||||
| Energy Technology — 5.4%(1) | ||||||
| United States — 5.4%(1) | ||||||
| ArcLight Clean Transition Corp. | 15,543 | 161,336 | ||||
| Bluescape Opportunities Acquisition | ||||||
| Corp. | 15,155 | 151,853 | ||||
| Climate Change Crisis Real Impact | ||||||
| Acquisition Corp. | 15,471 | 163,838 | ||||
| Northern Genesis Acquisition Corp | 25,810 | 391,796 | ||||
| Peridot Acquisition Corp. | 14,885 | 154,060 | ||||
| Qell Acquisition Corp. | 10,357 | 123,663 | ||||
| Rice Acquisition Corp. | 15,364 | 159,171 | ||||
| Spartan Acquisition Corp. | 17,033 | 180,379 | ||||
| Star Peak Energy Transition Corp | 15,646 | 164,987 | ||||
| Total Special Purpose | ||||||
| Acquisition Company Units | ||||||
| (Cost $1,453,329) | 1,651,083 | |||||
| Short-Term Investment — 0.3%(1) | ||||||
| United States Investment Company — 0.3%(1) | ||||||
| Invesco Government & Agency Portfolio — Institutional Class, | ||||||
| 0.01%(5) (Cost $76,098) | 76,098 | 76,098 | ||||
| Total Investments — 116.5%(1) | ||||||
| (Cost $38,870,547) | 35,301,855 | |||||
| Other Assets and Liabilities — 0.0%(1) | 5,092 | |||||
| Credit Facility Borrowings — (16.5)%(1) | (5,000,000 | ) | ||||
| Total Net Assets Applicable to | ||||||
| Common Stockholders — 100.0%(1) | $ | 30,306,947 | ||||
| (1) | Calculated as a percentage of net assets applicable to common stockholders. |
| (2) | Non-income producing security. |
| (3) | Restricted securities have a total fair value of $2,008,943, which represents 6.6% of net assets. See Note 6 to the financial statements for further disclosure. |
| (4) | Securities have been valued by using significant unobservable inputs in accordance with fair value procedures and are categorized as level 3 investments, as more fully described in Note 2 to the financial statements. |
| (5) | Rate indicated is the current yield as of November 30, 2020. |
| See accompanying Notes to Financial Statements. | |
| Tortoise | 31 |
| TPZ Schedule of Investments |
| November 30, 2020 |
| Principal Amount/ | |||||
| Shares/Units | Fair Value | ||||
| Corporate Bonds — 74.6%(1) | |||||
| Crude Oil Pipelines — 8.0%(1) | |||||
| Canada — 8.0%(1) | |||||
| Enbridge Inc., 5.500%, 07/15/2077 | 7,042,000 | $ | 7,147,630 | ||
| Natural Gas/Natural Gas Liquids Pipelines — 25.2%(1) | |||||
| United States — 25.2%(1) | |||||
| Cheniere Corp., | |||||
| 7.000%, 06/30/2024 | 4,000,000 | 4,617,114 | |||
| Cheniere Corp., | |||||
| 5.875%, 03/31/2025 | 2,000,000 | 2,293,490 | |||
| ONEOK, Inc., | |||||
| 4.250%, 02/01/2022 | 4,500,000 | 4,641,216 | |||
| ONEOK, Inc., | |||||
| 7.500%, 09/01/2023 | 2,000,000 | 2,301,823 | |||
| Rockies Express Pipeline LLC, | |||||
| 4.950%, 07/15/2029(2) | 3,000,000 | 3,022,500 | |||
| Ruby Pipeline, LLC, | |||||
| 6.000%, 04/01/2022(2) | 943,182 | 886,727 | |||
| Southern Star Central Corp., | |||||
| 5.125%, 07/15/2022(2) | 1,642,000 | 1,644,340 | |||
| Tallgrass Energy LP, | |||||
| 5.500%, 01/15/2028(2) | 3,250,000 | 3,095,625 | |||
| 22,502,835 | |||||
| Natural Gas Gathering/Processing — 25.9%(1) | |||||
| United States — 25.9%(1) | |||||
| Antero Midstream Partners LP, | |||||
| 5.750%, 03/01/2027(2) | 2,000,000 | 1,822,500 | |||
| Blue Racer Midstream, LLC, | |||||
| 6.625%, 07/15/2026(2) | 5,900,000 | 5,546,000 | |||
| EnLink Midstream LLC, | |||||
| 5.375%, 06/01/2029 | 3,000,000 | 2,842,500 | |||
| Hess Corporation, | |||||
| 5.625%, 02/15/2026(2) | 4,160,000 | 4,295,200 | |||
| The Williams Companies, Inc., | |||||
| 7.875%, 09/01/2021 | 5,000,000 | 5,271,216 | |||
| The Williams Companies, Inc., | |||||
| 4.550%, 06/24/2024 | 3,000,000 | 3,370,547 | |||
| 23,147,963 | |||||
| Oil and Gas Production — 3.6%(1) | |||||
| United States — 3.6%(1) | |||||
| Ascent Resources Utica Holdings, LLC, | |||||
| 10.000%, 04/01/2022(2) | 1,302,000 | 1,311,765 | |||
| Ascent Resources Utica Holdings, LLC, | |||||
| 7.000%, 11/01/2026(2) | 2,000,000 | 1,880,000 | |||
| 3,191,765 | |||||
| Power — 2.3%(1) | |||||
| United States — 2.3%(1) | |||||
| Duquesne Light Holdings, Inc., | |||||
| 5.900%, 12/01/2021(2) | 2,000,000 | 2,090,540 | |||
| Renewable Infrastructure — 5.5%(1) | |||||
| United States — 5.5%(1) | |||||
| NextEra Energy, Inc., | |||||
| 4.800%, 12/01/2077 | 4,500,000 | 4,944,721 | |||
| Refined Product Pipelines — 4.1%(1) | |||||
| United States — 4.1%(1) | |||||
| Buckeye Partners, | |||||
| 5.600%, 10/15/2044 | 2,000,000 | 1,844,900 | |||
| Buckeye Partners, | |||||
| 5.850%, 11/15/2043 | 2,000,000 | 1,860,000 | |||
| 3,704,900 | |||||
| Total Corporate Bonds | |||||
| (Cost $64,442,642) | 66,730,354 | ||||
| Convertible Note — 0.9%(1) | |||||
| Solar — 0.9%(1) | |||||
| Grand Cayman — 0.9%(1) | |||||
| Sunnova Energy Intl Inc., | |||||
| 9.750%, 04/30/2025(2)(3) | |||||
| (Cost $262,000) | 262,000 | 792,699 | |||
| Master Limited Partnerships — 24.6%(1) | |||||
| Crude Oil Pipelines — 3.3%(1) | |||||
| United States — 3.3%(1) | |||||
| BP Midstream Partners LP | 21,729 | 246,407 | |||
| NuStar Energy L.P. | 88,934 | 1,181,933 | |||
| PBF Logistics LP | 74,599 | 696,009 | |||
| Shell Midstream Partners, L.P. | 77,365 | 793,765 | |||
| 2,918,114 | |||||
| Renewable Infrastructure — 0.6%(1) | |||||
| United States — 0.6%(1) | |||||
| Nextera Energy Partners LP | 8,013 | 508,585 | |||
| Natural Gas/Natural Gas Liquids Pipelines — 7.0%(1) | |||||
| United States — 7.0%(1) | |||||
| DCP Midstream, LP | 84,184 | 1,359,572 | |||
| Energy Transfer LP | 302,035 | 1,866,576 | |||
| Enterprise Products Partners L.P. | 157,283 | 3,051,290 | |||
| 6,277,438 | |||||
| Natural Gas Gathering/Processing — 2.5%(1) | |||||
| United States — 2.5%(1) | |||||
| Noble Midstream Partners LP | 21,975 | 209,422 | |||
| Western Midstream Partners, LP | 154,434 | 1,992,199 | |||
| 2,201,621 | |||||
| See accompanying Notes to Financial Statements. | |
| 32 | Tortoise |
| 2020 Annual Report | November 30, 2020 |
| TPZ Schedule of Investments (continued) |
| November 30, 2020 |
| Principal Amount/ | ||||||
| Shares/Units | Fair Value | |||||
| Other — 0.2%(1) | ||||||
| United States — 0.2%(1) | ||||||
| Westlake Chemical Partners LP | 8,074 | $ | 171,411 | |||
| Refined Product Pipelines — 11.0%(1) | ||||||
| United States — 11.0%(1) | ||||||
| Holly Energy Partners, L.P. | 93,991 | 1,272,638 | ||||
| Magellan Midstream Partners, L.P. | 65,132 | 2,680,182 | ||||
| MPLX LP | 226,804 | 4,771,956 | ||||
| Phillips 66 Partners LP | 44,325 | 1,191,456 | ||||
| 9,916,232 | ||||||
| Total Master Limited Partnerships | ||||||
| (Cost $32,024,146) | 21,993,401 | |||||
| Common Stock — 17.1%(1) | ||||||
| Crude Oil Pipelines — 3.4%(1) | ||||||
| United States — 3.4%(1) | ||||||
| Enbridge Inc. | 53,741 | 1,677,257 | ||||
| Plains GP Holdings, L.P. | 173,099 | 1,372,675 | ||||
| 3,049,932 | ||||||
| Natural Gas/Natural Gas Liquids Pipelines — 9.2%(1) | ||||||
| Canada — 2.4%(1) | ||||||
| TC Energy Corporation | 48,667 | 2,137,941 | ||||
| United States — 6.8%(1) | ||||||
| Kinder Morgan Inc. | 214,709 | 3,087,515 | ||||
| ONEOK, Inc. | 5,606 | 201,087 | ||||
| The Williams Companies, Inc. | 135,347 | 2,839,580 | ||||
| 8,266,123 | ||||||
| Natural Gas Gathering/Processing — 2.7%(1) | ||||||
| United States — 2.7%(1) | ||||||
| EnLink Midstream LLC | 90,964 | 336,567 | ||||
| Equitrans Midstream Corporation | 108,596 | 886,143 | ||||
| Hess Midstream LP | 66,901 | 1,206,225 | ||||
| 2,428,935 | ||||||
| Power — 1.2%(1) | ||||||
| United States — 1.2%(1) | ||||||
| DTE Energy Company | 8,116 | 1,021,074 | ||||
| Renewable Infrastructure — 0.6%(1) | ||||||
| United States — 0.6%(1) | ||||||
| Atlantica Sustainable | ||||||
| Infrastructure PLC | 16,523 | 568,226 | ||||
| Total Common Stock | ||||||
| (Cost $18,827,164) | 15,334,290 | |||||
| Preferred Stock — 4.9%(1) | ||||||
| Natural Gas Gathering/Processing — 1.9%(1) | ||||||
| United States — 1.9%(1) | ||||||
| Targa Resources Corp., 9.500%(2)(3) | 1,685 | 1,695,076 | ||||
| Natural Gas Liquids Pipelines — 0.6%(1) | ||||||
| United States — 0.6%(1) | ||||||
| Altus Midstream Company, 7.000%(2)(3) | 483 | 564,322 | ||||
| Renewable Infrastructure — 2.4%(1) | ||||||
| United States — 2.4%(1) | ||||||
| Sempra Energy, 6.000%, 01/15/2021 | 21,189 | 2,173,144 | ||||
| Total Preferred Stock | ||||||
| (Cost $4,058,191) | 4,432,542 | |||||
| Special Purpose Acquisition Company Units — 6.1%(1) | ||||||
| Energy Technology — 6.1%(1) | ||||||
| United States — 6.1%(1) | ||||||
| ArcLight Clean Transition Corp. | 52,972 | 549,849 | ||||
| Bluescape Opportunities | ||||||
| Acquisition Corp. | 53,868 | 539,757 | ||||
| Climate Change Crisis Real Impact | ||||||
| Acquisition Corp. | 53,355 | 565,029 | ||||
| Northern Genesis Acquisition Corp | 81,638 | 1,239,265 | ||||
| Peridot Acquisition Corp. | 50,672 | 524,455 | ||||
| Qell Acquisition Corp. | 35,718 | 426,473 | ||||
| Rice Acquisition Corp. | 54,038 | 559,834 | ||||
| Spartan Acquisition Corp. | 56,247 | 595,656 | ||||
| Star Peak Energy Transition Corp | 42,121 | 444,166 | ||||
| Total Special Purpose | ||||||
| Acquisition Company Units | ||||||
| (Cost $4,808,664) | 5,444,484 | |||||
| Short-Term Investment — 0.1%(1) | ||||||
| United States Investment Company — 0.1%(1) | ||||||
| Invesco Government & Agency Portfolio — Institutional Class, | ||||||
| 0.01%(4) (Cost $43,354) | 43,354 | 43,354 | ||||
| Total Investments — 128.3%(1) | ||||||
| (Cost $124,466,161) | 114,771,124 | |||||
| Other Assets and Liabilities — 1.0%(1) | 854,818 | |||||
| Credit Facility Borrowings — (29.3)%(1) | (26,200,000 | ) | ||||
| Total Net Assets Applicable to | ||||||
| Common Stockholders — 100.0%(1) | $ | 89,425,942 | ||||
| (1) | Calculated as a percentage of net assets applicable to common stockholders. |
| (2) | Restricted securities have a total fair value of $28,647,294 which represents 32.0% of net assets. See Note 6 to the financial statements for further disclosure. |
| (3) | Securities have been valued by using significant unobservable inputs in accordance with fair value procedures and are categorized as level 3 investments, as more fully described in Note 2 to the financial statements. |
| (4) | Rate indicated is the current yield as of November 30, 2020. |
| See accompanying Notes to Financial Statements. | |
| Tortoise | 33 |
| TEAF Consolidated Schedule of Investments |
| November 30, 2020 |
| Principal Amount/ | |||||
| Shares/Units | Fair Value | ||||
| Common Stock — 38.1%(1) | |||||
| Natural Gas/Natural Gas Liquids Pipelines — 6.0%(1) | |||||
| Australia — 1.1%(1) | |||||
| APA Group(4) | 318,729 | $ | 2,421,508 | ||
| Italy — 1.8%(1) | |||||
| Snam SpA(2) | 693,360 | 3,889,724 | |||
| United States — 3.1%(1) | |||||
| Cheniere Energy Inc.(2)(3)(4) | 39,892 | 2,261,477 | |||
| ONEOK, Inc. | 28 | 1,004 | |||
| The Williams Companies, Inc.(4) | 204,900 | 4,298,802 | |||
| 12,872,515 | |||||
| Natural Gas Gathering/Processing — 3.4%(1) | |||||
| United States — 3.4%(1) | |||||
| Equitrans Midstream Corp.(4) | 559,599 | 4,566,326 | |||
| Targa Resources Corp.(2)(4) | 115,542 | 2,715,237 | |||
| 7,281,563 | |||||
| Other — 1.5%(1) | |||||
| Australia — 0.7%(1) | |||||
| Atlas Arteria Ltd.(4) | 321,360 | 1,528,590 | |||
| Spain — 0.8%(1) | |||||
| Ferrovial SA(4) | 61,350 | 1,706,586 | |||
| 3,235,176 | |||||
| Power — 19.7%(1) | |||||
| Australia — 1.7%(1) | |||||
| Spark Infrastructure Group(4) | 2,368,315 | 3,563,833 | |||
| Canada — 1.5%(1) | |||||
| Algonquin Power & Utilities Corp(4) | 201,460 | 3,156,781 | |||
| Italy — 2.9%(1) | |||||
| Enel SpA(2) | 631,186 | 6,301,846 | |||
| Portugal — 3.1%(1) | |||||
| EDP — Energias de Portugal SA(4) | 1,246,191 | 6,641,755 | |||
| Spain — 4.2%(1) | |||||
| Endesa SA | 177,950 | 5,088,046 | |||
| Iberdrola SA(2) | 287,193 | 3,920,800 | |||
| United States — 3.3%(1) | |||||
| Covanta Holding Corp(4) | 272,775 | 3,382,410 | |||
| Edison International(4) | 27,737 | 1,701,942 | |||
| FirstEnergy Corp(4) | 72,968 | 1,938,030 | |||
| United Kingdom — 3.0%(1) | |||||
| National Grid PLC | 330,254 | 3,735,335 | |||
| SSE PLC(4) | 149,189 | 2,667,144 | |||
| 42,097,922 | |||||
| Renewables — 4.9%(1) | |||||
| Canada — 4.9%(1) | |||||
| Brookfield Renewable Corp.(4) | 20,023 | 1,571,066 | |||
| Innergex Renewable Energy Inc(4) | 218,370 | 4,321,328 | |||
| TransAlta Renewables Inc(4) | 335,743 | 4,637,891 | |||
| 10,530,285 | |||||
| Transportation / Storage — 1.1%(1) | |||||
| Hong Kong — 1.1%(1) | |||||
| China Suntien Green Energy Corp. | 8,675,539 | 2,294,509 | |||
| Water Infrastructure — 1.5%(1) | |||||
| United Kingdom — 1.5%(1) | |||||
| Pennon Group PLC(4) | 252,172 | 3,179,633 | |||
| Total Common Stock | |||||
| (Cost $76,324,692) | 81,491,603 | ||||
| Master Limited Partnerships — 6.7%(1) | |||||
| Natural Gas/Natural Gas Liquids Pipelines — 1.9%(1) | |||||
| United States — 1.9%(1) | |||||
| Enterprise Products Partners L.P.(2)(4) | 209,000 | 4,054,596 | |||
| Refined Product Pipelines — 2.0%(1) | |||||
| United States — 2.0%(1) | |||||
| MPLX LP(2)(4) | 206,761 | 4,350,251 | |||
| Renewables — 2.8%(1) | |||||
| Canada — 0.8%(1) | |||||
| Brookfield Renewable Partners LP | 26,432 | 1,679,909 | |||
| United States — 2.0%(1) | |||||
| Enviva Partners LP(4) | 97,485 | 4,351,730 | |||
| 6,031,639 | |||||
| Total Master Limited Partnerships | |||||
| (Cost $10,903,999) | 14,436,486 | ||||
| Corporate Bonds — 15.1%(1) | |||||
| Education — 0.3%(1) | |||||
| United States — 0.3%(1) | |||||
| Village Charter School, Inc., 10.000%, | |||||
| 12/15/2021 | 800,000 | 600,000 | |||
| Healthcare — 2.5%(1) | |||||
| United States — 2.5%(1) | |||||
| Grace Commons Property, | |||||
| 15.000%, 10/31/2023(5) | 1,825,000 | 1,778,023 | |||
| Grace Commons Property, | |||||
| 8.000%, 10/31/2021(5) | 3,650,000 | 3,553,523 | |||
| 5,331,546 | |||||
| Natural Gas Gathering/Processing — 3.8%(1) | |||||
| United States — 3.8%(1) | |||||
| Antero Midstream Partners LP, | |||||
| 5.750%, 01/15/2028(4)(5) | 3,750,000 | 3,375,000 | |||
| Blue Racer Midstream, LLC, | |||||
| 6.625%, 07/15/2026(4)(5) | 3,000,000 | 2,820,000 | |||
| EQT Midstream Partners LP, | |||||
| 4.75%, 07/15/2023(4) | 1,750,000 | 1,785,000 | |||
| 7,980,000 | |||||
| Oil and Gas Production — 1.5%(1) | |||||
| United States — 1.5%(1) | |||||
| Ascent Resources Utica Holdings, LLC, | |||||
| 7.000%, 11/01/2026(4)(5) | 3,500,000 | 3,290,000 | |||
| See accompanying Notes to Financial Statements. | |
| 34 | Tortoise |
| 2020 Annual Report | November 30, 2020 |
| TEAF Consolidated Schedule of Investments (continued) |
| November 30, 2020 |
| Principal Amount/ | |||||
| Shares/Units | Fair Value | ||||
| Project Finance — 5.0%(1) | |||||
| United States — 5.0%(1) | |||||
| C2NC Holdings, | |||||
| 13.000%, 05/01/2027(4) | 10,715,000 | $ | 10,758,289 | ||
| Senior Living — 2.0%(1) | |||||
| United States — 2.0%(1) | |||||
| Drumlin Reserve Property LLC, | |||||
| 16.000%, 10/02/2025(5) | 1,050,000 | 1,055,211 | |||
| Drumlin Reserve Property LLC, | |||||
| 10.000%, 10/02/2025(5) | 1,705,311 | 1,713,802 | |||
| Realco Perry Hall MD LLC/OPCO, | |||||
| 10.000%, 10/01/2024(5) | 2,280,000 | 1,550,382 | |||
| 4,319,395 | |||||
| Total Corporate Bonds | |||||
| (Cost $33,322,352) | 32,279,230 | ||||
| Municipal Bonds — 10.8%(1) | |||||
| California — 0.2%(1) | |||||
| California ST Enterprise Dev A | |||||
| Rev Bonds, | |||||
| 10.000%, 06/15/2030 | 380,000 | 357,694 | |||
| Florida — 0.5%(1) | |||||
| Florida Development Finance Corp, | |||||
| 10.000%, 07/01/2025 | 445,000 | 400,500 | |||
| Florida Development Finance Corp, | |||||
| 10.000%, 02/15/2028 | 595,000 | 586,843 | |||
| 987,343 | |||||
| Ohio — 4.2%(1) | |||||
| Southern Ohio Port Authority, | |||||
| 13.000%, 12/01/2027 | 9,000,000 | 9,013,500 | |||
| Pennsylvania — 1.4%(1) | |||||
| Philadelphia Authority for Industrial | |||||
| Development, | |||||
| 5.210%, 06/15/2030 | 3,135,000 | 3,098,321 | |||
| Texas — 0.2%(1) | |||||
| Pioneer Technology & Arts Academy | |||||
| Project — Series B, | |||||
| 10.000%, 01/01/2026 | 410,000 | 369,000 | |||
| Wisconsin — 4.3%(1) | |||||
| Public Finance Authority, | |||||
| 9.000%, 06/01/2029 | 8,925,000 | 9,085,293 | |||
| Public Finance Authority | |||||
| Educational Facility Revenue, | |||||
| 12.000%, 01/01/2029 | 185,000 | 182,467 | |||
| 9,267,760 | |||||
| Total Municipal Bonds | |||||
| (Cost $23,050,757) | 23,093,618 | ||||
| Preferred Bonds — 4.7%(1) | |||||
| Natural Gas Gathering/Processing — 2.5%(1) | |||||
| United States — 2.5%(1) | |||||
| DCP Midstream LP, | |||||
| 7.375% Perpetuity(4) | 5,000,000 | 3,668,750 | |||
| EnLink Midstream Partners LP, | |||||
| 6.000%, Perpetuity | 3,000,000 | 1,650,000 | |||
| 5,318,750 | |||||
| Natural Gas/Natural Gas Liquids Pipelines — 2.2%(1) | |||||
| United States — 2.2%(1) | |||||
| Energy Transfer Operating LP, | |||||
| 6.250%, Perpetuity(4) | 6,000,000 | 4,781,250 | |||
| Total Preferred Bonds | |||||
| (Cost $13,385,258) | 10,100,000 | ||||
| Construction Note — 1.6%(1) | |||||
| Renewables — 1.6%(1) | |||||
| Bermuda — 1.6%(1) | |||||
| Saturn Solar Bermuda 1 Ltd., | |||||
| 8.000%, 12/31/2020 | |||||
| (Cost $3,778,904)(5)(6) | 3,510,000 | 3,522,987 | |||
| Convertible Note — 1.6%(1) | |||||
| Solar — 1.6%(1) | |||||
| Grand Cayman — 1.6%(1) | |||||
| Sunnova Energy Intl Inc., | |||||
| 9.75%, 04/30/2025 | |||||
| (Cost $1,090,300)(5)(6) | 1,098,000 | 3,322,076 | |||
| Preferred Stock — 10.2%(1) | |||||
| Natural Gas Gathering/Processing — 1.9%(1) | |||||
| United States — 1.9%(1) | |||||
| Targa Resources Corp., 9.500%(5)(6) | 4,000 | 4,023,920 | |||
| Natural Gas/Natural Gas Liquids Pipelines — 6.4%(1) | |||||
| United States — 6.4%(1) | |||||
| Altus Midstream Company, 7.000%(5)(6) | 4,294 | 5,015,933 | |||
| Crestwood Equity Partners LP, 9.250%(4) | 512,909 | 3,605,750 | |||
| Enterprise Products | |||||
| Partners L.P., 7.250%(5)(6) | 5,000 | 5,065,050 | |||
| 13,686,733 | |||||
| Renewables — 0.7%(1) | |||||
| United States — 0.7%(1) | |||||
| NextEra Energy Partners LP | 25,380 | 1,436,254 | |||
| Water Utilities — 1.2%(1) | |||||
| United States — 1.2%(1) | |||||
| Essential Utilities, Inc. | 43,148 | 2,537,534 | |||
| Total Preferred Stock | |||||
| (Cost $22,297,227) | 21,684,441 | ||||
| See accompanying Notes to Financial Statements. | |
| Tortoise | 35 |
| TEAF Consolidated Schedule of Investments (continued) |
| November 30, 2020 |
| Principal Amount/ | ||||||
| Shares/Units | Fair Value | |||||
| Private Investments — 22.2%(1) | ||||||
| Natural Gas/Natural Gas Liquids Pipelines — 0.1%(1) | ||||||
| Mexico — 0.1%(1) | ||||||
| Mexico Pacific Limited LLC (MPL) | ||||||
| Series A(5)(6) | 88,889 | $ | 237,334 | |||
| Renewables — 22.1%(1) | ||||||
| United States — 22.1%(1) | ||||||
| Renewable Holdco, LLC(5)(6)(7) | N/A | 15,395,885 | ||||
| Renewable Holdco I, LLC(5)(6)(7) | N/A | 25,581,152 | ||||
| Renewable Holdco II, LLC(5)(6)(7) | N/A | 6,216,336 | ||||
| 47,193,373 | ||||||
| Total Private Investments | ||||||
| (Cost $48,573,918) | 47,430,707 | |||||
| Special Purpose Acquisition Company Units — 2.4%(1) | ||||||
| Energy Technology — 2.4%(1) | ||||||
| United States — 2.4%(1) | ||||||
| ArcLight Clean Transition Corp. | 56,156 | 582,899 | ||||
| Bluescape Opportunities | ||||||
| Acquisition Corp. | 57,773 | 578,885 | ||||
| Climate Change Crisis Real Impact | ||||||
| Acquisition Corp.(4) | 56,338 | 596,619 | ||||
| Northern Genesis Acquisition Corp.(4) | 83,772 | 1,271,659 | ||||
| Peridot Acquisition Corp. | 53,786 | 556,685 | ||||
| Qell Acquisition Corp. | 37,714 | 450,305 | ||||
| Rice Acquisition Corp. | 57,928 | 600,134 | ||||
| Star Peak Energy Transition Corp. | 40,719 | 429,382 | ||||
| Total Special Purpose | ||||||
| Acquisition Company Units | ||||||
| (Cost $4,453,443) | 5,066,568 | |||||
| Short-Term Investment — 0.2%(1) | ||||||
| United States Investment Company — 0.2%(1) | ||||||
| First American Government Obligations Fund, | ||||||
| 0.05%(8) (Cost $475,125) | 475,125 | 475,125 | ||||
| Total Investments — 113.6%(1) | ||||||
| (Cost $237,655,975) | 242,902,841 | |||||
| Total Value of Options Written | ||||||
| (Premiums received $216,428)(9) — (0.1)%(1) | (219,521 | ) | ||||
| Other Assets and Liabilities — 1.0%(1) | 2,241,675 | |||||
| Credit Facility Borrowings — (14.5)%(1) | (31,100,000 | ) | ||||
| Total Net Assets Applicable to | ||||||
| Common Stockholders — 100.0%(1) | $ | 213,824,995 | ||||
| (1) | Calculated as a percentage of net assets applicable to common stockholders. |
| (2) | All or a portion of the security represents cover for outstanding call option contracts written. |
| (3) | Non-income producing security. |
| (4) | All or a portion of the security is segregated as collateral for the margin borrowing facility. See Note 11 to the financial statements for further disclosure. |
| (5) | Restricted securities have a total fair value of $87,516,614 which represents 40.8% of net assets. See Note 7 to the financial statements for further disclosure. |
| (6) | Securities have been valued by using significant unobservable inputs in accordance with fair value procedures and are categorized as level 3 investments, as more fully described in Note 2 to the financial statements. |
| (7) | Deemed to be an affiliate of the fund. See Affiliated Company Transactions Note 7 and Basis For Consolidation Note 13 to the financial statements for further disclosure. |
| (8) | Rate indicated is the current yield as of November 30, 2020. |
| (9) | See Schedule of Options Written and Note 12 to the financial statements for further disclosure. |
| See accompanying Notes to Financial Statements. | |
| 36 | Tortoise |
| 2020 Annual Report | November 30, 2020 |
| Schedule of Interest Rate Swap Contracts |
| November 30, 2020 |
| TYG | |||||||||||||
| Fixed Rate | Floating Rate | ||||||||||||
| Maturity | Notional | Paid by | Received by | Unrealized | |||||||||
| Counterparty | Date | Amount | TYG | TYG | Depreciation | ||||||||
| The Bank of Nova Scotia | 09/02/2021 | $ | 10,000,000 | 2.381% | 1-month U.S. Dollar LIBOR | $ | (188,015 | ) | |||||
Schedule of Options Written
November 30, 2020
| TEAF | ||||||||||||||
| Call Options Written | Expiration Date | Strike Price | Contracts | Notional Value | Fair Value | |||||||||
| Enterprise Products Partners L.P. | December 2020 | $ | 21.00 | 1,565 | $ | 3,286,500 | $ | (21,910 | ) | |||||
| Cheniere Energy Inc. | December 2020 | $ | 60.00 | 398 | 2,388,000 | (31,840 | ) | |||||||
| MPLX LP | December 2020 | $ | 23.00 | 1,550 | 3,565,000 | (23,250 | ) | |||||||
| Targa Resources Corp. | December 2020 | $ | 29.00 | 578 | 1,676,200 | (7,225 | ) | |||||||
| Targa Resources Corp. | December 2020 | $ | 30.00 | 577 | 1,731,000 | (4,327 | ) | |||||||
| Enel SpA | December 2020 | € | 8.70 | 1,200 | 6,226,665 | (30,203 | ) | |||||||
| Iberdrola SA | December 2020 | € | 11.50 | 2,800 | 3,840,970 | (53,440 | ) | |||||||
| Snam SpA | December 2020 | € | 4.80 | 345 | 1,975,356 | (30,659 | ) | |||||||
| Snam SpA | December 2020 | € | 4.90 | 345 | 2,016,509 | (16,667 | ) | |||||||
| Total Value of Call Options Written (Premiums received $216,428) | $ | 26,706,200 | $ | (219,521 | ) | |||||||||
| See accompanying Notes to Financial Statements. | |
| Tortoise | 37 |
| Statements of Assets & Liabilities |
| November 30, 2020 |
| Tortoise Energy | Tortoise | |||||||
| Infrastructure | Midstream Energy | |||||||
| Corp.(1) | Fund, Inc. | |||||||
| Assets | ||||||||
| Investments in unaffiliated securities at fair value(2) | $ | 391,689,782 | $ | 225,520,436 | ||||
| Investments in affiliated securities at fair value(3) | 10,365,844 | — | ||||||
| Cash | — | — | ||||||
| Foreign Currency | — | — | ||||||
| Receivable for investments sold | 235,670 | 130,408 | ||||||
| Dividends, distributions and interest receivable from investments | 814,519 | 525,259 | ||||||
| Tax reclaims receivable | — | — | ||||||
| Income tax receivable | 52,052,354 | — | ||||||
| Prepaid expenses and other assets | 680,592 | 272,406 | ||||||
| Total assets | 455,838,761 | 226,448,509 | ||||||
| Liabilities | ||||||||
| Call options written, at fair value(4) | — | — | ||||||
| Payable to Adviser | 551,620 | 300,856 | ||||||
| Accrued directors’ fees and expenses | 3,224 | 4,493 | ||||||
| Payable for shares repurchased | 585,258 | 311,047 | ||||||
| Accrued expenses and other liabilities | 2,279,873 | 512,550 | ||||||
| Unrealized depreciation of interest rate swap contracts | 188,015 | — | ||||||
| Current tax liability | 13,388,910 | 7,929,170 | ||||||
| Deferred tax liability | — | — | ||||||
| Credit facility borrowings | 13,200,000 | 40,000,000 | ||||||
| Senior notes, net(5) | 87,831,607 | 15,309,967 | ||||||
| Mandatory redeemable preferred stock, net(6) | 32,182,744 | 12,673,019 | ||||||
| Total liabilities | 150,211,251 | 77,041,102 | ||||||
| Net assets applicable to common stockholders | $ | 305,627,510 | $ | 149,407,407 | ||||
| Net Assets Applicable to Common Stockholders Consist of: | ||||||||
| Capital stock, $0.001 par value per share | $ | 12,250 | $ | 5,846 | ||||
| Additional paid-in capital | 648,240,797 | 568,237,758 | ||||||
| Total distributable earnings (accumulated losses) | (342,625,537 | ) | (418,836,197 | ) | ||||
| Net assets applicable to common stockholders | $ | 305,627,510 | $ | 149,407,407 | ||||
| Capital shares: | ||||||||
| Authorized | 100,000,000 | 100,000,000 | ||||||
| Outstanding | 12,249,839 | 5,845,517 | ||||||
| Net Asset Value per common share outstanding (net assets applicable | ||||||||
| to common stock, divided by common shares outstanding) | $ | 24.95 | $ | 25.56 | ||||
| (1) Consolidated Statement of Assets and Liabilities (See Note 13 to the financial statements for further disclosure) | ||||||||
| (2) Investments in unaffiliated securities at cost | $ | 449,516,940 | $ | 264,452,430 | ||||
| (3) Investments in affiliated securities at cost | $ | 52,206,470 | $ | — | ||||
| (4) Call options written, premiums received | $ | — | $ | — | ||||
| (5) Deferred debt issuance and offering costs | $ | 95,060 | $ | 10,888 | ||||
| (6) Deferred offering costs | $ | 117,256 | $ | 26,981 | ||||
| See accompanying Notes to Financial Statements. | |
| 38 | Tortoise |
| 2020 Annual Report | November 30, 2020 |
| Tortoise Power | Tortoise | ||||||||||||||
| Tortoise Pipeline | Tortoise Energy | and Energy | Essential Assets | ||||||||||||
| & Energy | Independence | Infrastructure | Income Term | ||||||||||||
| Fund, Inc. | Fund, Inc. | Fund, Inc. | Fund(1) | ||||||||||||
| $ | 68,908,185 | $ | 35,301,855 | $ | 114,771,124 | $ | 195,709,468 | ||||||||
| — | — | — | 47,193,373 | ||||||||||||
| — | — | — | 138,110 | ||||||||||||
| — | — | — | 97,905 | ||||||||||||
| 39,813 | 21,024 | 66,502 | 68,233 | ||||||||||||
| 147,392 | 146,655 | 1,352,816 | 2,673,512 | ||||||||||||
| 14,247 | 2,926 | 15,590 | 222,554 | ||||||||||||
| — | — | — | — | ||||||||||||
| 96,976 | 9,685 | 5,801 | 8,529 | ||||||||||||
| 69,206,613 | 35,482,145 | 116,211,833 | 246,111,684 | ||||||||||||
| — | — | — | 219,521 | ||||||||||||
| 124,181 | 58,752 | 174,245 | 533,163 | ||||||||||||
| 4,106 | 4,087 | 4,025 | 4,194 | ||||||||||||
| 72,097 | — | 127,737 | — | ||||||||||||
| 395,113 | 112,359 | 279,884 | 254,113 | ||||||||||||
| — | — | — | — | ||||||||||||
| — | — | — | — | ||||||||||||
| — | — | — | 175,698 | ||||||||||||
| — | 5,000,000 | 26,200,000 | 31,100,000 | ||||||||||||
| 14,426,670 | — | — | — | ||||||||||||
| 6,076,110 | — | — | — | ||||||||||||
| 21,098,277 | 5,175,198 | 26,785,891 | 32,286,689 | ||||||||||||
| $ | 48,108,336 | $ | 30,306,947 | $ | 89,425,942 | $ | 213,824,995 | ||||||||
| $ | 2,409 | $ | 1,846 | $ | 6,873 | $ | 13,491 | ||||||||
| 185,570,919 | 222,058,506 | 124,375,405 | 257,809,429 | ||||||||||||
| (137,464,992 | ) | (191,753,405 | ) | (34,956,336 | ) | (43,997,925 | ) | ||||||||
| $ | 48,108,336 | $ | 30,306,947 | $ | 89,425,942 | $ | 213,824,995 | ||||||||
| 100,000,000 | 100,000,000 | 100,000,000 | 100,000,000 | ||||||||||||
| 2,409,128 | 1,845,997 | 6,873,127 | 13,491,127 | ||||||||||||
| $ | 19.97 | $ | 16.42 | $ | 13.01 | $ | 15.85 | ||||||||
| $ | 86,547,182 | $ | 38,870,547 | $ | 124,466,161 | $ | 191,082,057 | ||||||||
| $ | — | $ | — | $ | — | $ | 46,573,918 | ||||||||
| $ | — | $ | — | $ | — | $ | 216,428 | ||||||||
| $ | 30,473 | $ | — | $ | — | $ | — | ||||||||
| $ | 23,890 | $ | — | $ | — | $ | — | ||||||||
| See accompanying Notes to Financial Statements. | |
| Tortoise | 39 |
| Statements of Operations |
| Year Ended November 30, 2020 |
| Tortoise Energy | Tortoise | |||||||
| Infrastructure | Midstream Energy | |||||||
| Corp.(1) | Fund, Inc. | |||||||
| Investment Income | ||||||||
| Distributions from master limited partnerships | $ | 51,890,639 | $ | 33,574,992 | ||||
| Dividends and distributions from common stock | 10,210,462 | 9,468,622 | ||||||
| Dividends and distributions from preferred stock | 5,753,127 | 3,573,720 | ||||||
| Dividends and distributions from affiliated investments | 1,275,000 | — | ||||||
| Less return of capital on distributions(2) | (61,794,265 | ) | (39,827,877 | ) | ||||
| Less foreign taxes withheld | (38,670 | ) | (35,333 | ) | ||||
| Net dividends and distributions from investments | 7,296,293 | 6,754,124 | ||||||
| Interest income | 2,315,816 | 1,207,603 | ||||||
| Total Investment Income | 9,612,109 | 7,961,727 | ||||||
| Operating Expenses | ||||||||
| Advisory fees | 7,259,328 | 4,665,308 | ||||||
| Administrator fees | 252,959 | 181,721 | ||||||
| Professional fees | 426,650 | 284,836 | ||||||
| Directors fees | 130,626 | 121,647 | ||||||
| Stockholder communication expenses | 149,865 | 98,620 | ||||||
| Custodian fees and expenses | 46,885 | 33,521 | ||||||
| Fund accounting fees | 66,060 | 47,686 | ||||||
| Registration fees | 67,222 | 75,751 | ||||||
| Swap breakage fees | — | — | ||||||
| Stock transfer agent fees | 44,582 | 35,074 | ||||||
| Franchise fees | 3,850 | — | ||||||
| Other operating expenses | 152,285 | 65,633 | ||||||
| Total Operating Expenses | 8,600,312 | 5,609,797 | ||||||
| Leverage Expenses | ||||||||
| Interest expense | 7,565,246 | 5,378,229 | ||||||
| Distributions to mandatory redeemable preferred stockholders | 3,800,725 | 2,538,023 | ||||||
| Amortization of debt issuance costs | 1,091,200 | 624,707 | ||||||
| Premium on redemption of senior notes | 2,332,000 | 2,888,000 | ||||||
| Premium on redemption of mandatory redeemable preferred stock | 1,327,000 | 1,193,000 | ||||||
| Other leverage expenses | 360,549 | 201,850 | ||||||
| Total Leverage Expenses | 16,476,720 | 12,823,809 | ||||||
| Total Expenses | 25,077,032 | 18,433,606 | ||||||
| Less fees waived by Adviser (Note 4) | — | — | ||||||
| Net Expenses | 25,077,032 | 18,433,606 | ||||||
| Net Investment Income (Loss), before Income Taxes | (15,464,923 | ) | (10,471,879 | ) | ||||
| Deferred tax benefit (expense) | 2,221,986 | 1,483,383 | ||||||
| Net Investment Income (Loss) | (13,242,937 | ) | (8,988,496 | ) | ||||
| (1) | Consolidated Statement of Operations (See Note 13 to the financial statements for further disclosure). |
| (2) | Return of Capital may be in excess of current year distributions due to prior year adjustments. See Note 2 to the financial statements for further disclosure. |
| See accompanying Notes to Financial Statements. | |
| 40 | Tortoise |
| 2020 Annual Report | November 30, 2020 |
| Tortoise Power | Tortoise | ||||||||||||||
| Tortoise Pipeline | Tortoise Energy | and Energy | Essential Assets | ||||||||||||
| & Energy | Independence | Infrastructure | Income Term | ||||||||||||
| Fund, Inc. | Fund, Inc. | Fund, Inc. | Fund(1) | ||||||||||||
| $ | 2,714,268 | $ | 383,241 | $ | 2,828,549 | $ | 3,348,601 | ||||||||
| 5,639,629 | 1,340,677 | 1,926,281 | 4,272,176 | ||||||||||||
| 201,118 | 189,715 | 165,468 | 1,182,618 | ||||||||||||
| — | — | — | 6,734,453 | ||||||||||||
| (5,443,214 | ) | (674,738 | ) | (3,794,831 | ) | (9,880,366 | ) | ||||||||
| (233,929 | ) | (26,492 | ) | (26,647 | ) | (331,403 | ) | ||||||||
| 2,877,872 | 1,212,403 | 1,098,820 | 5,326,079 | ||||||||||||
| 4,249 | 1,192 | 4,368,722 | 6,429,076 | ||||||||||||
| 2,882,121 | 1,213,595 | 5,467,542 | 11,755,155 | ||||||||||||
| 1,171,023 | 520,976 | 1,195,724 | 3,245,865 | ||||||||||||
| 52,564 | 30,394 | 60,593 | 96,184 | ||||||||||||
| 168,924 | 135,646 | 176,325 | 442,833 | ||||||||||||
| 108,558 | 106,565 | 97,577 | 91,947 | ||||||||||||
| 54,372 | 33,179 | 73,109 | 38,381 | ||||||||||||
| 12,832 | 7,107 | 9,605 | 36,356 | ||||||||||||
| 28,855 | 25,693 | 28,297 | 29,770 | ||||||||||||
| 37,761 | 38,159 | 24,450 | 14,986 | ||||||||||||
| — | — | 370,000 | — | ||||||||||||
| 30,915 | 29,825 | 14,964 | 15,238 | ||||||||||||
| — | — | — | — | ||||||||||||
| 29,942 | 30,354 | 18,700 | 21,782 | ||||||||||||
| 1,695,746 | 957,898 | 2,069,344 | 4,033,342 | ||||||||||||
| 1,004,457 | 243,369 | 966,641 | 483,244 | ||||||||||||
| 542,315 | — | — | — | ||||||||||||
| 99,590 | — | — | — | ||||||||||||
| 96,000 | — | — | — | ||||||||||||
| 99,000 | — | — | — | ||||||||||||
| 23,742 | — | — | — | ||||||||||||
| 1,865,104 | 243,369 | 966,641 | 483,244 | ||||||||||||
| 3,560,850 | 1,201,267 | 3,035,985 | 4,516,586 | ||||||||||||
| — | — | — | (212,695 | ) | |||||||||||
| 3,560,850 | 1,201,267 | 3,035,985 | 4,303,891 | ||||||||||||
| (678,729 | ) | 12,328 | 2,431,557 | 7,451,264 | |||||||||||
| — | — | — | (594,668 | ) | |||||||||||
| (678,729 | ) | 12,328 | 2,431,557 | 6,856,596 | |||||||||||
| See accompanying Notes to Financial Statements. | |
| Tortoise | 41 |
| Statements of Operations (continued) |
| Year Ended November 30, 2020 |
| Tortoise Energy | Tortoise | |||||||
| Infrastructure | Midstream Energy | |||||||
| Corp.(1) | Fund, Inc. | |||||||
| Realized and Unrealized Loss on Investments and Foreign Currency | ||||||||
| Net realized loss on investments in unaffiliated securities | $ | (759,974,046 | ) | $ | (578,297,977 | ) | ||
| Net realized gain (loss) on options | 60,673 | 85,772 | ||||||
| Net realized loss on interest rate swap settlements | (151,510 | ) | — | |||||
| Net realized loss on currency futures | — | — | ||||||
| Net realized gain (loss) on foreign currency and translation of other assets | ||||||||
| and liabilities denominated in foreign currency | (1,124 | ) | (939 | ) | ||||
| Net realized loss, before income taxes | (760,066,007 | ) | (578,213,144 | ) | ||||
| Current tax expense | (7,747,729 | ) | (34,222,098 | ) | ||||
| Deferred tax benefit | 135,353,671 | 50,520,193 | ||||||
| Income tax benefit, net | 127,605,942 | 16,298,095 | ||||||
| Net realized loss | (632,460,065 | ) | (561,915,049 | ) | ||||
| Net unrealized appreciation (depreciation) of investments in unaffiliated securities | 93,598,434 | 103,471,398 | ||||||
| Net unrealized appreciation (depreciation) of investments in affiliated securities | (2,452,247 | ) | — | |||||
| Net unrealized depreciation of options | (63,848 | ) | (69,929 | ) | ||||
| Net unrealized appreciation (depreciation) of interest rate swap contracts | (26,175 | ) | — | |||||
| Net unrealized appreciation of forward currency contracts | — | — | ||||||
| Net unrealized appreciation of other assets and liabilities due to foreign currency translation | 457 | 382 | ||||||
| Net unrealized appreciation (depreciation), before income taxes | 91,056,621 | 103,401,851 | ||||||
| Deferred tax expense | (21,103,500 | ) | (24,111,091 | ) | ||||
| Net unrealized appreciation (depreciation) | 69,953,121 | 79,290,760 | ||||||
| Net Realized and Unrealized Loss | (562,506,944 | ) | (482,624,289 | ) | ||||
| Net Decrease in Net Assets Applicable to Common Stockholders Resulting from Operations | $ | (575,749,881 | ) | $ | (491,612,785 | ) | ||
| (1) | Consolidated Statement of Operations (See Note 13 to the financial statements for further disclosure). |
| (2) | Return of Capital may be in excess of current year distributions due to prior year adjustments. See Note 2 to the financial statements for further disclosure. |
| See accompanying Notes to Financial Statements | |
| 42 | Tortoise |
| 2020 Annual Report | November 30, 2020 |
| Tortoise Power | Tortoise | ||||||||||||||
| Tortoise Pipeline | Tortoise Energy | and Energy | Essential Assets | ||||||||||||
| & Energy | Independence | Infrastructure | Income Term | ||||||||||||
| Fund, Inc. | Fund, Inc. | Fund, Inc. | Fund(1) | ||||||||||||
| $ | (95,778,897 | ) | $ | (48,687,660 | ) | $ | (25,729,010 | ) | $ | (38,363,108 | ) | ||||
| 187,001 | 1,449,541 | — | 1,773,832 | ||||||||||||
| — | — | (18,276 | ) | — | |||||||||||
| — | — | — | (534,591 | ) | |||||||||||
| (42,227 | ) | 1,592 | 1,418 | 405,629 | |||||||||||
| (95,634,123 | ) | (47,236,527 | ) | (25,745,868 | ) | (36,718,238 | ) | ||||||||
| — | — | — | — | ||||||||||||
| — | — | — | — | ||||||||||||
| — | — | — | — | ||||||||||||
| (95,634,123 | ) | (47,236,527 | ) | (25,745,868 | ) | (36,718,238 | ) | ||||||||
| 20,071,756 | 17,812,115 | (2,232,908 | ) | 20,013,193 | |||||||||||
| — | — | — | 1,012,053 | ||||||||||||
| (142,140 | ) | (354,660 | ) | — | (285,141 | ) | |||||||||
| — | — | 8,589 | — | ||||||||||||
| — | — | — | 320,491 | ||||||||||||
| 1,256 | 153 | 174 | 19,094 | ||||||||||||
| 19,930,872 | 17,457,608 | (2,224,145 | ) | 21,079,690 | |||||||||||
| — | — | — | — | ||||||||||||
| 19,930,872 | 17,457,608 | (2,224,145 | ) | 21,079,690 | |||||||||||
| (75,703,251 | ) | (29,778,919 | ) | (27,970,013 | ) | (15,638,548 | ) | ||||||||
| $ | (76,381,980 | ) | $ | (29,766,591 | ) | $ | (25,538,456 | ) | $ | (8,781,952 | ) | ||||
| See accompanying Notes to Financial Statements. | |
| Tortoise | 43 |
| Statements of Changes in Net Assets |
| Tortoise Energy Infrastructure Corp.(1) | ||||||||
| Year Ended | Year Ended | |||||||
| November 30, | November 30, | |||||||
| 2020 | 2019 | |||||||
| Operations | ||||||||
| Net investment income (loss) | $ | (13,242,937 | ) | $ | (16,044,174 | ) | ||
| Net realized gain (loss) | (632,460,065 | ) | 29,052,706 | |||||
| Net unrealized appreciation (depreciation) | 69,953,121 | (204,418,240 | ) | |||||
| Net decrease in net assets applicable to common stockholders resulting from operations | (575,749,881 | ) | (191,409,708 | ) | ||||
| Distributions to Common Stockholders | ||||||||
| From distributable earnings | — | — | ||||||
| From return of capital | (28,912,095 | ) | (140,587,568 | ) | ||||
| Total distributions to common stockholders | (28,912,095 | ) | (140,587,568 | ) | ||||
| Capital Stock Transactions | ||||||||
| Repurchases of common stock | (19,996,039 | ) | (3) | — | ||||
| Underwriting discounts and offering expenses associated with the issuance of common stock | — | (6,953 | ) | |||||
| Issuance of common shares from reinvestment of distributions to stockholders | — | 1,990,050 | ||||||
| Net increase (decrease) in net assets applicable to common stockholders | ||||||||
| from capital stock transactions | (19,996,039 | ) | 1,983,097 | |||||
| Total increase (decrease) in net assets applicable to common stockholders | (624,658,015 | ) | (330,014,179 | ) | ||||
| Net Assets | ||||||||
| Beginning of period | 930,285,525 | 1,260,299,704 | ||||||
| End of period | $ | 305,627,510 | $ | 930,285,525 | ||||
| Transactions in common shares | ||||||||
| Shares outstanding at beginning of period | 53,732,462 | 53,635,054 | ||||||
| Net share reduction due to reverse stock splits (See Note 14) | (40,299,345 | ) | — | |||||
| Shares repurchased (See Note 15) | (1,183,278 | ) | — | |||||
| Shares issued through offerings | — | — | ||||||
| Shares issued through reinvestment of distributions | — | 97,408 | ||||||
| Shares outstanding at end of period | 12,249,839 | 53,732,462 | ||||||
| (1) | Consolidated Statement of Changes in Net Assets (See Note 13 to the financial statements for further disclosure). |
| (2) | Commencement of operations. |
| (3) | Of the total repurchases of common stock in TYG, $18,095,163 is due to the share repurchase program as noted in Footnote 15 of Notes to Financial Statements, remaining amount is due to share repurchases executed in May 2020. |
| See accompanying Notes to Financial Statements. | |
| 44 | Tortoise |
| 2020 Annual Report | November 30, 2020 |
| Tortoise Midstream Energy Fund, Inc. | Tortoise Pipeline & Energy Fund, Inc. | ||||||||||||||
| Year Ended | Year Ended | Year Ended | Year Ended | ||||||||||||
| November 30, | November 30, | November 30, | November 30, | ||||||||||||
| 2020 | 2019 | 2020 | 2019 | ||||||||||||
| $ | (8,988,496 | ) | $ | (17,549,941 | ) | $ | (678,729 | ) | $ | (1,235,742 | ) | ||||
| (561,915,049 | ) | (35,175,815 | ) | (95,634,123 | ) | (15,534,668 | ) | ||||||||
| 79,290,760 | (87,752,183 | ) | 19,930,872 | (2,671,988 | ) | ||||||||||
| (491,612,785 | ) | (140,477,939 | ) | (76,381,980 | ) | (19,442,398 | ) | ||||||||
| — | — | — | — | ||||||||||||
| (18,637,769 | ) | (106,822,149 | ) | (4,041,041 | ) | (13,872,732 | ) | ||||||||
| (18,637,769 | ) | (106,822,149 | ) | (4,041,041 | ) | (13,872,732 | ) | ||||||||
| (8,050,210 | ) | — | (1,355,204 | ) | — | ||||||||||
| — | (24,715 | ) | — | — | |||||||||||
| — | — | — | — | ||||||||||||
| (8,050,210 | ) | (24,715 | ) | (1,355,204 | ) | — | |||||||||
| (518,300,764 | ) | (247,324,803 | ) | (81,778,225 | ) | (33,315,130 | ) | ||||||||
| 667,708,171 | 915,032,974 | 129,886,561 | 163,201,691 | ||||||||||||
| $ | 149,407,407 | $ | 667,708,171 | $ | 48,108,336 | $ | 129,886,561 | ||||||||
| 63,208,377 | 63,208,377 | 10,016,413 | 10,016,413 | ||||||||||||
| (56,887,538 | ) | — | (7,512,309 | ) | — | ||||||||||
| (475,322 | ) | — | (94,976 | ) | — | ||||||||||
| — | — | — | — | ||||||||||||
| — | — | — | — | ||||||||||||
| 5,845,517 | 63,208,377 | 2,409,128 | 10,016,413 | ||||||||||||
| See accompanying Notes to Financial Statements. | |
| Tortoise | 45 |
| Statements of Changes in Net Assets (continued) |
| Tortoise Energy Independence Fund, Inc. | ||||||||
| Year Ended | Year Ended | |||||||
| November 30, | November 30, | |||||||
| 2020 | 2019 | |||||||
| Operations | ||||||||
| Net investment income (loss) | $ | 12,328 | $ | (1,490,748 | ) | |||
| Net realized gain (loss) | (47,236,527 | ) | (83,448,293 | ) | ||||
| Net unrealized appreciation (depreciation) | 17,457,608 | 29,302,069 | ||||||
| Net decrease in net assets applicable to common stockholders resulting from operations | (29,766,591 | ) | (55,636,972 | ) | ||||
| Distributions to Common Stockholders | ||||||||
| From distributable earnings | (823 | ) | — | |||||
| From return of capital | (1,475,974 | ) | (15,828,822 | ) | ||||
| Total distributions to common stockholders | (1,476,797 | ) | (15,828,822 | ) | ||||
| Capital Stock Transactions | ||||||||
| Proceeds from issuance of common shares through offerings | — | — | ||||||
| Repurchases of common stock | — | — | ||||||
| Underwriting discounts and offering expenses associated with the issuance of common stock | — | — | ||||||
| Issuance of common shares from reinvestment of distributions to stockholders | — | 527,895 | ||||||
| Net increase (decrease) in net assets applicable to common stockholders | ||||||||
| from capital stock transactions | — | 527,895 | ||||||
| Total increase (decrease) in net assets applicable to common stockholders | (31,243,388 | ) | (70,937,899 | ) | ||||
| Net Assets | ||||||||
| Beginning of period | 61,550,335 | 132,488,234 | ||||||
| End of period | $ | 30,306,947 | $ | 61,550,335 | ||||
| Transactions in common shares | ||||||||
| Shares outstanding at beginning of period | 14,767,968 | 14,696,260 | ||||||
| Net share reduction due to reverse stock splits (See Note 14) | (12,921,971 | ) | — | |||||
| Shares repurchased (See Note 15) | — | — | ||||||
| Shares issued through offerings | — | — | ||||||
| Shares issued through reinvestment of distributions | — | 71,708 | ||||||
| Shares outstanding at end of period | 1,845,997 | 14,767,968 | ||||||
| (1) | Consolidated Statement of Changes in Net Assets (See Note 13 to the financial statements for further disclosure). |
| (2) | Commencement of operations. |
| See accompanying Notes to Financial Statements. | |
| 46 | Tortoise |
| 2020 Annual Report | November 30, 2020 |
| Tortoise Power and Energy | |||||||||||||||
| Infrastructure Fund, Inc. | Tortoise Essential Assets Income Term Fund(1) | ||||||||||||||
| Period from | |||||||||||||||
| Year Ended | Year Ended | Year Ended | March 29, 2019(2) | ||||||||||||
| November 30, | November 30, | November 30, | through | ||||||||||||
| 2020 | 2019 | 2020 | November 30, 2019 | ||||||||||||
| $ | 2,431,557 | $ | 2,722,077 | $ | 6,856,596 | $ | 4,144,381 | ||||||||
| (25,745,868 | ) | 4,821,830 | (36,718,238 | ) | (10,438,827 | ) | |||||||||
| (2,224,145 | ) | (11,426,405 | ) | 21,079,690 | (15,820,905 | ) | |||||||||
| (25,538,456 | ) | (3,882,498 | ) | (8,781,952 | ) | (22,115,351 | ) | ||||||||
| (4,161,698 | ) | (9,729,252 | ) | (8,677,372 | ) | (4,545,707 | ) | ||||||||
| (3,135,711 | ) | (697,748 | ) | (6,176,359 | ) | (5,700,804 | ) | ||||||||
| (7,297,409 | ) | (10,427,000 | ) | (14,853,731 | ) | (10,246,511 | ) | ||||||||
| — | — | — | 269,722,540 | ||||||||||||
| (753,123 | ) | — | — | — | |||||||||||
| — | — | — | — | ||||||||||||
| — | — | — | — | ||||||||||||
| (753,123 | ) | — | — | 269,722,540 | |||||||||||
| (33,588,988 | ) | (14,309,498 | ) | (23,635,683 | ) | 237,360,678 | |||||||||
| 123,014,930 | 137,324,428 | 237,460,678 | 100,000 | ||||||||||||
| $ | 89,425,942 | $ | 123,014,930 | $ | 213,824,995 | $ | 237,460,678 | ||||||||
| 6,951,333 | 6,951,333 | 13,491,127 | 5,000 | ||||||||||||
| — | — | — | — | ||||||||||||
| (78,206 | ) | — | — | — | |||||||||||
| — | — | — | 13,486,127 | ||||||||||||
| — | — | — | — | ||||||||||||
| 6,873,127 | 6,951,333 | 13,491,127 | 13,491,127 | ||||||||||||
| See accompanying Notes to Financial Statements. | |
| Tortoise | 47 |
| Statements of Cash Flows |
Year Ended November 30, 2020 |
| Tortoise Energy | ||||||||
| Infrastructure | Tortoise Midstream | |||||||
| Corp.(1) | Energy Fund, Inc. | |||||||
| Cash Flows From Operating Activities | ||||||||
| Dividends, distributions and interest received from investments | $ | 70,847,905 | $ | 45,710,558 | ||||
| Purchases of long-term investments | (276,717,199 | ) | (186,296,485 | ) | ||||
| Proceeds from sales of long-term investments | 811,272,476 | 608,201,789 | ||||||
| Sales (purchases) of short-term investments, net | 80,640 | 203,917 | ||||||
| Proceeds from litigation settlement | 1,834 | — | ||||||
| Proceeds from funds held in escrow | 955,424 | — | ||||||
| Call options written, net | (66,903 | ) | (29,401 | ) | ||||
| Payments on interest rate swap contracts, net | (151,510 | ) | — | |||||
| Payments on forward currency contracts, net | — | — | ||||||
| Interest received on securities sold, net | — | — | ||||||
| Interest expense paid | (11,053,097 | ) | (7,692,097 | ) | ||||
| Distributions to mandatory redeemable preferred stockholders | (6,220,961 | ) | (3,518,364 | ) | ||||
| Other leverage expenses paid | (207,175 | ) | (157,904 | ) | ||||
| Income taxes paid | (35,272,959 | ) | (23,973,194 | ) | ||||
| Premium on redemption of senior notes | (2,332,000 | ) | (2,888,000 | ) | ||||
| Premium on redemption of mandatory redeemable preferred stock | (1,327,000 | ) | (1,193,000 | ) | ||||
| Operating expenses paid | (11,013,265 | ) | (7,411,742 | ) | ||||
| Net cash provided by operating activities | 538,796,210 | 420,956,077 | ||||||
| Cash Flows From Financing Activities | ||||||||
| Payments on credit facilities, net | (80,700,000 | ) | (13,600,000 | ) | ||||
| Redemption of mandatory redeemable preferred stock | (132,700,000 | ) | (119,300,000 | ) | ||||
| Repayment of senior notes | (277,073,334 | ) | (261,679,145 | ) | ||||
| Redemption of common stock | (19,410,781 | ) | (7,739,163 | ) | ||||
| Distributions paid to common stockholders | (28,912,095 | ) | (18,637,769 | ) | ||||
| Net cash used in financing activities | (538,796,210 | ) | (420,956,077 | ) | ||||
| Net change in cash | — | — | ||||||
| Cash — beginning of year | — | — | ||||||
| Cash — end of year | $ | — | $ | — | ||||
| (1) | Consolidated Statement of Cash Flows (See Note 13 to the financial statements for further disclosure). |
| See accompanying Notes to Financial Statements. | |
| 48 | Tortoise |
| 2020 Annual Report | November 30, 2020 |
| Tortoise Power | Tortoise | ||||||||||||||
| Tortoise Pipeline | Tortoise Energy | and Energy | Essential Assets | ||||||||||||
| & Energy | Independence | Infrastructure | Income Term | ||||||||||||
| Fund, Inc. | Fund, Inc. | Fund, Inc. | Fund(1) | ||||||||||||
| $ | 7,916,136 | $ | 1,964,263 | $ | 9,039,713 | $ | 20,869,687 | ||||||||
| (36,078,010 | ) | (34,442,196 | ) | (37,881,722 | ) | (177,270,922 | ) | ||||||||
| 80,171,392 | 55,796,345 | 67,195,552 | 175,432,621 | ||||||||||||
| (1,328,438 | ) | 223,063 | 201,229 | (64,999 | ) | ||||||||||
| — | — | — | — | ||||||||||||
| — | — | — | — | ||||||||||||
| (38,578 | ) | 915,534 | — | 1,522,200 | |||||||||||
| — | — | (18,276 | ) | — | |||||||||||
| — | — | — | (534,591 | ) | |||||||||||
| — | — | 570,985 | — | ||||||||||||
| (1,279,842 | ) | (375,421 | ) | (1,105,166 | ) | (528,596 | ) | ||||||||
| (613,908 | ) | — | — | — | |||||||||||
| (25,590 | ) | — | — | — | |||||||||||
| — | — | — | — | ||||||||||||
| (96,000 | ) | — | — | — | |||||||||||
| (99,000 | ) | — | — | — | |||||||||||
| (1,961,157 | ) | (1,104,791 | ) | (2,192,143 | ) | (3,814,096 | ) | ||||||||
| 46,567,005 | 22,976,797 | 35,810,172 | 15,611,304 | ||||||||||||
| (11,800,000 | ) | (21,500,000 | ) | (27,900,000 | ) | (900,000 | ) | ||||||||
| (9,900,000 | ) | — | — | — | |||||||||||
| (19,542,857 | ) | — | — | — | |||||||||||
| (1,283,106 | ) | — | (625,386 | ) | — | ||||||||||
| (4,041,042 | ) | (1,476,797 | ) | (7,297,409 | ) | (14,853,731 | ) | ||||||||
| (46,567,005 | ) | (22,976,797 | ) | (35,822,795 | ) | (15,753,731 | ) | ||||||||
| — | — | (12,623 | ) | (142,427 | ) | ||||||||||
| — | — | 12,623 | 378,442 | ||||||||||||
| $ | — | $ | — | $ | — | $ | 236,015 | ||||||||
| See accompanying Notes to Financial Statements. | |
| Tortoise | 49 |
| Statements of Cash Flows (continued) |
| Year Ended November 30, 2020 |
| Tortoise Energy | Tortoise | |||||||
| Infrastructure | Midstream Energy | |||||||
| Corp.(1) | Fund, Inc. | |||||||
| Reconciliation of net decrease in net assets applicable to common stockholders | ||||||||
| resulting from operations to net cash provided by operating activities | ||||||||
| Net decrease in net assets applicable to common stockholders resulting from operations | $ | (575,749,881 | ) | $ | (491,612,785 | ) | ||
| Adjustments to reconcile net decrease in net assets applicable to common stockholders | ||||||||
| resulting from operations to net cash provided by operating activities: | ||||||||
| Purchases of long-term investments | (276,717,199 | ) | (186,296,485 | ) | ||||
| Proceeds from sales of long-term investments | 809,163,221 | 606,040,761 | ||||||
| Sales (purchases) of short-term investments, net | 80,640 | 203,917 | ||||||
| Proceeds from litigation settlement | 1,834 | — | ||||||
| Proceeds from funds held in escrow | 955,424 | — | ||||||
| Call options written, net | (66,903 | ) | (29,401 | ) | ||||
| Return of capital on distributions received | 61,794,265 | 39,827,877 | ||||||
| Deferred tax expense (benefit) | (116,472,157 | ) | (27,892,485 | ) | ||||
| Net unrealized (appreciation) depreciation | (91,056,621 | ) | (103,401,851 | ) | ||||
| Amortization (accretion) of market premium (discount), net | (531,119 | ) | (341,225 | ) | ||||
| Net realized loss | 759,914,497 | 578,213,144 | ||||||
| Amortization of debt issuance costs | 1,091,200 | 624,707 | ||||||
| Changes in operating assets and liabilities: | ||||||||
| (Increase) decrease in dividends, distributions and interest receivable from investments | (27,350 | ) | (1,737,821 | ) | ||||
| Decrease in current tax asset | 11,138,214 | 2,319,733 | ||||||
| Increase in income tax receivable | (52,052,354 | ) | — | |||||
| (Increase) decrease in receivable for investments sold | 2,109,255 | 2,161,028 | ||||||
| Decrease in receivable for premiums on options written | — | — | ||||||
| (Increase) decrease in prepaid expenses and other assets | 162,618 | 45,436 | ||||||
| Decrease in payable for investments purchased | — | — | ||||||
| Increase (decrease) in payable to Adviser, net of fees waived | (2,381,663 | ) | (1,753,529 | ) | ||||
| Increase in current tax liability | 13,388,910 | 7,929,170 | ||||||
| Decrease in accrued expenses and other liabilities | (5,948,621 | ) | (3,344,114 | ) | ||||
| Total adjustments | 1,114,546,091 | 912,568,862 | ||||||
| Net cash provided by operating activities | $ | 538,796,210 | $ | 420,956,077 | ||||
| (1) | Consolidated Statement of Cash Flows (See Note 13 to the financial statements for further disclosure). |
| See accompanying Notes to Financial Statements. | |
| 50 | Tortoise |
| 2020 Annual Report | November 30, 2020 |
| Tortoise Power | Tortoise | ||||||||||||||
| Tortoise Pipeline | Tortoise Energy | and Energy | Essential Assets | ||||||||||||
| & Energy | Independence | Infrastructure | Income Term | ||||||||||||
| Fund, Inc. | Fund, Inc. | Fund, Inc. | Fund(1) | ||||||||||||
| $ | (76,381,980 | ) | $ | (29,766,591 | ) | $ | (25,538,456 | ) | $ | (8,781,952 | ) | ||||
| (36,078,010 | ) | (34,442,196 | ) | (37,881,722 | ) | (176,330,061 | ) | ||||||||
| 80,211,205 | 55,817,369 | 67,262,054 | 175,500,854 | ||||||||||||
| (1,328,438 | ) | 223,063 | 201,229 | (64,999 | ) | ||||||||||
| — | — | — | — | ||||||||||||
| — | — | — | — | ||||||||||||
| (38,578 | ) | 915,534 | — | 1,455,465 | |||||||||||
| 5,443,214 | 674,738 | 3,794,831 | 9,880,366 | ||||||||||||
| — | — | — | 594,668 | ||||||||||||
| (19,930,872 | ) | (17,457,608 | ) | 2,224,145 | (21,079,690 | ) | |||||||||
| — | — | 284,293 | (320,048 | ) | |||||||||||
| 95,634,123 | 47,236,527 | 25,727,592 | 36,183,647 | ||||||||||||
| 99,590 | — | — | — | ||||||||||||
| (409,199 | ) | 75,930 | 64,032 | (445,786 | ) | ||||||||||
| — | — | — | — | ||||||||||||
| — | — | — | — | ||||||||||||
| (39,813 | ) | (21,024 | ) | (66,502 | ) | (68,233 | ) | ||||||||
| — | — | — | 66,735 | ||||||||||||
| (2,466 | ) | (62 | ) | 101 | (4,908 | ) | |||||||||
| — | — | — | (940,861 | ) | |||||||||||
| (247,364 | ) | (114,151 | ) | (117,674 | ) | 25,390 | |||||||||
| — | — | — | — | ||||||||||||
| (364,407 | ) | (164,732 | ) | (143,751 | ) | (59,283 | ) | ||||||||
| 122,948,985 | 52,743,388 | 61,348,628 | 24,393,256 | ||||||||||||
| $ | 46,567,005 | $ | 22,976,797 | $ | 35,810,172 | $ | 15,611,304 | ||||||||
| See accompanying Notes to Financial Statements. | |
| Tortoise | 51 |
| TYG Financial Highlights |
| Year Ended | Year Ended | Year Ended | Year Ended | Year Ended | |||||||||||||||||||||
| November 30, | November 30, | November 30, | November 30, | November 30, | |||||||||||||||||||||
| 2020 | 2019 | 2018 | 2017 | 2016 | |||||||||||||||||||||
| Per Common Share Data(1)(2) | |||||||||||||||||||||||||
| Net Asset Value, beginning of year | $ | 69.24 | $ | 94.00 | $ | 95.72 | $ | 115.32 | $ | 117.12 | |||||||||||||||
| Income (Loss) from Investment Operations | |||||||||||||||||||||||||
| Net investment loss(3) | (0.44 | ) | (1.20 | ) | (1.96 | ) | (2.60 | ) | (3.12 | ) | |||||||||||||||
| Net realized and unrealized gain (loss) | (41.67 | ) | (13.08 | ) | 10.36 | (6.56 | ) | 11.76 | |||||||||||||||||
| Total income (loss) from investment operations | (42.11 | ) | (14.28 | ) | 8.40 | (9.16 | ) | 8.64 | |||||||||||||||||
| Distributions to Common Stockholders | |||||||||||||||||||||||||
| From return of capital | (2.18 | ) | (10.48 | ) | (10.48 | ) | (10.48 | ) | (10.48 | ) | |||||||||||||||
| Capital Stock Transactions | |||||||||||||||||||||||||
| Premiums less underwriting discounts and offering | |||||||||||||||||||||||||
| costs on issuance of common stock(4) | — | (0.00 | ) | 0.36 | 0.04 | 0.04 | |||||||||||||||||||
| Net Asset Value, end of year | $ | 24.95 | $ | 69.24 | $ | 94.00 | $ | 95.72 | $ | 115.32 | |||||||||||||||
| Per common share market value, end of year | $ | 19.16 | $ | 67.28 | $ | 90.36 | $ | 103.44 | $ | 122.52 | |||||||||||||||
| Total investment return based on market value(5) | (69.69 | ) | % | (15.46 | ) | % | (3.42 | ) | % | (7.49 | ) | % | 26.21 | % | |||||||||||
| Supplemental Data and Ratios | |||||||||||||||||||||||||
| Net assets applicable to common stockholders, | |||||||||||||||||||||||||
| end of year (000’s) | $ | 305,628 | $ | 930,286 | $ | 1,260,300 | $ | 1,181,528 | $ | 1,412,274 | |||||||||||||||
| Average net assets (000’s) | $ | 468,705 | $ | 1,203,943 | $ | 1,388,683 | $ | 1,406,724 | $ | 1,345,764 | |||||||||||||||
| Ratio of Expenses to Average Net Assets | |||||||||||||||||||||||||
| Advisory fees | 1.55 | % | 1.62 | % | 1.58 | % | 1.74 | % | 1.74 | % | |||||||||||||||
| Other operating expenses | 0.28 | 0.14 | 0.13 | 0.12 | 0.12 | ||||||||||||||||||||
| Total operating expenses, before fee waiver | 1.83 | 1.76 | 1.71 | 1.86 | 1.86 | ||||||||||||||||||||
| Fee waiver(6) | — | (0.00 | ) | (0.04 | ) | (0.00 | ) | (0.01 | ) | ||||||||||||||||
| Total operating expenses | 1.83 | 1.76 | 1.67 | 1.86 | 1.85 | ||||||||||||||||||||
| Leverage expenses | 3.52 | 2.15 | 1.87 | 1.78 | 2.29 | ||||||||||||||||||||
| Income tax expense (benefit)(7) | (23.19 | ) | (5.49 | ) | (11.02 | ) | (5.28 | ) | 4.64 | ||||||||||||||||
| Total expenses | (17.85 | ) | % | (1.58 | ) | % | (7.48 | ) | % | (1.64 | ) | % | 8.78 | % | |||||||||||
| See accompanying Notes to Financial Statements. | |
| 52 | Tortoise |
| 2020 Annual Report | November 30, 2020 |
| Year Ended | Year Ended | Year Ended | Year Ended | Year Ended | |||||||||||||||||||||
| November 30, | November 30, | November 30, | November 30, | November 30, | |||||||||||||||||||||
| 2020 | 2019 | 2018 | 2017 | 2016 | |||||||||||||||||||||
| Ratio of net investment loss to average net assets | |||||||||||||||||||||||||
| before fee waiver | (2.83 | ) | % | (1.33 | ) | % | (1.89 | ) | % | (2.27 | ) | % | (2.83 | ) | % | ||||||||||
| Ratio of net investment loss to average net assets | |||||||||||||||||||||||||
| after fee waiver | (2.83 | ) | % | (1.33 | ) | % | (1.85 | ) | % | (2.27 | ) | % | (2.82 | ) | % | ||||||||||
| Portfolio turnover rate | 36.79 | % | 26.35 | % | 17.96 | % | 20.38 | % | 24.23 | % | |||||||||||||||
| Credit facility borrowings, end of year (000’s) | $ | 13,200 | $ | 93,900 | $ | 107,100 | $ | 112,700 | $ | 109,300 | |||||||||||||||
| Senior notes, end of year (000’s) | $ | 87,927 | $ | 365,000 | $ | 380,000 | $ | 412,500 | $ | 442,500 | |||||||||||||||
| Preferred stock, end of year (000’s) | $ | 32,300 | $ | 165,000 | $ | 165,000 | $ | 165,000 | $ | 165,000 | |||||||||||||||
| Per common share amount of senior notes | |||||||||||||||||||||||||
| outstanding, end of year | $ | 7.18 | $ | 27.17 | $ | 28.34 | $ | 33.41 | $ | 36.12 | |||||||||||||||
| Per common share amount of net assets, | |||||||||||||||||||||||||
| excluding senior notes, end of year | $ | 32.13 | $ | 96.41 | $ | 122.34 | $ | 129.13 | $ | 151.44 | |||||||||||||||
| Asset coverage, per $1,000 of principal amount | |||||||||||||||||||||||||
| of senior notes and credit facility borrowings(8) | $ | 4,342 | $ | 3,387 | $ | 3,926 | $ | 3,564 | $ | 3,858 | |||||||||||||||
| Asset coverage ratio of senior notes and | |||||||||||||||||||||||||
| credit facility borrowings(8) | 434 | % | 339 | % | 393 | % | 356 | % | 386 | % | |||||||||||||||
| Asset coverage, per $10 liquidation value per share | |||||||||||||||||||||||||
| of mandatory redeemable preferred stock(9) | $ | 33 | $ | 25 | $ | 29 | $ | 27 | $ | 30 | |||||||||||||||
| Asset coverage ratio of preferred stock(9) | 329 | % | 249 | % | 293 | % | 271 | % | 297 | % | |||||||||||||||
| (1) | Information presented relates to a share of common stock outstanding for the entire year. |
| (2) | During the year ended November 30, 2020, the Fund effected the following reverse stock split: May 1, 2020, 1 for 4. All historical per share information has been retroactively adjusted to reflect this reverse stock split. |
| (3) | The per common share data for the years ended November 30, 2019, 2018, 2017, and 2016, do not reflect the change in estimate of investment income and return of capital, for the respective year. See Note 2C to the financial statements for further disclosure. |
| (4) | Represents underwriting and offering costs of less than $0.01 for the year ended November 30, 2019. Represents premium on shelf offerings of $0.40 per share, less the underwriting and offering costs of $0.04 per share, for the year ended November 30, 2018. Represents the premium on the shelf offerings of $0.04 per share, less the underwriting and offering costs of less than $0.01 per share for the year ended November 30, 2017. Represents the premium on the shelf offerings of $0.04 per share, less the underwriting and offering costs of less than $0.01 per share for the year ended November 30, 2016. |
| (5) | Total investment return is calculated assuming a purchase of common stock at the beginning of the year and a sale at the closing price on the last day of the year reported (excluding brokerage commissions). The calculation also assumes reinvestment of distributions at actual prices pursuant to TYG’s dividend reinvestment plan. |
| (6) | Less than 0.01% for the years ended November 30, 2019 and 2017. |
| (7) | For the year ended November 30, 2020, TYG accrued $116,472,157 for net deferred income tax benefit and $7,747,729 for current income tax expense. For the year ended November 30, 2019, TYG accrued $73,090,370 for net deferred income tax benefit and $7,034,755 for current income tax expense. For the year ended November 30, 2018, TYG accrued $152,516,725 for net deferred income tax benefit, which included a deferred tax benefit of $125,271,378 due to the impact from the federal tax rate reduction related to the Tax Cuts and Jobs Act. For the year ended November 30, 2017, TYG accrued $35,365,364 for current income tax expense and $109,662,030 for net deferred income tax benefit. For the year ended November 30, 2016, TYG accrued $57,075,786 for current income tax expense and $5,303,392 for net deferred income tax expense. |
| (8) | Represents value of total assets less all liabilities and indebtedness not represented by senior notes, credit facility borrowings and preferred stock at the end of the year divided by senior notes and credit facility borrowings outstanding at the end of the year. |
| (9) | Represents value of total assets less all liabilities and indebtedness not represented by senior notes, credit facility borrowings and preferred stock at the end of the year divided by senior notes, credit facility borrowings and preferred stock outstanding at the end of the year. |
| See accompanying Notes to Financial Statements. | |
| Tortoise | 53 |
| NTG Financial Highlights |
| Year Ended | Year Ended | Year Ended | Year Ended | Year Ended | |||||||||||||||||||||
| November 30, | November 30, | November 30, | November 30, | November 30, | |||||||||||||||||||||
| 2020 | 2019 | 2018 | 2017 | 2016 | |||||||||||||||||||||
| Per Common Share Data(1)(2) | |||||||||||||||||||||||||
| Net Asset Value, beginning of year | $ | 105.60 | $ | 144.80 | $ | 159.60 | $ | 192.20 | $ | 186.50 | |||||||||||||||
| Income (Loss) from Investment Operations | |||||||||||||||||||||||||
| Net investment loss(3) | (0.30 | ) | (2.80 | ) | (4.30 | ) | (4.20 | ) | (4.60 | ) | |||||||||||||||
| Net realized and unrealized gain (loss)(3) | (76.77 | ) | (19.50 | ) | 13.60 | (11.50 | ) | 27.20 | |||||||||||||||||
| Total income (loss) from investment operations | (77.07 | ) | (22.30 | ) | 9.30 | (15.70 | ) | 22.60 | |||||||||||||||||
| Distributions to Common Stockholders | |||||||||||||||||||||||||
| From return of capital | (2.97 | ) | (16.90 | ) | (16.90 | ) | (16.90 | ) | (16.90 | ) | |||||||||||||||
| Capital stock transactions | |||||||||||||||||||||||||
| Premiums less underwriting discounts and offering | |||||||||||||||||||||||||
| costs on issuance of common stock(4) | — | (0.00 | ) | (7.20 | ) | — | — | ||||||||||||||||||
| Net Asset Value, end of year | $ | 25.56 | $ | 105.60 | $ | 144.80 | $ | 159.60 | $ | 192.20 | |||||||||||||||
| Per common share market value, end of year | $ | 19.46 | $ | 98.80 | $ | 137.20 | $ | 159.00 | $ | 189.00 | |||||||||||||||
| Total investment return based on market value(5) | (78.77 | ) | % | (17.63 | ) | % | (4.10 | ) | % | (7.67 | ) | % | 27.99 | % | |||||||||||
| Supplemental Data and Ratios | |||||||||||||||||||||||||
| Net assets applicable to common stockholders, | |||||||||||||||||||||||||
| end of year (000’s) | $ | 149,407 | $ | 667,708 | $ | 915,033 | $ | 754,085 | $ | 904,866 | |||||||||||||||
| Average net assets (000’s) | $ | 289,147 | $ | 871,496 | $ | 887,014 | $ | 892,196 | $ | 862,527 | |||||||||||||||
| Ratio of Expenses to Average Net Assets | |||||||||||||||||||||||||
| Advisory fees | 1.61 | % | 1.59 | % | 1.54 | % | 1.61 | % | 1.56 | % | |||||||||||||||
| Other operating expenses | 0.33 | 0.14 | 0.15 | 0.14 | 0.16 | ||||||||||||||||||||
| Total operating expenses, before fee waiver | 1.94 | 1.73 | 1.69 | 1.75 | 1.72 | ||||||||||||||||||||
| Fee waiver | — | (0.03 | ) | (0.09 | ) | — | (0.01 | ) | |||||||||||||||||
| Total operating expenses | 1.94 | 1.70 | 1.60 | 1.75 | 1.71 | ||||||||||||||||||||
| Leverage expenses | 4.43 | 2.34 | 1.98 | 1.89 | 1.95 | ||||||||||||||||||||
| Income tax expense (benefit)(6) | 2.19 | (4.80 | ) | (6.09 | ) | (4.33 | ) | 7.25 | |||||||||||||||||
| Total expenses | 8.56 | % | (0.76 | ) | % | (2.51 | ) | % | (0.69 | ) | % | 10.91 | % | ||||||||||||
| See accompanying Notes to Financial Statements. | |
| 54 | Tortoise |
2020 Annual Report | November 30, 2020 |
| Year Ended | Year Ended | Year Ended | Year Ended | Year Ended | |||||||||||||||||||||
| November 30, | November 30, | November 30, | November 30, | November 30, | |||||||||||||||||||||
| 2020 | 2019 | 2018 | 2017 | 2016 | |||||||||||||||||||||
| Ratio of net investment loss to average net assets | |||||||||||||||||||||||||
| before fee waiver | (3.11 | ) | % | (2.05 | ) | % | (2.65 | ) | % | (2.22 | ) | % | (2.53 | ) | % | ||||||||||
| Ratio of net investment loss to average net assets | |||||||||||||||||||||||||
| after fee waiver | (3.11 | ) | % | (2.02 | ) | % | (2.56 | ) | % | (2.22 | ) | % | (2.52 | ) | % | ||||||||||
| Portfolio turnover rate | 38.08 | % | 29.21 | % | 13.67 | % | 20.94 | % | 35.47 | % | |||||||||||||||
| Credit facility borrowings, end of year (000’s) | $ | 40,000 | $ | 53,600 | $ | 73,100 | $ | 49,800 | $ | 46,800 | |||||||||||||||
| Senior notes, end of year (000’s) | $ | 15,321 | $ | 277,000 | $ | 312,000 | $ | 284,000 | $ | 284,000 | |||||||||||||||
| Preferred stock, end of year (000’s) | $ | 12,700 | $ | 132,000 | $ | 132,000 | $ | 110,000 | $ | 110,000 | |||||||||||||||
| Per common share amount of senior notes | |||||||||||||||||||||||||
| outstanding, end of year | $ | 2.62 | $ | 43.82 | $ | 49.36 | $ | 60.11 | $ | 60.30 | |||||||||||||||
| Per common share amount of net assets, excluding | |||||||||||||||||||||||||
| senior notes, end of year | $ | 28.18 | $ | 149.42 | $ | 194.17 | $ | 219.71 | $ | 252.49 | |||||||||||||||
| Asset coverage, per $1,000 of principal amount | |||||||||||||||||||||||||
| of senior notes and credit facility borrowings(7) | $ | 3,930 | $ | 3,419 | $ | 3,719 | $ | 3,589 | $ | 4,068 | |||||||||||||||
| Asset coverage ratio of senior notes and credit | |||||||||||||||||||||||||
| facility borrowings(7) | 393 | % | 342 | % | 372 | % | 359 | % | 407 | % | |||||||||||||||
| Asset coverage, per $25 liquidation value per share | |||||||||||||||||||||||||
| of mandatory redeemable preferred stock(8) | $ | 80 | $ | 61 | $ | 69 | $ | 67 | $ | 76 | |||||||||||||||
| Asset coverage ratio of preferred stock(8) | 320 | % | 244 | % | 277 | % | 270 | % | 305 | % | |||||||||||||||
| (1) | Information presented relates to a share of common stock outstanding for the entire year. |
| (2) | During the year ended November 30, 2020, the Fund effected the following reverse stock split: May 1, 2020, 1 for 10. All historical per share information has been retroactively adjusted to reflect this reverse stock split. |
| (3) | The per common share data for the years ended November 30, 2019, 2018, 2017, and 2016, do not reflect the change in estimate of investment income and return of capital, for the respective year. See Note 2C to the financial statements for further disclosure. |
| (4) | Represents underwriting and offering costs of less than $0.01 for the year ending November 30, 2019. Represents the discounts on shares issued through rights offerings of $5.50, plus the underwriting and offering costs of $1.70 per share for the year ended November 30, 2018. Represents underwriting and offering costs of less than $0.01 for the year ending November 30, 2016. |
| (5) | Total investment return is calculated assuming a purchase of common stock at the beginning of the year and a sale at the closing price on the last day of the year reported (excluding brokerage commissions). This calculation also assumes reinvestment of distributions at actual prices pursuant to NTG’s dividend reinvestment plan. |
| (6) | For the year ended November 30, 2020, NTG accrued $27,892,485 for net deferred income tax benefit and $34,222,098 for current tax expense. For the year ended November 30, 2019, NTG accrued $40,282,948 for net deferred income tax benefit and $1,510,530 for current tax benefit. For the year ended November 30, 2018, NTG accrued $54,197,357 for net deferred income tax benefit, which included a deferred tax benefit of $47,436,124 due to the impact from the federal tax rate reduction related to the Tax Cuts and Jobs Act. For the year ended November 30, 2017, NTG accrued $440,504 for current income tax expense and $39,035,257 for net deferred income tax benefit. For the year ended November 30, 2016, NTG accrued $1,891,670 for current income tax expense and $60,652,872 for net deferred income tax expense. |
| (7) | Represents value of total assets less all liabilities and indebtedness not represented by senior notes, credit facility borrowings and preferred stock at the end of the year divided by senior notes and credit facility borrowings outstanding at the end of the year. |
| (8) | Represents value of total assets less all liabilities and indebtedness not represented by senior notes, credit facility borrowings and preferred stock at the end of the year divided by senior notes, credit facility borrowings and preferred stock outstanding at the end of the year. |
| See accompanying Notes to Financial Statements. | |
| Tortoise | 55 |
| TTP Financial Highlights |
| Year Ended | Year Ended | Year Ended | Year Ended | Year Ended | |||||||||||||||||||||
| November 30, | November 30, | November 30, | November 30, | November 30, | |||||||||||||||||||||
| 2020 | 2019 | 2018 | 2017 | 2016 | |||||||||||||||||||||
| Per Common Share Data(1)(2) | |||||||||||||||||||||||||
| Net Asset Value, beginning of year | $ | 51.88 | $ | 65.16 | $ | 75.28 | $ | 93.68 | $ | 78.84 | |||||||||||||||
| Income (Loss) from Investment Operations | |||||||||||||||||||||||||
| Net investment income (loss)(3) | (0.12 | ) | (0.48 | ) | (0.60 | ) | (0.20 | ) | 0.16 | ||||||||||||||||
| Net realized and unrealized gain (loss)(3) | (30.17 | ) | (7.24 | ) | (3.00 | ) | (11.68 | ) | 21.20 | ||||||||||||||||
| Total income (loss) from investment operations | (30.29 | ) | (7.72 | ) | (3.60 | ) | (11.88 | ) | 21.36 | ||||||||||||||||
| Distributions to Common Stockholders | |||||||||||||||||||||||||
| From net investment income | — | — | (0.16 | ) | (0.20 | ) | (1.52 | ) | |||||||||||||||||
| From net realized gains from | |||||||||||||||||||||||||
| investment transactions | — | — | — | (1.00 | ) | (5.00 | ) | ||||||||||||||||||
| From return of capital | (1.62 | ) | (5.56 | ) | (6.36 | ) | (5.32 | ) | — | ||||||||||||||||
| Total distributions to common stockholders | (1.62 | ) | (5.56 | ) | (6.52 | ) | (6.52 | ) | (6.52 | ) | |||||||||||||||
| Net Asset Value, end of year | $ | 19.97 | $ | 51.88 | $ | 65.16 | $ | 75.28 | $ | 93.68 | |||||||||||||||
| Per common share market value, end of year | $ | 15.15 | $ | 46.08 | $ | 57.32 | $ | 68.04 | $ | 86.20 | |||||||||||||||
| Total investment return based on market value(4) | (64.69 | ) | % | (11.10 | ) | % | (7.03 | ) | % | (14.18 | ) | % | 34.89 | % | |||||||||||
| Supplemental Data and Ratios | |||||||||||||||||||||||||
| Net assets applicable to common stockholders, | |||||||||||||||||||||||||
| end of year (000’s) | $ | 48,108 | $ | 129,887 | $ | 163,202 | $ | 188,517 | $ | 234,539 | |||||||||||||||
| Average net assets (000’s) | $ | 70,052 | $ | 157,017 | $ | 188,518 | $ | 219,359 | $ | 192,888 | |||||||||||||||
| Ratio of Expenses to Average Net Assets | |||||||||||||||||||||||||
| Advisory fees | 1.67 | % | 1.54 | % | 1.51 | % | 1.43 | % | 1.48 | % | |||||||||||||||
| Other operating expenses | 0.75 | 0.35 | 0.32 | 0.26 | 0.29 | ||||||||||||||||||||
| Total operating expenses, before fee waiver | 2.42 | 1.89 | 1.83 | 1.69 | 1.77 | ||||||||||||||||||||
| Fee waiver | — | — | — | (0.00 | ) | (0.07 | ) | ||||||||||||||||||
| Total operating expenses | 2.42 | 1.89 | 1.83 | 1.69 | 1.70 | ||||||||||||||||||||
| Leverage expenses | 2.66 | 1.62 | 1.40 | 1.06 | 1.23 | ||||||||||||||||||||
| Total expenses | 5.08 | % | 3.51 | % | 3.23 | % | 2.75 | % | 2.93 | % | |||||||||||||||
| See accompanying Notes to Financial Statements. | |
| 56 | Tortoise |
2020 Annual Report | November 30, 2020 |
| Year Ended | Year Ended | Year Ended | Year Ended | Year Ended | |||||||||||||||||||||
| November 30, | November 30, | November 30, | November 30, | November 30, | |||||||||||||||||||||
| 2020 | 2019 | 2018 | 2017 | 2016 | |||||||||||||||||||||
| Ratio of net investment income (loss) to average | |||||||||||||||||||||||||
| net assets before fee waiver | (0.97 | ) | % | (0.79 | ) | % | (0.80 | ) | % | (0.21 | ) | % | 0.12 | % | |||||||||||
| Ratio of net investment income (loss) to average | |||||||||||||||||||||||||
| net assets after fee waiver | (0.97 | ) | % | (0.79 | ) | % | (0.80 | ) | % | (0.21 | ) | % | 0.19 | % | |||||||||||
| Portfolio turnover rate | 35.61 | % | 21.31 | % | 14.27 | % | 24.23 | % | 90.22 | % | |||||||||||||||
| Credit facility borrowings, end of year (000’s) | $ | — | $ | 11,800 | $ | 19,800 | $ | 19,300 | $ | 16,600 | |||||||||||||||
| Senior notes, end of year (000’s) | $ | 14,457 | $ | 34,000 | $ | 34,000 | $ | 34,000 | $ | 34,000 | |||||||||||||||
| Preferred stock, end of year (000’s) | $ | 6,100 | $ | 16,000 | $ | 16,000 | $ | 16,000 | $ | 16,000 | |||||||||||||||
| Per common share amount of senior notes | |||||||||||||||||||||||||
| outstanding, end of year | $ | 6.00 | $ | 13.58 | $ | 13.58 | $ | 13.58 | $ | 13.56 | |||||||||||||||
| Per common share amount of net assets, excluding | |||||||||||||||||||||||||
| senior notes, end of year | $ | 25.97 | $ | 65.46 | $ | 78.74 | $ | 88.86 | $ | 107.24 | |||||||||||||||
| Asset coverage, per $1,000 of principal amount | |||||||||||||||||||||||||
| of senior notes and credit facility borrowings(5) | $ | 4,750 | $ | 4,185 | $ | 4,331 | $ | 4,837 | $ | 5,951 | |||||||||||||||
| Asset coverage ratio of senior notes and credit | |||||||||||||||||||||||||
| facility borrowings(5) | 475 | % | 419 | % | 433 | % | 484 | % | 595 | % | |||||||||||||||
| Asset coverage, per $25 liquidation value per share | |||||||||||||||||||||||||
| of mandatory redeemable preferred stock(6) | $ | 84 | $ | 78 | $ | 83 | $ | 93 | $ | 113 | |||||||||||||||
| Asset coverage ratio of preferred stock(6) | 334 | % | 310 | % | 334 | % | 372 | % | 452 | % | |||||||||||||||
| (1) | Information presented relates to a share of common stock outstanding for the entire year. |
| (2) | During the year ended November 30, 2020, the Fund effected the following reverse stock split: May 1, 2020, 1 for 4. All historical per share information has been retroactively adjusted to reflect this reverse stock split. |
| (3) | The per common share data for the years ended November 30, 2019, 2018, 2017, and 2016, do not reflect the change in estimate of investment income and return of capital, for the respective year. See Note 2C to the financial statements for further disclosure. |
| (4) | Total investment return is calculated assuming a purchase of common stock at the beginning of the year and a sale at the closing price on the last day of the year reported (excluding brokerage commissions). The calculation also assumes reinvestment of distributions at actual prices pursuant to TTP’s dividend reinvestment plan. |
| (5) | Represents value of total assets less all liabilities and indebtedness not represented by senior notes, credit facility borrowings and preferred stock at the end of the year divided by senior notes and credit facility borrowings outstanding at the end of the year. |
| (6) | Represents value of total assets less all liabilities and indebtedness not represented by senior notes, credit facility borrowings and preferred stock at the end of the year divided by senior notes, credit facility borrowings and preferred stock outstanding at the end of the year. |
| See accompanying Notes to Financial Statements. | |
| Tortoise | 57 |
| NDP Financial Highlights |
| Year Ended | Year Ended | Year Ended | Year Ended | Year Ended | |||||||||||||||||||||
| November 30, | November 30, | November 30, | November 30, | November 30, | |||||||||||||||||||||
| 2020 | 2019 | 2018 | 2017 | 2016 | |||||||||||||||||||||
| Per Common Share Data(1)(2) | |||||||||||||||||||||||||
| Net Asset Value, beginning of year | $ | 33.36 | $ | 72.16 | $ | 103.04 | $ | 135.60 | $ | 124.24 | |||||||||||||||
| Income (Loss) from Investment Operations | |||||||||||||||||||||||||
| Net investment loss(3) | — | (0.80 | ) | (2.32 | ) | (1.60 | ) | (0.96 | ) | ||||||||||||||||
| Net realized and unrealized gain (loss)(3) | (16.14 | ) | (29.36 | ) | (14.56 | ) | (16.96 | ) | 26.32 | ||||||||||||||||
| Total income (loss) from investment operations | (16.14 | ) | (30.16 | ) | (16.88 | ) | (18.56 | ) | 25.36 | ||||||||||||||||
| Distributions to Common Stockholders | |||||||||||||||||||||||||
| From net investment income(4) | (0.0 | ) | — | — | — | — | |||||||||||||||||||
| From return of capital | (0.80 | ) | (8.64 | ) | (14.00 | ) | (14.00 | ) | (14.00 | ) | |||||||||||||||
| Total distributions to common stockholders | (0.80 | ) | (8.64 | ) | (14.00 | ) | (14.00 | ) | (14.00 | ) | |||||||||||||||
| Net Asset Value, end of year | $ | 16.42 | $ | 33.36 | $ | 72.16 | $ | 103.04 | $ | 135.60 | |||||||||||||||
| Per common share market value, end of year | $ | 12.63 | $ | 29.04 | $ | 72.00 | $ | 99.12 | $ | 126.80 | |||||||||||||||
| Total investment return based on market value(5) | (54.88 | ) | % | (52.35 | ) | % | (15.10 | ) | % | (11.04 | ) | % | 36.27 | % | |||||||||||
| Supplemental Data and Ratios | |||||||||||||||||||||||||
| Net assets applicable to common stockholders, | |||||||||||||||||||||||||
| end of year (000’s) | $ | 30,307 | $ | 61,550 | $ | 132,488 | $ | 187,889 | $ | 246,088 | |||||||||||||||
| Average net assets (000’s) | $ | 37,057 | $ | 94,144 | $ | 176,481 | $ | 209,940 | $ | 212,528 | |||||||||||||||
| Ratio of Expenses to Average Net Assets | |||||||||||||||||||||||||
| Advisory fees | 1.40 | % | 1.52 | % | 1.50 | % | 1.43 | % | 1.42 | % | |||||||||||||||
| Other operating expenses | 1.18 | 0.51 | 0.32 | 0.26 | 0.29 | ||||||||||||||||||||
| Total operating expenses, before fee waiver | 2.58 | 2.03 | 1.82 | 1.69 | 1.71 | ||||||||||||||||||||
| Fee waiver | — | — | — | (0.01 | ) | (0.13 | ) | ||||||||||||||||||
| Total operating expenses | 2.58 | 2.03 | 1.82 | 1.68 | 1.58 | ||||||||||||||||||||
| Leverage expenses | 0.66 | 1.30 | 0.99 | 0.56 | 0.37 | ||||||||||||||||||||
| Total expenses | 3.24 | % | 3.33 | % | 2.81 | % | 2.24 | % | 1.95 | % | |||||||||||||||
| See accompanying Notes to Financial Statements. | |
| 58 | Tortoise |
| 2020 Annual Report | November 30, 2020 |
| Year Ended | Year Ended | Year Ended | Year Ended | Year Ended | |||||||||||||||||||||
| November 30, | November 30, | November 30, | November 30, | November 30, | |||||||||||||||||||||
| 2020 | 2019 | 2018 | 2017 | 2016 | |||||||||||||||||||||
| Ratio of net investment income (loss) to average | |||||||||||||||||||||||||
| net assets before fee waiver | 0.03 | % | (1.58 | ) | % | (2.40 | ) | % | (1.41 | ) | % | (0.98 | ) | % | |||||||||||
| Ratio of net investment income (loss) to average | |||||||||||||||||||||||||
| net assets after fee waiver | 0.03 | % | (1.58 | ) | % | (2.40 | ) | % | (1.40 | ) | % | (0.85 | ) | % | |||||||||||
| Portfolio turnover rate | 72.19 | % | 182.52 | % | 143.77 | % | 64.88 | % | 47.03 | % | |||||||||||||||
| Credit facility borrowings, end of year (000’s) | $ | 5,000 | $ | 26,500 | $ | 57,100 | $ | 64,500 | $ | 63,800 | |||||||||||||||
| Asset coverage, per $1,000 of principal amount | |||||||||||||||||||||||||
| of credit facility borrowings(6) | $ | 7,061 | $ | 3,323 | $ | 3,320 | $ | 3,913 | $ | 4,857 | |||||||||||||||
| Asset coverage ratio of credit facility borrowings(6) | 706 | % | 332 | % | 332 | % | 391 | % | 486 | % | |||||||||||||||
| (1) | Information presented relates to a share of common stock outstanding for the entire year. |
| (2) | During the year ended November 30, 2020, the Fund effected the following reverse stock split: May 1, 2020, 1 for 8. All historical per share information has been retroactively adjusted to reflect this reverse stock split. |
| (3) | The per common share data for the years ended November 30, 2019, 2018, 2017, and 2016 do not reflect the change in estimate of investment income and return of capital, for the respective year. See Note 2C to the financial statements for further disclosure. |
| (4) | Less than (0.01)% for the year ended November 30, 2020. |
| (5) | Total investment return is calculated assuming a purchase of common stock at the beginning of the year and a sale at the closing price on the last day of the year reported (excluding brokerage commissions). The calculation also assumes reinvestment of distributions at actual prices pursuant to NDP’s dividend reinvestment plan. |
| (6) | Represents value of total assets less all liabilities and indebtedness not represented by credit facility borrowings at the end of the year divided by credit facility borrowings outstanding at the end of the year. |
| See accompanying Notes to Financial Statements. | |
| Tortoise | 59 |
| TPZ Financial Highlights |
| Year Ended | Year Ended | Year Ended | Year Ended | Year Ended | |||||||||||||||||||||
| November 30, | November 30, | November 30, | November 30, | November 30, | |||||||||||||||||||||
| 2020 | 2019 | 2018 | 2017 | 2016 | |||||||||||||||||||||
| Per Common Share Data(1) | |||||||||||||||||||||||||
| Net Asset Value, beginning of year | $ | 17.70 | $ | 19.76 | $ | 21.33 | $ | 23.89 | $ | 21.23 | |||||||||||||||
| Income (loss) from Investment Operations | |||||||||||||||||||||||||
| Net investment income(2) | 0.35 | 0.39 | 0.24 | 0.59 | 0.71 | ||||||||||||||||||||
| Net realized and unrealized gain (loss)(2) | (3.99 | ) | (0.95 | ) | (0.31 | ) | (1.65 | ) | 3.49 | ||||||||||||||||
| Total income (loss) from investment operations | (3.64 | ) | (0.56 | ) | (0.07 | ) | (1.06 | ) | 4.20 | ||||||||||||||||
| Distributions to Common Stockholders(3) | |||||||||||||||||||||||||
| From net investment income | (0.60 | ) | (1.12 | ) | (0.57 | ) | (1.04 | ) | (1.29 | ) | |||||||||||||||
| From net realized gains from | |||||||||||||||||||||||||
| investment transactions | — | (0.28 | ) | (0.93 | ) | (0.36 | ) | (0.25 | ) | ||||||||||||||||
| From return of capital | (0.45 | ) | (0.10 | ) | — | (0.10 | ) | — | |||||||||||||||||
| Total distributions to common stockholders | (1.05 | ) | (1.50 | ) | (1.50 | ) | (1.50 | ) | (1.54 | ) | |||||||||||||||
| Net Asset Value, end of year | $ | 13.01 | $ | 17.70 | $ | 19.76 | $ | 21.33 | $ | 23.89 | |||||||||||||||
| Per common share market value, end of year | $ | 9.99 | $ | 15.57 | $ | 17.17 | $ | 19.94 | $ | 21.43 | |||||||||||||||
| Total investment return based on market value(4) | (29.23 | ) | % | (1.38 | ) | % | (6.82 | ) | % | (0.27 | ) | % | 25.57 | % | |||||||||||
| Total investment return based on net asset value(5) | (18.93 | ) | % | (2.59 | ) | % | 0.24 | % | (4.31 | ) | % | 22.18 | % | ||||||||||||
| Supplemental Data and Ratios | |||||||||||||||||||||||||
| Net assets applicable to common stockholders, | |||||||||||||||||||||||||
| end of year (000’s) | $ | 89,426 | $ | 123,015 | $ | 137,324 | $ | 148,243 | $ | 166,073 | |||||||||||||||
| Average net assets (000’s) | $ | 93,027 | $ | 137,701 | $ | 147,616 | $ | 162,708 | $ | 146,274 | |||||||||||||||
| Ratio of Expenses to Average Net Assets | |||||||||||||||||||||||||
| Advisory fees | 1.28 | % | 1.32 | % | 1.29 | % | 1.25 | % | 1.27 | % | |||||||||||||||
| Other operating expenses | 0.94 | 0.38 | 0.37 | 0.31 | 0.39 | ||||||||||||||||||||
| Total operating expenses, before fee waiver | 2.22 | 1.70 | 1.66 | 1.56 | 1.66 | ||||||||||||||||||||
| Fee waiver | — | — | — | — | — | ||||||||||||||||||||
| Total operating expenses | 2.22 | 1.70 | 1.66 | 1.56 | 1.66 | ||||||||||||||||||||
| Leverage expenses | 1.04 | 1.25 | 0.98 | 0.59 | 0.44 | ||||||||||||||||||||
| Total expenses | 3.26 | % | 2.95 | % | 2.64 | % | 2.15 | % | 2.10 | % | |||||||||||||||
| See accompanying Notes to Financial Statements. | |
| 60 | Tortoise |
| 2020 Annual Report | November 30, 2020 |
| Year Ended | Year Ended | Year Ended | Year Ended | Year Ended | |||||||||||||||||||||
| November 30, | November 30, | November 30, | November 30, | November 30, | |||||||||||||||||||||
| 2020 | 2019 | 2018 | 2017 | 2016 | |||||||||||||||||||||
| Ratio of net investment income to average | |||||||||||||||||||||||||
| net assets before fee waiver | 2.61 | % | 1.98 | % | 1.14 | % | 2.51 | % | 3.39 | % | |||||||||||||||
| Ratio of net investment income to average | |||||||||||||||||||||||||
| net assets after fee waiver | 2.61 | % | 1.98 | % | 1.14 | % | 2.51 | % | 3.39 | % | |||||||||||||||
| Portfolio turnover rate | 29.95 | % | 25.27 | % | 31.41 | % | 30.86 | % | 40.61 | % | |||||||||||||||
| Credit facility borrowings, end of year (000’s) | $ | 26,200 | $ | 54,100 | $ | 53,400 | $ | 53,400 | $ | 50,600 | |||||||||||||||
| Asset coverage, per $1,000 of principal amount | |||||||||||||||||||||||||
| of senior notes and credit facility borrowings(6) | $ | 4,413 | $ | 3,274 | $ | 3,572 | $ | 3,776 | $ | 4,282 | |||||||||||||||
| Asset coverage ratio of senior notes and credit | |||||||||||||||||||||||||
| facility borrowings(6) | 441 | % | 327 | % | 357 | % | 378 | % | 428 | % | |||||||||||||||
| (1) | Information presented relates to a share of common stock outstanding for the entire year. |
| (2) | The per common share data for the years ended November 30, 2019, 2018, 2017, and 2016 do not reflect the change in estimate of investment income and return of capital, for the respective year. See Note 2C to the financial statements for further disclosure. |
| (3) | The 2019 and 2018 distributions from net investment income and distributions from net realized gains from investments transactions include reclassifications made in the current period to reflect the appropriate historical tax character of the distributions. The 2019 and 2018 financial highlights previously disclosed $1.40 and $1.50, respectively from distributions from net investment income and $0 and $0, respectively, from distributions from net realized gains from investments. |
| (4) | Total investment return is calculated assuming a purchase of common stock at the beginning of the year and a sale at the closing price on the last day of the year reported (excluding brokerage commissions). The calculation also assumes reinvestment of distributions at actual prices pursuant to TPZ’s dividend reinvestment plan. |
| (5) | Total investment return is calculated assuming a purchase of common stock at the beginning of the year and a sale at net asset value on the last day of the year reported. The calculation also assumes reinvestment of distributions at actual prices pursuant to TPZ’s dividend reinvestment plan. |
| (6) | Represents value of total assets less all liabilities and indebtedness not represented by credit facility borrowings at the end of the year divided by credit facility borrowings outstanding at the end of the year. |
| See accompanying Notes to Financial Statements. | |
| Tortoise | 61 |
| TEAF Financial Highlights |
| Period From | ||||||||||
| Year Ended | March 29, 2019(1) | |||||||||
| November 30, | through | |||||||||
| 2020 | November 30, 2019 | |||||||||
| Per Common Share Data(2) | ||||||||||
| Net Asset Value, beginning of period | $ | 17.60 | $ | 20.00 | ||||||
| Income (loss) from Investment Operations | ||||||||||
| Net investment income | 0.51 | 0.31 | ||||||||
| Net realized and unrealized loss | (1.16 | ) | (1.95 | ) | ||||||
| Total loss from investment operations | (0.65 | ) | (1.64 | ) | ||||||
| Distributions to Common Stockholders | ||||||||||
| From net investment income | (0.46 | ) | (0.34 | ) | ||||||
| From return of capital | (0.64 | ) | (0.42 | ) | ||||||
| Total distributions to common stockholders | (1.10 | ) | (0.76 | ) | ||||||
| Net Asset Value, end of period | $ | 15.85 | $ | 17.60 | ||||||
| Per common share market value, end of period | $ | 13.04 | $ | 15.60 | ||||||
| Total investment return based on market value(3)(4) | (8.66 | ) | % | (18.45 | ) | % | ||||
| Supplemental Data and Ratios | ||||||||||
| Net assets applicable to common stockholders, end of period (000’s) | $ | 213,825 | $ | 237,461 | ||||||
| Average net assets (000’s) | $ | 210,055 | $ | 252,217 | ||||||
| Ratio of Expenses to Average Net Assets(5) | ||||||||||
| Advisory fees | 1.55 | % | 1.51 | % | ||||||
| Other operating expenses | 0.37 | 0.81 | ||||||||
| Total operating expenses, before fee waiver | 1.92 | 2.32 | ||||||||
| Fee waiver | (0.10 | ) | (0.28 | ) | ||||||
| Total operating expenses | 1.82 | 2.04 | ||||||||
| Leverage expenses | 0.23 | 0.36 | ||||||||
| Income tax expense (benefit)(6) | 0.28 | (0.24 | ) | |||||||
| Total expenses | 2.33 | % | 2.16 | % | ||||||
| See accompanying Notes to Financial Statements. | |
| 62 | Tortoise |
| 2020 Annual Report | November 30, 2020 |
| Period From | ||||||||||
| Year Ended | March 29, 2019(1) | |||||||||
| November 30, | through | |||||||||
| 2020 | November 30, 2019 | |||||||||
| Ratio of net investment income to average net assets before fee waiver(5) | 3.16 | % | 2.15 | % | ||||||
| Ratio of net investment income to average net assets after fee waiver(5) | 3.26 | % | 2.43 | % | ||||||
| Portfolio turnover rate(3) | 73.22 | % | 50.44 | % | ||||||
| Credit facility borrowings, end of period (000’s) | $ | 31,100 | $ | 32,000 | ||||||
| Asset coverage, per $1,000 of principal amount of senior notes and credit facility borrowings(7) | $ | 7,875 | $ | 8,421 | ||||||
| Asset coverage ratio of senior notes and credit facility borrowings(7) | 788 | % | 842 | % | ||||||
| (1) | Commencement of operations. |
| (2) | Information presented relates to a share of common stock outstanding for the entire period. |
| (3) | Not annualized for period less than one year. |
| (4) | Total investment return is calculated assuming a purchase of common stock at the beginning of the period and a sale at the closing price on the last day of the period reported (excluding brokerage commissions). The calculation also assumes reinvestment of distributions at actual prices pursuant to TEAF’s dividend reinvestment plan. |
| (5) | Annualized for period less than one year. |
| (6) | For the year ended November 30, 2020, TEAF accrued $594,668 for net deferred income tax expense. For the period ended November 30, 2019, TEAF accrued $418,970 for net deferred income tax benefit. |
| (7) | Represents value of total assets less all liabilities and indebtedness not represented by margin facility borrowings at the end of the period divided by margin facility borrowings outstanding at the end of the period. |
| See accompanying Notes to Financial Statements. | |
| Tortoise | 63 |
| Notes to Financial Statements |
| November 30, 2020 |
1. General Organization
This report covers the following companies, each of which is listed on the New York Stock Exchange (“NYSE”): Tortoise Energy Infrastructure Corp. (“TYG”), Tortoise Midstream Energy Fund, Inc. (“NTG”) (formerly Tortoise MLP Fund, Inc.), Tortoise Pipeline & Energy Fund, Inc. (“TTP”), Tortoise Energy Independence Fund, Inc. (“NDP”), Tortoise Power and Energy Infrastructure Fund, Inc. (“TPZ”), and Tortoise Essential Assets Income Term Fund (“TEAF”). These companies are individually referred to as a “Fund” or by their respective NYSE symbols, or collectively as the “Funds”, and each is a non-diversified, closed-end management investment company under the Investment Company Act of 1940, as amended (the “1940 Act”). Each of TYG, NTG, TTP, NDP and TEAF has a primary investment objective to seek a high level of total return with an emphasis on current distributions. TPZ has a primary investment objective to provide a high level of current income, with a secondary objective of capital appreciation. TEAF commenced operations on March 29, 2019.
2. Significant Accounting Policies
The Funds follow accounting and reporting guidance applicable to investment companies under U.S. generally accepted accounting principles (“GAAP”).
A. Use of Estimates
The preparation of financial statements in conformity with GAAP requires management to make estimates and assumptions that affect the reported amount of assets and liabilities and disclosure of contingent assets and liabilities as of the date of the financial statements, and the amount of income and expenses during the period reported. Actual results could differ from those estimates.
B. Security Valuation
In general, and where applicable, the Funds use readily available market quotations based upon the last updated sales price from the principal market to determine fair value. The Funds primarily own securities that are listed on a securities exchange or are traded in the over-the-counter market. The Funds value those securities at their last sale price on that exchange or over-the-counter market on the valuation date. If the security is listed on more than one exchange, the Funds use the price from the exchange that it considers to be the principal exchange on which the security is traded. If there has been no sale on such exchange or over-the-counter market on such day, the security is valued at the mean between the last bid price and last ask price on such day. Securities listed on the NASDAQ are valued at the NASDAQ Official Closing Price, which may not necessarily represent the last sale price. These securities are categorized as Level 1 in the fair value hierarchy.
Restricted securities are subject to statutory or contractual restrictions on their public resale, which may make it more difficult to obtain a valuation and may limit a Fund’s ability to dispose of them. Investments in private placement securities and other securities for which market quotations are not readily available are valued in good faith by using fair value procedures. Such fair value procedures consider factors such as discounts to publicly traded issues, time until conversion date, securities with similar yields, quality, type of issue, coupon, duration and rating. If events occur that affect the value of a Fund’s portfolio securities before the net asset value has been calculated (a “significant event”), the portfolio securities so affected are generally priced using fair value procedures.
An equity security of a publicly traded company acquired in a private placement transaction without registration under the Securities Act of 1933, as amended (the “1933 Act”), is subject to restrictions on resale that can affect the security’s liquidity and fair value. If such a security is convertible into publicly traded common shares, the security generally will be valued at the common share market price adjusted by a percentage discount due to the restrictions and categorized as Level 2 in the fair value hierarchy. To the extent that such securities are convertible or otherwise become freely tradable within a time frame that may be reasonably determined, an amortization schedule may be used to determine the discount. If the security has characteristics that are dissimilar to the class of security that trades on the open market, the security will generally be valued and categorized as Level 3 in the fair value hierarchy.
Unobservable inputs are used to measure fair value to the extent that observable inputs are not available, thereby allowing for situations in which there is little, if any, market activity. Unobservable inputs reflect the Funds’ own beliefs about the assumptions that market participants would use in pricing the asset or liability (including assumptions about risk). Unobservable inputs are developed based on the best information available in the circumstances, which might include the Fund’s own data. The Fund’s own data are adjusted if information is reasonably available without undue cost and effort that indicates that market participants would use different assumptions. Due to the inherent uncertainty of valuations of such investments, the fair values may differ significantly from the values that would have been used had an active market existed.
Options (including options on futures contracts) and futures contracts are valued using readily available market quotations. Exchange-traded options are valued at the last reported sale price on any exchange on which they trade. If there are no sales reported on any exchange, exchange-traded options shall be valued at the mean between the last highest bid and last lowest asked prices obtained as of the closing of the exchanges on which the option is traded. Exchange-traded domestic futures contracts are valued at the last reported sale price on the Chicago Mercantile Exchange. Exchange-traded foreign futures contracts are valued at the last reported sale price on the primary foreign exchange on which they principally trade. The value of Flexible Exchange Options (FLEX Options) are determined (i) by an evaluated price as determined by a third-party valuation service; or (ii) by using a quotation provided by a broker-dealer.
The Funds generally value debt securities at evaluated prices obtained from an independent third-party valuation service that utilizes a pricing matrix based upon yield data for securities with similar characteristics, or based on a direct written broker-dealer quotation from a dealer who has made a market in the security. Debt securities with 60 days or less to maturity at time of purchase are valued on the basis of amortized cost, which approximates fair value. The securities are categorized as level 2 in the fair value hierarchy.
| 64 | Tortoise |
| 2020 Annual Report | November 30, 2020 |
| Notes to Financial Statements (continued) |
Interest rate swap contracts are valued by using industry-accepted models, which discount the estimated future cash flows based on a forward rate curve and the stated terms of the interest rate swap agreement by using interest rates currently available in the market, or based on dealer quotations, if available, and are categorized as Level 2 in the fair value hierarchy.
Various inputs are used in determining the fair value of the Funds’ investments and financial instruments. These inputs are summarized in the three broad levels listed below:
Level 1 — quoted prices in active markets for identical investments
Level 2 — other significant observable inputs (including quoted prices for similar investments, market corroborated inputs, etc.)
Level 3 — significant unobservable inputs (including a Fund’s own assumptions in determining the fair value of investments)
The inputs or methodologies used for valuing securities are not necessarily an indication of the risk associated with investing in those securities.
The following tables provide the fair value measurements of applicable assets and liabilities by level within the fair value hierarchy as of November 30, 2020. These assets and liabilities are measured on a recurring basis.
| TYG: | ||||||||||||
| Description | Level 1 | Level 2 | Level 3 | Total | ||||||||
| Assets | ||||||||||||
| Investments: | ||||||||||||
| Master Limited Partnerships(a) | $ | 245,003,653 | $ | — | $ | — | $ | 245,003,653 | ||||
| Common Stock(a) | 82,924,451 | — | — | 82,924,451 | ||||||||
| Preferred Stock(a) | 3,523,743 | — | 34,068,604 | 37,592,347 | ||||||||
| Corporate Bonds(a) | — | 3,621,000 | — | 3,621,000 | ||||||||
| Convertible Note(a) | — | — | 3,954,420 | 3,954,420 | ||||||||
| Private Investment(a) | — | — | 10,365,844 | 10,365,844 | ||||||||
| Special Purpose Acquisition Company Units(a) | 18,452,953 | — | — | 18,452,953 | ||||||||
| Short-Term Investment(b) | 140,958 | — | — | 140,958 | ||||||||
| Total Assets | $ | 350,045,758 | $ | 3,621,000 | $ | 48,388,868 | $ | 402,055,626 | ||||
| Liabilities | ||||||||||||
| Interest Rate Swap Contracts | $ | — | $ | 188,015 | $ | — | $ | 188,015 | ||||
| NTG: | ||||||||||||
| Description | Level 1 | Level 2 | Level 3 | Total | ||||||||
| Assets | ||||||||||||
| Investments: | ||||||||||||
| Master Limited Partnerships(a) | $ | 128,649,312 | $ | — | $ | — | $ | 128,649,312 | ||||
| Common Stock(a) | 58,933,972 | — | — | 58,933,972 | ||||||||
| Preferred Stock(a) | 1,912,918 | — | 21,034,615 | 22,947,533 | ||||||||
| Corporate Bond(a) | — | 1,870,000 | — | 1,870,000 | ||||||||
| Convertible Note(a) | — | — | 2,753,269 | 2,753,269 | ||||||||
| Special Purpose Acquisition Company Units(a) | 10,269,314 | — | — | 10,269,314 | ||||||||
| Short-Term Investment(b) | 97,036 | — | — | 97,036 | ||||||||
| Total Assets | $ | 199,862,552 | $ | 1,870,000 | $ | 23,787,884 | $ | 225,520,436 | ||||
| TTP: | ||||||||||||
| Description | Level 1 | Level 2 | Level 3 | Total | ||||||||
| Assets | ||||||||||||
| Investments: | ||||||||||||
| Common Stock(a) | $ | 41,823,095 | $ | — | $ | — | $ | 41,823,095 | ||||
| Master Limited Partnerships(a) | 16,638,319 | — | — | 16,638,319 | ||||||||
| Preferred Stock(a) | 2,954,856 | — | 2,767,663 | 5,722,519 | ||||||||
| Special Purpose Acquisition Company Units(a) | 3,159,212 | — | — | 3,159,212 | ||||||||
| Short-Term Investment(b) | 1,565,040 | — | — | 1,565,040 | ||||||||
| Total Assets | $ | 66,140,522 | $ | — | $ | 2,767,663 | $ | 68,908,185 | ||||
| Tortoise | 65 |
| Notes to Financial Statements (continued) |
| NDP: | ||||||||||||
| Description | Level 1 | Level 2 | Level 3 | Total | ||||||||
| Assets | ||||||||||||
| Investments: | ||||||||||||
| Common Stock(a) | $ | 28,639,301 | $ | — | $ | — | $ | 28,639,301 | ||||
| Master Limited Partnerships(a) | 2,926,430 | — | — | 2,926,430 | ||||||||
| Preferred Stock(a) | — | — | 2,008,943 | 2,008,943 | ||||||||
| Special Purpose Acquisition Company Units(a) | 1,651,083 | — | — | 1,651,083 | ||||||||
| Short-Term Investment(b) | 76,098 | — | — | 76,098 | ||||||||
| Total Assets | $ | 33,292,912 | $ | — | $ | 2,008,943 | $ | 35,301,855 | ||||
| TPZ: | ||||||||||||
| Description | Level 1 | Level 2 | Level 3 | Total | ||||||||
| Assets | ||||||||||||
| Investments: | ||||||||||||
| Corporate Bonds(a) | $ | — | $ | 66,730,354 | $ | — | $ | 66,730,354 | ||||
| Convertible Note(a) | — | — | 792,699 | 792,699 | ||||||||
| Master Limited Partnerships(a) | 21,993,401 | — | — | 21,993,401 | ||||||||
| Common Stock(a) | 15,334,290 | — | — | 15,334,290 | ||||||||
| Preferred Stock(a) | 2,173,144 | — | 2,259,398 | 4,432,542 | ||||||||
| Special Purpose Acquisition Company Units(a) | 5,444,484 | — | — | 5,444,484 | ||||||||
| Short-Term Investment(b) | 43,354 | — | — | 43,354 | ||||||||
| Total Assets | $ | 44,988,673 | $ | 66,730,354 | $ | 3,052,097 | $ | 114,771,124 | ||||
| TEAF: | ||||||||||||
| Description | Level 1 | Level 2 | Level 3 | Total | ||||||||
| Assets | ||||||||||||
| Investments: | ||||||||||||
| Common Stock(a) | $ | 81,491,603 | $ | — | $ | — | $ | 81,491,603 | ||||
| Master Limited Partnerships(a) | 14,436,486 | — | — | 14,436,486 | ||||||||
| Corporate Bonds(a) | — | 32,279,230 | — | 32,279,230 | ||||||||
| Municipal Bonds(a) | — | 23,093,618 | — | 23,093,618 | ||||||||
| Preferred Bonds(a) | — | 10,100,000 | — | 10,100,000 | ||||||||
| Construction Note(a) | — | — | 3,522,987 | 3,522,987 | ||||||||
| Convertible Note(a) | — | — | 3,322,076 | 3,322,076 | ||||||||
| Preferred Stock(a) | 7,579,538 | — | 14,104,903 | 21,684,441 | ||||||||
| Private Investments(a) | — | — | 47,430,707 | 47,430,707 | ||||||||
| Special Purpose Acquisition Company Units(a) | 5,066,568 | — | — | 5,066,568 | ||||||||
| Short-Term Investment(b) | 475,125 | — | — | 475,125 | ||||||||
| Total Assets | $ | 109,049,320 | $ | 65,472,848 | $ | 68,380,673 | $ | 242,902,841 | ||||
| Liabilities | ||||||||||||
| Written Call Options | $ | 219,521 | $ | — | $ | — | $ | 219,521 | ||||
| (a) | All other industry classifications are identified in the Schedule of Investments. |
| (b) | Short-term investment is a sweep investment for cash balances. |
| 66 | Tortoise |
| 2020 Annual Report | November 30, 2020 |
| Notes to Financial Statements (continued) |
The following tables present each Fund’s assets measured at fair value on a recurring basis using significant unobservable inputs (Level 3) for the year ended November 30, 2020:
| Preferred Stock | TYG | NTG | TTP | NDP | TPZ | TEAF | ||||||||||||||||||
| Balance — beginning of year | $ | 40,613,580 | $ | 24,705,787 | $ | 5,990,475 | $ | 2,133,275 | $ | 4,629,781 | $ | 8,564,680 | ||||||||||||
| Purchases | 355,596 | 254,260 | 18,890 | — | 16,474 | 7,132,717 | ||||||||||||||||||
| Return of capital | — | — | — | — | — | — | ||||||||||||||||||
| Sales | (7,222,467 | ) | (4,329,758 | ) | (3,310,291 | ) | — | (2,439,257 | ) | — | ||||||||||||||
| Total realized gain/loss | 945,467 | 566,758 | 433,291 | — | 319,257 | — | ||||||||||||||||||
| Change in unrealized gain/loss | (623,572 | ) | (162,432 | ) | (364,702 | ) | (124,332 | ) | (266,857 | ) | (1,592,494 | ) | ||||||||||||
| Balance — end of year | $ | 34,068,604 | $ | 21,034,615 | $ | 2,767,663 | $ | 2,008,943 | $ | 2,259,398 | $ | 14,104,903 | ||||||||||||
| Private Investments | TYG | NTG | TTP | NDP | TPZ | TEAF | ||||||||||||||||||
| Balance — beginning of year | $ | 14,093,091 | $ | — | $ | — | $ | — | $ | — | $ | 40,885,774 | ||||||||||||
| Purchases | — | — | — | — | — | 13,221,864 | ||||||||||||||||||
| Return of capital | (1,275,000 | ) | — | — | — | — | (5,926,319 | ) | ||||||||||||||||
| Sales | — | — | — | — | — | — | ||||||||||||||||||
| Total realized gain/loss | — | — | — | — | — | — | ||||||||||||||||||
| Change in unrealized gain/loss | (2,452,247 | ) | — | — | — | — | (750,612 | ) | ||||||||||||||||
| Balance — end of year | $ | 10,365,844 | $ | — | $ | — | $ | — | $ | — | $ | 47,430,707 | ||||||||||||
| Construction Note | TYG | NTG | TTP | NDP | TPZ | TEAF | ||||||||||||||||||
| Balance — beginning of year | $ | — | $ | — | $ | — | $ | — | $ | — | $ | 3,516,669 | ||||||||||||
| Purchases | — | — | — | — | — | 8,234 | ||||||||||||||||||
| Return of capital | — | — | — | — | — | — | ||||||||||||||||||
| Sales | — | — | — | — | — | — | ||||||||||||||||||
| Total realized gain/loss | — | — | — | — | — | — | ||||||||||||||||||
| Change in unrealized gain/loss | — | — | — | — | — | (1,916 | ) | |||||||||||||||||
| Balance — end of year | $ | — | $ | — | $ | — | $ | — | $ | — | $ | 3,522,987 | ||||||||||||
| Convertible Note | TYG | NTG | TTP | NDP | TPZ | TEAF | ||||||||||||||||||
| Balance — beginning of year | $ | — | $ | — | $ | — | $ | — | $ | — | $ | — | ||||||||||||
| Purchases | 15,284,100 | 10,643,100 | — | — | 3,061,500 | 11,848,550 | ||||||||||||||||||
| Return of capital | — | — | — | — | — | — | ||||||||||||||||||
| Sales/Reorganizations | (16,463,579 | ) | (11,472,247 | ) | — | — | (3,299,565 | ) | (12,825,854 | ) | ||||||||||||||
| Total realized gain/loss | 2,497,382 | 1,685,365 | — | — | 500,065 | 2,010,728 | ||||||||||||||||||
| Change in unrealized gain/loss | 2,636,517 | 1,897,051 | — | — | 530,699 | 2,288,652 | ||||||||||||||||||
| Balance — end of year | $ | 3,954,420 | $ | 2,753,269 | $ | — | $ | — | $ | 792,699 | $ | 3,322,076 | ||||||||||||
| TYG | NTG | TTP | NDP | TPZ | TEAF | |||||||||||||||||||
| Change in unrealized | ||||||||||||||||||||||||
| gain/loss on investments | ||||||||||||||||||||||||
| still held at November 30, 2020 | $ | (243,576 | ) | $ | 2,083,678 | $ | (56,710 | ) | $ | (124,333 | ) | $ | 490,795 | $ | 529,468 | |||||||||
TYG, NTG, TTP, NDP and TPZ own units of preferred stock of Targa Resources Corp. (“TRGP Pfd”) that were issued in a private placement transaction that closed on March 16, 2016. TEAF owns units of TRGP Pfd that were purchased in a private placement transaction that closed on November 18, 2019. The preferred stock provides the purchaser an option to convert into common stock after 12 years. In addition, the preferred stock can be repurchased by the issuer at a price of $1,100 per share after five years and $1,050 per share after six years. A lattice model prepared by an independent third party is being utilized to determine fair value of the TRGP Pfd securities. Unobservable inputs used to determine the discount rate include a debt discount rate that generally reflects the credit worthiness of the company. An increase (decrease) in the debt discount rate would lead to a corresponding decrease (increase) in fair value of the preferred stock. An increase (decrease) in estimated future volatility would lead to a corresponding increase (decrease) in fair value of the preferred stock.
| Tortoise | 67 |
| Notes to Financial Statements (continued) |
TYG, NTG, TTP, TPZ and TEAF own units of preferred stock of Altus Midstream Company (“ALTM Pfd”) that were issued in a private placement transaction that closed on June 12, 2019. The preferred stock carries a conversion option into common stock after the 7th anniversary of issuance (June 12, 2026) with a conversion rate determined as the quotient of Altus’ common unit price divided by a 6% discount to the prior 20-Day Volume Weighted Average Price (“VWAP”). Alternately, Altus can force conversion into common stock at a value determined by a minimum rate of return: before 5 years: greater of 1.3x Multiple on Invested Capital (“MOIC”) or 11.5% Internal Rate of Return (“IRR”), and after 5 years: greater of 1.3x MOIC or 13.75% IRR. A discounted cash flow model prepared by an independent third party is being used to determine fair value of the ALTM Pfd securities. Unobservable inputs used to determine the discount rate include a debt discount rate that generally reflects the credit worthiness of the company. An increase (decrease) in the debt discount rate would lead to a corresponding decrease (increase) in fair value of the preferred stock.
TYG, NTG, TPZ and TEAF own a convertible note in Sunnova Energy International Inc. (“NOVA Note”) that was issued on May 13, 2020. The convertible notes provides the purchaser an option to convert into common stock equal to the aggregate principal amount of the notes to be converted, together with accrued but unpaid interest up to, but excluding, the date of the conversion, divided by $13.50. Additionally, the issuer has the right to redeem 33.33% of the security during the first two years at 115% of the principal amount, anytime on or after the 3 year anniversary and prior to the 4 year anniversary of the issuance date (May 14, 2023 through May 14, 2024), the issuer may redeem at a redemption price equal to 115% of the principal amount; and any time after the 4 year anniversary (May 14, 2024), the issuer may redeem at a redemption price equal to 110% of the principal amount. In addition, after 3 years, the issuer can force conversion to common stock equal to the aggregate principal amount of the notes to be converted, together with accrued but unpaid interest up to, but excluding, the date of the conversion, divided by $13.50 should the common stock price equals or exceeds the conversion price by 150%. On or after September 23, 2024, the purchaser has an option to require the issuer to redeem all of the notes for cash equal to 110% of the principal amount. A lattice model prepared by an independent third party is being utilized to determine fair value of NOVA Note. Unobservable inputs used to determine the discount rate include a debt discount rate that generally reflects the credit worthiness of the company. An increase (decrease) in the debt discount rate would lead to a corresponding decrease (increase) in fair value of the convertible note. An increase (decrease) in estimated future volatility would lead to a corresponding increase (decrease) in fair value of the convertible note.
TEAF owns units of preferred stock of Enterprise Products Partners L.P. (“EPD Pfd”) that were issued in a transaction that closed on September 30, 2020. The preferred stock carries a conversion option into common stock after the 5th anniversary of the Closing Date (September 30, 2025) with a conversion rate determined as the quotient equal to 100% of the Stated Series A Liquidation Preference plus accrued and unpaid distributions up to the applicable conversion date, divided by a 7.50% discount to the prior 5-Day VWAP of EPD’s common unit price. The issuer has an option to force conversion before the 2nd anniversary at 110%, after the 2nd anniversary and prior to the 4th anniversary at 107%, thereafter, prior to the 5th anniversary at 103%, thereafter, prior to the 6th anniversary at 101% and any time on or after the 6th anniversary at par. A lattice model prepared by an independent third party is being utilized to determine fair value of NOVA Note. Unobservable inputs used to determine the discount rate include a debt discount rate that generally reflects the credit worthiness of the company. An increase (decrease) in the debt discount rate would lead to a corresponding decrease (increase) in fair value of the convertible note. An increase (decrease) in estimated future volatility would lead to a corresponding increase (decrease) in fair value of the convertible note.
TEAF owns units of Mexico Pacific Limited LLC (“MPL”), which was issued in a private transaction that closed on October 23, 2019. MPL is a privately held LNG export development project off the west coast of Mexico. The value of MPL is marked at the most recent transaction price as the company is still in development with no day to day operations.
TEAF owns a construction note in Saturn Solar Bermuda 1, Ltd (“Saturn”). Under the terms of the note, Saturn pays interest monthly at an annual rate of 8%. A discounted cash flows model is being utilized to determine fair value of the construction note. Unobservable inputs used to determine the discount rate include a risk spread based on similar projects and an illiquidity spread due to the note being issued in the private market. An increase (decrease) in the risk spread or illiquidity spread would lead to a corresponding decrease (increase) in fair value of the note.
TYG wholly-owns private investments in TK NYS Solar Holdco, LLC and TEAF wholly-owns private investments in Renewable Holdco, LLC, Renewable Holdco I, LLC, and Renewable Holdco II, LLC. Discounted cash flow models are being utilized to determine the fair value of these holdings. Unobservable inputs used within the discounted cash flow models include weighted average cost of capital. An increase (decrease) in the weighted average cost of capital would lead to a corresponding decrease (increase) in the fair value of the private investment.
| 68 | Tortoise |
| 2020 Annual Report | November 30, 2020 |
| Notes to Financial Statements (continued) |
| Assets at Fair Value | TYG | NTG | TTP | NDP | TPZ | TEAF | ||||||||||||
| Construction Note | $ | — | $ | — | $ | — | $ | — | $ | — | $ | 3,522,987 | ||||||
| Convertible Note | $ | 3,954,420 | $ | 2,753,269 | $ | — | $ | — | $ | 792,699 | $ | 3,322,076 | ||||||
| Preferred Stock | $ | 34,068,604 | $ | 21,034,615 | $ | 2,767,663 | $ | 2,008,943 | $ | 2,259,398 | $ | 14,104,903 | ||||||
| Private Investments | $ | 10,365,844 | $ | — | $ | — | $ | — | $ | — | $ | 47,430,707 | ||||||
| Assets at Fair Value | Valuation Technique | Unobservable Inputs | Input | |||||||||||||||
| Preferred Stock (ALTM Pfd) | Discounted cash flow model | Debt discount rate | 8.64% | |||||||||||||||
| Preferred Stock (TRGP Pfd) | Lattice model | Debt discount rate | 8.40% | |||||||||||||||
| Convertible Note (NOVA Note) | Lattice model | Debt discount rate | 22.90% | |||||||||||||||
| Preferred Stock (EPD Pfd) | Lattice model | Debt discount rate | 7.06% | |||||||||||||||
| Private Investment (TK NYS Solar Holdco, LLC) | Discounted cash flow model | Post-contracted weighted average cost of capital | 8.50% | |||||||||||||||
| Private Investment (Mexico Pacific Limited) | Recent transaction | Purchase price | $2.67 | |||||||||||||||
| Private Investment (Renewable Holdco, LLC) | Recent transaction | Purchase price | $16,622,335 | |||||||||||||||
| Private Investment (Renewable Holdco I, LLC) | Discounted cash flow model | Weighted average cost of capital | 8.50% | |||||||||||||||
| Private Investment (Renewable Holdco II, LLC) | Discounted cash flow model | Contracted weighted average cost of capital | 6.50% | |||||||||||||||
| Private Investment (Renewable Holdco II, LLC) | Discounted cash flow model | Post-contracted weighted average cost of capital | 8.50% | |||||||||||||||
| Construction Note | Discounted cash flow model | Risk spread | 1.7500% | |||||||||||||||
| Construction Note | Discounted cash flow model | Illiquidity spread | 1.7255% | |||||||||||||||
C. Securities Transactions and Investment Income
Securities transactions are accounted for on the date the securities are purchased or sold (trade date). Realized gains and losses are reported on an identified cost basis. Interest income is recognized on the accrual basis, including amortization of premiums and accretion of discounts. Dividend income and distributions are recorded on the ex-dividend date. Distributions received from investments generally are comprised of ordinary income and return of capital. The Funds estimate the allocation of distributions between investment income and return of capital at the time such distributions are received based on historical information or regulatory filings. These estimates may subsequently be revised based on actual allocations received from the portfolio companies after their tax reporting periods are concluded, as the actual character of these distributions is not known until after the fiscal year-end of the Funds.
Subsequent to November 30, 2019, the Funds reallocated the amount of return of capital recognized for the period from December 1, 2018 through November 30, 2019 based on the 2019 tax reporting information received. The impact of this adjustment is as follows:
| Estimated Return | Revised Return | Increase/(Decrease) | |||||||
| of Capital % | of Capital % | in Return of Capital | |||||||
| TYG | 88% | 89% | $ | 2,235,694 | |||||
| NTG | 90% | 88% | $ | (1,725,051 | ) | ||||
| TTP | 68% | 65% | $ | (552,237 | ) | ||||
| NDP | 39% | 40% | $ | 13,518 | |||||
| TPZ | 82% | 78% | $ | (280,903 | ) | ||||
| TEAF | 52% | 50% | $ | (185,184 | ) | ||||
In addition, the Funds may be subject to withholding taxes on foreign-sourced income. The Funds accrue such taxes when the related income is earned.
D. Foreign Currency Translation
For foreign currency, investments in foreign securities, and other assets and liabilities denominated in a foreign currency, the Funds translate these amounts into U.S. dollars on the following basis: (i) market value of investment securities, assets and liabilities at the current rate of exchange on the valuation date, and (ii) purchases and sales of investment securities, income and expenses at the relevant rates of exchange on the respective dates of such transactions. The Funds do not isolate the portion of gains and losses on investments that is due to changes in the foreign exchange rates from that which is due to changes in market prices of securities.
| Tortoise | 69 |
| Notes to Financial Statements (continued) |
Each of TYG and NTG, as corporations, are obligated to pay federal and state income tax on its taxable income. Currently, the federal income tax rate for corporations is 21%.
TTP, NDP, TPZ and TEAF each qualify as a regulated investment company (“RIC”) under the Internal Revenue Code (“IRC”). As a result, TTP, NDP, TPZ and TEAF generally will not be subject to U.S. federal income tax on income and gains that they distribute each taxable year to stockholders if they meet certain minimum distribution requirements. However, TEAF’s taxable subsidiary, created to hold certain investments is generally subject to federal and state income taxes on its income. RICs are required to distribute substantially all of their income, in addition to meeting certain asset diversification requirements, and are subject to a 4% non-deductible U.S. federal excise tax on certain undistributed income unless the fund makes sufficient distributions to satisfy the excise tax avoidance requirement.
The Funds invest in master limited partnerships (“MLPs”), which generally are treated as partnerships for federal income tax purposes. As a limited partner in the MLPs, each Fund reports its allocable share of the MLP’s taxable income in computing its own taxable income. The Funds’ tax expense or benefit, if applicable, is included in the Statements of Operations based on the component of income or gains (losses) to which such expense or benefit relates. For TYG and NTG, deferred income taxes reflect the net tax effects of temporary differences between the carrying amounts of assets and liabilities for financial reporting purposes and the amounts used for income tax purposes. A valuation allowance is recognized if, based on the weight of available evidence, it is more likely than not that some portion or all of the deferred income tax asset will not be realized.
The Funds recognize the tax benefits of uncertain tax positions only when the position is “more likely than not” to be sustained upon examination by the tax authorities based on the technical merits of the tax position. The Funds’ policy is to record interest and penalties on uncertain tax positions as part of tax expense. As of November 30, 2020, the Funds had no uncertain tax positions and no penalties or interest was accrued. The Funds do not expect any change in their unrecognized tax positions in the next twelve months. The tax years ended on the following dates remain open to examination by federal and state tax authorities:
TYG — November 30, 2017 through 2020
NTG — November 30, 2017 through 2020
TTP, NDP and TPZ — November 30, 2017 through 2020
TEAF — November 30, 2019 through 2020
F. Distributions to Stockholders
Distributions to common stockholders are recorded on the ex-dividend date. The Funds may not declare or pay distributions to its common stockholders if it does not meet asset coverage ratios required under the 1940 Act or the rating agency guidelines for its debt and preferred stock following such distribution. The amount of any distributions will be determined by the Board of Directors. The character of distributions to common stockholders made during the year may differ from their ultimate characterization for federal income tax purposes.
As RICs, TTP, NDP, TPZ and TEAF each intend to make cash distributions of its investment company taxable income and capital gains to common stockholders. In addition, on an annual basis, TTP, NDP, TPZ and TEAF each may distribute additional capital gains in the last calendar quarter if necessary to meet minimum distribution requirements and thus avoid being subject to excise taxes. Distributions paid to stockholders in excess of investment company taxable income and net realized gains will be treated as return of capital to stockholders.
Distributions to mandatory redeemable preferred (“MRP”) stockholders are accrued daily based on applicable distribution rates for each series and paid periodically according to the terms of the agreements. The Funds may not declare or pay distributions to its preferred stockholders if it does not meet a 200% asset coverage ratio for its debt or the rating agency basic maintenance amount for the debt following such distribution. The character of distributions to preferred stockholders made during the year may differ from their ultimate characterization for federal income tax purposes.
For tax purposes, distributions to stockholders for the year ended November 30, 2020 were characterized as follows:
| TYG | NTG | TTP | NDP | TPZ | TEAF | |||||||||||||||||||||||||||||||
| Common | Preferred | Common | Preferred | Common | Preferred | Common | Common | Common | ||||||||||||||||||||||||||||
| Qualified dividend income | — | — | — | — | — | — | — | 8% | 19% | |||||||||||||||||||||||||||
| Ordinary dividend income | — | — | — | — | — | — | — | 49% | 39% | |||||||||||||||||||||||||||
| Return of capital | 100% | 100% | 100% | 100% | 100% | 100% | 100% | 43% | 42% | |||||||||||||||||||||||||||
| Long-term capital gain | — | — | — | — | — | — | — | — | — | |||||||||||||||||||||||||||
| * | For Federal income tax purposes, distributions of short-term capital gains are included in qualified dividend income. |
| 70 | Tortoise |
| 2020 Annual Report | November 30, 2020 |
| Notes to Financial Statements (continued) |
Offering costs related to the issuance of common stock are charged to additional paid-in capital when the stock is issued. Debt issuance costs related to senior notes and MRP Stock are deferred and amortized over the period the debt or MRP Stock is outstanding.
There were no offering or debt issuance costs recorded during the year ended November 30, 2020 for TYG, NTG, TTP, NDP, TPZ or TEAF.
H. Derivative Financial Instruments
The Funds have established policies and procedures for risk assessment and the approval, reporting and monitoring of derivative financial instrument activities. The Funds do not hold or issue derivative financial instruments for speculative purposes. All derivative financial instruments are recorded at fair value with changes in fair value during the reporting period, and amounts accrued under the agreements, included as unrealized gains or losses in the accompanying Statements of Operations. Derivative instruments that are subject to an enforceable master netting arrangement allow a Fund and the counterparty to the instrument to offset any exposure to the other party with amounts owed to the other party. The fair value of derivative financial instruments in a loss position are offset against the fair value of derivative financial instruments in a gain position, with the net fair value appropriately reflected as an asset or liability within the accompanying Statements of Assets & Liabilities.
TYG utilizes interest rate swap contracts in an attempt to manage interest rate risk. Cash settlements under the terms of the interest rate swap contracts and the termination of such contracts are recorded as realized gains or losses in the accompanying Statements of Operations.
TYG, NTG, TTP, NDP and TEAF may seek to provide current income from gains earned through an option strategy that normally consists of writing (selling) call options on selected equity securities held in the portfolio (“covered calls”). The premium received on a written call option is initially recorded as a liability and subsequently adjusted to the then current fair value of the option written. Premiums received from writing call options that expire unexercised are recorded as a realized gain on the expiration date. Premiums received from writing call options that are exercised are added to the proceeds from the sale of the underlying security to calculate the realized gain (loss). If a written call option is repurchased prior to its exercise, the realized gain (loss) is the difference between the premium received and the amount paid to repurchase the option.
TEAF may enter into forward currency contracts, which represent agreements to exchange currencies on specific future dates at predetermined rates. TEAF uses forward currency contracts to manage exposure to changes in exchange rates. On a daily basis, TEAF’s investment adviser values forward currency contracts and records unrealized appreciation or depreciation for open forward currency contracts in the Statements of Assets & Liabilities. Realized gains or losses are recorded at the time the forward currency contracts are closed.
I. Indemnifications
Under each of the Funds’ organizational documents, its officers and directors are indemnified against certain liabilities arising out of the performance of their duties to the Funds. In addition, in the normal course of business, the Funds may enter into contracts that provide general indemnification to other parties. A Fund’s maximum exposure under these arrangements is unknown, as this would involve future claims that may be made against the Funds that have not yet occurred, and may not occur. However, the Funds have not had prior claims or losses pursuant to these contracts and expect the risk of loss to be remote.
J. Cash and Cash Equivalents
Cash and cash equivalents include short-term, liquid investments with an original maturity of three months or less and money market fund accounts.
K. Recent Accounting and Regulatory Updates
In August 2018, the FASB issued ASU No. 2018-13 (“ASU 2018-13”), Fair Value Measurement (Topic 820): Disclosure Framework which modifies the disclosure requirements on fair value measurements. ASU 2018-13 is effective for fiscal years, and interim periods within those fiscal years, beginning after December 15, 2019, early adoption is permitted. Management has evaluated the guidance and does not believe it will have a material impact on the Fund’s financial statements and related disclosures or impact the Fund’s net assets or results of operations.
In March 2020, the Financial Accounting Standards Board (“FASB”) issued Accounting Standards Update (“ASU”) No. 2020-04 Reference Rate Reform (Topic 848); Facilitation of the Effects of Reference Rate Reform on Financial Reporting, which provides optional guidance for a limited period of time to ease the potential burden in accounting for (or recognizing the effects of) reference rate reform. The guidance is applicable to contracts referencing London Interbank Offered Rate (“LIBOR”) or another reference rate that is expected to be discontinued due to reference rate reform. The ASU is effective as of March 12, 2020 and generally can be applied through December 31, 2022. Management is evaluating the underlying securities referencing LIBOR or another reference rate that is expected to be discontinued as a reference rate over the period of time the ASU is effective.
| Tortoise | 71 |
| Notes to Financial Statements (continued) |
TYG, NTG, TTP, NDP and TPZ concentrate their investments in the energy sector. TEAF concentrates its investments in issuers operating in essential asset sectors. Funds that primarily invest in a particular sector may experience greater volatility than companies investing in a broad range of industry sectors. A Fund may, for defensive purposes, temporarily invest all or a significant portion of its assets in investment grade securities, short-term debt securities and cash or cash equivalents. To the extent a Fund uses this strategy, it may not achieve its investment objective.
Each of the funds have allocated a portion of their investment portfolios to units in special purpose acquisition companies (“SPACs”) acquired through IPO and/or secondary market transactions. A SPAC is a company that has no operations, but intends to merge with, acquire or otherwise invest in another company. Investing in such units involves considerations not usually associated with investing in securities of other types of companies, including, among other risks, the risk that a SPAC may not complete an investment in another company and be forced to liquidate its assets at a loss. The activity of identifying, completing and realizing attractive investments in SPACs is highly competitive, and involves a high degree of uncertainty. Moreover, the number of SPACs being sponsored has recently increased significantly which is expected to create additional competition and risk among SPACs.
As of the date these financial statements were issued, the outbreak of the novel coronavirus (“COVID-19”) in many countries continues to adversely impact global commercial activity, and has contributed to significant volatility in financial markets. The global impact of the outbreak has been rapidly evolving, and as cases of the virus have continued to be identified in additional countries, many countries have reacted by instituting quarantines and restrictions on travel. Such measures, as well as the general uncertainty surrounding the dangers and impact of COVID-19, are creating significant disruption in supply chains and economic activity. The outbreak could have a continued adverse impact on economic and market conditions and trigger a period of global economic slowdown. The rapid development and fluidity of this situation precludes any prediction as to the ultimate adverse impact of COVID- 19. Nevertheless, COVID-19 presents material uncertainty and risk with respect to our and our portfolio companies performance and financial results.
4. Agreements
The Funds have each entered into an Investment Advisory Agreement with Tortoise Capital Advisors, L.L.C. (the “Adviser”). The Funds each pay the Adviser a fee based on the Fund’s average monthly total assets (including any assets attributable to leverage and excluding any net deferred tax asset) minus accrued liabilities (other than net deferred tax liability, debt entered into for purposes of leverage and the aggregate liquidation preference of outstanding preferred stock) (“Managed Assets”), in exchange for the investment advisory services provided. Average monthly Managed Assets is the sum of the daily Managed Assets for the month divided by the number of days in the month. Accrued liabilities are expenses incurred in the normal course of each Fund’s operations. Waived fees are not subject to recapture by the Adviser. The annual fee rates paid to the Adviser as of November 30, 2020 are as follows:
TYG — 0.95% up to $2,500,000,000, 0.90% between $2,500,000,000 and $3,500,000,000, and 0.85% above $3,500,000,000.
NTG — 0.95%.
TTP — 1.10%.
NDP — 1.10%.
TPZ — 0.95%.
TEAF — 1.35%, less a fee waiver of 0.25% for one year following March 29, 2019.
U.S. Bancorp Fund Services, LLC d/b/a U.S. Bank Global Fund Services serves as each Fund’s administrator. Each Fund pays the administrator a monthly fee computed at an annual rate of 0.04% of the first $1,000,000,000 of the Fund’s Managed Assets, 0.01% on the next $500,000,000 of Managed Assets and 0.005% on the balance of the Fund’s Managed Assets.
U.S. Bank, N.A. serves as the Funds’ custodian. Each Fund pays the custodian a monthly fee computed at an annual rate of 0.004% of the Fund’s U.S. Dollar-denominated assets and 0.015% of the Fund’s Canadian Dollar-denominated assets, plus portfolio transaction fees.
| 72 | Tortoise |
| 2020 Annual Report | November 30, 2020 |
| Notes to Financial Statements (continued) |
5. Income Taxes TYG and NTG:
Deferred income taxes reflect the net tax effect of temporary differences between the carrying amount of assets and liabilities for financial reporting and tax purposes. Components of TYG’s and NTG’s deferred tax assets and liabilities as of November 30, 2020 are as follows:
| TYG | NTG | |||||||
| Deferred tax assets: | ||||||||
| Net operating loss carryforwards | $ | — | $ | 617,497 | ||||
| Capital loss carryforwards | 93,058,002 | 126,705,219 | ||||||
| Net unrealized loss on investment securities | 23,196,396 | 8,958,164 | ||||||
| Less: Valuation Allowance | (60,791,034 | ) | (118,528,790 | ) | ||||
| 55,463,364 | 17,752,090 | |||||||
| Deferred tax liabilities: | ||||||||
| Basis reduction of investments | 55,463,364 | 17,752,090 | ||||||
| 55,463,364 | 17,752,090 | |||||||
| Total net deferred tax liability (asset) | $ | — | $ | — | ||||
At November 30, 2020, a valuation allowance on deferred tax assets was necessary because each of TYG and NTG believe that it is not more likely than not that there is an ability to realize its deferred tax assets through future taxable income. TYG and NTG have recorded valuation allowances of $60,791,034 and $118,528,790 respectively. Any adjustments to TYG’s or NTG’s estimates of future taxable income will be made in the period such determination is made.
Total income tax expense for each of TYG and NTG differs from the amount computed by applying the federal statutory income tax rate of 21% to net investment loss and net realized and unrealized gains (losses) on investments for the period ended November 30, 2020, as follows:
| TYG | NTG | |||||||
| Application of statutory income tax rate | $ | (143,739,730 | ) | $ | (101,909,465 | ) | ||
| State income taxes, net of federal tax effect | (15,263,790 | ) | (9,754,192 | ) | ||||
| Permanent differences | 700,502 | 442,951 | ||||||
| Rate change on capital loss carryback | (12,241,106 | ) | — | |||||
| Rate change | 1,028,662 | (978,471 | ) | |||||
| Change in valuation allowance | 60,791,034 | 118,528,790 | ||||||
| Total income tax expense (benefit) | $ | (108,724,428 | ) | $ | 6,329,613 | |||
Total income taxes are being calculated by applying the federal rate plus a blended state income tax rate. During the year, each of TYG and NTG re-evaluated its blended state income tax rate, decreasing the overall rate from 23.31% to 23.23% and 23.02% to 23.01% respectively.
For the period ended November 30, 2020, the components of income tax expense for TYG and NTG include the following:
| TYG | NTG | |||||||
| Current tax expense | ||||||||
| Federal | $ | 555,719 | $ | 29,476,723 | ||||
| State | 7,192,010 | 4,745,375 | ||||||
| Total current tax expense | 7,747,729 | 34,222,098 | ||||||
| Deferred tax (benefit) | ||||||||
| Federal | (105,291,231 | ) | (25,455,984 | ) | ||||
| State (net of federal tax effect) | (11,180,926 | ) | (2,436,501 | ) | ||||
| Total deferred tax (benefit) | (116,472,157 | ) | (27,892,485 | ) | ||||
| Total income tax expense (benefit), net | $ | (108,724,428 | ) | $ | 6,329,613 | |||
As of November 30, 2020, TYG and NTG had capital loss carryforwards of approximately $572,000,000 and $551,000,000 respectively. TYG anticipates carrying back $171,000,000 of capital losses to prior three years. Capital losses not carried back can be carried forward for 5 years. If not utilized, TYG’s capital losses will expire in the year ending November 30, 2025 and NTG’s capital losses will expire in the years ending November 30, 2024 and 2025. The capital losses for the year ending November 30, 2020 have been estimated based on information currently available. Such estimate is subject to revision upon receipt of the 2020 tax reporting information from the individual MLPs. For corporations, capital losses can only be used to offset capital gains and cannot be used to offset ordinary income. As of November 30, 2020, NTG had approximately $770,000 of AMT credits available, which it estimates utilizing against its current tax liability.
| Tortoise | 73 |
| Notes to Financial Statements (continued) |
TTP, NDP, TPZ and TEAF:
It is the intention of TTP, NDP, TPZ and TEAF to qualify as RICs under Subchapter M of the IRC and distribute all of its taxable income. Accordingly, no provision for federal income taxes is required in the financial statements. However, TEAF’s taxable subsidiary created to make and hold certain investments is generally subject to federal and state income taxes on its income.
As of November 30, 2020, TEAF consolidated the balance of a deferred tax expense of $594,668 related to the investment activities of its taxable subsidiary. Total income taxes are computed by applying the federal statutory rate plus a blended state income tax rate totaling 27.98%.
At November 30, 2020, a valuation allowance on deferred tax assets was not deemed necessary because TEAF believes it is more likely than not that its able to realize its deferred tax assets through future taxable income. Any adjustments to TEAF’s estimates of future taxable income will be made in the period such determination is made.
Total income tax expense for TEAF’s taxable subsidiary differs from the amount computed by applying the federal statutory income tax rate of 21% to net income for the period ended November 30, 2020, as follows:
| Application of Statutory Income tax rate | $ | 440,229 | |
| State Income taxes, net of federal tax effect | 146,323 | ||
| Permanent differences | 10,042 | ||
| Other | (1,926 | ) | |
| Total income tax expense | $ | 594,668 |
The amount and character of income and capital gain distributions to be paid, if any, are determined in accordance with federal income tax regulations, which may differ from U.S. generally accepted accounting principles. These differences are primarily due to return of capital distributions from underlying investments, wash sales, straddles, swaps, differences in the timing of recognition of gains or losses on investments and distributions in excess of current earnings. These reclassifications have no impact on net assets or results of operations. Permanent book and tax basis differences resulted in the following reclassifications:
| TTP | NDP | TPZ | TEAF | |||||||||||||
| Distributable earnings (loss) | $ | 512,659 | $ | (928,875 | ) | $ | 12,389 | $ | 122,457 | |||||||
| Additional paid-in capital | $ | (512,659 | ) | $ | 928,875 | $ | (12,389 | ) | $ | (122,457 | ) | |||||
The tax character of distributions paid to stockholders for the years ending November 30, 2020 and November 30, 2019 was as follows:
| Year Ended November 30, 2020 | |||||||||||||||
| TTP | NDP | TPZ | TEAF | ||||||||||||
| Common | Preferred | Common | Common | Common | |||||||||||
| Ordinary income(1) | $ | — | $ | — | $ | 823 | $ | 4,161,698 | $ | 8,677,372 | |||||
| Return of capital | 4,041,041 | 613,908 | 1,475,974 | 3,135,711 | 6,176,359 | ||||||||||
| Total distributions | $ | 4,041,041 | $ | 613,908 | $ | 1,476,797 | $ | 7,297,409 | $ | 14,853,731 | |||||
| Year Ended November 30, 2019 | |||||||||||||||
| TTP | NDP | TPZ | TEAF | ||||||||||||
| Common | Preferred | Common | Common | Common | |||||||||||
| Ordinary income(1) | $ | — | $ | 367,805 | $ | — | $ | 7,757,597 | $ | 4,545,707 | |||||
| Long-term capital gain | — | — | — | 1,971,655 | — | ||||||||||
| Return of capital | 13,872,732 | 367,738 | 15,828,832 | 697,748 | 5,700,804 | ||||||||||
| Total distributions | $ | 13,872,732 | $ | 735,543 | $ | 15,828,832 | $ | 10,427,000 | $ | 10,246,511 | |||||
| (1) | For Federal income tax purposes, distributions of short-term capital gains are treated as ordinary income distributions. |
As of November 30, 2020, the components of accumulated earnings (deficit) on a tax basis were as follows:
| TTP | NDP | TPZ | TEAF | |||||||||||||||
| Unrealized appreciation (depreciation) | $ | (40,475,971 | ) | $ | (12,167,134 | ) | $ | (17,907,931 | ) | $ | 6,430,703 | |||||||
| Capital loss carryforwards | (96,906,032 | ) | (179,586,271 | ) | (17,039,588 | ) | (49,088,137 | ) | ||||||||||
| Undistributed ordinary income | — | — | — | — | ||||||||||||||
| Other temporary differences | (82,989 | ) | (1) | — | (8,817 | ) | (1,340,491 | ) | (2) | |||||||||
| Accumulated earnings (deficit) | $ | (137,464,992 | ) | $ | (191,753,405 | ) | $ | (34,956,336 | ) | $ | (43,997,925 | ) | ||||||
| (1) | Primarily related to losses deferred under straddle regulations per IRC Sec. 1092 and dividends payable. |
| (2) | Primarily related to expenses of TEAF’s taxable subsidiary and losses deferred under straddle regulations per IRC Sec. 1092. |
| 74 | Tortoise |
| 2020 Annual Report | November 30, 2020 |
| Notes to Financial Statements (continued) |
As of November 30, 2020, TTP, NDP, TPZ and TEAF had short-term capital loss carryforwards of approximately $17,780,000, $72,050,000, $2,600,000 and $49,100,000 respectively, and TTP, NDP and TPZ had long-term capital loss carryforwards of approximately $79,120,000, $107,600,000, $14,600,000 respectively, which may be carried forward for an unlimited period under the Regulated Investment Company Modernization Act of 2010. To the extent future net capital gains are realized, those gains will be offset by any unused capital loss carryforwards. Capital loss carryforwards will retain their character as either short-term or long-term capital losses. Thus, such losses must be used first to offset gains of the same character; for example, long-term loss carryforwards will first offset long-term gains, before they can be used to offset short-term gains.
In order to meet certain excise tax distribution requirements, TTP, NDP, TPZ and TEAF are required to measure and distribute annually net capital gains realized during a twelve month period ending October 31 and net investment income earned during a twelve month period ending December 31. In connection with this, TTP, NDP, TPZ and TEAF are permitted for tax purposes to defer into their next fiscal year, qualified late year losses. Qualified late year ordinary losses are any net ordinary losses incurred between January 1 and the end of their fiscal year, November 30, 2020. For the taxable year ended November 30, 2020, TTP, NDP, TPZ and TEAF do not plan to defer any losses.
As of November 30, 2020, the aggregate cost of investments, aggregate gross unrealized appreciation and aggregate gross unrealized depreciation on a federal income tax basis were as follows:
| TYG | NTG | TTP | NDP | TPZ | TEAF | |||||||||||||||||||
| Tax cost of investments | $ | 285,347,732 | $ | 183,165,001 | $ | 85,288,976 | $ | 45,971,657 | $ | 119,196,738 | $ | 235,683,325 | ||||||||||||
| Gross unrealized appreciation | ||||||||||||||||||||||||
| of investments | $ | 135,167,853 | $ | 50,264,816 | $ | 4,366,695 | $ | 3,256,159 | $ | 7,402,773 | $ | 16,747,477 | ||||||||||||
| Gross unrealized depreciation | ||||||||||||||||||||||||
| of investments | (18,459,959 | ) | (7,909,381 | ) | (20,747,486 | ) | (13,925,961 | ) | (11,828,387 | ) | (9,531,054 | ) | ||||||||||||
| Net unrealized appreciation | ||||||||||||||||||||||||
| (depreciation) of investments | $ | 116,707,894 | $ | 42,355,435 | $ | (16,380,791 | ) | $ | (10,669,802 | ) | $ | (4,425,614 | ) | $ | 7,216,423 | |||||||||
6. Restricted Securities
Certain of the Funds’ investments are restricted and are valued as determined in accordance with fair value procedures, as more fully described in Note 2. The following table shows the principal amount or shares, acquisition date(s), acquisition cost, fair value and the percent of net assets which the securities comprise at November 30, 2020.
| TYG: | ||||||||||||||||||
| Fair Value | ||||||||||||||||||
| Principal | as Percent | |||||||||||||||||
| Investment Security | Investment Type | Amount/Shares | Acquisition Date(s) | Acquisition Cost | Fair Value | of Net Assets | ||||||||||||
| Sunnova Energy Intl Inc., | ||||||||||||||||||
| 9.750%, 04/30/2025 | Convertible Note | $ | 1,307,000 | 5/14/20 | $ | 1,307,000 | $ | 3,954,420 | 1.3 | % | ||||||||
| Altus Midstream Company, | ||||||||||||||||||
| 7.000% | Preferred Stock | 10,427 | 06/12/19-5/14/20 | 10,427,344 | 12,180,492 | 4.0 | ||||||||||||
| Targa Resources Corp., | ||||||||||||||||||
| 9.500% | Preferred Stock | 21,758 | 03/16/16 | 19,265,393 | 21,888,112 | 7.2 | ||||||||||||
| TK NYS Solar Holdco, LLC | Private Investment | N/A | 08/18/17-08/19/19 | 55,256,470 | 10,365,844 | 3.4 | ||||||||||||
| $ | 86,256,207 | $ | 48,388,868 | 15.9 | % | |||||||||||||
| NTG: | ||||||||||||||||||
| Fair Value | ||||||||||||||||||
| Principal | as Percent | |||||||||||||||||
| Investment Security | Investment Type | Amount/Shares | Acquisition Date(s) | Acquisition Cost | Fair Value | of Net Assets | ||||||||||||
| Sunnova Energy Intl Inc., | ||||||||||||||||||
| 9.750%, 04/30/2025 | Convertible Note | $ | 910,000 | 5/14/20 | $ | 910,000 | $ | 2,753,269 | 1.8 | % | ||||||||
| Altus Midstream Company, | ||||||||||||||||||
| 7.000% | Preferred Stock | 7,456 | 06/12/19-5/14/20 | 7,455,805 | 8,709,349 | 5.8 | ||||||||||||
| Targa Resources Corp., | ||||||||||||||||||
| 9.500% | Preferred Stock | 12,252 | 03/16/16 | 10,848,405 | 12,325,266 | 8.3 | ||||||||||||
| $ | 19,214,210 | $ | 23,787,884 | 15.9 | % | |||||||||||||
| Tortoise | 75 |
| Notes to Financial Statements (continued) |
| TTP: | ||||||||||||||||||
| Fair Value | ||||||||||||||||||
| as Percent | ||||||||||||||||||
| Investment Security | Investment Type | Shares | Acquisition Date(s) | Acquisition Cost | Fair Value | of Net Assets | ||||||||||||
| Altus Midstream Company, | ||||||||||||||||||
| 7.000% | Preferred Stock | 554 | 06/12/19-5/14/20 | $ | 553,926 | $ | 647,057 | 1.4 | % | |||||||||
| Targa Resources Corp., | ||||||||||||||||||
| 9.500% | Preferred Stock | 2,108 | 03/16/16 | 1,866,506 | 2,120,606 | 4.4 | ||||||||||||
| $ | 2,420,432 | $ | 2,767,663 | 5.8 | % | |||||||||||||
| NDP: | ||||||||||||||||||
| Fair Value | ||||||||||||||||||
| as Percent | ||||||||||||||||||
| Investment Security | Investment Type | Shares | Acquisition Date | Acquisition Cost | Fair Value | of Net Assets | ||||||||||||
| Targa Resources Corp., | ||||||||||||||||||
| 9.500% | Preferred Stock | 1,997 | 03/16/16 | $ | 1,768,223 | $ | 2,008,943 | 6.6 | % | |||||||||
| TPZ: | ||||||||||||||||||
| Fair Value | ||||||||||||||||||
| Principal | as Percent | |||||||||||||||||
| Investment Security | Investment Type | Amount/Shares | Acquisition Date(s) | Acquisition Cost | Fair Value | of Net Assets | ||||||||||||
| Antero Midstream Partners LP, | ||||||||||||||||||
| 5.750%, 03/01/2027* | Corporate Bond | $ | 2,000,000 | 4/04/19 | $ | 2,040,000 | $ | 1,822,500 | 2.0 | % | ||||||||
| Ascent Resources Utica Holdings, LLC, | ||||||||||||||||||
| 10.000%, 04/01/2022* | Corporate Bond | $ | 1,302,000 | 08/27/18 | 1,445,220 | 1,311,765 | 1.5 | |||||||||||
| Ascent Resources Utica Holdings, LLC, | ||||||||||||||||||
| 7.000%, 11/01/2026* | Corporate Bond | $ | 2,000,000 | 10/11/18 | 2,000,278 | 1,880,000 | 2.1 | |||||||||||
| Blue Racer Midstream, LLC, | ||||||||||||||||||
| 6.625%, 07/15/2026* | Corporate Bond | $ | 5,900,000 | 6/18/18-02/05/19 | 5,936,250 | 5,546,000 | 6.2 | |||||||||||
| Duquesne Light Holdings, Inc., | ||||||||||||||||||
| 5.900%, 12/01/2021* | Corporate Bond | $ | 2,000,000 | 11/18/11-12/05/11 | 2,074,420 | 2,090,540 | 2.3 | |||||||||||
| Hess Corporation, | ||||||||||||||||||
| 5.625%, 02/15/2026* | Corporate Bond | $ | 4,160,000 | 07/19/18-08/06/18 | 4,196,600 | 4,295,200 | 4.8 | |||||||||||
| Rockies Express Pipeline LLC, | ||||||||||||||||||
| 4.950%, 07/15/2029* | Corporate Bond | $ | 3,000,000 | 04/12/19 | 3,002,670 | 3,022,500 | 3.4 | |||||||||||
| Ruby Pipeline, LLC, | ||||||||||||||||||
| 7.750%, 04/01/2022* | Corporate Bond | $ | 943,182 | 09/17/12 | 955,672 | 886,727 | 1.0 | |||||||||||
| Southern Star Central Corp., | ||||||||||||||||||
| 5.125%, 07/15/2022* | Corporate Bond | $ | 1,642,000 | 06/17/14 | 1,642,000 | 1,644,340 | 1.8 | |||||||||||
| Tallgrass Energy LP, | ||||||||||||||||||
| 5.500%, 01/15/2028* | Corporate Bond | $ | 3,250,000 | 09/24/18-02/06/19 | 3,261,250 | 3,095,625 | 3.5 | |||||||||||
| Sunnova Energy Intl Inc., | ||||||||||||||||||
| 9.750%, 04/30/2025 | Convertible Note | $ | 262,000 | 05/14/20 | 262,000 | 792,699 | 0.9 | |||||||||||
| Altus Midstream Company, | ||||||||||||||||||
| 7.000% | Preferred Stock | 483 | 06/12/19-05/14/20 | 483,100 | 564,322 | 0.6 | ||||||||||||
| Targa Resources Corp., | ||||||||||||||||||
| 9.500% | Preferred Stock | 1,685 | 03/16/16 | 1,424,734 | 1,695,076 | 1.9 | ||||||||||||
| $ | 28,943,916 | $ | 28,647,294 | 32.0 | % | |||||||||||||
| 76 | Tortoise |
| 2020 Annual Report | November 30, 2020 |
| Notes to Financial Statements (continued) |
| TEAF: | ||||||||||||||||||
| Fair Value | ||||||||||||||||||
| Principal | as Percent | |||||||||||||||||
| Investment Security | Investment Type | Amount/Shares | Acquisition Date(s) | Acquisition Cost | Fair Value | of Net Assets | ||||||||||||
| Antero Midstream Partners LP, | ||||||||||||||||||
| 5.750%, 01/15/2028* | Corporate Bond | $ | 3,750,000 | 10/31/19-11/19/19 | $ | 3,160,861 | $ | 3,375,000 | 1.6 | % | ||||||||
| Ascent Resources Utica Holdings, LLC, | ||||||||||||||||||
| 7.000%, 11/01/2026* | Corporate Bond | $ | 3,500,000 | 4/01/19 | 3,377,500 | 3,290,000 | 1.5 | |||||||||||
| Blue Racer Midstream, LLC, | ||||||||||||||||||
| 6.625%, 07/15/2026* | Corporate Bond | $ | 3,000,000 | 03/29/19 | 3,075,000 | 2,820,000 | 1.3 | |||||||||||
| Drumlin Reserve Property LLC, | ||||||||||||||||||
| 16.000%, 10/02/2025* | Corporate Bond | $ | 1,050,000 | 09/30/20 | 1,050,000 | 1,055,211 | 0.5 | |||||||||||
| Drumlin Reserve Property LLC, | ||||||||||||||||||
| 10.000%, 10/02/2025* | Corporate Bond | $ | 1,705,311 | 09/30/20 | 1,705,311 | 1,713,802 | 0.8 | |||||||||||
| Grace Commons Property, | ||||||||||||||||||
| 15.000%, 10/31/2023* | Corporate Bond | $ | 1,825,000 | 06/17/19 | 1,825,000 | 1,778,023 | 0.8 | |||||||||||
| Grace Commons Property, | ||||||||||||||||||
| 8.000%, 10/31/2021* | Corporate Bond | $ | 3,650,000 | 06/17/19 | 3,650,000 | 3,553,523 | 1.7 | |||||||||||
| Realco Perry Hall MD LLC/OPCO, | ||||||||||||||||||
| 10.000%, 10/01/2024* | Corporate Bond | $ | 2,280,000 | 10/01/19 | 2,280,000 | 1,550,382 | 0.7 | |||||||||||
| Targa Resources Corp., | ||||||||||||||||||
| 9.500% | Preferred Stock | 4,000 | 11/18/19 | 4,300,000 | 4,023,920 | 1.9 | ||||||||||||
| Altus Midstream Company, | ||||||||||||||||||
| 7.000% | Preferred Stock | 4,294 | 06/12/19-05/14/20 | 4,293,985 | 5,015,933 | 2.3 | ||||||||||||
| Enterprise Products Partners L.P., | ||||||||||||||||||
| 7.250% | Preferred Stock | 5,000 | 09/30/20 | 6,986,282 | 5,065,050 | 2.4 | ||||||||||||
| Mexico Pacific Limited LLC (MPL) | ||||||||||||||||||
| Series A | Private Investment | 88,889 | 10/23/19 | 2,000,000 | 237,334 | 0.1 | ||||||||||||
| Renewable Holdco, LLC | Private Investment | N/A | 07/25/19-9/11/20 | 14,356,143 | 15,395,885 | 7.2 | ||||||||||||
| Renewable Holdco I, LLC | Private Investment | N/A | 09/09/19 | 25,602,848 | 25,581,152 | 11.9 | ||||||||||||
| Renewable Holdco II, LLC | Private Investment | N/A | 10/15/19-11/02/20 | 6,614,927 | 6,216,336 | 2.9 | ||||||||||||
| Saturn Solar Bermuda1 Ltd., | ||||||||||||||||||
| 8.000%, 012/31/2020 | Construction Note | $ | 3,510,000 | 05/24/19-07/03/19 | 3,770,670 | 3,522,987 | 1.6 | |||||||||||
| Sunnova Energy Intl Inc., | ||||||||||||||||||
| 9.750%, 04/30/2025 | Convertible Note | $ | 1,098,000 | 05/14/20 | 1,090,300 | 3,322,076 | 1.6 | |||||||||||
| $ | 89,190,979 | $ | 87,516,614 | 40.8 | % | |||||||||||||
| * | Security is eligible for resale under Rule 144A under the 1933 Act. |
7. Affiliated Company Transactions
A summary of the transactions in affiliated companies during the year ended November 30, 2020 is as follows:
| TYG: | |||||||||||||||||||||||||||||||
| 11/30/19 | 11/30/20 | Net Change | |||||||||||||||||||||||||||||
| Share | Gross | Gross | Realized | Distributions | Share | 11/30/20 | in Unrealized | ||||||||||||||||||||||||
| Investment Security | Balance | Additions | Reductions | Gain/(Loss) | Received | Balance | Value | Depreciation | |||||||||||||||||||||||
| TK NYS Solar Holdco, LLC | N/A | $ | — | $ | — | $ | — | $ | 1,275,000 | N/A | $ | 10,365,844 | $ | (2,452,247 | ) | ||||||||||||||||
| TEAF: | |||||||||||||||||||||||||||||||
| Net Change in | |||||||||||||||||||||||||||||||
| 11/30/19 | 11/30/20 | Unrealized | |||||||||||||||||||||||||||||
| Share | Gross | Gross | Realized | Distributions | Share | 11/30/20 | Appreciation | ||||||||||||||||||||||||
| Investment Security | Balance | Additions | Reductions | Gain/(Loss) | Received | Balance | Value | (Depreciation) | |||||||||||||||||||||||
| Renewable Holdco, LLC | N/A | $ | 7,492,323 | $ | — | $ | — | $ | 5,645,169 | N/A | $ | 15,395,885 | $ | 373,501 | |||||||||||||||||
| Renewable Holdco I, LLC | N/A | $ | — | $ | — | $ | — | $ | 1,049,284 | N/A | $ | 25,581,152 | $ | 1,104,462 | |||||||||||||||||
| Renewable Holdco II, LLC | N/A | $ | 5,729,541 | $ | — | $ | — | $ | 40,000 | N/A | $ | 6,216,336 | $ | (465,910 | ) | ||||||||||||||||
| Total | N/A | $ | 13,221,864 | $ | — | $ | — | $ | 6,734,453 | N/A | $ | 47,193,373 | $ | 1,012,053 | |||||||||||||||||
| Tortoise | 77 |
| Notes to Financial Statements (continued) |
8. Investment Transactions
For the year ended November 30, 2020, the amount of security transactions (other than U.S. government securities and short-term investments), is as follows:
| TYG | NTG | TTP | NDP | TPZ | TEAF | |||||||||||||
| Purchases | $ | 276,717,199 | $ | 186,296,485 | $ | 36,078,010 | $ | 34,442,196 | $ | 37,881,722 | $ | 176,330,061 | ||||||
| Sales | $ | 809,163,221 | $ | 606,040,761 | $ | 80,211,205 | $ | 55,817,369 | $ | 67,262,054 | $ | 175,500,854 | ||||||
9. Senior Notes
TYG, NTG and TTP each have issued private senior notes (collectively, the “Notes”), which are unsecured obligations and, upon liquidation, dissolution or winding up of a Fund, will rank: (1) senior to all of the Fund’s outstanding preferred shares, if any; (2) senior to all of the Fund’s outstanding common shares; (3) on parity with any unsecured creditors of the Fund and any unsecured senior securities representing indebtedness of the Fund and (4) junior to any secured creditors of the Fund. Holders of the Notes are entitled to receive periodic cash interest payments until maturity. The Notes are not listed on any exchange or automated quotation system.
The Notes are redeemable in certain circumstances at the option of a Fund, subject to payment of any applicable make-whole amounts or early redemption premiums. The Notes for a Fund are also subject to a mandatory redemption if the Fund fails to meet asset coverage ratios required under the 1940 Act or the rating agency guidelines if such failure is not waived or cured. At November 30, 2020, each of TYG, NTG and TTP were in compliance with asset coverage covenants and basic maintenance covenants for its senior notes.
Details of each Fund’s outstanding Notes, including estimated fair value, as of November 30, 2020 are included below. The estimated fair value of each series of fixed-rate Notes was calculated, for disclosure purposes, by discounting future cash flows by a rate equal to the current U.S. Treasury rate with an equivalent maturity date, plus either 1) the spread between the interest rate on recently issued debt and the U.S. Treasury rate with a similar maturity date or 2) if there has not been a recent debt issuance, the spread between the AAA corporate finance debt rate and the U.S. Treasury rate with an equivalent maturity date plus the spread between the fixed rates of the Notes and the AAA corporate finance debt rate. The estimated fair value of floating rate Notes approximates the carrying amount because the interest rate fluctuates with changes in interest rates available in the current market. The estimated fair values in the following tables are Level 2 valuations within the fair value hierarchy.
| TYG: | ||||||||||||
| Estimated | ||||||||||||
| Series | Maturity Date | Interest Rate | Payment Frequency | Notional Amount | Fair Value | |||||||
| Series Z | June 14, 2021 | 2.98% | Semi-Annual | $ | 4,033,333 | $ | 4,133,693 | |||||
| Series R | January 22, 2022 | 3.77% | Semi-Annual | 8,066,667 | 8,435,118 | |||||||
| Series DD | September 27, 2022 | 4.21% | Semi-Annual | 4,194,667 | 4,471,820 | |||||||
| Series II | December 18, 2022 | 3.22% | Semi-Annual | 3,226,667 | 3,420,890 | |||||||
| Series K | December 19, 2022 | 3.87% | Semi-Annual | 3,226,666 | 3,472,432 | |||||||
| Series S | January 22, 2023 | 3.99% | Semi-Annual | 3,226,666 | 3,478,583 | |||||||
| Series P | September 27, 2023 | 4.39% | Semi-Annual | 3,872,000 | 4,266,709 | |||||||
| Series FF | November 20, 2023 | 4.16% | Semi-Annual | 3,226,667 | 3,527,807 | |||||||
| Series JJ | December 18, 2023 | 3.34% | Semi-Annual | 6,453,333 | 7,000,907 | |||||||
| Series T | January 22, 2024 | 4.16% | Semi-Annual | 8,066,667 | 8,968,168 | |||||||
| Series L | December 19, 2024 | 3.99% | Semi-Annual | 6,453,333 | 7,306,195 | |||||||
| Series AA | June 14, 2025 | 3.48% | Semi-Annual | 3,226,667 | 3,611,476 | |||||||
| Series NN | June 14, 2025 | 3.20% | Semi-Annual | 9,680,000 | 10,703,512 | |||||||
| Series KK | December 18, 2025 | 3.53% | Semi-Annual | 3,226,667 | 3,647,758 | |||||||
| Series OO | April 9, 2026 | 3.27% | Semi-Annual | 9,680,000 | 10,749,148 | |||||||
| Series PP | September 25, 2027 | 3.33% | Semi-Annual | 8,066,667 | 9,125,400 | |||||||
| $ | 87,926,667 | $ | 96,319,616 | |||||||||
TYG’s Series LL Notes, with a notional amount of $20,000,000 and a floating rate based on 3-month LIBOR plus 1.20% were prepaid in full on December 4, 2019.
TYG’s Series MM Notes, with a notional amount of $30,000,000 and a floating rate based on 3-month LIBOR plus 1.25% were redeemed in full on April 6, 2020.
On April 13, 2020, TYG prepaid $8,466,667 of Series Y Notes, $10,160,000 of Series O Notes, $8,466,667 of Series Z Notes, $16,933,333 of Series R Notes, $8,805,333 of Series DD Notes, $6,773,333 of Series II Notes, $6,773,333 of Series K Notes, $6,773,333 of Series S Notes, $8,128,000 of Series P Notes, $6,773,333 of Series FF Notes, $13,546,667 of Series JJ Notes, $16,933,333 of Series T Notes, $13,546,667 of Series L Notes, $6,773,333 of Series AA Notes, $20,320,000 of Series NN Notes, $6,773,333 of Series KK Notes, $20,320,000 of Series OO Notes and $16,933,333 of Series PP Notes subject to a 1% prepayment premium.
| 78 | Tortoise |
| 2020 Annual Report | November 30, 2020 |
| Notes to Financial Statements (continued) |
TYG’s Series Y Notes with a notional amount of $4,033,333 and a fixed interest rate of 2.77% were paid in full upon maturity on June 14, 2020.
TYG’s Series O Notes with a notional amount of $4,840,000 and a fixed interest rate of 3.78% were paid in full upon maturity on September 27, 2020.
| NTG: | |||||||||||||||
| Estimated | |||||||||||||||
| Series | Maturity Date | Interest Rate | Payment Frequency | Notional Amount | Fair Value | ||||||||||
| Series J | April 17, 2021 | 3.72 | % | Semi-Annual | $ | 6,128,342 | $ | 6,221,828 | |||||||
| Series M | April 17, 2021 | 3.06 | % | Semi-Annual | 2,042,781 | 2,067,150 | |||||||||
| Series P | October 16, 2023 | 3.79 | % | Semi-Annual | 2,979,055 | 3,227,952 | |||||||||
| Series Q | October 16, 2025 | 3.97 | % | Semi-Annual | 2,234,291 | 2,541,089 | |||||||||
| Series R | October 16, 2026 | 4.02 | % | Semi-Annual | 1,936,386 | 2,245,041 | |||||||||
| $ | 15,320,855 | $ | 16,303,060 | ||||||||||||
NTG’s Series L Notes, with a notional amount of $20,000,000 and a floating rate based on 3-month LIBOR plus 1.45% were prepaid in full on December 4, 2019.
On March 31, 2020, NTG prepaid $5,416,667 of Series P Notes, $4,062,500 of Series Q Notes, $3,520,833 of Series R Notes, $32,000,000 of Series N Notes and $25,000,000 of Series O Notes subject to a 2% prepayment premium.
On April 14, 2020, NTG prepaid $89,120,856 of Series D Notes, $23,871,658 of Series J Notes, $7,957,219 of Series M Notes, $11,604,278 of Series P Notes, $8,703,209 of Series Q Notes and $7,542,781 of Series R Notes subject to a 1% prepayment premium.
NTG’s Series D Notes with a notional amount of $22,879,144 and a fixed interest rate of 4.29% were paid in full on November 16, 2020.
| TTP: | |||||||||||||||
| Notional | Estimated | ||||||||||||||
| Series | Maturity Date | Interest Rate | Payment Frequency | Amount | Fair Value | ||||||||||
| Series D | December 15, 2021 | 4.08 | % | Semi-Annual | $ | 10,514,286 | $ | 10,947,612 | |||||||
| Series H | December 13, 2024 | 3.97 | % | Semi-Annual | 3,942,857 | 4,461,371 | |||||||||
| $ | 14,457,143 | $ | 15,408,983 | ||||||||||||
On April 6, 2020, TTP prepaid $6,000,000 of Series G Notes at par.
On April 14, 2020, TTP prepaid $2,057,143 of Series F Notes, $5,485,714 of Series D Notes and $2,057,143 of Series H Notes subject to a 1% prepayment premium.
TTP’s Series F Notes with a notional amount of $3,942,857 and a fixed interest rate of 3.01% were paid in full on November 16, 2020.
10. Mandatory Redeemable Preferred Stock
TYG, NTG and TTP each have issued and outstanding MRP Stock at November 30, 2020. The MRP Stock has rights determined by the Board of Directors. Except as otherwise indicated in the Funds’ Charter or Bylaws, or as otherwise required by law, the holders of MRP Stock have voting rights equal to the holders of common stock (one vote per MRP share) and will vote together with the holders of shares of common stock as a single class except on matters affecting only the holders of preferred stock or the holders of common stock. The 1940 Act requires that the holders of any preferred stock (including MRP Stock), voting separately as a single class, have the right to elect at least two directors at all times.
Under the 1940 Act, a fund may not declare dividends or make other distributions on shares of common stock or purchases of such shares if, at the time of the declaration, distribution or purchase, asset coverage with respect to the outstanding MRP Stock would be less than 200%. The MRP Stock is also subject to a mandatory redemption if a Fund fails to meet an asset coverage ratio of at least 225% as determined in accordance with the 1940 Act or a rating agency basic maintenance amount if such failure is not waived or cured. At November 30, 2020, each of TYG, NTG and TTP were in compliance with asset coverage covenants and basic maintenance covenants for its MRP Stock.
Details of each Fund’s outstanding MRP Stock, including estimated fair value, as of November 30, 2020 is included below. The estimated fair value of each series of TYG, NTG and TTP MRP Stock was calculated for disclosure purposes by discounting future cash flows at a rate equal to the current U.S. Treasury rate with an equivalent maturity date, plus either 1) the spread between the interest rate on recently issued preferred stock and the U.S. Treasury rate with a similar maturity date or 2) if there has not been a recent preferred stock issuance, the spread between the AA corporate finance debt rate and the U.S. Treasury rate with an equivalent maturity date plus the spread between the fixed rates of the MRP Stock and the AA corporate finance debt rate. The estimated fair values of each series of the TYG, NTG and TTP MRP Stock are Level 2 valuations within the fair value hierarchy.
| Tortoise | 79 |
| Notes to Financial Statements (continued) |
TYG:
TYG has 65,000,000 shares of preferred stock authorized and 3,230,000 shares of MRP Stock outstanding at November 30, 2020. TYG’s MRP Stock has a liquidation value of $10.00 per share plus any accumulated but unpaid distributions, whether or not declared. Holders of the MRP D Stock and MRP E Stock are entitled to receive cash interest payments semi-annually at a fixed rate until maturity. On April 9, 2020, TYG redeemed 6,836,061 of Series D MRP Shares and 6,433,939 of Series E MRP Shares for a total liquidation preference amount of $132,700,000. TYG paid a 1% premium upon redemption. The TYG MRP Stock is not listed on any exchange or automated quotation system.
| Mandatory | Aggregate Liquidation | Estimated | |||||||||||||||||
| Series | Redemption Date | Fixed Rate | Shares Outstanding | Preference | Fair Value | ||||||||||||||
| Series D | December 17, 2021 | 4.01 | % | 1,663,939 | $ | 16,639,390 | $ | 17,370,059 | |||||||||||
| Series E | December 17, 2024 | 4.34 | % | 1,566,061 | 15,660,610 | 17,580,499 | |||||||||||||
| 3,230,000 | $ | 32,300,000 | $ | 34,950,558 | |||||||||||||||
TYG’s MRP Stock is redeemable in certain circumstances at the option of TYG, subject to payment of any applicable make-whole amounts.
NTG:
NTG has 10,000,000 shares of preferred stock authorized and 508,000 shares of MRP Stock outstanding at November 30, 2020. NTG’s MRP Stock has a liquidation value of $25.00 per share plus any accumulated but unpaid distributions, whether or not declared. Holders of NTG MRP Stock are entitled to receive cash interest payments each quarter at a fixed rate until maturity. On April 10, 2020, NTG redeemed 180,757 of Series C MRP Shares, 1,446,061 of Series D MRP Shares, 1,446,061 of Series E MRP Shares, 903,788 of Series F MRP Shares and 795,333 of Series G MRP Shares for a total liquidation preference amount of $119,300,000. NTG paid a 1% premium upon redemption. The NTG MRP Stock is not listed on any exchange or automated quotation system.
| Mandatory | Aggregate Liquidation | Estimated | |||||||||||||||||
| Series | Redemption Date | Fixed Rate | Shares Outstanding | Preference | Fair Value | ||||||||||||||
| Series C | December 8, 2020 | 3.73 | % | 19,243 | $ | 481,075 | $ | 485,400 | |||||||||||
| Series D | December 8, 2022 | 4.19 | % | 153,939 | 3,848,475 | 4,081,064 | |||||||||||||
| Series G | October 16, 2023 | 4.39 | % | 84,667 | 2,116,675 | 2,292,093 | |||||||||||||
| Series E | December 13, 2024 | 3.78 | % | 153,939 | 3,848,475 | 4,187,305 | |||||||||||||
| Series F | December 13, 2027 | 4.07 | % | 96,212 | 2,405,300 | 2,746,430 | |||||||||||||
| 508,000 | $ | 12,700,000 | $ | 13,792,292 | |||||||||||||||
NTG’s MRP Stock is redeemable in certain circumstances at the option of NTG, subject to payment of any applicable make-whole amounts.
TTP:
TTP has 10,000,000 shares of preferred stock authorized and 244,000 shares of MRP Stock outstanding at November 30, 2020. TTP’s MRP Stock has a liquidation value of $25.00 per share plus any accumulated but unpaid distributions, whether or not declared. Holders of TTP MRP Stock are entitled to receive cash interest payments each quarter at a fixed rate until maturity. On April 10, 2020, TTP redeemed 396,000 of Series B MRP Shares. TTP paid a 1% premium upon redemption. The TTP MRP Stock is not listed on any exchange or automated quotation system.
| Mandatory | Aggregate Liquidation | Estimated | |||||||||||||||||
| Series | Redemption Date | Fixed Rate | Shares Outstanding | Preference | Fair Value | ||||||||||||||
| Series B | December 13, 2024 | 6.57 | % | 244,000 | $ | 6,100,000 | $ | 7,336,487 | |||||||||||
TTP’s MRP Stock is redeemable in certain circumstances at the option of TTP, subject to payment of any applicable make-whole amounts.
| 80 | Tortoise |
| 2020 Annual Report | November 30, 2020 |
| Notes to Financial Statements (continued) |
11. Credit Facilities
The following table shows key terms, average borrowing activity and interest rates for the period during which the facility was utilized during the year ended November 30, 2020 as well as the principal balance and interest rate in effect at November 30, 2020 for each of the Funds’ credit facilities:
| TYG | NTG | TTP | NDP | TPZ | TEAF | ||||||||
| Lending syndicate | Bank of America, | The Bank | The Bank | The Bank | The Bank | ||||||||
| agent | U.S. Bank, N.A. | N.A. | of Nova Scotia | of Nova Scotia | of Nova Scotia | of Nova Scotia | |||||||
| Unsecured, | Unsecured, | Unsecured, | Secured, | Secured, | |||||||||
| revolving credit | revolving credit | revolving credit | revolving credit | revolving credit | Margin loan | ||||||||
| Type of facility | facility | facility | facility | facility | facility | facility | |||||||
| Borrowing | |||||||||||||
| capacity | $90,000,000 | $65,000,000 | $20,000,000 | $12,000,000 | $30,000,000 | $45,000,000 | |||||||
| 364-day rolling | 179-day rolling | 179-day rolling | |||||||||||
| Maturity date | June 12, 2021 | June 12, 2021 | evergreen | evergreen | evergreen | N/A | |||||||
| 1-month LIBOR | 1-month LIBOR | 1-month LIBOR | 1-month LIBOR | 1-month LIBOR | 1-month LIBOR | ||||||||
| Interest rate | plus 1.10% | plus 1.10% | plus 1.125% | plus 0.80% | plus 1.10% | plus 0.80% | |||||||
| Non-usage fee | 0.15%-0.25%(1) | 0.15%-0.25%(2) | 0.15% | 0.20%(3) | 0.15-0.25%(4) | 0.20%(5) | |||||||
| For the period ended November 30, 2020: | |||||||||||||
| Average principal | |||||||||||||
| balance | $52,800,000 | $55,800,000 | $9,600,000 | $10,200,000 | $32,800,000 | $30,400,000 | |||||||
| Average interest | |||||||||||||
| rate | 2.49% | 2.37% | 2.74% | 1.45% | 2.92 | % | 1.45% | ||||||
| As of November 30, 2020: | |||||||||||||
| Principal balance | |||||||||||||
| outstanding | $13,200,000 | $40,000,000 | $— | $5,000,000 | $26,200,000 | (6) | $31,100,000 | ||||||
| Interest rate | 1.25% | 1.25% | N/A | 0.95% | 1.25 | % | 0.95% | ||||||
| (1) | Non-use fees are equal to a rate of 0.25% when the outstanding balance is below $45,000,000 and 0.15% when the outstanding balance is at least $45,000,000, but below $63,000,000. The outstanding balance will not be subject to the non-use fee when the amount outstanding is at least $63,000,000. |
| (2) | Non-use fees are equal to a rate of 0.25% when the outstanding balance is below $32,500,000 and 0.15% when the outstanding balance is at least $32,500,000, but below $45,500,000. The outstanding balance will not be subject to the non-use fee when the amount outstanding is at least $45,500,000. |
| (3) | Non-usage fee is waived if the outstanding balance on the facility is at least $8,400,000. |
| (4) | Non-use fees are equal to a rate of 0.25% when the outstanding balance is below $22,500,000 and 0.15% when the outstanding balance is at least $22,500,000. |
| (5) | Non-usage fee is waived if the outstanding balance on the facility is at least $31,500,000. |
| (6) | TPZ’s credit facility allows for interest rates to be fixed on all or a portion of the outstanding balance. Amounts reflect activity on the credit facility for the period from December 1, 2019 through August 31, 2020 and include $9,000,000 of the outstanding principal balance that has a rate of 2.23% plus 1.10% spread through June 30, 2023 and $15,000,000 of the outstanding principal balance that has a rate of 2.24% plus 1.10% spread through June 30, 2024. |
For the period from December 1, 2019 through April 2, 2020 (the date the agreement was terminated), TYG had a revolving credit facility with The Bank of Nova Scotia. The terms of the agreement provided for a $90,000,000 facility. Outstanding balances accrued interest at a variable rate equal to one-month LIBOR plus 1.20%. The average principal balance and interest rate during which this credit facility was utilized was approximately $62,200,000 and 2.83%, respectively.
Under the terms of the credit and margin facilities, the Funds must maintain asset coverage required under the 1940 Act. If a Fund fails to maintain the required coverage, it may be required to repay a portion of an outstanding balance until the coverage requirement has been met. At November 30, 2020, each Fund was in compliance with facility terms.
| Tortoise | 81 |
| Notes to Financial Statements (continued) |
12. Derivative Financial Instruments
The Funds have adopted the disclosure provisions of FASB Accounting Standard Codification 815, Derivatives and Hedging (“ASC 815”). ASC 815 requires enhanced disclosures about the Funds’ use of and accounting for derivative instruments and the effect of derivative instruments on the Funds’ results of operations and financial position. Tabular disclosure regarding derivative fair value and gain/loss by contract type (e.g., interest rate contracts, foreign exchange contracts, credit contracts, etc.) is required and derivatives accounted for as hedging instruments under ASC 815 must be disclosed separately from those that do not qualify for hedge accounting. Even though the Funds may use derivatives in an attempt to achieve an economic hedge, the Funds’ derivatives are not accounted for as hedging instruments under ASC 815 because investment companies account for their derivatives at fair value and record any changes in fair value in current period earnings.
Forward Currency Contracts
TEAF invests in derivative instruments for hedging or risk management purposes, and for short-term purposes such as maintaining market exposure pending investment of the proceeds of an offering or transitioning its portfolio between different asset classes. The Fund’s use of derivatives could enhance or decrease the cash available to the Fund for payment of distributions or interest, as the case may be. Derivatives can be illiquid, may disproportionately increase losses and have a potentially large negative impact on the Fund’s performance. Derivative transactions, including options on securities and securities indices and other transactions in which the Fund may engage (such as forward currency transactions, futures contracts and options thereon and total return swaps), may subject the Fund to increased risk of principal loss due to unexpected movements in stock prices, changes in stock volatility levels, interest rates and foreign currency exchange rates and imperfect correlations between the Fund’s securities holdings and indices upon which derivative transactions are based. The Fund also will be subject to credit risk with respect to the counterparties to any OTC derivatives contracts the Fund enters into.
Interest Rate Swap Contracts
TYG and TPZ have each entered into interest rate swap contracts in an attempt to protect it from increasing interest expense on its leverage resulting from increasing interest rates. A decline in interest rates may result in a decline in the value of the swap contracts, which may result in a decline in the net assets of TYG and TPZ. At the time the interest rate swap contracts reach their scheduled termination, there is a risk that TYG and TPZ will not be able to obtain a replacement transaction, or that the terms of the replacement would not be as favorable as on the expiring transaction. In addition, if TYG or TPZ is required to terminate any swap contract early due to a decline in net assets below a threshold amount or failing to maintain a required 300% asset coverage of the liquidation value of the outstanding debt, then TYG or TPZ could be required to make a payment to the extent of any net unrealized depreciation of the terminated swaps, in addition to redeeming all or some of its outstanding debt. TYG and TPZ each segregate a portion of its assets as collateral for the amount of any net liability of its interest rate swap contracts.
TYG and TPZ are exposed to credit risk on the interest rate swap contracts if the counterparty should fail to perform under the terms of the interest rate swap contracts. The amount of credit risk is limited to the net appreciation of the interest rate swap contracts, if any, as no collateral is pledged by the counterparty. In addition, if the counterparty to the interest rate swap contracts defaults, the Fund would incur a loss in the amount of the receivable and would not receive amounts due from the counterparty to offset the interest payments on the Fund’s leverage.
The average notional amount of all open swap agreements for TYG and TPZ for the year ended November 30, 2020 was $10,000,000 and $2,040,984, respectively.
The following table presents TYG’s interest rate swap contract, which is subject to a netting agreement, on a gross and a net basis at November 30, 2020:
| Gross Amounts Not Offset in the | ||||||||||||||||||||||||||||||
| Statement of Assets & Liabilities | ||||||||||||||||||||||||||||||
| Gross Amounts | Net Amounts of | |||||||||||||||||||||||||||||
| Gross Amounts | Offset in the | Assets Presented in | ||||||||||||||||||||||||||||
| of Recognized | Statements of | the Statements of | Financial | Cash Collateral | ||||||||||||||||||||||||||
| Description | Liabilities | Assets & Liabilities | Assets & Liabilities | Instruments | Received | Net Amount | ||||||||||||||||||||||||
| TYG: Interest Rate Swap Contracts | $ | 188,015 | $ | — | $ | — | $ | — | $ | — | $ | 188,015 | ||||||||||||||||||
| 82 | Tortoise |
| 2020 Annual Report | November 30, 2020 |
| Notes to Financial Statements (continued) |
Written Call Options
Transactions in written option contracts for TYG, NTG, TTP, NDP and TEAF for the year ended November 30, 2020 are as follows:
| TYG | NTG | TTP | |||||||||||||||||||
| Number of | Number of | Number of | |||||||||||||||||||
| Contracts | Premium | Contracts | Premium | Contracts | Premium | ||||||||||||||||
| Options outstanding at November 30, 2019 | 3,700 | $ | 127,576 | 3,600 | $ | 115,174 | 5,043 | $ | 225,578 | ||||||||||||
| Options written | 14,750 | 122,200 | 12,380 | 100,832 | 14,214 | 544,579 | |||||||||||||||
| Options closed* | (1,053 | ) | (37,877 | ) | (725 | ) | (26,079 | ) | (13,940 | ) | (527,297 | ) | |||||||||
| Options exercised | (1,197 | ) | (52,056 | ) | (825 | ) | (35,875 | ) | (1,079 | ) | (52,886 | ) | |||||||||
| Options expired | (16,200 | ) | (159,843 | ) | (14,430 | ) | (154,052 | ) | (4,238 | ) | (189,974 | ) | |||||||||
| Options outstanding at November 30, 2020 | — | $ | — | — | $ | — | — | $ | — | ||||||||||||
| NDP | TEAF | ||||||||||||||||||||
| Number of | Number of | ||||||||||||||||||||
| Contracts | Premium | Contracts | Premium | ||||||||||||||||||
| Options outstanding at November 30, 2019 | 24,139 | $ | 534,008 | 17,184 | $ | 570,114 | |||||||||||||||
| Options written | 82,077 | 1,394,004 | 103,155 | 2,926,935 | |||||||||||||||||
| Options closed* | (70,988 | ) | (1,390,773 | ) | (50,843 | ) | (1,649,361 | ) | |||||||||||||
| Options exercised | (16,616 | ) | (284,531 | ) | (24,118 | ) | (472,584 | ) | |||||||||||||
| Options expired | (18,612 | ) | (252,708 | ) | (36,020 | ) | (1,158,676 | ) | |||||||||||||
| Options outstanding at November 30, 2020 | — | $ | — | 9,358 | $ | 216,428 | |||||||||||||||
*The aggregate cost of closing written option contracts was $137,047 for TYG, $94,358 for NTG, $530,270 for TTP, $193,939 for NDP, and $998,886 for TEAF, resulting in net realized gain (loss) of $(99,170), $(68,280), $(2,974), $1,196,834 and $650,475 for TYG, NTG, TTP, NDP and TEAF, respectively.
The following table presents the types and fair value of derivatives by location as presented on the Statements of Assets & Liabilities at November 30, 2020:
| Assets/(Liabilities) | ||||||
| Derivatives not accounted for | ||||||
| as hedging instruments under ASC 815 | Location | Fair Value | ||||
| TYG: Interest rate swap contracts | Interest rate swap contracts | $ | (188,015 | ) | ||
| TEAF: Written equity call options | Options written, at fair value | $ | (219,521 | ) | ||
The following table presents the effect of derivatives on the Statements of Operations for the period ended November 30, 2020:
| Net Unrealized | ||||||||||
| Net Realized | Appreciation | |||||||||
| Derivatives not accounted for | Location of Gains (Losses) | Gain (Loss) on | (Depreciation) | |||||||
| as hedging instruments under ASC 815 | on Derivatives | Derivatives | of Derivatives | |||||||
| TYG: Interest rate swap contracts | Interest rate swaps | $ | (151,510 | ) | $ | (26,175 | ) | |||
| TYG: Written equity call options | Options | $ | 76,055 | $ | (63,848 | ) | ||||
| NTG: Written equity call options | Options | $ | (246,486 | ) | $ | (69,929 | ) | |||
| TTP: Written equity call options | Options | $ | 187,001 | $ | (142,140 | ) | ||||
| NDP: Written equity call options | Options | $ | 1,449,541 | $ | (354,660 | ) | ||||
| TPZ: Interest rate swap contracts | Interest rate swaps | $ | (18,276 | ) | $ | 8,589 | ||||
| TEAF: Written equity call options | Options | $ | 1,774,136 | $ | (285,141 | ) | ||||
| Tortoise | 83 |
| Notes to Financial Statements (continued) |
13. Basis For Consolidation
As of November 30, 2020, TYG has committed a total of $55,256,470 of equity funding to Tortoise Holdco II, LLC, a wholly-owned investment of TYG. Tortoise Holdco II, LLC wholly owns TK NYS Solar Holdco, LLC, which owns and operates renewable energy assets. TK NYS Solar Holdco, LLC acquired the commercial and industrial solar portfolio between August 2017 and November 2019. Fair value of TK NYS Solar Holdco, LLC is net of tax benefits.
TYG’s consolidated schedule of investments includes the portfolio holdings of the Fund and its subsidiary, Tortoise Holdco II, LLC. All inter-company transactions and balances have been eliminated.
As of November 30, 2020, TEAF has committed $53,592,265 to TEAF Solar Holdco, LLC, a wholly-owned investment of TEAF. TEAF Solar Holdco, LLC wholly owns each of Renewable Holdco, LLC and Renewable Holdco I, LLC, which owns and operates renewable energy assets. TEAF Solar Holdco, LLC owns a majority partnership interest in Renewable Holdco II, LLC. Renewable Holdco, LLC and Renewable Holdco II, LLC’s acquisition of the commercial and industrial solar portfolio is ongoing. Renewable Holdco I, LLC acquired the commercial and industrial solar portfolio in September 2019.
As of November 30, 2020, TEAF has provided $3,770,670 to TEAF Solar Holdco I, LLC, a wholly-owned investment of TEAF. TEAF Solar Holdco I, LLC has committed to $6,667,100 of debt funding to Saturn Solar Bermuda 1, Ltd. through a construction note. Under the terms of the note Tortoise Solar Holdco I, LLC receives cash payments monthly at an annual rate of 8%. As of November 30, 2020, $3,510,000 of the construction note had been funded.
TEAF’s consolidated schedule of investments includes the portfolio holdings of the Fund and its subsidiaries, TEAF Solar Holdco, LLC and TEAF Solar Holdco I, LLC. All inter-company transactions and balances have been eliminated.
14. Reverse Stock Split
On May 1, 2020, TYG, NTG, TTP, and NDP’s shares were adjusted to reflect a reverse stock split. The effect of this reverse stock split was to reduce the number of shares outstanding in the Funds, while maintaining each Fund’s and each stockholder’s aggregate net asset value. All historical per share information has been retroactively adjusted to reflect this reverse stock split. Set forth below are details regarding the reverse stock splits:
| Net Asset Value | Net Asset Value | Shares Outstanding | Shares Outstanding | ||||||||||||||||
| Fund | Rate | Before Split | After Split | Before Split | After Split | ||||||||||||||
| TYG | 1-for-4 | $ | 5.64 | $ | 22.56 | 53,732,462 | 13,433,117 | ||||||||||||
| NTG | 1-for-10 | $ | 2.32 | $ | 23.20 | 63,208,377 | 6,320,839 | ||||||||||||
| TTP | 1-for-4 | $ | 4.77 | $ | 19.08 | 10,016,413 | 2,504,104 | ||||||||||||
| NDP | 1-for-8 | $ | 1.98 | $ | 15.84 | 14,767,968 | 1,845,997 | ||||||||||||
15. Share Repurchase Programs
On July 8, 2020, each of TYG, NTG and TTP announced a share repurchase program effective through December 31, 2020. Under the program, each of TYG, NTG and TTP may purchase, in the open market, up to $25,000,000, $12,500,000 and $5,000,000, respectively, of its outstanding common shares, if trading at a discount to NAV in excess of 10%. On October 14, 2020, TPZ announced a share repurchase program effective through August 31, 2021. Under the program, TPZ may purchase, in the open market up to $5,000,000 of its outstanding common shares, if trading at a discount to NAV in excess of 10%.
Details of each Fund’s share repurchases under the programs through November 30, 2020 are included below.
| Dollars | Commission | Shares | Average | Average | ||||||||||||||||||
| Fund | Repurchased | Fees | Repurchased | Share Price | Discount to NAV | |||||||||||||||||
| TYG | $ | 18,095,163 | $ | 16,266 | 1,084,400 | $ | 16.69 | 24.8% | ||||||||||||||
| NTG | $ | 8,043,079 | $ | 7,131 | 475,322 | $ | 16.92 | 25.5% | ||||||||||||||
| TTP | $ | 1,353,780 | $ | 1,424 | 94,976 | $ | 14.25 | 25.0% | ||||||||||||||
| TPZ | $ | 751,950 | $ | 1,173 | 78,206 | $ | 9.62 | 24.8% | ||||||||||||||
| 84 | Tortoise |
| 2020 Annual Report | November 30, 2020 |
| Notes to Financial Statements (continued) |
16. Subsequent Events
TYG:
From the period from December 1, 2020 through the date the financial statements were issued, TYG repurchased 321,936 shares of its common stock at an average share price of $21.38 and average discount to NAV of 22.0%.
TYG has performed an evaluation of subsequent events through the date the financial statements were issued and has determined that no additional items require recognition or disclosure.
NTG:
From the period from December 1, 2020 through the date the financial statements were issued, NTG repurchased 202,526 shares of its common stock at an average share price of $21.96 and average discount to NAV of 21.7%.
NTG has performed an evaluation of subsequent events through the date the financial statements were issued and has determined that no additional items require recognition or disclosure.
TTP:
On November 11, 2020, the Board of Directors of each NDP and TTP approved the proposed mergers of NDP into TTP. As part of the merger, NDP common stockholders will be issued common stock of TTP and TTP would acquire all of the assets and liabilities of NDP. It is currently expected that the merger will take place during 2021, subject to obtaining the required stockholder votes of NDP and TTP.
From the period from December 1, 2020 through the date the financial statements were issued, TTP repurchased 82,292 shares of its common stock at an average share price of $17.75 and average discount to NAV of 18.1%.
TTP has performed an evaluation of subsequent events through the date the financial statements were issued and has determined that no additional items require recognition or disclosure.
NDP:
On November 11, 2020, the Board of Directors of each NDP and TTP approved the proposed mergers of NDP into TTP. As part of the merger, NDP common stockholders will be issued common stock of TTP and TTP would acquire all of the assets and liabilities of NDP. It is currently expected that the merger will take place during 2021, subject to obtaining the required stockholder votes of NDP and TTP. NDP has performed an evaluation of subsequent events through the date the financial statements were issued and has determined that no items require recognition or disclosure.
TPZ:
On December 31, 2020, TPZ paid a distribution in the amount of $0.05 per common share, for a total of $340,019. Of this total, the dividend reinvestment amounted to $3,382.
From the period from December 1, 2020 through the date the financial statements were issued, TPZ repurchased 114,951 shares of its common stock at an average share price of $11.29 and average discount to NAV of 17.8%.
TPZ has performed an evaluation of subsequent events through the date the financial statements were issued and has determined that no additional items require recognition or disclosure.
TEAF:
On December 31, 2020, TEAF paid a distribution in the amount of $0.075 per common share, for a total of $1,011,835. Of this total, the dividend reinvestment amounted to $53,639.
TEAF has performed an evaluation of subsequent events through the date the financial statements were issued and has determined that no additional items require recognition or disclosure.
| Tortoise | 85 |
| Report of Independent Registered Public Accounting Firm |
To the Shareholders and Board of Directors
Tortoise Energy Infrastructure Corp.
Tortoise Midstream Energy Fund, Inc.
Tortoise Pipeline & Energy Fund, Inc.
Tortoise Energy Independence Fund, Inc.
Tortoise Power and Energy Infrastructure Fund, Inc.
Tortoise Essential Assets Income Term Fund
Opinion on the Financial Statements
We have audited the accompanying statements of assets and liabilities of Tortoise Energy Infrastructure Corp. (consolidated), Tortoise Midstream Energy Fund, Inc., Tortoise Pipeline & Energy Fund, Inc., Tortoise Energy Independence Fund, Inc., Tortoise Power and Energy Infrastructure Fund, Inc., and Tortoise Essential Assets Income Term Fund (consolidated) (the “Funds”), including the schedules of investments, as of November 30, 2020, and the related statements of operations, cash flows, and changes in net assets, and the financial highlights for each of the periods indicated in the table below and the related notes (collectively referred to as the “financial statements”). In our opinion, the financial statements present fairly, in all material respects, the financial position of the Funds at November 30, 2020, the results of their operations, cash flows, changes in net assets and financial highlights for each of the periods indicated in the table below, in conformity with U.S. generally accepted accounting principles.
| Statement | Statement of | |||||
| Closed-End Funds | of operations | changes in net assets | Financial highlights | |||
| Tortoise Energy Infrastructure Corp. | For the year ended November 30, 2020 | For each of the two years in the period ended November 30, 2020 | For each of the five years in the period ended November 30, 2020 | |||
| Tortoise Midstream Energy Fund, Inc. | ||||||
| Tortoise Pipeline & Energy Fund, Inc. | ||||||
| Tortoise Energy Independence Fund, Inc. | ||||||
| Tortoise Power and Energy Infrastructure Fund, Inc. | ||||||
| Tortoise Essential Assets Income Term Fund | For the year ended November 30, 2020 | For the year ended November 30, 2020 and the period from March 29, 2019 (commencement of operations) to November 30, 2019 | ||||
Basis for Opinion
These financial statements are the responsibility of the Funds’ management. Our responsibility is to express an opinion on the Funds’ financial statements based on our audits. We are a public accounting firm registered with the Public Company Accounting Oversight Board (United States) (“PCAOB”) and are required to be independent with respect to the Funds in accordance with the U.S. federal securities laws and the applicable rules and regulations of the Securities and Exchange Commission and the PCAOB.
We conducted our audits in accordance with the standards of the PCAOB. Those standards require that we plan and perform the audit to obtain reasonable assurance about whether the financial statements are free of material misstatement, whether due to error or fraud. The Funds are not required to have, nor were we engaged to perform an audit of the Funds’ internal control over financial reporting. As part of our audits we are required to obtain an understanding of internal control over financial reporting but not for the purpose of expressing an opinion on the effectiveness of the Funds’ internal control over financial reporting. Accordingly, we express no such opinion.
Our audits included performing procedures to assess the risks of material misstatement of the financial statements, whether due to error or fraud, and performing procedures that respond to those risks. Such procedures included examining, on a test basis, evidence regarding the amounts and disclosures in the financial statements. Our procedures included confirmation of securities owned as of November 30, 2020, by correspondence with the custodian, counterparties, and brokers. Our audits also included evaluating the accounting principles used and significant estimates made by management, as well as evaluating the overall presentation of the financial statements. We believe that our audits provide a reasonable basis for our opinion.

We have served as the auditor of one or more Tortoise investment companies since 2004.
Minneapolis, Minnesota
January 28, 2021
| 86 | Tortoise |
| 2020 Annual Report | November 30, 2020 |
| Company Officers and Directors (unaudited) |
| November 30, 2020 |
| Number of | ||||||||
| Position(s) Held | Portfolios in | Other Public | ||||||
| With Company, Term | Fund Complex | Company | ||||||
| of Office and Length | Overseen | Directorships | ||||||
| Name and Age(1) | of Time Served(2) | Principal Occupation During Past Five Years | by Director(3) | Held | ||||
| Independent Directors | ||||||||
| Conrad S. Ciccotello (Born 1960) | Class I Director of TYG since 2003 and of NTG since 2010; Class II Director of NDP since 2012 and of TPZ since 2007; Class III Director of TTP since 2011; Class I Director of TEAF since 2019. | Professor and Director, Reiman School of Finance, University of Denver (faculty member since 2017); Senior Consultant to the finance practice of Charles River Associates, which provides economic, financial, and management consulting services (since May 2020); Associate Professor and Chairman of the Department of Risk Management and Insurance, Director of the Asset and Wealth Management Program, Robinson College of Business, Georgia State University (faculty member from 1999-2017); Investment Consultant to the University System of Georgia for its defined contribution retirement plan (2008-2017); Formerly Faculty Member, Pennsylvania State University (1997-1999); Published a number of academic and professional journal articles on investment company performance and structure, with a focus on MLPs. | 7 | CorEnergy Infrastructure Trust, Inc.; Peachtree Alternative Strategies Fund | ||||
| Rand C. Berney (Born 1955) | Class I Director of TTP since 2014; Class II Director of each of TYG and NTG since 2014; Class III Director of each of NDP and TPZ since 2014; Class II Director of TEAF since 2019. | Executive-in-Residence, College of Business Administration, Kansas State University since 2012; Formerly Senior Vice President of Corporate Shared Services of ConocoPhillips from April 2009 to 2012, Vice President and Controller of ConocoPhillips from 2002 to April 2009, and Vice President and Controller of Phillips Petroleum Company from 1997 to 2002; Member of the Oklahoma Society of CPAs, the Financial Executive Institute, American Institute of Certified Public Accountants, the Institute of Internal Auditors and the Institute of Management Accountants. | 6 | None | ||||
| Jennifer Paquette (Born 1962) | Class I Director of TTP since 2018; Class II Director of each of TYG and NTG since 2018; Class III Director of each of NDP and TPZ since 2018; Class II Director of TEAF since 2019. | Retired in 2017; Previously Chief Investment Officer of the Public Employees’ Retirement Association of Colorado (“Colorado PERA”) from 2003 to 2017; Held various positions within Colorado PERA from 1999 to 2003 and 1995 to 1996; Formerly Vice-President Institutional Account Executive at Merrill Lynch, Pierce, Fenner & Smith from 1991 to 1994; Vice-President, Portfolio Manager and Analyst at Alliance Capital Management from 1987 to 1991; Portfolio Assistant and Assistant at Mitchell Hutchins Asset Management from 1985 to 1987. Chartered Financial Analyst (“CFA”) charterholder. | 6 | None | ||||
| Alexandra Herger (Born 1957) | Class I Director of each of NDP and TPZ since 2015; Class II Director of TTP since 2015; Class III Director of each of TYG and NTG since 2015; Class III Director of TEAF since 2019. | Retired in 2014; Previously interim vice president of exploration for Marathon Oil in 2014 prior to her retirement; Director of international exploration and new ventures for Marathon Oil from 2008 to 2014; Held various positions with Shell Exploration and Production Co. between 2002 and 2008; Member of the Society of Exploration Geophysicists, the American Association of Petroleum Geologists, the Houston Geological Society and the Southeast Asia Petroleum Exploration Society; Member of the 2010 Leadership Texas/Foundation for Women’s Resources since 2010; Director of Panoro Energy ASA, an international independent oil and gas company listed on the Oslo Stock Exchange. | 6 | None | ||||
| Interested Directors (4) | ||||||||
| H. Kevin Birzer (Born 1959) | Class I Director and Chairman of the Board of NDP since 2012 and of TPZ since 2007; Class II Director and Chairman of the Board of TTP since 2011; Class III Director and Chairman of the Board of TYG since 2003 and of NTG since 2010; Class III Director and Chairman of the Board of TEAF since 2019. | Chief Executive Officer of the Adviser; Managing Director of the Adviser and member of the Investment Committee of the Adviser since 2002. CFA designation since 1988. | 6 | None |
| (1) | The address of each director and officer is 5100 W. 115th Place, Leawood, Kansas 66211. |
| (2) | Ending year of Director terms by Class are as follows: |
| TYG | NTG | TTP | NDP | TPZ | TEAF | ||||||||
| Class I | 2023 | 2023 | 2021 | 2022 | 2022 | 2023 | |||||||
| Class II | 2021 | 2021 | 2022 | 2023 | 2023 | 2021 | |||||||
| Class III | 2022 | 2022 | 2023 | 2021 | 2021 | 2022 |
| (3) | This number includes TYG, NTG, TTP, NDP, TPZ and TEAF. For Mr. Ciccotello, this number also includes the Ecofin Tax-Advantaged Social Impact Fund, Inc. (”TSIFX”). The Adviser serves as the investment adviser to TYG, NTG, TTP, NDP, TPZ, TEAF and TSIFX. |
| (4) | As a result of their respective positions held with the Adviser or its affiliates, these individuals are considered “interested persons” within the meaning of the 1940 Act. |
| Tortoise | 87 |
| Company Officers and Directors (unaudited) (continued) |
| November 30, 2020 |
| Number of | ||||||||
| Position(s) Held | Portfolios in | Other Public | ||||||
| With Company, Term | Fund Complex | Company | ||||||
| of Office and Length | Overseen | Directorships | ||||||
| Name and Age(1) | of Time Served(2) | Principal Occupation During Past Five Years | by Director | Held | ||||
| Interested Officers(3) | ||||||||
| P. Bradley Adams (Born 1960) | Chief Executive Officer of each of TYG, NTG, TTP, NDP and TPZ since June 30, 2015. Principal Financial Officer and Treasurer of each of TYG, NTG, TTP, NDP and TPZ since May 18, 2017; Chief Executive Officer and Principal Financial Officer of TEAF since November 5, 2018. | Managing Director of the Adviser since January 2013; Director of Financial Operations of the Adviser from 2005 to January 2013; Chief Financial Officer of NTG from 2010 to June 30, 2015, of each of TYG and TPZ from May 2011 to June 30, 2015, of each of TTP and NDP from its inception to June 30, 2015. | N/A | None | ||||
| Matthew G.P. Sallee (Born 1978) | President of TYG and NTG since June 30, 2015. | Managing Director of the Adviser since January 2014 and member of the Investment Committee of the Adviser since June 30, 2015; Portfolio Manager of the Adviser since July 2013; Senior Investment Analyst of the Adviser from June 2012 to July 2013; Investment Analyst of the Adviser from 2009 to June 2012; Research Analyst of the Adviser from 2005 to 2009. CFA designation since 2009. | N/A | None | ||||
| Brian A. Kessens (Born 1975) | President of TTP and TPZ since June 30, 2015. | Managing Director of the Adviser since January 2015 and a member of the Investment Committee of the Adviser since June 30, 2015; Portfolio Manager of the Adviser since July 2013; Senior Investment Analyst of the Adviser from June 2012 to July 2013; Investment Analyst of the Adviser from 2008 to June 2012. CFA designation since 2006. | N/A | None | ||||
Robert J. Thummel | President of NDP since June 30, 2015. | Managing Director of the Adviser since January 2014 and a member of the Investment Committee of the Adviser since June 30, 2015; Portfolio Manager of the Adviser since July 2013; Senior Investment Analyst of the Adviser from June 2012 to July 2013; Investment Analyst of the Adviser from 2004 to June 2012. | N/A | None | ||||
| Nicholas S. Holmes (Born 1985) | President of TEAF since May 20, 2019; Vice President of each of TYG and NTG since June 30, 2015. | Managing Director of the Adviser since January 2020; Portfolio Manager of the Adviser since January 2019; Investment Analyst of the Adviser from January 2015 to December 2018; Research Analyst of the Adviser from January 2012 through December 2014 and Assistant Research Analyst from January 2010 through December 2011. CFA designation since 2013. | N/A | None | ||||
| Stephen Pang (Born 1981) | Vice President of TTP from May 18, 2017 to December 11, 2020. | Managing Director of the Adviser since January 2019; Portfolio Manager of the Adviser since January 2018; Director of the Adviser from January 2017 to January 2019; Investment Analyst of the Adviser from January 2015 to January 2017; CFA designation since 2016. | N/A | Hyliion Holdings Corp. | ||||
| Shobana Gopal (Born 1962) | Vice President of each of TYG, NTG, TTP, NDP and TPZ since June 30, 2015; Vice President of TEAF since November 5, 2018. | Director, Tax of the Adviser since January 2013; Tax Analyst of the Adviser from September 2006 through December 2012. | N/A | None | ||||
| Ryan Channell (Born 1985) | Vice President of each of TYG, NTG, TPZ, TTP, NDP and TEAF from June 2020 to January 20, 2021; Assistant Vice President of TYG, NTG, TPZ, TTP and NDP from May 2017 to June 2020 and of TEAF from its inception to June 2020. | Director-Financial Operations of the Adviser from January 2020 to January 20, 2021; Vice President-Financial Operations of the Adviser from 2017 to 2020; Senior Financial Operations Analyst of the Adviser from 2015 to 2017. | N/A | None | ||||
| Courtney Gengler (Born 1986) | Vice President of each of TYG, NTG, TPZ, TTP, NDP and TEAF since June 16, 2020; Assistant Treasurer of each of TYG, NTG, TPZ, TTP and NDP since May 18, 2017 and of TEAF since its inception. | Director-Financial Operations of the Adviser since January 2020; Vice President-Accounting and Financial Reporting from 2017 to 2020. | N/A | None | ||||
| Diane Bono (Born 1958) | Secretary of each of TYG, NTG, TTP, NDP and TPZ since May 2013; Secretary of TEAF since November 5, 2018. | Chief Compliance Officer of the Adviser since June 2006; Chief Compliance Officer of TYG since June 2006 and of each of NTG, TTP, NDP and TPZ since its inception. | N/A | None |
| (1) | The address of each director and officer is 5100 W. 115th Place, Leawood, Kansas 66211. |
| (2) | Officers are elected annually. |
| (3) | As a result of their respective positions held with the Adviser or its affiliates, these individuals are considered “interested persons” within the meaning of the 1940 Act. |
| 88 | Tortoise |
| 2020 Annual Report | November 30, 2020 |
| Additional Information (unaudited) |
Notice to Shareholders
For stockholders that do not have a November 30, 2020 tax year end, this notice is for information purposes only. For stockholders with a November 30, 2020 tax year end, please consult your tax advisor as to the pertinence of this notice. For the fiscal year ended November 30, 2020, each Fund is designating the following items with regard to distributions paid during the year.
| Common Distributions | ||||||||||||||||||||||||||||||
| Qualifying for | ||||||||||||||||||||||||||||||
| Return of Capital | Long-Term Capital | Ordinary Income | Total | Qualifying | Corporate Dividends | |||||||||||||||||||||||||
| Fund | Distributions | Gain Distributions(1) | Distributions | Distributions | Dividends(2) | Rec. Deduction (3) | ||||||||||||||||||||||||
| TTP | 100.00 | % | 0.00 | % | 0.00 | % | 100.00 | % | 0.00 | % | 0.00 | % | ||||||||||||||||||
| NDP | 100.00 | % | 0.00 | % | 0.00 | % | 100.00 | % | 0.00 | % | 0.00 | % | ||||||||||||||||||
| TPZ | 42.97 | % | 0.00 | % | 57.03 | % | 100.00 | % | 14.58 | % | 10.31 | % | ||||||||||||||||||
| TEAF | 41.58 | % | 0.00 | % | 58.42 | % | 100.00 | % | 32.78 | % | 6.22 | % | ||||||||||||||||||
| Preferred Distributions | ||||||||||||||||||||||||||||||
| Qualifying for | ||||||||||||||||||||||||||||||
| Return of Capital | Long-Term Capital | Ordinary Income | Total | Qualifying | Corporate Dividends | |||||||||||||||||||||||||
| Fund | Distributions | Gain Distributions(1) | Distributions | Distributions | Dividends(2) | Rec. Deduction (3) | ||||||||||||||||||||||||
| TTP | 100.00 | % | 0.00 | % | 0.00 | % | 100.00 | % | 0.00 | % | 0.00 | % | ||||||||||||||||||
| (1) | The Fund designates long-term capital gain distributions per IRC Code Sec. 852(b)(3)(C). The long-term capital gain tax rate is variable based on the taxpayer’s taxable income. |
| (2) | Represents the portion of Ordinary Income Distributions taxable at the capital gain tax rates if the stockholder meets holding period requirements. |
| (3) | Represents the portion of Ordinary Income Distributions which qualify for the “Corporate Dividends Received Deduction.” |
Stockholder Proxy Voting Results
The annual meeting of stockholders for each Fund was held on June 16, 2020. The matters considered at the meeting by each fund, together with the actual vote tabulations relating to such matters are as follows:
1. To elect one director of the Fund, to hold office for a term of three years and until his successor is duly elected and qualified.
| TYG | NTG | TTP | NDP | TPZ | TPZ | |||||||
| Conrad S. Ciccotello | ||||||||||||
| Affirmative | 8,956,896 | 4,109,628 | 1,951,503 | 1,367,544 | 5,491,801 | 10,822,583 | ||||||
| Withheld | 662,849 | 923,102 | 79,800 | 123,569 | 287,010 | 281,163 | ||||||
| TOTAL | 9,619,745 | 5,032,730 | 2,031,303 | 1,491,113 | 5,778,811 | 11,103,746 |
Each of Rand C. Berney and Jennifer Paquette continued as a director with a term expiring on the date of the 2021 annual meeting of stockholders. H. Kevin Birzer and Alexandra Herger continued as a director with a term expiring on the date of the 2022 annual meeting of stockholders.
2. To ratify the selection of Ernst & Young LLP as the independent registered public accounting firm for the fiscal year ending November 30, 2020.
| TYG | NTG | TTP | NDP | TPZ | TPZ | |||||||
| Affirmative | 9,306,194 | 4,758,953 | 1,973,085 | 1,443,606 | 5,623,576 | 10,908,005 | ||||||
| Against | 189,003 | 207,958 | 22,876 | 27,020 | 63,195 | 88,613 | ||||||
| Abstain | 124,548 | 65,819 | 35,342 | 20,487 | 92,040 | 107,128 | ||||||
| TOTAL | 9,619,745 | 5,032,730 | 2,031,303 | 1,491,113 | 5,778,811 | 11,103,746 |
Based upon votes required for approval, each of these matters passed.
Director and Officer Compensation
The Funds do not compensate any of its directors who are “interested persons,” as defined in Section 2(a)(19) of the 1940 Act, nor any of its officers. For the period from December 1, 2019 through November 30, 2020, the aggregate compensation paid by the Funds to the independent directors was as follows:
| TYG | NTG | TTP | NDP | TPZ | TEAF | |||||
| $114,333 | $108,333 | $93,733 | $91,933 | $88,533 | $ 78,333 |
The Funds did not pay any special compensation to any of its directors or officers.
| Tortoise | 89 |
| Additional Information (unaudited) (continued) |
Forward-Looking Statements
This report contains “forward-looking statements” within the meaning of the 1933 Act and the Securities Exchange Act of 1934, as amended. By their nature, all forward-looking statements involve risks and uncertainties, and actual results could differ materially from those contemplated by the forward-looking statements. Several factors that could materially affect each Fund’s actual results are the performance of the portfolio of investments held by it, the conditions in the U.S. and international financial, petroleum and other markets, the price at which shares of each Fund will trade in the public markets and other factors discussed in filings with the Securities and Exchange Commission (SEC).
Proxy Voting Policies
A description of the policies and procedures that each Fund uses to determine how to vote proxies relating to portfolio securities owned by the Fund and information regarding how each Fund voted proxies relating to the portfolio of securities during the 12-month period ended June 30, 2020 are available to stockholders (i) without charge, upon request by calling the Adviser at (913) 981-1020 or toll-free at (866) 362-9331 and on or through the Adviser’s Web site at www.tortoiseecofin.com; and (ii) on the SEC’s Web site at www.sec.gov.
Form N-PORT
Each Fund files its complete schedule of portfolio holdings for the first and third quarters of each fiscal year with the SEC on Part F of Form N-PORT. Each Fund’s Form Part F of Form N-PORT are available without charge upon request by calling the Adviser at (866) 362-9331 or by visiting the SEC’s Web site at www.sec.gov.
Each Fund’s N-PORTs are also available through the Adviser’s Web site at www.tortoiseecofin.com.
Statement of Additional Information
The Statement of Additional Information (“SAI”) includes additional information about each Fund’s directors and is available upon request without charge by calling the Adviser at (866) 362-9331 or by visiting the SEC’s Web site at www.sec.gov.
Certifications
Each Fund’s Chief Executive Officer has submitted to the New York Stock Exchange the annual CEO certification as required by Section 303A.12(a) of the NYSE Listed Company Manual.
Each Fund has filed with the SEC, as an exhibit to its most recently filed Form N-CSR, the certification of its Chief Executive Officer and Principal Financial Officer required by Section 302 of the Sarbanes-Oxley Act.
Privacy Policy
In order to conduct its business, each Fund collects and maintains certain nonpublic personal information about its stockholders of record with respect to their transactions in shares of each Fund’s securities. This information includes the stockholder’s address, tax identification or Social Security number, share balances, and distribution elections. We do not collect or maintain personal information about stockholders whose share balances of our securities are held in “street name” by a financial institution such as a bank or broker.
We do not disclose any nonpublic personal information about you, the Funds’ other stockholders or the Funds’ former stockholders to third parties unless necessary to process a transaction, service an account, or as otherwise permitted by law.
To protect your personal information internally, we restrict access to nonpublic personal information about the Funds’ stockholders to those employees who need to know that information to provide services to our stockholders. We also maintain certain other safeguards to protect your nonpublic personal information.
Repurchase Disclosure
Notice is hereby given in accordance with Section 23(c) of the 1940 Act, that each Fund may from time to time purchase shares of its common stock in the open market.
| 90 | Tortoise |
| 2020 Annual Report | November 30, 2020 |
| Additional Information (unaudited) (continued) |
Automatic Dividend Reinvestment
Each of NTG, TTP, NDP and TPZ have an Automatic Dividend Reinvestment Plan and TYG has an Automatic Dividend Reinvestment and Cash Purchase Plan (each, a “Plan”). Each Plan allows participating common stockholders to reinvest distributions, including dividends, capital gains and return of capital in additional shares of the Fund’s common stock and TYG’s Plan also allows registered holders of the TYG’s common stock to make optional cash investments, in accordance with TYG’s Plan, on a monthly basis.
If a stockholder’s shares are registered directly with the Fund or with a brokerage firm that participates in the Fund’s Plan, all distributions are automatically reinvested for stockholders by the Agent in additional shares of common stock of the Fund (unless a stockholder is ineligible or elects otherwise). Stockholders holding shares that participate in the Plan in a brokerage account may not be able to transfer the shares to another broker and continue to participate in the Plan. Stockholders who elect not to participate in the Plan will receive all distributions payable in cash paid by check mailed directly to the stockholder of record (or, if the shares are held in street or other nominee name, then to such nominee) by Computershare, as dividend paying agent. Distributions subject to tax (if any) are taxable whether or not shares are reinvested.
Any single investment pursuant to the cash purchase option under TYG’s Plan must be in an amount of at least $100 and may not exceed $5,000 per month unless a request for waiver has been granted. A request for waiver should be directed to TYG at 1-866-362-9331 and TYG has the sole discretion to grant any requested waiver. Optional cash investments may be delivered to the Agent by personal check, by automatic or electronic bank account transfer or by online access at www.computershare.com. TYG reserves the right to reject any purchase order. Stockholders who hold shares in street or other nominee name who want to participate in optional cash investments should contact their broker, bank or other nominee and follow their instructions. There is no obligation to make an optional cash investment at any time, and the amount of such investments may vary from time to time. Optional cash investments must be received by the Agent no later than two business days prior to the monthly investment date (the “payment date”) for purchase of common shares on the next succeeding purchase date under TYG’s Plan. Scheduled optional cash purchases may be cancelled or refunded upon a participant’s written request received by the Agent at least two business days prior to the purchase date. Participants will not be able to instruct the Agent to purchase common shares at a specific time or at a specific price.
If on the distribution payment date or, for TYG, the purchase date for optional cash investments, the net asset value per share of the common stock is equal to or less than the market price per share of common stock plus estimated brokerage commissions, the Fund will issue additional shares of common stock to participants. The number of shares will be determined by the greater of the net asset value per share or 95 percent of the market price. Otherwise, shares generally will be purchased on the open market by the Agent as soon as possible following the payment date or purchase date, but in no event later than 30 days after such date except as necessary to comply with applicable law. There are no brokerage charges with respect to shares issued directly by the Fund as a result of distributions payable either in shares or in cash or, for TYG, as a result of optional cash investments. However, each participant will pay a pro rata share of brokerage commissions incurred with respect to the Agent’s open-market purchases in connection with the reinvestment of distributions or optional cash investments. If a participant elects to have the Agent sell part or all of his or her common stock and remit the proceeds, such participant will be charged a transaction fee of $15.00 plus his or her pro rata share of brokerage commissions on the shares sold.
Participation is completely voluntary. Stockholders may elect not to participate in the Plan, and participation may be terminated or resumed at any time without penalty, by giving notice in writing, by telephone or Internet to Computershare, the Plan Agent, at the address set forth below. Such termination will be effective with respect to a particular distribution if notice is received prior to such record date.
Additional information about the Plan may be obtained by writing to Computershare Trust Company, N.A, P.O. Box 30170, College Station, TX 77842-3170. You may also contact Computershare by phone at (800) 426-5523 or visit their Web site at www.computershare.com.
| Tortoise | 91 |
| Additional Information (unaudited) (continued) |
Approval of the Investment Advisory Agreements for all Funds and the Sub-Advisory Agreement for TEAF
In approving the renewal of the respective Investment Advisory Agreement of each of TYG, NTG, TPZ, TTP, NDP and TEAF in November 2020, and the investment sub-advisory agreement between the Adviser and Ecofin Advisors Limited (the “Sub-Adviser”) with respect to TEAF (the “TEAF Investment Sub-Advisory Agreement”), the directors who are not “interested persons” (as defined in the Investment Company Act of 1940) of the fund (“Independent Directors”) requested and received extensive data and information from the Adviser concerning the fund and the services provided to it by the Adviser under the Investment Advisory Agreement, including information from independent, third-party sources, regarding the factors considered in their evaluation, and with respect to TEAF, information concerning the services provided by the Sub-Adviser under the TEAF Investment Sub-Advisory Agreement. Before the Independent Directors voted on approval of the Investment Advisory Agreement and the TEAF Investment Sub-Advisory Agreement, the Independent Directors met with independent legal counsel during an executive session and discussed the agreements and related information.
Factors Considered for Each Fund
The Board, including the Independent Directors, considered and evaluated all the information provided by the Adviser. The Board, including the Independent Directors, did not identify any single factor as being all-important or controlling, and individual directors may have attributed different levels of importance to different factors. In deciding to renew the fund’s agreement, the decision of the Board, including the Independent Directors, was based on the following factors.
Nature, Extent and Quality of Services Provided. The Board considered information regarding the history, qualification and background of the Adviser, the Sub-Adviser, and the individuals primarily responsible for the portfolio management of the fund. Additionally, the Board considered the quality and extent of the resources devoted to research and analysis of the fund’s actual and potential investments, including the research and decision-making processes utilized by the Adviser and Sub-Adviser, as well as risk oversight and the methods adopted to seek to achieve compliance with the investment objectives, policies and restrictions of the fund, and meeting regulatory requirements. Further, the Board considered the quality and depth of the Adviser and Sub-Adviser personnel (including the number and caliber of portfolio managers and research analysts involved and the size and experience of the investment, accounting, trading, client service and compliance teams dedicated to the fund), and other Adviser and Sub-Adviser resources, use of affiliates of the Adviser, and the particular expertise with respect to energy companies, MLP markets and financing (including private financing).
In addition to advisory services, the Board considered the quality of the administrative and other non-investment advisory services provided to the fund. The Adviser provides the fund with certain services (in addition to any such services provided to the fund by third parties) and officers and other personnel as are necessary for the operations of the fund. In particular, the Adviser provides the fund with the following administrative services including, among others: (i) preparing disclosure documents, such as periodic stockholder reports and the prospectus and the statement of additional information in connection with public offerings; (ii) communicating with analysts to support secondary market analysis of the fund; (iii) oversight of daily accounting and pricing; (iv) preparing periodic filings with regulators and stock exchanges; (v) overseeing and coordinating the activities of other service providers, including with respect to TEAF, the affiliated Sub-Adviser; (vi) organizing Board meetings and preparing the materials for such Board meetings; (vii) providing compliance support; (viii) furnishing analytical and other support to assist the Board in its consideration of strategic issues; (ix) the responsible handling of the leverage target; and (x) performing other administrative services for the operation of the fund, such as press releases, fact sheets, investor calls and educational materials, leverage financing, tax reporting, tax management, fulfilling regulatory filing requirements and investor relations services.
The Board also reviewed information received from the Adviser and the fund’s Chief Compliance Officer (the “CCO”) regarding the compliance policies and procedures established pursuant to the 1940 Act and their applicability to the fund, including the fund’s Code of Ethics.
The Board, including the Independent Directors, concluded that the nature of the fund and the specialized expertise of the Adviser in energy infrastructure, including in the niche market of MLPs for each of TYG and NTG, the energy market for each of TTP, NDP and TPZ, and essential asset sectors with respect to TEAF, as well as the nature, extent and quality of services provided by the Adviser, and in addition with respect to TEAF the Sub-Adviser, to the fund, made the Adviser qualified to serve as the adviser, and with respect to TEAF, the Sub-Adviser qualified to serve as the sub-adviser. The Independent Directors recognized that the Adviser’s commitment to a long-term investment horizon correlated well to the investment strategy of the fund.
Investment Performance of the Fund and the Adviser, Costs of the Services To Be Provided and Profits To Be Realized by the Adviser and its Affiliates from the Relationship, and Fee Comparisons. The Board reviewed and evaluated information regarding the fund’s performance and the performance of other Adviser accounts (including other investment companies), and information regarding the nature of the markets during the performance period, with a particular focus on the MLP sector for each of TYG and NTG, on the energy sector for each of TTP, NDP and TPZ, and on the essential asset sectors with respect to TEAF. The Board considered the fund’s investment performance against peer funds for the following periods: one year, three year, five year, ten year (where applicable) and since inception
| 92 | Tortoise |
| 2020 Annual Report | November 30, 2020 |
| Additional Information (unaudited) (continued) |
for each of TYG, NTG, TTP, NDP and TPZ, for one year and since inception for TEAF, and for each of 2018, 2019 and year-to-date 2020 for each of TYG, NTG, TTP, NDP and TPZ and for fiscal year-to-date 2020 for TEAF, as well as against specialized sector (including a custom composite of sector indices (“custom composite”) for TPZ) and more general market indices for the same periods for the fund. The Board also considered senior management’s and portfolio managers’ analysis of the reasons for any over-performance or underperformance against its peers and/or sector market indices, as applicable. The Board noted that for the relevant periods, based on NAV: TYG underperformed the average for its peers in all periods except the period since inception and in 2018 where it outperformed its peers. TYG underperformed sector market indices and the general market index. NTG underperformed the average for its peers in all periods except 2018. NTG underperformed the specialized sector market indices and the general market index. TTP underperformed the average for its peers in all periods. TTP underperformed the specialized sector market index and, except for 2019, the general market index. NDP underperformed the average for its peers, the specialized sector market index and the general market index. TPZ outperformed the average for its peers in 2019 but underperformed in all other periods. TPZ underperformed the custom composite for all periods except since inception and underperformed the general market index. TEAF outperformed the average for its peers and the specialized sector market index for the 2020 fiscal year-to-date period and underperformed in other periods and underperformed the general market index. The Board noted that for the relevant periods, based on market, price, each of TYG and NTG underperformed the average of their peers except the since inception period for TYG and 2018 for NTG. TTP, NDP and TPZ underperformed the average for their peers. TEAF underperformed the average for its peers for the one year and since inception periods and performed in line for the 2020 fiscal year-to-date period. For TPZ, the Board noted the lack of peers and sector market indices with similar strategies to the fund and also took into account the custom composite to better reflect the strategy of the fund. The Adviser believes that performance relative to the applicable custom composite for TPZ is an appropriate performance metric for the fund. The Board also noted that the custom composite for TPZ and the sector market indices are pre expenses, in contrast to the fund and its peers, and the sector market indices are pre-tax accrual in contrast to TYG and NTG and their MLP peers. The Board also noted differences across the peer universe in distribution and leverage strategies, including the fund’s focus on sustainable distributions and leverage strategy, and took into account that stockholders, in pursuing their investment goals and objectives, may have purchased their shares based upon the reputation and the investment style, long-term philosophy and strategy of the Adviser. The Board also considered discussions with the Adviser regarding a variety of initiatives for the fund, including the Adviser’s plans to continue aftermarket support and investor communications regarding recent market price performance. Based upon their review and also considering market conditions and the extreme volatility in 2020, the Board, including the Independent Directors, concluded that the fund’s performance has been reasonable based on the fund’s strategy and compared to other closed-end funds that focus on the MLP sector (for each of TYG and NTG) and the energy sector (for each of TTP, NDP and TPZ).
The Adviser provided detailed information concerning its cost of providing services to the fund, its profitability in managing the fund, its overall profitability, and its financial condition. The Board reviewed the methodology used to prepare this financial information. This financial information regarding the Adviser is considered in order to evaluate the Adviser’s financial condition, its ability to continue to provide services under the Investment Advisory Agreement, and the reasonableness of the current management fee, and was, to the extent possible, evaluated in comparison to other more specialized investment advisers.
The Board considered and evaluated information regarding fees charged to, and services provided to, other investment companies advised by the Adviser (including the impact of any fee waiver or reimbursement arrangements and any expense reimbursement arrangements), and fees charged to separate institutional accounts and other accounts managed by the Adviser. The information provided to the Board discussed the significant differences in scope of services provided to the fund and to the Adviser’s other non-closed-end fund clients. The Board considered the fee comparisons in light of the different services provided in managing these other types of clients. The Board considered and evaluated the information comparing the fund’s contractual annual management fee and overall expenses with a peer group of comparable closed-end funds with similar investment objectives and strategies, including other MLP or energy investment companies, as applicable depending on the fund, and with respect to TEAF with a group of comparable funds that are multi strategy including significant allocations to private investments as well as funds structured as a term fund, in each case as determined by the Adviser. The Board also considered the management fee (based on total managed assets) charged by the Adviser to other Tortoise funds compared to the management fee of TEAF. The Board noted that the management fee paid by TEAF is higher than the management fees paid by the other Tortoise funds, but were advised by the Adviser that there are additional portfolio management challenges in managing a multi-strategy defined term fund such as TEAF. The Board considered the affiliated relationship of the Adviser to the Sub-Adviser for TEAF, and the in-depth knowledge of the Adviser of the Sub-Adviser’s operations, and the oversight of the Sub-Adviser by the Adviser. The Board also considered that the sub-advisory fee to Sub-Adviser is paid by the Adviser and TEAF incurs no additional expense for the Sub-Adviser’s services. Given the specialized universe of managers and funds fitting within the criteria for the peer group as well as a lack of reliable, consistent third party data, the Adviser did not believe that it would be beneficial to engage the services of an independent third-party to prepare the peer group analysis, and the Board, including the Independent Directors, concurred with this approach. The Adviser provided information on the methodology used for determining the peer group.
| Tortoise | 93 |
| Additional Information (unaudited) (continued) |
The Board, including the Independent Directors, concluded that the fees (including the management fee) and expenses that the fund is paying under the Investment Advisory Agreement, as well as the operating expense ratios of the fund, are reasonable given the nature, extent and quality of services provided under the Investment Advisory Agreement and that such fees and expenses are reasonable compared to the fees charged by advisers to comparable funds. The Board, including the Independent Directors, concluded that the fees payable by the Adviser to the Sub-Adviser under the TEAF Sub-Advisory Agreement are reasonable given the nature, extent and quality of services provided under the TEAF Sub-Advisory Agreement.
Economies of Scale. The Board considered information from the Adviser concerning whether economies of scale would be realized as the fund grows, and whether fee levels reflect any economies of scale for the benefit of the fund’s stockholders. The Board, including the Independent Directors, concluded that economies of scale are difficult to measure and predict overall. Accordingly, the Board reviewed other information, such as year-over-year profitability of the Adviser generally, the profitability of its management of the fund, and the fees of competitive funds not managed by the Adviser over a range of asset sizes. The Board, including the Independent Directors, concluded the Adviser is appropriately sharing any economies of scale through its fee structure and through reinvestment in its business resources to provide stockholders additional content and services.
Collateral Benefits Derived by the Adviser. The Board reviewed information from the Adviser concerning collateral benefits it receives as a result of its relationship with the fund. The Board, including the Independent Directors, concluded that the Adviser generally does not directly use the fund’s or stockholder information to generate profits in other lines of business, and therefore does not derive any significant collateral benefits from them.
The Board did not, with respect to their deliberations concerning their approval of the continuation of the Investment Advisory Agreement, consider the benefits the Adviser may derive from relationships the Adviser may have with brokers through soft dollar arrangements because the Adviser does not employ any third party soft dollar arrangements in rendering its advisory services to the fund. The Adviser receives unsolicited research from some of the brokers with whom it places trades on behalf of clients, however, the Adviser has no arrangements or understandings with such brokers regarding receipt of research in return for commissions. The Adviser does not consider this research when selecting brokers to execute fund transactions and does not put a specific value on unsolicited research, nor attempt to estimate and allocate the relative costs or benefits among clients.
Conclusions of the Directors
The Board, including the Independent Directors, concluded that no single factor reviewed was determinative as the principal factor in whether to approve the Investment Advisory Agreement and, with respect to TEAF, the TEAF Sub-Advisory Agreement. The process, as discussed above, describes only the most important factors, but not all of the matters, considered by the Board. On the basis of such information as the Board considered necessary to the exercise of its reasonable business judgment and its evaluation of all of the factors described above, and after discussion and as assisted by the advice of legal counsel that is independent of the Adviser, the Independent Directors determined that each factor, in the context of all of the other factors they considered, favored approval of the Investment Advisory Agreement and with respect to TEAF, the TEAF Sub-Advisory Agreement. It was noted that it was the judgment of the Board, including the Independent Directors, that approval of the Investment Advisory Agreement and, with respect to TEAF, the TEAF Sub-Advisory Agreement, was in the best interests of the fund and its stockholders. The Board, and separately, all of the Independent Directors, therefore unanimously concluded that the Investment Advisory Agreement between the fund and the Adviser and, with respect to TEAF, the TEAF Sub-Advisory Agreement between the Adviser and Sub-Adviser, is fair and reasonable in light of the services provided and should be renewed.
| 94 | Tortoise |
| 2020 Annual Report | November 30, 2020 |
| Additional Information (unaudited) (continued) |
Bylaws Amendment
On October 26, 2020, the Board of Directors of each Fund amended the Fund’s Bylaws, effective immediately, to elect to be subject to the Maryland Control Share Acquisition Act (MCSAA). The amendments to the Bylaws were adopted in an effort to protect each Fund’s ability to pursue its investment objective and long-term value for stockholders.
The MCSSA provides that any holder of “control shares” acquired in a “control share acquisition” will not be entitled to vote its shares unless the other stockholders of the corporation reinstate those voting rights at a meeting of stockholders by a vote of two-thirds of the votes entitled to be cast on the matter, excluding the “acquiring person” (i.e. the holder or group of holders acting in concert that acquires, or proposes to acquire, “control shares” and any other holders of “interested shares” as defined in the MCSAA). Generally, “control shares” are shares that, when aggregated with shares already owned by an acquiring person, would entitle the acquiring person to exercise 10% or more, 33% or more, or a majority of the total voting power of shares entitled to vote in the election of directors.
In addition, each Fund’s Bylaws include modifying the advance notice requirements and exclusive forum provisions.
The advance notice provisions were amended to require the continuous ownership by the stockholder(s) putting forth any such nominee or proposal of at least one percent (1%) of the Fund’s outstanding shares for a minimum period of at least three years prior to the date of such nomination or proposal and through the date of the related annual meeting. The advance notice provisions were also amended to require that the stockholder nominating an individual or proposing business to be considered must attend the meeting or give a legal proxy to another individual who attends the meeting in order for the proposal or nomination to be properly considered.
The Bylaws as amended designate the Circuit Court for Baltimore City, Maryland (or if such court lacks jurisdiction, the United States District Court for the District of Maryland, Northern Division) as the sole and exclusive forum for claims and directive actions brought on behalf of the Funds.
The above description of the MCSAA election and amendments to the Bylaws, is only a high-level summary and does not purport to be complete. Stockholders should refer to the actual provisions of the MCSAA and each Fund’s Bylaws for more information, including definitions of key terms, various exclusions and exemptions from the statute’s scope, and the procedures by which stockholders may approve the reinstatement of voting rights to holders of “control shares.”
Changes to Portfolio Managers
Effective March 20, 2020, Brett Jergens and Adam Peltzer were no longer portfolio managers for any of TYG, NTG, TTP, NDP, TPZ and TEAF. Effective July 2020, Jeremy Goff moved to a different position and was no longer a portfolio manager for TEAF. Effective April 2020, Vince Cubbage was added as a member of the portfolio management team for TEAF. Mr. Cubbage has served as Managing Director – Private Energy of the Adviser since January 2019; as Chief Executive Officer, President and Chairman of the Board of Tortoise Acquisition Corp. from November 2018 to October 2020. He also serves as a member of the Board of Directors of Hyliion Holdings Corp. since October 2020. Previously, he served as the Chief Executive Officer and a Member of the Board of Managers of Lightfoot Capital Partners GP LLC, the general partner of Lightfoot Capital Partners, LP, from 2006 to December 2018 and as the Chief Executive Officer, Director and Chairman of the Board of Arc Logistics GP LLC, the general partner of Arc Logistics Partners LP (and its predecessor) from July 2007 to December 2017.
| Tortoise | 95 |
| Additional Information (unaudited) (continued) |
Fund Investment Objectives, Policies and Risks
Changes in the Last Fiscal Year
The following information is a summary of certain changes since November 30, 2019. This information may not reflect all of the changes that have occurred since you purchased the relevant Fund.
Subsequent to the end of the fiscal year, and after providing 60 days’ prior written notice to its shareholders, Tortoise Energy Infrastructure Corporation (“TYG”) modified one of its non-fundamental investment policies eliminating the requirement to invest at least 70% of total assets in equity securities of MLPs and midstream entities in order to provide TYG with the ability to increase exposure to renewables and power infrastructure companies. In addition, at the same time, both TYG and Tortoise Midstream Energy Fund, Inc. (“NTG”) changed their non-fundamental investment policies to change the measurements from a percentage of “total assets” to a percentage of “total investments”. “Total investments” is defined as the value of all investments that would be reported as total investments in the schedule of investments of the respective Fund.
For each of TYG, NTG, TPZ, TTP and NDP there is a new cybersecurity risk factor. For each of the funds, there is a new epidemic risk factor. Both of these new risk factors are set forth below under “Principal Risk Factors”.
Except as noted above, during each Fund’s most recent fiscal year, there were no material changes in the Fund’s investment objectives or policies that have not been approved by shareholders or in the principal risk factors associated with investment in the Fund.
Investment Objectives and Policies
Tortoise Energy Infrastructure Corporation (TYG)
TYG’s investment objective is to seek a high level of total return with an emphasis on current distributions paid to stockholders. Under normal circumstances, TYG invests at least 90% of its total investments, defined as the value of all investments reported as total investments in its schedule of investments, in securities of energy infrastructure companies. Energy infrastructure companies engage in the business of transporting, processing, storing, distributing or marketing natural gas, natural gas liquids, coal, crude oil or refined petroleum products, or exploring, developing, managing or producing such commodities. Additionally energy infrastructure includes renewables and power infrastructure companies that generate, transport and distribute electricity.
TYG may invest up to 30% of its total investments in restricted securities, primarily through direct placements. Subject to this policy, TYG may invest without limitation in illiquid securities. The types of restricted securities that TYG may purchase include securities of private energy infrastructure companies and privately issued securities of publicly traded energy infrastructure companies. Restricted securities, whether issued by public companies or private companies, are generally considered illiquid. The aggregate of all of TYG’s investments in private companies that do not have any publicly traded shares or units are limited to 5% of its total investments.
TYG may invest up to 25% of its total investments in debt securities of energy infrastructure companies, including certain securities rated below investment grade (“junk bonds”). Below investment grade debt securities will be rated at least B3 by Moody’s and at least B- by S&P at the time of purchase, or comparably rated by another statistical rating organization or if unrated, determined to be of comparable quality by the Adviser.
TYG will not invest more than 10% of its total investments in a single issuer or engage in short sales. TYG may write covered call options, up to 10% of its total investments. These investment restrictions described above apply at the time of purchase, and TYG will not be required to reduce a position due solely to market value fluctuations.
TYG may change these non-fundamental investment policies without stockholder approval and will provide notice to stockholders of material changes (including notice through stockholder reports); provided, however, that a change in the policy of investing at least 90% of TYG’s total investments in energy infrastructure companies requires at least 60 days’ prior written notice to stockholders.
Under adverse market or economic conditions, TYG may invest up to 100% of its total investments in securities issued or guaranteed by the U.S. Government or its instrumentalities or agencies, short-term debt securities, certificates of deposit, bankers’ acceptances and other bank obligations, commercial paper rated in the highest category by a rating agency or other liquid fixed income securities deemed by the Adviser to be consistent with a defensive posture (collectively, “short-term securities”), or may hold cash. To the extent TYG invests in short-term securities or cash for defensive purposes, such investments are inconsistent with, and may result in TYG not achieving, its investment objective.
TYG also may invest in short-term securities or cash pending investment of any offering proceeds to meet working capital needs including, but not limited to, for collateral in connection with certain investment techniques, to hold a reserve pending payment of distributions, and to facilitate the payment of expenses and settlement of trades. The yield on such securities may be lower than the returns on energy infrastructure companies or yields on lower rated fixed income securities.
| 96 | Tortoise |
| 2020 Annual Report | November 30, 2020 |
| Additional Information (unaudited) (continued) |
Leverage. TYG’s policy is to utilize leverage in an amount that on average represents approximately 25% of its total assets. TYG considers market conditions at the time leverage is incurred and monitors for asset coverage ratios relative to 1940 Act requirements and financial covenants on an ongoing basis. Leverage as a percent of total assets will vary depending on market conditions, but will normally range between 20% - 30%.
TYG may use interest rate transactions for hedging purposes only, in an attempt to reduce the interest rate risk arising from its leveraged capital structure. TYG does not intend to hedge the interest rate risk of its portfolio holdings. Accordingly, if no leverage is outstanding, TYG currently does not expect to engage in interest rate transactions. Interest rate transactions that TYG may use for hedging purposes may expose it to certain risks that differ from the risks associated with its portfolio holdings.
Tortoise Midstream Energy Fund, Inc. (“NTG”)
NTG’s investment objective is to provide stockholders a high level of total return with an emphasis on current distributions paid to stockholders. NTG invests primarily in midstream energy entities that own and operate a network of pipeline and energy-related logistical infrastructure assets with an emphasis on those that transport, gather, process and store natural gas and natural gas liquids (NGLs). NTG targets midstream energy entities, including master limited partnerships (MLPs) benefiting from U.S. natural gas production and global consumption expansion with limited direct commodity exposure. Under normal circumstances, NTG invests at least 80% of its total investments in equity securities of midstream energy entities in the energy infrastructure sector, including MLPs, with at least 50% of its total investments in equity securities of natural gas infrastructure entities.
NTG may also invest up to 50% of its total investments in restricted securities, primarily through direct investments. Restricted securities, whether issued by public companies or private companies, are generally considered illiquid. The aggregate of all NTG’s investments in private companies that do not have any publicly traded shares or units is limited to 5% of its total investments.
NTG may invest up to 20% of its total investments in debt securities of midstream energy companies, including securities rated below investment grade (commonly referred to as “junk bonds”). Below investment grade debt securities will be rated at least B3 by Moody’s Investors Service, Inc. (“Moody’s”) and at least B- by Standard & Poor’s Ratings Group (“S&P”) at the time of purchase, or comparably rated by another statistical rating organization or if unrated, determined to be of comparable quality by the Adviser. NTG currently has no specific maturity policy with respect to debt securities.
NTG will not invest more than 10% of its total investments in any single issuer.
NTG may write covered call options, up to 10% of its total investments.
NTG may change its investment objective and other non-fundamental investment policies without stockholder approval and will provide written notice to stockholders of material changes (including notice through stockholder reports), although a change in the policy of investing at least 80% of NTG’s total investments in equity securities of midstream energy entities in the energy infrastructure sector, including MLPs, requires at least 60 days’ prior written notice to stockholders. Unless otherwise stated, these investment restrictions apply at the time of purchase. Furthermore, NTG is not required to reduce a position due solely to market value fluctuations.
Although inconsistent with NTG’s investment objective, under (i) adverse market or economic conditions which results in NTG taking a temporary defensive position or (ii) pending investment of offering or leverage proceeds, NTG may invest 100% of its total investments in mutual funds, cash, cash equivalents, securities issued or guaranteed by the U.S. Government or its instrumentalities or agencies, high quality, short-term money market instruments, short-term debt securities, certificates of deposit, bankers’ acceptances and other bank obligations, commercial paper or other liquid fixed income securities. The yield on these securities may be lower than the returns on the securities in which NTG will otherwise invest or yields on lower-rated, fixed income securities. NTG currently does not have a specific maturity policy. To the extent NTG invests in these securities on a temporary basis or for defensive purposes, NTG may not achieve its investment objectives.
Leverage. NTG’s policy is to utilize leverage in an amount that on average represents approximately 25% of its total assets. NTG considers market conditions at the time leverage is incurred and monitors for asset coverage ratios relative to 1940 Act requirements and financial covenants on an ongoing basis. Leverage as a percent of total assets will vary depending on market conditions, but will normally range between 20% - 30%.
NTG may use interest rate transactions for economic hedging purposes only, in an attempt to reduce the interest rate risk arising from its leveraged capital structure. NTG does not intend to hedge the interest rate risk of its portfolio holdings. Interest rate transactions that NTG may use for hedging purposes may expose it to certain risks that differ from the risks associated with its portfolio holdings.
| Tortoise | 97 |
| Additional Information (unaudited) (continued) |
Tortoise Power and Energy Infrastructure Fund, Inc. (“TPZ”)
TPZ’s primary investment objective is to provide a high level of current income, with a secondary objective of capital appreciation. TPZ invests primarily in power and energy infrastructure companies. TPZ seeks to invest in fixed income and dividend-paying equity securities of power and energy infrastructure companies that provide stable and defensive characteristics throughout economic cycles.
TPZ’s investment approach emphasizes current income, low volatility and minimization of downside risk. Under normal circumstances, the fund invests at least 80% of its total assets (including assets obtained through leverage) in securities of power and energy infrastructure companies. Power infrastructure companies use asset systems to provide electric power generation (including renewable energy), transmission and distribution. Energy infrastructure companies use a network of pipeline assets to transport, store, gather and/or process crude oil, refined petroleum products (including biodiesel and ethanol), natural gas or natural gas liquids.
Under normal circumstances, the fund will invest a minimum of 51% of its total assets in fixed income securities.
The fund will not invest more than 25% of its total assets in non-investment grade rated fixed income securities or more than 15% of its total assets in restricted securities that are ineligible for resale under Rule 144A, all of which may be illiquid securities. The fund may invest up to 10% of its total assets in securities issued by non-U.S. issuers (including Canadian issuers). The fund will not engage in short sales. These investment restrictions described above apply at the time of purchase, and the fund will not be required to reduce a position due solely to market value fluctuations.
As used for the purpose of each non-fundamental investment policy above, the term “total assets” includes any assets obtained through leverage. TPZ’s Board of Directors may change its non-fundamental investment policies without stockholder approval and will provide notice to stockholders of material changes in such policies (including notice through stockholder reports). Any change in the policy of investing under normal circumstances at least 80% of TPZ’s total assets (including assets obtained through leverage) in the securities of companies that derive more than 50% of their revenue from power or energy infrastructure operations requires at least 60 days’ prior written notice to stockholders. Unless otherwise stated, the investment restrictions described above apply at the time of purchase, and TPZ will not be required to reduce a position due solely to market value fluctuations.
In addition, to comply with federal tax requirements for qualification as a RIC, TPZ’s investments will be limited so that at the close of each quarter of each taxable year (i) at least 50% of the value of its total assets is represented by cash and cash items, U.S. Government securities, the securities of other RICs and other securities, with such other securities limited for purposes of such calculation, in respect of any one issuer, to an amount not greater than 5% of the value of its total assets and not more than 10% outstanding voting securities of such issuer, and (ii) not more than 25% of the value of TPZ’s total assets is invested in the securities of any one issuer (other than U.S. Government securities or the securities of other RICs), the securities (other than the securities of other RICs) of any two or more issuers that TPZ controls and that are determined to be engaged in the same business or similar or related trades or businesses, or the securities of one or more qualified publicly traded partnerships (which includes MLPs). These tax-related limitations may be changed by the Board of Directors to the extent appropriate in light of changes to applicable tax requirements.
Although inconsistent with its investment objectives, under adverse market or economic conditions or pending investment of offering or leverage proceeds, TPZ may invest 100% of its total assets in cash, cash equivalents, securities issued or guaranteed by the U.S. government or its instrumentalities or agencies, short-term money market instruments, short-term fixed income securities, certificates of deposit, bankers’ acceptances and other bank obligations, commercial paper or other liquid fixed income securities. The yield on these securities may be lower than the returns on the securities in which TPZ will otherwise invest or yields on lower-rated, fixed income securities. To the extent TPZ invests in these securities on a temporary basis or for defensive purposes, it may not achieve its investment objectives.
Leverage. TPZ’s policy is to utilize leverage in an amount that on average represents approximately 20% of its total assets. TPZ considers market conditions at the time leverage is incurred and monitors for asset coverage ratios relative to 1940 Act requirements and financial covenants on an ongoing basis. Leverage as a percent of total assets will vary depending on market conditions, but will normally range between 15% - 25%.
TPZ may use interest rate transactions, for hedging purposes only, in an attempt to reduce the interest rate risk arising from its leveraged capital structure. Interest rate transactions that TPZ may use for hedging purposes may expose it to certain risks that differ from the risks associated with its portfolio holdings.
| 98 | Tortoise |
| 2020 Annual Report | November 30, 2020 |
| Additional Information (unaudited) (continued) |
Tortoise Pipeline & Energy Fund, Inc. (“TTP”)
TTP has an investment objective of providing stockholders a high level of total return with an emphasis on current distributions. TTP invests primarily in equity securities of pipeline companies that transport natural gas, natural gas liquids (NGLs), crude oil and refined products and, to a lesser extent, in other energy infrastructure companies.
TTP’s investment approach emphasizes total return potential through current income and growth, low volatility and downside risk minimization. Under normal circumstances, TTP invests at least 80% of its total assets (including assets obtained through leverage) in equity securities of pipeline and other energy infrastructure companies. More than 75% of these companies will generally be structured as corporations or limited liability companies domiciled in the U.S. or Canada.
As a regulated investment company, TTP may invest up to 25% of its total assets in MLPs. TTP may invest up to 30% of its total assets in unregistered or otherwise restricted securities, primarily through direct investments, and will not invest in private companies. TTP may invest up to 30% of its total assets in non-U.S. issuers (including Canadian issuers). TTP may invest up to 20% of its total assets in debt securities, including those rated below investment grade. TTP will not invest more than 10% of its total assets in any single issuer and will not engage in short sales. These investment restrictions described above apply at the time of purchase, and TTP will not be required to reduce a position due solely to market value fluctuations.
TTP may also write (sell) covered call options to seek to enhance long-term return potential across economic environments, increase current income and mitigate portfolio risk through option income. TTP’s covered call strategy focuses on other energy companies that the Adviser believes are integral links in the value chain for pipeline companies. The fund typically aims to write call options that are approximately 5% - 15% out-of-the-money on approximately 20% of the portfolio, although it may adjust these targets depending on market volatility and other market conditions.
Leverage. TTP’s policy is to utilize leverage in an amount that on average represents approximately 25% of its total assets. TTP considers market conditions at the time leverage is incurred and monitors for asset coverage ratios relative to 1940 Act requirements and financial covenants on an ongoing basis. Leverage as a percent of total assets will vary depending on market conditions, but will normally range between 20% - 30%.
Tortoise Energy Independence Fund, Inc. (“NDP”)
NDP has an investment objective of providing stockholders a high level of total return with an emphasis on current distributions. NDP invests primarily in equity securities of upstream North American energy companies that engage in the exploration and production of crude oil, condensate, natural gas and natural gas liquids that generally have a significant presence in North American oil and gas fields, including shale reservoirs.
Under normal circumstances, NDP will invest at least 80% of its total assets in equity securities of North American energy companies, including at least 50% of its total assets in equity securities of upstream energy companies. “Total assets” are defined as the value of securities, cash or other assets held, including securities or assets obtained through leverage, and interest accrued but not yet received. NDP will invest in equity securities that are publicly traded on an exchange or in the over-the-counter (“OTC”) market, primarily consisting of common stock, but also including, among others, master limited partnerships (“MLPs”) and limited liability company (“LLC”) common units NDP may invest up to 35% of its total assets in securities of non-U.S. issuers (including Canadian issuers). An issuer of a security will generally be considered to be a non-U.S. issuer if it is organized under the laws of, or maintains its principal place of business in, a country other than the United States.
NDP may invest up to 30% of its total assets in restricted securities that are ineligible for resale under Rule 144A (“Rule 144A”) under the Securities Act of 1933, as amended (the “1933 Act”), all of which may be illiquid securities, primarily through direct investments in securities of listed companies, but will not invest in private companies. NDP will not invest more than 10% of its total assets in a single issuer or engage in short sales. As a registered investment company (“RIC”), NDP may invest up to 25% of its total assets in securities of MLPs.
NDP may also seek to provide current income from gains earned through an option strategy. NDP may also write (sell) call options on selected equity securities in its portfolio (“covered calls”). As a writer of such call options, in effect, during the term of the option, in exchange for the premium NDP receives, it sells the potential appreciation above the exercise price in the value of the security or securities covered by the options. Therefore, NDP may forego part of the potential appreciation for part of its equity portfolio in exchange for the call premium received.
Leverage. NDP’s policy is to utilize leverage in an amount that on average represents approximately 15% of its total assets. NDP considers market conditions at the time leverage is incurred and monitors for asset coverage ratios relative to 1940 Act requirements and financial covenants on an ongoing basis. Leverage as a percent of total assets will vary depending on market conditions, but will normally range between 10% - 20%.
| Tortoise | 99 |
| Additional Information (unaudited) (continued) |
Tortoise Essential Assets Income Term Fund (TEAF)
The Fund’s investment objective is to provide its common shareholders with a high level of total return with an emphasis on current distributions.
Under normal market conditions, the Fund will invest at least 80% of its total assets (including assets obtained through leverage) in issuers operating in essential asset sectors. The Fund considers essential assets to be assets and services that are indispensable to the economy and society. Essential asset sectors include the education, housing, healthcare, social and human services, power, water, energy, infrastructure, basic materials, industrial, transportation and telecommunications sectors. The Fund may invest across all levels of an issuer’s capital structure and emphasize income-generating investments, particularly in social infrastructure, sustainable infrastructure and energy infrastructure.
The Fund has adopted the following additional non-fundamental investment policies:
| ● | Under normal conditions, the Fund may invest up to 40% of its total assets in directly originated loans; |
| ● | Under normal conditions, the Fund may invest up to 25% of its total assets in direct placements in restricted equity securities in listed companies; |
| ● | Under normal conditions, the Fund may invest up to 25% of its total assets in direct equity investments in unlisted companies; |
| ● | Under normal conditions, the Fund may invest up to 30% of its total assets in securities of non-U.S. issuers, including Canadian issuers. An issuer of a security generally will be considered to be a non-U.S. issuer if it is organized under the laws of, or maintains its principal place of business in, a country other than the United States; |
| ● | As a RIC, the Fund may invest up to 25% of its total assets in securities of entities treated as qualified publicly traded partnerships for federal income tax purposes, which generally includes MLPs; |
| ● | the Fund will not engage in short sales of securities; |
| ● | Under normal conditions, the Fund may invest up to 10% of its total assets in securities of emerging market issuers; and |
| ● | Under normal conditions, the Fund may invest up to 10% of its total assets in non-directly originated corporate debt securities that are, at the time of purchase, rated CCC+ or lower by S&P and Fitch and Caa1 or lower by Moody’s. |
| ● | Under adverse market or economic conditions, the Fund may invest up to 100% of its total assets in money market mutual funds, cash, cash equivalents, securities issued or guaranteed by the U.S. government or its instrumentalities or agencies, high quality, short-term money market instruments, short-term debt securities, certificates of deposit, bankers’ acceptances and other bank obligations, commercial paper or other liquid debt securities. |
Leverage. Leverage as a percent of total assets will vary depending on market conditions, but will normally range between 10% - 15%.
Principal Risk Factors
Each fund’s NAV, ability to make distributions, ability to service debt securities and preferred stock, and ability to meet asset coverage requirements depends on the performance of its investment portfolio. The performance of each fund’s investment portfolio is subject to a number of risks. For each of TYG, NTG, TPZ, TTP and NDP, there is a new cybersecurity risk as follows:
Cybersecurity Risk. Investment advisers, including the Adviser, must rely in part on digital and network technologies (collectively “cyber networks”) to conduct their businesses. Such cyber networks might in some circumstances be at risk of cyberattacks that could potentially seek unauthorized access to digital systems for purposes such as misappropriating sensitive information, corrupting data, or causing operational disruption. Cyberattacks might potentially be carried out by persons using techniques that could range from efforts to electronically circumvent network security or overwhelm websites to intelligence gathering and social engineering functions aimed at obtaining information necessary to gain access. Nevertheless, cyber incidents could potentially occur, and might in some circumstances result in unauthorized access to sensitive information about the Adviser or its clients.
For each of the funds there is a new epidemic risk as follows:
Epidemic Risk. Widespread disease, including pandemics and epidemics have been and can be highly disruptive to economies and markets, adversely impacting individual companies, sectors, industries, markets, currencies, interest and inflation rates, credit ratings, investor sentiment, and other factors affecting the value of the Fund’s investments. Given the increasing interdependence among global economies and markets, conditions in one country, market, or region are increasingly likely to adversely affect markets, issuers, and/or foreign exchange rates in other countries, including the U.S. These disruptions could prevent the Fund from executing advantageous investment decisions in a timely manner and negatively impact its ability to achieve its investment objectives. Any such event(s) could have a significant adverse impact on the value and risk profile of the Fund.
The remaining risks are set out separately for each fund below.
| 100 | Tortoise |
| 2020 Annual Report | November 30, 2020 |
| Additional Information (unaudited) (continued) |
Tortoise Energy Infrastructure Corporation
Capital Markets Volatility Risk. Our capital structure and performance may be adversely impacted by weakness in the credit markets and stock market if such weakness results in declines in the value of MLPs and midstream energy entities in which we invest. If the value of our investments decline or remain volatile, there is a risk that we may be required to reduce outstanding leverage, which could adversely affect our stock price and ability to pay distributions at historical levels. A sustained economic slowdown may adversely affect the ability of MLPs and midstream energy entities to sustain their historical distribution levels, which in turn, may adversely affect our ability to sustain distributions at historical levels. MLPs and midstream energy entities that have historically relied heavily on outside capital to fund their growth may be impacted by a slowdown in the capital markets. The performance of the MLP and midstream energy sector is dependent on several factors including the condition of the financial sector, the general economy and the commodity markets.
Concentration Risk. Under normal circumstances, we concentrate our investments in the energy sector, with an emphasis on securities issued by MLPs and midstream entities in the energy infrastructure sector, a subset of the energy sector. The primary risks inherent in investments in MLPs and midstream entities in the energy infrastructure sector include the following: (1) the performance and level of distributions of MLPs and midstream entities can be affected by direct and indirect commodity price exposure, (2) a decrease in market demand for natural gas or other energy commodities could adversely affect MLPs’ and midstream entities’ revenues or cash flows, (3) energy infrastructure assets deplete over time and must be replaced and (4) a rising interest rate environment could increase the cost of capital for MLPs and midstream entities.
Industry Specific Risk. Energy infrastructure companies also are subject to risks specific to the industry they serve.
MLP Risk. We invest a substantial portion of our assets in equity securities of MLPs. As a result, we are subject to the risks associated with an investment in MLPs, including cash flow risk, tax risk, deferred tax risk and capital markets risk. Cash flow risk is the risk that MLPs will not make distributions to holders (including us) at anticipated levels or that such distributions will not have the expected tax character. MLPs also are subject to tax risk, which is the risk that an MLP might lose its partnership status for tax purposes. Deferred tax risk is the risk that we incur a current tax liability on that portion of an MLP’s income and gains that is not offset by tax deductions and losses. Capital markets risk is the risk that MLPs will be unable to raise capital to meet their obligations as they come due or execute their growth strategies, complete future acquisitions, take advantage of other business opportunities or respond to competitive pressures.
Equity Securities Risk. Equity securities, including MLP common units, can be affected by macro-economic and other factors affecting the stock market in general, expectations of interest rates, investor sentiment toward MLPs or the midstream energy sector, changes in a particular issuer’s financial condition, or unfavorable or unanticipated poor performance of a particular issuer (in the case of MLPs, generally measured in terms of DCF). Prices of common units of individual MLPs and other equity securities also can be affected by fundamentals unique to the partnership or company, including size, earnings power, coverage ratios and characteristics and features of different classes of securities.
Smaller Company Securities Risk. Investing in securities of smaller companies may involve greater risk than is associated with investing in more established companies. Companies with smaller capitalization may have limited product lines, markets or financial resources; may lack management depth or experience; and may be more vulnerable to adverse general market or economic developments than larger more established companies.
Debt Securities Risk: Investments in debt securities are generally subject to credit risk, extension risk, interest rate risk, prepayment risk and spread risk.
Below Investment Grade Securities Risk. Investing in below investment grade debt instruments (commonly referred to as “junk bonds”) involves additional risks than investment grade securities. Adverse changes in economic conditions are more likely to lead to a weakened capacity of a below investment grade issuer to make principal payments and interest payments than an investment grade issuer. An economic downturn could adversely affect the ability of highly leveraged issuers to service their obligations or to repay their obligations upon maturity. Similarly, downturns in profitability in the energy infrastructure industry could adversely affect the ability of below investment grade issuers in that industry to meet their obligations. The market values of lower quality securities tend to reflect individual developments of the issuer to a greater extent than do higher quality securities, which react primarily to fluctuations in the general level of interest rates.
The secondary market for below investment grade securities may not be as liquid as the secondary market for more highly rated securities. There are fewer dealers in the market for below investment grade securities than investment grade obligations. The prices quoted by different dealers may vary significantly, and the spread between the bid and asked price is generally much larger than for higher quality instruments. Under adverse market or economic conditions, the secondary market for below investment grade securities could contract further, independent of any specific adverse change in the condition of a particular issuer, and these instruments may become illiquid. As a result, it may be more difficult to sell these securities or we may be able to sell the securities only at prices lower than if such securities were widely traded. This may affect adversely our ability to make required distribution or interest payments on our outstanding senior securities. Prices realized upon the sale of such lower-rated or unrated securities, under these circumstances, may be less than the prices used in calculating our NAV.
| Tortoise | 101 |
| Additional Information (unaudited) (continued) |
Capital Markets Risk. Global financial markets and economic conditions have been, and may continue to be, volatile due to a variety of factors, including significant write-offs in the financial services sector. Despite more stabilized economic activity, if the volatility continues, the cost of raising capital in the debt and equity capital markets, and the ability to raise capital, may be impacted. In particular, concerns about the general stability of financial markets and specifically the solvency of lending counterparties, may impact the cost of raising capital from the credit markets through increased interest rates, tighter lending standards, difficulties in refinancing debt on existing terms or at all and reduced, or in some cases ceasing to provide, funding to borrowers. In addition, lending counterparties under existing revolving credit facilities and other debt instruments may be unwilling or unable to meet their funding obligations. As a result of any of the foregoing, we or the companies in which we invest may be unable to obtain new debt or equity financing on acceptable terms. If funding is not available when needed, or is available only on unfavorable terms, we or the companies in which we invest may not be able to meet obligations as they come due. Moreover, without adequate funding, midstream energy entities may be unable to execute their growth strategies, complete future acquisitions, take advantage of other business opportunities or respond to competitive pressures, any of which could have a material adverse effect on their revenues and results of operations.
Restricted Security Risk. We may invest up to 30% of total assets in restricted securities, primarily through direct placements. Restricted securities are less liquid than securities traded in the open market because of statutory and contractual restrictions on resale. Such securities are, therefore, unlike securities that are traded in the open market, which can be expected to be sold immediately if the market is adequate. This lack of liquidity creates special risks for us.
Liquidity Risk. Certain MLP and midstream energy securities may trade less frequently than those of other companies due to their smaller capitalizations. Investments in securities that are less actively traded or over time experience decreased trading volume may be difficult to dispose of when we believe it is desirable to do so, may restrict our ability to take advantage of other opportunities, and may be more difficult to value.
Tax Risk. Because we are treated as a corporation for federal income tax purposes, our financial statements reflect deferred tax assets or liabilities according to generally accepted accounting principles. Deferred tax assets may constitute a relatively high percentage of NAV. Realization of deferred tax assets including net operating loss and capital loss carryforwards, are dependent, in part, on generating sufficient taxable income of the appropriate character. Currently capital loss carryforwards have a five year carryover period, whereas net operating loss carryforwards for tax years beginning after 2017 have an indefinite carryover period. In addition, a substantial change in our ownership may limit our ability to utilize our loss carryforwards. Unexpected significant decreases in MLP cash distributions or significant declines in the fair value of our MLP investments, among other factors, may change our assessment regarding the recoverability of deferred tax assets and would likely result in a valuation allowance, or recording of a larger allowance. If a valuation allowance is required to reduce the deferred tax asset in the future, it could have a material impact on our NAV and results of operations in the period it is recorded. Conversely, in periods of generally increasing MLP prices, we will accrue a deferred tax liability to the extent the fair value of our assets exceeds our tax basis. We may incur significant tax liability during periods in which gains on MLP investments are realized.
Nondiversification Risk. We are a nondiversified investment company under the 1940 Act and we are not a regulated investment company under the Internal Revenue Code. Accordingly, there are no regulatory limits under the 1940 Act or Internal Revenue Code with respect to the number or size of securities held by us and we may invest more assets in fewer issuers as compared to a diversified fund.
Covered Call Risk. We cannot guarantee that our covered call option strategy will be effective. There are several risks associated with transactions in options on securities. The significant differences between the securities and options markets could result in an imperfect correlation between these markets. The use of options may require us to sell portfolio securities at inopportune times or for prices other than current market values, may limit the amount of appreciation we can realize on an investment, or may cause us to hold a security we might otherwise sell. There can be no assurance that a liquid market will exist when we seek to close out an option position. Factors such as supply and demand, interest rates, the current market price of the underlying security in relation to the exercise price of the option, the dividend or distribution yield of the underlying security, the actual or perceived volatility of the underlying security and the time remaining until the expiration date, could impact or cause to vary over time the amount of income we are able to generate through our covered call option strategy. The number of covered call options we can write is limited by the number of shares of the corresponding common stock we hold. Furthermore, our covered call option transactions may be subject to limitations established by each of the exchanges, boards of trade or other trading facilities on which such options are traded. If we fail to maintain any required asset coverage ratios in connection with any use by us of leverage, we may be required to redeem or prepay some or all of our leverage instruments. Such redemption or prepayment would likely result in our seeking to terminate early all or a portion of any option transaction. Early termination of an option could result in a termination payment by or to us.
Hedging Strategy Risk. We may use interest rate transactions for hedging purposes only, in an attempt to reduce the interest rate risk arising from our leveraged capital structure. There is no assurance that the interest rate hedging transactions into which we enter will be effective in reducing our exposure to interest rate risk. Hedging transactions are subject to correlation risk, which is the risk that payment on our hedging transactions may not correlate exactly with our payment obligations on senior securities. Interest rate transactions that we may use for hedging purposes, such as swaps, caps and floors, will expose us to certain risks that differ from the risks associated with our portfolio holdings.
| 102 | Tortoise |
| 2020 Annual Report | November 30, 2020 |
| Additional Information (unaudited) (continued) |
Delay in Use of Proceeds Risk. Although we expect to fully invest the net proceeds of any offering within three months after the closing of the offering, such investments may be delayed if suitable investments are unavailable at the time, if we are unable to secure firm commitments for direct investments, if market conditions and volumes of the securities of midstream energy entities are not favorable at the time or for other reasons.
Valuation Risk. We may invest up to 30% of total assets in restricted securities, which are subject to restrictions on resale. The value of such investments ordinarily will be based on fair valuations determined by the Adviser pursuant to procedures adopted by the Board of Directors. Restrictions on resale or the absence of a liquid secondary market may affect adversely our ability to determine NAV. The sale price of securities that are restricted or otherwise are not readily marketable may be higher or lower than our most recent valuations.
Competition Risk. At the time we completed our initial public offering in February 2004, we were the only publicly traded investment company offering access to a portfolio of energy infrastructure MLPs. Since that time, a number of alternative vehicles for investment in a portfolio of energy infrastructure MLPs, including other publicly traded investment companies and private funds, have emerged. These competitive conditions may adversely impact our ability to meet our investment objective, which in turn could adversely impact our ability to make interest or distribution payments.
Management Risk. The Adviser was formed in October 2002 to provide portfolio management services to institutional and high net worth investors seeking professional management of their MLP investments. The Adviser has been managing our portfolio since we began operations in February 2004. As of December 31, 2020, the Adviser had client assets under management of approximately $6.3 billion. To the extent that the Adviser’s assets under management grow, the Adviser may have to hire additional personnel and, to the extent it is unable to hire qualified individuals, its operations may be adversely affected.
Subsidiary Risks. By investing in any Subsidiary, we will be indirectly exposed to the risks associated with such Subsidiary’s investments. The instruments that will be held by any Subsidiary will generally be similar to those that are permitted to be held by the Company and will be subject to the same risks that apply to similar investments if held directly by the Company. The Subsidiaries will not be registered under the 1940 Act, and, unless otherwise noted, will not be subject to all of the protections of the 1940 Act. However, we will wholly own and control any Subsidiary, and we and any Subsidiary will each be managed by our Adviser and will share the same portfolio management team. Our Board of Directors will have oversight responsibility for the investment activities of the Company, including its investment in the Subsidiaries, and our role as sole shareholder of any Subsidiary. Changes in the laws of the United States and/or any jurisdiction in which a Subsidiary if formed could result in our inability or the inability of the Subsidiaries to operate as expected and could adversely affect the Company.
Additional Risks to Common Stockholders
Leverage Risk. We are currently leveraged and intend to continue to use leverage primarily for investment purposes. Leverage, which is a speculative technique, could cause us to lose money and can magnify the effect of any losses. Weakness in the credit markets may cause our leverage costs to increase and there is a risk that we may not be able to renew or replace existing leverage on favorable terms or at all. If the cost of leverage is no longer favorable, or if we are otherwise required to reduce our leverage, we may not be able to maintain common stock distributions at historical levels and common stockholders will bear any costs associated with selling portfolio securities. If our net asset value of our portfolio declines or remains subject to heightened market volatility, there is an increased risk that we will be unable to maintain coverage ratios for debt securities and preferred stock mandated by the 1940 Act, rating agency guidelines or contractual terms of bank lending facilities or privately placed notes. If we do not cure any deficiencies within specified cure periods, we will be required to redeem such senior securities in amounts that are sufficient to restore the required coverage ratios or, in some cases, offer to redeem all of such securities. As a result, we may be required to sell portfolio securities at inopportune times, and we may incur significant losses upon the sale of such securities. There is no assurance that a leveraging strategy will be successful.
Market Impact Risk. The sale of our common stock (or the perception that such sales may occur) may have an adverse effect on prices in the secondary market for our common stock. An increase in the number of common shares available may put downward pressure on the market price for our common stock.
Dilution Risk. The voting power of current stockholders will be diluted to the extent that such stockholders do not purchase shares in any future common stock offerings or do not purchase sufficient shares to maintain their percentage interest.
If we are unable to invest the proceeds of such offering as intended, our per share distribution may decrease and we may not participate in market advances to the same extent as if such proceeds were fully invested as planned.
Market Discount Risk. Our common stock has traded both at a premium and at a discount in relation to NAV. We cannot predict whether our shares will trade in the future at a premium or discount to NAV.
| Tortoise | 103 |
| Additional Information (unaudited) (continued) |
Additional Risks to Senior Security Holders
Additional risks of investing in senior securities, include the following:
Interest Rate Risk. Distributions and interest payable on our senior securities are subject to interest rate risk. To the extent that distributions or interest on such securities are based on short-term rates, our leverage costs may rise so that the amount of distributions or interest due to holders of senior securities would exceed the cash flow generated by our portfolio securities. To the extent that our leverage costs are fixed, our leverage costs may increase when our senior securities mature. This might require that we sell portfolio securities at a time when we would otherwise not do so, which may adversely affect our future ability to generate cash flow. In addition, rising market interest rates could negatively impact the value of our investment portfolio, reducing the amount of assets serving as asset coverage for senior securities.
Senior Leverage Risk. Our preferred stock will be junior in liquidation and with respect to distribution rights to our debt securities and any other borrowings. Senior securities representing indebtedness may constitute a substantial lien and burden on preferred stock by reason of their prior claim against our income and against our net assets in liquidation. We may not be permitted to declare distributions with respect to any series of our preferred stock unless at such time we meet applicable asset coverage requirements and the payment of principal or interest is not in default with respect to debt securities or any other borrowings.
Our debt securities, upon issuance, are expected to be unsecured obligations and, upon our liquidation, dissolution or winding up, will rank: (1) senior to all of our outstanding common stock and any outstanding preferred stock; (2) on a parity with any of our unsecured creditors and any unsecured senior securities representing our indebtedness; and (3) junior to any of our secured creditors. Secured creditors of ours may include, without limitation, parties entering into interest rate swap, floor or cap transactions, or other similar transactions with us that create liens, pledges, charges, security interests, security agreements or other encumbrances on our assets.
Ratings and Asset Coverage Risk. To the extent that senior securities are rated, a rating does not eliminate or necessarily mitigate the risks of investing in our senior securities, and a rating may not fully or accurately reflect all of the credit and market risks associated with that senior security. A rating agency could downgrade the rating of our shares of preferred stock or debt securities, which may make such securities less liquid in the secondary market, though probably with higher resulting interest rates. If a rating agency downgrades, or indicates a potential downgrade to, the rating assigned to a senior security, we may alter our portfolio or redeem a portion of our senior securities. We may voluntarily redeem a senior security under certain circumstances to the extent permitted by its governing documents.
Inflation Risk. Inflation is the reduction in the purchasing power of money resulting from an increase in the price of goods and services. Inflation risk is the risk that the inflation adjusted or “real” value of an investment in preferred stock or debt securities or the income from that investment will be worth less in the future. As inflation occurs, the real value of the preferred stock or debt securities and the distributions or interest payable to holders of preferred stock or debt securities declines.
Decline in Net Asset Value Risk. A material decline in our NAV may impair our ability to maintain required levels of asset coverage for our preferred stock or debt securities.
Tortoise Midstream Energy Fund, Inc.
We are designed primarily as a long-term investment vehicle, and our securities are not an appropriate investment for a short-term trading strategy. An investment in our securities should not constitute a complete investment program for any investor. Due to the uncertainty in all investments, there can be no assurance that we will achieve our investment objective. Investing in our securities involves risk, including the risk that you may receive little or no return on your investment. Before investing in our securities, you should consider carefully the summary risks set forth below.
Capital Markets Volatility Risk. Our capital structure and performance may be adversely impacted by weakness in the credit markets and stock market if such weakness results in declines in the value of MLPs and midstream energy entities in which we invest. If the value of our investments decline or remain volatile, there is a risk that we may be required to reduce outstanding leverage, which could adversely affect our stock price and ability to pay distributions at historical levels. A sustained economic slowdown may adversely affect the ability of MLPs and midstream energy entities to sustain their historical distribution levels, which in turn, may adversely affect our ability to sustain distributions at historical levels. MLPs and midstream energy entities that have historically relied heavily on outside capital to fund their growth may be impacted by a slowdown in the capital markets. The performance of the MLP and midstream energy sector is dependent on several factors including the condition of the financial sector, the general economy and the commodity markets.
Concentration Risk. Under normal circumstances, we will concentrate our investments in the energy infrastructure sector, and will invest in a portfolio consisting primarily of midstream energy entities in the energy infrastructure sector, including MLPs, with an emphasis on natural gas infrastructure entities. Risks inherent in the business of these types of entities include (1) the volume of natural gas or other energy commodities available for transporting, processing, storing or distributing, (2) energy commodity prices, (3) demand for natural gas, crude oil, and refined petroleum products, (4) climate change regulation, (5) depletion of natural gas reserves and other commodities, (6) changes in the regulatory environment, (7) extreme weather patterns, (8) a rising interest rate environment, (9) the threat of terrorism and related military activity and (10) face operating risks, including the risk of fire, explosions, blow-outs, pipe failure, abnormally pressured formations and environmental hazards.
| 104 | Tortoise |
| 2020 Annual Report | November 30, 2020 |
| Additional Information (unaudited) (continued) |
Industry Specific Risk. Energy infrastructure companies also are subject to risks specific to the industry they serve.
MLP Risk. We invest a substantial portion of our assets in equity securities of MLPs and their affiliates. As a result, we are subject to the risks associated with an investment in MLPs, including cash flow risk, tax risk, deferred tax risk and capital markets risk.
Equity Securities Risk. Equity securities, including MLP common units, can be affected by macro-economic and other factors affecting the stock market in general, expectations of interest rates, investor sentiment towards the midstream energy sector, changes in a particular issuer’s financial condition, or unfavorable or unanticipated poor performance of a particular issuer (in the case of MLPs, generally measured in terms of distributable cash flow). Prices of equity securities also can be affected by fundamentals unique to the entity, including size, earnings power, coverage ratio and characteristics and features of different classes of securities.
Smaller Company Securities Risk. Investing in securities of smaller companies may involve greater risk than is associated with investing in more established companies. Companies with smaller capitalization may have limited product lines, markets or financial resources; may lack management depth or experience; and may be more vulnerable to adverse general market or economic developments than larger more established companies.
Debt Securities Risk: Investments in debt securities are generally subject to credit risk, extension risk, interest rate risk, prepayment risk and spread risk.
Below Investment Grade Securities Risk. Investing in below investment grade debt instruments (commonly referred to as “junk bonds”) involves additional risks than investment grade securities. Adverse changes in economic conditions are more likely to lead to a weakened capacity of a below investment grade issuer to make principal payments and interest payments than an investment grade issuer. An economic downturn could adversely affect the ability of highly leveraged issuers to service their obligations or to repay their obligations upon maturity. Similarly, downturns in profitability in the energy infrastructure industry could adversely affect the ability of below investment grade issuers in that industry to meet their obligations. The market values of lower quality securities tend to reflect individual developments of the issuer to a greater extent than do higher quality securities, which react primarily to fluctuations in the general level of interest rates.
The secondary market for below investment grade securities may not be as liquid as the secondary market for more highly rated securities. There are fewer dealers in the market for below investment grade securities than investment grade obligations. The prices quoted by different dealers may vary significantly, and the spread between the bid and asked price is generally much larger than for higher quality instruments. Under adverse market or economic conditions, the secondary market for below investment grade securities could contract further, independent of any specific adverse change in the condition of a particular issuer, and these instruments may become illiquid. As a result, it may be more difficult to sell these securities or we may be able to sell the securities only at prices lower than if such securities were widely traded. This may affect adversely our ability to make required distribution or interest payments on our outstanding senior securities. Prices realized upon the sale of such lower-rated or unrated securities, under these circumstances, may be less than the prices used in calculating our NAV.
Capital Markets Risk. Global financial markets and economic conditions have been, and may continue to be, volatile due to a variety of factors, including significant write-offs in the financial services sector. Despite more stabilized economic activity, if the volatility continues, the cost of raising capital in the debt and equity capital markets, and the ability to raise capital, may be impacted. In particular, concerns about the general stability of financial markets and specifically the solvency of lending counterparties, may impact the cost of raising capital from the credit markets through increased interest rates, tighter lending standards, difficulties in refinancing debt on existing terms or at all and reduced, or in some cases ceasing to provide, funding to borrowers. In addition, lending counterparties under existing revolving credit facilities and other debt instruments may be unwilling or unable to meet their funding obligations. As a result of any of the foregoing, we or the companies in which we invest may be unable to obtain new debt or equity financing on acceptable terms. If funding is not available when needed, or is available only on unfavorable terms, we or the companies in which we invest may not be able to meet obligations as they come due. Moreover, without adequate funding, midstream energy entities may be unable to execute their growth strategies, complete future acquisitions, take advantage of other business opportunities or respond to competitive pressures, any of which could have a material adverse effect on their revenues and results of operations.
Restricted Securities Risk. We may invest up to 50% of Total Assets in restricted securities, primarily through direct placements. Restricted securities are less liquid than securities traded in the open market because of statutory and contractual restrictions on resale. Such securities are, therefore, unlike securities that are traded in the open market, which can be expected to be sold immediately if the market is adequate.
Liquidity Risk. Although equity securities of midstream energy entities trade on the NYSE, NYSE MKT LLC (formerly known as AMEX), and the NASDAQ National Market, certain midstream energy securities may trade less frequently than those of larger companies due to their smaller capitalizations. In the event certain midstream energy securities experience limited trading volumes, the prices of such securities may display abrupt or erratic movements at times. In addition, it may be more difficult for us to buy and sell significant amounts of such securities without an unfavorable impact on prevailing market prices.
| Tortoise | 105 |
| Additional Information (unaudited) (continued) |
Tax Risk. Because we are treated as a corporation for federal income tax purposes, our financial statements reflect deferred tax assets or liabilities according to generally accepted accounting principles. Deferred tax assets may constitute a relatively high percentage of NAV. Realization of deferred tax assets including net operating loss and capital loss carryforwards, are dependent, in part, on generating sufficient taxable income of the appropriate character prior to expiration of the loss carryforwards. Currently capital loss carryforwards have a five year carryover period, whereas net operating loss carryforwards have an indefinite carryover period. In addition, a substantial change in our ownership may limit our ability to utilize our loss carryforwards. Unexpected significant decreases in MLP cash distributions or significant declines in the fair value of our MLP investments, among other factors, may change our assessment regarding the recoverability of deferred tax assets and would likely result in a valuation allowance, or recording of a larger allowance. If a valuation allowance is required to reduce the deferred tax asset in the future, it could have a material impact on our NAV and results of operations in the period it is recorded. Conversely, in periods of generally increasing MLP prices, we will accrue a deferred tax liability to the extent the fair value of our assets exceeds our tax basis. We may incur significant tax liability during periods in which gains on MLP investments are realized. Because deferred taxes are not taken into account in calculating Managed Assets, our Adviser may have an incentive to defer taxes rather than incur taxes in the current period.
Nondiversification Risk. We are a non-diversified, closed-end management investment company under the 1940 Act and do not intend to be treated as a regulated investment company under the Internal Revenue Code. Accordingly, there will be no regulatory limits under the 1940 Act or the Internal Revenue Code on the number or size of securities that we hold, and we may invest more assets in fewer issuers as compared to a diversified fund.
Covered Call Risk. We cannot guarantee that our covered call option strategy will be effective. There are several risks associated with transactions in options on securities. The significant differences between the securities and options markets could result in an imperfect correlation between these markets. The use of options may require us to sell portfolio securities at inopportune times or for prices other than current market values, may limit the amount of appreciation we can realize on an investment, or may cause us to hold a security we might otherwise sell. There can be no assurance that a liquid market will exist when we seek to close out an option position. Factors such as supply and demand, interest rates, the current market price of the underlying security in relation to the exercise price of the option, the dividend or distribution yield of the underlying security, the actual or perceived volatility of the underlying security and the time remaining until the expiration date, could impact or cause to vary over time the amount of income we are able to generate through our covered call option strategy. The number of covered call options we can write is limited by the number of shares of the corresponding common stock we hold. Furthermore, our covered call option transactions may be subject to limitations established by each of the exchanges, boards of trade or other trading facilities on which such options are traded. If we fail to maintain any required asset coverage ratios in connection with any use by us of leverage, we may be required to redeem or prepay some or all of our leverage instruments. Such redemption or prepayment would likely result in our seeking to terminate early all or a portion of any option transaction. Early termination of an option could result in a termination payment by or to us.
Hedging Strategy Risk. We may use interest rate transactions for hedging purposes only, in an attempt to reduce the interest rate risk arising from our leveraged capital structure. There is no assurance that the interest rate hedging transactions into which we enter will be effective in reducing our exposure to interest rate risk. Hedging transactions are subject to correlation risk, which is the risk that payment on our hedging transactions may not correlate exactly with our payment obligations on senior securities.
Delay in Use of Proceeds Risk. Although we expect to fully invest the net proceeds of any offering within three months after the closing of the offering, such investments may be delayed if suitable investments are unavailable at the time, if we are unable to secure firm commitments for direct investments, if market conditions and volumes of the securities of midstream energy entities are not favorable at the time or for other reasons.
Valuation Risk. We may invest up to 50% of total assets in restricted securities, which are subject to restrictions on resale. The value of such investments ordinarily will be based on fair valuations determined by the Adviser pursuant to procedures adopted by the Board of Directors. Restrictions on resale or the absence of a liquid secondary market may affect adversely our ability to determine NAV. The sale price of securities that are restricted or otherwise are not readily marketable may be higher or lower than our most recent valuations.
Competition Risk. A number of alternatives exist for investing in a portfolio of energy infrastructure entities, including other publicly traded investment companies, structured notes, private funds, open-end funds and indexed products. These competitive conditions may adversely impact our ability to meet our investment objective, which in turn could adversely impact our ability to make distributions or interest or distribution payments.
Management Risk. The Adviser was formed in October 2002 to provide portfolio management services to institutional and high net worth investors seeking professional management of their MLP investments. The Adviser has been managing our portfolio since we began operations in July 2010. As of December 31, 2020, the Adviser had client assets under management of approximately $6.3 billion. To the extent that the Adviser’s assets under management grow, the Adviser may have to hire additional personnel and, to the extent it is unable to hire qualified individuals, its operations may be adversely affected.
| 106 | Tortoise |
| 2020 Annual Report | November 30, 2020 |
| Additional Information (unaudited) (continued) |
Subsidiary Risks. By investing in any Subsidiary, we will be indirectly exposed to the risks associated with such Subsidiary’s investments. The instruments that will be held by any Subsidiary will generally be similar to those that are permitted to be held by the Company and will be subject to the same risks that apply to similar investments if held directly by the Company. The Subsidiaries will not be registered under the 1940 Act, and, unless otherwise noted, will not be subject to all of the protections of the 1940 Act. However, we will wholly own and control any Subsidiary, and we and any Subsidiary will each be managed by our Adviser and will share the same portfolio management team. Our Board of Directors will have oversight responsibility for the investment activities of the Company, including its investment in the Subsidiaries, and our role as sole shareholder of any Subsidiary. Changes in the laws of the United States and/or any jurisdiction in which a Subsidiary if formed could result in our inability or the inability of the Subsidiaries to operate as expected and could adversely affect the Company.
Leverage Risk. Our use of leverage through the issuance of preferred stock or debt securities, and any borrowings (other than for temporary or emergency purposes) would be considered “senior securities” for purposes of the 1940 Act and create risks. Leverage is a speculative technique that may adversely affect common stockholders. If the return on securities acquired with borrowed funds or other leverage proceeds does not exceed the cost of the leverage, the use of leverage could cause us to lose money. Successful use of leverage depends on our Adviser’s ability to predict or hedge correctly interest rates and market movements, and there is no assurance that the use of a leveraging strategy will be successful during any period in which it is used. Because the fee paid to our Adviser will be calculated on the basis of Managed Assets, the fees will increase when leverage is utilized, giving our Adviser an incentive to utilize leverage.
Market Impact Risk. The sale of our common stock (or the perception that such sales may occur) may have an adverse effect on prices in the secondary market for our common stock. An increase in the number of common shares available may put downward pressure on the market price for our common stock.
Dilution Risk. The voting power of current stockholders will be diluted to the extent that such stockholders do not purchase shares in any future common stock offerings or do not purchase sufficient shares to maintain their percentage interest.
If we are unable to invest the proceeds of such offering as intended, our per share distribution may decrease and we may not participate in market advances to the same extent as if such proceeds were fully invested as planned.
Market Discount Risk. Our common stock has traded both at a premium and at a discount in relation to NAV. We cannot predict whether our shares will trade in the future at a premium or discount to NAV.
Additional Risks to Senior Securities Holders
Interest Rate Risk. Distributions and interest payable on our senior securities are subject to interest rate risk. To the extent that distributions or interest on such securities are based on short-term rates, our leverage costs may rise so that the amount of distributions or interest due to holders of senior securities would exceed the cash flow generated by our portfolio securities. To the extent that our leverage costs are fixed, our leverage costs may increase when our senior securities mature. This might require that we sell portfolio securities at a time when we would otherwise not do so, which may adversely affect our future ability to generate cash flow. In addition, rising market interest rates could negatively impact the value of our investment portfolio, reducing the amount of assets serving as asset coverage for senior securities.
Senior Leverage Risk. Preferred stock would be junior in liquidation and with respect to distribution rights to debt securities and any other borrowings. Senior securities representing indebtedness may constitute a substantial lien and burden on any preferred stock by reason of their prior claim against our income and against our net assets in liquidation. We may not be permitted to declare distributions with respect to any series of preferred stock unless at such time we meet applicable asset coverage requirements and the payment of principal or interest is not in default with respect to the Notes or any other borrowings.
Ratings and Asset Coverage Risk. To the extent that senior securities are rated, a rating does not eliminate or necessarily mitigate the risks of investing in our senior securities, and a rating may not fully or accurately reflect all of the credit and market risks associated with a security. A rating agency could downgrade the rating of our shares of preferred stock or debt securities, which may make such securities less liquid in the secondary market, though probably with higher resulting interest rates. If a rating agency downgrades, or indicates a potential downgrade to, the rating assigned to a senior security, we may alter our portfolio or redeem some senior securities. We may voluntarily redeem a senior security under certain circumstances to the extent permitted by its governing documents.
Inflation Risk. Inflation is the reduction in the purchasing power of money resulting from an increase in the price of goods and services. Inflation risk is the risk that the inflation adjusted or “real” value of an investment in preferred stock or debt securities or the income from that investment will be worth less in the future. As inflation occurs, the real value of the preferred stock or debt securities and the distributions payable to holders of preferred stock or interest payable to holders of debt securities declines.
Decline in Net Asset Value Risk. A material decline in our NAV may impair our ability to maintain required levels of asset coverage for our preferred stock or debt securities.
| Tortoise | 107 |
| Additional Information (unaudited) (continued) |
Tortoise Power and Energy Infrastructure Fund, Inc.
General Business Risk. We are a Maryland corporation registered as a non-diversified, closed-end management investment company under the 1940 Act. We are subject to all of the business risks and uncertainties associated with any business, including the risk that we will not achieve our investment objectives and that the value of an investment in our securities could decline substantially and cause you to lose some or all of your investment.
General Securities Risk. We invest in securities that may be subject to certain risks, including: (1) issuer risk, (2) credit risk, (3) interest rate risk, (4) reinvestment risk, (5) call or prepayment risk, (6) valuation risk, and (7) duration and maturity risk.
Capital Markets Risk. Global financial markets and economic conditions have been, and continue to be, volatile due to a variety of factors, including significant write-offs in the financial services sector. The third and fourth quarters of 2009 and the first and second quarters of 2010 witnessed more stabilized economic activity as expectations for an economic recovery increased. However, if the volatility continues, the cost of raising capital in the fixed income and equity capital markets and the ability to raise capital may be impacted. In particular, concerns about the general stability of financial markets and specifically the solvency of lending counterparties, may impact the cost of raising capital from the credit markets through increased interest rates, tighter lending standards, difficulties in refinancing debt on existing terms or at all and reduced, or in some cases ceasing to provide, funding to borrowers. In addition, lending counterparties under existing revolving credit facilities and other fixed income instruments may be unwilling or unable to meet their funding obligations. In addition, measures taken by the U.S. Government to stimulate the U.S. economy may not be successful or may not have the intended effect. As a result of any of the foregoing, companies may be unable to obtain new fixed income or equity financing on acceptable terms. If funding is not available when needed, or is available only on unfavorable terms, companies may not be able to meet their obligations as they come due. Moreover, without adequate funding, companies may be unable to execute their maintenance and growth strategies, complete future acquisitions, take advantage of other business opportunities or respond to competitive pressures, any of which could have a material adverse effect on their revenues and results of operations.
Investment Grade Fixed Income Securities Risk. We may invest a portion of our assets in fixed income securities rated “investment grade” by nationally recognized statistical rating organizations (“NRSROs”) or judged by our Adviser to be of comparable credit quality. Although we do not intend to do so, we may invest up to 100% in such securities. Investment grade fixed income securities are rated Baa3 or higher by Moody’s Investors Service (“Moody’s”), BBB- or higher by Standard & Poor’s Ratings Services (“S&P”), or BBB- or higher by Fitch, Inc. (“Fitch”). Investment grade fixed income securities generally pay yields above those of otherwise-comparable U.S. government securities because they are subject to greater risks than U.S. government securities, and yields that are below those of non-investment grade fixed income securities, commonly referred to as “junk bonds,” because they are considered to be subject to fewer risks than non-investment grade fixed income securities. Despite being considered to be subject to fewer risks than junk bonds, investment grade fixed income securities are, in fact, subject to risks, including volatility, credit risk and risk of default, sensitivity to general economic or industry conditions, potential lack of resale opportunities (illiquidity), and additional expenses to seek recovery from issuers who default.
MLP Risks. An investment in MLP securities involves some risks that differ from the risks involved in an investment in the common stock of a corporation, including governance risk, tax risk, and cash flow risk. Governance risk involves the risks associated with the ownership structure of MLPs. MLPs are also subject to tax risk, which is the risk that MLPs might lose their partnership status for tax purposes. Cash flow risk is the risk that MLPs will not make distributions to holders (including us) at anticipated levels or that such distributions will not have the expected tax character. As a result, there could be a material reduction in our cash flow and there could be a material decrease in the value of our common shares.
Restricted Securities Risk. We will not invest more than 15% of our total assets in restricted securities that are ineligible for resale under Rule 144A, all of which may be illiquid securities. Restricted securities (including Rule 144A securities) are less liquid than freely tradable securities because of statutory and contractual restrictions on resale. Such securities are, therefore, unlike freely tradable securities, which can be expected to be sold immediately if the market is adequate. This lack of liquidity creates special risks for us.
Rule 144A Securities Risk. The Fund may purchase Rule 144A securities. Rule 144A provides an exemption from the registration requirements of the 1933 Act for the resale of certain restricted securities to qualified institutional buyers, such as the Fund. Securities saleable among qualified institutional buyers pursuant to Rule 144A will not be counted towards the 15% limitation on restricted securities.
An insufficient number of qualified institutional buyers interested in purchasing Rule 144A-eligible securities held by us, however, could affect adversely the marketability of certain Rule 144A securities, and we might be unable to dispose of such securities promptly or at reasonable prices. To the extent that liquid Rule 144A securities that the Fund holds become illiquid, due to the lack of sufficient qualified institutional buyers or market or other conditions, the percentage of the Fund’s assets invested in illiquid assets would increase and the fair value of such investments may become not readily determinable. In addition, if for any reason we are required to liquidate all or a portion of our portfolio quickly, we may realize significantly less than the fair value at which we previously recorded these investments.
Tax Risk. We have elected to be treated, and intend to qualify each year, as a “regulated investment company” (“RIC”) under the Code. To maintain our qualification for federal income tax purposes as a RIC under the Code, we must meet certain source-of-income, asset diversification and annual distribution requirements, as discussed in detail below under “Certain U.S. Federal Income Tax Considerations.” If for any taxable year we fail to qualify for the special federal income tax treatment afforded to RICs, all of our taxable income will be subject to federal income tax at regular corporate rates (without any deduction for distributions to our stockholders) and our income available for distribution will be reduced.
| 108 | Tortoise |
| 2020 Annual Report | November 30, 2020 |
| Additional Information (unaudited) (continued) |
Equity Securities Risk. Equity securities of entities that operate in the power and energy infrastructure sectors can be affected by macroeconomic and other factors affecting the stock market in general, expectations about changes in interest rates, investor sentiment towards such entities, changes in a particular issuer’s financial condition, or unfavorable or unanticipated poor performance of a particular issuer (in the case of MLPs, generally measured in terms of distributions). Prices of equity securities of individual entities also can be affected by fundamentals unique to the company or partnership, including earnings power and coverage ratios.
Non-investment Grade Fixed Income Securities Risk. We will not invest more than 25% of our total assets in fixed income securities rated non-investment grade by NRSROs or unrated securities of comparable quality. Non-investment grade securities are rated Ba1 or lower by Moody’s, BB+ or lower by S&P or BB or lower by Fitch or, if unrated are determined by our Adviser to be of comparable credit quality. Non-investment grade securities, also sometimes referred to as “junk bonds,” generally pay a premium above the yields of U.S. government securities or fixed income securities of investment grade issuers because they are subject to greater risks than these securities. These risks, which reflect their speculative character, include the following: greater volatility; greater credit risk and risk of default; potentially greater sensitivity to general economic or industry conditions; potential lack of attractive resale opportunities (illiquidity); and additional expenses to seek recovery from issuers who default.
Non-U.S. Securities Risk. We may invest up to 10% of our total assets in securities issued by non-U.S. issuers (including Canadian issuers) and that otherwise meet our investment objectives. This may include investments in the securities of non-U.S. issuers that involve risks not ordinarily associated with investments in securities and instruments of U.S. issuers, including different accounting, auditing and financial standards, less government supervision and regulation, additional tax withholding and taxes, difficulty enforcing rights in foreign countries, less publicly available information, difficulty effecting transactions, higher expenses, and exchange rate risk.
Valuation Risk. The fair value of certain of our investments may not be readily determinable. The fair value of these securities will be determined pursuant to methodologies established by our Board of Directors. While the fair value of securities we acquire through direct placements generally will be based on a discount from quoted market prices, other factors may adversely affect our ability to determine the fair value of such a security. Our determination of fair value may differ materially from the values that would have been used if a ready market for these securities had existed.
Leverage Risk. Our use of leverage through borrowings or the issuance of preferred stock or fixed income securities, and any other transactions involving indebtedness (other than for temporary or emergency purposes) would be considered “senior securities” for purposes of the 1940 Act. Under normal circumstances, we will not employ leverage above 20% of our total assets at time of incurrence. Leverage is a speculative technique that may adversely affect common stockholders. If the return on securities acquired with borrowed funds or other leverage proceeds does not exceed the cost of the leverage, the use of leverage could cause us to lose money. There is no assurance that a leveraging strategy will be successful.
Hedging Strategy Risk. We may use interest rate swap transactions, for hedging purposes only, in an attempt to reduce the interest rate risk arising from our leveraged capital structure. Interest rate swap transactions that we may use for hedging purposes will expose us to certain risks that differ from the risks associated with our portfolio holdings. The use of hedging transactions might result in reduced overall performance, whether or not adjusted for risk, than if we had not engaged in such transactions.
Liquidity Risk. Certain securities may trade less frequently than those of larger companies that have larger market capitalizations. Investments in securities that are less actively traded or over time experience decreased trading volume may be difficult to dispose of when we believe it is desirable to do so, may restrict our ability to take advantage of other opportunities, and may be more difficult to value.
Non-Diversification Risk. We are registered as a non-diversified, closed-end management investment company under the 1940 Act. Accordingly, there are no regulatory limits under the 1940 Act on the number or size of securities that we hold, and we may invest more assets in fewer issuers compared to a diversified fund. However, in order to qualify as a RIC for federal income tax purposes, we must meet certain requirements.
Competition Risk. There are a number of alternatives to us as vehicles for investment in a portfolio of companies operating primarily in the power and energy infrastructure sectors, including publicly traded investment companies, structured notes, private funds, open-end funds and indexed products. In addition, recent tax law changes have increased the ability of RICs or other institutions to invest in MLPs. These competitive conditions may adversely impact our ability to meet our investment objectives, which in turn could adversely impact our ability to make interest or distribution payments on any securities we may issue.
Performance Risk. We may not be able to achieve operating results that will allow us to make distributions at a specific level or to increase the amount of these distributions from time to time. In addition, the 1940 Act and restrictions and provisions in credit facilities and fixed income securities may limit our ability to make distributions. For federal income tax purposes, we are required to distribute substantially all of our net investment income each year both to reduce our federal income tax liability and to avoid a potential excise tax. If our ability to make distributions on our common shares is limited, such limitations could, under certain circumstances, impair our ability to maintain our qualification for taxation as a RIC, which would have adverse consequences for our stockholders.
| Tortoise | 109 |
| Additional Information (unaudited) (continued) |
Legal and Regulatory Change Risks. The regulatory environment for closed-end companies is evolving, and changes in the regulation of closed-end companies may adversely affect the value of our investments, our ability to obtain the leverage that we might otherwise obtain, or to pursue our trading strategy. In addition, the securities markets are subject to comprehensive statutes and regulations. The Securities and Exchange Commission (“SEC”), other regulators and self-regulatory organizations and exchanges are authorized to take extraordinary actions in the event of market emergencies. The effect of any future regulatory change on us could be substantial and adverse.
Management Risk. Our Adviser was formed in October 2002 to provide portfolio management services to institutional and high-net worth investors seeking professional management of their MLP investments. Our Adviser has been managing our portfolio since we began operations in July 2009. As of December 31, 2020 the Adviser had client assets under management of approximately $6.3 billion. To the extent that the Adviser’s assets under management grow, the Adviser may have to hire additional personnel and, to the extent it is unable to hire qualified individuals, its operations may be adversely affected.
Concentration Risk. The Fund’s strategy of concentrating in power and energy infrastructure investments means that the performance of the Fund will be closely tied to the performance of these particular market sectors. The Fund’s concentrations in these investments may present more risk than if it were broadly diversified over numerous industries and sectors of the economy. A downturn in these investments would have a greater impact on the Fund than on a fund that does not concentrate in such investments. At times, the performance of these investments may lag the performance of other industries or the market as a whole.
Risks Related to Investing in the Power and Energy Infrastructure Sectors
Under normal circumstances, we plan to invest at least 80% of our total assets (including assets we obtain through leverage) in the securities of companies that derive more than 50% of their revenue from power or energy infrastructure operations. Our focus on the power and energy infrastructure sectors may present more risks than if it were broadly diversified over numerous sectors of the economy. Therefore, a downturn in the power and energy infrastructure sectors would have a larger impact on us than on an investment company that does not concentrate in these sectors. Specific risks of investing in the power and energy infrastructure sectors include the following: (1) interest rate risk, (2) credit rating downgrade risk, (3) terrorism and natural disasters risk, (4) climate change regulation risk, (5) operating risk (6) power infrastructure company risk, and (7) energy infrastructure company risk.
Power Infrastructure Company Risk. Companies operating in the power infrastructure sector also are subject to additional risks, including: (1) regulatory risk, (2) Federal Energy Regulatory Commission risk, (3) environmental risk and (4) competition risk. To the extent that any of these risks materialize for a company whose securities are in our portfolio, the value of these securities could decline and our net asset value and share price could be adversely affected.
Energy Infrastructure Company Risk. Companies operating in the energy infrastructure sector also are subject to additional risks, including: (1) pipeline company risk, (2) gathering and processing company risk, (3) propane company risk, (4) supply and demand risk, (5) price volatility risk, (6) competition risk, and (7) regulatory risk. To the extent that any of these risks materialize for a company whose securities are in our portfolio, the value of these securities could decline and our net asset value and share price would be adversely affected.
Additional Risks to Common Stockholders
Market Impact Risk. The sale of our common stock (or the perception that such sales may occur) may have an adverse effect on prices in the secondary market for our common stock by increasing the number of shares available, which may put downward pressure on the market price for our common stock. Our ability to sell shares of common stock below NAV may increase this pressure. These sales also might make it more difficult for us to sell additional equity securities in the future at a time and price we deem appropriate.
Dilution Risk. The voting power of current stockholders will be diluted to the extent that such stockholders do not purchase shares in any future common stock offerings or do not purchase sufficient shares to maintain their percentage interest. In addition, if we sell shares of common stock below NAV, our NAV will fall immediately after such issuance.
If we are unable to invest the proceeds of such offering as intended, our per share distribution may decrease and we may not participate in market advances to the same extent as if such proceeds were fully invested as planned.
Market Discount Risk. Our common stock has traded both at a premium and at a discount in relation to NAV. We cannot predict whether our shares will trade in the future at a premium or discount to NAV.
| 110 | Tortoise |
| 2020 Annual Report | November 30, 2020 |
| Additional Information (unaudited) (continued) |
Additional Risks to Senior Security Holders
Additional risks of investing in preferred stock or debt securities issued by us include the following:
Interest Rate Risk. Distributions and interest payable on our senior securities are subject to interest rate risk. To the extent that distributions on such securities are based on short-term rates, our leverage costs may rise so that the amount of distributions or interest due to holders of senior securities would exceed the cash flow generated by our portfolio securities. To the extent that our leverage costs are fixed, our leverage costs may increase when our senior securities mature. This might require that we sell portfolio securities at a time when we would otherwise not do so, which may adversely affect our future ability to generate cash flow. In addition, rising market interest rates could negatively impact the value of our investment portfolio, reducing the amount of assets serving as asset coverage for senior securities.
Senior Leverage Risk. Our preferred stock will be junior in liquidation and with respect to distribution rights to our debt securities and any other borrowings. Senior securities representing indebtedness may constitute a substantial lien and burden on preferred stock by reason of their prior claim against our income and against our net assets in liquidation. We may not be permitted to declare distributions with respect to any series of our preferred stock unless at such time we meet applicable asset coverage requirements and the payment of principal or interest is not in default with respect to senior debt securities or any other borrowings.
Our debt securities, upon issuance, are expected to be unsecured obligations and, upon our liquidation, dissolution or winding up, will rank: (1) senior to all of our outstanding common stock and any outstanding preferred stock; (2) on a parity with any of our unsecured creditors and any unsecured senior securities representing our indebtedness; and (3) junior to any of our secured creditors. Secured creditors of ours may include, without limitation, parties entering into interest rate swap, floor or cap transactions, or other similar transactions with us that create liens, pledges, charges, security interests, security agreements or other encumbrances on our assets.
Ratings and Asset Coverage Risk. To the extent that senior securities are rated, a rating does not eliminate or necessarily mitigate the risks of investing in our senior securities, and a rating may not fully or accurately reflect all of the credit and market risks associated with that senior security. A rating agency could downgrade the rating of our shares of preferred stock or debt securities, which may make such securities less liquid in the secondary market, though probably with higher resulting interest rates. If a rating agency downgrades, or indicates a potential downgrade to, the rating assigned to a senior security, we may alter our portfolio or redeem a portion of our senior securities. We may voluntarily redeem a senior security under certain circumstances to the extent permitted by its governing documents.
Inflation Risk. Inflation is the reduction in the purchasing power of money resulting from an increase in the price of goods and services. Inflation risk is the risk that the inflation adjusted or “real” value of an investment in preferred stock or debt securities or the income from that investment will be worth less in the future. As inflation occurs, the real value of the preferred stock or debt securities and the distributions or interest payable to holders of preferred stock or debt securities declines.
Decline in Net Asset Value Risk. A material decline in our NAV may impair our ability to maintain required levels of asset coverage for our preferred stock or debt securities.
Tortoise Pipeline & Energy Fund, Inc.
The following are the general risks of investing in our securities that affect our ability to achieve our investment objective. The risks below could lower the returns and distributions on common stock and reduce the amount of cash and net assets available to make distribution payments on preferred stock and interest payments on debt securities.
Capital Markets Volatility Risk. Our capital structure and performance may be adversely impacted by weakness in the credit markets and stock market if such weakness results in declines in the value of companies in which we invest. If the value of our investments decline or remain volatile, there is a risk that we may be required to reduce outstanding leverage, which could adversely affect our stock price and ability to pay distributions at historical levels. A sustained economic slowdown may adversely affect the ability of the companies in which we invest to obtain new debt or equity financing on acceptable terms. If funding is not available when needed, or is available only on unfavorable terms, we or the companies in which we invest may not be able to meet obligations as they come due. Moreover, without adequate funding, energy infrastructure companies may be unable to execute their growth strategies, complete future acquisitions, take advantage of other business opportunities or respond to competitive pressures, any of which could have a material adverse effect on their revenues and results of operations.
Rising interest rates could limit the capital appreciation of equity units of energy infrastructure companies as a result of the increased availability of alternative investments at competitive yields. Rising interest rates may increase the cost of capital for companies operating in this sector. A higher cost of capital or an inflationary period may lead to inadequate funding, which could limit growth from acquisition or expansion projects, the ability of such entities to make or grow dividends or distributions or meet debt obligations, the ability to respond to competitive pressures, all of which could adversely affect the prices of their securities.
| Tortoise | 111 |
| Additional Information (unaudited) (continued) |
Concentration Risk. Our strategy of concentrating in energy infrastructure investments means that our performance will be closely tied to the performance of the energy infrastructure sector, which includes midstream, upstream and downstream energy industries. Our concentration in these investments may present more risk than if we were broadly diversified over numerous industries and sectors of the economy. A downturn in these investments would have a greater impact on us than on a fund that does not concentrate in such investments. At times, the performance of these investments may lag the performance of other industries or the market as a whole. Risks inherent in the business of energy infrastructure companies include:
| ● | Supply and Demand Risk. A decrease in the production of natural gas, NGLs, crude oil, coal, refined petroleum products or other energy commodities, or a decrease in the volume of such commodities available for transporting, storing, gathering, processing, distributing, exploring, developing, managing or producing may adversely impact the financial performance and profitability of energy infrastructure companies. Production declines and volume decreases could be caused by various factors, including depletion of resources, declines in estimates of proved reserves, labor difficulties, political events, OPEC actions, changes in commodity prices, declines in production from existing facilities, environmental proceedings, increased regulations, equipment failures and unexpected maintenance problems, failure to obtain necessary permits, unscheduled outages, unanticipated expenses, inability to successfully carry out new construction or acquisitions, import supply disruption, increased competition from alternative energy sources or related commodity prices and other events. Alternatively, a sustained decline in or varying demand for such commodities could also adversely affect the financial performance of energy infrastructure companies. Factors that could lead to a decline in demand include economic recession or other adverse economic conditions, higher fuel taxes or governmental regulations, increases in fuel economy, consumer shifts to the use of alternative fuel sources, changes in commodity prices or weather. |
| ● | Operating Risk. energy infrastructure companies are subject to many operating risks, including: equipment failure causing outages; structural, maintenance, impairment and safety problems; transmission or transportation constraints, inoperability or inefficiencies; dependence on a specified fuel source, including the transportation of fuel; changes in electricity and fuel usage; availability of competitively priced alternative energy sources; changes in generation efficiency and market heat rates; lack of sufficient capital to maintain facilities; significant capital expenditures to keep older assets operating efficiently; seasonality; changes in supply and demand for energy commodities; catastrophic and/or weather- related events such as fires, explosions, floods, earthquakes, hurricanes and similar occurrences; storage, handling, disposal and decommissioning costs; and environmental compliance. Breakdown or failure of a pipeline or other energy infrastructure company’s assets may prevent the company from performing under applicable sales agreements, which in certain situations, could result in termination of the agreement or incurring a liability for liquidated damages. A company’s ability to successfully and timely complete capital improvements to existing or other capital projects is contingent upon many variables. Should any such efforts be unsuccessful, a pipeline or other energy infrastructure company could be subject to additional costs and / or the write-off of its investment in the project or improvement. As a result of the above risks and other potential hazards associated with energy infrastructure companies, certain companies may become exposed to significant liabilities for which they may not have adequate insurance coverage. Any of the aforementioned risks or related regulatory and environmental risks could have a material adverse effect on the business, financial condition, results of operations and cash flows of energy infrastructure companies. |
| ● | Regulatory Risk. Energy infrastructure issuers are subject to regulation by various governmental authorities in various jurisdictions and may be adversely affected by the imposition of special tariffs and changes in tax laws, regulatory policies and accounting standards. Regulation exists in multiple aspects of their operations, including how facilities are constructed, maintained and operated, environmental and safety controls, and the prices they may charge for the products and services they provide. Various governmental authorities have the power to enforce compliance with these regulations and the permits issued under them, and violators are subject to administrative, civil and criminal penalties, including fines, injunctions or both. Stricter laws, regulations or enforcement policies could be enacted in the future which may increase compliance costs and may adversely affect the financial performance of energy infrastructure companies. Pipeline companies engaged in interstate pipeline transportation of natural gas, refined petroleum products and other products are subject to regulation by the Federal Energy Regulatory Commission (“FERC”) with respect to tariff rates these companies may charge for pipeline transportation services. An adverse determination by the FERC with respect to the tariff rates of a pipeline or other energy infrastructure company could have a material adverse effect on its business, financial condition, results of operations and cash flows and its ability to make cash distributions to its equity owners. Prices for certain electric power companies are regulated in the U.S. with the intention of protecting the public while ensuring that the rate of return earned by such companies is sufficient to attract growth capital and to provide appropriate services but do not provide any assurance as to achievement of earnings levels. We could become subject to the FERC’s jurisdiction if we are deemed to be a holding company of a public utility company or of a holding company of a public utility company, and we may be required to aggregate securities held by us or other funds and accounts managed by the Adviser and its affiliates, or be prohibited from buying certain securities or be forced to divest certain securities. |
| 112 | Tortoise |
| 2020 Annual Report | November 30, 2020 |
| Additional Information (unaudited) (continued) |
| ● | Environmental Risk. Energy infrastructure company activities are subject to stringent environmental laws and regulation by many federal, state and local authorities, international treaties and foreign governmental authorities. Failure to comply with such laws and regulations or to obtain any necessary environmental permits pursuant to such laws and regulations could result in fines or other sanctions. Congress and other domestic and foreign governmental authorities have either considered or implemented various laws and regulations to restrict or tax certain emissions, particularly those involving air and water emissions. Existing environmental regulations could be revised or reinterpreted, new laws and regulations could be adopted or become applicable, and future changes in environmental laws and regulations could occur, which could impose additional costs on the operation of power plants. Energy infrastructure companies have made and will likely continue to make significant capital and other expenditures to comply with these and other environmental laws and regulations. Changes in, or new, environmental restrictions may force energy infrastructure companies to incur significant expenses or expenses that may exceed their estimates. There can be no assurance that such companies would be able to recover all or any increased environmental costs from their customers or that their business, financial condition or results of operations would not be materially and adversely affected by such expenditures or any changes in domestic or foreign environmental laws and regulations, in which case the value of these companies’ securities in our portfolio could be adversely affected. In addition, a pipeline or other energy infrastructure company may be responsible for any on-site liabilities associated with the environmental condition of facilities that it has acquired, leased or developed, regardless of when the liabilities arose and whether they are known or unknown. |
| ● | Price Volatility Risk. The volatility of energy commodity prices can affect certain energy infrastructure companies due to the impact of prices on the volume of commodities transported, stored, gathered, processed, distributed, developed or produced. Most pipeline companies are not subject to direct commodity price exposure because they do not own the underlying energy commodity. Nonetheless, the price of a pipeline company security can be adversely affected by the perception that the performance of all such entities is directly tied to commodity prices. However, the operations, cash flows and financial performance of other energy infrastructure companies in which we will invest may be more directly affected by energy commodity prices, especially those energy companies owning the underlying energy commodity. Commodity prices fluctuate for several reasons, including changes in global and domestic market and economic conditions, the impact of weather on demand, levels of domestic production and imported commodities, energy conservation, domestic and foreign governmental regulation, political instability, conservation efforts, and taxation and the availability of local, intrastate and interstate transportation systems. Volatility of commodity prices may also make it more difficult for energy companies to raise capital to the extent the market perceives that their performance may be directly or indirectly tied to commodity prices. Historically, energy commodity prices have been cyclical and exhibited significant volatility which may adversely impact other energy infrastructure companies in which we invest. |
| ● | Terrorism Risk. Energy infrastructure companies, and the market for their securities, are subject to disruption as a result of terrorist activities, such as the terrorist attacks on the World Trade Center on September 11, 2001; war, such as the wars in Afghanistan and Iraq and their aftermaths; and other geopolitical events, including upheaval in the Middle East or other energy producing regions. The U.S. government has issued warnings that energy assets, specifically those related to energy infrastructure, production facilities, and transmission and distribution facilities, might be specific targets of terrorist activity. Such events have led, and in the future may lead, to short-term market volatility and may have long-term effects on companies in the energy infrastructure industry and markets. Such events may also adversely affect our business and financial condition. |
| ● | Natural Disaster Risk. Natural risks, such as earthquakes, flood, lightning, hurricanes and wind, are inherent risks in infrastructure company operations. For example, extreme weather patterns, such as Hurricane Ivan in 2004 and Hurricanes Katrina and Rita in 2005, the Tohuku earthquake and resulting tsunami in Japan in 2011, Hurricane Sandy in 2012 and Hurricane Harvey in 2017, or the threat thereof, could result in substantial damage to the facilities of certain companies located in the affected areas and significant volatility in the supply of energy and could adversely impact the prices of the securities in which we invest. This volatility may create fluctuations in commodity prices and earnings of energy infrastructure companies. |
| ● | Climate Change Regulation Risk. Climate change regulation could result in increased operations and capital costs for the companies in which we invest. Voluntary initiatives and mandatory controls have been adopted or are being discussed both in the United States and worldwide to reduce emissions of “greenhouse gases” such as carbon dioxide, a by-product of burning fossil fuels, which some scientists and policymakers believe contribute to global climate change. These measures and future measures could result in increased costs to certain companies in which we invest to operate and maintain facilities and administer and manage a greenhouse gas emissions program and may reduce demand for fuels that generate greenhouse gases and that are managed or produced by companies in which we invest. |
Industry Specific Risk. Energy infrastructure companies are subject to specific risks, including:
| ● | Renewable and power infrastructure companies are subject to many risks, including earnings variability based upon weather patterns in the locations where the company operates, the change in the demand for electricity, the cost to produce power, and the regulatory environment. Further, share prices are partly based on the interest rate environment, the sustainability and potential growth of the dividend, and the outcome of various rate cases undertaken by the company or a regulatory body. |
| Tortoise | 113 |
| Additional Information (unaudited) (continued) |
| ● | Pipeline companies are subject to varying demand for crude oil, natural gas, NGLs or refined products in the markets served by the pipeline; changes in the availability of products for transporting, gathering, processing or sale due to natural declines in reserves and production in the supply areas serviced by the company’s facilities; sharp decreases in crude oil or natural gas prices that cause producers to curtail production or reduce capital spending for exploration activities; and environmental regulation. Specifically, demand for gasoline, which accounts for a substantial portion of refined product transportation, depends on price, prevailing economic conditions in the markets served, and demographic and seasonal factors. |
| ● | Processing companies are subject to declines in production of natural gas fields, which utilize the processing facilities as a way to market the gas, prolonged depression in the price of natural gas, which curtails production due to lack of drilling activity and declines in the prices of NGL products and natural gas prices, resulting in lower processing margins. |
| ● | Integrated energy companies are impacted by declines in the demand for and prices of natural gas, crude oil and refined petroleum products. Reductions in prices for natural gas and crude oil can cause a given reservoir to become uneconomic for continued production earlier than it would if prices were higher. The operating margins and cash flows of integrated energy companies may fluctuate widely in response to a variety of factors, including global and domestic economic conditions, weather conditions, natural disasters, the supply and price of imported energy commodities, change in the level and relationship in crude oil and refined petroleum product pricing, political instability, conservation efforts and governmental regulation. The accuracy of any reserve estimate is a function of the quality of available data, the accuracy of assumptions regarding future commodity prices and costs, and engineering and geological interpretations and judgments. Due to natural declines in reserves and production, exploitation and production companies must economically find or acquire and develop additional reserves in order to maintain and grow their revenues and distributions. Integrated energy companies are also subject to risks related to operations (such as fires and explosions) as well as the potential environmental and regulatory risks of such events, which may adversely impact their business and financial condition. |
| ● | Renewable and power infrastructure companies are subject to many risks, including earnings variability based upon weather patterns in the locations where the company operates, the change in the demand for electricity, the cost to produce power, and the regulatory environment.Furthermore, share prices are partly based on the interest rate environment, the sustainability and potential growth of the dividend, and the outcome of various rate cases undertaken by the company or a regulatory body. |
MLP Risks. An investment in MLP securities involves some risks that differ from the risks involved in an investment in the common stock of a corporation. Holders of MLP units have limited control and voting rights on matters affecting the partnership. Holders of units issued by an MLP are exposed to a remote possibility of liability for all of the obligations of that MLP in the event that a court determines that the rights of the holders of MLP units to vote to remove or replace the general partner of that MLP, to approve amendments to that MLP’s partnership agreement, or to take other action under the partnership agreement of that MLP would constitute “control” of the business of that MLP, or a court or governmental agency determines that the MLP is conducting business in a state without complying with the partnership statute of that state.
Holders of MLP units are also exposed to the risk that they will be required to repay amounts to the MLP that are wrongfully distributed to them. In addition, the value of our investment in an MLP will depend largely on the MLP’s treatment as a partnership for U.S. federal income tax purposes. If an MLP does not meet current legal requirements to maintain partnership status, or if it is unable to do so because of tax law changes, it would be treated as a corporation for U.S. federal income tax purposes. In that case, the MLP would be obligated to pay income tax at the entity level and distributions received by us generally would be taxed as dividend income. As a result, there could be a material reduction in our cash flow and there could be a material decrease in the value of our common shares.
Equity Securities Risk. Equity securities can be affected by macroeconomic and other factors affecting the stock market in general, expectations about changes in interest rates, investor sentiment toward such entities, changes in a particular issuer’s financial condition, or unfavorable or unanticipated poor performance of a particular issuer. Prices of equity securities of individual entities also can be affected by fundamentals unique to the company or partnership, including size, earnings power, coverage ratio and characteristics and features of different classes of securities. Equity securities are susceptible to general stock market fluctuations and to volatile increases and decreases in value. The equity securities we hold may experience sudden, unpredictable drops in value or long periods of decline in value. In addition, by writing covered call options, capital appreciation potential will be limited on a portion of our investment portfolio.
Foreign Securities Risk. Investments in securities (including ADRs) of foreign issuers involve risks not ordinarily associated with investments in securities and instruments of U.S. issuers. For example, foreign companies are not generally subject to uniform accounting, auditing and financial standards and requirements comparable to those applicable to U.S. companies. Foreign securities exchanges, brokers and companies may be subject to less government supervision and regulation than exists in the U.S. Dividend and interest income may be subject to withholding and other foreign taxes, which may adversely affect the net return on such investments. The Fund may not be able to pass through to its shareholders any foreign income tax credits as a result of any foreign income taxes it pays. There may be difficulty in obtaining or enforcing a court judgment abroad. In addition, it may be difficult to effect repatriation of capital invested in certain countries. With respect to certain countries, there are risks of expropriation, confiscatory taxation, political or social instability or diplomatic developments that could affect the Fund’s assets held in foreign countries. Furthermore, foreign companies operate and serve customers in many parts of the world,
| 114 | Tortoise |
| 2020 Annual Report | November 30, 2020 |
| Additional Information (unaudited) (continued) |
and encounter a variety of political and legal risks unique to those jurisdictions. Local economic conditions may vary and may have a meaningful influence on the outcome of business activities. Some of these risks are impacted by regional inflation, economic cycles, currency volatility, sovereign debt markets, local economic environments, and regional trade patterns. There may be less publicly available information about a foreign company than there is regarding a U.S. company, and many foreign companies are not subject to accounting, auditing, and financial reporting standards, regulatory framework and practices comparable to those in the U.S. Foreign securities markets may have substantially less volume than U.S. securities markets and some foreign company securities are less liquid than securities of otherwise comparable U.S. companies. Foreign markets also have different clearance and settlement procedures that could cause the Fund to encounter difficulties in purchasing and selling securities on such markets and may result in the Fund missing attractive investment opportunities or experiencing a loss. In addition, a portfolio that includes securities issued by foreign issuers can expect to have a higher expense ratio because of the increased transaction costs in foreign markets and the increased costs of maintaining the custody of such foreign securities. When investing in securities issued by foreign issuers, there is also the risk that the value of such an investment or the Fund’s income, measured in U.S. dollars, will decrease because of unfavorable changes in currency exchange rates.
Liquidity Risk. We may invest in securities of any market capitalization and may be exposed to liquidity risk when trading volume, lack of a market maker, or legal restrictions impair our ability to sell particular securities or close call option positions at an advantageous price or a timely manner. We may invest in mid-cap and small-cap companies, which may not have the management experience, financial resources, product diversification and competitive strengths of large-cap companies. Analysts and other investors may follow these companies less actively and therefore information about these companies may not be as readily available as that for large-cap companies. Therefore, their securities may be more volatile and less liquid than the securities of larger, more established companies. In the event certain securities experience limited trading volumes, the prices of such securities may display abrupt or erratic movements at times. In addition, it may be more difficult for us to buy and sell significant amounts of such securities without an unfavorable impact on prevailing market prices. As a result, these securities may be difficult to sell at a favorable price at the times when we believe it is desirable to do so. Investment of our capital in securities that are less actively traded (or over time experience decreased trading volume) may restrict our ability to take advantage of other market opportunities or to sell those securities. This also may affect adversely our ability to make required interest payments on our debt securities and distributions on any of our preferred stock, to redeem such securities, or to meet asset coverage requirements.
Non-Diversification Risk. We are classified as “non-diversified” under the 1940 Act. As a result, we can invest a greater portion of our assets in obligations of a single issuer than a “diversified” fund. We may therefore be more susceptible than a diversified fund to being adversely affected by any single corporate, economic, political or regulatory occurrence. We intend to maintain our status as a RIC under Subchapter M of the Code, and thus we intend to satisfy the diversification requirements of Subchapter M, including its less stringent diversification requirements that apply to the percentage of our total assets that are represented by cash and cash items (including receivables), U.S. government securities, the securities of other regulated investment companies and certain other securities.
Performance and Distribution Risk. We may not be able to achieve operating results that will allow us to make distributions at a specific level or to increase the amount of these distributions from time to time. We cannot assure you that you will receive distributions at a particular level or at all. Dividends and distributions on equity securities are not fixed but are declared at the discretion of the issuer’s board of directors. If stock market volatility declines, the level of premiums from writing covered call options will likely decrease as well. Payments to close-out written call options will reduce amounts available for distribution from gains earned in respect of call option expiration or close out. The equity securities in which we invest may not appreciate or may decline in value. Net realized and unrealized gains on the securities investments will be determined primarily by the direction and movement of the applicable securities markets and our holdings. Any gains that we do realize on the disposition of any securities may not be sufficient to offset losses on other securities or option transactions. A significant decline in the value of the securities in which we invest may negatively impact our ability to pay distributions or cause you to lose all or a part of your investment.
In addition, the 1940 Act may limit our ability to make distributions in certain circumstances. Restrictions and provisions in any future credit facilities and our debt securities may also limit our ability to make distributions. For federal income tax purposes, we are required to distribute substantially all of our net investment income each year both to reduce our federal income tax liability and to avoid a potential excise tax. If our ability to make distributions on our common shares is limited, such limitations could, under certain circumstances, impair our ability to maintain our qualification for taxation as a RIC, which would have adverse consequences for our stockholders.
Quarterly Results Risk. We could experience fluctuations in our operating results due to a number of factors, including the return on our investments, the level of our expenses, variations in and the timing of the recognition of realized and unrealized gains or losses on our investments and written call options, the level of call premium we receive by writing covered calls, the degree to which we encounter competition in our markets and general economic conditions. As a result of these factors, results for any period should not be relied upon as being indicative of performance in future periods.
Restricted Securities Risk. We may invest up to 30% of our total assets in unregistered or otherwise restricted securities, primarily through direct investments in securities of listed companies. Restricted securities (including Rule 144A securities) are less liquid than securities traded in the open market because of statutory and contractual restrictions on resale. Such securities are, therefore, unlike securities that are traded in the open market, which can be expected to be sold immediately if the market is adequate. This lack of liquidity may create special risks for us. However, we could sell such securities in private transactions with a limited number of purchasers or in public offerings under the 1933 Act.
| Tortoise | 115 |
| Additional Information (unaudited) (continued) |
Restricted securities are subject to statutory and contractual restrictions on their public resale, which may make it more difficult to value them, may limit our ability to dispose of them and may lower the amount we could realize upon their sale. To enable us to sell our holdings of a restricted security not registered under the 1933 Act, we may have to cause those securities to be registered. The expenses of registering restricted securities may be determined at the time we buy the securities. When we must arrange registration because we wish to sell the security, a considerable period may elapse between the time the decision is made to sell the security and the time the security is registered so that we could sell it. We would bear the risks of any downward price fluctuation during that period.
Portfolio Turnover Risk. We may, but under normal market conditions do not intend to, engage in frequent and active trading of portfolio securities to achieve our investment objective. However, annual portfolio turnover as a result of our purchases and sales of equity securities and call options may exceed 100%, which is higher than many other investment companies and would involve greater trading costs to us and may result in greater realization of taxable capital gains.
Hedging and Derivatives Risk. In addition to writing call options as part of the investment strategy, we may invest in derivative instruments for hedging or risk management purposes. Our use of derivatives could enhance or decrease the cash available to us for payment of distributions or interest, as the case may be. Derivatives can be illiquid, may disproportionately increase losses and have a potentially large negative impact on our performance. Derivative transactions, including options on securities and securities indices and other transactions in which we may engage (such as forward currency transactions, futures contracts and options thereon, and total return swaps), may subject us to increased risk of principal loss due to unexpected movements in stock prices, changes in stock volatility levels, interest rates and foreign currency exchange rates and imperfect correlations between our securities holdings and indices upon which derivative transactions are based. We also will be subject to credit risk with respect to the counterparties to any over-the-counter derivatives contracts we purchased. If a counterparty becomes bankrupt or otherwise fails to perform its obligations under a derivative contract, we may experience significant delays in obtaining any recovery under the derivative contract in a bankruptcy or other reorganization proceeding. We may obtain only a limited recovery or may obtain no recovery in such circumstances. In addition, if the counterparty to a derivative transaction defaults, we would not be able to use the anticipated net receipts under the derivative to offset our cost of financial leverage.
Interest rate transactions will expose us to certain risks that differ from the risks associated with our portfolio holdings. There are economic costs of hedging reflected in the price of interest rate swaps, floors, caps and similar techniques, the costs of which can be significant, particularly when long-term interest rates are substantially above short-term rates. In addition, our success in using hedging instruments is subject to our Adviser’s ability to predict correctly changes in the relationships of such hedging instruments to our leverage risk, and there can be no assurance that our Adviser’s judgment in this respect will be accurate. Consequently, the use of hedging transactions might result in a poorer overall performance, whether or not adjusted for risk, than if we had not engaged in such transactions. There is no assurance that the interest rate hedging transactions into which we enter will be effective in reducing our exposure to interest rate risk. Hedging transactions are subject to correlation risk, which is the risk that payment on our hedging transactions may not correlate exactly with our payment obligations on senior securities. To the extent there is a decline in interest rates, the value of certain derivatives could decline, and result in a decline in our net assets.
Tax Risk. We intend to elect to be treated, and to qualify each year, as a “regulated investment company” under the Code. To maintain our qualification for federal income tax purposes as a RIC under the Code, we must meet certain source-of-income, asset diversification and annual distribution requirements. If for any taxable year we fail to qualify for the special federal income tax treatment afforded to regulated investment companies, all of our taxable income will be subject to federal income tax at regular corporate rates (without any deduction for distributions to our stockholders) and our income available for distribution will be reduced.
Anti-Takeover Provisions Risks. Maryland law and our Charter and Bylaws include provisions that could delay, defer or prevent other entities or persons from acquiring control of us, causing us to engage in certain transactions or modifying our structure. These provisions may be regarded as “anti-takeover” provisions. Such provisions could limit the ability of common stockholders to sell their shares at a premium over the then-current market prices by discouraging a third party from seeking to obtain control of us.
Below Investment Grade Securities Risk. Investing in below investment grade debt instruments (commonly referred to as “junk bonds”) involves additional risks than investment grade securities. Adverse changes in economic conditions are more likely to lead to a weakened capacity of a below investment grade issuer to make principal payments and interest payments than an investment grade issuer. An economic downturn could adversely affect the ability of highly leveraged issuers to service their obligations or to repay their obligations upon maturity. Similarly, downturns in profitability in the energy infrastructure industry could adversely affect the ability of below investment grade issuers in that industry to meet their obligations. The market values of lower quality securities tend to reflect individual developments of the issuer to a greater extent than do higher quality securities, which react primarily to fluctuations in the general level of interest rates.
The secondary market for below investment grade securities may not be as liquid as the secondary market for more highly rated securities. There are fewer dealers in the market for below investment grade securities than investment grade obligations. The prices quoted by different dealers may vary significantly, and the spread between the bid and asked price is generally much larger than for higher quality instruments. Under adverse market or economic conditions, the secondary market for below investment grade securities could contract further, independent of any specific adverse change in the condition of a particular issuer, and these instruments may become illiquid. As a result, it may be more
| 116 | Tortoise |
| 2020 Annual Report | November 30, 2020 |
| Additional Information (unaudited) (continued) |
difficult to sell these securities or we may be able to sell the securities only at prices lower than if such securities were widely traded. This may affect adversely our ability to make required distribution or interest payments on our outstanding senior securities. Prices realized upon the sale of such lower-rated or unrated securities, under these circumstances, may be less than the prices used in calculating our NAV.
Because investors generally perceive that there are greater risks associated with lower quality securities of the type in which we may invest a portion of our assets, the yields and prices of such securities may tend to fluctuate more than those for higher rated securities. In the lower quality segments of the debt securities market, changes in perceptions of issuers’ creditworthiness tend to occur more frequently and in a more pronounced manner than do changes in higher quality segments of the debt securities market, resulting in greater yield and price volatility.
Factors having an adverse impact on the market value of below investment grade securities may have an adverse effect on our NAV and the market value of our common stock. In addition, we may incur additional expenses to the extent we are required to seek recovery upon a default in payment of principal or interest on our portfolio holdings. In certain circumstances, we may be required to foreclose on an issuer’s assets and take possession of its property or operations. In such circumstances, we would incur additional costs in disposing of such assets and potential liabilities from operating any business acquired.
Counterparty Risk. We may be subject to credit risk with respect to the counterparties to certain derivative agreements entered into by us. If a counterparty becomes bankrupt or otherwise fails to perform its obligations under a derivative contract due to financial difficulties, we may experience significant delays in obtaining any recovery under the derivative contract in a bankruptcy or other reorganization proceeding. We may obtain only a limited recovery or may obtain no recovery in such circumstances.
Management Risk. Our Adviser was formed in 2002 to provide portfolio management to institutional and high-net worth investors seeking professional management of their MLP investments. Our Adviser has been managing our portfolio since we began operations. As of December 31, 2020, our Adviser had client assets under management of approximately $6.3 billion. To the extent that the Adviser’s assets under management grow, the Adviser may have to hire additional personnel and, to the extent it is unable to hire qualified individuals, its operations may be adversely affected.
Additional Risks to Common Stockholders
Leverage Risk. Our use of leverage through the issuance of preferred stock (“Tortoise Preferred Shares”) and senior notes (“Tortoise Notes”) along with the issuance of any additional preferred stock or debt securities, and any additional borrowings or other transactions involving indebtedness (other than for temporary or emergency purposes) are or would be considered “senior securities” for purposes of the 1940 Act and create risks. Leverage is a speculative technique that may adversely affect common stockholders. If the return on securities acquired with borrowed funds or other leverage proceeds does not exceed the cost of the leverage, the use of leverage could cause us to lose money. Successful use of leverage depends on the Adviser’s ability to predict or hedge correctly interest rates and market movements, and there is no assurance that the use of a leveraging strategy will be successful during any period in which it is used. Because the fee paid to the Adviser will be calculated on the basis of Managed Assets, the fees will increase when leverage is utilized, giving the Adviser an incentive to utilize leverage.
Our issuance of senior securities involves offering expenses and other costs, including interest payments, which are borne indirectly by our common stockholders. Fluctuations in interest rates could increase interest or distribution payments on our senior securities, and could reduce cash available for distributions on common stock. Increased operating costs, including the financing cost associated with any leverage, may reduce our total return to common stockholders.
The 1940 Act and/or the rating agency guidelines applicable to senior securities impose asset coverage requirements, distribution limitations, voting right requirements (in the case of the senior equity securities), and restrictions on our portfolio composition and our use of certain investment techniques and strategies. The terms of any senior securities or other borrowings may impose additional requirements, restrictions and limitations that are more stringent than those currently required by the 1940 Act, and the guidelines of the rating agencies that rate outstanding senior securities. These requirements may have an adverse effect on us and may affect our ability to pay distributions on common stock and preferred stock. To the extent necessary, we intend to redeem our senior securities to maintain the required asset coverage. Doing so may require that we liquidate portfolio securities at a time when it would not otherwise be desirable to do so. Nevertheless, it is not anticipated that the 1940 Act requirements, the terms of any senior securities or the rating agency guidelines will impede the Adviser in managing our portfolio in accordance with our investment objective and policies.
Market Impact Risk. The sale of our common stock (or the perception that such sales may occur) may have an adverse effect on prices in the secondary market for our common stock. An increase in the number of common shares available may put downward pressure on the market price for our common stock.
Dilution Risk. The voting power of current stockholders will be diluted to the extent that current stockholders do not purchase shares in any future common stock offerings or do not purchase sufficient shares to maintain their percentage interest.
If we are unable to invest the proceeds of such offering as intended, our per share distribution may decrease and we may not participate in market advances to the same extent as if such proceeds were fully invested as planned.
| Tortoise | 117 |
| Additional Information (unaudited) (continued) |
Market Discount Risk. Our common stock has traded both at a premium and at a discount in relation to NAV. We cannot predict whether our shares will trade in the future at a premium or discount to NAV. Shares of closed-end investment companies frequently trade at a discount from NAV, but in some cases have traded above NAV. Continued development of alternatives as a vehicle for investment in MLP securities may contribute to reducing or eliminating any premium or may result in our shares trading at a discount. The risk of the shares of common stock trading at a discount is a risk separate from the risk of a decline in our NAV as a result of investment activities. Our NAV will be reduced immediately following an offering of our common or preferred stock, due to the offering costs for such stock, which are borne entirely by us. Although we also bear the offering costs of debt securities, such costs are amortized over time and therefore do not impact our NAV immediately following an offering.
Whether stockholders will realize a gain or loss for federal income tax purposes upon the sale of our common stock depends upon whether the market value of the common shares at the time of sale is above or below the stockholder’s basis in such shares, taking into account transaction costs, and is not directly dependent upon our NAV. Because the market value of our common stock will be determined by factors such as the relative demand for and supply of the shares in the market, general market conditions and other factors beyond our control, we cannot predict whether our common stock will trade at, below or above NAV, or at, below or above the public offering price for common stock.
Additional Risks to Senior Security Holders
Generally, an investment in preferred stock or debt securities (collectively, “senior securities”) is subject to the following risks:
Interest Rate Risk. Distributions and interest payable on our senior securities are subject to interest rate risk. To the extent that distributions or interest on such securities are based on short-term rates, our leverage costs may rise so that the amount of distributions or interest due to holders of senior securities would exceed the cash flow generated by our portfolio securities. To the extent that our leverage costs are fixed, our leverage costs may increase when our senior securities mature. This might require that we sell portfolio securities at a time when we would otherwise not do so, which may adversely affect our future ability to generate cash flow. In addition, rising market interest rates could negatively impact the value of our investment portfolio, reducing the amount of assets serving as asset coverage for senior securities.
Senior Leverage Risk. Preferred stock will be junior in liquidation and with respect to distribution rights to debt securities and any other borrowings. Senior securities representing indebtedness may constitute a substantial lien and burden on preferred stock by reason of their prior claim against our income and against our net assets in liquidation. We may not be permitted to declare distributions or other distributions with respect to any series of preferred stock unless at such time we meet applicable asset coverage requirements and the payment of principal or interest is not in default with respect to the Tortoise Notes or any other borrowings.
Our debt securities, upon issuance, are expected to be unsecured obligations and, upon our liquidation, dissolution or winding up, will rank: (1) senior to all of our outstanding common stock and any outstanding preferred stock; (2) on a parity with any of our unsecured creditors and any unsecured senior securities representing our indebtedness; and (3) junior to any of our secured creditors. Secured creditors of ours may include, without limitation, parties entering into interest rate swap, floor or cap transactions, or other similar transactions with us that create liens, pledges, charges, security interests, security agreements or other encumbrances on our assets.
Ratings and Asset Coverage Risk. To the extent that senior securities are rated, a rating does not eliminate or necessarily mitigate the risks of investing in our senior securities, and a rating may not fully or accurately reflect all of the credit and market risks associated with a security. A rating agency could downgrade the rating of our shares of preferred stock or debt securities, which may make such securities less liquid in the secondary market, though probably with higher resulting interest rates. If a rating agency downgrades, or indicates a potential downgrade to, the rating assigned to a senior security, we may alter our portfolio or redeem some senior securities. We may voluntarily redeem a senior security under certain circumstances to the extent permitted by its governing documents.
Inflation Risk. Inflation is the reduction in the purchasing power of money resulting from an increase in the price of goods and services. Inflation risk is the risk that the inflation adjusted or “real” value of an investment in preferred stock or debt securities or the income from that investment will be worth less in the future. As inflation occurs, the real value of the preferred stock or debt securities and the distributions or interest payable to holders of preferred stock or interest payable to holders of debt securities declines.
Decline in Net Asset Value Risk. A material decline in our NAV may impair our ability to maintain required levels of asset coverage for our preferred stock or debt securities.
General Risks Associated with an Investment in a Closed-End Fund
Market Discount Risk. As with any shares, the price of the Fund’s shares will fluctuate with market conditions and other factors. If shares are sold, the price received may be more or less than the original investment. Common shares are designed for long-term investors and should not be treated as trading vehicles. Common shares of closed-end management investment companies frequently trade at a discount from their NAV. Common shares of closed-end management investment companies like the Fund that invest primarily in equity securities have during some periods traded at prices higher than their NAV and during other periods traded at prices lower than their NAV. The Fund cannot assure you that its common shares will trade at a price higher than or equal to NAV. In addition to NAV, the market price of the Fund’s common shares may be affected by such factors as distribution levels, which are in turn affected by expenses, distribution stability, liquidity, the market for equity securities of MLPs, and market supply and demand the Fund’s shares may trade at a price that is less than the offering price.
| 118 | Tortoise |
| 2020 Annual Report | November 30, 2020 |
| Additional Information (unaudited) (continued) |
Investment Risk. An investment in the Fund’s common shares is subject to investment risk, including the possible loss of the entire amount that you invest. An investment in common shares represents an indirect investment in the securities owned by the Fund. The value of these securities, like other market investments, may move up or down. The Fund common shares at any point in time may be worth less than their value at closing of the Merger.
Tortoise Energy Independence Fund, Inc.
General. We are designed primarily as a long-term investment vehicle and not as a trading tool. An investment in our securities should not constitute a complete investment program for any investor and involves a high degree of risk. Due to the uncertainty in all investments, there can be no assurance that we will achieve our investment objective. The value of an investment in our common stock could decline substantially and cause you to lose some or all of your investment.
Non-Diversified Risk. We are classified as a “non-diversified” investment company under the 1940 Act. Therefore, we may invest a relatively high percentage of our assets in a smaller number of issuers or may invest a larger proportion of our assets in a single company. As a result, we may be more susceptible than a diversified fund to any single corporate, political, geographic or regulatory occurrence.
Concentration Risk. Our strategy of concentrating in North American energy investments, particularly upstream energy companies, means that our performance will be closely tied to the performance of the energy industry. Our concentration in these investments may present more risk than if we were broadly diversified over numerous industries and sectors of the economy. A downturn in these investments would have a greater impact on us than on a fund that does not concentrate in such investments. At times, the performance of these investments may lag the performance of other industries or the market as a whole. Risks inherent in the business of energy companies include:
| ● | Commodity Price Volatility Risk. The volatility of energy commodity prices can significantly affect energy companies due to the impact of prices on the volume of commodities developed, produced, gathered and processed. Historically, energy commodity prices have been cyclical and exhibited significant volatility which may adversely impact the value, operations, cash flows and financial performance of energy companies in which we invest. Commodity prices fluctuate for several reasons and can be swift, including changes in global and domestic energy market, general economic conditions, consumer demand, price and level of foreign imports, the impact of weather on demand, levels of domestic and worldwide supply, levels of production and imports, domestic and foreign governmental regulation, political instability, acts of war and terrorism, the success and costs of exploration projects, conservation and environmental protection efforts, alternative energy, taxation and the availability of local, intrastate and interstate transportation systems. |
| ● | Supply and Demand Risk. A decrease in the exploration, production or development of natural gas, NGLs, crude oil, refined petroleum products, or a decrease in the volume of such commodities, may adversely impact the financial performance and profitability of energy companies. Production declines and volume decreases could be caused by various factors, including changes in commodity prices, oversupply, depletion of resources, declines in estimates of proved reserves, catastrophic events affecting production, labor difficulties, political events, production variance from expectations, Organization of the Petroleum Exporting Countries (“OPEC”) actions, environmental proceedings, increased regulations, equipment failures and unexpected maintenance problems or outages, inability to obtain necessary permits or carryout new construction or acquisitions, unanticipated expenses, import supply disruption, increased competition from alternative energy sources, and other events. All of the above is particularly true for new or emerging areas of supply in North America that may have limited or no production history. Reductions in or prolonged periods of low prices for natural gas and crude oil can cause a given reservoir to become uneconomic for continued production earlier than it would if prices were higher. A sustained decline in or varying demand for such commodities, could also adversely affect the financial performance of energy companies. Factors that could lead to a decline in demand include economic recession or other adverse economic conditions, political and economic conditions in other natural resource producing countries including embargoes, hostilities in the Middle East, military campaigns and terrorism, OPEC actions, higher fuel taxes or governmental regulations, increases in fuel economy, consumer shifts to the use of alternative fuel sources, exchange rates, and changes in commodity prices or weather. |
| ● | Reserve & Depletion Risk. Energy companies’ estimates of proved reserves and projected future net revenue are generally based on internal reserve reports, engineering data, and reports of independent petroleum engineers. Estimated reserves are based on many assumptions that may prove inaccurate and require subjective estimates of underground accumulations and assumptions concerning future prices, production levels, and operating and development costs. As a result, estimated quantities of proved reserves, projections of future production rates, and the timing of related expenditures may prove to be inaccurate. Any material negative inaccuracies in these reserve estimates or underlying assumptions could materially lower the value of upstream energy companies. Future natural gas, NGL and oil production is highly dependent upon the success in acquiring or finding additional reserves that are economically recoverable. This can be particularly true for new areas of exploration and development, such as in North American oil and gas reservoirs, including shale. A portion of any one upstream company’s assets may be dedicated to crude oil or natural gas reserves that naturally deplete over time and a significant slowdown in the identification or availability of reasonably priced and accessible proved reserves for these companies could adversely affect their business. |
| Tortoise | 119 |
| Additional Information (unaudited) (continued) |
| ● | Operating Risk. Energy companies are subject to many operating risks, including: equipment failure causing outages; structural, maintenance, impairment and safety problems; transmission or transportation constraints, inoperability or inefficiencies; dependence on a specified fuel source; changes in electricity and fuel usage; availability of competitively priced alternative energy sources; changes in generation efficiency and market heat rates; lack of sufficient capital to maintain facilities; significant capital expenditures to keep older assets operating efficiently; seasonality; changes in supply and demand for energy; catastrophic and/or weather-related events such as spills, leaks, well blowouts, uncontrollable flows, ruptures, fires, explosions, floods, earthquakes, hurricanes, discharges of toxic gases and similar occurrences; storage, handling, disposal and decommissioning costs; and environmental compliance. Breakdown or failure of an energy company’s assets may prevent it from performing under applicable sales agreements, which in certain situations, could result in termination of the agreement or incurring a liability for liquidated damages. As a result of the above risks and other potential hazards associated with energy companies, certain companies may become exposed to significant liabilities for which they may not have adequate insurance coverage. Any of the aforementioned risks could have a material adverse effect on the business, financial condition, results of operations and cash flows of energy companies. The energy industry is cyclical and from time to time may experience a shortage of drilling rigs, equipment, supplies, or qualified personnel, or due to significant demand, such services may not be available on commercially reasonable terms. A company’s ability to successfully and timely complete capital improvements to existing or other capital projects is contingent upon many variables. Should any such efforts be unsuccessful, an energy company could be subject to additional costs and / or the write-off of its investment in the project or improvement. The marketability of oil and gas production depends in large part on the availability, proximity and capacity of pipeline systems owned by third parties. Oil and gas properties are subject to royalty interests, liens and other burdens, encumbrances, easements or restrictions, all of which could impact the production of a particular energy company. Oil and gas companies operate in a highly competitive and cyclical industry, with intense price competition. A significant portion of their revenues may depend on a relatively small number of customers, including governmental entities and utilities. Energy companies engaged in interstate pipeline transportation of natural gas, refined petroleum products and other products are subject to regulation by the Federal Energy Regulatory Commission (“FERC”) with respect to tariff rates these companies may charge for pipeline transportation services. An adverse determination by the FERC with respect to the tariff rates of an energy company could have a material adverse effect on its business, financial condition, results of operations and cash flows and its ability to make cash distributions to its equity owners. |
| ● | Regulatory Risk. Energy companies are subject to regulation by governmental authorities in various jurisdictions and may be adversely affected by the imposition of special tariffs and changes in tax laws, regulatory policies and accounting standards. Regulation exists in multiple aspects of their operations, including reports and permits concerning exploration, drilling, and production; how facilities are constructed, maintained and operated; how wells are spaced; the unitization and pooling of properties; environmental and safety controls, including emissions release, the reclamation and abandonment of wells and facility sites, remediation, protection of endangered species, and the discharge and disposition of waste materials; offshore oil and gas operations; and the prices they may charge for the oil and gas produced or transported under federal and state leases and other products and services. Various governmental authorities have the power to enforce compliance with these regulations and the permits issued under them, and violators are subject to administrative, civil and criminal penalties, including fines, injunctions or both. Stricter laws, regulations or enforcement policies could be enacted in the future which may increase compliance costs and may adversely affect the financial performance of energy companies. Additionally, legislation has been proposed that would, if enacted into law, make significant changes to U.S. federal income tax laws, including the elimination of certain U.S. federal income tax benefits currently available to oil and gas exploration and production companies. The use of methods such as hydraulic fracturing may be subject to new or different regulation in the future. Any new state or federal regulations that may be imposed on hydraulic fracturing could result in additional permitting and disclosure requirements (including of substances used in the fracturing process) and in additional operating restrictions. The imposition of various conditions and restrictions on drilling and completion operations could lead to operational delays and increased costs and, moreover, could delay or effectively prevent the development of oil and gas from formations that would not be economically viable without the use of hydraulic fracturing. |
| ● | Environmental Risk. Energy company activities are subject to stringent environmental laws and regulation by many federal, state and local authorities, international treaties and foreign governmental authorities. Failure to comply with such laws and regulations or to obtain any necessary environmental permits pursuant to such laws and regulations could result in fines or other sanctions. Congress and other domestic and foreign governmental authorities have either considered or implemented various laws and regulations to restrict or tax certain emissions, particularly those involving air and water emissions. Existing environmental regulations could be revised or reinterpreted, new laws and regulations could be adopted or become applicable, and future changes in environmental laws and regulations could occur, which could impose significant additional costs. Energy companies have made and will likely continue to make significant capital and other expenditures to comply with these and other environmental laws and regulations. There can be no assurance that such companies would be able to recover all or any increased environmental costs from their customers or that their business, financial condition or results of operations would not be materially and adversely affected by such expenditures or any changes in domestic or foreign environmental laws and regulations, in which case the value of these companies’ securities could be adversely affected. In addition, energy companies may be responsible for environmentally-related liabilities, including any on-site liabilities associated with the environmental condition of facilities that it has acquired, leased or developed, or liabilities from associated activities, regardless of when the liabilities arose and whether they are known or unknown. |
| 120 | Tortoise |
| 2020 Annual Report | November 30, 2020 |
| Additional Information (unaudited) (continued) |
Hydraulic fracturing is a common practice used to stimulate production of natural gas and/or oil from dense subsurface rock formations such as shales that generally exist several thousand feet below ground. The companies in which we will invest commonly apply hydraulic-fracturing techniques in onshore oil and natural gas drilling and completion programs. The process involves the injection of water, sand, and additives under pressure into a targeted subsurface formation. The water and pressure create fractures in the rock formations, which are held open by the grains of sand, enabling the oil or natural gas to flow to the wellbore. The use of hydraulic fracturing may produce certain wastes that may in the future be designated as hazardous wastes and may thus become subject to more rigorous and costly compliance and disposal requirements. The EPA has commenced a study of potential environmental effects of hydraulic fracturing on drinking water and groundwater, with initial results expected to be available by late 2012 and final results by 2014 and, more recently in October 2011, the EPA announced that it is launching a study regarding wastewater resulting from hydraulic fracturing activities and currently plans to propose standards by 2014 that such wastewater must meet before being transported to a treatment plant. Also, the Department of Energy is conducting an investigation into practices the agency could recommend to better protect the environment from drilling using hydraulic fracturing completion methods and the Department of the Interior has proposed disclosure, well testing and monitoring requirements for hydraulic fracturing on federal lands. The White House Council on Environmental Quality and a committee of the US House of Representatives are reviewing hydraulic-fracturing practices. At the same time, legislation has been introduced before Congress to provide for federal regulation of hydraulic fracturing and to require disclosure of the chemicals used in the fracturing process. In addition, some states have adopted, and other states are considering adopting, regulations that could impose more stringent permitting, disclosure and well construction requirements on hydraulic fracturing operations. Additional regulations could be imposed that could include, among other things, limiting injection of oil and gas well wastewater into underground disposal wells, due to concerns about the possibility of minor earthquakes being linked to such injection, an indirect activity to drilling utilized in certain geographic regions. If new laws or regulations that significantly restrict hydraulic fracturing or associated activity are adopted, such laws could make it more difficult or costly for the companies in which we invest to perform fracturing to stimulate production from tight formations, which could adversely impact their production levels, operations, cash flow and the value of their securities. | |
| ● | Climate Change Regulation Risk. Climate change regulation could result in increased operations and capital costs for the companies in which we invest. Voluntary initiatives and mandatory controls have been adopted or are being discussed both in the U.S. and worldwide to reduce emissions of “greenhouse gases” such as carbon dioxide, a by-product of burning fossil fuels, which some scientists and policymakers believe contribute to global climate change. These measures and future measures could result in increased costs to certain companies in which the Fund invests to operate and maintain facilities and administer and manage a greenhouse gas emissions program and may reduce demand for fuels that generate greenhouse gases and that are managed or produced by companies in which we invest. These actions could result in increased costs of operations and impact the demand and prices for fossil fuels. |
| ● | Terrorism Risk. Energy companies, and the market for their securities, are subject to disruption as a result of terrorist activities, such as the terrorist attacks on the World Trade Center on September 11, 2001; war, such as the wars in Afghanistan and Iraq and their aftermaths; and other geopolitical events, including upheaval in the Middle East or other energy producing regions. Cyber hacking could also cause significant disruption and harm to energy companies. The U.S. government has issued warnings that energy assets, specifically those related to energy, including exploration and production facilities, pipelines and transmission and distribution facilities, might be specific targets of terrorist activity. Such events have led, and in the future may lead, to short-term market volatility and may have long-term effects on companies in the energy industry and markets. Such events may also adversely affect our business and financial condition. |
| ● | Natural Disaster Risk. Natural risks, such as earthquakes, flood, lightning, hurricanes, tsunamis, tornadoes and wind, are inherent risks in energy company operations. For example, extreme weather patterns, such as Hurricane Ivan in 2004 and Hurricanes Katrina and Rita in 2005, the Tohuku earthquake and resulting tsunami in Japan in 2011, or the threat thereof, could result in substantial damage to the facilities of certain companies located in the affected areas and significant volatility in the supply of energy and could adversely impact the prices of the securities in which we invest. This volatility may create fluctuations in commodity prices and earnings of energy companies. |
Equity Securities Risk. Equity securities can be affected by macroeconomic and other factors affecting the stock market in general, expectations about changes in interest rates, investor sentiment toward such entities, changes in a particular issuer’s financial condition, or unfavorable or unanticipated poor performance of a particular issuer. Prices of equity securities of individual entities also can be affected by fundamentals unique to the company or partnership, including size, earnings power, coverage ratio and characteristics and features of different classes of securities. Equity securities are susceptible to general stock market fluctuations and to volatile increases and decreases in value. The equity securities held by the Fund may experience sudden, unpredictable drops in value or long periods of decline in value. In addition, by writing covered call options, capital appreciation potential will be limited on a portion of our investment portfolio.
MLP Risks. An investment in MLP securities involves some risks that differ from the risks involved in an investment in the common stock of a corporation. Holders of MLP units have limited control and voting rights on matters affecting the partnership. Holders of units issued by an MLP are exposed to a possibility of liability for all of the obligations of that MLP in the event that a court determines that the rights of the holders of MLP units to vote to remove or replace the general partner of that MLP, to approve amendments to that MLP’s partnership agreement, or to take other action under the partnership agreement of that MLP would constitute “control” of the business of that MLP, or a court or governmental agency determines that the MLP is conducting business in a state without complying with the partnership statute of that state.
| Tortoise | 121 |
| Additional Information (unaudited) (continued) |
Holders of MLP units are also exposed to the risk that they will be required to repay amounts to the MLP that are wrongfully distributed to them. In addition, the value of our investment in an MLP will depend largely on the MLP’s treatment as a partnership for U.S. federal income tax purposes. If an MLP does not meet current legal requirements to maintain partnership status, or if it is unable to do so because of tax law changes, it would be treated as a corporation for U.S. federal income tax purposes. In that case, the MLP would be obligated to pay income tax at the entity level and distributions received by us generally would be taxed as dividend income. As a result, there could be a material reduction in our cash flow and there could be a material decrease in the value of our common stock.
Certain MLPs in which we may invest depend upon their parent or sponsor entities for the majority of their revenues. Were their parent or sponsor entities to fail to make such payments or satisfy their obligations, the revenues and cash flows of such MLPs and ability of such MLPs to make distributions to unit holders, such as us, would be adversely affected.
Non-U.S. Securities Risk. Investments in securities of non-U.S. issuers (including Canadian issuers) involve risks not ordinarily associated with investments in securities and instruments of U.S. issuers. For example, non-U.S. companies are not generally subject to uniform accounting, auditing and financial standards and requirements comparable to those applicable to U.S. companies. Non-U.S. securities exchanges, brokers and companies may be subject to less government supervision and regulation than exists in the U.S. Dividend and interest income may be subject to withholding and other non-U.S. taxes, which may adversely affect the net return on such investments. Because we intend to limit our investments to no more than 35% of our Total Assets in securities issued by non-U.S. issuers (including Canadian issuers), we not be able to pass through to our stockholders any foreign income tax credits as a result of any foreign income taxes we pay. There may be difficulty in obtaining or enforcing a court judgment abroad. In addition, it may be difficult to effect repatriation of capital invested in certain countries. With respect to certain countries, there are also risks of expropriation, confiscatory taxation, political or social instability or diplomatic developments that could affect the Fund’s assets held in non-U.S. countries. There may be less publicly available information about a non-U.S. company than there is regarding a U.S. company. Non-U.S. securities markets may have substantially less volume than U.S. securities markets and some non-U.S. company securities are less liquid than securities of otherwise comparable U.S. companies. Non-U.S. markets also have different clearance and settlement procedures that could cause the Fund to encounter difficulties in purchasing and selling securities on such markets and may result in the Fund missing attractive investment opportunities or experiencing a loss. In addition, a portfolio that includes securities issued by non-U.S. issuers can expect to have a higher expense ratio because of the increased transaction costs in non-U.S. markets and the increased costs of maintaining the custody of such non-U.S. securities. When investing in securities issued by non-U.S. issuers, there is also the risk that the value of such an investment, measured in U.S. dollars, will decrease because of unfavorable changes in currency exchange rates. We may, but do not currently intend to, hedge our exposure to non-U.S. currencies.
Capital Markets Risk. Global financial markets and economic conditions have been, and may continue to be, volatile due to a variety of factors, including significant write-offs in the financial services sector. Despite more stabilized economic activity, if the volatility continues, the cost of raising capital in the debt and equity capital markets, and the ability to raise capital, may be impacted. In particular, concerns about the general stability of financial markets and specifically the solvency of lending counterparties, may impact the cost of raising capital from the credit markets through increased interest rates, tighter lending standards, difficulties in refinancing debt on existing terms or at all and reduced, or in some cases ceasing to provide, funding to borrowers. In addition, lending counterparties under existing revolving credit facilities and other debt instruments may be unwilling or unable to meet their funding obligations. As a result of any of the foregoing, we or the companies in which we invest may be unable to obtain new debt or equity financing on acceptable terms. If funding is not available when needed, or is available only on unfavorable terms, we or the companies in which we invest may not be able to meet obligations as they come due. Moreover, without adequate funding, energy companies may be unable to execute their growth strategies, complete future acquisitions, take advantage of other business opportunities or respond to competitive pressures, any of which could have a material adverse effect on their revenues and results of operations.
Rising interest rates could limit the capital appreciation of equity units of energy companies as a result of the increased availability of alternative investments at competitive yields. Rising interest rates may increase the cost of capital for companies operating in this sector. A higher cost of capital or an inflationary period may lead to inadequate funding, which could limit growth from acquisition or expansion projects, the ability of such entities to make or grow dividends or distributions or meet debt obligations, the ability to respond to competitive pressures, all of which could adversely affect the prices of their securities.
In 2010, several European Union (“EU”) countries, including Greece, Ireland, Italy, Spain, and Portugal, began to face budget issues, some of which may have negative long-term effects for the economies of those countries and other EU countries. There is continued concern about national-level support for the euro and the accompanying coordination of fiscal and wage policy among European Economic and Monetary Union member countries. A return to unfavorable economic conditions could impair our ability to achieve our investment objective. In addition, the events surrounding the recent negotiations regarding the U.S. federal government debt ceiling and the resulting agreement could adversely affect us. In 2011, S&P lowered its long-term sovereign credit rating on the U.S. federal government debt to “AA+” from “AAA.” We cannot predict the effects of these or similar events in the future on the U.S. economy and securities markets or on our portfolio.
| 122 | Tortoise |
| 2020 Annual Report | November 30, 2020 |
| Additional Information (unaudited) (continued) |
Credit Risk. Credit risk refers to the possibility that the issuer of a security or other instrument will be unable to make timely interest payments and/or repay the principal on its debt. Because we may invest up to 20% of our Total Assets in debt securities, including those rated below investment grade, commonly referred to as “junk bonds,” we may be subject to a greater degree of credit risk than a fund investing only in investment grade securities. Generally, lower-grade securities provide a higher yield than higher-grade securities of similar maturity but are subject to greater risks, such as greater credit risk, greater volatility and greater liquidity concerns. Such securities are generally regarded as predominantly speculative and are more susceptible to non-payment of interest and principal and default than higher-grade securities and are more sensitive to specific issuer developments or real or perceived general adverse economic changes than higher-grade securities. The market for lower-grade securities may also have less information available than the market for other securities, further complicating evaluations and valuations of such securities.
Covered Call Risks. We cannot guarantee that our covered call option strategy will be effective. There are several risks associated with transactions in options on securities, including:
| ● | There are significant differences between the securities and options markets that could result in an imperfect correlation between these markets, causing a given covered call option transaction not to achieve its objectives. A decision as to whether, when and how to use covered calls (or other options) involves the exercise of skill and judgment, and even a well-conceived transaction may be unsuccessful because of market behavior or unexpected events. |
| ● | The use of options may require us to sell portfolio securities at inopportune times or for prices other than current market values, may limit the amount of appreciation we can realize on an investment, or may cause us to hold a security we might otherwise sell. As the writer of a covered call option, we forego, during the option’s life, the opportunity to profit from increases in the market value of the security covering the call option above the exercise price of the call option, but retain the risk of loss should the price of the underlying security decline. Although such loss would be offset in part by the option premium received, in a situation in which the price of a particular stock on which we have written a covered call option declines rapidly and materially or in which prices in general on all or a substantial portion of the stocks on which we have written covered call options decline rapidly and materially, we could sustain material depreciation or loss to the extent we do not sell the underlying securities (which may require it to terminate, offset or otherwise cover our option position as well). |
| ● | There can be no assurance that a liquid market will exist when we seek to close out an option position. If we were unable to close out a covered call option that we had written on a security, we would not be able to sell the underlying security unless the option expired without exercise. Reasons for the absence of a liquid secondary market for exchange-traded options may include, but are not limited to, the following: (i) there may be insufficient trading interest; (ii) restrictions may be imposed by an exchange on opening transactions or closing transactions or both; (iii) trading halts, suspensions or other restrictions may be imposed with respect to particular classes or series of options; (iv) unusual or unforeseen circumstances may interrupt normal operations on an exchange; (v) the trading facilities may not be adequate to handle current trading volume; or (vi) the relevant exchange could discontinue the trading of options. In addition, our ability to terminate OTC options may be more limited than with exchange-traded options and may involve the risk that counterparties participating in such transactions will not fulfill their obligations. |
| ● | The principal factors affecting the market value of an option include supply and demand, interest rates, the current market price of the underlying security in relation to the exercise price of the option, the dividend or distribution yield of the underlying security, the actual or perceived volatility of the underlying security and the time remaining until the expiration date. Any of the foregoing could impact or cause to vary over time the amount of income we are able to generate through our covered call option strategy. |
| ● | The number of covered call options we can write is limited by the number of shares of the corresponding common stock we hold. Furthermore, our covered call option transactions may be subject to limitations established by each of the exchanges, boards of trade or other trading facilities on which such options are traded. |
| ● | If we fail to maintain any required asset coverage ratios in connection with any use by us of leverage, we may be required to redeem or prepay some or all of our leverage instruments. Such redemption or prepayment would likely result in our seeking to terminate early all or a portion of any option transaction. Early termination of an option could result in a termination payment by or to us. |
Legal and Regulatory Risk. Legal, tax and regulatory changes could occur and may adversely affect us or our ability to pursue our investment strategy and/or increase the costs of implementing such strategies. New (or revised) laws or regulations may be imposed by the Commodity Futures Trading Commission (“CFTC”), the SEC, the U.S. Federal Reserve or other banking regulators, other governmental regulatory authorities or self-regulatory organizations that supervise the financial markets that could adversely affect us. In particular, these agencies are empowered to promulgate a variety of new rules pursuant to recently enacted financial reform legislation in the United States. We also may be adversely affected by changes in the enforcement or interpretation of existing statutes and rules by these governmental regulatory authorities or self-regulatory organizations.
| Tortoise | 123 |
| Additional Information (unaudited) (continued) |
The recent instability in the financial markets has led the U.S. government and foreign governments to take a number of unprecedented actions designed to support certain financial institutions and segments of the financial markets that have experienced extreme volatility, and in some cases a lack of liquidity. U.S. federal and state governments and foreign governments, their regulatory agencies or self-regulatory organizations may take additional actions that affect the regulation of the securities in which we invest, or the issuers of such securities, in ways that are unforeseeable and on an “emergency” basis with little or no notice, with the consequence that some market participants’ ability to continue to implement certain strategies or manage the risk of their outstanding positions has been suddenly and/or substantially eliminated or otherwise negatively impacted. Given the complexities of the global financial markets and the limited timeframe within which governments have been able to take action, these interventions have sometimes been unclear in scope and application, resulting in confusion and uncertainty, which in itself has been materially detrimental to the efficient functioning of such markets as well as previously successful investment strategies. Decisions made by government policy makers could exacerbate the current economic difficulties in the U.S. and other countries.
In addition, the securities and futures markets are subject to comprehensive statutes, regulations and margin requirements. The CFTC, the SEC, the Federal Deposit Insurance Corporation, other regulators and self-regulatory organizations and exchanges are authorized under these statutes, regulations and otherwise to take extraordinary actions in the event of market emergencies. We and our Adviser have historically been eligible for exemptions from certain regulations. However, there is no assurance that we or our Adviser will continue to be eligible for such exemptions. For example, we have filed with the CFTC and the National Futures Association a notice claiming an exclusion from the definition of the term “commodity pool operator” under Regulation 4.5 under the Commodity Exchange Act, as amended (the “CEA”), with respect to our operation. However, the CFTC has recently adopted amendments to CFTC Regulation 4.5, which, when effective, may subject our Adviser to regulation by the CFTC, and require it to operate us subject to applicable CFTC requirements, including registration, disclosure and operational requirements. Compliance with these additional requirements may increase our expenses. Certain of the rules that would apply to us if we becomes subject to CFTC regulation have not yet been adopted, and while it is unclear what the effect of those rules would be on us if they are adopted, these rules could potentially limit or restrict our ability to pursue our investment objective and execute our investment strategy.
Congress recently enacted legislation that provides for new regulation of the derivatives market, including clearing, margin, reporting, recordkeeping, and registration requirements. Because the legislation leaves much to agency rule making, its ultimate impact remains unclear. New regulations could, among other things, restrict our ability to engage in derivative transactions (for example, by making certain types of derivative transactions no longer available to us) and/or increase the costs of such derivative transactions (for example, by increasing margin or capital requirements), and we may be unable to execute our investment strategy as a result. It is unclear how the regulatory changes will affect counterparty risk.
The CFTC and certain futures exchanges have established limits, referred to as “position limits,” on the maximum net long or net short positions which any person may hold or control in particular options and futures contracts; those position limits may also apply to certain other derivatives positions we may wish to take. All positions owned or controlled by the same person or entity, even if in different accounts, may be aggregated for purposes of determining whether the applicable position limits have been exceeded. Thus, even if we do not intend to exceed applicable position limits, it is possible that different clients managed by our Adviser and its affiliates may be aggregated for this purpose. Therefore it is possible that the trading decisions of our Adviser may have to be modified and that positions we hold may have to be liquidated in order to avoid exceeding such limits. The modification of investment decisions or the elimination of open positions, if it occurs, may adversely affect our performance.
Performance and Distribution Risk. We may not be able to achieve operating results that will allow us to make distributions at a specific level or to increase the amount of these distributions from time to time. We cannot assure you that you will receive distributions at a particular level or at all. Dividends and distributions on equity securities are not fixed but are declared at the discretion of the issuer’s board of directors. If stock market volatility declines, the level of premiums from writing covered call options will likely decrease as well. Payments to close-out written call options will reduce amounts available for distribution from gains earned in respect of call option expiration or close out. The equity securities in which we invest may not appreciate or may decline in value. Net realized and unrealized gains on the securities investments will be determined primarily by the direction and movement of the applicable securities markets and the Fund’s holdings. Any gains that we do realize on the disposition of any securities may not be sufficient to offset losses on other securities or option transactions. A significant decline in the value of the securities in which we invest may negatively impact our ability to pay distributions or cause you to lose all or a part of your investment.
In addition, the 1940 Act may limit our ability to make distributions in certain circumstances. Restrictions and provisions in any future credit facilities and our debt securities may also limit our ability to make distributions. For federal income tax purposes, we are required to distribute substantially all of our net investment income each year both to reduce our federal income tax liability and to avoid a potential excise tax. If our ability to make distributions on our common stock is limited, such limitations could, under certain circumstances, impair our ability to maintain our qualification for taxation as a RIC, which would have adverse consequences for our stockholders.
Operating Results Risk. We could experience fluctuations in our operating results due to a number of factors, including the return on our investments, the level of our expenses, variations in and the timing of the recognition of realized and unrealized gains or losses on our investments and written call options, the level of call premium we receive by writing covered calls, the degree to which we encounter competition in our markets and general economic conditions. As a result of these factors, results for any period should not be relied upon as being indicative of performance in future periods.
| 124 | Tortoise |
| 2020 Annual Report | November 30, 2020 |
| Additional Information (unaudited) (continued) |
Portfolio Turnover Risk. We may, but under normal market conditions do not intend to, engage in frequent and active trading of portfolio securities to achieve our investment objective. However, annual portfolio turnover as a result of our purchases and sales of equity securities and call options in connection with our covered call option strategy may exceed 100%, which is higher than many other investment companies and would involve greater trading costs to us and may result in greater realization of taxable capital gains.
Leverage Risk. Our use of leverage through the issuance of preferred stock or debt securities, and any borrowings or other transactions involving indebtedness (other than for temporary or emergency purposes) would be considered “senior securities” for purposes of the 1940 Act and create risks. Leverage is a speculative technique that may adversely affect common stockholders. If the return on securities acquired with borrowed funds or other leverage proceeds does not exceed the cost of the leverage, the use of leverage could cause us to lose money. Successful use of leverage depends on our Adviser’s ability to predict or hedge correctly interest rates and market movements, and there is no assurance that the use of a leveraging strategy will be successful during any period in which it is used. Because the fee paid to our Adviser will be calculated on the basis of Managed Assets, the fees will increase when leverage is utilized, giving our Adviser an incentive to utilize leverage.
Our issuance of senior securities involves offering expenses and other costs, including interest payments, which are borne indirectly by our common stockholders. Fluctuations in interest rates could increase interest or distribution payments on our senior securities, and could reduce cash available for distributions on common stock. Increased operating costs, including the financing cost associated with any leverage, may reduce our total return to common stockholders.
The 1940 Act and/or the rating agency guidelines applicable to senior securities impose asset coverage requirements, distribution limitations, voting right requirements (in the case of the senior equity securities), and restrictions on our portfolio composition and our use of certain investment techniques and strategies. The terms of any senior securities or other borrowings may impose additional requirements, restrictions and limitations that are more stringent than those currently required by the 1940 Act, and the guidelines of the rating agencies that rate outstanding senior securities. These requirements may have an adverse effect on us and may affect our ability to pay distributions on common stock and preferred stock. To the extent necessary, we currently intend to redeem any senior securities to maintain the required asset coverage. Doing so may require that we liquidate portfolio securities at a time when it would not otherwise be desirable to do so.
Hedging and Derivatives Risk. In addition to writing call options as part of the investment strategy, we may invest in derivative instruments for hedging or risk management purposes. Our use of derivatives could enhance or decrease the cash available to us for payment of distributions or interest, as the case may be. Derivatives can be illiquid, may disproportionately increase losses and have a potentially large negative impact on our performance. Derivative transactions, including options on securities and securities indices and other transactions in which we may engage (such as forward currency transactions, futures contracts and options thereon, and total return swaps), may subject us to increased risk of principal loss due to unexpected movements in stock prices, changes in stock volatility levels, interest rates and foreign currency exchange rates and imperfect correlations between our securities holdings and indices upon which derivative transactions are based. We also will be subject to credit risk with respect to the counterparties to any OTC derivatives contracts we purchased. If a counterparty becomes bankrupt or otherwise fails to perform its obligations under a derivative contract, we may experience significant delays in obtaining any recovery under the derivative contract in a bankruptcy or other reorganization proceeding. We may obtain only a limited recovery or may obtain no recovery in such circumstances. In addition, if the counterparty to a derivative transaction defaults, we would not be able to use the anticipated net receipts under the derivative to offset our cost of financial leverage.
Interest rate transactions will expose us to certain risks that differ from the risks associated with our portfolio holdings. There are economic costs of hedging reflected in the price of interest rate swaps, floors, caps and similar techniques, the costs of which can be significant, particularly when long-term interest rates are substantially above short-term rates. In addition, our success in using hedging instruments is subject to our Adviser’s ability to predict correctly changes in the relationships of such hedging instruments to our leverage risk, and there can be no assurance that our Adviser’s judgment in this respect will be accurate. Consequently, the use of hedging transactions might result in a poorer overall performance, whether or not adjusted for risk, than if we had not engaged in such transactions. There is no assurance that the interest rate hedging transactions into which we enter will be effective in reducing our exposure to interest rate risk. Hedging transactions are subject to correlation risk, which is the risk that payment on our hedging transactions may not correlate exactly with our payment obligations on senior securities. To the extent there is a decline in interest rates, the value of certain derivatives could decline, and result in a decline in our net assets
Tax Risk. We intend to elect to be treated, and to qualify each year, as a RIC under the Code. To maintain our qualification for federal income tax purposes as a RIC under the Code, we must meet certain source-of-income, asset diversification and annual distribution requirements. If for any taxable year we fail to qualify for the special federal income tax treatment afforded to regulated investment companies, all of our taxable income will be subject to federal income tax at regular corporate rates (without any deduction for distributions to our stockholders) and our income available for distribution will be reduced.
Liquidity Risk. We may invest in securities of any market capitalization and may be exposed to liquidity risk when trading volume, lack of a market maker, or legal restrictions impair our ability to sell particular securities or close call option positions at an advantageous price or a timely manner. We may invest in mid-capitalization and small-capitalization companies, which may be more volatile and more likely than large-capitalization companies to have narrower product lines, fewer financial resources, less management depth and experience and less competitive strength. In the event certain securities experience limited trading volumes, the prices of such securities may display abrupt or erratic movements at times. These securities may be difficult to sell at a favorable price at the times when we believe it is desirable to do so.
| Tortoise | 125 |
| Additional Information (unaudited) (continued) |
Delay in Use of Proceeds Risk. Although we expect to fully invest the net proceeds of this offering within three to six months after the closing of this offering, such investments may be delayed if suitable investments are unavailable at the time, if market conditions and volumes of securities are not favorable at the time or for other reasons. As a result, the proceeds may be invested in money market mutual funds, cash, cash equivalents, securities issued or guaranteed by the U.S. Government or its instrumentalities or agencies, high quality, short-term money market instruments, short-term debt securities, certificates of deposit, bankers’ acceptances and other bank obligations, commercial paper or other liquid debt securities. The three to six month timeframe associated with the anticipated use of proceeds could lower returns and lower our yield in the first year after the issuance of the common stock.
Restricted Securities Risk. We may invest up to 30% of our Total Assets in restricted securities that are ineligible for resale under Rule 144A, all of which may be illiquid securities. Restricted securities (including Rule 144A securities) are less liquid than securities traded in the open market because of statutory and contractual restrictions on resale. Such securities are, therefore, unlike securities that are traded in the open market, which can be expected to be sold immediately if the market is adequate. This lack of liquidity may create special risks for us. However, we could sell such securities in private transactions with a limited number of purchasers or in public offerings under the 1933 Act.
Restricted securities are subject to statutory and contractual restrictions on their public resale, which may make it more difficult to value them, may limit our ability to dispose of them and may lower the amount we could realize upon their sale. To enable us to sell our holdings of a restricted security not registered under the 1933 Act, we may have to cause those securities to be registered. The expenses of registering restricted securities may be determined at the time we buy the securities. When we must arrange registration because we wish to sell the security, a considerable period may elapse between the time the decision is made to sell the security and the time the security is registered so that we could sell it. We would bear the risks of any downward price fluctuation during that period.
Rule 144A Securities Risk. We may purchase Rule 144A securities. Rule 144A provides an exemption from the registration requirements of the 1933 Act for the resale of certain restricted securities to qualified institutional buyers, such as us. Securities saleable among qualified institutional buyers pursuant to Rule 144A will not be counted towards the 30% limitation on restricted securities. An insufficient number of qualified institutional buyers interested in purchasing Rule 144A-eligible securities held by us, however, could affect adversely the marketability of certain Rule 144A securities, and we might be unable to dispose of such securities promptly or at reasonable prices.
Anti-Takeover Provisions Risks. Maryland law and our Articles of Incorporation (“Charter”) and Bylaws include provisions that could delay, defer or prevent other entities or persons from acquiring control of us, causing us to engage in certain transactions or modifying our structure. These provisions may be regarded as “anti-takeover” provisions. Such provisions could limit the ability of common stockholders to sell their shares at a premium over the then-current market prices by discouraging a third party from seeking to obtain control of us.
Management Risk. To the extent that our Adviser’s assets under management grow, our Adviser may have to hire additional personnel and, to the extent they are unable to hire or retain qualified individuals, our operations may be adversely affected. There can be no guarantee that the Adviser’s application of investment techniques, call option strategy and risk analyses in making investment decisions for us will produce the desired results.
Market Discount Risk. Shares of closed-end investment companies frequently trade at a discount from net asset value but in some cases have traded above net asset value. Continued development of alternatives as a vehicle for investing in listed energy infrastructure securities may contribute to reducing or eliminating any premium or may result in our shares trading at a discount. The risk of the shares of common stock trading at a discount is a risk separate from the risk of a decline in our net asset value as a result of investment activities. Our net asset value will be reduced immediately following an offering of our common or preferred stock due to the offering costs for such stock, which are borne entirely by us. Although we also bear the offering costs of debt securities, such costs are amortized over time and therefore do not impact our net asset value immediately following an offering.
Whether stockholders will realize a gain or loss for federal income tax purposes upon the sale of our common stock depends upon whether the market value of the common stock at the time of sale is above or below the stockholder’s basis in such shares, taking into account transaction costs, and it is not directly dependent upon our net asset value. Because the market value of our common stock will be determined by factors such as the relative demand for and supply of the shares in the market, general market conditions and other factors beyond our control, we cannot predict whether our common stock will trade at, below or above net asset value, or at, below or above the public offering price for our common stock.
Tortoise Essential Assets Income Term Fund
Management Risk. Our ability to achieve our investment objective is directly related to our Adviser’s and our Subadviser’s investment strategies for the Fund. The value of your investment in our common shares may vary with the effectiveness of the research and analysis conducted by our Adviser and our Subadviser and their ability to identify and take advantage of attractive investment opportunities. If the investment strategies of our Adviser and our Subadviser do not produce the expected results, the value of your investment could be diminished or even lost entirely, and we could underperform the market or other funds with similar investment objectives.
Asset Allocation Risk. Our investment performance depends, at least in part, on how the Investment Committee of our Adviser allocates and reallocates our assets among the various asset classes and security types in which we may invest. Such allocation decisions could cause our investments to be allocated to asset classes and security types that perform poorly or underperform other asset classes and security types or available investments.
| 126 | Tortoise |
| 2020 Annual Report | November 30, 2020 |
| Additional Information (unaudited) (continued) |
Non-Diversified Risk. We are classified as a “non-diversified” investment company under the 1940 Act. Therefore, we may invest a relatively high percentage of our assets in a smaller number of issuers or may invest a larger proportion of our assets in a single issuer than a diversified fund. As a result, we may be more susceptible than a diversified fund to any single corporate, political, geographic or regulatory occurrence.
Limited Term and Tender Offer Risks. We are scheduled to dissolve as of the as of the close of business twelve years from the effective date of the initial registration statement of the Fund (such date, including any extension, the “Termination Date”). Our investment policies are not designed to return to common shareholders their original net asset value or purchase price. Our final distribution to common shareholders on the Termination Date and the amount paid to participating common shareholders upon completion of an eligible tender offer will be based upon our net asset value at such time. Our Declaration of Trust provides that an eligible tender offer (an “Eligible Tender Offer”) is a tender offer by the Fund to purchase up to 100% of the then-outstanding common shares of beneficial interest (“common shares”) of the Fund as of a date within the 12 months preceding the Termination Date. Depending on a variety of factors, including the performance of our investment portfolio over the period of our operations, the amount distributed to common shareholders in connection with our termination or paid to participating common shareholders upon completion of an Eligible Tender Offer may be less, and potentially significantly less, than your original investment. Additionally, given the nature of certain of our investments, the amount actually distributed upon our termination may be less than our net asset value per share on the Termination Date, and the amount actually paid upon completion of an Eligible Tender Offer may be less than our net asset value per share on the expiration date of the Eligible Tender Offer.
Because our assets will be liquidated in connection with our termination or to pay for common shares tendered in an Eligible Tender Offer, we may be required to sell portfolio securities when we otherwise would not, including at times when market conditions are not favorable, which may cause us to lose money. Given the nature of certain of our investments, particularly our direct investments, we may be unable to liquidate certain of our investments until well after the Termination Date. In this case, we may make one or more additional distributions after the Termination Date of any cash received from the ultimate liquidation of those investments. This would delay distribution payments, perhaps for an extended period of time, and there can be no assurance that the total value of the cash distribution made on the Termination Date and such subsequent distributions, if any, will equal our net asset value on the Termination Date, depending on the ultimate results of such post-Termination Date asset liquidations. If, as a result of lack of market liquidity or other adverse market conditions, our Board of Directors determines it is in the best interest of the Fund, we may transfer any portfolio investments that remain unsold on the Termination Date to a liquidating trust and distribute interests in such liquidating trust to common shareholders as part of our final distribution. Interests in the liquidating trust are expected to be nontransferable, except by operation of law. There can be no assurance as to the timing of or the value obtained from the liquidation of any investments transferred to a liquidating trust.
The obligation to terminate on the Termination Date also may impact adversely the implementation of our investment strategies. There can be no assurance that our Adviser and our Subadviser will be successful in their efforts to minimize any detrimental effects on our investment performance caused by our obligation to liquidate our investment portfolio and distribute all of our liquidated net assets to common shareholders of record on the Termination Date. In particular, our Adviser and our Subadviser may face difficulties exiting our direct investments on or prior to the Termination Date at favorable prices, if at all. In addition, as we approach the Termination Date, we may invest the proceeds of sold, matured or called securities in money market mutual funds, cash, cash equivalents, securities issued or guaranteed by the U.S. government or its instrumentalities or agencies, high quality, short-term money market instruments, short-term debt securities, certificates of deposit, bankers’ acceptances and other bank obligations, commercial paper or other liquid debt securities, which may adversely affect our investment performance. In the course of the liquidation, we must continue to satisfy the asset diversification requirements to qualify as a RIC for federal income tax purposes, which may also have a negative effect on our investment performance. If we fail to comply with these requirements, we may be liable for federal income tax in the year of the liquidation. Moreover, rather than reinvesting the proceeds of sold, matured or called securities, we may distribute the proceeds in one or more liquidating distributions prior to the final liquidation, which may cause fixed expenses to increase when expressed as a percentage of our total assets.
If we conduct an Eligible Tender Offer, we anticipate that funds to pay the aggregate purchase price of common shares accepted for purchase pursuant to the tender offer will be first derived from any cash on hand and then from the proceeds from the sale of portfolio investments. In addition, we may be required to dispose of portfolio investments in connection with any reduction in our outstanding leverage necessary in order to maintain our desired leverage ratios following an Eligible Tender Offer. The risks related to the disposition of portfolio investments in connection with our termination also would be present in connection with the disposition of portfolio investments in connection with an Eligible Tender Offer. It is likely that during the pendency of an Eligible Tender Offer, and possibly for a time thereafter, we will hold a greater than normal percentage of our total assets in money market mutual funds, cash, cash equivalents, securities issued or guaranteed by the U.S. government or its instrumentalities or agencies, high quality, short-term money market instruments, short-term debt securities, certificates of deposit, bankers’ acceptances and other bank obligations, commercial paper or other liquid debt securities, which may adversely affect our investment performance. If our tax basis for the portfolio investments sold is less than the sale proceeds, we will recognize capital gains, which we will be required to distribute to common shareholders. In addition, our purchase of tendered common shares pursuant to an Eligible Tender Offer will have tax consequences for tendering common shareholders and may have tax consequences for non-tendering common shareholders. The purchase of common shares pursuant to an Eligible Tender Offer will have the effect of increasing the proportionate interest in the Fund of non-tendering common shareholders. All shareholders remaining after an Eligible Tender Offer will be subject to proportionately higher expenses due to the reduction in our total assets resulting from payment for the tendered common shares. Such reduction in our total assets also may result in less investment flexibility, reduced diversification and greater volatility for the Fund, and may have an adverse effect on our investment performance.
| Tortoise | 127 |
| Additional Information (unaudited) (continued) |
We are not required to conduct an Eligible Tender Offer. Our Declaration of Trust provides that, following an Eligible Tender Offer, the Fund must have at least $100 million of net assets to ensure our continued viability (the “Termination Threshold”). If we conduct an Eligible Tender Offer, there can be no assurance that the number of tendered common shares would not result in our net assets totaling less than the Termination Threshold, in which case the Eligible Tender Offer will be terminated, no common shares will be repurchased pursuant to the Eligible Tender Offer and we will terminate on the Termination Date subject to permitted extensions. Following the completion of an Eligible Tender Offer in which the number of tendered common shares would result in our net assets totaling greater than the Termination Threshold, our Board of Directors may eliminate the Termination Date upon the affirmative vote of a majority of our Board of Directors and without a vote of our shareholders. Thereafter, we will have a perpetual existence. Our Adviser may have a conflict of interest in recommending to our Board of Directors that the Termination Date be eliminated and we have a perpetual existence. We are not required to conduct additional tender offers following an Eligible Tender Offer and conversion to perpetual existence. Therefore, remaining common shareholders may not have another opportunity to participate in a tender offer. Shares of closed-end management investment companies frequently trade at a discount from their net asset value, and as a result remaining common shareholders may only be able to sell their common shares at a discount to net asset value
Essential Asset-Based Investing Risks. Our focus on essential asset-based investments means that our performance will be closely tied to the performance of issuers or projects in essential asset sectors such as the education, housing, healthcare, social and human services, power, water, energy, infrastructure, basic materials, industrial, transportation and telecommunications sectors and the fiscal and financial health of issuers of municipal securities funding essential asset projects. The concentration of our investments in these sectors may present more risk than if we were broadly diversified over numerous industries and sectors of the economy. A downturn in one or more of these sectors would have a greater impact on us than on a fund that does not focus on essential asset-based investments. The performance of the securities of issuers in multiple essential asset sectors may react similarly to certain market, economic and other factors. This correlation may be higher during periods of market stress, and there may be times when the performance of securities of issuers in multiple essential asset sectors lags the performance of the market as a whole. There can be no assurance that the allocation of our assets among securities of issuers across the range of essential asset sectors will provide our common shareholders with any of the benefits typically associated with sector diversification.
In addition, our portfolio will be subject to sector specific risks of the energy and energy infrastructure sector, sustainable infrastructure sector and social infrastructure sector. Accordingly, we expect that the performance of our investment portfolio will be closely tied to the performance of these sectors. Risks inherent in the businesses of such companies may include:
| ● | Operating Risk. Energy and infrastructure companies are subject to many operating risks, including equipment failure causing outages; structural, maintenance, impairment and safety problems; transmission or transportation constraints, inoperability or inefficiencies; dependence on a specified fuel source; changes in electricity and fuel usage; availability of competitively priced alternative energy sources; changes in generation efficiency and market heat rates; lack of sufficient capital to maintain facilities; significant capital expenditures to keep older assets operating efficiently; seasonality; changes in supply and demand for energy; catastrophic and/or weather-related events such as spills, leaks, well blowouts, uncontrollable flows, ruptures, fires, explosions, floods, earthquakes, hurricanes, discharges of toxic gases and similar occurrences; storage, handling, disposal and decommissioning costs; and environmental compliance. The energy and infrastructure sectors are cyclical and from time to time may experience a shortage of drilling rigs, equipment, supplies or qualified personnel. A company may not be able to successfully and timely complete capital improvements to existing or other capital projects, which could subject the company to additional costs and/or the write-off of its investment in the project or improvement. The marketability of oil and gas production depends in large part on the availability, proximity and capacity of pipeline systems owned by third parties. Oil and gas properties are subject to royalty interests, liens and other burdens, encumbrances, easements or restrictions, all of which could impact the production of a particular energy company. Oil and gas companies operate in a highly competitive and cyclical industry, with intense price competition. A significant portion of their revenues may depend on a relatively small number of customers, including governmental entities and utilities. Energy companies engaged in interstate pipeline transportation of natural gas, refined petroleum products and other products are subject to federal regulation with respect to the tariff rates these companies may charge for pipeline transportation services. An adverse determination with respect to the tariff rates of an energy company could have a detrimental effect on its business. Clean energy-related investments are subject to many of the same operating risks that apply to traditional energy companies, as described above. Such companies can also be negatively affected by lower energy output resulting from variable inputs, mechanical breakdowns, faulty technology, competitive electricity markets or changing laws that mandate the use of renewable energy sources by electric utilities. In addition, companies that engage in energy efficiency projects may be unable to protect their intellectual property or face declines in the demand for their services due to changing governmental policies or budgets, among other things. Recently imposed tariffs on imports could affect a number of energy sectors, including oil, gas, solar and wind sectors by increasing operating costs. |
| ● | Construction Risk. To the extent we invest in projects that involve significant construction, including but not limited to clean energy-related investments, such projects are subject to construction risk. Construction delays may adversely affect companies that generate power from clean sources. The ability of these projects to generate revenues will often depend upon their successful completion of the construction and operation of generating assets. Capital equipment for renewable energy projects needs to be manufactured, shipped to project sites, installed |
| 128 | Tortoise |
| 2020 Annual Report | November 30, 2020 |
| Additional Information (unaudited) (continued) |
and tested on a timely basis. In addition, on-site roads, substations, interconnection facilities and other infrastructure all need to be either built or purchased and installed by the operating companies of these projects. Construction phases may not be completed or may be substantially delayed, as a result of inclement weather, labor disruptions, technical complications or other reasons, and material cost over-runs may be incurred, which may result in such projects being unable to earn positive income, which could negatively impact the market values of our Direct Investments in clean energy-related issuers. | |
| ● | Regulatory Risk. Energy and infrastructure companies, including sustainable and social infrastructure companies, are subject to regulation by governmental authorities in various jurisdictions and may be adversely affected by the imposition of special tariffs and changes in tax laws, regulatory policies and accounting standards. Regulation exists in multiple aspects of their operations, including reports and permits concerning exploration, drilling and production; how facilities are constructed, maintained and operated; how wells are spaced; the unitization and pooling of properties; environmental and safety controls, including emissions release, the reclamation and abandonment of wells and facility sites, remediation, protection of endangered species and the discharge and disposition of waste materials; offshore oil and gas operations; and the prices they may charge for the oil and gas produced or transported under federal and state leases and other products and services. Stricter laws, regulations or enforcement policies could be enacted in the future which may increase compliance costs and may adversely affect the financial performance of such companies. Additionally, future legislation may make significant changes to U.S. federal income tax laws, including the elimination of certain U.S. federal income tax benefits currently available to oil and gas exploration and production companies. The use of methods such as hydraulic fracturing may be subject to new or different regulation in the future. Any new state or federal regulations that may be imposed on hydraulic fracturing could result in additional permitting and disclosure requirements (including of substances used in the fracturing process) and in additional operating restrictions. The imposition of various conditions and restrictions on drilling and completion operations could lead to operational delays and increased costs and, moreover, could delay or effectively prevent the development of oil and gas from formations that would not be economically viable without the use of hydraulic fracturing. The market for electricity generation projects is influenced by U.S. federal, state and local government regulations and policies concerning the electric utility industry, as well as policies promulgated by electric utilities. Customer purchases of, or further investment in the research and development of, clean energy technologies could be deterred by these regulations and policies, which could result in a significant reduction in the potential demand for clean energy project development and investments. For example, without certain major incentive programs and or the regulatory mandated exception for clean energy systems, utility customers are often charged interconnection or stand by fees for putting distributed power generation on the electric utility network. These fees could increase the cost to customers of using clean energy and make it less desirable. |
| ● | Environmental Risk. Energy and infrastructure company activities, including sustainable and social infrastructure company activities, are subject to stringent environmental laws and regulation by many federal, state and local authorities, international treaties and foreign governmental authorities. Failure to comply with such laws and regulations or to obtain any necessary environmental permits pursuant to such laws and regulations could result in fines or other sanctions. Congress and other domestic and foreign governmental authorities have either considered or implemented various laws and regulations to restrict or tax certain emissions, particularly those involving air and water emissions. Existing environmental regulations could be revised or reinterpreted, new laws and regulations could be adopted or become applicable, and future changes in environmental laws and regulations could occur, which could impose significant additional costs. Energy companies have made and will likely continue to make significant capital and other expenditures to comply with these and other environmental laws and regulations. There can be no assurance that such companies would be able to recover all or any increased environmental costs from their customers. In addition, energy companies may be responsible for environmentally-related liabilities, including any on-site liabilities associated with the environmental condition of facilities that it has acquired, leased or developed, or liabilities from associated activities, regardless of when the liabilities arose and whether they are known or unknown. |
| ● | Climate Change Regulation Risk. Climate change regulation could result in increased operations and capital costs for the companies in which we invest. Voluntary initiatives and mandatory controls have been adopted or are being discussed both in the United States and worldwide to reduce emissions of “greenhouse gases” such as carbon dioxide, a by-product of burning fossil fuels, which some scientists and policymakers believe contribute to global climate change. These measures and future measures could result in increased costs to certain companies in which we invest and could impact the demand and prices for fossil fuels. |
| ● | Government Incentives Risk. The reduction or elimination of government economic incentives could impede growth of certain essential asset issuers including in particular clean energy companies. Because a significant portion of the revenues to the clean energy-related issuers in which we expect to invest are expected to involve the market for the international and domestic electricity grids, the reduction or elimination of government and economic incentives may adversely affect the growth of this market or result in increased price competition. |
| ● | Renewable Energy Risk. Renewable energy companies are dependent upon factors such as available solar resource, wind conditions, weather conditions and power generating equipment performance that may significantly impact the performance of such companies. Solar, wind and weather conditions generally have natural variations from season to season and from year to year and may also change permanently because of climate change or other factors. Solar and wind energy is highly dependent on weather conditions and, in particular, on available solar and wind conditions. Moreover, power generating equipment used generally by renewable energy companies is accompanied by the attendant costs of maintaining such equipment while in use and subject to risks of obsolescence associated with emerging and disruptive new technologies. |
| Tortoise | 129 |
| Additional Information (unaudited) (continued) |
| ● | Gas Risk. Gas transmission companies and gas distribution companies are undergoing significant changes. Many companies have diversified into oil and gas exploration and development, making returns more sensitive to energy prices. Gas utility companies have been adversely affected by disruptions in the oil industry and have also been affected by increased concentration and competition. In certain jurisdictions, acquisitions and dispositions in this industry might require regulatory approvals and be subject to significant regulatory requirements. Obtaining any such approvals and complying with any such regulatory requirements may be costly and/or time-consuming to obtain. For example, in the United States, interstate transmission companies are regulated by the Federal Energy Regulatory Commission (“FERC”), so certain of the Fund’s acquisitions and dispositions may be subject to FERC approval under the U.S. Federal Power Act, as amended. |
| ● | Commodity Price Volatility Risk. The volatility of energy commodity prices can significantly affect energy companies due to the impact of prices on the volume of commodities developed, produced, gathered and processed. In addition, the performance of clean energy-related investments may be affected by changes in the market price of electricity. Historically, commodity prices have been cyclical and exhibited significant volatility, which may adversely impact the market prices, operations, cash flows and financial performance of our investments in the energy sector. Commodity prices fluctuate for several reasons, including changes in global and domestic energy market, general economic conditions, consumer demand, price and level of foreign imports, the impact of weather on demand, levels of domestic and worldwide supply, levels of production and imports, domestic and foreign governmental regulation, political instability, acts of war and terrorism, the success and costs of resource development, conservation and environmental protection efforts, competition from other sources, taxation and the availability of local, intrastate and interstate transportation systems. |
| ● | Supply and Demand Risk. A decrease in the exploration, production or development of natural gas, natural gas liquids, crude oil or refined petroleum products, or a decrease in the volume of such commodities, may adversely impact the financial performance and profitability of energy companies. Production declines and volume decreases could be caused by various factors, including changes in commodity prices, oversupply, depletion of resources, declines in estimates of proved reserves, catastrophic events affecting production, labor difficulties, political events, production variance from expectations, Organization of the Petroleum Exporting Countries (“OPEC”) actions, environmental proceedings, increased regulations, equipment failures and unexpected maintenance problems or outages, inability to obtain necessary permits or carry out new construction or acquisitions, unanticipated expenses, import supply disruption, increased competition from alternative energy sources and other events. Reductions in or prolonged periods of low prices for natural gas and crude oil can cause a given reservoir to become uneconomic for continued production earlier than it would if prices were higher. A sustained decline in or varying demand for such commodities could also adversely affect the financial performance of energy companies. Factors that could lead to a decline in demand include economic recession or other adverse economic conditions, political and economic conditions in other natural resource producing countries including embargoes, hostilities in the Middle East, military campaigns and terrorism, OPEC actions, higher fuel taxes or governmental regulations, increases in fuel economy, consumer shifts to the use of alternative fuel sources, exchange rates and changes in commodity prices or weather. |
| ● | Water Risk. Water supply utilities are companies that collect, purify, distribute and sell water. In the United States and around the world the industry is highly fragmented because most of the supplies are owned by local authorities. Companies in this industry are generally mature and are experiencing little or no per capita volume growth. Water supply utilities are subject to the risk of existing or future environmental contamination, including, among others, soil and groundwater contamination as well as the delivery of contaminated water, as a result of the spillage of hazardous materials or other pollutants. Water supply utilities are also subject to the risk of increased costs, which may result from a number of factors, including fluctuations in water availability or costs associated with desalination. |
| ● | Public Infrastructure Risks. We may invest in public infrastructure projects that constitute significant strategic value to public or governmental bodies. Such assets may have a national or regional profile and may have monopolistic or oligopolistic characteristics. The very nature of these assets could create additional risks not common in other industry sectors. Given the national or regional profile and/or irreplaceable nature of certain strategic assets, such assets may constitute a higher risk target for terrorist acts or political actions, such as expropriation, which may negatively affect the operations, revenue, profitability or contractual relationships of investments. For example, in response to public pressure and/or lobbying efforts by specific interest groups, government entities may put pressure on these investments to reduce toll rates, limit or abandon planned rate increases and/or exempt certain classes of users from tolls. Given the essential nature of the services provided by certain public infrastructure, there is also a higher probability that if an owner of such assets fails to make such services available, users of such services may incur significant damage and may be unable to replace the supply or mitigate any such damage, thereby heightening the risks of third-party claims. These assets are also impacted by the interests of local communities and stakeholders, which may affect the operation of such assets. Certain of these communities may have or develop interests or objectives which are different from, or even in conflict with, the owners of such assets. |
| ● | Education Risks. Education facilities may be impacted by risks beyond their operating and financial performance, including being adversely impacted by changes in the political environment, public sentiment or regulation. This could cause a reduction or loss in funding from local, state and federal governments. Additionally, certain education facilities (such as charter schools) are also operated pursuant to charters granted by various state or other regulatory authorities and are dependent upon compliance with the terms of such charters in order to obtain funding from local, state and federal governments and we can be adversely affected by a facility’s failure to comply with its charter, an adverse audit or review, or non-renewal or revocation of a charter. |
| 130 | Tortoise |
| 2020 Annual Report | November 30, 2020 |
| Additional Information (unaudited) (continued) |
Equity Securities
Equity Securities Risk, Including Common Stock Risk. Market prices of common stocks and other equity securities may be affected by macroeconomic and other factors affecting the stock market in general, including changes in financial or political conditions that may affect particular industries or the economy in general and changes in investor sentiment. Prices of equity securities of individual issuers also can be affected by fundamentals unique to the issuer, including changes, or perceived changes, in the issuer’s business, financial condition or prospects, and may fall to zero in the event of the issuer’s bankruptcy. Equity security prices have historically experienced periods of significant volatility, particularly during recessions or other periods of financial stress, and can be expected to experience significant volatility in the future. The equity securities we hold may undergo sudden, unpredictable drops in price or long periods of price decline. There can be no assurance that the level of dividends paid with respect to the dividend paying equity securities in which we invest will be maintained. In addition, by writing covered call options on a portion of the listed equity securities in our investment portfolio, the capital appreciation potential of such securities will be limited.
The performance of certain of the equity securities in which we invest, including certain common stocks and the preferred equities and MLPs in which we invest, may be sensitive to changes in market interest rates and, accordingly, may be more highly correlated than the broader equity markets with the performance of debt securities, including the debt securities in which we invest. Accordingly, there can be no assurance that the allocation of our assets among equity and debt securities will provide our common shareholders with any of the benefits typically associated with asset class diversification.
Small- and Mid-Capitalization Company Risk. Investing in equity securities of small-capitalization and mid-capitalization companies may involve greater risks than investing in equity securities of larger, more established companies. Small-capitalization and mid-capitalization companies generally have limited product lines, markets and financial resources. Their equity securities may trade less frequently and in more limited volumes than the equity securities of larger, more established companies. Also, small-capitalization and mid-capitalization companies are typically subject to greater changes in earnings and business prospects than larger companies. As a result, the market prices of their equity securities may experience greater volatility and may decline more than those of large-capitalization companies in market downturns.
Preferred Equity Risk. The right of a holder of an issuer’s preferred equity to distributions, dividends and liquidation proceeds is junior to the rights of the issuer’s creditors, including holders of debt securities. Market prices of preferred equities may be subject to factors that affect debt and equity securities, including changes in market interest rates and changes, or perceived changes, in the issuer’s creditworthiness. Holders of preferred equity may suffer a loss of value if distribution or dividend rates are reduced or distributions or dividends are not paid. Under normal conditions, holders of preferred equity usually do not have voting rights with respect to the issuer. The ability of holders of preferred equity to participate in the issuer’s growth may be limited.
MLP Risks. An investment in MLPs involves some risks that differ from the risks involved in an investment in the common stock of a corporation. Holders of MLP common units have limited control and voting rights on matters affecting the MLP. Holders of MLP common units are exposed to a possibility of liability for all of the obligations of that MLP in the event that a court determines that the rights of the holders of MLP common units to vote to remove or replace the general partner of the MLP, to approve amendments to the MLP’s organizational documents or to take other action under the MLP’s organizational documents would constitute “control” of the business of that MLP, or a court or governmental agency determines that the MLP is conducting business in a state without complying with the limited partnership or LLC statute of that state.
Holders of MLP common units are also exposed to the risk that they will be required to repay amounts to the MLP that are wrongfully distributed to them. In addition, the market value of our investment in an MLP will depend largely on the MLP’s treatment as a qualified publicly traded partnership for federal income tax purposes. If an MLP does not meet current legal requirements to maintain status as a publicly traded partnership that is taxed as a partnership for federal income tax purposes or if it is unable to do so because of changes in tax laws or regulations, it would be treated as a corporation for federal income tax purposes. In that case, the MLP would be obligated to pay income tax at the entity level, and distributions received by us generally would be taxed as dividend income. As a result, there could be a material reduction in our cash flow and there could be a material decrease in the market price of our common shares.
Certain MLPs in which we may invest depend upon their parent or sponsor entities for the majority of their revenues. If the parent or sponsor entity of such an MLP fails to make such payments or satisfy its obligations, the revenues and cash flows of the MLP and the ability of the MLP to make distributions to common unit holders, such as us, would be adversely affected.
| Tortoise | 131 |
| Additional Information (unaudited) (continued) |
Debt Securities
Debt Securities Risks. Investments in debt securities are generally subject to credit risk, extension risk, interest rate risk, prepayment risk and spread risk:
| ● | Credit Risk. Credit risk is the risk that the market value of debt securities may decline if the issuer or the borrower, or a guarantor, defaults or otherwise becomes unable or unwilling, or is perceived to be unable or unwilling, to honor its financial obligations, such as making timely payments of principal or interest. We could lose money if the issuer of or borrower under, or a guarantor of, a debt security defaults or is unable or unwilling to make timely principal or interest payments. The lower quality or unrated securities in which we invest may present increased credit risk as compared to higher rated securities, including the possibility of default or bankruptcy. |
| ● | Extension Risk. During periods of rising market interest rates, it becomes more expensive for a borrower to refinance its existing debt obligations. During such periods, repayments of debt securities may occur more slowly than anticipated by the market because the issuer or borrower will prefer to pay interest at a lower rate. This may cause the market prices of such debt securities to decline. |
| ● | Interest Rate Risk. The market prices of debt securities typically decline in the event of increases in market interest rates, which are currently near historically low levels. Changes in government policy may cause market interest rates to rise, which may result in periods of market volatility or harm our performance and net asset value. Declines in market interest rates also may increase prepayments of debt securities, which, in turn, would increase prepayment risk. Debt securities with longer maturities tend to be more sensitive to changes in market interest rates, typically making their prices more volatile than securities with shorter maturities. The Federal Reserve recently raised the federal funds rate several times, and has indicated that it may continue to do so. Therefore, there is a risk that interest rates will rise, which will likely drive down bond prices. |
| ● | Prepayment, Call or Reinvestment Risk. Many issuers and borrowers have a right to prepay their debt securities prior to the stated maturity date. If market interest rates fall, an issuer or borrower may exercise this right in order to refinance its debt obligations at a lower rate. In that event, a holder of the issuer’s or borrower’s debt securities will not benefit from the rise in market price that normally accompanies a decline in market interest rates. Reinvestment risk is the risk that, upon the sale or repayment (at maturity or otherwise) of debt securities we hold, we will be required to reinvest the proceeds in debt securities paying lower interest rates than the debt securities that were sold or repaid. In this event, our distribution rate may decline. A decline in the income we receive from our investments is likely to have a negative effect on our market price, net asset value and/or overall return. |
| ● | Spread Risk. Wider credit spreads and decreasing market values typically represent a deterioration of a debt security’s credit soundness and a perceived greater likelihood or risk of default by the issuer. High Yield Securities Risks. High yield debt securities, commonly referred to as “junk” bonds, are debt securities rated below investment grade (i.e., BB+/Ba1 or lower) or unrated securities that our Adviser or Subadviser deems to be of comparable quality. These securities may be subject to greater levels of credit and liquidity risk than debt securities rated investment grade. In addition, high yield debt securities generally have greater price fluctuations, are less liquid and are more likely to experience a default than higher rated debt securities. High yield debt securities are considered predominately speculative with respect to the issuer’s continuing ability to make principal and interest payments. High yield debt securities are especially subject to adverse changes in general economic conditions and in the industries in which the issuers are engaged, to changes in the financial condition of the issuers and to price fluctuations in response to changes in interest rates. |
| During recessions, other periods of financial stress or periods of rising interest rates, highly leveraged issuers may experience financial stress that could adversely affect their ability to make payments of interest and principal and increase the possibility of default. The market prices of high yield debt securities have historically been subject to significant, rapid declines, reflecting an expectation that many issuers of such securities might experience financial difficulties. In these events, the yields on high yield debt securities rise dramatically, reflecting the risk that holders of such securities could lose a substantial portion of the value of their investment as a result of the issuers’ financial restructuring or default. It can be expected that similar market price declines will occur in the future. The market for high yield debt securities generally is thinner and less active than that for higher rated securities, which may limit our ability to sell such securities at fair value in response to changes in the economy or financial markets. Adverse publicity and investor perceptions, whether or not based on fundamental analysis, also may decrease the market prices and liquidity of high yield debt securities, especially in a thinly traded market. Changes by NRSROs in their rating of a debt security may affect the market price of such security. Analysis of the creditworthiness of issuers of high yield debt securities may be more complex than for issuers of higher-quality debt securities, and our ability to achieve our investment objective may, to the extent we invest in high yield debt securities, be more dependent upon our Adviser’s credit analysis than would be the case if we were investing in higher-quality debt securities. | |
| The corporate debt securities in which we invest generally will be high yield debt securities. Because the performance of high yield corporate debt securities, especially during periods of market stress, may be affected by changes, or perceived changes, in the issuer’s business, financial condition or prospects, the performance of our investments in high yield corporate debt securities may be correlated with the performance of equity securities, including the equity securities in which we invest. Accordingly, there can be no assurance that the allocation of our assets among equity and debt securities will provide our common shareholders with any of the benefits typically associated with asset class diversification. |
| 132 | Tortoise |
| 2020 Annual Report | November 30, 2020 |
| Additional Information (unaudited) (continued) |
Defaulted Securities Risks. Defaulted securities are speculative and involve substantial risks in addition to the risks of investing in high yield securities or unrated securities of comparable quality that have not defaulted. We generally will not receive interest payments on the defaulted securities and there is a substantial risk that principal will not be repaid. We may incur additional expenses to the extent we are required to seek recovery upon a default in the payment of principal of or interest on our portfolio holdings. In any reorganization or liquidation proceeding relating to a defaulted security, we may lose the value of our entire investment or may be required to accept cash or securities with a value less than our original investment. Defaulted securities and any securities received in exchange for defaulted securities may be subject to restrictions on resale.
Bank Loan and Loan Participation Risks. Investing in bank loans involves risks that are additional to and different from those relating to investing in other types of debt securities. Any specific collateral used to secure a bank loan may decline in value or become illiquid, which would adversely affect the loan’s value. In the event of a borrower’s bankruptcy or other default, we could experience delays or limitations with respect to our ability to realize the benefits of the collateral securing a bank loan, and there can be no assurance regarding the value that may be obtained upon the sale of collateral. No active trading market may exist for certain bank loans or loan participations, which may impair our ability to realize full value in the event we need to sell a loan or loan participation and make it difficult for us to value the bank loans and loan participations in which we invest. Adverse market conditions may impair the liquidity of some actively traded bank loans and loan participations. To the extent that a secondary market does exist for certain bank loans and loan participations, the market may be subject to irregular trading activity and wide bid/ask spreads, which may result in limited liquidity and pricing transparency. In addition, bank loans and loan participations may be subject to restrictions on sales or assignment and generally are subject to extended settlement periods that may be longer than seven days.
Subordinated loans are lower in priority of payment than senior loans. Accordingly, they are typically lower rated and subject to greater risk that the cash flow of the borrower and the collateral securing the loan, if any, may be insufficient to meet scheduled payments after giving effect to the borrower’s senior debt obligations. Subordinated loans generally have greater price volatility than senior loans and may be less liquid. We may not be able to unilaterally enforce all rights and remedies under a bank loan and with regard to any associated collateral. If we purchase a loan participation, we generally will have no direct right to enforce compliance by the borrower with the terms of the loan agreement, and we may not directly benefit from the collateral securing the underlying debt obligation. As a result, we would be exposed to the credit risk of both the borrower under the bank loan and the lender selling the participation.
There is typically less available information about most bank loans than is the case for many other types of debt instruments. Bank loans may not be deemed to be “securities” for purposes of the federal securities laws, and bank loan investors may not have the protections of the anti-fraud provisions of the federal securities laws and must rely instead on contractual provisions in loan agreements and applicable common-law fraud protections.
Municipal-Related Securities Risks. The yields on, and market prices of, municipal-related securities are dependent on a variety of factors, including general conditions of the municipal securities market, the size of a particular offering, the maturity of the obligation and the rating of the particular issue. The ability of issuers of municipal-related securities to make timely payments of interest and repayments of principal may be diminished during general economic downturns including in respect of potential reallocations of cost burdens among federal, state and local governments or among parties involved with operating and managing our issuers. In addition, laws enacted in the future by Congress or state legislatures or referenda could extend the time for payment of principal and/or interest, or impose other constraints on enforcement of such obligations or on the ability of municipalities to levy taxes.
Issuers of municipal-related securities might seek protection under the bankruptcy laws. In the event of bankruptcy of such an issuer, we could experience delays in collecting principal and interest and we may not be able to collect all principal and interest to which we are entitled.
The availability of information in the municipal-related securities market is less than in other markets, increasing the difficulty of evaluating and valuing securities. As a result, our investment performance may be more dependent on the analytical abilities of our Adviser. The municipal-related securities we hold may be secured by payments to be made by private entities, and changes in market conditions affecting such securities, including the downgrade of a private entity obligated to make such payments, could have a negative impact on the value of our investments, the municipal-related securities market generally or our performance. We may invest in municipal-related securities that are unsecured. While such unsecured investments may benefit from the same or similar financial and other covenants available to indebtedness ranking ahead of the investments and may benefit from cross-default provisions and security over an issuer’s assets, some or all of such terms may not be part of particular investments. Moreover, our ability to influence an issuer’s affairs, especially during periods of financial distress or following an insolvency, is likely to be substantially less than that of senior creditors. For example, under typical subordination terms, senior creditors are able to block the acceleration of the debt or the exercise by debt holders of other rights they may have as creditors. Accordingly, we may not be able to take steps to protect our investments in a timely manner or at all and there can be no assurance that our rate of return objectives overall or any particular investment will be achieved. The municipal-related securities market is a highly fragmented market that is very technically driven and it is expected that there will be regional variations in economic conditions or supply-demand fundamentals. Because the Fund expects to invest less than 50% of its total assets in tax-exempt municipal-related securities, the Fund does not expect to be eligible to pay “exempt interest dividends” to shareholders and interest on municipal-related securities will be taxable to shareholders of the Fund when received as a distribution from the Fund.
| Tortoise | 133 |
| Additional Information (unaudited) (continued) |
In addition, our investments may be more sensitive to adverse economic, business and/or political developments if our investment portfolio includes a substantial portion of its assets in the securities of similar or related projects and/or types municipal-related securities (for example only, revenue bonds, general obligation bonds or private activity bonds) as such events may adversely affect a specific industry or local political and economic conditions, leading to declines in the creditworthiness and value of our investments. The secondary market for certain municipal-related securities, particularly below investment grade municipal-related securities, tends to be less well-developed or liquid than many other securities markets, which may adversely affect our ability to sell our investments at attractive prices.
Municipal leases and certificates of participation involve special risks not normally associated with general obligation or revenue bonds. Leases and installment purchase or conditional sale contracts (which typically provide for title to the leased asset to pass eventually to the governmental issuer) are typically utilized as a means for governmental issuers to acquire property and equipment without meeting constitutional and statutory requirements for the issuance of debt. The debt issuance limitations are deemed to be inapplicable because of the inclusion in many leases or contracts of “non-appropriation” clauses that relieve the governmental issuer of any obligation to make future payments under the lease or contract unless money is appropriated for such purpose by the appropriate legislative body on a yearly or other periodic basis. In addition, such leases or contracts may be subject to the temporary abatement of payments in the event the governmental issuer is prevented from maintaining occupancy of the leased premises or utilizing the leased equipment. Although the obligations may be secured by the leased equipment or facilities, the disposition of the property in the event of non-appropriation or foreclosure might prove difficult, time consuming and costly, and may result in a delay in recovering or the failure to fully recover our original investment. In the event of non-appropriation, an issuer would be in default, and taking ownership of the assets may be a remedy available to us, although we do not anticipate that such a remedy would normally be pursued. Certificates of participation, which represent interests in unmanaged pools of municipal leases or installment contracts, involve the same risks as the underlying municipal leases. In addition, we may be dependent upon the municipal authority issuing the certificates of participation to exercise remedies with respect to the underlying securities. Certificates of participation also entail a risk of default or bankruptcy, both of the issuer of the municipal lease and also the municipal agency issuing the certificate of participation.
The municipal-related securities in which we invest generally will be directly originated municipal securities. Directly originated securities represent obligations structured directly by a single purchaser, or a limited number of institutional purchasers, and the issuer, and are typically not rated by credit rating agencies. We expect that the directly originated municipal-related securities in which we invest generally will be deemed by our Adviser to be of comparable quality to securities rated below investment grade and that such securities will belong to relatively small issues. We expect that the directly originated municipal-related securities in which we invest will have limited trading markets and therefore will tend to be less liquid than municipal securities rated investment grade or issued by traditional municipal issuers. This may make it difficult for us to value the municipal-related securities in which we invest. In addition, we will likely be able to sell such municipal-related securities only in private transactions with another investor or group of investors, and there can be no assurance that we will be able to successfully arrange such transactions if and when we desire to sell any of our municipal related securities or, if successfully arranged, that we will be able to obtain favorable values upon the sale of our municipal-related securities in such transactions.
Additional risks for investing in municipal securities depending on the types of each securities include:
| ● | Municipal Note Risks. Municipal notes are shorter term municipal debt obligations that typically provide interim financing in anticipation of tax collection, bond sales or revenue receipts. To the extent there is a shortfall in the anticipated proceeds, the notes may not be fully repaid by an issuer and our returns would be adversely affected. |
| ● | Private Activity Bond Risks. Private activity bonds are, in most cases, tax-exempt securities issued by states, municipalities or public authorities to provide funds, typically through a loan or lease arrangement, to a private entity for the purpose of financing construction or improvement of a facility to be used by the entity. Such bonds are secured typically by revenues derived from loan repayments or lease payments due from the entity, which may or may not be guaranteed by a parent entity or otherwise secured. Private activity securities generally are not secured by a pledge of the taxing power of the issuer of such bonds. Repayment of such securities generally depends on the revenues of a private entity and may be subject to additional risk of non-payment. |
| ● | General Obligation Bond Risks. General obligation bonds are secured by the issuer’s pledge of its full faith, credit and taxing power for the payment of principal and interest. Timely payments by the issuer and the repayment of principal when due depend on its credit quality, ability to raise tax revenues and ability to maintain an adequate tax base. The taxing power of any governmental entity may be limited, however, by provisions of its state constitution or laws, and an entity’s creditworthiness will depend on many factors, including, for example only, potential erosion of its tax base due to population declines, natural disasters, declines in the state’s industrial base or inability to attract new industries, economic limits on the ability to tax without eroding the tax base, state legislative proposals or voter initiatives to limit ad valorem real property taxes and the extent to which the entity relies on federal or state aid, access to capital markets or other factors beyond the state’s or entity’s control. |
| ● | Revenue Bond Risks. Revenue bonds are payable only from the revenues derived from a particular facility or class of facilities or, in certain cases, from the proceeds of a special excise tax or other specific revenue source (for example, payments from the user of the facility being financed) and accordingly, the timely payment of interest and the repayment of principal in accordance with the terms of the revenue or special obligation bond depends on the economic viability of such facility or such revenue source. |
| 134 | Tortoise |
| 2020 Annual Report | November 30, 2020 |
| Additional Information (unaudited) (continued) |
| ● | Moral Obligation Bond Risks. Moral obligation bonds are typically issued by special purpose public authorities. If an issuer of moral obligation bonds is unable to meet its obligations, the repayment of such bonds becomes a moral commitment but not a legal obligation of the state or municipality that created the special purpose public authority that issued the bonds. |
| ● | Municipal Commercial Paper Risks. Municipal commercial paper is typically unsecured and issued to meet short-term financing needs. The lack of security presents some risk of loss to us since, in the event of an issuer’s bankruptcy, unsecured creditors are repaid only after the secured creditors out of the assets, if any, that remain. |
| ● | Municipal Lease Obligation Risks. Certificates of participation issued by government authorities or entities to finance the acquisition or construction of equipment, land and/or facilities represent participations in a lease, an installment purchase contract or a conditional sales contract relating to such equipment, land or facilities and as with debt obligations, are subject to the risk of non-payment. |
| ● | Zero-Coupon Securities Risks. Interest on zero-coupon bonds is not paid on a current basis and accordingly, the values of such securities are subject to greater fluctuations than are the value of securities that distribute income regularly and may be more speculative than such bonds. Further, the values of zero coupon bonds may be highly volatile during periods when interest rates rise or fall. |
| ● | Tender Option Bond Risks. Investments in tender option bond transactions expose us to counterparty risk and leverage risk, as well as the risk of loss of principal. |
| ● | Variable Rate Demand Obligation Risks. If the bank or financial institution that is the counterparty on a VRDO is unable to pay, upon demand or at maturity, we may lose money. |
| ● | Financial Futures Risks. Trading in financial futures contracts may tend to be less liquid than trading in other futures contracts. The trading of futures contracts also is subject to certain market risks, such as inadequate trading activity, which could at times make it difficult or impossible to liquidate existing positions. |
| ● | Insured Municipal Bond Risks. Although municipal bond insurance is expected to protect us against losses caused by a bond issuer’s failure to make interest or principal payments, such insurance does not protect us or our investors against losses caused by declines in a bond’s market value. Further, we cannot be certain that any insurance company will make these payments. In addition, if we purchase the insurance, we will bear any related premiums and other related costs, which will reduce our returns. |
| ● | Participation Note Risks. Because a participation note is an obligation of the issuer, rather than a direct investment in shares of the underlying security or basket of securities, we may suffer losses potentially equal to the full value of the participation note if the issuer fails to perform its obligations. |
| ● | Pay-in-Kind Note Risks. An issuer’s ability to repay the principal of an investment in pay-in-kind notes may be dependent upon a liquidity event or the long-term success of such issuer, the occurrence of which is uncertain. |
Operating and Financial Risks of Issuers and Impact of Other Issuers. One of the fundamental risks associated with our investments is credit risk, which is the risk that an issuer will be unable to make principal and interest payments on its outstanding debt obligations when due and the related risk that the value of a debt security may decline because of concerns about the issuer’s ability or willingness to make such payments. Because we may invest our assets in high yield securities or unrated securities of comparable quality, our credit risks are greater than those of funds that buy only investment grade securities. Investments in inverse floaters will increase our credit risk. Our return would be adversely impacted if an issuer of debt securities in which we invest becomes unable to make such payments when due. Issuers in which we invest could deteriorate as a result of, among other factors, adverse developments in their businesses, changes in the competitive environment or an economic downturn. As a result, issuers that we expect to be stable may operate, or expect to operate, at a loss or have significant variations in operating results, may require substantial additional capital to support their operations or to maintain their competitive position or may otherwise have a weak financial condition or be experiencing financial distress. In addition, we and other investment funds sponsored by our Adviser have made (and/or will in the future make) investments in issuers that have operations and assets in many jurisdictions. It is possible that the activities of one issuer may have adverse consequences on one or more other issuers (including our issuers), even in cases where the issuers are held by different Tortoise investment funds and have no other connection to each other.
Risks of Investments in Less Established Issuers. Although from time to time we will seek to make investments in respect of established issuers, we have not established any minimum size for the issuers in which we may invest and are expected to make investments in smaller, less established issuers. For example, such issuers may have shorter operating histories on which to judge future performance and, if operating, may have negative cash flow. In the case of start-up enterprises, such issuers may not have significant or any operating revenues. Less established issuers tend to have smaller capitalizations and fewer resources (including cash) and, therefore, often are more vulnerable to funding shortfalls and financial failure. In addition, less mature issuers could be deemed to be more susceptible to irregular accounting or other fraudulent practices. In the event of fraud by any issuer in which we invest, we may suffer a partial or total loss of capital invested in that issuer. There can be no assurance that any such losses will be offset by gains (if any) realized on the Fund’s other investments.
| Tortoise | 135 |
| Additional Information (unaudited) (continued) |
U.S. Government Obligation Risks. While U.S. Treasury obligations are backed by the “full faith and credit” of the U.S. government, such securities are nonetheless subject to credit risk (i.e., the risk that the U.S. government may be, or be perceived to be, unable or unwilling to honor its financial obligations, such as making payments). Securities issued or guaranteed by federal agencies or authorities and U.S. government-sponsored instrumentalities or enterprises may or may not be backed by the full faith and credit of the U.S. government. Other Investment Risks
Liquidity Risk. Our Direct Investments will be highly illiquid, and we will likely be able to sell such securities only in private transactions with another investor or group of investors, and there can be no assurance that we will be able to successfully arrange such transactions if and when we desire to sell any of our Direct Investments or, if successfully arranged, that we will be able to obtain favorable values upon the sale of our Direct Investments in such transactions. In addition, our investments in debt securities may expose us to liquidity risk. The corporate debt securities in which we invest generally will be high yield debt securities, and these securities have historically been less liquid than securities rated investment grade, especially during periods of market stress. We expect that the directly originated municipal securities in which we invest will have limited trading markets and therefore will tend to be less liquid than municipal securities rated investment grade or issued by traditional municipal issuers.
With respect to our investments in listed equity securities, we may invest in securities of any market capitalization, including small- and mid-capitalization companies, and may be exposed to liquidity risk when trading volume, lack of a market maker, or legal restrictions impair our ability to sell particular securities or close call option positions at an advantageous price or a timely manner. We may invest in mid-capitalization and small-capitalization companies, which may be more volatile and more likely than large-capitalization companies to have narrower product lines, fewer financial resources, less management depth and experience and less competitive strength. In the event certain securities experience limited trading volumes, the prices of such securities may display abrupt or erratic movements at times. These securities may be difficult to sell at a favorable price at the times when we believe it is desirable to do so.
Private Company Securities Risk. Our investments in private companies may be subject to higher risk than investments in securities of public companies. Little public information may exist about many of the issuers of these securities, and we will be required to rely on the ability of our Adviser and Subadviser to obtain adequate information to evaluate the potential risks and returns involved in investing in these issuers. If our Adviser or Subadviser is unable to obtain all material information about the issuers of these securities, it may be difficult to make a fully informed investment decision, and we may lose some or all of our investment in these securities. These factors could subject us to greater risk than investments in securities of public companies and negatively affect our investment returns, which could negatively impact the dividends paid to you and the value of your investment. In addition, we will likely be able to sell our investments in private companies only in private transactions with another investor or group of investors, and there can be no assurance that we will be able to successfully arrange such transactions if and when we desire to sell any of our investments in private companies or, if successfully arranged, that we will be able to obtain favorable values upon the sale of our investments in private companies in such transactions.
Restricted Securities Risk, including Rule 144A Securities Risk. Restricted securities are less liquid than securities traded in the open market because of statutory and contractual restrictions on resale. Such securities are, therefore, unlike securities that are traded in the open market, which can be expected to be sold immediately if the market is adequate. This lack of liquidity may create special risks for us.
Restricted securities are subject to statutory and contractual restrictions on their public resale, which may make it more difficult to value them, may limit our ability to dispose of them and may lower the amount we could realize upon their sale. To enable us to sell our holdings of a restricted security not registered under the Securities Act, we may have to cause those securities to be registered. The expenses of registering restricted securities may be determined at the time we buy the securities. When we must arrange registration because we wish to sell the security, a considerable period may elapse between the time the decision is made to sell the security and the time the security is registered so that we could sell it. We would bear the risks of any downward price fluctuation during that period.
Rule 144A provides an exemption from the registration requirements of the Securities Act for the resale of certain restricted securities to qualified institutional buyers, such as us. However, an insufficient number of qualified institutional buyers interested in purchasing the Rule 144A-eligible securities that we hold could affect adversely the marketability of certain Rule 144A securities, and we might be unable to dispose of such securities promptly or at reasonable prices.
Non-U.S. Securities Risks. Investments in securities of non-U.S. issuers (including Canadian issuers) involve risks not ordinarily associated with investments in securities and instruments of U.S. issuers. For example, non-U.S. companies are not generally subject to uniform accounting, auditing and financial standards and requirements comparable to those applicable to U.S. companies. Non-U.S. securities exchanges, brokers and companies may be subject to less government supervision and regulation than exists in the U.S. Dividend and interest income may be subject to withholding and other non-U.S. taxes, which may adversely affect the net return on such investments. Because we intend to limit our investments in securities issued by non-U.S. issuers (including Canadian issuers) to no more than 30% of our total assets, we will not be able to pass through to our shareholders any foreign income tax credits as a result of any foreign income taxes we pay. There may be difficulty in obtaining or enforcing a court judgment abroad. In addition, it may be difficult to effect repatriation of capital invested in certain countries. With respect to certain countries, there are also risks of expropriation, confiscatory taxation, political or social instability or diplomatic developments that could affect the Fund’s assets held in non-U.S. countries. There may be less publicly available information about a non-U.S.
| 136 | Tortoise |
| 2020 Annual Report | November 30, 2020 |
| Additional Information (unaudited) (continued) |
company than there is regarding a U.S. company. Non-U.S. securities markets may have substantially less volume than U.S. securities markets and some non-U.S. company securities are less liquid than securities of otherwise comparable U.S. companies. Non-U.S. markets also have different clearance and settlement procedures that could cause the Fund to encounter difficulties in purchasing and selling securities on such markets and may result in the Fund missing attractive investment opportunities or experiencing a loss. In addition, a portfolio that includes securities issued by non-U.S. issuers can expect to have a higher expense ratio because of the increased transaction costs in non-U.S. markets and the increased costs of maintaining the custody of such non-U.S. securities. When investing in securities issued by non-U.S. issuers, there is also the risk that the market price of such an investment, measured in U.S. dollars, will decrease because of unfavorable changes in currency exchange rates. We do not currently intend to hedge our exposure to non-U.S. currencies.
Investments in companies domiciled in the United Kingdom (“UK”), or that otherwise have significant ties to the UK, are subject to Brexit risk. Brexit risk is the risk that the exit of the UK from the European Union occurs in a disruptive manner. Potential effects of a disruptive Brexit include, but are not limited to, adverse effects on supply chains and labor markets, the potential for new taxes to be imposed on goods crossing borders, declining real estate markets and a weakening of the pound sterling. Emerging Market Securities Risks. Investments in securities of non-U.S. issuers located in emerging markets involve all of the risks generally applicable to investments in securities of non-U.S. issuers. These risks are heightened with respect to investments in emerging market securities. In addition, investments in emerging market securities are subject to a number of risks, including risks related to economic structures that are less diverse and mature than those of developed countries; less stable political systems and less developed legal systems; national policies that may restrict foreign investment; wide fluctuations in the value of investments, possibly as a result of significant currency exchange rate fluctuations; smaller securities markets making investments less liquid; and special custody arrangements.
Terrorism and Cybersecurity Risks. Essential asset issuers are subject to disruption as a result of terrorist activities and other geopolitical events, including upheaval in the Middle East or other energy-producing regions. Cyber hacking could also cause significant disruption and harm to essential asset issuers. The U.S. government has issued warnings that certain essential assets, specifically those related to energy infrastructure, including exploration and production facilities, pipelines and transmission and distribution facilities, might be specific targets of terrorist activity. Additionally, digital and network technologies (collectively, “cyber networks”) might be at risk of cyberattacks that could potentially seek unauthorized access to digital systems for purposes such as misappropriating sensitive information, corrupting data or causing operational disruption. Cyberattacks might potentially be carried out by persons using techniques that could range from efforts to electronically circumvent network security or overwhelm websites to intelligence gathering and social engineering functions aimed at obtaining information necessary to gain access.
Covered Call Risks. We cannot guarantee that our covered call option overlay strategy will be effective. There are several risks associated with transactions in options on securities, including:
| ● | There are significant differences between the securities and options markets that could result in an imperfect correlation between these markets, causing a given covered call option transaction not to achieve its objectives. A decision as to whether, when and how to use covered calls (or other options) involves the exercise of skill and judgment, and even a well-conceived transaction may be unsuccessful because of market behavior or unexpected events. |
| ● | The use of options may require us to sell portfolio securities at inopportune times or for prices other than current market values, may limit the amount of appreciation we can realize on an investment or may cause us to hold a security we might otherwise sell. As the writer of a covered call option, we forego, during the option’s life, the opportunity to profit from increases in the market value of the security covering the call option above the exercise price of the call option, but retain the risk of loss should the price of the underlying security decline. Although such loss would be offset in part by the option premium received, in a situation in which the price of a particular stock on which we have written a covered call option declines rapidly and materially or in which prices in general on all or a substantial portion of the stocks on which we have written covered call options decline rapidly and materially, we could sustain material depreciation or loss to the extent we do not sell the underlying securities (which may require us to terminate, offset or otherwise cover our option position as well). |
| ● | There can be no assurance that a liquid market will exist when we seek to close out an option position. If we were unable to close out a covered call option that we had written on a security, we would not be able to sell the underlying security unless the option expired without exercise. Reasons for the absence of a liquid secondary market for exchange-traded options may include, but are not limited to, the following: (1) there may be insufficient trading interest; (2) restrictions may be imposed by an exchange on opening transactions or closing transactions or both; (3) trading halts, suspensions or other restrictions may be imposed with respect to particular classes or series of options; (4) unusual or unforeseen circumstances may interrupt normal operations on an exchange; (5) the trading facilities may not be adequate to handle current trading volume; or (6) the relevant exchange could discontinue the trading of options. In addition, our ability to terminate OTC options may be more limited than with exchange-traded options and may involve the risk that counterparties participating in such transactions will not fulfill their obligations. |
| ● | The principal factors affecting the market value of an option include supply and demand, interest rates, the current market price of the underlying security in relation to the exercise price of the option, the dividend or distribution yield of the underlying security, the actual or perceived volatility of the underlying security and the time remaining until the expiration date. Any of the foregoing could impact or cause to vary over time the amount of income we are able to generate through our covered call option overlay strategy. |
| Tortoise | 137 |
| Additional Information (unaudited) (continued) |
| ● | The number of covered call options we can write is limited by the number of shares of the corresponding common stock we hold. Furthermore, our covered call option transactions may be subject to limitations established by each of the exchanges, boards of trade or other trading facilities on which such options are traded. |
| ● | If we fail to maintain any required asset coverage ratios in connection with any use by us of leverage, we may be required to redeem or prepay some or all of our leverage instruments. Such redemption or prepayment would likely result in our seeking to terminate early all or a portion of any option transaction. Early termination of an option could result in a termination payment by or to us. Hedging and Derivatives Risks. In addition to writing call options as part of our investment strategy, we may invest in derivative instruments for hedging or risk management purposes, and for short-term purposes such as maintaining market exposure pending investment of the proceeds of this offering or transitioning our portfolio between different asset classes. Our use of derivatives could enhance or decrease the cash available to us for payment of distributions or interest, as the case may be. Derivatives can be illiquid, may disproportionately increase losses and have a potentially large negative impact on our performance. Derivative transactions, including options on securities and securities indices and other transactions in which we may engage (such as forward currency transactions, futures contracts and options thereon and total return swaps), may subject us to increased risk of principal loss due to unexpected movements in stock prices, changes in stock volatility levels, interest rates and foreign currency exchange rates and imperfect correlations between our securities holdings and indices upon which derivative transactions are based. We also will be subject to credit risk with respect to the counterparties to any OTC derivatives contracts we enter into. |
Interest rate transactions will expose us to certain risks that differ from the risks associated with our portfolio holdings. There are economic costs of hedging reflected in the price of interest rate swaps, floors, caps and similar techniques, the costs of which can be significant, particularly when long-term interest rates are substantially above short-term rates. In addition, our success in using hedging instruments is subject to our Adviser’s ability to predict correctly changes in the relationships of such hedging instruments to our leverage risk, and there can be no assurance that our Adviser’s judgment in this respect will be accurate. Consequently, the use of hedging transactions might result in a poorer overall performance, whether or not adjusted for risk, than if we had not engaged in such transactions. There is no assurance that the interest rate hedging transactions into which we enter will be effective in reducing our exposure to interest rate risk. Hedging transactions are subject to correlation risk, which is the risk that payment on our hedging transactions may not correlate exactly with our payment obligations on senior securities. To the extent there is a decline in interest rates, the market value of certain derivatives could decline and result in a decline in our net assets.
Counterparty Risk. The risk exists that a counterparty to a derivatives contract or other transaction in a financial instrument held by us or by a special purpose or structured vehicle in which we invest may become insolvent or otherwise fail to perform its obligations, including making payments to us, due to financial difficulties. We may obtain no or limited recovery in a bankruptcy or other reorganizational proceedings, and any recovery may be significantly delayed. Transactions that we enter into may involve counterparties in the financial services sector and, as a result, events affecting the financial services sector may cause our share value to fluctuate.
In the event of a counterparty’s (or its affiliate’s) insolvency, our ability to exercise remedies, such as the termination of transactions, netting of obligations and realization on collateral, could be stayed or eliminated under new special resolution regimes adopted in the United States, the European Union and various other jurisdictions. Such regimes generally provide government authorities with broad authority to intervene when a financial institution is experiencing financial difficulty. In particular, the regulatory authorities could reduce, eliminate or convert to equity the liabilities us of a counterparty subject to such proceedings in the European Union (sometimes referred to as a “bail in”).
Operational Risks
Distribution Risks. We may not be able to achieve operating results that will allow us to make distributions at a specific level or to increase the amount of these distributions from time to time. We cannot assure you that you will receive distributions at a particular level or at all. Dividends and distributions on equity securities are not fixed but are declared at the discretion of the issuer’s board of directors. If stock market volatility declines, the level of premiums from writing covered call options will likely decrease as well. Payments to close-out written call options will reduce amounts available for distribution from gains earned in respect of call option expiration or close out. A significant decline in the value of the securities in which we invest may negatively impact our ability to pay distributions or cause you to lose all or a part of your investment.
In addition, the 1940 Act may limit our ability to make distributions in certain circumstances. Restrictions and provisions in any future credit facilities and our debt securities also may limit our ability to make distributions. For federal income tax purposes, we are required to distribute substantially all of our net investment income each year to maintain our status as a RIC, to reduce our federal income tax liability and to avoid a potential excise tax. If our ability to make distributions on our common shares is limited, such limitations could, under certain circumstances, impair our ability to maintain our qualification for taxation as a RIC or result in our having an income or excise tax liability, which would have adverse consequences for our shareholders.
| 138 | Tortoise |
| 2020 Annual Report | November 30, 2020 |
| Additional Information (unaudited) (continued) |
Operating Results Risk. We could experience fluctuations in our operating results due to a number of factors, including the return on our investments, the level of our expenses, variations in and the timing of the recognition of realized and unrealized gains or losses on our investments and written call options, the level of call premium we receive by writing covered calls, the degree to which we encounter competition in our markets and general economic conditions. As a result of these factors, results for any period should not be relied upon as being indicative of performance in future periods.
Market Discount Risk. Shares of closed-end investment companies frequently trade at a discount from net asset value. Continued development of alternative vehicles for investing in essential asset companies may contribute to reducing or eliminating any premium or may result in our common shares trading at a discount. The risk that our common shares may trade at a discount is separate from the risk of a decline in our net asset value as a result of investment activities.
Whether shareholders will realize a gain or loss for federal income tax purposes upon the sale of their common shares depends upon whether the market value of the common shares at the time of sale is above or below the shareholder’s basis in such common shares, taking into account transaction costs, and it is not directly dependent upon our net asset value. Because the market price of our common shares will be determined by factors such as the relative demand for and supply of the shares in the market, general market conditions and other factors beyond our control, we cannot predict whether our common shares will trade at, below or above net asset value, or at, below or above the public offering price for our common shares.
Portfolio Turnover Risk. At times, particularly during our initial twelve months of operation, our portfolio turnover may be higher. High portfolio turnover involves greater transaction costs to us and may result in greater realization of capital gains, including short-term capital gains.
Valuation Risks. Our Direct Investments will typically consist of securities for which a liquid trading market does not exist. The fair value of these securities may not be readily determinable. We will value these securities in accordance with valuation procedures adopted by our Board of Directors. Our Board of Directors may use the services of an independent valuation firm to review the fair value of certain securities prepared by our Adviser. The types of factors that may be considered in fair value pricing of our investments include, as applicable, the nature and realizable value of any collateral, the issuer’s ability to make payments, the markets in which the issuer does business, comparison to publicly traded companies, discounted cash flow and other relevant factors. Because such valuations, and particularly valuations of non-traded securities and private companies, are inherently uncertain, they may fluctuate over short periods of time and may be based on estimates. The determination of fair value by our Board of Directors may differ materially from the values that would have been used if a liquid trading market for these securities existed. Our net asset value could be adversely affected if the determinations regarding the fair value of our investments were materially higher than the values that we ultimately realize upon the disposition of such securities.
Tax Risks. We intend to elect to be treated, and to qualify each year, as a RIC under the Code. To maintain our qualification for federal income tax purposes as a RIC under the Code, we must meet certain source-of-income, asset diversification and annual distribution requirements. If for any taxable year we fail to qualify for the special federal income tax treatment afforded RICs, all of our taxable income will be subject to federal income tax at regular corporate rates (without any deduction for distributions to our shareholders) and our income available for distribution will be reduced.
Leverage Risks. Our use of leverage through the issuance of preferred shares or debt securities, and any borrowings or other transactions involving indebtedness (other than for temporary or emergency purposes), would be considered “senior securities” for purposes of the 1940 Act and create risks. Leverage is a speculative technique that may adversely affect common shareholders. If the return on investments acquired with borrowed funds or other leverage proceeds does not exceed the cost of the leverage, the use of leverage could cause us to lose money. Successful use of leverage depends on our Adviser’s ability to predict or hedge correctly interest rates and market movements, and there is no assurance that the use of a leveraging strategy will be successful during any period in which it is used. Because the fee paid to our Adviser and Subadviser will be calculated on the basis of Managed Assets, the fees will increase when leverage is utilized, giving our Adviser an incentive to utilize leverage.
Our issuance of senior securities involves offering expenses and other costs, including interest payments, that are borne indirectly by our common shareholders. Fluctuations in interest rates could increase interest or distribution payments on our senior securities and could reduce cash available for distributions on common shares. Increased operating costs, including the financing cost associated with any leverage, may reduce our total return to common shareholders.
The 1940 Act and/or the rating agency guidelines applicable to senior securities impose asset coverage requirements, distribution limitations, voting right requirements (in the case of the senior equity securities) and restrictions on our portfolio composition and our use of certain investment techniques and strategies. The terms of any senior securities or other borrowings may impose additional requirements, restrictions and limitations that are more stringent than those currently required by the 1940 Act, and the guidelines of the rating agencies that rate outstanding senior securities. These requirements may have an adverse effect on us and may affect our ability to pay distributions on common shares and preferred shares. To the extent necessary, we currently intend to redeem any senior securities to maintain the required asset coverage. Doing so may require that we liquidate portfolio securities at a time when it would not otherwise be desirable to do so.
| Tortoise | 139 |
| Additional Information (unaudited) (continued) |
Capital Markets Risks. In the event of an economic downturn or increased financial stress, the cost of raising capital in the debt and equity capital markets may increase, and the ability to raise capital may be limited. In particular, concerns about the general stability of financial markets and specifically the solvency of lending counterparties may impact the cost of raising capital from the credit markets through increased interest rates, tighter lending standards, difficulties in refinancing debt on existing terms or at all and reduced, or in some cases ceasing to provide, funding to borrowers. In addition, lending counterparties under existing revolving credit facilities and other debt instruments may be unwilling or unable to meet their funding obligations. As a result of any of the foregoing, we or the companies in which we invest may be unable to obtain new debt or equity financing on acceptable terms. If funding is not available when needed, or is available only on unfavorable terms, we or the companies in which we invest may not be able to meet obligations as they come due. Moreover, without adequate funding, essential asset companies may be unable to execute their growth strategies, complete future acquisitions, take advantage of other business opportunities or respond to competitive pressures, any of which could have a material adverse effect on their revenues and results of operations.
Legal, Regulatory and Policy Risks. Legal and regulatory changes could occur that may adversely affect us, our investments and our ability to pursue our investment strategies and/or increase the costs of implementing such strategies. Certain changes have already been proposed and additional changes are expected. New or revised laws or regulations may be imposed by the SEC, the U.S. Commodity Futures Trading Commission (the “CFTC”), the Internal Revenue Service, the U.S. Federal Reserve or other governmental regulatory authorities or self-regulatory organizations that could adversely affect us. We also may be adversely affected by changes in the enforcement or interpretation of existing statutes and rules by governmental regulatory authorities or self-regulatory organizations.
Instability in financial markets during and following the 2007–2009 global financial crisis led the U.S. government and foreign governments to take a number of unprecedented actions designed to support certain financial institutions and segments of the financial markets that experienced extreme volatility, and in some cases a lack of liquidity. While economic and financial conditions in the United States and elsewhere have been recovering for several years, volatility remains and a perception that conditions remain fragile persists to some extent. Withdrawal of government support or investor perception that such efforts are not succeeding could adversely affect the market value and liquidity of certain securities.
In the event of future instability in financial markets, U.S. federal and state governments and foreign governments, their regulatory agencies or self-regulatory organizations may take additional actions that affect the regulation of the securities in which we invest, or the issuers of such securities, in ways that are unforeseeable and on an “emergency” basis with little or no notice, with the consequence that some market participants’ ability to continue to implement certain strategies or manage the risk of their outstanding positions may be suddenly and/or substantially eliminated or otherwise negatively impacted. Given the complexities of the global financial markets and the limited timeframe within which governments may be required to take action, these interventions may result in confusion and uncertainty, which in itself may be materially detrimental to the efficient functioning of such markets as well as previously successful investment strategies.
In addition, the securities and futures markets are subject to comprehensive statutes, regulations and margin requirements. The CFTC, the SEC, the Federal Deposit Insurance Corporation, other regulators and self-regulatory organizations and exchanges are authorized under these statutes and regulations and otherwise to take extraordinary actions in the event of market emergencies. We, our Adviser and our Subadviser historically have been eligible for exemptions from certain regulations. However, there is no assurance that we, our Adviser or our Subadviser will continue to be eligible for such exemptions.
The Dodd-Frank Wall Street Reform and Consumer Protection Act of 2010 (the “Dodd-Frank Act”) and related regulatory developments have imposed comprehensive new regulatory requirements on swaps and swap market participants. The new regulatory framework includes: (1) registration and regulation of swap dealers and major swap participants; (2) requiring central clearing and execution of standardized swaps; (3) imposing margin requirements on swap transactions; (4) regulating and monitoring swap transactions through position limits and large trader reporting requirements; and (5) imposing record keeping and centralized and public reporting requirements, on an anonymous basis, for most swaps. The CFTC is responsible for the regulation of most swaps and has completed most of its rules implementing the Dodd-Frank Act swap regulations. The SEC has jurisdiction over a small segment of the market referred to as “security-based swaps,” which includes swaps on single securities or credits, or narrow-based indices of securities or credits, but has not yet completed its rulemaking. The implementation of the provisions of the Dodd-Frank Act by the SEC and the CFTC could adversely affect our ability to pursue our investment objective. The Dodd-Frank Act and the rules promulgated thereunder could, among other things, adversely affect the value of our investments, restrict our ability to engage in derivative transactions and/or increase the costs of such derivative transactions.
The CFTC and certain futures exchanges have established limits, referred to as “position limits,” on the maximum net long or net short positions which any person may hold or control in particular options and futures contracts; those position limits also may apply to certain other derivatives positions we may wish to take. All positions owned or controlled by the same person or entity, even if in different accounts, may be aggregated for purposes of determining whether the applicable position limits have been exceeded. Thus, even if we do not intend to exceed applicable position limits, it is possible that different clients managed by our Adviser, our Subadviser and their affiliates may be aggregated for this purpose. Therefore it is possible that the trading decisions of our Adviser or our Subadviser may have to be modified and that positions we hold may have to be liquidated in order to avoid exceeding such limits. The modification of investment decisions or the elimination of open positions, if it occurs, may adversely affect our performance.
| 140 | Tortoise |
| 2020 Annual Report | November 30, 2020 |
| Additional Information (unaudited) (continued) |
Changes in U.S. social, political, regulatory and economic conditions or in laws and policies governing foreign trade, manufacturing, development, investment and support for clean energy initiatives, and any negative sentiments towards the United States as a result of such changes, could adversely affect the business of the essential asset companies in which we expect to invest. In addition, reduced immigration into the United States of educated professionals from overseas or negative sentiments towards the United States among non-U.S. employees or prospective employees could adversely affect the ability of the companies in which we expect to invest to hire and retain highly skilled employees. Any of these developments could have an adverse effect on the value of our investments.
The impact of continued trade tensions with China, or an escalation to a trade war, may adversely effect currencies, commodities and individual companies in which we invest. U.S. companies that source material and goods from China, and those that make large amounts of sales in China would be particularly vulnerable to an escalation of trade tensions. Uncertainty regarding the outcome of the trade tensions and the potential for a trade war could cause the dollar to decline against safe haven currencies, such as the Japanese yen and the euro.
Subsidiary Risks. By investing in any Subsidiary, we will be indirectly exposed to the risks associated with such Subsidiary’s investments. The instruments that will be held by any Subsidiary will generally be similar to those that are permitted to be held by the Fund and will be subject to the same risks that apply to similar investments if held directly by the Fund. The Subsidiaries will not be registered under the 1940 Act, and, unless otherwise noted, will not be subject to all of the investor protections of the 1940 Act. However, we will wholly own and control any Subsidiary, and we and any Subsidiary will each be managed by our Adviser or our Subadviser and will share the same portfolio management teams. Our Board of Directors will have oversight responsibility for the investment activities of the Fund, including its investment in the Subsidiaries, and our role as sole shareholder of any Subsidiary. Changes in the laws of the United States and/or any jurisdiction in which a Subsidiary is formed could result in our inability or the inability of the Subsidiaries to operate as expected and could adversely affect the Fund. For example, changes in U.S. tax laws could affect the U.S. tax treatment of, or consequences of owning, the Fund or the Subsidiaries, including under the RIC rules.
Segregation and Coverage Risks. Certain portfolio management techniques, such as, among other things, entering into swap agreements, using reverse repurchase agreements, futures contracts or other derivative transactions, may be considered senior securities under the 1940 Act unless steps are taken to segregate our assets or otherwise cover our obligations. To avoid having these instruments considered senior securities, we segregate liquid assets with a value equal (on a mark-to-market basis) to our obligations under these types of transactions, enter into offsetting transactions or otherwise cover such transactions. In cases where we do not follow such procedures, such instruments may be considered senior securities and our use of such transactions will be required to comply with the restrictions on senior securities under the 1940 Act. We may be unable to use segregated assets for certain other purposes, which could result in us earning a lower return on our portfolio than we might otherwise earn if we did not have to segregate those assets in respect of or otherwise cover such portfolio positions. To the extent our assets are segregated or committed as cover, it could limit our investment flexibility. Segregating assets and covering positions will not limit or offset losses on related positions. Limitations on Transactions with Affiliates Risk. The 1940 Act limits our ability to enter into certain transactions with certain of our affiliates. As a result of these restrictions, we may be prohibited from buying or selling any security directly from or to any portfolio company that is considered our affiliate under the 1940 Act. However, we may under certain circumstances purchase any such portfolio company’s securities in the secondary market, which could create a conflict for our Adviser or Subadviser between our interests and the interests of the portfolio company, in that the ability of our Adviser or Subadviser, as applicable, to recommend actions in our best interests might be impaired.
The 1940 Act also prohibits certain “joint” transactions with certain of our affiliates, including Other Tortoise Accounts, which could include investments in the same issuer (whether at the same or different times). To the extent there is a joint transaction among us and Other Tortoise Accounts requiring exemptive relief, we may rely on an exemptive order from the SEC obtained by the Adviser and certain Other Tortoise Accounts that permits us, among other things, to co-invest with certain other persons, including certain Other Tortoise Accounts, subject to certain terms and conditions. Such relief may not cover all circumstances and we may be precluded from participating in certain transactions due to regulatory restrictions on transactions with affiliates. Anti-Takeover Provisions Risks. Our Declaration of Trust and Bylaws include provisions that could delay, defer or prevent other entities or persons from acquiring control of us, causing us to engage in certain transactions or modify our structure. These provisions may be regarded as “anti-takeover” provisions. Such provisions could limit the ability of common shareholders to sell their shares at a premium over the then-current market prices by discouraging a third party from seeking to obtain control of us.
| Tortoise | 141 |
Office of the Company Board of Directors of Rand C. Berney Conrad S. Ciccotello Alexandra Herger Jennifer Paquette | Administrator Custodian Transfer, Dividend Disbursing Legal Counsel Investor Relations Stock Symbols This report is for stockholder information. This is not a |
 |
5100 W. 115th Place |
Item 2. Code of Ethics.
The Registrant has adopted a code of ethics that applies to the Registrant’s Principal Executive Officer and its Principal Financial Officer. The Registrant has not made any amendments to this code of ethics during the period covered by this report. The Registrant has not granted any waivers from any provisions of this code of ethics during the period covered by this report.
Item 3. Audit Committee Financial Expert.
The Registrant’s Board of Directors has determined that there is at least one “audit committee financial expert” serving on its audit committee. Mr. Rand Berney is the “audit committee financial expert” and is considered to be “independent” as each term is defined in Item 3 of Form N-CSR.
Item 4. Principal Accountant Fees and Services.
The Registrant has engaged its principal accountant to perform audit services, audit-related services and tax services during the fiscal year since its initial public offering on March 26, 2019. “Audit services” refer to performing an audit of the Registrant's annual financial statements or services that are normally provided by the accountant in connection with statutory and regulatory filings or engagements for the most recent fiscal year. “Audit-related services” refer to the assurance and related services by the principal accountant that are reasonably related to the performance of the audit. “Tax services” refer to professional services rendered by the principal accountant for tax compliance (including preparation of tax returns), tax advice, and tax planning. The following table details the approximate amounts of aggregate fees billed to the Registrant for the last two fiscal years for audit fees, audit-related fees, tax fees and other fees by the principal accountant.
| FYE 11/30/2020 | FYE 11/30/2019 | |||||
| Audit Fees | $ | 105,000 | $ | 93,000 | ||
| Audit-Related Fees | — | — | ||||
| Tax Fees | $ | 20,111 | $ | 4,000 | ||
| All Other Fees | — | — | ||||
| Aggregate Non-Audit Fees | $ | 20,111 | $ | 4,000 | ||
The audit committee has adopted pre-approval policies and procedures that require the audit committee to pre-approve (i) the selection of the Registrant’s independent registered public accounting firm, (ii) the engagement of the independent registered public accounting firm to provide any non-audit services to the Registrant, (iii) the engagement of the independent registered public accounting firm to provide any non-audit services to the Adviser or any entity controlling, controlled by, or under common control with the Adviser that provides ongoing services to the Registrant, if the engagement relates directly to the operations and financial reporting of the Registrant, and (iv) the fees and other compensation to be paid to the independent registered public accounting firm. The Chairman of the audit committee may grant the pre-approval of any engagement of the independent registered public accounting firm for non-audit services of less than $10,000, and such delegated pre-approvals will be presented to the full audit committee at its next meeting. Under certain limited circumstances, pre-approvals are not required under securities law regulations for certain non-audit services below certain de minimis thresholds. Since the adoption of these policies and procedures, the audit committee has pre-approved all audit and non-audit services provided to the Registrant by the principal accountant. None of these services provided by the principal accountant were approved by the audit committee pursuant to the de minimis exception under Rule 2.01(c)(7)(i)(C) or Rule 2.01(c)(7)(ii) of Regulation S-X. All of the principal accountant’s hours spent on auditing the Registrant’s financial statements were attributed to work performed by full-time permanent employees of the principal accountant.
In the Registrant’s fiscal years ended November 30, 2020 and 2019, the Adviser was billed approximately $39,750 and $45,100 in fees, respectively, for tax and other non-audit services provided to the Adviser. These non-audit services were not required to be preapproved by the Registrant’s audit committee. No entity controlling, controlled by, or under common control with the Adviser that provides ongoing services to the Registrant, has paid to, or been billed for fees by, the principal accountant for non-audit services rendered to the Adviser or such entity during the Registrant’s last two fiscal years. The audit committee has considered whether the principal accountant’s provision of services (other than audit services) to the Registrant, the Adviser or any entity controlling, controlled by, or under common control with the Adviser that provides services to the Registrant is compatible with maintaining the principal accountant’s independence in performing audit services.
Item 5. Audit Committee of Listed Registrants.
The Registrant has a separately-designated standing audit committee established in accordance with Section 3(a)(58)(A) of the Securities Exchange Act of 1934, and is comprised of Mr. Rand C. Berney, Mr. Conrad S. Ciccotello, Ms. Jennifer Paquette and Ms. Alexandra A. Herger.
Item 6. Investments.
| (a) | Schedule of Investments is included as part of the report to shareholders filed under Item 1. |
| (b) | Not applicable. |
Item 7. Disclosure of Proxy Voting Policies and Procedures for Closed-End Management Investment Companies.
Copies of the proxy voting policies and procedures of the Registrant and the Adviser are attached hereto as Exhibit 99.VOTEREG and Exhibit 99.VOTEADV, respectively.
Item 8. Portfolio Managers of Closed-End Management Investment Companies.
Unless otherwise indicated, information is presented as of November 30, 2020.
As of the date of this filing, portfolio managers of the Adviser and Subadviser are responsible for the day-to-day management of their respective sleeves of the Registrant’s overall investment portfolio.
Biographical information about each member of the portfolio management team as of the date of this filing is set forth below.
| Position(s) Held with | ||||
| Name and | Company and Length | |||
| Address* | of Time Served | Principal Occupation During Past Five Years | ||
| Brian A. Kessens | N/A | Managing Director of the Adviser since January 2015 and a member of the Investment Committee of the Adviser since June 30, 2015; Portfolio Manager of the Adviser since July 2013; Senior Investment Analyst of the Adviser from June 2012 to July 2013; Investment Analyst of the Adviser from 2008 to June 2012; President of TTP and TPZ since June 2015. CFA designation since 2006. | ||
| James R. Mick | N/A | Managing Director of the Adviser since January 2014 and a member of the Investment Committee of the Adviser since June 30, 2015; Portfolio Manager of the Adviser since July 2013; Senior Investment Analyst of the Adviser from June 2012 to July 2013; Investment Analyst of the Adviser from 2011 to June 2012. Research analyst of the Adviser from 2006 to 2011. CFA designation since 2010. | ||
| Matthew G.P. Sallee | N/A | Managing Director of the Adviser since January 2014 and member of the Investment Committee of the Adviser since June 30, 2015; Portfolio Manager of the Adviser since July 2013; Senior Investment Analyst of the Adviser from June 2012 to July 2013; Investment Analyst of the Adviser from 2009 to June 2012; Research Analyst of the Adviser from 2005 to 2009; President of TYG and NTG since June 2015. CFA designation since 2009. | ||
| Robert J. Thummel, Jr. | N/A | Managing Director of the Adviser since January 2014 and a member of the Investment Committee of the Adviser since June 30, 2015; Portfolio Manager of the Adviser since July 2013; Senior Investment Analyst of the Adviser from June 2012 to July 2013; Investment Analyst of the Adviser from 2004 to June 2012; President of NDP since June 2015. | ||
| Stephen Pang | N/A | Managing Director of the Adviser since January 2019; Portfolio Manager of the Adviser since January 2018; Director of the Adviser since January 2017; Investment Analyst of the Adviser from January 2015 to January 2017; Vice President of TTP from May 2017 to December 2020. CFA designation since 2016. | ||
| Nicholas S. Holmes | President since May 2019 | Managing Director of the Adviser since January 2020; Portfolio Manager of the Adviser since January 2019; Investment Analyst of the Adviser from January 2015 through December 2018; Research Analyst of the Adviser from January 2012 through December 2014 and Assistant Research Analyst from January 2010 through December 2011; President of TEAF since May 2019 and Vice President of TYG and NTG since June 2015. CFA designation since 2013. | ||
| Vince Cubbage | N/A | Managing Director – Private Energy of the Adviser since January 2019; Chief Executive Officer, President and Chairman of the Board of Tortoise Acquisition Corp. II since July 2020; Chief Executive Officer, President and Chairman of the Board of Tortoise Acquisition Corp. from November 2018 to October 2020; previously Chief Executive Officer and a Member of the Board of Managers of Lightfoot Capital Partners GP LLC, the general partner of Lightfoot Capital Partners, LP, from 2006 to December 2018; Chief Executive Officer, Director and Chairman of the Board of Arc Logistics GP LLC, the general partner of Arc Logistics Partners LP (and its predecessor) from July 2007 to December 2017. |
| David Sifford | N/A | Managing Director of the Adviser since January 2020; Managing Director of an affiliate of the Adviser from September 2018 through December 2019; Vice President of Education Investments at EPR Properties from May 2013 to August 2018. | ||
| Edward Russell | N/A | Managing Director of Adviser since 2014. | ||
| Jerry G. Polacek | N/A | Managing Director and Portfolio Manager of the Adviser since January 2018; Managing Partner of an affiliate of the Adviser from September 2016 through December 2017; Chief Executive Officer and Chief Investment Officer of Energy & Infrastructure Capital, LLC from March 2014 through July 2016. | ||
| Matthew S. Ordway | N/A | Managing Director and Portfolio Manager of the Adviser since January 2018; Partner of an affiliate of the Adviser from September 2016 through December 2017; Chief Financial Officer and Chief Operating Officer of Energy & Infrastructure Capital, LLC from March 2014 through July 2016. | ||
| Prashanth K. Prakash | N/A | Managing Director of the Adviser since January 2021; Director of the Adviser from January 2018 to January 2021; Vice President of the Adviser from September 2016 through December 2017; Vice President of Energy & Infrastructure Capital, LLC from March 2014 through July 2016. | ||
| Matthew Breidert | N/A | Managing Director of the Subadviser since January 2021; Portfolio Manager of the Subadviser since November 2018; Partner and Senior Portfolio Manager of Ecofin Ltd. from May 2016 to November 2018; Portfolio Manager of Ecofin Ltd. from March 2008 to May 2016. | ||
| Jean-Hugues de Lamaze | N/A | Managing Director of the Subadviser since January 2020; Portfolio Manager of the Subadviser since November 2018; Partner and Senior Portfolio Manager of Ecofin Ltd. from May 2016 to November 2018; Portfolio Manager of Ecofin Ltd. from 2006 to May 2016. | ||
| Maximilian Slee | N/A | Director of the Subadvisor since January 2021; Portfolio Manager of the Subadviser since November 2018; Analyst of Ecofin Ltd. from January 2010 to November 2018. | ||
| Michel Sznajer | N/A | Director of the Subadvisor since January 2021; Portfolio Manager of the Subadviser since November 2018; Portfolio Manager and Analyst of Ecofin Ltd. from October 2016 to November 2018; Partner of Silvaris Capital Management from May 2014 to June 2016. |
*The address of each portfolio manager is 5100 W. 115th Place, Leawood, Kansas 66211.
The Adviser also serves as the investment adviser to TYG, NTG, TTP, NDP and TPZ.
The following table provides information about the other accounts managed on a day-to-day basis by each of the portfolio managers as of November 30, 2020:
| Number of | ||||||||||
| Accounts | Total Assets of | |||||||||
| Paying a | Accounts Paying | |||||||||
| Number of | Total Assets of | Performance | a Performance | |||||||
| Name of Manager | Accounts | Accounts | Fee | Fee | ||||||
| Brian Kessens | ||||||||||
| Registered investment companies | 10 | $1,298,987,739 | — | — | ||||||
| Other pooled investment vehicles | 5 | $246,043,324 | — | — | ||||||
| Other accounts | 448 | $2,561,394,715 | 12 | $1,016,857,186 | ||||||
| James Mick | ||||||||||
| Registered investment companies | 8 | $933,365,945 | — | — | ||||||
| Other pooled investment vehicles | 5 | $246,043,324 | — | — | ||||||
| Other accounts | 448 | $2,561,394,715 | 12 | $1,016,857,186 | ||||||
| Matthew Sallee | ||||||||||
| Registered investment companies | 9 | $1,011,779,995 | — | — | ||||||
| Other pooled investment vehicles | 5 | $246,043,324 | — | — | ||||||
| Other accounts | 448 | $2,561,394,715 | 12 | $1,016,857,186 | ||||||
| Robert Thummel | ||||||||||
| Registered investment companies | 8 | $933,365,945 | — | — | ||||||
| Other pooled investment vehicles | 5 | $246,043,324 | — | — | ||||||
| Other accounts | 448 | $2,561,394,715 | 12 | $1,016,857,186 | ||||||
| Stephen Pang | ||||||||||
| Registered investment companies | 8 | $933,365,945 | — | — | ||||||
| Other pooled investment vehicles | 5 | $246,043,324 | — | — | ||||||
| Other accounts | 448 | $2,561,394,715 | 12 | $1,016,857,186 | ||||||
| Nick Holmes | ||||||||||
| Registered investment companies | 8 | $946,753,756 | — | — | ||||||
| Other pooled investment vehicles | 6 | $253,579,851 | — | — | ||||||
| Other accounts | 449 | $2,561,492,167 | 12 | $1,016,857,186 | ||||||
| Vince Cubbage | ||||||||||
| Registered investment companies | — | — | — | — | ||||||
| Other pooled investment vehicles | — | — | — | — | ||||||
| Other accounts | — | — | — | — | ||||||
| David Sifford | ||||||||||
| Registered investment companies | 1 | $240,128,211 | — | — | ||||||
| Other pooled investment vehicles | 4 | $205,445,714 | — | — | ||||||
| Other accounts | 2 | $24,442,321 | — | — | ||||||
| Ed Russell | ||||||||||
| Registered investment companies | — | — | — | — | ||||||
| Other pooled investment vehicles | — | — | — | — | ||||||
| Other accounts | — | — | — | — | ||||||
| Jerry G. Polacek | ||||||||||
| Registered investment companies | — | — | — | — | ||||||
| Other pooled investment vehicles | — | — | — | — | ||||||
| Other accounts | 1 | $5,470,913 | — | — | ||||||
| Matthew S. Ordway | ||||||||||
| Registered investment companies | — | — | — | — | ||||||
| Other pooled investment vehicles | — | — | — | — | ||||||
| Other accounts | 1 | $5,470,913 | — | — | ||||||
| Prashanth K. Prakash | ||||||||||
| Registered investment companies | — | — | — | — | ||||||
| Other pooled investment vehicles | — | — | — | — | ||||||
| Other accounts | 1 | $5,470,913 | — | — | ||||||
| Matthew Breidert | ||||||||||
| Registered investment companies | 2 | $117,233,249 | — | — | ||||||
| Other pooled investment vehicles | 4 | $223,035,292 | 3 | $181,507,274 | ||||||
| Other accounts | — | — | — | — | ||||||
| Jean-Hugues de Lamaze | ||||||||||
| Registered investment companies | 1 | $7,773,064 | — | — | ||||||
| Other pooled investment vehicles | 2 | $239,117,699 | — | — | ||||||
| Other accounts | — | — | — | — | ||||||
| Maximilian Slee | ||||||||||
| Registered investment companies | 1 | $7,773,064 | — | — | ||||||
| Other pooled investment vehicles | 3 | $181,507,274 | 3 | $181,507,274 | ||||||
| Other accounts | — | — | — | — | ||||||
| Michel Sznajer | ||||||||||
| Registered investment companies | 2 | $117,233,249 | — | — | ||||||
| Other pooled investment vehicles | 1 | $41,528,017 | — | — | ||||||
| Other accounts | — | — | — | — | ||||||
Material Conflicts of Interest
Conflicts of interest may arise from the fact that the Adviser, the Subadviser and their affiliates carry on substantial investment activities for other clients, in which the Registrant has no interest, some of which may have investment strategies similar to the Registrant. In addition, conflicts of interest may arise from the fact that a related person of the Adviser has an interest in a limited liability company client, similar to a general partner interest in a partnership, for which the Adviser also serves as manager. The Adviser or its affiliates may have financial incentives to favor certain of these accounts over the Registrant. For example, the Adviser or Subadviser may have an incentive to allocate potentially more favorable investment opportunities to other funds and clients that pay the Adviser an incentive or performance fee. Performance and incentive fees also create the incentive to allocate potentially riskier, but potentially better performing, investments to such funds and other clients in an effort to increase the incentive fee. The Adviser or Subadviser also may have an incentive to make investments in one fund, having the effect of increasing the value of a security in the same issuer held by another fund or client, which in turn, may result in an incentive fee being paid to the Adviser or Subadviser by that other fund or client. Any of the Adviser’s or its affiliates’ proprietary accounts or other customer accounts may compete with the Registrant for specific trades. The Adviser, the Subadviser or their affiliates may give advice and recommend securities to, or buy or sell securities for, other accounts and customers, which advice or securities recommended may differ from advice given to, or securities recommended or bought or sold for, the Registrant, even though their investment objectives may be the same as, or similar to, the Registrant’s objectives. The Adviser and the Subadviser have written allocation policies and procedures designed to address potential conflicts of interest. For instance, when two or more clients advised by the Adviser, the Subadviser or their affiliates seek to purchase or sell the same publicly traded securities, the securities actually purchased or sold will be allocated among the clients on a good faith equitable basis by the Adviser or the Subadviser in its discretion and in accordance with the clients’ various investment objectives and the Adviser’s or the Subadviser’s procedures. In some cases, this system may adversely affect the price or size of the position the Registrant may obtain or sell. In other cases, the Registrant’s ability to participate in volume transactions may produce better execution for it. When possible, the Adviser and the Subadviser combine all of the trade orders into one or more block orders, and each account participates at the average unit or share price obtained in a block order. When block orders are only partially filled, the Adviser and the Subadviser consider a number of factors in determining how allocations are made, with the overall goal to allocate in a manner so that accounts are not preferred or disadvantaged over time. The Adviser also has allocation policies for transactions involving private placement securities, which are designed to result in a fair and equitable participation in offerings or sales for each participating client.
The Adviser also serves as investment adviser for four other publicly traded management investment companies, all of which invest in the energy sector.
The Adviser and the Subadviser will evaluate a variety of factors in determining whether a particular investment opportunity or strategy is appropriate and feasible for the relevant account at a particular time, including, but not limited to, the following: (1) the nature of the investment opportunity taken in the context of the other investments at the time; (2) the liquidity of the investment relative to the needs of the particular entity or account; (3) the availability of the opportunity (i.e., size of obtainable position); (4) the transaction costs involved; and (5) the investment or regulatory limitations applicable to the particular entity or account. Because these considerations may differ when applied to the Registrant and relevant accounts under management in the context of any particular investment opportunity, the Registrant’s investment activities, on the one hand, and other managed accounts, on the other hand, may differ considerably from time to time. In addition, the Registrant’s fees and expenses will differ from those of the other managed accounts. Accordingly, stockholders should be aware that the Registrant’s future performance and the future performance of the other accounts of the Adviser may vary.
From time to time, the Adviser and the Subadviser may seed proprietary accounts for the purpose of evaluating a new investment strategy that eventually may be available to clients through one or more product structures. Such accounts also may serve the purpose of establishing a performance record for the strategy. The Adviser’s or Subadviser’s management of accounts with proprietary interests and nonproprietary client accounts may create an incentive to favor the proprietary accounts in the allocation of investment opportunities, and the timing and aggregation of investments. The Adviser’s and Subadviser’s proprietary seed accounts may include long-short strategies, and certain client strategies may permit short sales. A conflict of interest arises if a security is sold short at the same time as a long position, and continuously short selling in a security may adversely affect the stock price of the same security held long in client accounts. The Adviser and the Subadviser have adopted various policies to mitigate these conflicts, including policies that require the Adviser to avoid favoring any account, and that prohibit client and proprietary accounts from engaging in short sales with respect to individual stocks held long in client accounts. The Adviser’s policies also require transactions in proprietary accounts to be placed after client transactions.
Situations may occur when the Registrant could be disadvantaged because of the investment activities conducted by the Adviser, the Subadviser and their affiliates for their other accounts. Such situations may be based on, among other things, the following: (1) legal or internal restrictions on the combined size of positions that may be taken for the Registrant or the other accounts, thereby limiting the size of the Registrant’s position; (2) the difficulty of liquidating an investment for the Registrant or the other accounts where the market cannot absorb the sale of the combined position; or (3) limits on co-investing in negotiated transactions under the Investment Company Act of 1940.
The 1940 Act limits our ability to co-invest in negotiated private placements of securities with our affiliates, including other funds managed by the Adviser. We and our Adviser have received exemptive relief from the SEC that permits certain co-investment transactions. In this regard, our Adviser has the ability to allocate investment opportunities of certain negotiated transactions between us, other funds registered under the 1940 Act and other accounts managed by our Adviser pro rata based on available capital, up to the amount proposed to be invested by each. All accounts generally are required to participate on the same terms. Pursuant to the exemptive order, our Adviser will be required to provide the board of directors of each participating registered fund with certain information concerning the relevant investment. A majority (as defined in section 57(o) of the 1940 Act) of the directors eligible to consider the co-investment transaction of each participating registered fund must approve such registered fund’s participation in the co-investment transaction.
To the extent that the Adviser sources and structures private investments in publicly traded companies, certain employees of the Adviser may become aware of actions planned by such companies, such as acquisitions, which may not be announced to the public. It is possible that the Registrant could be precluded from investing in or selling securities of a company about which the Adviser has material, non-public information; however, it is the Adviser’s intention to ensure that any material, non-public information available to certain employees of the Adviser is not shared with the employees responsible for the purchase and sale of publicly traded securities or to confirm prior to receipt of any material non-public information that the information will shortly be made public. The Registrant’s investment opportunities also may be limited by affiliations of the Adviser, the Subadviser or their affiliates with essential asset companies.
The Adviser, the Subadviser and their principals, officers, employees, and affiliates may buy and sell securities or other investments for their own accounts and may have actual or potential conflicts of interest with respect to investments made on the Registrant’s behalf. As a result of differing trading and investment strategies or constraints, positions may be taken by principals, officers, employees, and affiliates of the Adviser or Subadviser that are the same as, different from, or made at a different time than positions taken for the Registrant. Further, the Adviser or Subadviser may at some time in the future, manage additional investment funds with the same investment objective as the Registrant’s.
Compensation
None of Messrs. Breidert, de Lamaze, Cubbage, Holmes, Kessens, Mick, Ordway, Pang, Polacek, Prakash, Russell, Sallee, Slee, Sifford, Sznajer or Thummel receives any direct compensation from the Registrant or any other of the managed accounts reflected in the table above. All such accounts are managed by the Adviser or the Subadviser. The team is motivated and retained through a market-based compensation structure, which includes salary, annual performance bonus and deferred compensation. Each of Messrs. Cubbage, Holmes, Kessens, Mick, Ordway, Pang, Polacek, Prakash, Russell, Sallee, Sifford, and Thummel has entered into an employment agreement with the Adviser and receives a base salary for the services he provides. Each of Messrs. Breidert, de Lamaze, Slee and Sznajer has entered into an employment agreement with the Subadviser and receives a base salary from the Subadviser for the services he provides. They are also eligible for an annual performance bonus. The annual bonus pool is based on the financial performance of the firm for the year. It is discretionarily awarded to associates based on firm profits, team performance and individual performance. Additional benefits received by Messrs. Breidert, de Lamaze, Cubbage, Holmes, Kessens, Mick, Ordway, Pang, Polacek, Prakash, Russell, Sallee, Slee, Sifford, Sznajer and Thummel are normal and customary employee benefits generally available to all full-time employees of the Adviser or Subadviser, as applicable. Each of Messrs. Breidert, de Lamaze, Cubbage, Holmes, Kessens, Mick, Ordway, Pang, Polacek, Prakash, Russell, Sallee, Slee, Sifford, Sznajer and Thummel owns an equity interest in TortoiseEcofin Investments, LLC that indirectly wholly owns the Adviser and the Subadviser, and each thus benefits from increases in the net income of the Adviser and the Subadviser.
Securities Owned in the Registrant by Portfolio Managers
The following table provides information about the dollar range of equity securities in the Registrant beneficially owned by each of the portfolio managers as of November 30, 2020:
| Aggregate Dollar Range of | ||||
| Portfolio Manager | Holdings in the Registrant | |||
| Brian Kessens | $10,001-$50,000 | |||
| James Mick | None | |||
| Matthew Sallee | $1-10,000 | |||
| Robert Thummel | $10,001-$50,000 | |||
| Stephen Pang | $1-10,000 | |||
| Nick Holmes | None | |||
| Vince Cubbage | None | |||
| David Sifford | None | |||
| Ed Russell | $10,001-$50,000 | |||
| Jerry G. Polacek | $10,001-$50,000 | |||
| Matthew S. Ordway | $1-$10,000 | |||
| Prashanth K. Prakash | None | |||
| Matthew Breidert | $100,001-$500,000 | |||
| Jean-Hugues de Lamaze | None | |||
| Maximilian Slee | None | |||
| Michel Sznajer | None |
Item 9. Purchases of Equity Securities by Closed-End Management Investment Company and Affiliated Purchasers.
| Period | (a) Total Number of Shares (or Units) Purchased | (b) Average Price Paid per Share (or Unit) | (c) Total Number of Shares (or Units) Purchased as Part of Publicly Announced Plans or Programs | (d) Maximum Number (or Approximate Dollar Value) of Shares (or Units) that May Yet Be Purchased Under the Plans or Programs |
| Month #1 | 0 | 0 | 0 | 0 |
| 6/1/20-6/30/20 | ||||
| Month #2 | 0 | 0 | 0 | 0 |
| 7/1/20-7/31/20 | ||||
| Month #3 | 0 | 0 | 0 | 0 |
| 8/1/20-8/31/20 | ||||
| Month #4 | 0 | 0 | 0 | 0 |
| 9/1/20-9/30/20 | ||||
| Month #5 | 0 | 0 | 0 | 0 |
| 10/1/20-10/31/20 | ||||
| Month #6 | 0 | 0 | 0 | 0 |
| 11/1/20-11/30/20 | ||||
| Total | 0 | 0 | 0 | 0 |
Item 10. Submission of Matters to a Vote of Security Holders.
In October 2020, the Registrant amended its bylaws, including modifying the advance notice requirements.
The advance notice provisions were amended to require the continuous ownership by the stockholder(s) putting forth any such nominee or proposal of at least one percent (1%) of the Registrant’s outstanding shares for a minimum period of at least three years prior to the date of such nomination or proposal and through the date of the related annual meeting. The advance notice provisions were also amended to require that the stockholder nominating an individual or proposing business to be considered must attend the meeting or give a legal proxy to another individual who attends the meeting in order for the proposal or nomination to be properly considered.
In addition, amendments were made to when the stockholder’s notice must be delivered to the secretary of the Registrant and the information required in the stockholder’s notice.
The amended bylaws of the Registrant were filed as an exhibit to a Form 8-K filing made on October 27, 2020.
Item 11. Controls and Procedures.
(a) The Registrant’s Chief Executive Officer, Principal Financial Officer and Treasurer has concluded that the Registrant's disclosure controls and procedures (as defined in Rule 30a-3(c) under the Investment Company Act of 1940 (the “1940 Act”)) are effective as of a date within 90 days of the filing date of this report, based on the evaluation of these controls and procedures required by Rule 30a-3(b) under the 1940 Act and Rules 13a-15(b) or 15d-15(b) under the Securities Exchange Act of 1934, as amended.
(b) There were no changes in the Registrant’s internal control over financial reporting (as defined in Rule 30a-3(d) under the 1940 Act) that occurred during the period covered by this report that have materially affected, or are reasonably likely to materially affect, the Registrant’s internal control over financial reporting.
Item 12. Disclosure of Securities Lending Activities For Closed-End Management Investment Companies.
The Registrant does not participate in securities lending activities.
Item 13. Exhibits.
(2) Certifications pursuant to Section 302 of the Sarbanes-Oxley Act of 2002. Filed herewith.
(3) Any written solicitation to purchase securities under Rule 23c-1 under the Act sent or given during the period covered by the report by or on behalf of the Registrant to 10 or more persons. None.
(b) Certification pursuant to Section 906 of the Sarbanes-Oxley Act of 2002. Furnished herewith.
SIGNATURES
Pursuant to the requirements of the Securities Exchange Act of 1934 and the Investment Company Act of 1940, the Registrant has duly caused this report to be signed on its behalf by the undersigned, thereunto duly authorized.
| (Registrant) | Tortoise Essential Assets Income Term Fund | |
| By (Signature and Title) | /s/ P. Bradley Adams | |
| P. Bradley Adams, Chief Executive Officer, Principal Financial Officer and Treasurer | ||
| Date February 5, 2021 | ||
Pursuant to the requirements of the Securities Exchange Act of 1934 and the Investment Company Act of 1940, this report has been signed below by the following persons on behalf of the Registrant and in the capacities and on the dates indicated. | ||
| By (Signature and Title) | /s/ P. Bradley Adams | |
| P. Bradley Adams, Chief Executive Officer, Principal Financial Officer and Treasurer | ||
| Date February 5, 2021 | ||