Exhibit 99.1
Investor Presentation Update Smaaash Entertainment Inc. NASDAQ – SMSH September 21, 2018
233 50 68 167 34 142 166 166 166 0 167 155 237 239 144 213 41 83 234 43 123 172 61 81 40 168 223 251 86 39 208 75 38 42 56 144 About this Presentation : This presentation (the “Presentation”) contemplates the potential investment by I - AM Capital Acquisition Company (“I - AM Capital”) in equity securities of Smaaash Entertainment Private Limited (“Smaaash”), referred to herein as the “proposed business combination” . This Presentation does not purport to contain all of the information that may be required to evaluate the proposed business combination and you should seek your own legal, accounting and other relevant professional advice . All information herein speaks only as of the date hereof, unless stated otherwise . Neither I - AM Capital nor Smaaash undertake any obligation to update or otherwise revise any information contained in this Presentation . Acceptance of this Presentation constitutes your acknowledgement and agreement that none of I - AM Capital, Smaaash and their respective affiliates, directors, officers, employees, partners, members, controlling persons, agents or advisers (i) makes any express or implied representation or warranty as to the accuracy or completeness of the information contained herein or (ii) shall have any liability to the recipient or its representatives relating to or arising from the information contained herein or any omissions from such information, or any other written or oral communication transmitted to any interested party in the course of its evaluation of the proposed business combination . No Offer or Solicitation : This Presentation is for information purposes only and does not constitute an offer to sell, a solicitation of an offer to buy, or a recommendation to purchase any equity, debt or other financial instruments of I - AM Capital, Smaaash, or their respective affiliates’ securities (as such term is defined under the U . S . Federal securities laws) . Use of Projections : This Presentation contains certain financial forecasts with respect to I - AM Capital and Smaaash . These financial projections have been provided by their respective management teams, and their independent auditors have not audited, reviewed, compiled, or performed any procedures with respect thereto for the purpose of their inclusion in this Presentation, and accordingly do not express an opinion or provide any other form of assurance with respect thereto for the purpose of this Presentation . These financial projections should not be relied upon as being necessarily indicative of future results . The inclusion of such information is not an admission or representation by them that such information is material . In this Presentation, certain of the above - mentioned financial projections have been prepared for purposes of providing comparisons with historical data . The assumptions and estimates underlying the projections are inherently uncertain and are subject to a wide variety of significant business, economic and competitive risks and uncertainties that could cause actual results to differ materially from those contained in the projections . Accordingly, there can be no assurance that the prospective results are indicative of the future performance of I - AM Capital or Smaaash or that actual results will not differ materially from those presented . Inclusion of the financial projections in this Presentation should not be regarded as a representation by any person that the results contained in the projections will be achieved . The information contained herein is not a guarantee of future performance . Disclaimer & Forward Looking Statements Non - GAAP Financial Measures : This Presentation includes certain financial measures not presented in accordance with generally accepted accounting principles (“GAAP”) including, but not limited to, EBITDA and certain ratios and other metrics derived therefrom . I - AM Capital believes that these non - GAAP measures of financial results provides useful information to management and investors regarding certain financial and business trends relating to Smaaash’s financial condition and results of operations . Smaaash’s management use these non - GAAP measures to compare its performance to that of prior periods for, among other reasons, trend analysis and for budgeting and planning purposes . I - AM Capital believes that the use of these non - GAAP measures provides an additional tool for investors to use in evaluating ongoing operating results and trends and in comparing Smaaash’s financial measures with other peer companies, many of which present similar non - GAAP measures to investors . These non - GAAP measures should not be considered in isolation or as an alternative to financial measures determined in accordance with GAAP . These measures are subject to inherent limitations as they reflect the exercise of judgment by management about which expenses and income are excluded or included in determining these non - GAAP measures . You should not place undue reliance on these non - GAAP measures . We urge you to review I - AM Capital and Smaaash’s financial statements, which will be presented in I - AM Capital’s proxy statement to be filed with the SEC and delivered to stockholders of I - AM Capital . Additional Information ; Participation in Solicitation : This Presentation does not contain all the information that should be considered concerning the proposed business combination . It is not intended to form the basis of any investment decision or any other decision with respect to the proposed business combination . In connection with the proposed business combination, I - AM Capital has filed with the SEC a preliminary proxy statement (which shall be amended) and will mail a definitive proxy statement and other relevant documentation to I - AM Capital stockholders . I - AM Capital stockholders and other interested persons are advised to read, when available, the preliminary proxy statement and any amendments thereto, and the definitive proxy statement, in connection with I - AM Capital’s solicitation of proxies for the stockholders meeting to be held to approve the transactions contemplated by the proposed business combination because these materials will contain important information about I - AM Capital, Smaaash and the proposed transaction . The definitive proxy statement will be mailed to I - AM Capital stockholders as of a record date to be established for voting on the proposed business combination when it becomes available . I - AM Capital stockholders will also be able to obtain a copy of the preliminary proxy statement and definitive proxy statement once they are available, without charge, at the SEC’s website at http : //sec . gov or by directing a request to I - AM Capital Acquisition Company, 1345 Avenue of the Americas, 11 th Floor, New York, NY 10105 . This Presentation shall not constitute a solicitation of a proxy, consent or authorization with respect to any securities or in respect of the proposed business combination . I - AM Capital and its directors and officers may be deemed participants in the solicitation of proxies of I - AM Capital’s stockholders with respect to the approval of the business combination . Information regarding I - AM Capital’s directors and officers and a description of their interest in I - AM Capital will be contained in the preliminary proxy statement and amendments thereto, and the definitive proxy statement for the business combination, when available . 2
233 50 68 167 34 142 166 166 166 0 167 155 237 239 144 213 41 83 234 43 123 172 61 81 40 168 223 251 86 39 208 75 38 42 56 144 Forward - Looking Statements : This Presentation includes “forward - looking statements” regarding I - AM Capital and Smaaash that reflect their current views and information currently available . This information is, where applicable, based on estimates, assumptions and analysis that management believes, as of the date hereof, provide a reasonable basis for the information contained herein . Forward - looking statements can generally be identified by the use of forward - looking words such as “may”, “will”, “expect”, “intend”, “plan”, “estimate”, “anticipate”, “believe”, or other similar words . Forward - looking statements may include, for example, statements about : the benefits of the business combination ; the future financial performance of I - AM Capital and Smaaash following the business combination ; and changes in strategy, future operations, financial position, estimated revenues, and losses, projected costs, prospects, plans and objectives of management . These forward - looking statements are based on information available as of the date of this Presentation, current expectations, forecasts and assumptions, and involve a number of judgments, risks and uncertainties . Accordingly, forward - looking statements should not be relied upon as representing I - AM Capital or Smaaash’s views as of any subsequent date, and neither I - AM Capital nor Smaaash undertakes any obligation to update forward - looking statements to reflect events or circumstances after the date they were made, whether as a result of new information, future events or otherwise, except as may be required under applicable securities laws . You should not place undue reliance on these forward - looking statements . As a result of a number of known and unknown risks and uncertainties, I - AM Capital and Smaaash’s actual results or performance may be materially different from those expressed or implied by these forward - looking statements . Some factors that could cause actual results to differ include : (i) the occurrence of any event, change or other circumstances that could delay the business combination or give rise to the termination of the definitive agreements relating to the business combination ; (ii) the outcome of any legal proceedings that may be instituted against the parties following announcement of the business combination ; (iii) the inability to complete the business combination due to the failure to obtain approval of the stockholders of I - AM Capital, or other conditions to closing in the definitive agreements relating to the business combination ; (iv) the risk that the proposed business combination disrupts current plans and operations of I - AM Capital or Smaaash as a result of the announcement and consummation of the business combination ; (v) I - AM Capital and Smaaash’s ability to realize the anticipated benefits of the business combination, which may be affected by, among other things, competition and the ability of I - AM Capital and Smaaash to grow and manage growth profitably following the business combination ; (vi) costs related to the business combination ; (vii) changes in applicable laws or regulations ; and (viii) the possibility that I - AM Capital or Smaaash may be adversely affected by other economic, business, and/or competitive factors . The foregoing list of factors is not exclusive . Additional information concerning these and other risk factors are contained in I - AM Capital’s prior and future filings with the SEC . All subsequent written and oral forward - looking statements concerning I - AM Capital and Smaaash, the transactions described herein or other matters and attributable to I - AM Capital, Smaaash, and their respective stockholders or any person acting on their behalf are expressly qualified in their entirety by the cautionary statements above . Exchange rate used for calculations : INR 65 to US $ 1 Disclaimer & Forward Looking Statements 3
233 50 68 167 34 142 166 166 166 0 167 155 237 239 144 213 41 83 234 43 123 172 61 81 40 168 223 40 168 223 208 75 38 42 56 144 I. Transaction Overview Table of Contents I. Introduction II. The Smaaash Growth Story III. Financial Overview IV. Transaction Overview Appendix 4

233 50 68 167 34 142 166 166 166 0 167 155 237 239 144 213 41 83 234 43 123 172 61 81 40 168 223 40 168 223 208 75 38 42 56 144 I. Introduction I. Introduction 5
233 50 68 167 34 142 166 166 166 0 167 155 237 239 144 213 41 83 234 43 123 172 61 81 40 168 223 251 86 39 208 75 38 42 56 144 ▪ I - AM Capital Acquisition Company (“I - AM”, NASDAQ: IAM), is pleased to discuss its announced business combination (the “Transacti on”) with Smaaash Entertainment Private Limited (“ Smaaash ”) ▪ I - AM is a Special Purpose Acquisition Company (“SPAC”), which completed a US$50 million initial public offering in August, 2017 – Formed to target acquisitions in the large, attractive and rapidly growing Indian market – Expects to invest up to US$49 million in Smaaash in exchange for common shares constituting 27.5% pro forma ownership ▪ Smaaash is the leader in the Family Entertainment Center (“FEC”) segment which it has redefined: – Positioned to capitalize on India’s rapidly expanding middle class – Proprietary disruptive technology ▪ The Transaction will enable Smaaash to accelerate its growth in India and internationally through several identified organic and strategic initiatives ▪ The Transaction has been structured to provide a compelling valuation to public company peers – 48.5% discount relative to peers’ median EV / EBITDA FY2020E multiple (1) ($45 million of EBITDA) – Additional structural protections to investors based on Smaaash’s earnings growth ▪ On August 24, 2018, I - AM Capital announced a special dividend of 600,000 shares, providing additional compensation for investors Executive Summary (1) Based on a $ 10.208 share price and peer median multiple of 11.8x 6

233 50 68 167 34 142 166 166 166 0 167 155 237 239 144 213 41 83 234 43 123 172 61 81 40 168 223 251 86 39 208 75 38 42 56 144 ▪ Definitive Agreement Signed: May 3, 2018 ▪ Transaction Announced: May 8, 2018 ▪ Preliminary Proxy Filed: June 22, 2018 ▪ Special Dividend Announced from I - AM: August 24, 2018 ▪ SPAC Vote: October 4, 2018 ▪ Target Closing: October 4, 2018 Overview ▪ Smaaash and I - AM have executed definitive agreements to invest up - to US$49 million into Smaaash in exchange for up to 27.5% (1) pro forma ownership of Smaaash ▪ I - AM will change its name to “Smaaash Entertainment Inc.” and its ticker symbol to “SMSH” (referred to herein as the “Company”) in connection with the closing of the Transaction Key Dates Management, Directors and Governance ▪ Existing Smaaash executive team will retain current positions at Smaaash ▪ Shripal Morakhia is expected to join the Company’s Board as Chairman ▪ The eight directors of I - AM will continue as directors of the Company ▪ Well experienced management team will execute the Company’s vision Transaction Overview (1) Assuming no redemptions by I - AM Capital public shareholders 7

233 50 68 167 34 142 166 166 166 0 167 155 237 239 144 213 41 83 234 43 123 172 61 81 40 168 223 40 168 223 208 75 38 42 56 144 II. The Smaaash Growth Story 8
233 50 68 167 34 142 166 166 166 0 167 155 237 239 144 213 41 83 234 43 123 172 61 81 40 168 223 251 86 39 208 75 38 42 56 144 Investment Highlights Cutting - Edge Development Capabilities & Proprietary IP Immersive & Differentiated Product Offering 3 Leader in Family Entertainment 4 Multiple, In - Place Growth Opportunities 5 Proven and Experienced Leadership Team 6 Large & Rapidly Growing Addressable Market 1 2 9
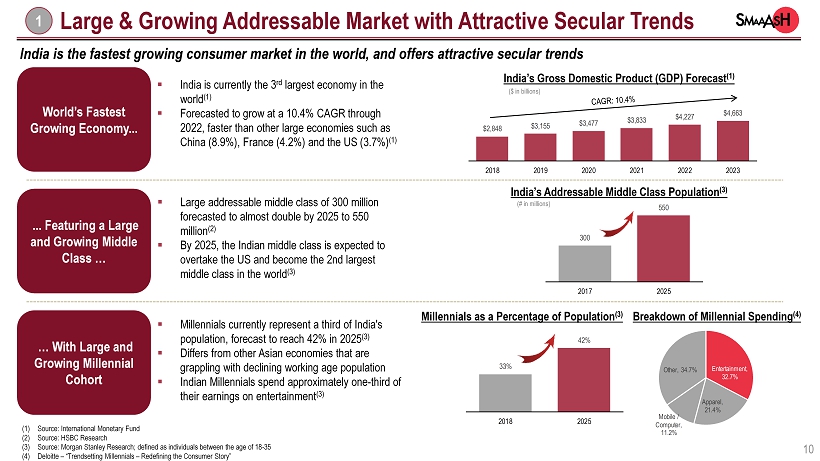
233 50 68 167 34 142 166 166 166 0 167 155 237 239 144 213 41 83 234 43 123 172 61 81 40 168 223 251 86 39 208 75 38 42 56 144 300 550 2017 2025 Large & Growing Addressable Market with Attractive Secular Trends Large, High Growth Population 1 India is the fastest growing consumer market in the world, and offers attractive secular trends World’s Fastest Growing Economy... ... Featuring a Large and Growing Middle Class … … With Large and Growing Millennial Cohort ($ in billions) ▪ India is currently the 3 rd largest economy in the world (1) ▪ Forecasted to grow at a 10.4% CAGR through 2022, faster than other large economies such as China (8.9%), France (4.2%) and the US (3.7%) (1) ▪ Large addressable middle class of 300 million forecasted to almost double by 2025 to 550 million (2) ▪ By 2025, the Indian middle class is expected to overtake the US and become the 2nd largest middle class in the world (3) India’s Addressable Middle Class Population (3) Breakdown of Millennial Spending (4) ▪ Millennials currently represent a third of India's population, forecast to reach 42% in 2025 (3) ▪ Differs from other Asian economies that are grappling with declining working age population ▪ Indian Millennials spend approximately one - third of their earnings on entertainment (3) Millennials as a Percentage of Population (3) India’s Gross Domestic Product (GDP) Forecast (1) (1) Source: International Monetary Fund (2) Source : HSBC Research (3) Source: Morgan Stanley Research; defined as individuals between the age of 18 - 35 (4) Deloitte – “Trendsetting Millennials – Redefining the Consumer Story” (# in millions) $2,848 $3,155 $3,477 $3,833 $4,227 $4,663 2018 2019 2020 2021 2022 2023 33% 42% 2018 2025 Entertainment , 32.7% Apparel , 21.4% Mobile / Computer , 11.2% Other , 34.7% 10
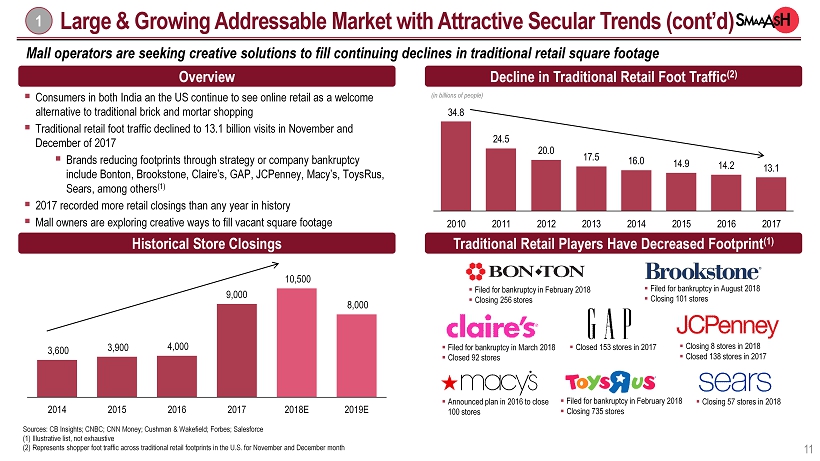
233 50 68 167 34 142 166 166 166 0 167 155 237 239 144 213 41 83 234 43 123 172 61 81 40 168 223 251 86 39 208 75 38 42 56 144 34.8 24.5 20.0 17.5 16.0 14.9 14.2 13.1 2010 2011 2012 2013 2014 2015 2016 2017 1 11 Large & Growing Addressable Market with Attractive Secular Trends (cont’d) Overview Decline in Traditional Retail Foot Traffic (2) Traditional Retail Players Have Decreased Footprint (1) Historical Store Closings ▪ Consumers in both India an the US continue to see online retail as a welcome alternative to traditional brick and mortar shopping ▪ Traditional retail foot traffic declined to 13.1 billion visits in November and December of 2017 ▪ Brands reducing footprints through strategy or company bankruptcy include Bonton , Brookstone , Claire’s, GAP, JCPenney , Macy’s, ToysRus , Sears, among others (1) ▪ 2017 recorded more retail closings than any year in history ▪ Mall owners are exploring creative ways to fill vacant square footage Mall operators are seeking creative solutions to fill continuing declines in traditional retail square footage Sources: CB Insights; CNBC; CNN Money; Cushman & Wakefield; Forbes; Salesforce (1) Illustrative list, not exhaustive (2) Represents shopper foot traffic across traditional retail footprints in the U.S. for November and December month (in billions of people) 3,600 3,900 4,000 9,000 10,500 8,000 2014 2015 2016 2017 2018E 2019E ▪ Filed for bankruptcy in March 2018 ▪ Closed 92 stores ▪ Filed for bankruptcy in February 2018 ▪ Closing 256 stores ▪ Filed for bankruptcy in August 2018 ▪ Closing 101 stores ▪ Closing 8 stores in 2018 ▪ Closed 138 stores in 2017 ▪ Closed 153 stores in 2017 ▪ Announced plan in 2016 to close 100 stores ▪ Filed for bankruptcy in February 2018 ▪ Closing 735 stores ▪ Closing 57 stores in 2018
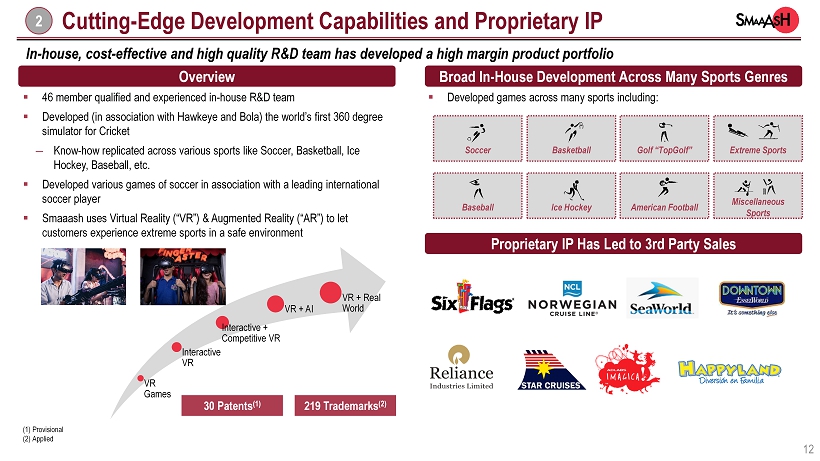
233 50 68 167 34 142 166 166 166 0 167 155 237 239 144 213 41 83 234 43 123 172 61 81 40 168 223 40 168 223 208 75 38 42 56 144 VR Games Interactive VR Interactive + Competitive VR VR + AI VR + Real World Cutting - Edge Development Capabilities and Proprietary IP ▪ 46 member qualified and experienced in - house R&D team ▪ Developed (in association with Hawkeye and Bola) the world’s first 360 degree simulator for Cricket ― Know - how replicated across various sports like Soccer, Basketball, Ice Hockey, Baseball, etc. ▪ Developed various games of soccer in association with a leading international soccer player ▪ Smaaash uses Virtual Reality (“VR”) & Augmented Reality (“AR”) to let customers experience extreme sports in a safe environment ▪ Developed games across many sports including: Soccer Basketball Golf “TopGolf” Extreme Sports Baseball Ice Hockey American Football Miscellaneous Sports 2 219 Trademarks (2) 30 Patents (1) In - house, cost - effective and high quality R&D team has developed a high margin product portfolio Overview Broad In - House Development Across Many Sports Genres Proprietary IP Has Led to 3rd Party Sales (1) Provisional (2) Applied 12
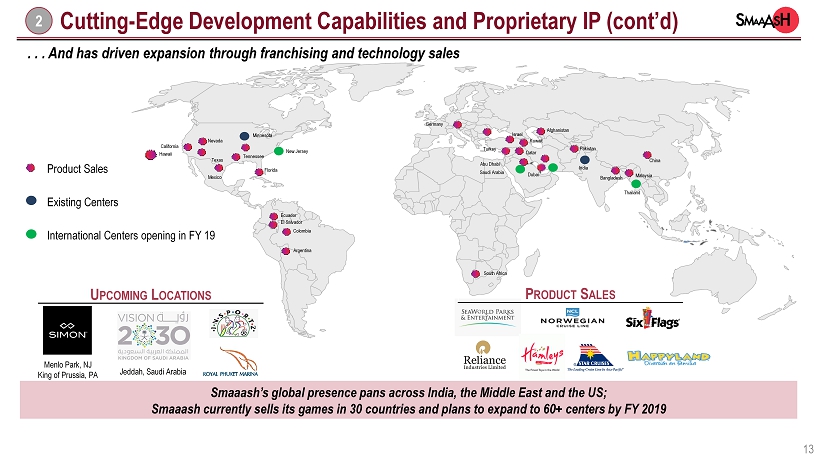
233 50 68 167 34 142 166 166 166 0 167 155 237 239 144 213 41 83 234 43 123 172 61 81 40 168 223 251 86 39 208 75 38 42 56 144 Cutting - Edge Development Capabilities and Proprietary IP (cont’d) U PCOMING L OCATIONS P RODUCT S ALES Menlo Park, NJ King of Prussia, PA Jeddah, Saudi Arabia 2 Product Sales Existing Centers International Centers opening in FY 19 Las Vegas Hawaii Texas Ecuador Turkey China Dubai Saudi Arabia Colombia Mexico Israel Qatar Abu Dhabi Germany California India Pakistan Afghanistan Argentina Malaysia Kuwait El Salvador South Africa Bangladesh Florida Nevada Tennessee Minnesota Thailand New Jersey . . . And has driven expansion through franchising and technology sales Smaaash’s global presence pans across India, the Middle East and the US; Smaaash currently sells its games in 30 countries and plans to expand to 60+ centers by FY 2019 13
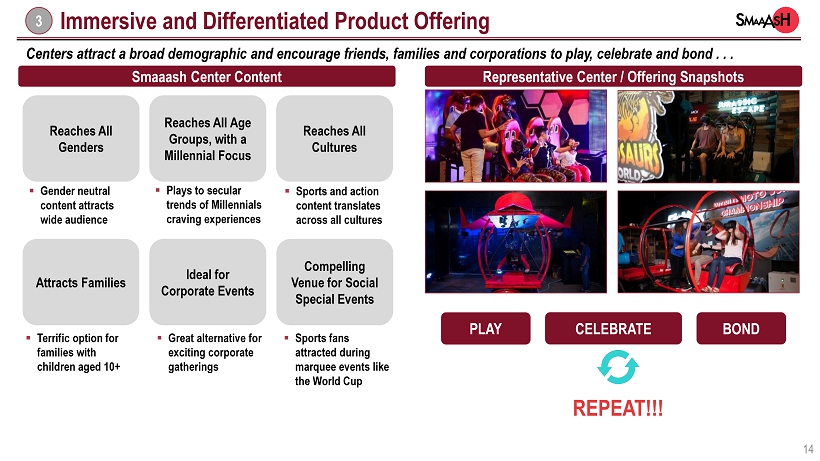
233 50 68 167 34 142 166 166 166 0 167 155 237 239 144 213 41 83 234 43 123 172 61 81 40 168 223 251 86 39 208 75 38 42 56 144 BOND CELEBRATE PLAY REPEAT!!! ▪ Gender neutral content attracts wide audience Immersive and Differentiated Product Offering 3 Centers attract a broad demographic and encourage friends, families and corporations to play, celebrate and bond . . . Attracts Families Ideal for Corporate Events Reaches All Cultures Reaches All Genders Reaches All Age Groups, with a Millennial Focus ▪ Plays to secular trends of Millennials craving experiences ▪ Sports and action content translates across all cultures ▪ Terrific option for families with children aged 10+ ▪ Great alternative for exciting corporate gatherings Compelling Venue for Social Special Events ▪ Sports fans attracted during marquee events like the World Cup Smaaash Center Content Representative Center / Offering Snapshots 14

233 50 68 167 34 142 166 166 166 0 167 155 237 239 144 213 41 83 234 43 123 172 61 81 40 168 223 251 86 39 208 75 38 42 56 144 Smaaash engages its audience physically and emotionally by encouraging bonding and team development through group play, all year round Immersive and Differentiated Product Offering (cont’d) 3 . . . While the concept is tremendously differentiated versus other family entertainment options Select Types of Entertainment Centers Age Neutral Group - Play Aspirational & Immersive Physically & Emotionally Engaging Challenging Low Capex Stand Alone Attraction Gaming Parlors & Bowling Alleys Theme Parks & Water Parks Children's Entertainment Centers Flight Simulator Source: Chlorophyll, a leading brand and marketing agency in Mumbai, India Select Types of Entertainment Centers Age Neutral Group - Play Aspirational & Immersive Physically & Emotionally Engaging Challenging Low Capex Stand Alone Attraction Gaming Parlors & Bowling Alleys Theme Parks & Water Parks Children's Entertainment Centers Flight Simulator 15

233 50 68 167 34 142 166 166 166 0 167 155 237 239 144 213 41 83 234 43 123 172 61 81 40 168 223 251 86 39 208 75 38 42 56 144 The Leader in Family Entertainment Smaaash has pioneered the FEC segment in India and enjoys ~80% market share (1 ) . . . Amritsar Chandigarh 1 1 NCR 5 Mumbai 1 Pune 1 3 Hyderabad 2 6 Vijayawada 1 1 Mysore 1 Mangalore Madurai 1 1 Indore Bhopal 1 1 2 Ludhiana 2 Bangalore 13 1 37 (2 ) Centers to - date Comprising ~800,000 square feet 17 1 Planned Expansion by 2019E Soccer ▪ Kid focused aspirational center ▪ In talks with leading global brands for setting up IP - based multi - themed kids centers ▪ The first Smaaash Junior center is scheduled to open in Bangalore, India by year - end 2018 ▪ Smaaash has designed and developed games around a famous soccer player ▪ Exclusively soccer focused center offering 27 games in Jeddah, Saudi Arabia is scheduled to open in September 2018 (FY 2019) ▪ Unique interactive games to cater from beginners to pros with added ability to improve skills 4 Dominant Footprint Current Brand Concepts Planned Brand Extensions ▪ Two lanes of bowling and one cricket lane ▪ No banquet hall ▪ No F&B unit ▪ Multiple Bowling lanes and two - to - three cricket lanes ▪ One banquet hall ▪ One F&B unit ▪ Three anchor games including Go - Karting and multiple lanes of Cricket & Bowling ▪ Multiple VR and arcade games ▪ Multiple banquet halls ▪ Multiple F&B options (1) Persistence Market Research – India Family Entertainment Center (“FEC”) Market – Industry Analysis 2013 - 17 & Forecast 2018 - 22 (2) Includes US location 16

233 50 68 167 34 142 166 166 166 0 167 155 237 239 144 213 41 83 234 43 123 172 61 81 40 168 223 251 86 39 208 75 38 42 56 144 10 16 16 23 12 20 34 1 11 29 37 60 FY 2013 FY 2017 FY 2018 Current Future . . . With expansion Underway Across Brand Categories and Product Sales ▪ 46 person in - house R&D team has developed over 65 proprietary games and has a substantial pipeline of original sports and virtual reality games ▪ Smaaash expects to have over 60 centers operational by March 31, 2019 The Leader in Family Entertainment (cont’d) 4 Rapidly Growing Footprint Increasing Portfolio of Games Launched 1 50 55 65 FY 2013 FY 2017 FY 2018 Current 17 Smaaash has grown from 252,000 sf in August 2017 to 824,000 sf currently (1) Source: Company management (1) As of August 31, 2018. (1)
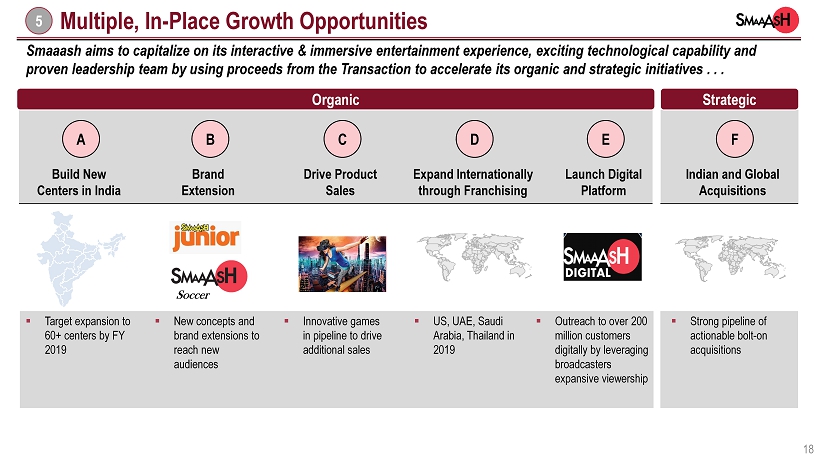
233 50 68 167 34 142 166 166 166 0 167 155 237 239 144 213 41 83 234 43 123 172 61 81 40 168 223 251 86 39 208 75 38 42 56 144 Multiple, In - Place Growth Opportunities Build New Centers in India A Drive Product Sales B Expand Internationally through Franchising C D Launch Digital Platform Indian and Global Acquisitions E Brand Extension F Soccer Smaaash aims to capitalize on its interactive & immersive entertainment experience, exciting technological capability and proven leadership team by using proceeds from the Transaction to accelerate its organic and strategic initiatives . . . ▪ Target expansion to 60+ centers by FY 2019 ▪ New concepts and brand extensions to reach new audiences ▪ Innovative games in pipeline to drive additional sales ▪ US, UAE, Saudi Arabia, Thailand in 2019 ▪ Outreach to over 200 million customers digitally by leveraging broadcasters expansive viewership ▪ Strong pipeline of actionable bolt - on acquisitions 5 Organic Strategic 18
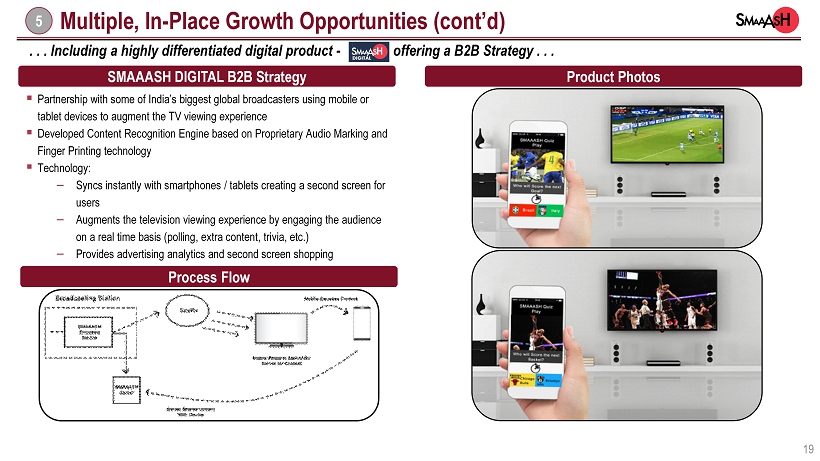
233 50 68 167 34 142 166 166 166 0 167 155 237 239 144 213 41 83 234 43 123 172 61 81 40 168 223 40 168 223 208 75 38 42 56 144 . . . Including a highly differentiated digital product - offering a B2B Strategy . . . Multiple, In - Place Growth Opportunities (cont’d) 5 ▪ Partnership with some of India’s biggest global broadcasters using mobile or tablet devices to augment the TV viewing experience ▪ Developed Content Recognition Engine based on Proprietary Audio Marking and Finger Printing technology ▪ Technology: – Syncs instantly with smartphones / tablets creating a second screen for users – Augments the television viewing experience by engaging the audience on a real time basis (polling, extra content, trivia, etc.) – Provides advertising analytics and second screen shopping The strategy ensures immediate traction without any investment in customer acquisition SMAAASH DIGITAL B2B Strategy Process Flow Product Photos 19
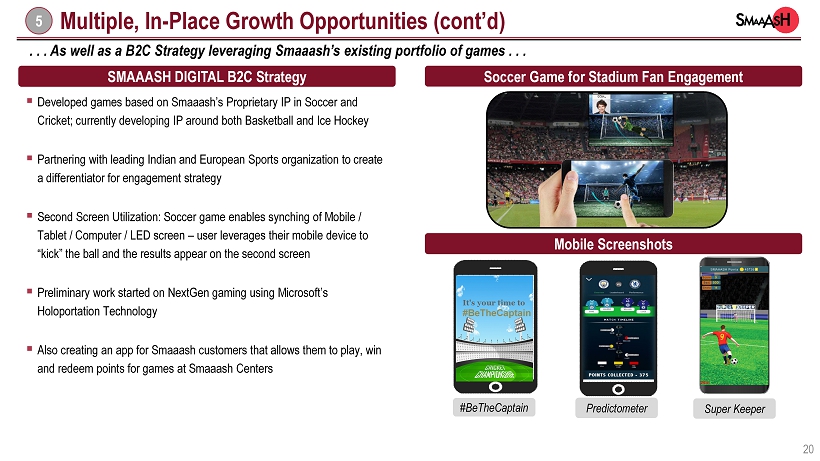
233 50 68 167 34 142 166 166 166 0 167 155 237 239 144 213 41 83 234 43 123 172 61 81 40 168 223 251 86 39 208 75 38 42 56 144 Multiple, In - Place Growth Opportunities (cont’d) 5 ▪ Developed games based on Smaaash’s Proprietary IP in Soccer and Cricket; currently developing IP around both Basketball and Ice Hockey ▪ Partnering with leading Indian and European Sports organization to create a differentiator for engagement strategy ▪ Second Screen Utilization: Soccer game enables synching of Mobile / Tablet / Computer / LED screen – user leverages their mobile device to “kick” the ball and the results appear on the second screen ▪ Preliminary work started on NextGen gaming using Microsoft’s Holoportation Technology ▪ Also creating an app for Smaaash customers that allows them to play, win and redeem points for games at Smaaash Centers . . . As well as a B2C Strategy leveraging Smaaash’s existing portfolio of games . . . Soccer Game for Stadium Fan Engagement SMAAASH DIGITAL B2C Strategy It's your time to #BeTheCaptain Mobile Screenshots #BeTheCaptain Predictometer Super Keeper 20

233 50 68 167 34 142 166 166 166 0 167 155 237 239 144 213 41 83 234 43 123 172 61 81 40 168 223 251 86 39 208 75 38 42 56 144 Proven and Experienced Leadership Team Shripal Morakhia CEO & Founder Vishwanath Kotian CFO 6 Smaaash boasts a leadership team with a proven track record of building and growing businesses Shripal Morakhia CEO & Founder Kaizad Bajina, CTO & CRO F. Jacob Cherian, CEO, I - AM Capital Suhel Kanuga, CFO, I - AM Capital ▪ Founded institutional brokerage and investment banking firm , SSKI, built into one of the largest institutional and investment banking firms in India ▪ Previously built Sharekhan (the “e - trade of India”), one of the first online trading companies in India and subsequently sold to Citigroup ▪ Also built and sold media businesses to the likes of Bertelsmann and Future Group ▪ Has produced 16 feature films ▪ Chairman & CEO of Millenium India ▪ Previously a Partner at CSC, a Fortune 500 company ▪ Director at KPMG LLP, J.P Morgan & Co. ▪ Adjunct Professor of Finance, Graduate School of Business, St. John’s Univ. NY for 10 years ▪ MBA in International Finance ▪ Co - founder , President & CFO of Millenium India ▪ Served on BOD of SAM Global Securities ▪ Principal in financial services division of CSC, a Fortune 500 company, prior experience at KPMG LLP ▪ Bachelors degree in Mathematics & Economics ▪ Member of Institute of Chartered Accountants of India since 1999 ▪ Previously worked for Ernst & Young in a variety of roles ▪ Part of Shripal Morakhia’s media endeavors ▪ Joined Smaaash in 2015 ▪ Well versed with IFRS reporting standards ▪ Heads a dedicated R&D team at Smaaash ▪ Headed the systems integration company responsible for making the fourth largest Indian city Wi - Fi enabled ▪ Business Administration graduate Chirag Gehlot CDO ▪ Prior 10 years of experience across technology and engineering companies ▪ Heads the Smaaash Digital division that is aiming to reach over 200mm customers digitally ▪ BIT degree from University of Swinburne Leadership 21
233 50 68 167 34 142 166 166 166 0 167 155 237 239 144 213 41 83 234 43 123 172 61 81 40 168 223 40 168 223 208 75 38 42 56 144 III. Financial Overview 22

233 50 68 167 34 142 166 166 166 0 167 155 237 239 144 213 41 83 234 43 123 172 61 81 40 168 223 251 86 39 208 75 38 42 56 144 $0.5 24.0% $0.3 36.0% Old New New Old $1.2 $1.5 $0.6 $3.3 $0.7 $0.3 $0.1 $1.1 Game Cost Construction Cost Other Cost Total A Smaaash center offers attractive unit economics at 50.8% EBITDA margin ▪ Decrease in Employee Cost has Led to Increase in Profitability per Center ▪ Decrease in employee costs contributed 85% of overall margin improvement; balance achieved through Other Cost initiatives Annual Employee Cost EBITDA Margin (1) Reduced Capex Costs Lower Operating Costs Attractive Unit Economics % of Revenue Revenue $650 100.0% Costs Employee 60 9.2% Rent 120 18.5% Other Cost 140 21.5% Total Costs $320 49.2% EBITDA $ 330 50.8% Set - up Costs of a Smaaash Regular Center Smaaash Zone Centers Representative Margin Profile Smaaash has improved profitability through Efficiencies of Scale and Cost Optimization Attractive Unit Economics through Capex and Opex Initiatives Source: Company management ( 1) EBITDA Margin includes allocated corporate costs ($ in thousands) 23 Old Center (average) New Center

233 50 68 167 34 142 166 166 166 0 167 155 237 239 144 213 41 83 234 43 123 172 61 81 40 168 223 251 86 39 208 75 38 42 56 144 $0.2 $0.8 $2.5 $4.9 $6.3 $8.1 67% 33% 49% 40% 40% 40% FY16 FY17 FY18 FY19 FY20 FY21 Company to utilize global access and international recognition of Smaaash brand to further drive high margin product sales Representative 3 rd Party Product Sales High Product Quality and Brand Recognition Drive Product Sales Representative Pipeline Product Sales Product Sales Forecast Product Sales EBITDA Forecast $0.3 $2.4 $5.1 $12.2 $15.8 $20.4 FY16 FY17 FY18 FY19 FY20 FY21 Source: Company management Note : Projections based on the closing of the Transaction and Smaaash expanding operations 24
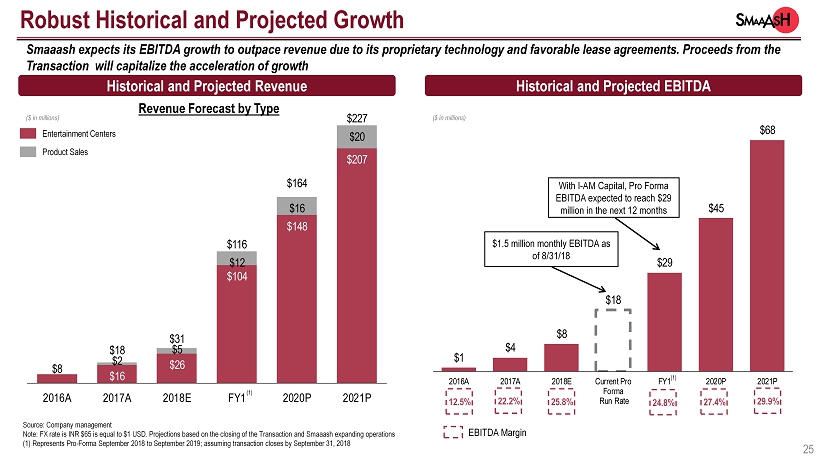
233 50 68 167 34 142 166 166 166 0 167 155 237 239 144 213 41 83 234 43 123 172 61 81 40 168 223 40 168 223 208 75 38 42 56 144 $1 $4 $8 $18 $29 $45 $68 2016A 2017A 2018E Current Pro Forma Run Rate FY1 2020P 2021P $8 $16 $26 $104 $148 $207 $2 $5 $12 $16 $20 $18 $31 $116 $164 $227 2016A 2017A 2018E FY1 2020P 2021P Robust Historical and Projected Growth Smaaash expects its EBITDA growth to outpace revenue due to its proprietary technology and favorable lease agreements. Procee ds from the Transaction will capitalize the acceleration of growth 12.5 % With I - AM Capital, Pro Forma EBITDA expected to reach $29 million in the next 12 months 22.2 % 25.8 % 24.8 % 27.4 % 29.9 % $1.5 million monthly EBITDA as of 8/31/18 Source: Company management Note: FX rate is INR $65 is equal to $1 USD. Projections based on the closing of the Transaction and Smaaash expanding operations (1) Represents Pro - Forma September 2018 to September 2019; assuming transaction closes by September 31, 2018 Historical and Projected Revenue Revenue Forecast by Type (1) Historical and Projected EBITDA (1) ($ in millions) ($ in millions) EBITDA Margin 25 Entertainment Centers Product Sales

233 50 68 167 34 142 166 166 166 0 167 155 237 239 144 213 41 83 234 43 123 172 61 81 40 168 223 40 168 223 208 75 38 42 56 144 IV. Transaction Overview 26

233 50 68 167 34 142 166 166 166 0 167 155 237 239 144 213 41 83 234 43 123 172 61 81 40 168 223 251 86 39 208 75 38 42 56 144 Pro Forma Capitalization (Diluted) (1) Pro Forma Cash (2) $50.3 Debt ( Smaaash ) 45.1 Net Debt (5.2) Equity Capitalization at Closing (3,4,5) $ 277.2 Pro Forma Enterprise Value (3,4,6) $ 271.9 Pro Forma Capitalization & Ownership ($ and shares in millions) Pro Forma Ownership (Diluted) (2) Actual # Shares (3) Adj. # of Shares (3) % Owned Smaaash Shareholders 235.8 19.3 72.5% I - AM Capital Shareholders 89.5 7.3 27.5% Pro Forma Outstanding Shares 325.3 26.6 100% Pro Forma Transaction Multiples (Diluted) (1) Enterprise Value (3,4) / 2020E EBITDA ( Smaaash YE March 31) 6.1x (1) Diluted share count is based on the treasury stock method of accounting. Actual ownership I - AM will receive of Smaaash before the effect of any dilution from existing warrants/options is 27.5%. (2) Assumes none of the I - AM Capital’s public shareholders exercise their redemption rights ($52.8m of cash), plus $1.9m of cash fro m Smaaash less $4.4 million of estimated Transaction costs. (3) Adj. share count reflects a 12.24x share conversion ratio based on the shares that I - AM Capital will receive in Smaaash . Adj share count reflects what the ownership I - AM would be on a reverse merger basis. (4) Based on a trust value per share of $ 10.208. (5) Pre - money equity value of Smaaash of $ 196.7m (6) Pre - money enterprise value of Smaaash of $ 239.9m 27.5% 72.5% I-AM Capital Shareholders Smaaash Shareholders $49 million of cash from I - AM utilized by Smaaash for growth capital (2) 27
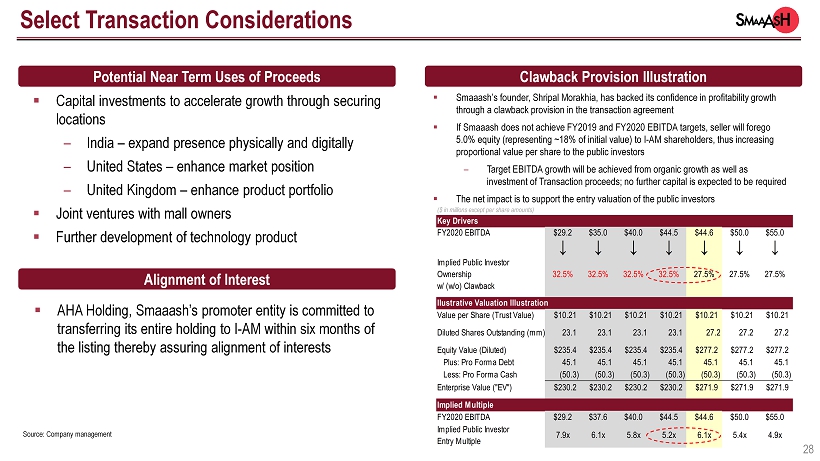
233 50 68 167 34 142 166 166 166 0 167 155 237 239 144 213 41 83 234 43 123 172 61 81 40 168 223 251 86 39 208 75 38 42 56 144 ($ in millions except per share amounts) Key Drivers FY2020 EBITDA $29.2 $35.0 $40.0 $44.5 $44.6 $50.0 $55.0 ↓ ↓ ↓ ↓ ↓ ↓ ↓ Implied Public Investor Ownership w/ (w/o) Clawback 32.5% 32.5% 32.5% 32.5% 27.5% 27.5% 27.5% Ilustrative Valuation Illustration Value per Share (Trust Value) $10.21 $10.21 $10.21 $10.21 $10.21 $10.21 $10.21 Diluted Shares Outstanding (mm) 23.1 23.1 23.1 23.1 27.2 27.2 27.2 Equity Value (Diluted) $235.4 $235.4 $235.4 $235.4 $277.2 $277.2 $277.2 Plus: Pro Forma Debt 45.1 45.1 45.1 45.1 45.1 45.1 45.1 Less: Pro Forma Cash (50.3) (50.3) (50.3) (50.3) (50.3) (50.3) (50.3) Enterprise Value ("EV") $230.2 $230.2 $230.2 $230.2 $271.9 $271.9 $271.9 Implied Multiple FY2020 EBITDA $29.2 $37.6 $40.0 $44.5 $44.6 $50.0 $55.0 Implied Public Investor Entry Multiple 7.9x 6.1x 5.8x 5.2x 6.1x 5.4x 4.9x Select Transaction Considerations Clawback Provision Illustration ▪ Capital investments to accelerate growth through securing locations – India – expand presence physically and digitally – United States – enhance market position – United Kingdom – enhance product portfolio ▪ Joint ventures with mall owners ▪ Further development of technology product ▪ Smaaash’s founder, Shripal Morakhia , has backed its confidence in profitability growth through a clawback provision in the transaction agreement ▪ If Smaaash does not achieve FY2019 and FY2020 EBITDA targets, seller will forego 5.0% equity (representing ~18% of initial value) to I - AM shareholders, thus increasing proportional value per share to the public investors – Target EBITDA growth will be achieved from organic growth as well as investment of Transaction proceeds; no further capital is expected to be required ▪ The net impact is to support the entry valuation of the public investors Potential Near Term Uses of Proceeds Alignment of Interest ▪ AHA Holding, Smaaash’s promoter entity is committed to transferring its entire holding to I - AM within six months of the listing thereby assuring alignment of interests 28 Source: Company management
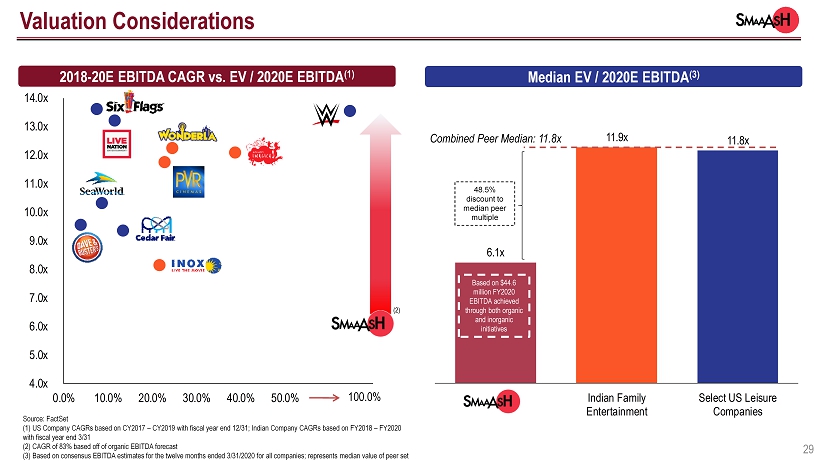
233 50 68 167 34 142 166 166 166 0 167 155 237 239 144 213 41 83 234 43 123 172 61 81 40 168 223 251 86 39 208 75 38 42 56 144 6.1x 11.9x 11.8x Smaaash Indian Family Entertainment Select US Leisure Companies 2018 - 20E EBITDA CAGR vs. EV / 2020E EBITDA (1) 4.0x 5.0x 6.0x 7.0x 8.0x 9.0x 10.0x 11.0x 12.0x 13.0x 14.0x 0.0% 10.0% 20.0% 30.0% 40.0% 50.0% 60.0% 70.0% Median EV / 2020E EBITDA (3) (2) 48.5% discount to median peer multiple Based on $44.6 million FY2020 EBITDA achieved through both organic and inorganic initiatives Source: FactSet (1) US Company CAGRs based on CY2017 – CY2019 with fiscal year end 12/31; Indian Company CAGRs based on FY2018 – FY2020 with fiscal year end 3/31 (2) CAGR of 83% based off of organic EBITDA forecast (3) Based on consensus EBITDA estimates for the twelve months ended 3/31/2020 for all companies; represents median value of peer set Combined Peer Median: 11.8x Median EV / 2020E EBITDA (3) 29 Valuation Considerations 100.0%

233 50 68 167 34 142 166 166 166 0 167 155 237 239 144 213 41 83 234 43 123 172 61 81 40 168 223 251 86 39 208 75 38 42 56 144 Investment Highlights Cutting - Edge Development Capabilities & Proprietary IP Immersive & Differentiated Product Offering 3 Leader in Family Entertainment 4 Multiple, In - Place Growth Opportunities 5 Proven and Experienced Leadership Team 6 Large & Rapidly Growing Addressable Market 1 2 30

233 50 68 167 34 142 166 166 166 0 167 155 237 239 144 213 41 83 234 43 123 172 61 81 40 168 223 40 168 223 208 75 38 42 56 144 Appendix 31

233 50 68 167 34 142 166 166 166 0 167 155 237 239 144 213 41 83 234 43 123 172 61 81 40 168 223 40 168 223 208 75 38 42 56 144 32 Appendix A: Operations, Financial & Transaction Update

233 50 68 167 34 142 166 166 166 0 167 155 237 239 144 213 41 83 234 43 123 172 61 81 40 168 223 40 168 223 208 75 38 42 56 144 ▪ July 2018: Two new centers opened ( Thane and Gwalior) ▪ September 2018: One planned center opening (Jalandhar) ▪ October 2018: Four new centers with a total of 54,000 sf planned to open Bridge to Current Center Count Operations Update: Growing Smaaash Footprint Footprint Smaaash has a growing domestic footprint, and is on track to have 42 centers and 920,000 sf in place by October 2018 As of 5/31/18 New Since 5/31/18 Planned Amritsar Chandigarh 1 1 NCR 5 Mumbai 1 1 3 Hyderabad 2 6 Vijayawada 1 1 Mysore 1 Mangalore Madurai 1 1 Indore Bhopal 1 1 2 Ludhiana 2 Bangalore Pune 1 1 Timeline of Recent Openings April 2018 May 2018 June 2018 July 2018 August 2018 September 2018 4/23/2018 Bhopal 5/3/2018 Seawoods 5/18/2018 Amritsar 7/6/2018 Thane 7/6/2018 Gwalior 9/25/2018 Jalandhar 33 1 2 3 1 2 3 Source: Company management 7 25 3 35 2 37 1 4 42 August 2017 March 2018 April 2018 May 2018 July 2018 Current September 2018 October 2018 Total
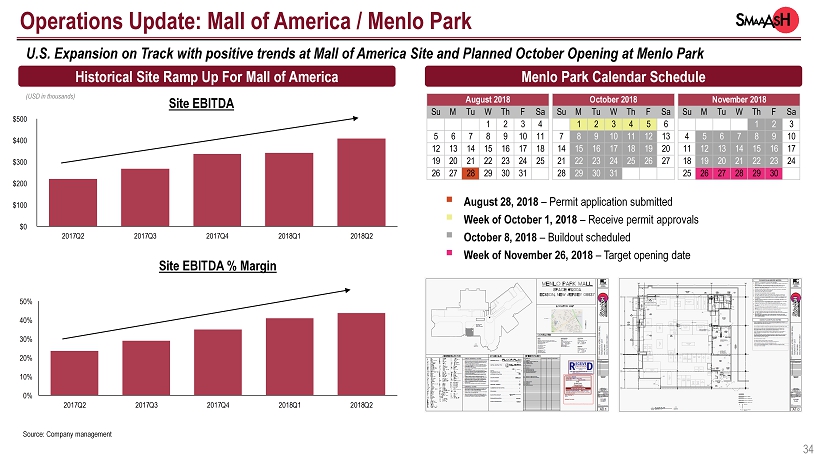
233 50 68 167 34 142 166 166 166 0 167 155 237 239 144 213 41 83 234 43 123 172 61 81 40 168 223 251 86 39 208 75 38 42 56 144 0% 10% 20% 30% 40% 50% 2017Q2 2017Q3 2017Q4 2018Q1 2018Q2 $0 $100 $200 $300 $400 $500 2017Q2 2017Q3 2017Q4 2018Q1 2018Q2 Operations Update: Mall of America / Menlo Park 34 Historical Site Ramp Up For Mall of America Menlo Park Calendar Schedule Site EBITDA % Margin Site EBITDA ▪ August 28, 2018 – Permit application submitted ▪ Week of October 1, 2018 – Receive permit approvals ▪ October 8, 2018 – Buildout scheduled ▪ Week of November 26, 2018 – Target opening date (USD in thousands) U.S. Expansion on Track with positive trends at Mall of America Site and Planned October Opening at Menlo Park Source: Company management August 2018 Su M Tu W Th F Sa 1 2 3 4 5 6 7 8 9 10 11 12 13 14 15 16 17 18 19 20 21 22 23 24 25 26 27 28 29 30 31 October 2018 Su M Tu W Th F Sa 1 2 3 4 5 6 7 8 9 10 11 12 13 14 15 16 17 18 19 20 21 22 23 24 25 26 27 28 29 30 31 November 2018 Su M Tu W Th F Sa 1 2 3 4 5 6 7 8 9 10 11 12 13 14 15 16 17 18 19 20 21 22 23 24 25 26 27 28 29 30
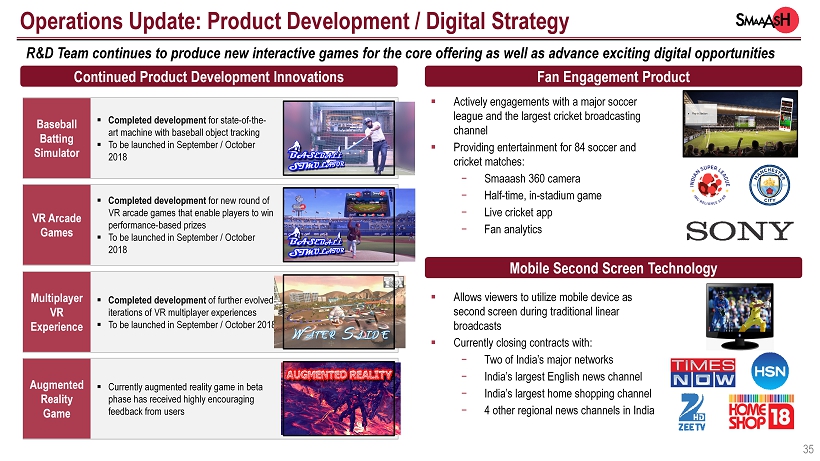
233 50 68 167 34 142 166 166 166 0 167 155 237 239 144 213 41 83 234 43 123 172 61 81 40 168 223 40 168 223 208 75 38 42 56 144 35 Operations Update: Product Development / Digital Strategy Mobile Second Screen Technology Fan Engagement Product R&D Team continues to produce new interactive games for the core offering as well as advance exciting digital opportunities ▪ Completed development for state - of - the - art machine with baseball object tracking ▪ To be launched in September / October 2018 Baseball Batting Simulator ▪ Completed development for new round of VR arcade games that enable players to win performance - based prizes ▪ To be launched in September / October 2018 VR Arcade Games ▪ Completed development of further evolved iterations of VR multiplayer experiences ▪ To be launched in September / October 2018 Multiplayer VR Experience ▪ Actively engagements with a major soccer league and the largest cricket broadcasting channel ▪ Providing entertainment for 84 soccer and cricket matches: − Smaaash 360 camera − Half - time, in - stadium game − Live cricket app − Fan analytics ▪ Allows viewers to utilize mobile device as second screen during traditional linear broadcasts �� Currently closing contracts with: − Two of India’s major networks − India’s largest English news channel − India’s largest home shopping channel − 4 other regional news channels in India Source: Company management Continued Product Development Innovations ▪ Currently augmented reality game in beta phase has received highly encouraging feedback from users Augmented Reality Game

233 50 68 167 34 142 166 166 166 0 167 155 237 239 144 213 41 83 234 43 123 172 61 81 40 168 223 251 86 39 208 75 38 42 56 144 ▪ Select India locations lost up to 10 business days due to heavy rains ▪ All India locations lost one day of business due to All India Strike ▪ Total Monthly Product Revenue Contribution has stayed consistent with May 31, 2018 figure of ~$500,000 ▪ Thane center opened 7/6/2018; $42,000 Run Rate EBITDA contribution (2) ▪ Gwalior center opened 7/6/2018; $15,600 Run Rate EBITDA contribution (2) $8.0 $18.1 $18.1 $45.0 $68.0 2018E Run Rate EBITDA 8/31/18 2019E 2020E 2021E $1.0 (3) $1.0 (3) $0.5 (2) $0.1 ($0.1) $0.5 (2) $1.5 $1.5 Monthly EBITDA as of 5/31/18 Contribution From Two New Center Openings Incremental Product Revenue Effect of Monsoons and Strike Monthly EBITDA as of 8/31/18 Monthly Run Rate EBITDA Bridge Financial Update 36 Annual Forecast Remains Unchanged Unchanged (1) ($ in millions) ($ in millions) Source: Company management (1) Based on $1.5 million pro forma EBITDA as of 8/31/18, annualized (2) Reflects Actual EBITDA Contribution for Product Sales for Month Ended 8/31/18 (3) Reflects Actual EBITDA Contribution for Centers for Month Ended 8/31/18 Annualized= $18.1mm Smaaash anticipates meeting annual EBITDA projections, driven by new centers, sponsorship revenue and product sales 1 Contribution From New Centers 3 Effect of Monsoons and Strike 1 2 3 2 Incremental Product Revenue

233 50 68 167 34 142 166 166 166 0 167 155 237 239 144 213 41 83 234 43 123 172 61 81 40 168 223 40 168 223 208 75 38 42 56 144 37 Transaction Update: Special Dividend Incentive Provided by I - AM Capital 600,000 share common stock dividend provides additional compensation to investors Source: Company management ▪ On August 24, 2018, I - AM Capital stated that it will provide a special dividend on all shares of I - AM Capital common stock that are outstanding at the end of the day immediately prior to the date of the closing of the proposed business combination, so long as such shares are still outstanding immediately after the closing – The number of shares to be issued per outstanding share will be equal of 600,000 divided by the number of shares of common stock eligible to receive the dividend – The Sponsor and Maxim have agreed to waive their rights for such dividend ▪ In connection with the special dividend, I - AM Capital has agreed to cancel a number of founder shares equal to the aggregate number of shares issued in the dividend Source: Company filings

233 50 68 167 34 142 166 166 166 0 167 155 237 239 144 213 41 83 234 43 123 172 61 81 40 168 223 40 168 223 208 75 38 42 56 144 38 Appendix B: Select Publicly Traded Companies
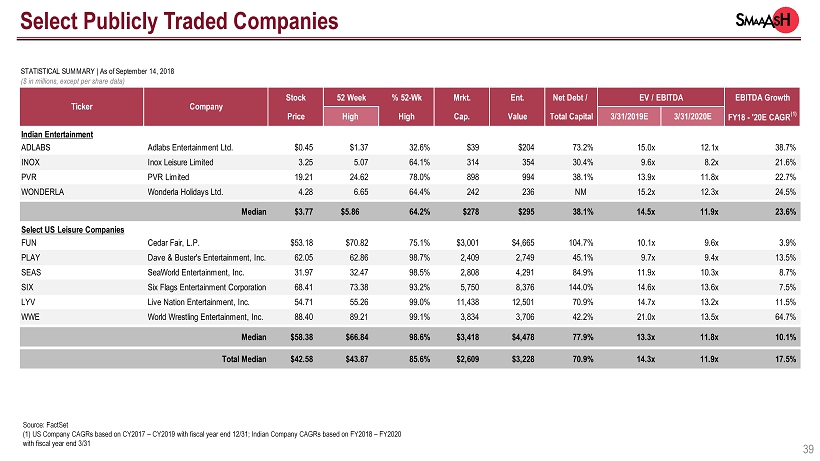
233 50 68 167 34 142 166 166 166 0 167 155 237 239 144 213 41 83 234 43 123 172 61 81 40 168 223 251 86 39 208 75 38 42 56 144 STATISTICAL SUMMARY | As of September 14, 2018 ($ in millions, except per share data) Stock 52 Week % 52-Wk Mrkt. Ent. Net Debt / EV / EBITDA EBITDA Growth Price High High Cap. Value Total Capital 3/31/2019E 3/31/2020E FY18 - '20E CAGR (1) Indian Entertainment ADLABS Adlabs Entertainment Ltd. $0.45 $1.37 32.6% $39 $204 73.2% 15.0x 12.1x 38.7% INOX Inox Leisure Limited 3.25 5.07 64.1% 314 354 30.4% 9.6x 8.2x 21.6% PVR PVR Limited 19.21 24.62 78.0% 898 994 38.1% 13.9x 11.8x 22.7% WONDERLA Wonderla Holidays Ltd. 4.28 6.65 64.4% 242 236 NM 15.2x 12.3x 24.5% Median $3.77 $5.86 64.2% $278 $295 38.1% 14.5x 11.9x 23.6% Select US Leisure Companies FUN Cedar Fair, L.P. $53.18 $70.82 75.1% $3,001 $4,665 104.7% 10.1x 9.6x 3.9% PLAY Dave & Buster's Entertainment, Inc. 62.05 62.86 98.7% 2,409 2,749 45.1% 9.7x 9.4x 13.5% SEAS SeaWorld Entertainment, Inc. 31.97 32.47 98.5% 2,808 4,291 84.9% 11.9x 10.3x 8.7% SIX Six Flags Entertainment Corporation 68.41 73.38 93.2% 5,750 8,376 144.0% 14.6x 13.6x 7.5% LYV Live Nation Entertainment, Inc. 54.71 55.26 99.0% 11,438 12,501 70.9% 14.7x 13.2x 11.5% WWE World Wrestling Entertainment, Inc. 88.40 89.21 99.1% 3,834 3,706 42.2% 21.0x 13.5x 64.7% Median $58.38 $66.84 98.6% $3,418 $4,478 77.9% 13.3x 11.8x 10.1% Total Median $42.58 $43.87 85.6% $2,609 $3,228 70.9% 14.3x 11.9x 17.5% Ticker Company Select Publicly Traded Companies Source: FactSet (1) US Company CAGRs based on CY2017 – CY2019 with fiscal year end 12/31; Indian Company CAGRs based on FY2018 – FY2020 with fiscal year end 3/31 39