`++`
UNITED STATES
SECURITIES AND EXCHANGE COMMISSION
Washington, D.C. 20549
FORM N-CSR
CERTIFIED SHAREHOLDER REPORT OF REGISTERED
MANAGEMENT INVESTMENT COMPANIES
| Investment Company Act file number | 811-23305 | |||||||||||||||||||
| AMERICAN CENTURY ETF TRUST | ||||||||||||||||||||
| (Exact name of registrant as specified in charter) | ||||||||||||||||||||
| 4500 MAIN STREET, KANSAS CITY, MISSOURI | 64111 | |||||||||||||||||||
| (Address of principal executive offices) | (Zip Code) | |||||||||||||||||||
| CHARLES A. ETHERINGTON 4500 MAIN STREET, KANSAS CITY, MISSOURI 64111 | ||||||||||||||||||||
| (Name and address of agent for service) | ||||||||||||||||||||
| Registrant’s telephone number, including area code: | 816-531-5575 | |||||||||||||||||||
| Date of fiscal year end: | 08-31 | |||||||||||||||||||
| Date of reporting period: | 08-31-2020 | |||||||||||||||||||
ITEM 1. REPORTS TO STOCKHOLDERS.

| Annual Report | |||||
| August 31, 2020 | |||||
American Century® Diversified Corporate Bond ETF (KORP) | |||||
Beginning on January 1, 2021, as permitted by regulations adopted by the Securities and Exchange Commission, paper copies of the fund’s shareholder reports like this one will no longer be sent by mail, unless you specifically request paper copies of the reports from the fund or from your financial intermediary, such as a broker-dealer or bank. Instead, the reports will be made available on a website, and you will be notified by mail each time a report is posted and provided with a website link to access the report.
If you already elected to receive shareholder reports electronically, you will not be affected by this change and you need not take any action. You may elect to receive shareholder reports and other communications from the fund or your financial intermediary electronically by calling or sending an email request to your appropriate contacts as listed on the back cover of this report.
You may elect to receive all future reports in paper free of charge. You can inform the fund or your financial intermediary that you wish to continue receiving paper copies of your shareholder reports by calling or sending an email request to your appropriate contacts as listed on the back cover of this report. Your election to receive reports in paper will apply to all funds held with the fund complex/your financial intermediary.
| Table of Contents | ||
| President’s Letter | |||||
| Performance | |||||
| Portfolio Commentary | |||||
| Fund Characteristics | |||||
| Shareholder Fee Example | |||||
| Schedule of Investments | |||||
| Statement of Assets and Liabilities | |||||
| Statement of Operations | |||||
| Statement of Changes in Net Assets | |||||
| Notes to Financial Statements | |||||
| Financial Highlights | |||||
| Report of Independent Registered Public Accounting Firm | |||||
| Management | |||||
| Approval of Management Agreement | |||||
| Liquidity Risk Management Program | |||||
| Additional Information | |||||
Any opinions expressed in this report reflect those of the author as of the date of the report, and do not necessarily represent the opinions of American Century Investments® or any other person in the American Century Investments organization. Any such opinions are subject to change at any time based upon market or other conditions and American Century Investments disclaims any responsibility to update such opinions. These opinions may not be relied upon as investment advice and, because investment decisions made by American Century Investments funds are based on numerous factors, may not be relied upon as an indication of trading intent on behalf of any American Century Investments fund. Security examples are used for representational purposes only and are not intended as recommendations to purchase or sell securities. Performance information for comparative indices and securities is provided to American Century Investments by third party vendors. To the best of American Century Investments’ knowledge, such information is accurate at the time of printing.
| President’s Letter | ||
 Jonathan Thomas
Dear Investor:
Thank you for reviewing this annual report for the period ended August 31, 2020. Annual reports help convey important information about fund returns, including market factors that affected performance. For additional investment insights, please visit americancenturyetfs.com.
Pandemic Disrupted Economic, Market Courses
Broad market sentiment was generally upbeat into early 2020. Dovish central banks, modest inflation, improving economic and corporate earnings data, and progress on U.S.-China trade helped boost global growth outlooks. Against this backdrop, risk assets largely remained in favor.
However, beginning in late February, COVID-19 quickly quashed the optimistic tone. The outbreak rapidly spread worldwide, halting most U.S. and global economic activity and triggering a deep worldwide recession. Global stocks and credit-sensitive assets sold off sharply, but central banks and federal governments stepped in quickly and aggressively to stabilize financial markets. These extraordinary efforts proved helpful, as most risk assets rebounded quickly, despite weak economic and corporate earnings data. As the period progressed, coronavirus infection and death rates declined in many regions and economies reopened. By the end of August, manufacturing, employment and other data suggested an economic recovery was underway.
Overall, global stocks delivered mixed results for the period. The broad U.S. stock market overcame the effects of the early 2020 sell-off to deliver a solid gain. U.S. stocks generally fared better than their counterparts elsewhere, and the growth style significantly outperformed value stocks, which struggled. Bond returns were broadly positive, as yields declined sharply.
A Slow Return to Normal
The return to pre-pandemic life will take time and patience, but we are confident we will get there. Several drug companies are in final stages of vaccine trials, and medical professionals continue to fine-tune virus treatment protocols. In the meantime, investors likely will face periods of outbreak-related disruptions, economic and political uncertainty, and heightened market volatility. These influences can be unsettling, but they tend to be temporary.
We appreciate your confidence in us during these extraordinary times. Our firm has a long history of helping clients weather unpredictable markets, and we’re confident we will continue to meet today’s challenges.
Sincerely,

Jonathan Thomas
President and Chief Executive Officer
American Century Investments
2
| Performance | ||
| Total Returns as of August 31, 2020 | ||||||||||||||||||||
| Average Annual Returns | ||||||||||||||||||||
| 1 year | Since Inception | Inception Date | ||||||||||||||||||
| Net Asset Value | 5.48% | 5.01% | 1/11/2018 | |||||||||||||||||
| Market Price | 5.58% | 5.15% | 1/11/2018 | |||||||||||||||||
| Bloomberg Barclays U.S. Intermediate Corporate Bond Index | 6.72% | 5.97% | — | |||||||||||||||||
Market price is determined using the bid/ask midpoint at 4:00 p.m. Eastern time, when the net asset value (NAV) is typically calculated. Market performance does not represent the returns you would receive if you traded shares at other times. NAV prices are used to calculate market price performance prior to the date when the fund first traded on the New York Stock Exchange.
| Growth of $10,000 Over Life of Fund | ||
| $10,000 investment made January 11, 2018 | ||
| Value on August 31, 2020 | |||||
| Net Asset Value — $11,377 | |||||
| Bloomberg Barclays U.S. Intermediate Corporate Bond Index — $11,652 | |||||
| Total Annual Fund Operating Expenses | |||||||||||||||||
| 0.29% | |||||||||||||||||
The total annual fund operating expenses shown is as stated in the fund’s prospectus current as of the date of this report. The prospectus may vary from the expense ratio shown elsewhere in this report because it is based on a different time period, includes acquired fund fees and expenses, and, if applicable, does not include fee waivers or expense reimbursements.
Data presented reflect past performance. Past performance is no guarantee of future results. Current performance may be higher or lower than the performance shown. Total returns for periods less than one year are not annualized. Investment return and principal value will fluctuate, and redemption value may be more or less than original cost. Data assumes reinvestment of dividends and capital gains, and none of the charts reflect the deduction of taxes that a shareholder would pay on fund distributions or the redemption of fund shares. To obtain performance data current to the most recent month end, please call 1-800-345-6488 or visit americancenturyetfs.com. For additional information about the fund, please consult the prospectus.
3
| Portfolio Commentary | ||
Portfolio Managers: Charles Tan, Jason Greenblath, Jeffrey Houston, Gavin Fleischman and Le Tran
Fund Strategy
American Century Diversified Corporate Bond ETF seeks to offer enhanced return potential versus passive capitalization-weighted corporate bond portfolios. We employ a holistic approach, emphasizing investment-grade credits, while dynamically allocating a portion of the portfolio to high-yield securities. We integrate fundamental and quantitative analysis in a systematically managed portfolio that strives to balance interest rate risk and credit risk. We seek to maintain a duration range of three to seven years, which we believe should mitigate interest rate risk without sacrificing yield.
The fund is an actively managed ETF that does not seek to replicate the performance of a specific index. To determine whether to buy or sell a security, we consider several factors, including fund requirements and standards, economic conditions, alternative investments, interest rates and various credit metrics.
Performance Review
The fund returned 5.58% on a market price basis for the 12-month period ended August 31, 2020. On a net asset value (NAV) basis, the fund returned 5.48%. For the same time period, the Bloomberg Barclays U.S. Intermediate Corporate Bond Index, the fund’s benchmark index, returned 6.72%. The fund’s NAV and market price returns reflect fees and operating expenses, while the index return does not.
High-Yield Bonds and Energy Sector Investments Hindered Performance
Like most asset classes, the corporate bond market endured extreme volatility during the 12-month period. Early on, higher-risk appetites led to high-yield corporate bonds outperforming investment-grade issues. The onset of the pandemic in March, however, drove investors into safe-haven U.S. Treasuries, resulting in a precipitous drop in all credit-sensitive assets. The prompt monetary and fiscal response by the Federal Reserve (Fed) and U.S. government restored liquidity, stabilized the markets and sparked a summer-long risk rally. Due in part to direct Fed support, investment-grade bonds generally outperformed high-yield issues during the rebound, and the fund’s out-of-index exposure to the riskier securities detracted from returns.
Additionally, a dramatic fall in the price of oil in March led to a significant decline in the fund’s energy sector holdings. More specifically, security selection in the integrated energy industry weighed on results. Security selection and overweight positions, compared to the index, in the midstream and refining industries also detracted. Having identified more value in other sectors, we pared our exposure to energy names.
Elsewhere, as the pandemic essentially shut down travel and tourism worldwide, our position in aircraft lease securities hurt relative returns. Because the holdings are well diversified across the globe and continued to trade at attractive levels, we maintained the exposure.
Hedges Buffered Decline
As the pandemic unfolded and economic volatility surged, we hedged our high-yield exposure. In combination with some sales of select high-yield holdings, the maneuver helped mitigate declines in March and April. Confident the worst was over, we unwound the hedges by the end of April.
Defensive Issues, Duration Bolstered Returns
Amid the market’s decline, we invested in the defensive electric utilities industry, which contributed positively to relative performance. An overweight position in the construction materials industry
4
further enhanced returns, as the U.S. construction industry continued to operate during the pandemic-related shutdowns. Similarly, health care largely sidestepped the market’s drop, and the fund benefited from an overweight stake in the sector.
The fund’s longer-than-index duration also proved beneficial as Treasury yields dropped. The broader interest rate environment also helped push corporate spreads to the tighter end of their historical range.
As risk-on investing resurfaced through the summer, we reduced our exposure to the electric utilities industry and BBB-rated securities that appeared unable to survive a gradual recovery. As part of this broader review, we identified some compelling opportunities in the industrials sector and among real estate investment trusts. The fund finished the period with BBB-rated bonds accounting for approximately 60% of the portfolio.
Portfolio Positioning
Going forward, we see several supportive factors for the corporate bond market, including the Fed’s lower-for-longer rate policy, even in the face of rising inflation. We also believe the economy is past the worst of the pandemic, although the recovery will likely be slow.
Notwithstanding the recovery’s likely stops and starts, we believe corporate credit remains an attractive place to invest, especially as investors seek higher-yielding investments in a low-rate environment. New issuance surged late in the period as many companies took advantage of low rates to refinance existing debt, adding to the attractiveness of the asset class.
Late in the period, we increased the fund’s allocation to high-yield bonds, and we expect to continue to actively seek additional opportunities within the space, as well as among BBB-rated securities. Furthermore, we anticipate maintaining a longer duration and capitalizing in part on the considerable volume of new issues coming to market.
5
| Fund Characteristics | ||
| AUGUST 31, 2020 | |||||
| Portfolio at a Glance | |||||
| Weighted Average Life to Maturity | 5.7 years | ||||
| Average Duration (Effective) | 4.7 years | ||||
| Types of Investments in Portfolio | % of net assets | ||||
| Corporate Bonds | 94.9% | ||||
| U.S. Treasury Securities | 1.1% | ||||
| Temporary Cash Investments | 4.2% | ||||
| Temporary Cash Investments - Securities Lending Collateral | —* | ||||
| Other Assets and Liabilities | (0.2)% | ||||
*Category is less than 0.05% of total net assets.
6
| Shareholder Fee Example | ||
Fund shareholders may incur two types of costs: (1) transaction costs, including brokerage commissions paid on purchases and sales of fund shares; and (2) ongoing costs, including management fees and other fund expenses. This example is intended to help you understand your ongoing costs (in dollars) of investing in your fund and to compare these costs with the ongoing cost of investing in other funds.
The example is based on an investment of $1,000 made at the beginning of the period and held for the entire period from March 1, 2020 to August 31, 2020.
Actual Expenses
The table provides information about actual account values and actual expenses. You may use the information, together with the amount you invested, to estimate the expenses that you paid over the period. Simply divide your account value by $1,000 (for example, an $8,600 account value divided by $1,000 = 8.6), then multiply the result by the number under the heading “Expenses Paid During Period” to estimate the expenses you paid on your account during this period.
Hypothetical Example for Comparison Purposes
The table also provides information about hypothetical account values and hypothetical expenses based on the actual expense ratio of your fund and an assumed rate of return of 5% per year before expenses, which is not the actual return of a fund. The hypothetical account values and expenses may not be used to estimate the actual ending account balance or expenses you paid for the period. You may use this information to compare the ongoing costs of investing in your fund and other funds. To do so, compare this 5% hypothetical example with the 5% hypothetical examples that appear in the shareholder reports of the other funds.
Please note that the expenses shown in the table are meant to highlight your ongoing costs only and do not reflect any transactional costs, such as brokerage commissions paid on purchases and sales of fund shares. Therefore, the table is useful in comparing ongoing costs only, and will not help you determine the relative total costs of owning different funds. In addition, if these transactional costs were included, your costs would have been higher.
| Beginning Account Value 3/1/20 | Ending Account Value 8/31/20 | Expenses Paid During Period(1) 3/1/20 - 8/31/20 | Annualized Expense Ratio(1) | |||||||||||
| Actual | $1,000 | $1,023.50 | $1.48 | 0.29% | ||||||||||
| Hypothetical | $1,000 | $1,023.68 | $1.48 | 0.29% | ||||||||||
(1)Expenses are equal to the fund's annualized expense ratio listed in the table above, multiplied by the average account value over the period, multiplied by 184, the number of days in the most recent fiscal half-year, divided by 366, to reflect the one-half year period. Annualized expense ratio reflects actual expenses, including any applicable fee waivers or expense reimbursements and excluding any acquired fund fees and expenses.
7
| Schedule of Investments | ||
AUGUST 31, 2020
| Principal Amount | Value | |||||||
| CORPORATE BONDS — 94.9% | ||||||||
| Aerospace and Defense — 0.6% | ||||||||
| Boeing Co. (The), 4.875%, 5/1/25 | $ | 374,000 | $ | 407,250 | ||||
| Boeing Co. (The), 5.15%, 5/1/30 | 268,000 | 300,638 | ||||||
| 707,888 | ||||||||
| Auto Components — 0.4% | ||||||||
| BorgWarner, Inc., 2.65%, 7/1/27 | 427,000 | 453,449 | ||||||
| Automobiles — 1.3% | ||||||||
| General Motors Co., 4.875%, 10/2/23 | 773,000 | 845,233 | ||||||
| General Motors Financial Co., Inc., 2.75%, 6/20/25 | 536,000 | 554,093 | ||||||
| General Motors Financial Co., Inc., 2.70%, 8/20/27 | 180,000 | 180,006 | ||||||
| 1,579,332 | ||||||||
| Banks — 16.1% | ||||||||
| Banco Santander SA, 2.75%, 5/28/25 | 400,000 | 425,641 | ||||||
| Bank of America Corp., MTN, VRN, 1.32%, 6/19/26 | 1,577,000 | 1,598,765 | ||||||
| Bank of America Corp., VRN, 3.00%, 12/20/23 | 1,613,000 | 1,700,676 | ||||||
| Bank of America Corp., VRN, 3.42%, 12/20/28 | 1,256,000 | 1,404,493 | ||||||
| Bank of Montreal, MTN, 1.85%, 5/1/25 | 397,000 | 417,112 | ||||||
| Barclays plc, VRN, 2.65%, 6/24/31 | 200,000 | 203,415 | ||||||
BNP Paribas SA, VRN, 2.59%, 8/12/35(1) | 400,000 | 395,872 | ||||||
| Canadian Imperial Bank of Commerce, 0.95%, 6/23/23 | 288,000 | 291,606 | ||||||
| Citigroup, Inc., 4.05%, 7/30/22 | 1,298,000 | 1,383,308 | ||||||
| Citigroup, Inc., VRN, 3.11%, 4/8/26 | 561,000 | 609,709 | ||||||
| Citigroup, Inc., VRN, 2.57%, 6/3/31 | 286,000 | 302,611 | ||||||
Cooperatieve Rabobank UA, VRN, 1.34%, 6/24/26(1) | 40,000 | 40,667 | ||||||
| Fifth Third BanCorp., 2.375%, 1/28/25 | 21,000 | 22,330 | ||||||
| Huntington Bancshares, Inc., 4.35%, 2/4/23 | 836,000 | 897,429 | ||||||
| JPMorgan Chase & Co., VRN, 2.08%, 4/22/26 | 1,390,000 | 1,460,230 | ||||||
| JPMorgan Chase & Co., VRN, 2.18%, 6/1/28 | 331,000 | 346,569 | ||||||
| JPMorgan Chase & Co., VRN, 2.52%, 4/22/31 | 1,337,000 | 1,433,985 | ||||||
| Lloyds Banking Group plc, VRN, 2.91%, 11/7/23 | 200,000 | 209,161 | ||||||
| Lloyds Banking Group plc, VRN, 2.44%, 2/5/26 | 600,000 | 631,143 | ||||||
| National Bank of Canada, VRN, 0.90%, 8/15/23 | 400,000 | 402,566 | ||||||
| Natwest Group plc, VRN, 2.36%, 5/22/24 | 200,000 | 207,191 | ||||||
Nordea Bank Abp, 0.75%, 8/28/25(1) | 680,000 | 678,220 | ||||||
| Royal Bank of Canada, MTN, 1.15%, 6/10/25 | 349,000 | 355,521 | ||||||
| Santander UK Group Holdings plc, VRN, 1.53%, 8/21/26 | 230,000 | 230,296 | ||||||
| Toronto-Dominion Bank (The), MTN, 0.75%, 6/12/23 | 301,000 | 304,169 | ||||||
| Truist Bank, 3.30%, 5/15/26 | 500,000 | 564,691 | ||||||
UniCredit SpA, VRN, 5.46%, 6/30/35(1) | 250,000 | 259,054 | ||||||
| Wells Fargo & Co., 4.125%, 8/15/23 | 1,065,000 | 1,165,061 | ||||||
| Wells Fargo & Co., 3.00%, 10/23/26 | 192,000 | 212,018 | ||||||
| Wells Fargo & Co., MTN, VRN, 3.20%, 6/17/27 | 536,000 | 587,054 | ||||||
| Wells Fargo & Co., MTN, VRN, 2.39%, 6/2/28 | 63,000 | 65,866 | ||||||
| Wells Fargo & Co., MTN, VRN, 2.57%, 2/11/31 | 293,000 | 307,730 | ||||||
| Wells Fargo & Co., VRN, 2.19%, 4/30/26 | 401,000 | 419,494 | ||||||
| 19,533,653 | ||||||||
8
| Principal Amount | Value | |||||||
| Beverages — 2.0% | ||||||||
| Constellation Brands, Inc., 3.20%, 2/15/23 | $ | 993,000 | $ | 1,052,938 | ||||
| Keurig Dr Pepper, Inc., 4.06%, 5/25/23 | 685,000 | 748,995 | ||||||
| PepsiCo, Inc., 3.00%, 10/15/27 | 536,000 | 607,710 | ||||||
| 2,409,643 | ||||||||
| Biotechnology — 2.4% | ||||||||
AbbVie, Inc., 2.60%, 11/21/24(1) | 1,500,000 | 1,608,517 | ||||||
| AbbVie, Inc., 3.20%, 5/14/26 | 685,000 | 762,641 | ||||||
| Amgen, Inc., 1.90%, 2/21/25 | 536,000 | 562,692 | ||||||
| 2,933,850 | ||||||||
| Building Products — 0.8% | ||||||||
| Lennox International, Inc., 1.70%, 8/1/27 | 204,000 | 206,100 | ||||||
| Masco Corp., 4.375%, 4/1/26 | 553,000 | 648,992 | ||||||
Standard Industries, Inc., 4.75%, 1/15/28(1) | 146,000 | 154,030 | ||||||
| 1,009,122 | ||||||||
| Capital Markets — 7.4% | ||||||||
| Ares Capital Corp., 4.25%, 3/1/25 | 625,000 | 645,856 | ||||||
Ares Finance Co. II LLC, 3.25%, 6/15/30(1) | 215,000 | 225,976 | ||||||
Credit Suisse Group AG, VRN, 2.19%, 6/5/26(1) | 500,000 | 517,499 | ||||||
| Goldman Sachs BDC, Inc., 3.75%, 2/10/25 | 156,000 | 163,717 | ||||||
| Goldman Sachs Group, Inc. (The), 3.00%, 4/26/22 | 1,069,000 | 1,086,588 | ||||||
| Goldman Sachs Group, Inc. (The), 3.50%, 4/1/25 | 94,000 | 104,259 | ||||||
| Goldman Sachs Group, Inc. (The), 3.50%, 11/16/26 | 801,000 | 893,945 | ||||||
| Goldman Sachs Group, Inc. (The), 2.60%, 2/7/30 | 229,000 | 244,314 | ||||||
| Goldman Sachs Group, Inc. (The), VRN, 2.91%, 6/5/23 | 1,140,000 | 1,186,781 | ||||||
| Intercontinental Exchange, Inc., 1.85%, 9/15/32 | 135,000 | 137,051 | ||||||
| Morgan Stanley, 4.875%, 11/1/22 | 1,138,000 | 1,240,296 | ||||||
| Morgan Stanley, 3.625%, 1/20/27 | 536,000 | 609,413 | ||||||
| Morgan Stanley, VRN, 2.19%, 4/28/26 | 1,279,000 | 1,346,934 | ||||||
| Oaktree Specialty Lending Corp., 3.50%, 2/25/25 | 268,000 | 269,974 | ||||||
UBS Group AG, 4.125%, 9/24/25(1) | 250,000 | 286,809 | ||||||
| 8,959,412 | ||||||||
| Chemicals — 1.9% | ||||||||
CF Industries, Inc., 4.50%, 12/1/26(1) | 555,000 | 631,875 | ||||||
| Dow Chemical Co. (The), 2.10%, 11/15/30 | 1,000,000 | 988,478 | ||||||
| Westlake Chemical Corp., 3.60%, 8/15/26 | 624,000 | 682,194 | ||||||
| 2,302,547 | ||||||||
| Commercial Services and Supplies — 1.4% | ||||||||
| RELX Capital, Inc., 3.00%, 5/22/30 | 149,000 | 164,316 | ||||||
| Republic Services, Inc., 2.30%, 3/1/30 | 536,000 | 569,956 | ||||||
| Waste Connections, Inc., 2.60%, 2/1/30 | 857,000 | 920,402 | ||||||
| 1,654,674 | ||||||||
| Communications Equipment — 0.2% | ||||||||
| Juniper Networks, Inc., 4.50%, 3/15/24 | 78,000 | 87,705 | ||||||
| Motorola Solutions, Inc., 2.30%, 11/15/30 | 204,000 | 203,637 | ||||||
| 291,342 | ||||||||
| Construction Materials — 1.4% | ||||||||
| Martin Marietta Materials, Inc., 2.50%, 3/15/30 | 503,000 | 524,663 | ||||||
| Vulcan Materials Co., 4.50%, 4/1/25 | 543,000 | 619,881 | ||||||
| Vulcan Materials Co., 3.50%, 6/1/30 | 536,000 | 607,152 | ||||||
| 1,751,696 | ||||||||
9
| Principal Amount | Value | |||||||
| Consumer Finance — 3.1% | ||||||||
| Capital One Financial Corp., 3.50%, 6/15/23 | $ | 1,135,000 | $ | 1,219,468 | ||||
Park Aerospace Holdings Ltd., 5.25%, 8/15/22(1) | 423,000 | 420,135 | ||||||
| Synchrony Financial, 3.75%, 8/15/21 | 1,195,000 | 1,221,439 | ||||||
| Synchrony Financial, 2.85%, 7/25/22 | 822,000 | 846,583 | ||||||
| 3,707,625 | ||||||||
| Containers and Packaging — 0.1% | ||||||||
| Berry Global, Inc., 5.125%, 7/15/23 | 177,000 | 179,434 | ||||||
| Diversified Financial Services — 1.1% | ||||||||
GE Capital Funding LLC, 4.40%, 5/15/30(1) | 450,000 | 474,866 | ||||||
NatWest Markets plc, 2.375%, 5/21/23(1) | 200,000 | 206,761 | ||||||
| Voya Financial, Inc., 3.65%, 6/15/26 | 627,000 | 710,423 | ||||||
| 1,392,050 | ||||||||
| Diversified Telecommunication Services — 2.3% | ||||||||
| AT&T, Inc., 2.30%, 6/1/27 | 96,000 | 101,959 | ||||||
| AT&T, Inc., 1.65%, 2/1/28 | 165,000 | 167,514 | ||||||
| AT&T, Inc., 2.75%, 6/1/31 | 427,000 | 453,191 | ||||||
Deutsche Telekom International Finance BV, 1.95%, 9/19/21(1) | 1,126,000 | 1,139,689 | ||||||
| Verizon Communications, Inc., 3.15%, 3/22/30 | 314,000 | 355,443 | ||||||
| Verizon Communications, Inc., 4.40%, 11/1/34 | 407,000 | 508,412 | ||||||
| 2,726,208 | ||||||||
| Electric Utilities — 4.1% | ||||||||
Berkshire Hathaway Energy Co., 4.05%, 4/15/25(1) | 801,000 | 916,971 | ||||||
| Duke Energy Corp., 2.65%, 9/1/26 | 861,000 | 940,595 | ||||||
| Edison International, 4.125%, 3/15/28 | 638,000 | 666,281 | ||||||
| NextEra Energy Capital Holdings, Inc., 3.55%, 5/1/27 | 861,000 | 994,177 | ||||||
| PSEG Power LLC, 3.00%, 6/15/21 | 861,000 | 877,106 | ||||||
| Southern Co. Gas Capital Corp., 1.75%, 1/15/31 | 570,000 | 565,727 | ||||||
| 4,960,857 | ||||||||
| Entertainment — 1.2% | ||||||||
| Netflix, Inc., 5.75%, 3/1/24 | 332,000 | 375,389 | ||||||
Netflix, Inc., 3.625%, 6/15/25(1) | 100,000 | 105,740 | ||||||
| Netflix, Inc., 5.875%, 11/15/28 | 41,000 | 50,401 | ||||||
Netflix, Inc., 5.375%, 11/15/29(1) | 95,000 | 114,356 | ||||||
| TWDC Enterprises 18 Corp., MTN, 2.125%, 9/13/22 | 280,000 | 288,997 | ||||||
| Walt Disney Co. (The), 1.75%, 1/13/26 | 311,000 | 324,533 | ||||||
| Walt Disney Co. (The), 2.20%, 1/13/28 | 139,000 | 147,570 | ||||||
| 1,406,986 | ||||||||
| Equity Real Estate Investment Trusts (REITs) — 5.6% | ||||||||
| Alexandria Real Estate Equities, Inc., 3.80%, 4/15/26 | 374,000 | 428,127 | ||||||
| Alexandria Real Estate Equities, Inc., 1.875%, 2/1/33 | 102,000 | 101,107 | ||||||
| American Tower Corp., 2.10%, 6/15/30 | 860,000 | 879,204 | ||||||
| Brixmor Operating Partnership LP, 4.05%, 7/1/30 | 110,000 | 118,207 | ||||||
| Crown Castle International Corp., 3.20%, 9/1/24 | 177,000 | 192,138 | ||||||
| Crown Castle International Corp., 3.70%, 6/15/26 | 536,000 | 606,497 | ||||||
| Equinix, Inc., 5.375%, 5/15/27 | 600,000 | 657,579 | ||||||
| Federal Realty Investment Trust, 3.95%, 1/15/24 | 258,000 | 280,000 | ||||||
| Highwoods Realty LP, 2.60%, 2/1/31 | 102,000 | 101,572 | ||||||
| Host Hotels & Resorts LP, 3.75%, 10/15/23 | 300,000 | 311,663 | ||||||
Iron Mountain, Inc., 4.50%, 2/15/31(1) | 92,000 | 94,645 | ||||||
| Kilroy Realty LP, 4.25%, 8/15/29 | 72,000 | 81,282 | ||||||
| Kilroy Realty LP, 3.05%, 2/15/30 | 175,000 | 181,974 | ||||||
10
| Principal Amount | Value | |||||||
| Kimco Realty Corp., 1.90%, 3/1/28 | $ | 263,000 | $ | 259,140 | ||||
| Lexington Realty Trust, 2.70%, 9/15/30 | 197,000 | 199,884 | ||||||
| Mid-America Apartments LP, 1.70%, 2/15/31 | 252,000 | 248,278 | ||||||
| National Retail Properties, Inc., 2.50%, 4/15/30 | 409,000 | 402,739 | ||||||
| Regency Centers LP, 2.95%, 9/15/29 | 85,000 | 87,653 | ||||||
| Regency Centers LP, 3.70%, 6/15/30 | 106,000 | 117,595 | ||||||
| Retail Properties of America, Inc., 4.00%, 3/15/25 | 196,000 | 195,629 | ||||||
| Simon Property Group LP, 3.50%, 9/1/25 | 386,000 | 424,662 | ||||||
| Spirit Realty LP, 3.20%, 2/15/31 | 184,000 | 180,092 | ||||||
| VEREIT Operating Partnership LP, 3.40%, 1/15/28 | 249,000 | 258,024 | ||||||
| Welltower, Inc., 2.70%, 2/15/27 | 119,000 | 126,633 | ||||||
Welltower, Inc., 2.75%, 1/15/31(2) | 235,000 | 239,342 | ||||||
| 6,773,666 | ||||||||
| Food and Staples Retailing — 0.2% | ||||||||
Albertsons Cos., Inc. / Safeway, Inc. / New Albertsons LP / Albertsons LLC, 3.50%, 2/15/23(1) | 110,000 | 112,585 | ||||||
| Sysco Corp., 3.30%, 7/15/26 | 171,000 | 185,304 | ||||||
| 297,889 | ||||||||
| Food Products — 1.8% | ||||||||
Lamb Weston Holdings, Inc., 4.875%, 11/1/26(1) | 268,000 | 281,023 | ||||||
Mondelez International Holdings Netherlands BV, 2.125%, 9/19/22(1) | 873,000 | 901,902 | ||||||
| Mondelez International, Inc., 2.75%, 4/13/30 | 511,000 | 559,676 | ||||||
Post Holdings, Inc., 5.00%, 8/15/26(1) | 374,000 | 388,786 | ||||||
| 2,131,387 | ||||||||
| Gas Utilities — 0.5% | ||||||||
| AmeriGas Partners LP / AmeriGas Finance Corp., 5.75%, 5/20/27 | 536,000 | 605,307 | ||||||
| Health Care Equipment and Supplies — 2.0% | ||||||||
Baxter International, Inc., 3.75%, 10/1/25(1) | 801,000 | 913,737 | ||||||
| Becton Dickinson and Co., 3.73%, 12/15/24 | 498,000 | 553,284 | ||||||
| DENTSPLY SIRONA, Inc., 3.25%, 6/1/30 | 314,000 | 340,443 | ||||||
| Stryker Corp., 1.15%, 6/15/25 | 354,000 | 359,863 | ||||||
| Zimmer Biomet Holdings, Inc., 3.55%, 3/20/30 | 266,000 | 297,787 | ||||||
| 2,465,114 | ||||||||
| Health Care Providers and Services — 3.5% | ||||||||
| Anthem, Inc., 4.10%, 3/1/28 | 597,000 | 699,184 | ||||||
Catalent Pharma Solutions, Inc., 5.00%, 7/15/27(1) | 216,000 | 228,245 | ||||||
Centene Corp., 5.375%, 6/1/26(1) | 250,000 | 264,688 | ||||||
| Centene Corp., 4.25%, 12/15/27 | 268,000 | 282,020 | ||||||
| CVS Health Corp., 4.30%, 3/25/28 | 861,000 | 1,014,276 | ||||||
DaVita, Inc., 4.625%, 6/1/30(1) | 268,000 | 281,902 | ||||||
HCA, Inc., 5.875%, 5/1/23(2) | 536,000 | 587,700 | ||||||
| Molina Healthcare, Inc., 5.375%, 11/15/22 | 321,000 | 337,852 | ||||||
| UnitedHealth Group, Inc., 2.95%, 10/15/27 | 536,000 | 601,307 | ||||||
| 4,297,174 | ||||||||
| Hotels, Restaurants and Leisure — 1.3% | ||||||||
| Las Vegas Sands Corp., 3.90%, 8/8/29 | 300,000 | 303,652 | ||||||
| Marriott International, Inc., 4.625%, 6/15/30 | 511,000 | 560,238 | ||||||
| Starbucks Corp., 1.30%, 5/7/22 | 758,000 | 770,227 | ||||||
| 1,634,117 | ||||||||
| Household Durables — 1.1% | ||||||||
| DR Horton, Inc., 4.75%, 2/15/23 | 765,000 | 826,281 | ||||||
11
| Principal Amount | Value | |||||||
| MDC Holdings, Inc., 3.85%, 1/15/30 | $ | 536,000 | $ | 547,642 | ||||
| 1,373,923 | ||||||||
| Industrial Conglomerates — 0.8% | ||||||||
| Carlisle Cos., Inc., 2.75%, 3/1/30 | 642,000 | 680,826 | ||||||
| General Electric Co., 3.625%, 5/1/30 | 256,000 | 264,070 | ||||||
| 944,896 | ||||||||
| Insurance — 2.9% | ||||||||
| American International Group, Inc., 4.25%, 3/15/29 | 359,000 | 421,473 | ||||||
| American International Group, Inc., 3.40%, 6/30/30 | 84,000 | 93,163 | ||||||
Athene Global Funding, 2.50%, 1/14/25(1) | 336,000 | 347,083 | ||||||
Athene Global Funding, 2.55%, 6/29/25(1) | 154,000 | 159,988 | ||||||
Athene Global Funding, 2.45%, 8/20/27(1) | 150,000 | 151,765 | ||||||
Belrose Funding Trust, 2.33%, 8/15/30(1) | 190,000 | 189,280 | ||||||
Equitable Financial Life Global Funding, 1.40%, 8/27/27(1) | 140,000 | 140,330 | ||||||
Five Corners Funding Trust II, 2.85%, 5/15/30(1) | 380,000 | 406,507 | ||||||
| Globe Life, Inc., 2.15%, 8/15/30 | 210,000 | 211,490 | ||||||
Great-West Lifeco US Finance 2020 LP, 0.90%, 8/12/25(1) | 148,000 | 147,999 | ||||||
Principal Life Global Funding II, 1.50%, 8/27/30(1) | 335,000 | 332,031 | ||||||
Protective Life Global Funding, 1.08%, 6/9/23(1) | 300,000 | 304,409 | ||||||
| Prudential Financial, Inc., VRN, 5.625%, 6/15/43 | 404,000 | 434,396 | ||||||
| Unum Group, 4.50%, 3/15/25 | 124,000 | 138,036 | ||||||
| 3,477,950 | ||||||||
| Internet and Direct Marketing Retail — 0.6% | ||||||||
Expedia Group, Inc., 3.60%, 12/15/23(1) | 300,000 | 305,567 | ||||||
| QVC, Inc., 4.375%, 9/1/28 | 460,000 | 479,815 | ||||||
| 785,382 | ||||||||
| IT Services — 1.5% | ||||||||
| Fiserv, Inc., 2.25%, 6/1/27 | 172,000 | 182,604 | ||||||
| Fiserv, Inc., 3.50%, 7/1/29 | 685,000 | 780,550 | ||||||
| International Business Machines Corp., 1.70%, 5/15/27 | 200,000 | 207,365 | ||||||
| International Business Machines Corp., 1.95%, 5/15/30 | 212,000 | 219,372 | ||||||
| PayPal Holdings, Inc., 2.30%, 6/1/30 | 151,000 | 160,842 | ||||||
| Western Union Co. (The), 2.85%, 1/10/25 | 261,000 | 276,010 | ||||||
| 1,826,743 | ||||||||
| Life Sciences Tools and Services — 0.7% | ||||||||
| Agilent Technologies, Inc., 2.10%, 6/4/30 | 278,000 | 285,946 | ||||||
| Thermo Fisher Scientific, Inc., 3.20%, 8/15/27 | 536,000 | 605,157 | ||||||
| 891,103 | ||||||||
| Machinery — 0.9% | ||||||||
Otis Worldwide Corp., 2.29%, 4/5/27(1) | 801,000 | 851,728 | ||||||
| Westinghouse Air Brake Technologies Corp., 3.20%, 6/15/25 | 215,000 | 226,533 | ||||||
| 1,078,261 | ||||||||
| Media — 3.2% | ||||||||
CCO Holdings LLC / CCO Holdings Capital Corp., 5.75%, 2/15/26(1) | 402,000 | 421,823 | ||||||
| Comcast Corp., 3.30%, 2/1/27 | 861,000 | 975,162 | ||||||
| Comcast Corp., 1.95%, 1/15/31 | 215,000 | 221,638 | ||||||
| CSC Holdings LLC, 5.875%, 9/15/22 | 285,000 | 302,734 | ||||||
| Discovery Communications LLC, 3.95%, 6/15/25 | 127,000 | 143,616 | ||||||
| Discovery Communications LLC, 3.625%, 5/15/30 | 65,000 | 72,045 | ||||||
| Time Warner Cable LLC, 4.00%, 9/1/21 | 223,000 | 228,214 | ||||||
| Time Warner Entertainment Co. LP, 8.375%, 3/15/23 | 360,000 | 428,311 | ||||||
| ViacomCBS, Inc., 4.75%, 5/15/25 | 147,000 | 169,870 | ||||||
12
| Principal Amount | Value | |||||||
| ViacomCBS, Inc., 3.70%, 6/1/28 | $ | 232,000 | $ | 257,389 | ||||
| ViacomCBS, Inc., 4.20%, 5/19/32 | 245,000 | 278,573 | ||||||
| WPP Finance 2010, 3.75%, 9/19/24 | 394,000 | 432,627 | ||||||
| 3,932,002 | ||||||||
| Metals and Mining — 1.7% | ||||||||
Newcrest Finance Pty Ltd., 3.25%, 5/13/30(1) | 536,000 | 592,602 | ||||||
| Reliance Steel & Aluminum Co., 2.15%, 8/15/30 | 153,000 | 151,802 | ||||||
| Southern Copper Corp., 3.875%, 4/23/25 | 641,000 | 708,779 | ||||||
| Steel Dynamics, Inc., 2.80%, 12/15/24 | 548,000 | 581,092 | ||||||
| 2,034,275 | ||||||||
| Multi-Utilities — 1.0% | ||||||||
| Ameren Corp., 3.50%, 1/15/31 | 541,000 | 621,187 | ||||||
| CenterPoint Energy, Inc., 4.25%, 11/1/28 | 498,000 | 591,511 | ||||||
| 1,212,698 | ||||||||
| Oil, Gas and Consumable Fuels — 6.0% | ||||||||
Aker BP ASA, 3.00%, 1/15/25(1) | 600,000 | 607,339 | ||||||
| Chevron Corp., 2.00%, 5/11/27 | 1,069,000 | 1,134,393 | ||||||
| Concho Resources, Inc., 2.40%, 2/15/31 | 9,000 | 8,828 | ||||||
| Diamondback Energy, Inc., 3.50%, 12/1/29 | 406,000 | 413,662 | ||||||
| Energy Transfer Operating LP, 3.60%, 2/1/23 | 511,000 | 530,999 | ||||||
| Enterprise Products Operating LLC, 3.125%, 7/31/29 | 409,000 | 447,130 | ||||||
| Exxon Mobil Corp., 1.57%, 4/15/23 | 1,069,000 | 1,102,957 | ||||||
| Hess Corp., 3.50%, 7/15/24 | 266,000 | 275,272 | ||||||
| Magellan Midstream Partners LP, 3.25%, 6/1/30 | 842,000 | 911,358 | ||||||
| ONEOK, Inc., 4.00%, 7/13/27 | 1,165,000 | 1,217,826 | ||||||
| Plains All American Pipeline LP / PAA Finance Corp., 3.80%, 9/15/30 | 630,000 | 634,913 | ||||||
| 7,284,677 | ||||||||
| Paper and Forest Products — 0.7% | ||||||||
Georgia-Pacific LLC, 2.10%, 4/30/27(1) | 801,000 | 844,296 | ||||||
| Pharmaceuticals — 1.7% | ||||||||
| Elanco Animal Health, Inc., 4.91%, 8/27/21 | 600,000 | 616,875 | ||||||
Horizon Therapeutics USA, Inc., 5.50%, 8/1/27(1) | 250,000 | 272,650 | ||||||
| Mylan NV, 3.95%, 6/15/26 | 522,000 | 591,974 | ||||||
Royalty Pharma plc, 1.20%, 9/2/25(1)(3) | 620,000 | 618,982 | ||||||
| 2,100,481 | ||||||||
| Professional Services — 0.5% | ||||||||
Jaguar Holding Co. II / PPD Development LP, 4.625%, 6/15/25(1) | 106,000 | 110,413 | ||||||
Jaguar Holding Co. II / PPD Development LP, 5.00%, 6/15/28(1) | 427,000 | 453,154 | ||||||
| 563,567 | ||||||||
| Road and Rail — 1.3% | ||||||||
Ashtead Capital, Inc., 4.125%, 8/15/25(1) | 600,000 | 619,500 | ||||||
Aviation Capital Group LLC, 5.50%, 12/15/24(1) | 230,000 | 236,749 | ||||||
| Union Pacific Corp., 2.40%, 2/5/30 | 619,000 | 670,176 | ||||||
| 1,526,425 | ||||||||
| Semiconductors and Semiconductor Equipment — 2.3% | ||||||||
| Broadcom Corp. / Broadcom Cayman Finance Ltd., 2.65%, 1/15/23 | 953,000 | 991,976 | ||||||
| Broadcom Corp. / Broadcom Cayman Finance Ltd., 3.125%, 1/15/25 | 151,000 | 162,086 | ||||||
| Broadcom, Inc., 2.25%, 11/15/23 | 149,000 | 155,125 | ||||||
| Broadcom, Inc., 3.15%, 11/15/25 | 182,000 | 197,256 | ||||||
Microchip Technology, Inc., 2.67%, 9/1/23(1) | 371,000 | 384,291 | ||||||
| Micron Technology, Inc., 4.64%, 2/6/24 | 268,000 | 298,255 | ||||||
13
| Principal Amount/Shares | Value | |||||||
NXP BV / NXP Funding LLC, 3.875%, 9/1/22(1) | $ | 250,000 | $ | 265,323 | ||||
NXP BV / NXP Funding LLC / NXP USA, Inc., 3.15%, 5/1/27(1) | 102,000 | 111,578 | ||||||
| QUALCOMM, Inc., 2.15%, 5/20/30 | 215,000 | 227,156 | ||||||
| 2,793,046 | ||||||||
| Technology Hardware, Storage and Peripherals — 1.9% | ||||||||
Dell International LLC / EMC Corp., 5.45%, 6/15/23(1) | 66,000 | 72,912 | ||||||
Dell International LLC / EMC Corp., 4.00%, 7/15/24(1) | 597,000 | 644,989 | ||||||
| EMC Corp., 3.375%, 6/1/23 | 125,000 | 129,452 | ||||||
| Hewlett Packard Enterprise Co., 1.45%, 4/1/24 | 450,000 | 456,020 | ||||||
| NetApp, Inc., 1.875%, 6/22/25 | 40,000 | 41,653 | ||||||
| Seagate HDD Cayman, 4.25%, 3/1/22 | 243,000 | 252,881 | ||||||
| Seagate HDD Cayman, 4.75%, 6/1/23 | 410,000 | 442,317 | ||||||
| Seagate HDD Cayman, 4.875%, 3/1/24 | 124,000 | 136,096 | ||||||
| Seagate HDD Cayman, 4.75%, 1/1/25 | 130,000 | 141,931 | ||||||
| 2,318,251 | ||||||||
| Textiles, Apparel and Luxury Goods — 0.6% | ||||||||
| NIKE, Inc., 2.40%, 3/27/25 | 536,000 | 577,778 | ||||||
PVH Corp., 4.625%, 7/10/25(1) | 94,000 | 96,856 | ||||||
| 674,634 | ||||||||
| Thrifts and Mortgage Finance — 0.7% | ||||||||
Nationwide Building Society, 1.00%, 8/28/25(1) | 795,000 | 799,015 | ||||||
| Trading Companies and Distributors — 0.3% | ||||||||
| Air Lease Corp., MTN, 2.875%, 1/15/26 | 184,000 | 183,046 | ||||||
Aircastle Ltd., 5.25%, 8/11/25(1) | 123,000 | 120,143 | ||||||
| 303,189 | ||||||||
| Water Utilities — 0.7% | ||||||||
| Essential Utilities, Inc., 2.70%, 4/15/30 | 801,000 | 866,820 | ||||||
| Wireless Telecommunication Services — 1.1% | ||||||||
T-Mobile USA, Inc., 3.875%, 4/15/30(1) | 332,000 | 379,861 | ||||||
T-Mobile USA, Inc., 2.55%, 2/15/31(1) | 129,000 | 135,049 | ||||||
| Vodafone Group plc, 2.95%, 2/19/23 | 741,000 | 784,793 | ||||||
| 1,299,703 | ||||||||
TOTAL CORPORATE BONDS (Cost $110,706,978) | 115,095,759 | |||||||
| U.S. TREASURY SECURITIES — 1.1% | ||||||||
| U.S. Treasury Notes, 1.375%, 1/31/25 (Cost $1,235,978) | 1,231,000 | 1,292,550 | ||||||
| TEMPORARY CASH INVESTMENTS — 4.2% | ||||||||
| State Street Institutional U.S. Government Money Market Fund, Premier Class (Cost $5,142,935) | 5,142,935 | 5,142,935 | ||||||
TEMPORARY CASH INVESTMENTS - SECURITIES LENDING COLLATERAL(4)† | ||||||||
| State Street Navigator Securities Lending Government Money Market Portfolio (Cost $14,048) | 14,048 | 14,048 | ||||||
TOTAL INVESTMENT SECURITIES — 100.2% (Cost $117,099,939) | 121,545,292 | |||||||
| OTHER ASSETS AND LIABILITIES — (0.2)% | (285,412) | |||||||
| TOTAL NET ASSETS — 100.0% | $ | 121,259,880 | ||||||
14
| NOTES TO SCHEDULE OF INVESTMENTS | ||||||||
| MTN | - | Medium Term Note | ||||||
| VRN | - | Variable Rate Note. The rate adjusts periodically based upon the terms set forth in the security’s offering documents. The rate shown is effective at the period end and the reference rate and spread, if any, is indicated. The security's effective maturity date may be shorter than the final maturity date shown. | ||||||
† Category is less than 0.05% of total net assets.
(1)Security was purchased pursuant to Rule 144A under the Securities Act of 1933 and may be sold in transactions exempt from registration, normally to qualified institutional investors. The aggregate value of these securities at the period end was $22,768,762, which represented 18.8% of total net assets.
(2)Security, or a portion thereof, is on loan. At the period end, the aggregate value of securities on loan was $13,630. The amount of securities on loan indicated may not correspond with the securities on loan identified because securities with pending sales are in the process of recall from the brokers.
(3)When-issued security. The issue price and yield are fixed on the date of the commitment, but payment and delivery are scheduled for a future date.
(4)Investment of cash collateral from securities on loan. At the period end, the aggregate value of the collateral held by the fund was $14,048.
See Notes to Financial Statements.
15
| Statement of Assets and Liabilities | ||
| AUGUST 31, 2020 | |||||
| Assets | |||||
| Investment securities, at value (cost of $117,085,891) — including $13,630 of securities on loan | $ | 121,531,244 | |||
| Investment made with cash collateral received for securities on loan, at value (cost of $14,048) | 14,048 | ||||
| Total investment securities, at value (cost of $117,099,939) | 121,545,292 | ||||
| Receivable for investments sold | 242,252 | ||||
| Interest receivable | 853,399 | ||||
| 122,640,943 | |||||
| Liabilities | |||||
| Payable for collateral received for securities on loan | 14,048 | ||||
| Payable for investments purchased | 1,337,577 | ||||
| Accrued management fees | 29,438 | ||||
| 1,381,063 | |||||
| Net Assets | $ | 121,259,880 | |||
| Shares outstanding (unlimited number of shares authorized) | 2,300,000 | ||||
| Net Asset Value Per Share | $ | 52.72 | |||
| Net Assets Consist of: | |||||
| Capital paid in | $ | 115,579,221 | |||
| Distributable earnings | 5,680,659 | ||||
| $ | 121,259,880 | ||||
See Notes to Financial Statements.
16
| Statement of Operations | ||
| YEAR ENDED AUGUST 31, 2020 | |||||
| Investment Income (Loss) | |||||
| Income: | |||||
| Interest | $ | 2,842,791 | |||
| Securities lending, net | 468 | ||||
| 2,843,259 | |||||
| Expenses: | |||||
| Management fees | 295,830 | ||||
| Other expenses | 261 | ||||
| 296,091 | |||||
| Net investment income (loss) | 2,547,168 | ||||
| Realized and Unrealized Gain (Loss) | |||||
| Net realized gain (loss) on: | |||||
| Investment transactions | 1,378,979 | ||||
| Futures contract transactions | (29,692) | ||||
| Swap agreement transactions | (184,500) | ||||
| 1,164,787 | |||||
| Change in net unrealized appreciation (depreciation) on: | |||||
| Investments | 2,241,279 | ||||
| Futures contracts | 2,784 | ||||
| Swap agreements | 42,017 | ||||
| 2,286,080 | |||||
| Net realized and unrealized gain (loss) | 3,450,867 | ||||
| Net Increase (Decrease) in Net Assets Resulting from Operations | $ | 5,998,035 | |||
See Notes to Financial Statements.
17
| Statement of Changes in Net Assets | ||
| YEARS ENDED AUGUST 31, 2020 AND AUGUST 31, 2019 | ||||||||
| Increase (Decrease) in Net Assets | August 31, 2020 | August 31, 2019 | ||||||
| Operations | ||||||||
| Net investment income (loss) | $ | 2,547,168 | $ | 1,336,780 | ||||
| Net realized gain (loss) | 1,164,787 | 132,752 | ||||||
| Change in net unrealized appreciation (depreciation) | 2,286,080 | 2,447,919 | ||||||
| Net increase (decrease) in net assets resulting from operations | 5,998,035 | 3,917,451 | ||||||
| Distributions to Shareholders | ||||||||
| From earnings | (2,757,995) | (1,157,153) | ||||||
| Capital Share Transactions | ||||||||
| Proceeds from shares sold | 53,791,152 | 49,282,909 | ||||||
| Payments for shares redeemed | (105,286) | — | ||||||
| Net increase (decrease) in net assets from capital share transactions | 53,685,866 | 49,282,909 | ||||||
| Net increase (decrease) in net assets | 56,925,906 | 52,043,207 | ||||||
| Net Assets | ||||||||
| Beginning of period | 64,333,974 | 12,290,767 | ||||||
| End of period | $ | 121,259,880 | $ | 64,333,974 | ||||
| Transactions in Shares of the Fund | ||||||||
| Sold | 1,050,000 | 1,000,000 | ||||||
| Redeemed | (2,000) | — | ||||||
| Net increase (decrease) in shares of the fund | 1,048,000 | 1,000,000 | ||||||
See Notes to Financial Statements.
18
| Notes to Financial Statements | ||
AUGUST 31, 2020
1. Organization
American Century ETF Trust (the trust) was registered as a Delaware statutory trust in 2017 and is registered under the Investment Company Act of 1940, as amended (the 1940 Act), as an open-end management investment company. American Century Diversified Corporate Bond ETF (the fund) is one fund in a series issued by the trust. The fund's investment objective is to seek to provide current income. Shares of the fund are listed for trading on the NYSE Arca, Inc.
2. Significant Accounting Policies
The following is a summary of significant accounting policies consistently followed by the fund in preparation of its financial statements. The fund is an investment company and follows accounting and reporting guidance in accordance with accounting principles generally accepted in the United States of America. This may require management to make certain estimates and assumptions at the date of the financial statements. Actual results could differ from these estimates. Management evaluated the impact of events or transactions occurring through the date the financial statements were issued that would merit recognition or disclosure.
Investment Valuations — The fund determines the fair value of its investments and computes its net asset value per share at the close of regular trading (usually 4 p.m. Eastern time) on the New York Stock Exchange (NYSE) on each day the NYSE is open. The Board of Trustees has adopted valuation policies and procedures to guide the investment advisor in the fund’s investment valuation process and to provide methodologies for the oversight of the fund’s pricing function.
Fixed income securities are valued at the evaluated mean as provided by independent pricing services or at the mean of the most recent bid and asked prices as provided by investment dealers. Corporate bonds and U.S. Treasury and Government Agency securities are valued using market models that consider trade data, quotations from dealers and active market makers, relevant yield curve and spread data, creditworthiness, trade data or market information on comparable securities, and other relevant security specific information.
Open-end management investment companies are valued at the reported net asset value per share. Exchange-traded futures contracts are valued at the settlement price as provided by the appropriate exchange. Swap agreements are valued at an evaluated mean as provided by independent pricing services or independent brokers.
If the fund determines that the market price for an investment is not readily available or the valuation methods mentioned above do not reflect an investment’s fair value, such investment is valued as determined in good faith by the Board of Trustees or its delegate, in accordance with policies and procedures adopted by the Board of Trustees. In its determination of fair value, the fund may review several factors including, but not limited to, market information regarding the specific investment or comparable investments and correlation with other investment types, futures indices or general market indicators. Circumstances that may cause the fund to use these procedures to value an investment include, but are not limited to: an investment has been declared in default or is distressed; trading in a security has been suspended during the trading day or a security is not actively trading on its principal exchange; prices received from a regular pricing source are deemed unreliable; or there is a foreign market holiday and no trading occurred.
The fund monitors for significant events occurring after the close of an investment’s primary exchange but before the fund’s net asset value per share is determined. Significant events may include, but are not limited to: corporate announcements and transactions; governmental action and political unrest that could impact a specific investment or an investment sector; or armed conflicts, natural disasters and similar events that could affect investments in a specific country or region.
Security Transactions — Security transactions are accounted for as of the trade date. Net realized gains and losses are determined on the identified cost basis, which is also used for federal income tax purposes.
Investment Income — Interest income is recorded on the accrual basis and includes accretion of discounts and amortization of premiums. Inflation adjustments related to inflation-linked debt securities are reflected as
19
interest income. Securities lending income is net of fees and rebates earned by the lending agent for its services.
Income Tax Status — It is the fund’s policy to distribute substantially all net investment income and net realized gains to shareholders and to otherwise qualify as a regulated investment company under provisions of the Internal Revenue Code. Accordingly, no provision has been made for income taxes. The fund files U.S. federal, state, local and non-U.S. tax returns as applicable. The fund's tax returns are subject to examination by the relevant taxing authority until expiration of the applicable statute of limitations, which is generally three years from the date of filing but can be longer in certain jurisdictions. At this time, management believes there are no uncertain tax positions which, based on their technical merit, would not be sustained upon examination and for which it is reasonably possible that the total amounts of unrecognized tax benefits will significantly change in the next twelve months.
Segregated Assets — In accordance with the 1940 Act, the fund segregates assets on its books and records to cover certain types of investment securities and other financial instruments. American Century Investment Management, Inc. (ACIM) (the investment advisor) monitors, on a daily basis, the securities segregated to ensure the fund designates a sufficient amount of liquid assets, marked-to-market daily. The fund may also receive assets or be required to pledge assets at the custodian bank or with a broker for collateral requirements.
Distributions to Shareholders — Distributions from net investment income, if any, are generally declared and paid monthly. Distributions from net realized gains, if any, are generally declared and paid annually.
Indemnifications — Under the trust’s organizational documents, its officers and trustees are indemnified against certain liabilities arising out of the performance of their duties to the fund. In addition, in the normal course of business, the fund enters into contracts that provide general indemnifications. The maximum exposure under these arrangements is unknown as this would involve future claims that may be made against a fund. The risk of material loss from such claims is considered by management to be remote.
Securities Lending — Securities are lent to qualified financial institutions and brokers. State Street Bank & Trust Co. serves as securities lending agent to the fund pursuant to a Securities Lending Agreement. The lending of securities exposes the fund to risks such as: the borrowers may fail to return the loaned securities, the borrowers may not be able to provide additional collateral, the fund may experience delays in recovery of the loaned securities or delays in access to collateral, or the fund may experience losses related to the investment collateral. To minimize certain risks, loan counterparties pledge collateral in the form of cash and/or securities. The lending agent has agreed to indemnify the fund in the case of default of any securities borrowed. Cash collateral received is invested in the State Street Navigator Securities Lending Government Money Market Portfolio, a money market mutual fund registered under the 1940 Act. The loans may also be secured by U.S. government securities in an amount at least equal to the market value of the securities loaned, plus accrued interest and dividends, determined on a daily basis and adjusted accordingly. By lending securities, the fund seeks to increase its net investment income through the receipt of interest and fees. Such income is reflected separately within the Statement of Operations. The value of loaned securities and related collateral outstanding at period end, if any, are shown on a gross basis within the Schedule of Investments and Statement of Assets and Liabilities.
The following table reflects a breakdown of transactions accounted for as secured borrowings, the gross obligation by the type of collateral pledged, and the remaining contractual maturity of those transactions as of August 31, 2020.
| Remaining Contractual Maturity of Agreements | |||||||||||||||||
| Overnight and Continuous | <30 days | Between 30 & 90 days | >90 days | Total | |||||||||||||
Securities Lending Transactions(1) | |||||||||||||||||
| Corporate Bonds | $ | 14,048 | — | — | — | $ | 14,048 | ||||||||||
| Gross amount of recognized liabilities for securities lending transactions | $ | 14,048 | |||||||||||||||
(1)Amount represents the payable for cash collateral received for securities on loan. This will generally be in the Overnight and Continuous column as the securities are typically callable on demand.
20
3. Fees and Transactions with Related Parties
Certain officers and trustees of the trust are also officers and/or directors of American Century Companies, Inc. (ACC). The trust's investment advisor, ACIM, and the trust’s administrator, American Century Services, LLC, are wholly owned, directly or indirectly, by ACC. Various funds issued by American Century Strategic Asset Allocations, Inc. own, in aggregate, 53% of the shares of the fund. Related parties do not invest in the fund for the purpose of exercising management or control.
Management Fees — The trust has entered into a management agreement with ACIM, under which ACIM provides the fund with investment advisory and management services in exchange for a single, unified management fee (the fee). The agreement provides that ACIM will pay all expenses of managing and operating the fund, except brokerage and other transaction fees and expenses relating to the acquisition and disposition of portfolio securities, acquired fund fees and expenses, interest, taxes, litigation expenses and extraordinary expenses. The fee is computed and accrued daily based on the daily net assets of the fund and paid monthly in arrears. The annual management fee is 0.29%.
Interfund Transactions — The fund may enter into security transactions with other American Century Investments funds and other client accounts of the investment advisor, in accordance with the 1940 Act rules and procedures adopted by the Board of Trustees. The rules and procedures require, among other things, that these transactions be effected at the independent current market price of the security. There were no interfund transactions during the period.
4. Investment Transactions
Purchases of investment securities, excluding short-term investments and in-kind transactions, for the period ended August 31, 2020 totaled $183,031,473, of which $4,534,773 represented U.S. Treasury and Government Agency obligations.
Sales of investment securities, excluding short-term investments and in-kind transactions, for the period ended August 31, 2020 totaled $169,796,976, of which 3,425,244 represented U.S. Treasury and Government Agency obligations.
Securities received in-kind through subscriptions for the period ended August 31, 2020 were $38,855,901. There were no securities delivered in-kind through redemptions during the period.
5. Capital Share Transactions
The fund’s shares may only be purchased and sold on a national securities exchange through a broker-dealer. The price of the fund’s shares is based on market price, and because ETF shares trade at market prices rather than net asset value (NAV), shares may trade at a price greater than NAV (a premium) or less than NAV (a discount). The fund issues and redeems shares that have been aggregated into blocks of 50,000 shares or multiples thereof (Creation Units) to authorized participants who have entered into agreements with the fund's distributor. The fund may issue and redeem Creation Units in return for a basket of securities (and an amount of cash) or entirely for cash. Investors transacting in Creation Units for cash may also pay an additional variable charge to compensate the fund for certain transaction costs and market impact expenses relating to investing in portfolio securities. Such variable charges, if any, are included in proceeds from shares sold in the Statement of Changes in Net Assets.
6. Fair Value Measurements
The fund’s investments valuation process is based on several considerations and may use multiple inputs to determine the fair value of the investments held by the fund. In conformity with accounting principles generally accepted in the United States of America, the inputs used to determine a valuation are classified into three broad levels.
•Level 1 valuation inputs consist of unadjusted quoted prices in an active market for identical investments.
•Level 2 valuation inputs consist of direct or indirect observable market data (including quoted prices for comparable investments, evaluations of subsequent market events, interest rates, prepayment speeds, credit risk, etc.). These inputs also consist of quoted prices for identical investments initially expressed in local currencies that are adjusted through translation into U.S. dollars.
•Level 3 valuation inputs consist of unobservable data (including a fund’s own assumptions).
21
The level classification is based on the lowest level input that is significant to the fair valuation measurement. The valuation inputs are not necessarily an indication of the risks associated with investing in these securities or other financial instruments.
The following is a summary of the level classifications as of period end. The Schedule of Investments provides additional information on the fund’s portfolio holdings.
| Level 1 | Level 2 | Level 3 | |||||||||
| Assets | |||||||||||
| Investment Securities | |||||||||||
| Corporate Bonds | — | $ | 115,095,759 | — | |||||||
| U.S. Treasury Securities | — | 1,292,550 | — | ||||||||
| Temporary Cash Investments | $ | 5,142,935 | — | — | |||||||
| Temporary Cash Investments - Securities Lending Collateral | 14,048 | — | — | ||||||||
| $ | 5,156,983 | $ | 116,388,309 | — | |||||||
7. Derivative Instruments
Credit Risk — The fund is subject to credit risk in the normal course of pursuing its investment objectives. The value of a bond generally declines as the credit quality of its issuer declines. Credit default swap agreements enable a fund to buy/sell protection against a credit event of a specific issuer or index. A fund may attempt to enhance returns by selling protection or attempt to mitigate credit risk by buying protection. The buyer/seller of credit protection against a security or basket of securities may pay/receive an up-front or periodic payment to compensate for/against potential default events. Changes in value, including the periodic amounts of interest to be paid or received on swap agreements, are recorded as unrealized appreciation (depreciation) on swap agreements. Upon entering into a centrally cleared swap, a fund is required to deposit cash or securities (initial margin) with a financial intermediary in an amount equal to a certain percentage of the notional amount. Subsequent payments (variation margin) are made or received daily, in cash, by a fund. The variation margin is equal to the daily change in the value and is a component of unrealized gains and losses. Realized gain or loss is recorded upon receipt or payment of a periodic settlement or termination of swap agreements. Net realized and unrealized gains or losses occurring during the holding period of swap agreements are a component of net realized gain (loss) on swap agreement transactions and change in net unrealized appreciation (depreciation) on swap agreements, respectively. The risks of entering into swap agreements include the possible lack of liquidity, failure of the counterparty to meet its obligations, and that there may be unfavorable changes in the underlying investments or instruments. The fund's average notional amount held during the period was $3,241,000.
Interest Rate Risk — The fund is subject to interest rate risk in the normal course of pursuing its investment objectives. The value of bonds generally declines as interest rates rise. A fund may enter into futures contracts based on a bond index or a specific underlying security. A fund may purchase futures contracts to gain exposure to increases in market value or sell futures contracts to protect against a decline in market value. Upon entering into a futures contract, a fund will segregate cash, cash equivalents or other appropriate liquid securities on its records in amounts sufficient to meet requirements. Subsequent payments (variation margin) are made or received daily, in cash, by a fund. The variation margin is equal to the daily change in the contract value and is recorded as unrealized gains and losses. A fund recognizes a realized gain or loss when the futures contract is closed or expires. Net realized and unrealized gains or losses occurring during the holding period of futures contracts are a component of net realized gain (loss) on futures contract transactions and change in net unrealized appreciation (depreciation) on futures contracts, respectively. One of the risks of entering into futures contracts is the possibility that the change in value of the contract may not correlate with the changes in value of the underlying securities. The fund's average notional exposure to interest rate risk derivative instruments held during the period was $2,387,677 futures contracts purchased.
At period end, the fund did not have any derivative instruments disclosed on the Statement of Assets and Liabilities.
22
Effect of Derivative Instruments on the Statement of Operations for the Year Ended August 31, 2020
| Net Realized Gain (Loss) | Change in Net Unrealized Appreciation (Depreciation) | |||||||||||||
| Type of Risk Exposure | Location on Statement of Operations | Value | Location on Statement of Operations | Value | ||||||||||
| Credit Risk | Net realized gain (loss) on swap agreement transactions | $ | (184,500) | Change in net unrealized appreciation (depreciation) on swap agreements | $ | 42,017 | ||||||||
| Interest Rate Risk | Net realized gain (loss) on futures contract transactions | (29,692) | Change in net unrealized appreciation (depreciation) on futures contracts | 2,784 | ||||||||||
| $ | (214,192) | $ | 44,801 | |||||||||||
8. Risk Factors
The value of the fund’s shares will go up and down, sometimes rapidly or unpredictably, based on the performance of the securities owned by the fund and other factors generally affecting the securities market. Market risks, including political, regulatory, economic and social developments, can affect the value of the fund’s investments. Natural disasters, public health emergencies, terrorism and other unforeseeable events may lead to increased market volatility and may have adverse long-term effects on world economies and markets generally.
The fund’s investment process may result in high portfolio turnover, which could mean high transaction costs, affecting both performance and capital gains tax liabilities to investors.
9. Federal Tax Information
The tax character of distributions paid during the years ended August 31, 2020 and August 31, 2019 were as follows:
| 2020 | 2019 | |||||||
| Distributions Paid From | ||||||||
| Ordinary income | $ | 2,704,848 | $ | 1,157,153 | ||||
| Long-term capital gains | $ | 53,147 | — | |||||
The book-basis character of distributions made during the year from net investment income or net realized gains may differ from their ultimate characterization for federal income tax purposes. These differences reflect the differing character of certain income items and net realized gains and losses for financial statement and tax purposes, and may result in reclassification among certain capital accounts on the financial statements.
As of period end, the federal tax cost of investments and the components of distributable earnings on a tax-basis were as follows:
| Federal tax cost of investments | $ | 117,118,370 | |||
| Gross tax appreciation of investments | $ | 4,448,502 | |||
| Gross tax depreciation of investments | (21,580) | ||||
| Net tax appreciation (depreciation) of investments | $ | 4,426,922 | |||
| Undistributed ordinary income | $ | 704,367 | |||
| Accumulated long-term capital gains | $ | 549,370 | |||
The difference between book-basis and tax-basis unrealized appreciation (depreciation) is attributable primarily to the tax deferral of losses on wash sales.
23
10. Recently Issued Accounting Standards
In March 2017, the Financial Accounting Standards Board (FASB) issued Accounting Standards Update No. 2017-08, “Receivables - Nonrefundable Fees and Other Costs (Subtopic 310-20), Premium Amortization on Purchased Callable Debt Securities” (ASU 2017-08). ASU 2017-08 amends the amortization period for certain purchased callable debt securities held at a premium, shortening such period to the earliest call date. The amendments are effective for fiscal years, and interim periods within those fiscal years, beginning after December 15, 2018. The adoption of ASU 2017-08 did not materially impact the financial statements.
24
| Financial Highlights | ||
| For a Share Outstanding Throughout the Years Ended August 31 (except as noted) | |||||||||||||||||||||||||||||||||||||||||
| Per-Share Data | Ratios and Supplemental Data | ||||||||||||||||||||||||||||||||||||||||
| Income From Investment Operations: | Distributions From: | Ratio to Average Net Assets of: | |||||||||||||||||||||||||||||||||||||||
| Net Asset Value, Beginning of Period | Net Investment Income (Loss)(1) | Net Realized and Unrealized Gain (Loss) | Total From Investment Operations | Net Investment Income | Net Realized Gains | Total Distributions | Net Asset Value, End of Period | Total Return(2) | Operating Expenses | Net Investment Income (Loss) | Portfolio Turnover Rate(3) | Net Assets, End of Period (in thousands) | |||||||||||||||||||||||||||||
| 2020 | $51.38 | 1.28 | 1.49 | 2.77 | (1.40) | (0.03) | (1.43) | $52.72 | 5.48% | 0.29% | 2.50% | 174% | $121,260 | ||||||||||||||||||||||||||||
| 2019 | $48.77 | 1.67 | 2.48 | 4.15 | (1.54) | — | (1.54) | $51.38 | 8.70% | 0.39% | 3.37% | 35% | $64,334 | ||||||||||||||||||||||||||||
2018(4) | $50.00 | 0.96 | (1.37) | (0.41) | (0.82) | — | (0.82) | $48.77 | (0.77)% | 0.45%(5) | 3.09%(5) | 38% | $12,291 | ||||||||||||||||||||||||||||
| Notes to Financial Highlights | ||
(1)Computed using average shares outstanding throughout the period.
(2)Total returns are calculated based on the net asset value of the last business day. Total returns for periods less than one year are not annualized.
(3)Excludes securities received or delivered in-kind.
(4)January 11, 2018 (fund inception) through August 31, 2018.
(5)Annualized.
See Notes to Financial Statements.
| Report of Independent Registered Public Accounting Firm | ||
To the Shareholders and the Board of Trustees of American Century ETF Trust:
Opinion on the Financial Statements and Financial Highlights
We have audited the accompanying statement of assets and liabilities, including the schedule of investments, of American Century Diversified Corporate Bond ETF (the "Fund"), one of the funds constituting the American Century ETF Trust, as of August 31, 2020, the related statement of operations for the year then ended, the statements of changes in net assets for each of the two years in the period then ended, the financial highlights for the two years in the period ended August 31, 2020 and the period from January 11, 2018 (fund inception) through August 31, 2018, and the related notes. In our opinion, the financial statements and financial highlights present fairly, in all material respects, the financial position of American Century Diversified Corporate Bond ETF as of August 31, 2020, and the results of its operations for the year then ended, the changes in its net assets for each of the two years in the period then ended, and the financial highlights for the two years in the period ended August 31, 2020 and the period from January 11, 2018 (fund inception) through August 31, 2018, in conformity with accounting principles generally accepted in the United States of America.
Basis for Opinion
These financial statements and financial highlights are the responsibility of the Fund's management. Our responsibility is to express an opinion on the Fund’s financial statements and financial highlights based on our audits. We are a public accounting firm registered with the Public Company Accounting Oversight Board (United States) (PCAOB) and are required to be independent with respect to the Fund in accordance with the U.S. federal securities laws and the applicable rules and regulations of the Securities and Exchange Commission and the PCAOB.
We conducted our audits in accordance with the standards of the PCAOB. Those standards require that we plan and perform the audit to obtain reasonable assurance about whether the financial statements and financial highlights are free of material misstatement, whether due to error or fraud. The Fund is not required to have, nor were we engaged to perform, an audit of its internal control over financial reporting. As part of our audits we are required to obtain an understanding of internal control over financial reporting but not for the purpose of expressing an opinion on the effectiveness of the Fund’s internal control over financial reporting. Accordingly, we express no such opinion.
Our audits included performing procedures to assess the risks of material misstatement of the financial statements and financial highlights, whether due to error or fraud, and performing procedures that respond to those risks. Such procedures included examining, on a test basis, evidence regarding the amounts and disclosures in the financial statements and financial highlights. Our audits also included evaluating the accounting principles used and significant estimates made by management, as well as evaluating the overall presentation of the financial statements and financial highlights. Our procedures included confirmation of securities owned as of August 31, 2020, by correspondence with the custodian and brokers; when replies were not received from brokers, we performed other auditing procedures. We believe that our audits provide a reasonable basis for our opinion.
DELOITTE & TOUCHE LLP
Kansas City, Missouri
October 16, 2020
We have served as the auditor of one or more American Century investment companies since 1997.
26
| Management | ||
The Board of Trustees
The individuals listed below serve as trustees of the funds. Each trustee will continue to serve in this capacity until death, retirement, resignation or removal from office. The board has adopted a mandatory retirement age for trustees who are not “interested persons,” as that term is defined in the Investment Company Act (independent trustees). Trustees who are not also officers of the trust shall retire by December 31st of the year in which they reach their 75th birthday.
Mr. Thomas is an “interested person” because he currently serves as President and Chief Executive Officer of American Century Companies, Inc. (ACC), the parent company of American Century Investment Management, Inc. (ACIM or the advisor). The other trustees are independent. They are not employees, directors or officers of, and have no financial interest in, ACC or any of its wholly owned, direct or indirect, subsidiaries, including ACIM and American Century Services, LLC (ACS), and they do not have any other affiliations, positions or relationships that would cause them to be considered “interested persons” under the Investment Company Act. The following trustees also serve in this capacity for a number of other registered investment companies in the American Century Investments family of funds: Jonathan S. Thomas, 15; Ronald J. Gilson, 8; and Stephen E. Yates, 7.
The following table presents additional information about the trustees. The mailing address for each trustee other than Jonathan S. Thomas is 330 Madison Avenue, New York, New York 10017. The mailing address for Jonathan S. Thomas is 4500 Main Street, Kansas City, Missouri 64111.
| Name (Year of Birth) | Position(s) Held with Funds | Length of Time Served | Principal Occupation(s) During Past 5 Years | Number of American Century Portfolios Overseen by Trustee | Other Directorships Held During Past 5 Years | ||||||||||||
| Independent Trustees | |||||||||||||||||
| Reginald M. Browne (1968) | Trustee and Chairman of the Board | Since 2017 (Chairman since 2019) | Principal, GTS Securities (automated capital markets trading firm)(2019 to present); Senior Managing Director, Co Global Head-ETF Group, Cantor Fitzgerald (financial services firm)(2013 to 2019) | 19 | None | ||||||||||||
| Ronald J. Gilson (1946) | Trustee | Since 2017 | Charles J. Meyers Professor of Law and Business, Emeritus, Stanford Law School (1979 to 2016); Marc and Eva Stern Professor of Law and Business, Columbia University School of Law (1992 to present) | 59 | None | ||||||||||||
| Barry A. Mendelson (1958) | Trustee | Since 2017 | Retired; Consultant regarding ETF and mutual fund matters (2015 to 2016); Principal and Senior Counsel, The Vanguard Group (investment management)(1998 to 2014) | 19 | None | ||||||||||||
| Stephen E. Yates (1948) | Trustee | Since 2017 | Retired | 82 | None | ||||||||||||
27
| Name (Year of Birth) | Position(s) Held with Funds | Length of Time Served | Principal Occupation(s) During Past 5 Years | Number of American Century Portfolios Overseen by Trustee | Other Directorships Held During Past 5 Years | ||||||||||||
| Interested Trustees | |||||||||||||||||
| Jonathan S. Thomas (1963) | Trustee | Since 2017 | President and Chief Executive Officer, ACC (2007 to present). Also serves as Chief Executive Officer, ACS; Executive Vice President, ACIM; Director, ACC, ACIM and other ACC subsidiaries | 122 | None | ||||||||||||
The Statement of Additional Information has additional information about the fund's trustees and is available without charge, upon request, by calling 1-800-345-6488.
28
Officers
The following table presents certain information about the executive officers of the funds. Each officer, except Edward Rosenberg, serves as an officer for each of the 16 investment companies in the American Century family of funds. No officer is compensated for his or her service as an officer of the funds. The listed officers are interested persons of the funds and are appointed or re-appointed on an annual basis. The mailing address for each officer listed below is 4500 Main Street, Kansas City, Missouri 64111.
| Name (Year of Birth) | Offices with the Funds | Principal Occupation(s) During the Past Five Years | ||||||
| Patrick Bannigan (1965) | President since 2019 | Executive Vice President and Director, ACC (2012 to present); Chief Financial Officer, Chief Accounting Officer and Treasurer, ACC (2015 to present). Also serves as President, ACS; Vice President, ACIM; Chief Financial Officer, Chief Accounting Officer and/or Director, ACIM, ACS and other ACC subsidiaries | ||||||
| R. Wes Campbell (1974) | Chief Financial Officer and Treasurer since 2018 | Vice President, ACS (2020 to present); Investment Operations and Investment Accounting, ACS (2000 to present) | ||||||
| Amy D. Shelton (1964) | Chief Compliance Officer and Vice President since 2017 | Chief Compliance Officer, American Century funds, (2014 to present); Chief Compliance Officer, ACIM (2014 to present); Chief Compliance Officer, ACIS (2009 to present). Also serves as Vice President, ACIS | ||||||
| Charles A. Etherington (1957) | General Counsel and Vice President since 2017 | Attorney, ACC (1994 to present); Vice President, ACC (2005 to present); General Counsel, ACC (2007 to present). Also serves as General Counsel, ACIM, ACS, ACIS and other ACC subsidiaries; and Senior Vice President, ACIM and ACS | ||||||
| Cleo Chang (1977) | Vice President since 2019 | Senior Vice President, ACIM (2015 to present); Chief Investment Officer, Wilshire Funds Management (2005 to 2015) | ||||||
| David H. Reinmiller (1963) | Vice President since 2017 | Attorney, ACC (1994 to present). Also serves as Vice President, ACIM and ACS | ||||||
| Edward Rosenberg (1973) | Vice President since 2017 | Senior Vice President, ACIM (2017 to present); Senior Vice President, Flexshares Head of ETF Capital Markets, Northern Trust (2012 to 2017) | ||||||
| C. Jean Wade (1964) | Vice President since 2017 | Senior Vice President, ACS (2017 to present); Vice President, ACS (2000 to 2017) | ||||||
| Ward D. Stauffer (1960) | Secretary since 2019 | Attorney, ACS (2003 to present) | ||||||
29
| Approval of Management Agreement | ||
At a meeting held on June 5, 2020, the Fund’s Board of Trustees (the "Board") unanimously approved the renewal of the management agreement pursuant to which American Century Investment Management, Inc. (the “Advisor”) acts as the investment advisor for the Fund. Under Section 15(c) of the Investment Company Act, contracts for investment advisory services are required to be reviewed, evaluated, and approved by a majority of a fund’s trustees (the “Trustees”), including a majority of the independent Trustees, each year.
Prior to its consideration of the renewal of the management agreement, the Trustees requested and reviewed extensive data and information compiled by the Advisor and certain independent providers of evaluation data concerning the Fund and the services provided to the Fund by the Advisor. This review was in addition to the oversight and evaluation undertaken by the Board and its Audit Committee on a continual basis and the information received was supplemental to the extensive information that the Board and its Audit Committee receive and consider throughout the year.
In connection with its consideration of the renewal of the management agreement, the Board’s review and evaluation of the services provided by the Advisor included, but was not limited to, the following:
•the nature, extent, and quality of investment management and other services provided and to be provided to the Fund;
•the wide range of other programs and services provided and to be provided to the Fund and its shareholders on a routine and non-routine basis;
•the Fund’s investment performance, including data comparing the Fund's performance to appropriate benchmarks of funds with similar objectives and strategies;
•the cost of owning the Fund compared to the cost of owning similar funds;
•the compliance policies, procedures, and regulatory experience of the Advisor and the Fund's service providers;
•the Advisor’s strategic plans;
•the Advisor’s business continuity plans and specifically its response to the COVID-19 pandemic;
•financial data showing the cost of services provided to the Fund, the profitability of the Fund to the Advisor, and the overall profitability of the Advisor;
•information regarding payments to intermediaries by the Advisor; and
•possible economies of scale associated with the Advisor’s management of the Fund; and
•possible collateral benefits to the Advisor from the management of the Fund.
The independent Trustees met separately in private session to discuss the renewal and to review and discuss the information provided in response to their request. The independent Trustees also held active discussions with the Advisor regarding the renewal of the management agreement. The independent Trustees had the benefit of the advice of their independent counsel throughout the process.
Factors Considered
The Trustees considered all of the information provided by the Advisor, the independent data providers, and independent counsel in connection with the approval. They determined that the information was sufficient for them to evaluate the management agreement for the Fund. In connection with their review, the Trustees did not identify any single factor as being all-important or
30
controlling, and each Trustee may have attributed different levels of importance to different factors. In deciding to renew the management agreement, the Board based its decision on a number of factors, including without limitation the following:
Nature, Extent and Quality of Services — Generally. Under the management agreement, the Advisor is responsible for providing or arranging for all services necessary for the operation of the Fund. The Board noted that the Advisor provides or arranges at its own expense a wide variety of services including without limitation the following:
•constructing and designing the Fund
•portfolio research and security selection
•initial capitalization/funding
•securities trading
•Fund administration
•custody of Fund assets
•daily valuation of the Fund’s portfolio
•shareholder servicing and transfer agency, including shareholder confirmations, recordkeeping, and communications
•legal services (except the independent Trustees’ counsel)
•regulatory and portfolio compliance
•financial reporting
•marketing and distribution (except amounts paid by the Fund under Rule 12b-1 plans)
Investment Management Services. The nature of the investment management services provided to the Fund is quite complex and allows Fund shareholders access to professional money management, instant diversification of their investments within an asset class, and liquidity. In evaluating investment performance, the Board expects the Advisor to manage the Fund in accordance with its investment objectives and approved strategies. Further, the Trustees recognize that the Advisor has an obligation to monitor trading activities, and in particular to seek the best execution of fund trades, and to evaluate the use of and payment for research. In providing these services, the Advisor utilizes teams of investment professionals (portfolio managers, analysts, research assistants, and securities traders) who require extensive information technology, research, training, compliance, and other systems to conduct their business. The Board provides oversight of the investment performance process. It regularly reviews investment performance information for the Fund, together with comparative information for appropriate benchmarks over different time horizons. The Trustees also review investment performance information during the management agreement renewal process. If performance concerns are identified, the Board discusses with the Advisor the reasons for such results and any efforts being undertaken to improve performance. The Fund’s performance was below its benchmark for the one-year and since inception periods reviewed by the Board. The Board found the investment management services provided by the Advisor to the Fund to be satisfactory and consistent with the management agreement.
Shareholder and Other Services. Under the management agreement, the Advisor provides or arranges for a comprehensive package of services to the Fund. The Board, directly and through its Audit Committee, regularly reviews reports and evaluations of such services at its regular meetings. These reports include, but are not limited to, information regarding the operational efficiency and accuracy of the shareholder and transfer agency services provided, staffing levels, shareholder satisfaction, technology support (including cyber security), new products and services offered to Fund shareholders, securities trading activities, portfolio valuation services, auditing services, and legal and operational compliance activities. The Board found the services provided by the Advisor to the Fund under the management agreement to be competitive and of high quality.
31
COVID-19 Response. During 2020, much of the world experienced unprecedented change and challenges from the impacts of the rapidly evolving, worldwide spread of the COVID-19 virus. The Board evaluated the Advisor’s response to the COVID-19 pandemic and its impact on service to the Fund. The Board found that Fund shareholders have continued to receive the Advisor’s investment management and other services without disruption, and Advisor personnel have demonstrated great resiliency in providing those services. The Board, directly and through its Audit Committee, continues to monitor the impact of the pandemic and the response of each of the Fund’s service providers.
Costs of Services and Profitability. The Advisor provides detailed information concerning its cost of providing various services to the Fund, its profitability in managing the Fund (pre- and post-distribution), its overall profitability, and its financial condition. The Trustees have reviewed with the Advisor the methodology used to prepare this financial information. This information is considered in evaluating the Advisor’s financial condition, its ability to continue to provide services under the management agreement, and the reasonableness of the current management fee. The Board concluded that the Advisor’s profits were reasonable in light of the services provided to the Fund.
Ethics. The Board generally considers the Advisor’s commitment to providing quality services to the Fund and to conducting its business ethically. They noted that the Advisor’s practices generally meet or exceed industry best practices.
Economies of Scale. The Board also reviewed information provided by the Advisor regarding the possible existence of economies of scale in connection with the management of the Fund. The Board concluded that economies of scale are difficult to measure and predict with precision, especially on a fund-by-fund basis. The Board concluded that the Advisor is appropriately sharing economies of scale, to the extent they exist, through its competitive fee structure, offering competitive fees from fund inception, and through reinvestment in its business, infrastructure, investment capabilities and initiatives to provide shareholders additional content and services.
Comparison to Other Funds’ Fees. The management agreement provides that the Fund pays the Advisor a single, all-inclusive (or unified) management fee for providing all services necessary for the management and operation of the Fund, other than brokerage expenses, expenses attributable to short sales, taxes, interest, extraordinary expenses, and expenses incurred in connection with the provision of shareholder services and distribution services under a plan adopted pursuant to Rule 12b-1 under the Investment Company Act. Under the unified fee structure, the Advisor is responsible for providing all investment advisory, custody, audit, administrative, compliance, recordkeeping, marketing and shareholder services, or arranging and supervising third parties to provide such services. The Board believes the unified fee structure is a benefit to Fund shareholders because it clearly discloses to shareholders the cost of owning Fund shares, and, since the unified fee cannot be increased without a vote of Fund shareholders, it shifts to the Advisor the risk of increased costs of operating the Fund and provides a direct incentive to minimize administrative inefficiencies. Part of the Board’s analysis of fee levels involves reviewing certain evaluative data compiled by an independent provider comparing the Fund’s unified fee to the total expense ratios of its peers. The unified fee charged to shareholders of the Fund was below the median of the total expense ratios of the Fund’s peer expense universe and was within the range of its peer expense group. The Board concluded that the management fee paid by the Fund to the Advisor under the management agreement is reasonable in light of the services provided to the Fund.
Comparison to Fees and Services Provided to Other Clients of the Advisor. The Board also requested information from the Advisor concerning the nature of the services, fees, costs, and profitability of its advisory services to funds or other advisory clients managed similarly to the Fund. The Advisor informed the Trustees that, as of December 31, 2019, it did not provide services to any other investment companies or comparable accounts that were managed similarly to the Fund.
32
Payments to Intermediaries. The Trustees also requested a description of payments made to intermediaries by the Fund and the Advisor and services provided in response thereto. These payments could include various payments made by the Fund or the Advisor to different types of intermediaries and recordkeepers for distribution and service activities provided for the Fund. The Trustees reviewed such information and received representations from the Advisor that all such payments by the Advisor were made from the Advisor’s resources and reasonable profits. The Board found such payments to be reasonable in scope and purpose.
Collateral or “Fall-Out” Benefits Derived by the Advisor. The Board considered the possible existence of collateral benefits the Advisor may receive as a result of its relationship with the Fund. They concluded that the Advisor’s primary business is managing funds and it generally does not use fund or shareholder information to generate profits in other lines of business, and therefore does not derive any significant collateral benefits from them. The Board noted that additional assets from other clients may offer the Advisor some benefit from increased leverage with service providers and counterparties. The Board also determined that the Advisor is able to provide investment management services to certain clients other than the Fund, at least in part, due to its existing infrastructure built to serve the fund complex. The Board concluded that appropriate allocation methodologies had been employed to assign resources and the cost of those resources to these other clients.
Existing Relationship. The Board also considered whether there was any reason for not continuing the existing arrangement with the Advisor. In this regard, the Board was mindful of the potential disruptions of the Fund’s operations and various risks, uncertainties, and other effects that could occur as a result of a decision not to continue such relationship. In particular, the Board recognized that most shareholders have invested in the Fund on the strength of the Advisor’s industry standing and reputation and in the expectation that the Advisor will have a continuing role in providing advisory services to the Fund.
Conclusion of the Trustees. As a result of this process, the Board, including all of the independent Trustees, taking into account all of the factors discussed above and the information provided by the Advisor and others in connection with its review and throughout the year, determined that the management fee is fair and reasonable in light of the services provided and that the investment management agreement between the Fund and the Advisor should be renewed.
33
| Liquidity Risk Management Program | ||
The Fund has adopted a liquidity risk management program (the “program”). The Fund’s Board of Trustees (the "Board") has designated American Century Investment Management, Inc. (“ACIM”) as the administrator of the program. Personnel of ACIM or its affiliates conduct the day-to-day operation of the program pursuant to policies and procedures administered by those members of the ACIM’s Investment Oversight Committee who are members of the ACIM’s Investment Management and Global Analytics departments.
Under the program, ACIM manages the Fund’s liquidity risk, which is the risk that the Fund could not meet shareholder redemption requests without significant dilution of remaining shareholders’ interests in the Fund. This risk is managed by monitoring the degree of liquidity of the Fund’s investments, limiting the amount of the Fund’s illiquid investments, and utilizing various risk management tools and facilities available to the Fund for meeting shareholder redemptions, among other means. ACIM’s process of determining the degree of liquidity of the Fund’s investments is supported by one or more third-party liquidity assessment vendors.
The Board reviewed a report prepared by ACIM regarding the operation and effectiveness of the program for the period December 1, 2018 through December 31, 2019. No significant liquidity events impacting the Fund were noted in the report. In addition, ACIM provided its assessment that the program had been effective in managing the Fund’s liquidity risk.
34
| Additional Information | ||
Retirement Account Information
As required by law, distributions you receive from certain retirement accounts are subject to federal income tax withholding, unless you elect not to have withholding apply*. Tax will be withheld on the total amount withdrawn even though you may be receiving amounts that are not subject to withholding, such as nondeductible contributions. In such case, excess amounts of withholding could occur. You may adjust your withholding election so that a greater or lesser amount will be withheld.
Remember, even if you elect not to have income tax withheld, you are liable for paying income tax on the taxable portion of your withdrawal. If you elect not to have income tax withheld or you don’t have enough income tax withheld, you may be responsible for payment of estimated tax. You may incur penalties under the estimated tax rules if your withholding and estimated tax payments are not sufficient. You can reduce or defer the income tax on a distribution by directly or indirectly rolling such distribution over to another IRA or eligible plan. You should consult your tax advisor for additional information.
State tax will be withheld if, at the time of your distribution, your address is within one of the mandatory withholding states and you have federal income tax withheld (or as otherwise required by state law). State taxes will be withheld from your distribution in accordance with the respective state rules.
*Some 403(b), 457 and qualified retirement plan distributions may be subject to 20% mandatory withholding, as they are subject to special tax and withholding rules. Your plan administrator or plan sponsor is required to provide you with a special tax notice explaining those rules at the time you request a distribution. If applicable, federal and/or state taxes may be withheld from your distribution amount.
Proxy Voting Policies
A description of the policies that the fund's investment advisor uses in exercising the voting rights associated with the securities purchased and/or held by the fund are available without charge, upon request, by calling 1-800-345-6488. It is also available on American Century Investments’ website at americancentury.com/proxy and on the Securities and Exchange Commission’s website at sec.gov. Information regarding how the investment advisor voted proxies relating to portfolio securities during the most recent 12-month period ended June 30 is available at americancentury.com/proxy. It is also available at sec.gov.
Quarterly Portfolio Disclosure
The fund files its complete schedule of portfolio holdings with the Securities and Exchange Commission (SEC) for the first and third quarters of each fiscal year as an exhibit to its reports on Form N-PORT. The fund's Form N-PORT reports are available on the SEC’s website at sec.gov.
35
Other Tax Information
The following information is provided pursuant to provisions of the Internal Revenue Code.
The fund hereby designates $53,147, or up to the maximum amount allowable, as long-term capital gain distributions (20% rate gain distributions) for the fiscal year ended August 31, 2020.
The fund hereby designates $199,332 as qualified short-term capital gain distributions for purposes of Internal Revenue Code Section 871 for the fiscal year ended August 31, 2020.
For nonresident alien shareholders, the fund hereby designates $2,391,194, or up to the maximum amount allowable, of ordinary income distributions as qualified interest income for the fiscal year ended August 31, 2020.
36
| Notes | ||
37
| Notes | ||
38
| Notes | ||
39
| Notes | ||
40
| ||||||||
| Contact Us | americancenturyetfs.com | |||||||
| American Century Sales Representatives, Financial Professionals, Broker Dealers, Insurance Companies, Banks and Trust Companies | 1-833-ACI-ETFS | |||||||
| Telecommunications Relay Service for the Deaf | 711 | |||||||
| American Century ETF Trust | ||||||||
Investment Advisor: American Century Investment Management, Inc. Kansas City, Missouri | ||||||||
Distributor: Foreside Fund Services, LLC - Distributor, not affiliated with American Century Investment Services, Inc. | ||||||||
| This report and the statements it contains are submitted for the general information of our shareholders. The report is not authorized for distribution to prospective investors unless preceded or accompanied by an effective prospectus. | ||||||||
| ©2020 American Century Proprietary Holdings, Inc. All rights reserved. CL-ANN-95461 2010 | ||||||||
| Annual Report | |||||
| August 31, 2020 | |||||
American Century® Diversified Municipal Bond ETF (TAXF) | |||||
Beginning on January 1, 2021, as permitted by regulations adopted by the Securities and Exchange Commission, paper copies of the fund’s shareholder reports like this one will no longer be sent by mail, unless you specifically request paper copies of the reports from the fund or from your financial intermediary, such as a broker-dealer or bank. Instead, the reports will be made available on a website, and you will be notified by mail each time a report is posted and provided with a website link to access the report.
If you already elected to receive shareholder reports electronically, you will not be affected by this change and you need not take any action. You may elect to receive shareholder reports and other communications from the fund or your financial intermediary electronically by calling or sending an email request to your appropriate contacts as listed on the back cover of this report.
You may elect to receive all future reports in paper free of charge. You can inform the fund or your financial intermediary that you wish to continue receiving paper copies of your shareholder reports by calling or sending an email request to your appropriate contacts as listed on the back cover of this report. Your election to receive reports in paper will apply to all funds held with the fund complex/your financial intermediary.
| Table of Contents | ||
| President’s Letter | |||||
| Performance | |||||
| Portfolio Commentary | |||||
| Fund Characteristics | |||||
| Shareholder Fee Example | |||||
| Schedule of Investments | |||||
| Statement of Assets and Liabilities | |||||
| Statement of Operations | |||||
| Statement of Changes in Net Assets | |||||
| Notes to Financial Statements | |||||
| Financial Highlights | |||||
| Report of Independent Registered Public Accounting Firm | |||||
| Management | |||||
| Approval of Management Agreement | |||||
| Liquidity Risk Management Program | |||||
| Additional Information | |||||
Any opinions expressed in this report reflect those of the author as of the date of the report, and do not necessarily represent the opinions of American Century Investments® or any other person in the American Century Investments organization. Any such opinions are subject to change at any time based upon market or other conditions and American Century Investments disclaims any responsibility to update such opinions. These opinions may not be relied upon as investment advice and, because investment decisions made by American Century Investments funds are based on numerous factors, may not be relied upon as an indication of trading intent on behalf of any American Century Investments fund. Security examples are used for representational purposes only and are not intended as recommendations to purchase or sell securities. Performance information for comparative indices and securities is provided to American Century Investments by third party vendors. To the best of American Century Investments’ knowledge, such information is accurate at the time of printing.
| President’s Letter | ||
Jonathan ThomasDear Investor:
Thank you for reviewing this annual report for the period ended August 31, 2020. Annual reports help convey important information about fund returns, including market factors that affected performance. For additional investment insights, please visit americancenturyetfs.com.
Pandemic Disrupted Economic, Market Courses
Broad market sentiment was generally upbeat into early 2020. Dovish central banks, modest inflation, improving economic and corporate earnings data, and progress on U.S.-China trade helped boost global growth outlooks. Against this backdrop, risk assets largely remained in favor.
However, beginning in late February, COVID-19 quickly quashed the optimistic tone. The outbreak rapidly spread worldwide, halting most U.S. and global economic activity and triggering a deep worldwide recession. Global stocks and credit-sensitive assets sold off sharply, but central banks and federal governments stepped in quickly and aggressively to stabilize financial markets. These extraordinary efforts proved helpful, as most risk assets rebounded quickly, despite weak economic and corporate earnings data. As the period progressed, coronavirus infection and death rates declined in many regions and economies reopened. By the end of August, manufacturing, employment and other data suggested an economic recovery was underway.
Overall, global stocks delivered mixed results for the period. The broad U.S. stock market overcame the effects of the early 2020 sell-off to deliver a solid gain. U.S. stocks generally fared better than their counterparts elsewhere, and the growth style significantly outperformed value stocks, which struggled. Bond returns were broadly positive, as yields declined sharply.
A Slow Return to Normal
The return to pre-pandemic life will take time and patience, but we are confident we will get there. Several drug companies are in final stages of vaccine trials, and medical professionals continue to fine-tune virus treatment protocols. In the meantime, investors likely will face periods of outbreak-related disruptions, economic and political uncertainty, and heightened market volatility. These influences can be unsettling, but they tend to be temporary.
We appreciate your confidence in us during these extraordinary times. Our firm has a long history of helping clients weather unpredictable markets, and we’re confident we will continue to meet today’s challenges.
Sincerely,
Jonathan Thomas
President and Chief Executive Officer
American Century Investments
2
| Performance | ||
| Total Returns as of August 31, 2020 | |||||||||||||||||||||||
| Average Annual Returns | |||||||||||||||||||||||
| 1 year | Since Inception | Inception Date | |||||||||||||||||||||
| Net Asset Value | 2.66% | 6.07% | 9/10/2018 | ||||||||||||||||||||
| Market Price | 2.69% | 6.11% | 9/10/2018 | ||||||||||||||||||||
| S&P National AMT-Free Municipal Bond Index | 3.01% | 5.98% | — | ||||||||||||||||||||
Market price is determined using the bid/ask midpoint at 4:00 p.m. Eastern time, when the net asset value (NAV) is typically calculated. Market performance does not represent the returns you would receive if you traded shares at other times. NAV prices are used to calculate market price performance prior to the date when the fund first traded on the New York Stock Exchange.
| Growth of $10,000 Over Life of Fund | ||
| $10,000 investment made September 10, 2018 | ||
| Value on August 31, 2020 | |||||
| Net Asset Value — $11,234 | |||||
| S&P National AMT-Free Municipal Bond Index — $11,215 | |||||
| Total Annual Fund Operating Expenses | |||||||||||||||||
| 0.29% | |||||||||||||||||
The total annual fund operating expenses shown is as stated in the fund’s prospectus current as of the date of this report. The prospectus may vary from the expense ratio shown elsewhere in this report because it is based on a different time period, includes acquired fund fees and expenses, and, if applicable, does not include fee waivers or expense reimbursements.
Data presented reflect past performance. Past performance is no guarantee of future results. Current performance may be higher or lower than the performance shown. Total returns for periods less than one year are not annualized. Investment return and principal value will fluctuate, and redemption value may be more or less than original cost. Data assumes reinvestment of dividends and capital gains, and none of the charts reflect the deduction of taxes that a shareholder would pay on fund distributions or the redemption of fund shares. To obtain performance data current to the most recent month end, please call 1-800-345-6488 or visit americancenturyetfs.com. For additional information about the fund, please consult the prospectus.
3
| Portfolio Commentary | ||
Portfolio Managers: Steven Permut, Joseph Gotelli and Alan Kruss
Fund Strategy
American Century Diversified Municipal Bond ETF seeks to provide consistent tax-free income. As an actively managed ETF that does not seek to replicate the performance of a specific index, the fund employs a research-driven process to select holdings. The fund draws from across the municipal bond (muni) universe and adjusts exposure depending on prevailing market conditions. We dynamically allocate holdings to investment-grade issues and may opportunistically include high-yield issues when the risk/reward balance is attractive. In selecting securities, we employ an active, time-tested process designed to identify attractive issues with low default risk, aiming to align risk exposures with our highest-conviction ideas.
Performance Review
The fund returned 2.69% on a market price basis for the 12 months ended August 31, 2020. On a net asset value (NAV) basis, the fund returned 2.66%. For the same time period, the S&P National AMT-Free Municipal Bond Index, the fund’s benchmark index, returned 3.01%. The fund’s NAV and market price returns reflect fees and operating expenses, while the index return does not.
Lower-Quality Securities, Duration Hindered Performance
Like most asset classes, the muni market endured extreme volatility during the 12-month period. Early on, waning trade tensions and an improving global growth outlook fostered risk-on investing, driving muni prices higher. However, as the coronavirus spread across the U.S. in early 2020, economic activity grinded to a halt, and risk assets sold off sharply. Robust demand for safe-haven assets led to considerable muni underperformance versus Treasuries.
Swift action by the Federal Reserve (Fed), including cutting short-term interest rates to near 0% and launching aggressive lending and asset-purchase plans, aided the market. The Fed’s efforts included the $500 billion Municipal Liquidity Facility, which restored market confidence that muni issuers would have access to liquidity as needed. Meanwhile, lawmakers passed the Coronavirus Aid, Relief and Economic Security (CARES) Act, which also helped soothe investors’ anxieties. A summer-long risk rally followed, especially as states lifted pandemic-related restrictions.
Demand for munis gradually recovered to nearly pre-COVID-19 levels by the end of the reporting period. New-issue levels similarly whipsawed through 2020, although taxable issuance remained greater than tax-exempt issuance. Overall, muni returns largely trailed Treasuries. Within the broad muni sector, higher-quality securities outperformed lower-quality issues, and general obligation (GO) bonds outperformed revenue bonds.
Against this backdrop, the fund’s exposure to lower-quality bonds detracted from relative returns, although we added select positions as spreads widened during the downturn. In addition, our yield curve positioning hurt performance, although our slightly longer-than-index duration mitigated a portion of the decline as muni yields recovered during the summer months.
Security Selection Gains Offset Sector Allocation Declines
Our security selection aided relative performance, led by investments in the hospital, transportation and student housing sectors. The gains mitigated the losses resulting from an overweight position, relative to the index, in the higher-risk student housing sector. Security selection also made up for much of the declines stemming from overweight stakes in the hospital and charter school sectors.
The fund also benefited from security selection in the toll facilities and water and sewer sectors, while underweight positions in higher-quality prerefunded and state GO bonds detracted. Exposure in the out-of-index multifamily housing and retirement community sectors also hindered results.
4
Portfolio Positioning
Given the prevailing uncertainty related to the pandemic, we’re continually evaluating the broad secular and cyclical repercussions. We’re also monitoring how sectors such as student housing, nursing homes, convention centers and airports will manage marketplace changes.
As good as the CARES Act was in addressing the initial expenses of fighting COVID-19, we’re waiting to see what the next round of stimulus looks like. And if no new relief is forthcoming, state and local governments will likely need to implement measures to right-size under a lower-revenue regime. Meanwhile, the upcoming election also looms large due to the potential for higher tax rates, which generally provide a tailwind to the muni market.
Ultimately, we’re confident in the market’s resiliency, and we expect credit fundamentals to remain largely stable. Although downgrade levels will likely rise as the impact of the pandemic plays out, we believe defaults will mostly affect the riskiest parts of the market. We believe opportunities will continue to arise across the asset class at all quality levels, and our fundamental credit research will help identify those opportunities.
5
| Fund Characteristics | ||
| AUGUST 31, 2020 | |||||
| Portfolio at a Glance | |||||
| Weighted Average Life to Maturity | 10.7 years | ||||
| Average Duration (Modified) | 5.4 years | ||||
| Top Five States and Territories | % of net assets | ||||
| California | 17.7% | ||||
| Illinois | 10.3% | ||||
| Texas | 9.3% | ||||
| Florida | 7.0% | ||||
| Arizona | 6.9% | ||||
| Top Five Sectors | % of fund investments | ||||
| Special Tax | 15% | ||||
| General Obligation (GO) - Local | 10% | ||||
| General Obligation (GO) - State | 10% | ||||
| Corporate Municipal | 8% | ||||
| Hospital | 7% | ||||
| Types of Investments in Portfolio | % of net assets | ||||
| Municipal Securities | 97.8% | ||||
| Temporary Cash Investments | 3.4% | ||||
| Other Assets and Liabilities | (1.2)% | ||||
6
| Shareholder Fee Example | ||
Fund shareholders may incur two types of costs: (1) transaction costs, including brokerage commissions paid on purchases and sales of fund shares; and (2) ongoing costs, including management fees and other fund expenses. This example is intended to help you understand your ongoing costs (in dollars) of investing in your fund and to compare these costs with the ongoing cost of investing in other funds.
The example is based on an investment of $1,000 made at the beginning of the period and held for the entire period from March 1, 2020 to August 31, 2020.
Actual Expenses
The table provides information about actual account values and actual expenses. You may use the information, together with the amount you invested, to estimate the expenses that you paid over the period. Simply divide your account value by $1,000 (for example, an $8,600 account value divided by $1,000 = 8.6), then multiply the result by the number under the heading “Expenses Paid During Period” to estimate the expenses you paid on your account during this period.
Hypothetical Example for Comparison Purposes
The table also provides information about hypothetical account values and hypothetical expenses based on the actual expense ratio of your fund and an assumed rate of return of 5% per year before expenses, which is not the actual return of a fund. The hypothetical account values and expenses may not be used to estimate the actual ending account balance or expenses you paid for the period. You may use this information to compare the ongoing costs of investing in your fund and other funds. To do so, compare this 5% hypothetical example with the 5% hypothetical examples that appear in the shareholder reports of the other funds.
Please note that the expenses shown in the table are meant to highlight your ongoing costs only and do not reflect any transactional costs, such as brokerage commissions paid on purchases and sales of fund shares. Therefore, the table is useful in comparing ongoing costs only, and will not help you determine the relative total costs of owning different funds. In addition, if these transactional costs were included, your costs would have been higher.
| Beginning Account Value 3/1/20 | Ending Account Value 8/31/20 | Expenses Paid During Period(1) 3/1/20 - 8/31/20 | Annualized Expense Ratio(1) | |||||||||||
| Actual | $1,000 | $992.10 | $1.45 | 0.29% | ||||||||||
| Hypothetical | $1,000 | $1,023.68 | $1.48 | 0.29% | ||||||||||
(1)Expenses are equal to the fund's annualized expense ratio listed in the table above, multiplied by the average account value over the period, multiplied by 184, the number of days in the most recent fiscal half-year, divided by 366, to reflect the one-half year period. Annualized expense ratio reflects actual expenses, including any applicable fee waivers or expense reimbursements and excluding any acquired fund fees and expenses.
7
| Schedule of Investments | ||
AUGUST 31, 2020
| Principal Amount | Value | |||||||
| MUNICIPAL SECURITIES — 97.8% | ||||||||
| Alabama — 1.5% | ||||||||
| Black Belt Energy Gas District Rev., VRN, 4.00%, 12/1/48 (GA: Goldman Sachs & Company) | $ | 535,000 | $ | 587,302 | ||||
| Southeast Alabama Gas Supply District Rev., VRN, 4.00%, 4/1/49 (GA: Goldman Sachs Group, Inc.) | 395,000 | 436,668 | ||||||
| 1,023,970 | ||||||||
| Arizona — 6.9% | ||||||||
| Arizona Department of Transportation State Highway Fund Rev., 5.00%, 7/1/29 | 160,000 | 186,094 | ||||||
| Arizona Industrial Development Authority Rev., 3.625%, 5/20/33 | 197,215 | 205,910 | ||||||
Arizona Industrial Development Authority Rev., (Legacy Cares, Inc.), 7.75%, 7/1/50(1) | 200,000 | 197,902 | ||||||
Arizona Industrial Development Authority Rev., (Pinecrest Academy of Nevada), 4.00%, 7/15/40(1) | 200,000 | 195,166 | ||||||
| Arizona Industrial Development Authority Rev., (Provident Group-NCCU Properties LLC), 5.00%, 6/1/27 (BAM) | 400,000 | 485,240 | ||||||
Industrial Development Authority of the City of Phoenix Rev., (BASIS Schools, Inc. Obligated Group), 4.00%, 7/1/25(1) | 515,000 | 530,579 | ||||||
| Industrial Development Authority of the City of Phoenix Rev., (Downtown Phoenix Student Housing LLC), 5.00%, 7/1/32 | 155,000 | 169,243 | ||||||
Industrial Development Authority of the City of Phoenix Rev., (Leman Academy of Excellence, Inc.), 5.00%, 7/1/54(1) | 60,000 | 61,209 | ||||||
Maricopa County Industrial Development Authority Rev., (Legacy Traditional School Obligated Group), 5.00%, 7/1/39(1) | 200,000 | 216,556 | ||||||
| Phoenix GO, 5.00%, 7/1/21 | 525,000 | 546,173 | ||||||
| Salt River Project Agricultural Improvement & Power District Rev., 5.00%, 1/1/38 | 750,000 | 944,520 | ||||||
| Salt Verde Financial Corp. Rev., 5.00%, 12/1/37 (GA: Citigroup Global Markets) | 335,000 | 458,659 | ||||||
Tempe Industrial Development Authority Rev., (Mirabella at ASU, Inc.), 4.00%, 10/1/23(1) | 440,000 | 439,107 | ||||||
| 4,636,358 | ||||||||
| California — 17.7% | ||||||||
| Anaheim Public Financing Authority Rev., (Anaheim), 5.00%, 9/1/30 (BAM) | 375,000 | 477,641 | ||||||
| Bay Area Toll Authority Rev., 4.00%, 4/1/29 | 230,000 | 272,341 | ||||||
| California Community College Financing Authority Rev., (NCCD-Orange Coast Properties LLC), 5.00%, 5/1/30 | 500,000 | 529,985 | ||||||
| California County Tobacco Securitization Agency Rev., 5.00%, 6/1/49 | 100,000 | 118,181 | ||||||
California County Tobacco Securitization Agency Rev., (Alameda County Tobacco Securitization Corp.), 0.00%, 6/1/50(2) | 100,000 | 16,267 | ||||||
| California Housing Finance Rev., 4.00%, 3/20/33 | 395,999 | 437,567 | ||||||
| California Housing Finance Rev., 4.25%, 1/15/35 | 492,956 | 555,793 | ||||||
California Pollution Control Financing Authority Rev., (San Diego County Water Authority), 5.00%, 7/1/39(1) | 500,000 | 582,420 | ||||||
California Statewide Communities Development Authority Rev., (Loma Linda University Medical Center Obligated Group), 5.25%, 12/1/38(1) | 240,000 | 265,042 | ||||||
| California Statewide Communities Development Authority Special Assessment, (Contra County Costa Assessment District No. 14-01), 4.00%, 9/2/21 | 330,000 | 337,960 | ||||||
| Elk Grove Finance Authority Special Tax, 5.00%, 9/1/30 | 515,000 | 602,370 | ||||||
8
| Principal Amount | Value | |||||||
| Folsom Ranch Financing Authority Special Tax, (Folsom Community Facilities District No. 19), 5.00%, 9/1/39 | $ | 500,000 | $ | 574,025 | ||||
| Golden State Tobacco Securitization Corp. Rev., 5.00%, 6/1/23 | 40,000 | 44,765 | ||||||
| Golden State Tobacco Securitization Corp. Rev., 3.50%, 6/1/36 | 465,000 | 471,933 | ||||||
| Golden State Tobacco Securitization Corp. Rev., 5.00%, 6/1/47 | 210,000 | 215,926 | ||||||
| Golden State Tobacco Securitization Corp. Rev., 5.25%, 6/1/47 | 100,000 | 103,141 | ||||||
Hastings Campus Housing Finance Authority Rev., 5.00%, 7/1/45(3) | 200,000 | 207,364 | ||||||
| Long Beach Bond Finance Authority Rev., 5.50%, 11/15/37 (GA: Merrill Lynch & Co.) | 100,000 | 145,669 | ||||||
Morongo Band of Mission Indians Rev., 5.00%, 10/1/42(1) | 100,000 | 109,738 | ||||||
| Norman Y Mineta San Jose International Airport SJC Rev., 5.00%, 3/1/22 | 500,000 | 528,880 | ||||||
| Orange County Community Facilities District Special Tax, 5.25%, 8/15/45 | 415,000 | 463,563 | ||||||
| Palomar Health GO, 5.00%, 8/1/27 | 545,000 | 664,840 | ||||||
| Poway Unified School District Special Tax, (Poway Unified School District Community Facilities District No. 16), 4.00%, 9/1/31 | 315,000 | 376,082 | ||||||
| San Buenaventura Rev., (Community Memorial Health System), 7.50%, 12/1/41 | 300,000 | 315,837 | ||||||
| San Francisco City & County Airport Comm-San Francisco International Airport Rev., 5.00%, 5/1/38 | 250,000 | 308,370 | ||||||
| Santa Paula Special Tax, (Santa Paula Harvest Community Facilities District No. 1), 5.00%, 9/1/35 | 600,000 | 692,496 | ||||||
| South Placer Wastewater Authority Rev., (Roseville), 5.00%, 11/1/33 | 550,000 | 785,779 | ||||||
| State of California GO, 5.25%, 8/1/32 (AGM) | 525,000 | 752,860 | ||||||
| State of California GO, 5.00%, 8/1/34 | 245,000 | 303,308 | ||||||
| Tobacco Securitization Authority of Southern California Rev., 5.00%, 6/1/30 | 230,000 | 306,040 | ||||||
| Tracy Community Facilities District Special Tax, (Tracy Community Facilities District No. 2016-01), 5.00%, 9/1/39 | 280,000 | 310,727 | ||||||
| 11,876,910 | ||||||||
| Colorado — 1.8% | ||||||||
| Colorado Health Facilities Authority Rev., (Frasier Meadows Manor, Inc.), 5.00%, 5/15/23 | 100,000 | 105,899 | ||||||
| Colorado Health Facilities Authority Rev., (Sisters of Charity of Leavenworth Health System, Inc. Obligated Group), 4.00%, 1/1/38 | 200,000 | 233,118 | ||||||
Denver Urban Renewal Authority Tax Allocation, 5.25%, 12/1/39(1) | 100,000 | 102,777 | ||||||
| Vauxmont Metropolitan District GO, 5.00%, 12/15/21 (AGM) | 100,000 | 105,362 | ||||||
| Vauxmont Metropolitan District GO, 5.00%, 12/15/22 (AGM) | 100,000 | 109,446 | ||||||
Village Metropolitan District GO, 5.00%, 12/1/49(3) | 500,000 | 514,215 | ||||||
| 1,170,817 | ||||||||
| Connecticut — 1.4% | ||||||||
| State of Connecticut GO, 5.00%, 4/15/34 | 750,000 | 952,815 | ||||||
| Florida — 7.0% | ||||||||
| Alachua County Health Facilities Authority Rev., (Shands Teaching Hospital & Clinics Obligated Group), VRN, 5.00%, 12/1/37 | 350,000 | 417,386 | ||||||
| Greater Orlando Aviation Authority Rev., 5.00%, 10/1/33 | 180,000 | 216,335 | ||||||
Lake County Rev., (Educational Charter Foundation of Florida, Inc.), 5.00%, 1/15/39(1) | 550,000 | 581,025 | ||||||
| Miami-Dade County Expressway Authority Rev., 5.00%, 7/1/30 | 585,000 | 674,166 | ||||||
| Miami-Dade County Water & Sewer System Rev., 4.00%, 10/1/35 | 135,000 | 158,364 | ||||||
| Osceola County Transportation Rev., 5.00%, 10/1/30 | 500,000 | 635,900 | ||||||
| Palm Beach County Health Facilities Authority Rev., (Baptist Health South Florida Obligated Group), 5.00%, 8/15/30 | 300,000 | 388,188 | ||||||
| Pinellas County Industrial Development Authority Rev., (Drs. Kiran & Pallavi Patel 2017 Foundation for Global Understanding, Inc.), 5.00%, 7/1/29 | 150,000 | 166,266 | ||||||
9
| Principal Amount | Value | |||||||
| Pinellas County Industrial Development Authority Rev., (Drs. Kiran & Pallavi Patel 2017 Foundation for Global Understanding, Inc.), 5.00%, 7/1/39 | $ | 375,000 | $ | 421,031 | ||||
| School District of Broward County COP, 5.00%, 7/1/23 | 515,000 | 576,512 | ||||||
| State of Florida GO, 5.00%, 6/1/21 | 430,000 | 445,669 | ||||||
| 4,680,842 | ||||||||
| Georgia — 0.9% | ||||||||
| Main Street Natural Gas, Inc. Rev., VRN, 4.00%, 3/1/50 (GA: Citigroup Global Markets) | 500,000 | 582,700 | ||||||
| Hawaii — 0.4% | ||||||||
| City & County Honolulu Wastewater System Rev., 4.00%, 7/1/32 | 250,000 | 284,450 | ||||||
| Illinois — 10.3% | ||||||||
| Chicago GO, 5.00%, 1/1/30 | 400,000 | 463,912 | ||||||
| Chicago GO, 5.00%, 1/1/40 | 380,000 | 382,348 | ||||||
| Chicago GO, 5.50%, 1/1/49 | 100,000 | 113,488 | ||||||
| Chicago Board of Education GO, 5.00%, 12/1/34 | 280,000 | 312,850 | ||||||
| Chicago Board of Education GO, 5.00%, 12/1/42 | 60,000 | 61,170 | ||||||
| Chicago Wastewater Transmission Rev., 5.50%, 1/1/30 (AGM-CR NATL-RE) | 100,000 | 128,289 | ||||||
| Illinois Finance Authority Rev., 5.00%, 11/1/49 | 200,000 | 208,652 | ||||||
| Illinois Finance Authority Rev., (State of Illinois Water Revolving Fund - Clean Water Program), 5.00%, 7/1/33 | 750,000 | 989,535 | ||||||
| Illinois State Toll Highway Authority Rev., 5.00%, 1/1/31 | 300,000 | 395,319 | ||||||
| Illinois State Toll Highway Authority Rev., 5.00%, 1/1/37 | 325,000 | 384,033 | ||||||
| Kane County School District No. 131 Aurora East Side GO, 4.00%, 12/1/31 (AGM) | 200,000 | 229,300 | ||||||
| Metropolitan Water Reclamation District of Greater Chicago GO, 5.00%, 12/1/28 | 400,000 | 490,516 | ||||||
| Northern Illinois University Rev., 4.00%, 4/1/35 (BAM) | 250,000 | 284,447 | ||||||
| Railsplitter Tobacco Settlement Authority Rev., 5.00%, 6/1/22 | 100,000 | 107,674 | ||||||
| State of Illinois GO, 5.00%, 11/1/21 | 440,000 | 456,342 | ||||||
| State of Illinois GO, 5.00%, 11/1/24 | 85,000 | 92,823 | ||||||
| State of Illinois GO, 5.00%, 10/1/25 | 105,000 | 117,577 | ||||||
| State of Illinois GO, 5.00%, 11/1/29 | 280,000 | 313,740 | ||||||
| State of Illinois GO, 5.00%, 10/1/30 | 600,000 | 685,854 | ||||||
| State of Illinois GO, 5.00%, 10/1/33 | 200,000 | 224,894 | ||||||
| State of Illinois GO, 5.50%, 5/1/39 | 40,000 | 46,778 | ||||||
| State of Illinois GO, 5.75%, 5/1/45 | 100,000 | 117,488 | ||||||
| Will County Community High School District No. 210 Lincoln-Way GO, 4.00%, 1/1/22 (AGM) | 300,000 | 308,898 | ||||||
| 6,915,927 | ||||||||
| Iowa — 0.8% | ||||||||
| Iowa Finance Authority Rev., (Iowa Fertilizer Co. LLC), 3.125%, 12/1/22 | 85,000 | 86,078 | ||||||
| Iowa Finance Authority Rev., (Lifespace Communities, Inc. Obligated Group), 5.00%, 5/15/48 | 400,000 | 423,532 | ||||||
| 509,610 | ||||||||
| Kentucky — 2.9% | ||||||||
| Ashland Rev., (Ashland Hospital Corp. Obligated Group), 5.00%, 2/1/30 | 370,000 | 449,091 | ||||||
| Kentucky Bond Development Corp. Rev., 5.00%, 9/1/38 | 250,000 | 283,627 | ||||||
| Kentucky Economic Development Finance Authority Rev., (Owensboro Health, Inc. Obligated Group), 5.25%, 6/1/41 | 100,000 | 112,180 | ||||||
| Kentucky Public Energy Authority Rev., VRN, 4.00%, 4/1/48 (GA: Morgan Stanley) | 300,000 | 331,290 | ||||||
10
| Principal Amount | Value | |||||||
| Kentucky Public Energy Authority Rev., VRN, 4.00%, 1/1/49 (GA: BP Corp. North America, Inc.) | $ | 440,000 | $ | 494,670 | ||||
| Kentucky Public Energy Authority Rev., VRN, 4.00%, 12/1/49 (GA: Morgan Stanley) | 250,000 | 283,193 | ||||||
| 1,954,051 | ||||||||
| Louisiana — 1.6% | ||||||||
| Greater Ouachita Water Co. Rev., 4.00%, 9/1/30 (BAM) | 100,000 | 121,667 | ||||||
| Louisiana Stadium & Exposition District Rev., 5.00%, 7/3/23 | 100,000 | 105,952 | ||||||
| New Orleans Aviation Board Rev., (Parking Facilities Corp.), 5.00%, 10/1/48 (AGM) | 250,000 | 293,633 | ||||||
| St. John the Baptist Rev., (Marathon Oil Corp.), VRN, 2.00%, 6/1/37 | 50,000 | 50,150 | ||||||
| St. John the Baptist Rev., (Marathon Oil Corp.), VRN, 2.10%, 6/1/37 | 500,000 | 502,750 | ||||||
| 1,074,152 | ||||||||
| Maryland — 2.6% | ||||||||
| Baltimore Rev., 4.00%, 9/1/27 | 200,000 | 206,970 | ||||||
| Brunswick Special Tax, 5.00%, 7/1/36 | 100,000 | 105,210 | ||||||
| Rockville Rev., (King Farm Presbyterian Retirement Community, Inc.), 3.50%, 11/1/26 | 325,000 | 318,799 | ||||||
| State of Maryland GO, 5.00%, 8/1/27 | 425,000 | 554,680 | ||||||
| State of Maryland GO, 5.00%, 8/1/31 | 245,000 | 329,902 | ||||||
| State of Maryland Department of Transportation Rev., 5.00%, 2/1/22 | 230,000 | 245,682 | ||||||
| 1,761,243 | ||||||||
| Massachusetts — 3.7% | ||||||||
| Massachusetts GO, 5.00%, 5/1/25 | 260,000 | 316,597 | ||||||
| Massachusetts Bay Transportation Authority Rev., 5.25%, 7/1/32 | 500,000 | 723,020 | ||||||
Massachusetts Development Finance Agency Rev., (Milford Regional Medical Center Obligated Group), 5.00%, 7/15/21(1)(3) | 130,000 | 133,832 | ||||||
Massachusetts Development Finance Agency Rev., (Milford Regional Medical Center Obligated Group), 5.00%, 7/15/22(1)(3) | 115,000 | 122,006 | ||||||
Massachusetts Development Finance Agency Rev., (NewBridge on the Charles, Inc. Obligated Group), 4.00%, 10/1/32(1) | 100,000 | 102,856 | ||||||
Massachusetts Development Finance Agency Rev., (NewBridge on the Charles, Inc.), 5.00%, 10/1/37(1) | 150,000 | 161,323 | ||||||
| Massachusetts Development Finance Agency Rev., (Wellforce Obligated Group), 4.00%, 10/1/45 (AGM) | 300,000 | 344,193 | ||||||
| Massachusetts Transportation Trust Fund Metropolitan Highway System Rev., 5.00%, 1/1/32 | 460,000 | 591,146 | ||||||
| 2,494,973 | ||||||||
| Michigan — 0.8% | ||||||||
| Detroit City School District GO, 5.25%, 5/1/32 (AGM Q-SBLF) | 95,000 | 130,723 | ||||||
| Detroit Downtown Development Authority Tax Allocation, 5.00%, 7/1/23 (AGM) | 350,000 | 392,854 | ||||||
| 523,577 | ||||||||
| Nebraska — 0.3% | ||||||||
| Omaha Public Power District Rev., 5.00%, 2/1/23 | 200,000 | 223,026 | ||||||
| Nevada — 2.3% | ||||||||
| Clark County Department of Aviation Rev., 5.00%, 7/1/21 | 420,000 | 434,960 | ||||||
| Las Vegas Special Improvement District No. 815 Special Assessment, 4.00%, 12/1/31 | 250,000 | 260,238 | ||||||
| Las Vegas Special Improvement District No. 815 Special Assessment, 5.00%, 12/1/49 | 200,000 | 211,622 | ||||||
Sparks Rev., 2.50%, 6/15/24(1) | 180,000 | 178,837 | ||||||
| State of Nevada Highway Improvement Rev., 4.00%, 12/1/33 | 360,000 | 430,200 | ||||||
| 1,515,857 | ||||||||
| New Hampshire — 0.5% | ||||||||
| New Hampshire Business Finance Authority Rev., 4.125%, 1/20/34 | 297,706 | 321,865 | ||||||
11
| Principal Amount | Value | |||||||
| New Jersey — 4.0% | ||||||||
| New Jersey Economic Development Authority Rev., 5.25%, 12/15/20 (Ambac) | $ | 40,000 | $ | 40,498 | ||||
| New Jersey Economic Development Authority Rev., 5.50%, 6/15/30 | 260,000 | 309,829 | ||||||
| New Jersey Transportation Trust Fund Authority Rev., 5.00%, 6/15/22 | 440,000 | 471,152 | ||||||
| New Jersey Transportation Trust Fund Authority Rev., 5.50%, 12/15/22 | 155,000 | 170,387 | ||||||
| New Jersey Transportation Trust Fund Authority Rev., 5.00%, 12/15/28 | 300,000 | 365,565 | ||||||
| New Jersey Transportation Trust Fund Authority Rev., 5.00%, 12/15/32 | 350,000 | 413,913 | ||||||
| New Jersey Transportation Trust Fund Authority Rev., 5.00%, 12/15/33 | 150,000 | 176,577 | ||||||
| New Jersey Turnpike Authority Rev., 5.00%, 1/1/48 | 150,000 | 180,753 | ||||||
| Tobacco Settlement Financing Corp. Rev., 5.00%, 6/1/29 | 100,000 | 127,349 | ||||||
| Tobacco Settlement Financing Corp. Rev., 5.00%, 6/1/30 | 100,000 | 126,404 | ||||||
| Tobacco Settlement Financing Corp. Rev., 5.00%, 6/1/46 | 280,000 | 317,408 | ||||||
| 2,699,835 | ||||||||
| New Mexico — 1.3% | ||||||||
| New Mexico Hospital Equipment Loan Council Rev., (Haverland Carter Lifestyle Obligated Group), 2.25%, 7/1/23 | 100,000 | 97,341 | ||||||
| New Mexico Municipal Energy Acquisition Authority Rev., VRN, 5.00%, 11/1/39 (LIQ FAC: Royal Bank of Canada) | 500,000 | 597,010 | ||||||
| Santa Fe Rev., (El Castillo Retirement Residences Obligated Group), 2.625%, 5/15/25 | 200,000 | 195,438 | ||||||
| 889,789 | ||||||||
| New York — 5.1% | ||||||||
| Metropolitan Transportation Authority Rev., 5.00%, 9/1/22 | 595,000 | 621,394 | ||||||
New York City GO, 5.00%, 8/1/27(3) | 320,000 | 404,486 | ||||||
| New York City Industrial Development Agency Rev., (TrIPs Obligated Group), 5.00%, 7/1/22 | 360,000 | 380,844 | ||||||
| New York City Water & Sewer System Rev., 5.00%, 6/15/22 | 125,000 | 135,786 | ||||||
New York City Water & Sewer System Rev., 5.00%, 6/15/22(4) | 85,000 | 92,175 | ||||||
| New York City Water & Sewer System Rev., 5.00%, 6/15/25 | 500,000 | 579,235 | ||||||
| New York Liberty Development Corp. Rev., (Goldman Sachs Headquarters LLC), 5.25%, 10/1/35 | 200,000 | 279,122 | ||||||
| New York Liberty Development Corp. Rev., (Goldman Sachs Headquarters LLC), 5.50%, 10/1/37 (GA: Goldman Sachs Group, Inc.) | 175,000 | 253,997 | ||||||
| New York State Dormitory Authority Rev., (State of New York Personal Income Tax Rev.), 4.00%, 2/15/37 | 500,000 | 593,585 | ||||||
| Yonkers Economic Development Corp. Rev., (Charter School of Educational Excellence), 5.00%, 10/15/39 | 100,000 | 106,238 | ||||||
| 3,446,862 | ||||||||
| North Carolina — 1.1% | ||||||||
North Carolina Medical Care Commission Rev., (Maryfield, Inc. Obligated Group), 2.875%, 10/1/26(3) | 50,000 | 50,041 | ||||||
| State of North Carolina Rev., 5.00%, 5/1/25 | 250,000 | 303,773 | ||||||
| State of North Carolina Rev., 5.00%, 3/1/34 | 275,000 | 356,081 | ||||||
| 709,895 | ||||||||
| Ohio — 2.0% | ||||||||
| Buckeye Tobacco Settlement Financing Authority Rev., 4.00%, 6/1/48 | 300,000 | 331,863 | ||||||
| Buckeye Tobacco Settlement Financing Authority Rev., 5.00%, 6/1/55 | 300,000 | 330,000 | ||||||
| Cuyahoga County Rev., (MetroHealth System), 5.00%, 2/15/42 | 360,000 | 405,281 | ||||||
12
| Principal Amount | Value | |||||||
| Northeast Ohio Regional Sewer District Rev., 4.00%, 11/15/37 | $ | 125,000 | $ | 150,855 | ||||
| Ohio Higher Educational Facility Commission Rev., (Cleveland Institute of Art), 5.50%, 12/1/53 | 100,000 | 102,387 | ||||||
| 1,320,386 | ||||||||
| Oregon — 0.6% | ||||||||
| Clackamas County Hospital Facility Authority Rev., (Rose Villa, Inc. Obligated Group), 5.125%, 11/15/40 | 250,000 | 265,668 | ||||||
| Clackamas County Hospital Facility Authority Rev., (Willamette View, Inc.), 5.00%, 11/15/47 | 100,000 | 104,985 | ||||||
| 370,653 | ||||||||
| Pennsylvania — 2.9% | ||||||||
| Commonwealth Financing Authority Rev., 5.00%, 6/1/25 | 275,000 | 329,216 | ||||||
| Pennsylvania GO, 5.00%, 7/15/29 | 500,000 | 664,505 | ||||||
| Pennsylvania State Public School Building Authority Rev., 5.00%, 6/1/29 (AGM) | 290,000 | 377,699 | ||||||
| Pennsylvania Turnpike Commission Rev., 5.00%, 12/1/46 | 180,000 | 207,468 | ||||||
| School District of Philadelphia GO, 5.00%, 9/1/20 | 350,000 | 350,000 | ||||||
| 1,928,888 | ||||||||
| South Carolina — 1.0% | ||||||||
| Berkeley County Special Assessment, (Berkeley County Nexton Improvement District), 4.25%, 11/1/40 | 100,000 | 100,880 | ||||||
| South Carolina Jobs-Economic Development Authority Rev., (Bon Secours Mercy Health, Inc.), VRN, 5.00%, 12/1/48 | 500,000 | 585,455 | ||||||
| 686,335 | ||||||||
| Tennessee — 0.3% | ||||||||
| Tennessee Energy Acquisition Corp. Rev., VRN, 4.00%, 11/1/49 (GA: Goldman Sachs Group, Inc.) | 185,000 | 211,631 | ||||||
| Texas — 9.3% | ||||||||
| Arlington Higher Education Finance Corp. Rev., 5.00%, 8/15/29 (PSF-GTD) | 400,000 | 531,708 | ||||||
| Arlington Higher Education Finance Corp. Rev., (Great Hearts America - Texas), 4.00%, 8/15/32 (PSF-GTD) | 425,000 | 518,976 | ||||||
| Bexar County Health Facilities Development Corp. Rev., (Army Retirement Residence Obligated Group), 5.00%, 7/15/25 | 115,000 | 123,724 | ||||||
| Central Texas Regional Mobility Authority Rev., 5.00%, 1/1/33 | 600,000 | 646,686 | ||||||
| Clifton Higher Education Finance Corp. Rev., (International American Education Federation, Inc.), 6.125%, 8/15/48 | 50,000 | 56,527 | ||||||
| Corpus Christi Utility System Rev. Rev., 5.00%, 7/15/33 | 400,000 | 534,328 | ||||||
| Dallas Area Rapid Transit Rev., 5.00%, 12/1/34 | 125,000 | 165,131 | ||||||
| Houston GO, 5.00%, 3/1/29 | 340,000 | 452,611 | ||||||
| New Hope Cultural Education Facilities Finance Corp. Rev., (CHF-Collegiate Housing Island Campus LLC), 4.00%, 4/1/21 | 425,000 | 424,821 | ||||||
| New Hope Cultural Education Facilities Finance Corp. Rev., (CHF-Collegiate Housing Island Campus LLC), 5.00%, 4/1/27 | 240,000 | 246,372 | ||||||
| North Texas Tollway Authority Rev., (North Texas Tollway System), 5.00%, 1/1/26 | 515,000 | 589,716 | ||||||
| Round Rock Independent School District GO, 5.00%, 8/1/24 (PSF-GTD) | 125,000 | 147,994 | ||||||
| San Antonio Water System Rev., 4.00%, 5/15/34 | 250,000 | 306,473 | ||||||
Texas Transportation Commission Turnpike System Rev., Series 2012 A, (First Tier), 5.00%, 8/15/22, Prerefunded at 100% of Par(4) | 825,000 | 902,311 | ||||||
| Texas Water Development Board Rev., (State Water Implementation Rev. Fund for Texas), 5.00%, 4/15/31 | 250,000 | 338,112 | ||||||
University of Texas System Rev., 5.00%, 8/15/22, Prerefunded at 100% of Par(4) | 250,000 | 273,428 | ||||||
| 6,258,918 | ||||||||
13
| Principal Amount/Shares | Value | |||||||
| Virginia — 1.7% | ||||||||
Hampton Roads Sanitation District Rev., 5.00%, 8/1/26, Prerefunded at 100% of Par(4) | $ | 250,000 | $ | 318,992 | ||||
| Hampton Roads Transportation Accountability Commission Rev., 5.00%, 7/1/22 | 510,000 | 553,921 | ||||||
Peninsula Town Center Community Development Authority Special Assessment, 5.00%, 9/1/45(1) | 200,000 | 208,254 | ||||||
| Virginia Beach Development Authority Rev., (Westminster-Canterbury on Chesapeake Bay Obligated Group), 5.00%, 9/1/24 | 35,000 | 38,759 | ||||||
| 1,119,926 | ||||||||
| Washington — 4.3% | ||||||||
| Energy Northwest Rev., (Bonneville Power Administration), 5.00%, 7/1/33 | 240,000 | 325,106 | ||||||
| Energy Northwest Rev., (Bonneville Power Administration), 5.00%, 7/1/35 | 365,000 | 479,548 | ||||||
| Port of Seattle Rev., 5.00%, 4/1/36 | 500,000 | 608,475 | ||||||
| State of Washington GO, 5.25%, 2/1/22 | 375,000 | 402,000 | ||||||
| Washington Health Care Facilities Authority Rev., (CommonSpirit Health Obligated Group), VRN, 5.00%, 8/1/49 | 300,000 | 353,901 | ||||||
| Washington Health Care Facilities Authority Rev., (Providence State Joseph Health Obligated Group), 5.00%, 10/1/33 | 650,000 | 693,862 | ||||||
| 2,862,892 | ||||||||
| Wisconsin — 0.8% | ||||||||
| Public Finance Authority Rev., (ACTS Retirement-Life Communities, Inc. Obligated Group), 5.00%, 11/15/41 | 100,000 | 118,524 | ||||||
Public Finance Authority Rev., (Bancroft Neurohealth Obligated Group), 5.125%, 6/1/48(1) | 25,000 | 26,668 | ||||||
| Public Finance Authority Rev., (Beyond Boone LLC), 4.00%, 7/1/39 (AGM) | 150,000 | 165,450 | ||||||
| Public Finance Authority Rev., (CHF-Wilmington LLC), 5.00%, 7/1/31 (AGM) | 75,000 | 91,830 | ||||||
| Public Finance Authority Rev., (Guilford College), 5.00%, 1/1/38 | 105,000 | 105,056 | ||||||
| 507,528 | ||||||||
TOTAL MUNICIPAL SECURITIES (Cost $63,063,204) | 65,516,681 | |||||||
| TEMPORARY CASH INVESTMENTS — 3.4% | ||||||||
| Morgan Stanley Institutional Liquidity Funds Tax-Exempt Portfolio, Institutional Share Class (Cost $2,282,338) | 2,281,920 | 2,281,920 | ||||||
TOTAL INVESTMENT SECURITIES — 101.2% (Cost $65,345,542) | 67,798,601 | |||||||
| OTHER ASSETS AND LIABILITIES — (1.2)% | (781,090) | |||||||
| TOTAL NET ASSETS — 100.0% | $ | 67,017,511 | ||||||
14
| NOTES TO SCHEDULE OF INVESTMENTS | ||||||||
| AGM | - | Assured Guaranty Municipal Corporation | ||||||
| AGM-CR | - | Assured Guaranty Municipal Corporation - Custodian Receipts | ||||||
| BAM | - | Build America Mutual Assurance Company | ||||||
| COP | - | Certificates of Participation | ||||||
| GA | - | Guaranty Agreement | ||||||
| GO | - | General Obligation | ||||||
| LIQ FAC | - | Liquidity Facilities | ||||||
| NATL-RE | - | National Public Finance Guarantee Corporation - Reinsured | ||||||
| PSF-GTD | - | Permanent School Fund Guaranteed | ||||||
| Q-SBLF | - | Qualified School Board Loan Fund | ||||||
| VRN | - | Variable Rate Note. The rate adjusts periodically based upon the terms set forth in the security’s offering documents. The rate shown is effective at the period end and the reference rate and spread, if any, is indicated. The security's effective maturity date may be shorter than the final maturity date shown. | ||||||
(1)Security was purchased pursuant to Rule 144A under the Securities Act of 1933 and may be sold in transactions exempt from registration, normally to qualified institutional investors. The aggregate value of these securities at the period end was $4,215,297, which represented 6.3% of total net assets.
(2)Security is a zero-coupon bond. Zero-coupon securities are issued at a substantial discount from their value at maturity.
(3)When-issued security. The issue price and yield are fixed on the date of the commitment, but payment and delivery are scheduled for a future date.
(4)Escrowed to maturity in U.S. government securities or state and local government securities.
See Notes to Financial Statements.
15
| Statement of Assets and Liabilities | ||
| AUGUST 31, 2020 | |||||
| Assets | |||||
| Investment securities, at value (cost of $65,345,542) | $ | 67,798,601 | |||
| Cash | 115 | ||||
| Interest receivable | 654,797 | ||||
| 68,453,513 | |||||
| Liabilities | |||||
| Payable for investments purchased | 1,419,905 | ||||
| Accrued management fees | 16,097 | ||||
| 1,436,002 | |||||
| Net Assets | $ | 67,017,511 | |||
| Shares outstanding (unlimited number of shares authorized) | 1,250,000 | ||||
| Net Asset Value Per Share | $ | 53.61 | |||
| Net Assets Consist of: | |||||
| Capital paid in | $ | 64,496,750 | |||
| Distributable earnings | 2,520,761 | ||||
| $ | 67,017,511 | ||||
See Notes to Financial Statements.
16
| Statement of Operations | ||
| YEAR ENDED AUGUST 31, 2020 | |||||
| Investment Income (Loss) | |||||
| Income: | |||||
| Interest | $ | 1,214,207 | |||
| Expenses: | |||||
| Management fees | 138,010 | ||||
| Net investment income (loss) | 1,076,197 | ||||
| Realized and Unrealized Gain (Loss) | |||||
| Net realized gain (loss) on investment transactions | (45,346) | ||||
| Change in net unrealized appreciation (depreciation) on investments | 1,218,506 | ||||
| Net realized and unrealized gain (loss) | 1,173,160 | ||||
| Net Increase (Decrease) in Net Assets Resulting from Operations | $ | 2,249,357 | |||
See Notes to Financial Statements.
17
| Statement of Changes in Net Assets | ||
| YEAR ENDED AUGUST 31, 2020 AND PERIOD ENDED AUGUST 31, 2019 | ||||||||
| Increase (Decrease) in Net Assets | August 31, 2020 | August 31, 2019(1) | ||||||
| Operations | ||||||||
| Net investment income (loss) | $ | 1,076,197 | $ | 445,711 | ||||
| Net realized gain (loss) | (45,346) | (12,465) | ||||||
| Change in net unrealized appreciation (depreciation) | 1,218,506 | 1,234,553 | ||||||
| Net increase (decrease) in net assets resulting from operations | 2,249,357 | 1,667,799 | ||||||
| Distributions to Shareholders | ||||||||
| From earnings | (1,008,385) | (388,010) | ||||||
| Capital Share Transactions | ||||||||
| Proceeds from shares sold | 39,092,924 | 25,403,826 | ||||||
| Net increase (decrease) in net assets | 40,333,896 | 26,683,615 | ||||||
| Net Assets | ||||||||
| Beginning of period | 26,683,615 | — | ||||||
| End of period | $ | 67,017,511 | $ | 26,683,615 | ||||
| Transactions in Shares of the Fund | ||||||||
| Sold | 750,000 | 500,000 | ||||||
(1)September 10, 2018 (fund inception) through August 31, 2019.
See Notes to Financial Statements.
18
| Notes to Financial Statements | ||
AUGUST 31, 2020
1. Organization
American Century ETF Trust (the trust) was registered as a Delaware statutory trust in 2017 and is registered under the Investment Company Act of 1940, as amended (the 1940 Act), as an open-end management investment company. American Century Diversified Municipal Bond ETF (the fund) is one fund in a series issued by the trust. The fund's investment objective is to seek current income that is exempt from federal income tax. Shares of the fund are listed for trading on the NYSE Arca, Inc. The fund incepted on September 10, 2018.
2. Significant Accounting Policies
The following is a summary of significant accounting policies consistently followed by the fund in preparation of its financial statements. The fund is an investment company and follows accounting and reporting guidance in accordance with accounting principles generally accepted in the United States of America. This may require management to make certain estimates and assumptions at the date of the financial statements. Actual results could differ from these estimates. Management evaluated the impact of events or transactions occurring through the date the financial statements were issued that would merit recognition or disclosure.
Investment Valuations — The fund determines the fair value of its investments and computes its net asset value per share at the close of regular trading (usually 4 p.m. Eastern time) on the New York Stock Exchange (NYSE) on each day the NYSE is open. The Board of Trustees has adopted valuation policies and procedures to guide the investment advisor in the fund’s investment valuation process and to provide methodologies for the oversight of the fund’s pricing function.
Fixed income securities are valued at the evaluated mean as provided by independent pricing services or at the mean of the most recent bid and asked prices as provided by investment dealers. Municipal securities are valued using market models that consider trade data, quotations from dealers and active market makers, relevant yield curve and spread data, creditworthiness, trade data or market information on comparable securities, and other relevant security specific information.
Open-end management investment companies are valued at the reported net asset value per share.
If the fund determines that the market price for an investment is not readily available or the valuation methods mentioned above do not reflect an investment’s fair value, such investment is valued as determined in good faith by the Board of Trustees or its delegate, in accordance with policies and procedures adopted by the Board of Trustees. In its determination of fair value, the fund may review several factors including, but not limited to, market information regarding the specific investment or comparable investments and correlation with other investment types, futures indices or general market indicators. Circumstances that may cause the fund to use these procedures to value an investment include, but are not limited to: an investment has been declared in default or is distressed; trading in a security has been suspended during the trading day or a security is not actively trading on its principal exchange; prices received from a regular pricing source are deemed unreliable; or there is a foreign market holiday and no trading occurred.
The fund monitors for significant events occurring after the close of an investment’s primary exchange but before the fund’s net asset value per share is determined. Significant events may include, but are not limited to: corporate announcements and transactions; governmental action and political unrest that could impact a specific investment or an investment sector; or armed conflicts, natural disasters and similar events that could affect investments in a specific country or region.
Security Transactions — Security transactions are accounted for as of the trade date. Net realized gains and losses are determined on the identified cost basis, which is also used for federal income tax purposes.
Investment Income — Interest income is recorded on the accrual basis and includes paydown gain (loss) and accretion of discounts and amortization of premiums.
19
Income Tax Status — It is the fund’s policy to distribute substantially all net investment income and net realized gains to shareholders and to otherwise qualify as a regulated investment company under provisions of the Internal Revenue Code. Accordingly, no provision has been made for income taxes. The fund files U.S. federal, state, local and non-U.S. tax returns as applicable. The fund's tax returns are subject to examination by the relevant taxing authority until expiration of the applicable statute of limitations, which is generally three years from the date of filing but can be longer in certain jurisdictions. At this time, management believes there are no uncertain tax positions which, based on their technical merit, would not be sustained upon examination and for which it is reasonably possible that the total amounts of unrecognized tax benefits will significantly change in the next twelve months.
Segregated Assets — In accordance with the 1940 Act, the fund segregates assets on its books and records to cover certain types of investment securities and other financial instruments. American Century Investment Management, Inc. (ACIM) (the investment advisor) monitors, on a daily basis, the securities segregated to ensure the fund designates a sufficient amount of liquid assets, marked-to-market daily. The fund may also receive assets or be required to pledge assets at the custodian bank or with a broker for collateral requirements.
Distributions to Shareholders — Distributions from net investment income, if any, are generally declared and paid monthly. Distributions from net realized gains, if any, are generally declared and paid annually.
Indemnifications — Under the trust’s organizational documents, its officers and trustees are indemnified against certain liabilities arising out of the performance of their duties to the fund. In addition, in the normal course of business, the fund enters into contracts that provide general indemnifications. The maximum exposure under these arrangements is unknown as this would involve future claims that may be made against a fund. The risk of material loss from such claims is considered by management to be remote.
3. Fees and Transactions with Related Parties
Certain officers and trustees of the trust are also officers and/or directors of American Century Companies, Inc. (ACC). The trust's investment advisor, ACIM, and the trust’s administrator, American Century Services, LLC, are wholly owned, directly or indirectly, by ACC. Various funds issued by American Century Municipal Trust own, in aggregate, 16% of the shares of the fund. ACIM owns 5% shares of the fund.
Management Fees — The trust has entered into a management agreement with ACIM, under which ACIM provides the fund with investment advisory and management services in exchange for a single, unified management fee (the fee). The agreement provides that ACIM will pay all expenses of managing and operating the fund, except brokerage and other transaction fees and expenses relating to the acquisition and disposition of portfolio securities, acquired fund fees and expenses, interest, taxes, litigation expenses and extraordinary expenses. The fee is computed and accrued daily based on the daily net assets of the fund and paid monthly in arrears. The annual management fee is 0.29%.
Interfund Transactions — The fund may enter into security transactions with other American Century Investments funds and other client accounts of the investment advisor, in accordance with the 1940 Act rules and procedures adopted by the Board of Trustees. The rules and procedures require, among other things, that these transactions be effected at the independent current market price of the security. There were no interfund transactions during the period.
4. Investment Transactions
Purchases and sales of investment securities, excluding short-term investments and in-kind transactions, for the period ended August 31, 2020 were $48,874,422 and $10,505,377, respectively.
There were no in-kind transactions during the period.
5. Capital Share Transactions
The fund’s shares may only be purchased and sold on a national securities exchange through a broker-dealer. The price of the fund’s shares is based on market price, and because ETF shares trade at market prices rather than net asset value (NAV), shares may trade at a price greater than NAV (a premium) or less than NAV (a discount). The fund issues and redeems shares that have been aggregated into blocks of 50,000 shares or multiples thereof (Creation Units) to authorized participants who have entered into agreements with the fund's distributor. The fund may issue and redeem Creation Units in return for a basket of securities (and
20
an amount of cash) or entirely for cash. Investors transacting in Creation Units for cash may also pay an additional variable charge to compensate the fund for certain transaction costs and market impact expenses relating to investing in portfolio securities. Such variable charges, if any, are included in proceeds from shares sold in the Statement of Changes in Net Assets.
6. Fair Value Measurements
The fund’s investments valuation process is based on several considerations and may use multiple inputs to determine the fair value of the investments held by the fund. In conformity with accounting principles generally accepted in the United States of America, the inputs used to determine a valuation are classified into three broad levels.
•Level 1 valuation inputs consist of unadjusted quoted prices in an active market for identical investments.
•Level 2 valuation inputs consist of direct or indirect observable market data (including quoted prices for comparable investments, evaluations of subsequent market events, interest rates, prepayment speeds, credit risk, etc.). These inputs also consist of quoted prices for identical investments initially expressed in local currencies that are adjusted through translation into U.S. dollars.
•Level 3 valuation inputs consist of unobservable data (including a fund’s own assumptions).
The level classification is based on the lowest level input that is significant to the fair valuation measurement. The valuation inputs are not necessarily an indication of the risks associated with investing in these securities or other financial instruments.
The following is a summary of the level classifications as of period end. The Schedule of Investments provides additional information on the fund’s portfolio holdings.
| Level 1 | Level 2 | Level 3 | |||||||||
| Assets | |||||||||||
| Investment Securities | |||||||||||
| Municipal Securities | — | $ | 65,516,681 | — | |||||||
| Temporary Cash Investments | $ | 2,281,920 | — | — | |||||||
| $ | 2,281,920 | $ | 65,516,681 | — | |||||||
7. Risk Factors
The novel coronavirus (COVID-19) pandemic has significantly stressed the financial resources of many municipal issuers, which may impair a municipal issuer’s ability to meet its financial obligations when due and could adversely impact the value of its bonds, which could negatively impact the performance of the fund.
8. Federal Tax Information
The tax character of distributions paid during the year ended August 31, 2020 and the period September 10, 2018 (fund inception) through August 31, 2019 were as follows:
| 2020 | 2019 | |||||||
| Distributions Paid From | ||||||||
| Exempt income | $ | 1,008,385 | $ | 388,010 | ||||
| Long-term capital gains | — | — | ||||||
The book-basis character of distributions made during the year from net investment income or net realized gains may differ from their ultimate characterization for federal income tax purposes. These differences reflect the differing character of certain income items and net realized gains and losses for financial statement and tax purposes, and may result in reclassification among certain capital accounts on the financial statements.
21
As of period end, the federal tax cost of investments and the components of distributable earnings on a tax-basis were as follows:
| Federal tax cost of investments | $ | 65,346,211 | |||
| Gross tax appreciation of investments | $ | 2,624,639 | |||
| Gross tax depreciation of investments | (172,249) | ||||
| Net tax appreciation (depreciation) of investments | $ | 2,452,390 | |||
| Undistributed exempt income | $ | 125,513 | |||
| Accumulated short-term capital losses | $ | (57,142) | |||
The difference between book-basis and tax-basis unrealized appreciation (depreciation) is attributable primarily to the tax deferral of losses on wash sales.
Accumulated capital losses represent net capital loss carryovers that may be used to offset future realized
capital gains for federal income tax purposes. The capital loss carryovers may be carried forward for an
unlimited period. Future capital loss carryover utilization in any given year may be subject to Internal Revenue
Code limitations.
9. Recently Issued Accounting Standards
In March 2017, the Financial Accounting Standards Board (FASB) issued Accounting Standards Update No. 2017-08, “Receivables - Nonrefundable Fees and Other Costs (Subtopic 310-20), Premium Amortization on Purchased Callable Debt Securities” (ASU 2017-08). ASU 2017-08 amends the amortization period for certain purchased callable debt securities held at a premium, shortening such period to the earliest call date. The amendments are effective for fiscal years, and interim periods within those fiscal years, beginning after December 15, 2018. The adoption of ASU 2017-08 did not materially impact the financial statements.
22
| Financial Highlights | ||
| For a Share Outstanding Throughout the Years Ended August 31 (except as noted) | |||||||||||||||||||||||||||||||||||
| Per-Share Data | Ratios and Supplemental Data | ||||||||||||||||||||||||||||||||||
| Income From Investment Operations: | Ratio to Average Net Assets of: | ||||||||||||||||||||||||||||||||||
| Net Asset Value, Beginning of Period | Net Investment Income (Loss)(1) | Net Realized and Unrealized Gain (Loss) | Total From Investment Operations | Distributions From Net Investment Income | Net Asset Value, End of Period | Total Return(2) | Operating Expenses | Net Investment Income (Loss) | Portfolio Turnover Rate(3) | Net Assets, End of Period (in thousands) | |||||||||||||||||||||||||
| 2020 | $53.37 | 1.19 | 0.20 | 1.39 | (1.15) | $53.61 | 2.66% | 0.29% | 2.26% | 23% | $67,018 | ||||||||||||||||||||||||
2019(4) | $50.00 | 1.36 | 3.26 | 4.62 | (1.25) | $53.37 | 9.42% | 0.29%(5) | 2.74%(5) | 19% | $26,684 | ||||||||||||||||||||||||
| Notes to Financial Highlights | ||
(1)Computed using average shares outstanding throughout the period.
(2)Total returns are calculated based on the net asset value of the last business day. Total returns for periods less than one year are not annualized.
(3)Excludes securities received or delivered in-kind.
(4)September 10, 2018 (fund inception) through August 31, 2019.
(5)Annualized.
See Notes to Financial Statements.
| Report of Independent Registered Public Accounting Firm | ||
To the Shareholders and the Board of Trustees of American Century ETF Trust:
Opinion on the Financial Statements and Financial Highlights
We have audited the accompanying statement of assets and liabilities, including the schedule of investments, of American Century Diversified Municipal Bond ETF (the “Fund”), one of the funds constituting the American Century ETF Trust, as of August 31, 2020, the related statement of operations for the year then ended, the statements of changes in net assets and the financial highlights for the year ended August 31, 2020, and the period from September 10, 2018 (fund inception) through August 31, 2019, and the related notes. In our opinion, the financial statements and financial highlights present fairly, in all material respects, the financial position of American Century Diversified Municipal Bond ETF as of August 31, 2020, and the results of its operations for the year then ended, the changes in its net assets and the financial highlights for the year ended August 31, 2020, and the period from September 10, 2018 (fund inception) through August 31, 2019, in conformity with accounting principles generally accepted in the United States of America.
Basis for Opinion
These financial statements and financial highlights are the responsibility of the Fund's management. Our responsibility is to express an opinion on the Fund’s financial statements and financial highlights based on our audits. We are a public accounting firm registered with the Public Company Accounting Oversight Board (United States) (PCAOB) and are required to be independent with respect to the Fund in accordance with the U.S. federal securities laws and the applicable rules and regulations of the Securities and Exchange Commission and the PCAOB.
We conducted our audits in accordance with the standards of the PCAOB. Those standards require that we plan and perform the audit to obtain reasonable assurance about whether the financial statements and financial highlights are free of material misstatement, whether due to error or fraud. The Fund is not required to have, nor were we engaged to perform, an audit of its internal control over financial reporting. As part of our audits we are required to obtain an understanding of internal control over financial reporting but not for the purpose of expressing an opinion on the effectiveness of the Fund’s internal control over financial reporting. Accordingly, we express no such opinion.
Our audits included performing procedures to assess the risks of material misstatement of the financial statements and financial highlights, whether due to error or fraud, and performing procedures that respond to those risks. Such procedures included examining, on a test basis, evidence regarding the amounts and disclosures in the financial statements and financial highlights. Our audits also included evaluating the accounting principles used and significant estimates made by management, as well as evaluating the overall presentation of the financial statements and financial highlights. Our procedures included confirmation of securities owned as of August 31, 2020, by correspondence with the custodian and brokers; when replies were not received from brokers, we performed other auditing procedures. We believe that our audits provide a reasonable basis for our opinion.
DELOITTE & TOUCHE LLP
Kansas City, Missouri
October 16, 2020
We have served as the auditor of one or more American Century investment companies since 1997.
24
| Management | ||
The Board of Trustees
The individuals listed below serve as trustees of the funds. Each trustee will continue to serve in this capacity until death, retirement, resignation or removal from office. The board has adopted a mandatory retirement age for trustees who are not “interested persons,” as that term is defined in the Investment Company Act (independent trustees). Trustees who are not also officers of the trust shall retire by December 31st of the year in which they reach their 75th birthday.
Mr. Thomas is an “interested person” because he currently serves as President and Chief Executive Officer of American Century Companies, Inc. (ACC), the parent company of American Century Investment Management, Inc. (ACIM or the advisor). The other trustees are independent. They are not employees, directors or officers of, and have no financial interest in, ACC or any of its wholly owned, direct or indirect, subsidiaries, including ACIM and American Century Services, LLC (ACS), and they do not have any other affiliations, positions or relationships that would cause them to be considered “interested persons” under the Investment Company Act. The following trustees also serve in this capacity for a number of other registered investment companies in the American Century Investments family of funds: Jonathan S. Thomas, 15; Ronald J. Gilson, 8; and Stephen E. Yates, 7.
The following table presents additional information about the trustees. The mailing address for each trustee other than Jonathan S. Thomas is 330 Madison Avenue, New York, New York 10017. The mailing address for Jonathan S. Thomas is 4500 Main Street, Kansas City, Missouri 64111.
| Name (Year of Birth) | Position(s) Held with Funds | Length of Time Served | Principal Occupation(s) During Past 5 Years | Number of American Century Portfolios Overseen by Trustee | Other Directorships Held During Past 5 Years | ||||||||||||
| Independent Trustees | |||||||||||||||||
| Reginald M. Browne (1968) | Trustee and Chairman of the Board | Since 2017 (Chairman since 2019) | Principal, GTS Securities (automated capital markets trading firm)(2019 to present); Senior Managing Director, Co Global Head-ETF Group, Cantor Fitzgerald (financial services firm)(2013 to 2019) | 19 | None | ||||||||||||
| Ronald J. Gilson (1946) | Trustee | Since 2017 | Charles J. Meyers Professor of Law and Business, Emeritus, Stanford Law School (1979 to 2016); Marc and Eva Stern Professor of Law and Business, Columbia University School of Law (1992 to present) | 59 | None | ||||||||||||
| Barry A. Mendelson (1958) | Trustee | Since 2017 | Retired; Consultant regarding ETF and mutual fund matters (2015 to 2016); Principal and Senior Counsel, The Vanguard Group (investment management)(1998 to 2014) | 19 | None | ||||||||||||
| Stephen E. Yates (1948) | Trustee | Since 2017 | Retired | 82 | None | ||||||||||||
25
| Name (Year of Birth) | Position(s) Held with Funds | Length of Time Served | Principal Occupation(s) During Past 5 Years | Number of American Century Portfolios Overseen by Trustee | Other Directorships Held During Past 5 Years | ||||||||||||
| Interested Trustees | |||||||||||||||||
| Jonathan S. Thomas (1963) | Trustee | Since 2017 | President and Chief Executive Officer, ACC (2007 to present). Also serves as Chief Executive Officer, ACS; Executive Vice President, ACIM; Director, ACC, ACIM and other ACC subsidiaries | 122 | None | ||||||||||||
The Statement of Additional Information has additional information about the fund's trustees and is available without charge, upon request, by calling 1-800-345-6488.
26
Officers
The following table presents certain information about the executive officers of the funds. Each officer, except Edward Rosenberg, serves as an officer for each of the 16 investment companies in the American Century family of funds. No officer is compensated for his or her service as an officer of the funds. The listed officers are interested persons of the funds and are appointed or re-appointed on an annual basis. The mailing address for each officer listed below is 4500 Main Street, Kansas City, Missouri 64111.
| Name (Year of Birth) | Offices with the Funds | Principal Occupation(s) During the Past Five Years | ||||||
| Patrick Bannigan (1965) | President since 2019 | Executive Vice President and Director, ACC (2012 to present); Chief Financial Officer, Chief Accounting Officer and Treasurer, ACC (2015 to present). Also serves as President, ACS; Vice President, ACIM; Chief Financial Officer, Chief Accounting Officer and/or Director, ACIM, ACS and other ACC subsidiaries | ||||||
| R. Wes Campbell (1974) | Chief Financial Officer and Treasurer since 2018 | Vice President, ACS (2020 to present); Investment Operations and Investment Accounting, ACS (2000 to present) | ||||||
| Amy D. Shelton (1964) | Chief Compliance Officer and Vice President since 2017 | Chief Compliance Officer, American Century funds, (2014 to present); Chief Compliance Officer, ACIM (2014 to present); Chief Compliance Officer, ACIS (2009 to present). Also serves as Vice President, ACIS | ||||||
| Charles A. Etherington (1957) | General Counsel and Vice President since 2017 | Attorney, ACC (1994 to present); Vice President, ACC (2005 to present); General Counsel, ACC (2007 to present). Also serves as General Counsel, ACIM, ACS, ACIS and other ACC subsidiaries; and Senior Vice President, ACIM and ACS | ||||||
| Cleo Chang (1977) | Vice President since 2019 | Senior Vice President, ACIM (2015 to present); Chief Investment Officer, Wilshire Funds Management (2005 to 2015) | ||||||
| David H. Reinmiller (1963) | Vice President since 2017 | Attorney, ACC (1994 to present). Also serves as Vice President, ACIM and ACS | ||||||
| Edward Rosenberg (1973) | Vice President since 2017 | Senior Vice President, ACIM (2017 to present); Senior Vice President, Flexshares Head of ETF Capital Markets, Northern Trust (2012 to 2017) | ||||||
| C. Jean Wade (1964) | Vice President since 2017 | Senior Vice President, ACS (2017 to present); Vice President, ACS (2000 to 2017) | ||||||
| Ward D. Stauffer (1960) | Secretary since 2019 | Attorney, ACS (2003 to present) | ||||||
27
| Approval of Management Agreement | ||
At a meeting held on June 5, 2020, the Fund’s Board of Trustees (the "Board") unanimously approved the renewal of the management agreement pursuant to which American Century Investment Management, Inc. (the “Advisor”) acts as the investment advisor for the Fund. Under Section 15(c) of the Investment Company Act, contracts for investment advisory services are required to be reviewed, evaluated, and approved by a majority of a fund’s trustees (the “Trustees”), including a majority of the independent Trustees, each year.
Prior to its consideration of the renewal of the management agreement, the Trustees requested and reviewed extensive data and information compiled by the Advisor and certain independent providers of evaluation data concerning the Fund and the services provided to the Fund by the Advisor. This review was in addition to the oversight and evaluation undertaken by the Board and its Audit Committee on a continual basis and the information received was supplemental to the extensive information that the Board and its Audit Committee receive and consider throughout the year.
In connection with its consideration of the renewal of the management agreement, the Board’s review and evaluation of the services provided by the Advisor included, but was not limited to, the following:
•the nature, extent, and quality of investment management and other services provided and to be provided to the Fund;
•the wide range of other programs and services provided and to be provided to the Fund and its shareholders on a routine and non-routine basis;
•the Fund’s investment performance, including data comparing the Fund's performance to appropriate benchmarks of funds with similar objectives and strategies;
•the cost of owning the Fund compared to the cost of owning similar funds;
•the compliance policies, procedures, and regulatory experience of the Advisor and the Fund's service providers;
•the Advisor’s strategic plans;
•the Advisor’s business continuity plans and specifically its response to the COVID-19 pandemic;
•financial data showing the cost of services provided to the Fund, the profitability of the Fund to the Advisor, and the overall profitability of the Advisor;
•information regarding payments to intermediaries by the Advisor; and
•possible economies of scale associated with the Advisor’s management of the Fund; and
•possible collateral benefits to the Advisor from the management of the Fund.
The independent Trustees met separately in private session to discuss the renewal and to review and discuss the information provided in response to their request. The independent Trustees also held active discussions with the Advisor regarding the renewal of the management agreement. The independent Trustees had the benefit of the advice of their independent counsel throughout the process.
Factors Considered
The Trustees considered all of the information provided by the Advisor, the independent data providers, and independent counsel in connection with the approval. They determined that the information was sufficient for them to evaluate the management agreement for the Fund. In connection with their review, the Trustees did not identify any single factor as being all-important or
28
controlling, and each Trustee may have attributed different levels of importance to different factors. In deciding to renew the management agreement, the Board based its decision on a number of factors, including without limitation the following:
Nature, Extent and Quality of Services — Generally. Under the management agreement, the Advisor is responsible for providing or arranging for all services necessary for the operation of the Fund. The Board noted that the Advisor provides or arranges at its own expense a wide variety of services including without limitation the following:
•constructing and designing the Fund
•portfolio research and security selection
•initial capitalization/funding
•securities trading
•Fund administration
•custody of Fund assets
•daily valuation of the Fund’s portfolio
•shareholder servicing and transfer agency, including shareholder confirmations, recordkeeping, and communications
•legal services (except the independent Trustees’ counsel)
•regulatory and portfolio compliance
•financial reporting
•marketing and distribution (except amounts paid by the Fund under Rule 12b-1 plans)
Investment Management Services. The nature of the investment management services provided to the Fund is quite complex and allows Fund shareholders access to professional money management, instant diversification of their investments within an asset class, and liquidity. In evaluating investment performance, the Board expects the Advisor to manage the Fund in accordance with its investment objectives and approved strategies. Further, the Trustees recognize that the Advisor has an obligation to monitor trading activities, and in particular to seek the best execution of fund trades, and to evaluate the use of and payment for research. In providing these services, the Advisor utilizes teams of investment professionals (portfolio managers, analysts, research assistants, and securities traders) who require extensive information technology, research, training, compliance, and other systems to conduct their business. The Board provides oversight of the investment performance process. It regularly reviews investment performance information for the Fund, together with comparative information for appropriate benchmarks over different time horizons. The Trustees also review investment performance information during the management agreement renewal process. If performance concerns are identified, the Board discusses with the Advisor the reasons for such results and any efforts being undertaken to improve performance. The Fund’s performance was above its benchmark for the one-year and since inception periods reviewed by the Board. The Board found the investment management services provided by the Advisor to the Fund to be satisfactory and consistent with the management agreement.
Shareholder and Other Services. Under the management agreement, the Advisor provides or arranges for a comprehensive package of services to the Fund. The Board, directly and through its Audit Committee, regularly reviews reports and evaluations of such services at its regular meetings. These reports include, but are not limited to, information regarding the operational efficiency and accuracy of the shareholder and transfer agency services provided, staffing levels, shareholder satisfaction, technology support (including cyber security), new products and services offered to Fund shareholders, securities trading activities, portfolio valuation services, auditing services, and legal and operational compliance activities. The Board found the services provided by the Advisor to the Fund under the management agreement to be competitive and of high quality.
29
COVID-19 Response. During 2020, much of the world experienced unprecedented change and challenges from the impacts of the rapidly evolving, worldwide spread of the COVID-19 virus. The Board evaluated the Advisor’s response to the COVID-19 pandemic and its impact on service to the Fund. The Board found that Fund shareholders have continued to receive the Advisor’s investment management and other services without disruption, and Advisor personnel have demonstrated great resiliency in providing those services. The Board, directly and through its Audit Committee, continues to monitor the impact of the pandemic and the response of each of the Fund’s service providers.
Costs of Services and Profitability. The Advisor provides detailed information concerning its cost of providing various services to the Fund, its profitability in managing the Fund (pre- and post-distribution), its overall profitability, and its financial condition. The Trustees have reviewed with the Advisor the methodology used to prepare this financial information. This information is considered in evaluating the Advisor’s financial condition, its ability to continue to provide services under the management agreement, and the reasonableness of the current management fee. The Board concluded that the Advisor’s profits were reasonable in light of the services provided to the Fund.
Ethics. The Board generally considers the Advisor’s commitment to providing quality services to the Fund and to conducting its business ethically. They noted that the Advisor’s practices generally meet or exceed industry best practices.
Economies of Scale. The Board also reviewed information provided by the Advisor regarding the possible existence of economies of scale in connection with the management of the Fund. The Board concluded that economies of scale are difficult to measure and predict with precision, especially on a fund-by-fund basis. The Board concluded that the Advisor is appropriately sharing economies of scale, to the extent they exist, through its competitive fee structure, offering competitive fees from fund inception, and through reinvestment in its business, infrastructure, investment capabilities and initiatives to provide shareholders additional content and services.
Comparison to Other Funds’ Fees. The management agreement provides that the Fund pays the Advisor a single, all-inclusive (or unified) management fee for providing all services necessary for the management and operation of the Fund, other than brokerage expenses, expenses attributable to short sales, taxes, interest, extraordinary expenses, and expenses incurred in connection with the provision of shareholder services and distribution services under a plan adopted pursuant to Rule 12b-1 under the Investment Company Act. Under the unified fee structure, the Advisor is responsible for providing all investment advisory, custody, audit, administrative, compliance, recordkeeping, marketing and shareholder services, or arranging and supervising third parties to provide such services. The Board believes the unified fee structure is a benefit to Fund shareholders because it clearly discloses to shareholders the cost of owning Fund shares, and, since the unified fee cannot be increased without a vote of Fund shareholders, it shifts to the Advisor the risk of increased costs of operating the Fund and provides a direct incentive to minimize administrative inefficiencies. Part of the Board’s analysis of fee levels involves reviewing certain evaluative data compiled by an independent provider comparing the Fund’s unified fee to the total expense ratios of its peers. The unified fee charged to shareholders of the Fund was below the median of the total expense ratios of the Fund’s peer expense universe and was the lowest of its peer expense group. The Board concluded that the management fee paid by the Fund to the Advisor under the management agreement is reasonable in light of the services provided to the Fund.
Comparison to Fees and Services Provided to Other Clients of the Advisor. The Board also requested information from the Advisor concerning the nature of the services, fees, costs, and profitability of its advisory services to funds or other advisory clients managed similarly to the Fund. The Advisor informed the Trustees that, as of December 31, 2019, it did not provide services to any other investment companies or comparable accounts that were managed similarly to the Fund.
30
Payments to Intermediaries. The Trustees also requested a description of payments made to intermediaries by the Fund and the Advisor and services provided in response thereto. These payments could include various payments made by the Fund or the Advisor to different types of intermediaries and recordkeepers for distribution and service activities provided for the Fund. The Trustees reviewed such information and received representations from the Advisor that all such payments by the Advisor were made from the Advisor’s resources and reasonable profits. The Board found such payments to be reasonable in scope and purpose.
Collateral or “Fall-Out” Benefits Derived by the Advisor. The Board considered the possible existence of collateral benefits the Advisor may receive as a result of its relationship with the Fund. They concluded that the Advisor’s primary business is managing funds and it generally does not use fund or shareholder information to generate profits in other lines of business, and therefore does not derive any significant collateral benefits from them. The Board noted that additional assets from other clients may offer the Advisor some benefit from increased leverage with service providers and counterparties. The Board also determined that the Advisor is able to provide investment management services to certain clients other than the Fund, at least in part, due to its existing infrastructure built to serve the fund complex. The Board concluded that appropriate allocation methodologies had been employed to assign resources and the cost of those resources to these other clients.
Existing Relationship. The Board also considered whether there was any reason for not continuing the existing arrangement with the Advisor. In this regard, the Board was mindful of the potential disruptions of the Fund’s operations and various risks, uncertainties, and other effects that could occur as a result of a decision not to continue such relationship. In particular, the Board recognized that most shareholders have invested in the Fund on the strength of the Advisor’s industry standing and reputation and in the expectation that the Advisor will have a continuing role in providing advisory services to the Fund.
Conclusion of the Trustees. As a result of this process, the Board, including all of the independent Trustees, taking into account all of the factors discussed above and the information provided by the Advisor and others in connection with its review and throughout the year, determined that the management fee is fair and reasonable in light of the services provided and that the investment management agreement between the Fund and the Advisor should be renewed.
31
| Liquidity Risk Management Program | ||
The Fund has adopted a liquidity risk management program (the “program”). The Fund’s Board of Trustees (the "Board") has designated American Century Investment Management, Inc. (“ACIM”) as the administrator of the program. Personnel of ACIM or its affiliates conduct the day-to-day operation of the program pursuant to policies and procedures administered by those members of the ACIM’s Investment Oversight Committee who are members of the ACIM’s Investment Management and Global Analytics departments.
Under the program, ACIM manages the Fund’s liquidity risk, which is the risk that the Fund could not meet shareholder redemption requests without significant dilution of remaining shareholders’ interests in the Fund. This risk is managed by monitoring the degree of liquidity of the Fund’s investments, limiting the amount of the Fund’s illiquid investments, and utilizing various risk management tools and facilities available to the Fund for meeting shareholder redemptions, among other means. ACIM’s process of determining the degree of liquidity of the Fund’s investments is supported by one or more third-party liquidity assessment vendors.
The Board reviewed a report prepared by ACIM regarding the operation and effectiveness of the program for the period December 1, 2018 through December 31, 2019. No significant liquidity events impacting the Fund were noted in the report. In addition, ACIM provided its assessment that the program had been effective in managing the Fund’s liquidity risk.
32
| Additional Information | ||
Retirement Account Information
As required by law, distributions you receive from certain retirement accounts are subject to federal income tax withholding, unless you elect not to have withholding apply*. Tax will be withheld on the total amount withdrawn even though you may be receiving amounts that are not subject to withholding, such as nondeductible contributions. In such case, excess amounts of withholding could occur. You may adjust your withholding election so that a greater or lesser amount will be withheld.
Remember, even if you elect not to have income tax withheld, you are liable for paying income tax on the taxable portion of your withdrawal. If you elect not to have income tax withheld or you don’t have enough income tax withheld, you may be responsible for payment of estimated tax. You may incur penalties under the estimated tax rules if your withholding and estimated tax payments are not sufficient. You can reduce or defer the income tax on a distribution by directly or indirectly rolling such distribution over to another IRA or eligible plan. You should consult your tax advisor for additional information.
State tax will be withheld if, at the time of your distribution, your address is within one of the mandatory withholding states and you have federal income tax withheld (or as otherwise required by state law). State taxes will be withheld from your distribution in accordance with the respective state rules.
*Some 403(b), 457 and qualified retirement plan distributions may be subject to 20% mandatory withholding, as they are subject to special tax and withholding rules. Your plan administrator or plan sponsor is required to provide you with a special tax notice explaining those rules at the time you request a distribution. If applicable, federal and/or state taxes may be withheld from your distribution amount.
Proxy Voting Policies
A description of the policies that the fund's investment advisor uses in exercising the voting rights associated with the securities purchased and/or held by the fund are available without charge, upon request, by calling 1-800-345-6488. It is also available on American Century Investments’ website at americancentury.com/proxy and on the Securities and Exchange Commission’s website at sec.gov. Information regarding how the investment advisor voted proxies relating to portfolio securities during the most recent 12-month period ended June 30 is available at americancentury.com/proxy. It is also available at sec.gov.
Quarterly Portfolio Disclosure
The fund files its complete schedule of portfolio holdings with the Securities and Exchange Commission (SEC) for the first and third quarters of each fiscal year as an exhibit to its reports on Form N-PORT. The fund's Form N-PORT reports are available on the SEC’s website at sec.gov.
33
Other Tax Information
The following information is provided pursuant to provisions of the Internal Revenue Code.
The fund designates $1,008,385 as exempt interest dividends for the fiscal year ended August 31, 2020.
34
| Notes | ||
35
| Notes | ||
36
| Notes | ||
37
| Notes | ||
38
| Notes | ||
39
| Notes | ||
40
| ||||||||
| Contact Us | americancenturyetfs.com | |||||||
| American Century Sales Representatives, Financial Professionals, Broker Dealers, Insurance Companies, Banks and Trust Companies | 1-833-ACI-ETFS | |||||||
| Telecommunications Relay Service for the Deaf | 711 | |||||||
| American Century ETF Trust | ||||||||
Investment Advisor: American Century Investment Management, Inc. Kansas City, Missouri | ||||||||
Distributor: Foreside Fund Services, LLC - Distributor, not affiliated with American Century Investment Services, Inc. | ||||||||
| This report and the statements it contains are submitted for the general information of our shareholders. The report is not authorized for distribution to prospective investors unless preceded or accompanied by an effective prospectus. | ||||||||
| ©2020 American Century Proprietary Holdings, Inc. All rights reserved. CL-ANN-95462 2010 | ||||||||
| Annual Report | |||||
| August 31, 2020 | |||||
American Century® Focused Dynamic Growth ETF (FDG) | |||||
Beginning on January 1, 2021, as permitted by regulations adopted by the Securities and Exchange Commission, paper copies of the fund’s shareholder reports like this one will no longer be sent by mail, unless you specifically request paper copies of the reports from the fund or from your financial intermediary, such as a broker-dealer or bank. Instead, the reports will be made available on a website, and you will be notified by mail each time a report is posted and provided with a website link to access the report.
If you already elected to receive shareholder reports electronically, you will not be affected by this change and you need not take any action. You may elect to receive shareholder reports and other communications from the fund or your financial intermediary electronically by calling or sending an email request to your appropriate contacts as listed on the back cover of this report.
You may elect to receive all future reports in paper free of charge. You can inform the fund or your financial intermediary that you wish to continue receiving paper copies of your shareholder reports by calling or sending an email request to your appropriate contacts as listed on the back cover of this report. Your election to receive reports in paper will apply to all funds held with the fund complex/your financial intermediary.
| Table of Contents | ||
| President’s Letter | |||||
| Performance | |||||
| Portfolio Commentary | |||||
| Fund Characteristics | |||||
| Shareholder Fee Example | |||||
| Schedule of Investments | |||||
| Statement of Assets and Liabilities | |||||
| Statement of Operations | |||||
| Statement of Changes in Net Assets | |||||
| Notes to Financial Statements | |||||
| Financial Highlights | |||||
| Report of Independent Registered Public Accounting Firm | |||||
| Management | |||||
| Approval of Management Agreement | |||||
| Additional Information | |||||
The fund utilizes the ActiveShares® methodology licensed from Precidian Investments, LLC (Precidian). Precidian’s products and services are protected by domestic and international intellectual property protections, including, without limitation, the following issued patents and pending patent applications: 7813987, 8285624, 7925562, 13011746, 14528658, 14208966, 16196560.
Any opinions expressed in this report reflect those of the author as of the date of the report, and do not necessarily represent the opinions of American Century Investments® or any other person in the American Century Investments organization. Any such opinions are subject to change at any time based upon market or other conditions and American Century Investments disclaims any responsibility to update such opinions. These opinions may not be relied upon as investment advice and, because investment decisions made by American Century Investments funds are based on numerous factors, may not be relied upon as an indication of trading intent on behalf of any American Century Investments fund. Security examples are used for representational purposes only and are not intended as recommendations to purchase or sell securities. Performance information for comparative indices and securities is provided to American Century Investments by third party vendors. To the best of American Century Investments’ knowledge, such information is accurate at the time of printing.
| President’s Letter | ||
Jonathan ThomasDear Investor:
Thank you for reviewing this annual report for the period ended August 31, 2020. Annual reports help convey important information about fund returns, including market factors that affected performance during the reporting period. For additional investment insights, please visit americancenturyetfs.com.
Stocks Staged Robust Recovery
The funds launched in late March, amid a significant sell-off in U.S. stocks. The rapidly spreading COVID-19 outbreak halted most U.S. and global economic activity, triggering a worldwide recession and an investor flight to quality. The Federal Reserve stepped in quickly and aggressively, slashing U.S. interest rates and launching several asset-purchase and lending programs. The federal government responded, too, with a massive package of financial aid to individuals, businesses and state and local governments. These extraordinary efforts proved helpful, as U.S. stocks rebounded quickly, despite weak economic and corporate earnings data.
As the period progressed, declining coronavirus infection and death rates in many regions and the reopening of state economies were positive influences. By the end of August, manufacturing, employment and other data suggested an economic recovery was underway, which helped fuel robust stock returns for the five-month reporting period.
A Slow Return to Normal
The return to pre-pandemic life will take time and patience, but we are confident we will get there. Several drug companies are in final stages of vaccine trials, and medical professionals continue to fine-tune virus treatment protocols. In the meantime, investors likely will face periods of outbreak-related disruptions, economic and political uncertainty, and heightened market volatility. These influences can be unsettling, but they tend to be temporary.
We appreciate your confidence in us during these extraordinary times. Our firm has a long history of helping clients weather unpredictable markets, and we’re confident we will continue to meet today’s challenges.
Sincerely,
Jonathan Thomas
President and Chief Executive Officer
American Century Investments
2
| Performance | ||
| Total Returns as of August 31, 2020 | ||||||||||||||||||||
| Since Inception | Inception Date | |||||||||||||||||||
| Net Asset Value | 70.11% | 3/31/2020 | ||||||||||||||||||
| Market Price | 70.26% | 3/31/2020 | ||||||||||||||||||
| Russell 1000 Growth Index | 51.88% | — | ||||||||||||||||||
Market price is determined using the bid/ask midpoint at 4:00 p.m. Eastern time, when the net asset value (NAV) is typically calculated. Market performance does not represent the returns you would receive if you traded shares at other times. NAV prices are used to calculate market price performance prior to the date when the fund first traded on the New York Stock Exchange.
Extraordinary performance is attributable in part to unusually favorable market conditions and may not be repeated or consistently achieved in the future.
| Total Annual Fund Operating Expenses | |||||||||||||||||
| 0.45% | |||||||||||||||||
The total annual fund operating expenses shown is as stated in the fund’s prospectus current as of the date of this report. The prospectus may vary from the expense ratio shown elsewhere in this report because it is based on a different time period, includes acquired fund fees and expenses, and, if applicable, does not include fee waivers or expense reimbursements.
Data presented reflect past performance. Past performance is no guarantee of future results. Current performance may be higher or lower than the performance shown. Total returns for periods less than one year are not annualized. Investment return and principal value will fluctuate, and redemption value may be more or less than original cost. Data assumes reinvestment of dividends and capital gains, and none of the charts reflect the deduction of taxes that a shareholder would pay on fund distributions or the redemption of fund shares. To obtain performance data current to the most recent month end, please call 1-800-345-6488 or visit americancenturyetfs.com. For additional information about the fund, please consult the prospectus.
3
| Portfolio Commentary | ||
Portfolio Managers: Keith Lee, Michael Li, Henry He, Prabha Ram and Rene Casis
Fund Strategy
American Century Focused Dynamic Growth ETF is an actively managed fund that seeks long-term capital growth. We look for liquid stocks of early and rapid stage growth companies we believe will increase in value over time. We make investment decisions based primarily on fundamental analysis of individual companies, rather than on broad economic forecasts. Management of the fund is based on the belief that, over the long term, stock price movements follow growth in earnings, revenues and/or cash flow. The fund invests primarily in securities of large-cap companies but may invest in companies of any market capitalization. The fund normally invests in a relatively limited number of companies, generally 30 to 45 securities, but may incorporate more securities to account for liquidity constraints.
Performance Review
For the period from the fund’s inception on March 31, 2020, through the fund’s fiscal year-end on August 31, 2020, the fund returned 70.26%* on a market price basis. On a net asset value (NAV) basis, the fund returned 70.11%. For the same time period, the Russell 1000 Growth Index, the fund’s benchmark, returned 51.88%. The fund’s NAV and market price returns reflect fees and operating expenses, while the index return does not.
Consumer Discretionary Stocks Led Performance
Stock selection within the consumer discretionary sector benefited performance. Electric car company Tesla outperformed on positive fundamental reports and was the leading individual contributor to relative performance. The company reported better-than-expected production numbers, successfully launched the Model Y and announced plans to ramp up production of a commercial semitruck. The company benefits from owning showrooms rather than traditional dealerships, operating a global battery-charging infrastructure and predominantly using over-the-air software updates, which helps profitability. The stock of fast-casual restaurant chain Chipotle Mexican Grill outperformed as online sales rose sharply. The company also said that it believed its balance sheet would allow it to weather the pandemic-driven downturn.
In the consumer staples sector, The Boston Beer Co. was a significant contributor to relative performance. The company reported better-than-expected earnings, helped by strong growth in its Truly hard seltzer brand and raised its 2020 growth outlook. We like Boston Beer for its potential to improve margins over time and for its ongoing innovation, which has driven the long-term growth of the business.
The information technology sector aided performance led by stock selection in the IT services industry. Square outperformed on optimism about continued growth trends in its cash app business and its merchant-based business showing signs of stabilizing after being negatively impacted by the COVID-19 virus. In the software industry, cloud-based electronic signature company DocuSign outperformed, as e-signatures and digital document management have increasingly become mainstream.
Financials Detracted
The financials sector hampered relative performance. Falling interest rates and increased credit risk weighed on the sector. Intercontinental Exchange was a significant detractor, due primarily to soft transactions volumes.
*Total returns for periods less than one year are not annualized.
4
Elsewhere, not owning Apple detracted as growth in the consumer electronics company’s services and wearable devices has taken the pressure off of iPhone sales as the driver of earnings. We seek to own early stage, high-growth companies, as opposed to later-stage, more mature companies such as Apple. Not owning NVIDIA detracted as the stock rose on anticipation of strong demand for its new gaming processors. Slack Technologies underperformed. This company provides a communications platform integrating messaging, audio and video with file sharing, archiving and project management. The platform allows employees across teams and companies to communicate more efficiently than through email. Slack lost ground due to increased competition and slightly less focus on the work-from-home trend.
The stock of Biogen detracted. The biotechnology company reported a generally positive earnings report, but the stock price was hurt by a federal court ruling that the patent was invalid on its multiple sclerosis drug Tecfidera, the company’s bestselling drug, and on the delay of a key drug to treat Alzheimer’s.
Portfolio Positioning
The fund typically holds a relatively small number of stocks (30 to 45) that we believe can sustain their high-growth rates and have potential for long-term capital appreciation in excess of the fund’s benchmark. We are primarily focused on sustainability of earnings growth, so we visit corporate managements to evaluate their companies’ quality and how well positioned they are to respond to changing market conditions and opportunities. The fund’s sector allocations are primarily the result of this investment process emphasizing growth and individual security selection. At the end of the reporting period, the consumer discretionary and financials sectors represented the largest overweight allocations versus the benchmark. The largest underweights were in the information technology and health care sectors. We had no holdings in the real estate sector.
5
| Fund Characteristics | ||
| AUGUST 31, 2020 | |||||
| Top Ten Holdings | % of net assets | ||||
| Amazon.com, Inc. | 8.8% | ||||
| Tesla, Inc. | 7.6% | ||||
| salesforce.com, Inc. | 5.7% | ||||
| Visa, Inc., Class A | 4.6% | ||||
| Alphabet, Inc., Class C | 4.5% | ||||
| MasterCard, Inc., Class A | 4.4% | ||||
| Square, Inc., Class A | 4.4% | ||||
| Facebook, Inc., Class A | 4.3% | ||||
| Boston Beer Co., Inc. (The), Class A | 4.1% | ||||
| Cognex Corp. | 4.0% | ||||
| Top Five Industries | % of net assets | ||||
| IT Services | 16.7% | ||||
| Software | 15.7% | ||||
| Interactive Media and Services | 8.8% | ||||
| Internet and Direct Marketing Retail | 8.8% | ||||
| Automobiles | 7.6% | ||||
| Types of Investments in Portfolio | % of net assets | ||||
| Common Stocks | 99.7% | ||||
| Temporary Cash Investments | 0.4% | ||||
| Other Assets and Liabilities | (0.1)% | ||||
6
| Shareholder Fee Example | ||
Fund shareholders may incur two types of costs: (1) transaction costs, including brokerage commissions paid on purchases and sales of fund shares; and (2) ongoing costs, including management fees and other fund expenses. This example is intended to help you understand your ongoing costs (in dollars) of investing in your fund and to compare these costs with the ongoing cost of investing in other funds.
The example is based on an investment of $1,000 made at the beginning of the period and held for the entire period from March 1, 2020 to August 31, 2020 (except as noted).
Actual Expenses
The table provides information about actual account values and actual expenses. You may use the information, together with the amount you invested, to estimate the expenses that you paid over the period. Simply divide your account value by $1,000 (for example, an $8,600 account value divided by $1,000 = 8.6), then multiply the result by the number under the heading “Expenses Paid During Period” to estimate the expenses you paid on your account during this period.
Hypothetical Example for Comparison Purposes
The table also provides information about hypothetical account values and hypothetical expenses based on the actual expense ratio of your fund and an assumed rate of return of 5% per year before expenses, which is not the actual return of a fund. The hypothetical account values and expenses may not be used to estimate the actual ending account balance or expenses you paid for the period. You may use this information to compare the ongoing costs of investing in your fund and other funds. To do so, compare this 5% hypothetical example with the 5% hypothetical examples that appear in the shareholder reports of the other funds.
Please note that the expenses shown in the table are meant to highlight your ongoing costs only and do not reflect any transactional costs, such as brokerage commissions paid on purchases and sales of fund shares. Therefore, the table is useful in comparing ongoing costs only, and will not help you determine the relative total costs of owning different funds. In addition, if these transactional costs were included, your costs would have been higher.
| Beginning Account Value 3/1/20 | Ending Account Value 8/31/20 | Expenses Paid During Period(1) 3/1/20 - 8/31/20 | Annualized Expense Ratio(1) | |||||||||||
| Actual | $1,000 | $1,701.10(2) | $2.56(3) | 0.45% | ||||||||||
| Hypothetical | $1,000 | $1,022.87(4) | $2.29(4) | 0.45% | ||||||||||
(1)Expenses are equal to the fund's annualized expense ratio listed in the table above, multiplied by the average account value over the period, multiplied by 184, the number of days in the most recent fiscal half-year, divided by 366, to reflect the one-half year period. Annualized expense ratio reflects actual expenses, including any applicable fee waivers or expense reimbursements and excluding any acquired fund fees and expenses.
(2)Ending account value based on actual return from March 31, 2020 (fund inception) through August 31, 2020.
(3)Expenses are equal to the fund's annualized expense ratio listed in the table above, multiplied by the average account value over the period, multiplied by 154, the number of days in the period from March 31, 2020 (fund inception) through August 31, 2020, divided by 366, to reflect the period. Had the fund been available for the full period, the expenses paid during the period would have been higher.
(4)Ending account value and expenses paid during the period assumes the fund had been available throughout the entire period and are calculated using the fund's annualized expense ratio listed in the table above.
7
| Schedule of Investments | ||
AUGUST 31, 2020
| Shares | Value | |||||||
| COMMON STOCKS — 99.7% | ||||||||
| Aerospace and Defense — 0.4% | ||||||||
| Lockheed Martin Corp. | 2,186 | $ | 853,108 | |||||
| Automobiles — 7.6% | ||||||||
Tesla, Inc.(1) | 31,788 | 15,840,596 | ||||||
| Beverages — 6.2% | ||||||||
Boston Beer Co., Inc. (The), Class A(1) | 9,824 | 8,664,572 | ||||||
| Constellation Brands, Inc., Class A | 23,128 | 4,266,653 | ||||||
| 12,931,225 | ||||||||
| Biotechnology — 5.8% | ||||||||
Alnylam Pharmaceuticals, Inc.(1) | 21,903 | 2,905,214 | ||||||
Argenx SE, ADR(1) | 13,925 | 3,220,435 | ||||||
Biogen, Inc.(1) | 3,946 | 1,135,027 | ||||||
Blueprint Medicines Corp.(1) | 35,969 | 2,785,080 | ||||||
Ionis Pharmaceuticals, Inc.(1) | 4,065 | 221,543 | ||||||
Regeneron Pharmaceuticals, Inc.(1) | 3,065 | 1,900,085 | ||||||
| 12,167,384 | ||||||||
| Capital Markets — 5.4% | ||||||||
| Intercontinental Exchange, Inc. | 46,798 | 4,971,351 | ||||||
| S&P Global, Inc. | 17,647 | 6,466,214 | ||||||
| 11,437,565 | ||||||||
| Diversified Consumer Services — 2.8% | ||||||||
Chegg, Inc.(1) | 80,277 | 5,919,626 | ||||||
| Electronic Equipment, Instruments and Components — 4.0% | ||||||||
| Cognex Corp. | 121,686 | 8,419,454 | ||||||
| Energy Equipment and Services — 1.0% | ||||||||
| Cactus, Inc., Class A | 93,710 | 2,070,054 | ||||||
| Entertainment — 2.2% | ||||||||
Netflix, Inc.(1) | 8,682 | 4,597,640 | ||||||
| Health Care Equipment and Supplies — 5.0% | ||||||||
Intuitive Surgical, Inc.(1) | 10,577 | 7,730,095 | ||||||
Silk Road Medical, Inc.(1) | 46,823 | 2,855,266 | ||||||
| 10,585,361 | ||||||||
| Hotels, Restaurants and Leisure — 2.5% | ||||||||
Chipotle Mexican Grill, Inc.(1) | 3,975 | 5,208,363 | ||||||
| Interactive Media and Services — 8.8% | ||||||||
Alphabet, Inc., Class C(1) | 5,767 | 9,424,316 | ||||||
Facebook, Inc., Class A(1) | 30,507 | 8,944,653 | ||||||
| 18,368,969 | ||||||||
| Internet and Direct Marketing Retail — 8.8% | ||||||||
Amazon.com, Inc.(1) | 5,321 | 18,362,558 | ||||||
| IT Services — 16.7% | ||||||||
BigCommerce Holdings, Inc.(1) | 3,231 | 380,612 | ||||||
| MasterCard, Inc., Class A | 25,643 | 9,185,066 | ||||||
Okta, Inc.(1) | 30,887 | 6,652,133 | ||||||
Square, Inc., Class A(1) | 57,045 | 9,102,100 | ||||||
| Visa, Inc., Class A | 45,321 | 9,607,599 | ||||||
| 34,927,510 | ||||||||
8
| Shares | Value | |||||||
| Machinery — 2.4% | ||||||||
| Westinghouse Air Brake Technologies Corp. | 74,524 | $ | 4,959,572 | |||||
| Professional Services — 1.5% | ||||||||
| Verisk Analytics, Inc. | 16,573 | 3,093,682 | ||||||
| Software — 15.7% | ||||||||
Adobe, Inc.(1) | 4,773 | 2,450,410 | ||||||
DocuSign, Inc.(1) | 34,244 | 7,636,412 | ||||||
RingCentral, Inc., Class A(1) | 14,262 | 4,146,962 | ||||||
salesforce.com, Inc.(1) | 43,457 | 11,848,551 | ||||||
Slack Technologies, Inc., Class A(1) | 205,968 | 6,763,989 | ||||||
| 32,846,324 | ||||||||
| Specialty Retail — 1.0% | ||||||||
| Ross Stores, Inc. | 22,905 | 2,086,188 | ||||||
| Textiles, Apparel and Luxury Goods — 1.9% | ||||||||
| NIKE, Inc., Class B | 35,540 | 3,976,571 | ||||||
TOTAL COMMON STOCKS (Cost $165,022,382) | 208,651,750 | |||||||
| TEMPORARY CASH INVESTMENTS — 0.4% | ||||||||
| State Street Institutional U.S. Government Money Market Fund, Premier Class (Cost $873,737) | 873,737 | 873,737 | ||||||
TOTAL INVESTMENT SECURITIES — 100.1% (Cost $165,896,119) | 209,525,487 | |||||||
| OTHER ASSETS AND LIABILITIES — (0.1)% | (312,082) | |||||||
| TOTAL NET ASSETS — 100.0% | $ | 209,213,405 | ||||||
| NOTES TO SCHEDULE OF INVESTMENTS | ||||||||
| ADR | - | American Depositary Receipt | ||||||
(1)Non-income producing.
See Notes to Financial Statements.
9
| Statement of Assets and Liabilities | ||
| AUGUST 31, 2020 | |||||
| Assets | |||||
| Investment securities, at value (cost of $165,896,119) | $ | 209,525,487 | |||
| Receivable for investments sold | 6,424,651 | ||||
| Dividends and interest receivable | 52,095 | ||||
| 216,002,233 | |||||
| Liabilities | |||||
| Payable for investments purchased | 6,721,394 | ||||
| Accrued management fees | 67,434 | ||||
| 6,788,828 | |||||
| Net Assets | $ | 209,213,405 | |||
| Shares outstanding (unlimited number of shares authorized) | 3,075,000 | ||||
| Net Asset Value Per Share | $ | 68.04 | |||
| Net Assets Consist of: | |||||
| Capital paid in | $ | 165,758,589 | |||
| Distributable earnings | 43,454,816 | ||||
| $ | 209,213,405 | ||||
See Notes to Financial Statements.
10
| Statement of Operations | ||
FOR THE PERIOD ENDED AUGUST 31, 2020(1) | |||||
| Investment Income (Loss) | |||||
| Income: | |||||
| Dividends | $ | 109,338 | |||
| Interest | 93 | ||||
| 109,431 | |||||
| Expenses: | |||||
| Management fees | 172,605 | ||||
| Net investment income (loss) | (63,174) | ||||
| Realized and Unrealized Gain (Loss) | |||||
| Net realized gain (loss) on investment transactions | (111,378) | ||||
| Change in net unrealized appreciation (depreciation) on investments | 43,629,368 | ||||
| Net realized and unrealized gain (loss) | 43,517,990 | ||||
| Net Increase (Decrease) in Net Assets Resulting from Operations | $ | 43,454,816 | |||
(1)March 31, 2020 (fund inception) through August 31, 2020.
See Notes to Financial Statements.
11
| Statement of Changes in Net Assets | ||
PERIOD ENDED AUGUST 31, 2020(1) | |||||
| Increase (Decrease) in Net Assets | |||||
| Operations | |||||
| Net investment income (loss) | $ | (63,174) | |||
| Net realized gain (loss) | (111,378) | ||||
| Change in net unrealized appreciation (depreciation) | 43,629,368 | ||||
| Net increase (decrease) in net assets resulting from operations | 43,454,816 | ||||
| Capital Share Transactions | |||||
| Proceeds from shares sold | 165,758,589 | ||||
| Net increase (decrease) in net assets | 209,213,405 | ||||
| Net Assets | |||||
| End of period | $ | 209,213,405 | |||
| Transactions in Shares of the Fund | |||||
| Sold | 3,075,000 | ||||
(1)March 31, 2020 (fund inception) through August 31, 2020.
See Notes to Financial Statements.
12
| Notes to Financial Statements | ||
AUGUST 31, 2020
1. Organization
American Century ETF Trust (the trust) was registered as a Delaware statutory trust in 2017 and is registered under the Investment Company Act of 1940, as amended (the 1940 Act), as an open-end management investment company. American Century Focused Dynamic Growth ETF (the fund) is one fund in a series issued by the trust. The fund's investment objective is to seek long-term capital growth. Shares of the fund are listed for trading on the Cboe BZX Exchange, Inc. The fund incepted on March 31, 2020.
2. Significant Accounting Policies
The following is a summary of significant accounting policies consistently followed by the fund in preparation of its financial statements. The fund is an investment company and follows accounting and reporting guidance in accordance with accounting principles generally accepted in the United States of America. This may require management to make certain estimates and assumptions at the date of the financial statements. Actual results could differ from these estimates. Management evaluated the impact of events or transactions occurring through the date the financial statements were issued that would merit recognition or disclosure.
Investment Valuations — The fund determines the fair value of its investments and computes its net asset value per share at the close of regular trading (usually 4 p.m. Eastern time) on the New York Stock Exchange (NYSE) on each day the NYSE is open. The Board of Trustees has adopted valuation policies and procedures to guide the investment advisor in the fund’s investment valuation process and to provide methodologies for the oversight of the fund’s pricing function.
Equity securities that are listed or traded on a domestic securities exchange are valued at the last reported sales price or at the official closing price as provided by the exchange. Equity securities traded on foreign securities exchanges are generally valued at the closing price of such securities on the exchange where primarily traded or at the close of the NYSE, if that is earlier. If no last sales price is reported, or if local convention or regulation so provides, the mean of the latest bid and asked prices may be used. Securities traded over-the-counter are valued at the mean of the latest bid and asked prices, the last sales price, or the official closing price.
Open-end management investment companies are valued at the reported net asset value per share.
If the fund determines that the market price for an investment is not readily available or the valuation methods mentioned above do not reflect an investment’s fair value, such investment is valued as determined in good faith by the Board of Trustees or its delegate, in accordance with policies and procedures adopted by the Board of Trustees. In its determination of fair value, the fund may review several factors including, but not limited to, market information regarding the specific investment or comparable investments and correlation with other investment types, futures indices or general market indicators. Circumstances that may cause the fund to use these procedures to value an investment include, but are not limited to: an investment has been declared in default or is distressed; trading in a security has been suspended during the trading day or a security is not actively trading on its principal exchange; prices received from a regular pricing source are deemed unreliable; or there is a foreign market holiday and no trading occurred.
The fund monitors for significant events occurring after the close of an investment’s primary exchange but before the fund’s net asset value per share is determined. Significant events may include, but are not limited to: corporate announcements and transactions; governmental action and political unrest that could impact a specific investment or an investment sector; or armed conflicts, natural disasters and similar events that could affect investments in a specific country or region. The fund also monitors for significant fluctuations between domestic and foreign markets, as evidenced by the U.S. market or such other indicators that the Board of Trustees, or its delegate, deems appropriate. The fund may apply a model-derived factor to the closing price of equity securities traded on foreign securities exchanges. The factor is based on observable market data as provided by an independent pricing service.
Security Transactions — Security transactions are accounted for as of the trade date. Net realized gains and losses are determined on the identified cost basis, which is also used for federal income tax purposes.
13
Investment Income — Dividend income less foreign taxes withheld, if any, is recorded as of the ex-dividend date. Distributions received on securities that represent a return of capital or long-term capital gain are recorded as a reduction of cost of investments and/or as a realized gain. The fund may estimate the components of distributions received that may be considered nontaxable distributions or long-term capital gain distributions for income tax purposes. Interest income is recorded on the accrual basis and includes accretion of discounts and amortization of premiums.
Income Tax Status — It is the fund’s policy to distribute substantially all net investment income and net realized gains to shareholders and to otherwise qualify as a regulated investment company under provisions of the Internal Revenue Code. Accordingly, no provision has been made for income taxes. The fund files U.S. federal, state, local and non-U.S. tax returns as applicable. The fund's tax returns are subject to examination by the relevant taxing authority until expiration of the applicable statute of limitations, which is generally three years from the date of filing but can be longer in certain jurisdictions. At this time, management believes there are no uncertain tax positions which, based on their technical merit, would not be sustained upon examination and for which it is reasonably possible that the total amounts of unrecognized tax benefits will significantly change in the next twelve months.
Distributions to Shareholders — Distributions from net investment income, if any, are generally declared and paid quarterly. Distributions from net realized gains, if any, are generally declared and paid annually.
Indemnifications — Under the trust’s organizational documents, its officers and trustees are indemnified against certain liabilities arising out of the performance of their duties to the fund. In addition, in the normal course of business, the fund enters into contracts that provide general indemnifications. The maximum exposure under these arrangements is unknown as this would involve future claims that may be made against a fund. The risk of material loss from such claims is considered by management to be remote.
3. Fees and Transactions with Related Parties
Certain officers and trustees of the trust are also officers and/or directors of American Century Companies, Inc. (ACC). The trust's investment advisor, American Century Investment Management, Inc. (ACIM), and the trust’s administrator, American Century Services, LLC, are wholly owned, directly or indirectly, by ACC. Various funds issued by American Century Strategic Asset Allocations, Inc. own, in aggregate, 57% of the shares of the fund. Related parties do not invest in the fund for the purpose of exercising management or control.
Management Fees — The trust has entered into a management agreement with ACIM, under which ACIM provides the fund with investment advisory and management services in exchange for a single, unified management fee (the fee). The agreement provides that ACIM will pay all expenses of managing and operating the fund, except brokerage and other transaction fees and expenses relating to the acquisition and disposition of portfolio securities, acquired fund fees and expenses, interest, taxes, litigation expenses and extraordinary expenses. The fee is computed and accrued daily based on the daily net assets of the fund and paid monthly in arrears. The annual management fee is 0.45%.
Interfund Transactions — The fund may enter into security transactions with other American Century Investments funds and other client accounts of the investment advisor, in accordance with the 1940 Act rules and procedures adopted by the Board of Trustees. The rules and procedures require, among other things, that these transactions be effected at the independent current market price of the security. During the period, the interfund purchases were $84,269,880 and there were no interfund sales.
4. Investment Transactions
Purchases and sales of investment securities, excluding short-term investments and in-kind transactions, for the period ended August 31, 2020 were $151,592,537 and $23,786,744, respectively.
Securities received in-kind through subscriptions for the period ended August 31, 2020 were $37,327,966. There were no securities delivered in-kind through redemptions during the period.
5. Capital Share Transactions
The fund’s shares may only be purchased and sold on a national securities exchange through a broker-dealer. The price of the fund’s shares is based on market price, and because ETF shares trade at market prices rather than net asset value (NAV), shares may trade at a price greater than NAV (a premium) or less than NAV (a discount). The fund issues and redeems shares that have been aggregated into blocks of 5,000
14
shares or multiples thereof (Creation Units) to authorized participants who have entered into agreements with the fund's distributor. The fund will generally issue and redeem Creation Units in return for a designated portfolio of securities (and an amount of cash) that the fund specifies each day. Investors transacting in Creation Units for cash may also pay an additional variable charge to compensate the fund for certain transaction costs and market impact expenses relating to investing in portfolio securities. Such variable charges, if any, are included in proceeds from shares sold in the Statement of Changes in Net Assets.
6. Fair Value Measurements
The fund’s investments valuation process is based on several considerations and may use multiple inputs to determine the fair value of the investments held by the fund. In conformity with accounting principles generally accepted in the United States of America, the inputs used to determine a valuation are classified into three broad levels.
•Level 1 valuation inputs consist of unadjusted quoted prices in an active market for identical investments.
•Level 2 valuation inputs consist of direct or indirect observable market data (including quoted prices for comparable investments, evaluations of subsequent market events, interest rates, prepayment speeds, credit risk, etc.). These inputs also consist of quoted prices for identical investments initially expressed in local currencies that are adjusted through translation into U.S. dollars.
•Level 3 valuation inputs consist of unobservable data (including a fund’s own assumptions).
The level classification is based on the lowest level input that is significant to the fair valuation measurement. The valuation inputs are not necessarily an indication of the risks associated with investing in these securities or other financial instruments.
As of period end, the fund’s investment securities were classified as Level 1. The Schedule of Investments provides additional information on the fund's portfolio holdings.
7. Risk Factors
The value of the fund’s shares will go up and down, sometimes rapidly or unpredictably, based on the performance of the securities owned by the fund and other factors generally affecting the securities market. Market risks, including political, regulatory, economic and social developments, can affect the value of the fund’s investments. Natural disasters, public health emergencies, terrorism and other unforeseeable events may lead to increased market volatility and may have adverse long-term effects on world economies and markets generally.
8. Federal Tax Information
The book-basis character of distributions made during the year from net investment income or net realized gains may differ from their ultimate characterization for federal income tax purposes. These differences reflect the differing character of certain income items and net realized gains and losses for financial statement and tax purposes, and may result in reclassification among certain capital accounts on the financial statements. There were no distributions paid by the fund during the period March 31, 2020 (fund inception) through August 31, 2020.
As of period end, the federal tax cost of investments and the components of distributable earnings on a tax-basis were as follows:
| Federal tax cost of investments | $ | 166,092,236 | |||
| Gross tax appreciation of investments | $ | 43,636,998 | |||
| Gross tax depreciation of investments | (203,747) | ||||
| Net tax appreciation (depreciation) of investments | $ | 43,433,251 | |||
| Undistributed ordinary income | $ | 21,565 | |||
The difference between book-basis and tax-basis unrealized appreciation (depreciation) is attributable primarily to the tax deferral of losses on wash sales.
15
| Financial Highlights | ||
| For a Share Outstanding Throughout the Period Indicated | ||||||||||||||||||||||||||||||||
| Per-Share Data | Ratios and Supplemental Data | |||||||||||||||||||||||||||||||
| Income From Investment Operations: | Ratio to Average Net Assets of: | |||||||||||||||||||||||||||||||
| Net Asset Value, Beginning of Period | Net Investment Income (Loss)(1) | Net Realized and Unrealized Gain (Loss) | Total From Investment Operations | Net Asset Value, End of Period | Total Return(2) | Operating Expenses | Net Investment Income (Loss) | Portfolio Turnover Rate(3) | Net Assets, End of Period (in thousands) | |||||||||||||||||||||||
2020(4) | $40.00 | (0.04) | 28.08 | 28.04 | $68.04 | 70.11% | 0.45%(5) | (0.16)%(5) | 27% | $209,213 | ||||||||||||||||||||||
| Notes to Financial Highlights | ||
(1)Computed using average shares outstanding throughout the period.
(2)Total returns are calculated based on the net asset value of the last business day. Total returns for periods less than one year are not annualized.
(3)Excludes securities received or delivered in-kind.
(4)March 31, 2020 (fund inception) through August 31, 2020.
(5)Annualized.
See Notes to Financial Statements.
| Report of Independent Registered Public Accounting Firm | ||
To the Shareholders and the Board of Trustees of American Century ETF Trust:
Opinion on the Financial Statements and Financial Highlights
We have audited the accompanying statement of assets and liabilities, including the schedule of investments, of American Century Focused Dynamic Growth ETF (the “Fund”), one of the funds constituting the American Century ETF Trust, as of August 31, 2020, and the related statement of operations, the statement of changes in net assets, and the financial highlights for the period from March 31, 2020 (fund inception) through August 31, 2020, and the related notes. In our opinion, the financial statements and financial highlights present fairly, in all material respects, the financial position of American Century Focused Dynamic Growth ETF as of August 31, 2020, and the results of its operations, the changes in its net assets, and the financial highlights for the period from March 31, 2020 (fund inception) through August 31, 2020, in conformity with accounting principles generally accepted in the United States of America.
Basis for Opinion
These financial statements and financial highlights are the responsibility of the Fund's management. Our responsibility is to express an opinion on the Fund’s financial statements and financial highlights based on our audit. We are a public accounting firm registered with the Public Company Accounting Oversight Board (United States) (PCAOB) and are required to be independent with respect to the Fund in accordance with the U.S. federal securities laws and the applicable rules and regulations of the Securities and Exchange Commission and the PCAOB.
We conducted our audit in accordance with the standards of the PCAOB. Those standards require that we plan and perform the audit to obtain reasonable assurance about whether the financial statements and financial highlights are free of material misstatement, whether due to error or fraud. The Fund is not required to have, nor were we engaged to perform, an audit of its internal control over financial reporting. As part of our audit we are required to obtain an understanding of internal control over financial reporting but not for the purpose of expressing an opinion on the effectiveness of the Fund’s internal control over financial reporting. Accordingly, we express no such opinion.
Our audit included performing procedures to assess the risks of material misstatement of the financial statements and financial highlights, whether due to error or fraud, and performing procedures that respond to those risks. Such procedures included examining, on a test basis, evidence regarding the amounts and disclosures in the financial statements and financial highlights. Our audit also included evaluating the accounting principles used and significant estimates made by management, as well as evaluating the overall presentation of the financial statements and financial highlights. Our procedures included confirmation of securities owned as of August 31, 2020, by correspondence with the custodian and brokers; when replies were not received from brokers, we performed other auditing procedures. We believe that our audit provides a reasonable basis for our opinion.
DELOITTE & TOUCHE LLP
Kansas City, Missouri
October 16, 2020
We have served as the auditor of one or more American Century investment companies since 1997.
17
| Management | ||
The Board of Trustees
The individuals listed below serve as trustees of the funds. Each trustee will continue to serve in this capacity until death, retirement, resignation or removal from office. The board has adopted a mandatory retirement age for trustees who are not “interested persons,” as that term is defined in the Investment Company Act (independent trustees). Trustees who are not also officers of the trust shall retire by December 31st of the year in which they reach their 75th birthday.
Mr. Thomas is an “interested person” because he currently serves as President and Chief Executive Officer of American Century Companies, Inc. (ACC), the parent company of American Century Investment Management, Inc. (ACIM or the advisor). The other trustees are independent. They are not employees, directors or officers of, and have no financial interest in, ACC or any of its wholly owned, direct or indirect, subsidiaries, including ACIM and American Century Services, LLC (ACS), and they do not have any other affiliations, positions or relationships that would cause them to be considered “interested persons” under the Investment Company Act. The following trustees also serve in this capacity for a number of other registered investment companies in the American Century Investments family of funds: Jonathan S. Thomas, 15; Ronald J. Gilson, 8; and Stephen E. Yates, 7.
The following table presents additional information about the trustees. The mailing address for each trustee other than Jonathan S. Thomas is 330 Madison Avenue, New York, New York 10017. The mailing address for Jonathan S. Thomas is 4500 Main Street, Kansas City, Missouri 64111.
| Name (Year of Birth) | Position(s) Held with Funds | Length of Time Served | Principal Occupation(s) During Past 5 Years | Number of American Century Portfolios Overseen by Trustee | Other Directorships Held During Past 5 Years | ||||||||||||
| Independent Trustees | |||||||||||||||||
| Reginald M. Browne (1968) | Trustee and Chairman of the Board | Since 2017 (Chairman since 2019) | Principal, GTS Securities (automated capital markets trading firm)(2019 to present); Senior Managing Director, Co Global Head-ETF Group, Cantor Fitzgerald (financial services firm)(2013 to 2019) | 19 | None | ||||||||||||
| Ronald J. Gilson (1946) | Trustee | Since 2017 | Charles J. Meyers Professor of Law and Business, Emeritus, Stanford Law School (1979 to 2016); Marc and Eva Stern Professor of Law and Business, Columbia University School of Law (1992 to present) | 59 | None | ||||||||||||
| Barry A. Mendelson (1958) | Trustee | Since 2017 | Retired; Consultant regarding ETF and mutual fund matters (2015 to 2016); Principal and Senior Counsel, The Vanguard Group (investment management)(1998 to 2014) | 19 | None | ||||||||||||
| Stephen E. Yates (1948) | Trustee | Since 2017 | Retired | 82 | None | ||||||||||||
18
| Name (Year of Birth) | Position(s) Held with Funds | Length of Time Served | Principal Occupation(s) During Past 5 Years | Number of American Century Portfolios Overseen by Trustee | Other Directorships Held During Past 5 Years | ||||||||||||
| Interested Trustees | |||||||||||||||||
| Jonathan S. Thomas (1963) | Trustee | Since 2017 | President and Chief Executive Officer, ACC (2007 to present). Also serves as Chief Executive Officer, ACS; Executive Vice President, ACIM; Director, ACC, ACIM and other ACC subsidiaries | 122 | None | ||||||||||||
The Statement of Additional Information has additional information about the fund's trustees and is available without charge, upon request, by calling 1-800-345-6488.
19
Officers
The following table presents certain information about the executive officers of the funds. Each officer, except Edward Rosenberg, serves as an officer for each of the 16 investment companies in the American Century family of funds. No officer is compensated for his or her service as an officer of the funds. The listed officers are interested persons of the funds and are appointed or re-appointed on an annual basis. The mailing address for each officer listed below is 4500 Main Street, Kansas City, Missouri 64111.
| Name (Year of Birth) | Offices with the Funds | Principal Occupation(s) During the Past Five Years | ||||||
| Patrick Bannigan (1965) | President since 2019 | Executive Vice President and Director, ACC (2012 to present); Chief Financial Officer, Chief Accounting Officer and Treasurer, ACC (2015 to present). Also serves as President, ACS; Vice President, ACIM; Chief Financial Officer, Chief Accounting Officer and/or Director, ACIM, ACS and other ACC subsidiaries | ||||||
| R. Wes Campbell (1974) | Chief Financial Officer and Treasurer since 2018 | Vice President, ACS (2020 to present); Investment Operations and Investment Accounting, ACS (2000 to present) | ||||||
| Amy D. Shelton (1964) | Chief Compliance Officer and Vice President since 2017 | Chief Compliance Officer, American Century funds, (2014 to present); Chief Compliance Officer, ACIM (2014 to present); Chief Compliance Officer, ACIS (2009 to present). Also serves as Vice President, ACIS | ||||||
| Charles A. Etherington (1957) | General Counsel and Vice President since 2017 | Attorney, ACC (1994 to present); Vice President, ACC (2005 to present); General Counsel, ACC (2007 to present). Also serves as General Counsel, ACIM, ACS, ACIS and other ACC subsidiaries; and Senior Vice President, ACIM and ACS | ||||||
| Cleo Chang (1977) | Vice President since 2019 | Senior Vice President, ACIM (2015 to present); Chief Investment Officer, Wilshire Funds Management (2005 to 2015) | ||||||
| David H. Reinmiller (1963) | Vice President since 2017 | Attorney, ACC (1994 to present). Also serves as Vice President, ACIM and ACS | ||||||
| Edward Rosenberg (1973) | Vice President since 2017 | Senior Vice President, ACIM (2017 to present); Senior Vice President, Flexshares Head of ETF Capital Markets, Northern Trust (2012 to 2017) | ||||||
| C. Jean Wade (1964) | Vice President since 2017 | Senior Vice President, ACS (2017 to present); Vice President, ACS (2000 to 2017) | ||||||
| Ward D. Stauffer (1960) | Secretary since 2019 | Attorney, ACS (2003 to present) | ||||||
20
| Approval of Management Agreement | ||
At a meeting held on June 13, 2019, the Fund’s Board of Trustees unanimously approved the initial management agreement pursuant to which American Century Investment Management, Inc. (the “Advisor”) acts as the investment advisor for the Fund. Under Section 15(c) of the Investment Company Act, new contracts for investment advisory services are required to be approved by a majority of a fund’s independent trustees and to be evaluated on an annual basis thereafter.
In advance of the Board’s consideration, the Advisor provided information concerning the Fund. The materials circulated and the discussions held at the meeting detailed the investment objective and strategy proposed to be utilized by the Advisor, the Fund’s characteristics and key attributes, the rationale for launching the Fund, the experience of the staff designated to manage the Fund, the proposed pricing, and the markets in which the Fund would be sold. The information considered and the discussions held included, but were not limited to, the following:
•The nature, extent, and quality of investment management, shareholder services, and other services to be provided by the Advisor to the Fund;
•The wide range of other programs and services to be provided by the Advisor to the Fund and its shareholders on a routine and non-routine basis;
•The Fund’s proposed investment objective and strategy, including a discussion of the Fund’s anticipated investment performance and proposed benchmark;
•The cost of owning the Fund compared to the cost of owning similar funds;
•The Advisor’s compliance policies, procedures, and regulatory experience; and
•Any collateral benefits derived by the Advisor from the management of the Fund.
American Century Investments’ funds utilize a unified management fee structure. Under the unified fee structure, the Advisor is responsible for providing all investment advisory, custody, audit, administrative, compliance, recordkeeping, marketing, and shareholder services, or arranging and supervising third parties to provide such services. By contrast, most other funds are charged a variety of fees, including an investment advisory fee, a transfer agency fee, an administrative fee, distribution charges, and other expenses. Other than their investment advisory fees and Rule 12b-1 fees, all other components of the total fees charged by these other funds may be increased without shareholder approval. The Advisor and Board believe the unified fee structure is a benefit to fund shareholders because it clearly discloses to shareholders the cost of owning fund shares, and because the unified fee cannot be increased without a vote of fund shareholders, it shifts to the Advisor the risk of increased costs of operating the fund and provides a direct incentive to minimize administrative inefficiencies.
Part of the Board’s analysis of fee levels involves reviewing certain evaluative data compiled by an independent provider and comparing the Fund’s annual unified management fee to the total expense ratio of peer funds selected by the independent provider. The Board found the Fund’s management fee to be below the median of the total expense ratios of its peer universe.
When considering the approval of the Fund’s management agreement, the independent Trustees considered the entrepreneurial risk that the Advisor assumes in launching a new fund. In particular, they considered the fact that the Advisor will assume a substantial part of the start-up costs of the Fund and the risk that the Fund will not grow to a level that will become profitable to the Advisor. The Board considered the position that the Fund would take in the lineup of the American Century Investments’ family of funds and the benefits to shareholders of existing funds of the broadened product offering. Finally, while not specifically discussed, but important in the decision to approve the management agreement, is the Trustees’ familiarity with the Advisor. In addition to overseeing the Fund, a majority of the Board also oversees and evaluates on a continuous basis the nature and quality of services the Advisor provides to other funds within the American Century Investments’ complex. As such, the Trustees have confidence in the Advisor’s integrity and competence in providing services to the Fund.
21
The independent Trustees considered all of the information provided by the Advisor, the independent data provider, and their independent counsel in connection with the approval and evaluated such information for the Fund. In connection with their review, the Trustees did not identify any single factor as being all-important or controlling, and each Trustee may have attributed different levels of importance to different factors. The independent Trustees concluded that the overall arrangements between the Fund and the Advisor, as provided in the management agreement, were fair and reasonable in light of the services to be provided and should be approved.
22
| Additional Information | ||
Retirement Account Information
As required by law, distributions you receive from certain retirement accounts are subject to federal income tax withholding, unless you elect not to have withholding apply*. Tax will be withheld on the total amount withdrawn even though you may be receiving amounts that are not subject to withholding, such as nondeductible contributions. In such case, excess amounts of withholding could occur. You may adjust your withholding election so that a greater or lesser amount will be withheld.
Remember, even if you elect not to have income tax withheld, you are liable for paying income tax on the taxable portion of your withdrawal. If you elect not to have income tax withheld or you don’t have enough income tax withheld, you may be responsible for payment of estimated tax. You may incur penalties under the estimated tax rules if your withholding and estimated tax payments are not sufficient. You can reduce or defer the income tax on a distribution by directly or indirectly rolling such distribution over to another IRA or eligible plan. You should consult your tax advisor for additional information.
State tax will be withheld if, at the time of your distribution, your address is within one of the mandatory withholding states and you have federal income tax withheld (or as otherwise required by state law). State taxes will be withheld from your distribution in accordance with the respective state rules.
*Some 403(b), 457 and qualified retirement plan distributions may be subject to 20% mandatory withholding, as they are subject to special tax and withholding rules. Your plan administrator or plan sponsor is required to provide you with a special tax notice explaining those rules at the time you request a distribution. If applicable, federal and/or state taxes may be withheld from your distribution amount.
Proxy Voting Policies
A description of the policies that the fund's investment advisor uses in exercising the voting rights associated with the securities purchased and/or held by the fund are available without charge, upon request, by calling 1-800-345-6488. It is also available on American Century Investments’ website at americancentury.com/proxy and on the Securities and Exchange Commission’s website at sec.gov. Information regarding how the investment advisor voted proxies relating to portfolio securities during the most recent 12-month period ended June 30 is available at americancentury.com/proxy. It is also available at sec.gov.
Quarterly Portfolio Disclosure
The fund files its complete schedule of portfolio holdings with the Securities and Exchange Commission (SEC) for the first and third quarters of each fiscal year as an exhibit to its reports on Form N-PORT. The fund's Form N-PORT reports are available on the SEC’s website at sec.gov.
23
| Notes | ||
24
| ||||||||
| Contact Us | americancenturyetfs.com | |||||||
| American Century Sales Representatives, Financial Professionals, Broker Dealers, Insurance Companies, Banks and Trust Companies | 1-833-ACI-ETFS | |||||||
| Telecommunications Relay Service for the Deaf | 711 | |||||||
| American Century ETF Trust | ||||||||
Investment Advisor: American Century Investment Management, Inc. Kansas City, Missouri | ||||||||
Distributor: Foreside Fund Services, LLC - Distributor, not affiliated with American Century Investment Services, Inc. | ||||||||
| This report and the statements it contains are submitted for the general information of our shareholders. The report is not authorized for distribution to prospective investors unless preceded or accompanied by an effective prospectus. | ||||||||
| ©2020 American Century Proprietary Holdings, Inc. All rights reserved. CL-ANN-96606 2010 | ||||||||
| Annual Report | |||||
| August 31, 2020 | |||||
American Century® Focused Large Cap Value ETF (FLV) | |||||
Beginning on January 1, 2021, as permitted by regulations adopted by the Securities and Exchange Commission, paper copies of the fund’s shareholder reports like this one will no longer be sent by mail, unless you specifically request paper copies of the reports from the fund or from your financial intermediary, such as a broker-dealer or bank. Instead, the reports will be made available on a website, and you will be notified by mail each time a report is posted and provided with a website link to access the report.
If you already elected to receive shareholder reports electronically, you will not be affected by this change and you need not take any action. You may elect to receive shareholder reports and other communications from the fund or your financial intermediary electronically by calling or sending an email request to your appropriate contacts as listed on the back cover of this report.
You may elect to receive all future reports in paper free of charge. You can inform the fund or your financial intermediary that you wish to continue receiving paper copies of your shareholder reports by calling or sending an email request to your appropriate contacts as listed on the back cover of this report. Your election to receive reports in paper will apply to all funds held with the fund complex/your financial intermediary.
| Table of Contents | ||
| President’s Letter | |||||
| Performance | |||||
| Portfolio Commentary | |||||
| Fund Characteristics | |||||
| Shareholder Fee Example | |||||
| Schedule of Investments | |||||
| Statement of Assets and Liabilities | |||||
| Statement of Operations | |||||
| Statement of Changes in Net Assets | |||||
| Notes to Financial Statements | |||||
| Financial Highlights | |||||
| Report of Independent Registered Public Accounting Firm | |||||
| Management | |||||
| Approval of Management Agreement | |||||
| Additional Information | |||||
The fund utilizes the ActiveShares® methodology licensed from Precidian Investments, LLC (Precidian). Precidian’s products and services are protected by domestic and international intellectual property protections, including, without limitation, the following issued patents and pending patent applications: 7813987, 8285624, 7925562, 13011746, 14528658, 14208966, 16196560.
Any opinions expressed in this report reflect those of the author as of the date of the report, and do not necessarily represent the opinions of American Century Investments® or any other person in the American Century Investments organization. Any such opinions are subject to change at any time based upon market or other conditions and American Century Investments disclaims any responsibility to update such opinions. These opinions may not be relied upon as investment advice and, because investment decisions made by American Century Investments funds are based on numerous factors, may not be relied upon as an indication of trading intent on behalf of any American Century Investments fund. Security examples are used for representational purposes only and are not intended as recommendations to purchase or sell securities. Performance information for comparative indices and securities is provided to American Century Investments by third party vendors. To the best of American Century Investments’ knowledge, such information is accurate at the time of printing.
| President’s Letter | ||
Jonathan ThomasDear Investor:
Thank you for reviewing this annual report for the period ended August 31, 2020. Annual reports help convey important information about fund returns, including market factors that affected performance during the reporting period. For additional investment insights, please visit americancenturyetfs.com.
Stocks Staged Robust Recovery
The funds launched in late March, amid a significant sell-off in U.S. stocks. The rapidly spreading COVID-19 outbreak halted most U.S. and global economic activity, triggering a worldwide recession and an investor flight to quality. The Federal Reserve stepped in quickly and aggressively, slashing U.S. interest rates and launching several asset-purchase and lending programs. The federal government responded, too, with a massive package of financial aid to individuals, businesses and state and local governments. These extraordinary efforts proved helpful, as U.S. stocks rebounded quickly, despite weak economic and corporate earnings data.
As the period progressed, declining coronavirus infection and death rates in many regions and the reopening of state economies were positive influences. By the end of August, manufacturing, employment and other data suggested an economic recovery was underway, which helped fuel robust stock returns for the five-month reporting period.
A Slow Return to Normal
The return to pre-pandemic life will take time and patience, but we are confident we will get there. Several drug companies are in final stages of vaccine trials, and medical professionals continue to fine-tune virus treatment protocols. In the meantime, investors likely will face periods of outbreak-related disruptions, economic and political uncertainty, and heightened market volatility. These influences can be unsettling, but they tend to be temporary.
We appreciate your confidence in us during these extraordinary times. Our firm has a long history of helping clients weather unpredictable markets, and we’re confident we will continue to meet today’s challenges.
Sincerely,
Jonathan Thomas
President and Chief Executive Officer
American Century Investments
2
| Performance | ||
| Total Returns as of August 31, 2020 | ||||||||||||||||||||
| Since Inception | Inception Date | |||||||||||||||||||
| Net Asset Value | 22.53% | 3/31/2020 | ||||||||||||||||||
| Market Price | 22.65% | 3/31/2020 | ||||||||||||||||||
| Russell 1000 Value Index | 23.72% | — | ||||||||||||||||||
Market price is determined using the bid/ask midpoint at 4:00 p.m. Eastern time, when the net asset value (NAV) is typically calculated. Market performance does not represent the returns you would receive if you traded shares at other times. NAV prices are used to calculate market price performance prior to the date when the fund first traded on the New York Stock Exchange.
| Total Annual Fund Operating Expenses | |||||||||||||||||
| 0.42% | |||||||||||||||||
The total annual fund operating expenses shown is as stated in the fund’s prospectus current as of the date of this report. The prospectus may vary from the expense ratio shown elsewhere in this report because it is based on a different time period, includes acquired fund fees and expenses, and, if applicable, does not include fee waivers or expense reimbursements.
Data presented reflect past performance. Past performance is no guarantee of future results. Current performance may be higher or lower than the performance shown. Total returns for periods less than one year are not annualized. Investment return and principal value will fluctuate, and redemption value may be more or less than original cost. Data assumes reinvestment of dividends and capital gains, and none of the charts reflect the deduction of taxes that a shareholder would pay on fund distributions or the redemption of fund shares. To obtain performance data current to the most recent month end, please call 1-800-345-6488 or visit americancenturyetfs.com. For additional information about the fund, please consult the prospectus.
3
| Portfolio Commentary | ||
Portfolio Managers: Phillip Davidson, Kevin Toney, Michael Liss, Brian Woglom, Philip Sundell, Rene Casis and Adam Krenn
Performance Summary
American Century Focused Large Cap Value ETF returned 22.65%* on a market price basis for the period beginning at the fund’s inception on March 31, 2020, through August 31, 2020. On a net asset value (NAV) basis, the fund returned 22.53%. The fund’s benchmark, the Russell 1000 Value Index, returned 23.72% during the same period. The fund’s NAV and market price returns reflect fees and operating expenses, while the index return does not.
Lack of holdings in consumer discretionary detracted from the fund’s relative results, as did selection in the financials sector. Our underweight and selection in the materials sector were other detractors. Meanwhile, selection in the industrials, health care and information technology sectors contributed to relative performance. Our overweight in industrials was also a positive.
Consumer Discretionary, Financials and Materials Detracted
It has been difficult for us to find higher-quality consumer discretionary companies with sustainable business models. Our lack of holdings in this sector was a drain on relative performance in the period.
The financials sector faced lower interest rates and increased credit risk, and selection in this sector hurt the fund’s relative results, particularly in the capital markets industry. In the insurance industry, Chubb was a top detractor.
Our underweight and stock selection in the materials sector detracted from the portfolio’s performance in the period, particularly in the chemicals industry. It has been difficult to find many higher-quality stocks in the sector that meet our valuation criteria.
Help from Industrials and Health Care
Selection and our overweight made industrials a top contributing sector. Despite the low oil price environment and weaker industrial end market due to COVID-19, Emerson Electric, an electrical company that we believe has best-in-class technologies and core platforms, delivered strong second-quarter results. Emerson has accelerated its restructuring program, resulting in structural cost savings, and continued to generate strong free cash flow.
Several holdings in the health care sector positively impacted relative performance. Quest Diagnostics, a clinical laboratory company, benefited from the surge in COVID-19 testing; moreover, reimbursement from Medicare, which sets the basis for commercial rates, was favorable. We exited the position. Hologic, a medical device company, was another key contributor; its stock was buoyed by strong sales for the company’s COVID-19 test.
Portfolio Positioning
We have identified several consumer staples holdings that offer attractive risk/reward profiles, leading to an overweight in the sector. We also remain overweight in the health care sector. According to our analysis, our health care holdings offer compelling valuations and risk/reward profiles.
On the other hand, it has been difficult for us to find higher-quality consumer discretionary companies with sustainable business models, leading to a notable underweight in the sector. Our real estate exposure also remains limited due to extended valuations throughout the sector.
* Total returns for periods less than one year are not annualized.
4
| Fund Characteristics | ||
| AUGUST 31, 2020 | |||||
| Top Ten Holdings | % of net assets | ||||
| Johnson & Johnson | 6.0% | ||||
| Berkshire Hathaway, Inc., Class B | 5.7% | ||||
| Mondelez International, Inc., Class A | 4.4% | ||||
| Verizon Communications, Inc. | 4.2% | ||||
| Medtronic plc | 4.1% | ||||
| Emerson Electric Co. | 4.0% | ||||
| Novartis AG, ADR | 3.5% | ||||
| Unilever NV, (New York) | 3.1% | ||||
| Republic Services, Inc. | 2.9% | ||||
| Texas Instruments, Inc. | 2.8% | ||||
| Top Five Industries | % of net assets | ||||
| Pharmaceuticals | 9.5% | ||||
| Health Care Equipment and Supplies | 9.0% | ||||
| Electrical Equipment | 8.1% | ||||
| Insurance | 6.4% | ||||
| Household Products | 6.1% | ||||
| Types of Investments in Portfolio | % of net assets | ||||
| Domestic Common Stocks | 88.3% | ||||
| Foreign Common Stocks* | 9.4% | ||||
| Total Common Stocks | 97.7% | ||||
| Temporary Cash Investments | 1.0% | ||||
| Other Assets and Liabilities | 1.3% | ||||
*Includes depositary shares, dual listed securities and foreign ordinary shares.
5
| Shareholder Fee Example | ||
Fund shareholders may incur two types of costs: (1) transaction costs, including brokerage commissions paid on purchases and sales of fund shares; and (2) ongoing costs, including management fees and other fund expenses. This example is intended to help you understand your ongoing costs (in dollars) of investing in your fund and to compare these costs with the ongoing cost of investing in other funds.
The example is based on an investment of $1,000 made at the beginning of the period and held for the entire period from March 1, 2020 to August 31, 2020 (except as noted).
Actual Expenses
The table provides information about actual account values and actual expenses. You may use the information, together with the amount you invested, to estimate the expenses that you paid over the period. Simply divide your account value by $1,000 (for example, an $8,600 account value divided by $1,000 = 8.6), then multiply the result by the number under the heading “Expenses Paid During Period” to estimate the expenses you paid on your account during this period.
Hypothetical Example for Comparison Purposes
The table also provides information about hypothetical account values and hypothetical expenses based on the actual expense ratio of your fund and an assumed rate of return of 5% per year before expenses, which is not the actual return of a fund. The hypothetical account values and expenses may not be used to estimate the actual ending account balance or expenses you paid for the period. You may use this information to compare the ongoing costs of investing in your fund and other funds. To do so, compare this 5% hypothetical example with the 5% hypothetical examples that appear in the shareholder reports of the other funds.
Please note that the expenses shown in the table are meant to highlight your ongoing costs only and do not reflect any transactional costs, such as brokerage commissions paid on purchases and sales of fund shares. Therefore, the table is useful in comparing ongoing costs only, and will not help you determine the relative total costs of owning different funds. In addition, if these transactional costs were included, your costs would have been higher.
| Beginning Account Value 3/1/20 | Ending Account Value 8/31/20 | Expenses Paid During Period(1) 3/1/20 - 8/31/20 | Annualized Expense Ratio(1) | |||||||||||
| Actual | $1,000 | $1,225.30(2) | $1.97(3) | 0.42% | ||||||||||
| Hypothetical | $1,000 | $1,023.03(4) | $2.14(4) | 0.42% | ||||||||||
(1)Expenses are equal to the fund's annualized expense ratio listed in the table above, multiplied by the average account value over the period, multiplied by 184, the number of days in the most recent fiscal half-year, divided by 366, to reflect the one-half year period. Annualized expense ratio reflects actual expenses, including any applicable fee waivers or expense reimbursements and excluding any acquired fund fees and expenses.
(2)Ending account value based on actual return from March 31, 2020 (fund inception) through August 31, 2020.
(3)Expenses are equal to the fund's annualized expense ratio listed in the table above, multiplied by the average account value over the period, multiplied by 154, the number of days in the period from March 31, 2020 (fund inception) through August 31, 2020, divided by 366, to reflect the period. Had the fund been available for the full period, the expenses paid during the period would have been higher.
(4)Ending account value and expenses paid during the period assumes the fund had been available throughout the entire period and are calculated using the fund's annualized expense ratio listed in the table above.
6
| Schedule of Investments | ||
AUGUST 31, 2020
| Shares | Value | |||||||
| COMMON STOCKS — 97.7% | ||||||||
| Aerospace and Defense — 0.7% | ||||||||
| Raytheon Technologies Corp. | 9,228 | $ | 562,908 | |||||
| Banks — 2.1% | ||||||||
| JPMorgan Chase & Co. | 10,190 | 1,020,936 | ||||||
| PNC Financial Services Group, Inc. (The) | 1,995 | 221,844 | ||||||
| Truist Financial Corp. | 12,150 | 471,542 | ||||||
| 1,714,322 | ||||||||
| Beverages — 2.7% | ||||||||
| PepsiCo, Inc. | 15,825 | 2,216,450 | ||||||
| Building Products — 2.6% | ||||||||
| Johnson Controls International plc | 52,894 | 2,154,373 | ||||||
| Capital Markets — 2.2% | ||||||||
| Bank of New York Mellon Corp. (The) | 49,362 | 1,825,407 | ||||||
| Commercial Services and Supplies — 2.9% | ||||||||
| Republic Services, Inc. | 25,706 | 2,383,460 | ||||||
| Communications Equipment — 4.2% | ||||||||
| Cisco Systems, Inc. | 47,627 | 2,010,812 | ||||||
F5 Networks, Inc.(1) | 11,250 | 1,488,712 | ||||||
| 3,499,524 | ||||||||
| Construction Materials — 0.6% | ||||||||
| Martin Marietta Materials, Inc. | 2,268 | 460,109 | ||||||
| Diversified Financial Services — 5.7% | ||||||||
Berkshire Hathaway, Inc., Class B(1) | 21,759 | 4,744,332 | ||||||
| Diversified Telecommunication Services — 4.2% | ||||||||
| Verizon Communications, Inc. | 57,983 | 3,436,652 | ||||||
| Electric Utilities — 3.3% | ||||||||
| Evergy, Inc. | 23,237 | 1,236,673 | ||||||
| Pinnacle West Capital Corp. | 20,292 | 1,488,418 | ||||||
| 2,725,091 | ||||||||
| Electrical Equipment — 8.1% | ||||||||
| ABB Ltd., ADR | 49,939 | 1,273,444 | ||||||
| Emerson Electric Co. | 48,174 | 3,346,648 | ||||||
| Hubbell, Inc. | 14,581 | 2,113,079 | ||||||
| 6,733,171 | ||||||||
| Electronic Equipment, Instruments and Components — 2.5% | ||||||||
| TE Connectivity Ltd. | 21,577 | 2,084,338 | ||||||
| Entertainment — 2.4% | ||||||||
| Walt Disney Co. (The) | 15,362 | 2,025,787 | ||||||
| Food and Staples Retailing — 2.5% | ||||||||
| Walmart, Inc. | 15,217 | 2,112,881 | ||||||
| Food Products — 4.4% | ||||||||
| Mondelez International, Inc., Class A | 61,676 | 3,603,112 | ||||||
| Gas Utilities — 1.4% | ||||||||
| Atmos Energy Corp. | 11,822 | 1,180,072 | ||||||
| Health Care Equipment and Supplies — 9.0% | ||||||||
| Becton Dickinson and Co. | 5,807 | 1,409,765 | ||||||
7
| Shares | Value | |||||||
Hologic, Inc.(1) | 17,666 | $ | 1,055,013 | |||||
| Medtronic plc | 31,244 | 3,357,793 | ||||||
| Zimmer Biomet Holdings, Inc. | 11,595 | 1,633,504 | ||||||
| 7,456,075 | ||||||||
| Health Care Technology — 2.0% | ||||||||
| Cerner Corp. | 22,906 | 1,680,613 | ||||||
| Household Products — 6.1% | ||||||||
| Colgate-Palmolive Co. | 22,298 | 1,767,340 | ||||||
| Kimberly-Clark Corp. | 13,078 | 2,063,185 | ||||||
| Procter & Gamble Co. (The) | 8,739 | 1,208,866 | ||||||
| 5,039,391 | ||||||||
| Industrial Conglomerates — 1.3% | ||||||||
| Honeywell International, Inc. | 6,458 | 1,069,122 | ||||||
| Insurance — 6.4% | ||||||||
| Aflac, Inc. | 42,598 | 1,547,159 | ||||||
| Chubb Ltd. | 15,242 | 1,905,250 | ||||||
| Marsh & McLennan Cos., Inc. | 14,266 | 1,639,306 | ||||||
| Reinsurance Group of America, Inc. | 2,372 | 217,465 | ||||||
| 5,309,180 | ||||||||
| Oil, Gas and Consumable Fuels — 2.7% | ||||||||
| Chevron Corp. | 13,624 | 1,143,462 | ||||||
| TOTAL SE, ADR | 26,687 | 1,056,005 | ||||||
| 2,199,467 | ||||||||
| Personal Products — 3.1% | ||||||||
| Unilever NV, (New York) | 44,833 | 2,600,314 | ||||||
| Pharmaceuticals — 9.5% | ||||||||
| Johnson & Johnson | 32,521 | 4,989,047 | ||||||
| Novartis AG, ADR | 33,536 | 2,886,108 | ||||||
| 7,875,155 | ||||||||
| Road and Rail — 1.9% | ||||||||
| Union Pacific Corp. | 8,071 | 1,553,183 | ||||||
| Semiconductors and Semiconductor Equipment — 3.2% | ||||||||
| Intel Corp. | 6,307 | 321,342 | ||||||
| Texas Instruments, Inc. | 16,142 | 2,294,585 | ||||||
| 2,615,927 | ||||||||
TOTAL COMMON STOCKS (Cost $75,910,778) | 80,860,416 | |||||||
| TEMPORARY CASH INVESTMENTS — 1.0% | ||||||||
| State Street Institutional U.S. Government Money Market Fund, Premier Class (Cost $803,968) | 803,968 | 803,968 | ||||||
TOTAL INVESTMENT SECURITIES — 98.7% (Cost $76,714,746) | 81,664,384 | |||||||
| OTHER ASSETS AND LIABILITIES — 1.3% | 1,058,843 | |||||||
| TOTAL NET ASSETS — 100.0% | $ | 82,723,227 | ||||||
| NOTES TO SCHEDULE OF INVESTMENTS | ||||||||
| ADR | - | American Depositary Receipt | ||||||
(1)Non-income producing.
See Notes to Financial Statements.
8
| Statement of Assets and Liabilities | ||
| AUGUST 31, 2020 | |||||
| Assets | |||||
| Investment securities, at value (cost of $76,714,746) | $ | 81,664,384 | |||
| Receivable for investments sold | 7,231,525 | ||||
| Dividends and interest receivable | 214,819 | ||||
| 89,110,728 | |||||
| Liabilities | |||||
| Payable for investments purchased | 6,358,342 | ||||
| Accrued management fees | 29,159 | ||||
| 6,387,501 | |||||
| Net Assets | $ | 82,723,227 | |||
| Shares outstanding (unlimited number of shares authorized) | 1,690,000 | ||||
| Net Asset Value Per Share | $ | 48.95 | |||
| Net Assets Consist of: | |||||
| Capital paid in | $ | 77,590,209 | |||
| Distributable earnings | 5,133,018 | ||||
| $ | 82,723,227 | ||||
See Notes to Financial Statements.
9
| Statement of Operations | ||
FOR THE PERIOD ENDED AUGUST 31, 2020(1) | |||||
| Investment Income (Loss) | |||||
| Income: | |||||
| Dividends (net of foreign taxes withheld of $9,149) | $ | 535,697 | |||
| Interest | 323 | ||||
| 536,020 | |||||
| Expenses: | |||||
| Management fees | 88,845 | ||||
| Net investment income (loss) | 447,175 | ||||
| Realized and Unrealized Gain (Loss) | |||||
| Net realized gain (loss) on investment transactions | (170,169) | ||||
| Change in net unrealized appreciation (depreciation) on investments | 4,949,638 | ||||
| Net realized and unrealized gain (loss) | 4,779,469 | ||||
| Net Increase (Decrease) in Net Assets Resulting from Operations | $ | 5,226,644 | |||
(1)March 31, 2020 (fund inception) through August 31, 2020.
See Notes to Financial Statements.
10
| Statement of Changes in Net Assets | ||
PERIOD ENDED AUGUST 31, 2020(1) | |||||
| Increase (Decrease) in Net Assets | |||||
| Operations | |||||
| Net investment income (loss) | $ | 447,175 | |||
| Net realized gain (loss) | (170,169) | ||||
| Change in net unrealized appreciation (depreciation) | 4,949,638 | ||||
| Net increase (decrease) in net assets resulting from operations | 5,226,644 | ||||
| Distributions to Shareholders | |||||
| From earnings | (93,626) | ||||
| Capital Share Transactions | |||||
| Proceeds from shares sold | 77,590,209 | ||||
| Net increase (decrease) in net assets | 82,723,227 | ||||
| Net Assets | |||||
| End of period | $ | 82,723,227 | |||
| Transactions in Shares of the Fund | |||||
| Sold | 1,690,000 | ||||
(1)March 31, 2020 (fund inception) through August 31, 2020.
See Notes to Financial Statements.
11
| Notes to Financial Statements | ||
AUGUST 31, 2020
1. Organization
American Century ETF Trust (the trust) was registered as a Delaware statutory trust in 2017 and is registered under the Investment Company Act of 1940, as amended (the 1940 Act), as an open-end management investment company. American Century Focused Large Cap Value ETF (the fund) is one fund in a series issued by the trust. The fund's investment objective is to seek long-term capital growth. Shares of the fund are listed for trading on the Cboe BZX Exchange, Inc. The fund incepted on March 31, 2020.
2. Significant Accounting Policies
The following is a summary of significant accounting policies consistently followed by the fund in preparation of its financial statements. The fund is an investment company and follows accounting and reporting guidance in accordance with accounting principles generally accepted in the United States of America. This may require management to make certain estimates and assumptions at the date of the financial statements. Actual results could differ from these estimates. Management evaluated the impact of events or transactions occurring through the date the financial statements were issued that would merit recognition or disclosure.
Investment Valuations — The fund determines the fair value of its investments and computes its net asset value per share at the close of regular trading (usually 4 p.m. Eastern time) on the New York Stock Exchange (NYSE) on each day the NYSE is open. The Board of Trustees has adopted valuation policies and procedures to guide the investment advisor in the fund’s investment valuation process and to provide methodologies for the oversight of the fund’s pricing function.
Equity securities that are listed or traded on a domestic securities exchange are valued at the last reported sales price or at the official closing price as provided by the exchange. Equity securities traded on foreign securities exchanges are generally valued at the closing price of such securities on the exchange where primarily traded or at the close of the NYSE, if that is earlier. If no last sales price is reported, or if local convention or regulation so provides, the mean of the latest bid and asked prices may be used. Securities traded over-the-counter are valued at the mean of the latest bid and asked prices, the last sales price, or the official closing price.
Open-end management investment companies are valued at the reported net asset value per share.
If the fund determines that the market price for an investment is not readily available or the valuation methods mentioned above do not reflect an investment’s fair value, such investment is valued as determined in good faith by the Board of Trustees or its delegate, in accordance with policies and procedures adopted by the Board of Trustees. In its determination of fair value, the fund may review several factors including, but not limited to, market information regarding the specific investment or comparable investments and correlation with other investment types, futures indices or general market indicators. Circumstances that may cause the fund to use these procedures to value an investment include, but are not limited to: an investment has been declared in default or is distressed; trading in a security has been suspended during the trading day or a security is not actively trading on its principal exchange; prices received from a regular pricing source are deemed unreliable; or there is a foreign market holiday and no trading occurred.
The fund monitors for significant events occurring after the close of an investment’s primary exchange but before the fund’s net asset value per share is determined. Significant events may include, but are not limited to: corporate announcements and transactions; governmental action and political unrest that could impact a specific investment or an investment sector; or armed conflicts, natural disasters and similar events that could affect investments in a specific country or region. The fund also monitors for significant fluctuations between domestic and foreign markets, as evidenced by the U.S. market or such other indicators that the Board of Trustees, or its delegate, deems appropriate. The fund may apply a model-derived factor to the closing price of equity securities traded on foreign securities exchanges. The factor is based on observable market data as provided by an independent pricing service.
12
Security Transactions — Security transactions are accounted for as of the trade date. Net realized gains and losses are determined on the identified cost basis, which is also used for federal income tax purposes.
Investment Income — Dividend income less foreign taxes withheld, if any, is recorded as of the ex-dividend date. Distributions received on securities that represent a return of capital or long-term capital gain are recorded as a reduction of cost of investments and/or as a realized gain. The fund may estimate the components of distributions received that may be considered nontaxable distributions or long-term capital gain distributions for income tax purposes. Interest income is recorded on the accrual basis and includes accretion of discounts and amortization of premiums.
Income Tax Status — It is the fund’s policy to distribute substantially all net investment income and net realized gains to shareholders and to otherwise qualify as a regulated investment company under provisions of the Internal Revenue Code. Accordingly, no provision has been made for income taxes. The fund files U.S. federal, state, local and non-U.S. tax returns as applicable. The fund's tax returns are subject to examination by the relevant taxing authority until expiration of the applicable statute of limitations, which is generally three years from the date of filing but can be longer in certain jurisdictions. At this time, management believes there are no uncertain tax positions which, based on their technical merit, would not be sustained upon examination and for which it is reasonably possible that the total amounts of unrecognized tax benefits will significantly change in the next twelve months.
Distributions to Shareholders — Distributions from net investment income, if any, are generally declared and paid quarterly. Distributions from net realized gains, if any, are generally declared and paid annually.
Indemnifications — Under the trust’s organizational documents, its officers and trustees are indemnified against certain liabilities arising out of the performance of their duties to the fund. In addition, in the normal course of business, the fund enters into contracts that provide general indemnifications. The maximum exposure under these arrangements is unknown as this would involve future claims that may be made against a fund. The risk of material loss from such claims is considered by management to be remote.
3. Fees and Transactions with Related Parties
Certain officers and trustees of the trust are also officers and/or directors of American Century Companies, Inc. (ACC). The trust's investment advisor, American Century Investment Management, Inc. (ACIM), and the trust’s administrator, American Century Services, LLC, are wholly owned, directly or indirectly, by ACC. Various funds issued by American Century Strategic Asset Allocations, Inc. own, in aggregate, 81% of the shares of the fund. Related parties do not invest in the fund for the purpose of exercising management or control.
Management Fees — The trust has entered into a management agreement with ACIM, under which ACIM provides the fund with investment advisory and management services in exchange for a single, unified management fee (the fee). The agreement provides that ACIM will pay all expenses of managing and operating the fund, except brokerage and other transaction fees and expenses relating to the acquisition and disposition of portfolio securities, acquired fund fees and expenses, interest, taxes, litigation expenses and extraordinary expenses. The fee is computed and accrued daily based on the daily net assets of the fund and paid monthly in arrears. The annual management fee is 0.42%.
Interfund Transactions — The fund may enter into security transactions with other American Century Investments funds and other client accounts of the investment advisor, in accordance with the 1940 Act rules and procedures adopted by the Board of Trustees. The rules and procedures require, among other things, that these transactions be effected at the independent current market price of the security. During the period, the interfund purchases were $59,024,020 and there were no interfund sales.
4. Investment Transactions
Purchases and sales of investment securities, excluding short-term investments and in-kind transactions, for the period ended August 31, 2020 were $95,685,599 and $32,160,305, respectively.
Securities received in-kind through subscriptions for the period ended August 31, 2020 were $12,555,652. There were no securities delivered in-kind through redemptions during the period.
13
5. Capital Share Transactions
The fund’s shares may only be purchased and sold on a national securities exchange through a broker-dealer. The price of the fund’s shares is based on market price, and because ETF shares trade at market prices rather than net asset value (NAV), shares may trade at a price greater than NAV (a premium) or less than NAV (a discount). The fund issues and redeems shares that have been aggregated into blocks of 5,000 shares or multiples thereof (Creation Units) to authorized participants who have entered into agreements with the fund's distributor. The fund will generally issue and redeem Creation Units in return for a designated portfolio of securities (and an amount of cash) that the fund specifies each day. Investors transacting in Creation Units for cash may also pay an additional variable charge to compensate the fund for certain transaction costs and market impact expenses relating to investing in portfolio securities. Such variable charges, if any, are included in proceeds from shares sold in the Statement of Changes in Net Assets.
6. Fair Value Measurements
The fund’s investments valuation process is based on several considerations and may use multiple inputs to determine the fair value of the investments held by the fund. In conformity with accounting principles generally accepted in the United States of America, the inputs used to determine a valuation are classified into three broad levels.
•Level 1 valuation inputs consist of unadjusted quoted prices in an active market for identical investments.
•Level 2 valuation inputs consist of direct or indirect observable market data (including quoted prices for comparable investments, evaluations of subsequent market events, interest rates, prepayment speeds, credit risk, etc.). These inputs also consist of quoted prices for identical investments initially expressed in local currencies that are adjusted through translation into U.S. dollars.
•Level 3 valuation inputs consist of unobservable data (including a fund’s own assumptions).
The level classification is based on the lowest level input that is significant to the fair valuation measurement. The valuation inputs are not necessarily an indication of the risks associated with investing in these securities or other financial instruments.
As of period end, the fund’s investment securities were classified as Level 1. The Schedule of Investments provides additional information on the fund's portfolio holdings.
7. Risk Factors
The value of the fund’s shares will go up and down, sometimes rapidly or unpredictably, based on the performance of the securities owned by the fund and other factors generally affecting the securities market. Market risks, including political, regulatory, economic and social developments, can affect the value of the fund’s investments. Natural disasters, public health emergencies, terrorism and other unforeseeable events may lead to increased market volatility and may have adverse long-term effects on world economies and markets generally.
There are certain risks involved in investing in foreign securities. These risks include those resulting from political events (such as civil unrest, national elections and imposition of exchange controls), social and economic events (such as labor strikes and rising inflation), and natural disasters. Securities of foreign issuers may be less liquid and more volatile. Investing a significant portion of assets in one country or region may accentuate these risks.
The fund’s investment process may result in high portfolio turnover, which could mean high transaction costs,
affecting both performance and capital gains tax liabilities to investors.
14
8. Federal Tax Information
The tax character of distributions paid during the period March 31, 2020 (fund inception) through August 31, 2020 were as follows:
| Distributions Paid From | |||||
| Ordinary income | $ | 93,626 | |||
| Long-term capital gains | — | ||||
The book-basis character of distributions made during the year from net investment income or net realized gains may differ from their ultimate characterization for federal income tax purposes. These differences reflect the differing character of certain income items and net realized gains and losses for financial statement and tax purposes, and may result in reclassification among certain capital accounts on the financial statements.
As of period end, the federal tax cost of investments and the components of distributable earnings on a tax-basis were as follows:
| Federal tax cost of investments | $ | 76,795,982 | |||
| Gross tax appreciation of investments | $ | 5,756,625 | |||
| Gross tax depreciation of investments | (888,223) | ||||
| Net tax appreciation (depreciation) of investments | $ | 4,868,402 | |||
| Undistributed ordinary income | $ | 353,549 | |||
| Accumulated short-term losses | $ | (88,933) | |||
The difference between book-basis and tax-basis unrealized appreciation (depreciation) is attributable primarily to the tax deferral of losses on wash sales.
Accumulated capital losses represent net capital loss carryovers that may be used to offset future realized capital gains for federal income tax purposes. The capital loss carryovers may be carried forward for an unlimited period. Future capital loss carryover utilization in any given year may be subject to Internal Revenue Code limitations.
15
| Financial Highlights | ||
| For a Share Outstanding Throughout the Period Indicated | |||||||||||||||||||||||||||||||||||
| Per-Share Data | Ratios and Supplemental Data | ||||||||||||||||||||||||||||||||||
| Income From Investment Operations: | Ratio to Average Net Assets of: | ||||||||||||||||||||||||||||||||||
| Net Asset Value, Beginning of Period | Net Investment Income (Loss)(1) | Net Realized and Unrealized Gain (Loss) | Total From Investment Operations | Distributions From Net Investment Income | Net Asset Value, End of Period | Total Return(2) | Operating Expenses | Net Investment Income (Loss) | Portfolio Turnover Rate(3) | Net Assets, End of Period (in thousands) | |||||||||||||||||||||||||
2020(4) | $40.00 | 0.41 | 8.60 | 9.01 | (0.06) | $48.95 | 22.53% | 0.42%(5) | 2.10%(5) | 73% | $82,723 | ||||||||||||||||||||||||
| Notes to Financial Highlights | ||
(1)Computed using average shares outstanding throughout the period.
(2)Total returns are calculated based on the net asset value of the last business day. Total returns for periods less than one year are not annualized.
(3)Excludes securities received or delivered in-kind.
(4)March 31, 2020 (fund inception) through August 31, 2020.
(5)Annualized.
See Notes to Financial Statements.
| Report of Independent Registered Public Accounting Firm | ||
To the Shareholders and the Board of Trustees of American Century ETF Trust:
Opinion on the Financial Statements and Financial Highlights
We have audited the accompanying statement of assets and liabilities, including the schedule of investments, of American Century Focused Large Cap Value ETF (the “Fund”), one of the funds constituting the American Century ETF Trust, as of August 31, 2020, and the related statement of operations, the statement of changes in net assets, and the financial highlights for the period from March 31, 2020 (fund inception) through August 31, 2020, and the related notes. In our opinion, the financial statements and financial highlights present fairly, in all material respects, the financial position of American Century Focused Large Cap Value ETF as of August 31, 2020, and the results of its operations, the changes in its net assets, and the financial highlights for the period from March 31, 2020 (fund inception) through August 31, 2020, in conformity with accounting principles generally accepted in the United States of America.
Basis for Opinion
These financial statements and financial highlights are the responsibility of the Fund's management. Our responsibility is to express an opinion on the Fund’s financial statements and financial highlights based on our audit. We are a public accounting firm registered with the Public Company Accounting Oversight Board (United States) (PCAOB) and are required to be independent with respect to the Fund in accordance with the U.S. federal securities laws and the applicable rules and regulations of the Securities and Exchange Commission and the PCAOB.
We conducted our audit in accordance with the standards of the PCAOB. Those standards require that we plan and perform the audit to obtain reasonable assurance about whether the financial statements and financial highlights are free of material misstatement, whether due to error or fraud. The Fund is not required to have, nor were we engaged to perform, an audit of its internal control over financial reporting. As part of our audit we are required to obtain an understanding of internal control over financial reporting but not for the purpose of expressing an opinion on the effectiveness of the Fund’s internal control over financial reporting. Accordingly, we express no such opinion.
Our audit included performing procedures to assess the risks of material misstatement of the financial statements and financial highlights, whether due to error or fraud, and performing procedures that respond to those risks. Such procedures included examining, on a test basis, evidence regarding the amounts and disclosures in the financial statements and financial highlights. Our audit also included evaluating the accounting principles used and significant estimates made by management, as well as evaluating the overall presentation of the financial statements and financial highlights. Our procedures included confirmation of securities owned as of August 31, 2020, by correspondence with the custodian and brokers; when replies were not received from brokers, we performed other auditing procedures. We believe that our audit provides a reasonable basis for our opinion.
DELOITTE & TOUCHE LLP
Kansas City, Missouri
October 16, 2020
We have served as the auditor of one or more American Century investment companies since 1997.
17
| Management | ||
The Board of Trustees
The individuals listed below serve as trustees of the funds. Each trustee will continue to serve in this capacity until death, retirement, resignation or removal from office. The board has adopted a mandatory retirement age for trustees who are not “interested persons,” as that term is defined in the Investment Company Act (independent trustees). Trustees who are not also officers of the trust shall retire by December 31st of the year in which they reach their 75th birthday.
Mr. Thomas is an “interested person” because he currently serves as President and Chief Executive Officer of American Century Companies, Inc. (ACC), the parent company of American Century Investment Management, Inc. (ACIM or the advisor). The other trustees are independent. They are not employees, directors or officers of, and have no financial interest in, ACC or any of its wholly owned, direct or indirect, subsidiaries, including ACIM and American Century Services, LLC (ACS), and they do not have any other affiliations, positions or relationships that would cause them to be considered “interested persons” under the Investment Company Act. The following trustees also serve in this capacity for a number of other registered investment companies in the American Century Investments family of funds: Jonathan S. Thomas, 15; Ronald J. Gilson, 8; and Stephen E. Yates, 7.
The following table presents additional information about the trustees. The mailing address for each trustee other than Jonathan S. Thomas is 330 Madison Avenue, New York, New York 10017. The mailing address for Jonathan S. Thomas is 4500 Main Street, Kansas City, Missouri 64111.
| Name (Year of Birth) | Position(s) Held with Funds | Length of Time Served | Principal Occupation(s) During Past 5 Years | Number of American Century Portfolios Overseen by Trustee | Other Directorships Held During Past 5 Years | ||||||||||||
| Independent Trustees | |||||||||||||||||
| Reginald M. Browne (1968) | Trustee and Chairman of the Board | Since 2017 (Chairman since 2019) | Principal, GTS Securities (automated capital markets trading firm)(2019 to present); Senior Managing Director, Co Global Head-ETF Group, Cantor Fitzgerald (financial services firm)(2013 to 2019) | 19 | None | ||||||||||||
| Ronald J. Gilson (1946) | Trustee | Since 2017 | Charles J. Meyers Professor of Law and Business, Emeritus, Stanford Law School (1979 to 2016); Marc and Eva Stern Professor of Law and Business, Columbia University School of Law (1992 to present) | 59 | None | ||||||||||||
| Barry A. Mendelson (1958) | Trustee | Since 2017 | Retired; Consultant regarding ETF and mutual fund matters (2015 to 2016); Principal and Senior Counsel, The Vanguard Group (investment management)(1998 to 2014) | 19 | None | ||||||||||||
| Stephen E. Yates (1948) | Trustee | Since 2017 | Retired | 82 | None | ||||||||||||
18
| Name (Year of Birth) | Position(s) Held with Funds | Length of Time Served | Principal Occupation(s) During Past 5 Years | Number of American Century Portfolios Overseen by Trustee | Other Directorships Held During Past 5 Years | ||||||||||||
| Interested Trustees | |||||||||||||||||
| Jonathan S. Thomas (1963) | Trustee | Since 2017 | President and Chief Executive Officer, ACC (2007 to present). Also serves as Chief Executive Officer, ACS; Executive Vice President, ACIM; Director, ACC, ACIM and other ACC subsidiaries | 122 | None | ||||||||||||
The Statement of Additional Information has additional information about the fund's trustees and is available without charge, upon request, by calling 1-800-345-6488.
19
Officers
The following table presents certain information about the executive officers of the funds. Each officer, except Edward Rosenberg, serves as an officer for each of the 16 investment companies in the American Century family of funds. No officer is compensated for his or her service as an officer of the funds. The listed officers are interested persons of the funds and are appointed or re-appointed on an annual basis. The mailing address for each officer listed below is 4500 Main Street, Kansas City, Missouri 64111.
| Name (Year of Birth) | Offices with the Funds | Principal Occupation(s) During the Past Five Years | ||||||
| Patrick Bannigan (1965) | President since 2019 | Executive Vice President and Director, ACC (2012 to present); Chief Financial Officer, Chief Accounting Officer and Treasurer, ACC (2015 to present). Also serves as President, ACS; Vice President, ACIM; Chief Financial Officer, Chief Accounting Officer and/or Director, ACIM, ACS and other ACC subsidiaries | ||||||
| R. Wes Campbell (1974) | Chief Financial Officer and Treasurer since 2018 | Vice President, ACS (2020 to present); Investment Operations and Investment Accounting, ACS (2000 to present) | ||||||
| Amy D. Shelton (1964) | Chief Compliance Officer and Vice President since 2017 | Chief Compliance Officer, American Century funds, (2014 to present); Chief Compliance Officer, ACIM (2014 to present); Chief Compliance Officer, ACIS (2009 to present). Also serves as Vice President, ACIS | ||||||
| Charles A. Etherington (1957) | General Counsel and Vice President since 2017 | Attorney, ACC (1994 to present); Vice President, ACC (2005 to present); General Counsel, ACC (2007 to present). Also serves as General Counsel, ACIM, ACS, ACIS and other ACC subsidiaries; and Senior Vice President, ACIM and ACS | ||||||
| Cleo Chang (1977) | Vice President since 2019 | Senior Vice President, ACIM (2015 to present); Chief Investment Officer, Wilshire Funds Management (2005 to 2015) | ||||||
| David H. Reinmiller (1963) | Vice President since 2017 | Attorney, ACC (1994 to present). Also serves as Vice President, ACIM and ACS | ||||||
| Edward Rosenberg (1973) | Vice President since 2017 | Senior Vice President, ACIM (2017 to present); Senior Vice President, Flexshares Head of ETF Capital Markets, Northern Trust (2012 to 2017) | ||||||
| C. Jean Wade (1964) | Vice President since 2017 | Senior Vice President, ACS (2017 to present); Vice President, ACS (2000 to 2017) | ||||||
| Ward D. Stauffer (1960) | Secretary since 2019 | Attorney, ACS (2003 to present) | ||||||
20
| Approval of Management Agreement | ||
At a meeting held on June 13, 2019, the Fund’s Board of Trustees unanimously approved the initial management agreement pursuant to which American Century Investment Management, Inc. (the “Advisor”) acts as the investment advisor for the Fund. Under Section 15(c) of the Investment Company Act, new contracts for investment advisory services are required to be approved by a majority of a fund’s independent trustees and to be evaluated on an annual basis thereafter.
In advance of the Board’s consideration, the Advisor provided information concerning the Fund. The materials circulated and the discussions held at the meeting detailed the investment objective and strategy proposed to be utilized by the Advisor, the Fund’s characteristics and key attributes, the rationale for launching the Fund, the experience of the staff designated to manage the Fund, the proposed pricing, and the markets in which the Fund would be sold. The information considered and the discussions held included, but were not limited to, the following:
•The nature, extent, and quality of investment management, shareholder services, and other services to be provided by the Advisor to the Fund;
•The wide range of other programs and services to be provided by the Advisor to the Fund and its shareholders on a routine and non-routine basis;
•The Fund’s proposed investment objective and strategy, including a discussion of the Fund’s anticipated investment performance and proposed benchmark;
•The cost of owning the Fund compared to the cost of owning similar funds;
•The Advisor’s compliance policies, procedures, and regulatory experience; and
•Any collateral benefits derived by the Advisor from the management of the Fund.
American Century Investments’ funds utilize a unified management fee structure. Under the unified fee structure, the Advisor is responsible for providing all investment advisory, custody, audit, administrative, compliance, recordkeeping, marketing, and shareholder services, or arranging and supervising third parties to provide such services. By contrast, most other funds are charged a variety of fees, including an investment advisory fee, a transfer agency fee, an administrative fee, distribution charges, and other expenses. Other than their investment advisory fees and Rule 12b-1 fees, all other components of the total fees charged by these other funds may be increased without shareholder approval. The Advisor and Board believe the unified fee structure is a benefit to fund shareholders because it clearly discloses to shareholders the cost of owning fund shares, and because the unified fee cannot be increased without a vote of fund shareholders, it shifts to the Advisor the risk of increased costs of operating the fund and provides a direct incentive to minimize administrative inefficiencies.
Part of the Board’s analysis of fee levels involves reviewing certain evaluative data compiled by an independent provider and comparing the Fund’s annual unified management fee to the total expense ratio of peer funds selected by the independent provider. The Board found the Fund’s management fee to be below the median of the total expense ratios of its peer universe.
When considering the approval of the Fund’s management agreement, the independent Trustees considered the entrepreneurial risk that the Advisor assumes in launching a new fund. In particular, they considered the fact that the Advisor will assume a substantial part of the start-up costs of the Fund and the risk that the Fund will not grow to a level that will become profitable to the Advisor. The Board considered the position that the Fund would take in the lineup of the American Century Investments’ family of funds and the benefits to shareholders of existing funds of the broadened product offering. Finally, while not specifically discussed, but important in the decision to approve the management agreement, is the Trustees’ familiarity with the Advisor. In addition to overseeing the Fund, a majority of the Board also oversees and evaluates on a continuous basis the nature and quality of services the Advisor provides to other funds within the American Century Investments’ complex. As such, the Trustees have confidence in the Advisor’s integrity and competence in providing services to the Fund.
21
The independent Trustees considered all of the information provided by the Advisor, the independent data provider, and their independent counsel in connection with the approval and evaluated such information for the Fund. In connection with their review, the Trustees did not identify any single factor as being all-important or controlling, and each Trustee may have attributed different levels of importance to different factors. The independent Trustees concluded that the overall arrangements between the Fund and the Advisor, as provided in the management agreement, were fair and reasonable in light of the services to be provided and should be approved.
22
| Additional Information | ||
Retirement Account Information
As required by law, distributions you receive from certain retirement accounts are subject to federal income tax withholding, unless you elect not to have withholding apply*. Tax will be withheld on the total amount withdrawn even though you may be receiving amounts that are not subject to withholding, such as nondeductible contributions. In such case, excess amounts of withholding could occur. You may adjust your withholding election so that a greater or lesser amount will be withheld.
Remember, even if you elect not to have income tax withheld, you are liable for paying income tax on the taxable portion of your withdrawal. If you elect not to have income tax withheld or you don’t have enough income tax withheld, you may be responsible for payment of estimated tax. You may incur penalties under the estimated tax rules if your withholding and estimated tax payments are not sufficient. You can reduce or defer the income tax on a distribution by directly or indirectly rolling such distribution over to another IRA or eligible plan. You should consult your tax advisor for additional information.
State tax will be withheld if, at the time of your distribution, your address is within one of the mandatory withholding states and you have federal income tax withheld (or as otherwise required by state law). State taxes will be withheld from your distribution in accordance with the respective state rules.
*Some 403(b), 457 and qualified retirement plan distributions may be subject to 20% mandatory withholding, as they are subject to special tax and withholding rules. Your plan administrator or plan sponsor is required to provide you with a special tax notice explaining those rules at the time you request a distribution. If applicable, federal and/or state taxes may be withheld from your distribution amount.
Proxy Voting Policies
A description of the policies that the fund's investment advisor uses in exercising the voting rights associated with the securities purchased and/or held by the fund are available without charge, upon request, by calling 1-800-345-6488. It is also available on American Century Investments’ website at americancentury.com/proxy and on the Securities and Exchange Commission’s website at sec.gov. Information regarding how the investment advisor voted proxies relating to portfolio securities during the most recent 12-month period ended June 30 is available at americancentury.com/proxy. It is also available at sec.gov.
Quarterly Portfolio Disclosure
The fund files its complete schedule of portfolio holdings with the Securities and Exchange Commission (SEC) for the first and third quarters of each fiscal year as an exhibit to its reports on Form N-PORT. The fund's Form N-PORT reports are available on the SEC’s website at sec.gov.
Other Tax Information
The following information is provided pursuant to provisions of the Internal Revenue Code.
The fund hereby designates up to the maximum amount allowable as qualified dividend
income for the fiscal year ended August 31, 2020.
For corporate taxpayers, the fund hereby designates $93,626, or up to the maximum amount
allowable, of ordinary income distributions paid during the fiscal year ended August 31, 2020 as
qualified for the corporate dividends received deduction.
23
| Notes | ||
24
| ||||||||
| Contact Us | americancenturyetfs.com | |||||||
| American Century Sales Representatives, Financial Professionals, Broker Dealers, Insurance Companies, Banks and Trust Companies | 1-833-ACI-ETFS | |||||||
| Telecommunications Relay Service for the Deaf | 711 | |||||||
| American Century ETF Trust | ||||||||
Investment Advisor: American Century Investment Management, Inc. Kansas City, Missouri | ||||||||
Distributor: Foreside Fund Services, LLC - Distributor, not affiliated with American Century Investment Services, Inc. | ||||||||
| This report and the statements it contains are submitted for the general information of our shareholders. The report is not authorized for distribution to prospective investors unless preceded or accompanied by an effective prospectus. | ||||||||
| ©2020 American Century Proprietary Holdings, Inc. All rights reserved. CL-ANN-96607 2010 | ||||||||
| Annual Report | |||||
| August 31, 2020 | |||||
American Century® Mid Cap Growth Impact ETF (MID) | |||||
Beginning on January 1, 2021, as permitted by regulations adopted by the Securities and Exchange Commission, paper copies of the fund’s shareholder reports like this one will no longer be sent by mail, unless you specifically request paper copies of the reports from the fund or from your financial intermediary, such as a broker-dealer or bank. Instead, the reports will be made available on a website, and you will be notified by mail each time a report is posted and provided with a website link to access the report.
If you already elected to receive shareholder reports electronically, you will not be affected by this change and you need not take any action. You may elect to receive shareholder reports and other communications from the fund or your financial intermediary electronically by calling or sending an email request to your appropriate contacts as listed on the back cover of this report.
You may elect to receive all future reports in paper free of charge. You can inform the fund or your financial intermediary that you wish to continue receiving paper copies of your shareholder reports by calling or sending an email request to your appropriate contacts as listed on the back cover of this report. Your election to receive reports in paper will apply to all funds held with the fund complex/your financial intermediary.
| Table of Contents | ||
| President’s Letter | |||||
| Performance | |||||
| Portfolio Commentary | |||||
| Fund Characteristics | |||||
| Shareholder Fee Example | |||||
| Schedule of Investments | |||||
| Statement of Assets and Liabilities | |||||
| Statement of Operations | |||||
| Statement of Changes in Net Assets | |||||
| Notes to Financial Statements | |||||
| Financial Highlights | |||||
| Report of Independent Registered Public Accounting Firm | |||||
| Management | |||||
| Approval of Management Agreement | |||||
| Additional Information | |||||
Any opinions expressed in this report reflect those of the author as of the date of the report, and do not necessarily represent the opinions of American Century Investments® or any other person in the American Century Investments organization. Any such opinions are subject to change at any time based upon market or other conditions and American Century Investments disclaims any responsibility to update such opinions. These opinions may not be relied upon as investment advice and, because investment decisions made by American Century Investments funds are based on numerous factors, may not be relied upon as an indication of trading intent on behalf of any American Century Investments fund. Security examples are used for representational purposes only and are not intended as recommendations to purchase or sell securities. Performance information for comparative indices and securities is provided to American Century Investments by third party vendors. To the best of American Century Investments’ knowledge, such information is accurate at the time of printing.
| President’s Letter | ||
Jonathan ThomasDear Investor:
Thank you for reviewing this annual report for the period ended August 31, 2020. Annual reports help convey important information about fund returns, including market factors that affected performance during the reporting period. For additional investment insights, please visit americancenturyetfs.com.
Summer Rally Boosted Stock Returns
The funds launched in mid-July, amid a remarkable U.S. stock market rally. Earlier in the year, the rapidly spreading COVID-19 outbreak halted most U.S. and global economic activity, triggering a worldwide recession and an investor flight to quality. The Federal Reserve stepped in quickly and aggressively, slashing U.S. interest rates and launching several asset-purchase and lending programs. The federal government responded, too, with a massive package of financial aid to individuals, businesses and state and local governments. These extraordinary efforts proved helpful, as U.S. stocks rebounded quickly and continued to rally through the summer, despite weak economic and corporate earnings data.
Additionally, declining coronavirus infection and death rates in many regions and the reopening of state economies were positive influences. By the end of August, manufacturing, employment and other data suggested an economic recovery was underway, which also helped fuel robust stock returns for the relatively short reporting period.
A Slow Return to Normal
The return to pre-pandemic life will take time and patience, but we are confident we will get there. Several drug companies are in final stages of vaccine trials, and medical professionals continue to fine-tune virus treatment protocols. In the meantime, investors likely will face periods of outbreak-related disruptions, economic and political uncertainty, and heightened market volatility. These influences can be unsettling, but they tend to be temporary.
We appreciate your confidence in us during these extraordinary times. Our firm has a long history of helping clients weather unpredictable markets, and we’re confident we will continue to meet today’s challenges.
Sincerely,
Jonathan Thomas
President and Chief Executive Officer
American Century Investments
2
| Performance | ||
| Total Returns as of August 31, 2020 | ||||||||||||||||||||
| Since Inception | Inception Date | |||||||||||||||||||
| Net Asset Value | 11.14% | 7/13/2020 | ||||||||||||||||||
| Market Price | 11.44% | 7/13/2020 | ||||||||||||||||||
| Russell Midcap Growth Index | 10.31% | — | ||||||||||||||||||
Market price is determined using the bid/ask midpoint at 4:00 p.m. Eastern time, when the net asset value (NAV) is typically calculated. Market performance does not represent the returns you would receive if you traded shares at other times. NAV prices are used to calculate market price performance prior to the date when the fund first traded on the New York Stock Exchange.
| Total Annual Fund Operating Expenses | |||||||||||||||||
| 0.45% | |||||||||||||||||
The total annual fund operating expenses shown is as stated in the fund’s prospectus current as of the date of this report. The prospectus may vary from the expense ratio shown elsewhere in this report because it is based on a different time period, includes acquired fund fees and expenses, and, if applicable, does not include fee waivers or expense reimbursements.
Data presented reflect past performance. Past performance is no guarantee of future results. Current performance may be higher or lower than the performance shown. Total returns for periods less than one year are not annualized. Investment return and principal value will fluctuate, and redemption value may be more or less than original cost. Data assumes reinvestment of dividends and capital gains, and none of the charts reflect the deduction of taxes that a shareholder would pay on fund distributions or the redemption of fund shares. To obtain performance data current to the most recent month end, please call 1-800-345-6488 or visit americancenturyetfs.com. For additional information about the fund, please consult the prospectus.
3
| Portfolio Commentary | ||
Portfolio Managers: Rob Brookby, Nalin Yogasundram and Rene Casis
Fund Strategy
American Century Mid Cap Growth Impact ETF is an actively managed fund that seeks long-term capital growth. We look for stocks of medium-capitalization companies we believe will increase in value over time, using proprietary fundamental research. The initial research process begins by analyzing the United Nations Sustainable Development Goals (SDG) to identify companies that generate, or could generate, social and environmental impact alongside a financial return. We make our investment decisions based primarily on our analysis of individual companies, rather than on broad economic forecasts. We generate an impact thesis to explain current or projected SDG alignment in combination with each security’s fundamental growth profile.
Performance Review
For the period from the fund’s inception on July 13, 2020, through the fund’s fiscal year-end on August 31, 2020, the fund returned 11.44%* on a market price basis. On a net asset value (NAV) basis, the fund returned 11.14%. For the same time period, the Russell Midcap Growth Index, the fund’s benchmark index, returned 10.31%. The fund’s NAV and market price returns reflect fees and operating expenses, while the index return does not.
Information Technology Led Performance
Stock selection in the IT services and software industries drove outperformance in the information technology sector. Square was a significant contributor on optimism about continued growth trends in its cash app business and its merchant-based business showing signs of stabilizing after being negatively impacted by the COVID-19 virus. Cloud-based electronic signature company DocuSign outperformed, as e-signatures and digital document management have increasingly become mainstream.
Other top contributors included Horizon Therapeutics, an innovative pharmaceuticals company focused on rare and rheumatic diseases. Revenues and earnings came in above expectations, largely due to sales of its thyroid eye disease treatment that launched in January. Trane Technologies, the heating, air conditioning and ventilation company that was spun off from Ingersoll Rand, outperformed on better-than-expected earnings and sales. The stock price of Peloton Interactive soared as the leader in home fitness benefited from the workout-at-home environment created by the pandemic.
Financials Detracted
Stock selection in the capital markets industry weighed on performance in the financials sector. Bond-trading platform company MarketAxess Holdings lagged despite posting earnings that beat analysts’ expectations on heavy volumes.
Elsewhere, Netherlands-based biotechnology company Argenx detracted on concerns about increased competition in its key myasthenia gravis market. The pandemic caused weakness in some health care stocks that had been performing well. Exact Sciences, which makes an at-home kit for the detection of colorectal cancer, and biopharmaceutical firm Alnylam Pharmaceuticals were two such detractors.
Keysight Technologies underperformed as consumer electronics sales and automobile production were slowed by the pandemic. This electronic test and measurement company has been successful in serving growth markets such as 5G, next-generation wireless, aerospace and automotive, and we continue to hold the stock for its long-term potential.
*Total returns for periods less than one year are not annualized.
4
Portfolio Positioning
Our process uses fundamental analysis aimed at identifying mid-cap companies producing attractive, sustainable earnings growth. We seek to reduce unintended, nonfundamental risks and align the portfolio with fundamental, company-specific risks that we believe will be rewarded over time. As a result of this approach, our sector and industry allocations reflect where we are finding opportunities at a given time.
At the end of the period, materials, consumer discretionary and health care were the fund’s largest overweights relative to the benchmark. Communication services and industrials represented the largest underweight sectors. The fund held no communication services stocks.
A strategy that considers the United Nations Sustainable Development Goals (SDG) criteria may limit the investment opportunities available to a portfolio. Therefore, the portfolio may underperform or perform differently than other portfolios that do not have an SDG investment focus. A portfolio’s SDG investment focus may also result in the portfolio investing in securities or industry sectors that perform differently or maintain a different risk profile than the market generally or compared to underlying holdings that are not screened for SDG standards.
5
| Fund Characteristics | ||
| AUGUST 31, 2020 | |||||
| Top Ten Holdings | % of net assets | ||||
| Square, Inc., Class A | 5.6% | ||||
| DocuSign, Inc. | 4.8% | ||||
| Splunk, Inc. | 4.8% | ||||
| Chipotle Mexican Grill, Inc. | 4.7% | ||||
| Twilio, Inc., Class A | 4.6% | ||||
| Cadence Design Systems, Inc. | 4.6% | ||||
| Horizon Therapeutics plc | 4.3% | ||||
| Ball Corp. | 4.2% | ||||
| Veeva Systems, Inc., Class A | 4.2% | ||||
| Align Technology, Inc. | 3.9% | ||||
| Top Five Industries | % of net assets | ||||
| Software | 20.6% | ||||
| IT Services | 10.2% | ||||
| Health Care Equipment and Supplies | 7.4% | ||||
| Biotechnology | 6.5% | ||||
| Health Care Technology | 6.5% | ||||
| Types of Investments in Portfolio | % of net assets | ||||
| Common Stocks | 99.8% | ||||
| Temporary Cash Investments | 0.2% | ||||
| Other Assets and Liabilities | —* | ||||
*Category is less than 0.05% of total net assets.
6
| Shareholder Fee Example | ||
Fund shareholders may incur two types of costs: (1) transaction costs, including brokerage commissions paid on purchases and sales of fund shares; and (2) ongoing costs, including management fees and other fund expenses. This example is intended to help you understand your ongoing costs (in dollars) of investing in your fund and to compare these costs with the ongoing cost of investing in other funds.
The example is based on an investment of $1,000 made at the beginning of the period and held for the entire period from March 1, 2020 to August 31, 2020 (except as noted).
Actual Expenses
The table provides information about actual account values and actual expenses. You may use the information, together with the amount you invested, to estimate the expenses that you paid over the period. Simply divide your account value by $1,000 (for example, an $8,600 account value divided by $1,000 = 8.6), then multiply the result by the number under the heading “Expenses Paid During Period” to estimate the expenses you paid on your account during this period.
Hypothetical Example for Comparison Purposes
The table also provides information about hypothetical account values and hypothetical expenses based on the actual expense ratio of your fund and an assumed rate of return of 5% per year before expenses, which is not the actual return of a fund. The hypothetical account values and expenses may not be used to estimate the actual ending account balance or expenses you paid for the period. You may use this information to compare the ongoing costs of investing in your fund and other funds. To do so, compare this 5% hypothetical example with the 5% hypothetical examples that appear in the shareholder reports of the other funds.
Please note that the expenses shown in the table are meant to highlight your ongoing costs only and do not reflect any transactional costs, such as brokerage commissions paid on purchases and sales of fund shares. Therefore, the table is useful in comparing ongoing costs only, and will not help you determine the relative total costs of owning different funds. In addition, if these transactional costs were included, your costs would have been higher.
| Beginning Account Value 3/1/20 | Ending Account Value 8/31/20 | Expenses Paid During Period(1) 3/1/20 - 8/31/20 | Annualized Expense Ratio(1) | |||||||||||
| Actual | $1,000 | $1,111.40(2) | $0.65(3) | 0.45% | ||||||||||
| Hypothetical | $1,000 | $1,022.87(4) | $2.29(4) | 0.45% | ||||||||||
(1)Expenses are equal to the fund's annualized expense ratio listed in the table above, multiplied by the average account value over the period, multiplied by 184, the number of days in the most recent fiscal half-year, divided by 366, to reflect the one-half year period. Annualized expense ratio reflects actual expenses, including any applicable fee waivers or expense reimbursements and excluding any acquired fund fees and expenses.
(2)Ending account value based on actual return from July 13, 2020 (fund inception) through August 31, 2020.
(3)Expenses are equal to the fund's annualized expense ratio listed in the table above, multiplied by the average account value over the period, multiplied by 50, the number of days in the period from July 13, 2020 (fund inception) through August 31, 2020, divided by 366, to reflect the period. Had the fund been available for the full period, the expenses paid during the period would have been higher.
(4)Ending account value and expenses paid during the period assumes the fund had been available throughout the entire period and are calculated using the fund's annualized expense ratio listed in the table above.
7
| Schedule of Investments | ||
AUGUST 31, 2020
| Shares | Value | |||||||
| COMMON STOCKS — 99.8% | ||||||||
| Auto Components — 3.4% | ||||||||
| Aptiv plc | 2,499 | $ | 215,214 | |||||
| Biotechnology — 6.5% | ||||||||
Alnylam Pharmaceuticals, Inc.(1) | 872 | 115,662 | ||||||
Argenx SE, ADR(1) | 587 | 135,756 | ||||||
Exact Sciences Corp.(1) | 2,200 | 165,638 | ||||||
| 417,056 | ||||||||
| Building Products — 5.3% | ||||||||
AZEK Co., Inc. (The)(1) | 3,151 | 124,401 | ||||||
| Trane Technologies plc | 1,799 | 212,984 | ||||||
| 337,385 | ||||||||
| Capital Markets — 6.0% | ||||||||
| MarketAxess Holdings, Inc. | 375 | 182,228 | ||||||
| MSCI, Inc. | 541 | 201,939 | ||||||
| 384,167 | ||||||||
| Chemicals — 2.8% | ||||||||
| Albemarle Corp. | 1,953 | 177,742 | ||||||
| Containers and Packaging — 4.2% | ||||||||
| Ball Corp. | 3,388 | 272,294 | ||||||
| Diversified Consumer Services — 3.8% | ||||||||
Chegg, Inc.(1) | 3,333 | 245,775 | ||||||
| Electrical Equipment — 2.4% | ||||||||
Sensata Technologies Holding plc(1) | 3,697 | 153,943 | ||||||
| Electronic Equipment, Instruments and Components — 3.9% | ||||||||
Keysight Technologies, Inc.(1) | 2,505 | 246,793 | ||||||
| Equity Real Estate Investment Trusts (REITs) — 1.4% | ||||||||
| SBA Communications Corp. | 298 | 91,209 | ||||||
| Health Care Equipment and Supplies — 7.4% | ||||||||
Align Technology, Inc.(1) | 839 | 249,166 | ||||||
DexCom, Inc.(1) | 531 | 225,893 | ||||||
| 475,059 | ||||||||
| Health Care Technology — 6.5% | ||||||||
Teladoc Health, Inc.(1) | 662 | 142,787 | ||||||
Veeva Systems, Inc., Class A(1) | 960 | 270,979 | ||||||
| 413,766 | ||||||||
| Hotels, Restaurants and Leisure — 4.7% | ||||||||
Chipotle Mexican Grill, Inc.(1) | 232 | 303,985 | ||||||
| IT Services — 10.2% | ||||||||
Square, Inc., Class A(1) | 2,240 | 357,414 | ||||||
Twilio, Inc., Class A(1) | 1,093 | 294,848 | ||||||
| 652,262 | ||||||||
| Leisure Products — 3.0% | ||||||||
Peloton Interactive, Inc., Class A(1) | 2,538 | 194,588 | ||||||
| Pharmaceuticals — 4.3% | ||||||||
Horizon Therapeutics plc(1) | 3,708 | 278,545 | ||||||
| Semiconductors and Semiconductor Equipment — 3.4% | ||||||||
| Marvell Technology Group Ltd. | 5,640 | 218,719 | ||||||
8
| Shares | Value | |||||||
| Software — 20.6% | ||||||||
Cadence Design Systems, Inc.(1) | 2,649 | $ | 293,801 | |||||
DocuSign, Inc.(1) | 1,391 | 310,193 | ||||||
Palo Alto Networks, Inc.(1) | 951 | 244,797 | ||||||
RingCentral, Inc., Class A(1) | 565 | 164,285 | ||||||
Splunk, Inc.(1) | 1,413 | 309,913 | ||||||
| 1,322,989 | ||||||||
TOTAL COMMON STOCKS (Cost $5,819,108) | 6,401,491 | |||||||
| TEMPORARY CASH INVESTMENTS — 0.2% | ||||||||
| State Street Institutional U.S. Government Money Market Fund, Premier Class (Cost $10,730) | 10,730 | 10,730 | ||||||
TOTAL INVESTMENT SECURITIES — 100.0% (Cost $5,829,838) | 6,412,221 | |||||||
OTHER ASSETS AND LIABILITIES† | (1,230) | |||||||
| TOTAL NET ASSETS — 100.0% | $ | 6,410,991 | ||||||
| NOTES TO SCHEDULE OF INVESTMENTS | ||||||||
| ADR | - | American Depositary Receipt | ||||||
† Category is less than 0.05% of total net assets.
(1)Non-income producing.
See Notes to Financial Statements.
9
| Statement of Assets and Liabilities | ||
| AUGUST 31, 2020 | |||||
| Assets | |||||
| Investment securities, at value (cost of $5,829,838) | $ | 6,412,221 | |||
| Cash | 507 | ||||
| Dividends receivable | 648 | ||||
| 6,413,376 | |||||
| Liabilities | |||||
| Accrued management fees | 2,385 | ||||
| Net Assets | $ | 6,410,991 | |||
| Shares outstanding (unlimited number of shares authorized) | 150,000 | ||||
| Net Asset Value Per Share | $ | 42.74 | |||
| Net Assets Consist of: | |||||
| Capital paid in | $ | 5,831,120 | |||
| Distributable earnings | 579,871 | ||||
| $ | 6,410,991 | ||||
See Notes to Financial Statements.
10
| Statement of Operations | ||
FOR THE PERIOD ENDED AUGUST 31, 2020(1) | |||||
| Investment Income (Loss) | |||||
| Income: | |||||
| Dividends | $ | 1,295 | |||
| Expenses: | |||||
| Management fees | 3,534 | ||||
| Net investment income (loss) | (2,239) | ||||
| Realized and Unrealized Gain (Loss) | |||||
| Net realized gain (loss) on investment transactions | (273) | ||||
| Change in net unrealized appreciation (depreciation) on investments | 582,383 | ||||
| Net realized and unrealized gain (loss) | 582,110 | ||||
| Net Increase (Decrease) in Net Assets Resulting from Operations | $ | 579,871 | |||
(1)July 13, 2020 (fund inception) through August 31, 2020.
See Notes to Financial Statements.
11
| Statement of Changes in Net Assets | ||
PERIOD ENDED AUGUST 31, 2020(1) | |||||
| Increase (Decrease) in Net Assets | |||||
| Operations | |||||
| Net investment income (loss) | $ | (2,239) | |||
| Net realized gain (loss) | (273) | ||||
| Change in net unrealized appreciation (depreciation) | 582,383 | ||||
| Net increase (decrease) in net assets resulting from operations | 579,871 | ||||
| Capital Share Transactions | |||||
| Proceeds from shares sold | 5,831,120 | ||||
| Net increase (decrease) in net assets | 6,410,991 | ||||
| Net Assets | |||||
| End of period | $ | 6,410,991 | |||
| Transactions in Shares of the Fund | |||||
| Sold | 150,000 | ||||
(1)July 13, 2020 (fund inception) through August 31, 2020.
See Notes to Financial Statements.
12
| Notes to Financial Statements | ||
AUGUST 31, 2020
1. Organization
American Century ETF Trust (the trust) was registered as a Delaware statutory trust in 2017 and is registered under the Investment Company Act of 1940, as amended (the 1940 Act), as an open-end management investment company. American Century Mid Cap Growth Impact ETF (the fund) is one fund in a series issued by the trust. The fund's investment objective is to seek long-term capital growth. Shares of the fund are listed for trading on the NYSE Arca, Inc. The fund incepted on July 13, 2020.
2. Significant Accounting Policies
The following is a summary of significant accounting policies consistently followed by the fund in preparation of its financial statements. The fund is an investment company and follows accounting and reporting guidance in accordance with accounting principles generally accepted in the United States of America. This may require management to make certain estimates and assumptions at the date of the financial statements. Actual results could differ from these estimates. Management evaluated the impact of events or transactions occurring through the date the financial statements were issued that would merit recognition or disclosure.
Investment Valuations — The fund determines the fair value of its investments and computes its net asset value per share at the close of regular trading (usually 4 p.m. Eastern time) on the New York Stock Exchange (NYSE) on each day the NYSE is open. The Board of Trustees has adopted valuation policies and procedures to guide the investment advisor in the fund’s investment valuation process and to provide methodologies for the oversight of the fund’s pricing function.
Equity securities that are listed or traded on a domestic securities exchange are valued at the last reported sales price or at the official closing price as provided by the exchange. Equity securities traded on foreign securities exchanges are generally valued at the closing price of such securities on the exchange where primarily traded or at the close of the NYSE, if that is earlier. If no last sales price is reported, or if local convention or regulation so provides, the mean of the latest bid and asked prices may be used. Securities traded over-the-counter are valued at the mean of the latest bid and asked prices, the last sales price, or the official closing price.
Open-end management investment companies are valued at the reported net asset value per share.
If the fund determines that the market price for an investment is not readily available or the valuation methods mentioned above do not reflect an investment’s fair value, such investment is valued as determined in good faith by the Board of Trustees or its delegate, in accordance with policies and procedures adopted by the Board of Trustees. In its determination of fair value, the fund may review several factors including, but not limited to, market information regarding the specific investment or comparable investments and correlation with other investment types, futures indices or general market indicators. Circumstances that may cause the fund to use these procedures to value an investment include, but are not limited to: an investment has been declared in default or is distressed; trading in a security has been suspended during the trading day or a security is not actively trading on its principal exchange; prices received from a regular pricing source are deemed unreliable; or there is a foreign market holiday and no trading occurred.
The fund monitors for significant events occurring after the close of an investment’s primary exchange but before the fund’s net asset value per share is determined. Significant events may include, but are not limited to: corporate announcements and transactions; governmental action and political unrest that could impact a specific investment or an investment sector; or armed conflicts, natural disasters and similar events that could affect investments in a specific country or region. The fund also monitors for significant fluctuations between domestic and foreign markets, as evidenced by the U.S. market or such other indicators that the Board of Trustees, or its delegate, deems appropriate. The fund may apply a model-derived factor to the closing price of equity securities traded on foreign securities exchanges. The factor is based on observable market data as provided by an independent pricing service.
Security Transactions — Security transactions are accounted for as of the trade date. Net realized gains and losses are determined on the identified cost basis, which is also used for federal income tax purposes.
13
Investment Income — Dividend income less foreign taxes withheld, if any, is recorded as of the ex-dividend date. Distributions received on securities that represent a return of capital or long-term capital gain are recorded as a reduction of cost of investments and/or as a realized gain. The fund may estimate the components of distributions received that may be considered nontaxable distributions or long-term capital gain distributions for income tax purposes.
Income Tax Status — It is the fund’s policy to distribute substantially all net investment income and net realized gains to shareholders and to otherwise qualify as a regulated investment company under provisions of the Internal Revenue Code. Accordingly, no provision has been made for income taxes. The fund files U.S. federal, state, local and non-U.S. tax returns as applicable. The fund's tax returns are subject to examination by the relevant taxing authority until expiration of the applicable statute of limitations, which is generally three years from the date of filing but can be longer in certain jurisdictions. At this time, management believes there are no uncertain tax positions which, based on their technical merit, would not be sustained upon examination and for which it is reasonably possible that the total amounts of unrecognized tax benefits will significantly change in the next twelve months.
Distributions to Shareholders — Distributions from net investment income, if any, are generally declared and paid quarterly. Distributions from net realized gains, if any, are generally declared and paid annually.
Indemnifications — Under the trust’s organizational documents, its officers and trustees are indemnified against certain liabilities arising out of the performance of their duties to the fund. In addition, in the normal course of business, the fund enters into contracts that provide general indemnifications. The maximum exposure under these arrangements is unknown as this would involve future claims that may be made against a fund. The risk of material loss from such claims is considered by management to be remote.
3. Fees and Transactions with Related Parties
Certain officers and trustees of the trust are also officers and/or directors of American Century Companies, Inc. (ACC). The trust's investment advisor, American Century Investment Management, Inc. (ACIM), and the trust’s administrator, American Century Services, LLC, are wholly owned, directly or indirectly, by ACC. ACIM owns 83% of the shares of the fund. Related parties do not invest in the fund for the purpose of exercising management or control.
Management Fees — The trust has entered into a management agreement with ACIM, under which ACIM provides the fund with investment advisory and management services in exchange for a single, unified management fee (the fee). The agreement provides that ACIM will pay all expenses of managing and operating the fund, except brokerage and other transaction fees and expenses relating to the acquisition and disposition of portfolio securities, acquired fund fees and expenses, interest, taxes, litigation expenses and extraordinary expenses. The fee is computed and accrued daily based on the daily net assets of the fund and paid monthly in arrears. The annual management fee is 0.45%.
4. Investment Transactions
Purchases and sales of investment securities, excluding short-term investments and in-kind transactions, for the period ended August 31, 2020 were $200,579 and $106,323, respectively.
Securities received in-kind through subscriptions for the period ended August 31, 2020 were $5,725,125. There were no securities delivered in-kind through redemptions during the period.
5. Capital Share Transactions
The fund’s shares may only be purchased and sold on a national securities exchange through a broker-dealer. The price of the fund’s shares is based on market price, and because ETF shares trade at market prices rather than net asset value (NAV), shares may trade at a price greater than NAV (a premium) or less than NAV (a discount). The fund issues and redeems shares that have been aggregated into blocks of 5,000 shares or multiples thereof (Creation Units) to authorized participants who have entered into agreements with the fund's distributor. The fund will generally issue and redeem Creation Units in return for a designated portfolio of securities (and an amount of cash) that the fund specifies each day. Investors transacting in Creation Units for cash may also pay an additional variable charge to compensate the fund for certain transaction costs and market impact expenses relating to investing in portfolio securities. Such variable charges, if any, are included in proceeds from shares sold in the Statement of Changes in Net Assets.
14
6. Fair Value Measurements
The fund’s investments valuation process is based on several considerations and may use multiple inputs to determine the fair value of the investments held by the fund. In conformity with accounting principles generally accepted in the United States of America, the inputs used to determine a valuation are classified into three broad levels.
•Level 1 valuation inputs consist of unadjusted quoted prices in an active market for identical investments.
•Level 2 valuation inputs consist of direct or indirect observable market data (including quoted prices for comparable investments, evaluations of subsequent market events, interest rates, prepayment speeds, credit risk, etc.). These inputs also consist of quoted prices for identical investments initially expressed in local currencies that are adjusted through translation into U.S. dollars.
•Level 3 valuation inputs consist of unobservable data (including a fund’s own assumptions).
The level classification is based on the lowest level input that is significant to the fair valuation measurement. The valuation inputs are not necessarily an indication of the risks associated with investing in these securities or other financial instruments.
As of period end, the fund’s investment securities were classified as Level 1. The Schedule of Investments provides additional information on the fund's portfolio holdings.
7. Risk Factors
The value of the fund’s shares will go up and down, sometimes rapidly or unpredictably, based on the performance of the securities owned by the fund and other factors generally affecting the securities market. Market risks, including political, regulatory, economic and social developments, can affect the value of the fund’s investments. Natural disasters, public health emergencies, terrorism and other unforeseeable events may lead to increased market volatility and may have adverse long-term effects on world economies and markets generally.
8. Federal Tax Information
The book-basis character of distributions made during the year from net investment income or net realized gains may differ from their ultimate characterization for federal income tax purposes. These differences reflect the differing character of certain income items and net realized gains and losses for financial statement and tax purposes, and may result in reclassification among certain capital accounts on the financial statements. There were no distributions paid by the fund during the period July 13, 2020 (fund inception) through August 31, 2020.
As of period end, the federal tax cost of investments and the components of distributable earnings on a tax-basis were as follows:
| Federal tax cost of investments | $ | 5,829,882 | |||
| Gross tax appreciation of investments | $ | 663,071 | |||
| Gross tax depreciation of investments | (80,732) | ||||
| Net tax appreciation (depreciation) of investments | $ | 582,339 | |||
| Undistributed ordinary income | — | ||||
| Accumulated short-term capital losses | $ | (229) | |||
| Late-year ordinary loss deferral | $ | (2,239) | |||
The difference between book-basis and tax-basis unrealized appreciation (depreciation) is attributable primarily to the tax deferral of losses on wash sales.
Accumulated capital losses represent net capital loss carryovers that may be used to offset future realized capital gains for federal income tax purposes. The capital loss carryovers may be carried forward for an unlimited period. Future capital loss carryover utilization in any given year may be subject to Internal Revenue Code limitations.
Loss deferrals represent certain qualified losses that the fund has elected to treat as having been incurred in the following fiscal year for federal income tax purposes.
15
| Financial Highlights | ||
| For a Share Outstanding Throughout the Period Indicated | ||||||||||||||||||||||||||||||||
| Per-Share Data | Ratios and Supplemental Data | |||||||||||||||||||||||||||||||
| Income From Investment Operations: | Ratio to Average Net Assets of: | |||||||||||||||||||||||||||||||
| Net Asset Value, Beginning of Period | Net Investment Income (Loss)(1) | Net Realized and Unrealized Gain (Loss) | Total From Investment Operations | Net Asset Value, End of Period | Total Return(2) | Operating Expenses | Net Investment Income (Loss) | Portfolio Turnover Rate(3) | Net Assets, End of Period (in thousands) | |||||||||||||||||||||||
2020(4) | $38.45 | (0.02) | 4.31 | 4.29 | $42.74 | 11.14% | 0.45%(5) | (0.29)%(5) | 2% | $6,411 | ||||||||||||||||||||||
| Notes to Financial Highlights | ||
(1)Computed using average shares outstanding throughout the period.
(2)Total returns are calculated based on the net asset value of the last business day. Total returns for periods less than one year are not annualized.
(3)Excludes securities received or delivered in-kind.
(4)July 13, 2020 (fund inception) through August 31, 2020.
(5)Annualized.
See Notes to Financial Statements.
| Report of Independent Registered Public Accounting Firm | ||
To the Shareholders and the Board of Trustees of American Century ETF Trust:
Opinion on the Financial Statements and Financial Highlights
We have audited the accompanying statement of assets and liabilities, including the schedule of investments, of American Century Mid Cap Growth Impact ETF (the “Fund”), one of the funds constituting the American Century ETF Trust, as of August 31, 2020, and the related statement of operations, the statement of changes in net assets, and the financial highlights for the period from July 13, 2020 (fund inception) through August 31, 2020, and the related notes. In our opinion, the financial statements and financial highlights present fairly, in all material respects, the financial position of American Century Mid Cap Growth Impact ETF as of August 31, 2020, and the results of its operations, the changes in its net assets, and the financial highlights for the period from July 13, 2020 (fund inception) through August 31, 2020, in conformity with accounting principles generally accepted in the United States of America.
Basis for Opinion
These financial statements and financial highlights are the responsibility of the Fund's management. Our responsibility is to express an opinion on the Fund’s financial statements and financial highlights based on our audit. We are a public accounting firm registered with the Public Company Accounting Oversight Board (United States) (PCAOB) and are required to be independent with respect to the Fund in accordance with the U.S. federal securities laws and the applicable rules and regulations of the Securities and Exchange Commission and the PCAOB.
We conducted our audit in accordance with the standards of the PCAOB. Those standards require that we plan and perform the audit to obtain reasonable assurance about whether the financial statements and financial highlights are free of material misstatement, whether due to error or fraud. The Fund is not required to have, nor were we engaged to perform, an audit of its internal control over financial reporting. As part of our audit we are required to obtain an understanding of internal control over financial reporting but not for the purpose of expressing an opinion on the effectiveness of the Fund’s internal control over financial reporting. Accordingly, we express no such opinion.
Our audit included performing procedures to assess the risks of material misstatement of the financial statements and financial highlights, whether due to error or fraud, and performing procedures that respond to those risks. Such procedures included examining, on a test basis, evidence regarding the amounts and disclosures in the financial statements and financial highlights. Our audit also included evaluating the accounting principles used and significant estimates made by management, as well as evaluating the overall presentation of the financial statements and financial highlights. Our procedures included confirmation of securities owned as of August 31, 2020, by correspondence with the custodian and brokers; when replies were not received from brokers, we performed other auditing procedures. We believe that our audit provides a reasonable basis for our opinion.
DELOITTE & TOUCHE LLP
Kansas City, Missouri
October 16, 2020
We have served as the auditor of one or more American Century investment companies since 1997.
17
| Management | ||
The Board of Trustees
The individuals listed below serve as trustees of the funds. Each trustee will continue to serve in this capacity until death, retirement, resignation or removal from office. The board has adopted a mandatory retirement age for trustees who are not “interested persons,” as that term is defined in the Investment Company Act (independent trustees). Trustees who are not also officers of the trust shall retire by December 31st of the year in which they reach their 75th birthday.
Mr. Thomas is an “interested person” because he currently serves as President and Chief Executive Officer of American Century Companies, Inc. (ACC), the parent company of American Century Investment Management, Inc. (ACIM or the advisor). The other trustees are independent. They are not employees, directors or officers of, and have no financial interest in, ACC or any of its wholly owned, direct or indirect, subsidiaries, including ACIM and American Century Services, LLC (ACS), and they do not have any other affiliations, positions or relationships that would cause them to be considered “interested persons” under the Investment Company Act. The following trustees also serve in this capacity for a number of other registered investment companies in the American Century Investments family of funds: Jonathan S. Thomas, 15; Ronald J. Gilson, 8; and Stephen E. Yates, 7.
The following table presents additional information about the trustees. The mailing address for each trustee other than Jonathan S. Thomas is 330 Madison Avenue, New York, New York 10017. The mailing address for Jonathan S. Thomas is 4500 Main Street, Kansas City, Missouri 64111.
| Name (Year of Birth) | Position(s) Held with Funds | Length of Time Served | Principal Occupation(s) During Past 5 Years | Number of American Century Portfolios Overseen by Trustee | Other Directorships Held During Past 5 Years | ||||||||||||
| Independent Trustees | |||||||||||||||||
| Reginald M. Browne (1968) | Trustee and Chairman of the Board | Since 2017 (Chairman since 2019) | Principal, GTS Securities (automated capital markets trading firm)(2019 to present); Senior Managing Director, Co Global Head-ETF Group, Cantor Fitzgerald (financial services firm)(2013 to 2019) | 19 | None | ||||||||||||
| Ronald J. Gilson (1946) | Trustee | Since 2017 | Charles J. Meyers Professor of Law and Business, Emeritus, Stanford Law School (1979 to 2016); Marc and Eva Stern Professor of Law and Business, Columbia University School of Law (1992 to present) | 59 | None | ||||||||||||
| Barry A. Mendelson (1958) | Trustee | Since 2017 | Retired; Consultant regarding ETF and mutual fund matters (2015 to 2016); Principal and Senior Counsel, The Vanguard Group (investment management)(1998 to 2014) | 19 | None | ||||||||||||
| Stephen E. Yates (1948) | Trustee | Since 2017 | Retired | 82 | None | ||||||||||||
18
| Name (Year of Birth) | Position(s) Held with Funds | Length of Time Served | Principal Occupation(s) During Past 5 Years | Number of American Century Portfolios Overseen by Trustee | Other Directorships Held During Past 5 Years | ||||||||||||
| Interested Trustees | |||||||||||||||||
| Jonathan S. Thomas (1963) | Trustee | Since 2017 | President and Chief Executive Officer, ACC (2007 to present). Also serves as Chief Executive Officer, ACS; Executive Vice President, ACIM; Director, ACC, ACIM and other ACC subsidiaries | 122 | None | ||||||||||||
The Statement of Additional Information has additional information about the fund's trustees and is available without charge, upon request, by calling 1-800-345-6488.
19
Officers
The following table presents certain information about the executive officers of the funds. Each officer, except Edward Rosenberg, serves as an officer for each of the 16 investment companies in the American Century family of funds. No officer is compensated for his or her service as an officer of the funds. The listed officers are interested persons of the funds and are appointed or re-appointed on an annual basis. The mailing address for each officer listed below is 4500 Main Street, Kansas City, Missouri 64111.
| Name (Year of Birth) | Offices with the Funds | Principal Occupation(s) During the Past Five Years | ||||||
| Patrick Bannigan (1965) | President since 2019 | Executive Vice President and Director, ACC (2012 to present); Chief Financial Officer, Chief Accounting Officer and Treasurer, ACC (2015 to present). Also serves as President, ACS; Vice President, ACIM; Chief Financial Officer, Chief Accounting Officer and/or Director, ACIM, ACS and other ACC subsidiaries | ||||||
| R. Wes Campbell (1974) | Chief Financial Officer and Treasurer since 2018 | Vice President, ACS (2020 to present); Investment Operations and Investment Accounting, ACS (2000 to present) | ||||||
| Amy D. Shelton (1964) | Chief Compliance Officer and Vice President since 2017 | Chief Compliance Officer, American Century funds, (2014 to present); Chief Compliance Officer, ACIM (2014 to present); Chief Compliance Officer, ACIS (2009 to present). Also serves as Vice President, ACIS | ||||||
| Charles A. Etherington (1957) | General Counsel and Vice President since 2017 | Attorney, ACC (1994 to present); Vice President, ACC (2005 to present); General Counsel, ACC (2007 to present). Also serves as General Counsel, ACIM, ACS, ACIS and other ACC subsidiaries; and Senior Vice President, ACIM and ACS | ||||||
| Cleo Chang (1977) | Vice President since 2019 | Senior Vice President, ACIM (2015 to present); Chief Investment Officer, Wilshire Funds Management (2005 to 2015) | ||||||
| David H. Reinmiller (1963) | Vice President since 2017 | Attorney, ACC (1994 to present). Also serves as Vice President, ACIM and ACS | ||||||
| Edward Rosenberg (1973) | Vice President since 2017 | Senior Vice President, ACIM (2017 to present); Senior Vice President, Flexshares Head of ETF Capital Markets, Northern Trust (2012 to 2017) | ||||||
| C. Jean Wade (1964) | Vice President since 2017 | Senior Vice President, ACS (2017 to present); Vice President, ACS (2000 to 2017) | ||||||
| Ward D. Stauffer (1960) | Secretary since 2019 | Attorney, ACS (2003 to present) | ||||||
20
| Approval of Management Agreement | ||
At a meeting held on November 21, 2019, the Fund’s Board of Trustees unanimously approved the initial management agreement pursuant to which American Century Investment Management, Inc. (the “Advisor”) acts as the investment advisor for the Fund. Under Section 15(c) of the Investment Company Act, new contracts for investment advisory services are required to be approved by a majority of a fund’s independent trustees and to be evaluated on an annual basis thereafter.
In advance of the Board’s consideration, the Advisor provided information concerning the Fund. The materials circulated and the discussions held at the meeting detailed the investment objective and strategy proposed to be utilized by the Advisor, the Fund’s characteristics and key attributes, the rationale for launching the Fund, the experience of the staff designated to manage the Fund, the proposed pricing, and the markets in which the Fund would be sold. The information considered and the discussions held included, but were not limited to, the following:
•The nature, extent, and quality of investment management, shareholder services, and other services to be provided by the Advisor to the Fund;
•The wide range of other programs and services to be provided by the Advisor to the Fund and its shareholders on a routine and non-routine basis;
•The Fund’s proposed investment objective and strategy, including a discussion of the Fund’s anticipated investment performance and proposed benchmark;
•The cost of owning the Fund compared to the cost of owning similar funds;
•The Advisor’s compliance policies, procedures, and regulatory experience; and
•Any collateral benefits derived by the Advisor from the management of the Fund.
American Century Investments’ funds utilize a unified management fee structure. Under the unified fee structure, the Advisor is responsible for providing all investment advisory, custody, audit, administrative, compliance, recordkeeping, marketing, and shareholder services, or arranging and supervising third parties to provide such services. By contrast, most other funds are charged a variety of fees, including an investment advisory fee, a transfer agency fee, an administrative fee, distribution charges, and other expenses. Other than their investment advisory fees and Rule 12b-1 fees, all other components of the total fees charged by these other funds may be increased without shareholder approval. The Advisor and Board believe the unified fee structure is a benefit to fund shareholders because it clearly discloses to shareholders the cost of owning fund shares, and because the unified fee cannot be increased without a vote of fund shareholders, it shifts to the Advisor the risk of increased costs of operating the fund and provides a direct incentive to minimize administrative inefficiencies.
Part of the Board’s analysis of fee levels involves reviewing certain evaluative data compiled by an independent provider and comparing the Fund’s annual unified management fee to the total expense ratio of peer funds selected by the independent provider. The Board found the Fund’s management fee to be below the median of the total expense ratios of its peer universe.
When considering the approval of the Fund’s management agreement, the independent Trustees considered the entrepreneurial risk that the Advisor assumes in launching a new fund. In particular, they considered the fact that the Advisor will assume a substantial part of the start-up costs of the Fund and the risk that the Fund will not grow to a level that will become profitable to the Advisor. The Board considered the position that the Fund would take in the lineup of the American Century Investments’ family of funds and the benefits to shareholders of existing funds of the broadened product offering. Finally, while not specifically discussed, but important in the decision to approve the management agreement, is the Trustees’ familiarity with the Advisor. In addition to overseeing the Fund, a majority of the Board also oversees and evaluates on a continuous basis the nature and quality of services the Advisor provides to other funds within the American Century Investments’ complex. As such, the Trustees have confidence in the Advisor’s integrity and competence in providing services to the Fund.
21
The independent Trustees considered all of the information provided by the Advisor, the independent data provider, and their independent counsel in connection with the approval and evaluated such information for the Fund. In connection with their review, the Trustees did not identify any single factor as being all-important or controlling, and each Trustee may have attributed different levels of importance to different factors. The independent Trustees concluded that the overall arrangements between the Fund and the Advisor, as provided in the management agreement, were fair and reasonable in light of the services to be provided and should be approved.
22
| Additional Information | ||
Retirement Account Information
As required by law, distributions you receive from certain retirement accounts are subject to federal income tax withholding, unless you elect not to have withholding apply*. Tax will be withheld on the total amount withdrawn even though you may be receiving amounts that are not subject to withholding, such as nondeductible contributions. In such case, excess amounts of withholding could occur. You may adjust your withholding election so that a greater or lesser amount will be withheld.
Remember, even if you elect not to have income tax withheld, you are liable for paying income tax on the taxable portion of your withdrawal. If you elect not to have income tax withheld or you don’t have enough income tax withheld, you may be responsible for payment of estimated tax. You may incur penalties under the estimated tax rules if your withholding and estimated tax payments are not sufficient. You can reduce or defer the income tax on a distribution by directly or indirectly rolling such distribution over to another IRA or eligible plan. You should consult your tax advisor for additional information.
State tax will be withheld if, at the time of your distribution, your address is within one of the mandatory withholding states and you have federal income tax withheld (or as otherwise required by state law). State taxes will be withheld from your distribution in accordance with the respective state rules.
*Some 403(b), 457 and qualified retirement plan distributions may be subject to 20% mandatory withholding, as they are subject to special tax and withholding rules. Your plan administrator or plan sponsor is required to provide you with a special tax notice explaining those rules at the time you request a distribution. If applicable, federal and/or state taxes may be withheld from your distribution amount.
Proxy Voting Policies
A description of the policies that the fund's investment advisor uses in exercising the voting rights associated with the securities purchased and/or held by the fund are available without charge, upon request, by calling 1-800-345-6488. It is also available on American Century Investments’ website at americancentury.com/proxy and on the Securities and Exchange Commission’s website at sec.gov. Information regarding how the investment advisor voted proxies relating to portfolio securities during the most recent 12-month period ended June 30 is available at americancentury.com/proxy. It is also available at sec.gov.
Quarterly Portfolio Disclosure
The fund files its complete schedule of portfolio holdings with the Securities and Exchange Commission (SEC) for the first and third quarters of each fiscal year as an exhibit to its reports on Form N-PORT. The fund's Form N-PORT reports are available on the SEC’s website at sec.gov.
23
| Notes | ||
24
| ||||||||
| Contact Us | americancenturyetfs.com | |||||||
| American Century Sales Representatives, Financial Professionals, Broker Dealers, Insurance Companies, Banks and Trust Companies | 1-833-ACI-ETFS | |||||||
| Telecommunications Relay Service for the Deaf | 711 | |||||||
| American Century ETF Trust | ||||||||
Investment Advisor: American Century Investment Management, Inc. Kansas City, Missouri | ||||||||
Distributor: Foreside Fund Services, LLC - Distributor, not affiliated with American Century Investment Services, Inc. | ||||||||
| This report and the statements it contains are submitted for the general information of our shareholders. The report is not authorized for distribution to prospective investors unless preceded or accompanied by an effective prospectus. | ||||||||
| ©2020 American Century Proprietary Holdings, Inc. All rights reserved. CL-ANN-96608 2010 | ||||||||
| Annual Report | |||||
| August 31, 2020 | |||||
American Century® Sustainable Equity ETF (ESGA) | |||||
Beginning on January 1, 2021, as permitted by regulations adopted by the Securities and Exchange Commission, paper copies of the fund’s shareholder reports like this one will no longer be sent by mail, unless you specifically request paper copies of the reports from the fund or from your financial intermediary, such as a broker-dealer or bank. Instead, the reports will be made available on a website, and you will be notified by mail each time a report is posted and provided with a website link to access the report.
If you already elected to receive shareholder reports electronically, you will not be affected by this change and you need not take any action. You may elect to receive shareholder reports and other communications from the fund or your financial intermediary electronically by calling or sending an email request to your appropriate contacts as listed on the back cover of this report.
You may elect to receive all future reports in paper free of charge. You can inform the fund or your financial intermediary that you wish to continue receiving paper copies of your shareholder reports by calling or sending an email request to your appropriate contacts as listed on the back cover of this report. Your election to receive reports in paper will apply to all funds held with the fund complex/your financial intermediary.
| Table of Contents | ||
| President’s Letter | |||||
| Performance | |||||
| Portfolio Commentary | |||||
| Fund Characteristics | |||||
| Shareholder Fee Example | |||||
| Schedule of Investments | |||||
| Statement of Assets and Liabilities | |||||
| Statement of Operations | |||||
| Statement of Changes in Net Assets | |||||
| Notes to Financial Statements | |||||
| Financial Highlights | |||||
| Report of Independent Registered Public Accounting Firm | |||||
| Management | |||||
| Approval of Management Agreement | |||||
| Additional Information | |||||
Any opinions expressed in this report reflect those of the author as of the date of the report, and do not necessarily represent the opinions of American Century Investments® or any other person in the American Century Investments organization. Any such opinions are subject to change at any time based upon market or other conditions and American Century Investments disclaims any responsibility to update such opinions. These opinions may not be relied upon as investment advice and, because investment decisions made by American Century Investments funds are based on numerous factors, may not be relied upon as an indication of trading intent on behalf of any American Century Investments fund. Security examples are used for representational purposes only and are not intended as recommendations to purchase or sell securities. Performance information for comparative indices and securities is provided to American Century Investments by third party vendors. To the best of American Century Investments’ knowledge, such information is accurate at the time of printing.
| President’s Letter | ||
Jonathan ThomasDear Investor:
Thank you for reviewing this annual report for the period ended August 31, 2020. Annual reports help convey important information about fund returns, including market factors that affected performance during the reporting period. For additional investment insights, please visit americancenturyetfs.com.
Summer Rally Boosted Stock Returns
The funds launched in mid-July, amid a remarkable U.S. stock market rally. Earlier in the year, the rapidly spreading COVID-19 outbreak halted most U.S. and global economic activity, triggering a worldwide recession and an investor flight to quality. The Federal Reserve stepped in quickly and aggressively, slashing U.S. interest rates and launching several asset-purchase and lending programs. The federal government responded, too, with a massive package of financial aid to individuals, businesses and state and local governments. These extraordinary efforts proved helpful, as U.S. stocks rebounded quickly and continued to rally through the summer, despite weak economic and corporate earnings data.
Additionally, declining coronavirus infection and death rates in many regions and the reopening of state economies were positive influences. By the end of August, manufacturing, employment and other data suggested an economic recovery was underway, which also helped fuel robust stock returns for the relatively short reporting period.
A Slow Return to Normal
The return to pre-pandemic life will take time and patience, but we are confident we will get there. Several drug companies are in final stages of vaccine trials, and medical professionals continue to fine-tune virus treatment protocols. In the meantime, investors likely will face periods of outbreak-related disruptions, economic and political uncertainty, and heightened market volatility. These influences can be unsettling, but they tend to be temporary.
We appreciate your confidence in us during these extraordinary times. Our firm has a long history of helping clients weather unpredictable markets, and we’re confident we will continue to meet today’s challenges.
Sincerely,
Jonathan Thomas
President and Chief Executive Officer
American Century Investments
2
| Performance | ||
| Total Returns as of August 31, 2020 | ||||||||||||||||||||
| Since Inception | Inception Date | |||||||||||||||||||
| Net Asset Value | 11.56% | 7/13/2020 | ||||||||||||||||||
| Market Price | 11.64% | 7/13/2020 | ||||||||||||||||||
| S&P 500 Index | 11.20% | — | ||||||||||||||||||
Market price is determined using the bid/ask midpoint at 4:00 p.m. Eastern time, when the net asset value (NAV) is typically calculated. Market performance does not represent the returns you would receive if you traded shares at other times. NAV prices are used to calculate market price performance prior to the date when the fund first traded on the New York Stock Exchange.
| Total Annual Fund Operating Expenses | |||||||||||||||||
| 0.39% | |||||||||||||||||
The total annual fund operating expenses shown is as stated in the fund’s prospectus current as of the date of this report. The prospectus may vary from the expense ratio shown elsewhere in this report because it is based on a different time period, includes acquired fund fees and expenses, and, if applicable, does not include fee waivers or expense reimbursements.
Data presented reflect past performance. Past performance is no guarantee of future results. Current performance may be higher or lower than the performance shown. Total returns for periods less than one year are not annualized. Investment return and principal value will fluctuate, and redemption value may be more or less than original cost. Data assumes reinvestment of dividends and capital gains, and none of the charts reflect the deduction of taxes that a shareholder would pay on fund distributions or the redemption of fund shares. To obtain performance data current to the most recent month end, please call 1-800-345-6488 or visit americancenturyetfs.com. For additional information about the fund, please consult the prospectus.
3
| Portfolio Commentary | ||
Portfolio Managers: Greg Woodhams, Justin Brown, Joe Reiland, Rob Bove and Rene Casis
Fund Strategy
American Century Sustainable Equity ETF is an actively managed fund that seeks long-term capital growth. We seek to invest in larger U.S. companies demonstrating both improving business fundamentals and sustainable corporate behaviors to deliver long-term financial returns and positive impacts to the environment, communities and corporate governance. As opposed to avoiding certain sectors entirely, we seek to invest in the most attractive companies within all sectors. A broad investment universe provides investors with both an attractive environmental, social and governance (ESG) profile and the potential for positive risk-adjusted returns over time. We construct our portfolio to intentionally acquire stock-specific risk aligned with our financial and sustainability research, while minimizing relative exposures related to sectors and common factor risks, such as market-capitalization size, volatility and momentum.
Performance Review
For the period from the fund’s inception on July 13, 2020, through the fund’s fiscal year-end on August 31, 2020, the fund returned 11.64%* on a market price basis. On a net asset value (NAV) basis, the fund returned 11.56%. For the same time period, the S&P 500 Index, the fund’s benchmark, returned 11.20%. The fund’s NAV and market price returns reflect fees and operating expenses, while the index return does not.
Utilities and Industrials Led Performance
Stock selection and an underweight allocation to the utilities sector outperformed relative to the benchmark. The sector suffered as the market shunned defensive stocks in favor of higher-growth companies. Stock choices in the electric utilities industry and avoiding multi-utilities were especially beneficial. Stock choices among industrials also benefited performance, led by choices in the machinery industry.
NVIDIA was the top individual contributor. NVIDIA’s stock rose on anticipation of strong demand for its new gaming processors. Not owning Exxon Mobil benefited performance. The energy giant faltered along with the sector as reduced demand and low prices weighed on the company. Its stock was also removed from the Dow Jones Industrial Average at the end of August. Not owning Eli Lilly and Co. helped relative performance. The pharmaceuticals company reported disappointing revenue, which it attributed to fewer new prescriptions as people avoided doctor visits during the pandemic. Not owning Netflix benefited performance as the streaming video service reported weaker-than-expected earnings and guided new subscriber growth lower. Not owning Gilead Sciences was beneficial as its stock price fell after the biotechnology company’s management reported sales and earnings below expectations.
Information Technology Detracted
Stock selection in the semiconductors and semiconductor equipment industry hampered performance in the information technology sector. Not owning Advanced Micro Devices detracted. The semiconductor company beat quarterly earnings expectations as it benefited from increased demand for gaming as well as missteps by its large competitor Intel. Netherlands-based semiconductor company ASML Holding lagged after it reported weaker-than-anticipated revenues.
*Total returns for periods less than one year are not annualized.
4
ConocoPhillips stock fell after the oil giant reported a disappointing quarter due to declining oil prices and low production. Lack of exposure to United Parcel Service detracted as package deliveries surged during the pandemic. Not owning Berkshire Hathaway also weighed on performance. The stock of Warren Buffett’s holding company bounced back strongly as the stock market recovered from business disruptions due to the pandemic.
Portfolio Positioning
Our process uses fundamental analysis aimed at identifying growing, large-cap companies demonstrating sustainable corporate behaviors. Rather than screen out certain industries or sectors, we seek to identify companies with the strongest fundamental growth and ESG characteristics in each sector. As a result of this approach, our sector and industry allocations reflect where we are finding opportunities at a given time.
At the end of the period, information technology and industrials were our largest overweights. We have found strong growth opportunities in information technology companies with attractive ESG profiles through bottom-up analysis. Our exposure to opportunities in the software and communications equipment industries led our technology overweight.
Communication services ended the period as the fund’s largest underweight. The relative positioning was largely attributable to an underweight in the entertainment, media and diversified telecommunication services industries.
A strategy or emphasis on environmental, social and governance factors (ESG) may limit the investment opportunities available to a portfolio. Therefore, the portfolio may underperform or perform differently than other portfolios that do not have an ESG investment focus. A portfolio’s ESG investment focus may also result in the portfolio investing in securities or industry sectors that perform differently or maintain a different risk profile than the market generally or compared to underlying holdings that are not screened for ESG standards.
5
| Fund Characteristics | ||
| AUGUST 31, 2020 | |||||
| Top Ten Holdings | % of net assets | ||||
| Microsoft Corp. | 7.7% | ||||
| Apple, Inc. | 7.2% | ||||
| Amazon.com, Inc. | 5.3% | ||||
| Alphabet, Inc., Class A | 3.7% | ||||
| Facebook, Inc., Class A | 2.3% | ||||
| Prologis, Inc. | 2.2% | ||||
| Procter & Gamble Co. (The) | 2.1% | ||||
| Home Depot, Inc. (The) | 2.1% | ||||
| NextEra Energy, Inc. | 2.0% | ||||
| NVIDIA Corp. | 1.9% | ||||
| Top Five Industries | % of net assets | ||||
| Software | 9.7% | ||||
| Technology Hardware, Storage and Peripherals | 7.2% | ||||
| IT Services | 6.3% | ||||
| Interactive Media and Services | 6.0% | ||||
| Internet and Direct Marketing Retail | 5.8% | ||||
| Types of Investments in Portfolio | % of net assets | ||||
| Common Stocks | 99.6% | ||||
| Temporary Cash Investments | 0.3% | ||||
| Other Assets and Liabilities | 0.1% | ||||
6
| Shareholder Fee Example | ||
Fund shareholders may incur two types of costs: (1) transaction costs, including brokerage commissions paid on purchases and sales of fund shares; and (2) ongoing costs, including management fees and other fund expenses. This example is intended to help you understand your ongoing costs (in dollars) of investing in your fund and to compare these costs with the ongoing cost of investing in other funds.
The example is based on an investment of $1,000 made at the beginning of the period and held for the entire period from March 1, 2020 to August 31, 2020 (except as noted).
Actual Expenses
The table provides information about actual account values and actual expenses. You may use the information, together with the amount you invested, to estimate the expenses that you paid over the period. Simply divide your account value by $1,000 (for example, an $8,600 account value divided by $1,000 = 8.6), then multiply the result by the number under the heading “Expenses Paid During Period” to estimate the expenses you paid on your account during this period.
Hypothetical Example for Comparison Purposes
The table also provides information about hypothetical account values and hypothetical expenses based on the actual expense ratio of your fund and an assumed rate of return of 5% per year before expenses, which is not the actual return of a fund. The hypothetical account values and expenses may not be used to estimate the actual ending account balance or expenses you paid for the period. You may use this information to compare the ongoing costs of investing in your fund and other funds. To do so, compare this 5% hypothetical example with the 5% hypothetical examples that appear in the shareholder reports of the other funds.
Please note that the expenses shown in the table are meant to highlight your ongoing costs only and do not reflect any transactional costs, such as brokerage commissions paid on purchases and sales of fund shares. Therefore, the table is useful in comparing ongoing costs only, and will not help you determine the relative total costs of owning different funds. In addition, if these transactional costs were included, your costs would have been higher.
| Beginning Account Value 3/1/20 | Ending Account Value 8/31/20 | Expenses Paid During Period(1) 3/1/20 - 8/31/20 | Annualized Expense Ratio(1) | |||||||||||
| Actual | $1,000 | $1,115.60(2) | $0.56(3) | 0.39% | ||||||||||
| Hypothetical | $1,000 | $1,023.18(4) | $1.98(4) | 0.39% | ||||||||||
(1)Expenses are equal to the fund's annualized expense ratio listed in the table above, multiplied by the average account value over the period, multiplied by 184, the number of days in the most recent fiscal half-year, divided by 366, to reflect the one-half year period. Annualized expense ratio reflects actual expenses, including any applicable fee waivers or expense reimbursements and excluding any acquired fund fees and expenses.
(2)Ending account value based on actual return from July 13, 2020 (fund inception) through August 31, 2020.
(3)Expenses are equal to the fund's annualized expense ratio listed in the table above, multiplied by the average account value over the period, multiplied by 50, the number of days in the period from July 13, 2020 (fund inception) through August 31, 2020, divided by 366, to reflect the period. Had the fund been available for the full period, the expenses paid during the period would have been higher.
(4)Ending account value and expenses paid during the period assumes the fund had been available throughout the entire period and are calculated using the fund's annualized expense ratio listed in the table above.
7
| Schedule of Investments | ||
AUGUST 31, 2020
| Shares | Value | |||||||
| COMMON STOCKS — 99.6% | ||||||||
| Aerospace and Defense — 0.9% | ||||||||
| Lockheed Martin Corp. | 2,029 | $ | 791,838 | |||||
| Air Freight and Logistics — 0.3% | ||||||||
| Expeditors International of Washington, Inc. | 2,910 | 257,215 | ||||||
| Auto Components — 0.7% | ||||||||
| Aptiv plc | 6,701 | 577,090 | ||||||
| Banks — 3.4% | ||||||||
| Bank of America Corp. | 49,674 | 1,278,609 | ||||||
| Citigroup, Inc. | 9,981 | 510,229 | ||||||
| JPMorgan Chase & Co. | 11,187 | 1,120,825 | ||||||
| 2,909,663 | ||||||||
| Beverages — 1.5% | ||||||||
| PepsiCo, Inc. | 8,999 | 1,260,400 | ||||||
| Biotechnology — 2.7% | ||||||||
| AbbVie, Inc. | 8,558 | 819,600 | ||||||
| Amgen, Inc. | 4,081 | 1,033,799 | ||||||
Vertex Pharmaceuticals, Inc.(1) | 1,453 | 405,561 | ||||||
| 2,258,960 | ||||||||
| Building Products — 1.7% | ||||||||
| Johnson Controls International plc | 18,303 | 745,481 | ||||||
| Masco Corp. | 11,693 | 681,702 | ||||||
| 1,427,183 | ||||||||
| Capital Markets — 4.0% | ||||||||
| Ameriprise Financial, Inc. | 1,708 | 267,815 | ||||||
| BlackRock, Inc. | 1,049 | 623,305 | ||||||
| Intercontinental Exchange, Inc. | 4,984 | 529,450 | ||||||
| Morgan Stanley | 18,047 | 943,136 | ||||||
| S&P Global, Inc. | 2,914 | 1,067,748 | ||||||
| 3,431,454 | ||||||||
| Chemicals — 2.3% | ||||||||
| Ecolab, Inc. | 2,178 | 429,240 | ||||||
| Linde plc | 3,910 | 976,484 | ||||||
| Sherwin-Williams Co. (The) | 778 | 522,077 | ||||||
| 1,927,801 | ||||||||
| Communications Equipment — 0.9% | ||||||||
| Cisco Systems, Inc. | 17,967 | 758,567 | ||||||
| Consumer Finance — 0.6% | ||||||||
| American Express Co. | 4,779 | 485,499 | ||||||
| Containers and Packaging — 0.7% | ||||||||
| Ball Corp. | 7,046 | 566,287 | ||||||
| Diversified Telecommunication Services — 1.2% | ||||||||
| Verizon Communications, Inc. | 17,486 | 1,036,395 | ||||||
| Electric Utilities — 2.0% | ||||||||
| NextEra Energy, Inc. | 6,193 | 1,728,900 | ||||||
| Electrical Equipment — 0.5% | ||||||||
| Eaton Corp. plc | 4,196 | 428,412 | ||||||
8
| Shares | Value | |||||||
| Electronic Equipment, Instruments and Components — 1.1% | ||||||||
| CDW Corp. | 1,704 | $ | 193,660 | |||||
| Cognex Corp. | 4,873 | 337,163 | ||||||
Keysight Technologies, Inc.(1) | 4,099 | 403,833 | ||||||
| 934,656 | ||||||||
| Entertainment — 1.6% | ||||||||
| Activision Blizzard, Inc. | 5,957 | 497,529 | ||||||
| Walt Disney Co. (The) | 6,677 | 880,496 | ||||||
| 1,378,025 | ||||||||
| Equity Real Estate Investment Trusts (REITs) — 3.0% | ||||||||
| Prologis, Inc. | 18,454 | 1,879,724 | ||||||
| SBA Communications Corp. | 2,081 | 636,932 | ||||||
| 2,516,656 | ||||||||
| Food and Staples Retailing — 1.0% | ||||||||
| Costco Wholesale Corp. | 1,287 | 447,439 | ||||||
| Sysco Corp. | 6,517 | 391,932 | ||||||
| 839,371 | ||||||||
| Food Products — 0.9% | ||||||||
Beyond Meat, Inc.(1) | 229 | 31,110 | ||||||
| Mondelez International, Inc., Class A | 10,677 | 623,750 | ||||||
Vital Farms, Inc.(1) | 2,993 | 117,924 | ||||||
| 772,784 | ||||||||
| Health Care Equipment and Supplies — 2.3% | ||||||||
| Baxter International, Inc. | 4,645 | 404,440 | ||||||
Edwards Lifesciences Corp.(1) | 7,475 | 641,654 | ||||||
| Medtronic plc | 6,677 | 717,577 | ||||||
| ResMed, Inc. | 954 | 172,464 | ||||||
| 1,936,135 | ||||||||
| Health Care Providers and Services — 3.1% | ||||||||
| Cigna Corp. | 2,196 | 389,504 | ||||||
| CVS Health Corp. | 10,276 | 638,345 | ||||||
| Humana, Inc. | 1,106 | 459,178 | ||||||
| UnitedHealth Group, Inc. | 3,587 | 1,121,117 | ||||||
| 2,608,144 | ||||||||
| Hotels, Restaurants and Leisure — 0.6% | ||||||||
Chipotle Mexican Grill, Inc.(1) | 362 | 474,321 | ||||||
| Household Products — 2.7% | ||||||||
| Colgate-Palmolive Co. | 5,933 | 470,249 | ||||||
| Procter & Gamble Co. (The) | 13,130 | 1,816,273 | ||||||
| 2,286,522 | ||||||||
| Industrial Conglomerates — 1.1% | ||||||||
| Honeywell International, Inc. | 5,855 | 969,295 | ||||||
| Insurance — 1.4% | ||||||||
| Aflac, Inc. | 4,629 | 168,125 | ||||||
| Marsh & McLennan Cos., Inc. | 2,418 | 277,852 | ||||||
| Progressive Corp. (The) | 2,739 | 260,315 | ||||||
| Prudential Financial, Inc. | 2,587 | 175,321 | ||||||
| Travelers Cos., Inc. (The) | 2,765 | 320,851 | ||||||
| 1,202,464 | ||||||||
| Interactive Media and Services — 6.0% | ||||||||
Alphabet, Inc., Class A(1) | 1,944 | 3,167,806 | ||||||
9
| Shares | Value | |||||||
Facebook, Inc., Class A(1) | 6,488 | $ | 1,902,282 | |||||
| 5,070,088 | ||||||||
| Internet and Direct Marketing Retail — 5.8% | ||||||||
Amazon.com, Inc.(1) | 1,292 | 4,458,640 | ||||||
| Expedia Group, Inc. | 4,701 | 461,403 | ||||||
| 4,920,043 | ||||||||
| IT Services — 6.3% | ||||||||
| Accenture plc, Class A | 4,244 | 1,018,263 | ||||||
| International Business Machines Corp. | 2,830 | 348,967 | ||||||
| MasterCard, Inc., Class A | 3,568 | 1,278,022 | ||||||
PayPal Holdings, Inc.(1) | 6,878 | 1,404,075 | ||||||
| Visa, Inc., Class A | 6,136 | 1,300,771 | ||||||
| 5,350,098 | ||||||||
| Life Sciences Tools and Services — 2.0% | ||||||||
| Agilent Technologies, Inc. | 6,594 | 662,169 | ||||||
| Thermo Fisher Scientific, Inc. | 2,364 | 1,014,109 | ||||||
| 1,676,278 | ||||||||
| Machinery — 1.6% | ||||||||
| Cummins, Inc. | 3,441 | 713,147 | ||||||
| Parker-Hannifin Corp. | 3,185 | 656,142 | ||||||
| 1,369,289 | ||||||||
| Media — 0.7% | ||||||||
| Comcast Corp., Class A | 13,929 | 624,158 | ||||||
| Multiline Retail — 0.4% | ||||||||
| Target Corp. | 2,353 | 355,797 | ||||||
| Oil, Gas and Consumable Fuels — 1.7% | ||||||||
| ConocoPhillips | 21,883 | 829,147 | ||||||
| Phillips 66 | 7,686 | 449,400 | ||||||
| Valero Energy Corp. | 3,350 | 176,177 | ||||||
| 1,454,724 | ||||||||
| Personal Products — 0.4% | ||||||||
| Estee Lauder Cos., Inc. (The), Class A | 1,385 | 307,082 | ||||||
| Pharmaceuticals — 3.6% | ||||||||
| Bristol-Myers Squibb Co. | 14,864 | 924,541 | ||||||
| Merck & Co., Inc. | 13,288 | 1,133,068 | ||||||
| Novo Nordisk A/S, ADR | 7,237 | 477,931 | ||||||
| Zoetis, Inc. | 3,159 | 505,756 | ||||||
| 3,041,296 | ||||||||
| Professional Services — 0.8% | ||||||||
| IHS Markit Ltd. | 8,725 | 697,302 | ||||||
| Road and Rail — 1.8% | ||||||||
| Norfolk Southern Corp. | 2,831 | 601,672 | ||||||
| Union Pacific Corp. | 4,833 | 930,063 | ||||||
| 1,531,735 | ||||||||
| Semiconductors and Semiconductor Equipment — 4.8% | ||||||||
| Applied Materials, Inc. | 8,398 | 517,317 | ||||||
| ASML Holding NV, NY Shares | 1,638 | 612,907 | ||||||
| Broadcom, Inc. | 1,599 | 555,093 | ||||||
| Intel Corp. | 6,378 | 324,959 | ||||||
| NVIDIA Corp. | 2,953 | 1,579,796 | ||||||
| Texas Instruments, Inc. | 3,301 | 469,237 | ||||||
| 4,059,309 | ||||||||
10
| Shares | Value | |||||||
| Software — 9.7% | ||||||||
Adobe, Inc.(1) | 1,699 | $ | 872,250 | |||||
| Microsoft Corp. | 28,880 | 6,513,306 | ||||||
salesforce.com, Inc.(1) | 3,212 | 875,752 | ||||||
| 8,261,308 | ||||||||
| Specialty Retail — 3.0% | ||||||||
| Home Depot, Inc. (The) | 6,238 | 1,778,079 | ||||||
| TJX Cos., Inc. (The) | 14,019 | 768,101 | ||||||
| 2,546,180 | ||||||||
| Technology Hardware, Storage and Peripherals — 7.2% | ||||||||
| Apple, Inc. | 47,416 | 6,118,561 | ||||||
| Textiles, Apparel and Luxury Goods — 1.6% | ||||||||
| NIKE, Inc., Class B | 9,535 | 1,066,871 | ||||||
| VF Corp. | 3,990 | 262,343 | ||||||
| 1,329,214 | ||||||||
TOTAL COMMON STOCKS (Cost $77,887,209) | 84,476,499 | |||||||
| TEMPORARY CASH INVESTMENTS — 0.3% | ||||||||
| State Street Institutional U.S. Government Money Market Fund, Premier Class (Cost $247,477) | 247,477 | 247,477 | ||||||
TOTAL INVESTMENT SECURITIES — 99.9% (Cost $78,134,686) | 84,723,976 | |||||||
| OTHER ASSETS AND LIABILITIES — 0.1% | 69,525 | |||||||
| TOTAL NET ASSETS — 100.0% | $ | 84,793,501 | ||||||
| NOTES TO SCHEDULE OF INVESTMENTS | ||||||||
| ADR | - | American Depositary Receipt | ||||||
(1)Non-income producing.
See Notes to Financial Statements.
11
| Statement of Assets and Liabilities | ||
| AUGUST 31, 2020 | |||||
| Assets | |||||
| Investment securities, at value (cost of $78,134,686) | $ | 84,723,976 | |||
| Cash | 469 | ||||
| Dividends and interest receivable | 93,402 | ||||
| 84,817,847 | |||||
| Liabilities | |||||
| Accrued management fees | 24,346 | ||||
| Net Assets | $ | 84,793,501 | |||
| Shares outstanding (unlimited number of shares authorized) | 1,920,000 | ||||
| Net Asset Value Per Share | $ | 44.16 | |||
| Net Assets Consist of: | |||||
| Capital paid in | $ | 78,165,014 | |||
| Distributable earnings | 6,628,487 | ||||
| $ | 84,793,501 | ||||
See Notes to Financial Statements.
12
| Statement of Operations | ||
FOR THE PERIOD ENDED AUGUST 31, 2020(1) | |||||
| Investment Income (Loss) | |||||
| Income: | |||||
| Dividends (net of foreign taxes withheld of $460) | $ | 138,370 | |||
| Interest | 15 | ||||
| 138,385 | |||||
| Expenses: | |||||
| Management fees | 35,488 | ||||
| Net investment income (loss) | 102,897 | ||||
| Realized and Unrealized Gain (Loss) | |||||
| Net realized gain (loss) on investment transactions | (63,700) | ||||
| Change in net unrealized appreciation (depreciation) on investments | 6,589,290 | ||||
| Net realized and unrealized gain (loss) | 6,525,590 | ||||
| Net Increase (Decrease) in Net Assets Resulting from Operations | $ | 6,628,487 | |||
(1)July 13, 2020 (fund inception) through August 31, 2020.
See Notes to Financial Statements.
13
| Statement of Changes in Net Assets | ||
PERIOD ENDED AUGUST 31, 2020(1) | |||||
| Increase (Decrease) in Net Assets | |||||
| Operations | |||||
| Net investment income (loss) | $ | 102,897 | |||
| Net realized gain (loss) | (63,700) | ||||
| Change in net unrealized appreciation (depreciation) | 6,589,290 | ||||
| Net increase (decrease) in net assets resulting from operations | 6,628,487 | ||||
| Capital Share Transactions | |||||
| Proceeds from shares sold | 78,165,014 | ||||
| Net increase (decrease) in net assets | 84,793,501 | ||||
| Net Assets | |||||
| End of period | $ | 84,793,501 | |||
| Transactions in Shares of the Fund | |||||
| Sold | 1,920,000 | ||||
(1)July 13, 2020 (fund inception) through August 31, 2020.
See Notes to Financial Statements.
14
| Notes to Financial Statements | ||
AUGUST 31, 2020
1. Organization
American Century ETF Trust (the trust) was registered as a Delaware statutory trust in 2017 and is registered under the Investment Company Act of 1940, as amended (the 1940 Act), as an open-end management investment company. American Century Sustainable Equity ETF (the fund) is one fund in a series issued by the trust. The fund's investment objective is to seek long-term capital growth. The fund is not permitted to invest in securities issued by companies assigned the Global Industry Classification Standard or the Bloomberg Industry Classification Standard for the tobacco industry. Shares of the fund are listed for trading on the NYSE Arca, Inc. The fund incepted on July 13, 2020.
2. Significant Accounting Policies
The following is a summary of significant accounting policies consistently followed by the fund in preparation of its financial statements. The fund is an investment company and follows accounting and reporting guidance in accordance with accounting principles generally accepted in the United States of America. This may require management to make certain estimates and assumptions at the date of the financial statements. Actual results could differ from these estimates. Management evaluated the impact of events or transactions occurring through the date the financial statements were issued that would merit recognition or disclosure.
Investment Valuations — The fund determines the fair value of its investments and computes its net asset value per share at the close of regular trading (usually 4 p.m. Eastern time) on the New York Stock Exchange (NYSE) on each day the NYSE is open. The Board of Trustees has adopted valuation policies and procedures to guide the investment advisor in the fund’s investment valuation process and to provide methodologies for the oversight of the fund’s pricing function.
Equity securities that are listed or traded on a domestic securities exchange are valued at the last reported sales price or at the official closing price as provided by the exchange. Equity securities traded on foreign securities exchanges are generally valued at the closing price of such securities on the exchange where primarily traded or at the close of the NYSE, if that is earlier. If no last sales price is reported, or if local convention or regulation so provides, the mean of the latest bid and asked prices may be used. Securities traded over-the-counter are valued at the mean of the latest bid and asked prices, the last sales price, or the official closing price.
Open-end management investment companies are valued at the reported net asset value per share.
If the fund determines that the market price for an investment is not readily available or the valuation methods mentioned above do not reflect an investment’s fair value, such investment is valued as determined in good faith by the Board of Trustees or its delegate, in accordance with policies and procedures adopted by the Board of Trustees. In its determination of fair value, the fund may review several factors including, but not limited to, market information regarding the specific investment or comparable investments and correlation with other investment types, futures indices or general market indicators. Circumstances that may cause the fund to use these procedures to value an investment include, but are not limited to: an investment has been declared in default or is distressed; trading in a security has been suspended during the trading day or a security is not actively trading on its principal exchange; prices received from a regular pricing source are deemed unreliable; or there is a foreign market holiday and no trading occurred.
The fund monitors for significant events occurring after the close of an investment’s primary exchange but before the fund’s net asset value per share is determined. Significant events may include, but are not limited to: corporate announcements and transactions; governmental action and political unrest that could impact a specific investment or an investment sector; or armed conflicts, natural disasters and similar events that could affect investments in a specific country or region. The fund also monitors for significant fluctuations between domestic and foreign markets, as evidenced by the U.S. market or such other indicators that the Board of Trustees, or its delegate, deems appropriate. The fund may apply a model-derived factor to the closing price of equity securities traded on foreign securities exchanges. The factor is based on observable market data as provided by an independent pricing service.
15
Security Transactions — Security transactions are accounted for as of the trade date. Net realized gains and losses are determined on the identified cost basis, which is also used for federal income tax purposes.
Investment Income — Dividend income less foreign taxes withheld, if any, is recorded as of the ex-dividend date. Distributions received on securities that represent a return of capital or long-term capital gain are recorded as a reduction of cost of investments and/or as a realized gain. The fund may estimate the components of distributions received that may be considered nontaxable distributions or long-term capital gain distributions for income tax purposes. Interest income is recorded on the accrual basis and includes accretion of discounts and amortization of premiums.
Income Tax Status — It is the fund’s policy to distribute substantially all net investment income and net realized gains to shareholders and to otherwise qualify as a regulated investment company under provisions of the Internal Revenue Code. Accordingly, no provision has been made for income taxes. The fund files U.S. federal, state, local and non-U.S. tax returns as applicable. The fund's tax returns are subject to examination by the relevant taxing authority until expiration of the applicable statute of limitations, which is generally three years from the date of filing but can be longer in certain jurisdictions. At this time, management believes there are no uncertain tax positions which, based on their technical merit, would not be sustained upon examination and for which it is reasonably possible that the total amounts of unrecognized tax benefits will significantly change in the next twelve months.
Distributions to Shareholders — Distributions from net investment income, if any, are generally declared and paid quarterly. Distributions from net realized gains, if any, are generally declared and paid annually.
Indemnifications — Under the trust’s organizational documents, its officers and trustees are indemnified against certain liabilities arising out of the performance of their duties to the fund. In addition, in the normal course of business, the fund enters into contracts that provide general indemnifications. The maximum exposure under these arrangements is unknown as this would involve future claims that may be made against a fund. The risk of material loss from such claims is considered by management to be remote.
3. Fees and Transactions with Related Parties
Certain officers and trustees of the trust are also officers and/or directors of American Century Companies, Inc. (ACC). The trust's investment advisor, American Century Investment Management, Inc. (ACIM), and the trust’s administrator, American Century Services, LLC, are wholly owned, directly or indirectly, by ACC.
Management Fees — The trust has entered into a management agreement with ACIM, under which ACIM provides the fund with investment advisory and management services in exchange for a single, unified management fee (the fee). The agreement provides that ACIM will pay all expenses of managing and operating the fund, except brokerage and other transaction fees and expenses relating to the acquisition and disposition of portfolio securities, acquired fund fees and expenses, interest, taxes, litigation expenses and extraordinary expenses. The fee is computed and accrued daily based on the daily net assets of the fund and paid monthly in arrears. The annual management fee is 0.39%.
4. Investment Transactions
Purchases and sales of investment securities, excluding short-term investments and in-kind transactions, for the period ended August 31, 2020 were $7,663,831 and $5,227,107, respectively.
Securities received in-kind through subscriptions for the period ended August 31, 2020 were $75,514,185. There were no securities delivered in-kind through redemptions during the period.
5. Capital Share Transactions
The fund’s shares may only be purchased and sold on a national securities exchange through a broker-dealer. The price of the fund’s shares is based on market price, and because ETF shares trade at market prices rather than net asset value (NAV), shares may trade at a price greater than NAV (a premium) or less than NAV (a discount). The fund issues and redeems shares that have been aggregated into blocks of 10,000 shares or multiples thereof (Creation Units) to authorized participants who have entered into agreements with the fund's distributor. The fund will generally issue and redeem Creation Units in return for a designated portfolio of securities (and an amount of cash) that the fund specifies each day. Investors transacting in Creation Units for cash may also pay an additional variable charge to compensate the fund for certain transaction costs and market impact expenses relating to investing in portfolio securities. Such variable charges, if any, are included in proceeds from shares sold in the Statement of Changes in Net Assets.
16
6. Fair Value Measurements
The fund’s investments valuation process is based on several considerations and may use multiple inputs to determine the fair value of the investments held by the fund. In conformity with accounting principles generally accepted in the United States of America, the inputs used to determine a valuation are classified into three broad levels.
•Level 1 valuation inputs consist of unadjusted quoted prices in an active market for identical investments.
•Level 2 valuation inputs consist of direct or indirect observable market data (including quoted prices for comparable investments, evaluations of subsequent market events, interest rates, prepayment speeds, credit risk, etc.). These inputs also consist of quoted prices for identical investments initially expressed in local currencies that are adjusted through translation into U.S. dollars.
•Level 3 valuation inputs consist of unobservable data (including a fund’s own assumptions).
The level classification is based on the lowest level input that is significant to the fair valuation measurement. The valuation inputs are not necessarily an indication of the risks associated with investing in these securities or other financial instruments.
As of period end, the fund’s investment securities were classified as Level 1. The Schedule of Investments provides additional information on the fund's portfolio holdings.
7. Risk Factors
The value of the fund’s shares will go up and down, sometimes rapidly or unpredictably, based on the performance of the securities owned by the fund and other factors generally affecting the securities market. Market risks, including political, regulatory, economic and social developments, can affect the value of the fund’s investments. Natural disasters, public health emergencies, terrorism and other unforeseeable events may lead to increased market volatility and may have adverse long-term effects on world economies and markets generally.
8. Federal Tax Information
The book-basis character of distributions made during the year from net investment income or net realized gains may differ from their ultimate characterization for federal income tax purposes. These differences reflect the differing character of certain income items and net realized gains and losses for financial statement and tax purposes, and may result in reclassification among certain capital accounts on the financial statements. There were no distributions paid by the fund during the period July 13, 2020 (fund inception) through August 31, 2020.
As of period end, the federal tax cost of investments and the components of distributable earnings on a tax-basis were as follows:
| Federal tax cost of investments | $ | 78,159,222 | |||
| Gross tax appreciation of investments | $ | 6,947,646 | |||
| Gross tax depreciation of investments | (382,892) | ||||
| Net tax appreciation (depreciation) of investments | $ | 6,564,754 | |||
| Undistributed ordinary income | $ | 102,897 | |||
| Accumulated short-term capital losses | $ | (39,164) | |||
The difference between book-basis and tax-basis unrealized appreciation (depreciation) is attributable primarily to the tax deferral of losses on wash sales.
Accumulated capital losses represent net capital loss carryovers that may be used to offset future realized
capital gains for federal income tax purposes. The capital loss carryovers may be carried forward for an
unlimited period. Future capital loss carryover utilization in any given year may be subject to Internal Revenue
Code limitations.
17
| Financial Highlights | ||
| For a Share Outstanding Throughout the Period Indicated | ||||||||||||||||||||||||||||||||
| Per-Share Data | Ratios and Supplemental Data | |||||||||||||||||||||||||||||||
| Income From Investment Operations: | Ratio to Average Net Assets of: | |||||||||||||||||||||||||||||||
| Net Asset Value, Beginning of Period | Net Investment Income (Loss)(1) | Net Realized and Unrealized Gain (Loss) | Total From Investment Operations | Net Asset Value, End of Period | Total Return(2) | Operating Expenses | Net Investment Income (Loss) | Portfolio Turnover Rate(3) | Net Assets, End of Period (in thousands) | |||||||||||||||||||||||
2020(4) | $39.59 | 0.06 | 4.51 | 4.57 | $44.16 | 11.56% | 0.39%(5) | 1.13%(5) | 10% | $84,794 | ||||||||||||||||||||||
| Notes to Financial Highlights | ||
(1)Computed using average shares outstanding throughout the period.
(2)Total returns are calculated based on the net asset value of the last business day. Total returns for periods less than one year are not annualized.
(3)Excludes securities received or delivered in-kind.
(4)July 13, 2020 (fund inception) through August 31, 2020.
(5)Annualized.
See Notes to Financial Statements.
| Report of Independent Registered Public Accounting Firm | ||
To the Shareholders and the Board of Trustees of American Century ETF Trust:
Opinion on the Financial Statements and Financial Highlights
We have audited the accompanying statement of assets and liabilities, including the schedule of investments, of American Century Sustainable Equity ETF (the “Fund”), one of the funds constituting the American Century ETF Trust, as of August 31, 2020, and the related statement of operations, the statement of changes in net assets, and the financial highlights for the period from July 13, 2020 (fund inception) through August 31, 2020, and the related notes. In our opinion, the financial statements and financial highlights present fairly, in all material respects, the financial position of American Century Sustainable Equity ETF as of August 31, 2020, and the results of its operations, the changes in its net assets, and the financial highlights for the period from July 13, 2020 (fund inception) through August 31, 2020, in conformity with accounting principles generally accepted in the United States of America.
Basis for Opinion
These financial statements and financial highlights are the responsibility of the Fund's management. Our responsibility is to express an opinion on the Fund’s financial statements and financial highlights based on our audit. We are a public accounting firm registered with the Public Company Accounting Oversight Board (United States) (PCAOB) and are required to be independent with respect to the Fund in accordance with the U.S. federal securities laws and the applicable rules and regulations of the Securities and Exchange Commission and the PCAOB.
We conducted our audit in accordance with the standards of the PCAOB. Those standards require that we plan and perform the audit to obtain reasonable assurance about whether the financial statements and financial highlights are free of material misstatement, whether due to error or fraud. The Fund is not required to have, nor were we engaged to perform, an audit of its internal control over financial reporting. As part of our audit we are required to obtain an understanding of internal control over financial reporting but not for the purpose of expressing an opinion on the effectiveness of the Fund’s internal control over financial reporting. Accordingly, we express no such opinion.
Our audit included performing procedures to assess the risks of material misstatement of the financial statements and financial highlights, whether due to error or fraud, and performing procedures that respond to those risks. Such procedures included examining, on a test basis, evidence regarding the amounts and disclosures in the financial statements and financial highlights. Our audit also included evaluating the accounting principles used and significant estimates made by management, as well as evaluating the overall presentation of the financial statements and financial highlights. Our procedures included confirmation of securities owned as of August 31, 2020, by correspondence with the custodian and brokers; when replies were not received from brokers, we performed other auditing procedures. We believe that our audit provides a reasonable basis for our opinion.
DELOITTE & TOUCHE LLP
Kansas City, Missouri
October 16, 2020
We have served as the auditor of one or more American Century investment companies since 1997.
19
| Management | ||
The Board of Trustees
The individuals listed below serve as trustees of the funds. Each trustee will continue to serve in this capacity until death, retirement, resignation or removal from office. The board has adopted a mandatory retirement age for trustees who are not “interested persons,” as that term is defined in the Investment Company Act (independent trustees). Trustees who are not also officers of the trust shall retire by December 31st of the year in which they reach their 75th birthday.
Mr. Thomas is an “interested person” because he currently serves as President and Chief Executive Officer of American Century Companies, Inc. (ACC), the parent company of American Century Investment Management, Inc. (ACIM or the advisor). The other trustees are independent. They are not employees, directors or officers of, and have no financial interest in, ACC or any of its wholly owned, direct or indirect, subsidiaries, including ACIM and American Century Services, LLC (ACS), and they do not have any other affiliations, positions or relationships that would cause them to be considered “interested persons” under the Investment Company Act. The following trustees also serve in this capacity for a number of other registered investment companies in the American Century Investments family of funds: Jonathan S. Thomas, 15; Ronald J. Gilson, 8; and Stephen E. Yates, 7.
The following table presents additional information about the trustees. The mailing address for each trustee other than Jonathan S. Thomas is 330 Madison Avenue, New York, New York 10017. The mailing address for Jonathan S. Thomas is 4500 Main Street, Kansas City, Missouri 64111.
| Name (Year of Birth) | Position(s) Held with Funds | Length of Time Served | Principal Occupation(s) During Past 5 Years | Number of American Century Portfolios Overseen by Trustee | Other Directorships Held During Past 5 Years | ||||||||||||
| Independent Trustees | |||||||||||||||||
| Reginald M. Browne (1968) | Trustee and Chairman of the Board | Since 2017 (Chairman since 2019) | Principal, GTS Securities (automated capital markets trading firm)(2019 to present); Senior Managing Director, Co Global Head-ETF Group, Cantor Fitzgerald (financial services firm)(2013 to 2019) | 19 | None | ||||||||||||
| Ronald J. Gilson (1946) | Trustee | Since 2017 | Charles J. Meyers Professor of Law and Business, Emeritus, Stanford Law School (1979 to 2016); Marc and Eva Stern Professor of Law and Business, Columbia University School of Law (1992 to present) | 59 | None | ||||||||||||
| Barry A. Mendelson (1958) | Trustee | Since 2017 | Retired; Consultant regarding ETF and mutual fund matters (2015 to 2016); Principal and Senior Counsel, The Vanguard Group (investment management)(1998 to 2014) | 19 | None | ||||||||||||
| Stephen E. Yates (1948) | Trustee | Since 2017 | Retired | 82 | None | ||||||||||||
20
| Name (Year of Birth) | Position(s) Held with Funds | Length of Time Served | Principal Occupation(s) During Past 5 Years | Number of American Century Portfolios Overseen by Trustee | Other Directorships Held During Past 5 Years | ||||||||||||
| Interested Trustees | |||||||||||||||||
| Jonathan S. Thomas (1963) | Trustee | Since 2017 | President and Chief Executive Officer, ACC (2007 to present). Also serves as Chief Executive Officer, ACS; Executive Vice President, ACIM; Director, ACC, ACIM and other ACC subsidiaries | 122 | None | ||||||||||||
The Statement of Additional Information has additional information about the fund's trustees and is available without charge, upon request, by calling 1-800-345-6488.
21
Officers
The following table presents certain information about the executive officers of the funds. Each officer, except Edward Rosenberg, serves as an officer for each of the 16 investment companies in the American Century family of funds. No officer is compensated for his or her service as an officer of the funds. The listed officers are interested persons of the funds and are appointed or re-appointed on an annual basis. The mailing address for each officer listed below is 4500 Main Street, Kansas City, Missouri 64111.
| Name (Year of Birth) | Offices with the Funds | Principal Occupation(s) During the Past Five Years | ||||||
| Patrick Bannigan (1965) | President since 2019 | Executive Vice President and Director, ACC (2012 to present); Chief Financial Officer, Chief Accounting Officer and Treasurer, ACC (2015 to present). Also serves as President, ACS; Vice President, ACIM; Chief Financial Officer, Chief Accounting Officer and/or Director, ACIM, ACS and other ACC subsidiaries | ||||||
| R. Wes Campbell (1974) | Chief Financial Officer and Treasurer since 2018 | Vice President, ACS (2020 to present); Investment Operations and Investment Accounting, ACS (2000 to present) | ||||||
| Amy D. Shelton (1964) | Chief Compliance Officer and Vice President since 2017 | Chief Compliance Officer, American Century funds, (2014 to present); Chief Compliance Officer, ACIM (2014 to present); Chief Compliance Officer, ACIS (2009 to present). Also serves as Vice President, ACIS | ||||||
| Charles A. Etherington (1957) | General Counsel and Vice President since 2017 | Attorney, ACC (1994 to present); Vice President, ACC (2005 to present); General Counsel, ACC (2007 to present). Also serves as General Counsel, ACIM, ACS, ACIS and other ACC subsidiaries; and Senior Vice President, ACIM and ACS | ||||||
| Cleo Chang (1977) | Vice President since 2019 | Senior Vice President, ACIM (2015 to present); Chief Investment Officer, Wilshire Funds Management (2005 to 2015) | ||||||
| David H. Reinmiller (1963) | Vice President since 2017 | Attorney, ACC (1994 to present). Also serves as Vice President, ACIM and ACS | ||||||
| Edward Rosenberg (1973) | Vice President since 2017 | Senior Vice President, ACIM (2017 to present); Senior Vice President, Flexshares Head of ETF Capital Markets, Northern Trust (2012 to 2017) | ||||||
| C. Jean Wade (1964) | Vice President since 2017 | Senior Vice President, ACS (2017 to present); Vice President, ACS (2000 to 2017) | ||||||
| Ward D. Stauffer (1960) | Secretary since 2019 | Attorney, ACS (2003 to present) | ||||||
22
| Approval of Management Agreement | ||
At a meeting held on November 27, 2018, the Fund’s Board of Trustees unanimously approved the initial management agreement pursuant to which American Century Investment Management, Inc. (the “Advisor”) acts as the investment advisor for the Fund. Under Section 15(c) of the Investment Company Act, new contracts for investment advisory services are required to be approved by a majority of a fund’s independent trustees and to be evaluated on an annual basis thereafter.
In advance of the Board’s consideration, the Advisor provided information concerning the Fund. The materials circulated and the discussions held at the meeting detailed the investment objective and strategy proposed to be utilized by the Advisor, the Fund’s characteristics and key attributes, the rationale for launching the Fund, the experience of the staff designated to manage the Fund, the proposed pricing, and the markets in which the Fund would be sold. The information considered and the discussions held included, but were not limited to, the following:
•The nature, extent, and quality of investment management, shareholder services, and other services to be provided by the Advisor to the Fund;
•The wide range of other programs and services to be provided by the Advisor to the Fund and its shareholders on a routine and non-routine basis;
•The Fund’s proposed investment objective and strategy, including a discussion of the Fund’s anticipated investment performance and proposed benchmark;
•The cost of owning the Fund compared to the cost of owning similar funds;
•The Advisor’s compliance policies, procedures, and regulatory experience; and
•Any collateral benefits derived by the Advisor from the management of the Fund.
American Century Investments’ funds utilize a unified management fee structure. Under the unified fee structure, the Advisor is responsible for providing all investment advisory, custody, audit, administrative, compliance, recordkeeping, marketing, and shareholder services, or arranging and supervising third parties to provide such services. By contrast, most other funds are charged a variety of fees, including an investment advisory fee, a transfer agency fee, an administrative fee, distribution charges, and other expenses. Other than their investment advisory fees and Rule 12b-1 fees, all other components of the total fees charged by these other funds may be increased without shareholder approval. The Advisor and Board believe the unified fee structure is a benefit to fund shareholders because it clearly discloses to shareholders the cost of owning fund shares, and because the unified fee cannot be increased without a vote of fund shareholders, it shifts to the Advisor the risk of increased costs of operating the fund and provides a direct incentive to minimize administrative inefficiencies.
Part of the Board’s analysis of fee levels involves reviewing certain evaluative data compiled by an independent provider and comparing the Fund’s annual unified management fee to the total expense ratio of peer funds selected by the independent provider. The Board found the Fund’s management fee to be below the median of the total expense ratios of its peer universe.
When considering the approval of the Fund’s management agreement, the independent Trustees considered the entrepreneurial risk that the Advisor assumes in launching a new fund. In particular, they considered the fact that the Advisor will assume a substantial part of the start-up costs of the Fund and the risk that the Fund will not grow to a level that will become profitable to the Advisor. The Board considered the position that the Fund would take in the lineup of the American Century Investments’ family of funds and the benefits to shareholders of existing funds of the broadened product offering. Finally, while not specifically discussed, but important in the decision to approve the management agreement, is the Trustees’ familiarity with the Advisor. In addition to overseeing the Fund, a majority of the Board also oversees and evaluates on a continuous basis the nature and quality of services the Advisor provides to other funds within the American Century Investments’ complex. As such, the Trustees have confidence in the Advisor’s integrity and competence in providing services to the Fund.
23
The independent Trustees considered all of the information provided by the Advisor, the independent data provider, and their independent counsel in connection with the approval and evaluated such information for the Fund. In connection with their review, the Trustees did not identify any single factor as being all-important or controlling, and each Trustee may have attributed different levels of importance to different factors. The independent Trustees concluded that the overall arrangements between the Fund and the Advisor, as provided in the management agreement, were fair and reasonable in light of the services to be provided and should be approved.
24
| Additional Information | ||
Retirement Account Information
As required by law, distributions you receive from certain retirement accounts are subject to federal income tax withholding, unless you elect not to have withholding apply*. Tax will be withheld on the total amount withdrawn even though you may be receiving amounts that are not subject to withholding, such as nondeductible contributions. In such case, excess amounts of withholding could occur. You may adjust your withholding election so that a greater or lesser amount will be withheld.
Remember, even if you elect not to have income tax withheld, you are liable for paying income tax on the taxable portion of your withdrawal. If you elect not to have income tax withheld or you don’t have enough income tax withheld, you may be responsible for payment of estimated tax. You may incur penalties under the estimated tax rules if your withholding and estimated tax payments are not sufficient. You can reduce or defer the income tax on a distribution by directly or indirectly rolling such distribution over to another IRA or eligible plan. You should consult your tax advisor for additional information.
State tax will be withheld if, at the time of your distribution, your address is within one of the mandatory withholding states and you have federal income tax withheld (or as otherwise required by state law). State taxes will be withheld from your distribution in accordance with the respective state rules.
*Some 403(b), 457 and qualified retirement plan distributions may be subject to 20% mandatory withholding, as they are subject to special tax and withholding rules. Your plan administrator or plan sponsor is required to provide you with a special tax notice explaining those rules at the time you request a distribution. If applicable, federal and/or state taxes may be withheld from your distribution amount.
Proxy Voting Policies
A description of the policies that the fund's investment advisor uses in exercising the voting rights associated with the securities purchased and/or held by the fund are available without charge, upon request, by calling 1-800-345-6488. It is also available on American Century Investments’ website at americancentury.com/proxy and on the Securities and Exchange Commission’s website at sec.gov. Information regarding how the investment advisor voted proxies relating to portfolio securities during the most recent 12-month period ended June 30 is available at americancentury.com/proxy. It is also available at sec.gov.
Quarterly Portfolio Disclosure
The fund files its complete schedule of portfolio holdings with the Securities and Exchange Commission (SEC) for the first and third quarters of each fiscal year as an exhibit to its reports on Form N-PORT. The fund's Form N-PORT reports are available on the SEC’s website at sec.gov.
25
| Notes | ||
26
| Notes | ||
27
| Notes | ||
28
| Notes | ||
29
| Notes | ||
30
| Notes | ||
31
| Notes | ||
32
| ||||||||
| Contact Us | americancenturyetfs.com | |||||||
| American Century Sales Representatives, Financial Professionals, Broker Dealers, Insurance Companies, Banks and Trust Companies | 1-833-ACI-ETFS | |||||||
| Telecommunications Relay Service for the Deaf | 711 | |||||||
| American Century ETF Trust | ||||||||
Investment Advisor: American Century Investment Management, Inc. Kansas City, Missouri | ||||||||
Distributor: Foreside Fund Services, LLC - Distributor, not affiliated with American Century Investment Services, Inc. | ||||||||
| This report and the statements it contains are submitted for the general information of our shareholders. The report is not authorized for distribution to prospective investors unless preceded or accompanied by an effective prospectus. | ||||||||
| ©2020 American Century Proprietary Holdings, Inc. All rights reserved. CL-ANN-96609 2010 | ||||||||
| Annual Report | |||||
| August 31, 2020 | |||||
American Century® STOXX® U.S. Quality Growth ETF (QGRO) | |||||
Beginning on January 1, 2021, as permitted by regulations adopted by the Securities and Exchange Commission, paper copies of the fund’s shareholder reports like this one will no longer be sent by mail, unless you specifically request paper copies of the reports from the fund or from your financial intermediary, such as a broker-dealer or bank. Instead, the reports will be made available on a website, and you will be notified by mail each time a report is posted and provided with a website link to access the report.
If you already elected to receive shareholder reports electronically, you will not be affected by this change and you need not take any action. You may elect to receive shareholder reports and other communications from the fund or your financial intermediary electronically by calling or sending an email request to your appropriate contacts as listed on the back cover of this report.
You may elect to receive all future reports in paper free of charge. You can inform the fund or your financial intermediary that you wish to continue receiving paper copies of your shareholder reports by calling or sending an email request to your appropriate contacts as listed on the back cover of this report. Your election to receive reports in paper will apply to all funds held with the fund complex/your financial intermediary.
| Table of Contents | ||
| President’s Letter | |||||
| Performance | |||||
| Portfolio Commentary | |||||
| Fund Characteristics | |||||
| Shareholder Fee Example | |||||
| Schedule of Investments | |||||
| Statement of Assets and Liabilities | |||||
| Statement of Operations | |||||
| Statement of Changes in Net Assets | |||||
| Notes to Financial Statements | |||||
| Financial Highlights | |||||
| Report of Independent Registered Public Accounting Firm | |||||
| Management | |||||
| Approval of Management Agreement | |||||
| Liquidity Risk Management Program | |||||
| Additional Information | |||||
The iSTOXX American Century USA Quality Growth Index is the intellectual property (including registered trademarks) of STOXX Limited, Zurich, Switzerland (“STOXX”), Deutsche Börse Group or their licensors, which is used under license. American Century STOXX U.S. Quality Growth ETF is neither sponsored nor promoted, distributed or in any other manner supported by STOXX, Deutsche Börse Group or their licensors, research partners or data providers and STOXX, Deutsche Börse Group and their licensors, research partners or data providers do not give any warranty, and exclude any liability (whether in negligence or otherwise) with respect thereto generally or specifically in relation to any errors, omissions or interruptions in the iSTOXX American Century USA Quality Growth Index or its data.
Any opinions expressed in this report reflect those of the author as of the date of the report, and do not necessarily represent the opinions of American Century Investments® or any other person in the American Century Investments organization. Any such opinions are subject to change at any time based upon market or other conditions and American Century Investments disclaims any responsibility to update such opinions. These opinions may not be relied upon as investment advice and, because investment decisions made by American Century Investments funds are based on numerous factors, may not be relied upon as an indication of trading intent on behalf of any American Century Investments fund. Security examples are used for representational purposes only and are not intended as recommendations to purchase or sell securities. Performance information for comparative indices and securities is provided to American Century Investments by third party vendors. To the best of American Century Investments’ knowledge, such information is accurate at the time of printing.
| President’s Letter | ||
Jonathan ThomasDear Investor:
Thank you for reviewing this annual report for the period ended August 31, 2020. Annual reports help convey important information about fund returns, including market factors that affected performance. For additional investment insights, please visit americancenturyetfs.com.
Pandemic Disrupted Economic, Market Courses
Broad market sentiment was generally upbeat into early 2020. Dovish central banks, modest inflation, improving economic and corporate earnings data, and progress on U.S.-China trade helped boost global growth outlooks. Against this backdrop, risk assets largely remained in favor.
However, beginning in late February, COVID-19 quickly quashed the optimistic tone. The outbreak rapidly spread worldwide, halting most U.S. and global economic activity and triggering a deep worldwide recession. Global stocks and credit-sensitive assets sold off sharply, but central banks and federal governments stepped in quickly and aggressively to stabilize financial markets. These extraordinary efforts proved helpful, as most risk assets rebounded quickly, despite weak economic and corporate earnings data. As the period progressed, coronavirus infection and death rates declined in many regions and economies reopened. By the end of August, manufacturing, employment and other data suggested an economic recovery was underway.
Overall, global stocks delivered mixed results for the period. The broad U.S. stock market overcame the effects of the early 2020 sell-off to deliver a solid gain. U.S. stocks generally fared better than their counterparts elsewhere, and the growth style significantly outperformed value stocks, which struggled. Bond returns were broadly positive, as yields declined sharply.
A Slow Return to Normal
The return to pre-pandemic life will take time and patience, but we are confident we will get there. Several drug companies are in final stages of vaccine trials, and medical professionals continue to fine-tune virus treatment protocols. In the meantime, investors likely will face periods of outbreak-related disruptions, economic and political uncertainty, and heightened market volatility. These influences can be unsettling, but they tend to be temporary.
We appreciate your confidence in us during these extraordinary times. Our firm has a long history of helping clients weather unpredictable markets, and we’re confident we will continue to meet today’s challenges.
Sincerely,
Jonathan Thomas
President and Chief Executive Officer
American Century Investments
2
| Performance | ||
| Total Returns as of August 31, 2020 | |||||||||||||||||||||||
| Average Annual Returns | |||||||||||||||||||||||
| 1 year | Since Inception | Inception Date | |||||||||||||||||||||
| Net Asset Value | 34.30% | 18.76% | 9/10/2018 | ||||||||||||||||||||
| Market Price | 34.53% | 18.86% | 9/10/2018 | ||||||||||||||||||||
iSTOXX® American Century USA Quality Growth Index | 34.65% | 19.08% | — | ||||||||||||||||||||
Market price is determined using the bid/ask midpoint at 4:00 p.m. Eastern time, when the net asset value (NAV) is typically calculated. Market performance does not represent the returns you would receive if you traded shares at other times. NAV prices are used to calculate market price performance prior to the date when the fund first traded on the New York Stock Exchange.
Extraordinary performance is attributable in part to unusually favorable market conditions and may not be repeated or consistently achieved in the future.
| Growth of $10,000 Over Life of Fund | ||
| $10,000 investment made September 10, 2018 | ||
| Value on August 31, 2020 | |||||
| Net Asset Value — $14,044 | |||||
iSTOXX® American Century USA Quality Growth Index — $14,119 | |||||
| Total Annual Fund Operating Expenses | |||||||||||||||||
| 0.29% | |||||||||||||||||
The total annual fund operating expenses shown is as stated in the fund’s prospectus current as of the date of this report. The prospectus may vary from the expense ratio shown elsewhere in this report because it is based on a different time period, includes acquired fund fees and expenses, and, if applicable, does not include fee waivers or expense reimbursements.
Data presented reflect past performance. Past performance is no guarantee of future results. Current performance may be higher or lower than the performance shown. Total returns for periods less than one year are not annualized. Investment return and principal value will fluctuate, and redemption value may be more or less than original cost. Data assumes reinvestment of dividends and capital gains, and none of the charts reflect the deduction of taxes that a shareholder would pay on fund distributions or the redemption of fund shares. To obtain performance data current to the most recent month end, please call 1-800-345-6488 or visit americancenturyetfs.com. For additional information about the fund, please consult the prospectus.
3
| Portfolio Commentary | ||
Portfolio Managers: Peruvemba Satish and Rene Casis
Fund Strategy
American Century STOXX® U.S. Quality Growth ETF seeks to provide investment results that closely correspond, before fees and expenses, to the performance of the iSTOXX® American Century USA Quality Growth Index (the underlying index). Under normal market conditions, the fund invests at least 80% of its assets in the component securities of the underlying index.
The STOXX® USA 900 Index, which consists of the 900 largest publicly traded U.S. equity securities, defines the universe we use to create the underlying index. The index is designed to measure the performance of securities in the universe and identify those that exhibit higher growth and quality characteristics relative to their peers. Though component securities of the underlying index may change from time to time, the index typically consists of 150 to 250 securities.
Performance Review
For the 12 months ended August 31, 2020, the fund returned 34.53% on a market price basis. On a net asset value (NAV) basis, the fund returned 34.30%. For the same time period, the underlying index returned 34.65%. The fund fully replicated the underlying index’s components during the reporting period. The fund’s NAV performance differed from the underlying index’s return due to fees and operating expenses associated with the fund.
For the same time period, the fund underperformed market-capitalization-weighted growth strategies, as measured by the Russell 1000 Growth Index* (growth index). The growth index is an unmanaged index generally representative of the performance of U.S. large-cap growth stocks. The fund’s underperformance versus the growth index was largely due to the different compositions of the fund and the growth index. Specifically, the fund tracks the underlying index, which is designed to measure the performance of securities in the universe and identify those that exhibit higher growth and quality characteristics relative to their peers. This approach led to underperformance versus the growth index, which selects and weights growth stocks based on market capitalization.
From a broad perspective, stock selection in the information technology, consumer discretionary and industrials sectors detracted from performance versus the growth index. An overweight allocation to utilities also hampered performance. Stock choices in the health care sector and an underweight allocation to consumer staples benefited the fund’s relative performance, as did an underweight allocation and stock selection in real estate.
At a higher level, it should be noted that the U.S. stock market has increasingly been concentrated in just a handful of names. This is especially true in the growth index, where the top five names make up well over 30% of the index. Part of the risk-aware portfolio construction process embedded in the fund’s index methodology is to cap individual position sizes to no more than 3.5%. In addition, we cap exposure to the high growth sleeve to a maximum of 65%, which is also meant to manage risk but has hampered results as a full allocation to high growth would have outperformed the combination. These risk management techniques were a contributor to the underperformance relative to the broad market index during this period.
The fund’s allocation closed the fiscal year with a bias toward high growth with a 65% weight in high growth and 35% weight in stable growth. Allocations are rebalanced monthly, based on a strategy informed by recent risk-adjusted performance.
*The Russell 1000 Growth Index returns for the one-year and since inception periods ended August 31, 2020, were 44.34% and 23.85%, respectively.
4
| Fund Characteristics | ||
| AUGUST 31, 2020 | |||||
| Top Ten Holdings | % of net assets | ||||
| Vertex Pharmaceuticals, Inc. | 3.5% | ||||
| Neurocrine Biosciences, Inc. | 3.1% | ||||
| Adobe, Inc. | 2.0% | ||||
| Fortinet, Inc. | 2.0% | ||||
| Regeneron Pharmaceuticals, Inc. | 1.9% | ||||
| West Pharmaceutical Services, Inc. | 1.8% | ||||
| Amazon.com, Inc. | 1.8% | ||||
| Charter Communications, Inc., Class A | 1.7% | ||||
| Veeva Systems, Inc., Class A | 1.7% | ||||
| Texas Instruments, Inc. | 1.7% | ||||
| Top Five Industries | % of net assets | ||||
| Software | 19.8% | ||||
| Semiconductors and Semiconductor Equipment | 12.7% | ||||
| Biotechnology | 9.4% | ||||
| Capital Markets | 5.0% | ||||
| Specialty Retail | 5.0% | ||||
| Types of Investments in Portfolio | % of net assets | ||||
| Common Stocks | 99.8% | ||||
| Temporary Cash Investments | 0.1% | ||||
| Other Assets and Liabilities | 0.1% | ||||
5
| Shareholder Fee Example | ||
Fund shareholders may incur two types of costs: (1) transaction costs, including brokerage commissions paid on purchases and sales of fund shares; and (2) ongoing costs, including management fees and other fund expenses. This example is intended to help you understand your ongoing costs (in dollars) of investing in your fund and to compare these costs with the ongoing cost of investing in other funds.
The example is based on an investment of $1,000 made at the beginning of the period and held for the entire period from March 1, 2020 to August 31, 2020.
Actual Expenses
The table provides information about actual account values and actual expenses. You may use the information, together with the amount you invested, to estimate the expenses that you paid over the period. Simply divide your account value by $1,000 (for example, an $8,600 account value divided by $1,000 = 8.6), then multiply the result by the number under the heading “Expenses Paid During Period” to estimate the expenses you paid on your account during this period.
Hypothetical Example for Comparison Purposes
The table also provides information about hypothetical account values and hypothetical expenses based on the actual expense ratio of your fund and an assumed rate of return of 5% per year before expenses, which is not the actual return of a fund. The hypothetical account values and expenses may not be used to estimate the actual ending account balance or expenses you paid for the period. You may use this information to compare the ongoing costs of investing in your fund and other funds. To do so, compare this 5% hypothetical example with the 5% hypothetical examples that appear in the shareholder reports of the other funds.
Please note that the expenses shown in the table are meant to highlight your ongoing costs only and do not reflect any transactional costs, such as brokerage commissions paid on purchases and sales of fund shares. Therefore, the table is useful in comparing ongoing costs only, and will not help you determine the relative total costs of owning different funds. In addition, if these transactional costs were included, your costs would have been higher.
| Beginning Account Value 3/1/20 | Ending Account Value 8/31/20 | Expenses Paid During Period(1) 3/1/20 - 8/31/20 | Annualized Expense Ratio(1) | |||||||||||
| Actual | $1,000 | $1,329.70 | $1.70 | 0.29% | ||||||||||
| Hypothetical | $1,000 | $1,023.68 | $1.48 | 0.29% | ||||||||||
(1)Expenses are equal to the fund's annualized expense ratio listed in the table above, multiplied by the average account value over the period, multiplied by 184, the number of days in the most recent fiscal half-year, divided by 366, to reflect the one-half year period. Annualized expense ratio reflects actual expenses, including any applicable fee waivers or expense reimbursements and excluding any acquired fund fees and expenses.
6
| Schedule of Investments | ||
AUGUST 31, 2020
| Shares | Value | |||||||
| COMMON STOCKS — 99.8% | ||||||||
| Aerospace and Defense — 0.5% | ||||||||
| BWX Technologies, Inc. | 9,077 | $ | 504,772 | |||||
| Lockheed Martin Corp. | 672 | 262,255 | ||||||
| Northrop Grumman Corp. | 774 | 265,180 | ||||||
| 1,032,207 | ||||||||
| Air Freight and Logistics — 0.1% | ||||||||
| Expeditors International of Washington, Inc. | 3,035 | 268,264 | ||||||
| Automobiles — 0.2% | ||||||||
Tesla, Inc.(1) | 656 | 326,898 | ||||||
| Beverages — 0.4% | ||||||||
Boston Beer Co., Inc. (The), Class A(1) | 303 | 267,240 | ||||||
Monster Beverage Corp.(1) | 6,320 | 529,995 | ||||||
| 797,235 | ||||||||
| Biotechnology — 9.4% | ||||||||
| AbbVie, Inc. | 2,821 | 270,167 | ||||||
Alexion Pharmaceuticals, Inc.(1) | 10,745 | 1,227,294 | ||||||
| Amgen, Inc. | 1,069 | 270,799 | ||||||
Exelixis, Inc.(1) | 12,095 | 268,751 | ||||||
Neurocrine Biosciences, Inc.(1) | 56,606 | 6,590,070 | ||||||
Regeneron Pharmaceuticals, Inc.(1) | 6,520 | 4,041,944 | ||||||
Vertex Pharmaceuticals, Inc.(1) | 27,282 | 7,614,952 | ||||||
| 20,283,977 | ||||||||
| Building Products — 0.4% | ||||||||
| Masco Corp. | 8,944 | 521,435 | ||||||
Trex Co., Inc.(1) | 1,803 | 269,531 | ||||||
| 790,966 | ||||||||
| Capital Markets — 5.0% | ||||||||
| Eaton Vance Corp. | 6,761 | 277,336 | ||||||
| FactSet Research Systems, Inc. | 745 | 261,048 | ||||||
| LPL Financial Holdings, Inc. | 12,997 | 1,067,834 | ||||||
| MarketAxess Holdings, Inc. | 7,120 | 3,459,893 | ||||||
| Moody's Corp. | 1,860 | 548,030 | ||||||
| MSCI, Inc. | 1,452 | 541,988 | ||||||
| S&P Global, Inc. | 6,597 | 2,417,273 | ||||||
| Tradeweb Markets, Inc., Class A | 38,838 | 2,225,029 | ||||||
| 10,798,431 | ||||||||
| Chemicals — 0.2% | ||||||||
| RPM International, Inc. | 3,127 | 265,076 | ||||||
| Sherwin-Williams Co. (The) | 396 | 265,736 | ||||||
| 530,812 | ||||||||
| Commercial Services and Supplies — 0.2% | ||||||||
| Cintas Corp. | 817 | 272,257 | ||||||
| Tetra Tech, Inc. | 2,845 | 262,622 | ||||||
| 534,879 | ||||||||
| Communications Equipment — 3.3% | ||||||||
Arista Networks, Inc.(1) | 12,093 | 2,702,181 | ||||||
Ciena Corp.(1) | 51,130 | 2,902,650 | ||||||
7
| Shares | Value | |||||||
| Cisco Systems, Inc. | 34,876 | $ | 1,472,465 | |||||
| 7,077,296 | ||||||||
| Construction and Engineering — 0.1% | ||||||||
| Quanta Services, Inc. | 5,189 | 265,936 | ||||||
| Construction Materials — 0.1% | ||||||||
| Vulcan Materials Co. | 2,131 | 255,720 | ||||||
| Containers and Packaging — 0.2% | ||||||||
| Avery Dennison Corp. | 2,289 | 264,127 | ||||||
Berry Global Group, Inc.(1) | 5,083 | 261,978 | ||||||
| 526,105 | ||||||||
| Distributors — 0.1% | ||||||||
| Pool Corp. | 791 | 259,321 | ||||||
| Diversified Consumer Services — 0.3% | ||||||||
Chegg, Inc.(1) | 3,516 | 259,270 | ||||||
frontdoor, Inc.(1) | 6,391 | 278,456 | ||||||
| 537,726 | ||||||||
| Electric Utilities — 0.9% | ||||||||
| IDACORP, Inc. | 4,326 | 388,908 | ||||||
| NextEra Energy, Inc. | 5,437 | 1,517,847 | ||||||
| 1,906,755 | ||||||||
| Electrical Equipment — 0.1% | ||||||||
Generac Holdings, Inc.(1) | 1,424 | 270,531 | ||||||
| Electronic Equipment, Instruments and Components — 0.1% | ||||||||
Zebra Technologies Corp., Class A(1) | 955 | 273,636 | ||||||
| Entertainment — 0.6% | ||||||||
Electronic Arts, Inc.(1) | 3,732 | 520,502 | ||||||
Netflix, Inc.(1) | 541 | 286,492 | ||||||
Take-Two Interactive Software, Inc.(1) | 1,534 | 262,606 | ||||||
Zynga, Inc., Class A(1) | 28,907 | 261,897 | ||||||
| 1,331,497 | ||||||||
| Equity Real Estate Investment Trusts (REITs) — 0.5% | ||||||||
| American Tower Corp. | 1,077 | 268,335 | ||||||
| Equinix, Inc. | 340 | 268,525 | ||||||
| SBA Communications Corp. | 871 | 266,587 | ||||||
| Weyerhaeuser Co. | 9,103 | 275,912 | ||||||
| 1,079,359 | ||||||||
| Food and Staples Retailing — 2.1% | ||||||||
BJ's Wholesale Club Holdings, Inc.(1) | 11,318 | 502,632 | ||||||
| Costco Wholesale Corp. | 770 | 267,698 | ||||||
| Kroger Co. (The) | 102,967 | 3,673,863 | ||||||
| 4,444,193 | ||||||||
| Food Products — 0.1% | ||||||||
| Tyson Foods, Inc., Class A | 4,176 | 262,253 | ||||||
| Health Care Equipment and Supplies — 3.4% | ||||||||
ABIOMED, Inc.(1) | 853 | 262,400 | ||||||
Align Technology, Inc.(1) | 1,789 | 531,297 | ||||||
| Danaher Corp. | 1,278 | 263,869 | ||||||
DexCom, Inc.(1) | 617 | 262,478 | ||||||
Edwards Lifesciences Corp.(1) | 6,605 | 566,973 | ||||||
| Hill-Rom Holdings, Inc. | 2,825 | 264,957 | ||||||
IDEXX Laboratories, Inc.(1) | 1,382 | 540,445 | ||||||
Quidel Corp.(1) | 1,139 | 200,418 | ||||||
8
| Shares | Value | |||||||
| ResMed, Inc. | 2,963 | $ | 535,651 | |||||
| West Pharmaceutical Services, Inc. | 13,529 | 3,841,695 | ||||||
| 7,270,183 | ||||||||
| Health Care Providers and Services — 4.4% | ||||||||
Amedisys, Inc.(1) | 8,831 | 2,136,219 | ||||||
| Chemed Corp. | 5,708 | 2,951,664 | ||||||
DaVita, Inc.(1) | 3,026 | 262,536 | ||||||
| HCA Healthcare, Inc. | 1,979 | 268,590 | ||||||
| Humana, Inc. | 1,308 | 543,042 | ||||||
LHC Group, Inc.(1) | 9,130 | 1,903,057 | ||||||
Molina Healthcare, Inc.(1) | 1,456 | 269,316 | ||||||
| Universal Health Services, Inc., Class B | 9,676 | 1,067,747 | ||||||
| 9,402,171 | ||||||||
| Health Care Technology — 1.9% | ||||||||
| Cerner Corp. | 3,695 | 271,102 | ||||||
Veeva Systems, Inc., Class A(1) | 13,259 | 3,742,618 | ||||||
| 4,013,720 | ||||||||
| Hotels, Restaurants and Leisure — 0.6% | ||||||||
Chipotle Mexican Grill, Inc.(1) | 209 | 273,849 | ||||||
| Domino's Pizza, Inc. | 1,265 | 517,334 | ||||||
| Yum China Holdings, Inc. | 4,819 | 278,104 | ||||||
| Yum! Brands, Inc. | 2,750 | 263,588 | ||||||
| 1,332,875 | ||||||||
| Household Durables — 1.1% | ||||||||
| D.R. Horton, Inc. | 7,031 | 501,803 | ||||||
Helen of Troy Ltd.(1) | 1,254 | 259,352 | ||||||
| Lennar Corp., Class A | 3,403 | 254,613 | ||||||
NVR, Inc.(1) | 63 | 262,605 | ||||||
| PulteGroup, Inc. | 5,624 | 250,774 | ||||||
Tempur Sealy International, Inc.(1) | 3,069 | 262,522 | ||||||
TopBuild Corp.(1) | 3,436 | 528,457 | ||||||
| 2,320,126 | ||||||||
| Household Products — 0.5% | ||||||||
| Church & Dwight Co., Inc. | 2,761 | 264,587 | ||||||
| Clorox Co. (The) | 1,211 | 270,658 | ||||||
| Colgate-Palmolive Co. | 3,376 | 267,582 | ||||||
| Kimberly-Clark Corp. | 1,700 | 268,192 | ||||||
| 1,071,019 | ||||||||
| Industrial Conglomerates — 0.1% | ||||||||
| 3M Co. | 1,627 | 265,233 | ||||||
| Insurance — 0.3% | ||||||||
| Aon plc, Class A | 1,379 | 275,786 | ||||||
| Arthur J. Gallagher & Co. | 2,545 | 267,989 | ||||||
| 543,775 | ||||||||
| Interactive Media and Services — 3.0% | ||||||||
Alphabet, Inc., Class C(1) | 165 | 269,639 | ||||||
Facebook, Inc., Class A(1) | 11,244 | 3,296,741 | ||||||
Match Group, Inc.(1) | 25,997 | 2,903,345 | ||||||
| 6,469,725 | ||||||||
| Internet and Direct Marketing Retail — 4.8% | ||||||||
Amazon.com, Inc.(1) | 1,110 | 3,830,566 | ||||||
| eBay, Inc. | 63,998 | 3,505,810 | ||||||
9
| Shares | Value | |||||||
Etsy, Inc.(1) | 25,377 | $ | 3,037,627 | |||||
| 10,374,003 | ||||||||
| IT Services — 4.4% | ||||||||
Akamai Technologies, Inc.(1) | 2,391 | 278,384 | ||||||
| Booz Allen Hamilton Holding Corp. | 6,141 | 540,777 | ||||||
| Cognizant Technology Solutions Corp., Class A | 3,964 | 265,033 | ||||||
EPAM Systems, Inc.(1) | 6,649 | 2,174,888 | ||||||
| MasterCard, Inc., Class A | 1,527 | 546,956 | ||||||
Pagseguro Digital Ltd., Class A(1) | 5,930 | 249,890 | ||||||
PayPal Holdings, Inc.(1) | 1,316 | 268,648 | ||||||
Shopify, Inc., Class A(1) | 2,559 | 2,728,969 | ||||||
Square, Inc., Class A(1) | 13,696 | 2,185,334 | ||||||
| Visa, Inc., Class A | 1,275 | 270,287 | ||||||
| 9,509,166 | ||||||||
| Leisure Products — 0.1% | ||||||||
| Brunswick Corp. | 4,302 | 266,251 | ||||||
| Life Sciences Tools and Services — 1.8% | ||||||||
Avantor, Inc.(1) | 12,150 | 274,225 | ||||||
Bio-Rad Laboratories, Inc., Class A(1) | 518 | 263,449 | ||||||
| Bio-Techne Corp. | 1,058 | 270,277 | ||||||
Illumina, Inc.(1) | 756 | 270,058 | ||||||
Mettler-Toledo International, Inc.(1) | 274 | 265,994 | ||||||
| PerkinElmer, Inc. | 2,283 | 268,755 | ||||||
Repligen Corp.(1) | 14,346 | 2,222,339 | ||||||
| 3,835,097 | ||||||||
| Machinery — 0.1% | ||||||||
| Snap-on, Inc. | 1,795 | 266,145 | ||||||
| Media — 3.0% | ||||||||
| Cable One, Inc. | 1,451 | 2,670,319 | ||||||
Charter Communications, Inc., Class A(1) | 6,093 | 3,750,912 | ||||||
| 6,421,231 | ||||||||
| Metals and Mining — 0.3% | ||||||||
| Newmont Corp. | 4,091 | 275,242 | ||||||
| Reliance Steel & Aluminum Co. | 2,531 | 265,426 | ||||||
| 540,668 | ||||||||
| Multi-Utilities — 0.1% | ||||||||
| WEC Energy Group, Inc. | 2,876 | 270,574 | ||||||
| Multiline Retail — 0.5% | ||||||||
| Dollar General Corp. | 2,671 | 539,221 | ||||||
Ollie's Bargain Outlet Holdings, Inc.(1) | 2,430 | 232,162 | ||||||
| Target Corp. | 1,736 | 262,501 | ||||||
| 1,033,884 | ||||||||
| Personal Products — 0.1% | ||||||||
Herbalife Nutrition Ltd.(1) | 5,300 | 260,495 | ||||||
| Pharmaceuticals — 1.1% | ||||||||
| Eli Lilly & Co. | 11,146 | 1,653,955 | ||||||
| Merck & Co., Inc. | 3,097 | 264,081 | ||||||
| Zoetis, Inc. | 3,347 | 535,855 | ||||||
| 2,453,891 | ||||||||
| Professional Services — 2.1% | ||||||||
| CoreLogic, Inc. | 3,986 | 264,670 | ||||||
CoStar Group, Inc.(1) | 4,349 | 3,690,562 | ||||||
10
| Shares | Value | |||||||
FTI Consulting, Inc.(1) | 2,278 | $ | 261,423 | |||||
| Verisk Analytics, Inc. | 1,427 | 266,378 | ||||||
| 4,483,033 | ||||||||
| Real Estate Management and Development — 0.1% | ||||||||
CBRE Group, Inc., Class A(1) | 5,600 | 263,368 | ||||||
| Road and Rail — 0.4% | ||||||||
| J.B. Hunt Transport Services, Inc. | 1,883 | 264,637 | ||||||
| Old Dominion Freight Line, Inc. | 2,685 | 542,853 | ||||||
| 807,490 | ||||||||
| Semiconductors and Semiconductor Equipment — 12.7% | ||||||||
Advanced Micro Devices, Inc.(1) | 3,073 | 279,090 | ||||||
| Applied Materials, Inc. | 41,430 | 2,552,088 | ||||||
Cirrus Logic, Inc.(1) | 4,390 | 265,990 | ||||||
Enphase Energy, Inc.(1) | 10,485 | 809,756 | ||||||
| Entegris, Inc. | 3,797 | 253,981 | ||||||
| Intel Corp. | 64,421 | 3,282,250 | ||||||
| KLA Corp. | 12,620 | 2,588,867 | ||||||
| Lam Research Corp. | 8,281 | 2,785,231 | ||||||
| Maxim Integrated Products, Inc. | 3,747 | 256,445 | ||||||
| MKS Instruments, Inc. | 2,170 | 259,380 | ||||||
| Monolithic Power Systems, Inc. | 6,840 | 1,827,169 | ||||||
| NVIDIA Corp. | 6,764 | 3,618,605 | ||||||
Qorvo, Inc.(1) | 2,011 | 257,951 | ||||||
| QUALCOMM, Inc. | 2,289 | 272,620 | ||||||
SolarEdge Technologies, Inc.(1) | 6,225 | 1,376,659 | ||||||
| Teradyne, Inc. | 29,383 | 2,496,673 | ||||||
| Texas Instruments, Inc. | 26,225 | 3,727,884 | ||||||
| Universal Display Corp. | 1,464 | 256,932 | ||||||
| Xilinx, Inc. | 2,567 | 267,379 | ||||||
| 27,434,950 | ||||||||
| Software — 19.8% | ||||||||
Adobe, Inc.(1) | 8,217 | 4,218,526 | ||||||
Aspen Technology, Inc.(1) | 2,103 | 267,144 | ||||||
Atlassian Corp. plc, Class A(1) | 1,538 | 294,927 | ||||||
Autodesk, Inc.(1) | 1,052 | 258,476 | ||||||
Cadence Design Systems, Inc.(1) | 31,006 | 3,438,876 | ||||||
Ceridian HCM Holding, Inc.(1) | 3,537 | 281,262 | ||||||
Check Point Software Technologies Ltd.(1) | 2,076 | 262,116 | ||||||
| Citrix Systems, Inc. | 22,282 | 3,235,346 | ||||||
Coupa Software, Inc.(1) | 880 | 288,411 | ||||||
DocuSign, Inc.(1) | 1,294 | 288,562 | ||||||
Fair Isaac Corp.(1) | 627 | 263,835 | ||||||
Five9, Inc.(1) | 17,150 | 2,185,596 | ||||||
Fortinet, Inc.(1) | 31,856 | 4,205,151 | ||||||
| Intuit, Inc. | 9,974 | 3,444,920 | ||||||
| Microsoft Corp. | 2,452 | 553,000 | ||||||
| Oracle Corp. (New York) | 4,731 | 270,708 | ||||||
Paycom Software, Inc.(1) | 5,542 | 1,659,607 | ||||||
Paylocity Holding Corp.(1) | 1,909 | 281,100 | ||||||
PTC, Inc.(1) | 3,011 | 275,236 | ||||||
Qualys, Inc.(1) | 2,479 | 263,121 | ||||||
RingCentral, Inc., Class A(1) | 7,474 | 2,173,215 | ||||||
11
| Shares | Value | |||||||
salesforce.com, Inc.(1) | 1,228 | $ | 334,814 | |||||
ServiceNow, Inc.(1) | 7,533 | 3,631,057 | ||||||
Synopsys, Inc.(1) | 2,455 | 543,292 | ||||||
Trade Desk, Inc. (The), Class A(1) | 3,388 | 1,630,644 | ||||||
VMware, Inc., Class A(1) | 18,862 | 2,724,427 | ||||||
Workday, Inc., Class A(1) | 9,881 | 2,368,575 | ||||||
Zoom Video Communications, Inc., Class A(1) | 9,137 | 2,970,439 | ||||||
| 42,612,383 | ||||||||
| Specialty Retail — 5.0% | ||||||||
| Best Buy Co., Inc. | 23,558 | 2,612,818 | ||||||
Floor & Decor Holdings, Inc., Class A(1) | 3,654 | 267,619 | ||||||
| Home Depot, Inc. (The) | 927 | 264,232 | ||||||
| Lowe's Cos., Inc. | 3,357 | 552,864 | ||||||
O'Reilly Automotive, Inc.(1) | 7,404 | 3,447,525 | ||||||
| Tractor Supply Co. | 22,507 | 3,349,717 | ||||||
| Williams-Sonoma, Inc. | 2,783 | 244,236 | ||||||
| 10,739,011 | ||||||||
| Technology Hardware, Storage and Peripherals — 0.3% | ||||||||
| Apple, Inc. | 4,252 | 548,678 | ||||||
| Textiles, Apparel and Luxury Goods — 1.7% | ||||||||
Deckers Outdoor Corp.(1) | 1,265 | 257,895 | ||||||
lululemon athletica, Inc.(1) | 8,413 | 3,160,512 | ||||||
| NIKE, Inc., Class B | 2,380 | 266,298 | ||||||
| 3,684,705 | ||||||||
| Trading Companies and Distributors — 1.1% | ||||||||
| Fastenal Co. | 11,082 | 541,467 | ||||||
HD Supply Holdings, Inc.(1) | 38,890 | 1,542,377 | ||||||
SiteOne Landscape Supply, Inc.(1) | 2,165 | 270,733 | ||||||
| 2,354,577 | ||||||||
| Water Utilities — 0.1% | ||||||||
| American Water Works Co., Inc. | 1,849 | 261,338 | ||||||
TOTAL COMMON STOCKS (Cost $184,295,656) | 214,963,762 | |||||||
| TEMPORARY CASH INVESTMENTS — 0.1% | ||||||||
| State Street Institutional U.S. Government Money Market Fund, Premier Class (Cost $253,232) | 253,232 | 253,232 | ||||||
TOTAL INVESTMENT SECURITIES — 99.9% (Cost $184,548,888) | 215,216,994 | |||||||
| OTHER ASSETS AND LIABILITIES — 0.1% | 221,539 | |||||||
| TOTAL NET ASSETS — 100.0% | $ | 215,438,533 | ||||||
| NOTES TO SCHEDULE OF INVESTMENTS | ||||||||
(1)Non-income producing.
See Notes to Financial Statements.
12
| Statement of Assets and Liabilities | ||
| AUGUST 31, 2020 | |||||
| Assets | |||||
| Investment securities, at value (cost of $184,548,888) | $ | 215,216,994 | |||
| Receivable for investments sold | 120,226,691 | ||||
| Receivable for capital shares sold | 52,964,210 | ||||
| Dividends and interest receivable | 466,038 | ||||
| 388,873,933 | |||||
| Liabilities | |||||
| Payable for investments purchased | 123,019,391 | ||||
| Payable for capital shares redeemed | 50,365,260 | ||||
| Accrued management fees | 50,749 | ||||
| 173,435,400 | |||||
| Net Assets | $ | 215,438,533 | |||
| Shares outstanding (unlimited number of shares authorized) | 3,850,000 | ||||
| Net Asset Value Per Share | $ | 55.96 | |||
| Net Assets Consist of: | |||||
| Capital paid in | $ | 187,838,397 | |||
| Distributable earnings | 27,600,136 | ||||
| $ | 215,438,533 | ||||
See Notes to Financial Statements.
13
| Statement of Operations | ||
| YEAR ENDED AUGUST 31, 2020 | |||||
| Investment Income (Loss) | |||||
| Income: | |||||
| Dividends | $ | 979,010 | |||
| Securities lending, net | 7,113 | ||||
| Interest | 1,785 | ||||
| 987,908 | |||||
| Expenses: | |||||
| Management fees | 418,184 | ||||
| Other expenses | 1,155 | ||||
| 419,339 | |||||
| Net investment income (loss) | 568,569 | ||||
| Realized and Unrealized Gain (Loss) | |||||
| Net realized gain (loss) on investment transactions (Note 4) | 26,461,497 | ||||
| Change in net unrealized appreciation (depreciation) on investments | 28,986,871 | ||||
| Net realized and unrealized gain (loss) | 55,448,368 | ||||
| Net Increase (Decrease) in Net Assets Resulting from Operations | $ | 56,016,937 | |||
See Notes to Financial Statements.
14
| Statement of Changes in Net Assets | ||
| YEAR ENDED AUGUST 31, 2020 AND PERIOD ENDED AUGUST 31, 2019 | ||||||||
| Increase (Decrease) in Net Assets | August 31, 2020 | August 31, 2019(1) | ||||||
| Operations | ||||||||
| Net investment income (loss) | $ | 568,569 | $ | 64,742 | ||||
| Net realized gain (loss) | 26,461,497 | (415,519) | ||||||
| Change in net unrealized appreciation (depreciation) | 28,986,871 | 1,681,235 | ||||||
| Net increase (decrease) in net assets resulting from operations | 56,016,937 | 1,330,458 | ||||||
| Distributions to Shareholders | ||||||||
| From earnings | (537,870) | (48,485) | ||||||
| Capital Share Transactions | ||||||||
| Proceeds from shares sold | 261,431,182 | 20,682,293 | ||||||
| Payments for shares redeemed | (123,435,982) | — | ||||||
| Net increase (decrease) in net assets from capital share transactions | 137,995,200 | 20,682,293 | ||||||
| Net increase (decrease) in net assets | 193,474,267 | 21,964,266 | ||||||
| Net Assets | ||||||||
| Beginning of period | 21,964,266 | — | ||||||
| End of period | $ | 215,438,533 | $ | 21,964,266 | ||||
| Transactions in Shares of the Fund | ||||||||
| Sold | 5,825,000 | 525,000 | ||||||
| Redeemed | (2,500,000) | — | ||||||
| Net increase (decrease) in shares of the fund | 3,325,000 | 525,000 | ||||||
(1)September 10, 2018 (fund inception) through August 31, 2019.
See Notes to Financial Statements.
15
| Notes to Financial Statements | ||
AUGUST 31, 2020
1. Organization
American Century ETF Trust (the trust) was registered as a Delaware statutory trust in 2017 and is registered under the Investment Company Act of 1940, as amended (the 1940 Act), as an open-end management investment company. American Century STOXX® U.S. Quality Growth ETF (the fund) is one fund in a series issued by the trust. The fund's investment objective is to seek to provide investment results that closely correspond, before fees and expenses, to the performance of the iSTOXX® American Century USA Quality Growth Index. Shares of the fund are listed for trading on the NYSE Arca, Inc. The fund incepted on September 10, 2018.
2. Significant Accounting Policies
The following is a summary of significant accounting policies consistently followed by the fund in preparation of its financial statements. The fund is an investment company and follows accounting and reporting guidance in accordance with accounting principles generally accepted in the United States of America. This may require management to make certain estimates and assumptions at the date of the financial statements. Actual results could differ from these estimates. Management evaluated the impact of events or transactions occurring through the date the financial statements were issued that would merit recognition or disclosure.
Investment Valuations — The fund determines the fair value of its investments and computes its net asset value per share at the close of regular trading (usually 4 p.m. Eastern time) on the New York Stock Exchange (NYSE) on each day the NYSE is open. The Board of Trustees has adopted valuation policies and procedures to guide the investment advisor in the fund’s investment valuation process and to provide methodologies for the oversight of the fund’s pricing function.
Equity securities that are listed or traded on a domestic securities exchange are valued at the last reported sales price or at the official closing price as provided by the exchange. Equity securities traded on foreign securities exchanges are generally valued at the closing price of such securities on the exchange where primarily traded or at the close of the NYSE, if that is earlier. If no last sales price is reported, or if local convention or regulation so provides, the mean of the latest bid and asked prices may be used. Securities traded over-the-counter are valued at the mean of the latest bid and asked prices, the last sales price, or the official closing price.
Open-end management investment companies are valued at the reported net asset value per share.
If the fund determines that the market price for an investment is not readily available or the valuation methods mentioned above do not reflect an investment’s fair value, such investment is valued as determined in good faith by the Board of Trustees or its delegate, in accordance with policies and procedures adopted by the Board of Trustees. In its determination of fair value, the fund may review several factors including, but not limited to, market information regarding the specific investment or comparable investments and correlation with other investment types, futures indices or general market indicators. Circumstances that may cause the fund to use these procedures to value an investment include, but are not limited to: an investment has been declared in default or is distressed; trading in a security has been suspended during the trading day or a security is not actively trading on its principal exchange; prices received from a regular pricing source are deemed unreliable; or there is a foreign market holiday and no trading occurred.
The fund monitors for significant events occurring after the close of an investment’s primary exchange but before the fund’s net asset value per share is determined. Significant events may include, but are not limited to: corporate announcements and transactions; governmental action and political unrest that could impact a specific investment or an investment sector; or armed conflicts, natural disasters and similar events that could affect investments in a specific country or region. The fund also monitors for significant fluctuations between domestic and foreign markets, as evidenced by the U.S. market or such other indicators that the Board of Trustees, or its delegate, deems appropriate. The fund may apply a model-derived factor to the closing price of equity securities traded on foreign securities exchanges. The factor is based on observable market data as provided by an independent pricing service.
16
Security Transactions — Security transactions are accounted for as of the trade date. Net realized gains and losses are determined on the identified cost basis, which is also used for federal income tax purposes.
Investment Income — Dividend income less foreign taxes withheld, if any, is recorded as of the ex-dividend date. Distributions received on securities that represent a return of capital or long-term capital gain are recorded as a reduction of cost of investments and/or as a realized gain. The fund may estimate the components of distributions received that may be considered nontaxable distributions or long-term capital gain distributions for income tax purposes. Interest income is recorded on the accrual basis and includes accretion of discounts and amortization of premiums. Securities lending income is net of fees and rebates earned by the lending agent for its services.
Income Tax Status — It is the fund’s policy to distribute substantially all net investment income and net realized gains to shareholders and to otherwise qualify as a regulated investment company under provisions of the Internal Revenue Code. Accordingly, no provision has been made for income taxes. The fund files U.S. federal, state, local and non-U.S. tax returns as applicable. The fund's tax returns are subject to examination by the relevant taxing authority until expiration of the applicable statute of limitations, which is generally three years from the date of filing but can be longer in certain jurisdictions. At this time, management believes there are no uncertain tax positions which, based on their technical merit, would not be sustained upon examination and for which it is reasonably possible that the total amounts of unrecognized tax benefits will significantly change in the next twelve months.
Segregated Assets — In accordance with the 1940 Act, the fund segregates assets on its books and records to cover certain types of investment securities and other financial instruments. American Century Investment Management, Inc. (ACIM) (the investment advisor) monitors, on a daily basis, the securities segregated to ensure the fund designates a sufficient amount of liquid assets, marked-to-market daily. The fund may also receive assets or be required to pledge assets at the custodian bank or with a broker for collateral requirements.
Distributions to Shareholders — Distributions from net investment income, if any, are generally declared and paid quarterly. Distributions from net realized gains, if any, are generally declared and paid annually.
Indemnifications — Under the trust’s organizational documents, its officers and trustees are indemnified against certain liabilities arising out of the performance of their duties to the fund. In addition, in the normal course of business, the fund enters into contracts that provide general indemnifications. The maximum exposure under these arrangements is unknown as this would involve future claims that may be made against a fund. The risk of material loss from such claims is considered by management to be remote.
Securities Lending — Securities are lent to qualified financial institutions and brokers. State Street Bank & Trust Co. serves as securities lending agent to the fund pursuant to a Securities Lending Agreement. The lending of securities exposes the fund to risks such as: the borrowers may fail to return the loaned securities, the borrowers may not be able to provide additional collateral, the fund may experience delays in recovery of the loaned securities or delays in access to collateral, or the fund may experience losses related to the investment collateral. To minimize certain risks, loan counterparties pledge collateral in the form of cash and/or securities. The lending agent has agreed to indemnify the fund in the case of default of any securities borrowed. Cash collateral received is invested in the State Street Navigator Securities Lending Government Money Market Portfolio, a money market mutual fund registered under the 1940 Act. The loans may also be secured by U.S. government securities in an amount at least equal to the market value of the securities loaned, plus accrued interest and dividends, determined on a daily basis and adjusted accordingly. By lending securities, the fund seeks to increase its net investment income through the receipt of interest and fees. Such income is reflected separately within the Statement of Operations. The value of loaned securities and related collateral outstanding at period end, if any, are shown on a gross basis within the Schedule of Investments and Statement of Assets and Liabilities.
3. Fees and Transactions with Related Parties
Certain officers and trustees of the trust are also officers and/or directors of American Century Companies, Inc. (ACC). The trust's investment advisor, ACIM, and the trust’s administrator, American Century Services, LLC, are wholly owned, directly or indirectly, by ACC. Various funds issued by American Century Strategic Asset Allocations, Inc. own, in aggregate, 67% of the shares of the fund. Related parties do not invest in the fund for the purpose of exercising management or control.
17
Management Fees — The trust has entered into a management agreement with ACIM, under which ACIM provides the fund with investment advisory and management services in exchange for a single, unified management fee (the fee). The agreement provides that ACIM will pay all expenses of managing and operating the fund, except brokerage and other transaction fees and expenses relating to the acquisition and disposition of portfolio securities, acquired fund fees and expenses, interest, taxes, litigation expenses and extraordinary expenses. The fee is computed and accrued daily based on the daily net assets of the fund and paid monthly in arrears. The annual management fee is 0.29%.
4. Investment Transactions
Purchases and sales of investment securities, excluding short-term investments and in-kind transactions, for the period ended August 31, 2020 were $265,856,750 and $260,936,284, respectively.
Securities received or delivered in-kind through subscriptions and redemptions for the period ended August 31, 2020 were $255,859,087 and $121,544,081, respectively. The fund incurred net realized gains of $29,312,881 from in-kind transactions. Net realized gain (loss) on in-kind transactions are not considered taxable for federal income tax purposes.
5. Capital Share Transactions
The fund’s shares may only be purchased and sold on a national securities exchange through a broker-dealer. The price of the fund’s shares is based on market price, and because ETF shares trade at market prices rather than net asset value (NAV), shares may trade at a price greater than NAV (a premium) or less than NAV (a discount). The fund issues and redeems shares that have been aggregated into blocks of 25,000 shares or multiples thereof (Creation Units) to authorized participants who have entered into agreements with the fund's distributor. The fund will generally issue and redeem Creation Units in return for a basket of securities (and an amount of cash) that the fund specifies each day. Investors transacting in Creation Units for cash may also pay an additional variable charge to compensate the fund for certain transaction costs and market impact expenses relating to investing in portfolio securities. Such variable charges, if any, are included in proceeds from shares sold in the Statement of Changes in Net Assets.
6. Fair Value Measurements
The fund’s investments valuation process is based on several considerations and may use multiple inputs to determine the fair value of the investments held by the fund. In conformity with accounting principles generally accepted in the United States of America, the inputs used to determine a valuation are classified into three broad levels.
•Level 1 valuation inputs consist of unadjusted quoted prices in an active market for identical investments.
•Level 2 valuation inputs consist of direct or indirect observable market data (including quoted prices for comparable investments, evaluations of subsequent market events, interest rates, prepayment speeds, credit risk, etc.). These inputs also consist of quoted prices for identical investments initially expressed in local currencies that are adjusted through translation into U.S. dollars.
•Level 3 valuation inputs consist of unobservable data (including a fund’s own assumptions).
The level classification is based on the lowest level input that is significant to the fair valuation measurement. The valuation inputs are not necessarily an indication of the risks associated with investing in these securities or other financial instruments.
As of period end, the fund’s investment securities were classified as Level 1. The Schedule of Investments provides additional information on the fund's portfolio holdings.
7. Risk Factors
The value of the fund’s shares will go up and down, sometimes rapidly or unpredictably, based on the performance of the securities owned by the fund and other factors generally affecting the securities market. Market risks, including political, regulatory, economic and social developments, can affect the value of the fund’s investments. Natural disasters, public health emergencies, terrorism and other unforeseeable events may lead to increased market volatility and may have adverse long-term effects on world economies and markets generally.
18
The fund seeks to track an index. If the fund's index has high portfolio turnover, the fund may also have high portfolio turnover, which could mean high transaction costs, affecting both performance and capital gains tax liabilities to investors.
The fund is not actively managed and does not attempt to take defensive positions under any market conditions, including declining markets. Therefore, the fund generally will not buy or sell securities unless they are added or removed from the index, even if the security is underperforming.
8. Federal Tax Information
The tax character of distributions paid during the year ended August 31, 2020 and the period September 10, 2018 (fund inception) through August 31, 2019 were as follows:
| 2020 | 2019 | |||||||
| Distributions Paid From | ||||||||
| Ordinary income | $ | 537,870 | $ | 48,485 | ||||
| Long-term capital gains | — | — | ||||||
The book-basis character of distributions made during the year from net investment income or net realized gains may differ from their ultimate characterization for federal income tax purposes. These differences reflect the differing character of certain income items and net realized gains and losses for financial statement and tax purposes, and may result in reclassification among certain capital accounts on the financial statements.
The reclassifications, which are primarily due to in-kind transactions, were made to capital paid in $29,160,904 and distributable earnings $(29,160,904).
As of period end, the federal tax cost of investments and the components of distributable earnings on a tax-basis were as follows:
| Federal tax cost of investments | $ | 184,715,574 | |||
| Gross tax appreciation of investments | $ | 30,933,961 | |||
| Gross tax depreciation of investments | (432,541) | ||||
| Net tax appreciation (depreciation) of investments | $ | 30,501,420 | |||
| Undistributed ordinary income | $ | 36,333 | |||
| Accumulated short-term capital losses | $ | (2,937,617) | |||
The difference between book-basis and tax-basis unrealized appreciation (depreciation) is attributable primarily to the tax deferral of losses on wash sales.
Accumulated capital losses represent net capital loss carryovers that may be used to offset future realized capital gains for federal income tax purposes. The capital loss carryovers may be carried forward for an unlimited period. Future capital loss carryover utilization in any given year may be subject to Internal Revenue Code limitations.
19
| Financial Highlights | ||
| For a Share Outstanding Throughout the Years Ended August 31 (except as noted) | |||||||||||||||||||||||||||||||||||
| Per-Share Data | Ratios and Supplemental Data | ||||||||||||||||||||||||||||||||||
| Income From Investment Operations: | Ratio to Average Net Assets of: | ||||||||||||||||||||||||||||||||||
| Net Asset Value, Beginning of Period | Net Investment Income (Loss)(1) | Net Realized and Unrealized Gain (Loss) | Total From Investment Operations | Distributions From Net Investment Income | Net Asset Value, End of Period | Total Return(2) | Operating Expenses | Net Investment Income (Loss) | Portfolio Turnover Rate(3) | Net Assets, End of Period (in thousands) | |||||||||||||||||||||||||
| 2020 | $41.84 | 0.18 | 14.11 | 14.29 | (0.17) | $55.96 | 34.30% | 0.29% | 0.39% | 180% | $215,439 | ||||||||||||||||||||||||
2019(4) | $40.15 | 0.18 | 1.64 | 1.82 | (0.13) | $41.84 | 4.57% | 0.29%(5) | 0.48%(5) | 191% | $21,964 | ||||||||||||||||||||||||
| Notes to Financial Highlights | ||
(1)Computed using average shares outstanding throughout the period.
(2)Total returns are calculated based on the net asset value of the last business day. Total returns for periods less than one year are not annualized.
(3)Excludes securities received or delivered in-kind.
(4)September 10, 2018 (fund inception) through August 31, 2019.
(5)Annualized.
See Notes to Financial Statements.
| Report of Independent Registered Public Accounting Firm | ||
To the Shareholders and the Board of Trustees of American Century ETF Trust:
Opinion on the Financial Statements and Financial Highlights
We have audited the accompanying statement of assets and liabilities, including the schedule of investments, of American Century STOXX® U.S. Quality Growth ETF (the “Fund”), one of the funds constituting the American Century ETF Trust, as of August 31, 2020, the related statement of operations for the year then ended, the statements of changes in net assets and the financial highlights for the year ended August 31, 2020, and the period from September 10, 2018 (fund inception) through August 31, 2019, and the related notes. In our opinion, the financial statements and financial highlights present fairly, in all material respects, the financial position of American Century STOXX® U.S. Quality Growth ETF as of August 31, 2020, and the results of its operations for the year then ended, the changes in its net assets and the financial highlights for the year ended August 31, 2020, and the period from September 10, 2018 (fund inception) through August 31, 2019, in conformity with accounting principles generally accepted in the United States of America.
Basis for Opinion
These financial statements and financial highlights are the responsibility of the Fund's management. Our responsibility is to express an opinion on the Fund’s financial statements and financial highlights based on our audits. We are a public accounting firm registered with the Public Company Accounting Oversight Board (United States) (PCAOB) and are required to be independent with respect to the Fund in accordance with the U.S. federal securities laws and the applicable rules and regulations of the Securities and Exchange Commission and the PCAOB.
We conducted our audits in accordance with the standards of the PCAOB. Those standards require that we plan and perform the audit to obtain reasonable assurance about whether the financial statements and financial highlights are free of material misstatement, whether due to error or fraud. The Fund is not required to have, nor were we engaged to perform, an audit of its internal control over financial reporting. As part of our audits we are required to obtain an understanding of internal control over financial reporting but not for the purpose of expressing an opinion on the effectiveness of the Fund’s internal control over financial reporting. Accordingly, we express no such opinion.
Our audits included performing procedures to assess the risks of material misstatement of the financial statements and financial highlights, whether due to error or fraud, and performing procedures that respond to those risks. Such procedures included examining, on a test basis, evidence regarding the amounts and disclosures in the financial statements and financial highlights. Our audits also included evaluating the accounting principles used and significant estimates made by management, as well as evaluating the overall presentation of the financial statements and financial highlights. Our procedures included confirmation of securities owned as of August 31, 2020, by correspondence with the custodian and brokers; when replies were not received from brokers, we performed other auditing procedures. We believe that our audits provide a reasonable basis for our opinion.
DELOITTE & TOUCHE LLP
Kansas City, Missouri
October 16, 2020
We have served as the auditor of one or more American Century investment companies since 1997.
21
| Management | ||
The Board of Trustees
The individuals listed below serve as trustees of the funds. Each trustee will continue to serve in this capacity until death, retirement, resignation or removal from office. The board has adopted a mandatory retirement age for trustees who are not “interested persons,” as that term is defined in the Investment Company Act (independent trustees). Trustees who are not also officers of the trust shall retire by December 31st of the year in which they reach their 75th birthday.
Mr. Thomas is an “interested person” because he currently serves as President and Chief Executive Officer of American Century Companies, Inc. (ACC), the parent company of American Century Investment Management, Inc. (ACIM or the advisor). The other trustees are independent. They are not employees, directors or officers of, and have no financial interest in, ACC or any of its wholly owned, direct or indirect, subsidiaries, including ACIM and American Century Services, LLC (ACS), and they do not have any other affiliations, positions or relationships that would cause them to be considered “interested persons” under the Investment Company Act. The following trustees also serve in this capacity for a number of other registered investment companies in the American Century Investments family of funds: Jonathan S. Thomas, 15; Ronald J. Gilson, 8; and Stephen E. Yates, 7.
The following table presents additional information about the trustees. The mailing address for each trustee other than Jonathan S. Thomas is 330 Madison Avenue, New York, New York 10017. The mailing address for Jonathan S. Thomas is 4500 Main Street, Kansas City, Missouri 64111.
| Name (Year of Birth) | Position(s) Held with Funds | Length of Time Served | Principal Occupation(s) During Past 5 Years | Number of American Century Portfolios Overseen by Trustee | Other Directorships Held During Past 5 Years | ||||||||||||
| Independent Trustees | |||||||||||||||||
| Reginald M. Browne (1968) | Trustee and Chairman of the Board | Since 2017 (Chairman since 2019) | Principal, GTS Securities (automated capital markets trading firm)(2019 to present); Senior Managing Director, Co Global Head-ETF Group, Cantor Fitzgerald (financial services firm)(2013 to 2019) | 19 | None | ||||||||||||
| Ronald J. Gilson (1946) | Trustee | Since 2017 | Charles J. Meyers Professor of Law and Business, Emeritus, Stanford Law School (1979 to 2016); Marc and Eva Stern Professor of Law and Business, Columbia University School of Law (1992 to present) | 59 | None | ||||||||||||
| Barry A. Mendelson (1958) | Trustee | Since 2017 | Retired; Consultant regarding ETF and mutual fund matters (2015 to 2016); Principal and Senior Counsel, The Vanguard Group (investment management)(1998 to 2014) | 19 | None | ||||||||||||
| Stephen E. Yates (1948) | Trustee | Since 2017 | Retired | 82 | None | ||||||||||||
22
| Name (Year of Birth) | Position(s) Held with Funds | Length of Time Served | Principal Occupation(s) During Past 5 Years | Number of American Century Portfolios Overseen by Trustee | Other Directorships Held During Past 5 Years | ||||||||||||
| Interested Trustees | |||||||||||||||||
| Jonathan S. Thomas (1963) | Trustee | Since 2017 | President and Chief Executive Officer, ACC (2007 to present). Also serves as Chief Executive Officer, ACS; Executive Vice President, ACIM; Director, ACC, ACIM and other ACC subsidiaries | 122 | None | ||||||||||||
The Statement of Additional Information has additional information about the fund's trustees and is available without charge, upon request, by calling 1-800-345-6488.
23
Officers
The following table presents certain information about the executive officers of the funds. Each officer, except Edward Rosenberg, serves as an officer for each of the 16 investment companies in the American Century family of funds. No officer is compensated for his or her service as an officer of the funds. The listed officers are interested persons of the funds and are appointed or re-appointed on an annual basis. The mailing address for each officer listed below is 4500 Main Street, Kansas City, Missouri 64111.
| Name (Year of Birth) | Offices with the Funds | Principal Occupation(s) During the Past Five Years | ||||||
| Patrick Bannigan (1965) | President since 2019 | Executive Vice President and Director, ACC (2012 to present); Chief Financial Officer, Chief Accounting Officer and Treasurer, ACC (2015 to present). Also serves as President, ACS; Vice President, ACIM; Chief Financial Officer, Chief Accounting Officer and/or Director, ACIM, ACS and other ACC subsidiaries | ||||||
| R. Wes Campbell (1974) | Chief Financial Officer and Treasurer since 2018 | Vice President, ACS (2020 to present); Investment Operations and Investment Accounting, ACS (2000 to present) | ||||||
| Amy D. Shelton (1964) | Chief Compliance Officer and Vice President since 2017 | Chief Compliance Officer, American Century funds, (2014 to present); Chief Compliance Officer, ACIM (2014 to present); Chief Compliance Officer, ACIS (2009 to present). Also serves as Vice President, ACIS | ||||||
| Charles A. Etherington (1957) | General Counsel and Vice President since 2017 | Attorney, ACC (1994 to present); Vice President, ACC (2005 to present); General Counsel, ACC (2007 to present). Also serves as General Counsel, ACIM, ACS, ACIS and other ACC subsidiaries; and Senior Vice President, ACIM and ACS | ||||||
| Cleo Chang (1977) | Vice President since 2019 | Senior Vice President, ACIM (2015 to present); Chief Investment Officer, Wilshire Funds Management (2005 to 2015) | ||||||
| David H. Reinmiller (1963) | Vice President since 2017 | Attorney, ACC (1994 to present). Also serves as Vice President, ACIM and ACS | ||||||
| Edward Rosenberg (1973) | Vice President since 2017 | Senior Vice President, ACIM (2017 to present); Senior Vice President, Flexshares Head of ETF Capital Markets, Northern Trust (2012 to 2017) | ||||||
| C. Jean Wade (1964) | Vice President since 2017 | Senior Vice President, ACS (2017 to present); Vice President, ACS (2000 to 2017) | ||||||
| Ward D. Stauffer (1960) | Secretary since 2019 | Attorney, ACS (2003 to present) | ||||||
24
| Approval of Management Agreement | ||
At a meeting held on June 5, 2020, the Fund’s Board of Trustees (the "Board") unanimously approved the renewal of the management agreement pursuant to which American Century Investment Management, Inc. (the “Advisor”) acts as the investment advisor for the Fund. Under Section 15(c) of the Investment Company Act, contracts for investment advisory services are required to be reviewed, evaluated, and approved by a majority of a fund’s trustees (the “Trustees”), including a majority of the independent Trustees, each year.
Prior to its consideration of the renewal of the management agreement, the Trustees requested and reviewed extensive data and information compiled by the Advisor and certain independent providers of evaluation data concerning the Fund and the services provided to the Fund by the Advisor. This review was in addition to the oversight and evaluation undertaken by the Board and its Audit Committee on a continual basis and the information received was supplemental to the extensive information that the Board and its Audit Committee receive and consider throughout the year.
In connection with its consideration of the renewal of the management agreement, the Board’s review and evaluation of the services provided by the Advisor included, but was not limited to, the following:
•the nature, extent, and quality of investment management and other services provided and to be provided to the Fund;
•the wide range of other programs and services provided and to be provided to the Fund and its shareholders on a routine and non-routine basis;
•the Fund’s investment performance, including data comparing the Fund's performance to appropriate benchmarks of funds with similar objectives and strategies;
•the cost of owning the Fund compared to the cost of owning similar funds;
•the compliance policies, procedures, and regulatory experience of the Advisor and the Fund's service providers;
•the Advisor’s strategic plans;
•the Advisor’s business continuity plans and specifically its response to the COVID-19 pandemic;
•financial data showing the cost of services provided to the Fund, the profitability of the Fund to the Advisor, and the overall profitability of the Advisor;
•information regarding payments to intermediaries by the Advisor; and
•possible economies of scale associated with the Advisor’s management of the Fund; and
•possible collateral benefits to the Advisor from the management of the Fund.
The independent Trustees met separately in private session to discuss the renewal and to review and discuss the information provided in response to their request. The independent Trustees also held active discussions with the Advisor regarding the renewal of the management agreement. The independent Trustees had the benefit of the advice of their independent counsel throughout the process.
Factors Considered
The Trustees considered all of the information provided by the Advisor, the independent data providers, and independent counsel in connection with the approval. They determined that the information was sufficient for them to evaluate the management agreement for the Fund. In connection with their review, the Trustees did not identify any single factor as being all-important or
25
controlling, and each Trustee may have attributed different levels of importance to different factors. In deciding to renew the management agreement, the Board based its decision on a number of factors, including without limitation the following:
Nature, Extent and Quality of Services — Generally. Under the management agreement, the Advisor is responsible for providing or arranging for all services necessary for the operation of the Fund. The Board noted that the Advisor provides or arranges at its own expense a wide variety of services including without limitation the following:
•constructing and designing the Fund
•portfolio research and security selection
•initial capitalization/funding
•securities trading
•Fund administration
•custody of Fund assets
•daily valuation of the Fund’s portfolio
•shareholder servicing and transfer agency, including shareholder confirmations, recordkeeping, and communications
•legal services (except the independent Trustees’ counsel)
•regulatory and portfolio compliance
•financial reporting
•marketing and distribution (except amounts paid by the Fund under Rule 12b-1 plans)
Investment Management Services. The nature of the investment management services provided to the Fund is quite complex and allows Fund shareholders access to professional money management, instant diversification of their investments within an asset class, and liquidity. In evaluating investment performance, the Board expects the Advisor to manage the Fund in accordance with its investment objectives and approved strategies. Further, the Trustees recognize that the Advisor has an obligation to monitor trading activities, and in particular to seek the best execution of fund trades, and to evaluate the use of and payment for research. In providing these services, the Advisor utilizes teams of investment professionals (portfolio managers, analysts, research assistants, and securities traders) who require extensive information technology, research, training, compliance, and other systems to conduct their business. The Board provides oversight of the investment performance process. It regularly reviews investment performance information for the Fund, together with comparative information for appropriate benchmarks over different time horizons. The Trustees also review investment performance information during the management agreement renewal process. If performance concerns are identified, the Board discusses with the Advisor the reasons for such results and any efforts being undertaken to improve performance. The Fund’s performance was below its benchmark for the one-year and since inception periods reviewed by the Board. The Board found the investment management services provided by the Advisor to the Fund to be satisfactory and consistent with the management agreement.
Shareholder and Other Services. Under the management agreement, the Advisor provides or arranges for a comprehensive package of services to the Fund. The Board, directly and through its Audit Committee, regularly reviews reports and evaluations of such services at its regular meetings. These reports include, but are not limited to, information regarding the operational efficiency and accuracy of the shareholder and transfer agency services provided, staffing levels, shareholder satisfaction, technology support (including cyber security), new products and services offered to Fund shareholders, securities trading activities, portfolio valuation services, auditing services, and legal and operational compliance activities. The Board found the services provided by the Advisor to the Fund under the management agreement to be competitive and of high quality.
26
COVID-19 Response. During 2020, much of the world experienced unprecedented change and challenges from the impacts of the rapidly evolving, worldwide spread of the COVID-19 virus. The Board evaluated the Advisor’s response to the COVID-19 pandemic and its impact on service to the Fund. The Board found that Fund shareholders have continued to receive the Advisor’s investment management and other services without disruption, and Advisor personnel have demonstrated great resiliency in providing those services. The Board, directly and through its Audit Committee, continues to monitor the impact of the pandemic and the response of each of the Fund’s service providers.
Costs of Services and Profitability. The Advisor provides detailed information concerning its cost of providing various services to the Fund, its profitability in managing the Fund (pre- and post-distribution), its overall profitability, and its financial condition. The Trustees have reviewed with the Advisor the methodology used to prepare this financial information. This information is considered in evaluating the Advisor’s financial condition, its ability to continue to provide services under the management agreement, and the reasonableness of the current management fee. The Board concluded that the Advisor’s profits were reasonable in light of the services provided to the Fund.
Ethics. The Board generally considers the Advisor’s commitment to providing quality services to the Fund and to conducting its business ethically. They noted that the Advisor’s practices generally meet or exceed industry best practices.
Economies of Scale. The Board also reviewed information provided by the Advisor regarding the possible existence of economies of scale in connection with the management of the Fund. The Board concluded that economies of scale are difficult to measure and predict with precision, especially on a fund-by-fund basis. The Board concluded that the Advisor is appropriately sharing economies of scale, to the extent they exist, through its competitive fee structure, offering competitive fees from fund inception, and through reinvestment in its business, infrastructure, investment capabilities and initiatives to provide shareholders additional content and services.
Comparison to Other Funds’ Fees. The management agreement provides that the Fund pays the Advisor a single, all-inclusive (or unified) management fee for providing all services necessary for the management and operation of the Fund, other than brokerage expenses, expenses attributable to short sales, taxes, interest, extraordinary expenses, and expenses incurred in connection with the provision of shareholder services and distribution services under a plan adopted pursuant to Rule 12b-1 under the Investment Company Act. Under the unified fee structure, the Advisor is responsible for providing all investment advisory, custody, audit, administrative, compliance, recordkeeping, marketing and shareholder services, or arranging and supervising third parties to provide such services. The Board believes the unified fee structure is a benefit to Fund shareholders because it clearly discloses to shareholders the cost of owning Fund shares, and, since the unified fee cannot be increased without a vote of Fund shareholders, it shifts to the Advisor the risk of increased costs of operating the Fund and provides a direct incentive to minimize administrative inefficiencies. Part of the Board’s analysis of fee levels involves reviewing certain evaluative data compiled by an independent provider comparing the Fund’s unified fee to the total expense ratios of its peers. The unified fee charged to shareholders of the Fund was below the median of the total expense ratios of the Fund’s peer expense universe and was within the range of its peer expense group. The Board concluded that the management fee paid by the Fund to the Advisor under the management agreement is reasonable in light of the services provided to the Fund.
Comparison to Fees and Services Provided to Other Clients of the Advisor. The Board also requested information from the Advisor concerning the nature of the services, fees, costs, and profitability of its advisory services to funds or other advisory clients managed similarly to the Fund. The Advisor informed the Trustees that, as of December 31, 2019, it did not provide services to any other investment companies or comparable accounts that were managed similarly to the Fund.
27
Payments to Intermediaries. The Trustees also requested a description of payments made to intermediaries by the Fund and the Advisor and services provided in response thereto. These payments could include various payments made by the Fund or the Advisor to different types of intermediaries and recordkeepers for distribution and service activities provided for the Fund. The Trustees reviewed such information and received representations from the Advisor that all such payments by the Advisor were made from the Advisor’s resources and reasonable profits. The Board found such payments to be reasonable in scope and purpose.
Collateral or “Fall-Out” Benefits Derived by the Advisor. The Board considered the possible existence of collateral benefits the Advisor may receive as a result of its relationship with the Fund. They concluded that the Advisor’s primary business is managing funds and it generally does not use fund or shareholder information to generate profits in other lines of business, and therefore does not derive any significant collateral benefits from them. The Board noted that additional assets from other clients may offer the Advisor some benefit from increased leverage with service providers and counterparties. The Board also determined that the Advisor is able to provide investment management services to certain clients other than the Fund, at least in part, due to its existing infrastructure built to serve the fund complex. The Board concluded that appropriate allocation methodologies had been employed to assign resources and the cost of those resources to these other clients.
Existing Relationship. The Board also considered whether there was any reason for not continuing the existing arrangement with the Advisor. In this regard, the Board was mindful of the potential disruptions of the Fund’s operations and various risks, uncertainties, and other effects that could occur as a result of a decision not to continue such relationship. In particular, the Board recognized that most shareholders have invested in the Fund on the strength of the Advisor’s industry standing and reputation and in the expectation that the Advisor will have a continuing role in providing advisory services to the Fund.
Conclusion of the Trustees. As a result of this process, the Board, including all of the independent Trustees, taking into account all of the factors discussed above and the information provided by the Advisor and others in connection with its review and throughout the year, determined that the management fee is fair and reasonable in light of the services provided and that the investment management agreement between the Fund and the Advisor should be renewed.
28
| Liquidity Risk Management Program | ||
The Fund has adopted a liquidity risk management program (the “program”). The Fund’s Board of Trustees (the "Board") has designated American Century Investment Management, Inc. (“ACIM”) as the administrator of the program. Personnel of ACIM or its affiliates conduct the day-to-day operation of the program pursuant to policies and procedures administered by those members of the ACIM’s Investment Oversight Committee who are members of the ACIM’s Investment Management and Global Analytics departments.
Under the program, ACIM manages the Fund’s liquidity risk, which is the risk that the Fund could not meet shareholder redemption requests without significant dilution of remaining shareholders’ interests in the Fund. This risk is managed by monitoring the degree of liquidity of the Fund’s investments, limiting the amount of the Fund’s illiquid investments, and utilizing various risk management tools and facilities available to the Fund for meeting shareholder redemptions, among other means. ACIM’s process of determining the degree of liquidity of the Fund’s investments is supported by one or more third-party liquidity assessment vendors.
The Board reviewed a report prepared by ACIM regarding the operation and effectiveness of the program for the period December 1, 2018 through December 31, 2019. No significant liquidity events impacting the Fund were noted in the report. In addition, ACIM provided its assessment that the program had been effective in managing the Fund’s liquidity risk.
29
| Additional Information | ||
Retirement Account Information
As required by law, distributions you receive from certain retirement accounts are subject to federal income tax withholding, unless you elect not to have withholding apply*. Tax will be withheld on the total amount withdrawn even though you may be receiving amounts that are not subject to withholding, such as nondeductible contributions. In such case, excess amounts of withholding could occur. You may adjust your withholding election so that a greater or lesser amount will be withheld.
Remember, even if you elect not to have income tax withheld, you are liable for paying income tax on the taxable portion of your withdrawal. If you elect not to have income tax withheld or you don’t have enough income tax withheld, you may be responsible for payment of estimated tax. You may incur penalties under the estimated tax rules if your withholding and estimated tax payments are not sufficient. You can reduce or defer the income tax on a distribution by directly or indirectly rolling such distribution over to another IRA or eligible plan. You should consult your tax advisor for additional information.
State tax will be withheld if, at the time of your distribution, your address is within one of the mandatory withholding states and you have federal income tax withheld (or as otherwise required by state law). State taxes will be withheld from your distribution in accordance with the respective state rules.
*Some 403(b), 457 and qualified retirement plan distributions may be subject to 20% mandatory withholding, as they are subject to special tax and withholding rules. Your plan administrator or plan sponsor is required to provide you with a special tax notice explaining those rules at the time you request a distribution. If applicable, federal and/or state taxes may be withheld from your distribution amount.
Proxy Voting Policies
A description of the policies that the fund's investment advisor uses in exercising the voting rights associated with the securities purchased and/or held by the fund are available without charge, upon request, by calling 1-800-345-6488. It is also available on American Century Investments’ website at americancentury.com/proxy and on the Securities and Exchange Commission’s website at sec.gov. Information regarding how the investment advisor voted proxies relating to portfolio securities during the most recent 12-month period ended June 30 is available at americancentury.com/proxy. It is also available at sec.gov.
Quarterly Portfolio Disclosure
The fund files its complete schedule of portfolio holdings with the Securities and Exchange Commission (SEC) for the first and third quarters of each fiscal year as an exhibit to its reports on Form N-PORT. The fund's Form N-PORT reports are available on the SEC’s website at sec.gov.
30
Other Tax Information
The following information is provided pursuant to provisions of the Internal Revenue Code.
The fund hereby designates up to the maximum amount allowable as qualified dividend income for the fiscal year ended August 31, 2020.
For corporate taxpayers, the fund hereby designates $537,870, or up to the maximum amount allowable, of ordinary income distributions paid during the fiscal year ended August 31, 2020 as qualified for the corporate dividends received deduction.
31
| Notes | ||
32
| ||||||||
| Contact Us | americancenturyetfs.com | |||||||
| American Century Sales Representatives, Financial Professionals, Broker Dealers, Insurance Companies, Banks and Trust Companies | 1-833-ACI-ETFS | |||||||
| Telecommunications Relay Service for the Deaf | 711 | |||||||
| American Century ETF Trust | ||||||||
Investment Advisor: American Century Investment Management, Inc. Kansas City, Missouri | ||||||||
Distributor: Foreside Fund Services, LLC - Distributor, not affiliated with American Century Investment Services, Inc. | ||||||||
| This report and the statements it contains are submitted for the general information of our shareholders. The report is not authorized for distribution to prospective investors unless preceded or accompanied by an effective prospectus. | ||||||||
| ©2020 American Century Proprietary Holdings, Inc. All rights reserved. CL-ANN-95463 2010 | ||||||||
| Annual Report | |||||
| August 31, 2020 | |||||
American Century® STOXX® U.S. Quality Value ETF (VALQ) | |||||
Beginning on January 1, 2021, as permitted by regulations adopted by the Securities and Exchange Commission, paper copies of the fund’s shareholder reports like this one will no longer be sent by mail, unless you specifically request paper copies of the reports from the fund or from your financial intermediary, such as a broker-dealer or bank. Instead, the reports will be made available on a website, and you will be notified by mail each time a report is posted and provided with a website link to access the report.
If you already elected to receive shareholder reports electronically, you will not be affected by this change and you need not take any action. You may elect to receive shareholder reports and other communications from the fund or your financial intermediary electronically by calling or sending an email request to your appropriate contacts as listed on the back cover of this report.
You may elect to receive all future reports in paper free of charge. You can inform the fund or your financial intermediary that you wish to continue receiving paper copies of your shareholder reports by calling or sending an email request to your appropriate contacts as listed on the back cover of this report. Your election to receive reports in paper will apply to all funds held with the fund complex/your financial intermediary.
| Table of Contents | ||
| President’s Letter | |||||
| Performance | |||||
| Portfolio Commentary | |||||
| Fund Characteristics | |||||
| Shareholder Fee Example | |||||
| Schedule of Investments | |||||
| Statement of Assets and Liabilities | |||||
| Statement of Operations | |||||
| Statement of Changes in Net Assets | |||||
| Notes to Financial Statements | |||||
| Financial Highlights | |||||
| Report of Independent Registered Public Accounting Firm | |||||
| Management | |||||
| Approval of Management Agreement | |||||
| Liquidity Risk Management Program | |||||
| Additional Information | |||||
The iSTOXX American Century USA Quality Value Index is the intellectual property (including registered trademarks) of STOXX Limited, Zurich, Switzerland (“STOXX”), Deutsche Börse Group or their licensors, which is used under license. American Century STOXX U.S. Quality Value ETF is neither sponsored nor promoted, distributed or in any other manner supported by STOXX, Deutsche Börse Group or their licensors, research partners or data providers and STOXX, Deutsche Börse Group and their licensors, research partners or data providers do not give any warranty, and exclude any liability (whether in negligence or otherwise) with respect thereto generally or specifically in relation to any errors, omissions or interruptions in the iSTOXX American Century USA Quality Value Index or its data.
Any opinions expressed in this report reflect those of the author as of the date of the report, and do not necessarily represent the opinions of American Century Investments® or any other person in the American Century Investments organization. Any such opinions are subject to change at any time based upon market or other conditions and American Century Investments disclaims any responsibility to update such opinions. These opinions may not be relied upon as investment advice and, because investment decisions made by American Century Investments funds are based on numerous factors, may not be relied upon as an indication of trading intent on behalf of any American Century Investments fund. Security examples are used for representational purposes only and are not intended as recommendations to purchase or sell securities. Performance information for comparative indices and securities is provided to American Century Investments by third party vendors. To the best of American Century Investments’ knowledge, such information is accurate at the time of printing.
| President’s Letter | ||
Jonathan ThomasDear Investor:
Thank you for reviewing this annual report for the period ended August 31, 2020. Annual reports help convey important information about fund returns, including market factors that affected performance. For additional investment insights, please visit americancenturyetfs.com.
Pandemic Disrupted Economic, Market Courses
Broad market sentiment was generally upbeat into early 2020. Dovish central banks, modest inflation, improving economic and corporate earnings data, and progress on U.S.-China trade helped boost global growth outlooks. Against this backdrop, risk assets largely remained in favor.
However, beginning in late February, COVID-19 quickly quashed the optimistic tone. The outbreak rapidly spread worldwide, halting most U.S. and global economic activity and triggering a deep worldwide recession. Global stocks and credit-sensitive assets sold off sharply, but central banks and federal governments stepped in quickly and aggressively to stabilize financial markets. These extraordinary efforts proved helpful, as most risk assets rebounded quickly, despite weak economic and corporate earnings data. As the period progressed, coronavirus infection and death rates declined in many regions and economies reopened. By the end of August, manufacturing, employment and other data suggested an economic recovery was underway.
Overall, global stocks delivered mixed results for the period. The broad U.S. stock market overcame the effects of the early 2020 sell-off to deliver a solid gain. U.S. stocks generally fared better than their counterparts elsewhere, and the growth style significantly outperformed value stocks, which struggled. Bond returns were broadly positive, as yields declined sharply.
A Slow Return to Normal
The return to pre-pandemic life will take time and patience, but we are confident we will get there. Several drug companies are in final stages of vaccine trials, and medical professionals continue to fine-tune virus treatment protocols. In the meantime, investors likely will face periods of outbreak-related disruptions, economic and political uncertainty, and heightened market volatility. These influences can be unsettling, but they tend to be temporary.
We appreciate your confidence in us during these extraordinary times. Our firm has a long history of helping clients weather unpredictable markets, and we’re confident we will continue to meet today’s challenges.
Sincerely,
Jonathan Thomas
President and Chief Executive Officer
American Century Investments
2
| Performance | ||
| Total Returns as of August 31, 2020 | ||||||||||||||||||||
| Average Annual Returns | ||||||||||||||||||||
| 1 year | Since Inception | Inception Date | ||||||||||||||||||
| Net Asset Value | 1.55% | 0.74% | 1/11/2018 | |||||||||||||||||
| Market Price | 1.75% | 0.79% | 1/11/2018 | |||||||||||||||||
iSTOXX® American Century USA Quality Value Index | 1.69% | 0.96% | — | |||||||||||||||||
Market price is determined using the bid/ask midpoint at 4:00 p.m. Eastern time, when the net asset value (NAV) is typically calculated. Market performance does not represent the returns you would receive if you traded shares at other times. NAV prices are used to calculate market price performance prior to the date when the fund first traded on the New York Stock Exchange.
| Growth of $10,000 Over Life of Fund | ||
| $10,000 investment made January 11, 2018 | ||
| Value on August 31, 2020 | |||||
| Net Asset Value — $10,197 | |||||
iSTOXX® American Century USA Quality Value Index — $10,255 | |||||
| Total Annual Fund Operating Expenses | |||||||||||||||||
| 0.29% | |||||||||||||||||
The total annual fund operating expenses shown is as stated in the fund’s prospectus current as of the date of this report. The prospectus may vary from the expense ratio shown elsewhere in this report because it is based on a different time period, includes acquired fund fees and expenses, and, if applicable, does not include fee waivers or expense reimbursements.
Data presented reflect past performance. Past performance is no guarantee of future results. Current performance may be higher or lower than the performance shown. Total returns for periods less than one year are not annualized. Investment return and principal value will fluctuate, and redemption value may be more or less than original cost. Data assumes reinvestment of dividends and capital gains, and none of the charts reflect the deduction of taxes that a shareholder would pay on fund distributions or the redemption of fund shares. To obtain performance data current to the most recent month end, please call 1-800-345-6488 or visit americancenturyetfs.com. For additional information about the fund, please consult the prospectus.
3
| Portfolio Commentary | ||
Portfolio Managers: Peruvemba Satish and Rene Casis
Fund Strategy
American Century STOXX® U.S. Quality Value ETF seeks to track the investment results (before fees and expenses) of the iSTOXX® American Century USA Quality Value Index (the underlying index). Under normal market conditions, the fund invests at least 80% of its assets in the component securities of the underlying index.
The STOXX® USA 900 Index, which consists of the 900 largest publicly traded U.S. equity securities, defines the universe we use to create the underlying index. From that universe, we use a rules-based methodology that screens and weights stocks based on fundamental measures of quality, value and income. The resulting underlying index is designed to include high-quality securities of large- and mid-cap companies that are undervalued or have sustainable income. Although component securities of the underlying index may change from time to time, the index typically consists of 200 to 300 securities.
Performance Review
For the 12-month period ended August 31, 2020, the fund returned 1.75% on a market price basis. On a net asset value (NAV) basis, the fund returned 1.55%. For the same time period, the underlying index returned 1.69%. The fund fully replicated the underlying index’s components during the reporting period. The fund’s NAV and market price returns reflect fees and operating expenses, while the index return does not.
For the same time period, the fund outperformed market-capitalization-weighted value strategies, as measured by the Russell 1000 Value Index* (value index). The value index is an unmanaged index generally representative of the performance of U.S. large-cap value stocks. The fund’s outperformance versus the value index was largely due to the different compositions of the fund and the value index. Specifically, the fund tracks the underlying index, which pursues risk-adjusted returns by dynamically allocating among companies that we believe are high quality, attractively valued companies and companies offering sustainable income.
From a broad perspective, the fund’s information technology overweight and several holdings in the information technology sector were key drivers of the fund’s outperformance versus the value index. More specifically, holdings in the computers and peripherals and communications equipment industries were among the fund’s top contributors. An underweight and security selection in the energy sector as well as an underweight in the financials sector also positively impacted relative returns. On the other hand, holdings and an overweight in the real estate sector negatively impacted relative results. The industrials sector was another area of weakness for the fund due to both security selection and an underweight in the sector. Within industrials, several holdings in the airlines as well as the aerospace and defense industries detracted from performance. Furthermore, stock selection in the consumer staples and communication services sectors weighed on performance.
The fund’s allocation closed the 12-month period with an 80% allocation to value and a 20% allocation to income. Over the course of the year, the allocation to value was as high as 80% and as low as 35%. Allocations are rebalanced monthly, based on a strategy informed by recent risk-adjusted performance.
*The Russell 1000 Value Index returns for the one year and since inception periods ended August 31, 2020, were 0.84% and 0.90%, respectively.
4
| Fund Characteristics | ||
| AUGUST 31, 2020 | |||||
| Top Ten Holdings | % of net assets | ||||
| Target Corp. | 2.6% | ||||
| Kroger Co. (The) | 2.6% | ||||
| Apple, Inc. | 2.2% | ||||
| Alphabet, Inc., Class C | 2.0% | ||||
| Biogen, Inc. | 2.0% | ||||
| Check Point Software Technologies Ltd. | 1.8% | ||||
| AT&T, Inc. | 1.7% | ||||
| International Business Machines Corp. | 1.7% | ||||
| United Parcel Service, Inc., Class B | 1.7% | ||||
| AbbVie, Inc. | 1.7% | ||||
| Top Five Industries | % of net assets | ||||
| Food and Staples Retailing | 6.1% | ||||
| Health Care Providers and Services | 5.9% | ||||
| Technology Hardware, Storage and Peripherals | 5.7% | ||||
| Biotechnology | 5.2% | ||||
| Software | 5.1% | ||||
| Types of Investments in Portfolio | % of net assets | ||||
| Common Stocks | 99.8% | ||||
| Temporary Cash Investments | 0.3% | ||||
| Other Assets and Liabilities | (0.1)% | ||||
5
| Shareholder Fee Example | ||
Fund shareholders may incur two types of costs: (1) transaction costs, including brokerage commissions paid on purchases and sales of fund shares; and (2) ongoing costs, including management fees and other fund expenses. This example is intended to help you understand your ongoing costs (in dollars) of investing in your fund and to compare these costs with the ongoing cost of investing in other funds.
The example is based on an investment of $1,000 made at the beginning of the period and held for the entire period from March 1, 2020 to August 31, 2020.
Actual Expenses
The table provides information about actual account values and actual expenses. You may use the information, together with the amount you invested, to estimate the expenses that you paid over the period. Simply divide your account value by $1,000 (for example, an $8,600 account value divided by $1,000 = 8.6), then multiply the result by the number under the heading “Expenses Paid During Period” to estimate the expenses you paid on your account during this period.
Hypothetical Example for Comparison Purposes
The table also provides information about hypothetical account values and hypothetical expenses based on the actual expense ratio of your fund and an assumed rate of return of 5% per year before expenses, which is not the actual return of a fund. The hypothetical account values and expenses may not be used to estimate the actual ending account balance or expenses you paid for the period. You may use this information to compare the ongoing costs of investing in your fund and other funds. To do so, compare this 5% hypothetical example with the 5% hypothetical examples that appear in the shareholder reports of the other funds.
Please note that the expenses shown in the table are meant to highlight your ongoing costs only and do not reflect any transactional costs, such as brokerage commissions paid on purchases and sales of fund shares. Therefore, the table is useful in comparing ongoing costs only, and will not help you determine the relative total costs of owning different funds. In addition, if these transactional costs were included, your costs would have been higher.
| Beginning Account Value 3/1/20 | Ending Account Value 8/31/20 | Expenses Paid During Period(1) 3/1/20 - 8/31/20 | Annualized Expense Ratio(1) | |||||||||||
| Actual | $1,000 | $1,029.00 | $1.48 | 0.29% | ||||||||||
| Hypothetical | $1,000 | $1,023.68 | $1.48 | 0.29% | ||||||||||
(1)Expenses are equal to the fund's annualized expense ratio listed in the table above, multiplied by the average account value over the period, multiplied by 184, the number of days in the most recent fiscal half-year, divided by 366, to reflect the one-half year period. Annualized expense ratio reflects actual expenses, including any applicable fee waivers or expense reimbursements and excluding any acquired fund fees and expenses.
6
| Schedule of Investments | ||
AUGUST 31, 2020
| Shares | Value | |||||||
| COMMON STOCKS — 99.8% | ||||||||
| Aerospace and Defense — 1.7% | ||||||||
| General Dynamics Corp. | 1,807 | $ | 269,876 | |||||
| Huntington Ingalls Industries, Inc. | 1,722 | 260,917 | ||||||
| L3Harris Technologies, Inc. | 1,512 | 273,279 | ||||||
| Lockheed Martin Corp. | 693 | 270,450 | ||||||
| Northrop Grumman Corp. | 798 | 273,403 | ||||||
| Textron, Inc. | 26,045 | 1,026,954 | ||||||
| 2,374,879 | ||||||||
| Air Freight and Logistics — 4.6% | ||||||||
| CH Robinson Worldwide, Inc. | 9,921 | 975,234 | ||||||
| Expeditors International of Washington, Inc. | 9,390 | 829,982 | ||||||
| FedEx Corp. | 10,216 | 2,245,886 | ||||||
| United Parcel Service, Inc., Class B | 14,113 | 2,309,169 | ||||||
| 6,360,271 | ||||||||
| Auto Components — 0.4% | ||||||||
| BorgWarner, Inc. | 6,675 | 270,938 | ||||||
| Lear Corp. | 2,375 | 270,584 | ||||||
| 541,522 | ||||||||
| Banks — 0.6% | ||||||||
| Bank of America Corp. | 10,526 | 270,939 | ||||||
| Popular, Inc. | 7,122 | 263,799 | ||||||
| Regions Financial Corp. | 23,432 | 270,874 | ||||||
| 805,612 | ||||||||
| Beverages — 0.4% | ||||||||
| Coca-Cola Co. (The) | 5,712 | 282,915 | ||||||
| PepsiCo, Inc. | 1,993 | 279,140 | ||||||
| 562,055 | ||||||||
| Biotechnology — 5.2% | ||||||||
| AbbVie, Inc. | 23,876 | 2,286,604 | ||||||
Alexion Pharmaceuticals, Inc.(1) | 3,070 | 350,655 | ||||||
| Amgen, Inc. | 1,103 | 279,412 | ||||||
Biogen, Inc.(1) | 9,492 | 2,730,279 | ||||||
Emergent BioSolutions, Inc.(1) | 6,643 | 757,634 | ||||||
Regeneron Pharmaceuticals, Inc.(1) | 731 | 453,169 | ||||||
United Therapeutics Corp.(1) | 2,605 | 278,631 | ||||||
| 7,136,384 | ||||||||
| Capital Markets — 2.0% | ||||||||
| Affiliated Managers Group, Inc. | 3,853 | 264,509 | ||||||
| Ameriprise Financial, Inc. | 1,743 | 273,302 | ||||||
| Bank of New York Mellon Corp. (The) | 7,463 | 275,982 | ||||||
| E*TRADE Financial Corp. | 5,071 | 274,341 | ||||||
| Invesco Ltd. | 25,578 | 260,896 | ||||||
| Janus Henderson Group plc | 13,064 | 270,686 | ||||||
| Lazard Ltd., Class A | 4,332 | 137,194 | ||||||
| Morgan Stanley | 5,258 | 274,783 | ||||||
| Raymond James Financial, Inc. | 3,557 | 269,336 | ||||||
7
| Shares | Value | |||||||
| State Street Corp. | 5,660 | $ | 385,389 | |||||
| 2,686,418 | ||||||||
| Chemicals — 1.8% | ||||||||
| CF Industries Holdings, Inc. | 10,233 | 333,903 | ||||||
| Eastman Chemical Co. | 3,726 | 272,408 | ||||||
| Huntsman Corp. | 17,372 | 375,582 | ||||||
| LyondellBasell Industries NV, Class A | 19,831 | 1,298,534 | ||||||
| Scotts Miracle-Gro Co. (The) | 391 | 65,895 | ||||||
| Valvoline, Inc. | 3,237 | 66,035 | ||||||
| 2,412,357 | ||||||||
| Commercial Services and Supplies — 0.4% | ||||||||
| Republic Services, Inc. | 3,739 | 346,680 | ||||||
| Waste Management, Inc. | 2,418 | 275,652 | ||||||
| 622,332 | ||||||||
| Communications Equipment — 2.4% | ||||||||
Ciena Corp.(1) | 14,993 | 851,153 | ||||||
| Cisco Systems, Inc. | 26,333 | 1,111,779 | ||||||
F5 Networks, Inc.(1) | 2,046 | 270,747 | ||||||
| Juniper Networks, Inc. | 32,277 | 806,925 | ||||||
Lumentum Holdings, Inc.(1) | 3,258 | 280,188 | ||||||
| 3,320,792 | ||||||||
| Construction and Engineering — 1.1% | ||||||||
| EMCOR Group, Inc. | 4,028 | 302,140 | ||||||
| Quanta Services, Inc. | 24,803 | 1,271,154 | ||||||
| 1,573,294 | ||||||||
| Consumer Finance — 0.2% | ||||||||
| American Express Co. | 2,763 | 280,693 | ||||||
| Containers and Packaging — 1.2% | ||||||||
| Amcor plc | 25,178 | 278,469 | ||||||
| AptarGroup, Inc. | 579 | 68,548 | ||||||
| International Paper Co. | 7,558 | 274,128 | ||||||
| Packaging Corp. of America | 3,449 | 349,177 | ||||||
| Sealed Air Corp. | 9,057 | 355,940 | ||||||
| Sonoco Products Co. | 5,091 | 269,976 | ||||||
| 1,596,238 | ||||||||
| Distributors — 0.3% | ||||||||
| Genuine Parts Co. | 724 | 68,375 | ||||||
LKQ Corp.(1) | 9,614 | 305,148 | ||||||
| 373,523 | ||||||||
| Diversified Financial Services — 0.2% | ||||||||
Berkshire Hathaway, Inc., Class B(1) | 1,380 | 300,895 | ||||||
| Diversified Telecommunication Services — 3.4% | ||||||||
| AT&T, Inc. | 80,770 | 2,407,754 | ||||||
| CenturyLink, Inc. | 76,465 | 821,999 | ||||||
Liberty Global plc, Class C(1) | 15,120 | 347,911 | ||||||
| Verizon Communications, Inc. | 18,424 | 1,091,990 | ||||||
| 4,669,654 | ||||||||
| Electric Utilities — 2.7% | ||||||||
| Alliant Energy Corp. | 1,806 | 97,795 | ||||||
| Exelon Corp. | 7,371 | 272,064 | ||||||
| IDACORP, Inc. | 765 | 68,773 | ||||||
| NextEra Energy, Inc. | 346 | 96,593 | ||||||
8
| Shares | Value | |||||||
| NRG Energy, Inc. | 22,255 | $ | 765,794 | |||||
| Portland General Electric Co. | 4,083 | 155,766 | ||||||
| PPL Corp. | 34,308 | 947,930 | ||||||
| Southern Co. (The) | 11,645 | 607,636 | ||||||
| Xcel Energy, Inc. | 9,698 | 673,769 | ||||||
| 3,686,120 | ||||||||
| Electrical Equipment — 0.4% | ||||||||
| Acuity Brands, Inc. | 2,484 | 271,477 | ||||||
| Eaton Corp. plc | 2,662 | 271,790 | ||||||
| Rockwell Automation, Inc. | 310 | 71,464 | ||||||
| 614,731 | ||||||||
| Electronic Equipment, Instruments and Components — 1.2% | ||||||||
Arrow Electronics, Inc.(1) | 3,665 | 287,922 | ||||||
| Corning, Inc. | 8,321 | 270,100 | ||||||
| Jabil, Inc. | 7,981 | 272,551 | ||||||
| SYNNEX Corp. | 6,398 | 813,506 | ||||||
| 1,644,079 | ||||||||
| Equity Real Estate Investment Trusts (REITs) — 1.3% | ||||||||
| CubeSmart | 9,569 | 302,572 | ||||||
| Equity Commonwealth | 8,909 | 279,654 | ||||||
| Kimco Realty Corp. | 23,154 | 277,616 | ||||||
| Life Storage, Inc. | 3,337 | 351,820 | ||||||
| Simon Property Group, Inc. | 3,987 | 270,518 | ||||||
| Welltower, Inc. | 4,752 | 273,335 | ||||||
| 1,755,515 | ||||||||
| Food and Staples Retailing — 6.1% | ||||||||
BJ's Wholesale Club Holdings, Inc.(1) | 5,837 | 259,221 | ||||||
| Casey's General Stores, Inc. | 3,081 | 547,956 | ||||||
| Costco Wholesale Corp. | 3,176 | 1,104,168 | ||||||
| Kroger Co. (The) | 98,611 | 3,518,441 | ||||||
| Walgreens Boots Alliance, Inc. | 44,211 | 1,680,902 | ||||||
| Walmart, Inc. | 8,920 | 1,238,542 | ||||||
| 8,349,230 | ||||||||
| Food Products — 3.8% | ||||||||
| Archer-Daniels-Midland Co. | 6,726 | 301,056 | ||||||
| Bunge Ltd. | 5,830 | 265,965 | ||||||
| Conagra Brands, Inc. | 7,492 | 287,393 | ||||||
| Flowers Foods, Inc. | 21,868 | 534,891 | ||||||
| General Mills, Inc. | 13,121 | 839,088 | ||||||
| Hershey Co. (The) | 501 | 74,469 | ||||||
| Hormel Foods Corp. | 1,328 | 67,701 | ||||||
| Ingredion, Inc. | 3,488 | 280,575 | ||||||
| J.M. Smucker Co. (The) | 2,948 | 354,291 | ||||||
| Kellogg Co. | 3,938 | 279,243 | ||||||
| McCormick & Co., Inc. | 371 | 76,500 | ||||||
| Tyson Foods, Inc., Class A | 29,246 | 1,836,649 | ||||||
| 5,197,821 | ||||||||
| Gas Utilities — 0.8% | ||||||||
| Atmos Energy Corp. | 681 | 67,977 | ||||||
| National Fuel Gas Co. | 6,044 | 275,848 | ||||||
| UGI Corp. | 20,364 | 703,169 | ||||||
| 1,046,994 | ||||||||
9
| Shares | Value | |||||||
| Health Care Equipment and Supplies — 0.8% | ||||||||
| Medtronic plc | 2,668 | $ | 286,730 | |||||
| West Pharmaceutical Services, Inc. | 2,990 | 849,040 | ||||||
| 1,135,770 | ||||||||
| Health Care Providers and Services — 5.9% | ||||||||
| AmerisourceBergen Corp. | 2,785 | 270,229 | ||||||
| Anthem, Inc. | 6,033 | 1,698,410 | ||||||
| Cardinal Health, Inc. | 5,413 | 274,764 | ||||||
| Chemed Corp. | 134 | 69,293 | ||||||
| CVS Health Corp. | 4,312 | 267,861 | ||||||
DaVita, Inc.(1) | 3,120 | 270,691 | ||||||
| HCA Healthcare, Inc. | 2,290 | 310,799 | ||||||
Henry Schein, Inc.(1) | 4,179 | 277,653 | ||||||
| Humana, Inc. | 4,231 | 1,756,584 | ||||||
| McKesson Corp. | 10,780 | 1,654,083 | ||||||
Molina Healthcare, Inc.(1) | 1,502 | 277,825 | ||||||
| Quest Diagnostics, Inc. | 2,313 | 257,298 | ||||||
| UnitedHealth Group, Inc. | 1,365 | 426,631 | ||||||
| Universal Health Services, Inc., Class B | 2,495 | 275,323 | ||||||
| 8,087,444 | ||||||||
| Health Care Technology — 0.2% | ||||||||
| Cerner Corp. | 3,811 | 279,613 | ||||||
| Hotels, Restaurants and Leisure — 0.6% | ||||||||
| Vail Resorts, Inc. | 1,225 | 266,646 | ||||||
| Wyndham Destinations, Inc. | 9,563 | 277,231 | ||||||
| Yum China Holdings, Inc. | 4,970 | 286,819 | ||||||
| 830,696 | ||||||||
| Household Durables — 2.6% | ||||||||
| D.R. Horton, Inc. | 4,567 | 325,947 | ||||||
| Lennar Corp., Class A | 3,510 | 262,618 | ||||||
Mohawk Industries, Inc.(1) | 5,865 | 541,515 | ||||||
| PulteGroup, Inc. | 23,203 | 1,034,622 | ||||||
Tempur Sealy International, Inc.(1) | 3,165 | 270,734 | ||||||
| Whirlpool Corp. | 6,064 | 1,077,694 | ||||||
| 3,513,130 | ||||||||
| Household Products — 3.3% | ||||||||
| Church & Dwight Co., Inc. | 7,371 | 706,363 | ||||||
| Clorox Co. (The) | 3,746 | 837,231 | ||||||
| Colgate-Palmolive Co. | 10,447 | 828,029 | ||||||
| Kimberly-Clark Corp. | 7,015 | 1,106,687 | ||||||
| Procter & Gamble Co. (The) | 8,088 | 1,118,813 | ||||||
| 4,597,123 | ||||||||
| Industrial Conglomerates — 1.2% | ||||||||
| 3M Co. | 6,712 | 1,094,190 | ||||||
| Carlisle Cos., Inc. | 2,132 | 279,185 | ||||||
| Honeywell International, Inc. | 1,663 | 275,310 | ||||||
| 1,648,685 | ||||||||
| Insurance — 2.0% | ||||||||
| Aflac, Inc. | 7,377 | 267,933 | ||||||
| Allstate Corp. (The) | 2,919 | 271,467 | ||||||
| American Financial Group, Inc. | 4,054 | 271,010 | ||||||
| Hartford Financial Services Group, Inc. (The) | 6,592 | 266,646 | ||||||
10
| Shares | Value | |||||||
| MetLife, Inc. | 14,678 | $ | 564,516 | |||||
| Principal Financial Group, Inc. | 6,177 | 260,113 | ||||||
| Reinsurance Group of America, Inc. | 2,916 | 267,339 | ||||||
| Travelers Cos., Inc. (The) | 2,367 | 274,667 | ||||||
| Unum Group | 14,675 | 271,194 | ||||||
| 2,714,885 | ||||||||
| Interactive Media and Services — 2.4% | ||||||||
Alphabet, Inc., Class C(1) | 1,702 | 2,781,374 | ||||||
Facebook, Inc., Class A(1) | 1,792 | 525,415 | ||||||
| 3,306,789 | ||||||||
| Internet and Direct Marketing Retail — 0.2% | ||||||||
MercadoLibre, Inc.(1) | 224 | 261,764 | ||||||
| IT Services — 4.4% | ||||||||
Akamai Technologies, Inc.(1) | 2,466 | 287,116 | ||||||
| Amdocs Ltd. | 4,541 | 278,046 | ||||||
| Booz Allen Hamilton Holding Corp. | 7,917 | 697,171 | ||||||
CACI International, Inc., Class A(1) | 1,170 | 274,002 | ||||||
| Cognizant Technology Solutions Corp., Class A | 24,619 | 1,646,026 | ||||||
| International Business Machines Corp. | 18,920 | 2,333,025 | ||||||
| MAXIMUS, Inc. | 881 | 68,322 | ||||||
| Western Union Co. (The) | 18,384 | 433,679 | ||||||
| 6,017,387 | ||||||||
| Leisure Products — 0.4% | ||||||||
| Brunswick Corp. | 4,436 | 274,544 | ||||||
| Polaris, Inc. | 2,640 | 266,746 | ||||||
| 541,290 | ||||||||
| Life Sciences Tools and Services — 0.1% | ||||||||
| Bio-Techne Corp. | 273 | 69,741 | ||||||
| Machinery — 0.8% | ||||||||
| AGCO Corp. | 4,811 | 342,062 | ||||||
| Caterpillar, Inc. | 1,939 | 275,939 | ||||||
| Cummins, Inc. | 1,303 | 270,047 | ||||||
| Oshkosh Corp. | 3,527 | 271,614 | ||||||
| 1,159,662 | ||||||||
| Media — 2.6% | ||||||||
| Comcast Corp., Class A | 15,211 | 681,605 | ||||||
DISH Network Corp., Class A(1) | 23,176 | 823,211 | ||||||
| Fox Corp., Class A | 10,174 | 283,448 | ||||||
| Interpublic Group of Cos., Inc. (The) | 18,869 | 335,113 | ||||||
| New York Times Co. (The), Class A | 13,713 | 594,184 | ||||||
| News Corp., Class A | 22,422 | 339,021 | ||||||
| Omnicom Group, Inc. | 5,087 | 275,156 | ||||||
| ViacomCBS, Inc., Class B | 9,927 | 276,467 | ||||||
| 3,608,205 | ||||||||
| Metals and Mining — 1.5% | ||||||||
| Nucor Corp. | 12,012 | 546,066 | ||||||
| Reliance Steel & Aluminum Co. | 2,610 | 273,711 | ||||||
| Steel Dynamics, Inc. | 42,220 | 1,246,334 | ||||||
| 2,066,111 | ||||||||
| Multi-Utilities — 0.7% | ||||||||
| Ameren Corp. | 1,103 | 87,259 | ||||||
| Consolidated Edison, Inc. | 10,505 | 749,427 | ||||||
11
| Shares | Value | |||||||
| DTE Energy Co. | 678 | $ | 80,458 | |||||
| WEC Energy Group, Inc. | 741 | 69,713 | ||||||
| 986,857 | ||||||||
| Multiline Retail — 2.8% | ||||||||
| Dollar General Corp. | 344 | 69,447 | ||||||
Dollar Tree, Inc.(1) | 2,947 | 283,708 | ||||||
| Target Corp. | 23,277 | 3,519,715 | ||||||
| 3,872,870 | ||||||||
| Oil, Gas and Consumable Fuels — 0.9% | ||||||||
| Chevron Corp. | 3,178 | 266,730 | ||||||
| Exxon Mobil Corp. | 6,695 | 267,398 | ||||||
| HollyFrontier Corp. | 10,506 | 250,778 | ||||||
| Phillips 66 | 4,441 | 259,665 | ||||||
| Valero Energy Corp. | 5,045 | 265,317 | ||||||
| 1,309,888 | ||||||||
| Personal Products — 0.2% | ||||||||
Herbalife Nutrition Ltd.(1) | 5,466 | 268,654 | ||||||
| Pharmaceuticals — 4.7% | ||||||||
| Bristol-Myers Squibb Co. | 1,091 | 67,860 | ||||||
| Johnson & Johnson | 7,199 | 1,104,399 | ||||||
| Merck & Co., Inc. | 12,829 | 1,093,929 | ||||||
Mylan NV(1) | 119,512 | 1,957,606 | ||||||
| Perrigo Co. plc | 5,218 | 272,901 | ||||||
| Pfizer, Inc. | 29,433 | 1,112,273 | ||||||
| Zoetis, Inc. | 5,177 | 828,838 | ||||||
| 6,437,806 | ||||||||
| Professional Services — 0.9% | ||||||||
| ManpowerGroup, Inc. | 10,510 | 770,488 | ||||||
| Nielsen Holdings plc | 17,795 | 271,907 | ||||||
| Robert Half International, Inc. | 4,999 | 265,947 | ||||||
| 1,308,342 | ||||||||
| Real Estate Management and Development — 0.2% | ||||||||
CBRE Group, Inc., Class A(1) | 5,775 | 271,598 | ||||||
| Road and Rail — 0.7% | ||||||||
| CSX Corp. | 3,609 | 275,944 | ||||||
| Landstar System, Inc. | 513 | 68,275 | ||||||
| Norfolk Southern Corp. | 1,281 | 272,251 | ||||||
| Old Dominion Freight Line, Inc. | 346 | 69,955 | ||||||
| Union Pacific Corp. | 1,780 | 342,543 | ||||||
| 1,028,968 | ||||||||
| Semiconductors and Semiconductor Equipment — 2.6% | ||||||||
| Applied Materials, Inc. | 4,273 | 263,217 | ||||||
| Broadcom, Inc. | 814 | 282,580 | ||||||
| Intel Corp. | 31,491 | 1,604,467 | ||||||
| KLA Corp. | 1,302 | 267,092 | ||||||
| Lam Research Corp. | 776 | 261,000 | ||||||
| Maxim Integrated Products, Inc. | 1,477 | 101,086 | ||||||
Qorvo, Inc.(1) | 2,074 | 266,032 | ||||||
| QUALCOMM, Inc. | 3,963 | 471,993 | ||||||
| 3,517,467 | ||||||||
| Software — 5.1% | ||||||||
| Blackbaud, Inc. | 4,191 | 267,595 | ||||||
12
| Shares | Value | |||||||
Check Point Software Technologies Ltd.(1) | 19,267 | $ | 2,432,651 | |||||
| Intuit, Inc. | 203 | 70,114 | ||||||
j2 Global, Inc.(1) | 14,994 | 1,049,430 | ||||||
| LogMeIn, Inc. | 2,395 | 206,066 | ||||||
| Microsoft Corp. | 2,148 | 484,439 | ||||||
| NortonLifeLock, Inc. | 11,651 | 274,032 | ||||||
| Oracle Corp. (New York) | 33,891 | 1,939,243 | ||||||
VMware, Inc., Class A(1) | 1,945 | 280,936 | ||||||
| 7,004,506 | ||||||||
| Specialty Retail — 1.3% | ||||||||
| Best Buy Co., Inc. | 5,058 | 560,983 | ||||||
| Foot Locker, Inc. | 9,227 | 279,855 | ||||||
| L Brands, Inc. | 11,901 | 349,889 | ||||||
| Lowe's Cos., Inc. | 1,649 | 271,574 | ||||||
| Williams-Sonoma, Inc. | 3,754 | 329,451 | ||||||
| 1,791,752 | ||||||||
| Technology Hardware, Storage and Peripherals — 5.7% | ||||||||
| Apple, Inc. | 23,200 | 2,993,728 | ||||||
| Hewlett Packard Enterprise Co. | 176,001 | 1,701,930 | ||||||
| HP, Inc. | 104,958 | 2,051,929 | ||||||
| NetApp, Inc. | 6,552 | 310,499 | ||||||
| Seagate Technology plc | 6,023 | 289,044 | ||||||
| Xerox Holdings Corp. | 28,946 | 545,921 | ||||||
| 7,893,051 | ||||||||
| Textiles, Apparel and Luxury Goods — 0.8% | ||||||||
| Hanesbrands, Inc. | 51,283 | 784,117 | ||||||
| Ralph Lauren Corp. | 3,960 | 272,567 | ||||||
| 1,056,684 | ||||||||
| Thrifts and Mortgage Finance — 0.7% | ||||||||
| Essent Group Ltd. | 11,849 | 423,009 | ||||||
| MGIC Investment Corp. | 61,022 | 559,572 | ||||||
| 982,581 | ||||||||
| Tobacco — 0.4% | ||||||||
| Altria Group, Inc. | 6,289 | 275,081 | ||||||
| Philip Morris International, Inc. | 3,437 | 274,238 | ||||||
| 549,319 | ||||||||
| Trading Companies and Distributors — 0.9% | ||||||||
HD Supply Holdings, Inc.(1) | 8,135 | 322,634 | ||||||
| W.W. Grainger, Inc. | 772 | 282,112 | ||||||
| Watsco, Inc. | 2,802 | 686,462 | ||||||
| 1,291,208 | ||||||||
Water Utilities† | ||||||||
| American Water Works Co., Inc. | 477 | 67,419 | ||||||
TOTAL COMMON STOCKS (Cost $126,274,635) | 137,388,674 | |||||||
| TEMPORARY CASH INVESTMENTS — 0.3% | ||||||||
| State Street Institutional U.S. Government Money Market Fund, Premier Class (Cost $389,034) | 389,034 | 389,034 | ||||||
TOTAL INVESTMENT SECURITIES — 100.1% (Cost $126,663,669) | 137,777,708 | |||||||
| OTHER ASSETS AND LIABILITIES — (0.1)% | (179,451) | |||||||
| TOTAL NET ASSETS — 100.0% | $ | 137,598,257 | ||||||
13
| NOTES TO SCHEDULE OF INVESTMENTS | ||||||||
† Category is less than 0.05% of total net assets.
(1)Non-income producing.
See Notes to Financial Statements.
14
| Statement of Assets and Liabilities | ||
| AUGUST 31, 2020 | |||||
| Assets | |||||
| Investment securities, at value (cost of $126,663,669) | $ | 137,777,708 | |||
| Receivable for investments sold | 42,270,878 | ||||
| Dividends and interest receivable | 380,599 | ||||
| 180,429,185 | |||||
| Liabilities | |||||
| Payable for investments purchased | 42,797,604 | ||||
| Accrued management fees | 33,324 | ||||
| 42,830,928 | |||||
| Net Assets | $ | 137,598,257 | |||
| Shares outstanding (unlimited number of shares authorized) | 3,550,000 | ||||
| Net Asset Value Per Share | $ | 38.76 | |||
| Net Assets Consist of: | |||||
| Capital paid in | $ | 142,303,046 | |||
| Distributable earnings | (4,704,789) | ||||
| $ | 137,598,257 | ||||
See Notes to Financial Statements.
15
| Statement of Operations | ||
| YEAR ENDED AUGUST 31, 2020 | |||||
| Investment Income (Loss) | |||||
| Income: | |||||
| Dividends (net of foreign taxes withheld of $559) | $ | 3,335,121 | |||
| Interest | 2,565 | ||||
| Securities lending, net | 185 | ||||
| 3,337,871 | |||||
| Expenses: | |||||
| Management fees | 328,239 | ||||
| Net investment income (loss) | 3,009,632 | ||||
| Realized and Unrealized Gain (Loss) | |||||
| Net realized gain (loss) on investment transactions (Note 4) | (14,863,742) | ||||
| Change in net unrealized appreciation (depreciation) on investments | 9,994,124 | ||||
| Net realized and unrealized gain (loss) | (4,869,618) | ||||
| Net Increase (Decrease) in Net Assets Resulting from Operations | $ | (1,859,986) | |||
See Notes to Financial Statements.
16
| Statement of Changes in Net Assets | ||
| YEARS ENDED AUGUST 31, 2020 AND AUGUST 31, 2019 | ||||||||
| Increase (Decrease) in Net Assets | August 31, 2020 | August 31, 2019 | ||||||
| Operations | ||||||||
| Net investment income (loss) | $ | 3,009,632 | $ | 508,344 | ||||
| Net realized gain (loss) | (14,863,742) | (887,679) | ||||||
| Change in net unrealized appreciation (depreciation) | 9,994,124 | 842,893 | ||||||
| Net increase (decrease) in net assets resulting from operations | (1,859,986) | 463,558 | ||||||
| Distributions to Shareholders | ||||||||
| From earnings | (2,568,849) | (379,921) | ||||||
| Capital Share Transactions | ||||||||
| Proceeds from shares sold | 112,503,720 | 25,969,935 | ||||||
| Payments for shares redeemed | (867,525) | (2,953,425) | ||||||
| Net increase (decrease) in net assets from capital share transactions | 111,636,195 | 23,016,510 | ||||||
| Net increase (decrease) in net assets | 107,207,360 | 23,100,147 | ||||||
| Net Assets | ||||||||
| Beginning of period | 30,390,897 | 7,290,750 | ||||||
| End of period | $ | 137,598,257 | $ | 30,390,897 | ||||
| Transactions in Shares of the Fund | ||||||||
| Sold | 2,800,000 | 675,000 | ||||||
| Redeemed | (25,001) | (75,000) | ||||||
| Net increase (decrease) in shares of the fund | 2,774,999 | 600,000 | ||||||
See Notes to Financial Statements.
17
| Notes to Financial Statements | ||
AUGUST 31, 2020
1. Organization
American Century ETF Trust (the trust) was registered as a Delaware statutory trust in 2017 and is registered under the Investment Company Act of 1940, as amended (the 1940 Act), as an open-end management investment company. American Century STOXX® U.S. Quality Value ETF (the fund) is one fund in a series issued by the trust. The fund's investment objective is to seek to provide investment results that closely correspond, before fees and expenses, to the performance of the iSTOXX® American Century USA Quality Value Index. Shares of the fund are listed for trading on the NYSE Arca, Inc.
2. Significant Accounting Policies
The following is a summary of significant accounting policies consistently followed by the fund in preparation of its financial statements. The fund is an investment company and follows accounting and reporting guidance in accordance with accounting principles generally accepted in the United States of America. This may require management to make certain estimates and assumptions at the date of the financial statements. Actual results could differ from these estimates. Management evaluated the impact of events or transactions occurring through the date the financial statements were issued that would merit recognition or disclosure.
Investment Valuations — The fund determines the fair value of its investments and computes its net asset value per share at the close of regular trading (usually 4 p.m. Eastern time) on the New York Stock Exchange (NYSE) on each day the NYSE is open. The Board of Trustees has adopted valuation policies and procedures to guide the investment advisor in the fund’s investment valuation process and to provide methodologies for the oversight of the fund’s pricing function.
Equity securities that are listed or traded on a domestic securities exchange are valued at the last reported sales price or at the official closing price as provided by the exchange. Equity securities traded on foreign securities exchanges are generally valued at the closing price of such securities on the exchange where primarily traded or at the close of the NYSE, if that is earlier. If no last sales price is reported, or if local convention or regulation so provides, the mean of the latest bid and asked prices may be used. Securities traded over-the-counter are valued at the mean of the latest bid and asked prices, the last sales price, or the official closing price.
Open-end management investment companies are valued at the reported net asset value per share.
If the fund determines that the market price for an investment is not readily available or the valuation methods mentioned above do not reflect an investment’s fair value, such investment is valued as determined in good faith by the Board of Trustees or its delegate, in accordance with policies and procedures adopted by the Board of Trustees. In its determination of fair value, the fund may review several factors including, but not limited to, market information regarding the specific investment or comparable investments and correlation with other investment types, futures indices or general market indicators. Circumstances that may cause the fund to use these procedures to value an investment include, but are not limited to: an investment has been declared in default or is distressed; trading in a security has been suspended during the trading day or a security is not actively trading on its principal exchange; prices received from a regular pricing source are deemed unreliable; or there is a foreign market holiday and no trading occurred.
The fund monitors for significant events occurring after the close of an investment’s primary exchange but before the fund’s net asset value per share is determined. Significant events may include, but are not limited to: corporate announcements and transactions; governmental action and political unrest that could impact a specific investment or an investment sector; or armed conflicts, natural disasters and similar events that could affect investments in a specific country or region. The fund also monitors for significant fluctuations between domestic and foreign markets, as evidenced by the U.S. market or such other indicators that the Board of Trustees, or its delegate, deems appropriate. The fund may apply a model-derived factor to the closing price of equity securities traded on foreign securities exchanges. The factor is based on observable market data as provided by an independent pricing service.
Security Transactions — Security transactions are accounted for as of the trade date. Net realized gains and losses are determined on the identified cost basis, which is also used for federal income tax purposes.
18
Investment Income — Dividend income less foreign taxes withheld, if any, is recorded as of the ex-dividend date. Distributions received on securities that represent a return of capital or long-term capital gain are recorded as a reduction of cost of investments and/or as a realized gain. The fund may estimate the components of distributions received that may be considered nontaxable distributions or long-term capital gain distributions for income tax purposes. Interest income is recorded on the accrual basis and includes accretion of discounts and amortization of premiums. Securities lending income is net of fees and rebates earned by the lending agent for its services.
Income Tax Status — It is the fund’s policy to distribute substantially all net investment income and net realized gains to shareholders and to otherwise qualify as a regulated investment company under provisions of the Internal Revenue Code. Accordingly, no provision has been made for income taxes. The fund files U.S. federal, state, local and non-U.S. tax returns as applicable. The fund's tax returns are subject to examination by the relevant taxing authority until expiration of the applicable statute of limitations, which is generally three years from the date of filing but can be longer in certain jurisdictions. At this time, management believes there are no uncertain tax positions which, based on their technical merit, would not be sustained upon examination and for which it is reasonably possible that the total amounts of unrecognized tax benefits will significantly change in the next twelve months.
Segregated Assets — In accordance with the 1940 Act, the fund segregates assets on its books and records to cover certain types of investment securities and other financial instruments. American Century Investment Management, Inc. (ACIM) (the investment advisor) monitors, on a daily basis, the securities segregated to ensure the fund designates a sufficient amount of liquid assets, marked-to-market daily. The fund may also receive assets or be required to pledge assets at the custodian bank or with a broker for collateral requirements.
Distributions to Shareholders — Distributions from net investment income, if any, are generally declared and paid quarterly. Distributions from net realized gains, if any, are generally declared and paid annually.
Indemnifications — Under the trust’s organizational documents, its officers and trustees are indemnified against certain liabilities arising out of the performance of their duties to the fund. In addition, in the normal course of business, the fund enters into contracts that provide general indemnifications. The maximum exposure under these arrangements is unknown as this would involve future claims that may be made against a fund. The risk of material loss from such claims is considered by management to be remote.
Securities Lending — Securities are lent to qualified financial institutions and brokers. State Street Bank & Trust Co. serves as securities lending agent to the fund pursuant to a Securities Lending Agreement. The lending of securities exposes the fund to risks such as: the borrowers may fail to return the loaned securities, the borrowers may not be able to provide additional collateral, the fund may experience delays in recovery of the loaned securities or delays in access to collateral, or the fund may experience losses related to the investment collateral. To minimize certain risks, loan counterparties pledge collateral in the form of cash and/or securities. The lending agent has agreed to indemnify the fund in the case of default of any securities borrowed. Cash collateral received is invested in the State Street Navigator Securities Lending Government Money Market Portfolio, a money market mutual fund registered under the 1940 Act. The loans may also be secured by U.S. government securities in an amount at least equal to the market value of the securities loaned, plus accrued interest and dividends, determined on a daily basis and adjusted accordingly. By lending securities, the fund seeks to increase its net investment income through the receipt of interest and fees. Such income is reflected separately within the Statement of Operations. The value of loaned securities and related collateral outstanding at period end, if any, are shown on a gross basis within the Schedule of Investments and Statement of Assets and Liabilities.
3. Fees and Transactions with Related Parties
Certain officers and trustees of the trust are also officers and/or directors of American Century Companies, Inc. (ACC). The trust's investment advisor, ACIM, and the trust’s administrator, American Century Services, LLC, are wholly owned, directly or indirectly, by ACC. Various funds issued by American Century Strategic Asset Allocations, Inc. own, in aggregate, 71% of the shares of the fund. Related parties do not invest in the fund for the purpose of exercising management or control.
19
Management Fees — The trust has entered into a management agreement with ACIM, under which ACIM provides the fund with investment advisory and management services in exchange for a single, unified management fee (the fee). The agreement provides that ACIM will pay all expenses of managing and operating the fund, except brokerage and other transaction fees and expenses relating to the acquisition and disposition of portfolio securities, acquired fund fees and expenses, interest, taxes, litigation expenses and extraordinary expenses. The fee is computed and accrued daily based on the daily net assets of the fund and paid monthly in arrears. The annual management fee is 0.29%.
4. Investment Transactions
Purchases and sales of investment securities, excluding short-term investments and in-kind transactions, for the period ended August 31, 2020 were $204,571,488 and $199,749,459, respectively.
Securities received or delivered in-kind through subscriptions and redemptions for the period ended August 31, 2020 were $111,860,190 and $854,510, respectively. The fund incurred net realized gains of $190,563 from in-kind transactions. Net realized gain (loss) on in-kind transactions are not considered taxable for federal income tax purposes.
5. Capital Share Transactions
The fund’s shares may only be purchased and sold on a national securities exchange through a broker-dealer. The price of the fund’s shares is based on market price, and because ETF shares trade at market prices rather than net asset value (NAV), shares may trade at a price greater than NAV (a premium) or less than NAV (a discount). The fund issues and redeems shares that have been aggregated into blocks of 25,000 shares or multiples thereof (Creation Units) to authorized participants who have entered into agreements with the fund's distributor. The fund will generally issue and redeem Creation Units in return for a basket of securities (and an amount of cash) that the fund specifies each day. Investors transacting in Creation Units for cash may also pay an additional variable charge to compensate the fund for certain transaction costs and market impact expenses relating to investing in portfolio securities. Such variable charges, if any, are included in proceeds from shares sold in the Statement of Changes in Net Assets.
6. Fair Value Measurements
The fund’s investments valuation process is based on several considerations and may use multiple inputs to determine the fair value of the investments held by the fund. In conformity with accounting principles generally accepted in the United States of America, the inputs used to determine a valuation are classified into three broad levels.
•Level 1 valuation inputs consist of unadjusted quoted prices in an active market for identical investments.
•Level 2 valuation inputs consist of direct or indirect observable market data (including quoted prices for comparable investments, evaluations of subsequent market events, interest rates, prepayment speeds, credit risk, etc.). These inputs also consist of quoted prices for identical investments initially expressed in local currencies that are adjusted through translation into U.S. dollars.
•Level 3 valuation inputs consist of unobservable data (including a fund’s own assumptions).
The level classification is based on the lowest level input that is significant to the fair valuation measurement. The valuation inputs are not necessarily an indication of the risks associated with investing in these securities or other financial instruments.
As of period end, the fund’s investment securities were classified as Level 1. The Schedule of Investments provides additional information on the fund's portfolio holdings.
7. Risk Factors
The value of the fund’s shares will go up and down, sometimes rapidly or unpredictably, based on the performance of the securities owned by the fund and other factors generally affecting the securities market. Market risks, including political, regulatory, economic and social developments, can affect the value of the fund’s investments. Natural disasters, public health emergencies, terrorism and other unforeseeable events may lead to increased market volatility and may have adverse long-term effects on world economies and markets generally.
20
The fund seeks to track an index. If the fund's index has high portfolio turnover, the fund may also have high portfolio turnover, which could mean high transaction costs, affecting both performance and capital gains tax liabilities to investors.
The fund is not actively managed and does not attempt to take defensive positions under any market conditions, including declining markets. Therefore, the fund generally will not buy or sell securities unless they are added or removed from the index, even if the security is underperforming.
8. Federal Tax Information
The tax character of distributions paid during the years ended August 31, 2020 and August 31, 2019 were as follows:
| 2020 | 2019 | |||||||
| Distributions Paid From | ||||||||
| Ordinary income | $ | 2,568,849 | $ | 379,921 | ||||
| Long-term capital gains | — | — | ||||||
The book-basis character of distributions made during the year from net investment income or net realized gains may differ from their ultimate characterization for federal income tax purposes. These differences reflect the differing character of certain income items and net realized gains and losses for financial statement and tax purposes, and may result in reclassification among certain capital accounts on the financial statements.
As of period end, the federal tax cost of investments and the components of distributable earnings on a tax-basis were as follows:
| Federal tax cost of investments | $ | 127,207,135 | |||
| Gross tax appreciation of investments | $ | 12,594,801 | |||
| Gross tax depreciation of investments | (2,024,228) | ||||
| Net tax appreciation (depreciation) of investments | $ | 10,570,573 | |||
| Undistributed ordinary income | $ | 589,492 | |||
| Accumulated short-term capital losses | $ | (15,147,667) | |||
| Accumulated long-term capital losses | $ | (717,187) | |||
The difference between book-basis and tax-basis unrealized appreciation (depreciation) is attributable primarily to the tax deferral of losses on wash sales.
Accumulated capital losses represent net capital loss carryovers that may be used to offset future realized capital gains for federal income tax purposes. The capital loss carryovers may be carried forward for an unlimited period. Future capital loss carryover utilization in any given year may be subject to Internal Revenue Code limitations.
21
| Financial Highlights | ||
| For a Share Outstanding Throughout the Years Ended August 31 (except as noted) | |||||||||||||||||||||||||||||||||||
| Per-Share Data | Ratios and Supplemental Data | ||||||||||||||||||||||||||||||||||
| Income From Investment Operations: | Ratio to Average Net Assets of: | ||||||||||||||||||||||||||||||||||
| Net Asset Value, Beginning of Period | Net Investment Income (Loss)(1) | Net Realized and Unrealized Gain (Loss) | Total From Investment Operations | Distributions From Net Investment Income | Net Asset Value, End of Period | Total Return(2) | Operating Expenses | Net Investment Income (Loss) | Portfolio Turnover Rate(3) | Net Assets, End of Period (in thousands) | |||||||||||||||||||||||||
| 2020 | $39.21 | 1.02 | (0.47) | 0.55 | (1.00) | $38.76 | 1.55% | 0.29% | 2.66% | 178% | $137,598 | ||||||||||||||||||||||||
| 2019 | $41.66 | 1.15 | (2.68) | (1.53) | (0.92) | $39.21 | (3.60)% | 0.29% | 2.94% | 190% | $30,391 | ||||||||||||||||||||||||
2018(4) | $40.37 | 0.55 | 1.11 | 1.66 | (0.37) | $41.66 | 4.16% | 0.29%(5) | 2.17%(5) | 77% | $7,291 | ||||||||||||||||||||||||
| Notes to Financial Highlights | ||
(1)Computed using average shares outstanding throughout the period.
(2)Total returns are calculated based on the net asset value of the last business day. Total returns for periods less than one year are not annualized.
(3)Excludes securities received or delivered in-kind.
(4)January 11, 2018 (fund inception) through August 31, 2018.
(5)Annualized.
See Notes to Financial Statements.
| Report of Independent Registered Public Accounting Firm | ||
To the Shareholders and the Board of Trustees of American Century ETF Trust:
Opinion on the Financial Statements and Financial Highlights
We have audited the accompanying statement of assets and liabilities, including the schedule of investments, of American Century STOXX® U.S. Quality Value ETF (the “Fund”), one of the funds constituting the American Century ETF Trust, as of August 31, 2020, the related statement of operations for the year then ended, the statements of changes in net assets for each of the two years in the period then ended, the financial highlights for the two years in the period ended August 31, 2020 and the period from January 11, 2018 (fund inception) through August 31, 2018, and the related notes. In our opinion, the financial statements and financial highlights present fairly, in all material respects, the financial position of American Century STOXX® U.S. Quality Value ETF as of August 31, 2020, and the results of its operations for the year then ended, the changes in its net assets for each of the two years in the period then ended, and the financial highlights for the two years in the period ended August 31, 2020 and the period from January 11, 2018 (fund inception) through August 31, 2018, in conformity with accounting principles generally accepted in the United States of America.
Basis for Opinion
These financial statements and financial highlights are the responsibility of the Fund's management. Our responsibility is to express an opinion on the Fund’s financial statements and financial highlights based on our audits. We are a public accounting firm registered with the Public Company Accounting Oversight Board (United States) (PCAOB) and are required to be independent with respect to the Fund in accordance with the U.S. federal securities laws and the applicable rules and regulations of the Securities and Exchange Commission and the PCAOB.
We conducted our audits in accordance with the standards of the PCAOB. Those standards require that we plan and perform the audit to obtain reasonable assurance about whether the financial statements and financial highlights are free of material misstatement, whether due to error or fraud. The Fund is not required to have, nor were we engaged to perform, an audit of its internal control over financial reporting. As part of our audits we are required to obtain an understanding of internal control over financial reporting but not for the purpose of expressing an opinion on the effectiveness of the Fund’s internal control over financial reporting. Accordingly, we express no such opinion.
Our audits included performing procedures to assess the risks of material misstatement of the financial statements and financial highlights, whether due to error or fraud, and performing procedures that respond to those risks. Such procedures included examining, on a test basis, evidence regarding the amounts and disclosures in the financial statements and financial highlights. Our audits also included evaluating the accounting principles used and significant estimates made by management, as well as evaluating the overall presentation of the financial statements and financial highlights. Our procedures included confirmation of securities owned as of August 31, 2020, by correspondence with the custodian and brokers; when replies were not received from brokers, we performed other auditing procedures. We believe that our audits provide a reasonable basis for our opinion.
DELOITTE & TOUCHE LLP
Kansas City, Missouri
October 16, 2020
We have served as the auditor of one or more American Century investment companies since 1997.
23
| Management | ||
The Board of Trustees
The individuals listed below serve as trustees of the funds. Each trustee will continue to serve in this capacity until death, retirement, resignation or removal from office. The board has adopted a mandatory retirement age for trustees who are not “interested persons,” as that term is defined in the Investment Company Act (independent trustees). Trustees who are not also officers of the trust shall retire by December 31st of the year in which they reach their 75th birthday.
Mr. Thomas is an “interested person” because he currently serves as President and Chief Executive Officer of American Century Companies, Inc. (ACC), the parent company of American Century Investment Management, Inc. (ACIM or the advisor). The other trustees are independent. They are not employees, directors or officers of, and have no financial interest in, ACC or any of its wholly owned, direct or indirect, subsidiaries, including ACIM and American Century Services, LLC (ACS), and they do not have any other affiliations, positions or relationships that would cause them to be considered “interested persons” under the Investment Company Act. The following trustees also serve in this capacity for a number of other registered investment companies in the American Century Investments family of funds: Jonathan S. Thomas, 15; Ronald J. Gilson, 8; and Stephen E. Yates, 7.
The following table presents additional information about the trustees. The mailing address for each trustee other than Jonathan S. Thomas is 330 Madison Avenue, New York, New York 10017. The mailing address for Jonathan S. Thomas is 4500 Main Street, Kansas City, Missouri 64111.
| Name (Year of Birth) | Position(s) Held with Funds | Length of Time Served | Principal Occupation(s) During Past 5 Years | Number of American Century Portfolios Overseen by Trustee | Other Directorships Held During Past 5 Years | ||||||||||||
| Independent Trustees | |||||||||||||||||
| Reginald M. Browne (1968) | Trustee and Chairman of the Board | Since 2017 (Chairman since 2019) | Principal, GTS Securities (automated capital markets trading firm)(2019 to present); Senior Managing Director, Co Global Head-ETF Group, Cantor Fitzgerald (financial services firm)(2013 to 2019) | 19 | None | ||||||||||||
| Ronald J. Gilson (1946) | Trustee | Since 2017 | Charles J. Meyers Professor of Law and Business, Emeritus, Stanford Law School (1979 to 2016); Marc and Eva Stern Professor of Law and Business, Columbia University School of Law (1992 to present) | 59 | None | ||||||||||||
| Barry A. Mendelson (1958) | Trustee | Since 2017 | Retired; Consultant regarding ETF and mutual fund matters (2015 to 2016); Principal and Senior Counsel, The Vanguard Group (investment management)(1998 to 2014) | 19 | None | ||||||||||||
| Stephen E. Yates (1948) | Trustee | Since 2017 | Retired | 82 | None | ||||||||||||
24
| Name (Year of Birth) | Position(s) Held with Funds | Length of Time Served | Principal Occupation(s) During Past 5 Years | Number of American Century Portfolios Overseen by Trustee | Other Directorships Held During Past 5 Years | ||||||||||||
| Interested Trustees | |||||||||||||||||
| Jonathan S. Thomas (1963) | Trustee | Since 2017 | President and Chief Executive Officer, ACC (2007 to present). Also serves as Chief Executive Officer, ACS; Executive Vice President, ACIM; Director, ACC, ACIM and other ACC subsidiaries | 122 | None | ||||||||||||
The Statement of Additional Information has additional information about the fund's trustees and is available without charge, upon request, by calling 1-800-345-6488.
25
Officers
The following table presents certain information about the executive officers of the funds. Each officer, except Edward Rosenberg, serves as an officer for each of the 16 investment companies in the American Century family of funds. No officer is compensated for his or her service as an officer of the funds. The listed officers are interested persons of the funds and are appointed or re-appointed on an annual basis. The mailing address for each officer listed below is 4500 Main Street, Kansas City, Missouri 64111.
| Name (Year of Birth) | Offices with the Funds | Principal Occupation(s) During the Past Five Years | ||||||
| Patrick Bannigan (1965) | President since 2019 | Executive Vice President and Director, ACC (2012 to present); Chief Financial Officer, Chief Accounting Officer and Treasurer, ACC (2015 to present). Also serves as President, ACS; Vice President, ACIM; Chief Financial Officer, Chief Accounting Officer and/or Director, ACIM, ACS and other ACC subsidiaries | ||||||
| R. Wes Campbell (1974) | Chief Financial Officer and Treasurer since 2018 | Vice President, ACS (2020 to present); Investment Operations and Investment Accounting, ACS (2000 to present) | ||||||
| Amy D. Shelton (1964) | Chief Compliance Officer and Vice President since 2017 | Chief Compliance Officer, American Century funds, (2014 to present); Chief Compliance Officer, ACIM (2014 to present); Chief Compliance Officer, ACIS (2009 to present). Also serves as Vice President, ACIS | ||||||
| Charles A. Etherington (1957) | General Counsel and Vice President since 2017 | Attorney, ACC (1994 to present); Vice President, ACC (2005 to present); General Counsel, ACC (2007 to present). Also serves as General Counsel, ACIM, ACS, ACIS and other ACC subsidiaries; and Senior Vice President, ACIM and ACS | ||||||
| Cleo Chang (1977) | Vice President since 2019 | Senior Vice President, ACIM (2015 to present); Chief Investment Officer, Wilshire Funds Management (2005 to 2015) | ||||||
| David H. Reinmiller (1963) | Vice President since 2017 | Attorney, ACC (1994 to present). Also serves as Vice President, ACIM and ACS | ||||||
| Edward Rosenberg (1973) | Vice President since 2017 | Senior Vice President, ACIM (2017 to present); Senior Vice President, Flexshares Head of ETF Capital Markets, Northern Trust (2012 to 2017) | ||||||
| C. Jean Wade (1964) | Vice President since 2017 | Senior Vice President, ACS (2017 to present); Vice President, ACS (2000 to 2017) | ||||||
| Ward D. Stauffer (1960) | Secretary since 2019 | Attorney, ACS (2003 to present) | ||||||
26
| Approval of Management Agreement | ||
At a meeting held on June 5, 2020, the Fund’s Board of Trustees (the "Board") unanimously approved the renewal of the management agreement pursuant to which American Century Investment Management, Inc. (the “Advisor”) acts as the investment advisor for the Fund. Under Section 15(c) of the Investment Company Act, contracts for investment advisory services are required to be reviewed, evaluated, and approved by a majority of a fund’s trustees (the “Trustees”), including a majority of the independent Trustees, each year.
Prior to its consideration of the renewal of the management agreement, the Trustees requested and reviewed extensive data and information compiled by the Advisor and certain independent providers of evaluation data concerning the Fund and the services provided to the Fund by the Advisor. This review was in addition to the oversight and evaluation undertaken by the Board and its Audit Committee on a continual basis and the information received was supplemental to the extensive information that the Board and its Audit Committee receive and consider throughout the year.
In connection with its consideration of the renewal of the management agreement, the Board’s review and evaluation of the services provided by the Advisor included, but was not limited to, the following:
•the nature, extent, and quality of investment management and other services provided and to be provided to the Fund;
•the wide range of other programs and services provided and to be provided to the Fund and its shareholders on a routine and non-routine basis;
•the Fund’s investment performance, including data comparing the Fund's performance to appropriate benchmarks of funds with similar objectives and strategies;
•the cost of owning the Fund compared to the cost of owning similar funds;
•the compliance policies, procedures, and regulatory experience of the Advisor and the Fund's service providers;
•the Advisor’s strategic plans;
•the Advisor’s business continuity plans and specifically its response to the COVID-19 pandemic;
•financial data showing the cost of services provided to the Fund, the profitability of the Fund to the Advisor, and the overall profitability of the Advisor;
•information regarding payments to intermediaries by the Advisor; and
•possible economies of scale associated with the Advisor’s management of the Fund; and
•possible collateral benefits to the Advisor from the management of the Fund.
The independent Trustees met separately in private session to discuss the renewal and to review and discuss the information provided in response to their request. The independent Trustees also held active discussions with the Advisor regarding the renewal of the management agreement. The independent Trustees had the benefit of the advice of their independent counsel throughout the process.
Factors Considered
The Trustees considered all of the information provided by the Advisor, the independent data providers, and independent counsel in connection with the approval. They determined that the information was sufficient for them to evaluate the management agreement for the Fund. In connection with their review, the Trustees did not identify any single factor as being all-important or
27
controlling, and each Trustee may have attributed different levels of importance to different factors. In deciding to renew the management agreement, the Board based its decision on a number of factors, including without limitation the following:
Nature, Extent and Quality of Services — Generally. Under the management agreement, the Advisor is responsible for providing or arranging for all services necessary for the operation of the Fund. The Board noted that the Advisor provides or arranges at its own expense a wide variety of services including without limitation the following:
•constructing and designing the Fund
•portfolio research and security selection
•initial capitalization/funding
•securities trading
•Fund administration
•custody of Fund assets
•daily valuation of the Fund’s portfolio
•shareholder servicing and transfer agency, including shareholder confirmations, recordkeeping, and communications
•legal services (except the independent Trustees’ counsel)
•regulatory and portfolio compliance
•financial reporting
•marketing and distribution (except amounts paid by the Fund under Rule 12b-1 plans)
Investment Management Services. The nature of the investment management services provided to the Fund is quite complex and allows Fund shareholders access to professional money management, instant diversification of their investments within an asset class, and liquidity. In evaluating investment performance, the Board expects the Advisor to manage the Fund in accordance with its investment objectives and approved strategies. Further, the Trustees recognize that the Advisor has an obligation to monitor trading activities, and in particular to seek the best execution of fund trades, and to evaluate the use of and payment for research. In providing these services, the Advisor utilizes teams of investment professionals (portfolio managers, analysts, research assistants, and securities traders) who require extensive information technology, research, training, compliance, and other systems to conduct their business. The Board provides oversight of the investment performance process. It regularly reviews investment performance information for the Fund, together with comparative information for appropriate benchmarks over different time horizons. The Trustees also review investment performance information during the management agreement renewal process. If performance concerns are identified, the Board discusses with the Advisor the reasons for such results and any efforts being undertaken to improve performance. The Fund’s performance was below its benchmark for the one-year and since inception periods reviewed by the Board. The Board found the investment management services provided by the Advisor to the Fund to be satisfactory and consistent with the management agreement.
Shareholder and Other Services. Under the management agreement, the Advisor provides or arranges for a comprehensive package of services to the Fund. The Board, directly and through its Audit Committee, regularly reviews reports and evaluations of such services at its regular meetings. These reports include, but are not limited to, information regarding the operational efficiency and accuracy of the shareholder and transfer agency services provided, staffing levels, shareholder satisfaction, technology support (including cyber security), new products and services offered to Fund shareholders, securities trading activities, portfolio valuation services, auditing services, and legal and operational compliance activities. The Board found the services provided by the Advisor to the Fund under the management agreement to be competitive and of high quality.
28
COVID-19 Response. During 2020, much of the world experienced unprecedented change and challenges from the impacts of the rapidly evolving, worldwide spread of the COVID-19 virus. The Board evaluated the Advisor’s response to the COVID-19 pandemic and its impact on service to the Fund. The Board found that Fund shareholders have continued to receive the Advisor’s investment management and other services without disruption, and Advisor personnel have demonstrated great resiliency in providing those services. The Board, directly and through its Audit Committee, continues to monitor the impact of the pandemic and the response of each of the Fund’s service providers.
Costs of Services and Profitability. The Advisor provides detailed information concerning its cost of providing various services to the Fund, its profitability in managing the Fund (pre- and post-distribution), its overall profitability, and its financial condition. The Trustees have reviewed with the Advisor the methodology used to prepare this financial information. This information is considered in evaluating the Advisor’s financial condition, its ability to continue to provide services under the management agreement, and the reasonableness of the current management fee. The Board concluded that the Advisor’s profits were reasonable in light of the services provided to the Fund.
Ethics. The Board generally considers the Advisor’s commitment to providing quality services to the Fund and to conducting its business ethically. They noted that the Advisor’s practices generally meet or exceed industry best practices.
Economies of Scale. The Board also reviewed information provided by the Advisor regarding the possible existence of economies of scale in connection with the management of the Fund. The Board concluded that economies of scale are difficult to measure and predict with precision, especially on a fund-by-fund basis. The Board concluded that the Advisor is appropriately sharing economies of scale, to the extent they exist, through its competitive fee structure, offering competitive fees from fund inception, and through reinvestment in its business, infrastructure, investment capabilities and initiatives to provide shareholders additional content and services.
Comparison to Other Funds’ Fees. The management agreement provides that the Fund pays the Advisor a single, all-inclusive (or unified) management fee for providing all services necessary for the management and operation of the Fund, other than brokerage expenses, expenses attributable to short sales, taxes, interest, extraordinary expenses, and expenses incurred in connection with the provision of shareholder services and distribution services under a plan adopted pursuant to Rule 12b-1 under the Investment Company Act. Under the unified fee structure, the Advisor is responsible for providing all investment advisory, custody, audit, administrative, compliance, recordkeeping, marketing and shareholder services, or arranging and supervising third parties to provide such services. The Board believes the unified fee structure is a benefit to Fund shareholders because it clearly discloses to shareholders the cost of owning Fund shares, and, since the unified fee cannot be increased without a vote of Fund shareholders, it shifts to the Advisor the risk of increased costs of operating the Fund and provides a direct incentive to minimize administrative inefficiencies. Part of the Board’s analysis of fee levels involves reviewing certain evaluative data compiled by an independent provider comparing the Fund’s unified fee to the total expense ratios of its peers. The unified fee charged to shareholders of the Fund was below the median of the total expense ratios of the Fund’s peer expense universe and was within the range of its peer expense group. The Board concluded that the management fee paid by the Fund to the Advisor under the management agreement is reasonable in light of the services provided to the Fund.
Comparison to Fees and Services Provided to Other Clients of the Advisor. The Board also requested information from the Advisor concerning the nature of the services, fees, costs, and profitability of its advisory services to funds or other advisory clients managed similarly to the Fund. The Advisor informed the Trustees that, as of December 31, 2019, it did not provide services to any other investment companies or comparable accounts that were managed similarly to the Fund.
29
Payments to Intermediaries. The Trustees also requested a description of payments made to intermediaries by the Fund and the Advisor and services provided in response thereto. These payments could include various payments made by the Fund or the Advisor to different types of intermediaries and recordkeepers for distribution and service activities provided for the Fund. The Trustees reviewed such information and received representations from the Advisor that all such payments by the Advisor were made from the Advisor’s resources and reasonable profits. The Board found such payments to be reasonable in scope and purpose.
Collateral or “Fall-Out” Benefits Derived by the Advisor. The Board considered the possible existence of collateral benefits the Advisor may receive as a result of its relationship with the Fund. They concluded that the Advisor’s primary business is managing funds and it generally does not use fund or shareholder information to generate profits in other lines of business, and therefore does not derive any significant collateral benefits from them. The Board noted that additional assets from other clients may offer the Advisor some benefit from increased leverage with service providers and counterparties. The Board also determined that the Advisor is able to provide investment management services to certain clients other than the Fund, at least in part, due to its existing infrastructure built to serve the fund complex. The Board concluded that appropriate allocation methodologies had been employed to assign resources and the cost of those resources to these other clients.
Existing Relationship. The Board also considered whether there was any reason for not continuing the existing arrangement with the Advisor. In this regard, the Board was mindful of the potential disruptions of the Fund’s operations and various risks, uncertainties, and other effects that could occur as a result of a decision not to continue such relationship. In particular, the Board recognized that most shareholders have invested in the Fund on the strength of the Advisor’s industry standing and reputation and in the expectation that the Advisor will have a continuing role in providing advisory services to the Fund.
Conclusion of the Trustees. As a result of this process, the Board, including all of the independent Trustees, taking into account all of the factors discussed above and the information provided by the Advisor and others in connection with its review and throughout the year, determined that the management fee is fair and reasonable in light of the services provided and that the investment management agreement between the Fund and the Advisor should be renewed.
30
| Liquidity Risk Management Program | ||
The Fund has adopted a liquidity risk management program (the “program”). The Fund’s Board of Trustees (the "Board") has designated American Century Investment Management, Inc. (“ACIM”) as the administrator of the program. Personnel of ACIM or its affiliates conduct the day-to-day operation of the program pursuant to policies and procedures administered by those members of the ACIM’s Investment Oversight Committee who are members of the ACIM’s Investment Management and Global Analytics departments.
Under the program, ACIM manages the Fund’s liquidity risk, which is the risk that the Fund could not meet shareholder redemption requests without significant dilution of remaining shareholders’ interests in the Fund. This risk is managed by monitoring the degree of liquidity of the Fund’s investments, limiting the amount of the Fund’s illiquid investments, and utilizing various risk management tools and facilities available to the Fund for meeting shareholder redemptions, among other means. ACIM’s process of determining the degree of liquidity of the Fund’s investments is supported by one or more third-party liquidity assessment vendors.
The Board reviewed a report prepared by ACIM regarding the operation and effectiveness of the program for the period December 1, 2018 through December 31, 2019. No significant liquidity events impacting the Fund were noted in the report. In addition, ACIM provided its assessment that the program had been effective in managing the Fund’s liquidity risk.
31
| Additional Information | ||
Retirement Account Information
As required by law, distributions you receive from certain retirement accounts are subject to federal income tax withholding, unless you elect not to have withholding apply*. Tax will be withheld on the total amount withdrawn even though you may be receiving amounts that are not subject to withholding, such as nondeductible contributions. In such case, excess amounts of withholding could occur. You may adjust your withholding election so that a greater or lesser amount will be withheld.
Remember, even if you elect not to have income tax withheld, you are liable for paying income tax on the taxable portion of your withdrawal. If you elect not to have income tax withheld or you don’t have enough income tax withheld, you may be responsible for payment of estimated tax. You may incur penalties under the estimated tax rules if your withholding and estimated tax payments are not sufficient. You can reduce or defer the income tax on a distribution by directly or indirectly rolling such distribution over to another IRA or eligible plan. You should consult your tax advisor for additional information.
State tax will be withheld if, at the time of your distribution, your address is within one of the mandatory withholding states and you have federal income tax withheld (or as otherwise required by state law). State taxes will be withheld from your distribution in accordance with the respective state rules.
*Some 403(b), 457 and qualified retirement plan distributions may be subject to 20% mandatory withholding, as they are subject to special tax and withholding rules. Your plan administrator or plan sponsor is required to provide you with a special tax notice explaining those rules at the time you request a distribution. If applicable, federal and/or state taxes may be withheld from your distribution amount.
Proxy Voting Policies
A description of the policies that the fund's investment advisor uses in exercising the voting rights associated with the securities purchased and/or held by the fund are available without charge, upon request, by calling 1-800-345-6488. It is also available on American Century Investments’ website at americancentury.com/proxy and on the Securities and Exchange Commission’s website at sec.gov. Information regarding how the investment advisor voted proxies relating to portfolio securities during the most recent 12-month period ended June 30 is available at americancentury.com/proxy. It is also available at sec.gov.
Quarterly Portfolio Disclosure
The fund files its complete schedule of portfolio holdings with the Securities and Exchange Commission (SEC) for the first and third quarters of each fiscal year as an exhibit to its reports on Form N-PORT. The fund's Form N-PORT reports are available on the SEC’s website at sec.gov.
Other Tax Information
The following information is provided pursuant to provisions of the Internal Revenue Code.
The fund hereby designates up to the maximum amount allowable as qualified dividend income for the fiscal year ended August 31, 2020.
For corporate taxpayers, the fund hereby designates $2,568,849, or up to the maximum amount allowable, of ordinary income distributions paid during the fiscal year ended August 31, 2020 as qualified for the corporate dividends received deduction.
32
| ||||||||
| Contact Us | americancenturyetfs.com | |||||||
| American Century Sales Representatives, Financial Professionals, Broker Dealers, Insurance Companies, Banks and Trust Companies | 1-833-ACI-ETFS | |||||||
| Telecommunications Relay Service for the Deaf | 711 | |||||||
| American Century ETF Trust | ||||||||
Investment Advisor: American Century Investment Management, Inc. Kansas City, Missouri | ||||||||
Distributor: Foreside Fund Services, LLC - Distributor, not affiliated with American Century Investment Services, Inc. | ||||||||
| This report and the statements it contains are submitted for the general information of our shareholders. The report is not authorized for distribution to prospective investors unless preceded or accompanied by an effective prospectus. | ||||||||
| ©2020 American Century Proprietary Holdings, Inc. All rights reserved. CL-ANN-95460 2010 | ||||||||
| Annual Report | |||||
| August 31, 2020 | |||||
American Century® Quality Diversified International ETF (QINT) | |||||
Beginning on January 1, 2021, as permitted by regulations adopted by the Securities and Exchange Commission, paper copies of the fund’s shareholder reports like this one will no longer be sent by mail, unless you specifically request paper copies of the reports from the fund or from your financial intermediary, such as a broker-dealer or bank. Instead, the reports will be made available on a website, and you will be notified by mail each time a report is posted and provided with a website link to access the report.
If you already elected to receive shareholder reports electronically, you will not be affected by this change and you need not take any action. You may elect to receive shareholder reports and other communications from the fund or your financial intermediary electronically by calling or sending an email request to your appropriate contacts as listed on the back cover of this report.
You may elect to receive all future reports in paper free of charge. You can inform the fund or your financial intermediary that you wish to continue receiving paper copies of your shareholder reports by calling or sending an email request to your appropriate contacts as listed on the back cover of this report. Your election to receive reports in paper will apply to all funds held with the fund complex/your financial intermediary.
| Table of Contents | ||
| President’s Letter | |||||
| Performance | |||||
| Portfolio Commentary | |||||
| Fund Characteristics | |||||
| Shareholder Fee Example | |||||
| Schedule of Investments | |||||
| Statement of Assets and Liabilities | |||||
| Statement of Operations | |||||
| Statement of Changes in Net Assets | |||||
| Notes to Financial Statements | |||||
| Financial Highlights | |||||
| Report of Independent Registered Public Accounting Firm | |||||
| Management | |||||
| Approval of Management Agreement | |||||
| Liquidity Risk Management Program | |||||
| Additional Information | |||||
Any opinions expressed in this report reflect those of the author as of the date of the report, and do not necessarily represent the opinions of American Century Investments® or any other person in the American Century Investments organization. Any such opinions are subject to change at any time based upon market or other conditions and American Century Investments disclaims any responsibility to update such opinions. These opinions may not be relied upon as investment advice and, because investment decisions made by American Century Investments funds are based on numerous factors, may not be relied upon as an indication of trading intent on behalf of any American Century Investments fund. Security examples are used for representational purposes only and are not intended as recommendations to purchase or sell securities. Performance information for comparative indices and securities is provided to American Century Investments by third party vendors. To the best of American Century Investments’ knowledge, such information is accurate at the time of printing.
| President’s Letter | ||
Jonathan ThomasDear Investor:
Thank you for reviewing this annual report for the period ended August 31, 2020. Annual reports help convey important information about fund returns, including market factors that affected performance. For additional investment insights, please visit americancenturyetfs.com.
Pandemic Disrupted Economic, Market Courses
Broad market sentiment was generally upbeat into early 2020. Dovish central banks, modest inflation, improving economic and corporate earnings data, and progress on U.S.-China trade helped boost global growth outlooks. Against this backdrop, risk assets largely remained in favor.
However, beginning in late February, COVID-19 quickly quashed the optimistic tone. The outbreak rapidly spread worldwide, halting most U.S. and global economic activity and triggering a deep worldwide recession. Global stocks and credit-sensitive assets sold off sharply, but central banks and federal governments stepped in quickly and aggressively to stabilize financial markets. These extraordinary efforts proved helpful, as most risk assets rebounded quickly, despite weak economic and corporate earnings data. As the period progressed, coronavirus infection and death rates declined in many regions and economies reopened. By the end of August, manufacturing, employment and other data suggested an economic recovery was underway.
Overall, global stocks delivered mixed results for the period. The broad U.S. stock market overcame the effects of the early 2020 sell-off to deliver a solid gain. U.S. stocks generally fared better than their counterparts elsewhere, and the growth style significantly outperformed value stocks, which struggled. Bond returns were broadly positive, as yields declined sharply.
A Slow Return to Normal
The return to pre-pandemic life will take time and patience, but we are confident we will get there. Several drug companies are in final stages of vaccine trials, and medical professionals continue to fine-tune virus treatment protocols. In the meantime, investors likely will face periods of outbreak-related disruptions, economic and political uncertainty, and heightened market volatility. These influences can be unsettling, but they tend to be temporary.
We appreciate your confidence in us during these extraordinary times. Our firm has a long history of helping clients weather unpredictable markets, and we’re confident we will continue to meet today’s challenges.
Sincerely,
Jonathan Thomas
President and Chief Executive Officer
American Century Investments
2
| Performance | ||
| Total Returns as of August 31, 2020 | |||||||||||||||||||||||
| Average Annual Returns | |||||||||||||||||||||||
| 1 year | Since Inception | Inception Date | |||||||||||||||||||||
| Net Asset Value | 16.67% | 5.72% | 9/10/2018 | ||||||||||||||||||||
| Market Price | 16.57% | 5.69% | 9/10/2018 | ||||||||||||||||||||
| Alpha Vee American Century Diversified International Equity Index | 17.84% | 6.64% | — | ||||||||||||||||||||
Market price is determined using the bid/ask midpoint at 4:00 p.m. Eastern time, when the net asset value (NAV) is typically calculated. Market performance does not represent the returns you would receive if you traded shares at other times. NAV prices are used to calculate market price performance prior to the date when the fund first traded on the New York Stock Exchange.
| Growth of $10,000 Over Life of Fund | ||
| $10,000 investment made September 10, 2018 | ||
| Value on August 31, 2020 | |||||
| Net Asset Value — $11,162 | |||||
| Alpha Vee American Century Diversified International Equity Index — $11,355 | |||||
| Total Annual Fund Operating Expenses | |||||||||||||||||
| 0.39% | |||||||||||||||||
The total annual fund operating expenses shown is as stated in the fund’s prospectus current as of the date of this report. The prospectus may vary from the expense ratio shown elsewhere in this report because it is based on a different time period, includes acquired fund fees and expenses, and, if applicable, does not include fee waivers or expense reimbursements.
Data presented reflect past performance. Past performance is no guarantee of future results. Current performance may be higher or lower than the performance shown. Total returns for periods less than one year are not annualized. Investment return and principal value will fluctuate, and redemption value may be more or less than original cost. Data assumes reinvestment of dividends and capital gains, and none of the charts reflect the deduction of taxes that a shareholder would pay on fund distributions or the redemption of fund shares. To obtain performance data current to the most recent month end, please call 1-800-345-6488 or visit americancenturyetfs.com. For additional information about the fund, please consult the prospectus.
3
| Portfolio Commentary | ||
Portfolio Managers: Peruvemba Satish and Rene Casis
Fund Strategy
American Century Quality Diversified International ETF seeks to deliver investment results that closely correspond, before fees and expenses, to the performance of the Alpha Vee American Century Diversified International Equity Index (the underlying index). The fund invests in a representative sample of securities included in the underlying index that collectively has an investment profile similar to the underlying index. Under normal market conditions, the fund invests at least 80% of its assets, exclusive of collateral held from securities lending, in the component securities of the underlying index.
The underlying index is designed to select securities with attractive growth, valuation and quality fundamentals. The universe of the index is comprised of large- and mid-capitalization equity securities of global issuers in developed and emerging markets, excluding the U.S.
Performance Review
For the 12 months ended August 31, 2020, the fund returned 16.57% on a market price basis. On a net asset value (NAV) basis, the fund returned 16.67%. For the same time period, the underlying index returned 17.84%. The fund’s NAV and market price returns reflect fees and operating expenses, while the index return does not.
Non-U.S. equities, as measured by the MSCI World ex-U.S. Index (world index), advanced during the reporting period. The world index, which is an unmanaged index generally representative of the performance of large- and mid-cap non-U.S. equities, returned 5.96%. The fund’s outperformance versus the world index was largely due to the different compositions of the fund and the world index. The fund tracks the Alpha Vee American Century Diversified International Equity Index, which is designed to distinguish between high-quality value and growth companies, primarily in developed markets, and dynamically allocates to each category depending on the market environment.
Broadly speaking, security selection in the financials, materials, consumer discretionary and health care sectors contributed significantly to performance versus the world index, while holdings in the utilities sector detracted modestly. Within financials, an underweight position in banks benefited relative performance as bank stocks declined amid persistently low interest rates and increased loan-loss provisions. Within the materials sector, metals and mining company stocks rose along with a price surge in commodities such as iron ore, as global economic activity began to recover following pandemic-related shutdowns. The accelerated shift to e-commerce drove contribution from consumer discretionary stocks, including both online retailers and luxury goods firms whose online sales cushioned losses from brick-and-mortar store closures. In health care, pharmaceuticals companies gained on positive news about a potential treatment for COVID-19 and cancer drug approvals.
On the downside, selection among utilities detracted slightly from returns. Two European multi-utilities stocks that are part of the world index benefited from a swap of renewable energy assets, but as those stocks are not held by the fund, their gain weighed on relative performance.
Dynamic allocation tilted toward growth for much of the reporting period. The fund’s allocation ended the reporting period where it began with an approximately 68% allocation to growth and 32% allocation to value. The allocation to value peaked at 51% in the fourth quarter of 2019. Allocations are rebalanced monthly, based on a strategy informed by recent risk-adjusted performance.
4
| Fund Characteristics | ||
| AUGUST 31, 2020 | |||||
| Top Ten Holdings | % of net assets | ||||
| Fortescue Metals Group Ltd. | 2.5% | ||||
| L'Oreal SA | 1.8% | ||||
| Roche Holding AG | 1.8% | ||||
| Hermes International | 1.6% | ||||
| EMS-Chemie Holding AG | 1.4% | ||||
| Chugai Pharmaceutical Co. Ltd. | 1.3% | ||||
| Partners Group Holding AG | 1.3% | ||||
| Euronext NV | 1.3% | ||||
| Canadian Pacific Railway Ltd. | 1.3% | ||||
| Constellation Software, Inc. | 1.2% | ||||
| Types of Investments in Portfolio | % of net assets | ||||
| Common Stocks | 99.3% | ||||
| Temporary Cash Investments | 0.2% | ||||
| Other Assets and Liabilities | 0.5% | ||||
| Investments by Country | % of net assets | ||||
| Japan | 22.3% | ||||
| France | 11.5% | ||||
| United Kingdom | 8.9% | ||||
| Switzerland | 7.4% | ||||
| Canada | 6.9% | ||||
| Australia | 6.8% | ||||
| China | 5.3% | ||||
| Germany | 4.6% | ||||
| Sweden | 4.3% | ||||
| Netherlands | 3.3% | ||||
| Italy | 3.3% | ||||
| Denmark | 2.6% | ||||
| Finland | 2.5% | ||||
| Other Countries | 9.6% | ||||
| Cash and Equivalents* | 0.7% | ||||
*Includes temporary cash investments and other assets and liabilities.
5
| Shareholder Fee Example | ||
Fund shareholders may incur two types of costs: (1) transaction costs, including brokerage commissions paid on purchases and sales of fund shares; and (2) ongoing costs, including management fees and other fund expenses. This example is intended to help you understand your ongoing costs (in dollars) of investing in your fund and to compare these costs with the ongoing cost of investing in other funds.
The example is based on an investment of $1,000 made at the beginning of the period and held for the entire period from March 1, 2020 to August 31, 2020.
Actual Expenses
The table provides information about actual account values and actual expenses. You may use the information, together with the amount you invested, to estimate the expenses that you paid over the period. Simply divide your account value by $1,000 (for example, an $8,600 account value divided by $1,000 = 8.6), then multiply the result by the number under the heading “Expenses Paid During Period” to estimate the expenses you paid on your account during this period.
Hypothetical Example for Comparison Purposes
The table also provides information about hypothetical account values and hypothetical expenses based on the actual expense ratio of your fund and an assumed rate of return of 5% per year before expenses, which is not the actual return of a fund. The hypothetical account values and expenses may not be used to estimate the actual ending account balance or expenses you paid for the period. You may use this information to compare the ongoing costs of investing in your fund and other funds. To do so, compare this 5% hypothetical example with the 5% hypothetical examples that appear in the shareholder reports of the other funds.
Please note that the expenses shown in the table are meant to highlight your ongoing costs only and do not reflect any transactional costs, such as brokerage commissions paid on purchases and sales of fund shares. Therefore, the table is useful in comparing ongoing costs only, and will not help you determine the relative total costs of owning different funds. In addition, if these transactional costs were included, your costs would have been higher.
| Beginning Account Value 3/1/20 | Ending Account Value 8/31/20 | Expenses Paid During Period(1) 3/1/20 - 8/31/20 | Annualized Expense Ratio(1) | |||||||||||
| Actual | $1,000 | $1,149.80 | $2.11 | 0.39% | ||||||||||
| Hypothetical | $1,000 | $1,023.18 | $1.98 | 0.39% | ||||||||||
(1)Expenses are equal to the fund's annualized expense ratio listed in the table above, multiplied by the average account value over the period, multiplied by 184, the number of days in the most recent fiscal half-year, divided by 366, to reflect the one-half year period. Annualized expense ratio reflects actual expenses, including any applicable fee waivers or expense reimbursements and excluding any acquired fund fees and expenses.
6
| Schedule of Investments | ||
AUGUST 31, 2020
| Shares | Value | |||||||
| COMMON STOCKS — 99.3% | ||||||||
| Australia — 6.8% | ||||||||
| AGL Energy Ltd. | 6,660 | $ | 72,260 | |||||
| Ampol Ltd. | 7,438 | 141,569 | ||||||
| Aristocrat Leisure Ltd. | 30,423 | 625,242 | ||||||
| BHP Group Ltd. | 3,222 | 89,019 | ||||||
| Coca-Cola Amatil Ltd. | 35,687 | 238,504 | ||||||
| Cochlear Ltd. | 1,044 | 147,068 | ||||||
| Crown Resorts Ltd. | 12,379 | 81,300 | ||||||
| CSL Ltd. | 853 | 179,829 | ||||||
| Evolution Mining Ltd. | 44,842 | 183,617 | ||||||
| Fortescue Metals Group Ltd. | 201,835 | 2,570,618 | ||||||
| James Hardie Industries plc | 7,764 | 174,081 | ||||||
| Magellan Financial Group Ltd. | 6,906 | 297,469 | ||||||
| Newcrest Mining Ltd. | 7,490 | 176,702 | ||||||
| Northern Star Resources Ltd. | 14,636 | 147,463 | ||||||
| Qantas Airways Ltd. | 56,068 | 159,861 | ||||||
| Santos Ltd. | 37,591 | 154,463 | ||||||
| Scentre Group | 100,126 | 163,615 | ||||||
| Sonic Healthcare Ltd. | 22,262 | 522,720 | ||||||
| South32 Ltd. | 58,443 | 89,143 | ||||||
| Stockland | 62,542 | 179,933 | ||||||
| Wesfarmers Ltd. | 8,084 | 281,451 | ||||||
| Woolworths Group Ltd. | 5,701 | 167,029 | ||||||
| 6,842,956 | ||||||||
| Austria — 0.4% | ||||||||
| ANDRITZ AG | 5,557 | 186,255 | ||||||
OMV AG(1) | 2,896 | 94,533 | ||||||
Raiffeisen Bank International AG(1) | 4,042 | 72,454 | ||||||
| 353,242 | ||||||||
| Belgium — 0.6% | ||||||||
| Ageas SA/NV | 2,179 | 91,875 | ||||||
| Elia Group SA | 1,142 | 123,130 | ||||||
Galapagos NV(1) | 681 | 92,695 | ||||||
| Proximus SADP | 3,556 | 70,536 | ||||||
| UCB SA | 2,274 | 270,312 | ||||||
| 648,548 | ||||||||
| Canada — 6.9% | ||||||||
| Alimentation Couche-Tard, Inc., B Shares | 4,307 | 140,718 | ||||||
| B2Gold Corp. | 24,470 | 164,517 | ||||||
| Canadian Pacific Railway Ltd. | 4,337 | 1,284,474 | ||||||
| Canadian Tire Corp. Ltd., Class A | 2,623 | 274,691 | ||||||
| Cenovus Energy, Inc. | 30,949 | 146,319 | ||||||
CGI, Inc.(1) | 1,168 | 82,131 | ||||||
| Constellation Software, Inc. | 1,009 | 1,169,331 | ||||||
| Dollarama, Inc. | 4,338 | 169,531 | ||||||
| Empire Co. Ltd., Class A | 3,645 | 94,975 | ||||||
| Franco-Nevada Corp. | 1,367 | 205,813 | ||||||
7
| Shares | Value | |||||||
| Great-West Lifeco, Inc. | 4,588 | $ | 93,700 | |||||
| Imperial Oil Ltd. | 8,631 | 142,487 | ||||||
| Intact Financial Corp. | 1,412 | 151,403 | ||||||
| Kirkland Lake Gold Ltd. | 7,910 | 421,923 | ||||||
| Loblaw Cos. Ltd. | 2,723 | 140,878 | ||||||
| Magna International, Inc. | 1,771 | 86,338 | ||||||
| Manulife Financial Corp. | 48,122 | 710,593 | ||||||
| Power Corp. of Canada | 4,591 | 91,753 | ||||||
| Quebecor, Inc., Class B | 6,131 | 152,175 | ||||||
| Ritchie Bros Auctioneers, Inc. | 14,254 | 834,925 | ||||||
| Teck Resources Ltd., Class B | 7,866 | 90,798 | ||||||
| Wheaton Precious Metals Corp. | 4,484 | 239,729 | ||||||
| WSP Global, Inc. | 2,089 | 141,875 | ||||||
| 7,031,077 | ||||||||
| China — 5.3% | ||||||||
Alibaba Group Holding Ltd., ADR(1) | 1,582 | 454,081 | ||||||
| Anhui Conch Cement Co. Ltd., H Shares | 79,000 | 570,808 | ||||||
| ANTA Sports Products Ltd. | 46,000 | 452,789 | ||||||
| Autohome, Inc., ADR | 2,479 | 198,915 | ||||||
| China Oilfield Services Ltd., H Shares | 234,000 | 182,762 | ||||||
| CSPC Pharmaceutical Group Ltd. | 102,000 | 225,957 | ||||||
JD.com, Inc., ADR(1) | 9,181 | 721,994 | ||||||
| Kunlun Energy Co. Ltd. | 50,000 | 37,143 | ||||||
| Li Ning Co. Ltd. | 60,500 | 254,682 | ||||||
| Momo, Inc., ADR | 6,849 | 139,720 | ||||||
| NetEase, Inc., ADR | 1,208 | 588,550 | ||||||
New Oriental Education & Technology Group, Inc., ADR(1) | 3,012 | 441,649 | ||||||
| Sino Biopharmaceutical Ltd. | 11,500 | 13,182 | ||||||
| Sunny Optical Technology Group Co. Ltd. | 1,300 | 19,092 | ||||||
| Tencent Holdings Ltd. | 10,400 | 708,739 | ||||||
Vipshop Holdings Ltd., ADR(1) | 1,251 | 20,654 | ||||||
| Yihai International Holding Ltd. | 23,000 | 362,520 | ||||||
| 5,393,237 | ||||||||
| Denmark — 2.6% | ||||||||
| AP Moller - Maersk A/S, B Shares | 76 | 116,539 | ||||||
| Carlsberg A/S, B Shares | 1,615 | 227,175 | ||||||
| Coloplast A/S, B Shares | 799 | 135,821 | ||||||
Genmab A/S(1) | 713 | 269,777 | ||||||
| Novo Nordisk A/S, B Shares | 14,723 | 975,464 | ||||||
| Pandora A/S | 4,517 | 329,377 | ||||||
| SimCorp A/S | 4,772 | 607,622 | ||||||
| 2,661,775 | ||||||||
| Finland — 2.5% | ||||||||
| Elisa Oyj | 2,746 | 161,934 | ||||||
| Fortum Oyj | 3,882 | 82,192 | ||||||
| Kone Oyj, B Shares | 2,513 | 216,102 | ||||||
| Neste Oyj | 21,584 | 1,155,229 | ||||||
| Orion Oyj, Class B | 2,508 | 117,951 | ||||||
| Stora Enso Oyj, R Shares | 20,751 | 306,426 | ||||||
| UPM-Kymmene Oyj | 7,889 | 240,018 | ||||||
| Valmet Oyj | 8,020 | 219,586 | ||||||
| 2,499,438 | ||||||||
8
| Shares | Value | |||||||
| France — 11.5% | ||||||||
| Air Liquide SA | 988 | $ | 164,476 | |||||
Amundi SA(1) | 8,483 | 661,113 | ||||||
| Arkema SA | 886 | 98,364 | ||||||
| AXA SA | 6,926 | 141,703 | ||||||
BNP Paribas SA(1) | 2,072 | 90,484 | ||||||
Bouygues SA(1) | 12,137 | 482,235 | ||||||
| Dassault Systemes SE | 792 | 149,430 | ||||||
Eiffage SA(1) | 840 | 77,522 | ||||||
Engie SA(1) | 6,446 | 89,868 | ||||||
| Euronext NV | 10,644 | 1,296,652 | ||||||
Faurecia SE(1) | 1,944 | 84,788 | ||||||
| Hermes International | 1,936 | 1,667,427 | ||||||
| Iliad SA | 761 | 163,029 | ||||||
| Kering SA | 256 | 157,775 | ||||||
| L'Oreal SA | 5,528 | 1,832,688 | ||||||
| Legrand SA | 1,968 | 164,432 | ||||||
| LVMH Moet Hennessy Louis Vuitton SE | 321 | 151,027 | ||||||
| Orange SA | 67,807 | 757,236 | ||||||
| Pernod Ricard SA | 861 | 147,899 | ||||||
Peugeot SA(1) | 21,134 | 363,445 | ||||||
Publicis Groupe SA(1) | 7,858 | 275,823 | ||||||
| Sanofi | 9,165 | 930,157 | ||||||
| Sartorius Stedim Biotech | 846 | 303,563 | ||||||
| Schneider Electric SE | 2,170 | 269,686 | ||||||
SCOR SE(1) | 3,013 | 80,876 | ||||||
| Sodexo SA | 1,104 | 79,112 | ||||||
| STMicroelectronics NV | 5,461 | 164,471 | ||||||
| Teleperformance | 566 | 174,813 | ||||||
| Thales SA | 971 | 76,015 | ||||||
| TOTAL SE | 1,988 | 78,828 | ||||||
| Valeo SA | 3,036 | 92,855 | ||||||
| Vinci SA | 814 | 76,437 | ||||||
| Wendel SE | 809 | 83,230 | ||||||
Worldline SA(1) | 1,797 | 165,904 | ||||||
| 11,593,363 | ||||||||
| Germany — 4.6% | ||||||||
| Allianz SE | 410 | 88,989 | ||||||
| Bechtle AG | 761 | 154,097 | ||||||
| Beiersdorf AG | 1,280 | 148,150 | ||||||
| Brenntag AG | 4,377 | 274,818 | ||||||
| Covestro AG | 6,443 | 307,147 | ||||||
| Deutsche Boerse AG | 815 | 154,391 | ||||||
Deutsche Lufthansa AG(1) | 11,188 | 117,028 | ||||||
| Deutsche Post AG | 7,224 | 328,305 | ||||||
| Deutsche Telekom AG | 13,531 | 238,205 | ||||||
| Evonik Industries AG | 16,529 | 480,797 | ||||||
Evotec SE(1) | 4,961 | 132,664 | ||||||
| Fresenius Medical Care AG & Co. KGaA | 875 | 74,240 | ||||||
| Fresenius SE & Co. KGaA | 1,530 | 70,781 | ||||||
| GEA Group AG | 3,094 | 113,092 | ||||||
| Hannover Rueck SE | 834 | 142,335 | ||||||
9
| Shares | Value | |||||||
| Lanxess AG | 1,431 | $ | 83,954 | |||||
| Merck KGaA | 648 | 88,078 | ||||||
MorphoSys AG(1) | 1,034 | 130,350 | ||||||
| Muenchener Rueckversicherungs-Gesellschaft AG | 915 | 263,411 | ||||||
| Nemetschek SE | 2,383 | 189,955 | ||||||
| Rational AG | 249 | 158,984 | ||||||
| Sartorius AG, Preference Shares | 362 | 153,638 | ||||||
| Schaeffler AG, Preference Shares | 9,568 | 64,559 | ||||||
| Symrise AG | 1,316 | 181,705 | ||||||
| Telefonica Deutschland Holding AG | 32,523 | 90,147 | ||||||
| Uniper SE | 2,379 | 78,123 | ||||||
| United Internet AG | 4,296 | 211,341 | ||||||
Zalando SE(1) | 1,983 | 173,645 | ||||||
| 4,692,929 | ||||||||
| Hong Kong — 0.5% | ||||||||
| Sands China Ltd. | 109,200 | 480,617 | ||||||
| WH Group Ltd. | 19,500 | 16,787 | ||||||
| 497,404 | ||||||||
| Ireland — 0.5% | ||||||||
| CRH plc | 2,287 | 86,660 | ||||||
Flutter Entertainment plc(1) | 1,052 | 174,381 | ||||||
| Kerry Group plc, A Shares | 1,083 | 142,671 | ||||||
| Smurfit Kappa Group plc | 2,284 | 81,010 | ||||||
| 484,722 | ||||||||
| Israel — 0.3% | ||||||||
| Bank Hapoalim BM | 12,091 | 73,223 | ||||||
| Bank Leumi Le-Israel BM | 14,029 | 71,841 | ||||||
| ICL Group Ltd. | 42,885 | 159,539 | ||||||
| Isracard Ltd. | 1 | 2 | ||||||
| 304,605 | ||||||||
| Italy — 3.3% | ||||||||
| A2A SpA | 53,586 | 78,333 | ||||||
| Assicurazioni Generali SpA | 5,354 | 83,210 | ||||||
| DiaSorin SpA | 4,411 | 799,114 | ||||||
| Eni SpA | 52,356 | 488,037 | ||||||
| Ferrari NV | 3,976 | 776,227 | ||||||
Fiat Chrysler Automobiles NV(1) | 19,101 | 211,008 | ||||||
| Hera SpA | 34,998 | 134,035 | ||||||
Intesa Sanpaolo SpA(1) | 43,067 | 92,866 | ||||||
| Mediobanca Banca di Credito Finanziario SpA | 11,455 | 99,645 | ||||||
Moncler SpA(1) | 3,607 | 140,236 | ||||||
| Prysmian SpA | 3,491 | 97,786 | ||||||
| Recordati Industria Chimica e Farmaceutica SpA | 3,000 | 163,782 | ||||||
| Snam SpA | 28,837 | 148,122 | ||||||
| 3,312,401 | ||||||||
| Japan — 22.3% | ||||||||
| Advantest Corp. | 8,100 | 385,830 | ||||||
| Ajinomoto Co., Inc. | 12,200 | 226,827 | ||||||
| Asahi Group Holdings Ltd. | 2,100 | 73,317 | ||||||
| Asahi Intecc Co. Ltd. | 4,400 | 130,177 | ||||||
| Astellas Pharma, Inc. | 43,700 | 685,001 | ||||||
| Bandai Namco Holdings, Inc. | 2,400 | 148,613 | ||||||
10
| Shares | Value | |||||||
| Brother Industries Ltd. | 15,700 | $ | 258,990 | |||||
| Capcom Co., Ltd. | 3,800 | 183,722 | ||||||
| Chugai Pharmaceutical Co. Ltd. | 29,900 | 1,331,552 | ||||||
| Cosmos Pharmaceutical Corp. | 900 | 158,175 | ||||||
| CyberAgent, Inc. | 2,700 | 143,610 | ||||||
| Dai Nippon Printing Co. Ltd. | 3,400 | 72,047 | ||||||
| Daiichi Sankyo Co. Ltd. | 1,400 | 124,774 | ||||||
| Fast Retailing Co. Ltd. | 200 | 118,988 | ||||||
| Fuji Electric Co. Ltd. | 2,800 | 87,158 | ||||||
| FUJIFILM Holdings Corp. | 1,700 | 80,811 | ||||||
| Fujitsu Ltd. | 2,700 | 351,751 | ||||||
| GMO Payment Gateway, Inc. | 1,200 | 126,706 | ||||||
| Hitachi Ltd. | 2,400 | 79,594 | ||||||
| Hoya Corp. | 11,600 | 1,137,870 | ||||||
| INPEX Corp. | 19,200 | 121,226 | ||||||
| ITOCHU Corp. | 5,400 | 138,328 | ||||||
| Itochu Techno-Solutions Corp. | 4,000 | 144,594 | ||||||
| Japan Airlines Co. Ltd. | 3,800 | 74,528 | ||||||
| Japan Tobacco, Inc. | 44,800 | 836,004 | ||||||
| Kakaku.com, Inc. | 5,500 | 146,011 | ||||||
| Kansai Paint Co. Ltd. | 6,500 | 154,608 | ||||||
| Kao Corp. | 1,100 | 83,598 | ||||||
| KDDI Corp. | 14,200 | 411,284 | ||||||
| Keyence Corp. | 400 | 164,458 | ||||||
| Kirin Holdings Co. Ltd. | 32,100 | 629,848 | ||||||
| Kobe Bussan Co. Ltd. | 3,500 | 205,958 | ||||||
| Konami Holdings Corp. | 2,100 | 80,686 | ||||||
| Kyocera Corp. | 1,400 | 79,934 | ||||||
| Lasertec Corp. | 4,900 | 368,281 | ||||||
| Lawson, Inc. | 4,400 | 216,795 | ||||||
| Lion Corp. | 10,700 | 227,632 | ||||||
| McDonald's Holdings Co. Japan Ltd. | 2,500 | 122,431 | ||||||
| Medipal Holdings Corp. | 4,200 | 80,117 | ||||||
| MEIJI Holdings Co. Ltd. | 1,000 | 80,636 | ||||||
| MINEBEA MITSUMI, Inc. | 12,200 | 209,484 | ||||||
| Mitsubishi Heavy Industries Ltd. | 2,900 | 71,779 | ||||||
| Mitsubishi UFJ Financial Group, Inc. | 18,000 | 74,850 | ||||||
| Mitsubishi UFJ Lease & Finance Co. Ltd. | 15,200 | 71,559 | ||||||
| Mitsui Chemicals, Inc. | 8,600 | 201,462 | ||||||
| MonotaRO Co. Ltd. | 22,100 | 870,952 | ||||||
| NEC Corp. | 11,600 | 610,034 | ||||||
| Nexon Co. Ltd. | 9,800 | 229,813 | ||||||
| Nihon M&A Center, Inc. | 6,700 | 332,612 | ||||||
| Nintendo Co. Ltd. | 1,700 | 908,222 | ||||||
| Nippon Express Co. Ltd. | 1,400 | 82,552 | ||||||
| Nippon Shinyaku Co. Ltd. | 1,600 | 131,842 | ||||||
| Nippon Telegraph & Telephone Corp. | 9,300 | 211,422 | ||||||
| Nissan Chemical Corp. | 3,000 | 157,626 | ||||||
| Nitori Holdings Co. Ltd. | 1,200 | 250,374 | ||||||
| Nitto Denko Corp. | 1,900 | 115,097 | ||||||
| Nomura Research Institute Ltd. | 5,300 | 140,901 | ||||||
| NTT DOCOMO, Inc. | 5,300 | 147,779 | ||||||
11
| Shares | Value | |||||||
| Obayashi Corp. | 8,400 | $ | 81,656 | |||||
| Olympus Corp. | 7,700 | 152,077 | ||||||
| Omron Corp. | 2,000 | 146,153 | ||||||
| Ono Pharmaceutical Co. Ltd. | 6,200 | 186,803 | ||||||
| Oracle Corp. (Tokyo) | 1,100 | 128,847 | ||||||
| ORIX Corp. | 5,600 | 69,054 | ||||||
| Otsuka Corp. | 5,300 | 259,826 | ||||||
| Otsuka Holdings Co. Ltd. | 2,500 | 109,590 | ||||||
| Panasonic Corp. | 9,700 | 89,127 | ||||||
| Pola Orbis Holdings, Inc. | 7,400 | 133,684 | ||||||
| Recruit Holdings Co. Ltd. | 27,200 | 1,025,903 | ||||||
| Ricoh Co. Ltd. | 10,000 | 74,460 | ||||||
| Santen Pharmaceutical Co. Ltd. | 7,900 | 150,458 | ||||||
| SCSK Corp. | 1,700 | 91,983 | ||||||
| Sekisui Chemical Co. Ltd. | 5,400 | 86,138 | ||||||
| Sekisui House Ltd. | 35,000 | 689,835 | ||||||
| Shimizu Corp. | 8,900 | 67,956 | ||||||
| Shin-Etsu Chemical Co. Ltd. | 1,100 | 132,749 | ||||||
| Shionogi & Co. Ltd. | 2,300 | 127,421 | ||||||
| SMC Corp. | 300 | 163,629 | ||||||
| Sony Corp. | 1,300 | 101,603 | ||||||
| Square Enix Holdings Co. Ltd. | 1,500 | 98,595 | ||||||
| Sumitomo Dainippon Pharma Co., Ltd. | 5,200 | 65,641 | ||||||
| Sumitomo Mitsui Financial Group, Inc. | 2,600 | 76,165 | ||||||
| Sundrug Co. Ltd. | 4,000 | 148,718 | ||||||
| Suntory Beverage & Food Ltd. | 2,100 | 80,824 | ||||||
| Taisei Corp. | 2,100 | 72,223 | ||||||
| Taisho Pharmaceutical Holdings Co. Ltd. | 1,200 | 73,820 | ||||||
| TDK Corp. | 800 | 82,561 | ||||||
| TIS, Inc. | 3,500 | 69,746 | ||||||
| Tohoku Electric Power Co., Inc. | 7,200 | 73,000 | ||||||
| Tokyo Electron Ltd. | 3,400 | 865,773 | ||||||
| Tosoh Corp. | 6,700 | 99,159 | ||||||
| Toyo Suisan Kaisha Ltd. | 2,600 | 147,446 | ||||||
| Trend Micro, Inc. | 3,800 | 234,541 | ||||||
| Tsuruha Holdings, Inc. | 900 | 120,031 | ||||||
| Unicharm Corp. | 3,900 | 169,706 | ||||||
| USS Co. Ltd. | 4,300 | 72,438 | ||||||
| Welcia Holdings Co. Ltd. | 4,200 | 179,613 | ||||||
| Yamaha Motor Co. Ltd. | 5,100 | 79,990 | ||||||
| Z Holdings Corp. | 86,100 | 570,649 | ||||||
| 22,540,421 | ||||||||
| Netherlands — 3.3% | ||||||||
| ASM International NV | 2,303 | 346,966 | ||||||
| ASML Holding NV | 1,370 | 514,829 | ||||||
| Heineken Holding NV | 957 | 78,641 | ||||||
| IMCD NV | 1,422 | 152,078 | ||||||
ING Groep NV(1) | 11,513 | 93,862 | ||||||
| Koninklijke Ahold Delhaize NV | 21,417 | 646,414 | ||||||
| Koninklijke DSM NV | 1,043 | 167,858 | ||||||
Koninklijke Philips NV(1) | 11,082 | 525,182 | ||||||
| Randstad NV | 1,774 | 92,588 | ||||||
12
| Shares | Value | |||||||
| Unilever NV (New York) | 10,453 | $ | 607,583 | |||||
| Wolters Kluwer NV | 1,683 | 138,464 | ||||||
| 3,364,465 | ||||||||
| New Zealand — 1.0% | ||||||||
a2 Milk Co. Ltd. (The)(1) | 65,492 | 819,603 | ||||||
| Fisher & Paykel Healthcare Corp. Ltd. | 7,271 | 179,899 | ||||||
| 999,502 | ||||||||
| Norway — 0.9% | ||||||||
| Equinor ASA | 5,088 | 82,906 | ||||||
| Orkla ASA | 23,614 | 241,888 | ||||||
Salmar ASA(1) | 2,983 | 162,486 | ||||||
| Telenor ASA | 8,850 | 144,827 | ||||||
TOMRA Systems ASA(1) | 4,073 | 198,653 | ||||||
| Yara International ASA | 2,260 | 95,245 | ||||||
| 926,005 | ||||||||
| Portugal — 0.1% | ||||||||
| Jeronimo Martins SGPS SA | 7,845 | 129,012 | ||||||
| Singapore — 1.5% | ||||||||
| DBS Group Holdings Ltd. | 5,400 | 82,730 | ||||||
| Genting Singapore Ltd. | 138,600 | 71,268 | ||||||
| Oversea-Chinese Banking Corp. Ltd. | 12,200 | 77,672 | ||||||
| Singapore Exchange Ltd. | 182,200 | 1,150,103 | ||||||
| Singapore Technologies Engineering Ltd. | 32,800 | 81,763 | ||||||
| 1,463,536 | ||||||||
| South Korea — 1.5% | ||||||||
| Hana Financial Group, Inc. | 8,418 | 198,715 | ||||||
| LG Chem Ltd. | 936 | 579,397 | ||||||
| NCSoft Corp. | 627 | 434,596 | ||||||
| Samsung Electronics Co. Ltd. | 411 | 18,687 | ||||||
| Samsung Life Insurance Co. Ltd. | 5,480 | 281,061 | ||||||
| 1,512,456 | ||||||||
| Spain — 1.4% | ||||||||
| ACS Actividades de Construccion y Servicios SA | 8,738 | 214,815 | ||||||
Aena SME SA(1) | 941 | 140,954 | ||||||
| Banco Bilbao Vizcaya Argentaria SA | 23,954 | 70,952 | ||||||
Banco Santander SA(1) | 32,855 | 73,960 | ||||||
| Industria de Diseno Textil SA | 4,817 | 135,576 | ||||||
| Naturgy Energy Group SA | 3,969 | 76,722 | ||||||
| Repsol SA | 42,153 | 333,562 | ||||||
| Telefonica SA | 92,423 | 366,491 | ||||||
| 1,413,032 | ||||||||
| Sweden — 4.3% | ||||||||
| Atlas Copco AB, A Shares | 22,672 | 1,050,470 | ||||||
| Evolution Gaming Group AB | 9,101 | 683,905 | ||||||
| Getinge AB, B Shares | 4,929 | 109,826 | ||||||
| Hennes & Mauritz AB, B Shares | 4,930 | 78,949 | ||||||
Industrivarden AB, A Shares(1) | 3,327 | 88,646 | ||||||
| Investor AB, B Shares | 1,493 | 95,552 | ||||||
Kinnevik AB, Class B(1) | 14,785 | 572,247 | ||||||
Kinnevik AB, Class B - Redemption Shares(1) | 14,785 | 11,914 | ||||||
Sandvik AB(1) | 12,610 | 248,036 | ||||||
Securitas AB, B Shares(1) | 6,052 | 86,495 | ||||||
13
| Shares | Value | |||||||
| SKF AB, B Shares | 14,088 | $ | 281,774 | |||||
| Swedish Match AB | 11,045 | 840,510 | ||||||
Volvo AB, B Shares(1) | 13,058 | 250,489 | ||||||
| 4,398,813 | ||||||||
| Switzerland — 7.4% | ||||||||
| ABB Ltd. | 3,790 | 96,608 | ||||||
| Adecco Group AG | 1,762 | 92,399 | ||||||
| Chocoladefabriken Lindt & Spruengli AG, Participation Ceritificate | 29 | 247,943 | ||||||
| EMS-Chemie Holding AG | 1,551 | 1,404,011 | ||||||
| Geberit AG | 276 | 159,507 | ||||||
| Givaudan SA | 41 | 172,708 | ||||||
Kuehne + Nagel International AG(1) | 933 | 181,310 | ||||||
| LafargeHolcim Ltd. | 1,800 | 85,684 | ||||||
| Logitech International SA | 3,332 | 247,051 | ||||||
| Nestle SA | 1,243 | 149,942 | ||||||
| Novartis AG | 970 | 83,938 | ||||||
| Partners Group Holding AG | 1,300 | 1,324,324 | ||||||
| Roche Holding AG | 5,145 | 1,805,053 | ||||||
| Sika AG | 784 | 188,512 | ||||||
Sonova Holding AG(1) | 613 | 143,631 | ||||||
| Swatch Group AG (The), Bearer Shares | 372 | 79,015 | ||||||
| Swiss Re AG | 1,098 | 88,528 | ||||||
| Temenos AG | 880 | 142,415 | ||||||
| UBS Group AG | 7,441 | 90,931 | ||||||
| VAT Group AG | 2,652 | 518,005 | ||||||
| Zurich Insurance Group AG | 417 | 154,883 | ||||||
| 7,456,398 | ||||||||
| Taiwan — 0.8% | ||||||||
| Advantech Co. Ltd. | 18,797 | 194,113 | ||||||
| Hotai Motor Co. Ltd. | 11,000 | 222,885 | ||||||
| Nanya Technology Corp. | 83,000 | 146,279 | ||||||
| Taiwan Semiconductor Manufacturing Co. Ltd. | 7,000 | 101,859 | ||||||
| Yageo Corp. | 16,000 | 180,834 | ||||||
| 845,970 | ||||||||
| United Kingdom — 8.9% | ||||||||
| Anglo American plc | 4,341 | 106,518 | ||||||
| Antofagasta plc | 7,120 | 102,388 | ||||||
| Ashtead Group plc | 4,522 | 157,726 | ||||||
| Associated British Foods plc | 3,292 | 90,899 | ||||||
| Auto Trader Group plc | 19,378 | 146,129 | ||||||
| BAE Systems plc | 12,176 | 84,711 | ||||||
| Barratt Developments plc | 24,135 | 171,271 | ||||||
| Berkeley Group Holdings plc | 4,105 | 250,456 | ||||||
| British Land Co. plc (The) | 21,786 | 107,401 | ||||||
| Burberry Group plc | 7,235 | 140,843 | ||||||
| Coca-Cola HBC AG | 2,941 | 78,521 | ||||||
| Compass Group plc | 9,138 | 149,332 | ||||||
| Direct Line Insurance Group plc | 22,553 | 89,640 | ||||||
| Evraz plc | 80,873 | 351,060 | ||||||
| Experian plc | 3,846 | 143,674 | ||||||
| Ferguson plc | 941 | 92,934 | ||||||
| GlaxoSmithKline plc | 39,550 | 779,561 | ||||||
14
| Shares | Value | |||||||
Glencore plc(1) | 177,977 | $ | 403,160 | |||||
| Halma plc | 4,643 | 137,887 | ||||||
| Hargreaves Lansdown plc | 19,418 | 420,286 | ||||||
| Hikma Pharmaceuticals plc | 7,758 | 246,289 | ||||||
| HomeServe plc | 8,344 | 145,127 | ||||||
| Howden Joinery Group plc | 18,362 | 138,172 | ||||||
InterContinental Hotels Group plc(1) | 2,794 | 164,830 | ||||||
| ITV plc | 75,034 | 61,003 | ||||||
| Kingfisher plc | 31,005 | 112,978 | ||||||
| Land Securities Group plc | 19,795 | 153,223 | ||||||
| London Stock Exchange Group plc | 1,347 | 158,714 | ||||||
| Mondi plc | 3,976 | 77,779 | ||||||
| Next plc | 3,456 | 279,403 | ||||||
| Pearson plc | 64,678 | 483,207 | ||||||
| Persimmon plc | 7,333 | 257,041 | ||||||
| Prudential plc | 10,337 | 171,074 | ||||||
| RELX plc | 5,776 | 131,667 | ||||||
Rentokil Initial plc(1) | 21,782 | 155,449 | ||||||
| Rightmove plc | 73,793 | 626,227 | ||||||
| Rio Tinto plc | 4,165 | 255,842 | ||||||
| Royal Dutch Shell plc, A Shares | 4,714 | 70,222 | ||||||
| Sage Group plc (The) | 8,675 | 86,157 | ||||||
| Smith & Nephew plc | 10,241 | 208,631 | ||||||
| Spirax-Sarco Engineering plc | 1,184 | 162,416 | ||||||
| Standard Life Aberdeen plc | 41,976 | 133,315 | ||||||
| Tate & Lyle plc | 8,900 | 81,654 | ||||||
| Taylor Wimpey plc | 83,094 | 136,184 | ||||||
| Vodafone Group plc | 47,254 | 69,839 | ||||||
| WM Morrison Supermarkets plc | 184,977 | 476,279 | ||||||
| 9,047,119 | ||||||||
| United States — 0.1% | ||||||||
| Perrigo Co. plc | 1,877 | 96,630 | ||||||
TOTAL COMMON STOCKS (Cost $89,924,861) | 100,509,056 | |||||||
| TEMPORARY CASH INVESTMENTS — 0.2% | ||||||||
| State Street Institutional U.S. Government Money Market Fund, Premier Class (Cost $228,725) | 228,725 | 228,725 | ||||||
TOTAL INVESTMENT SECURITIES — 99.5% (Cost $90,153,586) | 100,737,781 | |||||||
| OTHER ASSETS AND LIABILITIES — 0.5% | 533,072 | |||||||
| TOTAL NET ASSETS — 100.0% | $ | 101,270,853 | ||||||
15
| MARKET SECTOR DIVERSIFICATION | |||||
(as a % of net assets) | |||||
| Industrials | 14.3 | % | |||
| Health Care | 14.0 | % | |||
| Consumer Discretionary | 13.3 | % | |||
| Materials | 12.1 | % | |||
| Consumer Staples | 11.5 | % | |||
| Financials | 10.9 | % | |||
| Information Technology | 9.4 | % | |||
| Communication Services | 9.1 | % | |||
| Energy | 3.1 | % | |||
| Utilities | 1.0 | % | |||
| Real Estate | 0.6 | % | |||
| Cash and Equivalents* | 0.7 | % | |||
*Includes temporary cash investments and other assets and liabilities.
| NOTES TO SCHEDULE OF INVESTMENTS | ||||||||
| ADR | - | American Depositary Receipt | ||||||
(1)Non-income producing.
See Notes to Financial Statements.
16
| Statement of Assets and Liabilities | ||
| AUGUST 31, 2020 | |||||
| Assets | |||||
| Investment securities, at value (cost of $90,153,586) | $ | 100,737,781 | |||
| Foreign currency holdings, at value (cost of $160,095) | 159,018 | ||||
| Dividends and interest receivable | 407,182 | ||||
| 101,303,981 | |||||
| Liabilities | |||||
| Accrued management fees | 33,128 | ||||
| Net Assets | $ | 101,270,853 | |||
| Shares outstanding (unlimited number of shares authorized) | 2,350,000 | ||||
| Net Asset Value Per Share | $ | 43.09 | |||
| Net Assets Consist of: | |||||
| Capital paid in | $ | 93,369,423 | |||
| Distributable earnings | 7,901,430 | ||||
| $ | 101,270,853 | ||||
See Notes to Financial Statements.
17
| Statement of Operations | ||
| YEAR ENDED AUGUST 31, 2020 | |||||
| Investment Income (Loss) | |||||
| Income: | |||||
| Dividends (net of foreign taxes withheld of $187,579) | $ | 1,989,736 | |||
| Interest | 2,206 | ||||
| Securities lending, net | 1,185 | ||||
| 1,993,127 | |||||
| Expenses: | |||||
| Management fees | 325,350 | ||||
| Other expenses | 460 | ||||
| 325,810 | |||||
| Net investment income (loss) | 1,667,317 | ||||
| Realized and Unrealized Gain (Loss) | |||||
| Net realized gain (loss) on: | |||||
| Investment transactions | (294,030) | ||||
| Foreign currency translation transactions | (39,706) | ||||
| (333,736) | |||||
| Change in net unrealized appreciation (depreciation) on: | |||||
| Investments | 10,251,703 | ||||
| Translation of assets and liabilities in foreign currencies | 5,829 | ||||
| 10,257,532 | |||||
| Net realized and unrealized gain (loss) | 9,923,796 | ||||
| Net Increase (Decrease) in Net Assets Resulting from Operations | $ | 11,591,113 | |||
See Notes to Financial Statements.
18
| Statement of Changes in Net Assets | ||
| YEAR ENDED AUGUST 31, 2020 AND PERIOD ENDED AUGUST 31, 2019 | ||||||||
| Increase (Decrease) in Net Assets | August 31, 2020 | August 31, 2019(1) | ||||||
| Operations | ||||||||
| Net investment income (loss) | $ | 1,667,317 | $ | 362,298 | ||||
| Net realized gain (loss) | (333,736) | (940,976) | ||||||
| Change in net unrealized appreciation (depreciation) | 10,257,532 | 332,604 | ||||||
| Net increase (decrease) in net assets resulting from operations | 11,591,113 | (246,074) | ||||||
| Distributions to Shareholders | ||||||||
| From earnings | (1,315,435) | (298,490) | ||||||
| Capital Share Transactions | ||||||||
| Proceeds from shares sold | 84,459,734 | 19,263,880 | ||||||
| Payments for shares redeemed | (12,183,875) | — | ||||||
| Net increase (decrease) in net assets from capital share transactions | 72,275,859 | 19,263,880 | ||||||
| Net increase (decrease) in net assets | 82,551,537 | 18,719,316 | ||||||
| Net Assets | ||||||||
| Beginning of period | 18,719,316 | — | ||||||
| End of period | $ | 101,270,853 | $ | 18,719,316 | ||||
| Transactions in Shares of the Fund | ||||||||
| Sold | 2,150,000 | 500,000 | ||||||
| Redeemed | (300,000) | — | ||||||
| Net increase (decrease) in shares of the fund | 1,850,000 | 500,000 | ||||||
(1)September 10, 2018 (fund inception) through August 31, 2019.
See Notes to Financial Statements.
19
| Notes to Financial Statements | ||
AUGUST 31, 2020
1. Organization
American Century ETF Trust (the trust) was registered as a Delaware statutory trust in 2017 and is registered under the Investment Company Act of 1940, as amended (the 1940 Act), as an open-end management investment company. American Century Quality Diversified International ETF (the fund) is one fund in a series issued by the trust. The fund's investment objective is to seek to provide investment results that closely correspond, before fees and expenses, to the performance of the Alpha Vee American Century Diversified International Equity Index. Shares of the fund are listed for trading on the NYSE Arca, Inc. The fund incepted on September 10, 2018.
2. Significant Accounting Policies
The following is a summary of significant accounting policies consistently followed by the fund in preparation of its financial statements. The fund is an investment company and follows accounting and reporting guidance in accordance with accounting principles generally accepted in the United States of America. This may require management to make certain estimates and assumptions at the date of the financial statements. Actual results could differ from these estimates. Management evaluated the impact of events or transactions occurring through the date the financial statements were issued that would merit recognition or disclosure.
Investment Valuations — The fund determines the fair value of its investments and computes its net asset value per share at the close of regular trading (usually 4 p.m. Eastern time) on the New York Stock Exchange (NYSE) on each day the NYSE is open. The Board of Trustees has adopted valuation policies and procedures to guide the investment advisor in the fund’s investment valuation process and to provide methodologies for the oversight of the fund’s pricing function.
Equity securities that are listed or traded on a domestic securities exchange are valued at the last reported sales price or at the official closing price as provided by the exchange. Equity securities traded on foreign securities exchanges are generally valued at the closing price of such securities on the exchange where primarily traded or at the close of the NYSE, if that is earlier. If no last sales price is reported, or if local convention or regulation so provides, the mean of the latest bid and asked prices may be used. Securities traded over-the-counter are valued at the mean of the latest bid and asked prices, the last sales price, or the official closing price. Equity securities initially expressed in local currencies are translated into U.S. dollars at the mean of the appropriate currency exchange rate at the close of the London Stock Exchange as provided by an independent pricing service.
Open-end management investment companies are valued at the reported net asset value per share.
If the fund determines that the market price for an investment is not readily available or the valuation methods mentioned above do not reflect an investment’s fair value, such investment is valued as determined in good faith by the Board of Trustees or its delegate, in accordance with policies and procedures adopted by the Board of Trustees. In its determination of fair value, the fund may review several factors including, but not limited to, market information regarding the specific investment or comparable investments and correlation with other investment types, futures indices or general market indicators. Circumstances that may cause the fund to use these procedures to value an investment include, but are not limited to: an investment has been declared in default or is distressed; trading in a security has been suspended during the trading day or a security is not actively trading on its principal exchange; prices received from a regular pricing source are deemed unreliable; or there is a foreign market holiday and no trading occurred.
The fund monitors for significant events occurring after the close of an investment’s primary exchange but before the fund’s net asset value per share is determined. Significant events may include, but are not limited to: corporate announcements and transactions; governmental action and political unrest that could impact a specific investment or an investment sector; or armed conflicts, natural disasters and similar events that could affect investments in a specific country or region. The fund also monitors for significant fluctuations between domestic and foreign markets, as evidenced by the U.S. market or such other indicators that the Board of Trustees, or its delegate, deems appropriate. The fund may apply a model-derived factor to the closing price of equity securities traded on foreign securities exchanges. The factor is based on observable market data as provided by an independent pricing service.
20
Security Transactions — Security transactions are accounted for as of the trade date. Net realized gains and losses are determined on the identified cost basis, which is also used for federal income tax purposes.
Investment Income — Dividend income less foreign taxes withheld, if any, is recorded as of the ex-dividend date. Distributions received on securities that represent a return of capital or long-term capital gain are recorded as a reduction of cost of investments and/or as a realized gain. The fund may estimate the components of distributions received that may be considered nontaxable distributions or long-term capital gain distributions for income tax purposes. Interest income is recorded on the accrual basis and includes accretion of discounts and amortization of premiums. Securities lending income is net of fees and rebates earned by the lending agent for its services.
Foreign Currency Translations — All assets and liabilities initially expressed in foreign currencies are translated into U.S. dollars at prevailing exchange rates at period end. The fund may enter into spot foreign currency exchange contracts to facilitate transactions denominated in a foreign currency. Purchases and sales of investment securities, dividend and interest income, spot foreign currency exchange contracts, and expenses are translated at the rates of exchange prevailing on the respective dates of such transactions. Net realized and unrealized foreign currency exchange gains or losses related to investment securities are a component of net realized gain (loss) on investment transactions and change in net unrealized appreciation (depreciation) on investments, respectively.
Segregated Assets — In accordance with the 1940 Act, the fund segregates assets on its books and records to cover certain types of investment securities and other financial instruments. American Century Investment Management, Inc. (ACIM) (the investment advisor) monitors, on a daily basis, the securities segregated to ensure the fund designates a sufficient amount of liquid assets, marked-to-market daily. The fund may also receive assets or be required to pledge assets at the custodian bank or with a broker for collateral requirements.
Income Tax Status — It is the fund’s policy to distribute substantially all net investment income and net realized gains to shareholders and to otherwise qualify as a regulated investment company under provisions of the Internal Revenue Code. Accordingly, no provision has been made for income taxes. The fund files U.S. federal, state, local and non-U.S. tax returns as applicable. The fund's tax returns are subject to examination by the relevant taxing authority until expiration of the applicable statute of limitations, which is generally three years from the date of filing but can be longer in certain jurisdictions. At this time, management believes there are no uncertain tax positions which, based on their technical merit, would not be sustained upon examination and for which it is reasonably possible that the total amounts of unrecognized tax benefits will significantly change in the next twelve months.
Distributions to Shareholders — Distributions from net investment income, if any, are declared and paid semiannually. Distributions from net realized gains, if any, are generally declared and paid annually.
Indemnifications — Under the trust’s organizational documents, its officers and trustees are indemnified against certain liabilities arising out of the performance of their duties to the fund. In addition, in the normal course of business, the fund enters into contracts that provide general indemnifications. The maximum exposure under these arrangements is unknown as this would involve future claims that may be made against a fund. The risk of material loss from such claims is considered by management to be remote.
Securities Lending — Securities are lent to qualified financial institutions and brokers. State Street Bank & Trust Co. serves as securities lending agent to the fund pursuant to a Securities Lending Agreement. The lending of securities exposes the fund to risks such as: the borrowers may fail to return the loaned securities, the borrowers may not be able to provide additional collateral, the fund may experience delays in recovery of the loaned securities or delays in access to collateral, or the fund may experience losses related to the investment collateral. To minimize certain risks, loan counterparties pledge collateral in the form of cash and/or securities. The lending agent has agreed to indemnify the fund in the case of default of any securities borrowed. Cash collateral received is invested in the State Street Navigator Securities Lending Government Money Market Portfolio, a money market mutual fund registered under the 1940 Act. The loans may also be secured by U.S. government securities in an amount at least equal to the market value of the securities loaned, plus accrued interest and dividends, determined on a daily basis and adjusted accordingly. By lending securities, the fund seeks to increase its net investment income through the receipt of interest and fees. Such income is reflected separately within the Statement of Operations. The value of loaned securities and related collateral outstanding at period end, if any, are shown on a gross basis within the Schedule of Investments and Statement of Assets and Liabilities.
21
3. Fees and Transactions with Related Parties
Certain officers and trustees of the trust are also officers and/or directors of American Century Companies, Inc. (ACC). The trust's investment advisor, ACIM, and the trust’s administrator, American Century Services, LLC, are wholly owned, directly or indirectly, by ACC. Various funds issued by American Century Strategic Asset Allocations, Inc. own, in aggregate, 66% of the shares of the fund. Related parties do not invest in the fund for the purpose of exercising management or control.
Management Fees — The trust has entered into a management agreement with ACIM, under which ACIM provides the fund with investment advisory and management services in exchange for a single, unified management fee (the fee). The agreement provides that ACIM will pay all expenses of managing and operating the fund, except brokerage and other transaction fees and expenses relating to the acquisition and disposition of portfolio securities, acquired fund fees and expenses, interest, taxes, litigation expenses and extraordinary expenses. The fee is computed and accrued daily based on the daily net assets of the fund and paid monthly in arrears. The annual management fee is 0.39%.
4. Investment Transactions
Purchases and sales of investment securities, excluding short-term investments and in-kind transactions, for the period ended August 31, 2020 were $104,776,963 and $97,002,327, respectively.
Securities received or delivered in-kind through subscriptions and redemptions for the period ended August 31, 2020 were $74,588,749 and $10,487,041, respectively. The fund incurred net realized gains of $1,887,863 from in-kind transactions. Net realized gain (loss) on in-kind transactions are not considered taxable for federal income tax purposes.
5. Capital Share Transactions
The fund’s shares may only be purchased and sold on a national securities exchange through a broker-dealer. The price of the fund’s shares is based on market price, and because ETF shares trade at market prices rather than net asset value (NAV), shares may trade at a price greater than NAV (a premium) or less than NAV (a discount). The fund issues and redeems shares that have been aggregated into blocks of 50,000 shares or multiples thereof (Creation Units) to authorized participants who have entered into agreements with the fund's distributor. The fund will generally issue and redeem Creation Units in return for a basket of securities (and an amount of cash) that the fund specifies each day. Investors transacting in Creation Units for cash may also pay an additional variable charge to compensate the fund for certain transaction costs and market impact expenses relating to investing in portfolio securities. Such variable charges, if any, are included in proceeds from shares sold in the Statement of Changes in Net Assets.
6. Fair Value Measurements
The fund’s investments valuation process is based on several considerations and may use multiple inputs to determine the fair value of the investments held by the fund. In conformity with accounting principles generally accepted in the United States of America, the inputs used to determine a valuation are classified into three broad levels.
•Level 1 valuation inputs consist of unadjusted quoted prices in an active market for identical investments.
•Level 2 valuation inputs consist of direct or indirect observable market data (including quoted prices for comparable investments, evaluations of subsequent market events, interest rates, prepayment speeds, credit risk, etc.). These inputs also consist of quoted prices for identical investments initially expressed in local currencies that are adjusted through translation into U.S. dollars.
•Level 3 valuation inputs consist of unobservable data (including a fund’s own assumptions).
The level classification is based on the lowest level input that is significant to the fair valuation measurement. The valuation inputs are not necessarily an indication of the risks associated with investing in these securities or other financial instruments.
22
The following is a summary of the level classifications as of period end. The Schedule of Investments provides additional information on the fund’s portfolio holdings.
| Level 1 | Level 2 | Level 3 | |||||||||
| Assets | |||||||||||
| Investment Securities | |||||||||||
| Common Stocks | $ | 2,565,563 | $ | 97,943,493 | — | ||||||
| Temporary Cash Investments | 228,725 | — | — | ||||||||
| $ | 2,794,288 | $ | 97,943,493 | — | |||||||
7. Risk Factors
The value of the fund’s shares will go up and down, sometimes rapidly or unpredictably, based on the performance of the securities owned by the fund and other factors generally affecting the securities market. Market risks, including political, regulatory, economic and social developments, can affect the value of the fund’s investments. Natural disasters, public health emergencies, terrorism and other unforeseeable events may lead to increased market volatility and may have adverse long-term effects on world economies and markets generally.
There are certain risks involved in investing in foreign securities. These risks include those resulting from political events (such as civil unrest, national elections and imposition of exchange controls), social and economic events (such as labor strikes and rising inflation), and natural disasters. Securities of foreign issuers may be less liquid and more volatile. Investing in emerging markets or a significant portion of assets in one country or region may accentuate these risks.
The fund seeks to track an index. If the fund's index has high portfolio turnover, the fund may also have high portfolio turnover, which could mean high transaction costs, affecting both performance and capital gains tax liabilities to investors.
The fund is not actively managed and does not attempt to take defensive positions under any market conditions, including declining markets. Therefore, the fund generally will not buy or sell securities unless they are added or removed from the index, even if the security is underperforming.
8. Federal Tax Information
The tax character of distributions paid during the year ended August 31, 2020 and the period September 10, 2018 (fund inception) through August 31, 2019 were as follows:
| 2020 | 2019 | |||||||
| Distributions Paid From | ||||||||
| Ordinary income | $ | 1,315,435 | $ | 298,490 | ||||
| Long-term capital gains | — | — | ||||||
The book-basis character of distributions made during the year from net investment income or net realized gains may differ from their ultimate characterization for federal income tax purposes. These differences reflect the differing character of certain income items and net realized gains and losses for financial statement and tax purposes, and may result in reclassification among certain capital accounts on the financial statements.
The reclassifications, which are primarily due to in-kind transactions, were made to capital paid in $1,829,684 and distributable earnings $(1,829,684).
23
As of period end, the federal tax cost of investments and the components of distributable earnings on a tax-basis were as follows:
| Federal tax cost of investments | $ | 90,413,077 | |||
| Gross tax appreciation of investments | $ | 14,341,173 | |||
| Gross tax depreciation of investments | (4,016,469) | ||||
| Net tax appreciation (depreciation) of investments | 10,324,704 | ||||
| Net tax appreciation (depreciation) on translation of assets and liabilities in foreign currencies | 5,941 | ||||
| Net tax appreciation (depreciation) | $ | 10,330,645 | |||
| Undistributed ordinary income | $ | 496,716 | |||
| Accumulated short-term capital losses | $ | (2,852,329) | |||
| Accumulated long-term capital losses | $ | (73,602) | |||
The difference between book-basis and tax-basis unrealized appreciation (depreciation) is attributable primarily to the tax deferral of losses on wash sales.
Accumulated capital losses represent net capital loss carryovers that may be used to offset future realized capital gains for federal income tax purposes. The capital loss carryovers may be carried forward for an unlimited period. Future capital loss carryover utilization in any given year may be subject to Internal Revenue Code limitations.
24
| Financial Highlights | ||
| For a Share Outstanding Throughout the Years Ended August 31 (except as noted) | |||||||||||||||||||||||||||||||||||
| Per-Share Data | Ratios and Supplemental Data | ||||||||||||||||||||||||||||||||||
| Income From Investment Operations: | Ratio to Average Net Assets of: | ||||||||||||||||||||||||||||||||||
| Net Asset Value, Beginning of Period | Net Investment Income (Loss)(1) | Net Realized and Unrealized Gain (Loss) | Total From Investment Operations | Distributions From Net Investment Income | Net Asset Value, End of Period | Total Return(2) | Operating Expenses | Net Investment Income (Loss) | Portfolio Turnover Rate(3) | Net Assets, End of Period (in thousands) | |||||||||||||||||||||||||
| 2020 | $37.44 | 0.78 | 5.42 | 6.20 | (0.55) | $43.09 | 16.67% | 0.39% | 2.00% | 118% | $101,271 | ||||||||||||||||||||||||
2019(4) | $39.85 | 0.98 | (2.69) | (1.71) | (0.70) | $37.44 | (4.32)% | 0.39%(5) | 2.67%(5) | 119% | $18,719 | ||||||||||||||||||||||||
| Notes to Financial Highlights | ||
(1)Computed using average shares outstanding throughout the period.
(2)Total returns are calculated based on the net asset value of the last business day. Total returns for periods less than one year are not annualized.
(3)Excludes securities received or delivered in-kind.
(4)September 10, 2018 (fund inception) through August 31, 2019.
(5)Annualized.
See Notes to Financial Statements.
| Report of Independent Registered Public Accounting Firm | ||
To the Shareholders and the Board of Trustees of American Century ETF Trust:
Opinion on the Financial Statements and Financial Highlights
We have audited the accompanying statement of assets and liabilities, including the schedule of investments, of American Century Quality Diversified International ETF (the “Fund”), one of the funds constituting the American Century ETF Trust, as of August 31, 2020, the related statement of operations for the year then ended, the statements of changes in net assets and the financial highlights for the year ended August 31, 2020, and the period from September 10, 2018 (fund inception) through August 31, 2019, and the related notes. In our opinion, the financial statements and financial highlights present fairly, in all material respects, the financial position of American Century Quality Diversified International ETF as of August 31, 2020, and the results of its operations for the year then ended, the changes in its net assets and the financial highlights for the year ended August 31, 2020, and the period from September 10, 2018 (fund inception) through August 31, 2019, in conformity with accounting principles generally accepted in the United States of America.
Basis for Opinion
These financial statements and financial highlights are the responsibility of the Fund's management. Our responsibility is to express an opinion on the Fund’s financial statements and financial highlights based on our audits. We are a public accounting firm registered with the Public Company Accounting Oversight Board (United States) (PCAOB) and are required to be independent with respect to the Fund in accordance with the U.S. federal securities laws and the applicable rules and regulations of the Securities and Exchange Commission and the PCAOB.
We conducted our audits in accordance with the standards of the PCAOB. Those standards require that we plan and perform the audit to obtain reasonable assurance about whether the financial statements and financial highlights are free of material misstatement, whether due to error or fraud. The Fund is not required to have, nor were we engaged to perform, an audit of its internal control over financial reporting. As part of our audits we are required to obtain an understanding of internal control over financial reporting but not for the purpose of expressing an opinion on the effectiveness of the Fund’s internal control over financial reporting. Accordingly, we express no such opinion.
Our audits included performing procedures to assess the risks of material misstatement of the financial statements and financial highlights, whether due to error or fraud, and performing procedures that respond to those risks. Such procedures included examining, on a test basis, evidence regarding the amounts and disclosures in the financial statements and financial highlights. Our audits also included evaluating the accounting principles used and significant estimates made by management, as well as evaluating the overall presentation of the financial statements and financial highlights. Our procedures included confirmation of securities owned as of August 31, 2020, by correspondence with the custodian and brokers; when replies were not received from brokers, we performed other auditing procedures. We believe that our audits provide a reasonable basis for our opinion.
DELOITTE & TOUCHE LLP
Kansas City, Missouri
October 16, 2020
We have served as the auditor of one or more American Century investment companies since 1997.
26
| Management | ||
The Board of Trustees
The individuals listed below serve as trustees of the funds. Each trustee will continue to serve in this capacity until death, retirement, resignation or removal from office. The board has adopted a mandatory retirement age for trustees who are not “interested persons,” as that term is defined in the Investment Company Act (independent trustees). Trustees who are not also officers of the trust shall retire by December 31st of the year in which they reach their 75th birthday.
Mr. Thomas is an “interested person” because he currently serves as President and Chief Executive Officer of American Century Companies, Inc. (ACC), the parent company of American Century Investment Management, Inc. (ACIM or the advisor). The other trustees are independent. They are not employees, directors or officers of, and have no financial interest in, ACC or any of its wholly owned, direct or indirect, subsidiaries, including ACIM and American Century Services, LLC (ACS), and they do not have any other affiliations, positions or relationships that would cause them to be considered “interested persons” under the Investment Company Act. The following trustees also serve in this capacity for a number of other registered investment companies in the American Century Investments family of funds: Jonathan S. Thomas, 15; Ronald J. Gilson, 8; and Stephen E. Yates, 7.
The following table presents additional information about the trustees. The mailing address for each trustee other than Jonathan S. Thomas is 330 Madison Avenue, New York, New York 10017. The mailing address for Jonathan S. Thomas is 4500 Main Street, Kansas City, Missouri 64111.
| Name (Year of Birth) | Position(s) Held with Funds | Length of Time Served | Principal Occupation(s) During Past 5 Years | Number of American Century Portfolios Overseen by Trustee | Other Directorships Held During Past 5 Years | ||||||||||||
| Independent Trustees | |||||||||||||||||
| Reginald M. Browne (1968) | Trustee and Chairman of the Board | Since 2017 (Chairman since 2019) | Principal, GTS Securities (automated capital markets trading firm)(2019 to present); Senior Managing Director, Co Global Head-ETF Group, Cantor Fitzgerald (financial services firm)(2013 to 2019) | 19 | None | ||||||||||||
| Ronald J. Gilson (1946) | Trustee | Since 2017 | Charles J. Meyers Professor of Law and Business, Emeritus, Stanford Law School (1979 to 2016); Marc and Eva Stern Professor of Law and Business, Columbia University School of Law (1992 to present) | 59 | None | ||||||||||||
| Barry A. Mendelson (1958) | Trustee | Since 2017 | Retired; Consultant regarding ETF and mutual fund matters (2015 to 2016); Principal and Senior Counsel, The Vanguard Group (investment management)(1998 to 2014) | 19 | None | ||||||||||||
| Stephen E. Yates (1948) | Trustee | Since 2017 | Retired | 82 | None | ||||||||||||
27
| Name (Year of Birth) | Position(s) Held with Funds | Length of Time Served | Principal Occupation(s) During Past 5 Years | Number of American Century Portfolios Overseen by Trustee | Other Directorships Held During Past 5 Years | ||||||||||||
| Interested Trustees | |||||||||||||||||
| Jonathan S. Thomas (1963) | Trustee | Since 2017 | President and Chief Executive Officer, ACC (2007 to present). Also serves as Chief Executive Officer, ACS; Executive Vice President, ACIM; Director, ACC, ACIM and other ACC subsidiaries | 122 | None | ||||||||||||
The Statement of Additional Information has additional information about the fund's trustees and is available without charge, upon request, by calling 1-800-345-6488.
28
Officers
The following table presents certain information about the executive officers of the funds. Each officer, except Edward Rosenberg, serves as an officer for each of the 16 investment companies in the American Century family of funds. No officer is compensated for his or her service as an officer of the funds. The listed officers are interested persons of the funds and are appointed or re-appointed on an annual basis. The mailing address for each officer listed below is 4500 Main Street, Kansas City, Missouri 64111.
| Name (Year of Birth) | Offices with the Funds | Principal Occupation(s) During the Past Five Years | ||||||
| Patrick Bannigan (1965) | President since 2019 | Executive Vice President and Director, ACC (2012 to present); Chief Financial Officer, Chief Accounting Officer and Treasurer, ACC (2015 to present). Also serves as President, ACS; Vice President, ACIM; Chief Financial Officer, Chief Accounting Officer and/or Director, ACIM, ACS and other ACC subsidiaries | ||||||
| R. Wes Campbell (1974) | Chief Financial Officer and Treasurer since 2018 | Vice President, ACS (2020 to present); Investment Operations and Investment Accounting, ACS (2000 to present) | ||||||
| Amy D. Shelton (1964) | Chief Compliance Officer and Vice President since 2017 | Chief Compliance Officer, American Century funds, (2014 to present); Chief Compliance Officer, ACIM (2014 to present); Chief Compliance Officer, ACIS (2009 to present). Also serves as Vice President, ACIS | ||||||
| Charles A. Etherington (1957) | General Counsel and Vice President since 2017 | Attorney, ACC (1994 to present); Vice President, ACC (2005 to present); General Counsel, ACC (2007 to present). Also serves as General Counsel, ACIM, ACS, ACIS and other ACC subsidiaries; and Senior Vice President, ACIM and ACS | ||||||
| Cleo Chang (1977) | Vice President since 2019 | Senior Vice President, ACIM (2015 to present); Chief Investment Officer, Wilshire Funds Management (2005 to 2015) | ||||||
| David H. Reinmiller (1963) | Vice President since 2017 | Attorney, ACC (1994 to present). Also serves as Vice President, ACIM and ACS | ||||||
| Edward Rosenberg (1973) | Vice President since 2017 | Senior Vice President, ACIM (2017 to present); Senior Vice President, Flexshares Head of ETF Capital Markets, Northern Trust (2012 to 2017) | ||||||
| C. Jean Wade (1964) | Vice President since 2017 | Senior Vice President, ACS (2017 to present); Vice President, ACS (2000 to 2017) | ||||||
| Ward D. Stauffer (1960) | Secretary since 2019 | Attorney, ACS (2003 to present) | ||||||
29
| Approval of Management Agreement | ||
At a meeting held on June 5, 2020, the Fund’s Board of Trustees (the "Board") unanimously approved the renewal of the management agreement pursuant to which American Century Investment Management, Inc. (the “Advisor”) acts as the investment advisor for the Fund. Under Section 15(c) of the Investment Company Act, contracts for investment advisory services are required to be reviewed, evaluated, and approved by a majority of a fund’s trustees (the “Trustees”), including a majority of the independent Trustees, each year.
Prior to its consideration of the renewal of the management agreement, the Trustees requested and reviewed extensive data and information compiled by the Advisor and certain independent providers of evaluation data concerning the Fund and the services provided to the Fund by the Advisor. This review was in addition to the oversight and evaluation undertaken by the Board and its Audit Committee on a continual basis and the information received was supplemental to the extensive information that the Board and its Audit Committee receive and consider throughout the year.
In connection with its consideration of the renewal of the management agreement, the Board’s review and evaluation of the services provided by the Advisor included, but was not limited to, the following:
•the nature, extent, and quality of investment management and other services provided and to be provided to the Fund;
•the wide range of other programs and services provided and to be provided to the Fund and its shareholders on a routine and non-routine basis;
•the Fund’s investment performance, including data comparing the Fund's performance to appropriate benchmarks of funds with similar objectives and strategies;
•the cost of owning the Fund compared to the cost of owning similar funds;
•the compliance policies, procedures, and regulatory experience of the Advisor and the Fund's service providers;
•the Advisor’s strategic plans;
•the Advisor’s business continuity plans and specifically its response to the COVID-19 pandemic;
•financial data showing the cost of services provided to the Fund, the profitability of the Fund to the Advisor, and the overall profitability of the Advisor;
•information regarding payments to intermediaries by the Advisor; and
•possible economies of scale associated with the Advisor’s management of the Fund; and
•possible collateral benefits to the Advisor from the management of the Fund.
The independent Trustees met separately in private session to discuss the renewal and to review and discuss the information provided in response to their request. The independent Trustees also held active discussions with the Advisor regarding the renewal of the management agreement. The independent Trustees had the benefit of the advice of their independent counsel throughout the process.
Factors Considered
The Trustees considered all of the information provided by the Advisor, the independent data providers, and independent counsel in connection with the approval. They determined that the information was sufficient for them to evaluate the management agreement for the Fund. In connection with their review, the Trustees did not identify any single factor as being all-important or
30
controlling, and each Trustee may have attributed different levels of importance to different factors. In deciding to renew the management agreement, the Board based its decision on a number of factors, including without limitation the following:
Nature, Extent and Quality of Services — Generally. Under the management agreement, the Advisor is responsible for providing or arranging for all services necessary for the operation of the Fund. The Board noted that the Advisor provides or arranges at its own expense a wide variety of services including without limitation the following:
•constructing and designing the Fund
•portfolio research and security selection
•initial capitalization/funding
•securities trading
•Fund administration
•custody of Fund assets
•daily valuation of the Fund’s portfolio
•shareholder servicing and transfer agency, including shareholder confirmations, recordkeeping, and communications
•legal services (except the independent Trustees’ counsel)
•regulatory and portfolio compliance
•financial reporting
•marketing and distribution (except amounts paid by the Fund under Rule 12b-1 plans)
Investment Management Services. The nature of the investment management services provided to the Fund is quite complex and allows Fund shareholders access to professional money management, instant diversification of their investments within an asset class, and liquidity. In evaluating investment performance, the Board expects the Advisor to manage the Fund in accordance with its investment objectives and approved strategies. Further, the Trustees recognize that the Advisor has an obligation to monitor trading activities, and in particular to seek the best execution of fund trades, and to evaluate the use of and payment for research. In providing these services, the Advisor utilizes teams of investment professionals (portfolio managers, analysts, research assistants, and securities traders) who require extensive information technology, research, training, compliance, and other systems to conduct their business. The Board provides oversight of the investment performance process. It regularly reviews investment performance information for the Fund, together with comparative information for appropriate benchmarks over different time horizons. The Trustees also review investment performance information during the management agreement renewal process. If performance concerns are identified, the Board discusses with the Advisor the reasons for such results and any efforts being undertaken to improve performance. The Fund’s performance was below its benchmark for the one-year and since inception periods reviewed by the Board. The Board found the investment management services provided by the Advisor to the Fund to be satisfactory and consistent with the management agreement.
Shareholder and Other Services. Under the management agreement, the Advisor provides or arranges for a comprehensive package of services to the Fund. The Board, directly and through its Audit Committee, regularly reviews reports and evaluations of such services at its regular meetings. These reports include, but are not limited to, information regarding the operational efficiency and accuracy of the shareholder and transfer agency services provided, staffing levels, shareholder satisfaction, technology support (including cyber security), new products and services offered to Fund shareholders, securities trading activities, portfolio valuation services, auditing services, and legal and operational compliance activities. The Board found the services provided by the Advisor to the Fund under the management agreement to be competitive and of high quality.
31
COVID-19 Response. During 2020, much of the world experienced unprecedented change and challenges from the impacts of the rapidly evolving, worldwide spread of the COVID-19 virus. The Board evaluated the Advisor’s response to the COVID-19 pandemic and its impact on service to the Fund. The Board found that Fund shareholders have continued to receive the Advisor’s investment management and other services without disruption, and Advisor personnel have demonstrated great resiliency in providing those services. The Board, directly and through its Audit Committee, continues to monitor the impact of the pandemic and the response of each of the Fund’s service providers.
Costs of Services and Profitability. The Advisor provides detailed information concerning its cost of providing various services to the Fund, its profitability in managing the Fund (pre- and post-distribution), its overall profitability, and its financial condition. The Trustees have reviewed with the Advisor the methodology used to prepare this financial information. This information is considered in evaluating the Advisor’s financial condition, its ability to continue to provide services under the management agreement, and the reasonableness of the current management fee. The Board concluded that the Advisor’s profits were reasonable in light of the services provided to the Fund.
Ethics. The Board generally considers the Advisor’s commitment to providing quality services to the Fund and to conducting its business ethically. They noted that the Advisor’s practices generally meet or exceed industry best practices.
Economies of Scale. The Board also reviewed information provided by the Advisor regarding the possible existence of economies of scale in connection with the management of the Fund. The Board concluded that economies of scale are difficult to measure and predict with precision, especially on a fund-by-fund basis. The Board concluded that the Advisor is appropriately sharing economies of scale, to the extent they exist, through its competitive fee structure, offering competitive fees from fund inception, and through reinvestment in its business, infrastructure, investment capabilities and initiatives to provide shareholders additional content and services.
Comparison to Other Funds’ Fees. The management agreement provides that the Fund pays the Advisor a single, all-inclusive (or unified) management fee for providing all services necessary for the management and operation of the Fund, other than brokerage expenses, expenses attributable to short sales, taxes, interest, extraordinary expenses, and expenses incurred in connection with the provision of shareholder services and distribution services under a plan adopted pursuant to Rule 12b-1 under the Investment Company Act. Under the unified fee structure, the Advisor is responsible for providing all investment advisory, custody, audit, administrative, compliance, recordkeeping, marketing and shareholder services, or arranging and supervising third parties to provide such services. The Board believes the unified fee structure is a benefit to Fund shareholders because it clearly discloses to shareholders the cost of owning Fund shares, and, since the unified fee cannot be increased without a vote of Fund shareholders, it shifts to the Advisor the risk of increased costs of operating the Fund and provides a direct incentive to minimize administrative inefficiencies. Part of the Board’s analysis of fee levels involves reviewing certain evaluative data compiled by an independent provider comparing the Fund’s unified fee to the total expense ratios of its peers. The unified fee charged to shareholders of the Fund was below the median of the total expense ratios of the Fund’s peer expense universe and was within the range of its peer expense group. The Board concluded that the management fee paid by the Fund to the Advisor under the management agreement is reasonable in light of the services provided to the Fund.
Comparison to Fees and Services Provided to Other Clients of the Advisor. The Board also requested information from the Advisor concerning the nature of the services, fees, costs, and profitability of its advisory services to funds or other advisory clients managed similarly to the Fund. The Advisor informed the Trustees that, as of December 31, 2019, it did not provide services to any other investment companies or comparable accounts that were managed similarly to the Fund.
32
Payments to Intermediaries. The Trustees also requested a description of payments made to intermediaries by the Fund and the Advisor and services provided in response thereto. These payments could include various payments made by the Fund or the Advisor to different types of intermediaries and recordkeepers for distribution and service activities provided for the Fund. The Trustees reviewed such information and received representations from the Advisor that all such payments by the Advisor were made from the Advisor’s resources and reasonable profits. The Board found such payments to be reasonable in scope and purpose.
Collateral or “Fall-Out” Benefits Derived by the Advisor. The Board considered the possible existence of collateral benefits the Advisor may receive as a result of its relationship with the Fund. They concluded that the Advisor’s primary business is managing funds and it generally does not use fund or shareholder information to generate profits in other lines of business, and therefore does not derive any significant collateral benefits from them. The Board noted that additional assets from other clients may offer the Advisor some benefit from increased leverage with service providers and counterparties. The Board also determined that the Advisor is able to provide investment management services to certain clients other than the Fund, at least in part, due to its existing infrastructure built to serve the fund complex. The Board concluded that appropriate allocation methodologies had been employed to assign resources and the cost of those resources to these other clients.
Existing Relationship. The Board also considered whether there was any reason for not continuing the existing arrangement with the Advisor. In this regard, the Board was mindful of the potential disruptions of the Fund’s operations and various risks, uncertainties, and other effects that could occur as a result of a decision not to continue such relationship. In particular, the Board recognized that most shareholders have invested in the Fund on the strength of the Advisor’s industry standing and reputation and in the expectation that the Advisor will have a continuing role in providing advisory services to the Fund.
Conclusion of the Trustees. As a result of this process, the Board, including all of the independent Trustees, taking into account all of the factors discussed above and the information provided by the Advisor and others in connection with its review and throughout the year, determined that the management fee is fair and reasonable in light of the services provided and that the investment management agreement between the Fund and the Advisor should be renewed.
33
| Liquidity Risk Management Program | ||
The Fund has adopted a liquidity risk management program (the “program”). The Fund’s Board of Trustees (the "Board") has designated American Century Investment Management, Inc. (“ACIM”) as the administrator of the program. Personnel of ACIM or its affiliates conduct the day-to-day operation of the program pursuant to policies and procedures administered by those members of the ACIM’s Investment Oversight Committee who are members of the ACIM’s Investment Management and Global Analytics departments.
Under the program, ACIM manages the Fund’s liquidity risk, which is the risk that the Fund could not meet shareholder redemption requests without significant dilution of remaining shareholders’ interests in the Fund. This risk is managed by monitoring the degree of liquidity of the Fund’s investments, limiting the amount of the Fund’s illiquid investments, and utilizing various risk management tools and facilities available to the Fund for meeting shareholder redemptions, among other means. ACIM’s process of determining the degree of liquidity of the Fund’s investments is supported by one or more third-party liquidity assessment vendors.
The Board reviewed a report prepared by ACIM regarding the operation and effectiveness of the program for the period December 1, 2018 through December 31, 2019. No significant liquidity events impacting the Fund were noted in the report. In addition, ACIM provided its assessment that the program had been effective in managing the Fund’s liquidity risk.
34
| Additional Information | ||
Retirement Account Information
As required by law, distributions you receive from certain retirement accounts are subject to federal income tax withholding, unless you elect not to have withholding apply*. Tax will be withheld on the total amount withdrawn even though you may be receiving amounts that are not subject to withholding, such as nondeductible contributions. In such case, excess amounts of withholding could occur. You may adjust your withholding election so that a greater or lesser amount will be withheld.
Remember, even if you elect not to have income tax withheld, you are liable for paying income tax on the taxable portion of your withdrawal. If you elect not to have income tax withheld or you don’t have enough income tax withheld, you may be responsible for payment of estimated tax. You may incur penalties under the estimated tax rules if your withholding and estimated tax payments are not sufficient. You can reduce or defer the income tax on a distribution by directly or indirectly rolling such distribution over to another IRA or eligible plan. You should consult your tax advisor for additional information.
State tax will be withheld if, at the time of your distribution, your address is within one of the mandatory withholding states and you have federal income tax withheld (or as otherwise required by state law). State taxes will be withheld from your distribution in accordance with the respective state rules.
*Some 403(b), 457 and qualified retirement plan distributions may be subject to 20% mandatory withholding, as they are subject to special tax and withholding rules. Your plan administrator or plan sponsor is required to provide you with a special tax notice explaining those rules at the time you request a distribution. If applicable, federal and/or state taxes may be withheld from your distribution amount.
Proxy Voting Policies
A description of the policies that the fund's investment advisor uses in exercising the voting rights associated with the securities purchased and/or held by the fund are available without charge, upon request, by calling 1-800-345-6488. It is also available on American Century Investments’ website at americancentury.com/proxy and on the Securities and Exchange Commission’s website at sec.gov. Information regarding how the investment advisor voted proxies relating to portfolio securities during the most recent 12-month period ended June 30 is available at americancentury.com/proxy. It is also available at sec.gov.
Quarterly Portfolio Disclosure
The fund files its complete schedule of portfolio holdings with the Securities and Exchange Commission (SEC) for the first and third quarters of each fiscal year as an exhibit to its reports on Form N-PORT. The fund's Form N-PORT reports are available on the SEC’s website at sec.gov.
35
Other Tax Information
The following information is provided pursuant to provisions of the Internal Revenue Code.
The fund hereby designates up to the maximum amount allowable as qualified dividend income for the fiscal year ended August 31, 2020.
For the fiscal year ended August 31, 2020, the fund intends to pass through to shareholders foreign source income of $2,177,315 and foreign taxes paid of $180,879, or up to the maximum amount allowable, as a foreign tax credit. Foreign source income and foreign tax expense per outstanding share on August 31, 2020 are $0.9265 and $0.0770, respectively.
36
| Notes | ||
37
| Notes | ||
38
| Notes | ||
39
| Notes | ||
40
| ||||||||
| Contact Us | americancenturyetfs.com | |||||||
| American Century Sales Representatives, Financial Professionals, Broker Dealers, Insurance Companies, Banks and Trust Companies | 1-833-ACI-ETFS | |||||||
| Telecommunications Relay Service for the Deaf | 711 | |||||||
| American Century ETF Trust | ||||||||
Investment Advisor: American Century Investment Management, Inc. Kansas City, Missouri | ||||||||
Distributor: Foreside Fund Services, LLC - Distributor, not affiliated with American Century Investment Services, Inc. | ||||||||
| This report and the statements it contains are submitted for the general information of our shareholders. The report is not authorized for distribution to prospective investors unless preceded or accompanied by an effective prospectus. | ||||||||
| ©2020 American Century Proprietary Holdings, Inc. All rights reserved. CL-ANN-95464 2010 | ||||||||
| Annual Report | |||||
| August 31, 2020 | |||||
Avantis® Emerging Markets Equity ETF (AVEM) | |||||
Beginning on January 1, 2021, as permitted by regulations adopted by the Securities and Exchange Commission, paper copies of the fund’s shareholder reports like this one will no longer be sent by mail, unless you specifically request paper copies of the reports from the fund or from your financial intermediary, such as a broker-dealer or bank. Instead, the reports will be made available on a website, and you will be notified by mail each time a report is posted and provided with a website link to access the report.
If you already elected to receive shareholder reports electronically, you will not be affected by this change and you need not take any action. You may elect to receive shareholder reports and other communications from the fund or your financial intermediary electronically by calling or sending an email request to your appropriate contacts as listed on the back cover of this report.
You may elect to receive all future reports in paper free of charge. You can inform the fund or your financial intermediary that you wish to continue receiving paper copies of your shareholder reports by calling or sending an email request to your appropriate contacts as listed on the back cover of this report. Your election to receive reports in paper will apply to all funds held with the fund complex/your financial intermediary.
| Table of Contents | ||
| Chairman’s Letter | |||||
| Performance | |||||
| Portfolio Commentary | |||||
| Fund Characteristics | |||||
| Shareholder Fee Example | |||||
| Schedule of Investments | |||||
| Statement of Assets and Liabilities | |||||
| Statement of Operations | |||||
| Statement of Changes in Net Assets | |||||
| Notes to Financial Statements | |||||
| Financial Highlights | |||||
| Report of Independent Registered Public Accounting Firm | |||||
| Management | |||||
| Approval of Management Agreement | |||||
| Liquidity Risk Management Program | |||||
| Additional Information | |||||
Any opinions expressed in this report reflect those of the author as of the date of the report, and do not necessarily represent the opinions of American Century Investments® or any other person in the American Century Investments organization. Any such opinions are subject to change at any time based upon market or other conditions and American Century Investments disclaims any responsibility to update such opinions. These opinions may not be relied upon as investment advice and, because investment decisions made by American Century Investments funds are based on numerous factors, may not be relied upon as an indication of trading intent on behalf of any American Century Investments fund. Security examples are used for representational purposes only and are not intended as recommendations to purchase or sell securities. Performance information for comparative indices and securities is provided to American Century Investments by third party vendors. To the best of American Century Investments’ knowledge, such information is accurate at the time of printing.
| Chairman's Letter | ||
Jonathan ThomasDear Investor:
Thank you for reviewing this annual report for the period ended August 31, 2020. Annual reports help convey important information about fund returns, including market factors that affected performance. For additional investment insights, please visit avantisinvestors.com.
Pandemic Disrupted Economic, Market Courses
Broad market sentiment was generally upbeat early in the period. Dovish central banks, modest inflation, improving economic and corporate earnings data, and progress on U.S.-China trade helped boost global growth outlooks. Against this backdrop, stocks largely remained in favor.
However, beginning in late February, COVID-19 quickly quashed the optimistic tone. The outbreak rapidly spread worldwide, halting most U.S. and global economic activity and triggering a deep worldwide recession. Global stocks sold off sharply, but central banks and federal governments stepped in quickly and aggressively to stabilize financial markets. These extraordinary efforts proved helpful, as most stocks rebounded quickly. As the period progressed, coronavirus infection and death rates declined in many regions and economies reopened. By the end of August, manufacturing, employment and other data suggested an economic recovery was underway.
Overall, global stocks delivered mixed results for the period. U.S. stocks generally advanced and fared better than their counterparts elsewhere. The growth style significantly outperformed value stocks, which struggled.
A Slow Return to Normal
The return to pre-pandemic life will take time and patience, but we are confident we will get there. Several drug companies are in final stages of vaccine trials, and medical professionals continue to fine-tune virus treatment protocols. In the meantime, investors likely will face periods of outbreak-related disruptions, economic and political uncertainty, and heightened market volatility. These influences can be unsettling, but they tend to be temporary.
We appreciate your confidence in us during these extraordinary times. Our investment professionals have experience weathering unpredictable markets, and we’re confident we will continue to meet today’s challenges.
Sincerely,
Jonathan Thomas
Chairman
Avantis Investors
2
| Performance | ||
| Total Returns as of August 31, 2020 | |||||||||||||||||||||||
| Since Inception | Inception Date | ||||||||||||||||||||||
| Net Asset Value | 5.57% | 9/17/2019 | |||||||||||||||||||||
| Market Price | 6.12% | 9/17/2019 | |||||||||||||||||||||
| MSCI Emerging Markets IMI Index | 10.21% | — | |||||||||||||||||||||
Market price is determined using the bid/ask midpoint at 4:00 p.m. Eastern time, when the net asset value (NAV) is typically calculated. Market performance does not represent the returns you would receive if you traded shares at other times. NAV prices are used to calculate market price performance prior to the date when the fund first traded on the New York Stock Exchange.
| Growth of $10,000 Over Life of Fund | ||
| $10,000 investment made September 17, 2019 | ||
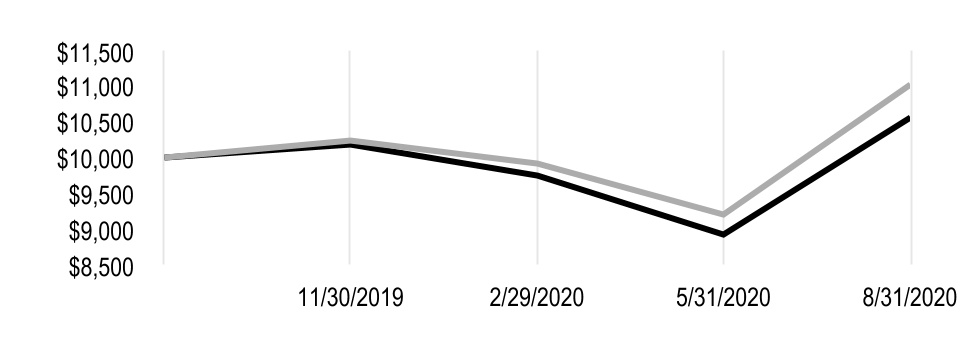
| Value on August 31, 2020 | |||||
| Net Asset Value — $10,557 | |||||
| MSCI Emerging Markets IMI Index — $11,021 | |||||
| Total Annual Fund Operating Expenses | |||||||||||||||||
| 0.33% | |||||||||||||||||
The total annual fund operating expenses shown is as stated in the fund’s prospectus current as of the date of this report. The prospectus may vary from the expense ratio shown elsewhere in this report because it is based on a different time period, includes acquired fund fees and expenses, and, if applicable, does not include fee waivers or expense reimbursements.
Data presented reflect past performance. Past performance is no guarantee of future results. Current performance may be higher or lower than the performance shown. Total returns for periods less than one year are not annualized. Investment return and principal value will fluctuate, and redemption value may be more or less than original cost. Data assumes reinvestment of dividends and capital gains, and none of the charts reflect the deduction of taxes that a shareholder would pay on fund distributions or the redemption of fund shares. To obtain performance data current to the most recent month end, please call 1-833-928-2684 or visit avantisinvestors.com. For additional information about the fund, please consult the prospectus.
3
| Portfolio Commentary | ||
Portfolio Managers: Eduardo Repetto, Mitch Firestein, Daniel Ong and Ted Randall
Fund Strategy
Avantis Emerging Markets Equity ETF seeks long-term capital appreciation by investing in a diverse group of companies related to emerging markets across market sectors, industry groups, countries and market capitalizations.
The fund seeks securities of companies that it expects to have higher returns. It places an enhanced emphasis on securities of companies with smaller market capitalizations and securities of companies it defines as high profitability or value companies. Conversely, the fund seeks to underweight or exclude securities it expects to have lower returns. These include securities of large companies with lower levels of profitability and higher prices relative to their book values or other financial metrics. Under normal market conditions, the fund will invest at least 80% of its assets in equity securities of companies related to emerging market countries.
The fund is an actively managed exchange-traded fund (ETF) that does not seek to replicate the performance of a specified index. The portfolio managers continually analyze market and financial data to make buy, sell and hold decisions. When buying or selling a security, the portfolio managers may consider the trade-off between expected returns of the security and implementation or tax costs of the trade. They do this in an attempt to gain trading efficiencies, avoid unnecessary risk and enhance fund performance.
Performance Review
For the period from Avantis Emerging Markets Equity ETF’s inception on September 17, 2019, through the fund’s fiscal year-end on August 31, 2020, the fund returned 6.12%* on a market price basis. On a net asset value (NAV) basis, the fund returned 5.57%. NAV and market price returns reflect fees and operating expenses, while index returns do not.
For the same time period, the fund underperformed the broad emerging markets stock universe, as measured by the MSCI Emerging Markets IMI Index, which returned 10.21%. The MSCI Emerging Markets IMI Index is an unmanaged index generally representative of the performance of emerging markets stocks across capitalization categories. The underperformance versus the index was largely due to the fund’s emphasis on smaller-cap companies with higher levels of profitability and lower prices relative to their book values, or more value-oriented stocks. These companies generally underperformed larger-cap companies with higher prices relative to their book values, or more growth-oriented stocks.
For example, large/mid-cap stocks (as measured by the MSCI Emerging Markets Index) returned 10.48% for the period, outperforming small-cap stocks (as measured by the MSCI Emerging Markets Small Cap Index), which returned 8.02%. Value stocks (as measured by the MSCI Emerging Markets IMI Value Index) returned -4.87% for the period, underperforming growth stocks, which returned 26.18% (as measured by the MSCI Emerging Markets IMI Growth Index).
*Total returns for periods less than one year are not annualized.
4
| Fund Characteristics | ||
| AUGUST 31, 2020 | |||||
| Top Ten Holdings | % of net assets | ||||
| Taiwan Semiconductor Manufacturing Co. Ltd., ADR | 3.8% | ||||
| Tencent Holdings Ltd. | 3.8% | ||||
| Alibaba Group Holding Ltd., ADR | 3.8% | ||||
| Samsung Electronics Co. Ltd., GDR | 2.7% | ||||
| JD.com, Inc., ADR | 1.5% | ||||
| China Construction Bank Corp., H Shares | 1.0% | ||||
| Reliance Industries Ltd., GDR | 0.9% | ||||
| LG Chem Ltd. | 0.9% | ||||
| Infosys Ltd., ADR | 0.9% | ||||
| China Mobile Ltd., ADR | 0.8% | ||||
| Types of Investments in Portfolio | % of net assets | ||||
| Common Stocks | 99.9% | ||||
| Rights | —* | ||||
| Warrants | —* | ||||
| Total Equity Exposure | 99.9% | ||||
| Temporary Cash Investments | 0.1% | ||||
| Temporary Cash Investments - Securities Lending Collateral | 0.1% | ||||
| Other Assets and Liabilities | (0.1)% | ||||
*Category is less than 0.05% of total net assets.
| Investments by Country | % of net assets | ||||
| China | 37.5% | ||||
| Taiwan | 14.5% | ||||
| South Korea | 13.4% | ||||
| India | 9.5% | ||||
| Brazil | 5.6% | ||||
| South Africa | 4.3% | ||||
| Russia | 2.6% | ||||
| Thailand | 2.4% | ||||
| Malaysia | 2.2% | ||||
| Mexico | 2.0% | ||||
| Other Countries | 5.9% | ||||
| Cash and Equivalents* | 0.1% | ||||
*Includes temporary cash investments, temporary cash investments - securities lending collateral and other assets and liabilities.
5
| Shareholder Fee Example | ||
Fund shareholders may incur two types of costs: (1) transaction costs, including brokerage commissions paid on purchases and sales of fund shares; and (2) ongoing costs, including management fees and other fund expenses. This example is intended to help you understand your ongoing costs (in dollars) of investing in your fund and to compare these costs with the ongoing cost of investing in other funds.
The example is based on an investment of $1,000 made at the beginning of the period and held for the entire period from March 1, 2020 to August 31, 2020.
Actual Expenses
The table provides information about actual account values and actual expenses. You may use the information, together with the amount you invested, to estimate the expenses that you paid over the period. Simply divide your account value by $1,000 (for example, an $8,600 account value divided by $1,000 = 8.6), then multiply the result by the number under the heading “Expenses Paid During Period” to estimate the expenses you paid on your account during this period.
Hypothetical Example for Comparison Purposes
The table also provides information about hypothetical account values and hypothetical expenses based on the actual expense ratio of your fund and an assumed rate of return of 5% per year before expenses, which is not the actual return of a fund. The hypothetical account values and expenses may not be used to estimate the actual ending account balance or expenses you paid for the period. You may use this information to compare the ongoing costs of investing in your fund and other funds. To do so, compare this 5% hypothetical example with the 5% hypothetical examples that appear in the shareholder reports of the other funds.
Please note that the expenses shown in the table are meant to highlight your ongoing costs only and do not reflect any transactional costs, such as brokerage commissions paid on purchases and sales of fund shares. Therefore, the table is useful in comparing ongoing costs only, and will not help you determine the relative total costs of owning different funds. In addition, if these transactional costs were included, your costs would have been higher.
| Beginning Account Value 3/1/20 | Ending Account Value 8/31/20 | Expenses Paid During Period(1) 3/1/20 - 8/31/20 | Annualized Expense Ratio(1) | |||||||||||
| Actual | $1,000 | $1,084.50 | $1.73 | 0.33% | ||||||||||
| Hypothetical | $1,000 | $1,023.48 | $1.68 | 0.33% | ||||||||||
(1)Expenses are equal to the fund's annualized expense ratio listed in the table above, multiplied by the average account value over the period, multiplied by 184, the number of days in the most recent fiscal half-year, divided by 366, to reflect the one-half year period. Annualized expense ratio reflects actual expenses, including any applicable fee waivers or expense reimbursements and excluding any acquired fund fees and expenses.
6
| Schedule of Investments | ||
AUGUST 31, 2020
| Shares | Value | |||||||
| COMMON STOCKS — 99.9% | ||||||||
| Brazil — 5.6% | ||||||||
| AES Tiete Energia SA | 29,900 | $ | 81,811 | |||||
Aliansce Sonae Shopping Centers SA(1) | 1,200 | 5,776 | ||||||
| Alliar Medicos A Frente SA | 300 | 652 | ||||||
| Alpargatas SA, Preference Shares | 3,700 | 25,191 | ||||||
| Alupar Investimento SA | 9,800 | 41,679 | ||||||
| Ambev SA, ADR | 97,412 | 219,177 | ||||||
| Arezzo Industria e Comercio SA | 5,100 | 52,243 | ||||||
| Atacadao SA | 13,500 | 47,978 | ||||||
Azul SA, ADR(1) | 2,181 | 26,499 | ||||||
B2W Cia Digital(1) | 3,400 | 69,694 | ||||||
| B3 SA - Brasil Bolsa Balcao | 23,900 | 257,170 | ||||||
| Banco ABC Brasil SA, Preference Shares | 8,800 | 21,829 | ||||||
| Banco Bradesco SA | 13,860 | 48,726 | ||||||
| Banco Bradesco SA, ADR | 105,054 | 396,054 | ||||||
| Banco BTG Pactual SA | 14,300 | 211,270 | ||||||
| Banco do Brasil SA | 20,490 | 122,861 | ||||||
| Banco do Estado do Rio Grande do Sul SA, Class B Preference Shares | 14,500 | 34,566 | ||||||
| Banco Inter SA, Preference Shares | 7,100 | 29,289 | ||||||
| Banco Santander Brasil SA, ADR | 10,106 | 52,248 | ||||||
| BB Seguridade Participacoes SA | 21,200 | 103,243 | ||||||
| BK Brasil Operacao e Assessoria a Restaurantes SA | 300 | 599 | ||||||
BR Malls Participacoes SA(1) | 64,100 | 108,462 | ||||||
| BR Properties SA | 31,200 | 52,166 | ||||||
| BrasilAgro - Co. Brasileira de Propriedades Agricolas | 1,500 | 5,736 | ||||||
| Braskem SA, ADR | 7,362 | 57,203 | ||||||
BRF SA, ADR(1) | 20,739 | 74,660 | ||||||
| Camil Alimentos SA | 17,100 | 40,171 | ||||||
| CCR SA | 82,100 | 199,612 | ||||||
| Centrais Eletricas Brasileiras SA, ADR | 6,395 | 41,440 | ||||||
| Centrais Eletricas Brasileiras SA, Class B Preference Shares | 3,000 | 19,648 | ||||||
| Cia Brasileira de Distribuicao, ADR | 4,088 | 47,339 | ||||||
| Cia de Locacao das Americas | 35,900 | 133,613 | ||||||
| Cia de Saneamento Basico do Estado de Sao Paulo, ADR | 18,109 | 157,548 | ||||||
| Cia de Saneamento de Minas Gerais-COPASA | 2,200 | 19,115 | ||||||
| Cia de Saneamento do Parana | 4,200 | 20,492 | ||||||
| Cia de Saneamento do Parana, Preference Shares | 38,700 | 37,792 | ||||||
| Cia de Transmissao de Energia Eletrica Paulista, Preference Shares | 9,100 | 35,663 | ||||||
| Cia Energetica de Minas Gerais, ADR | 37,486 | 73,473 | ||||||
| Cia Energetica de Sao Paulo, Class B Preference Shares | 17,100 | 93,545 | ||||||
| Cia Ferro Ligas da Bahia - FERBASA, Preference Shares | 2,900 | 9,470 | ||||||
| Cia Hering | 3,000 | 9,999 | ||||||
| Cia Paranaense de Energia, ADR | 8,226 | 93,036 | ||||||
| Cia Siderurgica Nacional SA, ADR | 64,547 | 176,213 | ||||||
| Cielo SA | 71,200 | 59,653 | ||||||
| Cogna Educacao | 6,100 | 6,413 | ||||||
7
| Shares | Value | |||||||
| Construtora Tenda SA | 3,500 | $ | 19,862 | |||||
Cosan Logistica SA(1) | 15,600 | 61,193 | ||||||
| Cosan SA | 4,300 | 65,577 | ||||||
| CVC Brasil Operadora e Agencia de Viagens SA | 1,100 | 3,668 | ||||||
| Cyrela Brazil Realty SA Empreendimentos e Participacoes | 20,000 | 88,309 | ||||||
| Direcional Engenharia SA | 5,900 | 16,208 | ||||||
| Duratex SA | 38,500 | 112,791 | ||||||
EcoRodovias Infraestrutura e Logistica SA(1) | 21,700 | 50,977 | ||||||
| EDP - Energias do Brasil SA | 23,400 | 80,086 | ||||||
Embraer SA, ADR(1) | 20,705 | 109,737 | ||||||
| Enauta Participacoes SA | 5,600 | 11,591 | ||||||
| Energisa SA | 3,000 | 24,083 | ||||||
Eneva SA(1) | 9,400 | 85,447 | ||||||
| Engie Brasil Energia SA | 15,000 | 117,952 | ||||||
| Equatorial Energia SA | 36,400 | 154,676 | ||||||
| Even Construtora e Incorporadora SA | 18,600 | 44,136 | ||||||
| Ez Tec Empreendimentos e Participacoes SA | 3,900 | 27,521 | ||||||
| Fleury SA | 9,700 | 46,123 | ||||||
| Fras-Le SA | 6,200 | 5,874 | ||||||
| Gerdau SA, ADR | 124,845 | 436,958 | ||||||
Gol Linhas Aereas Inteligentes SA, ADR(1) | 1,329 | 8,665 | ||||||
| Grendene SA | 6,800 | 9,582 | ||||||
Grupo SBF SA(1) | 7,300 | 40,481 | ||||||
| Guararapes Confeccoes SA | 12,600 | 40,547 | ||||||
| Hapvida Participacoes e Investimentos SA | 4,200 | 50,061 | ||||||
Helbor Empreendimentos SA(1) | 5,040 | 11,196 | ||||||
| Hypera SA | 6,800 | 39,843 | ||||||
| Iguatemi Empresa de Shopping Centers SA | 1,300 | 7,771 | ||||||
| Instituto Hermes Pardini SA | 1,300 | 6,160 | ||||||
| Iochpe Maxion SA | 18,600 | 39,383 | ||||||
| IRB Brasil Resseguros S/A | 25,696 | 32,832 | ||||||
| IRB Brasil Resseguros S/A | 71,500 | 93,445 | ||||||
| Itau Unibanco Holding SA, ADR | 129,778 | 552,854 | ||||||
| JBS SA | 49,800 | 203,436 | ||||||
| Jereissati Participacoes SA | 900 | 3,838 | ||||||
| JHSF Participacoes SA | 37,900 | 49,325 | ||||||
| JSL SA | 4,500 | 25,989 | ||||||
| Klabin SA | 103,600 | 486,940 | ||||||
Light SA(1) | 21,900 | 60,361 | ||||||
| Localiza Rent a Car SA | 38,630 | 342,124 | ||||||
Locaweb Servicos de Internet SA(1) | 3,300 | 37,015 | ||||||
| LOG Commercial Properties e Participacoes SA | 4,100 | 23,417 | ||||||
Log-in Logistica Intermodal SA(1) | 400 | 1,379 | ||||||
| Lojas Americanas SA, Preference Shares | 44,963 | 265,092 | ||||||
| Lojas Renner SA | 40,800 | 327,383 | ||||||
| M Dias Branco SA | 1,500 | 9,714 | ||||||
| Magazine Luiza SA | 28,500 | 488,222 | ||||||
| Mahle-Metal Leve SA | 3,500 | 10,822 | ||||||
| Marcopolo SA, Preference Shares | 96,800 | 50,180 | ||||||
Marfrig Global Foods SA(1) | 44,800 | 145,558 | ||||||
Marisa Lojas SA(1) | 15,881 | 24,234 | ||||||
| Metalurgica Gerdau SA, Preference Shares | 10,700 | 17,226 | ||||||
8
| Shares | Value | |||||||
Mills Estruturas e Servicos de Engenharia SA(1) | 5,200 | $ | 6,416 | |||||
Minerva SA(1) | 4,500 | 10,727 | ||||||
| Movida Participacoes SA | 22,400 | 66,401 | ||||||
| MRV Engenharia e Participacoes SA | 22,800 | 75,494 | ||||||
| Multiplan Empreendimentos Imobiliarios SA | 3,000 | 11,527 | ||||||
| Natura & Co. Holding SA | 33,156 | 299,575 | ||||||
| Notre Dame Intermedica Participacoes SA | 6,588 | 90,189 | ||||||
| Odontoprev SA | 11,600 | 27,187 | ||||||
Omega Geracao SA(1) | 5,500 | 40,709 | ||||||
Petro Rio SA(1) | 10,800 | 82,580 | ||||||
| Petrobras Distribuidora SA | 32,700 | 127,314 | ||||||
| Petroleo Brasileiro SA, ADR | 57,550 | 470,183 | ||||||
| Petroleo Brasileiro SA, ADR Preference Shares | 69,303 | 555,117 | ||||||
| Porto Seguro SA | 7,600 | 74,495 | ||||||
| Qualicorp Consultoria e Corretora de Seguros SA | 21,900 | 124,480 | ||||||
| Raia Drogasil SA | 5,400 | 107,073 | ||||||
| Randon SA Implementos e Participacoes, Preference Shares | 18,200 | 35,878 | ||||||
Rumo SA(1) | 34,200 | 143,080 | ||||||
| Santos Brasil Participacoes SA | 3,000 | 2,847 | ||||||
| Sao Martinho SA | 21,400 | 94,451 | ||||||
| Ser Educacional SA | 2,800 | 7,309 | ||||||
| SLC Agricola SA | 11,200 | 51,722 | ||||||
| Smiles Fidelidade SA | 4,400 | 11,389 | ||||||
StoneCo Ltd., A Shares(1) | 2,934 | 149,634 | ||||||
| Sul America SA | 39,400 | 313,920 | ||||||
Suzano SA, ADR(1) | 31,500 | 287,595 | ||||||
| Tegma Gestao Logistica SA | 2,200 | 10,361 | ||||||
| Telefonica Brasil SA, ADR Preference Shares | 9,698 | 84,664 | ||||||
| Tim Participacoes SA, ADR | 11,564 | 150,795 | ||||||
| TOTVS SA | 16,200 | 85,044 | ||||||
| Transmissora Alianca de Energia Eletrica SA | 24,400 | 125,908 | ||||||
| Trisul SA | 3,000 | 6,692 | ||||||
Tupy SA(1) | 6,500 | 20,004 | ||||||
| Ultrapar Participacoes SA, ADR | 43,232 | 152,177 | ||||||
| Unipar Carbocloro SA, Preference Shares | 3,700 | 19,930 | ||||||
| Usinas Siderurgicas de Minas Gerais SA Usiminas, Class A Preference Shares | 38,000 | 70,333 | ||||||
| Vale SA, ADR | 88,278 | 971,058 | ||||||
| Valid Solucoes e Servicos de Seguranca em Meios de Pagamento e Identificacao SA | 6,500 | 12,066 | ||||||
Via Varejo SA(1) | 9,200 | 34,106 | ||||||
| Vivara Participacoes SA | 3,800 | 16,245 | ||||||
Vulcabras Azaleia SA(1) | 700 | 755 | ||||||
| WEG SA | 16,600 | 199,376 | ||||||
| Wiz Solucoes e Corretagem de Seguros SA | 14,000 | 27,241 | ||||||
| YDUQS Participacoes SA | 15,000 | 73,788 | ||||||
| 13,816,696 | ||||||||
| Chile — 0.6% | ||||||||
| AES Gener SA | 269,638 | 42,310 | ||||||
| Aguas Andinas SA, A Shares | 185,179 | 56,209 | ||||||
| Banco de Chile | 781,764 | 65,518 | ||||||
| Banco de Credito e Inversiones SA | 1,368 | 42,853 | ||||||
| Banco Santander Chile, ADR | 4,327 | 66,549 | ||||||
9
| Shares | Value | |||||||
| Besalco SA | 44,236 | $ | 24,465 | |||||
CAP SA(1) | 7,006 | 62,176 | ||||||
| Cencosud SA | 32,850 | 50,486 | ||||||
| Cencosud Shopping SA | 11,235 | 17,341 | ||||||
| Cia Cervecerias Unidas SA, ADR | 4,812 | 63,518 | ||||||
Cia Sud Americana de Vapores SA(1) | 507,280 | 14,028 | ||||||
| Colbun SA | 405,145 | 63,573 | ||||||
| Embotelladora Andina SA, Class B Preference Shares | 25,842 | 55,407 | ||||||
| Empresa Nacional de Telecomunicaciones SA | 7,414 | 45,104 | ||||||
| Empresas CMPC SA | 48,652 | 101,060 | ||||||
| Empresas COPEC SA | 7,149 | 53,791 | ||||||
| Enel Americas SA, ADR | 34,338 | 244,143 | ||||||
| Enel Chile SA | 1,081,963 | 81,827 | ||||||
| Engie Energia Chile SA | 49,870 | 64,470 | ||||||
| Falabella SA | 12,198 | 39,285 | ||||||
| Forus SA | 4,221 | 5,266 | ||||||
| Grupo Security SA | 164,860 | 32,018 | ||||||
| Inversiones Aguas Metropolitanas SA | 44,574 | 35,373 | ||||||
| Itau CorpBanca Chile SA | 8,496,524 | 24,698 | ||||||
Latam Airlines Group SA, ADR(1) | 8,447 | 13,558 | ||||||
| Parque Arauco SA | 19,492 | 30,085 | ||||||
| Ripley Corp. SA | 56,617 | 20,754 | ||||||
| Salfacorp SA | 15,871 | 8,982 | ||||||
| SMU SA | 11,262 | 1,897 | ||||||
| Sociedad Quimica y Minera de Chile SA, ADR | 2,506 | 78,588 | ||||||
| Vina Concha y Toro SA | 3,709 | 6,202 | ||||||
| 1,511,534 | ||||||||
| China — 37.5% | ||||||||
21Vianet Group, Inc., ADR(1) | 5,663 | 131,438 | ||||||
360 Finance, Inc., ADR(1) | 12,700 | 158,750 | ||||||
| 361 Degrees International Ltd. | 40,000 | 5,307 | ||||||
3SBio, Inc.(1)(2) | 15,000 | 17,608 | ||||||
51job, Inc., ADR(1) | 1,473 | 96,540 | ||||||
58.com, Inc., ADR(1) | 366 | 20,262 | ||||||
| A-Living Services Co. Ltd., H Shares | 8,000 | 41,170 | ||||||
AAC Technologies Holdings, Inc.(2) | 75,000 | 472,600 | ||||||
| Agile Group Holdings Ltd. | 86,000 | 118,315 | ||||||
| Agricultural Bank of China Ltd., H Shares | 1,127,000 | 375,642 | ||||||
| Air China Ltd., H Shares | 54,000 | 37,086 | ||||||
| Ajisen China Holdings Ltd. | 30,000 | 4,832 | ||||||
| AK Medical Holdings Ltd. | 16,000 | 40,719 | ||||||
Alibaba Group Holding Ltd., ADR(1) | 32,206 | 9,244,088 | ||||||
Alibaba Health Information Technology Ltd.(1) | 48,000 | 115,353 | ||||||
Alibaba Pictures Group Ltd.(1) | 170,000 | 24,020 | ||||||
Aluminum Corp. of China Ltd., H Shares(1) | 96,000 | 23,350 | ||||||
Angang Steel Co. Ltd., H Shares(2) | 32,000 | 9,176 | ||||||
| Anhui Conch Cement Co. Ltd., H Shares | 57,000 | 411,846 | ||||||
| Anhui Expressway Co. Ltd., H Shares | 72,000 | 35,163 | ||||||
| ANTA Sports Products Ltd. | 88,000 | 866,200 | ||||||
Aoyuan Healthy Life Group Co. Ltd.(2) | 48,000 | 44,531 | ||||||
Ascletis Pharma, Inc.(1)(2) | 13,000 | 4,832 | ||||||
| Asia Cement China Holdings Corp. | 39,000 | 39,432 | ||||||
10
| Shares | Value | |||||||
| Atlas Corp. | 8,667 | $ | 74,796 | |||||
| Autohome, Inc., ADR | 4,965 | 398,392 | ||||||
AVIC International Holding HK Ltd.(1) | 310,000 | 5,052 | ||||||
| AviChina Industry & Technology Co. Ltd., H Shares | 108,000 | 67,160 | ||||||
| BAIC Motor Corp. Ltd., H Shares | 156,500 | 74,637 | ||||||
Baidu, Inc., ADR(1) | 10,399 | 1,295,403 | ||||||
| BAIOO Family Interactive Ltd. | 136,000 | 19,868 | ||||||
| Bank of China Ltd., H Shares | 3,105,000 | 1,012,554 | ||||||
| Bank of Chongqing Co. Ltd., H Shares | 79,000 | 44,246 | ||||||
| Bank of Communications Co. Ltd., H Shares | 411,000 | 214,269 | ||||||
| BBMG Corp., H Shares | 181,000 | 37,812 | ||||||
| Beijing Capital International Airport Co. Ltd., H Shares | 174,000 | 122,703 | ||||||
| Beijing Capital Land Ltd., H Shares | 135,000 | 25,527 | ||||||
| Beijing Chunlizhengda Medical Instruments Co. Ltd., H Shares | 11,500 | 65,592 | ||||||
Beijing Enterprises Clean Energy Group Ltd.(1) | 740,000 | 4,355 | ||||||
| Beijing Enterprises Holdings Ltd. | 19,000 | 60,255 | ||||||
Beijing Enterprises Water Group Ltd.(1) | 130,000 | 51,039 | ||||||
Beijing Gas Blue Sky Holdings Ltd.(1) | 88,000 | 1,418 | ||||||
| Beijing North Star Co. Ltd., H Shares | 4,000 | 865 | ||||||
| Beijing Tong Ren Tang Chinese Medicine Co. Ltd. | 31,000 | 35,448 | ||||||
Best Food Holding Co. Ltd.(1) | 8,000 | 671 | ||||||
| Best Pacific International Holdings Ltd. | 4,000 | 599 | ||||||
| Bestway Global Holding, Inc. | 8,000 | 1,875 | ||||||
Bilibili, Inc., ADR(1) | 1,121 | 52,967 | ||||||
| Binjiang Service Group Co. Ltd. | 24,500 | 53,757 | ||||||
| BOC Aviation Ltd. | 18,500 | 136,324 | ||||||
| Bosideng International Holdings Ltd. | 122,000 | 34,851 | ||||||
| Bright Scholar Education Holdings Ltd., ADR | 2,015 | 15,636 | ||||||
| Brilliance China Automotive Holdings Ltd. | 176,000 | 157,231 | ||||||
BYD Co. Ltd., H Shares(2) | 4,000 | 39,550 | ||||||
BYD Electronic International Co. Ltd.(2) | 16,000 | 67,220 | ||||||
CA Cultural Technology Group Ltd.(1) | 30,000 | 9,499 | ||||||
Canadian Solar, Inc.(1) | 8,814 | 286,367 | ||||||
| Canvest Environmental Protection Group Co. Ltd. | 103,000 | 44,851 | ||||||
CAR, Inc.(1)(2) | 119,000 | 37,836 | ||||||
| Central China Real Estate Ltd. | 117,000 | 51,072 | ||||||
CGN New Energy Holdings Co. Ltd.(1) | 228,000 | 40,877 | ||||||
| CGN Power Co. Ltd., H Shares | 645,000 | 139,643 | ||||||
| Chaowei Power Holdings Ltd. | 86,000 | 36,058 | ||||||
| China Aerospace International Holdings Ltd. | 48,000 | 3,015 | ||||||
| China Aircraft Leasing Group Holdings Ltd. | 5,000 | 4,556 | ||||||
| China BlueChemical Ltd., H Shares | 64,000 | 9,393 | ||||||
China Boton Group Co. Ltd.(1) | 6,000 | 1,299 | ||||||
| China Cinda Asset Management Co. Ltd., H Shares | 728,000 | 138,762 | ||||||
| China CITIC Bank Corp. Ltd., H Shares | 414,000 | 172,696 | ||||||
| China Coal Energy Co. Ltd., H Shares | 103,000 | 25,884 | ||||||
| China Communications Construction Co. Ltd., H Shares | 143,000 | 79,884 | ||||||
| China Communications Services Corp. Ltd., H Shares | 352,000 | 229,811 | ||||||
| China Conch Venture Holdings Ltd. | 68,000 | 294,076 | ||||||
| China Construction Bank Corp., H Shares | 3,615,000 | 2,546,208 | ||||||
| China Datang Corp. Renewable Power Co. Ltd., H Shares | 98,000 | 13,282 | ||||||
China Dongxiang Group Co. Ltd.(2) | 373,000 | 48,351 | ||||||
11
| Shares | Value | |||||||
| China East Education Holdings Ltd. | 73,000 | $ | 160,573 | |||||
China Eastern Airlines Corp. Ltd., H Shares(2) | 68,000 | 27,828 | ||||||
| China Education Group Holdings Ltd. | 8,000 | 15,708 | ||||||
China Energy Development Holdings Ltd.(1) | 248,000 | 4,574 | ||||||
| China Everbright Bank Co. Ltd., H Shares | 115,000 | 41,141 | ||||||
China Everbright Greentech Ltd.(2) | 32,000 | 14,165 | ||||||
| China Everbright International Ltd. | 324,000 | 195,241 | ||||||
| China Everbright Ltd. | 106,000 | 162,926 | ||||||
China Everbright Water Ltd.(2) | 28,300 | 4,674 | ||||||
China Evergrande Group(2) | 66,000 | 153,547 | ||||||
China First Capital Group Ltd.(1) | 102,000 | 2,116 | ||||||
| China Foods Ltd. | 102,000 | 36,115 | ||||||
| China Galaxy Securities Co. Ltd., H Shares | 227,500 | 135,823 | ||||||
| China Gas Holdings Ltd. | 22,000 | 60,021 | ||||||
| China Grand Pharmaceutical and Healthcare Holdings Ltd., Class A | 136,000 | 123,879 | ||||||
| China Harmony Auto Holding Ltd. | 157,000 | 71,973 | ||||||
China High Speed Transmission Equipment Group Co. Ltd.(2) | 53,000 | 38,563 | ||||||
| China Hongqiao Group Ltd. | 39,000 | 25,102 | ||||||
| China Huarong Asset Management Co. Ltd., H Shares | 653,000 | 74,749 | ||||||
China Index Holdings Ltd., ADR(1) | 1,125 | 1,890 | ||||||
China International Capital Corp. Ltd., H Shares(1) | 150,800 | 356,957 | ||||||
| China Jinmao Holdings Group Ltd. | 776,000 | 483,784 | ||||||
| China Lesso Group Holdings Ltd. | 169,000 | 314,457 | ||||||
| China Life Insurance Co. Ltd., ADR | 36,662 | 446,543 | ||||||
| China Lilang Ltd. | 46,000 | 26,492 | ||||||
China Literature Ltd.(1)(2) | 22,000 | 135,530 | ||||||
China Logistics Property Holdings Co. Ltd.(1) | 83,000 | 37,975 | ||||||
| China Longyuan Power Group Corp. Ltd., H Shares | 387,000 | 242,788 | ||||||
| China Maple Leaf Educational Systems Ltd. | 178,000 | 69,316 | ||||||
| China Medical System Holdings Ltd. | 135,000 | 152,034 | ||||||
| China Meidong Auto Holdings Ltd. | 54,000 | 182,191 | ||||||
| China Mengniu Dairy Co. Ltd. | 251,000 | 1,228,418 | ||||||
| China Merchants Bank Co. Ltd., H Shares | 205,000 | 974,692 | ||||||
| China Merchants Land Ltd. | 148,000 | 22,357 | ||||||
| China Merchants Port Holdings Co. Ltd. | 93,545 | 106,799 | ||||||
| China Minsheng Banking Corp. Ltd., H Shares | 449,000 | 272,958 | ||||||
| China Mobile Ltd., ADR | 52,747 | 1,847,727 | ||||||
China Modern Dairy Holdings Ltd.(1)(2) | 63,000 | 9,499 | ||||||
| China Molybdenum Co. Ltd., H Shares | 69,000 | 27,918 | ||||||
| China National Building Material Co. Ltd., H Shares | 584,000 | 816,434 | ||||||
| China New Higher Education Group Ltd. | 107,000 | 82,569 | ||||||
China Oil & Gas Group Ltd.(1) | 280,000 | 8,831 | ||||||
| China Oilfield Services Ltd., H Shares | 102,000 | 79,665 | ||||||
| China Oriental Group Co. Ltd. | 134,000 | 37,378 | ||||||
| China Overseas Grand Oceans Group Ltd. | 116,000 | 75,351 | ||||||
| China Overseas Land & Investment Ltd. | 170,000 | 488,510 | ||||||
| China Overseas Property Holdings Ltd. | 5,000 | 4,501 | ||||||
| China Pacific Insurance Group Co. Ltd., H Shares | 105,600 | 290,839 | ||||||
| China Petroleum & Chemical Corp., ADR | 7,089 | 325,243 | ||||||
| China Pioneer Pharma Holdings Ltd. | 123,000 | 18,970 | ||||||
| China Power International Development Ltd. | 567,000 | 109,606 | ||||||
| China Railway Construction Corp. Ltd., H Shares | 184,500 | 140,929 | ||||||
12
| Shares | Value | |||||||
| China Railway Group Ltd., H Shares | 341,000 | $ | 174,807 | |||||
| China Railway Signal & Communication Corp. Ltd., H Shares | 141,000 | 57,111 | ||||||
| China Reinsurance Group Corp., H Shares | 302,000 | 32,135 | ||||||
| China Resources Beer Holdings Co. Ltd. | 48,000 | 312,792 | ||||||
| China Resources Cement Holdings Ltd. | 154,000 | 223,609 | ||||||
| China Resources Gas Group Ltd. | 28,000 | 130,893 | ||||||
| China Resources Land Ltd. | 234,000 | 1,072,089 | ||||||
| China Resources Medical Holdings Co. Ltd. | 52,500 | 38,038 | ||||||
| China Resources Pharmaceutical Group Ltd. | 30,500 | 17,228 | ||||||
| China Resources Power Holdings Co. Ltd. | 206,000 | 243,982 | ||||||
| China Sanjiang Fine Chemicals Co. Ltd. | 30,000 | 8,086 | ||||||
| China SCE Group Holdings Ltd. | 225,000 | 116,825 | ||||||
China Shengmu Organic Milk Ltd.(1) | 59,000 | 5,399 | ||||||
| China Shenhua Energy Co. Ltd., H Shares | 180,000 | 298,735 | ||||||
| China Shineway Pharmaceutical Group Ltd. | 38,000 | 26,594 | ||||||
| China South City Holdings Ltd. | 470,000 | 47,619 | ||||||
China Southern Airlines Co. Ltd., H Shares(1)(2) | 116,000 | 60,982 | ||||||
| China State Construction International Holdings Ltd. | 282,000 | 217,045 | ||||||
China Suntien Green Energy Corp. Ltd., H Shares(1) | 72,000 | 19,124 | ||||||
| China Taiping Insurance Holdings Co. Ltd. | 117,800 | 184,882 | ||||||
| China Telecom Corp. Ltd., ADR | 7,966 | 259,134 | ||||||
| China Tobacco International HK Co. Ltd. | 24,000 | 48,099 | ||||||
| China Tower Corp. Ltd., H Shares | 2,446,000 | 466,230 | ||||||
| China Traditional Chinese Medicine Holdings Co. Ltd. | 158,000 | 67,393 | ||||||
| China Travel International Investment Hong Kong Ltd. | 278,000 | 41,916 | ||||||
| China Unicom (Hong Kong) Ltd., ADR | 31,156 | 220,584 | ||||||
| China Vanke Co. Ltd., H Shares | 83,800 | 259,432 | ||||||
| China Vast Industrial Urban Development Co. Ltd. | 5,000 | 1,950 | ||||||
| China Water Affairs Group Ltd. | 48,000 | 39,443 | ||||||
China Wood Optimization Holding Ltd.(1) | 8,000 | 1,582 | ||||||
| China Xinhua Education Group Ltd. | 56,000 | 18,981 | ||||||
| China XLX Fertiliser Ltd. | 30,000 | 9,720 | ||||||
| China Yongda Automobiles Services Holdings Ltd. | 140,500 | 168,303 | ||||||
| China Yuchai International Ltd. | 1,329 | 21,583 | ||||||
| China Yuhua Education Corp. Ltd. | 194,000 | 185,624 | ||||||
China ZhengTong Auto Services Holdings Ltd.(2) | 31,500 | 3,912 | ||||||
| China Zhongwang Holdings Ltd. | 49,600 | 10,468 | ||||||
Chinasoft International Ltd.(1) | 34,000 | 24,006 | ||||||
| Chongqing Rural Commercial Bank Co. Ltd., H Shares | 186,000 | 75,735 | ||||||
| CIFI Holdings Group Co. Ltd. | 129,631 | 110,032 | ||||||
CIMC Enric Holdings Ltd.(2) | 6,000 | 2,388 | ||||||
| CIMC Vehicles Group Co. Ltd., Class H | 20,000 | 18,049 | ||||||
| CITIC Ltd. | 276,000 | 250,647 | ||||||
CITIC Resources Holdings Ltd.(1) | 118,000 | 4,384 | ||||||
CITIC Securities Co. Ltd., H Shares(2) | 63,000 | 150,587 | ||||||
| CNOOC Ltd., ADR | 11,045 | 1,249,852 | ||||||
COFCO Meat Holdings Ltd.(2) | 17,000 | 7,978 | ||||||
Colour Life Services Group Co. Ltd.(1)(2) | 2,000 | 1,030 | ||||||
| Concord New Energy Group Ltd. | 290,000 | 12,848 | ||||||
| Consun Pharmaceutical Group Ltd. | 68,000 | 28,685 | ||||||
| COSCO SHIPPING Energy Transportation Co. Ltd., Class H | 136,000 | 62,384 | ||||||
COSCO SHIPPING Holdings Co. Ltd., Class H(1) | 300,000 | 150,304 | ||||||
13
| Shares | Value | |||||||
| COSCO SHIPPING International Hong Kong Co. Ltd. | 86,000 | $ | 23,790 | |||||
| COSCO SHIPPING Ports Ltd. | 95,775 | 54,097 | ||||||
| Country Garden Holdings Co. Ltd. | 473,966 | 582,306 | ||||||
| Country Garden Services Holdings Co. Ltd. | 117,000 | 813,942 | ||||||
| CPMC Holdings Ltd. | 50,000 | 21,553 | ||||||
| CRRC Corp. Ltd., H Shares | 159,000 | 71,322 | ||||||
| CSPC Pharmaceutical Group Ltd. | 405,600 | 898,505 | ||||||
| DaFa Properties Group Ltd. | 11,000 | 8,017 | ||||||
| Dali Foods Group Co. Ltd. | 216,000 | 132,122 | ||||||
Daqo New Energy Corp., ADR(1) | 2,005 | 226,184 | ||||||
Datang International Power Generation Co. Ltd., H Shares(2) | 184,000 | 24,652 | ||||||
| Dawnrays Pharmaceutical Holdings Ltd. | 55,000 | 6,574 | ||||||
Dexin China Holdings Co. Ltd.(1) | 50,000 | 19,458 | ||||||
Differ Group Holding Co. Ltd.(1) | 40,000 | 3,610 | ||||||
| Digital China Holdings Ltd. | 20,000 | 16,246 | ||||||
| Dongfeng Motor Group Co. Ltd., Class H | 134,000 | 92,285 | ||||||
| Dongyue Group Ltd. | 162,000 | 68,864 | ||||||
DouYu International Holdings Ltd., ADR(1) | 1,841 | 30,818 | ||||||
| ENN Energy Holdings Ltd. | 36,200 | 399,928 | ||||||
| Essex Bio-technology Ltd. | 25,000 | 15,448 | ||||||
| Ever Sunshine Lifestyle Services Group Ltd. | 80,000 | 164,268 | ||||||
| Fanhua, Inc., ADR | 3,361 | 68,195 | ||||||
| Fantasia Holdings Group Co. Ltd. | 192,000 | 38,985 | ||||||
| Far East Horizon Ltd. | 148,000 | 130,838 | ||||||
| FinVolution Group, ADR | 6,149 | 11,683 | ||||||
| Fosun International Ltd. | 186,500 | 206,613 | ||||||
| Fountain SET Holdings Ltd. | 38,000 | 4,357 | ||||||
| Fu Shou Yuan International Group Ltd. | 102,000 | 105,143 | ||||||
| Fufeng Group Ltd. | 63,000 | 21,088 | ||||||
Fullshare Holdings Ltd.(1) | 865,000 | 19,941 | ||||||
| Fuyao Glass Industry Group Co. Ltd., H Shares | 5,200 | 16,709 | ||||||
GCL-Poly Energy Holdings Ltd.(1) | 1,167,000 | 47,335 | ||||||
GDS Holdings Ltd., ADR(1) | 6,729 | 544,645 | ||||||
| Geely Automobile Holdings Ltd. | 383,000 | 801,038 | ||||||
| Gemdale Properties & Investment Corp. Ltd. | 952,000 | 168,956 | ||||||
| Genertec Universal Medical Group Co. Ltd. | 74,000 | 51,484 | ||||||
Genscript Biotech Corp.(1) | 98,000 | 188,698 | ||||||
| GF Securities Co. Ltd., H Shares | 66,000 | 77,404 | ||||||
Global Bio-Chem Technology Group Co. Ltd.(1) | 40,000 | 563 | ||||||
Global Cord Blood Corp.(1) | 4,088 | 14,267 | ||||||
Glorious Property Holdings Ltd.(1) | 187,000 | 6,740 | ||||||
Glory Sun Financial Group Ltd.(1) | 324,000 | 13,357 | ||||||
Golden Meditech Holdings Ltd.(1) | 28,000 | 2,995 | ||||||
GR Properties Ltd.(1) | 104,000 | 16,363 | ||||||
Grand Baoxin Auto Group Ltd.(1) | 30,500 | 4,624 | ||||||
| Great Wall Motor Co. Ltd., H Shares | 236,000 | 255,369 | ||||||
Greater China Financial Holdings Ltd.(1) | 96,000 | 2,466 | ||||||
| Greatview Aseptic Packaging Co. Ltd. | 24,000 | 10,059 | ||||||
| Greenland Hong Kong Holdings Ltd. | 137,000 | 45,499 | ||||||
| Greentown Service Group Co. Ltd. | 144,000 | 192,885 | ||||||
GSX Techedu, Inc., ADR(1) | 1,097 | 93,684 | ||||||
| Guangdong Investment Ltd. | 76,000 | 118,302 | ||||||
14
| Shares | Value | |||||||
| Guangzhou Automobile Group Co. Ltd., H Shares | 136,000 | $ | 116,365 | |||||
| Guangzhou R&F Properties Co. Ltd., H Shares | 76,000 | 96,402 | ||||||
| Guorui Properties Ltd. | 65,000 | 9,599 | ||||||
| Guotai Junan Securities Co. Ltd., H Shares | 23,400 | 36,176 | ||||||
Haichang Ocean Park Holdings Ltd.(1) | 61,000 | 4,790 | ||||||
Haidilao International Holding Ltd.(2) | 1,000 | 6,433 | ||||||
| Haier Electronics Group Co. Ltd. | 76,000 | 259,422 | ||||||
Hainan Meilan International Airport Co. Ltd., H Shares(1) | 20,000 | 115,844 | ||||||
| Haitian International Holdings Ltd. | 54,000 | 130,630 | ||||||
Haitong Securities Co. Ltd., H Shares(1) | 152,000 | 137,502 | ||||||
Hansoh Pharmaceutical Group Co. Ltd.(1) | 28,000 | 132,311 | ||||||
Harbin Electric Co. Ltd., H Shares(1) | 94,000 | 28,820 | ||||||
| Hebei Construction Group Corp. Ltd., H Shares | 68,000 | 149,466 | ||||||
| Hengan International Group Co. Ltd. | 68,000 | 534,080 | ||||||
Hi Sun Technology China Ltd.(1) | 120,000 | 14,658 | ||||||
| Hisense Home Appliances Group Co. Ltd., H Shares | 4,000 | 5,351 | ||||||
| HKC Holdings Ltd. | 8,000 | 4,764 | ||||||
| Hollysys Automation Technologies Ltd. | 5,932 | 64,244 | ||||||
| Homeland Interactive Technology Ltd. | 52,000 | 29,304 | ||||||
Hong Kong Finance Investment Holding Group Ltd.(1) | 200,000 | 15,487 | ||||||
| Honworld Group Ltd. | 7,500 | 2,583 | ||||||
| Hopson Development Holdings Ltd. | 88,000 | 175,868 | ||||||
Hua Hong Semiconductor Ltd.(1)(2) | 42,000 | 150,879 | ||||||
Huabao International Holdings Ltd.(2) | 18,000 | 15,918 | ||||||
| Huadian Power International Corp. Ltd., H Shares | 132,000 | 36,810 | ||||||
Huami Corp., ADR(1) | 3,740 | 47,199 | ||||||
| Huaneng Power International, Inc., H Shares | 336,000 | 140,296 | ||||||
| Huatai Securities Co. Ltd., H Shares | 6,800 | 11,903 | ||||||
| Huaxi Holdings Co. Ltd. | 14,000 | 3,070 | ||||||
| Huazhong In-Vehicle Holdings Co. Ltd. | 14,000 | 1,120 | ||||||
| Huazhu Group Ltd., ADR | 10,580 | 473,243 | ||||||
Huifu Payment Ltd.(1)(2) | 80,400 | 26,587 | ||||||
HUYA, Inc., ADR(1) | 4,072 | 116,948 | ||||||
| IGG, Inc. | 146,000 | 168,194 | ||||||
| IMAX China Holding, Inc. | 20,100 | 32,350 | ||||||
| Industrial & Commercial Bank of China Ltd., H Shares | 2,352,000 | 1,313,316 | ||||||
Inke Ltd.(1) | 18,000 | 2,896 | ||||||
Inspur International Ltd.(1) | 22,000 | 5,980 | ||||||
International Alliance Financial Leasing Co. Ltd.(1) | 30,000 | 3,246 | ||||||
iQIYI, Inc., ADR(1) | 878 | 19,009 | ||||||
| IVD Medical Holding Ltd. | 14,000 | 4,798 | ||||||
JD.com, Inc., ADR(1) | 46,093 | 3,624,754 | ||||||
| JH Educational Technology, Inc. | 52,000 | 25,051 | ||||||
| Jiangsu Expressway Co. Ltd., H Shares | 110,000 | 110,033 | ||||||
| Jiangxi Copper Co. Ltd., H Shares | 38,000 | 44,657 | ||||||
| Jiayuan International Group Ltd. | 16,000 | 7,599 | ||||||
| Jinchuan Group International Resources Co. Ltd. | 93,000 | 10,765 | ||||||
| Jingrui Holdings Ltd. | 30,000 | 7,925 | ||||||
JinkoSolar Holding Co. Ltd., ADR(1) | 5,110 | 116,712 | ||||||
Jiumaojiu International Holdings Ltd.(1) | 9,000 | 20,389 | ||||||
| JNBY Design Ltd. | 6,500 | 6,790 | ||||||
JOYY, Inc., ADR(1) | 4,203 | 359,104 | ||||||
15
| Shares | Value | |||||||
| Kaisa Group Holdings Ltd. | 336,000 | $ | 168,327 | |||||
Kaisa Prosperity Holdings Ltd.(1) | 3,500 | 13,059 | ||||||
Kandi Technologies Group, Inc.(1) | 2,104 | 14,160 | ||||||
Kasen International Holdings Ltd.(1)(2) | 30,000 | 3,555 | ||||||
| Kingboard Holdings Ltd. | 69,500 | 223,140 | ||||||
| Kingboard Laminates Holdings Ltd. | 155,500 | 194,085 | ||||||
| Kingdee International Software Group Co. Ltd. | 165,000 | 421,029 | ||||||
| Kingsoft Corp. Ltd. | 17,000 | 90,839 | ||||||
| Kunlun Energy Co. Ltd. | 116,000 | 86,171 | ||||||
| KWG Group Holdings Ltd. | 202,500 | 384,094 | ||||||
| Lee & Man Paper Manufacturing Ltd. | 50,000 | 29,717 | ||||||
| Lee's Pharmaceutical Holdings Ltd. | 47,500 | 36,125 | ||||||
| Lenovo Group Ltd. | 552,000 | 367,898 | ||||||
LexinFintech Holdings Ltd., ADR(1) | 7,115 | 55,568 | ||||||
| Li Ning Co. Ltd. | 246,500 | 1,037,665 | ||||||
Lifestyle China Group Ltd.(1) | 12,500 | 2,052 | ||||||
| Logan Group Co. Ltd. | 82,000 | 152,129 | ||||||
| Longfor Group Holdings Ltd. | 19,000 | 100,297 | ||||||
| Lonking Holdings Ltd. | 254,000 | 72,317 | ||||||
Luye Pharma Group Ltd.(2) | 147,000 | 79,475 | ||||||
| Maanshan Iron & Steel Co. Ltd., H Shares | 60,000 | 16,089 | ||||||
| Maoye International Holdings Ltd. | 77,000 | 3,609 | ||||||
Meitu, Inc.(1) | 137,000 | 29,945 | ||||||
Meituan Dianping, Class B(1) | 42,900 | 1,410,020 | ||||||
| Metallurgical Corp. of China Ltd., H Shares | 198,000 | 33,881 | ||||||
| Midea Real Estate Holding Ltd. | 6,000 | 15,264 | ||||||
| Minsheng Education Group Co. Ltd. | 118,000 | 17,929 | ||||||
MMG Ltd.(1) | 240,000 | 63,808 | ||||||
| Modern Land China Co. Ltd. | 104,000 | 15,128 | ||||||
| Momo, Inc., ADR | 9,591 | 195,656 | ||||||
Mulsanne Group Holding Ltd.(1)(2) | 28,500 | 19,935 | ||||||
Nam Tai Property, Inc.(1) | 3,469 | 31,949 | ||||||
| NetDragon Websoft Holdings Ltd. | 29,500 | 75,344 | ||||||
| NetEase, Inc., ADR | 1,623 | 790,742 | ||||||
| New China Life Insurance Co. Ltd., H Shares | 37,300 | 148,241 | ||||||
New Oriental Education & Technology Group, Inc., ADR(1) | 3,578 | 524,642 | ||||||
Nexteer Automotive Group Ltd.(2) | 94,000 | 60,493 | ||||||
| Nine Dragons Paper Holdings Ltd. | 137,000 | 151,709 | ||||||
NIO, Inc., ADR(1) | 21,812 | 415,082 | ||||||
Niu Technologies, ADR(1) | 36 | 744 | ||||||
Noah Holdings Ltd., ADR(1) | 2,268 | 63,504 | ||||||
OneSmart International Education Group Ltd., ADR(1) | 3,965 | 16,812 | ||||||
| Oshidori International Holdings Ltd. | 186,000 | 20,149 | ||||||
| Pacific Online Ltd. | 37,000 | 4,894 | ||||||
Panda Green Energy Group Ltd.(1) | 70,000 | 2,131 | ||||||
| PAX Global Technology Ltd. | 98,000 | 56,522 | ||||||
| People's Insurance Co. Group of China Ltd. (The), H Shares | 61,000 | 19,865 | ||||||
| Perennial Energy Holdings Ltd. | 55,000 | 32,265 | ||||||
| PetroChina Co. Ltd., ADR | 7,781 | 268,522 | ||||||
| PICC Property & Casualty Co. Ltd., H Shares | 218,000 | 167,799 | ||||||
Pinduoduo, Inc., ADR(1) | 3,668 | 326,232 | ||||||
Ping An Healthcare and Technology Co. Ltd.(1)(2) | 34,800 | 505,329 | ||||||
16
| Shares | Value | |||||||
| Ping An Insurance Group Co. of China Ltd., H Shares | 120,782 | $ | 1,279,810 | |||||
| Poly Property Group Co. Ltd. | 209,000 | 65,594 | ||||||
| Poly Property Services Co. Ltd. | 2,600 | 22,710 | ||||||
| Postal Savings Bank of China Co. Ltd., H Shares | 430,000 | 203,168 | ||||||
Pou Sheng International Holdings Ltd.(1) | 61,000 | 15,392 | ||||||
| Powerlong Commercial Management Holdings Ltd. | 9,000 | 28,385 | ||||||
| Powerlong Real Estate Holdings Ltd. | 132,000 | 95,343 | ||||||
| Prinx Chengshan Cayman Holding Ltd. | 12,500 | 13,114 | ||||||
PW Medtech Group Ltd.(1) | 29,000 | 5,650 | ||||||
| Qeeka Home Cayman, Inc. | 6,000 | 1,824 | ||||||
| Qingling Motors Co. Ltd., H Shares | 32,000 | 5,694 | ||||||
Qudian, Inc., ADR(1) | 10,797 | 17,167 | ||||||
| Redsun Properties Group Ltd. | 80,000 | 28,100 | ||||||
RISE Education Cayman Ltd., ADR(1) | 522 | 3,315 | ||||||
| Road King Infrastructure Ltd. | 27,000 | 35,850 | ||||||
| Ronshine China Holdings Ltd. | 54,500 | 44,198 | ||||||
| Sany Heavy Equipment International Holdings Co. Ltd. | 3,000 | 1,659 | ||||||
| Scholar Education Group | 17,000 | 52,380 | ||||||
Seazen Group Ltd.(1) | 6,000 | 5,428 | ||||||
Semiconductor Manufacturing International Corp.(1) | 187,500 | 599,159 | ||||||
| Shandong Weigao Group Medical Polymer Co. Ltd., H Shares | 72,000 | 167,698 | ||||||
Shanghai Electric Group Co. Ltd., H Shares(1) | 60,000 | 17,618 | ||||||
| Shanghai Fosun Pharmaceutical Group Co. Ltd., H Shares | 7,000 | 29,485 | ||||||
| Shanghai Fudan-Zhangjiang Bio-Pharmaceutical Co. Ltd., H Shares | 40,000 | 25,429 | ||||||
| Shanghai Industrial Holdings Ltd. | 48,000 | 71,701 | ||||||
| Shanghai Industrial Urban Development Group Ltd. | 196,000 | 22,858 | ||||||
| Shanghai Jin Jiang Capital Co. Ltd., H Shares | 10,000 | 1,713 | ||||||
| Shanghai Pharmaceuticals Holding Co. Ltd., H Shares | 63,100 | 112,410 | ||||||
| Sheng Ye Capital Ltd. | 22,000 | 22,552 | ||||||
| Shenzhen Expressway Co. Ltd., H Shares | 52,000 | 47,018 | ||||||
| Shenzhen International Holdings Ltd. | 126,000 | 201,831 | ||||||
| Shenzhen Investment Ltd. | 258,000 | 87,367 | ||||||
| Shenzhou International Group Holdings Ltd. | 43,300 | 694,396 | ||||||
| Shimao Group Holdings Ltd. | 78,500 | 352,267 | ||||||
| Shirble Department Store Holdings China Ltd. | 20,000 | 1,746 | ||||||
| Shoucheng Holdings Ltd. | 146,800 | 39,843 | ||||||
| Shougang Fushan Resources Group Ltd. | 210,000 | 47,606 | ||||||
| Shui On Land Ltd. | 411,500 | 56,167 | ||||||
| Sihuan Pharmaceutical Holdings Group Ltd. | 383,000 | 46,335 | ||||||
Silver Grant International Holdings Group Ltd.(1) | 40,000 | 5,255 | ||||||
Sina Corp.(1) | 6,379 | 259,530 | ||||||
| Sino Biopharmaceutical Ltd. | 217,500 | 249,303 | ||||||
| Sino-Ocean Group Holding Ltd. | 303,000 | 69,737 | ||||||
| Sinofert Holdings Ltd. | 290,000 | 27,203 | ||||||
Sinolink Worldwide Holdings Ltd.(1) | 270,000 | 17,075 | ||||||
| Sinopec Engineering Group Co. Ltd., H Shares | 96,500 | 42,704 | ||||||
| Sinopec Kantons Holdings Ltd. | 90,000 | 35,315 | ||||||
| Sinopec Shanghai Petrochemical Co. Ltd., ADR | 599 | 12,303 | ||||||
| Sinopharm Group Co. Ltd., H Shares | 12,000 | 29,425 | ||||||
| Sinotrans Ltd., H Shares | 138,000 | 32,721 | ||||||
| Sinotruk Hong Kong Ltd. | 79,000 | 204,838 | ||||||
| Skyfame Realty Holdings Ltd. | 158,000 | 20,572 | ||||||
17
| Shares | Value | |||||||
Skyworth Group Ltd.(1)(2) | 156,000 | $ | 54,018 | |||||
Sogou, Inc., ADR(1) | 4,028 | 34,842 | ||||||
SOHO China Ltd.(1) | 243,500 | 75,015 | ||||||
Sohu.com Ltd., ADR(1) | 1,588 | 31,982 | ||||||
| SSY Group Ltd. | 162,000 | 103,088 | ||||||
| Sun Art Retail Group Ltd. | 215,500 | 280,648 | ||||||
| Sun King Power Electronics Group | 76,000 | 16,765 | ||||||
| Sunac China Holdings Ltd. | 95,000 | 397,388 | ||||||
| Sunny Optical Technology Group Co. Ltd. | 37,400 | 549,273 | ||||||
TAL Education Group, ADR(1) | 8,536 | 630,042 | ||||||
| TCL Electronics Holdings Ltd. | 67,000 | 45,700 | ||||||
| Tencent Holdings Ltd. | 136,300 | 9,288,505 | ||||||
Tencent Music Entertainment Group, ADR(1) | 2,594 | 40,544 | ||||||
| Texhong Textile Group Ltd. | 23,000 | 17,796 | ||||||
Tian Ge Interactive Holdings Ltd.(1)(2) | 9,000 | 1,091 | ||||||
| Tiangong International Co. Ltd. | 28,000 | 9,389 | ||||||
| Tianjin Development Holdings Ltd. | 6,000 | 1,266 | ||||||
| Tianjin Port Development Holdings Ltd. | 60,000 | 4,385 | ||||||
Tianli Education International Holdings Ltd.(1) | 204,000 | 231,380 | ||||||
Tianneng Power International Ltd.(2) | 130,000 | 278,489 | ||||||
Tibet Water Resources Ltd.(1) | 19,000 | 1,478 | ||||||
| Times China Holdings Ltd. | 75,000 | 114,989 | ||||||
| Times Neighborhood Holdings Ltd. | 95,538 | 136,415 | ||||||
| Tingyi Cayman Islands Holding Corp. | 242,000 | 453,551 | ||||||
| Tong Ren Tang Technologies Co. Ltd., H Shares | 61,000 | 47,025 | ||||||
Tongcheng-Elong Holdings Ltd.(1) | 27,600 | 54,038 | ||||||
Tongda Group Holdings Ltd.(2) | 630,000 | 37,036 | ||||||
Tongdao Liepin Group(1) | 7,000 | 17,607 | ||||||
| Topsports International Holdings Ltd. | 98,000 | 120,969 | ||||||
| TravelSky Technology Ltd., H Shares | 27,000 | 56,066 | ||||||
Trigiant Group Ltd.(1) | 28,000 | 3,209 | ||||||
Trip.com Group Ltd., ADR(1) | 6,736 | 203,697 | ||||||
Truly International Holdings Ltd.(1) | 60,000 | 7,500 | ||||||
| Tsaker Chemical Group Ltd. | 15,000 | 2,746 | ||||||
| Tsingtao Brewery Co. Ltd., H Shares | 40,000 | 363,830 | ||||||
| Uni-President China Holdings Ltd. | 137,000 | 124,773 | ||||||
| Vinda International Holdings Ltd. | 52,000 | 177,435 | ||||||
Vipshop Holdings Ltd., ADR(1) | 58,428 | 964,646 | ||||||
| Want Want China Holdings Ltd. | 493,000 | 336,710 | ||||||
| Wasion Holdings Ltd. | 22,000 | 6,460 | ||||||
Weibo Corp., ADR(1) | 3,652 | 136,220 | ||||||
| Weichai Power Co. Ltd., H Shares | 205,000 | 412,637 | ||||||
Weimob, Inc.(1)(2) | 32,000 | 53,521 | ||||||
| West China Cement Ltd. | 324,000 | 56,659 | ||||||
| Wharf Holdings Ltd. (The) | 99,000 | 192,565 | ||||||
| Wisdom Education International Holdings Co. Ltd. | 66,000 | 34,272 | ||||||
| Wison Engineering Services Co. Ltd. | 19,000 | 1,910 | ||||||
WuXi AppTec Co. Ltd., H Shares(2) | 2,520 | 37,207 | ||||||
Wuxi Biologics Cayman, Inc.(1) | 10,000 | 258,801 | ||||||
X Financial, ADR(1) | 5,944 | 4,440 | ||||||
Xiabuxiabu Catering Management China Holdings Co. Ltd.(1) | 19,500 | 24,073 | ||||||
Xiaomi Corp., Class B(1) | 351,800 | 1,066,200 | ||||||
18
| Shares | Value | |||||||
| Xingda International Holdings Ltd. | 154,482 | $ | 38,029 | |||||
| Xinjiang Goldwind Science & Technology Co. Ltd., H Shares | 6,000 | 5,131 | ||||||
| Xinyi Solar Holdings Ltd. | 195,024 | 245,047 | ||||||
| Xinyuan Real Estate Co. Ltd., ADR | 4,488 | 9,335 | ||||||
| XTEP International Holdings Ltd. | 76,500 | 25,390 | ||||||
Yadea Group Holdings Ltd.(1) | 206,000 | 207,204 | ||||||
| Yanzhou Coal Mining Co. Ltd., H Shares | 146,000 | 112,137 | ||||||
YiChang HEC ChangJiang Pharmaceutical Co. Ltd., H Shares(2) | 35,600 | 50,514 | ||||||
| Yihai International Holding Ltd. | 31,000 | 488,611 | ||||||
| Yintech Investment Holdings Ltd., ADR | 876 | 6,386 | ||||||
Yiren Digital Ltd., ADR(1) | 2,015 | 6,569 | ||||||
Yixin Group Ltd.(1)(2) | 148,000 | 37,684 | ||||||
| Yongsheng Advanced Materials Co. Ltd. | 10,000 | 3,058 | ||||||
YuanShengTai Dairy Farm Ltd.(1) | 171,000 | 12,531 | ||||||
| Yuexiu Property Co. Ltd. | 464,000 | 88,395 | ||||||
| Yuexiu Transport Infrastructure Ltd. | 84,000 | 49,773 | ||||||
| Yum China Holdings, Inc. | 30,000 | 1,731,300 | ||||||
| Yuzhou Group Holdings Co. Ltd. | 229,661 | 106,882 | ||||||
| Zhaojin Mining Industry Co. Ltd., H Shares | 16,000 | 17,933 | ||||||
| Zhejiang Expressway Co. Ltd., H Shares | 176,000 | 118,524 | ||||||
| Zhenro Properties Group Ltd. | 34,000 | 19,852 | ||||||
ZhongAn Online P&C Insurance Co. Ltd., H Shares(1)(2) | 3,000 | 19,538 | ||||||
| Zhongliang Holdings Group Co. Ltd. | 79,500 | 51,150 | ||||||
| Zhongsheng Group Holdings Ltd. | 60,500 | 375,785 | ||||||
| Zhou Hei Ya International Holdings Co. Ltd. | 85,000 | 96,108 | ||||||
Zhuguang Holdings Group Co. Ltd.(1) | 60,000 | 8,405 | ||||||
| Zhuzhou CRRC Times Electric Co. Ltd., H Shares | 47,500 | 151,380 | ||||||
| Zijin Mining Group Co. Ltd., H Shares | 562,000 | 382,835 | ||||||
Zoomlion Heavy Industry Science and Technology Co. Ltd., Class H(1) | 34,800 | 34,714 | ||||||
| ZTE Corp., H Shares | 13,600 | 39,168 | ||||||
| ZTO Express Cayman, Inc., ADR | 16,982 | 569,406 | ||||||
| 92,005,735 | ||||||||
| Colombia — 0.3% | ||||||||
| Banco Davivienda SA, Preference Shares | 8,251 | 63,917 | ||||||
| Bancolombia SA | 6,749 | 46,906 | ||||||
| Bancolombia SA, ADR | 4,607 | 129,272 | ||||||
| Cementos Argos SA | 18,987 | 25,377 | ||||||
Corp. Financiera Colombiana SA(1) | 20,045 | 145,207 | ||||||
| Ecopetrol SA, ADR | 11,168 | 127,204 | ||||||
Empresa de Telecomunicaciones de Bogota(1) | 18,600 | 1,054 | ||||||
| Grupo Argos SA | 35,212 | 112,196 | ||||||
| Grupo Aval Acciones y Valores SA, Preference Shares | 27,076 | 6,767 | ||||||
| Interconexion Electrica SA ESP | 15,347 | 85,904 | ||||||
| 743,804 | ||||||||
| Czech Republic — 0.1% | ||||||||
| CEZ AS | 6,213 | 127,908 | ||||||
Komercni banka AS(1) | 2,534 | 60,911 | ||||||
| Moneta Money Bank AS | 37,037 | 93,285 | ||||||
| 282,104 | ||||||||
| Egypt — 0.1% | ||||||||
| Commercial International Bank Egypt S.A.E., GDR | 58,481 | 249,144 | ||||||
19
| Shares | Value | |||||||
| Greece — 0.3% | ||||||||
Aegean Airlines SA(1) | 5,277 | $ | 22,639 | |||||
Alpha Bank AE(1) | 55,240 | 36,432 | ||||||
| Athens Water Supply & Sewage Co. SA | 846 | 7,065 | ||||||
Ellaktor SA(1) | 8,314 | 10,899 | ||||||
Eurobank Ergasias Services and Holdings SA(1) | 76,130 | 36,418 | ||||||
Fourlis Holdings SA(1) | 2,838 | 13,496 | ||||||
GEK Terna Holding Real Estate Construction SA(1) | 6,077 | 43,939 | ||||||
| Hellenic Petroleum SA | 4,037 | 24,614 | ||||||
| Hellenic Telecommunications Organization SA | 6,366 | 104,028 | ||||||
| JUMBO SA | 2,114 | 36,701 | ||||||
| Motor Oil Hellas Corinth Refineries SA | 2,751 | 38,570 | ||||||
| Mytilineos SA | 3,897 | 36,643 | ||||||
National Bank of Greece SA(1) | 33,543 | 45,486 | ||||||
Piraeus Bank SA(1) | 32,353 | 46,432 | ||||||
Public Power Corp. SA(1) | 8,414 | 40,169 | ||||||
| Terna Energy SA | 4,744 | 67,144 | ||||||
Titan Cement International SA(1) | 1,929 | 26,167 | ||||||
Viohalco SA(1) | 2,750 | 7,481 | ||||||
| 644,323 | ||||||||
Hong Kong† | ||||||||
Anton Oilfield Services Group(1)(2) | 122,000 | 6,347 | ||||||
HC Group, Inc.(1) | 7,500 | 1,079 | ||||||
Honghua Group Ltd.(1) | 155,000 | 5,052 | ||||||
| 12,478 | ||||||||
| Hungary — 0.2% | ||||||||
| Magyar Telekom Telecommunications plc | 72,123 | 88,572 | ||||||
MOL Hungarian Oil & Gas plc(1) | 27,515 | 154,640 | ||||||
OTP Bank Nyrt(1) | 5,870 | 197,478 | ||||||
| Richter Gedeon Nyrt | 3,733 | 91,066 | ||||||
| 531,756 | ||||||||
| India — 9.5% | ||||||||
| Adani Enterprises Ltd. | 6,517 | 24,556 | ||||||
| Adani Ports & Special Economic Zone Ltd. | 31,574 | 152,128 | ||||||
Adani Power Ltd.(1) | 5,783 | 2,922 | ||||||
Adani Transmission Ltd.(1) | 6,391 | 21,980 | ||||||
Aditya Birla Fashion and Retail Ltd.(1) | 907 | 1,720 | ||||||
| Aegis Logistics Ltd. | 7,395 | 21,288 | ||||||
| Ajanta Pharma Ltd. | 1,683 | 33,919 | ||||||
Alok Industries Ltd.(1) | 45,160 | 19,361 | ||||||
| Amara Raja Batteries Ltd. | 1,358 | 13,405 | ||||||
| Ambuja Cements Ltd. | 45,962 | 131,200 | ||||||
| Apollo Hospitals Enterprise Ltd. | 4,066 | 90,212 | ||||||
| Apollo Tyres Ltd. | 11,846 | 19,853 | ||||||
| Ashok Leyland Ltd. | 49,812 | 45,603 | ||||||
Ashoka Buildcon Ltd.(1) | 4,266 | 3,940 | ||||||
| Asian Paints Ltd. | 5,153 | 132,830 | ||||||
| Aurobindo Pharma Ltd. | 24,206 | 265,541 | ||||||
| Avanti Feeds Ltd. | 2,467 | 17,324 | ||||||
Avenue Supermarts Ltd.(1) | 1,034 | 31,563 | ||||||
Axis Bank Ltd., GDR(1) | 19,160 | 674,569 | ||||||
| Bajaj Auto Ltd. | 4,287 | 172,472 | ||||||
20
| Shares | Value | |||||||
Bajaj Consumer Care Ltd.(1) | 4,501 | $ | 10,498 | |||||
| Bajaj Finance Ltd. | 5,044 | 237,626 | ||||||
| Bajaj Finserv Ltd. | 1,086 | 91,007 | ||||||
| Balkrishna Industries Ltd. | 5,826 | 104,257 | ||||||
| Balrampur Chini Mills Ltd. | 4,589 | 9,165 | ||||||
Bandhan Bank Ltd.(1) | 7,366 | 30,431 | ||||||
| Bata India Ltd. | 655 | 11,535 | ||||||
| BEML Ltd. | 1,894 | 17,143 | ||||||
| Berger Paints India Ltd. | 6,297 | 45,874 | ||||||
| Bharat Forge Ltd. | 10,427 | 69,357 | ||||||
| Bharat Heavy Electricals Ltd. | 40,626 | 21,179 | ||||||
| Bharat Petroleum Corp. Ltd. | 35,560 | 196,564 | ||||||
| Bharti Airtel Ltd. | 57,229 | 398,734 | ||||||
| Bharti Infratel Ltd. | 18,672 | 50,233 | ||||||
Biocon Ltd.(1) | 5,469 | 27,916 | ||||||
Birlasoft Ltd.(1) | 24,915 | 54,159 | ||||||
| Bliss Gvs Pharma Ltd. | 2,161 | 4,204 | ||||||
| Bombay Dyeing & Manufacturing Co. Ltd. | 1,774 | 1,645 | ||||||
| Bosch Ltd. | 325 | 56,405 | ||||||
| Britannia Industries Ltd. | 1,418 | 71,722 | ||||||
| Can Fin Homes Ltd. | 3,056 | 15,352 | ||||||
Canara Bank(1) | 28,501 | 41,428 | ||||||
| Capri Global Capital Ltd. | 2,655 | 7,869 | ||||||
| Carborundum Universal Ltd. | 6,059 | 22,148 | ||||||
| CCL Products India Ltd. | 7,908 | 26,569 | ||||||
| Ceat Ltd. | 2,872 | 34,193 | ||||||
Central Bank of India(1) | 14,132 | 3,389 | ||||||
| Central Depository Services India Ltd. | 5,186 | 28,580 | ||||||
| Century Textiles & Industries Ltd. | 3,804 | 17,196 | ||||||
| CESC Ltd. | 3,201 | 26,071 | ||||||
| Chambal Fertilizers and Chemicals Ltd. | 2,640 | 5,295 | ||||||
| Cipla Ltd. | 21,543 | 208,583 | ||||||
| City Union Bank Ltd. | 27,003 | 49,472 | ||||||
| Coal India Ltd. | 87,363 | 159,120 | ||||||
| Cochin Shipyard Ltd. | 3,845 | 17,267 | ||||||
| Coforge Ltd. | 1,543 | 40,277 | ||||||
| Colgate-Palmolive India Ltd. | 4,019 | 74,364 | ||||||
| Container Corp. of India Ltd. | 2,984 | 15,894 | ||||||
Crompton Greaves Consumer Electricals Ltd.(1) | 14,876 | 54,809 | ||||||
| Dabur India Ltd. | 10,224 | 65,877 | ||||||
Dalmia Bharat Ltd.(1) | 4,288 | 43,410 | ||||||
DCB Bank Ltd.(1) | 22,172 | 26,764 | ||||||
| Dilip Buildcon Ltd. | 1,294 | 6,460 | ||||||
Dish TV India Ltd.(1) | 19,610 | 2,953 | ||||||
| Divi's Laboratories Ltd. | 1,273 | 53,926 | ||||||
| DLF Ltd. | 49,663 | 106,550 | ||||||
| Dr Lal PathLabs Ltd. | 882 | 21,226 | ||||||
| Dr Reddy's Laboratories Ltd., ADR | 18,740 | 1,090,106 | ||||||
Edelweiss Financial Services Ltd.(1) | 60,790 | 66,039 | ||||||
| Eicher Motors Ltd. | 2,140 | 60,668 | ||||||
EID Parry India Ltd.(1) | 3,123 | 12,120 | ||||||
EIH Ltd.(1) | 2,058 | 2,441 | ||||||
21
| Shares | Value | |||||||
| Engineers India Ltd. | 26,238 | $ | 23,775 | |||||
| Equitas Holdings Ltd. | 15,764 | 11,614 | ||||||
| Eris Lifesciences Ltd. | 2,408 | 15,729 | ||||||
| Escorts Ltd. | 1,990 | 29,303 | ||||||
| Exide Industries Ltd. | 23,050 | 51,199 | ||||||
| FDC Ltd. | 7,760 | 32,715 | ||||||
Federal Bank Ltd.(1) | 136,520 | 101,987 | ||||||
Fortis Healthcare Ltd.(1) | 38,403 | 69,222 | ||||||
Future Lifestyle Fashions Ltd.(1) | 1,909 | 3,949 | ||||||
| GAIL India Ltd. | 56,471 | 73,270 | ||||||
| Glenmark Pharmaceuticals Ltd. | 18,624 | 118,574 | ||||||
GMR Infrastructure Ltd.(1) | 9,481 | 3,030 | ||||||
| Godrej Agrovet Ltd. | 886 | 5,886 | ||||||
| Godrej Consumer Products Ltd. | 5,556 | 49,169 | ||||||
Godrej Properties Ltd.(1) | 299 | 3,704 | ||||||
| Granules India Ltd. | 26,149 | 111,410 | ||||||
| Graphite India Ltd. | 6,301 | 16,153 | ||||||
| Grasim Industries Ltd. | 9,513 | 86,949 | ||||||
Greaves Cotton Ltd.(1) | 5,536 | 5,996 | ||||||
| Gujarat Narmada Valley Fertilizers & Chemicals Ltd. | 2,679 | 7,314 | ||||||
| Gujarat Pipavav Port Ltd. | 32,769 | 35,420 | ||||||
| Gujarat State Fertilizers & Chemicals Ltd. | 2,735 | 2,368 | ||||||
| Gujarat State Petronet Ltd. | 15,358 | 42,339 | ||||||
| Havells India Ltd. | 5,168 | 43,134 | ||||||
| HCL Technologies Ltd. | 17,854 | 168,276 | ||||||
| HDFC Asset Management Co. Ltd. | 2,411 | 78,857 | ||||||
HDFC Life Insurance Co. Ltd.(1) | 4,266 | 33,178 | ||||||
| HEG Ltd. | 1,525 | 17,721 | ||||||
| HeidelbergCement India Ltd. | 4,117 | 10,564 | ||||||
| Hero MotoCorp Ltd. | 8,211 | 334,803 | ||||||
| Hexaware Technologies Ltd. | 15,218 | 81,564 | ||||||
| HFCL Ltd. | 20,814 | 4,333 | ||||||
| Hikal Ltd. | 1,154 | 2,545 | ||||||
| Himadri Speciality Chemical Ltd. | 3,361 | 2,337 | ||||||
| Hindalco Industries Ltd. | 69,193 | 173,486 | ||||||
Hindustan Copper Ltd.(1) | 17,442 | 8,580 | ||||||
| Hindustan Petroleum Corp. Ltd. | 21,871 | 59,727 | ||||||
| Hindustan Unilever Ltd. | 26,009 | 747,016 | ||||||
| Housing Development Finance Corp. Ltd. | 32,715 | 811,428 | ||||||
ICICI Bank Ltd., ADR(1) | 29,401 | 315,767 | ||||||
| ICICI Lombard General Insurance Co. Ltd. | 3,113 | 53,024 | ||||||
| ICICI Prudential Life Insurance Co. Ltd. | 3,425 | 19,604 | ||||||
| ICICI Securities Ltd. | 6,739 | 43,599 | ||||||
IDFC First Bank Ltd.(1) | 166,897 | 72,363 | ||||||
| IDFC Ltd. | 51,602 | 19,243 | ||||||
| IIFL Finance Ltd. | 16,821 | 18,632 | ||||||
| IIFL Wealth Management Ltd. | 277 | 3,844 | ||||||
| India Cements Ltd. (The) | 26,125 | 40,580 | ||||||
| Indiabulls Housing Finance Ltd. | 40,406 | 113,539 | ||||||
Indiabulls Real Estate Ltd.(1) | 16,612 | 14,162 | ||||||
| Indiabulls Ventures Ltd. | 27,615 | 73,589 | ||||||
| Indian Energy Exchange Ltd. | 4,579 | 11,985 | ||||||
22
| Shares | Value | |||||||
| Indian Hotels Co. Ltd. (The) | 10,050 | $ | 14,100 | |||||
| Indian Oil Corp. Ltd. | 98,764 | 114,958 | ||||||
Indian Overseas Bank(1) | 35,971 | 5,163 | ||||||
| Indraprastha Gas Ltd. | 3,029 | 16,188 | ||||||
| Infibeam Avenues Ltd. | 7,614 | 7,881 | ||||||
| Info Edge India Ltd. | 398 | 17,608 | ||||||
| Infosys Ltd., ADR | 165,605 | 2,086,623 | ||||||
| Inox Leisure Ltd. | 6,380 | 24,456 | ||||||
InterGlobe Aviation Ltd.(1) | 3,806 | 61,566 | ||||||
| Ipca Laboratories Ltd. | 4,993 | 127,916 | ||||||
| IRB Infrastructure Developers Ltd. | 10,162 | 16,350 | ||||||
| IRCON International Ltd. | 5,615 | 6,809 | ||||||
| Jagran Prakashan Ltd. | 5,040 | 2,697 | ||||||
| Jai Corp. Ltd. | 5,849 | 7,388 | ||||||
| Jamna Auto Industries Ltd. | 7,525 | 4,045 | ||||||
| Jindal Saw Ltd. | 10,101 | 8,538 | ||||||
Jindal Stainless Hisar Ltd.(1) | 4,359 | 5,568 | ||||||
Jindal Stainless Ltd.(1) | 10,705 | 6,248 | ||||||
Jindal Steel & Power Ltd.(1) | 58,911 | 163,437 | ||||||
| JK Paper Ltd. | 3,285 | 4,237 | ||||||
| JK Tyre & Industries Ltd. | 28,125 | 22,799 | ||||||
| JM Financial Ltd. | 21,925 | 24,255 | ||||||
| JSW Energy Ltd. | 61,337 | 45,612 | ||||||
| JSW Steel Ltd. | 60,181 | 219,878 | ||||||
| Jubilant Foodworks Ltd. | 6,613 | 188,114 | ||||||
| Jubilant Life Sciences Ltd. | 11,999 | 127,362 | ||||||
Just Dial Ltd.(1) | 5,066 | 25,532 | ||||||
| Kajaria Ceramics Ltd. | 2,533 | 14,953 | ||||||
| Karnataka Bank Ltd. (The) | 13,179 | 8,148 | ||||||
Karur Vysya Bank Ltd. (The)(1) | 13,483 | 6,969 | ||||||
| Kaveri Seed Co. Ltd. | 1,806 | 14,131 | ||||||
| KEC International Ltd. | 5,784 | 25,262 | ||||||
| L&T Technology Services Ltd. | 1,206 | 25,615 | ||||||
| Larsen & Toubro Ltd. | 5,486 | 70,244 | ||||||
| LIC Housing Finance Ltd. | 24,390 | 99,531 | ||||||
| Lupin Ltd. | 11,261 | 141,993 | ||||||
| Mahanagar Gas Ltd. | 3,781 | 48,870 | ||||||
Mahindra & Mahindra Financial Services Ltd.(1) | 87,872 | 160,141 | ||||||
| Mahindra & Mahindra Ltd. | 64,666 | 531,169 | ||||||
Mahindra CIE Automotive Ltd.(1) | 6,648 | 11,772 | ||||||
| Manappuram Finance Ltd. | 19,742 | 39,588 | ||||||
| Marico Ltd. | 28,316 | 141,805 | ||||||
| Maruti Suzuki India Ltd. | 2,724 | 252,686 | ||||||
Max Healthcare Institute Ltd.(1) | 9,804 | 14,172 | ||||||
Max India Ltd. - New Spun Off(1) | 1,981 | 1,943 | ||||||
| Meghmani Organics Ltd. | 5,064 | 4,678 | ||||||
Metropolis Healthcare Ltd.(1) | 1,178 | 29,417 | ||||||
| Mindtree Ltd. | 3,095 | 48,407 | ||||||
| MOIL Ltd. | 5,683 | 11,352 | ||||||
| Motherson Sumi Systems Ltd. | 84,567 | 125,600 | ||||||
| Motilal Oswal Financial Services Ltd. | 1,751 | 16,252 | ||||||
| Mphasis Ltd. | 3,373 | 50,518 | ||||||
23
| Shares | Value | |||||||
| Multi Commodity Exchange of India Ltd. | 274 | $ | 5,947 | |||||
| Natco Pharma Ltd. | 9,014 | 91,859 | ||||||
| National Aluminium Co. Ltd. | 39,332 | 19,087 | ||||||
| NBCC India Ltd. | 53,896 | 19,468 | ||||||
| NCC Ltd. | 38,426 | 17,733 | ||||||
| Nestle India Ltd. | 1,129 | 244,512 | ||||||
| Nippon Life India Asset Management Ltd. | 9,395 | 34,675 | ||||||
| NOCIL Ltd. | 3,087 | 5,229 | ||||||
| NTPC Ltd. | 131,532 | 172,076 | ||||||
Oberoi Realty Ltd.(1) | 1,169 | 6,174 | ||||||
| Oil & Natural Gas Corp. Ltd. | 120,302 | 133,737 | ||||||
| Oil India Ltd. | 9,787 | 12,504 | ||||||
| Orient Electric Ltd. | 10,686 | 28,881 | ||||||
| Page Industries Ltd. | 450 | 115,951 | ||||||
| Petronet LNG Ltd. | 32,512 | 106,086 | ||||||
| Pfizer Ltd. | 380 | 23,670 | ||||||
| Phillips Carbon Black Ltd. | 3,756 | 5,855 | ||||||
| PI Industries Ltd. | 2,271 | 56,673 | ||||||
| Pidilite Industries Ltd. | 2,150 | 40,922 | ||||||
| Piramal Enterprises Ltd. | 1,641 | 30,310 | ||||||
PNB Housing Finance Ltd.(1) | 4,013 | 15,528 | ||||||
| Polycab India Ltd. | 4,772 | 57,752 | ||||||
| Power Finance Corp. Ltd. | 70,033 | 89,156 | ||||||
| Power Grid Corp. of India Ltd. | 95,349 | 231,485 | ||||||
| Praj Industries Ltd. | 2,731 | 2,530 | ||||||
| Prestige Estates Projects Ltd. | 11,052 | 37,103 | ||||||
| Prism Johnson Ltd. | 4,245 | 3,001 | ||||||
| PTC India Ltd. | 10,158 | 8,132 | ||||||
| PVR Ltd. | 2,026 | 35,964 | ||||||
Quess Corp. Ltd.(1) | 4,636 | 22,781 | ||||||
| Radico Khaitan Ltd. | 5,199 | 28,337 | ||||||
| Rain Industries Ltd. | 3,155 | 4,769 | ||||||
| Rajesh Exports Ltd. | 8,770 | 53,120 | ||||||
| Rallis India Ltd. | 766 | 3,051 | ||||||
| Ramco Cements Ltd. (The) | 4,903 | 46,055 | ||||||
| Rashtriya Chemicals & Fertilizers Ltd. | 4,665 | 2,995 | ||||||
Raymond Ltd.(1) | 829 | 3,227 | ||||||
| RBL Bank Ltd. | 46,603 | 123,466 | ||||||
| REC Ltd. | 70,753 | 101,844 | ||||||
| Redington India Ltd. | 23,646 | 34,522 | ||||||
| Reliance Industries Ltd., GDR | 37,863 | 2,203,992 | ||||||
SBI Life Insurance Co. Ltd.(1) | 4,555 | 51,176 | ||||||
| Sequent Scientific Ltd. | 4,729 | 8,335 | ||||||
Shipping Corp. of India Ltd.(1) | 8,530 | 6,797 | ||||||
| Shree Cement Ltd. | 141 | 38,792 | ||||||
| Shriram Transport Finance Co. Ltd. | 10,112 | 96,110 | ||||||
| Siemens Ltd. | 4,264 | 66,931 | ||||||
| Sobha Ltd. | 1,749 | 6,196 | ||||||
| SRF Ltd. | 1,110 | 61,078 | ||||||
State Bank of India, GDR(1) | 13,041 | 392,579 | ||||||
| Sterlite Technologies Ltd. | 16,412 | 33,369 | ||||||
| Strides Pharma Science Ltd. | 4,660 | 38,212 | ||||||
24
| Shares | Value | |||||||
| Sudarshan Chemical Industries | 1,112 | $ | 6,860 | |||||
| Sun Pharmaceutical Industries Ltd. | 9,800 | 69,213 | ||||||
| Sunteck Realty Ltd. | 2,969 | 10,578 | ||||||
Suzlon Energy Ltd.(1) | 249,334 | 12,587 | ||||||
| Swan Energy Ltd. | 1,248 | 2,168 | ||||||
| Tanla Solutions Ltd. | 10,078 | 31,292 | ||||||
| Tata Chemicals Ltd. | 7,217 | 30,578 | ||||||
| Tata Communications Ltd. | 918 | 10,809 | ||||||
| Tata Consultancy Services Ltd. | 17,678 | 542,031 | ||||||
| Tata Consumer Products Ltd. | 5,631 | 40,694 | ||||||
| Tata Elxsi Ltd. | 477 | 6,956 | ||||||
Tata Motors Ltd., ADR(1) | 42,800 | 416,872 | ||||||
| Tata Power Co. Ltd. (The) | 41,830 | 33,317 | ||||||
Tata Steel BSL Ltd.(1) | 11,941 | 3,924 | ||||||
| Tata Steel Ltd. | 27,381 | 153,108 | ||||||
| Tech Mahindra Ltd. | 7,853 | 78,845 | ||||||
| Thomas Cook India Ltd. | 5,926 | 2,785 | ||||||
| Tinplate Co. of India Ltd. (The) | 2,105 | 3,907 | ||||||
| Titan Co. Ltd. | 2,822 | 42,102 | ||||||
| Torrent Pharmaceuticals Ltd. | 1,076 | 38,885 | ||||||
| Torrent Power Ltd. | 4,198 | 18,966 | ||||||
| Trident Ltd. | 153,719 | 13,550 | ||||||
| Triveni Engineering & Industries Ltd. | 2,504 | 2,382 | ||||||
| Tube Investments of India Ltd. | 8,792 | 77,254 | ||||||
TV18 Broadcast Ltd.(1) | 12,414 | 5,322 | ||||||
| Ujjivan Financial Services Ltd. | 2,600 | 8,738 | ||||||
| UltraTech Cement Ltd. | 2,364 | 124,966 | ||||||
Union Bank of India(1) | 3,180 | 1,301 | ||||||
United Spirits Ltd.(1) | 18,698 | 138,670 | ||||||
| UPL Ltd. | 2,312 | 15,790 | ||||||
| V-Guard Industries Ltd. | 1,107 | 2,513 | ||||||
| Vakrangee Ltd. | 28,583 | 10,829 | ||||||
| Varun Beverages Ltd. | 3,201 | 32,023 | ||||||
| Vedanta Ltd., ADR | 50,315 | 352,708 | ||||||
| Venky's India Ltd. | 229 | 4,622 | ||||||
Vodafone Idea Ltd.(1) | 437,419 | 60,540 | ||||||
| Welspun Corp. Ltd. | 9,620 | 13,997 | ||||||
| Welspun India Ltd. | 50,703 | 37,394 | ||||||
Westlife Development Ltd.(1) | 371 | 1,865 | ||||||
| Wipro Ltd., ADR | 52,984 | 227,831 | ||||||
Wockhardt Ltd.(1) | 3,245 | 13,750 | ||||||
Yes Bank Ltd.(1) | 306,608 | 59,685 | ||||||
| Zee Entertainment Enterprises Ltd. | 16,528 | 45,536 | ||||||
| Zensar Technologies Ltd. | 7,305 | 17,002 | ||||||
| 23,226,034 | ||||||||
| Indonesia — 1.8% | ||||||||
| Ace Hardware Indonesia Tbk PT | 149,500 | 15,858 | ||||||
| Adaro Energy Tbk PT | 1,070,500 | 79,564 | ||||||
| Adhi Karya Persero Tbk PT | 189,200 | 7,707 | ||||||
Agung Podomoro Land Tbk PT(1) | 1,020,600 | 8,165 | ||||||
| AKR Corporindo Tbk PT | 59,900 | 11,898 | ||||||
Alam Sutera Realty Tbk PT(1) | 992,200 | 8,487 | ||||||
25
| Shares | Value | |||||||
| Aneka Tambang Tbk | 448,800 | $ | 25,166 | |||||
| Astra International Tbk PT | 805,000 | 281,496 | ||||||
Bank Brisyariah Tbk PT(1) | 155,400 | 10,271 | ||||||
| Bank BTPN Syariah Tbk PT | 106,000 | 28,292 | ||||||
| Bank Central Asia Tbk PT | 191,800 | 412,943 | ||||||
| Bank Mandiri Persero Tbk PT | 928,000 | 377,862 | ||||||
| Bank Negara Indonesia Persero Tbk PT | 477,100 | 166,383 | ||||||
| Bank Pembangunan Daerah Jawa Barat Dan Banten Tbk PT | 157,500 | 11,372 | ||||||
| Bank Pembangunan Daerah Jawa Timur Tbk PT | 408,800 | 16,672 | ||||||
| Bank Rakyat Indonesia Persero Tbk PT | 1,950,700 | 468,438 | ||||||
| Bank Tabungan Negara Persero Tbk PT | 311,200 | 33,475 | ||||||
Barito Pacific Tbk PT(1) | 396,500 | 22,822 | ||||||
| Bukit Asam Tbk PT | 141,200 | 19,693 | ||||||
Bumi Resources Tbk PT(1) | 761,500 | 2,615 | ||||||
Bumi Serpong Damai Tbk PT(1) | 416,700 | 21,995 | ||||||
Charoen Pokphand Indonesia Tbk PT(1) | 167,000 | 72,230 | ||||||
| Ciputra Development Tbk PT | 724,300 | 38,115 | ||||||
Erajaya Swasembada Tbk PT(1) | 173,000 | 20,380 | ||||||
Global Mediacom Tbk PT(1) | 976,100 | 19,777 | ||||||
Hanson International Tbk PT(1) | 1,531,500 | 5,258 | ||||||
| Indah Kiat Pulp & Paper Corp Tbk PT | 410,100 | 260,984 | ||||||
| Indika Energy Tbk PT | 173,000 | 12,172 | ||||||
| Indo Tambangraya Megah Tbk PT | 21,300 | 12,041 | ||||||
| Indocement Tunggal Prakarsa Tbk PT | 22,000 | 17,890 | ||||||
| Indofood CBP Sukses Makmur Tbk PT | 64,400 | 45,202 | ||||||
| Indofood Sukses Makmur Tbk PT | 405,700 | 212,184 | ||||||
| Indomobil Sukses Internasional Tbk PT | 19,800 | 1,053 | ||||||
| Industri Jamu Dan Farmasi Sido Muncul Tbk PT | 218,100 | 20,731 | ||||||
| Jasa Marga Persero Tbk PT | 234,300 | 62,735 | ||||||
| Kalbe Farma Tbk PT | 631,200 | 68,358 | ||||||
Kresna Graha Investama Tbk PT(1) | 465,400 | 3,879 | ||||||
| Link Net Tbk PT | 141,200 | 17,685 | ||||||
Lippo Karawaci Tbk PT(1) | 1,960,800 | 21,071 | ||||||
| Mahkota Group Tbk PT | 37,400 | 2,055 | ||||||
Matahari Department Store Tbk PT(1) | 470,500 | 40,798 | ||||||
Medco Energi Internasional Tbk PT(1) | 477,300 | 17,952 | ||||||
Media Nusantara Citra Tbk PT(1) | 708,900 | 43,192 | ||||||
Mitra Adiperkasa Tbk PT(1) | 1,662,700 | 77,471 | ||||||
| Mitra Pinasthika Mustika Tbk PT | 64,300 | 2,082 | ||||||
| Pabrik Kertas Tjiwi Kimia Tbk PT | 135,200 | 63,080 | ||||||
Pakuwon Jati Tbk PT(1) | 838,800 | 23,453 | ||||||
Panin Financial Tbk PT(1) | 883,000 | 12,439 | ||||||
| Perusahaan Gas Negara Tbk PT | 528,800 | 45,375 | ||||||
| Perusahaan Perkebunan London Sumatra Indonesia Tbk PT | 226,000 | 15,147 | ||||||
| PP Persero Tbk PT | 286,800 | 18,983 | ||||||
PT Bank Pan Indonesia Tbk(1) | 657,800 | 36,477 | ||||||
| PT Ramayana Lestari Sentosa Tbk | 547,700 | 24,548 | ||||||
| Puradelta Lestari Tbk PT | 976,100 | 15,138 | ||||||
Salim Ivomas Pratama Tbk PT(1) | 183,800 | 4,074 | ||||||
Sawit Sumbermas Sarana Tbk PT(1) | 564,700 | 33,262 | ||||||
| Semen Indonesia Persero Tbk PT | 43,300 | 31,305 | ||||||
Sentul City Tbk PT(1) | 2,139,400 | 7,334 | ||||||
26
| Shares | Value | |||||||
Siloam International Hospitals Tbk PT(1) | 35,000 | $ | 10,223 | |||||
| Sri Rejeki Isman Tbk PT | 918,200 | 13,834 | ||||||
Summarecon Agung Tbk PT(1) | 209,800 | 9,257 | ||||||
| Surya Citra Media Tbk PT | 794,500 | 67,419 | ||||||
| Surya Semesta Internusa Tbk PT | 440,500 | 11,282 | ||||||
| Telekomunikasi Indonesia Persero Tbk PT, ADR | 22,113 | 440,712 | ||||||
| Tower Bersama Infrastructure Tbk PT | 457,100 | 40,926 | ||||||
| Tunas Baru Lampung Tbk PT | 339,100 | 18,454 | ||||||
| Unilever Indonesia Tbk PT | 224,700 | 127,180 | ||||||
| United Tractors Tbk PT | 72,200 | 113,800 | ||||||
| Waskita Beton Precast Tbk PT | 768,800 | 8,837 | ||||||
| Waskita Karya Persero Tbk PT | 218,100 | 9,703 | ||||||
| Wijaya Karya Persero Tbk PT | 198,600 | 16,786 | ||||||
| XL Axiata Tbk PT | 458,200 | 76,609 | ||||||
| 4,422,106 | ||||||||
| Malaysia — 2.2% | ||||||||
| 7-Eleven Malaysia Holdings Bhd, Class B | 21,600 | 7,261 | ||||||
| Aeon Co. M Bhd | 32,500 | 6,512 | ||||||
| AEON Credit Service M Bhd | 4,800 | 10,413 | ||||||
AirAsia Group Bhd(1) | 64,400 | 10,166 | ||||||
| Alliance Bank Malaysia Bhd | 79,600 | 41,839 | ||||||
| AMMB Holdings Bhd | 74,600 | 52,267 | ||||||
| Axiata Group Bhd | 103,100 | 74,457 | ||||||
Berjaya Corp. Bhd(1) | 126,700 | 6,079 | ||||||
Berjaya Land Bhd(1) | 2,900 | 125 | ||||||
| Berjaya Sports Toto Bhd | 60,700 | 30,447 | ||||||
| Bermaz Auto Bhd | 30,900 | 10,093 | ||||||
Boustead Plantations Bhd(1) | 18,000 | 1,662 | ||||||
Bumi Armada Bhd(1) | 185,700 | 12,148 | ||||||
| Bursa Malaysia Bhd | 25,200 | 58,584 | ||||||
| Carlsberg Brewery Malaysia Bhd | 8,400 | 44,001 | ||||||
| CIMB Group Holdings Bhd | 148,100 | 117,284 | ||||||
| D&O Green Technologies Bhd | 10,300 | 2,161 | ||||||
| Datasonic Group Bhd | 72,300 | 22,883 | ||||||
Dayang Enterprise Holdings Bhd(1) | 47,620 | 13,470 | ||||||
| Dialog Group Bhd | 135,700 | 116,901 | ||||||
| DiGi.Com Bhd | 76,000 | 72,042 | ||||||
| DRB-Hicom Bhd | 107,800 | 52,738 | ||||||
| Dufu Technology Corp. Bhd | 13,600 | 10,960 | ||||||
| Duopharma Biotech Bhd | 7,973 | 6,963 | ||||||
| Eastern & Oriental Bhd | 43,200 | 4,301 | ||||||
Eco World Development Group Bhd(1) | 57,200 | 5,761 | ||||||
Eco World International Bhd(1) | 10,600 | 1,105 | ||||||
| Ekovest Bhd | 37,000 | 4,386 | ||||||
| FGV Holdings Bhd | 239,800 | 70,736 | ||||||
| Fraser & Neave Holdings Bhd | 5,900 | 43,511 | ||||||
| Frontken Corp. Bhd | 23,900 | 21,782 | ||||||
| Gamuda Bhd | 141,100 | 115,036 | ||||||
| Genting Bhd | 114,400 | 96,346 | ||||||
| Genting Malaysia Bhd | 161,500 | 88,338 | ||||||
| Genting Plantations Bhd | 3,100 | 7,401 | ||||||
| Globetronics Technology Bhd | 67,200 | 44,332 | ||||||
27
| Shares | Value | |||||||
| HAP Seng Consolidated Bhd | 14,800 | $ | 25,572 | |||||
| Hartalega Holdings Bhd | 44,200 | 176,027 | ||||||
Hengyuan Refining Co. Bhd(1) | 4,600 | 3,322 | ||||||
Hibiscus Petroleum Bhd(1) | 83,900 | 11,961 | ||||||
| Hong Leong Bank Bhd | 9,300 | 31,243 | ||||||
| Hong Leong Financial Group Bhd | 6,700 | 19,839 | ||||||
| Hong Leong Industries Bhd | 3,000 | 5,529 | ||||||
| Hup Seng Industries Bhd | 11,000 | 2,442 | ||||||
| IHH Healthcare Bhd | 31,100 | 40,053 | ||||||
| IJM Corp. Bhd | 89,900 | 25,889 | ||||||
| Inari Amertron Bhd | 102,600 | 55,585 | ||||||
| IOI Corp. Bhd | 29,200 | 31,259 | ||||||
| Kossan Rubber Industries | 36,700 | 141,592 | ||||||
| KPJ Healthcare Bhd | 167,400 | 33,149 | ||||||
| Kuala Lumpur Kepong Bhd | 7,300 | 39,737 | ||||||
LBS Bina Group Bhd(1) | 24,823 | 2,859 | ||||||
| Leong Hup International Bhd | 35,100 | 6,947 | ||||||
| Lotte Chemical Titan Holding Bhd | 12,300 | 5,369 | ||||||
| Mah Sing Group Bhd | 49,400 | 9,003 | ||||||
| Malakoff Corp. Bhd | 157,200 | 37,350 | ||||||
| Malayan Banking Bhd | 74,700 | 131,402 | ||||||
| Malaysia Airports Holdings Bhd | 30,900 | 37,811 | ||||||
| Malaysia Building Society Bhd | 37,000 | 5,149 | ||||||
Malaysia Marine and Heavy Engineering Holdings Bhd(1) | 17,700 | 1,570 | ||||||
| Malaysian Pacific Industries Bhd | 7,000 | 26,380 | ||||||
| Malaysian Resources Corp. Bhd | 86,500 | 10,465 | ||||||
| Matrix Concepts Holdings Bhd | 77,400 | 32,700 | ||||||
| Maxis Bhd | 82,600 | 99,141 | ||||||
| MBM Resources Bhd | 6,100 | 4,771 | ||||||
| Mega First Corp. Bhd | 13,200 | 24,574 | ||||||
| MISC Bhd | 45,000 | 82,188 | ||||||
| MMC Corp. Bhd | 33,500 | 6,022 | ||||||
| MNRB Holdings Bhd | 10,700 | 2,374 | ||||||
Muhibbah Engineering M Bhd(1) | 18,200 | 3,622 | ||||||
My EG Services Bhd(1) | 199,800 | 71,636 | ||||||
| Nestle Malaysia Bhd | 1,600 | 53,489 | ||||||
| OSK Holdings Bhd | 42,200 | 7,798 | ||||||
| Padini Holdings Bhd | 9,200 | 5,209 | ||||||
| Paramount Corp. Bhd | 16,000 | 2,984 | ||||||
| Pentamaster Corp. Bhd | 52,800 | 60,289 | ||||||
| Petron Malaysia Refining & Marketing Bhd | 2,900 | 2,442 | ||||||
| Petronas Chemicals Group Bhd | 26,400 | 34,585 | ||||||
| Petronas Dagangan Bhd | 8,300 | 41,026 | ||||||
| Petronas Gas Bhd | 23,600 | 93,444 | ||||||
| Pos Malaysia Bhd | 5,700 | 1,229 | ||||||
| Power Root Bhd | 5,800 | 3,105 | ||||||
| PPB Group Bhd | 8,900 | 38,455 | ||||||
| Press Metal Aluminium Holdings Bhd | 15,400 | 19,247 | ||||||
| Public Bank Bhd | 42,200 | 166,303 | ||||||
| QL Resources Bhd | 15,800 | 36,408 | ||||||
| Ranhill Utilities Bhd | 24,700 | 5,306 | ||||||
| RHB Bank Bhd | 84,700 | 93,090 | ||||||
28
| Shares | Value | |||||||
| Sam Engineering & Equipment M Bhd | 3,100 | $ | 5,132 | |||||
Sapura Energy Bhd(1) | 211,700 | 6,339 | ||||||
| Sarawak Oil Palms Bhd | 15,500 | 13,549 | ||||||
| Scientex Bhd | 17,400 | 39,254 | ||||||
| SEG International Bhd | 12,300 | 1,774 | ||||||
| Serba Dinamik Holdings Bhd | 12,810 | 5,559 | ||||||
| Sime Darby Bhd | 156,300 | 82,132 | ||||||
| Sime Darby Plantation Bhd | 26,500 | 32,425 | ||||||
| Sime Darby Property Bhd | 213,900 | 33,613 | ||||||
| SKP Resources Bhd | 94,400 | 36,456 | ||||||
| SP Setia Bhd Group | 169,600 | 32,344 | ||||||
| Sunway Bhd | 137,448 | 46,179 | ||||||
| Sunway Construction Group Bhd | 55,900 | 26,560 | ||||||
Supermax Corp. Bhd(1) | 111,884 | 599,179 | ||||||
| Syarikat Takaful Malaysia Keluarga Bhd | 9,000 | 10,907 | ||||||
| Ta Ann Holdings Bhd | 12,300 | 8,385 | ||||||
| TA Enterprise Bhd | 49,400 | 7,231 | ||||||
| Taliworks Corp. Bhd | 34,000 | 7,138 | ||||||
| Telekom Malaysia Bhd | 80,900 | 80,565 | ||||||
| Tenaga Nasional Bhd | 167,800 | 438,308 | ||||||
| TIME dotCom Bhd | 27,000 | 74,889 | ||||||
| Top Glove Corp. Bhd | 25,500 | 161,522 | ||||||
Tropicana Corp. Bhd(1) | 19,600 | 4,233 | ||||||
| Uchi Technologies Bhd | 9,500 | 6,276 | ||||||
UEM Sunrise Bhd(1) | 109,700 | 10,656 | ||||||
| Unisem M Bhd | 86,100 | 76,472 | ||||||
| UOA Development Bhd | 42,600 | 16,487 | ||||||
Velesto Energy Bhd(1) | 118,100 | 4,104 | ||||||
| ViTrox Corp. Bhd | 3,000 | 8,717 | ||||||
| VS Industry Bhd | 185,000 | 83,366 | ||||||
| Wah Seong Corp. Bhd | 29,848 | 3,778 | ||||||
WCT Holdings Bhd(1) | 49,894 | 4,995 | ||||||
| Westports Holdings Bhd | 44,900 | 39,412 | ||||||
| Yinson Holdings Bhd | 19,700 | 29,874 | ||||||
| YTL Corp. Bhd | 198,400 | 31,901 | ||||||
| 5,263,143 | ||||||||
| Mexico — 2.0% | ||||||||
| Alfa SAB de CV, Series A | 188,871 | 121,529 | ||||||
Alsea SAB de CV(1) | 75,412 | 78,197 | ||||||
| America Movil SAB de CV, Class L ADR | 41,707 | 507,574 | ||||||
| Arca Continental SAB de CV | 12,808 | 58,222 | ||||||
Banco del Bajio SA(1) | 76,449 | 61,140 | ||||||
| Banco Santander Mexico SA Institucion de Banca Multiple Grupo Financiero Santand, ADR | 36,100 | 116,242 | ||||||
Bolsa Mexicana de Valores SAB de CV(2) | 46,722 | 98,837 | ||||||
| Cemex SAB de CV, ADR | 9,153 | 29,381 | ||||||
| Coca-Cola Femsa SAB de CV | 34,137 | 142,043 | ||||||
Consorcio ARA SAB de CV(1) | 38,214 | 4,855 | ||||||
Controladora Vuela Cia de Aviacion SAB de CV, ADR(1) | 12,941 | 104,563 | ||||||
| Corp. Inmobiliaria Vesta SAB de CV | 75,304 | 111,844 | ||||||
Credito Real SAB de CV SOFOM ER(1) | 38,214 | 21,480 | ||||||
| El Puerto de Liverpool SAB de CV, Class C1 | 7,605 | 20,033 | ||||||
29
| Shares | Value | |||||||
| Fomento Economico Mexicano SAB de CV, ADR | 2,705 | $ | 157,783 | |||||
Genomma Lab Internacional SAB de CV, Class B(1) | 100,156 | 105,502 | ||||||
Gentera SAB de CV(1) | 122,333 | 40,084 | ||||||
| Gruma SAB de CV, B Shares | 24,770 | 292,617 | ||||||
Grupo Aeromexico SAB de CV(1) | 30,041 | 6,384 | ||||||
Grupo Aeroportuario del Centro Norte SAB de CV, ADR(1) | 5,197 | 189,483 | ||||||
| Grupo Aeroportuario del Pacifico SAB de CV, ADR | 2,528 | 195,869 | ||||||
Grupo Aeroportuario del Sureste SAB de CV, ADR(1) | 516 | 58,545 | ||||||
| Grupo Bimbo SAB de CV, Series A | 34,368 | 63,719 | ||||||
| Grupo Carso SAB de CV | 7,605 | 15,153 | ||||||
| Grupo Cementos de Chihuahua SAB de CV | 12,289 | 55,391 | ||||||
| Grupo Comercial Chedraui SA de CV | 20,994 | 24,120 | ||||||
Grupo Financiero Banorte SAB de CV(1) | 128,923 | 443,059 | ||||||
Grupo Financiero Inbursa SAB de CV(1) | 92,127 | 67,363 | ||||||
Grupo GICSA SAB de CV(1) | 36,166 | 5,058 | ||||||
Grupo Industrial Saltillo SAB de CV(1) | 26,514 | 20,599 | ||||||
| Grupo Mexico SAB de CV, Series B | 130,980 | 349,567 | ||||||
Grupo Rotoplas SAB de CV(1)(2) | 4,172 | 3,051 | ||||||
Grupo Televisa SAB, ADR(1) | 19,338 | 120,282 | ||||||
Grupo Traxion SAB de CV(1) | 39,968 | 28,567 | ||||||
Hoteles City Express SAB de CV(1)(2) | 26,594 | 6,684 | ||||||
| Industrias Bachoco SAB de CV | 13,371 | 42,291 | ||||||
| Industrias Penoles SAB de CV | 6,397 | 105,830 | ||||||
| Infraestructura Energetica Nova SAB de CV | 19,087 | 55,485 | ||||||
| Kimberly-Clark de Mexico SAB de CV, A Shares | 95,427 | 152,242 | ||||||
La Comer SAB de CV(2) | 56,433 | 86,653 | ||||||
| Megacable Holdings SAB de CV | 48,549 | 140,220 | ||||||
| Orbia Advance Corp. SAB de CV | 24,843 | 39,918 | ||||||
Promotora y Operadora de Infraestructura SAB de CV(1) | 10,030 | 74,265 | ||||||
| Qualitas Controladora SAB de CV | 24,843 | 97,864 | ||||||
Regional SAB de CV(1) | 26,745 | 66,856 | ||||||
Telesites SAB de CV(1) | 53,498 | 40,095 | ||||||
Unifin Financiera SAB de CV(1)(2) | 22,147 | 18,603 | ||||||
| Wal-Mart de Mexico SAB de CV | 137,608 | 329,525 | ||||||
| 4,974,667 | ||||||||
| Peru — 0.3% | ||||||||
| Cia de Minas Buenaventura SAA, ADR | 32,128 | 452,362 | ||||||
| Credicorp Ltd. | 1,463 | 190,892 | ||||||
| Southern Copper Corp. | 2,599 | 125,012 | ||||||
| 768,266 | ||||||||
| Philippines — 0.8% | ||||||||
| Aboitiz Equity Ventures, Inc. | 103,230 | 102,104 | ||||||
| Aboitiz Power Corp. | 60,500 | 33,252 | ||||||
Alliance Global Group, Inc.(1) | 381,700 | 48,526 | ||||||
| Ayala Corp. | 13,380 | 202,262 | ||||||
| Ayala Land, Inc. | 200,700 | 118,671 | ||||||
Ayalaland Logistics Holdings Corp.(1) | 28,000 | 1,002 | ||||||
| Bank of the Philippine Islands | 59,250 | 81,700 | ||||||
| BDO Unibank, Inc. | 86,790 | 153,710 | ||||||
Cebu Air, Inc.(1) | 28,050 | 20,176 | ||||||
Chelsea Logistics and Infrastructure Holdings Corp.(1) | 100,800 | 6,795 | ||||||
| Cosco Capital, Inc. | 227,200 | 22,547 | ||||||
30
| Shares | Value | |||||||
D&L Industries, Inc.(1) | 84,500 | $ | 7,910 | |||||
| DMCI Holdings, Inc. | 196,800 | 16,184 | ||||||
DoubleDragon Properties Corp.(1) | 36,700 | 11,454 | ||||||
East West Banking Corp.(1) | 70,500 | 12,283 | ||||||
| Filinvest Land, Inc. | 617,000 | 11,942 | ||||||
| Ginebra San Miguel, Inc. | 7,600 | 5,920 | ||||||
| Globe Telecom, Inc. | 1,100 | 47,401 | ||||||
| GT Capital Holdings, Inc. | 2,200 | 18,050 | ||||||
| International Container Terminal Services, Inc. | 66,870 | 144,623 | ||||||
| JG Summit Holdings, Inc. | 133,620 | 176,955 | ||||||
| Jollibee Foods Corp. | 15,630 | 43,433 | ||||||
| Manila Electric Co. | 7,370 | 40,914 | ||||||
| Manila Water Co., Inc. | 26,500 | 7,848 | ||||||
| Max's Group, Inc. | 49,400 | 4,846 | ||||||
Megaworld Corp.(1) | 429,800 | 25,762 | ||||||
| Metro Pacific Investments Corp. | 619,000 | 42,729 | ||||||
| Metropolitan Bank & Trust Co. | 108,510 | 74,662 | ||||||
| Nickel Asia Corp. | 220,000 | 14,669 | ||||||
| Petron Corp. | 169,700 | 10,600 | ||||||
Pilipinas Shell Petroleum Corp.(1) | 22,000 | 8,014 | ||||||
| PLDT, Inc., ADR | 3,557 | 105,252 | ||||||
| Puregold Price Club, Inc. | 55,200 | 61,329 | ||||||
| Robinsons Land Corp. | 157,500 | 47,399 | ||||||
| Security Bank Corp. | 15,070 | 30,075 | ||||||
| Semirara Mining & Power Corp. | 94,700 | 18,371 | ||||||
| SM Investments Corp. | 3,900 | 68,314 | ||||||
| SM Prime Holdings, Inc. | 95,100 | 57,149 | ||||||
| Universal Robina Corp. | 21,590 | 61,331 | ||||||
| Vista Land & Lifescapes, Inc. | 312,100 | 19,228 | ||||||
| Wilcon Depot, Inc. | 62,100 | 20,736 | ||||||
| 2,006,128 | ||||||||
| Poland — 0.9% | ||||||||
Alior Bank SA(1) | 4,947 | 18,333 | ||||||
AmRest Holdings SE(1) | 5,557 | 31,502 | ||||||
| Asseco Poland SA | 1,412 | 27,180 | ||||||
Bank Millennium SA(1) | 26,912 | 22,018 | ||||||
Bank Polska Kasa Opieki SA(1) | 3,474 | 49,172 | ||||||
| CCC SA | 1,040 | 16,205 | ||||||
CD Projekt SA(1) | 1,127 | 134,013 | ||||||
Ciech SA(1) | 4,495 | 38,310 | ||||||
Cyfrowy Polsat SA(1) | 9,153 | 71,339 | ||||||
Dino Polska SA(1) | 2,607 | 157,813 | ||||||
Enea SA(1) | 20,125 | 36,218 | ||||||
Eurocash SA(1) | 8,663 | 36,635 | ||||||
Famur SA(1) | 28,812 | 15,099 | ||||||
Grupa Azoty SA(1) | 4,169 | 30,374 | ||||||
| Grupa Lotos SA | 6,047 | 66,314 | ||||||
Jastrzebska Spolka Weglowa SA(1) | 4,517 | 19,170 | ||||||
KGHM Polska Miedz SA(1) | 10,350 | 383,231 | ||||||
KRUK SA(1) | 1,753 | 70,015 | ||||||
LPP SA(1) | 30 | 58,468 | ||||||
Lubelski Wegiel Bogdanka SA(1) | 1,813 | 9,329 | ||||||
31
| Shares | Value | |||||||
mBank SA(1) | 510 | $ | 25,988 | |||||
Orange Polska SA(1) | 75,067 | 147,114 | ||||||
PGE Polska Grupa Energetyczna SA(1) | 11,381 | 18,614 | ||||||
PKP Cargo SA(1) | 2,705 | 9,440 | ||||||
| PLAY Communications SA | 10,222 | 84,772 | ||||||
| Polski Koncern Naftowy ORLEN SA | 11,313 | 155,278 | ||||||
| Polskie Gornictwo Naftowe i Gazownictwo SA | 78,619 | 109,200 | ||||||
Powszechna Kasa Oszczednosci Bank Polski SA(1) | 18,315 | 106,920 | ||||||
Powszechny Zaklad Ubezpieczen SA(1) | 17,195 | 126,647 | ||||||
Santander Bank Polska SA(1) | 516 | 21,145 | ||||||
Tauron Polska Energia SA(1) | 46,934 | 32,095 | ||||||
| Warsaw Stock Exchange | 1,813 | 21,531 | ||||||
| 2,149,482 | ||||||||
| Russia — 2.6% | ||||||||
| Gazprom PJSC, ADR | 155,211 | 748,780 | ||||||
| Globaltrans Investment plc, GDR | 16,417 | 102,371 | ||||||
| LUKOIL PJSC, ADR | 23,380 | 1,599,192 | ||||||
| Magnit PJSC, GDR | 16,932 | 248,506 | ||||||
Mechel PJSC, ADR(1) | 1,818 | 3,072 | ||||||
| MMC Norilsk Nickel PJSC, ADR | 35,487 | 924,436 | ||||||
| Mobile TeleSystems PJSC, ADR | 33,133 | 308,800 | ||||||
Novatek PJSC, GDR(2) | 1,129 | 167,205 | ||||||
| Novolipetsk Steel PJSC, GDR | 11,946 | 251,829 | ||||||
| PhosAgro PJSC, GDR | 9,598 | 114,061 | ||||||
| Rosneft Oil Co. PJSC, GDR | 42,478 | 215,024 | ||||||
Sberbank of Russia PJSC, ADR (London)(1) | 51,424 | 620,945 | ||||||
| Severstal PAO, GDR | 6,923 | 88,240 | ||||||
Tatneft PJSC, ADR(1) | 15,374 | 686,910 | ||||||
TMK PJSC, GDR(1) | 11,588 | 35,744 | ||||||
VTB Bank PJSC, GDR(1) | 187,942 | 172,871 | ||||||
| X5 Retail Group NV, GDR | 4,654 | 170,336 | ||||||
| 6,458,322 | ||||||||
| South Africa — 4.3% | ||||||||
| Absa Group Ltd. | 42,272 | 191,981 | ||||||
| Adcock Ingram Holdings Ltd. | 4,654 | 11,052 | ||||||
| Advtech Ltd. | 35,578 | 17,102 | ||||||
| AECI Ltd. | 11,220 | 55,770 | ||||||
| African Oxygen Ltd. | 13,895 | 13,525 | ||||||
| African Rainbow Minerals Ltd. | 8,139 | 101,593 | ||||||
| Afrimat Ltd. | 9,681 | 21,228 | ||||||
| Alexander Forbes Group Holdings Ltd. | 87,669 | 17,054 | ||||||
Anglo American Platinum Ltd.(2) | 1,675 | 124,463 | ||||||
| AngloGold Ashanti Ltd., ADR | 22,641 | 668,136 | ||||||
Aspen Pharmacare Holdings Ltd.(1) | 18,315 | 146,794 | ||||||
| Astral Foods Ltd. | 4,405 | 34,518 | ||||||
| AVI Ltd. | 18,476 | 75,235 | ||||||
| Barloworld Ltd. | 24,511 | 86,431 | ||||||
| Bid Corp. Ltd. | 12,974 | 214,078 | ||||||
| Bidvest Group Ltd. (The) | 12,719 | 102,121 | ||||||
Brait SE(1) | 48,661 | 8,140 | ||||||
| Capitec Bank Holdings Ltd. | 1,044 | 51,363 | ||||||
Cashbuild Ltd.(2) | 1,658 | 17,483 | ||||||
32
| Shares | Value | |||||||
| Clicks Group Ltd. | 14,237 | $ | 192,794 | |||||
| Coronation Fund Managers Ltd. | 13,895 | 35,068 | ||||||
DataTec Ltd.(1) | 21,513 | 27,446 | ||||||
| Dis-Chem Pharmacies Ltd. | 14,418 | 15,531 | ||||||
| Discovery Ltd. | 10,901 | 77,749 | ||||||
| DRDGOLD Ltd. | 50,906 | 76,312 | ||||||
| EPP NV | 48,065 | 20,790 | ||||||
| Exxaro Resources Ltd. | 18,152 | 146,889 | ||||||
| Famous Brands Ltd. | 5,547 | 14,971 | ||||||
| FirstRand Ltd. | 156,763 | 348,898 | ||||||
| Foschini Group Ltd. (The) | 12,021 | 53,980 | ||||||
| Gold Fields Ltd., ADR | 87,906 | 1,145,415 | ||||||
Harmony Gold Mining Co. Ltd., ADR(1) | 54,894 | 355,713 | ||||||
| Impala Platinum Holdings Ltd. | 63,689 | 585,361 | ||||||
| Imperial Logistics Ltd. | 9,236 | 18,870 | ||||||
| Investec Ltd. | 16,408 | 30,321 | ||||||
| JSE Ltd. | 5,214 | 36,498 | ||||||
| KAP Industrial Holdings Ltd. | 378,313 | 61,299 | ||||||
| Kumba Iron Ore Ltd. | 3,799 | 118,736 | ||||||
| Liberty Holdings Ltd. | 14,866 | 52,919 | ||||||
| Life Healthcare Group Holdings Ltd. | 89,496 | 87,429 | ||||||
Massmart Holdings Ltd.(1)(2) | 6,757 | 10,865 | ||||||
Metair Investments Ltd.(1)(2) | 29,782 | 32,249 | ||||||
| MiX Telematics Ltd., ADR | 1,290 | 12,861 | ||||||
| Momentum Metropolitan Holdings | 133,332 | 119,210 | ||||||
Motus Holdings Ltd.(1) | 29,378 | 47,752 | ||||||
| Mr Price Group Ltd. | 8,750 | 59,688 | ||||||
MTN Group Ltd.(2) | 93,379 | 336,003 | ||||||
MultiChoice Group(1) | 27,688 | 158,245 | ||||||
| Murray & Roberts Holdings Ltd. | 20,297 | 6,621 | ||||||
| Naspers Ltd., N Shares | 5,595 | 1,018,431 | ||||||
| Nedbank Group Ltd. | 16,153 | 91,115 | ||||||
| NEPI Rockcastle plc | 26,911 | 125,608 | ||||||
| Netcare Ltd. | 86,468 | 63,790 | ||||||
Ninety One Ltd.(1) | 8,204 | 22,323 | ||||||
Northam Platinum Ltd.(1) | 20,995 | 197,577 | ||||||
| Oceana Group Ltd. | 6,312 | 23,389 | ||||||
| Old Mutual Ltd. | 168,746 | 111,385 | ||||||
Omnia Holdings Ltd.(1) | 32,204 | 47,122 | ||||||
Peregrine Holdings Ltd.(1) | 15,803 | 19,107 | ||||||
| Pick n Pay Stores Ltd. | 19,418 | 47,745 | ||||||
| Rand Merchant Investment Holdings Ltd. | 34,607 | 61,359 | ||||||
| Raubex Group Ltd. | 14,747 | 21,212 | ||||||
| Remgro Ltd. | 22,459 | 116,481 | ||||||
| Reunert Ltd. | 15,032 | 27,670 | ||||||
| RFG Holdings Ltd. | 19,543 | 14,884 | ||||||
| RMB Holdings Ltd. | 40,304 | 2,921 | ||||||
Royal Bafokeng Platinum Ltd.(1) | 12,028 | 45,736 | ||||||
| Sanlam Ltd. | 50,989 | 164,699 | ||||||
Sappi Ltd.(1) | 53,670 | 70,411 | ||||||
Sasol Ltd., ADR(1) | 39,648 | 317,977 | ||||||
| Shoprite Holdings Ltd. | 20,380 | 132,847 | ||||||
33
| Shares | Value | |||||||
Sibanye Stillwater Ltd., ADR(1) | 40,239 | $ | 495,342 | |||||
| SPAR Group Ltd. (The) | 11,477 | 109,451 | ||||||
| Standard Bank Group Ltd. | 54,126 | 335,959 | ||||||
Super Group Ltd.(1) | 15,880 | 16,885 | ||||||
Telkom SA SOC Ltd.(2) | 32,624 | 43,535 | ||||||
Tiger Brands Ltd.(2) | 7,432 | 75,610 | ||||||
| Truworths International Ltd. | 24,066 | 43,137 | ||||||
Tsogo Sun Gaming Ltd.(1) | 36,352 | 7,849 | ||||||
| Vodacom Group Ltd. | 27,469 | 206,881 | ||||||
| Wilson Bayly Holmes-Ovcon Ltd. | 6,071 | 39,665 | ||||||
| Woolworths Holdings Ltd. | 35,937 | 67,322 | ||||||
| Zeder Investments Ltd. | 120,266 | 17,020 | ||||||
| 10,446,995 | ||||||||
| South Korea — 13.4% | ||||||||
| Advanced Process Systems Corp. | 1,452 | 27,253 | ||||||
| AfreecaTV Co. Ltd. | 344 | 16,731 | ||||||
| Ahnlab, Inc. | 154 | 8,307 | ||||||
| AK Holdings, Inc. | 195 | 2,686 | ||||||
Alteogen, Inc.(1) | 640 | 112,623 | ||||||
| Amorepacific Corp. | 660 | 93,144 | ||||||
| AMOREPACIFIC Group | 691 | 29,599 | ||||||
Aprogen KIC, Inc.(1) | 7,616 | 19,597 | ||||||
Aprogen pharmaceuticals, Inc.(1) | 11,697 | 15,381 | ||||||
Asiana Airlines, Inc.(1) | 7,689 | 27,829 | ||||||
| BGF retail Co. Ltd. | 403 | 43,232 | ||||||
BH Co. Ltd.(1) | 865 | 14,683 | ||||||
Binex Co. Ltd.(1) | 318 | 9,600 | ||||||
| Binggrae Co. Ltd. | 366 | 17,887 | ||||||
| BNK Financial Group, Inc. | 22,051 | 93,882 | ||||||
| Boditech Med, Inc. | 886 | 20,354 | ||||||
| Boryung Pharmaceutical Co. Ltd. | 741 | 10,112 | ||||||
| Bukwang Pharmaceutical Co. Ltd. | 1,045 | 33,195 | ||||||
Cellivery Therapeutics, Inc.(1) | 228 | 45,655 | ||||||
Celltrion Healthcare Co. Ltd.(1) | 731 | 61,691 | ||||||
Celltrion Pharm, Inc.(1) | 215 | 20,112 | ||||||
Celltrion, Inc.(1) | 1,635 | 408,831 | ||||||
| Cheil Worldwide, Inc. | 958 | 14,651 | ||||||
| Chong Kun Dang Pharmaceutical Corp. | 273 | 44,588 | ||||||
| Chongkundang Holdings Corp. | 69 | 7,033 | ||||||
| Chunbo Co. Ltd. | 124 | 17,062 | ||||||
CJ CGV Co. Ltd.(1) | 377 | 6,965 | ||||||
| CJ CheilJedang Corp. | 738 | 251,945 | ||||||
| CJ Corp. | 825 | 56,171 | ||||||
| CJ ENM Co. Ltd. | 641 | 63,796 | ||||||
| CJ Freshway Corp. | 340 | 4,436 | ||||||
CJ Logistics Corp.(1) | 809 | 102,905 | ||||||
CMG Pharmaceutical Co. Ltd.(1) | 455 | 1,713 | ||||||
| Com2uSCorp | 424 | 39,626 | ||||||
| Cosmax, Inc. | 488 | 41,744 | ||||||
| Coway Co. Ltd. | 1,900 | 127,668 | ||||||
| COWELL FASHION Co. Ltd. | 6,235 | 31,547 | ||||||
| CS Wind Corp. | 565 | 48,551 | ||||||
34
| Shares | Value | |||||||
| Cuckoo Homesys Co. Ltd. | 1,195 | $ | 43,062 | |||||
| Daea TI Co. Ltd. | 1,211 | 6,180 | ||||||
| Daeduck Co. Ltd. | 339 | 1,752 | ||||||
Daeduck Electronics Co. Ltd.(1) | 587 | 5,388 | ||||||
| Daekyo Co. Ltd. | 454 | 1,513 | ||||||
| Daelim Industrial Co. Ltd. | 2,856 | 208,078 | ||||||
| Daesang Corp. | 2,858 | 69,984 | ||||||
| Daewon Pharmaceutical Co. Ltd. | 1,894 | 34,066 | ||||||
Daewoo Engineering & Construction Co. Ltd.(1) | 3,245 | 8,004 | ||||||
Daewoo Shipbuilding & Marine Engineering Co. Ltd.(1) | 2,305 | 42,522 | ||||||
| Daewoong Co. Ltd. | 556 | 16,689 | ||||||
| Daewoong Pharmaceutical Co. Ltd. | 61 | 5,949 | ||||||
| Daishin Securities Co. Ltd. | 3,857 | 33,163 | ||||||
| Daou Data Corp. | 2,961 | 33,565 | ||||||
| Daou Technology, Inc. | 3,637 | 59,287 | ||||||
| Dawonsys Co. Ltd. | 3,263 | 65,040 | ||||||
| DB HiTek Co. Ltd. | 5,864 | 174,393 | ||||||
| DB Insurance Co. Ltd. | 3,432 | 126,129 | ||||||
| DGB Financial Group, Inc. | 15,742 | 69,771 | ||||||
| Dongjin Semichem Co. Ltd. | 3,456 | 95,914 | ||||||
| DongKook Pharmaceutical Co. Ltd. | 102 | 12,974 | ||||||
Dongkuk Steel Mill Co. Ltd.(1) | 3,097 | 16,092 | ||||||
| Dongsuh Cos., Inc. | 533 | 11,518 | ||||||
Dongsung Pharmaceutical Co. Ltd.(1) | 1,763 | 18,316 | ||||||
| Dongwon Development Co. Ltd. | 10,306 | 33,241 | ||||||
| Doosan Bobcat, Inc. | 618 | 13,524 | ||||||
Doosan Fuel Cell Co. Ltd.(1) | 966 | 33,632 | ||||||
Doosan Heavy Industries & Construction Co. Ltd.(1) | 1,452 | 19,575 | ||||||
Doosan Infracore Co. Ltd.(1) | 5,164 | 34,759 | ||||||
Doosan Solus Co. Ltd.(1) | 607 | 20,383 | ||||||
| DoubleUGames Co. Ltd. | 216 | 13,252 | ||||||
| Douzone Bizon Co. Ltd. | 535 | 45,305 | ||||||
| E-MART, Inc. | 963 | 97,058 | ||||||
Easy Bio, Inc.(1) | 31 | 1,317 | ||||||
| Easy Holdings Co. Ltd. | 774 | 2,839 | ||||||
| Echo Marketing, Inc. | 658 | 16,252 | ||||||
| Ecopro BM Co. Ltd. | 165 | 21,396 | ||||||
| Ecopro Co. Ltd. | 438 | 17,251 | ||||||
| Eo Technics Co. Ltd. | 172 | 16,152 | ||||||
| Eugene Corp. | 8,020 | 26,859 | ||||||
| Eugene Investment & Securities Co. Ltd. | 1,946 | 5,781 | ||||||
| F&F Co. Ltd. | 634 | 51,312 | ||||||
| Fila Holdings Corp. | 621 | 18,051 | ||||||
| Foosung Co. Ltd. | 1,666 | 11,539 | ||||||
Genexine Co. Ltd.(1) | 429 | 64,786 | ||||||
| GOLFZON Co. Ltd. | 490 | 26,685 | ||||||
| Grand Korea Leisure Co. Ltd. | 2,113 | 21,019 | ||||||
| Green Cross Corp. | 247 | 54,937 | ||||||
| Green Cross Holdings Corp. | 230 | 5,302 | ||||||
| GS Engineering & Construction Corp. | 4,537 | 93,923 | ||||||
| GS Holdings Corp. | 2,500 | 68,132 | ||||||
| GS Retail Co. Ltd. | 2,741 | 75,900 | ||||||
35
| Shares | Value | |||||||
| Halla Holdings Corp. | 818 | $ | 18,637 | |||||
| Hana Financial Group, Inc. | 26,882 | 634,574 | ||||||
Hanall Biopharma Co. Ltd.(1) | 857 | 24,906 | ||||||
| Handok, Inc. | 398 | 12,950 | ||||||
| Handsome Co. Ltd. | 1,389 | 36,675 | ||||||
Hanjin Heavy Industries & Construction Co. Ltd.(1) | 13,064 | 69,218 | ||||||
| Hanjin Kal Corp. | 674 | 42,885 | ||||||
| Hanjin Transportation Co. Ltd. | 1,142 | 42,050 | ||||||
| Hankook Tire & Technology Co. Ltd. | 5,813 | 143,649 | ||||||
| Hanmi Pharm Co. Ltd. | 136 | 34,951 | ||||||
| Hanmi Semiconductor Co. Ltd. | 526 | 4,453 | ||||||
| Hanon Systems | 7,293 | 78,946 | ||||||
| Hansae Co. Ltd. | 2,679 | 39,059 | ||||||
| Hansol Chemical Co. Ltd. | 214 | 29,100 | ||||||
| Hansol Paper Co. Ltd. | 1,560 | 17,540 | ||||||
Hansol Technics Co. Ltd.(1) | 4,973 | 36,619 | ||||||
| Hanssem Co. Ltd. | 123 | 10,032 | ||||||
Hanwha Aerospace Co. Ltd.(1) | 865 | 18,756 | ||||||
| Hanwha Corp. | 4,518 | 104,072 | ||||||
Hanwha General Insurance Co. Ltd.(1) | 2,720 | 6,150 | ||||||
Hanwha Investment & Securities Co. Ltd.(1) | 4,234 | 6,376 | ||||||
| Hanwha Life Insurance Co. Ltd. | 21,352 | 27,357 | ||||||
| Hanwha Solutions Corp. | 11,168 | 373,066 | ||||||
| Harim Holdings Co. Ltd. | 1,990 | 10,884 | ||||||
| HDC Holdings Co. Ltd. | 710 | 6,725 | ||||||
| HDC Hyundai Development Co-Engineering & Construction, E Shares | 1,043 | 20,197 | ||||||
Helixmith Co. Ltd.(1) | 138 | 5,704 | ||||||
| Hite Jinro Co. Ltd. | 2,882 | 89,270 | ||||||
HLB Life Science Co. Ltd.(1) | 1,203 | 18,242 | ||||||
HLB, Inc.(1) | 635 | 46,410 | ||||||
HMM Co. Ltd.(1) | 10,285 | 49,435 | ||||||
| Hotel Shilla Co. Ltd. | 2,383 | 140,690 | ||||||
| HS Industries Co. Ltd. | 4,193 | 24,209 | ||||||
| Huchems Fine Chemical Corp. | 2,138 | 32,494 | ||||||
Hugel, Inc.(1) | 90 | 12,400 | ||||||
| Humedix Co. Ltd. | 95 | 2,226 | ||||||
| Huons Co. Ltd. | 859 | 52,170 | ||||||
| Huons Global Co. Ltd. | 54 | 1,548 | ||||||
Hyosung Advanced Materials Corp.(1) | 188 | 21,401 | ||||||
| Hyosung Corp. | 252 | 14,167 | ||||||
Hyosung Heavy Industries Corp.(1) | 247 | 9,144 | ||||||
Hyundai Bioscience Co. Ltd.(1) | 1,782 | 16,934 | ||||||
Hyundai Construction Equipment Co. Ltd.(1) | 1,923 | 35,172 | ||||||
| Hyundai Corp. | 225 | 2,548 | ||||||
| Hyundai Department Store Co. Ltd. | 1,144 | 51,600 | ||||||
Hyundai Electric & Energy System Co. Ltd.(1) | 4,593 | 45,217 | ||||||
| Hyundai Elevator Co. Ltd. | 2,506 | 86,374 | ||||||
| Hyundai Engineering & Construction Co. Ltd. | 1,314 | 35,569 | ||||||
| Hyundai Glovis Co. Ltd. | 1,097 | 133,683 | ||||||
| Hyundai Greenfood Co. Ltd. | 896 | 5,444 | ||||||
| Hyundai Heavy Industries Holdings Co. Ltd. | 297 | 56,359 | ||||||
36
| Shares | Value | |||||||
| Hyundai Home Shopping Network Corp. | 184 | $ | 10,090 | |||||
| Hyundai Hy Communications & Network Co. Ltd. | 1,145 | 3,544 | ||||||
| Hyundai Livart Furniture Co. Ltd. | 618 | 8,544 | ||||||
| Hyundai Marine & Fire Insurance Co. Ltd. | 5,376 | 99,713 | ||||||
| Hyundai Mipo Dockyard Co. Ltd. | 317 | 8,179 | ||||||
| Hyundai Mobis Co. Ltd. | 2,090 | 391,920 | ||||||
| Hyundai Motor Co. | 6,181 | 912,837 | ||||||
Hyundai Rotem Co. Ltd.(1) | 494 | 6,302 | ||||||
| Hyundai Steel Co. | 1,470 | 30,880 | ||||||
| Hyundai Wia Corp. | 1,160 | 40,447 | ||||||
| i-SENS, Inc. | 1,013 | 23,661 | ||||||
| ICD Co. Ltd. | 938 | 12,084 | ||||||
Il Dong Pharmaceutical Co. Ltd.(1) | 137 | 2,122 | ||||||
| Iljin Materials Co. Ltd. | 490 | 20,458 | ||||||
| Ilyang Pharmaceutical Co. Ltd. | 614 | 42,117 | ||||||
| iMarketKorea, Inc. | 4,599 | 29,770 | ||||||
| InBody Co. Ltd. | 424 | 5,693 | ||||||
| Industrial Bank of Korea | 9,720 | 66,002 | ||||||
| Innocean Worldwide, Inc. | 401 | 18,506 | ||||||
Innox Advanced Materials Co. Ltd.(1) | 317 | 13,438 | ||||||
Inscobee, Inc.(1) | 4,307 | 7,978 | ||||||
Insun ENT Co. Ltd.(1) | 3,047 | 26,516 | ||||||
Interflex Co. Ltd.(1) | 957 | 9,670 | ||||||
| INTOPS Co. Ltd. | 955 | 12,240 | ||||||
iNtRON Biotechnology, Inc.(1) | 213 | 3,037 | ||||||
| IS Dongseo Co. Ltd. | 734 | 27,337 | ||||||
ITM Semiconductor Co. Ltd.(1) | 368 | 17,714 | ||||||
| JB Financial Group Co. Ltd. | 16,223 | 58,407 | ||||||
Jcontentree Corp.(1) | 46 | 1,047 | ||||||
Jejuair Co. Ltd.(1) | 877 | 10,136 | ||||||
Jin Air Co. Ltd.(1) | 372 | 2,789 | ||||||
| Jusung Engineering Co. Ltd. | 5,248 | 28,771 | ||||||
| JW Holdings Corp. | 833 | 3,600 | ||||||
| JW Pharmaceutical Corp. | 372 | 11,929 | ||||||
| JYP Entertainment Corp. | 1,785 | 52,093 | ||||||
| Kakao Corp. | 1,404 | 478,813 | ||||||
| Kangwon Land, Inc. | 2,770 | 47,968 | ||||||
| KB Financial Group, Inc., ADR | 14,418 | 446,237 | ||||||
| KC Co. Ltd. | 1,647 | 27,794 | ||||||
| KC Tech Co. Ltd. | 1,621 | 27,275 | ||||||
| KCC Corp. | 592 | 69,205 | ||||||
KCC Glass Corp.(1) | 57 | 1,361 | ||||||
| KEPCO Plant Service & Engineering Co. Ltd. | 340 | 7,947 | ||||||
| Kginicis Co. Ltd. | 2,739 | 54,064 | ||||||
KH Vatec Co. Ltd.(1) | 337 | 6,304 | ||||||
| Kia Motors Corp. | 5,283 | 187,767 | ||||||
| KIWOOM Securities Co. Ltd. | 1,208 | 110,878 | ||||||
KMW Co. Ltd.(1) | 154 | 9,855 | ||||||
| Koentec Co. Ltd. | 896 | 7,322 | ||||||
| Koh Young Technology, Inc. | 92 | 6,948 | ||||||
| Kolmar BNH Co. Ltd. | 340 | 19,117 | ||||||
| Kolmar Korea Co. Ltd. | 583 | 22,385 | ||||||
37
| Shares | Value | |||||||
| Kolmar Korea Holdings Co. Ltd. | 429 | $ | 9,991 | |||||
| Kolon Corp. | 1,460 | 26,253 | ||||||
| Kolon Industries, Inc. | 665 | 17,919 | ||||||
Komipharm International Co. Ltd.(1) | 371 | 4,823 | ||||||
KONA I Co. Ltd.(1) | 684 | 7,514 | ||||||
| Korea Aerospace Industries Ltd. | 4,018 | 75,691 | ||||||
Korea Electric Power Corp., ADR(1) | 13,816 | 117,989 | ||||||
| Korea Electric Terminal Co. Ltd. | 185 | 6,954 | ||||||
| Korea Gas Corp. | 1,299 | 25,760 | ||||||
Korea Information & Communications Co. Ltd.(1) | 2,833 | 21,939 | ||||||
| Korea Investment Holdings Co. Ltd. | 4,108 | 210,676 | ||||||
Korea Line Corp.(1) | 2,298 | 31,061 | ||||||
| Korea Petrochemical Ind Co. Ltd. | 184 | 18,283 | ||||||
| Korea Real Estate Investment & Trust Co. Ltd. | 19,437 | 27,709 | ||||||
Korea Shipbuilding & Offshore Engineering Co. Ltd.(1) | 971 | 70,191 | ||||||
| Korea United Pharm, Inc. | 1,469 | 61,578 | ||||||
| Korea Zinc Co. Ltd. | 267 | 89,277 | ||||||
Korean Air Lines Co. Ltd.(1) | 8,717 | 127,648 | ||||||
| Korean Reinsurance Co. | 5,219 | 32,181 | ||||||
| KT Skylife Co. Ltd. | 4,098 | 29,311 | ||||||
| Kumho Industrial Co. Ltd. | 253 | 1,522 | ||||||
| Kumho Petrochemical Co. Ltd. | 707 | 59,540 | ||||||
Kumho Tire Co., Inc.(1) | 2,101 | 6,440 | ||||||
| Kwang Dong Pharmaceutical Co. Ltd. | 1,298 | 10,587 | ||||||
| Kyobo Securities Co. Ltd. | 927 | 5,254 | ||||||
| Kyung Dong Navien Co. Ltd. | 926 | 40,300 | ||||||
| L&C Bio Co. Ltd. | 239 | 26,465 | ||||||
| LEENO Industrial, Inc. | 244 | 25,979 | ||||||
LegoChem Biosciences, Inc.(1) | 1,052 | 47,461 | ||||||
| LF Corp. | 556 | 5,970 | ||||||
| LG Chem Ltd. | 3,553 | 2,199,357 | ||||||
| LG Corp. | 1,275 | 88,483 | ||||||
LG Display Co. Ltd., ADR(1) | 38,167 | 235,490 | ||||||
| LG Electronics, Inc. | 9,746 | 687,452 | ||||||
| LG Hausys Ltd. | 1,179 | 57,387 | ||||||
| LG HelloVision Co. Ltd. | 1,041 | 3,424 | ||||||
| LG Household & Health Care Ltd. | 96 | 119,420 | ||||||
| LG Innotek Co. Ltd. | 1,485 | 180,266 | ||||||
| LG International Corp. | 2,656 | 33,512 | ||||||
| LG Uplus Corp. | 13,888 | 139,528 | ||||||
| LIG Nex1 Co. Ltd. | 340 | 8,906 | ||||||
Lock&Lock Co. Ltd.(1) | 549 | 4,996 | ||||||
| Lotte Chemical Corp. | 306 | 48,592 | ||||||
| Lotte Chilsung Beverage Co. Ltd. | 189 | 14,922 | ||||||
| Lotte Corp. | 1,759 | 44,284 | ||||||
| Lotte Data Communication Co. | 842 | 23,201 | ||||||
| LOTTE Fine Chemical Co. Ltd. | 1,648 | 61,905 | ||||||
Lotte Non-Life Insurance Co. Ltd.(1) | 4,296 | 5,736 | ||||||
| Lotte Shopping Co. Ltd. | 828 | 52,867 | ||||||
Lotte Tour Development Co. Ltd.(1) | 483 | 7,685 | ||||||
| LS Corp. | 2,067 | 78,421 | ||||||
| LS Electric Co. Ltd. | 2,027 | 92,018 | ||||||
38
| Shares | Value | |||||||
LVMC Holdings(1) | 1,090 | $ | 3,578 | |||||
| Mando Corp. | 3,904 | 102,544 | ||||||
| Mcnex Co. Ltd. | 2,052 | 57,695 | ||||||
| Medytox, Inc. | 63 | 13,200 | ||||||
| Meerecompany, Inc. | 66 | 1,360 | ||||||
| MegaStudyEdu Co. Ltd. | 1,211 | 33,377 | ||||||
| Meritz Financial Group, Inc. | 4,490 | 34,842 | ||||||
| Meritz Fire & Marine Insurance Co. Ltd. | 5,157 | 55,140 | ||||||
| Meritz Securities Co. Ltd. | 23,080 | 61,976 | ||||||
Mezzion Pharma Co. Ltd.(1) | 53 | 7,595 | ||||||
| Mirae Asset Daewoo Co. Ltd. | 12,475 | 96,975 | ||||||
| Mirae Asset Life Insurance Co. Ltd. | 10,455 | 32,925 | ||||||
| Moorim P&P Co. Ltd. | 1,055 | 2,771 | ||||||
Muhak Co. Ltd.(1) | 242 | 1,235 | ||||||
| Namhae Chemical Corp. | 369 | 2,548 | ||||||
Namsun Aluminum Co. Ltd.(1) | 1,726 | 7,496 | ||||||
| NAVER Corp. | 3,646 | 984,939 | ||||||
| NCSoft Corp. | 406 | 281,413 | ||||||
Neowiz(1) | 1,167 | 30,105 | ||||||
| NEPES Corp. | 1,608 | 39,389 | ||||||
Netmarble Corp.(1) | 417 | 58,233 | ||||||
| Nexen Corp. | 1,428 | 4,479 | ||||||
| Nexen Tire Corp. | 1,860 | 7,911 | ||||||
| NH Investment & Securities Co. Ltd. | 3,336 | 25,044 | ||||||
NHN Corp.(1) | 514 | 31,442 | ||||||
| NHN KCP Corp. | 2,190 | 132,439 | ||||||
| NICE Holdings Co. Ltd. | 2,643 | 41,727 | ||||||
| NICE Information Service Co. Ltd. | 2,961 | 44,731 | ||||||
| NongShim Co. Ltd. | 155 | 47,075 | ||||||
| NS Shopping Co. Ltd. | 927 | 9,122 | ||||||
OCI Co. Ltd.(1) | 216 | 11,695 | ||||||
| Orion Corp./Republic of Korea | 1,029 | 121,379 | ||||||
| Orion Holdings Corp. | 587 | 6,462 | ||||||
Oscotec, Inc.(1) | 168 | 4,624 | ||||||
Osstem Implant Co. Ltd.(1) | 309 | 9,616 | ||||||
Pan Ocean Co. Ltd.(1) | 7,988 | 22,763 | ||||||
| Partron Co. Ltd. | 5,351 | 45,680 | ||||||
Pearl Abyss Corp.(1) | 287 | 43,878 | ||||||
Peptron, Inc.(1) | 90 | 1,533 | ||||||
| PHARMA RESEARCH PRODUCTS Co. Ltd. | 36 | 2,098 | ||||||
Pharmicell Co. Ltd.(1) | 978 | 18,443 | ||||||
| PI Advanced Materials Co. Ltd. | 745 | 17,824 | ||||||
| Poongsan Corp. | 2,881 | 55,811 | ||||||
| POSCO, ADR | 21,584 | 834,006 | ||||||
| POSCO Chemical Co. Ltd. | 185 | 13,766 | ||||||
| Posco ICT Co. Ltd. | 1,823 | 6,648 | ||||||
| Posco International Corp. | 5,322 | 60,706 | ||||||
| Pulmuone Co. Ltd. | 1,683 | 26,475 | ||||||
| RFHIC Corp. | 340 | 11,186 | ||||||
| S&T Motiv Co. Ltd. | 1,175 | 54,169 | ||||||
| S-1 Corp. | 828 | 60,689 | ||||||
| S-Oil Corp. | 855 | 40,443 | ||||||
39
| Shares | Value | |||||||
| Sam Chun Dang Pharm Co. Ltd. | 117 | $ | 5,749 | |||||
| Samjin Pharmaceutical Co. Ltd. | 1,819 | 44,538 | ||||||
| SAMPYO Cement Co. Ltd. | 973 | 2,792 | ||||||
Samsung Biologics Co. Ltd.(1) | 283 | 184,745 | ||||||
| Samsung C&T Corp. | 869 | 78,551 | ||||||
| Samsung Card Co. Ltd. | 1,425 | 34,495 | ||||||
| Samsung Electro-Mechanics Co. Ltd. | 4,640 | 483,497 | ||||||
| Samsung Electronics Co. Ltd., GDR | 5,621 | 6,574,104 | ||||||
Samsung Engineering Co. Ltd.(1) | 10,844 | 102,608 | ||||||
| Samsung Fire & Marine Insurance Co. Ltd. | 2,115 | 332,008 | ||||||
Samsung Heavy Industries Co. Ltd.(1) | 6,232 | 26,969 | ||||||
| Samsung Life Insurance Co. Ltd. | 981 | 50,314 | ||||||
| Samsung SDI Co. Ltd. | 1,676 | 636,866 | ||||||
| Samsung SDS Co. Ltd. | 551 | 72,738 | ||||||
| Samsung Securities Co. Ltd. | 2,307 | 58,239 | ||||||
| Samwha Capacitor Co. Ltd. | 1,445 | 65,438 | ||||||
| Samyang Foods Co. Ltd. | 339 | 30,302 | ||||||
| Sangsangin Co. Ltd. | 5,065 | 25,482 | ||||||
SBS Media Holdings Co. Ltd.(1) | 1,692 | 2,756 | ||||||
| Seah Besteel Corp. | 525 | 4,323 | ||||||
| Sebang Global Battery Co. Ltd. | 784 | 17,955 | ||||||
| Seegene, Inc. | 432 | 95,794 | ||||||
Sejong Telecom, Inc.(1) | 5,123 | 1,161 | ||||||
Seobu T&D(1) | 977 | 5,371 | ||||||
| Seoul Semiconductor Co. Ltd. | 5,088 | 69,448 | ||||||
| SFA Engineering Corp. | 1,152 | 32,011 | ||||||
SFA Semicon Co. Ltd.(1) | 13,190 | 55,066 | ||||||
Shin Poong Pharmaceutical Co. Ltd.(1) | 907 | 103,988 | ||||||
| Shinhan Financial Group Co. Ltd., ADR | 15,643 | 389,824 | ||||||
| Shinsegae International, Inc. | 135 | 15,363 | ||||||
| Shinsegae, Inc. | 604 | 102,957 | ||||||
| Silicon Works Co. Ltd. | 803 | 30,331 | ||||||
SillaJen, Inc.(1) | 626 | 6,376 | ||||||
| SK Chemicals Co. Ltd. | 1,152 | 376,814 | ||||||
| SK D&D Co. Ltd. | 871 | 30,323 | ||||||
| SK Discovery Co. Ltd. | 725 | 47,034 | ||||||
| SK Holdings Co. Ltd. | 2,518 | 451,767 | ||||||
| SK Hynix, Inc. | 17,433 | 1,096,905 | ||||||
| SK Innovation Co. Ltd. | 783 | 94,935 | ||||||
| SK Materials Co. Ltd. | 403 | 83,674 | ||||||
| SK Networks Co. Ltd. | 20,012 | 87,206 | ||||||
| SK Securities Co. Ltd. | 12,360 | 7,792 | ||||||
| SK Telecom Co. Ltd., ADR | 11,405 | 261,973 | ||||||
| SKC Co. Ltd. | 750 | 58,095 | ||||||
| SL Corp. | 401 | 4,045 | ||||||
SM Entertainment Co. Ltd.(1) | 278 | 8,009 | ||||||
| Songwon Industrial Co. Ltd. | 463 | 4,754 | ||||||
Soulbrain Co. Ltd.(1) | 577 | 105,306 | ||||||
| Soulbrain Holdings Co., Ltd. | 713 | 27,751 | ||||||
Ssangyong Motor Co.(1) | 2,905 | 8,830 | ||||||
ST Pharm Co. Ltd.(1) | 124 | 6,729 | ||||||
Studio Dragon Corp.(1) | 273 | 18,318 | ||||||
40
| Shares | Value | |||||||
| Suheung Co. Ltd. | 124 | $ | 5,918 | |||||
| Sung Kwang Bend Co. Ltd. | 420 | 2,397 | ||||||
| Sungwoo Hitech Co. Ltd. | 2,998 | 7,623 | ||||||
Taewoong Co. Ltd.(1) | 329 | 3,430 | ||||||
| Taeyoung Engineering & Construction Co. Ltd. | 3,238 | 59,073 | ||||||
Taihan Electric Wire Co. Ltd.(1) | 26,822 | 15,549 | ||||||
Taihan Fiberoptics Co. Ltd.(1) | 470 | 1,352 | ||||||
Telcon RF Pharmaceutical, Inc.(1) | 379 | 1,755 | ||||||
| TES Co. Ltd. | 1,577 | 28,166 | ||||||
| TK Corp. | 380 | 2,126 | ||||||
| Tokai Carbon Korea Co. Ltd. | 154 | 14,095 | ||||||
| Tongyang Life Insurance Co. Ltd. | 2,410 | 6,025 | ||||||
| Tongyang, Inc. | 2,830 | 2,762 | ||||||
| Toptec Co. Ltd. | 790 | 10,980 | ||||||
| Value Added Technology Co. Ltd. | 136 | 2,443 | ||||||
| Vieworks Co. Ltd. | 352 | 9,640 | ||||||
Webzen, Inc.(1) | 2,458 | 70,973 | ||||||
| Wemade Co. Ltd. | 563 | 16,932 | ||||||
| Whanin Pharmaceutical Co. Ltd. | 148 | 1,962 | ||||||
| Winix, Inc. | 494 | 7,650 | ||||||
| WiSoL Co. Ltd. | 559 | 7,482 | ||||||
Wonik Holdings Co. Ltd.(1) | 2,225 | 8,003 | ||||||
WONIK IPS Co. Ltd.(1) | 340 | 9,102 | ||||||
| Wonik Materials Co. Ltd. | 745 | 15,298 | ||||||
| Woongjin Thinkbig Co. Ltd. | 11,642 | 26,808 | ||||||
| Woori Financial Group, Inc. | 47,107 | 336,711 | ||||||
Woori Investment Bank Co. Ltd.(1) | 4,836 | 2,183 | ||||||
| Y G-1 Co. Ltd. | 226 | 762 | ||||||
YG Entertainment, Inc.(1) | 628 | 24,598 | ||||||
| Youlchon Chemical Co. Ltd. | 239 | 3,099 | ||||||
| Youngone Corp. | 1,349 | 35,532 | ||||||
Yuanta Securities Korea Co. Ltd.(1) | 3,369 | 8,518 | ||||||
| Yuhan Corp. | 1,025 | 57,747 | ||||||
Yungjin Pharmaceutical Co. Ltd.(1) | 1,448 | 8,312 | ||||||
| Zinus, Inc. | 315 | 22,287 | ||||||
| 32,964,374 | ||||||||
| Taiwan — 14.5% | ||||||||
| A-DATA Technology Co. Ltd. | 11,000 | 19,421 | ||||||
| Aaeon Technology, Inc. | 1,000 | 2,463 | ||||||
| AcBel Polytech, Inc. | 30,000 | 26,395 | ||||||
| Accton Technology Corp. | 9,000 | 71,663 | ||||||
| Acer, Inc. | 71,000 | 56,389 | ||||||
| Acter Group Corp. Ltd. | 5,000 | 34,846 | ||||||
| Advanced Ceramic X Corp. | 1,000 | 12,585 | ||||||
| Advanced International Multitech Co. Ltd. | 6,000 | 6,922 | ||||||
| Advanced Wireless Semiconductor Co. | 1,000 | 2,929 | ||||||
| Advantech Co. Ltd. | 2,199 | 22,709 | ||||||
| Airtac International Group | 4,000 | 88,008 | ||||||
| Alchip Technologies Ltd. | 3,000 | 53,675 | ||||||
| Alpha Networks, Inc. | 35,772 | 34,008 | ||||||
| Altek Corp. | 31,000 | 27,194 | ||||||
| Amazing Microelectronic Corp. | 9,000 | 25,004 | ||||||
41
| Shares | Value | |||||||
AmTRAN Technology Co. Ltd.(1) | 13,000 | $ | 4,656 | |||||
| Apex International Co. Ltd. | 19,000 | 46,711 | ||||||
| Arcadyan Technology Corp. | 14,061 | 43,937 | ||||||
| Ardentec Corp. | 64,000 | 71,171 | ||||||
| Argosy Research, Inc. | 7,545 | 30,125 | ||||||
| ASE Technology Holding Co. Ltd., ADR | 85,622 | 351,906 | ||||||
| Asia Cement Corp. | 119,000 | 171,931 | ||||||
| Asia Optical Co., Inc. | 2,000 | 4,487 | ||||||
Asia Pacific Telecom Co. Ltd.(1) | 7,209 | 1,819 | ||||||
| Asia Polymer Corp. | 59,850 | 37,678 | ||||||
| Asia Vital Components Co. Ltd. | 19,000 | 45,263 | ||||||
| ASMedia Technology, Inc. | 1,000 | 59,997 | ||||||
| ASROCK, Inc. | 3,000 | 20,294 | ||||||
| Asustek Computer, Inc. | 36,000 | 297,404 | ||||||
| Aten International Co. Ltd. | 9,000 | 25,880 | ||||||
AU Optronics Corp., ADR(1) | 69,020 | 240,190 | ||||||
| AURAS Technology Co. Ltd. | 8,000 | 60,353 | ||||||
| Aurora Corp. | 1,000 | 2,880 | ||||||
| AVY Precision Technology, Inc. | 3,060 | 2,568 | ||||||
| Bank of Kaohsiung Co. Ltd. | 30,000 | 10,323 | ||||||
| Basso Industry Corp. | 3,000 | 4,066 | ||||||
| BenQ Materials Corp. | 4,000 | 3,050 | ||||||
| BES Engineering Corp. | 131,000 | 36,383 | ||||||
| Bioteque Corp. | 1,000 | 4,769 | ||||||
| Bizlink Holding, Inc. | 9,000 | 75,483 | ||||||
| Brogent Technologies, Inc. | 1,000 | 3,566 | ||||||
| Capital Futures Corp. | 2,000 | 2,601 | ||||||
| Capital Securities Corp. | 180,000 | 67,340 | ||||||
| Career Technology MFG. Co. Ltd. | 5,100 | 4,880 | ||||||
| Casetek Holdings Ltd. | 11,000 | 31,868 | ||||||
| Caswell, Inc. | 3,000 | 12,947 | ||||||
| Catcher Technology Co. Ltd. | 37,000 | 252,040 | ||||||
| Cathay Financial Holding Co. Ltd. | 293,000 | 397,098 | ||||||
| Cayman Engley Industrial Co. Ltd. | 7,000 | 18,594 | ||||||
| Center Laboratories, Inc. | 1,094 | 2,980 | ||||||
| Central Reinsurance Co. Ltd. | 13,000 | 8,875 | ||||||
| Chailease Holding Co. Ltd. | 5,200 | 22,900 | ||||||
| Chang Hwa Commercial Bank Ltd. | 65,520 | 40,634 | ||||||
| Chang Wah Electromaterials, Inc. | 20,000 | 13,675 | ||||||
| Chang Wah Technology Co. Ltd. | 7,000 | 9,242 | ||||||
| Channel Well Technology Co. Ltd. | 20,000 | 30,954 | ||||||
| Charoen Pokphand Enterprise | 18,000 | 41,758 | ||||||
| Chaun-Choung Technology Corp. | 1,000 | 9,148 | ||||||
| CHC Healthcare Group | 5,000 | 7,061 | ||||||
| CHC Resources Corp. | 4,000 | 6,212 | ||||||
| Chenbro Micom Co. Ltd. | 10,000 | 31,028 | ||||||
| Cheng Loong Corp. | 85,000 | 87,363 | ||||||
| Cheng Shin Rubber Industry Co. Ltd. | 56,000 | 68,571 | ||||||
| Cheng Uei Precision Industry Co. Ltd. | 43,000 | 61,286 | ||||||
| Chia Chang Co. Ltd. | 6,000 | 7,986 | ||||||
| Chia Hsin Cement Corp. | 13,000 | 7,435 | ||||||
| Chicony Electronics Co. Ltd. | 34,000 | 102,352 | ||||||
42
| Shares | Value | |||||||
| Chicony Power Technology Co. Ltd. | 12,000 | $ | 30,223 | |||||
| Chief Telecom, Inc. | 2,000 | 26,581 | ||||||
| Chieftek Precision Co. Ltd. | 1,000 | 2,723 | ||||||
| Chilisin Electronics Corp. | 9,000 | 30,204 | ||||||
| Chin-Poon Industrial Co. Ltd. | 43,000 | 37,180 | ||||||
China Airlines Ltd.(1) | 248,000 | 71,922 | ||||||
| China Bills Finance Corp. | 38,000 | 18,890 | ||||||
| China Chemical & Pharmaceutical Co. Ltd. | 4,000 | 3,293 | ||||||
| China Development Financial Holding Corp. | 717,000 | 208,323 | ||||||
| China General Plastics Corp. | 51,450 | 33,402 | ||||||
| China Life Insurance Co. Ltd. | 129,000 | 90,177 | ||||||
China Man-Made Fiber Corp.(1) | 49,000 | 12,692 | ||||||
| China Metal Products | 11,000 | 10,042 | ||||||
China Motor Corp.(1) | 30,800 | 44,349 | ||||||
| China Petrochemical Development Corp. | 97,000 | 28,443 | ||||||
| China Steel Corp. | 501,000 | 338,646 | ||||||
| Chinese Maritime Transport Ltd. | 6,000 | 5,287 | ||||||
| Ching Feng Home Fashions Co. Ltd. | 7,000 | 8,311 | ||||||
| Chipbond Technology Corp. | 40,000 | 76,368 | ||||||
| ChipMOS Technologies, Inc. | 74,000 | 73,296 | ||||||
| Chlitina Holding Ltd. | 3,000 | 21,438 | ||||||
| Chong Hong Construction Co. Ltd. | 3,000 | 8,562 | ||||||
| Chroma ATE, Inc. | 2,000 | 10,945 | ||||||
Chung Hung Steel Corp.(1) | 110,000 | 34,740 | ||||||
Chung Hwa Pulp Corp.(1) | 10,000 | 3,372 | ||||||
| Chung-Hsin Electric & Machinery Manufacturing Corp. | 61,000 | 77,940 | ||||||
| Chunghwa Telecom Co. Ltd., ADR | 7,676 | 283,398 | ||||||
| Cleanaway Co. Ltd. | 2,000 | 10,830 | ||||||
| Clevo Co. | 29,000 | 29,210 | ||||||
| CMC Magnetics Corp. | 45,685 | 12,629 | ||||||
| Co-Tech Development Corp. | 8,000 | 10,330 | ||||||
| Compal Electronics, Inc. | 143,000 | 89,986 | ||||||
| Compeq Manufacturing Co. Ltd. | 92,000 | 136,221 | ||||||
| Concraft Holding Co. Ltd. | 6,899 | 21,507 | ||||||
| Continental Holdings Corp. | 9,000 | 5,768 | ||||||
| Coretronic Corp. | 42,000 | 50,072 | ||||||
| CTBC Financial Holding Co. Ltd. | 880,000 | 567,526 | ||||||
| CTCI Corp. | 17,000 | 20,816 | ||||||
| Cyberlink Corp. | 1,000 | 4,069 | ||||||
| CyberTAN Technology, Inc. | 16,000 | 8,234 | ||||||
D-Link Corp.(1) | 5,000 | 3,208 | ||||||
| DA CIN Construction Co. Ltd. | 3,000 | 2,511 | ||||||
| Da-Li Development Co. Ltd. | 2,199 | 2,171 | ||||||
| Dadi Early-Childhood Education Group Ltd. | 1,000 | 6,147 | ||||||
| Dafeng TV Ltd. | 4,000 | 5,513 | ||||||
| Darfon Electronics Corp. | 5,000 | 6,873 | ||||||
Darwin Precisions Corp.(1) | 5,000 | 1,841 | ||||||
| Daxin Materials Corp. | 2,000 | 5,783 | ||||||
| Delta Electronics, Inc. | 32,000 | 205,593 | ||||||
| Depo Auto Parts Ind Co. Ltd. | 4,000 | 6,731 | ||||||
| Dimerco Express Corp. | 16,000 | 36,873 | ||||||
| Double Bond Chemical Industry Co. Ltd. | 3,000 | 6,398 | ||||||
43
| Shares | Value | |||||||
Dynamic Electronics Co. Ltd.(1) | 45,000 | $ | 26,880 | |||||
| Dynapack International Technology Corp. | 7,000 | 19,269 | ||||||
| E Ink Holdings, Inc. | 17,000 | 23,807 | ||||||
| E-LIFE MALL Corp. | 4,000 | 9,546 | ||||||
| E.Sun Financial Holding Co. Ltd. | 191,105 | 176,892 | ||||||
| Eastern Media International Corp. | 3,000 | 1,655 | ||||||
| Eclat Textile Co. Ltd. | 3,000 | 39,447 | ||||||
| ECOVE Environment Corp. | 1,000 | 7,336 | ||||||
| Egis Technology, Inc. | 5,000 | 28,344 | ||||||
| Elan Microelectronics Corp. | 14,000 | 67,530 | ||||||
| Elite Advanced Laser Corp. | 18,000 | 39,003 | ||||||
| Elite Material Co. Ltd. | 14,000 | 80,760 | ||||||
| Elite Semiconductor Microelectronics Technology, Inc. | 33,000 | 40,733 | ||||||
Elitegroup Computer Systems Co. Ltd.(1) | 44,000 | 20,938 | ||||||
| eMemory Technology, Inc. | 1,000 | 17,656 | ||||||
Epistar Corp.(1) | 51,000 | 69,163 | ||||||
| Eson Precision Ind Co. Ltd. | 5,000 | 5,831 | ||||||
| Eternal Materials Co. Ltd. | 82,000 | 96,232 | ||||||
| Eva Airways Corp. | 138,000 | 53,867 | ||||||
Everest Textile Co. Ltd.(1) | 3,000 | 973 | ||||||
| Evergreen International Storage & Transport Corp. | 69,000 | 33,807 | ||||||
Evergreen Marine Corp. Taiwan Ltd.(1) | 139,190 | 82,244 | ||||||
| Everlight Chemical Industrial Corp. | 54,000 | 29,407 | ||||||
| Everlight Electronics Co. Ltd. | 54,000 | 63,379 | ||||||
| Excelsior Medical Co. Ltd. | 6,000 | 11,540 | ||||||
| Far Eastern Department Stores Ltd. | 103,000 | 91,035 | ||||||
| Far Eastern International Bank | 143,000 | 54,517 | ||||||
| Far Eastern New Century Corp. | 176,000 | 158,199 | ||||||
| Far EasTone Telecommunications Co. Ltd. | 78,000 | 162,657 | ||||||
| Faraday Technology Corp. | 2,000 | 2,952 | ||||||
| Farglory F T Z Investment Holding Co. Ltd. | 17,000 | 16,333 | ||||||
| Farglory Land Development Co. Ltd. | 29,000 | 47,378 | ||||||
Federal Corp.(1) | 13,000 | 10,354 | ||||||
| Feng Hsin Steel Co. Ltd. | 38,000 | 73,703 | ||||||
| Feng TAY Enterprise Co. Ltd. | 10,800 | 62,523 | ||||||
| Firich Enterprises Co. Ltd. | 3,223 | 3,027 | ||||||
| First Financial Holding Co. Ltd. | 187,460 | 135,508 | ||||||
| First Steamship Co. Ltd. | 69,000 | 23,571 | ||||||
| Fitipower Integrated Technology, Inc. | 4,000 | 4,553 | ||||||
| FLEXium Interconnect, Inc. | 31,000 | 132,554 | ||||||
| Flytech Technology Co. Ltd. | 1,000 | 2,112 | ||||||
FocalTech Systems Co. Ltd.(1) | 44,000 | 49,401 | ||||||
| Forest Water Environment Engineering Co. Ltd. | 1,000 | 1,435 | ||||||
| Formosa Advanced Technologies Co. Ltd. | 26,000 | 31,011 | ||||||
| Formosa Chemicals & Fibre Corp. | 33,000 | 76,121 | ||||||
| Formosa International Hotels Corp. | 5,000 | 22,375 | ||||||
| Formosa Petrochemical Corp. | 17,000 | 47,411 | ||||||
| Formosa Plastics Corp. | 61,000 | 162,305 | ||||||
| Formosa Sumco Technology Corp. | 7,000 | 24,509 | ||||||
| Formosa Taffeta Co. Ltd. | 44,000 | 47,395 | ||||||
| Formosan Rubber Group, Inc. | 22,000 | 15,584 | ||||||
| Formosan Union Chemical | 6,650 | 3,224 | ||||||
44
| Shares | Value | |||||||
| Foxconn Technology Co. Ltd. | 34,000 | $ | 60,303 | |||||
| Foxsemicon Integrated Technology, Inc. | 10,000 | 64,761 | ||||||
| Fubon Financial Holding Co. Ltd. | 326,000 | 474,313 | ||||||
| Fulltech Fiber Glass Corp. | 11,000 | 3,815 | ||||||
| Fusheng Precision Co. Ltd. | 7,000 | 41,182 | ||||||
| Gamania Digital Entertainment Co. Ltd. | 3,000 | 6,898 | ||||||
| GCS Holdings, Inc. | 1,000 | 1,605 | ||||||
| GEM Services, Inc. | 1,000 | 1,962 | ||||||
| Gemtek Technology Corp. | 35,000 | 33,012 | ||||||
| General Interface Solution Holding Ltd. | 11,000 | 48,492 | ||||||
| Genesys Logic, Inc. | 12,000 | 28,462 | ||||||
| Genius Electronic Optical Co. Ltd. | 1,079 | 20,965 | ||||||
| Getac Technology Corp. | 29,000 | 48,158 | ||||||
| Giant Manufacturing Co. Ltd. | 2,000 | 20,712 | ||||||
Giantplus Technology Co. Ltd.(1) | 6,000 | 2,048 | ||||||
| Gigabyte Technology Co. Ltd. | 37,000 | 106,732 | ||||||
| Ginko International Co. Ltd. | 3,150 | 13,581 | ||||||
| Global Brands Manufacture Ltd. | 39,000 | 26,492 | ||||||
| Global Lighting Technologies, Inc. | 1,000 | 4,299 | ||||||
Global PMX Co. Ltd.(1) | 1,000 | 7,028 | ||||||
| Globalwafers Co. Ltd. | 11,000 | 147,647 | ||||||
| Globe Union Industrial Corp. | 13,000 | 6,145 | ||||||
| Gloria Material Technology Corp. | 8,000 | 4,362 | ||||||
Gold Circuit Electronics Ltd.(1) | 20,000 | 34,849 | ||||||
| Golden Friends Corp. | 1,000 | 1,901 | ||||||
| Goldsun Building Materials Co. Ltd. | 30,000 | 22,095 | ||||||
| Gourmet Master Co. Ltd. | 10,000 | 33,973 | ||||||
| Grand Ocean Retail Group Ltd. | 3,000 | 2,548 | ||||||
Grand Pacific Petrochemical(1) | 80,000 | 52,155 | ||||||
| Grape King Bio Ltd. | 5,000 | 30,627 | ||||||
| Great China Metal Industry | 9,000 | 6,653 | ||||||
| Great Wall Enterprise Co. Ltd. | 26,000 | 40,012 | ||||||
| Greatek Electronics, Inc. | 12,000 | 20,515 | ||||||
| GTM Holdings Corp. | 7,000 | 5,466 | ||||||
| Gudeng Precision Industrial Co. Ltd. | 3,113 | 28,599 | ||||||
| Hannstar Board Corp. | 33,927 | 50,158 | ||||||
HannStar Display Corp.(1) | 244,000 | 66,631 | ||||||
| HannsTouch Solution, Inc. | 28,000 | 9,413 | ||||||
| Heran Co. Ltd. | 7,000 | 26,082 | ||||||
| Highwealth Construction Corp. | 6,000 | 9,469 | ||||||
| HIM International Music, Inc. | 1,000 | 3,474 | ||||||
| Hiroca Holdings Ltd. | 3,000 | 6,296 | ||||||
| Hitron Technology, Inc. | 42,000 | 31,839 | ||||||
| Hiwin Technologies Corp. | 3,090 | 33,630 | ||||||
| Ho Tung Chemical Corp. | 151,000 | 50,010 | ||||||
| Holiday Entertainment Co. Ltd. | 13,000 | 28,064 | ||||||
| Holtek Semiconductor, Inc. | 2,000 | 4,344 | ||||||
| Holy Stone Enterprise Co. Ltd. | 9,000 | 31,774 | ||||||
| Hon Hai Precision Industry Co. Ltd. | 435,000 | 1,138,220 | ||||||
| Hong Pu Real Estate Development Co. Ltd. | 11,000 | 9,022 | ||||||
| Hotai Finance Co. Ltd. | 6,000 | 16,489 | ||||||
| Hotai Motor Co. Ltd. | 5,000 | 101,311 | ||||||
45
| Shares | Value | |||||||
| Hsin Kuang Steel Co. Ltd. | 2,000 | $ | 2,030 | |||||
| Hsin Yung Chien Co. Ltd. | 1,000 | 2,856 | ||||||
| Hsing TA Cement Co. | 12,000 | 7,554 | ||||||
HTC Corp.(1) | 48,000 | 49,113 | ||||||
| Hu Lane Associate, Inc. | 9,225 | 23,564 | ||||||
| Hua Nan Financial Holdings Co. Ltd. | 141,508 | 86,958 | ||||||
| Huaku Development Co. Ltd. | 31,000 | 94,579 | ||||||
| Huang Hsiang Construction Corp. | 3,000 | 3,945 | ||||||
| Hung Ching Development & Construction Co. Ltd. | 7,000 | 4,633 | ||||||
| Hung Sheng Construction Ltd. | 23,600 | 13,849 | ||||||
| Huxen Corp. | 3,000 | 5,011 | ||||||
| I-Sheng Electric Wire & Cable Co. Ltd. | 10,000 | 14,035 | ||||||
| Ibase Technology, Inc. | 1,000 | 1,607 | ||||||
| IBF Financial Holdings Co. Ltd. | 91,576 | 36,026 | ||||||
| Ichia Technologies, Inc. | 18,000 | 10,513 | ||||||
| IEI Integration Corp. | 3,000 | 4,669 | ||||||
| Innodisk Corp. | 8,160 | 44,119 | ||||||
| Innolux Corp. | 515,000 | 159,203 | ||||||
| Intai Technology Corp. | 2,400 | 8,209 | ||||||
| International CSRC Investment Holdings Co. | 19,000 | 13,306 | ||||||
| International Games System Co. Ltd. | 3,000 | 89,892 | ||||||
| Inventec Corp. | 130,000 | 100,579 | ||||||
| Iron Force Industrial Co. Ltd. | 3,000 | 8,371 | ||||||
| ITE Technology, Inc. | 4,000 | 10,160 | ||||||
| ITEQ Corp. | 11,000 | 44,671 | ||||||
| Jentech Precision Industrial Co. Ltd. | 3,000 | 31,204 | ||||||
| Jih Sun Financial Holdings Co. Ltd. | 91,470 | 32,386 | ||||||
| Jourdeness Group Ltd. | 1,000 | 2,918 | ||||||
| KEE TAI Properties Co. Ltd. | 28,000 | 9,725 | ||||||
| Kenda Rubber Industrial Co. Ltd. | 20,000 | 21,763 | ||||||
| Kindom Development Co. Ltd. | 43,000 | 57,735 | ||||||
| King Yuan Electronics Co. Ltd. | 77,000 | 81,586 | ||||||
| King's Town Bank Co. Ltd. | 74,000 | 91,949 | ||||||
| Kinik Co. | 6,000 | 13,060 | ||||||
| Kinpo Electronics | 146,000 | 57,067 | ||||||
| Kinsus Interconnect Technology Corp. | 18,000 | 38,993 | ||||||
| KMC Kuei Meng International, Inc. | 1,000 | 6,618 | ||||||
| KS Terminals, Inc. | 1,000 | 1,478 | ||||||
| Kung Long Batteries Industrial Co. Ltd. | 10,000 | 47,310 | ||||||
| Kuoyang Construction Co. Ltd. | 5,000 | 4,934 | ||||||
| L&K Engineering Co. Ltd. | 3,000 | 2,899 | ||||||
| Lanner Electronics, Inc. | 1,000 | 1,898 | ||||||
| Largan Precision Co. Ltd. | 2,000 | 229,612 | ||||||
Lealea Enterprise Co. Ltd.(1) | 17,000 | 5,300 | ||||||
| Lelon Electronics Corp. | 3,000 | 5,635 | ||||||
| Lemtech Holdings Co. Ltd. | 1,000 | 4,384 | ||||||
Lextar Electronics Corp.(1) | 25,000 | 18,311 | ||||||
| Li Cheng Enterprise Co. Ltd. | 1,072 | 1,130 | ||||||
Li Peng Enterprise Co. Ltd.(1) | 14,000 | 3,202 | ||||||
| Lian HWA Food Corp. | 2,100 | 3,004 | ||||||
| Lien Hwa Industrial Holdings Corp. | 6,960 | 9,949 | ||||||
| Lion Travel Service Co. Ltd. | 1,000 | 2,215 | ||||||
46
| Shares | Value | |||||||
| Lite-On Technology Corp. | 168,000 | $ | 265,491 | |||||
| Long Bon International Co. Ltd. | 4,800 | 2,312 | ||||||
| Longchen Paper & Packaging Co. Ltd. | 91,000 | 53,925 | ||||||
| Longwell Co. | 17,000 | 30,768 | ||||||
| Lotes Co. Ltd. | 3,000 | 43,611 | ||||||
Lotus Pharmaceutical Co. Ltd.(1) | 1,000 | 2,727 | ||||||
| Lumax International Corp. Ltd. | 10,000 | 22,845 | ||||||
| Lung Yen Life Service Corp. | 18,000 | 33,704 | ||||||
| Macauto Industrial Co. Ltd. | 4,000 | 12,661 | ||||||
| Machvision, Inc. | 1,039 | 9,846 | ||||||
| Macronix International | 32,000 | 32,779 | ||||||
| Makalot Industrial Co. Ltd. | 6,000 | 40,204 | ||||||
| Marketech International Corp. | 2,000 | 7,620 | ||||||
| Mechema Chemicals International Corp. | 2,000 | 4,582 | ||||||
| MediaTek, Inc. | 23,000 | 435,361 | ||||||
| Mega Financial Holding Co. Ltd. | 248,000 | 246,523 | ||||||
| Mercuries & Associates Holding Ltd. | 55,000 | 46,506 | ||||||
Mercuries Life Insurance Co. Ltd.(1) | 130,000 | 41,658 | ||||||
| Merry Electronics Co. Ltd. | 13,000 | 68,046 | ||||||
| Micro-Star International Co. Ltd. | 39,000 | 179,383 | ||||||
Microbio Co. Ltd.(1) | 6,000 | 17,318 | ||||||
| Mirle Automation Corp. | 5,000 | 7,864 | ||||||
| Mitac Holdings Corp. | 42,560 | 41,842 | ||||||
| MOSA Industrial Corp. | 13,000 | 14,579 | ||||||
| MPI Corp. | 11,000 | 42,227 | ||||||
| Nak Sealing Technologies Corp. | 3,000 | 6,600 | ||||||
| Namchow Holdings Co. Ltd. | 20,000 | 29,182 | ||||||
| Nan Kang Rubber Tire Co. Ltd. | 34,000 | 54,329 | ||||||
| Nan Liu Enterprise Co. Ltd. | 6,000 | 55,197 | ||||||
| Nan Pao Resins Chemical Co. Ltd. | 1,000 | 4,318 | ||||||
| Nan Ya Plastics Corp. | 50,000 | 104,617 | ||||||
| Nan Ya Printed Circuit Board Corp. | 3,000 | 12,269 | ||||||
| Nantex Industry Co. Ltd. | 11,000 | 17,556 | ||||||
| Nanya Technology Corp. | 30,000 | 52,872 | ||||||
Newmax Technology Co. Ltd.(1) | 1,000 | 1,563 | ||||||
| Nichidenbo Corp. | 23,000 | 35,492 | ||||||
| Nien Made Enterprise Co. Ltd. | 11,000 | 126,459 | ||||||
| Novatek Microelectronics Corp. | 13,000 | 106,044 | ||||||
| Nuvoton Technology Corp. | 2,000 | 2,912 | ||||||
| O-Bank Co. Ltd. | 68,000 | 15,810 | ||||||
Ocean Plastics Co. Ltd.(1) | 2,000 | 2,493 | ||||||
OptoTech Corp.(1) | 35,000 | 25,420 | ||||||
Orient Semiconductor Electronics Ltd.(1) | 65,000 | 23,980 | ||||||
| Oriental Union Chemical Corp. | 8,000 | 4,635 | ||||||
| P-Duke Technology Co. Ltd. | 2,000 | 4,590 | ||||||
| Pacific Hospital Supply Co. Ltd. | 1,198 | 3,062 | ||||||
| Paiho Shih Holdings Corp. | 1,000 | 1,020 | ||||||
| Pan Jit International, Inc. | 37,000 | 46,181 | ||||||
| Pan-International Industrial Corp. | 14,000 | 8,431 | ||||||
| Parade Technologies Ltd. | 2,000 | 70,539 | ||||||
| Pegatron Corp. | 132,000 | 280,868 | ||||||
| PharmaEngine, Inc. | 13,000 | 31,754 | ||||||
47
| Shares | Value | |||||||
PharmaEssentia Corp.(1) | 1,000 | $ | 3,879 | |||||
| Pharmally International Holding Co. Ltd. | 1,282 | 2,473 | ||||||
| Phison Electronics Corp. | 1,000 | 9,413 | ||||||
| Pixart Imaging, Inc. | 3,000 | 17,609 | ||||||
| Polytronics Technology Corp. | 2,000 | 5,167 | ||||||
| Pou Chen Corp. | 107,000 | 100,679 | ||||||
| Power Wind Health Industry, Inc. | 4,050 | 23,632 | ||||||
| Powertech Technology, Inc. | 67,000 | 196,678 | ||||||
| Poya International Co. Ltd. | 3,000 | 58,694 | ||||||
| President Chain Store Corp. | 17,000 | 156,462 | ||||||
| President Securities Corp. | 37,740 | 20,948 | ||||||
| Primax Electronics Ltd. | 29,000 | 44,020 | ||||||
| Prince Housing & Development Corp. | 108,000 | 37,664 | ||||||
| Promate Electronic Co. Ltd. | 2,000 | 2,258 | ||||||
| Prosperity Dielectrics Co. Ltd. | 7,000 | 12,827 | ||||||
| Qisda Corp. | 15,000 | 9,495 | ||||||
| Quang Viet Enterprise Co. Ltd. | 6,000 | 24,406 | ||||||
| Quanta Computer, Inc. | 149,000 | 390,130 | ||||||
| Quanta Storage, Inc. | 25,000 | 37,265 | ||||||
| Radiant Opto-Electronics Corp. | 42,000 | 154,499 | ||||||
| Radium Life Tech Co. Ltd. | 24,000 | 8,489 | ||||||
| Realtek Semiconductor Corp. | 19,000 | 245,590 | ||||||
| Rechi Precision Co. Ltd. | 2,000 | 1,351 | ||||||
| Rexon Industrial Corp. Ltd. | 1,000 | 3,414 | ||||||
| Rich Development Co. Ltd. | 92,000 | 29,311 | ||||||
Ritek Corp.(1) | 119,000 | 23,771 | ||||||
Roo Hsing Co. Ltd.(1) | 75,000 | 31,793 | ||||||
| Ruentex Development Co. Ltd. | 75,000 | 110,163 | ||||||
| Ruentex Engineering & Construction Co. | 1,000 | 2,063 | ||||||
| Ruentex Industries Ltd. | 28,000 | 66,277 | ||||||
| Ruentex Materials Co. Ltd. | 3,000 | 3,975 | ||||||
| Sampo Corp. | 50,000 | 39,619 | ||||||
| San Fang Chemical Industry Co. Ltd. | 13,000 | 9,231 | ||||||
San Far Property Ltd.(1) | 11,000 | 6,331 | ||||||
| San Shing Fastech Corp. | 17,000 | 26,056 | ||||||
| Sanyang Motor Co. Ltd. | 6,000 | 4,837 | ||||||
Savior Lifetec Corp.(1) | 7,000 | 8,330 | ||||||
| SCI Pharmtech, Inc. | 2,000 | 8,771 | ||||||
| ScinoPharm Taiwan Ltd. | 2,000 | 2,235 | ||||||
| SDI Corp. | 15,000 | 24,312 | ||||||
| Senao International Co. Ltd. | 1,000 | 988 | ||||||
| Senao Networks, Inc. | 1,000 | 3,159 | ||||||
| Sesoda Corp. | 8,640 | 6,938 | ||||||
| Shane Global Holding, Inc. | 1,000 | 3,681 | ||||||
| Shanghai Commercial & Savings Bank Ltd. (The) | 53,000 | 75,385 | ||||||
| Sheng Yu Steel Co. Ltd. | 7,000 | 4,297 | ||||||
| Shin Kong Financial Holding Co. Ltd. | 575,313 | 162,243 | ||||||
| Shin Zu Shing Co. Ltd. | 13,536 | 69,425 | ||||||
Shining Building Business Co. Ltd.(1) | 19,000 | 6,497 | ||||||
| Shinkong Insurance Co. Ltd. | 14,000 | 16,818 | ||||||
| Shinkong Synthetic Fibers Corp. | 109,000 | 45,226 | ||||||
| Shiny Chemical Industrial Co. Ltd. | 1,200 | 4,384 | ||||||
48
| Shares | Value | |||||||
| Sigurd Microelectronics Corp. | 58,063 | $ | 75,326 | |||||
| Silergy Corp. | 1,000 | 63,341 | ||||||
| Simplo Technology Co. Ltd. | 10,000 | 113,930 | ||||||
| Sinbon Electronics Co. Ltd. | 4,000 | 24,595 | ||||||
| Sincere Navigation Corp. | 44,060 | 23,890 | ||||||
| Sinmag Equipment Corp. | 1,000 | 2,640 | ||||||
| Sino-American Silicon Products, Inc. | 45,000 | 147,527 | ||||||
| Sinon Corp. | 62,000 | 44,555 | ||||||
| SinoPac Financial Holdings Co. Ltd. | 584,000 | 214,416 | ||||||
| Sinyi Realty, Inc. | 9,000 | 8,987 | ||||||
| Sitronix Technology Corp. | 13,000 | 63,654 | ||||||
| Soft-World International Corp. | 4,000 | 12,493 | ||||||
| Solar Applied Materials Technology Co. | 3,000 | 4,147 | ||||||
| Sonix Technology Co. Ltd. | 4,000 | 7,311 | ||||||
| Speed Tech Corp. | 1,000 | 4,183 | ||||||
| St Shine Optical Co. Ltd. | 4,000 | 40,288 | ||||||
| Standard Chemical & Pharmaceutical Co. Ltd. | 2,000 | 2,689 | ||||||
| Standard Foods Corp. | 18,000 | 39,031 | ||||||
| Stark Technology, Inc. | 14,000 | 29,558 | ||||||
| Sunjuice Holdings Co. Ltd. | 1,000 | 7,586 | ||||||
| Sunny Friend Environmental Technology Co. Ltd. | 1,000 | 8,378 | ||||||
| Sunonwealth Electric Machine Industry Co. Ltd. | 21,000 | 44,624 | ||||||
| Sunplus Technology Co. Ltd. | 25,000 | 10,526 | ||||||
| Sunrex Technology Corp. | 12,000 | 29,923 | ||||||
| Supreme Electronics Co. Ltd. | 45,000 | 45,628 | ||||||
| Swancor Holding Co. Ltd. | 4,000 | 19,268 | ||||||
| Sweeten Real Estate Development Co. Ltd. | 4,320 | 3,140 | ||||||
| Syncmold Enterprise Corp. | 11,000 | 30,993 | ||||||
| Synnex Technology International Corp. | 105,000 | 156,197 | ||||||
| Systex Corp. | 17,000 | 50,562 | ||||||
| TA Chen Stainless Pipe | 1,020 | 737 | ||||||
| Ta Ya Electric Wire & Cable | 64,000 | 32,509 | ||||||
| TA-I Technology Co. Ltd. | 8,750 | 20,653 | ||||||
| Taichung Commercial Bank Co. Ltd. | 205,140 | 77,903 | ||||||
| TaiDoc Technology Corp. | 1,000 | 6,969 | ||||||
| Taiflex Scientific Co. Ltd. | 22,000 | 38,622 | ||||||
Taigen Biopharmaceuticals Holdings Ltd.(1) | 2,000 | 1,588 | ||||||
TaiMed Biologics, Inc.(1) | 1,000 | 3,903 | ||||||
| Taimide Tech, Inc. | 1,000 | 2,368 | ||||||
| Tainan Spinning Co. Ltd. | 94,000 | 37,400 | ||||||
| Taishin Financial Holding Co. Ltd. | 494,174 | 222,860 | ||||||
| TaiSol Electronics Co. Ltd. | 10,000 | 22,743 | ||||||
| Taisun Enterprise Co. Ltd. | 4,000 | 3,123 | ||||||
| Taiwan Business Bank | 300,800 | 102,401 | ||||||
| Taiwan Cement Corp. | 315,004 | 459,705 | ||||||
| Taiwan Cogeneration Corp. | 28,000 | 35,715 | ||||||
| Taiwan Cooperative Financial Holding Co. Ltd. | 144,200 | 98,379 | ||||||
| Taiwan FamilyMart Co. Ltd. | 1,000 | 9,154 | ||||||
| Taiwan Fertilizer Co. Ltd. | 25,000 | 46,162 | ||||||
| Taiwan Fire & Marine Insurance Co. Ltd. | 8,000 | 5,369 | ||||||
| Taiwan FU Hsing Industrial Co. Ltd. | 11,000 | 16,108 | ||||||
Taiwan Glass Industry Corp.(1) | 72,000 | 28,168 | ||||||
49
| Shares | Value | |||||||
| Taiwan High Speed Rail Corp. | 84,000 | $ | 92,640 | |||||
| Taiwan Hon Chuan Enterprise Co. Ltd. | 29,000 | 57,971 | ||||||
Taiwan Land Development Corp.(1) | 30,000 | 7,964 | ||||||
| Taiwan Mask Corp. | 1,000 | 1,021 | ||||||
| Taiwan Mobile Co. Ltd. | 22,000 | 76,050 | ||||||
| Taiwan Navigation Co. Ltd. | 9,000 | 5,330 | ||||||
| Taiwan Paiho Ltd. | 16,000 | 42,908 | ||||||
| Taiwan PCB Techvest Co. Ltd. | 37,000 | 53,472 | ||||||
| Taiwan Sakura Corp. | 4,000 | 6,471 | ||||||
| Taiwan Secom Co. Ltd. | 27,000 | 78,175 | ||||||
| Taiwan Semiconductor Co. Ltd. | 14,000 | 17,850 | ||||||
| Taiwan Semiconductor Manufacturing Co. Ltd., ADR | 117,636 | 9,322,653 | ||||||
| Taiwan Shin Kong Security Co. Ltd. | 7,070 | 8,754 | ||||||
| Taiwan Steel Union Co. Ltd. | 1,000 | 2,415 | ||||||
| Taiwan Styrene Monomer | 30,000 | 16,053 | ||||||
| Taiwan Surface Mounting Technology Corp. | 23,000 | 92,858 | ||||||
Taiwan TEA Corp.(1) | 17,000 | 9,539 | ||||||
| Taiwan Union Technology Corp. | 6,000 | 24,249 | ||||||
| Taiyen Biotech Co. Ltd. | 6,000 | 6,253 | ||||||
Tatung Co. Ltd.(1) | 38,000 | 22,200 | ||||||
| TCI Co. Ltd. | 3,000 | 32,635 | ||||||
| Teco Electric and Machinery Co. Ltd. | 66,000 | 65,898 | ||||||
| Test Research, Inc. | 20,000 | 39,976 | ||||||
| Test Rite International Co. Ltd. | 33,000 | 25,376 | ||||||
| Thinking Electronic Industrial Co. Ltd. | 8,000 | 29,640 | ||||||
| Thye Ming Industrial Co. Ltd. | 9,000 | 8,689 | ||||||
Ton Yi Industrial Corp.(1) | 34,000 | 11,239 | ||||||
| Tong Hsing Electronic Industries Ltd. | 7,244 | 32,619 | ||||||
| Tong Yang Industry Co. Ltd. | 33,000 | 43,455 | ||||||
| Top Bright Holding Co. Ltd. | 3,000 | 13,455 | ||||||
| TOPBI International Holdings Ltd. | 3,446 | 4,101 | ||||||
| Topco Scientific Co. Ltd. | 14,000 | 57,085 | ||||||
| Topkey Corp. | 6,000 | 37,258 | ||||||
TPK Holding Co. Ltd.(1) | 26,000 | 43,548 | ||||||
| Trade-Van Information Services Co. | 2,000 | 3,170 | ||||||
| Transcend Information, Inc. | 16,000 | 35,879 | ||||||
| Tripod Technology Corp. | 32,000 | 126,008 | ||||||
| TSRC Corp. | 50,000 | 29,824 | ||||||
| Ttet Union Corp. | 1,000 | 4,034 | ||||||
| TTFB Co. Ltd. | 1,000 | 7,438 | ||||||
| TTY Biopharm Co. Ltd. | 2,000 | 4,724 | ||||||
| Tung Ho Steel Enterprise Corp. | 67,000 | 60,993 | ||||||
Tung Thih Electronic Co. Ltd.(1) | 1,000 | 3,116 | ||||||
| TXC Corp. | 17,000 | 44,583 | ||||||
| TYC Brother Industrial Co. Ltd. | 10,000 | 7,671 | ||||||
| U-Ming Marine Transport Corp. | 17,000 | 17,333 | ||||||
| Uni-President Enterprises Corp. | 111,000 | 251,797 | ||||||
| Unimicron Technology Corp. | 51,000 | 127,609 | ||||||
| Union Bank of Taiwan | 119,840 | 41,836 | ||||||
| Unitech Printed Circuit Board Corp. | 48,000 | 33,735 | ||||||
| United Integrated Services Co. Ltd. | 6,000 | 41,971 | ||||||
| United Microelectronics Corp. | 877,000 | 627,187 | ||||||
50
| Shares | Value | |||||||
United Renewable Energy Co. Ltd.(1) | 30,000 | $ | 11,763 | |||||
| Universal Cement Corp. | 12,000 | 7,949 | ||||||
| Universal Microwave Technology, Inc. | 1,000 | 2,633 | ||||||
Unizyx Holding Corp.(1) | 4,000 | 3,049 | ||||||
| UPC Technology Corp. | 97,000 | 42,232 | ||||||
| USI Corp. | 43,000 | 18,921 | ||||||
| Vanguard International Semiconductor Corp. | 33,000 | 105,025 | ||||||
| Ventec International Group Co. Ltd. | 6,000 | 17,479 | ||||||
| Visual Photonics Epitaxy Co. Ltd. | 1,000 | 2,618 | ||||||
| Vivotek, Inc. | 1,000 | 2,580 | ||||||
| Voltronic Power Technology Corp. | 2,000 | 70,418 | ||||||
| Wafer Works Corp. | 41,000 | 48,554 | ||||||
| Wah Lee Industrial Corp. | 2,000 | 3,851 | ||||||
| Walsin Lihwa Corp. | 277,000 | 158,607 | ||||||
| Walsin Technology Corp. | 23,000 | 124,921 | ||||||
| Wan Hai Lines Ltd. | 47,000 | 33,869 | ||||||
| Wei Chuan Foods Corp. | 20,000 | 14,193 | ||||||
| Weikeng Industrial Co. Ltd. | 18,000 | 11,038 | ||||||
| Well Shin Technology Co. Ltd. | 5,000 | 8,021 | ||||||
| Win Semiconductors Corp. | 12,000 | 116,492 | ||||||
| Winbond Electronics Corp. | 98,000 | 40,397 | ||||||
| Wisdom Marine Lines Co. Ltd. | 16,378 | 12,909 | ||||||
| Wistron Corp. | 224,000 | 242,773 | ||||||
| Wistron Information Technology & Services Corp. | 1,000 | 3,396 | ||||||
| Wiwynn Corp. | 5,000 | 132,890 | ||||||
| Wowprime Corp. | 10,000 | 24,505 | ||||||
| WPG Holdings Ltd. | 36,000 | 50,353 | ||||||
| WT Microelectronics Co. Ltd. | 11,000 | 14,623 | ||||||
| WUS Printed Circuit Co. Ltd. | 10,000 | 10,751 | ||||||
XinTec, Inc.(1) | 1,000 | 4,187 | ||||||
| Xxentria Technology Materials Corp. | 16,000 | 28,240 | ||||||
| Yageo Corp. | 10,000 | 113,021 | ||||||
Yang Ming Marine Transport Corp.(1) | 147,000 | 50,473 | ||||||
| YC INOX Co. Ltd. | 45,000 | 36,493 | ||||||
| Yem Chio Co. Ltd. | 5,000 | 2,611 | ||||||
| Yeong Guan Energy Technology Group Co. Ltd. | 1,000 | 3,529 | ||||||
| YFY, Inc. | 137,000 | 85,013 | ||||||
Yieh Phui Enterprise Co. Ltd.(1) | 51,000 | 16,475 | ||||||
| Youngtek Electronics Corp. | 15,000 | 29,454 | ||||||
| Yuan High-Tech Development Co. Ltd. | 4,000 | 44,996 | ||||||
| Yuanta Financial Holding Co. Ltd. | 479,440 | 299,740 | ||||||
| Yulon Finance Corp. | 13,200 | 44,775 | ||||||
Yulon Motor Co. Ltd.(1) | 95,000 | 81,606 | ||||||
| YungShin Global Holding Corp. | 3,000 | 4,496 | ||||||
| Zeng Hsing Industrial Co. Ltd. | 3,000 | 14,041 | ||||||
| Zhen Ding Technology Holding Ltd. | 30,000 | 125,190 | ||||||
Zinwell Corp.(1) | 3,000 | 1,892 | ||||||
| Zippy Technology Corp. | 3,000 | 3,611 | ||||||
| ZongTai Real Estate Development Co. Ltd. | 2,000 | 2,574 | ||||||
| 35,523,405 | ||||||||
| Thailand — 2.4% | ||||||||
| Advanced Info Service PCL, NVDR | 38,400 | 225,373 | ||||||
51
| Shares | Value | |||||||
| AEON Thana Sinsap Thailand PCL, NVDR | 3,000 | $ | 10,259 | |||||
| Airports of Thailand PCL, NVDR | 80,100 | 143,617 | ||||||
| Ananda Development PCL, NVDR | 53,000 | 2,477 | ||||||
| AP Thailand PCL, NVDR | 115,200 | 23,172 | ||||||
Asia Aviation PCL, NVDR(1) | 56,600 | 3,787 | ||||||
| Asia Sermkij Leasing PCL, NVDR | 19,600 | 11,628 | ||||||
| B Grimm Power PCL, NVDR | 54,200 | 80,342 | ||||||
| Bangchak Corp. PCL, NVDR | 69,300 | 39,256 | ||||||
| Bangkok Airways PCL, NVDR | 59,900 | 11,011 | ||||||
| Bangkok Bank PCL, NVDR | 43,300 | 147,565 | ||||||
| Bangkok Chain Hospital PCL, NVDR | 43,300 | 21,652 | ||||||
| Bangkok Dusit Medical Services PCL, NVDR | 141,900 | 94,616 | ||||||
| Bangkok Expressway & Metro PCL, NVDR | 149,500 | 43,291 | ||||||
| Bangkok Land PCL, NVDR | 879,400 | 27,858 | ||||||
| Bangkok Life Assurance PCL, NVDR | 97,200 | 50,063 | ||||||
| Banpu PCL, NVDR | 254,200 | 46,733 | ||||||
| Banpu Power PCL, NVDR | 27,900 | 12,775 | ||||||
| BCPG PCL, NVDR | 27,900 | 11,443 | ||||||
| Beauty Community PCL, NVDR | 243,500 | 10,750 | ||||||
BEC World PCL, NVDR(1) | 149,500 | 22,108 | ||||||
| Berli Jucker PCL, NVDR | 11,300 | 13,347 | ||||||
| BTS Group Holdings PCL, NVDR | 112,700 | 37,555 | ||||||
| Bumrungrad Hospital PCL, NVDR | 22,200 | 78,612 | ||||||
| Cal-Comp Electronics Thailand PCL, NVDR | 406,300 | 22,921 | ||||||
| Carabao Group PCL, NVDR | 10,500 | 40,977 | ||||||
| Central Pattana PCL, NVDR | 73,600 | 110,767 | ||||||
Central Plaza Hotel PCL, NVDR(1) | 18,100 | 15,653 | ||||||
Central Retail Corp. PCL, NVDR(1) | 29,266 | 27,817 | ||||||
| CH Karnchang PCL, NVDR | 36,500 | 22,511 | ||||||
| Charoen Pokphand Foods PCL, NVDR | 155,000 | 161,332 | ||||||
| Chularat Hospital PCL, NVDR | 242,600 | 20,229 | ||||||
CK Power PCL, NVDR(1) | 121,300 | 23,496 | ||||||
| Com7 PCL, NVDR | 51,500 | 67,713 | ||||||
CP ALL PCL, NVDR(1) | 132,900 | 271,875 | ||||||
| Diamond Building Products PCL, NVDR | 51,200 | 10,981 | ||||||
| Dynasty Ceramic PCL, NVDR | 278,500 | 23,052 | ||||||
| Eastern Polymer Group PCL, NVDR | 72,200 | 10,910 | ||||||
| Eastern Water Resources Development and Management PCL, NVDR | 43,300 | 13,834 | ||||||
| Electricity Generating PCL, NVDR | 5,700 | 40,558 | ||||||
| Energy Absolute PCL, NVDR | 60,000 | 80,571 | ||||||
| Erawan Group PCL (The), NVDR | 140,500 | 14,940 | ||||||
Esso Thailand PCL, NVDR(1) | 63,400 | 13,345 | ||||||
| GFPT PCL, NVDR | 52,500 | 21,877 | ||||||
| Gulf Energy Development PCL, NVDR | 16,200 | 16,361 | ||||||
| Gunkul Engineering PCL, NVDR | 535,200 | 43,537 | ||||||
| Hana Microelectronics PCL, NVDR | 51,900 | 66,083 | ||||||
| Home Product Center PCL, NVDR | 244,400 | 116,637 | ||||||
| Ichitan Group PCL, NVDR | 86,500 | 24,646 | ||||||
| Indorama Ventures PCL, NVDR | 23,000 | 17,402 | ||||||
| Intouch Holdings PCL, NVDR | 28,000 | 48,947 | ||||||
| IRPC PCL, NVDR | 804,700 | 60,195 | ||||||
52
| Shares | Value | |||||||
Italian-Thai Development PCL, NVDR(1) | 502,200 | $ | 16,686 | |||||
| Jasmine International PCL, NVDR | 382,100 | 35,502 | ||||||
| Jay Mart PCL, NVDR | 62,257 | 31,236 | ||||||
| JMT Network Services PCL, NVDR | 27,900 | 28,786 | ||||||
| JWD Infologistics PCL, NVDR | 61,400 | 14,851 | ||||||
| Kasikornbank PCL, NVDR | 11,300 | 30,460 | ||||||
| KCE Electronics PCL, NVDR | 37,600 | 35,185 | ||||||
| KGI Securities Thailand PCL, NVDR | 236,700 | 25,530 | ||||||
| Khon Kaen Sugar Industry PCL, NVDR | 124,100 | 8,116 | ||||||
| Kiatnakin Phatra Bank PCL, NVDR | 36,500 | 46,391 | ||||||
| Krung Thai Bank PCL, NVDR | 224,400 | 68,517 | ||||||
| Krungthai Card PCL, NVDR | 35,000 | 34,525 | ||||||
| Land & Houses PCL, NVDR | 112,700 | 26,611 | ||||||
| LPN Development PCL, NVDR | 87,800 | 13,940 | ||||||
| Major Cineplex Group PCL, NVDR | 59,700 | 33,476 | ||||||
| MBK PCL, NVDR | 61,700 | 24,733 | ||||||
| MC Group PCL, NVDR | 20,300 | 6,269 | ||||||
MCOT PCL, NVDR(1) | 1,000 | 147 | ||||||
| Mega Lifesciences PCL, NVDR | 51,400 | 62,112 | ||||||
Minor International PCL, NVDR(1) | 141,200 | 101,417 | ||||||
| MK Restaurants Group PCL, NVDR | 9,300 | 15,432 | ||||||
Muangthai Capital PCL, NVDR(1) | 48,900 | 77,930 | ||||||
| Namyong Terminal PCL, NVDR | 51,400 | 4,910 | ||||||
| Noble Development PCL, NVDR | 43,500 | 16,749 | ||||||
Nok Airlines PCL, NVDR(1) | 21,000 | 526 | ||||||
Origin Property PCL, NVDR(1) | 80,100 | 18,945 | ||||||
| Osotspa PCL, NVDR | 20,800 | 26,017 | ||||||
| Plan B Media PCL, NVDR | 59,900 | 10,509 | ||||||
| Polyplex Thailand PCL, NVDR | 42,700 | 34,074 | ||||||
Precious Shipping PCL, NVDR(1) | 68,800 | 10,306 | ||||||
| Property Perfect PCL, NVDR | 730,710 | 8,658 | ||||||
| PTG Energy PCL, NVDR | 87,800 | 54,136 | ||||||
| PTT Exploration & Production PCL, NVDR | 41,000 | 116,571 | ||||||
| PTT Global Chemical PCL, NVDR | 40,800 | 60,223 | ||||||
| PTT PCL, NVDR | 289,200 | 332,840 | ||||||
| Quality Houses PCL, NVDR | 664,400 | 47,289 | ||||||
| Rajthanee Hospital PCL, NVDR | 34,000 | 23,441 | ||||||
| Ratch Group PCL, NVDR | 37,200 | 66,815 | ||||||
| Ratchthani Leasing PCL, NVDR | 129,000 | 15,101 | ||||||
| Rojana Industrial Park PCL, NVDR | 122,000 | 16,809 | ||||||
| RS PCL, NVDR | 27,900 | 16,789 | ||||||
| Samart Corp. PCL, NVDR | 72,200 | 11,461 | ||||||
| Sansiri PCL, NVDR | 777,100 | 18,117 | ||||||
| Sappe PCL, NVDR | 2,500 | 1,376 | ||||||
| SEAFCO PCL, NVDR | 60,800 | 10,983 | ||||||
| Siam Cement PCL (The), NVDR | 13,900 | 157,543 | ||||||
| Siam Commercial Bank PCL (The), NVDR | 30,200 | 69,925 | ||||||
| Siam Future Development PCL, NVDR | 87,800 | 12,540 | ||||||
| Siam Global House PCL, NVDR | 122,495 | 80,446 | ||||||
| Siamgas & Petrochemicals PCL, NVDR | 64,200 | 18,403 | ||||||
| Sikarin PCL, NVDR | 21,100 | 4,067 | ||||||
| Sino-Thai Engineering & Construction PCL, NVDR | 87,800 | 37,013 | ||||||
53
| Shares | Value | |||||||
| Somboon Advance Technology PCL, NVDR | 27,900 | $ | 10,609 | |||||
| SPCG PCL, NVDR | 56,800 | 32,643 | ||||||
Sri Trang Agro-Industry PCL, NVDR(1) | 79,200 | 65,877 | ||||||
| Srisawad Corp. PCL, NVDR | 43,300 | 63,334 | ||||||
| Star Petroleum Refining PCL, NVDR | 87,800 | 19,199 | ||||||
| STP & I PCL, NVDR | 90,600 | 11,440 | ||||||
| Supalai PCL, NVDR | 121,000 | 65,117 | ||||||
| Super Energy Corp. PCL, NVDR | 2,098,300 | 55,131 | ||||||
| Taokaenoi Food & Marketing PCL, NVDR | 51,600 | 17,866 | ||||||
Thai Airways International PCL, NVDR(1) | 69,400 | 7,356 | ||||||
| Thai Oil PCL, NVDR | 59,900 | 79,359 | ||||||
| Thai Union Group PCL, NVDR | 262,200 | 118,365 | ||||||
| Thai Vegetable Oil PCL, NVDR | 45,000 | 39,128 | ||||||
| Thaifoods Group PCL, NVDR | 316,200 | 46,555 | ||||||
| Thanachart Capital PCL, NVDR | 11,300 | 11,647 | ||||||
| Thoresen Thai Agencies PCL, NVDR | 200,100 | 18,455 | ||||||
| Tipco Asphalt PCL, NVDR | 67,400 | 53,596 | ||||||
| Tisco Financial Group PCL, NVDR | 21,100 | 45,428 | ||||||
| TMB Bank PCL, NVDR | 1,642,100 | 49,406 | ||||||
| TOA Paint Thailand PCL, NVDR | 27,300 | 34,361 | ||||||
| Total Access Communication PCL, NVDR | 51,800 | 59,278 | ||||||
| TPI Polene PCL, NVDR | 400,700 | 16,179 | ||||||
| TPI Polene Power PCL, NVDR | 284,300 | 39,402 | ||||||
| TQM Corp. PCL, NVDR | 11,700 | 47,214 | ||||||
| True Corp. PCL, NVDR | 875,000 | 92,924 | ||||||
| TTW PCL, NVDR | 43,900 | 18,884 | ||||||
U City PCL, NVDR(1) | 508,700 | 22,417 | ||||||
| Unique Engineering & Construction PCL, NVDR | 129,200 | 20,427 | ||||||
| United Paper PCL, NVDR | 19,500 | 8,925 | ||||||
| Univentures PCL, NVDR | 26,000 | 2,398 | ||||||
| VGI PCL, NVDR | 146,900 | 32,832 | ||||||
| Vinythai PCL, NVDR | 25,000 | 19,001 | ||||||
| WHA Corp. PCL, NVDR | 149,900 | 15,340 | ||||||
| Workpoint Entertainment PCL, NVDR | 19,600 | 6,468 | ||||||
| 5,865,452 | ||||||||
| Turkey — 0.5% | ||||||||
Akbank T.A.S.(1) | 89,498 | 59,514 | ||||||
| Aksa Akrilik Kimya Sanayii AS | 20,299 | 18,512 | ||||||
Aksa Enerji Uretim AS(1) | 7,011 | 4,900 | ||||||
| Aksigorta AS | 3,110 | 3,084 | ||||||
Alarko Holding AS(1) | 4,087 | 2,745 | ||||||
Albaraka Turk Katilim Bankasi AS(1) | 30,642 | 6,080 | ||||||
| Anadolu Cam Sanayii AS | 4,571 | 3,171 | ||||||
| Anadolu Efes Biracilik Ve Malt Sanayii AS | 4,856 | 12,823 | ||||||
| Aselsan Elektronik Sanayi Ve Ticaret AS | 10,764 | 23,771 | ||||||
| AvivaSA Emeklilik ve Hayat AS | 1,929 | 3,362 | ||||||
| Aygaz AS | 4,238 | 6,587 | ||||||
| BIM Birlesik Magazalar AS | 11,900 | 109,853 | ||||||
Borusan Mannesmann Boru Sanayi ve Ticaret AS(1) | 2,241 | 3,759 | ||||||
| Brisa Bridgestone Sabanci Sanayi ve Ticaret AS | 2,541 | 3,935 | ||||||
Cimsa Cimento Sanayi VE Ticaret AS(1) | 2,951 | 4,590 | ||||||
| Coca-Cola Icecek AS | 4,176 | 24,624 | ||||||
54
| Shares | Value | |||||||
| Deva Holding AS | 4,011 | $ | 10,756 | |||||
| Dogan Sirketler Grubu Holding AS | 93,300 | 26,642 | ||||||
| Dogus Otomotiv Servis ve Ticaret AS | 2,247 | 4,493 | ||||||
| EIS Eczacibasi Ilac ve Sinai ve Finansal Yatirimlar Sanayi ve Ticaret AS | 9,914 | 8,029 | ||||||
| Eregli Demir ve Celik Fabrikalari TAS | 57,191 | 67,697 | ||||||
| Ford Otomotiv Sanayi AS | 1,813 | 20,833 | ||||||
Gubre Fabrikalari TAS(1) | 5,436 | 21,961 | ||||||
| Haci Omer Sabanci Holding AS | 59,555 | 62,654 | ||||||
Ipek Dogal Enerji Kaynaklari Arastirma Ve Uretim AS(1) | 18,108 | 28,577 | ||||||
| Is Yatirim Menkul Degerler AS | 27,641 | 30,550 | ||||||
| Kardemir Karabuk Demir Celik Sanayi ve Ticaret AS, Class D | 91,540 | 37,940 | ||||||
| KOC Holding AS | 13,033 | 26,426 | ||||||
Koza Altin Isletmeleri AS(1) | 1,658 | 17,527 | ||||||
Koza Anadolu Metal Madencilik Isletmeleri AS(1) | 26,003 | 45,440 | ||||||
Logo Yazilim Sanayi Ve Ticaret AS(1) | 385 | 4,880 | ||||||
Mavi Giyim Sanayi Ve Ticaret AS, B Shares(1) | 1,303 | 6,587 | ||||||
Migros Ticaret AS(1) | 5,382 | 28,713 | ||||||
| Nuh Cimento Sanayi AS | 7,942 | 20,089 | ||||||
Pegasus Hava Tasimaciligi AS(1) | 4,230 | 26,350 | ||||||
Petkim Petrokimya Holding AS(1) | 11,589 | 6,168 | ||||||
Sekerbank Turk AS(1) | 19,517 | 3,660 | ||||||
| Selcuk Ecza Deposu Ticaret ve Sanayi A.S. | 19,071 | 20,727 | ||||||
| Soda Sanayii AS | 18,840 | 17,455 | ||||||
Sok Marketler Ticaret AS(1) | 10,284 | 17,976 | ||||||
| TAV Havalimanlari Holding AS | 14,498 | 29,580 | ||||||
| Tekfen Holding AS | 12,719 | 25,669 | ||||||
| Trakya Cam Sanayii AS | 40,041 | 21,425 | ||||||
Tupras Turkiye Petrol Rafinerileri AS(1) | 3,136 | 34,110 | ||||||
Turk Hava Yollari AO(1) | 39,528 | 56,787 | ||||||
| Turk Traktor ve Ziraat Makineleri AS | 790 | 10,048 | ||||||
| Turkcell Iletisim Hizmetleri AS, ADR | 16,422 | 80,139 | ||||||
Turkiye Garanti Bankasi AS(1) | 80,409 | 73,951 | ||||||
Turkiye Halk Bankasi AS(1) | 49,552 | 33,109 | ||||||
Turkiye Is Bankasi AS, C Shares(1) | 67,909 | 45,368 | ||||||
Turkiye Sinai Kalkinma Bankasi AS(1) | 142,600 | 21,128 | ||||||
Ulusoy Elektrik Imalat Taahhut Ve Ticaret AS(1) | 777 | 4,326 | ||||||
Vestel Elektronik Sanayi ve Ticaret AS(1) | 11,329 | 28,317 | ||||||
Zorlu Enerji Elektrik Uretim AS(1) | 12,683 | 4,652 | ||||||
| 1,322,049 | ||||||||
TOTAL COMMON STOCKS (Cost $215,906,620) | 245,187,997 | |||||||
RIGHTS† | ||||||||
Brazil† | ||||||||
Banco ABC Brasil SA(1) | 104 | 49 | ||||||
Chile† | ||||||||
Cia Sud Americana de Vapores SA(1) | 200,213 | 773 | ||||||
South Korea† | ||||||||
LVMC Holdings(1) | 728 | 873 | ||||||
Thailand† | ||||||||
Gulf Energy Development PCL, NVDR(1) | 1,620 | 78 | ||||||
55
| Shares | Value | |||||||
Ratchthani Leasing PCL, NVDR(1) | 64,500 | $ | 5,513 | |||||
| 5,591 | ||||||||
TOTAL RIGHTS (Cost $6,356) | 7,286 | |||||||
WARRANTS† | ||||||||
Malaysia† | ||||||||
Serba Dinamik Holdings Bhd(1) | 3,660 | 206 | ||||||
Thailand† | ||||||||
BTS Group Holdings PCL, NVDR(1) | 4,630 | 132 | ||||||
Jay Mart PCL No. 3, NVDR(1) | 6,384 | 1,149 | ||||||
Jay Mart PCL No. 4, NVDR(1) | 6,384 | 808 | ||||||
Minor International PCL, NVDR(1) | 6,418 | 2,031 | ||||||
Srisawad Corp. PCL, NVDR(1) | 1,732 | 1 | ||||||
| 4,121 | ||||||||
TOTAL WARRANTS (Cost $—) | 4,327 | |||||||
| TEMPORARY CASH INVESTMENTS — 0.1% | ||||||||
| State Street Institutional U.S. Government Money Market Fund, Premier Class (Cost $190,727) | 190,727 | 190,727 | ||||||
TEMPORARY CASH INVESTMENTS - SECURITIES LENDING COLLATERAL(3) — 0.1% | ||||||||
| State Street Navigator Securities Lending Government Money Market Portfolio (Cost $204,078) | 204,078 | 204,078 | ||||||
TOTAL INVESTMENT SECURITIES — 100.1% (Cost $216,307,781) | 245,594,415 | |||||||
| OTHER ASSETS AND LIABILITIES — (0.1)% | (148,677) | |||||||
| TOTAL NET ASSETS — 100.0% | $ | 245,445,738 | ||||||
| MARKET SECTOR DIVERSIFICATION | |||||
(as a % of net assets) | |||||
| Information Technology | 17.2 | % | |||
| Consumer Discretionary | 16.1 | % | |||
| Financials | 16.1 | % | |||
| Communication Services | 10.4 | % | |||
| Materials | 9.9 | % | |||
| Industrials | 7.6 | % | |||
| Consumer Staples | 5.9 | % | |||
| Energy | 5.5 | % | |||
| Health Care | 4.8 | % | |||
| Real Estate | 3.7 | % | |||
| Utilities | 2.7 | % | |||
| Cash and Equivalents* | 0.1 | % | |||
*Includes temporary cash investments, temporary cash investments - securities lending collateral and other assets and liabilities.
56
| NOTES TO SCHEDULE OF INVESTMENTS | ||||||||
| ADR | - | American Depositary Receipt | ||||||
| GDR | - | Global Depositary Receipt | ||||||
| NVDR | - | Non-Voting Depositary Receipt | ||||||
† Category is less than 0.05% of total net assets.
(1)Non-income producing.
(2)Security, or a portion thereof, is on loan. At the period end, the aggregate value of securities on loan was $2,277,175. The amount of securities on loan indicated may not correspond with the securities on loan identified because securities with pending sales are in the process of recall from the brokers.
(3)Investment of cash collateral from securities on loan. At the period end, the aggregate value of the collateral held by the fund was $2,497,265, which includes securities collateral of $2,293,187.
See Notes to Financial Statements.
57
| Statement of Assets and Liabilities | ||
| AUGUST 31, 2020 | |||||
| Assets | |||||
| Investment securities, at value (cost of $216,103,703) — including $2,277,175 of securities on loan | $ | 245,390,337 | |||
| Investment made with cash collateral received for securities on loan, at value (cost of $204,078) | 204,078 | ||||
| Total investment securities, at value (cost of $216,307,781) | 245,594,415 | ||||
| Foreign currency holdings, at value (cost of $90,361) | 90,779 | ||||
| Dividends and interest receivable | 352,530 | ||||
| Securities lending receivable | 4,343 | ||||
| 246,042,067 | |||||
| Liabilities | |||||
| Disbursements in excess of demand deposit cash | 1,418 | ||||
| Payable for collateral received for securities on loan | 204,078 | ||||
| Payable for investments purchased | 154,778 | ||||
| Accrued management fees | 68,604 | ||||
| Accrued foreign taxes | 167,451 | ||||
| 596,329 | |||||
| Net Assets | $ | 245,445,738 | |||
| Shares outstanding (unlimited number of shares authorized) | 4,700,000 | ||||
| Net Asset Value Per Share | $ | 52.22 | |||
| Net Assets Consist of: | |||||
| Capital paid in | $ | 216,143,126 | |||
| Distributable earnings | 29,302,612 | ||||
| $ | 245,445,738 | ||||
See Notes to Financial Statements.
58
| Statement of Operations | ||
FOR THE PERIOD ENDED AUGUST 31, 2020(1) | |||||
| Investment Income (Loss) | |||||
| Income: | |||||
| Dividends (net of foreign taxes withheld of $560,827) | $ | 4,176,992 | |||
| Securities lending, net | 21,611 | ||||
| Interest | 917 | ||||
| 4,199,520 | |||||
| Expenses: | |||||
| Management fees | 422,970 | ||||
| Other expenses | 3,027 | ||||
| 425,997 | |||||
| Net investment income (loss) | 3,773,523 | ||||
| Realized and Unrealized Gain (Loss) | |||||
| Net realized gain (loss) on: | |||||
| Investment transactions | (1,805,547) | ||||
| Futures contract transactions | 60,629 | ||||
| Foreign currency translation transactions | 27,922 | ||||
| (1,716,996) | |||||
| Change in net unrealized appreciation (depreciation) on: | |||||
| Investments (includes (increase) decrease in accrued foreign taxes of $(167,451)) | 29,119,183 | ||||
| Translation of assets and liabilities in foreign currencies | 9 | ||||
| 29,119,192 | |||||
| Net realized and unrealized gain (loss) | 27,402,196 | ||||
| Net Increase (Decrease) in Net Assets Resulting from Operations | $ | 31,175,719 | |||
(1)September 17, 2019 (fund inception) through August 31, 2020.
See Notes to Financial Statements.
59
| Statement of Changes in Net Assets | ||
PERIOD ENDED AUGUST 31, 2020(1) | |||||
| Increase (Decrease) in Net Assets | |||||
| Operations | |||||
| Net investment income (loss) | $ | 3,773,523 | |||
| Net realized gain (loss) | (1,716,996) | ||||
| Change in net unrealized appreciation (depreciation) | 29,119,192 | ||||
| Net increase (decrease) in net assets resulting from operations | 31,175,719 | ||||
| Distributions to Shareholders | |||||
| From earnings | (1,873,420) | ||||
| Capital Share Transactions | |||||
| Proceeds from shares sold | 216,143,439 | ||||
| Net increase (decrease) in net assets | 245,445,738 | ||||
| Net Assets | |||||
| End of period | $ | 245,445,738 | |||
| Transactions in Shares of the Fund | |||||
| Sold | 4,700,000 | ||||
(1)September 17, 2019 (fund inception) through August 31, 2020.
See Notes to Financial Statements.
60
| Notes to Financial Statements | ||
AUGUST 31, 2020
1. Organization
American Century ETF Trust (the trust) was registered as a Delaware statutory trust in 2017 and is registered under the Investment Company Act of 1940, as amended (the 1940 Act), as an open-end management investment company. Avantis Emerging Markets Equity ETF (the fund) is one fund in a series issued by the trust. The fund's investment objective is to seek long-term capital appreciation. Shares of the fund are listed for trading on the NYSE Arca, Inc. The fund incepted on September 17, 2019.
2. Significant Accounting Policies
The following is a summary of significant accounting policies consistently followed by the fund in preparation of its financial statements. The fund is an investment company and follows accounting and reporting guidance in accordance with accounting principles generally accepted in the United States of America. This may require management to make certain estimates and assumptions at the date of the financial statements. Actual results could differ from these estimates. Management evaluated the impact of events or transactions occurring through the date the financial statements were issued that would merit recognition or disclosure.
Investment Valuations — The fund determines the fair value of its investments and computes its net asset value per share at the close of regular trading (usually 4 p.m. Eastern time) on the New York Stock Exchange (NYSE) on each day the NYSE is open. The Board of Trustees has adopted valuation policies and procedures to guide the investment advisor in the fund’s investment valuation process and to provide methodologies for the oversight of the fund’s pricing function.
Equity securities that are listed or traded on a domestic securities exchange are valued at the last reported sales price or at the official closing price as provided by the exchange. Equity securities traded on foreign securities exchanges are generally valued at the closing price of such securities on the exchange where primarily traded or at the close of the NYSE, if that is earlier. If no last sales price is reported, or if local convention or regulation so provides, the mean of the latest bid and asked prices may be used. Securities traded over-the-counter are valued at the mean of the latest bid and asked prices, the last sales price, or the official closing price. Equity securities initially expressed in local currencies are translated into U.S. dollars at the mean of the appropriate currency exchange rate at the close of the NYSE as provided by an independent pricing service.
Open-end management investment companies are valued at the reported net asset value per share. Exchange-traded futures contracts are valued at the settlement price as provided by the appropriate exchange.
If the fund determines that the market price for an investment is not readily available or the valuation methods mentioned above do not reflect an investment’s fair value, such investment is valued as determined in good faith by the Board of Trustees or its delegate, in accordance with policies and procedures adopted by the Board of Trustees. In its determination of fair value, the fund may review several factors including, but not limited to, market information regarding the specific investment or comparable investments and correlation with other investment types, futures indices or general market indicators. Circumstances that may cause the fund to use these procedures to value an investment include, but are not limited to: an investment has been declared in default or is distressed; trading in a security has been suspended during the trading day or a security is not actively trading on its principal exchange; prices received from a regular pricing source are deemed unreliable; or there is a foreign market holiday and no trading occurred.
The fund monitors for significant events occurring after the close of an investment’s primary exchange but before the fund’s net asset value per share is determined. Significant events may include, but are not limited to: corporate announcements and transactions; governmental action and political unrest that could impact a specific investment or an investment sector; or armed conflicts, natural disasters and similar events that could affect investments in a specific country or region. The fund also monitors for significant fluctuations between domestic and foreign markets, as evidenced by the U.S. market or such other indicators that the Board of Trustees, or its delegate, deems appropriate. The fund may apply a model-derived factor to the closing price of equity securities traded on foreign securities exchanges. The factor is based on observable market data as provided by an independent pricing service.
61
Security Transactions — Security transactions are accounted for as of the trade date. Net realized gains and losses are determined on the identified cost basis, which is also used for federal income tax purposes. Certain countries impose taxes on realized gains on the sale of securities registered in their country. The fund records the foreign tax expense, if any, on an accrual basis. The foreign tax expense on realized gains and unrealized appreciation reduces the net realized gain (loss) on investment transactions and net unrealized appreciation (depreciation) on investments, respectively.
Investment Income — Dividend income less foreign taxes withheld, if any, is recorded as of the ex-dividend date. Distributions received on securities that represent a return of capital or long-term capital gain are recorded as a reduction of cost of investments and/or as a realized gain. The fund may estimate the components of distributions received that may be considered nontaxable distributions or long-term capital gain distributions for income tax purposes. Interest income is recorded on the accrual basis and includes accretion of discounts and amortization of premiums. Securities lending income is net of fees and rebates earned by the lending agent for its services.
Foreign Currency Translations — All assets and liabilities initially expressed in foreign currencies are translated into U.S. dollars at prevailing exchange rates at period end. The fund may enter into spot foreign currency exchange contracts to facilitate transactions denominated in a foreign currency. Purchases and sales of investment securities, dividend and interest income, spot foreign currency exchange contracts, and expenses are translated at the rates of exchange prevailing on the respective dates of such transactions. Net realized and unrealized foreign currency exchange gains or losses related to investment securities are a component of net realized gain (loss) on investment transactions and change in net unrealized appreciation (depreciation) on investments, respectively.
Segregated Assets — In accordance with the 1940 Act, the fund segregates assets on its books and records to cover certain types of investment securities and other financial instruments. American Century Investment Management, Inc. (ACIM) (the investment advisor) monitors, on a daily basis, the securities segregated to ensure the fund designates a sufficient amount of liquid assets, marked-to-market daily. The fund may also receive assets or be required to pledge assets at the custodian bank or with a broker for collateral requirements.
Income Tax Status — It is the fund’s policy to distribute substantially all net investment income and net realized gains to shareholders and to otherwise qualify as a regulated investment company under provisions of the Internal Revenue Code. Accordingly, no provision has been made for income taxes. The fund files U.S. federal, state, local and non-U.S. tax returns as applicable. The fund's tax returns are subject to examination by the relevant taxing authority until expiration of the applicable statute of limitations, which is generally three years from the date of filing but can be longer in certain jurisdictions. At this time, management believes there are no uncertain tax positions which, based on their technical merit, would not be sustained upon examination and for which it is reasonably possible that the total amounts of unrecognized tax benefits will significantly change in the next twelve months.
Distributions to Shareholders — Distributions from net investment income, if any, are generally declared and paid semiannually. Distributions from net realized gains, if any, are generally declared and paid annually.
Indemnifications — Under the trust’s organizational documents, its officers and trustees are indemnified against certain liabilities arising out of the performance of their duties to the fund. In addition, in the normal course of business, the fund enters into contracts that provide general indemnifications. The maximum exposure under these arrangements is unknown as this would involve future claims that may be made against a fund. The risk of material loss from such claims is considered by management to be remote.
62
Securities Lending — Securities are lent to qualified financial institutions and brokers. State Street Bank & Trust Co. serves as securities lending agent to the fund pursuant to a Securities Lending Agreement. The lending of securities exposes the fund to risks such as: the borrowers may fail to return the loaned securities, the borrowers may not be able to provide additional collateral, the fund may experience delays in recovery of the loaned securities or delays in access to collateral, or the fund may experience losses related to the investment collateral. To minimize certain risks, loan counterparties pledge collateral in the form of cash and/or securities. The lending agent has agreed to indemnify the fund in the case of default of any securities borrowed. Cash collateral received is invested in the State Street Navigator Securities Lending Government Money Market Portfolio, a money market mutual fund registered under the 1940 Act. The loans may also be secured by U.S. government securities in an amount at least equal to the market value of the securities loaned, plus accrued interest and dividends, determined on a daily basis and adjusted accordingly. By lending securities, the fund seeks to increase its net investment income through the receipt of interest and fees. Such income is reflected separately within the Statement of Operations. The value of loaned securities and related collateral outstanding at period end, if any, are shown on a gross basis within the Schedule of Investments and Statement of Assets and Liabilities.
The following table reflects a breakdown of transactions accounted for as secured borrowings, the gross obligation by the type of collateral pledged, and the remaining contractual maturity of those transactions as of August 31, 2020.
| Remaining Contractual Maturity of Agreements | |||||||||||||||||
| Overnight and Continuous | <30 days | Between 30 & 90 days | >90 days | Total | |||||||||||||
Securities Lending Transactions(1) | |||||||||||||||||
| Common Stocks | $ | 204,078 | — | — | — | $ | 204,078 | ||||||||||
| Gross amount of recognized liabilities for securities lending transactions | $ | 204,078 | |||||||||||||||
(1)Amount represents the payable for cash collateral received for securities on loan. This will generally be in the Overnight and Continuous column as the securities are typically callable on demand.
3. Fees and Transactions with Related Parties
Certain officers and trustees of the trust are also officers and/or directors of American Century Companies, Inc. (ACC). The trust's investment advisor, ACIM, and the trust’s administrator, American Century Services, LLC, are wholly owned, directly or indirectly, by ACC. Various funds issued by American Century Strategic Asset Allocations, Inc. own, in aggregate, 31% of the shares of the fund. Related parties do not invest in the fund for the purpose of exercising management or control.
Management Fees — The trust has entered into a management agreement with ACIM, under which ACIM provides the fund with investment advisory and management services in exchange for a single, unified management fee (the fee). The agreement provides that ACIM will pay all expenses of managing and operating the fund, except brokerage and other transaction fees and expenses relating to the acquisition and disposition of portfolio securities, acquired fund fees and expenses, interest, taxes, litigation expenses and extraordinary expenses. The fee is computed and accrued daily based on the daily net assets of the fund and paid monthly in arrears. The annual management fee is 0.33%.
4. Investment Transactions
Purchases and sales of investment securities, excluding short-term investments and in-kind transactions, for the period ended August 31, 2020 were $140,323,546 and $10,184,035, respectively.
Securities received in-kind through subscriptions for the period ended August 31, 2020 were $87,476,808. There were no securities delivered in-kind through redemptions during the period.
63
5. Capital Share Transactions
The fund’s shares may only be purchased and sold on a national securities exchange through a broker-dealer. The price of the fund’s shares is based on market price, and because ETF shares trade at market prices rather than net asset value (NAV), shares may trade at a price greater than NAV (a premium) or less than NAV (a discount). The fund issues and redeems shares that have been aggregated into blocks of 50,000 shares or multiples thereof (Creation Units) to authorized participants who have entered into agreements with the fund's distributor. The fund will generally issue and redeem Creation Units in return for a basket of securities (and an amount of cash) that the fund specifies each day. Investors transacting in Creation Units for cash may also pay an additional variable charge to compensate the fund for certain transaction costs and market impact expenses relating to investing in portfolio securities. Such variable charges, if any, are included in proceeds from shares sold in the Statement of Changes in Net Assets.
6. Fair Value Measurements
The fund’s investments valuation process is based on several considerations and may use multiple inputs to determine the fair value of the investments held by the fund. In conformity with accounting principles generally accepted in the United States of America, the inputs used to determine a valuation are classified into three broad levels.
•Level 1 valuation inputs consist of unadjusted quoted prices in an active market for identical investments.
•Level 2 valuation inputs consist of direct or indirect observable market data (including quoted prices for comparable investments, evaluations of subsequent market events, interest rates, prepayment speeds, credit risk, etc.). These inputs also consist of quoted prices for identical investments initially expressed in local currencies that are adjusted through translation into U.S. dollars.
•Level 3 valuation inputs consist of unobservable data (including a fund’s own assumptions).
The level classification is based on the lowest level input that is significant to the fair valuation measurement. The valuation inputs are not necessarily an indication of the risks associated with investing in these securities or other financial instruments.
The following is a summary of the level classifications as of period end. The Schedule of Investments provides additional information on the fund’s portfolio holdings.
| Level 1 | Level 2 | Level 3 | |||||||||
| Assets | |||||||||||
| Investment Securities | |||||||||||
| Common Stocks | |||||||||||
| Brazil | $ | 5,344,327 | $ | 8,472,369 | — | ||||||
| Chile | 466,356 | 1,045,178 | — | ||||||||
| China | 29,323,221 | 62,682,514 | — | ||||||||
| Colombia | 256,476 | 487,328 | — | ||||||||
| India | 4,489,907 | 18,736,127 | — | ||||||||
| Indonesia | 440,712 | 3,981,394 | — | ||||||||
| Mexico | 1,479,722 | 3,494,945 | — | ||||||||
| Peru | 768,266 | — | — | ||||||||
| Philippines | 105,252 | 1,900,876 | — | ||||||||
| Russia | 311,872 | 6,146,450 | — | ||||||||
| South Africa | 2,995,444 | 7,451,551 | — | ||||||||
| South Korea | 2,285,519 | 30,678,855 | — | ||||||||
| Taiwan | 10,198,147 | 25,325,258 | — | ||||||||
| Turkey | 80,139 | 1,241,910 | — | ||||||||
| Other Countries | — | 14,997,882 | — | ||||||||
| Rights | — | 7,286 | — | ||||||||
| Warrants | — | 4,327 | — | ||||||||
| Temporary Cash Investments | 190,727 | — | — | ||||||||
| Temporary Cash Investments - Securities Lending Collateral | 204,078 | — | — | ||||||||
| $ | 58,940,165 | $ | 186,654,250 | — | |||||||
64
7. Derivative Instruments
Equity Price Risk — The fund is subject to equity price risk in the normal course of pursuing its investment objectives. A fund may enter into futures contracts based on an equity index in order to manage its exposure to changes in market conditions. A fund may purchase futures contracts to gain exposure to increases in market value or sell futures contracts to protect against a decline in market value. Upon entering into a futures contract, a fund is required to deposit either cash or securities in an amount equal to a certain percentage of the contract value (initial margin). Subsequent payments (variation margin) are made or received daily, in cash, by a fund. The variation margin is equal to the daily change in the contract value and is recorded as unrealized gains and losses. A fund recognizes a realized gain or loss when the contract is closed or expires. Net realized and unrealized gains or losses occurring during the holding period of futures contracts are a component of net realized gain (loss) on futures contract transactions and change in net unrealized appreciation (depreciation) on futures contracts, respectively. One of the risks of entering into futures contracts is the possibility that the change in value of the contract may not correlate with the changes in value of the underlying securities. During the period, the fund participated in equity price risk derivative instruments for temporary investment purposes.
At period end, the fund did not have any derivative instruments disclosed on the Statement of Assets and Liabilities. For the period from September 17, 2019 (fund inception) through August 31, 2020, the effect of equity price risk derivative instruments on the Statement of Operations was $60,629 in net realized gain (loss) on futures contract transactions.
8. Risk Factors
The value of the fund’s shares will go up and down, sometimes rapidly or unpredictably, based on the performance of the securities owned by the fund and other factors generally affecting the securities market. Market risks, including political, regulatory, economic and social developments, can affect the value of the fund’s investments. Natural disasters, public health emergencies, terrorism and other unforeseeable events may lead to increased market volatility and may have adverse long-term effects on world economies and markets generally.
There are certain risks involved in investing in foreign securities. These risks include those resulting from political events (such as civil unrest, national elections and imposition of exchange controls), social and economic events (such as labor strikes and rising inflation), and natural disasters. Securities of foreign issuers may be less liquid and more volatile. Investing in emerging markets or a significant portion of assets in one country or region may accentuate these risks.
9. Federal Tax Information
The tax character of distributions paid during the period September 17, 2019 (fund inception) through August 31, 2020 were as follows:
| Distributions Paid From | |||||
| Ordinary income | $ | 1,873,420 | |||
| Long-term capital gains | — | ||||
The book-basis character of distributions made during the year from net investment income or net realized gains may differ from their ultimate characterization for federal income tax purposes. These differences reflect the differing character of certain income items and net realized gains and losses for financial statement and tax purposes, and may result in reclassification among certain capital accounts on the financial statements.
65
As of period end, the federal tax cost of investments and the components of distributable earnings on a tax-basis were as follows:
| Federal tax cost of investments | $ | 217,215,298 | |||
| Gross tax appreciation of investments | $ | 42,806,534 | |||
| Gross tax depreciation of investments | (14,427,417) | ||||
| Net tax appreciation (depreciation) of investments | 28,379,117 | ||||
| Net tax appreciation (depreciation) on derivatives and translation of assets and liabilities in foreign currencies | (167,442) | ||||
| Net tax appreciation (depreciation) | $ | 28,211,675 | |||
| Undistributed ordinary income | $ | 2,640,560 | |||
| Accumulated short-term capital losses | $ | (1,549,623) | |||
The difference between book-basis and tax-basis unrealized appreciation (depreciation) is attributable primarily to the realization to ordinary income for tax purposes of unrealized gains on investments in passive foreign investment companies.
Accumulated capital losses represent net capital loss carryovers that may be used to offset future realized capital gains for federal income tax purposes. The capital loss carryovers may be carried forward for an unlimited period. Future capital loss carryover utilization in any given year may be subject to Internal Revenue Code limitations.
66
| Financial Highlights | ||
| For a Share Outstanding Throughout the Period Indicated | |||||||||||||||||||||||||||||||||||
| Per-Share Data | Ratios and Supplemental Data | ||||||||||||||||||||||||||||||||||
| Income From Investment Operations: | Ratio to Average Net Assets of: | ||||||||||||||||||||||||||||||||||
| Net Asset Value, Beginning of Period | Net Investment Income (Loss)(1) | Net Realized and Unrealized Gain (Loss) | Total From Investment Operations | Distributions From Net Investment Income | Net Asset Value, End of Period | Total Return(2) | Operating Expenses | Net Investment Income (Loss) | Portfolio Turnover Rate(3) | Net Assets, End of Period (in thousands) | |||||||||||||||||||||||||
2020(4) | $50.00 | 1.35 | 1.41 | 2.76 | (0.54) | $52.22 | 5.57% | 0.33%(5) | 2.95%(5) | 8% | $245,446 | ||||||||||||||||||||||||
| Notes to Financial Highlights | ||
(1)Computed using average shares outstanding throughout the period.
(2)Total returns are calculated based on the net asset value of the last business day. Total returns for periods less than one year are not annualized.
(3)Excludes securities received or delivered in-kind.
(4)September 17, 2019 (fund inception) through August 31, 2020.
(5)Annualized.
See Notes to Financial Statements.
| Report of Independent Registered Public Accounting Firm | ||
To the Shareholders and the Board of Trustees of American Century ETF Trust:
Opinion on the Financial Statements and Financial Highlights
We have audited the accompanying statement of assets and liabilities, including the schedule of investments, of Avantis® Emerging Markets Equity ETF (the “Fund”), one of the funds constituting the American Century ETF Trust, as of August 31, 2020, and the related statement of operations, the statement of changes in net assets, and the financial highlights for the period from September 17, 2019 (fund inception) through August 31, 2020, and the related notes. In our opinion, the financial statements and financial highlights present fairly, in all material respects, the financial position of Avantis® Emerging Markets Equity ETF as of August 31, 2020, and the results of its operations, the changes in its net assets, and the financial highlights for the period from September 17, 2019 (fund inception) through August 31, 2020, in conformity with accounting principles generally accepted in the United States of America.
Basis for Opinion
These financial statements and financial highlights are the responsibility of the Fund's management. Our responsibility is to express an opinion on the Fund’s financial statements and financial highlights based on our audit. We are a public accounting firm registered with the Public Company Accounting Oversight Board (United States) (PCAOB) and are required to be independent with respect to the Fund in accordance with the U.S. federal securities laws and the applicable rules and regulations of the Securities and Exchange Commission and the PCAOB.
We conducted our audit in accordance with the standards of the PCAOB. Those standards require that we plan and perform the audit to obtain reasonable assurance about whether the financial statements and financial highlights are free of material misstatement, whether due to error or fraud. The Fund is not required to have, nor were we engaged to perform, an audit of its internal control over financial reporting. As part of our audit we are required to obtain an understanding of internal control over financial reporting but not for the purpose of expressing an opinion on the effectiveness of the Fund’s internal control over financial reporting. Accordingly, we express no such opinion.
Our audit included performing procedures to assess the risks of material misstatement of the financial statements and financial highlights, whether due to error or fraud, and performing procedures that respond to those risks. Such procedures included examining, on a test basis, evidence regarding the amounts and disclosures in the financial statements and financial highlights. Our audit also included evaluating the accounting principles used and significant estimates made by management, as well as evaluating the overall presentation of the financial statements and financial highlights. Our procedures included confirmation of securities owned as of August 31, 2020, by correspondence with the custodian and brokers; when replies were not received from brokers, we performed other auditing procedures. We believe that our audit provides a reasonable basis for our opinion.
DELOITTE & TOUCHE LLP
Kansas City, Missouri
October 16, 2020
We have served as the auditor of one or more American Century investment companies since 1997.
68
| Management | ||
The Board of Trustees
The individuals listed below serve as trustees of the funds. Each trustee will continue to serve in this capacity until death, retirement, resignation or removal from office. The board has adopted a mandatory retirement age for trustees who are not “interested persons,” as that term is defined in the Investment Company Act (independent trustees). Trustees who are not also officers of the trust shall retire by December 31st of the year in which they reach their 75th birthday.
Mr. Thomas is an “interested person” because he currently serves as President and Chief Executive Officer of American Century Companies, Inc. (ACC), the parent company of American Century Investment Management, Inc. (ACIM or the advisor). The other trustees are independent. They are not employees, directors or officers of, and have no financial interest in, ACC or any of its wholly owned, direct or indirect, subsidiaries, including ACIM and American Century Services, LLC (ACS), and they do not have any other affiliations, positions or relationships that would cause them to be considered “interested persons” under the Investment Company Act. The following trustees also serve in this capacity for a number of other registered investment companies in the American Century Investments family of funds: Jonathan S. Thomas, 15; Ronald J. Gilson, 8; and Stephen E. Yates, 7.
The following table presents additional information about the trustees. The mailing address for each trustee other than Jonathan S. Thomas is 330 Madison Avenue, New York, New York 10017. The mailing address for Jonathan S. Thomas is 4500 Main Street, Kansas City, Missouri 64111.
| Name (Year of Birth) | Position(s) Held with Funds | Length of Time Served | Principal Occupation(s) During Past 5 Years | Number of American Century Portfolios Overseen by Trustee | Other Directorships Held During Past 5 Years | ||||||||||||
| Independent Trustees | |||||||||||||||||
| Reginald M. Browne (1968) | Trustee and Chairman of the Board | Since 2017 (Chairman since 2019) | Principal, GTS Securities (automated capital markets trading firm)(2019 to present); Senior Managing Director, Co Global Head-ETF Group, Cantor Fitzgerald (financial services firm)(2013 to 2019) | 19 | None | ||||||||||||
| Ronald J. Gilson (1946) | Trustee | Since 2017 | Charles J. Meyers Professor of Law and Business, Emeritus, Stanford Law School (1979 to 2016); Marc and Eva Stern Professor of Law and Business, Columbia University School of Law (1992 to present) | 59 | None | ||||||||||||
| Barry A. Mendelson (1958) | Trustee | Since 2017 | Retired; Consultant regarding ETF and mutual fund matters (2015 to 2016); Principal and Senior Counsel, The Vanguard Group (investment management)(1998 to 2014) | 19 | None | ||||||||||||
| Stephen E. Yates (1948) | Trustee | Since 2017 | Retired | 82 | None | ||||||||||||
69
| Name (Year of Birth) | Position(s) Held with Funds | Length of Time Served | Principal Occupation(s) During Past 5 Years | Number of American Century Portfolios Overseen by Trustee | Other Directorships Held During Past 5 Years | ||||||||||||
| Interested Trustees | |||||||||||||||||
| Jonathan S. Thomas (1963) | Trustee | Since 2017 | President and Chief Executive Officer, ACC (2007 to present). Also serves as Chief Executive Officer, ACS; Executive Vice President, ACIM; Director, ACC, ACIM and other ACC subsidiaries | 122 | None | ||||||||||||
The Statement of Additional Information has additional information about the fund's trustees and is available without charge, upon request, by calling 1-800-345-6488.
70
Officers
The following table presents certain information about the executive officers of the funds. Each officer, except Edward Rosenberg, serves as an officer for each of the 16 investment companies in the American Century family of funds. No officer is compensated for his or her service as an officer of the funds. The listed officers are interested persons of the funds and are appointed or re-appointed on an annual basis. The mailing address for each officer listed below is 4500 Main Street, Kansas City, Missouri 64111.
| Name (Year of Birth) | Offices with the Funds | Principal Occupation(s) During the Past Five Years | ||||||
| Patrick Bannigan (1965) | President since 2019 | Executive Vice President and Director, ACC (2012 to present); Chief Financial Officer, Chief Accounting Officer and Treasurer, ACC (2015 to present). Also serves as President, ACS; Vice President, ACIM; Chief Financial Officer, Chief Accounting Officer and/or Director, ACIM, ACS and other ACC subsidiaries | ||||||
| R. Wes Campbell (1974) | Chief Financial Officer and Treasurer since 2018 | Vice President, ACS (2020 to present); Investment Operations and Investment Accounting, ACS (2000 to present) | ||||||
| Amy D. Shelton (1964) | Chief Compliance Officer and Vice President since 2017 | Chief Compliance Officer, American Century funds, (2014 to present); Chief Compliance Officer, ACIM (2014 to present); Chief Compliance Officer, ACIS (2009 to present). Also serves as Vice President, ACIS | ||||||
| Charles A. Etherington (1957) | General Counsel and Vice President since 2017 | Attorney, ACC (1994 to present); Vice President, ACC (2005 to present); General Counsel, ACC (2007 to present). Also serves as General Counsel, ACIM, ACS, ACIS and other ACC subsidiaries; and Senior Vice President, ACIM and ACS | ||||||
| Cleo Chang (1977) | Vice President since 2019 | Senior Vice President, ACIM (2015 to present); Chief Investment Officer, Wilshire Funds Management (2005 to 2015) | ||||||
| David H. Reinmiller (1963) | Vice President since 2017 | Attorney, ACC (1994 to present). Also serves as Vice President, ACIM and ACS | ||||||
| Edward Rosenberg (1973) | Vice President since 2017 | Senior Vice President, ACIM (2017 to present); Senior Vice President, Flexshares Head of ETF Capital Markets, Northern Trust (2012 to 2017) | ||||||
| C. Jean Wade (1964) | Vice President since 2017 | Senior Vice President, ACS (2017 to present); Vice President, ACS (2000 to 2017) | ||||||
| Ward D. Stauffer (1960) | Secretary since 2019 | Attorney, ACS (2003 to present) | ||||||
71
| Approval of Management Agreement | ||
At a meeting held on June 5, 2020, the Fund’s Board of Trustees (the "Board") unanimously approved the renewal of the management agreement pursuant to which American Century Investment Management, Inc. (the “Advisor”) acts as the investment advisor for the Fund. Under Section 15(c) of the Investment Company Act, contracts for investment advisory services are required to be reviewed, evaluated, and approved by a majority of a fund’s trustees (the “Trustees”), including a majority of the independent Trustees, each year.
Prior to its consideration of the renewal of the management agreement, the Trustees requested and reviewed extensive data and information compiled by the Advisor and certain independent providers of evaluation data concerning the Fund and the services provided to the Fund by the Advisor. This review was in addition to the oversight and evaluation undertaken by the Board and its Audit Committee on a continual basis and the information received was supplemental to the extensive information that the Board and its Audit Committee receive and consider throughout the year.
In connection with its consideration of the renewal of the management agreement, the Board’s review and evaluation of the services provided by the Advisor included, but was not limited to, the following:
•the nature, extent, and quality of investment management and other services provided and to be provided to the Fund;
•the wide range of other programs and services provided and to be provided to the Fund and its shareholders on a routine and non-routine basis;
•the Fund’s investment performance, including data comparing the Fund's performance to appropriate benchmarks of funds with similar objectives and strategies;
•the cost of owning the Fund compared to the cost of owning similar funds;
•the compliance policies, procedures, and regulatory experience of the Advisor and the Fund's service providers;
•the Advisor’s strategic plans;
•the Advisor’s business continuity plans and specifically its response to the COVID-19 pandemic;
•financial data showing the cost of services provided to the Fund, the profitability of the Fund to the Advisor, and the overall profitability of the Advisor;
•information regarding payments to intermediaries by the Advisor; and
•possible economies of scale associated with the Advisor’s management of the Fund; and
•possible collateral benefits to the Advisor from the management of the Fund.
The independent Trustees met separately in private session to discuss the renewal and to review and discuss the information provided in response to their request. The independent Trustees also held active discussions with the Advisor regarding the renewal of the management agreement. The independent Trustees had the benefit of the advice of their independent counsel throughout the process.
Factors Considered
The Trustees considered all of the information provided by the Advisor, the independent data providers, and independent counsel in connection with the approval. They determined that the information was sufficient for them to evaluate the management agreement for the Fund. In connection with their review, the Trustees did not identify any single factor as being all-important or
72
controlling, and each Trustee may have attributed different levels of importance to different factors. In deciding to renew the management agreement, the Board based its decision on a number of factors, including without limitation the following:
Nature, Extent and Quality of Services — Generally. Under the management agreement, the Advisor is responsible for providing or arranging for all services necessary for the operation of the Fund. The Board noted that the Advisor provides or arranges at its own expense a wide variety of services including without limitation the following:
•constructing and designing the Fund
•portfolio research and security selection
•initial capitalization/funding
•securities trading
•Fund administration
•custody of Fund assets
•daily valuation of the Fund’s portfolio
•shareholder servicing and transfer agency, including shareholder confirmations, recordkeeping, and communications
•legal services (except the independent Trustees’ counsel)
•regulatory and portfolio compliance
•financial reporting
•marketing and distribution (except amounts paid by the Fund under Rule 12b-1 plans)
Investment Management Services. The nature of the investment management services provided to the Fund is quite complex and allows Fund shareholders access to professional money management, instant diversification of their investments within an asset class, and liquidity. In evaluating investment performance, the Board expects the Advisor to manage the Fund in accordance with its investment objectives and approved strategies. Further, the Trustees recognize that the Advisor has an obligation to monitor trading activities, and in particular to seek the best execution of fund trades, and to evaluate the use of and payment for research. In providing these services, the Advisor utilizes teams of investment professionals (portfolio managers, analysts, research assistants, and securities traders) who require extensive information technology, research, training, compliance, and other systems to conduct their business. The Board provides oversight of the investment performance process. It regularly reviews investment performance information for the Fund, together with comparative information for appropriate benchmarks over different time horizons. The Trustees also review investment performance information during the management agreement renewal process. If performance concerns are identified, the Board discusses with the Advisor the reasons for such results and any efforts being undertaken to improve performance. The Fund’s performance since inception reviewed by the Board was below its benchmark. The Board found the investment management services provided by the Advisor to the Fund to be satisfactory and consistent with the management agreement.
Shareholder and Other Services. Under the management agreement, the Advisor provides or arranges for a comprehensive package of services to the Fund. The Board, directly and through its Audit Committee, regularly reviews reports and evaluations of such services at its regular meetings. These reports include, but are not limited to, information regarding the operational efficiency and accuracy of the shareholder and transfer agency services provided, staffing levels, shareholder satisfaction, technology support (including cyber security), new products and services offered to Fund shareholders, securities trading activities, portfolio valuation services, auditing services, and legal and operational compliance activities. The Board found the services provided by the Advisor to the Fund under the management agreement to be competitive and of high quality.
73
COVID-19 Response. During 2020, much of the world experienced unprecedented change and challenges from the impacts of the rapidly evolving, worldwide spread of the COVID-19 virus. The Board evaluated the Advisor’s response to the COVID-19 pandemic and its impact on service to the Fund. The Board found that Fund shareholders have continued to receive the Advisor’s investment management and other services without disruption, and Advisor personnel have demonstrated great resiliency in providing those services. The Board, directly and through its Audit Committee, continues to monitor the impact of the pandemic and the response of each of the Fund’s service providers.
Costs of Services and Profitability. The Advisor provides detailed information concerning its cost of providing various services to the Fund, its profitability in managing the Fund (pre- and post-distribution), its overall profitability, and its financial condition. The Trustees have reviewed with the Advisor the methodology used to prepare this financial information. This information is considered in evaluating the Advisor’s financial condition, its ability to continue to provide services under the management agreement, and the reasonableness of the current management fee. The Board concluded that the Advisor’s profits were reasonable in light of the services provided to the Fund.
Ethics. The Board generally considers the Advisor’s commitment to providing quality services to the Fund and to conducting its business ethically. They noted that the Advisor’s practices generally meet or exceed industry best practices.
Economies of Scale. The Board also reviewed information provided by the Advisor regarding the possible existence of economies of scale in connection with the management of the Fund. The Board concluded that economies of scale are difficult to measure and predict with precision, especially on a fund-by-fund basis. The Board concluded that the Advisor is appropriately sharing economies of scale, to the extent they exist, through its competitive fee structure, offering competitive fees from fund inception, and through reinvestment in its business, infrastructure, investment capabilities and initiatives to provide shareholders additional content and services.
Comparison to Other Funds’ Fees. The management agreement provides that the Fund pays the Advisor a single, all-inclusive (or unified) management fee for providing all services necessary for the management and operation of the Fund, other than brokerage expenses, expenses attributable to short sales, taxes, interest, extraordinary expenses, and expenses incurred in connection with the provision of shareholder services and distribution services under a plan adopted pursuant to Rule 12b-1 under the Investment Company Act. Under the unified fee structure, the Advisor is responsible for providing all investment advisory, custody, audit, administrative, compliance, recordkeeping, marketing and shareholder services, or arranging and supervising third parties to provide such services. The Board believes the unified fee structure is a benefit to Fund shareholders because it clearly discloses to shareholders the cost of owning Fund shares, and, since the unified fee cannot be increased without a vote of Fund shareholders, it shifts to the Advisor the risk of increased costs of operating the Fund and provides a direct incentive to minimize administrative inefficiencies. Part of the Board’s analysis of fee levels involves reviewing certain evaluative data compiled by an independent provider comparing the Fund’s unified fee to the total expense ratios of its peers. The unified fee charged to shareholders of the Fund was below the median of the total expense ratios of the Fund’s peer expense universe and was the lowest of its peer expense group. The Board concluded that the management fee paid by the Fund to the Advisor under the management agreement is reasonable in light of the services provided to the Fund.
Comparison to Fees and Services Provided to Other Clients of the Advisor. The Board also requested information from the Advisor concerning the nature of the services, fees, costs, and profitability of its advisory services to funds or other advisory clients managed similarly to the Fund. The Advisor informed the Trustees that, as of December 31, 2019, it did not provide services to any other investment companies or comparable accounts that were managed similarly to the Fund.
74
Payments to Intermediaries. The Trustees also requested a description of payments made to intermediaries by the Fund and the Advisor and services provided in response thereto. These payments could include various payments made by the Fund or the Advisor to different types of intermediaries and recordkeepers for distribution and service activities provided for the Fund. The Trustees reviewed such information and received representations from the Advisor that all such payments by the Advisor were made from the Advisor’s resources and reasonable profits. The Board found such payments to be reasonable in scope and purpose.
Collateral or “Fall-Out” Benefits Derived by the Advisor. The Board considered the possible existence of collateral benefits the Advisor may receive as a result of its relationship with the Fund. They concluded that the Advisor’s primary business is managing funds and it generally does not use fund or shareholder information to generate profits in other lines of business, and therefore does not derive any significant collateral benefits from them. The Board noted that additional assets from other clients may offer the Advisor some benefit from increased leverage with service providers and counterparties. The Board also determined that the Advisor is able to provide investment management services to certain clients other than the Fund, at least in part, due to its existing infrastructure built to serve the fund complex. The Board concluded that appropriate allocation methodologies had been employed to assign resources and the cost of those resources to these other clients.
Existing Relationship. The Board also considered whether there was any reason for not continuing the existing arrangement with the Advisor. In this regard, the Board was mindful of the potential disruptions of the Fund’s operations and various risks, uncertainties, and other effects that could occur as a result of a decision not to continue such relationship. In particular, the Board recognized that most shareholders have invested in the Fund on the strength of the Advisor’s industry standing and reputation and in the expectation that the Advisor will have a continuing role in providing advisory services to the Fund.
Conclusion of the Trustees. As a result of this process, the Board, including all of the independent Trustees, taking into account all of the factors discussed above and the information provided by the Advisor and others in connection with its review and throughout the year, determined that the management fee is fair and reasonable in light of the services provided and that the investment management agreement between the Fund and the Advisor should be renewed.
75
| Liquidity Risk Management Program | ||
The Fund has adopted a liquidity risk management program (the “program”). The Fund’s Board of Trustees (the "Board") has designated American Century Investment Management, Inc. (“ACIM”) as the administrator of the program. Personnel of ACIM or its affiliates conduct the day-to-day operation of the program pursuant to policies and procedures administered by those members of the ACIM’s Investment Oversight Committee who are members of the ACIM’s Investment Management and Global Analytics departments.
Under the program, ACIM manages the Fund’s liquidity risk, which is the risk that the Fund could not meet shareholder redemption requests without significant dilution of remaining shareholders’ interests in the Fund. This risk is managed by monitoring the degree of liquidity of the Fund’s investments, limiting the amount of the Fund’s illiquid investments, and utilizing various risk management tools and facilities available to the Fund for meeting shareholder redemptions, among other means. ACIM’s process of determining the degree of liquidity of the Fund’s investments is supported by one or more third-party liquidity assessment vendors.
The Board reviewed a report prepared by ACIM regarding the operation and effectiveness of the program for the period December 1, 2018 through December 31, 2019. No significant liquidity events impacting the Fund were noted in the report. In addition, ACIM provided its assessment that the program had been effective in managing the Fund’s liquidity risk.
76
| Additional Information | ||
Retirement Account Information
As required by law, distributions you receive from certain retirement accounts are subject to federal income tax withholding, unless you elect not to have withholding apply*. Tax will be withheld on the total amount withdrawn even though you may be receiving amounts that are not subject to withholding, such as nondeductible contributions. In such case, excess amounts of withholding could occur. You may adjust your withholding election so that a greater or lesser amount will be withheld.
Remember, even if you elect not to have income tax withheld, you are liable for paying income tax on the taxable portion of your withdrawal. If you elect not to have income tax withheld or you don’t have enough income tax withheld, you may be responsible for payment of estimated tax. You may incur penalties under the estimated tax rules if your withholding and estimated tax payments are not sufficient. You can reduce or defer the income tax on a distribution by directly or indirectly rolling such distribution over to another IRA or eligible plan. You should consult your tax advisor for additional information.
State tax will be withheld if, at the time of your distribution, your address is within one of the mandatory withholding states and you have federal income tax withheld (or as otherwise required by state law). State taxes will be withheld from your distribution in accordance with the respective state rules.
*Some 403(b), 457 and qualified retirement plan distributions may be subject to 20% mandatory withholding, as they are subject to special tax and withholding rules. Your plan administrator or plan sponsor is required to provide you with a special tax notice explaining those rules at the time you request a distribution. If applicable, federal and/or state taxes may be withheld from your distribution amount.
Proxy Voting Policies
A description of the policies that the fund's investment advisor uses in exercising the voting rights associated with the securities purchased and/or held by the fund are available without charge, upon request, by calling 1-800-345-6488. It is also available on American Century Investments’ website at americancentury.com/proxy and on the Securities and Exchange Commission’s website at sec.gov. Information regarding how the investment advisor voted proxies relating to portfolio securities during the most recent 12-month period ended June 30 is available at americancentury.com/proxy. It is also available at sec.gov.
Quarterly Portfolio Disclosure
The fund files its complete schedule of portfolio holdings with the Securities and Exchange Commission (SEC) for the first and third quarters of each fiscal year as an exhibit to its reports on Form N-PORT. The fund's Form N-PORT reports are available on the SEC’s website at sec.gov.
77
Other Tax Information
The following information is provided pursuant to provisions of the Internal Revenue Code.
The fund hereby designates up to the maximum amount allowable as qualified dividend income for the fiscal year ended August 31, 2020.
For the fiscal year ended August 31, 2020, the fund intends to pass through to shareholders foreign source income of $4,732,870 and foreign taxes paid of $552,369, or up to the maximum amount allowable, as a foreign tax credit. Foreign source income and foreign tax expense per outstanding share on August 31, 2020 are $1.0070 and $0.1175, respectively.
78
| Notes | ||
79
| Notes | ||
80
| ||||||||
| Contact Us | avantisinvestors.com | |||||||
| American Century Sales Representatives, Financial Professionals, Broker Dealers, Insurance Companies, Banks and Trust Companies | 1-833-928-2684 | |||||||
| Telecommunications Relay Service for the Deaf | 711 | |||||||
| American Century ETF Trust | ||||||||
Investment Advisor: American Century Investment Management, Inc. Kansas City, Missouri | ||||||||
Distributor: Foreside Fund Services, LLC - Distributor, not affiliated with American Century Investment Services, Inc. | ||||||||
| This report and the statements it contains are submitted for the general information of our shareholders. The report is not authorized for distribution to prospective investors unless preceded or accompanied by an effective prospectus. | ||||||||
| ©2020 American Century Proprietary Holdings, Inc. All rights reserved. CL-ANN-96042 2010 | ||||||||
| Annual Report | |||||
| August 31, 2020 | |||||
Avantis® International Equity ETF (AVDE) | |||||
Beginning on January 1, 2021, as permitted by regulations adopted by the Securities and Exchange Commission, paper copies of the fund’s shareholder reports like this one will no longer be sent by mail, unless you specifically request paper copies of the reports from the fund or from your financial intermediary, such as a broker-dealer or bank. Instead, the reports will be made available on a website, and you will be notified by mail each time a report is posted and provided with a website link to access the report.
If you already elected to receive shareholder reports electronically, you will not be affected by this change and you need not take any action. You may elect to receive shareholder reports and other communications from the fund or your financial intermediary electronically by calling or sending an email request to your appropriate contacts as listed on the back cover of this report.
You may elect to receive all future reports in paper free of charge. You can inform the fund or your financial intermediary that you wish to continue receiving paper copies of your shareholder reports by calling or sending an email request to your appropriate contacts as listed on the back cover of this report. Your election to receive reports in paper will apply to all funds held with the fund complex/your financial intermediary.
| Table of Contents | ||
| Chairman’s Letter | |||||
| Performance | |||||
| Portfolio Commentary | |||||
| Fund Characteristics | |||||
| Shareholder Fee Example | |||||
| Schedule of Investments | |||||
| Statement of Assets and Liabilities | |||||
| Statement of Operations | |||||
| Statement of Changes in Net Assets | |||||
| Notes to Financial Statements | |||||
| Financial Highlights | |||||
| Report of Independent Registered Public Accounting Firm | |||||
| Management | |||||
| Approval of Management Agreement | |||||
| Liquidity Risk Management Program | |||||
| Additional Information | |||||
Any opinions expressed in this report reflect those of the author as of the date of the report, and do not necessarily represent the opinions of American Century Investments® or any other person in the American Century Investments organization. Any such opinions are subject to change at any time based upon market or other conditions and American Century Investments disclaims any responsibility to update such opinions. These opinions may not be relied upon as investment advice and, because investment decisions made by American Century Investments funds are based on numerous factors, may not be relied upon as an indication of trading intent on behalf of any American Century Investments fund. Security examples are used for representational purposes only and are not intended as recommendations to purchase or sell securities. Performance information for comparative indices and securities is provided to American Century Investments by third party vendors. To the best of American Century Investments’ knowledge, such information is accurate at the time of printing.
| Chairman's Letter | ||
Jonathan ThomasDear Investor:
Thank you for reviewing this annual report for the period ended August 31, 2020. Annual reports help convey important information about fund returns, including market factors that affected performance. For additional investment insights, please visit avantisinvestors.com.
Pandemic Disrupted Economic, Market Courses
Broad market sentiment was generally upbeat early in the period. Dovish central banks, modest inflation, improving economic and corporate earnings data, and progress on U.S.-China trade helped boost global growth outlooks. Against this backdrop, stocks largely remained in favor.
However, beginning in late February, COVID-19 quickly quashed the optimistic tone. The outbreak rapidly spread worldwide, halting most U.S. and global economic activity and triggering a deep worldwide recession. Global stocks sold off sharply, but central banks and federal governments stepped in quickly and aggressively to stabilize financial markets. These extraordinary efforts proved helpful, as most stocks rebounded quickly. As the period progressed, coronavirus infection and death rates declined in many regions and economies reopened. By the end of August, manufacturing, employment and other data suggested an economic recovery was underway.
Overall, global stocks delivered mixed results for the period. U.S. stocks generally advanced and fared better than their counterparts elsewhere. The growth style significantly outperformed value stocks, which struggled.
A Slow Return to Normal
The return to pre-pandemic life will take time and patience, but we are confident we will get there. Several drug companies are in final stages of vaccine trials, and medical professionals continue to fine-tune virus treatment protocols. In the meantime, investors likely will face periods of outbreak-related disruptions, economic and political uncertainty, and heightened market volatility. These influences can be unsettling, but they tend to be temporary.
We appreciate your confidence in us during these extraordinary times. Our investment professionals have experience weathering unpredictable markets, and we’re confident we will continue to meet today’s challenges.
Sincerely,
Jonathan Thomas
Chairman
Avantis Investors
2
| Performance | ||
| Total Returns as of August 31, 2020 | |||||||||||||||||||||||
| Since Inception | Inception Date | ||||||||||||||||||||||
| Net Asset Value | 1.52% | 9/24/2019 | |||||||||||||||||||||
| Market Price | 1.90% | 9/24/2019 | |||||||||||||||||||||
| MSCI World ex USA IMI Index | 3.08% | — | |||||||||||||||||||||
Market price is determined using the bid/ask midpoint at 4:00 p.m. Eastern time, when the net asset value (NAV) is typically calculated. Market performance does not represent the returns you would receive if you traded shares at other times. NAV prices are used to calculate market price performance prior to the date when the fund first traded on the New York Stock Exchange.
| Growth of $10,000 Over Life of Fund | ||
| $10,000 investment made September 24, 2019 | ||

| Value on August 31, 2020 | |||||
| Net Asset Value — $10,152 | |||||
| MSCI World ex USA IMI Index — $10,308 | |||||
| Total Annual Fund Operating Expenses | |||||||||||||||||
| 0.23% | |||||||||||||||||
The total annual fund operating expenses shown is as stated in the fund’s prospectus current as of the date of this report. The prospectus may vary from the expense ratio shown elsewhere in this report because it is based on a different time period, includes acquired fund fees and expenses, and, if applicable, does not include fee waivers or expense reimbursements.
Data presented reflect past performance. Past performance is no guarantee of future results. Current performance may be higher or lower than the performance shown. Total returns for periods less than one year are not annualized. Investment return and principal value will fluctuate, and redemption value may be more or less than original cost. Data assumes reinvestment of dividends and capital gains, and none of the charts reflect the deduction of taxes that a shareholder would pay on fund distributions or the redemption of fund shares. To obtain performance data current to the most recent month end, please call 1-833-928-2684 or visit avantisinvestors.com. For additional information about the fund, please consult the prospectus.
3
| Portfolio Commentary | ||
Portfolio Managers: Eduardo Repetto, Mitch Firestein, Daniel Ong and Ted Randall
Fund Strategy
Avantis International Equity ETF seeks long-term capital appreciation by investing in a diverse group of non-U.S. companies across countries, market sectors, industry groups and market capitalizations.
The fund seeks securities of companies that it expects to have higher returns. It places an emphasis on the securities of companies with smaller market capitalizations and securities of companies it defines as high profitability or value companies. Conversely, the fund seeks to underweight or exclude securities it expects to have lower returns. This includes securities of large companies with lower levels of profitability and higher prices relative to their book values or other financial metrics. Under normal market conditions, the fund will invest at least 80% of its assets in equity securities.
The portfolio is an actively managed exchange-traded fund (ETF) that does not seek to replicate the performance of a specified index. The portfolio managers continually analyze market and financial data to make buy, sell and hold decisions. When buying or selling a security, the portfolio managers may consider the trade-off between expected returns of the security and implementation or tax costs of the trade. They do this in an attempt to gain trading efficiencies, avoid unnecessary risk and enhance portfolio performance.
Performance Review
For the period from Avantis International Equity ETF’s inception on September 24, 2019, through the fund’s fiscal year-end on August 31, 2020, the fund returned 1.90%* on a market price basis. On a net asset value (NAV) basis, the fund returned 1.52%. NAV and market price returns reflect fees and operating expenses, while index returns do not.
For the same time period, the fund underperformed the total non-U.S. developed markets stock universe, as measured by the MSCI World ex-USA IMI Index, which returned 3.08%. The MSCI World ex-USA IMI Index is an unmanaged index generally representative of the performance of non-U.S. developed markets stocks across capitalization categories. The underperformance versus the index was largely due to the fund’s emphasis on companies with higher levels of profitability and lower prices relative to their book values. These companies generally underperformed companies with lower levels of profitability and higher prices relative to their book values.
For example, value stocks (as measured by the MSCI World ex-USA IMI Value Index) returned -7.89% for the reporting period, underperforming growth stocks, which returned 14.18% (as measured by the MSCI World ex-USA IMI Growth Index).
*Total returns for periods less than one year are not annualized.
4
| Fund Characteristics | ||
| AUGUST 31, 2020 | |||||
| Top Ten Holdings | % of net assets | ||||
| Novartis AG, ADR | 1.2% | ||||
| Roche Holding AG, ADR | 1.2% | ||||
| Nestle SA, ADR | 0.9% | ||||
| Toyota Motor Corp., ADR | 0.7% | ||||
| Reckitt Benckiser Group plc | 0.6% | ||||
| Novo Nordisk A/S, ADR | 0.5% | ||||
| Royal Dutch Shell plc* | 0.5% | ||||
| AstraZeneca plc, ADR | 0.5% | ||||
| LVMH Moet Hennessy Louis Vuitton SE | 0.5% | ||||
| Sony Corp., ADR | 0.5% | ||||
| *Includes all classes of the issuer held by the fund. | |||||
| Types of Investments in Portfolio | % of net assets | ||||
| Common Stocks | 99.7% | ||||
| Rights | —* | ||||
| Total Equity Exposure | 99.7% | ||||
| Temporary Cash Investments | 0.8% | ||||
| Temporary Cash Investments - Securities Lending Collateral | 1.1% | ||||
| Other Assets and Liabilities | (1.6)% | ||||
*Category is less than 0.05% of total net assets.
| Investments by Country | % of net assets | ||||
| Japan | 22.8% | ||||
| United Kingdom | 12.9% | ||||
| Canada | 9.6% | ||||
| France | 8.8% | ||||
| Switzerland | 8.7% | ||||
| Germany | 8.1% | ||||
| Australia | 6.4% | ||||
| Netherlands | 3.6% | ||||
| Sweden | 3.5% | ||||
| Hong Kong | 2.9% | ||||
| Italy | 2.2% | ||||
| Denmark | 2.2% | ||||
| Spain | 2.0% | ||||
| Other Countries | 6.0% | ||||
| Cash and Equivalents* | 0.3% | ||||
*Includes temporary cash investments, temporary cash investments - securities lending collateral and other assets and liabilities.
5
| Shareholder Fee Example | ||
Fund shareholders may incur two types of costs: (1) transaction costs, including brokerage commissions paid on purchases and sales of fund shares; and (2) ongoing costs, including management fees and other fund expenses. This example is intended to help you understand your ongoing costs (in dollars) of investing in your fund and to compare these costs with the ongoing cost of investing in other funds.
The example is based on an investment of $1,000 made at the beginning of the period and held for the entire period from March 1, 2020 to August 31, 2020.
Actual Expenses
The table provides information about actual account values and actual expenses. You may use the information, together with the amount you invested, to estimate the expenses that you paid over the period. Simply divide your account value by $1,000 (for example, an $8,600 account value divided by $1,000 = 8.6), then multiply the result by the number under the heading “Expenses Paid During Period” to estimate the expenses you paid on your account during this period.
Hypothetical Example for Comparison Purposes
The table also provides information about hypothetical account values and hypothetical expenses based on the actual expense ratio of your fund and an assumed rate of return of 5% per year before expenses, which is not the actual return of a fund. The hypothetical account values and expenses may not be used to estimate the actual ending account balance or expenses you paid for the period. You may use this information to compare the ongoing costs of investing in your fund and other funds. To do so, compare this 5% hypothetical example with the 5% hypothetical examples that appear in the shareholder reports of the other funds.
Please note that the expenses shown in the table are meant to highlight your ongoing costs only and do not reflect any transactional costs, such as brokerage commissions paid on purchases and sales of fund shares. Therefore, the table is useful in comparing ongoing costs only, and will not help you determine the relative total costs of owning different funds. In addition, if these transactional costs were included, your costs would have been higher.
| Beginning Account Value 3/1/20 | Ending Account Value 8/31/20 | Expenses Paid During Period(1) 3/1/20 - 8/31/20 | Annualized Expense Ratio(1) | |||||||||||
| Actual | $1,000 | $1,056.40 | $1.19 | 0.23% | ||||||||||
| Hypothetical | $1,000 | $1,023.98 | $1.17 | 0.23% | ||||||||||
(1)Expenses are equal to the fund's annualized expense ratio listed in the table above, multiplied by the average account value over the period, multiplied by 184, the number of days in the most recent fiscal half-year, divided by 366, to reflect the one-half year period. Annualized expense ratio reflects actual expenses, including any applicable fee waivers or expense reimbursements and excluding any acquired fund fees and expenses.
6
| Schedule of Investments | ||
AUGUST 31, 2020
| Shares | Value | |||||||
| COMMON STOCKS — 99.7% | ||||||||
| Australia — 6.4% | ||||||||
| Adairs Ltd. | 9,091 | $ | 22,910 | |||||
| Adbri Ltd. | 12,301 | 22,777 | ||||||
Afterpay Ltd.(1) | 48 | 3,210 | ||||||
| AGL Energy Ltd. | 8,571 | 92,742 | ||||||
Ainsworth Game Technology Ltd.(1) | 6,266 | 1,746 | ||||||
Alkane Resources Ltd.(1)(2) | 41,332 | 34,334 | ||||||
| Alliance Aviation Services Ltd. | 5,113 | 13,852 | ||||||
| Altium Ltd. | 1,276 | 34,183 | ||||||
Alumina Ltd.(2) | 16,110 | 18,334 | ||||||
| AMA Group Ltd. | 3,862 | 1,780 | ||||||
AMP Ltd.(1) | 180,225 | 200,377 | ||||||
| Ampol Ltd. | 1,956 | 37,128 | ||||||
| Ansell Ltd. | 1,315 | 37,259 | ||||||
| APA Group | 25,605 | 195,209 | ||||||
| Appen Ltd. | 1,795 | 45,517 | ||||||
| ARB Corp. Ltd. | 2,334 | 44,710 | ||||||
Ardent Leisure Group Ltd.(1) | 14,195 | 4,385 | ||||||
| Aristocrat Leisure Ltd. | 14,969 | 306,805 | ||||||
| ASX Ltd. | 1,036 | 66,409 | ||||||
| Atlas Arteria Ltd. | 5,643 | 26,884 | ||||||
Atlassian Corp. plc, Class A(1) | 1,823 | 349,578 | ||||||
| Aurelia Metals Ltd. | 44,031 | 17,333 | ||||||
| Aurizon Holdings Ltd. | 92,230 | 292,892 | ||||||
| AusNet Services | 70,367 | 94,401 | ||||||
| Austal Ltd. | 13,119 | 33,982 | ||||||
| Australia & New Zealand Banking Group Ltd. | 58,223 | 769,799 | ||||||
Australian Agricultural Co. Ltd.(1) | 31,863 | 24,545 | ||||||
Australian Ethical Investment Ltd.(2) | 3,602 | 12,506 | ||||||
| Australian Finance Group Ltd. | 21,000 | 28,441 | ||||||
| Australian Pharmaceutical Industries Ltd. | 29,178 | 23,334 | ||||||
Australian Strategic Materials Ltd.(1)(2) | 8,265 | 13,777 | ||||||
Bank of Queensland Ltd.(2) | 20,858 | 92,570 | ||||||
| Beach Energy Ltd. | 112,057 | 124,566 | ||||||
| Bega Cheese Ltd. | 8,295 | 31,982 | ||||||
Bendigo & Adelaide Bank Ltd.(2) | 19,322 | 91,348 | ||||||
| BHP Group Ltd., ADR | 24,682 | 1,358,991 | ||||||
| Bingo Industries Ltd. | 14,590 | 23,825 | ||||||
Blackmores Ltd.(1)(2) | 287 | 13,247 | ||||||
| BlueScope Steel Ltd. | 16,402 | 150,593 | ||||||
| Boral Ltd. | 57,462 | 166,998 | ||||||
| Brambles Ltd. | 42,332 | 343,716 | ||||||
| Brickworks Ltd. | 2,078 | 27,214 | ||||||
| carsales.com Ltd. | 7,695 | 116,438 | ||||||
| Cedar Woods Properties Ltd. | 5,399 | 21,113 | ||||||
| Challenger Ltd. | 40,669 | 120,028 | ||||||
| CIMIC Group Ltd. | 1,947 | 29,996 | ||||||
7
| Shares | Value | |||||||
| Cleanaway Waste Management Ltd. | 4,483 | $ | 8,481 | |||||
| Coca-Cola Amatil Ltd. | 26,891 | 179,232 | ||||||
| Cochlear Ltd. | 1,428 | 200,619 | ||||||
| Codan Ltd. | 7,690 | 61,073 | ||||||
| Coles Group Ltd. | 25,925 | 336,806 | ||||||
| Collins Foods Ltd. | 3,084 | 23,527 | ||||||
| Commonwealth Bank of Australia | 21,905 | 1,085,996 | ||||||
| Computershare Ltd. | 4,640 | 44,792 | ||||||
Cooper Energy Ltd.(1) | 56,919 | 13,681 | ||||||
Coronado Global Resources, Inc.(2) | 16,149 | 7,351 | ||||||
| Costa Group Holdings Ltd. | 1,695 | 4,305 | ||||||
| Credit Corp. Group Ltd. | 1,276 | 17,652 | ||||||
| Crown Resorts Ltd. | 7,305 | 47,847 | ||||||
| CSL Ltd. | 3,972 | 835,110 | ||||||
| CSR Ltd. | 34,694 | 92,614 | ||||||
Dacian Gold Ltd.(1) | 1,833 | 453 | ||||||
| Data#3 Ltd. | 3,992 | 18,418 | ||||||
| Dicker Data Ltd. | 5,124 | 28,120 | ||||||
| Domino's Pizza Enterprises Ltd. | 1,794 | 106,562 | ||||||
| Downer EDI Ltd. | 7,883 | 25,528 | ||||||
Eclipx Group Ltd.(1) | 23,165 | 25,282 | ||||||
Emeco Holdings Ltd.(1) | 11,402 | 7,400 | ||||||
Emeco Holdings Ltd.(1) | 23,944 | 15,429 | ||||||
| Evolution Mining Ltd. | 43,226 | 176,522 | ||||||
FlexiGroup Ltd.(1) | 4,408 | 3,918 | ||||||
| FlexiGroup Ltd. | 14,105 | 12,363 | ||||||
| Flight Centre Travel Group Ltd. | 586 | 5,563 | ||||||
| Fortescue Metals Group Ltd. | 56,669 | 719,798 | ||||||
Galaxy Resources Ltd.(1) | 11,139 | 9,948 | ||||||
| Genworth Mortgage Insurance Australia Ltd. | 14,720 | 16,148 | ||||||
GrainCorp Ltd., A Shares(1) | 4,758 | 15,022 | ||||||
| GUD Holdings Ltd. | 1,841 | 15,415 | ||||||
| GWA Group Ltd. | 6,196 | 11,467 | ||||||
| Harvey Norman Holdings Ltd. | 18,684 | 59,981 | ||||||
| Healius Ltd. | 5,898 | 14,345 | ||||||
HT&E Ltd.(2) | 14,203 | 14,447 | ||||||
| Huon Aquaculture Group Ltd. | 1,162 | 2,446 | ||||||
| IDP Education Ltd. | 4,268 | 62,263 | ||||||
| IGO Ltd. | 33,011 | 107,276 | ||||||
| Iluka Resources Ltd. | 28,151 | 208,043 | ||||||
| Imdex Ltd. | 22,126 | 20,050 | ||||||
| Incitec Pivot Ltd. | 81,089 | 123,472 | ||||||
| Infomedia Ltd. | 19,073 | 23,623 | ||||||
| Inghams Group Ltd. | 13,182 | 31,088 | ||||||
| Insurance Australia Group Ltd. | 26,615 | 92,314 | ||||||
| Integrated Research Ltd. | 5,328 | 16,326 | ||||||
| InvoCare Ltd. | 2,643 | 19,261 | ||||||
| IPH Ltd. | 4,483 | 22,464 | ||||||
| IRESS Ltd. | 3,238 | 25,360 | ||||||
| James Hardie Industries plc | 21,234 | 474,811 | ||||||
| Japara Healthcare Ltd. | 9,605 | 3,181 | ||||||
| JB Hi-Fi Ltd. | 2,951 | 108,668 | ||||||
8
| Shares | Value | |||||||
| Johns Lyng Group Ltd. | 11,144 | $ | 21,392 | |||||
Jumbo Interactive Ltd.(2) | 2,751 | 27,268 | ||||||
Karoon Energy Ltd.(1)(2) | 25,998 | 15,043 | ||||||
| Lendlease Corp. Ltd. | 14,548 | 122,733 | ||||||
Lovisa Holdings Ltd.(2) | 3,473 | 18,906 | ||||||
Lynas Corp. Ltd.(1) | 15,630 | 27,975 | ||||||
| MACA Ltd. | 13,062 | 9,872 | ||||||
| Macmahon Holdings Ltd. | 88,374 | 16,898 | ||||||
| Macquarie Group Ltd. | 4,491 | 416,196 | ||||||
| Magellan Financial Group Ltd. | 6,401 | 274,971 | ||||||
Mayne Pharma Group Ltd.(1) | 40,701 | 10,066 | ||||||
| McMillan Shakespeare Ltd. | 6,154 | 41,214 | ||||||
| Medibank Pvt Ltd. | 78,417 | 156,709 | ||||||
Mesoblast Ltd.(1) | 19,474 | 75,362 | ||||||
| Metcash Ltd. | 35,320 | 75,487 | ||||||
| Mineral Resources Ltd. | 13,939 | 296,909 | ||||||
| MNF Group Ltd. | 38 | 142 | ||||||
| Moelis Australia Ltd. | 1,438 | 4,004 | ||||||
| Monadelphous Group Ltd. | 2,436 | 19,814 | ||||||
MyState Ltd.(2) | 4,216 | 12,200 | ||||||
| National Australia Bank Ltd. | 60,138 | 780,605 | ||||||
| Netwealth Group Ltd. | 4,239 | 43,544 | ||||||
| New Energy Solar Ltd. | 13,073 | 7,991 | ||||||
| New Hope Corp. Ltd. | 37,601 | 32,838 | ||||||
| Newcrest Mining Ltd. | 22,446 | 528,108 | ||||||
| nib holdings Ltd. | 14,467 | 48,505 | ||||||
| Nick Scali Ltd. | 5,399 | 34,642 | ||||||
Nickel Mines Ltd.(1) | 60,643 | 30,308 | ||||||
| Nine Entertainment Co. Holdings Ltd. | 19,958 | 24,009 | ||||||
| Northern Star Resources Ltd. | 10,630 | 106,811 | ||||||
| NRW Holdings Ltd. | 16,149 | 25,958 | ||||||
Nufarm Ltd.(1) | 10,618 | 31,292 | ||||||
| OFX Group Ltd. | 13,330 | 11,106 | ||||||
| Oil Search Ltd. | 56,020 | 132,219 | ||||||
| Omni Bridgeway Ltd. | 2,722 | 8,928 | ||||||
| oOh!media Ltd. | 10,050 | 7,561 | ||||||
| Orica Ltd. | 16,880 | 214,078 | ||||||
| Origin Energy Ltd. | 20,355 | 82,547 | ||||||
Orocobre Ltd.(1)(2) | 6,392 | 12,164 | ||||||
| Orora Ltd. | 67,652 | 111,095 | ||||||
| OZ Minerals Ltd. | 16,770 | 179,661 | ||||||
| Pacific Current Group Ltd. | 6,044 | 27,110 | ||||||
| Peet Ltd. | 34,145 | 25,799 | ||||||
| Perenti Global Ltd. | 138,971 | 121,030 | ||||||
| Perpetual Ltd. | 1,515 | 34,031 | ||||||
Perseus Mining Ltd.(1) | 109,732 | 116,688 | ||||||
| Platinum Asset Management Ltd. | 17,268 | 46,520 | ||||||
PolyNovo Ltd.(1)(2) | 21,116 | 34,205 | ||||||
| Premier Investments Ltd. | 2,616 | 36,104 | ||||||
| Pro Medicus Ltd. | 1,555 | 29,595 | ||||||
| PWR Holdings Ltd. | 4,477 | 16,163 | ||||||
| Qantas Airways Ltd. | 48,972 | 139,252 | ||||||
9
| Shares | Value | |||||||
| QBE Insurance Group Ltd. | 28,804 | $ | 222,096 | |||||
| Qube Holdings Ltd. | 12,419 | 24,767 | ||||||
| Ramelius Resources Ltd. | 62,679 | 96,061 | ||||||
| Ramsay Health Care Ltd. | 1,956 | 92,868 | ||||||
| REA Group Ltd. | 914 | 75,908 | ||||||
Red 5 Ltd.(1) | 120,345 | 27,036 | ||||||
| Regis Resources Ltd. | 24,964 | 97,117 | ||||||
Resolute Mining Ltd.(1) | 23,926 | 19,466 | ||||||
| Rio Tinto Ltd. | 5,766 | 412,059 | ||||||
| Sandfire Resources Ltd. | 6,685 | 22,676 | ||||||
| Santos Ltd. | 74,071 | 303,538 | ||||||
Saracen Mineral Holdings Ltd.(1) | 58,605 | 225,359 | ||||||
| SeaLink Travel Group Ltd. | 5,372 | 18,795 | ||||||
| SEEK Ltd. | 2,314 | 34,773 | ||||||
| Select Harvests Ltd. | 4,003 | 16,058 | ||||||
Senex Energy Ltd.(1) | 100,290 | 22,055 | ||||||
| Servcorp Ltd. | 9,369 | 17,763 | ||||||
| Service Stream Ltd. | 12,148 | 17,128 | ||||||
| Sigma Healthcare Ltd. | 95,424 | 47,619 | ||||||
Silver Lake Resources Ltd.(1) | 32,935 | 52,627 | ||||||
| Sims Ltd. | 9,737 | 57,107 | ||||||
| SmartGroup Corp. Ltd. | 3,238 | 14,048 | ||||||
| Sonic Healthcare Ltd. | 3,746 | 87,720 | ||||||
| South32 Ltd. | 93,756 | 142,619 | ||||||
| Spark Infrastructure Group | 41,194 | 67,546 | ||||||
| St. Barbara Ltd. | 51,413 | 130,658 | ||||||
| Stanmore Coal Ltd. | 8,590 | 4,840 | ||||||
| Star Entertainment Grp Ltd. (The) | 18,505 | 39,468 | ||||||
| Steadfast Group Ltd. | 11,137 | 29,222 | ||||||
| Suncorp Group Ltd. | 18,550 | 125,040 | ||||||
| Super Retail Group Ltd. | 5,752 | 44,810 | ||||||
Superloop Ltd.(1) | 4,641 | 3,825 | ||||||
| Sydney Airport | 10,422 | 43,828 | ||||||
| Technology One Ltd. | 11,134 | 66,123 | ||||||
| Telstra Corp. Ltd. | 105,784 | 223,750 | ||||||
TPG Telecom Ltd.(1) | 5,521 | 33,224 | ||||||
| Transurban Group | 35,317 | 346,863 | ||||||
| Treasury Wine Estates Ltd. | 10,560 | 71,226 | ||||||
Tuas Ltd.(1) | 2,759 | 1,021 | ||||||
United Malt Grp Ltd.(1) | 4,758 | 13,847 | ||||||
| Viva Energy Group Ltd. | 66,374 | 80,659 | ||||||
Vocus Group Ltd.(1) | 11,260 | 27,380 | ||||||
Wagners Holding Co. Ltd.(1) | 2,847 | 2,344 | ||||||
Washington H Soul Pattinson & Co. Ltd.(2) | 1,677 | 25,610 | ||||||
| Wesfarmers Ltd. | 20,593 | 715,023 | ||||||
| Western Areas Ltd. | 26,751 | 43,254 | ||||||
Westgold Resources Ltd.(1) | 30,728 | 48,141 | ||||||
| Westpac Banking Corp., ADR | 52,723 | 671,691 | ||||||
| Whitehaven Coal Ltd. | 45,534 | 30,699 | ||||||
| WiseTech Global Ltd. | 1,154 | 23,800 | ||||||
| Woodside Petroleum Ltd. | 25,104 | 357,123 | ||||||
| Woolworths Group Ltd. | 15,493 | 452,690 | ||||||
10
| Shares | Value | |||||||
| WPP AUNZ Ltd. | 9,336 | $ | 2,200 | |||||
| 21,782,421 | ||||||||
| Austria — 0.2% | ||||||||
| ANDRITZ AG | 906 | 30,301 | ||||||
| AT&S Austria Technologie & Systemtechnik AG | 1,936 | 37,455 | ||||||
BAWAG Group AG(1) | 1,565 | 58,913 | ||||||
| CA Immobilien Anlagen AG | 676 | 21,088 | ||||||
Erste Group Bank AG(1) | 3,598 | 87,421 | ||||||
| EVN AG | 2,071 | 34,891 | ||||||
FACC AG(1)(2) | 260 | 1,774 | ||||||
IMMOFINANZ AG(1) | 2,078 | 34,506 | ||||||
Lenzing AG(1)(2) | 300 | 15,572 | ||||||
Oesterreichische Post AG(2) | 1,547 | 51,681 | ||||||
OMV AG(1) | 2,175 | 70,843 | ||||||
POLYTEC Holding AG(1) | 913 | 5,662 | ||||||
Porr AG(1)(2) | 657 | 9,422 | ||||||
Raiffeisen Bank International AG(1) | 3,592 | 64,248 | ||||||
S IMMO AG(1) | 794 | 14,383 | ||||||
| Schoeller-Bleckmann Oilfield Equipment AG | 231 | 6,887 | ||||||
Telekom Austria AG(1) | 3,960 | 29,226 | ||||||
| UNIQA Insurance Group AG | 4,748 | 31,546 | ||||||
| Verbund AG | 936 | 50,243 | ||||||
Vienna Insurance Group AG Wiener Versicherung Gruppe(1) | 1,040 | 25,445 | ||||||
| voestalpine AG | 2,176 | 54,011 | ||||||
Wienerberger AG(1) | 1,444 | 38,954 | ||||||
| Zumtobel Group AG | 1,444 | 11,014 | ||||||
| 785,486 | ||||||||
| Belgium — 1.0% | ||||||||
Ackermans & van Haaren NV(1) | 1,034 | 147,091 | ||||||
| Ageas SA/NV | 5,778 | 243,092 | ||||||
AGFA-Gevaert NV(1) | 8,468 | 35,725 | ||||||
| Anheuser-Busch InBev SA, ADR | 8,319 | 483,750 | ||||||
Argenx SE, ADR(1) | 535 | 123,729 | ||||||
| Barco NV | 1,876 | 40,032 | ||||||
| Bekaert SA | 3,336 | 67,206 | ||||||
bpost SA(1) | 6,044 | 60,450 | ||||||
| Colruyt SA | 2,460 | 155,622 | ||||||
| D'ieteren SA | 1,292 | 84,410 | ||||||
Deceuninck NV(1) | 10,496 | 19,662 | ||||||
Econocom Group SA(1) | 9,857 | 29,710 | ||||||
| Elia Group SA | 648 | 69,715 | ||||||
| Euronav NV | 10,391 | 94,910 | ||||||
Exmar NV(1) | 3,725 | 9,221 | ||||||
| Fagron | 2,959 | 67,146 | ||||||
Galapagos NV, ADR(1) | 1,422 | 189,354 | ||||||
Ion Beam Applications(2) | 1,317 | 14,250 | ||||||
| KBC Group NV | 4,858 | 278,576 | ||||||
| Melexis NV | 1,418 | 113,772 | ||||||
Mithra Pharmaceuticals SA(1) | 914 | 18,677 | ||||||
Ontex Group NV(1)(2) | 3,439 | 45,939 | ||||||
| Orange Belgium SA | 2,454 | 41,360 | ||||||
| Proximus SADP | 8,333 | 164,933 | ||||||
11
| Shares | Value | |||||||
| Recticel SA | 2,841 | $ | 29,071 | |||||
| Solvay SA | 2,732 | 236,641 | ||||||
| Telenet Group Holding NV | 517 | 20,094 | ||||||
Tessenderlo Group SA(1) | 1,432 | 53,555 | ||||||
| UCB SA | 933 | 110,665 | ||||||
| Umicore SA | 4,858 | 223,352 | ||||||
| 3,271,710 | ||||||||
| Canada — 9.6% | ||||||||
| Absolute Software Corp. | 653 | 8,010 | ||||||
| Aecon Group, Inc. | 5,368 | 59,839 | ||||||
| Agnico Eagle Mines Ltd. | 4,109 | 338,776 | ||||||
Aimia, Inc.(1) | 1,681 | 4,549 | ||||||
Air Canada(1) | 3,232 | 43,610 | ||||||
Alacer Gold Corp.(1) | 9,739 | 67,274 | ||||||
| Alamos Gold, Inc., Class A | 13,969 | 146,185 | ||||||
| Alaris Royalty Corp. | 2,597 | 23,753 | ||||||
| Algonquin Power & Utilities Corp. | 18,422 | 255,353 | ||||||
| Alimentation Couche-Tard, Inc., B Shares | 12,427 | 405,579 | ||||||
AltaGas Ltd.(2) | 5,368 | 69,428 | ||||||
| Altius Minerals Corp. | 653 | 5,472 | ||||||
Americas Gold & Silver Corp.(1)(2) | 2,340 | 6,979 | ||||||
| Andrew Peller Ltd., A Shares | 653 | 4,561 | ||||||
ARC Resources Ltd.(2) | 10,740 | 54,180 | ||||||
Argonaut Gold, Inc.(1) | 16,110 | 34,212 | ||||||
Aritzia, Inc.(1) | 3,587 | 51,371 | ||||||
| Atco Ltd., Class I | 3,842 | 117,055 | ||||||
Atrium Mortgage Investment Corp.(2) | 2,597 | 21,344 | ||||||
| B2Gold Corp. | 75,070 | 504,169 | ||||||
Badger Daylighting Ltd.(2) | 2,597 | 74,405 | ||||||
| Bank of Montreal | 15,045 | 954,824 | ||||||
| Bank of Nova Scotia (The) | 20,004 | 864,511 | ||||||
| Barrick Gold Corp., (Toronto) | 22,006 | 651,905 | ||||||
Bausch Health Cos., Inc.(1) | 7,453 | 123,707 | ||||||
Baytex Energy Corp.(1) | 21,482 | 11,035 | ||||||
| BCE, Inc. | 2,597 | 111,617 | ||||||
Birchcliff Energy Ltd.(2) | 16,110 | 19,762 | ||||||
Bird Construction, Inc.(2) | 1,681 | 8,802 | ||||||
BlackBerry Ltd.(1) | 5,368 | 27,985 | ||||||
Bombardier, Inc., B Shares(1)(2) | 21,482 | 6,753 | ||||||
| Boralex, Inc., A Shares | 5,656 | 145,265 | ||||||
| Brookfield Asset Management, Inc., Class A | 10,596 | 357,600 | ||||||
| BRP, Inc. | 653 | 35,465 | ||||||
| CAE, Inc. | 10,740 | 170,279 | ||||||
| Cameco Corp. | 9,744 | 112,878 | ||||||
Canaccord Genuity Group, Inc.(2) | 7,965 | 47,264 | ||||||
| Canacol Energy Ltd. | 9,366 | 25,276 | ||||||
| Canadian Imperial Bank of Commerce | 12,815 | 1,017,458 | ||||||
| Canadian National Railway Co. | 7,965 | 836,956 | ||||||
| Canadian Natural Resources Ltd. | 49,110 | 968,382 | ||||||
| Canadian Pacific Railway Ltd. | 2,597 | 768,319 | ||||||
| Canadian Tire Corp. Ltd., Class A | 282 | 29,500 | ||||||
| Canadian Utilities Ltd., A Shares | 5,140 | 129,017 | ||||||
12
| Shares | Value | |||||||
| Canadian Western Bank | 5,650 | $ | 120,160 | |||||
Canfor Corp.(1) | 2,597 | 33,867 | ||||||
| Canfor Pulp Products, Inc. | 1,681 | 6,328 | ||||||
| Capital Power Corp. | 9,767 | 214,307 | ||||||
| Cascades, Inc. | 7,051 | 74,978 | ||||||
| CCL Industries, Inc., Class B | 3,842 | 142,004 | ||||||
Celestica, Inc.(1) | 5,368 | 42,760 | ||||||
| Cenovus Energy, Inc. | 41,181 | 194,484 | ||||||
| Centerra Gold, Inc. | 13,339 | 173,749 | ||||||
CGI, Inc.(1) | 3,998 | 280,827 | ||||||
| Chorus Aviation, Inc. | 5,368 | 11,112 | ||||||
| CI Financial Corp. | 6,910 | 98,113 | ||||||
| Colliers International Group, Inc. | 2,597 | 164,678 | ||||||
| Constellation Software, Inc. | 282 | 326,459 | ||||||
| Corus Entertainment, Inc., B Shares | 4,108 | 10,047 | ||||||
| Crescent Point Energy Corp. | 32,224 | 56,575 | ||||||
CRH Medical Corp.(1) | 10,740 | 25,525 | ||||||
Denison Mines Corp.(1)(2) | 12,054 | 6,469 | ||||||
| Dollarama, Inc. | 2,970 | 115,945 | ||||||
| DREAM Unlimited Corp., Class A | 2,684 | 39,426 | ||||||
| Dundee Precious Metals, Inc. | 7,965 | 57,645 | ||||||
| ECN Capital Corp. | 7,965 | 31,448 | ||||||
Eldorado Gold Corp., (Toronto)(1) | 8,711 | 99,508 | ||||||
| Element Fleet Management Corp. | 23,567 | 193,870 | ||||||
Emera, Inc.(2) | 5,368 | 219,148 | ||||||
| Empire Co. Ltd., Class A | 5,368 | 139,720 | ||||||
| Enbridge, Inc. | 16,668 | 533,258 | ||||||
Endeavour Mining Corp.(1) | 3,052 | 84,609 | ||||||
| Enerflex Ltd. | 5,368 | 24,075 | ||||||
Energy Fuels, Inc.(1) | 1,804 | 3,283 | ||||||
| Enerplus Corp. | 10,112 | 26,824 | ||||||
| Enghouse Systems Ltd. | 2,597 | 144,907 | ||||||
Equinox Gold Corp.(1) | 4,376 | 57,202 | ||||||
ERO Copper Corp.(1) | 3,706 | 56,513 | ||||||
| Evertz Technologies Ltd. | 1,022 | 9,316 | ||||||
| Exchange Income Corp. | 2,597 | 63,255 | ||||||
Extendicare, Inc.(2) | 5,368 | 23,993 | ||||||
| Fairfax Financial Holdings Ltd. | 506 | 155,984 | ||||||
| Fiera Capital Corp. | 653 | 5,172 | ||||||
| Finning International, Inc. | 9,615 | 146,766 | ||||||
| Firm Capital Mortgage Investment Corp. | 2,597 | 24,390 | ||||||
First Majestic Silver Corp.(1)(2) | 2,597 | 32,275 | ||||||
| First National Financial Corp. | 282 | 7,167 | ||||||
| First Quantum Minerals Ltd. | 17,269 | 170,923 | ||||||
| Fortis, Inc. | 2,597 | 103,872 | ||||||
Fortuna Silver Mines, Inc.(1) | 12,796 | 93,197 | ||||||
| Franco-Nevada Corp. | 2,597 | 390,580 | ||||||
Freehold Royalties Ltd.(2) | 5,368 | 17,120 | ||||||
| Frontera Energy Corp. | 6,682 | 13,985 | ||||||
Galiano Gold, Inc.(1)(2) | 9,623 | 15,272 | ||||||
| Genworth MI Canada, Inc. | 2,597 | 70,920 | ||||||
| George Weston Ltd. | 2,597 | 187,615 | ||||||
13
| Shares | Value | |||||||
| Gibson Energy, Inc. | 6,559 | $ | 119,428 | |||||
| Gildan Activewear, Inc. | 2,199 | 42,636 | ||||||
| goeasy Ltd. | 2,597 | 129,298 | ||||||
Gold Standard Ventures Corp.(1) | 4,481 | 4,054 | ||||||
Gran Colombia Gold Corp.(1) | 5,882 | 27,057 | ||||||
Great Panther Mining Ltd.(1)(2) | 6,908 | 6,885 | ||||||
| Great-West Lifeco, Inc. | 5,020 | 102,413 | ||||||
| Hardwoods Distribution, Inc. | 1,312 | 23,205 | ||||||
| High Liner Foods, Inc. | 5,368 | 33,541 | ||||||
| HLS Therapeutics, Inc. | 653 | 8,260 | ||||||
Home Capital Group, Inc.(1) | 3,706 | 62,621 | ||||||
| Hudbay Minerals, Inc. | 7,965 | 35,723 | ||||||
Husky Energy, Inc.(2) | 10,740 | 36,312 | ||||||
| Hydro One Ltd. | 9,380 | 194,166 | ||||||
| iA Financial Corp., Inc. | 6,528 | 234,975 | ||||||
IAMGOLD Corp.(1) | 21,482 | 92,394 | ||||||
IGM Financial, Inc.(2) | 2,597 | 63,374 | ||||||
| Imperial Oil Ltd. | 5,368 | 88,524 | ||||||
| Innergex Renewable Energy, Inc. | 7,051 | 121,738 | ||||||
| Intact Financial Corp. | 637 | 68,230 | ||||||
Inter Pipeline Ltd.(2) | 16,110 | 170,073 | ||||||
Interfor Corp.(1) | 2,597 | 34,047 | ||||||
| Intertape Polymer Group, Inc. | 2,597 | 29,885 | ||||||
IPL Plastics, Inc.(1) | 653 | 4,981 | ||||||
Ivanhoe Mines Ltd., Class A(1) | 10,740 | 42,405 | ||||||
Kelt Exploration Ltd.(1)(2) | 10,740 | 13,668 | ||||||
Keyera Corp.(2) | 10,112 | 184,665 | ||||||
Kinaxis, Inc.(1) | 282 | 43,009 | ||||||
Kinross Gold Corp.(1) | 64,452 | 572,204 | ||||||
| Kirkland Lake Gold Ltd. | 13,173 | 701,900 | ||||||
Knight Therapeutics, Inc.(1) | 5,368 | 25,557 | ||||||
| Labrador Iron Ore Royalty Corp. | 2,597 | 54,534 | ||||||
Largo Resources Ltd.(1) | 26,624 | 21,841 | ||||||
| Laurentian Bank of Canada | 2,597 | 55,689 | ||||||
| Linamar Corp. | 3,232 | 101,345 | ||||||
| Loblaw Cos. Ltd. | 3,998 | 206,620 | ||||||
Lucara Diamond Corp.(2) | 4,763 | 2,008 | ||||||
Lundin Gold, Inc.(1) | 5,368 | 45,723 | ||||||
| Lundin Mining Corp. | 41,359 | 259,059 | ||||||
| Magna International, Inc. | 10,740 | 523,023 | ||||||
Major Drilling Group International, Inc.(1) | 6,168 | 31,919 | ||||||
| Manulife Financial Corp. | 40,041 | 590,630 | ||||||
| Martinrea International, Inc. | 5,368 | 41,278 | ||||||
| MCAN Mortgage Corp. | 653 | 6,844 | ||||||
MEG Energy Corp.(1) | 9,080 | 25,200 | ||||||
| Methanex Corp. | 5,131 | 114,433 | ||||||
| Metro, Inc. | 2,597 | 117,312 | ||||||
Morneau Shepell, Inc.(2) | 1,681 | 36,382 | ||||||
MTY Food Group, Inc.(2) | 653 | 17,422 | ||||||
| Mullen Group Ltd. | 5,368 | 40,290 | ||||||
| National Bank of Canada | 13,069 | 718,402 | ||||||
New Gold, Inc.(1) | 50,141 | 82,265 | ||||||
14
| Shares | Value | |||||||
NexGen Energy Ltd.(1)(2) | 2,713 | $ | 5,366 | |||||
| Norbord, Inc. | 2,597 | 88,800 | ||||||
| North American Construction Group Ltd. | 2,597 | 18,517 | ||||||
| North West Co., Inc. (The) | 1,022 | 22,331 | ||||||
Northern Dynasty Minerals Ltd.(1) | 8,595 | 9,093 | ||||||
| Northland Power, Inc. | 6,396 | 179,128 | ||||||
Novagold Resources, Inc.(1) | 523 | 5,539 | ||||||
| Nutrien Ltd. | 5,368 | 198,818 | ||||||
NuVista Energy Ltd.(1)(2) | 16,110 | 10,004 | ||||||
OceanaGold Corp.(1) | 17,650 | 40,730 | ||||||
| Onex Corp. | 2,597 | 126,092 | ||||||
| Open Text Corp. | 4,365 | 197,979 | ||||||
Orla Mining Ltd.(1)(2) | 3,082 | 13,799 | ||||||
| Osisko Gold Royalties Ltd. | 2,597 | 31,856 | ||||||
| Pan American Silver Corp. | 6,646 | 239,936 | ||||||
Paramount Resources Ltd., A Shares(1)(2) | 5,368 | 10,906 | ||||||
Parex Resources, Inc.(1) | 11,381 | 155,749 | ||||||
Parkland Corp.(2) | 2,970 | 84,181 | ||||||
| Pason Systems, Inc. | 2,597 | 11,847 | ||||||
Pembina Pipeline Corp.(2) | 11,536 | 285,669 | ||||||
Peyto Exploration & Development Corp.(2) | 10,740 | 23,467 | ||||||
| Power Corp. of Canada | 5,406 | 107,925 | ||||||
| PrairieSky Royalty Ltd. | 2,597 | 18,795 | ||||||
Precision Drilling Corp.(1) | 21,482 | 15,152 | ||||||
Premier Gold Mines Ltd.(1) | 7,567 | 15,896 | ||||||
Pretium Resources, Inc.(1) | 2,597 | 33,350 | ||||||
| Primo Water Corp. | 2,597 | 35,560 | ||||||
| Quebecor, Inc., Class B | 5,368 | 133,094 | ||||||
Real Matters, Inc.(1) | 5,368 | 108,895 | ||||||
| Restaurant Brands International, Inc. | 2,597 | 140,706 | ||||||
| Richelieu Hardware Ltd. | 1,312 | 35,014 | ||||||
| Ritchie Bros Auctioneers, Inc. | 2,597 | 151,955 | ||||||
| Rogers Communications, Inc., Class B | 7,965 | 331,338 | ||||||
| Rogers Sugar, Inc. | 1,681 | 6,147 | ||||||
Roxgold, Inc.(1) | 34,684 | 43,077 | ||||||
| Royal Bank of Canada | 20,384 | 1,552,300 | ||||||
| Russel Metals, Inc. | 2,597 | 37,292 | ||||||
Sabina Gold & Silver Corp.(1) | 18,711 | 38,875 | ||||||
Sandstorm Gold Ltd.(1)(2) | 5,368 | 49,015 | ||||||
| Saputo, Inc. | 2,597 | 64,788 | ||||||
Secure Energy Services, Inc.(2) | 7,965 | 9,221 | ||||||
Seven Generations Energy Ltd., Class A(1) | 14,481 | 45,741 | ||||||
| Shaw Communications, Inc., B Shares | 20,595 | 385,105 | ||||||
Shopify, Inc., Class A(1) | 780 | 833,150 | ||||||
Sienna Senior Living, Inc.(2) | 2,597 | 22,260 | ||||||
Sierra Metals, Inc.(1) | 3,741 | 6,166 | ||||||
Sierra Wireless, Inc.(1)(2) | 653 | 8,105 | ||||||
Silvercorp Metals, Inc.(2) | 12,054 | 104,058 | ||||||
| Sleep Country Canada Holdings, Inc. | 282 | 4,350 | ||||||
SSR Mining, Inc.(1) | 2,597 | 55,709 | ||||||
| Stantec, Inc. | 2,722 | 88,379 | ||||||
| Stelco Holdings, Inc. | 1,312 | 9,495 | ||||||
15
| Shares | Value | |||||||
Sun Life Financial, Inc.(2) | 7,965 | $ | 332,437 | |||||
| Suncor Energy, Inc. | 32,369 | 519,403 | ||||||
Superior Plus Corp.(2) | 5,368 | 49,715 | ||||||
Tamarack Valley Energy Ltd.(1)(2) | 10,740 | 7,740 | ||||||
| TC Energy Corp. | 11,938 | 558,208 | ||||||
| Teck Resources Ltd., Class B | 12,427 | 143,291 | ||||||
| TELUS Corp. | 10,740 | 197,780 | ||||||
Teranga Gold Corp.(1) | 9,080 | 105,673 | ||||||
Tervita Corp.(1) | 5,368 | 12,346 | ||||||
| TFI International, Inc. | 2,597 | 114,803 | ||||||
| Thomson Reuters Corp. | 1,040 | 79,502 | ||||||
Tidewater Midstream and Infrastructure Ltd.(2) | 12,054 | 7,486 | ||||||
Timbercreek Financial Corp.(2) | 5,368 | 34,570 | ||||||
| TMX Group Ltd. | 274 | 28,804 | ||||||
| TORC Oil & Gas Ltd. | 10,740 | 14,409 | ||||||
Torex Gold Resources, Inc.(1) | 7,708 | 119,016 | ||||||
| Toromont Industries Ltd. | 2,597 | 146,958 | ||||||
| Toronto-Dominion Bank (The) | 20,741 | 1,034,705 | ||||||
| Tourmaline Oil Corp. | 8,081 | 102,658 | ||||||
| TransAlta Corp. | 23,917 | 153,659 | ||||||
| TransAlta Renewables, Inc. | 2,597 | 31,737 | ||||||
| Transcontinental, Inc., Class A | 2,597 | 30,542 | ||||||
Trican Well Service Ltd.(1)(2) | 10,367 | 8,902 | ||||||
| Tricon Residential, Inc. | 5,368 | 45,352 | ||||||
Turquoise Hill Resources Ltd.(1)(2) | 18,968 | 20,941 | ||||||
Vermilion Energy, Inc.(2) | 5,368 | 21,318 | ||||||
Viemed Healthcare, Inc.(1)(2) | 5,368 | 58,851 | ||||||
Wesdome Gold Mines Ltd.(1) | 7,965 | 88,056 | ||||||
| West Fraser Timber Co. Ltd. | 2,597 | 139,273 | ||||||
Western Forest Products, Inc.(2) | 8,222 | 7,438 | ||||||
| Westshore Terminals Investment Corp. | 1,681 | 21,316 | ||||||
| Wheaton Precious Metals Corp. | 5,368 | 286,683 | ||||||
| Whitecap Resources, Inc. | 16,110 | 31,742 | ||||||
| WSP Global, Inc. | 2,597 | 176,186 | ||||||
| Yamana Gold, Inc. | 66,255 | 410,427 | ||||||
| 32,864,383 | ||||||||
| Denmark — 2.2% | ||||||||
Alm Brand A/S(1) | 2,174 | 23,393 | ||||||
| Ambu A/S, B Shares | 3,392 | 99,515 | ||||||
| AP Moller - Maersk A/S, A Shares | 26 | 36,938 | ||||||
| AP Moller - Maersk A/S, B Shares | 46 | 70,390 | ||||||
Bang & Olufsen A/S(1)(2) | 1,874 | 4,123 | ||||||
Bavarian Nordic A/S(1)(2) | 1,093 | 38,611 | ||||||
| Carlsberg A/S, B Shares | 769 | 107,946 | ||||||
| Chr Hansen Holding A/S | 944 | 108,391 | ||||||
| Coloplast A/S, B Shares | 1,549 | 262,763 | ||||||
| D/S Norden A/S | 914 | 14,107 | ||||||
| Danske Andelskassers Bank A/S | 9,343 | 10,423 | ||||||
Danske Bank A/S(1) | 9,367 | 144,721 | ||||||
Demant A/S(1) | 1,615 | 48,173 | ||||||
Dfds A/S(1) | 1,551 | 58,458 | ||||||
Drilling Co. of 1972 A/S (The)(1) | 1,315 | 31,192 | ||||||
16
| Shares | Value | |||||||
| DSV Panalpina A/S | 3,715 | $ | 580,083 | |||||
FLSmidth & Co. A/S(1) | 1,034 | 29,858 | ||||||
Genmab A/S, ADR(1) | 10,906 | 411,811 | ||||||
| GN Store Nord A/S | 2,501 | 180,953 | ||||||
| H Lundbeck A/S | 1,753 | 57,512 | ||||||
H+H International A/S, B Shares(1) | 1,677 | 31,700 | ||||||
ISS A/S(1) | 914 | 14,023 | ||||||
Jyske Bank A/S(1) | 1,166 | 34,702 | ||||||
Netcompany Group A/S(1) | 635 | 54,856 | ||||||
Nilfisk Holding A/S(1) | 269 | 3,513 | ||||||
NKT A/S(1) | 516 | 16,452 | ||||||
| NNIT A/S | 1,299 | 29,129 | ||||||
| Novo Nordisk A/S, ADR | 26,802 | 1,770,004 | ||||||
| Novozymes A/S, B Shares | 3,891 | 229,710 | ||||||
| Orsted A/S | 4,370 | 618,346 | ||||||
| Pandora A/S | 7,849 | 571,152 | ||||||
| Per Aarsleff Holding A/S | 1,276 | 51,627 | ||||||
| Ringkjoebing Landbobank A/S | 914 | 68,914 | ||||||
| Rockwool International A/S, B Shares | 245 | 92,940 | ||||||
| Royal Unibrew A/S | 1,147 | 119,987 | ||||||
| Schouw & Co. A/S | 380 | 37,025 | ||||||
| SimCorp A/S | 2,815 | 357,689 | ||||||
Spar Nord Bank A/S(1) | 3,328 | 27,708 | ||||||
Sydbank A/S(1) | 2,056 | 34,534 | ||||||
| Topdanmark A/S | 1,275 | 54,881 | ||||||
TORM plc(2) | 1,313 | 9,069 | ||||||
| Tryg A/S | 2,811 | 86,241 | ||||||
| Vestas Wind Systems A/S | 5,261 | 797,759 | ||||||
| 7,431,322 | ||||||||
| Finland — 1.0% | ||||||||
Aktia Bank Oyj(1) | 2,841 | 32,085 | ||||||
| Altia Oyj | 1,389 | 14,085 | ||||||
| CapMan Oyj, B Shares | 6,599 | 15,959 | ||||||
| Cargotec Oyj, B Shares | 1,465 | 46,256 | ||||||
Caverion OYJ(1) | 2,217 | 16,395 | ||||||
Citycon Oyj(2) | 2,558 | 20,533 | ||||||
| Elisa Oyj | 3,344 | 196,770 | ||||||
F-Secure Oyj(1) | 1,054 | 3,810 | ||||||
Finnair Oyj(1)(2) | 37,208 | 19,408 | ||||||
| Fortum Oyj | 8,967 | 189,441 | ||||||
HKScan Oyj, A Shares(1) | 3,096 | 7,084 | ||||||
Huhtamaki Oyj(1) | 1,566 | 75,717 | ||||||
| Kemira Oyj | 5,124 | 70,852 | ||||||
| Kesko Oyj, B Shares | 9,847 | 218,394 | ||||||
| Kone Oyj, B Shares | 3,488 | 299,293 | ||||||
| Konecranes Oyj | 1,288 | 36,652 | ||||||
| Metsa Board Oyj | 4,758 | 38,722 | ||||||
| Metso Outotec Oyj | 20,049 | 148,562 | ||||||
Musti Group Oyj(1) | 343 | 7,395 | ||||||
| Neles Oyj | 3,603 | 49,162 | ||||||
| Neste Oyj | 6,171 | 329,569 | ||||||
Nokia Oyj, ADR(1) | 42,861 | 210,019 | ||||||
17
| Shares | Value | |||||||
| Nokian Renkaat Oyj | 914 | $ | 25,454 | |||||
| Oriola Oyj, B Shares | 1,935 | 4,424 | ||||||
| Orion Oyj, Class B | 4,627 | 217,135 | ||||||
Outokumpu Oyj(1)(2) | 9,613 | 25,967 | ||||||
Rovio Entertainment Oyj(2) | 1,257 | 10,199 | ||||||
| Sampo Oyj, A Shares | 6,908 | 278,419 | ||||||
| Sanoma Oyj | 3,787 | 49,065 | ||||||
| Scanfil Oyj | 1,097 | 7,694 | ||||||
| Stora Enso Oyj, R Shares | 11,123 | 163,894 | ||||||
| Suominen Oyj | 2,539 | 14,380 | ||||||
Talenom Oyj(2) | 1,624 | 16,779 | ||||||
| TietoEVRY Oyj | 1,041 | 31,328 | ||||||
| Tokmanni Group Corp. | 1,350 | 24,568 | ||||||
| UPM-Kymmene Oyj | 13,833 | 419,945 | ||||||
| Uponor Oyj | 3,482 | 61,158 | ||||||
| Valmet Oyj | 1,315 | 35,926 | ||||||
| Verkkokauppa.com Oyj | 1,898 | 11,055 | ||||||
| Wartsila Oyj Abp | 6,528 | 55,760 | ||||||
| YIT Oyj | 9,216 | 56,669 | ||||||
| 3,555,982 | ||||||||
| France — 8.8% | ||||||||
| ABC arbitrage | 1,289 | 10,490 | ||||||
Accor SA(1) | 3,720 | 114,482 | ||||||
| Aeroports de Paris | 1,540 | 161,237 | ||||||
Air France-KLM(1)(2) | 17,148 | 77,174 | ||||||
| Air Liquide SA | 7,099 | 1,179,225 | ||||||
Airbus SE(1) | 8,325 | 685,475 | ||||||
Akka Technologies(1)(2) | 300 | 5,887 | ||||||
| Albioma SA | 2,326 | 123,488 | ||||||
| ALD SA | 6,650 | 68,292 | ||||||
Alstom SA(1) | 11,800 | 657,471 | ||||||
Alten SA(1) | 1,916 | 166,014 | ||||||
Amundi SA(1) | 1,530 | 118,980 | ||||||
| APERAM SA | 2,353 | 69,486 | ||||||
ArcelorMittal SA(1) | 28,394 | 356,629 | ||||||
| Arkema SA | 4,111 | 455,413 | ||||||
Atos SE(1) | 2,374 | 205,661 | ||||||
| AXA SA | 18,930 | 386,457 | ||||||
| Beneteau SA | 1,190 | 10,084 | ||||||
Bigben Interactive(1) | 1,795 | 28,690 | ||||||
| BioMerieux | 1,935 | 293,166 | ||||||
BNP Paribas SA, ADR(1) | 46,446 | 1,011,129 | ||||||
| Bollore SA | 6,406 | 24,050 | ||||||
| Bonduelle SCA | 262 | 6,350 | ||||||
Bouygues SA(1) | 9,630 | 381,793 | ||||||
Bureau Veritas SA(1) | 10,368 | 234,892 | ||||||
| Capgemini SE | 3,592 | 496,930 | ||||||
| Carrefour SA | 19,825 | 318,307 | ||||||
Casino Guichard Perrachon SA(1)(2) | 400 | 10,389 | ||||||
Cellectis SA, ADR(1) | 387 | 7,140 | ||||||
CGG SA(1) | 67,916 | 61,757 | ||||||
| Chargeurs SA | 258 | 4,972 | ||||||
18
| Shares | Value | |||||||
Cie de Saint-Gobain(1) | 19,321 | $ | 782,820 | |||||
| Cie Generale des Etablissements Michelin SCA | 6,281 | 708,667 | ||||||
| Cie Plastic Omnium SA | 2,597 | 58,556 | ||||||
Claranova SADIR(1) | 910 | 7,508 | ||||||
CNP Assurances(1) | 4,239 | 56,701 | ||||||
Coface SA(1) | 7,436 | 58,171 | ||||||
Credit Agricole SA(1) | 31,595 | 323,412 | ||||||
| Danone SA, ADR | 23,562 | 307,955 | ||||||
Dassault Aviation SA(1) | 37 | 33,646 | ||||||
| Dassault Systemes SE | 1,405 | 264,511 | ||||||
DBV Technologies SA(1)(2) | 415 | 1,845 | ||||||
| Derichebourg SA | 6,406 | 18,477 | ||||||
| Edenred | 2,606 | 134,703 | ||||||
Eiffage SA(1) | 4,996 | 460,071 | ||||||
| Electricite de France SA | 17,525 | 184,220 | ||||||
| Elior Group SA | 2,078 | 12,178 | ||||||
Elis SA(1) | 4,129 | 53,415 | ||||||
Engie SA(1) | 28,789 | 400,493 | ||||||
Eramet SA(1) | 636 | 21,680 | ||||||
EssilorLuxottica SA(1) | 2,712 | 363,288 | ||||||
Etablissements Maurel et Prom SA(1) | 2,308 | 4,592 | ||||||
Eurazeo SE(1) | 1,073 | 56,672 | ||||||
Eurofins Scientific SE(1) | 156 | 125,048 | ||||||
| Euronext NV | 4,496 | 546,512 | ||||||
| Eutelsat Communications SA | 13,713 | 137,518 | ||||||
Faurecia SE(1) | 5,011 | 218,082 | ||||||
FIGEAC-AERO(1) | 652 | 2,472 | ||||||
Fnac Darty SA(1) | 135 | 5,893 | ||||||
| Gaztransport Et Technigaz SA | 1,309 | 123,176 | ||||||
Genfit(1)(2) | 262 | 1,319 | ||||||
Getlink SE(1) | 23,943 | 366,735 | ||||||
Groupe SFPI(1) | 1,804 | 2,862 | ||||||
| Hermes International | 523 | 449,467 | ||||||
Iliad SA(2) | 1,795 | 383,706 | ||||||
| Imerys SA | 666 | 27,013 | ||||||
Ingenico Group SA(1)(2) | 634 | 107,719 | ||||||
Innate Pharma SA(1) | 5,115 | 32,996 | ||||||
Interparfums SA(1) | 154 | 7,692 | ||||||
| Ipsen SA | 1,046 | 108,306 | ||||||
| Jacquet Metal Service SA | 152 | 1,779 | ||||||
JCDecaux SA(1) | 128 | 2,441 | ||||||
| Kaufman & Broad SA | 1,427 | 56,418 | ||||||
| Kering SA | 1,696 | 1,042,988 | ||||||
| L'Oreal SA | 3,514 | 1,162,457 | ||||||
| La Francaise des Jeux SAEM | 1,022 | 37,900 | ||||||
Lagardere SCA(1)(2) | 2,283 | 45,333 | ||||||
| Legrand SA | 3,600 | 300,135 | ||||||
LISI(1) | 798 | 18,086 | ||||||
Lumibird(1) | 158 | 2,225 | ||||||
| LVMH Moet Hennessy Louis Vuitton SE | 3,496 | 1,641,255 | ||||||
Maisons du Monde SA(1) | 3,784 | 61,353 | ||||||
Manitou BF SA(1) | 143 | 2,826 | ||||||
19
| Shares | Value | |||||||
Mersen SA(1) | 676 | $ | 20,566 | |||||
Metropole Television SA(1) | 1,947 | 24,289 | ||||||
Natixis SA(1) | 23,926 | 65,965 | ||||||
Nexans SA(1) | 2,858 | 160,466 | ||||||
| Nexity SA | 2,840 | 97,622 | ||||||
| Orange SA, ADR | 27,141 | 302,079 | ||||||
Orpea(1) | 1,605 | 192,858 | ||||||
| Pernod Ricard SA | 3,345 | 573,341 | ||||||
Peugeot SA(1) | 26,857 | 460,860 | ||||||
Poxel SA(1) | 392 | 3,166 | ||||||
Publicis Groupe SA(1) | 2,578 | 90,293 | ||||||
| Quadient SA | 1,805 | 25,125 | ||||||
| Remy Cointreau SA | 395 | 65,041 | ||||||
Renault SA(1) | 4,867 | 138,298 | ||||||
Rexel SA(1) | 10,004 | 133,748 | ||||||
| Rubis SCA | 409 | 19,335 | ||||||
Safran SA(1) | 5,772 | 667,651 | ||||||
| Sanofi, ADR | 20,609 | 1,042,403 | ||||||
| Sartorius Stedim Biotech | 517 | 185,107 | ||||||
| Schneider Electric SE | 4,228 | 524,310 | ||||||
SCOR SE(1) | 3,962 | 106,118 | ||||||
| SEB SA | 517 | 90,842 | ||||||
| SES SA | 18,814 | 133,507 | ||||||
SMCP SA(1) | 12 | 57 | ||||||
| Societe BIC SA | 638 | 36,776 | ||||||
Societe Generale SA(1) | 10,780 | 174,358 | ||||||
| Sodexo SA | 1,532 | 109,543 | ||||||
Sopra Steria Group(1) | 515 | 83,723 | ||||||
| SPIE SA | 3,846 | 65,250 | ||||||
| STMicroelectronics NV, (New York) | 33,279 | 1,006,690 | ||||||
| Suez SA | 3,600 | 62,378 | ||||||
Tarkett SA(1) | 1,765 | 22,843 | ||||||
| Teleperformance | 395 | 121,733 | ||||||
Television Francaise 1(1)(2) | 2,959 | 18,068 | ||||||
| Thales SA | 395 | 30,856 | ||||||
| TOTAL SE, ADR | 32,100 | 1,270,197 | ||||||
| Trigano SA | 517 | 65,723 | ||||||
Ubisoft Entertainment SA(1) | 3,202 | 263,679 | ||||||
| Valeo SA | 19,220 | 586,560 | ||||||
Vallourec SA(1)(2) | 268 | 8,198 | ||||||
Valneva SE(1) | 1,057 | 6,581 | ||||||
| Veolia Environnement SA | 19,060 | 460,047 | ||||||
| Verallia SA | 325 | 10,564 | ||||||
Verimatrix SA(1) | 1,658 | 5,696 | ||||||
| Vicat SA | 517 | 17,884 | ||||||
| Vinci SA | 12,944 | 1,212,843 | ||||||
Virbac SA(1) | 144 | 32,324 | ||||||
| Vivendi SA | 4,239 | 120,501 | ||||||
Worldline SA(1) | 635 | 58,497 | ||||||
X-Fab Silicon Foundries SE(1)(2) | 1,022 | 3,444 | ||||||
| 30,044,806 | ||||||||
20
| Shares | Value | |||||||
| Germany — 8.1% | ||||||||
| 7C Solarparken AG | 1,295 | $ | 5,439 | |||||
Aareal Bank AG(1) | 3,217 | 71,934 | ||||||
adidas AG(1) | 4,138 | 1,252,809 | ||||||
ADO Properties SA(1) | 1,836 | 56,374 | ||||||
ADVA Optical Networking SE(1) | 1,817 | 15,387 | ||||||
AIXTRON SE(1) | 2,436 | 27,971 | ||||||
| Allianz SE | 5,527 | 1,197,010 | ||||||
Aroundtown SA(1) | 29,833 | 163,301 | ||||||
Aumann AG(1) | 167 | 2,455 | ||||||
AURELIUS Equity Opportunities SE & Co. KGaA(1) | 1,536 | 31,872 | ||||||
| Aurubis AG | 2,123 | 152,523 | ||||||
| BASF SE | 16,392 | 1,000,175 | ||||||
Bauer AG(1) | 1,557 | 16,992 | ||||||
| Bayer AG | 12,597 | 832,343 | ||||||
| Bayerische Motoren Werke AG | 5,199 | 373,775 | ||||||
| Bayerische Motoren Werke AG, Preference Shares | 1,345 | 75,600 | ||||||
| Bechtle AG | 1,442 | 291,360 | ||||||
| Befesa SA | 676 | 28,141 | ||||||
| Beiersdorf AG | 2,202 | 254,311 | ||||||
| Borussia Dortmund GmbH & Co. KGaA | 4,483 | 30,008 | ||||||
| Brenntag AG | 5,632 | 352,847 | ||||||
| CANCOM SE | 395 | 21,752 | ||||||
| Carl Zeiss Meditec AG | 693 | 78,128 | ||||||
CECONOMY AG(1) | 3,558 | 16,440 | ||||||
Commerzbank AG(1) | 24,188 | 140,555 | ||||||
| CompuGroup Medical SE & Co. KgaA | 1,036 | 92,792 | ||||||
| Continental AG | 3,759 | 409,603 | ||||||
Corestate Capital Holding SA(1) | 136 | 2,613 | ||||||
| Covestro AG | 8,699 | 413,792 | ||||||
| CropEnergies AG | 2,042 | 29,805 | ||||||
CTS Eventim AG & Co. KGaA(1) | 3,365 | 167,272 | ||||||
| Daimler AG | 20,893 | 1,064,998 | ||||||
Delivery Hero SE(1) | 1,036 | 111,126 | ||||||
| Dermapharm Holding SE | 128 | 6,808 | ||||||
Deutsche Bank AG(1) | 56,284 | 536,387 | ||||||
| Deutsche Boerse AG | 1,541 | 291,288 | ||||||
Deutsche EuroShop AG(1) | 2,330 | 34,677 | ||||||
Deutsche Lufthansa AG(1) | 6,162 | 64,315 | ||||||
Deutsche Pfandbriefbank AG(1) | 7,680 | 55,953 | ||||||
| Deutsche Post AG, ADR | 18,950 | 862,604 | ||||||
| Deutsche Telekom AG | 72,198 | 1,268,236 | ||||||
| Deutsche Wohnen SE | 4,241 | 225,728 | ||||||
Deutz AG(1) | 4,361 | 23,413 | ||||||
Dialog Semiconductor plc(1) | 5,372 | 232,852 | ||||||
| DIC Asset AG | 2,078 | 27,391 | ||||||
Draegerwerk AG & Co. KGaA, Preference Shares(1) | 734 | 62,189 | ||||||
| Duerr AG | 1,174 | 38,810 | ||||||
| E.ON SE | 45,925 | 543,525 | ||||||
| Eckert & Ziegler Strahlen- und Medizintechnik AG | 636 | 32,181 | ||||||
| Elmos Semiconductor SE | 914 | 23,711 | ||||||
ElringKlinger AG(1) | 2,197 | 15,745 | ||||||
21
| Shares | Value | |||||||
| Encavis AG | 7,680 | $ | 140,353 | |||||
| Evonik Industries AG | 7,954 | 230,864 | ||||||
Evotec SE(1) | 1,423 | 37,970 | ||||||
Flatex AG(1) | 792 | 38,432 | ||||||
Fraport AG Frankfurt Airport Services Worldwide(1) | 1,677 | 76,018 | ||||||
| Fresenius Medical Care AG & Co. KGaA, ADR | 1,677 | 71,071 | ||||||
| Fresenius SE & Co. KGaA | 1,795 | 82,860 | ||||||
| FUCHS PETROLUB SE, Preference Shares | 3,364 | 158,639 | ||||||
| GEA Group AG | 7,847 | 286,199 | ||||||
| Gerresheimer AG | 1,555 | 183,127 | ||||||
| Grand City Properties SA | 3,238 | 83,132 | ||||||
| GRENKE AG | 275 | 20,091 | ||||||
| Hamburger Hafen und Logistik AG | 1,663 | 30,758 | ||||||
| Hannover Rueck SE | 1,181 | 201,118 | ||||||
| HeidelbergCement AG | 2,693 | 171,003 | ||||||
Heidelberger Druckmaschinen AG(1) | 2,597 | 1,866 | ||||||
HelloFresh SE(1) | 1,057 | 54,329 | ||||||
| Henkel AG & Co. KGaA | 1,690 | 151,741 | ||||||
| Henkel AG & Co. KGaA, Preference Shares | 2,841 | 289,487 | ||||||
| Hornbach Baumarkt AG | 275 | 12,402 | ||||||
| Hornbach Holding AG & Co. KGaA | 779 | 84,841 | ||||||
| HUGO BOSS AG | 1,816 | 48,087 | ||||||
Hypoport SE(1) | 31 | 18,560 | ||||||
| Indus Holding AG | 806 | 27,898 | ||||||
| Infineon Technologies AG, ADR | 21,762 | 603,460 | ||||||
| IVU Traffic Technologies AG | 1,162 | 21,502 | ||||||
| Jenoptik AG | 3,033 | 81,025 | ||||||
JOST Werke AG(1) | 1,181 | 49,656 | ||||||
| Jungheinrich AG, Preference Shares | 2,338 | 75,009 | ||||||
| K+S AG | 5,525 | 38,311 | ||||||
| KION Group AG | 2,203 | 186,306 | ||||||
Kloeckner & Co. SE(1) | 4,756 | 29,190 | ||||||
| Knorr-Bremse AG | 1,902 | 241,698 | ||||||
Koenig & Bauer AG(1) | 153 | 3,406 | ||||||
| Krones AG | 160 | 10,550 | ||||||
| Lanxess AG | 5,268 | 308,390 | ||||||
| LEG Immobilien AG | 1,446 | 212,843 | ||||||
Leoni AG(1) | 913 | 6,415 | ||||||
| LPKF Laser & Electronics AG | 1,662 | 41,347 | ||||||
| Merck KGaA | 677 | 91,819 | ||||||
| METRO AG | 11,394 | 112,754 | ||||||
| MLP SE | 5,002 | 34,274 | ||||||
MorphoSys AG(1) | 268 | 33,712 | ||||||
MPH Health Care AG(1) | 773 | 2,444 | ||||||
| MTU Aero Engines AG | 2,208 | 409,056 | ||||||
| Muenchener Rueckversicherungs-Gesellschaft AG | 2,685 | 771,281 | ||||||
| Mutares SE & Co. KGaA | 399 | 4,776 | ||||||
| Nemetschek SE | 2,437 | 193,838 | ||||||
| New Work SE | 173 | 51,464 | ||||||
Nordex SE(1) | 2,078 | 27,144 | ||||||
| Norma Group SE | 2,301 | 74,339 | ||||||
| PATRIZIA AG | 1,315 | 38,760 | ||||||
22
| Shares | Value | |||||||
| Pfeiffer Vacuum Technology AG | 152 | $ | 29,531 | |||||
Porsche Automobil Holding SE, Preference Shares(1) | 3,872 | 236,973 | ||||||
ProSiebenSat.1 Media SE(1) | 9,724 | 110,064 | ||||||
Puma SE(1) | 3,680 | 304,098 | ||||||
QIAGEN NV(1) | 1,258 | 64,108 | ||||||
| QSC AG | 2,115 | 3,295 | ||||||
| Rational AG | 138 | 87,920 | ||||||
| Rheinmetall AG | 1,685 | 155,935 | ||||||
Rocket Internet SE(1) | 2,328 | 52,641 | ||||||
RTL Group SA(1) | 635 | 21,068 | ||||||
| RWE AG | 17,811 | 706,190 | ||||||
S&T AG(1) | 1,786 | 49,827 | ||||||
SAF-Holland SE(1) | 2,558 | 21,069 | ||||||
Salzgitter AG(1) | 1,548 | 24,984 | ||||||
| SAP SE, ADR | 7,176 | 1,186,982 | ||||||
| Sartorius AG, Preference Shares | 1,055 | 446,784 | ||||||
| Scout24 AG | 2,870 | 266,849 | ||||||
SGL Carbon SE(1) | 1,038 | 4,031 | ||||||
| Siemens AG, ADR | 11,794 | 818,857 | ||||||
| Siemens Healthineers AG | 2,308 | 104,924 | ||||||
| Siltronic AG | 1,181 | 109,796 | ||||||
Sixt SE(1) | 551 | 49,823 | ||||||
| Sixt SE, Preference Shares | 673 | 37,871 | ||||||
SLM Solutions Group AG(1) | 160 | 1,433 | ||||||
SMA Solar Technology AG(1) | 134 | 6,058 | ||||||
| Software AG | 792 | 39,479 | ||||||
| Stabilus SA | 1,831 | 96,896 | ||||||
Stroeer SE & Co. KGaA(1) | 1,572 | 122,483 | ||||||
| Suedzucker AG | 2,314 | 47,244 | ||||||
SUESS MicroTec SE(1) | 275 | 4,984 | ||||||
| Symrise AG | 2,436 | 335,616 | ||||||
TAG Immobilien AG(1) | 5,498 | 164,060 | ||||||
Takkt AG(1) | 258 | 3,400 | ||||||
TeamViewer AG(1) | 1,601 | 86,781 | ||||||
Tele Columbus AG(1) | 3,322 | 13,673 | ||||||
| Telefonica Deutschland Holding AG | 63,918 | 176,782 | ||||||
thyssenkrupp AG(1) | 1,917 | 13,796 | ||||||
| Uniper SE | 5,506 | 180,416 | ||||||
| United Internet AG | 3,084 | 151,387 | ||||||
Varta AG(1) | 894 | 139,151 | ||||||
| VERBIO Vereinigte BioEnergie AG | 2,597 | 44,630 | ||||||
Volkswagen AG(1) | 528 | 94,763 | ||||||
Volkswagen AG, Preference Shares(1) | 3,223 | 536,785 | ||||||
| Vonovia SE | 11,273 | 807,134 | ||||||
| Wacker Chemie AG | 611 | 59,684 | ||||||
Wacker Neuson SE(1) | 263 | 5,139 | ||||||
Washtec AG(1) | 395 | 17,709 | ||||||
| Wuestenrot & Wuerttembergische AG | 1,276 | 22,171 | ||||||
Zalando SE(1) | 2,589 | 226,217 | ||||||
| 27,674,422 | ||||||||
| Hong Kong — 2.9% | ||||||||
| Aeon Credit Service Asia Co. Ltd. | 2,000 | 1,332 | ||||||
23
| Shares | Value | |||||||
| AIA Group Ltd. | 106,464 | $ | 1,083,179 | |||||
Apollo Future Mobility Group Ltd.(1)(2) | 20,000 | 1,082 | ||||||
| Asia Allied Infrastructure Holdings Ltd. | 10,000 | 787 | ||||||
| ASM Pacific Technology Ltd. | 19,200 | 206,454 | ||||||
Ausnutria Dairy Corp. Ltd.(1)(2) | 32,000 | 52,753 | ||||||
| Bank of East Asia Ltd. (The) | 58,600 | 131,956 | ||||||
BeiGene Ltd., ADR(1) | 275 | 66,432 | ||||||
| BOC Hong Kong Holdings Ltd. | 83,500 | 234,930 | ||||||
| BOCOM International Holdings Co. Ltd. | 33,000 | 4,542 | ||||||
| Bright Smart Securities & Commodities Group Ltd. | 8,000 | 1,867 | ||||||
| Budweiser Brewing Co. APAC Ltd. | 8,800 | 29,549 | ||||||
| Cafe de Coral Holdings Ltd. | 22,000 | 50,690 | ||||||
| Century City International Holdings Ltd. | 16,000 | 835 | ||||||
| Chen Hsong Holdings | 4,000 | 926 | ||||||
China Star Entertainment Ltd.(1) | 20,000 | 4,202 | ||||||
China Tonghai International Financial Ltd.(1) | 20,000 | 668 | ||||||
| Chinese Estates Holdings Ltd. | 26,500 | 17,140 | ||||||
| Chow Sang Sang Holdings International Ltd. | 23,000 | 25,822 | ||||||
| Chuang's Consortium International Ltd. | 16,000 | 1,947 | ||||||
| CITIC Telecom International Holdings Ltd. | 4,000 | 1,386 | ||||||
| CK Asset Holdings Ltd. | 82,000 | 441,382 | ||||||
| CK Hutchison Holdings Ltd. | 40,500 | 262,846 | ||||||
| CK Infrastructure Holdings Ltd. | 4,000 | 20,982 | ||||||
| CLP Holdings Ltd. | 23,500 | 230,603 | ||||||
Comba Telecom Systems Holdings Ltd.(2) | 124,000 | 54,033 | ||||||
| Convenience Retail Asia Ltd. | 32,000 | 16,432 | ||||||
| Cowell e Holdings, Inc. | 36,000 | 14,371 | ||||||
| Crystal International Group Ltd. | 11,500 | 3,102 | ||||||
| CSI Properties Ltd. | 240,000 | 7,433 | ||||||
| Dah Sing Banking Group Ltd. | 19,200 | 18,212 | ||||||
| Dah Sing Financial Holdings Ltd. | 8,000 | 22,716 | ||||||
| Dairy Farm International Holdings Ltd. | 18,500 | 77,179 | ||||||
| Dickson Concepts International Ltd. | 15,500 | 7,020 | ||||||
| Dream International Ltd. | 2,000 | 773 | ||||||
| Eagle Nice International Holdings Ltd. | 4,000 | 1,524 | ||||||
Emperor Capital Group Ltd.(1) | 36,000 | 666 | ||||||
| Emperor Entertainment Hotel Ltd. | 10,000 | 1,469 | ||||||
| Emperor International Holdings Ltd. | 32,000 | 4,826 | ||||||
Esprit Holdings Ltd.(1) | 42,500 | 4,860 | ||||||
| Fairwood Holdings Ltd. | 4,500 | 11,041 | ||||||
| Far East Consortium International Ltd. | 36,000 | 11,494 | ||||||
FIH Mobile Ltd.(1) | 66,000 | 7,577 | ||||||
| First Pacific Co. Ltd. | 102,000 | 28,536 | ||||||
| FSE Services Group Ltd. | 3,000 | 1,227 | ||||||
| Galaxy Entertainment Group Ltd. | 44,000 | 343,581 | ||||||
| Get Nice Holdings Ltd. | 280,000 | 5,670 | ||||||
| Giordano International Ltd. | 16,000 | 2,679 | ||||||
| Grand Ming Group Holdings Ltd. | 8,000 | 4,725 | ||||||
| Guotai Junan International Holdings Ltd. | 195,000 | 28,592 | ||||||
| Haitong International Securities Group Ltd. | 89,000 | 23,677 | ||||||
| Hang Lung Group Ltd. | 46,000 | 118,493 | ||||||
| Hang Lung Properties Ltd. | 77,000 | 216,379 | ||||||
24
| Shares | Value | |||||||
| Hang Seng Bank Ltd. | 15,000 | $ | 235,039 | |||||
| Health & Happiness H&H International Holdings Ltd. | 3,500 | 15,261 | ||||||
| Henderson Land Development Co. Ltd. | 34,000 | 132,713 | ||||||
Hengdeli Holdings Ltd.(1) | 128,000 | 4,953 | ||||||
| HK Electric Investments & HK Electric Investments Ltd. | 2,000 | 2,033 | ||||||
| HKBN Ltd. | 9,000 | 16,838 | ||||||
| HKT Trust & HKT Ltd. | 53,000 | 75,674 | ||||||
| Hong Kong & China Gas Co. Ltd. | 58,800 | 85,383 | ||||||
| Hong Kong Exchanges & Clearing Ltd. | 18,788 | 944,485 | ||||||
| Hongkong & Shanghai Hotels Ltd. (The) | 20,000 | 15,994 | ||||||
| Hongkong Land Holdings Ltd. | 30,800 | 117,610 | ||||||
Hua Medicine(1) | 7,000 | 5,225 | ||||||
| Hutchison Telecommunications Hong Kong Holdings Ltd. | 68,000 | 10,833 | ||||||
| Hysan Development Co. Ltd. | 21,000 | 66,278 | ||||||
| International Housewares Retail Co. Ltd. | 24,000 | 7,549 | ||||||
IT Ltd.(1) | 8,000 | 1,087 | ||||||
| Jacobson Pharma Corp. Ltd. | 8,000 | 1,307 | ||||||
| Jardine Matheson Holdings Ltd. | 1,300 | 54,374 | ||||||
| Jardine Strategic Holdings Ltd. | 2,400 | 48,124 | ||||||
| Johnson Electric Holdings Ltd. | 18,000 | 35,467 | ||||||
| K Wah International Holdings Ltd. | 62,000 | 29,368 | ||||||
| Karrie International Holdings Ltd. | 40,000 | 5,878 | ||||||
| Keck Seng Investments | 2,000 | 774 | ||||||
| Kerry Logistics Network Ltd. | 7,000 | 11,598 | ||||||
| Kerry Properties Ltd. | 12,500 | 32,413 | ||||||
| Kwoon Chung Bus Holdings Ltd. | 4,000 | 1,243 | ||||||
| Lai Sun Development Co. Ltd. | 8,400 | 8,766 | ||||||
Leyou Technologies Holdings Ltd.(1)(2) | 25,000 | 10,435 | ||||||
| Lifestyle International Holdings Ltd. | 26,000 | 23,823 | ||||||
| Luk Fook Holdings International Ltd. | 25,000 | 55,805 | ||||||
Macau Legend Development Ltd.(1) | 10,000 | 1,212 | ||||||
| Man Wah Holdings Ltd. | 104,000 | 144,725 | ||||||
Mandarin Oriental International Ltd.(1) | 14,200 | 23,698 | ||||||
| Melco International Development Ltd. | 42,000 | 91,894 | ||||||
| Melco Resorts & Entertainment Ltd., ADR | 8,578 | 167,443 | ||||||
MGM China Holdings Ltd.(2) | 6,000 | 8,715 | ||||||
| Microport Scientific Corp. | 8,000 | 36,260 | ||||||
| Minmetals Land Ltd. | 72,000 | 8,790 | ||||||
| Minth Group Ltd. | 48,000 | 160,297 | ||||||
| Modern Dental Group Ltd. | 9,000 | 1,481 | ||||||
| MTR Corp. Ltd. | 22,286 | 115,137 | ||||||
| Multifield International Holdings Ltd. | 32,000 | 1,115 | ||||||
| New World Development Co. Ltd. | 67,750 | 350,518 | ||||||
NewOcean Energy Holdings Ltd.(1) | 8,000 | 720 | ||||||
| Nissin Foods Co. Ltd. | 7,000 | 7,588 | ||||||
| NWS Holdings Ltd. | 57,000 | 48,319 | ||||||
O-Net Technologies Group Ltd.(1) | 2,000 | 1,626 | ||||||
| Pacific Basin Shipping Ltd. | 183,000 | 26,640 | ||||||
| Pacific Textiles Holdings Ltd. | 44,000 | 19,431 | ||||||
| Paliburg Holdings Ltd. | 4,000 | 945 | ||||||
| PCCW Ltd. | 145,000 | 90,786 | ||||||
| Perfect Shape Medical Ltd. | 24,000 | 7,702 | ||||||
25
| Shares | Value | |||||||
| Pico Far East Holdings Ltd. | 16,000 | $ | 2,033 | |||||
| Playmates Holdings Ltd. | 16,000 | 1,672 | ||||||
| Power Assets Holdings Ltd. | 21,000 | 119,645 | ||||||
| Public Financial Holdings Ltd. | 4,000 | 999 | ||||||
| Regal Hotels International Holdings Ltd. | 4,000 | 1,445 | ||||||
| Regina Miracle International Holdings Ltd. | 5,000 | 1,410 | ||||||
Sa Sa International Holdings Ltd.(2) | 6,000 | 1,010 | ||||||
| Sands China Ltd. | 52,000 | 228,864 | ||||||
| SAS Dragon Holdings Ltd. | 4,000 | 1,240 | ||||||
| Shangri-La Asia Ltd. | 58,000 | 47,169 | ||||||
| Shun Tak Holdings Ltd. | 74,000 | 25,475 | ||||||
| Singamas Container Holdings Ltd. | 62,000 | 2,674 | ||||||
| Sino Land Co. Ltd. | 76,000 | 88,268 | ||||||
| SITC International Holdings Co. Ltd. | 85,000 | 110,771 | ||||||
| SJM Holdings Ltd. | 123,000 | 168,804 | ||||||
| SmarTone Telecommunications Holdings Ltd. | 12,500 | 6,850 | ||||||
| Soundwill Holdings Ltd. | 2,000 | 1,822 | ||||||
| Sun Hung Kai & Co. Ltd. | 33,000 | 13,569 | ||||||
| Sun Hung Kai Properties Ltd. | 16,000 | 213,143 | ||||||
| SUNeVision Holdings Ltd. | 44,000 | 32,659 | ||||||
| Swire Pacific Ltd., Class A | 14,500 | 78,027 | ||||||
| Swire Properties Ltd. | 28,200 | 76,262 | ||||||
| Symphony Holdings Ltd. | 10,000 | 1,132 | ||||||
| Techtronic Industries Co. Ltd. | 29,500 | 372,795 | ||||||
| Television Broadcasts Ltd. | 1,200 | 1,354 | ||||||
| Texwinca Holdings Ltd. | 32,000 | 4,657 | ||||||
TK Group Holdings Ltd.(2) | 4,000 | 1,334 | ||||||
| United Laboratories International Holdings Ltd. (The) | 56,000 | 65,793 | ||||||
| Upbest Group Ltd. | 8,000 | 866 | ||||||
| Value Partners Group Ltd. | 12,000 | 5,480 | ||||||
Vitasoy International Holdings Ltd.(2) | 44,000 | 156,393 | ||||||
| VTech Holdings Ltd. | 6,200 | 36,109 | ||||||
| Wang On Group Ltd. | 620,000 | 5,101 | ||||||
| WH Group Ltd. | 352,100 | 303,123 | ||||||
| Wharf Real Estate Investment Co. Ltd. | 52,000 | 215,398 | ||||||
| Wynn Macau Ltd. | 48,800 | 90,882 | ||||||
| Xin Point Holdings Ltd. | 5,000 | 1,280 | ||||||
| Xinyi Glass Holdings Ltd. | 104,000 | 178,503 | ||||||
| Yue Yuen Industrial Holdings Ltd. | 23,000 | 39,747 | ||||||
| 9,987,709 | ||||||||
| Ireland — 0.6% | ||||||||
AIB Group plc(1) | 16,778 | 20,709 | ||||||
Bank of Ireland Group plc(1) | 40,450 | 90,944 | ||||||
| C&C Group plc | 4,410 | 12,615 | ||||||
Cairn Homes plc(1) | 23,549 | 21,950 | ||||||
| Cpl Resources plc | 851 | 7,213 | ||||||
| CRH plc | 13,829 | 512,588 | ||||||
| Dalata Hotel Group plc | 12,690 | 41,466 | ||||||
FBD Holdings plc(1) | 1,472 | 10,577 | ||||||
| Glanbia plc | 5,100 | 58,699 | ||||||
Glenveagh Properties plc(1) | 11,263 | 9,484 | ||||||
| Kerry Group plc, A Shares | 4,548 | 597,836 | ||||||
26
| Shares | Value | |||||||
Kingspan Group plc(1) | 2,200 | $ | 188,838 | |||||
| Origin Enterprises plc | 9,051 | 37,185 | ||||||
Permanent TSB Group Holdings plc(1) | 4,495 | 2,736 | ||||||
| Smurfit Kappa Group plc | 11,417 | 404,064 | ||||||
Uniphar plc(1) | 4,021 | 11,040 | ||||||
| 2,027,944 | ||||||||
| Israel — 0.8% | ||||||||
| Adgar Investment and Development Ltd. | 2,591 | 3,658 | ||||||
Airport City Ltd.(1) | 2,180 | 25,364 | ||||||
Allot Ltd.(1) | 607 | 6,386 | ||||||
| Alony Hetz Properties & Investments Ltd. | 1,917 | 22,462 | ||||||
| Amot Investments Ltd. | 3,842 | 19,681 | ||||||
Arko Holdings Ltd.(1) | 9,988 | 6,063 | ||||||
| Ashtrom Group Ltd. | 1,410 | 18,999 | ||||||
| Ashtrom Properties Ltd. | 932 | 3,805 | ||||||
| AudioCodes Ltd. | 1,046 | 32,813 | ||||||
| Azrieli Group Ltd. | 518 | 27,899 | ||||||
| Bank Hapoalim BM | 18,060 | 109,283 | ||||||
| Bank Leumi Le-Israel BM | 25,710 | 131,552 | ||||||
BATM Advanced Communications(1)(2) | 7,085 | 12,682 | ||||||
Bezeq The Israeli Telecommunication Corp. Ltd.(1) | 20,877 | 23,825 | ||||||
| Caesarstone Ltd. | 1,341 | 14,798 | ||||||
Camtek Ltd.(1) | 2,043 | 31,165 | ||||||
| Carasso Motors Ltd. | 1,552 | 4,961 | ||||||
Cellcom Israel Ltd.(1) | 5,994 | 21,846 | ||||||
Ceragon Networks Ltd.(1) | 1,161 | 2,670 | ||||||
Check Point Software Technologies Ltd.(1) | 1,729 | 218,304 | ||||||
Clal Insurance Enterprises Holdings Ltd.(1) | 1,677 | 16,454 | ||||||
Compugen Ltd.(1) | 491 | 8,489 | ||||||
CyberArk Software Ltd.(1) | 747 | 82,544 | ||||||
| Delek Automotive Systems Ltd. | 1,685 | 9,359 | ||||||
| Elbit Systems Ltd. | 519 | 69,988 | ||||||
| Elco Ltd. | 317 | 11,567 | ||||||
| Electra Consumer Products 1970 Ltd. | 477 | 13,343 | ||||||
| Electra Ltd. | 48 | 21,771 | ||||||
Equital Ltd.(1) | 914 | 18,262 | ||||||
Fattal Holdings 1998 Ltd.(1) | 150 | 9,911 | ||||||
| FIBI Holdings Ltd. | 679 | 17,836 | ||||||
| First International Bank of Israel Ltd. | 1,571 | 36,752 | ||||||
Fiverr International Ltd.(1) | 108 | 13,030 | ||||||
| Fox Wizel Ltd. | 552 | 27,313 | ||||||
| Freshmarket Ltd. | 2,544 | 10,834 | ||||||
| Gazit-Globe Ltd. | 2,957 | 15,344 | ||||||
Gilat Satellite Networks Ltd.(1) | 3,084 | 16,662 | ||||||
Hagag Group Real Estate Development(1) | 909 | 2,352 | ||||||
Harel Insurance Investments & Financial Services Ltd.(1) | 3,482 | 24,943 | ||||||
| Hilan Ltd. | 635 | 29,847 | ||||||
| ICL Group Ltd. | 13,571 | 50,446 | ||||||
| Inrom Construction Industries Ltd. | 8,205 | 32,925 | ||||||
| Isracard Ltd. | 3,854 | 10,723 | ||||||
Israel Corp. Ltd. (The)(1) | 37 | 4,398 | ||||||
| Israel Discount Bank Ltd., A Shares | 31,992 | 102,372 | ||||||
27
| Shares | Value | |||||||
| Ituran Location and Control Ltd. | 914 | $ | 13,253 | |||||
Kamada Ltd.(1) | 646 | 6,348 | ||||||
| Kenon Holdings Ltd. | 137 | 3,039 | ||||||
Kornit Digital Ltd.(1) | 552 | 34,185 | ||||||
| Magic Software Enterprises Ltd. | 953 | 14,508 | ||||||
| Matrix IT Ltd. | 1,555 | 39,961 | ||||||
| Maytronics Ltd. | 1,809 | 26,663 | ||||||
Mediterranean Towers Ltd.(1) | 4,988 | 11,371 | ||||||
| Melisron Ltd. | 395 | 15,810 | ||||||
| Menora Mivtachim Holdings Ltd. | 1,677 | 21,781 | ||||||
| Migdal Insurance & Financial Holdings Ltd. | 6,038 | 4,905 | ||||||
Mivne Real Estate KD Ltd.(1) | 15,370 | 31,777 | ||||||
| Mizrahi Tefahot Bank Ltd. | 3,346 | 68,085 | ||||||
Naphtha Israel Petroleum Corp. Ltd.(1) | 1,293 | 4,767 | ||||||
Nawi Brothers Ltd.(1) | 1,403 | 6,523 | ||||||
Nice Ltd., ADR(1) | 670 | 154,000 | ||||||
| Oil Refineries Ltd. | 69,721 | 14,185 | ||||||
Partner Communications Co. Ltd.(1) | 9,340 | 40,304 | ||||||
| Paz Oil Co. Ltd. | 285 | 28,871 | ||||||
Phoenix Holdings Ltd. (The)(1) | 5,399 | 26,975 | ||||||
Radware Ltd.(1) | 961 | 24,909 | ||||||
Raval Ics Ltd.(1) | 1,918 | 4,250 | ||||||
| Sapiens International Corp. NV | 1,036 | 34,487 | ||||||
Shapir Engineering and Industry Ltd.(1) | 5,643 | 39,380 | ||||||
Shikun & Binui Ltd.(1) | 10,740 | 47,892 | ||||||
| Shufersal Ltd. | 7,421 | 58,351 | ||||||
Silicom Ltd.(1) | 463 | 17,080 | ||||||
| Strauss Group Ltd. | 1,524 | 44,472 | ||||||
| Summit Real Estate Holdings Ltd. | 1,024 | 10,049 | ||||||
| Tel Aviv Stock Exchange Ltd. | 2,538 | 11,844 | ||||||
Teva Pharmaceutical Industries Ltd., ADR(1) | 8,206 | 80,993 | ||||||
Tower Semiconductor Ltd.(1) | 4,130 | 81,038 | ||||||
| Union Bank of Israel | 762 | 4,197 | ||||||
Wix.com Ltd.(1) | 412 | 121,388 | ||||||
| ZUR Shamir Holdings Ltd. | 905 | 1,960 | ||||||
| 2,545,282 | ||||||||
| Italy — 2.2% | ||||||||
| A2A SpA | 89,917 | 131,157 | ||||||
| ACEA SpA | 3,238 | 66,723 | ||||||
Amplifon SpA(1) | 2,078 | 69,195 | ||||||
Arnoldo Mondadori Editore SpA(1) | 544 | 684 | ||||||
| Ascopiave SpA | 6,284 | 24,627 | ||||||
| Assicurazioni Generali SpA | 6,528 | 101,235 | ||||||
ASTM SpA(1) | 1,683 | 34,245 | ||||||
Atlantia SpA(1) | 5,521 | 87,810 | ||||||
Autogrill SpA(1) | 4,117 | 21,059 | ||||||
| Azimut Holding SpA | 4,758 | 92,191 | ||||||
Banca Farmafactoring SpA(1) | 7,704 | 42,779 | ||||||
Banca Generali SpA(1) | 1,154 | 35,225 | ||||||
Banca IFIS SpA(1) | 1,555 | 16,188 | ||||||
| Banca Mediolanum SpA | 3,360 | 24,900 | ||||||
Banca Monte dei Paschi di Siena SpA(1) | 14,985 | 25,603 | ||||||
28
| Shares | Value | |||||||
Banca Popolare di Sondrio SCPA(1) | 31,761 | $ | 76,285 | |||||
Banco BPM SpA(1) | 55,657 | 93,690 | ||||||
Banco di Desio e della Brianza SpA(1) | 2,079 | 5,583 | ||||||
BPER Banca(1) | 16,522 | 45,319 | ||||||
Brunello Cucinelli SpA(1) | 792 | 25,020 | ||||||
| Buzzi Unicem SpA | 1,276 | 31,316 | ||||||
Cairo Communication SpA(1) | 1,292 | 2,054 | ||||||
| Carel Industries SpA | 894 | 21,871 | ||||||
| Cementir Holding NV | 907 | 6,329 | ||||||
Cerved Group SpA(1) | 4,367 | 37,269 | ||||||
CIR SpA-Compagnie Industriali(1) | 13,212 | 6,321 | ||||||
CNH Industrial NV(1) | 28,394 | 224,961 | ||||||
Credito Emiliano SpA(1) | 4,758 | 24,150 | ||||||
Credito Valtellinese SpA(1) | 1,197 | 10,616 | ||||||
d'Amico International Shipping SA(1) | 35,698 | 3,990 | ||||||
| Danieli & C Officine Meccaniche SpA | 415 | 6,194 | ||||||
| Danieli & C Officine Meccaniche SpA, Preference Shares | 1,532 | 13,352 | ||||||
| Datalogic SpA | 161 | 2,173 | ||||||
| Davide Campari-Milano NV | 3,600 | 37,013 | ||||||
De' Longhi SpA(1) | 537 | 17,830 | ||||||
| DiaSorin SpA | 153 | 27,658 | ||||||
El.En. SpA(1) | 250 | 6,633 | ||||||
| Enav SpA | 5,752 | 24,152 | ||||||
| Enel SpA | 125,871 | 1,141,521 | ||||||
| Eni SpA, ADR | 18,326 | 340,864 | ||||||
| ERG SpA | 1,693 | 44,755 | ||||||
Esprinet SpA(1) | 2,825 | 17,611 | ||||||
| Falck Renewables SpA | 2,590 | 17,363 | ||||||
| Ferrari NV | 2,172 | 423,113 | ||||||
Fiat Chrysler Automobiles NV(1) | 26,253 | 289,385 | ||||||
| Fiera Milano SpA | 654 | 2,071 | ||||||
Fincantieri SpA(1) | 27,906 | 19,758 | ||||||
FinecoBank Banca Fineco SpA(1) | 7,930 | 120,075 | ||||||
Freni Brembo SpA(1) | 7,817 | 75,315 | ||||||
Geox SpA(1) | 2,582 | 2,031 | ||||||
| Gruppo MutuiOnline SpA | 514 | 14,232 | ||||||
| Hera SpA | 32,625 | 124,675 | ||||||
IMA Industria Macchine Automatiche SpA(1) | 895 | 71,788 | ||||||
IMMSI SpA(1) | 5,389 | 2,484 | ||||||
| Infrastrutture Wireless Italiane SpA | 2,560 | 24,973 | ||||||
| Interpump Group SpA | 914 | 31,999 | ||||||
Intesa Sanpaolo SpA(1) | 228,154 | 490,904 | ||||||
| Iren SpA | 44,000 | 115,052 | ||||||
| Italgas SpA | 23,823 | 153,525 | ||||||
| Leonardo SpA | 4,117 | 27,865 | ||||||
Maire Tecnimont SpA(1) | 9,626 | 17,405 | ||||||
Mediaset SpA(1) | 8,728 | 16,137 | ||||||
| Mediobanca Banca di Credito Finanziario SpA | 8,571 | 74,396 | ||||||
Moncler SpA(1) | 4,483 | 173,915 | ||||||
OVS SpA(1) | 13,943 | 13,416 | ||||||
| Piaggio & C SpA | 8,850 | 25,140 | ||||||
Piovan SpA(1) | 515 | 2,507 | ||||||
29
| Shares | Value | |||||||
Pirelli & C SpA(1) | 4,239 | $ | 18,328 | |||||
| Poste Italiane SpA | 6,807 | 62,424 | ||||||
| Prysmian SpA | 8,331 | 232,850 | ||||||
| RAI Way SpA | 6,009 | 39,213 | ||||||
| Recordati Industria Chimica e Farmaceutica SpA | 1,795 | 97,783 | ||||||
| Reno de Medici SpA | 6,142 | 6,022 | ||||||
| Reply SpA | 800 | 88,743 | ||||||
| Retelit SpA | 1,805 | 4,362 | ||||||
Safilo Group SpA(1) | 3,360 | 2,608 | ||||||
| Saipem SpA | 17,281 | 36,989 | ||||||
Salvatore Ferragamo SpA(1) | 2,709 | 38,985 | ||||||
Saras SpA(1) | 40,565 | 28,161 | ||||||
| Sesa SpA | 517 | 46,322 | ||||||
| Snam SpA | 59,633 | 305,640 | ||||||
Societa Cattolica di Assicurazioni SC(1) | 2,959 | 17,576 | ||||||
Sogefi SpA(1) | 5,008 | 5,458 | ||||||
Technogym SpA(1) | 4,759 | 42,819 | ||||||
| Telecom Italia SpA/Milano | 85,960 | 40,883 | ||||||
| Telecom Italia SpA/Milano, Preference Shares | 53,606 | 25,304 | ||||||
| Tenaris SA, ADR | 4,228 | 49,298 | ||||||
| Terna Rete Elettrica Nazionale SpA | 42,848 | 309,789 | ||||||
Tinexta Spa(1) | 910 | 18,954 | ||||||
Tod's SpA(1) | 31 | 892 | ||||||
UniCredit SpA(1) | 37,731 | 371,721 | ||||||
Unieuro SpA(1) | 392 | 4,189 | ||||||
Unione di Banche Italiane SpA(1) | 36,713 | 158,866 | ||||||
Unipol Gruppo SpA(1) | 12,792 | 61,616 | ||||||
| Webuild SpA | 13,941 | 18,121 | ||||||
| 7,531,591 | ||||||||
| Japan — 22.8% | ||||||||
| 77 Bank Ltd. (The) | 1,900 | 27,774 | ||||||
| A&D Co. Ltd. | 400 | 2,410 | ||||||
ABC-Mart, Inc.(2) | 900 | 47,326 | ||||||
| Access Co. Ltd. | 200 | 1,784 | ||||||
| Achilles Corp. | 400 | 6,688 | ||||||
| Acom Co. Ltd. | 3,100 | 12,089 | ||||||
| Ad-sol Nissin Corp. | 300 | 7,000 | ||||||
Adastria Co. Ltd.(2) | 1,700 | 26,503 | ||||||
| ADEKA Corp. | 3,300 | 48,154 | ||||||
| Advan Co. Ltd. | 200 | 2,540 | ||||||
| Advantest Corp. | 3,500 | 166,921 | ||||||
Aeon Co. Ltd.(2) | 17,500 | 433,572 | ||||||
| Aeon Delight Co. Ltd. | 800 | 23,634 | ||||||
Aeon Fantasy Co. Ltd.(2) | 200 | 3,217 | ||||||
AEON Financial Service Co. Ltd.(2) | 3,900 | 34,582 | ||||||
Aeon Mall Co. Ltd.(2) | 4,100 | 54,154 | ||||||
Aeria, Inc.(1) | 900 | 4,565 | ||||||
| AGC, Inc. | 7,300 | 206,277 | ||||||
| Ai Holdings Corp. | 900 | 15,040 | ||||||
| Aica Kogyo Co. Ltd. | 1,200 | 41,120 | ||||||
| Aichi Corp. | 500 | 3,869 | ||||||
| Aichi Steel Corp. | 700 | 17,488 | ||||||
30
| Shares | Value | |||||||
| Aida Engineering Ltd. | 1,400 | $ | 9,053 | |||||
Aiful Corp.(1) | 3,100 | 7,382 | ||||||
| Ain Holdings, Inc. | 900 | 58,377 | ||||||
| Air Water, Inc. | 3,200 | 44,781 | ||||||
| Airport Facilities Co. Ltd. | 1,500 | 5,910 | ||||||
| Aisan Industry Co. Ltd. | 900 | 4,034 | ||||||
| Aisin Seiki Co. Ltd. | 5,000 | 171,316 | ||||||
| Aizawa Securities Co. Ltd. | 400 | 2,605 | ||||||
| Ajinomoto Co., Inc. | 10,800 | 201,044 | ||||||
| Akatsuki, Inc. | 300 | 11,431 | ||||||
Akebono Brake Industry Co. Ltd.(1) | 600 | 946 | ||||||
| Alconix Corp. | 1,500 | 19,913 | ||||||
| Alfresa Holdings Corp. | 3,400 | 68,208 | ||||||
| Alinco, Inc. | 300 | 2,625 | ||||||
| Alpen Co. Ltd. | 200 | 3,385 | ||||||
| Alps Alpine Co. Ltd. | 7,100 | 112,367 | ||||||
| Altech Corp. | 900 | 15,484 | ||||||
| Amada Co. Ltd. | 5,900 | 52,389 | ||||||
| Amano Corp. | 2,000 | 41,621 | ||||||
| Amuse, Inc. | 900 | 19,908 | ||||||
ANA Holdings, Inc.(1) | 2,200 | 54,302 | ||||||
| Anest Iwata Corp. | 1,100 | 8,470 | ||||||
Anritsu Corp.(2) | 2,900 | 63,257 | ||||||
| AOKI Holdings, Inc. | 1,400 | 7,540 | ||||||
| Aomori Bank Ltd. (The) | 700 | 14,569 | ||||||
| Aoyama Trading Co. Ltd. | 900 | 5,403 | ||||||
| Aozora Bank Ltd. | 4,600 | 82,231 | ||||||
| Arakawa Chemical Industries Ltd. | 200 | 2,237 | ||||||
| Arata Corp. | 1,000 | 47,746 | ||||||
| Arcland Sakamoto Co. Ltd. | 1,800 | 35,741 | ||||||
| Arcland Service Holdings Co. Ltd. | 700 | 13,071 | ||||||
Arcs Co. Ltd.(2) | 1,200 | 29,789 | ||||||
| Argo Graphics, Inc. | 600 | 19,850 | ||||||
| Arisawa Manufacturing Co. Ltd. | 1,100 | 9,690 | ||||||
| ARTERIA Networks Corp. | 1,000 | 16,498 | ||||||
| Artnature, Inc. | 1,100 | 6,378 | ||||||
| Aruhi Corp. | 1,000 | 15,989 | ||||||
| AS One Corp. | 100 | 12,758 | ||||||
| Asahi Co. Ltd. | 1,300 | 22,400 | ||||||
| Asahi Diamond Industrial Co. Ltd. | 2,000 | 9,343 | ||||||
| Asahi Group Holdings Ltd. | 5,400 | 188,761 | ||||||
| Asahi Holdings, Inc. | 2,500 | 83,780 | ||||||
| Asahi Intecc Co. Ltd. | 2,200 | 65,168 | ||||||
| Asahi Kasei Corp. | 22,000 | 184,162 | ||||||
| Asahi Net, Inc. | 900 | 8,000 | ||||||
| ASAHI YUKIZAI Corp. | 100 | 1,175 | ||||||
| Asanuma Corp. | 500 | 20,870 | ||||||
| Asia Pile Holdings Corp. | 400 | 1,750 | ||||||
| Asics Corp. | 1,300 | 17,877 | ||||||
| ASKA Pharmaceutical Co. Ltd. | 200 | 2,247 | ||||||
| ASKUL Corp. | 1,100 | 33,893 | ||||||
| Astellas Pharma, Inc. | 30,100 | 472,399 | ||||||
31
| Shares | Value | |||||||
| Asukanet Co. Ltd. | 100 | $ | 1,269 | |||||
| Ateam, Inc. | 100 | 871 | ||||||
Atom Corp.(2) | 1,600 | 13,572 | ||||||
| Autobacs Seven Co. Ltd. | 800 | 10,341 | ||||||
| Avant Corp. | 900 | 8,811 | ||||||
| Avex, Inc. | 600 | 5,172 | ||||||
| Awa Bank Ltd. (The) | 1,300 | 29,274 | ||||||
| Axial Retailing, Inc. | 1,200 | 54,382 | ||||||
| Azbil Corp. | 2,100 | 65,778 | ||||||
| Bandai Namco Holdings, Inc. | 3,500 | 216,994 | ||||||
| Bando Chemical Industries Ltd. | 1,400 | 7,648 | ||||||
| Bank of Iwate Ltd. (The) | 600 | 14,117 | ||||||
| Bank of Kyoto Ltd. (The) | 1,800 | 76,577 | ||||||
| Bank of Nagoya Ltd. (The) | 300 | 6,593 | ||||||
| Bank of Okinawa Ltd. (The) | 700 | 19,693 | ||||||
| Bank of the Ryukyus Ltd. | 600 | 4,999 | ||||||
BASE, Inc.(1) | 100 | 8,587 | ||||||
| BayCurrent Consulting, Inc. | 500 | 53,305 | ||||||
| Beenos, Inc. | 900 | 13,797 | ||||||
Belc Co. Ltd.(2) | 600 | 42,375 | ||||||
| Bell System24 Holdings, Inc. | 1,200 | 19,494 | ||||||
| Belluna Co. Ltd. | 1,900 | 18,164 | ||||||
| Benefit One, Inc. | 2,100 | 50,648 | ||||||
| Benesse Holdings, Inc. | 3,500 | 89,250 | ||||||
| BeNEXT Group, Inc. | 800 | 8,475 | ||||||
Bengo4.com, Inc.(1) | 100 | 10,213 | ||||||
Bic Camera, Inc.(2) | 3,100 | 34,276 | ||||||
| BML, Inc. | 1,000 | 25,455 | ||||||
| Bookoff Group Holdings Ltd. | 100 | 801 | ||||||
| Br Holdings Corp. | 2,100 | 12,593 | ||||||
BrainPad, Inc.(1) | 100 | 3,666 | ||||||
| Bridgestone Corp. | 12,700 | 401,918 | ||||||
| Broadleaf Co. Ltd. | 2,000 | 9,535 | ||||||
| Brother Industries Ltd. | 8,000 | 132,131 | ||||||
| Bunka Shutter Co. Ltd. | 2,700 | 19,184 | ||||||
| CAC Holdings Corp. | 100 | 1,226 | ||||||
| Calbee, Inc. | 2,600 | 81,136 | ||||||
| Can Do Co. Ltd. | 500 | 10,201 | ||||||
| Canon Electronics, Inc. | 700 | 9,755 | ||||||
| Canon Marketing Japan, Inc. | 500 | 8,930 | ||||||
| Canon, Inc., ADR | 10,572 | 181,416 | ||||||
| Capcom Co. Ltd. | 3,200 | 154,903 | ||||||
| Carenet, Inc. | 300 | 7,681 | ||||||
| Casio Computer Co. Ltd. | 8,500 | 136,529 | ||||||
| Cawachi Ltd. | 600 | 17,068 | ||||||
| Central Automotive Products Ltd. | 500 | 10,844 | ||||||
| Central Glass Co. Ltd. | 900 | 17,791 | ||||||
| Central Japan Railway Co. | 1,400 | 209,112 | ||||||
| Central Security Patrols Co. Ltd. | 100 | 3,353 | ||||||
Change, Inc.(1) | 600 | 41,858 | ||||||
| Charm Care Corp. KK | 800 | 7,528 | ||||||
| Chiba Bank Ltd. (The) | 14,500 | 75,056 | ||||||
32
| Shares | Value | |||||||
| Chiba Kogyo Bank Ltd. (The) | 700 | $ | 1,457 | |||||
| Chikaranomoto Holdings Co. Ltd. | 200 | 1,281 | ||||||
| Chiyoda Co. Ltd. | 100 | 951 | ||||||
Chiyoda Corp.(1) | 400 | 1,042 | ||||||
| Chiyoda Integre Co. Ltd. | 100 | 1,511 | ||||||
| Chubu Electric Power Co., Inc. | 9,200 | 113,613 | ||||||
| Chubu Shiryo Co. Ltd. | 1,300 | 19,983 | ||||||
| Chudenko Corp. | 900 | 19,121 | ||||||
| Chugai Pharmaceutical Co. Ltd. | 9,600 | 428,047 | ||||||
| Chugoku Bank Ltd. (The) | 5,000 | 46,155 | ||||||
Chugoku Electric Power Co., Inc. (The)(2) | 4,800 | 58,526 | ||||||
| CI Takiron Corp. | 800 | 5,084 | ||||||
| Citizen Watch Co. Ltd. | 4,200 | 13,319 | ||||||
| CKD Corp. | 700 | 9,560 | ||||||
| Cleanup Corp. | 200 | 962 | ||||||
| CMIC Holdings Co. Ltd. | 500 | 6,171 | ||||||
| CMK Corp. | 400 | 1,748 | ||||||
| Coca-Cola Bottlers Japan Holdings, Inc. | 4,800 | 79,948 | ||||||
| cocokara fine, Inc. | 600 | 33,538 | ||||||
| COLOPL, Inc. | 300 | 2,722 | ||||||
Colowide Co. Ltd.(2) | 1,800 | 28,109 | ||||||
| Computer Engineering & Consulting Ltd. | 1,600 | 24,509 | ||||||
| COMSYS Holdings Corp. | 2,700 | 75,281 | ||||||
| Comture Corp. | 800 | 16,847 | ||||||
| Concordia Financial Group Ltd. | 30,900 | 101,592 | ||||||
| CONEXIO Corp. | 800 | 9,801 | ||||||
| Core Corp. | 100 | 1,267 | ||||||
| Cosel Co. Ltd. | 100 | 816 | ||||||
| Cosmo Energy Holdings Co. Ltd. | 3,700 | 58,373 | ||||||
| Cosmos Initia Co. Ltd. | 200 | 787 | ||||||
Cosmos Pharmaceutical Corp.(2) | 800 | 140,772 | ||||||
Create Restaurants Holdings, Inc.(2) | 2,600 | 16,125 | ||||||
| Create SD Holdings Co. Ltd. | 1,600 | 57,694 | ||||||
| Credit Saison Co. Ltd. | 7,700 | 87,518 | ||||||
| Creek & River Co. Ltd. | 700 | 7,950 | ||||||
| Cresco Ltd. | 700 | 8,343 | ||||||
| CTI Engineering Co. Ltd. | 800 | 13,845 | ||||||
| CTS Co. Ltd. | 1,300 | 10,388 | ||||||
| Curves Holdings Co. Ltd. | 2,300 | 14,644 | ||||||
| CyberAgent, Inc. | 3,100 | 165,088 | ||||||
CYBERDYNE, Inc.(1)(2) | 200 | 895 | ||||||
| Cybernet Systems Co. Ltd. | 500 | 3,755 | ||||||
| Cybozu, Inc. | 900 | 26,490 | ||||||
Dai Nippon Printing Co. Ltd.(2) | 5,100 | 108,203 | ||||||
| Dai Nippon Toryo Co. Ltd. | 400 | 3,326 | ||||||
| Dai-ichi Life Holdings, Inc. | 17,300 | 261,001 | ||||||
| Daibiru Corp. | 1,300 | 14,612 | ||||||
| Daicel Corp. | 7,600 | 54,993 | ||||||
| Daido Metal Co. Ltd. | 2,400 | 11,971 | ||||||
| Daido Steel Co. Ltd. | 600 | 19,917 | ||||||
| Daifuku Co. Ltd. | 400 | 35,127 | ||||||
| Daihen Corp. | 800 | 31,531 | ||||||
33
| Shares | Value | |||||||
| Daiho Corp. | 300 | $ | 7,617 | |||||
| Daiichi Kigenso Kagaku-Kogyo Co. Ltd. | 500 | 3,676 | ||||||
| Daiichi Sankyo Co. Ltd. | 3,400 | 303,394 | ||||||
| Daiichikosho Co. Ltd. | 1,500 | 46,688 | ||||||
| Daiken Corp. | 300 | 4,682 | ||||||
| Daiki Aluminium Industry Co. Ltd. | 1,500 | 7,091 | ||||||
| Daikin Industries Ltd. | 2,700 | 507,708 | ||||||
| Daikoku Denki Co. Ltd. | 200 | 1,934 | ||||||
| Daikokutenbussan Co. Ltd. | 600 | 33,143 | ||||||
| Daikyonishikawa Corp. | 800 | 4,319 | ||||||
| Daio Paper Corp. | 4,000 | 54,523 | ||||||
| Daiseki Co. Ltd. | 700 | 16,859 | ||||||
| Daishi Hokuetsu Financial Group, Inc. | 1,800 | 34,327 | ||||||
| Daito Pharmaceutical Co. Ltd. | 900 | 29,294 | ||||||
| Daito Trust Construction Co. Ltd. | 1,600 | 141,717 | ||||||
| Daiwa House Industry Co. Ltd. | 5,400 | 144,440 | ||||||
| Daiwa Industries Ltd. | 900 | 7,757 | ||||||
Daiwa Securities Group, Inc.(2) | 27,400 | 123,314 | ||||||
| Daiwabo Holdings Co. Ltd. | 1,400 | 84,111 | ||||||
| DCM Holdings Co. Ltd. | 7,300 | 89,379 | ||||||
| DD Holdings Co. Ltd. | 200 | 1,649 | ||||||
| Dear Life Co. Ltd. | 300 | 1,612 | ||||||
| DeNA Co. Ltd. | 1,800 | 28,609 | ||||||
| Denka Co. Ltd. | 3,400 | 95,482 | ||||||
| Densan System Co. Ltd. | 100 | 3,392 | ||||||
| Denso Corp. | 7,000 | 293,516 | ||||||
| Dentsu Group, Inc. | 3,300 | 86,286 | ||||||
| Denyo Co. Ltd. | 700 | 14,338 | ||||||
Descente Ltd.(1) | 600 | 10,258 | ||||||
| Dexerials Corp. | 2,200 | 21,940 | ||||||
| DIC Corp. | 4,400 | 104,076 | ||||||
| Digital Arts, Inc. | 400 | 30,817 | ||||||
| Digital Garage, Inc. | 2,000 | 60,595 | ||||||
| Digital Hearts Holdings Co. Ltd. | 700 | 6,819 | ||||||
| Digital Information Technologies Corp. | 500 | 5,815 | ||||||
| Dip Corp. | 1,400 | 30,926 | ||||||
| Disco Corp. | 100 | 23,235 | ||||||
| DKK Co. Ltd. | 100 | 2,225 | ||||||
| DKS Co. Ltd. | 300 | 12,408 | ||||||
| DMG Mori Co. Ltd. | 3,500 | 44,319 | ||||||
| Doshisha Co. Ltd. | 900 | 17,240 | ||||||
| Double Standard, Inc. | 200 | 8,698 | ||||||
| Doutor Nichires Holdings Co. Ltd. | 1,100 | 17,033 | ||||||
| Dowa Holdings Co. Ltd. | 1,900 | 58,407 | ||||||
| DTS Corp. | 2,200 | 46,103 | ||||||
| Duskin Co. Ltd. | 600 | 15,077 | ||||||
| DyDo Group Holdings, Inc. | 700 | 32,789 | ||||||
| E-Guardian, Inc. | 600 | 19,012 | ||||||
| Eagle Industry Co. Ltd. | 1,200 | 8,412 | ||||||
| Earth Corp. | 300 | 22,123 | ||||||
| East Japan Railway Co. | 2,900 | 188,479 | ||||||
| Ebara Corp. | 4,300 | 109,838 | ||||||
34
| Shares | Value | |||||||
| Ebase Co. Ltd. | 900 | $ | 10,167 | |||||
| Eco's Co. Ltd. | 500 | 10,480 | ||||||
| EDION Corp. | 4,300 | 48,672 | ||||||
| eGuarantee, Inc. | 200 | 4,247 | ||||||
| Ehime Bank Ltd. (The) | 1,500 | 16,338 | ||||||
| Eiken Chemical Co. Ltd. | 400 | 7,182 | ||||||
| Eisai Co. Ltd. | 1,500 | 130,895 | ||||||
| Eizo Corp. | 400 | 15,087 | ||||||
| Elan Corp. | 100 | 2,315 | ||||||
| Elecom Co. Ltd. | 700 | 31,644 | ||||||
| Electric Power Development Co. Ltd. | 3,100 | 46,710 | ||||||
| Elematec Corp. | 200 | 1,742 | ||||||
| EM Systems Co. Ltd. | 200 | 1,638 | ||||||
| en-japan, Inc. | 1,100 | 31,738 | ||||||
| ENEOS Holdings, Inc. | 93,100 | 364,351 | ||||||
| Enigmo, Inc. | 1,200 | 17,550 | ||||||
| EPS Holdings, Inc. | 100 | 948 | ||||||
| eRex Co. Ltd. | 400 | 4,758 | ||||||
| ES-Con Japan Ltd. | 1,800 | 12,920 | ||||||
| ESPEC Corp. | 1,100 | 18,956 | ||||||
euglena Co. Ltd.(1) | 200 | 1,488 | ||||||
| Exedy Corp. | 1,500 | 20,081 | ||||||
| Ezaki Glico Co. Ltd. | 700 | 29,714 | ||||||
| F.C.C. Co. Ltd. | 2,500 | 45,376 | ||||||
| FAN Communications, Inc. | 1,400 | 6,004 | ||||||
| Fancl Corp. | 1,400 | 45,637 | ||||||
| FANUC Corp. | 800 | 140,036 | ||||||
| Fast Retailing Co. Ltd. | 700 | 416,967 | ||||||
| Feed One Co. Ltd. | 9,100 | 15,787 | ||||||
| Ferrotec Holdings Corp. | 3,400 | 24,572 | ||||||
| Fibergate, Inc. | 100 | 1,690 | ||||||
| FIDEA Holdings Co. Ltd. | 1,900 | 1,859 | ||||||
Financial Products Group Co. Ltd.(2) | 2,400 | 12,167 | ||||||
| FINDEX, Inc. | 200 | 2,334 | ||||||
| First Bank of Toyama Ltd. (The) | 400 | 999 | ||||||
| First Juken Co. Ltd. | 100 | 933 | ||||||
| Fixstars Corp. | 800 | 8,762 | ||||||
| FJ Next Co. Ltd. | 100 | 766 | ||||||
| Foster Electric Co. Ltd. | 500 | 5,482 | ||||||
| FP Corp. | 400 | 30,419 | ||||||
| France Bed Holdings Co. Ltd. | 900 | 7,247 | ||||||
| Freebit Co. Ltd. | 200 | 1,607 | ||||||
Freee KK(1) | 400 | 22,048 | ||||||
| FTGroup Co. Ltd. | 200 | 2,546 | ||||||
| Fudo Tetra Corp. | 700 | 9,290 | ||||||
| Fuji Co. Ltd. | 1,000 | 17,546 | ||||||
| Fuji Corp. Ltd. | 200 | 978 | ||||||
Fuji Corp./Aichi(2) | 600 | 10,704 | ||||||
| Fuji Electric Co. Ltd. | 2,000 | 62,332 | ||||||
| Fuji Kyuko Co. Ltd. | 1,000 | 31,718 | ||||||
Fuji Oil Co. Ltd.(1) | 500 | 867 | ||||||
| Fuji Seal International, Inc. | 1,700 | 30,839 | ||||||
35
| Shares | Value | |||||||
| Fuji Soft, Inc. | 600 | $ | 27,121 | |||||
| Fujibo Holdings, Inc. | 600 | 20,243 | ||||||
| Fujicco Co. Ltd. | 600 | 11,758 | ||||||
| FUJIFILM Holdings Corp. | 2,900 | 138,023 | ||||||
| Fujikura Ltd. | 14,100 | 40,968 | ||||||
| Fujimori Kogyo Co. Ltd. | 1,000 | 37,005 | ||||||
| Fujio Food Group, Inc. | 200 | 2,467 | ||||||
| Fujita Kanko, Inc. | 100 | 1,423 | ||||||
| Fujitec Co. Ltd. | 1,600 | 31,894 | ||||||
| Fujitsu General Ltd. | 2,000 | 52,197 | ||||||
| Fujitsu Ltd. | 4,000 | 521,753 | ||||||
| Fukui Bank Ltd. (The) | 600 | 9,721 | ||||||
| Fukui Computer Holdings, Inc. | 400 | 10,310 | ||||||
| Fukuoka Financial Group, Inc. | 6,000 | 98,992 | ||||||
| Fukushima Galilei Co. Ltd. | 100 | 3,145 | ||||||
| Fukuyama Transporting Co. Ltd. | 1,200 | 58,998 | ||||||
| FULLCAST Holdings Co. Ltd. | 500 | 7,545 | ||||||
| Fumakilla Ltd. | 800 | 14,063 | ||||||
Funai Electric Co. Ltd.(1) | 200 | 928 | ||||||
| Funai Soken Holdings, Inc. | 1,300 | 26,012 | ||||||
| Furukawa Battery Co. Ltd. (The) | 1,200 | 12,563 | ||||||
| Furukawa Co. Ltd. | 2,100 | 21,069 | ||||||
| Furukawa Electric Co. Ltd. | 3,100 | 73,533 | ||||||
| Furuno Electric Co. Ltd. | 1,800 | 15,967 | ||||||
| Furyu Corp. | 800 | 7,850 | ||||||
| Fuso Chemical Co. Ltd. | 1,000 | 33,601 | ||||||
| Futaba Corp. | 800 | 6,739 | ||||||
| Futaba Industrial Co. Ltd. | 2,600 | 13,554 | ||||||
| Future Corp. | 1,100 | 19,926 | ||||||
| Fuyo General Lease Co. Ltd. | 1,100 | 66,171 | ||||||
| G-7 Holdings, Inc. | 800 | 24,162 | ||||||
| G-Tekt Corp. | 500 | 4,864 | ||||||
| Gakken Holdings Co. Ltd. | 800 | 12,115 | ||||||
| Gakujo Co. Ltd. | 100 | 951 | ||||||
| GCA Corp. | 200 | 1,176 | ||||||
| Gecoss Corp. | 800 | 7,163 | ||||||
| Genki Sushi Co. Ltd. | 100 | 2,169 | ||||||
| Genky DrugStores Co. Ltd. | 500 | 16,251 | ||||||
| Geo Holdings Corp. | 2,300 | 37,256 | ||||||
| Giken Ltd. | 200 | 7,153 | ||||||
| GLOBERIDE, Inc. | 600 | 18,921 | ||||||
| Glory Ltd. | 1,700 | 35,413 | ||||||
GMO Cloud KK(2) | 300 | 24,764 | ||||||
| GMO Financial Holdings, Inc. | 3,600 | 22,852 | ||||||
| GMO Internet, Inc. | 2,100 | 56,500 | ||||||
| GMO Payment Gateway, Inc. | 1,000 | 105,718 | ||||||
GNI Group Ltd.(1) | 100 | 2,353 | ||||||
| Godo Steel Ltd. | 500 | 8,971 | ||||||
| Goldcrest Co. Ltd. | 800 | 11,101 | ||||||
| Goldwin, Inc. | 800 | 57,651 | ||||||
| Grace Technology, Inc. | 400 | 15,207 | ||||||
| Gree, Inc. | 1,800 | 7,630 | ||||||
36
| Shares | Value | |||||||
| gremz, Inc. | 400 | $ | 6,174 | |||||
| GS Yuasa Corp. | 3,700 | 60,616 | ||||||
| Gumi, Inc. | 200 | 1,899 | ||||||
| GungHo Online Entertainment, Inc. | 1,900 | 39,157 | ||||||
| Gunma Bank Ltd. (The) | 14,600 | 47,707 | ||||||
| Gunze Ltd. | 700 | 25,177 | ||||||
| Gurunavi, Inc. | 1,000 | 6,089 | ||||||
| H-One Co. Ltd. | 200 | 994 | ||||||
| H.U. Group Holdings, Inc. | 2,000 | 49,323 | ||||||
| H2O Retailing Corp. | 3,500 | 24,396 | ||||||
| Hachijuni Bank Ltd. (The) | 12,200 | 47,093 | ||||||
| Hagihara Industries, Inc. | 700 | 9,608 | ||||||
| Hakuhodo DY Holdings, Inc. | 3,300 | 40,958 | ||||||
| Hakuto Co. Ltd. | 100 | 1,044 | ||||||
| Hamakyorex Co. Ltd. | 1,100 | 34,304 | ||||||
| Hamamatsu Photonics KK | 1,200 | 54,638 | ||||||
| Hamee Corp. | 400 | 9,228 | ||||||
| Hankyu Hanshin Holdings, Inc. | 7,100 | 230,415 | ||||||
| Hanwa Co. Ltd. | 1,300 | 26,084 | ||||||
| Happinet Corp. | 200 | 2,337 | ||||||
| Harima Chemicals Group, Inc. | 300 | 2,658 | ||||||
| Harmonic Drive Systems, Inc. | 200 | 10,511 | ||||||
| Haseko Corp. | 13,800 | 188,010 | ||||||
| Hazama Ando Corp. | 12,200 | 82,674 | ||||||
| Heiwa Corp. | 2,500 | 42,154 | ||||||
| Heiwa Real Estate Co. Ltd. | 2,200 | 58,453 | ||||||
| Heiwado Co. Ltd. | 2,300 | 47,745 | ||||||
| Hibiya Engineering Ltd. | 600 | 9,998 | ||||||
Hiday Hidaka Corp.(2) | 1,000 | 16,403 | ||||||
| Hikari Tsushin, Inc. | 600 | 144,608 | ||||||
| Hino Motors Ltd. | 5,100 | 33,925 | ||||||
| Hioki EE Corp. | 100 | 3,229 | ||||||
| Hirakawa Hewtech Corp. | 100 | 855 | ||||||
| Hirano Tecseed Co. Ltd. | 100 | 1,301 | ||||||
| Hirose Electric Co. Ltd. | 600 | 67,887 | ||||||
| Hiroshima Bank Ltd. (The) | 10,500 | 53,066 | ||||||
| Hiroshima Gas Co. Ltd. | 1,600 | 5,402 | ||||||
HIS Co. Ltd.(2) | 1,000 | 17,806 | ||||||
| Hisaka Works Ltd. | 200 | 1,533 | ||||||
Hisamitsu Pharmaceutical Co., Inc.(2) | 1,100 | 50,702 | ||||||
| Hitachi Capital Corp. | 3,000 | 72,851 | ||||||
| Hitachi Construction Machinery Co. Ltd. | 1,900 | 66,494 | ||||||
| Hitachi Ltd. | 12,200 | 405,099 | ||||||
| Hitachi Metals Ltd. | 2,400 | 35,940 | ||||||
| Hitachi Transport System Ltd. | 2,200 | 76,398 | ||||||
| Hitachi Zosen Corp. | 12,200 | 48,014 | ||||||
| Hochiki Corp. | 800 | 8,938 | ||||||
| Hodogaya Chemical Co. Ltd. | 100 | 4,986 | ||||||
| Hogy Medical Co. Ltd. | 400 | 12,661 | ||||||
| Hokkaido Electric Power Co., Inc. | 5,200 | 22,210 | ||||||
| Hokkoku Bank Ltd. (The) | 800 | 22,339 | ||||||
| Hokuetsu Corp. | 3,400 | 11,542 | ||||||
37
| Shares | Value | |||||||
| Hokuetsu Industries Co. Ltd. | 1,100 | $ | 10,707 | |||||
| Hokuhoku Financial Group, Inc. | 5,500 | 50,931 | ||||||
| Hokuriku Electric Power Co. | 7,300 | 53,874 | ||||||
| Hokuto Corp. | 1,500 | 30,459 | ||||||
| Honda Motor Co. Ltd., ADR | 27,504 | 703,552 | ||||||
| Honeys Holdings Co. Ltd. | 1,200 | 12,834 | ||||||
| Hoosiers Holdings | 2,700 | 15,981 | ||||||
| Horiba Ltd. | 1,400 | 76,543 | ||||||
| Hoshizaki Corp. | 700 | 53,463 | ||||||
| Hosiden Corp. | 1,000 | 8,768 | ||||||
| Hosokawa Micron Corp. | 400 | 21,306 | ||||||
| Hotland Co. Ltd. | 600 | 6,446 | ||||||
| House Foods Group, Inc. | 900 | 30,375 | ||||||
| Hoya Corp., ADR | 4,756 | 468,942 | ||||||
| Hulic Co. Ltd. | 12,200 | 110,944 | ||||||
| Hyakugo Bank Ltd. (The) | 8,500 | 26,106 | ||||||
| Hyakujushi Bank Ltd. (The) | 900 | 15,271 | ||||||
| I K K, Inc. | 200 | 1,036 | ||||||
| I'll, Inc. | 200 | 3,258 | ||||||
| I-Net Corp./Kanagawa | 900 | 12,731 | ||||||
| I-PEX, Inc. | 500 | 9,662 | ||||||
| Ibiden Co. Ltd. | 5,000 | 156,525 | ||||||
| IBJ, Inc. | 300 | 2,565 | ||||||
| Ichibanya Co. Ltd. | 100 | 4,901 | ||||||
| Ichigo, Inc. | 14,400 | 38,473 | ||||||
| Ichikoh Industries Ltd. | 600 | 2,791 | ||||||
| Ichinen Holdings Co. Ltd. | 1,200 | 13,832 | ||||||
| Ichiyoshi Securities Co. Ltd. | 200 | 886 | ||||||
| Icom, Inc. | 100 | 2,516 | ||||||
| IDEA Consultants, Inc. | 200 | 3,427 | ||||||
| Idec Corp. | 800 | 13,431 | ||||||
Idemitsu Kosan Co. Ltd.(2) | 6,600 | 145,242 | ||||||
| IDOM, Inc. | 3,700 | 18,868 | ||||||
| IHI Corp. | 3,300 | 48,369 | ||||||
| Iida Group Holdings Co. Ltd. | 2,500 | 48,725 | ||||||
| Iino Kaiun Kaisha Ltd. | 5,100 | 16,901 | ||||||
| IJTT Co. Ltd. | 300 | 1,215 | ||||||
| IMAGICA GROUP, Inc. | 200 | 733 | ||||||
| Imasen Electric Industrial | 200 | 1,201 | ||||||
| Inaba Denki Sangyo Co. Ltd. | 1,600 | 39,451 | ||||||
| Inaba Seisakusho Co. Ltd. | 100 | 1,230 | ||||||
| Inabata & Co. Ltd. | 1,400 | 17,219 | ||||||
| Ines Corp. | 1,400 | 17,601 | ||||||
| Infocom Corp. | 1,100 | 36,596 | ||||||
| Infomart Corp. | 4,600 | 31,635 | ||||||
| Information Services International-Dentsu Ltd. | 500 | 26,670 | ||||||
| INPEX Corp. | 28,000 | 177,005 | ||||||
| Insource Co. Ltd. | 200 | 4,961 | ||||||
| Intage Holdings, Inc. | 2,000 | 17,355 | ||||||
| Intelligent Wave, Inc. | 200 | 1,476 | ||||||
| Inter Action Corp. | 500 | 8,083 | ||||||
| Internet Initiative Japan, Inc. | 1,900 | 76,645 | ||||||
38
| Shares | Value | |||||||
| Inui Global Logistics Co. Ltd. | 100 | $ | 754 | |||||
IPS, Inc.(1) | 400 | 8,442 | ||||||
| IR Japan Holdings Ltd. | 300 | 36,626 | ||||||
| Iriso Electronics Co. Ltd. | 600 | 22,098 | ||||||
| Iseki & Co. Ltd. | 800 | 8,723 | ||||||
| Isetan Mitsukoshi Holdings Ltd. | 7,300 | 40,095 | ||||||
| Ishihara Sangyo Kaisha Ltd. | 300 | 2,033 | ||||||
| Isuzu Motors Ltd. | 15,000 | 147,913 | ||||||
| Itfor, Inc. | 1,300 | 9,830 | ||||||
| ITmedia, Inc. | 500 | 11,965 | ||||||
Ito En Ltd.(2) | 1,800 | 108,751 | ||||||
ITOCHU Corp.(2) | 14,700 | 377,021 | ||||||
| Itochu Enex Co. Ltd. | 3,500 | 30,987 | ||||||
| Itochu Techno-Solutions Corp. | 2,000 | 72,386 | ||||||
| Itoham Yonekyu Holdings, Inc. | 5,100 | 33,948 | ||||||
| Itoki Corp. | 400 | 1,368 | ||||||
| IwaiCosmo Holdings, Inc. | 800 | 9,489 | ||||||
| Iwatani Corp. | 2,200 | 79,077 | ||||||
| Iyo Bank Ltd. (The) | 8,900 | 56,497 | ||||||
| Izumi Co. Ltd. | 2,500 | 97,292 | ||||||
J Front Retailing Co. Ltd.(2) | 14,200 | 98,536 | ||||||
| J Trust Co. Ltd. | 500 | 1,271 | ||||||
| J-Oil Mills, Inc. | 400 | 13,943 | ||||||
| JAC Recruitment Co. Ltd. | 100 | 1,199 | ||||||
| Jaccs Co. Ltd. | 700 | 11,464 | ||||||
| Jafco Co. Ltd. | 1,100 | 44,227 | ||||||
| Japan Airlines Co. Ltd. | 2,800 | 54,983 | ||||||
Japan Airport Terminal Co. Ltd.(2) | 500 | 22,440 | ||||||
| Japan Aviation Electronics Industry Ltd. | 2,900 | 37,632 | ||||||
Japan Best Rescue System Co. Ltd.(2) | 1,100 | 9,747 | ||||||
Japan Display, Inc.(1) | 1,900 | 946 | ||||||
| Japan Elevator Service Holdings Co. Ltd. | 1,000 | 34,568 | ||||||
| Japan Exchange Group, Inc. | 9,100 | 235,570 | ||||||
| Japan Lifeline Co. Ltd. | 900 | 11,942 | ||||||
| Japan Material Co. Ltd. | 1,800 | 23,913 | ||||||
| Japan Medical Dynamic Marketing, Inc. | 100 | 1,785 | ||||||
| Japan Petroleum Exploration Co. Ltd. | 800 | 13,890 | ||||||
| Japan Post Bank Co. Ltd. | 4,200 | 33,621 | ||||||
| Japan Post Holdings Co. Ltd. | 17,700 | 129,967 | ||||||
| Japan Post Insurance Co. Ltd. | 5,400 | 85,816 | ||||||
| Japan Securities Finance Co. Ltd. | 3,200 | 16,334 | ||||||
| Japan Steel Works Ltd. (The) | 1,200 | 17,088 | ||||||
| Japan Transcity Corp. | 1,700 | 7,982 | ||||||
| Japan Wool Textile Co. Ltd. (The) | 2,900 | 26,597 | ||||||
| JCR Pharmaceuticals Co. Ltd. | 100 | 10,753 | ||||||
| JCU Corp. | 400 | 13,666 | ||||||
| JDC Corp. | 2,700 | 14,785 | ||||||
| Jeol Ltd. | 1,000 | 29,288 | ||||||
| JFE Holdings, Inc. | 14,600 | 108,518 | ||||||
| JGC Holdings Corp. | 4,400 | 48,424 | ||||||
JINS Holdings, Inc.(2) | 600 | 41,345 | ||||||
| JK Holdings Co. Ltd. | 1,200 | 8,412 | ||||||
39
| Shares | Value | |||||||
| JM Holdings Co. Ltd. | 500 | $ | 16,313 | |||||
JMDC, Inc.(1) | 100 | 7,638 | ||||||
| Joshin Denki Co. Ltd. | 700 | 15,591 | ||||||
| Joyful Honda Co. Ltd. | 800 | 11,405 | ||||||
| JP-Holdings, Inc. | 2,700 | 6,867 | ||||||
| JSP Corp. | 100 | 1,464 | ||||||
| JSR Corp. | 2,200 | 46,659 | ||||||
| JTEKT Corp. | 6,000 | 46,147 | ||||||
JTOWER, Inc.(1) | 100 | 5,214 | ||||||
| Juki Corp. | 200 | 864 | ||||||
| Juroku Bank Ltd. (The) | 1,300 | 23,415 | ||||||
| Justsystems Corp. | 700 | 53,646 | ||||||
| JVCKenwood Corp. | 12,700 | 18,770 | ||||||
| K's Holdings Corp. | 9,300 | 131,540 | ||||||
| Kadokawa Corp. | 1,500 | 38,346 | ||||||
| Kaga Electronics Co. Ltd. | 1,200 | 23,709 | ||||||
| Kagome Co. Ltd. | 4,400 | 136,784 | ||||||
| Kajima Corp. | 18,600 | 230,544 | ||||||
| Kakaku.com, Inc. | 3,400 | 90,372 | ||||||
| Kaken Pharmaceutical Co. Ltd. | 1,300 | 60,224 | ||||||
| Kakiyasu Honten Co. Ltd. | 400 | 9,405 | ||||||
| Kamakura Shinsho Ltd. | 200 | 1,766 | ||||||
| Kamei Corp. | 1,600 | 14,899 | ||||||
| Kamigumi Co. Ltd. | 3,000 | 61,836 | ||||||
| Kanamoto Co. Ltd. | 2,100 | 45,479 | ||||||
| Kandenko Co. Ltd. | 5,800 | 45,473 | ||||||
| Kaneka Corp. | 2,100 | 52,938 | ||||||
| Kanematsu Corp. | 4,900 | 61,857 | ||||||
| Kanematsu Electronics Ltd. | 700 | 26,693 | ||||||
| Kansai Electric Power Co., Inc. (The) | 15,300 | 150,404 | ||||||
| Kansai Mirai Financial Group, Inc. | 2,900 | 12,175 | ||||||
| Kansai Paint Co. Ltd. | 2,800 | 66,682 | ||||||
| Kanto Denka Kogyo Co. Ltd. | 3,000 | 21,594 | ||||||
| Kao Corp. | 6,500 | 494,592 | ||||||
Kappa Create Co. Ltd.(1) | 500 | 6,928 | ||||||
| Kasai Kogyo Co. Ltd. | 800 | 2,870 | ||||||
| Katakura Industries Co. Ltd. | 600 | 6,801 | ||||||
| Kato Sangyo Co. Ltd. | 800 | 27,523 | ||||||
| Kato Works Co. Ltd. | 100 | 998 | ||||||
| KAWADA TECHNOLOGIES, Inc. | 100 | 4,705 | ||||||
| Kawai Musical Instruments Manufacturing Co. Ltd. | 100 | 2,442 | ||||||
| Kawasaki Heavy Industries Ltd. | 4,700 | 66,328 | ||||||
Kawasaki Kisen Kaisha Ltd.(1) | 4,500 | 50,017 | ||||||
| KDDI Corp. | 34,700 | 1,006,273 | ||||||
| KeePer Technical Laboratory Co. Ltd. | 100 | 2,415 | ||||||
| Keihan Holdings Co. Ltd. | 2,800 | 120,613 | ||||||
| Keihanshin Building Co. Ltd. | 900 | 12,788 | ||||||
| Keikyu Corp. | 10,300 | 153,509 | ||||||
| Keio Corp. | 1,600 | 96,475 | ||||||
| Keisei Electric Railway Co. Ltd. | 2,200 | 64,629 | ||||||
| Keiyo Bank Ltd. (The) | 4,200 | 19,580 | ||||||
Keiyo Co. Ltd.(2) | 300 | 2,424 | ||||||
40
| Shares | Value | |||||||
| Kenedix, Inc. | 8,000 | $ | 38,867 | |||||
| Kewpie Corp. | 5,300 | 100,343 | ||||||
| Key Coffee, Inc. | 100 | 2,057 | ||||||
| Keyence Corp. | 1,200 | 493,978 | ||||||
KeyHolder, Inc.(2) | 330 | 3,787 | ||||||
| KFC Holdings Japan Ltd. | 700 | 19,118 | ||||||
| KH Neochem Co. Ltd. | 1,700 | 36,695 | ||||||
| Kikkoman Corp. | 1,200 | 65,038 | ||||||
| Kinden Corp. | 3,200 | 52,781 | ||||||
| King Jim Co. Ltd. | 200 | 1,677 | ||||||
| Kintetsu Department Store Co. Ltd. | 400 | 10,747 | ||||||
| Kintetsu Group Holdings Co. Ltd. | 4,100 | 180,067 | ||||||
| Kintetsu World Express, Inc. | 1,800 | 36,995 | ||||||
| Kirin Holdings Co. Ltd. | 19,100 | 375,229 | ||||||
| Kirindo Holdings Co. Ltd. | 500 | 12,935 | ||||||
| Kisoji Co. Ltd. | 100 | 2,236 | ||||||
| Kissei Pharmaceutical Co. Ltd. | 500 | 10,893 | ||||||
| Kitanotatsujin Corp. | 1,100 | 5,696 | ||||||
| Kito Corp. | 1,000 | 10,521 | ||||||
| Kitz Corp. | 3,800 | 22,136 | ||||||
| Kiyo Bank Ltd. (The) | 3,000 | 44,313 | ||||||
KLab, Inc.(1) | 1,900 | 15,655 | ||||||
| Koa Corp. | 200 | 2,016 | ||||||
| Koatsu Gas Kogyo Co. Ltd. | 1,100 | 8,123 | ||||||
| Kobayashi Pharmaceutical Co. Ltd. | 200 | 17,802 | ||||||
| Kobe Bussan Co. Ltd. | 1,600 | 94,268 | ||||||
Kobe Steel Ltd.(1) | 6,600 | 25,257 | ||||||
| Koei Tecmo Holdings Co. Ltd. | 300 | 11,900 | ||||||
| Kohnan Shoji Co. Ltd. | 2,100 | 75,796 | ||||||
| Koito Manufacturing Co. Ltd. | 3,600 | 174,098 | ||||||
Kojima Co. Ltd.(2) | 1,800 | 9,561 | ||||||
| Kokusai Pulp & Paper Co. Ltd. | 400 | 1,046 | ||||||
| Kokuyo Co. Ltd. | 1,400 | 15,592 | ||||||
| Komatsu Ltd. | 15,600 | 336,824 | ||||||
| Komatsu Matere Co. Ltd. | 200 | 1,457 | ||||||
| KOMEDA Holdings Co. Ltd. | 200 | 3,445 | ||||||
| Komeri Co. Ltd. | 2,000 | 61,882 | ||||||
| Komori Corp. | 300 | 2,026 | ||||||
| Konami Holdings Corp. | 3,100 | 119,254 | ||||||
| Kondotec, Inc. | 1,100 | 12,138 | ||||||
| Konica Minolta, Inc. | 10,200 | 32,897 | ||||||
| Konishi Co. Ltd. | 900 | 12,613 | ||||||
| Konoike Transport Co. Ltd. | 1,100 | 11,671 | ||||||
| Kose Corp. | 100 | 11,704 | ||||||
Koshidaka Holdings Co. Ltd.(2) | 1,600 | 6,895 | ||||||
| Kotobuki Spirits Co. Ltd. | 500 | 23,303 | ||||||
| Kourakuen Holdings Corp. | 600 | 9,427 | ||||||
| Krosaki Harima Corp. | 100 | 2,898 | ||||||
| Kubota Corp. | 13,000 | 234,587 | ||||||
| Kumagai Gumi Co. Ltd. | 2,000 | 51,035 | ||||||
| Kumiai Chemical Industry Co. Ltd. | 200 | 1,945 | ||||||
Kura Sushi, Inc.(2) | 500 | 22,532 | ||||||
41
| Shares | Value | |||||||
| Kurabo Industries Ltd. | 400 | $ | 7,566 | |||||
| Kuraray Co. Ltd. | 14,200 | 143,919 | ||||||
| Kureha Corp. | 400 | 17,111 | ||||||
| Kurimoto Ltd. | 400 | 7,043 | ||||||
| Kurita Water Industries Ltd. | 3,900 | 121,820 | ||||||
| Kusuri no Aoki Holdings Co. Ltd. | 200 | 17,069 | ||||||
KYB Corp.(1) | 600 | 11,998 | ||||||
| Kyocera Corp. | 2,600 | 148,631 | ||||||
| Kyoei Steel Ltd. | 800 | 10,038 | ||||||
| Kyokuto Kaihatsu Kogyo Co. Ltd. | 800 | 9,799 | ||||||
| Kyokuto Securities Co. Ltd. | 200 | 1,102 | ||||||
| Kyokuyo Co. Ltd. | 600 | 15,209 | ||||||
| KYORIN Holdings, Inc. | 900 | 17,018 | ||||||
| Kyoritsu Maintenance Co. Ltd. | 1,200 | 43,912 | ||||||
| Kyosan Electric Manufacturing Co. Ltd. | 300 | 1,421 | ||||||
| Kyowa Exeo Corp. | 2,000 | 50,132 | ||||||
| Kyowa Kirin Co. Ltd. | 1,600 | 41,350 | ||||||
| Kyudenko Corp. | 2,400 | 68,428 | ||||||
| Kyushu Electric Power Co., Inc. | 8,400 | 74,377 | ||||||
Kyushu Financial Group, Inc.(2) | 12,200 | 55,945 | ||||||
| Kyushu Railway Co. | 6,100 | 134,448 | ||||||
| LAC Co. Ltd. | 1,200 | 12,645 | ||||||
| Lacto Japan Co. Ltd. | 600 | 20,260 | ||||||
| Lasertec Corp. | 700 | 52,676 | ||||||
Lawson, Inc.(2) | 2,300 | 113,464 | ||||||
| LEC, Inc. | 1,500 | 23,707 | ||||||
Leopalace21 Corp.(1)(2) | 15,500 | 26,720 | ||||||
| Life Corp. | 1,300 | 59,404 | ||||||
| Like Co. Ltd. | 100 | 1,842 | ||||||
LINE Corp., ADR(1) | 779 | 39,651 | ||||||
Link And Motivation, Inc.(2) | 200 | 666 | ||||||
| Lintec Corp. | 200 | 4,733 | ||||||
| Lion Corp. | 4,700 | 100,111 | ||||||
Litalico, Inc.(1) | 100 | 2,486 | ||||||
| LIXIL Group Corp. | 9,100 | 166,632 | ||||||
M&A Capital Partners Co. Ltd.(1) | 200 | 7,324 | ||||||
| m-up Holdings, Inc. | 400 | 13,941 | ||||||
| M3, Inc. | 4,100 | 236,990 | ||||||
| Mabuchi Motor Co. Ltd. | 900 | 31,633 | ||||||
| Macnica Fuji Electronics Holdings, Inc. | 3,300 | 55,586 | ||||||
| Macromill, Inc. | 200 | 1,622 | ||||||
| Maeda Corp. | 8,000 | 59,262 | ||||||
| Maeda Kosen Co. Ltd. | 1,000 | 24,035 | ||||||
| Maeda Road Construction Co. Ltd. | 2,600 | 47,899 | ||||||
| Makino Milling Machine Co. Ltd. | 500 | 17,098 | ||||||
| Makita Corp. | 3,000 | 137,961 | ||||||
| Mani, Inc. | 600 | 15,200 | ||||||
| MarkLines Co. Ltd. | 400 | 8,216 | ||||||
Marubeni Corp.(2) | 25,800 | 154,422 | ||||||
| Marudai Food Co. Ltd. | 700 | 12,217 | ||||||
| Maruha Nichiro Corp. | 2,100 | 47,452 | ||||||
| Marui Group Co. Ltd. | 7,100 | 129,334 | ||||||
42
| Shares | Value | |||||||
| Maruichi Steel Tube Ltd. | 600 | $ | 16,063 | |||||
| Marusan Securities Co. Ltd. | 300 | 1,189 | ||||||
| Maruwa Co. Ltd. | 500 | 42,118 | ||||||
| Maruwa Unyu Kikan Co. Ltd. | 900 | 34,809 | ||||||
| Maruzen CHI Holdings Co. Ltd. | 300 | 1,050 | ||||||
| Maruzen Showa Unyu Co. Ltd. | 800 | 25,834 | ||||||
| Marvelous, Inc. | 200 | 1,493 | ||||||
| Matching Service Japan Co. Ltd. | 100 | 772 | ||||||
| Matsui Construction Co. Ltd. | 200 | 1,320 | ||||||
| Matsumotokiyoshi Holdings Co. Ltd. | 1,300 | 45,487 | ||||||
| Matsuya Co. Ltd. | 200 | 1,174 | ||||||
Matsuyafoods Holdings Co. Ltd.(2) | 400 | 13,405 | ||||||
| Max Co. Ltd. | 700 | 10,466 | ||||||
| Maxell Holdings Ltd. | 400 | 3,825 | ||||||
| Mazda Motor Corp. | 14,600 | 93,179 | ||||||
| McDonald's Holdings Co. Japan Ltd. | 1,600 | 78,452 | ||||||
| MCJ Co. Ltd. | 5,400 | 47,899 | ||||||
| Mebuki Financial Group, Inc. | 34,000 | 82,280 | ||||||
| MEC Co. Ltd. | 600 | 10,443 | ||||||
| Media Do Co. Ltd. | 300 | 19,081 | ||||||
Medical Data Vision Co. Ltd.(1)(2) | 1,100 | 18,748 | ||||||
| Medipal Holdings Corp. | 4,300 | 82,126 | ||||||
Medley, Inc.(1) | 400 | 17,129 | ||||||
MedPeer, Inc.(1) | 100 | 4,441 | ||||||
| Megmilk Snow Brand Co. Ltd. | 2,700 | 61,381 | ||||||
| Meidensha Corp. | 800 | 12,309 | ||||||
| MEIJI Holdings Co. Ltd. | 1,700 | 137,250 | ||||||
| Meiko Electronics Co. Ltd. | 1,200 | 18,672 | ||||||
Meiko Network Japan Co. Ltd.(2) | 200 | 1,417 | ||||||
| Meisei Industrial Co. Ltd. | 600 | 4,431 | ||||||
| Meitec Corp. | 1,300 | 62,572 | ||||||
| Meiwa Corp. | 300 | 1,327 | ||||||
| Members Co. Ltd. | 100 | 1,491 | ||||||
| Menicon Co. Ltd. | 700 | 42,815 | ||||||
Mercari, Inc.(1) | 1,400 | 63,272 | ||||||
| METAWATER Co. Ltd. | 500 | 20,999 | ||||||
| Micronics Japan Co. Ltd. | 800 | 8,214 | ||||||
| Mie Kotsu Group Holdings, Inc. | 3,300 | 14,334 | ||||||
| Milbon Co. Ltd. | 400 | 22,028 | ||||||
| Mimasu Semiconductor Industry Co. Ltd. | 1,200 | 24,283 | ||||||
MINEBEA MITSUMI, Inc.(2) | 13,500 | 232,091 | ||||||
Ministop Co. Ltd.(2) | 1,000 | 14,279 | ||||||
| Mirait Holdings Corp. | 2,000 | 27,799 | ||||||
| Miroku Jyoho Service Co. Ltd. | 800 | 16,330 | ||||||
| MISUMI Group, Inc. | 2,600 | 67,686 | ||||||
| Mitani Sangyo Co. Ltd. | 400 | 1,323 | ||||||
Mitsuba Corp.(1) | 900 | 3,160 | ||||||
| Mitsubishi Chemical Holdings Corp. | 33,700 | 196,604 | ||||||
| Mitsubishi Corp. | 2,700 | 63,890 | ||||||
| Mitsubishi Electric Corp. | 28,900 | 396,801 | ||||||
| Mitsubishi Estate Co. Ltd. | 13,900 | 217,526 | ||||||
| Mitsubishi Gas Chemical Co., Inc. | 5,600 | 99,817 | ||||||
43
| Shares | Value | |||||||
| Mitsubishi Heavy Industries Ltd. | 5,600 | $ | 138,778 | |||||
| Mitsubishi Logisnext Co. Ltd. | 1,100 | 10,342 | ||||||
| Mitsubishi Logistics Corp. | 900 | 27,237 | ||||||
| Mitsubishi Materials Corp. | 1,400 | 29,350 | ||||||
| Mitsubishi Motors Corp. | 8,300 | 19,889 | ||||||
| Mitsubishi Paper Mills Ltd. | 300 | 950 | ||||||
| Mitsubishi Pencil Co. Ltd. | 700 | 8,782 | ||||||
| Mitsubishi Shokuhin Co. Ltd. | 400 | 10,314 | ||||||
| Mitsubishi UFJ Financial Group, Inc., ADR | 165,768 | 692,910 | ||||||
| Mitsubishi UFJ Lease & Finance Co. Ltd. | 17,100 | 80,602 | ||||||
| Mitsuboshi Belting Ltd. | 800 | 12,360 | ||||||
| Mitsui & Co. Ltd. | 19,200 | 344,660 | ||||||
| Mitsui Chemicals, Inc. | 5,200 | 121,964 | ||||||
Mitsui E&S Holdings Co. Ltd.(1) | 5,200 | 21,015 | ||||||
| Mitsui Fudosan Co. Ltd. | 7,200 | 130,122 | ||||||
| Mitsui High-Tec, Inc. | 400 | 6,016 | ||||||
| Mitsui Mining & Smelting Co. Ltd. | 3,600 | 86,191 | ||||||
| Mitsui OSK Lines Ltd. | 3,700 | 68,261 | ||||||
| Mitsui Sugar Co. Ltd. | 1,000 | 18,290 | ||||||
| Mitsui-Soko Holdings Co. Ltd. | 1,100 | 18,377 | ||||||
| Mitsuuroko Group Holdings Co. Ltd. | 400 | 4,259 | ||||||
| Miura Co. Ltd. | 1,300 | 53,188 | ||||||
| Mixi, Inc. | 1,300 | 28,685 | ||||||
| Mizuho Financial Group, Inc., ADR | 170,021 | 465,858 | ||||||
| Mizuho Leasing Co. Ltd. | 1,300 | 32,715 | ||||||
| Mizuno Corp. | 600 | 10,742 | ||||||
| Mochida Pharmaceutical Co. Ltd. | 300 | 11,066 | ||||||
| Modec, Inc. | 1,200 | 20,007 | ||||||
| Monex Group, Inc. | 7,600 | 19,639 | ||||||
| Monogatari Corp. (The) | 400 | 34,392 | ||||||
MonotaRO Co. Ltd.(2) | 2,600 | 102,591 | ||||||
| Morinaga & Co. Ltd. | 1,800 | 65,964 | ||||||
| Morinaga Milk Industry Co. Ltd. | 2,200 | 107,343 | ||||||
| Moriroku Holdings Co. Ltd. | 200 | 3,172 | ||||||
| Morita Holdings Corp. | 800 | 14,632 | ||||||
| Morito Co. Ltd. | 200 | 1,101 | ||||||
| MOS Food Services, Inc. | 100 | 2,739 | ||||||
| MrMax Holdings Ltd. | 1,900 | 13,517 | ||||||
MS&AD Insurance Group Holdings, Inc.(2) | 9,200 | 254,903 | ||||||
| MTI Ltd. | 1,300 | 8,959 | ||||||
| Murata Manufacturing Co. Ltd. | 8,800 | 520,551 | ||||||
| Musashi Seimitsu Industry Co. Ltd. | 2,700 | 27,032 | ||||||
| Musashino Bank Ltd. (The) | 300 | 4,358 | ||||||
| Nabtesco Corp. | 1,800 | 56,897 | ||||||
| Nachi-Fujikoshi Corp. | 700 | 21,691 | ||||||
| Nagase & Co. Ltd. | 2,600 | 33,796 | ||||||
| Nagoya Railroad Co. Ltd. | 6,100 | 170,167 | ||||||
| Nakanishi, Inc. | 100 | 1,599 | ||||||
| Nakayama Steel Works Ltd. | 300 | 982 | ||||||
| Namura Shipbuilding Co. Ltd. | 400 | 576 | ||||||
| Nankai Electric Railway Co. Ltd. | 5,100 | 112,124 | ||||||
| Nanto Bank Ltd. (The) | 900 | 16,630 | ||||||
44
| Shares | Value | |||||||
| NEC Capital Solutions Ltd. | 500 | $ | 8,507 | |||||
| NEC Corp. | 7,700 | 405,434 | ||||||
NEC Networks & System Integration Corp.(2) | 4,200 | 78,019 | ||||||
| NET One Systems Co. Ltd. | 4,000 | 153,587 | ||||||
| Neturen Co. Ltd. | 500 | 2,345 | ||||||
| Nexon Co. Ltd. | 6,800 | 159,658 | ||||||
| NGK Insulators Ltd. | 6,300 | 89,283 | ||||||
| NGK Spark Plug Co. Ltd. | 4,400 | 75,535 | ||||||
| NH Foods Ltd. | 2,100 | 95,047 | ||||||
| NHK Spring Co. Ltd. | 5,700 | 35,764 | ||||||
| Nichi-iko Pharmaceutical Co. Ltd. | 3,100 | 34,725 | ||||||
| Nichias Corp. | 1,400 | 33,152 | ||||||
| Nichiban Co. Ltd. | 100 | 1,485 | ||||||
| Nichicon Corp. | 500 | 3,669 | ||||||
| Nichiden Corp. | 100 | 1,863 | ||||||
| Nichiha Corp. | 1,500 | 35,290 | ||||||
| Nichirei Corp. | 4,000 | 104,366 | ||||||
| Nichireki Co. Ltd. | 1,600 | 25,039 | ||||||
| Nidec Corp., ADR | 9,274 | 194,893 | ||||||
| Nifco, Inc. | 4,200 | 107,569 | ||||||
| Nihon Chouzai Co. Ltd. | 700 | 10,844 | ||||||
| Nihon Flush Co. Ltd. | 1,200 | 15,771 | ||||||
| Nihon House Holdings Co. Ltd. | 900 | 2,218 | ||||||
| Nihon Kohden Corp. | 600 | 20,579 | ||||||
| Nihon M&A Center, Inc. | 3,300 | 164,025 | ||||||
| Nihon Nohyaku Co. Ltd. | 300 | 1,411 | ||||||
| Nihon Parkerizing Co. Ltd. | 500 | 4,803 | ||||||
| Nihon Tokushu Toryo Co. Ltd. | 200 | 1,789 | ||||||
| Nihon Unisys Ltd. | 2,200 | 63,047 | ||||||
| Niitaka Co. Ltd. | 200 | 5,768 | ||||||
| Nikkiso Co. Ltd. | 1,500 | 14,666 | ||||||
| Nikko Co. Ltd. | 500 | 3,014 | ||||||
| Nikkon Holdings Co. Ltd. | 2,200 | 48,488 | ||||||
| Nikon Corp. | 3,600 | 28,166 | ||||||
| Nintendo Co. Ltd. | 1,300 | 695,375 | ||||||
| Nippo Corp. | 1,100 | 28,487 | ||||||
| Nippon Air Conditioning Services Co. Ltd. | 500 | 3,383 | ||||||
| Nippon Aqua Co. Ltd. | 200 | 1,171 | ||||||
| Nippon Carbon Co. Ltd. | 700 | 22,747 | ||||||
| Nippon Ceramic Co. Ltd. | 500 | 11,820 | ||||||
Nippon Chemi-Con Corp.(1) | 600 | 9,635 | ||||||
| Nippon Chemical Industrial Co. Ltd. | 100 | 2,040 | ||||||
| Nippon Coke & Engineering Co. Ltd. | 27,700 | 16,142 | ||||||
Nippon Denko Co. Ltd.(1)(2) | 3,700 | 6,693 | ||||||
| Nippon Densetsu Kogyo Co. Ltd. | 1,300 | 25,825 | ||||||
| Nippon Electric Glass Co. Ltd. | 2,200 | 40,774 | ||||||
| Nippon Express Co. Ltd. | 2,600 | 153,498 | ||||||
| Nippon Fine Chemical Co. Ltd. | 400 | 5,785 | ||||||
| Nippon Flour Mills Co. Ltd. | 1,300 | 20,706 | ||||||
| Nippon Gas Co. Ltd. | 600 | 23,313 | ||||||
| Nippon Hume Corp. | 200 | 1,423 | ||||||
| Nippon Kanzai Co. Ltd. | 500 | 9,399 | ||||||
45
| Shares | Value | |||||||
| Nippon Kayaku Co. Ltd. | 4,300 | $ | 41,877 | |||||
| Nippon Koei Co. Ltd. | 1,000 | 26,238 | ||||||
| Nippon Light Metal Holdings Co. Ltd. | 34,000 | 59,554 | ||||||
| Nippon Paint Holdings Co. Ltd. | 700 | 60,078 | ||||||
Nippon Paper Industries Co. Ltd.(2) | 5,200 | 66,144 | ||||||
| Nippon Parking Development Co. Ltd. | 9,600 | 12,032 | ||||||
| Nippon Pillar Packing Co. Ltd. | 200 | 2,741 | ||||||
| Nippon Seiki Co. Ltd. | 3,000 | 30,707 | ||||||
Nippon Sheet Glass Co. Ltd.(1) | 1,600 | 6,405 | ||||||
| Nippon Shinyaku Co. Ltd. | 300 | 24,751 | ||||||
| Nippon Shokubai Co. Ltd. | 700 | 36,716 | ||||||
| Nippon Signal Co. Ltd. | 1,200 | 11,560 | ||||||
| Nippon Soda Co. Ltd. | 800 | 22,625 | ||||||
| Nippon Steel Corp. | 8,400 | 82,415 | ||||||
| Nippon Steel Trading Corp. | 500 | 15,020 | ||||||
| Nippon Suisan Kaisha Ltd. | 9,000 | 40,348 | ||||||
| Nippon Systemware Co. Ltd. | 400 | 7,287 | ||||||
| Nippon Telegraph & Telephone Corp. | 20,400 | 464,334 | ||||||
| Nippon Thompson Co. Ltd. | 400 | 1,363 | ||||||
| Nippon Yakin Kogyo Co. Ltd. | 600 | 8,555 | ||||||
| Nippon Yusen KK | 8,400 | 129,729 | ||||||
| Nipro Corp. | 7,100 | 80,075 | ||||||
| Nishi-Nippon Financial Holdings, Inc. | 5,300 | 34,753 | ||||||
| Nishi-Nippon Railroad Co. Ltd. | 1,500 | 43,629 | ||||||
| Nishimatsu Construction Co. Ltd. | 3,200 | 60,819 | ||||||
Nishimatsuya Chain Co. Ltd.(2) | 400 | 5,042 | ||||||
| Nishio Rent All Co. Ltd. | 800 | 17,568 | ||||||
| Nissan Chemical Corp. | 2,100 | 110,474 | ||||||
| Nissan Motor Co. Ltd. | 53,500 | 216,805 | ||||||
| Nissan Shatai Co. Ltd. | 200 | 1,800 | ||||||
| Nissan Tokyo Sales Holdings Co. Ltd. | 500 | 1,192 | ||||||
| Nissei Plastic Industrial Co. Ltd. | 200 | 1,603 | ||||||
| Nissha Co. Ltd. | 600 | 6,549 | ||||||
| Nisshin Group Holdings Co. Ltd. | 600 | 2,284 | ||||||
| Nisshin Oillio Group Ltd. (The) | 1,300 | 38,748 | ||||||
| Nisshin Seifun Group, Inc. | 2,900 | 48,141 | ||||||
| Nisshinbo Holdings, Inc. | 7,700 | 52,909 | ||||||
| Nissin Electric Co. Ltd. | 3,000 | 31,795 | ||||||
| Nissin Foods Holdings Co. Ltd. | 700 | 70,068 | ||||||
| Nisso Corp. | 200 | 1,409 | ||||||
| Nitori Holdings Co. Ltd. | 1,300 | 271,572 | ||||||
| Nitta Corp. | 400 | 8,890 | ||||||
| Nitto Denko Corp. | 2,400 | 145,564 | ||||||
| Nitto Kogyo Corp. | 1,200 | 21,363 | ||||||
| Nitto Seiko Co. Ltd. | 300 | 1,281 | ||||||
| Nittoc Construction Co. Ltd. | 1,200 | 8,906 | ||||||
| Nittoku Co. Ltd. | 400 | 12,277 | ||||||
| Noevir Holdings Co. Ltd. | 800 | 36,536 | ||||||
| NOF Corp. | 1,300 | 52,511 | ||||||
| Nohmi Bosai Ltd. | 1,200 | 25,179 | ||||||
| Nojima Corp. | 2,500 | 73,972 | ||||||
| NOK Corp. | 3,300 | 35,835 | ||||||
46
| Shares | Value | |||||||
| Nomura Co. Ltd. | 600 | $ | 4,236 | |||||
| Noritake Co. Ltd./Nagoya Japan | 300 | 9,595 | ||||||
| Noritsu Koki Co. Ltd. | 1,000 | 14,938 | ||||||
| Noritz Corp. | 1,000 | 12,661 | ||||||
| North Pacific Bank Ltd. | 11,000 | 23,103 | ||||||
| NS Solutions Corp. | 700 | 20,333 | ||||||
| NS Tool Co. Ltd. | 200 | 4,388 | ||||||
| NS United Kaiun Kaisha Ltd. | 200 | 2,586 | ||||||
| NSD Co. Ltd. | 2,200 | 38,362 | ||||||
| NSK Ltd. | 6,000 | 45,554 | ||||||
| NTN Corp. | 15,100 | 28,602 | ||||||
| NTT Data Corp. | 15,600 | 177,677 | ||||||
| NTT DOCOMO, Inc. | 18,200 | 508,089 | ||||||
| Obara Group, Inc. | 500 | 16,973 | ||||||
| Obayashi Corp. | 27,000 | 262,789 | ||||||
| OBIC Business Consultants Co. Ltd. | 100 | 5,947 | ||||||
| Obic Co. Ltd. | 500 | 88,617 | ||||||
Odakyu Electric Railway Co. Ltd.(2) | 6,900 | 170,532 | ||||||
| Oenon Holdings, Inc. | 300 | 1,174 | ||||||
| Ogaki Kyoritsu Bank Ltd. (The) | 1,500 | 31,354 | ||||||
| Ohara, Inc. | 100 | 961 | ||||||
| Ohsho Food Service Corp. | 400 | 22,247 | ||||||
| Oiles Corp. | 700 | 9,069 | ||||||
Oisix ra daichi, Inc.(1) | 1,000 | 31,589 | ||||||
| Oji Holdings Corp. | 33,100 | 148,043 | ||||||
| Okabe Co. Ltd. | 1,200 | 8,925 | ||||||
| Okamoto Industries, Inc. | 600 | 23,950 | ||||||
| Okamura Corp. | 2,000 | 14,033 | ||||||
| Okasan Securities Group, Inc. | 4,800 | 14,558 | ||||||
| Oki Electric Industry Co. Ltd. | 5,100 | 48,835 | ||||||
| Okinawa Electric Power Co., Inc. (The) | 1,575 | 24,654 | ||||||
| OKUMA Corp. | 500 | 22,755 | ||||||
| Okumura Corp. | 700 | 16,860 | ||||||
| Okuwa Co. Ltd. | 1,100 | 15,180 | ||||||
| Olympus Corp. | 25,000 | 494,363 | ||||||
| Omron Corp. | 1,900 | 139,016 | ||||||
| Ono Pharmaceutical Co. Ltd. | 2,700 | 81,450 | ||||||
| Onoken Co. Ltd. | 600 | 6,379 | ||||||
| Onward Holdings Co. Ltd. | 5,500 | 14,132 | ||||||
Open Door, Inc.(1) | 600 | 7,706 | ||||||
| Open House Co. Ltd. | 3,200 | 113,172 | ||||||
| Optex Group Co. Ltd. | 800 | 10,220 | ||||||
Optim Corp.(1) | 400 | 11,337 | ||||||
| Optorun Co. Ltd. | 1,200 | 23,741 | ||||||
| Oracle Corp. (Tokyo) | 800 | 93,822 | ||||||
| Organo Corp. | 400 | 21,122 | ||||||
| Oricon, Inc. | 100 | 877 | ||||||
| Orient Corp. | 26,000 | 28,629 | ||||||
| Oriental Land Co. Ltd. | 1,400 | 189,917 | ||||||
| ORIX Corp., ADR | 7,287 | 452,960 | ||||||
| Osaka Gas Co. Ltd. | 1,600 | 31,309 | ||||||
| Osaka Organic Chemical Industry Ltd. | 900 | 20,582 | ||||||
47
| Shares | Value | |||||||
| Osaka Soda Co. Ltd. | 700 | $ | 16,677 | |||||
| Osaka Steel Co. Ltd. | 400 | 4,077 | ||||||
| OSAKA Titanium Technologies Co. Ltd. | 400 | 3,510 | ||||||
| Osaki Electric Co. Ltd. | 400 | 2,042 | ||||||
| OSG Corp. | 3,400 | 49,913 | ||||||
| OSJB Holdings Corp. | 8,200 | 17,755 | ||||||
| Otsuka Corp. | 3,000 | 147,252 | ||||||
| Otsuka Holdings Co. Ltd. | 5,300 | 232,617 | ||||||
| Outsourcing, Inc. | 1,400 | 11,551 | ||||||
| Oyo Corp. | 800 | 9,161 | ||||||
| Pacific Industrial Co. Ltd. | 1,600 | 14,981 | ||||||
| Pacific Metals Co. Ltd. | 100 | 1,714 | ||||||
| Pack Corp. (The) | 400 | 10,144 | ||||||
| PAL GROUP Holdings Co. Ltd. | 1,100 | 11,902 | ||||||
| PALTAC Corp. | 1,300 | 71,883 | ||||||
| Pan Pacific International Holdings Corp. | 12,000 | 282,344 | ||||||
| Panasonic Corp. | 70,700 | 650,416 | ||||||
| PAPYLESS Co. Ltd. | 300 | 7,675 | ||||||
| Paramount Bed Holdings Co. Ltd. | 800 | 31,824 | ||||||
| Park24 Co. Ltd. | 2,800 | 50,588 | ||||||
| Pasona Group, Inc. | 1,200 | 15,547 | ||||||
| PC Depot Corp. | 1,500 | 10,040 | ||||||
| PCA Corp. | 300 | 13,482 | ||||||
| Penta-Ocean Construction Co. Ltd. | 25,100 | 160,729 | ||||||
PeptiDream, Inc.(1) | 900 | 36,524 | ||||||
| Persol Holdings Co. Ltd. | 4,000 | 62,195 | ||||||
| Phil Co., Inc. | 100 | 1,789 | ||||||
| PIA Corp. | 300 | 8,474 | ||||||
| Pigeon Corp. | 1,300 | 59,393 | ||||||
| Pilot Corp. | 1,200 | 35,127 | ||||||
| Piolax, Inc. | 1,000 | 15,392 | ||||||
| Plenus Co. Ltd. | 600 | 9,925 | ||||||
| Pola Orbis Holdings, Inc. | 1,300 | 23,514 | ||||||
| Poletowin Pitcrew Holdings, Inc. | 1,700 | 15,594 | ||||||
| Premium Group Co. Ltd. | 100 | 1,849 | ||||||
| Press Kogyo Co. Ltd. | 6,300 | 18,088 | ||||||
| Pressance Corp. | 200 | 2,628 | ||||||
| Prestige International, Inc. | 3,500 | 29,453 | ||||||
| Prima Meat Packers Ltd. | 1,500 | 43,822 | ||||||
| Proto Corp. | 700 | 8,037 | ||||||
| PS Mitsubishi Construction Co. Ltd. | 1,900 | 10,275 | ||||||
QB Net Holdings Co. Ltd.(1) | 100 | 1,873 | ||||||
| Qol Holdings Co. Ltd. | 500 | 5,404 | ||||||
| Quick Co. Ltd. | 600 | 6,891 | ||||||
| Raito Kogyo Co. Ltd. | 2,000 | 30,272 | ||||||
| Raiznext Corp. | 500 | 6,259 | ||||||
| Rakus Co. Ltd. | 1,100 | 29,300 | ||||||
| Rakuten, Inc. | 25,300 | 222,221 | ||||||
| Recruit Holdings Co. Ltd. | 16,500 | 623,095 | ||||||
| Relia, Inc. | 2,500 | 29,492 | ||||||
| Relo Group, Inc. | 2,500 | 56,774 | ||||||
| Renaissance, Inc. | 200 | 1,791 | ||||||
48
| Shares | Value | |||||||
Renesas Electronics Corp.(1) | 13,300 | $ | 83,373 | |||||
| Rengo Co. Ltd. | 10,800 | 79,692 | ||||||
| Resona Holdings, Inc. | 43,200 | 158,535 | ||||||
| Resorttrust, Inc. | 4,400 | 62,371 | ||||||
| Restar Holdings Corp. | 700 | 12,844 | ||||||
| Retail Partners Co. Ltd. | 1,400 | 24,600 | ||||||
| Rheon Automatic Machinery Co. Ltd. | 100 | 1,037 | ||||||
Ricoh Co. Ltd.(2) | 28,400 | 211,726 | ||||||
| Ricoh Leasing Co. Ltd. | 500 | 12,765 | ||||||
| Ride On Express Holdings Co. Ltd. | 500 | 11,840 | ||||||
| Riken Technos Corp. | 700 | 2,550 | ||||||
| Riken Vitamin Co. Ltd. | 600 | 12,455 | ||||||
| Ringer Hut Co. Ltd. | 100 | 2,321 | ||||||
| Rinnai Corp. | 700 | 64,629 | ||||||
| Riso Kagaku Corp. | 100 | 1,250 | ||||||
Riso Kyoiku Co. Ltd.(2) | 5,600 | 15,616 | ||||||
| Rohm Co. Ltd. | 1,300 | 83,447 | ||||||
| Rohto Pharmaceutical Co. Ltd. | 2,100 | 66,716 | ||||||
| Rokko Butter Co. Ltd. | 800 | 13,175 | ||||||
| Roland DG Corp. | 100 | 1,187 | ||||||
| Rorze Corp. | 700 | 32,731 | ||||||
| Round One Corp. | 4,700 | 37,721 | ||||||
| Royal Holdings Co. Ltd. | 900 | 15,638 | ||||||
Rozetta Corp.(1) | 300 | 10,101 | ||||||
RPA Holdings, Inc.(1) | 100 | 751 | ||||||
| RS Technologies Co. Ltd. | 400 | 11,800 | ||||||
| Ryobi Ltd. | 900 | 10,035 | ||||||
| Ryoden Corp. | 1,000 | 13,560 | ||||||
| Ryohin Keikaku Co. Ltd. | 7,500 | 116,969 | ||||||
| Ryosan Co. Ltd. | 1,000 | 18,426 | ||||||
| Ryoyo Electro Corp. | 100 | 2,822 | ||||||
| S Foods, Inc. | 800 | 21,718 | ||||||
| S-Pool, Inc. | 2,000 | 13,434 | ||||||
| Sac's Bar Holdings, Inc. | 200 | 1,024 | ||||||
Saizeriya Co. Ltd.(1)(2) | 1,500 | 28,098 | ||||||
| Sakai Chemical Industry Co. Ltd. | 200 | 3,751 | ||||||
| Sakai Moving Service Co. Ltd. | 500 | 21,575 | ||||||
| Sakata INX Corp. | 400 | 3,673 | ||||||
| Sakata Seed Corp. | 300 | 9,861 | ||||||
| Sakura Internet, Inc. | 1,300 | 7,471 | ||||||
| Sala Corp. | 1,100 | 5,994 | ||||||
| SAMTY Co. Ltd. | 200 | 2,632 | ||||||
| San ju San Financial Group, Inc. | 900 | 11,343 | ||||||
| San-A Co. Ltd. | 1,200 | 48,630 | ||||||
| San-Ai Oil Co. Ltd. | 1,900 | 16,734 | ||||||
| San-In Godo Bank Ltd. (The) | 6,000 | 29,947 | ||||||
| Sanei Architecture Planning Co. Ltd. | 100 | 1,237 | ||||||
| Sangetsu Corp. | 1,900 | 29,027 | ||||||
| Sanken Electric Co. Ltd. | 900 | 18,540 | ||||||
| Sanki Engineering Co. Ltd. | 900 | 9,611 | ||||||
| Sankyo Co. Ltd. | 800 | 22,040 | ||||||
| Sankyo Seiko Co. Ltd. | 300 | 1,142 | ||||||
49
| Shares | Value | |||||||
| Sankyo Tateyama, Inc. | 1,100 | $ | 9,509 | |||||
| Sankyu, Inc. | 2,200 | 91,737 | ||||||
| Sanoh Industrial Co. Ltd. | 2,100 | 13,047 | ||||||
| Sanrio Co. Ltd. | 100 | 1,669 | ||||||
Sansan, Inc.(1) | 300 | 15,696 | ||||||
| Santen Pharmaceutical Co. Ltd. | 3,800 | 72,461 | ||||||
| Sanwa Holdings Corp. | 7,800 | 78,320 | ||||||
| Sanyo Chemical Industries Ltd. | 400 | 18,592 | ||||||
| Sanyo Denki Co. Ltd. | 100 | 4,457 | ||||||
| Sanyo Special Steel Co. Ltd. | 100 | 856 | ||||||
| Sapporo Holdings Ltd. | 3,200 | 56,992 | ||||||
| Sato Holdings Corp. | 900 | 17,155 | ||||||
| Sawada Holdings Co. Ltd. | 1,700 | 14,083 | ||||||
| Sawai Pharmaceutical Co. Ltd. | 400 | 20,439 | ||||||
| SB Technology Corp. | 600 | 17,493 | ||||||
| SBI Holdings, Inc. | 12,800 | 290,542 | ||||||
| SBS Holdings, Inc. | 1,400 | 26,877 | ||||||
| SCREEN Holdings Co. Ltd. | 300 | 14,585 | ||||||
| SCSK Corp. | 2,200 | 119,182 | ||||||
| SEC Carbon Ltd. | 100 | 5,725 | ||||||
| Secom Co. Ltd. | 1,500 | 141,721 | ||||||
| Sega Sammy Holdings, Inc. | 5,500 | 63,695 | ||||||
| Seibu Holdings, Inc. | 9,000 | 98,801 | ||||||
| Seikagaku Corp. | 200 | 2,045 | ||||||
| Seikitokyu Kogyo Co. Ltd. | 1,700 | 13,807 | ||||||
Seiko Epson Corp.(2) | 12,700 | 151,247 | ||||||
| Seiko Holdings Corp. | 600 | 8,432 | ||||||
| Seiko PMC Corp. | 200 | 1,214 | ||||||
| Seino Holdings Co. Ltd. | 4,500 | 68,781 | ||||||
| Seiren Co. Ltd. | 2,800 | 37,060 | ||||||
| Sekisui Chemical Co. Ltd. | 9,000 | 143,739 | ||||||
| Sekisui House Ltd. | 19,500 | 384,808 | ||||||
| Sekisui Jushi Corp. | 800 | 16,656 | ||||||
| Sekisui Kasei Co. Ltd. | 200 | 1,050 | ||||||
| Senko Group Holdings Co. Ltd. | 7,000 | 61,933 | ||||||
| Senshu Ikeda Holdings, Inc. | 9,700 | 15,152 | ||||||
| Septeni Holdings Co. Ltd. | 3,300 | 8,658 | ||||||
| Seria Co. Ltd. | 2,000 | 88,041 | ||||||
Seven & i Holdings Co. Ltd.(2) | 15,900 | 514,422 | ||||||
| Seven Bank Ltd. | 26,200 | 65,681 | ||||||
| SFP Holdings Co. Ltd. | 200 | 2,700 | ||||||
| SG Holdings Co. Ltd. | 3,300 | 151,580 | ||||||
| Sharp Corp. | 2,700 | 33,361 | ||||||
| Shibaura Machine Co. Ltd. | 400 | 7,924 | ||||||
| Shibuya Corp. | 800 | 22,404 | ||||||
SHIFT, Inc.(1) | 300 | 34,746 | ||||||
| Shiga Bank Ltd. (The) | 1,400 | 32,667 | ||||||
| Shikoku Bank Ltd. (The) | 1,600 | 11,596 | ||||||
| Shikoku Chemicals Corp. | 1,000 | 10,164 | ||||||
| Shikoku Electric Power Co., Inc. | 4,300 | 32,667 | ||||||
| Shima Seiki Manufacturing Ltd. | 100 | 1,420 | ||||||
Shimachu Co. Ltd.(2) | 900 | 25,161 | ||||||
50
| Shares | Value | |||||||
| Shimadzu Corp. | 3,500 | $ | 104,363 | |||||
Shimamura Co. Ltd.(2) | 600 | 49,447 | ||||||
| Shimano, Inc. | 700 | 148,176 | ||||||
| Shimizu Corp. | 22,700 | 173,540 | ||||||
| Shin Nippon Air Technologies Co. Ltd. | 700 | 13,509 | ||||||
| Shin Nippon Biomedical Laboratories Ltd. | 900 | 6,052 | ||||||
| Shin-Etsu Chemical Co. Ltd. | 2,900 | 350,404 | ||||||
| Shin-Etsu Polymer Co. Ltd. | 400 | 3,294 | ||||||
| Shindengen Electric Manufacturing Co. Ltd. | 300 | 5,358 | ||||||
| Shinko Electric Industries Co. Ltd. | 1,000 | 14,845 | ||||||
| Shinko Shoji Co. Ltd. | 200 | 1,691 | ||||||
| Shinmaywa Industries Ltd. | 2,100 | 18,505 | ||||||
| Shinnihon Corp. | 1,800 | 14,166 | ||||||
| Shinnihonseiyaku Co. Ltd. | 500 | 12,330 | ||||||
| Shinoken Group Co. Ltd. | 1,900 | 17,163 | ||||||
| Shinsei Bank Ltd. | 4,600 | 53,338 | ||||||
| Shionogi & Co. Ltd. | 3,700 | 205,234 | ||||||
| Ship Healthcare Holdings, Inc. | 2,100 | 96,895 | ||||||
| Shiseido Co. Ltd. | 3,932 | 228,682 | ||||||
| Shizuoka Bank Ltd. (The) | 11,300 | 78,398 | ||||||
| SHO-BOND Holdings Co. Ltd. | 600 | 28,336 | ||||||
| Shochiku Co. Ltd. | 100 | 13,388 | ||||||
| Shoei Co. Ltd. | 1,500 | 45,780 | ||||||
| Shoei Foods Corp. | 200 | 7,771 | ||||||
| Showa Denko KK | 4,000 | 77,799 | ||||||
| Showa Sangyo Co. Ltd. | 800 | 26,606 | ||||||
| SIGMAXYZ, Inc. | 300 | 3,911 | ||||||
| Sinanen Holdings Co. Ltd. | 300 | 8,367 | ||||||
| Sinfonia Technology Co. Ltd. | 500 | 5,009 | ||||||
| Sinko Industries Ltd. | 1,300 | 16,702 | ||||||
| Sintokogio Ltd. | 1,200 | 7,984 | ||||||
| SK-Electronics Co. Ltd. | 200 | 1,935 | ||||||
| SKY Perfect JSAT Holdings, Inc. | 5,100 | 19,408 | ||||||
| Skylark Holdings Co. Ltd. | 5,700 | 90,546 | ||||||
| SMC Corp. | 395 | 215,709 | ||||||
| SMS Co. Ltd. | 1,800 | 49,600 | ||||||
| SNT Corp. | 400 | 803 | ||||||
| Sodick Co. Ltd. | 1,400 | 9,624 | ||||||
Softbank Corp.(2) | 18,800 | 246,760 | ||||||
| SoftBank Group Corp. | 12,000 | 745,187 | ||||||
| Softbrain Co. Ltd. | 400 | 3,251 | ||||||
| Softcreate Holdings Corp. | 500 | 12,880 | ||||||
| Sohgo Security Services Co. Ltd. | 1,800 | 84,092 | ||||||
| Sojitz Corp. | 38,800 | 88,764 | ||||||
| Solasto Corp. | 1,200 | 14,190 | ||||||
| Soliton Systems KK | 600 | 10,003 | ||||||
| Sompo Holdings, Inc. | 6,300 | 235,337 | ||||||
| Sony Corp., ADR | 20,467 | 1,609,525 | ||||||
| Sotetsu Holdings, Inc. | 3,900 | 106,100 | ||||||
| Space Co. Ltd. | 200 | 1,513 | ||||||
| Sparx Group Co. Ltd. | 900 | 1,733 | ||||||
| Square Enix Holdings Co. Ltd. | 1,200 | 78,972 | ||||||
51
| Shares | Value | |||||||
| SRA Holdings | 700 | $ | 15,544 | |||||
SRS Holdings Co. Ltd.(1) | 200 | 1,764 | ||||||
| ST Corp. | 100 | 1,918 | ||||||
| St. Marc Holdings Co. Ltd. | 900 | 13,797 | ||||||
| Stanley Electric Co. Ltd. | 3,600 | 103,055 | ||||||
| Starts Corp., Inc. | 1,900 | 39,729 | ||||||
| Stella Chemifa Corp. | 400 | 9,859 | ||||||
| Strike Co. Ltd. | 300 | 13,477 | ||||||
Studio Alice Co. Ltd.(2) | 500 | 7,218 | ||||||
| Subaru Corp. | 15,800 | 327,070 | ||||||
Sugi Holdings Co. Ltd.(2) | 1,900 | 137,120 | ||||||
| SUMCO Corp. | 14,300 | 193,446 | ||||||
| Sumida Corp. | 1,100 | 6,686 | ||||||
| Sumitomo Bakelite Co. Ltd. | 300 | 7,918 | ||||||
| Sumitomo Chemical Co. Ltd. | 39,500 | 128,135 | ||||||
Sumitomo Corp.(2) | 16,800 | 217,409 | ||||||
Sumitomo Dainippon Pharma Co., Ltd.(2) | 2,500 | 31,597 | ||||||
| Sumitomo Densetsu Co. Ltd. | 800 | 16,867 | ||||||
| Sumitomo Electric Industries Ltd. | 22,000 | 258,466 | ||||||
| Sumitomo Forestry Co. Ltd. | 7,800 | 124,467 | ||||||
| Sumitomo Heavy Industries Ltd. | 2,400 | 54,076 | ||||||
| Sumitomo Metal Mining Co. Ltd. | 3,600 | 109,613 | ||||||
| Sumitomo Mitsui Construction Co. Ltd. | 2,500 | 10,052 | ||||||
| Sumitomo Mitsui Financial Group, Inc., ADR | 95,171 | 559,605 | ||||||
| Sumitomo Mitsui Trust Holdings, Inc. | 7,200 | 208,138 | ||||||
| Sumitomo Osaka Cement Co. Ltd. | 1,200 | 38,862 | ||||||
| Sumitomo Realty & Development Co. Ltd. | 6,900 | 203,248 | ||||||
| Sumitomo Riko Co. Ltd. | 1,700 | 8,774 | ||||||
| Sumitomo Rubber Industries Ltd. | 9,700 | 93,200 | ||||||
| Sumitomo Seika Chemicals Co. Ltd. | 500 | 16,270 | ||||||
| Sumitomo Warehouse Co. Ltd. (The) | 2,000 | 24,728 | ||||||
| Sun Frontier Fudousan Co. Ltd. | 500 | 3,840 | ||||||
| Sundrug Co. Ltd. | 2,500 | 93,063 | ||||||
| Suntory Beverage & Food Ltd. | 3,700 | 142,579 | ||||||
Suruga Bank Ltd.(2) | 8,000 | 28,684 | ||||||
| Sushiro Global Holdings Ltd. | 3,500 | 81,197 | ||||||
| Suzuken Co. Ltd. | 2,200 | 81,649 | ||||||
| Suzuki Motor Corp. | 7,400 | 302,447 | ||||||
| SWCC Showa Holdings Co. Ltd. | 1,900 | 19,936 | ||||||
| Sysmex Corp. | 2,000 | 174,487 | ||||||
| System Information Co. Ltd. | 700 | 8,182 | ||||||
| Systena Corp. | 1,900 | 30,593 | ||||||
| Syuppin Co. Ltd. | 500 | 3,931 | ||||||
| T Hasegawa Co. Ltd. | 700 | 13,974 | ||||||
| T&D Holdings, Inc. | 12,900 | 133,878 | ||||||
| T-Gaia Corp. | 1,200 | 23,597 | ||||||
| Tachi-S Co. Ltd. | 200 | 1,653 | ||||||
Tadano Ltd.(2) | 1,600 | 13,065 | ||||||
| Taihei Dengyo Kaisha Ltd. | 500 | 10,414 | ||||||
| Taiheiyo Cement Corp. | 4,300 | 108,994 | ||||||
| Taiho Kogyo Co. Ltd. | 400 | 1,963 | ||||||
| Taikisha Ltd. | 1,600 | 43,473 | ||||||
52
| Shares | Value | |||||||
| Taiko Pharmaceutical Co. Ltd. | 1,500 | $ | 36,048 | |||||
| Taisei Corp. | 7,300 | 251,369 | ||||||
| Taisho Pharmaceutical Holdings Co. Ltd. | 500 | 30,796 | ||||||
| Taiyo Nippon Sanso Corp. | 2,500 | 43,710 | ||||||
| Taiyo Yuden Co. Ltd. | 5,700 | 153,193 | ||||||
| Takamatsu Construction Group Co. Ltd. | 1,000 | 20,874 | ||||||
| Takamiya Co. Ltd. | 1,200 | 5,766 | ||||||
| Takaoka Toko Co. Ltd. | 100 | 951 | ||||||
| Takara & Co. Ltd. | 600 | 14,218 | ||||||
| Takara Bio, Inc. | 300 | 8,090 | ||||||
| Takara Holdings, Inc. | 3,100 | 28,995 | ||||||
| Takara Leben Co. Ltd. | 5,800 | 18,910 | ||||||
| Takara Standard Co. Ltd. | 900 | 11,330 | ||||||
| Takasago International Corp. | 400 | 7,417 | ||||||
| Takasago Thermal Engineering Co. Ltd. | 700 | 9,578 | ||||||
Takashimaya Co. Ltd.(2) | 5,300 | 41,688 | ||||||
Takeda Pharmaceutical Co. Ltd., ADR(1) | 16,313 | 303,585 | ||||||
| Takeei Corp. | 1,600 | 14,715 | ||||||
| Takeuchi Manufacturing Co. Ltd. | 1,900 | 39,777 | ||||||
| Takuma Co. Ltd. | 4,700 | 75,237 | ||||||
| Tama Home Co. Ltd. | 800 | 9,703 | ||||||
| Tamron Co. Ltd. | 900 | 14,523 | ||||||
| Tamura Corp. | 2,200 | 10,739 | ||||||
| Tanseisha Co. Ltd. | 1,200 | 8,053 | ||||||
| Taoka Chemical Co. Ltd. | 100 | 10,396 | ||||||
| Tatsuta Electric Wire and Cable Co. Ltd. | 400 | 2,335 | ||||||
| Tayca Corp. | 100 | 1,239 | ||||||
| Tazmo Co. Ltd. | 600 | 7,762 | ||||||
| TDC Soft, Inc. | 200 | 1,776 | ||||||
| TDK Corp. | 3,600 | 371,979 | ||||||
TeamSpirit, Inc.(1) | 100 | 2,017 | ||||||
| TechMatrix Corp. | 1,800 | 37,088 | ||||||
| TECHNO ASSOCIE Co. Ltd. | 200 | 1,842 | ||||||
| TECHNO HORIZON HOLDINGS Co. Ltd. | 800 | 6,319 | ||||||
| TechnoPro Holdings, Inc. | 600 | 31,938 | ||||||
| Teijin Ltd. | 6,400 | 100,346 | ||||||
| Teikoku Electric Manufacturing Co. Ltd. | 900 | 9,640 | ||||||
| Teikoku Sen-I Co. Ltd. | 800 | 20,188 | ||||||
| Tekken Corp. | 300 | 5,842 | ||||||
| Tenma Corp. | 500 | 9,333 | ||||||
TerraSky Co. Ltd.(1) | 100 | 4,263 | ||||||
| Terumo Corp. | 5,500 | 223,190 | ||||||
| THK Co. Ltd. | 1,400 | 32,455 | ||||||
| TIS, Inc. | 8,400 | 167,595 | ||||||
| TKC Corp. | 700 | 39,213 | ||||||
TKP Corp.(1) | 100 | 2,651 | ||||||
| Toa Corp. (Hyogo) | 200 | 1,430 | ||||||
| Toa Corp. (Tokyo) | 100 | 1,506 | ||||||
| Toagosei Co. Ltd. | 1,500 | 14,678 | ||||||
| Tobishima Corp. | 1,000 | 10,462 | ||||||
| Tobu Railway Co. Ltd. | 6,600 | 205,845 | ||||||
| TOC Co. Ltd. | 500 | 3,205 | ||||||
53
| Shares | Value | |||||||
| Tocalo Co. Ltd. | 1,000 | $ | 10,047 | |||||
| Tochigi Bank Ltd. (The) | 900 | 1,399 | ||||||
Toda Corp.(2) | 12,800 | 83,557 | ||||||
| Toho Bank Ltd. (The) | 7,100 | 15,117 | ||||||
| Toho Co. Ltd. | 1,800 | 68,374 | ||||||
| Toho Gas Co. Ltd. | 300 | 13,240 | ||||||
| Toho Holdings Co. Ltd. | 2,800 | 54,082 | ||||||
| Toho Titanium Co. Ltd. | 1,400 | 9,060 | ||||||
Toho Zinc Co. Ltd.(1) | 100 | 1,765 | ||||||
| Tohoku Electric Power Co., Inc. | 14,200 | 144,149 | ||||||
| Tokai Carbon Co. Ltd. | 8,400 | 78,708 | ||||||
| Tokai Corp/Gifu | 600 | 11,877 | ||||||
| TOKAI Holdings Corp. | 5,400 | 51,307 | ||||||
| Tokai Rika Co. Ltd. | 3,100 | 46,434 | ||||||
| Tokai Tokyo Financial Holdings, Inc. | 2,700 | 6,506 | ||||||
| Token Corp. | 300 | 19,493 | ||||||
| Tokio Marine Holdings, Inc. | 5,800 | 267,046 | ||||||
| Tokuyama Corp. | 4,000 | 93,362 | ||||||
| Tokyo Broadcasting System Holdings, Inc. | 800 | 13,783 | ||||||
Tokyo Century Corp.(2) | 1,500 | 76,772 | ||||||
| Tokyo Dome Corp. | 4,400 | 33,223 | ||||||
Tokyo Electric Power Co. Holdings, Inc.(1) | 32,300 | 94,945 | ||||||
Tokyo Electron Device Ltd.(2) | 400 | 11,245 | ||||||
| Tokyo Electron Ltd. | 2,400 | 611,884 | ||||||
| Tokyo Energy & Systems, Inc. | 400 | 2,889 | ||||||
| Tokyo Gas Co. Ltd. | 3,200 | 71,204 | ||||||
| Tokyo Kiraboshi Financial Group, Inc. | 1,200 | 12,698 | ||||||
| Tokyo Ohka Kogyo Co. Ltd. | 500 | 24,411 | ||||||
| Tokyo Seimitsu Co. Ltd. | 500 | 15,246 | ||||||
| Tokyo Steel Manufacturing Co. Ltd. | 3,700 | 24,767 | ||||||
| Tokyo Tatemono Co. Ltd. | 3,300 | 40,083 | ||||||
| Tokyotokeiba Co. Ltd. | 600 | 27,740 | ||||||
| Tokyu Construction Co. Ltd. | 1,900 | 8,716 | ||||||
| Tokyu Corp. | 13,600 | 181,579 | ||||||
| Tokyu Fudosan Holdings Corp. | 9,500 | 40,746 | ||||||
| Tomoku Co. Ltd. | 900 | 13,957 | ||||||
| TOMONY Holdings, Inc. | 6,500 | 20,760 | ||||||
| Tomy Co. Ltd. | 3,900 | 31,312 | ||||||
| Topcon Corp. | 3,700 | 29,706 | ||||||
| Toppan Forms Co. Ltd. | 1,300 | 11,768 | ||||||
| Toppan Printing Co. Ltd. | 5,700 | 88,421 | ||||||
| Topre Corp. | 1,400 | 15,555 | ||||||
| Topy Industries Ltd. | 100 | 1,071 | ||||||
| Toray Industries, Inc. | 38,600 | 182,869 | ||||||
| Toridoll Holdings Corp. | 1,600 | 20,753 | ||||||
| Torii Pharmaceutical Co. Ltd. | 500 | 12,984 | ||||||
| Torikizoku Co. Ltd. | 100 | 1,373 | ||||||
| Tosei Corp. | 700 | 6,115 | ||||||
| Toshiba Corp. | 2,700 | 77,644 | ||||||
Toshiba TEC Corp.(2) | 1,500 | 62,762 | ||||||
| Tosho Co. Ltd. | 500 | 6,253 | ||||||
| Tosoh Corp. | 12,800 | 189,671 | ||||||
54
| Shares | Value | |||||||
| Totetsu Kogyo Co. Ltd. | 1,100 | $ | 27,171 | |||||
| TOTO Ltd. | 2,200 | 96,056 | ||||||
| Towa Bank Ltd. (The) | 700 | 4,473 | ||||||
| Towa Corp. | 1,300 | 13,120 | ||||||
| Towa Pharmaceutical Co. Ltd. | 1,600 | 31,700 | ||||||
| Toyo Construction Co. Ltd. | 5,400 | 20,496 | ||||||
| Toyo Corp. | 200 | 1,799 | ||||||
| Toyo Gosei Co. Ltd. | 300 | 21,855 | ||||||
| Toyo Ink SC Holdings Co. Ltd. | 400 | 7,001 | ||||||
| Toyo Seikan Group Holdings Ltd. | 4,800 | 53,002 | ||||||
| Toyo Suisan Kaisha Ltd. | 1,100 | 62,457 | ||||||
| Toyo Tanso Co. Ltd. | 200 | 3,136 | ||||||
| Toyo Tire Corp. | 5,300 | 88,111 | ||||||
| Toyobo Co. Ltd. | 5,200 | 74,872 | ||||||
| Toyoda Gosei Co. Ltd. | 3,200 | 69,700 | ||||||
| Toyota Boshoku Corp. | 4,400 | 62,257 | ||||||
| Toyota Industries Corp. | 2,900 | 168,773 | ||||||
| Toyota Motor Corp., ADR | 16,292 | 2,157,550 | ||||||
| Toyota Tsusho Corp. | 4,100 | 118,001 | ||||||
| TPR Co. Ltd. | 1,500 | 19,997 | ||||||
| Transaction Co. Ltd. | 200 | 2,135 | ||||||
| Transcosmos, Inc. | 1,200 | 32,678 | ||||||
| Trend Micro, Inc. | 3,700 | 228,649 | ||||||
| Tri Chemical Laboratories, Inc. | 200 | 18,296 | ||||||
| TS Tech Co. Ltd. | 1,900 | 55,583 | ||||||
| TSI Holdings Co. Ltd. | 1,800 | 5,461 | ||||||
| Tsubakimoto Chain Co. | 1,000 | 23,217 | ||||||
| Tsugami Corp. | 800 | 8,546 | ||||||
| Tsukada Global Holdings, Inc. | 500 | 1,239 | ||||||
| Tsukishima Kikai Co. Ltd. | 800 | 9,461 | ||||||
| Tsukui Corp. | 4,100 | 23,880 | ||||||
| Tsumura & Co. | 1,200 | 34,047 | ||||||
| Tsuruha Holdings, Inc. | 1,300 | 173,590 | ||||||
| Tsuzuki Denki Co. Ltd. | 500 | 7,632 | ||||||
| TV Asahi Holdings Corp. | 600 | 9,484 | ||||||
| UACJ Corp. | 1,700 | 31,058 | ||||||
| Ube Industries Ltd. | 5,500 | 98,113 | ||||||
| Uchida Yoko Co. Ltd. | 600 | 35,554 | ||||||
| Ulvac, Inc. | 1,000 | 35,458 | ||||||
| Unicharm Corp. | 3,000 | 130,703 | ||||||
| Union Tool Co. | 100 | 2,751 | ||||||
| Unipres Corp. | 1,200 | 10,388 | ||||||
| United Arrows Ltd. | 700 | 10,683 | ||||||
| United Super Markets Holdings, Inc. | 1,900 | 22,312 | ||||||
| UNITED, Inc. | 100 | 1,237 | ||||||
Unitika Ltd.(1) | 4,600 | 16,062 | ||||||
Universal Entertainment Corp.(1) | 400 | 7,840 | ||||||
| UPR Corp. | 200 | 7,610 | ||||||
| Ushio, Inc. | 1,800 | 22,219 | ||||||
| USS Co. Ltd. | 4,000 | 67,467 | ||||||
UT Group Co. Ltd.(1) | 500 | 14,776 | ||||||
UUUM, Inc.(1) | 100 | 2,157 | ||||||
55
| Shares | Value | |||||||
| Valor Holdings Co. Ltd. | 2,800 | $ | 71,577 | |||||
| Valqua Ltd. | 500 | 8,327 | ||||||
| Value HR Co. Ltd. | 200 | 2,636 | ||||||
| ValueCommerce Co. Ltd. | 900 | 29,913 | ||||||
| Valuence Holdings, Inc. | 100 | 1,511 | ||||||
Vector, Inc.(1) | 1,000 | 8,889 | ||||||
VIA Holdings, Inc.(1) | 200 | 655 | ||||||
Vision, Inc.(1) | 300 | 2,274 | ||||||
| Vital KSK Holdings, Inc. | 900 | 9,087 | ||||||
| VT Holdings Co. Ltd. | 6,300 | 23,150 | ||||||
| Wacoal Holdings Corp. | 400 | 7,102 | ||||||
| Wacom Co. Ltd. | 10,300 | 67,369 | ||||||
| Wakachiku Construction Co. Ltd. | 300 | 3,357 | ||||||
| Wakita & Co. Ltd. | 2,000 | 17,695 | ||||||
| Warabeya Nichiyo Holdings Co. Ltd. | 900 | 12,683 | ||||||
| Watahan & Co. Ltd. | 600 | 15,474 | ||||||
WATAMI Co. Ltd.(2) | 200 | 1,962 | ||||||
| WDB Holdings Co. Ltd. | 300 | 7,998 | ||||||
| Welcia Holdings Co. Ltd. | 3,000 | 128,453 | ||||||
| West Japan Railway Co. | 3,700 | 193,703 | ||||||
| Will Group, Inc. | 200 | 1,457 | ||||||
| World Co. Ltd. | 600 | 8,777 | ||||||
| World Holdings Co. Ltd. | 500 | 8,394 | ||||||
| Wowow, Inc. | 300 | 7,654 | ||||||
| Xebio Holdings Co. Ltd. | 500 | 3,549 | ||||||
YA-MAN Ltd.(2) | 2,000 | 26,249 | ||||||
| Yahagi Construction Co. Ltd. | 2,000 | 17,100 | ||||||
| Yakult Honsha Co. Ltd. | 1,300 | 74,203 | ||||||
| YAKUODO Holdings Co. Ltd. | 700 | 16,651 | ||||||
| YAMABIKO Corp. | 2,000 | 20,346 | ||||||
| YAMADA Consulting Group Co. Ltd. | 600 | 6,030 | ||||||
| Yamada Denki Co. Ltd. | 14,100 | 75,601 | ||||||
| Yamagata Bank Ltd. (The) | 1,100 | 13,577 | ||||||
| Yamaguchi Financial Group, Inc. | 7,700 | 50,596 | ||||||
| Yamaha Corp. | 4,400 | 214,035 | ||||||
| Yamaha Motor Co. Ltd. | 13,900 | 218,281 | ||||||
| Yamaichi Electronics Co. Ltd. | 1,300 | 16,710 | ||||||
| Yamanashi Chuo Bank Ltd. (The) | 1,200 | 9,169 | ||||||
| Yamato Corp. | 600 | 3,537 | ||||||
| Yamato Holdings Co. Ltd. | 6,800 | 177,585 | ||||||
| Yamato Kogyo Co. Ltd. | 400 | 9,497 | ||||||
| Yamazaki Baking Co. Ltd. | 3,400 | 55,382 | ||||||
| Yamazen Corp. | 900 | 8,454 | ||||||
| Yaoko Co. Ltd. | 1,100 | 85,943 | ||||||
Yaskawa Electric Corp.(2) | 1,400 | 50,251 | ||||||
| Yasuda Logistics Corp. | 200 | 1,705 | ||||||
| Yellow Hat Ltd. | 1,600 | 26,333 | ||||||
| Yodogawa Steel Works Ltd. | 600 | 10,435 | ||||||
| Yokogawa Bridge Holdings Corp. | 700 | 12,641 | ||||||
| Yokogawa Electric Corp. | 6,500 | 105,929 | ||||||
| Yokohama Reito Co. Ltd. | 3,000 | 25,505 | ||||||
| Yokohama Rubber Co. Ltd. (The) | 5,000 | 78,086 | ||||||
56
| Shares | Value | |||||||
| Yokowo Co. Ltd. | 1,000 | $ | 25,134 | |||||
| Yondoshi Holdings, Inc. | 600 | 9,760 | ||||||
| Yonex Co. Ltd. | 200 | 1,221 | ||||||
| Yorozu Corp. | 1,200 | 10,567 | ||||||
Yoshimura Food Holdings KK(1) | 100 | 914 | ||||||
Yoshinoya Holdings Co. Ltd.(2) | 3,500 | 69,186 | ||||||
| Yuasa Trading Co. Ltd. | 600 | 17,401 | ||||||
| Yumeshin Holdings Co. Ltd. | 600 | 3,833 | ||||||
| Yurtec Corp. | 2,300 | 13,761 | ||||||
| Yushin Precision Equipment Co. Ltd. | 200 | 1,322 | ||||||
Z Holdings Corp.(2) | 58,900 | 390,853 | ||||||
| Zenkoku Hosho Co. Ltd. | 2,700 | 95,409 | ||||||
| Zenrin Co. Ltd. | 1,100 | 11,485 | ||||||
Zensho Holdings Co. Ltd.(2) | 3,367 | 75,769 | ||||||
| Zeon Corp. | 3,500 | 36,531 | ||||||
| ZERIA Pharmaceutical Co. Ltd. | 100 | 1,846 | ||||||
| ZIGExN Co. Ltd. | 600 | 1,874 | ||||||
| Zojirushi Corp. | 200 | 3,016 | ||||||
| ZOZO, Inc. | 3,000 | 84,322 | ||||||
| 77,946,926 | ||||||||
| Netherlands — 3.6% | ||||||||
| Aalberts NV | 5,124 | 193,308 | ||||||
| ABN AMRO Bank NV, CVA | 11,276 | 107,389 | ||||||
Accell Group NV(1) | 792 | 23,637 | ||||||
Adyen NV(1) | 421 | 709,758 | ||||||
| Aegon NV | 50,527 | 138,444 | ||||||
AerCap Holdings NV(1) | 7,939 | 234,756 | ||||||
| Akzo Nobel NV | 3,225 | 319,133 | ||||||
Alfen Beheer BV(1) | 1,046 | 75,872 | ||||||
Altice Europe NV(1) | 5,368 | 23,793 | ||||||
AMG Advanced Metallurgical Group NV(2) | 1,491 | 30,612 | ||||||
Arcadis NV(1) | 1,917 | 44,006 | ||||||
| ASM International NV | 1,696 | 254,961 | ||||||
| ASML Holding NV, (New York) | 3,611 | 1,351,164 | ||||||
| ASR Nederland NV | 5,002 | 173,362 | ||||||
Basic-Fit NV(1) | 1,555 | 43,742 | ||||||
| BE Semiconductor Industries NV | 5,368 | 256,489 | ||||||
Boskalis Westminster(1) | 3,339 | 69,956 | ||||||
| Coca-Cola European Partners plc | 5,753 | 236,793 | ||||||
| Corbion NV | 10,273 | 475,487 | ||||||
Flow Traders(2) | 2,458 | 96,812 | ||||||
| ForFarmers NV | 2,567 | 16,567 | ||||||
Fugro NV, CVA(1)(2) | 3,360 | 14,346 | ||||||
Heijmans NV, CVA(1) | 913 | 7,711 | ||||||
| Heineken Holding NV | 2,052 | 168,255 | ||||||
| Heineken NV | 2,075 | 192,235 | ||||||
| IMCD NV | 1,036 | 110,556 | ||||||
| ING Groep NV, ADR | 79,053 | 639,539 | ||||||
Just Eat Takeaway.com NV(1) | 395 | 43,942 | ||||||
Kendrion NV(1) | 516 | 8,158 | ||||||
| Koninklijke Ahold Delhaize NV | 33,561 | 1,010,744 | ||||||
Koninklijke BAM Groep NV(1) | 14,254 | 21,945 | ||||||
57
| Shares | Value | |||||||
| Koninklijke DSM NV, ADR | 21,871 | $ | 879,597 | |||||
| Koninklijke KPN NV | 181,246 | 475,492 | ||||||
Koninklijke Philips NV(1) | 12,042 | 571,875 | ||||||
| Koninklijke Vopak NV | 4,096 | 224,932 | ||||||
NIBC Holding NV(1) | 1,438 | 12,681 | ||||||
| NN Group NV | 12,285 | 462,425 | ||||||
OCI NV(1)(2) | 2,719 | 36,955 | ||||||
Pharming Group NV(1)(2) | 69,588 | 88,132 | ||||||
| PostNL NV | 6,689 | 19,916 | ||||||
Prosus NV(1) | 2,571 | 257,174 | ||||||
| Randstad NV | 3,985 | 207,531 | ||||||
| SBM Offshore NV | 2,959 | 51,213 | ||||||
SIF Holding NV(1)(2) | 1,025 | 16,752 | ||||||
Signify NV(1) | 4,966 | 165,765 | ||||||
| TKH Group NV, CVA | 2,200 | 86,219 | ||||||
TomTom NV(1) | 2,200 | 17,673 | ||||||
| Unilever NV, (New York) | 20,266 | 1,175,428 | ||||||
Wolters Kluwer NV(2) | 6,170 | 506,515 | ||||||
| 12,349,747 | ||||||||
| New Zealand — 0.4% | ||||||||
a2 Milk Co. Ltd.(1) | 12,149 | 151,707 | ||||||
| Air New Zealand Ltd. | 33,287 | 31,176 | ||||||
| Arvida Group Ltd. | 29,697 | 32,316 | ||||||
| Auckland International Airport Ltd. | 9,369 | 41,698 | ||||||
| Chorus Ltd. | 21,832 | 124,396 | ||||||
| Contact Energy Ltd. | 15,499 | 65,082 | ||||||
| Fisher & Paykel Healthcare Corp. Ltd. | 4,548 | 112,733 | ||||||
Fletcher Building Ltd.(1) | 24,064 | 57,852 | ||||||
| Genesis Energy Ltd. | 15,870 | 32,236 | ||||||
| Hallenstein Glasson Holdings Ltd. | 3,578 | 10,905 | ||||||
| Infratil Ltd. | 12,691 | 42,304 | ||||||
| Kathmandu Holdings Ltd. | 6,450 | 5,356 | ||||||
| Mercury NZ Ltd. | 20,872 | 72,805 | ||||||
| Meridian Energy Ltd. | 15,870 | 54,286 | ||||||
| Metlifecare Ltd. | 8,404 | 33,618 | ||||||
| New Zealand Refining Co. Ltd. (The) | 20,355 | 9,031 | ||||||
| NZX Ltd. | 4,133 | 4,504 | ||||||
| Oceania Healthcare Ltd. | 31,251 | 21,822 | ||||||
Pushpay Holdings Ltd.(1) | 5,578 | 32,782 | ||||||
Restaurant Brands New Zealand Ltd.(1) | 921 | 7,560 | ||||||
| Ryman Healthcare Ltd. | 4,841 | 43,764 | ||||||
| Sanford Ltd. | 3,467 | 13,453 | ||||||
| Scales Corp. Ltd. | 1,024 | 3,375 | ||||||
| SKYCITY Entertainment Group Ltd. | 25,533 | 43,671 | ||||||
| Spark New Zealand Ltd. | 35,553 | 115,627 | ||||||
| Summerset Group Holdings Ltd. | 11,419 | 66,361 | ||||||
Synlait Milk Ltd.(1) | 2,171 | 9,291 | ||||||
| Tourism Holdings Ltd. | 5,372 | 7,476 | ||||||
TOWER Ltd.(1) | 32,624 | 12,509 | ||||||
| Warehouse Group Ltd. (The) | 4,906 | 6,765 | ||||||
| Z Energy Ltd. | 18,433 | 33,313 | ||||||
| 1,299,774 | ||||||||
58
| Shares | Value | |||||||
| Norway — 0.7% | ||||||||
Adevinta ASA(1) | 1,419 | $ | 26,458 | |||||
Akastor ASA(1) | 3,621 | 2,790 | ||||||
| Aker BP ASA | 3,708 | 73,519 | ||||||
Aker Carbon Capture AS(1)(2) | 1,079 | 630 | ||||||
Aker Offshore Wind Holding AS(1)(2) | 1,079 | 408 | ||||||
Aker Solutions ASA(1)(2) | 1,439 | 1,615 | ||||||
American Shipping Co. ASA(1) | 3,331 | 11,114 | ||||||
Atea ASA(1) | 1,956 | 22,860 | ||||||
| Austevoll Seafood ASA | 2,719 | 25,063 | ||||||
Avance Gas Holding Ltd.(2) | 4,361 | 10,461 | ||||||
Axactor SE(1) | 1,676 | 1,595 | ||||||
B2Holding ASA(1) | 18,545 | 13,910 | ||||||
Bakkafrost P/F(1) | 785 | 49,101 | ||||||
| Bonheur ASA | 304 | 8,383 | ||||||
| Borregaard ASA | 3,503 | 51,002 | ||||||
BW Energy Ltd.(1) | 1,031 | 2,413 | ||||||
| BW LPG Ltd. | 4,758 | 22,170 | ||||||
| BW Offshore Ltd. | 5,124 | 19,788 | ||||||
DNB ASA(1) | 15,641 | 250,289 | ||||||
DNO ASA(2) | 17,268 | 10,892 | ||||||
| Elkem ASA | 9,979 | 20,537 | ||||||
| Entra ASA | 2,558 | 34,956 | ||||||
| Equinor ASA, ADR | 15,221 | 244,297 | ||||||
| Europris ASA | 1,793 | 9,030 | ||||||
FLEX LNG Ltd.(2) | 415 | 2,231 | ||||||
| Frontline Ltd. | 2,379 | 18,937 | ||||||
Gjensidige Forsikring ASA(1) | 2,717 | 57,831 | ||||||
| Golden Ocean Group Ltd. | 4,986 | 20,389 | ||||||
| Grieg Seafood ASA | 2,078 | 21,047 | ||||||
Hexagon Composites ASA(1) | 1,520 | 9,265 | ||||||
| Kid ASA | 1,569 | 14,900 | ||||||
Kitron ASA(1) | 6,153 | 11,509 | ||||||
Komplett Bank ASA(1) | 4,733 | 3,777 | ||||||
| Kongsberg Gruppen ASA | 808 | 11,987 | ||||||
| Leroy Seafood Group ASA | 4,239 | 26,763 | ||||||
Mowi ASA(2) | 5,775 | 112,742 | ||||||
Nordic Semiconductor ASA(1) | 1,682 | 17,246 | ||||||
Norsk Hydro ASA(1) | 28,294 | 90,127 | ||||||
| Norway Royal Salmon ASA | 396 | 10,018 | ||||||
Norwegian Finans Holding ASA(1) | 8,314 | 62,839 | ||||||
Ocean Yield ASA(2) | 4,605 | 11,578 | ||||||
Odfjell Drilling Ltd.(1) | 7,425 | 9,843 | ||||||
Odfjell SE, A Shares(1) | 1,031 | 2,583 | ||||||
| Orkla ASA | 9,857 | 100,302 | ||||||
Otello Corp ASA(1) | 1,955 | 3,541 | ||||||
Pareto Bank ASA(1) | 2,439 | 10,698 | ||||||
PGS ASA(1) | 10,319 | 3,827 | ||||||
Salmar ASA(1) | 635 | 34,360 | ||||||
Sbanken ASA(1) | 3,482 | 26,827 | ||||||
Schibsted ASA, B Shares(1) | 792 | 31,374 | ||||||
| Selvaag Bolig ASA | 4,640 | 28,250 | ||||||
59
| Shares | Value | |||||||
| SpareBank 1 BV | 2,210 | $ | 9,339 | |||||
| SpareBank 1 Nord Norge | 5,651 | 43,498 | ||||||
| Sparebank 1 Oestlandet | 2,719 | 27,694 | ||||||
| SpareBank 1 SMN | 7,690 | 76,471 | ||||||
SpareBank 1 SR-Bank ASA(1) | 6,699 | 60,215 | ||||||
| Sparebanken Vest | 6,013 | 44,711 | ||||||
| Stolt-Nielsen Ltd. | 2,314 | 22,640 | ||||||
Storebrand ASA(1) | 13,689 | 83,886 | ||||||
Subsea 7 SA(1) | 11,794 | 95,155 | ||||||
| Telenor ASA | 9,621 | 156,404 | ||||||
| TGS Nopec Geophysical Co. ASA | 5,285 | 68,516 | ||||||
TOMRA Systems ASA(1) | 914 | 44,284 | ||||||
| Treasure ASA | 2,313 | 3,307 | ||||||
Veidekke ASA(1) | 2,300 | 30,937 | ||||||
Wallenius Wilhelmsen ASA(1)(2) | 3,724 | 6,538 | ||||||
| Yara International ASA | 1,669 | 69,874 | ||||||
| 2,511,541 | ||||||||
| Portugal — 0.2% | ||||||||
| Altri SGPS SA | 3,483 | 17,410 | ||||||
Banco Comercial Portugues SA, R Shares(1)(2) | 124,066 | 14,601 | ||||||
CTT-Correios de Portugal SA(1) | 4,680 | 14,548 | ||||||
| EDP - Energias de Portugal SA | 29,981 | 151,863 | ||||||
| Galp Energia SGPS SA | 9,746 | 104,287 | ||||||
| Jeronimo Martins SGPS SA | 5,518 | 90,547 | ||||||
Mota-Engil SGPS SA(1) | 10,136 | 19,050 | ||||||
| NOS SGPS SA | 6,071 | 24,534 | ||||||
| REN - Redes Energeticas Nacionais SGPS SA | 24,720 | 71,668 | ||||||
| Semapa-Sociedade de Investimento e Gestao | 799 | 7,262 | ||||||
| Sonae SGPS SA | 22,123 | 15,759 | ||||||
| 531,529 | ||||||||
| Singapore — 1.1% | ||||||||
| Accordia Golf Trust | 90,200 | 47,954 | ||||||
| AEM Holdings Ltd. | 15,500 | 45,455 | ||||||
| Ascendas India Trust | 14,300 | 14,018 | ||||||
| Aspial Corp. Ltd. | 37,900 | 4,039 | ||||||
| Boustead Singapore Ltd. | 1,000 | 525 | ||||||
| BRC Asia Ltd. | 2,000 | 1,659 | ||||||
| CapitaLand Ltd. | 39,500 | 80,021 | ||||||
| Centurion Corp. Ltd. | 14,400 | 3,763 | ||||||
| China Sunsine Chemical Holdings Ltd. | 40,100 | 10,743 | ||||||
| Chip Eng Seng Corp. Ltd. | 13,800 | 4,559 | ||||||
| Chuan Hup Holdings Ltd. | 16,800 | 2,657 | ||||||
| City Developments Ltd. | 25,000 | 147,241 | ||||||
| ComfortDelGro Corp. Ltd. | 44,100 | 47,716 | ||||||
| DBS Group Holdings Ltd. | 23,568 | 360,688 | ||||||
| Far East Orchard Ltd. | 15,500 | 11,043 | ||||||
| First Resources Ltd. | 1,200 | 1,145 | ||||||
| Food Empire Holdings Ltd. | 4,000 | 1,844 | ||||||
| Frencken Group Ltd. | 51,700 | 35,549 | ||||||
| Golden Agri-Resources Ltd. | 448,300 | 47,648 | ||||||
| GuocoLand Ltd. | 27,500 | 29,456 | ||||||
60
| Shares | Value | |||||||
| Hong Leong Asia Ltd. | 13,700 | $ | 4,919 | |||||
| Hutchison Port Holdings Trust, U Shares | 195,600 | 20,655 | ||||||
iFAST Corp. Ltd.(2) | 1,400 | 2,361 | ||||||
Indofood Agri Resources Ltd.(1) | 79,500 | 16,945 | ||||||
| Japfa Ltd. | 53,900 | 24,633 | ||||||
| Jardine Cycle & Carriage Ltd. | 3,900 | 54,127 | ||||||
| Keppel Corp. Ltd. | 69,300 | 232,986 | ||||||
| Keppel Infrastructure Trust | 91,400 | 36,571 | ||||||
| KSH Holdings Ltd. | 3,100 | 783 | ||||||
| Lian Beng Group Ltd. | 52,000 | 14,514 | ||||||
| Mewah International, Inc. | 25,900 | 4,454 | ||||||
| NetLink NBN Trust | 50,900 | 36,232 | ||||||
| Oversea-Chinese Banking Corp. Ltd. | 63,500 | 403,996 | ||||||
| Oxley Holdings Ltd. | 13,000 | 2,148 | ||||||
| QAF Ltd. | 13,000 | 8,784 | ||||||
| Raffles Medical Group Ltd. | 51,500 | 30,972 | ||||||
SATS Ltd.(2) | 6,000 | 13,193 | ||||||
| Sembcorp Industries Ltd. | 61,200 | 83,724 | ||||||
Sembcorp Marine Ltd.(1)(2) | 27,400 | 4,106 | ||||||
| Sheng Siong Group Ltd. | 31,800 | 40,981 | ||||||
| SIIC Environment Holdings Ltd. | 15,900 | 2,312 | ||||||
| Silverlake Axis Ltd. | 3,100 | 726 | ||||||
| Singapore Airlines Ltd. | 55,350 | 147,808 | ||||||
| Singapore Exchange Ltd. | 28,100 | 177,252 | ||||||
| Singapore Post Ltd. | 92,400 | 47,430 | ||||||
Singapore Press Holdings Ltd.(2) | 40,600 | 32,488 | ||||||
| Singapore Technologies Engineering Ltd. | 45,500 | 113,342 | ||||||
| Singapore Telecommunications Ltd. | 68,200 | 114,921 | ||||||
| SingHaiyi Group Ltd. | 42,400 | 2,300 | ||||||
| Stamford Land Corp. Ltd. | 52,100 | 11,650 | ||||||
| StarHub Ltd. | 27,300 | 24,437 | ||||||
| Tuan Sing Holdings Ltd. | 13,300 | 2,967 | ||||||
| UMS Holdings Ltd. | 13,000 | 9,412 | ||||||
| United Overseas Bank Ltd. | 27,100 | 388,980 | ||||||
| UOL Group Ltd. | 25,100 | 121,042 | ||||||
| Venture Corp. Ltd. | 3,400 | 49,396 | ||||||
| Wilmar International Ltd. | 88,400 | 282,122 | ||||||
| Wing Tai Holdings Ltd. | 15,300 | 19,320 | ||||||
| Yangzijiang Shipbuilding Holdings Ltd. | 143,800 | 96,559 | ||||||
| Yanlord Land Group Ltd. | 44,400 | 39,333 | ||||||
| 3,618,604 | ||||||||
| Spain — 2.0% | ||||||||
Acciona SA(2) | 153 | 18,315 | ||||||
Acerinox SA(1) | 8,600 | 69,618 | ||||||
| ACS Actividades de Construccion y Servicios SA | 11,121 | 272,804 | ||||||
Aena SME SA(1) | 1,662 | 248,413 | ||||||
| Amadeus IT Group SA | 5,887 | 332,286 | ||||||
Applus Services SA(1) | 1,956 | 16,103 | ||||||
| Atresmedia Corp. de Medios de Comunicacion SA | 6,284 | 16,925 | ||||||
| Banco Bilbao Vizcaya Argentaria SA, ADR | 120,984 | 349,644 | ||||||
| Banco de Sabadell SA | 245,295 | 100,281 | ||||||
Banco Santander SA, ADR(1) | 131,753 | 293,809 | ||||||
61
| Shares | Value | |||||||
| Bankia SA | 39,684 | $ | 50,455 | |||||
| Bankinter SA | 11,259 | 60,973 | ||||||
| CaixaBank SA | 108,223 | 239,908 | ||||||
| Cellnex Telecom SA | 4,835 | 309,583 | ||||||
| Cia de Distribucion Integral Logista Holdings SA | 1,276 | 22,641 | ||||||
Construcciones y Auxiliar de Ferrocarriles SA(1) | 931 | 33,474 | ||||||
| Ebro Foods SA | 1,276 | 31,310 | ||||||
| Enagas SA | 14,715 | 360,123 | ||||||
| Ence Energia y Celulosa SA | 7,045 | 22,606 | ||||||
| Endesa SA | 9,334 | 258,960 | ||||||
| Ercros SA | 3,354 | 8,451 | ||||||
| Faes Farma SA | 14,227 | 56,285 | ||||||
| Ferrovial SA | 17,690 | 473,067 | ||||||
| Fomento de Construcciones y Contratas SA | 4,165 | 40,775 | ||||||
| Gestamp Automocion SA | 5,124 | 13,715 | ||||||
| Grifols SA | 1,917 | 51,990 | ||||||
| Grupo Catalana Occidente SA | 1,418 | 36,785 | ||||||
Grupo Empresarial San Jose SA(2) | 406 | 2,227 | ||||||
Grupo Ezentis SA(1)(2) | 17,005 | 6,216 | ||||||
| Iberdrola SA | 71,425 | 900,117 | ||||||
| Industria de Diseno Textil SA | 12,168 | 341,729 | ||||||
Liberbank SA(1) | 89,304 | 24,093 | ||||||
| Mapfre SA | 23,926 | 45,312 | ||||||
Masmovil Ibercom SA(1) | 1,276 | 34,169 | ||||||
Mediaset Espana Comunicacion SA(1) | 7,568 | 25,165 | ||||||
Melia Hotels International SA(1) | 5,002 | 20,936 | ||||||
Metrovacesa SA(1) | 2,597 | 19,772 | ||||||
| Naturgy Energy Group SA | 7,448 | 143,659 | ||||||
Neinor Homes SA(1) | 3,360 | 45,142 | ||||||
Obrascon Huarte Lain SA(1) | 8,078 | 5,992 | ||||||
| Pharma Mar SA | 1,088 | 110,661 | ||||||
Promotora de Informaciones SA, A Shares(1) | 2,314 | 1,127 | ||||||
| Prosegur Cash SA | 27,280 | 22,619 | ||||||
| Prosegur Cia de Seguridad SA | 11,380 | 27,591 | ||||||
| Red Electrica Corp. SA | 22,122 | 423,108 | ||||||
| Repsol SA | 52,448 | 414,125 | ||||||
| Sacyr SA | 23,036 | 52,313 | ||||||
| Siemens Gamesa Renewable Energy SA | 1,677 | 45,062 | ||||||
Talgo SA(1) | 5,908 | 26,954 | ||||||
Tecnicas Reunidas SA(1)(2) | 2,341 | 29,899 | ||||||
| Telefonica SA, ADR | 63,369 | 250,308 | ||||||
Tubacex SA(1)(2) | 5,117 | 7,372 | ||||||
Unicaja Banco SA(1) | 33,148 | 23,834 | ||||||
| Viscofan SA | 1,437 | 106,363 | ||||||
| Zardoya Otis SA | 4,880 | 33,917 | ||||||
| 6,979,081 | ||||||||
| Sweden — 3.5% | ||||||||
AAK AB(1) | 3,842 | 76,153 | ||||||
| AcadeMedia AB | 5,521 | 46,440 | ||||||
| AddTech AB, B Shares | 820 | 42,462 | ||||||
AF POYRY AB(1) | 2,558 | 71,327 | ||||||
Alfa Laval AB(1) | 7,546 | 184,285 | ||||||
62
| Shares | Value | |||||||
| Alimak Group AB | 1,917 | $ | 27,150 | |||||
Amasten Fastighets AB(1) | 23,929 | 20,252 | ||||||
| Arjo AB, B Shares | 11,137 | 66,246 | ||||||
| Assa Abloy AB, B Shares | 6,301 | 145,784 | ||||||
| Atlas Copco AB, Class A ADR | 8,825 | 409,656 | ||||||
| Atlas Copco AB, B Shares | 5,131 | 205,877 | ||||||
| Avanza Bank Holding AB | 6,177 | 121,915 | ||||||
| Axfood AB | 2,719 | 60,122 | ||||||
| Beijer Ref AB | 1,918 | 76,259 | ||||||
Bilia AB, A Shares(1) | 6,153 | 72,880 | ||||||
| BillerudKorsnas AB | 8,606 | 144,753 | ||||||
| BioGaia AB, B Shares | 517 | 33,934 | ||||||
| Boliden AB | 8,465 | 252,791 | ||||||
| Bonava AB, B Shares | 2,314 | 16,459 | ||||||
Bravida Holding AB(1) | 3,717 | 43,992 | ||||||
| Bure Equity AB | 2,739 | 84,488 | ||||||
| Castellum AB | 5,368 | 109,801 | ||||||
Cavotec SA(1) | 5,775 | 13,692 | ||||||
Cellavision AB(1) | 635 | 23,224 | ||||||
| Cibus Nordic Real Estate AB | 1,795 | 31,532 | ||||||
| Clas Ohlson AB, B Shares | 3,720 | 43,154 | ||||||
Cloetta AB, B Shares(1) | 8,972 | 25,031 | ||||||
| Dios Fastigheter AB | 3,600 | 23,242 | ||||||
Dometic Group AB(1) | 3,199 | 39,319 | ||||||
Elanders AB, B Shares(1) | 1,404 | 11,342 | ||||||
| Electrolux AB, Series B | 10,034 | 217,672 | ||||||
Electrolux Professional AB, B Shares(1) | 4,494 | 19,891 | ||||||
Elekta AB, B Shares(2) | 5,124 | 64,200 | ||||||
Eltel AB(1) | 5,005 | 12,148 | ||||||
Embracer Group AB(1) | 3,393 | 66,645 | ||||||
Eolus Vind AB, B Shares(2) | 2,958 | 52,493 | ||||||
| Epiroc AB, A Shares | 18,570 | 276,714 | ||||||
| Epiroc AB, B Shares | 11,130 | 160,171 | ||||||
| EQT AB | 2,133 | 39,303 | ||||||
Essity AB, B Shares(1) | 10,650 | 366,606 | ||||||
| Fabege AB | 6,784 | 82,681 | ||||||
Fastighets AB Balder, B Shares(1) | 1,795 | 71,477 | ||||||
Fingerprint Cards AB, B Shares(1)(2) | 5,761 | 8,906 | ||||||
| Fortnox AB | 1,967 | 68,429 | ||||||
| Getinge AB, B Shares | 5,765 | 128,084 | ||||||
Granges AB(1) | 5,001 | 44,520 | ||||||
Haldex AB(1) | 920 | 4,204 | ||||||
| Hennes & Mauritz AB, B Shares | 16,805 | 268,342 | ||||||
Hexagon AB, B Shares(1) | 3,482 | 252,468 | ||||||
Hexatronic Group AB(1)(2) | 1,064 | 8,378 | ||||||
Hexpol AB(1) | 6,528 | 53,909 | ||||||
HIQ International AB(1) | 3,905 | 31,776 | ||||||
Hoist Finance AB(1) | 7,573 | 26,894 | ||||||
Holmen AB, B Shares(1) | 2,597 | 92,466 | ||||||
| Hufvudstaden AB, A Shares | 2,436 | 30,178 | ||||||
| Husqvarna AB, B Shares | 18,092 | 196,463 | ||||||
| ICA Gruppen AB | 3,075 | 150,868 | ||||||
63
| Shares | Value | |||||||
Indutrade AB(1) | 1,957 | $ | 103,016 | |||||
| Instalco AB | 559 | 10,994 | ||||||
| Internationella Engelska Skolan i Sverige Holding II AB | 645 | 5,755 | ||||||
| Investment AB Latour, B Shares | 1,279 | 28,520 | ||||||
Inwido AB(1) | 4,758 | 47,197 | ||||||
| JM AB | 1,036 | 31,609 | ||||||
Karo Pharma AB(1) | 786 | 5,768 | ||||||
| Klovern AB, B Shares | 33,401 | 51,386 | ||||||
KNOW IT AB(1) | 251 | 6,458 | ||||||
| Kungsleden AB | 5,521 | 43,659 | ||||||
| Lifco AB, B Shares | 792 | 62,968 | ||||||
Lime Technologies AB(2) | 250 | 9,400 | ||||||
| Lindab International AB | 2,558 | 41,063 | ||||||
Loomis AB(1) | 1,677 | 42,157 | ||||||
| Lundin Energy AB | 1,277 | 31,188 | ||||||
Maha Energy AB(1)(2) | 9,982 | 16,293 | ||||||
Mekonomen AB(1) | 2,560 | 27,345 | ||||||
| Millicom International Cellular SA, SDR | 2,078 | 61,684 | ||||||
| MIPS AB | 1,280 | 51,274 | ||||||
Modern Times Group MTG AB, B Shares(1) | 5,104 | 69,654 | ||||||
Momentum Group AB, Class B(1) | 933 | 15,528 | ||||||
| Mycronic AB | 3,732 | 84,920 | ||||||
| NCC AB, B Shares | 3,522 | 63,416 | ||||||
NetEnt AB(1) | 8,331 | 79,992 | ||||||
New Wave Group AB, B Shares(1) | 784 | 4,242 | ||||||
Nibe Industrier AB, B Shares(1) | 9,595 | 269,791 | ||||||
Nobia AB(1) | 4,483 | 28,847 | ||||||
Nobina AB(1) | 7,052 | 42,662 | ||||||
Nolato AB, B Shares(1) | 1,154 | 112,425 | ||||||
Nordea Bank Abp(1) | 46,806 | 377,251 | ||||||
Nordic Entertainment Group AB, B Shares(1) | 2,719 | 113,378 | ||||||
| NP3 Fastigheter AB | 2,597 | 30,638 | ||||||
Nyfosa AB(1) | 7,164 | 51,720 | ||||||
Ovzon AB(1) | 894 | 7,380 | ||||||
Pandox AB(1) | 2,436 | 27,715 | ||||||
| Paradox Interactive AB | 1,917 | 51,349 | ||||||
Peab AB, Class B(1) | 5,246 | 51,281 | ||||||
RaySearch Laboratories AB(1) | 2,043 | 22,906 | ||||||
| Resurs Holding AB | 6,082 | 31,553 | ||||||
Saab AB, B Shares(1) | 1,154 | 34,663 | ||||||
| Sagax AB, D Shares | 2,946 | 10,457 | ||||||
Sandvik AB(1) | 21,362 | 418,978 | ||||||
SAS AB(1)(2) | 7,955 | 5,981 | ||||||
Scandi Standard AB(1) | 3,842 | 33,241 | ||||||
Scandic Hotels Group AB(2) | 6,076 | 21,098 | ||||||
Securitas AB, B Shares(1) | 5,368 | 76,499 | ||||||
Sinch AB(1) | 461 | 46,764 | ||||||
Skandinaviska Enskilda Banken AB, A Shares(1) | 36,367 | 360,788 | ||||||
Skanska AB, B Shares(1) | 2,959 | 60,339 | ||||||
| SKF AB, B Shares | 16,801 | 335,071 | ||||||
| SkiStar AB | 2,078 | 24,989 | ||||||
Spotify Technology SA(1) | 849 | 239,554 | ||||||
64
| Shares | Value | |||||||
SSAB AB, A Shares(1) | 9,098 | $ | 29,698 | |||||
SSAB AB, B Shares(1) | 26,373 | 81,431 | ||||||
Stillfront Group AB(1) | 888 | 95,535 | ||||||
Svenska Cellulosa AB SCA, B Shares(1) | 11,015 | 142,058 | ||||||
Svenska Handelsbanken AB, A Shares(1) | 22,275 | 223,950 | ||||||
| Sweco AB, B Shares | 1,154 | 71,217 | ||||||
Swedbank AB, A Shares(1) | 20,259 | 343,679 | ||||||
Swedish Orphan Biovitrum AB(1) | 4,483 | 100,506 | ||||||
| Tele2 AB, B Shares | 5,887 | 83,381 | ||||||
| Telefonaktiebolaget LM Ericsson, ADR | 31,605 | 368,198 | ||||||
| Telia Co. AB | 54,874 | 211,434 | ||||||
| Tethys Oil AB | 3,448 | 18,923 | ||||||
| Thule Group AB | 1,276 | 40,283 | ||||||
Tobii AB(1) | 908 | 5,466 | ||||||
Trelleborg AB, B Shares(1) | 5,893 | 102,728 | ||||||
| Troax Group AB | 2,558 | 49,660 | ||||||
| Vitec Software Group AB, B Shares | 1,917 | 66,512 | ||||||
Volvo AB, B Shares(1) | 27,500 | 526,012 | ||||||
| Wallenstam AB, B Shares | 4,615 | 60,450 | ||||||
| Wihlborgs Fastigheter AB | 4,879 | 78,050 | ||||||
| 11,901,423 | ||||||||
| Switzerland — 8.7% | ||||||||
| ABB Ltd., ADR | 24,330 | 620,415 | ||||||
| Adecco Group AG | 4,485 | 234,281 | ||||||
Alcon, Inc.(1) | 7,877 | 447,277 | ||||||
| Allreal Holding AG | 646 | 133,745 | ||||||
ams AG(1) | 13,070 | 231,115 | ||||||
Arbonia AG(1) | 1,822 | 23,891 | ||||||
Aryzta AG(1)(2) | 31,343 | 22,425 | ||||||
Ascom Holding AG(1) | 521 | 6,980 | ||||||
Autoneum Holding AG(1)(2) | 230 | 27,631 | ||||||
| Baloise Holding AG | 1,664 | 258,968 | ||||||
| Banque Cantonale Vaudoise | 385 | 41,129 | ||||||
| Barry Callebaut AG | 41 | 90,685 | ||||||
Basilea Pharmaceutica AG(1) | 127 | 7,061 | ||||||
| Belimo Holding AG | 13 | 113,553 | ||||||
| BKW AG | 517 | 50,640 | ||||||
| Bobst Group SA | 456 | 29,525 | ||||||
| Bossard Holding AG, Class A | 387 | 68,537 | ||||||
| Bucher Industries AG | 380 | 142,180 | ||||||
| Cembra Money Bank AG | 1,566 | 186,678 | ||||||
| Chocoladefabriken Lindt & Spruengli AG | 2 | 176,621 | ||||||
| Chocoladefabriken Lindt & Spruengli AG, Participation Ceritificate | 24 | 204,400 | ||||||
| Cie Financiere Richemont SA | 6,810 | 450,942 | ||||||
| Clariant AG | 9,869 | 205,135 | ||||||
| Comet Holding AG | 325 | 51,027 | ||||||
| Credit Suisse Group AG, ADR | 64,223 | 704,526 | ||||||
| Daetwyler Holding AG | 457 | 106,625 | ||||||
| DKSH Holding AG | 1,617 | 108,329 | ||||||
dormakaba Holding AG(1) | 153 | 98,933 | ||||||
Dufry AG(1) | 461 | 13,839 | ||||||
EFG International AG(1) | 4,239 | 29,206 | ||||||
65
| Shares | Value | |||||||
| Emmi AG | 49 | $ | 50,288 | |||||
EMS-Chemie Holding AG(2) | 152 | 137,062 | ||||||
Flughafen Zurich AG(1) | 1,040 | 156,409 | ||||||
| Forbo Holding AG | 54 | 89,264 | ||||||
| Galenica AG | 3,848 | 276,208 | ||||||
GAM Holding AG(1) | 6,162 | 15,097 | ||||||
| Geberit AG | 1,003 | 577,414 | ||||||
| Georg Fischer AG | 261 | 259,564 | ||||||
| Givaudan SA | 40 | 167,844 | ||||||
| Helvetia Holding AG | 1,692 | 159,083 | ||||||
| Huber + Suhner AG | 845 | 65,318 | ||||||
Idorsia Ltd.(1) | 914 | 27,124 | ||||||
| Implenia AG | 932 | 32,126 | ||||||
Ina Invest Holding AG(1) | 184 | 3,928 | ||||||
| Inficon Holding AG | 134 | 114,629 | ||||||
| Interroll Holding AG | 53 | 141,849 | ||||||
| Julius Baer Group Ltd. | 7,421 | 355,270 | ||||||
| Kardex Holding AG | 503 | 104,079 | ||||||
Komax Holding AG(1) | 130 | 21,951 | ||||||
Kuehne + Nagel International AG(1) | 1,914 | 370,508 | ||||||
LafargeHolcim Ltd.(1) | 10,512 | 498,459 | ||||||
Landis+Gyr Group AG(1) | 920 | 55,589 | ||||||
Leonteq AG(1) | 638 | 25,462 | ||||||
| Logitech International SA | 4,361 | 322,094 | ||||||
| Lonza Group AG | 1,265 | 783,823 | ||||||
Medacta Group SA(1) | 450 | 42,655 | ||||||
Meyer Burger Technology AG(1)(2) | 36,977 | 7,770 | ||||||
| Mobilezone Holding AG | 2,315 | 24,984 | ||||||
Mobimo Holding AG(1) | 275 | 80,748 | ||||||
Molecular Partners AG(1) | 467 | 10,435 | ||||||
| Nestle SA, ADR | 26,654 | 3,209,275 | ||||||
| Novartis AG, ADR | 49,215 | 4,235,443 | ||||||
| OC Oerlikon Corp. AG | 2,558 | 23,288 | ||||||
| Partners Group Holding AG | 586 | 594,653 | ||||||
| PSP Swiss Property AG | 1,678 | 200,480 | ||||||
| Roche Holding AG, ADR | 94,210 | 4,116,977 | ||||||
| Schindler Holding AG | 909 | 239,048 | ||||||
| Schindler Holding AG, Bearer Participation Certificate | 1,844 | 491,675 | ||||||
Schmolz + Bickenbach AG(1) | 17,780 | 3,123 | ||||||
Sensirion Holding AG(1) | 262 | 14,197 | ||||||
| SFS Group AG | 930 | 87,561 | ||||||
| SGS SA | 1 | 2,585 | ||||||
SIG Combibloc Group AG(1) | 15,307 | 300,620 | ||||||
| Sika AG | 2,514 | 602,149 | ||||||
Softwareone Holding AG(1) | 1,095 | 32,496 | ||||||
Sonova Holding AG(1) | 276 | 64,419 | ||||||
| Straumann Holding AG | 31 | 30,463 | ||||||
| Sulzer AG | 1,402 | 124,700 | ||||||
Sunrise Communications Group AG(1) | 2,078 | 247,240 | ||||||
| Swatch Group AG (The) | 792 | 31,207 | ||||||
| Swatch Group AG (The), Bearer Shares | 517 | 109,388 | ||||||
Swiss Life Holding AG(1) | 1,411 | 570,258 | ||||||
66
| Shares | Value | |||||||
| Swiss Prime Site AG | 3,215 | $ | 289,271 | |||||
| Swiss Re AG | 5,405 | 434,101 | ||||||
| Swisscom AG | 1,079 | 596,670 | ||||||
| Swissquote Group Holding SA | 635 | 55,772 | ||||||
| Tecan Group AG | 458 | 206,917 | ||||||
| Temenos AG | 1,666 | 268,574 | ||||||
u-blox Holding AG(1) | 399 | 22,499 | ||||||
| UBS Group AG | 104,777 | 1,273,041 | ||||||
| Valiant Holding AG | 644 | 61,606 | ||||||
Valora Holding AG(1) | 156 | 29,052 | ||||||
VAT Group AG(1) | 805 | 156,629 | ||||||
| Vifor Pharma AG | 1,424 | 210,127 | ||||||
| Vontobel Holding AG | 1,564 | 115,341 | ||||||
| Zehnder Group AG | 307 | 15,888 | ||||||
| Zurich Insurance Group AG | 2,306 | 853,183 | ||||||
| 29,783,249 | ||||||||
| United Kingdom — 12.9% | ||||||||
| 3i Group plc | 24,334 | 305,117 | ||||||
| Admiral Group plc | 10,132 | 356,982 | ||||||
| Aggreko plc | 17,431 | 111,192 | ||||||
| AJ Bell plc | 1,379 | 8,281 | ||||||
| Anglo American plc | 33,263 | 814,853 | ||||||
| Anglo Asian Mining plc | 15,364 | 31,423 | ||||||
| Anglo Pacific Group plc | 10,906 | 15,452 | ||||||
| Antofagasta plc | 9,597 | 137,781 | ||||||
| Aptitude Software Group plc | 515 | 3,056 | ||||||
Arix Bioscience plc(1) | 2,086 | 2,189 | ||||||
Arrow Global Group plc(2) | 3,602 | 5,502 | ||||||
| Ashmore Group plc | 11,252 | 63,413 | ||||||
| Ashtead Group plc | 17,689 | 615,972 | ||||||
ASOS plc(1) | 1,923 | 126,945 | ||||||
| Associated British Foods plc | 4,301 | 118,564 | ||||||
Aston Martin Lagonda Global Holdings plc(1) | 14,235 | 10,852 | ||||||
| AstraZeneca plc, ADR | 29,419 | 1,647,464 | ||||||
Atalaya Mining plc(1) | 1,817 | 4,454 | ||||||
Augean plc(1) | 8,214 | 18,666 | ||||||
| Auto Trader Group plc | 38,624 | 290,784 | ||||||
| Avast plc | 9,995 | 71,614 | ||||||
| AVEVA Group plc | 517 | 35,053 | ||||||
| Aviva plc | 116,255 | 439,327 | ||||||
| B&M European Value Retail SA | 5,781 | 36,784 | ||||||
| Babcock International Group plc | 3,720 | 13,531 | ||||||
| BAE Systems plc, ADR | 16,366 | 456,775 | ||||||
Bank of Georgia Group plc(1) | 1,555 | 19,105 | ||||||
Barclays plc, ADR(1) | 96,447 | 561,322 | ||||||
| Barratt Developments plc | 20,475 | 145,060 | ||||||
| Beazley plc | 7,289 | 41,917 | ||||||
| Bellway plc | 2,597 | 82,892 | ||||||
| Berkeley Group Holdings plc | 3,744 | 228,055 | ||||||
| BHP Group plc, ADR | 20,858 | 941,322 | ||||||
| Biffa plc | 20,607 | 56,470 | ||||||
| Bloomsbury Publishing plc | 1,848 | 5,208 | ||||||
67
| Shares | Value | |||||||
| Bodycote plc | 7,839 | $ | 58,786 | |||||
boohoo Group plc(1) | 24,201 | 93,597 | ||||||
| BP plc, ADR | 60,707 | 1,270,597 | ||||||
| Brewin Dolphin Holdings plc | 6,685 | 22,296 | ||||||
| Britvic plc | 16,389 | 185,670 | ||||||
| BT Group plc | 269,072 | 376,407 | ||||||
| Bunzl plc | 2,817 | 91,203 | ||||||
| Burberry Group plc | 14,344 | 278,775 | ||||||
| Burford Capital Ltd. | 9,496 | 71,872 | ||||||
Cairn Energy plc(1) | 63,326 | 119,202 | ||||||
Capita plc(1) | 85,440 | 35,700 | ||||||
| Carnival plc, ADR | 2,960 | 41,381 | ||||||
| Centamin plc | 70,465 | 197,609 | ||||||
| Central Asia Metals plc | 10,376 | 24,424 | ||||||
| Centrica plc | 29,178 | 17,967 | ||||||
| Chemring Group plc | 27,646 | 89,433 | ||||||
| Clinigen Group plc | 5,129 | 46,828 | ||||||
| Clipper Logistics plc | 2,200 | 12,317 | ||||||
| Close Brothers Group plc | 8,212 | 123,276 | ||||||
| Coats Group plc | 129,584 | 96,152 | ||||||
Coca-Cola HBC AG(1) | 10,010 | 266,815 | ||||||
| Compass Group plc | 29,311 | 478,210 | ||||||
| Computacenter plc | 2,200 | 60,019 | ||||||
| ConvaTec Group plc | 17,268 | 44,227 | ||||||
| Countryside Properties plc | 6,807 | 29,460 | ||||||
| Cranswick plc | 635 | 31,662 | ||||||
| Crest Nicholson Holdings plc | 13,705 | 36,294 | ||||||
| Croda International plc | 4,003 | 315,127 | ||||||
| Curtis Banks Group plc | 739 | 2,163 | ||||||
| CVS Group plc | 2,314 | 36,933 | ||||||
| Dart Group plc | 7,194 | 68,662 | ||||||
| DCC plc | 635 | 56,261 | ||||||
| Dechra Pharmaceuticals plc | 676 | 28,465 | ||||||
| Devro plc | 12,301 | 28,513 | ||||||
| DFS Furniture plc | 16,111 | 36,612 | ||||||
| Diageo plc, ADR | 5,003 | 672,403 | ||||||
| Diploma plc | 1,276 | 32,856 | ||||||
| Direct Line Insurance Group plc | 33,976 | 134,821 | ||||||
| Diversified Gas & Oil plc | 56,029 | 82,444 | ||||||
| Domino's Pizza Group plc | 8,087 | 36,258 | ||||||
| dotdigital group plc | 22,010 | 41,817 | ||||||
| Drax Group plc | 25,846 | 97,210 | ||||||
| DS Smith plc | 23,043 | 79,579 | ||||||
| Dunelm Group plc | 7,826 | 149,493 | ||||||
| easyJet plc | 5,246 | 44,404 | ||||||
| Electrocomponents plc | 33,925 | 307,921 | ||||||
| Elementis plc | 16,749 | 16,154 | ||||||
| EMIS Group plc | 2,709 | 37,384 | ||||||
EnQuest plc(1) | 141,737 | 24,441 | ||||||
| Equiniti Group plc | 2,975 | 4,510 | ||||||
| Essentra plc | 4,758 | 19,353 | ||||||
| Euromoney Institutional Investor plc | 1,315 | 14,713 | ||||||
68
| Shares | Value | |||||||
| Evraz plc | 16,021 | $ | 69,431 | |||||
| Experian plc, ADR | 11,765 | 436,834 | ||||||
| Ferguson plc | 7,419 | 731,504 | ||||||
| Ferrexpo plc | 21,360 | 52,727 | ||||||
Firstgroup plc(1) | 20,475 | 11,950 | ||||||
| Forterra plc | 16,394 | 34,817 | ||||||
Foxtons Group plc(1) | 3,961 | 2,062 | ||||||
Frasers Group plc(1) | 11,012 | 51,521 | ||||||
| Fresnillo plc | 2,959 | 49,937 | ||||||
Frontier Developments plc(1) | 1,956 | 59,353 | ||||||
Funding Circle Holdings plc(1) | 2,055 | 2,282 | ||||||
| G4S plc | 42,980 | 82,503 | ||||||
| Galliford Try Holdings plc | 11,802 | 13,577 | ||||||
| Games Workshop Group plc | 2,726 | 335,691 | ||||||
| Gateley Holdings plc | 6,529 | 11,870 | ||||||
| Genus plc | 635 | 28,606 | ||||||
| GlaxoSmithKline plc, ADR | 31,739 | 1,256,864 | ||||||
Glencore plc(1) | 282,355 | 638,550 | ||||||
| Go-Ahead Group plc (The) | 3,746 | 33,513 | ||||||
| GoCo Group plc | 3,108 | 4,736 | ||||||
Golar LNG Ltd.(1) | 2,205 | 22,822 | ||||||
| Grafton Group plc | 11,901 | 124,008 | ||||||
| Grainger plc | 14,844 | 62,108 | ||||||
| Greencore Group plc | 28,014 | 47,072 | ||||||
| Greggs plc | 6,661 | 126,171 | ||||||
| Gulf Keystone Petroleum Ltd. | 15,351 | 17,258 | ||||||
| Gym Group plc (The) | 8,850 | 18,810 | ||||||
| Halma plc | 3,601 | 106,766 | ||||||
| Hargreaves Lansdown plc | 8,571 | 185,207 | ||||||
| Hays plc | 73,290 | 118,152 | ||||||
| Helical plc | 5,887 | 22,317 | ||||||
| Hikma Pharmaceuticals plc | 4,597 | 145,699 | ||||||
| Hill & Smith Holdings plc | 2,719 | 44,197 | ||||||
Hiscox Ltd.(1) | 2,466 | 26,257 | ||||||
Hochschild Mining plc(1) | 10,132 | 32,587 | ||||||
| HomeServe plc | 4,001 | 69,475 | ||||||
| Hotel Chocolat Group plc | 2,586 | 12,557 | ||||||
| Howden Joinery Group plc | 35,683 | 268,070 | ||||||
| HSBC Holdings plc, ADR | 53,371 | 1,154,415 | ||||||
| Hunting plc | 1,937 | 4,184 | ||||||
Hurricane Energy plc(1)(2) | 1,149 | 71 | ||||||
Ibstock plc(1) | 28,172 | 58,202 | ||||||
| IG Group Holdings plc | 24,577 | 260,516 | ||||||
| IMI plc | 14,107 | 198,759 | ||||||
| Impax Asset Management Group plc | 1,035 | 6,973 | ||||||
Inchcape plc(1) | 23,925 | 161,668 | ||||||
Indivior plc(1) | 82,241 | 130,448 | ||||||
Informa plc(1) | 7,927 | 44,205 | ||||||
| IntegraFin Holdings plc | 16,739 | 120,158 | ||||||
InterContinental Hotels Group plc(1) | 1,677 | 98,771 | ||||||
| Intermediate Capital Group plc | 4,218 | 77,077 | ||||||
| Intertek Group plc | 4,001 | 314,268 | ||||||
69
| Shares | Value | |||||||
| Investec plc | 20,984 | $ | 41,332 | |||||
IQE plc(1)(2) | 5,643 | 4,679 | ||||||
| ITV plc | 154,128 | 125,102 | ||||||
| IWG plc | 23,440 | 88,235 | ||||||
| J D Wetherspoon plc | 6,170 | 84,415 | ||||||
| J Sainsbury plc | 113,564 | 279,021 | ||||||
Jadestone Energy, Inc.(1) | 11,393 | 10,042 | ||||||
| JD Sports Fashion plc | 19,448 | 188,687 | ||||||
| John Laing Group plc | 12,809 | 48,867 | ||||||
John Wood Group plc(1) | 17,690 | 58,598 | ||||||
| Johnson Matthey plc | 1,956 | 62,099 | ||||||
| Joules Group plc | 2,966 | 4,401 | ||||||
Just Group plc(1) | 64,734 | 44,045 | ||||||
| Kainos Group plc | 4,350 | 65,126 | ||||||
| KAZ Minerals plc | 8,453 | 66,078 | ||||||
| Keller Group plc | 6,406 | 53,631 | ||||||
| Keystone Law Group plc | 1,534 | 9,074 | ||||||
| Kingfisher plc | 48,098 | 174,975 | ||||||
| Lancashire Holdings Ltd. | 2,841 | 29,166 | ||||||
| Learning Technologies Group plc | 4,750 | 9,651 | ||||||
| Legal & General Group plc | 98,105 | 288,185 | ||||||
Liberty Global plc, Class A(1) | 1,956 | 45,712 | ||||||
Liberty Global plc, Class C(1) | 5,381 | 123,817 | ||||||
| Liontrust Asset Management plc | 3,099 | 52,611 | ||||||
| Lloyds Banking Group plc, ADR | 354,933 | 511,104 | ||||||
| London Stock Exchange Group plc | 3,073 | 361,489 | ||||||
| Lookers plc | 15,149 | 4,253 | ||||||
LSL Property Services plc(1) | 1,054 | 3,012 | ||||||
| Luceco plc | 5,407 | 13,150 | ||||||
| Luxfer Holdings plc | 1,555 | 22,112 | ||||||
| M&G plc | 99,724 | 230,619 | ||||||
| Man Group plc | 13,461 | 22,052 | ||||||
| Marks & Spencer Group plc | 65,364 | 97,074 | ||||||
| Marshalls plc | 5,505 | 46,802 | ||||||
| Marston's plc | 67,694 | 47,917 | ||||||
McCarthy & Stone plc(1) | 14,863 | 14,258 | ||||||
| Mediclinic International plc | 9,369 | 32,755 | ||||||
| Meggitt plc | 6,284 | 24,436 | ||||||
| Micro Focus International plc, ADR | 3,482 | 14,207 | ||||||
Mitchells & Butlers plc(1) | 15,992 | 36,812 | ||||||
| Mitie Group plc | 19,317 | 8,636 | ||||||
| Mondi plc | 18,430 | 359,936 | ||||||
| Moneysupermarket.com Group plc | 27,622 | 112,470 | ||||||
| Morgan Advanced Materials plc | 15,618 | 48,227 | ||||||
| Morgan Sindall Group plc | 1,677 | 28,425 | ||||||
| Morses Club plc | 2,215 | 1,658 | ||||||
| Mortgage Advice Bureau Holdings Ltd. | 2,980 | 25,895 | ||||||
| Motorpoint group plc | 8,188 | 29,616 | ||||||
| National Express Group plc | 31,500 | 53,056 | ||||||
| National Grid plc, ADR | 8,969 | 506,569 | ||||||
Natwest Group plc, ADR(1) | 44,905 | 131,572 | ||||||
| NCC Group plc | 2,057 | 4,966 | ||||||
70
| Shares | Value | |||||||
| Next plc | 5,514 | $ | 445,051 | |||||
Ninety One plc(1) | 10,491 | 30,937 | ||||||
| Norcros plc | 4,089 | 7,487 | ||||||
| Numis Corp. plc | 1,147 | 4,492 | ||||||
Ocado Group plc(1) | 12,283 | 411,696 | ||||||
| On the Beach Group plc | 3,616 | 14,743 | ||||||
| OneSavings Bank plc | 18,796 | 76,382 | ||||||
| Pagegroup plc | 19,058 | 98,133 | ||||||
| Pan African Resources plc | 183,550 | 60,113 | ||||||
| Paragon Banking Group plc | 13,209 | 62,672 | ||||||
| Pearson plc, ADR | 5,894 | 43,910 | ||||||
| Pennon Group plc | 3,482 | 46,825 | ||||||
| Persimmon plc | 4,880 | 170,776 | ||||||
Petrofac Ltd.(2) | 21,641 | 46,575 | ||||||
Petropavlovsk plc(1)(2) | 307,207 | 150,507 | ||||||
| Phoenix Group Holdings plc | 23,157 | 214,209 | ||||||
| Photo-Me International plc | 23,283 | 15,034 | ||||||
| Playtech plc | 19,474 | 96,708 | ||||||
| Plus500 Ltd. | 11,254 | 219,414 | ||||||
| Polypipe Group plc | 5,124 | 29,982 | ||||||
Premier Foods plc(1) | 68,422 | 78,202 | ||||||
| Premier Miton Group plc | 4,634 | 5,536 | ||||||
Premier Oil plc(1)(2) | 52,340 | 15,280 | ||||||
Provident Financial plc(1) | 5,650 | 18,610 | ||||||
| Prudential plc, ADR | 6,008 | 193,818 | ||||||
Purplebricks Group plc(1) | 2,337 | 2,830 | ||||||
| PZ Cussons plc | 6,029 | 16,710 | ||||||
| QinetiQ Group plc | 7,326 | 28,576 | ||||||
| Quilter plc | 150,041 | 286,912 | ||||||
| Rathbone Brothers plc | 1,038 | 23,422 | ||||||
| Reach plc | 33,031 | 23,225 | ||||||
| Reckitt Benckiser Group plc | 18,201 | 1,831,825 | ||||||
| Redde Northgate plc | 21,768 | 54,647 | ||||||
| Redrow plc | 11,796 | 72,370 | ||||||
| RELX plc, ADR | 26,344 | 596,955 | ||||||
| Renewi plc | 52,187 | 16,184 | ||||||
| Renishaw plc | 517 | 33,062 | ||||||
Rentokil Initial plc(1) | 34,275 | 244,205 | ||||||
| Restaurant Group plc (The) | 44,891 | 33,875 | ||||||
| Restore plc | 5,124 | 25,370 | ||||||
| Rhi Magnesita NV | 1,424 | 51,472 | ||||||
| Rightmove plc | 42,463 | 359,760 | ||||||
| Rio Tinto plc, ADR | 20,727 | 1,269,114 | ||||||
RM plc(1) | 6,168 | 15,501 | ||||||
| Rockrose Energy plc | 266 | 6,564 | ||||||
| Rolls-Royce Holdings plc, ADR | 13,712 | 44,153 | ||||||
| Rotork plc | 18,543 | 74,312 | ||||||
| Royal Dutch Shell plc, Class A ADR | 31,924 | 947,504 | ||||||
| Royal Dutch Shell plc, Class B ADR | 28,844 | 810,516 | ||||||
| Royal Mail plc | 56,018 | 134,413 | ||||||
| RPS Group plc | 14,102 | 8,039 | ||||||
| RSA Insurance Group plc | 30,164 | 182,714 | ||||||
71
| Shares | Value | |||||||
| Sabre Insurance Group plc | 3,962 | $ | 14,154 | |||||
| Saga plc | 14,738 | 2,681 | ||||||
| Sage Group plc (The) | 13,811 | 136,941 | ||||||
| Savills plc | 2,847 | 31,055 | ||||||
| Schroders plc | 1,661 | 64,346 | ||||||
| Secure Trust Bank plc | 653 | 5,590 | ||||||
| Senior plc | 10,740 | 7,487 | ||||||
Serco Group plc(1) | 16,110 | 30,278 | ||||||
| Serica Energy plc | 16,790 | 26,778 | ||||||
| Severn Trent plc | 8,348 | 261,241 | ||||||
| SIG plc | 22,520 | 9,567 | ||||||
| Signature Aviation plc | 18,576 | 65,481 | ||||||
| Sirius Real Estate Ltd. | 75,861 | 75,447 | ||||||
| Smart Metering Systems plc | 666 | 5,698 | ||||||
| Smith & Nephew plc, ADR | 4,446 | 180,730 | ||||||
| Smiths Group plc | 2,959 | 55,361 | ||||||
| Softcat plc | 7,167 | 132,498 | ||||||
| Spectris plc | 1,036 | 35,120 | ||||||
| Speedy Hire plc | 48,354 | 33,329 | ||||||
| Spirax-Sarco Engineering plc | 931 | 127,500 | ||||||
| Spire Healthcare Group plc | 17,909 | 21,977 | ||||||
| Spirent Communications plc | 21,100 | 82,219 | ||||||
| SSE plc | 35,837 | 606,818 | ||||||
| SSP Group plc | 22,000 | 72,168 | ||||||
| St Modwen Properties plc | 11,908 | 51,574 | ||||||
| St. James's Place plc | 29,286 | 383,573 | ||||||
| Stagecoach Group plc | 15,992 | 9,175 | ||||||
Standard Chartered plc (London)(1) | 66,502 | 347,712 | ||||||
| Standard Life Aberdeen plc | 32,265 | 102,305 | ||||||
Stobart Group Ltd.(1) | 2,200 | 718 | ||||||
| Stock Spirits Group plc | 4,258 | 12,518 | ||||||
| Strix Group plc | 2,821 | 8,386 | ||||||
| STV Group plc | 651 | 1,840 | ||||||
| Superdry plc | 5,261 | 9,396 | ||||||
| Synthomer plc | 13,433 | 56,348 | ||||||
| TalkTalk Telecom Group plc | 20,233 | 19,879 | ||||||
| Tate & Lyle plc | 19,554 | 179,107 | ||||||
| Taylor Wimpey plc | 49,903 | 81,652 | ||||||
| Telecom Plus plc | 392 | 7,189 | ||||||
| Tesco plc | 151,081 | 443,088 | ||||||
TI Fluid Systems plc(1) | 5,536 | 11,657 | ||||||
| TP ICAP plc | 28,014 | 113,781 | ||||||
| Tracsis plc | 399 | 3,390 | ||||||
Trainline plc(1) | 3,295 | 17,438 | ||||||
| Travis Perkins plc | 14,466 | 237,754 | ||||||
Tremor International Ltd.(1) | 1,694 | 3,378 | ||||||
| TUI AG | 2,558 | 11,470 | ||||||
Tullow Oil plc(2) | 99,889 | 27,400 | ||||||
| U & I Group plc | 4,874 | 4,307 | ||||||
| UDG Healthcare plc | 2,841 | 27,704 | ||||||
| Ultra Electronics Holdings plc | 1,036 | 32,351 | ||||||
| Unilever plc, ADR | 13,746 | 818,987 | ||||||
72
| Shares | Value | |||||||
| United Utilities Group plc | 30,580 | $ | 341,248 | |||||
| Urban & Civic plc | 3,857 | 11,882 | ||||||
| Vectura Group plc | 8,843 | 12,977 | ||||||
| Vertu Motors plc | 32,369 | 10,445 | ||||||
Vesuvius plc(1) | 5,887 | 32,287 | ||||||
| Victrex plc | 3,841 | 99,198 | ||||||
Virgin Money UK plc(1) | 35,706 | 44,465 | ||||||
| Vistry Group plc | 16,972 | 144,291 | ||||||
| Vodafone Group plc, ADR | 44,638 | 659,303 | ||||||
| Watkin Jones plc | 1,294 | 2,553 | ||||||
| Weir Group plc (The) | 1,315 | 22,298 | ||||||
| WH Smith plc | 5,388 | 84,772 | ||||||
Whitbread plc(1) | 4,600 | 155,977 | ||||||
| Wincanton plc | 1,696 | 4,409 | ||||||
| WM Morrison Supermarkets plc | 70,341 | 180,816 | ||||||
| WPP plc, ADR | 1,276 | 54,090 | ||||||
Yellow Cake plc(1) | 5,649 | 16,911 | ||||||
| 43,868,041 | ||||||||
TOTAL COMMON STOCKS (Cost $294,234,094) | 340,292,973 | |||||||
RIGHTS† | ||||||||
Australia† | ||||||||
Coronado Global Resources, Inc.(1) | 2,936 | 43 | ||||||
Lynas Corp. Ltd.(1) | 2,029 | 210 | ||||||
| 253 | ||||||||
Italy† | ||||||||
Ascopiave SpA(1) | 6,190 | 7 | ||||||
Singapore† | ||||||||
Sembcorp Marine Ltd.(1) | 137,000 | 101 | ||||||
TOTAL RIGHTS (Cost $8,634) | 361 | |||||||
| TEMPORARY CASH INVESTMENTS — 0.8% | ||||||||
| State Street Institutional U.S. Government Money Market Fund, Premier Class (Cost $2,759,328) | 2,759,328 | 2,759,328 | ||||||
TEMPORARY CASH INVESTMENTS - SECURITIES LENDING COLLATERAL(3) — 1.1% | ||||||||
| State Street Navigator Securities Lending Government Money Market Portfolio (Cost $3,789,955) | 3,789,955 | 3,789,955 | ||||||
TOTAL INVESTMENT SECURITIES — 101.6% (Cost $300,792,011) | 346,842,617 | |||||||
| OTHER ASSETS AND LIABILITIES — (1.6)% | (5,498,522) | |||||||
| TOTAL NET ASSETS — 100.0% | $ | 341,344,095 | ||||||
73
| MARKET SECTOR DIVERSIFICATION | |||||
(as a % of net assets) | |||||
| Financials | 16.4 | % | |||
| Industrials | 16.2 | % | |||
| Consumer Discretionary | 11.8 | % | |||
| Materials | 11.8 | % | |||
| Consumer Staples | 9.2 | % | |||
| Health Care | 8.8 | % | |||
| Information Technology | 8.2 | % | |||
| Communication Services | 5.6 | % | |||
| Utilities | 4.8 | % | |||
| Energy | 4.3 | % | |||
| Real Estate | 2.6 | % | |||
| Cash and Equivalents* | 0.3 | % | |||
*Includes temporary cash investments, temporary cash investments - securities lending collateral and other assets and liabilities.
| NOTES TO SCHEDULE OF INVESTMENTS | ||||||||
| ADR | - | American Depositary Receipt | ||||||
| CVA | - | Certificaten Van Aandelen | ||||||
| SDR | - | Swedish Depositary Receipt | ||||||
† Category is less than 0.05% of total net assets.
(1)Non-income producing.
(2)Security, or a portion thereof, is on loan. At the period end, the aggregate value of securities on loan was $7,637,612. The amount of securities on loan indicated may not correspond with the securities on loan identified because securities with pending sales are in the process of recall from the brokers.
(3)Investment of cash collateral from securities on loan. At the period end, the aggregate value of the collateral held by the fund was $8,154,833, which includes securities collateral of $4,364,878.
See Notes to Financial Statements.
74
| Statement of Assets and Liabilities | ||
| AUGUST 31, 2020 | |||||
| Assets | |||||
| Investment securities, at value (cost of $297,002,056) — including $7,637,612 of securities on loan | $ | 343,052,662 | |||
| Investment made with cash collateral received for securities on loan, at value (cost of $3,789,955) | 3,789,955 | ||||
| Total investment securities, at value (cost of $300,792,011) | 346,842,617 | ||||
| Foreign currency holdings, at value (cost of $64,188) | 64,363 | ||||
| Dividends and interest receivable | 950,996 | ||||
| Securities lending receivable | 5,804 | ||||
| 347,863,780 | |||||
| Liabilities | |||||
| Disbursements in excess of demand deposit cash | 1,185 | ||||
| Payable for collateral received for securities on loan | 3,789,955 | ||||
| Payable for investments purchased | 2,664,279 | ||||
| Accrued management fees | 64,266 | ||||
| 6,519,685 | |||||
| Net Assets | $ | 341,344,095 | |||
| Shares outstanding (unlimited number of shares authorized) | 6,800,000 | ||||
| Net Asset Value Per Share | $ | 50.20 | |||
| Net Assets Consist of: | |||||
| Capital paid in | $ | 294,873,218 | |||
| Distributable earnings | 46,470,877 | ||||
| $ | 341,344,095 | ||||
See Notes to Financial Statements.
75
| Statement of Operations | ||
FOR THE PERIOD ENDED AUGUST 31, 2020(1) | |||||
| Investment Income (Loss) | |||||
| Income: | |||||
| Dividends (net of foreign taxes withheld of $488,017) | $ | 4,582,772 | |||
| Securities lending, net | 32,657 | ||||
| Interest | 1,000 | ||||
| 4,616,429 | |||||
| Expenses: | |||||
| Management fees | 379,637 | ||||
| Other expenses | 1,079 | ||||
| 380,716 | |||||
| Net investment income (loss) | 4,235,713 | ||||
| Realized and Unrealized Gain (Loss) | |||||
| Net realized gain (loss) on: | |||||
| Investment transactions | (1,097,481) | ||||
| Futures contract transactions | 1,347 | ||||
| Foreign currency translation transactions | (41,469) | ||||
| (1,137,603) | |||||
| Change in net unrealized appreciation (depreciation) on: | |||||
| Investments | 46,050,606 | ||||
| Translation of assets and liabilities in foreign currencies | 19,212 | ||||
| 46,069,818 | |||||
| Net realized and unrealized gain (loss) | 44,932,215 | ||||
| Net Increase (Decrease) in Net Assets Resulting from Operations | $ | 49,167,928 | |||
(1)September 24, 2019 (fund inception) through August 31, 2020.
See Notes to Financial Statements.
76
| Statement of Changes in Net Assets | ||
PERIOD ENDED AUGUST 31, 2020(1) | |||||
| Increase (Decrease) in Net Assets | |||||
| Operations | |||||
| Net investment income (loss) | $ | 4,235,713 | |||
| Net realized gain (loss) | (1,137,603) | ||||
| Change in net unrealized appreciation (depreciation) | 46,069,818 | ||||
| Net increase (decrease) in net assets resulting from operations | 49,167,928 | ||||
| Distributions to Shareholders | |||||
| From earnings | (2,697,051) | ||||
| Capital Share Transactions | |||||
| Proceeds from shares sold | 294,873,218 | ||||
| Net increase (decrease) in net assets | 341,344,095 | ||||
| Net Assets | |||||
| End of period | $ | 341,344,095 | |||
| Transactions in Shares of the Fund | |||||
| Sold | 6,800,000 | ||||
(1)September 24, 2019 (fund inception) through August 31, 2020.
See Notes to Financial Statements.
77
| Notes to Financial Statements | ||
AUGUST 31, 2020
1. Organization
American Century ETF Trust (the trust) was registered as a Delaware statutory trust in 2017 and is registered under the Investment Company Act of 1940, as amended (the 1940 Act), as an open-end management investment company. Avantis International Equity ETF (the fund) is one fund in a series issued by the trust. The fund's investment objective is to seek long-term capital appreciation. Shares of the fund are listed for trading on the NYSE Arca, Inc. The fund incepted on September 24, 2019.
2. Significant Accounting Policies
The following is a summary of significant accounting policies consistently followed by the fund in preparation of its financial statements. The fund is an investment company and follows accounting and reporting guidance in accordance with accounting principles generally accepted in the United States of America. This may require management to make certain estimates and assumptions at the date of the financial statements. Actual results could differ from these estimates. Management evaluated the impact of events or transactions occurring through the date the financial statements were issued that would merit recognition or disclosure.
Investment Valuations — The fund determines the fair value of its investments and computes its net asset value per share at the close of regular trading (usually 4 p.m. Eastern time) on the New York Stock Exchange (NYSE) on each day the NYSE is open. The Board of Trustees has adopted valuation policies and procedures to guide the investment advisor in the fund’s investment valuation process and to provide methodologies for the oversight of the fund’s pricing function.
Equity securities that are listed or traded on a domestic securities exchange are valued at the last reported sales price or at the official closing price as provided by the exchange. Equity securities traded on foreign securities exchanges are generally valued at the closing price of such securities on the exchange where primarily traded or at the close of the NYSE, if that is earlier. If no last sales price is reported, or if local convention or regulation so provides, the mean of the latest bid and asked prices may be used. Securities traded over-the-counter are valued at the mean of the latest bid and asked prices, the last sales price, or the official closing price. Equity securities initially expressed in local currencies are translated into U.S. dollars at the mean of the appropriate currency exchange rate at the close of the NYSE as provided by an independent pricing service.
Open-end management investment companies are valued at the reported net asset value per share. Exchange-traded futures contracts are valued at the settlement price as provided by the appropriate exchange.
If the fund determines that the market price for an investment is not readily available or the valuation methods mentioned above do not reflect an investment’s fair value, such investment is valued as determined in good faith by the Board of Trustees or its delegate, in accordance with policies and procedures adopted by the Board of Trustees. In its determination of fair value, the fund may review several factors including, but not limited to, market information regarding the specific investment or comparable investments and correlation with other investment types, futures indices or general market indicators. Circumstances that may cause the fund to use these procedures to value an investment include, but are not limited to: an investment has been declared in default or is distressed; trading in a security has been suspended during the trading day or a security is not actively trading on its principal exchange; prices received from a regular pricing source are deemed unreliable; or there is a foreign market holiday and no trading occurred.
The fund monitors for significant events occurring after the close of an investment’s primary exchange but before the fund’s net asset value per share is determined. Significant events may include, but are not limited to: corporate announcements and transactions; governmental action and political unrest that could impact a specific investment or an investment sector; or armed conflicts, natural disasters and similar events that could affect investments in a specific country or region. The fund also monitors for significant fluctuations between domestic and foreign markets, as evidenced by the U.S. market or such other indicators that the Board of Trustees, or its delegate, deems appropriate. The fund may apply a model-derived factor to the closing price of equity securities traded on foreign securities exchanges. The factor is based on observable market data as provided by an independent pricing service.
78
Security Transactions — Security transactions are accounted for as of the trade date. Net realized gains and losses are determined on the identified cost basis, which is also used for federal income tax purposes.
Investment Income — Dividend income less foreign taxes withheld, if any, is recorded as of the ex-dividend date. Distributions received on securities that represent a return of capital or long-term capital gain are recorded as a reduction of cost of investments and/or as a realized gain. The fund may estimate the components of distributions received that may be considered nontaxable distributions or long-term capital gain distributions for income tax purposes. Interest income is recorded on the accrual basis and includes accretion of discounts and amortization of premiums. Securities lending income is net of fees and rebates earned by the lending agent for its services.
Foreign Currency Translations — All assets and liabilities initially expressed in foreign currencies are translated into U.S. dollars at prevailing exchange rates at period end. The fund may enter into spot foreign currency exchange contracts to facilitate transactions denominated in a foreign currency. Purchases and sales of investment securities, dividend and interest income, spot foreign currency exchange contracts, and expenses are translated at the rates of exchange prevailing on the respective dates of such transactions. Net realized and unrealized foreign currency exchange gains or losses related to investment securities are a component of net realized gain (loss) on investment transactions and change in net unrealized appreciation (depreciation) on investments, respectively.
Segregated Assets — In accordance with the 1940 Act, the fund segregates assets on its books and records to cover certain types of investment securities and other financial instruments. American Century Investment Management, Inc. (ACIM) (the investment advisor) monitors, on a daily basis, the securities segregated to ensure the fund designates a sufficient amount of liquid assets, marked-to-market daily. The fund may also receive assets or be required to pledge assets at the custodian bank or with a broker for collateral requirements.
Income Tax Status — It is the fund’s policy to distribute substantially all net investment income and net realized gains to shareholders and to otherwise qualify as a regulated investment company under provisions of the Internal Revenue Code. Accordingly, no provision has been made for income taxes. The fund files U.S. federal, state, local and non-U.S. tax returns as applicable. The fund's tax returns are subject to examination by the relevant taxing authority until expiration of the applicable statute of limitations, which is generally three years from the date of filing but can be longer in certain jurisdictions. At this time, management believes there are no uncertain tax positions which, based on their technical merit, would not be sustained upon examination and for which it is reasonably possible that the total amounts of unrecognized tax benefits will significantly change in the next twelve months.
Distributions to Shareholders — Distributions from net investment income, if any, are declared and paid semiannually. Distributions from net realized gains, if any, are generally declared and paid annually.
Indemnifications — Under the trust’s organizational documents, its officers and trustees are indemnified against certain liabilities arising out of the performance of their duties to the fund. In addition, in the normal course of business, the fund enters into contracts that provide general indemnifications. The maximum exposure under these arrangements is unknown as this would involve future claims that may be made against a fund. The risk of material loss from such claims is considered by management to be remote.
Securities Lending — Securities are lent to qualified financial institutions and brokers. State Street Bank & Trust Co. serves as securities lending agent to the fund pursuant to a Securities Lending Agreement. The lending of securities exposes the fund to risks such as: the borrowers may fail to return the loaned securities, the borrowers may not be able to provide additional collateral, the fund may experience delays in recovery of the loaned securities or delays in access to collateral, or the fund may experience losses related to the investment collateral. To minimize certain risks, loan counterparties pledge collateral in the form of cash and/or securities. The lending agent has agreed to indemnify the fund in the case of default of any securities borrowed. Cash collateral received is invested in the State Street Navigator Securities Lending Government Money Market Portfolio, a money market mutual fund registered under the 1940 Act. The loans may also be secured by U.S. government securities in an amount at least equal to the market value of the securities loaned, plus accrued interest and dividends, determined on a daily basis and adjusted accordingly. By lending securities, the fund seeks to increase its net investment income through the receipt of interest and fees. Such income is reflected separately within the Statement of Operations. The value of loaned securities and related collateral outstanding at period end, if any, are shown on a gross basis within the Schedule of Investments and Statement of Assets and Liabilities.
79
The following table reflects a breakdown of transactions accounted for as secured borrowings, the gross obligation by the type of collateral pledged, and the remaining contractual maturity of those transactions as of August 31, 2020.
| Remaining Contractual Maturity of Agreements | |||||||||||||||||
| Overnight and Continuous | <30 days | Between 30 & 90 days | >90 days | Total | |||||||||||||
Securities Lending Transactions(1) | |||||||||||||||||
| Common Stocks | $ | 3,789,955 | — | — | — | $ | 3,789,955 | ||||||||||
| Gross amount of recognized liabilities for securities lending transactions | $ | 3,789,955 | |||||||||||||||
(1)Amount represents the payable for cash collateral received for securities on loan. This will generally be in the Overnight and Continuous column as the securities are typically callable on demand.
3. Fees and Transactions with Related Parties
Certain officers and trustees of the trust are also officers and/or directors of American Century Companies, Inc. (ACC). The trust's investment advisor, ACIM, and the trust’s administrator, American Century Services, LLC, are wholly owned, directly or indirectly, by ACC. Various funds issued by American Century Strategic Asset Allocations, Inc. own, in aggregate, 19% of the shares of the fund.
Management Fees — The trust has entered into a management agreement with ACIM, under which ACIM provides the fund with investment advisory and management services in exchange for a single, unified management fee (the fee). The agreement provides that ACIM will pay all expenses of managing and operating the fund, except brokerage and other transaction fees and expenses relating to the acquisition and disposition of portfolio securities, acquired fund fees and expenses, interest, taxes, litigation expenses and extraordinary expenses. The fee is computed and accrued daily based on the daily net assets of the fund and paid monthly in arrears. The annual management fee is 0.23%.
4. Investment Transactions
Purchases and sales of investment securities, excluding short-term investments and in-kind transactions, for the period ended August 31, 2020 were $99,546,305 and $12,753,353, respectively.
Securities received in-kind through subscriptions for the period ended August 31, 2020 were $208,553,698. There were no securities delivered in-kind through redemptions during the period.
5. Capital Share Transactions
The fund’s shares may only be purchased and sold on a national securities exchange through a broker-dealer. The price of the fund’s shares is based on market price, and because ETF shares trade at market prices rather than net asset value (NAV), shares may trade at a price greater than NAV (a premium) or less than NAV (a discount). The fund issues and redeems shares that have been aggregated into blocks of 50,000 shares or multiples thereof (Creation Units) to authorized participants who have entered into agreements with the fund's distributor. The fund will generally issue and redeem Creation Units in return for a basket of securities (and an amount of cash) that the fund specifies each day. Investors transacting in Creation Units for cash may also pay an additional variable charge to compensate the fund for certain transaction costs and market impact expenses relating to investing in portfolio securities. Such variable charges, if any, are included in proceeds from shares sold in the Statement of Changes in Net Assets.
6. Fair Value Measurements
The fund’s investments valuation process is based on several considerations and may use multiple inputs to determine the fair value of the investments held by the fund. In conformity with accounting principles generally accepted in the United States of America, the inputs used to determine a valuation are classified into three broad levels.
•Level 1 valuation inputs consist of unadjusted quoted prices in an active market for identical investments.
•Level 2 valuation inputs consist of direct or indirect observable market data (including quoted prices for comparable investments, evaluations of subsequent market events, interest rates, prepayment speeds,
80
credit risk, etc.). These inputs also consist of quoted prices for identical investments initially expressed in local currencies that are adjusted through translation into U.S. dollars.
•Level 3 valuation inputs consist of unobservable data (including a fund’s own assumptions).
The level classification is based on the lowest level input that is significant to the fair valuation measurement. The valuation inputs are not necessarily an indication of the risks associated with investing in these securities or other financial instruments.
The following is a summary of the level classifications as of period end. The Schedule of Investments provides additional information on the fund’s portfolio holdings.
| Level 1 | Level 2 | Level 3 | |||||||||
| Assets | |||||||||||
| Investment Securities | |||||||||||
| Common Stocks | |||||||||||
| Australia | $ | 2,380,260 | $ | 19,402,161 | — | ||||||
| Belgium | 796,833 | 2,474,877 | — | ||||||||
| Canada | 8,822 | 32,855,561 | — | ||||||||
| Denmark | 2,181,815 | 5,249,507 | — | ||||||||
| Finland | 210,019 | 3,345,963 | — | ||||||||
| France | 5,304,222 | 24,740,584 | — | ||||||||
| Germany | 4,143,469 | 23,530,953 | — | ||||||||
| Hong Kong | 233,875 | 9,753,834 | — | ||||||||
| Israel | 824,842 | 1,720,440 | — | ||||||||
| Italy | 390,162 | 7,141,429 | — | ||||||||
| Japan | 7,830,447 | 70,116,479 | — | ||||||||
| Netherlands | 5,227,596 | 7,122,151 | — | ||||||||
| Norway | 263,234 | 2,248,307 | — | ||||||||
| Singapore | 278,016 | 3,340,588 | — | ||||||||
| Spain | 893,761 | 6,085,320 | — | ||||||||
| Sweden | 1,017,408 | 10,884,015 | — | ||||||||
| Switzerland | 14,159,677 | 15,623,572 | — | ||||||||
| United Kingdom | 15,436,372 | 28,431,669 | — | ||||||||
| Other Countries | — | 4,644,733 | — | ||||||||
| Rights | — | 361 | — | ||||||||
| Temporary Cash Investments | 2,759,328 | — | — | ||||||||
| Temporary Cash Investments - Securities Lending Collateral | 3,789,955 | — | — | ||||||||
| $ | 68,130,113 | $ | 278,712,504 | — | |||||||
7. Derivative Instruments
Equity Price Risk — The fund is subject to equity price risk in the normal course of pursuing its investment objectives. A fund may enter into futures contracts based on an equity index in order to manage its exposure to changes in market conditions. A fund may purchase futures contracts to gain exposure to increases in market value or sell futures contracts to protect against a decline in market value. Upon entering into a futures contract, a fund is required to deposit either cash or securities in an amount equal to a certain percentage of the contract value (initial margin). Subsequent payments (variation margin) are made or received daily, in cash, by a fund. The variation margin is equal to the daily change in the contract value and is recorded as unrealized gains and losses. A fund recognizes a realized gain or loss when the contract is closed or expires. Net realized and unrealized gains or losses occurring during the holding period of futures contracts are a component of net realized gain (loss) on futures contract transactions and change in net unrealized appreciation (depreciation) on futures contracts, respectively. One of the risks of entering into futures contracts is the possibility that the change in value of the contract may not correlate with the changes in value of the underlying securities. During the period, the fund participated in equity price risk derivative instruments for temporary investment purposes.
81
At period end, the fund did not have any derivative instruments disclosed on the Statement of Assets and Liabilities. For the period from September 24, 2019 (fund inception) through August 31, 2020, the effect of equity price risk derivative instruments on the Statement of Operations was $1,347 in net realized gain (loss) on futures contract transactions.
8. Risk Factors
The value of the fund’s shares will go up and down, sometimes rapidly or unpredictably, based on the performance of the securities owned by the fund and other factors generally affecting the securities market. Market risks, including political, regulatory, economic and social developments, can affect the value of the fund’s investments. Natural disasters, public health emergencies, terrorism and other unforeseeable events may lead to increased market volatility and may have adverse long-term effects on world economies and markets generally.
There are certain risks involved in investing in foreign securities. These risks include those resulting from political events (such as civil unrest, national elections and imposition of exchange controls), social and economic events (such as labor strikes and rising inflation), and natural disasters. Securities of foreign issuers may be less liquid and more volatile. Investing in a significant portion of assets in one country or region may accentuate these risks.
9. Federal Tax Information
The tax character of distributions paid during the period September 24, 2019 (fund inception) through August 31, 2020 were as follows:
| Distributions Paid From | |||||
| Ordinary income | $ | 2,697,051 | |||
| Long-term capital gains | — | ||||
The book-basis character of distributions made during the year from net investment income or net realized gains may differ from their ultimate characterization for federal income tax purposes. These differences reflect the differing character of certain income items and net realized gains and losses for financial statement and tax purposes, and may result in reclassification among certain capital accounts on the financial statements.
As of period end, the components of investments for federal income tax purposes were as follows:
| Federal tax cost of investments | $ | 301,615,368 | |||
| Gross tax appreciation of investments | $ | 53,795,823 | |||
| Gross tax depreciation of investments | (8,568,574) | ||||
| Net tax appreciation (depreciation) of investments | 45,227,249 | ||||
| Net tax appreciation (depreciation) on derivatives and translation of assets and liabilities in foreign currencies | 17,720 | ||||
| Net tax appreciation (depreciation) | $ | 45,244,969 | |||
| Undistributed ordinary income | $ | 2,296,163 | |||
| Accumulated short-term capital losses | $ | (1,070,255) | |||
The difference between book-basis and tax-basis unrealized appreciation (depreciation) is attributable primarily to the realization to ordinary income for tax purposes of unrealized gains on investments in passive foreign investment companies.
Accumulated capital losses represent net capital loss carryovers that may be used to offset future realized capital gains for federal income tax purposes. The capital loss carryovers may be carried forward for an unlimited period. Future capital loss carryover utilization in any given year may be subject to Internal Revenue Code limitations.
82
| Financial Highlights | ||
| For a Share Outstanding Throughout the Period Indicated | |||||||||||||||||||||||||||||||||||
| Per-Share Data | Ratios and Supplemental Data | ||||||||||||||||||||||||||||||||||
| Income From Investment Operations: | Ratio to Average Net Assets of: | ||||||||||||||||||||||||||||||||||
| Net Asset Value, Beginning of Period | Net Investment Income (Loss)(1) | Net Realized and Unrealized Gain (Loss) | Total From Investment Operations | Distributions From Net Investment Income | Net Asset Value, End of Period | Total Return(2) | Operating Expenses | Net Investment Income (Loss) | Portfolio Turnover Rate(3) | Net Assets, End of Period (in thousands) | |||||||||||||||||||||||||
2020(4) | $50.00 | 1.12 | (0.37) | 0.75 | (0.55) | $50.20 | 1.52% | 0.23%(5) | 2.57%(5) | 8% | $341,344 | ||||||||||||||||||||||||
| Notes to Financial Highlights | ||
(1)Computed using average shares outstanding throughout the period.
(2)Total returns are calculated based on the net asset value of the last business day. Total returns for periods less than one year are not annualized.
(3)Excludes securities received or delivered in-kind.
(4)September 24, 2019 (fund inception) through August 31, 2020.
(5)Annualized.
See Notes to Financial Statements.
| Report of Independent Registered Public Accounting Firm | ||
To the Shareholders and the Board of Trustees of American Century ETF Trust:
Opinion on the Financial Statements and Financial Highlights
We have audited the accompanying statement of assets and liabilities, including the schedule of investments, of Avantis® International Equity ETF (the “Fund”), one of the funds constituting the American Century ETF Trust, as of August 31, 2020, and the related statement of operations, the statement of changes in net assets, and the financial highlights for the period from September 24, 2019 (fund inception) through August 31, 2020, and the related notes. In our opinion, the financial statements and financial highlights present fairly, in all material respects, the financial position of Avantis® International Equity ETF as of August 31, 2020, and the results of its operations, the changes in its net assets, and the financial highlights for the period from September 24, 2019 (fund inception) through August 31, 2020, in conformity with accounting principles generally accepted in the United States of America.
Basis for Opinion
These financial statements and financial highlights are the responsibility of the Fund's management. Our responsibility is to express an opinion on the Fund’s financial statements and financial highlights based on our audit. We are a public accounting firm registered with the Public Company Accounting Oversight Board (United States) (PCAOB) and are required to be independent with respect to the Fund in accordance with the U.S. federal securities laws and the applicable rules and regulations of the Securities and Exchange Commission and the PCAOB.
We conducted our audit in accordance with the standards of the PCAOB. Those standards require that we plan and perform the audit to obtain reasonable assurance about whether the financial statements and financial highlights are free of material misstatement, whether due to error or fraud. The Fund is not required to have, nor were we engaged to perform, an audit of its internal control over financial reporting. As part of our audit we are required to obtain an understanding of internal control over financial reporting but not for the purpose of expressing an opinion on the effectiveness of the Fund’s internal control over financial reporting. Accordingly, we express no such opinion.
Our audit included performing procedures to assess the risks of material misstatement of the financial statements and financial highlights, whether due to error or fraud, and performing procedures that respond to those risks. Such procedures included examining, on a test basis, evidence regarding the amounts and disclosures in the financial statements and financial highlights. Our audit also included evaluating the accounting principles used and significant estimates made by management, as well as evaluating the overall presentation of the financial statements and financial highlights. Our procedures included confirmation of securities owned as of August 31, 2020, by correspondence with the custodian and brokers; when replies were not received from brokers, we performed other auditing procedures. We believe that our audit provides a reasonable basis for our opinion.
DELOITTE & TOUCHE LLP
Kansas City, Missouri
October 16, 2020
We have served as the auditor of one or more American Century investment companies since 1997
84
| Management | ||
The Board of Trustees
The individuals listed below serve as trustees of the funds. Each trustee will continue to serve in this capacity until death, retirement, resignation or removal from office. The board has adopted a mandatory retirement age for trustees who are not “interested persons,” as that term is defined in the Investment Company Act (independent trustees). Trustees who are not also officers of the trust shall retire by December 31st of the year in which they reach their 75th birthday.
Mr. Thomas is an “interested person” because he currently serves as President and Chief Executive Officer of American Century Companies, Inc. (ACC), the parent company of American Century Investment Management, Inc. (ACIM or the advisor). The other trustees are independent. They are not employees, directors or officers of, and have no financial interest in, ACC or any of its wholly owned, direct or indirect, subsidiaries, including ACIM and American Century Services, LLC (ACS), and they do not have any other affiliations, positions or relationships that would cause them to be considered “interested persons” under the Investment Company Act. The following trustees also serve in this capacity for a number of other registered investment companies in the American Century Investments family of funds: Jonathan S. Thomas, 15; Ronald J. Gilson, 8; and Stephen E. Yates, 7.
The following table presents additional information about the trustees. The mailing address for each trustee other than Jonathan S. Thomas is 330 Madison Avenue, New York, New York 10017. The mailing address for Jonathan S. Thomas is 4500 Main Street, Kansas City, Missouri 64111.
| Name (Year of Birth) | Position(s) Held with Funds | Length of Time Served | Principal Occupation(s) During Past 5 Years | Number of American Century Portfolios Overseen by Trustee | Other Directorships Held During Past 5 Years | ||||||||||||
| Independent Trustees | |||||||||||||||||
| Reginald M. Browne (1968) | Trustee and Chairman of the Board | Since 2017 (Chairman since 2019) | Principal, GTS Securities (automated capital markets trading firm)(2019 to present); Senior Managing Director, Co Global Head-ETF Group, Cantor Fitzgerald (financial services firm)(2013 to 2019) | 19 | None | ||||||||||||
| Ronald J. Gilson (1946) | Trustee | Since 2017 | Charles J. Meyers Professor of Law and Business, Emeritus, Stanford Law School (1979 to 2016); Marc and Eva Stern Professor of Law and Business, Columbia University School of Law (1992 to present) | 59 | None | ||||||||||||
| Barry A. Mendelson (1958) | Trustee | Since 2017 | Retired; Consultant regarding ETF and mutual fund matters (2015 to 2016); Principal and Senior Counsel, The Vanguard Group (investment management)(1998 to 2014) | 19 | None | ||||||||||||
| Stephen E. Yates (1948) | Trustee | Since 2017 | Retired | 82 | None | ||||||||||||
85
| Name (Year of Birth) | Position(s) Held with Funds | Length of Time Served | Principal Occupation(s) During Past 5 Years | Number of American Century Portfolios Overseen by Trustee | Other Directorships Held During Past 5 Years | ||||||||||||
| Interested Trustees | |||||||||||||||||
| Jonathan S. Thomas (1963) | Trustee | Since 2017 | President and Chief Executive Officer, ACC (2007 to present). Also serves as Chief Executive Officer, ACS; Executive Vice President, ACIM; Director, ACC, ACIM and other ACC subsidiaries | 122 | None | ||||||||||||
The Statement of Additional Information has additional information about the fund's trustees and is available without charge, upon request, by calling 1-800-345-6488.
86
Officers
The following table presents certain information about the executive officers of the funds. Each officer, except Edward Rosenberg, serves as an officer for each of the 16 investment companies in the American Century family of funds. No officer is compensated for his or her service as an officer of the funds. The listed officers are interested persons of the funds and are appointed or re-appointed on an annual basis. The mailing address for each officer listed below is 4500 Main Street, Kansas City, Missouri 64111.
| Name (Year of Birth) | Offices with the Funds | Principal Occupation(s) During the Past Five Years | ||||||
| Patrick Bannigan (1965) | President since 2019 | Executive Vice President and Director, ACC (2012 to present); Chief Financial Officer, Chief Accounting Officer and Treasurer, ACC (2015 to present). Also serves as President, ACS; Vice President, ACIM; Chief Financial Officer, Chief Accounting Officer and/or Director, ACIM, ACS and other ACC subsidiaries | ||||||
| R. Wes Campbell (1974) | Chief Financial Officer and Treasurer since 2018 | Vice President, ACS (2020 to present); Investment Operations and Investment Accounting, ACS (2000 to present) | ||||||
| Amy D. Shelton (1964) | Chief Compliance Officer and Vice President since 2017 | Chief Compliance Officer, American Century funds, (2014 to present); Chief Compliance Officer, ACIM (2014 to present); Chief Compliance Officer, ACIS (2009 to present). Also serves as Vice President, ACIS | ||||||
| Charles A. Etherington (1957) | General Counsel and Vice President since 2017 | Attorney, ACC (1994 to present); Vice President, ACC (2005 to present); General Counsel, ACC (2007 to present). Also serves as General Counsel, ACIM, ACS, ACIS and other ACC subsidiaries; and Senior Vice President, ACIM and ACS | ||||||
| Cleo Chang (1977) | Vice President since 2019 | Senior Vice President, ACIM (2015 to present); Chief Investment Officer, Wilshire Funds Management (2005 to 2015) | ||||||
| David H. Reinmiller (1963) | Vice President since 2017 | Attorney, ACC (1994 to present). Also serves as Vice President, ACIM and ACS | ||||||
| Edward Rosenberg (1973) | Vice President since 2017 | Senior Vice President, ACIM (2017 to present); Senior Vice President, Flexshares Head of ETF Capital Markets, Northern Trust (2012 to 2017) | ||||||
| C. Jean Wade (1964) | Vice President since 2017 | Senior Vice President, ACS (2017 to present); Vice President, ACS (2000 to 2017) | ||||||
| Ward D. Stauffer (1960) | Secretary since 2019 | Attorney, ACS (2003 to present) | ||||||
87
| Approval of Management Agreement | ||
At a meeting held on June 5, 2020, the Fund’s Board of Trustees (the "Board") unanimously approved the renewal of the management agreement pursuant to which American Century Investment Management, Inc. (the “Advisor”) acts as the investment advisor for the Fund. Under Section 15(c) of the Investment Company Act, contracts for investment advisory services are required to be reviewed, evaluated, and approved by a majority of a fund’s trustees (the “Trustees”), including a majority of the independent Trustees, each year.
Prior to its consideration of the renewal of the management agreement, the Trustees requested and reviewed extensive data and information compiled by the Advisor and certain independent providers of evaluation data concerning the Fund and the services provided to the Fund by the Advisor. This review was in addition to the oversight and evaluation undertaken by the Board and its Audit Committee on a continual basis and the information received was supplemental to the extensive information that the Board and its Audit Committee receive and consider throughout the year.
In connection with its consideration of the renewal of the management agreement, the Board’s review and evaluation of the services provided by the Advisor included, but was not limited to, the following:
•the nature, extent, and quality of investment management and other services provided and to be provided to the Fund;
•the wide range of other programs and services provided and to be provided to the Fund and its shareholders on a routine and non-routine basis;
•the Fund’s investment performance, including data comparing the Fund's performance to appropriate benchmarks of funds with similar objectives and strategies;
•the cost of owning the Fund compared to the cost of owning similar funds;
•the compliance policies, procedures, and regulatory experience of the Advisor and the Fund's service providers;
•the Advisor’s strategic plans;
•the Advisor’s business continuity plans and specifically its response to the COVID-19 pandemic;
•financial data showing the cost of services provided to the Fund, the profitability of the Fund to the Advisor, and the overall profitability of the Advisor;
•information regarding payments to intermediaries by the Advisor; and
•possible economies of scale associated with the Advisor’s management of the Fund; and
•possible collateral benefits to the Advisor from the management of the Fund.
The independent Trustees met separately in private session to discuss the renewal and to review and discuss the information provided in response to their request. The independent Trustees also held active discussions with the Advisor regarding the renewal of the management agreement. The independent Trustees had the benefit of the advice of their independent counsel throughout the process.
Factors Considered
The Trustees considered all of the information provided by the Advisor, the independent data providers, and independent counsel in connection with the approval. They determined that the information was sufficient for them to evaluate the management agreement for the Fund. In connection with their review, the Trustees did not identify any single factor as being all-important or
88
controlling, and each Trustee may have attributed different levels of importance to different factors. In deciding to renew the management agreement, the Board based its decision on a number of factors, including without limitation the following:
Nature, Extent and Quality of Services — Generally. Under the management agreement, the Advisor is responsible for providing or arranging for all services necessary for the operation of the Fund. The Board noted that the Advisor provides or arranges at its own expense a wide variety of services including without limitation the following:
•constructing and designing the Fund
•portfolio research and security selection
•initial capitalization/funding
•securities trading
•Fund administration
•custody of Fund assets
•daily valuation of the Fund’s portfolio
•shareholder servicing and transfer agency, including shareholder confirmations, recordkeeping, and communications
•legal services (except the independent Trustees’ counsel)
•regulatory and portfolio compliance
•financial reporting
•marketing and distribution (except amounts paid by the Fund under Rule 12b-1 plans)
Investment Management Services. The nature of the investment management services provided to the Fund is quite complex and allows Fund shareholders access to professional money management, instant diversification of their investments within an asset class, and liquidity. In evaluating investment performance, the Board expects the Advisor to manage the Fund in accordance with its investment objectives and approved strategies. Further, the Trustees recognize that the Advisor has an obligation to monitor trading activities, and in particular to seek the best execution of fund trades, and to evaluate the use of and payment for research. In providing these services, the Advisor utilizes teams of investment professionals (portfolio managers, analysts, research assistants, and securities traders) who require extensive information technology, research, training, compliance, and other systems to conduct their business. The Board provides oversight of the investment performance process. It regularly reviews investment performance information for the Fund, together with comparative information for appropriate benchmarks over different time horizons. The Trustees also review investment performance information during the management agreement renewal process. If performance concerns are identified, the Board discusses with the Advisor the reasons for such results and any efforts being undertaken to improve performance. The Fund’s performance reviewed by the Board was above its benchmark. The Board found the investment management services provided by the Advisor to the Fund to be satisfactory and consistent with the management agreement.
Shareholder and Other Services. Under the management agreement, the Advisor provides or arranges for a comprehensive package of services to the Fund. The Board, directly and through its Audit Committee, regularly reviews reports and evaluations of such services at its regular meetings. These reports include, but are not limited to, information regarding the operational efficiency and accuracy of the shareholder and transfer agency services provided, staffing levels, shareholder satisfaction, technology support (including cyber security), new products and services offered to Fund shareholders, securities trading activities, portfolio valuation services, auditing services, and legal and operational compliance activities. The Board found the services provided by the Advisor to the Fund under the management agreement to be competitive and of high quality.
89
COVID-19 Response. During 2020, much of the world experienced unprecedented change and challenges from the impacts of the rapidly evolving, worldwide spread of the COVID-19 virus. The Board evaluated the Advisor’s response to the COVID-19 pandemic and its impact on service to the Fund. The Board found that Fund shareholders have continued to receive the Advisor’s investment management and other services without disruption, and Advisor personnel have demonstrated great resiliency in providing those services. The Board, directly and through its Audit Committee, continues to monitor the impact of the pandemic and the response of each of the Fund’s service providers.
Costs of Services and Profitability. The Advisor provides detailed information concerning its cost of providing various services to the Fund, its profitability in managing the Fund (pre- and post-distribution), its overall profitability, and its financial condition. The Trustees have reviewed with the Advisor the methodology used to prepare this financial information. This information is considered in evaluating the Advisor’s financial condition, its ability to continue to provide services under the management agreement, and the reasonableness of the current management fee. The Board concluded that the Advisor’s profits were reasonable in light of the services provided to the Fund.
Ethics. The Board generally considers the Advisor’s commitment to providing quality services to the Fund and to conducting its business ethically. They noted that the Advisor’s practices generally meet or exceed industry best practices.
Economies of Scale. The Board also reviewed information provided by the Advisor regarding the possible existence of economies of scale in connection with the management of the Fund. The Board concluded that economies of scale are difficult to measure and predict with precision, especially on a fund-by-fund basis. The Board concluded that the Advisor is appropriately sharing economies of scale, to the extent they exist, through its competitive fee structure, offering competitive fees from fund inception, and through reinvestment in its business, infrastructure, investment capabilities and initiatives to provide shareholders additional content and services.
Comparison to Other Funds’ Fees. The management agreement provides that the Fund pays the Advisor a single, all-inclusive (or unified) management fee for providing all services necessary for the management and operation of the Fund, other than brokerage expenses, expenses attributable to short sales, taxes, interest, extraordinary expenses, and expenses incurred in connection with the provision of shareholder services and distribution services under a plan adopted pursuant to Rule 12b-1 under the Investment Company Act. Under the unified fee structure, the Advisor is responsible for providing all investment advisory, custody, audit, administrative, compliance, recordkeeping, marketing and shareholder services, or arranging and supervising third parties to provide such services. The Board believes the unified fee structure is a benefit to Fund shareholders because it clearly discloses to shareholders the cost of owning Fund shares, and, since the unified fee cannot be increased without a vote of Fund shareholders, it shifts to the Advisor the risk of increased costs of operating the Fund and provides a direct incentive to minimize administrative inefficiencies. Part of the Board’s analysis of fee levels involves reviewing certain evaluative data compiled by an independent provider comparing the Fund’s unified fee to the total expense ratios of its peers. The unified fee charged to shareholders of the Fund was below the median of the total expense ratios of the Fund’s peer expense universe and was the lowest of its peer expense group. The Board concluded that the management fee paid by the Fund to the Advisor under the management agreement is reasonable in light of the services provided to the Fund.
Comparison to Fees and Services Provided to Other Clients of the Advisor. The Board also requested information from the Advisor concerning the nature of the services, fees, costs, and profitability of its advisory services to funds or other advisory clients managed similarly to the Fund. The Advisor informed the Trustees that, as of December 31, 2019, it did not provide services to any other investment companies or comparable accounts that were managed similarly to the Fund.
90
Payments to Intermediaries. The Trustees also requested a description of payments made to intermediaries by the Fund and the Advisor and services provided in response thereto. These payments could include various payments made by the Fund or the Advisor to different types of intermediaries and recordkeepers for distribution and service activities provided for the Fund. The Trustees reviewed such information and received representations from the Advisor that all such payments by the Advisor were made from the Advisor’s resources and reasonable profits. The Board found such payments to be reasonable in scope and purpose.
Collateral or “Fall-Out” Benefits Derived by the Advisor. The Board considered the possible existence of collateral benefits the Advisor may receive as a result of its relationship with the Fund. They concluded that the Advisor’s primary business is managing funds and it generally does not use fund or shareholder information to generate profits in other lines of business, and therefore does not derive any significant collateral benefits from them. The Board noted that additional assets from other clients may offer the Advisor some benefit from increased leverage with service providers and counterparties. The Board also determined that the Advisor is able to provide investment management services to certain clients other than the Fund, at least in part, due to its existing infrastructure built to serve the fund complex. The Board concluded that appropriate allocation methodologies had been employed to assign resources and the cost of those resources to these other clients.
Existing Relationship. The Board also considered whether there was any reason for not continuing the existing arrangement with the Advisor. In this regard, the Board was mindful of the potential disruptions of the Fund’s operations and various risks, uncertainties, and other effects that could occur as a result of a decision not to continue such relationship. In particular, the Board recognized that most shareholders have invested in the Fund on the strength of the Advisor’s industry standing and reputation and in the expectation that the Advisor will have a continuing role in providing advisory services to the Fund.
Conclusion of the Trustees. As a result of this process, the Board, including all of the independent Trustees, taking into account all of the factors discussed above and the information provided by the Advisor and others in connection with its review and throughout the year, determined that the management fee is fair and reasonable in light of the services provided and that the investment management agreement between the Fund and the Advisor should be renewed.
91
| Liquidity Risk Management Program | ||
The Fund has adopted a liquidity risk management program (the “program”). The Fund’s Board of Trustees (the "Board") has designated American Century Investment Management, Inc. (“ACIM”) as the administrator of the program. Personnel of ACIM or its affiliates conduct the day-to-day operation of the program pursuant to policies and procedures administered by those members of the ACIM’s Investment Oversight Committee who are members of the ACIM’s Investment Management and Global Analytics departments.
Under the program, ACIM manages the Fund’s liquidity risk, which is the risk that the Fund could not meet shareholder redemption requests without significant dilution of remaining shareholders’ interests in the Fund. This risk is managed by monitoring the degree of liquidity of the Fund’s investments, limiting the amount of the Fund’s illiquid investments, and utilizing various risk management tools and facilities available to the Fund for meeting shareholder redemptions, among other means. ACIM’s process of determining the degree of liquidity of the Fund’s investments is supported by one or more third-party liquidity assessment vendors.
The Board reviewed a report prepared by ACIM regarding the operation and effectiveness of the program for the period December 1, 2018 through December 31, 2019. No significant liquidity events impacting the Fund were noted in the report. In addition, ACIM provided its assessment that the program had been effective in managing the Fund’s liquidity risk.
92
| Additional Information | ||
Retirement Account Information
As required by law, distributions you receive from certain retirement accounts are subject to federal income tax withholding, unless you elect not to have withholding apply*. Tax will be withheld on the total amount withdrawn even though you may be receiving amounts that are not subject to withholding, such as nondeductible contributions. In such case, excess amounts of withholding could occur. You may adjust your withholding election so that a greater or lesser amount will be withheld.
Remember, even if you elect not to have income tax withheld, you are liable for paying income tax on the taxable portion of your withdrawal. If you elect not to have income tax withheld or you don’t have enough income tax withheld, you may be responsible for payment of estimated tax. You may incur penalties under the estimated tax rules if your withholding and estimated tax payments are not sufficient. You can reduce or defer the income tax on a distribution by directly or indirectly rolling such distribution over to another IRA or eligible plan. You should consult your tax advisor for additional information.
State tax will be withheld if, at the time of your distribution, your address is within one of the mandatory withholding states and you have federal income tax withheld (or as otherwise required by state law). State taxes will be withheld from your distribution in accordance with the respective state rules.
*Some 403(b), 457 and qualified retirement plan distributions may be subject to 20% mandatory withholding, as they are subject to special tax and withholding rules. Your plan administrator or plan sponsor is required to provide you with a special tax notice explaining those rules at the time you request a distribution. If applicable, federal and/or state taxes may be withheld from your distribution amount.
Proxy Voting Policies
A description of the policies that the fund's investment advisor uses in exercising the voting rights associated with the securities purchased and/or held by the fund are available without charge, upon request, by calling 1-800-345-6488. It is also available on American Century Investments’ website at americancentury.com/proxy and on the Securities and Exchange Commission’s website at sec.gov. Information regarding how the investment advisor voted proxies relating to portfolio securities during the most recent 12-month period ended June 30 is available at americancentury.com/proxy. It is also available at sec.gov.
Quarterly Portfolio Disclosure
The fund files its complete schedule of portfolio holdings with the Securities and Exchange Commission (SEC) for the first and third quarters of each fiscal year as an exhibit to its reports on Form N-PORT. The fund's Form N-PORT reports are available on the SEC’s website at sec.gov.
93
Other Tax Information
The following information is provided pursuant to provisions of the Internal Revenue Code.
The fund hereby designates up to the maximum amount allowable as qualified dividend income for the fiscal year ended August 31, 2020.
For the fiscal year ended August 31, 2020, the fund intends to pass through to shareholders foreign source income of $5,066,472 and foreign taxes paid of $451,490, or up to the maximum amount allowable, as a foreign tax credit. Foreign source income and foreign tax expense per outstanding share on August 31, 2020 are $0.7451 and $0.0664, respectively.
94
| Notes | ||
95
| Notes | ||
96
| ||||||||
| Contact Us | avantisinvestors.com | |||||||
| American Century Sales Representatives, Financial Professionals, Broker Dealers, Insurance Companies, Banks and Trust Companies | 1-833-928-2684 | |||||||
| Telecommunications Relay Service for the Deaf | 711 | |||||||
| American Century ETF Trust | ||||||||
Investment Advisor: American Century Investment Management, Inc. Kansas City, Missouri | ||||||||
Distributor: Foreside Fund Services, LLC - Distributor, not affiliated with American Century Investment Services, Inc. | ||||||||
| This report and the statements it contains are submitted for the general information of our shareholders. The report is not authorized for distribution to prospective investors unless preceded or accompanied by an effective prospectus. | ||||||||
| ©2020 American Century Proprietary Holdings, Inc. All rights reserved. CL-ANN-96043 2010 | ||||||||
| Annual Report | |||||
| August 31, 2020 | |||||
Avantis® International Small Cap Value ETF (AVDV) | |||||
Beginning on January 1, 2021, as permitted by regulations adopted by the Securities and Exchange Commission, paper copies of the fund’s shareholder reports like this one will no longer be sent by mail, unless you specifically request paper copies of the reports from the fund or from your financial intermediary, such as a broker-dealer or bank. Instead, the reports will be made available on a website, and you will be notified by mail each time a report is posted and provided with a website link to access the report.
If you already elected to receive shareholder reports electronically, you will not be affected by this change and you need not take any action. You may elect to receive shareholder reports and other communications from the fund or your financial intermediary electronically by calling or sending an email request to your appropriate contacts as listed on the back cover of this report.
You may elect to receive all future reports in paper free of charge. You can inform the fund or your financial intermediary that you wish to continue receiving paper copies of your shareholder reports by calling or sending an email request to your appropriate contacts as listed on the back cover of this report. Your election to receive reports in paper will apply to all funds held with the fund complex/your financial intermediary.
| Table of Contents | ||
| Chairman’s Letter | |||||
| Performance | |||||
| Portfolio Commentary | |||||
| Fund Characteristics | |||||
| Shareholder Fee Example | 6 | ||||
| Schedule of Investments | |||||
| Statement of Assets and Liabilities | |||||
| Statement of Operations | |||||
| Statement of Changes in Net Assets | |||||
| Notes to Financial Statements | |||||
| Financial Highlights | |||||
| Report of Independent Registered Public Accounting Firm | |||||
| Management | |||||
| Approval of Management Agreement | |||||
| Liquidity Risk Management Program | |||||
| Additional Information | |||||
Any opinions expressed in this report reflect those of the author as of the date of the report, and do not necessarily represent the opinions of American Century Investments® or any other person in the American Century Investments organization. Any such opinions are subject to change at any time based upon market or other conditions and American Century Investments disclaims any responsibility to update such opinions. These opinions may not be relied upon as investment advice and, because investment decisions made by American Century Investments funds are based on numerous factors, may not be relied upon as an indication of trading intent on behalf of any American Century Investments fund. Security examples are used for representational purposes only and are not intended as recommendations to purchase or sell securities. Performance information for comparative indices and securities is provided to American Century Investments by third party vendors. To the best of American Century Investments’ knowledge, such information is accurate at the time of printing.
| Chairman's Letter | ||
Jonathan ThomasDear Investor:
Thank you for reviewing this annual report for the period ended August 31, 2020. Annual reports help convey important information about fund returns, including market factors that affected performance. For additional investment insights, please visit avantisinvestors.com.
Pandemic Disrupted Economic, Market Courses
Broad market sentiment was generally upbeat early in the period. Dovish central banks, modest inflation, improving economic and corporate earnings data, and progress on U.S.-China trade helped boost global growth outlooks. Against this backdrop, stocks largely remained in favor.
However, beginning in late February, COVID-19 quickly quashed the optimistic tone. The outbreak rapidly spread worldwide, halting most U.S. and global economic activity and triggering a deep worldwide recession. Global stocks sold off sharply, but central banks and federal governments stepped in quickly and aggressively to stabilize financial markets. These extraordinary efforts proved helpful, as most stocks rebounded quickly. As the period progressed, coronavirus infection and death rates declined in many regions and economies reopened. By the end of August, manufacturing, employment and other data suggested an economic recovery was underway.
Overall, global stocks delivered mixed results for the period. U.S. stocks generally advanced and fared better than their counterparts elsewhere. The growth style significantly outperformed value stocks, which struggled.
A Slow Return to Normal
The return to pre-pandemic life will take time and patience, but we are confident we will get there. Several drug companies are in final stages of vaccine trials, and medical professionals continue to fine-tune virus treatment protocols. In the meantime, investors likely will face periods of outbreak-related disruptions, economic and political uncertainty, and heightened market volatility. These influences can be unsettling, but they tend to be temporary.
We appreciate your confidence in us during these extraordinary times. Our investment professionals have experience weathering unpredictable markets, and we’re confident we will continue to meet today’s challenges.
Sincerely,
Jonathan Thomas
Chairman
Avantis Investors
2
| Performance | ||
| Total Returns as of August 31, 2020 | |||||||||||||||||||||||
| Since Inception | Inception Date | ||||||||||||||||||||||
| Net Asset Value | -2.58% | 9/24/2019 | |||||||||||||||||||||
| Market Price | -2.24% | 9/24/2019 | |||||||||||||||||||||
| MSCI World ex-USA Small Cap Index | 7.05% | — | |||||||||||||||||||||
Market price is determined using the bid/ask midpoint at 4:00 p.m. Eastern time, when the net asset value (NAV) is typically calculated. Market performance does not represent the returns you would receive if you traded shares at other times. NAV prices are used to calculate market price performance prior to the date when the fund first traded on the New York Stock Exchange.
| Growth of $10,000 Over Life of Fund | ||
| $10,000 investment made September 24, 2019 | ||
| Value on August 31, 2020 | |||||
| Net Asset Value — $9,742 | |||||
| MSCI World ex-USA Small Cap Index — $10,705 | |||||
| Total Annual Fund Operating Expenses | |||||||||||||||||
| 0.36% | |||||||||||||||||
The total annual fund operating expenses shown is as stated in the fund’s prospectus current as of the date of this report. The prospectus may vary from the expense ratio shown elsewhere in this report because it is based on a different time period, includes acquired fund fees and expenses, and, if applicable, does not include fee waivers or expense reimbursements.
Data presented reflect past performance. Past performance is no guarantee of future results. Current performance may be higher or lower than the performance shown. Total returns for periods less than one year are not annualized. Investment return and principal value will fluctuate, and redemption value may be more or less than original cost. Data assumes reinvestment of dividends and capital gains, and none of the charts reflect the deduction of taxes that a shareholder would pay on fund distributions or the redemption of fund shares. To obtain performance data current to the most recent month end, please call 1-833-928-2684 or visit avantisinvestors.com. For additional information about the fund, please consult the prospectus.
3
| Portfolio Commentary | ||
Portfolio Managers: Eduardo Repetto, Mitch Firestein, Daniel Ong and Ted Randall
Fund Strategy
Avantis International Small Cap Value ETF seeks long-term capital appreciation by investing in a diverse group of non-U.S. small-capitalization (small-cap) value companies across countries, market sectors and industry groups.
The fund seeks securities of companies that it expects to have higher returns. It places an enhanced emphasis on securities of companies with smaller market capitalizations and securities of companies it defines as high profitability or value companies. Conversely, the fund seeks to underweight or exclude securities it expects to have lower returns. These include securities of large companies with lower levels of profitability and higher prices relative to their book values or other financial metrics. Under normal market conditions, the fund will invest at least 80% of its assets in securities of small-cap companies.
The portfolio is an actively managed exchange-traded fund (ETF) that does not seek to replicate the performance of a specified index. The portfolio managers continually analyze market and financial data to make buy, sell and hold decisions. When buying or selling a security, the portfolio managers may consider the trade-off between expected returns of the security and implementation or tax costs of the trade. They do this in an attempt to gain trading efficiencies, avoid unnecessary risk and enhance portfolio performance.
Performance Review
For the period from Avantis International Small Cap Value ETF’s inception on September 24, 2019, through the fund’s fiscal year-end on August 31, 2020, the fund returned -2.24%* on a market price basis. On a net asset value (NAV) basis, the fund returned -2.58%. NAV and market price returns reflect fees and operating expenses, while index returns do not.
For the same time period, the fund underperformed the total non-U.S. developed markets small-cap stock universe, as measured by the MSCI World ex-USA Small Cap Index, which returned 7.05%. The MSCI World ex-USA Small Cap Index is an unmanaged index generally representative of the performance of non-U.S. developed markets small-cap stocks. The underperformance versus the index was largely due to the fund’s emphasis on small-cap companies with higher levels of profitability and lower prices relative to their book values. These value-oriented companies generally underperformed companies with lower levels of profitability and higher prices relative to their book values.
For example, small-cap value stocks (as measured by the MSCI World ex-USA Small Cap Value Index) returned -3.56% for the reporting period, underperforming small-cap growth stocks, which returned 17.74% (as measured by the MSCI World ex-USA Small Cap Growth Index).
Meanwhile, the exclusion of real estate investment trusts (REITs) in the fund aided results. REITs were significant underperformers for the reporting period.
*Total returns for periods less than one year are not annualized.
4
| Fund Characteristics | ||
| AUGUST 31, 2020 | |||||
| Top Ten Holdings | % of net assets | ||||
| Valiant Holding AG | 1.0% | ||||
| J Sainsbury plc | 0.7% | ||||
| Mineral Resources Ltd. | 0.7% | ||||
| Quilter plc | 0.7% | ||||
| Rheinmetall AG | 0.7% | ||||
| Dialog Semiconductor plc | 0.7% | ||||
| Nolato AB, B Shares | 0.7% | ||||
| Conzzeta AG | 0.7% | ||||
| Bure Equity AB | 0.6% | ||||
| St. James's Place plc | 0.6% | ||||
| Types of Investments in Portfolio | % of net assets | ||||
| Common Stocks | 99.8% | ||||
| Rights | —* | ||||
| Total Equity Exposure | 99.8% | ||||
| Temporary Cash Investments | 0.1% | ||||
| Temporary Cash Investments - Securities Lending Collateral | 1.5% | ||||
| Other Assets and Liabilities | (1.4)% | ||||
*Category is less than 0.05% of total net assets.
| Investments by Country | % of net assets | ||||
| Japan | 27.4% | ||||
| United Kingdom | 15.5% | ||||
| Canada | 8.8% | ||||
| Australia | 7.9% | ||||
| Sweden | 6.7% | ||||
| Germany | 5.4% | ||||
| Switzerland | 4.9% | ||||
| France | 2.8% | ||||
| Italy | 2.7% | ||||
| Netherlands | 2.1% | ||||
| Norway | 2.1% | ||||
| Other Countries | 13.5% | ||||
| Cash and Equivalents* | 0.2% | ||||
*Includes temporary cash investments, temporary cash investments - securities lending collateral and other assets and liabilities.
5
| Shareholder Fee Example | ||
Fund shareholders may incur two types of costs: (1) transaction costs, including brokerage commissions paid on purchases and sales of fund shares; and (2) ongoing costs, including management fees and other fund expenses. This example is intended to help you understand your ongoing costs (in dollars) of investing in your fund and to compare these costs with the ongoing cost of investing in other funds.
The example is based on an investment of $1,000 made at the beginning of the period and held for the entire period from March 1, 2020 to August 31, 2020.
Actual Expenses
The table provides information about actual account values and actual expenses. You may use the information, together with the amount you invested, to estimate the expenses that you paid over the period. Simply divide your account value by $1,000 (for example, an $8,600 account value divided by $1,000 = 8.6), then multiply the result by the number under the heading “Expenses Paid During Period” to estimate the expenses you paid on your account during this period.
Hypothetical Example for Comparison Purposes
The table also provides information about hypothetical account values and hypothetical expenses based on the actual expense ratio of your fund and an assumed rate of return of 5% per year before expenses, which is not the actual return of a fund. The hypothetical account values and expenses may not be used to estimate the actual ending account balance or expenses you paid for the period. You may use this information to compare the ongoing costs of investing in your fund and other funds. To do so, compare this 5% hypothetical example with the 5% hypothetical examples that appear in the shareholder reports of the other funds.
Please note that the expenses shown in the table are meant to highlight your ongoing costs only and do not reflect any transactional costs, such as brokerage commissions paid on purchases and sales of fund shares. Therefore, the table is useful in comparing ongoing costs only, and will not help you determine the relative total costs of owning different funds. In addition, if these transactional costs were included, your costs would have been higher.
| Beginning Account Value 3/1/20 | Ending Account Value 8/31/20 | Expenses Paid During Period(1) 3/1/20 - 8/31/20 | Annualized Expense Ratio(1) | |||||||||||
| Actual | $1,000 | $1,025.00 | $1.83 | 0.36% | ||||||||||
| Hypothetical | $1,000 | $1,023.33 | $1.83 | 0.36% | ||||||||||
(1)Expenses are equal to the fund's annualized expense ratio listed in the table above, multiplied by the average account value over the period, multiplied by 184, the number of days in the most recent fiscal half-year, divided by 366, to reflect the one-half year period. Annualized expense ratio reflects actual expenses, including any applicable fee waivers or expense reimbursements and excluding any acquired fund fees and expenses.
6
| Schedule of Investments | ||
AUGUST 31, 2020
| Shares | Value | |||||||
| COMMON STOCKS — 99.8% | ||||||||
| Australia — 7.9% | ||||||||
| Adairs Ltd. | 37,430 | $ | 94,328 | |||||
| Adbri Ltd. | 125,595 | 232,562 | ||||||
| Alliance Aviation Services Ltd. | 39,424 | 106,803 | ||||||
| Asaleo Care Ltd. | 97,601 | 78,776 | ||||||
| Aurelia Metals Ltd. | 293,177 | 115,408 | ||||||
| Austal Ltd. | 11,119 | 28,801 | ||||||
| Australian Finance Group Ltd. | 58,332 | 79,001 | ||||||
| Beach Energy Ltd. | 868,955 | 965,955 | ||||||
Bega Cheese Ltd.(1) | 110,437 | 425,804 | ||||||
| Boral Ltd. | 440,039 | 1,278,857 | ||||||
| Cedar Woods Properties Ltd. | 22,585 | 88,320 | ||||||
| Challenger Ltd. | 46,778 | 138,058 | ||||||
Coronado Global Resources, Inc.(1) | 67,683 | 30,809 | ||||||
| CSR Ltd. | 258,779 | 690,801 | ||||||
| Dicker Data Ltd. | 10,907 | 59,857 | ||||||
Eclipx Group Ltd.(2) | 141,580 | 154,518 | ||||||
Emeco Holdings Ltd.(2) | 162,100 | 104,455 | ||||||
Emeco Holdings Ltd.(2) | 77,191 | 50,100 | ||||||
| Flight Centre Travel Group Ltd. | 42,083 | 399,492 | ||||||
Galaxy Resources Ltd.(2) | 135,655 | 121,155 | ||||||
| Genworth Mortgage Insurance Australia Ltd. | 80,724 | 88,556 | ||||||
| Grange Resources Ltd. | 133,825 | 27,574 | ||||||
| IGO Ltd. | 275,715 | 895,989 | ||||||
| Iluka Resources Ltd. | 209,552 | 1,548,641 | ||||||
| Inghams Group Ltd. | 169,758 | 400,346 | ||||||
| MACA Ltd. | 87,434 | 66,079 | ||||||
| Macmahon Holdings Ltd. | 341,437 | 65,286 | ||||||
| McMillan Shakespeare Ltd. | 41,887 | 280,523 | ||||||
| McPherson's Ltd. | 67,891 | 169,683 | ||||||
| Mineral Resources Ltd. | 93,368 | 1,988,796 | ||||||
| MNF Group Ltd. | 6,915 | 25,931 | ||||||
MyState Ltd.(1) | 28,492 | 82,451 | ||||||
| New Hope Corp. Ltd. | 121,482 | 106,095 | ||||||
| Nick Scali Ltd. | 25,372 | 162,795 | ||||||
| NRW Holdings Ltd. | 175,477 | 282,063 | ||||||
Nufarm Ltd.(2) | 160,934 | 474,278 | ||||||
| OFX Group Ltd. | 69,898 | 58,237 | ||||||
| Orora Ltd. | 553,533 | 908,986 | ||||||
| OZ Minerals Ltd. | 111,894 | 1,198,745 | ||||||
| Pacific Current Group Ltd. | 28,635 | 128,441 | ||||||
| Perenti Global Ltd. | 586,511 | 510,794 | ||||||
Perseus Mining Ltd.(2) | 701,020 | 745,461 | ||||||
| Platinum Asset Management Ltd. | 83,407 | 224,697 | ||||||
| Ramelius Resources Ltd. | 380,888 | 583,746 | ||||||
Red 5 Ltd.(2) | 398,816 | 89,596 | ||||||
| Regis Resources Ltd. | 318,362 | 1,238,514 | ||||||
7
| Shares | Value | |||||||
Resimac Group Ltd.(1) | 17,516 | $ | 17,249 | |||||
Resolute Mining Ltd.(2) | 489,959 | 398,635 | ||||||
| Sandfire Resources Ltd. | 63,152 | 214,215 | ||||||
| Select Harvests Ltd. | 7,516 | 30,151 | ||||||
Senex Energy Ltd.(2) | 550,239 | 121,005 | ||||||
| Servcorp Ltd. | 21,755 | 41,247 | ||||||
| Sigma Healthcare Ltd. | 500,367 | 249,695 | ||||||
| Sims Ltd. | 72,969 | 427,957 | ||||||
| Southern Cross Media Group Ltd. | 666,861 | 76,722 | ||||||
| St. Barbara Ltd. | 479,426 | 1,218,386 | ||||||
| Stanmore Coal Ltd. | 26,761 | 15,077 | ||||||
| Super Retail Group Ltd. | 20,495 | 159,663 | ||||||
| Viva Energy Group Ltd. | 423,365 | 514,481 | ||||||
| Western Areas Ltd. | 119,841 | 193,772 | ||||||
Westgold Resources Ltd.(2) | 166,509 | 260,865 | ||||||
| Whitehaven Coal Ltd. | 330,448 | 222,787 | ||||||
| 21,758,070 | ||||||||
| Austria — 0.6% | ||||||||
| AT&S Austria Technologie & Systemtechnik AG | 14,314 | 276,926 | ||||||
IMMOFINANZ AG(2) | 25,436 | 422,369 | ||||||
Lenzing AG(2) | 1,734 | 90,005 | ||||||
Oesterreichische Post AG(1) | 12,477 | 416,826 | ||||||
POLYTEC Holding AG(2) | 5,730 | 35,537 | ||||||
Porr AG(1)(2) | 4,018 | 57,623 | ||||||
| UNIQA Insurance Group AG | 37,435 | 248,718 | ||||||
Vienna Insurance Group AG Wiener Versicherung Gruppe(2) | 10,469 | 256,135 | ||||||
| 1,804,139 | ||||||||
| Belgium — 1.9% | ||||||||
| Bekaert SA | 59,180 | 1,192,227 | ||||||
bpost SA(2) | 93,946 | 939,621 | ||||||
Deceuninck NV(2) | 88,797 | 166,346 | ||||||
Kinepolis Group NV(2) | 15,454 | 605,401 | ||||||
| Orange Belgium SA | 59,161 | 997,109 | ||||||
Tessenderlo Group SA(2) | 33,166 | 1,240,367 | ||||||
| 5,141,071 | ||||||||
| Canada — 8.8% | ||||||||
Advantage Oil & Gas Ltd.(1)(2) | 48,159 | 80,120 | ||||||
| Aecon Group, Inc. | 24,630 | 274,558 | ||||||
Air Canada(2) | 2,010 | 27,121 | ||||||
| Alaris Royalty Corp. | 3,820 | 34,939 | ||||||
ARC Resources Ltd.(1) | 126,891 | 640,122 | ||||||
Argonaut Gold, Inc.(2) | 59,004 | 125,305 | ||||||
| B2Gold Corp. | 137,854 | 925,826 | ||||||
Baytex Energy Corp.(1)(2) | 121,172 | 62,242 | ||||||
Birchcliff Energy Ltd.(1) | 52,932 | 64,930 | ||||||
Bird Construction, Inc.(1) | 10,088 | 52,824 | ||||||
| Canacol Energy Ltd. | 45,007 | 121,459 | ||||||
| Canadian Western Bank | 26,470 | 562,945 | ||||||
| Capital Power Corp. | 45,377 | 995,660 | ||||||
| Cascades, Inc. | 34,055 | 362,129 | ||||||
Celestica, Inc.(2) | 34,222 | 272,601 | ||||||
| Cenovus Energy, Inc. | 280,572 | 1,325,046 | ||||||
8
| Shares | Value | |||||||
CES Energy Solutions Corp.(1) | 76,822 | $ | 55,952 | |||||
China Gold International Resources Corp. Ltd.(2) | 71,290 | 96,194 | ||||||
| Chorus Aviation, Inc. | 26,317 | 54,476 | ||||||
Crescent Point Energy Corp.(1) | 210,007 | 368,702 | ||||||
CRH Medical Corp.(2) | 22,239 | 52,855 | ||||||
| Dundee Precious Metals, Inc. | 49,369 | 357,299 | ||||||
Endeavour Mining Corp.(2) | 17,652 | 489,360 | ||||||
Enerplus Corp.(1) | 71,122 | 188,663 | ||||||
Equinox Gold Corp.(2) | 16,149 | 211,094 | ||||||
| Equitable Group, Inc. | 5,896 | 349,371 | ||||||
ERO Copper Corp.(2) | 21,044 | 320,899 | ||||||
| Exchange Income Corp. | 3,711 | 90,389 | ||||||
| Finning International, Inc. | 45,510 | 694,679 | ||||||
| First National Financial Corp. | 5,545 | 140,926 | ||||||
Fortuna Silver Mines, Inc.(2) | 50,876 | 370,546 | ||||||
| Frontera Energy Corp. | 18,731 | 39,204 | ||||||
| Genworth MI Canada, Inc. | 12,144 | 331,636 | ||||||
| goeasy Ltd. | 5,223 | 260,039 | ||||||
Gran Colombia Gold Corp.(2) | 20,353 | 93,624 | ||||||
| Hardwoods Distribution, Inc. | 8,067 | 142,681 | ||||||
| High Liner Foods, Inc. | 8,067 | 50,405 | ||||||
| HLS Therapeutics, Inc. | 3,686 | 46,628 | ||||||
Home Capital Group, Inc.(2) | 18,529 | 313,090 | ||||||
| Hudbay Minerals, Inc. | 73,625 | 330,208 | ||||||
Husky Energy, Inc.(1) | 85,653 | 289,592 | ||||||
IAMGOLD Corp.(2) | 144,623 | 622,022 | ||||||
| Innergex Renewable Energy, Inc. | 30,660 | 529,354 | ||||||
Kelt Exploration Ltd.(1)(2) | 61,141 | 77,812 | ||||||
Keyera Corp.(1) | 53,630 | 979,389 | ||||||
Largo Resources Ltd.(2) | 54,923 | 45,055 | ||||||
| Linamar Corp. | 18,024 | 565,172 | ||||||
| Lundin Mining Corp. | 149,976 | 939,398 | ||||||
| Martinrea International, Inc. | 26,317 | 202,369 | ||||||
MEG Energy Corp.(2) | 43,761 | 121,451 | ||||||
| Methanex Corp. | 18,544 | 413,574 | ||||||
| Mullen Group Ltd. | 18,176 | 136,423 | ||||||
New Gold, Inc.(2) | 226,160 | 371,052 | ||||||
| North American Construction Group Ltd. | 8,067 | 57,518 | ||||||
| Northland Power, Inc. | 35,379 | 990,834 | ||||||
NuVista Energy Ltd.(1)(2) | 98,587 | 61,222 | ||||||
Paramount Resources Ltd., A Shares(1)(2) | 10,129 | 20,579 | ||||||
Parex Resources, Inc.(2) | 49,907 | 682,976 | ||||||
Peyto Exploration & Development Corp.(1) | 54,917 | 119,993 | ||||||
Precision Drilling Corp.(1)(2) | 50,876 | 35,884 | ||||||
Real Matters, Inc.(2) | 28,461 | 577,359 | ||||||
Roxgold, Inc.(2) | 90,157 | 111,975 | ||||||
| Russel Metals, Inc. | 23,464 | 336,935 | ||||||
Secure Energy Services, Inc.(1) | 32,012 | 37,059 | ||||||
Seven Generations Energy Ltd., Class A(2) | 102,305 | 323,147 | ||||||
Tamarack Valley Energy Ltd.(1)(2) | 52,932 | 38,146 | ||||||
Teranga Gold Corp.(2) | 40,747 | 474,213 | ||||||
| TORC Oil & Gas Ltd. | 52,932 | 71,017 | ||||||
9
| Shares | Value | |||||||
Torex Gold Resources, Inc.(2) | 29,513 | $ | 455,700 | |||||
| Tourmaline Oil Corp. | 63,925 | 812,080 | ||||||
| TransAlta Corp. | 41,612 | 267,343 | ||||||
| Transcontinental, Inc., Class A | 9,088 | 106,881 | ||||||
Trican Well Service Ltd.(1)(2) | 61,141 | 52,500 | ||||||
Turquoise Hill Resources Ltd.(2) | 247,710 | 273,471 | ||||||
Vermilion Energy, Inc.(1) | 31,483 | 125,029 | ||||||
Whitecap Resources, Inc.(1) | 170,746 | 336,426 | ||||||
| Yamana Gold, Inc. | 194,068 | 1,202,184 | ||||||
| 24,239,881 | ||||||||
| Denmark — 1.8% | ||||||||
| D/S Norden A/S | 32,180 | 496,683 | ||||||
Dfds A/S(2) | 20,815 | 784,526 | ||||||
H+H International A/S, B Shares(2) | 20,176 | 381,388 | ||||||
Jyske Bank A/S(2) | 30,062 | 894,681 | ||||||
NKT A/S(2) | 26,972 | 859,945 | ||||||
| NNIT A/S | 16,495 | 369,887 | ||||||
| Ringkjoebing Landbobank A/S | 3,913 | 295,034 | ||||||
Spar Nord Bank A/S(2) | 20,246 | 168,563 | ||||||
| Topdanmark A/S | 990 | 42,614 | ||||||
TORM plc(1) | 16,517 | 114,084 | ||||||
Zealand Pharma A/S(2) | 13,487 | 513,939 | ||||||
| 4,921,344 | ||||||||
| Finland — 1.3% | ||||||||
| Altia Oyj | 5,776 | 58,572 | ||||||
Finnair Oyj(1)(2) | 580,249 | 302,658 | ||||||
HKScan Oyj, A Shares(1)(2) | 45,019 | 103,012 | ||||||
| Kemira Oyj | 57,968 | 801,550 | ||||||
| Neles Oyj | 13,913 | 189,838 | ||||||
Outokumpu Oyj(1)(2) | 269,350 | 727,583 | ||||||
Talenom Oyj(1) | 3,108 | 32,111 | ||||||
| Uponor Oyj | 47,084 | 826,990 | ||||||
| YIT Oyj | 100,179 | 616,002 | ||||||
| 3,658,316 | ||||||||
| France — 2.8% | ||||||||
Air France-KLM(1)(2) | 41,146 | 185,175 | ||||||
| Albioma SA | 19,199 | 1,019,281 | ||||||
ALD SA(1) | 32,704 | 335,854 | ||||||
| APERAM SA | 16,866 | 498,066 | ||||||
Bigben Interactive(2) | 10,469 | 167,331 | ||||||
CGG SA(2) | 434,285 | 394,900 | ||||||
| Cie Plastic Omnium SA | 19,211 | 433,160 | ||||||
| Derichebourg SA | 66,236 | 191,050 | ||||||
Eramet SA(2) | 204 | 6,954 | ||||||
Etablissements Maurel et Prom SA(1)(2) | 37,921 | 75,443 | ||||||
| Eutelsat Communications SA | 32,995 | 330,882 | ||||||
FIGEAC-AERO(2) | 5,557 | 21,070 | ||||||
| Gaztransport Et Technigaz SA | 12,143 | 1,142,644 | ||||||
Innate Pharma SA(2) | 14,820 | 95,601 | ||||||
LISI(2) | 11,260 | 255,202 | ||||||
Maisons du Monde SA(2) | 29,155 | 472,710 | ||||||
Metropole Television SA(2) | 18,023 | 224,840 | ||||||
10
| Shares | Value | |||||||
Nexans SA(2) | 20,224 | $ | 1,135,502 | |||||
| SES SA | 17,638 | 125,162 | ||||||
Television Francaise 1(1)(2) | 31,697 | 193,544 | ||||||
| Valeo SA | 13,133 | 400,796 | ||||||
| 7,705,167 | ||||||||
| Germany — 5.4% | ||||||||
Aareal Bank AG(2) | 27,823 | 622,139 | ||||||
| Aurubis AG | 16,859 | 1,211,202 | ||||||
Bauer AG(2) | 6,076 | 66,310 | ||||||
| Borussia Dortmund GmbH & Co. KGaA | 37,745 | 252,656 | ||||||
| CropEnergies AG | 12,785 | 186,608 | ||||||
Deutsche Pfandbriefbank AG(2) | 60,154 | 438,253 | ||||||
Deutz AG(2) | 33,201 | 178,249 | ||||||
Dialog Semiconductor plc(2) | 43,772 | 1,897,316 | ||||||
Draegerwerk AG & Co. KGaA, Preference Shares(2) | 4,559 | 386,265 | ||||||
ElringKlinger AG(2) | 16,863 | 120,852 | ||||||
| Hamburger Hafen und Logistik AG | 13,823 | 255,663 | ||||||
| Hornbach Holding AG & Co. KGaA | 3,044 | 331,521 | ||||||
| HUGO BOSS AG | 36,224 | 959,192 | ||||||
JOST Werke AG(2) | 8,428 | 354,358 | ||||||
| Jungheinrich AG, Preference Shares | 33,514 | 1,075,216 | ||||||
| K+S AG | 104,975 | 727,905 | ||||||
Kloeckner & Co. SE(2) | 32,192 | 197,580 | ||||||
| METRO AG | 37,758 | 373,650 | ||||||
| MLP SE | 24,956 | 171,002 | ||||||
| Rheinmetall AG | 20,711 | 1,916,656 | ||||||
SAF-Holland SE(2) | 25,248 | 207,958 | ||||||
Salzgitter AG(2) | 24,489 | 395,247 | ||||||
| Siltronic AG | 10,119 | 940,747 | ||||||
SMA Solar Technology AG(2) | 6,626 | 299,557 | ||||||
| Wacker Chemie AG | 10,786 | 1,053,594 | ||||||
| Wuestenrot & Wuerttembergische AG | 11,456 | 199,050 | ||||||
| 14,818,746 | ||||||||
| Hong Kong — 1.7% | ||||||||
| Aeon Credit Service Asia Co. Ltd. | 10,000 | 6,662 | ||||||
| BOCOM International Holdings Co. Ltd. | 468,000 | 64,413 | ||||||
| Bright Smart Securities & Commodities Group Ltd. | 132,000 | 30,809 | ||||||
| Chow Sang Sang Holdings International Ltd. | 220,000 | 246,994 | ||||||
| Convenience Retail Asia Ltd. | 56,000 | 28,755 | ||||||
| Cowell e Holdings, Inc. | 1,158,000 | 462,270 | ||||||
| Crystal International Group Ltd. | 44,000 | 11,868 | ||||||
| CSI Properties Ltd. | 830,000 | 25,706 | ||||||
| Dah Sing Banking Group Ltd. | 22,800 | 21,627 | ||||||
| Dah Sing Financial Holdings Ltd. | 102,400 | 290,766 | ||||||
Emperor Capital Group Ltd.(2) | 264,000 | 4,888 | ||||||
| Far East Consortium International Ltd. | 134,000 | 42,785 | ||||||
| First Pacific Co. Ltd. | 690,000 | 193,039 | ||||||
| FSE Services Group Ltd. | 5,000 | 2,044 | ||||||
| Get Nice Financial Group Ltd. | 16,000 | 1,484 | ||||||
| Get Nice Holdings Ltd. | 2,700,000 | 54,675 | ||||||
| Guotai Junan International Holdings Ltd. | 4,590,000 | 673,007 | ||||||
| Hang Lung Group Ltd. | 66,000 | 170,012 | ||||||
11
| Shares | Value | |||||||
Hengdeli Holdings Ltd.(2) | 232,000 | $ | 8,977 | |||||
| Hongkong & Shanghai Hotels Ltd. (The) | 56,000 | 44,783 | ||||||
| Johnson Electric Holdings Ltd. | 153,000 | 301,470 | ||||||
| K Wah International Holdings Ltd. | 665,000 | 314,993 | ||||||
| Lippo China Resources Ltd. | 50,000 | 876 | ||||||
| Minmetals Land Ltd. | 400,000 | 48,835 | ||||||
| Pacific Basin Shipping Ltd. | 2,481,000 | 361,164 | ||||||
| Pacific Textiles Holdings Ltd. | 439,000 | 193,871 | ||||||
| Pico Far East Holdings Ltd. | 144,000 | 18,298 | ||||||
| Regal Hotels International Holdings Ltd. | 12,000 | 4,335 | ||||||
| Shun Tak Holdings Ltd. | 2,434,000 | 837,914 | ||||||
| Singamas Container Holdings Ltd. | 766,000 | 33,034 | ||||||
| Soundwill Holdings Ltd. | 2,500 | 2,277 | ||||||
| Sun Hung Kai & Co. Ltd. | 278,000 | 114,306 | ||||||
| Texwinca Holdings Ltd. | 420,000 | 61,122 | ||||||
| United Laboratories International Holdings Ltd. (The) | 62,000 | 72,842 | ||||||
| Xin Point Holdings Ltd. | 9,000 | 2,304 | ||||||
| 4,753,205 | ||||||||
| Ireland — 0.3% | ||||||||
| Dalata Hotel Group plc | 201,583 | 658,698 | ||||||
FBD Holdings plc(2) | 6,074 | 43,642 | ||||||
Permanent TSB Group Holdings plc(2) | 32,550 | 19,811 | ||||||
| 722,151 | ||||||||
| Israel — 1.6% | ||||||||
| Adgar Investment and Development Ltd. | 12,943 | 18,272 | ||||||
| Ashtrom Group Ltd. | 15,352 | 206,858 | ||||||
| Caesarstone Ltd. | 14,092 | 155,505 | ||||||
| Carasso Motors Ltd. | 18,766 | 59,989 | ||||||
Cellcom Israel Ltd.(2) | 57,783 | 210,599 | ||||||
Equital Ltd.(2) | 6,549 | 130,848 | ||||||
Fattal Holdings 1998 Ltd.(2) | 3,864 | 255,307 | ||||||
| FIBI Holdings Ltd. | 9,395 | 246,788 | ||||||
| First International Bank of Israel Ltd. | 13,310 | 311,375 | ||||||
| Fox Wizel Ltd. | 4,539 | 224,591 | ||||||
| Gazit-Globe Ltd. | 24,125 | 125,189 | ||||||
| Inrom Construction Industries Ltd. | 8,601 | 34,515 | ||||||
| Isracard Ltd. | 105,110 | 292,440 | ||||||
Israel Corp. Ltd. (The)(2) | 487 | 57,884 | ||||||
| Melisron Ltd. | 8,331 | 333,459 | ||||||
| Menora Mivtachim Holdings Ltd. | 8,254 | 107,202 | ||||||
Naphtha Israel Petroleum Corp. Ltd.(2) | 10,420 | 38,418 | ||||||
Nawi Brothers Ltd.(2) | 9,573 | 44,508 | ||||||
| Oil Refineries Ltd. | 1,014,042 | 206,317 | ||||||
Partner Communications Co. Ltd.(2) | 37,096 | 160,075 | ||||||
| Paz Oil Co. Ltd. | 2,873 | 291,036 | ||||||
Phoenix Holdings Ltd. (The)(2) | 82,809 | 413,741 | ||||||
| Rami Levy Chain Stores Hashikma Marketing 2006 Ltd. | 432 | 25,981 | ||||||
Silicom Ltd.(2) | 587 | 21,654 | ||||||
Tower Semiconductor Ltd.(2) | 24,765 | 485,936 | ||||||
| 4,458,487 | ||||||||
| Italy — 2.7% | ||||||||
Aeffe SpA(2) | 11,456 | 12,271 | ||||||
12
| Shares | Value | |||||||
Banca Farmafactoring SpA(2) | 131,803 | $ | 731,889 | |||||
Banca IFIS SpA(2) | 29,141 | 303,369 | ||||||
Banca Popolare di Sondrio SCPA(2) | 402,872 | 967,637 | ||||||
Banco di Desio e della Brianza SpA(2) | 68,561 | 184,112 | ||||||
Biesse SpA(2) | 16,646 | 279,076 | ||||||
Cairo Communication SpA(2) | 81,200 | 129,072 | ||||||
| Cementir Holding NV | 15,812 | 110,338 | ||||||
| Danieli & C Officine Meccaniche SpA | 21,030 | 313,904 | ||||||
| Danieli & C Officine Meccaniche SpA, Preference Shares | 68,915 | 600,613 | ||||||
Digital Bros SpA(2) | 2,722 | 72,174 | ||||||
Elica SpA(2) | 46,001 | 144,485 | ||||||
Esprinet SpA(2) | 1,811 | 11,290 | ||||||
Fincantieri SpA(2) | 67,324 | 47,666 | ||||||
FNM SpA(2) | 205,760 | 158,599 | ||||||
Geox SpA(2) | 46,011 | 36,186 | ||||||
Maire Tecnimont SpA(2) | 138,576 | 250,557 | ||||||
| Massimo Zanetti Beverage Group SpA | 6,198 | 27,670 | ||||||
Mediaset SpA(2) | 193,306 | 357,407 | ||||||
OVS SpA(2) | 403,447 | 388,192 | ||||||
| RAI Way SpA | 55,198 | 360,202 | ||||||
| Reno de Medici SpA | 301,175 | 295,311 | ||||||
Saras SpA(2) | 701,793 | 487,203 | ||||||
Sogefi SpA(2) | 21,573 | 23,513 | ||||||
Technogym SpA(2) | 90,643 | 815,555 | ||||||
| Webuild SpA | 219,746 | 285,627 | ||||||
| 7,393,918 | ||||||||
| Japan — 27.4% | ||||||||
| A&D Co. Ltd. | 900 | 5,423 | ||||||
| Adastria Co. Ltd. | 6,300 | 98,218 | ||||||
| ADEKA Corp. | 15,700 | 229,097 | ||||||
Aeon Fantasy Co. Ltd.(1) | 800 | 12,868 | ||||||
| AEON Financial Service Co. Ltd. | 27,600 | 244,734 | ||||||
| Aichi Steel Corp. | 700 | 17,488 | ||||||
| Airport Facilities Co. Ltd. | 3,500 | 13,790 | ||||||
| Aisan Industry Co. Ltd. | 4,700 | 21,068 | ||||||
| Akatsuki, Inc. | 800 | 30,482 | ||||||
| Alconix Corp. | 3,900 | 51,775 | ||||||
| Alinco, Inc. | 500 | 4,374 | ||||||
| Alps Alpine Co. Ltd. | 68,600 | 1,085,685 | ||||||
| Amuse, Inc. | 2,000 | 44,240 | ||||||
| AOKI Holdings, Inc. | 4,600 | 24,776 | ||||||
| Aoyama Trading Co. Ltd. | 400 | 2,402 | ||||||
| Aozora Bank Ltd. | 29,600 | 529,137 | ||||||
| Arata Corp. | 3,300 | 157,563 | ||||||
| Arcland Sakamoto Co. Ltd. | 5,400 | 107,224 | ||||||
| Artnature, Inc. | 2,000 | 11,597 | ||||||
| Asahi Co. Ltd. | 3,800 | 65,478 | ||||||
| Asahi Holdings, Inc. | 4,500 | 150,804 | ||||||
| Asanuma Corp. | 2,600 | 108,525 | ||||||
| Asia Pile Holdings Corp. | 1,400 | 6,126 | ||||||
| Bando Chemical Industries Ltd. | 4,500 | 24,582 | ||||||
| Bank of the Ryukyus Ltd. | 11,200 | 93,313 | ||||||
13
| Shares | Value | |||||||
| Bunka Shutter Co. Ltd. | 9,100 | $ | 64,658 | |||||
| Cawachi Ltd. | 600 | 17,068 | ||||||
| Chiba Kogyo Bank Ltd. (The) | 2,000 | 4,163 | ||||||
| Chubu Shiryo Co. Ltd. | 2,700 | 41,503 | ||||||
| Cleanup Corp. | 600 | 2,885 | ||||||
| CMIC Holdings Co. Ltd. | 1,200 | 14,811 | ||||||
| CONEXIO Corp. | 200 | 2,450 | ||||||
| Cosmo Energy Holdings Co. Ltd. | 32,700 | 515,891 | ||||||
| Credit Saison Co. Ltd. | 46,900 | 533,062 | ||||||
| CTI Engineering Co. Ltd. | 2,200 | 38,073 | ||||||
| Dai Nippon Toryo Co. Ltd. | 2,000 | 16,631 | ||||||
| Daicel Corp. | 63,500 | 459,484 | ||||||
| Daido Metal Co. Ltd. | 7,400 | 36,910 | ||||||
| Daiichi Kigenso Kagaku-Kogyo Co. Ltd. | 300 | 2,205 | ||||||
| Daiichikosho Co. Ltd. | 9,900 | 308,140 | ||||||
| Daiki Aluminium Industry Co. Ltd. | 3,900 | 18,437 | ||||||
| Daikoku Denki Co. Ltd. | 300 | 2,901 | ||||||
| Daikokutenbussan Co. Ltd. | 1,600 | 88,380 | ||||||
| Daikyonishikawa Corp. | 6,200 | 33,470 | ||||||
| Daio Paper Corp. | 13,400 | 182,653 | ||||||
| Daito Pharmaceutical Co. Ltd. | 1,400 | 45,568 | ||||||
| Daiwabo Holdings Co. Ltd. | 9,600 | 576,760 | ||||||
DCM Holdings Co. Ltd.(1) | 57,200 | 700,336 | ||||||
| Denka Co. Ltd. | 12,600 | 353,846 | ||||||
| Denyo Co. Ltd. | 1,000 | 20,483 | ||||||
| DIC Corp. | 34,100 | 806,585 | ||||||
| Dowa Holdings Co. Ltd. | 12,500 | 384,256 | ||||||
| DyDo Group Holdings, Inc. | 2,400 | 112,418 | ||||||
| Eagle Industry Co. Ltd. | 7,900 | 55,378 | ||||||
| Ebara Corp. | 32,800 | 837,836 | ||||||
| Eco's Co. Ltd. | 2,800 | 58,688 | ||||||
| EDION Corp. | 26,200 | 296,559 | ||||||
| Electric Power Development Co. Ltd. | 31,600 | 476,145 | ||||||
| ES-Con Japan Ltd. | 600 | 4,307 | ||||||
| Eslead Corp. | 700 | 8,612 | ||||||
| Exedy Corp. | 4,900 | 65,598 | ||||||
| F.C.C. Co. Ltd. | 14,600 | 264,995 | ||||||
| Feed One Co. Ltd. | 29,800 | 51,699 | ||||||
| Ferrotec Holdings Corp. | 8,100 | 58,540 | ||||||
| FIDEA Holdings Co. Ltd. | 20,400 | 19,957 | ||||||
Financial Products Group Co. Ltd.(1) | 5,700 | 28,897 | ||||||
| Foster Electric Co. Ltd. | 2,700 | 29,605 | ||||||
| Fuji Co. Ltd. | 3,500 | 61,412 | ||||||
| Fujibo Holdings, Inc. | 400 | 13,495 | ||||||
| Fujikura Ltd. | 130,100 | 378,012 | ||||||
| Fujimori Kogyo Co. Ltd. | 2,600 | 96,214 | ||||||
| Fujita Kanko, Inc. | 1,100 | 15,654 | ||||||
| Fukuyama Transporting Co. Ltd. | 1,700 | 83,581 | ||||||
| Fumakilla Ltd. | 1,400 | 24,610 | ||||||
| Furukawa Battery Co. Ltd. (The) | 6,600 | 69,096 | ||||||
| Furukawa Co. Ltd. | 8,300 | 83,274 | ||||||
| Furukawa Electric Co. Ltd. | 33,400 | 792,258 | ||||||
14
| Shares | Value | |||||||
| Furuno Electric Co. Ltd. | 2,900 | $ | 25,724 | |||||
| Furyu Corp. | 6,400 | 62,804 | ||||||
| Futaba Industrial Co. Ltd. | 12,700 | 66,208 | ||||||
| Fuyo General Lease Co. Ltd. | 4,700 | 282,730 | ||||||
| G-7 Holdings, Inc. | 600 | 18,122 | ||||||
| G-Tekt Corp. | 3,200 | 31,130 | ||||||
| Gecoss Corp. | 2,200 | 19,699 | ||||||
| Genky DrugStores Co. Ltd. | 900 | 29,251 | ||||||
| Geo Holdings Corp. | 13,800 | 223,533 | ||||||
| GLOBERIDE, Inc. | 1,200 | 37,841 | ||||||
| GMO Financial Holdings, Inc. | 5,500 | 34,912 | ||||||
| Goldcrest Co. Ltd. | 3,400 | 47,179 | ||||||
| GS Yuasa Corp. | 32,900 | 538,992 | ||||||
| GungHo Online Entertainment, Inc. | 1,800 | 37,096 | ||||||
| H2O Retailing Corp. | 19,800 | 138,014 | ||||||
| Hagihara Industries, Inc. | 200 | 2,745 | ||||||
| Hamakyorex Co. Ltd. | 4,800 | 149,690 | ||||||
| Hanwa Co. Ltd. | 13,600 | 272,876 | ||||||
| Harima Chemicals Group, Inc. | 300 | 2,658 | ||||||
| Hazama Ando Corp. | 58,900 | 399,138 | ||||||
| Heiwa Real Estate Co. Ltd. | 7,900 | 209,900 | ||||||
| Heiwado Co. Ltd. | 8,500 | 176,449 | ||||||
| Hinokiya Group Co. Ltd. | 1,100 | 18,584 | ||||||
| Hiroshima Bank Ltd. (The) | 64,200 | 324,458 | ||||||
| Hitachi Capital Corp. | 26,400 | 641,090 | ||||||
| Hitachi Transport System Ltd. | 9,700 | 336,844 | ||||||
| Hitachi Zosen Corp. | 69,200 | 272,344 | ||||||
| Hochiki Corp. | 1,300 | 14,524 | ||||||
| Hokuetsu Corp. | 22,700 | 77,061 | ||||||
| Hokuhoku Financial Group, Inc. | 25,900 | 239,839 | ||||||
| Hokuto Corp. | 8,000 | 162,449 | ||||||
| Honeys Holdings Co. Ltd. | 3,500 | 37,432 | ||||||
| Hoosiers Holdings | 7,600 | 44,984 | ||||||
| I-Net Corp./Kanagawa | 1,400 | 19,803 | ||||||
| Ichigo, Inc. | 65,900 | 176,065 | ||||||
| Ichikoh Industries Ltd. | 700 | 3,256 | ||||||
| Ichinen Holdings Co. Ltd. | 4,300 | 49,564 | ||||||
| IDEA Consultants, Inc. | 200 | 3,427 | ||||||
| IDOM, Inc. | 2,600 | 13,259 | ||||||
| IHI Corp. | 29,100 | 426,527 | ||||||
| Iino Kaiun Kaisha Ltd. | 21,500 | 71,249 | ||||||
| Inabata & Co. Ltd. | 1,000 | 12,299 | ||||||
| Ines Corp. | 2,800 | 35,202 | ||||||
| Internet Initiative Japan, Inc. | 12,000 | 484,077 | ||||||
| Isetan Mitsukoshi Holdings Ltd. | 64,500 | 354,263 | ||||||
| Itochu Enex Co. Ltd. | 18,700 | 165,558 | ||||||
| IwaiCosmo Holdings, Inc. | 2,800 | 33,212 | ||||||
Iwatani Corp.(1) | 8,500 | 305,526 | ||||||
Izumi Co. Ltd.(1) | 19,900 | 774,446 | ||||||
J Front Retailing Co. Ltd.(1) | 54,600 | 378,879 | ||||||
| Jaccs Co. Ltd. | 3,400 | 55,680 | ||||||
| Japan Aviation Electronics Industry Ltd. | 16,500 | 214,114 | ||||||
15
| Shares | Value | |||||||
| Japan Transcity Corp. | 4,400 | $ | 20,658 | |||||
| Japan Wool Textile Co. Ltd. (The) | 9,900 | 90,797 | ||||||
| JDC Corp. | 14,000 | 76,661 | ||||||
| JFE Holdings, Inc. | 72,000 | 535,159 | ||||||
| JGC Holdings Corp. | 38,500 | 423,713 | ||||||
| JK Holdings Co. Ltd. | 3,300 | 23,134 | ||||||
| Joshin Denki Co. Ltd. | 2,200 | 49,001 | ||||||
| JSP Corp. | 1,200 | 17,570 | ||||||
| JTEKT Corp. | 68,000 | 522,996 | ||||||
| JVCKenwood Corp. | 49,900 | 73,751 | ||||||
| K's Holdings Corp. | 57,000 | 806,215 | ||||||
| Kaga Electronics Co. Ltd. | 3,400 | 67,176 | ||||||
| Kamei Corp. | 4,100 | 38,179 | ||||||
| Kanamoto Co. Ltd. | 17,700 | 383,327 | ||||||
| Kandenko Co. Ltd. | 29,400 | 230,501 | ||||||
| Kaneka Corp. | 19,400 | 489,049 | ||||||
| Kanematsu Corp. | 27,700 | 349,683 | ||||||
| Kanto Denka Kogyo Co. Ltd. | 11,700 | 84,218 | ||||||
| Kasai Kogyo Co. Ltd. | 700 | 2,511 | ||||||
| KAWADA TECHNOLOGIES, Inc. | 200 | 9,409 | ||||||
| Kawasaki Heavy Industries Ltd. | 51,100 | 721,136 | ||||||
Kawasaki Kisen Kaisha Ltd.(2) | 15,700 | 174,505 | ||||||
| Keikyu Corp. | 49,100 | 731,777 | ||||||
| Kewpie Corp. | 21,300 | 403,265 | ||||||
| Kintetsu World Express, Inc. | 3,800 | 78,101 | ||||||
| Kirindo Holdings Co. Ltd. | 1,500 | 38,806 | ||||||
| Kito Corp. | 1,700 | 17,886 | ||||||
| Kitz Corp. | 12,600 | 73,398 | ||||||
| Kiyo Bank Ltd. (The) | 22,200 | 327,914 | ||||||
Kobe Steel Ltd.(2) | 100,800 | 385,736 | ||||||
| Kohnan Shoji Co. Ltd. | 15,200 | 548,616 | ||||||
Kojima Co. Ltd.(1) | 5,200 | 27,621 | ||||||
| Komeri Co. Ltd. | 9,300 | 287,752 | ||||||
| Konica Minolta, Inc. | 124,200 | 400,574 | ||||||
| Konoike Transport Co. Ltd. | 3,700 | 39,259 | ||||||
Koshidaka Holdings Co. Ltd.(1) | 4,600 | 19,822 | ||||||
| Kumagai Gumi Co. Ltd. | 15,900 | 405,728 | ||||||
| Kuraray Co. Ltd. | 81,700 | 828,041 | ||||||
| Kurimoto Ltd. | 800 | 14,087 | ||||||
| Kuriyama Holdings Corp. | 400 | 1,922 | ||||||
KYB Corp.(2) | 4,300 | 85,985 | ||||||
| Kyoei Steel Ltd. | 3,700 | 46,425 | ||||||
| Kyokuyo Co. Ltd. | 1,800 | 45,627 | ||||||
| Kyudenko Corp. | 21,100 | 601,598 | ||||||
| Lacto Japan Co. Ltd. | 1,800 | 60,780 | ||||||
Lawson, Inc.(1) | 1,800 | 88,798 | ||||||
| Life Corp. | 5,900 | 269,601 | ||||||
| Macnica Fuji Electronics Holdings, Inc. | 11,700 | 197,078 | ||||||
| Maeda Corp. | 46,700 | 345,943 | ||||||
| Maeda Road Construction Co. Ltd. | 12,500 | 230,285 | ||||||
| Marudai Food Co. Ltd. | 1,400 | 24,434 | ||||||
| Maruha Nichiro Corp. | 7,300 | 164,952 | ||||||
16
| Shares | Value | |||||||
| Maruwa Co. Ltd. | 200 | $ | 16,847 | |||||
| Maruzen Showa Unyu Co. Ltd. | 2,500 | 80,730 | ||||||
| Mazda Motor Corp. | 63,600 | 405,904 | ||||||
| Mebuki Financial Group, Inc. | 19,800 | 47,916 | ||||||
| Megmilk Snow Brand Co. Ltd. | 9,600 | 218,242 | ||||||
Meiko Electronics Co. Ltd.(1) | 2,400 | 37,343 | ||||||
| Mie Kotsu Group Holdings, Inc. | 8,900 | 38,659 | ||||||
| Mimasu Semiconductor Industry Co. Ltd. | 3,300 | 66,778 | ||||||
Ministop Co. Ltd.(1) | 3,300 | 47,120 | ||||||
| Mitani Sangyo Co. Ltd. | 4,200 | 13,892 | ||||||
Mitsuba Corp.(2) | 2,900 | 10,183 | ||||||
| Mitsubishi Materials Corp. | 20,600 | 431,865 | ||||||
| Mitsubishi UFJ Lease & Finance Co. Ltd. | 152,000 | 716,466 | ||||||
| Mitsuboshi Belting Ltd. | 400 | 6,180 | ||||||
| Mitsui Chemicals, Inc. | 40,700 | 954,601 | ||||||
Mitsui E&S Holdings Co. Ltd.(2) | 13,200 | 53,345 | ||||||
| Mitsui Mining & Smelting Co. Ltd. | 29,300 | 701,498 | ||||||
| Mitsui OSK Lines Ltd. | 44,700 | 824,664 | ||||||
| Mitsui Sugar Co. Ltd. | 3,400 | 62,187 | ||||||
| Mitsui-Soko Holdings Co. Ltd. | 6,400 | 106,919 | ||||||
| Mizuho Leasing Co. Ltd. | 4,700 | 118,278 | ||||||
| Modec, Inc. | 6,200 | 103,369 | ||||||
| Morinaga Milk Industry Co. Ltd. | 12,200 | 595,264 | ||||||
| Moriroku Holdings Co. Ltd. | 300 | 4,758 | ||||||
| MrMax Holdings Ltd. | 9,700 | 69,006 | ||||||
| Musashi Seimitsu Industry Co. Ltd. | 8,000 | 80,096 | ||||||
| Musashino Bank Ltd. (The) | 3,800 | 55,203 | ||||||
| Nachi-Fujikoshi Corp. | 4,900 | 151,839 | ||||||
| Nankai Electric Railway Co. Ltd. | 36,600 | 804,654 | ||||||
| NEC Capital Solutions Ltd. | 2,100 | 35,731 | ||||||
| NHK Spring Co. Ltd. | 10,100 | 63,371 | ||||||
| Nichi-iko Pharmaceutical Co. Ltd. | 7,700 | 86,253 | ||||||
| Nichiha Corp. | 4,700 | 110,576 | ||||||
| Nichireki Co. Ltd. | 4,900 | 76,681 | ||||||
| Nifco, Inc. | 36,300 | 929,704 | ||||||
| Nihon Chouzai Co. Ltd. | 1,200 | 18,591 | ||||||
Nihon Flush Co. Ltd.(1) | 3,600 | 47,312 | ||||||
| Nihon House Holdings Co. Ltd. | 2,100 | 5,176 | ||||||
| Nihon Tokushu Toryo Co. Ltd. | 1,400 | 12,526 | ||||||
| Nikkon Holdings Co. Ltd. | 2,600 | 57,304 | ||||||
| Nippon Carbon Co. Ltd. | 3,900 | 126,736 | ||||||
| Nippon Chemical Industrial Co. Ltd. | 300 | 6,119 | ||||||
| Nippon Coke & Engineering Co. Ltd. | 34,600 | 20,163 | ||||||
| Nippon Express Co. Ltd. | 5,700 | 336,515 | ||||||
| Nippon Koei Co. Ltd. | 2,900 | 76,089 | ||||||
| Nippon Light Metal Holdings Co. Ltd. | 180,500 | 316,160 | ||||||
Nippon Paper Industries Co. Ltd.(1) | 48,500 | 616,918 | ||||||
| Nippon Seiki Co. Ltd. | 7,600 | 77,791 | ||||||
| Nippon Yakin Kogyo Co. Ltd. | 1,510 | 21,531 | ||||||
| Nippon Yusen KK | 80,400 | 1,241,690 | ||||||
Nipro Corp.(1) | 20,500 | 231,203 | ||||||
| Nishi-Nippon Financial Holdings, Inc. | 3,100 | 20,327 | ||||||
17
| Shares | Value | |||||||
| Nishimatsu Construction Co. Ltd. | 24,800 | $ | 471,346 | |||||
| Nishio Rent All Co. Ltd. | 5,800 | 127,367 | ||||||
| Nisshin Group Holdings Co. Ltd. | 400 | 1,523 | ||||||
| Nisshin Oillio Group Ltd. (The) | 4,700 | 140,089 | ||||||
| Nissin Electric Co. Ltd. | 17,300 | 183,353 | ||||||
Nisso Corp.(1) | 2,400 | 16,911 | ||||||
| Nitto Kogyo Corp. | 8,300 | 147,759 | ||||||
| Nittoc Construction Co. Ltd. | 3,300 | 24,492 | ||||||
| Nojima Corp. | 7,900 | 233,752 | ||||||
| NOK Corp. | 24,100 | 261,707 | ||||||
| Noritz Corp. | 1,700 | 21,524 | ||||||
| NS United Kaiun Kaisha Ltd. | 1,100 | 14,222 | ||||||
| NTN Corp. | 101,800 | 192,827 | ||||||
| Oji Holdings Corp. | 222,800 | 996,496 | ||||||
| Oki Electric Industry Co. Ltd. | 43,700 | 418,448 | ||||||
| Onward Holdings Co. Ltd. | 13,000 | 33,402 | ||||||
| Open House Co. Ltd. | 1,100 | 38,903 | ||||||
| Organo Corp. | 300 | 15,841 | ||||||
| Orient Corp. | 136,100 | 149,862 | ||||||
| Osaka Organic Chemical Industry Ltd. | 600 | 13,721 | ||||||
| OSJB Holdings Corp. | 29,800 | 64,524 | ||||||
| Pacific Industrial Co. Ltd. | 10,900 | 102,060 | ||||||
| PAL GROUP Holdings Co. Ltd. | 3,700 | 40,033 | ||||||
| Pasco Corp. | 500 | 6,196 | ||||||
| Pasona Group, Inc. | 4,800 | 62,187 | ||||||
| Penta-Ocean Construction Co. Ltd. | 133,600 | 855,511 | ||||||
| Press Kogyo Co. Ltd. | 32,500 | 93,310 | ||||||
| Prima Meat Packers Ltd. | 3,300 | 96,408 | ||||||
| PS Mitsubishi Construction Co. Ltd. | 5,100 | 27,580 | ||||||
| Renaissance, Inc. | 1,400 | 12,539 | ||||||
| Rengo Co. Ltd. | 81,800 | 603,594 | ||||||
| Resorttrust, Inc. | 22,900 | 324,614 | ||||||
| Retail Partners Co. Ltd. | 5,200 | 91,372 | ||||||
| Ricoh Leasing Co. Ltd. | 3,000 | 76,590 | ||||||
| Riken Technos Corp. | 11,300 | 41,167 | ||||||
| Rokko Butter Co. Ltd. | 1,900 | 31,290 | ||||||
Round One Corp.(1) | 22,600 | 181,384 | ||||||
| Ryobi Ltd. | 2,500 | 27,876 | ||||||
| Ryoden Corp. | 1,700 | 23,052 | ||||||
| Ryosan Co. Ltd. | 2,200 | 40,537 | ||||||
| Sakura Internet, Inc. | 500 | 2,874 | ||||||
| Sala Corp. | 11,700 | 63,757 | ||||||
| San-A Co. Ltd. | 2,100 | 85,102 | ||||||
| San-Ai Oil Co. Ltd. | 19,800 | 174,385 | ||||||
| Sanei Architecture Planning Co. Ltd. | 1,600 | 19,795 | ||||||
| Sankyo Tateyama, Inc. | 4,100 | 35,444 | ||||||
| Sankyu, Inc. | 19,900 | 829,799 | ||||||
| Sanoh Industrial Co. Ltd. | 2,600 | 16,154 | ||||||
| Sanwa Holdings Corp. | 32,100 | 322,319 | ||||||
| Sapporo Holdings Ltd. | 21,800 | 388,257 | ||||||
| Sawada Holdings Co. Ltd. | 800 | 6,628 | ||||||
| SBI Holdings, Inc. | 63,500 | 1,441,361 | ||||||
18
| Shares | Value | |||||||
| SBS Holdings, Inc. | 7,400 | $ | 142,065 | |||||
| SEC Carbon Ltd. | 100 | 5,725 | ||||||
| Seibu Holdings, Inc. | 42,700 | 468,757 | ||||||
| Seikitokyu Kogyo Co. Ltd. | 6,400 | 51,980 | ||||||
Seiko Epson Corp.(1) | 31,300 | 372,759 | ||||||
| Seino Holdings Co. Ltd. | 20,000 | 305,693 | ||||||
| Seiren Co. Ltd. | 5,100 | 67,502 | ||||||
| Senko Group Holdings Co. Ltd. | 30,800 | 272,504 | ||||||
| Shibuya Corp. | 1,600 | 44,808 | ||||||
| Shin Nippon Air Technologies Co. Ltd. | 200 | 3,860 | ||||||
| Shinagawa Refractories Co. Ltd. | 100 | 2,107 | ||||||
| Shindengen Electric Manufacturing Co. Ltd. | 800 | 14,289 | ||||||
| Shinmaywa Industries Ltd. | 1,200 | 10,574 | ||||||
| Shinnihon Corp. | 5,300 | 41,712 | ||||||
| Shinoken Group Co. Ltd. | 3,600 | 32,520 | ||||||
| Shinsei Bank Ltd. | 31,800 | 368,728 | ||||||
| Showa Denko KK | 51,900 | 1,009,444 | ||||||
| Sinko Industries Ltd. | 3,300 | 42,396 | ||||||
| SK-Electronics Co. Ltd. | 200 | 1,935 | ||||||
| SKY Perfect JSAT Holdings, Inc. | 20,400 | 77,632 | ||||||
| Sotetsu Holdings, Inc. | 19,000 | 516,897 | ||||||
| St. Marc Holdings Co. Ltd. | 1,900 | 29,128 | ||||||
| Starts Corp., Inc. | 6,700 | 140,096 | ||||||
Studio Alice Co. Ltd.(1) | 1,700 | 24,540 | ||||||
Sugi Holdings Co. Ltd.(1) | 4,100 | 295,890 | ||||||
| SUMCO Corp. | 66,100 | 894,181 | ||||||
| Sumida Corp. | 3,400 | 20,666 | ||||||
| Sumitomo Densetsu Co. Ltd. | 700 | 14,759 | ||||||
| Sumitomo Forestry Co. Ltd. | 57,900 | 923,930 | ||||||
| Sumitomo Osaka Cement Co. Ltd. | 7,600 | 246,126 | ||||||
| Sumitomo Riko Co. Ltd. | 4,900 | 25,290 | ||||||
| Sumitomo Rubber Industries Ltd. | 85,600 | 822,468 | ||||||
| Sumitomo Seika Chemicals Co. Ltd. | 900 | 29,286 | ||||||
Suruga Bank Ltd.(1) | 39,600 | 141,984 | ||||||
| SWCC Showa Holdings Co. Ltd. | 5,100 | 53,514 | ||||||
| T-Gaia Corp. | 900 | 17,698 | ||||||
| Taiheiyo Cement Corp. | 59,500 | 1,508,174 | ||||||
| Taikisha Ltd. | 9,700 | 263,553 | ||||||
| Taiyo Yuden Co. Ltd. | 20,600 | 553,644 | ||||||
| Takamatsu Construction Group Co. Ltd. | 3,600 | 75,147 | ||||||
| Takamiya Co. Ltd. | 1,600 | 7,688 | ||||||
| Takara Leben Co. Ltd. | 22,200 | 72,379 | ||||||
| Takara Standard Co. Ltd. | 500 | 6,294 | ||||||
Takashimaya Co. Ltd.(1) | 39,600 | 311,482 | ||||||
| Takeei Corp. | 4,700 | 43,226 | ||||||
| Takuma Co. Ltd. | 31,000 | 496,242 | ||||||
| Tamron Co. Ltd. | 3,400 | 54,864 | ||||||
| Teijin Ltd. | 84,200 | 1,320,180 | ||||||
| Teikoku Electric Manufacturing Co. Ltd. | 900 | 9,640 | ||||||
| Tobishima Corp. | 1,500 | 15,692 | ||||||
Toda Corp.(1) | 63,700 | 415,825 | ||||||
| Toho Holdings Co. Ltd. | 4,000 | 77,260 | ||||||
19
| Shares | Value | |||||||
| Toho Titanium Co. Ltd. | 1,900 | $ | 12,296 | |||||
| TOKAI Holdings Corp. | 23,800 | 226,131 | ||||||
| Tokai Rika Co. Ltd. | 19,100 | 286,094 | ||||||
| Tokuyama Corp. | 28,300 | 660,533 | ||||||
| Tokyo Dome Corp. | 24,300 | 183,481 | ||||||
Tokyo Electron Device Ltd.(1) | 900 | 25,302 | ||||||
| Tomoku Co. Ltd. | 1,300 | 20,160 | ||||||
| TOMONY Holdings, Inc. | 3,100 | 9,901 | ||||||
| Topre Corp. | 7,100 | 78,888 | ||||||
| Tosho Co. Ltd. | 1,800 | 22,511 | ||||||
| Tosoh Corp. | 63,600 | 942,427 | ||||||
| Towa Corp. | 2,400 | 24,222 | ||||||
| Towa Pharmaceutical Co. Ltd. | 3,400 | 67,362 | ||||||
| Toyo Construction Co. Ltd. | 25,500 | 96,787 | ||||||
| Toyo Gosei Co. Ltd. | 200 | 14,570 | ||||||
| Toyo Seikan Group Holdings Ltd. | 30,500 | 336,783 | ||||||
| Toyo Tanso Co. Ltd. | 1,500 | 23,521 | ||||||
| Toyobo Co. Ltd. | 39,700 | 571,619 | ||||||
| Toyoda Gosei Co. Ltd. | 28,200 | 614,230 | ||||||
| Toyota Boshoku Corp. | 31,300 | 442,874 | ||||||
| TPR Co. Ltd. | 8,500 | 113,319 | ||||||
| TS Tech Co. Ltd. | 5,800 | 169,674 | ||||||
| Tsubakimoto Chain Co. | 9,300 | 215,922 | ||||||
| Tsukishima Kikai Co. Ltd. | 4,900 | 57,948 | ||||||
| Tsukui Corp. | 5,900 | 34,363 | ||||||
| Tsuzuki Denki Co. Ltd. | 4,200 | 64,113 | ||||||
| UACJ Corp. | 3,700 | 67,597 | ||||||
| Ube Industries Ltd. | 49,400 | 881,229 | ||||||
| Uchida Yoko Co. Ltd. | 4,000 | 237,029 | ||||||
| Unipres Corp. | 9,100 | 78,778 | ||||||
Unitika Ltd.(2) | 13,100 | 45,741 | ||||||
| Valor Holdings Co. Ltd. | 10,400 | 265,859 | ||||||
| VT Holdings Co. Ltd. | 22,800 | 83,780 | ||||||
| Wacom Co. Ltd. | 19,600 | 128,197 | ||||||
| Wakachiku Construction Co. Ltd. | 500 | 5,596 | ||||||
| Wakita & Co. Ltd. | 7,200 | 63,704 | ||||||
| Warabeya Nichiyo Holdings Co. Ltd. | 2,400 | 33,821 | ||||||
| Xebio Holdings Co. Ltd. | 900 | 6,388 | ||||||
| Yahagi Construction Co. Ltd. | 5,600 | 47,879 | ||||||
| YAMABIKO Corp. | 7,100 | 72,229 | ||||||
| Yamato Corp. | 700 | 4,126 | ||||||
| Yaoko Co. Ltd. | 1,100 | 85,943 | ||||||
| Yokohama Reito Co. Ltd. | 11,400 | 96,920 | ||||||
| Yokohama Rubber Co. Ltd. (The) | 57,100 | 891,745 | ||||||
| Yorozu Corp. | 3,700 | 32,580 | ||||||
| Yurtec Corp. | 6,900 | 41,284 | ||||||
| Zeon Corp. | 1,100 | 11,481 | ||||||
| 75,244,271 | ||||||||
| Netherlands — 2.1% | ||||||||
AerCap Holdings NV(2) | 34,621 | 1,023,743 | ||||||
| ASR Nederland NV | 32,566 | 1,128,688 | ||||||
| BE Semiconductor Industries NV | 20,253 | 967,712 | ||||||
20
| Shares | Value | |||||||
Flow Traders(1) | 6,205 | $ | 244,393 | |||||
Fugro NV, CVA(1)(2) | 48,702 | 207,947 | ||||||
Heijmans NV, CVA(2) | 29,318 | 247,624 | ||||||
Koninklijke BAM Groep NV(2) | 184,736 | 284,416 | ||||||
NIBC Holding NV(2) | 27,993 | 246,856 | ||||||
Pharming Group NV(1)(2) | 763,989 | 967,581 | ||||||
SIF Holding NV(1)(2) | 10,928 | 178,601 | ||||||
| TKH Group NV, CVA | 6,242 | 244,626 | ||||||
| 5,742,187 | ||||||||
| New Zealand — 0.8% | ||||||||
| Air New Zealand Ltd. | 441,595 | 413,595 | ||||||
| New Zealand Refining Co. Ltd. (The) | 171,366 | 76,028 | ||||||
| Oceania Healthcare Ltd. | 212,500 | 148,383 | ||||||
| SKYCITY Entertainment Group Ltd. | 663,515 | 1,134,853 | ||||||
| Tourism Holdings Ltd. | 55,096 | 76,677 | ||||||
| Z Energy Ltd. | 168,064 | 303,736 | ||||||
| 2,153,272 | ||||||||
| Norway — 2.1% | ||||||||
Aker Carbon Capture AS(1)(2) | 48,485 | 28,306 | ||||||
Aker Offshore Wind Holding AS(2) | 48,485 | 18,316 | ||||||
Aker Solutions ASA(2) | 64,648 | 72,574 | ||||||
Avance Gas Holding Ltd.(1) | 45,650 | 109,501 | ||||||
BW Energy Ltd.(2) | 11,629 | 27,219 | ||||||
| BW LPG Ltd. | 98,301 | 458,036 | ||||||
| BW Offshore Ltd. | 89,478 | 345,551 | ||||||
DNO ASA(1) | 402,827 | 254,086 | ||||||
| Golden Ocean Group Ltd. | 31,831 | 130,167 | ||||||
| Grieg Seafood ASA | 24,848 | 251,677 | ||||||
Komplett Bank ASA(2) | 47,352 | 37,787 | ||||||
Norwegian Finans Holding ASA(2) | 104,070 | 786,586 | ||||||
Odfjell Drilling Ltd.(2) | 43,482 | 57,643 | ||||||
PGS ASA(2) | 435,365 | 161,452 | ||||||
| Selvaag Bolig ASA | 27,650 | 168,346 | ||||||
| SpareBank 1 Nord Norge | 56,775 | 437,019 | ||||||
| Sparebank 1 Oestlandet | 22,243 | 226,549 | ||||||
| SpareBank 1 SMN | 3,596 | 35,760 | ||||||
| Sparebanken Vest | 75,182 | 559,035 | ||||||
| Stolt-Nielsen Ltd. | 24,651 | 241,187 | ||||||
| TGS Nopec Geophysical Co. ASA | 75,300 | 976,206 | ||||||
Veidekke ASA(2) | 18,790 | 252,745 | ||||||
Wallenius Wilhelmsen ASA(1)(2) | 49,028 | 86,071 | ||||||
| 5,721,819 | ||||||||
| Portugal — 0.2% | ||||||||
Mota-Engil SGPS SA(2) | 62,083 | 116,679 | ||||||
| Semapa-Sociedade de Investimento e Gestao | 52,588 | 477,974 | ||||||
| Sonae SGPS SA | 65,429 | 46,608 | ||||||
| 641,261 | ||||||||
| Singapore — 1.5% | ||||||||
| Accordia Golf Trust | 993,100 | 527,968 | ||||||
Banyan Tree Holdings Ltd.(2) | 151,800 | 26,196 | ||||||
| Boustead Singapore Ltd. | 215,100 | 112,915 | ||||||
| BRC Asia Ltd. | 63,700 | 52,829 | ||||||
21
| Shares | Value | |||||||
| China Sunsine Chemical Holdings Ltd. | 472,600 | $ | 126,617 | |||||
| Chip Eng Seng Corp. Ltd. | 174,300 | 57,581 | ||||||
| Food Empire Holdings Ltd. | 100,300 | 46,233 | ||||||
| Frencken Group Ltd. | 921,600 | 633,687 | ||||||
| Golden Agri-Resources Ltd. | 8,588,000 | 912,775 | ||||||
| Hong Leong Asia Ltd. | 233,000 | 83,663 | ||||||
| Hour Glass Ltd. (The) | 151,900 | 78,615 | ||||||
| Hutchison Port Holdings Trust, U Shares | 6,166,800 | 651,190 | ||||||
Indofood Agri Resources Ltd.(2) | 197,900 | 42,181 | ||||||
| Japfa Ltd. | 874,100 | 399,480 | ||||||
| Koufu Group Ltd. | 83,700 | 41,741 | ||||||
| Mewah International, Inc. | 116,300 | 20,001 | ||||||
OUE Ltd.(2) | 99,300 | 87,024 | ||||||
| QAF Ltd. | 46,300 | 31,284 | ||||||
| Sunningdale Tech Ltd. | 119,100 | 102,978 | ||||||
| 4,034,958 | ||||||||
| Spain — 1.8% | ||||||||
Acerinox SA(2) | 98,095 | 794,090 | ||||||
| Atresmedia Corp. de Medios de Comunicacion SA | 44,830 | 120,739 | ||||||
| Banco de Sabadell SA | 323,467 | 132,239 | ||||||
Construcciones y Auxiliar de Ferrocarriles SA(2) | 11,798 | 424,200 | ||||||
| Ence Energia y Celulosa SA | 48,688 | 156,233 | ||||||
| Ercros SA | 28,115 | 70,840 | ||||||
| Gestamp Automocion SA | 94,763 | 253,650 | ||||||
Grenergy Renovables(2) | 2,354 | 44,955 | ||||||
Liberbank SA(2) | 724,346 | 195,421 | ||||||
Masmovil Ibercom SA(2) | 6,857 | 183,617 | ||||||
Mediaset Espana Comunicacion SA(2) | 90,666 | 301,478 | ||||||
Melia Hotels International SA(2) | 73,155 | 306,185 | ||||||
Neinor Homes SA(2) | 51,222 | 688,176 | ||||||
| Prosegur Cia de Seguridad SA | 91,176 | 221,060 | ||||||
| Sacyr SA | 250,286 | 568,383 | ||||||
Tecnicas Reunidas SA(1)(2) | 19,548 | 249,663 | ||||||
| Viscofan SA | 2,170 | 160,618 | ||||||
| 4,871,547 | ||||||||
| Sweden — 6.7% | ||||||||
| Bahnhof AB, B Shares | 42,207 | 163,416 | ||||||
Bilia AB, A Shares(2) | 83,788 | 992,433 | ||||||
BioArctic AB(2) | 23,166 | 243,657 | ||||||
| Bonava AB, B Shares | 41,487 | 295,087 | ||||||
| Bure Equity AB | 56,821 | 1,752,720 | ||||||
| Cibus Nordic Real Estate AB | 7,290 | 128,060 | ||||||
| Clas Ohlson AB, B Shares | 57,672 | 669,027 | ||||||
Collector AB(1)(2) | 36,979 | 59,741 | ||||||
| Dios Fastigheter AB | 56,642 | 365,682 | ||||||
Electrolux Professional AB, B Shares(2) | 54,019 | 239,090 | ||||||
Eolus Vind AB, B Shares(1) | 32,537 | 577,404 | ||||||
| G5 Entertainment AB | 3,181 | 138,287 | ||||||
Granges AB(2) | 70,767 | 629,987 | ||||||
Haldex AB(2) | 19,530 | 89,243 | ||||||
Hexatronic Group AB(1)(2) | 23,258 | 183,146 | ||||||
Hoist Finance AB(1)(2) | 65,236 | 231,673 | ||||||
22
| Shares | Value | |||||||
| Klovern AB, B Shares | 493,811 | $ | 759,710 | |||||
| Kungsleden AB | 84,780 | 670,418 | ||||||
Maha Energy AB(1)(2) | 35,689 | 58,252 | ||||||
Mekonomen AB(2) | 20,611 | 220,156 | ||||||
Modern Times Group MTG AB, B Shares(2) | 81,605 | 1,113,668 | ||||||
| Mycronic AB | 72,843 | 1,657,510 | ||||||
| NCC AB, B Shares | 38,732 | 697,394 | ||||||
Nobia AB(2) | 66,247 | 426,278 | ||||||
Nobina AB(2) | 68,564 | 414,788 | ||||||
Nolato AB, B Shares(2) | 19,125 | 1,863,199 | ||||||
| NP3 Fastigheter AB | 35,790 | 422,237 | ||||||
Orexo AB(2) | 21,740 | 127,031 | ||||||
Pandox AB(2) | 53,761 | 611,657 | ||||||
| Paradox Interactive AB | 28,642 | 767,212 | ||||||
RaySearch Laboratories AB(1)(2) | 15,153 | 169,894 | ||||||
| Resurs Holding AB | 117,074 | 607,380 | ||||||
SAS AB(1)(2) | 207,437 | 155,968 | ||||||
Scandi Standard AB(2) | 54,141 | 468,422 | ||||||
| SkiStar AB | 38,843 | 467,103 | ||||||
| Tethys Oil AB | 23,742 | 130,296 | ||||||
| 18,567,226 | ||||||||
| Switzerland — 4.9% | ||||||||
Arbonia AG(2) | 26,171 | 343,163 | ||||||
Autoneum Holding AG(1)(2) | 3,840 | 461,321 | ||||||
| Bobst Group SA | 8,412 | 544,668 | ||||||
| Bossard Holding AG, Class A | 4,215 | 746,472 | ||||||
| Bucher Industries AG | 792 | 296,334 | ||||||
| Conzzeta AG | 1,729 | 1,797,624 | ||||||
EFG International AG(2) | 178,281 | 1,228,343 | ||||||
| Huber + Suhner AG | 21,459 | 1,658,762 | ||||||
| Implenia AG | 16,739 | 576,991 | ||||||
Ina Invest Holding AG(2) | 3,307 | 70,603 | ||||||
Leonteq AG(2) | 25,415 | 1,014,311 | ||||||
Schmolz + Bickenbach AG(2) | 914,271 | 160,605 | ||||||
| Sulzer AG | 6,284 | 558,925 | ||||||
| Swissquote Group Holding SA | 3,545 | 311,357 | ||||||
u-blox Holding AG(2) | 5,908 | 333,139 | ||||||
| Valiant Holding AG | 27,452 | 2,626,098 | ||||||
| Zehnder Group AG | 12,973 | 671,384 | ||||||
| 13,400,100 | ||||||||
| United Kingdom — 15.5% | ||||||||
| Aggreko plc | 122,021 | 778,368 | ||||||
| Anglo Asian Mining plc | 41,285 | 84,437 | ||||||
Bank of Georgia Group plc(2) | 13,485 | 165,682 | ||||||
| Biffa plc | 101,599 | 278,416 | ||||||
| Bodycote plc | 52,945 | 397,043 | ||||||
| Britvic plc | 86,088 | 975,287 | ||||||
| Burford Capital Ltd. | 36,533 | 276,505 | ||||||
Cairn Energy plc(2) | 322,558 | 607,167 | ||||||
| Centamin plc | 482,248 | 1,352,392 | ||||||
| Central Asia Metals plc | 55,087 | 129,671 | ||||||
| Close Brothers Group plc | 62,197 | 933,683 | ||||||
23
| Shares | Value | |||||||
| CMC Markets plc | 17,703 | $ | 75,576 | |||||
| Coats Group plc | 611,918 | 454,048 | ||||||
| Computacenter plc | 36,050 | 983,492 | ||||||
| Crest Nicholson Holdings plc | 108,883 | 288,349 | ||||||
| Daily Mail & General Trust plc | 42,075 | 371,533 | ||||||
| Dart Group plc | 41,292 | 394,107 | ||||||
| Devro plc | 82,717 | 191,732 | ||||||
| Direct Line Insurance Group plc | 144,657 | 574,017 | ||||||
| Diversified Gas & Oil plc | 202,245 | 297,593 | ||||||
| easyJet plc | 63,171 | 534,698 | ||||||
| Electrocomponents plc | 164,923 | 1,496,929 | ||||||
EnQuest plc(2) | 901,174 | 155,399 | ||||||
| Evraz plc | 155,687 | 674,708 | ||||||
| Ferrexpo plc | 103,111 | 254,527 | ||||||
| Forterra plc | 88,328 | 187,587 | ||||||
| Galliford Try Holdings plc | 43,791 | 50,377 | ||||||
| Go-Ahead Group plc (The) | 19,176 | 171,553 | ||||||
Golar LNG Ltd.(2) | 15,576 | 161,212 | ||||||
| Grafton Group plc | 56,369 | 587,363 | ||||||
| Greggs plc | 41,614 | 788,242 | ||||||
| Gulf Keystone Petroleum Ltd. | 97,724 | 109,862 | ||||||
| Gym Group plc (The) | 69,269 | 147,227 | ||||||
| Halfords Group plc | 73,229 | 161,417 | ||||||
| Hays plc | 456,129 | 735,335 | ||||||
Hochschild Mining plc(2) | 111,554 | 358,782 | ||||||
| Howden Joinery Group plc | 213,789 | 1,606,097 | ||||||
Ibstock plc(2) | 164,473 | 339,792 | ||||||
| IG Group Holdings plc | 141,134 | 1,496,016 | ||||||
Inchcape plc(2) | 172,798 | 1,167,643 | ||||||
Indivior plc(2) | 202,890 | 321,817 | ||||||
| IWG plc | 140,106 | 527,399 | ||||||
| J Sainsbury plc | 837,851 | 2,058,555 | ||||||
Jadestone Energy, Inc.(2) | 143,917 | 126,856 | ||||||
Just Group plc(2) | 189,391 | 128,863 | ||||||
| KAZ Minerals plc | 74,162 | 579,729 | ||||||
| Keller Group plc | 37,071 | 310,358 | ||||||
| Lookers plc | 51,425 | 14,436 | ||||||
| Luceco plc | 38,264 | 93,059 | ||||||
| Luxfer Holdings plc | 5,716 | 81,282 | ||||||
| Marks & Spencer Group plc | 345,705 | 513,417 | ||||||
| Marston's plc | 363,703 | 257,449 | ||||||
Mitchells & Butlers plc(2) | 96,730 | 222,661 | ||||||
| OneSavings Bank plc | 85,054 | 345,636 | ||||||
| Pagegroup plc | 141,212 | 727,123 | ||||||
| Pan African Resources plc | 1,140,108 | 373,390 | ||||||
Petrofac Ltd.(1) | 104,813 | 225,575 | ||||||
Petropavlovsk plc(1)(2) | 478,686 | 234,517 | ||||||
| Photo-Me International plc | 138,730 | 89,579 | ||||||
| Playtech plc | 92,186 | 457,797 | ||||||
| Plus500 Ltd. | 47,527 | 926,610 | ||||||
Premier Oil plc(1)(2) | 312,949 | 91,364 | ||||||
Provident Financial plc(2) | 60,913 | 200,632 | ||||||
24
| Shares | Value | |||||||
| Quilter plc | 1,006,124 | $ | 1,923,931 | |||||
| Reach plc | 165,144 | 116,118 | ||||||
| Redde Northgate plc | 72,474 | 181,940 | ||||||
| Redrow plc | 96,224 | 590,348 | ||||||
| Rhi Magnesita NV | 9,268 | 334,999 | ||||||
| Royal Mail plc | 375,210 | 900,304 | ||||||
| RSA Insurance Group plc | 43,325 | 262,436 | ||||||
| Serica Energy plc | 76,487 | 121,986 | ||||||
| Sirius Real Estate Ltd. | 442,716 | 440,300 | ||||||
| Speedy Hire plc | 247,222 | 170,403 | ||||||
| St. James's Place plc | 128,798 | 1,686,929 | ||||||
| Stock Spirits Group plc | 7,125 | 20,947 | ||||||
| Superdry plc | 17,209 | 30,734 | ||||||
| Tate & Lyle plc | 174,328 | 1,596,774 | ||||||
| Taylor Wimpey plc | 328,108 | 536,857 | ||||||
| Travis Perkins plc | 64,197 | 1,055,100 | ||||||
Tullow Oil plc(1) | 451,397 | 123,819 | ||||||
| Victrex plc | 10,859 | 280,445 | ||||||
| Vistry Group plc | 89,290 | 759,120 | ||||||
| WM Morrison Supermarkets plc | 653,597 | 1,680,117 | ||||||
| 42,515,575 | ||||||||
TOTAL COMMON STOCKS (Cost $258,223,786) | 274,266,711 | |||||||
RIGHTS† | ||||||||
Australia† | ||||||||
Coronado Global Resources, Inc.(2) (Cost $—) | 12,306 | 182 | ||||||
| TEMPORARY CASH INVESTMENTS — 0.1% | ||||||||
| State Street Institutional U.S. Government Money Market Fund, Premier Class (Cost $250,503) | 250,503 | 250,503 | ||||||
TEMPORARY CASH INVESTMENTS - SECURITIES LENDING COLLATERAL(3) — 1.5% | ||||||||
| State Street Navigator Securities Lending Government Money Market Portfolio (Cost $4,232,507) | 4,232,507 | 4,232,507 | ||||||
TOTAL INVESTMENT SECURITIES — 101.4% (Cost $262,706,796) | 278,749,903 | |||||||
| OTHER ASSETS AND LIABILITIES — (1.4)% | (3,925,220) | |||||||
| TOTAL NET ASSETS — 100.0% | $ | 274,824,683 | ||||||
25
| MARKET SECTOR DIVERSIFICATION | |||||
(as a % of net assets) | |||||
| Industrials | 25.1 | % | |||
| Materials | 21.3 | % | |||
| Financials | 14.2 | % | |||
| Consumer Discretionary | 13.6 | % | |||
| Energy | 6.9 | % | |||
| Consumer Staples | 5.5 | % | |||
| Information Technology | 5.0 | % | |||
| Communication Services | 3.0 | % | |||
| Real Estate | 2.2 | % | |||
| Utilities | 1.7 | % | |||
| Health Care | 1.3 | % | |||
| Cash and Equivalents* | 0.2 | % | |||
*Includes temporary cash investments, temporary cash investments - securities lending collateral and other assets and liabilities.
| NOTES TO SCHEDULE OF INVESTMENTS | ||||||||
| CVA | - | Certificaten Van Aandelen | ||||||
†Category is less than 0.05% of total net assets.
(1)Security, or a portion thereof, is on loan. At the period end, the aggregate value of securities on loan was $8,418,254. The amount of securities on loan indicated may not correspond with the securities on loan identified because securities with pending sales are in the process of recall from the brokers.
(2)Non-income producing.
(3)Investment of cash collateral from securities on loan. At the period end, the aggregate value of the collateral held by the fund was $8,997,566, which includes securities collateral of $4,765,059.
See Notes to Financial Statements.
26
| Statement of Assets and Liabilities | ||
| AUGUST 31, 2020 | |||||
| Assets | |||||
| Investment securities, at value (cost of $258,474,289) — including $8,418,254 of securities on loan | $ | 274,517,396 | |||
| Investment made with cash collateral received for securities on loan, at value (cost of $4,232,507) | 4,232,507 | ||||
| Total investment securities, at value (cost of $262,706,796) | 278,749,903 | ||||
| Foreign currency holdings, at value (cost of $33,652) | 34,479 | ||||
| Dividends and interest receivable | 565,239 | ||||
| Securities lending receivable | 8,619 | ||||
| 279,358,240 | |||||
| Liabilities | |||||
| Payable for collateral received for securities on loan | 4,232,507 | ||||
| Payable for investments purchased | 232,544 | ||||
| Accrued management fees | 68,506 | ||||
| 4,533,557 | |||||
| Net Assets | $ | 274,824,683 | |||
| Shares outstanding (unlimited number of shares authorized) | 5,700,000 | ||||
| Net Asset Value Per Share | $ | 48.21 | |||
| Net Assets Consist of: | |||||
| Capital paid in | $ | 259,346,813 | |||
| Distributable earnings | 15,477,870 | ||||
| $ | 274,824,683 | ||||
See Notes to Financial Statements.
27
| Statement of Operations | ||
FOR THE PERIOD ENDED AUGUST 31, 2020(1) | |||||
| Investment Income (Loss) | |||||
| Income: | |||||
| Dividends (net of foreign taxes withheld of $213,731) | $ | 2,054,134 | |||
| Securities lending, net | 25,648 | ||||
| Interest | 702 | ||||
| 2,080,484 | |||||
| Expenses: | |||||
| Management fees | 292,899 | ||||
| Other expenses | 1,403 | ||||
| 294,302 | |||||
| Net investment income (loss) | 1,786,182 | ||||
| Realized and Unrealized Gain (Loss) | |||||
| Net realized gain (loss) on: | |||||
| Investment transactions | (1,131,740) | ||||
| Futures contract transactions | (35,683) | ||||
| Foreign currency translation transactions | (12,054) | ||||
| (1,179,477) | |||||
| Change in net unrealized appreciation (depreciation) on: | |||||
| Investments | 16,043,107 | ||||
| Translation of assets and liabilities in foreign currencies | 8,295 | ||||
| 16,051,402 | |||||
| Net realized and unrealized gain (loss) | 14,871,925 | ||||
| Net Increase (Decrease) in Net Assets Resulting from Operations | $ | 16,658,107 | |||
(1)September 24, 2019 (fund inception) through August 31, 2020.
See Notes to Financial Statements.
28
| Statement of Changes in Net Assets | ||
PERIOD ENDED AUGUST 31, 2020(1) | |||||
| Increase (Decrease) in Net Assets | |||||
| Operations | |||||
| Net investment income (loss) | $ | 1,786,182 | |||
| Net realized gain (loss) | (1,179,477) | ||||
| Change in net unrealized appreciation (depreciation) | 16,051,402 | ||||
| Net increase (decrease) in net assets resulting from operations | 16,658,107 | ||||
| Distributions to Shareholders | |||||
| From earnings | (1,180,237) | ||||
| Capital Share Transactions | |||||
| Proceeds from shares sold | 259,346,813 | ||||
| Net increase (decrease) in net assets | 274,824,683 | ||||
| Net Assets | |||||
| End of period | $ | 274,824,683 | |||
| Transactions in Shares of the Fund | |||||
| Sold | 5,700,000 | ||||
(1)September 24, 2019 (fund inception) through August 31, 2020.
See Notes to Financial Statements.
29
| Notes to Financial Statements | ||
AUGUST 31, 2020
1. Organization
American Century ETF Trust (the trust) was registered as a Delaware statutory trust in 2017 and is registered under the Investment Company Act of 1940, as amended (the 1940 Act), as an open-end management investment company. Avantis International Small Cap Value ETF (the fund) is one fund in a series issued by the trust. The fund's investment objective is to seek long-term capital appreciation. Shares of the fund are listed for trading on the NYSE Arca, Inc. The fund incepted on September 24, 2019.
2. Significant Accounting Policies
The following is a summary of significant accounting policies consistently followed by the fund in preparation of its financial statements. The fund is an investment company and follows accounting and reporting guidance in accordance with accounting principles generally accepted in the United States of America. This may require management to make certain estimates and assumptions at the date of the financial statements. Actual results could differ from these estimates. Management evaluated the impact of events or transactions occurring through the date the financial statements were issued that would merit recognition or disclosure.
Investment Valuations — The fund determines the fair value of its investments and computes its net asset value per share at the close of regular trading (usually 4 p.m. Eastern time) on the New York Stock Exchange (NYSE) on each day the NYSE is open. The Board of Trustees has adopted valuation policies and procedures to guide the investment advisor in the fund’s investment valuation process and to provide methodologies for the oversight of the fund’s pricing function.
Equity securities that are listed or traded on a domestic securities exchange are valued at the last reported sales price or at the official closing price as provided by the exchange. Equity securities traded on foreign securities exchanges are generally valued at the closing price of such securities on the exchange where primarily traded or at the close of the NYSE, if that is earlier. If no last sales price is reported, or if local convention or regulation so provides, the mean of the latest bid and asked prices may be used. Securities traded over-the-counter are valued at the mean of the latest bid and asked prices, the last sales price, or the official closing price. Equity securities initially expressed in local currencies are translated into U.S. dollars at the mean of the appropriate currency exchange rate at the close of the NYSE as provided by an independent pricing service.
Open-end management investment companies are valued at the reported net asset value per share. Exchange-traded futures contracts are valued at the settlement price as provided by the appropriate exchange.
If the fund determines that the market price for an investment is not readily available or the valuation methods mentioned above do not reflect an investment’s fair value, such investment is valued as determined in good faith by the Board of Trustees or its delegate, in accordance with policies and procedures adopted by the Board of Trustees. In its determination of fair value, the fund may review several factors including, but not limited to, market information regarding the specific investment or comparable investments and correlation with other investment types, futures indices or general market indicators. Circumstances that may cause the fund to use these procedures to value an investment include, but are not limited to: an investment has been declared in default or is distressed; trading in a security has been suspended during the trading day or a security is not actively trading on its principal exchange; prices received from a regular pricing source are deemed unreliable; or there is a foreign market holiday and no trading occurred.
The fund monitors for significant events occurring after the close of an investment’s primary exchange but before the fund’s net asset value per share is determined. Significant events may include, but are not limited to: corporate announcements and transactions; governmental action and political unrest that could impact a specific investment or an investment sector; or armed conflicts, natural disasters and similar events that could affect investments in a specific country or region. The fund also monitors for significant fluctuations between domestic and foreign markets, as evidenced by the U.S. market or such other indicators that the Board of Trustees, or its delegate, deems appropriate. The fund may apply a model-derived factor to the closing price of equity securities traded on foreign securities exchanges. The factor is based on observable market data as provided by an independent pricing service.
30
Security Transactions — Security transactions are accounted for as of the trade date. Net realized gains and losses are determined on the identified cost basis, which is also used for federal income tax purposes.
Investment Income — Dividend income less foreign taxes withheld, if any, is recorded as of the ex-dividend date. Distributions received on securities that represent a return of capital or long-term capital gain are recorded as a reduction of cost of investments and/or as a realized gain. The fund may estimate the components of distributions received that may be considered nontaxable distributions or long-term capital gain distributions for income tax purposes. Interest income is recorded on the accrual basis and includes accretion of discounts and amortization of premiums. Securities lending income is net of fees and rebates earned by the lending agent for its services.
Foreign Currency Translations — All assets and liabilities initially expressed in foreign currencies are translated into U.S. dollars at prevailing exchange rates at period end. The fund may enter into spot foreign currency exchange contracts to facilitate transactions denominated in a foreign currency. Purchases and sales of investment securities, dividend and interest income, spot foreign currency exchange contracts, and expenses are translated at the rates of exchange prevailing on the respective dates of such transactions. Net realized and unrealized foreign currency exchange gains or losses related to investment securities are a component of net realized gain (loss) on investment transactions and change in net unrealized appreciation (depreciation) on investments, respectively.
Segregated Assets — In accordance with the 1940 Act, the fund segregates assets on its books and records to cover certain types of investment securities and other financial instruments. American Century Investment Management, Inc. (ACIM) (the investment advisor) monitors, on a daily basis, the securities segregated to ensure the fund designates a sufficient amount of liquid assets, marked-to-market daily. The fund may also receive assets or be required to pledge assets at the custodian bank or with a broker for collateral requirements.
Income Tax Status — It is the fund’s policy to distribute substantially all net investment income and net realized gains to shareholders and to otherwise qualify as a regulated investment company under provisions of the Internal Revenue Code. Accordingly, no provision has been made for income taxes. The fund files U.S. federal, state, local and non-U.S. tax returns as applicable. The fund's tax returns are subject to examination by the relevant taxing authority until expiration of the applicable statute of limitations, which is generally three years from the date of filing but can be longer in certain jurisdictions. At this time, management believes there are no uncertain tax positions which, based on their technical merit, would not be sustained upon examination and for which it is reasonably possible that the total amounts of unrecognized tax benefits will significantly change in the next twelve months.
Distributions to Shareholders — Distributions from net investment income, if any, are generally declared and paid semiannually. Distributions from net realized gains, if any, are generally declared and paid annually.
Indemnifications — Under the trust’s organizational documents, its officers and trustees are indemnified against certain liabilities arising out of the performance of their duties to the fund. In addition, in the normal course of business, the fund enters into contracts that provide general indemnifications. The maximum exposure under these arrangements is unknown as this would involve future claims that may be made against a fund. The risk of material loss from such claims is considered by management to be remote.
Securities Lending — Securities are lent to qualified financial institutions and brokers. State Street Bank & Trust Co. serves as securities lending agent to the fund pursuant to a Securities Lending Agreement. The lending of securities exposes the fund to risks such as: the borrowers may fail to return the loaned securities, the borrowers may not be able to provide additional collateral, the fund may experience delays in recovery of the loaned securities or delays in access to collateral, or the fund may experience losses related to the investment collateral. To minimize certain risks, loan counterparties pledge collateral in the form of cash and/or securities. The lending agent has agreed to indemnify the fund in the case of default of any securities borrowed. Cash collateral received is invested in the State Street Navigator Securities Lending Government Money Market Portfolio, a money market mutual fund registered under the 1940 Act. The loans may also be secured by U.S. government securities in an amount at least equal to the market value of the securities loaned, plus accrued interest and dividends, determined on a daily basis and adjusted accordingly. By lending securities, the fund seeks to increase its net investment income through the receipt of interest and fees. Such income is reflected separately within the Statement of Operations. The value of loaned securities and related collateral outstanding at period end, if any, are shown on a gross basis within the Schedule of Investments and Statement of Assets and Liabilities.
31
The following table reflects a breakdown of transactions accounted for as secured borrowings, the gross obligation by the type of collateral pledged, and the remaining contractual maturity of those transactions as of August 31, 2020.
| Remaining Contractual Maturity of Agreements | |||||||||||||||||
| Overnight and Continuous | <30 days | Between 30 & 90 days | >90 days | Total | |||||||||||||
Securities Lending Transactions(1) | |||||||||||||||||
| Common Stocks | $ | 4,232,507 | — | — | — | $ | 4,232,507 | ||||||||||
| Gross amount of recognized liabilities for securities lending transactions | $ | 4,232,507 | |||||||||||||||
(1)Amount represents the payable for cash collateral received for securities on loan. This will generally be in the Overnight and Continuous column as the securities are typically callable on demand.
3. Fees and Transactions with Related Parties
Certain officers and trustees of the trust are also officers and/or directors of American Century Companies, Inc. (ACC). The trust's investment advisor, ACIM, and the trust’s administrator, American Century Services, LLC, are wholly owned, directly or indirectly, by ACC. Various funds issued by American Century Strategic Asset Allocations, Inc. own, in aggregate, 7% of the shares of the fund.
Management Fees — The trust has entered into a management agreement with ACIM, under which ACIM provides the fund with investment advisory and management services in exchange for a single, unified management fee (the fee). The agreement provides that ACIM will pay all expenses of managing and operating the fund, except brokerage and other transaction fees and expenses relating to the acquisition and disposition of portfolio securities, acquired fund fees and expenses, interest, taxes, litigation expenses and extraordinary expenses. The fee is computed and accrued daily based on the daily net assets of the fund and paid monthly in arrears. The annual management fee is 0.36%.
4. Investment Transactions
Purchases and sales of investment securities, excluding short-term investments and in-kind transactions, for the period ended August 31, 2020 were $88,656,526 and $27,227,737, respectively.
Securities received in-kind through subscriptions for the period ended August 31, 2020 were $198,016,845.
There were no securities delivered in-kind through redemptions during the period.
5. Capital Share Transactions
The fund’s shares may only be purchased and sold on a national securities exchange through a broker-dealer. The price of the fund’s shares is based on market price, and because ETF shares trade at market prices rather than net asset value (NAV), shares may trade at a price greater than NAV (a premium) or less than NAV (a discount). The fund issues and redeems shares that have been aggregated into blocks of 30,000 shares or multiples thereof (Creation Units) to authorized participants who have entered into agreements with the fund's distributor. The fund will generally issue and redeem Creation Units in return for a basket of securities (and an amount of cash) that the fund specifies each day. Investors transacting in Creation Units for cash may also pay an additional variable charge to compensate the fund for certain transaction costs and market impact expenses relating to investing in portfolio securities. Such variable charges, if any, are included in proceeds from shares sold in the Statement of Changes in Net Assets.
6. Fair Value Measurements
The fund’s investments valuation process is based on several considerations and may use multiple inputs to determine the fair value of the investments held by the fund. In conformity with accounting principles generally accepted in the United States of America, the inputs used to determine a valuation are classified into three broad levels.
•Level 1 valuation inputs consist of unadjusted quoted prices in an active market for identical investments.
•Level 2 valuation inputs consist of direct or indirect observable market data (including quoted prices for comparable investments, evaluations of subsequent market events, interest rates, prepayment speeds,
32
credit risk, etc.). These inputs also consist of quoted prices for identical investments initially expressed in local currencies that are adjusted through translation into U.S. dollars.
•Level 3 valuation inputs consist of unobservable data (including a fund’s own assumptions).
The level classification is based on the lowest level input that is significant to the fair valuation measurement. The valuation inputs are not necessarily an indication of the risks associated with investing in these securities or other financial instruments.
The following is a summary of the level classifications as of period end. The Schedule of Investments provides additional information on the fund’s portfolio holdings.
| Level 1 | Level 2 | Level 3 | |||||||||
| Assets | |||||||||||
| Investment Securities | |||||||||||
| Common Stocks | $ | 1,443,396 | $ | 272,823,315 | — | ||||||
| Rights | — | 182 | — | ||||||||
| Temporary Cash Investments | 250,503 | — | — | ||||||||
| Temporary Cash Investments - Securities Lending Collateral | 4,232,507 | — | — | ||||||||
| $ | 5,926,406 | $ | 272,823,497 | — | |||||||
7. Derivative Instruments
Equity Price Risk — The fund is subject to equity price risk in the normal course of pursuing its investment objectives. A fund may enter into futures contracts based on an equity index in order to manage its exposure to changes in market conditions. A fund may purchase futures contracts to gain exposure to increases in market value or sell futures contracts to protect against a decline in market value. Upon entering into a futures contract, a fund is required to deposit either cash or securities in an amount equal to a certain percentage of the contract value (initial margin). Subsequent payments (variation margin) are made or received daily, in cash, by a fund. The variation margin is equal to the daily change in the contract value and is recorded as unrealized gains and losses. A fund recognizes a realized gain or loss when the contract is closed or expires. Net realized and unrealized gains or losses occurring during the holding period of futures contracts are a component of net realized gain (loss) on futures contract transactions and change in net unrealized appreciation (depreciation) on futures contracts, respectively. One of the risks of entering into futures contracts is the possibility that the change in value of the contract may not correlate with the changes in value of the underlying securities. During the period, the fund participated in equity price risk derivative instruments for temporary investment purposes.
At period end, the fund did not have any derivative instruments disclosed on the Statement of Assets and Liabilities. For the period from September 24, 2019 (fund inception) through August 31, 2020, the effect of equity price risk derivative instruments on the Statement of Operations was $(35,683) in net realized gain (loss) on futures contract transactions.
8. Risk Factors
The value of the fund’s shares will go up and down, sometimes rapidly or unpredictably, based on the performance of the securities owned by the fund and other factors generally affecting the securities market. Market risks, including political, regulatory, economic and social developments, can affect the value of the fund’s investments. Natural disasters, public health emergencies, terrorism and other unforeseeable events may lead to increased market volatility and may have adverse long-term effects on world economies and markets generally.
There are certain risks involved in investing in foreign securities. These risks include those resulting from political events (such as civil unrest, national elections and imposition of exchange controls), social and economic events (such as labor strikes and rising inflation), and natural disasters. Securities of foreign issuers may be less liquid and more volatile. Investing a significant portion of assets in one country or region may accentuate these risks.
The fund invests in common stocks of small companies. Because of this, the fund may be subject to greater
risk and market fluctuations than a fund investing in larger, more established companies.
33
9. Federal Tax Information
The tax character of distributions paid during the period September 24, 2019 (fund inception) through August 31, 2020 were as follows:
| Distributions Paid From | |||||
| Ordinary income | $ | 1,180,237 | |||
| Long-term capital gains | — | ||||
The book-basis character of distributions made during the year from net investment income or net realized gains may differ from their ultimate characterization for federal income tax purposes. These differences reflect the differing character of certain income items and net realized gains and losses for financial statement and tax purposes, and may result in reclassification among certain capital accounts on the financial statements.
As of period end, the federal tax cost of investments and the components of distributable earnings on a tax-basis were as follows:
| Federal tax cost of investments | $ | 264,046,815 | |||
| Gross tax appreciation of investments | $ | 23,487,380 | |||
| Gross tax depreciation of investments | (8,784,292) | ||||
| Net tax appreciation (depreciation) of investments | 14,703,088 | ||||
| Net tax appreciation (depreciation) on derivatives and translation of assets and liabilities in foreign currencies | 7,144 | ||||
| Net tax appreciation (depreciation) | $ | 14,710,232 | |||
| Undistributed ordinary income | $ | 1,965,520 | |||
| Accumulated short-term capital losses | $ | (1,176,472) | |||
| Accumulated long-term capital losses | $ | (21,410) | |||
The difference between book-basis and tax-basis unrealized appreciation (depreciation) is attributable
primarily to the realization to ordinary income for tax purposes of unrealized gains on investments in passive
foreign investment companies.
Accumulated capital losses represent net capital loss carryovers that may be used to offset future realized
capital gains for federal income tax purposes. The capital loss carryovers may be carried forward for an
unlimited period. Future capital loss carryover utilization in any given year may be subject to Internal Revenue
Code limitations.
34
| Financial Highlights | ||
| For a Share Outstanding Throughout the Period Indicated | |||||||||||||||||||||||||||||||||||
| Per-Share Data | Ratios and Supplemental Data | ||||||||||||||||||||||||||||||||||
| Income From Investment Operations: | Ratio to Average Net Assets of: | ||||||||||||||||||||||||||||||||||
| Net Asset Value, Beginning of Period | Net Investment Income (Loss)(1) | Net Realized and Unrealized Gain (Loss) | Total From Investment Operations | Distributions From Net Investment Income | Net Asset Value, End of Period | Total Return(2) | Operating Expenses | Net Investment Income (Loss) | Portfolio Turnover Rate(3) | Net Assets, End of Period (in thousands) | |||||||||||||||||||||||||
2020(4) | $50.00 | 0.93 | (2.22) | (1.29) | (0.50) | $48.21 | (2.58)% | 0.36%(5) | 2.20%(5) | 32% | $274,825 | ||||||||||||||||||||||||
| Notes to Financial Highlights | ||
(1)Computed using average shares outstanding throughout the period.
(2)Total returns are calculated based on the net asset value of the last business day. Total returns for periods less than one year are not annualized.
(3)Excludes securities received or delivered in-kind.
(4)September 24, 2019 (fund inception) through August 31, 2020.
(5)Annualized.
See Notes to Financial Statements.
| Report of Independent Registered Public Accounting Firm | ||
To the Shareholders and the Board of Trustees of American Century ETF Trust:
Opinion on the Financial Statements and Financial Highlights
We have audited the accompanying statement of assets and liabilities, including the schedule of investments, of Avantis® International Small Cap Value ETF (the “Fund”), one of the funds constituting the American Century ETF Trust, as of August 31, 2020, and the related statement of operations, the statement of changes in net assets, and the financial highlights for the period from September 24, 2019 (fund inception) through August 31, 2020, and the related notes. In our opinion, the financial statements and financial highlights present fairly, in all material respects, the financial position of Avantis® International Small Cap Value ETF as of August 31, 2020, and the results of its operations, the changes in its net assets, and the financial highlights for the period from September 24, 2019 (fund inception) through August 31, 2020, in conformity with accounting principles generally accepted in the United States of America.
Basis for Opinion
These financial statements and financial highlights are the responsibility of the Fund's management. Our responsibility is to express an opinion on the Fund’s financial statements and financial highlights based on our audit. We are a public accounting firm registered with the Public Company Accounting Oversight Board (United States) (PCAOB) and are required to be independent with respect to the Fund in accordance with the U.S. federal securities laws and the applicable rules and regulations of the Securities and Exchange Commission and the PCAOB.
We conducted our audit in accordance with the standards of the PCAOB. Those standards require that we plan and perform the audit to obtain reasonable assurance about whether the financial statements and financial highlights are free of material misstatement, whether due to error or fraud. The Fund is not required to have, nor were we engaged to perform, an audit of its internal control over financial reporting. As part of our audit we are required to obtain an understanding of internal control over financial reporting but not for the purpose of expressing an opinion on the effectiveness of the Fund’s internal control over financial reporting. Accordingly, we express no such opinion.
Our audit included performing procedures to assess the risks of material misstatement of the financial statements and financial highlights, whether due to error or fraud, and performing procedures that respond to those risks. Such procedures included examining, on a test basis, evidence regarding the amounts and disclosures in the financial statements and financial highlights. Our audit also included evaluating the accounting principles used and significant estimates made by management, as well as evaluating the overall presentation of the financial statements and financial highlights. Our procedures included confirmation of securities owned as of August 31, 2020, by correspondence with the custodian and brokers; when replies were not received from brokers, we performed other auditing procedures. We believe that our audit provides a reasonable basis for our opinion.
DELOITTE & TOUCHE LLP
Kansas City, Missouri
October 16, 2020
We have served as the auditor of one or more American Century investment companies since 1997.
36
| Management | ||
The Board of Trustees
The individuals listed below serve as trustees of the funds. Each trustee will continue to serve in this capacity until death, retirement, resignation or removal from office. The board has adopted a mandatory retirement age for trustees who are not “interested persons,” as that term is defined in the Investment Company Act (independent trustees). Trustees who are not also officers of the trust shall retire by December 31st of the year in which they reach their 75th birthday.
Mr. Thomas is an “interested person” because he currently serves as President and Chief Executive Officer of American Century Companies, Inc. (ACC), the parent company of American Century Investment Management, Inc. (ACIM or the advisor). The other trustees are independent. They are not employees, directors or officers of, and have no financial interest in, ACC or any of its wholly owned, direct or indirect, subsidiaries, including ACIM and American Century Services, LLC (ACS), and they do not have any other affiliations, positions or relationships that would cause them to be considered “interested persons” under the Investment Company Act. The following trustees also serve in this capacity for a number of other registered investment companies in the American Century Investments family of funds: Jonathan S. Thomas, 15; Ronald J. Gilson, 8; and Stephen E. Yates, 7.
The following table presents additional information about the trustees. The mailing address for each trustee other than Jonathan S. Thomas is 330 Madison Avenue, New York, New York 10017. The mailing address for Jonathan S. Thomas is 4500 Main Street, Kansas City, Missouri 64111.
| Name (Year of Birth) | Position(s) Held with Funds | Length of Time Served | Principal Occupation(s) During Past 5 Years | Number of American Century Portfolios Overseen by Trustee | Other Directorships Held During Past 5 Years | ||||||||||||
| Independent Trustees | |||||||||||||||||
| Reginald M. Browne (1968) | Trustee and Chairman of the Board | Since 2017 (Chairman since 2019) | Principal, GTS Securities (automated capital markets trading firm)(2019 to present); Senior Managing Director, Co Global Head-ETF Group, Cantor Fitzgerald (financial services firm)(2013 to 2019) | 19 | None | ||||||||||||
| Ronald J. Gilson (1946) | Trustee | Since 2017 | Charles J. Meyers Professor of Law and Business, Emeritus, Stanford Law School (1979 to 2016); Marc and Eva Stern Professor of Law and Business, Columbia University School of Law (1992 to present) | 59 | None | ||||||||||||
| Barry A. Mendelson (1958) | Trustee | Since 2017 | Retired; Consultant regarding ETF and mutual fund matters (2015 to 2016); Principal and Senior Counsel, The Vanguard Group (investment management)(1998 to 2014) | 19 | None | ||||||||||||
| Stephen E. Yates (1948) | Trustee | Since 2017 | Retired | 82 | None | ||||||||||||
37
| Name (Year of Birth) | Position(s) Held with Funds | Length of Time Served | Principal Occupation(s) During Past 5 Years | Number of American Century Portfolios Overseen by Trustee | Other Directorships Held During Past 5 Years | ||||||||||||
| Interested Trustees | |||||||||||||||||
| Jonathan S. Thomas (1963) | Trustee | Since 2017 | President and Chief Executive Officer, ACC (2007 to present). Also serves as Chief Executive Officer, ACS; Executive Vice President, ACIM; Director, ACC, ACIM and other ACC subsidiaries | 122 | None | ||||||||||||
The Statement of Additional Information has additional information about the fund's trustees and is available without charge, upon request, by calling 1-800-345-6488.
38
Officers
The following table presents certain information about the executive officers of the funds. Each officer, except Edward Rosenberg, serves as an officer for each of the 16 investment companies in the American Century family of funds. No officer is compensated for his or her service as an officer of the funds. The listed officers are interested persons of the funds and are appointed or re-appointed on an annual basis. The mailing address for each officer listed below is 4500 Main Street, Kansas City, Missouri 64111.
| Name (Year of Birth) | Offices with the Funds | Principal Occupation(s) During the Past Five Years | ||||||
| Patrick Bannigan (1965) | President since 2019 | Executive Vice President and Director, ACC (2012 to present); Chief Financial Officer, Chief Accounting Officer and Treasurer, ACC (2015 to present). Also serves as President, ACS; Vice President, ACIM; Chief Financial Officer, Chief Accounting Officer and/or Director, ACIM, ACS and other ACC subsidiaries | ||||||
| R. Wes Campbell (1974) | Chief Financial Officer and Treasurer since 2018 | Vice President, ACS (2020 to present); Investment Operations and Investment Accounting, ACS (2000 to present) | ||||||
| Amy D. Shelton (1964) | Chief Compliance Officer and Vice President since 2017 | Chief Compliance Officer, American Century funds, (2014 to present); Chief Compliance Officer, ACIM (2014 to present); Chief Compliance Officer, ACIS (2009 to present). Also serves as Vice President, ACIS | ||||||
| Charles A. Etherington (1957) | General Counsel and Vice President since 2017 | Attorney, ACC (1994 to present); Vice President, ACC (2005 to present); General Counsel, ACC (2007 to present). Also serves as General Counsel, ACIM, ACS, ACIS and other ACC subsidiaries; and Senior Vice President, ACIM and ACS | ||||||
| Cleo Chang (1977) | Vice President since 2019 | Senior Vice President, ACIM (2015 to present); Chief Investment Officer, Wilshire Funds Management (2005 to 2015) | ||||||
| David H. Reinmiller (1963) | Vice President since 2017 | Attorney, ACC (1994 to present). Also serves as Vice President, ACIM and ACS | ||||||
| Edward Rosenberg (1973) | Vice President since 2017 | Senior Vice President, ACIM (2017 to present); Senior Vice President, Flexshares Head of ETF Capital Markets, Northern Trust (2012 to 2017) | ||||||
| C. Jean Wade (1964) | Vice President since 2017 | Senior Vice President, ACS (2017 to present); Vice President, ACS (2000 to 2017) | ||||||
| Ward D. Stauffer (1960) | Secretary since 2019 | Attorney, ACS (2003 to present) | ||||||
39
| Approval of Management Agreement | ||
At a meeting held on June 5, 2020, the Fund’s Board of Trustees (the "Board") unanimously approved the renewal of the management agreement pursuant to which American Century Investment Management, Inc. (the “Advisor”) acts as the investment advisor for the Fund. Under Section 15(c) of the Investment Company Act, contracts for investment advisory services are required to be reviewed, evaluated, and approved by a majority of a fund’s trustees (the “Trustees”), including a majority of the independent Trustees, each year.
Prior to its consideration of the renewal of the management agreement, the Trustees requested and reviewed extensive data and information compiled by the Advisor and certain independent providers of evaluation data concerning the Fund and the services provided to the Fund by the Advisor. This review was in addition to the oversight and evaluation undertaken by the Board and its Audit Committee on a continual basis and the information received was supplemental to the extensive information that the Board and its Audit Committee receive and consider throughout the year.
In connection with its consideration of the renewal of the management agreement, the Board’s review and evaluation of the services provided by the Advisor included, but was not limited to, the following:
•the nature, extent, and quality of investment management and other services provided and to be provided to the Fund;
•the wide range of other programs and services provided and to be provided to the Fund and its shareholders on a routine and non-routine basis;
•the Fund’s investment performance, including data comparing the Fund's performance to appropriate benchmarks of funds with similar objectives and strategies;
•the cost of owning the Fund compared to the cost of owning similar funds;
•the compliance policies, procedures, and regulatory experience of the Advisor and the Fund's service providers;
•the Advisor’s strategic plans;
•the Advisor’s business continuity plans and specifically its response to the COVID-19 pandemic;
•financial data showing the cost of services provided to the Fund, the profitability of the Fund to the Advisor, and the overall profitability of the Advisor;
•information regarding payments to intermediaries by the Advisor; and
•possible economies of scale associated with the Advisor’s management of the Fund; and
•possible collateral benefits to the Advisor from the management of the Fund.
The independent Trustees met separately in private session to discuss the renewal and to review and discuss the information provided in response to their request. The independent Trustees also held active discussions with the Advisor regarding the renewal of the management agreement. The independent Trustees had the benefit of the advice of their independent counsel throughout the process.
Factors Considered
The Trustees considered all of the information provided by the Advisor, the independent data providers, and independent counsel in connection with the approval. They determined that the information was sufficient for them to evaluate the management agreement for the Fund. In connection with their review, the Trustees did not identify any single factor as being all-important or
40
controlling, and each Trustee may have attributed different levels of importance to different factors. In deciding to renew the management agreement, the Board based its decision on a number of factors, including without limitation the following:
Nature, Extent and Quality of Services — Generally. Under the management agreement, the Advisor is responsible for providing or arranging for all services necessary for the operation of the Fund. The Board noted that the Advisor provides or arranges at its own expense a wide variety of services including without limitation the following:
•constructing and designing the Fund
•portfolio research and security selection
•initial capitalization/funding
•securities trading
•Fund administration
•custody of Fund assets
•daily valuation of the Fund’s portfolio
•shareholder servicing and transfer agency, including shareholder confirmations, recordkeeping, and communications
•legal services (except the independent Trustees’ counsel)
•regulatory and portfolio compliance
•financial reporting
•marketing and distribution (except amounts paid by the Fund under Rule 12b-1 plans)
Investment Management Services. The nature of the investment management services provided to the Fund is quite complex and allows Fund shareholders access to professional money management, instant diversification of their investments within an asset class, and liquidity. In evaluating investment performance, the Board expects the Advisor to manage the Fund in accordance with its investment objectives and approved strategies. Further, the Trustees recognize that the Advisor has an obligation to monitor trading activities, and in particular to seek the best execution of fund trades, and to evaluate the use of and payment for research. In providing these services, the Advisor utilizes teams of investment professionals (portfolio managers, analysts, research assistants, and securities traders) who require extensive information technology, research, training, compliance, and other systems to conduct their business. The Board provides oversight of the investment performance process. It regularly reviews investment performance information for the Fund, together with comparative information for appropriate benchmarks over different time horizons. The Trustees also review investment performance information during the management agreement renewal process. If performance concerns are identified, the Board discusses with the Advisor the reasons for such results and any efforts being undertaken to improve performance. The Fund’s performance reviewed by the Board was above its benchmark. The Board found the investment management services provided by the Advisor to the Fund to be satisfactory and consistent with the management agreement.
Shareholder and Other Services. Under the management agreement, the Advisor provides or arranges for a comprehensive package of services to the Fund. The Board, directly and through its Audit Committee, regularly reviews reports and evaluations of such services at its regular meetings. These reports include, but are not limited to, information regarding the operational efficiency and accuracy of the shareholder and transfer agency services provided, staffing levels, shareholder satisfaction, technology support (including cyber security), new products and services offered to Fund shareholders, securities trading activities, portfolio valuation services, auditing services, and legal and operational compliance activities. The Board found the services provided by the Advisor to the Fund under the management agreement to be competitive and of high quality.
41
COVID-19 Response. During 2020, much of the world experienced unprecedented change and challenges from the impacts of the rapidly evolving, worldwide spread of the COVID-19 virus. The Board evaluated the Advisor’s response to the COVID-19 pandemic and its impact on service to the Fund. The Board found that Fund shareholders have continued to receive the Advisor’s investment management and other services without disruption, and Advisor personnel have demonstrated great resiliency in providing those services. The Board, directly and through its Audit Committee, continues to monitor the impact of the pandemic and the response of each of the Fund’s service providers.
Costs of Services and Profitability. The Advisor provides detailed information concerning its cost of providing various services to the Fund, its profitability in managing the Fund (pre- and post-distribution), its overall profitability, and its financial condition. The Trustees have reviewed with the Advisor the methodology used to prepare this financial information. This information is considered in evaluating the Advisor’s financial condition, its ability to continue to provide services under the management agreement, and the reasonableness of the current management fee. The Board concluded that the Advisor’s profits were reasonable in light of the services provided to the Fund.
Ethics. The Board generally considers the Advisor’s commitment to providing quality services to the Fund and to conducting its business ethically. They noted that the Advisor’s practices generally meet or exceed industry best practices.
Economies of Scale. The Board also reviewed information provided by the Advisor regarding the possible existence of economies of scale in connection with the management of the Fund. The Board concluded that economies of scale are difficult to measure and predict with precision, especially on a fund-by-fund basis. The Board concluded that the Advisor is appropriately sharing economies of scale, to the extent they exist, through its competitive fee structure, offering competitive fees from fund inception, and through reinvestment in its business, infrastructure, investment capabilities and initiatives to provide shareholders additional content and services.
Comparison to Other Funds’ Fees. The management agreement provides that the Fund pays the Advisor a single, all-inclusive (or unified) management fee for providing all services necessary for the management and operation of the Fund, other than brokerage expenses, expenses attributable to short sales, taxes, interest, extraordinary expenses, and expenses incurred in connection with the provision of shareholder services and distribution services under a plan adopted pursuant to Rule 12b-1 under the Investment Company Act. Under the unified fee structure, the Advisor is responsible for providing all investment advisory, custody, audit, administrative, compliance, recordkeeping, marketing and shareholder services, or arranging and supervising third parties to provide such services. The Board believes the unified fee structure is a benefit to Fund shareholders because it clearly discloses to shareholders the cost of owning Fund shares, and, since the unified fee cannot be increased without a vote of Fund shareholders, it shifts to the Advisor the risk of increased costs of operating the Fund and provides a direct incentive to minimize administrative inefficiencies. Part of the Board’s analysis of fee levels involves reviewing certain evaluative data compiled by an independent provider comparing the Fund’s unified fee to the total expense ratios of its peers. The unified fee charged to shareholders of the Fund was below the median of the total expense ratios of the Fund’s peer expense universe and was within the range of its peer expense group. The Board concluded that the management fee paid by the Fund to the Advisor under the management agreement is reasonable in light of the services provided to the Fund.
Comparison to Fees and Services Provided to Other Clients of the Advisor. The Board also requested information from the Advisor concerning the nature of the services, fees, costs, and profitability of its advisory services to funds or other advisory clients managed similarly to the Fund. The Advisor informed the Trustees that, as of December 31, 2019, it did not provide services to any other investment companies or comparable accounts that were managed similarly to the Fund.
42
Payments to Intermediaries. The Trustees also requested a description of payments made to intermediaries by the Fund and the Advisor and services provided in response thereto. These payments could include various payments made by the Fund or the Advisor to different types of intermediaries and recordkeepers for distribution and service activities provided for the Fund. The Trustees reviewed such information and received representations from the Advisor that all such payments by the Advisor were made from the Advisor’s resources and reasonable profits. The Board found such payments to be reasonable in scope and purpose.
Collateral or “Fall-Out” Benefits Derived by the Advisor. The Board considered the possible existence of collateral benefits the Advisor may receive as a result of its relationship with the Fund. They concluded that the Advisor’s primary business is managing funds and it generally does not use fund or shareholder information to generate profits in other lines of business, and therefore does not derive any significant collateral benefits from them. The Board noted that additional assets from other clients may offer the Advisor some benefit from increased leverage with service providers and counterparties. The Board also determined that the Advisor is able to provide investment management services to certain clients other than the Fund, at least in part, due to its existing infrastructure built to serve the fund complex. The Board concluded that appropriate allocation methodologies had been employed to assign resources and the cost of those resources to these other clients.
Existing Relationship. The Board also considered whether there was any reason for not continuing the existing arrangement with the Advisor. In this regard, the Board was mindful of the potential disruptions of the Fund’s operations and various risks, uncertainties, and other effects that could occur as a result of a decision not to continue such relationship. In particular, the Board recognized that most shareholders have invested in the Fund on the strength of the Advisor’s industry standing and reputation and in the expectation that the Advisor will have a continuing role in providing advisory services to the Fund.
Conclusion of the Trustees. As a result of this process, the Board, including all of the independent Trustees, taking into account all of the factors discussed above and the information provided by the Advisor and others in connection with its review and throughout the year, determined that the management fee is fair and reasonable in light of the services provided and that the investment management agreement between the Fund and the Advisor should be renewed.
43
| Liquidity Risk Management Program | ||
The Fund has adopted a liquidity risk management program (the “program”). The Fund’s Board of Trustees (the "Board") has designated American Century Investment Management, Inc. (“ACIM”) as the administrator of the program. Personnel of ACIM or its affiliates conduct the day-to-day operation of the program pursuant to policies and procedures administered by those members of the ACIM’s Investment Oversight Committee who are members of the ACIM’s Investment Management and Global Analytics departments.
Under the program, ACIM manages the Fund’s liquidity risk, which is the risk that the Fund could not meet shareholder redemption requests without significant dilution of remaining shareholders’ interests in the Fund. This risk is managed by monitoring the degree of liquidity of the Fund’s investments, limiting the amount of the Fund’s illiquid investments, and utilizing various risk management tools and facilities available to the Fund for meeting shareholder redemptions, among other means. ACIM’s process of determining the degree of liquidity of the Fund’s investments is supported by one or more third-party liquidity assessment vendors.
The Board reviewed a report prepared by ACIM regarding the operation and effectiveness of the program for the period December 1, 2018 through December 31, 2019. No significant liquidity events impacting the Fund were noted in the report. In addition, ACIM provided its assessment that the program had been effective in managing the Fund’s liquidity risk.
44
| Additional Information | ||
Retirement Account Information
As required by law, distributions you receive from certain retirement accounts are subject to federal income tax withholding, unless you elect not to have withholding apply*. Tax will be withheld on the total amount withdrawn even though you may be receiving amounts that are not subject to withholding, such as nondeductible contributions. In such case, excess amounts of withholding could occur. You may adjust your withholding election so that a greater or lesser amount will be withheld.
Remember, even if you elect not to have income tax withheld, you are liable for paying income tax on the taxable portion of your withdrawal. If you elect not to have income tax withheld or you don’t have enough income tax withheld, you may be responsible for payment of estimated tax. You may incur penalties under the estimated tax rules if your withholding and estimated tax payments are not sufficient. You can reduce or defer the income tax on a distribution by directly or indirectly rolling such distribution over to another IRA or eligible plan. You should consult your tax advisor for additional information.
State tax will be withheld if, at the time of your distribution, your address is within one of the mandatory withholding states and you have federal income tax withheld (or as otherwise required by state law). State taxes will be withheld from your distribution in accordance with the respective state rules.
*Some 403(b), 457 and qualified retirement plan distributions may be subject to 20% mandatory withholding, as they are subject to special tax and withholding rules. Your plan administrator or plan sponsor is required to provide you with a special tax notice explaining those rules at the time you request a distribution. If applicable, federal and/or state taxes may be withheld from your distribution amount.
Proxy Voting Policies
A description of the policies that the fund's investment advisor uses in exercising the voting rights associated with the securities purchased and/or held by the fund are available without charge, upon request, by calling 1-800-345-6488. It is also available on American Century Investments’ website at americancentury.com/proxy and on the Securities and Exchange Commission’s website at sec.gov. Information regarding how the investment advisor voted proxies relating to portfolio securities during the most recent 12-month period ended June 30 is available at americancentury.com/proxy. It is also available at sec.gov.
Quarterly Portfolio Disclosure
The fund files its complete schedule of portfolio holdings with the Securities and Exchange Commission (SEC) for the first and third quarters of each fiscal year as an exhibit to its reports on Form N-PORT. The fund's Form N-PORT reports are available on the SEC’s website at sec.gov.
45
Other Tax Information
The following information is provided pursuant to provisions of the Internal Revenue Code.
The fund hereby designates up to the maximum amount allowable as qualified dividend income for
the fiscal year ended August 31, 2020.
For the fiscal year ended August 31, 2020, the fund intends to pass through to shareholders
foreign source income of $2,260,179 and foreign taxes paid of $196,099, or up to the maximum
amount allowable, as a foreign tax credit. Foreign source income and foreign tax expense per
outstanding share on August 31, 2020 are $0.3965 and $0.0344, respectively.
46
| Notes | ||
47
| Notes | ||
48
| ||||||||
| Contact Us | avantisinvestors.com | |||||||
| American Century Sales Representatives, Financial Professionals, Broker Dealers, Insurance Companies, Banks and Trust Companies | 1-833-928-2684 | |||||||
| Telecommunications Relay Service for the Deaf | 711 | |||||||
| American Century ETF Trust | ||||||||
Investment Advisor: American Century Investment Management, Inc. Kansas City, Missouri | ||||||||
Distributor: Foreside Fund Services, LLC - Distributor, not affiliated with American Century Investment Services, Inc. | ||||||||
| This report and the statements it contains are submitted for the general information of our shareholders. The report is not authorized for distribution to prospective investors unless preceded or accompanied by an effective prospectus. | ||||||||
| ©2020 American Century Proprietary Holdings, Inc. All rights reserved. CL-ANN-96044 2010 | ||||||||
| Annual Report | |||||
| August 31, 2020 | |||||
Avantis® U.S. Equity ETF (AVUS) | |||||
Beginning on January 1, 2021, as permitted by regulations adopted by the Securities and Exchange Commission, paper copies of the fund’s shareholder reports like this one will no longer be sent by mail, unless you specifically request paper copies of the reports from the fund or from your financial intermediary, such as a broker-dealer or bank. Instead, the reports will be made available on a website, and you will be notified by mail each time a report is posted and provided with a website link to access the report.
If you already elected to receive shareholder reports electronically, you will not be affected by this change and you need not take any action. You may elect to receive shareholder reports and other communications from the fund or your financial intermediary electronically by calling or sending an email request to your appropriate contacts as listed on the back cover of this report.
You may elect to receive all future reports in paper free of charge. You can inform the fund or your financial intermediary that you wish to continue receiving paper copies of your shareholder reports by calling or sending an email request to your appropriate contacts as listed on the back cover of this report. Your election to receive reports in paper will apply to all funds held with the fund complex/your financial intermediary.
| Table of Contents | ||
| Chairman’s Letter | |||||
| Performance | |||||
| Portfolio Commentary | |||||
| Fund Characteristics | |||||
| Shareholder Fee Example | |||||
| Schedule of Investments | |||||
| Statement of Assets and Liabilities | |||||
| Statement of Operations | |||||
| Statement of Changes in Net Assets | |||||
| Notes to Financial Statements | |||||
| Financial Highlights | |||||
| Report of Independent Registered Public Accounting Firm | |||||
| Management | |||||
| Approval of Management Agreement | |||||
| Liquidity Risk Management Program | |||||
| Additional Information | |||||
Any opinions expressed in this report reflect those of the author as of the date of the report, and do not necessarily represent the opinions of American Century Investments® or any other person in the American Century Investments organization. Any such opinions are subject to change at any time based upon market or other conditions and American Century Investments disclaims any responsibility to update such opinions. These opinions may not be relied upon as investment advice and, because investment decisions made by American Century Investments funds are based on numerous factors, may not be relied upon as an indication of trading intent on behalf of any American Century Investments fund. Security examples are used for representational purposes only and are not intended as recommendations to purchase or sell securities. Performance information for comparative indices and securities is provided to American Century Investments by third party vendors. To the best of American Century Investments’ knowledge, such information is accurate at the time of printing.
| Chairman's Letter | ||
Jonathan ThomasDear Investor:
Thank you for reviewing this annual report for the period ended August 31, 2020. Annual reports help convey important information about fund returns, including market factors that affected performance. For additional investment insights, please visit avantisinvestors.com.
Pandemic Disrupted Economic, Market Courses
Broad market sentiment was generally upbeat early in the period. Dovish central banks, modest inflation, improving economic and corporate earnings data, and progress on U.S.-China trade helped boost global growth outlooks. Against this backdrop, stocks largely remained in favor.
However, beginning in late February, COVID-19 quickly quashed the optimistic tone. The outbreak rapidly spread worldwide, halting most U.S. and global economic activity and triggering a deep worldwide recession. Global stocks sold off sharply, but central banks and federal governments stepped in quickly and aggressively to stabilize financial markets. These extraordinary efforts proved helpful, as most stocks rebounded quickly. As the period progressed, coronavirus infection and death rates declined in many regions and economies reopened. By the end of August, manufacturing, employment and other data suggested an economic recovery was underway.
Overall, global stocks delivered mixed results for the period. U.S. stocks generally advanced and fared better than their counterparts elsewhere. The growth style significantly outperformed value stocks, which struggled.
A Slow Return to Normal
The return to pre-pandemic life will take time and patience, but we are confident we will get there. Several drug companies are in final stages of vaccine trials, and medical professionals continue to fine-tune virus treatment protocols. In the meantime, investors likely will face periods of outbreak-related disruptions, economic and political uncertainty, and heightened market volatility. These influences can be unsettling, but they tend to be temporary.
We appreciate your confidence in us during these extraordinary times. Our investment professionals have experience weathering unpredictable markets, and we’re confident we will continue to meet today’s challenges.
Sincerely,
Jonathan Thomas
Chairman
Avantis Investors
2
| Performance | ||
| Total Returns as of August 31, 2020 | |||||||||||||||||||||||
| Since Inception | Inception Date | ||||||||||||||||||||||
| Net Asset Value | 13.50% | 9/24/2019 | |||||||||||||||||||||
| Market Price | 13.48% | 9/24/2019 | |||||||||||||||||||||
| Russell 3000 Index | 19.67% | — | |||||||||||||||||||||
Market price is determined using the bid/ask midpoint at 4:00 p.m. Eastern time, when the net asset value (NAV) is typically calculated. Market performance does not represent the returns you would receive if you traded shares at other times. NAV prices are used to calculate market price performance prior to the date when the fund first traded on the New York Stock Exchange.
| Growth of $10,000 Over Life of Fund | ||
| $10,000 investment made September 24, 2019 | ||
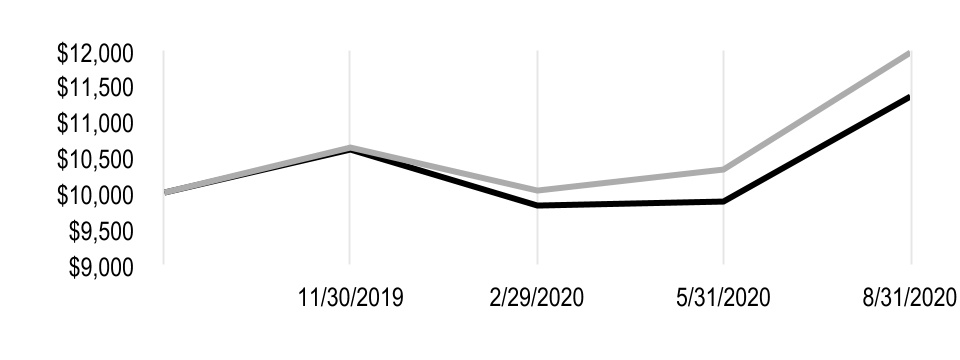
| Value on August 31, 2020 | |||||
| Net Asset Value — $11,350 | |||||
| Russell 3000 Index — $11,967 | |||||
| Total Annual Fund Operating Expenses | |||||||||||||||||
| 0.15% | |||||||||||||||||
The total annual fund operating expenses shown is as stated in the fund’s prospectus current as of the date of this report. The prospectus may vary from the expense ratio shown elsewhere in this report because it is based on a different time period, includes acquired fund fees and expenses, and, if applicable, does not include fee waivers or expense reimbursements.
Data presented reflect past performance. Past performance is no guarantee of future results. Current performance may be higher or lower than the performance shown. Total returns for periods less than one year are not annualized. Investment return and principal value will fluctuate, and redemption value may be more or less than original cost. Data assumes reinvestment of dividends and capital gains, and none of the charts reflect the deduction of taxes that a shareholder would pay on fund distributions or the redemption of fund shares. To obtain performance data current to the most recent month end, please call 1-833-928-2684 or visit avantisinvestors.com. For additional information about the fund, please consult the prospectus.
3
| Portfolio Commentary | ||
Portfolio Managers: Eduardo Repetto, Mitch Firestein, Daniel Ong and Ted Randall
Fund Strategy
Avantis U.S. Equity ETF seeks long-term capital appreciation by investing in a diverse group of U.S. companies across market sectors, industry groups and market capitalizations.
The fund seeks securities of companies that it expects to have higher returns. It places an enhanced emphasis on securities of companies with smaller market capitalizations and securities of companies it defines as high profitability or value companies. Conversely, the fund seeks to underweight or exclude securities it expects to have lower returns. These include securities of large companies with lower levels of profitability and higher prices relative to their book values or other financial metrics. Under normal market conditions, the fund will invest at least 80% of its assets in equity securities of U.S. companies.
The fund is an actively managed exchange-traded fund (ETF) that does not seek to replicate the performance of a specified index. The portfolio managers continually analyze market and financial data to make buy, sell and hold decisions. When buying or selling a security, the portfolio managers may consider the trade-off between expected returns of the security and implementation or tax costs of the trade. They do this in an attempt to gain trading efficiencies, avoid unnecessary risk and enhance fund performance.
Performance Review
For the period from Avantis U.S. Equity ETF’s inception on September 24, 2019, through the fund’s fiscal year-end on August 31, 2020, the fund returned 13.48%* on a market price basis. On a net asset value (NAV) basis, the fund returned 13.50%. NAV and market price returns reflect fees and operating expenses, while index returns do not.
For the same time period, the fund underperformed the total U.S. stock market, as measured by the Russell 3000 Index, which returned 19.67%. The Russell 3000 Index is an unmanaged index generally representative of the performance of the broad U.S. stock market, including all capitalization categories. The underperformance versus the index was largely due to the fund’s emphasis on companies with smaller market capitalizations, higher levels of profitability and lower prices relative to their book values. These value-oriented companies generally underperformed large-cap companies with lower levels of profitability and higher prices relative to their book values.
For example, large-cap stocks (as measured by the Russell 1000 Index) returned 20.81% for the period, outperforming small-cap stocks (as measured by the Russell 2000 Index), which returned 3.24%. Value stocks (as measured by the Russell 3000 Value Index) returned -2.88% for the period, underperforming growth stocks, which returned 42.99% (as measured by the Russell 3000 Growth Index).
*Total returns for periods less than one year are not annualized.
4
| Fund Characteristics | ||
| AUGUST 31, 2020 | |||||
| Top Ten Holdings | % of net assets | ||||
| Apple, Inc. | 5.8% | ||||
| Microsoft Corp. | 3.7% | ||||
| Amazon.com, Inc. | 3.4% | ||||
| Alphabet, Inc.* | 2.1% | ||||
| Facebook, Inc., Class A | 2.0% | ||||
| Johnson & Johnson | 1.2% | ||||
| MasterCard, Inc., Class A | 0.9% | ||||
| Verizon Communications, Inc. | 0.9% | ||||
| JPMorgan Chase & Co. | 0.9% | ||||
| Visa, Inc., Class A | 0.7% | ||||
| *Includes all classes of the issuer held by the fund. | |||||
| Top Five Industries | % of net assets | ||||
| Software | 6.6% | ||||
| Technology Hardware, Storage and Peripherals | 6.1% | ||||
| Semiconductors and Semiconductor Equipment | 4.8% | ||||
| Banks | 4.6% | ||||
| IT Services | 4.5% | ||||
| Types of Investments in Portfolio | % of net assets | ||||
| Common Stocks | 99.7% | ||||
| Temporary Cash Investments | 0.1% | ||||
| Other Assets and Liabilities | 0.2% | ||||
5
| Shareholder Fee Example | ||
Fund shareholders may incur two types of costs: (1) transaction costs, including brokerage commissions paid on purchases and sales of fund shares; and (2) ongoing costs, including management fees and other fund expenses. This example is intended to help you understand your ongoing costs (in dollars) of investing in your fund and to compare these costs with the ongoing cost of investing in other funds.
The example is based on an investment of $1,000 made at the beginning of the period and held for the entire period from March 1, 2020 to August 31, 2020.
Actual Expenses
The table provides information about actual account values and actual expenses. You may use the information, together with the amount you invested, to estimate the expenses that you paid over the period. Simply divide your account value by $1,000 (for example, an $8,600 account value divided by $1,000 = 8.6), then multiply the result by the number under the heading “Expenses Paid During Period” to estimate the expenses you paid on your account during this period.
Hypothetical Example for Comparison Purposes
The table also provides information about hypothetical account values and hypothetical expenses based on the actual expense ratio of your fund and an assumed rate of return of 5% per year before expenses, which is not the actual return of a fund. The hypothetical account values and expenses may not be used to estimate the actual ending account balance or expenses you paid for the period. You may use this information to compare the ongoing costs of investing in your fund and other funds. To do so, compare this 5% hypothetical example with the 5% hypothetical examples that appear in the shareholder reports of the other funds.
Please note that the expenses shown in the table are meant to highlight your ongoing costs only and do not reflect any transactional costs, such as brokerage commissions paid on purchases and sales of fund shares. Therefore, the table is useful in comparing ongoing costs only, and will not help you determine the relative total costs of owning different funds. In addition, if these transactional costs were included, your costs would have been higher.
| Beginning Account Value 3/1/20 | Ending Account Value 8/31/20 | Expenses Paid During Period(1) 3/1/20 - 8/31/20 | Annualized Expense Ratio(1) | |||||||||||
| Actual | $1,000 | $1,155.20 | $0.81 | 0.15% | ||||||||||
| Hypothetical | $1,000 | $1,024.38 | $0.76 | 0.15% | ||||||||||
(1)Expenses are equal to the fund's annualized expense ratio listed in the table above, multiplied by the average account value over the period, multiplied by 184, the number of days in the most recent fiscal half-year, divided by 366, to reflect the one-half year period. Annualized expense ratio reflects actual expenses, including any applicable fee waivers or expense reimbursements and excluding any acquired fund fees and expenses.
6
| Schedule of Investments | ||
AUGUST 31, 2020
| Shares | Value | |||||||
| COMMON STOCKS — 99.7% | ||||||||
| Aerospace and Defense — 1.1% | ||||||||
| AAR Corp. | 1,880 | $ | 37,938 | |||||
Aerojet Rocketdyne Holdings, Inc.(1) | 4,685 | 193,818 | ||||||
AeroVironment, Inc.(1) | 278 | 21,236 | ||||||
Astronics Corp.(1) | 860 | 7,774 | ||||||
Axon Enterprise, Inc.(1) | 865 | 74,113 | ||||||
| Boeing Co. (The) | 2,901 | 498,450 | ||||||
| BWX Technologies, Inc. | 3,690 | 205,201 | ||||||
| Cubic Corp. | 1,832 | 86,251 | ||||||
| Curtiss-Wright Corp. | 1,149 | 117,566 | ||||||
Ducommun, Inc.(1) | 350 | 13,080 | ||||||
| General Dynamics Corp. | 1,370 | 204,609 | ||||||
| HEICO Corp. | 350 | 38,472 | ||||||
| HEICO Corp., Class A | 605 | 54,075 | ||||||
| Hexcel Corp. | 4,175 | 164,453 | ||||||
| Howmet Aerospace, Inc. | 6,453 | 113,057 | ||||||
| Huntington Ingalls Industries, Inc. | 1,055 | 159,854 | ||||||
| Kaman Corp. | 1,818 | 84,083 | ||||||
| L3Harris Technologies, Inc. | 1,885 | 340,695 | ||||||
| Lockheed Martin Corp. | 2,647 | 1,033,018 | ||||||
Mercury Systems, Inc.(1) | 605 | 45,823 | ||||||
| Moog, Inc., Class A | 605 | 36,475 | ||||||
| National Presto Industries, Inc. | 34 | 3,058 | ||||||
| Northrop Grumman Corp. | 1,111 | 380,640 | ||||||
| Park Aerospace Corp. | 537 | 5,955 | ||||||
Parsons Corp.(1) | 1,106 | 36,786 | ||||||
| Raytheon Technologies Corp. | 6,050 | 369,050 | ||||||
| Spirit AeroSystems Holdings, Inc., Class A | 4,467 | 91,842 | ||||||
Teledyne Technologies, Inc.(1) | 350 | 109,763 | ||||||
| Textron, Inc. | 5,237 | 206,495 | ||||||
| TransDigm Group, Inc. | 317 | 158,395 | ||||||
| Triumph Group, Inc. | 14 | 101 | ||||||
Vectrus, Inc.(1) | 7 | 304 | ||||||
| 4,892,430 | ||||||||
| Air Freight and Logistics — 1.0% | ||||||||
Air Transport Services Group, Inc.(1) | 3,139 | 79,793 | ||||||
Atlas Air Worldwide Holdings, Inc.(1) | 1,115 | 62,875 | ||||||
| CH Robinson Worldwide, Inc. | 3,155 | 310,137 | ||||||
Echo Global Logistics, Inc.(1) | 522 | 14,261 | ||||||
| Expeditors International of Washington, Inc. | 4,940 | 436,647 | ||||||
| FedEx Corp. | 6,249 | 1,373,780 | ||||||
| Forward Air Corp. | 1,115 | 65,774 | ||||||
Hub Group, Inc., Class A(1) | 1,829 | 98,473 | ||||||
| United Parcel Service, Inc., Class B | 11,873 | 1,942,660 | ||||||
XPO Logistics, Inc.(1) | 860 | 75,912 | ||||||
| 4,460,312 | ||||||||
7
| Shares | Value | |||||||
| Airlines — 0.5% | ||||||||
| Alaska Air Group, Inc. | 5,704 | $ | 222,171 | |||||
| Allegiant Travel Co. | 832 | 106,995 | ||||||
| American Airlines Group, Inc. | 1,880 | 24,534 | ||||||
| Delta Air Lines, Inc. | 16,790 | 517,972 | ||||||
| Hawaiian Holdings, Inc. | 2,900 | 38,976 | ||||||
JetBlue Airways Corp.(1) | 15,218 | 175,311 | ||||||
Mesa Air Group, Inc.(1) | 1,082 | 3,960 | ||||||
| SkyWest, Inc. | 3,133 | 105,426 | ||||||
| Southwest Airlines Co. | 15,218 | 571,892 | ||||||
Spirit Airlines, Inc.(1) | 3,858 | 68,981 | ||||||
United Airlines Holdings, Inc.(1) | 7,983 | 287,388 | ||||||
| 2,123,606 | ||||||||
| Auto Components — 0.7% | ||||||||
Adient plc(1) | 1,880 | 32,599 | ||||||
American Axle & Manufacturing Holdings, Inc.(1) | 8,009 | 62,310 | ||||||
| Aptiv plc | 6,453 | 555,732 | ||||||
| Autoliv, Inc. | 4,409 | 345,401 | ||||||
| BorgWarner, Inc. | 9,894 | 401,597 | ||||||
| Cooper Tire & Rubber Co. | 2,658 | 91,887 | ||||||
Cooper-Standard Holdings, Inc.(1) | 581 | 10,528 | ||||||
| Dana, Inc. | 7,053 | 98,389 | ||||||
Delphi Technologies plc(1) | 3,570 | 62,011 | ||||||
Fox Factory Holding Corp.(1) | 350 | 35,284 | ||||||
| Gentex Corp. | 14,198 | 384,056 | ||||||
Gentherm, Inc.(1) | 1,625 | 73,499 | ||||||
| Goodyear Tire & Rubber Co. (The) | 11,607 | 111,369�� | ||||||
| LCI Industries | 1,306 | 148,401 | ||||||
| Lear Corp. | 2,925 | 333,245 | ||||||
Modine Manufacturing Co.(1) | 2,900 | 19,633 | ||||||
Motorcar Parts of America, Inc.(1) | 273 | 4,753 | ||||||
| Standard Motor Products, Inc. | 350 | 15,904 | ||||||
Stoneridge, Inc.(1) | 1,115 | 22,523 | ||||||
Tenneco, Inc., Class A(1) | 3,950 | 32,114 | ||||||
Veoneer, Inc.(1) | 1,880 | 26,094 | ||||||
Visteon Corp.(1) | 1,134 | 85,538 | ||||||
XPEL, Inc.(1) | 571 | 14,218 | ||||||
| 2,967,085 | ||||||||
| Automobiles — 1.1% | ||||||||
| Ford Motor Co. | 117,416 | 800,777 | ||||||
| General Motors Co. | 32,238 | 955,212 | ||||||
| Harley-Davidson, Inc. | 8,344 | 231,212 | ||||||
Tesla, Inc.(1) | 5,575 | 2,778,134 | ||||||
| Thor Industries, Inc. | 862 | 81,399 | ||||||
| Winnebago Industries, Inc. | 1,866 | 100,727 | ||||||
| 4,947,461 | ||||||||
| Banks — 4.6% | ||||||||
| 1st Source Corp. | 350 | 12,058 | ||||||
| Allegiance Bancshares, Inc. | 605 | 15,379 | ||||||
| Altabancorp | 860 | 17,733 | ||||||
| Amalgamated Bank, Class A | 553 | 6,509 | ||||||
Amerant Bancorp, Inc.(1) | 1,370 | 18,015 | ||||||
8
| Shares | Value | |||||||
| American National Bankshares, Inc. | 269 | $ | 6,063 | |||||
| Ameris Bancorp | 1,816 | 44,528 | ||||||
| Arrow Financial Corp. | 355 | 10,171 | ||||||
| Associated Banc-Corp. | 4,126 | 55,453 | ||||||
Atlantic Capital Bancshares, Inc.(1) | 783 | 9,032 | ||||||
| Atlantic Union Bankshares Corp. | 1,880 | 43,729 | ||||||
| Banc of California, Inc. | 1,880 | 20,661 | ||||||
| BancFirst Corp. | 585 | 25,740 | ||||||
Bancorp, Inc. (The)(1) | 3,690 | 35,055 | ||||||
| BancorpSouth Bank | 2,383 | 51,425 | ||||||
| Bank First Corp. | 86 | 5,366 | ||||||
| Bank of America Corp. | 85,239 | 2,194,052 | ||||||
| Bank of Commerce Holdings | 592 | 4,351 | ||||||
| Bank of Hawaii Corp. | 1,607 | 88,449 | ||||||
| Bank of Marin Bancorp | 350 | 11,141 | ||||||
| Bank OZK | 4,447 | 102,459 | ||||||
| BankUnited, Inc. | 3,408 | 79,679 | ||||||
| Banner Corp. | 1,065 | 38,468 | ||||||
| Bar Harbor Bankshares | 338 | 6,848 | ||||||
Baycom Corp.(1) | 312 | 3,615 | ||||||
| BCB Bancorp, Inc. | 586 | 4,773 | ||||||
| Berkshire Hills Bancorp, Inc. | 1,368 | 12,558 | ||||||
| BOK Financial Corp. | 605 | 33,965 | ||||||
| Boston Private Financial Holdings, Inc. | 3,665 | 21,770 | ||||||
| Bridge Bancorp, Inc. | 860 | 17,209 | ||||||
| Brookline Bancorp, Inc. | 2,390 | 22,944 | ||||||
| Bryn Mawr Bank Corp. | 605 | 16,420 | ||||||
| Business First Bancshares, Inc. | 321 | 4,645 | ||||||
| Byline Bancorp, Inc. | 793 | 10,024 | ||||||
| Cadence BanCorp | 2,412 | 22,914 | ||||||
| Camden National Corp. | 350 | 11,429 | ||||||
| Capital City Bank Group, Inc. | 309 | 6,263 | ||||||
| Cathay General Bancorp. | 2,390 | 59,009 | ||||||
| CBTX, Inc. | 313 | 4,930 | ||||||
| Central Pacific Financial Corp. | 1,274 | 19,734 | ||||||
| Central Valley Community Bancorp | 340 | 4,090 | ||||||
| CIT Group, Inc. | 2,900 | 57,043 | ||||||
| Citigroup, Inc. | 32,323 | 1,652,352 | ||||||
| Citizens & Northern Corp. | 320 | 5,485 | ||||||
| Citizens Financial Group, Inc. | 10,135 | 262,192 | ||||||
| City Holding Co. | 350 | 22,393 | ||||||
| Civista Bancshares, Inc. | 346 | 4,619 | ||||||
| CNB Financial Corp. | 612 | 9,761 | ||||||
| Codorus Valley Bancorp, Inc. | 317 | 4,089 | ||||||
| Columbia Banking System, Inc. | 1,625 | 45,354 | ||||||
| Comerica, Inc. | 5,218 | 206,268 | ||||||
| Commerce Bancshares, Inc. | 2,857 | 170,191 | ||||||
| Community Bank System, Inc. | 1,078 | 64,863 | ||||||
| Community Bankers Trust Corp. | 869 | 4,458 | ||||||
| Community Trust Bancorp, Inc. | 350 | 11,295 | ||||||
| ConnectOne Bancorp, Inc. | 1,115 | 16,859 | ||||||
| Cullen/Frost Bankers, Inc. | 860 | 59,736 | ||||||
9
| Shares | Value | |||||||
Customers Bancorp, Inc.(1) | 1,370 | $ | 17,495 | |||||
| CVB Financial Corp. | 3,155 | 57,453 | ||||||
| Dime Community Bancshares, Inc. | 60 | 774 | ||||||
| Eagle Bancorp, Inc. | 605 | 17,412 | ||||||
| East West Bancorp, Inc. | 6,003 | 220,790 | ||||||
| Enterprise Financial Services Corp. | 605 | 18,096 | ||||||
Equity Bancshares, Inc., Class A(1) | 522 | 8,300 | ||||||
| F.N.B. Corp. | 8,860 | 66,450 | ||||||
| Farmers National Banc Corp. | 825 | 9,620 | ||||||
| FB Financial Corp. | 928 | 25,056 | ||||||
| Fifth Third Bancorp | 22,734 | 469,684 | ||||||
| Financial Institutions, Inc. | 860 | 14,818 | ||||||
| First BanCorp | 4,430 | 25,384 | ||||||
| First Bancorp/Southern Pines NC | 851 | 17,403 | ||||||
| First Bancshares, Inc. (The) | 605 | 12,971 | ||||||
| First Busey Corp. | 1,584 | 28,219 | ||||||
| First Business Financial Services, Inc. | 290 | 4,495 | ||||||
| First Choice Bancorp | 330 | 4,670 | ||||||
| First Citizens BancShares, Inc., Class A | 79 | 31,059 | ||||||
| First Commonwealth Financial Corp. | 2,900 | 23,780 | ||||||
| First Community Bankshares, Inc. | 613 | 11,794 | ||||||
| First Financial Bancorp | 2,390 | 32,791 | ||||||
| First Financial Bankshares, Inc. | 2,900 | 87,797 | ||||||
| First Financial Corp. | 350 | 12,037 | ||||||
| First Foundation, Inc. | 1,880 | 28,557 | ||||||
| First Hawaiian, Inc. | 3,665 | 60,582 | ||||||
| First Horizon National Corp. | 15,153 | 144,711 | ||||||
| First Internet Bancorp | 291 | 4,252 | ||||||
| First Interstate BancSystem, Inc., Class A | 860 | 28,208 | ||||||
| First Merchants Corp. | 1,312 | 33,561 | ||||||
| First Mid Bancshares, Inc. | 605 | 15,754 | ||||||
| First Midwest Bancorp, Inc. | 2,651 | 33,031 | ||||||
| First of Long Island Corp. (The) | 1,115 | 17,132 | ||||||
| First Republic Bank | 2,135 | 241,063 | ||||||
| Flushing Financial Corp. | 1,124 | 13,634 | ||||||
| Fulton Financial Corp. | 4,940 | 48,313 | ||||||
| German American Bancorp, Inc. | 605 | 17,152 | ||||||
| Glacier Bancorp, Inc. | 2,135 | 74,906 | ||||||
| Great Southern Bancorp, Inc. | 553 | 21,313 | ||||||
| Great Western Bancorp, Inc. | 1,605 | 22,358 | ||||||
| Guaranty Bancshares, Inc. | 274 | 7,247 | ||||||
| Hancock Whitney Corp. | 1,880 | 37,619 | ||||||
| Hanmi Financial Corp. | 1,370 | 13,056 | ||||||
| Heartland Financial USA, Inc. | 1,073 | 36,943 | ||||||
| Heritage Commerce Corp. | 2,390 | 16,563 | ||||||
| Heritage Financial Corp. | 860 | 17,148 | ||||||
| Hilltop Holdings, Inc. | 2,645 | 54,487 | ||||||
| Home BancShares, Inc. | 4,430 | 71,810 | ||||||
| HomeTrust Bancshares, Inc. | 867 | 12,164 | ||||||
| Hope Bancorp, Inc. | 3,920 | 33,163 | ||||||
| Horizon Bancorp, Inc. | 1,625 | 18,167 | ||||||
Howard Bancorp, Inc.(1) | 524 | 5,140 | ||||||
10
| Shares | Value | |||||||
| Huntington Bancshares, Inc. | 36,668 | $ | 345,046 | |||||
| Independent Bank Corp. (Massachusetts) | 572 | 35,950 | ||||||
| Independent Bank Corp. (Michigan) | 1,123 | 16,744 | ||||||
| Independent Bank Group, Inc. | 605 | 28,132 | ||||||
| International Bancshares Corp. | 2,312 | 73,013 | ||||||
| Investar Holding Corp. | 284 | 3,862 | ||||||
| Investors Bancorp, Inc. | 6,453 | 50,011 | ||||||
| JPMorgan Chase & Co. | 37,476 | 3,754,720 | ||||||
| KeyCorp | 33,267 | 409,849 | ||||||
| Lakeland Bancorp, Inc. | 1,880 | 19,984 | ||||||
| Lakeland Financial Corp. | 871 | 39,796 | ||||||
| Live Oak Bancshares, Inc. | 1,370 | 30,387 | ||||||
| M&T Bank Corp. | 1,880 | 194,129 | ||||||
| Macatawa Bank Corp. | 2,654 | 19,427 | ||||||
MainStreet Bancshares, Inc.(1) | 72 | 923 | ||||||
| Mercantile Bank Corp. | 605 | 13,213 | ||||||
Metropolitan Bank Holding Corp.(1) | 82 | 2,540 | ||||||
| Midland States Bancorp, Inc. | 860 | 12,565 | ||||||
| MidWestOne Financial Group, Inc. | 861 | 16,350 | ||||||
| MVB Financial Corp. | 587 | 8,335 | ||||||
| National Bank Holdings Corp., Class A | 805 | 22,894 | ||||||
| NBT Bancorp, Inc. | 1,086 | 33,090 | ||||||
Nicolet Bankshares, Inc.(1) | 95 | 5,702 | ||||||
| Northeast Bank | 342 | 6,382 | ||||||
| Northrim BanCorp, Inc. | 270 | 7,266 | ||||||
| OceanFirst Financial Corp. | 1,358 | 21,198 | ||||||
| OFG Bancorp | 2,888 | 37,082 | ||||||
| Old National Bancorp | 4,430 | 61,931 | ||||||
| Old Second Bancorp, Inc. | 2,139 | 17,476 | ||||||
| Origin Bancorp, Inc. | 605 | 14,326 | ||||||
| Orrstown Financial Services, Inc. | 329 | 4,530 | ||||||
| Pacific Premier Bancorp, Inc. | 2,804 | 63,342 | ||||||
| PacWest Bancorp | 2,863 | 54,626 | ||||||
| Park National Corp. | 291 | 26,164 | ||||||
| Parke Bancorp, Inc. | 547 | 6,728 | ||||||
| PCB Bancorp. | 347 | 3,314 | ||||||
| Peapack-Gladstone Financial Corp. | 860 | 14,620 | ||||||
| People's United Financial, Inc. | 8,593 | 90,914 | ||||||
| Peoples Bancorp, Inc. | 605 | 12,790 | ||||||
| Pinnacle Financial Partners, Inc. | 1,370 | 54,731 | ||||||
| PNC Financial Services Group, Inc. (The) | 6,188 | 688,106 | ||||||
| Popular, Inc. | 3,665 | 135,752 | ||||||
| Preferred Bank | 784 | 29,322 | ||||||
| Premier Financial Bancorp, Inc. | 330 | 4,231 | ||||||
| Prosperity Bancshares, Inc. | 1,638 | 89,304 | ||||||
| QCR Holdings, Inc. | 605 | 18,132 | ||||||
| RBB Bancorp | 608 | 7,886 | ||||||
| Regions Financial Corp. | 22,198 | 256,609 | ||||||
| Reliant Bancorp, Inc. | 273 | 3,959 | ||||||
| Renasant Corp. | 1,554 | 39,425 | ||||||
| Republic Bancorp, Inc., Class A | 499 | 15,349 | ||||||
| S&T Bancorp, Inc. | 1,050 | 21,205 | ||||||
11
| Shares | Value | |||||||
| Sandy Spring Bancorp, Inc. | 1,092 | $ | 26,121 | |||||
Seacoast Banking Corp. of Florida(1) | 860 | 17,406 | ||||||
| ServisFirst Bancshares, Inc. | 2,100 | 76,965 | ||||||
| Sierra Bancorp | 860 | 15,368 | ||||||
| Signature Bank | 1,895 | 183,872 | ||||||
| Simmons First National Corp., Class A | 2,863 | 48,871 | ||||||
| SmartFinancial, Inc. | 334 | 4,599 | ||||||
| South Plains Financial, Inc. | 525 | 7,497 | ||||||
| South State Corp. | 1,663 | 92,596 | ||||||
Southern First Bancshares, Inc.(1) | 606 | 15,695 | ||||||
| Southern National Bancorp of Virginia, Inc. | 796 | 6,806 | ||||||
| Southside Bancshares, Inc. | 605 | 16,671 | ||||||
Spirit of Texas Bancshares, Inc.(1) | 303 | 3,788 | ||||||
| Sterling Bancorp | 5,760 | 67,219 | ||||||
| Stock Yards Bancorp, Inc. | 605 | 25,973 | ||||||
| Summit Financial Group, Inc. | 522 | 7,700 | ||||||
SVB Financial Group(1) | 1,586 | 405,033 | ||||||
| Synovus Financial Corp. | 5,450 | 119,191 | ||||||
| TCF Financial Corp. | 2,697 | 72,495 | ||||||
Texas Capital Bancshares, Inc.(1) | 2,135 | 69,153 | ||||||
| Tompkins Financial Corp. | 326 | 21,575 | ||||||
| Towne Bank | 1,625 | 28,811 | ||||||
| TriCo Bancshares | 605 | 16,752 | ||||||
TriState Capital Holdings, Inc.(1) | 1,122 | 15,596 | ||||||
Triumph Bancorp, Inc.(1) | 605 | 17,279 | ||||||
| Truist Financial Corp. | 18,865 | 732,151 | ||||||
| Trustmark Corp. | 1,625 | 38,155 | ||||||
| U.S. Bancorp | 19,897 | 724,251 | ||||||
| UMB Financial Corp. | 1,330 | 71,448 | ||||||
| Umpqua Holdings Corp. | 6,259 | 70,602 | ||||||
| United Bankshares, Inc. | 2,593 | 67,781 | ||||||
| United Community Banks, Inc. | 2,390 | 43,307 | ||||||
| United Security Bancshares | 759 | 4,622 | ||||||
| Univest Financial Corp. | 860 | 13,837 | ||||||
| Valley National Bancorp | 12,189 | 91,539 | ||||||
| Veritex Holdings, Inc. | 1,115 | 20,048 | ||||||
| Washington Trust Bancorp, Inc. | 585 | 19,527 | ||||||
| Webster Financial Corp. | 2,132 | 58,630 | ||||||
| Wells Fargo & Co. | 51,405 | 1,241,431 | ||||||
| WesBanco, Inc. | 1,893 | 42,062 | ||||||
| West Bancorporation, Inc. | 1,121 | 19,730 | ||||||
| Westamerica BanCorp | 605 | 36,820 | ||||||
| Western Alliance Bancorp | 3,971 | 140,176 | ||||||
| Wintrust Financial Corp. | 1,565 | 68,109 | ||||||
| Zions Bancorp N.A. | 6,957 | 223,737 | ||||||
| 20,176,353 | ||||||||
| Beverages — 1.2% | ||||||||
Boston Beer Co., Inc. (The), Class A(1) | 274 | 241,663 | ||||||
| Brown-Forman Corp., Class A | 612 | 40,686 | ||||||
| Brown-Forman Corp., Class B | 6,264 | 458,337 | ||||||
| Coca-Cola Co. (The) | 26,279 | 1,301,599 | ||||||
| Coca-Cola Consolidated, Inc. | 95 | 25,963 | ||||||
12
| Shares | Value | |||||||
| Constellation Brands, Inc., Class A | 2,390 | $ | 440,907 | |||||
| Keurig Dr Pepper, Inc. | 1,880 | 56,080 | ||||||
| MGP Ingredients, Inc. | 346 | 12,300 | ||||||
| Molson Coors Beverage Co., Class B | 3,123 | 117,550 | ||||||
Monster Beverage Corp.(1) | 5,705 | 478,421 | ||||||
National Beverage Corp.(1) | 350 | 28,462 | ||||||
NewAge, Inc.(1) | 63 | 137 | ||||||
| PepsiCo, Inc. | 14,453 | 2,024,287 | ||||||
| 5,226,392 | ||||||||
| Biotechnology — 2.7% | ||||||||
| AbbVie, Inc. | 8,430 | 807,341 | ||||||
ACADIA Pharmaceuticals, Inc.(1) | 860 | 34,047 | ||||||
Acceleron Pharma, Inc.(1) | 619 | 60,334 | ||||||
ADMA Biologics, Inc.(1) | 40 | 102 | ||||||
Adverum Biotechnologies, Inc.(1) | 1,398 | 17,056 | ||||||
Agenus, Inc.(1) | 60 | 261 | ||||||
Agios Pharmaceuticals, Inc.(1) | 299 | 12,262 | ||||||
Aimmune Therapeutics, Inc.(1) | 541 | 18,513 | ||||||
Akebia Therapeutics, Inc.(1) | 3,254 | 33,874 | ||||||
Alector, Inc.(1) | 604 | 7,804 | ||||||
Alexion Pharmaceuticals, Inc.(1) | 2,137 | 244,088 | ||||||
Alkermes plc(1) | 3,163 | 52,316 | ||||||
Allogene Therapeutics, Inc.(1) | 554 | 19,750 | ||||||
Alnylam Pharmaceuticals, Inc.(1) | 1,119 | 148,424 | ||||||
Altimmune, Inc.(1) | 125 | 2,109 | ||||||
| Amgen, Inc. | 6,713 | 1,700,537 | ||||||
Amicus Therapeutics, Inc.(1) | 2,060 | 30,076 | ||||||
AnaptysBio, Inc.(1) | 793 | 13,743 | ||||||
Anika Therapeutics, Inc.(1) | 350 | 13,416 | ||||||
Ardelyx, Inc.(1) | 1,092 | 6,268 | ||||||
Arena Pharmaceuticals, Inc.(1) | 3,410 | 238,086 | ||||||
Arrowhead Pharmaceuticals, Inc.(1) | 5,960 | 251,750 | ||||||
Assembly Biosciences, Inc.(1) | 282 | 6,167 | ||||||
Atara Biotherapeutics, Inc.(1) | 326 | 4,395 | ||||||
Atreca, Inc., Class A(1) | 292 | 4,152 | ||||||
Avid Bioservices, Inc.(1) | 2,924 | 24,532 | ||||||
Avrobio, Inc.(1) | 1,370 | 23,728 | ||||||
Beyondspring, Inc.(1) | 15 | 186 | ||||||
Biogen, Inc.(1) | 4,548 | 1,308,187 | ||||||
Biohaven Pharmaceutical Holding Co. Ltd.(1) | 420 | 26,624 | ||||||
BioMarin Pharmaceutical, Inc.(1) | 1,607 | 125,394 | ||||||
BioSpecifics Technologies Corp.(1) | 54 | 3,483 | ||||||
Bluebird Bio, Inc.(1) | 518 | 30,717 | ||||||
Blueprint Medicines Corp.(1) | 706 | 54,666 | ||||||
Catalyst Pharmaceuticals, Inc.(1) | 3,396 | 11,139 | ||||||
Celldex Therapeutics, Inc.(1) | 1,137 | 13,576 | ||||||
Coherus Biosciences, Inc.(1) | 1,065 | 20,203 | ||||||
CRISPR Therapeutics AG(1) | 801 | 74,862 | ||||||
Cyclerion Therapeutics, Inc.(1) | 6 | 41 | ||||||
Cytokinetics, Inc.(1) | 2,652 | 63,542 | ||||||
CytomX Therapeutics, Inc.(1) | 874 | 6,380 | ||||||
Deciphera Pharmaceuticals, Inc.(1) | 14 | 630 | ||||||
13
| Shares | Value | |||||||
Denali Therapeutics, Inc.(1) | 1,480 | $ | 47,212 | |||||
Dicerna Pharmaceuticals, Inc.(1) | 4,201 | 77,803 | ||||||
Eagle Pharmaceuticals, Inc.(1) | 605 | 24,006 | ||||||
Editas Medicine, Inc.(1) | 28 | 986 | ||||||
Eiger BioPharmaceuticals, Inc.(1) | 2 | 22 | ||||||
Emergent BioSolutions, Inc.(1) | 1,631 | 186,016 | ||||||
Enanta Pharmaceuticals, Inc.(1) | 277 | 14,457 | ||||||
Esperion Therapeutics, Inc.(1) | 1,165 | 42,057 | ||||||
Exact Sciences Corp.(1) | 1,046 | 78,753 | ||||||
Exelixis, Inc.(1) | 13,045 | 289,860 | ||||||
FibroGen, Inc.(1) | 605 | 27,122 | ||||||
Frequency Therapeutics, Inc.(1) | 433 | 8,374 | ||||||
G1 Therapeutics, Inc.(1) | 581 | 8,918 | ||||||
Geron Corp.(1) | 7,465 | 15,303 | ||||||
| Gilead Sciences, Inc. | 25,010 | 1,669,418 | ||||||
Global Blood Therapeutics, Inc.(1) | 814 | 51,103 | ||||||
Gossamer Bio, Inc.(1) | 1,858 | 25,826 | ||||||
Halozyme Therapeutics, Inc.(1) | 18 | 522 | ||||||
Harpoon Therapeutics, Inc.(1) | 7 | 96 | ||||||
Heron Therapeutics, Inc.(1) | 571 | 8,165 | ||||||
ImmunoGen, Inc.(1) | 8,352 | 30,902 | ||||||
Immunomedics, Inc.(1) | 2,260 | 100,706 | ||||||
Incyte Corp.(1) | 1,880 | 181,138 | ||||||
Intellia Therapeutics, Inc.(1) | 316 | 6,819 | ||||||
Invitae Corp.(1) | 1,939 | 67,787 | ||||||
Ionis Pharmaceuticals, Inc.(1) | 1,988 | 108,346 | ||||||
Iovance Biotherapeutics, Inc.(1) | 1,223 | 40,763 | ||||||
Ironwood Pharmaceuticals, Inc.(1) | 819 | 8,272 | ||||||
Kadmon Holdings, Inc.(1) | 2,869 | 14,345 | ||||||
Karyopharm Therapeutics, Inc.(1) | 3,208 | 48,794 | ||||||
Kura Oncology, Inc.(1) | 1,125 | 28,001 | ||||||
Ligand Pharmaceuticals, Inc.(1) | 320 | 32,640 | ||||||
MacroGenics, Inc.(1) | 2 | 58 | ||||||
Madrigal Pharmaceuticals, Inc.(1) | 122 | 13,139 | ||||||
Mirati Therapeutics, Inc.(1) | 509 | 76,029 | ||||||
Mirum Pharmaceuticals, Inc.(1) | 606 | 15,732 | ||||||
Moderna, Inc.(1) | 1,625 | 105,446 | ||||||
Momenta Pharmaceuticals, Inc.(1) | 1,115 | 58,170 | ||||||
Myriad Genetics, Inc.(1) | 860 | 11,498 | ||||||
Natera, Inc.(1) | 896 | 57,084 | ||||||
Neurocrine Biosciences, Inc.(1) | 605 | 70,434 | ||||||
Novavax, Inc.(1) | 312 | 34,426 | ||||||
OPKO Health, Inc.(1) | 6,515 | 21,109 | ||||||
PDL BioPharma, Inc.(1) | 1,874 | 6,278 | ||||||
Pfenex, Inc.(1) | 581 | 7,280 | ||||||
Protagonist Therapeutics, Inc.(1) | 3 | 67 | ||||||
Prothena Corp. plc(1) | 586 | 7,595 | ||||||
Radius Health, Inc.(1) | 860 | 10,647 | ||||||
Regeneron Pharmaceuticals, Inc.(1) | 2,087 | 1,293,794 | ||||||
REGENXBIO, Inc.(1) | 795 | 24,263 | ||||||
Retrophin, Inc.(1) | 315 | 6,171 | ||||||
Rhythm Pharmaceuticals, Inc.(1) | 800 | 23,608 | ||||||
14
| Shares | Value | |||||||
Sage Therapeutics, Inc.(1) | 422 | $ | 22,130 | |||||
Sangamo Therapeutics, Inc.(1) | 2,645 | 29,188 | ||||||
Sarepta Therapeutics, Inc.(1) | 95 | 13,910 | ||||||
Seattle Genetics, Inc.(1) | 605 | 95,796 | ||||||
Solid Biosciences, Inc.(1) | 3 | 7 | ||||||
Spectrum Pharmaceuticals, Inc.(1) | 339 | 1,427 | ||||||
Syndax Pharmaceuticals, Inc.(1) | 77 | 1,256 | ||||||
TCR2 Therapeutics, Inc.(1) | 2 | 40 | ||||||
Turning Point Therapeutics, Inc.(1) | 780 | 60,980 | ||||||
Ultragenyx Pharmaceutical, Inc.(1) | 1,011 | 85,996 | ||||||
United Therapeutics Corp.(1) | 1,817 | 194,346 | ||||||
Vanda Pharmaceuticals, Inc.(1) | 783 | 8,057 | ||||||
Veracyte, Inc.(1) | 21 | 700 | ||||||
Vericel Corp.(1) | 8 | 127 | ||||||
Vertex Pharmaceuticals, Inc.(1) | 2,900 | 809,448 | ||||||
Viking Therapeutics, Inc.(1) | 788 | 5,272 | ||||||
Voyager Therapeutics, Inc.(1) | 1,625 | 19,159 | ||||||
Xencor, Inc.(1) | 860 | 30,745 | ||||||
| 11,980,705 | ||||||||
| Building Products — 0.9% | ||||||||
| AAON, Inc. | 851 | 48,447 | ||||||
| Advanced Drainage Systems, Inc. | 2,645 | 146,745 | ||||||
| Allegion plc | 1,880 | 194,373 | ||||||
Alpha Pro Tech Ltd.(1) | 615 | 8,628 | ||||||
| AO Smith Corp. | 5,064 | 247,984 | ||||||
| Apogee Enterprises, Inc. | 1,370 | 28,674 | ||||||
Armstrong Flooring, Inc.(1) | 329 | 1,273 | ||||||
| Armstrong World Industries, Inc. | 2,645 | 195,042 | ||||||
Builders FirstSource, Inc.(1) | 4,932 | 151,018 | ||||||
| Carrier Global Corp. | 3,290 | 98,207 | ||||||
| CSW Industrials, Inc. | 350 | 25,288 | ||||||
| Fortune Brands Home & Security, Inc. | 1,915 | 161,013 | ||||||
Gibraltar Industries, Inc.(1) | 1,083 | 67,628 | ||||||
| Insteel Industries, Inc. | 849 | 15,656 | ||||||
JELD-WEN Holding, Inc.(1) | 3,155 | 66,413 | ||||||
| Johnson Controls International plc | 9,370 | 381,640 | ||||||
| Lennox International, Inc. | 95 | 26,631 | ||||||
| Masco Corp. | 2,335 | 136,130 | ||||||
Masonite International Corp.(1) | 1,568 | 143,143 | ||||||
| Owens Corning | 5,195 | 351,390 | ||||||
| Patrick Industries, Inc. | 1,387 | 77,963 | ||||||
PGT Innovations, Inc.(1) | 2,645 | 47,954 | ||||||
| Quanex Building Products Corp. | 1,637 | 27,518 | ||||||
| Simpson Manufacturing Co., Inc. | 2,149 | 211,333 | ||||||
| Trane Technologies plc | 1,881 | 222,692 | ||||||
Trex Co., Inc.(1) | 3,155 | 471,641 | ||||||
| UFP Industries, Inc. | 3,410 | 202,383 | ||||||
| 3,756,807 | ||||||||
| Capital Markets — 3.4% | ||||||||
| Affiliated Managers Group, Inc. | 350 | 24,027 | ||||||
| Ameriprise Financial, Inc. | 4,685 | 734,608 | ||||||
| Ares Management Corp., Class A | 1,115 | 45,102 | ||||||
15
| Shares | Value | |||||||
| Artisan Partners Asset Management, Inc., Class A | 3,081 | $ | 119,266 | |||||
Assetmark Financial Holdings, Inc.(1) | 84 | 2,029 | ||||||
| B. Riley Financial, Inc. | 1,346 | 36,046 | ||||||
| Bank of New York Mellon Corp. (The) | 14,036 | 519,051 | ||||||
| BGC Partners, Inc., Class A | 6,708 | 16,904 | ||||||
| BlackRock, Inc. | 1,117 | 663,710 | ||||||
| Cboe Global Markets, Inc. | 1,115 | 102,346 | ||||||
| Charles Schwab Corp. (The) | 19,736 | 701,220 | ||||||
| CME Group, Inc. | 3,924 | 690,114 | ||||||
| Cohen & Steers, Inc. | 1,115 | 67,457 | ||||||
| Cowen, Inc., Class A | 1,886 | 34,118 | ||||||
| Diamond Hill Investment Group, Inc. | 95 | 11,771 | ||||||
| E*TRADE Financial Corp. | 6,198 | 335,312 | ||||||
| Eaton Vance Corp. | 4,430 | 181,719 | ||||||
| Evercore, Inc., Class A | 1,324 | 81,929 | ||||||
| FactSet Research Systems, Inc. | 605 | 211,992 | ||||||
| Federated Hermes, Inc. | 1,370 | 32,757 | ||||||
| Franklin Resources, Inc. | 3,665 | 77,185 | ||||||
| Goldman Sachs Group, Inc. (The) | 5,972 | 1,223,484 | ||||||
| Hamilton Lane, Inc., Class A | 831 | 60,754 | ||||||
| Houlihan Lokey, Inc. | 605 | 35,453 | ||||||
| Interactive Brokers Group, Inc., Class A | 350 | 18,557 | ||||||
| Intercontinental Exchange, Inc. | 5,198 | 552,184 | ||||||
| Invesco Ltd. | 12,370 | 126,174 | ||||||
| Janus Henderson Group plc | 6,433 | 133,292 | ||||||
| KKR & Co., Inc., Class A | 7,473 | 267,683 | ||||||
| Lazard Ltd., Class A | 5,450 | 172,601 | ||||||
| LPL Financial Holdings, Inc. | 1,625 | 133,510 | ||||||
| MarketAxess Holdings, Inc. | 350 | 170,079 | ||||||
| Moelis & Co., Class A | 1,612 | 51,439 | ||||||
| Moody's Corp. | 2,900 | 854,456 | ||||||
| Morgan Stanley | 28,707 | 1,500,228 | ||||||
| Morningstar, Inc. | 350 | 56,052 | ||||||
| MSCI, Inc. | 558 | 208,285 | ||||||
| Nasdaq, Inc. | 607 | 81,593 | ||||||
| Northern Trust Corp. | 5,677 | 464,890 | ||||||
| Oppenheimer Holdings, Inc., Class A | 313 | 7,647 | ||||||
| Piper Sandler Cos. | 572 | 43,157 | ||||||
| Pzena Investment Management, Inc., Class A | 14 | 69 | ||||||
| Raymond James Financial, Inc. | 4,475 | 338,847 | ||||||
| S&P Global, Inc. | 3,596 | 1,317,646 | ||||||
| Safeguard Scientifics, Inc. | 2 | 12 | ||||||
| SEI Investments Co. | 4,763 | 249,391 | ||||||
| State Street Corp. | 6,529 | 444,560 | ||||||
| Stifel Financial Corp. | 2,645 | 134,128 | ||||||
StoneX Group, Inc.(1) | 605 | 34,303 | ||||||
| T. Rowe Price Group, Inc. | 6,963 | 969,319 | ||||||
| TD Ameritrade Holding Corp. | 6,311 | 242,216 | ||||||
| Victory Capital Holdings, Inc., Class A | 530 | 9,217 | ||||||
| Virtu Financial, Inc., Class A | 305 | 7,878 | ||||||
| Virtus Investment Partners, Inc. | 285 | 40,441 | ||||||
| Waddell & Reed Financial, Inc., Class A | 3,155 | 49,691 | ||||||
16
| Shares | Value | |||||||
| WisdomTree Investments, Inc. | 1,535 | $ | 5,741 | |||||
| 14,693,640 | ||||||||
| Chemicals — 2.3% | ||||||||
AdvanSix, Inc.(1) | 1,064 | 13,545 | ||||||
| Air Products and Chemicals, Inc. | 3,155 | 922,080 | ||||||
| Albemarle Corp. | 3,602 | 327,818 | ||||||
| Ashland Global Holdings, Inc. | 2,088 | 153,865 | ||||||
| Avient Corp. | 2,048 | 52,265 | ||||||
Axalta Coating Systems Ltd.(1) | 5,149 | 122,804 | ||||||
| Balchem Corp. | 328 | 32,046 | ||||||
| Cabot Corp. | 2,674 | 98,965 | ||||||
| Celanese Corp. | 4,430 | 448,094 | ||||||
| CF Industries Holdings, Inc. | 3,410 | 111,268 | ||||||
| Chase Corp. | 95 | 9,269 | ||||||
| Chemours Co. (The) | 10,895 | 225,091 | ||||||
| Corteva, Inc. | 20,923 | 597,352 | ||||||
| Dow, Inc. | 13,470 | 607,766 | ||||||
| DuPont de Nemours, Inc. | 11,879 | 662,373 | ||||||
| Eastman Chemical Co. | 3,715 | 271,604 | ||||||
| Ecolab, Inc. | 1,992 | 392,583 | ||||||
Element Solutions, Inc.(1) | 2,900 | 31,175 | ||||||
Ferro Corp.(1) | 5,931 | 73,960 | ||||||
| FMC Corp. | 4,698 | 502,028 | ||||||
| FutureFuel Corp. | 353 | 4,271 | ||||||
GCP Applied Technologies, Inc.(1) | 1,828 | 47,638 | ||||||
| H.B. Fuller Co. | 350 | 16,859 | ||||||
| Hawkins, Inc. | 605 | 30,383 | ||||||
| Huntsman Corp. | 2,135 | 46,159 | ||||||
Ingevity Corp.(1) | 548 | 30,781 | ||||||
| Innospec, Inc. | 1,088 | 81,263 | ||||||
| International Flavors & Fragrances, Inc. | 350 | 43,326 | ||||||
Koppers Holdings, Inc.(1) | 860 | 20,692 | ||||||
| Kronos Worldwide, Inc. | 532 | 6,645 | ||||||
| Linde plc | 4,947 | 1,235,464 | ||||||
Livent Corp.(1) | 8,810 | 74,709 | ||||||
| LyondellBasell Industries NV, Class A | 8,059 | 527,703 | ||||||
| Minerals Technologies, Inc. | 1,069 | 54,252 | ||||||
| Mosaic Co. (The) | 9,604 | 175,081 | ||||||
| NewMarket Corp. | 342 | 127,392 | ||||||
| Olin Corp. | 7,750 | 87,187 | ||||||
| Orion Engineered Carbons SA | 4,382 | 53,241 | ||||||
| PPG Industries, Inc. | 2,900 | 349,160 | ||||||
PQ Group Holdings, Inc.(1) | 758 | 8,831 | ||||||
| Quaker Chemical Corp. | 69 | 13,110 | ||||||
Rayonier Advanced Materials, Inc.(1) | 56 | 177 | ||||||
| RPM International, Inc. | 1,376 | 116,643 | ||||||
| Scotts Miracle-Gro Co. (The) | 1,370 | 230,886 | ||||||
| Sensient Technologies Corp. | 1,320 | 72,890 | ||||||
| Sherwin-Williams Co. (The) | 865 | 580,458 | ||||||
| Stepan Co. | 826 | 95,229 | ||||||
Trecora Resources(1) | 63 | 379 | ||||||
| Tredegar Corp. | 1,860 | 31,490 | ||||||
17
| Shares | Value | |||||||
| Trinseo SA | 2,363 | $ | 58,862 | |||||
| Tronox Holdings plc, Class A | 5,781 | 51,798 | ||||||
| Valvoline, Inc. | 1,880 | 38,352 | ||||||
| Westlake Chemical Corp. | 1,340 | 79,489 | ||||||
| WR Grace & Co. | 2,310 | 94,040 | ||||||
| 10,140,791 | ||||||||
| Commercial Services and Supplies — 0.8% | ||||||||
| ABM Industries, Inc. | 607 | 23,151 | ||||||
| ACCO Brands Corp. | 1,118 | 7,245 | ||||||
| ADT, Inc. | 1,578 | 16,806 | ||||||
| Brady Corp., Class A | 1,088 | 51,016 | ||||||
| Brink's Co. (The) | 1,327 | 64,174 | ||||||
Casella Waste Systems, Inc., Class A(1) | 1,625 | 91,244 | ||||||
Cimpress plc(1) | 543 | 50,336 | ||||||
| Cintas Corp. | 860 | 286,586 | ||||||
Clean Harbors, Inc.(1) | 2,135 | 130,448 | ||||||
Copart, Inc.(1) | 5,991 | 618,990 | ||||||
| Covanta Holding Corp. | 2,644 | 24,959 | ||||||
| Deluxe Corp. | 350 | 9,940 | ||||||
| Ennis, Inc. | 1,370 | 25,112 | ||||||
Harsco Corp.(1) | 15 | 212 | ||||||
| Healthcare Services Group, Inc. | 1,115 | 23,192 | ||||||
Heritage-Crystal Clean, Inc.(1) | 671 | 9,850 | ||||||
| Herman Miller, Inc. | 3,853 | 91,817 | ||||||
| HNI Corp. | 1,896 | 60,388 | ||||||
IAA, Inc.(1) | 1,111 | 58,128 | ||||||
| Interface, Inc. | 2,135 | 16,141 | ||||||
| KAR Auction Services, Inc. | 3,410 | 59,129 | ||||||
| Kimball International, Inc., Class B | 2,604 | 29,191 | ||||||
| Knoll, Inc. | 1,838 | 23,655 | ||||||
| McGrath RentCorp | 1,556 | 103,256 | ||||||
| MSA Safety, Inc. | 350 | 44,083 | ||||||
PICO Holdings, Inc.(1) | 540 | 4,801 | ||||||
| Pitney Bowes, Inc. | 2,605 | 14,301 | ||||||
| Quad/Graphics, Inc. | 1,373 | 4,792 | ||||||
| Republic Services, Inc. | 860 | 79,739 | ||||||
| Rollins, Inc. | 1,370 | 75,542 | ||||||
| Steelcase, Inc., Class A | 4,683 | 48,937 | ||||||
Stericycle, Inc.(1) | 86 | 5,513 | ||||||
Team, Inc.(1) | 1,370 | 8,727 | ||||||
| Tetra Tech, Inc. | 605 | 55,848 | ||||||
| UniFirst Corp. | 400 | 77,048 | ||||||
| US Ecology, Inc. | 7 | 260 | ||||||
| Viad Corp. | 331 | 7,093 | ||||||
| VSE Corp. | 260 | 7,548 | ||||||
| Waste Connections, Inc. | 2,390 | 239,072 | ||||||
| Waste Management, Inc. | 6,708 | 764,712 | ||||||
| 3,312,982 | ||||||||
| Communications Equipment — 0.6% | ||||||||
| ADTRAN, Inc. | 1,003 | 11,123 | ||||||
Arista Networks, Inc.(1) | 838 | 187,251 | ||||||
Ciena Corp.(1) | 5,210 | 295,772 | ||||||
18
| Shares | Value | |||||||
| Cisco Systems, Inc. | 27,904 | $ | 1,178,107 | |||||
| Comtech Telecommunications Corp. | 860 | 14,276 | ||||||
EchoStar Corp., Class A(1) | 1,625 | 47,743 | ||||||
Extreme Networks, Inc.(1) | 3,920 | 17,130 | ||||||
F5 Networks, Inc.(1) | 1,110 | 146,886 | ||||||
Infinera Corp.(1) | 5,705 | 41,589 | ||||||
Inseego Corp.(1) | 493 | 5,660 | ||||||
| InterDigital, Inc. | 595 | 36,384 | ||||||
| Juniper Networks, Inc. | 3,410 | 85,250 | ||||||
Lumentum Holdings, Inc.(1) | 3,121 | 268,406 | ||||||
| Motorola Solutions, Inc. | 1,121 | 173,475 | ||||||
NETGEAR, Inc.(1) | 1,322 | 44,089 | ||||||
NetScout Systems, Inc.(1) | 1,116 | 25,824 | ||||||
| Ubiquiti, Inc. | 95 | 17,266 | ||||||
ViaSat, Inc.(1) | 860 | 34,194 | ||||||
Viavi Solutions, Inc.(1) | 4,430 | 59,074 | ||||||
| 2,689,499 | ||||||||
| Construction and Engineering — 0.3% | ||||||||
AECOM(1) | 804 | 31,766 | ||||||
Aegion Corp.(1) | 1,370 | 22,173 | ||||||
Ameresco, Inc., Class A(1) | 566 | 19,323 | ||||||
| Arcosa, Inc. | 1,115 | 51,613 | ||||||
| Argan, Inc. | 72 | 3,048 | ||||||
| Comfort Systems USA, Inc. | 605 | 30,655 | ||||||
Construction Partners, Inc., Class A(1) | 759 | 14,186 | ||||||
Dycom Industries, Inc.(1) | 1,102 | 67,784 | ||||||
| EMCOR Group, Inc. | 1,197 | 89,787 | ||||||
| Fluor Corp. | 1,370 | 13,042 | ||||||
Great Lakes Dredge & Dock Corp.(1) | 4,175 | 39,120 | ||||||
HC2 Holdings, Inc.(1) | 3,210 | 8,025 | ||||||
IES Holdings, Inc.(1) | 275 | 7,928 | ||||||
| Jacobs Engineering Group, Inc. | 1,118 | 100,922 | ||||||
MasTec, Inc.(1) | 3,410 | 157,576 | ||||||
MYR Group, Inc.(1) | 605 | 23,480 | ||||||
Northwest Pipe Co.(1) | 299 | 8,471 | ||||||
Orion Group Holdings, Inc.(1) | 8 | 21 | ||||||
| Primoris Services Corp. | 1,880 | 35,833 | ||||||
| Quanta Services, Inc. | 3,856 | 197,620 | ||||||
Sterling Construction Co., Inc.(1) | 49 | 693 | ||||||
Tutor Perini Corp.(1) | 2,426 | 30,446 | ||||||
| Valmont Industries, Inc. | 1,076 | 136,706 | ||||||
WillScot Mobile Mini Holdings Corp.(1) | 3,082 | 55,168 | ||||||
| 1,145,386 | ||||||||
| Construction Materials — 0.2% | ||||||||
| Eagle Materials, Inc. | 2,086 | 170,572 | ||||||
| Martin Marietta Materials, Inc. | 1,083 | 219,708 | ||||||
Summit Materials, Inc., Class A(1) | 1,115 | 16,603 | ||||||
US Concrete, Inc.(1) | 538 | 14,359 | ||||||
| Vulcan Materials Co. | 2,135 | 256,200 | ||||||
| 677,442 | ||||||||
| Consumer Finance — 1.0% | ||||||||
| Ally Financial, Inc. | 16,238 | 371,525 | ||||||
19
| Shares | Value | |||||||
| American Express Co. | 12,649 | $ | 1,285,012 | |||||
| Capital One Financial Corp. | 12,634 | 872,125 | ||||||
Credit Acceptance Corp.(1) | 333 | 128,804 | ||||||
| Discover Financial Services | 9,880 | 524,430 | ||||||
Elevate Credit, Inc.(1) | 1,849 | 3,643 | ||||||
Encore Capital Group, Inc.(1) | 605 | 27,794 | ||||||
Enova International, Inc.(1) | 28 | 478 | ||||||
| FirstCash, Inc. | 350 | 20,913 | ||||||
Green Dot Corp., Class A(1) | 1,874 | 97,560 | ||||||
LendingClub Corp.(1) | 1,880 | 10,020 | ||||||
LendingTree, Inc.(1) | 4 | 1,236 | ||||||
| Navient Corp. | 12,141 | 110,362 | ||||||
| Nelnet, Inc., Class A | 1,088 | 71,253 | ||||||
| OneMain Holdings, Inc. | 4,631 | 134,670 | ||||||
PRA Group, Inc.(1) | 1,115 | 52,043 | ||||||
Regional Management Corp.(1) | 862 | 15,766 | ||||||
| Santander Consumer USA Holdings, Inc. | 5,930 | 102,055 | ||||||
| SLM Corp. | 22,758 | 173,871 | ||||||
| Synchrony Financial | 21,957 | 544,753 | ||||||
World Acceptance Corp.(1) | 95 | 8,644 | ||||||
| 4,556,957 | ||||||||
| Containers and Packaging — 0.7% | ||||||||
| Amcor plc | 8,605 | 95,171 | ||||||
| AptarGroup, Inc. | 2,393 | 283,307 | ||||||
| Ardagh Group SA | 68 | 1,035 | ||||||
| Avery Dennison Corp. | 2,674 | 308,553 | ||||||
| Ball Corp. | 3,155 | 253,567 | ||||||
Berry Global Group, Inc.(1) | 3,391 | 174,772 | ||||||
Crown Holdings, Inc.(1) | 2,390 | 183,671 | ||||||
| Graphic Packaging Holding Co. | 6,708 | 93,778 | ||||||
| Greif, Inc., Class A | 33 | 1,216 | ||||||
| International Paper Co. | 13,418 | 486,671 | ||||||
| O-I Glass, Inc. | 2,900 | 31,552 | ||||||
| Packaging Corp. of America | 3,920 | 396,861 | ||||||
| Sealed Air Corp. | 860 | 33,798 | ||||||
| Silgan Holdings, Inc. | 1,311 | 49,897 | ||||||
| Sonoco Products Co. | 3,022 | 160,257 | ||||||
UFP Technologies, Inc.(1) | 85 | 3,503 | ||||||
| WestRock Co. | 10,102 | 306,394 | ||||||
| 2,864,003 | ||||||||
| Distributors — 0.2% | ||||||||
| Core-Mark Holding Co., Inc. | 1,690 | 56,480 | ||||||
Funko, Inc., Class A(1) | 2 | 12 | ||||||
| Genuine Parts Co. | 2,099 | 198,229 | ||||||
LKQ Corp.(1) | 2,900 | 92,046 | ||||||
| Pool Corp. | 1,625 | 532,740 | ||||||
| Weyco Group, Inc. | 41 | 738 | ||||||
| 880,245 | ||||||||
| Diversified Consumer Services — 0.2% | ||||||||
Adtalem Global Education, Inc.(1) | 1,364 | 45,285 | ||||||
American Public Education, Inc.(1) | 262 | 8,237 | ||||||
Bright Horizons Family Solutions, Inc.(1) | 500 | 66,505 | ||||||
20
| Shares | Value | |||||||
Chegg, Inc.(1) | 605 | $ | 44,613 | |||||
| Collectors Universe, Inc. | 860 | 38,261 | ||||||
frontdoor, Inc.(1) | 864 | 37,645 | ||||||
| Graham Holdings Co., Class B | 30 | 12,839 | ||||||
Grand Canyon Education, Inc.(1) | 883 | 83,037 | ||||||
| H&R Block, Inc. | 5,450 | 79,025 | ||||||
K12, Inc.(1) | 800 | 29,768 | ||||||
Laureate Education, Inc., Class A(1) | 2,135 | 26,730 | ||||||
| OneSpaWorld Holdings Ltd. | 1,625 | 11,261 | ||||||
Perdoceo Education Corp.(1) | 3,966 | 56,991 | ||||||
| Service Corp. International | 2,135 | 97,463 | ||||||
ServiceMaster Global Holdings, Inc.(1) | 557 | 22,224 | ||||||
| Strategic Education, Inc. | 282 | 28,925 | ||||||
Universal Technical Institute, Inc.(1) | 836 | 5,894 | ||||||
WW International, Inc.(1) | 605 | 14,205 | ||||||
| 708,908 | ||||||||
| Diversified Financial Services — 0.7% | ||||||||
| Banco Latinoamericano de Comercio Exterior SA, E Shares | 1,370 | 16,687 | ||||||
Berkshire Hathaway, Inc., Class B(1) | 11,166 | 2,434,635 | ||||||
Cannae Holdings, Inc.(1) | 1,370 | 51,690 | ||||||
| Equitable Holdings, Inc. | 12,175 | 257,988 | ||||||
| Jefferies Financial Group, Inc. | 9,880 | 173,295 | ||||||
| Marlin Business Services Corp. | 132 | 884 | ||||||
| Voya Financial, Inc. | 3,684 | 191,237 | ||||||
| 3,126,416 | ||||||||
| Diversified Telecommunication Services — 1.5% | ||||||||
| AT&T, Inc. | 66,279 | 1,975,777 | ||||||
| ATN International, Inc. | 350 | 20,300 | ||||||
| CenturyLink, Inc. | 13,178 | 141,663 | ||||||
| Cogent Communications Holdings, Inc. | 429 | 28,855 | ||||||
Consolidated Communications Holdings, Inc.(1) | 2,193 | 17,062 | ||||||
GCI Liberty, Inc., Class A(1) | 1,880 | 151,866 | ||||||
Iridium Communications, Inc.(1) | 4,418 | 123,748 | ||||||
| Verizon Communications, Inc. | 66,598 | 3,947,263 | ||||||
Vonage Holdings Corp.(1) | 2,390 | 27,366 | ||||||
| 6,433,900 | ||||||||
| Electric Utilities — 1.8% | ||||||||
| ALLETE, Inc. | 1,370 | 73,925 | ||||||
| Alliant Energy Corp. | 5,225 | 282,934 | ||||||
| American Electric Power Co., Inc. | 9,860 | 777,264 | ||||||
| Avangrid, Inc. | 824 | 39,585 | ||||||
| Duke Energy Corp. | 4,177 | 335,580 | ||||||
| Edison International | 8,095 | 424,826 | ||||||
| Entergy Corp. | 5,960 | 590,874 | ||||||
| Evergy, Inc. | 5,215 | 277,542 | ||||||
| Eversource Energy | 3,155 | 270,415 | ||||||
| Exelon Corp. | 20,399 | 752,927 | ||||||
| FirstEnergy Corp. | 9,037 | 258,368 | ||||||
| Hawaiian Electric Industries, Inc. | 4,407 | 152,526 | ||||||
| IDACORP, Inc. | 1,325 | 119,118 | ||||||
| MGE Energy, Inc. | 350 | 22,747 | ||||||
| NextEra Energy, Inc. | 2,375 | 663,029 | ||||||
21
| Shares | Value | |||||||
| NRG Energy, Inc. | 1,629 | $ | 56,054 | |||||
| OGE Energy Corp. | 3,954 | 125,974 | ||||||
| Otter Tail Corp. | 605 | 23,504 | ||||||
| Pinnacle West Capital Corp. | 3,920 | 287,532 | ||||||
| PNM Resources, Inc. | 2,144 | 93,650 | ||||||
| Portland General Electric Co. | 3,928 | 149,853 | ||||||
| PPL Corp. | 12,470 | 344,546 | ||||||
| Southern Co. (The) | 12,753 | 665,452 | ||||||
| Spark Energy, Inc., Class A | 2 | 18 | ||||||
| Xcel Energy, Inc. | 13,441 | 933,813 | ||||||
| 7,722,056 | ||||||||
| Electrical Equipment — 0.6% | ||||||||
| Acuity Brands, Inc. | 1,028 | 112,350 | ||||||
| Allied Motion Technologies, Inc. | 68 | 2,896 | ||||||
| AMETEK, Inc. | 2,135 | 214,995 | ||||||
Atkore International Group, Inc.(1) | 2,894 | 77,357 | ||||||
| AZZ, Inc. | 605 | 21,012 | ||||||
| Eaton Corp. plc | 4,685 | 478,339 | ||||||
| Emerson Electric Co. | 4,990 | 346,655 | ||||||
| Encore Wire Corp. | 605 | 31,224 | ||||||
Generac Holdings, Inc.(1) | 882 | 167,562 | ||||||
| GrafTech International Ltd. | 82 | 546 | ||||||
| Hubbell, Inc. | 605 | 87,677 | ||||||
| LSI Industries, Inc. | 1,085 | 7,443 | ||||||
| nVent Electric plc | 1,827 | 34,932 | ||||||
Orion Energy Systems, Inc.(1) | 1,916 | 12,224 | ||||||
Plug Power, Inc.(1) | 357 | 4,634 | ||||||
| Powell Industries, Inc. | 266 | 7,179 | ||||||
| Regal Beloit Corp. | 1,357 | 134,153 | ||||||
| Rockwell Automation, Inc. | 2,653 | 611,596 | ||||||
Sensata Technologies Holding plc(1) | 1,357 | 56,505 | ||||||
Sunrun, Inc.(1) | 5,450 | 308,225 | ||||||
Thermon Group Holdings, Inc.(1) | 320 | 4,211 | ||||||
TPI Composites, Inc.(1) | 2,310 | 70,940 | ||||||
| 2,792,655 | ||||||||
| Electronic Equipment, Instruments and Components — 1.1% | ||||||||
| Amphenol Corp., Class A | 1,880 | 206,424 | ||||||
Arrow Electronics, Inc.(1) | 2,938 | 230,809 | ||||||
| Avnet, Inc. | 4,430 | 121,869 | ||||||
| Badger Meter, Inc. | 860 | 53,053 | ||||||
| Benchmark Electronics, Inc. | 2,135 | 41,867 | ||||||
| CDW Corp. | 2,645 | 300,604 | ||||||
| Cognex Corp. | 1,880 | 130,077 | ||||||
Coherent, Inc.(1) | 860 | 96,888 | ||||||
| Corning, Inc. | 16,101 | 522,638 | ||||||
| CTS Corp. | 860 | 17,974 | ||||||
| Dolby Laboratories, Inc., Class A | 1,370 | 95,695 | ||||||
ePlus, Inc.(1) | 354 | 27,159 | ||||||
Fabrinet(1) | 605 | 42,217 | ||||||
FARO Technologies, Inc.(1) | 350 | 19,775 | ||||||
Flex Ltd.(1) | 26,253 | 285,108 | ||||||
| FLIR Systems, Inc. | 1,880 | 69,372 | ||||||
22
| Shares | Value | |||||||
II-VI, Inc.(1) | 1,370 | $ | 60,965 | |||||
Insight Enterprises, Inc.(1) | 809 | 48,382 | ||||||
IPG Photonics Corp.(1) | 779 | 125,988 | ||||||
Itron, Inc.(1) | 95 | 5,659 | ||||||
| Jabil, Inc. | 7,728 | 263,911 | ||||||
Keysight Technologies, Inc.(1) | 2,900 | 285,708 | ||||||
Kimball Electronics, Inc.(1) | 1,307 | 17,625 | ||||||
Knowles Corp.(1) | 1,370 | 20,632 | ||||||
| Littelfuse, Inc. | 95 | 17,180 | ||||||
| Methode Electronics, Inc. | 860 | 24,347 | ||||||
| National Instruments Corp. | 2,645 | 94,929 | ||||||
Novanta, Inc.(1) | 349 | 37,402 | ||||||
OSI Systems, Inc.(1) | 350 | 27,563 | ||||||
| PC Connection, Inc. | 278 | 12,313 | ||||||
Plexus Corp.(1) | 350 | 26,625 | ||||||
Rogers Corp.(1) | 297 | 33,653 | ||||||
Sanmina Corp.(1) | 3,920 | 110,936 | ||||||
ScanSource, Inc.(1) | 1,133 | 27,974 | ||||||
| SYNNEX Corp. | 2,089 | 265,616 | ||||||
| TE Connectivity Ltd. | 5,960 | 575,736 | ||||||
Trimble, Inc.(1) | 860 | 45,073 | ||||||
TTM Technologies, Inc.(1) | 4,430 | 50,768 | ||||||
| Vishay Intertechnology, Inc. | 4,175 | 66,758 | ||||||
Vishay Precision Group, Inc.(1) | 519 | 12,928 | ||||||
Zebra Technologies Corp., Class A(1) | 350 | 100,285 | ||||||
| 4,620,485 | ||||||||
| Energy Equipment and Services — 0.4% | ||||||||
| Archrock, Inc. | 8,561 | 56,160 | ||||||
Aspen Aerogels, Inc.(1) | 575 | 4,887 | ||||||
| Baker Hughes Co. | 1,115 | 15,922 | ||||||
Bristow Group, Inc.(1) | 416 | 7,867 | ||||||
| Cactus, Inc., Class A | 2,609 | 57,633 | ||||||
ChampionX Corp.(1) | 3,292 | 33,710 | ||||||
| Core Laboratories NV | 350 | 7,325 | ||||||
| DMC Global, Inc. | 605 | 21,435 | ||||||
Dril-Quip, Inc.(1) | 1,065 | 35,283 | ||||||
Exterran Corp.(1) | 2,143 | 9,858 | ||||||
Frank's International NV(1) | 1,354 | 3,128 | ||||||
Geospace Technologies Corp.(1) | 328 | 2,148 | ||||||
| Halliburton Co. | 34,131 | 552,240 | ||||||
Helix Energy Solutions Group, Inc.(1) | 3,665 | 13,121 | ||||||
| Helmerich & Payne, Inc. | 4,174 | 68,788 | ||||||
| Liberty Oilfield Services, Inc., Class A | 1,613 | 10,404 | ||||||
Matrix Service Co.(1) | 1,625 | 15,015 | ||||||
National Energy Services Reunited Corp.(1) | 311 | 2,345 | ||||||
| National Oilwell Varco, Inc. | 14,745 | 176,940 | ||||||
Newpark Resources, Inc.(1) | 3,920 | 7,644 | ||||||
NexTier Oilfield Solutions, Inc.(1) | 10,915 | 27,506 | ||||||
Oceaneering International, Inc.(1) | 5,245 | 28,271 | ||||||
Oil States International, Inc.(1) | 2,135 | 9,373 | ||||||
| Patterson-UTI Energy, Inc. | 10,666 | 41,064 | ||||||
ProPetro Holding Corp.(1) | 3,155 | 19,813 | ||||||
23
| Shares | Value | |||||||
RPC, Inc.(1) | 1,623 | $ | 5,080 | |||||
| Schlumberger NV | 10,310 | 195,993 | ||||||
SEACOR Holdings, Inc.(1) | 350 | 11,063 | ||||||
SEACOR Marine Holdings, Inc.(1) | 539 | 1,445 | ||||||
Select Energy Services, Inc., Class A(1) | 1,386 | 6,611 | ||||||
| Solaris Oilfield Infrastructure, Inc., Class A | 2,135 | 16,610 | ||||||
| TechnipFMC plc | 5,195 | 40,001 | ||||||
Tidewater, Inc.(1) | 555 | 3,813 | ||||||
Transocean Ltd.(1) | 12,389 | 15,115 | ||||||
| US Silica Holdings, Inc. | 1,045 | 4,661 | ||||||
| 1,528,272 | ||||||||
| Entertainment — 1.4% | ||||||||
| Activision Blizzard, Inc. | 6,198 | 517,657 | ||||||
| Cinemark Holdings, Inc. | 1,880 | 27,542 | ||||||
Electronic Arts, Inc.(1) | 3,920 | 546,723 | ||||||
Eros International plc(1) | 3,228 | 10,039 | ||||||
IMAX Corp.(1) | 1,625 | 24,976 | ||||||
Liberty Media Corp.-Liberty Braves, Class C(1) | 1,855 | 36,043 | ||||||
Liberty Media Corp.-Liberty Formula One, Class C(1) | 2,645 | 103,102 | ||||||
Live Nation Entertainment, Inc.(1) | 1,370 | 77,816 | ||||||
Madison Square Garden Entertainment Corp.(1) | 901 | 67,728 | ||||||
Madison Square Garden Sports Corp., Class A(1) | 95 | 15,580 | ||||||
| Marcus Corp. (The) | 605 | 9,480 | ||||||
Netflix, Inc.(1) | 5,484 | 2,904,107 | ||||||
Roku, Inc.(1) | 350 | 60,718 | ||||||
Take-Two Interactive Software, Inc.(1) | 3,410 | 583,758 | ||||||
| Walt Disney Co. (The) | 7,791 | 1,027,399 | ||||||
| World Wrestling Entertainment, Inc., Class A | 95 | 4,187 | ||||||
Zynga, Inc., Class A(1) | 8,350 | 75,651 | ||||||
| 6,092,506 | ||||||||
| Food and Staples Retailing — 1.7% | ||||||||
| Andersons, Inc. (The) | 757 | 13,422 | ||||||
BJ's Wholesale Club Holdings, Inc.(1) | 1,186 | 52,670 | ||||||
| Casey's General Stores, Inc. | 2,113 | 375,797 | ||||||
| Costco Wholesale Corp. | 6,739 | 2,342,881 | ||||||
HF Foods Group, Inc.(1) | 781 | 6,201 | ||||||
| Ingles Markets, Inc., Class A | 860 | 34,744 | ||||||
| Kroger Co. (The) | 31,278 | 1,115,999 | ||||||
Performance Food Group Co.(1) | 42 | 1,533 | ||||||
| PriceSmart, Inc. | 819 | 53,849 | ||||||
| SpartanNash Co. | 2,397 | 47,892 | ||||||
Sprouts Farmers Market, Inc.(1) | 5,159 | 120,463 | ||||||
| Sysco Corp. | 8,605 | 517,505 | ||||||
United Natural Foods, Inc.(1) | 1,814 | 32,743 | ||||||
US Foods Holding Corp.(1) | 1,858 | 45,242 | ||||||
| Village Super Market, Inc., Class A | 868 | 22,082 | ||||||
| Walgreens Boots Alliance, Inc. | 13,243 | 503,499 | ||||||
| Walmart, Inc. | 14,198 | 1,971,392 | ||||||
| Weis Markets, Inc. | 812 | 39,975 | ||||||
| 7,297,889 | ||||||||
| Food Products — 1.2% | ||||||||
| Archer-Daniels-Midland Co. | 9,336 | 417,879 | ||||||
24
| Shares | Value | |||||||
| B&G Foods, Inc. | 2,675 | $ | 83,300 | |||||
Beyond Meat, Inc.(1) | 19 | 2,581 | ||||||
| Bunge Ltd. | 7,058 | 321,986 | ||||||
Cal-Maine Foods, Inc.(1) | 350 | 13,507 | ||||||
| Calavo Growers, Inc. | 553 | 35,099 | ||||||
| Campbell Soup Co. | 3,920 | 206,231 | ||||||
| Conagra Brands, Inc. | 2,135 | 81,899 | ||||||
Darling Ingredients, Inc.(1) | 8,109 | 259,245 | ||||||
| Flowers Foods, Inc. | 8,088 | 197,832 | ||||||
| Fresh Del Monte Produce, Inc. | 1,083 | 25,115 | ||||||
| General Mills, Inc. | 4,430 | 283,298 | ||||||
Hain Celestial Group, Inc. (The)(1) | 1,963 | 64,367 | ||||||
| Hershey Co. (The) | 4,166 | 619,234 | ||||||
| Hormel Foods Corp. | 4,175 | 212,842 | ||||||
Hostess Brands, Inc.(1) | 2,645 | 33,962 | ||||||
| Ingredion, Inc. | 1,920 | 154,445 | ||||||
| J&J Snack Foods Corp. | 340 | 46,223 | ||||||
| J.M. Smucker Co. (The) | 1,370 | 164,647 | ||||||
| John B Sanfilippo & Son, Inc. | 558 | 44,439 | ||||||
| Kellogg Co. | 2,900 | 205,639 | ||||||
| Kraft Heinz Co. (The) | 4,430 | 155,227 | ||||||
| Lamb Weston Holdings, Inc. | 5,611 | 352,651 | ||||||
| Lancaster Colony Corp. | 350 | 62,202 | ||||||
Landec Corp.(1) | 575 | 5,888 | ||||||
| McCormick & Co., Inc. | 612 | 126,194 | ||||||
| Mondelez International, Inc., Class A | 11,665 | 681,469 | ||||||
Pilgrim's Pride Corp.(1) | 2,135 | 34,160 | ||||||
Post Holdings, Inc.(1) | 350 | 30,807 | ||||||
| Sanderson Farms, Inc. | 339 | 39,649 | ||||||
| Seaboard Corp. | 2 | 5,366 | ||||||
Seneca Foods Corp., Class A(1) | 270 | 12,787 | ||||||
| Tootsie Roll Industries, Inc. | 616 | 19,706 | ||||||
TreeHouse Foods, Inc.(1) | 350 | 14,984 | ||||||
| Tyson Foods, Inc., Class A | 3,410 | 214,148 | ||||||
| 5,229,008 | ||||||||
| Gas Utilities — 0.2% | ||||||||
| Atmos Energy Corp. | 1,625 | 162,208 | ||||||
| Chesapeake Utilities Corp. | 297 | 24,295 | ||||||
| National Fuel Gas Co. | 2,095 | 95,616 | ||||||
| New Jersey Resources Corp. | 1,315 | 39,634 | ||||||
| Northwest Natural Holding Co. | 860 | 43,955 | ||||||
| ONE Gas, Inc. | 1,087 | 80,568 | ||||||
| South Jersey Industries, Inc. | 56 | 1,240 | ||||||
| Southwest Gas Holdings, Inc. | 1,597 | 100,403 | ||||||
| Spire, Inc. | 353 | 20,548 | ||||||
| Star Group LP | 1,099 | 10,770 | ||||||
| UGI Corp. | 3,121 | 107,768 | ||||||
| 687,005 | ||||||||
| Health Care Equipment and Supplies — 2.6% | ||||||||
| Abbott Laboratories | 9,387 | 1,027,595 | ||||||
ABIOMED, Inc.(1) | 291 | 89,517 | ||||||
Align Technology, Inc.(1) | 1,651 | 490,314 | ||||||
25
| Shares | Value | |||||||
AngioDynamics, Inc.(1) | 557 | $ | 5,216 | |||||
Apyx Medical Corp.(1) | 601 | 2,759 | ||||||
| Atrion Corp. | 10 | 6,317 | ||||||
Avanos Medical, Inc.(1) | 605 | 19,602 | ||||||
Axogen, Inc.(1) | 1,626 | 19,301 | ||||||
| Baxter International, Inc. | 9,807 | 853,895 | ||||||
| Becton Dickinson and Co. | 1,344 | 326,283 | ||||||
Boston Scientific Corp.(1) | 6,708 | 275,162 | ||||||
Cardiovascular Systems, Inc.(1) | 350 | 11,435 | ||||||
| Cooper Cos., Inc. (The) | 605 | 190,200 | ||||||
CryoLife, Inc.(1) | 1,121 | 22,667 | ||||||
| Danaher Corp. | 3,161 | 652,652 | ||||||
| DENTSPLY SIRONA, Inc. | 2,645 | 118,681 | ||||||
DexCom, Inc.(1) | 500 | 212,705 | ||||||
Edwards Lifesciences Corp.(1) | 7,170 | 615,473 | ||||||
FONAR Corp.(1) | 262 | 6,647 | ||||||
Glaukos Corp.(1) | 558 | 26,689 | ||||||
Globus Medical, Inc., Class A(1) | 1,562 | 88,284 | ||||||
Haemonetics Corp.(1) | 1,036 | 92,888 | ||||||
| Hill-Rom Holdings, Inc. | 350 | 32,826 | ||||||
Hologic, Inc.(1) | 2,135 | 127,502 | ||||||
ICU Medical, Inc.(1) | 361 | 72,287 | ||||||
IDEXX Laboratories, Inc.(1) | 2,645 | 1,034,354 | ||||||
Inogen, Inc.(1) | 88 | 2,660 | ||||||
Insulet Corp.(1) | 709 | 154,739 | ||||||
Integer Holdings Corp.(1) | 759 | 52,568 | ||||||
Integra LifeSciences Holdings Corp.(1) | 605 | 28,913 | ||||||
Intuitive Surgical, Inc.(1) | 1,103 | 806,117 | ||||||
Lantheus Holdings, Inc.(1) | 2,110 | 28,316 | ||||||
LivaNova plc(1) | 2,874 | 134,791 | ||||||
Masimo Corp.(1) | 822 | 184,128 | ||||||
| Medtronic plc | 9,806 | 1,053,851 | ||||||
Meridian Bioscience, Inc.(1) | 2,164 | 30,599 | ||||||
Merit Medical Systems, Inc.(1) | 1,193 | 58,576 | ||||||
Natus Medical, Inc.(1) | 1,631 | 29,619 | ||||||
Neogen Corp.(1) | 605 | 46,101 | ||||||
Nevro Corp.(1) | 306 | 42,087 | ||||||
Novocure Ltd.(1) | 350 | 28,962 | ||||||
NuVasive, Inc.(1) | 962 | 50,149 | ||||||
OraSure Technologies, Inc.(1) | 1,913 | 22,420 | ||||||
Orthofix Medical, Inc.(1) | 575 | 17,446 | ||||||
Oxford Immunotec Global plc(1) | 590 | 8,030 | ||||||
Penumbra, Inc.(1) | 348 | 72,784 | ||||||
Quidel Corp.(1) | 606 | 106,632 | ||||||
| ResMed, Inc. | 1,880 | 339,866 | ||||||
Shockwave Medical, Inc.(1) | 21 | 1,334 | ||||||
Sientra, Inc.(1) | 6 | 23 | ||||||
| STERIS plc | 860 | 137,290 | ||||||
| Stryker Corp. | 1,906 | 377,693 | ||||||
Surmodics, Inc.(1) | 606 | 27,421 | ||||||
Tandem Diabetes Care, Inc.(1) | 97 | 10,934 | ||||||
| Teleflex, Inc. | 241 | 94,701 | ||||||
26
| Shares | Value | |||||||
| Utah Medical Products, Inc. | 44 | $ | 3,615 | |||||
Varex Imaging Corp.(1) | 862 | 9,560 | ||||||
Varian Medical Systems, Inc.(1) | 1,843 | 320,074 | ||||||
| West Pharmaceutical Services, Inc. | 1,625 | 461,435 | ||||||
| Zimmer Biomet Holdings, Inc. | 2,135 | 300,779 | ||||||
| 11,465,464 | ||||||||
| Health Care Providers and Services — 1.9% | ||||||||
Acadia Healthcare Co., Inc.(1) | 605 | 18,701 | ||||||
Amedisys, Inc.(1) | 350 | 84,665 | ||||||
| AmerisourceBergen Corp. | 1,880 | 182,416 | ||||||
AMN Healthcare Services, Inc.(1) | 1,119 | 60,247 | ||||||
| Anthem, Inc. | 1,896 | 533,762 | ||||||
Brookdale Senior Living, Inc.(1) | 11,410 | 31,378 | ||||||
| Cardinal Health, Inc. | 2,645 | 134,260 | ||||||
Centene Corp.(1) | 9,328 | 571,993 | ||||||
| Chemed Corp. | 303 | 156,684 | ||||||
| Cigna Corp. | 1,122 | 199,009 | ||||||
CorVel Corp.(1) | 350 | 29,057 | ||||||
Cross Country Healthcare, Inc.(1) | 4,181 | 26,717 | ||||||
| CVS Health Corp. | 5,441 | 337,995 | ||||||
DaVita, Inc.(1) | 350 | 30,366 | ||||||
| Encompass Health Corp. | 860 | 56,106 | ||||||
| Ensign Group, Inc. (The) | 2,369 | 138,681 | ||||||
Guardant Health, Inc.(1) | 499 | 47,655 | ||||||
Hanger, Inc.(1) | 362 | 7,153 | ||||||
| HCA Healthcare, Inc. | 1,626 | 220,681 | ||||||
HealthEquity, Inc.(1) | 610 | 35,063 | ||||||
Henry Schein, Inc.(1) | 2,135 | 141,849 | ||||||
| Humana, Inc. | 3,426 | 1,422,372 | ||||||
InfuSystem Holdings, Inc.(1) | 1,098 | 15,976 | ||||||
Joint Corp. (The)(1) | 583 | 10,412 | ||||||
Laboratory Corp. of America Holdings(1) | 499 | 87,699 | ||||||
LHC Group, Inc.(1) | 95 | 19,802 | ||||||
Magellan Health, Inc.(1) | 575 | 43,390 | ||||||
| McKesson Corp. | 1,666 | 255,631 | ||||||
Molina Healthcare, Inc.(1) | 2,373 | 438,934 | ||||||
| National HealthCare Corp. | 171 | 10,893 | ||||||
| National Research Corp. | 556 | 31,136 | ||||||
| Owens & Minor, Inc. | 5,450 | 90,361 | ||||||
| Patterson Cos., Inc. | 4,685 | 135,912 | ||||||
Pennant Group, Inc. (The)(1) | 609 | 22,557 | ||||||
| Premier, Inc., Class A | 3,110 | 101,852 | ||||||
Providence Service Corp. (The)(1) | 329 | 30,462 | ||||||
| Quest Diagnostics, Inc. | 862 | 95,889 | ||||||
R1 RCM, Inc.(1) | 844 | 12,238 | ||||||
RadNet, Inc.(1) | 1,887 | 27,211 | ||||||
Select Medical Holdings Corp.(1) | 9 | 181 | ||||||
Tenet Healthcare Corp.(1) | 836 | 23,558 | ||||||
Triple-S Management Corp., Class B(1) | 310 | 5,766 | ||||||
| UnitedHealth Group, Inc. | 6,770 | 2,115,963 | ||||||
| Universal Health Services, Inc., Class B | 2,086 | 230,190 | ||||||
| 8,272,823 | ||||||||
27
| Shares | Value | |||||||
| Health Care Technology — 0.3% | ||||||||
Allscripts Healthcare Solutions, Inc.(1) | 2,648 | $ | 23,647 | |||||
| Cerner Corp. | 10,135 | 743,605 | ||||||
Change Healthcare, Inc.(1) | 6,192 | 87,617 | ||||||
Evolent Health, Inc., Class A(1) | 1,054 | 15,104 | ||||||
HealthStream, Inc.(1) | 860 | 17,815 | ||||||
HMS Holdings Corp.(1) | 6 | 167 | ||||||
Livongo Health, Inc.(1) | 891 | 122,334 | ||||||
NextGen Healthcare, Inc.(1) | 559 | 7,412 | ||||||
| Simulations Plus, Inc. | 1,373 | 81,803 | ||||||
Teladoc Health, Inc.(1) | 95 | 20,491 | ||||||
Veeva Systems, Inc., Class A(1) | 1,370 | 386,710 | ||||||
Vocera Communications, Inc.(1) | 610 | 17,074 | ||||||
| 1,523,779 | ||||||||
| Hotels, Restaurants and Leisure — 1.6% | ||||||||
| Aramark | 3,862 | 106,437 | ||||||
| BJ's Restaurants, Inc. | 1,075 | 33,884 | ||||||
| Bloomin' Brands, Inc. | 2,904 | 41,643 | ||||||
| Boyd Gaming Corp. | 1,998 | 53,506 | ||||||
| Brinker International, Inc. | 304 | 13,692 | ||||||
Caesars Entertainment, Inc.(1) | 2,734 | 125,219 | ||||||
| Carnival Corp. | 6,198 | 102,143 | ||||||
Carrols Restaurant Group, Inc.(1) | 62 | 413 | ||||||
Century Casinos, Inc.(1) | 4 | 25 | ||||||
| Cheesecake Factory, Inc. (The) | 1,345 | 39,718 | ||||||
Chipotle Mexican Grill, Inc.(1) | 404 | 529,353 | ||||||
| Choice Hotels International, Inc. | 286 | 28,397 | ||||||
| Churchill Downs, Inc. | 1,077 | 188,217 | ||||||
Chuy's Holdings, Inc.(1) | 1,115 | 24,798 | ||||||
| Cracker Barrel Old Country Store, Inc. | 1,307 | 174,759 | ||||||
| Darden Restaurants, Inc. | 3,920 | 339,746 | ||||||
| Dave & Buster's Entertainment, Inc. | 605 | 10,061 | ||||||
Denny's Corp.(1) | 1,115 | 12,778 | ||||||
| Dine Brands Global, Inc. | 32 | 1,906 | ||||||
| Domino's Pizza, Inc. | 341 | 139,455 | ||||||
| Dunkin' Brands Group, Inc. | 605 | 46,028 | ||||||
| Extended Stay America, Inc. | 6,453 | 80,598 | ||||||
Fiesta Restaurant Group, Inc.(1) | 291 | 2,916 | ||||||
Golden Entertainment, Inc.(1) | 1,320 | 16,949 | ||||||
Hilton Grand Vacations, Inc.(1) | 6,178 | 135,360 | ||||||
| Hilton Worldwide Holdings, Inc. | 1,883 | 170,148 | ||||||
| Hyatt Hotels Corp., Class A | 1,077 | 60,840 | ||||||
J Alexander's Holdings, Inc.(1) | 14 | 57 | ||||||
| Jack in the Box, Inc. | 95 | 7,827 | ||||||
| Las Vegas Sands Corp. | 8,350 | 423,428 | ||||||
Lindblad Expeditions Holdings, Inc.(1) | 1,880 | 18,621 | ||||||
| Marriott International, Inc., Class A | 3,665 | 377,165 | ||||||
| Marriott Vacations Worldwide Corp. | 350 | 33,135 | ||||||
| McDonald's Corp. | 4,436 | 947,175 | ||||||
| MGM Resorts International | 7,027 | 158,107 | ||||||
Monarch Casino & Resort, Inc.(1) | 350 | 16,104 | ||||||
Norwegian Cruise Line Holdings Ltd.(1) | 6,963 | 119,137 | ||||||
28
| Shares | Value | |||||||
| Papa John's International, Inc. | 262 | $ | 25,752 | |||||
Penn National Gaming, Inc.(1) | 7,319 | 374,001 | ||||||
Planet Fitness, Inc., Class A(1) | 605 | 36,778 | ||||||
Playa Hotels & Resorts NV(1) | 3,665 | 15,466 | ||||||
| RCI Hospitality Holdings, Inc. | 263 | 5,029 | ||||||
Red Lion Hotels Corp.(1) | 315 | 715 | ||||||
Red Robin Gourmet Burgers, Inc.(1) | 860 | 9,546 | ||||||
| Red Rock Resorts, Inc., Class A | 4,190 | 71,544 | ||||||
| Royal Caribbean Cruises Ltd. | 2,305 | 158,676 | ||||||
| Ruth's Hospitality Group, Inc. | 1,370 | 14,077 | ||||||
Scientific Games Corp., Class A(1) | 529 | 10,942 | ||||||
SeaWorld Entertainment, Inc.(1) | 3,155 | 64,362 | ||||||
| Six Flags Entertainment Corp. | 563 | 12,234 | ||||||
| Starbucks Corp. | 8,243 | 696,286 | ||||||
| Texas Roadhouse, Inc. | 2,943 | 185,380 | ||||||
| Twin River Worldwide Holdings, Inc. | 1,115 | 26,682 | ||||||
| Vail Resorts, Inc. | 350 | 76,184 | ||||||
| Wendy's Co. (The) | 4,175 | 87,424 | ||||||
| Wingstop, Inc. | 260 | 42,484 | ||||||
| Wyndham Destinations, Inc. | 808 | 23,424 | ||||||
| Wyndham Hotels & Resorts, Inc. | 350 | 18,326 | ||||||
| Wynn Resorts Ltd. | 3,920 | 342,804 | ||||||
| Yum! Brands, Inc. | 2,135 | 204,640 | ||||||
| 7,082,501 | ||||||||
| Household Durables — 0.9% | ||||||||
Beazer Homes USA, Inc.(1) | 2,135 | 26,132 | ||||||
Cavco Industries, Inc.(1) | 95 | 18,136 | ||||||
Century Communities, Inc.(1) | 860 | 30,685 | ||||||
| D.R. Horton, Inc. | 7,218 | 515,149 | ||||||
| Ethan Allen Interiors, Inc. | 1,370 | 19,509 | ||||||
| Garmin Ltd. | 2,135 | 221,207 | ||||||
Green Brick Partners, Inc.(1) | 792 | 11,278 | ||||||
Helen of Troy Ltd.(1) | 262 | 54,187 | ||||||
| Hooker Furniture Corp. | 81 | 1,997 | ||||||
Installed Building Products, Inc.(1) | 605 | 52,526 | ||||||
iRobot Corp.(1) | 1,070 | 79,212 | ||||||
| KB Home | 3,128 | 111,857 | ||||||
| La-Z-Boy, Inc. | 2,383 | 77,448 | ||||||
Legacy Housing Corp.(1) | 63 | 962 | ||||||
| Leggett & Platt, Inc. | 1,115 | 45,715 | ||||||
| Lennar Corp., Class A | 5,195 | 388,690 | ||||||
LGI Homes, Inc.(1) | 355 | 39,710 | ||||||
| Lifetime Brands, Inc. | 86 | 845 | ||||||
Lovesac Co. (The)(1) | 286 | 7,570 | ||||||
| M.D.C. Holdings, Inc. | 1,625 | 70,493 | ||||||
M/I Homes, Inc.(1) | 1,076 | 45,795 | ||||||
Meritage Homes Corp.(1) | 2,390 | 229,512 | ||||||
Mohawk Industries, Inc.(1) | 1,928 | 178,012 | ||||||
| Newell Brands, Inc. | 18,629 | 297,691 | ||||||
NVR, Inc.(1) | 55 | 229,259 | ||||||
| PulteGroup, Inc. | 10,900 | 486,031 | ||||||
Skyline Champion Corp.(1) | 1,434 | 40,926 | ||||||
29
| Shares | Value | |||||||
Sonos, Inc.(1) | 3,920 | $ | 55,154 | |||||
Taylor Morrison Home Corp.(1) | 4,903 | 115,368 | ||||||
Tempur Sealy International, Inc.(1) | 1,115 | 95,377 | ||||||
| Toll Brothers, Inc. | 3,690 | 155,792 | ||||||
TopBuild Corp.(1) | 95 | 14,611 | ||||||
TRI Pointe Group, Inc.(1) | 4,430 | 74,778 | ||||||
Turtle Beach Corp.(1) | 89 | 1,742 | ||||||
Universal Electronics, Inc.(1) | 864 | 35,493 | ||||||
| Whirlpool Corp. | 1,341 | 238,323 | ||||||
ZAGG, Inc.(1) | 2 | 6 | ||||||
| 4,067,178 | ||||||||
| Household Products — 1.0% | ||||||||
Central Garden & Pet Co.(1) | 35 | 1,424 | ||||||
Central Garden & Pet Co., Class A(1) | 860 | 31,958 | ||||||
| Church & Dwight Co., Inc. | 2,900 | 277,907 | ||||||
| Clorox Co. (The) | 2,635 | 588,923 | ||||||
| Colgate-Palmolive Co. | 4,940 | 391,544 | ||||||
| Energizer Holdings, Inc. | 1,274 | 58,973 | ||||||
| Kimberly-Clark Corp. | 2,135 | 336,818 | ||||||
| Oil-Dri Corp. of America | 155 | 5,428 | ||||||
| Procter & Gamble Co. (The) | 17,662 | 2,443,184 | ||||||
| Reynolds Consumer Products, Inc. | 424 | 14,090 | ||||||
| Spectrum Brands Holdings, Inc. | 605 | 36,058 | ||||||
| WD-40 Co. | 268 | 54,774 | ||||||
| 4,241,081 | ||||||||
| Independent Power and Renewable Electricity Producers — 0.2% | ||||||||
| AES Corp. (The) | 26,577 | 471,742 | ||||||
| Clearway Energy, Inc., Class A | 1,625 | 39,244 | ||||||
| Clearway Energy, Inc., Class C | 1,880 | 47,959 | ||||||
| NextEra Energy Partners LP | 1,103 | 66,533 | ||||||
| Ormat Technologies, Inc. | 1,608 | 97,879 | ||||||
Sunnova Energy International, Inc.(1) | 545 | 12,927 | ||||||
| Vistra Corp. | 17,830 | 342,871 | ||||||
| 1,079,155 | ||||||||
| Industrial Conglomerates — 0.5% | ||||||||
| 3M Co. | 3,671 | 598,447 | ||||||
| Carlisle Cos., Inc. | 1,643 | 215,151 | ||||||
| General Electric Co. | 42,068 | 266,711 | ||||||
| Honeywell International, Inc. | 5,968 | 988,002 | ||||||
| Raven Industries, Inc. | 605 | 15,034 | ||||||
| Roper Technologies, Inc. | 353 | 150,798 | ||||||
| 2,234,143 | ||||||||
| Insurance — 3.0% | ||||||||
| Aflac, Inc. | 13,943 | 506,410 | ||||||
| Alleghany Corp. | 300 | 166,368 | ||||||
| Allstate Corp. (The) | 8,239 | 766,227 | ||||||
Ambac Financial Group, Inc.(1) | 1,370 | 17,303 | ||||||
| American Equity Investment Life Holding Co. | 5,679 | 135,785 | ||||||
| American Financial Group, Inc. | 1,880 | 125,678 | ||||||
| American International Group, Inc. | 17,880 | 521,023 | ||||||
| American National Group, Inc. | 270 | 20,253 | ||||||
| AMERISAFE, Inc. | 794 | 52,984 | ||||||
30
| Shares | Value | |||||||
| Aon plc, Class A | 2,390 | $ | 477,976 | |||||
Arch Capital Group Ltd.(1) | 9,115 | 287,487 | ||||||
| Argo Group International Holdings Ltd. | 800 | 29,712 | ||||||
| Arthur J. Gallagher & Co. | 1,370 | 144,261 | ||||||
| Assurant, Inc. | 1,902 | 231,207 | ||||||
| Assured Guaranty Ltd. | 2,645 | 56,735 | ||||||
Athene Holding Ltd., Class A(1) | 5,211 | 190,514 | ||||||
| Axis Capital Holdings Ltd. | 2,567 | 122,600 | ||||||
Brighthouse Financial, Inc.(1) | 3,368 | 102,252 | ||||||
| Brown & Brown, Inc. | 1,115 | 51,736 | ||||||
| Chubb Ltd. | 4,175 | 521,875 | ||||||
| Cincinnati Financial Corp. | 2,645 | 210,039 | ||||||
Citizens, Inc.(1) | 1,116 | 6,529 | ||||||
| CNA Financial Corp. | 350 | 11,260 | ||||||
| CNO Financial Group, Inc. | 6,775 | 110,433 | ||||||
| Crawford & Co., Class A | 1,276 | 8,753 | ||||||
eHealth, Inc.(1) | 837 | 52,831 | ||||||
| Employers Holdings, Inc. | 1,365 | 44,472 | ||||||
Enstar Group Ltd.(1) | 283 | 50,654 | ||||||
| Erie Indemnity Co., Class A | 350 | 74,704 | ||||||
| Everest Re Group Ltd. | 605 | 133,148 | ||||||
| FBL Financial Group, Inc., Class A | 272 | 10,078 | ||||||
| Fidelity National Financial, Inc. | 9,089 | 298,392 | ||||||
| First American Financial Corp. | 3,920 | 206,074 | ||||||
Genworth Financial, Inc., Class A(1) | 15,983 | 48,269 | ||||||
| Globe Life, Inc. | 3,407 | 281,009 | ||||||
Greenlight Capital Re Ltd., A Shares(1) | 829 | 6,027 | ||||||
Hallmark Financial Services, Inc.(1) | 526 | 1,757 | ||||||
| Hanover Insurance Group, Inc. (The) | 860 | 88,141 | ||||||
| Hartford Financial Services Group, Inc. (The) | 14,453 | 584,624 | ||||||
| HCI Group, Inc. | 85 | 4,651 | ||||||
| Heritage Insurance Holdings, Inc. | 796 | 10,388 | ||||||
| Horace Mann Educators Corp. | 2,829 | 110,501 | ||||||
| James River Group Holdings Ltd. | 575 | 28,008 | ||||||
| Kemper Corp. | 1,370 | 106,394 | ||||||
| Kinsale Capital Group, Inc. | 543 | 112,526 | ||||||
| Lincoln National Corp. | 3,665 | 132,123 | ||||||
| Loews Corp. | 5,195 | 186,293 | ||||||
Markel Corp.(1) | 95 | 103,249 | ||||||
| Marsh & McLennan Cos., Inc. | 3,158 | 362,886 | ||||||
MBIA, Inc.(1) | 2,900 | 23,519 | ||||||
| Mercury General Corp. | 572 | 25,586 | ||||||
| MetLife, Inc. | 13,178 | 506,826 | ||||||
| National General Holdings Corp. | 3,631 | 123,636 | ||||||
| National Western Life Group, Inc., Class A | 30 | 6,600 | ||||||
| Old Republic International Corp. | 9,020 | 145,312 | ||||||
Palomar Holdings, Inc.(1) | 546 | 61,343 | ||||||
| Primerica, Inc. | 2,124 | 265,181 | ||||||
| Principal Financial Group, Inc. | 7,983 | 336,164 | ||||||
| ProAssurance Corp. | 1,586 | 24,298 | ||||||
| Progressive Corp. (The) | 14,963 | 1,422,084 | ||||||
| Prudential Financial, Inc. | 5,195 | 352,065 | ||||||
31
| Shares | Value | |||||||
| Reinsurance Group of America, Inc. | 1,370 | $ | 125,602 | |||||
| RenaissanceRe Holdings Ltd. | 860 | 158,016 | ||||||
| RLI Corp. | 860 | 80,659 | ||||||
| Safety Insurance Group, Inc. | 535 | 38,734 | ||||||
| Selective Insurance Group, Inc. | 1,625 | 97,191 | ||||||
| State Auto Financial Corp. | 612 | 9,443 | ||||||
| Stewart Information Services Corp. | 605 | 25,815 | ||||||
Third Point Reinsurance Ltd.(1) | 2,900 | 24,824 | ||||||
| Travelers Cos., Inc. (The) | 6,708 | 778,396 | ||||||
Trupanion, Inc.(1) | 7 | 439 | ||||||
| United Fire Group, Inc. | 575 | 14,479 | ||||||
| Universal Insurance Holdings, Inc. | 1,608 | 29,828 | ||||||
| Unum Group | 6,810 | 125,849 | ||||||
Watford Holdings Ltd.(1) | 1,115 | 17,840 | ||||||
| White Mountains Insurance Group Ltd. | 40 | 35,656 | ||||||
| Willis Towers Watson plc | 500 | 102,765 | ||||||
| WR Berkley Corp. | 2,900 | 179,945 | ||||||
| 13,050,694 | ||||||||
| Interactive Media and Services — 4.3% | ||||||||
Alphabet, Inc., Class A(1) | 2,620 | 4,269,369 | ||||||
Alphabet, Inc., Class C(1) | 2,861 | 4,675,389 | ||||||
Cars.com, Inc.(1) | 4,687 | 40,683 | ||||||
Facebook, Inc., Class A(1) | 29,666 | 8,698,071 | ||||||
IAC/InterActiveCorp(1) | 350 | 46,547 | ||||||
Match Group, Inc.(1) | 1,887 | 210,740 | ||||||
QuinStreet, Inc.(1) | 820 | 10,783 | ||||||
Snap, Inc., Class A(1) | 6,770 | 152,934 | ||||||
| TripAdvisor, Inc. | 1,166 | 27,250 | ||||||
TrueCar, Inc.(1) | 1,421 | 6,721 | ||||||
Twitter, Inc.(1) | 8,598 | 348,907 | ||||||
Yelp, Inc.(1) | 860 | 19,883 | ||||||
Zillow Group, Inc., Class A(1) | 861 | 73,426 | ||||||
Zillow Group, Inc., Class C(1) | 1,115 | 95,622 | ||||||
| 18,676,325 | ||||||||
| Internet and Direct Marketing Retail — 4.0% | ||||||||
1-800-Flowers.com, Inc., Class A(1) | 343 | 10,266 | ||||||
Amazon.com, Inc.(1) | 4,272 | 14,742,501 | ||||||
Booking Holdings, Inc.(1) | 606 | 1,157,733 | ||||||
CarParts.com, Inc.(1) | 782 | 10,987 | ||||||
| eBay, Inc. | 11,155 | 611,071 | ||||||
Etsy, Inc.(1) | 605 | 72,418 | ||||||
| Expedia Group, Inc. | 860 | 84,409 | ||||||
Grubhub, Inc.(1) | 350 | 25,322 | ||||||
Magnite, Inc.(1) | 1,046 | 7,688 | ||||||
MercadoLibre, Inc.(1) | 262 | 306,171 | ||||||
| PetMed Express, Inc. | 1,367 | 47,517 | ||||||
Quotient Technology, Inc.(1) | 1,020 | 8,884 | ||||||
| Shutterstock, Inc. | 609 | 30,645 | ||||||
Stamps.com, Inc.(1) | 552 | 137,636 | ||||||
Wayfair, Inc., Class A(1) | 566 | 167,853 | ||||||
| 17,421,101 | ||||||||
32
| Shares | Value | |||||||
| IT Services — 4.5% | ||||||||
| Accenture plc, Class A | 6,963 | $ | 1,670,633 | |||||
Akamai Technologies, Inc.(1) | 3,920 | 456,406 | ||||||
| Alliance Data Systems Corp. | 1,018 | 45,922 | ||||||
| Amdocs Ltd. | 4,430 | 271,249 | ||||||
| Automatic Data Processing, Inc. | 4,940 | 687,105 | ||||||
Black Knight, Inc.(1) | 1,116 | 93,856 | ||||||
| Booz Allen Hamilton Holding Corp. | 2,900 | 255,374 | ||||||
| Broadridge Financial Solutions, Inc. | 2,645 | 363,423 | ||||||
CACI International, Inc., Class A(1) | 77 | 18,033 | ||||||
Cardtronics plc, Class A(1) | 860 | 18,671 | ||||||
| Cass Information Systems, Inc. | 350 | 13,706 | ||||||
| Cognizant Technology Solutions Corp., Class A | 11,867 | 793,428 | ||||||
| CSG Systems International, Inc. | 1,880 | 80,032 | ||||||
| DXC Technology Co. | 9,025 | 180,319 | ||||||
EPAM Systems, Inc.(1) | 860 | 281,306 | ||||||
Euronet Worldwide, Inc.(1) | 1,036 | 107,102 | ||||||
| EVERTEC, Inc. | 1,370 | 47,977 | ||||||
ExlService Holdings, Inc.(1) | 602 | 38,341 | ||||||
| Fidelity National Information Services, Inc. | 3,732 | 562,972 | ||||||
Fiserv, Inc.(1) | 5,186 | 516,422 | ||||||
FleetCor Technologies, Inc.(1) | 609 | 153,133 | ||||||
Gartner, Inc.(1) | 860 | 111,645 | ||||||
| Genpact Ltd. | 1,625 | 68,542 | ||||||
| Global Payments, Inc. | 1,887 | 333,282 | ||||||
GoDaddy, Inc., Class A(1) | 860 | 71,965 | ||||||
| International Business Machines Corp. | 8,095 | 998,194 | ||||||
| Jack Henry & Associates, Inc. | 1,370 | 226,625 | ||||||
| KBR, Inc. | 3,155 | 78,843 | ||||||
| Leidos Holdings, Inc. | 860 | 77,821 | ||||||
LiveRamp Holdings, Inc.(1) | 821 | 45,845 | ||||||
| ManTech International Corp., Class A | 303 | 22,680 | ||||||
| MasterCard, Inc., Class A | 11,089 | 3,971,969 | ||||||
| MAXIMUS, Inc. | 1,370 | 106,243 | ||||||
MongoDB, Inc.(1) | 95 | 22,211 | ||||||
| NIC, Inc. | 3,410 | 72,906 | ||||||
Okta, Inc.(1) | 350 | 75,379 | ||||||
| Paychex, Inc. | 6,198 | 473,961 | ||||||
PayPal Holdings, Inc.(1) | 10,372 | 2,117,340 | ||||||
| Perspecta, Inc. | 1,370 | 28,455 | ||||||
| Sabre Corp. | 5,960 | 41,660 | ||||||
| Science Applications International Corp. | 354 | 29,545 | ||||||
Square, Inc., Class A(1) | 860 | 137,222 | ||||||
| Switch, Inc., Class A | 1,880 | 32,336 | ||||||
Sykes Enterprises, Inc.(1) | 1,115 | 36,912 | ||||||
| TTEC Holdings, Inc. | 860 | 48,753 | ||||||
Twilio, Inc., Class A(1) | 605 | 163,205 | ||||||
Unisys Corp.(1) | 665 | 7,754 | ||||||
VeriSign, Inc.(1) | 605 | 129,954 | ||||||
Virtusa Corp.(1) | 569 | 22,498 | ||||||
| Visa, Inc., Class A | 15,057 | 3,191,933 | ||||||
| Western Union Co. (The) | 10,390 | 245,100 | ||||||
33
| Shares | Value | |||||||
WEX, Inc.(1) | 350 | $ | 55,899 | |||||
| 19,702,087 | ||||||||
| Leisure Products — 0.3% | ||||||||
| Acushnet Holdings Corp. | 1,123 | 39,631 | ||||||
American Outdoor Brands, Inc.(1) | 141 | 2,147 | ||||||
| Brunswick Corp. | 4,167 | 257,896 | ||||||
| Callaway Golf Co. | 1,370 | 28,578 | ||||||
| Clarus Corp. | 296 | 3,722 | ||||||
| Hasbro, Inc. | 3,423 | 270,212 | ||||||
| Johnson Outdoors, Inc., Class A | 34 | 2,914 | ||||||
Malibu Boats, Inc., Class A(1) | 1,558 | 80,782 | ||||||
| Marine Products Corp. | 2 | 29 | ||||||
MasterCraft Boat Holdings, Inc.(1) | 1,051 | 21,976 | ||||||
Mattel, Inc.(1) | 2,645 | 28,421 | ||||||
Nautilus, Inc.(1) | 912 | 10,807 | ||||||
Peloton Interactive, Inc., Class A(1) | 1,257 | 96,374 | ||||||
| Polaris, Inc. | 2,637 | 266,442 | ||||||
Smith & Wesson Brands, Inc.(1) | 572 | 10,445 | ||||||
| Sturm Ruger & Co., Inc. | 598 | 42,374 | ||||||
Vista Outdoor, Inc.(1) | 2,645 | 51,339 | ||||||
YETI Holdings, Inc.(1) | 12 | 617 | ||||||
| 1,214,706 | ||||||||
| Life Sciences Tools and Services — 0.8% | ||||||||
Adaptive Biotechnologies Corp.(1) | 1,829 | 76,105 | ||||||
| Agilent Technologies, Inc. | 2,645 | 265,611 | ||||||
Bio-Rad Laboratories, Inc., Class A(1) | 259 | 131,725 | ||||||
| Bio-Techne Corp. | 260 | 66,420 | ||||||
| Bruker Corp. | 3,145 | 132,153 | ||||||
Charles River Laboratories International, Inc.(1) | 569 | 124,583 | ||||||
Illumina, Inc.(1) | 1,606 | 573,695 | ||||||
IQVIA Holdings, Inc.(1) | 612 | 100,215 | ||||||
| Luminex Corp. | 819 | 21,859 | ||||||
Medpace Holdings, Inc.(1) | 95 | 12,330 | ||||||
Mettler-Toledo International, Inc.(1) | 549 | 532,958 | ||||||
NeoGenomics, Inc.(1) | 893 | 34,782 | ||||||
| PerkinElmer, Inc. | 95 | 11,183 | ||||||
PRA Health Sciences, Inc.(1) | 350 | 37,419 | ||||||
Repligen Corp.(1) | 629 | 97,438 | ||||||
Syneos Health, Inc.(1) | 350 | 22,085 | ||||||
| Thermo Fisher Scientific, Inc. | 1,866 | 800,477 | ||||||
Waters Corp.(1) | 2,120 | 458,471 | ||||||
| 3,499,509 | ||||||||
| Machinery — 2.8% | ||||||||
| AGCO Corp. | 1,902 | 135,232 | ||||||
| Alamo Group, Inc. | 95 | 10,535 | ||||||
| Albany International Corp., Class A | 1,370 | 71,103 | ||||||
| Allison Transmission Holdings, Inc. | 2,655 | 95,235 | ||||||
| Astec Industries, Inc. | 1,600 | 84,352 | ||||||
| Barnes Group, Inc. | 1,063 | 42,095 | ||||||
| Caterpillar, Inc. | 12,284 | 1,748,136 | ||||||
CIRCOR International, Inc.(1) | 1,117 | 33,119 | ||||||
Colfax Corp.(1) | 2,143 | 71,319 | ||||||
34
| Shares | Value | |||||||
| Columbus McKinnon Corp. | 1,044 | $ | 37,975 | |||||
Commercial Vehicle Group, Inc.(1) | 1,102 | 4,970 | ||||||
| Crane Co. | 535 | 30,249 | ||||||
| Cummins, Inc. | 4,947 | 1,025,266 | ||||||
| Deere & Co. | 8,512 | 1,788,031 | ||||||
| Donaldson Co., Inc. | 5,222 | 262,980 | ||||||
| Douglas Dynamics, Inc. | 350 | 13,436 | ||||||
| Dover Corp. | 1,115 | 122,472 | ||||||
Energy Recovery, Inc.(1) | 2,400 | 20,424 | ||||||
| Enerpac Tool Group Corp. | 1,115 | 23,192 | ||||||
| EnPro Industries, Inc. | 830 | 48,572 | ||||||
| ESCO Technologies, Inc. | 564 | 50,715 | ||||||
| Federal Signal Corp. | 1,370 | 44,004 | ||||||
| Flowserve Corp. | 1,880 | 55,798 | ||||||
| Fortive Corp. | 860 | 62,015 | ||||||
| Franklin Electric Co., Inc. | 1,360 | 80,730 | ||||||
| Gorman-Rupp Co. (The) | 881 | 28,148 | ||||||
| Graco, Inc. | 6,790 | 393,956 | ||||||
| Greenbrier Cos., Inc. (The) | 860 | 23,383 | ||||||
| Helios Technologies, Inc. | 605 | 24,872 | ||||||
| Hyster-Yale Materials Handling, Inc. | 45 | 1,815 | ||||||
| IDEX Corp. | 605 | 109,039 | ||||||
| Illinois Tool Works, Inc. | 4,424 | 873,961 | ||||||
Ingersoll Rand, Inc.(1) | 3,892 | 136,454 | ||||||
| ITT, Inc. | 2,643 | 166,007 | ||||||
| John Bean Technologies Corp. | 607 | 62,224 | ||||||
| Kennametal, Inc. | 4,201 | 121,913 | ||||||
| Lincoln Electric Holdings, Inc. | 2,649 | 256,185 | ||||||
| Lindsay Corp. | 259 | 25,882 | ||||||
Lydall, Inc.(1) | 1,089 | 20,451 | ||||||
Manitowoc Co., Inc. (The)(1) | 339 | 3,193 | ||||||
Mayville Engineering Co., Inc.(1) | 3 | 26 | ||||||
Meritor, Inc.(1) | 2,135 | 48,593 | ||||||
Middleby Corp. (The)(1) | 292 | 28,587 | ||||||
| Miller Industries, Inc. | 350 | 10,979 | ||||||
| Mueller Industries, Inc. | 3,124 | 92,783 | ||||||
| Mueller Water Products, Inc., Class A | 7,473 | 80,708 | ||||||
Navistar International Corp.(1) | 265 | 8,475 | ||||||
| Nordson Corp. | 335 | 62,474 | ||||||
| Oshkosh Corp. | 3,145 | 242,196 | ||||||
| Otis Worldwide Corp. | 1,645 | 103,470 | ||||||
| PACCAR, Inc. | 11,866 | 1,018,577 | ||||||
| Park-Ohio Holdings Corp. | 532 | 8,416 | ||||||
| Parker-Hannifin Corp. | 1,370 | 282,234 | ||||||
| Pentair plc | 1,046 | 47,216 | ||||||
Proto Labs, Inc.(1) | 353 | 51,891 | ||||||
RBC Bearings, Inc.(1) | 353 | 46,610 | ||||||
| REV Group, Inc. | 801 | 6,208 | ||||||
| Rexnord Corp. | 860 | 24,906 | ||||||
| Shyft Group, Inc. (The) | 2,135 | 42,636 | ||||||
| Snap-on, Inc. | 1,644 | 243,756 | ||||||
SPX Corp.(1) | 605 | 25,307 | ||||||
35
| Shares | Value | |||||||
SPX FLOW, Inc.(1) | 2,347 | $ | 102,048 | |||||
| Standex International Corp. | 520 | 30,077 | ||||||
| Stanley Black & Decker, Inc. | 860 | 138,718 | ||||||
| Tennant Co. | 518 | 34,431 | ||||||
| Terex Corp. | 4,202 | 82,233 | ||||||
| Timken Co. (The) | 2,883 | 156,230 | ||||||
| Toro Co. (The) | 1,587 | 119,469 | ||||||
TriMas Corp.(1) | 860 | 21,741 | ||||||
| Trinity Industries, Inc. | 4,967 | 101,674 | ||||||
| Wabash National Corp. | 2,900 | 35,409 | ||||||
| Watts Water Technologies, Inc., Class A | 608 | 58,216 | ||||||
Welbilt, Inc.(1) | 2,645 | 19,520 | ||||||
| Westinghouse Air Brake Technologies Corp. | 4,196 | 279,244 | ||||||
| Woodward, Inc. | 1,348 | 115,510 | ||||||
| Xylem, Inc. | 1,370 | 109,847 | ||||||
| 12,089,853 | ||||||||
Marine† | ||||||||
| Costamare, Inc. | 4,940 | 24,947 | ||||||
| Genco Shipping & Trading Ltd. | 6 | 43 | ||||||
Kirby Corp.(1) | 1,128 | 47,872 | ||||||
| Matson, Inc. | 2,351 | 94,205 | ||||||
| Scorpio Bulkers, Inc. | 449 | 6,272 | ||||||
| 173,339 | ||||||||
| Media — 1.1% | ||||||||
Altice USA, Inc., Class A(1) | 6,198 | 170,941 | ||||||
AMC Networks, Inc., Class A(1) | 350 | 8,502 | ||||||
| Cable One, Inc. | 95 | 174,831 | ||||||
Charter Communications, Inc., Class A(1) | 900 | 554,049 | ||||||
| Comcast Corp., Class A | 37,949 | 1,700,495 | ||||||
Discovery, Inc., Class A(1) | 860 | 18,976 | ||||||
Discovery, Inc., Class C(1) | 2,390 | 47,728 | ||||||
DISH Network Corp., Class A(1) | 7,728 | 274,499 | ||||||
| Entercom Communications Corp., Class A | 6,017 | 9,025 | ||||||
| Fox Corp., Class A | 7,983 | 222,406 | ||||||
| Fox Corp., Class B | 3,410 | 94,798 | ||||||
| Interpublic Group of Cos., Inc. (The) | 2,135 | 37,918 | ||||||
| John Wiley & Sons, Inc., Class A | 3 | 95 | ||||||
Liberty Broadband Corp., Class A(1) | 95 | 13,128 | ||||||
Liberty Broadband Corp., Class C(1) | 2,135 | 299,092 | ||||||
Liberty Media Corp.-Liberty SiriusXM, Class C(1) | 3,273 | 117,812 | ||||||
Liberty Media Corp.-Liberty SiriusXM, Class A(1) | 1,370 | 49,745 | ||||||
| Meredith Corp. | 605 | 8,470 | ||||||
| New York Times Co. (The), Class A | 4,430 | 191,952 | ||||||
| News Corp., Class A | 7,473 | 112,992 | ||||||
| News Corp., Class B | 2,135 | 32,174 | ||||||
| Nexstar Media Group, Inc., Class A | 350 | 33,603 | ||||||
| Omnicom Group, Inc. | 2,900 | 156,861 | ||||||
| Scholastic Corp. | 605 | 13,612 | ||||||
| Sinclair Broadcast Group, Inc., Class A | 6 | 125 | ||||||
| Sirius XM Holdings, Inc. | 7,728 | 45,363 | ||||||
TechTarget, Inc.(1) | 339 | 13,452 | ||||||
| TEGNA, Inc. | 24 | 300 | ||||||
36
| Shares | Value | |||||||
| ViacomCBS, Inc., Class B | 6,483 | $ | 180,552 | |||||
| 4,583,496 | ||||||||
| Metals and Mining — 0.8% | ||||||||
Alcoa Corp.(1) | 5,744 | 83,977 | ||||||
Allegheny Technologies, Inc.(1) | 3,864 | 32,187 | ||||||
Arconic Corp.(1) | 5,065 | 112,696 | ||||||
| Carpenter Technology Corp. | 1,369 | 28,790 | ||||||
Century Aluminum Co.(1) | 832 | 8,212 | ||||||
| Cleveland-Cliffs, Inc. | 18,329 | 120,605 | ||||||
Coeur Mining, Inc.(1) | 13,987 | 118,330 | ||||||
| Commercial Metals Co. | 8,242 | 172,011 | ||||||
| Compass Minerals International, Inc. | 1,391 | 79,190 | ||||||
Contura Energy, Inc.(1) | 21 | 87 | ||||||
| Freeport-McMoRan, Inc. | 19,138 | 298,744 | ||||||
| Haynes International, Inc. | 324 | 6,072 | ||||||
| Hecla Mining Co. | 15,728 | 94,683 | ||||||
| Kaiser Aluminum Corp. | 857 | 55,088 | ||||||
| Materion Corp. | 534 | 29,151 | ||||||
| Newmont Corp. | 12,670 | 852,438 | ||||||
| Nucor Corp. | 7,218 | 328,130 | ||||||
| Olympic Steel, Inc. | 312 | 3,432 | ||||||
| Reliance Steel & Aluminum Co. | 3,199 | 335,479 | ||||||
| Royal Gold, Inc. | 1,370 | 186,758 | ||||||
Ryerson Holding Corp.(1) | 780 | 4,298 | ||||||
| Schnitzer Steel Industries, Inc., Class A | 1,370 | 27,044 | ||||||
| Steel Dynamics, Inc. | 10,826 | 319,583 | ||||||
| SunCoke Energy, Inc. | 4,685 | 16,772 | ||||||
| United States Steel Corp. | 7,490 | 58,647 | ||||||
| Warrior Met Coal, Inc. | 3,684 | 56,991 | ||||||
| Worthington Industries, Inc. | 1,313 | 54,529 | ||||||
| 3,483,924 | ||||||||
| Multi-Utilities — 0.8% | ||||||||
| Ameren Corp. | 7,254 | 573,864 | ||||||
| Avista Corp. | 1,630 | 60,082 | ||||||
| Black Hills Corp. | 354 | 19,852 | ||||||
| CenterPoint Energy, Inc. | 5,705 | 114,499 | ||||||
| CMS Energy Corp. | 5,495 | 332,392 | ||||||
| Consolidated Edison, Inc. | 5,705 | 406,995 | ||||||
| Dominion Energy, Inc. | 2,905 | 227,868 | ||||||
| DTE Energy Co. | 2,409 | 285,876 | ||||||
| MDU Resources Group, Inc. | 2,357 | 55,672 | ||||||
| NiSource, Inc. | 8,011 | 177,524 | ||||||
| NorthWestern Corp. | 867 | 44,772 | ||||||
| Public Service Enterprise Group, Inc. | 9,115 | 476,168 | ||||||
| Sempra Energy | 5,584 | 690,462 | ||||||
| Unitil Corp. | 804 | 33,929 | ||||||
| WEC Energy Group, Inc. | 1,625 | 152,880 | ||||||
| 3,652,835 | ||||||||
| Multiline Retail — 0.9% | ||||||||
| Big Lots, Inc. | 2,567 | 121,034 | ||||||
| Dillard's, Inc., Class A | 350 | 10,574 | ||||||
| Dollar General Corp. | 4,175 | 842,849 | ||||||
37
| Shares | Value | |||||||
Dollar Tree, Inc.(1) | 6,442 | $ | 620,171 | |||||
| Kohl's Corp. | 6,759 | 144,372 | ||||||
| Macy's, Inc. | 14,040 | 97,859 | ||||||
| Nordstrom, Inc. | 6,702 | 107,232 | ||||||
Ollie's Bargain Outlet Holdings, Inc.(1) | 580 | 55,413 | ||||||
| Target Corp. | 13,424 | 2,029,843 | ||||||
| 4,029,347 | ||||||||
| Oil, Gas and Consumable Fuels — 2.8% | ||||||||
| Antero Midstream Corp. | 13,087 | 88,599 | ||||||
Antero Resources Corp.(1) | 7,983 | 25,705 | ||||||
| Apache Corp. | 22,435 | 332,038 | ||||||
| Arch Resources, Inc. | 350 | 13,185 | ||||||
| Berry Corp. | 2,900 | 11,426 | ||||||
Bonanza Creek Energy, Inc.(1) | 1,065 | 21,343 | ||||||
| Cabot Oil & Gas Corp. | 14,481 | 274,705 | ||||||
Cheniere Energy, Inc.(1) | 1,645 | 85,622 | ||||||
| Chevron Corp. | 24,353 | 2,043,947 | ||||||
| Cimarex Energy Co. | 5,732 | 159,235 | ||||||
Clean Energy Fuels Corp.(1) | 2,145 | 5,663 | ||||||
CNX Resources Corp.(1) | 6,357 | 69,673 | ||||||
Comstock Resources, Inc.(1) | 845 | 4,867 | ||||||
| Concho Resources, Inc. | 5,193 | 269,932 | ||||||
| ConocoPhillips | 26,135 | 990,255 | ||||||
CONSOL Energy, Inc.(1) | 866 | 4,477 | ||||||
| Continental Resources, Inc. | 2,888 | 49,616 | ||||||
| CVR Energy, Inc. | 1,592 | 26,570 | ||||||
| Delek US Holdings, Inc. | 3,947 | 62,086 | ||||||
| Devon Energy Corp. | 18,319 | 199,128 | ||||||
| DHT Holdings, Inc. | 4,940 | 26,133 | ||||||
Diamond S Shipping, Inc.(1) | 2,645 | 21,663 | ||||||
| Diamondback Energy, Inc. | 3,667 | 142,866 | ||||||
Dorian LPG Ltd.(1) | 2,395 | 20,214 | ||||||
EnLink Midstream LLC(1) | 5,716 | 17,091 | ||||||
| EOG Resources, Inc. | 13,693 | 620,841 | ||||||
| EQT Corp. | 6,516 | 103,409 | ||||||
| Equitrans Midstream Corp. | 4,903 | 50,403 | ||||||
| Evolution Petroleum Corp. | 867 | 2,367 | ||||||
| Exxon Mobil Corp. | 39,223 | 1,566,567 | ||||||
| GasLog Ltd. | 6 | 18 | ||||||
Goodrich Petroleum Corp.(1) | 68 | 561 | ||||||
Green Plains, Inc.(1) | 2,827 | 37,825 | ||||||
| Hess Corp. | 8,350 | 384,434 | ||||||
| HollyFrontier Corp. | 7,799 | 186,162 | ||||||
| International Seaways, Inc. | 780 | 13,229 | ||||||
| Kinder Morgan, Inc. | 21,433 | 296,204 | ||||||
Magnolia Oil & Gas Corp., Class A(1) | 7,225 | 46,529 | ||||||
| Marathon Oil Corp. | 33,108 | 174,810 | ||||||
| Marathon Petroleum Corp. | 5,454 | 193,399 | ||||||
Matador Resources Co.(1) | 6,259 | 60,900 | ||||||
Montage Resources Corp.(1) | 594 | 3,065 | ||||||
| Murphy Oil Corp. | 9,870 | 135,614 | ||||||
| NACCO Industries, Inc., Class A | 259 | 5,310 | ||||||
38
| Shares | Value | |||||||
NextDecade Corp.(1) | 320 | $ | 426 | |||||
| Noble Energy, Inc. | 15,473 | 153,956 | ||||||
| Nordic American Tankers Ltd. | 5,001 | 21,804 | ||||||
| Occidental Petroleum Corp. | 19,385 | 246,965 | ||||||
| ONEOK, Inc. | 13,347 | 366,776 | ||||||
Overseas Shipholding Group, Inc., Class A(1) | 2,093 | 4,416 | ||||||
| Ovintiv, Inc. | 6,879 | 76,219 | ||||||
| Panhandle Oil and Gas, Inc., Class A | 272 | 514 | ||||||
Par Pacific Holdings, Inc.(1) | 2,390 | 20,745 | ||||||
| Parsley Energy, Inc., Class A | 12,442 | 133,751 | ||||||
| PBF Energy, Inc., Class A | 4,018 | 34,394 | ||||||
PDC Energy, Inc.(1) | 4,895 | 74,110 | ||||||
| Peabody Energy Corp. | 2,135 | 5,572 | ||||||
Penn Virginia Corp.(1) | 605 | 6,909 | ||||||
| Phillips 66 | 5,960 | 348,481 | ||||||
| Pioneer Natural Resources Co. | 4,713 | 489,822 | ||||||
Plains GP Holdings LP, Class A(1) | 1,115 | 8,151 | ||||||
| Range Resources Corp. | 16,893 | 126,022 | ||||||
Renewable Energy Group, Inc.(1) | 1,140 | 38,110 | ||||||
REX American Resources Corp.(1) | 50 | 3,089 | ||||||
| Scorpio Tankers, Inc. | 1,792 | 21,217 | ||||||
| SFL Corp. Ltd. | 4,172 | 36,630 | ||||||
| SM Energy Co. | 6,562 | 15,946 | ||||||
Southwestern Energy Co.(1) | 17,880 | 49,706 | ||||||
Talos Energy, Inc.(1) | 1,311 | 9,846 | ||||||
| Targa Resources Corp. | 4,731 | 80,474 | ||||||
Teekay Corp.(1) | 3,685 | 9,397 | ||||||
Teekay Tankers Ltd., Class A(1) | 856 | 10,734 | ||||||
| Valero Energy Corp. | 11,697 | 615,145 | ||||||
| Williams Cos., Inc. (The) | 18,407 | 382,129 | ||||||
| World Fuel Services Corp. | 1,560 | 41,184 | ||||||
WPX Energy, Inc.(1) | 17,056 | 94,831 | ||||||
| 12,375,157 | ||||||||
| Paper and Forest Products — 0.1% | ||||||||
| Boise Cascade Co. | 2,610 | 119,538 | ||||||
Clearwater Paper Corp.(1) | 529 | 17,806 | ||||||
| Domtar Corp. | 3,170 | 90,409 | ||||||
| Louisiana-Pacific Corp. | 5,729 | 188,713 | ||||||
| Mercer International, Inc. | 2,135 | 17,891 | ||||||
| Neenah, Inc. | 833 | 36,885 | ||||||
| P.H. Glatfelter Co. | 1,880 | 28,181 | ||||||
| Schweitzer-Mauduit International, Inc. | 1,567 | 47,527 | ||||||
| Verso Corp., Class A | 1,825 | 23,926 | ||||||
| 570,876 | ||||||||
| Personal Products — 0.3% | ||||||||
| Coty, Inc., Class A | 1,274 | 4,561 | ||||||
Edgewell Personal Care Co.(1) | 1,413 | 40,567 | ||||||
| Estee Lauder Cos., Inc. (The), Class A | 4,413 | 978,450 | ||||||
Herbalife Nutrition Ltd.(1) | 740 | 36,371 | ||||||
| Inter Parfums, Inc. | 187 | 8,353 | ||||||
Lifevantage Corp.(1) | 839 | 12,602 | ||||||
| Medifast, Inc. | 560 | 91,123 | ||||||
39
| Shares | Value | |||||||
Nature's Sunshine Products, Inc.(1) | 2 | $ | 22 | |||||
| Nu Skin Enterprises, Inc., Class A | 2,114 | 99,929 | ||||||
USANA Health Sciences, Inc.(1) | 321 | 25,170 | ||||||
| 1,297,148 | ||||||||
| Pharmaceuticals — 3.7% | ||||||||
Amneal Pharmaceuticals, Inc.(1) | 2,635 | 10,830 | ||||||
Amphastar Pharmaceuticals, Inc.(1) | 588 | 11,983 | ||||||
ANI Pharmaceuticals, Inc.(1) | 272 | 8,530 | ||||||
| Bristol-Myers Squibb Co. | 34,328 | 2,135,202 | ||||||
Catalent, Inc.(1) | 4,175 | 386,187 | ||||||
Collegium Pharmaceutical, Inc.(1) | 1,625 | 30,972 | ||||||
Corcept Therapeutics, Inc.(1) | 6,216 | 78,943 | ||||||
Durect Corp.(1) | 3 | 5 | ||||||
Elanco Animal Health, Inc.(1) | 10,590 | 307,745 | ||||||
| Eli Lilly & Co. | 11,100 | 1,647,129 | ||||||
Endo International plc(1) | 2,698 | 8,121 | ||||||
Evofem Biosciences, Inc.(1) | 183 | 608 | ||||||
Horizon Therapeutics plc(1) | 4,152 | 311,898 | ||||||
Innoviva, Inc.(1) | 3,090 | 36,184 | ||||||
Intersect ENT, Inc.(1) | 870 | 17,470 | ||||||
Intra-Cellular Therapies, Inc.(1) | 525 | 9,566 | ||||||
Jazz Pharmaceuticals plc(1) | 2,309 | 310,307 | ||||||
| Johnson & Johnson | 34,891 | 5,352,628 | ||||||
Lannett Co., Inc.(1) | 3,085 | 16,227 | ||||||
Mallinckrodt plc(1) | 1,370 | 2,165 | ||||||
| Merck & Co., Inc. | 29,165 | 2,486,900 | ||||||
Mylan NV(1) | 15,465 | 253,317 | ||||||
MyoKardia, Inc.(1) | 534 | 58,441 | ||||||
Nektar Therapeutics(1) | 3,169 | 61,288 | ||||||
NGM Biopharmaceuticals, Inc.(1) | 530 | 9,885 | ||||||
Omeros Corp.(1) | 1,627 | 19,443 | ||||||
| Perrigo Co. plc | 2,357 | 123,271 | ||||||
| Pfizer, Inc. | 29,694 | 1,122,136 | ||||||
| Phibro Animal Health Corp., Class A | 1,115 | 23,928 | ||||||
Prestige Consumer Healthcare, Inc.(1) | 1,893 | 68,962 | ||||||
Reata Pharmaceuticals, Inc., Class A(1) | 83 | 8,711 | ||||||
Revance Therapeutics, Inc.(1) | 791 | 23,121 | ||||||
SIGA Technologies, Inc.(1) | 3,421 | 23,776 | ||||||
Strongbridge Biopharma plc(1) | 1,316 | 5,053 | ||||||
Supernus Pharmaceuticals, Inc.(1) | 2,491 | 54,777 | ||||||
Theravance Biopharma, Inc.(1) | 297 | 5,444 | ||||||
Verrica Pharmaceuticals, Inc.(1) | 2 | 18 | ||||||
| Zoetis, Inc. | 8,040 | 1,287,204 | ||||||
| 16,318,375 | ||||||||
| Professional Services — 0.5% | ||||||||
Acacia Research Corp.(1) | 1,879 | 7,131 | ||||||
ASGN, Inc.(1) | 350 | 25,120 | ||||||
| Barrett Business Services, Inc. | 267 | 15,371 | ||||||
| BG Staffing, Inc. | 7 | 66 | ||||||
| CoreLogic, Inc. | 605 | 40,172 | ||||||
CoStar Group, Inc.(1) | 259 | 219,787 | ||||||
| CRA International, Inc. | 526 | 22,360 | ||||||
40
| Shares | Value | |||||||
| Equifax, Inc. | 1,625 | $ | 273,439 | |||||
| Exponent, Inc. | 1,115 | 89,707 | ||||||
Franklin Covey Co.(1) | 267 | 5,271 | ||||||
FTI Consulting, Inc.(1) | 605 | 69,430 | ||||||
| Heidrick & Struggles International, Inc. | 867 | 18,753 | ||||||
| IHS Markit Ltd. | 1,625 | 129,870 | ||||||
InnerWorkings, Inc.(1) | 6 | 17 | ||||||
| Insperity, Inc. | 851 | 57,332 | ||||||
| Kelly Services, Inc., Class A | 1,115 | 21,174 | ||||||
| Kforce, Inc. | 1,115 | 38,289 | ||||||
| Korn Ferry | 1,789 | 54,564 | ||||||
| ManpowerGroup, Inc. | 2,594 | 190,166 | ||||||
| Nielsen Holdings plc | 2,400 | 36,672 | ||||||
| Resources Connection, Inc. | 1,885 | 23,167 | ||||||
| Robert Half International, Inc. | 4,975 | 264,670 | ||||||
| TransUnion | 1,880 | 163,034 | ||||||
TriNet Group, Inc.(1) | 1,085 | 73,606 | ||||||
TrueBlue, Inc.(1) | 1,370 | 23,180 | ||||||
| Verisk Analytics, Inc. | 1,880 | 350,940 | ||||||
| 2,213,288 | ||||||||
| Real Estate Management and Development — 0.2% | ||||||||
CBRE Group, Inc., Class A(1) | 9,288 | 436,815 | ||||||
| CTO Realty Growth, Inc. | 95 | 4,006 | ||||||
Cushman & Wakefield plc(1) | 1,370 | 15,906 | ||||||
Forestar Group, Inc.(1) | 305 | 5,420 | ||||||
FRP Holdings, Inc.(1) | 261 | 10,722 | ||||||
Howard Hughes Corp. (The)(1) | 860 | 50,834 | ||||||
| Jones Lang LaSalle, Inc. | 860 | 88,614 | ||||||
| Kennedy-Wilson Holdings, Inc. | 2,135 | 30,509 | ||||||
Marcus & Millichap, Inc.(1) | 1,070 | 30,185 | ||||||
| Newmark Group, Inc., Class A | 3,155 | 13,977 | ||||||
| RE/MAX Holdings, Inc., Class A | 1,276 | 44,839 | ||||||
Redfin Corp.(1) | 1,010 | 48,046 | ||||||
| RMR Group, Inc. (The), Class A | 350 | 9,877 | ||||||
St. Joe Co. (The)(1) | 1,626 | 37,739 | ||||||
Tejon Ranch Co.(1) | 568 | 8,128 | ||||||
| 835,617 | ||||||||
| Road and Rail — 2.1% | ||||||||
| AMERCO | 316 | 112,145 | ||||||
| ArcBest Corp. | 1,393 | 47,111 | ||||||
Avis Budget Group, Inc.(1) | 860 | 29,335 | ||||||
| CSX Corp. | 21,213 | 1,621,946 | ||||||
Daseke, Inc.(1) | 1,384 | 8,512 | ||||||
| Heartland Express, Inc. | 2,390 | 49,437 | ||||||
| J.B. Hunt Transport Services, Inc. | 4,150 | 583,241 | ||||||
| Kansas City Southern | 3,856 | 701,946 | ||||||
| Knight-Swift Transportation Holdings, Inc. | 3,510 | 159,565 | ||||||
| Landstar System, Inc. | 1,880 | 250,209 | ||||||
Lyft, Inc., Class A(1) | 1,880 | 55,780 | ||||||
| Marten Transport Ltd. | 3,202 | 58,148 | ||||||
| Norfolk Southern Corp. | 6,475 | 1,376,132 | ||||||
| Old Dominion Freight Line, Inc. | 4,036 | 815,999 | ||||||
41
| Shares | Value | |||||||
| Ryder System, Inc. | 3,397 | $ | 138,937 | |||||
Saia, Inc.(1) | 1,625 | 218,075 | ||||||
| Schneider National, Inc., Class B | 2,135 | 57,773 | ||||||
Uber Technologies, Inc.(1) | 2,906 | 97,729 | ||||||
| Union Pacific Corp. | 12,887 | 2,479,974 | ||||||
| Universal Logistics Holdings, Inc. | 10 | 215 | ||||||
US Xpress Enterprises, Inc., Class A(1) | 1,893 | 18,116 | ||||||
| Werner Enterprises, Inc. | 3,115 | 143,321 | ||||||
| 9,023,646 | ||||||||
| Semiconductors and Semiconductor Equipment — 4.8% | ||||||||
Advanced Energy Industries, Inc.(1) | 605 | 44,843 | ||||||
Advanced Micro Devices, Inc.(1) | 6,453 | 586,061 | ||||||
Ambarella, Inc.(1) | 350 | 18,445 | ||||||
Amkor Technology, Inc.(1) | 3,410 | 41,585 | ||||||
| Analog Devices, Inc. | 2,391 | 279,460 | ||||||
| Applied Materials, Inc. | 25,869 | 1,593,530 | ||||||
| Broadcom, Inc. | 1,885 | 654,378 | ||||||
| Brooks Automation, Inc. | 1,339 | 69,133 | ||||||
| Cabot Microelectronics Corp. | 262 | 39,900 | ||||||
CEVA, Inc.(1) | 861 | 36,377 | ||||||
Cirrus Logic, Inc.(1) | 1,880 | 113,909 | ||||||
Cree, Inc.(1) | 1,370 | 86,447 | ||||||
Diodes, Inc.(1) | 1,625 | 79,398 | ||||||
Enphase Energy, Inc.(1) | 1,625 | 125,499 | ||||||
| Entegris, Inc. | 2,135 | 142,810 | ||||||
First Solar, Inc.(1) | 1,322 | 101,252 | ||||||
FormFactor, Inc.(1) | 2,110 | 55,134 | ||||||
Inphi Corp.(1) | 350 | 39,893 | ||||||
| Intel Corp. | 52,410 | 2,670,290 | ||||||
| KLA Corp. | 1,880 | 385,663 | ||||||
| Kulicke & Soffa Industries, Inc. | 1,115 | 26,738 | ||||||
| Lam Research Corp. | 4,430 | 1,489,986 | ||||||
Lattice Semiconductor Corp.(1) | 1,880 | 53,768 | ||||||
| Marvell Technology Group Ltd. | 7,728 | 299,692 | ||||||
| Maxim Integrated Products, Inc. | 7,983 | 546,357 | ||||||
MaxLinear, Inc.(1) | 759 | 18,482 | ||||||
| Microchip Technology, Inc. | 1,625 | 178,263 | ||||||
Micron Technology, Inc.(1) | 28,390 | 1,292,029 | ||||||
| MKS Instruments, Inc. | 605 | 72,316 | ||||||
| Monolithic Power Systems, Inc. | 350 | 93,496 | ||||||
| NVIDIA Corp. | 5,002 | 2,675,970 | ||||||
ON Semiconductor Corp.(1) | 10,390 | 222,034 | ||||||
Onto Innovation, Inc.(1) | 785 | 24,523 | ||||||
Photronics, Inc.(1) | 2,645 | 26,529 | ||||||
| Power Integrations, Inc. | 700 | 39,179 | ||||||
Qorvo, Inc.(1) | 3,920 | 502,818 | ||||||
| QUALCOMM, Inc. | 10,909 | 1,299,262 | ||||||
Rambus, Inc.(1) | 2,900 | 38,947 | ||||||
Semtech Corp.(1) | 1,043 | 61,172 | ||||||
Silicon Laboratories, Inc.(1) | 606 | 62,060 | ||||||
| Skyworks Solutions, Inc. | 5,207 | 754,234 | ||||||
SMART Global Holdings, Inc.(1) | 860 | 21,672 | ||||||
42
| Shares | Value | |||||||
SolarEdge Technologies, Inc.(1) | 1,441 | $ | 318,677 | |||||
Synaptics, Inc.(1) | 1,625 | 138,661 | ||||||
| Teradyne, Inc. | 7,218 | 613,313 | ||||||
| Texas Instruments, Inc. | 15,228 | 2,164,660 | ||||||
Ultra Clean Holdings, Inc.(1) | 2,627 | 64,414 | ||||||
| Universal Display Corp. | 610 | 107,055 | ||||||
| Xilinx, Inc. | 3,920 | 408,307 | ||||||
| 20,778,621 | ||||||||
| Software — 6.6% | ||||||||
ACI Worldwide, Inc.(1) | 2,101 | 61,727 | ||||||
Adobe, Inc.(1) | 3,492 | 1,792,758 | ||||||
Alarm.com Holdings, Inc.(1) | 1 | 60 | ||||||
Alteryx, Inc., Class A(1) | 355 | 42,895 | ||||||
Anaplan, Inc.(1) | 350 | 21,438 | ||||||
ANSYS, Inc.(1) | 612 | 207,474 | ||||||
Appfolio, Inc., Class A(1) | 95 | 15,963 | ||||||
Aspen Technology, Inc.(1) | 2,645 | 335,994 | ||||||
Autodesk, Inc.(1) | 1,237 | 303,931 | ||||||
Avalara, Inc.(1) | 350 | 46,343 | ||||||
| Blackbaud, Inc. | 1,115 | 71,193 | ||||||
Blackline, Inc.(1) | 372 | 32,502 | ||||||
Bottomline Technologies de, Inc.(1) | 758 | 36,104 | ||||||
Cadence Design Systems, Inc.(1) | 3,410 | 378,203 | ||||||
| CDK Global, Inc. | 1,055 | 49,184 | ||||||
Cerence, Inc.(1) | 7 | 372 | ||||||
Ceridian HCM Holding, Inc.(1) | 350 | 27,832 | ||||||
| Citrix Systems, Inc. | 1,880 | 272,976 | ||||||
Cloudera, Inc.(1) | 3,155 | 41,678 | ||||||
CommVault Systems, Inc.(1) | 350 | 15,131 | ||||||
Cornerstone OnDemand, Inc.(1) | 605 | 21,338 | ||||||
Coupa Software, Inc.(1) | 262 | 85,868 | ||||||
Crowdstrike Holdings, Inc., Class A(1) | 1,198 | 150,625 | ||||||
Datadog, Inc., Class A(1) | 913 | 76,281 | ||||||
DocuSign, Inc.(1) | 350 | 78,050 | ||||||
Dropbox, Inc., Class A(1) | 1,370 | 29,003 | ||||||
Everbridge, Inc.(1) | 99 | 14,712 | ||||||
Fair Isaac Corp.(1) | 350 | 147,276 | ||||||
Five9, Inc.(1) | 304 | 38,742 | ||||||
Fortinet, Inc.(1) | 4,685 | 618,443 | ||||||
Guidewire Software, Inc.(1) | 862 | 96,811 | ||||||
HubSpot, Inc.(1) | 425 | 127,364 | ||||||
| Intuit, Inc. | 3,090 | 1,067,255 | ||||||
j2 Global, Inc.(1) | 605 | 42,344 | ||||||
Manhattan Associates, Inc.(1) | 2,900 | 282,025 | ||||||
| Microsoft Corp. | 72,317 | 16,309,653 | ||||||
MicroStrategy, Inc., Class A(1) | 72 | 10,400 | ||||||
Mimecast Ltd.(1) | 6 | 295 | ||||||
New Relic, Inc.(1) | 424 | 26,046 | ||||||
| NortonLifeLock, Inc. | 13,535 | 318,343 | ||||||
Nuance Communications, Inc.(1) | 1,625 | 48,685 | ||||||
Nutanix, Inc., Class A(1) | 1,887 | 54,176 | ||||||
| Oracle Corp. (New York) | 18,392 | 1,052,390 | ||||||
43
| Shares | Value | |||||||
Palo Alto Networks, Inc.(1) | 350 | $ | 90,093 | |||||
Paycom Software, Inc.(1) | 2,098 | 628,267 | ||||||
Paylocity Holding Corp.(1) | 607 | 89,381 | ||||||
| Pegasystems, Inc. | 95 | 12,205 | ||||||
| Progress Software Corp. | 605 | 22,923 | ||||||
Proofpoint, Inc.(1) | 95 | 10,419 | ||||||
PTC, Inc.(1) | 376 | 34,370 | ||||||
Q2 Holdings, Inc.(1) | 350 | 34,052 | ||||||
Qualys, Inc.(1) | 865 | 91,811 | ||||||
RealPage, Inc.(1) | 350 | 21,917 | ||||||
RingCentral, Inc., Class A(1) | 95 | 27,623 | ||||||
salesforce.com, Inc.(1) | 3,910 | 1,066,061 | ||||||
ServiceNow, Inc.(1) | 1,577 | 760,146 | ||||||
ShotSpotter, Inc.(1) | 279 | 8,359 | ||||||
Slack Technologies, Inc., Class A(1) | 3,241 | 106,434 | ||||||
Smartsheet, Inc., Class A(1) | 1,350 | 73,615 | ||||||
Splunk, Inc.(1) | 605 | 132,695 | ||||||
| SS&C Technologies Holdings, Inc. | 605 | 38,551 | ||||||
Synopsys, Inc.(1) | 861 | 190,539 | ||||||
TeleNav, Inc.(1) | 2,122 | 9,740 | ||||||
Teradata Corp.(1) | 1,115 | 27,150 | ||||||
Trade Desk, Inc. (The), Class A(1) | 95 | 45,724 | ||||||
Tyler Technologies, Inc.(1) | 261 | 90,126 | ||||||
Verint Systems, Inc.(1) | 500 | 23,780 | ||||||
VMware, Inc., Class A(1) | 350 | 50,554 | ||||||
Workday, Inc., Class A(1) | 605 | 145,025 | ||||||
| Xperi Holding Corp. | 1,370 | 17,166 | ||||||
Zendesk, Inc.(1) | 499 | 48,094 | ||||||
Zoom Video Communications, Inc., Class A(1) | 1,140 | 370,614 | ||||||
Zscaler, Inc.(1) | 350 | 50,169 | ||||||
| 28,767,486 | ||||||||
| Specialty Retail — 3.4% | ||||||||
| Aaron's, Inc. | 3,909 | 218,474 | ||||||
| Abercrombie & Fitch Co., Class A | 1,880 | 24,459 | ||||||
| Advance Auto Parts, Inc. | 2,091 | 326,844 | ||||||
America's Car-Mart, Inc.(1) | 77 | 7,739 | ||||||
| American Eagle Outfitters, Inc. | 4,430 | 55,862 | ||||||
Asbury Automotive Group, Inc.(1) | 823 | 87,065 | ||||||
At Home Group, Inc.(1) | 840 | 16,052 | ||||||
AutoNation, Inc.(1) | 4,430 | 251,890 | ||||||
AutoZone, Inc.(1) | 142 | 169,876 | ||||||
| Bed Bath & Beyond, Inc. | 8,244 | 100,412 | ||||||
| Best Buy Co., Inc. | 8,095 | 897,816 | ||||||
Boot Barn Holdings, Inc.(1) | 605 | 17,079 | ||||||
| Buckle, Inc. (The) | 1,820 | 34,107 | ||||||
Burlington Stores, Inc.(1) | 2,135 | 420,446 | ||||||
| Caleres, Inc. | 2,860 | 22,337 | ||||||
| Camping World Holdings, Inc., Class A | 519 | 15,082 | ||||||
CarMax, Inc.(1) | 7,728 | 826,355 | ||||||
Carvana Co.(1) | 95 | 20,516 | ||||||
| Cato Corp. (The), Class A | 1,625 | 13,000 | ||||||
| Chico's FAS, Inc. | 3,924 | 5,023 | ||||||
44
| Shares | Value | |||||||
| Children's Place, Inc. (The) | 605 | $ | 12,079 | |||||
| Citi Trends, Inc. | 593 | 11,463 | ||||||
Conn's, Inc.(1) | 531 | 6,786 | ||||||
| Designer Brands, Inc., Class A | 86 | 606 | ||||||
| Dick's Sporting Goods, Inc. | 3,110 | 168,313 | ||||||
Five Below, Inc.(1) | 1,115 | 122,037 | ||||||
Floor & Decor Holdings, Inc., Class A(1) | 1,625 | 119,015 | ||||||
| Foot Locker, Inc. | 3,905 | 118,439 | ||||||
GameStop Corp., Class A(1) | 1,554 | 10,381 | ||||||
| Gap, Inc. (The) | 14,464 | 251,529 | ||||||
Genesco, Inc.(1) | 1,062 | 20,709 | ||||||
| Group 1 Automotive, Inc. | 350 | 30,254 | ||||||
| Guess?, Inc. | 1,850 | 21,275 | ||||||
| Haverty Furniture Cos., Inc. | 873 | 18,438 | ||||||
Hibbett Sports, Inc.(1) | 1,119 | 37,341 | ||||||
| Home Depot, Inc. (The) | 6,475 | 1,845,634 | ||||||
Hudson Ltd., Class A(1) | 2,390 | 18,021 | ||||||
| L Brands, Inc. | 1,370 | 40,278 | ||||||
| Lithia Motors, Inc., Class A | 1,305 | 324,893 | ||||||
| Lowe's Cos., Inc. | 14,433 | 2,376,971 | ||||||
Lumber Liquidators Holdings, Inc.(1) | 801 | 19,216 | ||||||
MarineMax, Inc.(1) | 577 | 16,970 | ||||||
| Monro, Inc. | 354 | 16,316 | ||||||
Murphy USA, Inc.(1) | 1,871 | 252,323 | ||||||
O'Reilly Automotive, Inc.(1) | 1,370 | 637,913 | ||||||
| ODP Corp. (The) | 3,760 | 87,909 | ||||||
| Penske Automotive Group, Inc. | 350 | 16,509 | ||||||
| Rent-A-Center, Inc. | 3,665 | 112,515 | ||||||
RH(1) | 74 | 24,461 | ||||||
| Ross Stores, Inc. | 11,855 | 1,079,753 | ||||||
Sally Beauty Holdings, Inc.(1) | 584 | 6,517 | ||||||
| Shoe Carnival, Inc. | 613 | 20,155 | ||||||
| Signet Jewelers Ltd. | 2,625 | 45,334 | ||||||
Sleep Number Corp.(1) | 260 | 12,480 | ||||||
| Sonic Automotive, Inc., Class A | 860 | 36,344 | ||||||
Sportsman's Warehouse Holdings, Inc.(1) | 2,885 | 45,280 | ||||||
| Tilly's, Inc., Class A | 1,319 | 8,362 | ||||||
| TJX Cos., Inc. (The) | 28,633 | 1,568,802 | ||||||
| Tractor Supply Co. | 4,685 | 697,269 | ||||||
Ulta Beauty, Inc.(1) | 2,569 | 596,470 | ||||||
Urban Outfitters, Inc.(1) | 3,910 | 92,041 | ||||||
| Williams-Sonoma, Inc. | 2,098 | 184,120 | ||||||
Zumiez, Inc.(1) | 860 | 22,085 | ||||||
| 14,684,040 | ||||||||
| Technology Hardware, Storage and Peripherals — 6.1% | ||||||||
3D Systems Corp.(1) | 3,154 | 17,315 | ||||||
| Apple, Inc. | 197,256 | 25,453,914 | ||||||
Dell Technologies, Inc., Class C(1) | 605 | 39,978 | ||||||
| Hewlett Packard Enterprise Co. | 7,983 | 77,196 | ||||||
| HP, Inc. | 9,115 | 178,198 | ||||||
NCR Corp.(1) | 2,917 | 59,623 | ||||||
| NetApp, Inc. | 3,651 | 173,021 | ||||||
45
| Shares | Value | |||||||
Pure Storage, Inc., Class A(1) | 1,625 | $ | 24,798 | |||||
| Seagate Technology plc | 8,860 | 425,191 | ||||||
Stratasys Ltd.(1) | 1,115 | 16,569 | ||||||
Super Micro Computer, Inc.(1) | 450 | 12,326 | ||||||
| Western Digital Corp. | 1,625 | 62,433 | ||||||
| Xerox Holdings Corp. | 8,974 | 169,250 | ||||||
| 26,709,812 | ||||||||
| Textiles, Apparel and Luxury Goods — 1.3% | ||||||||
Capri Holdings Ltd.(1) | 9,091 | 144,002 | ||||||
| Carter's, Inc. | 2,367 | 188,461 | ||||||
| Columbia Sportswear Co. | 544 | 46,550 | ||||||
Crocs, Inc.(1) | 4,951 | 197,594 | ||||||
Deckers Outdoor Corp.(1) | 1,335 | 272,167 | ||||||
Fossil Group, Inc.(1) | 2,390 | 15,380 | ||||||
G-III Apparel Group Ltd.(1) | 1,115 | 12,332 | ||||||
| Hanesbrands, Inc. | 8,389 | 128,268 | ||||||
| Kontoor Brands, Inc. | 34 | 751 | ||||||
| Levi Strauss & Co., Class A | 1,646 | 20,279 | ||||||
lululemon athletica, Inc.(1) | 3,155 | 1,185,239 | ||||||
| Movado Group, Inc. | 7 | 76 | ||||||
| NIKE, Inc., Class B | 18,562 | 2,076,902 | ||||||
| Oxford Industries, Inc. | 793 | 39,277 | ||||||
| PVH Corp. | 2,352 | 131,148 | ||||||
| Ralph Lauren Corp. | 1,580 | 108,751 | ||||||
| Rocky Brands, Inc. | 271 | 6,526 | ||||||
Skechers USA, Inc., Class A(1) | 5,184 | 154,742 | ||||||
| Steven Madden Ltd. | 3,338 | 70,632 | ||||||
| Tapestry, Inc. | 10,831 | 159,541 | ||||||
Under Armour, Inc., Class A(1) | 6,011 | 58,968 | ||||||
Under Armour, Inc., Class C(1) | 3,665 | 32,435 | ||||||
Unifi, Inc.(1) | 353 | 4,317 | ||||||
Vera Bradley, Inc.(1) | 527 | 2,777 | ||||||
| VF Corp. | 8,860 | 582,545 | ||||||
Vince Holding Corp.(1) | 46 | 231 | ||||||
| Wolverine World Wide, Inc. | 860 | 21,483 | ||||||
| 5,661,374 | ||||||||
| Thrifts and Mortgage Finance — 0.3% | ||||||||
Axos Financial, Inc.(1) | 2,605 | 64,552 | ||||||
Bridgewater Bancshares, Inc.(1) | 855 | 8,311 | ||||||
Columbia Financial, Inc.(1) | 1,880 | 20,060 | ||||||
| Essent Group Ltd. | 4,175 | 149,047 | ||||||
| Federal Agricultural Mortgage Corp., Class C | 537 | 36,597 | ||||||
| Flagstar Bancorp, Inc. | 1,110 | 34,876 | ||||||
| Home Bancorp, Inc. | 269 | 6,499 | ||||||
| HomeStreet, Inc. | 860 | 23,538 | ||||||
| Kearny Financial Corp. | 2,369 | 18,383 | ||||||
| Merchants Bancorp | 352 | 7,174 | ||||||
| Meridian Bancorp, Inc. | 1,618 | 18,834 | ||||||
| Meta Financial Group, Inc. | 1,360 | 26,221 | ||||||
| MGIC Investment Corp. | 15,218 | 139,549 | ||||||
Mr. Cooper Group, Inc.(1) | 4,730 | 86,677 | ||||||
| New York Community Bancorp, Inc. | 13,228 | 119,713 | ||||||
46
| Shares | Value | |||||||
NMI Holdings, Inc., Class A(1) | 3,155 | $ | 54,108 | |||||
| Northfield Bancorp, Inc. | 1,625 | 15,698 | ||||||
| Northwest Bancshares, Inc. | 2,390 | 24,163 | ||||||
| OP Bancorp | 578 | 3,526 | ||||||
| PCSB Financial Corp. | 352 | 4,463 | ||||||
| PennyMac Financial Services, Inc. | 2,403 | 126,686 | ||||||
| Premier Financial Corp. | 1,889 | 34,521 | ||||||
| Provident Financial Services, Inc. | 1,370 | 18,057 | ||||||
| Radian Group, Inc. | 9,879 | 152,532 | ||||||
| Southern Missouri Bancorp, Inc. | 298 | 7,057 | ||||||
| Sterling Bancorp, Inc. | 3 | 9 | ||||||
| Territorial Bancorp, Inc. | 270 | 5,713 | ||||||
| TFS Financial Corp. | 1,625 | 25,106 | ||||||
| TrustCo Bank Corp. NY | 3,920 | 23,363 | ||||||
| Walker & Dunlop, Inc. | 2,077 | 113,778 | ||||||
| Washington Federal, Inc. | 2,645 | 62,025 | ||||||
| Waterstone Financial, Inc. | 1,626 | 25,187 | ||||||
| Western New England Bancorp, Inc. | 793 | 4,060 | ||||||
| WSFS Financial Corp. | 1,556 | 45,591 | ||||||
| 1,505,674 | ||||||||
| Trading Companies and Distributors — 0.7% | ||||||||
| Air Lease Corp. | 5,960 | 185,237 | ||||||
| Applied Industrial Technologies, Inc. | 1,372 | 82,608 | ||||||
BMC Stock Holdings, Inc.(1) | 4,466 | 178,283 | ||||||
CAI International, Inc.(1) | 717 | 15,638 | ||||||
| Fastenal Co. | 17,293 | 844,936 | ||||||
| GATX Corp. | 1,901 | 127,139 | ||||||
General Finance Corp.(1) | 2 | 13 | ||||||
GMS, Inc.(1) | 1,115 | 29,536 | ||||||
| H&E Equipment Services, Inc. | 2,103 | 42,607 | ||||||
HD Supply Holdings, Inc.(1) | 1,636 | 64,884 | ||||||
Herc Holdings, Inc.(1) | 1,578 | 64,619 | ||||||
Lawson Products, Inc.(1) | 53 | 1,903 | ||||||
MRC Global, Inc.(1) | 2,394 | 13,622 | ||||||
| MSC Industrial Direct Co., Inc., Class A | 1,793 | 118,159 | ||||||
NOW, Inc.(1) | 2,390 | 17,375 | ||||||
| Rush Enterprises, Inc., Class A | 1,572 | 75,959 | ||||||
SiteOne Landscape Supply, Inc.(1) | 860 | 107,543 | ||||||
| Systemax, Inc. | 1,115 | 24,742 | ||||||
Textainer Group Holdings Ltd.(1) | 2,666 | 31,299 | ||||||
Titan Machinery, Inc.(1) | 31 | 418 | ||||||
| Triton International Ltd. | 3,155 | 113,769 | ||||||
United Rentals, Inc.(1) | 1,115 | 197,411 | ||||||
Univar Solutions, Inc.(1) | 823 | 14,970 | ||||||
Veritiv Corp.(1) | 1,076 | 18,701 | ||||||
| W.W. Grainger, Inc. | 1,657 | 605,518 | ||||||
| Watsco, Inc. | 350 | 85,746 | ||||||
WESCO International, Inc.(1) | 350 | 16,397 | ||||||
| 3,079,032 | ||||||||
Transportation Infrastructure† | ||||||||
| Macquarie Infrastructure Corp. | 1,625 | 45,532 | ||||||
47
| Shares | Value | |||||||
| Water Utilities — 0.1% | ||||||||
| American States Water Co. | 821 | $ | 62,462 | |||||
| American Water Works Co., Inc. | 1,625 | 229,677 | ||||||
| Artesian Resources Corp., Class A | 260 | 9,149 | ||||||
| California Water Service Group | 350 | 15,869 | ||||||
| Consolidated Water Co. Ltd. | 322 | 3,874 | ||||||
| Essential Utilities, Inc. | 3,665 | 155,763 | ||||||
| Global Water Resources, Inc. | 7 | 77 | ||||||
| 476,871 | ||||||||
| Wireless Telecommunication Services — 0.3% | ||||||||
Boingo Wireless, Inc.(1) | 3,008 | 39,074 | ||||||
| Shenandoah Telecommunications Co. | 2,982 | 164,904 | ||||||
T-Mobile US, Inc.(1) | 9,404 | 1,097,259 | ||||||
| Telephone and Data Systems, Inc. | 3,283 | 75,936 | ||||||
United States Cellular Corp.(1) | 549 | 19,973 | ||||||
| 1,397,146 | ||||||||
TOTAL COMMON STOCKS (Cost $364,853,239) | 435,014,231 | |||||||
| TEMPORARY CASH INVESTMENTS — 0.1% | ||||||||
| State Street Institutional U.S. Government Money Market Fund, Premier Class (Cost $363,513) | 363,513 | 363,513 | ||||||
TOTAL INVESTMENT SECURITIES — 99.8% (Cost $365,216,752) | 435,377,744 | |||||||
| OTHER ASSETS AND LIABILITIES — 0.2% | 721,253 | |||||||
| TOTAL NET ASSETS — 100.0% | $ | 436,098,997 | ||||||
| NOTES TO SCHEDULE OF INVESTMENTS | ||
† Category is less than 0.05% of total net assets.
(1)Non-income producing.
See Notes to Financial Statements.
48
| Statement of Assets and Liabilities | ||
| AUGUST 31, 2020 | |||||
| Assets | |||||
| Investment securities, at value (cost of $365,216,752) | $ | 435,377,744 | |||
| Receivable for capital shares sold | 3,380,280 | ||||
| Dividends and interest receivable | 671,245 | ||||
| 439,429,269 | |||||
| Liabilities | |||||
| Payable for investments purchased | 3,277,491 | ||||
| Accrued management fees | 52,781 | ||||
| 3,330,272 | |||||
| Net Assets | $ | 436,098,997 | |||
| Shares outstanding (unlimited number of shares authorized) | 7,770,000 | ||||
| Net Asset Value Per Share | $ | 56.13 | |||
| Net Assets Consist of: | |||||
| Capital paid in | $ | 365,310,689 | |||
| Distributable earnings | 70,788,308 | ||||
| $ | 436,098,997 | ||||
See Notes to Financial Statements.
49
| Statement of Operations | ||
FOR THE PERIOD ENDED AUGUST 31, 2020(1) | |||||
| Investment Income (Loss) | |||||
| Income: | |||||
| Dividends (net of foreign taxes withheld of $883) | $ | 4,187,944 | |||
| Securities lending, net | 3,003 | ||||
| Interest | 1,268 | ||||
| 4,192,215 | |||||
| Expenses: | |||||
| Management fees | 329,876 | ||||
| Net investment income (loss) | 3,862,339 | ||||
| Realized and Unrealized Gain (Loss) | |||||
| Net realized gain (loss) on: | |||||
| Investment transactions (Note 4) | 233,222 | ||||
| Futures contract transactions | 6,597 | ||||
| 239,819 | |||||
| Change in net unrealized appreciation (depreciation) on investments | 70,160,992 | ||||
| Net realized and unrealized gain (loss) | 70,400,811 | ||||
| Net Increase (Decrease) in Net Assets Resulting from Operations | $ | 74,263,150 | |||
(1)September 24, 2019 (fund inception) through August 31, 2020.
See Notes to Financial Statements.
50
| Statement of Changes in Net Assets | ||
PERIOD ENDED AUGUST 31, 2020(1) | |||||
| Increase (Decrease) in Net Assets | |||||
| Operations | |||||
| Net investment income (loss) | $ | 3,862,339 | |||
| Net realized gain (loss) | 239,819 | ||||
| Change in net unrealized appreciation (depreciation) | 70,160,992 | ||||
| Net increase (decrease) in net assets resulting from operations | 74,263,150 | ||||
| Distributions to Shareholders | |||||
| From earnings | (2,641,471) | ||||
| Capital Share Transactions | |||||
| Proceeds from shares sold | 367,410,828 | ||||
| Payments for shares redeemed | (2,933,510) | ||||
| Net increase (decrease) in net assets from capital share transactions | 364,477,318 | ||||
| Net increase (decrease) in net assets | 436,098,997 | ||||
| Net Assets | |||||
| End of period | $ | 436,098,997 | |||
| Transactions in Shares of the Fund | |||||
| Sold | 7,830,000 | ||||
| Redeemed | (60,000) | ||||
| Net increase (decrease) in shares of the fund | 7,770,000 | ||||
(1)September 24, 2019 (fund inception) through August 31, 2020.
See Notes to Financial Statements.
51
| Notes to Financial Statements | ||
AUGUST 31, 2020
1. Organization
American Century ETF Trust (the trust) was registered as a Delaware statutory trust in 2017 and is registered under the Investment Company Act of 1940, as amended (the 1940 Act), as an open-end management investment company. Avantis U.S. Equity ETF (the fund) is one fund in a series issued by the trust. The fund's investment objective is to seek long-term capital appreciation. Shares of the fund are listed for trading on the NYSE Arca, Inc. The fund incepted on September 24, 2019.
2. Significant Accounting Policies
The following is a summary of significant accounting policies consistently followed by the fund in preparation of its financial statements. The fund is an investment company and follows accounting and reporting guidance in accordance with accounting principles generally accepted in the United States of America. This may require management to make certain estimates and assumptions at the date of the financial statements. Actual results could differ from these estimates. Management evaluated the impact of events or transactions occurring through the date the financial statements were issued that would merit recognition or disclosure.
Investment Valuations — The fund determines the fair value of its investments and computes its net asset value per share at the close of regular trading (usually 4 p.m. Eastern time) on the New York Stock Exchange (NYSE) on each day the NYSE is open. The Board of Trustees has adopted valuation policies and procedures to guide the investment advisor in the fund’s investment valuation process and to provide methodologies for the oversight of the fund’s pricing function.
Equity securities that are listed or traded on a domestic securities exchange are valued at the last reported sales price or at the official closing price as provided by the exchange. Equity securities traded on foreign securities exchanges are generally valued at the closing price of such securities on the exchange where primarily traded or at the close of the NYSE, if that is earlier. If no last sales price is reported, or if local convention or regulation so provides, the mean of the latest bid and asked prices may be used. Securities traded over-the-counter are valued at the mean of the latest bid and asked prices, the last sales price, or the official closing price.
Open-end management investment companies are valued at the reported net asset value per share. Exchange-traded futures contracts are valued at the settlement price as provided by the appropriate exchange.
If the fund determines that the market price for an investment is not readily available or the valuation methods mentioned above do not reflect an investment’s fair value, such investment is valued as determined in good faith by the Board of Trustees or its delegate, in accordance with policies and procedures adopted by the Board of Trustees. In its determination of fair value, the fund may review several factors including, but not limited to, market information regarding the specific investment or comparable investments and correlation with other investment types, futures indices or general market indicators. Circumstances that may cause the fund to use these procedures to value an investment include, but are not limited to: an investment has been declared in default or is distressed; trading in a security has been suspended during the trading day or a security is not actively trading on its principal exchange; prices received from a regular pricing source are deemed unreliable; or there is a foreign market holiday and no trading occurred.
The fund monitors for significant events occurring after the close of an investment’s primary exchange but before the fund’s net asset value per share is determined. Significant events may include, but are not limited to: corporate announcements and transactions; governmental action and political unrest that could impact a specific investment or an investment sector; or armed conflicts, natural disasters and similar events that could affect investments in a specific country or region. The fund also monitors for significant fluctuations between domestic and foreign markets, as evidenced by the U.S. market or such other indicators that the Board of Trustees, or its delegate, deems appropriate. The fund may apply a model-derived factor to the closing price of equity securities traded on foreign securities exchanges. The factor is based on observable market data as provided by an independent pricing service.
52
Security Transactions — Security transactions are accounted for as of the trade date. Net realized gains and losses are determined on the identified cost basis, which is also used for federal income tax purposes.
Investment Income — Dividend income less foreign taxes withheld, if any, is recorded as of the ex-dividend date. Distributions received on securities that represent a return of capital or long-term capital gain are recorded as a reduction of cost of investments and/or as a realized gain. The fund may estimate the components of distributions received that may be considered nontaxable distributions or long-term capital gain distributions for income tax purposes. Interest income is recorded on the accrual basis and includes accretion of discounts and amortization of premiums. Securities lending income is net of fees and rebates earned by the lending agent for its services.
Segregated Assets — In accordance with the 1940 Act, the fund segregates assets on its books and records to cover certain types of investment securities and other financial instruments. American Century Investment Management, Inc. (ACIM) (the investment advisor) monitors, on a daily basis, the securities segregated to ensure the fund designates a sufficient amount of liquid assets, marked-to-market daily. The fund may also receive assets or be required to pledge assets at the custodian bank or with a broker for collateral requirements.
Income Tax Status — It is the fund’s policy to distribute substantially all net investment income and net realized gains to shareholders and to otherwise qualify as a regulated investment company under provisions of the Internal Revenue Code. Accordingly, no provision has been made for income taxes. The fund files U.S. federal, state, local and non-U.S. tax returns as applicable. The fund's tax returns are subject to examination by the relevant taxing authority until expiration of the applicable statute of limitations, which is generally three years from the date of filing but can be longer in certain jurisdictions. At this time, management believes there are no uncertain tax positions which, based on their technical merit, would not be sustained upon examination and for which it is reasonably possible that the total amounts of unrecognized tax benefits will significantly change in the next twelve months.
Distributions to Shareholders — Distributions from net investment income, if any, are generally declared and paid quarterly. Distributions from net realized gains, if any, are generally declared and paid annually.
Indemnifications — Under the trust’s organizational documents, its officers and trustees are indemnified against certain liabilities arising out of the performance of their duties to the fund. In addition, in the normal course of business, the fund enters into contracts that provide general indemnifications. The maximum exposure under these arrangements is unknown as this would involve future claims that may be made against a fund. The risk of material loss from such claims is considered by management to be remote.
Securities Lending — Securities are lent to qualified financial institutions and brokers. State Street Bank & Trust Co. serves as securities lending agent to the fund pursuant to a Securities Lending Agreement. The lending of securities exposes the fund to risks such as: the borrowers may fail to return the loaned securities, the borrowers may not be able to provide additional collateral, the fund may experience delays in recovery of the loaned securities or delays in access to collateral, or the fund may experience losses related to the investment collateral. To minimize certain risks, loan counterparties pledge collateral in the form of cash and/or securities. The lending agent has agreed to indemnify the fund in the case of default of any securities borrowed. Cash collateral received is invested in the State Street Navigator Securities Lending Government Money Market Portfolio, a money market mutual fund registered under the 1940 Act. The loans may also be secured by U.S. government securities in an amount at least equal to the market value of the securities loaned, plus accrued interest and dividends, determined on a daily basis and adjusted accordingly. By lending securities, the fund seeks to increase its net investment income through the receipt of interest and fees. Such income is reflected separately within the Statement of Operations. The value of loaned securities and related collateral outstanding at period end, if any, are shown on a gross basis within the Schedule of Investments and Statement of Assets and Liabilities.
3. Fees and Transactions with Related Parties
Certain officers and trustees of the trust are also officers and/or directors of American Century Companies, Inc. (ACC). The trust's investment advisor, ACIM, and the trust’s administrator, American Century Services, LLC, are wholly owned, directly or indirectly, by ACC. Various funds issued by American Century Strategic Asset Allocations, Inc. own, in aggregate, 31% of the shares of the fund. Related parties do not invest in the fund for the purpose of exercising management or control.
53
Management Fees — The trust has entered into a management agreement with ACIM, under which ACIM provides the fund with investment advisory and management services in exchange for a single, unified management fee (the fee). The agreement provides that ACIM will pay all expenses of managing and operating the fund, except brokerage and other transaction fees and expenses relating to the acquisition and disposition of portfolio securities, acquired fund fees and expenses, interest, taxes, litigation expenses and extraordinary expenses. The fee is computed and accrued daily based on the daily net assets of the fund and paid monthly in arrears. The annual management fee is 0.15%.
4. Investment Transactions
Purchases and sales of investment securities, excluding short-term investments and in-kind transactions, for the period ended August 31, 2020 were $23,804,204 and $6,598,952, respectively.
Securities received or delivered in-kind through subscriptions and redemptions for the period ended August 31, 2020 were $351,180,534 and $2,844,808, respectively. The fund incurred net realized gains of $833,398 from in-kind transactions. Net realized gain (loss) on in-kind transactions are not considered taxable for federal income tax purposes.
5. Capital Share Transactions
The fund’s shares may only be purchased and sold on a national securities exchange through a broker-dealer. The price of the fund’s shares is based on market price, and because ETF shares trade at market prices rather than net asset value (NAV), shares may trade at a price greater than NAV (a premium) or less than NAV (a discount). The fund issues and redeems shares that have been aggregated into blocks of 30,000 shares or multiples thereof (Creation Units) to authorized participants who have entered into agreements with the fund's distributor. The fund will generally issue and redeem Creation Units in return for a basket of securities (and an amount of cash) that the fund specifies each day. Investors transacting in Creation Units for cash may also pay an additional variable charge to compensate the fund for certain transaction costs and market impact expenses relating to investing in portfolio securities. Such variable charges, if any, are included in proceeds from shares sold in the Statement of Changes in Net Assets.
6. Fair Value Measurements
The fund’s investments valuation process is based on several considerations and may use multiple inputs to determine the fair value of the investments held by the fund. In conformity with accounting principles generally accepted in the United States of America, the inputs used to determine a valuation are classified into three broad levels.
•Level 1 valuation inputs consist of unadjusted quoted prices in an active market for identical investments.
•Level 2 valuation inputs consist of direct or indirect observable market data (including quoted prices for comparable investments, evaluations of subsequent market events, interest rates, prepayment speeds, credit risk, etc.). These inputs also consist of quoted prices for identical investments initially expressed in local currencies that are adjusted through translation into U.S. dollars.
•Level 3 valuation inputs consist of unobservable data (including a fund’s own assumptions).
The level classification is based on the lowest level input that is significant to the fair valuation measurement. The valuation inputs are not necessarily an indication of the risks associated with investing in these securities or other financial instruments.
As of period end, the fund’s investment securities were classified as Level 1. The Schedule of Investments provides additional information on the fund's portfolio holdings.
54
7. Derivative Instruments
Equity Price Risk — The fund is subject to equity price risk in the normal course of pursuing its investment objectives. A fund may enter into futures contracts based on an equity index in order to manage its exposure to changes in market conditions. A fund may purchase futures contracts to gain exposure to increases in market value or sell futures contracts to protect against a decline in market value. Upon entering into a futures contract, a fund is required to deposit either cash or securities in an amount equal to a certain percentage of the contract value (initial margin). Subsequent payments (variation margin) are made or received daily, in cash, by a fund. The variation margin is equal to the daily change in the contract value and is recorded as unrealized gains and losses. A fund recognizes a realized gain or loss when the contract is closed or expires. Net realized and unrealized gains or losses occurring during the holding period of futures contracts are a component of net realized gain (loss) on futures contract transactions and change in net unrealized appreciation (depreciation) on futures contracts, respectively. One of the risks of entering into futures contracts is the possibility that the change in value of the contract may not correlate with the changes in value of the underlying securities. During the period, the fund participated in equity price risk derivative instruments for temporary investment purposes.
At period end, the fund did not have any derivative instruments disclosed on the Statement of Assets and Liabilities. For the period from September 24, 2019 (fund inception) through August 31, 2020, the effect of equity price risk derivative instruments on the Statement of Operations was $6,597 in net realized gain (loss) on futures contract transactions.
8. Risk Factors
The value of the fund’s shares will go up and down, sometimes rapidly or unpredictably, based on the performance of the securities owned by the fund and other factors generally affecting the securities market. Market risks, including political, regulatory, economic and social developments, can affect the value of the fund’s investments. Natural disasters, public health emergencies, terrorism and other unforeseeable events may lead to increased market volatility and may have adverse long-term effects on world economies and markets generally.
9. Federal Tax Information
The tax character of distributions paid during the period September 24, 2019 (fund inception) through August 31, 2020 were as follows:
| Distributions Paid From | |||||
| Ordinary income | $ | 2,641,471 | |||
| Long-term capital gains | — | ||||
The book-basis character of distributions made during the year from net investment income or net realized gains may differ from their ultimate characterization for federal income tax purposes. These differences reflect the differing character of certain income items and net realized gains and losses for financial statement and tax purposes, and may result in reclassification among certain capital accounts on the financial statements.
As of period end, the federal tax cost of investments and the components of distributable earnings on a tax-basis were as follows:
| Federal tax cost of investments | $ | 365,199,003 | |||
| Gross tax appreciation of investments | $ | 83,966,275 | |||
| Gross tax depreciation of investments | (13,787,534) | ||||
| Net tax appreciation (depreciation) of investments | $ | 70,178,741 | |||
| Undistributed ordinary income | $ | 1,209,886 | |||
| Accumulated short-term capital losses | $ | (600,319) | |||
The difference between book-basis and tax-basis unrealized appreciation (depreciation) is attributable primarily to return of capital dividends received.
Accumulated capital losses represent net capital loss carryovers that may be used to offset future realized capital gains for federal income tax purposes. The capital loss carryovers may be carried forward for an unlimited period. Future capital loss carryover utilization in any given year may be subject to Internal Revenue Code limitations.
55
| Financial Highlights | ||
| For a Share Outstanding Throughout the Period Indicated | |||||||||||||||||||||||||||||||||||
| Per-Share Data | Ratios and Supplemental Data | ||||||||||||||||||||||||||||||||||
| Income From Investment Operations: | Ratio to Average Net Assets of: | ||||||||||||||||||||||||||||||||||
| Net Asset Value, Beginning of Period | Net Investment Income (Loss)(1) | Net Realized and Unrealized Gain (Loss) | Total From Investment Operations | Distributions From Net Investment Income | Net Asset Value, End of Period | Total Return(2) | Operating Expenses | Net Investment Income (Loss) | Portfolio Turnover Rate(3) | Net Assets, End of Period (in thousands) | |||||||||||||||||||||||||
2020(4) | $50.00 | 0.82 | 5.84 | 6.66 | (0.53) | $56.13 | 13.50% | 0.15%(5) | 1.76%(5) | 3% | $436,099 | ||||||||||||||||||||||||
| Notes to Financial Highlights | ||
(1)Computed using average shares outstanding throughout the period.
(2)Total returns are calculated based on the net asset value of the last business day. Total returns for periods less than one year are not annualized.
(3)Excludes securities received or delivered in-kind.
(4)September 24, 2019 (fund inception) through August 31, 2020.
(5)Annualized.
See Notes to Financial Statements.
| Report of Independent Registered Public Accounting Firm | ||
To the Shareholders and the Board of Trustees of American Century ETF Trust:
Opinion on the Financial Statements and Financial Highlights
We have audited the accompanying statement of assets and liabilities, including the schedule of investments, of Avantis® U.S. Equity ETF (the “Fund”), one of the funds constituting the American Century ETF Trust, as of August 31, 2020, and the related statement of operations, the statement of changes in net assets, and the financial highlights for the period from September 24, 2019 (fund inception) through August 31, 2020, and the related notes. In our opinion, the financial statements and financial highlights present fairly, in all material respects, the financial position of Avantis® U.S. Equity ETF as of August 31, 2020, and the results of its operations, the changes in its net assets, and the financial highlights for the period from September 24, 2019 (fund inception) through August 31, 2020, in conformity with accounting principles generally accepted in the United States of America.
Basis for Opinion
These financial statements and financial highlights are the responsibility of the Fund's management. Our responsibility is to express an opinion on the Fund’s financial statements and financial highlights based on our audit. We are a public accounting firm registered with the Public Company Accounting Oversight Board (United States) (PCAOB) and are required to be independent with respect to the Fund in accordance with the U.S. federal securities laws and the applicable rules and regulations of the Securities and Exchange Commission and the PCAOB.
We conducted our audit in accordance with the standards of the PCAOB. Those standards require that we plan and perform the audit to obtain reasonable assurance about whether the financial statements and financial highlights are free of material misstatement, whether due to error or fraud. The Fund is not required to have, nor were we engaged to perform, an audit of its internal control over financial reporting. As part of our audit we are required to obtain an understanding of internal control over financial reporting but not for the purpose of expressing an opinion on the effectiveness of the Fund’s internal control over financial reporting. Accordingly, we express no such opinion.
Our audit included performing procedures to assess the risks of material misstatement of the financial statements and financial highlights, whether due to error or fraud, and performing procedures that respond to those risks. Such procedures included examining, on a test basis, evidence regarding the amounts and disclosures in the financial statements and financial highlights. Our audit also included evaluating the accounting principles used and significant estimates made by management, as well as evaluating the overall presentation of the financial statements and financial highlights. Our procedures included confirmation of securities owned as of August 31, 2020, by correspondence with the custodian and brokers; when replies were not received from brokers, we performed other auditing procedures. We believe that our audit provides a reasonable basis for our opinion.
DELOITTE & TOUCHE LLP
Kansas City, Missouri
October 16, 2020
We have served as the auditor of one or more American Century investment companies since 1997.
57
| Management | ||
The Board of Trustees
The individuals listed below serve as trustees of the funds. Each trustee will continue to serve in this capacity until death, retirement, resignation or removal from office. The board has adopted a mandatory retirement age for trustees who are not “interested persons,” as that term is defined in the Investment Company Act (independent trustees). Trustees who are not also officers of the trust shall retire by December 31st of the year in which they reach their 75th birthday.
Mr. Thomas is an “interested person” because he currently serves as President and Chief Executive Officer of American Century Companies, Inc. (ACC), the parent company of American Century Investment Management, Inc. (ACIM or the advisor). The other trustees are independent. They are not employees, directors or officers of, and have no financial interest in, ACC or any of its wholly owned, direct or indirect, subsidiaries, including ACIM and American Century Services, LLC (ACS), and they do not have any other affiliations, positions or relationships that would cause them to be considered “interested persons” under the Investment Company Act. The following trustees also serve in this capacity for a number of other registered investment companies in the American Century Investments family of funds: Jonathan S. Thomas, 15; Ronald J. Gilson, 8; and Stephen E. Yates, 7.
The following table presents additional information about the trustees. The mailing address for each trustee other than Jonathan S. Thomas is 330 Madison Avenue, New York, New York 10017. The mailing address for Jonathan S. Thomas is 4500 Main Street, Kansas City, Missouri 64111.
| Name (Year of Birth) | Position(s) Held with Funds | Length of Time Served | Principal Occupation(s) During Past 5 Years | Number of American Century Portfolios Overseen by Trustee | Other Directorships Held During Past 5 Years | ||||||||||||
| Independent Trustees | |||||||||||||||||
| Reginald M. Browne (1968) | Trustee and Chairman of the Board | Since 2017 (Chairman since 2019) | Principal, GTS Securities (automated capital markets trading firm)(2019 to present); Senior Managing Director, Co Global Head-ETF Group, Cantor Fitzgerald (financial services firm)(2013 to 2019) | 19 | None | ||||||||||||
| Ronald J. Gilson (1946) | Trustee | Since 2017 | Charles J. Meyers Professor of Law and Business, Emeritus, Stanford Law School (1979 to 2016); Marc and Eva Stern Professor of Law and Business, Columbia University School of Law (1992 to present) | 59 | None | ||||||||||||
| Barry A. Mendelson (1958) | Trustee | Since 2017 | Retired; Consultant regarding ETF and mutual fund matters (2015 to 2016); Principal and Senior Counsel, The Vanguard Group (investment management)(1998 to 2014) | 19 | None | ||||||||||||
| Stephen E. Yates (1948) | Trustee | Since 2017 | Retired | 82 | None | ||||||||||||
58
| Name (Year of Birth) | Position(s) Held with Funds | Length of Time Served | Principal Occupation(s) During Past 5 Years | Number of American Century Portfolios Overseen by Trustee | Other Directorships Held During Past 5 Years | ||||||||||||
| Interested Trustees | |||||||||||||||||
| Jonathan S. Thomas (1963) | Trustee | Since 2017 | President and Chief Executive Officer, ACC (2007 to present). Also serves as Chief Executive Officer, ACS; Executive Vice President, ACIM; Director, ACC, ACIM and other ACC subsidiaries | 122 | None | ||||||||||||
The Statement of Additional Information has additional information about the fund's trustees and is available without charge, upon request, by calling 1-800-345-6488.
59
Officers
The following table presents certain information about the executive officers of the funds. Each officer, except Edward Rosenberg, serves as an officer for each of the 16 investment companies in the American Century family of funds. No officer is compensated for his or her service as an officer of the funds. The listed officers are interested persons of the funds and are appointed or re-appointed on an annual basis. The mailing address for each officer listed below is 4500 Main Street, Kansas City, Missouri 64111.
| Name (Year of Birth) | Offices with the Funds | Principal Occupation(s) During the Past Five Years | ||||||
| Patrick Bannigan (1965) | President since 2019 | Executive Vice President and Director, ACC (2012 to present); Chief Financial Officer, Chief Accounting Officer and Treasurer, ACC (2015 to present). Also serves as President, ACS; Vice President, ACIM; Chief Financial Officer, Chief Accounting Officer and/or Director, ACIM, ACS and other ACC subsidiaries | ||||||
| R. Wes Campbell (1974) | Chief Financial Officer and Treasurer since 2018 | Vice President, ACS (2020 to present); Investment Operations and Investment Accounting, ACS (2000 to present) | ||||||
| Amy D. Shelton (1964) | Chief Compliance Officer and Vice President since 2017 | Chief Compliance Officer, American Century funds, (2014 to present); Chief Compliance Officer, ACIM (2014 to present); Chief Compliance Officer, ACIS (2009 to present). Also serves as Vice President, ACIS | ||||||
| Charles A. Etherington (1957) | General Counsel and Vice President since 2017 | Attorney, ACC (1994 to present); Vice President, ACC (2005 to present); General Counsel, ACC (2007 to present). Also serves as General Counsel, ACIM, ACS, ACIS and other ACC subsidiaries; and Senior Vice President, ACIM and ACS | ||||||
| Cleo Chang (1977) | Vice President since 2019 | Senior Vice President, ACIM (2015 to present); Chief Investment Officer, Wilshire Funds Management (2005 to 2015) | ||||||
| David H. Reinmiller (1963) | Vice President since 2017 | Attorney, ACC (1994 to present). Also serves as Vice President, ACIM and ACS | ||||||
| Edward Rosenberg (1973) | Vice President since 2017 | Senior Vice President, ACIM (2017 to present); Senior Vice President, Flexshares Head of ETF Capital Markets, Northern Trust (2012 to 2017) | ||||||
| C. Jean Wade (1964) | Vice President since 2017 | Senior Vice President, ACS (2017 to present); Vice President, ACS (2000 to 2017) | ||||||
| Ward D. Stauffer (1960) | Secretary since 2019 | Attorney, ACS (2003 to present) | ||||||
60
| Approval of Management Agreement | ||
At a meeting held on June 5, 2020, the Fund’s Board of Trustees (the "Board") unanimously approved the renewal of the management agreement pursuant to which American Century Investment Management, Inc. (the “Advisor”) acts as the investment advisor for the Fund. Under Section 15(c) of the Investment Company Act, contracts for investment advisory services are required to be reviewed, evaluated, and approved by a majority of a fund’s trustees (the “Trustees”), including a majority of the independent Trustees, each year.
Prior to its consideration of the renewal of the management agreement, the Trustees requested and reviewed extensive data and information compiled by the Advisor and certain independent providers of evaluation data concerning the Fund and the services provided to the Fund by the Advisor. This review was in addition to the oversight and evaluation undertaken by the Board and its Audit Committee on a continual basis and the information received was supplemental to the extensive information that the Board and its Audit Committee receive and consider throughout the year.
In connection with its consideration of the renewal of the management agreement, the Board’s review and evaluation of the services provided by the Advisor included, but was not limited to, the following:
•the nature, extent, and quality of investment management and other services provided and to be provided to the Fund;
•the wide range of other programs and services provided and to be provided to the Fund and its shareholders on a routine and non-routine basis;
•the Fund’s investment performance, including data comparing the Fund's performance to appropriate benchmarks of funds with similar objectives and strategies;
•the cost of owning the Fund compared to the cost of owning similar funds;
•the compliance policies, procedures, and regulatory experience of the Advisor and the Fund's service providers;
•the Advisor’s strategic plans;
•the Advisor’s business continuity plans and specifically its response to the COVID-19 pandemic;
•financial data showing the cost of services provided to the Fund, the profitability of the Fund to the Advisor, and the overall profitability of the Advisor;
•information regarding payments to intermediaries by the Advisor; and
•possible economies of scale associated with the Advisor’s management of the Fund; and
•possible collateral benefits to the Advisor from the management of the Fund.
The independent Trustees met separately in private session to discuss the renewal and to review and discuss the information provided in response to their request. The independent Trustees also held active discussions with the Advisor regarding the renewal of the management agreement. The independent Trustees had the benefit of the advice of their independent counsel throughout the process.
Factors Considered
The Trustees considered all of the information provided by the Advisor, the independent data providers, and independent counsel in connection with the approval. They determined that the information was sufficient for them to evaluate the management agreement for the Fund. In connection with their review, the Trustees did not identify any single factor as being all-important or
61
controlling, and each Trustee may have attributed different levels of importance to different factors. In deciding to renew the management agreement, the Board based its decision on a number of factors, including without limitation the following:
Nature, Extent and Quality of Services — Generally. Under the management agreement, the Advisor is responsible for providing or arranging for all services necessary for the operation of the Fund. The Board noted that the Advisor provides or arranges at its own expense a wide variety of services including without limitation the following:
•constructing and designing the Fund
•portfolio research and security selection
•initial capitalization/funding
•securities trading
•Fund administration
•custody of Fund assets
•daily valuation of the Fund’s portfolio
•shareholder servicing and transfer agency, including shareholder confirmations, recordkeeping, and communications
•legal services (except the independent Trustees’ counsel)
•regulatory and portfolio compliance
•financial reporting
•marketing and distribution (except amounts paid by the Fund under Rule 12b-1 plans)
Investment Management Services. The nature of the investment management services provided to the Fund is quite complex and allows Fund shareholders access to professional money management, instant diversification of their investments within an asset class, and liquidity. In evaluating investment performance, the Board expects the Advisor to manage the Fund in accordance with its investment objectives and approved strategies. Further, the Trustees recognize that the Advisor has an obligation to monitor trading activities, and in particular to seek the best execution of fund trades, and to evaluate the use of and payment for research. In providing these services, the Advisor utilizes teams of investment professionals (portfolio managers, analysts, research assistants, and securities traders) who require extensive information technology, research, training, compliance, and other systems to conduct their business. The Board provides oversight of the investment performance process. It regularly reviews investment performance information for the Fund, together with comparative information for appropriate benchmarks over different time horizons. The Trustees also review investment performance information during the management agreement renewal process. If performance concerns are identified, the Board discusses with the Advisor the reasons for such results and any efforts being undertaken to improve performance. The Fund’s performance reviewed by the Board was slightly below its benchmark. The Board found the investment management services provided by the Advisor to the Fund to be satisfactory and consistent with the management agreement.
Shareholder and Other Services. Under the management agreement, the Advisor provides or arranges for a comprehensive package of services to the Fund. The Board, directly and through its Audit Committee, regularly reviews reports and evaluations of such services at its regular meetings. These reports include, but are not limited to, information regarding the operational efficiency and accuracy of the shareholder and transfer agency services provided, staffing levels, shareholder satisfaction, technology support (including cyber security), new products and services offered to Fund shareholders, securities trading activities, portfolio valuation services, auditing services, and legal and operational compliance activities. The Board found the services provided by the Advisor to the Fund under the management agreement to be competitive and of high quality.
62
COVID-19 Response. During 2020, much of the world experienced unprecedented change and challenges from the impacts of the rapidly evolving, worldwide spread of the COVID-19 virus. The Board evaluated the Advisor’s response to the COVID-19 pandemic and its impact on service to the Fund. The Board found that Fund shareholders have continued to receive the Advisor’s investment management and other services without disruption, and Advisor personnel have demonstrated great resiliency in providing those services. The Board, directly and through its Audit Committee, continues to monitor the impact of the pandemic and the response of each of the Fund’s service providers.
Costs of Services and Profitability. The Advisor provides detailed information concerning its cost of providing various services to the Fund, its profitability in managing the Fund (pre- and post-distribution), its overall profitability, and its financial condition. The Trustees have reviewed with the Advisor the methodology used to prepare this financial information. This information is considered in evaluating the Advisor’s financial condition, its ability to continue to provide services under the management agreement, and the reasonableness of the current management fee. The Board concluded that the Advisor’s profits were reasonable in light of the services provided to the Fund.
Ethics. The Board generally considers the Advisor’s commitment to providing quality services to the Fund and to conducting its business ethically. They noted that the Advisor’s practices generally meet or exceed industry best practices.
Economies of Scale. The Board also reviewed information provided by the Advisor regarding the possible existence of economies of scale in connection with the management of the Fund. The Board concluded that economies of scale are difficult to measure and predict with precision, especially on a fund-by-fund basis. The Board concluded that the Advisor is appropriately sharing economies of scale, to the extent they exist, through its competitive fee structure, offering competitive fees from fund inception, and through reinvestment in its business, infrastructure, investment capabilities and initiatives to provide shareholders additional content and services.
Comparison to Other Funds’ Fees. The management agreement provides that the Fund pays the Advisor a single, all-inclusive (or unified) management fee for providing all services necessary for the management and operation of the Fund, other than brokerage expenses, expenses attributable to short sales, taxes, interest, extraordinary expenses, and expenses incurred in connection with the provision of shareholder services and distribution services under a plan adopted pursuant to Rule 12b-1 under the Investment Company Act. Under the unified fee structure, the Advisor is responsible for providing all investment advisory, custody, audit, administrative, compliance, recordkeeping, marketing and shareholder services, or arranging and supervising third parties to provide such services. The Board believes the unified fee structure is a benefit to Fund shareholders because it clearly discloses to shareholders the cost of owning Fund shares, and, since the unified fee cannot be increased without a vote of Fund shareholders, it shifts to the Advisor the risk of increased costs of operating the Fund and provides a direct incentive to minimize administrative inefficiencies. Part of the Board’s analysis of fee levels involves reviewing certain evaluative data compiled by an independent provider comparing the Fund’s unified fee to the total expense ratios of its peers. The unified fee charged to shareholders of the Fund was below the median of the total expense ratios of the Fund’s peer expense universe and was the lowest of its peer expense group. The Board concluded that the management fee paid by the Fund to the Advisor under the management agreement is reasonable in light of the services provided to the Fund.
Comparison to Fees and Services Provided to Other Clients of the Advisor. The Board also requested information from the Advisor concerning the nature of the services, fees, costs, and profitability of its advisory services to funds or other advisory clients managed similarly to the Fund. The Advisor informed the Trustees that, as of December 31, 2019, it did not provide services to any other investment companies or comparable accounts that were managed similarly to the Fund.
63
Payments to Intermediaries. The Trustees also requested a description of payments made to intermediaries by the Fund and the Advisor and services provided in response thereto. These payments could include various payments made by the Fund or the Advisor to different types of intermediaries and recordkeepers for distribution and service activities provided for the Fund. The Trustees reviewed such information and received representations from the Advisor that all such payments by the Advisor were made from the Advisor’s resources and reasonable profits. The Board found such payments to be reasonable in scope and purpose.
Collateral or “Fall-Out” Benefits Derived by the Advisor. The Board considered the possible existence of collateral benefits the Advisor may receive as a result of its relationship with the Fund. They concluded that the Advisor’s primary business is managing funds and it generally does not use fund or shareholder information to generate profits in other lines of business, and therefore does not derive any significant collateral benefits from them. The Board noted that additional assets from other clients may offer the Advisor some benefit from increased leverage with service providers and counterparties. The Board also determined that the Advisor is able to provide investment management services to certain clients other than the Fund, at least in part, due to its existing infrastructure built to serve the fund complex. The Board concluded that appropriate allocation methodologies had been employed to assign resources and the cost of those resources to these other clients.
Existing Relationship. The Board also considered whether there was any reason for not continuing the existing arrangement with the Advisor. In this regard, the Board was mindful of the potential disruptions of the Fund’s operations and various risks, uncertainties, and other effects that could occur as a result of a decision not to continue such relationship. In particular, the Board recognized that most shareholders have invested in the Fund on the strength of the Advisor’s industry standing and reputation and in the expectation that the Advisor will have a continuing role in providing advisory services to the Fund.
Conclusion of the Trustees. As a result of this process, the Board, including all of the independent Trustees, taking into account all of the factors discussed above and the information provided by the Advisor and others in connection with its review and throughout the year, determined that the management fee is fair and reasonable in light of the services provided and that the investment management agreement between the Fund and the Advisor should be renewed.
64
| Liquidity Risk Management Program | ||
The Fund has adopted a liquidity risk management program (the “program”). The Fund’s Board of Trustees (the "Board") has designated American Century Investment Management, Inc. (“ACIM”) as the administrator of the program. Personnel of ACIM or its affiliates conduct the day-to-day operation of the program pursuant to policies and procedures administered by those members of the ACIM’s Investment Oversight Committee who are members of the ACIM’s Investment Management and Global Analytics departments.
Under the program, ACIM manages the Fund’s liquidity risk, which is the risk that the Fund could not meet shareholder redemption requests without significant dilution of remaining shareholders’ interests in the Fund. This risk is managed by monitoring the degree of liquidity of the Fund’s investments, limiting the amount of the Fund’s illiquid investments, and utilizing various risk management tools and facilities available to the Fund for meeting shareholder redemptions, among other means. ACIM’s process of determining the degree of liquidity of the Fund’s investments is supported by one or more third-party liquidity assessment vendors.
The Board reviewed a report prepared by ACIM regarding the operation and effectiveness of the program for the period December 1, 2018 through December 31, 2019. No significant liquidity events impacting the Fund were noted in the report. In addition, ACIM provided its assessment that the program had been effective in managing the Fund’s liquidity risk.
65
| Additional Information | ||
Retirement Account Information
As required by law, distributions you receive from certain retirement accounts are subject to federal income tax withholding, unless you elect not to have withholding apply*. Tax will be withheld on the total amount withdrawn even though you may be receiving amounts that are not subject to withholding, such as nondeductible contributions. In such case, excess amounts of withholding could occur. You may adjust your withholding election so that a greater or lesser amount will be withheld.
Remember, even if you elect not to have income tax withheld, you are liable for paying income tax on the taxable portion of your withdrawal. If you elect not to have income tax withheld or you don’t have enough income tax withheld, you may be responsible for payment of estimated tax. You may incur penalties under the estimated tax rules if your withholding and estimated tax payments are not sufficient. You can reduce or defer the income tax on a distribution by directly or indirectly rolling such distribution over to another IRA or eligible plan. You should consult your tax advisor for additional information.
State tax will be withheld if, at the time of your distribution, your address is within one of the mandatory withholding states and you have federal income tax withheld (or as otherwise required by state law). State taxes will be withheld from your distribution in accordance with the respective state rules.
*Some 403(b), 457 and qualified retirement plan distributions may be subject to 20% mandatory withholding, as they are subject to special tax and withholding rules. Your plan administrator or plan sponsor is required to provide you with a special tax notice explaining those rules at the time you request a distribution. If applicable, federal and/or state taxes may be withheld from your distribution amount.
Proxy Voting Policies
A description of the policies that the fund's investment advisor uses in exercising the voting rights associated with the securities purchased and/or held by the fund are available without charge, upon request, by calling 1-800-345-6488. It is also available on American Century Investments’ website at americancentury.com/proxy and on the Securities and Exchange Commission’s website at sec.gov. Information regarding how the investment advisor voted proxies relating to portfolio securities during the most recent 12-month period ended June 30 is available at americancentury.com/proxy. It is also available at sec.gov.
Quarterly Portfolio Disclosure
The fund files its complete schedule of portfolio holdings with the Securities and Exchange Commission (SEC) for the first and third quarters of each fiscal year as an exhibit to its reports on Form N-PORT. The fund's Form N-PORT reports are available on the SEC’s website at sec.gov.
66
Other Tax Information
The following information is provided pursuant to provisions of the Internal Revenue Code.
The fund hereby designates up to the maximum amount allowable as qualified dividend income for the fiscal year ended August 31, 2020.
For corporate taxpayers, the fund hereby designates $2,641,471, or up to the maximum amount allowable, of ordinary income distributions paid during the fiscal year ended August 31, 2020 as qualified for the corporate dividends received deduction.
67
| Notes | ||
68
| Notes | ||
69
| Notes | ||
70
| Notes | ||
71
| Notes | ||
72
| ||||||||
| Contact Us | avantisinvestors.com | |||||||
| American Century Sales Representatives, Financial Professionals, Broker Dealers, Insurance Companies, Banks and Trust Companies | 1-833-928-2684 | |||||||
| Telecommunications Relay Service for the Deaf | 711 | |||||||
| American Century ETF Trust | ||||||||
Investment Advisor: American Century Investment Management, Inc. Kansas City, Missouri | ||||||||
Distributor: Foreside Fund Services, LLC - Distributor, not affiliated with American Century Investment Services, Inc. | ||||||||
| This report and the statements it contains are submitted for the general information of our shareholders. The report is not authorized for distribution to prospective investors unless preceded or accompanied by an effective prospectus. | ||||||||
| ©2020 American Century Proprietary Holdings, Inc. All rights reserved. CL-ANN-96045 2010 | ||||||||
| Annual Report | |||||
| August 31, 2020 | |||||
Avantis® U.S. Small Cap Value ETF (AVUV) | |||||
Beginning on January 1, 2021, as permitted by regulations adopted by the Securities and Exchange Commission, paper copies of the fund’s shareholder reports like this one will no longer be sent by mail, unless you specifically request paper copies of the reports from the fund or from your financial intermediary, such as a broker-dealer or bank. Instead, the reports will be made available on a website, and you will be notified by mail each time a report is posted and provided with a website link to access the report.
If you already elected to receive shareholder reports electronically, you will not be affected by this change and you need not take any action. You may elect to receive shareholder reports and other communications from the fund or your financial intermediary electronically by calling or sending an email request to your appropriate contacts as listed on the back cover of this report.
You may elect to receive all future reports in paper free of charge. You can inform the fund or your financial intermediary that you wish to continue receiving paper copies of your shareholder reports by calling or sending an email request to your appropriate contacts as listed on the back cover of this report. Your election to receive reports in paper will apply to all funds held with the fund complex/your financial intermediary.
| Table of Contents | ||
| Chairman’s Letter | |||||
| Performance | |||||
| Portfolio Commentary | |||||
| Fund Characteristics | |||||
| Shareholder Fee Example | |||||
| Schedule of Investments | |||||
| Statement of Assets and Liabilities | |||||
| Statement of Operations | |||||
| Statement of Changes in Net Assets | |||||
| Notes to Financial Statements | |||||
| Financial Highlights | |||||
| Report of Independent Registered Public Accounting Firm | |||||
| Management | |||||
| Approval of Management Agreement | |||||
| Liquidity Risk Management Program | |||||
| Additional Information | |||||
Any opinions expressed in this report reflect those of the author as of the date of the report, and do not necessarily represent the opinions of American Century Investments® or any other person in the American Century Investments organization. Any such opinions are subject to change at any time based upon market or other conditions and American Century Investments disclaims any responsibility to update such opinions. These opinions may not be relied upon as investment advice and, because investment decisions made by American Century Investments funds are based on numerous factors, may not be relied upon as an indication of trading intent on behalf of any American Century Investments fund. Security examples are used for representational purposes only and are not intended as recommendations to purchase or sell securities. Performance information for comparative indices and securities is provided to American Century Investments by third party vendors. To the best of American Century Investments’ knowledge, such information is accurate at the time of printing.
| Chairman's Letter | ||
Jonathan ThomasDear Investor:
Thank you for reviewing this annual report for the period ended August 31, 2020. Annual reports help convey important information about fund returns, including market factors that affected performance. For additional investment insights, please visit avantisinvestors.com.
Pandemic Disrupted Economic, Market Courses
Broad market sentiment was generally upbeat early in the period. Dovish central banks, modest inflation, improving economic and corporate earnings data, and progress on U.S.-China trade helped boost global growth outlooks. Against this backdrop, stocks largely remained in favor.
However, beginning in late February, COVID-19 quickly quashed the optimistic tone. The outbreak rapidly spread worldwide, halting most U.S. and global economic activity and triggering a deep worldwide recession. Global stocks sold off sharply, but central banks and federal governments stepped in quickly and aggressively to stabilize financial markets. These extraordinary efforts proved helpful, as most stocks rebounded quickly. As the period progressed, coronavirus infection and death rates declined in many regions and economies reopened. By the end of August, manufacturing, employment and other data suggested an economic recovery was underway.
Overall, global stocks delivered mixed results for the period. U.S. stocks generally advanced and fared better than their counterparts elsewhere. The growth style significantly outperformed value stocks, which struggled.
A Slow Return to Normal
The return to pre-pandemic life will take time and patience, but we are confident we will get there. Several drug companies are in final stages of vaccine trials, and medical professionals continue to fine-tune virus treatment protocols. In the meantime, investors likely will face periods of outbreak-related disruptions, economic and political uncertainty, and heightened market volatility. These influences can be unsettling, but they tend to be temporary.
We appreciate your confidence in us during these extraordinary times. Our investment professionals have experience weathering unpredictable markets, and we’re confident we will continue to meet today’s challenges.
Sincerely,
Jonathan Thomas
Chairman
Avantis Investors
2
| Performance | ||
| Total Returns as of August 31, 2020 | |||||||||||||||||||||||
| Since Inception | Inception Date | ||||||||||||||||||||||
| Net Asset Value | -9.09% | 9/24/2019 | |||||||||||||||||||||
| Market Price | -9.07% | 9/24/2019 | |||||||||||||||||||||
| Russell 2000 Value Index | -10.80% | — | |||||||||||||||||||||
Market price is determined using the bid/ask midpoint at 4:00 p.m. Eastern time, when the net asset value (NAV) is typically calculated. Market performance does not represent the returns you would receive if you traded shares at other times. NAV prices are used to calculate market price performance prior to the date when the fund first traded on the New York Stock Exchange.
| Growth of $10,000 Over Life of Fund | ||
| $10,000 investment made September 24, 2019 | ||
| Value on August 31, 2020 | |||||
| Net Asset Value — $9,091 | |||||
| Russell 2000 Value Index — $8,920 | |||||
| Total Annual Fund Operating Expenses | |||||||||||||||||
| 0.25% | |||||||||||||||||
The total annual fund operating expenses shown is as stated in the fund’s prospectus current as of the date of this report. The prospectus may vary from the expense ratio shown elsewhere in this report because it is based on a different time period, includes acquired fund fees and expenses, and, if applicable, does not include fee waivers or expense reimbursements.
Data presented reflect past performance. Past performance is no guarantee of future results. Current performance may be higher or lower than the performance shown. Total returns for periods less than one year are not annualized. Investment return and principal value will fluctuate, and redemption value may be more or less than original cost. Data assumes reinvestment of dividends and capital gains, and none of the charts reflect the deduction of taxes that a shareholder would pay on fund distributions or the redemption of fund shares. To obtain performance data current to the most recent month end, please call 1-833-928-2684 or visit avantisinvestors.com. For additional information about the fund, please consult the prospectus.
3
| Portfolio Commentary | ||
Portfolio Managers: Eduardo Repetto, Mitch Firestein, Daniel Ong and Ted Randall
Fund Strategy
Avantis U.S. Small Cap Value ETF seeks long-term capital appreciation by investing in a diverse group of U.S. small-capitalization (small-cap) companies across market sectors and industry groups.
The fund seeks securities of companies that it expects to have higher returns. It places an enhanced emphasis on securities of companies with smaller market capitalizations and securities of companies it defines as high profitability or value companies. Conversely, the fund seeks to underweight or exclude securities it expects to have lower returns. These include securities of large companies with lower levels of profitability and higher prices relative to their book values or other financial metrics. Under normal market conditions, the fund will invest at least 80% of its assets in securities of small-cap companies located in the U.S.
The portfolio is an actively managed exchange-traded fund (ETF) that does not seek to replicate the performance of a specified index. The portfolio managers continually analyze market and financial data to make buy, sell and hold decisions. When buying or selling a security, the portfolio managers may consider the trade-off between expected returns of the security and implementation or tax costs of the trade. They do this in an attempt to gain trading efficiencies, avoid unnecessary risk and enhance portfolio performance.
Performance Review
For the period from Avantis U.S. Small Cap Value ETF’s inception on September 24, 2019, through the fund’s fiscal year-end on August 31, 2020, the fund returned -9.07%* on a market price basis. On a net asset value (NAV) basis, the fund returned -9.09%. NAV and market price returns reflect fees and operating expenses, while index returns do not.
For the same time period, the portfolio outperformed the broad U.S. small-cap value universe, as measured by the Russell 2000 Value Index, which returned -10.80%. The Russell 2000 Value Index is an unmanaged index generally representative of the performance of U.S. small-cap companies with lower price-to-book ratios and lower forecasted growth values. The fund’s outperformance was largely due to the fund’s emphasis on companies with higher profitability versus the Russell 2000 Value Index. In addition, the fund’s exclusion of real estate investment trusts (REITs) also aided relative results. REITs were significant underperformers for the reporting period.
*Total returns for periods less than one year are not annualized.
4
| Fund Characteristics | ||
| AUGUST 31, 2020 | |||||
| Top Ten Holdings | % of net assets | ||||
| Penn National Gaming, Inc. | 1.3% | ||||
| Lithia Motors, Inc., Class A | 1.2% | ||||
| Saia, Inc. | 0.8% | ||||
| Murphy USA, Inc. | 0.8% | ||||
| Timken Co. (The) | 0.8% | ||||
| UFP Industries, Inc. | 0.8% | ||||
| EQT Corp. | 0.8% | ||||
| Dick's Sporting Goods, Inc. | 0.8% | ||||
| Texas Roadhouse, Inc. | 0.8% | ||||
| Chemours Co. (The) | 0.8% | ||||
| Top Five Industries | % of net assets | ||||
| Banks | 12.4% | ||||
| Oil, Gas and Consumable Fuels | 8.8% | ||||
| Specialty Retail | 8.0% | ||||
| Hotels, Restaurants and Leisure | 4.7% | ||||
| Thrifts and Mortgage Finance | 4.6% | ||||
| Types of Investments in Portfolio | % of net assets | ||||
| Common Stocks | 99.8% | ||||
| Temporary Cash Investments | 0.1% | ||||
| Other Assets and Liabilities | 0.1% | ||||
5
| Shareholder Fee Example | ||
Fund shareholders may incur two types of costs: (1) transaction costs, including brokerage commissions paid on purchases and sales of fund shares; and (2) ongoing costs, including management fees and other fund expenses. This example is intended to help you understand your ongoing costs (in dollars) of investing in your fund and to compare these costs with the ongoing cost of investing in other funds.
The example is based on an investment of $1,000 made at the beginning of the period and held for the entire period from March 1, 2020 to August 31, 2020.
Actual Expenses
The table provides information about actual account values and actual expenses. You may use the information, together with the amount you invested, to estimate the expenses that you paid over the period. Simply divide your account value by $1,000 (for example, an $8,600 account value divided by $1,000 = 8.6), then multiply the result by the number under the heading “Expenses Paid During Period” to estimate the expenses you paid on your account during this period.
Hypothetical Example for Comparison Purposes
The table also provides information about hypothetical account values and hypothetical expenses based on the actual expense ratio of your fund and an assumed rate of return of 5% per year before expenses, which is not the actual return of a fund. The hypothetical account values and expenses may not be used to estimate the actual ending account balance or expenses you paid for the period. You may use this information to compare the ongoing costs of investing in your fund and other funds. To do so, compare this 5% hypothetical example with the 5% hypothetical examples that appear in the shareholder reports of the other funds.
Please note that the expenses shown in the table are meant to highlight your ongoing costs only and do not reflect any transactional costs, such as brokerage commissions paid on purchases and sales of fund shares. Therefore, the table is useful in comparing ongoing costs only, and will not help you determine the relative total costs of owning different funds. In addition, if these transactional costs were included, your costs would have been higher.
| Beginning Account Value 3/1/20 | Ending Account Value 8/31/20 | Expenses Paid During Period(1) 3/1/20 - 8/31/20 | Annualized Expense Ratio(1) | |||||||||||
| Actual | $1,000 | $1,030.10 | $1.28 | 0.25% | ||||||||||
| Hypothetical | $1,000 | $1,023.88 | $1.27 | 0.25% | ||||||||||
(1)Expenses are equal to the fund's annualized expense ratio listed in the table above, multiplied by the average account value over the period, multiplied by 184, the number of days in the most recent fiscal half-year, divided by 366, to reflect the one-half year period. Annualized expense ratio reflects actual expenses, including any applicable fee waivers or expense reimbursements and excluding any acquired fund fees and expenses.
6
| Schedule of Investments | ||
AUGUST 31, 2020
| Shares | Value | |||||||
| COMMON STOCKS — 99.8% | ||||||||
| Aerospace and Defense — 0.4% | ||||||||
| AAR Corp. | 5,458 | $ | 110,142 | |||||
| Hexcel Corp. | 18,713 | 737,105 | ||||||
| Spirit AeroSystems Holdings, Inc., Class A | 22,410 | 460,750 | ||||||
| 1,307,997 | ||||||||
| Air Freight and Logistics — 0.7% | ||||||||
Atlas Air Worldwide Holdings, Inc.(1) | 17,599 | 992,408 | ||||||
Hub Group, Inc., Class A(1) | 25,568 | 1,376,581 | ||||||
| 2,368,989 | ||||||||
| Airlines — 1.8% | ||||||||
| Allegiant Travel Co. | 11,897 | 1,529,954 | ||||||
| Hawaiian Holdings, Inc. | 48,453 | 651,209 | ||||||
JetBlue Airways Corp.(1) | 136,581 | 1,573,413 | ||||||
Mesa Air Group, Inc.(1) | 21,617 | 79,118 | ||||||
| SkyWest, Inc. | 45,264 | 1,523,134 | ||||||
Spirit Airlines, Inc.(1) | 55,923 | 999,903 | ||||||
| 6,356,731 | ||||||||
| Auto Components — 2.9% | ||||||||
American Axle & Manufacturing Holdings, Inc.(1) | 97,714 | 760,215 | ||||||
| Cooper Tire & Rubber Co. | 42,934 | 1,484,228 | ||||||
Cooper-Standard Holdings, Inc.(1) | 10,302 | 186,672 | ||||||
| Dana, Inc. | 115,043 | 1,604,850 | ||||||
Delphi Technologies plc(1) | 58,259 | 1,011,959 | ||||||
Gentherm, Inc.(1) | 27,167 | 1,228,764 | ||||||
| Goodyear Tire & Rubber Co. (The) | 186,261 | 1,787,174 | ||||||
Modine Manufacturing Co.(1) | 45,644 | 309,010 | ||||||
Tenneco, Inc., Class A(1) | 63,787 | 518,588 | ||||||
Visteon Corp.(1) | 19,761 | 1,490,572 | ||||||
| 10,382,032 | ||||||||
| Banks — 12.4% | ||||||||
| 1st Source Corp. | 6,251 | 215,347 | ||||||
| ACNB Corp. | 5,549 | 116,640 | ||||||
| Altabancorp | 13,737 | 283,257 | ||||||
| Amalgamated Bank, Class A | 12,161 | 143,135 | ||||||
Amerant Bancorp, Inc.(1) | 18,465 | 242,815 | ||||||
| Arrow Financial Corp. | 10,277 | 294,436 | ||||||
| Associated Banc-Corp. | 122,507 | 1,646,494 | ||||||
| BancFirst Corp. | 13,751 | 605,044 | ||||||
Bancorp, Inc. (The)(1) | 49,600 | 471,200 | ||||||
| Bank of Commerce Holdings | 14,131 | 103,863 | ||||||
| Bank of Hawaii Corp. | 33,041 | 1,818,577 | ||||||
| Bank OZK | 95,736 | 2,205,757 | ||||||
| BankFinancial Corp. | 9,403 | 68,266 | ||||||
| BankUnited, Inc. | 78,763 | 1,841,479 | ||||||
| Bankwell Financial Group, Inc. | 3,994 | 62,306 | ||||||
| Banner Corp. | 22,010 | 795,001 | ||||||
| BCB Bancorp, Inc. | 12,161 | 99,051 | ||||||
7
| Shares | Value | |||||||
| Boston Private Financial Holdings, Inc. | 75,207 | $ | 446,730 | |||||
| Bridge Bancorp, Inc. | 13,038 | 260,890 | ||||||
| Byline Bancorp, Inc. | 19,253 | 243,358 | ||||||
| Cadence BanCorp | 43,732 | 415,454 | ||||||
| Cathay General Bancorp. | 67,712 | 1,671,809 | ||||||
| CB Financial Services, Inc. | 3,165 | 58,869 | ||||||
| Central Pacific Financial Corp. | 24,405 | 378,033 | ||||||
| Central Valley Community Bancorp | 9,098 | 109,449 | ||||||
| CIT Group, Inc. | 18,642 | 366,688 | ||||||
| City Holding Co. | 8,498 | 543,702 | ||||||
| CNB Financial Corp. | 12,181 | 194,287 | ||||||
| Codorus Valley Bancorp, Inc. | 7,432 | 95,873 | ||||||
| Community Bankers Trust Corp. | 17,677 | 90,683 | ||||||
| County Bancorp, Inc. | 3,887 | 75,019 | ||||||
Customers Bancorp, Inc.(1) | 22,405 | 286,112 | ||||||
| Eagle Bancorp, Inc. | 23,587 | 678,834 | ||||||
| Enterprise Financial Services Corp. | 6,345 | 189,779 | ||||||
| Farmers National Banc Corp. | 20,829 | 242,866 | ||||||
| Financial Institutions, Inc. | 12,555 | 216,323 | ||||||
| First BanCorp | 109,481 | 627,326 | ||||||
| First Bancorp, Inc. (The) | 3,192 | 67,926 | ||||||
| First Business Financial Services, Inc. | 5,934 | 91,977 | ||||||
| First Choice Bancorp | 7,919 | 112,054 | ||||||
| First Foundation, Inc. | 31,538 | 479,062 | ||||||
| First Horizon National Corp. | 106,110 | 1,013,351 | ||||||
| First Internet Bancorp | 7,039 | 102,840 | ||||||
| First Mid Bancshares, Inc. | 10,191 | 265,374 | ||||||
| First of Long Island Corp. (The) | 16,899 | 259,653 | ||||||
| First United Corp. | 5,463 | 62,551 | ||||||
| Franklin Financial Services Corp. | 3,160 | 75,334 | ||||||
| Great Southern Bancorp, Inc. | 10,669 | 411,183 | ||||||
| Hanmi Financial Corp. | 25,955 | 247,351 | ||||||
| Hawthorn Bancshares, Inc. | 4,484 | 82,147 | ||||||
| Hilltop Holdings, Inc. | 61,023 | 1,257,074 | ||||||
| Hope Bancorp, Inc. | 86,258 | 729,743 | ||||||
| Independent Bank Corp. (Michigan) | 18,465 | 275,313 | ||||||
| International Bancshares Corp. | 50,771 | 1,603,348 | ||||||
| Lakeland Bancorp, Inc. | 36,251 | 385,348 | ||||||
| Lakeland Financial Corp. | 20,829 | 951,677 | ||||||
| Macatawa Bank Corp. | 22,799 | 166,889 | ||||||
| Mackinac Financial Corp. | 7,039 | 70,531 | ||||||
| Mercantile Bank Corp. | 13,343 | 291,411 | ||||||
Metropolitan Bank Holding Corp.(1) | 3,887 | 120,380 | ||||||
| Midland States Bancorp, Inc. | 19,253 | 281,286 | ||||||
| MidWestOne Financial Group, Inc. | 10,979 | 208,491 | ||||||
| MVB Financial Corp. | 12,643 | 179,531 | ||||||
| Northeast Bank | 7,827 | 146,052 | ||||||
| Northrim BanCorp, Inc. | 4,775 | 128,495 | ||||||
| OFG Bancorp | 48,409 | 621,572 | ||||||
| Old Second Bancorp, Inc. | 25,557 | 208,801 | ||||||
| Orrstown Financial Services, Inc. | 8,221 | 113,203 | ||||||
| Parke Bancorp, Inc. | 8,311 | 102,225 | ||||||
8
| Shares | Value | |||||||
| PCB Bancorp. | 10,585 | $ | 101,087 | |||||
| Peapack-Gladstone Financial Corp. | 14,131 | 240,227 | ||||||
| Popular, Inc. | 22,660 | 839,326 | ||||||
| Preferred Bank | 12,960 | 484,704 | ||||||
| Premier Financial Bancorp, Inc. | 9,403 | 120,546 | ||||||
| QCR Holdings, Inc. | 11,784 | 353,166 | ||||||
| RBB Bancorp | 12,555 | 162,838 | ||||||
| Red River Bancshares, Inc. | 446 | 19,410 | ||||||
| Republic Bancorp, Inc., Class A | 9,491 | 291,943 | ||||||
| ServisFirst Bancshares, Inc. | 40,135 | 1,470,948 | ||||||
| Sierra Bancorp | 11,373 | 203,236 | ||||||
| SmartFinancial, Inc. | 8,229 | 113,313 | ||||||
Southern First Bancshares, Inc.(1) | 5,561 | 144,030 | ||||||
| Southern National Bancorp of Virginia, Inc. | 16,508 | 141,143 | ||||||
| Stock Yards Bancorp, Inc. | 14,521 | 623,387 | ||||||
| Summit Financial Group, Inc. | 8,705 | 128,399 | ||||||
| Synovus Financial Corp. | 47,021 | 1,028,349 | ||||||
Texas Capital Bancshares, Inc.(1) | 46,851 | 1,517,504 | ||||||
| TriCo Bancshares | 6,756 | 187,074 | ||||||
TriState Capital Holdings, Inc.(1) | 20,041 | 278,570 | ||||||
| UMB Financial Corp. | 18,666 | 1,002,738 | ||||||
| United Community Banks, Inc. | 66,569 | 1,206,230 | ||||||
| United Security Bancshares | 12,555 | 76,460 | ||||||
| Unity Bancorp, Inc. | 5,935 | 78,817 | ||||||
| Washington Trust Bancorp, Inc. | 11,784 | 393,350 | ||||||
| Webster Financial Corp. | 24,559 | 675,373 | ||||||
| West Bancorporation, Inc. | 12,161 | 214,034 | ||||||
| Western Alliance Bancorp | 36,633 | 1,293,145 | ||||||
| Wintrust Financial Corp. | 28,047 | 1,220,605 | ||||||
| 43,926,877 | ||||||||
| Beverages — 0.2% | ||||||||
National Beverage Corp.(1) | 9,338 | 759,366 | ||||||
| Biotechnology — 0.5% | ||||||||
Arena Pharmaceuticals, Inc.(1) | 24,339 | 1,699,349 | ||||||
| Building Products — 1.6% | ||||||||
| Apogee Enterprises, Inc. | 19,273 | 403,384 | ||||||
Armstrong Flooring, Inc.(1) | 8,720 | 33,747 | ||||||
| Insteel Industries, Inc. | 5,319 | 98,082 | ||||||
Masonite International Corp.(1) | 22,011 | 2,009,384 | ||||||
| Quanex Building Products Corp. | 26,773 | 450,054 | ||||||
| UFP Industries, Inc. | 46,866 | 2,781,497 | ||||||
| 5,776,148 | ||||||||
| Capital Markets — 2.1% | ||||||||
| B. Riley Financial, Inc. | 13,364 | 357,888 | ||||||
| Diamond Hill Investment Group, Inc. | 2,372 | 293,915 | ||||||
| Evercore, Inc., Class A | 27,935 | 1,728,618 | ||||||
| Janus Henderson Group plc | 7,978 | 165,304 | ||||||
| Moelis & Co., Class A | 35,801 | 1,142,410 | ||||||
| Oppenheimer Holdings, Inc., Class A | 6,645 | 162,337 | ||||||
| Piper Sandler Cos. | 11,373 | 858,093 | ||||||
| Stifel Financial Corp. | 2,853 | 144,676 | ||||||
StoneX Group, Inc.(1) | 13,352 | 757,058 | ||||||
9
| Shares | Value | |||||||
| Virtus Investment Partners, Inc. | 5,069 | $ | 719,291 | |||||
| Waddell & Reed Financial, Inc., Class A | 69,688 | 1,097,586 | ||||||
| 7,427,176 | ||||||||
| Chemicals — 3.4% | ||||||||
AdvanSix, Inc.(1) | 27,131 | 345,378 | ||||||
AgroFresh Solutions, Inc.(1) | 18,889 | 46,845 | ||||||
| Cabot Corp. | 48,038 | 1,777,886 | ||||||
| Chemours Co. (The) | 130,420 | 2,694,477 | ||||||
Ferro Corp.(1) | 36,195 | 451,352 | ||||||
| Hawkins, Inc. | 8,615 | 432,645 | ||||||
| Kronos Worldwide, Inc. | 14,525 | 181,417 | ||||||
Livent Corp.(1) | 144,893 | 1,228,693 | ||||||
| Orion Engineered Carbons SA | 20,468 | 248,686 | ||||||
Rayonier Advanced Materials, Inc.(1) | 68,108 | 215,221 | ||||||
| Sensient Technologies Corp. | 8,618 | 475,886 | ||||||
| Stepan Co. | 16,889 | 1,947,133 | ||||||
| Tredegar Corp. | 29,891 | 506,055 | ||||||
| Trinseo SA | 44,474 | 1,107,847 | ||||||
| Tronox Holdings plc, Class A | 48,803 | 437,275 | ||||||
| 12,096,796 | ||||||||
| Commercial Services and Supplies — 1.2% | ||||||||
| Ennis, Inc. | 18,173 | 333,111 | ||||||
| Herman Miller, Inc. | 24,010 | 572,158 | ||||||
| HNI Corp. | 15,528 | 494,567 | ||||||
| Kimball International, Inc., Class B | 35,407 | 396,913 | ||||||
| McGrath RentCorp | 22,406 | 1,486,862 | ||||||
| Quad/Graphics, Inc. | 32,649 | 113,945 | ||||||
| Steelcase, Inc., Class A | 80,324 | 839,386 | ||||||
| 4,236,942 | ||||||||
| Communications Equipment — 0.1% | ||||||||
EchoStar Corp., Class A(1) | 17,673 | 519,233 | ||||||
| Construction and Engineering — 1.9% | ||||||||
| Arcosa, Inc. | 18,393 | 851,412 | ||||||
| Fluor Corp. | 44,438 | 423,050 | ||||||
Great Lakes Dredge & Dock Corp.(1) | 62,202 | 582,833 | ||||||
MasTec, Inc.(1) | 21,053 | 972,859 | ||||||
MYR Group, Inc.(1) | 12,949 | 502,551 | ||||||
Northwest Pipe Co.(1) | 9,796 | 277,520 | ||||||
| Primoris Services Corp. | 30,466 | 580,682 | ||||||
Tutor Perini Corp.(1) | 20,476 | 256,974 | ||||||
| Valmont Industries, Inc. | 16,908 | 2,148,161 | ||||||
| 6,596,042 | ||||||||
| Construction Materials — 0.5% | ||||||||
| Eagle Materials, Inc. | 22,735 | 1,859,041 | ||||||
| Consumer Finance — 1.7% | ||||||||
Elevate Credit, Inc.(1) | 29,103 | 57,333 | ||||||
Green Dot Corp., Class A(1) | 19,268 | 1,003,092 | ||||||
| Navient Corp. | 185,133 | 1,682,859 | ||||||
| Nelnet, Inc., Class A | 14,548 | 952,748 | ||||||
| OneMain Holdings, Inc. | 21,220 | 617,078 | ||||||
Oportun Financial Corp.(1) | 6,742 | 84,612 | ||||||
Regional Management Corp.(1) | 7,827 | 143,156 | ||||||
10
| Shares | Value | |||||||
| SLM Corp. | 196,159 | $ | 1,498,655 | |||||
| 6,039,533 | ||||||||
| Distributors — 0.1% | ||||||||
| Core-Mark Holding Co., Inc. | 7,207 | 240,858 | ||||||
| Diversified Consumer Services — 0.5% | ||||||||
American Public Education, Inc.(1) | 8,314 | 261,392 | ||||||
| Collectors Universe, Inc. | 6,322 | 281,266 | ||||||
Perdoceo Education Corp.(1) | 64,572 | 927,899 | ||||||
Universal Technical Institute, Inc.(1) | 16,495 | 116,290 | ||||||
| 1,586,847 | ||||||||
| Diversified Financial Services — 0.1% | ||||||||
| Alerus Financial Corp. | 7,038 | 144,913 | ||||||
| Banco Latinoamericano de Comercio Exterior SA, E Shares | 21,263 | 258,983 | ||||||
| Marlin Business Services Corp. | 7,039 | 47,161 | ||||||
| 451,057 | ||||||||
| Diversified Telecommunication Services — 0.7% | ||||||||
Iridium Communications, Inc.(1) | 88,610 | 2,481,966 | ||||||
| Electrical Equipment — 0.5% | ||||||||
| Encore Wire Corp. | 16,626 | 858,068 | ||||||
| LSI Industries, Inc. | 20,445 | 140,253 | ||||||
| Powell Industries, Inc. | 7,044 | 190,117 | ||||||
TPI Composites, Inc.(1) | 18,071 | 554,960 | ||||||
| 1,743,398 | ||||||||
| Electronic Equipment, Instruments and Components — 3.3% | ||||||||
| Avnet, Inc. | 54,728 | 1,505,567 | ||||||
| Bel Fuse, Inc., Class B | 106 | 1,274 | ||||||
| Jabil, Inc. | 53,927 | 1,841,607 | ||||||
| Methode Electronics, Inc. | 34,235 | 969,193 | ||||||
Plexus Corp.(1) | 27,943 | 2,125,624 | ||||||
Sanmina Corp.(1) | 71,690 | 2,028,827 | ||||||
TTM Technologies, Inc.(1) | 98,072 | 1,123,905 | ||||||
| Vishay Intertechnology, Inc. | 140,249 | 2,242,582 | ||||||
| 11,838,579 | ||||||||
| Energy Equipment and Services — 1.7% | ||||||||
| Archrock, Inc. | 144,490 | 947,855 | ||||||
| Cactus, Inc., Class A | 12,700 | 280,543 | ||||||
| DMC Global, Inc. | 10,585 | 375,027 | ||||||
Exterran Corp.(1) | 32,646 | 150,172 | ||||||
Helix Energy Solutions Group, Inc.(1) | 108,694 | 389,125 | ||||||
| Helmerich & Payne, Inc. | 68,134 | 1,122,848 | ||||||
| Liberty Oilfield Services, Inc., Class A | 35,847 | 231,213 | ||||||
Newpark Resources, Inc.(1) | 78,354 | 152,790 | ||||||
NexTier Oilfield Solutions, Inc.(1) | 161,435 | 406,816 | ||||||
Oceaneering International, Inc.(1) | 81,552 | 439,565 | ||||||
| Patterson-UTI Energy, Inc. | 165,372 | 636,682 | ||||||
ProPetro Holding Corp.(1) | 49,233 | 309,183 | ||||||
RPC, Inc.(1) | 43,318 | 135,585 | ||||||
Select Energy Services, Inc., Class A(1) | 48,403 | 230,882 | ||||||
| Solaris Oilfield Infrastructure, Inc., Class A | 26,345 | 204,964 | ||||||
| US Silica Holdings, Inc. | 34,665 | 154,606 | ||||||
| 6,167,856 | ||||||||
11
| Shares | Value | |||||||
| Entertainment — 0.3% | ||||||||
Eros International plc(1) | 57,102 | $ | 177,587 | |||||
IMAX Corp.(1) | 38,212 | 587,318 | ||||||
| Marcus Corp. (The) | 19,647 | 307,869 | ||||||
| 1,072,774 | ||||||||
| Food and Staples Retailing — 1.2% | ||||||||
| Ingles Markets, Inc., Class A | 18,465 | 745,986 | ||||||
| Natural Grocers by Vitamin Cottage, Inc. | 10,191 | 119,438 | ||||||
| PriceSmart, Inc. | 18,878 | 1,241,228 | ||||||
| SpartanNash Co. | 35,404 | 707,372 | ||||||
United Natural Foods, Inc.(1) | 34,117 | 615,812 | ||||||
| Village Super Market, Inc., Class A | 8,615 | 219,166 | ||||||
| Weis Markets, Inc. | 13,343 | 656,876 | ||||||
| 4,305,878 | ||||||||
| Food Products — 0.3% | ||||||||
| Fresh Del Monte Produce, Inc. | 428 | 9,925 | ||||||
| John B Sanfilippo & Son, Inc. | 8,221 | 654,721 | ||||||
Seneca Foods Corp., Class A(1) | 4,675 | 221,408 | ||||||
| 886,054 | ||||||||
| Health Care Equipment and Supplies — 0.1% | ||||||||
FONAR Corp.(1) | 4,675 | 118,605 | ||||||
Meridian Bioscience, Inc.(1) | 9,650 | 136,451 | ||||||
| 255,056 | ||||||||
| Health Care Providers and Services — 1.5% | ||||||||
Brookdale Senior Living, Inc.(1) | 191,773 | 527,376 | ||||||
| Ensign Group, Inc. (The) | 21,746 | 1,273,011 | ||||||
InfuSystem Holdings, Inc.(1) | 12,555 | 182,675 | ||||||
| Owens & Minor, Inc. | 75,597 | 1,253,398 | ||||||
| Patterson Cos., Inc. | 71,369 | 2,070,415 | ||||||
| 5,306,875 | ||||||||
| Hotels, Restaurants and Leisure — 4.7% | ||||||||
| BJ's Restaurants, Inc. | 16,882 | 532,121 | ||||||
| Bluegreen Vacations Corp. | 4,675 | 25,993 | ||||||
Carrols Restaurant Group, Inc.(1) | 16,120 | 107,359 | ||||||
| Cheesecake Factory, Inc. (The) | 33,080 | 976,852 | ||||||
Chuy's Holdings, Inc.(1) | 12,264 | 272,751 | ||||||
| Cracker Barrel Old Country Store, Inc. | 13,367 | 1,787,302 | ||||||
| Extended Stay America, Inc. | 152,082 | 1,899,504 | ||||||
Golden Entertainment, Inc.(1) | 15,707 | 201,678 | ||||||
Hilton Grand Vacations, Inc.(1) | 60,261 | 1,320,319 | ||||||
J Alexander's Holdings, Inc.(1) | 12,161 | 49,738 | ||||||
Norwegian Cruise Line Holdings Ltd.(1) | 74,526 | 1,275,140 | ||||||
Penn National Gaming, Inc.(1) | 92,591 | 4,731,400 | ||||||
Playa Hotels & Resorts NV(1) | 64,592 | 272,578 | ||||||
Potbelly Corp.(1) | 12,161 | 52,049 | ||||||
| RCI Hospitality Holdings, Inc. | 6,645 | 127,052 | ||||||
Red Robin Gourmet Burgers, Inc.(1) | 14,525 | 161,228 | ||||||
| Texas Roadhouse, Inc. | 43,245 | 2,724,003 | ||||||
| 16,517,067 | ||||||||
| Household Durables — 3.3% | ||||||||
Beazer Homes USA, Inc.(1) | 31,861 | 389,979 | ||||||
| Ethan Allen Interiors, Inc. | 21,617 | 307,826 | ||||||
12
| Shares | Value | |||||||
| Hamilton Beach Brands Holding Co., Class A | 4,675 | $ | 102,149 | |||||
iRobot Corp.(1) | 3,580 | 265,027 | ||||||
| KB Home | 50,169 | 1,794,043 | ||||||
| La-Z-Boy, Inc. | 39,741 | 1,291,582 | ||||||
Legacy Housing Corp.(1) | 4,675 | 71,387 | ||||||
Meritage Homes Corp.(1) | 27,528 | 2,643,514 | ||||||
Taylor Morrison Home Corp.(1) | 80,423 | 1,892,353 | ||||||
TRI Pointe Group, Inc.(1) | 116,228 | 1,961,929 | ||||||
Turtle Beach Corp.(1) | 9,403 | 184,017 | ||||||
Universal Electronics, Inc.(1) | 13,737 | 564,316 | ||||||
VOXX International Corp.(1) | 12,963 | 81,408 | ||||||
| 11,549,530 | ||||||||
| Insurance — 3.9% | ||||||||
Ambac Financial Group, Inc.(1) | 22,053 | 278,529 | ||||||
| American Equity Investment Life Holding Co. | 79,180 | 1,893,194 | ||||||
| AMERISAFE, Inc. | 14,912 | 995,078 | ||||||
| CNO Financial Group, Inc. | 126,431 | 2,060,825 | ||||||
| Crawford & Co., Class A | 11,472 | 78,698 | ||||||
| Employers Holdings, Inc. | 28,325 | 922,829 | ||||||
| FBL Financial Group, Inc., Class A | 428 | 15,857 | ||||||
Genworth Financial, Inc., Class A(1) | 414,758 | 1,252,569 | ||||||
| HCI Group, Inc. | 3,096 | 169,413 | ||||||
| Horace Mann Educators Corp. | 39,791 | 1,554,236 | ||||||
| James River Group Holdings Ltd. | 6,774 | 329,962 | ||||||
| National General Holdings Corp. | 63,778 | 2,171,641 | ||||||
| National Western Life Group, Inc., Class A | 432 | 95,036 | ||||||
| Safety Insurance Group, Inc. | 73 | 5,285 | ||||||
| Selective Insurance Group, Inc. | 18,889 | 1,129,751 | ||||||
Third Point Reinsurance Ltd.(1) | 20,078 | 171,868 | ||||||
| Unum Group | 33,688 | 622,554 | ||||||
Watford Holdings Ltd.(1) | 14,912 | 238,592 | ||||||
| 13,985,917 | ||||||||
| Interactive Media and Services — 0.1% | ||||||||
Cars.com, Inc.(1) | 39,405 | 342,035 | ||||||
| Internet and Direct Marketing Retail — 0.3% | ||||||||
1-800-Flowers.com, Inc., Class A(1) | 18,976 | 567,952 | ||||||
| PetMed Express, Inc. | 14,131 | 491,193 | ||||||
| 1,059,145 | ||||||||
IT Services† | ||||||||
Net 1 UEPS Technologies, Inc.(1) | 20,982 | 67,982 | ||||||
Sykes Enterprises, Inc.(1) | 12 | 397 | ||||||
| 68,379 | ||||||||
| Leisure Products — 0.5% | ||||||||
Malibu Boats, Inc., Class A(1) | 16,494 | 855,214 | ||||||
Vista Outdoor, Inc.(1) | 47,224 | 916,618 | ||||||
| 1,771,832 | ||||||||
| Machinery — 3.7% | ||||||||
| Albany International Corp., Class A | 22,434 | 1,164,325 | ||||||
| Astec Industries, Inc. | 24,371 | 1,284,839 | ||||||
Commercial Vehicle Group, Inc.(1) | 30,679 | 138,362 | ||||||
| EnPro Industries, Inc. | 16,922 | 990,275 | ||||||
| Kennametal, Inc. | 66,568 | 1,931,803 | ||||||
13
| Shares | Value | |||||||
Lydall, Inc.(1) | 14,525 | $ | 272,779 | |||||
Mayville Engineering Co., Inc.(1) | 4,382 | 37,466 | ||||||
| Miller Industries, Inc. | 8,615 | 270,253 | ||||||
| Mueller Industries, Inc. | 43,734 | 1,298,900 | ||||||
| Park-Ohio Holdings Corp. | 7,039 | 111,357 | ||||||
| REV Group, Inc. | 20,053 | 155,411 | ||||||
| Shyft Group, Inc. (The) | 29,929 | 597,682 | ||||||
| Timken Co. (The) | 51,986 | 2,817,121 | ||||||
| Trinity Industries, Inc. | 84,702 | 1,733,850 | ||||||
| Wabash National Corp. | 38,598 | 471,282 | ||||||
| 13,275,705 | ||||||||
| Marine — 0.5% | ||||||||
| Costamare, Inc. | 45,281 | 228,669 | ||||||
Eagle Bulk Shipping, Inc.(1) | 31,076 | 82,041 | ||||||
| Genco Shipping & Trading Ltd. | 9,806 | 69,721 | ||||||
| Matson, Inc. | 34,658 | 1,388,746 | ||||||
| Pangaea Logistics Solutions Ltd. | 14,525 | 35,586 | ||||||
| Scorpio Bulkers, Inc. | 5,562 | 77,701 | ||||||
| 1,882,464 | ||||||||
| Media — 0.1% | ||||||||
Cumulus Media, Inc., Class A(1) | 12,555 | 62,398 | ||||||
| Entercom Communications Corp., Class A | 124,455 | 186,683 | ||||||
| Entravision Communications Corp., Class A | 48,015 | 72,983 | ||||||
| Townsquare Media, Inc., Class A | 7,433 | 34,563 | ||||||
| Tribune Publishing Co. | 4,761 | 54,037 | ||||||
| 410,664 | ||||||||
| Metals and Mining — 3.2% | ||||||||
Alcoa Corp.(1) | 114,657 | 1,676,285 | ||||||
Allegheny Technologies, Inc.(1) | 95,317 | 793,991 | ||||||
Arconic Corp.(1) | 46,467 | 1,033,891 | ||||||
| Cleveland-Cliffs, Inc. | 284,323 | 1,870,845 | ||||||
| Commercial Metals Co. | 120,554 | 2,515,962 | ||||||
Contura Energy, Inc.(1) | 18,458 | 76,416 | ||||||
| Kaiser Aluminum Corp. | 13,343 | 857,688 | ||||||
| Olympic Steel, Inc. | 5,857 | 64,427 | ||||||
| Schnitzer Steel Industries, Inc., Class A | 23,981 | 473,385 | ||||||
| SunCoke Energy, Inc. | 91,750 | 328,465 | ||||||
| United States Steel Corp. | 114,604 | 897,349 | ||||||
| Warrior Met Coal, Inc. | 51,955 | 803,744 | ||||||
| 11,392,448 | ||||||||
| Multiline Retail — 1.3% | ||||||||
| Big Lots, Inc. | 41,706 | 1,966,438 | ||||||
| Dillard's, Inc., Class A | 7,433 | 224,551 | ||||||
| Kohl's Corp. | 43,529 | 929,779 | ||||||
| Macy's, Inc. | 194,658 | 1,356,766 | ||||||
| Nordstrom, Inc. | 4,887 | 78,192 | ||||||
| 4,555,726 | ||||||||
| Oil, Gas and Consumable Fuels — 8.8% | ||||||||
| Antero Midstream Corp. | 227,921 | 1,543,025 | ||||||
Antero Resources Corp.(1) | 93,362 | 300,626 | ||||||
| Apache Corp. | 129,371 | 1,914,691 | ||||||
| Arch Resources, Inc. | 14,919 | 561,999 | ||||||
14
| Shares | Value | |||||||
| Berry Corp. | 68,109 | $ | 268,349 | |||||
Bonanza Creek Energy, Inc.(1) | 15,337 | 307,353 | ||||||
| Cimarex Energy Co. | 59,947 | 1,665,328 | ||||||
CNX Resources Corp.(1) | 137,000 | 1,501,520 | ||||||
Comstock Resources, Inc.(1) | 19,658 | 113,230 | ||||||
CONSOL Energy, Inc.(1) | 23,193 | 119,908 | ||||||
| CVR Energy, Inc. | 17,304 | 288,804 | ||||||
| Delek US Holdings, Inc. | 65,381 | 1,028,443 | ||||||
| Devon Energy Corp. | 83,868 | 911,645 | ||||||
| DHT Holdings, Inc. | 109,894 | 581,339 | ||||||
Dorian LPG Ltd.(1) | 30,679 | 258,931 | ||||||
Earthstone Energy, Inc., Class A(1) | 10,979 | 32,168 | ||||||
EnLink Midstream LLC(1) | 134,735 | 402,858 | ||||||
| EQT Corp. | 174,429 | 2,768,188 | ||||||
| Evolution Petroleum Corp. | 25,163 | 68,695 | ||||||
| GasLog Ltd. | 16 | 47 | ||||||
Goodrich Petroleum Corp.(1) | 9,797 | 80,825 | ||||||
| Kosmos Energy Ltd. | 103,259 | 151,791 | ||||||
Magnolia Oil & Gas Corp., Class A(1) | 114,604 | 738,050 | ||||||
| Marathon Oil Corp. | 82,727 | 436,799 | ||||||
Matador Resources Co.(1) | 109,869 | 1,069,025 | ||||||
Montage Resources Corp.(1) | 12,555 | 64,784 | ||||||
| Murphy Oil Corp. | 119,787 | 1,645,873 | ||||||
| NACCO Industries, Inc., Class A | 3,493 | 71,607 | ||||||
| Noble Energy, Inc. | 99,300 | 988,035 | ||||||
Overseas Shipholding Group, Inc., Class A(1) | 41,317 | 87,179 | ||||||
| Ovintiv, Inc. | 97,074 | 1,075,580 | ||||||
| Panhandle Oil and Gas, Inc., Class A | 8,615 | 16,282 | ||||||
Par Pacific Holdings, Inc.(1) | 42,499 | 368,891 | ||||||
| Parsley Energy, Inc., Class A | 122,183 | 1,313,467 | ||||||
| PBF Energy, Inc., Class A | 81,924 | 701,269 | ||||||
PDC Energy, Inc.(1) | 82,318 | 1,246,295 | ||||||
| Peabody Energy Corp. | 52,349 | 136,631 | ||||||
Penn Virginia Corp.(1) | 16,886 | 192,838 | ||||||
| Range Resources Corp. | 248,852 | 1,856,436 | ||||||
| Rattler Midstream LP | 7,524 | 62,976 | ||||||
| Scorpio Tankers, Inc. | 434 | 5,139 | ||||||
| SFL Corp. Ltd. | 74,456 | 653,724 | ||||||
SilverBow Resources, Inc.(1) | 4,281 | 21,148 | ||||||
| SM Energy Co. | 113,481 | 275,759 | ||||||
Southwestern Energy Co.(1) | 548,477 | 1,524,766 | ||||||
Talos Energy, Inc.(1) | 28,357 | 212,961 | ||||||
Teekay Tankers Ltd., Class A(1) | 18,871 | 236,642 | ||||||
WPX Energy, Inc.(1) | 260,407 | 1,447,863 | ||||||
| 31,319,782 | ||||||||
| Paper and Forest Products — 1.4% | ||||||||
| Boise Cascade Co. | 38,165 | 1,747,957 | ||||||
| Domtar Corp. | 46,440 | 1,324,469 | ||||||
| Mercer International, Inc. | 35,801 | 300,012 | ||||||
| Neenah, Inc. | 14,131 | 625,721 | ||||||
| Schweitzer-Mauduit International, Inc. | 22,434 | 680,423 | ||||||
15
| Shares | Value | |||||||
| Verso Corp., Class A | 31,461 | $ | 412,454 | |||||
| 5,091,036 | ||||||||
| Personal Products — 1.1% | ||||||||
Lifevantage Corp.(1) | 9,009 | 135,315 | ||||||
| Medifast, Inc. | 2,821 | 459,033 | ||||||
| Nu Skin Enterprises, Inc., Class A | 53,941 | 2,549,791 | ||||||
USANA Health Sciences, Inc.(1) | 9,009 | 706,396 | ||||||
| 3,850,535 | ||||||||
| Pharmaceuticals — 0.7% | ||||||||
ANI Pharmaceuticals, Inc.(1) | 1,588 | 49,800 | ||||||
Corcept Therapeutics, Inc.(1) | 60,318 | 766,039 | ||||||
Innoviva, Inc.(1) | 51,996 | 608,873 | ||||||
Lannett Co., Inc.(1) | 57,470 | 302,292 | ||||||
Mallinckrodt plc(1) | 67,780 | 107,092 | ||||||
Supernus Pharmaceuticals, Inc.(1) | 34,920 | 767,891 | ||||||
| 2,601,987 | ||||||||
| Professional Services — 0.3% | ||||||||
| BG Staffing, Inc. | 472 | 4,428 | ||||||
| CRA International, Inc. | 1,604 | 68,186 | ||||||
| Heidrick & Struggles International, Inc. | 10,191 | 220,431 | ||||||
| Kforce, Inc. | 18,465 | 634,088 | ||||||
| 927,133 | ||||||||
| Real Estate Management and Development — 0.4% | ||||||||
Marcus & Millichap, Inc.(1) | 16,899 | 476,721 | ||||||
| RE/MAX Holdings, Inc., Class A | 16,898 | 593,796 | ||||||
| RMR Group, Inc. (The), Class A | 10,274 | 289,932 | ||||||
| 1,360,449 | ||||||||
| Road and Rail — 3.4% | ||||||||
| ArcBest Corp. | 25,951 | 877,663 | ||||||
| Heartland Express, Inc. | 39,378 | 814,534 | ||||||
| Landstar System, Inc. | 12,662 | 1,685,186 | ||||||
| Marten Transport Ltd. | 57,923 | 1,051,882 | ||||||
| Ryder System, Inc. | 50,412 | 2,061,851 | ||||||
Saia, Inc.(1) | 22,128 | 2,969,578 | ||||||
| Schneider National, Inc., Class B | 22,809 | 617,211 | ||||||
US Xpress Enterprises, Inc., Class A(1) | 12,555 | 120,151 | ||||||
| Werner Enterprises, Inc. | 41,342 | 1,902,145 | ||||||
| 12,100,201 | ||||||||
| Semiconductors and Semiconductor Equipment — 2.0% | ||||||||
Amkor Technology, Inc.(1) | 67,337 | 821,175 | ||||||
Diodes, Inc.(1) | 37,442 | 1,829,416 | ||||||
Photronics, Inc.(1) | 50,051 | 502,012 | ||||||
SMART Global Holdings, Inc.(1) | 12,949 | 326,315 | ||||||
Synaptics, Inc.(1) | 30,698 | 2,619,460 | ||||||
Ultra Clean Holdings, Inc.(1) | 43,287 | 1,061,397 | ||||||
| 7,159,775 | ||||||||
| Specialty Retail — 8.0% | ||||||||
| Abercrombie & Fitch Co., Class A | 57,922 | 753,565 | ||||||
| American Eagle Outfitters, Inc. | 121,720 | 1,534,889 | ||||||
Asbury Automotive Group, Inc.(1) | 6,831 | 722,652 | ||||||
AutoNation, Inc.(1) | 46,518 | 2,645,013 | ||||||
Barnes & Noble Education, Inc.(1) | 22,799 | 51,982 | ||||||
16
| Shares | Value | |||||||
| Bed Bath & Beyond, Inc. | 121,328 | $ | 1,477,775 | |||||
| Buckle, Inc. (The) | 27,133 | 508,472 | ||||||
| Caleres, Inc. | 30,322 | 236,815 | ||||||
| Cato Corp. (The), Class A | 19,253 | 154,024 | ||||||
| Children's Place, Inc. (The) | 11,766 | 234,908 | ||||||
| Citi Trends, Inc. | 8,615 | 166,528 | ||||||
Conn's, Inc.(1) | 10,979 | 140,312 | ||||||
| Dick's Sporting Goods, Inc. | 50,776 | 2,747,997 | ||||||
| Foot Locker, Inc. | 71,361 | 2,164,379 | ||||||
| Gap, Inc. (The) | 62,632 | 1,089,170 | ||||||
Genesco, Inc.(1) | 12,555 | 244,823 | ||||||
| Guess?, Inc. | 27,927 | 321,161 | ||||||
| Haverty Furniture Cos., Inc. | 8,219 | 173,585 | ||||||
Hibbett Sports, Inc.(1) | 17,283 | 576,734 | ||||||
Hudson Ltd., Class A(1) | 30,285 | 228,349 | ||||||
| Lithia Motors, Inc., Class A | 17,713 | 4,409,828 | ||||||
Murphy USA, Inc.(1) | 21,073 | 2,841,905 | ||||||
| ODP Corp. (The) | 59,375 | 1,388,188 | ||||||
| Shoe Carnival, Inc. | 6,645 | 218,488 | ||||||
| Signet Jewelers Ltd. | 70,149 | 1,211,473 | ||||||
| Sonic Automotive, Inc., Class A | 5,460 | 230,740 | ||||||
Sportsman's Warehouse Holdings, Inc.(1) | 29,891 | 469,139 | ||||||
| Tilly's, Inc., Class A | 16,101 | 102,080 | ||||||
TravelCenters of America, Inc.(1) | 3,493 | 74,610 | ||||||
Urban Outfitters, Inc.(1) | 57,474 | 1,352,938 | ||||||
| 28,472,522 | ||||||||
| Textiles, Apparel and Luxury Goods — 1.4% | ||||||||
Capri Holdings Ltd.(1) | 52,867 | 837,413 | ||||||
| Culp, Inc. | 8,615 | 103,380 | ||||||
Deckers Outdoor Corp.(1) | 4,504 | 918,231 | ||||||
Fossil Group, Inc.(1) | 47,221 | 303,867 | ||||||
G-III Apparel Group Ltd.(1) | 29,520 | 326,491 | ||||||
| Oxford Industries, Inc. | 13,737 | 680,394 | ||||||
| PVH Corp. | 29,431 | 1,641,073 | ||||||
| Rocky Brands, Inc. | 1,253 | 30,172 | ||||||
Vera Bradley, Inc.(1) | 14,138 | 74,507 | ||||||
| 4,915,528 | ||||||||
| Thrifts and Mortgage Finance — 4.6% | ||||||||
Axos Financial, Inc.(1) | 49,197 | 1,219,102 | ||||||
Bridgewater Bancshares, Inc.(1) | 18,071 | 175,650 | ||||||
| Essent Group Ltd. | 34,253 | 1,222,832 | ||||||
| Federal Agricultural Mortgage Corp., Class C | 9,101 | 620,233 | ||||||
| Flagstar Bancorp, Inc. | 27,133 | 852,519 | ||||||
| FS Bancorp, Inc. | 3,556 | 140,889 | ||||||
| Hingham Institution For Savings (The) | 1,212 | 222,232 | ||||||
| Home Bancorp, Inc. | 5,158 | 124,617 | ||||||
| HomeStreet, Inc. | 19,762 | 540,886 | ||||||
| Luther Burbank Corp. | 11,373 | 105,655 | ||||||
| Merchants Bancorp | 12,161 | 247,841 | ||||||
| Meta Financial Group, Inc. | 13,054 | 251,681 | ||||||
| MGIC Investment Corp. | 128,476 | 1,178,125 | ||||||
Mr. Cooper Group, Inc.(1) | 52,397 | 960,175 | ||||||
17
| Shares | Value | |||||||
NMI Holdings, Inc., Class A(1) | 56,720 | $ | 972,748 | |||||
| OP Bancorp | 10,585 | 64,568 | ||||||
| PennyMac Financial Services, Inc. | 38,612 | 2,035,625 | ||||||
| Provident Financial Services, Inc. | 8,505 | 112,096 | ||||||
| Radian Group, Inc. | 78,748 | 1,215,869 | ||||||
| Riverview Bancorp, Inc. | 18,071 | 74,633 | ||||||
| Severn Bancorp, Inc. | 8,615 | 52,896 | ||||||
| Southern Missouri Bancorp, Inc. | 5,561 | 131,684 | ||||||
| Sterling Bancorp, Inc. | 14,525 | 43,139 | ||||||
| Territorial Bancorp, Inc. | 5,857 | 123,934 | ||||||
| TrustCo Bank Corp. NY | 77,186 | 460,029 | ||||||
| Walker & Dunlop, Inc. | 26,860 | 1,471,391 | ||||||
| Washington Federal, Inc. | 45,537 | 1,067,843 | ||||||
| Waterstone Financial, Inc. | 18,071 | 279,920 | ||||||
| WSFS Financial Corp. | 15,836 | 463,995 | ||||||
| 16,432,807 | ||||||||
| Trading Companies and Distributors — 3.2% | ||||||||
| Air Lease Corp. | 62,666 | 1,947,659 | ||||||
BMC Stock Holdings, Inc.(1) | 62,991 | 2,514,601 | ||||||
CAI International, Inc.(1) | 10,312 | 224,905 | ||||||
| GATX Corp. | 33,082 | 2,212,524 | ||||||
| H&E Equipment Services, Inc. | 25,163 | 509,802 | ||||||
Herc Holdings, Inc.(1) | 22,809 | 934,029 | ||||||
NOW, Inc.(1) | 59,072 | 429,453 | ||||||
| Rush Enterprises, Inc., Class A | 2,107 | 101,810 | ||||||
| Systemax, Inc. | 9,890 | 219,459 | ||||||
Textainer Group Holdings Ltd.(1) | 24,546 | 288,170 | ||||||
| Triton International Ltd. | 52,792 | 1,903,680 | ||||||
Veritiv Corp.(1) | 10,585 | 183,967 | ||||||
| 11,470,059 | ||||||||
| Wireless Telecommunication Services — 1.2% | ||||||||
| Shenandoah Telecommunications Co. | 39,373 | 2,177,327 | ||||||
| Telephone and Data Systems, Inc. | 77,958 | 1,803,169 | ||||||
United States Cellular Corp.(1) | 10,585 | 385,082 | ||||||
| 4,365,578 | ||||||||
TOTAL COMMON STOCKS (Cost $308,103,365) | 354,567,754 | |||||||
| TEMPORARY CASH INVESTMENTS — 0.1% | ||||||||
| State Street Institutional U.S. Government Money Market Fund, Premier Class (Cost $301,292) | 301,292 | 301,292 | ||||||
TOTAL INVESTMENT SECURITIES — 99.9% (Cost $308,404,657) | 354,869,046 | |||||||
| OTHER ASSETS AND LIABILITIES — 0.1% | 429,439 | |||||||
| TOTAL NET ASSETS — 100.0% | $ | 355,298,485 | ||||||
NOTES TO SCHEDULE OF INVESTMENTS | ||
† Category is less than 0.05% of total net assets.
(1)Non-income producing.
See Notes to Financial Statements
18
| Statement of Assets and Liabilities | ||
| AUGUST 31, 2020 | |||||
| Assets | |||||
| Investment securities, at value (cost of $308,404,657) | $ | 354,869,046 | |||
| Receivable for capital shares sold | 899,490 | ||||
| Dividends and interest receivable | 491,899 | ||||
| 356,260,435 | |||||
| Liabilities | |||||
| Payable for investments purchased | 890,554 | ||||
| Accrued management fees | 71,396 | ||||
| 961,950 | |||||
| Net Assets | $ | 355,298,485 | |||
| Shares outstanding (unlimited number of shares authorized) | 7,900,000 | ||||
| Net Asset Value Per Share | $ | 44.97 | |||
| Net Assets Consist of: | |||||
| Capital paid in | $ | 311,600,590 | |||
| Distributable earnings | 43,697,895 | ||||
| $ | 355,298,485 | ||||
See Notes to Financial Statements.
19
| Statement of Operations | ||
FOR THE PERIOD ENDED AUGUST 31, 2020(1) | |||||
| Investment Income (Loss) | |||||
| Income: | |||||
| Dividends (net of foreign taxes withheld of $4,931) | $ | 2,685,568 | |||
| Securities lending, net | 7,410 | ||||
| Interest | 519 | ||||
| 2,693,497 | |||||
| Expenses: | |||||
| Management fees | 317,911 | ||||
| Net investment income (loss) | 2,375,586 | ||||
| Realized and Unrealized Gain (Loss) | |||||
| Net realized gain (loss) on investment transactions | (3,749,254) | ||||
| Change in net unrealized appreciation (depreciation) on investments | 46,464,389 | ||||
| Net realized and unrealized gain (loss) | 42,715,135 | ||||
| Net Increase (Decrease) in Net Assets Resulting from Operations | $ | 45,090,721 | |||
(1)September 24, 2019 (fund inception) through August 31, 2020.
See Notes to Financial Statements.
20
| Statement of Changes in Net Assets | ||
PERIOD ENDED AUGUST 31, 2020(1) | |||||
| Increase (Decrease) in Net Assets | |||||
| Operations | |||||
| Net investment income (loss) | $ | 2,375,586 | |||
| Net realized gain (loss) | (3,749,254) | ||||
| Change in net unrealized appreciation (depreciation) | 46,464,389 | ||||
| Net increase (decrease) in net assets resulting from operations | 45,090,721 | ||||
| Distributions to Shareholders | |||||
| From earnings | (1,392,826) | ||||
| Capital Share Transactions | |||||
| Proceeds from shares sold | 311,600,590 | ||||
| Net increase (decrease) in net assets | 355,298,485 | ||||
| Net Assets | |||||
| End of period | $ | 355,298,485 | |||
| Transactions in Shares of the Fund | |||||
| Sold | 7,900,000 | ||||
(1)September 24, 2019 (fund inception) through August 31, 2020.
See Notes to Financial Statements.
21
| Notes to Financial Statements | ||
AUGUST 31, 2020
1. Organization
American Century ETF Trust (the trust) was registered as a Delaware statutory trust in 2017 and is registered under the Investment Company Act of 1940, as amended (the 1940 Act), as an open-end management investment company. Avantis U.S. Small Cap Value ETF (the fund) is one fund in a series issued by the trust. The fund's investment objective is to seek long-term capital appreciation. Shares of the fund are listed for trading on the NYSE Arca, Inc. The fund incepted on September 24, 2019.
2. Significant Accounting Policies
The following is a summary of significant accounting policies consistently followed by the fund in preparation of its financial statements. The fund is an investment company and follows accounting and reporting guidance in accordance with accounting principles generally accepted in the United States of America. This may require management to make certain estimates and assumptions at the date of the financial statements. Actual results could differ from these estimates. Management evaluated the impact of events or transactions occurring through the date the financial statements were issued that would merit recognition or disclosure.
Investment Valuations — The fund determines the fair value of its investments and computes its net asset value per share at the close of regular trading (usually 4 p.m. Eastern time) on the New York Stock Exchange (NYSE) on each day the NYSE is open. The Board of Trustees has adopted valuation policies and procedures to guide the investment advisor in the fund’s investment valuation process and to provide methodologies for the oversight of the fund’s pricing function.
Equity securities that are listed or traded on a domestic securities exchange are valued at the last reported sales price or at the official closing price as provided by the exchange. Equity securities traded on foreign securities exchanges are generally valued at the closing price of such securities on the exchange where primarily traded or at the close of the NYSE, if that is earlier. If no last sales price is reported, or if local convention or regulation so provides, the mean of the latest bid and asked prices may be used. Securities traded over-the-counter are valued at the mean of the latest bid and asked prices, the last sales price, or the official closing price.
Open-end management investment companies are valued at the reported net asset value per share.
If the fund determines that the market price for an investment is not readily available or the valuation methods mentioned above do not reflect an investment’s fair value, such investment is valued as determined in good faith by the Board of Trustees or its delegate, in accordance with policies and procedures adopted by the Board of Trustees. In its determination of fair value, the fund may review several factors including, but not limited to, market information regarding the specific investment or comparable investments and correlation with other investment types, futures indices or general market indicators. Circumstances that may cause the fund to use these procedures to value an investment include, but are not limited to: an investment has been declared in default or is distressed; trading in a security has been suspended during the trading day or a security is not actively trading on its principal exchange; prices received from a regular pricing source are deemed unreliable; or there is a foreign market holiday and no trading occurred.
The fund monitors for significant events occurring after the close of an investment’s primary exchange but before the fund’s net asset value per share is determined. Significant events may include, but are not limited to: corporate announcements and transactions; governmental action and political unrest that could impact a specific investment or an investment sector; or armed conflicts, natural disasters and similar events that could affect investments in a specific country or region. The fund also monitors for significant fluctuations between domestic and foreign markets, as evidenced by the U.S. market or such other indicators that the Board of Trustees, or its delegate, deems appropriate. The fund may apply a model-derived factor to the closing price of equity securities traded on foreign securities exchanges. The factor is based on observable market data as provided by an independent pricing service.
Security Transactions — Security transactions are accounted for as of the trade date. Net realized gains and losses are determined on the identified cost basis, which is also used for federal income tax purposes.
22
Investment Income — Dividend income less foreign taxes withheld, if any, is recorded as of the ex-dividend date. Distributions received on securities that represent a return of capital or long-term capital gain are recorded as a reduction of cost of investments and/or as a realized gain. The fund may estimate the components of distributions received that may be considered nontaxable distributions or long-term capital gain distributions for income tax purposes. Interest income is recorded on the accrual basis and includes accretion of discounts and amortization of premiums. Securities lending income is net of fees and rebates earned by the lending agent for its services.
Segregated Assets — In accordance with the 1940 Act, the fund segregates assets on its books and records to cover certain types of investment securities and other financial instruments. American Century Investment Management, Inc. (ACIM) (the investment advisor) monitors, on a daily basis, the securities segregated to ensure the fund designates a sufficient amount of liquid assets, marked-to-market daily. The fund may also receive assets or be required to pledge assets at the custodian bank or with a broker for collateral requirements.
Income Tax Status — It is the fund’s policy to distribute substantially all net investment income and net realized gains to shareholders and to otherwise qualify as a regulated investment company under provisions of the Internal Revenue Code. Accordingly, no provision has been made for income taxes. The fund files U.S. federal, state, local and non-U.S. tax returns as applicable. The fund's tax returns are subject to examination by the relevant taxing authority until expiration of the applicable statute of limitations, which is generally three years from the date of filing but can be longer in certain jurisdictions. At this time, management believes there are no uncertain tax positions which, based on their technical merit, would not be sustained upon examination and for which it is reasonably possible that the total amounts of unrecognized tax benefits will significantly change in the next twelve months.
Distributions to Shareholders — Distributions from net investment income, if any, are generally declared and paid quarterly. Distributions from net realized gains, if any, are generally declared and paid annually.
Indemnifications — Under the trust’s organizational documents, its officers and trustees are indemnified against certain liabilities arising out of the performance of their duties to the fund. In addition, in the normal course of business, the fund enters into contracts that provide general indemnifications. The maximum exposure under these arrangements is unknown as this would involve future claims that may be made against a fund. The risk of material loss from such claims is considered by management to be remote.
Securities Lending — Securities are lent to qualified financial institutions and brokers. State Street Bank & Trust Co. serves as securities lending agent to the fund pursuant to a Securities Lending Agreement. The lending of securities exposes the fund to risks such as: the borrowers may fail to return the loaned securities, the borrowers may not be able to provide additional collateral, the fund may experience delays in recovery of the loaned securities or delays in access to collateral, or the fund may experience losses related to the investment collateral. To minimize certain risks, loan counterparties pledge collateral in the form of cash and/or securities. The lending agent has agreed to indemnify the fund in the case of default of any securities borrowed. Cash collateral received is invested in the State Street Navigator Securities Lending Government Money Market Portfolio, a money market mutual fund registered under the 1940 Act. The loans may also be secured by U.S. government securities in an amount at least equal to the market value of the securities loaned, plus accrued interest and dividends, determined on a daily basis and adjusted accordingly. By lending securities, the fund seeks to increase its net investment income through the receipt of interest and fees. Such income is reflected separately within the Statement of Operations. The value of loaned securities and related collateral outstanding at period end, if any, are shown on a gross basis within the Schedule of Investments and Statement of Assets and Liabilities.
3. Fees and Transactions with Related Parties
Certain officers and trustees of the trust are also officers and/or directors of American Century Companies, Inc. (ACC). The trust's investment advisor, ACIM, and the trust’s administrator, American Century Services, LLC, are wholly owned, directly or indirectly, by ACC. Various funds issued by American Century Strategic Asset Allocations Inc. own, in aggregate, 8% of the shares of the fund.
23
Management Fees — The trust has entered into a management agreement with ACIM, under which ACIM provides the fund with investment advisory and management services in exchange for a single, unified management fee (the fee). The agreement provides that ACIM will pay all expenses of managing and operating the fund, except brokerage and other transaction fees and expenses relating to the acquisition and disposition of portfolio securities, acquired fund fees and expenses, interest, taxes, litigation expenses and extraordinary expenses. The fee is computed and accrued daily based on the daily net assets of the fund and paid monthly in arrears. The annual management fee is 0.25%.
4. Investment Transactions
Purchases and sales of investment securities, excluding short-term investments and in-kind transactions, for the period ended August 31, 2020 were $29,614,757 and $26,337,876, respectively.
Securities received in-kind through subscriptions for the period ended August 31, 2020 were $308,696,462. There were no securities delivered in-kind through redemptions during the period.
5. Capital Share Transactions
The fund’s shares may only be purchased and sold on a national securities exchange through a broker-dealer. The price of the fund’s shares is based on market price, and because ETF shares trade at market prices rather than net asset value (NAV), shares may trade at a price greater than NAV (a premium) or less than NAV (a discount). The fund issues and redeems shares that have been aggregated into blocks of 20,000 shares or multiples thereof (Creation Units) to authorized participants who have entered into agreements with the fund's distributor. The fund will generally issue and redeem Creation Units in return for a basket of securities (and an amount of cash) that the fund specifies each day. Investors transacting in Creation Units for cash may also pay an additional variable charge to compensate the fund for certain transaction costs and market impact expenses relating to investing in portfolio securities. Such variable charges, if any, are included in proceeds from shares sold in the Statement of Changes in Net Assets.
6. Fair Value Measurements
The fund’s investments valuation process is based on several considerations and may use multiple inputs to determine the fair value of the investments held by the fund. In conformity with accounting principles generally accepted in the United States of America, the inputs used to determine a valuation are classified into three broad levels.
•Level 1 valuation inputs consist of unadjusted quoted prices in an active market for identical investments.
•Level 2 valuation inputs consist of direct or indirect observable market data (including quoted prices for comparable investments, evaluations of subsequent market events, interest rates, prepayment speeds, credit risk, etc.). These inputs also consist of quoted prices for identical investments initially expressed in local currencies that are adjusted through translation into U.S. dollars.
•Level 3 valuation inputs consist of unobservable data (including a fund’s own assumptions).
The level classification is based on the lowest level input that is significant to the fair valuation measurement. The valuation inputs are not necessarily an indication of the risks associated with investing in these securities or other financial instruments.
As of period end, the fund’s investment securities were classified as Level 1. The Schedule of Investments provides additional information on the fund's portfolio holdings.
7. Risk Factors
The value of the fund’s shares will go up and down, sometimes rapidly or unpredictably, based on the performance of the securities owned by the fund and other factors generally affecting the securities market. Market risks, including political, regulatory, economic and social developments, can affect the value of the fund’s investments. Natural disasters, public health emergencies, terrorism and other unforeseeable events may lead to increased market volatility and may have adverse long-term effects on world economies and markets generally.
24
The fund invests in common stocks of small companies. Because of this, the fund may be subject to greater risk and market fluctuations than a fund investing in larger, more established companies.
8. Federal Tax Information
The tax character of distributions paid during the period September 24, 2019 (fund inception) through August 31, 2020 were as follows:
| Distributions Paid From | |||||
| Ordinary Income | $ | 1,392,826 | |||
| Long-term capital gains | — | ||||
The book-basis character of distributions made during the year from net investment income or net realized gains may differ from their ultimate characterization for federal income tax purposes. These differences reflect the differing character of certain income items and net realized gains and losses for financial statement and tax purposes, and may result in reclassification among certain capital accounts on the financial statements.
As of period end, the federal tax cost of investments and the components of distributable earnings on a tax-basis were as follows:
| Federal tax cost of investments | $ | 308,423,299 | |||
| Gross tax appreciation of investments | $ | 55,922,624 | |||
| Gross tax depreciation of investments | (9,476,877) | ||||
| Net tax appreciation (depreciation) of investments | $ | 46,445,747 | |||
| Undistributed ordinary income | $ | 1,014,158 | |||
| Accumulated short-term capital losses | $ | (3,762,010) | |||
The difference between book-basis and tax-basis unrealized appreciation (depreciation) is attributable primarily to the tax deferral of losses on wash sales.
Accumulated capital losses represent net capital loss carryovers that may be used to offset future realized capital gains for federal income tax purposes. The capital loss carryovers may be carried forward for an unlimited period. Future capital loss carryover utilization in any given year may be subject to Internal Revenue Code limitations.
25
| Financial Highlights | ||
| For a Share Outstanding Throughout the Period Indicated | |||||||||||||||||||||||||||||||||||
| Per-Share Data | Ratios and Supplemental Data | ||||||||||||||||||||||||||||||||||
| Income From Investment Operations: | Ratio to Average Net Assets of: | ||||||||||||||||||||||||||||||||||
| Net Asset Value, Beginning of Period | Net Investment Income (Loss)(1) | Net Realized and Unrealized Gain (Loss) | Total From Investment Operations | Distributions From Net Investment Income | Net Asset Value, End of Period | Total Return(2) | Operating Expenses | Net Investment Income (Loss) | Portfolio Turnover Rate(3) | Net Assets, End of Period (in thousands) | |||||||||||||||||||||||||
2020(4) | $50.00 | 0.72 | (5.30) | (4.58) | (0.45) | $44.97 | (9.09)% | 0.25%(5) | 1.87%(5) | 20% | $355,298 | ||||||||||||||||||||||||
| Notes to Financial Highlights | ||
(1)Computed using average shares outstanding throughout the period.
(2)Total returns are calculated based on the net asset value of the last business day. Total returns for periods less than one year are not annualized.
(3)Excludes securities received or delivered in-kind.
(4)September 24, 2019 (fund inception) through August 31, 2020.
(5)Annualized.
See Notes to Financial Statements.
| Report of Independent Registered Public Accounting Firm | ||
To the Shareholders and the Board of Trustees of American Century ETF Trust:
Opinion on the Financial Statements and Financial Highlights
We have audited the accompanying statement of assets and liabilities, including the schedule of investments, of Avantis® U.S. Small Cap Value ETF (the "Fund"), one of the funds constituting the American Century ETF Trust, as of August 31, 2020, and the related statement of operations, the statement of changes in net assets, and the financial highlights for the period from September 24, 2019 (fund inception) through August 31, 2020, and the related notes. In our opinion, the financial statements and financial highlights present fairly, in all material respects, the financial position of Avantis® U.S. Small Cap Value ETF as of August 31, 2020, and the results of its operations, the changes in its net assets, and the financial highlights for the period from September 24, 2019 (fund inception) through August 31, 2020, in conformity with accounting principles generally accepted in the United States of America.
Basis for Opinion
These financial statements and financial highlights are the responsibility of the Fund's management. Our responsibility is to express an opinion on the Fund’s financial statements and financial highlights based on our audit. We are a public accounting firm registered with the Public Company Accounting Oversight Board (United States) (PCAOB) and are required to be independent with respect to the Fund in accordance with the U.S. federal securities laws and the applicable rules and regulations of the Securities and Exchange Commission and the PCAOB.
We conducted our audit in accordance with the standards of the PCAOB. Those standards require that we plan and perform the audit to obtain reasonable assurance about whether the financial statements and financial highlights are free of material misstatement, whether due to error or fraud. The Fund is not required to have, nor were we engaged to perform, an audit of its internal control over financial reporting. As part of our audit we are required to obtain an understanding of internal control over financial reporting but not for the purpose of expressing an opinion on the effectiveness of the Fund’s internal control over financial reporting. Accordingly, we express no such opinion.
Our audit included performing procedures to assess the risks of material misstatement of the financial statements and financial highlights, whether due to error or fraud, and performing procedures that respond to those risks. Such procedures included examining, on a test basis, evidence regarding the amounts and disclosures in the financial statements and financial highlights. Our audit also included evaluating the accounting principles used and significant estimates made by management, as well as evaluating the overall presentation of the financial statements and financial highlights. Our procedures included confirmation of securities owned as of August 31, 2020, by correspondence with the custodian and brokers; when replies were not received from brokers, we performed other auditing procedures. We believe that our audit provides a reasonable basis for our opinion.
DELOITTE & TOUCHE LLP
Kansas City, Missouri
October 16, 2020
We have served as the auditor of one or more American Century investment companies since 1997.
27
| Management | ||
The Board of Trustees
The individuals listed below serve as trustees of the funds. Each trustee will continue to serve in this capacity until death, retirement, resignation or removal from office. The board has adopted a mandatory retirement age for trustees who are not “interested persons,” as that term is defined in the Investment Company Act (independent trustees). Trustees who are not also officers of the trust shall retire by December 31st of the year in which they reach their 75th birthday.
Mr. Thomas is an “interested person” because he currently serves as President and Chief Executive Officer of American Century Companies, Inc. (ACC), the parent company of American Century Investment Management, Inc. (ACIM or the advisor). The other trustees are independent. They are not employees, directors or officers of, and have no financial interest in, ACC or any of its wholly owned, direct or indirect, subsidiaries, including ACIM and American Century Services, LLC (ACS), and they do not have any other affiliations, positions or relationships that would cause them to be considered “interested persons” under the Investment Company Act. The following trustees also serve in this capacity for a number of other registered investment companies in the American Century Investments family of funds: Jonathan S. Thomas, 15; Ronald J. Gilson, 8; and Stephen E. Yates, 7.
The following table presents additional information about the trustees. The mailing address for each trustee other than Jonathan S. Thomas is 330 Madison Avenue, New York, New York 10017. The mailing address for Jonathan S. Thomas is 4500 Main Street, Kansas City, Missouri 64111.
| Name (Year of Birth) | Position(s) Held with Funds | Length of Time Served | Principal Occupation(s) During Past 5 Years | Number of American Century Portfolios Overseen by Trustee | Other Directorships Held During Past 5 Years | ||||||||||||
| Independent Trustees | |||||||||||||||||
| Reginald M. Browne (1968) | Trustee and Chairman of the Board | Since 2017 (Chairman since 2019) | Principal, GTS Securities (automated capital markets trading firm)(2019 to present); Senior Managing Director, Co Global Head-ETF Group, Cantor Fitzgerald (financial services firm)(2013 to 2019) | 19 | None | ||||||||||||
| Ronald J. Gilson (1946) | Trustee | Since 2017 | Charles J. Meyers Professor of Law and Business, Emeritus, Stanford Law School (1979 to 2016); Marc and Eva Stern Professor of Law and Business, Columbia University School of Law (1992 to present) | 59 | None | ||||||||||||
| Barry A. Mendelson (1958) | Trustee | Since 2017 | Retired; Consultant regarding ETF and mutual fund matters (2015 to 2016); Principal and Senior Counsel, The Vanguard Group (investment management)(1998 to 2014) | 19 | None | ||||||||||||
| Stephen E. Yates (1948) | Trustee | Since 2017 | Retired | 82 | None | ||||||||||||
28
| Name (Year of Birth) | Position(s) Held with Funds | Length of Time Served | Principal Occupation(s) During Past 5 Years | Number of American Century Portfolios Overseen by Trustee | Other Directorships Held During Past 5 Years | ||||||||||||
| Interested Trustees | |||||||||||||||||
| Jonathan S. Thomas (1963) | Trustee | Since 2017 | President and Chief Executive Officer, ACC (2007 to present). Also serves as Chief Executive Officer, ACS; Executive Vice President, ACIM; Director, ACC, ACIM and other ACC subsidiaries | 122 | None | ||||||||||||
The Statement of Additional Information has additional information about the fund's trustees and is available without charge, upon request, by calling 1-800-345-6488.
29
Officers
The following table presents certain information about the executive officers of the funds. Each officer, except Edward Rosenberg, serves as an officer for each of the 16 investment companies in the American Century family of funds. No officer is compensated for his or her service as an officer of the funds. The listed officers are interested persons of the funds and are appointed or re-appointed on an annual basis. The mailing address for each officer listed below is 4500 Main Street, Kansas City, Missouri 64111.
| Name (Year of Birth) | Offices with the Funds | Principal Occupation(s) During the Past Five Years | ||||||
| Patrick Bannigan (1965) | President since 2019 | Executive Vice President and Director, ACC (2012 to present); Chief Financial Officer, Chief Accounting Officer and Treasurer, ACC (2015 to present). Also serves as President, ACS; Vice President, ACIM; Chief Financial Officer, Chief Accounting Officer and/or Director, ACIM, ACS and other ACC subsidiaries | ||||||
| R. Wes Campbell (1974) | Chief Financial Officer and Treasurer since 2018 | Vice President, ACS (2020 to present); Investment Operations and Investment Accounting, ACS (2000 to present) | ||||||
| Amy D. Shelton (1964) | Chief Compliance Officer and Vice President since 2017 | Chief Compliance Officer, American Century funds, (2014 to present); Chief Compliance Officer, ACIM (2014 to present); Chief Compliance Officer, ACIS (2009 to present). Also serves as Vice President, ACIS | ||||||
| Charles A. Etherington (1957) | General Counsel and Vice President since 2017 | Attorney, ACC (1994 to present); Vice President, ACC (2005 to present); General Counsel, ACC (2007 to present). Also serves as General Counsel, ACIM, ACS, ACIS and other ACC subsidiaries; and Senior Vice President, ACIM and ACS | ||||||
| Cleo Chang (1977) | Vice President since 2019 | Senior Vice President, ACIM (2015 to present); Chief Investment Officer, Wilshire Funds Management (2005 to 2015) | ||||||
| David H. Reinmiller (1963) | Vice President since 2017 | Attorney, ACC (1994 to present). Also serves as Vice President, ACIM and ACS | ||||||
| Edward Rosenberg (1973) | Vice President since 2017 | Senior Vice President, ACIM (2017 to present); Senior Vice President, Flexshares Head of ETF Capital Markets, Northern Trust (2012 to 2017) | ||||||
| C. Jean Wade (1964) | Vice President since 2017 | Senior Vice President, ACS (2017 to present); Vice President, ACS (2000 to 2017) | ||||||
| Ward D. Stauffer (1960) | Secretary since 2019 | Attorney, ACS (2003 to present) | ||||||
30
| Approval of Management Agreement | ||
At a meeting held on June 5, 2020, the Fund’s Board of Trustees (the "Board") unanimously approved the renewal of the management agreement pursuant to which American Century Investment Management, Inc. (the “Advisor”) acts as the investment advisor for the Fund. Under Section 15(c) of the Investment Company Act, contracts for investment advisory services are required to be reviewed, evaluated, and approved by a majority of a fund’s trustees (the “Trustees”), including a majority of the independent Trustees, each year.
Prior to its consideration of the renewal of the management agreement, the Trustees requested and reviewed extensive data and information compiled by the Advisor and certain independent providers of evaluation data concerning the Fund and the services provided to the Fund by the Advisor. This review was in addition to the oversight and evaluation undertaken by the Board and its Audit Committee on a continual basis and the information received was supplemental to the extensive information that the Board and its Audit Committee receive and consider throughout the year.
In connection with its consideration of the renewal of the management agreement, the Board’s review and evaluation of the services provided by the Advisor included, but was not limited to, the following:
•the nature, extent, and quality of investment management and other services provided and to be provided to the Fund;
•the wide range of other programs and services provided and to be provided to the Fund and its shareholders on a routine and non-routine basis;
•the Fund’s investment performance, including data comparing the Fund's performance to appropriate benchmarks of funds with similar objectives and strategies;
•the cost of owning the Fund compared to the cost of owning similar funds;
•the compliance policies, procedures, and regulatory experience of the Advisor and the Fund's service providers;
•the Advisor’s strategic plans;
•the Advisor’s business continuity plans and specifically its response to the COVID-19 pandemic;
•financial data showing the cost of services provided to the Fund, the profitability of the Fund to the Advisor, and the overall profitability of the Advisor;
•information regarding payments to intermediaries by the Advisor; and
•possible economies of scale associated with the Advisor’s management of the Fund; and
•possible collateral benefits to the Advisor from the management of the Fund.
The independent Trustees met separately in private session to discuss the renewal and to review and discuss the information provided in response to their request. The independent Trustees also held active discussions with the Advisor regarding the renewal of the management agreement. The independent Trustees had the benefit of the advice of their independent counsel throughout the process.
Factors Considered
The Trustees considered all of the information provided by the Advisor, the independent data providers, and independent counsel in connection with the approval. They determined that the information was sufficient for them to evaluate the management agreement for the Fund. In connection with their review, the Trustees did not identify any single factor as being all-important or
31
controlling, and each Trustee may have attributed different levels of importance to different factors. In deciding to renew the management agreement, the Board based its decision on a number of factors, including without limitation the following:
Nature, Extent and Quality of Services — Generally. Under the management agreement, the Advisor is responsible for providing or arranging for all services necessary for the operation of the Fund. The Board noted that the Advisor provides or arranges at its own expense a wide variety of services including without limitation the following:
•constructing and designing the Fund
•portfolio research and security selection
•initial capitalization/funding
•securities trading
•Fund administration
•custody of Fund assets
•daily valuation of the Fund’s portfolio
•shareholder servicing and transfer agency, including shareholder confirmations, recordkeeping, and communications
•legal services (except the independent Trustees’ counsel)
•regulatory and portfolio compliance
•financial reporting
•marketing and distribution (except amounts paid by the Fund under Rule 12b-1 plans)
Investment Management Services. The nature of the investment management services provided to the Fund is quite complex and allows Fund shareholders access to professional money management, instant diversification of their investments within an asset class, and liquidity. In evaluating investment performance, the Board expects the Advisor to manage the Fund in accordance with its investment objectives and approved strategies. Further, the Trustees recognize that the Advisor has an obligation to monitor trading activities, and in particular to seek the best execution of fund trades, and to evaluate the use of and payment for research. In providing these services, the Advisor utilizes teams of investment professionals (portfolio managers, analysts, research assistants, and securities traders) who require extensive information technology, research, training, compliance, and other systems to conduct their business. The Board provides oversight of the investment performance process. It regularly reviews investment performance information for the Fund, together with comparative information for appropriate benchmarks over different time horizons. The Trustees also review investment performance information during the management agreement renewal process. If performance concerns are identified, the Board discusses with the Advisor the reasons for such results and any efforts being undertaken to improve performance. The Fund’s performance since inception reviewed by the Board was above its benchmark. The Board found the investment management services provided by the Advisor to the Fund to be satisfactory and consistent with the management agreement.
Shareholder and Other Services. Under the management agreement, the Advisor provides or arranges for a comprehensive package of services to the Fund. The Board, directly and through its Audit Committee, regularly reviews reports and evaluations of such services at its regular meetings. These reports include, but are not limited to, information regarding the operational efficiency and accuracy of the shareholder and transfer agency services provided, staffing levels, shareholder satisfaction, technology support (including cyber security), new products and services offered to Fund shareholders, securities trading activities, portfolio valuation services, auditing services, and legal and operational compliance activities. The Board found the services provided by the Advisor to the Fund under the management agreement to be competitive and of high quality.
32
COVID-19 Response. During 2020, much of the world experienced unprecedented change and challenges from the impacts of the rapidly evolving, worldwide spread of the COVID-19 virus. The Board evaluated the Advisor’s response to the COVID-19 pandemic and its impact on service to the Fund. The Board found that Fund shareholders have continued to receive the Advisor’s investment management and other services without disruption, and Advisor personnel have demonstrated great resiliency in providing those services. The Board, directly and through its Audit Committee, continues to monitor the impact of the pandemic and the response of each of the Fund’s service providers.
Costs of Services and Profitability. The Advisor provides detailed information concerning its cost of providing various services to the Fund, its profitability in managing the Fund (pre- and post-distribution), its overall profitability, and its financial condition. The Trustees have reviewed with the Advisor the methodology used to prepare this financial information. This information is considered in evaluating the Advisor’s financial condition, its ability to continue to provide services under the management agreement, and the reasonableness of the current management fee. The Board concluded that the Advisor’s profits were reasonable in light of the services provided to the Fund.
Ethics. The Board generally considers the Advisor’s commitment to providing quality services to the Fund and to conducting its business ethically. They noted that the Advisor’s practices generally meet or exceed industry best practices.
Economies of Scale. The Board also reviewed information provided by the Advisor regarding the possible existence of economies of scale in connection with the management of the Fund. The Board concluded that economies of scale are difficult to measure and predict with precision, especially on a fund-by-fund basis. The Board concluded that the Advisor is appropriately sharing economies of scale, to the extent they exist, through its competitive fee structure, offering competitive fees from fund inception, and through reinvestment in its business, infrastructure, investment capabilities and initiatives to provide shareholders additional content and services.
Comparison to Other Funds’ Fees. The management agreement provides that the Fund pays the Advisor a single, all-inclusive (or unified) management fee for providing all services necessary for the management and operation of the Fund, other than brokerage expenses, expenses attributable to short sales, taxes, interest, extraordinary expenses, and expenses incurred in connection with the provision of shareholder services and distribution services under a plan adopted pursuant to Rule 12b-1 under the Investment Company Act. Under the unified fee structure, the Advisor is responsible for providing all investment advisory, custody, audit, administrative, compliance, recordkeeping, marketing and shareholder services, or arranging and supervising third parties to provide such services. The Board believes the unified fee structure is a benefit to Fund shareholders because it clearly discloses to shareholders the cost of owning Fund shares, and, since the unified fee cannot be increased without a vote of Fund shareholders, it shifts to the Advisor the risk of increased costs of operating the Fund and provides a direct incentive to minimize administrative inefficiencies. Part of the Board’s analysis of fee levels involves reviewing certain evaluative data compiled by an independent provider comparing the Fund’s unified fee to the total expense ratios of its peers. The unified fee charged to shareholders of the Fund was below the median of the total expense ratios of the Fund’s peer expense universe and the lowest of its peer expense group. The Board concluded that the management fee paid by the Fund to the Advisor under the management agreement is reasonable in light of the services provided to the Fund.
Comparison to Fees and Services Provided to Other Clients of the Advisor. The Board also requested information from the Advisor concerning the nature of the services, fees, costs, and profitability of its advisory services to funds or other advisory clients managed similarly to the Fund. The Advisor informed the Trustees that, as of December 31, 2019, it did not provide services to any other investment companies or comparable accounts that were managed similarly to the Fund.
33
Payments to Intermediaries. The Trustees also requested a description of payments made to intermediaries by the Fund and the Advisor and services provided in response thereto. These payments could include various payments made by the Fund or the Advisor to different types of intermediaries and recordkeepers for distribution and service activities provided for the Fund. The Trustees reviewed such information and received representations from the Advisor that all such payments by the Advisor were made from the Advisor’s resources and reasonable profits. The Board found such payments to be reasonable in scope and purpose.
Collateral or “Fall-Out” Benefits Derived by the Advisor. The Board considered the possible existence of collateral benefits the Advisor may receive as a result of its relationship with the Fund. They concluded that the Advisor’s primary business is managing funds and it generally does not use fund or shareholder information to generate profits in other lines of business, and therefore does not derive any significant collateral benefits from them. The Board noted that additional assets from other clients may offer the Advisor some benefit from increased leverage with service providers and counterparties. The Board also determined that the Advisor is able to provide investment management services to certain clients other than the Fund, at least in part, due to its existing infrastructure built to serve the fund complex. The Board concluded that appropriate allocation methodologies had been employed to assign resources and the cost of those resources to these other clients.
Existing Relationship. The Board also considered whether there was any reason for not continuing the existing arrangement with the Advisor. In this regard, the Board was mindful of the potential disruptions of the Fund’s operations and various risks, uncertainties, and other effects that could occur as a result of a decision not to continue such relationship. In particular, the Board recognized that most shareholders have invested in the Fund on the strength of the Advisor’s industry standing and reputation and in the expectation that the Advisor will have a continuing role in providing advisory services to the Fund.
Conclusion of the Trustees. As a result of this process, the Board, including all of the independent Trustees, taking into account all of the factors discussed above and the information provided by the Advisor and others in connection with its review and throughout the year, determined that the management fee is fair and reasonable in light of the services provided and that the investment management agreement between the Fund and the Advisor should be renewed.
34
| Liquidity Risk Management Program | ||
The Fund has adopted a liquidity risk management program (the “program”). The Fund’s Board of Trustees (the "Board") has designated American Century Investment Management, Inc. (“ACIM”) as the administrator of the program. Personnel of ACIM or its affiliates conduct the day-to-day operation of the program pursuant to policies and procedures administered by those members of the ACIM’s Investment Oversight Committee who are members of the ACIM’s Investment Management and Global Analytics departments.
Under the program, ACIM manages the Fund’s liquidity risk, which is the risk that the Fund could not meet shareholder redemption requests without significant dilution of remaining shareholders’ interests in the Fund. This risk is managed by monitoring the degree of liquidity of the Fund’s investments, limiting the amount of the Fund’s illiquid investments, and utilizing various risk management tools and facilities available to the Fund for meeting shareholder redemptions, among other means. ACIM’s process of determining the degree of liquidity of the Fund’s investments is supported by one or more third-party liquidity assessment vendors.
The Board reviewed a report prepared by ACIM regarding the operation and effectiveness of the program for the period December 1, 2018 through December 31, 2019. No significant liquidity events impacting the Fund were noted in the report. In addition, ACIM provided its assessment that the program had been effective in managing the Fund’s liquidity risk.
35
| Additional Information | ||
Retirement Account Information
As required by law, distributions you receive from certain retirement accounts are subject to federal income tax withholding, unless you elect not to have withholding apply*. Tax will be withheld on the total amount withdrawn even though you may be receiving amounts that are not subject to withholding, such as nondeductible contributions. In such case, excess amounts of withholding could occur. You may adjust your withholding election so that a greater or lesser amount will be withheld.
Remember, even if you elect not to have income tax withheld, you are liable for paying income tax on the taxable portion of your withdrawal. If you elect not to have income tax withheld or you don’t have enough income tax withheld, you may be responsible for payment of estimated tax. You may incur penalties under the estimated tax rules if your withholding and estimated tax payments are not sufficient. You can reduce or defer the income tax on a distribution by directly or indirectly rolling such distribution over to another IRA or eligible plan. You should consult your tax advisor for additional information.
State tax will be withheld if, at the time of your distribution, your address is within one of the mandatory withholding states and you have federal income tax withheld (or as otherwise required by state law). State taxes will be withheld from your distribution in accordance with the respective state rules.
*Some 403(b), 457 and qualified retirement plan distributions may be subject to 20% mandatory withholding, as they are subject to special tax and withholding rules. Your plan administrator or plan sponsor is required to provide you with a special tax notice explaining those rules at the time you request a distribution. If applicable, federal and/or state taxes may be withheld from your distribution amount.
Proxy Voting Policies
A description of the policies that the fund's investment advisor uses in exercising the voting rights associated with the securities purchased and/or held by the fund are available without charge, upon request, by calling 1-800-345-6488. It is also available on American Century Investments’ website at americancentury.com/proxy and on the Securities and Exchange Commission’s website at sec.gov. Information regarding how the investment advisor voted proxies relating to portfolio securities during the most recent 12-month period ended June 30 is available at americancentury.com/proxy. It is also available at sec.gov.
Quarterly Portfolio Disclosure
The fund files its complete schedule of portfolio holdings with the Securities and Exchange Commission (SEC) for the first and third quarters of each fiscal year as an exhibit to its reports on Form N-PORT. The fund's Form N-PORT reports are available on the SEC’s website at sec.gov.
36
Other Tax Information
The following information is provided pursuant to provisions of the Internal Revenue Code.
The fund hereby designates up to the maximum amount allowable as qualified dividend income for
the fiscal year ended August 31, 2020.
For corporate taxpayers, the fund hereby designates $1,392,826, or up to the maximum amount
allowable, of ordinary income distributions paid during the fiscal year ended August 31, 2020 as
qualified for the corporate dividends received deduction.
37
| Notes | ||
38
| Notes | ||
39
| Notes | ||
40
| ||||||||
| Contact Us | avantisinvestors.com | |||||||
| American Century Sales Representatives, Financial Professionals, Broker Dealers, Insurance Companies, Banks and Trust Companies | 1-833-928-2684 | |||||||
| Telecommunications Relay Service for the Deaf | 711 | |||||||
| American Century ETF Trust | ||||||||
Investment Advisor: American Century Investment Management, Inc. Kansas City, Missouri | ||||||||
Distributor: Foreside Fund Services, LLC - Distributor, not affiliated with American Century Investment Services, Inc. | ||||||||
| This report and the statements it contains are submitted for the general information of our shareholders. The report is not authorized for distribution to prospective investors unless preceded or accompanied by an effective prospectus. | ||||||||
| ©2020 American Century Proprietary Holdings, Inc. All rights reserved. CL-ANN-96046 2010 | ||||||||
| Annual Report | |||||
| August 31, 2020 | |||||
Avantis® Emerging Markets Equity Fund | |||||
| Institutional Class (AVEEX) | |||||
Beginning on January 1, 2021, as permitted by regulations adopted by the Securities and Exchange Commission, paper copies of the fund’s shareholder reports like this one will no longer be sent by mail, unless you specifically request paper copies of the reports from the fund or from your financial intermediary, such as a broker-dealer or bank. Instead, the reports will be made available on a website, and you will be notified by mail each time a report is posted and provided with a website link to access the report.
If you already elected to receive shareholder reports electronically, you will not be affected by this change and you need not take any action. You may elect to receive shareholder reports and other communications from the fund or your financial intermediary electronically by calling or sending an email request to your appropriate contacts as listed on the back cover of this report.
You may elect to receive all future reports in paper free of charge. You can inform the fund or your financial intermediary that you wish to continue receiving paper copies of your shareholder reports by calling or sending an email request to your appropriate contacts as listed on the back cover of this report. Your election to receive reports in paper will apply to all funds held with the fund complex/your financial intermediary.
| Table of Contents | ||
| Chairman’s Letter | |||||
| Performance | |||||
| Portfolio Commentary | |||||
| Fund Characteristics | |||||
| Shareholder Fee Example | |||||
| Schedule of Investments | |||||
| Statement of Assets and Liabilities | |||||
| Statement of Operations | |||||
| Statement of Changes in Net Assets | |||||
| Notes to Financial Statements | |||||
| Financial Highlights | |||||
| Report of Independent Registered Public Accounting Firm | |||||
| Management | |||||
| Approval of Management Agreement | |||||
| Liquidity Risk Management Program | |||||
| Additional Information | |||||
Any opinions expressed in this report reflect those of the author as of the date of the report, and do not necessarily represent the opinions of American Century Investments® or any other person in the American Century Investments organization. Any such opinions are subject to change at any time based upon market or other conditions and American Century Investments disclaims any responsibility to update such opinions. These opinions may not be relied upon as investment advice and, because investment decisions made by American Century Investments funds are based on numerous factors, may not be relied upon as an indication of trading intent on behalf of any American Century Investments fund. Security examples are used for representational purposes only and are not intended as recommendations to purchase or sell securities. Performance information for comparative indices and securities is provided to American Century Investments by third party vendors. To the best of American Century Investments’ knowledge, such information is accurate at the time of printing.
| Chairman's Letter | ||
Jonathan ThomasDear Investor:
Thank you for reviewing this annual report for the period ended August 31, 2020. Annual reports help convey important information about fund returns, including market factors that affected performance. For additional investment insights, please visit avantisinvestors.com.
Pandemic Disrupted Economic, Market Courses
Broad market sentiment was generally upbeat early in the period. Dovish central banks, modest inflation, improving economic and corporate earnings data, and progress on U.S.-China trade helped boost global growth outlooks. Against this backdrop, stocks largely remained in favor.
However, beginning in late February, COVID-19 quickly quashed the optimistic tone. The outbreak rapidly spread worldwide, halting most U.S. and global economic activity and triggering a deep worldwide recession. Global stocks sold off sharply, but central banks and federal governments stepped in quickly and aggressively to stabilize financial markets. These extraordinary efforts proved helpful, as most stocks rebounded quickly. As the period progressed, coronavirus infection and death rates declined in many regions and economies reopened. By the end of August, manufacturing, employment and other data suggested an economic recovery was underway.
Overall, global stocks delivered mixed results for the period. U.S. stocks generally advanced and fared better than their counterparts elsewhere. The growth style significantly outperformed value stocks, which struggled.
A Slow Return to Normal
The return to pre-pandemic life will take time and patience, but we are confident we will get there. Several drug companies are in final stages of vaccine trials, and medical professionals continue to fine-tune virus treatment protocols. In the meantime, investors likely will face periods of outbreak-related disruptions, economic and political uncertainty, and heightened market volatility. These influences can be unsettling, but they tend to be temporary.
We appreciate your confidence in us during these extraordinary times. Our investment professionals have experience weathering unpredictable markets, and we’re confident we will continue to meet today’s challenges.
Sincerely,
Jonathan Thomas
Chairman
Avantis Investors
2
| Performance | ||
| Total Returns as of August 31, 2020 | |||||||||||||||||||||||
| Ticker Symbol | Since Inception | Inception Date | |||||||||||||||||||||
| Institutional Class | AVEEX | 3.57% | 12/4/2019 | ||||||||||||||||||||
| MSCI Emerging Markets IMI Index | — | 8.02% | — | ||||||||||||||||||||
| Growth of $10,000 Over Life of Fund | ||
| $10,000 investment made December 4, 2019 | ||
| Value on August 31, 2020 | |||||
| Institutional Class — $10,357 | |||||
| MSCI Emerging Markets IMI Index — $10,802 | |||||
| Total Annual Fund Operating Expenses | |||||||||||||||||
Institutional Class 0.33% | |||||||||||||||||
The total annual fund operating expenses shown is as stated in the fund’s prospectus current as of the date of this report. The prospectus may vary from the expense ratio shown elsewhere in this report because it is based on a different time period, includes acquired fund fees and expenses, and, if applicable, does not include fee waivers or expense reimbursements.
Data presented reflect past performance. Past performance is no guarantee of future results. Current performance may be higher or lower than the performance shown. Total returns for periods less than one year are not annualized. Investment return and principal value will fluctuate, and redemption value may be more or less than original cost. Data assumes reinvestment of dividends and capital gains, and none of the charts reflect the deduction of taxes that a shareholder would pay on fund distributions or the redemption of fund shares. To obtain performance data current to the most recent month end, please call 1-833-928-2684 or visit avantisinvestors.com. For additional information about the fund, please consult the prospectus.
3
| Portfolio Commentary | ||
Portfolio Managers: Eduardo Repetto, Mitch Firestein, Daniel Ong and Ted Randall
Fund Strategy
Avantis Emerging Markets Equity seeks long-term capital appreciation by investing in a diverse group of companies related to emerging markets across market sectors, industry groups, countries and market capitalizations.
The fund seeks securities of companies that it expects to have higher returns. It places an enhanced emphasis on securities of companies with smaller market capitalizations and securities of companies it defines as high profitability or value companies. Conversely, the fund seeks to underweight or exclude securities it expects to have lower returns. These include securities of large companies with lower levels of profitability and higher prices relative to their book values or other financial metrics. Under normal market conditions, the fund will invest at least 80% of its assets in equity securities of companies related to emerging market countries.
The portfolio managers continually analyze market and financial data to make buy, sell and hold decisions. When buying or selling a security, the portfolio managers may consider the trade-off between expected returns of the security and implementation or tax costs of the trade. They do this in an attempt to gain trading efficiencies, avoid unnecessary risk and enhance fund performance.
Performance Review
For the period from Avantis Emerging Markets Equity’s inception on December 4, 2019, through the fund’s fiscal year-end on August 31, 2020, the fund returned 3.57%.* For the same time period, the fund’s benchmark, the MSCI Emerging Markets IMI Index, returned 8.02%. Fund returns reflect fees and operating expenses, while index returns do not.
The MSCI Emerging Markets IMI Index is an unmanaged index generally representative of the performance of emerging markets stocks across capitalization categories. The fund’s underperformance versus the index was largely due to the fund’s emphasis on companies with smaller market capitalizations, higher levels of profitability and lower prices relative to their book values. These value-oriented companies generally underperformed larger-cap companies with growth characteristics, or higher prices relative to their book values.
For example, large/mid-cap growth stocks (as measured by the MSCI Emerging Markets Growth Index) returned 23.08% for the period, outperforming small-cap value stocks (as measured by the MSCI Emerging Markets Small Cap Value Index), which returned -1.98%.
*Total returns for periods less than one year are not annualized.
4
| Fund Characteristics | ||
| AUGUST 31, 2020 | |||||
| Top Ten Holdings | % of net assets | ||||
| Taiwan Semiconductor Manufacturing Co. Ltd., ADR | 3.4% | ||||
| Alibaba Group Holding Ltd., ADR | 3.4% | ||||
| Tencent Holdings Ltd. | 3.3% | ||||
| Samsung Electronics Co. Ltd., GDR | 2.6% | ||||
| JD.com, Inc., ADR | 1.6% | ||||
| China Construction Bank Corp., H Shares | 1.3% | ||||
| China Mobile Ltd., ADR | 0.9% | ||||
| Infosys Ltd., ADR | 0.7% | ||||
| Reliance Industries Ltd., GDR | 0.7% | ||||
| LG Chem Ltd. | 0.7% | ||||
| Types of Investments in Portfolio | % of net assets | ||||
| Common Stocks | 99.1% | ||||
| Rights | —* | ||||
| Warrants | —* | ||||
| Total Equity Exposure | 99.1% | ||||
| Temporary Cash Investments | 1.5% | ||||
| Temporary Cash Investments - Securities Lending Collateral | 0.1% | ||||
| Other Assets and Liabilities | (0.7)% | ||||
*Category is less than 0.05% of total net assets.
| Investments by Country | % of net assets | ||||
| China | 37.4% | ||||
| Taiwan | 14.3% | ||||
| South Korea | 13.6% | ||||
| India | 9.7% | ||||
| Brazil | 5.5% | ||||
| South Africa | 4.1% | ||||
| Russia | 2.5% | ||||
| Thailand | 2.3% | ||||
| Malaysia | 2.2% | ||||
| Other Countries | 7.5% | ||||
| Cash and Equivalents* | 0.9% | ||||
*Includes temporary cash investments, temporary cash investments - securities lending collateral and other assets and liabilities.
5
| Shareholder Fee Example | ||
Fund shareholders may incur two types of costs: (1) transaction costs, including sales charges (loads) on purchase payments and redemption/exchange fees; and (2) ongoing costs, including management fees; distribution and service (12b-1) fees; and other fund expenses. This example is intended to help you understand your ongoing costs (in dollars) of investing in your fund and to compare these costs with the ongoing cost of investing in other mutual funds.
The example is based on an investment of $1,000 made at the beginning of the period and held for the entire period from March 1, 2020 to August 31, 2020.
Actual Expenses
The table provides information about actual account values and actual expenses for each class. You may use the information, together with the amount you invested, to estimate the expenses that you paid over the period. First, identify the share class you own. Then simply divide your account value by $1,000 (for example, an $8,600 account value divided by $1,000 = 8.6), then multiply the result by the number under the heading “Expenses Paid During Period” to estimate the expenses you paid on your account during this period.
Hypothetical Example for Comparison Purposes
The table also provides information about hypothetical account values and hypothetical expenses based on the actual expense ratio of each class of your fund and an assumed rate of return of 5% per year before expenses, which is not the actual return of a fund’s share class. The hypothetical account values and expenses may not be used to estimate the actual ending account balance or expenses you paid for the period. You may use this information to compare the ongoing costs of investing in your fund and other funds. To do so, compare this 5% hypothetical example with the 5% hypothetical examples that appear in the shareholder reports of the other funds.
Please note that the expenses shown in the table are meant to highlight your ongoing costs only and do not reflect any transactional costs, such as sales charges (loads) or redemption/exchange fees. Therefore, the table is useful in comparing ongoing costs only, and will not help you determine the relative total costs of owning different funds. In addition, if these transactional costs were included, your costs would have been higher.
| Beginning Account Value 3/1/20 | Ending Account Value 8/31/20 | Expenses Paid During Period(1) 3/1/20 - 8/31/20 | Annualized Expense Ratio(1) | |||||||||||
| Actual | ||||||||||||||
| Institutional Class | $1,000 | $1,086.20 | $1.73 | 0.33% | ||||||||||
| Hypothetical | ||||||||||||||
| Institutional Class | $1,000 | $1,023.48 | $1.68 | 0.33% | ||||||||||
(1)Expenses are equal to the class's annualized expense ratio listed in the table above, multiplied by the average account value over the period, multiplied by 184, the number of days in the most recent fiscal half-year, divided by 366, to reflect the one-half year period. Annualized expense ratio reflects actual expenses, including any applicable fee waivers or expense reimbursements and excluding any acquired fund fees and expenses.
6
| Schedule of Investments | ||
AUGUST 31, 2020
| Shares | Value | |||||||
| COMMON STOCKS — 99.1% | ||||||||
| Brazil — 5.5% | ||||||||
| AES Tiete Energia SA | 4,200 | $ | 11,492 | |||||
Aliansce Sonae Shopping Centers SA(1) | 200 | 963 | ||||||
| Alpargatas SA, Preference Shares | 1,200 | 8,170 | ||||||
| Alupar Investimento SA | 1,700 | 7,230 | ||||||
| Ambev SA, ADR | 11,695 | 26,314 | ||||||
Anima Holding SA(1) | 200 | 1,084 | ||||||
| Arezzo Industria e Comercio SA | 900 | 9,219 | ||||||
| Atacadao SA | 1,700 | 6,042 | ||||||
Azul SA, ADR(1) | 139 | 1,689 | ||||||
B2W Cia Digital(1) | 700 | 14,349 | ||||||
| B3 SA - Brasil Bolsa Balcao | 3,800 | 40,889 | ||||||
| Banco ABC Brasil SA, Preference Shares | 2,400 | 5,953 | ||||||
| Banco Bradesco SA | 5,060 | 17,789 | ||||||
| Banco Bradesco SA, ADR | 18,231 | 68,731 | ||||||
| Banco BTG Pactual SA | 1,700 | 25,116 | ||||||
| Banco do Brasil SA | 2,160 | 12,952 | ||||||
| Banco do Estado do Rio Grande do Sul SA, Class B Preference Shares | 2,800 | 6,675 | ||||||
| Banco Mercantil do Brasil SA, Preference Shares | 400 | 1,132 | ||||||
| Banco Pan SA, Preference Shares | 4,400 | 6,811 | ||||||
| Banco Santander Brasil SA, ADR | 2,143 | 11,079 | ||||||
| BB Seguridade Participacoes SA | 5,300 | 25,811 | ||||||
BR Malls Participacoes SA(1) | 7,800 | 13,198 | ||||||
| BR Properties SA | 5,500 | 9,196 | ||||||
| BrasilAgro - Co. Brasileira de Propriedades Agricolas | 300 | 1,147 | ||||||
| Braskem SA, ADR | 1,253 | 9,736 | ||||||
BRF SA, ADR(1) | 2,869 | 10,328 | ||||||
| Camil Alimentos SA | 600 | 1,410 | ||||||
| CCR SA | 13,300 | 32,337 | ||||||
| Centrais Eletricas Brasileiras SA, ADR | 194 | 1,257 | ||||||
| Centrais Eletricas Brasileiras SA, Class B Preference Shares | 200 | 1,310 | ||||||
| Cia Brasileira de Distribuicao, ADR | 491 | 5,686 | ||||||
| Cia de Locacao das Americas | 4,400 | 16,376 | ||||||
| Cia de Saneamento Basico do Estado de Sao Paulo, ADR | 1,439 | 12,519 | ||||||
| Cia de Saneamento de Minas Gerais-COPASA | 900 | 7,820 | ||||||
| Cia de Saneamento do Parana | 600 | 2,927 | ||||||
| Cia de Saneamento do Parana, Preference Shares | 4,800 | 4,687 | ||||||
| Cia de Transmissao de Energia Eletrica Paulista, Preference Shares | 400 | 1,568 | ||||||
| Cia Energetica de Minas Gerais, ADR | 451 | 884 | ||||||
| Cia Energetica de Sao Paulo, Class B Preference Shares | 3,500 | 19,147 | ||||||
| Cia Ferro Ligas da Bahia - FERBASA, Preference Shares | 300 | 980 | ||||||
| Cia Hering | 300 | 1,000 | ||||||
| Cia Paranaense de Energia, ADR | 452 | 5,112 | ||||||
| Cia Siderurgica Nacional SA, ADR | 2,007 | 5,479 | ||||||
| Cielo SA | 19,000 | 15,919 | ||||||
| Cogna Educacao | 1,400 | 1,472 | ||||||
7
| Shares | Value | |||||||
| Construtora Tenda SA | 300 | $ | 1,702 | |||||
Cosan Logistica SA(1) | 1,600 | 6,276 | ||||||
| Cosan SA | 1,000 | 15,251 | ||||||
| Cristal Pigmentos do Brasil SA, Preference Shares | 200 | 754 | ||||||
| CVC Brasil Operadora e Agencia de Viagens SA | 400 | 1,334 | ||||||
| Cyrela Brazil Realty SA Empreendimentos e Participacoes | 4,700 | 20,753 | ||||||
| Direcional Engenharia SA | 400 | 1,099 | ||||||
Dommo Energia SA(1) | 1,400 | 322 | ||||||
| Duratex SA | 5,100 | 14,941 | ||||||
EcoRodovias Infraestrutura e Logistica SA(1) | 3,900 | 9,162 | ||||||
| EDP - Energias do Brasil SA | 4,400 | 15,059 | ||||||
Embraer SA, ADR(1) | 2,301 | 12,195 | ||||||
| Enauta Participacoes SA | 700 | 1,449 | ||||||
| Energisa SA | 100 | 803 | ||||||
Eneva SA(1) | 1,700 | 15,453 | ||||||
| Engie Brasil Energia SA | 2,400 | 18,872 | ||||||
| Equatorial Energia SA | 6,700 | 28,471 | ||||||
Eucatex SA Industria e Comercio, Preference Shares(1) | 700 | 813 | ||||||
| Even Construtora e Incorporadora SA | 2,500 | 5,932 | ||||||
| Ez Tec Empreendimentos e Participacoes SA | 200 | 1,411 | ||||||
| Fleury SA | 1,400 | 6,657 | ||||||
| Fras-Le SA | 1,000 | 947 | ||||||
Gafisa SA(1) | 1,311 | 1,185 | ||||||
| Gerdau SA, ADR | 12,021 | 42,073 | ||||||
Gol Linhas Aereas Inteligentes SA, ADR(1) | 87 | 567 | ||||||
| Grazziotin SA, Preference Shares | 200 | 974 | ||||||
| Grendene SA | 800 | 1,127 | ||||||
| Guararapes Confeccoes SA | 800 | 2,574 | ||||||
| Hapvida Participacoes e Investimentos SA | 900 | 10,727 | ||||||
Helbor Empreendimentos SA(1) | 720 | 1,599 | ||||||
| Hypera SA | 1,600 | 9,375 | ||||||
| Iguatemi Empresa de Shopping Centers SA | 200 | 1,196 | ||||||
| Industrias Romi SA | 300 | 668 | ||||||
| Instituto Hermes Pardini SA | 1,400 | 6,634 | ||||||
| Iochpe Maxion SA | 2,900 | 6,140 | ||||||
| IRB Brasil Resseguros S/A | 9,500 | 12,416 | ||||||
| IRB Brasil Resseguros S/A | 3,414 | 4,362 | ||||||
| Itau Unibanco Holding SA, ADR | 14,277 | 60,820 | ||||||
| JBS SA | 8,200 | 33,497 | ||||||
| Jereissati Participacoes SA | 200 | 853 | ||||||
| JHSF Participacoes SA | 2,600 | 3,384 | ||||||
| JSL SA | 400 | 2,310 | ||||||
| Kepler Weber SA | 200 | 1,642 | ||||||
| Klabin SA | 12,300 | 57,812 | ||||||
Light SA(1) | 3,600 | 9,922 | ||||||
| Localiza Rent a Car SA | 3,680 | 32,592 | ||||||
Locaweb Servicos de Internet SA(1) | 500 | 5,608 | ||||||
| LOG Commercial Properties e Participacoes SA | 500 | 2,856 | ||||||
Log-in Logistica Intermodal SA(1) | 1,900 | 6,551 | ||||||
| Lojas Americanas SA, Preference Shares | 6,515 | 38,411 | ||||||
| Lojas Renner SA | 6,600 | 52,959 | ||||||
| M Dias Branco SA | 200 | 1,295 | ||||||
8
| Shares | Value | |||||||
| Magazine Luiza SA | 2,600 | $ | 44,540 | |||||
| Mahle-Metal Leve SA | 300 | 928 | ||||||
| Marcopolo SA, Preference Shares | 14,900 | 7,724 | ||||||
Marfrig Global Foods SA(1) | 4,300 | 13,971 | ||||||
Marisa Lojas SA(1) | 1,500 | 2,289 | ||||||
| Metalurgica Gerdau SA, Preference Shares | 1,900 | 3,059 | ||||||
Mills Estruturas e Servicos de Engenharia SA(1) | 600 | 740 | ||||||
Minerva SA(1) | 300 | 715 | ||||||
| Movida Participacoes SA | 3,700 | 10,968 | ||||||
| MRV Engenharia e Participacoes SA | 1,300 | 4,304 | ||||||
| Multiplan Empreendimentos Imobiliarios SA | 400 | 1,537 | ||||||
| Natura & Co. Holding SA | 5,578 | 50,399 | ||||||
| Notre Dame Intermedica Participacoes SA | 1,700 | 23,273 | ||||||
| Odontoprev SA | 2,500 | 5,859 | ||||||
Omega Geracao SA(1) | 1,000 | 7,402 | ||||||
Paranapanema SA(1) | 200 | 413 | ||||||
Petro Rio SA(1) | 2,800 | 21,410 | ||||||
| Petrobras Distribuidora SA | 4,900 | 19,078 | ||||||
| Petroleo Brasileiro SA, ADR | 10,443 | 85,319 | ||||||
| Petroleo Brasileiro SA, ADR Preference Shares | 13,864 | 111,051 | ||||||
| Porto Seguro SA | 1,900 | 18,624 | ||||||
| Portobello SA | 1,500 | 1,243 | ||||||
Profarma Distribuidora de Produtos Farmaceuticos SA(1) | 1,200 | 1,154 | ||||||
| Qualicorp Consultoria e Corretora de Seguros SA | 4,300 | 24,441 | ||||||
| Raia Drogasil SA | 500 | 9,914 | ||||||
| Randon SA Implementos e Participacoes, Preference Shares | 1,700 | 3,351 | ||||||
Rumo SA(1) | 6,400 | 26,775 | ||||||
| Santos Brasil Participacoes SA | 600 | 570 | ||||||
| Sao Carlos Empreendimentos e Participacoes SA | 100 | 712 | ||||||
| Sao Martinho SA | 3,400 | 15,006 | ||||||
| Ser Educacional SA | 200 | 522 | ||||||
| SLC Agricola SA | 1,600 | 7,389 | ||||||
| Smiles Fidelidade SA | 400 | 1,035 | ||||||
StoneCo Ltd., A Shares(1) | 445 | 22,695 | ||||||
| Sul America SA | 3,600 | 28,683 | ||||||
Suzano SA, ADR(1) | 4,011 | 36,620 | ||||||
| Tegma Gestao Logistica SA | 400 | 1,884 | ||||||
| Telefonica Brasil SA, ADR Preference Shares | 1,317 | 11,497 | ||||||
| Tim Participacoes SA, ADR | 1,696 | 22,116 | ||||||
| TOTVS SA | 2,800 | 14,699 | ||||||
| Transmissora Alianca de Energia Eletrica SA | 4,400 | 22,705 | ||||||
| Trisul SA | 300 | 669 | ||||||
Tupy SA(1) | 700 | 2,154 | ||||||
| Ultrapar Participacoes SA, ADR | 4,671 | 16,442 | ||||||
| Unipar Carbocloro SA, Preference Shares | 1,700 | 9,157 | ||||||
| Usinas Siderurgicas de Minas Gerais SA Usiminas, Class A Preference Shares | 2,800 | 5,182 | ||||||
| Vale SA, ADR | 12,584 | 138,424 | ||||||
| Valid Solucoes e Servicos de Seguranca em Meios de Pagamento e Identificacao SA | 600 | 1,114 | ||||||
Via Varejo SA(1) | 2,100 | 7,785 | ||||||
| Vivara Participacoes SA | 800 | 3,420 | ||||||
Vulcabras Azaleia SA(1) | 600 | 647 | ||||||
9
| Shares | Value | |||||||
| WEG SA | 2,400 | $ | 28,825 | |||||
| Wiz Solucoes e Corretagem de Seguros SA | 600 | 1,167 | ||||||
| YDUQS Participacoes SA | 2,900 | 14,266 | ||||||
| 1,998,636 | ||||||||
| Chile — 0.6% | ||||||||
| AES Gener SA | 51,133 | 8,024 | ||||||
| Aguas Andinas SA, A Shares | 26,700 | 8,105 | ||||||
| Banco de Chile | 199,919 | 16,755 | ||||||
| Banco de Credito e Inversiones SA | 364 | 11,402 | ||||||
| Banco Santander Chile, ADR | 128 | 1,969 | ||||||
| Besalco SA | 2,057 | 1,138 | ||||||
CAP SA(1) | 490 | 4,349 | ||||||
| Cencosud SA | 7,693 | 11,823 | ||||||
| Cia Cervecerias Unidas SA, ADR | 742 | 9,794 | ||||||
Cia Sud Americana de Vapores SA(1) | 224,423 | 6,206 | ||||||
| Colbun SA | 85,998 | 13,494 | ||||||
| Embotelladora Andina SA, Class B Preference Shares | 4,667 | 10,006 | ||||||
| Empresa Nacional de Telecomunicaciones SA | 2,863 | 17,418 | ||||||
| Empresas CMPC SA | 7,757 | 16,113 | ||||||
| Empresas COPEC SA | 1,730 | 13,017 | ||||||
| Enel Americas SA, ADR | 2,409 | 17,128 | ||||||
| Enel Chile SA | 179,025 | 13,539 | ||||||
| Engie Energia Chile SA | 7,585 | 9,805 | ||||||
| Falabella SA | 2,574 | 8,290 | ||||||
| Grupo Security SA | 30,991 | 6,019 | ||||||
| Inversiones Aguas Metropolitanas SA | 7,601 | 6,032 | ||||||
| Itau CorpBanca Chile SA | 230,881 | 671 | ||||||
Latam Airlines Group SA, ADR(1) | 802 | 1,287 | ||||||
| Parque Arauco SA | 1,251 | 1,931 | ||||||
| Ripley Corp. SA | 3,501 | 1,283 | ||||||
| Salfacorp SA | 2,048 | 1,159 | ||||||
| Sociedad Quimica y Minera de Chile SA, ADR | 335 | 10,506 | ||||||
| 227,263 | ||||||||
| China — 37.4% | ||||||||
21Vianet Group, Inc., ADR(1) | 290 | 6,731 | ||||||
360 Finance, Inc., ADR(1) | 1,436 | 17,950 | ||||||
| 361 Degrees International Ltd. | 6,000 | 796 | ||||||
3SBio, Inc.(1)(2) | 3,000 | 3,521 | ||||||
51job, Inc., ADR(1) | 74 | 4,850 | ||||||
| A-Living Services Co. Ltd., H Shares | 3,000 | 15,439 | ||||||
AAC Technologies Holdings, Inc.(2) | 10,000 | 63,013 | ||||||
| Agile Group Holdings Ltd. | 10,000 | 13,758 | ||||||
| Agricultural Bank of China Ltd., H Shares | 207,000 | 68,995 | ||||||
| Air China Ltd., H Shares | 12,000 | 8,241 | ||||||
| Ajisen China Holdings Ltd. | 4,000 | 644 | ||||||
| AK Medical Holdings Ltd. | 2,000 | 5,090 | ||||||
Alibaba Group Holding Ltd., ADR(1) | 4,293 | 1,232,220 | ||||||
Alibaba Health Information Technology Ltd.(1) | 6,000 | 14,419 | ||||||
Alibaba Pictures Group Ltd.(1) | 20,000 | 2,826 | ||||||
Aluminum Corp. of China Ltd., H Shares(1) | 6,000 | 1,459 | ||||||
Angang Steel Co. Ltd., H Shares(2) | 4,000 | 1,147 | ||||||
| Anhui Conch Cement Co. Ltd., H Shares | 13,000 | 93,930 | ||||||
10
| Shares | Value | |||||||
| Anhui Expressway Co. Ltd., H Shares | 10,000 | $ | 4,884 | |||||
| ANTA Sports Products Ltd. | 10,000 | 98,432 | ||||||
Aoyuan Healthy Life Group Co. Ltd.(2) | 4,000 | 3,711 | ||||||
| Asia Cement China Holdings Corp. | 8,500 | 8,594 | ||||||
| Atlas Corp. | 1,088 | 9,389 | ||||||
| Autohome, Inc., ADR | 636 | 51,033 | ||||||
| AviChina Industry & Technology Co. Ltd., H Shares | 17,000 | 10,572 | ||||||
| BAIC Motor Corp. Ltd., H Shares | 13,000 | 6,200 | ||||||
Baidu, Inc., ADR(1) | 1,247 | 155,339 | ||||||
| BAIOO Family Interactive Ltd. | 10,000 | 1,461 | ||||||
| Bank of China Ltd., H Shares | 600,000 | 195,663 | ||||||
| Bank of Chongqing Co. Ltd., H Shares | 11,500 | 6,441 | ||||||
| Bank of Communications Co. Ltd., H Shares | 51,000 | 26,588 | ||||||
| BBMG Corp., H Shares | 5,000 | 1,044 | ||||||
| Beijing Capital International Airport Co. Ltd., H Shares | 24,000 | 16,925 | ||||||
| Beijing Capital Land Ltd., H Shares | 6,000 | 1,134 | ||||||
| Beijing Chunlizhengda Medical Instruments Co. Ltd., H Shares | 2,500 | 14,259 | ||||||
Beijing Enterprises Clean Energy Group Ltd.(1) | 120,000 | 706 | ||||||
| Beijing Enterprises Holdings Ltd. | 1,500 | 4,757 | ||||||
Beijing Enterprises Water Group Ltd.(1) | 30,000 | 11,778 | ||||||
| Beijing North Star Co. Ltd., H Shares | 4,000 | 865 | ||||||
| Beijing Tong Ren Tang Chinese Medicine Co. Ltd. | 4,000 | 4,574 | ||||||
| Binjiang Service Group Co. Ltd. | 3,000 | 6,582 | ||||||
| BOC Aviation Ltd. | 2,700 | 19,896 | ||||||
| Bosideng International Holdings Ltd. | 10,000 | 2,857 | ||||||
| Bright Scholar Education Holdings Ltd., ADR | 109 | 846 | ||||||
| Brilliance China Automotive Holdings Ltd. | 30,000 | 26,801 | ||||||
BYD Co. Ltd., H Shares(2) | 1,500 | 14,831 | ||||||
BYD Electronic International Co. Ltd.(2) | 6,500 | 27,308 | ||||||
CA Cultural Technology Group Ltd.(1) | 4,000 | 1,267 | ||||||
Canadian Solar, Inc.(1) | 1,067 | 34,667 | ||||||
CanSino Biologics, Inc., H Shares(1)(2) | 200 | 4,214 | ||||||
| Canvest Environmental Protection Group Co. Ltd. | 15,000 | 6,532 | ||||||
CAR, Inc.(1)(2) | 7,000 | 2,226 | ||||||
| Central China Real Estate Ltd. | 18,000 | 7,857 | ||||||
CGN New Energy Holdings Co. Ltd.(1) | 38,000 | 6,813 | ||||||
| CGN Power Co. Ltd., H Shares | 111,000 | 24,032 | ||||||
| Chaowei Power Holdings Ltd. | 4,000 | 1,677 | ||||||
| Cheetah Mobile, Inc., ADR | 309 | 599 | ||||||
| China Aircraft Leasing Group Holdings Ltd. | 1,000 | 911 | ||||||
| China Beststudy Education Group | 17,000 | 7,605 | ||||||
| China BlueChemical Ltd., H Shares | 6,000 | 881 | ||||||
| China Cinda Asset Management Co. Ltd., H Shares | 99,000 | 18,870 | ||||||
| China CITIC Bank Corp. Ltd., H Shares | 59,000 | 24,611 | ||||||
| China Coal Energy Co. Ltd., H Shares | 13,000 | 3,267 | ||||||
| China Communications Construction Co. Ltd., H Shares | 23,000 | 12,848 | ||||||
| China Communications Services Corp. Ltd., H Shares | 48,000 | 31,338 | ||||||
| China Conch Venture Holdings Ltd. | 13,500 | 58,383 | ||||||
| China Construction Bank Corp., H Shares | 674,000 | 474,729 | ||||||
China Customer Relations Centers, Inc.(1) | 94 | 376 | ||||||
| China Datang Corp. Renewable Power Co. Ltd., H Shares | 12,000 | 1,626 | ||||||
China Dongxiang Group Co. Ltd.(2) | 56,000 | 7,259 | ||||||
11
| Shares | Value | |||||||
| China East Education Holdings Ltd. | 11,500 | $ | 25,296 | |||||
China Eastern Airlines Corp. Ltd., H Shares(2) | 14,000 | 5,729 | ||||||
| China Education Group Holdings Ltd. | 3,000 | 5,890 | ||||||
China Energy Development Holdings Ltd.(1) | 48,000 | 885 | ||||||
| China Everbright Bank Co. Ltd., H Shares | 20,000 | 7,155 | ||||||
China Everbright Greentech Ltd.(2) | 15,000 | 6,640 | ||||||
| China Everbright International Ltd. | 40,000 | 24,104 | ||||||
| China Everbright Ltd. | 18,000 | 27,667 | ||||||
China Evergrande Group(2) | 11,000 | 25,591 | ||||||
China First Capital Group Ltd.(1) | 28,000 | 581 | ||||||
| China Foods Ltd. | 22,000 | 7,789 | ||||||
| China Galaxy Securities Co. Ltd., H Shares | 33,500 | 20,000 | ||||||
| China Gas Holdings Ltd. | 4,600 | 12,550 | ||||||
| China Grand Pharmaceutical and Healthcare Holdings Ltd., Class A | 20,000 | 18,217 | ||||||
| China Harmony Auto Holding Ltd. | 31,500 | 14,440 | ||||||
China High Speed Transmission Equipment Group Co. Ltd.(2) | 8,000 | 5,821 | ||||||
| China Hongqiao Group Ltd. | 7,500 | 4,827 | ||||||
| China Huarong Asset Management Co. Ltd., H Shares | 114,000 | 13,050 | ||||||
China International Capital Corp. Ltd., H Shares(1) | 20,800 | 49,235 | ||||||
| China Jinmao Holdings Group Ltd. | 94,000 | 58,603 | ||||||
| China Kepei Education Group Ltd. | 6,000 | 5,291 | ||||||
| China Lesso Group Holdings Ltd. | 23,000 | 42,796 | ||||||
| China Life Insurance Co. Ltd., ADR | 5,814 | 70,814 | ||||||
| China Lilang Ltd. | 2,000 | 1,152 | ||||||
China Literature Ltd.(1)(2) | 3,200 | 19,713 | ||||||
China Logistics Property Holdings Co. Ltd.(1) | 3,000 | 1,373 | ||||||
| China Longyuan Power Group Corp. Ltd., H Shares | 75,000 | 47,052 | ||||||
| China Maple Leaf Educational Systems Ltd. | 42,000 | 16,355 | ||||||
| China Medical System Holdings Ltd. | 19,000 | 21,397 | ||||||
| China Meidong Auto Holdings Ltd. | 12,000 | 40,487 | ||||||
| China Mengniu Dairy Co. Ltd. | 41,000 | 200,658 | ||||||
| China Merchants Bank Co. Ltd., H Shares | 25,000 | 118,865 | ||||||
| China Merchants Land Ltd. | 40,000 | 6,043 | ||||||
| China Merchants Port Holdings Co. Ltd. | 12,756 | 14,563 | ||||||
| China Minsheng Banking Corp. Ltd., H Shares | 69,000 | 41,947 | ||||||
| China Mobile Ltd., ADR | 8,885 | 311,242 | ||||||
China Modern Dairy Holdings Ltd.(1)(2) | 11,000 | 1,659 | ||||||
| China Molybdenum Co. Ltd., H Shares | 9,000 | 3,642 | ||||||
| China National Building Material Co. Ltd., H Shares | 74,000 | 103,452 | ||||||
| China New Higher Education Group Ltd. | 14,000 | 10,803 | ||||||
China Oil & Gas Group Ltd.(1) | 40,000 | 1,262 | ||||||
| China Oilfield Services Ltd., H Shares | 16,000 | 12,496 | ||||||
| China Oriental Group Co. Ltd. | 26,000 | 7,252 | ||||||
| China Overseas Grand Oceans Group Ltd. | 18,000 | 11,692 | ||||||
| China Overseas Land & Investment Ltd. | 42,000 | 120,691 | ||||||
| China Overseas Property Holdings Ltd. | 5,000 | 4,501 | ||||||
| China Pacific Insurance Group Co. Ltd., H Shares | 12,600 | 34,702 | ||||||
| China Petroleum & Chemical Corp., ADR | 1,220 | 55,974 | ||||||
| China Pioneer Pharma Holdings Ltd. | 22,000 | 3,393 | ||||||
| China Power International Development Ltd. | 91,000 | 17,591 | ||||||
| China Railway Construction Corp. Ltd., H Shares | 22,500 | 17,186 | ||||||
| China Railway Group Ltd., H Shares | 61,000 | 31,270 | ||||||
12
| Shares | Value | |||||||
| China Railway Signal & Communication Corp. Ltd., H Shares | 31,000 | $ | 12,556 | |||||
| China Reinsurance Group Corp., H Shares | 43,000 | 4,575 | ||||||
| China Resources Beer Holdings Co. Ltd. | 8,000 | 52,132 | ||||||
| China Resources Cement Holdings Ltd. | 42,000 | 60,984 | ||||||
| China Resources Gas Group Ltd. | 10,000 | 46,748 | ||||||
| China Resources Land Ltd. | 32,000 | 146,610 | ||||||
| China Resources Medical Holdings Co. Ltd. | 9,000 | 6,521 | ||||||
| China Resources Pharmaceutical Group Ltd. | 9,500 | 5,366 | ||||||
| China Resources Power Holdings Co. Ltd. | 28,000 | 33,163 | ||||||
| China SCE Group Holdings Ltd. | 34,000 | 17,654 | ||||||
| China Shenhua Energy Co. Ltd., H Shares | 20,500 | 34,023 | ||||||
| China Shineway Pharmaceutical Group Ltd. | 8,000 | 5,599 | ||||||
| China South City Holdings Ltd. | 82,000 | 8,308 | ||||||
China Southern Airlines Co. Ltd., H Shares(1)(2) | 18,000 | 9,463 | ||||||
| China State Construction International Holdings Ltd. | 42,000 | 32,326 | ||||||
China Sunshine Paper Holdings Co. Ltd.(1) | 7,000 | 1,345 | ||||||
China Suntien Green Energy Corp. Ltd., H Shares(1) | 14,000 | 3,719 | ||||||
| China Taiping Insurance Holdings Co. Ltd. | 10,600 | 16,636 | ||||||
| China Telecom Corp. Ltd., ADR | 1,117 | 36,336 | ||||||
| China Tobacco International HK Co. Ltd. | 3,000 | 6,012 | ||||||
| China Tower Corp. Ltd., H Shares | 410,000 | 78,150 | ||||||
| China Traditional Chinese Medicine Holdings Co. Ltd. | 24,000 | 10,237 | ||||||
| China Travel International Investment Hong Kong Ltd. | 22,000 | 3,317 | ||||||
| China Unicom (Hong Kong) Ltd., ADR | 4,511 | 31,938 | ||||||
| China Vanke Co. Ltd., H Shares | 11,100 | 34,364 | ||||||
| China Water Affairs Group Ltd. | 8,000 | 6,574 | ||||||
| China Xinhua Education Group Ltd. | 17,000 | 5,762 | ||||||
| China XLX Fertiliser Ltd. | 4,000 | 1,296 | ||||||
| China Yongda Automobiles Services Holdings Ltd. | 24,500 | 29,348 | ||||||
China Youzan Ltd.(1) | 32,000 | 6,960 | ||||||
| China Yuchai International Ltd. | 138 | 2,241 | ||||||
| China Yuhua Education Corp. Ltd. | 36,000 | 34,446 | ||||||
China ZhengTong Auto Services Holdings Ltd.(2) | 9,000 | 1,118 | ||||||
| China Zhongwang Holdings Ltd. | 20,400 | 4,305 | ||||||
Chinasoft International Ltd.(1) | 10,000 | 7,060 | ||||||
| Chongqing Rural Commercial Bank Co. Ltd., H Shares | 26,000 | 10,587 | ||||||
| CIFI Holdings Group Co. Ltd. | 20,000 | 16,976 | ||||||
CIMC Enric Holdings Ltd.(2) | 2,000 | 796 | ||||||
| CITIC Ltd. | 50,000 | 45,407 | ||||||
CITIC Resources Holdings Ltd.(1) | 18,000 | 669 | ||||||
CITIC Securities Co. Ltd., H Shares(2) | 11,500 | 27,488 | ||||||
| CNOOC Ltd., ADR | 996 | 112,707 | ||||||
COFCO Meat Holdings Ltd.(2) | 4,000 | 1,877 | ||||||
Colour Life Services Group Co. Ltd.(1)(2) | 2,000 | 1,030 | ||||||
| Concord New Energy Group Ltd. | 120,000 | 5,317 | ||||||
| Consun Pharmaceutical Group Ltd. | 11,000 | 4,640 | ||||||
| COSCO SHIPPING Energy Transportation Co. Ltd., Class H | 20,000 | 9,174 | ||||||
COSCO SHIPPING Holdings Co. Ltd., Class H(1) | 26,000 | 13,026 | ||||||
| COSCO SHIPPING International Hong Kong Co. Ltd. | 16,000 | 4,426 | ||||||
| COSCO SHIPPING Ports Ltd. | 16,656 | 9,408 | ||||||
| Country Garden Holdings Co. Ltd. | 58,123 | 71,409 | ||||||
| Country Garden Services Holdings Co. Ltd. | 18,000 | 125,222 | ||||||
13
| Shares | Value | |||||||
| CPMC Holdings Ltd. | 3,000 | $ | 1,293 | |||||
| CRRC Corp. Ltd., H Shares | 25,000 | 11,214 | ||||||
| CSPC Pharmaceutical Group Ltd. | 48,000 | 106,332 | ||||||
| DaFa Properties Group Ltd. | 2,000 | 1,458 | ||||||
| Dali Foods Group Co. Ltd. | 31,000 | 18,962 | ||||||
Daqo New Energy Corp., ADR(1) | 274 | 30,910 | ||||||
Datang International Power Generation Co. Ltd., H Shares(2) | 6,000 | 804 | ||||||
| Dawnrays Pharmaceutical Holdings Ltd. | 7,000 | 837 | ||||||
Dexin China Holdings Co. Ltd.(1) | 5,000 | 1,946 | ||||||
| Digital China Holdings Ltd. | 9,000 | 7,311 | ||||||
| Dongfeng Motor Group Co. Ltd., Class H | 26,000 | 17,906 | ||||||
| Dongyue Group Ltd. | 19,000 | 8,077 | ||||||
E-House China Enterprise Holdings Ltd.(2) | 5,400 | 6,376 | ||||||
| ENN Energy Holdings Ltd. | 7,500 | 82,858 | ||||||
| Essex Bio-technology Ltd. | 2,000 | 1,236 | ||||||
| Ever Sunshine Lifestyle Services Group Ltd. | 10,000 | 20,533 | ||||||
| Fanhua, Inc., ADR | 253 | 5,133 | ||||||
| Fantasia Holdings Group Co. Ltd. | 28,500 | 5,787 | ||||||
| Far East Horizon Ltd. | 20,000 | 17,681 | ||||||
| FinVolution Group, ADR | 416 | 790 | ||||||
| Fosun International Ltd. | 29,000 | 32,127 | ||||||
| Fountain SET Holdings Ltd. | 6,000 | 688 | ||||||
| Fu Shou Yuan International Group Ltd. | 16,000 | 16,493 | ||||||
| Fufeng Group Ltd. | 20,000 | 6,695 | ||||||
| Fuyao Glass Industry Group Co. Ltd., H Shares | 5,200 | 16,709 | ||||||
GCL-Poly Energy Holdings Ltd.(1) | 180,000 | 7,301 | ||||||
GDS Holdings Ltd., ADR(1) | 612 | 49,535 | ||||||
| Geely Automobile Holdings Ltd. | 45,000 | 94,117 | ||||||
| Gemdale Properties & Investment Corp. Ltd. | 114,000 | 20,232 | ||||||
| Genertec Universal Medical Group Co. Ltd. | 10,000 | 6,957 | ||||||
Genscript Biotech Corp.(1) | 14,000 | 26,957 | ||||||
| GF Securities Co. Ltd., H Shares | 11,400 | 13,370 | ||||||
Global Cord Blood Corp.(1) | 225 | 785 | ||||||
Glory Sun Financial Group Ltd.(1) | 140,000 | 5,772 | ||||||
| Great Wall Motor Co. Ltd., H Shares | 25,500 | 27,593 | ||||||
| Greatview Aseptic Packaging Co. Ltd. | 3,000 | 1,257 | ||||||
| Greenland Hong Kong Holdings Ltd. | 22,000 | 7,306 | ||||||
| Greentown Service Group Co. Ltd. | 26,000 | 34,826 | ||||||
GSX Techedu, Inc., ADR(1) | 157 | 13,408 | ||||||
| Guangdong Investment Ltd. | 12,000 | 18,679 | ||||||
| Guangzhou Automobile Group Co. Ltd., H Shares | 20,000 | 17,112 | ||||||
| Guangzhou R&F Properties Co. Ltd., H Shares | 13,600 | 17,251 | ||||||
| Guorui Properties Ltd. | 29,000 | 4,283 | ||||||
| Guotai Junan Securities Co. Ltd., H Shares | 4,400 | 6,802 | ||||||
Haichang Ocean Park Holdings Ltd.(1) | 8,000 | 628 | ||||||
Haidilao International Holding Ltd.(2) | 3,000 | 19,300 | ||||||
| Haier Electronics Group Co. Ltd. | 11,000 | 37,548 | ||||||
| Haitian International Holdings Ltd. | 11,000 | 26,610 | ||||||
Haitong Securities Co. Ltd., H Shares(1) | 16,800 | 15,198 | ||||||
Hansoh Pharmaceutical Group Co. Ltd.(1) | 4,000 | 18,902 | ||||||
Harbin Electric Co. Ltd., H Shares(1) | 4,000 | 1,226 | ||||||
| Hebei Construction Group Corp. Ltd., H Shares | 3,000 | 6,594 | ||||||
14
| Shares | Value | |||||||
| Hengan International Group Co. Ltd. | 11,000 | $ | 86,395 | |||||
Hi Sun Technology China Ltd.(1) | 21,000 | 2,565 | ||||||
| HKC Holdings Ltd. | 2,000 | 1,191 | ||||||
| Hollysys Automation Technologies Ltd. | 682 | 7,386 | ||||||
| Homeland Interactive Technology Ltd. | 12,000 | 6,762 | ||||||
| Hopson Development Holdings Ltd. | 6,000 | 11,991 | ||||||
Hua Hong Semiconductor Ltd.(1)(2) | 6,000 | 21,554 | ||||||
Huabao International Holdings Ltd.(2) | 17,000 | 15,033 | ||||||
| Huadian Power International Corp. Ltd., H Shares | 30,000 | 8,366 | ||||||
Huami Corp., ADR(1) | 597 | 7,534 | ||||||
| Huaneng Power International, Inc., H Shares | 38,000 | 15,867 | ||||||
| Huatai Securities Co. Ltd., H Shares | 6,000 | 10,502 | ||||||
| Huaxi Holdings Co. Ltd. | 4,000 | 877 | ||||||
| Huazhu Group Ltd., ADR | 1,636 | 73,178 | ||||||
Huifu Payment Ltd.(1)(2) | 16,800 | 5,556 | ||||||
HUYA, Inc., ADR(1) | 252 | 7,237 | ||||||
| IGG, Inc. | 22,000 | 25,344 | ||||||
| IMAX China Holding, Inc. | 700 | 1,127 | ||||||
| Industrial & Commercial Bank of China Ltd., H Shares | 367,000 | 204,926 | ||||||
Inke Ltd.(1) | 38,000 | 6,113 | ||||||
Innovent Biologics, Inc.(1) | 1,500 | 9,965 | ||||||
Inspur International Ltd.(1) | 4,000 | 1,087 | ||||||
iQIYI, Inc., ADR(1) | 951 | 20,589 | ||||||
JD.com, Inc., ADR(1) | 7,427 | 584,059 | ||||||
| Jiangsu Expressway Co. Ltd., H Shares | 12,000 | 12,004 | ||||||
| Jiangxi Copper Co. Ltd., H Shares | 9,000 | 10,577 | ||||||
| Jiayuan International Group Ltd. | 18,000 | 8,549 | ||||||
| Jingrui Holdings Ltd. | 6,000 | 1,585 | ||||||
JinkoSolar Holding Co. Ltd., ADR(1) | 527 | 12,037 | ||||||
| JNBY Design Ltd. | 1,000 | 1,045 | ||||||
JOYY, Inc., ADR(1) | 368 | 31,442 | ||||||
| Kaisa Group Holdings Ltd. | 37,000 | 18,536 | ||||||
Kandi Technologies Group, Inc.(1) | 639 | 4,300 | ||||||
Kasen International Holdings Ltd.(1)(2) | 3,000 | 356 | ||||||
| Kingboard Holdings Ltd. | 12,000 | 38,528 | ||||||
| Kingboard Laminates Holdings Ltd. | 20,000 | 24,963 | ||||||
| Kingdee International Software Group Co. Ltd. | 29,000 | 73,999 | ||||||
| Kingsoft Corp. Ltd. | 3,000 | 16,030 | ||||||
| Kunlun Energy Co. Ltd. | 16,000 | 11,886 | ||||||
| KWG Group Holdings Ltd. | 29,000 | 55,006 | ||||||
| Lee & Man Chemical Co. Ltd. | 4,000 | 1,497 | ||||||
| Lee & Man Paper Manufacturing Ltd. | 38,000 | 22,585 | ||||||
| Lee's Pharmaceutical Holdings Ltd. | 2,000 | 1,521 | ||||||
| Lenovo Group Ltd. | 72,000 | 47,987 | ||||||
LexinFintech Holdings Ltd., ADR(1) | 977 | 7,630 | ||||||
| Li Ning Co. Ltd. | 33,000 | 138,917 | ||||||
| Logan Group Co. Ltd. | 30,000 | 55,657 | ||||||
| Longfor Group Holdings Ltd. | 8,500 | 44,870 | ||||||
| Lonking Holdings Ltd. | 38,000 | 10,819 | ||||||
| Luye Pharma Group Ltd. | 17,500 | 9,461 | ||||||
| Maanshan Iron & Steel Co. Ltd., H Shares | 4,000 | 1,073 | ||||||
Maoyan Entertainment(1) | 800 | 1,587 | ||||||
15
| Shares | Value | |||||||
Meitu, Inc.(1) | 30,000 | $ | 6,557 | |||||
Meituan Dianping, Class B(1) | 3,600 | 118,323 | ||||||
| Metallurgical Corp. of China Ltd., H Shares | 5,000 | 856 | ||||||
| Midea Real Estate Holding Ltd. | 600 | 1,526 | ||||||
| Minsheng Education Group Co. Ltd. | 34,000 | 5,166 | ||||||
MMG Ltd.(1) | 64,000 | 17,016 | ||||||
| Modern Land China Co. Ltd. | 10,000 | 1,455 | ||||||
| Momo, Inc., ADR | 1,519 | 30,988 | ||||||
Mulsanne Group Holding Ltd.(1)(2) | 2,500 | 1,749 | ||||||
Nam Tai Property, Inc.(1) | 124 | 1,142 | ||||||
| NetDragon Websoft Holdings Ltd. | 5,000 | 12,770 | ||||||
| NetEase, Inc., ADR | 523 | 254,811 | ||||||
| New China Life Insurance Co. Ltd., H Shares | 4,800 | 19,077 | ||||||
New Oriental Education & Technology Group, Inc., ADR(1) | 504 | 73,901 | ||||||
Nexteer Automotive Group Ltd.(2) | 15,000 | 9,653 | ||||||
| Nine Dragons Paper Holdings Ltd. | 39,000 | 43,187 | ||||||
NIO, Inc., ADR(1) | 3,631 | 69,098 | ||||||
Niu Technologies, ADR(1) | 119 | 2,460 | ||||||
Noah Holdings Ltd., ADR(1) | 83 | 2,324 | ||||||
OneSmart International Education Group Ltd., ADR(1) | 516 | 2,188 | ||||||
| Oshidori International Holdings Ltd. | 18,000 | 1,950 | ||||||
| Pacific Millennium Packaging Group Corp. | 2,000 | 1,194 | ||||||
| Pacific Online Ltd. | 6,000 | 794 | ||||||
| PAX Global Technology Ltd. | 17,000 | 9,805 | ||||||
| People's Insurance Co. Group of China Ltd. (The), H Shares | 31,000 | 10,095 | ||||||
| Perennial Energy Holdings Ltd. | 15,000 | 8,800 | ||||||
| PetroChina Co. Ltd., ADR | 808 | 27,884 | ||||||
| Phoenix New Media Ltd., ADR | 318 | 480 | ||||||
| PICC Property & Casualty Co. Ltd., H Shares | 34,000 | 26,171 | ||||||
Pinduoduo, Inc., ADR(1) | 562 | 49,984 | ||||||
Ping An Healthcare and Technology Co. Ltd.(1)(2) | 5,900 | 85,674 | ||||||
| Ping An Insurance Group Co. of China Ltd., H Shares | 17,006 | 180,196 | ||||||
| Poly Property Group Co. Ltd. | 34,000 | 10,671 | ||||||
| Postal Savings Bank of China Co. Ltd., H Shares | 79,000 | 37,326 | ||||||
Pou Sheng International Holdings Ltd.(1) | 10,000 | 2,523 | ||||||
| Powerlong Real Estate Holdings Ltd. | 16,000 | 11,557 | ||||||
| Prinx Chengshan Cayman Holding Ltd. | 6,000 | 6,295 | ||||||
PW Medtech Group Ltd.(1) | 7,000 | 1,364 | ||||||
| Q Technology Group Co. Ltd. | 10,000 | 12,504 | ||||||
| Qingling Motors Co. Ltd., H Shares | 6,000 | 1,068 | ||||||
Qudian, Inc., ADR(1) | 1,559 | 2,479 | ||||||
| Redsun Properties Group Ltd. | 20,000 | 7,025 | ||||||
| Road King Infrastructure Ltd. | 5,000 | 6,639 | ||||||
| Ronshine China Holdings Ltd. | 11,000 | 8,921 | ||||||
| Scholar Education Group | 5,000 | 15,406 | ||||||
Semiconductor Manufacturing International Corp.(1) | 27,500 | 87,877 | ||||||
| Shandong Weigao Group Medical Polymer Co. Ltd., H Shares | 8,000 | 18,633 | ||||||
Shanghai Electric Group Co. Ltd., H Shares(1) | 20,000 | 5,873 | ||||||
| Shanghai Fosun Pharmaceutical Group Co. Ltd., H Shares | 3,500 | 14,742 | ||||||
| Shanghai Fudan-Zhangjiang Bio-Pharmaceutical Co. Ltd., H Shares | 8,000 | 5,086 | ||||||
| Shanghai Haohai Biological Technology Co. Ltd., H Shares | 200 | 1,407 | ||||||
| Shanghai Industrial Holdings Ltd. | 8,000 | 11,950 | ||||||
16
| Shares | Value | |||||||
| Shanghai Pharmaceuticals Holding Co. Ltd., H Shares | 9,800 | $ | 17,458 | |||||
| Sheng Ye Capital Ltd. | 8,000 | 8,201 | ||||||
| Shenzhen Expressway Co. Ltd., H Shares | 6,000 | 5,425 | ||||||
| Shenzhen International Holdings Ltd. | 15,000 | 24,027 | ||||||
| Shenzhen Investment Ltd. | 42,000 | 14,222 | ||||||
| Shenzhou International Group Holdings Ltd. | 6,600 | 105,843 | ||||||
| Shimao Group Holdings Ltd. | 15,500 | 69,556 | ||||||
| Shirble Department Store Holdings China Ltd. | 8,000 | 698 | ||||||
| Shoucheng Holdings Ltd. | 7,200 | 1,954 | ||||||
| Shougang Fushan Resources Group Ltd. | 36,000 | 8,161 | ||||||
| Shui On Land Ltd. | 64,000 | 8,736 | ||||||
| Sihuan Pharmaceutical Holdings Group Ltd. | 105,000 | 12,703 | ||||||
Silver Grant International Holdings Group Ltd.(1) | 8,000 | 1,051 | ||||||
Sina Corp.(1) | 598 | 24,330 | ||||||
| Sino Biopharmaceutical Ltd. | 22,500 | 25,790 | ||||||
| Sino-Ocean Group Holding Ltd. | 48,000 | 11,047 | ||||||
| Sinofert Holdings Ltd. | 12,000 | 1,126 | ||||||
| Sinopec Engineering Group Co. Ltd., H Shares | 19,000 | 8,408 | ||||||
| Sinopec Kantons Holdings Ltd. | 18,000 | 7,063 | ||||||
| Sinopec Shanghai Petrochemical Co. Ltd., ADR | 365 | 7,497 | ||||||
| Sinopharm Group Co. Ltd., H Shares | 2,800 | 6,866 | ||||||
| Sinotrans Ltd., H Shares | 4,000 | 948 | ||||||
| Sinotruk Hong Kong Ltd. | 12,000 | 31,115 | ||||||
| Skyfame Realty Holdings Ltd. | 46,000 | 5,989 | ||||||
Skyworth Group Ltd.(1)(2) | 26,000 | 9,003 | ||||||
Sogou, Inc., ADR(1) | 215 | 1,860 | ||||||
SOHO China Ltd.(1) | 31,500 | 9,704 | ||||||
Sohu.com Ltd., ADR(1) | 304 | 6,123 | ||||||
Sparkle Roll Group Ltd.(1) | 32,000 | 1,074 | ||||||
| SSY Group Ltd. | 28,000 | 17,818 | ||||||
| Sun Art Retail Group Ltd. | 32,500 | 42,325 | ||||||
| Sun King Power Electronics Group | 42,000 | 9,265 | ||||||
| Sunac China Holdings Ltd. | 12,000 | 50,196 | ||||||
| Sunny Optical Technology Group Co. Ltd. | 6,500 | 95,462 | ||||||
TAL Education Group, ADR(1) | 1,450 | 107,024 | ||||||
| TCL Electronics Holdings Ltd. | 10,000 | 6,821 | ||||||
| Tencent Holdings Ltd. | 17,500 | 1,192,581 | ||||||
Tencent Music Entertainment Group, ADR(1) | 145 | 2,266 | ||||||
| Texhong Textile Group Ltd. | 8,000 | 6,190 | ||||||
Tian Ge Interactive Holdings Ltd.(1)(2) | 5,000 | 606 | ||||||
| Tiangong International Co. Ltd. | 4,000 | 1,341 | ||||||
| Tianjin Port Development Holdings Ltd. | 12,000 | 877 | ||||||
Tianli Education International Holdings Ltd.(1) | 28,000 | 31,758 | ||||||
Tianneng Power International Ltd.(2) | 18,000 | 38,560 | ||||||
| Times China Holdings Ltd. | 11,000 | 16,865 | ||||||
| Times Neighborhood Holdings Ltd. | 10,000 | 14,279 | ||||||
| Tingyi Cayman Islands Holding Corp. | 34,000 | 63,722 | ||||||
| Tong Ren Tang Technologies Co. Ltd., H Shares | 9,000 | 6,938 | ||||||
Tongcheng-Elong Holdings Ltd.(1) | 2,800 | 5,482 | ||||||
Tongda Group Holdings Ltd.(2) | 110,000 | 6,467 | ||||||
| Topsports International Holdings Ltd. | 15,000 | 18,516 | ||||||
Towngas China Co. Ltd.(1) | 11,000 | 4,987 | ||||||
17
| Shares | Value | |||||||
| TravelSky Technology Ltd., H Shares | 2,000 | $ | 4,153 | |||||
Trigiant Group Ltd.(1) | 6,000 | 688 | ||||||
Trip.com Group Ltd., ADR(1) | 1,556 | 47,053 | ||||||
Truly International Holdings Ltd.(1) | 8,000 | 1,000 | ||||||
| Tsingtao Brewery Co. Ltd., H Shares | 6,000 | 54,574 | ||||||
| Uni-President China Holdings Ltd. | 17,000 | 15,483 | ||||||
| United Strength Power Holdings Ltd. | 2,000 | 1,320 | ||||||
| Vinda International Holdings Ltd. | 8,000 | 27,298 | ||||||
Vipshop Holdings Ltd., ADR(1) | 8,308 | 137,165 | ||||||
| Want Want China Holdings Ltd. | 70,000 | 47,809 | ||||||
| Wasion Holdings Ltd. | 6,000 | 1,762 | ||||||
Weibo Corp., ADR(1) | 360 | 13,428 | ||||||
| Weichai Power Co. Ltd., H Shares | 20,000 | 40,257 | ||||||
| West China Cement Ltd. | 60,000 | 10,492 | ||||||
| Wharf Holdings Ltd. (The) | 12,000 | 23,341 | ||||||
| Wisdom Education International Holdings Co. Ltd. | 12,000 | 6,231 | ||||||
WuXi AppTec Co. Ltd., H Shares(2) | 140 | 2,067 | ||||||
Wuxi Biologics Cayman, Inc.(1) | 500 | 12,940 | ||||||
| Xiamen International Port Co. Ltd., H Shares | 8,000 | 884 | ||||||
Xiaomi Corp., Class B(1) | 51,400 | 155,778 | ||||||
| Xingda International Holdings Ltd. | 30,896 | 7,606 | ||||||
| Xinyi Solar Holdings Ltd. | 34,541 | 43,401 | ||||||
| XTEP International Holdings Ltd. | 20,000 | 6,638 | ||||||
Xunlei Ltd., ADR(1) | 202 | 725 | ||||||
Yadea Group Holdings Ltd.(1) | 26,000 | 26,152 | ||||||
| Yanzhou Coal Mining Co. Ltd., H Shares | 30,000 | 23,042 | ||||||
YiChang HEC ChangJiang Pharmaceutical Co. Ltd., H Shares(2) | 2,400 | 3,405 | ||||||
| Yihai International Holding Ltd. | 4,000 | 63,047 | ||||||
| Yincheng International Holding Co. Ltd. | 4,000 | 1,289 | ||||||
Yixin Group Ltd.(1)(2) | 7,000 | 1,782 | ||||||
| Yongsheng Advanced Materials Co. Ltd. | 5,000 | 1,529 | ||||||
YuanShengTai Dairy Farm Ltd.(1) | 25,000 | 1,832 | ||||||
| Yuexiu Property Co. Ltd. | 86,000 | 16,384 | ||||||
| Yuexiu Transport Infrastructure Ltd. | 16,000 | 9,481 | ||||||
| Yum China Holdings, Inc. | 4,562 | 263,273 | ||||||
| Yuzhou Group Holdings Co. Ltd. | 41,881 | 19,491 | ||||||
| Zhaojin Mining Industry Co. Ltd., H Shares | 8,000 | 8,966 | ||||||
| Zhejiang Expressway Co. Ltd., H Shares | 24,000 | 16,162 | ||||||
| Zhenro Properties Group Ltd. | 16,000 | 9,342 | ||||||
ZhongAn Online P&C Insurance Co. Ltd., H Shares(1)(2) | 2,200 | 14,328 | ||||||
| Zhongliang Holdings Group Co. Ltd. | 14,000 | 9,008 | ||||||
| Zhongsheng Group Holdings Ltd. | 10,000 | 62,113 | ||||||
| Zhou Hei Ya International Holdings Co. Ltd. | 16,500 | 18,656 | ||||||
| Zhuzhou CRRC Times Electric Co. Ltd., H Shares | 5,500 | 17,528 | ||||||
| Zijin Mining Group Co. Ltd., H Shares | 84,000 | 57,221 | ||||||
Zoomlion Heavy Industry Science and Technology Co. Ltd., Class H(1) | 14,800 | 14,764 | ||||||
| ZTE Corp., H Shares | 1,400 | 4,032 | ||||||
| ZTO Express Cayman, Inc., ADR | 3,007 | 100,825 | ||||||
| 13,677,867 | ||||||||
| Colombia — 0.3% | ||||||||
| Banco Davivienda SA, Preference Shares | 1,082 | 8,382 | ||||||
18
| Shares | Value | |||||||
| Bancolombia SA | 337 | $ | 2,342 | |||||
| Bancolombia SA, ADR | 369 | 10,354 | ||||||
| Cementos Argos SA | 1,760 | 2,352 | ||||||
Corp. Financiera Colombiana SA(1) | 3,119 | 22,594 | ||||||
| Ecopetrol SA, ADR | 1,146 | 13,053 | ||||||
| Grupo Argos SA | 6,893 | 21,963 | ||||||
| Grupo Aval Acciones y Valores SA, Preference Shares | 3,792 | 948 | ||||||
| Interconexion Electrica SA ESP | 1,404 | 7,859 | ||||||
| 89,847 | ||||||||
| Czech Republic — 0.1% | ||||||||
| CEZ AS | 905 | 18,631 | ||||||
Komercni banka AS(1) | 647 | 15,552 | ||||||
| Moneta Money Bank AS | 3,101 | 7,811 | ||||||
| 41,994 | ||||||||
| Egypt — 0.1% | ||||||||
| Commercial International Bank Egypt S.A.E., GDR | 9,172 | 39,075 | ||||||
| Greece — 0.3% | ||||||||
Aegean Airlines SA(1) | 410 | 1,759 | ||||||
Alpha Bank AE(1) | 9,561 | 6,306 | ||||||
| Athens Water Supply & Sewage Co. SA | 574 | 4,794 | ||||||
Attica Bank SA(1) | 2,201 | 459 | ||||||
Eurobank Ergasias Services and Holdings SA(1) | 3,058 | 1,463 | ||||||
Fourlis Holdings SA(1) | 301 | 1,431 | ||||||
GEK Terna Holding Real Estate Construction SA(1) | 1,659 | 11,995 | ||||||
| Hellenic Petroleum SA | 215 | 1,311 | ||||||
| Hellenic Telecommunications Organization SA | 935 | 15,279 | ||||||
| JUMBO SA | 330 | 5,729 | ||||||
| Motor Oil Hellas Corinth Refineries SA | 207 | 2,902 | ||||||
| Mytilineos SA | 418 | 3,930 | ||||||
National Bank of Greece SA(1) | 6,706 | 9,094 | ||||||
Piraeus Bank SA(1) | 1,645 | 2,361 | ||||||
Public Power Corp. SA(1) | 1,790 | 8,546 | ||||||
| Terna Energy SA | 691 | 9,780 | ||||||
Titan Cement International SA(1) | 452 | 6,131 | ||||||
Viohalco SA(1) | 450 | 1,224 | ||||||
| 94,494 | ||||||||
Hong Kong† | ||||||||
Anton Oilfield Services Group(1)(2) | 12,000 | 624 | ||||||
Goodbaby International Holdings Ltd.(1) | 10,000 | 1,461 | ||||||
| 2,085 | ||||||||
| Hungary — 0.2% | ||||||||
| Magyar Telekom Telecommunications plc | 10,305 | 12,655 | ||||||
MOL Hungarian Oil & Gas plc(1) | 4,315 | 24,251 | ||||||
OTP Bank Nyrt(1) | 780 | 26,241 | ||||||
| Richter Gedeon Nyrt | 707 | 17,247 | ||||||
| 80,394 | ||||||||
| India — 9.7% | ||||||||
| Adani Enterprises Ltd. | 2,037 | 7,675 | ||||||
| Adani Ports & Special Economic Zone Ltd. | 6,946 | 33,467 | ||||||
Adani Transmission Ltd.(1) | 2,093 | 7,198 | ||||||
| Alembic Pharmaceuticals Ltd. | 891 | 11,379 | ||||||
| Amara Raja Batteries Ltd. | 928 | 9,161 | ||||||
19
| Shares | Value | |||||||
| Ambuja Cements Ltd. | 8,422 | $ | 24,041 | |||||
| Apollo Hospitals Enterprise Ltd. | 725 | 16,086 | ||||||
| Apollo Tyres Ltd. | 3,967 | 6,649 | ||||||
| Ashok Leyland Ltd. | 5,779 | 5,291 | ||||||
| Asian Paints Ltd. | 621 | 16,008 | ||||||
AU Small Finance Bank Ltd.(1) | 441 | 3,984 | ||||||
| Aurobindo Pharma Ltd. | 4,288 | 47,039 | ||||||
| Avanti Feeds Ltd. | 994 | 6,980 | ||||||
Avenue Supermarts Ltd.(1) | 184 | 5,617 | ||||||
Axis Bank Ltd., GDR(1) | 1,866 | 65,697 | ||||||
| Bajaj Auto Ltd. | 481 | 19,351 | ||||||
Bajaj Consumer Care Ltd.(1) | 1,965 | 4,583 | ||||||
| Bajaj Finance Ltd. | 774 | 36,464 | ||||||
| Bajaj Finserv Ltd. | 254 | 21,285 | ||||||
| Balkrishna Industries Ltd. | 1,126 | 20,150 | ||||||
| Bata India Ltd. | 341 | 6,005 | ||||||
| Berger Paints India Ltd. | 829 | 6,039 | ||||||
| Bharat Forge Ltd. | 1,126 | 7,490 | ||||||
| Bharat Petroleum Corp. Ltd. | 7,523 | 41,585 | ||||||
| Bharti Airtel Ltd. | 7,381 | 51,426 | ||||||
| Bharti Infratel Ltd. | 3,023 | 8,133 | ||||||
Biocon Ltd.(1) | 1,056 | 5,390 | ||||||
Birlasoft Ltd.(1) | 11,057 | 24,035 | ||||||
| Bosch Ltd. | 40 | 6,942 | ||||||
| Britannia Industries Ltd. | 139 | 7,031 | ||||||
| Can Fin Homes Ltd. | 1,008 | 5,064 | ||||||
Canara Bank(1) | 5,192 | 7,547 | ||||||
| CCL Products India Ltd. | 1,635 | 5,493 | ||||||
| Central Depository Services India Ltd. | 1,383 | 7,622 | ||||||
| Century Textiles & Industries Ltd. | 1,098 | 4,963 | ||||||
| CESC Ltd. | 405 | 3,299 | ||||||
| Cipla Ltd. | 2,621 | 25,377 | ||||||
| City Union Bank Ltd. | 4,898 | 8,974 | ||||||
| Coal India Ltd. | 10,958 | 19,958 | ||||||
| Coforge Ltd. | 315 | 8,222 | ||||||
| Colgate-Palmolive India Ltd. | 625 | 11,565 | ||||||
| Container Corp. of India Ltd. | 978 | 5,209 | ||||||
Crompton Greaves Consumer Electricals Ltd.(1) | 2,168 | 7,988 | ||||||
| Dabur India Ltd. | 1,659 | 10,689 | ||||||
Dalmia Bharat Ltd.(1) | 678 | 6,864 | ||||||
DCB Bank Ltd.(1) | 2,843 | 3,432 | ||||||
| Divi's Laboratories Ltd. | 342 | 14,488 | ||||||
| DLF Ltd. | 9,125 | 19,577 | ||||||
| Dr Lal PathLabs Ltd. | 172 | 4,139 | ||||||
| Dr Reddy's Laboratories Ltd., ADR | 1,238 | 72,014 | ||||||
Edelweiss Financial Services Ltd.(1) | 6,352 | 6,900 | ||||||
| Eicher Motors Ltd. | 220 | 6,237 | ||||||
| Endurance Technologies Ltd. | 611 | 9,103 | ||||||
| Equitas Holdings Ltd. | 6,013 | 4,430 | ||||||
| Eris Lifesciences Ltd. | 765 | 4,997 | ||||||
| Escorts Ltd. | 516 | 7,598 | ||||||
| Exide Industries Ltd. | 5,216 | 11,586 | ||||||
20
| Shares | Value | |||||||
| FDC Ltd. | 1,453 | $ | 6,126 | |||||
Federal Bank Ltd.(1) | 23,188 | 17,323 | ||||||
Fortis Healthcare Ltd.(1) | 5,887 | 10,611 | ||||||
Future Lifestyle Fashions Ltd.(1) | 1,257 | 2,600 | ||||||
| GAIL India Ltd. | 8,113 | 10,527 | ||||||
| Glenmark Pharmaceuticals Ltd. | 2,953 | 18,801 | ||||||
| Godrej Consumer Products Ltd. | 1,224 | 10,832 | ||||||
| Granules India Ltd. | 2,474 | 10,541 | ||||||
| Graphite India Ltd. | 1,876 | 4,809 | ||||||
| Grasim Industries Ltd. | 3,301 | 30,171 | ||||||
| Gujarat Pipavav Port Ltd. | 5,912 | 6,390 | ||||||
| Gujarat State Petronet Ltd. | 2,534 | 6,986 | ||||||
| Havells India Ltd. | 701 | 5,851 | ||||||
| HCL Technologies Ltd. | 8,432 | 79,472 | ||||||
| HDFC Asset Management Co. Ltd. | 377 | 12,331 | ||||||
HDFC Life Insurance Co. Ltd.(1) | 810 | 6,300 | ||||||
| HEG Ltd. | 507 | 5,891 | ||||||
| HeidelbergCement India Ltd. | 1,854 | 4,757 | ||||||
| Hero MotoCorp Ltd. | 1,090 | 44,445 | ||||||
| Hexaware Technologies Ltd. | 2,769 | 14,841 | ||||||
| Hindalco Industries Ltd. | 13,365 | 33,510 | ||||||
| Hindustan Petroleum Corp. Ltd. | 12,037 | 32,871 | ||||||
| Hindustan Unilever Ltd. | 4,074 | 117,011 | ||||||
| Housing Development Finance Corp. Ltd. | 5,183 | 128,554 | ||||||
ICICI Bank Ltd., ADR(1) | 3,123 | 33,541 | ||||||
| ICICI Lombard General Insurance Co. Ltd. | 346 | 5,894 | ||||||
| ICICI Prudential Life Insurance Co. Ltd. | 1,107 | 6,336 | ||||||
| ICICI Securities Ltd. | 1,089 | 7,045 | ||||||
IDFC First Bank Ltd.(1) | 14,704 | 6,375 | ||||||
| IDFC Ltd. | 18,066 | 6,737 | ||||||
| IIFL Finance Ltd. | 3,382 | 3,746 | ||||||
| India Cements Ltd. (The) | 2,690 | 4,178 | ||||||
| Indiabulls Housing Finance Ltd. | 5,114 | 14,370 | ||||||
Indiabulls Real Estate Ltd.(1) | 5,663 | 4,828 | ||||||
| Indiabulls Ventures Ltd. | 4,561 | 12,154 | ||||||
| Indian Hotels Co. Ltd. (The) | 3,722 | 5,222 | ||||||
| Indian Oil Corp. Ltd. | 9,357 | 10,891 | ||||||
| Indraprastha Gas Ltd. | 747 | 3,992 | ||||||
| Info Edge India Ltd. | 188 | 8,317 | ||||||
| Infosys Ltd., ADR | 21,685 | 273,231 | ||||||
| Inox Leisure Ltd. | 1,813 | 6,950 | ||||||
InterGlobe Aviation Ltd.(1) | 474 | 7,667 | ||||||
| Ipca Laboratories Ltd. | 680 | 17,421 | ||||||
| IRB Infrastructure Developers Ltd. | 4,609 | 7,416 | ||||||
Jindal Steel & Power Ltd.(1) | 10,525 | 29,199 | ||||||
| JM Financial Ltd. | 5,686 | 6,290 | ||||||
| JSW Energy Ltd. | 5,368 | 3,992 | ||||||
| JSW Steel Ltd. | 12,244 | 44,735 | ||||||
| Jubilant Foodworks Ltd. | 1,020 | 29,015 | ||||||
| Jubilant Life Sciences Ltd. | 1,228 | 13,034 | ||||||
Just Dial Ltd.(1) | 979 | 4,934 | ||||||
| L&T Technology Services Ltd. | 301 | 6,393 | ||||||
21
| Shares | Value | |||||||
| Larsen & Toubro Ltd. | 1,517 | $ | 19,424 | |||||
| LIC Housing Finance Ltd. | 3,329 | 13,585 | ||||||
| Lupin Ltd. | 2,335 | 29,443 | ||||||
| Mahanagar Gas Ltd. | 423 | 5,467 | ||||||
Mahindra & Mahindra Financial Services Ltd.(1) | 14,900 | 27,154 | ||||||
| Mahindra & Mahindra Ltd. | 7,623 | 62,616 | ||||||
| Manappuram Finance Ltd. | 3,601 | 7,221 | ||||||
| Marico Ltd. | 5,270 | 26,392 | ||||||
| Maruti Suzuki India Ltd. | 477 | 44,248 | ||||||
Metropolis Healthcare Ltd.(1) | 216 | 5,394 | ||||||
| Mindtree Ltd. | 902 | 14,108 | ||||||
| MOIL Ltd. | 2,822 | 5,637 | ||||||
| Motherson Sumi Systems Ltd. | 10,627 | 15,783 | ||||||
| Motilal Oswal Financial Services Ltd. | 657 | 6,098 | ||||||
| Mphasis Ltd. | 530 | 7,938 | ||||||
| Natco Pharma Ltd. | 1,718 | 17,508 | ||||||
| National Aluminium Co. Ltd. | 10,492 | 5,092 | ||||||
| Nestle India Ltd. | 158 | 34,219 | ||||||
| Nippon Life India Asset Management Ltd. | 1,267 | 4,676 | ||||||
| NTPC Ltd. | 17,986 | 23,530 | ||||||
| Oil & Natural Gas Corp. Ltd. | 6,053 | 6,729 | ||||||
| Oil India Ltd. | 5,015 | 6,407 | ||||||
| Orient Electric Ltd. | 1,553 | 4,197 | ||||||
| Page Industries Ltd. | 56 | 14,429 | ||||||
| Petronet LNG Ltd. | 6,885 | 22,466 | ||||||
| Pfizer Ltd. | 82 | 5,108 | ||||||
| PI Industries Ltd. | 292 | 7,287 | ||||||
| Pidilite Industries Ltd. | 239 | 4,549 | ||||||
| Piramal Enterprises Ltd. | 424 | 7,832 | ||||||
| Polycab India Ltd. | 446 | 5,398 | ||||||
| Power Finance Corp. Ltd. | 10,140 | 12,909 | ||||||
| Power Grid Corp. of India Ltd. | 13,471 | 32,704 | ||||||
| Prestige Estates Projects Ltd. | 3,967 | 13,318 | ||||||
| PVR Ltd. | 305 | 5,414 | ||||||
Quess Corp. Ltd.(1) | 585 | 2,875 | ||||||
| Radico Khaitan Ltd. | 1,230 | 6,704 | ||||||
| Rajesh Exports Ltd. | 1,625 | 9,843 | ||||||
| Ramco Cements Ltd. (The) | 615 | 5,777 | ||||||
| RBL Bank Ltd. | 5,920 | 15,684 | ||||||
| REC Ltd. | 11,155 | 16,057 | ||||||
| Redington India Ltd. | 3,999 | 5,838 | ||||||
| Reliance Industries Ltd., GDR | 4,686 | 272,770 | ||||||
SBI Life Insurance Co. Ltd.(1) | 541 | 6,078 | ||||||
| Shree Cement Ltd. | 19 | 5,227 | ||||||
| Shriram Transport Finance Co. Ltd. | 1,461 | 13,886 | ||||||
| Siemens Ltd. | 636 | 9,983 | ||||||
| SRF Ltd. | 129 | 7,098 | ||||||
State Bank of India, GDR(1) | 733 | 22,066 | ||||||
| Strides Pharma Science Ltd. | 949 | 7,782 | ||||||
| Sun Pharmaceutical Industries Ltd. | 2,827 | 19,966 | ||||||
| Sunteck Realty Ltd. | 990 | 3,527 | ||||||
| Tata Chemicals Ltd. | 1,558 | 6,601 | ||||||
22
| Shares | Value | |||||||
| Tata Consultancy Services Ltd. | 3,688 | $ | 113,079 | |||||
Tata Motors Ltd., ADR(1) | 6,831 | 66,534 | ||||||
| Tata Power Co. Ltd. (The) | 9,532 | 7,592 | ||||||
| Tata Steel Ltd. | 5,876 | 32,857 | ||||||
| Tech Mahindra Ltd. | 4,473 | 44,909 | ||||||
| Titan Co. Ltd. | 740 | 11,040 | ||||||
| Torrent Pharmaceuticals Ltd. | 179 | 6,469 | ||||||
| Torrent Power Ltd. | 960 | 4,337 | ||||||
| Trident Ltd. | 68,002 | 5,994 | ||||||
| Tube Investments of India Ltd. | 929 | 8,163 | ||||||
| UltraTech Cement Ltd. | 513 | 27,118 | ||||||
Union Bank of India(1) | 17,616 | 7,209 | ||||||
United Spirits Ltd.(1) | 3,063 | 22,716 | ||||||
| UPL Ltd. | 1,059 | 7,233 | ||||||
| Vakrangee Ltd. | 11,233 | 4,256 | ||||||
| Varun Beverages Ltd. | 712 | 7,123 | ||||||
| Vedanta Ltd., ADR | 8,580 | 60,146 | ||||||
Vodafone Idea Ltd.(1) | 76,548 | 10,594 | ||||||
| Welspun Corp. Ltd. | 3,502 | 5,095 | ||||||
| Wipro Ltd., ADR | 8,383 | 36,047 | ||||||
Wockhardt Ltd.(1) | 1,407 | 5,962 | ||||||
Yes Bank Ltd.(1) | 105,873 | 20,609 | ||||||
| Zee Entertainment Enterprises Ltd. | 2,790 | 7,687 | ||||||
| 3,525,781 | ||||||||
| Indonesia — 1.6% | ||||||||
| Ace Hardware Indonesia Tbk PT | 16,900 | 1,793 | ||||||
| Adaro Energy Tbk PT | 215,200 | 15,994 | ||||||
Agung Podomoro Land Tbk PT(1) | 80,200 | 642 | ||||||
| AKR Corporindo Tbk PT | 38,600 | 7,667 | ||||||
Alam Sutera Realty Tbk PT(1) | 59,300 | 507 | ||||||
| Aneka Tambang Tbk | 161,800 | 9,073 | ||||||
| Astra International Tbk PT | 89,300 | 31,227 | ||||||
| Bank BTPN Syariah Tbk PT | 29,000 | 7,740 | ||||||
| Bank Central Asia Tbk PT | 26,400 | 56,839 | ||||||
| Bank Mandiri Persero Tbk PT | 155,400 | 63,276 | ||||||
| Bank Negara Indonesia Persero Tbk PT | 61,000 | 21,273 | ||||||
| Bank Pembangunan Daerah Jawa Barat Dan Banten Tbk PT | 14,700 | 1,061 | ||||||
| Bank Pembangunan Daerah Jawa Timur Tbk PT | 24,900 | 1,015 | ||||||
| Bank Rakyat Indonesia Persero Tbk PT | 204,100 | 49,012 | ||||||
| Bank Tabungan Negara Persero Tbk PT | 27,700 | 2,980 | ||||||
Barito Pacific Tbk PT(1) | 75,800 | 4,363 | ||||||
| Bukit Asam Tbk PT | 60,300 | 8,410 | ||||||
Bumi Serpong Damai Tbk PT(1) | 24,500 | 1,293 | ||||||
Charoen Pokphand Indonesia Tbk PT(1) | 15,500 | 6,704 | ||||||
| Ciputra Development Tbk PT | 36,000 | 1,894 | ||||||
Erajaya Swasembada Tbk PT(1) | 72,500 | 8,541 | ||||||
Global Mediacom Tbk PT(1) | 53,600 | 1,086 | ||||||
| Indah Kiat Pulp & Paper Corp Tbk PT | 47,800 | 30,419 | ||||||
| Indika Energy Tbk PT | 12,700 | 894 | ||||||
| Indo Tambangraya Megah Tbk PT | 1,900 | 1,074 | ||||||
| Indocement Tunggal Prakarsa Tbk PT | 1,500 | 1,220 | ||||||
| Indofood CBP Sukses Makmur Tbk PT | 13,800 | 9,686 | ||||||
23
| Shares | Value | |||||||
| Indofood Sukses Makmur Tbk PT | 51,700 | $ | 27,039 | |||||
| Industri Jamu Dan Farmasi Sido Muncul Tbk PT | 11,200 | 1,065 | ||||||
| Jasa Marga Persero Tbk PT | 40,000 | 10,710 | ||||||
| Kalbe Farma Tbk PT | 66,400 | 7,191 | ||||||
Kresna Graha Investama Tbk PT(1) | 28,000 | 233 | ||||||
| Link Net Tbk PT | 9,300 | 1,165 | ||||||
Lippo Karawaci Tbk PT(1) | 201,500 | 2,165 | ||||||
Matahari Department Store Tbk PT(1) | 48,500 | 4,206 | ||||||
Medco Energi Internasional Tbk PT(1) | 59,100 | 2,223 | ||||||
Media Nusantara Citra Tbk PT(1) | 116,000 | 7,068 | ||||||
Mitra Adiperkasa Tbk PT(1) | 70,300 | 3,276 | ||||||
| Pabrik Kertas Tjiwi Kimia Tbk PT | 8,400 | 3,919 | ||||||
Pakuwon Jati Tbk PT(1) | 27,500 | 769 | ||||||
Panin Financial Tbk PT(1) | 50,100 | 706 | ||||||
| Perusahaan Gas Negara Tbk PT | 38,500 | 3,304 | ||||||
| Perusahaan Perkebunan London Sumatra Indonesia Tbk PT | 14,800 | 992 | ||||||
| PP Persero Tbk PT | 10,100 | 669 | ||||||
PT Adi Sarana Armada Tbk(1) | 18,500 | 698 | ||||||
PT Bank Pan Indonesia Tbk(1) | 16,900 | 937 | ||||||
PT Buana Lintas Lautan Tbk(1) | 81,100 | 1,578 | ||||||
| PT Buyung Poetra Sembada | 17,000 | 799 | ||||||
PT Indosat Tbk(1) | 13,500 | 2,126 | ||||||
| PT Japfa Comfeed Indonesia Tbk | 78,400 | 6,551 | ||||||
PT Malindo Feedmill Tbk(1) | 13,400 | 563 | ||||||
| PT Ramayana Lestari Sentosa Tbk | 13,500 | 605 | ||||||
PT Rimo International Lestari Tbk(1) | 329,900 | 1,133 | ||||||
| PT Selamat Sempurna Tbk | 68,200 | 5,847 | ||||||
PT Surya Esa Perkasa Tbk(1) | 52,700 | 568 | ||||||
| Puradelta Lestari Tbk PT | 105,100 | 1,630 | ||||||
Salim Ivomas Pratama Tbk PT(1) | 44,700 | 991 | ||||||
Sawit Sumbermas Sarana Tbk PT(1) | 103,500 | 6,096 | ||||||
| Semen Indonesia Persero Tbk PT | 16,500 | 11,929 | ||||||
Siloam International Hospitals Tbk PT(1) | 2,000 | 584 | ||||||
| Sri Rejeki Isman Tbk PT | 54,600 | 823 | ||||||
Summarecon Agung Tbk PT(1) | 14,200 | 626 | ||||||
| Surya Citra Media Tbk PT | 114,900 | 9,750 | ||||||
| Surya Semesta Internusa Tbk PT | 20,600 | 528 | ||||||
| Telekomunikasi Indonesia Persero Tbk PT, ADR | 2,605 | 51,918 | ||||||
| Tower Bersama Infrastructure Tbk PT | 32,500 | 2,910 | ||||||
| Tunas Baru Lampung Tbk PT | 24,900 | 1,355 | ||||||
| Unilever Indonesia Tbk PT | 39,200 | 22,187 | ||||||
| United Tractors Tbk PT | 16,200 | 25,534 | ||||||
| Waskita Beton Precast Tbk PT | 48,300 | 555 | ||||||
| Waskita Karya Persero Tbk PT | 11,200 | 498 | ||||||
| Wijaya Karya Persero Tbk PT | 60,800 | 5,139 | ||||||
| XL Axiata Tbk PT | 48,600 | 8,126 | ||||||
| 594,967 | ||||||||
| Malaysia — 2.2% | ||||||||
| 7-Eleven Malaysia Holdings Bhd, Class B | 3,000 | 1,008 | ||||||
| Aeon Co. M Bhd | 5,500 | 1,102 | ||||||
| AEON Credit Service M Bhd | 500 | 1,085 | ||||||
AirAsia Group Bhd(1) | 8,300 | 1,310 | ||||||
24
| Shares | Value | |||||||
| Alliance Bank Malaysia Bhd | 11,900 | $ | 6,255 | |||||
| AMMB Holdings Bhd | 15,600 | 10,930 | ||||||
| ATA IMS Bhd | 2,900 | 1,050 | ||||||
| Axiata Group Bhd | 10,300 | 7,439 | ||||||
Berjaya Corp. Bhd(1) | 17,400 | 835 | ||||||
| Berjaya Sports Toto Bhd | 7,400 | 3,712 | ||||||
| Bermaz Auto Bhd | 4,200 | 1,372 | ||||||
Bumi Armada Bhd(1) | 18,600 | 1,217 | ||||||
| Bursa Malaysia Bhd | 700 | 1,627 | ||||||
| Carlsberg Brewery Malaysia Bhd | 1,700 | 8,905 | ||||||
| CIMB Group Holdings Bhd | 25,100 | 19,877 | ||||||
Coastal Contracts Bhd(1) | 3,400 | 530 | ||||||
| D&O Green Technologies Bhd | 5,600 | 1,175 | ||||||
Dagang NeXchange Bhd(1) | 15,500 | 876 | ||||||
| Datasonic Group Bhd | 14,100 | 4,463 | ||||||
Dayang Enterprise Holdings Bhd(1) | 2,900 | 820 | ||||||
| Dialog Group Bhd | 20,700 | 17,832 | ||||||
| DiGi.Com Bhd | 15,500 | 14,693 | ||||||
| DRB-Hicom Bhd | 5,900 | 2,886 | ||||||
| Dufu Technology Corp. Bhd | 2,800 | 2,257 | ||||||
| Econpile Holdings Bhd | 5,500 | 790 | ||||||
| Ekovest Bhd | 9,600 | 1,138 | ||||||
| FGV Holdings Bhd | 40,300 | 11,888 | ||||||
| Fraser & Neave Holdings Bhd | 900 | 6,637 | ||||||
| Frontken Corp. Bhd | 3,300 | 3,008 | ||||||
| Gamuda Bhd | 25,500 | 20,790 | ||||||
| Genting Bhd | 13,600 | 11,454 | ||||||
| Genting Malaysia Bhd | 21,500 | 11,760 | ||||||
| Genting Plantations Bhd | 300 | 716 | ||||||
| Globetronics Technology Bhd | 12,200 | 8,048 | ||||||
| Hai-O Enterprise Bhd | 2,000 | 866 | ||||||
| HAP Seng Consolidated Bhd | 500 | 864 | ||||||
| Hartalega Holdings Bhd | 5,700 | 22,700 | ||||||
Hengyuan Refining Co. Bhd(1) | 1,000 | 722 | ||||||
Hibiscus Petroleum Bhd(1) | 7,000 | 998 | ||||||
| Hong Leong Bank Bhd | 2,200 | 7,391 | ||||||
| Hong Leong Financial Group Bhd | 300 | 888 | ||||||
| Hong Leong Industries Bhd | 400 | 737 | ||||||
| IHH Healthcare Bhd | 4,300 | 5,538 | ||||||
| IJM Corp. Bhd | 18,600 | 5,356 | ||||||
| Inari Amertron Bhd | 26,100 | 14,140 | ||||||
| IOI Corp. Bhd | 7,800 | 8,350 | ||||||
JAKS Resources Bhd(1) | 4,300 | 779 | ||||||
Jaya Tiasa Holdings Bhd(1) | 5,700 | 909 | ||||||
| Kossan Rubber Industries | 5,800 | 22,377 | ||||||
| KPJ Healthcare Bhd | 33,800 | 6,693 | ||||||
KSL Holdings Bhd(1) | 5,500 | 746 | ||||||
| Kuala Lumpur Kepong Bhd | 400 | 2,177 | ||||||
| Land & General Bhd | 29,900 | 752 | ||||||
LBS Bina Group Bhd(1) | 8,961 | 1,032 | ||||||
| Leong Hup International Bhd | 5,600 | 1,108 | ||||||
| Lii Hen Industries Bhd | 1,400 | 1,045 | ||||||
25
| Shares | Value | |||||||
| Lotte Chemical Titan Holding Bhd | 1,900 | $ | 829 | |||||
| Mah Sing Group Bhd | 6,700 | 1,221 | ||||||
| Malakoff Corp. Bhd | 6,800 | 1,616 | ||||||
| Malayan Banking Bhd | 9,300 | 16,359 | ||||||
| Malaysia Airports Holdings Bhd | 5,100 | 6,241 | ||||||
| Malaysia Building Society Bhd | 5,500 | 765 | ||||||
Malaysia Marine and Heavy Engineering Holdings Bhd(1) | 4,700 | 417 | ||||||
| Malaysian Pacific Industries Bhd | 2,600 | 9,798 | ||||||
| Malaysian Resources Corp. Bhd | 9,900 | 1,198 | ||||||
| Matrix Concepts Holdings Bhd | 12,200 | 5,154 | ||||||
| Maxis Bhd | 12,000 | 14,403 | ||||||
Media Prima Bhd(1) | 15,000 | 683 | ||||||
| Mega First Corp. Bhd | 2,100 | 3,909 | ||||||
| MISC Bhd | 5,500 | 10,045 | ||||||
| MKH Bhd | 2,900 | 870 | ||||||
| MMC Corp. Bhd | 5,600 | 1,007 | ||||||
Muhibbah Engineering M Bhd(1) | 2,000 | 398 | ||||||
My EG Services Bhd(1) | 19,800 | 7,099 | ||||||
Naim Holdings Bhd(1) | 4,300 | 850 | ||||||
| Nestle Malaysia Bhd | 300 | 10,029 | ||||||
OCK Group Bhd(1) | 7,100 | 860 | ||||||
| OSK Holdings Bhd | 6,600 | 1,220 | ||||||
| Padini Holdings Bhd | 2,100 | 1,189 | ||||||
| Paramount Corp. Bhd | 3,400 | 634 | ||||||
| Pentamaster Corp. Bhd | 9,300 | 10,619 | ||||||
| Perak Transit Bhd | 16,700 | 1,102 | ||||||
| Petronas Chemicals Group Bhd | 8,100 | 10,611 | ||||||
| Petronas Dagangan Bhd | 2,100 | 10,380 | ||||||
| Petronas Gas Bhd | 2,500 | 9,899 | ||||||
| Poh Huat Resources Holdings Bhd | 2,800 | 901 | ||||||
| PPB Group Bhd | 1,800 | 7,777 | ||||||
| Press Metal Aluminium Holdings Bhd | 1,700 | 2,125 | ||||||
| Public Bank Bhd | 8,200 | 32,315 | ||||||
| QL Resources Bhd | 1,500 | 3,456 | ||||||
| Ranhill Utilities Bhd | 3,700 | 795 | ||||||
| RHB Bank Bhd | 11,400 | 12,529 | ||||||
| Sam Engineering & Equipment M Bhd | 600 | 993 | ||||||
Sapura Energy Bhd(1) | 43,200 | 1,294 | ||||||
| Sarawak Oil Palms Bhd | 1,400 | 1,224 | ||||||
| Scientex Bhd | 4,100 | 9,250 | ||||||
| Serba Dinamik Holdings Bhd | 4,000 | 1,736 | ||||||
| Sime Darby Bhd | 16,800 | 8,828 | ||||||
| Sime Darby Plantation Bhd | 2,900 | 3,548 | ||||||
| Sime Darby Property Bhd | 5,400 | 849 | ||||||
| SKP Resources Bhd | 5,100 | 1,970 | ||||||
| SP Setia Bhd Group | 3,200 | 610 | ||||||
| Sunway Bhd | 27,600 | 9,273 | ||||||
| Sunway Construction Group Bhd | 11,200 | 5,322 | ||||||
Supermax Corp. Bhd(1) | 18,067 | 96,755 | ||||||
| Syarikat Takaful Malaysia Keluarga Bhd | 1,400 | 1,697 | ||||||
| Ta Ann Holdings Bhd | 1,700 | 1,159 | ||||||
| TA Enterprise Bhd | 7,300 | 1,068 | ||||||
26
| Shares | Value | |||||||
| Taliworks Corp. Bhd | 23,700 | $ | 4,976 | |||||
| Telekom Malaysia Bhd | 11,200 | 11,154 | ||||||
| Tenaga Nasional Bhd | 19,400 | 50,674 | ||||||
| Thong Guan Industries Bhd | 1,200 | 1,552 | ||||||
| TIME dotCom Bhd | 4,000 | 11,095 | ||||||
| Top Glove Corp. Bhd | 6,500 | 41,172 | ||||||
Tropicana Corp. Bhd(1) | 4,600 | 993 | ||||||
| Uchi Technologies Bhd | 1,500 | 991 | ||||||
UEM Sunrise Bhd(1) | 6,800 | 661 | ||||||
| Unisem M Bhd | 13,300 | 11,813 | ||||||
| UOA Development Bhd | 13,700 | 5,302 | ||||||
Velesto Energy Bhd(1) | 22,900 | 796 | ||||||
| ViTrox Corp. Bhd | 600 | 1,743 | ||||||
Vizione Holdings Bhd(1) | 5,100 | 611 | ||||||
| VS Industry Bhd | 33,400 | 15,051 | ||||||
| Wah Seong Corp. Bhd | 4,120 | 522 | ||||||
WCT Holdings Bhd(1) | 7,373 | 738 | ||||||
| Westports Holdings Bhd | 8,400 | 7,373 | ||||||
| Yinson Holdings Bhd | 700 | 1,061 | ||||||
| YTL Corp. Bhd | 26,900 | 4,325 | ||||||
| 813,135 | ||||||||
| Mexico — 1.9% | ||||||||
| Alfa SAB de CV, Series A | 35,200 | 22,649 | ||||||
Alsea SAB de CV(1) | 4,700 | 4,874 | ||||||
| America Movil SAB de CV, Class L ADR | 5,200 | 63,284 | ||||||
| Arca Continental SAB de CV | 2,200 | 10,001 | ||||||
Banco del Bajio SA(1) | 8,200 | 6,558 | ||||||
| Banco Santander Mexico SA Institucion de Banca Multiple Grupo Financiero Santand, ADR | 1,644 | 5,294 | ||||||
Bolsa Mexicana de Valores SAB de CV(2) | 4,400 | 9,308 | ||||||
| Cemex SAB de CV, ADR | 708 | 2,273 | ||||||
| Coca-Cola Femsa SAB de CV | 4,700 | 19,556 | ||||||
Consorcio ARA SAB de CV(1) | 4,900 | 623 | ||||||
Controladora Vuela Cia de Aviacion SAB de CV, ADR(1) | 2,081 | 16,814 | ||||||
| Corp. Inmobiliaria Vesta SAB de CV | 8,600 | 12,773 | ||||||
Credito Real SAB de CV SOFOM ER(1) | 1,900 | 1,068 | ||||||
| El Puerto de Liverpool SAB de CV, Class C1 | 600 | 1,580 | ||||||
| Fomento Economico Mexicano SAB de CV, ADR | 319 | 18,607 | ||||||
Genomma Lab Internacional SAB de CV, Class B(1) | 12,200 | 12,851 | ||||||
Gentera SAB de CV(1) | 18,400 | 6,029 | ||||||
| Gruma SAB de CV, B Shares | 2,065 | 24,395 | ||||||
Grupo Aeromexico SAB de CV(1) | 10,056 | 2,137 | ||||||
Grupo Aeroportuario del Centro Norte SAB de CV, ADR(1) | 694 | 25,303 | ||||||
| Grupo Aeroportuario del Pacifico SAB de CV, ADR | 336 | 26,033 | ||||||
Grupo Aeroportuario del Sureste SAB de CV, ADR(1) | 122 | 13,842 | ||||||
| Grupo Bimbo SAB de CV, Series A | 5,100 | 9,456 | ||||||
| Grupo Carso SAB de CV | 1,200 | 2,391 | ||||||
| Grupo Cementos de Chihuahua SAB de CV | 3,100 | 13,973 | ||||||
| Grupo Comercial Chedraui SA de CV | 1,300 | 1,494 | ||||||
Grupo Financiero Banorte SAB de CV(1) | 16,700 | 57,391 | ||||||
Grupo Financiero Inbursa SAB de CV(1) | 20,800 | 15,209 | ||||||
Grupo GICSA SAB de CV(1) | 8,000 | 1,119 | ||||||
27
| Shares | Value | |||||||
Grupo Industrial Saltillo SAB de CV(1) | 1,800 | $ | 1,398 | |||||
| Grupo Mexico SAB de CV, Series B | 22,700 | 60,583 | ||||||
Grupo Rotoplas SAB de CV(1) | 1,749 | 1,279 | ||||||
Grupo Televisa SAB, ADR(1) | 4,505 | 28,021 | ||||||
Grupo Traxion SAB de CV(1) | 1,500 | 1,072 | ||||||
Hoteles City Express SAB de CV(1) | 1,300 | 327 | ||||||
| Industrias Bachoco SAB de CV | 700 | 2,214 | ||||||
| Industrias Penoles SAB de CV | 1,920 | 31,764 | ||||||
| Infraestructura Energetica Nova SAB de CV | 4,000 | 11,628 | ||||||
| Kimberly-Clark de Mexico SAB de CV, A Shares | 13,900 | 22,176 | ||||||
| La Comer SAB de CV | 2,600 | 3,992 | ||||||
| Megacable Holdings SAB de CV | 6,100 | 17,618 | ||||||
Nemak SAB de CV(2) | 5,900 | 1,704 | ||||||
| Orbia Advance Corp. SAB de CV | 9,600 | 15,425 | ||||||
Promotora y Operadora de Infraestructura SAB de CV(1) | 1,600 | 11,847 | ||||||
| Qualitas Controladora SAB de CV | 3,400 | 13,394 | ||||||
Regional SAB de CV(1) | 5,500 | 13,749 | ||||||
Telesites SAB de CV(1) | 23,900 | 17,912 | ||||||
Unifin Financiera SAB de CV(1)(2) | 700 | 588 | ||||||
| Wal-Mart de Mexico SAB de CV | 14,300 | 34,244 | ||||||
| 697,820 | ||||||||
| Peru — 0.3% | ||||||||
| Cia de Minas Buenaventura SAA, ADR | 2,742 | 38,607 | ||||||
| Credicorp Ltd. | 294 | 38,361 | ||||||
| Southern Copper Corp. | 567 | 27,273 | ||||||
| 104,241 | ||||||||
| Philippines — 0.8% | ||||||||
| Aboitiz Equity Ventures, Inc. | 11,600 | 11,473 | ||||||
| Aboitiz Power Corp. | 12,100 | 6,650 | ||||||
Alliance Global Group, Inc.(1) | 44,700 | 5,683 | ||||||
| Ayala Corp. | 870 | 13,151 | ||||||
| Ayala Land, Inc. | 15,500 | 9,165 | ||||||
Ayalaland Logistics Holdings Corp.(1) | 17,000 | 609 | ||||||
| Bank of the Philippine Islands | 6,330 | 8,728 | ||||||
| BDO Unibank, Inc. | 9,240 | 16,365 | ||||||
Cebu Air, Inc.(1) | 6,390 | 4,596 | ||||||
| Century Pacific Food, Inc. | 6,000 | 2,006 | ||||||
Chelsea Logistics and Infrastructure Holdings Corp.(1) | 9,200 | 620 | ||||||
| Cosco Capital, Inc. | 51,700 | 5,131 | ||||||
D&L Industries, Inc.(1) | 40,800 | 3,819 | ||||||
| DMCI Holdings, Inc. | 71,300 | 5,864 | ||||||
DoubleDragon Properties Corp.(1) | 2,700 | 843 | ||||||
East West Banking Corp.(1) | 5,400 | 941 | ||||||
EEI Corp.(1) | 5,000 | 586 | ||||||
| Filinvest Land, Inc. | 41,000 | 794 | ||||||
| First Gen Corp. | 22,300 | 11,171 | ||||||
| Ginebra San Miguel, Inc. | 1,300 | 1,013 | ||||||
Global Ferronickel Holdings, Inc.(1) | 35,000 | 926 | ||||||
| Globe Telecom, Inc. | 260 | 11,204 | ||||||
| GT Capital Holdings, Inc. | 720 | 5,907 | ||||||
Integrated Micro-Electronics, Inc.(1) | 6,600 | 634 | ||||||
| International Container Terminal Services, Inc. | 6,410 | 13,863 | ||||||
28
| Shares | Value | |||||||
| JG Summit Holdings, Inc. | 9,010 | $ | 11,932 | |||||
| Jollibee Foods Corp. | 2,450 | 6,808 | ||||||
| Manila Electric Co. | 1,270 | 7,050 | ||||||
| Manila Water Co., Inc. | 2,800 | 829 | ||||||
| Max's Group, Inc. | 4,100 | 402 | ||||||
Megaworld Corp.(1) | 99,000 | 5,934 | ||||||
| Metro Pacific Investments Corp. | 166,000 | 11,459 | ||||||
| Metropolitan Bank & Trust Co. | 15,720 | 10,816 | ||||||
| Nickel Asia Corp. | 18,000 | 1,200 | ||||||
| Petron Corp. | 75,000 | 4,685 | ||||||
Pilipinas Shell Petroleum Corp.(1) | 1,600 | 583 | ||||||
| PLDT, Inc., ADR | 598 | 17,695 | ||||||
| Puregold Price Club, Inc. | 11,900 | 13,221 | ||||||
| Robinsons Land Corp. | 20,700 | 6,230 | ||||||
| Robinsons Retail Holdings, Inc. | 3,900 | 5,634 | ||||||
| Security Bank Corp. | 3,090 | 6,167 | ||||||
| Semirara Mining & Power Corp. | 25,000 | 4,850 | ||||||
| SM Investments Corp. | 545 | 9,546 | ||||||
| SM Prime Holdings, Inc. | 8,100 | 4,868 | ||||||
| Universal Robina Corp. | 4,080 | 11,590 | ||||||
| Vista Land & Lifescapes, Inc. | 13,800 | 850 | ||||||
| Wilcon Depot, Inc. | 17,100 | 5,710 | ||||||
| 289,801 | ||||||||
| Poland — 0.9% | ||||||||
Alior Bank SA(1) | 357 | 1,323 | ||||||
AmRest Holdings SE(1) | 1,309 | 7,421 | ||||||
| Asseco Poland SA | 388 | 7,469 | ||||||
Bank Millennium SA(1) | 6,136 | 5,020 | ||||||
Bank Polska Kasa Opieki SA(1) | 515 | 7,289 | ||||||
| CCC SA | 89 | 1,387 | ||||||
CD Projekt SA(1) | 133 | 15,815 | ||||||
Ciech SA(1) | 710 | 6,051 | ||||||
Cyfrowy Polsat SA(1) | 1,265 | 9,860 | ||||||
Dino Polska SA(1) | 342 | 20,703 | ||||||
Enea SA(1) | 1,082 | 1,947 | ||||||
Eurocash SA(1) | 1,467 | 6,204 | ||||||
Famur SA(1) | 6,958 | 3,646 | ||||||
Grupa Azoty SA(1) | 224 | 1,632 | ||||||
| Grupa Lotos SA | 431 | 4,727 | ||||||
Jastrzebska Spolka Weglowa SA(1) | 271 | 1,150 | ||||||
KGHM Polska Miedz SA(1) | 1,569 | 58,096 | ||||||
KRUK SA(1) | 388 | 15,497 | ||||||
LPP SA(1) | 10 | 19,489 | ||||||
Lubelski Wegiel Bogdanka SA(1) | 109 | 561 | ||||||
mBank SA(1) | 58 | 2,956 | ||||||
| Neuca SA | 24 | 3,296 | ||||||
Orange Polska SA(1) | 8,940 | 17,520 | ||||||
PGE Polska Grupa Energetyczna SA(1) | 892 | 1,459 | ||||||
PKP Cargo SA(1) | 196 | 684 | ||||||
| PLAY Communications SA | 1,373 | 11,386 | ||||||
| Polski Koncern Naftowy ORLEN SA | 1,386 | 19,024 | ||||||
29
| Shares | Value | |||||||
| Polskie Gornictwo Naftowe i Gazownictwo SA | 10,706 | $ | 14,870 | |||||
Powszechna Kasa Oszczednosci Bank Polski SA(1) | 2,643 | 15,429 | ||||||
Powszechny Zaklad Ubezpieczen SA(1) | 2,097 | 15,445 | ||||||
Santander Bank Polska SA(1) | 121 | 4,958 | ||||||
Tauron Polska Energia SA(1) | 17,464 | 11,942 | ||||||
| Warsaw Stock Exchange | 465 | 5,522 | ||||||
| 319,778 | ||||||||
| Russia — 2.5% | ||||||||
| Gazprom PJSC, ADR | 17,494 | 84,396 | ||||||
| Globaltrans Investment plc, GDR | 3,179 | 19,823 | ||||||
| LUKOIL PJSC, ADR | 3,238 | 221,479 | ||||||
| Magnit PJSC, GDR | 4,635 | 68,026 | ||||||
Mail.ru Group Ltd., GDR(1) | 87 | 2,684 | ||||||
| MMC Norilsk Nickel PJSC, ADR | 5,139 | 133,871 | ||||||
| Mobile TeleSystems PJSC, ADR | 3,830 | 35,696 | ||||||
| Novatek PJSC, GDR | 188 | 27,843 | ||||||
| Novolipetsk Steel PJSC, GDR | 1,958 | 41,276 | ||||||
| O'Key Group SA, GDR | 1,578 | 1,165 | ||||||
| PhosAgro PJSC, GDR | 2,182 | 25,930 | ||||||
| Ros Agro plc, GDR | 125 | 1,260 | ||||||
| Rosneft Oil Co. PJSC, GDR | 4,995 | 25,285 | ||||||
Sberbank of Russia PJSC, ADR (London)(1) | 6,710 | 81,023 | ||||||
| Severstal PAO, GDR | 1,564 | 19,935 | ||||||
Tatneft PJSC, ADR(1) | 1,814 | 81,049 | ||||||
TMK PJSC, GDR(1) | 2,869 | 8,850 | ||||||
VTB Bank PJSC, GDR(1) | 24,790 | 22,802 | ||||||
| X5 Retail Group NV, GDR | 529 | 19,361 | ||||||
| 921,754 | ||||||||
| South Africa — 4.1% | ||||||||
| Absa Group Ltd. | 5,563 | 25,265 | ||||||
| Adcock Ingram Holdings Ltd. | 305 | 724 | ||||||
| Advtech Ltd. | 12,737 | 6,123 | ||||||
| AECI Ltd. | 1,697 | 8,435 | ||||||
| African Oxygen Ltd. | 915 | 891 | ||||||
| African Rainbow Minerals Ltd. | 1,302 | 16,252 | ||||||
| Afrimat Ltd. | 756 | 1,658 | ||||||
| Alexander Forbes Group Holdings Ltd. | 4,775 | 929 | ||||||
| Anglo American Platinum Ltd. | 238 | 17,685 | ||||||
| AngloGold Ashanti Ltd., ADR | 3,220 | 95,022 | ||||||
Aspen Pharmacare Holdings Ltd.(1) | 4,101 | 32,869 | ||||||
| Astral Foods Ltd. | 723 | 5,666 | ||||||
| AVI Ltd. | 3,350 | 13,641 | ||||||
| Balwin Properties Ltd. | 4,197 | 755 | ||||||
| Barloworld Ltd. | 1,806 | 6,368 | ||||||
| Bid Corp. Ltd. | 1,813 | 29,915 | ||||||
| Bidvest Group Ltd. (The) | 2,298 | 18,451 | ||||||
Blue Label Telecoms Ltd.(1) | 5,048 | 951 | ||||||
Brait SE(1) | 4,194 | 702 | ||||||
| Capitec Bank Holdings Ltd. | 267 | 13,136 | ||||||
| Cashbuild Ltd. | 488 | 5,146 | ||||||
| City Lodge Hotels Ltd. | 2,646 | 445 | ||||||
| Clicks Group Ltd. | 1,996 | 27,029 | ||||||
30
| Shares | Value | |||||||
| Coronation Fund Managers Ltd. | 3,377 | $ | 8,523 | |||||
| Curro Holdings Ltd. | 896 | 433 | ||||||
DataTec Ltd.(1) | 6,090 | 7,770 | ||||||
| Dis-Chem Pharmacies Ltd. | 4,130 | 4,449 | ||||||
| Discovery Ltd. | 2,815 | 20,077 | ||||||
| DRDGOLD Ltd. | 20,138 | 30,188 | ||||||
EOH Holdings Ltd.(1) | 1,194 | 338 | ||||||
| EPP NV | 3,537 | 1,530 | ||||||
| Exxaro Resources Ltd. | 3,352 | 27,125 | ||||||
| Famous Brands Ltd. | 293 | 791 | ||||||
| FirstRand Ltd. | 27,428 | 61,045 | ||||||
| Foschini Group Ltd. (The) | 3,686 | 16,552 | ||||||
| Gold Fields Ltd., ADR | 9,385 | 122,287 | ||||||
Harmony Gold Mining Co. Ltd., ADR(1) | 8,375 | 54,270 | ||||||
| Impala Platinum Holdings Ltd. | 7,480 | 68,748 | ||||||
| Imperial Logistics Ltd. | 426 | 870 | ||||||
| Investec Ltd. | 3,260 | 6,024 | ||||||
| JSE Ltd. | 799 | 5,593 | ||||||
| KAP Industrial Holdings Ltd. | 44,978 | 7,288 | ||||||
| Kumba Iron Ore Ltd. | 679 | 21,222 | ||||||
| Lewis Group Ltd. | 508 | 528 | ||||||
| Liberty Holdings Ltd. | 2,210 | 7,867 | ||||||
| Life Healthcare Group Holdings Ltd. | 14,356 | 14,024 | ||||||
Massmart Holdings Ltd.(1) | 2,982 | 4,795 | ||||||
Metair Investments Ltd.(1) | 1,914 | 2,073 | ||||||
| MiX Telematics Ltd., ADR | 83 | 828 | ||||||
| Momentum Metropolitan Holdings | 18,542 | 16,578 | ||||||
Motus Holdings Ltd.(1) | 4,714 | 7,662 | ||||||
| Mpact Ltd. | 965 | 570 | ||||||
| Mr Price Group Ltd. | 2,425 | 16,542 | ||||||
| MTN Group Ltd. | 8,228 | 29,607 | ||||||
MultiChoice Group(1) | 3,427 | 19,586 | ||||||
| Murray & Roberts Holdings Ltd. | 1,453 | 474 | ||||||
Nampak Ltd.(1) | 4,076 | 251 | ||||||
| Naspers Ltd., N Shares | 870 | 158,362 | ||||||
| Nedbank Group Ltd. | 3,003 | 16,939 | ||||||
| NEPI Rockcastle plc | 2,475 | 11,552 | ||||||
| Netcare Ltd. | 24,526 | 18,094 | ||||||
Ninety One Ltd.(1) | 573 | 1,559 | ||||||
Northam Platinum Ltd.(1) | 2,554 | 24,035 | ||||||
| Oceana Group Ltd. | 464 | 1,719 | ||||||
| Old Mutual Ltd. | 31,053 | 20,497 | ||||||
Omnia Holdings Ltd.(1) | 2,481 | 3,630 | ||||||
| Pepkor Holdings Ltd. | 8,240 | 4,712 | ||||||
Peregrine Holdings Ltd.(1) | 1,307 | 1,580 | ||||||
| Pick n Pay Stores Ltd. | 3,941 | 9,690 | ||||||
PPC Ltd.(1) | 7,668 | 362 | ||||||
| Rand Merchant Investment Holdings Ltd. | 8,384 | 14,865 | ||||||
| Raubex Group Ltd. | 1,373 | 1,975 | ||||||
| Remgro Ltd. | 3,757 | 19,485 | ||||||
| Reunert Ltd. | 3,156 | 5,809 | ||||||
| RFG Holdings Ltd. | 1,040 | 792 | ||||||
31
| Shares | Value | |||||||
| RMB Holdings Ltd. | 8,812 | $ | 639 | |||||
Royal Bafokeng Platinum Ltd.(1) | 876 | 3,331 | ||||||
| Sanlam Ltd. | 7,841 | 25,327 | ||||||
Sappi Ltd.(1) | 7,891 | 10,352 | ||||||
Sasol Ltd., ADR(1) | 3,697 | 29,650 | ||||||
| Shoprite Holdings Ltd. | 5,291 | 34,489 | ||||||
Sibanye Stillwater Ltd., ADR(1) | 3,129 | 38,518 | ||||||
| SPAR Group Ltd. (The) | 1,587 | 15,135 | ||||||
| Standard Bank Group Ltd. | 5,794 | 35,963 | ||||||
Sun International Ltd.(1) | 488 | 359 | ||||||
Super Group Ltd.(1) | 5,448 | 5,793 | ||||||
| Telkom SA SOC Ltd. | 1,510 | 2,015 | ||||||
| Tiger Brands Ltd. | 1,491 | 15,169 | ||||||
| Trencor Ltd. | 1,689 | 522 | ||||||
| Truworths International Ltd. | 1,793 | 3,214 | ||||||
Tsogo Sun Gaming Ltd.(1) | 3,616 | 781 | ||||||
Tsogo Sun Hotels Ltd.(1) | 3,866 | 406 | ||||||
| Vodacom Group Ltd. | 3,008 | 22,655 | ||||||
| Wilson Bayly Holmes-Ovcon Ltd. | 577 | 3,770 | ||||||
| Woolworths Holdings Ltd. | 3,379 | 6,330 | ||||||
| Zeder Investments Ltd. | 8,750 | 1,238 | ||||||
| 1,485,879 | ||||||||
| South Korea — 13.6% | ||||||||
| Advanced Process Systems Corp. | 181 | 3,397 | ||||||
| AfreecaTV Co. Ltd. | 68 | 3,307 | ||||||
Alteogen, Inc.(1) | 120 | 21,117 | ||||||
| Amorepacific Corp. | 128 | 18,064 | ||||||
| AMOREPACIFIC Group | 58 | 2,484 | ||||||
Aprogen KIC, Inc.(1) | 437 | 1,124 | ||||||
Aprogen pharmaceuticals, Inc.(1) | 1,383 | 1,819 | ||||||
Asiana Airlines, Inc.(1) | 1,097 | 3,970 | ||||||
| BGF retail Co. Ltd. | 80 | 8,582 | ||||||
BH Co. Ltd.(1) | 157 | 2,665 | ||||||
Binex Co. Ltd.(1) | 410 | 12,377 | ||||||
| BNK Financial Group, Inc. | 3,562 | 15,165 | ||||||
| Boditech Med, Inc. | 309 | 7,098 | ||||||
Celltrion Healthcare Co. Ltd.(1) | 96 | 8,102 | ||||||
Celltrion, Inc.(1) | 259 | 64,763 | ||||||
| Cheil Worldwide, Inc. | 192 | 2,936 | ||||||
| Chong Kun Dang Pharmaceutical Corp. | 53 | 8,656 | ||||||
| Chongkundang Holdings Corp. | 42 | 4,281 | ||||||
| CJ CheilJedang Corp. | 131 | 44,722 | ||||||
| CJ Corp. | 193 | 13,141 | ||||||
| CJ ENM Co. Ltd. | 204 | 20,303 | ||||||
CJ Logistics Corp.(1) | 123 | 15,646 | ||||||
| Com2uSCorp | 44 | 4,112 | ||||||
| Cosmax, Inc. | 83 | 7,100 | ||||||
| Coway Co. Ltd. | 251 | 16,866 | ||||||
| COWELL FASHION Co. Ltd. | 866 | 4,382 | ||||||
| CS Wind Corp. | 229 | 19,678 | ||||||
| Cuckoo Homesys Co. Ltd. | 216 | 7,784 | ||||||
| Daea TI Co. Ltd. | 824 | 4,205 | ||||||
32
| Shares | Value | |||||||
| Daelim Industrial Co. Ltd. | 496 | $ | 36,137 | |||||
| Daesang Corp. | 518 | 12,684 | ||||||
Daewoo Engineering & Construction Co. Ltd.(1) | 1,018 | 2,511 | ||||||
Daewoo Shipbuilding & Marine Engineering Co. Ltd.(1) | 196 | 3,616 | ||||||
| Daishin Securities Co. Ltd. | 202 | 1,737 | ||||||
| Daou Data Corp. | 673 | 7,629 | ||||||
| Daou Technology, Inc. | 207 | 3,374 | ||||||
| Dawonsys Co. Ltd. | 551 | 10,983 | ||||||
| DB HiTek Co. Ltd. | 807 | 24,000 | ||||||
| DB Insurance Co. Ltd. | 540 | 19,845 | ||||||
| DGB Financial Group, Inc. | 1,923 | 8,523 | ||||||
| Dong-A Socio Holdings Co. Ltd. | 49 | 4,463 | ||||||
| Dong-A ST Co. Ltd. | 58 | 4,610 | ||||||
| Dongjin Semichem Co. Ltd. | 597 | 16,568 | ||||||
| DongKook Pharmaceutical Co. Ltd. | 83 | 10,558 | ||||||
Dongkuk Steel Mill Co. Ltd.(1) | 483 | 2,510 | ||||||
| Dongsuh Cos., Inc. | 282 | 6,094 | ||||||
| Dongwon Development Co. Ltd. | 641 | 2,067 | ||||||
| Dongwon Industries Co. Ltd. | 40 | 7,480 | ||||||
Doosan Infracore Co. Ltd.(1) | 985 | 6,630 | ||||||
| DoubleUGames Co. Ltd. | 96 | 5,890 | ||||||
| Douzone Bizon Co. Ltd. | 61 | 5,166 | ||||||
| E-MART, Inc. | 155 | 15,622 | ||||||
| Eo Technics Co. Ltd. | 17 | 1,596 | ||||||
| Eugene Corp. | 974 | 3,262 | ||||||
| F&F Co. Ltd. | 96 | 7,770 | ||||||
Feelux Co. Ltd.(1) | 311 | 935 | ||||||
| Fila Holdings Corp. | 91 | 2,645 | ||||||
Genexine Co. Ltd.(1) | 81 | 12,232 | ||||||
| GOLFZON Co. Ltd. | 83 | 4,520 | ||||||
| Grand Korea Leisure Co. Ltd. | 242 | 2,407 | ||||||
| Green Cross Corp. | 41 | 9,119 | ||||||
| GS Engineering & Construction Corp. | 788 | 16,313 | ||||||
| GS Holdings Corp. | 809 | 22,048 | ||||||
| GS Retail Co. Ltd. | 446 | 12,350 | ||||||
| Halla Holdings Corp. | 152 | 3,463 | ||||||
| Hana Financial Group, Inc. | 3,628 | 85,642 | ||||||
| Hana Tour Service, Inc. | 48 | 1,546 | ||||||
| Handsome Co. Ltd. | 74 | 1,954 | ||||||
Hanjin Heavy Industries & Construction Co. Ltd.(1) | 2,594 | 13,744 | ||||||
| Hanjin Kal Corp. | 187 | 11,898 | ||||||
| Hanjin Transportation Co. Ltd. | 119 | 4,382 | ||||||
| Hankook Tire & Technology Co. Ltd. | 672 | 16,606 | ||||||
| Hanmi Pharm Co. Ltd. | 25 | 6,425 | ||||||
| Hanon Systems | 1,480 | 16,021 | ||||||
| Hansae Co. Ltd. | 542 | 7,902 | ||||||
| Hansol Chemical Co. Ltd. | 45 | 6,119 | ||||||
| Hansol Paper Co. Ltd. | 319 | 3,587 | ||||||
Hansol Technics Co. Ltd.(1) | 511 | 3,763 | ||||||
Hanwha Aerospace Co. Ltd.(1) | 134 | 2,906 | ||||||
| Hanwha Corp. | 937 | 21,584 | ||||||
Hanwha General Insurance Co. Ltd.(1) | 2,607 | 5,895 | ||||||
33
| Shares | Value | |||||||
Hanwha Investment & Securities Co. Ltd.(1) | 1,230 | $ | 1,852 | |||||
| Hanwha Life Insurance Co. Ltd. | 1,969 | 2,523 | ||||||
| Hanwha Solutions Corp. | 2,090 | 69,816 | ||||||
| Harim Holdings Co. Ltd. | 345 | 1,887 | ||||||
| HDC Hyundai Development Co-Engineering & Construction, E Shares | 178 | 3,447 | ||||||
Helixmith Co. Ltd.(1) | 88 | 3,638 | ||||||
| Hite Jinro Co. Ltd. | 419 | 12,978 | ||||||
HLB Life Science Co. Ltd.(1) | 239 | 3,624 | ||||||
HLB, Inc.(1) | 56 | 4,093 | ||||||
HMM Co. Ltd.(1) | 1,519 | 7,301 | ||||||
| Hotel Shilla Co. Ltd. | 319 | 18,833 | ||||||
| HS Industries Co. Ltd. | 758 | 4,376 | ||||||
| Huchems Fine Chemical Corp. | 426 | 6,474 | ||||||
Hugel, Inc.(1) | 45 | 6,200 | ||||||
| Huons Co. Ltd. | 108 | 6,559 | ||||||
Hyosung Advanced Materials Corp.(1) | 16 | 1,821 | ||||||
| Hyosung Corp. | 57 | 3,204 | ||||||
Hyundai Bioscience Co. Ltd.(1) | 161 | 1,530 | ||||||
Hyundai Construction Equipment Co. Ltd.(1) | 148 | 2,707 | ||||||
| Hyundai Department Store Co. Ltd. | 221 | 9,968 | ||||||
Hyundai Electric & Energy System Co. Ltd.(1) | 591 | 5,818 | ||||||
| Hyundai Elevator Co. Ltd. | 412 | 14,200 | ||||||
| Hyundai Engineering & Construction Co. Ltd. | 375 | 10,151 | ||||||
| Hyundai Glovis Co. Ltd. | 133 | 16,208 | ||||||
| Hyundai Heavy Industries Holdings Co. Ltd. | 69 | 13,094 | ||||||
| Hyundai Home Shopping Network Corp. | 76 | 4,168 | ||||||
| Hyundai Livart Furniture Co. Ltd. | 429 | 5,931 | ||||||
| Hyundai Marine & Fire Insurance Co. Ltd. | 814 | 15,098 | ||||||
| Hyundai Mipo Dockyard Co. Ltd. | 101 | 2,606 | ||||||
| Hyundai Mobis Co. Ltd. | 222 | 41,630 | ||||||
| Hyundai Motor Co. | 861 | 127,156 | ||||||
| Hyundai Steel Co. | 167 | 3,508 | ||||||
| Hyundai Wia Corp. | 94 | 3,278 | ||||||
| ICD Co. Ltd. | 248 | 3,195 | ||||||
| Iljin Materials Co. Ltd. | 112 | 4,676 | ||||||
| Ilyang Pharmaceutical Co. Ltd. | 116 | 7,957 | ||||||
| iMarketKorea, Inc. | 532 | 3,444 | ||||||
| Industrial Bank of Korea | 2,016 | 13,689 | ||||||
| Innocean Worldwide, Inc. | 122 | 5,630 | ||||||
Innox Advanced Materials Co. Ltd.(1) | 160 | 6,782 | ||||||
Inscobee, Inc.(1) | 756 | 1,400 | ||||||
Insun ENT Co. Ltd.(1) | 580 | 5,047 | ||||||
Interflex Co. Ltd.(1) | 276 | 2,789 | ||||||
| IS Dongseo Co. Ltd. | 141 | 5,251 | ||||||
| JB Financial Group Co. Ltd. | 3,642 | 13,112 | ||||||
| Jeil Pharmaceutical Co. Ltd. | 24 | 1,115 | ||||||
Jejuair Co. Ltd.(1) | 154 | 1,780 | ||||||
| Jusung Engineering Co. Ltd. | 892 | 4,890 | ||||||
| JW Holdings Corp. | 377 | 1,629 | ||||||
| JW Pharmaceutical Corp. | 299 | 9,588 | ||||||
| JYP Entertainment Corp. | 645 | 18,824 | ||||||
34
| Shares | Value | |||||||
| Kakao Corp. | 175 | $ | 59,681 | |||||
| Kangwon Land, Inc. | 467 | 8,087 | ||||||
| KB Financial Group, Inc., ADR | 1,730 | 53,543 | ||||||
| KC Co. Ltd. | 241 | 4,067 | ||||||
| KC Tech Co. Ltd. | 253 | 4,257 | ||||||
| KCC Corp. | 80 | 9,352 | ||||||
KCC Glass Corp.(1) | 16 | 382 | ||||||
| KEPCO Plant Service & Engineering Co. Ltd. | 121 | 2,828 | ||||||
| Kginicis Co. Ltd. | 423 | 8,349 | ||||||
| Kia Motors Corp. | 1,832 | 65,112 | ||||||
| KIWOOM Securities Co. Ltd. | 185 | 16,980 | ||||||
| Koh Young Technology, Inc. | 46 | 3,474 | ||||||
| Kolmar BNH Co. Ltd. | 169 | 9,502 | ||||||
| Kolmar Korea Co. Ltd. | 104 | 3,993 | ||||||
| Kolmar Korea Holdings Co. Ltd. | 244 | 5,683 | ||||||
| Kolon Industries, Inc. | 95 | 2,560 | ||||||
Komipharm International Co. Ltd.(1) | 185 | 2,405 | ||||||
| Korea Aerospace Industries Ltd. | 802 | 15,108 | ||||||
Korea Electric Power Corp., ADR(1) | 2,740 | 23,400 | ||||||
| Korea Gas Corp. | 430 | 8,527 | ||||||
Korea Information & Communications Co. Ltd.(1) | 595 | 4,608 | ||||||
| Korea Investment Holdings Co. Ltd. | 482 | 24,719 | ||||||
Korea Line Corp.(1) | 210 | 2,838 | ||||||
| Korea Petrochemical Ind Co. Ltd. | 26 | 2,583 | ||||||
| Korea Real Estate Investment & Trust Co. Ltd. | 2,088 | 2,977 | ||||||
Korea Shipbuilding & Offshore Engineering Co. Ltd.(1) | 148 | 10,699 | ||||||
| Korea United Pharm, Inc. | 247 | 10,354 | ||||||
| Korea Zinc Co. Ltd. | 42 | 14,044 | ||||||
Korean Air Lines Co. Ltd.(1) | 1,307 | 19,139 | ||||||
| Korean Reinsurance Co. | 545 | 3,361 | ||||||
| KT Skylife Co. Ltd. | 727 | 5,200 | ||||||
| Kumho Petrochemical Co. Ltd. | 283 | 23,833 | ||||||
Kumho Tire Co., Inc.(1) | 1,542 | 4,726 | ||||||
| Kwang Dong Pharmaceutical Co. Ltd. | 671 | 5,473 | ||||||
| Kyobo Securities Co. Ltd. | 138 | 782 | ||||||
| Kyung Dong Navien Co. Ltd. | 141 | 6,136 | ||||||
| L&C Bio Co. Ltd. | 49 | 5,426 | ||||||
| LEENO Industrial, Inc. | 24 | 2,555 | ||||||
LegoChem Biosciences, Inc.(1) | 200 | 9,023 | ||||||
| LG Chem Ltd. | 440 | 272,366 | ||||||
| LG Corp. | 313 | 21,722 | ||||||
LG Display Co. Ltd., ADR(1) | 2,486 | 15,339 | ||||||
| LG Electronics, Inc. | 1,303 | 91,909 | ||||||
| LG Hausys Ltd. | 209 | 10,173 | ||||||
| LG Household & Health Care Ltd. | 50 | 62,198 | ||||||
| LG Innotek Co. Ltd. | 289 | 35,082 | ||||||
| LG International Corp. | 711 | 8,971 | ||||||
| LG Uplus Corp. | 3,397 | 34,129 | ||||||
| LIG Nex1 Co. Ltd. | 173 | 4,532 | ||||||
| Lotte Chemical Corp. | 69 | 10,957 | ||||||
| Lotte Chilsung Beverage Co. Ltd. | 28 | 2,211 | ||||||
| Lotte Corp. | 231 | 5,816 | ||||||
35
| Shares | Value | |||||||
| LOTTE Fine Chemical Co. Ltd. | 103 | $ | 3,869 | |||||
| Lotte Shopping Co. Ltd. | 119 | 7,598 | ||||||
Lotte Tour Development Co. Ltd.(1) | 388 | 6,173 | ||||||
| LS Corp. | 434 | 16,466 | ||||||
| LS Electric Co. Ltd. | 313 | 14,209 | ||||||
| Mando Corp. | 617 | 16,206 | ||||||
| Mcnex Co. Ltd. | 325 | 9,138 | ||||||
MedPacto, Inc.(1) | 98 | 8,726 | ||||||
| MegaStudyEdu Co. Ltd. | 209 | 5,760 | ||||||
| Meritz Financial Group, Inc. | 383 | 2,972 | ||||||
| Meritz Fire & Marine Insurance Co. Ltd. | 1,106 | 11,826 | ||||||
| Meritz Securities Co. Ltd. | 3,333 | 8,950 | ||||||
| Mirae Asset Daewoo Co. Ltd. | 2,022 | 15,718 | ||||||
| Mirae Asset Life Insurance Co. Ltd. | 2,237 | 7,045 | ||||||
| NAVER Corp. | 611 | 165,057 | ||||||
| NCSoft Corp. | 52 | 36,043 | ||||||
Neowiz(1) | 283 | 7,301 | ||||||
| NEPES Corp. | 356 | 8,720 | ||||||
Netmarble Corp.(1) | 56 | 7,820 | ||||||
| NH Investment & Securities Co. Ltd. | 357 | 2,680 | ||||||
NHN Corp.(1) | 94 | 5,750 | ||||||
| NHN KCP Corp. | 307 | 18,566 | ||||||
| NICE Holdings Co. Ltd. | 459 | 7,247 | ||||||
| NICE Information Service Co. Ltd. | 536 | 8,097 | ||||||
| NongShim Co. Ltd. | 22 | 6,682 | ||||||
OCI Co. Ltd.(1) | 74 | 4,007 | ||||||
| Orion Corp./Republic of Korea | 69 | 8,139 | ||||||
| Orion Holdings Corp. | 171 | 1,883 | ||||||
Osstem Implant Co. Ltd.(1) | 144 | 4,481 | ||||||
Pan Ocean Co. Ltd.(1) | 1,048 | 2,986 | ||||||
| Partron Co. Ltd. | 1,065 | 9,092 | ||||||
Pearl Abyss Corp.(1) | 25 | 3,822 | ||||||
| PI Advanced Materials Co. Ltd. | 430 | 10,288 | ||||||
| Poongsan Corp. | 487 | 9,434 | ||||||
| POSCO, ADR | 2,817 | 108,849 | ||||||
| POSCO Chemical Co. Ltd. | 149 | 11,087 | ||||||
| Posco International Corp. | 743 | 8,475 | ||||||
| Pulmuone Co. Ltd. | 627 | 9,863 | ||||||
| RFHIC Corp. | 133 | 4,376 | ||||||
| S&T Motiv Co. Ltd. | 205 | 9,451 | ||||||
| S-1 Corp. | 175 | 12,827 | ||||||
| S-Oil Corp. | 200 | 9,460 | ||||||
| Samchully Co. Ltd. | 65 | 3,962 | ||||||
| Samjin Pharmaceutical Co. Ltd. | 249 | 6,097 | ||||||
Samsung Biologics Co. Ltd.(1) | 30 | 19,584 | ||||||
| Samsung C&T Corp. | 341 | 30,824 | ||||||
| Samsung Card Co. Ltd. | 109 | 2,639 | ||||||
| Samsung Electro-Mechanics Co. Ltd. | 619 | 64,501 | ||||||
| Samsung Electronics Co. Ltd., GDR | 814 | 952,023 | ||||||
Samsung Engineering Co. Ltd.(1) | 1,675 | 15,849 | ||||||
| Samsung Fire & Marine Insurance Co. Ltd. | 317 | 49,762 | ||||||
Samsung Heavy Industries Co. Ltd.(1) | 655 | 2,835 | ||||||
36
| Shares | Value | |||||||
| Samsung Life Insurance Co. Ltd. | 226 | $ | 11,591 | |||||
| Samsung SDI Co. Ltd. | 179 | 68,018 | ||||||
| Samsung SDS Co. Ltd. | 90 | 11,881 | ||||||
| Samsung Securities Co. Ltd. | 572 | 14,440 | ||||||
| Samwha Capacitor Co. Ltd. | 200 | 9,057 | ||||||
| Samyang Foods Co. Ltd. | 51 | 4,559 | ||||||
| Sangsangin Co. Ltd. | 878 | 4,417 | ||||||
| Seah Besteel Corp. | 93 | 766 | ||||||
| Seegene, Inc. | 123 | 27,275 | ||||||
| Seoul Semiconductor Co. Ltd. | 725 | 9,896 | ||||||
| SFA Engineering Corp. | 105 | 2,918 | ||||||
SFA Semicon Co. Ltd.(1) | 2,124 | 8,867 | ||||||
| Shinhan Financial Group Co. Ltd., ADR | 1,736 | 43,261 | ||||||
| Shinsegae International, Inc. | 26 | 2,959 | ||||||
| Shinsegae, Inc. | 89 | 15,171 | ||||||
| SK Chemicals Co. Ltd. | 169 | 55,279 | ||||||
| SK Discovery Co. Ltd. | 88 | 5,709 | ||||||
| SK Holdings Co. Ltd. | 281 | 50,416 | ||||||
| SK Hynix, Inc. | 1,965 | 123,640 | ||||||
| SK Innovation Co. Ltd. | 234 | 28,371 | ||||||
| SK Materials Co. Ltd. | 25 | 5,191 | ||||||
| SK Networks Co. Ltd. | 3,102 | 13,517 | ||||||
| SK Securities Co. Ltd. | 8,304 | 5,235 | ||||||
| SK Telecom Co. Ltd., ADR | 1,606 | 36,890 | ||||||
| SKC Co. Ltd. | 96 | 7,436 | ||||||
SM Entertainment Co. Ltd.(1) | 126 | 3,630 | ||||||
Soulbrain Co. Ltd.(1) | 82 | 14,966 | ||||||
| Soulbrain Holdings Co., Ltd. | 101 | 3,931 | ||||||
Studio Dragon Corp.(1) | 61 | 4,093 | ||||||
| Taeyoung Engineering & Construction Co. Ltd. | 803 | 14,650 | ||||||
| TES Co. Ltd. | 187 | 3,340 | ||||||
| Tokai Carbon Korea Co. Ltd. | 67 | 6,132 | ||||||
| Tongyang Life Insurance Co. Ltd. | 1,989 | 4,972 | ||||||
| Tongyang, Inc. | 3,527 | 3,442 | ||||||
| Toptec Co. Ltd. | 247 | 3,433 | ||||||
| Value Added Technology Co. Ltd. | 38 | 683 | ||||||
| Vieworks Co. Ltd. | 33 | 904 | ||||||
Webzen, Inc.(1) | 493 | 14,235 | ||||||
| Winix, Inc. | 64 | 991 | ||||||
| WiSoL Co. Ltd. | 429 | 5,742 | ||||||
| Wonik Materials Co. Ltd. | 174 | 3,573 | ||||||
| Woongjin Thinkbig Co. Ltd. | 2,317 | 5,335 | ||||||
| Woori Financial Group, Inc. | 5,056 | 36,139 | ||||||
| Youngone Corp. | 199 | 5,241 | ||||||
Yuanta Securities Korea Co. Ltd.(1) | 1,036 | 2,619 | ||||||
| Yuhan Corp. | 95 | 5,352 | ||||||
| 4,958,201 | ||||||||
| Taiwan — 14.3% | ||||||||
| A-DATA Technology Co. Ltd. | 2,000 | 3,531 | ||||||
| Ability Enterprise Co. Ltd. | 2,000 | 864 | ||||||
| AcBel Polytech, Inc. | 2,000 | 1,760 | ||||||
| Accton Technology Corp. | 1,000 | 7,963 | ||||||
37
| Shares | Value | |||||||
| Ace Pillar Co. Ltd. | 2,000 | $ | 1,526 | |||||
| Acer, Inc. | 3,000 | 2,383 | ||||||
| ACES Electronic Co. Ltd. | 2,000 | 2,241 | ||||||
| Acter Group Corp. Ltd. | 1,000 | 6,969 | ||||||
| Advanced International Multitech Co. Ltd. | 1,000 | 1,154 | ||||||
| Advantech Co. Ltd. | 1,099 | 11,349 | ||||||
| Airmate Cayman International Co. Ltd. | 1,020 | 882 | ||||||
| Airtac International Group | 1,000 | 22,002 | ||||||
| Alchip Technologies Ltd. | 1,000 | 17,892 | ||||||
| Allis Electric Co. Ltd. | 2,100 | 2,179 | ||||||
| Alltek Technology Corp. | 2,000 | 1,398 | ||||||
| Alltop Technology Co. Ltd. | 2,000 | 5,995 | ||||||
| Alpha Networks, Inc. | 5,773 | 5,488 | ||||||
| Altek Corp. | 2,000 | 1,754 | ||||||
| Amazing Microelectronic Corp. | 1,000 | 2,778 | ||||||
| Ampire Co. Ltd. | 2,000 | 1,334 | ||||||
| AMPOC Far-East Co. Ltd. | 2,000 | 2,174 | ||||||
AmTRAN Technology Co. Ltd.(1) | 3,000 | 1,074 | ||||||
| Apacer Technology, Inc. | 1,000 | 1,272 | ||||||
| APCB, Inc. | 2,000 | 1,485 | ||||||
| Apex International Co. Ltd. | 4,000 | 9,834 | ||||||
| Arcadyan Technology Corp. | 1,000 | 3,125 | ||||||
| Ardentec Corp. | 9,000 | 10,008 | ||||||
| Argosy Research, Inc. | 2,155 | 8,604 | ||||||
| ASE Technology Holding Co. Ltd., ADR | 12,219 | 50,220 | ||||||
| Asia Cement Corp. | 20,000 | 28,896 | ||||||
| Asia Optical Co., Inc. | 2,000 | 4,487 | ||||||
Asia Pacific Telecom Co. Ltd.(1) | 2,621 | 661 | ||||||
| Asia Polymer Corp. | 3,150 | 1,983 | ||||||
| Asia Vital Components Co. Ltd. | 6,000 | 14,294 | ||||||
| ASROCK, Inc. | 2,000 | 13,529 | ||||||
| Asustek Computer, Inc. | 7,000 | 57,829 | ||||||
| Aten International Co. Ltd. | 2,000 | 5,751 | ||||||
AU Optronics Corp., ADR(1) | 6,082 | 21,165 | ||||||
| Audix Corp. | 1,000 | 1,380 | ||||||
| AURAS Technology Co. Ltd. | 1,000 | 7,544 | ||||||
| AVY Precision Technology, Inc. | 1,020 | 856 | ||||||
| Bank of Kaohsiung Co. Ltd. | 4,000 | 1,376 | ||||||
| BenQ Materials Corp. | 2,000 | 1,525 | ||||||
| BES Engineering Corp. | 25,000 | 6,943 | ||||||
| Bin Chuan Enterprise Co. Ltd. | 2,000 | 2,224 | ||||||
| Bizlink Holding, Inc. | 1,000 | 8,387 | ||||||
| Brighton-Best International Taiwan, Inc. | 1,000 | 877 | ||||||
| Capital Securities Corp. | 27,000 | 10,101 | ||||||
| Career Technology MFG. Co. Ltd. | 1,020 | 976 | ||||||
| Casetek Holdings Ltd. | 4,000 | 11,588 | ||||||
| Catcher Technology Co. Ltd. | 5,000 | 34,060 | ||||||
| Cathay Financial Holding Co. Ltd. | 33,000 | 44,724 | ||||||
| Central Reinsurance Co. Ltd. | 2,000 | 1,365 | ||||||
| Chailease Holding Co. Ltd. | 1,040 | 4,580 | ||||||
| ChainQui Construction Development Co. Ltd. | 2,200 | 1,487 | ||||||
| Chang Hwa Commercial Bank Ltd. | 7,280 | 4,515 | ||||||
38
| Shares | Value | |||||||
| Chang Wah Electromaterials, Inc. | 10,000 | $ | 6,838 | |||||
| Chang Wah Technology Co. Ltd. | 1,000 | 1,320 | ||||||
| Channel Well Technology Co. Ltd. | 2,000 | 3,095 | ||||||
| Charoen Pokphand Enterprise | 3,000 | 6,960 | ||||||
| CHC Healthcare Group | 1,000 | 1,412 | ||||||
| Chenbro Micom Co. Ltd. | 2,000 | 6,206 | ||||||
| Cheng Loong Corp. | 12,000 | 12,334 | ||||||
| Cheng Shin Rubber Industry Co. Ltd. | 9,000 | 11,020 | ||||||
| Cheng Uei Precision Industry Co. Ltd. | 5,000 | 7,126 | ||||||
| Chia Chang Co. Ltd. | 1,000 | 1,331 | ||||||
| Chia Hsin Cement Corp. | 2,000 | 1,144 | ||||||
| Chicony Electronics Co. Ltd. | 9,000 | 27,093 | ||||||
| Chicony Power Technology Co. Ltd. | 4,000 | 10,074 | ||||||
| Chilisin Electronics Corp. | 1,000 | 3,356 | ||||||
| Chin-Poon Industrial Co. Ltd. | 7,000 | 6,053 | ||||||
China Airlines Ltd.(1) | 33,000 | 9,570 | ||||||
| China Bills Finance Corp. | 12,000 | 5,965 | ||||||
| China Chemical & Pharmaceutical Co. Ltd. | 2,000 | 1,647 | ||||||
| China Development Financial Holding Corp. | 109,000 | 31,670 | ||||||
| China General Plastics Corp. | 2,100 | 1,363 | ||||||
| China Life Insurance Co. Ltd. | 20,000 | 13,981 | ||||||
China Man-Made Fiber Corp.(1) | 6,000 | 1,554 | ||||||
| China Metal Products | 1,000 | 913 | ||||||
China Motor Corp.(1) | 5,000 | 7,199 | ||||||
| China Petrochemical Development Corp. | 10,000 | 2,932 | ||||||
| China Steel Chemical Corp. | 2,000 | 6,294 | ||||||
| China Steel Corp. | 35,000 | 23,658 | ||||||
| Chinese Maritime Transport Ltd. | 1,000 | 881 | ||||||
| Ching Feng Home Fashions Co. Ltd. | 1,000 | 1,187 | ||||||
| Chipbond Technology Corp. | 7,000 | 13,364 | ||||||
| ChipMOS Technologies, Inc. | 4,000 | 3,962 | ||||||
| Chlitina Holding Ltd. | 1,000 | 7,146 | ||||||
| Chong Hong Construction Co. Ltd. | 2,000 | 5,708 | ||||||
| Chroma ATE, Inc. | 1,000 | 5,473 | ||||||
Chung Hung Steel Corp.(1) | 4,000 | 1,263 | ||||||
| Chung-Hsin Electric & Machinery Manufacturing Corp. | 9,000 | 11,499 | ||||||
| Chunghwa Telecom Co. Ltd., ADR | 1,359 | 50,174 | ||||||
| Cleanaway Co. Ltd. | 1,000 | 5,415 | ||||||
| Clevo Co. | 8,000 | 8,058 | ||||||
| CMC Magnetics Corp. | 7,000 | 1,935 | ||||||
| Co-Tech Development Corp. | 1,000 | 1,291 | ||||||
| Compal Electronics, Inc. | 41,000 | 25,800 | ||||||
| Compeq Manufacturing Co. Ltd. | 13,000 | 19,249 | ||||||
| Concord Securities Co. Ltd. | 4,028 | 1,513 | ||||||
| Coretronic Corp. | 7,000 | 8,345 | ||||||
| Creative Sensor, Inc. | 2,000 | 1,181 | ||||||
| CTBC Financial Holding Co. Ltd. | 126,000 | 81,259 | ||||||
| CTCI Corp. | 3,000 | 3,673 | ||||||
| CyberTAN Technology, Inc. | 3,000 | 1,544 | ||||||
| Delta Electronics, Inc. | 5,000 | 32,124 | ||||||
| Dimerco Express Corp. | 2,000 | 4,609 | ||||||
| Dyaco International, Inc. | 1,000 | 4,715 | ||||||
39
| Shares | Value | |||||||
Dynamic Electronics Co. Ltd.(1) | 3,000 | $ | 1,792 | |||||
| E Ink Holdings, Inc. | 1,000 | 1,400 | ||||||
| E-LIFE MALL Corp. | 1,000 | 2,387 | ||||||
| E.Sun Financial Holding Co. Ltd. | 37,789 | 34,979 | ||||||
| Eclat Textile Co. Ltd. | 1,000 | 13,149 | ||||||
| Edom Technology Co. Ltd. | 2,000 | 1,255 | ||||||
| Elite Advanced Laser Corp. | 3,000 | 6,500 | ||||||
| Elite Material Co. Ltd. | 4,000 | 23,074 | ||||||
| Elite Semiconductor Microelectronics Technology, Inc. | 5,000 | 6,172 | ||||||
Elitegroup Computer Systems Co. Ltd.(1) | 3,000 | 1,428 | ||||||
Epistar Corp.(1) | 9,000 | 12,205 | ||||||
| Eson Precision Ind Co. Ltd. | 1,000 | 1,166 | ||||||
| Eternal Materials Co. Ltd. | 11,000 | 12,909 | ||||||
| Eva Airways Corp. | 24,000 | 9,368 | ||||||
| Evergreen International Storage & Transport Corp. | 13,000 | 6,370 | ||||||
Evergreen Marine Corp. Taiwan Ltd.(1) | 24,000 | 14,181 | ||||||
| Everlight Chemical Industrial Corp. | 2,000 | 1,089 | ||||||
| Everlight Electronics Co. Ltd. | 6,000 | 7,042 | ||||||
| Excellence Opto, Inc. | 2,000 | 2,251 | ||||||
| Excelsior Medical Co. Ltd. | 3,000 | 5,770 | ||||||
| Far Eastern Department Stores Ltd. | 15,000 | 13,258 | ||||||
| Far Eastern International Bank | 27,000 | 10,294 | ||||||
| Far Eastern New Century Corp. | 30,000 | 26,966 | ||||||
| Far EasTone Telecommunications Co. Ltd. | 13,000 | 27,109 | ||||||
| Farglory F T Z Investment Holding Co. Ltd. | 2,000 | 1,921 | ||||||
| Farglory Land Development Co. Ltd. | 2,000 | 3,267 | ||||||
Federal Corp.(1) | 3,000 | 2,389 | ||||||
| Feng Hsin Steel Co. Ltd. | 7,000 | 13,577 | ||||||
| Feng TAY Enterprise Co. Ltd. | 1,200 | 6,947 | ||||||
| First Financial Holding Co. Ltd. | 36,050 | 26,059 | ||||||
| First Steamship Co. Ltd. | 15,000 | 5,124 | ||||||
| FLEXium Interconnect, Inc. | 5,000 | 21,380 | ||||||
| Flytech Technology Co. Ltd. | 2,000 | 4,224 | ||||||
FocalTech Systems Co. Ltd.(1) | 7,000 | 7,859 | ||||||
| Formosa Advanced Technologies Co. Ltd. | 5,000 | 5,964 | ||||||
| Formosa Chemicals & Fibre Corp. | 7,000 | 16,147 | ||||||
| Formosa International Hotels Corp. | 1,000 | 4,475 | ||||||
| Formosa Optical Technology Co. Ltd. | 1,000 | 2,042 | ||||||
| Formosa Petrochemical Corp. | 4,000 | 11,155 | ||||||
| Formosa Plastics Corp. | 11,000 | 29,268 | ||||||
| Formosa Sumco Technology Corp. | 2,000 | 7,003 | ||||||
| Formosa Taffeta Co. Ltd. | 5,000 | 5,386 | ||||||
| Formosan Rubber Group, Inc. | 2,000 | 1,417 | ||||||
| Founding Construction & Development Co. Ltd. | 2,000 | 1,097 | ||||||
| Foxconn Technology Co. Ltd. | 6,000 | 10,642 | ||||||
| Foxsemicon Integrated Technology, Inc. | 1,000 | 6,476 | ||||||
| FSP Technology, Inc. | 2,000 | 2,243 | ||||||
| Fubon Financial Holding Co. Ltd. | 40,000 | 58,198 | ||||||
| Fulgent Sun International Holding Co. Ltd. | 1,000 | 4,277 | ||||||
| Full Wang International Development Co. Ltd. | 2,000 | 998 | ||||||
| Fusheng Precision Co. Ltd. | 1,000 | 5,883 | ||||||
| G Shank Enterprise Co. Ltd. | 2,000 | 1,303 | ||||||
40
| Shares | Value | |||||||
| Gemtek Technology Corp. | 8,000 | $ | 7,546 | |||||
| General Interface Solution Holding Ltd. | 3,000 | 13,225 | ||||||
| Genesys Logic, Inc. | 1,000 | 2,372 | ||||||
| Getac Technology Corp. | 5,000 | 8,303 | ||||||
| Giant Manufacturing Co. Ltd. | 1,000 | 10,356 | ||||||
| Gigabyte Technology Co. Ltd. | 7,000 | 20,193 | ||||||
| Ginko International Co. Ltd. | 2,100 | 9,054 | ||||||
| Global Brands Manufacture Ltd. | 2,000 | 1,359 | ||||||
| Globalwafers Co. Ltd. | 2,000 | 26,845 | ||||||
| Globe Union Industrial Corp. | 2,000 | 945 | ||||||
| Gloria Material Technology Corp. | 2,000 | 1,090 | ||||||
Gold Circuit Electronics Ltd.(1) | 2,000 | 3,485 | ||||||
| Goldsun Building Materials Co. Ltd. | 7,000 | 5,156 | ||||||
| Gourmet Master Co. Ltd. | 2,000 | 6,795 | ||||||
Grand Pacific Petrochemical(1) | 15,000 | 9,779 | ||||||
| Grape King Bio Ltd. | 1,000 | 6,125 | ||||||
| Greatek Electronics, Inc. | 6,000 | 10,257 | ||||||
| GTM Holdings Corp. | 2,000 | 1,562 | ||||||
| Hannstar Board Corp. | 5,301 | 7,837 | ||||||
HannStar Display Corp.(1) | 33,000 | 9,012 | ||||||
| HannsTouch Solution, Inc. | 3,000 | 1,009 | ||||||
| Highlight Tech Corp. | 2,000 | 2,483 | ||||||
| Highwealth Construction Corp. | 1,000 | 1,578 | ||||||
| Hiroca Holdings Ltd. | 1,000 | 2,099 | ||||||
| Hitron Technology, Inc. | 7,000 | 5,307 | ||||||
| Hiwin Technologies Corp. | 1,030 | 11,210 | ||||||
| Ho Tung Chemical Corp. | 6,000 | 1,987 | ||||||
| Holiday Entertainment Co. Ltd. | 1,000 | 2,159 | ||||||
| Holy Stone Enterprise Co. Ltd. | 3,000 | 10,592 | ||||||
| Hon Hai Precision Industry Co. Ltd. | 63,000 | 164,846 | ||||||
| Hong Pu Real Estate Development Co. Ltd. | 2,000 | 1,640 | ||||||
| Hong YI Fiber Industry Co. | 2,000 | 1,049 | ||||||
| Hota Industrial Manufacturing Co. Ltd. | 2,000 | 7,101 | ||||||
| Hotai Finance Co. Ltd. | 2,000 | 5,496 | ||||||
| Hotai Motor Co. Ltd. | 1,000 | 20,262 | ||||||
| Hsing TA Cement Co. | 2,000 | 1,259 | ||||||
HTC Corp.(1) | 9,000 | 9,209 | ||||||
| Hu Lane Associate, Inc. | 1,025 | 2,618 | ||||||
| Hua Nan Financial Holdings Co. Ltd. | 26,400 | 16,223 | ||||||
| Huaku Development Co. Ltd. | 4,000 | 12,204 | ||||||
| Huang Hsiang Construction Corp. | 1,000 | 1,315 | ||||||
| Hung Ching Development & Construction Co. Ltd. | 2,000 | 1,324 | ||||||
| Hung Sheng Construction Ltd. | 2,400 | 1,408 | ||||||
| I-Sheng Electric Wire & Cable Co. Ltd. | 1,000 | 1,404 | ||||||
| IBF Financial Holdings Co. Ltd. | 25,426 | 10,003 | ||||||
| Ichia Technologies, Inc. | 2,000 | 1,168 | ||||||
| Innodisk Corp. | 1,020 | 5,515 | ||||||
| Innolux Corp. | 93,000 | 28,749 | ||||||
| Inpaq Technology Co. Ltd. | 1,000 | 1,222 | ||||||
Integrated Service Technology, Inc.(1) | 1,000 | 2,166 | ||||||
| International CSRC Investment Holdings Co. | 3,000 | 2,101 | ||||||
| Inventec Corp. | 31,000 | 23,984 | ||||||
41
| Shares | Value | |||||||
| ITE Technology, Inc. | 1,000 | $ | 2,540 | |||||
| ITEQ Corp. | 2,000 | 8,122 | ||||||
| Jentech Precision Industrial Co. Ltd. | 1,000 | 10,401 | ||||||
| Jih Sun Financial Holdings Co. Ltd. | 19,310 | 6,837 | ||||||
K Laser Technology, Inc.(1) | 2,000 | 1,097 | ||||||
| Kenda Rubber Industrial Co. Ltd. | 1,000 | 1,088 | ||||||
| Kenmec Mechanical Engineering Co. Ltd. | 2,000 | 1,841 | ||||||
| Kindom Development Co. Ltd. | 6,000 | 8,056 | ||||||
| King Yuan Electronics Co. Ltd. | 13,000 | 13,774 | ||||||
| King's Town Bank Co. Ltd. | 7,000 | 8,698 | ||||||
| Kinik Co. | 1,000 | 2,177 | ||||||
| Kinpo Electronics | 22,000 | 8,599 | ||||||
| Kinsus Interconnect Technology Corp. | 6,000 | 12,998 | ||||||
| KS Terminals, Inc. | 1,000 | 1,478 | ||||||
| Kung Long Batteries Industrial Co. Ltd. | 2,000 | 9,462 | ||||||
Kung Sing Engineering Corp.(1) | 4,000 | 1,467 | ||||||
| Kuoyang Construction Co. Ltd. | 1,000 | 987 | ||||||
| L&K Engineering Co. Ltd. | 1,000 | 966 | ||||||
Lextar Electronics Corp.(1) | 3,000 | 2,197 | ||||||
| Lien Hwa Industrial Holdings Corp. | 1,160 | 1,658 | ||||||
Lingsen Precision Industries Ltd.(1) | 4,000 | 1,576 | ||||||
| Lite-On Technology Corp. | 23,000 | 36,347 | ||||||
| Long Da Construction & Development Corp. | 2,000 | 1,195 | ||||||
| Longchen Paper & Packaging Co. Ltd. | 15,000 | 8,889 | ||||||
| Longwell Co. | 1,000 | 1,810 | ||||||
| Lotes Co. Ltd. | 1,000 | 14,537 | ||||||
| Lumax International Corp. Ltd. | 1,000 | 2,284 | ||||||
| Lung Yen Life Service Corp. | 3,000 | 5,617 | ||||||
| Macauto Industrial Co. Ltd. | 2,000 | 6,330 | ||||||
| Macronix International | 5,000 | 5,122 | ||||||
| Makalot Industrial Co. Ltd. | 2,000 | 13,401 | ||||||
| MediaTek, Inc. | 3,000 | 56,786 | ||||||
| Mega Financial Holding Co. Ltd. | 28,000 | 27,833 | ||||||
| Meiloon Industrial Co. | 2,000 | 1,606 | ||||||
| Mercuries & Associates Holding Ltd. | 4,400 | 3,720 | ||||||
Mercuries Life Insurance Co. Ltd.(1) | 21,000 | 6,729 | ||||||
| Merry Electronics Co. Ltd. | 2,000 | 10,469 | ||||||
| Micro-Star International Co. Ltd. | 8,000 | 36,797 | ||||||
Microbio Co. Ltd.(1) | 2,000 | 5,773 | ||||||
| Mitac Holdings Corp. | 7,840 | 7,708 | ||||||
| Mobiletron Electronics Co. Ltd. | 1,000 | 1,017 | ||||||
| MPI Corp. | 2,000 | 7,678 | ||||||
| Namchow Holdings Co. Ltd. | 1,000 | 1,459 | ||||||
| Nan Kang Rubber Tire Co. Ltd. | 3,000 | 4,794 | ||||||
| Nan Liu Enterprise Co. Ltd. | 1,000 | 9,199 | ||||||
| Nan Ren Lake Leisure Amusement Co. Ltd. | 2,000 | 637 | ||||||
| Nan Ya Plastics Corp. | 8,000 | 16,739 | ||||||
| Nan Ya Printed Circuit Board Corp. | 1,000 | 4,090 | ||||||
| Nantex Industry Co. Ltd. | 1,000 | 1,596 | ||||||
| Nanya Technology Corp. | 2,000 | 3,525 | ||||||
| Nichidenbo Corp. | 4,000 | 6,172 | ||||||
| Nien Made Enterprise Co. Ltd. | 2,000 | 22,992 | ||||||
42
| Shares | Value | |||||||
| Novatek Microelectronics Corp. | 2,000 | $ | 16,314 | |||||
| O-Bank Co. Ltd. | 21,000 | 4,883 | ||||||
| O-TA Precision Industry Co. Ltd. | 1,000 | 1,522 | ||||||
OptoTech Corp.(1) | 2,000 | 1,453 | ||||||
Orient Semiconductor Electronics Ltd.(1) | 4,000 | 1,476 | ||||||
| Oriental Union Chemical Corp. | 2,000 | 1,159 | ||||||
| Pan Jit International, Inc. | 2,000 | 2,496 | ||||||
| Pan-International Industrial Corp. | 2,000 | 1,204 | ||||||
| Parade Technologies Ltd. | 1,000 | 35,270 | ||||||
| Pegatron Corp. | 20,000 | 42,556 | ||||||
| PharmaEngine, Inc. | 3,000 | 7,328 | ||||||
| Phison Electronics Corp. | 1,000 | 9,413 | ||||||
| Plotech Co. Ltd. | 2,000 | 1,667 | ||||||
| Pou Chen Corp. | 11,000 | 10,350 | ||||||
| Powertech Technology, Inc. | 11,000 | 32,290 | ||||||
| Poya International Co. Ltd. | 1,000 | 19,565 | ||||||
| President Chain Store Corp. | 2,000 | 18,407 | ||||||
| President Securities Corp. | 14,280 | 7,926 | ||||||
| Primax Electronics Ltd. | 3,000 | 4,554 | ||||||
| Prince Housing & Development Corp. | 19,000 | 6,626 | ||||||
| Promate Electronic Co. Ltd. | 1,000 | 1,129 | ||||||
| Qisda Corp. | 2,000 | 1,266 | ||||||
| Quang Viet Enterprise Co. Ltd. | 1,000 | 4,068 | ||||||
| Quanta Computer, Inc. | 17,000 | 44,512 | ||||||
| Quanta Storage, Inc. | 5,000 | 7,453 | ||||||
| Radiant Opto-Electronics Corp. | 3,000 | 11,036 | ||||||
| Radium Life Tech Co. Ltd. | 2,000 | 707 | ||||||
| Realtek Semiconductor Corp. | 3,000 | 38,777 | ||||||
| Rechi Precision Co. Ltd. | 2,000 | 1,351 | ||||||
| Rich Development Co. Ltd. | 6,000 | 1,912 | ||||||
Roo Hsing Co. Ltd.(1) | 3,000 | 1,272 | ||||||
| Ruentex Development Co. Ltd. | 3,000 | 4,407 | ||||||
| Ruentex Engineering & Construction Co. | 2,000 | 4,127 | ||||||
| Ruentex Industries Ltd. | 4,000 | 9,468 | ||||||
| Ruentex Materials Co. Ltd. | 1,000 | 1,325 | ||||||
| Sampo Corp. | 9,000 | 7,132 | ||||||
| San Fang Chemical Industry Co. Ltd. | 2,000 | 1,420 | ||||||
San Far Property Ltd.(1) | 2,000 | 1,151 | ||||||
| San Shing Fastech Corp. | 3,000 | 4,598 | ||||||
| Sanyang Motor Co. Ltd. | 2,000 | 1,612 | ||||||
| SCI Pharmtech, Inc. | 1,000 | 4,386 | ||||||
| SDI Corp. | 1,000 | 1,621 | ||||||
| Sercomm Corp. | 1,000 | 2,644 | ||||||
| Shan-Loong Transportation Co. Ltd. | 2,000 | 2,031 | ||||||
| Shanghai Commercial & Savings Bank Ltd. (The) | 8,000 | 11,379 | ||||||
| Sheng Yu Steel Co. Ltd. | 2,000 | 1,228 | ||||||
| ShenMao Technology, Inc. | 2,000 | 1,808 | ||||||
| Shin Kong Financial Holding Co. Ltd. | 87,118 | 24,568 | ||||||
| Shin Zu Shing Co. Ltd. | 3,123 | 16,018 | ||||||
Shining Building Business Co. Ltd.(1) | 3,000 | 1,026 | ||||||
| Shinkong Insurance Co. Ltd. | 5,000 | 6,006 | ||||||
| Shinkong Synthetic Fibers Corp. | 16,000 | 6,639 | ||||||
43
| Shares | Value | |||||||
| Sigurd Microelectronics Corp. | 7,000 | $ | 9,081 | |||||
| Simplo Technology Co. Ltd. | 2,000 | 22,786 | ||||||
| Sinbon Electronics Co. Ltd. | 1,000 | 6,149 | ||||||
| Sincere Navigation Corp. | 2,000 | 1,084 | ||||||
| Sino-American Silicon Products, Inc. | 7,000 | 22,949 | ||||||
| Sinon Corp. | 10,000 | 7,186 | ||||||
| SinoPac Financial Holdings Co. Ltd. | 78,000 | 28,638 | ||||||
| Sinyi Realty, Inc. | 1,000 | 999 | ||||||
| Sirtec International Co. Ltd. | 1,000 | 910 | ||||||
| Sitronix Technology Corp. | 1,000 | 4,896 | ||||||
| Siward Crystal Technology Co. Ltd. | 2,000 | 1,545 | ||||||
| Soft-World International Corp. | 1,000 | 3,123 | ||||||
| Solar Applied Materials Technology Co. | 2,000 | 2,765 | ||||||
| Sonix Technology Co. Ltd. | 1,000 | 1,828 | ||||||
| Sporton International, Inc. | 1,000 | 9,139 | ||||||
| St Shine Optical Co. Ltd. | 1,000 | 10,072 | ||||||
| Standard Foods Corp. | 3,000 | 6,505 | ||||||
| Stark Technology, Inc. | 3,000 | 6,334 | ||||||
| Sunjuice Holdings Co. Ltd. | 1,000 | 7,586 | ||||||
| Sunonwealth Electric Machine Industry Co. Ltd. | 1,000 | 2,125 | ||||||
| Supreme Electronics Co. Ltd. | 7,000 | 7,098 | ||||||
| Sweeten Real Estate Development Co. Ltd. | 2,160 | 1,570 | ||||||
| Syncmold Enterprise Corp. | 2,000 | 5,635 | ||||||
| Synnex Technology International Corp. | 20,000 | 29,752 | ||||||
| Systex Corp. | 4,000 | 11,897 | ||||||
| T3EX Global Holdings Corp. | 2,000 | 2,435 | ||||||
| Ta Ya Electric Wire & Cable | 2,000 | 1,016 | ||||||
| TA-I Technology Co. Ltd. | 3,000 | 7,081 | ||||||
Tai-Saw Technology Co. Ltd.(1) | 2,000 | 1,868 | ||||||
| Taichung Commercial Bank Co. Ltd. | 27,352 | 10,387 | ||||||
| Taiflex Scientific Co. Ltd. | 4,000 | 7,022 | ||||||
| Tainan Spinning Co. Ltd. | 3,000 | 1,194 | ||||||
| Taishin Financial Holding Co. Ltd. | 72,642 | 32,760 | ||||||
| TaiSol Electronics Co. Ltd. | 2,000 | 4,549 | ||||||
| Taisun Enterprise Co. Ltd. | 2,000 | 1,562 | ||||||
| Taita Chemical Co. Ltd. | 3,090 | 2,336 | ||||||
| Taiwan Business Bank | 45,150 | 15,370 | ||||||
| Taiwan Cement Corp. | 45,150 | 65,890 | ||||||
| Taiwan Cogeneration Corp. | 7,000 | 8,929 | ||||||
| Taiwan Cooperative Financial Holding Co. Ltd. | 36,050 | 24,595 | ||||||
| Taiwan FamilyMart Co. Ltd. | 1,000 | 9,154 | ||||||
| Taiwan Fertilizer Co. Ltd. | 4,000 | 7,386 | ||||||
| Taiwan Fire & Marine Insurance Co. Ltd. | 2,000 | 1,342 | ||||||
| Taiwan FU Hsing Industrial Co. Ltd. | 4,000 | 5,858 | ||||||
Taiwan Glass Industry Corp.(1) | 6,000 | 2,347 | ||||||
| Taiwan High Speed Rail Corp. | 11,000 | 12,131 | ||||||
| Taiwan Hon Chuan Enterprise Co. Ltd. | 5,000 | 9,995 | ||||||
| Taiwan Hopax Chemicals Manufacturing Co. Ltd. | 2,000 | 1,535 | ||||||
Taiwan Land Development Corp.(1) | 4,000 | 1,062 | ||||||
| Taiwan Mobile Co. Ltd. | 2,000 | 6,914 | ||||||
| Taiwan Paiho Ltd. | 1,000 | 2,682 | ||||||
| Taiwan PCB Techvest Co. Ltd. | 6,000 | 8,671 | ||||||
44
| Shares | Value | |||||||
| Taiwan Sakura Corp. | 1,000 | $ | 1,618 | |||||
| Taiwan Secom Co. Ltd. | 4,000 | 11,581 | ||||||
| Taiwan Semiconductor Co. Ltd. | 1,000 | 1,275 | ||||||
| Taiwan Semiconductor Manufacturing Co. Ltd., ADR | 15,781 | 1,250,644 | ||||||
| Taiwan Shin Kong Security Co. Ltd. | 1,010 | 1,251 | ||||||
| Taiwan Styrene Monomer | 2,000 | 1,070 | ||||||
| Taiwan Surface Mounting Technology Corp. | 4,000 | 16,149 | ||||||
Taiwan TEA Corp.(1) | 2,000 | 1,122 | ||||||
| Taiwan Union Technology Corp. | 1,000 | 4,041 | ||||||
Tatung Co. Ltd.(1) | 2,000 | 1,168 | ||||||
| Te Chang Construction Co. Ltd. | 1,000 | 1,017 | ||||||
| Teco Electric and Machinery Co. Ltd. | 9,000 | 8,986 | ||||||
| Tera Autotech Corp. | 1,081 | 916 | ||||||
| Test Research, Inc. | 1,000 | 1,999 | ||||||
| Test Rite International Co. Ltd. | 2,000 | 1,538 | ||||||
| Thinking Electronic Industrial Co. Ltd. | 2,000 | 7,410 | ||||||
| Thye Ming Industrial Co. Ltd. | 1,000 | 965 | ||||||
Ton Yi Industrial Corp.(1) | 4,000 | 1,322 | ||||||
| Tong Hsing Electronic Industries Ltd. | 1,000 | 4,503 | ||||||
| Tong Yang Industry Co. Ltd. | 2,000 | 2,634 | ||||||
| Tong-Tai Machine & Tool Co. Ltd. | 2,000 | 875 | ||||||
| Topco Scientific Co. Ltd. | 2,000 | 8,155 | ||||||
| Topoint Technology Co. Ltd. | 2,000 | 1,565 | ||||||
TPK Holding Co. Ltd.(1) | 2,000 | 3,350 | ||||||
| Transcend Information, Inc. | 3,000 | 6,727 | ||||||
| Tripod Technology Corp. | 2,000 | 7,875 | ||||||
| Tsann Kuen Enterprise Co. Ltd. | 2,000 | 1,257 | ||||||
| TSRC Corp. | 2,000 | 1,193 | ||||||
| TTY Biopharm Co. Ltd. | 1,000 | 2,362 | ||||||
| Tung Ho Steel Enterprise Corp. | 10,000 | 9,103 | ||||||
| TXC Corp. | 2,000 | 5,245 | ||||||
| TYC Brother Industrial Co. Ltd. | 2,000 | 1,534 | ||||||
| Tyntek Corp. | 3,000 | 1,647 | ||||||
| U-Ming Marine Transport Corp. | 5,000 | 5,098 | ||||||
| Uni-President Enterprises Corp. | 20,000 | 45,369 | ||||||
| Unimicron Technology Corp. | 7,000 | 17,515 | ||||||
| Union Bank of Taiwan | 22,470 | 7,844 | ||||||
| Union Insurance Co. Ltd. | 2,000 | 1,291 | ||||||
| Unitech Printed Circuit Board Corp. | 5,000 | 3,514 | ||||||
| United Microelectronics Corp. | 118,000 | 84,388 | ||||||
| Univacco Technology, Inc. | 2,000 | 1,625 | ||||||
| Universal Cement Corp. | 2,000 | 1,325 | ||||||
| UPC Technology Corp. | 4,000 | 1,742 | ||||||
| USI Corp. | 6,000 | 2,640 | ||||||
| Vanguard International Semiconductor Corp. | 4,000 | 12,730 | ||||||
| Wafer Works Corp. | 6,000 | 7,105 | ||||||
| Wah Lee Industrial Corp. | 1,000 | 1,925 | ||||||
| Walsin Lihwa Corp. | 37,000 | 21,186 | ||||||
| Walsin Technology Corp. | 3,000 | 16,294 | ||||||
Walton Advanced Engineering, Inc.(1) | 3,000 | 1,016 | ||||||
| Wan Hai Lines Ltd. | 3,000 | 2,162 | ||||||
| Wei Chuan Foods Corp. | 2,000 | 1,419 | ||||||
45
| Shares | Value | |||||||
| Weikeng Industrial Co. Ltd. | 2,000 | $ | 1,226 | |||||
| Well Shin Technology Co. Ltd. | 1,000 | 1,604 | ||||||
| Weltrend Semiconductor | 2,000 | 2,006 | ||||||
| Win Semiconductors Corp. | 2,000 | 19,415 | ||||||
| Winbond Electronics Corp. | 13,000 | 5,359 | ||||||
| Winstek Semiconductor Co. Ltd. | 2,000 | 1,605 | ||||||
| Wisdom Marine Lines Co. Ltd. | 2,047 | 1,613 | ||||||
| Wistron Corp. | 30,000 | 32,514 | ||||||
| Wiwynn Corp. | 1,000 | 26,578 | ||||||
| WPG Holdings Ltd. | 6,000 | 8,392 | ||||||
| WT Microelectronics Co. Ltd. | 5,000 | 6,647 | ||||||
| WUS Printed Circuit Co. Ltd. | 2,000 | 2,150 | ||||||
| Xxentria Technology Materials Corp. | 1,000 | 1,765 | ||||||
| Yageo Corp. | 1,000 | 11,302 | ||||||
Yang Ming Marine Transport Corp.(1) | 5,000 | 1,717 | ||||||
| YC INOX Co. Ltd. | 2,000 | 1,622 | ||||||
| YCC Parts Manufacturing Co. Ltd. | 1,000 | 1,539 | ||||||
| Yem Chio Co. Ltd. | 3,000 | 1,567 | ||||||
| YFY, Inc. | 24,000 | 14,893 | ||||||
Yieh Phui Enterprise Co. Ltd.(1) | 5,000 | 1,615 | ||||||
| Yonyu Plastics Co. Ltd. | 1,000 | 1,140 | ||||||
| Youngtek Electronics Corp. | 1,000 | 1,964 | ||||||
| Yuanta Financial Holding Co. Ltd. | 67,600 | 42,263 | ||||||
| Yulon Finance Corp. | 1,100 | 3,731 | ||||||
Yulon Motor Co. Ltd.(1) | 10,000 | 8,590 | ||||||
| YungShin Global Holding Corp. | 1,000 | 1,499 | ||||||
| Yungtay Engineering Co. Ltd. | 1,000 | 1,863 | ||||||
| Zeng Hsing Industrial Co. Ltd. | 1,000 | 4,680 | ||||||
| Zenitron Corp. | 2,000 | 1,351 | ||||||
| Zero One Technology Co. Ltd. | 2,000 | 2,918 | ||||||
| Zhen Ding Technology Holding Ltd. | 3,000 | 12,519 | ||||||
Zig Sheng Industrial Co. Ltd.(1) | 4,000 | 1,201 | ||||||
| 5,224,900 | ||||||||
| Thailand — 2.3% | ||||||||
| Advanced Info Service PCL, NVDR | 5,600 | 32,867 | ||||||
| AEON Thana Sinsap Thailand PCL, NVDR | 500 | 1,710 | ||||||
| Airports of Thailand PCL, NVDR | 9,200 | 16,495 | ||||||
| Amanah Leasing PCL | 9,200 | 764 | ||||||
| Amata Corp. PCL, NVDR | 12,200 | 5,146 | ||||||
| AP Thailand PCL, NVDR | 41,200 | 8,287 | ||||||
| Asia Sermkij Leasing PCL, NVDR | 1,200 | 712 | ||||||
| B Grimm Power PCL, NVDR | 9,700 | 14,378 | ||||||
| Bangchak Corp. PCL, NVDR | 18,000 | 10,196 | ||||||
| Bangkok Airways PCL, NVDR | 4,300 | 790 | ||||||
| Bangkok Aviation Fuel Services PCL, NVDR | 1,000 | 704 | ||||||
| Bangkok Bank PCL, NVDR | 2,700 | 9,202 | ||||||
| Bangkok Chain Hospital PCL, NVDR | 5,900 | 2,950 | ||||||
| Bangkok Dusit Medical Services PCL, NVDR | 23,700 | 15,803 | ||||||
| Bangkok Expressway & Metro PCL, NVDR | 33,200 | 9,614 | ||||||
| Bangkok Land PCL, NVDR | 61,200 | 1,939 | ||||||
| Bangkok Life Assurance PCL, NVDR | 14,300 | 7,365 | ||||||
| Banpu PCL, NVDR | 19,300 | 3,548 | ||||||
46
| Shares | Value | |||||||
| Banpu Power PCL, NVDR | 1,800 | $ | 824 | |||||
| BCPG PCL, NVDR | 3,600 | 1,477 | ||||||
BEC World PCL, NVDR(1) | 5,100 | 754 | ||||||
| Berli Jucker PCL, NVDR | 1,000 | 1,181 | ||||||
| BTS Group Holdings PCL, NVDR | 7,200 | 2,399 | ||||||
| Bumrungrad Hospital PCL, NVDR | 4,200 | 14,873 | ||||||
| Cal-Comp Electronics Thailand PCL, NVDR | 24,300 | 1,371 | ||||||
| Carabao Group PCL, NVDR | 3,100 | 12,098 | ||||||
| Central Pattana PCL, NVDR | 10,800 | 16,254 | ||||||
Central Plaza Hotel PCL, NVDR(1) | 1,900 | 1,643 | ||||||
Central Retail Corp. PCL, NVDR(1) | 5,741 | 5,457 | ||||||
| CH Karnchang PCL, NVDR | 12,400 | 7,648 | ||||||
| Charoen Pokphand Foods PCL, NVDR | 23,700 | 24,668 | ||||||
| Chularat Hospital PCL, NVDR | 50,400 | 4,203 | ||||||
CK Power PCL, NVDR(1) | 6,000 | 1,162 | ||||||
| Com7 PCL, NVDR | 3,300 | 4,339 | ||||||
CP ALL PCL, NVDR(1) | 15,500 | 31,709 | ||||||
| Dhipaya Insurance PCL, NVDR | 5,900 | 5,347 | ||||||
| Diamond Building Products PCL, NVDR | 5,000 | 1,072 | ||||||
| Dohome PCL, NVDR | 3,500 | 1,564 | ||||||
| Dynasty Ceramic PCL, NVDR | 84,500 | 6,994 | ||||||
| Eastern Polymer Group PCL, NVDR | 4,300 | 650 | ||||||
| Eastern Water Resources Development and Management PCL, NVDR | 2,900 | 927 | ||||||
Ekachai Medical Care PCL, NVDR(1) | 4,700 | 650 | ||||||
| Electricity Generating PCL, NVDR | 1,000 | 7,115 | ||||||
| Energy Absolute PCL, NVDR | 4,500 | 6,043 | ||||||
| Erawan Group PCL (The), NVDR | 8,700 | 925 | ||||||
Esso Thailand PCL, NVDR(1) | 4,400 | 926 | ||||||
| GFPT PCL, NVDR | 16,100 | 6,709 | ||||||
| Global Power Synergy PCL, NVDR | 800 | 1,639 | ||||||
| Gulf Energy Development PCL, NVDR | 2,500 | 2,525 | ||||||
| Gunkul Engineering PCL, NVDR | 30,600 | 2,489 | ||||||
| Haad Thip PCL, NVDR | 1,400 | 1,204 | ||||||
| Hana Microelectronics PCL, NVDR | 10,400 | 13,242 | ||||||
| Home Product Center PCL, NVDR | 30,200 | 14,413 | ||||||
| Ichitan Group PCL, NVDR | 5,600 | 1,596 | ||||||
| Indorama Ventures PCL, NVDR | 19,400 | 14,678 | ||||||
| Intouch Holdings PCL, NVDR | 4,900 | 8,566 | ||||||
| IRPC PCL, NVDR | 69,200 | 5,176 | ||||||
Italian-Thai Development PCL, NVDR(1) | 149,800 | 4,977 | ||||||
| Jasmine International PCL, NVDR | 53,400 | 4,962 | ||||||
| Jay Mart PCL, NVDR | 5,000 | 2,509 | ||||||
| JMT Network Services PCL, NVDR | 2,100 | 2,167 | ||||||
| JWD Infologistics PCL, NVDR | 3,900 | 943 | ||||||
| Kasikornbank PCL, NVDR | 3,000 | 8,087 | ||||||
| KCE Electronics PCL, NVDR | 7,800 | 7,299 | ||||||
| KGI Securities Thailand PCL, NVDR | 47,000 | 5,069 | ||||||
| Kiatnakin Phatra Bank PCL, NVDR | 4,500 | 5,719 | ||||||
| Krung Thai Bank PCL, NVDR | 23,800 | 7,267 | ||||||
| Krungthai Card PCL, NVDR | 10,800 | 10,653 | ||||||
| Land & Houses PCL, NVDR | 28,200 | 6,659 | ||||||
47
| Shares | Value | |||||||
| LPN Development PCL, NVDR | 37,300 | $ | 5,922 | |||||
| Major Cineplex Group PCL, NVDR | 17,300 | 9,701 | ||||||
| MBK PCL, NVDR | 6,500 | 2,606 | ||||||
| MC Group PCL, NVDR | 4,300 | 1,328 | ||||||
| MCS Steel PCL, NVDR | 3,400 | 1,475 | ||||||
| Mega Lifesciences PCL, NVDR | 7,500 | 9,063 | ||||||
Minor International PCL, NVDR(1) | 13,500 | 9,696 | ||||||
MK Real Estate Development PCL, NVDR(1) | 10,100 | 947 | ||||||
| MK Restaurants Group PCL, NVDR | 600 | 996 | ||||||
Muangthai Capital PCL, NVDR(1) | 6,200 | 9,881 | ||||||
| Noble Development PCL, NVDR | 2,700 | 1,040 | ||||||
Nusasiri PCL, NVDR(1) | 94,600 | 940 | ||||||
| Osotspa PCL, NVDR | 4,000 | 5,003 | ||||||
| Polyplex Thailand PCL, NVDR | 2,400 | 1,915 | ||||||
Precious Shipping PCL, NVDR(1) | 4,300 | 644 | ||||||
| Premier Marketing PCL, NVDR | 3,900 | 902 | ||||||
| Prima Marine PCL, NVDR | 5,000 | 1,424 | ||||||
| Property Perfect PCL, NVDR | 40,700 | 482 | ||||||
| Pruksa Holding PCL, NVDR | 16,600 | 6,168 | ||||||
| PTG Energy PCL, NVDR | 19,400 | 11,962 | ||||||
| PTT Exploration & Production PCL, NVDR | 9,000 | 25,589 | ||||||
| PTT Global Chemical PCL, NVDR | 11,800 | 17,417 | ||||||
| PTT PCL, NVDR | 34,700 | 39,936 | ||||||
| Quality Houses PCL, NVDR | 108,900 | 7,751 | ||||||
Raimon Land PCL, NVDR(1) | 40,600 | 818 | ||||||
| Rajthanee Hospital PCL, NVDR | 1,400 | 965 | ||||||
| Ratch Group PCL, NVDR | 3,900 | 7,005 | ||||||
| Ratchthani Leasing PCL, NVDR | 9,300 | 1,089 | ||||||
Regional Container Lines PCL, NVDR(1) | 8,100 | 854 | ||||||
| Rojana Industrial Park PCL, NVDR | 6,800 | 937 | ||||||
| RS PCL, NVDR | 2,400 | 1,444 | ||||||
| S 11 Group PCL, NVDR | 4,200 | 856 | ||||||
| Sansiri PCL, NVDR | 159,700 | 3,723 | ||||||
| SEAFCO PCL, NVDR | 5,200 | 939 | ||||||
| Siam Cement PCL (The), NVDR | 2,600 | 29,469 | ||||||
| Siam Commercial Bank PCL (The), NVDR | 4,400 | 10,188 | ||||||
| Siam Future Development PCL, NVDR | 5,800 | 828 | ||||||
| Siam Global House PCL, NVDR | 5,448 | 3,578 | ||||||
| Siamgas & Petrochemicals PCL, NVDR | 27,100 | 7,768 | ||||||
| Singha Estate PCL, NVDR | 20,100 | 928 | ||||||
| Sino-Thai Engineering & Construction PCL, NVDR | 17,200 | 7,251 | ||||||
| SNC Former PCL, NVDR | 2,800 | 898 | ||||||
| Somboon Advance Technology PCL, NVDR | 2,000 | 760 | ||||||
| SPCG PCL, NVDR | 13,200 | 7,586 | ||||||
Sri Trang Agro-Industry PCL, NVDR(1) | 22,400 | 18,632 | ||||||
| Srisawad Corp. PCL, NVDR | 7,600 | 11,116 | ||||||
Srisawad Finance PCL, NVDR(1) | 4,400 | 3,937 | ||||||
| Star Petroleum Refining PCL, NVDR | 18,400 | 4,024 | ||||||
| STP & I PCL, NVDR | 7,300 | 922 | ||||||
| Supalai PCL, NVDR | 17,300 | 9,310 | ||||||
| Super Energy Corp. PCL, NVDR | 129,100 | 3,392 | ||||||
| Susco PCL, NVDR | 10,600 | 896 | ||||||
48
| Shares | Value | |||||||
| Taokaenoi Food & Marketing PCL, NVDR | 2,900 | $ | 1,004 | |||||
Thai Airways International PCL, NVDR(1) | 6,800 | 721 | ||||||
| Thai Oil PCL, NVDR | 5,400 | 7,154 | ||||||
| Thai Union Group PCL, NVDR | 32,500 | 14,671 | ||||||
| Thai Vegetable Oil PCL, NVDR | 3,400 | 2,956 | ||||||
| Thaifoods Group PCL, NVDR | 70,100 | 10,321 | ||||||
| Thanachart Capital PCL, NVDR | 1,200 | 1,237 | ||||||
| Thoresen Thai Agencies PCL, NVDR | 7,000 | 646 | ||||||
| Tipco Asphalt PCL, NVDR | 11,200 | 8,906 | ||||||
| Tisco Financial Group PCL, NVDR | 3,400 | 7,320 | ||||||
| TMB Bank PCL, NVDR | 80,600 | 2,425 | ||||||
| TOA Paint Thailand PCL, NVDR | 2,300 | 2,895 | ||||||
| Total Access Communication PCL, NVDR | 6,500 | 7,438 | ||||||
| TPI Polene PCL, NVDR | 156,800 | 6,331 | ||||||
| TPI Polene Power PCL, NVDR | 10,200 | 1,414 | ||||||
| TQM Corp. PCL, NVDR | 700 | 2,825 | ||||||
| True Corp. PCL, NVDR | 110,200 | 11,703 | ||||||
| TTW PCL, NVDR | 2,500 | 1,075 | ||||||
U City PCL, NVDR(1) | 30,800 | 1,357 | ||||||
| Unique Engineering & Construction PCL, NVDR | 4,000 | 632 | ||||||
| Univanich Palm Oil PCL, NVDR | 5,800 | 834 | ||||||
| VGI PCL, NVDR | 3,100 | 693 | ||||||
| Vinythai PCL, NVDR | 1,500 | 1,140 | ||||||
| WHA Corp. PCL, NVDR | 9,100 | 931 | ||||||
| WP Energy PCL, NVDR | 5,900 | 888 | ||||||
| Zen Corp. Group PCL, NVDR | 2,200 | 609 | ||||||
| 856,318 | ||||||||
| Turkey — 0.4% | ||||||||
Akbank T.A.S.(1) | 9,455 | 6,287 | ||||||
| Aksa Akrilik Kimya Sanayii AS | 1,279 | 1,166 | ||||||
Aksa Enerji Uretim AS(1) | 7,931 | 5,542 | ||||||
| Anadolu Efes Biracilik Ve Malt Sanayii AS | 267 | 705 | ||||||
Arcelik AS(1) | 470 | 1,347 | ||||||
| Aselsan Elektronik Sanayi Ve Ticaret AS | 614 | 1,356 | ||||||
| Aygaz AS | 474 | 737 | ||||||
Bagfas Bandirma Gubre Fabrikalari AS(1) | 416 | 797 | ||||||
Bera Holding AS(1) | 2,301 | 2,675 | ||||||
| BIM Birlesik Magazalar AS | 2,155 | 19,893 | ||||||
| Cemtas Celik Makina Sanayi Ve Ticaret AS | 729 | 1,094 | ||||||
| Coca-Cola Icecek AS | 165 | 973 | ||||||
| Dogan Sirketler Grubu Holding AS | 3,552 | 1,014 | ||||||
| Eregli Demir ve Celik Fabrikalari TAS | 9,230 | 10,926 | ||||||
| Ford Otomotiv Sanayi AS | 106 | 1,218 | ||||||
| Haci Omer Sabanci Holding AS | 12,123 | 12,754 | ||||||
Ipek Dogal Enerji Kaynaklari Arastirma Ve Uretim AS(1) | 856 | 1,351 | ||||||
| Is Yatirim Menkul Degerler AS | 1,327 | 1,467 | ||||||
| Kardemir Karabuk Demir Celik Sanayi ve Ticaret AS, Class D | 15,130 | 6,271 | ||||||
| KOC Holding AS | 2,319 | 4,702 | ||||||
Koza Altin Isletmeleri AS(1) | 75 | 793 | ||||||
Koza Anadolu Metal Madencilik Isletmeleri AS(1) | 4,008 | 7,004 | ||||||
Mavi Giyim Sanayi Ve Ticaret AS, B Shares(1) | 783 | 3,958 | ||||||
Migros Ticaret AS(1) | 260 | 1,387 | ||||||
49
| Shares | Value | |||||||
NET Holding AS(1) | 2,629 | $ | 776 | |||||
| Nuh Cimento Sanayi AS | 462 | 1,169 | ||||||
Pegasus Hava Tasimaciligi AS(1) | 201 | 1,252 | ||||||
Petkim Petrokimya Holding AS(1) | 2,348 | 1,250 | ||||||
| Selcuk Ecza Deposu Ticaret ve Sanayi A.S. | 1,189 | 1,292 | ||||||
Sok Marketler Ticaret AS(1) | 577 | 1,009 | ||||||
| TAV Havalimanlari Holding AS | 626 | 1,277 | ||||||
| Tekfen Holding AS | 2,125 | 4,289 | ||||||
| Trakya Cam Sanayii AS | 2,741 | 1,467 | ||||||
Tupras Turkiye Petrol Rafinerileri AS(1) | 508 | 5,525 | ||||||
Turk Hava Yollari AO(1) | 5,902 | 8,479 | ||||||
| Turk Traktor ve Ziraat Makineleri AS | 120 | 1,526 | ||||||
| Turkcell Iletisim Hizmetleri AS, ADR | 2,099 | 10,243 | ||||||
Turkiye Garanti Bankasi AS(1) | 7,976 | 7,335 | ||||||
Turkiye Halk Bankasi AS(1) | 8,002 | 5,347 | ||||||
Turkiye Is Bankasi AS, C Shares(1) | 9,358 | 6,252 | ||||||
Turkiye Sinai Kalkinma Bankasi AS(1) | 10,264 | 1,521 | ||||||
Turkiye Vakiflar Bankasi TAO, D Shares(1) | 3,470 | 1,921 | ||||||
Vestel Elektronik Sanayi ve Ticaret AS(1) | 502 | 1,255 | ||||||
Zorlu Enerji Elektrik Uretim AS(1) | 4,083 | 1,498 | ||||||
| 160,100 | ||||||||
TOTAL COMMON STOCKS (Cost $30,974,243) | 36,204,330 | |||||||
RIGHTS† | ||||||||
Brazil† | ||||||||
Banco ABC Brasil SA(1) | 28 | 13 | ||||||
Gafisa SA(1) | 638 | 93 | ||||||
| 106 | ||||||||
Chile† | ||||||||
Cia Sud Americana de Vapores SA(1) | 88,575 | 342 | ||||||
South Africa† | ||||||||
Curro Holdings Ltd.(1) | 404 | 3 | ||||||
Thailand† | ||||||||
Gulf Energy Development PCL, NVDR(1) | 250 | 12 | ||||||
Ratchthani Leasing PCL, NVDR(1) | 4,650 | 398 | ||||||
| 410 | ||||||||
TOTAL RIGHTS (Cost $439) | 861 | |||||||
WARRANTS† | ||||||||
Malaysia† | ||||||||
Vizione Holdings Bhd(1) | 2,040 | — | ||||||
Thailand† | ||||||||
BTS Group Holdings PCL, NVDR(1) | 720 | 21 | ||||||
Jay Mart PCL No. 3, NVDR(1) | 556 | 100 | ||||||
Jay Mart PCL No. 4, NVDR(1) | 556 | 70 | ||||||
Minor International PCL, NVDR(1) | 613 | 194 | ||||||
Srisawad Corp. PCL, NVDR(1) | 304 | — | ||||||
| 385 | ||||||||
TOTAL WARRANTS (Cost $—) | 385 | |||||||
| TEMPORARY CASH INVESTMENTS — 1.5% | ||||||||
| State Street Institutional U.S. Government Money Market Fund, Premier Class (Cost $552,372) | 552,372 | 552,372 | ||||||
50
| Shares | Value | |||||||
TEMPORARY CASH INVESTMENTS - SECURITIES LENDING COLLATERAL(3) — 0.1% | ||||||||
| State Street Navigator Securities Lending Government Money Market Portfolio (Cost $21,366) | 21,366 | $ | 21,366 | |||||
TOTAL INVESTMENT SECURITIES — 100.7% (Cost $31,548,420) | 36,779,314 | |||||||
| OTHER ASSETS AND LIABILITIES — (0.7)% | (240,724) | |||||||
| TOTAL NET ASSETS — 100.0% | $ | 36,538,590 | ||||||
| FUTURES CONTRACTS PURCHASED | |||||||||||||||||
| Reference Entity | Contracts | Expiration Date | Notional Amount | Unrealized Appreciation (Depreciation)^ | |||||||||||||
| S&P 500 E-Mini | 2 | September 2020 | $ | 349,890 | $ | 20,874 | |||||||||||
^Amount represents value and unrealized appreciation (depreciation).
| MARKET SECTOR DIVERSIFICATION | |||||
(as a % of net assets) | |||||
| Information Technology | 17.9 | % | |||
| Consumer Discretionary | 16.2 | % | |||
| Financials | 15.4 | % | |||
| Communication Services | 10.3 | % | |||
| Materials | 10.0 | % | |||
| Industrials | 7.8 | % | |||
| Consumer Staples | 6.1 | % | |||
| Energy | 5.2 | % | |||
| Health Care | 4.2 | % | |||
| Real Estate | 3.4 | % | |||
| Utilities | 2.6 | % | |||
| Cash and Equivalents* | 0.9 | % | |||
*Includes temporary cash investments, temporary cash investments - securities lending collateral and other assets and liabilities.
| NOTES TO SCHEDULE OF INVESTMENTS | ||||||||
| ADR | - | American Depositary Receipt | ||||||
| GDR | - | Global Depositary Receipt | ||||||
| NVDR | - | Non-Voting Depositary Receipt | ||||||
† Category is less than 0.05% of total net assets.
(1)Non-income producing.
(2)Security, or a portion thereof, is on loan. At the period end, the aggregate value of securities on loan was $460,568. The amount of securities on loan indicated may not correspond with the securities on loan identified because securities with pending sales are in the process of recall from the brokers.
(3)Investment of cash collateral from securities on loan. At the period end, the aggregate value of the collateral held by the fund was $501,457, which includes securities collateral of $480,091.
See Notes to Financial Statements.
51
| Statement of Assets and Liabilities | ||
| AUGUST 31, 2020 | |||||
| Assets | |||||
| Investment securities, at value (cost of $31,527,054) — including $460,568 of securities on loan | $ | 36,757,948 | |||
| Investment made with cash collateral received for securities on loan, at value (cost of $21,366) | 21,366 | ||||
| Total investment securities, at value (cost of $31,548,420) | 36,779,314 | ||||
| Foreign currency holdings, at value (cost of $12,783) | 12,860 | ||||
| Deposits with broker for futures contracts | 24,000 | ||||
| Dividends and interest receivable | 55,922 | ||||
| Securities lending receivable | 796 | ||||
| 36,872,892 | |||||
| Liabilities | |||||
| Disbursements in excess of demand deposit cash | 238 | ||||
| Payable for collateral received for securities on loan | 21,366 | ||||
| Payable for capital shares redeemed | 210,950 | ||||
| Payable for variation margin on futures contracts | 1,583 | ||||
| Accrued management fees | 10,262 | ||||
| Accrued foreign taxes | 89,903 | ||||
| 334,302 | |||||
| Net Assets | $ | 36,538,590 | |||
| Institutional Class Capital Shares | |||||
| Shares outstanding (unlimited number of shares authorized) | 3,538,878 | ||||
| Net Asset Value Per Share | $ | 10.32 | |||
| Net Assets Consist of: | |||||
| Capital paid in | $ | 31,004,958 | |||
| Distributable earnings | 5,533,632 | ||||
| $ | 36,538,590 | ||||
See Notes to Financial Statements.
52
| Statement of Operations | ||
FOR THE PERIOD ENDED AUGUST 31, 2020(1) | |||||
| Investment Income (Loss) | |||||
| Income: | |||||
| Dividends (net of foreign taxes withheld of $85,700) | $ | 643,824 | |||
| Securities lending, net | 2,549 | ||||
| Interest | 1,861 | ||||
| 648,234 | |||||
| Expenses: | |||||
| Management fees | 59,631 | ||||
| Net investment income (loss) | 588,603 | ||||
| Realized and Unrealized Gain (Loss) | |||||
| Net realized gain (loss) on: | |||||
| Investment transactions | (247,231) | ||||
| Futures contract transactions | 67,870 | ||||
| Foreign currency translation transactions | (613) | ||||
| (179,974) | |||||
| Change in net unrealized appreciation (depreciation) on: | |||||
| Investments (includes (increase) decrease in accrued foreign taxes of $(89,903)) | 5,140,991 | ||||
| Futures contracts | 20,874 | ||||
| Translation of assets and liabilities in foreign currencies | 24 | ||||
| 5,161,889 | |||||
| Net realized and unrealized gain (loss) | 4,981,915 | ||||
| Net Increase (Decrease) in Net Assets Resulting from Operations | $ | 5,570,518 | |||
(1)December 4, 2019 (fund inception) through August 31, 2020.
See Notes to Financial Statements.
53
| Statement of Changes in Net Assets | ||
PERIOD ENDED AUGUST 31, 2020(1) | |||||
| Increase (Decrease) in Net Assets | |||||
| Operations | |||||
| Net investment income (loss) | $ | 588,603 | |||
| Net realized gain (loss) | (179,974) | ||||
| Change in net unrealized appreciation (depreciation) | 5,161,889 | ||||
| Net increase (decrease) in net assets resulting from operations | 5,570,518 | ||||
| Distributions to Shareholders | |||||
| From earnings | (36,886) | ||||
| Capital Share Transactions | |||||
| Proceeds from shares sold | 34,601,945 | ||||
| Proceeds from reinvestment of distributions | 36,886 | ||||
| Payments for shares redeemed | (3,633,873) | ||||
| Net increase (decrease) in net assets from capital share transactions | 31,004,958 | ||||
| Net increase (decrease) in net assets | 36,538,590 | ||||
| Net Assets | |||||
| End of period | $ | 36,538,590 | |||
| Transactions in Shares of the Fund | |||||
| Sold | 3,922,272 | ||||
| Issued in reinvestment of distributions | 3,471 | ||||
| Redeemed | (386,865) | ||||
| Net increase (decrease) in shares of the fund | 3,538,878 | ||||
(1)December 4, 2019 (fund inception) through August 31, 2020.
See Notes to Financial Statements.
54
| Notes to Financial Statements | ||
AUGUST 31, 2020
1. Organization
American Century ETF Trust (the trust) was registered as a Delaware statutory trust in 2017 and is registered under the Investment Company Act of 1940, as amended (the 1940 Act), as an open-end management investment company. Avantis Emerging Markets Equity Fund (the fund) is one fund in a series issued by the trust. The fund’s investment objective is to seek long-term capital appreciation. The fund offers the Institutional Class. The Institutional Class commenced sale on December 4, 2019, the fund's inception date.
2. Significant Accounting Policies
The following is a summary of significant accounting policies consistently followed by the fund in preparation of its financial statements. The fund is an investment company and follows accounting and reporting guidance in accordance with accounting principles generally accepted in the United States of America. This may require management to make certain estimates and assumptions at the date of the financial statements. Actual results could differ from these estimates. Management evaluated the impact of events or transactions occurring through the date the financial statements were issued that would merit recognition or disclosure.
Investment Valuations — The fund determines the fair value of its investments and computes its net asset value per share at the close of regular trading (usually 4 p.m. Eastern time) on the New York Stock Exchange (NYSE) on each day the NYSE is open. The Board of Trustees has adopted valuation policies and procedures to guide the investment advisor in the fund’s investment valuation process and to provide methodologies for the oversight of the fund’s pricing function.
Equity securities that are listed or traded on a domestic securities exchange are valued at the last reported sales price or at the official closing price as provided by the exchange. Equity securities traded on foreign securities exchanges are generally valued at the closing price of such securities on the exchange where primarily traded or at the close of the NYSE, if that is earlier. If no last sales price is reported, or if local convention or regulation so provides, the mean of the latest bid and asked prices may be used. Securities traded over-the-counter are valued at the mean of the latest bid and asked prices, the last sales price, or the official closing price. Equity securities initially expressed in local currencies are translated into U.S. dollars at the mean of the appropriate currency exchange rate at the close of the NYSE as provided by an independent pricing service.
Open-end management investment companies are valued at the reported net asset value per share. Exchange-traded futures contracts are valued at the settlement price as provided by the appropriate exchange.
If the fund determines that the market price for an investment is not readily available or the valuation methods mentioned above do not reflect an investment’s fair value, such investment is valued as determined in good faith by the Board of Trustees or its delegate, in accordance with policies and procedures adopted by the Board of Trustees. In its determination of fair value, the fund may review several factors including, but not limited to, market information regarding the specific investment or comparable investments and correlation with other investment types, futures indices or general market indicators. Circumstances that may cause the fund to use these procedures to value an investment include, but are not limited to: an investment has been declared in default or is distressed; trading in a security has been suspended during the trading day or a security is not actively trading on its principal exchange; prices received from a regular pricing source are deemed unreliable; or there is a foreign market holiday and no trading occurred.
The fund monitors for significant events occurring after the close of an investment’s primary exchange but before the fund’s net asset value per share is determined. Significant events may include, but are not limited to: corporate announcements and transactions; governmental action and political unrest that could impact a specific investment or an investment sector; or armed conflicts, natural disasters and similar events that could affect investments in a specific country or region. The fund also monitors for significant fluctuations between domestic and foreign markets, as evidenced by the U.S. market or such other indicators that the Board of Trustees, or its delegate, deems appropriate. The fund may apply a model-derived factor to the closing price of equity securities traded on foreign securities exchanges. The factor is based on observable market data as provided by an independent pricing service.
55
Security Transactions — Security transactions are accounted for as of the trade date. Net realized gains and losses are determined on the identified cost basis, which is also used for federal income tax purposes. Certain countries impose taxes on realized gains on the sale of securities registered in their country. The fund records the foreign tax expense, if any, on an accrual basis. The foreign tax expense on realized gains and unrealized appreciation reduces the net realized gain (loss) on investment transactions and net unrealized appreciation (depreciation) on investments, respectively.
Investment Income — Dividend income less foreign taxes withheld, if any, is recorded as of the ex-dividend date. Distributions received on securities that represent a return of capital or long-term capital gain are recorded as a reduction of cost of investments and/or as a realized gain. The fund may estimate the components of distributions received that may be considered nontaxable distributions or long-term capital gain distributions for income tax purposes. Interest income is recorded on the accrual basis and includes accretion of discounts and amortization of premiums. Securities lending income is net of fees and rebates earned by the lending agent for its services.
Foreign Currency Translations — All assets and liabilities initially expressed in foreign currencies are translated into U.S. dollars at prevailing exchange rates at period end. The fund may enter into spot foreign currency exchange contracts to facilitate transactions denominated in a foreign currency. Purchases and sales of investment securities, dividend and interest income, spot foreign currency exchange contracts, and expenses are translated at the rates of exchange prevailing on the respective dates of such transactions. Net realized and unrealized foreign currency exchange gains or losses related to investment securities are a component of net realized gain (loss) on investment transactions and change in net unrealized appreciation (depreciation) on investments, respectively.
Segregated Assets — In accordance with the 1940 Act, the fund segregates assets on its books and records to cover certain types of investment securities and other financial instruments. American Century Investment Management, Inc. (ACIM) (the investment advisor) monitors, on a daily basis, the securities segregated to ensure the fund designates a sufficient amount of liquid assets, marked-to-market daily. The fund may also receive assets or be required to pledge assets at the custodian bank or with a broker for collateral requirements.
Income Tax Status — It is the fund’s policy to distribute substantially all net investment income and net realized gains to shareholders and to otherwise qualify as a regulated investment company under provisions of the Internal Revenue Code. Accordingly, no provision has been made for income taxes. The fund files U.S. federal, state, local and non-U.S. tax returns as applicable. The fund's tax returns are subject to examination by the relevant taxing authority until expiration of the applicable statute of limitations, which is generally three years from the date of filing but can be longer in certain jurisdictions. At this time, management believes there are no uncertain tax positions which, based on their technical merit, would not be sustained upon examination and for which it is reasonably possible that the total amounts of unrecognized tax benefits will significantly change in the next twelve months.
Distributions to Shareholders — Distributions from net investment income and net realized gains, if any, are generally declared and paid annually.
Indemnifications — Under the trust’s organizational documents, its officers and trustees are indemnified against certain liabilities arising out of the performance of their duties to the fund. In addition, in the normal course of business, the fund enters into contracts that provide general indemnifications. The maximum exposure under these arrangements is unknown as this would involve future claims that may be made against a fund. The risk of material loss from such claims is considered by management to be remote.
Securities Lending — Securities are lent to qualified financial institutions and brokers. State Street Bank & Trust Co. serves as securities lending agent to the fund pursuant to a Securities Lending Agreement. The lending of securities exposes the fund to risks such as: the borrowers may fail to return the loaned securities, the borrowers may not be able to provide additional collateral, the fund may experience delays in recovery of the loaned securities or delays in access to collateral, or the fund may experience losses related to the investment collateral. To minimize certain risks, loan counterparties pledge collateral in the form of cash and/or securities. The lending agent has agreed to indemnify the fund in the case of default of any securities borrowed. Cash collateral received is invested in the State Street Navigator Securities Lending Government Money Market Portfolio, a money market mutual fund registered under the 1940 Act. The loans may also be secured by U.S. government securities in an amount at least equal to the market value of the securities loaned, plus accrued interest and dividends, determined on a daily basis and adjusted accordingly. By lending securities, the fund seeks to increase its net investment income through the receipt of interest and fees. Such income is reflected separately within the Statement of Operations. The value of loaned securities and related collateral outstanding at period end, if any, are shown on a gross basis within the Schedule of Investments and Statement of Assets and Liabilities.
56
The following table reflects a breakdown of transactions accounted for as secured borrowings, the gross obligation by the type of collateral pledged, and the remaining contractual maturity of those transactions as of August 31, 2020.
| Remaining Contractual Maturity of Agreements | |||||||||||||||||
| Overnight and Continuous | <30 days | Between 30 & 90 days | >90 days | Total | |||||||||||||
Securities Lending Transactions(1) | |||||||||||||||||
| Common Stocks | $ | 21,366 | — | — | — | $ | 21,366 | ||||||||||
| Gross amount of recognized liabilities for securities lending transactions | $ | 21,366 | |||||||||||||||
(1)Amount represents the payable for cash collateral received for securities on loan. This will generally be in the Overnight and Continuous column as the securities are typically callable on demand.
3. Fees and Transactions with Related Parties
Certain officers and trustees of the trust are also officers and/or directors of American Century Companies, Inc. (ACC). The trust's investment advisor, ACIM, the fund's distributor, American Century Investment Services, Inc., and the trust's transfer agent, American Century Services, LLC, are wholly owned, directly or indirectly, by ACC. ACIM owns 34% of the shares of the fund. Related parties do not invest in the fund for the purpose of exercising management or control.
Management Fees — The trust has entered into a management agreement with ACIM, under which ACIM provides the fund with investment advisory and management services in exchange for a single, unified management fee (the fee). The agreement provides that ACIM will pay all expenses of managing and operating the fund, except brokerage and other transaction fees and expenses relating to the acquisition and disposition of portfolio securities, acquired fund fees and expenses, interest, taxes, litigation expenses and extraordinary expenses. The fee is computed and accrued daily based on the daily net assets of the fund and paid monthly in arrears. The annual management fee is 0.33%.
Interfund Transactions — The fund may enter into security transactions with other American Century Investments funds and other client accounts of the investment advisor, in accordance with the 1940 Act rules and procedures adopted by the Board of Trustees. The rules and procedures require, among other things, that these transactions be effected at the independent current market price of the security. There were no interfund transactions during the period.
4. Investment Transactions
Purchases and sales of investment securities, excluding short-term investments, for the period ended August 31, 2020 were $32,026,482 and $837,593, respectively.
5. Fair Value Measurements
The fund’s investments valuation process is based on several considerations and may use multiple inputs to determine the fair value of the investments held by the fund. In conformity with accounting principles generally accepted in the United States of America, the inputs used to determine a valuation are classified into three broad levels.
•Level 1 valuation inputs consist of unadjusted quoted prices in an active market for identical investments.
•Level 2 valuation inputs consist of direct or indirect observable market data (including quoted prices for comparable investments, evaluations of subsequent market events, interest rates, prepayment speeds, credit risk, etc.). These inputs also consist of quoted prices for identical investments initially expressed in local currencies that are adjusted through translation into U.S. dollars.
•Level 3 valuation inputs consist of unobservable data (including a fund’s own assumptions).
The level classification is based on the lowest level input that is significant to the fair valuation measurement. The valuation inputs are not necessarily an indication of the risks associated with investing in these securities or other financial instruments.
57
The following is a summary of the level classifications as of period end. The Schedule of Investments provides additional information on the fund’s portfolio holdings.
| Level 1 | Level 2 | Level 3 | |||||||||
| Assets | |||||||||||
| Investment Securities | |||||||||||
| Common Stocks | |||||||||||
| Brazil | $ | 718,633 | $ | 1,280,003 | — | ||||||
| Chile | 40,684 | 186,579 | — | ||||||||
| China | 4,220,513 | 9,457,354 | — | ||||||||
| Colombia | 23,407 | 66,440 | — | ||||||||
| India | 541,513 | 2,984,268 | — | ||||||||
| Indonesia | 51,918 | 543,049 | — | ||||||||
| Mexico | 199,471 | 498,349 | — | ||||||||
| Peru | 104,241 | — | — | ||||||||
| Philippines | 17,695 | 272,106 | — | ||||||||
| Russia | 35,696 | 886,058 | — | ||||||||
| South Africa | 340,575 | 1,145,304 | — | ||||||||
| South Korea | 281,282 | 4,676,919 | — | ||||||||
| Taiwan | 1,372,203 | 3,852,697 | — | ||||||||
| Turkey | 10,243 | 149,857 | — | ||||||||
| Other Countries | — | 2,247,273 | — | ||||||||
| Rights | — | 861 | — | ||||||||
| Warrants | — | 385 | — | ||||||||
| Temporary Cash Investments | 552,372 | — | — | ||||||||
| Temporary Cash Investments - Securities Lending Collateral | 21,366 | — | — | ||||||||
| $ | 8,531,812 | $ | 28,247,502 | — | |||||||
| Other Financial Instruments | |||||||||||
| Futures Contracts | $ | 20,874 | — | — | |||||||
6. Derivative Instruments
Equity Price Risk — The fund is subject to equity price risk in the normal course of pursuing its investment objectives. A fund may enter into futures contracts based on an equity index in order to manage its exposure to changes in market conditions. A fund may purchase futures contracts to gain exposure to increases in market value or sell futures contracts to protect against a decline in market value. Upon entering into a futures contract, a fund is required to deposit either cash or securities in an amount equal to a certain percentage of the contract value (initial margin). Subsequent payments (variation margin) are made or received daily, in cash, by a fund. The variation margin is equal to the daily change in the contract value and is recorded as unrealized gains and losses. A fund recognizes a realized gain or loss when the contract is closed or expires. Net realized and unrealized gains or losses occurring during the holding period of futures contracts are a component of net realized gain (loss) on futures contract transactions and change in net unrealized appreciation (depreciation) on futures contracts, respectively. One of the risks of entering into futures contracts is the possibility that the change in value of the contract may not correlate with the changes in value of the underlying securities. The fund's average notional exposure to equity price risk derivative instruments held during the period was $277,351 futures contracts purchased.
The value of equity price risk derivative instruments as of August 31, 2020, is disclosed on the Statement of Assets and Liabilities as a liability of $1,583 in payable for variation margin on futures contracts*. For the period from December 4, 2019 (fund inception) through August 31, 2020, the effect of equity price risk derivative instruments on the Statement of Operations was $67,870 in net realized gain (loss) on futures contract transactions and $20,874 in change in net unrealized appreciation (depreciation) on futures contracts.
* Included in the unrealized appreciation (depreciation) on futures contracts, as reported in the Schedule of Investments.
58
7. Risk Factors
The value of the fund’s shares will go up and down, sometimes rapidly or unpredictably, based on the performance of the securities owned by the fund and other factors generally affecting the securities market. Market risks, including political, regulatory, economic and social developments, can affect the value of the fund’s investments. Natural disasters, public health emergencies, terrorism and other unforeseeable events may lead to increased market volatility and may have adverse long-term effects on world economies and markets generally.
There are certain risks involved in investing in foreign securities. These risks include those resulting from political events (such as civil unrest, national elections and imposition of exchange controls), social and economic events (such as labor strikes and rising inflation), and natural disasters. Securities of foreign issuers may be less liquid and more volatile. Investing in emerging markets or a significant portion of assets in one country or region may accentuate these risks.
8. Federal Tax Information
The tax character of distributions paid during the period December 4, 2019 (fund inception) through August 31, 2020 were as follows:
| Distributions Paid From | |||||
| Ordinary income | $ | 36,886 | |||
| Long-term capital gains | — | ||||
The book-basis character of distributions made during the year from net investment income or net realized gains may differ from their ultimate characterization for federal income tax purposes. These differences reflect the differing character of certain income items and net realized gains and losses for financial statement and tax purposes, and may result in reclassification among certain capital accounts on the financial statements.
As of period end, the federal tax cost of investments and the components of distributable earnings on a tax-basis were as follows:
| Federal tax cost of investments | $ | 31,786,355 | |||
| Gross tax appreciation of investments | $ | 6,917,004 | |||
| Gross tax depreciation of investments | (1,924,045) | ||||
| Net tax appreciation (depreciation) of investments | 4,992,959 | ||||
| Net tax appreciation (depreciation) on derivatives and translation of assets and liabilities in foreign currencies | (89,880) | ||||
| Net tax appreciation (depreciation) | $ | 4,903,079 | |||
| Undistributed ordinary income | $ | 685,808 | |||
| Accumulated short-term capital losses | $ | (55,255) | |||
The difference between book-basis and tax-basis unrealized appreciation (depreciation) is attributable primarily to the realization to ordinary income for tax purposes of unrealized gains on investments in passive foreign investment companies.
Accumulated capital losses represent net capital loss carryovers that may be used to offset future realized capital gains for federal income tax purposes. The capital loss carryovers may be carried forward for an unlimited period. Future capital loss carryover utilization in any given year may be subject to Internal Revenue Code limitations.
59
| Financial Highlights | ||
| For a Share Outstanding Throughout the Period Indicated | |||||||||||||||||||||||||||||||||||
| Per-Share Data | Ratios and Supplemental Data | ||||||||||||||||||||||||||||||||||
| Income From Investment Operations: | Ratio to Average Net Assets of: | ||||||||||||||||||||||||||||||||||
| Net Asset Value, Beginning of Period | Net Investment Income (Loss)(1) | Net Realized and Unrealized Gain (Loss) | Total From Investment Operations | Distributions From Net Investment Income | Net Asset Value, End of Period | Total Return(2) | Operating Expenses | Net Investment Income (Loss) | Portfolio Turnover Rate | Net Assets, End of Period (in thousands) | |||||||||||||||||||||||||
| Institutional Class | |||||||||||||||||||||||||||||||||||
2020(3) | $10.00 | 0.23 | 0.12 | 0.35 | (0.03) | $10.32 | 3.57% | 0.33%(4) | 3.26%(4) | 4% | $36,539 | ||||||||||||||||||||||||
| Notes to Financial Highlights | ||
(1)Computed using average shares outstanding throughout the period.
(2)Total returns are calculated based on the net asset value of the last business day. Total returns for periods less than one year are not annualized.
(3)December 4, 2019 (fund inception) through August 31, 2020.
(4)Annualized.
See Notes to Financial Statements.
| Report of Independent Registered Public Accounting Firm | ||
To the Shareholders and the Board of Trustees of American Century ETF Trust:
Opinion on the Financial Statements and Financial Highlights
We have audited the accompanying statement of assets and liabilities, including the schedule of investments, of Avantis® Emerging Markets Equity Fund (the “Fund”), one of the funds constituting the American Century ETF Trust, as of August 31, 2020, and the related statement of operations, the statement of changes in net assets, and the financial highlights for the period from December 4, 2019 (fund inception) through August 31, 2020, and the related notes. In our opinion, the financial statements and financial highlights present fairly, in all material respects, the financial position of AAvantis® Emerging Markets Equity Fund as of August 31, 2020, and the results of its operations, the changes in its net assets, and the financial highlights for the period from December 4, 2019 (fund inception) through August 31, 2020, in conformity with accounting principles generally accepted in the United States of America.
Basis for Opinion
These financial statements and financial highlights are the responsibility of the Fund's management. Our responsibility is to express an opinion on the Fund’s financial statements and financial highlights based on our audit. We are a public accounting firm registered with the Public Company Accounting Oversight Board (United States) (PCAOB) and are required to be independent with respect to the Fund in accordance with the U.S. federal securities laws and the applicable rules and regulations of the Securities and Exchange Commission and the PCAOB.
We conducted our audit in accordance with the standards of the PCAOB. Those standards require that we plan and perform the audit to obtain reasonable assurance about whether the financial statements and financial highlights are free of material misstatement, whether due to error or fraud.
The Fund is not required to have, nor were we engaged to perform, an audit of its internal control over financial reporting. As part of our audit we are required to obtain an understanding of internal control over financial reporting but not for the purpose of expressing an opinion on the effectiveness of the Fund’s internal control over financial reporting. Accordingly, we express no such opinion.
Our audit included performing procedures to assess the risks of material misstatement of the financial statements and financial highlights, whether due to error or fraud, and performing procedures that respond to those risks. Such procedures included examining, on a test basis, evidence regarding the amounts and disclosures in the financial statements and financial highlights. Our audit also included evaluating the accounting principles used and significant estimates made by management, as well as evaluating the overall presentation of the financial statements and financial highlights. Our procedures included confirmation of securities owned as of August 31, 2020, by correspondence with the custodian and brokers; when replies were not received from brokers, we performed other auditing procedures. We believe that our audit provides a reasonable basis for our opinion.
DELOITTE & TOUCHE LLP
Kansas City, Missouri
October 16, 2020
We have served as the auditor of one or more American Century investment companies since 1997.
61
| Management | ||
The Board of Trustees
The individuals listed below serve as trustees of the funds. Each trustee will continue to serve in this capacity until death, retirement, resignation or removal from office. The board has adopted a mandatory retirement age for trustees who are not “interested persons,” as that term is defined in the Investment Company Act (independent trustees). Trustees who are not also officers of the trust shall retire by December 31st of the year in which they reach their 75th birthday.
Mr. Thomas is an “interested person” because he currently serves as President and Chief Executive Officer of American Century Companies, Inc. (ACC), the parent company of American Century Investment Management, Inc. (ACIM or the advisor). The other trustees are independent. They are not employees, directors or officers of, and have no financial interest in, ACC or any of its wholly owned, direct or indirect, subsidiaries, including ACIM and American Century Services, LLC (ACS), and they do not have any other affiliations, positions or relationships that would cause them to be considered “interested persons” under the Investment Company Act. The following trustees also serve in this capacity for a number of other registered investment companies in the American Century Investments family of funds: Jonathan S. Thomas, 15; Ronald J. Gilson, 8; and Stephen E. Yates, 7.
The following table presents additional information about the trustees. The mailing address for each trustee other than Jonathan S. Thomas is 330 Madison Avenue, New York, New York 10017. The mailing address for Jonathan S. Thomas is 4500 Main Street, Kansas City, Missouri 64111.
| Name (Year of Birth) | Position(s) Held with Funds | Length of Time Served | Principal Occupation(s) During Past 5 Years | Number of American Century Portfolios Overseen by Trustee | Other Directorships Held During Past 5 Years | ||||||||||||
| Independent Trustees | |||||||||||||||||
| Reginald M. Browne (1968) | Trustee and Chairman of the Board | Since 2017 (Chairman since 2019) | Principal, GTS Securities (automated capital markets trading firm)(2019 to present); Senior Managing Director, Co Global Head-ETF Group, Cantor Fitzgerald (financial services firm)(2013 to 2019) | 19 | None | ||||||||||||
| Ronald J. Gilson (1946) | Trustee | Since 2017 | Charles J. Meyers Professor of Law and Business, Emeritus, Stanford Law School (1979 to 2016); Marc and Eva Stern Professor of Law and Business, Columbia University School of Law (1992 to present) | 59 | None | ||||||||||||
| Barry A. Mendelson (1958) | Trustee | Since 2017 | Retired; Consultant regarding ETF and mutual fund matters (2015 to 2016); Principal and Senior Counsel, The Vanguard Group (investment management)(1998 to 2014) | 19 | None | ||||||||||||
| Stephen E. Yates (1948) | Trustee | Since 2017 | Retired | 82 | None | ||||||||||||
62
| Name (Year of Birth) | Position(s) Held with Funds | Length of Time Served | Principal Occupation(s) During Past 5 Years | Number of American Century Portfolios Overseen by Trustee | Other Directorships Held During Past 5 Years | ||||||||||||
| Interested Trustees | |||||||||||||||||
| Jonathan S. Thomas (1963) | Trustee | Since 2017 | President and Chief Executive Officer, ACC (2007 to present). Also serves as Chief Executive Officer, ACS; Executive Vice President, ACIM; Director, ACC, ACIM and other ACC subsidiaries | 122 | None | ||||||||||||
The Statement of Additional Information has additional information about the fund's trustees and is available without charge, upon request, by calling 1-800-345-6488.
63
Officers
The following table presents certain information about the executive officers of the funds. Each officer, except Edward Rosenberg, serves as an officer for each of the 16 investment companies in the American Century family of funds. No officer is compensated for his or her service as an officer of the funds. The listed officers are interested persons of the funds and are appointed or re-appointed on an annual basis. The mailing address for each officer listed below is 4500 Main Street, Kansas City, Missouri 64111.
| Name (Year of Birth) | Offices with the Funds | Principal Occupation(s) During the Past Five Years | ||||||
| Patrick Bannigan (1965) | President since 2019 | Executive Vice President and Director, ACC (2012 to present); Chief Financial Officer, Chief Accounting Officer and Treasurer, ACC (2015 to present). Also serves as President, ACS; Vice President, ACIM; Chief Financial Officer, Chief Accounting Officer and/or Director, ACIM, ACS and other ACC subsidiaries | ||||||
| R. Wes Campbell (1974) | Chief Financial Officer and Treasurer since 2018 | Vice President, ACS (2020 to present); Investment Operations and Investment Accounting, ACS (2000 to present) | ||||||
| Amy D. Shelton (1964) | Chief Compliance Officer and Vice President since 2017 | Chief Compliance Officer, American Century funds, (2014 to present); Chief Compliance Officer, ACIM (2014 to present); Chief Compliance Officer, ACIS (2009 to present). Also serves as Vice President, ACIS | ||||||
| Charles A. Etherington (1957) | General Counsel and Vice President since 2017 | Attorney, ACC (1994 to present); Vice President, ACC (2005 to present); General Counsel, ACC (2007 to present). Also serves as General Counsel, ACIM, ACS, ACIS and other ACC subsidiaries; and Senior Vice President, ACIM and ACS | ||||||
| Cleo Chang (1977) | Vice President since 2019 | Senior Vice President, ACIM (2015 to present); Chief Investment Officer, Wilshire Funds Management (2005 to 2015) | ||||||
| David H. Reinmiller (1963) | Vice President since 2017 | Attorney, ACC (1994 to present). Also serves as Vice President, ACIM and ACS | ||||||
| Edward Rosenberg (1973) | Vice President since 2017 | Senior Vice President, ACIM (2017 to present); Senior Vice President, Flexshares Head of ETF Capital Markets, Northern Trust (2012 to 2017) | ||||||
| C. Jean Wade (1964) | Vice President since 2017 | Senior Vice President, ACS (2017 to present); Vice President, ACS (2000 to 2017) | ||||||
| Ward D. Stauffer (1960) | Secretary since 2019 | Attorney, ACS (2003 to present) | ||||||
64
| Approval of Management Agreement | ||
At a meeting held on June 5, 2020, the Fund’s Board of Trustees (the "Board") unanimously approved the renewal of the management agreement pursuant to which American Century Investment Management, Inc. (the “Advisor”) acts as the investment advisor for the Fund. Under Section 15(c) of the Investment Company Act, contracts for investment advisory services are required to be reviewed, evaluated, and approved by a majority of a fund’s trustees (the “Trustees”), including a majority of the independent Trustees, each year.
Prior to its consideration of the renewal of the management agreement, the Trustees requested and reviewed extensive data and information compiled by the Advisor and certain independent providers of evaluation data concerning the Fund and the services provided to the Fund by the Advisor. This review was in addition to the oversight and evaluation undertaken by the Board and its Audit Committee on a continual basis and the information received was supplemental to the extensive information that the Board and its Audit Committee receive and consider throughout the year.
In connection with its consideration of the renewal of the management agreement, the Board’s review and evaluation of the services provided by the Advisor included, but was not limited to, the following:
•the nature, extent, and quality of investment management and other services provided and to be provided to the Fund;
•the wide range of other programs and services provided and to be provided to the Fund and its shareholders on a routine and non-routine basis;
•the Fund’s investment performance, including data comparing the Fund's performance to appropriate benchmarks of funds with similar objectives and strategies;
•the cost of owning the Fund compared to the cost of owning similar funds;
•the compliance policies, procedures, and regulatory experience of the Advisor and the Fund's service providers;
•the Advisor’s strategic plans;
•the Advisor’s business continuity plans and specifically its response to the COVID-19 pandemic;
•financial data showing the cost of services provided to the Fund, the profitability of the Fund to the Advisor, and the overall profitability of the Advisor;
•information regarding payments to intermediaries by the Advisor; and
•possible economies of scale associated with the Advisor’s management of the Fund; and
•possible collateral benefits to the Advisor from the management of the Fund.
The independent Trustees met separately in private session to discuss the renewal and to review and discuss the information provided in response to their request. The independent Trustees also held active discussions with the Advisor regarding the renewal of the management agreement. The independent Trustees had the benefit of the advice of their independent counsel throughout the process.
Factors Considered
The Trustees considered all of the information provided by the Advisor, the independent data providers, and independent counsel in connection with the approval. They determined that the information was sufficient for them to evaluate the management agreement for the Fund. In connection with their review, the Trustees did not identify any single factor as being all-important or
65
controlling, and each Trustee may have attributed different levels of importance to different factors. In deciding to renew the management agreement, the Board based its decision on a number of factors, including without limitation the following:
Nature, Extent and Quality of Services — Generally. Under the management agreement, the Advisor is responsible for providing or arranging for all services necessary for the operation of the Fund. The Board noted that the Advisor provides or arranges at its own expense a wide variety of services including without limitation the following:
•constructing and designing the Fund
•portfolio research and security selection
•initial capitalization/funding
•securities trading
•Fund administration
•custody of Fund assets
•daily valuation of the Fund’s portfolio
•shareholder servicing and transfer agency, including shareholder confirmations, recordkeeping, and communications
•legal services (except the independent Trustees’ counsel)
•regulatory and portfolio compliance
•financial reporting
•marketing and distribution (except amounts paid by the Fund under Rule 12b-1 plans)
Investment Management Services. The nature of the investment management services provided to the Fund is quite complex and allows Fund shareholders access to professional money management, instant diversification of their investments within an asset class, and liquidity. In evaluating investment performance, the Board expects the Advisor to manage the Fund in accordance with its investment objectives and approved strategies. Further, the Trustees recognize that the Advisor has an obligation to monitor trading activities, and in particular to seek the best execution of fund trades, and to evaluate the use of and payment for research. In providing these services, the Advisor utilizes teams of investment professionals (portfolio managers, analysts, research assistants, and securities traders) who require extensive information technology, research, training, compliance, and other systems to conduct their business. The Board provides oversight of the investment performance process. It regularly reviews investment performance information for the Fund, together with comparative information for appropriate benchmarks over different time horizons. If performance concerns are identified, the Board discusses with the Advisor the reasons for such results and any efforts being undertaken to improve performance. The Board found the investment management services provided by the Advisor to the Fund to be satisfactory and consistent with the management agreement.
Shareholder and Other Services. Under the management agreement, the Advisor provides or arranges for a comprehensive package of services to the Fund. The Board, directly and through its Audit Committee, regularly reviews reports and evaluations of such services at its regular meetings. These reports include, but are not limited to, information regarding the operational efficiency and accuracy of the shareholder and transfer agency services provided, staffing levels, shareholder satisfaction, technology support (including cyber security), new products and services offered to Fund shareholders, securities trading activities, portfolio valuation services, auditing services, and legal and operational compliance activities. The Board found the services provided by the Advisor to the Fund under the management agreement to be competitive and of high quality.
COVID-19 Response. During 2020, much of the world experienced unprecedented change and challenges from the impacts of the rapidly evolving, worldwide spread of the COVID-19 virus. The
66
Board evaluated the Advisor’s response to the COVID-19 pandemic and its impact on service to the Fund. The Board found that Fund shareholders have continued to receive the Advisor’s investment management and other services without disruption, and Advisor personnel have demonstrated great resiliency in providing those services. The Board, directly and through its Audit Committee, continues to monitor the impact of the pandemic and the response of each of the Fund’s service providers.
Costs of Services and Profitability. The Advisor provides detailed information concerning its cost of providing various services to the Fund, its profitability in managing the Fund (pre- and post-distribution), its overall profitability, and its financial condition. The Trustees have reviewed with the Advisor the methodology used to prepare this financial information. This information is considered in evaluating the Advisor’s financial condition, its ability to continue to provide services under the management agreement, and the reasonableness of the current management fee. The Board concluded that the Advisor’s profits were reasonable in light of the services provided to the Fund.
Ethics. The Board generally considers the Advisor’s commitment to providing quality services to the Fund and to conducting its business ethically. They noted that the Advisor’s practices generally meet or exceed industry best practices.
Economies of Scale. The Board also reviewed information provided by the Advisor regarding the possible existence of economies of scale in connection with the management of the Fund. The Board concluded that economies of scale are difficult to measure and predict with precision, especially on a fund-by-fund basis. The Board concluded that the Advisor is appropriately sharing economies of scale, to the extent they exist, through its competitive fee structure, offering competitive fees from fund inception, and through reinvestment in its business, infrastructure, investment capabilities and initiatives to provide shareholders additional content and services.
Comparison to Other Funds’ Fees. The management agreement provides that the Fund pays the Advisor a single, all-inclusive (or unified) management fee for providing all services necessary for the management and operation of the Fund, other than brokerage expenses, expenses attributable to short sales, taxes, interest, extraordinary expenses, and expenses incurred in connection with the provision of shareholder services and distribution services under a plan adopted pursuant to Rule 12b-1 under the Investment Company Act. Under the unified fee structure, the Advisor is responsible for providing all investment advisory, custody, audit, administrative, compliance, recordkeeping, marketing and shareholder services, or arranging and supervising third parties to provide such services. The Board believes the unified fee structure is a benefit to Fund shareholders because it clearly discloses to shareholders the cost of owning Fund shares, and, since the unified fee cannot be increased without a vote of Fund shareholders, it shifts to the Advisor the risk of increased costs of operating the Fund and provides a direct incentive to minimize administrative inefficiencies. Part of the Board’s analysis of fee levels involves reviewing certain evaluative data compiled by an independent provider comparing the Fund’s unified fee to the total expense ratios of its peers. The unified fee charged to shareholders of the Fund was below the median of the total expense ratios of the Fund’s peer expense universe and the lowest of its peer expense group. The Board concluded that the management fee paid by the Fund to the Advisor under the management agreement is reasonable in light of the services provided to the Fund.
Comparison to Fees and Services Provided to Other Clients of the Advisor. The Board also requested information from the Advisor concerning the nature of the services, fees, costs, and profitability of its advisory services to funds or other advisory clients managed similarly to the Fund. The Advisor informed the Trustees that, as of December 31, 2019, it did not provide services to any other investment companies or comparable accounts that were managed similarly to the Fund.
67
Payments to Intermediaries. The Trustees also requested a description of payments made to intermediaries by the Fund and the Advisor and services provided in response thereto. These payments could include various payments made by the Fund or the Advisor to different types of intermediaries and recordkeepers for distribution and service activities provided for the Fund. The Trustees reviewed such information and received representations from the Advisor that all such payments by the Advisor were made from the Advisor’s resources and reasonable profits. The Board found such payments to be reasonable in scope and purpose.
Collateral or “Fall-Out” Benefits Derived by the Advisor. The Board considered the possible existence of collateral benefits the Advisor may receive as a result of its relationship with the Fund. They concluded that the Advisor’s primary business is managing funds and it generally does not use fund or shareholder information to generate profits in other lines of business, and therefore does not derive any significant collateral benefits from them. The Board noted that additional assets from other clients may offer the Advisor some benefit from increased leverage with service providers and counterparties. The Board also determined that the Advisor is able to provide investment management services to certain clients other than the Fund, at least in part, due to its existing infrastructure built to serve the fund complex. The Board concluded that appropriate allocation methodologies had been employed to assign resources and the cost of those resources to these other clients.
Existing Relationship. The Board also considered whether there was any reason for not continuing the existing arrangement with the Advisor. In this regard, the Board was mindful of the potential disruptions of the Fund’s operations and various risks, uncertainties, and other effects that could occur as a result of a decision not to continue such relationship. In particular, the Board recognized that most shareholders have invested in the Fund on the strength of the Advisor’s industry standing and reputation and in the expectation that the Advisor will have a continuing role in providing advisory services to the Fund.
Conclusion of the Trustees. As a result of this process, the Board, including all of the independent Trustees, taking into account all of the factors discussed above and the information provided by the Advisor and others in connection with its review and throughout the year, determined that the management fee is fair and reasonable in light of the services provided and that the investment management agreement between the Fund and the Advisor should be renewed.
68
| Liquidity Risk Management Program | ||
The Fund has adopted a liquidity risk management program (the “program”). The Fund’s Board of Trustees (the "Board") has designated American Century Investment Management, Inc. (“ACIM”) as the administrator of the program. Personnel of ACIM or its affiliates conduct the day-to-day operation of the program pursuant to policies and procedures administered by those members of the ACIM’s Investment Oversight Committee who are members of the ACIM’s Investment Management and Global Analytics departments.
Under the program, ACIM manages the Fund’s liquidity risk, which is the risk that the Fund could not meet shareholder redemption requests without significant dilution of remaining shareholders’ interests in the Fund. This risk is managed by monitoring the degree of liquidity of the Fund’s investments, limiting the amount of the Fund’s illiquid investments, and utilizing various risk management tools and facilities available to the Fund for meeting shareholder redemptions, among other means. ACIM’s process of determining the degree of liquidity of the Fund’s investments is supported by one or more third-party liquidity assessment vendors.
The Board reviewed a report prepared by ACIM regarding the operation and effectiveness of the program for the period December 1, 2018 through December 31, 2019. No significant liquidity events impacting the Fund were noted in the report. In addition, ACIM provided its assessment that the program had been effective in managing the Fund’s liquidity risk.
69
| Additional Information | ||
Retirement Account Information
As required by law, distributions you receive from certain retirement accounts are subject to federal income tax withholding, unless you elect not to have withholding apply*. Tax will be withheld on the total amount withdrawn even though you may be receiving amounts that are not subject to withholding, such as nondeductible contributions. In such case, excess amounts of withholding could occur. You may adjust your withholding election so that a greater or lesser amount will be withheld.
If you don’t want us to withhold on this amount, you must notify us to not withhold the federal income tax. You may notify us in writing or in certain situations by telephone or through other electronic means. For systematic withdrawals, your withholding election will remain in effect until revoked or changed by filing a new election. You have the right to revoke your election at any time and change your withholding percentage for future distributions.
Remember, even if you elect not to have income tax withheld, you are liable for paying income tax on the taxable portion of your withdrawal. If you elect not to have income tax withheld or you don’t have enough income tax withheld, you may be responsible for payment of estimated tax. You may incur penalties under the estimated tax rules if your withholding and estimated tax payments are not sufficient. You can reduce or defer the income tax on a distribution by directly or indirectly rolling such distribution over to another IRA or eligible plan. You should consult your tax advisor for additional information.
State tax will be withheld if, at the time of your distribution, your address is within one of the mandatory withholding states and you have federal income tax withheld (or as otherwise required by state law). State taxes will be withheld from your distribution in accordance with the respective state rules.
*Some 403(b), 457 and qualified retirement plan distributions may be subject to 20% mandatory withholding, as they are subject to special tax and withholding rules. Your plan administrator or plan sponsor is required to provide you with a special tax notice explaining those rules at the time you request a distribution. If applicable, federal and/or state taxes may be withheld from your distribution amount.
Proxy Voting Policies
A description of the policies that the fund's investment advisor uses in exercising the voting rights associated with the securities purchased and/or held by the fund are available without charge, upon request, by calling 1-800-345-6488. It is also available on American Century Investments’ website at americancentury.com/proxy and on the Securities and Exchange Commission’s website at sec.gov. Information regarding how the investment advisor voted proxies relating to portfolio securities during the most recent 12-month period ended June 30 is available at americancentury.com/proxy. It is also available at sec.gov.
Quarterly Portfolio Disclosure
The fund files its complete schedule of portfolio holdings with the Securities and Exchange Commission (SEC) for the first and third quarters of each fiscal year as an exhibit to its reports on Form N-PORT. The fund's Form N-PORT reports are available on the SEC’s website at sec.gov.
70
Other Tax Information
The following information is provided pursuant to provisions of the Internal Revenue Code.
The fund hereby designates up to the maximum amount allowable as qualified dividend income for the fiscal year ended August 31, 2020.
For corporate taxpayers, the fund hereby designates $633, or up to the maximum amount allowable, of ordinary income distributions paid during the fiscal year ended August 31, 2020 as qualified for the corporate dividends received deduction.
For the fiscal year ended August 31, 2020, the fund intends to pass through to shareholders foreign source income of $728,891 and foreign taxes paid of $85,111, or up to the maximum amount allowable, as a foreign tax credit. Foreign source income and foreign tax expense per outstanding share on August 31, 2020 are $0.2060 and $0.0241, respectively.
71
| Notes | ||
72
| ||||||||
| Contact Us | avantisinvestors.com | |||||||
| American Century Sales Representatives, Financial Professionals, Broker Dealers, Insurance Companies, Banks and Trust Companies | 1-833-928-2684 | |||||||
| Telecommunications Relay Service for the Deaf | 711 | |||||||
| American Century ETF Trust | ||||||||
Investment Advisor: American Century Investment Management, Inc. Kansas City, Missouri | ||||||||
| This report and the statements it contains are submitted for the general information of our shareholders. The report is not authorized for distribution to prospective investors unless preceded or accompanied by an effective prospectus. | ||||||||
| ©2020 American Century Proprietary Holdings, Inc. All rights reserved. CL-ANN-96047 2010 | ||||||||
| Annual Report | |||||
| August 31, 2020 | |||||
Avantis® International Equity Fund | |||||
| Institutional Class (AVDEX) | |||||
Beginning on January 1, 2021, as permitted by regulations adopted by the Securities and Exchange Commission, paper copies of the fund’s shareholder reports like this one will no longer be sent by mail, unless you specifically request paper copies of the reports from the fund or from your financial intermediary, such as a broker-dealer or bank. Instead, the reports will be made available on a website, and you will be notified by mail each time a report is posted and provided with a website link to access the report.
If you already elected to receive shareholder reports electronically, you will not be affected by this change and you need not take any action. You may elect to receive shareholder reports and other communications from the fund or your financial intermediary electronically by calling or sending an email request to your appropriate contacts as listed on the back cover of this report.
You may elect to receive all future reports in paper free of charge. You can inform the fund or your financial intermediary that you wish to continue receiving paper copies of your shareholder reports by calling or sending an email request to your appropriate contacts as listed on the back cover of this report. Your election to receive reports in paper will apply to all funds held with the fund complex/your financial intermediary.
| Table of Contents | ||
| Chairman's Letter | |||||
| Performance | |||||
| Portfolio Commentary | |||||
| Fund Characteristics | |||||
| Shareholder Fee Example | |||||
| Schedule of Investments | |||||
| Statement of Assets and Liabilities | |||||
| Statement of Operations | |||||
| Statement of Changes in Net Assets | |||||
| Notes to Financial Statements | |||||
| Financial Highlights | |||||
| Report of Independent Registered Public Accounting Firm | |||||
| Management | |||||
| Approval of Management Agreement | |||||
| Liquidity Risk Management Program | |||||
| Additional Information | |||||
Any opinions expressed in this report reflect those of the author as of the date of the report, and do not necessarily represent the opinions of American Century Investments® or any other person in the American Century Investments organization. Any such opinions are subject to change at any time based upon market or other conditions and American Century Investments disclaims any responsibility to update such opinions. These opinions may not be relied upon as investment advice and, because investment decisions made by American Century Investments funds are based on numerous factors, may not be relied upon as an indication of trading intent on behalf of any American Century Investments fund. Security examples are used for representational purposes only and are not intended as recommendations to purchase or sell securities. Performance information for comparative indices and securities is provided to American Century Investments by third party vendors. To the best of American Century Investments’ knowledge, such information is accurate at the time of printing.
| Chairman's Letter | ||
Jonathan ThomasDear Investor:
Thank you for reviewing this annual report for the period ended August 31, 2020. Annual reports help convey important information about fund returns, including market factors that affected performance. For additional investment insights, please visit avantisinvestors.com.
Pandemic Disrupted Economic, Market Courses
Broad market sentiment was generally upbeat early in the period. Dovish central banks, modest inflation, improving economic and corporate earnings data, and progress on U.S.-China trade helped boost global growth outlooks. Against this backdrop, stocks largely remained in favor.
However, beginning in late February, COVID-19 quickly quashed the optimistic tone. The outbreak rapidly spread worldwide, halting most U.S. and global economic activity and triggering a deep worldwide recession. Global stocks sold off sharply, but central banks and federal governments stepped in quickly and aggressively to stabilize financial markets. These extraordinary efforts proved helpful, as most stocks rebounded quickly. As the period progressed, coronavirus infection and death rates declined in many regions and economies reopened. By the end of August, manufacturing, employment and other data suggested an economic recovery was underway.
Overall, global stocks delivered mixed results for the period. U.S. stocks generally advanced and fared better than their counterparts elsewhere. The growth style significantly outperformed value stocks, which struggled.
A Slow Return to Normal
The return to pre-pandemic life will take time and patience, but we are confident we will get there. Several drug companies are in final stages of vaccine trials, and medical professionals continue to fine-tune virus treatment protocols. In the meantime, investors likely will face periods of outbreak-related disruptions, economic and political uncertainty, and heightened market volatility. These influences can be unsettling, but they tend to be temporary.
We appreciate your confidence in us during these extraordinary times. Our investment professionals have experience weathering unpredictable markets, and we’re confident we will continue to meet today’s challenges.
Sincerely,
Jonathan Thomas
Chairman
Avantis Investors
2
| Performance | ||
| Total Returns as of August 31, 2020 | ||||||||||||||||||||||||||
| Ticker Symbol | Since Inception | Inception Date | ||||||||||||||||||||||||
| Institutional Class | AVDEX | -2.10% | 12/4/2019 | |||||||||||||||||||||||
| MSCI World ex USA IMI Index | — | -0.68% | — | |||||||||||||||||||||||
| Growth of $10,000 Over Life of Fund | ||
| $10,000 investment made December 4, 2019 | ||
| Value on August 31, 2020 | |||||
| Institutional Class — $9,790 | |||||
| MSCI World ex USA IMI Index — $9,932 | |||||
| Total Annual Fund Operating Expenses | |||||||||||||||||
Institutional Class 0.23% | |||||||||||||||||
The total annual fund operating expenses shown is as stated in the fund’s prospectus current as of the date of this report. The prospectus may vary from the expense ratio shown elsewhere in this report because it is based on a different time period, includes acquired fund fees and expenses, and, if applicable, does not include fee waivers or expense reimbursements.
Data presented reflect past performance. Past performance is no guarantee of future results. Current performance may be higher or lower than the performance shown. Total returns for periods less than one year are not annualized. Investment return and principal value will fluctuate, and redemption value may be more or less than original cost. Data assumes reinvestment of dividends and capital gains, and none of the charts reflect the deduction of taxes that a shareholder would pay on fund distributions or the redemption of fund shares. To obtain performance data current to the most recent month end, please call 1-833-928-2684 or visit avantisinvestors.com. For additional information about the fund, please consult the prospectus.
3
| Portfolio Commentary | ||
Portfolio Managers: Eduardo Repetto, Mitch Firestein, Daniel Ong and Ted Randall
Fund Strategy
Avantis International Equity seeks long-term capital appreciation by investing in a diverse group of non-U.S. companies across countries, market sectors, industry groups and market capitalizations.
The fund seeks securities of companies that it expects to have higher returns. It places an emphasis on the security weights of companies with smaller market capitalizations and securities of companies it defines as high profitability or value companies. Conversely, the fund seeks to underweight or exclude securities it expects to have lower returns. These include securities of large companies with lower levels of profitability and higher prices relative to their book values or other financial metrics. Under normal market conditions, the fund will invest at least 80% of its assets in equity securities.
The portfolio managers continually analyze market and financial data to make buy, sell and hold decisions. When buying or selling a security, the portfolio managers may consider the trade-off between expected returns of the security and implementation or tax costs of the trade. They do this in an attempt to gain trading efficiencies, avoid unnecessary risk and enhance portfolio performance.
Performance Review
For the period from Avantis International Equity’s inception on December 4, 2019, through the portfolio’s fiscal year-end on August 31, 2020, the fund returned -2.10%.* For the same time period, the fund’s benchmark, the MSCI World ex-USA IMI Index, returned -0.68%. Fund returns reflect fees and operating expenses, while index returns do not.
The MSCI World ex-USA IMI Index is an unmanaged index generally representative of the performance of non-U.S. developed markets stocks across capitalization categories. The fund’s underperformance versus the index was largely due to the fund’s emphasis on smaller-cap companies with higher levels of profitability and lower prices relative to their book values, or more value-oriented stocks. These companies generally underperformed larger-cap companies with lower levels of profitability and higher prices relative to their book values.
For example, large/mid-cap growth stocks (as measured by the MSCI World ex-USA Growth Index) returned 9.52% for the reporting period, outperforming small-cap value stocks (as measured by the MSCI World ex-USA Small Cap Value Index), which returned -8.78% for the reporting period.
*Total returns for periods less than one year are not annualized.
4
| Fund Characteristics | ||
| AUGUST 31, 2020 | |||||
| Top Ten Holdings | % of net assets | ||||
| Roche Holding AG, ADR | 1.3% | ||||
| Novartis AG, ADR | 1.2% | ||||
| Nestle SA, ADR | 0.9% | ||||
| Reckitt Benckiser Group plc | 0.6% | ||||
| Toyota Motor Corp., ADR | 0.6% | ||||
| Novo Nordisk A/S, ADR | 0.6% | ||||
| TOTAL SE, ADR | 0.5% | ||||
| ASML Holding NV, (New York) | 0.5% | ||||
| LVMH Moet Hennessy Louis Vuitton SE | 0.5% | ||||
| Royal Bank of Canada | 0.5% | ||||
| Types of Investments in Portfolio | % of net assets | ||||
| Common Stocks | 98.5% | ||||
| Rights | —* | ||||
| Total Equity Exposure | 98.5% | ||||
| Temporary Cash Investments | 1.5% | ||||
| Temporary Cash Investments - Securities Lending Collateral | 0.6% | ||||
| Other Assets and Liabilities | (0.6)% | ||||
*Category is less than 0.05% of total net assets.
| Investments by Country | % of net assets | ||||
| Japan | 22.7% | ||||
| United Kingdom | 12.6% | ||||
| Canada | 9.2% | ||||
| Switzerland | 8.7% | ||||
| France | 8.7% | ||||
| Germany | 8.0% | ||||
| Australia | 6.3% | ||||
| Netherlands | 3.6% | ||||
| Sweden | 3.5% | ||||
| Hong Kong | 3.0% | ||||
| Italy | 2.1% | ||||
| Denmark | 2.1% | ||||
| Spain | 2.0% | ||||
| Other Countries | 6.0% | ||||
| Cash and Equivalents* | 1.5% | ||||
*Includes temporary cash investments, temporary cash investments - securities lending collateral and other assets and liabilities.
5
| Shareholder Fee Example | ||
Fund shareholders may incur two types of costs: (1) transaction costs, including sales charges (loads) on purchase payments and redemption/exchange fees; and (2) ongoing costs, including management fees; distribution and service (12b-1) fees; and other fund expenses. This example is intended to help you understand your ongoing costs (in dollars) of investing in your fund and to compare these costs with the ongoing cost of investing in other mutual funds.
The example is based on an investment of $1,000 made at the beginning of the period and held for the entire period from March 1, 2020 to August 31, 2020.
Actual Expenses
The table provides information about actual account values and actual expenses for each class. You may use the information, together with the amount you invested, to estimate the expenses that you paid over the period. First, identify the share class you own. Then simply divide your account value by $1,000 (for example, an $8,600 account value divided by $1,000 = 8.6), then multiply the result by the number under the heading “Expenses Paid During Period” to estimate the expenses you paid on your account during this period.
Hypothetical Example for Comparison Purposes
The table also provides information about hypothetical account values and hypothetical expenses based on the actual expense ratio of each class of your fund and an assumed rate of return of 5% per year before expenses, which is not the actual return of a fund’s share class. The hypothetical account values and expenses may not be used to estimate the actual ending account balance or expenses you paid for the period. You may use this information to compare the ongoing costs of investing in your fund and other funds. To do so, compare this 5% hypothetical example with the 5% hypothetical examples that appear in the shareholder reports of the other funds.
Please note that the expenses shown in the table are meant to highlight your ongoing costs only and do not reflect any transactional costs, such as sales charges (loads) or redemption/exchange fees. Therefore, the table is useful in comparing ongoing costs only, and will not help you determine the relative total costs of owning different funds. In addition, if these transactional costs were included, your costs would have been higher.
| Beginning Account Value 3/1/20 | Ending Account Value 8/31/20 | Expenses Paid During Period(1) 3/1/20 - 8/31/20 | Annualized Expense Ratio(1) | |||||||||||
| Actual | ||||||||||||||
| Institutional Class | $1,000 | $1,067.70 | $1.20 | 0.23% | ||||||||||
| Hypothetical | ||||||||||||||
| Institutional Class | $1,000 | $1,023.98 | $1.17 | 0.23% | ||||||||||
(1)Expenses are equal to the class's annualized expense ratio listed in the table above, multiplied by the average account value over the period, multiplied by 184, the number of days in the most recent fiscal half-year, divided by 366, to reflect the one-half year period. Annualized expense ratio reflects actual expenses, including any applicable fee waivers or expense reimbursements and excluding any acquired fund fees and expenses.
6
| Schedule of Investments | ||
AUGUST 31, 2020
| Shares | Value | |||||||
| COMMON STOCKS — 98.5% | ||||||||
| Australia — 6.3% | ||||||||
| Adbri Ltd. | 2,864 | $ | 5,303 | |||||
Afterpay Ltd.(1) | 244 | 16,320 | ||||||
| AGL Energy Ltd. | 1,195 | 12,930 | ||||||
Alkane Resources Ltd.(1)(2) | 2,522 | 2,095 | ||||||
| Alliance Aviation Services Ltd. | 1,918 | 5,196 | ||||||
| Altium Ltd. | 249 | 6,671 | ||||||
| Alumina Ltd. | 4,089 | 4,654 | ||||||
AMP Ltd.(1) | 36,465 | 40,542 | ||||||
| Ampol Ltd. | 1,124 | 21,335 | ||||||
| Ansell Ltd. | 204 | 5,780 | ||||||
| APA Group | 3,944 | 30,069 | ||||||
| Appen Ltd. | 277 | 7,024 | ||||||
| ARB Corp. Ltd. | 363 | 6,954 | ||||||
Ardent Leisure Group Ltd.(1) | 1,272 | 393 | ||||||
| Aristocrat Leisure Ltd. | 1,647 | 33,757 | ||||||
| Asaleo Care Ltd. | 1,434 | 1,157 | ||||||
| ASX Ltd. | 140 | 8,974 | ||||||
| Atlas Arteria Ltd. | 1,021 | 4,864 | ||||||
Atlassian Corp. plc, Class A(1) | 327 | 62,706 | ||||||
| Aurelia Metals Ltd. | 13,171 | 5,185 | ||||||
| Aurizon Holdings Ltd. | 11,212 | 35,606 | ||||||
| AusNet Services | 9,877 | 13,250 | ||||||
| Austal Ltd. | 2,271 | 5,882 | ||||||
| Australia & New Zealand Banking Group Ltd. | 6,634 | 87,712 | ||||||
Australian Agricultural Co. Ltd.(1) | 2,182 | 1,681 | ||||||
Australian Ethical Investment Ltd.(2) | 409 | 1,420 | ||||||
| Australian Finance Group Ltd. | 704 | 953 | ||||||
| Australian Pharmaceutical Industries Ltd. | 6,282 | 5,024 | ||||||
Australian Strategic Materials Ltd.(1)(2) | 504 | 840 | ||||||
Bank of Queensland Ltd.(2) | 3,447 | 15,298 | ||||||
| Beach Energy Ltd. | 11,144 | 12,388 | ||||||
Bega Cheese Ltd.(2) | 3,179 | 12,257 | ||||||
Bendigo & Adelaide Bank Ltd.(2) | 1,967 | 9,299 | ||||||
| BHP Group Ltd., ADR | 3,846 | 211,761 | ||||||
| Bingo Industries Ltd. | 515 | 841 | ||||||
Blackmores Ltd.(1) | 116 | 5,354 | ||||||
| BlueScope Steel Ltd. | 3,246 | 29,803 | ||||||
| Boral Ltd. | 7,801 | 22,672 | ||||||
| Brambles Ltd. | 6,294 | 51,104 | ||||||
| Breville Group Ltd. | 274 | 5,427 | ||||||
| Brickworks Ltd. | 607 | 7,949 | ||||||
| carsales.com Ltd. | 1,626 | 24,604 | ||||||
| Cedar Woods Properties Ltd. | 198 | 774 | ||||||
| Challenger Ltd. | 5,195 | 15,332 | ||||||
| CIMIC Group Ltd. | 343 | 5,284 | ||||||
| Class Ltd. | 662 | 902 | ||||||
7
| Shares | Value | |||||||
| Cleanaway Waste Management Ltd. | 4,316 | $ | 8,165 | |||||
| Coca-Cola Amatil Ltd. | 3,093 | 20,615 | ||||||
| Cochlear Ltd. | 108 | 15,173 | ||||||
| Codan Ltd. | 230 | 1,827 | ||||||
| Coles Group Ltd. | 5,726 | 74,390 | ||||||
| Collins Foods Ltd. | 144 | 1,099 | ||||||
| Commonwealth Bank of Australia | 3,599 | 178,430 | ||||||
| Computershare Ltd. | 576 | 5,560 | ||||||
| Costa Group Holdings Ltd. | 578 | 1,468 | ||||||
| Credit Corp. Group Ltd. | 200 | 2,767 | ||||||
| Crown Resorts Ltd. | 2,184 | 14,305 | ||||||
| CSL Ltd. | 698 | 146,754 | ||||||
| CSR Ltd. | 4,888 | 13,048 | ||||||
| Data#3 Ltd. | 932 | 4,300 | ||||||
| Dicker Data Ltd. | 234 | 1,284 | ||||||
| Domino's Pizza Enterprises Ltd. | 338 | 20,077 | ||||||
| Downer EDI Ltd. | 361 | 1,169 | ||||||
Eclipx Group Ltd.(1) | 917 | 1,001 | ||||||
| Elders Ltd. | 290 | 2,136 | ||||||
Emeco Holdings Ltd.(1) | 717 | 462 | ||||||
EML Payments Ltd.(1) | 318 | 791 | ||||||
| Evolution Mining Ltd. | 9,829 | 40,139 | ||||||
| FlexiGroup Ltd. | 743 | 651 | ||||||
| Flight Centre Travel Group Ltd. | 361 | 3,427 | ||||||
| Fortescue Metals Group Ltd. | 7,775 | 98,756 | ||||||
Galaxy Resources Ltd.(1) | 7,275 | 6,497 | ||||||
| Genworth Mortgage Insurance Australia Ltd. | 1,713 | 1,879 | ||||||
GrainCorp Ltd., A Shares(1) | 1,592 | 5,026 | ||||||
| GUD Holdings Ltd. | 684 | 5,727 | ||||||
| Harvey Norman Holdings Ltd. | 2,081 | 6,681 | ||||||
HT&E Ltd.(2) | 1,854 | 1,886 | ||||||
| IDP Education Ltd. | 1,098 | 16,018 | ||||||
| IGO Ltd. | 4,813 | 15,641 | ||||||
| Iluka Resources Ltd. | 3,894 | 28,778 | ||||||
| Incitec Pivot Ltd. | 717 | 1,092 | ||||||
| Infomedia Ltd. | 4,782 | 5,923 | ||||||
| Inghams Group Ltd. | 2,141 | 5,049 | ||||||
| Insurance Australia Group Ltd. | 3,120 | 10,822 | ||||||
Integrated Research Ltd.(2) | 1,922 | 5,889 | ||||||
| InvoCare Ltd. | 556 | 4,052 | ||||||
| IOOF Holdings Ltd. | 255 | 842 | ||||||
| IPH Ltd. | 175 | 877 | ||||||
| IRESS Ltd. | 114 | 893 | ||||||
| James Hardie Industries plc | 1,775 | 39,691 | ||||||
| JB Hi-Fi Ltd. | 392 | 14,435 | ||||||
| Johns Lyng Group Ltd. | 704 | 1,351 | ||||||
Jumbo Interactive Ltd.(2) | 617 | 6,116 | ||||||
| Jupiter Mines Ltd. | 22,840 | 4,623 | ||||||
Karoon Energy Ltd.(1)(2) | 1,342 | 777 | ||||||
| Kogan.com Ltd. | 842 | 12,776 | ||||||
| Lendlease Corp. Ltd. | 1,169 | 9,862 | ||||||
Lovisa Holdings Ltd.(2) | 134 | 729 | ||||||
8
| Shares | Value | |||||||
Lynas Corp. Ltd.(1) | 5,893 | $ | 10,547 | |||||
| Macmahon Holdings Ltd. | 6,093 | 1,165 | ||||||
| Macquarie Group Ltd. | 1,064 | 98,605 | ||||||
| Magellan Financial Group Ltd. | 644 | 27,665 | ||||||
Mayne Pharma Group Ltd.(1) | 3,287 | 813 | ||||||
| McMillan Shakespeare Ltd. | 218 | 1,460 | ||||||
| Medibank Pvt Ltd. | 13,001 | 25,981 | ||||||
| Metcash Ltd. | 3,653 | 7,807 | ||||||
| Mineral Resources Ltd. | 1,750 | 37,276 | ||||||
| Monadelphous Group Ltd. | 90 | 732 | ||||||
| Money3 Corp. Ltd. | 3,577 | 5,649 | ||||||
Myer Holdings Ltd.(1)(2) | 2,868 | 482 | ||||||
MyState Ltd.(2) | 613 | 1,774 | ||||||
| National Australia Bank Ltd. | 6,451 | 83,736 | ||||||
| Netwealth Group Ltd. | 1,149 | 11,803 | ||||||
| New Energy Solar Ltd. | 2,331 | 1,425 | ||||||
| New Hope Corp. Ltd. | 4,936 | 4,311 | ||||||
| Newcrest Mining Ltd. | 2,594 | 61,031 | ||||||
NEXTDC Ltd.(1) | 771 | 6,900 | ||||||
| nib holdings Ltd. | 3,090 | 10,360 | ||||||
| Nick Scali Ltd. | 1,075 | 6,898 | ||||||
| Nine Entertainment Co. Holdings Ltd. | 9,409 | 11,319 | ||||||
| Northern Star Resources Ltd. | 1,805 | 18,137 | ||||||
| NRW Holdings Ltd. | 5,096 | 8,191 | ||||||
Nufarm Ltd.(1) | 3,201 | 9,433 | ||||||
| Oil Search Ltd. | 5,268 | 12,434 | ||||||
| Omni Bridgeway Ltd. | 656 | 2,152 | ||||||
| Orica Ltd. | 1,286 | 16,309 | ||||||
| Origin Energy Ltd. | 5,239 | 21,246 | ||||||
Orocobre Ltd.(1)(2) | 535 | 1,018 | ||||||
| Orora Ltd. | 8,876 | 14,576 | ||||||
| OZ Minerals Ltd. | 2,164 | 23,183 | ||||||
| Pacific Current Group Ltd. | 220 | 987 | ||||||
Paladin Energy Ltd.(1) | 44,959 | 5,429 | ||||||
| Peet Ltd. | 1,161 | 877 | ||||||
| Pendal Group Ltd. | 904 | 3,790 | ||||||
| Perenti Global Ltd. | 7,641 | 6,655 | ||||||
| Perpetual Ltd. | 305 | 6,851 | ||||||
Perseus Mining Ltd.(1) | 15,994 | 17,008 | ||||||
Pilbara Minerals Ltd.(1)(2) | 24,769 | 6,201 | ||||||
| Platinum Asset Management Ltd. | 2,221 | 5,983 | ||||||
PolyNovo Ltd.(1) | 1,093 | 1,771 | ||||||
| Premier Investments Ltd. | 548 | 7,563 | ||||||
| Pro Medicus Ltd. | 76 | 1,446 | ||||||
| PWR Holdings Ltd. | 302 | 1,090 | ||||||
| Qantas Airways Ltd. | 4,383 | 12,463 | ||||||
| QBE Insurance Group Ltd. | 2,300 | 17,734 | ||||||
| Qube Holdings Ltd. | 2,698 | 5,381 | ||||||
| Ramelius Resources Ltd. | 9,222 | 14,134 | ||||||
| Ramsay Health Care Ltd. | 540 | 25,638 | ||||||
| REA Group Ltd. | 143 | 11,876 | ||||||
Red 5 Ltd.(1) | 29,625 | 6,655 | ||||||
9
| Shares | Value | |||||||
| Regis Resources Ltd. | 5,642 | $ | 21,949 | |||||
| Reliance Worldwide Corp. Ltd. | 356 | 986 | ||||||
Resolute Mining Ltd.(1) | 13,533 | 11,011 | ||||||
| Rio Tinto Ltd. | 977 | 69,820 | ||||||
| Sandfire Resources Ltd. | 1,804 | 6,119 | ||||||
| Santos Ltd. | 8,887 | 36,418 | ||||||
Saracen Mineral Holdings Ltd.(1) | 2,347 | 9,025 | ||||||
| SeaLink Travel Group Ltd. | 288 | 1,008 | ||||||
| SEEK Ltd. | 519 | 7,799 | ||||||
| Select Harvests Ltd. | 821 | 3,293 | ||||||
Senex Energy Ltd.(1) | 4,432 | 975 | ||||||
Seven Group Holdings Ltd.(2) | 77 | 1,066 | ||||||
| Sigma Healthcare Ltd. | 13,377 | 6,675 | ||||||
Silver Lake Resources Ltd.(1) | 8,626 | 13,784 | ||||||
| Sims Ltd. | 1,174 | 6,885 | ||||||
| SmartGroup Corp. Ltd. | 213 | 924 | ||||||
| Sonic Healthcare Ltd. | 474 | 11,100 | ||||||
| South32 Ltd. | 25,586 | 38,921 | ||||||
| Southern Cross Media Group Ltd. | 1,599 | 184 | ||||||
| Spark Infrastructure Group | 8,055 | 13,208 | ||||||
| St. Barbara Ltd. | 9,225 | 23,444 | ||||||
| Star Entertainment Grp Ltd. (The) | 4,164 | 8,881 | ||||||
| Steadfast Group Ltd. | 2,302 | 6,040 | ||||||
| Suncorp Group Ltd. | 2,400 | 16,178 | ||||||
| Super Retail Group Ltd. | 1,871 | 14,576 | ||||||
| Sydney Airport | 2,096 | 8,814 | ||||||
| Tassal Group Ltd. | 826 | 2,202 | ||||||
| Technology One Ltd. | 1,557 | 9,247 | ||||||
| Telstra Corp. Ltd. | 12,909 | 27,305 | ||||||
TPG Telecom Ltd.(1) | 1,035 | 6,228 | ||||||
| Transurban Group | 5,081 | 49,903 | ||||||
| Treasury Wine Estates Ltd. | 3,054 | 20,599 | ||||||
Tuas Ltd.(1) | 517 | 191 | ||||||
United Malt Grp Ltd.(1) | 889 | 2,587 | ||||||
Village Roadshow Ltd.(2) | 468 | 731 | ||||||
| Viva Energy Group Ltd. | 7,433 | 9,033 | ||||||
Vocus Group Ltd.(1) | 2,212 | 5,379 | ||||||
Washington H Soul Pattinson & Co. Ltd.(2) | 499 | 7,620 | ||||||
| Wesfarmers Ltd. | 1,719 | 59,687 | ||||||
| Western Areas Ltd. | 3,767 | 6,091 | ||||||
Westgold Resources Ltd.(1) | 4,361 | 6,832 | ||||||
| Westpac Banking Corp., ADR | 8,726 | 111,169 | ||||||
| Whitehaven Coal Ltd. | 8,636 | 5,822 | ||||||
| WiseTech Global Ltd. | 66 | 1,361 | ||||||
| Woodside Petroleum Ltd. | 3,522 | 50,103 | ||||||
| Woolworths Group Ltd. | 1,786 | 52,185 | ||||||
| Worley Ltd. | 123 | 853 | ||||||
| 3,215,213 | ||||||||
| Austria — 0.2% | ||||||||
Addiko Bank AG(1) | 63 | 513 | ||||||
| ANDRITZ AG | 158 | 5,284 | ||||||
| AT&S Austria Technologie & Systemtechnik AG | 321 | 6,210 | ||||||
10
| Shares | Value | |||||||
BAWAG Group AG(1) | 272 | $ | 10,239 | |||||
| CA Immobilien Anlagen AG | 25 | 780 | ||||||
DO & CO. AG(1) | 12 | 525 | ||||||
Erste Group Bank AG(1) | 582 | 14,141 | ||||||
| EVN AG | 389 | 6,554 | ||||||
IMMOFINANZ AG(1) | 260 | 4,317 | ||||||
Lenzing AG(1) | 88 | 4,568 | ||||||
| Oesterreichische Post AG | 141 | 4,710 | ||||||
OMV AG(1) | 275 | 8,957 | ||||||
Porr AG(1) | 59 | 846 | ||||||
Raiffeisen Bank International AG(1) | 434 | 7,763 | ||||||
S IMMO AG(1) | 41 | 743 | ||||||
Telekom Austria AG(1) | 134 | 989 | ||||||
| UNIQA Insurance Group AG | 655 | 4,352 | ||||||
| Verbund AG | 155 | 8,320 | ||||||
Vienna Insurance Group AG Wiener Versicherung Gruppe(1) | 237 | 5,798 | ||||||
| voestalpine AG | 461 | 11,443 | ||||||
Wienerberger AG(1) | 313 | 8,444 | ||||||
| 115,496 | ||||||||
| Belgium — 1.0% | ||||||||
Ackermans & van Haaren NV(1) | 141 | 20,058 | ||||||
| Ageas SA/NV | 756 | 31,806 | ||||||
AGFA-Gevaert NV(1) | 1,104 | 4,658 | ||||||
| Anheuser-Busch InBev SA, ADR | 1,047 | 60,883 | ||||||
Argenx SE, ADR(1) | 79 | 18,270 | ||||||
| Barco NV | 491 | 10,477 | ||||||
| Bekaert SA | 521 | 10,496 | ||||||
bpost SA(1) | 707 | 7,071 | ||||||
Cie d'Entreprises CFE(1) | 92 | 6,592 | ||||||
| Colruyt SA | 369 | 23,343 | ||||||
| D'ieteren SA | 122 | 7,971 | ||||||
Econocom Group SA(1) | 704 | 2,122 | ||||||
| Elia Group SA | 104 | 11,189 | ||||||
| Euronav NV | 1,106 | 10,102 | ||||||
| EVS Broadcast Equipment SA | 45 | 837 | ||||||
| Fagron | 492 | 11,164 | ||||||
Galapagos NV, ADR(1) | 169 | 22,504 | ||||||
| Gimv NV | 124 | 7,062 | ||||||
Ion Beam Applications(2) | 379 | 4,101 | ||||||
| KBC Group NV | 794 | 45,531 | ||||||
Kinepolis Group NV(1) | 140 | 5,484 | ||||||
| Melexis NV | 162 | 12,998 | ||||||
Mithra Pharmaceuticals SA(1) | 219 | 4,475 | ||||||
Ontex Group NV(1) | 466 | 6,225 | ||||||
| Orange Belgium SA | 283 | 4,770 | ||||||
| Proximus SADP | 1,117 | 22,109 | ||||||
| Recticel SA | 118 | 1,207 | ||||||
| Solvay SA | 461 | 39,931 | ||||||
| Telenet Group Holding NV | 98 | 3,809 | ||||||
Tessenderlo Group SA(1) | 202 | 7,555 | ||||||
| UCB SA | 272 | 32,262 | ||||||
11
| Shares | Value | |||||||
| Umicore SA | 645 | $ | 29,655 | |||||
| 486,717 | ||||||||
| Canada — 9.2% | ||||||||
Advantage Oil & Gas Ltd.(1) | 600 | 998 | ||||||
| Aecon Group, Inc. | 460 | 5,128 | ||||||
| Agnico Eagle Mines Ltd. | 700 | 57,713 | ||||||
Air Canada(1) | 600 | 8,096 | ||||||
Alacer Gold Corp.(1) | 3,300 | 22,795 | ||||||
| Alamos Gold, Inc., Class A | 2,100 | 21,976 | ||||||
| Alaris Royalty Corp. | 100 | 915 | ||||||
| Algonquin Power & Utilities Corp. | 1,900 | 26,337 | ||||||
| Alimentation Couche-Tard, Inc., B Shares | 1,900 | 62,010 | ||||||
| AltaGas Ltd. | 700 | 9,054 | ||||||
| Altius Minerals Corp. | 500 | 4,190 | ||||||
ARC Resources Ltd.(2) | 2,800 | 14,125 | ||||||
Argonaut Gold, Inc.(1) | 700 | 1,487 | ||||||
Aritzia, Inc.(1) | 600 | 8,593 | ||||||
| Atco Ltd., Class I | 400 | 12,187 | ||||||
Atrium Mortgage Investment Corp.(2) | 100 | 822 | ||||||
| AutoCanada, Inc. | 100 | 1,152 | ||||||
| B2Gold Corp. | 8,400 | 56,414 | ||||||
Badger Daylighting Ltd.(2) | 400 | 11,460 | ||||||
Ballard Power Systems, Inc.(1) | 500 | 8,299 | ||||||
| Bank of Montreal | 1,500 | 95,197 | ||||||
| Bank of Nova Scotia (The) | 2,800 | 121,007 | ||||||
| Barrick Gold Corp., (Toronto) | 2,600 | 77,022 | ||||||
Bausch Health Cos., Inc.(1) | 1,120 | 18,590 | ||||||
Baytex Energy Corp.(1) | 1,000 | 514 | ||||||
| BCE, Inc. | 400 | 17,192 | ||||||
Birchcliff Energy Ltd.(2) | 700 | 859 | ||||||
Bird Construction, Inc.(2) | 300 | 1,571 | ||||||
BlackBerry Ltd.(1) | 1,700 | 8,863 | ||||||
Bombardier, Inc., B Shares(1)(2) | 700 | 220 | ||||||
| Boralex, Inc., A Shares | 600 | 15,410 | ||||||
| Boyd Group Services, Inc. | 99 | 15,765 | ||||||
| Brookfield Asset Management, Inc., Class A | 1,700 | 57,373 | ||||||
| BRP, Inc. | 100 | 5,431 | ||||||
| CAE, Inc. | 800 | 12,684 | ||||||
| Cameco Corp. | 1,800 | 20,852 | ||||||
| Canacol Energy Ltd. | 2,100 | 5,667 | ||||||
Canada Goose Holdings, Inc.(1)(2) | 100 | 2,453 | ||||||
| Canadian Imperial Bank of Commerce | 1,800 | 142,913 | ||||||
| Canadian National Railway Co. | 1,400 | 147,111 | ||||||
| Canadian Natural Resources Ltd. | 4,700 | 92,678 | ||||||
| Canadian Pacific Railway Ltd. | 300 | 88,755 | ||||||
| Canadian Tire Corp. Ltd., Class A | 400 | 41,845 | ||||||
| Canadian Utilities Ltd., A Shares | 700 | 17,570 | ||||||
| Canadian Western Bank | 500 | 10,634 | ||||||
Canfor Corp.(1) | 500 | 6,520 | ||||||
| Capital Power Corp. | 1,200 | 26,330 | ||||||
Capstone Mining Corp.(1) | 5,000 | 4,983 | ||||||
| Cascades, Inc. | 800 | 8,507 | ||||||
12
| Shares | Value | |||||||
| CCL Industries, Inc., Class B | 500 | $ | 18,480 | |||||
Celestica, Inc.(1) | 1,700 | 13,542 | ||||||
| Cenovus Energy, Inc. | 4,300 | 20,307 | ||||||
| Centerra Gold, Inc. | 1,200 | 15,631 | ||||||
| CES Energy Solutions Corp. | 800 | 583 | ||||||
CGI, Inc.(1) | 600 | 42,145 | ||||||
| Chorus Aviation, Inc. | 200 | 414 | ||||||
| CI Financial Corp. | 800 | 11,359 | ||||||
| Cogeco Communications, Inc. | 100 | 7,496 | ||||||
| Cogeco, Inc. | 100 | 6,013 | ||||||
| Colliers International Group, Inc. | 300 | 19,023 | ||||||
| Computer Modelling Group Ltd. | 200 | 800 | ||||||
| Corus Entertainment, Inc., B Shares | 300 | 734 | ||||||
| Crescent Point Energy Corp. | 4,600 | 8,076 | ||||||
CRH Medical Corp.(1) | 400 | 951 | ||||||
Descartes Systems Group, Inc. (The)(1) | 200 | 12,204 | ||||||
| Dollarama, Inc. | 500 | 19,519 | ||||||
| DREAM Unlimited Corp., Class A | 400 | 5,876 | ||||||
| Dundee Precious Metals, Inc. | 1,390 | 10,060 | ||||||
| ECN Capital Corp. | 300 | 1,185 | ||||||
Eldorado Gold Corp., (Toronto)(1) | 1,200 | 13,708 | ||||||
| Element Fleet Management Corp. | 2,600 | 21,388 | ||||||
| Emera, Inc. | 800 | 32,660 | ||||||
| Empire Co. Ltd., Class A | 1,000 | 26,028 | ||||||
Enbridge, Inc.(2) | 2,800 | 89,580 | ||||||
Endeavour Mining Corp.(1) | 1,468 | 40,697 | ||||||
| Enerflex Ltd. | 200 | 897 | ||||||
Enerplus Corp.(2) | 2,200 | 5,836 | ||||||
| Enghouse Systems Ltd. | 300 | 16,739 | ||||||
Equinox Gold Corp.(1) | 900 | 11,764 | ||||||
| Equitable Group, Inc. | 100 | 5,926 | ||||||
ERO Copper Corp.(1) | 600 | 9,149 | ||||||
| Evertz Technologies Ltd. | 400 | 3,646 | ||||||
| Exco Technologies Ltd. | 200 | 1,081 | ||||||
Extendicare, Inc.(2) | 200 | 894 | ||||||
| Fairfax Financial Holdings Ltd. | 100 | 30,827 | ||||||
| Finning International, Inc. | 900 | 13,738 | ||||||
First Majestic Silver Corp.(1)(2) | 900 | 11,185 | ||||||
First Mining Gold Corp.(1) | 9,000 | 3,346 | ||||||
| First National Financial Corp. | 100 | 2,542 | ||||||
| First Quantum Minerals Ltd. | 2,400 | 23,754 | ||||||
| FirstService Corp. | 100 | 12,513 | ||||||
| Fortis, Inc. | 700 | 27,998 | ||||||
Fortuna Silver Mines, Inc.(1) | 2,200 | 16,023 | ||||||
| Franco-Nevada Corp. | 200 | 30,079 | ||||||
| Frontera Energy Corp. | 200 | 419 | ||||||
Galiano Gold, Inc.(1) | 1,100 | 1,746 | ||||||
| Genworth MI Canada, Inc. | 300 | 8,193 | ||||||
| George Weston Ltd. | 300 | 21,673 | ||||||
| Gibson Energy, Inc. | 700 | 12,746 | ||||||
| Gildan Activewear, Inc. | 500 | 9,694 | ||||||
| goeasy Ltd. | 200 | 9,957 | ||||||
13
| Shares | Value | |||||||
Gran Colombia Gold Corp.(1) | 300 | $ | 1,380 | |||||
| Great-West Lifeco, Inc. | 400 | 8,160 | ||||||
| Hardwoods Distribution, Inc. | 100 | 1,769 | ||||||
| High Liner Foods, Inc. | 200 | 1,250 | ||||||
Home Capital Group, Inc.(1) | 600 | 10,138 | ||||||
| Hudbay Minerals, Inc. | 2,400 | 10,764 | ||||||
Husky Energy, Inc.(2) | 1,900 | 6,424 | ||||||
| Hydro One Ltd. | 1,500 | 31,050 | ||||||
| iA Financial Corp., Inc. | 700 | 25,196 | ||||||
IAMGOLD Corp.(1) | 5,900 | 25,376 | ||||||
IGM Financial, Inc.(2) | 300 | 7,321 | ||||||
| Imperial Oil Ltd. | 800 | 13,193 | ||||||
| Innergex Renewable Energy, Inc. | 700 | 12,086 | ||||||
| Intact Financial Corp. | 200 | 21,422 | ||||||
Inter Pipeline Ltd.(2) | 1,500 | 15,835 | ||||||
Interfor Corp.(1) | 500 | 6,555 | ||||||
| Intertape Polymer Group, Inc. | 900 | 10,357 | ||||||
Ivanhoe Mines Ltd., Class A(1) | 2,400 | 9,476 | ||||||
| Jamieson Wellness, Inc. | 200 | 5,791 | ||||||
Kelt Exploration Ltd.(1)(2) | 400 | 509 | ||||||
Keyera Corp.(2) | 1,500 | 27,393 | ||||||
Kinaxis, Inc.(1) | 100 | 15,251 | ||||||
Kinross Gold Corp.(1) | 9,800 | 87,004 | ||||||
| Kirkland Lake Gold Ltd. | 1,330 | 70,867 | ||||||
Knight Therapeutics, Inc.(1) | 1,000 | 4,761 | ||||||
| Labrador Iron Ore Royalty Corp. | 500 | 10,499 | ||||||
Largo Resources Ltd.(1) | 7,000 | 5,742 | ||||||
| Laurentian Bank of Canada | 300 | 6,433 | ||||||
| Linamar Corp. | 500 | 15,678 | ||||||
| Loblaw Cos. Ltd. | 700 | 36,177 | ||||||
| Lundin Mining Corp. | 4,300 | 26,934 | ||||||
MAG Silver Corp.(1) | 300 | 5,085 | ||||||
| Magna International, Inc. | 1,600 | 77,918 | ||||||
Major Drilling Group International, Inc.(1) | 300 | 1,553 | ||||||
| Manulife Financial Corp. | 5,000 | 73,753 | ||||||
| Martinrea International, Inc. | 1,100 | 8,459 | ||||||
MEG Energy Corp.(1) | 3,100 | 8,604 | ||||||
| Methanex Corp. | 200 | 4,460 | ||||||
| Metro, Inc. | 600 | 27,103 | ||||||
| Morneau Shepell, Inc. | 300 | 6,493 | ||||||
| MTY Food Group, Inc. | 200 | 5,336 | ||||||
| Mullen Group Ltd. | 1,400 | 10,508 | ||||||
| National Bank of Canada | 1,900 | 104,443 | ||||||
New Gold, Inc.(1) | 8,300 | 13,618 | ||||||
| Norbord, Inc. | 100 | 3,419 | ||||||
| North American Construction Group Ltd. | 100 | 713 | ||||||
North West Co., Inc. (The)(2) | 300 | 6,555 | ||||||
| Northland Power, Inc. | 580 | 16,244 | ||||||
Novagold Resources, Inc.(1) | 392 | 4,151 | ||||||
| Nutrien Ltd. | 1,600 | 59,260 | ||||||
NuVista Energy Ltd.(1)(2) | 600 | 373 | ||||||
OceanaGold Corp.(1) | 3,700 | 8,538 | ||||||
14
| Shares | Value | |||||||
| Onex Corp. | 300 | $ | 14,566 | |||||
| Open Text Corp. | 600 | 27,214 | ||||||
| Osisko Gold Royalties Ltd. | 900 | 11,040 | ||||||
Osisko Mining, Inc.(1) | 1,400 | 4,272 | ||||||
| Pan American Silver Corp. | 770 | 27,799 | ||||||
Parex Resources, Inc.(1) | 1,300 | 17,790 | ||||||
| Parkland Corp. | 500 | 14,172 | ||||||
| Pason Systems, Inc. | 200 | 912 | ||||||
| Pembina Pipeline Corp. | 1,300 | 32,192 | ||||||
Peyto Exploration & Development Corp.(2) | 3,100 | 6,773 | ||||||
| Pizza Pizza Royalty Corp. | 200 | 1,348 | ||||||
| Power Corp. of Canada | 605 | 12,078 | ||||||
| PrairieSky Royalty Ltd. | 700 | 5,066 | ||||||
Premier Gold Mines Ltd.(1) | 2,000 | 4,201 | ||||||
Premium Brands Holdings Corp.(2) | 100 | 7,379 | ||||||
Pretium Resources, Inc.(1) | 1,350 | 17,336 | ||||||
| Primo Water Corp. | 700 | 9,585 | ||||||
| Quarterhill, Inc. | 800 | 1,129 | ||||||
| Quebecor, Inc., Class B | 500 | 12,397 | ||||||
Real Matters, Inc.(1) | 650 | 13,186 | ||||||
| Restaurant Brands International, Inc. | 500 | 27,090 | ||||||
| Richelieu Hardware Ltd. | 400 | 10,675 | ||||||
| Ritchie Bros Auctioneers, Inc. | 400 | 23,405 | ||||||
| Rogers Communications, Inc., Class B | 1,100 | 45,759 | ||||||
Roxgold, Inc.(1) | 5,300 | 6,583 | ||||||
| Royal Bank of Canada | 3,083 | 234,779 | ||||||
Russel Metals, Inc.(2) | 700 | 10,052 | ||||||
Sabina Gold & Silver Corp.(1) | 3,500 | 7,272 | ||||||
Sandstorm Gold Ltd.(1)(2) | 800 | 7,305 | ||||||
| Saputo, Inc. | 500 | 12,474 | ||||||
Secure Energy Services, Inc.(2) | 400 | 463 | ||||||
Seven Generations Energy Ltd., Class A(1) | 900 | 2,843 | ||||||
| Shaw Communications, Inc., B Shares | 2,900 | 54,227 | ||||||
Shopify, Inc., Class A(1) | 100 | 106,814 | ||||||
Sienna Senior Living, Inc.(2) | 100 | 857 | ||||||
Silvercorp Metals, Inc.(2) | 800 | 6,906 | ||||||
| Sleep Country Canada Holdings, Inc. | 200 | 3,085 | ||||||
SNC-Lavalin Group, Inc.(2) | 100 | 1,769 | ||||||
Sprott, Inc.(2) | 200 | 8,501 | ||||||
SSR Mining, Inc.(1) | 700 | 15,016 | ||||||
| Stantec, Inc. | 400 | 12,987 | ||||||
| Sun Life Financial, Inc. | 1,400 | 58,432 | ||||||
| Suncor Energy, Inc. | 3,700 | 59,371 | ||||||
SunOpta, Inc.(1) | 900 | 6,106 | ||||||
Superior Plus Corp.(2) | 800 | 7,409 | ||||||
Tamarack Valley Energy Ltd.(1) | 800 | 577 | ||||||
| TC Energy Corp. | 1,500 | 70,138 | ||||||
| Teck Resources Ltd., Class B | 2,100 | 24,214 | ||||||
| TELUS Corp. | 1,400 | 25,781 | ||||||
Teranga Gold Corp.(1) | 1,000 | 11,638 | ||||||
Tervita Corp.(1) | 200 | 460 | ||||||
| TFI International, Inc. | 400 | 17,682 | ||||||
15
| Shares | Value | |||||||
| Thomson Reuters Corp. | 200 | $ | 15,289 | |||||
Timbercreek Financial Corp.(2) | 700 | 4,508 | ||||||
| TMX Group Ltd. | 100 | 10,513 | ||||||
| TORC Oil & Gas Ltd. | 400 | 537 | ||||||
Torex Gold Resources, Inc.(1) | 1,060 | 16,367 | ||||||
| Toromont Industries Ltd. | 300 | 16,976 | ||||||
| Toronto-Dominion Bank (The) | 3,458 | 172,509 | ||||||
| Tourmaline Oil Corp. | 2,000 | 25,407 | ||||||
| TransAlta Corp. | 3,000 | 19,274 | ||||||
TransAlta Renewables, Inc.(2) | 500 | 6,110 | ||||||
| Transcontinental, Inc., Class A | 560 | 6,586 | ||||||
| Tricon Residential, Inc. | 1,030 | 8,702 | ||||||
Turquoise Hill Resources Ltd.(1) | 11,000 | 12,144 | ||||||
Uranium Participation Corp.(1) | 1,400 | 4,980 | ||||||
Vermilion Energy, Inc.(2) | 1,500 | 5,957 | ||||||
Viemed Healthcare, Inc. (Toronto)(1) | 200 | 2,193 | ||||||
Viemed Healthcare, Inc.(1) | 474 | 5,152 | ||||||
| Wajax Corp. | 100 | 926 | ||||||
Wesdome Gold Mines Ltd.(1) | 700 | 7,739 | ||||||
| West Fraser Timber Co. Ltd. | 100 | 5,363 | ||||||
Westshore Terminals Investment Corp.(2) | 600 | 7,608 | ||||||
| Wheaton Precious Metals Corp. | 800 | 42,725 | ||||||
Whitecap Resources, Inc.(2) | 5,400 | 10,640 | ||||||
| Winpak Ltd. | 200 | 6,727 | ||||||
| WSP Global, Inc. | 200 | 13,568 | ||||||
| Yamana Gold, Inc. | 6,700 | 41,504 | ||||||
| 4,697,577 | ||||||||
China† | ||||||||
| China Yongda Automobiles Services Holdings Ltd. | 14,500 | 17,369 | ||||||
| Greatview Aseptic Packaging Co. Ltd. | 14,000 | 5,868 | ||||||
| 23,237 | ||||||||
| Denmark — 2.1% | ||||||||
ALK-Abello A/S(1) | 5 | 1,689 | ||||||
Alm Brand A/S(1) | 379 | 4,078 | ||||||
| Ambu A/S, B Shares | 468 | 13,730 | ||||||
| AP Moller - Maersk A/S, A Shares | 7 | 9,945 | ||||||
| AP Moller - Maersk A/S, B Shares | 9 | 13,772 | ||||||
Bavarian Nordic A/S(1)(2) | 238 | 8,407 | ||||||
| Carlsberg A/S, B Shares | 125 | 17,547 | ||||||
| Chemometec A/S | 95 | 6,048 | ||||||
| Chr Hansen Holding A/S | 223 | 25,605 | ||||||
| Coloplast A/S, B Shares | 324 | 54,961 | ||||||
| D/S Norden A/S | 305 | 4,708 | ||||||
Danske Bank A/S(1) | 1,949 | 30,112 | ||||||
Demant A/S(1) | 172 | 5,130 | ||||||
Dfds A/S(1) | 208 | 7,840 | ||||||
Drilling Co. of 1972 A/S (The)(1) | 45 | 1,067 | ||||||
| DSV Panalpina A/S | 193 | 30,136 | ||||||
FLSmidth & Co. A/S(1) | 181 | 5,226 | ||||||
Genmab A/S, ADR(1) | 1,712 | 64,645 | ||||||
| GN Store Nord A/S | 283 | 20,476 | ||||||
| H Lundbeck A/S | 204 | 6,693 | ||||||
16
| Shares | Value | |||||||
H+H International A/S, B Shares(1) | 331 | $ | 6,257 | |||||
ISS A/S(1) | 46 | 706 | ||||||
Jyske Bank A/S(1) | 261 | 7,768 | ||||||
Netcompany Group A/S(1) | 132 | 11,403 | ||||||
NKT A/S(1) | 223 | 7,110 | ||||||
| NNIT A/S | 254 | 5,696 | ||||||
| Novo Nordisk A/S, ADR | 4,369 | 288,529 | ||||||
| Novozymes A/S, B Shares | 850 | 50,181 | ||||||
| Orsted A/S | 577 | 81,644 | ||||||
| Pandora A/S | 1,170 | 85,138 | ||||||
| Per Aarsleff Holding A/S | 45 | 1,821 | ||||||
| Ringkjoebing Landbobank A/S | 119 | 8,972 | ||||||
| Rockwool International A/S, B Shares | 51 | 19,347 | ||||||
| Royal Unibrew A/S | 105 | 10,984 | ||||||
| Schouw & Co. A/S | 57 | 5,554 | ||||||
| SimCorp A/S | 158 | 20,076 | ||||||
| Solar A/S, B Shares | 25 | 1,262 | ||||||
SP Group A/S(1) | 96 | 3,538 | ||||||
Spar Nord Bank A/S(1) | 147 | 1,224 | ||||||
Sydbank A/S(1) | 331 | 5,560 | ||||||
| Topdanmark A/S | 245 | 10,546 | ||||||
TORM plc(2) | 105 | 725 | ||||||
| Tryg A/S | 503 | 15,432 | ||||||
| Vestas Wind Systems A/S | 709 | 107,510 | ||||||
| 1,088,798 | ||||||||
| Finland — 1.1% | ||||||||
Aktia Bank Oyj(1) | 500 | 5,647 | ||||||
| Altia Oyj | 360 | 3,651 | ||||||
| CapMan Oyj, B Shares | 696 | 1,683 | ||||||
| Cargotec Oyj, B Shares | 258 | 8,146 | ||||||
Caverion OYJ(1) | 704 | 5,206 | ||||||
Citycon Oyj(2) | 126 | 1,011 | ||||||
| Elisa Oyj | 523 | 30,775 | ||||||
Finnair Oyj(1)(2) | 1,716 | 895 | ||||||
| Fortum Oyj | 901 | 19,035 | ||||||
HKScan Oyj, A Shares(1)(2) | 1,333 | 3,050 | ||||||
Huhtamaki Oyj(1) | 287 | 13,877 | ||||||
| Kemira Oyj | 742 | 10,260 | ||||||
| Kesko Oyj, B Shares | 1,344 | 29,808 | ||||||
| Kone Oyj, B Shares | 467 | 40,072 | ||||||
| Konecranes Oyj | 267 | 7,598 | ||||||
Marimekko Oyj(1) | 28 | 1,117 | ||||||
| Metsa Board Oyj | 1,029 | 8,374 | ||||||
| Metso Outotec Oyj | 2,567 | 19,021 | ||||||
| Neles Oyj | 508 | 6,932 | ||||||
| Neste Oyj | 895 | 47,798 | ||||||
Nokia Oyj, ADR(1) | 6,339 | 31,061 | ||||||
| Nokian Renkaat Oyj | 237 | 6,600 | ||||||
| Oriola Oyj, B Shares | 441 | 1,008 | ||||||
| Orion Oyj, Class B | 698 | 32,756 | ||||||
Outokumpu Oyj(1)(2) | 3,333 | 9,003 | ||||||
| Sampo Oyj, A Shares | 908 | 36,596 | ||||||
17
| Shares | Value | |||||||
| Sanoma Oyj | 490 | $ | 6,348 | |||||
| Stora Enso Oyj, R Shares | 2,401 | 35,378 | ||||||
Talenom Oyj(2) | 433 | 4,474 | ||||||
| TietoEVRY Oyj | 97 | 2,919 | ||||||
| Tokmanni Group Corp. | 341 | 6,206 | ||||||
| UPM-Kymmene Oyj | 2,370 | 71,949 | ||||||
| Uponor Oyj | 617 | 10,837 | ||||||
| Valmet Oyj | 267 | 7,295 | ||||||
| Wartsila Oyj Abp | 632 | 5,398 | ||||||
| YIT Oyj | 1,099 | 6,758 | ||||||
| 538,542 | ||||||||
| France — 8.7% | ||||||||
| ABC arbitrage | 396 | 3,223 | ||||||
Accor SA(1) | 552 | 16,988 | ||||||
| Aeroports de Paris | 115 | 12,040 | ||||||
Air France-KLM(1)(2) | 1,403 | 6,314 | ||||||
| Air Liquide SA | 832 | 138,205 | ||||||
Airbus SE(1) | 1,051 | 86,539 | ||||||
| AKWEL | 46 | 769 | ||||||
| Albioma SA | 255 | 13,538 | ||||||
ALD SA(2) | 1,038 | 10,660 | ||||||
Alstom SA(1) | 1,817 | 101,239 | ||||||
Alten SA(1) | 263 | 22,788 | ||||||
Amundi SA(1) | 191 | 14,853 | ||||||
| APERAM SA | 467 | 13,791 | ||||||
ArcelorMittal SA(1) | 2,916 | 36,625 | ||||||
| Arkema SA | 636 | 70,455 | ||||||
Atos SE(1) | 712 | 61,681 | ||||||
| Aubay | 27 | 1,076 | ||||||
| AXA SA | 3,174 | 64,797 | ||||||
| Beneteau SA | 88 | 746 | ||||||
Bigben Interactive(1) | 62 | 991 | ||||||
| BioMerieux | 136 | 20,605 | ||||||
BNP Paribas SA, ADR(1) | 6,691 | 145,663 | ||||||
| Bollore SA | 241 | 905 | ||||||
| Bonduelle SCA | 188 | 4,557 | ||||||
Bouygues SA(1) | 1,215 | 48,170 | ||||||
Bureau Veritas SA(1) | 1,569 | 35,546 | ||||||
| Capgemini SE | 174 | 24,072 | ||||||
| Carrefour SA | 960 | 15,414 | ||||||
Casino Guichard Perrachon SA(1)(2) | 140 | 3,636 | ||||||
Cellectis SA, ADR(1) | 316 | 5,830 | ||||||
CGG SA(1) | 5,929 | 5,391 | ||||||
Cie de Saint-Gobain(1) | 2,425 | 98,253 | ||||||
| Cie des Alpes | 32 | 593 | ||||||
| Cie Generale des Etablissements Michelin SCA | 1,131 | 127,607 | ||||||
| Cie Plastic Omnium SA | 480 | 10,823 | ||||||
CNP Assurances(1) | 696 | 9,310 | ||||||
Coface SA(1) | 233 | 1,823 | ||||||
Credit Agricole SA(1) | 2,354 | 24,096 | ||||||
| Danone SA, ADR | 1,430 | 18,690 | ||||||
Dassault Aviation SA(1) | 19 | 17,277 | ||||||
18
| Shares | Value | |||||||
| Dassault Systemes SE | 357 | $ | 67,210 | |||||
| Derichebourg SA | 1,448 | 4,177 | ||||||
Devoteam SA(1) | 70 | 8,157 | ||||||
| Edenred | 438 | 22,640 | ||||||
Eiffage SA(1) | 787 | 72,473 | ||||||
| Electricite de France SA | 2,597 | 27,299 | ||||||
Elis SA(1) | 701 | 9,069 | ||||||
Engie SA(1) | 2,862 | 39,814 | ||||||
Eramet SA(1) | 180 | 6,136 | ||||||
EssilorLuxottica SA(1) | 396 | 53,046 | ||||||
Eurazeo SE(1) | 79 | 4,172 | ||||||
Eurofins Scientific SE(1) | 24 | 19,238 | ||||||
| Euronext NV | 453 | 55,064 | ||||||
| Eutelsat Communications SA | 1,356 | 13,598 | ||||||
Faurecia SE(1) | 763 | 33,206 | ||||||
| Gaztransport Et Technigaz SA | 174 | 16,373 | ||||||
Getlink SE(1) | 2,780 | 42,581 | ||||||
| Hermes International | 96 | 82,503 | ||||||
Iliad SA(2) | 169 | 36,126 | ||||||
| Imerys SA | 381 | 15,453 | ||||||
Ingenico Group SA(1)(2) | 20 | 3,398 | ||||||
Innate Pharma SA(1) | 719 | 4,638 | ||||||
Interparfums SA(1) | 25 | 1,249 | ||||||
| Ipsen SA | 371 | 38,414 | ||||||
JCDecaux SA(1) | 633 | 12,072 | ||||||
| Kaufman & Broad SA | 197 | 7,789 | ||||||
| Kering SA | 234 | 143,903 | ||||||
Korian SA(1) | 207 | 8,023 | ||||||
| L'Oreal SA | 491 | 162,426 | ||||||
| La Francaise des Jeux SAEM | 173 | 6,416 | ||||||
Lagardere SCA(1)(2) | 505 | 10,028 | ||||||
| Legrand SA | 646 | 53,858 | ||||||
LISI(1) | 56 | 1,269 | ||||||
| LNA Sante SA | 19 | 1,168 | ||||||
| LVMH Moet Hennessy Louis Vuitton SE | 516 | 242,245 | ||||||
Maisons du Monde SA(1) | 672 | 10,896 | ||||||
Mersen SA(1) | 230 | 6,997 | ||||||
Metropole Television SA(1) | 374 | 4,666 | ||||||
MGI Digital Graphic Technology(1) | 17 | 893 | ||||||
Natixis SA(1) | 4,255 | 11,731 | ||||||
Nexans SA(1) | 362 | 20,325 | ||||||
| Nexity SA | 294 | 10,106 | ||||||
| Orange SA, ADR | 5,372 | 59,790 | ||||||
Orpea(1) | 451 | 54,192 | ||||||
| Pernod Ricard SA | 690 | 118,268 | ||||||
Peugeot SA(1) | 3,184 | 54,637 | ||||||
Publicis Groupe SA(1) | 325 | 11,383 | ||||||
| Quadient SA | 48 | 668 | ||||||
| Remy Cointreau SA | 109 | 17,948 | ||||||
Renault SA(1) | 986 | 28,018 | ||||||
Rexel SA(1) | 1,737 | 23,223 | ||||||
| Rubis SCA | 102 | 4,822 | ||||||
19
| Shares | Value | |||||||
Safran SA(1) | 831 | $ | 96,122 | |||||
| Sanofi, ADR | 3,033 | 153,409 | ||||||
| Sartorius Stedim Biotech | 97 | 34,730 | ||||||
| Schneider Electric SE | 674 | 83,582 | ||||||
SCOR SE(1) | 449 | 12,026 | ||||||
| SEB SA | 131 | 23,018 | ||||||
| SES SA | 1,595 | 11,318 | ||||||
| Societe BIC SA | 77 | 4,438 | ||||||
Societe Generale SA(1) | 1,963 | 31,750 | ||||||
| Sodexo SA | 186 | 13,300 | ||||||
SOITEC(1) | 58 | 7,731 | ||||||
Sopra Steria Group(1) | 72 | 11,705 | ||||||
| SPIE SA | 545 | 9,246 | ||||||
| STMicroelectronics NV, (New York) | 3,668 | 110,957 | ||||||
| Suez SA | 662 | 11,471 | ||||||
Tarkett SA(1) | 303 | 3,921 | ||||||
| Teleperformance | 205 | 63,178 | ||||||
Television Francaise 1(1)(2) | 128 | 782 | ||||||
| Thales SA | 50 | 3,906 | ||||||
| TOTAL SE, ADR | 6,822 | 269,946 | ||||||
| Trigano SA | 86 | 10,933 | ||||||
Ubisoft Entertainment SA(1) | 864 | 71,149 | ||||||
| Valeo SA | 1,910 | 58,290 | ||||||
Vallourec SA(1)(2) | 22 | 673 | ||||||
| Veolia Environnement SA | 2,617 | 63,166 | ||||||
| Verallia SA | 109 | 3,543 | ||||||
| Vicat SA | 24 | 830 | ||||||
| Vilmorin & Cie SA | 19 | 1,077 | ||||||
| Vinci SA | 1,713 | 160,507 | ||||||
Virbac SA(1) | 30 | 6,734 | ||||||
| Vivendi SA | 581 | 16,516 | ||||||
Worldline SA(1) | 120 | 11,055 | ||||||
| 4,420,382 | ||||||||
| Germany — 8.0% | ||||||||
Aareal Bank AG(1) | 258 | 5,769 | ||||||
adidas AG(1) | 495 | 149,865 | ||||||
ADO Properties SA(1) | 223 | 6,847 | ||||||
ADVA Optical Networking SE(1) | 742 | 6,284 | ||||||
AIXTRON SE(1) | 204 | 2,342 | ||||||
| Allianz SE | 849 | 183,872 | ||||||
Amadeus Fire AG(1) | 60 | 7,576 | ||||||
Aroundtown SA(1) | 4,039 | 22,109 | ||||||
AURELIUS Equity Opportunities SE & Co. KGaA(1) | 44 | 913 | ||||||
| Aurubis AG | 280 | 20,116 | ||||||
| BASF SE | 2,361 | 144,059 | ||||||
| Bayer AG | 921 | 60,855 | ||||||
| Bayerische Motoren Werke AG | 1,343 | 96,553 | ||||||
| Bayerische Motoren Werke AG, Preference Shares | 212 | 11,916 | ||||||
| BayWa AG | 138 | 4,762 | ||||||
| Bechtle AG | 116 | 23,438 | ||||||
| Befesa SA | 137 | 5,703 | ||||||
| Beiersdorf AG | 278 | 32,106 | ||||||
20
| Shares | Value | |||||||
| Bertrandt AG | 18 | $ | 735 | |||||
Bijou Brigitte AG(1) | 20 | 556 | ||||||
| Borussia Dortmund GmbH & Co. KGaA | 725 | 4,853 | ||||||
| Brenntag AG | 718 | 44,983 | ||||||
| Carl Zeiss Meditec AG | 103 | 11,612 | ||||||
Cewe Stiftung & Co. KGAA(1) | 64 | 7,602 | ||||||
Commerzbank AG(1) | 5,773 | 33,547 | ||||||
| CompuGroup Medical SE & Co. KgaA | 156 | 13,973 | ||||||
| Continental AG | 511 | 55,682 | ||||||
| Covestro AG | 1,325 | 63,027 | ||||||
| CropEnergies AG | 109 | 1,591 | ||||||
CTS Eventim AG & Co. KGaA(1) | 300 | 14,913 | ||||||
| Daimler AG | 3,360 | 171,272 | ||||||
Delivery Hero SE(1) | 171 | 18,342 | ||||||
| Dermapharm Holding SE | 119 | 6,329 | ||||||
Deutsche Bank AG(1) | 8,388 | 79,938 | ||||||
| Deutsche Beteiligungs AG | 23 | 867 | ||||||
| Deutsche Boerse AG | 106 | 20,037 | ||||||
Deutsche EuroShop AG(1) | 385 | 5,730 | ||||||
Deutsche Lufthansa AG(1) | 1,393 | 14,539 | ||||||
Deutsche Pfandbriefbank AG(1) | 1,014 | 7,388 | ||||||
| Deutsche Post AG, ADR | 2,895 | 131,780 | ||||||
| Deutsche Telekom AG | 9,621 | 169,003 | ||||||
| Deutsche Wohnen SE | 1,437 | 76,484 | ||||||
Deutz AG(1) | 1,338 | 7,183 | ||||||
Dialog Semiconductor plc(1) | 611 | 26,484 | ||||||
| DIC Asset AG | 312 | 4,113 | ||||||
Draegerwerk AG & Co. KGaA(1) | 78 | 5,764 | ||||||
Draegerwerk AG & Co. KGaA, Preference Shares(1) | 119 | 10,082 | ||||||
| Duerr AG | 433 | 14,314 | ||||||
| E.ON SE | 4,273 | 50,571 | ||||||
| Eckert & Ziegler Strahlen- und Medizintechnik AG | 152 | 7,691 | ||||||
| Elmos Semiconductor SE | 32 | 830 | ||||||
ElringKlinger AG(1) | 121 | 867 | ||||||
| Encavis AG | 683 | 12,482 | ||||||
| Energiekontor AG | 43 | 1,540 | ||||||
| Evonik Industries AG | 960 | 27,864 | ||||||
Evotec SE(1) | 293 | 7,818 | ||||||
Flatex AG(1) | 123 | 5,969 | ||||||
Fraport AG Frankfurt Airport Services Worldwide(1) | 234 | 10,607 | ||||||
| Freenet AG | 282 | 6,089 | ||||||
| Fresenius Medical Care AG & Co. KGaA, ADR | 215 | 9,112 | ||||||
| Fresenius SE & Co. KGaA | 1,122 | 51,793 | ||||||
| FUCHS PETROLUB SE, Preference Shares | 475 | 22,400 | ||||||
| GEA Group AG | 1,455 | 53,067 | ||||||
| Gerresheimer AG | 174 | 20,491 | ||||||
| Grand City Properties SA | 684 | 17,561 | ||||||
| GRENKE AG | 122 | 8,913 | ||||||
| Hamburger Hafen und Logistik AG | 72 | 1,332 | ||||||
| Hannover Rueck SE | 187 | 31,845 | ||||||
| HeidelbergCement AG | 265 | 16,827 | ||||||
HelloFresh SE(1) | 251 | 12,901 | ||||||
21
| Shares | Value | |||||||
| Henkel AG & Co. KGaA | 217 | $ | 19,484 | |||||
| Henkel AG & Co. KGaA, Preference Shares | 340 | 34,645 | ||||||
| HOCHTIEF AG | 127 | 11,274 | ||||||
| Hornbach Baumarkt AG | 49 | 2,210 | ||||||
| Hornbach Holding AG & Co. KGaA | 83 | 9,040 | ||||||
| HUGO BOSS AG | 433 | 11,466 | ||||||
Hypoport SE(1) | 22 | 13,172 | ||||||
| Indus Holding AG | 184 | 6,369 | ||||||
| Infineon Technologies AG, ADR | 2,725 | 75,564 | ||||||
| IVU Traffic Technologies AG | 272 | 5,033 | ||||||
| Jenoptik AG | 456 | 12,182 | ||||||
JOST Werke AG(1) | 169 | 7,106 | ||||||
| Jungheinrich AG, Preference Shares | 525 | 16,843 | ||||||
| K+S AG | 874 | 6,060 | ||||||
| KION Group AG | 342 | 28,923 | ||||||
Kloeckner & Co. SE(1) | 236 | 1,448 | ||||||
| Knorr-Bremse AG | 308 | 39,139 | ||||||
| Krones AG | 117 | 7,715 | ||||||
| KWS Saat SE & Co. KGaA | 64 | 5,523 | ||||||
| Lanxess AG | 470 | 27,514 | ||||||
| LEG Immobilien AG | 257 | 37,829 | ||||||
Leifheit AG(1) | 4 | 144 | ||||||
Leoni AG(1) | 81 | 569 | ||||||
| LPKF Laser & Electronics AG | 302 | 7,513 | ||||||
| Merck KGaA | 112 | 15,190 | ||||||
| METRO AG | 925 | 9,154 | ||||||
| MLP SE | 192 | 1,316 | ||||||
MorphoSys AG(1) | 9 | 1,132 | ||||||
| MTU Aero Engines AG | 257 | 47,612 | ||||||
| Muenchener Rueckversicherungs-Gesellschaft AG | 356 | 102,263 | ||||||
| Nemetschek SE | 312 | 24,816 | ||||||
| New Work SE | 30 | 8,924 | ||||||
| Norma Group SE | 326 | 10,532 | ||||||
OHB SE(1) | 22 | 1,020 | ||||||
| PATRIZIA AG | 274 | 8,076 | ||||||
| Pfeiffer Vacuum Technology AG | 35 | 6,800 | ||||||
Porsche Automobil Holding SE, Preference Shares(1) | 482 | 29,499 | ||||||
ProSiebenSat.1 Media SE(1) | 1,049 | 11,873 | ||||||
publity AG(1) | 24 | 1,037 | ||||||
Puma SE(1) | 566 | 46,772 | ||||||
QIAGEN NV(1) | 69 | 3,516 | ||||||
| Rational AG | 21 | 13,379 | ||||||
| Rheinmetall AG | 272 | 25,172 | ||||||
Rocket Internet SE(1) | 411 | 9,294 | ||||||
RTL Group SA(1) | 47 | 1,559 | ||||||
| RWE AG | 2,602 | 103,167 | ||||||
S&T AG(1) | 507 | 14,145 | ||||||
SAF-Holland SE(1) | 128 | 1,054 | ||||||
Salzgitter AG(1) | 369 | 5,956 | ||||||
| SAP SE, ADR | 1,164 | 192,537 | ||||||
| Sartorius AG, Preference Shares | 110 | 46,584 | ||||||
Schaltbau Holding AG(1) | 104 | 3,351 | ||||||
22
| Shares | Value | |||||||
| Scout24 AG | 510 | $ | 47,419 | |||||
| Siemens AG, ADR | 1,911 | 132,681 | ||||||
| Siemens Healthineers AG | 277 | 12,593 | ||||||
| Siltronic AG | 222 | 20,639 | ||||||
Sixt SE(1) | 81 | 7,324 | ||||||
| Sixt SE, Preference Shares | 103 | 5,796 | ||||||
SMA Solar Technology AG(1) | 128 | 5,787 | ||||||
| Software AG | 355 | 17,696 | ||||||
| Stabilus SA | 172 | 9,102 | ||||||
| STO SE & Co. KGaA, Preference Shares | 9 | 1,193 | ||||||
| STRATEC SE | 14 | 1,717 | ||||||
Stroeer SE & Co. KGaA(1) | 187 | 14,570 | ||||||
| Suedzucker AG | 252 | 5,145 | ||||||
| Symrise AG | 301 | 41,470 | ||||||
TAG Immobilien AG(1) | 474 | 14,144 | ||||||
TeamViewer AG(1) | 294 | 15,936 | ||||||
Tele Columbus AG(1) | 308 | 1,268 | ||||||
| Telefonica Deutschland Holding AG | 9,369 | 25,912 | ||||||
thyssenkrupp AG(1) | 382 | 2,749 | ||||||
| Traffic Systems SE | 40 | 1,495 | ||||||
| Uniper SE | 749 | 24,543 | ||||||
| United Internet AG | 485 | 23,808 | ||||||
Varta AG(1) | 163 | 25,371 | ||||||
| VERBIO Vereinigte BioEnergie AG | 88 | 1,512 | ||||||
| Villeroy & Boch AG, Preference Shares | 64 | 875 | ||||||
Volkswagen AG(1) | 84 | 15,076 | ||||||
Volkswagen AG, Preference Shares(1) | 432 | 71,949 | ||||||
| Vonovia SE | 1,732 | 124,009 | ||||||
Vossloh AG(1) | 144 | 6,443 | ||||||
| Wacker Chemie AG | 93 | 9,084 | ||||||
Wacker Neuson SE(1) | 180 | 3,517 | ||||||
Washtec AG(1) | 18 | 807 | ||||||
| Wuestenrot & Wuerttembergische AG | 218 | 3,788 | ||||||
Zalando SE(1) | 587 | 51,290 | ||||||
| 4,065,581 | ||||||||
| Hong Kong — 3.0% | ||||||||
| AIA Group Ltd. | 17,868 | 181,791 | ||||||
| ASM Pacific Technology Ltd. | 1,400 | 15,054 | ||||||
Ausnutria Dairy Corp. Ltd.(1)(2) | 6,000 | 9,891 | ||||||
| Bank of East Asia Ltd. (The) | 8,200 | 18,465 | ||||||
BeiGene Ltd., ADR(1) | 33 | 7,972 | ||||||
| BOC Hong Kong Holdings Ltd. | 11,000 | 30,949 | ||||||
| Bright Smart Securities & Commodities Group Ltd. | 14,000 | 3,268 | ||||||
| Budweiser Brewing Co. APAC Ltd. | 1,900 | 6,380 | ||||||
| Cafe de Coral Holdings Ltd. | 2,000 | 4,608 | ||||||
| Chinese Estates Holdings Ltd. | 7,500 | 4,851 | ||||||
| Chow Sang Sang Holdings International Ltd. | 1,000 | 1,123 | ||||||
| CK Asset Holdings Ltd. | 12,000 | 64,593 | ||||||
| CK Hutchison Holdings Ltd. | 6,500 | 42,185 | ||||||
| CK Infrastructure Holdings Ltd. | 2,500 | 13,114 | ||||||
| CLP Holdings Ltd. | 7,500 | 73,597 | ||||||
Comba Telecom Systems Holdings Ltd.(2) | 18,000 | 7,843 | ||||||
23
| Shares | Value | |||||||
| Convenience Retail Asia Ltd. | 4,000 | $ | 2,054 | |||||
| Cowell e Holdings, Inc. | 14,000 | 5,589 | ||||||
| Dah Sing Banking Group Ltd. | 800 | 759 | ||||||
| Dah Sing Financial Holdings Ltd. | 400 | 1,136 | ||||||
| Dairy Farm International Holdings Ltd. | 2,300 | 9,595 | ||||||
Esprit Holdings Ltd.(1) | 5,100 | 583 | ||||||
| Fairwood Holdings Ltd. | 2,000 | 4,907 | ||||||
| Far East Consortium International Ltd. | 3,000 | 958 | ||||||
FIH Mobile Ltd.(1) | 6,000 | 689 | ||||||
| First Pacific Co. Ltd. | 6,000 | 1,679 | ||||||
| Galaxy Entertainment Group Ltd. | 7,000 | 54,661 | ||||||
| Get Nice Holdings Ltd. | 34,000 | 689 | ||||||
| Giordano International Ltd. | 4,000 | 670 | ||||||
| Guotai Junan International Holdings Ltd. | 40,000 | 5,865 | ||||||
| Haitong International Securities Group Ltd. | 4,000 | 1,064 | ||||||
| Hang Lung Group Ltd. | 9,000 | 23,183 | ||||||
| Hang Lung Properties Ltd. | 11,000 | 30,911 | ||||||
| Hang Seng Bank Ltd. | 2,500 | 39,173 | ||||||
| Health & Happiness H&H International Holdings Ltd. | 1,500 | 6,540 | ||||||
| Henderson Land Development Co. Ltd. | 4,000 | 15,613 | ||||||
| HK Electric Investments & HK Electric Investments Ltd. | 8,000 | 8,131 | ||||||
| HKBN Ltd. | 1,500 | 2,806 | ||||||
| HKT Trust & HKT Ltd. | 6,000 | 8,567 | ||||||
| Hong Kong & China Gas Co. Ltd. | 13,650 | 19,821 | ||||||
| Hong Kong Exchanges & Clearing Ltd. | 2,500 | 125,677 | ||||||
| Hongkong & Shanghai Hotels Ltd. (The) | 1,000 | 800 | ||||||
| Hongkong Land Holdings Ltd. | 4,100 | 15,656 | ||||||
| Hutchison Telecommunications Hong Kong Holdings Ltd. | 20,000 | 3,186 | ||||||
| Hysan Development Co. Ltd. | 5,000 | 15,781 | ||||||
| Jardine Matheson Holdings Ltd. | 400 | 16,730 | ||||||
| Jardine Strategic Holdings Ltd. | 500 | 10,026 | ||||||
| Johnson Electric Holdings Ltd. | 4,000 | 7,882 | ||||||
| K Wah International Holdings Ltd. | 11,000 | 5,210 | ||||||
| Kerry Properties Ltd. | 3,000 | 7,779 | ||||||
| Lai Sun Development Co. Ltd. | 3,600 | 3,757 | ||||||
| Lifestyle International Holdings Ltd. | 5,000 | 4,581 | ||||||
| Luk Fook Holdings International Ltd. | 3,000 | 6,697 | ||||||
| Man Wah Holdings Ltd. | 16,800 | 23,379 | ||||||
Mandarin Oriental International Ltd.(1) | 3,400 | 5,674 | ||||||
| Melco International Development Ltd. | 5,000 | 10,940 | ||||||
| Melco Resorts & Entertainment Ltd., ADR | 929 | 18,134 | ||||||
MGM China Holdings Ltd.(2) | 800 | 1,162 | ||||||
| Minmetals Land Ltd. | 28,000 | 3,418 | ||||||
| Minth Group Ltd. | 4,000 | 13,358 | ||||||
| MTR Corp. Ltd. | 3,000 | 15,499 | ||||||
| New World Development Co. Ltd. | 7,000 | 36,216 | ||||||
| NWS Holdings Ltd. | 5,000 | 4,238 | ||||||
O-Net Technologies Group Ltd.(1) | 6,000 | 4,878 | ||||||
| Oriental Watch Holdings | 4,000 | 1,030 | ||||||
| Pacific Basin Shipping Ltd. | 56,000 | 8,152 | ||||||
| Pacific Textiles Holdings Ltd. | 12,000 | 5,299 | ||||||
| PCCW Ltd. | 21,000 | 13,148 | ||||||
24
| Shares | Value | |||||||
| Pico Far East Holdings Ltd. | 4,000 | $ | 508 | |||||
| Power Assets Holdings Ltd. | 4,500 | 25,638 | ||||||
| Sands China Ltd. | 5,600 | 24,647 | ||||||
| Shangri-La Asia Ltd. | 2,000 | 1,627 | ||||||
| Shun Tak Holdings Ltd. | 16,000 | 5,508 | ||||||
| Sino Land Co. Ltd. | 24,000 | 27,874 | ||||||
| SITC International Holdings Co. Ltd. | 13,000 | 16,941 | ||||||
| SJM Holdings Ltd. | 19,000 | 26,075 | ||||||
| SmarTone Telecommunications Holdings Ltd. | 1,500 | 822 | ||||||
| Sun Hung Kai & Co. Ltd. | 10,000 | 4,112 | ||||||
| Sun Hung Kai Properties Ltd. | 2,000 | 26,643 | ||||||
| SUNeVision Holdings Ltd. | 2,000 | 1,484 | ||||||
| Swire Pacific Ltd., Class A | 2,500 | 13,453 | ||||||
| Swire Properties Ltd. | 2,000 | 5,409 | ||||||
| Techtronic Industries Co. Ltd. | 4,000 | 50,549 | ||||||
| Texwinca Holdings Ltd. | 4,000 | 582 | ||||||
| United Laboratories International Holdings Ltd. (The) | 10,000 | 11,749 | ||||||
| Value Partners Group Ltd. | 2,000 | 913 | ||||||
| Vitasoy International Holdings Ltd. | 6,000 | 21,326 | ||||||
| VTech Holdings Ltd. | 1,000 | 5,824 | ||||||
| WH Group Ltd. | 39,500 | 34,006 | ||||||
| Wharf Real Estate Investment Co. Ltd. | 7,000 | 28,996 | ||||||
| Wynn Macau Ltd. | 7,600 | 14,154 | ||||||
| Xinyi Glass Holdings Ltd. | 18,000 | 30,895 | ||||||
| Yue Yuen Industrial Holdings Ltd. | 3,500 | 6,048 | ||||||
| 1,505,397 | ||||||||
| Ireland — 0.6% | ||||||||
AIB Group plc(1) | 4,433 | 5,472 | ||||||
Bank of Ireland Group plc(1) | 5,700 | 12,815 | ||||||
| C&C Group plc | 303 | 867 | ||||||
Cairn Homes plc(1) | 7,836 | 7,304 | ||||||
| CRH plc | 1,609 | 59,639 | ||||||
| Dalata Hotel Group plc | 525 | 1,716 | ||||||
FBD Holdings plc(1) | 510 | 3,664 | ||||||
| Glanbia plc | 784 | 9,024 | ||||||
Glenveagh Properties plc(1) | 1,162 | 979 | ||||||
| Kerry Group plc, A Shares | 720 | 94,644 | ||||||
Kingspan Group plc(1) | 271 | 23,261 | ||||||
| Origin Enterprises plc | 1,105 | 4,540 | ||||||
| Smurfit Kappa Group plc | 1,927 | 68,199 | ||||||
| 292,124 | ||||||||
| Israel — 0.8% | ||||||||
AFI Properties Ltd.(1) | 174 | 4,737 | ||||||
Airport City Ltd.(1) | 284 | 3,304 | ||||||
| Alony Hetz Properties & Investments Ltd. | 537 | 6,292 | ||||||
| Amot Investments Ltd. | 717 | 3,673 | ||||||
| Ashtrom Group Ltd. | 80 | 1,078 | ||||||
| AudioCodes Ltd. | 183 | 5,741 | ||||||
| Azrieli Group Ltd. | 70 | 3,770 | ||||||
| Bank Hapoalim BM | 3,177 | 19,224 | ||||||
| Bank Leumi Le-Israel BM | 4,231 | 21,649 | ||||||
BATM Advanced Communications(1)(2) | 2,332 | 4,174 | ||||||
25
| Shares | Value | |||||||
| Bayside Land Corp. | 2 | $ | 1,205 | |||||
Bezeq The Israeli Telecommunication Corp. Ltd.(1) | 5,510 | 6,288 | ||||||
| Caesarstone Ltd. | 67 | 739 | ||||||
Camtek Ltd.(1) | 100 | 1,526 | ||||||
Cellcom Israel Ltd.(1) | 759 | 2,766 | ||||||
Check Point Software Technologies Ltd.(1) | 280 | 35,353 | ||||||
Clal Insurance Enterprises Holdings Ltd.(1) | 66 | 648 | ||||||
CyberArk Software Ltd.(1) | 126 | 13,923 | ||||||
| Danel Adir Yeoshua Ltd. | 12 | 1,526 | ||||||
| Elbit Systems Ltd. | 33 | 4,450 | ||||||
| Elco Ltd. | 83 | 3,029 | ||||||
| Electra Consumer Products 1970 Ltd. | 158 | 4,420 | ||||||
| Electra Ltd. | 11 | 4,989 | ||||||
Energix-Renewable Energies Ltd.(1) | 935 | 4,399 | ||||||
Equital Ltd.(1) | 35 | 699 | ||||||
Fattal Holdings 1998 Ltd.(1) | 7 | 463 | ||||||
| FIBI Holdings Ltd. | 173 | 4,544 | ||||||
| First International Bank of Israel Ltd. | 212 | 4,960 | ||||||
| FMS Enterprises Migun Ltd. | 27 | 684 | ||||||
| Fox Wizel Ltd. | 130 | 6,432 | ||||||
| Gazit-Globe Ltd. | 640 | 3,321 | ||||||
Harel Insurance Investments & Financial Services Ltd.(1) | 123 | 881 | ||||||
| Hilan Ltd. | 26 | 1,222 | ||||||
| ICL Group Ltd. | 3,029 | 11,259 | ||||||
| IDI Insurance Co. Ltd. | 30 | 807 | ||||||
| Inrom Construction Industries Ltd. | 1,146 | 4,599 | ||||||
| Isracard Ltd. | 1,770 | 4,923 | ||||||
Israel Corp. Ltd. (The)(1) | 6 | 713 | ||||||
| Israel Discount Bank Ltd., A Shares | 4,926 | 15,763 | ||||||
| Ituran Location and Control Ltd. | 43 | 624 | ||||||
Kamada Ltd.(1) | 533 | 5,238 | ||||||
Kornit Digital Ltd.(1) | 68 | 4,211 | ||||||
| Matrix IT Ltd. | 212 | 5,448 | ||||||
| Maytronics Ltd. | 330 | 4,864 | ||||||
Mediterranean Towers Ltd.(1) | 327 | 746 | ||||||
| Melisron Ltd. | 16 | 640 | ||||||
| Menora Mivtachim Holdings Ltd. | 69 | 896 | ||||||
Mivne Real Estate KD Ltd.(1) | 2,451 | 5,067 | ||||||
| Mizrahi Tefahot Bank Ltd. | 525 | 10,683 | ||||||
Nice Ltd., ADR(1) | 106 | 24,364 | ||||||
| Novolog Ltd. | 5,599 | 4,587 | ||||||
| Oil Refineries Ltd. | 2,871 | 584 | ||||||
Partner Communications Co. Ltd.(1) | 1,319 | 5,692 | ||||||
| Paz Oil Co. Ltd. | 16 | 1,621 | ||||||
Phoenix Holdings Ltd. (The)(1) | 1,064 | 5,316 | ||||||
Radware Ltd.(1) | 185 | 4,795 | ||||||
| Rami Levy Chain Stores Hashikma Marketing 2006 Ltd. | 98 | 5,894 | ||||||
| Sapiens International Corp. NV | 45 | 1,498 | ||||||
Shapir Engineering and Industry Ltd.(1) | 867 | 6,051 | ||||||
Shikun & Binui Ltd.(1) | 1,660 | 7,402 | ||||||
| Shufersal Ltd. | 1,530 | 12,030 | ||||||
| Strauss Group Ltd. | 234 | 6,828 | ||||||
26
| Shares | Value | |||||||
| Summit Real Estate Holdings Ltd. | 79 | $ | 775 | |||||
| Tel Aviv Stock Exchange Ltd. | 917 | 4,279 | ||||||
Teva Pharmaceutical Industries Ltd., ADR(1) | 1,494 | 14,746 | ||||||
Tower Semiconductor Ltd.(1) | 396 | 7,770 | ||||||
Wix.com Ltd.(1) | 66 | 19,446 | ||||||
| 392,268 | ||||||||
| Italy — 2.1% | ||||||||
| A2A SpA | 13,621 | 19,868 | ||||||
| ACEA SpA | 668 | 13,765 | ||||||
Amplifon SpA(1) | 364 | 12,121 | ||||||
| Anima Holding SpA | 197 | 866 | ||||||
| Ascopiave SpA | 1,761 | 6,901 | ||||||
| Assicurazioni Generali SpA | 718 | 11,135 | ||||||
ASTM SpA(1) | 208 | 4,232 | ||||||
Atlantia SpA(1) | 706 | 11,229 | ||||||
Autogrill SpA(1) | 1,256 | 6,425 | ||||||
| Azimut Holding SpA | 652 | 12,633 | ||||||
Banca Farmafactoring SpA(1) | 1,044 | 5,797 | ||||||
Banca Generali SpA(1) | 427 | 13,034 | ||||||
Banca IFIS SpA(1) | 69 | 718 | ||||||
| Banca Mediolanum SpA | 100 | 741 | ||||||
Banca Monte dei Paschi di Siena SpA(1) | 639 | 1,092 | ||||||
Banca Popolare di Sondrio SCPA(1) | 3,766 | 9,045 | ||||||
Banco BPM SpA(1) | 5,819 | 9,795 | ||||||
BPER Banca(1) | 1,686 | 4,625 | ||||||
Brunello Cucinelli SpA(1) | 330 | 10,425 | ||||||
| Buzzi Unicem SpA | 275 | 6,749 | ||||||
| Carel Industries SpA | 333 | 8,147 | ||||||
Cerved Group SpA(1) | 735 | 6,273 | ||||||
CIR SpA-Compagnie Industriali(1) | 10,844 | 5,188 | ||||||
CNH Industrial NV(1) | 4,288 | 33,973 | ||||||
Credito Emiliano SpA(1) | 173 | 878 | ||||||
Credito Valtellinese SpA(1) | 543 | 4,816 | ||||||
| Danieli & C Officine Meccaniche SpA | 239 | 3,567 | ||||||
| Danieli & C Officine Meccaniche SpA, Preference Shares | 502 | 4,375 | ||||||
| Davide Campari-Milano NV | 589 | 6,056 | ||||||
De' Longhi SpA(1) | 287 | 9,529 | ||||||
| DiaSorin SpA | 42 | 7,592 | ||||||
| Enav SpA | 848 | 3,561 | ||||||
| Enel SpA | 16,148 | 146,446 | ||||||
| Eni SpA, ADR | 2,748 | 51,113 | ||||||
| ERG SpA | 342 | 9,041 | ||||||
Esprinet SpA(1) | 190 | 1,184 | ||||||
| Falck Renewables SpA | 779 | 5,222 | ||||||
| Ferrari NV | 313 | 60,974 | ||||||
Fiat Chrysler Automobiles NV(1) | 4,272 | 47,090 | ||||||
Fincantieri SpA(1) | 5,427 | 3,842 | ||||||
FinecoBank Banca Fineco SpA(1) | 1,391 | 21,062 | ||||||
Freni Brembo SpA(1) | 747 | 7,197 | ||||||
| Gruppo MutuiOnline SpA | 307 | 8,500 | ||||||
| Hera SpA | 4,203 | 16,062 | ||||||
IMA Industria Macchine Automatiche SpA(1) | 85 | 6,818 | ||||||
27
| Shares | Value | |||||||
| Infrastrutture Wireless Italiane SpA | 103 | $ | 1,005 | |||||
| Interpump Group SpA | 205 | 7,177 | ||||||
Intesa Sanpaolo SpA(1) | 28,211 | 60,700 | ||||||
| Iren SpA | 6,949 | 18,170 | ||||||
| Italgas SpA | 5,175 | 33,350 | ||||||
| Leonardo SpA | 821 | 5,557 | ||||||
Maire Tecnimont SpA(1) | 2,317 | 4,189 | ||||||
MARR SpA(1) | 45 | 690 | ||||||
Mediaset SpA(1) | 524 | 969 | ||||||
| Mediobanca Banca di Credito Finanziario SpA | 1,032 | 8,958 | ||||||
Moncler SpA(1) | 821 | 31,850 | ||||||
Nexi SpA(1) | 501 | 8,911 | ||||||
OVS SpA(1) | 539 | 519 | ||||||
| Piaggio & C SpA | 317 | 900 | ||||||
Pirelli & C SpA(1) | 223 | 964 | ||||||
| Poste Italiane SpA | 1,180 | 10,821 | ||||||
| Prysmian SpA | 1,027 | 28,705 | ||||||
| RAI Way SpA | 862 | 5,625 | ||||||
| Recordati Industria Chimica e Farmaceutica SpA | 372 | 20,265 | ||||||
| Reno de Medici SpA | 4,439 | 4,353 | ||||||
| Reply SpA | 152 | 16,861 | ||||||
| Saipem SpA | 4,130 | 8,840 | ||||||
Salvatore Ferragamo SpA(1) | 392 | 5,641 | ||||||
Saras SpA(1) | 2,214 | 1,537 | ||||||
| Sesa SpA | 25 | 2,240 | ||||||
| Snam SpA | 6,797 | 34,837 | ||||||
Societa Cattolica di Assicurazioni SC(1) | 967 | 5,744 | ||||||
Technogym SpA(1) | 1,118 | 10,059 | ||||||
| Telecom Italia SpA/Milano | 11,906 | 5,663 | ||||||
| Telecom Italia SpA/Milano, Preference Shares | 2,984 | 1,409 | ||||||
| Tenaris SA, ADR | 656 | 7,649 | ||||||
| Terna Rete Elettrica Nazionale SpA | 4,694 | 33,937 | ||||||
UniCredit SpA(1) | 3,485 | 34,334 | ||||||
Unione di Banche Italiane SpA(1) | 4,141 | 17,919 | ||||||
Unipol Gruppo SpA(1) | 1,764 | 8,497 | ||||||
| Webuild SpA | 3,333 | 4,332 | ||||||
| 1,092,879 | ||||||||
| Japan — 22.7% | ||||||||
| 77 Bank Ltd. (The) | 500 | 7,309 | ||||||
| A&D Co. Ltd. | 200 | 1,205 | ||||||
| ABC-Mart, Inc. | 100 | 5,258 | ||||||
| Acom Co. Ltd. | 300 | 1,170 | ||||||
| Adastria Co. Ltd. | 300 | 4,677 | ||||||
| ADEKA Corp. | 400 | 5,837 | ||||||
| Advantest Corp. | 500 | 23,846 | ||||||
| Aeon Co. Ltd. | 2,500 | 61,939 | ||||||
| Aeon Delight Co. Ltd. | 200 | 5,908 | ||||||
| AEON Financial Service Co. Ltd. | 600 | 5,320 | ||||||
| Aeon Mall Co. Ltd. | 700 | 9,246 | ||||||
| AGC, Inc. | 1,000 | 28,257 | ||||||
| Ai Holdings Corp. | 100 | 1,671 | ||||||
| Aica Kogyo Co. Ltd. | 200 | 6,853 | ||||||
28
| Shares | Value | |||||||
| Aida Engineering Ltd. | 200 | $ | 1,293 | |||||
Aiful Corp.(1) | 500 | 1,191 | ||||||
| Ain Holdings, Inc. | 100 | 6,486 | ||||||
| Air Water, Inc. | 1,200 | 16,793 | ||||||
| Aisan Industry Co. Ltd. | 200 | 897 | ||||||
| Aisin Seiki Co. Ltd. | 800 | 27,411 | ||||||
| Ajinomoto Co., Inc. | 1,400 | 26,061 | ||||||
| Alconix Corp. | 100 | 1,328 | ||||||
| Alfresa Holdings Corp. | 400 | 8,024 | ||||||
| Alps Alpine Co. Ltd. | 1,000 | 15,826 | ||||||
| Altech Corp. | 300 | 5,161 | ||||||
| Amada Co. Ltd. | 900 | 7,991 | ||||||
| Amano Corp. | 400 | 8,324 | ||||||
| Amuse, Inc. | 200 | 4,424 | ||||||
ANA Holdings, Inc.(1) | 300 | 7,405 | ||||||
| Anritsu Corp. | 100 | 2,181 | ||||||
| AOKI Holdings, Inc. | 100 | 539 | ||||||
| Aoyama Trading Co. Ltd. | 100 | 600 | ||||||
| Aozora Bank Ltd. | 500 | 8,938 | ||||||
| Arata Corp. | 200 | 9,549 | ||||||
| Arcland Sakamoto Co. Ltd. | 400 | 7,943 | ||||||
| Arcs Co. Ltd. | 100 | 2,482 | ||||||
| Argo Graphics, Inc. | 100 | 3,308 | ||||||
| Arisawa Manufacturing Co. Ltd. | 200 | 1,762 | ||||||
| ARTERIA Networks Corp. | 100 | 1,650 | ||||||
| Artnature, Inc. | 200 | 1,160 | ||||||
| Aruhi Corp. | 200 | 3,198 | ||||||
| Asahi Co. Ltd. | 300 | 5,169 | ||||||
| Asahi Diamond Industrial Co. Ltd. | 200 | 934 | ||||||
| Asahi Group Holdings Ltd. | 700 | 24,469 | ||||||
| Asahi Holdings, Inc. | 300 | 10,054 | ||||||
| Asahi Intecc Co. Ltd. | 300 | 8,887 | ||||||
| Asahi Kasei Corp. | 4,300 | 35,995 | ||||||
| Asanuma Corp. | 100 | 4,174 | ||||||
| Asia Pile Holdings Corp. | 200 | 875 | ||||||
| Asics Corp. | 100 | 1,375 | ||||||
| ASKUL Corp. | 200 | 6,162 | ||||||
| Astellas Pharma, Inc. | 3,700 | 58,069 | ||||||
| Atom Corp. | 200 | 1,697 | ||||||
| Awa Bank Ltd. (The) | 300 | 6,755 | ||||||
| Axial Retailing, Inc. | 100 | 4,532 | ||||||
| Azbil Corp. | 100 | 3,132 | ||||||
| Bandai Namco Holdings, Inc. | 500 | 30,999 | ||||||
| Bando Chemical Industries Ltd. | 200 | 1,093 | ||||||
| Bank of Iwate Ltd. (The) | 200 | 4,706 | ||||||
| Bank of Kyoto Ltd. (The) | 300 | 12,763 | ||||||
| Bank of Okinawa Ltd. (The) | 100 | 2,813 | ||||||
| Bank of the Ryukyus Ltd. | 100 | 833 | ||||||
| BayCurrent Consulting, Inc. | 100 | 10,661 | ||||||
| Belc Co. Ltd. | 100 | 7,062 | ||||||
| Belluna Co. Ltd. | 200 | 1,912 | ||||||
| Benefit One, Inc. | 400 | 9,647 | ||||||
29
| Shares | Value | |||||||
| Benesse Holdings, Inc. | 500 | $ | 12,750 | |||||
| Bic Camera, Inc. | 400 | 4,423 | ||||||
| BML, Inc. | 200 | 5,091 | ||||||
| Bridgestone Corp. | 1,600 | 50,635 | ||||||
| Broadleaf Co. Ltd. | 200 | 953 | ||||||
| Brother Industries Ltd. | 1,000 | 16,516 | ||||||
| Bunka Shutter Co. Ltd. | 200 | 1,421 | ||||||
| Calbee, Inc. | 300 | 9,362 | ||||||
| Canon, Inc., ADR | 994 | 17,057 | ||||||
| Capcom Co. Ltd. | 500 | 24,204 | ||||||
| Casio Computer Co. Ltd. | 1,100 | 17,668 | ||||||
| Cawachi Ltd. | 200 | 5,689 | ||||||
| Central Glass Co. Ltd. | 100 | 1,977 | ||||||
| Central Japan Railway Co. | 300 | 44,810 | ||||||
Change, Inc.(1) | 200 | 13,953 | ||||||
| Chiba Bank Ltd. (The) | 2,800 | 14,494 | ||||||
| Chilled & Frozen Logistics Holdings Co. Ltd. | 100 | 1,570 | ||||||
| Chubu Electric Power Co., Inc. | 1,700 | 20,994 | ||||||
| Chubu Shiryo Co. Ltd. | 400 | 6,149 | ||||||
| Chudenko Corp. | 200 | 4,249 | ||||||
| Chugai Pharmaceutical Co. Ltd. | 1,200 | 53,506 | ||||||
| Chugoku Bank Ltd. (The) | 800 | 7,385 | ||||||
| Chugoku Electric Power Co., Inc. (The) | 1,000 | 12,193 | ||||||
| Citizen Watch Co. Ltd. | 300 | 951 | ||||||
| Cleanup Corp. | 200 | 962 | ||||||
| CMK Corp. | 200 | 874 | ||||||
| Coca-Cola Bottlers Japan Holdings, Inc. | 600 | 9,993 | ||||||
| cocokara fine, Inc. | 100 | 5,590 | ||||||
| Colowide Co. Ltd. | 100 | 1,562 | ||||||
| Computer Engineering & Consulting Ltd. | 300 | 4,596 | ||||||
| COMSYS Holdings Corp. | 500 | 13,941 | ||||||
| Comture Corp. | 200 | 4,212 | ||||||
| Concordia Financial Group Ltd. | 4,800 | 15,781 | ||||||
| Cosmo Energy Holdings Co. Ltd. | 400 | 6,311 | ||||||
| Cosmos Pharmaceutical Corp. | 200 | 35,193 | ||||||
| Create Restaurants Holdings, Inc. | 200 | 1,240 | ||||||
| Create SD Holdings Co. Ltd. | 200 | 7,212 | ||||||
| Credit Saison Co. Ltd. | 1,100 | 12,503 | ||||||
| Curves Holdings Co. Ltd. | 100 | 637 | ||||||
| CyberAgent, Inc. | 500 | 26,627 | ||||||
| Cybozu, Inc. | 200 | 5,887 | ||||||
| Dai Nippon Printing Co. Ltd. | 700 | 14,851 | ||||||
| Dai-ichi Life Holdings, Inc. | 3,000 | 45,260 | ||||||
| Daibiru Corp. | 100 | 1,124 | ||||||
| Daicel Corp. | 1,500 | 10,854 | ||||||
| Daido Metal Co. Ltd. | 200 | 998 | ||||||
| Daido Steel Co. Ltd. | 200 | 6,639 | ||||||
| Daifuku Co. Ltd. | 100 | 8,782 | ||||||
| Daihen Corp. | 100 | 3,941 | ||||||
| Daiho Corp. | 100 | 2,539 | ||||||
| Daiichi Jitsugyo Co. Ltd. | 200 | 6,813 | ||||||
| Daiichi Kigenso Kagaku-Kogyo Co. Ltd. | 200 | 1,470 | ||||||
30
| Shares | Value | |||||||
| Daiichi Sankyo Co. Ltd. | 500 | $ | 44,617 | |||||
| Daiichikosho Co. Ltd. | 300 | 9,338 | ||||||
| Daiki Aluminium Industry Co. Ltd. | 200 | 946 | ||||||
| Daikin Industries Ltd. | 500 | 94,020 | ||||||
| Daikokutenbussan Co. Ltd. | 200 | 11,048 | ||||||
| Daikyonishikawa Corp. | 200 | 1,080 | ||||||
| Daio Paper Corp. | 400 | 5,452 | ||||||
| Daiseki Co. Ltd. | 100 | 2,408 | ||||||
| Daishi Hokuetsu Financial Group, Inc. | 300 | 5,721 | ||||||
| Daito Pharmaceutical Co. Ltd. | 200 | 6,510 | ||||||
| Daito Trust Construction Co. Ltd. | 300 | 26,572 | ||||||
| Daiwa House Industry Co. Ltd. | 1,000 | 26,748 | ||||||
| Daiwa Securities Group, Inc. | 3,700 | 16,652 | ||||||
| Daiwabo Holdings Co. Ltd. | 200 | 12,016 | ||||||
| DCM Holdings Co. Ltd. | 1,000 | 12,244 | ||||||
| DeNA Co. Ltd. | 400 | 6,357 | ||||||
| Denka Co. Ltd. | 600 | 16,850 | ||||||
| Denso Corp. | 1,100 | 46,124 | ||||||
| Dentsu Group, Inc. | 400 | 10,459 | ||||||
| Denyo Co. Ltd. | 200 | 4,097 | ||||||
| Dexerials Corp. | 100 | 997 | ||||||
| DIC Corp. | 600 | 14,192 | ||||||
| Digital Arts, Inc. | 100 | 7,704 | ||||||
| Digital Garage, Inc. | 300 | 9,089 | ||||||
| Dip Corp. | 300 | 6,627 | ||||||
| DKS Co. Ltd. | 100 | 4,136 | ||||||
| DMG Mori Co. Ltd. | 700 | 8,864 | ||||||
| Doshisha Co. Ltd. | 400 | 7,662 | ||||||
| Doutor Nichires Holdings Co. Ltd. | 300 | 4,645 | ||||||
| Dowa Holdings Co. Ltd. | 300 | 9,222 | ||||||
| DTS Corp. | 300 | 6,287 | ||||||
| Duskin Co. Ltd. | 100 | 2,513 | ||||||
| DyDo Group Holdings, Inc. | 200 | 9,368 | ||||||
| Eagle Industry Co. Ltd. | 200 | 1,402 | ||||||
| Earth Corp. | 100 | 7,374 | ||||||
| East Japan Railway Co. | 900 | 58,494 | ||||||
| Ebara Corp. | 500 | 12,772 | ||||||
| EDION Corp. | 700 | 7,923 | ||||||
| Ehime Bank Ltd. (The) | 100 | 1,089 | ||||||
| Eiken Chemical Co. Ltd. | 200 | 3,591 | ||||||
| Eisai Co. Ltd. | 300 | 26,179 | ||||||
| Eizo Corp. | 200 | 7,544 | ||||||
| Elecom Co. Ltd. | 100 | 4,521 | ||||||
| Electric Power Development Co. Ltd. | 1,100 | 16,575 | ||||||
| en-japan, Inc. | 100 | 2,885 | ||||||
| ENEOS Holdings, Inc. | 14,300 | 55,964 | ||||||
| eRex Co. Ltd. | 100 | 1,190 | ||||||
| ESPEC Corp. | 200 | 3,447 | ||||||
| Exedy Corp. | 100 | 1,339 | ||||||
| Ezaki Glico Co. Ltd. | 100 | 4,245 | ||||||
| F.C.C. Co. Ltd. | 300 | 5,445 | ||||||
| Fancl Corp. | 300 | 9,779 | ||||||
31
| Shares | Value | |||||||
| FANUC Corp. | 200 | $ | 35,009 | |||||
| Fast Retailing Co. Ltd. | 100 | 59,567 | ||||||
| Ferrotec Holdings Corp. | 200 | 1,445 | ||||||
| Foster Electric Co. Ltd. | 100 | 1,096 | ||||||
| FP Corp. | 100 | 7,605 | ||||||
| France Bed Holdings Co. Ltd. | 200 | 1,610 | ||||||
Freee KK(1) | 100 | 5,512 | ||||||
| Fuji Co. Ltd. | 100 | 1,755 | ||||||
| Fuji Corp./Aichi | 100 | 1,784 | ||||||
| Fuji Electric Co. Ltd. | 300 | 9,350 | ||||||
| Fuji Kyuko Co. Ltd. | 200 | 6,344 | ||||||
| Fuji Seal International, Inc. | 300 | 5,442 | ||||||
| Fuji Soft, Inc. | 200 | 9,040 | ||||||
| Fujibo Holdings, Inc. | 100 | 3,374 | ||||||
| Fujicco Co. Ltd. | 200 | 3,919 | ||||||
| FUJIFILM Holdings Corp. | 400 | 19,038 | ||||||
| Fujikura Ltd. | 2,200 | 6,392 | ||||||
| Fujimi, Inc. | 200 | 6,671 | ||||||
| Fujimori Kogyo Co. Ltd. | 100 | 3,701 | ||||||
| Fujitec Co. Ltd. | 100 | 1,993 | ||||||
| Fujitsu General Ltd. | 400 | 10,439 | ||||||
| Fujitsu Ltd. | 700 | 91,307 | ||||||
| Fukuda Corp. | 200 | 9,195 | ||||||
| Fukui Computer Holdings, Inc. | 100 | 2,577 | ||||||
| Fukuoka Financial Group, Inc. | 800 | 13,199 | ||||||
| Fukuyama Transporting Co. Ltd. | 200 | 9,833 | ||||||
| Funai Soken Holdings, Inc. | 200 | 4,002 | ||||||
| Furukawa Co. Ltd. | 300 | 3,010 | ||||||
| Furukawa Electric Co. Ltd. | 300 | 7,116 | ||||||
| Furuno Electric Co. Ltd. | 100 | 887 | ||||||
| Fuso Chemical Co. Ltd. | 200 | 6,720 | ||||||
| Futaba Industrial Co. Ltd. | 200 | 1,043 | ||||||
| Future Corp. | 300 | 5,434 | ||||||
| Fuyo General Lease Co. Ltd. | 100 | 6,016 | ||||||
| G-7 Holdings, Inc. | 100 | 3,020 | ||||||
| G-Tekt Corp. | 100 | 973 | ||||||
| Gakken Holdings Co. Ltd. | 400 | 6,058 | ||||||
| Genky DrugStores Co. Ltd. | 200 | 6,500 | ||||||
| Geo Holdings Corp. | 500 | 8,099 | ||||||
| GLOBERIDE, Inc. | 200 | 6,307 | ||||||
| Glory Ltd. | 300 | 6,249 | ||||||
| GMO Financial Holdings, Inc. | 200 | 1,270 | ||||||
| GMO Internet, Inc. | 400 | 10,762 | ||||||
| GMO Payment Gateway, Inc. | 100 | 10,572 | ||||||
GNI Group Ltd.(1) | 100 | 2,353 | ||||||
| Goldcrest Co. Ltd. | 100 | 1,388 | ||||||
| Goldwin, Inc. | 200 | 14,413 | ||||||
| Grace Technology, Inc. | 100 | 3,802 | ||||||
| GS Yuasa Corp. | 400 | 6,553 | ||||||
| GungHo Online Entertainment, Inc. | 400 | 8,244 | ||||||
| Gunma Bank Ltd. (The) | 1,700 | 5,555 | ||||||
| Gunze Ltd. | 100 | 3,597 | ||||||
32
| Shares | Value | |||||||
| H-One Co. Ltd. | 200 | $ | 994 | |||||
| H.U. Group Holdings, Inc. | 100 | 2,466 | ||||||
| H2O Retailing Corp. | 200 | 1,394 | ||||||
| Hachijuni Bank Ltd. (The) | 1,700 | 6,562 | ||||||
| Hakuhodo DY Holdings, Inc. | 500 | 6,206 | ||||||
| Halows Co. Ltd. | 200 | 7,528 | ||||||
| Hamakyorex Co. Ltd. | 200 | 6,237 | ||||||
| Hamamatsu Photonics KK | 100 | 4,553 | ||||||
| Hankyu Hanshin Holdings, Inc. | 1,100 | 35,698 | ||||||
| Hanwa Co. Ltd. | 100 | 2,006 | ||||||
| Haseko Corp. | 1,400 | 19,073 | ||||||
| Hazama Ando Corp. | 1,100 | 7,454 | ||||||
| Heiwa Corp. | 300 | 5,058 | ||||||
| Heiwa Real Estate Co. Ltd. | 300 | 7,971 | ||||||
| Heiwado Co. Ltd. | 400 | 8,303 | ||||||
| Hiday Hidaka Corp. | 300 | 4,921 | ||||||
| Hikari Tsushin, Inc. | 100 | 24,101 | ||||||
| Hino Motors Ltd. | 400 | 2,661 | ||||||
| Hirose Electric Co. Ltd. | 100 | 11,314 | ||||||
| Hiroshima Bank Ltd. (The) | 1,500 | 7,581 | ||||||
| HIS Co. Ltd. | 300 | 5,342 | ||||||
| Hisamitsu Pharmaceutical Co., Inc. | 200 | 9,218 | ||||||
| Hitachi Capital Corp. | 300 | 7,285 | ||||||
| Hitachi Construction Machinery Co. Ltd. | 300 | 10,499 | ||||||
| Hitachi Ltd. | 1,000 | 33,205 | ||||||
| Hitachi Metals Ltd. | 400 | 5,990 | ||||||
| Hitachi Transport System Ltd. | 500 | 17,363 | ||||||
| Hitachi Zosen Corp. | 1,900 | 7,478 | ||||||
| Hogy Medical Co. Ltd. | 100 | 3,165 | ||||||
| Hokkaido Electric Power Co., Inc. | 1,300 | 5,552 | ||||||
| Hokko Chemical Industry Co. Ltd. | 200 | 1,244 | ||||||
| Hokkoku Bank Ltd. (The) | 100 | 2,792 | ||||||
| Hokuetsu Corp. | 200 | 679 | ||||||
| Hokuetsu Industries Co. Ltd. | 100 | 973 | ||||||
| Hokuhoku Financial Group, Inc. | 1,100 | 10,186 | ||||||
| Hokuriku Electric Power Co. | 1,300 | 9,594 | ||||||
| Hokuto Corp. | 200 | 4,061 | ||||||
| Honda Motor Co. Ltd., ADR | 4,139 | 105,876 | ||||||
| Honeys Holdings Co. Ltd. | 100 | 1,070 | ||||||
| Hoosiers Holdings | 200 | 1,184 | ||||||
| Horiba Ltd. | 200 | 10,935 | ||||||
| Hoshizaki Corp. | 100 | 7,638 | ||||||
| Hosiden Corp. | 100 | 877 | ||||||
| Hosokawa Micron Corp. | 100 | 5,327 | ||||||
| House Foods Group, Inc. | 200 | 6,750 | ||||||
| Hoya Corp., ADR | 484 | 47,722 | ||||||
| Hulic Co. Ltd. | 2,000 | 18,188 | ||||||
| Hyakugo Bank Ltd. (The) | 2,000 | 6,143 | ||||||
| Hyakujushi Bank Ltd. (The) | 200 | 3,393 | ||||||
| I-Net Corp./Kanagawa | 100 | 1,415 | ||||||
| I-PEX, Inc. | 200 | 3,865 | ||||||
| Ibiden Co. Ltd. | 700 | 21,914 | ||||||
33
| Shares | Value | |||||||
| Ichibanya Co. Ltd. | 100 | $ | 4,901 | |||||
| Ichigo, Inc. | 600 | 1,603 | ||||||
| Ichikoh Industries Ltd. | 200 | 930 | ||||||
| Ichinen Holdings Co. Ltd. | 100 | 1,153 | ||||||
| Icom, Inc. | 200 | 5,032 | ||||||
| Idemitsu Kosan Co. Ltd. | 1,200 | 26,408 | ||||||
| IDOM, Inc. | 900 | 4,590 | ||||||
| IHI Corp. | 500 | 7,329 | ||||||
| Iida Group Holdings Co. Ltd. | 400 | 7,796 | ||||||
| Iino Kaiun Kaisha Ltd. | 400 | 1,326 | ||||||
| Inaba Denki Sangyo Co. Ltd. | 100 | 2,466 | ||||||
| Inabata & Co. Ltd. | 100 | 1,230 | ||||||
| Ines Corp. | 100 | 1,257 | ||||||
| Infocom Corp. | 200 | 6,654 | ||||||
| Infomart Corp. | 200 | 1,375 | ||||||
| Information Services International-Dentsu Ltd. | 200 | 10,668 | ||||||
| INPEX Corp. | 4,600 | 29,079 | ||||||
| Intage Holdings, Inc. | 600 | 5,207 | ||||||
| Inter Action Corp. | 200 | 3,233 | ||||||
| Internet Initiative Japan, Inc. | 300 | 12,102 | ||||||
| IR Japan Holdings Ltd. | 100 | 12,209 | ||||||
| Isetan Mitsukoshi Holdings Ltd. | 1,200 | 6,591 | ||||||
| Ishihara Sangyo Kaisha Ltd. | 100 | 678 | ||||||
| Isuzu Motors Ltd. | 1,800 | 17,750 | ||||||
| Ito En Ltd. | 300 | 18,125 | ||||||
| ITOCHU Corp. | 1,300 | 33,342 | ||||||
| Itochu Enex Co. Ltd. | 600 | 5,312 | ||||||
| Itochu Techno-Solutions Corp. | 300 | 10,858 | ||||||
| Itoham Yonekyu Holdings, Inc. | 900 | 5,991 | ||||||
| IwaiCosmo Holdings, Inc. | 100 | 1,186 | ||||||
| Iwatani Corp. | 300 | 10,783 | ||||||
| Iyo Bank Ltd. (The) | 1,300 | 8,252 | ||||||
| Izumi Co. Ltd. | 300 | 11,675 | ||||||
| J Front Retailing Co. Ltd. | 1,600 | 11,103 | ||||||
| Jaccs Co. Ltd. | 100 | 1,638 | ||||||
| Jafco Co. Ltd. | 300 | 12,062 | ||||||
| Japan Airlines Co. Ltd. | 300 | 5,891 | ||||||
| Japan Airport Terminal Co. Ltd. | 200 | 8,976 | ||||||
| Japan Aviation Electronics Industry Ltd. | 600 | 7,786 | ||||||
| Japan Exchange Group, Inc. | 1,400 | 36,241 | ||||||
| Japan Lifeline Co. Ltd. | 100 | 1,327 | ||||||
| Japan Material Co. Ltd. | 500 | 6,642 | ||||||
| Japan Petroleum Exploration Co. Ltd. | 100 | 1,736 | ||||||
| Japan Post Bank Co. Ltd. | 700 | 5,604 | ||||||
| Japan Post Holdings Co. Ltd. | 3,100 | 22,763 | ||||||
| Japan Post Insurance Co. Ltd. | 600 | 9,535 | ||||||
| Japan Pulp & Paper Co. Ltd. | 200 | 7,155 | ||||||
| Japan Securities Finance Co. Ltd. | 700 | 3,573 | ||||||
| Japan Steel Works Ltd. (The) | 200 | 2,848 | ||||||
| Japan Wool Textile Co. Ltd. (The) | 700 | 6,420 | ||||||
| JCU Corp. | 100 | 3,416 | ||||||
| JDC Corp. | 200 | 1,095 | ||||||
34
| Shares | Value | |||||||
| Jeol Ltd. | 200 | $ | 5,858 | |||||
| JFE Holdings, Inc. | 1,500 | 11,149 | ||||||
| JGC Holdings Corp. | 1,000 | 11,006 | ||||||
| JINS Holdings, Inc. | 100 | 6,891 | ||||||
| JSR Corp. | 400 | 8,483 | ||||||
| JTEKT Corp. | 1,000 | 7,691 | ||||||
| Juroku Bank Ltd. (The) | 200 | 3,602 | ||||||
| Justsystems Corp. | 200 | 15,327 | ||||||
| JVCKenwood Corp. | 500 | 739 | ||||||
| K's Holdings Corp. | 1,600 | 22,631 | ||||||
| Kadokawa Corp. | 200 | 5,113 | ||||||
| Kaga Electronics Co. Ltd. | 100 | 1,976 | ||||||
| Kagome Co. Ltd. | 800 | 24,870 | ||||||
| Kajima Corp. | 2,800 | 34,706 | ||||||
| Kakaku.com, Inc. | 500 | 13,290 | ||||||
| Kaken Pharmaceutical Co. Ltd. | 200 | 9,265 | ||||||
| Kamei Corp. | 100 | 931 | ||||||
| Kamigumi Co. Ltd. | 400 | 8,245 | ||||||
| Kanamoto Co. Ltd. | 300 | 6,497 | ||||||
| Kandenko Co. Ltd. | 900 | 7,056 | ||||||
| Kaneka Corp. | 300 | 7,563 | ||||||
| Kanematsu Corp. | 900 | 11,362 | ||||||
| Kanematsu Electronics Ltd. | 200 | 7,627 | ||||||
| Kansai Electric Power Co., Inc. (The) | 2,500 | 24,576 | ||||||
| Kansai Mirai Financial Group, Inc. | 200 | 840 | ||||||
| Kansai Paint Co. Ltd. | 400 | 9,526 | ||||||
| Kanto Denka Kogyo Co. Ltd. | 200 | 1,440 | ||||||
| Kao Corp. | 900 | 68,482 | ||||||
| Kasai Kogyo Co. Ltd. | 200 | 717 | ||||||
| Katitas Co. Ltd. | 200 | 4,986 | ||||||
| Kato Sangyo Co. Ltd. | 100 | 3,440 | ||||||
| Kawasaki Heavy Industries Ltd. | 700 | 9,879 | ||||||
Kawasaki Kisen Kaisha Ltd.(1) | 600 | 6,669 | ||||||
| KDDI Corp. | 4,700 | 136,296 | ||||||
| Keihan Holdings Co. Ltd. | 400 | 17,230 | ||||||
| Keihanshin Building Co. Ltd. | 300 | 4,263 | ||||||
| Keikyu Corp. | 1,500 | 22,356 | ||||||
| Keio Corp. | 200 | 12,059 | ||||||
| Keisei Electric Railway Co. Ltd. | 300 | 8,813 | ||||||
| Keiyo Bank Ltd. (The) | 200 | 932 | ||||||
| Kenedix, Inc. | 1,000 | 4,858 | ||||||
| Kewpie Corp. | 700 | 13,253 | ||||||
| Keyence Corp. | 200 | 82,330 | ||||||
| KFC Holdings Japan Ltd. | 100 | 2,731 | ||||||
| KH Neochem Co. Ltd. | 400 | 8,634 | ||||||
| Kikkoman Corp. | 100 | 5,420 | ||||||
| Kinden Corp. | 400 | 6,598 | ||||||
| Kintetsu Group Holdings Co. Ltd. | 700 | 30,743 | ||||||
| Kintetsu World Express, Inc. | 500 | 10,277 | ||||||
| Kirin Holdings Co. Ltd. | 2,800 | 55,007 | ||||||
| Kitanotatsujin Corp. | 200 | 1,036 | ||||||
| Kito Corp. | 100 | 1,052 | ||||||
35
| Shares | Value | |||||||
| Kitz Corp. | 900 | $ | 5,243 | |||||
| Kiyo Bank Ltd. (The) | 500 | 7,385 | ||||||
| Koatsu Gas Kogyo Co. Ltd. | 200 | 1,477 | ||||||
| Kobayashi Pharmaceutical Co. Ltd. | 100 | 8,901 | ||||||
| Kobe Bussan Co. Ltd. | 200 | 11,783 | ||||||
Kobe Steel Ltd.(1) | 300 | 1,148 | ||||||
| Koei Tecmo Holdings Co. Ltd. | 200 | 7,933 | ||||||
| Kohnan Shoji Co. Ltd. | 300 | 10,828 | ||||||
| Koito Manufacturing Co. Ltd. | 700 | 33,852 | ||||||
| Kokuyo Co. Ltd. | 500 | 5,568 | ||||||
| Komatsu Ltd. | 2,200 | 47,501 | ||||||
| KOMEDA Holdings Co. Ltd. | 200 | 3,445 | ||||||
| Komeri Co. Ltd. | 300 | 9,282 | ||||||
| Komori Corp. | 100 | 675 | ||||||
| Konami Holdings Corp. | 500 | 19,234 | ||||||
| Konica Minolta, Inc. | 1,400 | 4,515 | ||||||
| Konishi Co. Ltd. | 400 | 5,606 | ||||||
| Konoike Transport Co. Ltd. | 400 | 4,244 | ||||||
| Koshidaka Holdings Co. Ltd. | 100 | 431 | ||||||
| Kotobuki Spirits Co. Ltd. | 100 | 4,661 | ||||||
| Kubota Corp. | 2,000 | 36,090 | ||||||
| Kumagai Gumi Co. Ltd. | 400 | 10,207 | ||||||
| Kura Sushi, Inc. | 200 | 9,013 | ||||||
| Kurabo Industries Ltd. | 200 | 3,783 | ||||||
| Kuraray Co. Ltd. | 2,700 | 27,365 | ||||||
| Kureha Corp. | 100 | 4,278 | ||||||
| Kurita Water Industries Ltd. | 600 | 18,742 | ||||||
KYB Corp.(1) | 100 | 2,000 | ||||||
| Kyocera Corp. | 400 | 22,866 | ||||||
| Kyokuyo Co. Ltd. | 200 | 5,070 | ||||||
| Kyoritsu Maintenance Co. Ltd. | 200 | 7,319 | ||||||
| Kyowa Exeo Corp. | 200 | 5,013 | ||||||
| Kyowa Kirin Co. Ltd. | 200 | 5,169 | ||||||
| Kyudenko Corp. | 300 | 8,554 | ||||||
| Kyushu Electric Power Co., Inc. | 2,500 | 22,136 | ||||||
| Kyushu Financial Group, Inc. | 1,500 | 6,878 | ||||||
| Kyushu Railway Co. | 800 | 17,633 | ||||||
| Lacto Japan Co. Ltd. | 200 | 6,753 | ||||||
| Lasertec Corp. | 200 | 15,050 | ||||||
| Lawson, Inc. | 300 | 14,800 | ||||||
| LEC, Inc. | 400 | 6,322 | ||||||
| Life Corp. | 200 | 9,139 | ||||||
LINE Corp., ADR(1) | 81 | 4,123 | ||||||
| Lintec Corp. | 200 | 4,733 | ||||||
| Lion Corp. | 800 | 17,040 | ||||||
| LIXIL Group Corp. | 1,600 | 29,298 | ||||||
M&A Capital Partners Co. Ltd.(1) | 100 | 3,662 | ||||||
| M3, Inc. | 800 | 46,242 | ||||||
| Mabuchi Motor Co. Ltd. | 100 | 3,515 | ||||||
| Macnica Fuji Electronics Holdings, Inc. | 400 | 6,738 | ||||||
| Maeda Corp. | 800 | 5,926 | ||||||
| Maeda Kosen Co. Ltd. | 100 | 2,404 | ||||||
36
| Shares | Value | |||||||
| Maeda Road Construction Co. Ltd. | 300 | $ | 5,527 | |||||
| Makino Milling Machine Co. Ltd. | 100 | 3,420 | ||||||
| Makita Corp. | 400 | 18,395 | ||||||
| Mani, Inc. | 200 | 5,067 | ||||||
| Marubeni Corp. | 2,500 | 14,963 | ||||||
| Marudai Food Co. Ltd. | 200 | 3,491 | ||||||
| Maruha Nichiro Corp. | 400 | 9,038 | ||||||
| Marui Group Co. Ltd. | 700 | 12,751 | ||||||
| Maruichi Steel Tube Ltd. | 200 | 5,354 | ||||||
| Maruwa Co. Ltd. | 100 | 8,424 | ||||||
| Maruwa Unyu Kikan Co. Ltd. | 200 | 7,735 | ||||||
| Maruzen Showa Unyu Co. Ltd. | 200 | 6,458 | ||||||
| Matsumotokiyoshi Holdings Co. Ltd. | 100 | 3,499 | ||||||
| Matsuyafoods Holdings Co. Ltd. | 100 | 3,351 | ||||||
| Maxell Holdings Ltd. | 100 | 956 | ||||||
| Mazda Motor Corp. | 2,500 | 15,955 | ||||||
| McDonald's Holdings Co. Japan Ltd. | 300 | 14,710 | ||||||
| MCJ Co. Ltd. | 900 | 7,983 | ||||||
| Mebuki Financial Group, Inc. | 4,300 | 10,406 | ||||||
| Medipal Holdings Corp. | 500 | 9,550 | ||||||
| Megmilk Snow Brand Co. Ltd. | 400 | 9,093 | ||||||
| Meidensha Corp. | 100 | 1,539 | ||||||
| MEIJI Holdings Co. Ltd. | 200 | 16,147 | ||||||
| Meiko Electronics Co. Ltd. | 100 | 1,556 | ||||||
| Meisei Industrial Co. Ltd. | 200 | 1,477 | ||||||
| Meitec Corp. | 200 | 9,626 | ||||||
| Menicon Co. Ltd. | 100 | 6,116 | ||||||
Mercari, Inc.(1) | 300 | 13,558 | ||||||
| METAWATER Co. Ltd. | 100 | 4,200 | ||||||
| Micronics Japan Co. Ltd. | 100 | 1,027 | ||||||
| Mie Kotsu Group Holdings, Inc. | 200 | 869 | ||||||
| Milbon Co. Ltd. | 100 | 5,507 | ||||||
| Mimasu Semiconductor Industry Co. Ltd. | 100 | 2,024 | ||||||
| MINEBEA MITSUMI, Inc. | 1,600 | 27,507 | ||||||
| Ministop Co. Ltd. | 100 | 1,428 | ||||||
| Mirait Holdings Corp. | 500 | 6,950 | ||||||
| Miroku Jyoho Service Co. Ltd. | 200 | 4,082 | ||||||
| MISUMI Group, Inc. | 100 | 2,603 | ||||||
Mitsuba Corp.(1) | 200 | 702 | ||||||
| Mitsubishi Chemical Holdings Corp. | 4,600 | 26,836 | ||||||
| Mitsubishi Corp. | 2,600 | 61,524 | ||||||
| Mitsubishi Electric Corp. | 3,100 | 42,563 | ||||||
| Mitsubishi Estate Co. Ltd. | 1,500 | 23,474 | ||||||
| Mitsubishi Gas Chemical Co., Inc. | 700 | 12,477 | ||||||
| Mitsubishi Heavy Industries Ltd. | 800 | 19,825 | ||||||
| Mitsubishi Logisnext Co. Ltd. | 400 | 3,761 | ||||||
| Mitsubishi Logistics Corp. | 200 | 6,053 | ||||||
| Mitsubishi Materials Corp. | 400 | 8,386 | ||||||
| Mitsubishi Motors Corp. | 600 | 1,438 | ||||||
| Mitsubishi UFJ Financial Group, Inc., ADR | 25,209 | 105,374 | ||||||
| Mitsubishi UFJ Lease & Finance Co. Ltd. | 2,100 | 9,899 | ||||||
| Mitsuboshi Belting Ltd. | 100 | 1,545 | ||||||
37
| Shares | Value | |||||||
| Mitsui & Co. Ltd. | 3,100 | $ | 55,648 | |||||
| Mitsui Chemicals, Inc. | 1,100 | 25,800 | ||||||
Mitsui E&S Holdings Co. Ltd.(1) | 200 | 808 | ||||||
| Mitsui Fudosan Co. Ltd. | 1,200 | 21,687 | ||||||
| Mitsui Matsushima Holdings Co. Ltd. | 100 | 690 | ||||||
| Mitsui Mining & Smelting Co. Ltd. | 400 | 9,577 | ||||||
| Mitsui OSK Lines Ltd. | 700 | 12,914 | ||||||
| Mitsui Sugar Co. Ltd. | 100 | 1,829 | ||||||
| Mitsui-Soko Holdings Co. Ltd. | 100 | 1,671 | ||||||
| Mitsuuroko Group Holdings Co. Ltd. | 400 | 4,259 | ||||||
| Miura Co. Ltd. | 200 | 8,183 | ||||||
| Mixi, Inc. | 300 | 6,620 | ||||||
| Mizuho Financial Group, Inc., ADR | 25,142 | 68,889 | ||||||
| Mizuho Leasing Co. Ltd. | 300 | 7,550 | ||||||
| Mizuno Corp. | 100 | 1,790 | ||||||
| Mochida Pharmaceutical Co. Ltd. | 100 | 3,689 | ||||||
| Modec, Inc. | 100 | 1,667 | ||||||
| Monex Group, Inc. | 2,000 | 5,168 | ||||||
| Monogatari Corp. (The) | 100 | 8,598 | ||||||
| MonotaRO Co. Ltd. | 400 | 15,783 | ||||||
| Morinaga & Co. Ltd. | 200 | 7,329 | ||||||
| Morinaga Milk Industry Co. Ltd. | 300 | 14,638 | ||||||
| MrMax Holdings Ltd. | 400 | 2,846 | ||||||
| MS&AD Insurance Group Holdings, Inc. | 1,400 | 38,790 | ||||||
| Murata Manufacturing Co. Ltd. | 1,200 | 70,984 | ||||||
| Musashi Seimitsu Industry Co. Ltd. | 600 | 6,007 | ||||||
| Musashino Bank Ltd. (The) | 400 | 5,811 | ||||||
| Nabtesco Corp. | 300 | 9,483 | ||||||
| Nachi-Fujikoshi Corp. | 200 | 6,198 | ||||||
| Nagaileben Co. Ltd. | 200 | 5,134 | ||||||
| Nagase & Co. Ltd. | 500 | 6,499 | ||||||
| Nagoya Railroad Co. Ltd. | 1,100 | 30,686 | ||||||
| Nankai Electric Railway Co. Ltd. | 600 | 13,191 | ||||||
| Nanto Bank Ltd. (The) | 100 | 1,848 | ||||||
| NEC Corp. | 1,200 | 63,184 | ||||||
| NEC Networks & System Integration Corp. | 300 | 5,573 | ||||||
| NET One Systems Co. Ltd. | 600 | 23,038 | ||||||
| Nexon Co. Ltd. | 1,200 | 28,175 | ||||||
| NGK Insulators Ltd. | 1,100 | 15,589 | ||||||
| NGK Spark Plug Co. Ltd. | 900 | 15,450 | ||||||
| NH Foods Ltd. | 300 | 13,578 | ||||||
| NHK Spring Co. Ltd. | 1,000 | 6,274 | ||||||
| Nichi-iko Pharmaceutical Co. Ltd. | 400 | 4,481 | ||||||
| Nichias Corp. | 100 | 2,368 | ||||||
| Nichicon Corp. | 100 | 734 | ||||||
| Nichiha Corp. | 300 | 7,058 | ||||||
| Nichirei Corp. | 500 | 13,046 | ||||||
| Nichireki Co. Ltd. | 100 | 1,565 | ||||||
| Nidec Corp., ADR | 1,294 | 27,193 | ||||||
| Nifco, Inc. | 800 | 20,489 | ||||||
Nihon Dempa Kogyo Co. Ltd.(1) | 200 | 696 | ||||||
| Nihon Flush Co. Ltd. | 400 | 5,257 | ||||||
38
| Shares | Value | |||||||
| Nihon House Holdings Co. Ltd. | 300 | $ | 739 | |||||
| Nihon Kohden Corp. | 200 | 6,860 | ||||||
| Nihon M&A Center, Inc. | 500 | 24,852 | ||||||
| Nihon Nohyaku Co. Ltd. | 200 | 940 | ||||||
| Nihon Parkerizing Co. Ltd. | 100 | 961 | ||||||
| Nihon Plast Co. Ltd. | 200 | 772 | ||||||
| Nihon Unisys Ltd. | 600 | 17,195 | ||||||
| Nikkiso Co. Ltd. | 100 | 978 | ||||||
| Nikkon Holdings Co. Ltd. | 100 | 2,204 | ||||||
| Nikon Corp. | 600 | 4,694 | ||||||
| Nintendo Co. Ltd. | 300 | 160,471 | ||||||
| Nippo Corp. | 100 | 2,590 | ||||||
| Nippon Carbon Co. Ltd. | 100 | 3,250 | ||||||
| Nippon Densetsu Kogyo Co. Ltd. | 100 | 1,987 | ||||||
| Nippon Electric Glass Co. Ltd. | 100 | 1,853 | ||||||
| Nippon Express Co. Ltd. | 400 | 23,615 | ||||||
| Nippon Flour Mills Co. Ltd. | 100 | 1,593 | ||||||
| Nippon Gas Co. Ltd. | 200 | 7,771 | ||||||
| Nippon Kayaku Co. Ltd. | 700 | 6,817 | ||||||
| Nippon Koei Co. Ltd. | 200 | 5,248 | ||||||
| Nippon Light Metal Holdings Co. Ltd. | 3,000 | 5,255 | ||||||
| Nippon Paint Holdings Co. Ltd. | 100 | 8,583 | ||||||
| Nippon Paper Industries Co. Ltd. | 900 | 11,448 | ||||||
| Nippon Parking Development Co. Ltd. | 3,300 | 4,136 | ||||||
| Nippon Seiki Co. Ltd. | 400 | 4,094 | ||||||
Nippon Sheet Glass Co. Ltd.(1) | 200 | 801 | ||||||
| Nippon Shokubai Co. Ltd. | 100 | 5,245 | ||||||
| Nippon Signal Co. Ltd. | 100 | 963 | ||||||
| Nippon Soda Co. Ltd. | 100 | 2,828 | ||||||
| Nippon Steel Corp. | 1,500 | 14,717 | ||||||
| Nippon Steel Trading Corp. | 200 | 6,008 | ||||||
| Nippon Suisan Kaisha Ltd. | 900 | 4,035 | ||||||
| Nippon Telegraph & Telephone Corp. | 3,000 | 68,284 | ||||||
| Nippon Yakin Kogyo Co. Ltd. | 200 | 2,852 | ||||||
| Nippon Yusen KK | 600 | 9,266 | ||||||
| Nipro Corp. | 1,300 | 14,662 | ||||||
| Nishi-Nippon Financial Holdings, Inc. | 900 | 5,902 | ||||||
| Nishi-Nippon Railroad Co. Ltd. | 100 | 2,909 | ||||||
| Nishimatsu Construction Co. Ltd. | 300 | 5,702 | ||||||
| Nishio Rent All Co. Ltd. | 300 | 6,588 | ||||||
| Nissan Chemical Corp. | 400 | 21,043 | ||||||
| Nissan Motor Co. Ltd. | 3,700 | 14,994 | ||||||
| Nissha Co. Ltd. | 100 | 1,091 | ||||||
| Nisshin Group Holdings Co. Ltd. | 200 | 761 | ||||||
| Nisshin Oillio Group Ltd. (The) | 300 | 8,942 | ||||||
| Nisshin Seifun Group, Inc. | 400 | 6,640 | ||||||
| Nisshinbo Holdings, Inc. | 400 | 2,749 | ||||||
| Nissin Electric Co. Ltd. | 500 | 5,299 | ||||||
| Nissin Foods Holdings Co. Ltd. | 100 | 10,010 | ||||||
| Nitori Holdings Co. Ltd. | 200 | 41,780 | ||||||
| Nitto Denko Corp. | 400 | 24,261 | ||||||
| Nitto Kogyo Corp. | 100 | 1,780 | ||||||
39
| Shares | Value | |||||||
| Nittoc Construction Co. Ltd. | 200 | $ | 1,484 | |||||
| Nittoku Co. Ltd. | 200 | 6,139 | ||||||
| Noevir Holdings Co. Ltd. | 100 | 4,567 | ||||||
| NOF Corp. | 200 | 8,079 | ||||||
| Nojima Corp. | 500 | 14,794 | ||||||
| NOK Corp. | 200 | 2,172 | ||||||
| Nomura Co. Ltd. | 100 | 706 | ||||||
| Noritake Co. Ltd./Nagoya Japan | 100 | 3,198 | ||||||
| Noritz Corp. | 300 | 3,798 | ||||||
| North Pacific Bank Ltd. | 3,000 | 6,301 | ||||||
| NS Solutions Corp. | 200 | 5,809 | ||||||
| NSK Ltd. | 1,000 | 7,592 | ||||||
| NTN Corp. | 1,000 | 1,894 | ||||||
| NTT Data Corp. | 1,900 | 21,640 | ||||||
| NTT DOCOMO, Inc. | 2,500 | 69,792 | ||||||
| Obara Group, Inc. | 200 | 6,789 | ||||||
| Obayashi Corp. | 3,500 | 34,065 | ||||||
| Obic Co. Ltd. | 100 | 17,723 | ||||||
| Odakyu Electric Railway Co. Ltd. | 1,200 | 29,658 | ||||||
| Ogaki Kyoritsu Bank Ltd. (The) | 100 | 2,090 | ||||||
| Oiles Corp. | 400 | 5,182 | ||||||
Oisix ra daichi, Inc.(1) | 300 | 9,477 | ||||||
| Oji Holdings Corp. | 5,000 | 22,363 | ||||||
| Okamura Corp. | 400 | 2,807 | ||||||
| Okasan Securities Group, Inc. | 1,000 | 3,033 | ||||||
| Oki Electric Industry Co. Ltd. | 500 | 4,788 | ||||||
| Okinawa Electric Power Co., Inc. (The) | 315 | 4,931 | ||||||
| Okumura Corp. | 200 | 4,817 | ||||||
| Okuwa Co. Ltd. | 100 | 1,380 | ||||||
| Olympus Corp. | 2,700 | 53,391 | ||||||
| Omron Corp. | 200 | 14,633 | ||||||
| Ono Pharmaceutical Co. Ltd. | 500 | 15,083 | ||||||
| Onward Holdings Co. Ltd. | 1,000 | 2,569 | ||||||
| Open House Co. Ltd. | 600 | 21,220 | ||||||
Optim Corp.(1) | 200 | 5,669 | ||||||
| Optorun Co. Ltd. | 100 | 1,978 | ||||||
| Oracle Corp. (Tokyo) | 100 | 11,728 | ||||||
| Organo Corp. | 100 | 5,280 | ||||||
| Orient Corp. | 3,800 | 4,184 | ||||||
| Oriental Land Co. Ltd. | 200 | 27,131 | ||||||
| ORIX Corp., ADR | 874 | 54,328 | ||||||
| Osaka Gas Co. Ltd. | 200 | 3,914 | ||||||
| Osaka Soda Co. Ltd. | 200 | 4,765 | ||||||
| OSAKA Titanium Technologies Co. Ltd. | 100 | 877 | ||||||
| OSG Corp. | 100 | 1,468 | ||||||
| OSJB Holdings Corp. | 1,400 | 3,031 | ||||||
| Otsuka Corp. | 500 | 24,542 | ||||||
| Otsuka Holdings Co. Ltd. | 700 | 30,723 | ||||||
| Outsourcing, Inc. | 100 | 825 | ||||||
| Pacific Industrial Co. Ltd. | 100 | 936 | ||||||
| Pack Corp. (The) | 100 | 2,536 | ||||||
| PAL GROUP Holdings Co. Ltd. | 400 | 4,328 | ||||||
40
| Shares | Value | |||||||
| PALTAC Corp. | 200 | $ | 11,059 | |||||
| Pan Pacific International Holdings Corp. | 1,900 | 44,704 | ||||||
| Panasonic Corp. | 8,200 | 75,437 | ||||||
| Paramount Bed Holdings Co. Ltd. | 200 | 7,956 | ||||||
| Park24 Co. Ltd. | 500 | 9,034 | ||||||
| Penta-Ocean Construction Co. Ltd. | 1,600 | 10,246 | ||||||
PeptiDream, Inc.(1) | 100 | 4,058 | ||||||
| Persol Holdings Co. Ltd. | 600 | 9,329 | ||||||
| Pigeon Corp. | 300 | 13,706 | ||||||
| Pilot Corp. | 300 | 8,782 | ||||||
| Piolax, Inc. | 100 | 1,539 | ||||||
| Plenus Co. Ltd. | 200 | 3,308 | ||||||
| Pola Orbis Holdings, Inc. | 300 | 5,426 | ||||||
| Poletowin Pitcrew Holdings, Inc. | 100 | 917 | ||||||
| Press Kogyo Co. Ltd. | 300 | 861 | ||||||
| Pressance Corp. | 100 | 1,314 | ||||||
| Prestige International, Inc. | 600 | 5,049 | ||||||
| Prima Meat Packers Ltd. | 200 | 5,843 | ||||||
| PS Mitsubishi Construction Co. Ltd. | 200 | 1,082 | ||||||
| Raito Kogyo Co. Ltd. | 500 | 7,568 | ||||||
| Rakuten, Inc. | 4,500 | 39,525 | ||||||
| Recruit Holdings Co. Ltd. | 2,000 | 75,527 | ||||||
| Relia, Inc. | 500 | 5,898 | ||||||
| Relo Group, Inc. | 400 | 9,084 | ||||||
Renesas Electronics Corp.(1) | 500 | 3,134 | ||||||
| Rengo Co. Ltd. | 1,700 | 12,544 | ||||||
| Resona Holdings, Inc. | 6,100 | 22,386 | ||||||
| Resorttrust, Inc. | 800 | 11,340 | ||||||
| Ricoh Co. Ltd. | 3,200 | 23,856 | ||||||
| Ricoh Leasing Co. Ltd. | 200 | 5,106 | ||||||
| Rinnai Corp. | 100 | 9,233 | ||||||
| Riso Kyoiku Co. Ltd. | 1,600 | 4,462 | ||||||
| Rohm Co. Ltd. | 100 | 6,419 | ||||||
| Rohto Pharmaceutical Co. Ltd. | 300 | 9,531 | ||||||
| Rorze Corp. | 100 | 4,676 | ||||||
| Round One Corp. | 700 | 5,618 | ||||||
| Royal Holdings Co. Ltd. | 200 | 3,475 | ||||||
| Ryobi Ltd. | 100 | 1,115 | ||||||
| Ryohin Keikaku Co. Ltd. | 600 | 9,358 | ||||||
| Ryosan Co. Ltd. | 200 | 3,685 | ||||||
| S Foods, Inc. | 200 | 5,430 | ||||||
| S-Pool, Inc. | 200 | 1,343 | ||||||
Saizeriya Co. Ltd.(1) | 200 | 3,746 | ||||||
| Sakai Moving Service Co. Ltd. | 100 | 4,315 | ||||||
| Sakata INX Corp. | 100 | 918 | ||||||
| Sakata Seed Corp. | 200 | 6,574 | ||||||
| Sakura Internet, Inc. | 200 | 1,149 | ||||||
| Sala Corp. | 200 | 1,090 | ||||||
| San-A Co. Ltd. | 100 | 4,052 | ||||||
| San-Ai Oil Co. Ltd. | 700 | 6,165 | ||||||
| San-In Godo Bank Ltd. (The) | 800 | 3,993 | ||||||
| Sanei Architecture Planning Co. Ltd. | 100 | 1,237 | ||||||
41
| Shares | Value | |||||||
| Sangetsu Corp. | 300 | $ | 4,583 | |||||
| Sanken Electric Co. Ltd. | 300 | 6,180 | ||||||
| Sanki Engineering Co. Ltd. | 100 | 1,068 | ||||||
| Sankyo Co. Ltd. | 200 | 5,510 | ||||||
| Sankyo Tateyama, Inc. | 100 | 864 | ||||||
| Sankyu, Inc. | 300 | 12,510 | ||||||
| Sanoh Industrial Co. Ltd. | 100 | 621 | ||||||
| Santen Pharmaceutical Co. Ltd. | 1,000 | 19,069 | ||||||
| Sanwa Holdings Corp. | 1,000 | 10,041 | ||||||
| Sanyo Chemical Industries Ltd. | 100 | 4,648 | ||||||
| Sapporo Holdings Ltd. | 600 | 10,686 | ||||||
| Sato Holdings Corp. | 100 | 1,906 | ||||||
| Sawada Holdings Co. Ltd. | 200 | 1,657 | ||||||
| Sawai Pharmaceutical Co. Ltd. | 100 | 5,110 | ||||||
| SB Technology Corp. | 200 | 5,831 | ||||||
| SBI Holdings, Inc. | 1,900 | 43,127 | ||||||
| SBS Holdings, Inc. | 100 | 1,920 | ||||||
| SCSK Corp. | 300 | 16,252 | ||||||
| Secom Co. Ltd. | 300 | 28,344 | ||||||
| Sega Sammy Holdings, Inc. | 600 | 6,949 | ||||||
| Seibu Holdings, Inc. | 1,200 | 13,174 | ||||||
| Seikitokyu Kogyo Co. Ltd. | 200 | 1,624 | ||||||
| Seiko Epson Corp. | 1,600 | 19,055 | ||||||
| Seiko Holdings Corp. | 100 | 1,405 | ||||||
| Seino Holdings Co. Ltd. | 900 | 13,756 | ||||||
| Seiren Co. Ltd. | 400 | 5,294 | ||||||
| Sekisui Chemical Co. Ltd. | 1,100 | 17,568 | ||||||
| Sekisui House Ltd. | 2,500 | 49,334 | ||||||
| Sekisui Jushi Corp. | 100 | 2,082 | ||||||
| Senko Group Holdings Co. Ltd. | 700 | 6,193 | ||||||
| Senshu Ikeda Holdings, Inc. | 2,000 | 3,124 | ||||||
| Seria Co. Ltd. | 300 | 13,206 | ||||||
| Seven & i Holdings Co. Ltd. | 2,200 | 71,178 | ||||||
| Seven Bank Ltd. | 2,400 | 6,017 | ||||||
| SG Holdings Co. Ltd. | 500 | 22,967 | ||||||
| Sharp Corp. | 300 | 3,707 | ||||||
| Shibaura Machine Co. Ltd. | 200 | 3,962 | ||||||
| Shibuya Corp. | 100 | 2,801 | ||||||
SHIFT, Inc.(1) | 100 | 11,582 | ||||||
| Shiga Bank Ltd. (The) | 100 | 2,333 | ||||||
| Shikoku Bank Ltd. (The) | 200 | 1,449 | ||||||
| Shikoku Chemicals Corp. | 100 | 1,016 | ||||||
| Shikoku Electric Power Co., Inc. | 900 | 6,837 | ||||||
| Shimachu Co. Ltd. | 100 | 2,796 | ||||||
| Shimadzu Corp. | 300 | 8,945 | ||||||
| Shimamura Co. Ltd. | 100 | 8,241 | ||||||
| Shimano, Inc. | 100 | 21,168 | ||||||
| Shimizu Corp. | 3,100 | 23,699 | ||||||
| Shin Nippon Air Technologies Co. Ltd. | 200 | 3,860 | ||||||
| Shin-Etsu Chemical Co. Ltd. | 500 | 60,414 | ||||||
| Shin-Etsu Polymer Co. Ltd. | 200 | 1,647 | ||||||
| Shinmaywa Industries Ltd. | 500 | 4,406 | ||||||
42
| Shares | Value | |||||||
| Shinnihon Corp. | 200 | $ | 1,574 | |||||
| Shinoken Group Co. Ltd. | 100 | 903 | ||||||
| Shinsei Bank Ltd. | 1,000 | 11,595 | ||||||
| Shionogi & Co. Ltd. | 600 | 33,281 | ||||||
| Ship Healthcare Holdings, Inc. | 500 | 23,070 | ||||||
| Shizuoka Bank Ltd. (The) | 1,800 | 12,488 | ||||||
| Shoei Co. Ltd. | 200 | 6,104 | ||||||
| Showa Denko KK | 1,100 | 21,395 | ||||||
| Showa Sangyo Co. Ltd. | 200 | 6,652 | ||||||
| Sinanen Holdings Co. Ltd. | 200 | 5,578 | ||||||
| Sinko Industries Ltd. | 200 | 2,569 | ||||||
| Sintokogio Ltd. | 200 | 1,331 | ||||||
| SKY Perfect JSAT Holdings, Inc. | 300 | 1,142 | ||||||
| Skylark Holdings Co. Ltd. | 900 | 14,297 | ||||||
| SMC Corp. | 53 | 28,943 | ||||||
| SMS Co. Ltd. | 300 | 8,267 | ||||||
| Sodick Co. Ltd. | 200 | 1,375 | ||||||
| Softbank Corp. | 2,800 | 36,751 | ||||||
| SoftBank Group Corp. | 1,700 | 105,568 | ||||||
| Sohgo Security Services Co. Ltd. | 300 | 14,015 | ||||||
| Sojitz Corp. | 3,000 | 6,863 | ||||||
| Solasto Corp. | 100 | 1,183 | ||||||
| Sompo Holdings, Inc. | 1,000 | 37,355 | ||||||
| Sony Corp., ADR | 2,653 | 208,632 | ||||||
| Sotetsu Holdings, Inc. | 600 | 16,323 | ||||||
| Square Enix Holdings Co. Ltd. | 200 | 13,162 | ||||||
| St. Marc Holdings Co. Ltd. | 300 | 4,599 | ||||||
| Stanley Electric Co. Ltd. | 500 | 14,313 | ||||||
| Starts Corp., Inc. | 200 | 4,182 | ||||||
| Stella Chemifa Corp. | 200 | 4,929 | ||||||
| Strike Co. Ltd. | 100 | 4,492 | ||||||
| Subaru Corp. | 2,500 | 51,752 | ||||||
| Sugi Holdings Co. Ltd. | 300 | 21,651 | ||||||
| SUMCO Corp. | 1,500 | 20,292 | ||||||
| Sumida Corp. | 100 | 608 | ||||||
| Sumitomo Chemical Co. Ltd. | 3,400 | 11,029 | ||||||
| Sumitomo Corp. | 2,000 | 25,882 | ||||||
| Sumitomo Dainippon Pharma Co., Ltd. | 400 | 5,056 | ||||||
| Sumitomo Densetsu Co. Ltd. | 100 | 2,108 | ||||||
| Sumitomo Electric Industries Ltd. | 2,900 | 34,071 | ||||||
| Sumitomo Forestry Co. Ltd. | 1,100 | 17,553 | ||||||
| Sumitomo Heavy Industries Ltd. | 400 | 9,013 | ||||||
| Sumitomo Metal Mining Co. Ltd. | 600 | 18,269 | ||||||
| Sumitomo Mitsui Construction Co. Ltd. | 300 | 1,206 | ||||||
| Sumitomo Mitsui Financial Group, Inc., ADR | 15,317 | 90,064 | ||||||
| Sumitomo Mitsui Trust Holdings, Inc. | 1,100 | 31,799 | ||||||
| Sumitomo Osaka Cement Co. Ltd. | 300 | 9,715 | ||||||
| Sumitomo Realty & Development Co. Ltd. | 1,100 | 32,402 | ||||||
| Sumitomo Riko Co. Ltd. | 200 | 1,032 | ||||||
| Sumitomo Rubber Industries Ltd. | 1,400 | 13,452 | ||||||
| Sumitomo Seika Chemicals Co. Ltd. | 200 | 6,508 | ||||||
| Sumitomo Warehouse Co. Ltd. (The) | 500 | 6,182 | ||||||
43
| Shares | Value | |||||||
| Sundrug Co. Ltd. | 300 | $ | 11,168 | |||||
| Suntory Beverage & Food Ltd. | 500 | 19,267 | ||||||
| Suruga Bank Ltd. | 1,300 | 4,661 | ||||||
| Sushiro Global Holdings Ltd. | 400 | 9,280 | ||||||
| Suzuken Co. Ltd. | 400 | 14,845 | ||||||
| Suzuki Motor Corp. | 1,400 | 57,220 | ||||||
| SWCC Showa Holdings Co. Ltd. | 200 | 2,099 | ||||||
| Sysmex Corp. | 400 | 34,897 | ||||||
| Systena Corp. | 500 | 8,051 | ||||||
| T Hasegawa Co. Ltd. | 200 | 3,993 | ||||||
| T&D Holdings, Inc. | 1,300 | 13,492 | ||||||
| T-Gaia Corp. | 100 | 1,966 | ||||||
| Tadano Ltd. | 200 | 1,633 | ||||||
| Taihei Dengyo Kaisha Ltd. | 100 | 2,083 | ||||||
| Taiheiyo Cement Corp. | 600 | 15,208 | ||||||
| Taikisha Ltd. | 200 | 5,434 | ||||||
| Taiko Pharmaceutical Co. Ltd. | 600 | 14,419 | ||||||
| Taisei Corp. | 1,200 | 41,321 | ||||||
| Taisho Pharmaceutical Holdings Co. Ltd. | 100 | 6,159 | ||||||
| Taiyo Nippon Sanso Corp. | 100 | 1,748 | ||||||
| Taiyo Yuden Co. Ltd. | 900 | 24,188 | ||||||
| Takamatsu Construction Group Co. Ltd. | 100 | 2,087 | ||||||
| Takara Holdings, Inc. | 200 | 1,871 | ||||||
| Takara Leben Co. Ltd. | 1,500 | 4,890 | ||||||
| Takara Standard Co. Ltd. | 100 | 1,259 | ||||||
| Takashimaya Co. Ltd. | 800 | 6,293 | ||||||
Takeda Pharmaceutical Co. Ltd., ADR(1) | 2,193 | 40,812 | ||||||
| Takeei Corp. | 100 | 920 | ||||||
| Takeuchi Manufacturing Co. Ltd. | 400 | 8,374 | ||||||
| Takuma Co. Ltd. | 500 | 8,004 | ||||||
| Tama Home Co. Ltd. | 100 | 1,213 | ||||||
| Tamron Co. Ltd. | 200 | 3,227 | ||||||
| Tamura Corp. | 200 | 976 | ||||||
| Tatsuta Electric Wire and Cable Co. Ltd. | 200 | 1,167 | ||||||
| TDK Corp. | 500 | 51,664 | ||||||
| TechMatrix Corp. | 400 | 8,242 | ||||||
| TechnoPro Holdings, Inc. | 100 | 5,323 | ||||||
| Teijin Ltd. | 1,400 | 21,951 | ||||||
| Teikoku Electric Manufacturing Co. Ltd. | 400 | 4,284 | ||||||
| Teikoku Sen-I Co. Ltd. | 200 | 5,047 | ||||||
| Terumo Corp. | 800 | 32,464 | ||||||
| THK Co. Ltd. | 300 | 6,955 | ||||||
| TIS, Inc. | 900 | 17,957 | ||||||
| TKC Corp. | 100 | 5,602 | ||||||
| Toagosei Co. Ltd. | 200 | 1,957 | ||||||
| Tobu Railway Co. Ltd. | 1,100 | 34,308 | ||||||
| TOC Co. Ltd. | 200 | 1,282 | ||||||
| Tocalo Co. Ltd. | 100 | 1,005 | ||||||
| Toda Corp. | 1,300 | 8,486 | ||||||
| Toho Bank Ltd. (The) | 500 | 1,065 | ||||||
| Toho Co. Ltd. | 300 | 11,396 | ||||||
| Toho Gas Co. Ltd. | 100 | 4,413 | ||||||
44
| Shares | Value | |||||||
| Toho Holdings Co. Ltd. | 300 | $ | 5,794 | |||||
| Toho Titanium Co. Ltd. | 600 | 3,883 | ||||||
| Tohoku Electric Power Co., Inc. | 2,400 | 24,363 | ||||||
| Tokai Carbon Co. Ltd. | 1,300 | 12,181 | ||||||
| Tokai Corp/Gifu | 200 | 3,959 | ||||||
| TOKAI Holdings Corp. | 900 | 8,551 | ||||||
| Tokai Rika Co. Ltd. | 500 | 7,489 | ||||||
| Tokai Tokyo Financial Holdings, Inc. | 1,400 | 3,373 | ||||||
| Token Corp. | 100 | 6,498 | ||||||
| Tokio Marine Holdings, Inc. | 1,100 | 50,647 | ||||||
| Tokuyama Corp. | 500 | 11,670 | ||||||
| Tokyo Century Corp. | 300 | 15,354 | ||||||
| Tokyo Dome Corp. | 800 | 6,041 | ||||||
Tokyo Electric Power Co. Holdings, Inc.(1) | 6,500 | 19,107 | ||||||
| Tokyo Electron Device Ltd. | 200 | 5,623 | ||||||
| Tokyo Electron Ltd. | 300 | 76,485 | ||||||
| Tokyo Gas Co. Ltd. | 600 | 13,351 | ||||||
| Tokyo Ohka Kogyo Co. Ltd. | 100 | 4,882 | ||||||
| Tokyo Seimitsu Co. Ltd. | 200 | 6,098 | ||||||
| Tokyo Steel Manufacturing Co. Ltd. | 200 | 1,339 | ||||||
| Tokyo Tatemono Co. Ltd. | 200 | 2,429 | ||||||
| Tokyotokeiba Co. Ltd. | 200 | 9,247 | ||||||
| Tokyu Construction Co. Ltd. | 200 | 917 | ||||||
| Tokyu Corp. | 2,000 | 26,703 | ||||||
| Tokyu Fudosan Holdings Corp. | 1,500 | 6,434 | ||||||
| TOMONY Holdings, Inc. | 1,400 | 4,471 | ||||||
| Tomy Co. Ltd. | 600 | 4,817 | ||||||
| Topcon Corp. | 700 | 5,620 | ||||||
| Toppan Forms Co. Ltd. | 100 | 905 | ||||||
| Toppan Printing Co. Ltd. | 700 | 10,859 | ||||||
| Topre Corp. | 500 | 5,555 | ||||||
| Toray Industries, Inc. | 3,900 | 18,476 | ||||||
| Toridoll Holdings Corp. | 200 | 2,594 | ||||||
| Torii Pharmaceutical Co. Ltd. | 100 | 2,597 | ||||||
| Tosei Corp. | 100 | 874 | ||||||
| Toshiba Corp. | 500 | 14,379 | ||||||
| Toshiba TEC Corp. | 300 | 12,552 | ||||||
| Tosoh Corp. | 1,800 | 26,672 | ||||||
| Totetsu Kogyo Co. Ltd. | 100 | 2,470 | ||||||
| TOTO Ltd. | 500 | 21,831 | ||||||
| Towa Bank Ltd. (The) | 200 | 1,278 | ||||||
| Towa Pharmaceutical Co. Ltd. | 100 | 1,981 | ||||||
| Toyo Construction Co. Ltd. | 700 | 2,657 | ||||||
| Toyo Gosei Co. Ltd. | 100 | 7,285 | ||||||
| Toyo Ink SC Holdings Co. Ltd. | 200 | 3,501 | ||||||
| Toyo Seikan Group Holdings Ltd. | 1,000 | 11,042 | ||||||
| Toyo Suisan Kaisha Ltd. | 200 | 11,356 | ||||||
| Toyo Tire Corp. | 900 | 14,962 | ||||||
| Toyobo Co. Ltd. | 900 | 12,959 | ||||||
| Toyoda Gosei Co. Ltd. | 500 | 10,891 | ||||||
| Toyota Boshoku Corp. | 600 | 8,490 | ||||||
| Toyota Industries Corp. | 400 | 23,279 | ||||||
45
| Shares | Value | |||||||
| Toyota Motor Corp., ADR | 2,270 | $ | 300,616 | |||||
| Toyota Tsusho Corp. | 500 | 14,390 | ||||||
| TPR Co. Ltd. | 200 | 2,666 | ||||||
| Transcosmos, Inc. | 200 | 5,446 | ||||||
| Trend Micro, Inc. | 600 | 37,078 | ||||||
| Tri Chemical Laboratories, Inc. | 100 | 9,148 | ||||||
| TS Tech Co. Ltd. | 300 | 8,776 | ||||||
| Tsubakimoto Chain Co. | 100 | 2,322 | ||||||
| Tsukishima Kikai Co. Ltd. | 500 | 5,913 | ||||||
| Tsukui Corp. | 200 | 1,165 | ||||||
| Tsumura & Co. | 200 | 5,674 | ||||||
| Tsuruha Holdings, Inc. | 200 | 26,706 | ||||||
| UACJ Corp. | 500 | 9,135 | ||||||
| Ube Industries Ltd. | 900 | 16,055 | ||||||
| Uchida Yoko Co. Ltd. | 200 | 11,851 | ||||||
| Ulvac, Inc. | 200 | 7,092 | ||||||
| Unicharm Corp. | 500 | 21,784 | ||||||
| Unipres Corp. | 100 | 866 | ||||||
| United Super Markets Holdings, Inc. | 200 | 2,349 | ||||||
Universal Entertainment Corp.(1) | 100 | 1,960 | ||||||
| Ushio, Inc. | 500 | 6,172 | ||||||
| USS Co. Ltd. | 400 | 6,747 | ||||||
UT Group Co. Ltd.(1) | 200 | 5,910 | ||||||
| Valor Holdings Co. Ltd. | 300 | 7,669 | ||||||
| ValueCommerce Co. Ltd. | 200 | 6,647 | ||||||
| Vital KSK Holdings, Inc. | 400 | 4,039 | ||||||
| VT Holdings Co. Ltd. | 300 | 1,102 | ||||||
| Wacoal Holdings Corp. | 200 | 3,551 | ||||||
| Wacom Co. Ltd. | 1,800 | 11,773 | ||||||
| Wakita & Co. Ltd. | 600 | 5,309 | ||||||
| Welcia Holdings Co. Ltd. | 400 | 17,127 | ||||||
| West Japan Railway Co. | 500 | 26,176 | ||||||
| World Co. Ltd. | 100 | 1,463 | ||||||
| Wowow, Inc. | 200 | 5,103 | ||||||
| Yahagi Construction Co. Ltd. | 400 | 3,420 | ||||||
| Yakult Honsha Co. Ltd. | 200 | 11,416 | ||||||
| YAKUODO Holdings Co. Ltd. | 200 | 4,757 | ||||||
| YAMABIKO Corp. | 100 | 1,017 | ||||||
| Yamada Denki Co. Ltd. | 1,700 | 9,115 | ||||||
| Yamaguchi Financial Group, Inc. | 1,300 | 8,542 | ||||||
| Yamaha Corp. | 700 | 34,051 | ||||||
| Yamaha Motor Co. Ltd. | 1,300 | 20,415 | ||||||
| Yamaichi Electronics Co. Ltd. | 100 | 1,285 | ||||||
| Yamato Corp. | 200 | 1,179 | ||||||
| Yamato Holdings Co. Ltd. | 900 | 23,504 | ||||||
| Yamato Kogyo Co. Ltd. | 200 | 4,748 | ||||||
| Yamazaki Baking Co. Ltd. | 700 | 11,402 | ||||||
| Yamazen Corp. | 200 | 1,879 | ||||||
| Yaoko Co. Ltd. | 200 | 15,626 | ||||||
| Yaskawa Electric Corp. | 100 | 3,589 | ||||||
| Yellow Hat Ltd. | 100 | 1,646 | ||||||
| Yodogawa Steel Works Ltd. | 200 | 3,478 | ||||||
46
| Shares | Value | |||||||
| Yokogawa Bridge Holdings Corp. | 100 | $ | 1,806 | |||||
| Yokogawa Electric Corp. | 600 | 9,778 | ||||||
| Yokohama Reito Co. Ltd. | 700 | 5,951 | ||||||
| Yokohama Rubber Co. Ltd. (The) | 700 | 10,932 | ||||||
| Yokowo Co. Ltd. | 200 | 5,027 | ||||||
| Yorozu Corp. | 100 | 881 | ||||||
| Yoshinoya Holdings Co. Ltd. | 600 | 11,861 | ||||||
| Yotai Refractories Co. Ltd. | 200 | 1,327 | ||||||
| Yuasa Trading Co. Ltd. | 100 | 2,900 | ||||||
| Yumeshin Holdings Co. Ltd. | 200 | 1,278 | ||||||
| Yurtec Corp. | 200 | 1,197 | ||||||
| Z Holdings Corp. | 8,700 | 57,732 | ||||||
| Zenkoku Hosho Co. Ltd. | 500 | 17,668 | ||||||
| Zensho Holdings Co. Ltd. | 600 | 13,502 | ||||||
| Zeon Corp. | 200 | 2,088 | ||||||
| ZERIA Pharmaceutical Co. Ltd. | 200 | 3,692 | ||||||
| ZOZO, Inc. | 400 | 11,243 | ||||||
| 11,543,882 | ||||||||
| Netherlands — 3.6% | ||||||||
| Aalberts NV | 418 | 15,769 | ||||||
| ABN AMRO Bank NV, CVA | 1,545 | 14,714 | ||||||
Accell Group NV(1) | 69 | 2,059 | ||||||
Adyen NV(1) | 65 | 109,583 | ||||||
| Aegon NV | 9,157 | 25,090 | ||||||
AerCap Holdings NV(1) | 915 | 27,057 | ||||||
| Akzo Nobel NV | 886 | 87,675 | ||||||
Alfen Beheer BV(1) | 179 | 12,984 | ||||||
Altice Europe NV(1) | 1,031 | 4,570 | ||||||
AMG Advanced Metallurgical Group NV(2) | 381 | 7,822 | ||||||
Arcadis NV(1) | 522 | 11,983 | ||||||
| ASM International NV | 329 | 49,459 | ||||||
| ASML Holding NV, (New York) | 668 | 249,952 | ||||||
| ASR Nederland NV | 786 | 27,242 | ||||||
Basic-Fit NV(1) | 334 | 9,395 | ||||||
| BE Semiconductor Industries NV | 737 | 35,215 | ||||||
Boskalis Westminster(1) | 617 | 12,927 | ||||||
| Coca-Cola European Partners plc | 1,266 | 52,109 | ||||||
| Corbion NV | 582 | 26,938 | ||||||
Flow Traders(2) | 404 | 15,912 | ||||||
| ForFarmers NV | 632 | 4,079 | ||||||
Fugro NV, CVA(1)(2) | 1,166 | 4,979 | ||||||
| Heineken Holding NV | 62 | 5,084 | ||||||
| Heineken NV | 471 | 43,635 | ||||||
| IMCD NV | 81 | 8,644 | ||||||
| ING Groep NV, ADR | 11,294 | 91,368 | ||||||
Just Eat Takeaway.com NV(1) | 95 | 10,568 | ||||||
Kendrion NV(1) | 45 | 711 | ||||||
| Koninklijke Ahold Delhaize NV | 5,312 | 159,980 | ||||||
Koninklijke BAM Groep NV(1) | 2,679 | 4,125 | ||||||
| Koninklijke DSM NV, ADR | 2,632 | 105,852 | ||||||
| Koninklijke KPN NV | 29,204 | 76,616 | ||||||
Koninklijke Philips NV(1) | 1,088 | 51,669 | ||||||
47
| Shares | Value | |||||||
| Koninklijke Vopak NV | 513 | $ | 28,171 | |||||
Nederland Apparatenfabriek(1) | 19 | 998 | ||||||
NIBC Holding NV(1) | 506 | 4,462 | ||||||
| NN Group NV | 1,982 | 74,605 | ||||||
OCI NV(1) | 591 | 8,032 | ||||||
Pharming Group NV(1)(2) | 6,312 | 7,994 | ||||||
| PostNL NV | 483 | 1,438 | ||||||
Prosus NV(1) | 468 | 46,814 | ||||||
| Randstad NV | 757 | 39,423 | ||||||
| SBM Offshore NV | 1,193 | 20,648 | ||||||
Signify NV(1) | 919 | 30,676 | ||||||
| TKH Group NV, CVA | 291 | 11,404 | ||||||
TomTom NV(1) | 753 | 6,049 | ||||||
| Unilever NV, (New York) | 2,896 | 167,968 | ||||||
Wolters Kluwer NV(2) | 401 | 32,919 | ||||||
| 1,847,366 | ||||||||
| New Zealand — 0.4% | ||||||||
a2 Milk Co. Ltd.(1) | 1,826 | 22,801 | ||||||
| Air New Zealand Ltd. | 4,184 | 3,919 | ||||||
| Arvida Group Ltd. | 960 | 1,045 | ||||||
| Auckland International Airport Ltd. | 1,633 | 7,268 | ||||||
| Chorus Ltd. | 2,721 | 15,504 | ||||||
| Contact Energy Ltd. | 1,579 | 6,630 | ||||||
| Fisher & Paykel Healthcare Corp. Ltd. | 651 | 16,137 | ||||||
Fletcher Building Ltd.(1) | 3,632 | 8,732 | ||||||
| Genesis Energy Ltd. | 552 | 1,121 | ||||||
| Hallenstein Glasson Holdings Ltd. | 237 | 722 | ||||||
| Infratil Ltd. | 578 | 1,927 | ||||||
| Kathmandu Holdings Ltd. | 507 | 421 | ||||||
| Mercury NZ Ltd. | 1,963 | 6,847 | ||||||
| Meridian Energy Ltd. | 2,645 | 9,048 | ||||||
| Metlifecare Ltd. | 271 | 1,084 | ||||||
| New Zealand Refining Co. Ltd. (The) | 788 | 350 | ||||||
| NZX Ltd. | 2,074 | 2,260 | ||||||
| Oceania Healthcare Ltd. | 10,328 | 7,212 | ||||||
Pushpay Holdings Ltd.(1) | 1,552 | 9,121 | ||||||
| Ryman Healthcare Ltd. | 931 | 8,416 | ||||||
| Sanford Ltd. | 585 | 2,270 | ||||||
| Scales Corp. Ltd. | 162 | 534 | ||||||
| SKYCITY Entertainment Group Ltd. | 4,175 | 7,141 | ||||||
| Spark New Zealand Ltd. | 7,379 | 23,998 | ||||||
| Summerset Group Holdings Ltd. | 1,675 | 9,734 | ||||||
Synlait Milk Ltd.(1) | 167 | 715 | ||||||
| Z Energy Ltd. | 2,828 | 5,111 | ||||||
| 180,068 | ||||||||
| Norway — 0.7% | ||||||||
Adevinta ASA(1) | 508 | 9,472 | ||||||
| Aker BP ASA | 462 | 9,160 | ||||||
Atea ASA(1) | 72 | 842 | ||||||
| Austevoll Seafood ASA | 108 | 996 | ||||||
Avance Gas Holding Ltd.(2) | 187 | 449 | ||||||
Bakkafrost P/F(1) | 34 | 2,127 | ||||||
48
| Shares | Value | |||||||
| Borregaard ASA | 682 | $ | 9,930 | |||||
Bouvet ASA(2) | 26 | 1,732 | ||||||
BW Energy Ltd.(1) | 49 | 115 | ||||||
| BW LPG Ltd. | 1,378 | 6,421 | ||||||
| BW Offshore Ltd. | 245 | 946 | ||||||
DNB ASA(1) | 1,495 | 23,923 | ||||||
DNO ASA(2) | 928 | 585 | ||||||
| Elkem ASA | 2,800 | 5,762 | ||||||
| Entra ASA | 98 | 1,339 | ||||||
| Equinor ASA, ADR | 1,903 | 30,543 | ||||||
| Europris ASA | 1,242 | 6,255 | ||||||
| Fjordkraft Holding ASA | 637 | 6,806 | ||||||
| Frontline Ltd. | 857 | 6,822 | ||||||
Gjensidige Forsikring ASA(1) | 310 | 6,598 | ||||||
| Golden Ocean Group Ltd. | 201 | 822 | ||||||
| Grieg Seafood ASA | 515 | 5,216 | ||||||
| Kongsberg Gruppen ASA | 294 | 4,362 | ||||||
| Leroy Seafood Group ASA | 821 | 5,183 | ||||||
Mowi ASA(2) | 1,218 | 23,778 | ||||||
Nordic Semiconductor ASA(1) | 634 | 6,501 | ||||||
Norsk Hydro ASA(1) | 6,378 | 20,316 | ||||||
| Norway Royal Salmon ASA | 39 | 987 | ||||||
Norwegian Finans Holding ASA(1) | 1,247 | 9,425 | ||||||
Odfjell Drilling Ltd.(1)(2) | 354 | 469 | ||||||
| Orkla ASA | 1,053 | 10,715 | ||||||
PGS ASA(1) | 1,017 | 377 | ||||||
Salmar ASA(1) | 167 | 9,037 | ||||||
Sbanken ASA(1) | 858 | 6,611 | ||||||
| Scatec Solar ASA | 510 | 11,065 | ||||||
Schibsted ASA, B Shares(1) | 39 | 1,545 | ||||||
| Selvaag Bolig ASA | 147 | 895 | ||||||
| SpareBank 1 Nord Norge | 924 | 7,112 | ||||||
| Sparebank 1 Oestlandet | 104 | 1,059 | ||||||
| SpareBank 1 SMN | 767 | 7,627 | ||||||
SpareBank 1 SR-Bank ASA(1) | 788 | 7,083 | ||||||
| Sparebanken More | 30 | 1,023 | ||||||
| Sparebanken Vest | 955 | 7,101 | ||||||
| Stolt-Nielsen Ltd. | 82 | 802 | ||||||
Storebrand ASA(1) | 1,675 | 10,264 | ||||||
Subsea 7 SA(1) | 1,267 | 10,222 | ||||||
| Telenor ASA | 952 | 15,476 | ||||||
| TGS Nopec Geophysical Co. ASA | 612 | 7,934 | ||||||
TOMRA Systems ASA(1) | 354 | 17,152 | ||||||
Veidekke ASA(1) | 669 | 8,999 | ||||||
| Yara International ASA | 445 | 18,630 | ||||||
| 368,611 | ||||||||
| Portugal — 0.2% | ||||||||
| Altri SGPS SA | 612 | 3,059 | ||||||
Banco Comercial Portugues SA, R Shares(1)(2) | 47,877 | 5,635 | ||||||
CTT-Correios de Portugal SA(1) | 1,350 | 4,197 | ||||||
| EDP - Energias de Portugal SA | 4,786 | 24,243 | ||||||
| Galp Energia SGPS SA | 1,659 | 17,752 | ||||||
49
| Shares | Value | |||||||
| Jeronimo Martins SGPS SA | 584 | $ | 9,583 | |||||
| NOS SGPS SA | 979 | 3,956 | ||||||
| REN - Redes Energeticas Nacionais SGPS SA | 4,262 | 12,356 | ||||||
| Sonae SGPS SA | 1,952 | 1,390 | ||||||
| 82,171 | ||||||||
| Singapore — 1.0% | ||||||||
| Accordia Golf Trust | 11,900 | 6,326 | ||||||
| AEM Holdings Ltd. | 4,500 | 13,197 | ||||||
| Ascendas India Trust | 4,700 | 4,607 | ||||||
| CapitaLand Ltd. | 10,100 | 20,461 | ||||||
| Chip Eng Seng Corp. Ltd. | 8,400 | 2,775 | ||||||
| City Developments Ltd. | 2,500 | 14,724 | ||||||
| ComfortDelGro Corp. Ltd. | 12,200 | 13,200 | ||||||
| DBS Group Holdings Ltd. | 4,152 | 63,536 | ||||||
| Far East Orchard Ltd. | 3,900 | 2,779 | ||||||
| Frencken Group Ltd. | 6,300 | 4,332 | ||||||
| Fu Yu Corp. Ltd. | 17,800 | 3,260 | ||||||
| Golden Agri-Resources Ltd. | 40,800 | 4,336 | ||||||
| GuocoLand Ltd. | 800 | 857 | ||||||
| Hour Glass Ltd. (The) | 1,700 | 880 | ||||||
| Hutchison Port Holdings Trust, U Shares | 74,900 | 7,909 | ||||||
| Japfa Ltd. | 10,400 | 4,753 | ||||||
| Jardine Cycle & Carriage Ltd. | 500 | 6,939 | ||||||
| Keppel Corp. Ltd. | 6,000 | 20,172 | ||||||
| Keppel Infrastructure Trust | 10,900 | 4,361 | ||||||
| NetLink NBN Trust | 1,500 | 1,068 | ||||||
| OUE Ltd. | 1,000 | 876 | ||||||
| Oversea-Chinese Banking Corp. Ltd. | 6,100 | 38,809 | ||||||
| QAF Ltd. | 5,200 | 3,514 | ||||||
| Raffles Medical Group Ltd. | 9,500 | 5,713 | ||||||
Rex International Holding Ltd.(1) | 7,900 | 959 | ||||||
SATS Ltd.(2) | 300 | 660 | ||||||
| Sembcorp Industries Ltd. | 8,900 | 12,176 | ||||||
Sembcorp Marine Ltd.(1) | 8,300 | 1,244 | ||||||
| Sheng Siong Group Ltd. | 5,700 | 7,346 | ||||||
| Singapore Airlines Ltd. | 5,000 | 13,352 | ||||||
| Singapore Exchange Ltd. | 2,800 | 17,662 | ||||||
| Singapore Post Ltd. | 4,500 | 2,310 | ||||||
Singapore Press Holdings Ltd.(2) | 13,100 | 10,483 | ||||||
| Singapore Technologies Engineering Ltd. | 12,900 | 32,134 | ||||||
| Singapore Telecommunications Ltd. | 20,000 | 33,701 | ||||||
| StarHub Ltd. | 4,500 | 4,028 | ||||||
| UMS Holdings Ltd. | 1,600 | 1,158 | ||||||
| United Overseas Bank Ltd. | 3,600 | 51,673 | ||||||
| UOL Group Ltd. | 3,400 | 16,396 | ||||||
| Venture Corp. Ltd. | 500 | 7,264 | ||||||
| Wilmar International Ltd. | 10,400 | 33,191 | ||||||
| Wing Tai Holdings Ltd. | 4,300 | 5,430 | ||||||
| Yangzijiang Shipbuilding Holdings Ltd. | 32,800 | 22,024 | ||||||
| Yanlord Land Group Ltd. | 8,800 | 7,796 | ||||||
| 530,371 | ||||||||
50
| Shares | Value | |||||||
| Spain — 2.0% | ||||||||
Acciona SA(2) | 193 | $ | 23,103 | |||||
Acerinox SA(1) | 1,044 | 8,451 | ||||||
| ACS Actividades de Construccion y Servicios SA | 2,202 | 54,016 | ||||||
Aena SME SA(1) | 250 | 37,367 | ||||||
Almirall SA(1) | 439 | 4,826 | ||||||
| Amadeus IT Group SA | 810 | 45,720 | ||||||
Applus Services SA(1) | 732 | 6,026 | ||||||
| Banco Bilbao Vizcaya Argentaria SA, ADR | 25,912 | 74,886 | ||||||
| Banco de Sabadell SA | 17,065 | 6,976 | ||||||
Banco Santander SA, ADR(1) | 24,470 | 54,568 | ||||||
| Bankia SA | 5,355 | 6,809 | ||||||
| Bankinter SA | 3,327 | 18,017 | ||||||
| CaixaBank SA | 14,347 | 31,804 | ||||||
| Cellnex Telecom SA | 335 | 21,450 | ||||||
| Cia de Distribucion Integral Logista Holdings SA | 44 | 781 | ||||||
| CIE Automotive SA | 246 | 4,253 | ||||||
Construcciones y Auxiliar de Ferrocarriles SA(1) | 134 | 4,818 | ||||||
| Ebro Foods SA | 287 | 7,042 | ||||||
| Enagas SA | 1,589 | 38,888 | ||||||
| Ence Energia y Celulosa SA | 1,443 | 4,630 | ||||||
| Endesa SA | 1,123 | 31,156 | ||||||
| Ercros SA | 385 | 970 | ||||||
| Faes Farma SA | 1,847 | 7,307 | ||||||
| Ferrovial SA | 1,118 | 29,898 | ||||||
| Fomento de Construcciones y Contratas SA | 466 | 4,562 | ||||||
| Gestamp Automocion SA | 1,752 | 4,690 | ||||||
| Grifols SA | 122 | 3,309 | ||||||
| Grupo Catalana Occidente SA | 262 | 6,797 | ||||||
| Iberdrola SA | 10,734 | 135,273 | ||||||
| Industria de Diseno Textil SA | 2,325 | 65,296 | ||||||
Liberbank SA(1) | 2,918 | 787 | ||||||
| Mapfre SA | 2,977 | 5,638 | ||||||
Masmovil Ibercom SA(1) | 559 | 14,969 | ||||||
Mediaset Espana Comunicacion SA(1) | 1,081 | 3,594 | ||||||
Melia Hotels International SA(1) | 378 | 1,582 | ||||||
| Miquel y Costas & Miquel SA | 58 | 816 | ||||||
Naturgy Energy Group SA(2) | 1,284 | 24,766 | ||||||
Neinor Homes SA(1) | 540 | 7,255 | ||||||
| Pharma Mar SA | 50 | 5,086 | ||||||
| Prosegur Cash SA | 3,818 | 3,166 | ||||||
| Prosegur Cia de Seguridad SA | 2,790 | 6,764 | ||||||
| Red Electrica Corp. SA | 3,279 | 62,715 | ||||||
| Repsol SA | 6,436 | 50,818 | ||||||
| Sacyr SA | 4,238 | 9,624 | ||||||
| Siemens Gamesa Renewable Energy SA | 400 | 10,748 | ||||||
Solaria Energia y Medio Ambiente SA(1) | 705 | 14,397 | ||||||
Talgo SA(1) | 319 | 1,455 | ||||||
Tecnicas Reunidas SA(1)(2) | 508 | 6,488 | ||||||
| Telefonica SA, ADR | 5,600 | 22,120 | ||||||
Tubacex SA(1)(2) | 322 | 464 | ||||||
Unicaja Banco SA(1) | 1,492 | 1,073 | ||||||
51
| Shares | Value | |||||||
| Viscofan SA | 341 | $ | 25,240 | |||||
| Zardoya Otis SA | 674 | 4,684 | ||||||
| 1,027,938 | ||||||||
| Sweden — 3.5% | ||||||||
AAK AB(1) | 416 | 8,246 | ||||||
| AcadeMedia AB | 673 | 5,661 | ||||||
| AddTech AB, B Shares | 116 | 6,007 | ||||||
AF POYRY AB(1) | 464 | 12,938 | ||||||
Alfa Laval AB(1) | 1,011 | 24,690 | ||||||
| Alimak Group AB | 274 | 3,881 | ||||||
Amasten Fastighets AB(1) | 1,158 | 980 | ||||||
| Arjo AB, B Shares | 2,424 | 14,419 | ||||||
| Assa Abloy AB, B Shares | 808 | 18,695 | ||||||
| Atlas Copco AB, Class A ADR | 1,521 | 70,605 | ||||||
| Atlas Copco AB, B Shares | 846 | 33,945 | ||||||
| Atrium Ljungberg AB, B Shares | 56 | 800 | ||||||
| Avanza Bank Holding AB | 925 | 18,257 | ||||||
| Axfood AB | 660 | 14,594 | ||||||
| Beijer Ref AB | 384 | 15,268 | ||||||
Bilia AB, A Shares(1) | 790 | 9,357 | ||||||
| BillerudKorsnas AB | 1,065 | 17,913 | ||||||
BioArctic AB(1) | 99 | 1,041 | ||||||
| BioGaia AB, B Shares | 118 | 7,745 | ||||||
| Boliden AB | 1,577 | 47,094 | ||||||
| Bonava AB, B Shares | 824 | 5,861 | ||||||
Bravida Holding AB(1) | 855 | 10,119 | ||||||
| Bure Equity AB | 775 | 23,906 | ||||||
| Castellum AB | 464 | 9,491 | ||||||
| Catena AB | 162 | 6,619 | ||||||
| Cibus Nordic Real Estate AB | 262 | 4,602 | ||||||
| Clas Ohlson AB, B Shares | 579 | 6,717 | ||||||
Cloetta AB, B Shares(1) | 1,689 | 4,712 | ||||||
| Dios Fastigheter AB | 130 | 839 | ||||||
Dometic Group AB(1) | 104 | 1,278 | ||||||
| Electrolux AB, Series B | 1,180 | 25,598 | ||||||
Electrolux Professional AB, B Shares(1) | 395 | 1,748 | ||||||
Elekta AB, B Shares(2) | 625 | 7,831 | ||||||
Eltel AB(1) | 1,494 | 3,626 | ||||||
Embracer Group AB(1) | 598 | 11,746 | ||||||
Eolus Vind AB, B Shares(2) | 472 | 8,376 | ||||||
| Epiroc AB, A Shares | 2,631 | 39,205 | ||||||
| Epiroc AB, B Shares | 1,825 | 26,263 | ||||||
| EQT AB | 319 | 5,878 | ||||||
Essity AB, B Shares(1) | 1,632 | 56,179 | ||||||
| Fabege AB | 797 | 9,714 | ||||||
Fastighets AB Balder, B Shares(1) | 263 | 10,473 | ||||||
| Fortnox AB | 374 | 13,011 | ||||||
| Getinge AB, B Shares | 345 | 7,665 | ||||||
Granges AB(1) | 835 | 7,433 | ||||||
| Hennes & Mauritz AB, B Shares | 1,761 | 28,120 | ||||||
Hexagon AB, B Shares(1) | 594 | 43,069 | ||||||
Hexpol AB(1) | 938 | 7,746 | ||||||
52
| Shares | Value | |||||||
HIQ International AB(1) | 954 | $ | 7,763 | |||||
HMS Networks AB(1) | 126 | 3,206 | ||||||
Hoist Finance AB(1) | 298 | 1,058 | ||||||
Holmen AB, B Shares(1) | 256 | 9,115 | ||||||
| Hufvudstaden AB, A Shares | 383 | 4,745 | ||||||
| Husqvarna AB, B Shares | 2,710 | 29,428 | ||||||
| ICA Gruppen AB | 153 | 7,507 | ||||||
Indutrade AB(1) | 317 | 16,687 | ||||||
| Internationella Engelska Skolan i Sverige Holding II AB | 499 | 4,453 | ||||||
| Investment AB Latour, B Shares | 184 | 4,103 | ||||||
| INVISIO AB | 463 | 8,113 | ||||||
Inwido AB(1) | 628 | 6,229 | ||||||
| JM AB | 56 | 1,709 | ||||||
Karo Pharma AB(1) | 252 | 1,849 | ||||||
| Klovern AB, B Shares | 3,754 | 5,775 | ||||||
| Kopparbergs Bryggeri AB, B Shares | 56 | 1,237 | ||||||
| Kungsleden AB | 767 | 6,065 | ||||||
| Lifco AB, B Shares | 157 | 12,482 | ||||||
Lime Technologies AB(2) | 93 | 3,497 | ||||||
| Lindab International AB | 778 | 12,489 | ||||||
Loomis AB(1) | 416 | 10,458 | ||||||
| Lundin Energy AB | 263 | 6,423 | ||||||
Mekonomen AB(1) | 117 | 1,250 | ||||||
| Millicom International Cellular SA, SDR | 259 | 7,688 | ||||||
| MIPS AB | 195 | 7,811 | ||||||
Modern Times Group MTG AB, B Shares(1) | 956 | 13,047 | ||||||
Munters Group AB(1) | 204 | 1,535 | ||||||
| Mycronic AB | 537 | 12,219 | ||||||
| NCC AB, B Shares | 607 | 10,929 | ||||||
NetEnt AB(1) | 995 | 9,554 | ||||||
Nibe Industrier AB, B Shares(1) | 1,404 | 39,478 | ||||||
Nobia AB(1) | 1,165 | 7,496 | ||||||
Nobina AB(1) | 994 | 6,013 | ||||||
Nolato AB, B Shares(1) | 203 | 19,777 | ||||||
Nordea Bank Abp(1) | 7,588 | 61,158 | ||||||
Nordic Entertainment Group AB, B Shares(1) | 422 | 17,597 | ||||||
Nordic Waterproofing Holding AS(1) | 311 | 4,244 | ||||||
| NP3 Fastigheter AB | 89 | 1,050 | ||||||
Nyfosa AB(1) | 1,109 | 8,006 | ||||||
Pandox AB(1) | 470 | 5,347 | ||||||
| Paradox Interactive AB | 279 | 7,473 | ||||||
Peab AB, Class B(1) | 759 | 7,419 | ||||||
RaySearch Laboratories AB(1) | 89 | 998 | ||||||
Recipharm AB, B Shares(1) | 436 | 7,512 | ||||||
| Resurs Holding AB | 903 | 4,685 | ||||||
Saab AB, B Shares(1) | 109 | 3,274 | ||||||
Samhallsbyggnadsbolaget i Norden AB(2) | 2,935 | 8,161 | ||||||
Sandvik AB(1) | 3,212 | 62,998 | ||||||
SAS AB(1)(2) | 644 | 484 | ||||||
Scandi Standard AB(1) | 736 | 6,368 | ||||||
Scandic Hotels Group AB(2) | 200 | 695 | ||||||
Securitas AB, B Shares(1) | 514 | 7,325 | ||||||
53
| Shares | Value | |||||||
Sinch AB(1) | 66 | $ | 6,695 | |||||
Skandinaviska Enskilda Banken AB, A Shares(1) | 5,123 | 50,824 | ||||||
Skanska AB, B Shares(1) | 795 | 16,211 | ||||||
| SKF AB, B Shares | 1,710 | 34,103 | ||||||
| SkiStar AB | 525 | 6,313 | ||||||
Spotify Technology SA(1) | 155 | 43,735 | ||||||
SSAB AB, A Shares(1) | 1,528 | 4,988 | ||||||
SSAB AB, B Shares(1) | 4,117 | 12,712 | ||||||
Stillfront Group AB(1) | 158 | 16,998 | ||||||
Svenska Cellulosa AB SCA, B Shares(1) | 1,510 | 19,474 | ||||||
Svenska Handelsbanken AB, A Shares(1) | 4,451 | 44,750 | ||||||
| Sweco AB, B Shares | 56 | 3,456 | ||||||
Swedbank AB, A Shares(1) | 3,405 | 57,763 | ||||||
Swedish Orphan Biovitrum AB(1) | 423 | 9,483 | ||||||
| Tele2 AB, B Shares | 267 | 3,782 | ||||||
| Telefonaktiebolaget LM Ericsson, ADR | 6,735 | 78,463 | ||||||
| Telia Co. AB | 4,994 | 19,242 | ||||||
| Tethys Oil AB | 134 | 735 | ||||||
| Thule Group AB | 297 | 9,376 | ||||||
Trelleborg AB, B Shares(1) | 1,045 | 18,217 | ||||||
| Troax Group AB | 287 | 5,572 | ||||||
| Vitec Software Group AB, B Shares | 386 | 13,393 | ||||||
Vitrolife AB(1) | 318 | 8,545 | ||||||
Volvo AB, B Shares(1) | 1,961 | 37,509 | ||||||
| Wallenstam AB, B Shares | 557 | 7,296 | ||||||
| Wihlborgs Fastigheter AB | 591 | 9,454 | ||||||
| 1,775,032 | ||||||||
| Switzerland — 8.7% | ||||||||
| ABB Ltd., ADR | 2,007 | 51,178 | ||||||
| Adecco Group AG | 603 | 31,499 | ||||||
Alcon, Inc.(1) | 795 | 45,142 | ||||||
| Allreal Holding AG | 84 | 17,391 | ||||||
ALSO Holding AG(1) | 53 | 14,272 | ||||||
Aluflexpack AG(1) | 50 | 1,439 | ||||||
ams AG(1) | 1,577 | 27,886 | ||||||
APG SGA SA(1) | 4 | 819 | ||||||
Arbonia AG(1) | 387 | 5,074 | ||||||
Aryzta AG(1) | 998 | 714 | ||||||
Autoneum Holding AG(1) | 35 | 4,205 | ||||||
| Bachem Holding AG, Class B | 18 | 7,595 | ||||||
| Baloise Holding AG | 191 | 29,725 | ||||||
| Banque Cantonale Vaudoise | 176 | 18,802 | ||||||
| Barry Callebaut AG | 11 | 24,330 | ||||||
| Belimo Holding AG | 2 | 17,470 | ||||||
| Bell Food Group AG | 17 | 4,372 | ||||||
| BKW AG | 65 | 6,367 | ||||||
| Bobst Group SA | 90 | 5,827 | ||||||
| Bossard Holding AG, Class A | 40 | 7,084 | ||||||
| Bucher Industries AG | 43 | 16,089 | ||||||
| Burkhalter Holding AG | 46 | 3,029 | ||||||
| Cembra Money Bank AG | 180 | 21,457 | ||||||
| Chocoladefabriken Lindt & Spruengli AG, Participation Ceritificate | 5 | 42,583 | ||||||
54
| Shares | Value | |||||||
| Cie Financiere Richemont SA | 1,046 | $ | 69,264 | |||||
| Clariant AG | 1,780 | 36,999 | ||||||
| Comet Holding AG | 69 | 10,833 | ||||||
| Conzzeta AG | 9 | 9,357 | ||||||
| Credit Suisse Group AG, ADR | 7,077 | 77,635 | ||||||
| Daetwyler Holding AG | 76 | 17,732 | ||||||
| DKSH Holding AG | 215 | 14,404 | ||||||
dormakaba Holding AG(1) | 20 | 12,932 | ||||||
Dufry AG(1) | 163 | 4,893 | ||||||
EFG International AG(1) | 847 | 5,836 | ||||||
| Emmi AG | 11 | 11,289 | ||||||
| EMS-Chemie Holding AG | 39 | 35,167 | ||||||
Evolva Holding SA(1) | 11,416 | 3,058 | ||||||
Flughafen Zurich AG(1) | 104 | 15,641 | ||||||
| Forbo Holding AG | 10 | 16,530 | ||||||
| Galenica AG | 191 | 13,710 | ||||||
GAM Holding AG(1) | 1,436 | 3,518 | ||||||
| Geberit AG | 130 | 74,839 | ||||||
| Georg Fischer AG | 25 | 24,862 | ||||||
| Givaudan SA | 21 | 88,118 | ||||||
| Gurit Holding AG | 6 | 11,294 | ||||||
| Helvetia Holding AG | 108 | 10,154 | ||||||
| Huber + Suhner AG | 125 | 9,662 | ||||||
| Implenia AG | 101 | 3,481 | ||||||
Ina Invest Holding AG(1) | 20 | 427 | ||||||
| Inficon Holding AG | 14 | 11,976 | ||||||
| Interroll Holding AG | 8 | 21,411 | ||||||
| Intershop Holding AG | 7 | 4,437 | ||||||
| Julius Baer Group Ltd. | 953 | 45,624 | ||||||
| Kardex Holding AG | 96 | 19,864 | ||||||
Komax Holding AG(1) | 7 | 1,182 | ||||||
Kuehne + Nagel International AG(1) | 212 | 41,038 | ||||||
LafargeHolcim Ltd.(1) | 1,384 | 65,627 | ||||||
Landis+Gyr Group AG(1) | 94 | 5,680 | ||||||
| LEM Holding SA | 2 | 3,566 | ||||||
Leonteq AG(1) | 78 | 3,113 | ||||||
| Liechtensteinische Landesbank AG | 79 | 5,190 | ||||||
| Logitech International SA | 538 | 39,736 | ||||||
| Lonza Group AG | 173 | 107,195 | ||||||
Medacta Group SA(1) | 74 | 7,014 | ||||||
| Mobilezone Holding AG | 498 | 5,374 | ||||||
Mobimo Holding AG(1) | 39 | 11,451 | ||||||
Molecular Partners AG(1) | 163 | 3,642 | ||||||
| Nestle SA, ADR | 3,679 | 442,970 | ||||||
| Novartis AG, ADR | 7,083 | 609,563 | ||||||
| OC Oerlikon Corp. AG | 497 | 4,525 | ||||||
| Orior AG | 86 | 7,432 | ||||||
| Partners Group Holding AG | 135 | 136,993 | ||||||
| PSP Swiss Property AG | 185 | 22,103 | ||||||
| Rieter Holding AG | 8 | 711 | ||||||
| Roche Holding AG, ADR | 14,977 | 654,495 | ||||||
| Schindler Holding AG | 133 | 34,976 | ||||||
55
| Shares | Value | |||||||
| Schindler Holding AG, Bearer Participation Certificate | 283 | $ | 75,458 | |||||
| Schweiter Technologies AG | 5 | 6,944 | ||||||
Sensirion Holding AG(1) | 118 | 6,394 | ||||||
| SFS Group AG | 137 | 12,899 | ||||||
| SGS SA | 17 | 43,950 | ||||||
Siegfried Holding AG(1) | 13 | 7,375 | ||||||
SIG Combibloc Group AG(1) | 1,900 | 37,315 | ||||||
| Sika AG | 252 | 60,359 | ||||||
Softwareone Holding AG(1) | 150 | 4,452 | ||||||
Sonova Holding AG(1) | 123 | 28,708 | ||||||
| St Galler Kantonalbank AG | 21 | 9,661 | ||||||
Stadler Rail AG(1) | 192 | 8,586 | ||||||
| Straumann Holding AG | 20 | 19,653 | ||||||
| Sulzer AG | 134 | 11,919 | ||||||
Sunrise Communications Group AG(1) | 170 | 20,227 | ||||||
| Swatch Group AG (The) | 153 | 6,029 | ||||||
| Swatch Group AG (The), Bearer Shares | 92 | 19,466 | ||||||
Swiss Life Holding AG(1) | 116 | 46,882 | ||||||
| Swiss Prime Site AG | 362 | 32,571 | ||||||
| Swiss Re AG | 600 | 48,189 | ||||||
| Swisscom AG | 156 | 86,266 | ||||||
| Swissquote Group Holding SA | 74 | 6,499 | ||||||
| Tecan Group AG | 60 | 27,107 | ||||||
| Temenos AG | 241 | 38,851 | ||||||
u-blox Holding AG(1) | 60 | 3,383 | ||||||
| UBS Group AG | 14,282 | 173,526 | ||||||
| Valiant Holding AG | 92 | 8,801 | ||||||
Valora Holding AG(1) | 20 | 3,725 | ||||||
VAT Group AG(1) | 270 | 52,534 | ||||||
Vetropack Holding AG(1) | 50 | 3,130 | ||||||
| Vifor Pharma AG | 182 | 26,856 | ||||||
| Vontobel Holding AG | 191 | 14,086 | ||||||
| VP Bank AG | 24 | 3,106 | ||||||
| VZ Holding AG | 90 | 8,053 | ||||||
| Ypsomed Holding AG | 8 | 1,255 | ||||||
| Zehnder Group AG | 116 | 6,003 | ||||||
| Zurich Insurance Group AG | 407 | 150,583 | ||||||
| 4,423,673 | ||||||||
| United Kingdom — 12.6% | ||||||||
| 3i Group plc | 2,591 | 32,488 | ||||||
| Abcam plc | 229 | 3,838 | ||||||
| Admiral Group plc | 1,412 | 49,749 | ||||||
| AG Barr plc | 685 | 3,892 | ||||||
| Aggreko plc | 2,394 | 15,271 | ||||||
| AJ Bell plc | 973 | 5,843 | ||||||
| Anglo American plc | 3,647 | 89,342 | ||||||
| Anglo Asian Mining plc | 529 | 1,082 | ||||||
| Antofagasta plc | 2,058 | 29,546 | ||||||
| Ashmore Group plc | 1,623 | 9,147 | ||||||
| Ashtead Group plc | 2,821 | 98,234 | ||||||
ASOS plc(1) | 30 | 1,980 | ||||||
| Associated British Foods plc | 593 | 16,347 | ||||||
56
| Shares | Value | |||||||
Aston Martin Lagonda Global Holdings plc(1) | 770 | $ | 587 | |||||
| AstraZeneca plc, ADR | 4,108 | 230,048 | ||||||
Augean plc(1) | 438 | 995 | ||||||
| Auto Trader Group plc | 5,072 | 38,185 | ||||||
| Avast plc | 411 | 2,945 | ||||||
| Avation plc | 288 | 487 | ||||||
| AVEVA Group plc | 136 | 9,221 | ||||||
| Aviva plc | 16,337 | 61,737 | ||||||
| B&M European Value Retail SA | 1,540 | 9,799 | ||||||
| BAE Systems plc, ADR | 963 | 26,877 | ||||||
| Balfour Beatty plc | 1,849 | 5,512 | ||||||
Bank of Georgia Group plc(1) | 478 | 5,873 | ||||||
Barclays plc, ADR(1) | 12,569 | 73,152 | ||||||
| Barratt Developments plc | 2,590 | 18,349 | ||||||
| Beazley plc | 2,177 | 12,519 | ||||||
| Bellway plc | 270 | 8,618 | ||||||
| Berkeley Group Holdings plc | 307 | 18,700 | ||||||
| BHP Group plc, ADR | 2,693 | 121,535 | ||||||
| Biffa plc | 4,089 | 11,205 | ||||||
| Bioventix plc | 97 | 5,446 | ||||||
| Bodycote plc | 1,154 | 8,654 | ||||||
boohoo Group plc(1) | 4,861 | 18,800 | ||||||
| BP plc, ADR | 9,516 | 199,170 | ||||||
| Brewin Dolphin Holdings plc | 1,438 | 4,796 | ||||||
| Britvic plc | 2,606 | 29,523 | ||||||
| BT Group plc | 43,843 | 61,332 | ||||||
| Bunzl plc | 1,040 | 33,671 | ||||||
| Burberry Group plc | 2,572 | 49,987 | ||||||
| Burford Capital Ltd. | 2,226 | 16,848 | ||||||
Cairn Energy plc(1) | 4,937 | 9,293 | ||||||
Capita plc(1) | 2,336 | 976 | ||||||
| Carnival plc, ADR | 433 | 6,053 | ||||||
| Centamin plc | 9,004 | 25,250 | ||||||
| Central Asia Metals plc | 2,002 | 4,713 | ||||||
| Centrica plc | 22,171 | 13,652 | ||||||
| Chemring Group plc | 1,059 | 3,426 | ||||||
| Clinigen Group plc | 497 | 4,538 | ||||||
| Clipper Logistics plc | 1,166 | 6,528 | ||||||
| Close Brothers Group plc | 1,299 | 19,500 | ||||||
| CMC Markets plc | 1,424 | 6,079 | ||||||
| Coats Group plc | 19,625 | 14,562 | ||||||
Coca-Cola HBC AG(1) | 1,124 | 29,960 | ||||||
| Compass Group plc | 4,253 | 69,388 | ||||||
| Computacenter plc | 643 | 17,542 | ||||||
| ConvaTec Group plc | 4,010 | 10,270 | ||||||
| Countryside Properties plc | 390 | 1,688 | ||||||
| Cranswick plc | 117 | 5,834 | ||||||
| Crest Nicholson Holdings plc | 2,022 | 5,355 | ||||||
| Croda International plc | 656 | 51,642 | ||||||
| CVS Group plc | 810 | 12,928 | ||||||
| Daily Mail & General Trust plc | 954 | 8,424 | ||||||
| Dart Group plc | 851 | 8,122 | ||||||
57
| Shares | Value | |||||||
| DCC plc | 226 | $ | 20,024 | |||||
| Dechra Pharmaceuticals plc | 30 | 1,263 | ||||||
| Devro plc | 2,672 | 6,193 | ||||||
| DFS Furniture plc | 3,043 | 6,915 | ||||||
| Diageo plc, ADR | 543 | 72,979 | ||||||
| Diploma plc | 266 | 6,849 | ||||||
| Direct Line Insurance Group plc | 6,931 | 27,503 | ||||||
| Diversified Gas & Oil plc | 6,380 | 9,388 | ||||||
| Dixons Carphone plc | 686 | 847 | ||||||
| Domino's Pizza Group plc | 1,387 | 6,219 | ||||||
| Drax Group plc | 1,060 | 3,987 | ||||||
| DS Smith plc | 4,136 | 14,284 | ||||||
| Dunelm Group plc | 1,103 | 21,070 | ||||||
| easyJet plc | 1,158 | 9,802 | ||||||
| Eckoh plc | 1,273 | 1,072 | ||||||
| Electrocomponents plc | 4,506 | 40,899 | ||||||
| EMIS Group plc | 360 | 4,968 | ||||||
EnQuest plc(1) | 27,355 | 4,717 | ||||||
| Essentra plc | 981 | 3,990 | ||||||
| Euromoney Institutional Investor plc | 62 | 694 | ||||||
| Evraz plc | 3,776 | 16,364 | ||||||
| Experian plc, ADR | 1,675 | 62,193 | ||||||
| Ferguson plc | 707 | 69,709 | ||||||
| Ferrexpo plc | 4,115 | 10,158 | ||||||
Firstgroup plc(1) | 819 | 478 | ||||||
| Forterra plc | 2,009 | 4,267 | ||||||
Frasers Group plc(1) | 2,273 | 10,634 | ||||||
| Fresnillo plc | 497 | 8,388 | ||||||
Frontier Developments plc(1) | 65 | 1,972 | ||||||
| G4S plc | 4,670 | 8,964 | ||||||
| Galliford Try Holdings plc | 2,747 | 3,160 | ||||||
| Games Workshop Group plc | 365 | 44,948 | ||||||
| Gateley Holdings plc | 451 | 820 | ||||||
| Genus plc | 152 | 6,847 | ||||||
| GlaxoSmithKline plc, ADR | 4,429 | 175,388 | ||||||
Glencore plc(1) | 45,869 | 103,733 | ||||||
| Go-Ahead Group plc (The) | 672 | 6,012 | ||||||
Golar LNG Ltd.(1) | 1,158 | 11,985 | ||||||
| Grafton Group plc | 2,008 | 20,923 | ||||||
| Grainger plc | 1,786 | 7,473 | ||||||
| Greggs plc | 938 | 17,767 | ||||||
| Gulf Keystone Petroleum Ltd. | 636 | 715 | ||||||
| Gym Group plc (The) | 298 | 633 | ||||||
| Halfords Group plc | 2,386 | 5,259 | ||||||
| Halma plc | 558 | 16,544 | ||||||
| Hargreaves Lansdown plc | 2,120 | 45,810 | ||||||
| Hays plc | 11,502 | 18,543 | ||||||
| Helical plc | 1,145 | 4,341 | ||||||
| Hikma Pharmaceuticals plc | 744 | 23,581 | ||||||
| Hill & Smith Holdings plc | 682 | 11,086 | ||||||
Hiscox Ltd.(1) | 476 | 5,068 | ||||||
Hochschild Mining plc(1) | 4,168 | 13,405 | ||||||
58
| Shares | Value | |||||||
| HomeServe plc | 887 | $ | 15,402 | |||||
| Hotel Chocolat Group plc | 183 | 889 | ||||||
| Howden Joinery Group plc | 4,660 | 35,008 | ||||||
| HSBC Holdings plc, ADR | 8,472 | 183,249 | ||||||
Ibstock plc(1) | 3,125 | 6,456 | ||||||
| IG Group Holdings plc | 2,376 | 25,186 | ||||||
| IMI plc | 2,241 | 31,574 | ||||||
| Impax Asset Management Group plc | 566 | 3,813 | ||||||
Inchcape plc(1) | 3,685 | 24,901 | ||||||
Indivior plc(1) | 10,086 | 15,998 | ||||||
Informa plc(1) | 300 | 1,673 | ||||||
| IntegraFin Holdings plc | 2,862 | 20,544 | ||||||
InterContinental Hotels Group plc(1) | 244 | 14,371 | ||||||
| Intermediate Capital Group plc | 607 | 11,092 | ||||||
| International Personal Finance plc | 904 | 820 | ||||||
| Intertek Group plc | 741 | 58,204 | ||||||
| Investec plc | 5,046 | 9,939 | ||||||
| ITV plc | 9,932 | 8,062 | ||||||
| IWG plc | 6,218 | 23,406 | ||||||
| J D Wetherspoon plc | 583 | 7,976 | ||||||
| J Sainsbury plc | 16,249 | 39,923 | ||||||
Jadestone Energy, Inc.(1) | 2,676 | 2,359 | ||||||
| JD Sports Fashion plc | 3,019 | 29,291 | ||||||
| John Laing Group plc | 1,980 | 7,554 | ||||||
| Johnson Matthey plc | 323 | 10,255 | ||||||
| Judges Scientific plc | 96 | 6,820 | ||||||
| Jupiter Fund Management plc | 1,426 | 4,016 | ||||||
Just Group plc(1) | 13,695 | 9,318 | ||||||
| Kainos Group plc | 783 | 11,723 | ||||||
| KAZ Minerals plc | 2,693 | 21,051 | ||||||
| Keller Group plc | 1,301 | 10,892 | ||||||
| Kingfisher plc | 7,674 | 27,917 | ||||||
| Knights Group Holdings plc | 237 | 1,482 | ||||||
| Lancashire Holdings Ltd. | 652 | 6,694 | ||||||
| Legal & General Group plc | 20,598 | 60,507 | ||||||
Liberty Global plc, Class A(1) | 256 | 5,983 | ||||||
Liberty Global plc, Class C(1) | 653 | 15,026 | ||||||
| Liontrust Asset Management plc | 522 | 8,862 | ||||||
| Lloyds Banking Group plc, ADR | 13,889 | 20,000 | ||||||
| London Stock Exchange Group plc | 245 | 28,820 | ||||||
| Luxfer Holdings plc | 249 | 3,541 | ||||||
| M&G plc | 10,269 | 23,748 | ||||||
| Man Group plc | 2,957 | 4,844 | ||||||
| Marks & Spencer Group plc | 15,714 | 23,337 | ||||||
| Marshalls plc | 1,265 | 10,755 | ||||||
| Marston's plc | 6,983 | 4,943 | ||||||
McCarthy & Stone plc(1) | 5,324 | 5,107 | ||||||
| Mediclinic International plc | 414 | 1,447 | ||||||
| Meggitt plc | 1,397 | 5,432 | ||||||
| Micro Focus International plc, ADR | 162 | 661 | ||||||
Mitchells & Butlers plc(1) | 600 | 1,381 | ||||||
| Mitie Group plc | 1,968 | 880 | ||||||
59
| Shares | Value | |||||||
| Mondi plc | 2,319 | $ | 45,290 | |||||
| Moneysupermarket.com Group plc | 4,312 | 17,557 | ||||||
| Morgan Advanced Materials plc | 3,279 | 10,125 | ||||||
| Morgan Sindall Group plc | 55 | 932 | ||||||
| Mortgage Advice Bureau Holdings Ltd. | 524 | 4,553 | ||||||
| Motorpoint group plc | 1,442 | 5,216 | ||||||
| Naked Wines plc | 964 | 5,865 | ||||||
| National Express Group plc | 4,027 | 6,783 | ||||||
| National Grid plc, ADR | 1,449 | 81,839 | ||||||
Natwest Group plc, ADR(1) | 4,497 | 13,176 | ||||||
Network International Holdings plc(1) | 2,214 | 11,081 | ||||||
| Next plc | 885 | 71,431 | ||||||
Ninety One plc(1) | 541 | 1,595 | ||||||
| Norcros plc | 340 | 623 | ||||||
Ocado Group plc(1) | 886 | 29,697 | ||||||
| On the Beach Group plc | 178 | 726 | ||||||
| OneSavings Bank plc | 2,623 | 10,659 | ||||||
| Pagegroup plc | 3,043 | 15,669 | ||||||
| Pan African Resources plc | 11,404 | 3,735 | ||||||
| Paragon Banking Group plc | 1,659 | 7,871 | ||||||
| Pearson plc, ADR | 1,902 | 14,170 | ||||||
| Pennon Group plc | 2,230 | 29,988 | ||||||
| Persimmon plc | 1,177 | 41,189 | ||||||
Petrofac Ltd.(2) | 2,622 | 5,643 | ||||||
Petropavlovsk plc(1)(2) | 26,205 | 12,838 | ||||||
| Phoenix Group Holdings plc | 2,290 | 21,183 | ||||||
| Photo-Me International plc | 906 | 585 | ||||||
| Playtech plc | 1,571 | 7,802 | ||||||
| Plus500 Ltd. | 1,313 | 25,599 | ||||||
| Polypipe Group plc | 796 | 4,658 | ||||||
Premier Foods plc(1) | 10,225 | 11,687 | ||||||
Premier Oil plc(1)(2) | 3,028 | 884 | ||||||
Provident Financial plc(1) | 1,810 | 5,962 | ||||||
| Prudential plc, ADR | 2,623 | 84,618 | ||||||
| PZ Cussons plc | 381 | 1,056 | ||||||
| QinetiQ Group plc | 1,672 | 6,522 | ||||||
| Quilter plc | 19,448 | 37,189 | ||||||
| Rathbone Brothers plc | 322 | 7,266 | ||||||
| Reach plc | 3,941 | 2,771 | ||||||
| Reckitt Benckiser Group plc | 3,066 | 308,575 | ||||||
| Redde Northgate plc | 2,672 | 6,708 | ||||||
| Redrow plc | 1,779 | 10,914 | ||||||
| RELX plc, ADR | 4,538 | 102,831 | ||||||
| Renewi plc | 8,776 | 2,722 | ||||||
| Renishaw plc | 107 | 6,843 | ||||||
Rentokil Initial plc(1) | 4,796 | 34,171 | ||||||
| Restaurant Group plc (The) | 616 | 465 | ||||||
| Restore plc | 170 | 842 | ||||||
| Rhi Magnesita NV | 334 | 12,073 | ||||||
| Rightmove plc | 5,889 | 49,893 | ||||||
| Rio Tinto plc, ADR | 2,852 | 174,628 | ||||||
| Rolls-Royce Holdings plc, ADR | 1,802 | 5,802 | ||||||
60
| Shares | Value | |||||||
| Rotork plc | 3,859 | $ | 15,465 | |||||
| Royal Dutch Shell plc, Class A ADR | 3,227 | 95,777 | ||||||
| Royal Dutch Shell plc, Class B ADR | 2,919 | 82,024 | ||||||
| Royal Mail plc | 8,658 | 20,775 | ||||||
| RPS Group plc | 912 | 520 | ||||||
| RSA Insurance Group plc | 4,720 | 28,591 | ||||||
| Sabre Insurance Group plc | 263 | 940 | ||||||
| Saga plc | 1,626 | 296 | ||||||
| Sage Group plc (The) | 1,702 | 16,876 | ||||||
| Savills plc | 492 | 5,367 | ||||||
| Schroders plc | 234 | 9,065 | ||||||
Serco Group plc(1) | 541 | 1,017 | ||||||
| Serica Energy plc | 3,636 | 5,799 | ||||||
| Severn Trent plc | 201 | 6,290 | ||||||
Shanta Gold Ltd.(1) | 16,512 | 3,575 | ||||||
| SIG plc | 916 | 389 | ||||||
| Signature Aviation plc | 5,137 | 18,108 | ||||||
| Sirius Real Estate Ltd. | 6,667 | 6,631 | ||||||
| Smart Metering Systems plc | 512 | 4,380 | ||||||
| Smith & Nephew plc, ADR | 921 | 37,439 | ||||||
| Smiths Group plc | 1,086 | 20,318 | ||||||
| Softcat plc | 957 | 17,692 | ||||||
| Spectris plc | 435 | 14,746 | ||||||
| Speedy Hire plc | 5,125 | 3,532 | ||||||
| Spirax-Sarco Engineering plc | 254 | 34,785 | ||||||
| Spire Healthcare Group plc | 642 | 788 | ||||||
| Spirent Communications plc | 3,163 | 12,325 | ||||||
| SSE plc | 4,651 | 78,754 | ||||||
| SSP Group plc | 1,016 | 3,333 | ||||||
| St Modwen Properties plc | 863 | 3,738 | ||||||
| St. James's Place plc | 4,354 | 57,026 | ||||||
| Stagecoach Group plc | 3,838 | 2,202 | ||||||
Standard Chartered plc (London)(1) | 6,901 | 36,083 | ||||||
| Standard Life Aberdeen plc | 3,591 | 11,386 | ||||||
Stobart Group Ltd.(1) | 1,118 | 365 | ||||||
| Stock Spirits Group plc | 1,858 | 5,462 | ||||||
| Strix Group plc | 2,672 | 7,943 | ||||||
Studio Retail Group plc(1) | 420 | 1,274 | ||||||
| Superdry plc | 157 | 280 | ||||||
| Synthomer plc | 2,700 | 11,326 | ||||||
| TalkTalk Telecom Group plc | 4,696 | 4,614 | ||||||
| Tate & Lyle plc | 3,061 | 28,037 | ||||||
| Tatton Asset Management plc | 821 | 3,160 | ||||||
| Taylor Wimpey plc | 21,501 | 35,180 | ||||||
| TEN Entertainment Group plc | 282 | 476 | ||||||
| Tesco plc | 26,855 | 78,760 | ||||||
TI Fluid Systems plc(1) | 1,823 | 3,839 | ||||||
| Topps Tiles plc | 1,038 | 737 | ||||||
| TP ICAP plc | 1,363 | 5,536 | ||||||
Trainline plc(1) | 174 | 921 | ||||||
| Travis Perkins plc | 1,000 | 16,435 | ||||||
| Treatt plc | 501 | 3,918 | ||||||
61
| Shares | Value | |||||||
| TUI AG | 1,047 | $ | 4,695 | |||||
| Tullow Oil plc | 13,780 | 3,780 | ||||||
| UDG Healthcare plc | 656 | 6,397 | ||||||
| Ultra Electronics Holdings plc | 39 | 1,218 | ||||||
| Unilever plc, ADR | 2,177 | 129,706 | ||||||
| United Utilities Group plc | 4,817 | 53,754 | ||||||
| Urban & Civic plc | 233 | 718 | ||||||
| Vertu Motors plc | 1,944 | 627 | ||||||
Vesuvius plc(1) | 1,468 | 8,051 | ||||||
| Victrex plc | 494 | 12,758 | ||||||
Virgin Money UK plc(1) | 7,338 | 9,138 | ||||||
| Vistry Group plc | 1,198 | 10,185 | ||||||
| Vodafone Group plc, ADR | 9,390 | 138,690 | ||||||
| Vp plc | 87 | 745 | ||||||
| Watkin Jones plc | 1,905 | 3,758 | ||||||
| Weir Group plc (The) | 1,832 | 31,065 | ||||||
| WH Smith plc | 1,030 | 16,206 | ||||||
Whitbread plc(1) | 334 | 11,325 | ||||||
| WM Morrison Supermarkets plc | 13,386 | 34,410 | ||||||
| WPP plc, ADR | 174 | 7,376 | ||||||
Yellow Cake plc(1) | 1,065 | 3,188 | ||||||
| 6,425,601 | ||||||||
TOTAL COMMON STOCKS (Cost $42,985,304) | 50,138,924 | |||||||
RIGHTS† | ||||||||
Australia† | ||||||||
Emeco Holdings Ltd.(1) | 341 | 8 | ||||||
FlexiGroup Ltd.(1) | 232 | 11 | ||||||
Lynas Corp. Ltd.(1) | 765 | 79 | ||||||
| 98 | ||||||||
Italy† | ||||||||
Ascopiave SpA(1) | 689 | 1 | ||||||
Singapore† | ||||||||
Sembcorp Marine Ltd.(1) | 41,500 | 30 | ||||||
TOTAL RIGHTS (Cost $2,207) | 129 | |||||||
| TEMPORARY CASH INVESTMENTS — 1.5% | ||||||||
| State Street Institutional U.S. Government Money Market Fund, Premier Class (Cost $770,962) | 770,962 | 770,962 | ||||||
TEMPORARY CASH INVESTMENTS - SECURITIES LENDING COLLATERAL(3) — 0.6% | ||||||||
| State Street Navigator Securities Lending Government Money Market Portfolio (Cost $290,376) | 290,376 | 290,376 | ||||||
TOTAL INVESTMENT SECURITIES — 100.6% (Cost $44,048,849) | 51,200,391 | |||||||
| OTHER ASSETS AND LIABILITIES — (0.6)% | (302,282) | |||||||
| TOTAL NET ASSETS — 100.0% | $ | 50,898,109 | ||||||
62
| FUTURES CONTRACTS PURCHASED | |||||||||||||||||
| Reference Entity | Contracts | Expiration Date | Notional Amount | Unrealized Appreciation (Depreciation)^ | |||||||||||||
| S&P 500 E-Mini | 3 | September 2020 | $ | 524,835 | $ | 38,080 | |||||||||||
^ Amount represents value and unrealized appreciation (depreciation).
| MARKET SECTOR DIVERSIFICATION | |||||
(as a % of net assets) | |||||
| Financials | 16.8 | % | |||
| Industrials | 15.9 | % | |||
| Materials | 11.9 | % | |||
| Consumer Discretionary | 11.4 | % | |||
| Health Care | 9.0 | % | |||
| Consumer Staples | 8.6 | % | |||
| Information Technology | 7.8 | % | |||
| Communication Services | 5.5 | % | |||
| Utilities | 5.1 | % | |||
| Energy | 3.9 | % | |||
| Real Estate | 2.6 | % | |||
| Cash and Equivalents* | 1.5 | % | |||
*Includes temporary cash investments, temporary cash investments - securities lending collateral and other assets and liabilities.
| NOTES TO SCHEDULE OF INVESTMENTS | ||||||||
| ADR | - | American Depositary Receipt | ||||||
| CVA | - | Certificaten Van Aandelen | ||||||
| SDR | - | Swedish Depositary Receipt | ||||||
† Category is less than 0.05% of total net assets.
(1)Non-income producing.
(2)Security, or a portion thereof, is on loan. At the period end, the aggregate value of securities on loan was $602,666. The amount of securities on loan indicated may not correspond with the securities on loan identified because securities with pending sales are in the process of recall from the brokers.
(3)Investment of cash collateral from securities on loan. At the period end, the aggregate value of the collateral held by the fund was $645,644, which includes securities collateral of $355,268.
See Notes to Financial Statements.
63
| Statement of Assets and Liabilities | ||
| AUGUST 31, 2020 | |||||
| Assets | |||||
| Investment securities, at value (cost of $43,758,473) — including $602,666 of securities on loan | $ | 50,910,015 | |||
| Investment made with cash collateral received for securities on loan, at value (cost of $290,376) | 290,376 | ||||
| Total investment securities, at value (cost of $44,048,849) | 51,200,391 | ||||
| Foreign currency holdings, at value (cost of $8,700) | 8,693 | ||||
| Deposits with broker for futures contracts | 36,000 | ||||
| Receivable for capital shares sold | 138,200 | ||||
| Dividends and interest receivable | 129,648 | ||||
| Securities lending receivable | 788 | ||||
| 51,513,720 | |||||
| Liabilities | |||||
| Disbursements in excess of demand deposit cash | 133 | ||||
| Payable for collateral received for securities on loan | 290,376 | ||||
| Payable for investments purchased | 249 | ||||
| Payable for capital shares redeemed | 313,200 | ||||
| Payable for variation margin on futures contracts | 1,858 | ||||
| Accrued management fees | 9,795 | ||||
| 615,611 | |||||
| Net Assets | $ | 50,898,109 | |||
| Institutional Class Capital Shares | |||||
| Shares outstanding (unlimited number of shares authorized) | 5,205,284 | ||||
| Net Asset Value Per Share | $ | 9.78 | |||
| Net Assets Consist of: | |||||
| Capital paid in | $ | 43,227,621 | |||
| Distributable earnings | 7,670,488 | ||||
| $ | 50,898,109 | ||||
See Notes to Financial Statements.
64
| Statement of Operations | ||
FOR THE PERIOD ENDED AUGUST 31, 2020(1) | |||||
| Investment Income (Loss) | |||||
| Income: | |||||
| Dividends (net of foreign taxes withheld of $71,706) | $ | 604,935 | |||
| Securities lending, net | 4,150 | ||||
| Interest | 1,406 | ||||
| 610,491 | |||||
| Expenses: | |||||
| Management fees | 50,781 | ||||
| Net investment income (loss) | 559,710 | ||||
| Realized and Unrealized Gain (Loss) | |||||
| Net realized gain (loss) on: | |||||
| Investment transactions | (108,813) | ||||
| Futures contract transactions | 18,972 | ||||
| Foreign currency translation transactions | 23,060 | ||||
| (66,781) | |||||
| Change in net unrealized appreciation (depreciation) on: | |||||
| Investments | 7,151,542 | ||||
| Futures contracts | 38,080 | ||||
| Translation of assets and liabilities in foreign currencies | 1,977 | ||||
| 7,191,599 | |||||
| Net realized and unrealized gain (loss) | 7,124,818 | ||||
| Net Increase (Decrease) in Net Assets Resulting from Operations | $ | 7,684,528 | |||
(1)December 4, 2019 (fund inception) through August 31, 2020.
See Notes to Financial Statements.
65
| Statement of Changes in Net Assets | ||
PERIOD ENDED AUGUST 31, 2020(1) | |||||
| Increase (Decrease) in Net Assets | |||||
| Operations | |||||
| Net investment income (loss) | $ | 559,710 | |||
| Net realized gain (loss) | (66,781) | ||||
| Change in net unrealized appreciation (depreciation) | 7,191,599 | ||||
| Net increase (decrease) in net assets resulting from operations | 7,684,528 | ||||
| Distributions to Shareholders | |||||
| From earnings | (14,040) | ||||
| Capital Share Transactions | |||||
| Proceeds from shares sold | 47,235,391 | ||||
| Proceeds from reinvestment of distributions | 14,040 | ||||
| Payments for shares redeemed | (4,021,810) | ||||
| Net increase (decrease) in net assets from capital share transactions | 43,227,621 | ||||
| Net increase (decrease) in net assets | 50,898,109 | ||||
| Net Assets | |||||
| End of period | $ | 50,898,109 | |||
| Transactions in Shares of the Fund | |||||
| Sold | 5,642,579 | ||||
| Issued in reinvestment of distributions | 1,363 | ||||
| Redeemed | (438,658) | ||||
| Net increase (decrease) in shares of the fund | 5,205,284 | ||||
(1)December 4, 2019 (fund inception) through August 31, 2020.
See Notes to Financial Statements.
66
| Notes to Financial Statements | ||
AUGUST 31, 2020
1. Organization
American Century ETF Trust (the trust) was registered as a Delaware statutory trust in 2017 and is registered under the Investment Company Act of 1940, as amended (the 1940 Act), as an open-end management investment company. Avantis International Equity Fund (the fund) is one fund in a series issued by the trust. The fund’s investment objective is to seek long-term capital appreciation. The fund offers the Institutional Class. The Institutional Class commenced sale on December 4, 2019, the fund's inception date.
2. Significant Accounting Policies
The following is a summary of significant accounting policies consistently followed by the fund in preparation of its financial statements. The fund is an investment company and follows accounting and reporting guidance in accordance with accounting principles generally accepted in the United States of America. This may require management to make certain estimates and assumptions at the date of the financial statements. Actual results could differ from these estimates. Management evaluated the impact of events or transactions occurring through the date the financial statements were issued that would merit recognition or disclosure.
Investment Valuations — The fund determines the fair value of its investments and computes its net asset value per share at the close of regular trading (usually 4 p.m. Eastern time) on the New York Stock Exchange (NYSE) on each day the NYSE is open. The Board of Trustees has adopted valuation policies and procedures to guide the investment advisor in the fund’s investment valuation process and to provide methodologies for the oversight of the fund’s pricing function.
Equity securities that are listed or traded on a domestic securities exchange are valued at the last reported sales price or at the official closing price as provided by the exchange. Equity securities traded on foreign securities exchanges are generally valued at the closing price of such securities on the exchange where primarily traded or at the close of the NYSE, if that is earlier. If no last sales price is reported, or if local convention or regulation so provides, the mean of the latest bid and asked prices may be used. Securities traded over-the-counter are valued at the mean of the latest bid and asked prices, the last sales price, or the official closing price. Equity securities initially expressed in local currencies are translated into U.S. dollars at the mean of the appropriate currency exchange rate at the close of the NYSE as provided by an independent pricing service.
Open-end management investment companies are valued at the reported net asset value per share. Exchange-traded futures contracts are valued at the settlement price as provided by the appropriate exchange.
If the fund determines that the market price for an investment is not readily available or the valuation methods mentioned above do not reflect an investment’s fair value, such investment is valued as determined in good faith by the Board of Trustees or its delegate, in accordance with policies and procedures adopted by the Board of Trustees. In its determination of fair value, the fund may review several factors including, but not limited to, market information regarding the specific investment or comparable investments and correlation with other investment types, futures indices or general market indicators. Circumstances that may cause the fund to use these procedures to value an investment include, but are not limited to: an investment has been declared in default or is distressed; trading in a security has been suspended during the trading day or a security is not actively trading on its principal exchange; prices received from a regular pricing source are deemed unreliable; or there is a foreign market holiday and no trading occurred.
The fund monitors for significant events occurring after the close of an investment’s primary exchange but before the fund’s net asset value per share is determined. Significant events may include, but are not limited to: corporate announcements and transactions; governmental action and political unrest that could impact a specific investment or an investment sector; or armed conflicts, natural disasters and similar events that could affect investments in a specific country or region. The fund also monitors for significant fluctuations between domestic and foreign markets, as evidenced by the U.S. market or such other indicators that the Board of Trustees, or its delegate, deems appropriate. The fund may apply a model-derived factor to the closing price of equity securities traded on foreign securities exchanges. The factor is based on observable market data as provided by an independent pricing service.
67
Security Transactions — Security transactions are accounted for as of the trade date. Net realized gains and losses are determined on the identified cost basis, which is also used for federal income tax purposes.
Investment Income — Dividend income less foreign taxes withheld, if any, is recorded as of the ex-dividend date. Distributions received on securities that represent a return of capital or long-term capital gain are recorded as a reduction of cost of investments and/or as a realized gain. The fund may estimate the components of distributions received that may be considered nontaxable distributions or long-term capital gain distributions for income tax purposes. Interest income is recorded on the accrual basis and includes accretion of discounts and amortization of premiums. Securities lending income is net of fees and rebates earned by the lending agent for its services.
Foreign Currency Translations — All assets and liabilities initially expressed in foreign currencies are translated into U.S. dollars at prevailing exchange rates at period end. The fund may enter into spot foreign currency exchange contracts to facilitate transactions denominated in a foreign currency. Purchases and sales of investment securities, dividend and interest income, spot foreign currency exchange contracts, and expenses are translated at the rates of exchange prevailing on the respective dates of such transactions. Net realized and unrealized foreign currency exchange gains or losses related to investment securities are a component of net realized gain (loss) on investment transactions and change in net unrealized appreciation (depreciation) on investments, respectively.
Segregated Assets — In accordance with the 1940 Act, the fund segregates assets on its books and records to cover certain types of investment securities and other financial instruments. American Century Investment Management, Inc. (ACIM) (the investment advisor) monitors, on a daily basis, the securities segregated to ensure the fund designates a sufficient amount of liquid assets, marked-to-market daily. The fund may also receive assets or be required to pledge assets at the custodian bank or with a broker for collateral requirements.
Income Tax Status — It is the fund’s policy to distribute substantially all net investment income and net realized gains to shareholders and to otherwise qualify as a regulated investment company under provisions of the Internal Revenue Code. Accordingly, no provision has been made for income taxes. The fund files U.S. federal, state, local and non-U.S. tax returns as applicable. The fund's tax returns are subject to examination by the relevant taxing authority until expiration of the applicable statute of limitations, which is generally three years from the date of filing but can be longer in certain jurisdictions. At this time, management believes there are no uncertain tax positions which, based on their technical merit, would not be sustained upon examination and for which it is reasonably possible that the total amounts of unrecognized tax benefits will significantly change in the next twelve months.
Distributions to Shareholders — Distributions from net investment income and net realized gains, if any, are generally declared and paid annually.
Indemnifications — Under the trust’s organizational documents, its officers and trustees are indemnified against certain liabilities arising out of the performance of their duties to the fund. In addition, in the normal course of business, the fund enters into contracts that provide general indemnifications. The maximum exposure under these arrangements is unknown as this would involve future claims that may be made against a fund. The risk of material loss from such claims is considered by management to be remote.
Securities Lending — Securities are lent to qualified financial institutions and brokers. State Street Bank & Trust Co. serves as securities lending agent to the fund pursuant to a Securities Lending Agreement. The lending of securities exposes the fund to risks such as: the borrowers may fail to return the loaned securities, the borrowers may not be able to provide additional collateral, the fund may experience delays in recovery of the loaned securities or delays in access to collateral, or the fund may experience losses related to the investment collateral. To minimize certain risks, loan counterparties pledge collateral in the form of cash and/or securities. The lending agent has agreed to indemnify the fund in the case of default of any securities borrowed. Cash collateral received is invested in the State Street Navigator Securities Lending Government Money Market Portfolio, a money market mutual fund registered under the 1940 Act. The loans may also be secured by U.S. government securities in an amount at least equal to the market value of the securities loaned, plus accrued interest and dividends, determined on a daily basis and adjusted accordingly. By lending securities, the fund seeks to increase its net investment income through the receipt of interest and fees. Such income is reflected separately within the Statement of Operations. The value of loaned securities and related collateral outstanding at period end, if any, are shown on a gross basis within the Schedule of Investments and Statement of Assets and Liabilities.
68
The following table reflects a breakdown of transactions accounted for as secured borrowings, the gross obligation by the type of collateral pledged, and the remaining contractual maturity of those transactions as of August 31, 2020.
| Remaining Contractual Maturity of Agreements | |||||||||||||||||
| Overnight and Continuous | <30 days | Between 30 & 90 days | >90 days | Total | |||||||||||||
Securities Lending Transactions(1) | |||||||||||||||||
| Common Stocks | $ | 290,376 | — | — | — | $ | 290,376 | ||||||||||
| Gross amount of recognized liabilities for securities lending transactions | $ | 290,376 | |||||||||||||||
(1)Amount represents the payable for cash collateral received for securities on loan. This will generally be in the Overnight and Continuous column as the securities are typically callable on demand.
3. Fees and Transactions with Related Parties
Certain officers and trustees of the trust are also officers and/or directors of American Century Companies, Inc. (ACC). The trust's investment advisor, ACIM, the fund's distributor, American Century Investment Services, Inc., and the trust's transfer agent, American Century Services, LLC, are wholly owned, directly or indirectly, by ACC. ACIM owns 20% of the shares of the fund.
Management Fees — The trust has entered into a management agreement with ACIM, under which ACIM provides the fund with investment advisory and management services in exchange for a single, unified management fee (the fee). The agreement provides that ACIM will pay all expenses of managing and operating the fund, except brokerage and other transaction fees and expenses relating to the acquisition and disposition of portfolio securities, acquired fund fees and expenses, interest, taxes, litigation expenses and extraordinary expenses. The fee is computed and accrued daily based on the daily net assets of the fund and paid monthly in arrears. The annual management fee is 0.23%.
Interfund Transactions — The fund may enter into security transactions with other American Century Investments funds and other client accounts of the investment advisor, in accordance with the 1940 Act rules and procedures adopted by the Board of Trustees. The rules and procedures require, among other things, that these transactions be effected at the independent current market price of the security. There were no interfund transactions during the period.
4. Investment Transactions
Purchases and sales of investment securities, excluding short-term investments, for the period ended August 31, 2020 were $43,801,859 and $715,836, respectively.
5. Fair Value Measurements
The fund’s investments valuation process is based on several considerations and may use multiple inputs to determine the fair value of the investments held by the fund. In conformity with accounting principles generally accepted in the United States of America, the inputs used to determine a valuation are classified into three broad levels.
•Level 1 valuation inputs consist of unadjusted quoted prices in an active market for identical investments.
•Level 2 valuation inputs consist of direct or indirect observable market data (including quoted prices for comparable investments, evaluations of subsequent market events, interest rates, prepayment speeds, credit risk, etc.). These inputs also consist of quoted prices for identical investments initially expressed in local currencies that are adjusted through translation into U.S. dollars.
•Level 3 valuation inputs consist of unobservable data (including a fund’s own assumptions).
The level classification is based on the lowest level input that is significant to the fair valuation measurement. The valuation inputs are not necessarily an indication of the risks associated with investing in these securities or other financial instruments.
69
The following is a summary of the level classifications as of period end. The Schedule of Investments provides additional information on the fund’s portfolio holdings.
| Level 1 | Level 2 | Level 3 | |||||||||
| Assets | |||||||||||
| Investment Securities | |||||||||||
| Common Stocks | |||||||||||
| Australia | $ | 385,636 | $ | 2,829,577 | — | ||||||
| Belgium | 101,657 | 385,060 | — | ||||||||
| Canada | 9,303 | 4,688,274 | — | ||||||||
| Denmark | 353,174 | 735,624 | — | ||||||||
| Finland | 31,061 | 507,481 | — | ||||||||
| France | 800,910 | 3,619,472 | — | ||||||||
| Germany | 625,128 | 3,440,453 | — | ||||||||
| Hong Kong | 26,106 | 1,479,291 | — | ||||||||
| Israel | 123,942 | 268,326 | — | ||||||||
| Italy | 58,762 | 1,034,117 | — | ||||||||
| Japan | 1,070,686 | 10,473,196 | — | ||||||||
| Netherlands | 771,065 | 1,076,301 | — | ||||||||
| Norway | 37,365 | 331,246 | — | ||||||||
| Singapore | 63,536 | 466,835 | — | ||||||||
| Spain | 151,574 | 876,364 | — | ||||||||
| Sweden | 192,803 | 1,582,229 | — | ||||||||
| Switzerland | 2,009,367 | 2,414,306 | — | ||||||||
| United Kingdom | 2,175,916 | 4,249,685 | — | ||||||||
| Other Countries | — | 693,096 | — | ||||||||
| Rights | — | 129 | — | ||||||||
| Temporary Cash Investments | 770,962 | — | — | ||||||||
| Temporary Cash Investments - Securities Lending Collateral | 290,376 | — | — | ||||||||
| $ | 10,049,329 | $ | 41,151,062 | — | |||||||
| Other Financial Instruments | |||||||||||
| Futures Contracts | $ | 38,080 | — | — | |||||||
6. Derivative Instruments
Equity Price Risk — The fund is subject to equity price risk in the normal course of pursuing its investment objectives. A fund may enter into futures contracts based on an equity index in order to manage its exposure to changes in market conditions. A fund may purchase futures contracts to gain exposure to increases in market value or sell futures contracts to protect against a decline in market value. Upon entering into a futures contract, a fund is required to deposit either cash or securities in an amount equal to a certain percentage of the contract value (initial margin). Subsequent payments (variation margin) are made or received daily, in cash, by a fund. The variation margin is equal to the daily change in the contract value and is recorded as unrealized gains and losses. A fund recognizes a realized gain or loss when the contract is closed or expires. Net realized and unrealized gains or losses occurring during the holding period of futures contracts are a component of net realized gain (loss) on futures contract transactions and change in net unrealized appreciation (depreciation) on futures contracts, respectively. One of the risks of entering into futures contracts is the possibility that the change in value of the contract may not correlate with the changes in value of the underlying securities. The fund's average notional exposure to equity price risk derivative instruments held during the period was $473,910 futures contracts purchased.
The value of equity price risk derivative instruments as of August 31, 2020, is disclosed on the Statement of Assets and Liabilities as a liability of $1,858 in payable for variation margin on futures contracts*. For the period from December 4, 2019 (fund inception) through August 31, 2020, the effect of equity price risk derivative instruments on the Statement of Operations was $18,972 in net realized gain (loss) on futures contract transactions and $38,080 in change in net unrealized appreciation (depreciation) on futures contracts.
* Included in the unrealized appreciation (depreciation) on futures contracts as reported in the Schedule of Investments
70
7. Risk Factors
The value of the fund’s shares will go up and down, sometimes rapidly or unpredictably, based on the performance of the securities owned by the fund and other factors generally affecting the securities market. Market risks, including political, regulatory, economic and social developments, can affect the value of the fund’s investments. Natural disasters, public health emergencies, terrorism and other unforeseeable events may lead to increased market volatility and may have adverse long-term effects on world economies and markets generally.
There are certain risks involved in investing in foreign securities. These risks include those resulting from political events (such as civil unrest, national elections and imposition of exchange controls), social and economic events (such as labor strikes and rising inflation), and natural disasters. Securities of foreign issuers may be less liquid and more volatile. Investing a significant portion of assets in one country or region may accentuate these risks.
8. Federal Tax Information
The tax character of distributions paid during the period December 4, 2019 (fund inception) through August 31, 2020 were as follows:
| Distributions Paid From | |||||
| Ordinary income | $ | 14,040 | |||
| Long-term capital gains | — | ||||
The book-basis character of distributions made during the year from net investment income or net realized gains may differ from their ultimate characterization for federal income tax purposes. These differences reflect the differing character of certain income items and net realized gains and losses for financial statement and tax purposes, and may result in reclassification among certain capital accounts on the financial statements.
As of period end, the federal tax cost of investments and the components of distributable earnings on a tax-basis were as follows:
| Federal tax cost of investments | $ | 44,168,419 | |||
| Gross tax appreciation of investments | $ | 8,221,179 | |||
| Gross tax depreciation of investments | (1,189,207) | ||||
| Net tax appreciation (depreciation) of investments | 7,031,972 | ||||
| Net tax appreciation (depreciation) on derivatives and translation of assets and liabilities in foreign currencies | 1,977 | ||||
| Net tax appreciation (depreciation) | $ | 7,033,949 | |||
| Undistributed ordinary income | $ | 679,903 | |||
| Accumulated short-term capital losses | $ | (43,364) | |||
The difference between book-basis and tax-basis unrealized appreciation (depreciation) is attributable primarily to the realization to ordinary income for tax purposes of unrealized gains on investments in passive foreign investment companies.
Accumulated capital losses represent net capital loss carryovers that may be used to offset future realized capital gains for federal income tax purposes. The capital loss carryovers may be carried forward for an unlimited period. Future capital loss carryover utilization in any given year may be subject to Internal Revenue Code limitations.
71
| Financial Highlights | ||
| For a Share Outstanding Throughout the Period Indicated | |||||||||||||||||||||||||||||||||||
| Per-Share Data | Ratios and Supplemental Data | ||||||||||||||||||||||||||||||||||
| Income From Investment Operations: | Ratio to Average Net Assets of: | ||||||||||||||||||||||||||||||||||
| Net Asset Value, Beginning of Period | Net Investment Income (Loss)(1) | Net Realized and Unrealized Gain (Loss) | Total From Investment Operations | Distributions From Net Investment Income | Net Asset Value, End of Period | Total Return(2) | Operating Expenses | Net Investment Income (Loss) | Portfolio Turnover Rate | Net Assets, End of Period (in thousands) | |||||||||||||||||||||||||
| Institutional Class | |||||||||||||||||||||||||||||||||||
2020(3) | $10.00 | 0.17 | (0.38) | (0.21) | (0.01) | $9.78 | (2.10)% | 0.23%(4) | 2.54%(4) | 2% | $50,898 | ||||||||||||||||||||||||
| Notes to Financial Highlights | ||
(1)Computed using average shares outstanding throughout the period.
(2)Total returns are calculated based on the net asset value of the last business day. Total returns for periods less than one year are not annualized.
(3)December 4, 2019 (fund inception) through August 31, 2020.
(4)Annualized.
See Notes to Financial Statements.
| Report of Independent Registered Public Accounting Firm | ||
To the Shareholders and the Board of Trustees of American Century ETF Trust:
Opinion on the Financial Statements and Financial Highlights
We have audited the accompanying statement of assets and liabilities, including the schedule of investments, of Avantis® International Equity Fund (the "Fund”), one of the funds constituting the American Century ETF Trust, as of August 31, 2020, and the related statement of operations, the statement of changes in net assets, and the financial highlights for the period from December 4, 2019 (fund inception) through August 31, 2020, and the related notes. In our opinion, the financial statements and financial highlights present fairly, in all material respects, the financial position of Avantis® International Equity Fund as of August 31, 2020, and the results of its operations, the changes in its net assets, and the financial highlights for the period from December 4, 2019 (fund inception) through August 31, 2020, in conformity with accounting principles generally accepted in the United States of America.
Basis for Opinion
These financial statements and financial highlights are the responsibility of the Fund's management. Our responsibility is to express an opinion on the Fund’s financial statements and financial highlights based on our audit. We are a public accounting firm registered with the Public Company Accounting Oversight Board (United States) (PCAOB) and are required to be independent with respect to the Fund in accordance with the U.S. federal securities laws and the applicable rules and regulations of the Securities and Exchange Commission and the PCAOB.
We conducted our audit in accordance with the standards of the PCAOB. Those standards require that we plan and perform the audit to obtain reasonable assurance about whether the financial statements and financial highlights are free of material misstatement, whether due to error or fraud. The Fund is not required to have, nor were we engaged to perform, an audit of its internal control over financial reporting. As part of our audit we are required to obtain an understanding of internal control over financial reporting but not for the purpose of expressing an opinion on the effectiveness of the Fund’s internal control over financial reporting. Accordingly, we express no such opinion.
Our audit included performing procedures to assess the risks of material misstatement of the financial statements and financial highlights, whether due to error or fraud, and performing procedures that respond to those risks. Such procedures included examining, on a test basis, evidence regarding the amounts and disclosures in the financial statements and financial highlights. Our audit also included evaluating the accounting principles used and significant estimates made by management, as well as evaluating the overall presentation of the financial statements and financial highlights. Our procedures included confirmation of securities owned as of August 31, 2020, by correspondence with the custodian and brokers; when replies were not received from brokers, we performed other auditing procedures. We believe that our audit provides a reasonable basis for our opinion.
DELOITTE & TOUCHE LLP
Kansas City, Missouri
October 16, 2020
We have served as the auditor of one or more American Century investment companies since 1997.
73
| Management | ||
The Board of Trustees
The individuals listed below serve as trustees of the funds. Each trustee will continue to serve in this capacity until death, retirement, resignation or removal from office. The board has adopted a mandatory retirement age for trustees who are not “interested persons,” as that term is defined in the Investment Company Act (independent trustees). Trustees who are not also officers of the trust shall retire by December 31st of the year in which they reach their 75th birthday.
Mr. Thomas is an “interested person” because he currently serves as President and Chief Executive Officer of American Century Companies, Inc. (ACC), the parent company of American Century Investment Management, Inc. (ACIM or the advisor). The other trustees are independent. They are not employees, directors or officers of, and have no financial interest in, ACC or any of its wholly owned, direct or indirect, subsidiaries, including ACIM and American Century Services, LLC (ACS), and they do not have any other affiliations, positions or relationships that would cause them to be considered “interested persons” under the Investment Company Act. The following trustees also serve in this capacity for a number of other registered investment companies in the American Century Investments family of funds: Jonathan S. Thomas, 15; Ronald J. Gilson, 8; and Stephen E. Yates, 7.
The following table presents additional information about the trustees. The mailing address for each trustee other than Jonathan S. Thomas is 330 Madison Avenue, New York, New York 10017. The mailing address for Jonathan S. Thomas is 4500 Main Street, Kansas City, Missouri 64111.
| Name (Year of Birth) | Position(s) Held with Funds | Length of Time Served | Principal Occupation(s) During Past 5 Years | Number of American Century Portfolios Overseen by Trustee | Other Directorships Held During Past 5 Years | ||||||||||||
| Independent Trustees | |||||||||||||||||
| Reginald M. Browne (1968) | Trustee and Chairman of the Board | Since 2017 (Chairman since 2019) | Principal, GTS Securities (automated capital markets trading firm)(2019 to present); Senior Managing Director, Co Global Head-ETF Group, Cantor Fitzgerald (financial services firm)(2013 to 2019) | 19 | None | ||||||||||||
| Ronald J. Gilson (1946) | Trustee | Since 2017 | Charles J. Meyers Professor of Law and Business, Emeritus, Stanford Law School (1979 to 2016); Marc and Eva Stern Professor of Law and Business, Columbia University School of Law (1992 to present) | 59 | None | ||||||||||||
| Barry A. Mendelson (1958) | Trustee | Since 2017 | Retired; Consultant regarding ETF and mutual fund matters (2015 to 2016); Principal and Senior Counsel, The Vanguard Group (investment management)(1998 to 2014) | 19 | None | ||||||||||||
| Stephen E. Yates (1948) | Trustee | Since 2017 | Retired | 82 | None | ||||||||||||
74
| Name (Year of Birth) | Position(s) Held with Funds | Length of Time Served | Principal Occupation(s) During Past 5 Years | Number of American Century Portfolios Overseen by Trustee | Other Directorships Held During Past 5 Years | ||||||||||||
| Interested Trustees | |||||||||||||||||
| Jonathan S. Thomas (1963) | Trustee | Since 2017 | President and Chief Executive Officer, ACC (2007 to present). Also serves as Chief Executive Officer, ACS; Executive Vice President, ACIM; Director, ACC, ACIM and other ACC subsidiaries | 122 | None | ||||||||||||
The Statement of Additional Information has additional information about the fund's trustees and is available without charge, upon request, by calling 1-800-345-6488.
75
Officers
The following table presents certain information about the executive officers of the funds. Each officer, except Edward Rosenberg, serves as an officer for each of the 16 investment companies in the American Century family of funds. No officer is compensated for his or her service as an officer of the funds. The listed officers are interested persons of the funds and are appointed or re-appointed on an annual basis. The mailing address for each officer listed below is 4500 Main Street, Kansas City, Missouri 64111.
| Name (Year of Birth) | Offices with the Funds | Principal Occupation(s) During the Past Five Years | ||||||
| Patrick Bannigan (1965) | President since 2019 | Executive Vice President and Director, ACC (2012 to present); Chief Financial Officer, Chief Accounting Officer and Treasurer, ACC (2015 to present). Also serves as President, ACS; Vice President, ACIM; Chief Financial Officer, Chief Accounting Officer and/or Director, ACIM, ACS and other ACC subsidiaries | ||||||
| R. Wes Campbell (1974) | Chief Financial Officer and Treasurer since 2018 | Vice President, ACS (2020 to present); Investment Operations and Investment Accounting, ACS (2000 to present) | ||||||
| Amy D. Shelton (1964) | Chief Compliance Officer and Vice President since 2017 | Chief Compliance Officer, American Century funds, (2014 to present); Chief Compliance Officer, ACIM (2014 to present); Chief Compliance Officer, ACIS (2009 to present). Also serves as Vice President, ACIS | ||||||
| Charles A. Etherington (1957) | General Counsel and Vice President since 2017 | Attorney, ACC (1994 to present); Vice President, ACC (2005 to present); General Counsel, ACC (2007 to present). Also serves as General Counsel, ACIM, ACS, ACIS and other ACC subsidiaries; and Senior Vice President, ACIM and ACS | ||||||
| Cleo Chang (1977) | Vice President since 2019 | Senior Vice President, ACIM (2015 to present); Chief Investment Officer, Wilshire Funds Management (2005 to 2015) | ||||||
| David H. Reinmiller (1963) | Vice President since 2017 | Attorney, ACC (1994 to present). Also serves as Vice President, ACIM and ACS | ||||||
| Edward Rosenberg (1973) | Vice President since 2017 | Senior Vice President, ACIM (2017 to present); Senior Vice President, Flexshares Head of ETF Capital Markets, Northern Trust (2012 to 2017) | ||||||
| C. Jean Wade (1964) | Vice President since 2017 | Senior Vice President, ACS (2017 to present); Vice President, ACS (2000 to 2017) | ||||||
| Ward D. Stauffer (1960) | Secretary since 2019 | Attorney, ACS (2003 to present) | ||||||
76
| Approval of Management Agreement | ||
At a meeting held on June 5, 2020, the Fund’s Board of Trustees (the "Board") unanimously approved the renewal of the management agreement pursuant to which American Century Investment Management, Inc. (the “Advisor”) acts as the investment advisor for the Fund. Under Section 15(c) of the Investment Company Act, contracts for investment advisory services are required to be reviewed, evaluated, and approved by a majority of a fund’s trustees (the “Trustees”), including a majority of the independent Trustees, each year.
Prior to its consideration of the renewal of the management agreement, the Trustees requested and reviewed extensive data and information compiled by the Advisor and certain independent providers of evaluation data concerning the Fund and the services provided to the Fund by the Advisor. This review was in addition to the oversight and evaluation undertaken by the Board and its Audit Committee on a continual basis and the information received was supplemental to the extensive information that the Board and its Audit Committee receive and consider throughout the year.
In connection with its consideration of the renewal of the management agreement, the Board’s review and evaluation of the services provided by the Advisor included, but was not limited to, the following:
•the nature, extent, and quality of investment management and other services provided and to be provided to the Fund;
•the wide range of other programs and services provided and to be provided to the Fund and its shareholders on a routine and non-routine basis;
•the Fund’s investment performance, including data comparing the Fund's performance to appropriate benchmarks of funds with similar objectives and strategies;
•the cost of owning the Fund compared to the cost of owning similar funds;
•the compliance policies, procedures, and regulatory experience of the Advisor and the Fund's service providers;
•the Advisor’s strategic plans;
•the Advisor’s business continuity plans and specifically its response to the COVID-19 pandemic;
•financial data showing the cost of services provided to the Fund, the profitability of the Fund to the Advisor, and the overall profitability of the Advisor;
•information regarding payments to intermediaries by the Advisor; and
•possible economies of scale associated with the Advisor’s management of the Fund; and
•possible collateral benefits to the Advisor from the management of the Fund.
The independent Trustees met separately in private session to discuss the renewal and to review and discuss the information provided in response to their request. The independent Trustees also held active discussions with the Advisor regarding the renewal of the management agreement. The independent Trustees had the benefit of the advice of their independent counsel throughout the process.
Factors Considered
The Trustees considered all of the information provided by the Advisor, the independent data providers, and independent counsel in connection with the approval. They determined that the information was sufficient for them to evaluate the management agreement for the Fund. In connection with their review, the Trustees did not identify any single factor as being all-important or
77
controlling, and each Trustee may have attributed different levels of importance to different factors. In deciding to renew the management agreement, the Board based its decision on a number of factors, including without limitation the following:
Nature, Extent and Quality of Services — Generally. Under the management agreement, the Advisor is responsible for providing or arranging for all services necessary for the operation of the Fund. The Board noted that the Advisor provides or arranges at its own expense a wide variety of services including without limitation the following:
•constructing and designing the Fund
•portfolio research and security selection
•initial capitalization/funding
•securities trading
•Fund administration
•custody of Fund assets
•daily valuation of the Fund’s portfolio
•shareholder servicing and transfer agency, including shareholder confirmations, recordkeeping, and communications
•legal services (except the independent Trustees’ counsel)
•regulatory and portfolio compliance
•financial reporting
•marketing and distribution (except amounts paid by the Fund under Rule 12b-1 plans)
Investment Management Services. The nature of the investment management services provided to the Fund is quite complex and allows Fund shareholders access to professional money management, instant diversification of their investments within an asset class, and liquidity. In evaluating investment performance, the Board expects the Advisor to manage the Fund in accordance with its investment objectives and approved strategies. Further, the Trustees recognize that the Advisor has an obligation to monitor trading activities, and in particular to seek the best execution of fund trades, and to evaluate the use of and payment for research. In providing these services, the Advisor utilizes teams of investment professionals (portfolio managers, analysts, research assistants, and securities traders) who require extensive information technology, research, training, compliance, and other systems to conduct their business. The Board provides oversight of the investment performance process. It regularly reviews investment performance information for the Fund, together with comparative information for appropriate benchmarks over different time horizons. If performance concerns are identified, the Board discusses with the Advisor the reasons for such results and any efforts being undertaken to improve performance. The Board found the investment management services provided by the Advisor to the Fund to be satisfactory and consistent with the management agreement.
Shareholder and Other Services. Under the management agreement, the Advisor provides or arranges for a comprehensive package of services to the Fund. The Board, directly and through its Audit Committee, regularly reviews reports and evaluations of such services at its regular meetings. These reports include, but are not limited to, information regarding the operational efficiency and accuracy of the shareholder and transfer agency services provided, staffing levels, shareholder satisfaction, technology support (including cyber security), new products and services offered to Fund shareholders, securities trading activities, portfolio valuation services, auditing services, and legal and operational compliance activities. The Board found the services provided by the Advisor to the Fund under the management agreement to be competitive and of high quality.
COVID-19 Response. During 2020, much of the world experienced unprecedented change and challenges from the impacts of the rapidly evolving, worldwide spread of the COVID-19 virus. The
78
Board evaluated the Advisor’s response to the COVID-19 pandemic and its impact on service to the Fund. The Board found that Fund shareholders have continued to receive the Advisor’s investment management and other services without disruption, and Advisor personnel have demonstrated great resiliency in providing those services. The Board, directly and through its Audit Committee, continues to monitor the impact of the pandemic and the response of each of the Fund’s service providers.
Costs of Services and Profitability. The Advisor provides detailed information concerning its cost of providing various services to the Fund, its profitability in managing the Fund (pre- and post-distribution), its overall profitability, and its financial condition. The Trustees have reviewed with the Advisor the methodology used to prepare this financial information. This information is considered in evaluating the Advisor’s financial condition, its ability to continue to provide services under the management agreement, and the reasonableness of the current management fee. The Board concluded that the Advisor’s profits were reasonable in light of the services provided to the Fund.
Ethics. The Board generally considers the Advisor’s commitment to providing quality services to the Fund and to conducting its business ethically. They noted that the Advisor’s practices generally meet or exceed industry best practices.
Economies of Scale. The Board also reviewed information provided by the Advisor regarding the possible existence of economies of scale in connection with the management of the Fund. The Board concluded that economies of scale are difficult to measure and predict with precision, especially on a fund-by-fund basis. The Board concluded that the Advisor is appropriately sharing economies of scale, to the extent they exist, through its competitive fee structure, offering competitive fees from fund inception, and through reinvestment in its business, infrastructure, investment capabilities and initiatives to provide shareholders additional content and services.
Comparison to Other Funds’ Fees. The management agreement provides that the Fund pays the Advisor a single, all-inclusive (or unified) management fee for providing all services necessary for the management and operation of the Fund, other than brokerage expenses, expenses attributable to short sales, taxes, interest, extraordinary expenses, and expenses incurred in connection with the provision of shareholder services and distribution services under a plan adopted pursuant to Rule 12b-1 under the Investment Company Act. Under the unified fee structure, the Advisor is responsible for providing all investment advisory, custody, audit, administrative, compliance, recordkeeping, marketing and shareholder services, or arranging and supervising third parties to provide such services. The Board believes the unified fee structure is a benefit to Fund shareholders because it clearly discloses to shareholders the cost of owning Fund shares, and, since the unified fee cannot be increased without a vote of Fund shareholders, it shifts to the Advisor the risk of increased costs of operating the Fund and provides a direct incentive to minimize administrative inefficiencies. Part of the Board’s analysis of fee levels involves reviewing certain evaluative data compiled by an independent provider comparing the Fund’s unified fee to the total expense ratios of its peers. The unified fee charged to shareholders of the Fund was below the median of the total expense ratios of the Fund’s peer expense universe and the lowest of its peer expense group. The Board concluded that the management fee paid by the Fund to the Advisor under the management agreement is reasonable in light of the services provided to the Fund.
Comparison to Fees and Services Provided to Other Clients of the Advisor. The Board also requested information from the Advisor concerning the nature of the services, fees, costs, and profitability of its advisory services to funds or other advisory clients managed similarly to the Fund. The Advisor informed the Trustees that, as of December 31, 2019, it did not provide services to any other investment companies or comparable accounts that were managed similarly to the Fund.
79
Payments to Intermediaries. The Trustees also requested a description of payments made to intermediaries by the Fund and the Advisor and services provided in response thereto. These payments could include various payments made by the Fund or the Advisor to different types of intermediaries and recordkeepers for distribution and service activities provided for the Fund. The Trustees reviewed such information and received representations from the Advisor that all such payments by the Advisor were made from the Advisor’s resources and reasonable profits. The Board found such payments to be reasonable in scope and purpose.
Collateral or “Fall-Out” Benefits Derived by the Advisor. The Board considered the possible existence of collateral benefits the Advisor may receive as a result of its relationship with the Fund. They concluded that the Advisor’s primary business is managing funds and it generally does not use fund or shareholder information to generate profits in other lines of business, and therefore does not derive any significant collateral benefits from them. The Board noted that additional assets from other clients may offer the Advisor some benefit from increased leverage with service providers and counterparties. The Board also determined that the Advisor is able to provide investment management services to certain clients other than the Fund, at least in part, due to its existing infrastructure built to serve the fund complex. The Board concluded that appropriate allocation methodologies had been employed to assign resources and the cost of those resources to these other clients.
Existing Relationship. The Board also considered whether there was any reason for not continuing the existing arrangement with the Advisor. In this regard, the Board was mindful of the potential disruptions of the Fund’s operations and various risks, uncertainties, and other effects that could occur as a result of a decision not to continue such relationship. In particular, the Board recognized that most shareholders have invested in the Fund on the strength of the Advisor’s industry standing and reputation and in the expectation that the Advisor will have a continuing role in providing advisory services to the Fund.
Conclusion of the Trustees. As a result of this process, the Board, including all of the independent Trustees, taking into account all of the factors discussed above and the information provided by the Advisor and others in connection with its review and throughout the year, determined that the management fee is fair and reasonable in light of the services provided and that the investment management agreement between the Fund and the Advisor should be renewed.
80
| Liquidity Risk Management Program | ||
The Fund has adopted a liquidity risk management program (the “program”). The Fund’s Board of Trustees (the "Board") has designated American Century Investment Management, Inc. (“ACIM”) as the administrator of the program. Personnel of ACIM or its affiliates conduct the day-to-day operation of the program pursuant to policies and procedures administered by those members of the ACIM’s Investment Oversight Committee who are members of the ACIM’s Investment Management and Global Analytics departments.
Under the program, ACIM manages the Fund’s liquidity risk, which is the risk that the Fund could not meet shareholder redemption requests without significant dilution of remaining shareholders’ interests in the Fund. This risk is managed by monitoring the degree of liquidity of the Fund’s investments, limiting the amount of the Fund’s illiquid investments, and utilizing various risk management tools and facilities available to the Fund for meeting shareholder redemptions, among other means. ACIM’s process of determining the degree of liquidity of the Fund’s investments is supported by one or more third-party liquidity assessment vendors.
The Board reviewed a report prepared by ACIM regarding the operation and effectiveness of the program for the period December 1, 2018 through December 31, 2019. No significant liquidity events impacting the Fund were noted in the report. In addition, ACIM provided its assessment that the program had been effective in managing the Fund’s liquidity risk.
81
| Additional Information | ||
Retirement Account Information
As required by law, distributions you receive from certain retirement accounts are subject to federal income tax withholding, unless you elect not to have withholding apply*. Tax will be withheld on the total amount withdrawn even though you may be receiving amounts that are not subject to withholding, such as nondeductible contributions. In such case, excess amounts of withholding could occur. You may adjust your withholding election so that a greater or lesser amount will be withheld.
If you don’t want us to withhold on this amount, you must notify us to not withhold the federal income tax. You may notify us in writing or in certain situations by telephone or through other electronic means. For systematic withdrawals, your withholding election will remain in effect until revoked or changed by filing a new election. You have the right to revoke your election at any time and change your withholding percentage for future distributions.
Remember, even if you elect not to have income tax withheld, you are liable for paying income tax on the taxable portion of your withdrawal. If you elect not to have income tax withheld or you don’t have enough income tax withheld, you may be responsible for payment of estimated tax. You may incur penalties under the estimated tax rules if your withholding and estimated tax payments are not sufficient. You can reduce or defer the income tax on a distribution by directly or indirectly rolling such distribution over to another IRA or eligible plan. You should consult your tax advisor for additional information.
State tax will be withheld if, at the time of your distribution, your address is within one of the mandatory withholding states and you have federal income tax withheld (or as otherwise required by state law). State taxes will be withheld from your distribution in accordance with the respective state rules.
*Some 403(b), 457 and qualified retirement plan distributions may be subject to 20% mandatory withholding, as they are subject to special tax and withholding rules. Your plan administrator or plan sponsor is required to provide you with a special tax notice explaining those rules at the time you request a distribution. If applicable, federal and/or state taxes may be withheld from your distribution amount.
Proxy Voting Policies
A description of the policies that the fund's investment advisor uses in exercising the voting rights associated with the securities purchased and/or held by the fund are available without charge, upon request, by calling 1-800-345-6488. It is also available on American Century Investments’ website at americancentury.com/proxy and on the Securities and Exchange Commission’s website at sec.gov. Information regarding how the investment advisor voted proxies relating to portfolio securities during the most recent 12-month period ended June 30 is available at americancentury.com/proxy. It is also available at sec.gov.
Quarterly Portfolio Disclosure
The fund files its complete schedule of portfolio holdings with the Securities and Exchange Commission (SEC) for the first and third quarters of each fiscal year as an exhibit to its reports on Form N-PORT. The fund's Form N-PORT reports are available on the SEC’s website at sec.gov.
82
Other Tax Information
The following information is provided pursuant to provisions of the Internal Revenue Code.
The fund hereby designates up to the maximum amount allowable as qualified dividend income for the fiscal year ended August 31, 2020.
For the fiscal year ended August 31, 2020, the fund intends to pass through to shareholders foreign source income of $676,112 and foreign taxes paid of $67,349, or up to the maximum amount allowable, as a foreign tax credit. Foreign source income and foreign tax expense per outstanding share on August 31, 2020 are $0.1299 and $0.0129, respectively.
83
| Notes | ||
84
| Notes | ||
85
| Notes | ||
86
| Notes | ||
87
| Notes | ||
88
| ||||||||
| Contact Us | avantisinvestors.com | |||||||
| American Century Sales Representatives, Financial Professionals, Broker Dealers, Insurance Companies, Banks and Trust Companies | 1-833-928-2684 | |||||||
| Telecommunications Relay Service for the Deaf | 711 | |||||||
| American Century ETF Trust | ||||||||
Investment Advisor: American Century Investment Management, Inc. Kansas City, Missouri | ||||||||
| This report and the statements it contains are submitted for the general information of our shareholders. The report is not authorized for distribution to prospective investors unless preceded or accompanied by an effective prospectus. | ||||||||
| ©2020 American Century Proprietary Holdings, Inc. All rights reserved. CL-ANN-96048 2010 | ||||||||
| Annual Report | |||||
| August 31, 2020 | |||||
Avantis® International Small Cap Value Fund | |||||
| Institutional Class (AVDVX) | |||||
Beginning on January 1, 2021, as permitted by regulations adopted by the Securities and Exchange Commission, paper copies of the fund’s shareholder reports like this one will no longer be sent by mail, unless you specifically request paper copies of the reports from the fund or from your financial intermediary, such as a broker-dealer or bank. Instead, the reports will be made available on a website, and you will be notified by mail each time a report is posted and provided with a website link to access the report.
If you already elected to receive shareholder reports electronically, you will not be affected by this change and you need not take any action. You may elect to receive shareholder reports and other communications from the fund or your financial intermediary electronically by calling or sending an email request to your appropriate contacts as listed on the back cover of this report.
You may elect to receive all future reports in paper free of charge. You can inform the fund or your financial intermediary that you wish to continue receiving paper copies of your shareholder reports by calling or sending an email request to your appropriate contacts as listed on the back cover of this report. Your election to receive reports in paper will apply to all funds held with the fund complex/your financial intermediary.
| Table of Contents | ||
| Chairman’s Letter | |||||
| Performance | |||||
| Portfolio Commentary | |||||
| Fund Characteristics | |||||
| Shareholder Fee Example | |||||
| Schedule of Investments | |||||
| Statement of Assets and Liabilities | |||||
| Statement of Operations | |||||
| Statement of Changes in Net Assets | |||||
| Notes to Financial Statements | |||||
| Financial Highlights | |||||
| Report of Independent Registered Public Accounting Firm | |||||
| Management | |||||
| Approval of Management Agreement | |||||
| Liquidity Risk Management Program | |||||
| Additional Information | |||||
Any opinions expressed in this report reflect those of the author as of the date of the report, and do not necessarily represent the opinions of American Century Investments® or any other person in the American Century Investments organization. Any such opinions are subject to change at any time based upon market or other conditions and American Century Investments disclaims any responsibility to update such opinions. These opinions may not be relied upon as investment advice and, because investment decisions made by American Century Investments funds are based on numerous factors, may not be relied upon as an indication of trading intent on behalf of any American Century Investments fund. Security examples are used for representational purposes only and are not intended as recommendations to purchase or sell securities. Performance information for comparative indices and securities is provided to American Century Investments by third party vendors. To the best of American Century Investments’ knowledge, such information is accurate at the time of printing.
| Chairman's Letter | ||
Jonathan ThomasDear Investor:
Thank you for reviewing this annual report for the period ended August 31, 2020. Annual reports help convey important information about fund returns, including market factors that affected performance. For additional investment insights, please visit avantisinvestors.com.
Pandemic Disrupted Economic, Market Courses
Broad market sentiment was generally upbeat early in the period. Dovish central banks, modest inflation, improving economic and corporate earnings data, and progress on U.S.-China trade helped boost global growth outlooks. Against this backdrop, stocks largely remained in favor.
However, beginning in late February, COVID-19 quickly quashed the optimistic tone. The outbreak rapidly spread worldwide, halting most U.S. and global economic activity and triggering a deep worldwide recession. Global stocks sold off sharply, but central banks and federal governments stepped in quickly and aggressively to stabilize financial markets. These extraordinary efforts proved helpful, as most stocks rebounded quickly. As the period progressed, coronavirus infection and death rates declined in many regions and economies reopened. By the end of August, manufacturing, employment and other data suggested an economic recovery was underway.
Overall, global stocks delivered mixed results for the period. U.S. stocks generally advanced and fared better than their counterparts elsewhere. The growth style significantly outperformed value stocks, which struggled.
A Slow Return to Normal
The return to pre-pandemic life will take time and patience, but we are confident we will get there. Several drug companies are in final stages of vaccine trials, and medical professionals continue to fine-tune virus treatment protocols. In the meantime, investors likely will face periods of outbreak-related disruptions, economic and political uncertainty, and heightened market volatility. These influences can be unsettling, but they tend to be temporary.
We appreciate your confidence in us during these extraordinary times. Our investment professionals have experience weathering unpredictable markets, and we’re confident we will continue to meet today’s challenges.
Sincerely,
Jonathan Thomas
Chairman
Avantis Investors
2
| Performance | ||
| Total Returns as of August 31, 2020 | |||||||||||||||||||||||
| Ticker Symbol | Since Inception | Inception Date | |||||||||||||||||||||
| Institutional Class | AVDVX | -6.43% | 12/4/2019 | ||||||||||||||||||||
| MSCI World ex-USA Small Cap Index | — | 1.27% | — | ||||||||||||||||||||
| Growth of $10,000 Over Life of Fund | ||
| $10,000 investment made December 4, 2019 | ||
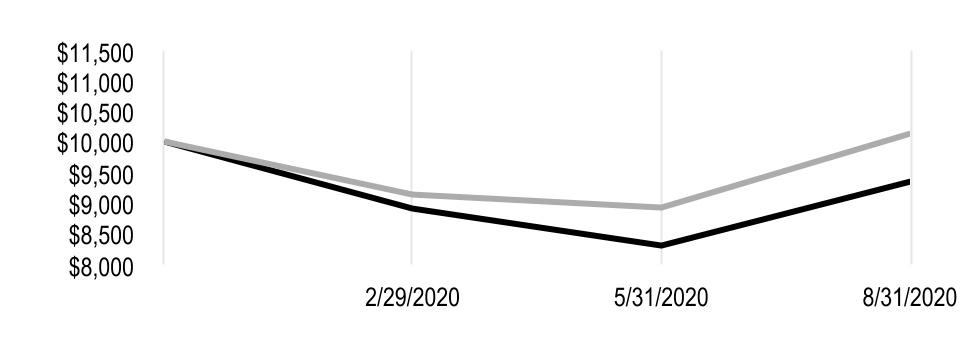
| Value on August 31, 2020 | |||||
| Institutional Class — $9,357 | |||||
| MSCI World ex-USA Small Cap Index — $10,127 | |||||
| Total Annual Fund Operating Expenses | |||||||||||||||||
| Institutional Class | 0.36% | ||||||||||||||||
The total annual fund operating expenses shown is as stated in the fund’s prospectus current as of the date of this report. The prospectus may vary from the expense ratio shown elsewhere in this report because it is based on a different time period, includes acquired fund fees and expenses, and, if applicable, does not include fee waivers or expense reimbursements.
Data presented reflect past performance. Past performance is no guarantee of future results. Current performance may be higher or lower than the performance shown. Total returns for periods less than one year are not annualized. Investment return and principal value will fluctuate, and redemption value may be more or less than original cost. Data assumes reinvestment of dividends and capital gains, and none of the charts reflect the deduction of taxes that a shareholder would pay on fund distributions or the redemption of fund shares. To obtain performance data current to the most recent month end, please call 1-833-928-2684 or visit avantisinvestors.com. For additional information about the fund, please consult the prospectus.
3
| Portfolio Commentary | ||
Portfolio Managers: Eduardo Repetto, Mitch Firestein, Daniel Ong and Ted Randall
Fund Strategy
Avantis International Small Cap Value seeks long-term capital appreciation by investing in a diverse group of non-U.S. small-capitalization (small-cap) value companies across countries, market sectors and industry groups.
The fund seeks securities of companies that it expects to have higher returns. It places an enhanced emphasis on securities of companies with smaller market capitalizations and securities of companies it defines as high profitability or value companies. Conversely, the fund seeks to underweight or exclude securities it expects to have lower returns. These include securities of large companies with lower levels of profitability and higher prices relative to their book values or other financial metrics. Under normal market conditions, the fund will invest at least 80% of its assets in securities of small-cap companies.
The portfolio managers continually analyze market and financial data to make buy, sell and hold decisions. When buying or selling a security, the portfolio managers may consider the trade-off between expected returns of the security and implementation or tax costs of the trade. They do this in an attempt to gain trading efficiencies, avoid unnecessary risk and enhance portfolio performance.
Performance Review
For the period from Avantis International Small Cap Value’s inception on December 4, 2019, through the fund’s fiscal year-end on August 31, 2020, the fund returned -6.43%*. For the same time period, the fund’s benchmark, the MSCI World ex-USA Small Cap Index, returned 1.27%. Fund returns reflect fees and operating expenses, while index returns do not.
The MSCI World ex-USA Small Cap Index is an unmanaged index generally representative of the performance of non-U.S. developed markets small-cap stocks. The fund’s underperformance versus the index was largely due to the fund’s emphasis on small-cap companies with higher levels of profitability and lower prices relative to their book values. These companies generally underperformed companies with lower levels of profitability and higher prices relative to their book values.
For example, small-cap value stocks (as measured by the MSCI World ex-USA Small Cap Value Index) returned -8.78% for the reporting period, underperforming small-cap growth stocks, which returned 11.42% (as measured by the MSCI World ex-USA Small Cap Growth Index).
Meanwhile, the exclusion of real estate investment trusts (REITs) in the fund aided results. REITs were significant underperformers for the reporting period.
*Total returns for periods less than one year are not annualized.
4
| Fund Characteristics | ||
| AUGUST 31, 2020 | |||||
| Top Ten Holdings | % of net assets | ||||
| Bucher Industries AG | 0.9% | ||||
| WM Morrison Supermarkets plc | 0.9% | ||||
| ASR Nederland NV | 0.7% | ||||
| Direct Line Insurance Group plc | 0.7% | ||||
| J Sainsbury plc | 0.7% | ||||
| Nolato AB, B Shares | 0.7% | ||||
| Quilter plc | 0.6% | ||||
| Tate & Lyle plc | 0.6% | ||||
| Bure Equity AB | 0.6% | ||||
| Electrocomponents plc | 0.6% | ||||
| Types of Investments in Portfolio | % of net assets | ||||
| Common Stocks | 98.9% | ||||
| Rights | —* | ||||
| Total Equity Exposure | 98.9% | ||||
| Temporary Cash Investments | 0.8% | ||||
| Temporary Cash Investments - Securities Lending Collateral | 1.8% | ||||
| Other Assets and Liabilities | (1.5)% | ||||
*Category is less than 0.05% of total net assets.
| Investments by Country | % of net assets | ||||
| Japan | 27.0% | ||||
| United Kingdom | 15.2% | ||||
| Canada | 8.7% | ||||
| Australia | 7.6% | ||||
| Sweden | 6.9% | ||||
| Germany | 5.2% | ||||
| Switzerland | 4.9% | ||||
| Italy | 2.7% | ||||
| France | 2.6% | ||||
| Hong Kong | 2.1% | ||||
| Netherlands | 2.0% | ||||
| Other Countries | 14.0% | ||||
| Cash and Equivalents* | 1.1% | ||||
*Includes temporary cash investments, temporary cash investments - securities lending collateral and other assets and liabilities.
5
| Shareholder Fee Example | ||
Fund shareholders may incur two types of costs: (1) transaction costs, including sales charges (loads) on purchase payments and redemption/exchange fees; and (2) ongoing costs, including management fees; distribution and service (12b-1) fees; and other fund expenses. This example is intended to help you understand your ongoing costs (in dollars) of investing in your fund and to compare these costs with the ongoing cost of investing in other mutual funds.
The example is based on an investment of $1,000 made at the beginning of the period and held for the entire period from March 1, 2020 to August 31, 2020.
Actual Expenses
The table provides information about actual account values and actual expenses for each class. You may use the information, together with the amount you invested, to estimate the expenses that you paid over the period. First, identify the share class you own. Then simply divide your account value by $1,000 (for example, an $8,600 account value divided by $1,000 = 8.6), then multiply the result by the number under the heading “Expenses Paid During Period” to estimate the expenses you paid on your account during this period.
Hypothetical Example for Comparison Purposes
The table also provides information about hypothetical account values and hypothetical expenses based on the actual expense ratio of each class of your fund and an assumed rate of return of 5% per year before expenses, which is not the actual return of a fund’s share class. The hypothetical account values and expenses may not be used to estimate the actual ending account balance or expenses you paid for the period. You may use this information to compare the ongoing costs of investing in your fund and other funds. To do so, compare this 5% hypothetical example with the 5% hypothetical examples that appear in the shareholder reports of the other funds.
Please note that the expenses shown in the table are meant to highlight your ongoing costs only and do not reflect any transactional costs, such as sales charges (loads) or redemption/exchange fees. Therefore, the table is useful in comparing ongoing costs only, and will not help you determine the relative total costs of owning different funds. In addition, if these transactional costs were included, your costs would have been higher.
| Beginning Account Value 3/1/20 | Ending Account Value 8/31/20 | Expenses Paid During Period(1) 3/1/20 - 8/31/20 | Annualized Expense Ratio(1) | |||||||||||
| Actual | ||||||||||||||
| Institutional Class | $1,000 | $1,050.70 | $1.86 | 0.36% | ||||||||||
| Hypothetical | ||||||||||||||
| Institutional Class | $1,000 | $1,023.33 | $1.83 | 0.36% | ||||||||||
(1)Expenses are equal to the class's annualized expense ratio listed in the table above, multiplied by the average account value over the period, multiplied by 184, the number of days in the most recent fiscal half-year, divided by 366, to reflect the one-half year period. Annualized expense ratio reflects actual expenses, including any applicable fee waivers or expense reimbursements and excluding any acquired fund fees and expenses.
6
| Schedule of Investments | ||
AUGUST 31, 2020
| Shares | Value | |||||||
| COMMON STOCKS — 98.9% | ||||||||
| Australia — 7.6% | ||||||||
| Adairs Ltd. | 10,087 | $ | 25,420 | |||||
| Adbri Ltd. | 31,461 | 58,256 | ||||||
| Alliance Aviation Services Ltd. | 9,551 | 25,874 | ||||||
Ardent Leisure Group Ltd.(1) | 23,468 | 7,249 | ||||||
| Aurelia Metals Ltd. | 87,243 | 34,343 | ||||||
| Australian Finance Group Ltd. | 9,691 | 13,125 | ||||||
| Australian Pharmaceutical Industries Ltd. | 14,184 | 11,343 | ||||||
Bank of Queensland Ltd.(2) | 1,197 | 5,312 | ||||||
| Beach Energy Ltd. | 111,115 | 123,519 | ||||||
Bega Cheese Ltd.(2) | 19,955 | 76,939 | ||||||
Berkeley Energia Ltd.(1) | 25 | 15 | ||||||
| Boral Ltd. | 23,590 | 68,558 | ||||||
Byron Energy Ltd.(1) | 7,834 | 1,644 | ||||||
| Cedar Woods Properties Ltd. | 4,413 | 17,257 | ||||||
| Challenger Ltd. | 27,594 | 81,439 | ||||||
| Class Ltd. | 1,392 | 1,896 | ||||||
Coronado Global Resources, Inc.(2) | 10,230 | 4,657 | ||||||
| CSR Ltd. | 40,763 | 108,815 | ||||||
Dacian Gold Ltd.(1) | 19,924 | 4,920 | ||||||
Eclipx Group Ltd.(1) | 22,450 | 24,502 | ||||||
Emeco Holdings Ltd.(1) | 16,461 | 10,607 | ||||||
Emeco Holdings Ltd.(1) | 7,839 | 5,088 | ||||||
Fleetwood Corp. Ltd.(1) | 1,403 | 1,919 | ||||||
FlexiGroup Ltd.(1) | 6,159 | 5,474 | ||||||
| FlexiGroup Ltd. | 19,706 | 17,272 | ||||||
| Flight Centre Travel Group Ltd. | 5,824 | 55,287 | ||||||
Galaxy Resources Ltd.(1) | 40,725 | 36,372 | ||||||
HT&E Ltd.(2) | 9,466 | 9,629 | ||||||
| IGO Ltd. | 40,212 | 130,677 | ||||||
| Iluka Resources Ltd. | 32,262 | 238,424 | ||||||
| Imdex Ltd. | 30,795 | 27,906 | ||||||
| Inghams Group Ltd. | 18,437 | 43,481 | ||||||
| Japara Healthcare Ltd. | 2,261 | 749 | ||||||
| Kogan.com Ltd. | 1,966 | 29,831 | ||||||
| MACA Ltd. | 10,937 | 8,266 | ||||||
| Macmahon Holdings Ltd. | 111,757 | 21,369 | ||||||
| McMillan Shakespeare Ltd. | 5,066 | 33,928 | ||||||
| McPherson's Ltd. | 1,589 | 3,971 | ||||||
Medusa Mining Ltd.(1) | 4,832 | 3,345 | ||||||
| Mineral Resources Ltd. | 7,736 | 164,782 | ||||||
| Money3 Corp. Ltd. | 13,629 | 21,522 | ||||||
| Mortgage Choice Ltd. | 1,714 | 1,070 | ||||||
| Nick Scali Ltd. | 4,199 | 26,942 | ||||||
| NRW Holdings Ltd. | 26,014 | 41,815 | ||||||
Nufarm Ltd.(1) | 26,922 | 79,340 | ||||||
| OFX Group Ltd. | 16,524 | 13,767 | ||||||
7
| Shares | Value | |||||||
| Orora Ltd. | 82,421 | $ | 135,348 | |||||
| OZ Minerals Ltd. | 9,681 | 103,715 | ||||||
| Pacific Current Group Ltd. | 868 | 3,893 | ||||||
Paladin Energy Ltd.(1) | 135,011 | 16,303 | ||||||
| Perenti Global Ltd. | 53,999 | 47,028 | ||||||
Perseus Mining Ltd.(1) | 90,914 | 96,677 | ||||||
| Platinum Asset Management Ltd. | 8,647 | 23,295 | ||||||
| Ramelius Resources Ltd. | 68,093 | 104,359 | ||||||
Red 5 Ltd.(1) | 143,361 | 32,207 | ||||||
| Regis Resources Ltd. | 45,012 | 175,109 | ||||||
Reject Shop Ltd. (The)(1) | 3,585 | 18,278 | ||||||
Resimac Group Ltd.(2) | 9,096 | 8,958 | ||||||
Resolute Mining Ltd.(1) | 93,431 | 76,016 | ||||||
| Sandfire Resources Ltd. | 16,239 | 55,084 | ||||||
| Select Harvests Ltd. | 6,791 | 27,242 | ||||||
Senex Energy Ltd.(1) | 95,424 | 20,985 | ||||||
| Sigma Healthcare Ltd. | 49,483 | 24,693 | ||||||
Silver Lake Resources Ltd.(1) | 16,398 | 26,203 | ||||||
| Sims Ltd. | 11,052 | 64,819 | ||||||
| Southern Cross Media Group Ltd. | 128,606 | 14,796 | ||||||
| St. Barbara Ltd. | 63,100 | 160,359 | ||||||
| Stanmore Coal Ltd. | 4,616 | 2,601 | ||||||
| Super Retail Group Ltd. | 11,680 | 90,991 | ||||||
| Viva Energy Group Ltd. | 15,764 | 19,157 | ||||||
| Western Areas Ltd. | 25,543 | 41,301 | ||||||
Westgold Resources Ltd.(1) | 30,002 | 47,003 | ||||||
| Whitehaven Coal Ltd. | 60,856 | 41,029 | ||||||
| 3,205,365 | ||||||||
| Austria — 0.7% | ||||||||
Addiko Bank AG(1) | 311 | 2,533 | ||||||
| AT&S Austria Technologie & Systemtechnik AG | 6,274 | 121,380 | ||||||
| Kapsch TrafficCom AG | 106 | 1,720 | ||||||
Lenzing AG(1) | 2,060 | 106,926 | ||||||
| Oesterreichische Post AG | 868 | 28,998 | ||||||
POLYTEC Holding AG(1) | 469 | 2,909 | ||||||
Porr AG(1) | 867 | 12,434 | ||||||
Semperit AG Holding(1) | 819 | 17,114 | ||||||
| 294,014 | ||||||||
| Belgium — 1.8% | ||||||||
| Bekaert SA | 11,271 | 227,063 | ||||||
bpost SA(1) | 14,882 | 148,846 | ||||||
Cie d'Entreprises CFE(1) | 615 | 44,065 | ||||||
Jensen-Group NV(1) | 250 | 6,801 | ||||||
Kinepolis Group NV(1) | 2,915 | 114,193 | ||||||
| Orange Belgium SA | 9,162 | 154,418 | ||||||
Tessenderlo Group SA(1) | 2,032 | 75,994 | ||||||
Van de Velde NV(1) | 101 | 2,525 | ||||||
| 773,905 | ||||||||
| Canada — 8.7% | ||||||||
Advantage Oil & Gas Ltd.(1) | 10,200 | 16,969 | ||||||
| Aecon Group, Inc. | 3,800 | 42,360 | ||||||
Air Canada(1) | 3,900 | 52,624 | ||||||
8
| Shares | Value | |||||||
Alacer Gold Corp.(1) | 7,100 | $ | 49,044 | |||||
| Alaris Royalty Corp. | 1,400 | 12,805 | ||||||
| Algoma Central Corp. | 200 | 1,582 | ||||||
ARC Resources Ltd.(2) | 7,900 | 39,853 | ||||||
Argonaut Gold, Inc.(1) | 12,600 | 26,758 | ||||||
| B2Gold Corp. | 15,800 | 106,113 | ||||||
Badger Daylighting Ltd.(2) | 1,900 | 54,436 | ||||||
Baytex Energy Corp.(1)(2) | 19,200 | 9,862 | ||||||
Birchcliff Energy Ltd.(2) | 10,900 | 13,371 | ||||||
Bird Construction, Inc.(2) | 400 | 2,095 | ||||||
| Boralex, Inc., A Shares | 1,500 | 38,525 | ||||||
| Caledonia Mining Corp. plc | 300 | 5,453 | ||||||
Canacol Energy Ltd.(2) | 8,800 | 23,748 | ||||||
| Canadian Western Bank | 4,900 | 104,210 | ||||||
| Capital Power Corp. | 6,800 | 149,205 | ||||||
Capstone Mining Corp.(1) | 4,000 | 3,987 | ||||||
Cardinal Energy Ltd.(2) | 1,100 | 506 | ||||||
| Cascades, Inc. | 5,800 | 61,675 | ||||||
Celestica, Inc.(1) | 7,200 | 57,353 | ||||||
| Cenovus Energy, Inc. | 14,900 | 70,368 | ||||||
| CES Energy Solutions Corp. | 7,500 | 5,462 | ||||||
China Gold International Resources Corp. Ltd.(1) | 1,900 | 2,564 | ||||||
| Chorus Aviation, Inc. | 3,100 | 6,417 | ||||||
| Clearwater Seafoods, Inc. | 400 | 1,880 | ||||||
Crescent Point Energy Corp.(2) | 22,400 | 39,327 | ||||||
CRH Medical Corp.(1) | 1,500 | 3,565 | ||||||
| DREAM Unlimited Corp., Class A | 1,750 | 25,706 | ||||||
| Dundee Precious Metals, Inc. | 3,900 | 28,226 | ||||||
Endeavour Mining Corp.(1) | 3,293 | 91,291 | ||||||
Enerplus Corp.(2) | 9,200 | 24,404 | ||||||
Ensign Energy Services, Inc.(2) | 900 | 490 | ||||||
| Equitable Group, Inc. | 550 | 32,591 | ||||||
ERO Copper Corp.(1) | 3,500 | 53,371 | ||||||
| Exchange Income Corp. | 600 | 14,614 | ||||||
| Exco Technologies Ltd. | 700 | 3,783 | ||||||
| Finning International, Inc. | 9,300 | 141,958 | ||||||
| First National Financial Corp. | 900 | 22,873 | ||||||
Fortuna Silver Mines, Inc.(1) | 2,600 | 18,937 | ||||||
| Frontera Energy Corp. | 2,200 | 4,605 | ||||||
| goeasy Ltd. | 600 | 29,872 | ||||||
Gran Colombia Gold Corp.(1) | 4,400 | 20,240 | ||||||
| Hardwoods Distribution, Inc. | 900 | 15,918 | ||||||
| Hudbay Minerals, Inc. | 13,300 | 59,650 | ||||||
Husky Energy, Inc.(2) | 13,500 | 45,643 | ||||||
| iA Financial Corp., Inc. | 3,900 | 140,380 | ||||||
IAMGOLD Corp.(1) | 25,500 | 109,675 | ||||||
| Intertape Polymer Group, Inc. | 2,600 | 29,920 | ||||||
Kelt Exploration Ltd.(1)(2) | 6,000 | 7,636 | ||||||
Keyera Corp.(2) | 8,900 | 162,532 | ||||||
Kinross Gold Corp.(1) | 6,400 | 56,819 | ||||||
Largo Resources Ltd.(1) | 10,900 | 8,942 | ||||||
| Linamar Corp. | 3,100 | 97,206 | ||||||
9
| Shares | Value | |||||||
| Lundin Mining Corp. | 15,200 | $ | 95,208 | |||||
| Magellan Aerospace Corp. | 200 | 1,113 | ||||||
Major Drilling Group International, Inc.(1) | 2,700 | 13,972 | ||||||
| Martinrea International, Inc. | 6,400 | 49,214 | ||||||
MEG Energy Corp.(1) | 8,100 | 22,480 | ||||||
| Methanex Corp. | 3,100 | 69,137 | ||||||
Mountain Province Diamonds, Inc.(1) | 1,800 | 531 | ||||||
| Mullen Group Ltd. | 4,700 | 35,277 | ||||||
| Neo Performance Materials, Inc. | 200 | 1,633 | ||||||
New Gold, Inc.(1) | 51,900 | 85,150 | ||||||
North American Construction Group Ltd.(2) | 1,300 | 9,269 | ||||||
NuVista Energy Ltd.(1)(2) | 2,700 | 1,677 | ||||||
OceanaGold Corp.(1) | 5,800 | 13,384 | ||||||
Parex Resources, Inc.(1) | 8,400 | 114,954 | ||||||
| Pason Systems, Inc. | 3,500 | 15,966 | ||||||
Peyto Exploration & Development Corp.(2) | 7,500 | 16,387 | ||||||
| Polaris Infrastructure, Inc. | 200 | 2,176 | ||||||
Precision Drilling Corp.(1)(2) | 12,200 | 8,605 | ||||||
Pretium Resources, Inc.(1) | 2,400 | 30,820 | ||||||
Real Matters, Inc.(1) | 1,900 | 38,543 | ||||||
Resolute Forest Products, Inc.(1) | 2,000 | 9,522 | ||||||
Roxgold, Inc.(1) | 24,000 | 29,808 | ||||||
Russel Metals, Inc.(2) | 3,800 | 54,567 | ||||||
Secure Energy Services, Inc.(2) | 5,300 | 6,136 | ||||||
Seven Generations Energy Ltd., Class A(1) | 10,600 | 33,482 | ||||||
Sierra Metals, Inc.(1) | 1,200 | 1,978 | ||||||
| Stelco Holdings, Inc. | 2,000 | 14,475 | ||||||
Surge Energy, Inc.(2) | 2,100 | 483 | ||||||
Tamarack Valley Energy Ltd.(1) | 2,100 | 1,513 | ||||||
| TORC Oil & Gas Ltd. | 4,900 | 6,574 | ||||||
Torex Gold Resources, Inc.(1) | 5,300 | 81,835 | ||||||
| Total Energy Services, Inc. | 400 | 708 | ||||||
| Tourmaline Oil Corp. | 13,800 | 175,310 | ||||||
| TransAlta Corp. | 15,600 | 100,225 | ||||||
Transat AT, Inc.(1) | 900 | 3,609 | ||||||
| Transcontinental, Inc., Class A | 2,300 | 27,049 | ||||||
Turquoise Hill Resources Ltd.(1) | 59,300 | 65,467 | ||||||
Vermilion Energy, Inc.(2) | 6,000 | 23,828 | ||||||
Whitecap Resources, Inc.(2) | 14,700 | 28,964 | ||||||
| Yamana Gold, Inc. | 19,100 | 118,318 | ||||||
| 3,658,746 | ||||||||
| Denmark — 1.6% | ||||||||
Brodrene Hartmann A/S(1) | 40 | 3,010 | ||||||
| D/S Norden A/S | 3,337 | 51,505 | ||||||
| Danske Andelskassers Bank A/S | 754 | 841 | ||||||
Dfds A/S(1) | 2,808 | 105,835 | ||||||
Drilling Co. of 1972 A/S (The)(1) | 1,033 | 24,503 | ||||||
H+H International A/S, B Shares(1) | 2,251 | 42,551 | ||||||
Jyske Bank A/S(1) | 5,303 | 157,824 | ||||||
NKT A/S(1) | 3,376 | 107,637 | ||||||
| NNIT A/S | 1,386 | 31,080 | ||||||
| North Media AS | 675 | 7,973 | ||||||
10
| Shares | Value | |||||||
| Ringkjoebing Landbobank A/S | 537 | $ | 40,489 | |||||
| RTX A/S | 738 | 28,142 | ||||||
| Schouw & Co. A/S | 506 | 49,301 | ||||||
| Solar A/S, B Shares | 276 | 13,933 | ||||||
TORM plc(2) | 2,190 | 15,126 | ||||||
| 679,750 | ||||||||
| Finland — 1.5% | ||||||||
| Altia Oyj | 1,656 | 16,793 | ||||||
| Aspo Oyj | 1,402 | 9,668 | ||||||
| Atria Oyj | 936 | 9,530 | ||||||
Finnair Oyj(1)(2) | 51,634 | 26,932 | ||||||
HKScan Oyj, A Shares(1)(2) | 3,016 | 6,901 | ||||||
| Kemira Oyj | 8,450 | 116,842 | ||||||
Marimekko Oyj(1) | 408 | 16,280 | ||||||
| Neles Oyj | 11,853 | 161,730 | ||||||
Outokumpu Oyj(1)(2) | 30,536 | 82,486 | ||||||
Talenom Oyj(2) | 1,513 | 15,632 | ||||||
| Uponor Oyj | 5,458 | 95,865 | ||||||
| Verkkokauppa.com Oyj | 1,926 | 11,218 | ||||||
| YIT Oyj | 12,000 | 73,788 | ||||||
| 643,665 | ||||||||
| France — 2.6% | ||||||||
Air France-KLM(1)(2) | 9,557 | 43,011 | ||||||
| AKWEL | 113 | 1,888 | ||||||
| Albioma SA | 408 | 21,661 | ||||||
ALD SA(2) | 7,477 | 76,785 | ||||||
| APERAM SA | 1,255 | 37,061 | ||||||
| Boiron SA | 41 | 1,695 | ||||||
Catana Group(1) | 626 | 1,724 | ||||||
CGG SA(1) | 23,379 | 21,259 | ||||||
| Cie des Alpes | 206 | 3,817 | ||||||
| Cie Plastic Omnium SA | 3,827 | 86,289 | ||||||
Coface SA(1) | 911 | 7,127 | ||||||
| Derichebourg SA | 6,026 | 17,381 | ||||||
Eramet SA(1) | 626 | 21,339 | ||||||
Etablissements Maurel et Prom SA(1)(2) | 2,552 | 5,077 | ||||||
| Eutelsat Communications SA | 9,741 | 97,685 | ||||||
FIGEAC-AERO(1) | 125 | 474 | ||||||
| Gaztransport Et Technigaz SA | 1,173 | 110,378 | ||||||
Groupe Crit(1) | 26 | 1,488 | ||||||
| Groupe Guillin | 90 | 2,137 | ||||||
| Guerbet | 63 | 2,221 | ||||||
| Imerys SA | 2,195 | 89,028 | ||||||
Innate Pharma SA(1) | 437 | 2,819 | ||||||
JCDecaux SA(1) | 213 | 4,062 | ||||||
Le Belier(1) | 57 | 2,578 | ||||||
LISI(1) | 1,037 | 23,503 | ||||||
| LNA Sante SA | 53 | 3,257 | ||||||
Maisons du Monde SA(1) | 2,847 | 46,160 | ||||||
Mersen SA(1) | 547 | 16,641 | ||||||
Metropole Television SA(1) | 1,066 | 13,299 | ||||||
Nexans SA(1) | 1,863 | 104,600 | ||||||
11
| Shares | Value | |||||||
| SES SA | 13,129 | $ | 93,165 | |||||
SMCP SA(1) | 1,256 | 5,973 | ||||||
Synergie SA(1) | 286 | 7,029 | ||||||
Tarkett SA(1) | 1,945 | 25,173 | ||||||
Television Francaise 1(1)(2) | 2,551 | 15,577 | ||||||
| Valeo SA | 2,789 | 85,115 | ||||||
Vallourec SA(1)(2) | 92 | 2,814 | ||||||
| Vilmorin & Cie SA | 69 | 3,911 | ||||||
Xilam Animation SA(1) | 33 | 1,890 | ||||||
| 1,107,091 | ||||||||
| Germany — 5.2% | ||||||||
Aareal Bank AG(1) | 2,912 | 65,114 | ||||||
ADVA Optical Networking SE(1) | 3,282 | 27,794 | ||||||
| Aurubis AG | 2,940 | 211,219 | ||||||
Bauer AG(1) | 541 | 5,904 | ||||||
Bijou Brigitte AG(1) | 66 | 1,834 | ||||||
| Borussia Dortmund GmbH & Co. KGaA | 4,890 | 32,733 | ||||||
CENIT AG(1) | 128 | 1,725 | ||||||
Centrotec SE(1) | 106 | 1,777 | ||||||
Cewe Stiftung & Co. KGAA(1) | 215 | 25,539 | ||||||
| CropEnergies AG | 666 | 9,721 | ||||||
Deutsche EuroShop AG(1) | 2,312 | 34,409 | ||||||
Deutsche Pfandbriefbank AG(1) | 2,710 | 19,744 | ||||||
Deutz AG(1) | 9,714 | 52,152 | ||||||
Dialog Semiconductor plc(1) | 1,701 | 73,731 | ||||||
Draegerwerk AG & Co. KGaA, Preference Shares(1) | 25 | 2,118 | ||||||
| Duerr AG | 5,057 | 167,174 | ||||||
| Einhell Germany AG, Preference Shares | 98 | 9,107 | ||||||
ElringKlinger AG(1) | 2,503 | 17,938 | ||||||
Flatex AG(1) | 234 | 11,355 | ||||||
| Hamburger Hafen und Logistik AG | 1,672 | 30,924 | ||||||
| Hornbach Baumarkt AG | 395 | 17,814 | ||||||
| Hornbach Holding AG & Co. KGaA | 884 | 96,276 | ||||||
| HUGO BOSS AG | 4,180 | 110,684 | ||||||
| Indus Holding AG | 391 | 13,534 | ||||||
JOST Werke AG(1) | 1,178 | 49,529 | ||||||
| Jungheinrich AG, Preference Shares | 5,462 | 175,235 | ||||||
| K+S AG | 10,947 | 75,907 | ||||||
Kloeckner & Co. SE(1) | 4,828 | 29,632 | ||||||
| MBB SE | 34 | 2,961 | ||||||
| METRO AG | 7,921 | 78,385 | ||||||
| Mutares SE & Co. KGaA | 177 | 2,119 | ||||||
OHB SE(1) | 236 | 10,941 | ||||||
publity AG(1) | 146 | 6,306 | ||||||
| Rheinmetall AG | 1,666 | 154,176 | ||||||
SAF-Holland SE(1) | 4,848 | 39,931 | ||||||
Salzgitter AG(1) | 3,211 | 51,825 | ||||||
SGL Carbon SE(1) | 1,052 | 4,085 | ||||||
| Siltronic AG | 2,040 | 189,656 | ||||||
SMA Solar Technology AG(1) | 692 | 31,285 | ||||||
| Steico SE | 140 | 7,167 | ||||||
| STO SE & Co. KGaA, Preference Shares | 117 | 15,503 | ||||||
12
| Shares | Value | |||||||
Surteco Group SE(1) | 65 | $ | 1,676 | |||||
Technotrans SE(1) | 162 | 3,182 | ||||||
| Villeroy & Boch AG, Preference Shares | 504 | 6,887 | ||||||
Vossloh AG(1) | 226 | 10,111 | ||||||
| Wacker Chemie AG | 1,735 | 169,478 | ||||||
| Wuestenrot & Wuerttembergische AG | 1,952 | 33,916 | ||||||
| 2,190,213 | ||||||||
| Hong Kong — 2.1% | ||||||||
| Analogue Holdings Ltd. | 12,000 | 1,546 | ||||||
| BOCOM International Holdings Co. Ltd. | 92,000 | 12,662 | ||||||
| Chinese Estates Holdings Ltd. | 64,000 | 41,396 | ||||||
| Chow Sang Sang Holdings International Ltd. | 48,000 | 53,890 | ||||||
Comba Telecom Systems Holdings Ltd.(2) | 48,000 | 20,916 | ||||||
| Cowell e Holdings, Inc. | 58,000 | 23,153 | ||||||
| Crystal International Group Ltd. | 27,000 | 7,283 | ||||||
| CSI Properties Ltd. | 630,000 | 19,512 | ||||||
| Dah Sing Banking Group Ltd. | 29,600 | 28,077 | ||||||
| Dah Sing Financial Holdings Ltd. | 15,600 | 44,296 | ||||||
| Dickson Concepts International Ltd. | 25,000 | 11,323 | ||||||
| Eagle Nice International Holdings Ltd. | 6,000 | 2,286 | ||||||
Emperor Capital Group Ltd.(1) | 72,000 | 1,333 | ||||||
| First Pacific Co. Ltd. | 230,000 | 64,346 | ||||||
| FSE Services Group Ltd. | 4,000 | 1,636 | ||||||
| Get Nice Holdings Ltd. | 154,000 | 3,118 | ||||||
| Giordano International Ltd. | 76,000 | 12,727 | ||||||
| Guotai Junan International Holdings Ltd. | 339,000 | 49,706 | ||||||
| Hang Lung Group Ltd. | 9,000 | 23,183 | ||||||
| International Housewares Retail Co. Ltd. | 10,000 | 3,145 | ||||||
IT Ltd.(1) | 6,000 | 815 | ||||||
| K Wah International Holdings Ltd. | 182,000 | 86,209 | ||||||
| Lai Sun Development Co. Ltd. | 8,700 | 9,080 | ||||||
| Lifestyle International Holdings Ltd. | 8,500 | 7,788 | ||||||
| Luk Fook Holdings International Ltd. | 20,000 | 44,644 | ||||||
| Minmetals Land Ltd. | 80,000 | 9,767 | ||||||
| Oriental Watch Holdings | 12,000 | 3,091 | ||||||
| Pacific Basin Shipping Ltd. | 571,000 | 83,122 | ||||||
| Pacific Textiles Holdings Ltd. | 104,000 | 45,928 | ||||||
| Pico Far East Holdings Ltd. | 22,000 | 2,796 | ||||||
| Regal Hotels International Holdings Ltd. | 28,000 | 10,115 | ||||||
| Shun Tak Holdings Ltd. | 246,000 | 84,686 | ||||||
| Singamas Container Holdings Ltd. | 44,000 | 1,898 | ||||||
SOCAM Development Ltd.(1) | 6,000 | 1,106 | ||||||
| Sun Hung Kai & Co. Ltd. | 54,000 | 22,203 | ||||||
| Tai Hing Group Holdings Ltd. | 8,000 | 1,503 | ||||||
| Texwinca Holdings Ltd. | 56,000 | 8,150 | ||||||
| United Laboratories International Holdings Ltd. (The) | 26,000 | 30,547 | ||||||
| 878,982 | ||||||||
| Ireland — 0.4% | ||||||||
| Cpl Resources plc | 710 | 6,018 | ||||||
| Dalata Hotel Group plc | 32,429 | 105,966 | ||||||
FBD Holdings plc(1) | 2,442 | 17,546 | ||||||
Glenveagh Properties plc(1) | 32,943 | 27,740 | ||||||
13
| Shares | Value | |||||||
Permanent TSB Group Holdings plc(1) | 4,574 | $ | 2,784 | |||||
| 160,054 | ||||||||
| Israel — 1.9% | ||||||||
| Adgar Investment and Development Ltd. | 786 | 1,110 | ||||||
| Ashtrom Group Ltd. | 1,714 | 23,095 | ||||||
| Ashtrom Properties Ltd. | 2,290 | 9,349 | ||||||
| Aspen Group Ltd. | 664 | 1,060 | ||||||
| Blue Square Real Estate Ltd. | 215 | 9,351 | ||||||
| Caesarstone Ltd. | 2,704 | 29,839 | ||||||
| Carasso Motors Ltd. | 2,263 | 7,234 | ||||||
Cellcom Israel Ltd.(1) | 8,733 | 31,829 | ||||||
| Delta Galil Industries Ltd. | 544 | 8,475 | ||||||
Dor Alon Energy in Israel 1988 Ltd.(1) | 81 | 1,905 | ||||||
| Duniec Brothers Ltd. | 80 | 2,343 | ||||||
El Al Israel Airlines(1) | 6,775 | 1,483 | ||||||
Equital Ltd.(1) | 2,082 | 41,598 | ||||||
Fattal Holdings 1998 Ltd.(1) | 317 | 20,945 | ||||||
| FIBI Holdings Ltd. | 1,464 | 38,456 | ||||||
| Fox Wizel Ltd. | 692 | 34,240 | ||||||
| Gazit-Globe Ltd. | 4,222 | 21,909 | ||||||
Hadera Paper Ltd.(1) | 120 | 3,795 | ||||||
| IDI Insurance Co. Ltd. | 228 | 6,134 | ||||||
| Inrom Construction Industries Ltd. | 6,953 | 27,901 | ||||||
| Isracard Ltd. | 17,789 | 49,493 | ||||||
Israel Corp. Ltd. (The)(1) | 68 | 8,082 | ||||||
| Israel Land Development - Urban Renewal Ltd. | 937 | 6,910 | ||||||
Mediterranean Towers Ltd.(1) | 2,099 | 4,785 | ||||||
Mehadrin Ltd.(1) | 7 | 269 | ||||||
| Melisron Ltd. | 1,144 | 45,790 | ||||||
| Menora Mivtachim Holdings Ltd. | 2,274 | 29,535 | ||||||
Naphtha Israel Petroleum Corp. Ltd.(1) | 2,351 | 8,668 | ||||||
| Norstar Holdings, Inc. | 120 | 680 | ||||||
| Oil Refineries Ltd. | 99,581 | 20,261 | ||||||
Partner Communications Co. Ltd.(1) | 12,604 | 54,388 | ||||||
| Paz Oil Co. Ltd. | 736 | 74,557 | ||||||
Perion Network Ltd.(1) | 571 | 3,453 | ||||||
Phoenix Holdings Ltd. (The)(1) | 14,372 | 71,807 | ||||||
| Property & Building Corp. Ltd. | 116 | 7,575 | ||||||
| Rami Levy Chain Stores Hashikma Marketing 2006 Ltd. | 92 | 5,533 | ||||||
| Sarine Technologies Ltd. | 5,000 | 877 | ||||||
Scope Metals Group Ltd.(1) | 69 | 1,138 | ||||||
Silicom Ltd.(1) | 620 | 22,872 | ||||||
| Tamar Petroleum Ltd. | 732 | 475 | ||||||
Tower Semiconductor Ltd.(1) | 2,114 | 41,481 | ||||||
| Union Bank of Israel | 2,191 | 12,068 | ||||||
| Victory Supermarket Chain Ltd. | 265 | 6,319 | ||||||
XLMedia plc(1) | 2,423 | 769 | ||||||
| 799,836 | ||||||||
| Italy — 2.7% | ||||||||
Aeffe SpA(1) | 1,917 | 2,053 | ||||||
| Alerion Cleanpower SpA | 1,027 | 8,208 | ||||||
Banca Farmafactoring SpA(1) | 21,438 | 119,043 | ||||||
14
| Shares | Value | |||||||
Banca IFIS SpA(1) | 3,352 | $ | 34,896 | |||||
Banca Popolare di Sondrio SCPA(1) | 39,089 | 93,886 | ||||||
Banca Sistema SpA(1)(2) | 3,556 | 7,677 | ||||||
Banco di Desio e della Brianza SpA(1) | 1,212 | 3,255 | ||||||
Biesse SpA(1) | 2,396 | 40,170 | ||||||
Cairo Communication SpA(1) | 6,551 | 10,413 | ||||||
Carraro SpA/Campodarsego(1) | 3,100 | 4,964 | ||||||
| Cementir Holding NV | 1,262 | 8,806 | ||||||
d'Amico International Shipping SA(1) | 82,680 | 9,241 | ||||||
| Danieli & C Officine Meccaniche SpA | 1,860 | 27,763 | ||||||
| Danieli & C Officine Meccaniche SpA, Preference Shares | 5,760 | 50,200 | ||||||
Digital Bros SpA(1) | 442 | 11,720 | ||||||
Digital Value SpA(1) | 109 | 4,059 | ||||||
Elica SpA(1) | 1,324 | 4,158 | ||||||
Emak SpA(1) | 11,086 | 11,107 | ||||||
Esprinet SpA(1) | 6,207 | 38,694 | ||||||
Fila SpA(1)(2) | 3,049 | 26,609 | ||||||
Fincantieri SpA(1)(2) | 102,884 | 72,843 | ||||||
FNM SpA(1) | 18,952 | 14,608 | ||||||
Gefran SpA(1) | 350 | 2,047 | ||||||
Geox SpA(1)(2) | 10,679 | 8,399 | ||||||
Maire Tecnimont SpA(1)(2) | 19,207 | 34,728 | ||||||
| Massimo Zanetti Beverage Group SpA | 1,249 | 5,576 | ||||||
OVS SpA(1)(2) | 21,272 | 20,468 | ||||||
| RAI Way SpA | 15,278 | 99,699 | ||||||
Ratti SpA(1) | 349 | 1,762 | ||||||
| Reno de Medici SpA | 33,183 | 32,537 | ||||||
Sabaf SpA(1) | 181 | 2,591 | ||||||
Saras SpA(1) | 84,734 | 58,824 | ||||||
| Servizi Italia SpA | 1,623 | 4,434 | ||||||
| Sesa SpA | 544 | 48,742 | ||||||
Societa Sportiva Lazio SpA(1) | 1,527 | 2,551 | ||||||
Sogefi SpA(1) | 7,814 | 8,517 | ||||||
Technogym SpA(1) | 18,211 | 163,852 | ||||||
Webuild SpA(2) | 45,762 | 59,482 | ||||||
| 1,158,582 | ||||||||
| Japan — 27.0% | ||||||||
| A&D Co. Ltd. | 200 | 1,205 | ||||||
| Adastria Co. Ltd. | 1,100 | 17,149 | ||||||
| ADEKA Corp. | 1,400 | 20,429 | ||||||
| Aeon Fantasy Co. Ltd. | 100 | 1,608 | ||||||
| AEON Financial Service Co. Ltd. | 5,800 | 51,430 | ||||||
| Aichi Steel Corp. | 700 | 17,488 | ||||||
| Aichi Tokei Denki Co. Ltd. | 100 | 4,233 | ||||||
| Air Water, Inc. | 3,400 | 47,580 | ||||||
| Airport Facilities Co. Ltd. | 400 | 1,576 | ||||||
| Aisan Industry Co. Ltd. | 1,800 | 8,068 | ||||||
| Ajis Co. Ltd. | 200 | 5,449 | ||||||
| Akatsuki, Inc. | 300 | 11,431 | ||||||
| Alconix Corp. | 1,300 | 17,258 | ||||||
| Alinco, Inc. | 200 | 1,750 | ||||||
| Alps Alpine Co. Ltd. | 7,000 | 110,784 | ||||||
15
| Shares | Value | |||||||
| Amuse, Inc. | 200 | $ | 4,424 | |||||
| AOKI Holdings, Inc. | 1,200 | 6,463 | ||||||
| Aoyama Trading Co. Ltd. | 1,200 | 7,205 | ||||||
| Aoyama Zaisan Networks Co. Ltd. | 100 | 1,446 | ||||||
| Aozora Bank Ltd. | 4,200 | 75,080 | ||||||
| Arata Corp. | 800 | 38,197 | ||||||
| Arcland Sakamoto Co. Ltd. | 1,900 | 37,727 | ||||||
| Arealink Co. Ltd. | 200 | 1,885 | ||||||
| Artnature, Inc. | 300 | 1,740 | ||||||
| Asahi Co. Ltd. | 1,100 | 18,954 | ||||||
| Asahi Holdings, Inc. | 2,100 | 70,375 | ||||||
| Asahi Kogyosha Co. Ltd. | 100 | 2,636 | ||||||
| Asanuma Corp. | 500 | 20,870 | ||||||
| Asia Pile Holdings Corp. | 800 | 3,501 | ||||||
| Axial Retailing, Inc. | 400 | 18,128 | ||||||
| Bando Chemical Industries Ltd. | 1,300 | 7,102 | ||||||
| Bank of the Ryukyus Ltd. | 2,300 | 19,162 | ||||||
| Beenos, Inc. | 700 | 10,731 | ||||||
| BeNEXT Group, Inc. | 700 | 7,416 | ||||||
| Bunka Shutter Co. Ltd. | 1,100 | 7,816 | ||||||
| Cawachi Ltd. | 100 | 2,845 | ||||||
| Central Sports Co. Ltd. | 300 | 6,296 | ||||||
| Chilled & Frozen Logistics Holdings Co. Ltd. | 500 | 7,852 | ||||||
| Chubu Shiryo Co. Ltd. | 300 | 4,611 | ||||||
| CK-San-Etsu Co. Ltd. | 200 | 6,299 | ||||||
| Cleanup Corp. | 300 | 1,442 | ||||||
| CMIC Holdings Co. Ltd. | 100 | 1,234 | ||||||
| Cosmo Energy Holdings Co. Ltd. | 3,200 | 50,485 | ||||||
| Credit Saison Co. Ltd. | 8,400 | 95,474 | ||||||
| CTI Engineering Co. Ltd. | 500 | 8,653 | ||||||
| Dai Nippon Toryo Co. Ltd. | 900 | 7,484 | ||||||
| Daicel Corp. | 2,100 | 15,196 | ||||||
| Daido Metal Co. Ltd. | 2,100 | 10,474 | ||||||
| Daiichi Jitsugyo Co. Ltd. | 300 | 10,219 | ||||||
| Daiichi Kigenso Kagaku-Kogyo Co. Ltd. | 200 | 1,470 | ||||||
| Daiki Aluminium Industry Co. Ltd. | 1,700 | 8,037 | ||||||
| Daikoku Denki Co. Ltd. | 100 | 967 | ||||||
| Daikokutenbussan Co. Ltd. | 200 | 11,048 | ||||||
| Daikyonishikawa Corp. | 2,100 | 11,337 | ||||||
| Daio Paper Corp. | 1,800 | 24,535 | ||||||
| Daito Pharmaceutical Co. Ltd. | 800 | 26,039 | ||||||
| Daitron Co. Ltd. | 100 | 1,336 | ||||||
| Daiwabo Holdings Co. Ltd. | 1,300 | 78,103 | ||||||
| DCM Holdings Co. Ltd. | 7,600 | 93,052 | ||||||
| Denka Co. Ltd. | 1,000 | 28,083 | ||||||
| Denyo Co. Ltd. | 400 | 8,193 | ||||||
| DIC Corp. | 4,600 | 108,806 | ||||||
| Dowa Holdings Co. Ltd. | 2,900 | 89,147 | ||||||
| DyDo Group Holdings, Inc. | 300 | 14,052 | ||||||
| Eagle Industry Co. Ltd. | 1,300 | 9,113 | ||||||
| Ebara Corp. | 4,800 | 122,610 | ||||||
| Eco's Co. Ltd. | 100 | 2,096 | ||||||
16
| Shares | Value | |||||||
| EDION Corp. | 5,300 | $ | 59,991 | |||||
| Electric Power Development Co. Ltd. | 7,900 | 119,036 | ||||||
| eRex Co. Ltd. | 200 | 2,379 | ||||||
| Eslead Corp. | 100 | 1,230 | ||||||
| ESPEC Corp. | 300 | 5,170 | ||||||
| Exedy Corp. | 1,400 | 18,742 | ||||||
| F.C.C. Co. Ltd. | 2,400 | 43,561 | ||||||
| Feed One Co. Ltd. | 3,300 | 5,725 | ||||||
| Ferrotec Holdings Corp. | 2,600 | 18,791 | ||||||
| Financial Products Group Co. Ltd. | 2,000 | 10,139 | ||||||
| Foster Electric Co. Ltd. | 700 | 7,675 | ||||||
| Fuji Co. Ltd. | 300 | 5,264 | ||||||
| Fujikura Ltd. | 12,500 | 36,319 | ||||||
| Fujimori Kogyo Co. Ltd. | 1,100 | 40,706 | ||||||
| Fukuda Corp. | 100 | 4,597 | ||||||
| Fukuoka Financial Group, Inc. | 1,100 | 18,149 | ||||||
| Fukuyama Transporting Co. Ltd. | 700 | 34,416 | ||||||
| Fumakilla Ltd. | 300 | 5,273 | ||||||
| Furukawa Battery Co. Ltd. (The) | 1,000 | 10,469 | ||||||
| Furukawa Co. Ltd. | 1,900 | 19,063 | ||||||
| Furukawa Electric Co. Ltd. | 4,100 | 97,253 | ||||||
| Furuno Electric Co. Ltd. | 1,200 | 10,644 | ||||||
| Furyu Corp. | 200 | 1,963 | ||||||
| Futaba Industrial Co. Ltd. | 2,900 | 15,118 | ||||||
| Fuyo General Lease Co. Ltd. | 1,200 | 72,186 | ||||||
| G-7 Holdings, Inc. | 200 | 6,041 | ||||||
| G-Tekt Corp. | 900 | 8,755 | ||||||
| Gecoss Corp. | 400 | 3,582 | ||||||
| Genky DrugStores Co. Ltd. | 200 | 6,500 | ||||||
| Geo Holdings Corp. | 2,000 | 32,396 | ||||||
| GLOBERIDE, Inc. | 600 | 18,921 | ||||||
| GMO Financial Holdings, Inc. | 1,100 | 6,982 | ||||||
| Godo Steel Ltd. | 400 | 7,177 | ||||||
| Goldcrest Co. Ltd. | 900 | 12,489 | ||||||
| GS Yuasa Corp. | 4,300 | 70,446 | ||||||
| GungHo Online Entertainment, Inc. | 100 | 2,061 | ||||||
| H-One Co. Ltd. | 200 | 994 | ||||||
| H2O Retailing Corp. | 3,200 | 22,305 | ||||||
| Hagihara Industries, Inc. | 400 | 5,490 | ||||||
| Halows Co. Ltd. | 100 | 3,764 | ||||||
| Hamakyorex Co. Ltd. | 800 | 24,948 | ||||||
| Hanwa Co. Ltd. | 1,500 | 30,097 | ||||||
| Harima Chemicals Group, Inc. | 200 | 1,772 | ||||||
| Hazama Ando Corp. | 7,300 | 49,469 | ||||||
| Heiwa Corp. | 1,200 | 20,234 | ||||||
| Heiwa Real Estate Co. Ltd. | 2,100 | 55,796 | ||||||
| Heiwado Co. Ltd. | 2,000 | 41,517 | ||||||
| Hiroshima Bank Ltd. (The) | 14,400 | 72,776 | ||||||
| Hitachi Capital Corp. | 3,000 | 72,851 | ||||||
| Hitachi Transport System Ltd. | 2,500 | 86,816 | ||||||
| Hitachi Zosen Corp. | 13,300 | 52,344 | ||||||
| Hochiki Corp. | 400 | 4,469 | ||||||
17
| Shares | Value | |||||||
| Hokkan Holdings Ltd. | 100 | $ | 1,337 | |||||
| Hokko Chemical Industry Co. Ltd. | 600 | 3,732 | ||||||
| Hokuetsu Corp. | 4,600 | 15,616 | ||||||
| Hokuhoku Financial Group, Inc. | 6,400 | 59,265 | ||||||
| Hokuriku Electrical Construction Co. Ltd. | 400 | 3,790 | ||||||
| Hokuto Corp. | 800 | 16,245 | ||||||
| Honeys Holdings Co. Ltd. | 600 | 6,417 | ||||||
| Hoosiers Holdings | 2,300 | 13,614 | ||||||
| Hosokawa Micron Corp. | 100 | 5,327 | ||||||
| I-Net Corp./Kanagawa | 200 | 2,829 | ||||||
| Ichigo, Inc. | 6,900 | 18,435 | ||||||
| Ichikoh Industries Ltd. | 1,200 | 5,581 | ||||||
| Ichinen Holdings Co. Ltd. | 1,300 | 14,985 | ||||||
| IDOM, Inc. | 3,300 | 16,828 | ||||||
| IHI Corp. | 4,400 | 64,492 | ||||||
| Iino Kaiun Kaisha Ltd. | 5,400 | 17,895 | ||||||
| IJTT Co. Ltd. | 400 | 1,621 | ||||||
| Imasen Electric Industrial | 200 | 1,201 | ||||||
| Ines Corp. | 500 | 6,286 | ||||||
| Innotech Corp. | 200 | 1,910 | ||||||
| Internet Initiative Japan, Inc. | 1,600 | 64,544 | ||||||
| Ishihara Sangyo Kaisha Ltd. | 1,500 | 10,166 | ||||||
| Itochu Enex Co. Ltd. | 3,200 | 28,331 | ||||||
| Itochu-Shokuhin Co. Ltd. | 100 | 5,272 | ||||||
| IwaiCosmo Holdings, Inc. | 1,000 | 11,861 | ||||||
| Iwasaki Electric Co. Ltd. | 200 | 2,663 | ||||||
| Iwatani Corp. | 1,300 | 46,728 | ||||||
| Izumi Co. Ltd. | 2,200 | 85,617 | ||||||
| J Front Retailing Co. Ltd. | 8,500 | 58,983 | ||||||
| J-Oil Mills, Inc. | 300 | 10,457 | ||||||
| Jaccs Co. Ltd. | 800 | 13,101 | ||||||
| Japan Aviation Electronics Industry Ltd. | 800 | 10,381 | ||||||
| Japan Electronic Materials Corp. | 400 | 7,510 | ||||||
| Japan Pulp & Paper Co. Ltd. | 100 | 3,578 | ||||||
| Japan Transcity Corp. | 2,000 | 9,390 | ||||||
| Japan Wool Textile Co. Ltd. (The) | 2,700 | 24,763 | ||||||
| JDC Corp. | 2,600 | 14,237 | ||||||
| JFE Holdings, Inc. | 5,000 | 37,164 | ||||||
| JK Holdings Co. Ltd. | 1,100 | 7,711 | ||||||
| JMS Co. Ltd. | 400 | 3,304 | ||||||
| Joshin Denki Co. Ltd. | 200 | 4,455 | ||||||
| JSP Corp. | 300 | 4,393 | ||||||
| JTEKT Corp. | 9,900 | 76,142 | ||||||
| JVCKenwood Corp. | 7,900 | 11,676 | ||||||
| K's Holdings Corp. | 3,600 | 50,919 | ||||||
| Kaga Electronics Co. Ltd. | 1,100 | 21,734 | ||||||
| Kamei Corp. | 1,400 | 13,037 | ||||||
| Kanamoto Co. Ltd. | 2,200 | 47,645 | ||||||
| Kandenko Co. Ltd. | 5,800 | 45,473 | ||||||
| Kaneka Corp. | 2,600 | 65,543 | ||||||
| Kanematsu Corp. | 4,800 | 60,595 | ||||||
| Kanto Denka Kogyo Co. Ltd. | 2,600 | 18,715 | ||||||
18
| Shares | Value | |||||||
| Kasai Kogyo Co. Ltd. | 200 | $ | 717 | |||||
| KAWADA TECHNOLOGIES, Inc. | 100 | 4,705 | ||||||
| Kawasaki Heavy Industries Ltd. | 8,200 | 115,720 | ||||||
Kawasaki Kisen Kaisha Ltd.(1) | 1,700 | 18,895 | ||||||
| Keikyu Corp. | 4,300 | 64,086 | ||||||
| Kewpie Corp. | 1,900 | 35,972 | ||||||
| KH Neochem Co. Ltd. | 1,800 | 38,853 | ||||||
| Kintetsu World Express, Inc. | 700 | 14,387 | ||||||
| Kirindo Holdings Co. Ltd. | 200 | 5,174 | ||||||
Kitagawa Corp.(1) | 200 | 2,623 | ||||||
| Kito Corp. | 900 | 9,469 | ||||||
| Kiyo Bank Ltd. (The) | 3,800 | 56,129 | ||||||
Kobe Steel Ltd.(1) | 12,100 | 46,304 | ||||||
| Kohnan Shoji Co. Ltd. | 1,900 | 68,577 | ||||||
| Kojima Co. Ltd. | 1,400 | 7,436 | ||||||
| Komeri Co. Ltd. | 2,200 | 68,070 | ||||||
| Konica Minolta, Inc. | 11,600 | 37,413 | ||||||
| Konoike Transport Co. Ltd. | 1,200 | 12,733 | ||||||
| Koshidaka Holdings Co. Ltd. | 1,500 | 6,464 | ||||||
| Kumagai Gumi Co. Ltd. | 2,100 | 53,587 | ||||||
| Kuraray Co. Ltd. | 7,000 | 70,946 | ||||||
| Kurimoto Ltd. | 100 | 1,761 | ||||||
| Kuriyama Holdings Corp. | 200 | 961 | ||||||
KYB Corp.(1) | 800 | 15,997 | ||||||
| Kyodo Printing Co. Ltd. | 100 | 2,480 | ||||||
| Kyoei Steel Ltd. | 800 | 10,038 | ||||||
| Kyokuyo Co. Ltd. | 600 | 15,209 | ||||||
| Kyudenko Corp. | 2,800 | 79,833 | ||||||
| Lacto Japan Co. Ltd. | 200 | 6,753 | ||||||
| Lawson, Inc. | 500 | 24,666 | ||||||
| Life Corp. | 500 | 22,848 | ||||||
| Macnica Fuji Electronics Holdings, Inc. | 3,200 | 53,902 | ||||||
| Maeda Corp. | 9,400 | 69,633 | ||||||
| Maeda Road Construction Co. Ltd. | 2,700 | 49,742 | ||||||
| Marubun Corp. | 700 | 3,115 | ||||||
| Marudai Food Co. Ltd. | 300 | 5,236 | ||||||
| Maruha Nichiro Corp. | 700 | 15,817 | ||||||
| Maruzen Showa Unyu Co. Ltd. | 700 | 22,604 | ||||||
| Mazda Motor Corp. | 2,700 | 17,232 | ||||||
| MCJ Co. Ltd. | 1,200 | 10,644 | ||||||
| Mebuki Financial Group, Inc. | 48,700 | 117,854 | ||||||
| Medius Holdings Co. Ltd. | 400 | 3,114 | ||||||
| Megmilk Snow Brand Co. Ltd. | 900 | 20,460 | ||||||
| Meiko Electronics Co. Ltd. | 600 | 9,336 | ||||||
| Mie Kotsu Group Holdings, Inc. | 2,500 | 10,859 | ||||||
| Mimasu Semiconductor Industry Co. Ltd. | 1,000 | 20,236 | ||||||
| Ministop Co. Ltd. | 900 | 12,851 | ||||||
Mitsuba Corp.(1) | 300 | 1,053 | ||||||
| Mitsubishi Kakoki Kaisha Ltd. | 200 | 3,278 | ||||||
| Mitsubishi Materials Corp. | 1,100 | 23,061 | ||||||
| Mitsubishi UFJ Lease & Finance Co. Ltd. | 8,800 | 41,480 | ||||||
| Mitsuboshi Belting Ltd. | 1,300 | 20,084 | ||||||
19
| Shares | Value | |||||||
Mitsui E&S Holdings Co. Ltd.(1) | 3,100 | $ | 12,528 | |||||
| Mitsui Matsushima Holdings Co. Ltd. | 200 | 1,381 | ||||||
| Mitsui Mining & Smelting Co. Ltd. | 3,900 | 93,373 | ||||||
| Mitsui OSK Lines Ltd. | 6,200 | 114,383 | ||||||
| Mitsui Sugar Co. Ltd. | 200 | 3,658 | ||||||
| Mitsui-Soko Holdings Co. Ltd. | 1,000 | 16,706 | ||||||
| Mitsuuroko Group Holdings Co. Ltd. | 500 | 5,324 | ||||||
| Miyaji Engineering Group, Inc. | 200 | 3,050 | ||||||
| Miyazaki Bank Ltd. (The) | 100 | 2,315 | ||||||
| Mizuho Leasing Co. Ltd. | 1,400 | 35,232 | ||||||
| Modec, Inc. | 800 | 13,338 | ||||||
| Monogatari Corp. (The) | 300 | 25,794 | ||||||
| Morinaga Milk Industry Co. Ltd. | 2,200 | 107,343 | ||||||
| Moriroku Holdings Co. Ltd. | 100 | 1,586 | ||||||
| MrMax Holdings Ltd. | 1,500 | 10,671 | ||||||
| Musashi Seimitsu Industry Co. Ltd. | 2,600 | 26,031 | ||||||
| Musashino Bank Ltd. (The) | 1,500 | 21,790 | ||||||
| Nachi-Fujikoshi Corp. | 700 | 21,691 | ||||||
| Nankai Electric Railway Co. Ltd. | 6,000 | 131,911 | ||||||
| NEC Capital Solutions Ltd. | 700 | 11,910 | ||||||
| NEC Networks & System Integration Corp. | 900 | 16,718 | ||||||
| Nichi-iko Pharmaceutical Co. Ltd. | 1,100 | 12,322 | ||||||
| Nichiha Corp. | 1,500 | 35,290 | ||||||
| Nichireki Co. Ltd. | 600 | 9,390 | ||||||
| Nichirin Co. Ltd. | 100 | 1,239 | ||||||
| Nifco, Inc. | 5,000 | 128,058 | ||||||
| Nihon Chouzai Co. Ltd. | 200 | 3,098 | ||||||
| Nihon Dengi Co. Ltd. | 200 | 6,687 | ||||||
| Nihon Flush Co. Ltd. | 1,000 | 13,142 | ||||||
| Nihon House Holdings Co. Ltd. | 400 | 986 | ||||||
| Nihon Tokushu Toryo Co. Ltd. | 200 | 1,789 | ||||||
| Nippon Carbon Co. Ltd. | 700 | 22,747 | ||||||
| Nippon Chemical Industrial Co. Ltd. | 100 | 2,040 | ||||||
| Nippon Coke & Engineering Co. Ltd. | 2,200 | 1,282 | ||||||
| Nippon Express Co. Ltd. | 1,600 | 94,460 | ||||||
| Nippon Koei Co. Ltd. | 800 | 20,990 | ||||||
| Nippon Light Metal Holdings Co. Ltd. | 30,000 | 52,547 | ||||||
| Nippon Paper Industries Co. Ltd. | 6,300 | 80,136 | ||||||
| Nippon Piston Ring Co. Ltd. | 400 | 3,890 | ||||||
| Nippon Seiki Co. Ltd. | 2,800 | 28,660 | ||||||
Nippon Sharyo Ltd.(1) | 100 | 2,332 | ||||||
| Nippon Yakin Kogyo Co. Ltd. | 800 | 11,407 | ||||||
| Nippon Yusen KK | 10,500 | 162,161 | ||||||
| Nipro Corp. | 2,600 | 29,323 | ||||||
| Nishi-Nippon Financial Holdings, Inc. | 800 | 5,246 | ||||||
| Nishikawa Rubber Co. Ltd. | 200 | 2,516 | ||||||
| Nishimatsu Construction Co. Ltd. | 3,200 | 60,819 | ||||||
| Nishio Rent All Co. Ltd. | 900 | 19,764 | ||||||
| Nisshin Group Holdings Co. Ltd. | 300 | 1,142 | ||||||
| Nisshin Oillio Group Ltd. (The) | 500 | 14,903 | ||||||
| Nissin Corp. | 500 | 7,571 | ||||||
| Nissin Electric Co. Ltd. | 3,000 | 31,795 | ||||||
20
| Shares | Value | |||||||
| Nisso Corp. | 700 | $ | 4,932 | |||||
| Nittetsu Mining Co. Ltd. | 100 | 3,966 | ||||||
| Nitto Fuji Flour Milling Co. Ltd. | 100 | 5,741 | ||||||
| Nitto Kogyo Corp. | 1,000 | 17,802 | ||||||
| Nittoc Construction Co. Ltd. | 300 | 2,227 | ||||||
| Nojima Corp. | 2,100 | 62,137 | ||||||
| NOK Corp. | 4,900 | 53,210 | ||||||
| Noritz Corp. | 200 | 2,532 | ||||||
| NS United Kaiun Kaisha Ltd. | 400 | 5,172 | ||||||
| NTN Corp. | 16,300 | 30,875 | ||||||
| Oji Holdings Corp. | 11,900 | 53,224 | ||||||
| Oki Electric Industry Co. Ltd. | 4,200 | 40,217 | ||||||
| Okura Industrial Co. Ltd. | 200 | 2,994 | ||||||
| Onward Holdings Co. Ltd. | 3,300 | 8,479 | ||||||
| Orient Corp. | 27,700 | 30,501 | ||||||
| Osaka Organic Chemical Industry Ltd. | 200 | 4,574 | ||||||
| OSJB Holdings Corp. | 7,500 | 16,239 | ||||||
| OUG Holdings, Inc. | 200 | 5,343 | ||||||
| Pacific Industrial Co. Ltd. | 1,900 | 17,790 | ||||||
| PAL GROUP Holdings Co. Ltd. | 1,000 | 10,820 | ||||||
| Pasona Group, Inc. | 1,100 | 14,251 | ||||||
| Penta-Ocean Construction Co. Ltd. | 16,700 | 106,939 | ||||||
| Press Kogyo Co. Ltd. | 3,600 | 10,336 | ||||||
| Prima Meat Packers Ltd. | 600 | 17,529 | ||||||
| PS Mitsubishi Construction Co. Ltd. | 1,700 | 9,193 | ||||||
| Renaissance, Inc. | 100 | 896 | ||||||
| Rengo Co. Ltd. | 12,000 | 88,547 | ||||||
| Resorttrust, Inc. | 3,900 | 55,284 | ||||||
| Retail Partners Co. Ltd. | 1,500 | 26,357 | ||||||
| Ricoh Leasing Co. Ltd. | 600 | 15,318 | ||||||
| Riken Corp. | 200 | 4,877 | ||||||
| Riken Technos Corp. | 1,900 | 6,922 | ||||||
| Rokko Butter Co. Ltd. | 400 | 6,587 | ||||||
| Round One Corp. | 4,500 | 36,116 | ||||||
| Ryobi Ltd. | 1,000 | 11,150 | ||||||
| Ryoden Corp. | 800 | 10,848 | ||||||
| Ryosan Co. Ltd. | 400 | 7,370 | ||||||
| Sakura Internet, Inc. | 300 | 1,724 | ||||||
| Sala Corp. | 3,300 | 17,983 | ||||||
| San Holdings, Inc. | 400 | 4,275 | ||||||
| San-A Co. Ltd. | 300 | 12,157 | ||||||
| San-Ai Oil Co. Ltd. | 3,700 | 32,587 | ||||||
| Sanei Architecture Planning Co. Ltd. | 500 | 6,186 | ||||||
| Sanken Electric Co. Ltd. | 1,000 | 20,600 | ||||||
| Sankyo Frontier Co. Ltd. | 200 | 6,443 | ||||||
| Sankyo Tateyama, Inc. | 1,200 | 10,374 | ||||||
| Sankyu, Inc. | 2,400 | 100,076 | ||||||
| Sanoh Industrial Co. Ltd. | 1,000 | 6,213 | ||||||
| Sanwa Holdings Corp. | 3,100 | 31,127 | ||||||
| Sapporo Holdings Ltd. | 1,500 | 26,715 | ||||||
| Sawada Holdings Co. Ltd. | 200 | 1,657 | ||||||
| SBI Holdings, Inc. | 5,100 | 115,763 | ||||||
21
| Shares | Value | |||||||
| SBS Holdings, Inc. | 300 | $ | 5,759 | |||||
| SCSK Corp. | 500 | 27,087 | ||||||
| SEC Carbon Ltd. | 100 | 5,725 | ||||||
| Seibu Holdings, Inc. | 8,200 | 90,019 | ||||||
| Seika Corp. | 300 | 3,557 | ||||||
| Seikitokyu Kogyo Co. Ltd. | 1,800 | 14,619 | ||||||
| Seiko Epson Corp. | 4,500 | 53,592 | ||||||
| Seiren Co. Ltd. | 900 | 11,912 | ||||||
| Sekisui Kasei Co. Ltd. | 800 | 4,200 | ||||||
| Senko Group Holdings Co. Ltd. | 6,500 | 57,509 | ||||||
| Shibusawa Warehouse Co. Ltd. (The) | 100 | 1,867 | ||||||
| Shibuya Corp. | 300 | 8,401 | ||||||
| Shikoku Bank Ltd. (The) | 200 | 1,449 | ||||||
| Shin Nippon Air Technologies Co. Ltd. | 100 | 1,930 | ||||||
| Shin-Keisei Electric Railway Co. Ltd. | 200 | 4,256 | ||||||
| Shinagawa Refractories Co. Ltd. | 200 | 4,213 | ||||||
| Shindengen Electric Manufacturing Co. Ltd. | 100 | 1,786 | ||||||
| Shinki Bus Co. Ltd. | 200 | 5,711 | ||||||
| Shinmaywa Industries Ltd. | 200 | 1,762 | ||||||
| Shinnihon Corp. | 1,700 | 13,379 | ||||||
| Shinoken Group Co. Ltd. | 1,200 | 10,840 | ||||||
| Shinwa Co. Ltd. | 100 | 1,867 | ||||||
| Ship Healthcare Holdings, Inc. | 300 | 13,842 | ||||||
| Showa Denko KK | 3,100 | 60,294 | ||||||
| Sinko Industries Ltd. | 900 | 11,563 | ||||||
| SK-Electronics Co. Ltd. | 100 | 968 | ||||||
| SMK Corp. | 200 | 4,637 | ||||||
| Sotetsu Holdings, Inc. | 1,600 | 43,528 | ||||||
| St. Marc Holdings Co. Ltd. | 800 | 12,264 | ||||||
| Starts Corp., Inc. | 1,800 | 37,638 | ||||||
| Studio Alice Co. Ltd. | 400 | 5,774 | ||||||
| Subaru Enterprise Co. Ltd. | 100 | 7,041 | ||||||
| Sugi Holdings Co. Ltd. | 700 | 50,518 | ||||||
| Sumida Corp. | 200 | 1,216 | ||||||
| Sumitomo Forestry Co. Ltd. | 8,400 | 134,042 | ||||||
| Sumitomo Osaka Cement Co. Ltd. | 2,200 | 71,247 | ||||||
| Sumitomo Riko Co. Ltd. | 1,600 | 8,258 | ||||||
| Sumitomo Rubber Industries Ltd. | 12,000 | 115,299 | ||||||
| Sumitomo Seika Chemicals Co. Ltd. | 500 | 16,270 | ||||||
| Suruga Bank Ltd. | 8,200 | 29,401 | ||||||
| Suzuki Co. Ltd. | 500 | 3,159 | ||||||
| SWCC Showa Holdings Co. Ltd. | 700 | 7,345 | ||||||
| T-Gaia Corp. | 900 | 17,698 | ||||||
| Tachikawa Corp. | 400 | 4,526 | ||||||
| Taiheiyo Cement Corp. | 7,600 | 192,641 | ||||||
| Taikisha Ltd. | 1,600 | 43,473 | ||||||
| Taiyo Yuden Co. Ltd. | 1,400 | 37,626 | ||||||
| Takamatsu Construction Group Co. Ltd. | 1,000 | 20,874 | ||||||
| Takamiya Co. Ltd. | 1,000 | 4,805 | ||||||
| Takara Leben Co. Ltd. | 4,300 | 14,019 | ||||||
| Takara Standard Co. Ltd. | 200 | 2,518 | ||||||
| Takashimaya Co. Ltd. | 7,600 | 59,779 | ||||||
22
| Shares | Value | |||||||
| Takeei Corp. | 1,000 | $ | 9,197 | |||||
| Takuma Co. Ltd. | 1,400 | 22,411 | ||||||
| Tamron Co. Ltd. | 800 | 12,909 | ||||||
| Techno Smart Corp. | 200 | 1,481 | ||||||
| Teijin Ltd. | 10,600 | 166,198 | ||||||
| Toa Oil Co. Ltd. | 200 | 3,290 | ||||||
| TOA ROAD Corp. | 200 | 6,231 | ||||||
| Tobishima Corp. | 200 | 2,092 | ||||||
| Toda Corp. | 4,400 | 28,723 | ||||||
| Toenec Corp. | 100 | 3,489 | ||||||
| Toho Holdings Co. Ltd. | 800 | 15,452 | ||||||
| Toho Titanium Co. Ltd. | 1,900 | 12,296 | ||||||
| TOKAI Holdings Corp. | 4,700 | 44,656 | ||||||
| Tokai Rika Co. Ltd. | 3,400 | 50,928 | ||||||
| Tokuyama Corp. | 3,800 | 88,693 | ||||||
| Tokyo Century Corp. | 700 | 35,827 | ||||||
| Tokyo Dome Corp. | 5,000 | 37,753 | ||||||
| Tokyo Electron Device Ltd. | 200 | 5,623 | ||||||
| Tomen Devices Corp. | 100 | 3,479 | ||||||
| Tomoku Co. Ltd. | 500 | 7,754 | ||||||
| TOMONY Holdings, Inc. | 900 | 2,875 | ||||||
| Tonami Holdings Co. Ltd. | 300 | 16,295 | ||||||
| Topre Corp. | 1,900 | 21,111 | ||||||
| Toshiba TEC Corp. | 200 | 8,368 | ||||||
| Tosho Co. Ltd. | 500 | 6,253 | ||||||
| Tosoh Corp. | 5,300 | 78,536 | ||||||
| Towa Corp. | 1,400 | 14,130 | ||||||
| Towa Pharmaceutical Co. Ltd. | 1,300 | 25,756 | ||||||
| Toyo Construction Co. Ltd. | 5,400 | 20,496 | ||||||
| Toyo Gosei Co. Ltd. | 100 | 7,285 | ||||||
| Toyo Seikan Group Holdings Ltd. | 3,700 | 40,856 | ||||||
| Toyo Tanso Co. Ltd. | 300 | 4,704 | ||||||
| Toyobo Co. Ltd. | 5,100 | 73,432 | ||||||
| Toyoda Gosei Co. Ltd. | 3,900 | 84,947 | ||||||
| Toyota Boshoku Corp. | 4,300 | 60,842 | ||||||
| TPR Co. Ltd. | 1,000 | 13,332 | ||||||
| Trancom Co. Ltd. | 100 | 7,020 | ||||||
| TS Tech Co. Ltd. | 1,100 | 32,180 | ||||||
| Tsubakimoto Chain Co. | 1,200 | 27,861 | ||||||
| Tsukishima Kikai Co. Ltd. | 1,000 | 11,826 | ||||||
| Tsukui Corp. | 3,600 | 20,967 | ||||||
| Tsuzuki Denki Co. Ltd. | 300 | 4,579 | ||||||
| UACJ Corp. | 2,000 | 36,539 | ||||||
| Ube Industries Ltd. | 6,700 | 119,519 | ||||||
| Uchida Yoko Co. Ltd. | 500 | 29,629 | ||||||
| Ueki Corp. | 200 | 4,888 | ||||||
| Unipres Corp. | 1,300 | 11,254 | ||||||
Unitika Ltd.(1) | 1,800 | 6,285 | ||||||
| Valor Holdings Co. Ltd. | 2,400 | 61,352 | ||||||
| VT Holdings Co. Ltd. | 3,100 | 11,391 | ||||||
| Wacom Co. Ltd. | 1,100 | 7,195 | ||||||
| Wakachiku Construction Co. Ltd. | 100 | 1,119 | ||||||
23
| Shares | Value | |||||||
| Wakita & Co. Ltd. | 2,100 | $ | 18,580 | |||||
| Warabeya Nichiyo Holdings Co. Ltd. | 500 | 7,046 | ||||||
| Watts Co. Ltd. | 300 | 2,653 | ||||||
| World Holdings Co. Ltd. | 500 | 8,394 | ||||||
| Xebio Holdings Co. Ltd. | 200 | 1,420 | ||||||
| Yahagi Construction Co. Ltd. | 1,600 | 13,680 | ||||||
| YAMABIKO Corp. | 2,100 | 21,364 | ||||||
| Yamaha Motor Co. Ltd. | 4,500 | 70,666 | ||||||
| Yaoko Co. Ltd. | 200 | 15,626 | ||||||
| Yashima Denki Co. Ltd. | 600 | 5,542 | ||||||
| Yokohama Reito Co. Ltd. | 2,800 | 23,805 | ||||||
| Yokohama Rubber Co. Ltd. (The) | 7,700 | 120,253 | ||||||
| Yomiuri Land Co. Ltd. | 200 | 7,513 | ||||||
| Yorozu Corp. | 1,100 | 9,686 | ||||||
| Yotai Refractories Co. Ltd. | 800 | 5,308 | ||||||
| Yurtec Corp. | 2,300 | 13,761 | ||||||
| 11,419,570 | ||||||||
| Netherlands — 2.0% | ||||||||
AerCap Holdings NV(1) | 5,601 | 165,621 | ||||||
| AFC Ajax NV | 61 | 1,241 | ||||||
AMG Advanced Metallurgical Group NV(2) | 347 | 7,124 | ||||||
| ASR Nederland NV | 8,994 | 311,718 | ||||||
Basic-Fit NV(1) | 384 | 10,802 | ||||||
| BE Semiconductor Industries NV | 1,194 | 57,051 | ||||||
Flow Traders(2) | 685 | 26,980 | ||||||
| ForFarmers NV | 764 | 4,931 | ||||||
Fugro NV, CVA(1)(2) | 2,216 | 9,462 | ||||||
Heijmans NV, CVA(1) | 190 | 1,605 | ||||||
Koninklijke BAM Groep NV(1) | 14,761 | 22,726 | ||||||
| Koninklijke Vopak NV | 969 | 53,212 | ||||||
Nederland Apparatenfabriek(1) | 63 | 3,310 | ||||||
NIBC Holding NV(1) | 215 | 1,896 | ||||||
Pharming Group NV(1)(2) | 33,077 | 41,891 | ||||||
SIF Holding NV(1)(2) | 899 | 14,693 | ||||||
| TKH Group NV, CVA | 2,383 | 93,391 | ||||||
| 827,654 | ||||||||
| New Zealand — 0.8% | ||||||||
| Air New Zealand Ltd. | 57,283 | 53,651 | ||||||
| New Zealand Refining Co. Ltd. (The) | 5,917 | 2,625 | ||||||
| Oceania Healthcare Ltd. | 73,443 | 51,283 | ||||||
| PGG Wrightson Ltd. | 3,178 | 5,811 | ||||||
| Sanford Ltd. | 1,821 | 7,066 | ||||||
| SKYCITY Entertainment Group Ltd. | 89,125 | 152,437 | ||||||
Tourism Holdings Ltd.(2) | 4,670 | 6,499 | ||||||
| Warehouse Group Ltd. (The) | 4,880 | 6,729 | ||||||
| Z Energy Ltd. | 35,255 | 63,715 | ||||||
| 349,816 | ||||||||
| Norway — 1.9% | ||||||||
| ABG Sundal Collier Holding ASA | 53,135 | 26,811 | ||||||
Aker Carbon Capture AS(1)(2) | 4,035 | 2,356 | ||||||
Aker Offshore Wind Holding AS(1)(2) | 4,035 | 1,524 | ||||||
Aker Solutions ASA(1)(2) | 5,381 | 6,041 | ||||||
24
| Shares | Value | |||||||
American Shipping Co. ASA(1) | 927 | $ | 3,093 | |||||
| Austevoll Seafood ASA | 3,969 | 36,586 | ||||||
Avance Gas Holding Ltd.(2) | 1,075 | 2,579 | ||||||
BW Energy Ltd.(1) | 3,346 | 7,832 | ||||||
| BW LPG Ltd. | 4,673 | 21,774 | ||||||
| BW Offshore Ltd. | 12,434 | 48,018 | ||||||
DNO ASA(2) | 68,567 | 43,249 | ||||||
| Hoegh LNG Holdings Ltd. | 923 | 1,257 | ||||||
| Kid ASA | 631 | 5,993 | ||||||
Komplett Bank ASA(1) | 2,201 | 1,756 | ||||||
Kvaerner ASA(1) | 8,284 | 7,700 | ||||||
| Norway Royal Salmon ASA | 559 | 14,142 | ||||||
Norwegian Finans Holding ASA(1) | 17,835 | 134,801 | ||||||
Odfjell Drilling Ltd.(1)(2) | 1,894 | 2,511 | ||||||
Pareto Bank ASA(1) | 3,713 | 16,286 | ||||||
PGS ASA(1) | 10,121 | 3,753 | ||||||
| Selvaag Bolig ASA | 953 | 5,802 | ||||||
| SpareBank 1 BV | 2,011 | 8,498 | ||||||
| SpareBank 1 Nord Norge | 3,272 | 25,186 | ||||||
| Sparebanken More | 267 | 9,106 | ||||||
| Sparebanken Vest | 4,609 | 34,271 | ||||||
| Stolt-Nielsen Ltd. | 2,273 | 22,239 | ||||||
| TGS Nopec Geophysical Co. ASA | 10,907 | 141,401 | ||||||
Veidekke ASA(1) | 12,566 | 169,026 | ||||||
Wallenius Wilhelmsen ASA(1) | 3,219 | 5,651 | ||||||
| 809,242 | ||||||||
| Portugal — 0.2% | ||||||||
Ibersol SGPS SA(1) | 1,076 | 6,930 | ||||||
Mota-Engil SGPS SA(1) | 18,902 | 35,524 | ||||||
| Semapa-Sociedade de Investimento e Gestao | 3,545 | 32,221 | ||||||
Sonae Capital SGPS SA(1) | 8,698 | 7,160 | ||||||
| Sonae SGPS SA | 28,511 | 20,310 | ||||||
| 102,145 | ||||||||
| Singapore — 1.5% | ||||||||
| Accordia Golf Trust | 143,500 | 76,290 | ||||||
| BRC Asia Ltd. | 5,500 | 4,561 | ||||||
| Centurion Corp. Ltd. | 10,500 | 2,744 | ||||||
| China Sunsine Chemical Holdings Ltd. | 27,500 | 7,368 | ||||||
| Food Empire Holdings Ltd. | 7,400 | 3,411 | ||||||
| Frencken Group Ltd. | 106,600 | 73,297 | ||||||
| Fu Yu Corp. Ltd. | 20,700 | 3,791 | ||||||
| Golden Agri-Resources Ltd. | 1,280,600 | 136,108 | ||||||
| Hong Leong Asia Ltd. | 13,400 | 4,811 | ||||||
| Hour Glass Ltd. (The) | 10,500 | 5,434 | ||||||
| Hutchison Port Holdings Trust, U Shares | 1,399,200 | 147,750 | ||||||
| Japfa Ltd. | 126,100 | 57,630 | ||||||
| Lian Beng Group Ltd. | 18,700 | 5,220 | ||||||
| OUE Ltd. | 37,000 | 32,426 | ||||||
| Penguin International Ltd. | 7,300 | 2,243 | ||||||
| QAF Ltd. | 10,700 | 7,230 | ||||||
Rex International Holding Ltd.(1)(2) | 201,600 | 24,462 | ||||||
| Sing Holdings Ltd. | 11,800 | 3,249 | ||||||
25
| Shares | Value | |||||||
| Sunningdale Tech Ltd. | 5,000 | $ | 4,323 | |||||
| Yanlord Land Group Ltd. | 28,500 | 25,248 | ||||||
Ying Li International Real Estate Ltd.(1) | 4,700 | 297 | ||||||
| 627,893 | ||||||||
| Spain — 1.7% | ||||||||
Acerinox SA(1) | 14,129 | 114,376 | ||||||
Almirall SA(1) | 1,021 | 11,223 | ||||||
Amper SA(1)(2) | 16,112 | 3,267 | ||||||
| Atresmedia Corp. de Medios de Comunicacion SA | 2,455 | 6,612 | ||||||
| Banco de Sabadell SA | 244,412 | 99,920 | ||||||
| Ence Energia y Celulosa SA | 13,800 | 44,282 | ||||||
| Ercros SA | 2,866 | 7,221 | ||||||
| Gestamp Automocion SA | 19,265 | 51,566 | ||||||
Grenergy Renovables(1) | 84 | 1,604 | ||||||
Masmovil Ibercom SA(1) | 194 | 5,195 | ||||||
Mediaset Espana Comunicacion SA(1) | 7,851 | 26,106 | ||||||
Melia Hotels International SA(1) | 6,438 | 26,946 | ||||||
| Miquel y Costas & Miquel SA | 385 | 5,419 | ||||||
Neinor Homes SA(1) | 5,106 | 68,600 | ||||||
| Prosegur Cia de Seguridad SA | 20,975 | 50,855 | ||||||
| Sacyr SA | 37,772 | 85,778 | ||||||
Tecnicas Reunidas SA(1)(2) | 2,833 | 36,182 | ||||||
Tubacex SA(1)(2) | 1,612 | 2,323 | ||||||
| Viscofan SA | 1,052 | 77,866 | ||||||
| 725,341 | ||||||||
| Sweden — 6.9% | ||||||||
AQ Group AB(1) | 739 | 16,346 | ||||||
Arise AB(1) | 2,112 | 9,236 | ||||||
| Bahnhof AB, B Shares | 3,307 | 12,804 | ||||||
Bilia AB, A Shares(1) | 10,796 | 127,874 | ||||||
BioArctic AB(1) | 4,762 | 50,086 | ||||||
| Bonava AB, B Shares | 7,708 | 54,825 | ||||||
| Bredband2 i Skandinavien AB | 21,892 | 4,125 | ||||||
Bulten AB(1) | 1,528 | 11,757 | ||||||
| Bure Equity AB | 7,969 | 245,814 | ||||||
Cavotec SA(1) | 1,100 | 2,608 | ||||||
| Cibus Nordic Real Estate AB | 777 | 13,649 | ||||||
| Clas Ohlson AB, B Shares | 6,352 | 73,687 | ||||||
Collector AB(1)(2) | 4,995 | 8,070 | ||||||
| CTT Systems AB | 1,145 | 17,044 | ||||||
| Dios Fastigheter AB | 11,040 | 71,274 | ||||||
Elanders AB, B Shares(1) | 400 | 3,231 | ||||||
Electrolux Professional AB, B Shares(1) | 29,320 | 129,771 | ||||||
Eolus Vind AB, B Shares(2) | 3,712 | 65,873 | ||||||
Fastator AB(1) | 261 | 3,633 | ||||||
| G5 Entertainment AB | 723 | 31,431 | ||||||
Granges AB(1) | 12,252 | 109,071 | ||||||
Haldex AB(1) | 691 | 3,158 | ||||||
Hexatronic Group AB(1)(2) | 4,267 | 33,601 | ||||||
HIQ International AB(1) | 8,280 | 67,376 | ||||||
Hoist Finance AB(1)(2) | 7,800 | 27,700 | ||||||
| Klovern AB, B Shares | 31,192 | 47,988 | ||||||
26
| Shares | Value | |||||||
| Kopparbergs Bryggeri AB, B Shares | 729 | $ | 16,107 | |||||
Maha Energy AB(1)(2) | 5,400 | 8,814 | ||||||
Mekonomen AB(1) | 4,689 | 50,085 | ||||||
Modern Times Group MTG AB, B Shares(1) | 9,442 | 128,855 | ||||||
| Mycronic AB | 10,334 | 235,146 | ||||||
| NCC AB, B Shares | 12,002 | 216,104 | ||||||
Nobia AB(1) | 11,479 | 73,864 | ||||||
Nobina AB(1) | 11,476 | 69,426 | ||||||
Nolato AB, B Shares(1) | 2,859 | 278,530 | ||||||
| NP3 Fastigheter AB | 2,370 | 27,960 | ||||||
Orexo AB(1) | 3,770 | 22,029 | ||||||
Pandox AB(1) | 6,364 | 72,405 | ||||||
| Paradox Interactive AB | 669 | 17,920 | ||||||
RaySearch Laboratories AB(1) | 3,561 | 39,926 | ||||||
| Resurs Holding AB | 12,936 | 67,112 | ||||||
Rottneros AB(1) | 3,013 | 2,787 | ||||||
SAS AB(1)(2) | 15,864 | 11,928 | ||||||
Scandi Standard AB(1) | 6,235 | 53,945 | ||||||
Semcon AB(1) | 398 | 2,860 | ||||||
Sintercast AB(1) | 142 | 2,242 | ||||||
| SkiStar AB | 6,366 | 76,554 | ||||||
SolTech Energy Sweden AB(1) | 2,171 | 5,631 | ||||||
Stendorren Fastigheter AB(1) | 1,094 | 14,868 | ||||||
Stillfront Group AB(1) | 1,362 | 146,530 | ||||||
| Tethys Oil AB | 4,020 | 22,062 | ||||||
TF Bank AB(1) | 180 | 1,824 | ||||||
| 2,907,546 | ||||||||
| Switzerland — 4.9% | ||||||||
Arbonia AG(1) | 5,672 | 74,373 | ||||||
Autoneum Holding AG(1) | 582 | 69,919 | ||||||
| Bell Food Group AG | 160 | 41,144 | ||||||
| Bellevue Group AG | 642 | 17,184 | ||||||
| Bergbahnen Engelberg-Truebsee-Titlis AG BET | 80 | 3,496 | ||||||
| Bobst Group SA | 1,424 | 92,203 | ||||||
| Bucher Industries AG | 1,065 | 398,479 | ||||||
| Burkhalter Holding AG | 341 | 22,453 | ||||||
Calida Holding AG(1) | 234 | 7,118 | ||||||
| Conzzeta AG | 153 | 159,073 | ||||||
EFG International AG(1) | 9,039 | 62,278 | ||||||
Feintool International Holding AG(1) | 177 | 10,027 | ||||||
| Forbo Holding AG | 7 | 11,571 | ||||||
| Glarner Kantonalbank | 150 | 5,143 | ||||||
| Gurit Holding AG | 15 | 28,234 | ||||||
| Huber + Suhner AG | 2,214 | 171,140 | ||||||
| Implenia AG | 2,355 | 81,176 | ||||||
Ina Invest Holding AG(1) | 368 | 7,857 | ||||||
Klingelnberg AG(1) | 117 | 1,941 | ||||||
Leonteq AG(1) | 1,421 | 56,712 | ||||||
| Liechtensteinische Landesbank AG | 189 | 12,418 | ||||||
MCH Group AG(1) | 170 | 2,812 | ||||||
| Orior AG | 384 | 33,186 | ||||||
| Phoenix Mecano AG | 43 | 16,698 | ||||||
27
| Shares | Value | |||||||
| Schaffner Holding AG | 15 | $ | 3,003 | |||||
Schmolz + Bickenbach AG(1) | 48,711 | 8,557 | ||||||
| St Galler Kantonalbank AG | 69 | 31,744 | ||||||
| Sulzer AG | 2,534 | 225,385 | ||||||
| Swissquote Group Holding SA | 932 | 81,858 | ||||||
u-blox Holding AG(1) | 705 | 39,753 | ||||||
| Valiant Holding AG | 2,088 | 199,741 | ||||||
| VP Bank AG | 145 | 18,764 | ||||||
| Zehnder Group AG | 1,240 | 64,173 | ||||||
| 2,059,613 | ||||||||
| United Kingdom — 15.2% | ||||||||
| Aggreko plc | 14,066 | 89,727 | ||||||
| Anglo Asian Mining plc | 891 | 1,822 | ||||||
| Anglo Pacific Group plc | 10,480 | 14,849 | ||||||
| Argentex Group plc | 696 | 1,525 | ||||||
Augean plc(1) | 986 | 2,241 | ||||||
Bank of Georgia Group plc(1) | 2,259 | 27,755 | ||||||
| Biffa plc | 19,801 | 54,261 | ||||||
| Bodycote plc | 3,814 | 28,602 | ||||||
| Burford Capital Ltd. | 12,840 | 97,181 | ||||||
Cairn Energy plc(1) | 26,479 | 49,843 | ||||||
| Centamin plc | 29,462 | 82,622 | ||||||
| Central Asia Metals plc | 8,958 | 21,086 | ||||||
Circassia Group plc(1) | 11,045 | 4,725 | ||||||
| Close Brothers Group plc | 9,195 | 138,033 | ||||||
| CMC Markets plc | 2,737 | 11,685 | ||||||
| Coats Group plc | 92,657 | 68,752 | ||||||
| Computacenter plc | 4,909 | 133,924 | ||||||
| Crest Nicholson Holdings plc | 11,725 | 31,051 | ||||||
| Daily Mail & General Trust plc | 9,595 | 84,726 | ||||||
| Dart Group plc | 5,621 | 53,649 | ||||||
| Devro plc | 13,264 | 30,745 | ||||||
| DFS Furniture plc | 12,740 | 28,951 | ||||||
| Direct Line Insurance Group plc | 76,186 | 302,316 | ||||||
| Diversified Gas & Oil plc | 43,485 | 63,986 | ||||||
| Dunelm Group plc | 817 | 15,606 | ||||||
| easyJet plc | 8,785 | 74,359 | ||||||
| Eckoh plc | 2,370 | 1,996 | ||||||
| Electrocomponents plc | 26,782 | 243,088 | ||||||
EnQuest plc(1) | 93,172 | 16,067 | ||||||
| Evraz plc | 29,878 | 129,484 | ||||||
| Ferrexpo plc | 27,030 | 66,723 | ||||||
| Forterra plc | 9,868 | 20,957 | ||||||
Frasers Group plc(1) | 12,899 | 60,350 | ||||||
| Galliford Try Holdings plc | 2,987 | 3,436 | ||||||
| Games Workshop Group plc | 267 | 32,879 | ||||||
| Go-Ahead Group plc (The) | 1,839 | 16,452 | ||||||
Golar LNG Ltd.(1) | 4,148 | 42,932 | ||||||
| Grafton Group plc | 13,217 | 137,721 | ||||||
| Greggs plc | 5,481 | 103,820 | ||||||
| Gulf Keystone Petroleum Ltd. | 7,801 | 8,770 | ||||||
| Gym Group plc (The) | 6,746 | 14,338 | ||||||
28
| Shares | Value | |||||||
| Hays plc | 85,032 | $ | 137,082 | |||||
| Hikma Pharmaceuticals plc | 808 | 25,609 | ||||||
Hochschild Mining plc(1) | 18,689 | 60,108 | ||||||
| Howden Joinery Group plc | 12,664 | 95,139 | ||||||
Ibstock plc(1) | 20,356 | 42,054 | ||||||
| IG Group Holdings plc | 9,068 | 96,120 | ||||||
Inchcape plc(1) | 24,276 | 164,039 | ||||||
Indivior plc(1) | 58,220 | 92,346 | ||||||
| IWG plc | 5,701 | 21,460 | ||||||
| J Sainsbury plc | 122,722 | 301,521 | ||||||
Jadestone Energy, Inc.(1) | 6,211 | 5,475 | ||||||
| Joules Group plc | 516 | 766 | ||||||
Just Group plc(1) | 59,053 | 40,180 | ||||||
| KAZ Minerals plc | 13,076 | 102,216 | ||||||
| Keller Group plc | 5,044 | 42,228 | ||||||
| Luxfer Holdings plc | 358 | 5,091 | ||||||
| Marks & Spencer Group plc | 79,076 | 117,438 | ||||||
| Marston's plc | 37,394 | 26,469 | ||||||
McBride plc(1) | 1,428 | 1,145 | ||||||
Mitchells & Butlers plc(1) | 6,884 | 15,846 | ||||||
| Motorpoint group plc | 61 | 221 | ||||||
| N Brown Group plc | 1,163 | 853 | ||||||
| Naked Wines plc | 5,268 | 32,050 | ||||||
| Norcros plc | 1,050 | 1,922 | ||||||
| OneSavings Bank plc | 24,245 | 98,525 | ||||||
| Pagegroup plc | 20,131 | 103,658 | ||||||
| Pan African Resources plc | 75,333 | 24,672 | ||||||
Petrofac Ltd.(2) | 12,957 | 27,886 | ||||||
Petropavlovsk plc(1)(2) | 149,839 | 73,409 | ||||||
Pharos Energy plc(1) | 2,309 | 426 | ||||||
| Phoenix Group Holdings plc | 7,560 | 69,932 | ||||||
| Photo-Me International plc | 12,371 | 7,988 | ||||||
| Plus500 Ltd. | 6,930 | 135,111 | ||||||
Premier Oil plc(1)(2) | 40,946 | 11,954 | ||||||
Provident Financial plc(1) | 11,706 | 38,557 | ||||||
| Quilter plc | 139,003 | 265,804 | ||||||
| Rathbone Brothers plc | 1,229 | 27,732 | ||||||
| Reach plc | 16,663 | 11,716 | ||||||
| Redde Northgate plc | 14,613 | 36,685 | ||||||
| Redrow plc | 12,936 | 79,364 | ||||||
| Rhi Magnesita NV | 2,040 | 73,737 | ||||||
| Rockrose Energy plc | 246 | 6,071 | ||||||
| Royal Mail plc | 51,904 | 124,542 | ||||||
| RSA Insurance Group plc | 23,588 | 142,881 | ||||||
| Secure Trust Bank plc | 121 | 1,036 | ||||||
| Senior plc | 17,659 | 12,311 | ||||||
| Serica Energy plc | 5,537 | 8,831 | ||||||
Shanta Gold Ltd.(1) | 37,260 | 8,068 | ||||||
| SIG plc | 25,434 | 10,805 | ||||||
| Sirius Real Estate Ltd. | 53,805 | 53,511 | ||||||
| Speedy Hire plc | 33,225 | 22,901 | ||||||
| Spire Healthcare Group plc | 2,396 | 2,940 | ||||||
29
| Shares | Value | |||||||
| St. James's Place plc | 9,449 | $ | 123,758 | |||||
Stobart Group Ltd.(1) | 21,063 | 6,872 | ||||||
| Stock Spirits Group plc | 3,671 | 10,793 | ||||||
| Superdry plc | 492 | 879 | ||||||
| Synthomer plc | 4,935 | 20,701 | ||||||
| Tate & Lyle plc | 27,557 | 252,411 | ||||||
| Taylor Wimpey plc | 58,417 | 95,583 | ||||||
TI Fluid Systems plc(1) | 14,042 | 29,568 | ||||||
| Trans-Siberian Gold plc | 4,755 | 6,487 | ||||||
Tremor International Ltd.(1) | 946 | 1,886 | ||||||
Tullow Oil plc(2) | 90,518 | 24,829 | ||||||
| Vertu Motors plc | 3,181 | 1,026 | ||||||
| Victrex plc | 1,725 | 44,550 | ||||||
Virgin Money UK plc(1) | 28,287 | 35,226 | ||||||
| Vistry Group plc | 10,659 | 90,620 | ||||||
| Vp plc | 235 | 2,013 | ||||||
| WM Morrison Supermarkets plc | 143,029 | 367,666 | ||||||
| 6,436,334 | ||||||||
TOTAL COMMON STOCKS (Cost $37,970,621) | 41,815,357 | |||||||
RIGHTS† | ||||||||
Australia† | ||||||||
Coronado Global Resources, Inc.(1) | 1,860 | 28 | ||||||
Sweden† | ||||||||
SolTech Energy Sweden AB(1) | 2,171 | 365 | ||||||
TOTAL RIGHTS (Cost $—) | 393 | |||||||
| TEMPORARY CASH INVESTMENTS — 0.8% | ||||||||
| State Street Institutional U.S. Government Money Market Fund, Premier Class (Cost $330,935) | 330,935 | 330,935 | ||||||
TEMPORARY CASH INVESTMENTS - SECURITIES LENDING COLLATERAL(3) — 1.8% | ||||||||
| State Street Navigator Securities Lending Government Money Market Portfolio (Cost $752,208) | 752,208 | 752,208 | ||||||
TOTAL INVESTMENT SECURITIES — 101.5% (Cost $39,053,764) | 42,898,893 | |||||||
| OTHER ASSETS AND LIABILITIES — (1.5)% | (635,396) | |||||||
| TOTAL NET ASSETS — 100.0% | $ | 42,263,497 | ||||||
| FUTURES CONTRACTS PURCHASED | ||||||||||||||
| Reference Entity | Contracts | Expiration Date | Notional Amount | Unrealized Appreciation (Depreciation)^ | ||||||||||
| Russell 2000 E-Mini Index | 3 | September 2020 | $ | 234,195 | $ | 22,315 | ||||||||
^ Amount represents value and unrealized appreciation (depreciation).
30
| MARKET SECTOR DIVERSIFICATION | |||||
(as a % of net assets) | |||||
| Industrials | 25.8 | % | |||
| Materials | 20.2 | % | |||
| Financials | 14.4 | % | |||
| Consumer Discretionary | 14.3 | % | |||
| Energy | 6.0 | % | |||
| Consumer Staples | 5.8 | % | |||
| Information Technology | 4.9 | % | |||
| Communication Services | 2.8 | % | |||
| Real Estate | 2.1 | % | |||
| Health Care | 1.5 | % | |||
| Utilities | 1.1 | % | |||
| Cash and Equivalents* | 1.1 | % | |||
*Includes temporary cash investments, temporary cash investments - securities lending collateral and other assets and liabilities.
| NOTES TO SCHEDULE OF INVESTMENTS | ||||||||
| CVA | - | Certificaten Van Aandelen | ||||||
†Category is less than 0.05% of total net assets.
(1)Non-income producing.
(2)Security, or a portion thereof, is on loan. At the period end, the aggregate value of securities on loan was $1,275,322. The amount of securities on loan indicated may not correspond with the securities on loan identified because securities with pending sales are in the process of recall from the brokers.
(3)Investment of cash collateral from securities on loan. At the period end, the aggregate value of the collateral held by the fund was $1,367,814, which includes securities collateral of $615,606.
See Notes to Financial Statements.
31
| Statement of Assets and Liabilities | ||
| AUGUST 31, 2020 | |||||
| Assets | |||||
| Investment securities, at value (cost of $38,301,556) — including $1,275,322 of securities on loan | $ | 42,146,685 | |||
| Investment made with cash collateral received for securities on loan, at value (cost of $752,208) | 752,208 | ||||
| Total investment securities, at value (cost of $39,053,764) | 42,898,893 | ||||
| Foreign currency holdings, at value (cost of $1,928) | 1,951 | ||||
| Deposits with broker for futures contracts | 17,400 | ||||
| Receivable for capital shares sold | 14,345 | ||||
| Receivable for variation margin on futures contracts | 10,062 | ||||
| Dividends and interest receivable | 108,353 | ||||
| Securities lending receivable | 2,414 | ||||
| 43,053,418 | |||||
| Liabilities | |||||
| Payable for collateral received for securities on loan | 752,208 | ||||
| Payable for investments purchased | 10,740 | ||||
| Payable for capital shares redeemed | 14,345 | ||||
| Accrued management fees | 12,628 | ||||
| 789,921 | |||||
| Net Assets | $ | 42,263,497 | |||
| Institutional Class Capital Shares | |||||
| Shares outstanding (unlimited number of shares authorized) | 4,535,156 | ||||
| Net Asset Value Per Share | $ | 9.32 | |||
| Net Assets Consist of: | |||||
| Capital paid in | $ | 38,302,922 | |||
| Distributable earnings | 3,960,575 | ||||
| $ | 42,263,497 | ||||
See Notes to Financial Statements.
32
| Statement of Operations | ||
FOR THE PERIOD ENDED AUGUST 31, 2020(1) | |||||
| Investment Income (Loss) | |||||
| Income: | |||||
| Dividends (net of foreign taxes withheld of $36,263) | $ | 327,836 | |||
| Securities lending, net | 5,400 | ||||
| Interest | 2,864 | ||||
| 336,100 | |||||
| Expenses: | |||||
| Management fees | 47,662 | ||||
| Foreign currency overdraft fees | 3,069 | ||||
| Other expenses | 154 | ||||
| 50,885 | |||||
| Fees reimbursed | (3,069) | ||||
| 47,816 | |||||
| Net investment income (loss) | 288,284 | ||||
| Realized and Unrealized Gain (Loss) | |||||
| Net realized gain (loss) on: | |||||
| Investment transactions | (243,717) | ||||
| Futures contract transactions | 82,448 | ||||
| Foreign currency translation transactions | (812) | ||||
| (162,081) | |||||
| Change in net unrealized appreciation (depreciation) on: | |||||
| Investments | 3,845,129 | ||||
| Futures contracts | 22,315 | ||||
| Translation of assets and liabilities in foreign currencies | 1,430 | ||||
| 3,868,874 | |||||
| Net realized and unrealized gain (loss) | 3,706,793 | ||||
| Net Increase (Decrease) in Net Assets Resulting from Operations | $ | 3,995,077 | |||
(1)December 4, 2019 (fund inception) through August 31, 2020.
See Notes to Financial Statements.
33
| Statement of Changes in Net Assets | ||
PERIOD ENDED AUGUST 31, 2020(1) | |||||
| Increase (Decrease) in Net Assets | |||||
| Operations | |||||
| Net investment income (loss) | $ | 288,284 | |||
| Net realized gain (loss) | (162,081) | ||||
| Change in net unrealized appreciation (depreciation) | 3,868,874 | ||||
| Net increase (decrease) in net assets resulting from operations | 3,995,077 | ||||
| Distributions to Shareholders | |||||
| From earnings | (34,502) | ||||
| Capital Share Transactions | |||||
| Proceeds from shares sold | 40,974,725 | ||||
| Proceeds from reinvestment of distributions | 34,502 | ||||
| Payments for shares redeemed | (2,706,305) | ||||
| Net increase (decrease) in net assets from capital share transactions | 38,302,922 | ||||
| Net increase (decrease) in net assets | 42,263,497 | ||||
| Net Assets | |||||
| End of period | $ | 42,263,497 | |||
| Transactions in Shares of the Fund | |||||
| Sold | 4,850,159 | ||||
| Issued in reinvestment of distributions | 3,321 | ||||
| Redeemed | (318,324) | ||||
| Net increase (decrease) in shares of the fund | 4,535,156 | ||||
(1)December 4, 2019 (fund inception) through August 31, 2020.
See Notes to Financial Statements.
34
| Notes to Financial Statements | ||
AUGUST 31, 2020
1. Organization
American Century ETF Trust (the trust) was registered as a Delaware statutory trust in 2017 and is registered under the Investment Company Act of 1940, as amended (the 1940 Act), as an open end management investment company. Avantis International Small Cap Value Fund (the fund) is one fund in a series issued by the trust. The fund’s investment objective is to seek long-term capital appreciation. The fund offers the Institutional Class. The Institutional Class commenced sale on December 4, 2019, the fund's inception date.
2. Significant Accounting Policies
The following is a summary of significant accounting policies consistently followed by the fund in preparation of its financial statements. The fund is an investment company and follows accounting and reporting guidance in accordance with accounting principles generally accepted in the United States of America. This may require management to make certain estimates and assumptions at the date of the financial statements. Actual results could differ from these estimates. Management evaluated the impact of events or transactions occurring through the date the financial statements were issued that would merit recognition or disclosure.
Investment Valuations — The fund determines the fair value of its investments and computes its net asset value per share at the close of regular trading (usually 4 p.m. Eastern time) on the New York Stock Exchange (NYSE) on each day the NYSE is open. The Board of Trustees has adopted valuation policies and procedures to guide the investment advisor in the fund’s investment valuation process and to provide methodologies for the oversight of the fund’s pricing function.
Equity securities that are listed or traded on a domestic securities exchange are valued at the last reported sales price or at the official closing price as provided by the exchange. Equity securities traded on foreign securities exchanges are generally valued at the closing price of such securities on the exchange where primarily traded or at the close of the NYSE, if that is earlier. If no last sales price is reported, or if local convention or regulation so provides, the mean of the latest bid and asked prices may be used. Securities traded over-the-counter are valued at the mean of the latest bid and asked prices, the last sales price, or the official closing price. Equity securities initially expressed in local currencies are translated into U.S. dollars at the mean of the appropriate currency exchange rate at the close of the NYSE as provided by an independent pricing service.
Open-end management investment companies are valued at the reported net asset value per share. Exchange-traded futures contracts are valued at the settlement price as provided by the appropriate exchange.
If the fund determines that the market price for an investment is not readily available or the valuation methods mentioned above do not reflect an investment’s fair value, such investment is valued as determined in good faith by the Board of Trustees or its delegate, in accordance with policies and procedures adopted by the Board of Trustees. In its determination of fair value, the fund may review several factors including, but not limited to, market information regarding the specific investment or comparable investments and correlation with other investment types, futures indices or general market indicators. Circumstances that may cause the fund to use these procedures to value an investment include, but are not limited to: an investment has been declared in default or is distressed; trading in a security has been suspended during the trading day or a security is not actively trading on its principal exchange; prices received from a regular pricing source are deemed unreliable; or there is a foreign market holiday and no trading occurred.
The fund monitors for significant events occurring after the close of an investment’s primary exchange but before the fund’s net asset value per share is determined. Significant events may include, but are not limited to: corporate announcements and transactions; governmental action and political unrest that could impact a specific investment or an investment sector; or armed conflicts, natural disasters and similar events that could affect investments in a specific country or region. The fund also monitors for significant fluctuations between domestic and foreign markets, as evidenced by the U.S. market or such other indicators that the Board of Trustees, or its delegate, deems appropriate. The fund may apply a model-derived factor to the closing price of equity securities traded on foreign securities exchanges. The factor is based on observable market data as provided by an independent pricing service.
35
Security Transactions — Security transactions are accounted for as of the trade date. Net realized gains and losses are determined on the identified cost basis, which is also used for federal income tax purposes.
Investment Income — Dividend income less foreign taxes withheld, if any, is recorded as of the ex-dividend date. Distributions received on securities that represent a return of capital or long-term capital gain are recorded as a reduction of cost of investments and/or as a realized gain. The fund may estimate the components of distributions received that may be considered nontaxable distributions or long-term capital gain distributions for income tax purposes. Interest income is recorded on the accrual basis and includes accretion of discounts and amortization of premiums. Securities lending income is net of fees and rebates earned by the lending agent for its services.
Foreign Currency Translations — All assets and liabilities initially expressed in foreign currencies are translated into U.S. dollars at prevailing exchange rates at period end. The fund may enter into spot foreign currency exchange contracts to facilitate transactions denominated in a foreign currency. Purchases and sales of investment securities, dividend and interest income, spot foreign currency exchange contracts, and expenses are translated at the rates of exchange prevailing on the respective dates of such transactions. Net realized and unrealized foreign currency exchange gains or losses related to investment securities are a component of net realized gain (loss) on investment transactions and change in net unrealized appreciation (depreciation) on investments, respectively.
Segregated Assets — In accordance with the 1940 Act, the fund segregates assets on its books and records to cover certain types of investment securities and other financial instruments. American Century Investment Management, Inc. (ACIM) (the investment advisor) monitors, on a daily basis, the securities segregated to ensure the fund designates a sufficient amount of liquid assets, marked-to-market daily. The fund may also receive assets or be required to pledge assets at the custodian bank or with a broker for collateral requirements.
Income Tax Status — It is the fund’s policy to distribute substantially all net investment income and net realized gains to shareholders and to otherwise qualify as a regulated investment company under provisions of the Internal Revenue Code. Accordingly, no provision has been made for income taxes. The fund files U.S. federal, state, local and non-U.S. tax returns as applicable. The fund's tax returns are subject to examination by the relevant taxing authority until expiration of the applicable statute of limitations, which is generally three years from the date of filing but can be longer in certain jurisdictions. At this time, management believes there are no uncertain tax positions which, based on their technical merit, would not be sustained upon examination and for which it is reasonably possible that the total amounts of unrecognized tax benefits will significantly change in the next twelve months.
Distributions to Shareholders — Distributions from net investment income and net realized gains, if any, are generally declared and paid annually.
Indemnifications — Under the trust’s organizational documents, its officers and trustees are indemnified against certain liabilities arising out of the performance of their duties to the fund. In addition, in the normal course of business, the fund enters into contracts that provide general indemnifications. The maximum exposure under these arrangements is unknown as this would involve future claims that may be made against a fund. The risk of material loss from such claims is considered by management to be remote.
Securities Lending — Securities are lent to qualified financial institutions and brokers. State Street Bank & Trust Co. serves as securities lending agent to the fund pursuant to a Securities Lending Agreement. The lending of securities exposes the fund to risks such as: the borrowers may fail to return the loaned securities, the borrowers may not be able to provide additional collateral, the fund may experience delays in recovery of the loaned securities or delays in access to collateral, or the fund may experience losses related to the investment collateral. To minimize certain risks, loan counterparties pledge collateral in the form of cash and/or securities. The lending agent has agreed to indemnify the fund in the case of default of any securities borrowed. Cash collateral received is invested in the State Street Navigator Securities Lending Government Money Market Portfolio, a money market mutual fund registered under the 1940 Act. The loans may also be secured by U.S. government securities in an amount at least equal to the market value of the securities loaned, plus accrued interest and dividends, determined on a daily basis and adjusted accordingly. By lending securities, the fund seeks to increase its net investment income through the receipt of interest and fees. Such income is reflected separately within the Statement of Operations. The value of loaned securities and related collateral outstanding at period end, if any, are shown on a gross basis within the Schedule of Investments and Statement of Assets and Liabilities.
36
The following table reflects a breakdown of transactions accounted for as secured borrowings, the gross obligation by the type of collateral pledged, and the remaining contractual maturity of those transactions as of August 31, 2020.
| Remaining Contractual Maturity of Agreements | |||||||||||||||||
| Overnight and Continuous | <30 days | Between 30 & 90 days | >90 days | Total | |||||||||||||
Securities Lending Transactions(1) | |||||||||||||||||
| Common Stocks | $ | 752,208 | — | — | — | $ | 752,208 | ||||||||||
| Gross amount of recognized liabilities for securities lending transactions | $ | 752,208 | |||||||||||||||
(1)Amount represents the payable for cash collateral received for securities on loan. This will generally be in the Overnight and Continuous column as the securities are typically callable on demand.
3. Fees and Transactions with Related Parties
Certain officers and trustees of the trust are also officers and/or directors of American Century Companies, Inc. (ACC). The trust's investment advisor, ACIM, the fund's distributor, American Century Investment Services, Inc., and the trust's transfer agent, American Century Services, LLC, are wholly owned, directly or indirectly, by ACC. ACIM owns 17% of the shares of the fund.
Management Fees — The trust has entered into a management agreement with ACIM, under which ACIM provides the fund with investment advisory and management services in exchange for a single, unified management fee (the fee). The agreement provides that ACIM will pay all expenses of managing and operating the fund, except brokerage and other transaction fees and expenses relating to the acquisition and disposition of portfolio securities, acquired fund fees and expenses, interest, taxes, litigation expenses and extraordinary expenses. The fee is computed and accrued daily based on the daily net assets of the fund and paid monthly in arrears. The annual management fee is 0.36%.
Interfund Transactions — The fund may enter into security transactions with other American Century Investments funds and other client accounts of the investment advisor, in accordance with the 1940 Act rules and procedures adopted by the Board of Trustees. The rules and procedures require, among other things, that these transactions be effected at the independent current market price of the security. There were no interfund transactions during the period
4. Investment Transactions
Purchases and sales of investment securities, excluding short-term investments, for the period ended August 31, 2020 were $40,386,095 and $2,186,491, respectively.
5. Fair Value Measurements
The fund’s investments valuation process is based on several considerations and may use multiple inputs to determine the fair value of the investments held by the fund. In conformity with accounting principles generally accepted in the United States of America, the inputs used to determine a valuation are classified into three broad levels.
•Level 1 valuation inputs consist of unadjusted quoted prices in an active market for identical investments.
•Level 2 valuation inputs consist of direct or indirect observable market data (including quoted prices for comparable investments, evaluations of subsequent market events, interest rates, prepayment speeds, credit risk, etc.). These inputs also consist of quoted prices for identical investments initially expressed in local currencies that are adjusted through translation into U.S. dollars.
•Level 3 valuation inputs consist of unobservable data (including a fund’s own assumptions).
The level classification is based on the lowest level input that is significant to the fair valuation measurement. The valuation inputs are not necessarily an indication of the risks associated with investing in these securities or other financial instruments.
37
The following is a summary of the level classifications as of period end. The Schedule of Investments provides additional information on the fund’s portfolio holdings.
| Level 1 | Level 2 | Level 3 | |||||||||
| Assets | |||||||||||
| Investment Securities | |||||||||||
| Common Stocks | $ | 266,355 | $ | 41,549,002 | — | ||||||
| Rights | — | 393 | — | ||||||||
| Temporary Cash Investments | 330,935 | — | — | ||||||||
| Temporary Cash Investments - Securities Lending Collateral | 752,208 | — | — | ||||||||
| $ | 1,349,498 | $ | 41,549,395 | — | |||||||
| Other Financial Instruments | |||||||||||
| Futures Contracts | $ | 22,315 | — | — | |||||||
6. Derivative Instruments
Equity Price Risk — The fund is subject to equity price risk in the normal course of pursuing its investment objectives. A fund may enter into futures contracts based on an equity index in order to manage its exposure to changes in market conditions. A fund may purchase futures contracts to gain exposure to increases in market value or sell futures contracts to protect against a decline in market value. Upon entering into a futures contract, a fund is required to deposit either cash or securities in an amount equal to a certain percentage of the contract value (initial margin). Subsequent payments (variation margin) are made or received daily, in cash, by a fund. The variation margin is equal to the daily change in the contract value and is recorded as unrealized gains and losses. A fund recognizes a realized gain or loss when the contract is closed or expires. Net realized and unrealized gains or losses occurring during the holding period of futures contracts are a component of net realized gain (loss) on futures contract transactions and change in net unrealized appreciation (depreciation) on futures contracts, respectively. One of the risks of entering into futures contracts is the possibility that the change in value of the contract may not correlate with the changes in value of the underlying securities. The fund's average notional exposure to equity price risk derivative instruments held during the period was $217,801 futures contracts purchased.
The value of equity price risk derivative instruments as of August 31, 2020, is disclosed on the Statement of Assets and Liabilities as an asset of $10,062 in receivable for variation margin on futures contracts*. For the period from December 4, 2019 (fund inception) through August 31, 2020, the effect of equity price risk derivative instruments on the Statement of Operations was $82,448 in net realized gain (loss) on futures contract transactions and $22,315 in change in net unrealized appreciation (depreciation) on futures contracts.
* Included in the unrealized appreciation (depreciation) on futures contracts as reported in the Schedule of Investments.
7. Risk Factors
The value of the fund’s shares will go up and down, sometimes rapidly or unpredictably, based on the performance of the securities owned by the fund and other factors generally affecting the securities market. Market risks, including political, regulatory, economic and social developments, can affect the value of the fund’s investments. Natural disasters, public health emergencies, terrorism and other unforeseeable events may lead to increased market volatility and may have adverse long-term effects on world economies and markets generally.
The fund invests in common stocks of small companies. Because of this, the fund may be subject to greater risk and market fluctuations than a fund investing in larger, more established companies.
There are certain risks involved in investing in foreign securities. These risks include those resulting from political events (such as civil unrest, national elections and imposition of exchange controls), social and economic events (such as labor strikes and rising inflation), and natural disasters. Securities of foreign issuers may be less liquid and more volatile. Investing a significant portion of assets in one country or region may accentuate these risks.
38
8. Federal Tax Information
The tax character of distributions paid during the period December 4, 2019 (fund inception) through August 31, 2020 were as follows:
| Distributions Paid From | |||||
| Ordinary income | $ | 34,502 | |||
| Long-term capital gains | — | ||||
The book-basis character of distributions made during the year from net investment income or net realized gains may differ from their ultimate characterization for federal income tax purposes. These differences reflect the differing character of certain income items and net realized gains and losses for financial statement and tax purposes, and may result in reclassification among certain capital accounts on the financial statements.
As of period end, the federal tax cost of investments and the components of distributable earnings on a tax-basis were as follows:
| Federal tax cost of investments | $ | 39,250,538 | |||
| Gross tax appreciation of investments | $ | 5,041,411 | |||
| Gross tax depreciation of investments | (1,393,056) | ||||
| Net tax appreciation (depreciation) of investments | 3,648,355 | ||||
| Net tax appreciation (depreciation) on derivatives and translation of assets and liabilities in foreign currencies | 1,291 | ||||
| Net tax appreciation (depreciation) | $ | 3,649,646 | |||
| Undistributed ordinary income | $ | 446,888 | |||
| Accumulated short-term capital losses | $ | (135,959) | |||
The difference between book-basis and tax-basis unrealized appreciation (depreciation) is attributable
primarily to the realization to ordinary income for tax purposes of unrealized gains on investments in passive
foreign investment companies.
Accumulated capital losses represent net capital loss carryovers that may be used to offset future realized
capital gains for federal income tax purposes. The capital loss carryovers may be carried forward for an
unlimited period. Future capital loss carryover utilization in any given year may be subject to Internal Revenue
Code limitations.
39
| Financial Highlights | ||
| For a Share Outstanding Throughout the Period Indicated | |||||||||||||||||||||||||||||||||||
| Per-Share Data | Ratios and Supplemental Data | ||||||||||||||||||||||||||||||||||
| Income From Investment Operations: | Ratio to Average Net Assets of: | ||||||||||||||||||||||||||||||||||
| Net Asset Value, Beginning of Period | Net Investment Income (Loss)(1) | Net Realized and Unrealized Gain (Loss) | Total From Investment Operations | Distributions From Net Investment Income | Net Asset Value, End of Period | Total Return(2) | Operating Expenses | Net Investment Income (Loss) | Portfolio Turnover Rate | Net Assets, End of Period (in thousands) | |||||||||||||||||||||||||
2020(3) | $10.00 | 0.14 | (0.78) | (0.64) | (0.04) | $9.32 | (6.43)% | 0.36%(4)(5) | 2.18%(4)(5) | 12% | $42,263 | ||||||||||||||||||||||||
| Notes to Financial Highlights | ||
(1)Computed using average shares outstanding throughout the period.
(2)Total returns are calculated based on the net asset value of the last business day. Total returns for periods less than one year are not annualized.
(3)December 4, 2019 (fund inception) through August 31, 2020.
(4)Annualized.
(5)The annualized ratio of operating expenses to average net assets before expense reimbursement and the annualized ratio of net investment income (loss) to average net assets before expense reimbursement was 0.38% and 2.16%, respectively.
See Notes to Financial Statements.
| Report of Independent Registered Public Accounting Firm | ||
To the Shareholders and the Board of Trustees of American Century ETF Trust:
Opinion on the Financial Statements and Financial Highlights
We have audited the accompanying statement of assets and liabilities, including the schedule of investments, of Avantis® International Small Cap Value Fund (the “Fund”), one of the funds constituting the American Century ETF Trust, as of August 31, 2020, and the related statement of operations, the statement of changes in net assets, and the financial highlights for the period from December 4, 2019 (fund inception) through August 31, 2020, and the related notes. In our opinion, the financial statements and financial highlights present fairly, in all material respects, the financial position of Avantis® International Small Cap Value Fund as of August 31, 2020, and the results of its operations, the changes in its net assets, and the financial highlights for the period from December 4, 2019 (fund inception) through August 31, 2020, in conformity with accounting principles generally accepted in the United States of America.
Basis for Opinion
These financial statements and financial highlights are the responsibility of the Fund's management. Our responsibility is to express an opinion on the Fund’s financial statements and financial highlights based on our audit. We are a public accounting firm registered with the Public Company Accounting Oversight Board (United States) (PCAOB) and are required to be independent with respect to the Fund in accordance with the U.S. federal securities laws and the applicable rules and regulations of the Securities and Exchange Commission and the PCAOB.
We conducted our audit in accordance with the standards of the PCAOB. Those standards require that we plan and perform the audit to obtain reasonable assurance about whether the financial statements and financial highlights are free of material misstatement, whether due to error or fraud. The Fund is not required to have, nor were we engaged to perform, an audit of its internal control over financial reporting. As part of our audit we are required to obtain an understanding of internal control over financial reporting but not for the purpose of expressing an opinion on the effectiveness of the Fund’s internal control over financial reporting. Accordingly, we express no such opinion.
Our audit included performing procedures to assess the risks of material misstatement of the financial statements and financial highlights, whether due to error or fraud, and performing procedures that respond to those risks. Such procedures included examining, on a test basis, evidence regarding the amounts and disclosures in the financial statements and financial highlights. Our audit also included evaluating the accounting principles used and significant estimates made by management, as well as evaluating the overall presentation of the financial statements and financial highlights. Our procedures included confirmation of securities owned as of August 31, 2020, by correspondence with the custodian and brokers; when replies were not received from brokers, we performed other auditing procedures. We believe that our audit provides a reasonable basis for our opinion.
DELOITTE & TOUCHE LLP
Kansas City, Missouri
October 16, 2020
We have served as the auditor of one or more American Century investment companies since 1997.
41
| Management | ||
The Board of Trustees
The individuals listed below serve as trustees of the funds. Each trustee will continue to serve in this capacity until death, retirement, resignation or removal from office. The board has adopted a mandatory retirement age for trustees who are not “interested persons,” as that term is defined in the Investment Company Act (independent trustees). Trustees who are not also officers of the trust shall retire by December 31st of the year in which they reach their 75th birthday.
Mr. Thomas is an “interested person” because he currently serves as President and Chief Executive Officer of American Century Companies, Inc. (ACC), the parent company of American Century Investment Management, Inc. (ACIM or the advisor). The other trustees are independent. They are not employees, directors or officers of, and have no financial interest in, ACC or any of its wholly owned, direct or indirect, subsidiaries, including ACIM and American Century Services, LLC (ACS), and they do not have any other affiliations, positions or relationships that would cause them to be considered “interested persons” under the Investment Company Act. The following trustees also serve in this capacity for a number of other registered investment companies in the American Century Investments family of funds: Jonathan S. Thomas, 15; Ronald J. Gilson, 8; and Stephen E. Yates, 7.
The following table presents additional information about the trustees. The mailing address for each trustee other than Jonathan S. Thomas is 330 Madison Avenue, New York, New York 10017. The mailing address for Jonathan S. Thomas is 4500 Main Street, Kansas City, Missouri 64111.
| Name (Year of Birth) | Position(s) Held with Funds | Length of Time Served | Principal Occupation(s) During Past 5 Years | Number of American Century Portfolios Overseen by Trustee | Other Directorships Held During Past 5 Years | ||||||||||||
| Independent Trustees | |||||||||||||||||
| Reginald M. Browne (1968) | Trustee and Chairman of the Board | Since 2017 (Chairman since 2019) | Principal, GTS Securities (automated capital markets trading firm)(2019 to present); Senior Managing Director, Co Global Head-ETF Group, Cantor Fitzgerald (financial services firm)(2013 to 2019) | 19 | None | ||||||||||||
| Ronald J. Gilson (1946) | Trustee | Since 2017 | Charles J. Meyers Professor of Law and Business, Emeritus, Stanford Law School (1979 to 2016); Marc and Eva Stern Professor of Law and Business, Columbia University School of Law (1992 to present) | 59 | None | ||||||||||||
| Barry A. Mendelson (1958) | Trustee | Since 2017 | Retired; Consultant regarding ETF and mutual fund matters (2015 to 2016); Principal and Senior Counsel, The Vanguard Group (investment management)(1998 to 2014) | 19 | None | ||||||||||||
| Stephen E. Yates (1948) | Trustee | Since 2017 | Retired | 82 | None | ||||||||||||
42
| Name (Year of Birth) | Position(s) Held with Funds | Length of Time Served | Principal Occupation(s) During Past 5 Years | Number of American Century Portfolios Overseen by Trustee | Other Directorships Held During Past 5 Years | ||||||||||||
| Interested Trustees | |||||||||||||||||
| Jonathan S. Thomas (1963) | Trustee | Since 2017 | President and Chief Executive Officer, ACC (2007 to present). Also serves as Chief Executive Officer, ACS; Executive Vice President, ACIM; Director, ACC, ACIM and other ACC subsidiaries | 122 | None | ||||||||||||
The Statement of Additional Information has additional information about the fund's trustees and is available without charge, upon request, by calling 1-800-345-6488.
43
Officers
The following table presents certain information about the executive officers of the funds. Each officer, except Edward Rosenberg, serves as an officer for each of the 16 investment companies in the American Century family of funds. No officer is compensated for his or her service as an officer of the funds. The listed officers are interested persons of the funds and are appointed or re-appointed on an annual basis. The mailing address for each officer listed below is 4500 Main Street, Kansas City, Missouri 64111.
| Name (Year of Birth) | Offices with the Funds | Principal Occupation(s) During the Past Five Years | ||||||
| Patrick Bannigan (1965) | President since 2019 | Executive Vice President and Director, ACC (2012 to present); Chief Financial Officer, Chief Accounting Officer and Treasurer, ACC (2015 to present). Also serves as President, ACS; Vice President, ACIM; Chief Financial Officer, Chief Accounting Officer and/or Director, ACIM, ACS and other ACC subsidiaries | ||||||
| R. Wes Campbell (1974) | Chief Financial Officer and Treasurer since 2018 | Vice President, ACS (2020 to present); Investment Operations and Investment Accounting, ACS (2000 to present) | ||||||
| Amy D. Shelton (1964) | Chief Compliance Officer and Vice President since 2017 | Chief Compliance Officer, American Century funds, (2014 to present); Chief Compliance Officer, ACIM (2014 to present); Chief Compliance Officer, ACIS (2009 to present). Also serves as Vice President, ACIS | ||||||
| Charles A. Etherington (1957) | General Counsel and Vice President since 2017 | Attorney, ACC (1994 to present); Vice President, ACC (2005 to present); General Counsel, ACC (2007 to present). Also serves as General Counsel, ACIM, ACS, ACIS and other ACC subsidiaries; and Senior Vice President, ACIM and ACS | ||||||
| Cleo Chang (1977) | Vice President since 2019 | Senior Vice President, ACIM (2015 to present); Chief Investment Officer, Wilshire Funds Management (2005 to 2015) | ||||||
| David H. Reinmiller (1963) | Vice President since 2017 | Attorney, ACC (1994 to present). Also serves as Vice President, ACIM and ACS | ||||||
| Edward Rosenberg (1973) | Vice President since 2017 | Senior Vice President, ACIM (2017 to present); Senior Vice President, Flexshares Head of ETF Capital Markets, Northern Trust (2012 to 2017) | ||||||
| C. Jean Wade (1964) | Vice President since 2017 | Senior Vice President, ACS (2017 to present); Vice President, ACS (2000 to 2017) | ||||||
| Ward D. Stauffer (1960) | Secretary since 2019 | Attorney, ACS (2003 to present) | ||||||
44
| Approval of Management Agreement | ||
At a meeting held on June 5, 2020, the Fund’s Board of Trustees (the "Board") unanimously approved the renewal of the management agreement pursuant to which American Century Investment Management, Inc. (the “Advisor”) acts as the investment advisor for the Fund. Under Section 15(c) of the Investment Company Act, contracts for investment advisory services are required to be reviewed, evaluated, and approved by a majority of a fund’s trustees (the “Trustees”), including a majority of the independent Trustees, each year.
Prior to its consideration of the renewal of the management agreement, the Trustees requested and reviewed extensive data and information compiled by the Advisor and certain independent providers of evaluation data concerning the Fund and the services provided to the Fund by the Advisor. This review was in addition to the oversight and evaluation undertaken by the Board and its Audit Committee on a continual basis and the information received was supplemental to the extensive information that the Board and its Audit Committee receive and consider throughout the year.
In connection with its consideration of the renewal of the management agreement, the Board’s review and evaluation of the services provided by the Advisor included, but was not limited to, the following:
•the nature, extent, and quality of investment management and other services provided and to be provided to the Fund;
•the wide range of other programs and services provided and to be provided to the Fund and its shareholders on a routine and non-routine basis;
•the Fund’s investment performance, including data comparing the Fund's performance to appropriate benchmarks of funds with similar objectives and strategies;
•the cost of owning the Fund compared to the cost of owning similar funds;
•the compliance policies, procedures, and regulatory experience of the Advisor and the Fund's service providers;
•the Advisor’s strategic plans;
•the Advisor’s business continuity plans and specifically its response to the COVID-19 pandemic;
•financial data showing the cost of services provided to the Fund, the profitability of the Fund to the Advisor, and the overall profitability of the Advisor;
•information regarding payments to intermediaries by the Advisor; and
•possible economies of scale associated with the Advisor’s management of the Fund; and
•possible collateral benefits to the Advisor from the management of the Fund.
The independent Trustees met separately in private session to discuss the renewal and to review and discuss the information provided in response to their request. The independent Trustees also held active discussions with the Advisor regarding the renewal of the management agreement. The independent Trustees had the benefit of the advice of their independent counsel throughout the process.
Factors Considered
The Trustees considered all of the information provided by the Advisor, the independent data providers, and independent counsel in connection with the approval. They determined that the information was sufficient for them to evaluate the management agreement for the Fund. In connection with their review, the Trustees did not identify any single factor as being all-important or
45
controlling, and each Trustee may have attributed different levels of importance to different factors. In deciding to renew the management agreement, the Board based its decision on a number of factors, including without limitation the following:
Nature, Extent and Quality of Services — Generally. Under the management agreement, the Advisor is responsible for providing or arranging for all services necessary for the operation of the Fund. The Board noted that the Advisor provides or arranges at its own expense a wide variety of services including without limitation the following:
•constructing and designing the Fund
•portfolio research and security selection
•initial capitalization/funding
•securities trading
•Fund administration
•custody of Fund assets
•daily valuation of the Fund’s portfolio
•shareholder servicing and transfer agency, including shareholder confirmations, recordkeeping, and communications
•legal services (except the independent Trustees’ counsel)
•regulatory and portfolio compliance
•financial reporting
•marketing and distribution (except amounts paid by the Fund under Rule 12b-1 plans)
Investment Management Services. The nature of the investment management services provided to the Fund is quite complex and allows Fund shareholders access to professional money management, instant diversification of their investments within an asset class, and liquidity. In evaluating investment performance, the Board expects the Advisor to manage the Fund in accordance with its investment objectives and approved strategies. Further, the Trustees recognize that the Advisor has an obligation to monitor trading activities, and in particular to seek the best execution of fund trades, and to evaluate the use of and payment for research. In providing these services, the Advisor utilizes teams of investment professionals (portfolio managers, analysts, research assistants, and securities traders) who require extensive information technology, research, training, compliance, and other systems to conduct their business. The Board provides oversight of the investment performance process. It regularly reviews investment performance information for the Fund, together with comparative information for appropriate benchmarks over different time horizons. If performance concerns are identified, the Board discusses with the Advisor the reasons for such results and any efforts being undertaken to improve performance.The Board found the investment management services provided by the Advisor to the Fund to be satisfactory and consistent with the management agreement.
Shareholder and Other Services. Under the management agreement, the Advisor provides or arranges for a comprehensive package of services to the Fund. The Board, directly and through its Audit Committee, regularly reviews reports and evaluations of such services at its regular meetings. These reports include, but are not limited to, information regarding the operational efficiency and accuracy of the shareholder and transfer agency services provided, staffing levels, shareholder satisfaction, technology support (including cyber security), new products and services offered to Fund shareholders, securities trading activities, portfolio valuation services, auditing services, and legal and operational compliance activities. The Board found the services provided by the Advisor to the Fund under the management agreement to be competitive and of high quality.
COVID-19 Response. During 2020, much of the world experienced unprecedented change and challenges from the impacts of the rapidly evolving, worldwide spread of the COVID-19 virus. The
46
Board evaluated the Advisor’s response to the COVID-19 pandemic and its impact on service to the Fund. The Board found that Fund shareholders have continued to receive the Advisor’s investment management and other services without disruption, and Advisor personnel have demonstrated great resiliency in providing those services. The Board, directly and through its Audit Committee, continues to monitor the impact of the pandemic and the response of each of the Fund’s service providers.
Costs of Services and Profitability. The Advisor provides detailed information concerning its cost of providing various services to the Fund, its profitability in managing the Fund (pre- and post-distribution), its overall profitability, and its financial condition. The Trustees have reviewed with the Advisor the methodology used to prepare this financial information. This information is considered in evaluating the Advisor’s financial condition, its ability to continue to provide services under the management agreement, and the reasonableness of the current management fee. The Board concluded that the Advisor’s profits were reasonable in light of the services provided to the Fund.
Ethics. The Board generally considers the Advisor’s commitment to providing quality services to the Fund and to conducting its business ethically. They noted that the Advisor’s practices generally meet or exceed industry best practices.
Economies of Scale. The Board also reviewed information provided by the Advisor regarding the possible existence of economies of scale in connection with the management of the Fund. The Board concluded that economies of scale are difficult to measure and predict with precision, especially on a fund-by-fund basis. The Board concluded that the Advisor is appropriately sharing economies of scale, to the extent they exist, through its competitive fee structure, offering competitive fees from fund inception, and through reinvestment in its business, infrastructure, investment capabilities and initiatives to provide shareholders additional content and services.
Comparison to Other Funds’ Fees. The management agreement provides that the Fund pays the Advisor a single, all-inclusive (or unified) management fee for providing all services necessary for the management and operation of the Fund, other than brokerage expenses, expenses attributable to short sales, taxes, interest, extraordinary expenses, and expenses incurred in connection with the provision of shareholder services and distribution services under a plan adopted pursuant to Rule 12b-1 under the Investment Company Act. Under the unified fee structure, the Advisor is responsible for providing all investment advisory, custody, audit, administrative, compliance, recordkeeping, marketing and shareholder services, or arranging and supervising third parties to provide such services. The Board believes the unified fee structure is a benefit to Fund shareholders because it clearly discloses to shareholders the cost of owning Fund shares, and, since the unified fee cannot be increased without a vote of Fund shareholders, it shifts to the Advisor the risk of increased costs of operating the Fund and provides a direct incentive to minimize administrative inefficiencies. Part of the Board’s analysis of fee levels involves reviewing certain evaluative data compiled by an independent provider comparing the Fund’s unified fee to the total expense ratios of its peers. The unified fee charged to shareholders of the Fund was below the median of the total expense ratios of the Fund’s peer expense universe and was the lowest of its peer expense group. The Board concluded that the management fee paid by the Fund to the Advisor under the management agreement is reasonable in light of the services provided to the Fund.
Comparison to Fees and Services Provided to Other Clients of the Advisor. The Board also requested information from the Advisor concerning the nature of the services, fees, costs, and profitability of its advisory services to funds or other advisory clients managed similarly to the Fund. The Advisor informed the Trustees that, as of December 31, 2019, it did not provide services to any other investment companies or comparable accounts that were managed similarly to the Fund.
47
Payments to Intermediaries. The Trustees also requested a description of payments made to intermediaries by the Fund and the Advisor and services provided in response thereto. These payments could include various payments made by the Fund or the Advisor to different types of intermediaries and recordkeepers for distribution and service activities provided for the Fund. The Trustees reviewed such information and received representations from the Advisor that all such payments by the Advisor were made from the Advisor’s resources and reasonable profits. The Board found such payments to be reasonable in scope and purpose.
Collateral or “Fall-Out” Benefits Derived by the Advisor. The Board considered the possible existence of collateral benefits the Advisor may receive as a result of its relationship with the Fund. They concluded that the Advisor’s primary business is managing funds and it generally does not use fund or shareholder information to generate profits in other lines of business, and therefore does not derive any significant collateral benefits from them. The Board noted that additional assets from other clients may offer the Advisor some benefit from increased leverage with service providers and counterparties. The Board also determined that the Advisor is able to provide investment management services to certain clients other than the Fund, at least in part, due to its existing infrastructure built to serve the fund complex. The Board concluded that appropriate allocation methodologies had been employed to assign resources and the cost of those resources to these other clients.
Existing Relationship. The Board also considered whether there was any reason for not continuing the existing arrangement with the Advisor. In this regard, the Board was mindful of the potential disruptions of the Fund’s operations and various risks, uncertainties, and other effects that could occur as a result of a decision not to continue such relationship. In particular, the Board recognized that most shareholders have invested in the Fund on the strength of the Advisor’s industry standing and reputation and in the expectation that the Advisor will have a continuing role in providing advisory services to the Fund.
Conclusion of the Trustees. As a result of this process, the Board, including all of the independent Trustees, taking into account all of the factors discussed above and the information provided by the Advisor and others in connection with its review and throughout the year, determined that the management fee is fair and reasonable in light of the services provided and that the investment management agreement between the Fund and the Advisor should be renewed.
48
| Liquidity Risk Management Program | ||
The Fund has adopted a liquidity risk management program (the “program”). The Fund’s Board of Trustees (the "Board") has designated American Century Investment Management, Inc. (“ACIM”) as the administrator of the program. Personnel of ACIM or its affiliates conduct the day-to-day operation of the program pursuant to policies and procedures administered by those members of the ACIM’s Investment Oversight Committee who are members of the ACIM’s Investment Management and Global Analytics departments.
Under the program, ACIM manages the Fund’s liquidity risk, which is the risk that the Fund could not meet shareholder redemption requests without significant dilution of remaining shareholders’ interests in the Fund. This risk is managed by monitoring the degree of liquidity of the Fund’s investments, limiting the amount of the Fund’s illiquid investments, and utilizing various risk management tools and facilities available to the Fund for meeting shareholder redemptions, among other means. ACIM’s process of determining the degree of liquidity of the Fund’s investments is supported by one or more third-party liquidity assessment vendors.
The Board reviewed a report prepared by ACIM regarding the operation and effectiveness of the program for the period December 1, 2018 through December 31, 2019. No significant liquidity events impacting the Fund were noted in the report. In addition, ACIM provided its assessment that the program had been effective in managing the Fund’s liquidity risk.
49
| Additional Information | ||
Retirement Account Information
As required by law, distributions you receive from certain retirement accounts are subject to federal income tax withholding, unless you elect not to have withholding apply*. Tax will be withheld on the total amount withdrawn even though you may be receiving amounts that are not subject to withholding, such as nondeductible contributions. In such case, excess amounts of withholding could occur. You may adjust your withholding election so that a greater or lesser amount will be withheld.
If you don’t want us to withhold on this amount, you must notify us to not withhold the federal income tax. You may notify us in writing or in certain situations by telephone or through other electronic means. For systematic withdrawals, your withholding election will remain in effect until revoked or changed by filing a new election. You have the right to revoke your election at any time and change your withholding percentage for future distributions.
Remember, even if you elect not to have income tax withheld, you are liable for paying income tax on the taxable portion of your withdrawal. If you elect not to have income tax withheld or you don’t have enough income tax withheld, you may be responsible for payment of estimated tax. You may incur penalties under the estimated tax rules if your withholding and estimated tax payments are not sufficient. You can reduce or defer the income tax on a distribution by directly or indirectly rolling such distribution over to another IRA or eligible plan. You should consult your tax advisor for additional information.
State tax will be withheld if, at the time of your distribution, your address is within one of the mandatory withholding states and you have federal income tax withheld (or as otherwise required by state law). State taxes will be withheld from your distribution in accordance with the respective state rules.
*Some 403(b), 457 and qualified retirement plan distributions may be subject to 20% mandatory withholding, as they are subject to special tax and withholding rules. Your plan administrator or plan sponsor is required to provide you with a special tax notice explaining those rules at the time you request a distribution. If applicable, federal and/or state taxes may be withheld from your distribution amount.
Proxy Voting Policies
A description of the policies that the fund's investment advisor uses in exercising the voting rights associated with the securities purchased and/or held by the fund are available without charge, upon request, by calling 1-800-345-6488. It is also available on American Century Investments’ website at americancentury.com/proxy and on the Securities and Exchange Commission’s website at sec.gov. Information regarding how the investment advisor voted proxies relating to portfolio securities during the most recent 12-month period ended June 30 is available at americancentury.com/proxy. It is also available at sec.gov.
Quarterly Portfolio Disclosure
The fund files its complete schedule of portfolio holdings with the Securities and Exchange Commission (SEC) for the first and third quarters of each fiscal year as an exhibit to its reports on Form N-PORT. The fund's Form N-PORT reports are available on the SEC’s website at sec.gov.
50
Other Tax Information
The following information is provided pursuant to provisions of the Internal Revenue Code.
The fund hereby designates up to the maximum amount allowable as qualified dividend income for
the fiscal year ended August 31, 2020.
For the fiscal year ended August 31, 2020, the fund intends to pass through to shareholders
foreign source income of $362,906 and foreign taxes paid of $34,463, or up to the maximum
amount allowable, as a foreign tax credit. Foreign source income and foreign tax expense per
outstanding share on August 31, 2020 are $0.0800 and $0.0076, respectively.
51
| Notes | ||
52
| Notes | ||
53
| Notes | ||
54
| Notes | ||
55
| Notes | ||
56
| ||||||||
| Contact Us | avantisinvestors.com | |||||||
| American Century Sales Representatives, Financial Professionals, Broker Dealers, Insurance Companies, Banks and Trust Companies | 1-833-928-2684 | |||||||
| Telecommunications Relay Service for the Deaf | 711 | |||||||
| American Century ETF Trust | ||||||||
Investment Advisor: American Century Investment Management, Inc. Kansas City, Missouri | ||||||||
| This report and the statements it contains are submitted for the general information of our shareholders. The report is not authorized for distribution to prospective investors unless preceded or accompanied by an effective prospectus. | ||||||||
| ©2020 American Century Proprietary Holdings, Inc. All rights reserved. CL-ANN-96049 2010 | ||||||||
| Annual Report | |||||
| August 31, 2020 | |||||
Avantis® U.S. Equity Fund | |||||
| Institutional Class (AVUSX) | |||||
Beginning on January 1, 2021, as permitted by regulations adopted by the Securities and Exchange Commission, paper copies of the fund’s shareholder reports like this one will no longer be sent by mail, unless you specifically request paper copies of the reports from the fund or from your financial intermediary, such as a broker-dealer or bank. Instead, the reports will be made available on a website, and you will be notified by mail each time a report is posted and provided with a website link to access the report.
If you already elected to receive shareholder reports electronically, you will not be affected by this change and you need not take any action. You may elect to receive shareholder reports and other communications from the fund or your financial intermediary electronically by calling or sending an email request to your appropriate contacts as listed on the back cover of this report.
You may elect to receive all future reports in paper free of charge. You can inform the fund or your financial intermediary that you wish to continue receiving paper copies of your shareholder reports by calling or sending an email request to your appropriate contacts as listed on the back cover of this report. Your election to receive reports in paper will apply to all funds held with the fund complex/your financial intermediary.
| Table of Contents | ||
| Chairman’s Letter | |||||
| Performance | |||||
| Portfolio Commentary | |||||
| Fund Characteristics | |||||
| Shareholder Fee Example | |||||
| Schedule of Investments | |||||
| Statement of Assets and Liabilities | |||||
| Statement of Operations | |||||
| Statement of Changes in Net Assets | |||||
| Notes to Financial Statements | |||||
| Financial Highlights | |||||
| Report of Independent Registered Public Accounting Firm | |||||
| Management | |||||
| Approval of Management Agreement | |||||
| Liquidity Risk Management Program | |||||
| Additional Information | |||||
Any opinions expressed in this report reflect those of the author as of the date of the report, and do not necessarily represent the opinions of American Century Investments® or any other person in the American Century Investments organization. Any such opinions are subject to change at any time based upon market or other conditions and American Century Investments disclaims any responsibility to update such opinions. These opinions may not be relied upon as investment advice and, because investment decisions made by American Century Investments funds are based on numerous factors, may not be relied upon as an indication of trading intent on behalf of any American Century Investments fund. Security examples are used for representational purposes only and are not intended as recommendations to purchase or sell securities. Performance information for comparative indices and securities is provided to American Century Investments by third party vendors. To the best of American Century Investments’ knowledge, such information is accurate at the time of printing.
| Chairman's Letter | ||
Jonathan ThomasDear Investor:
Thank you for reviewing this annual report for the period ended August 31, 2020. Annual reports help convey important information about fund returns, including market factors that affected performance. For additional investment insights, please visit avantisinvestors.com.
Pandemic Disrupted Economic, Market Courses
Broad market sentiment was generally upbeat early in the period. Dovish central banks, modest inflation, improving economic and corporate earnings data, and progress on U.S.-China trade helped boost global growth outlooks. Against this backdrop, stocks largely remained in favor.
However, beginning in late February, COVID-19 quickly quashed the optimistic tone. The outbreak rapidly spread worldwide, halting most U.S. and global economic activity and triggering a deep worldwide recession. Global stocks sold off sharply, but central banks and federal governments stepped in quickly and aggressively to stabilize financial markets. These extraordinary efforts proved helpful, as most stocks rebounded quickly. As the period progressed, coronavirus infection and death rates declined in many regions and economies reopened. By the end of August, manufacturing, employment and other data suggested an economic recovery was underway.
Overall, global stocks delivered mixed results for the period. U.S. stocks generally advanced and fared better than their counterparts elsewhere. The growth style significantly outperformed value stocks, which struggled.
A Slow Return to Normal
The return to pre-pandemic life will take time and patience, but we are confident we will get there. Several drug companies are in final stages of vaccine trials, and medical professionals continue to fine-tune virus treatment protocols. In the meantime, investors likely will face periods of outbreak-related disruptions, economic and political uncertainty, and heightened market volatility. These influences can be unsettling, but they tend to be temporary.
We appreciate your confidence in us during these extraordinary times. Our investment professionals have experience weathering unpredictable markets, and we’re confident we will continue to meet today’s challenges.
Sincerely,
Jonathan Thomas
Chairman
Avantis Investors
2
| Performance | ||
| Total Returns as of August 31, 2020 | |||||||||||||||||||||||
| Ticker Symbol | Since Inception | Inception Date | |||||||||||||||||||||
| Institutional Class | AVUSX | 9.37% | 12/4/2019 | ||||||||||||||||||||
| Russell 3000 Index | — | 13.56% | — | ||||||||||||||||||||
| Growth of $10,000 Over Life of Fund | ||
| $10,000 investment made December 4, 2019 | ||
| Value on August 31, 2020 | |||||
| Institutional Class — $10,937 | |||||
| Russell 3000 Index — $11,356 | |||||
| Total Annual Fund Operating Expenses | |||||||||||||||||
Institutional Class 0.15% | |||||||||||||||||
The total annual fund operating expenses shown is as stated in the fund’s prospectus current as of the date of this report. The prospectus may vary from the expense ratio shown elsewhere in this report because it is based on a different time period, includes acquired fund fees and expenses, and, if applicable, does not include fee waivers or expense reimbursements.
Data presented reflect past performance. Past performance is no guarantee of future results. Current performance may be higher or lower than the performance shown. Total returns for periods less than one year are not annualized. Investment return and principal value will fluctuate, and redemption value may be more or less than original cost. Data assumes reinvestment of dividends and capital gains, and none of the charts reflect the deduction of taxes that a shareholder would pay on fund distributions or the redemption of fund shares. To obtain performance data current to the most recent month end, please call 1-833-928-2684 or visit avantisinvestors.com. For additional information about the fund, please consult the prospectus.
3
| Portfolio Commentary | ||
Portfolio Managers: Eduardo Repetto, Mitch Firestein, Daniel Ong and Ted Randall
Fund Strategy
Avantis U.S. Equity seeks long-term capital appreciation by investing in a diverse group of U.S. companies across market sectors, industry groups and market capitalizations.
The fund seeks securities of companies that it expects to have higher returns. It places an enhanced emphasis on securities of companies with smaller market capitalizations and securities of companies it defines as high profitability or value companies. Conversely, the fund seeks to underweight or exclude securities it expects to have lower returns. These include securities of large companies with lower levels of profitability and higher prices relative to their book values or other financial metrics. Under normal market conditions, the fund will invest at least 80% of its assets in equity securities of U.S. companies.
The portfolio managers continually analyze market and financial data to make buy, sell and hold decisions. When buying or selling a security, the portfolio managers may consider the trade-off between expected returns of the security and implementation or tax costs of the trade. They do this in an attempt to gain trading efficiencies, avoid unnecessary risk and enhance fund performance.
Performance Review
For the period from Avantis U.S. Equity’s inception on December 4, 2019, through the fund’s fiscal year-end on August 31, 2020, the fund returned 9.37%.* For the same time period, the fund’s benchmark, the Russell 3000 Index, returned 13.56%. Fund returns reflect fees and operating expenses, while index returns do not.
The Russell 3000 Index is an unmanaged index generally representative of the performance of the broad U.S. stock market, including all capitalization categories. The fund’s underperformance versus the index was largely due to the fund’s emphasis on smaller-cap companies with higher levels of profitability and lower prices relative to their book values, or more value-oriented stocks. These companies generally underperformed larger-cap companies with lower levels of profitability and higher prices relative to their book value.
For example, small-cap value stocks (as measured by the Russell 2000 Value Index) returned -14.16% for the period, underperforming large growth stocks, which returned 35.95% (as measured by the Russell 1000 Growth Index).
*Total returns for periods less than one year are not annualized.
4
| Fund Characteristics | ||
| AUGUST 31, 2020 | |||||
| Top Ten Holdings | % of net assets | ||||
| Apple, Inc. | 5.2% | ||||
| Amazon.com, Inc. | 3.7% | ||||
| Microsoft Corp. | 3.6% | ||||
| Alphabet, Inc.* | 2.3% | ||||
| Facebook, Inc., Class A | 1.9% | ||||
| Johnson & Johnson | 1.2% | ||||
| Verizon Communications, Inc. | 0.9% | ||||
| MasterCard, Inc., Class A | 0.9% | ||||
| Netflix, Inc. | 0.8% | ||||
| Intel Corp. | 0.8% | ||||
| *Includes all classes of the issuer held by the fund. | |||||
| Top Five Industries | % of net assets | ||||
| Software | 6.7% | ||||
| Technology Hardware, Storage and Peripherals | 5.4% | ||||
| Semiconductors and Semiconductor Equipment | 5.0% | ||||
| Interactive Media and Services | 4.6% | ||||
| IT Services | 4.5% | ||||
| Types of Investments in Portfolio | % of net assets | ||||
| Common Stocks | 99.0% | ||||
| Temporary Cash Investments | 2.2% | ||||
| Other Assets and Liabilities | (1.2)% | ||||
5
| Shareholder Fee Example | ||
Fund shareholders may incur two types of costs: (1) transaction costs, including sales charges (loads) on purchase payments and redemption/exchange fees; and (2) ongoing costs, including management fees; distribution and service (12b-1) fees; and other fund expenses. This example is intended to help you understand your ongoing costs (in dollars) of investing in your fund and to compare these costs with the ongoing cost of investing in other mutual funds.
The example is based on an investment of $1,000 made at the beginning of the period and held for the entire period from March 1, 2020 to August 31, 2020.
Actual Expenses
The table provides information about actual account values and actual expenses for each class. You may use the information, together with the amount you invested, to estimate the expenses that you paid over the period. First, identify the share class you own. Then simply divide your account value by $1,000 (for example, an $8,600 account value divided by $1,000 = 8.6), then multiply the result by the number under the heading “Expenses Paid During Period” to estimate the expenses you paid on your account during this period.
Hypothetical Example for Comparison Purposes
The table also provides information about hypothetical account values and hypothetical expenses based on the actual expense ratio of each class of your fund and an assumed rate of return of 5% per year before expenses, which is not the actual return of a fund’s share class. The hypothetical account values and expenses may not be used to estimate the actual ending account balance or expenses you paid for the period. You may use this information to compare the ongoing costs of investing in your fund and other funds. To do so, compare this 5% hypothetical example with the 5% hypothetical examples that appear in the shareholder reports of the other funds.
Please note that the expenses shown in the table are meant to highlight your ongoing costs only and do not reflect any transactional costs, such as sales charges (loads) or redemption/exchange fees. Therefore, the table is useful in comparing ongoing costs only, and will not help you determine the relative total costs of owning different funds. In addition, if these transactional costs were included, your costs would have been higher.
| Beginning Account Value 3/1/20 | Ending Account Value 8/31/20 | Expenses Paid During Period(1) 3/1/20 - 8/31/20 | Annualized Expense Ratio(1) | |||||||||||
| Actual | ||||||||||||||
| Institutional Class | $1,000 | $1,172.90 | $0.82 | 0.15% | ||||||||||
| Hypothetical | ||||||||||||||
| Institutional Class | $1,000 | $1,024.38 | $0.76 | 0.15% | ||||||||||
(1)Expenses are equal to the class's annualized expense ratio listed in the table above, multiplied by the average account value over the period, multiplied by 184, the number of days in the most recent fiscal half-year, divided by 366, to reflect the one-half year period. Annualized expense ratio reflects actual expenses, including any applicable fee waivers or expense reimbursements and excluding any acquired fund fees and expenses.
6
| Schedule of Investments | ||
AUGUST 31, 2020
| Shares | Value | |||||||
| COMMON STOCKS — 99.0% | ||||||||
| Aerospace and Defense — 1.0% | ||||||||
| AAR Corp. | 38 | $ | 767 | |||||
Aerojet Rocketdyne Holdings, Inc.(1) | 361 | 14,935 | ||||||
AeroVironment, Inc.(1) | 75 | 5,729 | ||||||
Astronics Corp.(1) | 1 | 9 | ||||||
Axon Enterprise, Inc.(1) | 109 | 9,339 | ||||||
| Boeing Co. (The) | 197 | 33,848 | ||||||
| BWX Technologies, Inc. | 478 | 26,582 | ||||||
| Cubic Corp. | 50 | 2,354 | ||||||
| Curtiss-Wright Corp. | 124 | 12,688 | ||||||
Ducommun, Inc.(1) | 111 | 4,148 | ||||||
| General Dynamics Corp. | 153 | 22,851 | ||||||
| HEICO Corp. | 49 | 5,386 | ||||||
| HEICO Corp., Class A | 108 | 9,653 | ||||||
| Hexcel Corp. | 180 | 7,090 | ||||||
| Howmet Aerospace, Inc. | 549 | 9,618 | ||||||
| Huntington Ingalls Industries, Inc. | 82 | 12,425 | ||||||
| Kaman Corp. | 42 | 1,942 | ||||||
| L3Harris Technologies, Inc. | 154 | 27,834 | ||||||
| Lockheed Martin Corp. | 321 | 125,273 | ||||||
| Maxar Technologies, Inc. | 218 | 5,047 | ||||||
Mercury Systems, Inc.(1) | 91 | 6,892 | ||||||
| Moog, Inc., Class A | 80 | 4,823 | ||||||
| Northrop Grumman Corp. | 152 | 52,077 | ||||||
Parsons Corp.(1) | 30 | 998 | ||||||
| Raytheon Technologies Corp. | 868 | 52,948 | ||||||
| Spirit AeroSystems Holdings, Inc., Class A | 307 | 6,312 | ||||||
Teledyne Technologies, Inc.(1) | 56 | 17,562 | ||||||
| Textron, Inc. | 511 | 20,149 | ||||||
| TransDigm Group, Inc. | 27 | 13,491 | ||||||
Virgin Galactic Holdings, Inc.(1) | 203 | 3,634 | ||||||
| 516,404 | ||||||||
| Air Freight and Logistics — 1.1% | ||||||||
Air Transport Services Group, Inc.(1) | 452 | 11,490 | ||||||
Atlas Air Worldwide Holdings, Inc.(1) | 165 | 9,304 | ||||||
| CH Robinson Worldwide, Inc. | 334 | 32,832 | ||||||
Echo Global Logistics, Inc.(1) | 155 | 4,235 | ||||||
| Expeditors International of Washington, Inc. | 757 | 66,911 | ||||||
| FedEx Corp. | 821 | 180,489 | ||||||
| Forward Air Corp. | 154 | 9,084 | ||||||
Hub Group, Inc., Class A(1) | 212 | 11,414 | ||||||
| United Parcel Service, Inc., Class B | 1,347 | 220,396 | ||||||
XPO Logistics, Inc.(1) | 91 | 8,033 | ||||||
| 554,188 | ||||||||
| Airlines — 0.4% | ||||||||
| Alaska Air Group, Inc. | 425 | 16,554 | ||||||
| Allegiant Travel Co. | 50 | 6,430 | ||||||
7
| Shares | Value | |||||||
| Delta Air Lines, Inc. | 1,639 | $ | 50,563 | |||||
| Hawaiian Holdings, Inc. | 262 | 3,521 | ||||||
JetBlue Airways Corp.(1) | 1,102 | 12,695 | ||||||
| SkyWest, Inc. | 111 | 3,735 | ||||||
| Southwest Airlines Co. | 1,516 | 56,972 | ||||||
Spirit Airlines, Inc.(1) | 309 | 5,525 | ||||||
United Airlines Holdings, Inc.(1) | 878 | 31,608 | ||||||
| 187,603 | ||||||||
| Auto Components — 0.7% | ||||||||
American Axle & Manufacturing Holdings, Inc.(1) | 653 | 5,080 | ||||||
| Aptiv plc | 928 | 79,919 | ||||||
| Autoliv, Inc. | 410 | 32,119 | ||||||
| BorgWarner, Inc. | 1,157 | 46,963 | ||||||
| Cooper Tire & Rubber Co. | 339 | 11,719 | ||||||
| Dana, Inc. | 699 | 9,751 | ||||||
Delphi Technologies plc(1) | 788 | 13,688 | ||||||
Dorman Products, Inc.(1) | 66 | 5,590 | ||||||
Fox Factory Holding Corp.(1) | 140 | 14,113 | ||||||
| Gentex Corp. | 1,164 | 31,486 | ||||||
Gentherm, Inc.(1) | 150 | 6,785 | ||||||
| Goodyear Tire & Rubber Co. (The) | 873 | 8,376 | ||||||
| LCI Industries | 115 | 13,067 | ||||||
| Lear Corp. | 293 | 33,382 | ||||||
| Standard Motor Products, Inc. | 19 | 863 | ||||||
Stoneridge, Inc.(1) | 39 | 788 | ||||||
Tenneco, Inc., Class A(1) | 101 | 821 | ||||||
Veoneer, Inc.(1) | 342 | 4,747 | ||||||
Visteon Corp.(1) | 192 | 14,483 | ||||||
Workhorse Group, Inc.(1) | 232 | 4,202 | ||||||
XPEL, Inc.(1) | 189 | 4,706 | ||||||
| 342,648 | ||||||||
| Automobiles — 0.9% | ||||||||
| Ford Motor Co. | 10,613 | 72,381 | ||||||
| General Motors Co. | 3,072 | 91,023 | ||||||
| Harley-Davidson, Inc. | 665 | 18,427 | ||||||
Tesla, Inc.(1) | 580 | 289,026 | ||||||
| Thor Industries, Inc. | 149 | 14,070 | ||||||
| Winnebago Industries, Inc. | 123 | 6,639 | ||||||
| 491,566 | ||||||||
| Banks — 3.4% | ||||||||
| Allegiance Bancshares, Inc. | 27 | 686 | ||||||
| Altabancorp | 34 | 701 | ||||||
Amerant Bancorp, Inc.(1) | 46 | 605 | ||||||
| Ameris Bancorp | 160 | 3,923 | ||||||
| Arrow Financial Corp. | 28 | 802 | ||||||
| Associated Banc-Corp. | 371 | 4,986 | ||||||
| Atlantic Union Bankshares Corp. | 191 | 4,443 | ||||||
| Banc of California, Inc. | 64 | 703 | ||||||
| BancFirst Corp. | 91 | 4,004 | ||||||
Bancorp, Inc. (The)(1) | 87 | 827 | ||||||
| BancorpSouth Bank | 190 | 4,100 | ||||||
| Bank First Corp. | 48 | 2,995 | ||||||
8
| Shares | Value | |||||||
| Bank of America Corp. | 6,134 | $ | 157,889 | |||||
| Bank of Hawaii Corp. | 166 | 9,137 | ||||||
| Bank of Marin Bancorp | 22 | 700 | ||||||
| Bank OZK | 529 | 12,188 | ||||||
| BankUnited, Inc. | 347 | 8,113 | ||||||
| Banner Corp. | 111 | 4,009 | ||||||
| Berkshire Hills Bancorp, Inc. | 1 | 9 | ||||||
| BOK Financial Corp. | 86 | 4,828 | ||||||
| Boston Private Financial Holdings, Inc. | 87 | 517 | ||||||
| Bridge Bancorp, Inc. | 30 | 600 | ||||||
| Brookline Bancorp, Inc. | 293 | 2,813 | ||||||
| Bryn Mawr Bank Corp. | 25 | 679 | ||||||
| Cadence BanCorp | 155 | 1,473 | ||||||
| Camden National Corp. | 23 | 751 | ||||||
| Cathay General Bancorp. | 215 | 5,308 | ||||||
| Central Pacific Financial Corp. | 34 | 527 | ||||||
| CIT Group, Inc. | 209 | 4,111 | ||||||
| Citigroup, Inc. | 2,703 | 138,177 | ||||||
| Citizens Financial Group, Inc. | 863 | 22,326 | ||||||
| City Holding Co. | 55 | 3,519 | ||||||
| CNB Financial Corp. | 32 | 510 | ||||||
| Columbia Banking System, Inc. | 154 | 4,298 | ||||||
| Comerica, Inc. | 467 | 18,461 | ||||||
| Commerce Bancshares, Inc. | 343 | 20,433 | ||||||
| Community Bank System, Inc. | 133 | 8,003 | ||||||
| Community Trust Bancorp, Inc. | 22 | 710 | ||||||
| ConnectOne Bancorp, Inc. | 40 | 605 | ||||||
CrossFirst Bankshares, Inc.(1) | 269 | 2,483 | ||||||
| Cullen/Frost Bankers, Inc. | 149 | 10,350 | ||||||
Customers Bancorp, Inc.(1) | 44 | 562 | ||||||
| CVB Financial Corp. | 410 | 7,466 | ||||||
| Dime Community Bancshares, Inc. | 49 | 632 | ||||||
| Eagle Bancorp, Inc. | 144 | 4,144 | ||||||
| East West Bancorp, Inc. | 611 | 22,473 | ||||||
| Enterprise Financial Services Corp. | 123 | 3,679 | ||||||
| F.N.B. Corp. | 660 | 4,950 | ||||||
| FB Financial Corp. | 26 | 702 | ||||||
| Fifth Third Bancorp | 1,763 | 36,424 | ||||||
| Financial Institutions, Inc. | 31 | 534 | ||||||
| First BanCorp | 711 | 4,074 | ||||||
| First Bancorp/Southern Pines NC | 25 | 511 | ||||||
| First Busey Corp. | 234 | 4,169 | ||||||
| First Citizens BancShares, Inc., Class A | 14 | 5,504 | ||||||
| First Commonwealth Financial Corp. | 70 | 574 | ||||||
| First Financial Bancorp | 265 | 3,636 | ||||||
| First Financial Bankshares, Inc. | 456 | 13,805 | ||||||
| First Financial Corp. | 22 | 757 | ||||||
| First Foundation, Inc. | 283 | 4,299 | ||||||
| First Hawaiian, Inc. | 414 | 6,843 | ||||||
| First Horizon National Corp. | 1,169 | 11,164 | ||||||
| First Interstate BancSystem, Inc., Class A | 148 | 4,854 | ||||||
| First Merchants Corp. | 144 | 3,684 | ||||||
9
| Shares | Value | |||||||
| First Midwest Bancorp, Inc. | 301 | $ | 3,750 | |||||
| First of Long Island Corp. (The) | 40 | 615 | ||||||
| First Republic Bank | 360 | 40,648 | ||||||
| Flushing Financial Corp. | 47 | 570 | ||||||
| Fulton Financial Corp. | 353 | 3,452 | ||||||
| German American Bancorp, Inc. | 30 | 851 | ||||||
| Glacier Bancorp, Inc. | 327 | 11,473 | ||||||
| Great Southern Bancorp, Inc. | 16 | 617 | ||||||
| Great Western Bancorp, Inc. | 42 | 585 | ||||||
| Hancock Whitney Corp. | 221 | 4,422 | ||||||
| Heartland Financial USA, Inc. | 121 | 4,166 | ||||||
| Heritage Commerce Corp. | 80 | 554 | ||||||
| Heritage Financial Corp. | 36 | 718 | ||||||
| Hilltop Holdings, Inc. | 244 | 5,026 | ||||||
| Home BancShares, Inc. | 536 | 8,689 | ||||||
| Hope Bancorp, Inc. | 424 | 3,587 | ||||||
| Horizon Bancorp, Inc. | 53 | 593 | ||||||
| Huntington Bancshares, Inc. | 2,714 | 25,539 | ||||||
| Independent Bank Corp. (Massachusetts) | 127 | 7,982 | ||||||
| Independent Bank Corp. (Michigan) | 45 | 671 | ||||||
| Independent Bank Group, Inc. | 99 | 4,603 | ||||||
| International Bancshares Corp. | 189 | 5,969 | ||||||
| Investors Bancorp, Inc. | 543 | 4,208 | ||||||
| JPMorgan Chase & Co. | 2,811 | 281,634 | ||||||
| KeyCorp | 2,587 | 31,872 | ||||||
| Lakeland Bancorp, Inc. | 59 | 627 | ||||||
| Lakeland Financial Corp. | 96 | 4,386 | ||||||
| M&T Bank Corp. | 256 | 26,435 | ||||||
| Mercantile Bank Corp. | 28 | 612 | ||||||
| Midland States Bancorp, Inc. | 35 | 511 | ||||||
| MidWestOne Financial Group, Inc. | 28 | 532 | ||||||
| National Bank Holdings Corp., Class A | 135 | 3,839 | ||||||
| NBT Bancorp, Inc. | 117 | 3,565 | ||||||
Nicolet Bankshares, Inc.(1) | 14 | 840 | ||||||
| OceanFirst Financial Corp. | 261 | 4,074 | ||||||
| OFG Bancorp | 52 | 668 | ||||||
| Old National Bancorp | 317 | 4,432 | ||||||
| Old Second Bancorp, Inc. | 75 | 613 | ||||||
| Origin Bancorp, Inc. | 28 | 663 | ||||||
| Pacific Premier Bancorp, Inc. | 212 | 4,789 | ||||||
| PacWest Bancorp | 254 | 4,846 | ||||||
| Park National Corp. | 42 | 3,776 | ||||||
| Peapack-Gladstone Financial Corp. | 33 | 561 | ||||||
| People's United Financial, Inc. | 789 | 8,348 | ||||||
| Peoples Bancorp, Inc. | 29 | 613 | ||||||
| Pinnacle Financial Partners, Inc. | 135 | 5,393 | ||||||
| PNC Financial Services Group, Inc. (The) | 613 | 68,166 | ||||||
| Popular, Inc. | 258 | 9,556 | ||||||
| Preferred Bank | 83 | 3,104 | ||||||
| Prosperity Bancshares, Inc. | 225 | 12,267 | ||||||
| QCR Holdings, Inc. | 24 | 719 | ||||||
| Regions Financial Corp. | 2,670 | 30,865 | ||||||
10
| Shares | Value | |||||||
| Renasant Corp. | 154 | $ | 3,907 | |||||
| Republic Bancorp, Inc., Class A | 22 | 677 | ||||||
| S&T Bancorp, Inc. | 104 | 2,100 | ||||||
| Sandy Spring Bancorp, Inc. | 141 | 3,373 | ||||||
Seacoast Banking Corp. of Florida(1) | 178 | 3,603 | ||||||
| ServisFirst Bancshares, Inc. | 232 | 8,503 | ||||||
| Sierra Bancorp | 35 | 625 | ||||||
| Signature Bank | 191 | 18,533 | ||||||
| Simmons First National Corp., Class A | 230 | 3,926 | ||||||
| South State Corp. | 133 | 7,405 | ||||||
| Southside Bancshares, Inc. | 102 | 2,811 | ||||||
| Sterling Bancorp | 540 | 6,302 | ||||||
| Stock Yards Bancorp, Inc. | 142 | 6,096 | ||||||
SVB Financial Group(1) | 240 | 61,291 | ||||||
| Synovus Financial Corp. | 344 | 7,523 | ||||||
| TCF Financial Corp. | 490 | 13,171 | ||||||
Texas Capital Bancshares, Inc.(1) | 195 | 6,316 | ||||||
| Tompkins Financial Corp. | 47 | 3,110 | ||||||
| Towne Bank | 212 | 3,759 | ||||||
| TriCo Bancshares | 140 | 3,877 | ||||||
TriState Capital Holdings, Inc.(1) | 41 | 570 | ||||||
Triumph Bancorp, Inc.(1) | 28 | 800 | ||||||
| Truist Financial Corp. | 1,235 | 47,930 | ||||||
| Trustmark Corp. | 187 | 4,391 | ||||||
| U.S. Bancorp | 1,897 | 69,051 | ||||||
| UMB Financial Corp. | 159 | 8,541 | ||||||
| Umpqua Holdings Corp. | 541 | 6,102 | ||||||
| United Bankshares, Inc. | 194 | 5,071 | ||||||
| United Community Banks, Inc. | 217 | 3,932 | ||||||
| Univest Financial Corp. | 38 | 611 | ||||||
| Valley National Bancorp | 1,087 | 8,163 | ||||||
| Veritex Holdings, Inc. | 39 | 701 | ||||||
| Washington Trust Bancorp, Inc. | 19 | 634 | ||||||
| Webster Financial Corp. | 213 | 5,857 | ||||||
| Wells Fargo & Co. | 4,117 | 99,426 | ||||||
| WesBanco, Inc. | 180 | 4,000 | ||||||
| Westamerica BanCorp | 71 | 4,321 | ||||||
| Western Alliance Bancorp | 357 | 12,602 | ||||||
| Wintrust Financial Corp. | 195 | 8,486 | ||||||
| Zions Bancorp N.A. | 587 | 18,878 | ||||||
| 1,752,311 | ||||||||
| Beverages — 1.2% | ||||||||
Boston Beer Co., Inc. (The), Class A(1) | 32 | 28,224 | ||||||
| Brown-Forman Corp., Class A | 56 | 3,723 | ||||||
| Brown-Forman Corp., Class B | 516 | 37,756 | ||||||
| Coca-Cola Co. (The) | 3,027 | 149,927 | ||||||
| Coca-Cola Consolidated, Inc. | 34 | 9,292 | ||||||
| Constellation Brands, Inc., Class A | 59 | 10,884 | ||||||
| Keurig Dr Pepper, Inc. | 440 | 13,125 | ||||||
| MGP Ingredients, Inc. | 91 | 3,235 | ||||||
| Molson Coors Beverage Co., Class B | 428 | 16,110 | ||||||
Monster Beverage Corp.(1) | 706 | 59,205 | ||||||
11
| Shares | Value | |||||||
National Beverage Corp.(1) | 79 | $ | 6,424 | |||||
| PepsiCo, Inc. | 1,883 | 263,733 | ||||||
| 601,638 | ||||||||
| Biotechnology — 3.1% | ||||||||
| AbbVie, Inc. | 1,265 | 121,149 | ||||||
ACADIA Pharmaceuticals, Inc.(1) | 198 | 7,839 | ||||||
Acceleron Pharma, Inc.(1) | 63 | 6,141 | ||||||
Adverum Biotechnologies, Inc.(1) | 241 | 2,940 | ||||||
Agios Pharmaceuticals, Inc.(1) | 100 | 4,101 | ||||||
Aimmune Therapeutics, Inc.(1) | 27 | 924 | ||||||
Akebia Therapeutics, Inc.(1) | 228 | 2,373 | ||||||
Alector, Inc.(1) | 64 | 827 | ||||||
Alexion Pharmaceuticals, Inc.(1) | 486 | 55,511 | ||||||
Alkermes plc(1) | 424 | 7,013 | ||||||
Allakos, Inc.(1) | 54 | 4,837 | ||||||
Allogene Therapeutics, Inc.(1) | 125 | 4,456 | ||||||
Alnylam Pharmaceuticals, Inc.(1) | 119 | 15,784 | ||||||
Altimmune, Inc.(1) | 125 | 2,109 | ||||||
| Amgen, Inc. | 773 | 195,816 | ||||||
Amicus Therapeutics, Inc.(1) | 341 | 4,979 | ||||||
AnaptysBio, Inc.(1) | 151 | 2,617 | ||||||
Anika Therapeutics, Inc.(1) | 17 | 652 | ||||||
Arcus Biosciences, Inc.(1) | 121 | 2,880 | ||||||
Ardelyx, Inc.(1) | 348 | 1,997 | ||||||
Arena Pharmaceuticals, Inc.(1) | 478 | 33,374 | ||||||
Arrowhead Pharmaceuticals, Inc.(1) | 166 | 7,012 | ||||||
Assembly Biosciences, Inc.(1) | 133 | 2,909 | ||||||
Avid Bioservices, Inc.(1) | 621 | 5,210 | ||||||
Biogen, Inc.(1) | 545 | 156,764 | ||||||
Biohaven Pharmaceutical Holding Co. Ltd.(1) | 76 | 4,818 | ||||||
BioMarin Pharmaceutical, Inc.(1) | 299 | 23,331 | ||||||
BioSpecifics Technologies Corp.(1) | 54 | 3,483 | ||||||
Bluebird Bio, Inc.(1) | 123 | 7,294 | ||||||
Blueprint Medicines Corp.(1) | 112 | 8,672 | ||||||
Bridgebio Pharma, Inc.(1) | 204 | 6,091 | ||||||
Calithera Biosciences, Inc.(1) | 173 | 697 | ||||||
Catalyst Pharmaceuticals, Inc.(1) | 713 | 2,339 | ||||||
Celldex Therapeutics, Inc.(1) | 295 | 3,522 | ||||||
ChemoCentryx, Inc.(1) | 63 | 3,370 | ||||||
Coherus Biosciences, Inc.(1) | 149 | 2,826 | ||||||
CRISPR Therapeutics AG(1) | 117 | 10,935 | ||||||
Cytokinetics, Inc.(1) | 143 | 3,426 | ||||||
Deciphera Pharmaceuticals, Inc.(1) | 82 | 3,691 | ||||||
Denali Therapeutics, Inc.(1) | 150 | 4,785 | ||||||
Dicerna Pharmaceuticals, Inc.(1) | 492 | 9,112 | ||||||
Eagle Pharmaceuticals, Inc.(1) | 19 | 754 | ||||||
Editas Medicine, Inc.(1) | 33 | 1,163 | ||||||
Emergent BioSolutions, Inc.(1) | 194 | 22,126 | ||||||
Enanta Pharmaceuticals, Inc.(1) | 47 | 2,453 | ||||||
Esperion Therapeutics, Inc.(1) | 126 | 4,549 | ||||||
Exact Sciences Corp.(1) | 159 | 11,971 | ||||||
Exelixis, Inc.(1) | 1,645 | 36,552 | ||||||
12
| Shares | Value | |||||||
FibroGen, Inc.(1) | 118 | $ | 5,290 | |||||
Frequency Therapeutics, Inc.(1) | 165 | 3,191 | ||||||
Geron Corp.(1) | 1,857 | 3,807 | ||||||
| Gilead Sciences, Inc. | 3,293 | 219,808 | ||||||
Global Blood Therapeutics, Inc.(1) | 101 | 6,341 | ||||||
Gossamer Bio, Inc.(1) | 39 | 542 | ||||||
Halozyme Therapeutics, Inc.(1) | 124 | 3,595 | ||||||
Heron Therapeutics, Inc.(1) | 189 | 2,703 | ||||||
Immunomedics, Inc.(1) | 246 | 10,962 | ||||||
Incyte Corp.(1) | 388 | 37,384 | ||||||
Inovio Pharmaceuticals, Inc.(1) | 96 | 1,151 | ||||||
Intellia Therapeutics, Inc.(1) | 139 | 3,000 | ||||||
Invitae Corp.(1) | 264 | 9,229 | ||||||
Ionis Pharmaceuticals, Inc.(1) | 272 | 14,824 | ||||||
Iovance Biotherapeutics, Inc.(1) | 83 | 2,766 | ||||||
Ironwood Pharmaceuticals, Inc.(1) | 72 | 727 | ||||||
Kura Oncology, Inc.(1) | 167 | 4,157 | ||||||
Ligand Pharmaceuticals, Inc.(1) | 44 | 4,488 | ||||||
MacroGenics, Inc.(1) | 141 | 4,080 | ||||||
Madrigal Pharmaceuticals, Inc.(1) | 28 | 3,016 | ||||||
Mirati Therapeutics, Inc.(1) | 53 | 7,917 | ||||||
Moderna, Inc.(1) | 346 | 22,452 | ||||||
Momenta Pharmaceuticals, Inc.(1) | 202 | 10,538 | ||||||
Myriad Genetics, Inc.(1) | 46 | 615 | ||||||
Natera, Inc.(1) | 97 | 6,180 | ||||||
Neurocrine Biosciences, Inc.(1) | 209 | 24,332 | ||||||
Novavax, Inc.(1) | 83 | 9,158 | ||||||
OPKO Health, Inc.(1) | 1,613 | 5,226 | ||||||
PDL BioPharma, Inc.(1) | 752 | 2,519 | ||||||
PTC Therapeutics, Inc.(1) | 93 | 4,596 | ||||||
Regeneron Pharmaceuticals, Inc.(1) | 274 | 169,861 | ||||||
REGENXBIO, Inc.(1) | 102 | 3,113 | ||||||
Retrophin, Inc.(1) | 176 | 3,448 | ||||||
Rhythm Pharmaceuticals, Inc.(1) | 119 | 3,512 | ||||||
Sage Therapeutics, Inc.(1) | 94 | 4,929 | ||||||
Sangamo Therapeutics, Inc.(1) | 415 | 4,579 | ||||||
Sarepta Therapeutics, Inc.(1) | 74 | 10,835 | ||||||
Seattle Genetics, Inc.(1) | 106 | 16,784 | ||||||
Spectrum Pharmaceuticals, Inc.(1) | 83 | 349 | ||||||
Turning Point Therapeutics, Inc.(1) | 32 | 2,502 | ||||||
Ultragenyx Pharmaceutical, Inc.(1) | 97 | 8,251 | ||||||
United Therapeutics Corp.(1) | 107 | 11,445 | ||||||
Vanda Pharmaceuticals, Inc.(1) | 59 | 607 | ||||||
VBI Vaccines, Inc.(1) | 770 | 3,280 | ||||||
Vertex Pharmaceuticals, Inc.(1) | 336 | 93,784 | ||||||
Viela Bio, Inc.(1) | 67 | 2,257 | ||||||
Viking Therapeutics, Inc.(1) | 399 | 2,669 | ||||||
Vir Biotechnology, Inc.(1) | 118 | 4,777 | ||||||
Voyager Therapeutics, Inc.(1) | 243 | 2,865 | ||||||
Xencor, Inc.(1) | 108 | 3,861 | ||||||
Zymeworks, Inc.(1) | 83 | 2,691 | ||||||
| 1,619,167 | ||||||||
13
| Shares | Value | |||||||
| Building Products — 0.8% | ||||||||
| AAON, Inc. | 81 | $ | 4,611 | |||||
| Advanced Drainage Systems, Inc. | 100 | 5,548 | ||||||
| Allegion plc | 174 | 17,990 | ||||||
American Woodmark Corp.(1) | 7 | 612 | ||||||
| AO Smith Corp. | 609 | 29,823 | ||||||
| Apogee Enterprises, Inc. | 163 | 3,412 | ||||||
| Armstrong World Industries, Inc. | 78 | 5,752 | ||||||
Builders FirstSource, Inc.(1) | 317 | 9,707 | ||||||
| Carrier Global Corp. | 2,189 | 65,342 | ||||||
| CSW Industrials, Inc. | 63 | 4,552 | ||||||
| Fortune Brands Home & Security, Inc. | 251 | 21,104 | ||||||
Gibraltar Industries, Inc.(1) | 186 | 11,615 | ||||||
| Insteel Industries, Inc. | 69 | 1,272 | ||||||
JELD-WEN Holding, Inc.(1) | 450 | 9,472 | ||||||
| Johnson Controls International plc | 430 | 17,514 | ||||||
| Lennox International, Inc. | 43 | 12,054 | ||||||
| Masco Corp. | 218 | 12,709 | ||||||
Masonite International Corp.(1) | 167 | 15,245 | ||||||
| Owens Corning | 565 | 38,217 | ||||||
| Patrick Industries, Inc. | 186 | 10,455 | ||||||
PGT Innovations, Inc.(1) | 395 | 7,161 | ||||||
| Quanex Building Products Corp. | 291 | 4,892 | ||||||
| Simpson Manufacturing Co., Inc. | 239 | 23,503 | ||||||
| Trane Technologies plc | 276 | 32,676 | ||||||
Trex Co., Inc.(1) | 303 | 45,295 | ||||||
| UFP Industries, Inc. | 379 | 22,494 | ||||||
| 433,027 | ||||||||
| Capital Markets — 3.5% | ||||||||
| Affiliated Managers Group, Inc. | 86 | 5,904 | ||||||
| Ameriprise Financial, Inc. | 580 | 90,944 | ||||||
| Apollo Global Management, Inc. | 155 | 7,265 | ||||||
| Ares Management Corp., Class A | 118 | 4,773 | ||||||
| Artisan Partners Asset Management, Inc., Class A | 407 | 15,755 | ||||||
| B. Riley Financial, Inc. | 194 | 5,195 | ||||||
| Bank of New York Mellon Corp. (The) | 1,909 | 70,595 | ||||||
| BGC Partners, Inc., Class A | 876 | 2,208 | ||||||
| BlackRock, Inc. | 184 | 109,331 | ||||||
| Blackstone Group, Inc. (The), Class A | 768 | 40,666 | ||||||
| Brightsphere Investment Group, Inc. | 354�� | 4,906 | ||||||
| Carlyle Group, Inc. (The) | 249 | 6,427 | ||||||
| Cboe Global Markets, Inc. | 172 | 15,788 | ||||||
| Charles Schwab Corp. (The) | 2,715 | 96,464 | ||||||
| CME Group, Inc. | 387 | 68,062 | ||||||
| Cohen & Steers, Inc. | 175 | 10,587 | ||||||
| Cowen, Inc., Class A | 194 | 3,509 | ||||||
| Diamond Hill Investment Group, Inc. | 26 | 3,222 | ||||||
| E*TRADE Financial Corp. | 1,079 | 58,374 | ||||||
| Eaton Vance Corp. | 594 | 24,366 | ||||||
| Evercore, Inc., Class A | 176 | 10,891 | ||||||
| FactSet Research Systems, Inc. | 94 | 32,938 | ||||||
| Federated Hermes, Inc. | 254 | 6,073 | ||||||
14
| Shares | Value | |||||||
| Franklin Resources, Inc. | 812 | $ | 17,101 | |||||
| Goldman Sachs Group, Inc. (The) | 692 | 141,770 | ||||||
| Hamilton Lane, Inc., Class A | 77 | 5,629 | ||||||
| Houlihan Lokey, Inc. | 83 | 4,864 | ||||||
| Interactive Brokers Group, Inc., Class A | 110 | 5,832 | ||||||
| Intercontinental Exchange, Inc. | 612 | 65,013 | ||||||
| Invesco Ltd. | 1,053 | 10,741 | ||||||
| Janus Henderson Group plc | 865 | 17,923 | ||||||
| KKR & Co., Inc., Class A | 1,133 | 40,584 | ||||||
| Lazard Ltd., Class A | 432 | 13,681 | ||||||
| LPL Financial Holdings, Inc. | 182 | 14,953 | ||||||
| MarketAxess Holdings, Inc. | 62 | 30,128 | ||||||
| Moelis & Co., Class A | 316 | 10,084 | ||||||
| Moody's Corp. | 261 | 76,901 | ||||||
| Morgan Stanley | 2,621 | 136,973 | ||||||
| Morningstar, Inc. | 28 | 4,484 | ||||||
| MSCI, Inc. | 76 | 28,369 | ||||||
| Nasdaq, Inc. | 55 | 7,393 | ||||||
| Northern Trust Corp. | 570 | 46,677 | ||||||
| Piper Sandler Cos. | 80 | 6,036 | ||||||
| Raymond James Financial, Inc. | 374 | 28,319 | ||||||
| S&P Global, Inc. | 344 | 126,048 | ||||||
| SEI Investments Co. | 603 | 31,573 | ||||||
| State Street Corp. | 620 | 42,216 | ||||||
| Stifel Financial Corp. | 278 | 14,097 | ||||||
StoneX Group, Inc.(1) | 103 | 5,840 | ||||||
| T. Rowe Price Group, Inc. | 757 | 105,382 | ||||||
| TD Ameritrade Holding Corp. | 781 | 29,975 | ||||||
| Tradeweb Markets, Inc., Class A | 77 | 4,411 | ||||||
| Virtus Investment Partners, Inc. | 52 | 7,379 | ||||||
| Waddell & Reed Financial, Inc., Class A | 375 | 5,906 | ||||||
| WisdomTree Investments, Inc. | 863 | 3,228 | ||||||
| 1,783,753 | ||||||||
| Chemicals — 2.5% | ||||||||
AdvanSix, Inc.(1) | 50 | 636 | ||||||
| Air Products and Chemicals, Inc. | 499 | 145,838 | ||||||
| Albemarle Corp. | 439 | 39,953 | ||||||
| Ashland Global Holdings, Inc. | 147 | 10,832 | ||||||
| Avient Corp. | 71 | 1,812 | ||||||
Axalta Coating Systems Ltd.(1) | 609 | 14,525 | ||||||
| Balchem Corp. | 73 | 7,132 | ||||||
| Cabot Corp. | 389 | 14,397 | ||||||
| Celanese Corp. | 517 | 52,295 | ||||||
| CF Industries Holdings, Inc. | 297 | 9,691 | ||||||
| Chase Corp. | 49 | 4,781 | ||||||
| Chemours Co. (The) | 1,147 | 23,697 | ||||||
| Corteva, Inc. | 1,532 | 43,739 | ||||||
| Dow, Inc. | 2,626 | 118,485 | ||||||
| DuPont de Nemours, Inc. | 1,089 | 60,723 | ||||||
| Eastman Chemical Co. | 599 | 43,793 | ||||||
| Ecolab, Inc. | 262 | 51,635 | ||||||
Ferro Corp.(1) | 549 | 6,846 | ||||||
15
| Shares | Value | |||||||
| FMC Corp. | 568 | $ | 60,696 | |||||
GCP Applied Technologies, Inc.(1) | 219 | 5,707 | ||||||
| H.B. Fuller Co. | 20 | 963 | ||||||
| Hawkins, Inc. | 100 | 5,022 | ||||||
| Huntsman Corp. | 1,053 | 22,766 | ||||||
Ingevity Corp.(1) | 95 | 5,336 | ||||||
| Innospec, Inc. | 76 | 5,676 | ||||||
| International Flavors & Fragrances, Inc. | 102 | 12,627 | ||||||
Koppers Holdings, Inc.(1) | 27 | 650 | ||||||
| Kronos Worldwide, Inc. | 305 | 3,809 | ||||||
| Linde plc | 716 | 178,814 | ||||||
Livent Corp.(1) | 812 | 6,886 | ||||||
| LyondellBasell Industries NV, Class A | 1,108 | 72,552 | ||||||
| Minerals Technologies, Inc. | 116 | 5,887 | ||||||
| Mosaic Co. (The) | 698 | 12,725 | ||||||
| NewMarket Corp. | 54 | 20,114 | ||||||
| Olin Corp. | 606 | 6,817 | ||||||
| Orion Engineered Carbons SA | 472 | 5,735 | ||||||
| PPG Industries, Inc. | 363 | 43,705 | ||||||
| Quaker Chemical Corp. | 30 | 5,700 | ||||||
| RPM International, Inc. | 216 | 18,310 | ||||||
| Scotts Miracle-Gro Co. (The) | 41 | 6,910 | ||||||
| Sensient Technologies Corp. | 282 | 15,572 | ||||||
| Sherwin-Williams Co. (The) | 92 | 61,737 | ||||||
| Stepan Co. | 116 | 13,374 | ||||||
| Tredegar Corp. | 240 | 4,063 | ||||||
| Trinseo SA | 208 | 5,181 | ||||||
| Tronox Holdings plc, Class A | 641 | 5,743 | ||||||
| Valvoline, Inc. | 253 | 5,161 | ||||||
| Westlake Chemical Corp. | 174 | 10,322 | ||||||
| WR Grace & Co. | 181 | 7,369 | ||||||
| 1,286,739 | ||||||||
| Commercial Services and Supplies — 0.7% | ||||||||
| ACCO Brands Corp. | 111 | 719 | ||||||
| ADT, Inc. | 111 | 1,182 | ||||||
| Brady Corp., Class A | 168 | 7,878 | ||||||
| Brink's Co. (The) | 93 | 4,497 | ||||||
Casella Waste Systems, Inc., Class A(1) | 178 | 9,995 | ||||||
Cimpress plc(1) | 8 | 742 | ||||||
| Cintas Corp. | 121 | 40,322 | ||||||
Clean Harbors, Inc.(1) | 175 | 10,692 | ||||||
Copart, Inc.(1) | 735 | 75,940 | ||||||
| Covanta Holding Corp. | 362 | 3,417 | ||||||
| Deluxe Corp. | 31 | 880 | ||||||
| Ennis, Inc. | 205 | 3,758 | ||||||
| Healthcare Services Group, Inc. | 219 | 4,555 | ||||||
| Herman Miller, Inc. | 216 | 5,147 | ||||||
| HNI Corp. | 287 | 9,141 | ||||||
IAA, Inc.(1) | 127 | 6,645 | ||||||
| Interface, Inc. | 198 | 1,497 | ||||||
| KAR Auction Services, Inc. | 64 | 1,110 | ||||||
| Kimball International, Inc., Class B | 62 | 695 | ||||||
16
| Shares | Value | |||||||
| Knoll, Inc. | 284 | $ | 3,655 | |||||
| McGrath RentCorp | 85 | 5,641 | ||||||
| MSA Safety, Inc. | 70 | 8,817 | ||||||
| Pitney Bowes, Inc. | 207 | 1,136 | ||||||
| Republic Services, Inc. | 140 | 12,981 | ||||||
| Rollins, Inc. | 279 | 15,384 | ||||||
| Steelcase, Inc., Class A | 187 | 1,954 | ||||||
Stericycle, Inc.(1) | 75 | 4,808 | ||||||
Team, Inc.(1) | 2 | 13 | ||||||
| Tetra Tech, Inc. | 56 | 5,169 | ||||||
| UniFirst Corp. | 53 | 10,209 | ||||||
| US Ecology, Inc. | 18 | 668 | ||||||
| Viad Corp. | 16 | 343 | ||||||
| VSE Corp. | 101 | 2,932 | ||||||
| Waste Connections, Inc. | 327 | 32,710 | ||||||
| Waste Management, Inc. | 579 | 66,006 | ||||||
| 361,238 | ||||||||
| Communications Equipment — 0.7% | ||||||||
| ADTRAN, Inc. | 351 | 3,892 | ||||||
Arista Networks, Inc.(1) | 197 | 44,020 | ||||||
Ciena Corp.(1) | 741 | 42,066 | ||||||
| Cisco Systems, Inc. | 3,468 | 146,419 | ||||||
CommScope Holding Co., Inc.(1) | 269 | 2,771 | ||||||
| Comtech Telecommunications Corp. | 1 | 17 | ||||||
EchoStar Corp., Class A(1) | 138 | 4,054 | ||||||
Extreme Networks, Inc.(1) | 145 | 634 | ||||||
F5 Networks, Inc.(1) | 221 | 29,245 | ||||||
| InterDigital, Inc. | 118 | 7,216 | ||||||
| Juniper Networks, Inc. | 507 | 12,675 | ||||||
Lumentum Holdings, Inc.(1) | 363 | 31,218 | ||||||
| Motorola Solutions, Inc. | 132 | 20,427 | ||||||
NETGEAR, Inc.(1) | 40 | 1,334 | ||||||
NetScout Systems, Inc.(1) | 121 | 2,800 | ||||||
ViaSat, Inc.(1) | 92 | 3,658 | ||||||
Viavi Solutions, Inc.(1) | 472 | 6,294 | ||||||
| 358,740 | ||||||||
| Construction and Engineering — 0.3% | ||||||||
AECOM(1) | 294 | 11,616 | ||||||
Aegion Corp.(1) | 37 | 599 | ||||||
Ameresco, Inc., Class A(1) | 165 | 5,633 | ||||||
API Group Corp.(1) | 273 | 3,860 | ||||||
| Arcosa, Inc. | 183 | 8,471 | ||||||
| Argan, Inc. | 63 | 2,667 | ||||||
| Comfort Systems USA, Inc. | 119 | 6,030 | ||||||
Dycom Industries, Inc.(1) | 57 | 3,506 | ||||||
| EMCOR Group, Inc. | 149 | 11,176 | ||||||
| Fluor Corp. | 404 | 3,846 | ||||||
| Granite Construction, Inc. | 195 | 3,625 | ||||||
Great Lakes Dredge & Dock Corp.(1) | 472 | 4,423 | ||||||
IES Holdings, Inc.(1) | 104 | 2,998 | ||||||
| Jacobs Engineering Group, Inc. | 84 | 7,583 | ||||||
MasTec, Inc.(1) | 280 | 12,939 | ||||||
17
| Shares | Value | |||||||
MYR Group, Inc.(1) | 159 | $ | 6,171 | |||||
Northwest Pipe Co.(1) | 29 | 821 | ||||||
| Primoris Services Corp. | 269 | 5,127 | ||||||
| Quanta Services, Inc. | 559 | 28,649 | ||||||
Sterling Construction Co., Inc.(1) | 71 | 1,004 | ||||||
Tutor Perini Corp.(1) | 360 | 4,518 | ||||||
| Valmont Industries, Inc. | 94 | 11,943 | ||||||
WillScot Mobile Mini Holdings Corp.(1) | 779 | 13,944 | ||||||
| 161,149 | ||||||||
| Construction Materials — 0.1% | ||||||||
| Eagle Materials, Inc. | 243 | 19,870 | ||||||
| Martin Marietta Materials, Inc. | 122 | 24,750 | ||||||
Summit Materials, Inc., Class A(1) | 234 | 3,484 | ||||||
US Concrete, Inc.(1) | 24 | 641 | ||||||
| Vulcan Materials Co. | 249 | 29,880 | ||||||
| 78,625 | ||||||||
| Consumer Finance — 0.8% | ||||||||
| Ally Financial, Inc. | 1,166 | 26,678 | ||||||
| American Express Co. | 1,174 | 119,267 | ||||||
| Capital One Financial Corp. | 1,083 | 74,759 | ||||||
Credit Acceptance Corp.(1) | 51 | 19,727 | ||||||
| Discover Financial Services | 891 | 47,294 | ||||||
Encore Capital Group, Inc.(1) | 213 | 9,785 | ||||||
Enova International, Inc.(1) | 44 | 752 | ||||||
| FirstCash, Inc. | 66 | 3,943 | ||||||
Green Dot Corp., Class A(1) | 313 | 16,295 | ||||||
LendingClub Corp.(1) | 282 | 1,503 | ||||||
LendingTree, Inc.(1) | 12 | 3,707 | ||||||
| Navient Corp. | 793 | 7,208 | ||||||
| Nelnet, Inc., Class A | 88 | 5,763 | ||||||
| OneMain Holdings, Inc. | 348 | 10,120 | ||||||
Oportun Financial Corp.(1) | 218 | 2,736 | ||||||
PRA Group, Inc.(1) | 123 | 5,741 | ||||||
| Santander Consumer USA Holdings, Inc. | 476 | 8,192 | ||||||
| SLM Corp. | 2,214 | 16,915 | ||||||
| Synchrony Financial | 1,739 | 43,145 | ||||||
World Acceptance Corp.(1) | 33 | 3,003 | ||||||
| 426,533 | ||||||||
| Containers and Packaging — 0.7% | ||||||||
| Amcor plc | 914 | 10,109 | ||||||
| AptarGroup, Inc. | 303 | 35,872 | ||||||
| Avery Dennison Corp. | 368 | 42,464 | ||||||
| Ball Corp. | 492 | 39,542 | ||||||
Berry Global Group, Inc.(1) | 133 | 6,855 | ||||||
Crown Holdings, Inc.(1) | 225 | 17,291 | ||||||
| Graphic Packaging Holding Co. | 390 | 5,452 | ||||||
| International Paper Co. | 2,001 | 72,576 | ||||||
| Myers Industries, Inc. | 219 | 3,351 | ||||||
| O-I Glass, Inc. | 556 | 6,049 | ||||||
| Packaging Corp. of America | 521 | 52,746 | ||||||
| Sealed Air Corp. | 117 | 4,598 | ||||||
| Silgan Holdings, Inc. | 152 | 5,785 | ||||||
18
| Shares | Value | |||||||
| Sonoco Products Co. | 413 | $ | 21,902 | |||||
UFP Technologies, Inc.(1) | 50 | 2,061 | ||||||
| WestRock Co. | 925 | 28,055 | ||||||
| 354,708 | ||||||||
| Distributors — 0.3% | ||||||||
| Core-Mark Holding Co., Inc. | 222 | 7,419 | ||||||
| Genuine Parts Co. | 562 | 53,075 | ||||||
LKQ Corp.(1) | 506 | 16,061 | ||||||
| Pool Corp. | 178 | 58,356 | ||||||
| 134,911 | ||||||||
| Diversified Consumer Services — 0.2% | ||||||||
Adtalem Global Education, Inc.(1) | 150 | 4,980 | ||||||
American Public Education, Inc.(1) | 77 | 2,421 | ||||||
Bright Horizons Family Solutions, Inc.(1) | 43 | 5,719 | ||||||
Chegg, Inc.(1) | 96 | 7,079 | ||||||
| Collectors Universe, Inc. | 127 | 5,650 | ||||||
frontdoor, Inc.(1) | 115 | 5,011 | ||||||
| Graham Holdings Co., Class B | 7 | 2,996 | ||||||
Grand Canyon Education, Inc.(1) | 225 | 21,159 | ||||||
| H&R Block, Inc. | 87 | 1,262 | ||||||
K12, Inc.(1) | 121 | 4,502 | ||||||
Laureate Education, Inc., Class A(1) | 310 | 3,881 | ||||||
Perdoceo Education Corp.(1) | 340 | 4,886 | ||||||
| Service Corp. International | 223 | 10,180 | ||||||
ServiceMaster Global Holdings, Inc.(1) | 96 | 3,830 | ||||||
| Strategic Education, Inc. | 64 | 6,565 | ||||||
WW International, Inc.(1) | 23 | 540 | ||||||
| 90,661 | ||||||||
| Diversified Financial Services — 0.6% | ||||||||
| Banco Latinoamericano de Comercio Exterior SA, E Shares | 47 | 572 | ||||||
Berkshire Hathaway, Inc., Class B(1) | 1,017 | 221,747 | ||||||
Cannae Holdings, Inc.(1) | 312 | 11,772 | ||||||
| Equitable Holdings, Inc. | 1,502 | 31,827 | ||||||
| Jefferies Financial Group, Inc. | 348 | 6,104 | ||||||
| Voya Financial, Inc. | 271 | 14,068 | ||||||
| 286,090 | ||||||||
| Diversified Telecommunication Services — 1.5% | ||||||||
Anterix, Inc.(1) | 60 | 2,624 | ||||||
| AT&T, Inc. | 8,866 | 264,295 | ||||||
| ATN International, Inc. | 49 | 2,842 | ||||||
Bandwidth, Inc., Class A(1) | 39 | 6,142 | ||||||
| CenturyLink, Inc. | 788 | 8,471 | ||||||
| Cogent Communications Holdings, Inc. | 50 | 3,363 | ||||||
Consolidated Communications Holdings, Inc.(1) | 479 | 3,727 | ||||||
GCI Liberty, Inc., Class A(1) | 210 | 16,964 | ||||||
Iridium Communications, Inc.(1) | 496 | 13,893 | ||||||
| Verizon Communications, Inc. | 7,655 | 453,712 | ||||||
Vonage Holdings Corp.(1) | 279 | 3,194 | ||||||
| 779,227 | ||||||||
| Electric Utilities — 1.5% | ||||||||
| ALLETE, Inc. | 98 | 5,288 | ||||||
| Alliant Energy Corp. | 548 | 29,674 | ||||||
19
| Shares | Value | |||||||
| American Electric Power Co., Inc. | 1,009 | $ | 79,539 | |||||
| Avangrid, Inc. | 94 | 4,516 | ||||||
| Duke Energy Corp. | 759 | 60,978 | ||||||
| Edison International | 832 | 43,663 | ||||||
| Entergy Corp. | 534 | 52,941 | ||||||
| Evergy, Inc. | 657 | 34,966 | ||||||
| Eversource Energy | 139 | 11,914 | ||||||
| Exelon Corp. | 2,194 | 80,980 | ||||||
| FirstEnergy Corp. | 840 | 24,016 | ||||||
| Hawaiian Electric Industries, Inc. | 415 | 14,363 | ||||||
| IDACORP, Inc. | 86 | 7,731 | ||||||
| MGE Energy, Inc. | 65 | 4,224 | ||||||
| NextEra Energy, Inc. | 299 | 83,472 | ||||||
| NRG Energy, Inc. | 521 | 17,928 | ||||||
| OGE Energy Corp. | 260 | 8,284 | ||||||
| Otter Tail Corp. | 99 | 3,846 | ||||||
PG&E Corp.(1) | 966 | 8,945 | ||||||
| Pinnacle West Capital Corp. | 209 | 15,330 | ||||||
| PNM Resources, Inc. | 273 | 11,925 | ||||||
| Portland General Electric Co. | 345 | 13,162 | ||||||
| PPL Corp. | 1,349 | 37,273 | ||||||
| Southern Co. (The) | 850 | 44,353 | ||||||
| Xcel Energy, Inc. | 1,097 | 76,214 | ||||||
| 775,525 | ||||||||
| Electrical Equipment — 0.7% | ||||||||
| Acuity Brands, Inc. | 179 | 19,563 | ||||||
| Allied Motion Technologies, Inc. | 69 | 2,939 | ||||||
| AMETEK, Inc. | 309 | 31,116 | ||||||
Atkore International Group, Inc.(1) | 240 | 6,415 | ||||||
| AZZ, Inc. | 132 | 4,584 | ||||||
| Eaton Corp. plc | 622 | 63,506 | ||||||
| Emerson Electric Co. | 1,055 | 73,291 | ||||||
| Encore Wire Corp. | 87 | 4,490 | ||||||
| EnerSys | 103 | 7,414 | ||||||
Generac Holdings, Inc.(1) | 98 | 18,618 | ||||||
| Hubbell, Inc. | 79 | 11,449 | ||||||
| nVent Electric plc | 226 | 4,321 | ||||||
| Regal Beloit Corp. | 178 | 17,597 | ||||||
| Rockwell Automation, Inc. | 239 | 55,097 | ||||||
Sensata Technologies Holding plc(1) | 141 | 5,871 | ||||||
Sunrun, Inc.(1) | 235 | 13,290 | ||||||
Thermon Group Holdings, Inc.(1) | 39 | 513 | ||||||
TPI Composites, Inc.(1) | 321 | 9,858 | ||||||
Vertiv Holdings Co.(1) | 294 | 4,772 | ||||||
Vicor Corp.(1) | 59 | 5,135 | ||||||
| 359,839 | ||||||||
| Electronic Equipment, Instruments and Components — 1.3% | ||||||||
| Amphenol Corp., Class A | 312 | 34,258 | ||||||
Arrow Electronics, Inc.(1) | 425 | 33,388 | ||||||
| Avnet, Inc. | 497 | 13,672 | ||||||
| Badger Meter, Inc. | 152 | 9,377 | ||||||
| Belden, Inc. | 19 | 640 | ||||||
20
| Shares | Value | |||||||
| Benchmark Electronics, Inc. | 57 | $ | 1,118 | |||||
| CDW Corp. | 296 | 33,640 | ||||||
| Cognex Corp. | 310 | 21,449 | ||||||
Coherent, Inc.(1) | 85 | 9,576 | ||||||
| Corning, Inc. | 2,994 | 97,185 | ||||||
| CTS Corp. | 37 | 773 | ||||||
| Dolby Laboratories, Inc., Class A | 147 | 10,268 | ||||||
ePlus, Inc.(1) | 53 | 4,066 | ||||||
Fabrinet(1) | 124 | 8,653 | ||||||
FARO Technologies, Inc.(1) | 88 | 4,972 | ||||||
Flex Ltd.(1) | 2,326 | 25,260 | ||||||
| FLIR Systems, Inc. | 255 | 9,409 | ||||||
II-VI, Inc.(1) | 229 | 10,190 | ||||||
Insight Enterprises, Inc.(1) | 88 | 5,263 | ||||||
IPG Photonics Corp.(1) | 104 | 16,820 | ||||||
Itron, Inc.(1) | 11 | 655 | ||||||
| Jabil, Inc. | 714 | 24,383 | ||||||
Keysight Technologies, Inc.(1) | 406 | 39,999 | ||||||
Knowles Corp.(1) | 279 | 4,202 | ||||||
| Littelfuse, Inc. | 74 | 13,382 | ||||||
| Methode Electronics, Inc. | 221 | 6,256 | ||||||
| National Instruments Corp. | 320 | 11,485 | ||||||
nLight, Inc.(1) | 132 | 3,084 | ||||||
Novanta, Inc.(1) | 75 | 8,038 | ||||||
OSI Systems, Inc.(1) | 109 | 8,584 | ||||||
Plexus Corp.(1) | 169 | 12,856 | ||||||
Rogers Corp.(1) | 49 | 5,552 | ||||||
Sanmina Corp.(1) | 449 | 12,707 | ||||||
ScanSource, Inc.(1) | 128 | 3,160 | ||||||
| SYNNEX Corp. | 177 | 22,506 | ||||||
| TE Connectivity Ltd. | 816 | 78,826 | ||||||
Trimble, Inc.(1) | 136 | 7,128 | ||||||
TTM Technologies, Inc.(1) | 682 | 7,816 | ||||||
| Vishay Intertechnology, Inc. | 692 | 11,065 | ||||||
Zebra Technologies Corp., Class A(1) | 75 | 21,490 | ||||||
| 653,151 | ||||||||
| Energy Equipment and Services — 0.3% | ||||||||
| Archrock, Inc. | 844 | 5,537 | ||||||
| Baker Hughes Co. | 522 | 7,454 | ||||||
| Cactus, Inc., Class A | 266 | 5,876 | ||||||
ChampionX Corp.(1) | 309 | 3,164 | ||||||
| Core Laboratories NV | 23 | 481 | ||||||
| DMC Global, Inc. | 21 | 744 | ||||||
Dril-Quip, Inc.(1) | 125 | 4,141 | ||||||
Exterran Corp.(1) | 201 | 925 | ||||||
| Halliburton Co. | 2,509 | 40,596 | ||||||
Helix Energy Solutions Group, Inc.(1) | 155 | 555 | ||||||
| Helmerich & Payne, Inc. | 188 | 3,098 | ||||||
| Liberty Oilfield Services, Inc., Class A | 478 | 3,083 | ||||||
Matrix Service Co.(1) | 1 | 9 | ||||||
| Nabors Industries Ltd. | 42 | 1,679 | ||||||
| National Oilwell Varco, Inc. | 1,219 | 14,628 | ||||||
21
| Shares | Value | |||||||
NexTier Oilfield Solutions, Inc.(1) | 193 | $ | 486 | |||||
Oceaneering International, Inc.(1) | 618 | 3,331 | ||||||
| Patterson-UTI Energy, Inc. | 362 | 1,394 | ||||||
ProPetro Holding Corp.(1) | 579 | 3,636 | ||||||
| Schlumberger NV | 2,218 | 42,164 | ||||||
SEACOR Holdings, Inc.(1) | 24 | 759 | ||||||
| TechnipFMC plc | 875 | 6,738 | ||||||
| 150,478 | ||||||||
| Entertainment — 1.5% | ||||||||
| Activision Blizzard, Inc. | 867 | 72,412 | ||||||
| Cinemark Holdings, Inc. | 374 | 5,479 | ||||||
Electronic Arts, Inc.(1) | 506 | 70,572 | ||||||
Eros International plc(1) | 1,180 | 3,670 | ||||||
IMAX Corp.(1) | 47 | 722 | ||||||
Liberty Media Corp.-Liberty Braves, Class C(1) | 183 | 3,556 | ||||||
Liberty Media Corp.-Liberty Formula One, Class C(1) | 247 | 9,628 | ||||||
Live Nation Entertainment, Inc.(1) | 107 | 6,077 | ||||||
Madison Square Garden Entertainment Corp.(1) | 108 | 8,118 | ||||||
Madison Square Garden Sports Corp., Class A(1) | 45 | 7,380 | ||||||
| Marcus Corp. (The) | 31 | 486 | ||||||
Netflix, Inc.(1) | 804 | 425,766 | ||||||
Roku, Inc.(1) | 68 | 11,797 | ||||||
Take-Two Interactive Software, Inc.(1) | 212 | 36,292 | ||||||
| Walt Disney Co. (The) | 892 | 117,628 | ||||||
| World Wrestling Entertainment, Inc., Class A | 67 | 2,953 | ||||||
Zynga, Inc., Class A(1) | 962 | 8,716 | ||||||
| 791,252 | ||||||||
| Food and Staples Retailing — 1.8% | ||||||||
| Andersons, Inc. (The) | 149 | 2,642 | ||||||
BJ's Wholesale Club Holdings, Inc.(1) | 174 | 7,727 | ||||||
| Casey's General Stores, Inc. | 215 | 38,238 | ||||||
| Costco Wholesale Corp. | 843 | 293,077 | ||||||
Grocery Outlet Holding Corp.(1) | 68 | 2,797 | ||||||
| Ingles Markets, Inc., Class A | 119 | 4,808 | ||||||
| Kroger Co. (The) | 3,635 | 129,697 | ||||||
| Natural Grocers by Vitamin Cottage, Inc. | 165 | 1,934 | ||||||
Performance Food Group Co.(1) | 128 | 4,673 | ||||||
| PriceSmart, Inc. | 143 | 9,402 | ||||||
| SpartanNash Co. | 383 | 7,652 | ||||||
Sprouts Farmers Market, Inc.(1) | 947 | 22,112 | ||||||
| Sysco Corp. | 524 | 31,513 | ||||||
United Natural Foods, Inc.(1) | 510 | 9,206 | ||||||
US Foods Holding Corp.(1) | 36 | 877 | ||||||
| Village Super Market, Inc., Class A | 118 | 3,002 | ||||||
| Walgreens Boots Alliance, Inc. | 1,866 | 70,945 | ||||||
| Walmart, Inc. | 1,949 | 270,619 | ||||||
| Weis Markets, Inc. | 88 | 4,332 | ||||||
| 915,253 | ||||||||
| Food Products — 1.2% | ||||||||
| Archer-Daniels-Midland Co. | 1,109 | 49,639 | ||||||
| B&G Foods, Inc. | 309 | 9,622 | ||||||
Beyond Meat, Inc.(1) | 36 | 4,891 | ||||||
22
| Shares | Value | |||||||
| Bunge Ltd. | 523 | $ | 23,859 | |||||
Cal-Maine Foods, Inc.(1) | 107 | 4,129 | ||||||
| Calavo Growers, Inc. | 64 | 4,062 | ||||||
| Campbell Soup Co. | 309 | 16,256 | ||||||
| Conagra Brands, Inc. | 317 | 12,160 | ||||||
Darling Ingredients, Inc.(1) | 823 | 26,311 | ||||||
| Flowers Foods, Inc. | 914 | 22,356 | ||||||
| Fresh Del Monte Produce, Inc. | 140 | 3,247 | ||||||
Freshpet, Inc.(1) | 23 | 2,613 | ||||||
| General Mills, Inc. | 662 | 42,335 | ||||||
Hain Celestial Group, Inc. (The)(1) | 272 | 8,919 | ||||||
| Hershey Co. (The) | 358 | 53,213 | ||||||
| Hormel Foods Corp. | 509 | 25,949 | ||||||
Hostess Brands, Inc.(1) | 304 | 3,903 | ||||||
| Ingredion, Inc. | 347 | 27,913 | ||||||
| J&J Snack Foods Corp. | 26 | 3,535 | ||||||
| J.M. Smucker Co. (The) | 240 | 28,843 | ||||||
| John B Sanfilippo & Son, Inc. | 56 | 4,460 | ||||||
| Kellogg Co. | 365 | 25,882 | ||||||
| Kraft Heinz Co. (The) | 1,160 | 40,646 | ||||||
| Lamb Weston Holdings, Inc. | 403 | 25,329 | ||||||
| Lancaster Colony Corp. | 55 | 9,775 | ||||||
| McCormick & Co., Inc. | 80 | 16,496 | ||||||
| Mondelez International, Inc., Class A | 1,568 | 91,603 | ||||||
Pilgrim's Pride Corp.(1) | 232 | 3,712 | ||||||
Post Holdings, Inc.(1) | 42 | 3,697 | ||||||
| Sanderson Farms, Inc. | 41 | 4,795 | ||||||
| Seaboard Corp. | 1 | 2,683 | ||||||
Seneca Foods Corp., Class A(1) | 72 | 3,410 | ||||||
Simply Good Foods Co. (The)(1) | 222 | 5,517 | ||||||
TreeHouse Foods, Inc.(1) | 20 | 856 | ||||||
| Tyson Foods, Inc., Class A | 336 | 21,101 | ||||||
| 633,717 | ||||||||
| Gas Utilities — 0.2% | ||||||||
| Atmos Energy Corp. | 200 | 19,964 | ||||||
| Chesapeake Utilities Corp. | 12 | 982 | ||||||
| National Fuel Gas Co. | 436 | 19,899 | ||||||
| New Jersey Resources Corp. | 367 | 11,061 | ||||||
| Northwest Natural Holding Co. | 145 | 7,411 | ||||||
| ONE Gas, Inc. | 105 | 7,783 | ||||||
| South Jersey Industries, Inc. | 61 | 1,351 | ||||||
| Southwest Gas Holdings, Inc. | 144 | 9,053 | ||||||
| Spire, Inc. | 69 | 4,017 | ||||||
| UGI Corp. | 316 | 10,911 | ||||||
| 92,432 | ||||||||
| Health Care Equipment and Supplies — 2.9% | ||||||||
| Abbott Laboratories | 1,423 | 155,776 | ||||||
ABIOMED, Inc.(1) | 116 | 35,684 | ||||||
Align Technology, Inc.(1) | 273 | 81,076 | ||||||
| Atrion Corp. | 6 | 3,790 | ||||||
Avanos Medical, Inc.(1) | 137 | 4,439 | ||||||
| Baxter International, Inc. | 1,432 | 124,684 | ||||||
23
| Shares | Value | |||||||
| Becton Dickinson and Co. | 173 | $ | 41,999 | |||||
Boston Scientific Corp.(1) | 1,461 | 59,930 | ||||||
Cardiovascular Systems, Inc.(1) | 88 | 2,875 | ||||||
Cerus Corp.(1) | 478 | 3,045 | ||||||
| Cooper Cos., Inc. (The) | 82 | 25,779 | ||||||
| Danaher Corp. | 414 | 85,479 | ||||||
| DENTSPLY SIRONA, Inc. | 367 | 16,467 | ||||||
DexCom, Inc.(1) | 64 | 27,226 | ||||||
Edwards Lifesciences Corp.(1) | 971 | 83,351 | ||||||
Envista Holdings Corp.(1) | 223 | 5,350 | ||||||
Glaukos Corp.(1) | 94 | 4,496 | ||||||
Globus Medical, Inc., Class A(1) | 166 | 9,382 | ||||||
Haemonetics Corp.(1) | 89 | 7,980 | ||||||
| Hill-Rom Holdings, Inc. | 72 | 6,753 | ||||||
Hologic, Inc.(1) | 88 | 5,255 | ||||||
ICU Medical, Inc.(1) | 45 | 9,011 | ||||||
IDEXX Laboratories, Inc.(1) | 270 | 105,586 | ||||||
Inogen, Inc.(1) | 69 | 2,086 | ||||||
Insulet Corp.(1) | 103 | 22,480 | ||||||
Integer Holdings Corp.(1) | 67 | 4,640 | ||||||
Integra LifeSciences Holdings Corp.(1) | 169 | 8,077 | ||||||
Intuitive Surgical, Inc.(1) | 138 | 100,856 | ||||||
iRhythm Technologies, Inc.(1) | 28 | 6,165 | ||||||
Lantheus Holdings, Inc.(1) | 271 | 3,637 | ||||||
LivaNova plc(1) | 65 | 3,048 | ||||||
Masimo Corp.(1) | 104 | 23,296 | ||||||
| Medtronic plc | 981 | 105,428 | ||||||
Meridian Bioscience, Inc.(1) | 297 | 4,200 | ||||||
Merit Medical Systems, Inc.(1) | 118 | 5,794 | ||||||
Natus Medical, Inc.(1) | 189 | 3,432 | ||||||
Neogen Corp.(1) | 91 | 6,934 | ||||||
Nevro Corp.(1) | 37 | 5,089 | ||||||
Novocure Ltd.(1) | 60 | 4,965 | ||||||
NuVasive, Inc.(1) | 102 | 5,317 | ||||||
OraSure Technologies, Inc.(1) | 227 | 2,660 | ||||||
Orthofix Medical, Inc.(1) | 22 | 667 | ||||||
Penumbra, Inc.(1) | 37 | 7,739 | ||||||
Quidel Corp.(1) | 69 | 12,141 | ||||||
| ResMed, Inc. | 134 | 24,225 | ||||||
| STERIS plc | 140 | 22,350 | ||||||
| Stryker Corp. | 322 | 63,808 | ||||||
Surmodics, Inc.(1) | 74 | 3,348 | ||||||
Tandem Diabetes Care, Inc.(1) | 48 | 5,411 | ||||||
| Teleflex, Inc. | 33 | 12,967 | ||||||
| Utah Medical Products, Inc. | 36 | 2,957 | ||||||
Varex Imaging Corp.(1) | 34 | 377 | ||||||
Varian Medical Systems, Inc.(1) | 198 | 34,387 | ||||||
| West Pharmaceutical Services, Inc. | 172 | 48,841 | ||||||
| Zimmer Biomet Holdings, Inc. | 296 | 41,700 | ||||||
Zynex, Inc.(1) | 136 | 2,013 | ||||||
| 1,506,448 | ||||||||
24
| Shares | Value | |||||||
| Health Care Providers and Services — 1.9% | ||||||||
Acadia Healthcare Co., Inc.(1) | 103 | $ | 3,184 | |||||
Addus HomeCare Corp.(1) | 33 | 3,091 | ||||||
Amedisys, Inc.(1) | 24 | 5,806 | ||||||
| AmerisourceBergen Corp. | 268 | 26,004 | ||||||
AMN Healthcare Services, Inc.(1) | 88 | 4,738 | ||||||
| Anthem, Inc. | 433 | 121,898 | ||||||
BioTelemetry, Inc.(1) | 56 | 2,216 | ||||||
Brookdale Senior Living, Inc.(1) | 316 | 869 | ||||||
| Cardinal Health, Inc. | 625 | 31,725 | ||||||
Centene Corp.(1) | 975 | 59,787 | ||||||
| Chemed Corp. | 35 | 18,099 | ||||||
| Cigna Corp. | 191 | 33,878 | ||||||
CorVel Corp.(1) | 57 | 4,732 | ||||||
| CVS Health Corp. | 740 | 45,969 | ||||||
DaVita, Inc.(1) | 52 | 4,512 | ||||||
| Encompass Health Corp. | 74 | 4,828 | ||||||
| Ensign Group, Inc. (The) | 336 | 19,669 | ||||||
Guardant Health, Inc.(1) | 93 | 8,881 | ||||||
Hanger, Inc.(1) | 173 | 3,418 | ||||||
| HCA Healthcare, Inc. | 141 | 19,136 | ||||||
HealthEquity, Inc.(1) | 18 | 1,035 | ||||||
Henry Schein, Inc.(1) | 243 | 16,145 | ||||||
| Humana, Inc. | 367 | 152,367 | ||||||
InfuSystem Holdings, Inc.(1) | 278 | 4,045 | ||||||
Laboratory Corp. of America Holdings(1) | 62 | 10,896 | ||||||
LHC Group, Inc.(1) | 33 | 6,879 | ||||||
Magellan Health, Inc.(1) | 56 | 4,226 | ||||||
| McKesson Corp. | 287 | 44,037 | ||||||
Molina Healthcare, Inc.(1) | 312 | 57,711 | ||||||
| National HealthCare Corp. | 56 | 3,567 | ||||||
| National Research Corp. | 76 | 4,256 | ||||||
| Owens & Minor, Inc. | 446 | 7,395 | ||||||
| Patterson Cos., Inc. | 511 | 14,824 | ||||||
Pennant Group, Inc. (The)(1) | 123 | 4,556 | ||||||
| Premier, Inc., Class A | 380 | 12,445 | ||||||
Providence Service Corp. (The)(1) | 43 | 3,981 | ||||||
| Quest Diagnostics, Inc. | 54 | 6,007 | ||||||
Tenet Healthcare Corp.(1) | 23 | 648 | ||||||
Triple-S Management Corp., Class B(1) | 157 | 2,920 | ||||||
| UnitedHealth Group, Inc. | 587 | 183,467 | ||||||
| Universal Health Services, Inc., Class B | 216 | 23,836 | ||||||
| 987,683 | ||||||||
| Health Care Technology — 0.4% | ||||||||
Allscripts Healthcare Solutions, Inc.(1) | 78 | 696 | ||||||
| Cerner Corp. | 1,188 | 87,164 | ||||||
Change Healthcare, Inc.(1) | 1,093 | 15,466 | ||||||
Evolent Health, Inc., Class A(1) | 505 | 7,237 | ||||||
HealthStream, Inc.(1) | 34 | 704 | ||||||
Inspire Medical Systems, Inc.(1) | 42 | 5,017 | ||||||
Livongo Health, Inc.(1) | 123 | 16,888 | ||||||
NextGen Healthcare, Inc.(1) | 281 | 3,726 | ||||||
25
| Shares | Value | |||||||
Omnicell, Inc.(1) | 37 | $ | 2,467 | |||||
| Simulations Plus, Inc. | 52 | 3,098 | ||||||
Teladoc Health, Inc.(1) | 49 | 10,569 | ||||||
Veeva Systems, Inc., Class A(1) | 169 | 47,704 | ||||||
| 200,736 | ||||||||
| Hotels, Restaurants and Leisure — 1.5% | ||||||||
| Aramark | 74 | 2,039 | ||||||
| BJ's Restaurants, Inc. | 25 | 788 | ||||||
| Bloomin' Brands, Inc. | 64 | 918 | ||||||
| Boyd Gaming Corp. | 228 | 6,106 | ||||||
| Brinker International, Inc. | 23 | 1,036 | ||||||
Caesars Entertainment, Inc.(1) | 510 | 23,358 | ||||||
| Carnival Corp. | 1,200 | 19,776 | ||||||
| Cheesecake Factory, Inc. (The) | 153 | 4,518 | ||||||
Chipotle Mexican Grill, Inc.(1) | 89 | 116,615 | ||||||
| Choice Hotels International, Inc. | 10 | 993 | ||||||
| Churchill Downs, Inc. | 96 | 16,777 | ||||||
Chuy's Holdings, Inc.(1) | 28 | 623 | ||||||
| Cracker Barrel Old Country Store, Inc. | 95 | 12,702 | ||||||
| Darden Restaurants, Inc. | 420 | 36,401 | ||||||
| Dave & Buster's Entertainment, Inc. | 24 | 399 | ||||||
| Domino's Pizza, Inc. | 43 | 17,585 | ||||||
| Dunkin' Brands Group, Inc. | 71 | 5,402 | ||||||
| Extended Stay America, Inc. | 1,154 | 14,414 | ||||||
Golden Entertainment, Inc.(1) | 55 | 706 | ||||||
Hilton Grand Vacations, Inc.(1) | 398 | 8,720 | ||||||
| Hilton Worldwide Holdings, Inc. | 126 | 11,385 | ||||||
| Hyatt Hotels Corp., Class A | 74 | 4,180 | ||||||
| Jack in the Box, Inc. | 49 | 4,037 | ||||||
| Las Vegas Sands Corp. | 876 | 44,422 | ||||||
| Marriott International, Inc., Class A | 319 | 32,828 | ||||||
| Marriott Vacations Worldwide Corp. | 8 | 757 | ||||||
| McDonald's Corp. | 469 | 100,141 | ||||||
| MGM Resorts International | 721 | 16,223 | ||||||
Norwegian Cruise Line Holdings Ltd.(1) | 655 | 11,207 | ||||||
| Papa John's International, Inc. | 62 | 6,094 | ||||||
Penn National Gaming, Inc.(1) | 966 | 49,363 | ||||||
Planet Fitness, Inc., Class A(1) | 105 | 6,383 | ||||||
Playa Hotels & Resorts NV(1) | 128 | 540 | ||||||
Red Robin Gourmet Burgers, Inc.(1) | 1 | 11 | ||||||
| Red Rock Resorts, Inc., Class A | 429 | 7,325 | ||||||
| Royal Caribbean Cruises Ltd. | 502 | 34,558 | ||||||
| Ruth's Hospitality Group, Inc. | 42 | 432 | ||||||
SeaWorld Entertainment, Inc.(1) | 273 | 5,569 | ||||||
| Six Flags Entertainment Corp. | 18 | 391 | ||||||
| Starbucks Corp. | 725 | 61,241 | ||||||
| Texas Roadhouse, Inc. | 415 | 26,141 | ||||||
| Twin River Worldwide Holdings, Inc. | 52 | 1,244 | ||||||
| Vail Resorts, Inc. | 48 | 10,448 | ||||||
| Wendy's Co. (The) | 255 | 5,340 | ||||||
| Wingstop, Inc. | 31 | 5,065 | ||||||
| Wyndham Destinations, Inc. | 21 | 609 | ||||||
26
| Shares | Value | |||||||
| Wyndham Hotels & Resorts, Inc. | 18 | $ | 943 | |||||
| Wynn Resorts Ltd. | 351 | 30,695 | ||||||
| Yum! Brands, Inc. | 226 | 21,662 | ||||||
| 789,110 | ||||||||
| Household Durables — 1.0% | ||||||||
Beazer Homes USA, Inc.(1) | 65 | 796 | ||||||
Cavco Industries, Inc.(1) | 26 | 4,964 | ||||||
Century Communities, Inc.(1) | 35 | 1,249 | ||||||
| D.R. Horton, Inc. | 1,097 | 78,293 | ||||||
| Garmin Ltd. | 263 | 27,249 | ||||||
Helen of Troy Ltd.(1) | 60 | 12,409 | ||||||
Installed Building Products, Inc.(1) | 71 | 6,164 | ||||||
iRobot Corp.(1) | 143 | 10,586 | ||||||
| KB Home | 436 | 15,591 | ||||||
| La-Z-Boy, Inc. | 327 | 10,627 | ||||||
| Leggett & Platt, Inc. | 168 | 6,888 | ||||||
| Lennar Corp., B Shares | 63 | 3,736 | ||||||
| Lennar Corp., Class A | 646 | 48,334 | ||||||
LGI Homes, Inc.(1) | 61 | 6,823 | ||||||
| M.D.C. Holdings, Inc. | 139 | 6,030 | ||||||
M/I Homes, Inc.(1) | 29 | 1,234 | ||||||
Meritage Homes Corp.(1) | 230 | 22,087 | ||||||
Mohawk Industries, Inc.(1) | 197 | 18,189 | ||||||
| Newell Brands, Inc. | 1,040 | 16,619 | ||||||
NVR, Inc.(1) | 17 | 70,862 | ||||||
| PulteGroup, Inc. | 982 | 43,787 | ||||||
Skyline Champion Corp.(1) | 171 | 4,880 | ||||||
Sonos, Inc.(1) | 536 | 7,542 | ||||||
Taylor Morrison Home Corp.(1) | 611 | 14,377 | ||||||
Tempur Sealy International, Inc.(1) | 126 | 10,778 | ||||||
| Toll Brothers, Inc. | 268 | 11,315 | ||||||
TopBuild Corp.(1) | 38 | 5,844 | ||||||
TRI Pointe Group, Inc.(1) | 633 | 10,685 | ||||||
Turtle Beach Corp.(1) | 208 | 4,071 | ||||||
Universal Electronics, Inc.(1) | 94 | 3,862 | ||||||
| Whirlpool Corp. | 283 | 50,295 | ||||||
| 536,166 | ||||||||
| Household Products — 1.1% | ||||||||
Central Garden & Pet Co., Class A(1) | 153 | 5,686 | ||||||
| Church & Dwight Co., Inc. | 351 | 33,636 | ||||||
| Clorox Co. (The) | 308 | 68,838 | ||||||
| Colgate-Palmolive Co. | 1,409 | 111,678 | ||||||
| Energizer Holdings, Inc. | 128 | 5,925 | ||||||
| Kimberly-Clark Corp. | 267 | 42,122 | ||||||
| Procter & Gamble Co. (The) | 1,919 | 265,455 | ||||||
| Reynolds Consumer Products, Inc. | 84 | 2,791 | ||||||
| Spectrum Brands Holdings, Inc. | 77 | 4,589 | ||||||
| WD-40 Co. | 43 | 8,788 | ||||||
| 549,508 | ||||||||
| Independent Power and Renewable Electricity Producers — 0.3% | ||||||||
| AES Corp. (The) | 2,719 | 48,262 | ||||||
| Brookfield Renewable Corp., Class A | 154 | 7,842 | ||||||
27
| Shares | Value | |||||||
| Clearway Energy, Inc., Class A | 132 | $ | 3,188 | |||||
| Clearway Energy, Inc., Class C | 187 | 4,770 | ||||||
| NextEra Energy Partners LP | 181 | 10,918 | ||||||
| Ormat Technologies, Inc. | 135 | 8,217 | ||||||
Sunnova Energy International, Inc.(1) | 166 | 3,938 | ||||||
| Vistra Corp. | 2,381 | 45,787 | ||||||
| 132,922 | ||||||||
| Industrial Conglomerates — 0.6% | ||||||||
| 3M Co. | 756 | 123,243 | ||||||
| Carlisle Cos., Inc. | 99 | 12,964 | ||||||
| General Electric Co. | 4,554 | 28,872 | ||||||
| Honeywell International, Inc. | 652 | 107,939 | ||||||
| Raven Industries, Inc. | 29 | 721 | ||||||
| Roper Technologies, Inc. | 55 | 23,495 | ||||||
| 297,234 | ||||||||
| Insurance — 2.6% | ||||||||
| Aflac, Inc. | 1,207 | 43,838 | ||||||
| Alleghany Corp. | 20 | 11,091 | ||||||
| Allstate Corp. (The) | 817 | 75,981 | ||||||
Ambac Financial Group, Inc.(1) | 53 | 669 | ||||||
| American Equity Investment Life Holding Co. | 499 | 11,931 | ||||||
| American Financial Group, Inc. | 185 | 12,367 | ||||||
| American International Group, Inc. | 1,503 | 43,797 | ||||||
| American National Group, Inc. | 8 | 600 | ||||||
| AMERISAFE, Inc. | 104 | 6,940 | ||||||
| Aon plc, Class A | 290 | 57,997 | ||||||
Arch Capital Group Ltd.(1) | 670 | 21,132 | ||||||
| Argo Group International Holdings Ltd. | 15 | 557 | ||||||
| Arthur J. Gallagher & Co. | 148 | 15,584 | ||||||
| Assurant, Inc. | 151 | 18,356 | ||||||
| Assured Guaranty Ltd. | 214 | 4,590 | ||||||
Athene Holding Ltd., Class A(1) | 317 | 11,590 | ||||||
| Axis Capital Holdings Ltd. | 187 | 8,931 | ||||||
Brighthouse Financial, Inc.(1) | 326 | 9,897 | ||||||
| Brown & Brown, Inc. | 100 | 4,640 | ||||||
| Chubb Ltd. | 516 | 64,500 | ||||||
| Cincinnati Financial Corp. | 303 | 24,061 | ||||||
| CNA Financial Corp. | 23 | 740 | ||||||
| CNO Financial Group, Inc. | 710 | 11,573 | ||||||
| Employers Holdings, Inc. | 102 | 3,323 | ||||||
Enstar Group Ltd.(1) | 31 | 5,549 | ||||||
| Erie Indemnity Co., Class A | 109 | 23,265 | ||||||
| Everest Re Group Ltd. | 90 | 19,807 | ||||||
| Fidelity National Financial, Inc. | 845 | 27,741 | ||||||
| First American Financial Corp. | 471 | 24,760 | ||||||
Genworth Financial, Inc., Class A(1) | 1,525 | 4,605 | ||||||
| Globe Life, Inc. | 304 | 25,074 | ||||||
| Goosehead Insurance, Inc., Class A | 43 | 4,419 | ||||||
| Hanover Insurance Group, Inc. (The) | 77 | 7,892 | ||||||
| Hartford Financial Services Group, Inc. (The) | 893 | 36,122 | ||||||
| HCI Group, Inc. | 51 | 2,791 | ||||||
| Horace Mann Educators Corp. | 264 | 10,312 | ||||||
28
| Shares | Value | |||||||
| James River Group Holdings Ltd. | 157 | $ | 7,647 | |||||
| Kemper Corp. | 210 | 16,309 | ||||||
| Kinsale Capital Group, Inc. | 61 | 12,641 | ||||||
| Lincoln National Corp. | 250 | 9,012 | ||||||
| Loews Corp. | 416 | 14,918 | ||||||
Markel Corp.(1) | 23 | 24,997 | ||||||
| Marsh & McLennan Cos., Inc. | 334 | 38,380 | ||||||
MBIA, Inc.(1) | 105 | 852 | ||||||
| Mercury General Corp. | 116 | 5,189 | ||||||
| MetLife, Inc. | 1,106 | 42,537 | ||||||
| National General Holdings Corp. | 272 | 9,262 | ||||||
| National Western Life Group, Inc., Class A | 6 | 1,320 | ||||||
| Old Republic International Corp. | 705 | 11,358 | ||||||
Palomar Holdings, Inc.(1) | 19 | 2,135 | ||||||
| Primerica, Inc. | 272 | 33,959 | ||||||
| Principal Financial Group, Inc. | 783 | 32,972 | ||||||
| ProAssurance Corp. | 33 | 506 | ||||||
| Progressive Corp. (The) | 1,725 | 163,944 | ||||||
| Prudential Financial, Inc. | 536 | 36,325 | ||||||
| Reinsurance Group of America, Inc. | 71 | 6,509 | ||||||
| RenaissanceRe Holdings Ltd. | 103 | 18,925 | ||||||
| RLI Corp. | 126 | 11,818 | ||||||
| Safety Insurance Group, Inc. | 53 | 3,837 | ||||||
| Selective Insurance Group, Inc. | 197 | 11,783 | ||||||
| Stewart Information Services Corp. | 119 | 5,078 | ||||||
Third Point Reinsurance Ltd.(1) | 591 | 5,059 | ||||||
| Travelers Cos., Inc. (The) | 919 | 106,641 | ||||||
| United Fire Group, Inc. | 6 | 151 | ||||||
| Universal Insurance Holdings, Inc. | 35 | 649 | ||||||
| Unum Group | 538 | 9,942 | ||||||
Watford Holdings Ltd.(1) | 197 | 3,152 | ||||||
| White Mountains Insurance Group Ltd. | 8 | 7,131 | ||||||
| Willis Towers Watson plc | 81 | 16,648 | ||||||
| WR Berkley Corp. | 306 | 18,987 | ||||||
| 1,347,595 | ||||||||
| Interactive Media and Services — 4.6% | ||||||||
Alphabet, Inc., Class A(1) | 370 | 602,926 | ||||||
Alphabet, Inc., Class C(1) | 365 | 596,476 | ||||||
ANGI Homeservices, Inc., Class A(1) | 184 | 2,553 | ||||||
Cars.com, Inc.(1) | 79 | 686 | ||||||
Facebook, Inc., Class A(1) | 3,415 | 1,001,278 | ||||||
IAC/InterActiveCorp(1) | 39 | 5,187 | ||||||
Match Group, Inc.(1) | 236 | 26,356 | ||||||
Pinterest, Inc., Class A(1) | 540 | 19,867 | ||||||
Snap, Inc., Class A(1) | 1,063 | 24,013 | ||||||
| TripAdvisor, Inc. | 227 | 5,305 | ||||||
Twitter, Inc.(1) | 1,154 | 46,829 | ||||||
Yelp, Inc.(1) | 159 | 3,676 | ||||||
Zillow Group, Inc., Class A(1) | 82 | 6,993 | ||||||
Zillow Group, Inc., Class C(1) | 231 | 19,810 | ||||||
| 2,361,955 | ||||||||
29
| Shares | Value | |||||||
| Internet and Direct Marketing Retail — 4.5% | ||||||||
1-800-Flowers.com, Inc., Class A(1) | 194 | $ | 5,806 | |||||
Amazon.com, Inc.(1) | 553 | 1,908,381 | ||||||
Booking Holdings, Inc.(1) | 90 | 171,940 | ||||||
| eBay, Inc. | 1,343 | 73,569 | ||||||
Etsy, Inc.(1) | 240 | 28,728 | ||||||
| Expedia Group, Inc. | 77 | 7,558 | ||||||
Grubhub, Inc.(1) | 158 | 11,431 | ||||||
MercadoLibre, Inc.(1) | 40 | 46,744 | ||||||
| PetMed Express, Inc. | 134 | 4,658 | ||||||
Qurate Retail, Inc., Series A(1) | 432 | 4,774 | ||||||
Revolve Group, Inc.(1) | 188 | 3,775 | ||||||
| Shutterstock, Inc. | 118 | 5,938 | ||||||
Stamps.com, Inc.(1) | 41 | 10,223 | ||||||
Wayfair, Inc., Class A(1) | 60 | 17,794 | ||||||
| 2,301,319 | ||||||||
| IT Services — 4.5% | ||||||||
| Accenture plc, Class A | 1,248 | 299,433 | ||||||
Akamai Technologies, Inc.(1) | 359 | 41,798 | ||||||
| Alliance Data Systems Corp. | 32 | 1,444 | ||||||
| Amdocs Ltd. | 188 | 11,511 | ||||||
| Automatic Data Processing, Inc. | 644 | 89,574 | ||||||
Black Knight, Inc.(1) | 116 | 9,756 | ||||||
| Booz Allen Hamilton Holding Corp. | 172 | 15,146 | ||||||
| Broadridge Financial Solutions, Inc. | 255 | 35,037 | ||||||
CACI International, Inc., Class A(1) | 15 | 3,513 | ||||||
Cardtronics plc, Class A(1) | 24 | 521 | ||||||
| Cass Information Systems, Inc. | 18 | 705 | ||||||
| Cognizant Technology Solutions Corp., Class A | 1,662 | 111,121 | ||||||
| CSG Systems International, Inc. | 193 | 8,216 | ||||||
| DXC Technology Co. | 933 | 18,641 | ||||||
EPAM Systems, Inc.(1) | 91 | 29,766 | ||||||
Euronet Worldwide, Inc.(1) | 62 | 6,410 | ||||||
| EVERTEC, Inc. | 149 | 5,218 | ||||||
ExlService Holdings, Inc.(1) | 77 | 4,904 | ||||||
Fastly, Inc., Class A(1) | 96 | 8,913 | ||||||
| Fidelity National Information Services, Inc. | 270 | 40,730 | ||||||
Fiserv, Inc.(1) | 216 | 21,509 | ||||||
FleetCor Technologies, Inc.(1) | 65 | 16,344 | ||||||
Gartner, Inc.(1) | 88 | 11,424 | ||||||
| Genpact Ltd. | 157 | 6,622 | ||||||
| Global Payments, Inc. | 272 | 48,041 | ||||||
GoDaddy, Inc., Class A(1) | 238 | 19,916 | ||||||
| International Business Machines Corp. | 1,037 | 127,873 | ||||||
International Money Express, Inc.(1) | 272 | 4,602 | ||||||
| Jack Henry & Associates, Inc. | 200 | 33,084 | ||||||
| KBR, Inc. | 416 | 10,396 | ||||||
| Leidos Holdings, Inc. | 119 | 10,768 | ||||||
Limelight Networks, Inc.(1) | 363 | 2,058 | ||||||
LiveRamp Holdings, Inc.(1) | 174 | 9,716 | ||||||
| ManTech International Corp., Class A | 42 | 3,144 | ||||||
| MasterCard, Inc., Class A | 1,236 | 442,723 | ||||||
30
| Shares | Value | |||||||
| MAXIMUS, Inc. | 157 | $ | 12,175 | |||||
MongoDB, Inc.(1) | 31 | 7,248 | ||||||
| NIC, Inc. | 328 | 7,013 | ||||||
Okta, Inc.(1) | 76 | 16,368 | ||||||
| Paychex, Inc. | 892 | 68,211 | ||||||
PayPal Holdings, Inc.(1) | 1,063 | 217,001 | ||||||
| Perspecta, Inc. | 40 | 831 | ||||||
| Sabre Corp. | 579 | 4,047 | ||||||
| Science Applications International Corp. | 73 | 6,093 | ||||||
Square, Inc., Class A(1) | 265 | 42,283 | ||||||
| Switch, Inc., Class A | 66 | 1,135 | ||||||
Sykes Enterprises, Inc.(1) | 167 | 5,529 | ||||||
| TTEC Holdings, Inc. | 119 | 6,746 | ||||||
Tucows, Inc., Class A(1) | 51 | 3,224 | ||||||
Twilio, Inc., Class A(1) | 162 | 43,701 | ||||||
VeriSign, Inc.(1) | 88 | 18,902 | ||||||
Virtusa Corp.(1) | 23 | 909 | ||||||
| Visa, Inc., Class A | 1,666 | 353,175 | ||||||
| Western Union Co. (The) | 352 | 8,304 | ||||||
WEX, Inc.(1) | 49 | 7,826 | ||||||
| 2,341,298 | ||||||||
| Leisure Products — 0.3% | ||||||||
| Acushnet Holdings Corp. | 153 | 5,399 | ||||||
American Outdoor Brands, Inc.(1) | 64 | 967 | ||||||
| Brunswick Corp. | 224 | 13,863 | ||||||
| Callaway Golf Co. | 250 | 5,215 | ||||||
| Hasbro, Inc. | 190 | 14,999 | ||||||
| Johnson Outdoors, Inc., Class A | 43 | 3,686 | ||||||
Malibu Boats, Inc., Class A(1) | 168 | 8,711 | ||||||
MasterCraft Boat Holdings, Inc.(1) | 188 | 3,931 | ||||||
Mattel, Inc.(1) | 485 | 5,211 | ||||||
Peloton Interactive, Inc., Class A(1) | 287 | 22,004 | ||||||
| Polaris, Inc. | 358 | 36,172 | ||||||
Smith & Wesson Brands, Inc.(1) | 254 | 4,638 | ||||||
| Sturm Ruger & Co., Inc. | 94 | 6,661 | ||||||
Vista Outdoor, Inc.(1) | 357 | 6,930 | ||||||
YETI Holdings, Inc.(1) | 54 | 2,775 | ||||||
| 141,162 | ||||||||
| Life Sciences Tools and Services — 0.9% | ||||||||
10X Genomics, Inc., Class A(1) | 52 | 5,960 | ||||||
Adaptive Biotechnologies Corp.(1) | 381 | 15,853 | ||||||
| Agilent Technologies, Inc. | 328 | 32,938 | ||||||
Avantor, Inc.(1) | 343 | 7,742 | ||||||
Bio-Rad Laboratories, Inc., Class A(1) | 46 | 23,395 | ||||||
| Bio-Techne Corp. | 68 | 17,371 | ||||||
| Bruker Corp. | 274 | 11,513 | ||||||
Charles River Laboratories International, Inc.(1) | 76 | 16,640 | ||||||
Fluidigm Corp.(1) | 380 | 2,983 | ||||||
Illumina, Inc.(1) | 212 | 75,731 | ||||||
IQVIA Holdings, Inc.(1) | 114 | 18,667 | ||||||
| Luminex Corp. | 105 | 2,802 | ||||||
Medpace Holdings, Inc.(1) | 47 | 6,100 | ||||||
31
| Shares | Value | |||||||
Mettler-Toledo International, Inc.(1) | 78 | $ | 75,721 | |||||
NeoGenomics, Inc.(1) | 104 | 4,051 | ||||||
| PerkinElmer, Inc. | 47 | 5,533 | ||||||
PRA Health Sciences, Inc.(1) | 50 | 5,346 | ||||||
Repligen Corp.(1) | 77 | 11,928 | ||||||
Syneos Health, Inc.(1) | 19 | 1,199 | ||||||
| Thermo Fisher Scientific, Inc. | 218 | 93,518 | ||||||
Waters Corp.(1) | 45 | 9,732 | ||||||
| 444,723 | ||||||||
| Machinery — 2.9% | ||||||||
| AGCO Corp. | 309 | 21,970 | ||||||
| Alamo Group, Inc. | 41 | 4,547 | ||||||
| Albany International Corp., Class A | 153 | 7,941 | ||||||
| Allison Transmission Holdings, Inc. | 251 | 9,003 | ||||||
| Altra Industrial Motion Corp. | 163 | 6,365 | ||||||
| Astec Industries, Inc. | 125 | 6,590 | ||||||
| Barnes Group, Inc. | 102 | 4,039 | ||||||
| Caterpillar, Inc. | 1,540 | 219,157 | ||||||
Chart Industries, Inc.(1) | 132 | 8,675 | ||||||
CIRCOR International, Inc.(1) | 18 | 534 | ||||||
Colfax Corp.(1) | 94 | 3,128 | ||||||
| Columbus McKinnon Corp. | 129 | 4,692 | ||||||
| Crane Co. | 19 | 1,074 | ||||||
| Cummins, Inc. | 583 | 120,827 | ||||||
| Deere & Co. | 1,025 | 215,312 | ||||||
| Donaldson Co., Inc. | 692 | 34,849 | ||||||
| Douglas Dynamics, Inc. | 99 | 3,801 | ||||||
| Dover Corp. | 136 | 14,938 | ||||||
| Enerpac Tool Group Corp. | 189 | 3,931 | ||||||
| EnPro Industries, Inc. | 113 | 6,613 | ||||||
| ESCO Technologies, Inc. | 68 | 6,115 | ||||||
Evoqua Water Technologies Corp.(1) | 222 | 4,542 | ||||||
| Federal Signal Corp. | 138 | 4,433 | ||||||
| Flowserve Corp. | 387 | 11,486 | ||||||
| Fortive Corp. | 167 | 12,042 | ||||||
| Franklin Electric Co., Inc. | 226 | 13,415 | ||||||
| Gorman-Rupp Co. (The) | 133 | 4,249 | ||||||
| Graco, Inc. | 789 | 45,778 | ||||||
| Greenbrier Cos., Inc. (The) | 114 | 3,100 | ||||||
| Helios Technologies, Inc. | 112 | 4,604 | ||||||
| IDEX Corp. | 100 | 18,023 | ||||||
| Illinois Tool Works, Inc. | 489 | 96,602 | ||||||
Ingersoll Rand, Inc.(1) | 662 | 23,210 | ||||||
| ITT, Inc. | 395 | 24,810 | ||||||
| John Bean Technologies Corp. | 17 | 1,743 | ||||||
| Kadant, Inc. | 50 | 5,822 | ||||||
| Kennametal, Inc. | 521 | 15,119 | ||||||
| Lincoln Electric Holdings, Inc. | 324 | 31,334 | ||||||
| Lindsay Corp. | 30 | 2,998 | ||||||
Manitowoc Co., Inc. (The)(1) | 304 | 2,864 | ||||||
Meritor, Inc.(1) | 244 | 5,553 | ||||||
Middleby Corp. (The)(1) | 60 | 5,874 | ||||||
32
| Shares | Value | |||||||
| Miller Industries, Inc. | 27 | $ | 847 | |||||
| Mueller Industries, Inc. | 354 | 10,514 | ||||||
| Mueller Water Products, Inc., Class A | 610 | 6,588 | ||||||
| Nordson Corp. | 58 | 10,816 | ||||||
| Oshkosh Corp. | 318 | 24,489 | ||||||
| Otis Worldwide Corp. | 840 | 52,836 | ||||||
| PACCAR, Inc. | 1,340 | 115,026 | ||||||
| Parker-Hannifin Corp. | 99 | 20,395 | ||||||
| Pentair plc | 138 | 6,229 | ||||||
Proto Labs, Inc.(1) | 71 | 10,437 | ||||||
RBC Bearings, Inc.(1) | 59 | 7,790 | ||||||
| Rexnord Corp. | 160 | 4,634 | ||||||
| Shyft Group, Inc. (The) | 277 | 5,532 | ||||||
| Snap-on, Inc. | 243 | 36,030 | ||||||
SPX Corp.(1) | 21 | 878 | ||||||
SPX FLOW, Inc.(1) | 156 | 6,783 | ||||||
| Standex International Corp. | 69 | 3,991 | ||||||
| Stanley Black & Decker, Inc. | 102 | 16,453 | ||||||
| Tennant Co. | 15 | 997 | ||||||
| Terex Corp. | 110 | 2,153 | ||||||
| Timken Co. (The) | 399 | 21,622 | ||||||
| Toro Co. (The) | 202 | 15,207 | ||||||
TriMas Corp.(1) | 158 | 3,994 | ||||||
| Trinity Industries, Inc. | 481 | 9,846 | ||||||
| Wabash National Corp. | 397 | 4,847 | ||||||
| Watts Water Technologies, Inc., Class A | 51 | 4,883 | ||||||
Welbilt, Inc.(1) | 90 | 664 | ||||||
| Westinghouse Air Brake Technologies Corp. | 500 | 33,275 | ||||||
| Woodward, Inc. | 92 | 7,884 | ||||||
| Xylem, Inc. | 219 | 17,559 | ||||||
| 1,504,901 | ||||||||
Marine† | ||||||||
| Costamare, Inc. | 92 | 465 | ||||||
Kirby Corp.(1) | 99 | 4,202 | ||||||
| Matson, Inc. | 322 | 12,902 | ||||||
| 17,569 | ||||||||
| Media — 1.0% | ||||||||
Altice USA, Inc., Class A(1) | 620 | 17,100 | ||||||
AMC Networks, Inc., Class A(1) | 21 | 510 | ||||||
| Cable One, Inc. | 22 | 40,487 | ||||||
Charter Communications, Inc., Class A(1) | 104 | 64,023 | ||||||
| Comcast Corp., Class A | 5,484 | 245,738 | ||||||
Discovery, Inc., Class A(1) | 31 | 684 | ||||||
Discovery, Inc., Class C(1) | 196 | 3,914 | ||||||
DISH Network Corp., Class A(1) | 830 | 29,482 | ||||||
| Fox Corp., Class A | 601 | 16,744 | ||||||
| Fox Corp., Class B | 258 | 7,172 | ||||||
| Interpublic Group of Cos., Inc. (The) | 538 | 9,555 | ||||||
| John Wiley & Sons, Inc., Class A | 69 | 2,184 | ||||||
Liberty Broadband Corp., Class A(1) | 32 | 4,422 | ||||||
Liberty Broadband Corp., Class C(1) | 244 | 34,182 | ||||||
Liberty Media Corp.-Liberty SiriusXM, Class C(1) | 25 | 900 | ||||||
33
| Shares | Value | |||||||
Liberty Media Corp.-Liberty SiriusXM, Class A(1) | 20 | $ | 726 | |||||
| New York Times Co. (The), Class A | 308 | 13,346 | ||||||
| News Corp., Class A | 939 | 14,198 | ||||||
| News Corp., Class B | 76 | 1,145 | ||||||
| Nexstar Media Group, Inc., Class A | 64 | 6,145 | ||||||
| Omnicom Group, Inc. | 222 | 12,008 | ||||||
| Scholastic Corp. | 27 | 607 | ||||||
| Sirius XM Holdings, Inc. | 772 | 4,532 | ||||||
TechTarget, Inc.(1) | 102 | 4,047 | ||||||
| TEGNA, Inc. | 52 | 651 | ||||||
| ViacomCBS, Inc., Class B | 254 | 7,074 | ||||||
| 541,576 | ||||||||
| Metals and Mining — 0.8% | ||||||||
Alcoa Corp.(1) | 1,115 | 16,301 | ||||||
Allegheny Technologies, Inc.(1) | 473 | 3,940 | ||||||
Arconic Corp.(1) | 564 | 12,549 | ||||||
| Carpenter Technology Corp. | 35 | 736 | ||||||
Century Aluminum Co.(1) | 451 | 4,451 | ||||||
| Cleveland-Cliffs, Inc. | 2,702 | 17,779 | ||||||
Coeur Mining, Inc.(1) | 817 | 6,912 | ||||||
| Commercial Metals Co. | 772 | 16,112 | ||||||
| Compass Minerals International, Inc. | 174 | 9,906 | ||||||
| Freeport-McMoRan, Inc. | 3,303 | 51,560 | ||||||
| Haynes International, Inc. | 22 | 412 | ||||||
| Hecla Mining Co. | 1,911 | 11,504 | ||||||
| Kaiser Aluminum Corp. | 68 | 4,371 | ||||||
| Materion Corp. | 76 | 4,149 | ||||||
| Newmont Corp. | 1,471 | 98,969 | ||||||
| Nucor Corp. | 1,378 | 62,644 | ||||||
| Reliance Steel & Aluminum Co. | 304 | 31,881 | ||||||
| Royal Gold, Inc. | 172 | 23,447 | ||||||
| Schnitzer Steel Industries, Inc., Class A | 245 | 4,836 | ||||||
| Steel Dynamics, Inc. | 1,092 | 32,236 | ||||||
| United States Steel Corp. | 1,247 | 9,764 | ||||||
| Warrior Met Coal, Inc. | 343 | 5,306 | ||||||
| Worthington Industries, Inc. | 178 | 7,392 | ||||||
| 437,157 | ||||||||
| Multi-Utilities — 0.9% | ||||||||
| Ameren Corp. | 730 | 57,750 | ||||||
| Avista Corp. | 150 | 5,529 | ||||||
| Black Hills Corp. | 62 | 3,477 | ||||||
| CenterPoint Energy, Inc. | 611 | 12,263 | ||||||
| CMS Energy Corp. | 695 | 42,041 | ||||||
| Consolidated Edison, Inc. | 569 | 40,592 | ||||||
| Dominion Energy, Inc. | 1,247 | 97,815 | ||||||
| DTE Energy Co. | 449 | 53,283 | ||||||
| MDU Resources Group, Inc. | 461 | 10,889 | ||||||
| NiSource, Inc. | 1,057 | 23,423 | ||||||
| NorthWestern Corp. | 73 | 3,770 | ||||||
| Public Service Enterprise Group, Inc. | 1,138 | 59,449 | ||||||
| Sempra Energy | 355 | 43,896 | ||||||
| Unitil Corp. | 82 | 3,460 | ||||||
34
| Shares | Value | |||||||
| WEC Energy Group, Inc. | 165 | $ | 15,523 | |||||
| 473,160 | ||||||||
| Multiline Retail — 0.9% | ||||||||
| Big Lots, Inc. | 345 | 16,267 | ||||||
| Dillard's, Inc., Class A | 1 | 30 | ||||||
| Dollar General Corp. | 478 | 96,499 | ||||||
Dollar Tree, Inc.(1) | 922 | 88,761 | ||||||
| Kohl's Corp. | 566 | 12,090 | ||||||
| Macy's, Inc. | 520 | 3,624 | ||||||
| Nordstrom, Inc. | 456 | 7,296 | ||||||
Ollie's Bargain Outlet Holdings, Inc.(1) | 135 | 12,898 | ||||||
| Target Corp. | 1,466 | 221,674 | ||||||
| 459,139 | ||||||||
| Oil, Gas and Consumable Fuels — 2.7% | ||||||||
| Antero Midstream Corp. | 1,690 | 11,441 | ||||||
Antero Resources Corp.(1) | 953 | 3,069 | ||||||
| Apache Corp. | 1,396 | 20,661 | ||||||
| Arch Resources, Inc. | 99 | 3,729 | ||||||
| Berry Corp. | 97 | 382 | ||||||
Bonanza Creek Energy, Inc.(1) | 162 | 3,246 | ||||||
| Brigham Minerals, Inc., Class A | 234 | 2,764 | ||||||
| Cabot Oil & Gas Corp. | 2,830 | 53,685 | ||||||
Cheniere Energy, Inc.(1) | 208 | 10,826 | ||||||
| Chevron Corp. | 3,032 | 254,476 | ||||||
| Cimarex Energy Co. | 443 | 12,307 | ||||||
CNX Resources Corp.(1) | 1,161 | 12,725 | ||||||
Comstock Resources, Inc.(1) | 789 | 4,545 | ||||||
| Concho Resources, Inc. | 424 | 22,039 | ||||||
| ConocoPhillips | 2,294 | 86,920 | ||||||
Contango Oil & Gas Co.(1) | 709 | 1,149 | ||||||
| Continental Resources, Inc. | 137 | 2,354 | ||||||
| CVR Energy, Inc. | 183 | 3,054 | ||||||
| Devon Energy Corp. | 1,238 | 13,457 | ||||||
| DHT Holdings, Inc. | 468 | 2,476 | ||||||
Diamond S Shipping, Inc.(1) | 70 | 573 | ||||||
| Diamondback Energy, Inc. | 360 | 14,026 | ||||||
Dorian LPG Ltd.(1) | 70 | 591 | ||||||
EnLink Midstream LLC(1) | 1,137 | 3,400 | ||||||
| EOG Resources, Inc. | 1,370 | 62,116 | ||||||
| EQT Corp. | 2,009 | 31,883 | ||||||
| Equitrans Midstream Corp. | 437 | 4,492 | ||||||
| Exxon Mobil Corp. | 3,828 | 152,890 | ||||||
Green Plains, Inc.(1) | 66 | 883 | ||||||
| Hess Corp. | 1,165 | 53,637 | ||||||
| HollyFrontier Corp. | 587 | 14,012 | ||||||
| International Seaways, Inc. | 38 | 644 | ||||||
| Kinder Morgan, Inc. | 2,070 | 28,607 | ||||||
| Kosmos Energy Ltd. | 2,198 | 3,231 | ||||||
Magnolia Oil & Gas Corp., Class A(1) | 271 | 1,745 | ||||||
| Marathon Oil Corp. | 2,440 | 12,883 | ||||||
| Marathon Petroleum Corp. | 1,239 | 43,935 | ||||||
Matador Resources Co.(1) | 554 | 5,390 | ||||||
35
| Shares | Value | |||||||
| Murphy Oil Corp. | 500 | $ | 6,870 | |||||
| Noble Energy, Inc. | 1,373 | 13,661 | ||||||
| Nordic American Tankers Ltd. | 931 | 4,059 | ||||||
| Occidental Petroleum Corp. | 2,212 | 28,181 | ||||||
| ONEOK, Inc. | 1,077 | 29,596 | ||||||
| Ovintiv, Inc. | 907 | 10,050 | ||||||
Par Pacific Holdings, Inc.(1) | 61 | 529 | ||||||
| Parsley Energy, Inc., Class A | 772 | 8,299 | ||||||
| PBF Energy, Inc., Class A | 517 | 4,426 | ||||||
PDC Energy, Inc.(1) | 404 | 6,117 | ||||||
| Peabody Energy Corp. | 4 | 10 | ||||||
| Phillips 66 | 1,080 | 63,148 | ||||||
| Pioneer Natural Resources Co. | 453 | 47,080 | ||||||
| Range Resources Corp. | 2,015 | 15,032 | ||||||
Renewable Energy Group, Inc.(1) | 155 | 5,182 | ||||||
| Scorpio Tankers, Inc. | 36 | 426 | ||||||
| SFL Corp. Ltd. | 382 | 3,354 | ||||||
| SM Energy Co. | 628 | 1,526 | ||||||
Southwestern Energy Co.(1) | 4,270 | 11,871 | ||||||
Talos Energy, Inc.(1) | 2 | 15 | ||||||
| Targa Resources Corp. | 427 | 7,263 | ||||||
Teekay Corp.(1) | 209 | 533 | ||||||
Teekay Tankers Ltd., Class A(1) | 2 | 25 | ||||||
| Valero Energy Corp. | 1,109 | 58,322 | ||||||
| Williams Cos., Inc. (The) | 3,757 | 77,995 | ||||||
| World Fuel Services Corp. | 40 | 1,056 | ||||||
WPX Energy, Inc.(1) | 1,777 | 9,880 | ||||||
| 1,374,749 | ||||||||
| Paper and Forest Products — 0.1% | ||||||||
| Boise Cascade Co. | 274 | 12,549 | ||||||
Clearwater Paper Corp.(1) | 102 | 3,433 | ||||||
| Domtar Corp. | 273 | 7,786 | ||||||
| Louisiana-Pacific Corp. | 255 | 8,400 | ||||||
| Mercer International, Inc. | 465 | 3,897 | ||||||
| Neenah, Inc. | 89 | 3,941 | ||||||
| P.H. Glatfelter Co. | 55 | 824 | ||||||
| Schweitzer-Mauduit International, Inc. | 238 | 7,219 | ||||||
| Verso Corp., Class A | 280 | 3,671 | ||||||
| 51,720 | ||||||||
| Personal Products — 0.3% | ||||||||
BellRing Brands, Inc., Class A(1) | 86 | 1,672 | ||||||
| Coty, Inc., Class A | 226 | 809 | ||||||
Edgewell Personal Care Co.(1) | 155 | 4,450 | ||||||
elf Beauty, Inc.(1) | 178 | 3,476 | ||||||
| Estee Lauder Cos., Inc. (The), Class A | 441 | 97,779 | ||||||
Herbalife Nutrition Ltd.(1) | 154 | 7,569 | ||||||
| Inter Parfums, Inc. | 14 | 625 | ||||||
| Medifast, Inc. | 115 | 18,713 | ||||||
| Nu Skin Enterprises, Inc., Class A | 401 | 18,955 | ||||||
USANA Health Sciences, Inc.(1) | 104 | 8,155 | ||||||
| 162,203 | ||||||||
36
| Shares | Value | |||||||
| Pharmaceuticals — 3.5% | ||||||||
Amneal Pharmaceuticals, Inc.(1) | 658 | $ | 2,704 | |||||
Amphastar Pharmaceuticals, Inc.(1) | 157 | 3,200 | ||||||
ANI Pharmaceuticals, Inc.(1) | 16 | 502 | ||||||
| Bristol-Myers Squibb Co. | 3,070 | 190,954 | ||||||
Catalent, Inc.(1) | 140 | 12,950 | ||||||
Corcept Therapeutics, Inc.(1) | 728 | 9,246 | ||||||
Elanco Animal Health, Inc.(1) | 826 | 24,003 | ||||||
| Eli Lilly & Co. | 1,477 | 219,172 | ||||||
Evofem Biosciences, Inc.(1) | 87 | 289 | ||||||
Horizon Therapeutics plc(1) | 508 | 38,161 | ||||||
Innoviva, Inc.(1) | 449 | 5,258 | ||||||
Intra-Cellular Therapies, Inc.(1) | 66 | 1,202 | ||||||
Jazz Pharmaceuticals plc(1) | 185 | 24,862 | ||||||
| Johnson & Johnson | 3,890 | 596,765 | ||||||
Lannett Co., Inc.(1) | 110 | 579 | ||||||
| Merck & Co., Inc. | 3,487 | 297,336 | ||||||
Mylan NV(1) | 1,813 | 29,697 | ||||||
MyoKardia, Inc.(1) | 95 | 10,397 | ||||||
Nektar Therapeutics(1) | 498 | 9,631 | ||||||
| Perrigo Co. plc | 312 | 16,318 | ||||||
| Pfizer, Inc. | 3,963 | 149,762 | ||||||
| Phibro Animal Health Corp., Class A | 137 | 2,940 | ||||||
Prestige Consumer Healthcare, Inc.(1) | 211 | 7,687 | ||||||
Reata Pharmaceuticals, Inc., Class A(1) | 1 | 105 | ||||||
Revance Therapeutics, Inc.(1) | 61 | 1,783 | ||||||
Supernus Pharmaceuticals, Inc.(1) | 333 | 7,323 | ||||||
Theravance Biopharma, Inc.(1) | 88 | 1,613 | ||||||
| Zoetis, Inc. | 776 | 124,237 | ||||||
Zogenix, Inc.(1) | 21 | 497 | ||||||
| 1,789,173 | ||||||||
| Professional Services — 0.5% | ||||||||
ASGN, Inc.(1) | 52 | 3,732 | ||||||
| Barrett Business Services, Inc. | 11 | 633 | ||||||
| CoreLogic, Inc. | 115 | 7,636 | ||||||
CoStar Group, Inc.(1) | 29 | 24,609 | ||||||
| CRA International, Inc. | 19 | 808 | ||||||
| Equifax, Inc. | 81 | 13,630 | ||||||
| Exponent, Inc. | 150 | 12,068 | ||||||
FTI Consulting, Inc.(1) | 60 | 6,886 | ||||||
| Heidrick & Struggles International, Inc. | 139 | 3,007 | ||||||
| ICF International, Inc. | 43 | 2,937 | ||||||
| IHS Markit Ltd. | 195 | 15,584 | ||||||
| Insperity, Inc. | 120 | 8,084 | ||||||
| Kelly Services, Inc., Class A | 46 | 874 | ||||||
| Kforce, Inc. | 132 | 4,533 | ||||||
| Korn Ferry | 193 | 5,886 | ||||||
| ManpowerGroup, Inc. | 236 | 17,301 | ||||||
| Nielsen Holdings plc | 284 | 4,339 | ||||||
| Robert Half International, Inc. | 593 | 31,548 | ||||||
| TransUnion | 179 | 15,523 | ||||||
TriNet Group, Inc.(1) | 277 | 18,792 | ||||||
37
| Shares | Value | |||||||
TrueBlue, Inc.(1) | 43 | $ | 728 | |||||
| Verisk Analytics, Inc. | 222 | 41,441 | ||||||
| 240,579 | ||||||||
| Real Estate Management and Development — 0.2% | ||||||||
CBRE Group, Inc., Class A(1) | 934 | 43,926 | ||||||
Cushman & Wakefield plc(1) | 257 | 2,984 | ||||||
FRP Holdings, Inc.(1) | 20 | 821 | ||||||
Howard Hughes Corp. (The)(1) | 89 | 5,261 | ||||||
| Jones Lang LaSalle, Inc. | 76 | 7,831 | ||||||
| Kennedy-Wilson Holdings, Inc. | 249 | 3,558 | ||||||
Marcus & Millichap, Inc.(1) | 133 | 3,752 | ||||||
| Newmark Group, Inc., Class A | 91 | 403 | ||||||
| RE/MAX Holdings, Inc., Class A | 151 | 5,306 | ||||||
Redfin Corp.(1) | 167 | 7,944 | ||||||
| RMR Group, Inc. (The), Class A | 21 | 593 | ||||||
St. Joe Co. (The)(1) | 156 | 3,621 | ||||||
| 86,000 | ||||||||
| Road and Rail — 2.1% | ||||||||
| AMERCO | 48 | 17,035 | ||||||
| ArcBest Corp. | 201 | 6,798 | ||||||
Avis Budget Group, Inc.(1) | 174 | 5,935 | ||||||
Covenant Logistics Group, Inc., Class A(1) | 158 | 2,896 | ||||||
| CSX Corp. | 2,346 | 179,375 | ||||||
| Heartland Express, Inc. | 232 | 4,799 | ||||||
| J.B. Hunt Transport Services, Inc. | 435 | 61,135 | ||||||
| Kansas City Southern | 371 | 67,537 | ||||||
| Knight-Swift Transportation Holdings, Inc. | 428 | 19,457 | ||||||
| Landstar System, Inc. | 221 | 29,413 | ||||||
Lyft, Inc., Class A(1) | 304 | 9,020 | ||||||
| Marten Transport Ltd. | 469 | 8,517 | ||||||
| Norfolk Southern Corp. | 721 | 153,234 | ||||||
| Old Dominion Freight Line, Inc. | 473 | 95,631 | ||||||
| Ryder System, Inc. | 411 | 16,810 | ||||||
Saia, Inc.(1) | 189 | 25,364 | ||||||
| Schneider National, Inc., Class B | 267 | 7,225 | ||||||
Uber Technologies, Inc.(1) | 1,312 | 44,122 | ||||||
| Union Pacific Corp. | 1,513 | 291,162 | ||||||
US Xpress Enterprises, Inc., Class A(1) | 274 | 2,622 | ||||||
| Werner Enterprises, Inc. | 423 | 19,462 | ||||||
| 1,067,549 | ||||||||
| Semiconductors and Semiconductor Equipment — 5.0% | ||||||||
Advanced Micro Devices, Inc.(1) | 847 | 76,925 | ||||||
Ambarella, Inc.(1) | 19 | 1,001 | ||||||
Amkor Technology, Inc.(1) | 485 | 5,915 | ||||||
| Analog Devices, Inc. | 210 | 24,545 | ||||||
| Applied Materials, Inc. | 2,339 | 144,082 | ||||||
Axcelis Technologies, Inc.(1) | 46 | 1,087 | ||||||
| Broadcom, Inc. | 286 | 99,285 | ||||||
| Brooks Automation, Inc. | 199 | 10,274 | ||||||
| Cabot Microelectronics Corp. | 83 | 12,640 | ||||||
CEVA, Inc.(1) | 78 | 3,296 | ||||||
Cirrus Logic, Inc.(1) | 153 | 9,270 | ||||||
38
| Shares | Value | |||||||
| Cohu, Inc. | 70 | $ | 1,204 | |||||
Cree, Inc.(1) | 315 | 19,877 | ||||||
Diodes, Inc.(1) | 201 | 9,821 | ||||||
Enphase Energy, Inc.(1) | 297 | 22,937 | ||||||
| Entegris, Inc. | 203 | 13,579 | ||||||
First Solar, Inc.(1) | 342 | 26,194 | ||||||
FormFactor, Inc.(1) | 55 | 1,437 | ||||||
Ichor Holdings Ltd.(1) | 32 | 805 | ||||||
Inphi Corp.(1) | 46 | 5,243 | ||||||
| Intel Corp. | 8,012 | 408,211 | ||||||
| KLA Corp. | 241 | 49,439 | ||||||
| Kulicke & Soffa Industries, Inc. | 162 | 3,885 | ||||||
| Lam Research Corp. | 425 | 142,944 | ||||||
Lattice Semiconductor Corp.(1) | 52 | 1,487 | ||||||
| Marvell Technology Group Ltd. | 1,013 | 39,284 | ||||||
| Maxim Integrated Products, Inc. | 1,014 | 69,398 | ||||||
MaxLinear, Inc.(1) | 215 | 5,235 | ||||||
| Microchip Technology, Inc. | 159 | 17,442 | ||||||
Micron Technology, Inc.(1) | 3,003 | 136,667 | ||||||
| MKS Instruments, Inc. | 105 | 12,551 | ||||||
| Monolithic Power Systems, Inc. | 86 | 22,973 | ||||||
| NVIDIA Corp. | 668 | 357,367 | ||||||
| NXP Semiconductors NV | 376 | 47,286 | ||||||
ON Semiconductor Corp.(1) | 1,484 | 31,713 | ||||||
Onto Innovation, Inc.(1) | 175 | 5,467 | ||||||
PDF Solutions, Inc.(1) | 158 | 3,271 | ||||||
Photronics, Inc.(1) | 344 | 3,450 | ||||||
| Power Integrations, Inc. | 166 | 9,291 | ||||||
Qorvo, Inc.(1) | 273 | 35,018 | ||||||
| QUALCOMM, Inc. | 683 | 81,345 | ||||||
Rambus, Inc.(1) | 310 | 4,163 | ||||||
Semtech Corp.(1) | 111 | 6,510 | ||||||
Silicon Laboratories, Inc.(1) | 54 | 5,530 | ||||||
| Skyworks Solutions, Inc. | 586 | 84,882 | ||||||
SMART Global Holdings, Inc.(1) | 156 | 3,931 | ||||||
SolarEdge Technologies, Inc.(1) | 177 | 39,144 | ||||||
Synaptics, Inc.(1) | 197 | 16,810 | ||||||
| Teradyne, Inc. | 719 | 61,093 | ||||||
| Texas Instruments, Inc. | 1,816 | 258,144 | ||||||
Ultra Clean Holdings, Inc.(1) | 244 | 5,983 | ||||||
| Universal Display Corp. | 83 | 14,567 | ||||||
Veeco Instruments, Inc.(1) | 260 | 3,091 | ||||||
| Xilinx, Inc. | 756 | 78,745 | ||||||
| 2,555,734 | ||||||||
| Software — 6.7% | ||||||||
ACI Worldwide, Inc.(1) | 88 | 2,585 | ||||||
Adobe, Inc.(1) | 419 | 215,110 | ||||||
Alteryx, Inc., Class A(1) | 36 | 4,350 | ||||||
| American Software, Inc., Class A | 149 | 2,110 | ||||||
Anaplan, Inc.(1) | 81 | 4,961 | ||||||
ANSYS, Inc.(1) | 56 | 18,985 | ||||||
Appfolio, Inc., Class A(1) | 12 | 2,016 | ||||||
39
| Shares | Value | |||||||
Aspen Technology, Inc.(1) | 224 | $ | 28,455 | |||||
Autodesk, Inc.(1) | 184 | 45,209 | ||||||
Avalara, Inc.(1) | 80 | 10,593 | ||||||
| Blackbaud, Inc. | 48 | 3,065 | ||||||
Blackline, Inc.(1) | 37 | 3,233 | ||||||
Bottomline Technologies de, Inc.(1) | 113 | 5,382 | ||||||
Cadence Design Systems, Inc.(1) | 522 | 57,895 | ||||||
| CDK Global, Inc. | 109 | 5,082 | ||||||
Ceridian HCM Holding, Inc.(1) | 67 | 5,328 | ||||||
| Citrix Systems, Inc. | 238 | 34,558 | ||||||
Cloudera, Inc.(1) | 435 | 5,746 | ||||||
Cloudflare, Inc., Class A(1) | 189 | 7,231 | ||||||
CommVault Systems, Inc.(1) | 112 | 4,842 | ||||||
Cornerstone OnDemand, Inc.(1) | 81 | 2,857 | ||||||
Coupa Software, Inc.(1) | 40 | 13,110 | ||||||
Crowdstrike Holdings, Inc., Class A(1) | 161 | 20,242 | ||||||
Datadog, Inc., Class A(1) | 145 | 12,115 | ||||||
Digital Turbine, Inc.(1) | 276 | 6,676 | ||||||
DocuSign, Inc.(1) | 111 | 24,753 | ||||||
Dropbox, Inc., Class A(1) | 548 | 11,601 | ||||||
Dynatrace, Inc.(1) | 102 | 4,511 | ||||||
Elastic NV(1) | 33 | 3,583 | ||||||
Envestnet, Inc.(1) | 56 | 4,647 | ||||||
Everbridge, Inc.(1) | 22 | 3,269 | ||||||
Fair Isaac Corp.(1) | 67 | 28,193 | ||||||
Five9, Inc.(1) | 51 | 6,499 | ||||||
Fortinet, Inc.(1) | 587 | 77,487 | ||||||
Guidewire Software, Inc.(1) | 131 | 14,713 | ||||||
HubSpot, Inc.(1) | 61 | 18,280 | ||||||
| Intuit, Inc. | 335 | 115,706 | ||||||
j2 Global, Inc.(1) | 56 | 3,919 | ||||||
Manhattan Associates, Inc.(1) | 295 | 28,689 | ||||||
Medallia, Inc.(1) | 100 | 3,619 | ||||||
| Microsoft Corp. | 8,122 | 1,831,755 | ||||||
MicroStrategy, Inc., Class A(1) | 6 | 867 | ||||||
Mimecast Ltd.(1) | 111 | 5,466 | ||||||
Mitek Systems, Inc.(1) | 300 | 3,807 | ||||||
New Relic, Inc.(1) | 81 | 4,976 | ||||||
| NortonLifeLock, Inc. | 1,682 | 39,561 | ||||||
Nuance Communications, Inc.(1) | 66 | 1,977 | ||||||
Nutanix, Inc., Class A(1) | 186 | 5,340 | ||||||
OneSpan, Inc.(1) | 120 | 2,586 | ||||||
| Oracle Corp. (New York) | 2,068 | 118,331 | ||||||
Palo Alto Networks, Inc.(1) | 109 | 28,058 | ||||||
Paycom Software, Inc.(1) | 85 | 25,454 | ||||||
Paylocity Holding Corp.(1) | 100 | 14,725 | ||||||
| Pegasystems, Inc. | 43 | 5,524 | ||||||
Ping Identity Holding Corp.(1) | 116 | 3,998 | ||||||
| Progress Software Corp. | 99 | 3,751 | ||||||
Proofpoint, Inc.(1) | 38 | 4,167 | ||||||
PTC, Inc.(1) | 65 | 5,942 | ||||||
Q2 Holdings, Inc.(1) | 13 | 1,265 | ||||||
40
| Shares | Value | |||||||
Qualys, Inc.(1) | 116 | $ | 12,312 | |||||
RealPage, Inc.(1) | 76 | 4,759 | ||||||
RingCentral, Inc., Class A(1) | 52 | 15,120 | ||||||
salesforce.com, Inc.(1) | 525 | 143,141 | ||||||
ServiceNow, Inc.(1) | 185 | 89,174 | ||||||
ShotSpotter, Inc.(1) | 76 | 2,277 | ||||||
Slack Technologies, Inc., Class A(1) | 459 | 15,074 | ||||||
Smartsheet, Inc., Class A(1) | 104 | 5,671 | ||||||
Splunk, Inc.(1) | 87 | 19,082 | ||||||
| SS&C Technologies Holdings, Inc. | 131 | 8,347 | ||||||
Synopsys, Inc.(1) | 147 | 32,531 | ||||||
Teradata Corp.(1) | 38 | 925 | ||||||
Trade Desk, Inc. (The), Class A(1) | 32 | 15,402 | ||||||
Tyler Technologies, Inc.(1) | 37 | 12,776 | ||||||
VMware, Inc., Class A(1) | 80 | 11,555 | ||||||
Workday, Inc., Class A(1) | 93 | 22,293 | ||||||
| Xperi Holding Corp. | 52 | 652 | ||||||
Zendesk, Inc.(1) | 62 | 5,976 | ||||||
Zoom Video Communications, Inc., Class A(1) | 152 | 49,415 | ||||||
Zscaler, Inc.(1) | 44 | 6,307 | ||||||
| 3,451,544 | ||||||||
| Specialty Retail — 3.3% | ||||||||
| Aaron's, Inc. | 145 | 8,104 | ||||||
| Abercrombie & Fitch Co., Class A | 332 | 4,319 | ||||||
| Advance Auto Parts, Inc. | 324 | 50,644 | ||||||
| American Eagle Outfitters, Inc. | 1,022 | 12,887 | ||||||
Asbury Automotive Group, Inc.(1) | 105 | 11,108 | ||||||
At Home Group, Inc.(1) | 539 | 10,300 | ||||||
AutoNation, Inc.(1) | 462 | 26,269 | ||||||
AutoZone, Inc.(1) | 19 | 22,730 | ||||||
| Bed Bath & Beyond, Inc. | 499 | 6,078 | ||||||
| Best Buy Co., Inc. | 1,031 | 114,348 | ||||||
Boot Barn Holdings, Inc.(1) | 25 | 706 | ||||||
| Buckle, Inc. (The) | 211 | 3,954 | ||||||
Burlington Stores, Inc.(1) | 306 | 60,261 | ||||||
| Caleres, Inc. | 55 | 430 | ||||||
CarMax, Inc.(1) | 727 | 77,738 | ||||||
Carvana Co.(1) | 50 | 10,798 | ||||||
| Cato Corp. (The), Class A | 52 | 416 | ||||||
| Designer Brands, Inc., Class A | 104 | 733 | ||||||
| Dick's Sporting Goods, Inc. | 404 | 21,864 | ||||||
Five Below, Inc.(1) | 137 | 14,995 | ||||||
Floor & Decor Holdings, Inc., Class A(1) | 217 | 15,893 | ||||||
| Foot Locker, Inc. | 535 | 16,227 | ||||||
| Gap, Inc. (The) | 1,052 | 18,294 | ||||||
Genesco, Inc.(1) | 1 | 20 | ||||||
| Group 1 Automotive, Inc. | 69 | 5,964 | ||||||
| Guess?, Inc. | 55 | 632 | ||||||
| Haverty Furniture Cos., Inc. | 49 | 1,035 | ||||||
Hibbett Sports, Inc.(1) | 185 | 6,173 | ||||||
| Home Depot, Inc. (The) | 641 | 182,711 | ||||||
Hudson Ltd., Class A(1) | 56 | 422 | ||||||
41
| Shares | Value | |||||||
| L Brands, Inc. | 285 | $ | 8,379 | |||||
| Lithia Motors, Inc., Class A | 120 | 29,875 | ||||||
| Lowe's Cos., Inc. | 1,582 | 260,540 | ||||||
Lumber Liquidators Holdings, Inc.(1) | 214 | 5,134 | ||||||
MarineMax, Inc.(1) | 148 | 4,353 | ||||||
| Monro, Inc. | 56 | 2,581 | ||||||
Murphy USA, Inc.(1) | 167 | 22,522 | ||||||
National Vision Holdings, Inc.(1) | 114 | 4,283 | ||||||
O'Reilly Automotive, Inc.(1) | 206 | 95,920 | ||||||
| ODP Corp. (The) | 348 | 8,136 | ||||||
| Penske Automotive Group, Inc. | 95 | 4,481 | ||||||
| Rent-A-Center, Inc. | 196 | 6,017 | ||||||
RH(1) | 63 | 20,825 | ||||||
| Ross Stores, Inc. | 1,080 | 98,366 | ||||||
Sally Beauty Holdings, Inc.(1) | 407 | 4,542 | ||||||
| Shoe Carnival, Inc. | 27 | 888 | ||||||
| Signet Jewelers Ltd. | 404 | 6,977 | ||||||
| Sonic Automotive, Inc., Class A | 143 | 6,043 | ||||||
Sportsman's Warehouse Holdings, Inc.(1) | 496 | 7,785 | ||||||
| TJX Cos., Inc. (The) | 3,303 | 180,971 | ||||||
| Tractor Supply Co. | 617 | 91,828 | ||||||
Ulta Beauty, Inc.(1) | 262 | 60,831 | ||||||
Urban Outfitters, Inc.(1) | 279 | 6,568 | ||||||
| Williams-Sonoma, Inc. | 502 | 44,056 | ||||||
| Winmark Corp. | 24 | 3,707 | ||||||
Zumiez, Inc.(1) | 144 | 3,698 | ||||||
| 1,695,359 | ||||||||
| Technology Hardware, Storage and Peripherals — 5.4% | ||||||||
3D Systems Corp.(1) | 118 | 648 | ||||||
| Apple, Inc. | 20,592 | 2,657,192 | ||||||
Dell Technologies, Inc., Class C(1) | 199 | 13,150 | ||||||
| Hewlett Packard Enterprise Co. | 341 | 3,297 | ||||||
| HP, Inc. | 1,076 | 21,036 | ||||||
NCR Corp.(1) | 106 | 2,166 | ||||||
| NetApp, Inc. | 405 | 19,193 | ||||||
Pure Storage, Inc., Class A(1) | 489 | 7,462 | ||||||
| Seagate Technology plc | 920 | 44,151 | ||||||
Stratasys Ltd.(1) | 65 | 966 | ||||||
Super Micro Computer, Inc.(1) | 118 | 3,232 | ||||||
| Western Digital Corp. | 138 | 5,302 | ||||||
| Xerox Holdings Corp. | 779 | 14,692 | ||||||
| 2,792,487 | ||||||||
| Textiles, Apparel and Luxury Goods — 1.2% | ||||||||
Capri Holdings Ltd.(1) | 332 | 5,259 | ||||||
| Carter's, Inc. | 178 | 14,172 | ||||||
| Columbia Sportswear Co. | 107 | 9,156 | ||||||
Crocs, Inc.(1) | 427 | 17,042 | ||||||
Deckers Outdoor Corp.(1) | 162 | 33,027 | ||||||
G-III Apparel Group Ltd.(1) | 88 | 973 | ||||||
| Hanesbrands, Inc. | 1,150 | 17,584 | ||||||
| Kontoor Brands, Inc. | 143 | 3,160 | ||||||
| Levi Strauss & Co., Class A | 279 | 3,437 | ||||||
42
| Shares | Value | |||||||
lululemon athletica, Inc.(1) | 351 | $ | 131,860 | |||||
| NIKE, Inc., Class B | 2,419 | 270,662 | ||||||
| Oxford Industries, Inc. | 78 | 3,863 | ||||||
| PVH Corp. | 167 | 9,312 | ||||||
| Ralph Lauren Corp. | 124 | 8,535 | ||||||
Skechers USA, Inc., Class A(1) | 234 | 6,985 | ||||||
| Steven Madden Ltd. | 211 | 4,465 | ||||||
| Tapestry, Inc. | 1,097 | 16,159 | ||||||
Under Armour, Inc., Class A(1) | 728 | 7,142 | ||||||
Under Armour, Inc., Class C(1) | 297 | 2,628 | ||||||
| VF Corp. | 933 | 61,345 | ||||||
| Wolverine World Wide, Inc. | 305 | 7,619 | ||||||
| 634,385 | ||||||||
| Thrifts and Mortgage Finance — 0.3% | ||||||||
Axos Financial, Inc.(1) | 284 | 7,038 | ||||||
Columbia Financial, Inc.(1) | 177 | 1,889 | ||||||
| Essent Group Ltd. | 386 | 13,780 | ||||||
| Federal Agricultural Mortgage Corp., Class C | 74 | 5,043 | ||||||
| Flagstar Bancorp, Inc. | 172 | 5,404 | ||||||
| HomeStreet, Inc. | 153 | 4,188 | ||||||
| Kearny Financial Corp. | 70 | 543 | ||||||
| Merchants Bancorp | 148 | 3,016 | ||||||
| Meridian Bancorp, Inc. | 49 | 570 | ||||||
| Meta Financial Group, Inc. | 155 | 2,988 | ||||||
| MGIC Investment Corp. | 1,489 | 13,654 | ||||||
Mr. Cooper Group, Inc.(1) | 541 | 9,914 | ||||||
| New York Community Bancorp, Inc. | 1,364 | 12,344 | ||||||
NMI Holdings, Inc., Class A(1) | 312 | 5,351 | ||||||
| Northfield Bancorp, Inc. | 59 | 570 | ||||||
| Northwest Bancshares, Inc. | 378 | 3,822 | ||||||
| PennyMac Financial Services, Inc. | 336 | 17,714 | ||||||
| Premier Financial Corp. | 66 | 1,206 | ||||||
| Provident Financial Services, Inc. | 42 | 554 | ||||||
| Radian Group, Inc. | 541 | 8,353 | ||||||
| TFS Financial Corp. | 68 | 1,051 | ||||||
| TrustCo Bank Corp. NY | 113 | 673 | ||||||
| Walker & Dunlop, Inc. | 163 | 8,929 | ||||||
| Washington Federal, Inc. | 156 | 3,658 | ||||||
| Waterstone Financial, Inc. | 149 | 2,308 | ||||||
| WSFS Financial Corp. | 154 | 4,512 | ||||||
| 139,072 | ||||||||
| Trading Companies and Distributors — 0.7% | ||||||||
| Air Lease Corp. | 475 | 14,763 | ||||||
| Applied Industrial Technologies, Inc. | 194 | 11,681 | ||||||
BMC Stock Holdings, Inc.(1) | 390 | 15,569 | ||||||
CAI International, Inc.(1) | 171 | 3,729 | ||||||
| Fastenal Co. | 2,152 | 105,147 | ||||||
| GATX Corp. | 222 | 14,847 | ||||||
GMS, Inc.(1) | 167 | 4,424 | ||||||
| H&E Equipment Services, Inc. | 215 | 4,356 | ||||||
HD Supply Holdings, Inc.(1) | 171 | 6,782 | ||||||
Herc Holdings, Inc.(1) | 149 | 6,101 | ||||||
43
| Shares | Value | |||||||
MRC Global, Inc.(1) | 76 | $ | 432 | |||||
| MSC Industrial Direct Co., Inc., Class A | 244 | 16,079 | ||||||
NOW, Inc.(1) | 598 | 4,347 | ||||||
| Rush Enterprises, Inc., Class A | 209 | 10,099 | ||||||
SiteOne Landscape Supply, Inc.(1) | 123 | 15,381 | ||||||
| Systemax, Inc. | 136 | 3,018 | ||||||
Textainer Group Holdings Ltd.(1) | 266 | 3,123 | ||||||
| Triton International Ltd. | 360 | 12,982 | ||||||
United Rentals, Inc.(1) | 156 | 27,620 | ||||||
Veritiv Corp.(1) | 210 | 3,650 | ||||||
| W.W. Grainger, Inc. | 202 | 73,817 | ||||||
| Watsco, Inc. | 76 | 18,619 | ||||||
WESCO International, Inc.(1) | 109 | 5,107 | ||||||
| 381,673 | ||||||||
Transportation Infrastructure† | ||||||||
| Macquarie Infrastructure Corp. | 154 | 4,315 | ||||||
Water Utilities† | ||||||||
| American States Water Co. | 69 | 5,250 | ||||||
| American Water Works Co., Inc. | 60 | 8,480 | ||||||
| California Water Service Group | 95 | 4,307 | ||||||
| Essential Utilities, Inc. | 134 | 5,695 | ||||||
| 23,732 | ||||||||
| Wireless Telecommunication Services — 0.4% | ||||||||
Boingo Wireless, Inc.(1) | 308 | 4,001 | ||||||
| Shenandoah Telecommunications Co. | 328 | 18,138 | ||||||
T-Mobile US, Inc.(1) | 1,647 | 192,172 | ||||||
| Telephone and Data Systems, Inc. | 441 | 10,200 | ||||||
United States Cellular Corp.(1) | 112 | 4,075 | ||||||
| 228,586 | ||||||||
TOTAL COMMON STOCKS (Cost $41,484,184) | 51,022,794 | |||||||
| TEMPORARY CASH INVESTMENTS — 2.2% | ||||||||
| State Street Institutional U.S. Government Money Market Fund, Premier Class (Cost $1,150,521) | 1,150,521 | 1,150,521 | ||||||
TOTAL INVESTMENT SECURITIES — 101.2% (Cost $42,634,705) | 52,173,315 | |||||||
| OTHER ASSETS AND LIABILITIES — (1.2)% | (642,089) | |||||||
| TOTAL NET ASSETS — 100.0% | $ | 51,531,226 | ||||||
| FUTURES CONTRACTS PURCHASED | |||||||||||||||||
| Reference Entity | Contracts | Expiration Date | Notional Amount | Unrealized Appreciation (Depreciation)^ | |||||||||||||
| S&P 500 E-Mini | 3 | September 2020 | $ | 524,835 | $ | 46,218 | |||||||||||
^Amount represents value and unrealized appreciation (depreciation).
| NOTES TO SCHEDULE OF INVESTMENTS | ||
† Category is less than 0.05% of total net assets.
(1)Non-income producing.
See Notes to Financial Statements.
44
| Statement of Assets and Liabilities | ||
| AUGUST 31, 2020 | |||||
| Assets | |||||
| Investment securities, at value (cost of $42,634,705) | $ | 52,173,315 | |||
| Deposits with broker for futures contracts | 36,000 | ||||
| Dividends and interest receivable | 77,117 | ||||
| 52,286,432 | |||||
| Liabilities | |||||
| Payable for capital shares redeemed | 744,879 | ||||
| Payable for variation margin on futures contracts | 3,924 | ||||
| Accrued management fees | 6,403 | ||||
| 755,206 | |||||
| Net Assets | $ | 51,531,226 | |||
| Institutional Class Capital Shares | |||||
| Shares outstanding (unlimited number of shares authorized) | 4,719,606 | ||||
| Net Asset Value Per Share | $ | 10.92 | |||
| Net Assets Consist of: | |||||
| Capital paid in | $ | 41,747,025 | |||
| Distributable earnings | 9,784,201 | ||||
| $ | 51,531,226 | ||||
See Notes to Financial Statements.
45
| Statement of Operations | ||
FOR THE PERIOD ENDED AUGUST 31, 2020(1) | |||||
| Investment Income (Loss) | |||||
| Income: | |||||
| Dividends (net of foreign taxes withheld of $92) | $ | 355,226 | |||
| Interest | 1,258 | ||||
| Securities lending, net | 117 | ||||
| 356,601 | |||||
| Expenses: | |||||
| Management fees | 30,143 | ||||
| Net investment income (loss) | 326,458 | ||||
| Realized and Unrealized Gain (Loss) | |||||
| Net realized gain (loss) on: | |||||
| Investment transactions | (298,305) | ||||
| Futures contract transactions | 187,024 | ||||
| (111,281) | |||||
| Change in net unrealized appreciation (depreciation) on: | |||||
| Investments | 9,538,610 | ||||
| Futures contracts | 46,218 | ||||
| 9,584,828 | |||||
| Net realized and unrealized gain (loss) | 9,473,547 | ||||
| Net Increase (Decrease) in Net Assets Resulting from Operations | $ | 9,800,005 | |||
(1)December 4, 2019 (fund inception) through August 31, 2020.
See Notes to Financial Statements.
46
| Statement of Changes in Net Assets | ||
PERIOD ENDED AUGUST 31, 2020(1) | |||||
| Increase (Decrease) in Net Assets | |||||
| Operations | |||||
| Net investment income (loss) | $ | 326,458 | |||
| Net realized gain (loss) | (111,281) | ||||
| Change in net unrealized appreciation (depreciation) | 9,584,828 | ||||
| Net increase (decrease) in net assets resulting from operations | 9,800,005 | ||||
| Distributions to Shareholders | |||||
| From earnings | (15,804) | ||||
| Capital Share Transactions | |||||
| Proceeds from shares sold | 47,661,440 | ||||
| Proceeds from reinvestment of distributions | 15,804 | ||||
| Payments for shares redeemed | (5,930,219) | ||||
| Net increase (decrease) in net assets from capital share transactions | 41,747,025 | ||||
| Net increase (decrease) in net assets | 51,531,226 | ||||
| Net Assets | |||||
| End of period | $ | 51,531,226 | |||
| Transactions in Shares of the Fund | |||||
| Sold | 5,307,267 | ||||
| Issued in reinvestment of distributions | 1,534 | ||||
| Redeemed | (589,195) | ||||
| Net increase (decrease) in shares of the fund | 4,719,606 | ||||
(1)December 4, 2019 (fund inception) through August 31, 2020.
See Notes to Financial Statements.
47
| Notes to Financial Statements | ||
AUGUST 31, 2020
1. Organization
American Century ETF Trust (the trust) was registered as a Delaware statutory trust in 2017 and is registered under the Investment Company Act of 1940, as amended (the 1940 Act), as an open-end management investment company. Avantis U.S. Equity Fund (the fund) is one fund in a series issued by the trust. The fund’s investment objective is to seek long-term capital appreciation. The fund offers the Institutional Class. The Institutional Class commenced sale on December 4, 2019, the fund's inception date.
2. Significant Accounting Policies
The following is a summary of significant accounting policies consistently followed by the fund in preparation of its financial statements. The fund is an investment company and follows accounting and reporting guidance in accordance with accounting principles generally accepted in the United States of America. This may require management to make certain estimates and assumptions at the date of the financial statements. Actual results could differ from these estimates. Management evaluated the impact of events or transactions occurring through the date the financial statements were issued that would merit recognition or disclosure.
Investment Valuations — The fund determines the fair value of its investments and computes its net asset value per share at the close of regular trading (usually 4 p.m. Eastern time) on the New York Stock Exchange (NYSE) on each day the NYSE is open. The Board of Trustees has adopted valuation policies and procedures to guide the investment advisor in the fund’s investment valuation process and to provide methodologies for the oversight of the fund’s pricing function.
Equity securities that are listed or traded on a domestic securities exchange are valued at the last reported sales price or at the official closing price as provided by the exchange. Equity securities traded on foreign securities exchanges are generally valued at the closing price of such securities on the exchange where primarily traded or at the close of the NYSE, if that is earlier. If no last sales price is reported, or if local convention or regulation so provides, the mean of the latest bid and asked prices may be used. Securities traded over-the-counter are valued at the mean of the latest bid and asked prices, the last sales price, or the official closing price.
Open-end management investment companies are valued at the reported net asset value per share. Exchange-traded futures contracts are valued at the settlement price as provided by the appropriate exchange.
If the fund determines that the market price for an investment is not readily available or the valuation methods mentioned above do not reflect an investment’s fair value, such investment is valued as determined in good faith by the Board of Trustees or its delegate, in accordance with policies and procedures adopted by the Board of Trustees. In its determination of fair value, the fund may review several factors including, but not limited to, market information regarding the specific investment or comparable investments and correlation with other investment types, futures indices or general market indicators. Circumstances that may cause the fund to use these procedures to value an investment include, but are not limited to: an investment has been declared in default or is distressed; trading in a security has been suspended during the trading day or a security is not actively trading on its principal exchange; prices received from a regular pricing source are deemed unreliable; or there is a foreign market holiday and no trading occurred.
The fund monitors for significant events occurring after the close of an investment’s primary exchange but before the fund’s net asset value per share is determined. Significant events may include, but are not limited to: corporate announcements and transactions; governmental action and political unrest that could impact a specific investment or an investment sector; or armed conflicts, natural disasters and similar events that could affect investments in a specific country or region. The fund also monitors for significant fluctuations between domestic and foreign markets, as evidenced by the U.S. market or such other indicators that the Board of Trustees, or its delegate, deems appropriate. The fund may apply a model-derived factor to the closing price of equity securities traded on foreign securities exchanges. The factor is based on observable market data as provided by an independent pricing service.
48
Security Transactions — Security transactions are accounted for as of the trade date. Net realized gains and losses are determined on the identified cost basis, which is also used for federal income tax purposes.
Investment Income — Dividend income less foreign taxes withheld, if any, is recorded as of the ex-dividend date. Distributions received on securities that represent a return of capital or long-term capital gain are recorded as a reduction of cost of investments and/or as a realized gain. The fund may estimate the components of distributions received that may be considered nontaxable distributions or long-term capital gain distributions for income tax purposes. Interest income is recorded on the accrual basis and includes accretion of discounts and amortization of premiums. Securities lending income is net of fees and rebates earned by the lending agent for its services.
Segregated Assets — In accordance with the 1940 Act, the fund segregates assets on its books and records to cover certain types of investment securities and other financial instruments. American Century Investment Management, Inc. (ACIM) (the investment advisor) monitors, on a daily basis, the securities segregated to ensure the fund designates a sufficient amount of liquid assets, marked-to-market daily. The fund may also receive assets or be required to pledge assets at the custodian bank or with a broker for collateral requirements.
Income Tax Status — It is the fund’s policy to distribute substantially all net investment income and net realized gains to shareholders and to otherwise qualify as a regulated investment company under provisions of the Internal Revenue Code. Accordingly, no provision has been made for income taxes. The fund files U.S. federal, state, local and non-U.S. tax returns as applicable. The fund's tax returns are subject to examination by the relevant taxing authority until expiration of the applicable statute of limitations, which is generally three years from the date of filing but can be longer in certain jurisdictions. At this time, management believes there are no uncertain tax positions which, based on their technical merit, would not be sustained upon examination and for which it is reasonably possible that the total amounts of unrecognized tax benefits will significantly change in the next twelve months.
Distributions to Shareholders — Distributions from net investment income and net realized gains, if any, are generally declared and paid annually.
Indemnifications — Under the trust’s organizational documents, its officers and trustees are indemnified against certain liabilities arising out of the performance of their duties to the fund. In addition, in the normal course of business, the fund enters into contracts that provide general indemnifications. The maximum exposure under these arrangements is unknown as this would involve future claims that may be made against a fund. The risk of material loss from such claims is considered by management to be remote.
Securities Lending — Securities are lent to qualified financial institutions and brokers. State Street Bank & Trust Co. serves as securities lending agent to the fund pursuant to a Securities Lending Agreement. The lending of securities exposes the fund to risks such as: the borrowers may fail to return the loaned securities, the borrowers may not be able to provide additional collateral, the fund may experience delays in recovery of the loaned securities or delays in access to collateral, or the fund may experience losses related to the investment collateral. To minimize certain risks, loan counterparties pledge collateral in the form of cash and/or securities. The lending agent has agreed to indemnify the fund in the case of default of any securities borrowed. Cash collateral received is invested in the State Street Navigator Securities Lending Government Money Market Portfolio, a money market mutual fund registered under the 1940 Act. The loans may also be secured by U.S. government securities in an amount at least equal to the market value of the securities loaned, plus accrued interest and dividends, determined on a daily basis and adjusted accordingly. By lending securities, the fund seeks to increase its net investment income through the receipt of interest and fees. Such income is reflected separately within the Statement of Operations. The value of loaned securities and related collateral outstanding at period end, if any, are shown on a gross basis within the Schedule of Investments and Statement of Assets and Liabilities.
3. Fees and Transactions with Related Parties
Certain officers and trustees of the trust are also officers and/or directors of American Century Companies, Inc. (ACC). The trust's investment advisor, ACIM, the fund's distributor, American Century Investment Services, Inc., and the trust’s transfer agent, American Century Services, LLC, are wholly owned, directly or indirectly, by ACC. ACIM owns 13% of the shares of the fund.
49
Management Fees — The trust has entered into a management agreement with ACIM, under which ACIM provides the fund with investment advisory and management services in exchange for a single, unified management fee (the fee). The agreement provides that ACIM will pay all expenses of managing and operating the fund, except brokerage and other transaction fees and expenses relating to the acquisition and disposition of portfolio securities, acquired fund fees and expenses, interest, taxes, litigation expenses and extraordinary expenses. The fee is computed and accrued daily based on the daily net assets of the fund and paid monthly in arrears. The annual management fee is 0.15%.
Interfund Transactions — The fund may enter into security transactions with other American Century Investments funds and other client accounts of the investment advisor, in accordance with the 1940 Act rules and procedures adopted by the Board of Trustees. The rules and procedures require, among other things, that these transactions be effected at the independent current market price of the security. There were no interfund transactions during the period.
4. Investment Transactions
Purchases and sales of investment securities, excluding short-term investments, for the period ended August 31, 2020 were $42,657,964 and $822,526, respectively.
5. Fair Value Measurements
The fund’s investments valuation process is based on several considerations and may use multiple inputs to determine the fair value of the investments held by the fund. In conformity with accounting principles generally accepted in the United States of America, the inputs used to determine a valuation are classified into three broad levels.
•Level 1 valuation inputs consist of unadjusted quoted prices in an active market for identical investments.
•Level 2 valuation inputs consist of direct or indirect observable market data (including quoted prices for comparable investments, evaluations of subsequent market events, interest rates, prepayment speeds, credit risk, etc.). These inputs also consist of quoted prices for identical investments initially expressed in local currencies that are adjusted through translation into U.S. dollars.
•Level 3 valuation inputs consist of unobservable data (including a fund’s own assumptions).
The level classification is based on the lowest level input that is significant to the fair valuation measurement. The valuation inputs are not necessarily an indication of the risks associated with investing in these securities or other financial instruments.
As of period end, the fund’s investment securities were classified as Level 1. The Schedule of Investments provides additional information on the fund's portfolio holdings.
6. Derivative Instruments
Equity Price Risk — The fund is subject to equity price risk in the normal course of pursuing its investment objectives. A fund may enter into futures contracts based on an equity index in order to manage its exposure to changes in market conditions. A fund may purchase futures contracts to gain exposure to increases in market value or sell futures contracts to protect against a decline in market value. Upon entering into a futures contract, a fund is required to deposit either cash or securities in an amount equal to a certain percentage of the contract value (initial margin). Subsequent payments (variation margin) are made or received daily, in cash, by a fund. The variation margin is equal to the daily change in the contract value and is recorded as unrealized gains and losses. A fund recognizes a realized gain or loss when the contract is closed or expires. Net realized and unrealized gains or losses occurring during the holding period of futures contracts are a component of net realized gain (loss) on futures contract transactions and change in net unrealized appreciation (depreciation) on futures contracts, respectively. One of the risks of entering into futures contracts is the possibility that the change in value of the contract may not correlate with the changes in value of the underlying securities. The fund's average notional exposure to equity price risk derivative instruments held during the period was $414,466 futures contracts purchased.
50
The value of equity price risk derivative instruments as of August 31, 2020, is disclosed on the Statement of Assets and Liabilities as a liability of $3,924 in payable for variation margin on futures contracts*. For the period from December 4, 2019 (fund inception) through August 31, 2020, the effect of equity price risk derivative instruments on the Statement of Operations was $187,024 in net realized gain (loss) on futures contract transactions and $46,218 in change in net unrealized appreciation (depreciation) on futures contracts.
* Included in the unrealized appreciation (depreciation) on futures contracts as reported in the Schedule of Investments.
7. Risk Factors
The value of the fund’s shares will go up and down, sometimes rapidly or unpredictably, based on the performance of the securities owned by the fund and other factors generally affecting the securities market. Market risks, including political, regulatory, economic and social developments, can affect the value of the fund’s investments. Natural disasters, public health emergencies, terrorism and other unforeseeable events may lead to increased market volatility and may have adverse long-term effects on world economies and markets generally.
8. Federal Tax Information
The tax character of distributions paid during the period December 4, 2019 (fund inception) through August 31, 2020 were as follows:
| Distributions Paid From | |||||
| Ordinary income | $ | 15,804 | |||
| Long-term capital gains | — | ||||
The book-basis character of distributions made during the year from net investment income or net realized gains may differ from their ultimate characterization for federal income tax purposes. These differences reflect the differing character of certain income items and net realized gains and losses for financial statement and tax purposes, and may result in reclassification among certain capital accounts on the financial statements.
As of period end, the federal tax cost of investments and the components of distributable earnings on a tax-basis were as follows:
| Federal tax cost of investments | $ | 42,847,923 | |||
| Gross tax appreciation of investments | $ | 10,165,107 | |||
| Gross tax depreciation of investments | (839,715) | ||||
| Net tax appreciation (depreciation) of investments | $ | 9,325,392 | |||
| Undistributed ordinary income | $ | 318,864 | |||
| Accumulated long-term gains | $ | 139,945 | |||
The difference between book-basis and tax-basis unrealized appreciation (depreciation) is attributable primarily to the tax deferral of losses on wash sales.
51
| Financial Highlights | ||
| For a Share Outstanding Throughout the Period Indicated | |||||||||||||||||||||||||||||||||||
| Per-Share Data | Ratios and Supplemental Data | ||||||||||||||||||||||||||||||||||
| Income From Investment Operations: | Ratio to Average Net Assets of: | ||||||||||||||||||||||||||||||||||
| Net Asset Value, Beginning of Period | Net Investment Income (Loss)(1) | Net Realized and Unrealized Gain (Loss) | Total From Investment Operations | Distributions From Net Investment Income | Net Asset Value, End of Period | Total Return(2) | Operating Expenses | Net Investment Income (Loss) | Portfolio Turnover Rate | Net Assets, End of Period (in thousands) | |||||||||||||||||||||||||
| Institutional Class | |||||||||||||||||||||||||||||||||||
2020(3) | $10.00 | 0.12 | 0.82 | 0.94 | (0.02) | $10.92 | 9.37% | 0.15%(4) | 1.62%(4) | 3% | $51,531 | ||||||||||||||||||||||||
| Notes to Financial Highlights | ||
(1)Computed using average shares outstanding throughout the period.
(2)Total returns are calculated based on the net asset value of the last business day. Total returns for periods less than one year are not annualized.
(3)December 4, 2019 (fund inception) through August 31, 2020.
(4)Annualized.
See Notes to Financial Statements.
| Report of Independent Registered Public Accounting Firm | ||
To the Shareholders and the Board of Trustees of American Century ETF Trust:
Opinion on the Financial Statements and Financial Highlights
We have audited the accompanying statement of assets and liabilities, including the schedule of investments, of Avantis® U.S. Equity Fund (the “Fund”), one of the funds constituting the American Century ETF Trust, as of August 31, 2020, and the related statement of operations, the statement of changes in net assets, and the financial highlights for the period from December 4, 2019 (fund inception) through August 31, 2020, and the related notes. In our opinion, the financial statements and financial highlights present fairly, in all material respects, the financial position of Avantis® U.S. Equity Fund as of August 31, 2020, and the results of its operations, the changes in its net assets, and the financial highlights for the period from December 4, 2019 (fund inception) through August 31, 2020, in conformity with accounting principles generally accepted in the United States of America.
Basis for Opinion
These financial statements and financial highlights are the responsibility of the Fund's management. Our responsibility is to express an opinion on the Fund’s financial statements and financial highlights based on our audit. We are a public accounting firm registered with the Public Company Accounting Oversight Board (United States) (PCAOB) and are required to be independent with respect to the Fund in accordance with the U.S. federal securities laws and the applicable rules and regulations of the Securities and Exchange Commission and the PCAOB.
We conducted our audit in accordance with the standards of the PCAOB. Those standards require that we plan and perform the audit to obtain reasonable assurance about whether the financial statements and financial highlights are free of material misstatement, whether due to error or fraud. The Fund is not required to have, nor were we engaged to perform, an audit of its internal control over financial reporting. As part of our audit we are required to obtain an understanding of internal control over financial reporting but not for the purpose of expressing an opinion on the effectiveness of the Fund’s internal control over financial reporting. Accordingly, we express no such opinion.
Our audit included performing procedures to assess the risks of material misstatement of the financial statements and financial highlights, whether due to error or fraud, and performing procedures that respond to those risks. Such procedures included examining, on a test basis, evidence regarding the amounts and disclosures in the financial statements and financial highlights. Our audit also included evaluating the accounting principles used and significant estimates made by management, as well as evaluating the overall presentation of the financial statements and financial highlights. Our procedures included confirmation of securities owned as of August 31, 2020, by correspondence with the custodian and brokers; when replies were not received from brokers, we performed other auditing procedures. We believe that our audit provides a reasonable basis for our opinion.
DELOITTE & TOUCHE LLP
Kansas City, Missouri
October 16, 2020
We have served as the auditor of one or more American Century investment companies since 1997.
53
| Management | ||
The Board of Trustees
The individuals listed below serve as trustees of the funds. Each trustee will continue to serve in this capacity until death, retirement, resignation or removal from office. The board has adopted a mandatory retirement age for trustees who are not “interested persons,” as that term is defined in the Investment Company Act (independent trustees). Trustees who are not also officers of the trust shall retire by December 31st of the year in which they reach their 75th birthday.
Mr. Thomas is an “interested person” because he currently serves as President and Chief Executive Officer of American Century Companies, Inc. (ACC), the parent company of American Century Investment Management, Inc. (ACIM or the advisor). The other trustees are independent. They are not employees, directors or officers of, and have no financial interest in, ACC or any of its wholly owned, direct or indirect, subsidiaries, including ACIM and American Century Services, LLC (ACS), and they do not have any other affiliations, positions or relationships that would cause them to be considered “interested persons” under the Investment Company Act. The following trustees also serve in this capacity for a number of other registered investment companies in the American Century Investments family of funds: Jonathan S. Thomas, 15; Ronald J. Gilson, 8; and Stephen E. Yates, 7.
The following table presents additional information about the trustees. The mailing address for each trustee other than Jonathan S. Thomas is 330 Madison Avenue, New York, New York 10017. The mailing address for Jonathan S. Thomas is 4500 Main Street, Kansas City, Missouri 64111.
| Name (Year of Birth) | Position(s) Held with Funds | Length of Time Served | Principal Occupation(s) During Past 5 Years | Number of American Century Portfolios Overseen by Trustee | Other Directorships Held During Past 5 Years | ||||||||||||
| Independent Trustees | |||||||||||||||||
| Reginald M. Browne (1968) | Trustee and Chairman of the Board | Since 2017 (Chairman since 2019) | Principal, GTS Securities (automated capital markets trading firm)(2019 to present); Senior Managing Director, Co Global Head-ETF Group, Cantor Fitzgerald (financial services firm)(2013 to 2019) | 19 | None | ||||||||||||
| Ronald J. Gilson (1946) | Trustee | Since 2017 | Charles J. Meyers Professor of Law and Business, Emeritus, Stanford Law School (1979 to 2016); Marc and Eva Stern Professor of Law and Business, Columbia University School of Law (1992 to present) | 59 | None | ||||||||||||
| Barry A. Mendelson (1958) | Trustee | Since 2017 | Retired; Consultant regarding ETF and mutual fund matters (2015 to 2016); Principal and Senior Counsel, The Vanguard Group (investment management)(1998 to 2014) | 19 | None | ||||||||||||
| Stephen E. Yates (1948) | Trustee | Since 2017 | Retired | 82 | None | ||||||||||||
54
| Name (Year of Birth) | Position(s) Held with Funds | Length of Time Served | Principal Occupation(s) During Past 5 Years | Number of American Century Portfolios Overseen by Trustee | Other Directorships Held During Past 5 Years | ||||||||||||
| Interested Trustees | |||||||||||||||||
| Jonathan S. Thomas (1963) | Trustee | Since 2017 | President and Chief Executive Officer, ACC (2007 to present). Also serves as Chief Executive Officer, ACS; Executive Vice President, ACIM; Director, ACC, ACIM and other ACC subsidiaries | 122 | None | ||||||||||||
The Statement of Additional Information has additional information about the fund's trustees and is available without charge, upon request, by calling 1-800-345-6488.
55
Officers
The following table presents certain information about the executive officers of the funds. Each officer, except Edward Rosenberg, serves as an officer for each of the 16 investment companies in the American Century family of funds. No officer is compensated for his or her service as an officer of the funds. The listed officers are interested persons of the funds and are appointed or re-appointed on an annual basis. The mailing address for each officer listed below is 4500 Main Street, Kansas City, Missouri 64111.
| Name (Year of Birth) | Offices with the Funds | Principal Occupation(s) During the Past Five Years | ||||||
| Patrick Bannigan (1965) | President since 2019 | Executive Vice President and Director, ACC (2012 to present); Chief Financial Officer, Chief Accounting Officer and Treasurer, ACC (2015 to present). Also serves as President, ACS; Vice President, ACIM; Chief Financial Officer, Chief Accounting Officer and/or Director, ACIM, ACS and other ACC subsidiaries | ||||||
| R. Wes Campbell (1974) | Chief Financial Officer and Treasurer since 2018 | Vice President, ACS (2020 to present); Investment Operations and Investment Accounting, ACS (2000 to present) | ||||||
| Amy D. Shelton (1964) | Chief Compliance Officer and Vice President since 2017 | Chief Compliance Officer, American Century funds, (2014 to present); Chief Compliance Officer, ACIM (2014 to present); Chief Compliance Officer, ACIS (2009 to present). Also serves as Vice President, ACIS | ||||||
| Charles A. Etherington (1957) | General Counsel and Vice President since 2017 | Attorney, ACC (1994 to present); Vice President, ACC (2005 to present); General Counsel, ACC (2007 to present). Also serves as General Counsel, ACIM, ACS, ACIS and other ACC subsidiaries; and Senior Vice President, ACIM and ACS | ||||||
| Cleo Chang (1977) | Vice President since 2019 | Senior Vice President, ACIM (2015 to present); Chief Investment Officer, Wilshire Funds Management (2005 to 2015) | ||||||
| David H. Reinmiller (1963) | Vice President since 2017 | Attorney, ACC (1994 to present). Also serves as Vice President, ACIM and ACS | ||||||
| Edward Rosenberg (1973) | Vice President since 2017 | Senior Vice President, ACIM (2017 to present); Senior Vice President, Flexshares Head of ETF Capital Markets, Northern Trust (2012 to 2017) | ||||||
| C. Jean Wade (1964) | Vice President since 2017 | Senior Vice President, ACS (2017 to present); Vice President, ACS (2000 to 2017) | ||||||
| Ward D. Stauffer (1960) | Secretary since 2019 | Attorney, ACS (2003 to present) | ||||||
56
| Approval of Management Agreement | ||
At a meeting held on June 5, 2020, the Fund’s Board of Trustees (the "Board") unanimously approved the renewal of the management agreement pursuant to which American Century Investment Management, Inc. (the “Advisor”) acts as the investment advisor for the Fund. Under Section 15(c) of the Investment Company Act, contracts for investment advisory services are required to be reviewed, evaluated, and approved by a majority of a fund’s trustees (the “Trustees”), including a majority of the independent Trustees, each year.
Prior to its consideration of the renewal of the management agreement, the Trustees requested and reviewed extensive data and information compiled by the Advisor and certain independent providers of evaluation data concerning the Fund and the services provided to the Fund by the Advisor. This review was in addition to the oversight and evaluation undertaken by the Board and its Audit Committee on a continual basis and the information received was supplemental to the extensive information that the Board and its Audit Committee receive and consider throughout the year.
In connection with its consideration of the renewal of the management agreement, the Board’s review and evaluation of the services provided by the Advisor included, but was not limited to, the following:
•the nature, extent, and quality of investment management and other services provided and to be provided to the Fund;
•the wide range of other programs and services provided and to be provided to the Fund and its shareholders on a routine and non-routine basis;
•the Fund’s investment performance, including data comparing the Fund's performance to appropriate benchmarks of funds with similar objectives and strategies;
•the cost of owning the Fund compared to the cost of owning similar funds;
•the compliance policies, procedures, and regulatory experience of the Advisor and the Fund's service providers;
•the Advisor’s strategic plans;
•the Advisor’s business continuity plans and specifically its response to the COVID-19 pandemic;
•financial data showing the cost of services provided to the Fund, the profitability of the Fund to the Advisor, and the overall profitability of the Advisor;
•information regarding payments to intermediaries by the Advisor; and
•possible economies of scale associated with the Advisor’s management of the Fund; and
•possible collateral benefits to the Advisor from the management of the Fund.
The independent Trustees met separately in private session to discuss the renewal and to review and discuss the information provided in response to their request. The independent Trustees also held active discussions with the Advisor regarding the renewal of the management agreement. The independent Trustees had the benefit of the advice of their independent counsel throughout the process.
Factors Considered
The Trustees considered all of the information provided by the Advisor, the independent data providers, and independent counsel in connection with the approval. They determined that the information was sufficient for them to evaluate the management agreement for the Fund. In connection with their review, the Trustees did not identify any single factor as being all-important or
57
controlling, and each Trustee may have attributed different levels of importance to different factors. In deciding to renew the management agreement, the Board based its decision on a number of factors, including without limitation the following:
Nature, Extent and Quality of Services — Generally. Under the management agreement, the Advisor is responsible for providing or arranging for all services necessary for the operation of the Fund. The Board noted that the Advisor provides or arranges at its own expense a wide variety of services including without limitation the following:
•constructing and designing the Fund
•portfolio research and security selection
•initial capitalization/funding
•securities trading
•Fund administration
•custody of Fund assets
•daily valuation of the Fund’s portfolio
•shareholder servicing and transfer agency, including shareholder confirmations, recordkeeping, and communications
•legal services (except the independent Trustees’ counsel)
•regulatory and portfolio compliance
•financial reporting
•marketing and distribution (except amounts paid by the Fund under Rule 12b-1 plans)
Investment Management Services. The nature of the investment management services provided to the Fund is quite complex and allows Fund shareholders access to professional money management, instant diversification of their investments within an asset class, and liquidity. In evaluating investment performance, the Board expects the Advisor to manage the Fund in accordance with its investment objectives and approved strategies. Further, the Trustees recognize that the Advisor has an obligation to monitor trading activities, and in particular to seek the best execution of fund trades, and to evaluate the use of and payment for research. In providing these services, the Advisor utilizes teams of investment professionals (portfolio managers, analysts, research assistants, and securities traders) who require extensive information technology, research, training, compliance, and other systems to conduct their business. The Board provides oversight of the investment performance process. It regularly reviews investment performance information for the Fund, together with comparative information for appropriate benchmarks over different time horizons. If performance concerns are identified, the Board discusses with the Advisor the reasons for such results and any efforts being undertaken to improve performance.The Board found the investment management services provided by the Advisor to the Fund to be satisfactory and consistent with the management agreement.
Shareholder and Other Services. Under the management agreement, the Advisor provides or arranges for a comprehensive package of services to the Fund. The Board, directly and through its Audit Committee, regularly reviews reports and evaluations of such services at its regular meetings. These reports include, but are not limited to, information regarding the operational efficiency and accuracy of the shareholder and transfer agency services provided, staffing levels, shareholder satisfaction, technology support (including cyber security), new products and services offered to Fund shareholders, securities trading activities, portfolio valuation services, auditing services, and legal and operational compliance activities. The Board found the services provided by the Advisor to the Fund under the management agreement to be competitive and of high quality.
COVID-19 Response. During 2020, much of the world experienced unprecedented change and challenges from the impacts of the rapidly evolving, worldwide spread of the COVID-19 virus. The
58
Board evaluated the Advisor’s response to the COVID-19 pandemic and its impact on service to the Fund. The Board found that Fund shareholders have continued to receive the Advisor’s investment management and other services without disruption, and Advisor personnel have demonstrated great resiliency in providing those services. The Board, directly and through its Audit Committee, continues to monitor the impact of the pandemic and the response of each of the Fund’s service providers.
Costs of Services and Profitability. The Advisor provides detailed information concerning its cost of providing various services to the Fund, its profitability in managing the Fund (pre- and post-distribution), its overall profitability, and its financial condition. The Trustees have reviewed with the Advisor the methodology used to prepare this financial information. This information is considered in evaluating the Advisor’s financial condition, its ability to continue to provide services under the management agreement, and the reasonableness of the current management fee. The Board concluded that the Advisor’s profits were reasonable in light of the services provided to the Fund.
Ethics. The Board generally considers the Advisor’s commitment to providing quality services to the Fund and to conducting its business ethically. They noted that the Advisor’s practices generally meet or exceed industry best practices.
Economies of Scale. The Board also reviewed information provided by the Advisor regarding the possible existence of economies of scale in connection with the management of the Fund. The Board concluded that economies of scale are difficult to measure and predict with precision, especially on a fund-by-fund basis. The Board concluded that the Advisor is appropriately sharing economies of scale, to the extent they exist, through its competitive fee structure, offering competitive fees from fund inception, and through reinvestment in its business, infrastructure, investment capabilities and initiatives to provide shareholders additional content and services.
Comparison to Other Funds’ Fees. The management agreement provides that the Fund pays the Advisor a single, all-inclusive (or unified) management fee for providing all services necessary for the management and operation of the Fund, other than brokerage expenses, expenses attributable to short sales, taxes, interest, extraordinary expenses, and expenses incurred in connection with the provision of shareholder services and distribution services under a plan adopted pursuant to Rule 12b-1 under the Investment Company Act. Under the unified fee structure, the Advisor is responsible for providing all investment advisory, custody, audit, administrative, compliance, recordkeeping, marketing and shareholder services, or arranging and supervising third parties to provide such services. The Board believes the unified fee structure is a benefit to Fund shareholders because it clearly discloses to shareholders the cost of owning Fund shares, and, since the unified fee cannot be increased without a vote of Fund shareholders, it shifts to the Advisor the risk of increased costs of operating the Fund and provides a direct incentive to minimize administrative inefficiencies. Part of the Board’s analysis of fee levels involves reviewing certain evaluative data compiled by an independent provider comparing the Fund’s unified fee to the total expense ratios of its peers. The unified fee charged to shareholders of the Fund was below the median of the total expense ratios of the Fund’s peer expense universe and was the lowest of its peer expense group. The Board concluded that the management fee paid by the Fund to the Advisor under the management agreement is reasonable in light of the services provided to the Fund.
Comparison to Fees and Services Provided to Other Clients of the Advisor. The Board also requested information from the Advisor concerning the nature of the services, fees, costs, and profitability of its advisory services to funds or other advisory clients managed similarly to the Fund. The Advisor informed the Trustees that, as of December 31, 2019, it did not provide services to any other investment companies or comparable accounts that were managed similarly to the Fund.
59
Payments to Intermediaries. The Trustees also requested a description of payments made to intermediaries by the Fund and the Advisor and services provided in response thereto. These payments could include various payments made by the Fund or the Advisor to different types of intermediaries and recordkeepers for distribution and service activities provided for the Fund. The Trustees reviewed such information and received representations from the Advisor that all such payments by the Advisor were made from the Advisor’s resources and reasonable profits. The Board found such payments to be reasonable in scope and purpose.
Collateral or “Fall-Out” Benefits Derived by the Advisor. The Board considered the possible existence of collateral benefits the Advisor may receive as a result of its relationship with the Fund. They concluded that the Advisor’s primary business is managing funds and it generally does not use fund or shareholder information to generate profits in other lines of business, and therefore does not derive any significant collateral benefits from them. The Board noted that additional assets from other clients may offer the Advisor some benefit from increased leverage with service providers and counterparties. The Board also determined that the Advisor is able to provide investment management services to certain clients other than the Fund, at least in part, due to its existing infrastructure built to serve the fund complex. The Board concluded that appropriate allocation methodologies had been employed to assign resources and the cost of those resources to these other clients.
Existing Relationship. The Board also considered whether there was any reason for not continuing the existing arrangement with the Advisor. In this regard, the Board was mindful of the potential disruptions of the Fund’s operations and various risks, uncertainties, and other effects that could occur as a result of a decision not to continue such relationship. In particular, the Board recognized that most shareholders have invested in the Fund on the strength of the Advisor’s industry standing and reputation and in the expectation that the Advisor will have a continuing role in providing advisory services to the Fund.
Conclusion of the Trustees. As a result of this process, the Board, including all of the independent Trustees, taking into account all of the factors discussed above and the information provided by the Advisor and others in connection with its review and throughout the year, determined that the management fee is fair and reasonable in light of the services provided and that the investment management agreement between the Fund and the Advisor should be renewed.
60
| Liquidity Risk Management Program | ||
The Fund has adopted a liquidity risk management program (the “program”). The Fund’s Board of Trustees (the "Board") has designated American Century Investment Management, Inc. (“ACIM”) as the administrator of the program. Personnel of ACIM or its affiliates conduct the day-to-day operation of the program pursuant to policies and procedures administered by those members of the ACIM’s Investment Oversight Committee who are members of the ACIM’s Investment Management and Global Analytics departments.
Under the program, ACIM manages the Fund’s liquidity risk, which is the risk that the Fund could not meet shareholder redemption requests without significant dilution of remaining shareholders’ interests in the Fund. This risk is managed by monitoring the degree of liquidity of the Fund’s investments, limiting the amount of the Fund’s illiquid investments, and utilizing various risk management tools and facilities available to the Fund for meeting shareholder redemptions, among other means. ACIM’s process of determining the degree of liquidity of the Fund’s investments is supported by one or more third-party liquidity assessment vendors.
The Board reviewed a report prepared by ACIM regarding the operation and effectiveness of the program for the period December 1, 2018 through December 31, 2019. No significant liquidity events impacting the Fund were noted in the report. In addition, ACIM provided its assessment that the program had been effective in managing the Fund’s liquidity risk.
61
| Additional Information | ||
Retirement Account Information
As required by law, distributions you receive from certain retirement accounts are subject to federal income tax withholding, unless you elect not to have withholding apply*. Tax will be withheld on the total amount withdrawn even though you may be receiving amounts that are not subject to withholding, such as nondeductible contributions. In such case, excess amounts of withholding could occur. You may adjust your withholding election so that a greater or lesser amount will be withheld.
If you don’t want us to withhold on this amount, you must notify us to not withhold the federal income tax. You may notify us in writing or in certain situations by telephone or through other electronic means. For systematic withdrawals, your withholding election will remain in effect until revoked or changed by filing a new election. You have the right to revoke your election at any time and change your withholding percentage for future distributions.
Remember, even if you elect not to have income tax withheld, you are liable for paying income tax on the taxable portion of your withdrawal. If you elect not to have income tax withheld or you don’t have enough income tax withheld, you may be responsible for payment of estimated tax. You may incur penalties under the estimated tax rules if your withholding and estimated tax payments are not sufficient. You can reduce or defer the income tax on a distribution by directly or indirectly rolling such distribution over to another IRA or eligible plan. You should consult your tax advisor for additional information.
State tax will be withheld if, at the time of your distribution, your address is within one of the mandatory withholding states and you have federal income tax withheld (or as otherwise required by state law). State taxes will be withheld from your distribution in accordance with the respective state rules.
*Some 403(b), 457 and qualified retirement plan distributions may be subject to 20% mandatory withholding, as they are subject to special tax and withholding rules. Your plan administrator or plan sponsor is required to provide you with a special tax notice explaining those rules at the time you request a distribution. If applicable, federal and/or state taxes may be withheld from your distribution amount.
Proxy Voting Policies
A description of the policies that the fund's investment advisor uses in exercising the voting rights associated with the securities purchased and/or held by the fund are available without charge, upon request, by calling 1-800-345-6488. It is also available on American Century Investments’ website at americancentury.com/proxy and on the Securities and Exchange Commission’s website at sec.gov. Information regarding how the investment advisor voted proxies relating to portfolio securities during the most recent 12-month period ended June 30 is available at americancentury.com/proxy. It is also available at sec.gov.
Quarterly Portfolio Disclosure
The fund files its complete schedule of portfolio holdings with the Securities and Exchange Commission (SEC) for the first and third quarters of each fiscal year as an exhibit to its reports on Form N-PORT. The fund's Form N-PORT reports are available on the SEC’s website at sec.gov.
62
Other Tax Information
The following information is provided pursuant to provisions of the Internal Revenue Code.
The fund hereby designates up to the maximum amount allowable as qualified dividend income for the fiscal year ended August 31, 2020.
For corporate taxpayers, the fund hereby designates $15,804, or up to the maximum amount allowable, of ordinary income distributions paid during the fiscal year ended August 31, 2020 as qualified for the corporate dividends received deduction.
63
| Notes | ||
64
| ||||||||
| Contact Us | avantisinvestors.com | |||||||
| American Century Sales Representatives, Financial Professionals, Broker Dealers, Insurance Companies, Banks and Trust Companies | 1-833-928-2684 | |||||||
| Telecommunications Relay Service for the Deaf | 711 | |||||||
| American Century ETF Trust | ||||||||
Investment Advisor: American Century Investment Management, Inc. Kansas City, Missouri | ||||||||
| This report and the statements it contains are submitted for the general information of our shareholders. The report is not authorized for distribution to prospective investors unless preceded or accompanied by an effective prospectus. | ||||||||
| ©2020 American Century Proprietary Holdings, Inc. All rights reserved. CL-ANN-96050 2010 | ||||||||
| Annual Report | |||||
| August 31, 2020 | |||||
Avantis® U.S. Small Cap Value Fund | |||||
| Institutional Class (AVUVX) | |||||
Beginning on January 1, 2021, as permitted by regulations adopted by the Securities and Exchange Commission, paper copies of the fund’s shareholder reports like this one will no longer be sent by mail, unless you specifically request paper copies of the reports from the fund or from your financial intermediary, such as a broker-dealer or bank. Instead, the reports will be made available on a website, and you will be notified by mail each time a report is posted and provided with a website link to access the report.
If you already elected to receive shareholder reports electronically, you will not be affected by this change and you need not take any action. You may elect to receive shareholder reports and other communications from the fund or your financial intermediary electronically by calling or sending an email request to your appropriate contacts as listed on the back cover of this report.
You may elect to receive all future reports in paper free of charge. You can inform the fund or your financial intermediary that you wish to continue receiving paper copies of your shareholder reports by calling or sending an email request to your appropriate contacts as listed on the back cover of this report. Your election to receive reports in paper will apply to all funds held with the fund complex/your financial intermediary.
| Table of Contents | ||
| Chairman’s Letter | |||||
| Performance | |||||
| Portfolio Commentary | |||||
| Fund Characteristics | |||||
| Shareholder Fee Example | |||||
| Schedule of Investments | |||||
| Statement of Assets and Liabilities | |||||
| Statement of Operations | |||||
| Statement of Changes in Net Assets | |||||
| Notes to Financial Statements | |||||
| Financial Highlights | |||||
| Report of Independent Registered Public Accounting Firm | |||||
| Management | |||||
| Approval of Management Agreement | |||||
| Liquidity Risk Management Program | |||||
| Additional Information | |||||
Any opinions expressed in this report reflect those of the author as of the date of the report, and do not necessarily represent the opinions of American Century Investments® or any other person in the American Century Investments organization. Any such opinions are subject to change at any time based upon market or other conditions and American Century Investments disclaims any responsibility to update such opinions. These opinions may not be relied upon as investment advice and, because investment decisions made by American Century Investments funds are based on numerous factors, may not be relied upon as an indication of trading intent on behalf of any American Century Investments fund. Security examples are used for representational purposes only and are not intended as recommendations to purchase or sell securities. Performance information for comparative indices and securities is provided to American Century Investments by third party vendors. To the best of American Century Investments’ knowledge, such information is accurate at the time of printing.
| Chairman's Letter | ||
Jonathan ThomasDear Investor:
Thank you for reviewing this annual report for the period ended August 31, 2020. Annual reports help convey important information about fund returns, including market factors that affected performance. For additional investment insights, please visit avantisinvestors.com.
Pandemic Disrupted Economic, Market Courses
Broad market sentiment was generally upbeat early in the period. Dovish central banks, modest inflation, improving economic and corporate earnings data, and progress on U.S.-China trade helped boost global growth outlooks. Against this backdrop, stocks largely remained in favor.
However, beginning in late February, COVID-19 quickly quashed the optimistic tone. The outbreak rapidly spread worldwide, halting most U.S. and global economic activity and triggering a deep worldwide recession. Global stocks sold off sharply, but central banks and federal governments stepped in quickly and aggressively to stabilize financial markets. These extraordinary efforts proved helpful, as most stocks rebounded quickly. As the period progressed, coronavirus infection and death rates declined in many regions and economies reopened. By the end of August, manufacturing, employment and other data suggested an economic recovery was underway.
Overall, global stocks delivered mixed results for the period. U.S. stocks generally advanced and fared better than their counterparts elsewhere. The growth style significantly outperformed value stocks, which struggled.
A Slow Return to Normal
The return to pre-pandemic life will take time and patience, but we are confident we will get there. Several drug companies are in final stages of vaccine trials, and medical professionals continue to fine-tune virus treatment protocols. In the meantime, investors likely will face periods of outbreak-related disruptions, economic and political uncertainty, and heightened market volatility. These influences can be unsettling, but they tend to be temporary.
We appreciate your confidence in us during these extraordinary times. Our investment professionals have experience weathering unpredictable markets, and we’re confident we will continue to meet today’s challenges.
Sincerely,
Jonathan Thomas
Chairman
Avantis Investors
2
| Performance | ||
| Total Returns as of August 31, 2020 | ||||||||||||||||||||||||||
| Ticker Symbol | Since Inception | Inception Date | ||||||||||||||||||||||||
| Institutional Class | AVUVX | -9.57% | 12/4/2019 | |||||||||||||||||||||||
| Russell 2000 Value Index | — | -14.16% | — | |||||||||||||||||||||||
| Growth of $10,000 Over Life of Fund | ||
| $10,000 investment made December 4, 2019 | ||
| Value on August 31, 2020 | |||||
| Institutional Class — $9,043 | |||||
| Russell 2000 Value Index — $8,584 | |||||
| Total Annual Fund Operating Expenses | ||||||||
| Institutional Class | 0.25% | |||||||
The total annual fund operating expenses shown is as stated in the fund’s prospectus current as of the date of this report. The prospectus may vary from the expense ratio shown elsewhere in this report because it is based on a different time period, includes acquired fund fees and expenses, and, if applicable, does not include fee waivers or expense reimbursements.
Data presented reflect past performance. Past performance is no guarantee of future results. Current performance may be higher or lower than the performance shown. Total returns for periods less than one year are not annualized. Investment return and principal value will fluctuate, and redemption value may be more or less than original cost. Data assumes reinvestment of dividends and capital gains, and none of the charts reflect the deduction of taxes that a shareholder would pay on fund distributions or the redemption of fund shares. To obtain performance data current to the most recent month end, please call 1-833-928-2684 or visit avantisinvestors.com. For additional information about the fund, please consult the prospectus.
3
| Portfolio Commentary | ||
Portfolio Managers: Eduardo Repetto, Mitch Firestein, Daniel Ong and Ted Randall
Fund Strategy
Avantis U.S. Small Cap Value seeks long-term capital appreciation by investing in a diverse group of U.S. small-capitalization (small-cap) companies across market sectors and industry groups.
The fund seeks securities of companies that it expects to have higher returns. It places an enhanced emphasis on securities of companies with smaller market capitalizations and securities of companies it defines as high profitability or value companies. Conversely, the fund seeks to underweight or exclude securities it expects to have lower returns. These include securities of large companies with lower levels of profitability and higher prices relative to their book values or other financial metrics. Under normal market conditions, the fund will invest at least 80% of its assets in securities of small-cap companies located in the U.S.
The portfolio managers continually analyze market and financial data to make buy, sell and hold decisions. When buying or selling a security, the portfolio managers may consider the trade-off between expected returns of the security and implementation or tax costs of the trade. They do this in an attempt to gain trading efficiencies, avoid unnecessary risk and enhance portfolio performance.
Performance Review
For the period from Avantis U.S. Small Cap Value’s inception on December 4, 2019, through the fund’s fiscal year-end on August 31, 2020, the fund returned -9.57%.* For the same time period, the fund’s benchmark, the Russell 2000 Value Index, returned -14.16%. Fund returns reflect fees and operating expenses, while index returns do not.
The Russell 2000 Value Index is an unmanaged index generally representative of the performance of U.S. small-cap companies with lower price-to-book ratios and lower forecasted growth values. The small-cap companies held by the fund with high combined book-to-market and profitability characteristics were additive to performance. Additionally, the fund’s exclusion of real estate investment trusts (REITs) also added value. REITs were significant underperformers for the reporting period.
*Total returns for periods less than one year are not annualized.
4
| Fund Characteristics | ||
| AUGUST 31, 2020 | |||||
| Top Ten Holdings | % of net assets | ||||
| EQT Corp. | 1.0% | ||||
| Lithia Motors, Inc., Class A | 0.9% | ||||
| Meritage Homes Corp. | 0.9% | ||||
| Texas Roadhouse, Inc. | 0.9% | ||||
| Saia, Inc. | 0.9% | ||||
| UFP Industries, Inc. | 0.8% | ||||
| AutoNation, Inc. | 0.8% | ||||
| Foot Locker, Inc. | 0.8% | ||||
| Air Lease Corp. | 0.8% | ||||
| Murphy USA, Inc. | 0.8% | ||||
| Top Five Industries | % of net assets | ||||
| Banks | 10.7% | ||||
| Oil, Gas and Consumable Fuels | 7.9% | ||||
| Specialty Retail | 7.9% | ||||
| Thrifts and Mortgage Finance | 4.8% | ||||
| Insurance | 4.0% | ||||
| Types of Investments in Portfolio | % of net assets | ||||
| Common Stocks | 98.6% | ||||
| Temporary Cash Investments | 1.3% | ||||
| Other Assets and Liabilities | 0.1% | ||||
5
| Shareholder Fee Example | ||
Fund shareholders may incur two types of costs: (1) transaction costs, including sales charges (loads) on purchase payments and redemption/exchange fees; and (2) ongoing costs, including management fees; distribution and service (12b-1) fees; and other fund expenses. This example is intended to help you understand your ongoing costs (in dollars) of investing in your fund and to compare these costs with the ongoing cost of investing in other mutual funds.
The example is based on an investment of $1,000 made at the beginning of the period and held for the entire period from March 1, 2020 to August 31, 2020.
Actual Expenses
The table provides information about actual account values and actual expenses for each class. You may use the information, together with the amount you invested, to estimate the expenses that you paid over the period. First, identify the share class you own. Then simply divide your account value by $1,000 (for example, an $8,600 account value divided by $1,000 = 8.6), then multiply the result by the number under the heading “Expenses Paid During Period” to estimate the expenses you paid on your account during this period.
Hypothetical Example for Comparison Purposes
The table also provides information about hypothetical account values and hypothetical expenses based on the actual expense ratio of each class of your fund and an assumed rate of return of 5% per year before expenses, which is not the actual return of a fund’s share class. The hypothetical account values and expenses may not be used to estimate the actual ending account balance or expenses you paid for the period. You may use this information to compare the ongoing costs of investing in your fund and other funds. To do so, compare this 5% hypothetical example with the 5% hypothetical examples that appear in the shareholder reports of the other funds.
Please note that the expenses shown in the table are meant to highlight your ongoing costs only and do not reflect any transactional costs, such as sales charges (loads) or redemption/exchange fees. Therefore, the table is useful in comparing ongoing costs only, and will not help you determine the relative total costs of owning different funds. In addition, if these transactional costs were included, your costs would have been higher.
| Beginning Account Value 3/1/20 | Ending Account Value 8/31/20 | Expenses Paid During Period(1) 3/1/20 - 8/31/20 | Annualized Expense Ratio(1) | |||||||||||
| Actual | ||||||||||||||
| Institutional Class | $1,000 | $1,059.90 | $1.29 | 0.25% | ||||||||||
| Hypothetical | ||||||||||||||
| Institutional Class | $1,000 | $1,023.88 | $1.27 | 0.25% | ||||||||||
(1)Expenses are equal to the class's annualized expense ratio listed in the table above, multiplied by the average account value over the period, multiplied by 184, the number of days in the most recent fiscal half-year, divided by 366, to reflect the one-half year period. Annualized expense ratio reflects actual expenses, including any applicable fee waivers or expense reimbursements and excluding any acquired fund fees and expenses.
6
| Schedule of Investments | ||
AUGUST 31, 2020
| Shares | Value | |||||||
| COMMON STOCKS — 98.6% | ||||||||
| Aerospace and Defense — 1.1% | ||||||||
| AAR Corp. | 3,479 | $ | 70,206 | |||||
Astronics Corp.(1) | 1,856 | 16,778 | ||||||
Ducommun, Inc.(1) | 1,809 | 67,602 | ||||||
| Hexcel Corp. | 11,563 | 455,467 | ||||||
| Maxar Technologies, Inc. | 3,007 | 69,612 | ||||||
| Spirit AeroSystems Holdings, Inc., Class A | 11,024 | 226,654 | ||||||
| 906,319 | ||||||||
| Air Freight and Logistics — 0.7% | ||||||||
Atlas Air Worldwide Holdings, Inc.(1) | 5,267 | 297,006 | ||||||
Hub Group, Inc., Class A(1) | 5,449 | 293,374 | ||||||
| 590,380 | ||||||||
| Airlines — 1.8% | ||||||||
| Allegiant Travel Co. | 2,343 | 301,310 | ||||||
| Hawaiian Holdings, Inc. | 6,380 | 85,747 | ||||||
JetBlue Airways Corp.(1) | 51,719 | 595,803 | ||||||
Mesa Air Group, Inc.(1) | 4,324 | 15,826 | ||||||
| SkyWest, Inc. | 7,419 | 249,649 | ||||||
Spirit Airlines, Inc.(1) | 10,089 | 180,391 | ||||||
| 1,428,726 | ||||||||
| Auto Components — 2.8% | ||||||||
American Axle & Manufacturing Holdings, Inc.(1) | 21,676 | 168,639 | ||||||
| Cooper Tire & Rubber Co. | 9,539 | 329,763 | ||||||
Cooper-Standard Holdings, Inc.(1) | 1,824 | 33,051 | ||||||
| Dana, Inc. | 28,452 | 396,906 | ||||||
Delphi Technologies plc(1) | 18,939 | 328,971 | ||||||
Gentherm, Inc.(1) | 2,430 | 109,909 | ||||||
| Goodyear Tire & Rubber Co. (The) | 35,128 | 337,053 | ||||||
Modine Manufacturing Co.(1) | 8,884 | 60,145 | ||||||
| Strattec Security Corp. | 45 | 941 | ||||||
Superior Industries International, Inc.(1) | 365 | 562 | ||||||
Tenneco, Inc., Class A(1) | 11,463 | 93,194 | ||||||
Visteon Corp.(1) | 5,124 | 386,503 | ||||||
| 2,245,637 | ||||||||
| Automobiles — 0.1% | ||||||||
| Harley-Davidson, Inc. | 2,016 | 55,863 | ||||||
| Banks — 10.7% | ||||||||
| 1st Constitution Bancorp | 116 | 1,412 | ||||||
| 1st Source Corp. | 952 | 32,796 | ||||||
| ACNB Corp. | 1,014 | 21,314 | ||||||
| Altabancorp | 2,281 | 47,034 | ||||||
| Amalgamated Bank, Class A | 1,776 | 20,904 | ||||||
Amerant Bancorp, Inc.(1) | 556 | 7,311 | ||||||
| Arrow Financial Corp. | 387 | 11,088 | ||||||
| Associated Banc-Corp. | 18,057 | 242,686 | ||||||
Atlantic Capital Bancshares, Inc.(1) | 259 | 2,988 | ||||||
| BancFirst Corp. | 3,290 | 144,760 | ||||||
7
| Shares | Value | |||||||
Bancorp, Inc. (The)(1) | 8,133 | $ | 77,263 | |||||
| Bank of Commerce Holdings | 1,653 | 12,150 | ||||||
| Bank of Hawaii Corp. | 6,581 | 362,218 | ||||||
| Bank OZK | 19,881 | 458,058 | ||||||
| BankFinancial Corp. | 377 | 2,737 | ||||||
| BankUnited, Inc. | 9,985 | 233,449 | ||||||
| Bankwell Financial Group, Inc. | 770 | 12,012 | ||||||
| BCB Bancorp, Inc. | 1,905 | 15,516 | ||||||
| Boston Private Financial Holdings, Inc. | 10,844 | 64,413 | ||||||
| Bridge Bancorp, Inc. | 231 | 4,622 | ||||||
| Byline Bancorp, Inc. | 2,900 | 36,656 | ||||||
| C&F Financial Corp. | 431 | 13,779 | ||||||
| Cadence BanCorp | 11,170 | 106,115 | ||||||
| Cambridge Bancorp | 25 | 1,371 | ||||||
| Camden National Corp. | 293 | 9,568 | ||||||
Capital Bancorp, Inc.(1) | 853 | 8,880 | ||||||
| Capstar Financial Holdings, Inc. | 1,549 | 15,784 | ||||||
| Cathay General Bancorp. | 12,409 | 306,378 | ||||||
| CB Financial Services, Inc. | 282 | 5,245 | ||||||
| Central Pacific Financial Corp. | 2,480 | 38,415 | ||||||
| Central Valley Community Bancorp | 1,301 | 15,651 | ||||||
| Chemung Financial Corp. | 144 | 4,134 | ||||||
| CIT Group, Inc. | 10,688 | 210,233 | ||||||
| CNB Financial Corp. | 1,855 | 29,587 | ||||||
Coastal Financial Corp.(1) | 250 | 3,438 | ||||||
| Codorus Valley Bancorp, Inc. | 1,552 | 20,021 | ||||||
| Colony Bankcorp, Inc. | 416 | 4,576 | ||||||
| Community Bankers Trust Corp. | 2,613 | 13,405 | ||||||
| Community Financial Corp. (The) | 459 | 10,208 | ||||||
| Community Trust Bancorp, Inc. | 187 | 6,034 | ||||||
| ConnectOne Bancorp, Inc. | 392 | 5,927 | ||||||
| County Bancorp, Inc. | 174 | 3,358 | ||||||
Customers Bancorp, Inc.(1) | 2,348 | 29,984 | ||||||
| Eagle Bancorp Montana, Inc. | 426 | 7,510 | ||||||
| Eagle Bancorp, Inc. | 5,106 | 146,951 | ||||||
| Enterprise Bancorp, Inc. | 1,329 | 28,879 | ||||||
| Enterprise Financial Services Corp. | 3,609 | 107,945 | ||||||
Esquire Financial Holdings, Inc.(1) | 681 | 11,236 | ||||||
| Evans Bancorp, Inc. | 566 | 12,905 | ||||||
| Farmers National Banc Corp. | 324 | 3,778 | ||||||
| FB Financial Corp. | 2,377 | 64,179 | ||||||
| Financial Institutions, Inc. | 1,490 | 25,673 | ||||||
| First BanCorp | 24,020 | 137,635 | ||||||
| First Bancorp, Inc. (The) | 227 | 4,831 | ||||||
| First Business Financial Services, Inc. | 977 | 15,143 | ||||||
| First Choice Bancorp | 1,335 | 18,890 | ||||||
| First Community Corp. | 85 | 1,078 | ||||||
| First Foundation, Inc. | 5,126 | 77,864 | ||||||
| First Guaranty Bancshares, Inc. | 242 | 3,105 | ||||||
| First Horizon National Corp. | 43,944 | 419,665 | ||||||
| First Internet Bancorp | 1,054 | 15,399 | ||||||
| First Mid Bancshares, Inc. | 1,561 | 40,648 | ||||||
8
| Shares | Value | |||||||
| First of Long Island Corp. (The) | 985 | $ | 15,135 | |||||
| First Savings Financial Group, Inc. | 21 | 914 | ||||||
| First United Corp. | 345 | 3,950 | ||||||
| FNCB Bancorp, Inc. | 206 | 1,205 | ||||||
| Franklin Financial Services Corp. | 146 | 3,481 | ||||||
| Great Southern Bancorp, Inc. | 1,605 | 61,857 | ||||||
| Hancock Whitney Corp. | 7,651 | 153,097 | ||||||
| Hanmi Financial Corp. | 693 | 6,604 | ||||||
| Hawthorn Bancshares, Inc. | 733 | 13,429 | ||||||
| HBT Financial, Inc. | 1,434 | 16,993 | ||||||
| Hilltop Holdings, Inc. | 10,592 | 218,195 | ||||||
| Hope Bancorp, Inc. | 1,783 | 15,084 | ||||||
| Horizon Bancorp, Inc. | 4,164 | 46,554 | ||||||
| Independent Bank Corp. (Michigan) | 3,075 | 45,848 | ||||||
| International Bancshares Corp. | 7,991 | 252,356 | ||||||
| Investors Bancorp, Inc. | 5,931 | 45,965 | ||||||
| Lakeland Bancorp, Inc. | 2,104 | 22,366 | ||||||
| Lakeland Financial Corp. | 3,035 | 138,669 | ||||||
| Landmark Bancorp, Inc. | 178 | 3,740 | ||||||
| Level One Bancorp, Inc. | 61 | 982 | ||||||
Limestone Bancorp, Inc.(1) | 58 | 624 | ||||||
| Macatawa Bank Corp. | 3,374 | 24,698 | ||||||
| Mackinac Financial Corp. | 1,064 | 10,661 | ||||||
| Mercantile Bank Corp. | 2,069 | 45,187 | ||||||
| Metrocity Bankshares, Inc. | 2,510 | 34,236 | ||||||
Metropolitan Bank Holding Corp.(1) | 797 | 24,683 | ||||||
| Middlefield Banc Corp. | 74 | 1,406 | ||||||
| Midland States Bancorp, Inc. | 2,692 | 39,330 | ||||||
| MidWestOne Financial Group, Inc. | 1,869 | 35,492 | ||||||
| MVB Financial Corp. | 1,331 | 18,900 | ||||||
| Northeast Bank | 1,333 | 24,874 | ||||||
| Northrim BanCorp, Inc. | 776 | 20,882 | ||||||
| Oak Valley Bancorp | 775 | 10,462 | ||||||
| OFG Bancorp | 987 | 12,673 | ||||||
| Old Second Bancorp, Inc. | 4,135 | 33,783 | ||||||
| Orrstown Financial Services, Inc. | 967 | 13,316 | ||||||
| Parke Bancorp, Inc. | 1,430 | 17,589 | ||||||
| PCB Bancorp. | 1,436 | 13,714 | ||||||
| Peapack-Gladstone Financial Corp. | 2,151 | 36,567 | ||||||
| Penns Woods Bancorp, Inc. | 185 | 3,839 | ||||||
| Peoples Bancorp of North Carolina, Inc. | 588 | 9,996 | ||||||
| Peoples Bancorp, Inc. | 497 | 10,507 | ||||||
| Plumas Bancorp | 642 | 12,686 | ||||||
| Popular, Inc. | 11,717 | 433,998 | ||||||
| Preferred Bank | 2,515 | 94,061 | ||||||
| Premier Financial Bancorp, Inc. | 861 | 11,038 | ||||||
| QCR Holdings, Inc. | 1,786 | 53,526 | ||||||
| RBB Bancorp | 1,879 | 24,371 | ||||||
| Red River Bancshares, Inc. | 185 | 8,051 | ||||||
| Republic Bancorp, Inc., Class A | 1,206 | 37,097 | ||||||
| Salisbury Bancorp, Inc. | 31 | 1,107 | ||||||
| SB Financial Group, Inc. | 128 | 1,772 | ||||||
9
| Shares | Value | |||||||
Select Bancorp, Inc.(1) | 278 | $ | 2,127 | |||||
| ServisFirst Bancshares, Inc. | 7,912 | 289,975 | ||||||
| Shore Bancshares, Inc. | 1,790 | 17,452 | ||||||
| Sierra Bancorp | 1,762 | 31,487 | ||||||
Southern First Bancshares, Inc.(1) | 1,110 | 28,749 | ||||||
| Southern National Bancorp of Virginia, Inc. | 455 | 3,890 | ||||||
| Sterling Bancorp | 23,118 | 269,787 | ||||||
| Stock Yards Bancorp, Inc. | 3,185 | 136,732 | ||||||
| Summit Financial Group, Inc. | 1,425 | 21,019 | ||||||
| Synovus Financial Corp. | 16,965 | 371,025 | ||||||
Texas Capital Bancshares, Inc.(1) | 5,867 | 190,032 | ||||||
| TriCo Bancshares | 373 | 10,328 | ||||||
TriState Capital Holdings, Inc.(1) | 2,322 | 32,276 | ||||||
| UMB Financial Corp. | 1,099 | 59,038 | ||||||
| Union Bankshares, Inc. | 156 | 3,022 | ||||||
| United Community Banks, Inc. | 8,536 | 154,672 | ||||||
| United Security Bancshares | 898 | 5,469 | ||||||
| Unity Bancorp, Inc. | 1,160 | 15,405 | ||||||
| Veritex Holdings, Inc. | 6,177 | 111,062 | ||||||
| Washington Trust Bancorp, Inc. | 1,626 | 54,276 | ||||||
| Webster Financial Corp. | 10,753 | 295,707 | ||||||
| West Bancorporation, Inc. | 1,925 | 33,880 | ||||||
| Wintrust Financial Corp. | 8,795 | 382,758 | ||||||
| 8,524,510 | ||||||||
| Beverages — 0.2% | ||||||||
National Beverage Corp.(1) | 2,168 | 176,302 | ||||||
| Biotechnology — 0.6% | ||||||||
Arena Pharmaceuticals, Inc.(1) | 5,963 | 416,337 | ||||||
Catalyst Pharmaceuticals, Inc.(1) | 14,859 | 48,737 | ||||||
Lexicon Pharmaceuticals, Inc.(1) | 7,385 | 12,924 | ||||||
| 477,998 | ||||||||
| Building Products — 2.0% | ||||||||
Alpha Pro Tech Ltd.(1) | 2,500 | 35,075 | ||||||
| Apogee Enterprises, Inc. | 4,411 | 92,322 | ||||||
Armstrong Flooring, Inc.(1) | 248 | 960 | ||||||
| Insteel Industries, Inc. | 3,487 | 64,300 | ||||||
JELD-WEN Holding, Inc.(1) | 1,875 | 39,469 | ||||||
Masonite International Corp.(1) | 4,235 | 386,613 | ||||||
| Patrick Industries, Inc. | 3,975 | 223,435 | ||||||
| Quanex Building Products Corp. | 5,773 | 97,044 | ||||||
| UFP Industries, Inc. | 10,844 | 643,591 | ||||||
| 1,582,809 | ||||||||
| Capital Markets — 2.6% | ||||||||
| B. Riley Financial, Inc. | 2,466 | 66,039 | ||||||
| Diamond Hill Investment Group, Inc. | 433 | 53,653 | ||||||
| Evercore, Inc., Class A | 6,062 | 375,117 | ||||||
| GAMCO Investors, Inc., Class A | 200 | 2,524 | ||||||
| Hennessy Advisors, Inc. | 490 | 4,307 | ||||||
| Janus Henderson Group plc | 9,844 | 203,968 | ||||||
| Moelis & Co., Class A | 1,338 | 42,696 | ||||||
| Oppenheimer Holdings, Inc., Class A | 1,092 | 26,678 | ||||||
| Piper Sandler Cos. | 2,946 | 222,276 | ||||||
10
| Shares | Value | |||||||
| Stifel Financial Corp. | 11,272 | $ | 571,603 | |||||
StoneX Group, Inc.(1) | 2,963 | 168,002 | ||||||
| Virtus Investment Partners, Inc. | 1,245 | 176,665 | ||||||
| Waddell & Reed Financial, Inc., Class A | 11,370 | 179,077 | ||||||
| 2,092,605 | ||||||||
| Chemicals — 3.5% | ||||||||
AdvanSix, Inc.(1) | 5,522 | 70,295 | ||||||
| Cabot Corp. | 10,640 | 393,786 | ||||||
| Chemours Co. (The) | 29,838 | 616,453 | ||||||
Ferro Corp.(1) | 11,846 | 147,720 | ||||||
| Hawkins, Inc. | 1,663 | 83,516 | ||||||
| Kronos Worldwide, Inc. | 4,254 | 53,132 | ||||||
Livent Corp.(1) | 29,991 | 254,324 | ||||||
| Orion Engineered Carbons SA | 5,932 | 72,074 | ||||||
Rayonier Advanced Materials, Inc.(1) | 1,478 | 4,671 | ||||||
| Sensient Technologies Corp. | 4,953 | 273,505 | ||||||
| Stepan Co. | 3,487 | 402,016 | ||||||
Trecora Resources(1) | 3,178 | 19,100 | ||||||
| Tredegar Corp. | 5,425 | 91,845 | ||||||
| Trinseo SA | 5,588 | 139,197 | ||||||
| Tronox Holdings plc, Class A | 18,222 | 163,269 | ||||||
Venator Materials plc(1) | 1,829 | 3,932 | ||||||
| 2,788,835 | ||||||||
| Commercial Services and Supplies — 1.9% | ||||||||
| Acme United Corp. | 677 | 14,921 | ||||||
Clean Harbors, Inc.(1) | 6,330 | 386,763 | ||||||
| Ennis, Inc. | 4,231 | 77,554 | ||||||
Heritage-Crystal Clean, Inc.(1) | 1,838 | 26,982 | ||||||
| Herman Miller, Inc. | 7,386 | 176,008 | ||||||
| HNI Corp. | 7,027 | 223,810 | ||||||
| Interface, Inc. | 5,980 | 45,209 | ||||||
| Kimball International, Inc., Class B | 5,265 | 59,021 | ||||||
| McGrath RentCorp | 4,309 | 285,945 | ||||||
| Quad/Graphics, Inc. | 3,723 | 12,993 | ||||||
| Steelcase, Inc., Class A | 11,466 | 119,820 | ||||||
| Viad Corp. | 830 | 17,787 | ||||||
| VSE Corp. | 1,101 | 31,962 | ||||||
| 1,478,775 | ||||||||
| Communications Equipment — 0.2% | ||||||||
Aviat Networks, Inc.(1) | 301 | 6,526 | ||||||
| Communications Systems, Inc. | 127 | 593 | ||||||
EchoStar Corp., Class A(1) | 5,335 | 156,742 | ||||||
Genasys, Inc.(1) | 5,919 | 29,595 | ||||||
| 193,456 | ||||||||
| Construction and Engineering — 2.5% | ||||||||
Ameresco, Inc., Class A(1) | 4,511 | 154,006 | ||||||
| Arcosa, Inc. | 3,804 | 176,087 | ||||||
| Fluor Corp. | 18,737 | 178,376 | ||||||
Goldfield Corp. (The)(1) | 2,383 | 10,414 | ||||||
Great Lakes Dredge & Dock Corp.(1) | 11,485 | 107,614 | ||||||
HC2 Holdings, Inc.(1) | 10,273 | 25,683 | ||||||
MasTec, Inc.(1) | 7,809 | 360,854 | ||||||
11
| Shares | Value | |||||||
MYR Group, Inc.(1) | 3,120 | $ | 121,087 | |||||
Northwest Pipe Co.(1) | 1,907 | 54,025 | ||||||
Orion Group Holdings, Inc.(1) | 2,241 | 5,849 | ||||||
| Primoris Services Corp. | 7,560 | 144,094 | ||||||
Tutor Perini Corp.(1) | 8,806 | 110,515 | ||||||
| Valmont Industries, Inc. | 3,439 | 436,925 | ||||||
WillScot Mobile Mini Holdings Corp.(1) | 7,350 | 131,565 | ||||||
| 2,017,094 | ||||||||
| Construction Materials — 0.8% | ||||||||
| Eagle Materials, Inc. | 6,801 | 556,118 | ||||||
| United States Lime & Minerals, Inc. | 69 | 6,357 | ||||||
US Concrete, Inc.(1) | 1,702 | 45,426 | ||||||
| 607,901 | ||||||||
| Consumer Finance — 2.5% | ||||||||
Atlanticus Holdings Corp.(1) | 425 | 3,613 | ||||||
Elevate Credit, Inc.(1) | 1,295 | 2,551 | ||||||
Green Dot Corp., Class A(1) | 9,306 | 484,470 | ||||||
| Navient Corp. | 25,158 | 228,686 | ||||||
| Nelnet, Inc., Class A | 2,487 | 162,874 | ||||||
| OneMain Holdings, Inc. | 14,192 | 412,703 | ||||||
Oportun Financial Corp.(1) | 2,789 | 35,002 | ||||||
Regional Management Corp.(1) | 1,260 | 23,045 | ||||||
| SLM Corp. | 71,801 | 548,560 | ||||||
World Acceptance Corp.(1) | 814 | 74,066 | ||||||
| 1,975,570 | ||||||||
| Containers and Packaging — 0.1% | ||||||||
| Myers Industries, Inc. | 5,983 | 91,540 | ||||||
| Distributors — 0.4% | ||||||||
| Core-Mark Holding Co., Inc. | 8,509 | 284,371 | ||||||
| Diversified Consumer Services — 0.3% | ||||||||
American Public Education, Inc.(1) | 422 | 13,268 | ||||||
Lincoln Educational Services Corp.(1) | 3,686 | 29,009 | ||||||
Perdoceo Education Corp.(1) | 11,304 | 162,438 | ||||||
Universal Technical Institute, Inc.(1) | 3,761 | 26,515 | ||||||
| 231,230 | ||||||||
| Diversified Financial Services — 0.1% | ||||||||
A-Mark Precious Metals, Inc.(1) | 764 | 18,275 | ||||||
| Alerus Financial Corp. | 813 | 16,739 | ||||||
| Banco Latinoamericano de Comercio Exterior SA, E Shares | 3,004 | 36,589 | ||||||
| Marlin Business Services Corp. | 441 | 2,955 | ||||||
| 74,558 | ||||||||
| Diversified Telecommunication Services — 0.2% | ||||||||
| Alaska Communications Systems Group, Inc. | 7,079 | 15,857 | ||||||
| ATN International, Inc. | 1,855 | 107,590 | ||||||
Iridium Communications, Inc.(1) | 1,632 | 45,712 | ||||||
| 169,159 | ||||||||
| Electrical Equipment — 0.6% | ||||||||
| Allied Motion Technologies, Inc. | 171 | 7,283 | ||||||
| Encore Wire Corp. | 3,449 | 178,003 | ||||||
| LSI Industries, Inc. | 4,646 | 31,872 | ||||||
Orion Energy Systems, Inc.(1) | 5,281 | 33,693 | ||||||
| Powell Industries, Inc. | 1,326 | 35,789 | ||||||
12
| Shares | Value | |||||||
| Preformed Line Products Co. | 32 | $ | 1,741 | |||||
TPI Composites, Inc.(1) | 6,981 | 214,386 | ||||||
| 502,767 | ||||||||
| Electronic Equipment, Instruments and Components — 2.8% | ||||||||
| Avnet, Inc. | 19,701 | 541,974 | ||||||
| Bel Fuse, Inc., Class B | 196 | 2,356 | ||||||
Kimball Electronics, Inc.(1) | 4,692 | 63,272 | ||||||
| Methode Electronics, Inc. | 6,225 | 176,230 | ||||||
Plexus Corp.(1) | 5,109 | 388,642 | ||||||
Sanmina Corp.(1) | 12,697 | 359,325 | ||||||
ScanSource, Inc.(1) | 3,654 | 90,217 | ||||||
TTM Technologies, Inc.(1) | 18,387 | 210,715 | ||||||
| Vishay Intertechnology, Inc. | 23,821 | 380,898 | ||||||
| 2,213,629 | ||||||||
| Energy Equipment and Services — 1.5% | ||||||||
| Archrock, Inc. | 27,322 | 179,232 | ||||||
| Cactus, Inc., Class A | 5,841 | 129,028 | ||||||
| DMC Global, Inc. | 2,621 | 92,862 | ||||||
Exterran Corp.(1) | 6,080 | 27,968 | ||||||
Gulf Island Fabrication, Inc.(1) | 202 | 566 | ||||||
Helix Energy Solutions Group, Inc.(1) | 2,770 | 9,917 | ||||||
| Helmerich & Payne, Inc. | 11,769 | 193,953 | ||||||
| Liberty Oilfield Services, Inc., Class A | 6,877 | 44,357 | ||||||
| Nabors Industries Ltd. | 757 | 30,265 | ||||||
Natural Gas Services Group, Inc.(1) | 1,108 | 9,063 | ||||||
Newpark Resources, Inc.(1) | 7,794 | 15,198 | ||||||
NexTier Oilfield Solutions, Inc.(1) | 17,921 | 45,161 | ||||||
Oceaneering International, Inc.(1) | 10,123 | 54,563 | ||||||
| Patterson-UTI Energy, Inc. | 22,360 | 86,086 | ||||||
ProPetro Holding Corp.(1) | 12,921 | 81,144 | ||||||
RPC, Inc.(1) | 10,610 | 33,209 | ||||||
Select Energy Services, Inc., Class A(1) | 8,218 | 39,200 | ||||||
| Solaris Oilfield Infrastructure, Inc., Class A | 2,866 | 22,297 | ||||||
| US Silica Holdings, Inc. | 12,542 | 55,937 | ||||||
| 1,150,006 | ||||||||
| Entertainment — 0.4% | ||||||||
Eros International plc(1) | 24,682 | 76,761 | ||||||
IMAX Corp.(1) | 2,972 | 45,679 | ||||||
Liberty Media Corp.-Liberty Braves, Class A(1) | 1,496 | 29,307 | ||||||
Liberty Media Corp.-Liberty Braves, Class C(1) | 5,439 | 105,680 | ||||||
| Marcus Corp. (The) | 2,548 | 39,927 | ||||||
| 297,354 | ||||||||
| Food and Staples Retailing — 1.2% | ||||||||
| Ingles Markets, Inc., Class A | 3,531 | 142,652 | ||||||
| Natural Grocers by Vitamin Cottage, Inc. | 2,534 | 29,699 | ||||||
| PriceSmart, Inc. | 3,510 | 230,783 | ||||||
| SpartanNash Co. | 5,083 | 101,558 | ||||||
United Natural Foods, Inc.(1) | 15,881 | 286,652 | ||||||
| Village Super Market, Inc., Class A | 2,044 | 51,999 | ||||||
| Weis Markets, Inc. | 1,375 | 67,691 | ||||||
| 911,034 | ||||||||
13
| Shares | Value | |||||||
| Food Products — 0.4% | ||||||||
| Alico, Inc. | 953 | $ | 30,801 | |||||
| Fresh Del Monte Produce, Inc. | 1,913 | 44,362 | ||||||
| John B Sanfilippo & Son, Inc. | 1,628 | 129,654 | ||||||
| Rocky Mountain Chocolate Factory, Inc. | 114 | 372 | ||||||
Seneca Foods Corp., Class A(1) | 1,720 | 81,459 | ||||||
| 286,648 | ||||||||
| Health Care Equipment and Supplies — 0.1% | ||||||||
FONAR Corp.(1) | 555 | 14,080 | ||||||
Lantheus Holdings, Inc.(1) | 461 | 6,187 | ||||||
Meridian Bioscience, Inc.(1) | 4,165 | 58,893 | ||||||
Natus Medical, Inc.(1) | 859 | 15,600 | ||||||
| 94,760 | ||||||||
| Health Care Providers and Services — 1.0% | ||||||||
Brookdale Senior Living, Inc.(1) | 18,266 | 50,232 | ||||||
| Ensign Group, Inc. (The) | 1,285 | 75,224 | ||||||
InfuSystem Holdings, Inc.(1) | 2,415 | 35,138 | ||||||
| Owens & Minor, Inc. | 11,068 | 183,508 | ||||||
| Patterson Cos., Inc. | 14,533 | 421,602 | ||||||
| Psychemedics Corp. | 112 | 507 | ||||||
Surgery Partners, Inc.(1) | 630 | 12,027 | ||||||
| 778,238 | ||||||||
| Hotels, Restaurants and Leisure — 3.7% | ||||||||
| BJ's Restaurants, Inc. | 2,500 | 78,800 | ||||||
| Bluegreen Vacations Corp. | 1,045 | 5,810 | ||||||
Carrols Restaurant Group, Inc.(1) | 3,545 | 23,610 | ||||||
Century Casinos, Inc.(1) | 3,520 | 21,648 | ||||||
| Cheesecake Factory, Inc. (The) | 6,023 | 177,859 | ||||||
Chuy's Holdings, Inc.(1) | 2,374 | 52,798 | ||||||
| Cracker Barrel Old Country Store, Inc. | 4,054 | 542,060 | ||||||
| Extended Stay America, Inc. | 30,708 | 383,543 | ||||||
Golden Entertainment, Inc.(1) | 2,886 | 37,056 | ||||||
Hilton Grand Vacations, Inc.(1) | 11,680 | 255,909 | ||||||
J Alexander's Holdings, Inc.(1) | 139 | 569 | ||||||
Lindblad Expeditions Holdings, Inc.(1) | 2,651 | 26,258 | ||||||
Norwegian Cruise Line Holdings Ltd.(1) | 14,928 | 255,418 | ||||||
Penn National Gaming, Inc.(1) | 3,853 | 196,888 | ||||||
Playa Hotels & Resorts NV(1) | 3,477 | 14,673 | ||||||
Potbelly Corp.(1) | 4,123 | 17,647 | ||||||
| RCI Hospitality Holdings, Inc. | 1,200 | 22,944 | ||||||
Red Robin Gourmet Burgers, Inc.(1) | 1,373 | 15,240 | ||||||
| Red Rock Resorts, Inc., Class A | 7,014 | 119,764 | ||||||
SeaWorld Entertainment, Inc.(1) | 1,508 | 30,763 | ||||||
Target Hospitality Corp.(1) | 494 | 716 | ||||||
| Texas Roadhouse, Inc. | 10,924 | 688,103 | ||||||
| Twin River Worldwide Holdings, Inc. | 119 | 2,848 | ||||||
| 2,970,924 | ||||||||
| Household Durables — 3.4% | ||||||||
Beazer Homes USA, Inc.(1) | 5,121 | 62,681 | ||||||
| Ethan Allen Interiors, Inc. | 863 | 12,289 | ||||||
| Hamilton Beach Brands Holding Co., Class A | 1,353 | 29,563 | ||||||
iRobot Corp.(1) | 426 | 31,537 | ||||||
14
| Shares | Value | |||||||
| KB Home | 15,341 | $ | 548,594 | |||||
| La-Z-Boy, Inc. | 7,866 | 255,645 | ||||||
Legacy Housing Corp.(1) | 861 | 13,147 | ||||||
| Lifetime Brands, Inc. | 267 | 2,622 | ||||||
M/I Homes, Inc.(1) | 427 | 18,173 | ||||||
Meritage Homes Corp.(1) | 7,177 | 689,207 | ||||||
New Home Co., Inc. (The)(1) | 211 | 914 | ||||||
Taylor Morrison Home Corp.(1) | 23,194 | 545,755 | ||||||
TRI Pointe Group, Inc.(1) | 22,024 | 371,765 | ||||||
Turtle Beach Corp.(1) | 3,029 | 59,278 | ||||||
Universal Electronics, Inc.(1) | 2,099 | 86,227 | ||||||
| 2,727,397 | ||||||||
| Household Products — 0.1% | ||||||||
| Oil-Dri Corp. of America | 1,065 | 37,296 | ||||||
| Insurance — 4.0% | ||||||||
Ambac Financial Group, Inc.(1) | 1,040 | 13,135 | ||||||
| American Equity Investment Life Holding Co. | 17,957 | 429,352 | ||||||
| American National Group, Inc. | 802 | 60,158 | ||||||
| AMERISAFE, Inc. | 1,952 | 130,257 | ||||||
| CNO Financial Group, Inc. | 23,659 | 385,642 | ||||||
| Crawford & Co., Class A | 1,407 | 9,652 | ||||||
| Employers Holdings, Inc. | 3,572 | 116,376 | ||||||
| FBL Financial Group, Inc., Class A | 899 | 33,308 | ||||||
Genworth Financial, Inc., Class A(1) | 7,844 | 23,689 | ||||||
| HCI Group, Inc. | 895 | 48,974 | ||||||
| Horace Mann Educators Corp. | 7,780 | 303,887 | ||||||
| Investors Title Co. | 36 | 4,898 | ||||||
| James River Group Holdings Ltd. | 3,957 | 192,746 | ||||||
| National General Holdings Corp. | 9,537 | 324,735 | ||||||
| National Western Life Group, Inc., Class A | 63 | 13,859 | ||||||
NI Holdings, Inc.(1) | 1,243 | 20,286 | ||||||
ProSight Global, Inc.(1) | 179 | 1,697 | ||||||
| Protective Insurance Corp., Class B | 1,065 | 15,293 | ||||||
| Selective Insurance Group, Inc. | 6,952 | 415,799 | ||||||
Third Point Reinsurance Ltd.(1) | 14,363 | 122,947 | ||||||
| Tiptree, Inc. | 2,578 | 14,540 | ||||||
| Unum Group | 23,632 | 436,719 | ||||||
Watford Holdings Ltd.(1) | 3,030 | 48,480 | ||||||
| 3,166,429 | ||||||||
Interactive Media and Services† | ||||||||
Cars.com, Inc.(1) | 1,805 | 15,667 | ||||||
| Internet and Direct Marketing Retail — 0.2% | ||||||||
1-800-Flowers.com, Inc., Class A(1) | 5,435 | 162,670 | ||||||
| PetMed Express, Inc. | 674 | 23,428 | ||||||
| 186,098 | ||||||||
IT Services† | ||||||||
Computer Task Group, Inc.(1) | 362 | 1,738 | ||||||
| Leisure Products — 0.6% | ||||||||
| Johnson Outdoors, Inc., Class A | 82 | 7,028 | ||||||
Malibu Boats, Inc., Class A(1) | 4,149 | 215,126 | ||||||
| Marine Products Corp. | 921 | 13,308 | ||||||
15
| Shares | Value | |||||||
Vista Outdoor, Inc.(1) | 11,107 | $ | 215,587 | |||||
| 451,049 | ||||||||
| Machinery — 3.7% | ||||||||
| Albany International Corp., Class A | 5,341 | 277,198 | ||||||
| Astec Industries, Inc. | 4,278 | 225,536 | ||||||
CIRCOR International, Inc.(1) | 1,884 | 55,861 | ||||||
Commercial Vehicle Group, Inc.(1) | 484 | 2,183 | ||||||
| EnPro Industries, Inc. | 3,257 | 190,600 | ||||||
| Gorman-Rupp Co. (The) | 246 | 7,860 | ||||||
| Greenbrier Cos., Inc. (The) | 4,678 | 127,195 | ||||||
| Kennametal, Inc. | 14,901 | 432,427 | ||||||
L.B. Foster Co., Class A(1) | 1,249 | 18,672 | ||||||
Lydall, Inc.(1) | 3,441 | 64,622 | ||||||
| Miller Industries, Inc. | 2,093 | 65,657 | ||||||
| Mueller Industries, Inc. | 9,479 | 281,526 | ||||||
| Park-Ohio Holdings Corp. | 1,381 | 21,847 | ||||||
| REV Group, Inc. | 2,913 | 22,576 | ||||||
| Shyft Group, Inc. (The) | 6,175 | 123,315 | ||||||
| Timken Co. (The) | 10,474 | 567,586 | ||||||
| Titan International, Inc. | 360 | 857 | ||||||
| Trinity Industries, Inc. | 16,566 | 339,106 | ||||||
| Wabash National Corp. | 9,413 | 114,933 | ||||||
| 2,939,557 | ||||||||
| Marine — 0.4% | ||||||||
| Costamare, Inc. | 7,096 | 35,835 | ||||||
| Genco Shipping & Trading Ltd. | 234 | 1,664 | ||||||
| Matson, Inc. | 7,768 | 311,264 | ||||||
| Scorpio Bulkers, Inc. | 383 | 5,350 | ||||||
| 354,113 | ||||||||
| Media — 0.1% | ||||||||
Cumulus Media, Inc., Class A(1) | 2,049 | 10,184 | ||||||
| Entercom Communications Corp., Class A | 3,807 | 5,711 | ||||||
| Entravision Communications Corp., Class A | 758 | 1,152 | ||||||
| Saga Communications, Inc., Class A | 1,004 | 22,590 | ||||||
| Townsquare Media, Inc., Class A | 134 | 623 | ||||||
| Tribune Publishing Co. | 341 | 3,870 | ||||||
| 44,130 | ||||||||
| Metals and Mining — 3.8% | ||||||||
Alcoa Corp.(1) | 36,533 | 534,112 | ||||||
Allegheny Technologies, Inc.(1) | 12,818 | 106,774 | ||||||
Arconic Corp.(1) | 19,166 | 426,444 | ||||||
| Carpenter Technology Corp. | 2,295 | 48,264 | ||||||
| Cleveland-Cliffs, Inc. | 63,999 | 421,113 | ||||||
| Commercial Metals Co. | 23,330 | 486,897 | ||||||
Contura Energy, Inc.(1) | 1,581 | 6,545 | ||||||
| Haynes International, Inc. | 1,668 | 31,258 | ||||||
| Kaiser Aluminum Corp. | 2,946 | 189,369 | ||||||
| Olympic Steel, Inc. | 2,234 | 24,574 | ||||||
Ramaco Resources, Inc.(1) | 727 | 2,196 | ||||||
Ryerson Holding Corp.(1) | 3,000 | 16,530 | ||||||
| Schnitzer Steel Industries, Inc., Class A | 5,134 | 101,345 | ||||||
| SunCoke Energy, Inc. | 18,751 | 67,129 | ||||||
16
| Shares | Value | |||||||
Synalloy Corp.(1) | 850 | $ | 5,364 | |||||
TimkenSteel Corp.(1) | 6,221 | 23,453 | ||||||
| United States Steel Corp. | 43,865 | 343,463 | ||||||
| Warrior Met Coal, Inc. | 11,130 | 172,181 | ||||||
| 3,007,011 | ||||||||
| Multiline Retail — 1.6% | ||||||||
| Big Lots, Inc. | 8,822 | 415,957 | ||||||
| Dillard's, Inc., Class A | 1,241 | 37,491 | ||||||
| Kohl's Corp. | 20,173 | 430,895 | ||||||
| Macy's, Inc. | 33,653 | 234,562 | ||||||
| Nordstrom, Inc. | 9,381 | 150,096 | ||||||
| 1,269,001 | ||||||||
| Oil, Gas and Consumable Fuels — 7.9% | ||||||||
| Adams Resources & Energy, Inc. | 237 | 5,041 | ||||||
| Antero Midstream Corp. | 52,607 | 356,149 | ||||||
Antero Resources Corp.(1) | 39,683 | 127,779 | ||||||
| Arch Resources, Inc. | 2,684 | 101,106 | ||||||
| Berry Corp. | 5,570 | 21,946 | ||||||
Bonanza Creek Energy, Inc.(1) | 3,603 | 72,204 | ||||||
| Cimarex Energy Co. | 17,953 | 498,734 | ||||||
CNX Resources Corp.(1) | 31,420 | 344,363 | ||||||
Comstock Resources, Inc.(1) | 10,381 | 59,795 | ||||||
CONSOL Energy, Inc.(1) | 4,590 | 23,730 | ||||||
Contango Oil & Gas Co.(1) | 17,729 | 28,721 | ||||||
| Continental Resources, Inc. | 1,112 | 19,104 | ||||||
| CVR Energy, Inc. | 3,605 | 60,167 | ||||||
| Delek US Holdings, Inc. | 9,105 | 143,222 | ||||||
| Devon Energy Corp. | 7,995 | 86,906 | ||||||
| DHT Holdings, Inc. | 25,419 | 134,467 | ||||||
Dorian LPG Ltd.(1) | 8,170 | 68,955 | ||||||
Earthstone Energy, Inc., Class A(1) | 3,473 | 10,176 | ||||||
EnLink Midstream LLC(1) | 36,659 | 109,610 | ||||||
| EQT Corp. | 51,873 | 823,224 | ||||||
| Evolution Petroleum Corp. | 5,183 | 14,150 | ||||||
| Falcon Minerals Corp. | 3,449 | 9,692 | ||||||
| GasLog Ltd. | 4,333 | 12,782 | ||||||
Goodrich Petroleum Corp.(1) | 2,477 | 20,435 | ||||||
Green Plains, Inc.(1) | 813 | 10,878 | ||||||
| Kosmos Energy Ltd. | 31,611 | 46,468 | ||||||
Laredo Petroleum, Inc.(1) | 1,073 | 17,544 | ||||||
Magnolia Oil & Gas Corp., Class A(1) | 14,081 | 90,682 | ||||||
| Marathon Oil Corp. | 18,322 | 96,740 | ||||||
Matador Resources Co.(1) | 13,545 | 131,793 | ||||||
Montage Resources Corp.(1) | 4,824 | 24,892 | ||||||
| Murphy Oil Corp. | 18,427 | 253,187 | ||||||
| NACCO Industries, Inc., Class A | 434 | 8,897 | ||||||
| Noble Energy, Inc. | 11,652 | 115,937 | ||||||
| Nordic American Tankers Ltd. | 2,008 | 8,755 | ||||||
Overseas Shipholding Group, Inc., Class A(1) | 20,289 | 42,810 | ||||||
| Ovintiv, Inc. | 43,026 | 476,728 | ||||||
| Panhandle Oil and Gas, Inc., Class A | 1,650 | 3,118 | ||||||
Par Pacific Holdings, Inc.(1) | 4,869 | 42,263 | ||||||
17
| Shares | Value | |||||||
| Parsley Energy, Inc., Class A | 7,892 | $ | 84,839 | |||||
| PBF Energy, Inc., Class A | 10,047 | 86,002 | ||||||
PDC Energy, Inc.(1) | 13,569 | 205,435 | ||||||
| Peabody Energy Corp. | 8,203 | 21,410 | ||||||
Penn Virginia Corp.(1) | 1,915 | 21,869 | ||||||
PrimeEnergy Resources Corp.(1) | 7 | 471 | ||||||
| Range Resources Corp. | 61,178 | 456,388 | ||||||
| Rattler Midstream LP | 5,688 | 47,609 | ||||||
| SFL Corp. Ltd. | 14,131 | 124,070 | ||||||
SilverBow Resources, Inc.(1) | 117 | 578 | ||||||
| SM Energy Co. | 11,880 | 28,868 | ||||||
Southwestern Energy Co.(1) | 135,842 | 377,641 | ||||||
Talos Energy, Inc.(1) | 2,423 | 18,197 | ||||||
Teekay Tankers Ltd., Class A(1) | 3,136 | 39,325 | ||||||
WPX Energy, Inc.(1) | 45,114 | 250,834 | ||||||
| 6,286,686 | ||||||||
| Paper and Forest Products — 1.3% | ||||||||
| Boise Cascade Co. | 7,254 | 332,233 | ||||||
Clearwater Paper Corp.(1) | 3,624 | 121,984 | ||||||
| Domtar Corp. | 7,634 | 217,722 | ||||||
| Mercer International, Inc. | 11,212 | 93,956 | ||||||
| Neenah, Inc. | 3,090 | 136,825 | ||||||
| Schweitzer-Mauduit International, Inc. | 1,573 | 47,709 | ||||||
| Verso Corp., Class A | 5,244 | 68,749 | ||||||
| 1,019,178 | ||||||||
| Personal Products — 0.7% | ||||||||
| Medifast, Inc. | 93 | 15,133 | ||||||
| Nu Skin Enterprises, Inc., Class A | 9,311 | 440,131 | ||||||
USANA Health Sciences, Inc.(1) | 905 | 70,961 | ||||||
| 526,225 | ||||||||
| Pharmaceuticals — 0.8% | ||||||||
ANI Pharmaceuticals, Inc.(1) | 137 | 4,296 | ||||||
Corcept Therapeutics, Inc.(1) | 11,248 | 142,850 | ||||||
Innoviva, Inc.(1) | 13,492 | 157,991 | ||||||
Lannett Co., Inc.(1) | 8,191 | 43,085 | ||||||
Mallinckrodt plc(1) | 4,646 | 7,341 | ||||||
| Phibro Animal Health Corp., Class A | 2,972 | 63,779 | ||||||
Supernus Pharmaceuticals, Inc.(1) | 8,052 | 177,063 | ||||||
| 596,405 | ||||||||
| Professional Services — 0.4% | ||||||||
| Barrett Business Services, Inc. | 809 | 46,574 | ||||||
| CRA International, Inc. | 242 | 10,288 | ||||||
| Heidrick & Struggles International, Inc. | 3,397 | 73,477 | ||||||
| Kforce, Inc. | 2,436 | 83,652 | ||||||
TrueBlue, Inc.(1) | 3,680 | 62,266 | ||||||
| 276,257 | ||||||||
| Real Estate Management and Development — 0.3% | ||||||||
Altisource Portfolio Solutions SA(1) | 55 | 620 | ||||||
Marcus & Millichap, Inc.(1) | 639 | 18,026 | ||||||
| RE/MAX Holdings, Inc., Class A | 3,675 | 129,140 | ||||||
| RMR Group, Inc. (The), Class A | 2,641 | 74,529 | ||||||
| 222,315 | ||||||||
18
| Shares | Value | |||||||
| Road and Rail — 2.7% | ||||||||
| ArcBest Corp. | 5,138 | $ | 173,767 | |||||
Covenant Logistics Group, Inc., Class A(1) | 2,198 | 40,289 | ||||||
| Heartland Express, Inc. | 591 | 12,225 | ||||||
| Marten Transport Ltd. | 11,233 | 203,991 | ||||||
PAM Transportation Services, Inc.(1) | 50 | 1,825 | ||||||
| Ryder System, Inc. | 10,401 | 425,401 | ||||||
Saia, Inc.(1) | 5,025 | 674,355 | ||||||
| Schneider National, Inc., Class B | 1,680 | 45,461 | ||||||
US Xpress Enterprises, Inc., Class A(1) | 5,048 | 48,309 | ||||||
USA Truck, Inc.(1) | 137 | 1,528 | ||||||
| Werner Enterprises, Inc. | 11,807 | 543,240 | ||||||
| 2,170,391 | ||||||||
| Semiconductors and Semiconductor Equipment — 0.8% | ||||||||
Amkor Technology, Inc.(1) | 14,496 | 176,779 | ||||||
Amtech Systems, Inc.(1) | 506 | 2,874 | ||||||
AXT, Inc.(1) | 331 | 1,867 | ||||||
Diodes, Inc.(1) | 767 | 37,476 | ||||||
Photronics, Inc.(1) | 10,798 | 108,304 | ||||||
SMART Global Holdings, Inc.(1) | 2,667 | 67,208 | ||||||
Synaptics, Inc.(1) | 619 | 52,819 | ||||||
Ultra Clean Holdings, Inc.(1) | 8,727 | 213,986 | ||||||
| 661,313 | ||||||||
Software† | ||||||||
TeleNav, Inc.(1) | 6,990 | 32,084 | ||||||
| Specialty Retail — 7.9% | ||||||||
| Abercrombie & Fitch Co., Class A | 12,798 | 166,502 | ||||||
| American Eagle Outfitters, Inc. | 30,364 | 382,890 | ||||||
Asbury Automotive Group, Inc.(1) | 3,415 | 361,273 | ||||||
AutoNation, Inc.(1) | 11,121 | 632,340 | ||||||
Barnes & Noble Education, Inc.(1) | 673 | 1,534 | ||||||
| Bed Bath & Beyond, Inc. | 18,594 | 226,475 | ||||||
| Buckle, Inc. (The) | 5,953 | 111,559 | ||||||
Build-A-Bear Workshop, Inc.(1) | 638 | 1,646 | ||||||
| Caleres, Inc. | 3,811 | 29,764 | ||||||
| Cato Corp. (The), Class A | 4,075 | 32,600 | ||||||
| Children's Place, Inc. (The) | 2,340 | 46,718 | ||||||
| Citi Trends, Inc. | 2,154 | 41,637 | ||||||
Conn's, Inc.(1) | 2,522 | 32,231 | ||||||
| Dick's Sporting Goods, Inc. | 7,201 | 389,718 | ||||||
| Foot Locker, Inc. | 20,523 | 622,463 | ||||||
| Gap, Inc. (The) | 23,706 | 412,247 | ||||||
Genesco, Inc.(1) | 2,173 | 42,374 | ||||||
| Guess?, Inc. | 4,763 | 54,775 | ||||||
| Haverty Furniture Cos., Inc. | 3,154 | 66,613 | ||||||
Hibbett Sports, Inc.(1) | 3,417 | 114,025 | ||||||
Hudson Ltd., Class A(1) | 3,963 | 29,881 | ||||||
| Lithia Motors, Inc., Class A | 2,829 | 704,308 | ||||||
Murphy USA, Inc.(1) | 4,574 | 616,850 | ||||||
| ODP Corp. (The) | 6,983 | 163,263 | ||||||
| Shoe Carnival, Inc. | 1,673 | 55,008 | ||||||
| Signet Jewelers Ltd. | 14,061 | 242,834 | ||||||
19
| Shares | Value | |||||||
| Sonic Automotive, Inc., Class A | 4,528 | $ | 191,353 | |||||
Sportsman's Warehouse Holdings, Inc.(1) | 9,469 | 148,616 | ||||||
| Tilly's, Inc., Class A | 3,583 | 22,716 | ||||||
TravelCenters of America, Inc.(1) | 2,915 | 62,264 | ||||||
Urban Outfitters, Inc.(1) | 8,273 | 194,746 | ||||||
Zumiez, Inc.(1) | 2,805 | 72,032 | ||||||
| 6,273,255 | ||||||||
| Technology Hardware, Storage and Peripherals — 0.2% | ||||||||
| Xerox Holdings Corp. | 7,951 | 149,956 | ||||||
| Textiles, Apparel and Luxury Goods — 1.5% | ||||||||
Capri Holdings Ltd.(1) | 14,079 | 223,011 | ||||||
| Crown Crafts, Inc. | 151 | 903 | ||||||
| Culp, Inc. | 117 | 1,404 | ||||||
Fossil Group, Inc.(1) | 4,100 | 26,383 | ||||||
G-III Apparel Group Ltd.(1) | 6,476 | 71,625 | ||||||
| Oxford Industries, Inc. | 2,875 | 142,399 | ||||||
| PVH Corp. | 7,649 | 426,508 | ||||||
| Rocky Brands, Inc. | 1,088 | 26,199 | ||||||
| Steven Madden Ltd. | 8,440 | 178,590 | ||||||
| Superior Group of Cos., Inc. | 233 | 5,392 | ||||||
| Wolverine World Wide, Inc. | 2,908 | 72,642 | ||||||
| 1,175,056 | ||||||||
| Thrifts and Mortgage Finance — 4.8% | ||||||||
Axos Financial, Inc.(1) | 9,412 | 233,229 | ||||||
Bridgewater Bancshares, Inc.(1) | 3,124 | 30,365 | ||||||
| Essent Group Ltd. | 10,352 | 369,566 | ||||||
| Federal Agricultural Mortgage Corp., Class C | 1,518 | 103,452 | ||||||
| Flagstar Bancorp, Inc. | 5,904 | 185,504 | ||||||
| FS Bancorp, Inc. | 490 | 19,414 | ||||||
| Greene County Bancorp, Inc. | 134 | 3,144 | ||||||
| Hingham Institution For Savings (The) | 203 | 37,222 | ||||||
| Home Bancorp, Inc. | 904 | 21,841 | ||||||
| HomeStreet, Inc. | 3,910 | 107,017 | ||||||
| Luther Burbank Corp. | 515 | 4,784 | ||||||
| Merchants Bancorp | 2,641 | 53,824 | ||||||
| Meta Financial Group, Inc. | 3,246 | 62,583 | ||||||
| MGIC Investment Corp. | 47,988 | 440,050 | ||||||
MMA Capital Holdings, Inc.(1) | 79 | 1,855 | ||||||
Mr. Cooper Group, Inc.(1) | 15,009 | 275,040 | ||||||
NMI Holdings, Inc., Class A(1) | 8,361 | 143,391 | ||||||
| Northwest Bancshares, Inc. | 228 | 2,305 | ||||||
| OP Bancorp | 1,343 | 8,192 | ||||||
| PennyMac Financial Services, Inc. | 9,829 | 518,185 | ||||||
Pioneer Bancorp, Inc.(1) | 1,771 | 14,239 | ||||||
| Provident Financial Services, Inc. | 1,367 | 18,017 | ||||||
| Radian Group, Inc. | 30,282 | 467,554 | ||||||
| Riverview Bancorp, Inc. | 2,994 | 12,365 | ||||||
| Severn Bancorp, Inc. | 129 | 792 | ||||||
| Southern Missouri Bancorp, Inc. | 1,003 | 23,751 | ||||||
| Sterling Bancorp, Inc. | 586 | 1,740 | ||||||
| Territorial Bancorp, Inc. | 99 | 2,095 | ||||||
| Timberland Bancorp, Inc. | 963 | 16,843 | ||||||
20
| Shares | Value | |||||||
| TrustCo Bank Corp. NY | 9,895 | $ | 58,974 | |||||
| Walker & Dunlop, Inc. | 5,771 | 316,135 | ||||||
| Waterstone Financial, Inc. | 2,784 | 43,124 | ||||||
| WSFS Financial Corp. | 8,079 | 236,715 | ||||||
| 3,833,307 | ||||||||
| Trading Companies and Distributors — 3.7% | ||||||||
| Air Lease Corp. | 19,952 | 620,108 | ||||||
BMC Stock Holdings, Inc.(1) | 11,347 | 452,972 | ||||||
CAI International, Inc.(1) | 3,003 | 65,495 | ||||||
| GATX Corp. | 6,738 | 450,637 | ||||||
| H&E Equipment Services, Inc. | 3,571 | 72,348 | ||||||
Herc Holdings, Inc.(1) | 4,039 | 165,397 | ||||||
MRC Global, Inc.(1) | 7,614 | 43,324 | ||||||
NOW, Inc.(1) | 20,736 | 150,751 | ||||||
| Rush Enterprises, Inc., Class A | 5,505 | 266,002 | ||||||
| Rush Enterprises, Inc., Class B | 356 | 14,877 | ||||||
| Systemax, Inc. | 2,425 | 53,811 | ||||||
Textainer Group Holdings Ltd.(1) | 9,357 | 109,851 | ||||||
| Triton International Ltd. | 10,625 | 383,138 | ||||||
Veritiv Corp.(1) | 3,856 | 67,017 | ||||||
Willis Lease Finance Corp.(1) | 215 | 4,597 | ||||||
| 2,920,325 | ||||||||
| Wireless Telecommunication Services — 0.9% | ||||||||
| Shenandoah Telecommunications Co. | 3,412 | 188,684 | ||||||
| Telephone and Data Systems, Inc. | 16,794 | 388,445 | ||||||
United States Cellular Corp.(1) | 2,845 | 103,501 | ||||||
| 680,630 | ||||||||
TOTAL COMMON STOCKS (Cost $65,283,787) | 78,221,867 | |||||||
| TEMPORARY CASH INVESTMENTS — 1.3% | ||||||||
| State Street Institutional U.S. Government Money Market Fund, Premier Class (Cost $1,019,655) | 1,019,655 | 1,019,655 | ||||||
TOTAL INVESTMENT SECURITIES — 99.9% (Cost $66,303,442) | 79,241,522 | |||||||
| OTHER ASSETS AND LIABILITIES — 0.1% | 96,105 | |||||||
| TOTAL NET ASSETS — 100.0% | $ | 79,337,627 | ||||||
| FUTURES CONTRACTS PURCHASED | ||||||||||||||
| Reference Entity | Contracts | Expiration Date | Notional Amount | Unrealized Appreciation (Depreciation)^ | ||||||||||
| Russell 2000 E-Mini Index | 11 | September 2020 | $ | 858,715 | $ | 35,946 | ||||||||
^Amount represents value and unrealized appreciation (depreciation).
NOTES TO SCHEDULE OF INVESTMENTS | ||
† Category is less than 0.05% of total net assets.
(1)Non-income producing.
See Notes to Financial Statements.
21
| Statement of Assets and Liabilities | ||
| AUGUST 31, 2020 | |||||
| Assets | |||||
| Investment securities, at value (cost of $66,303,442) | $ | 79,241,522 | |||
| Deposits with broker for futures contracts | 63,800 | ||||
| Dividends and interest receivable | 110,107 | ||||
| 79,415,429 | |||||
| Liabilities | |||||
| Payable for capital shares redeemed | 53,251 | ||||
| Payable for variation margin on futures contracts | 7,920 | ||||
| Accrued management fees | 16,631 | ||||
| 77,802 | |||||
| Net Assets | $ | 79,337,627 | |||
| Institutional Class Capital Shares | |||||
| Shares outstanding (unlimited number of shares authorized) | 8,783,284 | ||||
| Net Asset Value Per Share | $ | 9.03 | |||
| Net Assets Consist of: | |||||
| Capital paid in | $ | 66,376,631 | |||
| Distributable earnings | 12,960,996 | ||||
| $ | 79,337,627 | ||||
See Notes to Financial Statements.
22
| Statement of Operations | ||
FOR THE PERIOD ENDED AUGUST 31, 2020(1) | |||||
| Investment Income (Loss) | |||||
| Income: | |||||
| Dividends (net of foreign taxes withheld of $723) | $ | 508,838 | |||
| Interest | 1,910 | ||||
| Securities lending, net | 967 | ||||
| 511,715 | |||||
| Expenses: | |||||
| Management fees | 59,790 | ||||
| Other expenses | 129 | ||||
| 59,919 | |||||
| Net investment income (loss) | 451,796 | ||||
| Realized and Unrealized Gain (Loss) | |||||
| Net realized gain (loss) on: | |||||
| Investment transactions | (762,284) | ||||
| Futures contract transactions | 307,114 | ||||
| (455,170) | |||||
| Change in net unrealized appreciation (depreciation) on: | |||||
| Investments | 12,938,080 | ||||
| Futures contracts | 35,946 | ||||
| 12,974,026 | |||||
| Net realized and unrealized gain (loss) | 12,518,856 | ||||
| Net Increase (Decrease) in Net Assets Resulting from Operations | $ | 12,970,652 | |||
(1)December 4, 2019 (fund inception) through August 31, 2020.
See Notes to Financial Statements.
23
| Statement of Changes in Net Assets | ||
PERIOD ENDED AUGUST 31, 2020(1) | |||||
| Increase (Decrease) in Net Assets | |||||
| Operations | |||||
| Net investment income (loss) | $ | 451,796 | |||
| Net realized gain (loss) | (455,170) | ||||
| Change in net unrealized appreciation (depreciation) | 12,974,026 | ||||
| Net increase (decrease) in net assets resulting from operations | 12,970,652 | ||||
| Distributions to Shareholders | |||||
| From earnings | (9,656) | ||||
| Capital Share Transactions | |||||
| Proceeds from shares sold | 73,544,735 | ||||
| Proceeds from reinvestment of distributions | 9,656 | ||||
| Payments for shares redeemed | (7,177,760) | ||||
| Net increase (decrease) in net assets from capital share transactions | 66,376,631 | ||||
| Net increase (decrease) in net assets | 79,337,627 | ||||
| Net Assets | |||||
| End of period | $ | 79,337,627 | |||
| Transactions in Shares of the Fund | |||||
| Sold | 9,720,837 | ||||
| Issued in reinvestment of distributions | 922 | ||||
| Redeemed | (938,475) | ||||
| Net increase (decrease) in shares of the fund | 8,783,284 | ||||
(1)December 4, 2019 (fund inception) through August 31, 2020.
See Notes to Financial Statements.
24
| Notes to Financial Statements | ||
AUGUST 31, 2020
1. Organization
American Century ETF Trust (the trust) was registered as a Delaware statutory trust in 2017 and is registered under the Investment Company Act of 1940, as amended (the 1940 Act), as an open-end management investment company. Avantis U.S. Small Cap Value Fund (the fund) is one fund in a series issued by the trust. The fund’s investment objective is to seek long-term capital appreciation. The fund offers the Institutional Class. The Institutional Class commenced sale on December 4, 2019, the fund's inception date.
2. Significant Accounting Policies
The following is a summary of significant accounting policies consistently followed by the fund in preparation of its financial statements. The fund is an investment company and follows accounting and reporting guidance in accordance with accounting principles generally accepted in the United States of America. This may require management to make certain estimates and assumptions at the date of the financial statements. Actual results could differ from these estimates. Management evaluated the impact of events or transactions occurring through the date the financial statements were issued that would merit recognition or disclosure.
Investment Valuations — The fund determines the fair value of its investments and computes its net asset value per share at the close of regular trading (usually 4 p.m. Eastern time) on the New York Stock Exchange (NYSE) on each day the NYSE is open. The Board of Trustees has adopted valuation policies and procedures to guide the investment advisor in the fund’s investment valuation process and to provide methodologies for the oversight of the fund’s pricing function.
Equity securities that are listed or traded on a domestic securities exchange are valued at the last reported sales price or at the official closing price as provided by the exchange. Equity securities traded on foreign securities exchanges are generally valued at the closing price of such securities on the exchange where primarily traded or at the close of the NYSE, if that is earlier. If no last sales price is reported, or if local convention or regulation so provides, the mean of the latest bid and asked prices may be used. Securities traded over-the-counter are valued at the mean of the latest bid and asked prices, the last sales price, or the official closing price.
Open-end management investment companies are valued at the reported net asset value per share. Exchange-traded futures contracts are valued at the settlement price as provided by the appropriate exchange.
If the fund determines that the market price for an investment is not readily available or the valuation methods mentioned above do not reflect an investment’s fair value, such investment is valued as determined in good faith by the Board of Trustees or its delegate, in accordance with policies and procedures adopted by the Board of Trustees. In its determination of fair value, the fund may review several factors including, but not limited to, market information regarding the specific investment or comparable investments and correlation with other investment types, futures indices or general market indicators. Circumstances that may cause the fund to use these procedures to value an investment include, but are not limited to: an investment has been declared in default or is distressed; trading in a security has been suspended during the trading day or a security is not actively trading on its principal exchange; prices received from a regular pricing source are deemed unreliable; or there is a foreign market holiday and no trading occurred.
The fund monitors for significant events occurring after the close of an investment’s primary exchange but before the fund’s net asset value per share is determined. Significant events may include, but are not limited to: corporate announcements and transactions; governmental action and political unrest that could impact a specific investment or an investment sector; or armed conflicts, natural disasters and similar events that could affect investments in a specific country or region. The fund also monitors for significant fluctuations between domestic and foreign markets, as evidenced by the U.S. market or such other indicators that the Board of Trustees, or its delegate, deems appropriate. The fund may apply a model-derived factor to the closing price of equity securities traded on foreign securities exchanges. The factor is based on observable market data as provided by an independent pricing service.
25
Security Transactions — Security transactions are accounted for as of the trade date. Net realized gains and losses are determined on the identified cost basis, which is also used for federal income tax purposes.
Investment Income ��� Dividend income less foreign taxes withheld, if any, is recorded as of the ex-dividend date. Distributions received on securities that represent a return of capital or long-term capital gain are recorded as a reduction of cost of investments and/or as a realized gain. The fund may estimate the components of distributions received that may be considered nontaxable distributions or long-term capital gain distributions for income tax purposes. Interest income is recorded on the accrual basis and includes accretion of discounts and amortization of premiums. Securities lending income is net of fees and rebates earned by the lending agent for its services.
Segregated Assets — In accordance with the 1940 Act, the fund segregates assets on its books and records to cover certain types of investment securities and other financial instruments. American Century Investment Management, Inc. (ACIM) (the investment advisor) monitors, on a daily basis, the securities segregated to ensure the fund designates a sufficient amount of liquid assets, marked-to-market daily. The fund may also receive assets or be required to pledge assets at the custodian bank or with a broker for collateral requirements.
Income Tax Status — It is the fund’s policy to distribute substantially all net investment income and net realized gains to shareholders and to otherwise qualify as a regulated investment company under provisions of the Internal Revenue Code. Accordingly, no provision has been made for income taxes. The fund files U.S. federal, state, local and non-U.S. tax returns as applicable. The fund's tax returns are subject to examination by the relevant taxing authority until expiration of the applicable statute of limitations, which is generally three years from the date of filing but can be longer in certain jurisdictions. At this time, management believes there are no uncertain tax positions which, based on their technical merit, would not be sustained upon examination and for which it is reasonably possible that the total amounts of unrecognized tax benefits will significantly change in the next twelve months.
Distributions to Shareholders — Distributions from net investment income and net realized gains, if any, are generally declared and paid annually.
Indemnifications — Under the trust’s organizational documents, its officers and trustees are indemnified against certain liabilities arising out of the performance of their duties to the fund. In addition, in the normal course of business, the fund enters into contracts that provide general indemnifications. The maximum exposure under these arrangements is unknown as this would involve future claims that may be made against a fund. The risk of material loss from such claims is considered by management to be remote.
Securities Lending — Securities are lent to qualified financial institutions and brokers. State Street Bank & Trust Co. serves as securities lending agent to the fund pursuant to a Securities Lending Agreement. The lending of securities exposes the fund to risks such as: the borrowers may fail to return the loaned securities, the borrowers may not be able to provide additional collateral, the fund may experience delays in recovery of the loaned securities or delays in access to collateral, or the fund may experience losses related to the investment collateral. To minimize certain risks, loan counterparties pledge collateral in the form of cash and/or securities. The lending agent has agreed to indemnify the fund in the case of default of any securities borrowed. Cash collateral received is invested in the State Street Navigator Securities Lending Government Money Market Portfolio, a money market mutual fund registered under the 1940 Act. The loans may also be secured by U.S. government securities in an amount at least equal to the market value of the securities loaned, plus accrued interest and dividends, determined on a daily basis and adjusted accordingly. By lending securities, the fund seeks to increase its net investment income through the receipt of interest and fees. Such income is reflected separately within the Statement of Operations. The value of loaned securities and related collateral outstanding at period end, if any, are shown on a gross basis within the Schedule of Investments and Statement of Assets and Liabilities.
3. Fees and Transactions with Related Parties
Certain officers and trustees of the trust are also officers and/or directors of American Century Companies, Inc. (ACC). The trust's investment advisor, ACIM, the fund's distributor, American Century Investment Services, Inc., and the trust’s transfer agent, American Century Services, LLC, are wholly owned, directly or indirectly, by ACC. ACIM owns 6% of the shares of the fund.
26
Management Fees — The trust has entered into a management agreement with ACIM, under which ACIM provides the fund with investment advisory and management services in exchange for a single, unified management fee (the fee). The agreement provides that ACIM will pay all expenses of managing and operating the fund, except brokerage and other transaction fees and expenses relating to the acquisition and disposition of portfolio securities, acquired fund fees and expenses, interest, taxes, litigation expenses and extraordinary expenses. The fee is computed and accrued daily based on the daily net assets of the fund and paid monthly in arrears. The annual management fee is 0.25%.
Interfund Transactions — The fund may enter into security transactions with other American Century Investments funds and other client accounts of the investment advisor, in accordance with the 1940 Act rules and procedures adopted by the Board of Trustees. The rules and procedures require, among other things, that these transactions be effected at the independent current market price of the security. There were no interfund transactions during the period.
4. Investment Transactions
Purchases and sales of investment securities, excluding short-term investments, for the period ended August 31, 2020 were $67,420,132 and $1,362,488, respectively.
5. Fair Value Measurements
The fund’s investments valuation process is based on several considerations and may use multiple inputs to determine the fair value of the investments held by the fund. In conformity with accounting principles generally accepted in the United States of America, the inputs used to determine a valuation are classified into three broad levels.
•Level 1 valuation inputs consist of unadjusted quoted prices in an active market for identical investments.
•Level 2 valuation inputs consist of direct or indirect observable market data (including quoted prices for comparable investments, evaluations of subsequent market events, interest rates, prepayment speeds, credit risk, etc.). These inputs also consist of quoted prices for identical investments initially expressed in local currencies that are adjusted through translation into U.S. dollars.
•Level 3 valuation inputs consist of unobservable data (including a fund’s own assumptions).
The level classification is based on the lowest level input that is significant to the fair valuation measurement. The valuation inputs are not necessarily an indication of the risks associated with investing in these securities or other financial instruments.
As of period end, the fund’s investment securities and unrealized appreciation (depreciation) on futures contracts were classified as Level 1. The Schedule of Investments provides additional information on the fund's portfolio holdings.
6. Derivative Instruments
Equity Price Risk — The fund is subject to equity price risk in the normal course of pursuing its investment objectives. A fund may enter into futures contracts based on an equity index in order to manage its exposure to changes in market conditions. A fund may purchase futures contracts to gain exposure to increases in market value or sell futures contracts to protect against a decline in market value. Upon entering into a futures contract, a fund is required to deposit either cash or securities in an amount equal to a certain percentage of the contract value (initial margin). Subsequent payments (variation margin) are made or received daily, in cash, by a fund. The variation margin is equal to the daily change in the contract value and is recorded as unrealized gains and losses. A fund recognizes a realized gain or loss when the contract is closed or expires. Net realized and unrealized gains or losses occurring during the holding period of futures contracts are a component of net realized gain (loss) on futures contract transactions and change in net unrealized appreciation (depreciation) on futures contracts, respectively. One of the risks of entering into futures contracts is the possibility that the change in value of the contract may not correlate with the changes in value of the underlying securities. The fund's average notional exposure to equity price risk derivative instruments held during the period was $554,280 futures contracts purchased.
27
The value of equity price risk derivative instruments as of August 31, 2020, is disclosed on the Statement of Assets and Liabilities as a liability of $7,920 in payable for variation margin on futures contracts*. For the period from December 4, 2019 (fund inception) through August 31, 2020, the effect of equity price risk derivative instruments on the Statement of Operations was $307,114 in net realized gain (loss) on futures contract transactions and $35,946 in change in net unrealized appreciation (depreciation) on futures contracts.
*Included in the unrealized appreciation (depreciation) on futures contracts, as reported in the Schedule of Investments.
7. Risk Factors
The value of the fund’s shares will go up and down, sometimes rapidly or unpredictably, based on the performance of the securities owned by the fund and other factors generally affecting the securities market. Market risks, including political, regulatory, economic and social developments, can affect the value of the fund’s investments. Natural disasters, public health emergencies, terrorism and other unforeseeable events may lead to increased market volatility and may have adverse long-term effects on world economies and markets generally.
The fund invests in common stocks of small companies. Because of this, the fund may be subject to greater risk and market fluctuations than a fund investing in larger, more established companies.
8. Federal Tax Information
The tax character of distributions paid during the period December 4, 2019 (fund inception) through August 31, 2020 were as follows:
| Distributions Paid From | |||||
| Ordinary income | $ | 9,656 | |||
| Long-term capital gains | — | ||||
The book-basis character of distributions made during the year from net investment income or net realized gains may differ from their ultimate characterization for federal income tax purposes. These differences reflect the differing character of certain income items and net realized gains and losses for financial statement and tax purposes, and may result in reclassification among certain capital accounts on the financial statements.
As of period end, the federal tax cost of investments and the components of distributable earnings on a tax-basis were as follows:
| Federal tax cost of investments | $ | 66,747,377 | |||
| Gross tax appreciation of investments | $ | 13,926,798 | |||
| Gross tax depreciation of investments | (1,432,653) | ||||
| Net tax appreciation (depreciation) of investments | $ | 12,494,145 | |||
| Undistributed ordinary income | $ | 442,059 | |||
| Accumulated long-term gains | $ | 24,792 | |||
The difference between book-basis and tax-basis unrealized appreciation (depreciation) is attributable primarily to the tax deferral of losses on wash sales.
28
| Financial Highlights | ||
| For a Share Outstanding Throughout the Period Indicated | |||||||||||||||||||||||||||||||||||
| Per-Share Data | Ratios and Supplemental Data | ||||||||||||||||||||||||||||||||||
| Income From Investment Operations: | Ratio to Average Net Assets of: | ||||||||||||||||||||||||||||||||||
| Net Asset Value, Beginning of Period | Net Investment Income (Loss)(1) | Net Realized and Unrealized Gain (Loss) | Total From Investment Operations | Distributions From Net Investment Income | Net Asset Value, End of Period | Total Return(2) | Operating Expenses | Net Investment Income (Loss) | Portfolio Turnover Rate | Net Assets, End of Period (in thousands) | |||||||||||||||||||||||||
| Institutional Class | |||||||||||||||||||||||||||||||||||
2020(3) | $10.00 | 0.11 | (1.07) | (0.96) | (0.01) | $9.03 | (9.57)% | 0.25%(4) | 1.89%(4) | 4% | $79,338 | ||||||||||||||||||||||||
| Notes to Financial Highlights | ||
(1)Computed using average shares outstanding throughout the period.
(2)Total returns are calculated based on the net asset value of the last business day. Total returns for periods less than one year are not annualized.
(3)December 4, 2019 (fund inception) through August 31, 2020.
(4)Annualized.
See Notes to Financial Statements.
| Report of Independent Registered Public Accounting Firm | ||
To the Shareholders and the Board of Trustees of American Century ETF Trust:
Opinion on the Financial Statements and Financial Highlights
We have audited the accompanying statement of assets and liabilities, including the schedule of investments, of Avantis® U.S. Small Cap Value Fund (the “Fund”), one of the funds constituting the American Century ETF Trust, as of August 31, 2020, and the related statement of operations, the statement of changes in net assets, and the financial highlights for the period from December 4, 2019 (fund inception) through August 31, 2020, and the related notes. In our opinion, the financial statements and financial highlights present fairly, in all material respects, the financial position of Avantis® U.S. Small Cap Value Fund as of August 31, 2020, and the results of its operations, the changes in its net assets, and the financial highlights for the period from December 4, 2019 (fund inception) through August 31, 2020, in conformity with accounting principles generally accepted in the United States of America.
Basis for Opinion
These financial statements and financial highlights are the responsibility of the Fund's management. Our responsibility is to express an opinion on the Fund’s financial statements and financial highlights based on our audit. We are a public accounting firm registered with the Public Company Accounting Oversight Board (United States) (PCAOB) and are required to be independent with respect to the Fund in accordance with the U.S. federal securities laws and the applicable rules and regulations of the Securities and Exchange Commission and the PCAOB.
We conducted our audit in accordance with the standards of the PCAOB. Those standards require that we plan and perform the audit to obtain reasonable assurance about whether the financial statements and financial highlights are free of material misstatement, whether due to error or fraud. The Fund is not required to have, nor were we engaged to perform, an audit of its internal control over financial reporting. As part of our audit we are required to obtain an understanding of internal control over financial reporting but not for the purpose of expressing an opinion on the effectiveness of the Fund’s internal control over financial reporting. Accordingly, we express no such opinion.
Our audit included performing procedures to assess the risks of material misstatement of the financial statements and financial highlights, whether due to error or fraud, and performing procedures that respond to those risks. Such procedures included examining, on a test basis, evidence regarding the amounts and disclosures in the financial statements and financial highlights. Our audit also included evaluating the accounting principles used and significant estimates made by management, as well as evaluating the overall presentation of the financial statements and financial highlights. Our procedures included confirmation of securities owned as of August 31, 2020, by correspondence with the custodian and brokers; when replies were not received from brokers, we performed other auditing procedures. We believe that our audit provides a reasonable basis for our opinion.
DELOITTE & TOUCHE LLP
Kansas City, Missouri
October 16, 2020
We have served as the auditor of one or more American Century investment companies since 1997.
30
| Management | ||
The Board of Trustees
The individuals listed below serve as trustees of the funds. Each trustee will continue to serve in this capacity until death, retirement, resignation or removal from office. The board has adopted a mandatory retirement age for trustees who are not “interested persons,” as that term is defined in the Investment Company Act (independent trustees). Trustees who are not also officers of the trust shall retire by December 31st of the year in which they reach their 75th birthday.
Mr. Thomas is an “interested person” because he currently serves as President and Chief Executive Officer of American Century Companies, Inc. (ACC), the parent company of American Century Investment Management, Inc. (ACIM or the advisor). The other trustees are independent. They are not employees, directors or officers of, and have no financial interest in, ACC or any of its wholly owned, direct or indirect, subsidiaries, including ACIM and American Century Services, LLC (ACS), and they do not have any other affiliations, positions or relationships that would cause them to be considered “interested persons” under the Investment Company Act. The following trustees also serve in this capacity for a number of other registered investment companies in the American Century Investments family of funds: Jonathan S. Thomas, 15; Ronald J. Gilson, 8; and Stephen E. Yates, 7.
The following table presents additional information about the trustees. The mailing address for each trustee other than Jonathan S. Thomas is 330 Madison Avenue, New York, New York 10017. The mailing address for Jonathan S. Thomas is 4500 Main Street, Kansas City, Missouri 64111.
| Name (Year of Birth) | Position(s) Held with Funds | Length of Time Served | Principal Occupation(s) During Past 5 Years | Number of American Century Portfolios Overseen by Trustee | Other Directorships Held During Past 5 Years | ||||||||||||
| Independent Trustees | |||||||||||||||||
| Reginald M. Browne (1968) | Trustee and Chairman of the Board | Since 2017 (Chairman since 2019) | Principal, GTS Securities (automated capital markets trading firm)(2019 to present); Senior Managing Director, Co Global Head-ETF Group, Cantor Fitzgerald (financial services firm)(2013 to 2019) | 19 | None | ||||||||||||
| Ronald J. Gilson (1946) | Trustee | Since 2017 | Charles J. Meyers Professor of Law and Business, Emeritus, Stanford Law School (1979 to 2016); Marc and Eva Stern Professor of Law and Business, Columbia University School of Law (1992 to present) | 59 | None | ||||||||||||
| Barry A. Mendelson (1958) | Trustee | Since 2017 | Retired; Consultant regarding ETF and mutual fund matters (2015 to 2016); Principal and Senior Counsel, The Vanguard Group (investment management)(1998 to 2014) | 19 | None | ||||||||||||
| Stephen E. Yates (1948) | Trustee | Since 2017 | Retired | 82 | None | ||||||||||||
31
| Name (Year of Birth) | Position(s) Held with Funds | Length of Time Served | Principal Occupation(s) During Past 5 Years | Number of American Century Portfolios Overseen by Trustee | Other Directorships Held During Past 5 Years | ||||||||||||
| Interested Trustees | |||||||||||||||||
| Jonathan S. Thomas (1963) | Trustee | Since 2017 | President and Chief Executive Officer, ACC (2007 to present). Also serves as Chief Executive Officer, ACS; Executive Vice President, ACIM; Director, ACC, ACIM and other ACC subsidiaries | 122 | None | ||||||||||||
The Statement of Additional Information has additional information about the fund's trustees and is available without charge, upon request, by calling 1-800-345-6488.
32
Officers
The following table presents certain information about the executive officers of the funds. Each officer, except Edward Rosenberg, serves as an officer for each of the 16 investment companies in the American Century family of funds. No officer is compensated for his or her service as an officer of the funds. The listed officers are interested persons of the funds and are appointed or re-appointed on an annual basis. The mailing address for each officer listed below is 4500 Main Street, Kansas City, Missouri 64111.
| Name (Year of Birth) | Offices with the Funds | Principal Occupation(s) During the Past Five Years | ||||||
| Patrick Bannigan (1965) | President since 2019 | Executive Vice President and Director, ACC (2012 to present); Chief Financial Officer, Chief Accounting Officer and Treasurer, ACC (2015 to present). Also serves as President, ACS; Vice President, ACIM; Chief Financial Officer, Chief Accounting Officer and/or Director, ACIM, ACS and other ACC subsidiaries | ||||||
| R. Wes Campbell (1974) | Chief Financial Officer and Treasurer since 2018 | Vice President, ACS (2020 to present); Investment Operations and Investment Accounting, ACS (2000 to present) | ||||||
| Amy D. Shelton (1964) | Chief Compliance Officer and Vice President since 2017 | Chief Compliance Officer, American Century funds, (2014 to present); Chief Compliance Officer, ACIM (2014 to present); Chief Compliance Officer, ACIS (2009 to present). Also serves as Vice President, ACIS | ||||||
| Charles A. Etherington (1957) | General Counsel and Vice President since 2017 | Attorney, ACC (1994 to present); Vice President, ACC (2005 to present); General Counsel, ACC (2007 to present). Also serves as General Counsel, ACIM, ACS, ACIS and other ACC subsidiaries; and Senior Vice President, ACIM and ACS | ||||||
| Cleo Chang (1977) | Vice President since 2019 | Senior Vice President, ACIM (2015 to present); Chief Investment Officer, Wilshire Funds Management (2005 to 2015) | ||||||
| David H. Reinmiller (1963) | Vice President since 2017 | Attorney, ACC (1994 to present). Also serves as Vice President, ACIM and ACS | ||||||
| Edward Rosenberg (1973) | Vice President since 2017 | Senior Vice President, ACIM (2017 to present); Senior Vice President, Flexshares Head of ETF Capital Markets, Northern Trust (2012 to 2017) | ||||||
| C. Jean Wade (1964) | Vice President since 2017 | Senior Vice President, ACS (2017 to present); Vice President, ACS (2000 to 2017) | ||||||
| Ward D. Stauffer (1960) | Secretary since 2019 | Attorney, ACS (2003 to present) | ||||||
33
| Approval of Management Agreement | ||
At a meeting held on June 5, 2020, the Fund’s Board of Trustees (the "Board") unanimously approved the renewal of the management agreement pursuant to which American Century Investment Management, Inc. (the “Advisor”) acts as the investment advisor for the Fund. Under Section 15(c) of the Investment Company Act, contracts for investment advisory services are required to be reviewed, evaluated, and approved by a majority of a fund’s trustees (the “Trustees”), including a majority of the independent Trustees, each year.
Prior to its consideration of the renewal of the management agreement, the Trustees requested and reviewed extensive data and information compiled by the Advisor and certain independent providers of evaluation data concerning the Fund and the services provided to the Fund by the Advisor. This review was in addition to the oversight and evaluation undertaken by the Board and its Audit Committee on a continual basis and the information received was supplemental to the extensive information that the Board and its Audit Committee receive and consider throughout the year.
In connection with its consideration of the renewal of the management agreement, the Board’s review and evaluation of the services provided by the Advisor included, but was not limited to, the following:
•the nature, extent, and quality of investment management and other services provided and to be provided to the Fund;
•the wide range of other programs and services provided and to be provided to the Fund and its shareholders on a routine and non-routine basis;
•the Fund’s investment performance, including data comparing the Fund's performance to appropriate benchmarks of funds with similar objectives and strategies;
•the cost of owning the Fund compared to the cost of owning similar funds;
•the compliance policies, procedures, and regulatory experience of the Advisor and the Fund's service providers;
•the Advisor’s strategic plans;
•the Advisor’s business continuity plans and specifically its response to the COVID-19 pandemic;
•financial data showing the cost of services provided to the Fund, the profitability of the Fund to the Advisor, and the overall profitability of the Advisor;
•information regarding payments to intermediaries by the Advisor; and
•possible economies of scale associated with the Advisor’s management of the Fund; and
•possible collateral benefits to the Advisor from the management of the Fund.
The independent Trustees met separately in private session to discuss the renewal and to review and discuss the information provided in response to their request. The independent Trustees also held active discussions with the Advisor regarding the renewal of the management agreement. The independent Trustees had the benefit of the advice of their independent counsel throughout the process.
Factors Considered
The Trustees considered all of the information provided by the Advisor, the independent data providers, and independent counsel in connection with the approval. They determined that the information was sufficient for them to evaluate the management agreement for the Fund. In connection with their review, the Trustees did not identify any single factor as being all-important or
34
controlling, and each Trustee may have attributed different levels of importance to different factors. In deciding to renew the management agreement, the Board based its decision on a number of factors, including without limitation the following:
Nature, Extent and Quality of Services — Generally. Under the management agreement, the Advisor is responsible for providing or arranging for all services necessary for the operation of the Fund. The Board noted that the Advisor provides or arranges at its own expense a wide variety of services including without limitation the following:
•constructing and designing the Fund
•portfolio research and security selection
•initial capitalization/funding
•securities trading
•Fund administration
•custody of Fund assets
•daily valuation of the Fund’s portfolio
•shareholder servicing and transfer agency, including shareholder confirmations, recordkeeping, and communications
•legal services (except the independent Trustees’ counsel)
•regulatory and portfolio compliance
•financial reporting
•marketing and distribution (except amounts paid by the Fund under Rule 12b-1 plans)
Investment Management Services. The nature of the investment management services provided to the Fund is quite complex and allows Fund shareholders access to professional money management, instant diversification of their investments within an asset class, and liquidity. In evaluating investment performance, the Board expects the Advisor to manage the Fund in accordance with its investment objectives and approved strategies. Further, the Trustees recognize that the Advisor has an obligation to monitor trading activities, and in particular to seek the best execution of fund trades, and to evaluate the use of and payment for research. In providing these services, the Advisor utilizes teams of investment professionals (portfolio managers, analysts, research assistants, and securities traders) who require extensive information technology, research, training, compliance, and other systems to conduct their business. The Board provides oversight of the investment performance process. It regularly reviews investment performance information for the Fund, together with comparative information for appropriate benchmarks over different time horizons. If performance concerns are identified, the Board discusses with the Advisor the reasons for such results and any efforts being undertaken to improve performance. The Board found the investment management services provided by the Advisor to the Fund to be satisfactory and consistent with the management agreement.
Shareholder and Other Services. Under the management agreement, the Advisor provides or arranges for a comprehensive package of services to the Fund. The Board, directly and through its Audit Committee, regularly reviews reports and evaluations of such services at its regular meetings. These reports include, but are not limited to, information regarding the operational efficiency and accuracy of the shareholder and transfer agency services provided, staffing levels, shareholder satisfaction, technology support (including cyber security), new products and services offered to Fund shareholders, securities trading activities, portfolio valuation services, auditing services, and legal and operational compliance activities. The Board found the services provided by the Advisor to the Fund under the management agreement to be competitive and of high quality.
COVID-19 Response. During 2020, much of the world experienced unprecedented change and challenges from the impacts of the rapidly evolving, worldwide spread of the COVID-19 virus. The
35
Board evaluated the Advisor’s response to the COVID-19 pandemic and its impact on service to the Fund. The Board found that Fund shareholders have continued to receive the Advisor’s investment management and other services without disruption, and Advisor personnel have demonstrated great resiliency in providing those services. The Board, directly and through its Audit Committee, continues to monitor the impact of the pandemic and the response of each of the Fund’s service providers.
Costs of Services and Profitability. The Advisor provides detailed information concerning its cost of providing various services to the Fund, its profitability in managing the Fund (pre- and post-distribution), its overall profitability, and its financial condition. The Trustees have reviewed with the Advisor the methodology used to prepare this financial information. This information is considered in evaluating the Advisor’s financial condition, its ability to continue to provide services under the management agreement, and the reasonableness of the current management fee. The Board concluded that the Advisor’s profits were reasonable in light of the services provided to the Fund.
Ethics. The Board generally considers the Advisor’s commitment to providing quality services to the Fund and to conducting its business ethically. They noted that the Advisor’s practices generally meet or exceed industry best practices.
Economies of Scale. The Board also reviewed information provided by the Advisor regarding the possible existence of economies of scale in connection with the management of the Fund. The Board concluded that economies of scale are difficult to measure and predict with precision, especially on a fund-by-fund basis. The Board concluded that the Advisor is appropriately sharing economies of scale, to the extent they exist, through its competitive fee structure, offering competitive fees from fund inception, and through reinvestment in its business, infrastructure, investment capabilities and initiatives to provide shareholders additional content and services.
Comparison to Other Funds’ Fees. The management agreement provides that the Fund pays the Advisor a single, all-inclusive (or unified) management fee for providing all services necessary for the management and operation of the Fund, other than brokerage expenses, expenses attributable to short sales, taxes, interest, extraordinary expenses, and expenses incurred in connection with the provision of shareholder services and distribution services under a plan adopted pursuant to Rule 12b-1 under the Investment Company Act. Under the unified fee structure, the Advisor is responsible for providing all investment advisory, custody, audit, administrative, compliance, recordkeeping, marketing and shareholder services, or arranging and supervising third parties to provide such services. The Board believes the unified fee structure is a benefit to Fund shareholders because it clearly discloses to shareholders the cost of owning Fund shares, and, since the unified fee cannot be increased without a vote of Fund shareholders, it shifts to the Advisor the risk of increased costs of operating the Fund and provides a direct incentive to minimize administrative inefficiencies. Part of the Board’s analysis of fee levels involves reviewing certain evaluative data compiled by an independent provider comparing the Fund’s unified fee to the total expense ratios of its peers. The unified fee charged to shareholders of the Fund was below the median of the total expense ratios of the Fund’s peer expense universe and was the lowest of its peer expense group. The Board concluded that the management fee paid by the Fund to the Advisor under the management agreement is reasonable in light of the services provided to the Fund.
Comparison to Fees and Services Provided to Other Clients of the Advisor. The Board also requested information from the Advisor concerning the nature of the services, fees, costs, and profitability of its advisory services to funds or other advisory clients managed similarly to the Fund. The Advisor informed the Trustees that, as of December 31, 2019, it did not provide services to any other investment companies or comparable accounts that were managed similarly to the Fund.
36
Payments to Intermediaries. The Trustees also requested a description of payments made to intermediaries by the Fund and the Advisor and services provided in response thereto. These payments could include various payments made by the Fund or the Advisor to different types of intermediaries and recordkeepers for distribution and service activities provided for the Fund. The Trustees reviewed such information and received representations from the Advisor that all such payments by the Advisor were made from the Advisor’s resources and reasonable profits. The Board found such payments to be reasonable in scope and purpose.
Collateral or “Fall-Out” Benefits Derived by the Advisor. The Board considered the possible existence of collateral benefits the Advisor may receive as a result of its relationship with the Fund. They concluded that the Advisor’s primary business is managing funds and it generally does not use fund or shareholder information to generate profits in other lines of business, and therefore does not derive any significant collateral benefits from them. The Board noted that additional assets from other clients may offer the Advisor some benefit from increased leverage with service providers and counterparties. The Board also determined that the Advisor is able to provide investment management services to certain clients other than the Fund, at least in part, due to its existing infrastructure built to serve the fund complex. The Board concluded that appropriate allocation methodologies had been employed to assign resources and the cost of those resources to these other clients.
Existing Relationship. The Board also considered whether there was any reason for not continuing the existing arrangement with the Advisor. In this regard, the Board was mindful of the potential disruptions of the Fund’s operations and various risks, uncertainties, and other effects that could occur as a result of a decision not to continue such relationship. In particular, the Board recognized that most shareholders have invested in the Fund on the strength of the Advisor’s industry standing and reputation and in the expectation that the Advisor will have a continuing role in providing advisory services to the Fund.
Conclusion of the Trustees. As a result of this process, the Board, including all of the independent Trustees, taking into account all of the factors discussed above and the information provided by the Advisor and others in connection with its review and throughout the year, determined that the management fee is fair and reasonable in light of the services provided and that the investment management agreement between the Fund and the Advisor should be renewed.
37
| Liquidity Risk Management Program | ||
The Fund has adopted a liquidity risk management program (the “program”). The Fund’s Board of Trustees (the "Board") has designated American Century Investment Management, Inc. (“ACIM”) as the administrator of the program. Personnel of ACIM or its affiliates conduct the day-to-day operation of the program pursuant to policies and procedures administered by those members of the ACIM’s Investment Oversight Committee who are members of the ACIM’s Investment Management and Global Analytics departments.
Under the program, ACIM manages the Fund’s liquidity risk, which is the risk that the Fund could not meet shareholder redemption requests without significant dilution of remaining shareholders’ interests in the Fund. This risk is managed by monitoring the degree of liquidity of the Fund’s investments, limiting the amount of the Fund’s illiquid investments, and utilizing various risk management tools and facilities available to the Fund for meeting shareholder redemptions, among other means. ACIM’s process of determining the degree of liquidity of the Fund’s investments is supported by one or more third-party liquidity assessment vendors.
The Board reviewed a report prepared by ACIM regarding the operation and effectiveness of the program for the period December 1, 2018 through December 31, 2019. No significant liquidity events impacting the Fund were noted in the report. In addition, ACIM provided its assessment that the program had been effective in managing the Fund’s liquidity risk.
38
| Additional Information | ||
Retirement Account Information
As required by law, distributions you receive from certain retirement accounts are subject to federal income tax withholding, unless you elect not to have withholding apply*. Tax will be withheld on the total amount withdrawn even though you may be receiving amounts that are not subject to withholding, such as nondeductible contributions. In such case, excess amounts of withholding could occur. You may adjust your withholding election so that a greater or lesser amount will be withheld.
If you don’t want us to withhold on this amount, you must notify us to not withhold the federal income tax. You may notify us in writing or in certain situations by telephone or through other electronic means. For systematic withdrawals, your withholding election will remain in effect until revoked or changed by filing a new election. You have the right to revoke your election at any time and change your withholding percentage for future distributions.
Remember, even if you elect not to have income tax withheld, you are liable for paying income tax on the taxable portion of your withdrawal. If you elect not to have income tax withheld or you don’t have enough income tax withheld, you may be responsible for payment of estimated tax. You may incur penalties under the estimated tax rules if your withholding and estimated tax payments are not sufficient. You can reduce or defer the income tax on a distribution by directly or indirectly rolling such distribution over to another IRA or eligible plan. You should consult your tax advisor for additional information.
State tax will be withheld if, at the time of your distribution, your address is within one of the mandatory withholding states and you have federal income tax withheld (or as otherwise required by state law). State taxes will be withheld from your distribution in accordance with the respective state rules.
*Some 403(b), 457 and qualified retirement plan distributions may be subject to 20% mandatory withholding, as they are subject to special tax and withholding rules. Your plan administrator or plan sponsor is required to provide you with a special tax notice explaining those rules at the time you request a distribution. If applicable, federal and/or state taxes may be withheld from your distribution amount.
Proxy Voting Policies
A description of the policies that the fund's investment advisor uses in exercising the voting rights associated with the securities purchased and/or held by the fund are available without charge, upon request, by calling 1-800-345-6488. It is also available on American Century Investments’ website at americancentury.com/proxy and on the Securities and Exchange Commission’s website at sec.gov. Information regarding how the investment advisor voted proxies relating to portfolio securities during the most recent 12-month period ended June 30 is available at americancentury.com/proxy. It is also available at sec.gov.
Quarterly Portfolio Disclosure
The fund files its complete schedule of portfolio holdings with the Securities and Exchange Commission (SEC) for the first and third quarters of each fiscal year as an exhibit to its reports on Form N-PORT. The fund's Form N-PORT reports are available on the SEC’s website at sec.gov.
39
Other Tax Information
The following information is provided pursuant to provisions of the Internal Revenue Code.
The fund hereby designates up to the maximum amount allowable as qualified dividend income for
the fiscal year ended August 31, 2020.
For corporate taxpayers, the fund hereby designates $9,656, or up to the maximum amount
allowable, of ordinary income distributions paid during the fiscal year ended August 31, 2020 as
qualified for the corporate dividends received deduction.
40
| ||||||||
| Contact Us | avantisinvestors.com | |||||||
| American Century Sales Representatives, Financial Professionals, Broker Dealers, Insurance Companies, Banks and Trust Companies | 1-833-928-2684 | |||||||
| Telecommunications Relay Service for the Deaf | 711 | |||||||
| American Century ETF Trust | ||||||||
Investment Advisor: American Century Investment Management, Inc. Kansas City, Missouri | ||||||||
| This report and the statements it contains are submitted for the general information of our shareholders. The report is not authorized for distribution to prospective investors unless preceded or accompanied by an effective prospectus. | ||||||||
| ©2020 American Century Proprietary Holdings, Inc. All rights reserved. CL-ANN-96051 2010 | ||||||||
ITEM 2. CODE OF ETHICS.
(a) The registrant has adopted a Code of Ethics for Senior Financial Officers that applies to the registrant’s principal executive officer, principal financial officer, principal accounting officer, and persons performing similar functions.
(b) No response required.
(c) None.
(d) None.
(e) Not applicable.
(f) The registrant’s Code of Ethics for Senior Financial Officers was filed as Exhibit 13(a)(1) to American Century ETF Trust’s Annual Certified Shareholder Report on Form N-CSR, File No. 811-23305, on October 25, 2018, and is incorporated herein by reference.
ITEM 3. AUDIT COMMITTEE FINANCIAL EXPERT.
(a)(1) The registrant's board has determined that the registrant has at least one audit committee financial expert serving on its audit committee.
(a)(2) Barry A. Mendelson, Ronald J. Gilson, Reginald M. Browne and Stephen E. Yates are the registrant's designated audit committee financial experts. They are "independent" as defined in Item 3 of Form N-CSR.
(a)(3) Not applicable.
(b) No response required.
(c) No response required.
(d) No response required.
ITEM 4. PRINCIPAL ACCOUNTANT FEES AND SERVICES.
(a) Audit Fees.
The aggregate fees billed for each of the last two fiscal years for professional services rendered by the principal accountant for the audit of the registrant’s annual financial statements or services that are normally provided by the accountant in connection with statutory and regulatory filings or engagements for those fiscal years were as follows:
FY 2019: $80,480
FY 2020: $307,330
(b) Audit-Related Fees.
The aggregate fees billed in each of the last two fiscal years for assurance and related services by the principal accountant that are reasonably related to the performance of the audit of the registrant’s financial statements and are not reported under paragraph (a) of this Item were as follows:
For services rendered to the registrant:
FY 2019: $0
FY 2020: $0
Fees required to be approved pursuant to paragraph (c)(7)(ii) of Rule 2-01 of Regulation S-X (relating to certain engagements for non-audit services with the registrant’s investment adviser and its affiliates):
FY 2019: $0
FY 2020: $0
(c) Tax Fees.
The aggregate fees billed in each of the last two fiscal years for professional services rendered by the principal accountant for tax compliance, tax advice, and tax planning were as follows:
For services rendered to the registrant:
FY 2019: $0
FY 2020: $0
Fees required to be approved pursuant to paragraph (c)(7)(ii) of Rule 2-01 of Regulation S-X (relating to certain engagements for non-audit services with the registrant’s investment adviser and its affiliates):
FY 2019: $0
FY 2020: $0
(d) All Other Fees.
The aggregate fees billed in each of the last two fiscal years for products and services provided by the principal accountant, other than the services reported in paragraphs (a) through (c) of this Item were as follows:
For services rendered to the registrant:
FY 2019: $0
FY 2020: $0
Fees required to be approved pursuant to paragraph (c)(7)(ii) of Rule 2-01 of Regulation S-X (relating to certain engagements for non-audit services with the registrant’s investment adviser and its affiliates):
FY 2019: $0
FY 2020: $0
(e)(1) In accordance with paragraph (c)(7)(i)(A) of Rule 2-01 of Regulation S-X, before the accountant is engaged by the registrant to render audit or non-audit services, the engagement is approved by the registrant’s audit committee. Pursuant to paragraph (c)(7)(ii) of Rule 2-01 of Regulation S-X, the registrant’s audit committee also pre-approves its accountant’s engagements for non-audit services with the registrant’s investment adviser, its parent company, and any entity controlled by, or under common control with the investment adviser that provides ongoing services to the registrant, if the engagement relates directly to the operations and financial reporting of the registrant.
(e)(2) All services described in each of paragraphs (b) through (d) of this Item were pre-approved before the engagement by the registrant’s audit committee pursuant to paragraph (c)(7)(i)(A) of Rule 2-01 of Regulation S-X.
Consequently, none of such services were required to be approved by the audit committee pursuant to paragraph (c)(7)(i)(C).
(f) The percentage of hours expended on the principal accountant’s engagement to audit the registrant’s financial statements for the most recent fiscal year that were attributed to work performed by persons other than the principal accountant’s full-time, permanent employees was less than 50%.
(g) The aggregate non-audit fees billed by the registrant’s accountant for services rendered to the registrant, and rendered to the registrant’s investment adviser (not including any sub-adviser whose role is primarily portfolio management and is subcontracted with or overseen by another investment adviser), and any entity controlling, controlled by, or under common control with the adviser that provides ongoing services to the registrant for each of the last two fiscal years of the registrant were as follows:
FY 2019: $119,500
FY 2020: $0
(h) The registrant’s investment adviser and accountant have notified the registrant’s audit committee of all non-audit services that were rendered by the registrant’s accountant to the registrant’s investment adviser, its parent company, and any entity controlled by, or under common control with the investment adviser that provides services to the registrant, which services were not required to be pre-approved pursuant to paragraph (c)(7)(ii) of Rule 2-01 of Regulation S-X. The notification provided to the registrant’s audit committee included sufficient details regarding such services to allow the registrant’s audit committee to consider the continuing independence of its principal accountant.
ITEM 5. AUDIT COMMITTEE OF LISTED REGISTRANTS.
(a) The registrant has a separately-designated standing audit committee established in accordance with Section 3(a)(58)(A) of the Securities Exchange Act of 1934. The audit committee members are Barry A. Mendelson, Ronald J. Gilson, Stephen E. Yates and Reginald Browne.
(b) Not applicable.
ITEM 6. INVESTMENTS.
(a) The schedule of investments is included as part of the report to stockholders filed under Item 1 of this Form.
(b) Not applicable.
ITEM 7. DISCLOSURE OF PROXY VOTING POLICIES AND PROCEDURES FOR CLOSED-END MANAGEMENT INVESTMENT COMPANIES.
Not applicable.
ITEM 8. PORTFOLIO MANAGERS OF CLOSED-END MANAGEMENT INVESTMENT COMPANIES.
Not applicable.
ITEM 9. PURCHASES OF EQUITY SECURITIES BY CLOSED-END MANAGEMENT INVESTMENT COMPANY AND AFFILIATED PURCHASERS.
Not applicable.
ITEM 10. SUBMISSION OF MATTERS TO A VOTE OF SECURITY HOLDERS.
During the reporting period, there were no material changes to the procedures by which shareholders may recommend nominees to the registrant’s board.
ITEM 11. CONTROLS AND PROCEDURES.
(a) The registrant's principal executive officer and principal financial officer have concluded that the registrant's disclosure controls and procedures (as defined in Rule 30a-3(c) under the Investment Company Act of 1940) are effective based on their evaluation of these controls and procedures as of a date within 90 days of the filing date of this report.
(b) There were no changes in the registrant's internal control over financial reporting (as defined in Rule 30a-3(d) under the Investment Company Act of 1940) that occurred during the period covered by this report that have materially affected, or are reasonably likely to materially affect, the registrant's internal control over financial reporting.
ITEM 12. DISCLOSURE OF SECURITIES LENDING ACTIVITIES FOR CLOSED-END MANAGEMENT INVESTMENT COMPANIES.
Not applicable.
ITEM 13. EXHIBITS.
(a)(1) Registrant’s Code of Ethics for Senior Financial Officers, which is the subject of the disclosure required by Item 2 of Form N-CSR, was filed as Exhibit 13(a)(1) to American Century ETF Trust’s Certified Shareholder Report on Form N-CSR, File No. 811-21591, on File No. 811-23305, on October 25, 2018.
(a)(2) Separate certifications by the registrant’s principal executive officer and principal financial officer, pursuant to Section 302 of the Sarbanes-Oxley Act of 2002 and Rule 30a-2(a) under the Investment Company Act of 1940, are filed and attached hereto as EX-99.CERT.
(a)(3) Not applicable.
(a)(4) Not applicable.
(b) A certification by the registrant’s chief executive officer and chief financial officer, pursuant to Section 906 of the Sarbanes-Oxley Act of 2002, is furnished and attached hereto as EX-99.906CERT.
SIGNATURES
Pursuant to the requirements of the Securities Exchange Act of 1934 and the Investment Company Act of 1940, the registrant has duly caused this report to be signed on its behalf by the undersigned, thereunto duly authorized.
| Registrant: | American Century ETF Trust | |||||||||||||
| By: | /s/ Patrick Bannigan | |||||||||||||
| Name: | Patrick Bannigan | |||||||||||||
| Title: | President | |||||||||||||
| Date: | October 28, 2020 | |||||||||||||
Pursuant to the requirements of the Securities Exchange Act of 1934 and the Investment Company Act of 1940, this report has been signed below by the following persons on behalf of the registrant and in the capacities and on the dates indicated.
| By: | /s/ Patrick Bannigan | ||||||||||
| Name: | Patrick Bannigan | ||||||||||
| Title: | President | ||||||||||
| (principal executive officer) | |||||||||||
| Date: | October 28, 2020 | ||||||||||
| By: | /s/ R. Wes Campbell | ||||||||||
| Name: | R. Wes Campbell | ||||||||||
| Title: | Treasurer and Chief Financial Officer | ||||||||||
| (principal financial officer) | |||||||||||
| Date: | October 28, 2020 | ||||||||||