Exhibit 99.1

ANNUAL REPORT 2021 | ||||||
01
|
| |||||
04 |
| |||||
07 | ||||||
08 | ||||||
10 | ||||||
12 | ||||||
14 | ||||||
16 | ||||||
| 18 | |||||
41 | ||||||
54 | ||||||
59 | ||||||
62 | ||||||
68 | ||||||
70 | ||||||
131 | ||||||
133 | ||||||
| About this report: You can find this report and information on Nutrien on our website at nutrien.com. While we include certain non-financial information in this report, more detailed information on our sustainability strategy and performance is provided on our website at nutrien.com/sustainability. | ||||||
| The Corporate Overview and A Message to Our Shareholders contain certain non-IFRS financial measures, which do not have a standard meaning under IFRS including: | ||
• Adjusted EBITDA • Adjusted net earnings per share • Free cash flow and free cash flow including changes in non-cash operating working capital • Retail cash operating coverage ratio • Potash cash cost of product manufactured per tonne • Retail adjusted average working capital to sales • Ammonia controllable cash cost of product Manufactured per tonne • Retail normalized comparable store sales • Adjusted net-debt |
For definitions, further information and reconciliation of these measures to the most directly comparable measures under IFRS, see the “Non-IFRS Financial Measures” section.
See the “Other Financial Measures” and “Terms & Definitions” section for definitions, abbreviations and terms used in this annual report. |
Nutrien Annual Report 2021 | 1
Leading Global Ag Solutions Provider
Nutrien is forging a pathway that creates lasting value for all its stakeholders by taking meaningful action to address two of the world’s biggest challenges: strengthening food security and advancing climate-smart agricultural practices.
Our integrated business model provides several competitive advantages and capabilities that are unique in the agriculture industry. We are focused on enhancing our direct relationship with the grower by delivering innovative products and solutions through our global Nutrien Ag Solutions (“Retail”) platform, while leveraging the strengths of our world-class crop nutrient production and distribution network.
Our leading position provides a clear pathway to address key Environmental, Social and Governance (“ESG”) topics and multiple avenues to sustainably grow returns for our shareholders.
Link to Basic Beliefs and Strategy
$3.9B Cash Provided by Operating Activities (2021)
| $2.1B Cash Returned to Shareholders from Dividends and Share Repurchases (2021)
|
~225K Acres Subscribed In Carbon Pilot Program (2021)
| ||
 |  |  |
OVERVIEW | MANAGEMENT’S DISCUSSION & ANALYSIS FOUR-YEAR HIGHLIGHTS FINANCIAL STATEMENTS OTHER INFORMATION
2 | Nutrien Annual Report 2021
2021 PERFORMANCE HIGHLIGHTS
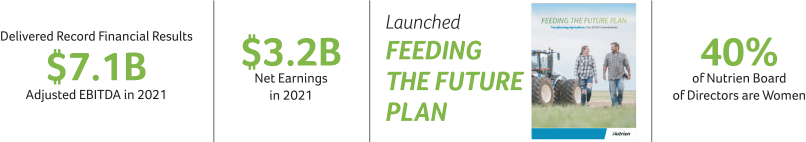
DELIVERED RESULTS THAT MATTER
Nutrien delivered record financial results in 2021 driven by strong operational performance and strengthening market fundamentals. We utilized our strong cash flow to fortify the balance sheet, invest in the business and return significant cash to our shareholders. We also made great progress on our ESG priorities, including climate and people-related initiatives.
| Year ended December 31 | ||||||||||||||||||||
| (millions of US dollars, except as otherwise noted) | 2021 |
| 2020 |
| Change (%) | |||||||||||||||
Financial Performance | ||||||||||||||||||||
Sales | $ | 27,712 | $ | 20,908 |
|
| 33 |
| ||||||||||||
Gross Margin | 9,409 |
| 5,239 |
|
| 80 |
| |||||||||||||
Net Earnings | 3,179 |
| 459 |
|
| 593 |
| |||||||||||||
Diluted Net Earnings per Share | 5.52 |
| 0.81 |
|
| 581 |
| |||||||||||||
Adjusted Net Earnings per Share 1 | 6.23 |
| 1.80 |
|
| 246 |
| |||||||||||||
Adjusted EBITDA 1 | 7,126 |
| 3,667 |
|
| 94 |
| |||||||||||||
Retail Adjusted EBITDA | 1,939 |
| 1,430 |
|
| 36 |
| |||||||||||||
Potash Adjusted EBITDA | 2,736 |
| 1,190 |
|
| 130 |
| |||||||||||||
Nitrogen Adjusted EBITDA | 2,308 |
| 1,080 |
|
| 114 |
| |||||||||||||
Phosphate Adjusted EBITDA | 540 |
| 232 |
|
| 133 |
| |||||||||||||
Cash Provided by Operating Activities | 3,886 |
| 3,323 |
|
| 17 |
| |||||||||||||
Free Cash Flow 1 | 4,300 |
| 1,830 |
|
| 135 |
| |||||||||||||
Cash used for Dividends and Share Repurchases 2 | 2,080 |
| 1,190 |
|
| 75 |
| |||||||||||||
Adjusted Net Debt/Adjusted EBITDA 3 | 1.4x |
| 2.6x |
|
| -46 |
| |||||||||||||
Retail Normalized Comparable Store Sales 1 | 7% |
| 6% |
|
| 1 |
| |||||||||||||
Non-Financial Performance | ||||||||||||||||||||
CO2 Equivalent Captured (Mmt) | 1.1 |
| 1.0 |
|
| 10 |
| |||||||||||||
Environmental Incidents | 24 |
| 23 |
|
| 4 |
| |||||||||||||
Lost-Time Injury Frequency 4 | 0.27 |
| 0.26 |
|
| 4 |
| |||||||||||||
Total Employees | 23,500 |
| 23,100 |
|
| 2 |
| |||||||||||||
Proportion of Women in Senior Leadership (director level and above) 5 | 21% |
| 19% |
|
| 2 |
| |||||||||||||
Voluntary Employee Turnover Rate 5 | 12% |
| 9% |
|
| 3 |
| |||||||||||||
Community Investment | $ | 19 | $ | 18 |
|
| 6 |
| ||||||||||||
| 1 | These are non-IFRS financial measures. See the “Non-IFRS Financial Measures” section. |
| 2 | This is a supplementary financial measure. See the “Other Financial Measures” section. |
| 3 | This is a capital management financial measure that includes a non-IFRS component. See the “Non-IFRS Financial Measures” and “Other Financial Measures” sections. |
| 4 | Frequency based for every 200,000 hours worked. |
| 5 | Based on regular full-time and part-time employees. |
 |
Find out more at nutrien.com
|
OVERVIEW | MANAGEMENT’S DISCUSSION & ANALYSIS FOUR-YEAR HIGHLIGHTS FINANCIAL STATEMENTS OTHER INFORMATION
Nutrien Annual Report 2021 | 3
2021 PERFORMANCE HIGHLIGHTS
ADVANCED STRATEGIC INITIATIVES
We made significant progress on our strategic targets due to the focus and strong execution of our teams. In 2021, our Retail business surpassed its long-term financial goals by utilizing the size and scale of our global network to capture the benefits of the favorable market conditions. We advanced our digital and proprietary products initiatives, which remain key drivers of Retail organic growth. Our Potash and Nitrogen operations performed very well despite weather-related production challenges and macro-inflationary pressures. Our focus remains on increasing production volumes and driving operational efficiencies across our asset base.
| 2023 Targets | 2021 | 2020 | ||||||||||
Nutrien Ag Solutions (“Retail”) |
|
|
|
|
|
|
|
|
| |||
Total Retail Adjusted EBITDA Margin 1 |
| >10.5% |
|
| 10.9% |
|
| 9.7% |
| |||
US Retail Adjusted EBITDA Margin 1,2 |
| – |
|
| 11.6% |
|
| 10.6% |
| |||
Retail Adjusted Average Working Capital to Sales 3 |
| 17% |
|
| 13% |
|
| 15% |
| |||
Retail Cash Operating Coverage Ratio 3 |
| 60% |
|
| 58% |
|
| 62% |
| |||
Retail Adjusted EBITDA per US Selling Location (thousand dollars) 1,4 | $ | >1,100 |
| $ | 1,481 |
| $ | 1,075 |
| |||
Retail Proprietary Products as a % of Total Retail Margin |
| 29% |
|
| 23% |
|
| 23% |
| |||
Retail Digital Platform Sales to Total Sales 1,5 |
| >50% |
|
| 17% |
|
| 11% |
| |||
Retail Digital Platform Sales (million dollars) 1,5 |
| – |
| $ | 2,148 |
| $ | 1,211 |
| |||
Potash and Nitrogen | ||||||||||||
Potash Sales Volumes (million tonnes) |
| 14.0-16.0 |
|
| 13.6 |
|
| 12.8 |
| |||
Potash Cash Cost of Product Manufactured per Tonne 3,6 | $ | 53-58 |
| $ | 63 |
| $ | 59 |
| |||
Nitrogen Sales Volumes (million tonnes) |
| 11.5-12.0 |
|
| 10.7 |
|
| 11.0 |
| |||
Ammonia Operating Rate 7 |
| 96% |
|
| 90% |
|
| 93% |
| |||
Ammonia Controllable Cash Cost of Product Manufactured per Tonne 3 | $ | ~42 |
| $ | 50 |
| $ | 43 |
| |||
IFRS Comparable Information | ||||||||||||
Potash Cost of Goods Sold (“COGS”) (million dollars) 2 |
| – |
| $ | 1,285 |
| $ | 1,183 |
| |||
Nitrogen Manufactured Cost of Goods Sold (“COGS”) (million dollars) 2 |
| – |
| $ | 2,353 |
| $ | 1,804 |
| |||
| 1 | This is a supplementary financial measure. See the “Other Financial Measures” section. |
| 2 | No target was provided. |
| 3 | These are non-IFRS financial measures. See the “Non-IFRS Financial Measures” section. |
| 4 | Calculation is based on number of selling locations only, excluding acquisitions. |
| 5 | Platform generated revenue includes grower and employee orders that are entered directly into the digital platform. North American digital Retail sales as a proportion of total North American Retail sales. |
| 6 | Assuming production ranges of 14Mmt to 16Mmt and is not adjusted for the impact of inflation. Applies to 2023 target only. |
| 7 | Capacity utilization represents production volumes divided by production capacity (excluding Joffrey and Trinidad facilities). |
OVERVIEW | MANAGEMENT’S DISCUSSION & ANALYSIS FOUR-YEAR HIGHLIGHTS FINANCIAL STATEMENTS OTHER INFORMATION
4 | Nutrien Annual Report 2021
DELIVERED RECORD RESULTS AND POSITIONED
FOR LONG-TERM SUCCESS
| Nutrien’s vision is to be the world’s leading ag solutions provider. We own and operate world-class assets across the value chain that are positioned to generate significant free cash flow through the agriculture cycle. We demonstrated the strength of our business model in 2021 by delivering record financial results, returning $2.1 billion to shareholders and achieving our all-time- best safety performance. |

RUSSELL GIRLING
CHAIR OF THE BOARD |
The Board provides regular oversight on strategic priorities identified by management, evaluating organic and inorganic opportunities against the basic beliefs for our business and in the context of the risks that exist in our operating environment. Through this process, the Board and management team ensure alignment on strategic priorities and capital allocation that will enhance the sustainability of the business and deliver the greatest long-term value for stakeholders. This includes a focus on integrating our key ESG risks and opportunities into our business planning and reporting activities.
It is vital that we continuously evaluate our strategic objectives and evolve our leadership to ensure our business is best positioned to adapt to changes in the global landscape. We recently strengthened our Board by diversifying its composition while, at the same time, adding expertise related to digital technologies and international leadership experience to support our growing, global Retail business.
We made the difficult decision to part ways with a CEO in early 2022 that was appointed to a 2-year transition role. We recognize this decision and others related to executive leadership have created uncertainty. However, these changes have not distracted our team from delivering exceptional results and we are confident these decisions were both necessary and in the best long-term interest of the company and its shareholders.
While we are in the midst of a comprehensive executive search, we have appointed Ken Seitz as interim CEO to lead Nutrien. We believe he has the global experience and leadership capabilities to succeed. We are highly confident that Ken and the management team will deliver on the opportunities created by attractive market fundamentals and vigorously pursue the company’s strategic priorities, in accordance with our core values of safety and integrity. We expect another excellent year across all of our businesses and will utilize our financial strength to invest in strategic initiatives that drive long-term growth as well as return significant cash to our shareholders.
Thank you for your support as we position Nutrien for continued success in the years to come.
|

Russell Girling
Chair of the Board
February 17, 2022
OVERVIEW | MANAGEMENT’S DISCUSSION & ANALYSIS FOUR-YEAR HIGHLIGHTS FINANCIAL STATEMENTS OTHER INFORMATION
Nutrien Annual Report 2021 | 5
A MESSAGE TO OUR SHAREHOLDERS
2021 was an extraordinary year as the world continued to navigate through challenges related to the COVID-19 pandemic. A number of key issues rose to the forefront that not only impacted the agriculture industry but society as a whole, including supply chain disruptions, food insecurity and the impacts of climate change. These are complex matters that require a sustained and focused effort to ensure we have a long-term approach that addresses the needs of all stakeholders. It will take leadership, innovation and investment to solve these challenges and Nutrien has demonstrated the capability to deliver in each of these areas.
Delivering Exceptional Results
Our ~23,500 employees work diligently to ensure our operations are safe, reliable and efficient. We produced and shipped record fertilizer volumes in 2021 and leveraged the strength of our global supply chain to ensure our customers had the products and services they needed, when they needed them. We achieved an all-time-best safety performance in 2021, with no fatalities or life-altering injuries. This is an incredible accomplishment considering the many external distractions and overall fatigue level that our society has faced during the pandemic.
We delivered record adjusted EBITDA 1 of $7.1 billion (net earnings of $3.2 billion) and cash provided by operating activities of $3.9 billion. This performance was underpinned by the strong execution of our teams, the competitive advantages of our integrated business model and the benefit of robust market fundamentals.
Our Retail business performed exceptionally well as we continued to strengthen our relationship with the grower through the reliability of our supply chain, innovative proprietary products, digital capabilities and financing products. Sales and gross margins increased in each of the major product categories. We generated organic growth of 34 percent and adjusted EBITDA margins 2 rose to nearly 11 percent. We carefully managed inventory levels and drove significant improvements in our working capital metrics through strategic supplier management.
In Potash, we responded to extremely tight global market fundamentals and safely and efficiently increased our production by nearly 1 million tonnes. We ramped up production in a very short time showcasing the flexibility and superior asset quality of our low-cost, integrated six-mine network. This represented a small portion of our low-cost available production capacity.
We also made great progress on our Next Generation Potash initiatives which will increase the reliability and efficiency of our sites and improve safety performance. Our most significant achievement in 2021 was to remove more employees from the active mining face by achieving over 5,300 hours of tele-remote and autonomous mining.
Our Nitrogen business generated significantly higher margins as global supply tightened and escalating feedstock costs impacted producers in
other regions. The Nitrogen team completed two large plant turnarounds during the year, which were critical sustaining projects that will enhance the safety, efficiency and reliability of our sites. We completed Phase 1 of our brownfield expansions on time and on-budget. These projects represent some of the lowest-cost nitrogen capacity built in recent history and we expect will generate very attractive returns on investment.
Advancing Capital Allocation Priorities
Nutrien’s integrated model provides a unique platform to generate significant free cash flow through the cycle. We utilized our free cash flow in 2021 to strengthen and reposition the balance sheet. We paid down $2.1 billion of long-term debt and do not expect the need to materially reduce our
“The strength and diversity of Nutrien’s cash flow is unmatched in the agriculture sector. We made great strides towards achieving our longer-term strategic goals, having reached many of our 2023 financial and operating targets.”

KEN SEITZ INTERIM PRESIDENT AND CHIEF EXECUTIVE OFFICER |
|
| 1 | These are non-IFRS financial measures. See the “Non-IFRS Financial Measures” section. |
| 2 | This is a supplementary financial measure. See the “Non-IFRS Financial Measures” section. |
OVERVIEW | MANAGEMENT’S DISCUSSION & ANALYSIS FOUR-YEAR HIGHLIGHTS FINANCIAL STATEMENTS OTHER INFORMATION
6 | Nutrien Annual Report 2021
total debt any further in the near-term. Our balance sheet is well positioned to take advantage of value-enhancing opportunities at any point in the cycle.
We have a well-defined Retail strategy and set of priorities that include growing our network in Brazil, tuck-in acquisitions in other core markets, expanding our proprietary products business and enhancing our digital capabilities. In 2021, we grew our Retail business through the completion of 14 strategic acquisitions, primarily in Brazil and the US. The Brazilian market provides a significant opportunity for targeted growth due to its rapidly expanding agriculture production and fragmented Retail structure. We have deployed $300 million in this market since 2020 and these acquisitions are performing well above our investment hurdle rates. Approximately 35 percent of our Retail earnings now reside outside of the US and we expect that share will continue to grow over the next 5 years, providing greater geographic and seasonal diversity.
Our Potash position is unmatched, and we expect to utilize our existing capacity to increase production as the market needs it, with minimal capital required. In Nitrogen, our focus is on further enhancing the advantaged position of our North American assets. We have embarked on a Phase 2 brownfield expansion plan that is expected to add an additional half-million tonnes of low-cost, environmentally efficient capacity for a total investment of $260 million. We are also evaluating options to increase the production of low-carbon ammonia and will likely have more to discuss in this area in 2022.
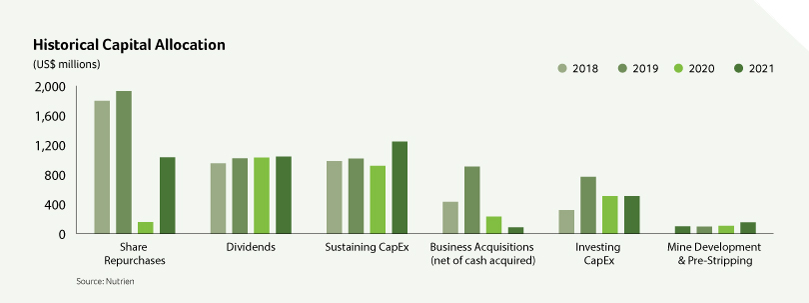
Since 2018, Nutrien has allocated $9 billion to shareholders through dividends and share repurchases, including $2.1 billion returned in 2021. We have demonstrated the ability to pay a sustainable and growing dividend even through the most difficult market conditions and distribute excess cash through share repurchases.
With strong projected cash flow in 2022, we expect to fund our identified growth projects and return significant cash to shareholders on a relatively balanced cadence throughout the year. In February, the Board of Directors approved an increase in the quarterly dividend to $0.48 per share and we plan to allocate a minimum of $2 billion to share repurchases in 2022.
Addressing ESG Priorities
We launched our Feeding the Future Plan in 2021, which set out a number of ambitious long-term commitments to drive systemic change across our company and industry. The plan is centered on three key pillars that focus on Feeding the Planet Sustainability, Environment and Climate Action, and Inclusive Agriculture. We will take an integrated approach to ensure that our strategic, operational, and capital allocation decisions support each of these sustainability priorities.
Our direct link to the grower provides the opportunity to develop innovative solutions that improve carbon outcomes at the farm.
We launched a pilot carbon program in North America that covered ~225,000 acres and formed partnerships with a diverse set of collaborators across the value chain. Following a successful launch, we plan to expand the program in 2022 and further support our growers in generating and monetizing high-quality carbon assets and credits.
To meet our 2030 GHG intensity targets we expect to invest $500-$700 million to enable a portfolio of emissions reduction projects, primarily in our Nitrogen business. We have approved and commenced with the first tranche of decarbonization projects in Nitrogen, allocating $50 million towards projects that are expected to reduce our CO2 equivalent emissions by approximately 1 million tonnes by the end of 2023 and provide a significant step towards our 2030 GHG emissions reduction targets. In addition, we are committed to setting a science-based emissions reduction target and are working in partnership with peers in our sector to develop a pathway for decarbonization that supports the world’s journey towards net zero.
Looking Ahead
The outlook for our industry and our company has never been stronger. Global grain and oilseed inventories remain well below historic levels, and crop prices and grower margins are supportive of crop input spending in key regions where we operate. We entered 2022 with significantly higher prices for our products and the capability to bring on more low-cost potash and nitrogen volumes.
With this opportunity comes great responsibility. We know our customers will be relying on us to utilize the strength of our global network to safely and efficiently supply the products and solutions they need. In doing so, we expect to deliver superior long-term value for our customers and shareholders.
As I conclude this letter, I want to acknowledge the dedication and commitment of our employees. They demonstrated unwavering strength and perseverance to deliver record results in 2021 amid the uncertainty of the pandemic, global supply chain issues and our own leadership transitions.
I am humbled by them, and the opportunity we collectively have to deliver value for our stakeholders. We have bold plans for 2022 and beyond, and I am extremely confident in our capability to deliver.
Thank You,

Ken Seitz
Interim President and Chief Executive Officer
February 17, 2022
OVERVIEW | MANAGEMENT’S DISCUSSION & ANALYSIS FOUR-YEAR HIGHLIGHTS FINANCIAL STATEMENTS OTHER INFORMATION
Nutrien Annual Report 2021 | 7

MANAGEMENT’S DISCUSSION & ANALYSIS
As at and for the year ended December 31, 2021
| ||||
The following management’s discussion and analysis (“MD&A”) is the responsibility of management and is dated as of February 17, 2022. The Board of Directors (“Board”) of Nutrien carries out its responsibility for review of this disclosure principally through its audit committee, comprised exclusively of independent directors. The audit committee reviews and, prior to its publication, recommends to the Board approval of this disclosure. The Board has approved this disclosure. The term “Nutrien” refers to Nutrien Ltd. and the terms “we”, “us”, “our”, “Nutrien” and “the Company” refer to Nutrien and, as applicable, Nutrien and its direct and indirect subsidiaries. This MD&A is based on the Company’s audited consolidated financial statements for the year ended December 31, 2021 (“consolidated financial statements”) based on International Financial Reporting Standards (“IFRS”) as issued by the International Accounting Standards Board, unless otherwise stated.
This MD&A contains certain non-IFRS financial measures and ratios, which do not have a standard meaning under IFRS and, therefore, may not be comparable to similar measures presented by other issuers. Such non-IFRS financial measures and ratios include:
| ||||
• Adjusted EBITDA • Adjusted net earnings and adjusted net earnings per share • Adjusted EBITDA and adjusted net earnings per share guidance • Free cash flow and free cash flow including changes in non-cash operating working capital • Growth capital | • Gross margin excluding depreciation and amortization per tonne - manufactured • Potash cash cost of product manufactured per tonne • Ammonia controllable cash cost of product manufactured per tonne | • Retail adjusted average working capital to sales and Retail adjusted average working capital to sales excluding Nutrien Financial • Nutrien Financial adjusted net interest margin • Retail cash operating coverage ratio • Retail normalized comparable store sales • Adjusted net debt | ||
For definitions, further information and reconciliation of these measures to the most directly comparable measures under IFRS, see the “Non-IFRS Financial Measures” section.
Also see the cautionary statement in the “Forward-Looking Statements” section.
All references to per share amounts pertain to diluted net earnings (loss) per share. Financial data in this annual report are stated in millions of US dollars, which is the functional currency of Nutrien and the majority of its subsidiaries unless otherwise noted. N/m indicates information that is not meaningful.
See the “Other Financial Measures” and “Terms & Definitions” section for definitions, abbreviations and terms used in this annual report including the MD&A.
Additional information relating to Nutrien (which, except as otherwise noted, is not incorporated by reference herein), including our Annual Information Form for the year ended December 31, 2021, can be found on SEDAR at www.sedar.com and on EDGAR at www.sec.gov. The Company is a foreign private issuer under the rules and regulations of the US Securities and Exchange Commission (the “SEC”).
The information contained on or accessible from our website or any other website is not incorporated by reference into this MD&A or any other report or document we file with or furnish to applicable Canadian or US securities regulatory authorities. | ||||
OVERVIEW | MANAGEMENT’S DISCUSSION & ANALYSIS | FOUR-YEAR HIGHLIGHTS FINANCIAL STATEMENTS OTHER INFORMATION
8 | Nutrien Annual Report 2021
ADVANTAGED POSITION ACROSS THE AGRICULTURE VALUE CHAIN
Nutrien is uniquely positioned with a world-class network of production assets, distribution capabilities and a direct connection to the grower. This creates several pathways to achieve our financial, strategic and sustainability related objectives while delivering value for all stakeholders.

#1 Global Ag Retailer
| ||||||||
Nutrien has the leading Retail businesses in North America and Australia and we are growing signifcantly in South America.
We have a direct and trusted channel to the grower through our approximately 3,900 agronomists and feld experts.
Our full suite of crop inputs, services and grower solutions offers customers optionality and agnostic support along with a unique opportunity to advance climate-smart agricultural practices.
Link to Retail “Our Business” | >2,000 Retail Locations
~2,000 Proprietary Products
On-farm CARBON PROGRAM
SUSTAINABILITY and DIGITAL SOLUTIONS | |||||||
| #1 Global Potash Producer | ||||||||
We operate the largest and most reliable Potash assets in the world with an unparalleled logistics and distribution network.
Our 6 mines are located in Saskatchewan with advantaged geology that supports low- cost production and minimizes operational risk.
We have 4Mmt of available production capacity and the option to advance incremental brownfield projects at some of the most attractive economics in the industry.
Link to Potash “Our Business” |
21Mmt Nameplate Potash capacity
6 Mine Network
4 Marine Terminals Through Canpotex
~300 Distribution Points | |||||||
OVERVIEW | MANAGEMENT’S DISCUSSION & ANALYSIS | FOUR-YEAR HIGHLIGHTS FINANCIAL STATEMENTS OTHER INFORMATION
Nutrien Annual Report 2021 | 9
Nutrien is supported by approximately 23,500 talented employees who work towards the common goal of helping growers increase food production in a sustainable manner.
As the largest provider of whole-acre crop inputs and services, we are well positioned to achieve our vision to Be the Leading Global Ag Solutions Provider.

#3 Global Nitrogen Producer | ||||
Our Nitrogen production network is flexible and diversified, with strategically located assets that have access to lower-cost natural gas and close proximity to key nitrogen markets.
We are a leading low-carbon ammonia producer with several low-risk pathways to expand our production.
Link to Nitrogen “Our Business” |
7.1Mmt Nameplate Ammonia Capacity
9 Nitrogen Facilities
13 Ammonia Plants
1Mmt Low-carbon Ammonia Production Capability |

#2 North American Phosphate Producer | ||||
Our Phosphate business has access to high-quality, integrated phosphate rock reserves, which allows for the production of a diverse and premium product portfolio.
Link to Phosphate “Our Business” |
1.7Mmt Nameplate P2O5Capacity
2 Large Integrated Phosphate Mines
4 Upgrade Facilities | |||
OVERVIEW | MANAGEMENT’S DISCUSSION & ANALYSIS | FOUR-YEAR HIGHLIGHTS FINANCIAL STATEMENTS OTHER INFORMATION
10 | Nutrien Annual Report 2021
GENERATING VALUE TODAY AND PREPARING
FOR THE FUTURE
Our strategy is to maximize the value of our integrated model to improve the profitability and sustainability of our customers. We continue to explore ways to further enhance the capabilities of our business to capture additional value across the supply chain. We believe this platform provides a number of advantages compared to our competitors, including operational, financial and sustainability benefits.
Operational and Supply Chain Benefits
Nutrien’s world-class integrated network provides opportunity to optimize operating, transportation and logistics costs, increase the reliability of supply to our customers and support volume growth. This integration includes the efficient delivery of our manufactured fertilizer products as well as proprietary seed, crop protection and nutritional products direct to our Retail network.
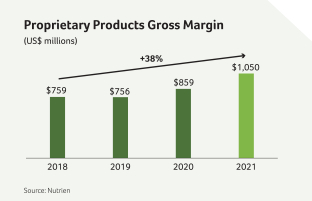
Since 2018, we have increased the volume of our manufactured fertilizer product sold directly through our Retail channel by approximately 20 percent and have grown proprietary product gross margin by 38 percent. In 2021, global crop input supply was extremely tight and we were able to utilize our integrated network to efficiently supply the needs of our customers, supporting an increase in sales and margins.
World-Class Production Assets
|
Global Supply Chain
| |||
27Mmt Potash, Nitrogen, Phosphate Manufactured Sales Volume in 2021 | ~440 Wholesale Fertilizer Distribution Points Strategically Positioned to Serve our Customers | |||
~2,000 Proprietary Products Enhance Value for Nutrien and Our Growers |
>1,000 Crop Input Suppliers Providing Diverse Product Offerings and Supply Sources | |||
OVERVIEW | MANAGEMENT’S DISCUSSION & ANALYSIS | FOUR-YEAR HIGHLIGHTS FINANCIAL STATEMENTS OTHER INFORMATION
Nutrien Annual Report 2021 | 11
Financial and Capital Allocation Advantages
|  | |
The scale of our assets provides for a more stable and diverse earnings base than our fertilizer peers. The stability of our Retail earnings has allowed Nutrien to provide investors with a sustainable and growing dividend through the cycle, which we have increased by 15 percent between 2018 and 2021. Our low-cost fertilizer production assets have historically generated significant free cash flow, providing additional capital to strategically grow our Retail business.
| ||
| Sustainable Agriculture Solutions | ||
Nutrien has the capability to make meaningful improvements to ESG topics that impact agriculture from fertilizer production to grower practices in the field. Our agronomists and digital teams support our customers by providing the best agnostic advice and access to the products they need. We utilize this field level knowledge to develop innovative products and solutions that not only improve the grower’s profitability but also their environmental performance. We will use our leading global position to develop partnerships that make a difference across the agriculture value chain, including working with peers to support the development of science-based emissions targets for our industry. | ||
|
Leading Ag Retail Network
|
Sustainable Ag Solutions
| |||||||
| >2,000 Retail locations Across North America, South America and Australia
| LEADING PROVIDER OF INNOVATIVE PRODUCTS AND SERVICES
| ||||||
~3,900 Agronomists and Crop Consultants Provide a Direct Connection to the Grower
| >10 Suppliers and Downstream Partners in Carbon Pilot Program
| |||||||
OVERVIEW | MANAGEMENT’S DISCUSSION & ANALYSIS | FOUR-YEAR HIGHLIGHTS FINANCIAL STATEMENTS OTHER INFORMATION
12 | Nutrien Annual Report 2021
NUTRIEN’S BASIC BELIEFS & STRATEGIC APPROACH
DRIVING OUR ACTIONS AND PERFORMANCE
Our strategy and capital allocation priorities are informed by a number of key factors that we believe will impact our operating environment over the long-term. We test these views as part of a robust annual strategic planning process to ensure that we proactively identify any opportunities and risks that could impact our business and strategic priorities.

Basic Belief |
Long-term demand growth for agricultural products and services is supported by a growing global population and the need to increase output, while minimizing the environmental impacts of production.
|
A company’s ability to address its key ESG risks and opportunities is critical to long-term corporate viability. | ||
| Nutrien’s Approach | Leverage our leading production and distribution businesses to meet the expected growth in global crop input demand.
Evolve our portfolio of crop inputs and solutions to help growers sustainably increase crop yields, while improving their profitability.
Link to Integrated Model | Ensuring our strategic, operational and capital allocation decisions support our sustainability priorities.
Continue to establish Nutrien as a global industry leader in sustainability, with a focus on initiatives that enhance on-farm environmental performance and reduce GHG emissions from our facilities.
Link to Feeding the Future | ||
OVERVIEW | MANAGEMENT’S DISCUSSION & ANALYSIS | FOUR-YEAR HIGHLIGHTS FINANCIAL STATEMENTS OTHER INFORMATION
Nutrien Annual Report 2021 | 13

Technology and innovation will play an increasingly important role in driving competitive differentiation, supporting operational efficiencies, sustainability and growth. | A low-cost, reliable production network and supply chain are essential to delivering value through the cycle. | Effective talent management and forward-looking workforce planning are essential to long-term strategic execution. | ||
Invest and deploy solutions and technology, using our unique channel to support the customer and strengthen our global scale.
Accelerate grower adoption of innovative and comprehensive solutions and technology, such as our proprietary products and digital sustainability tools, engaging leading technology in our fertilizer production that lowers cost and improves safety. | Enhancing the value of our competitively advantaged world-class production platform, maximizing asset quality, integration value and operational resiliency.
Executing on initiatives that drive best-in-class safety, operating and cost performance and maximize the quality and resilience of earnings through the cycle.
Link to Strategic Score Card and Business Strategy | Invest in our people programs to ensure we attract and retain the talent required to deliver on our current and future business needs.
Fostering a purpose-driven culture and accelerating people and leadership development programs, while delivering a step improvement in diversity and inclusion.
Link to How NTR Delivers Value | ||
OVERVIEW | MANAGEMENT’S DISCUSSION & ANALYSIS | FOUR-YEAR HIGHLIGHTS FINANCIAL STATEMENTS OTHER INFORMATION
14 | Nutrien Annual Report 2021
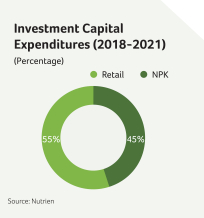
CREATING LONG-TERM VALUE THROUGH
DISCIPLINED CAPITAL ALLOCATION
Nutrien has a proven track record of value generation and efficient capital allocation. Our capital allocation policy prioritizes safe and reliable operations, a strong balance sheet, growing our business, and strong returns to shareholders through a sustainable dividend and share repurchases.
Priorities

Safe and |
SUSTAINING CAPITAL |
2021 $1.2B |
2020 $0.9B | |||
Strong |
ADJUSTED NET DEBT/ADJUSTED |
2021 1.4x |
2020 2.6x | |||

Value |
INVESTING CAPITAL |
2021 $510M |
2020 $511M | |||
BUSINESS ACQUISITIONS 3
| $88M
| $233M
| ||||
GROWTH CAPITAL 4 |
$598M |
$744M | ||||
Return |
CASH USED FOR DIVIDENDS AND SHARE |
2021 $2.1B |
2020 $1.2B |
| 1 | This is a supplementary financial measure. See the “Other Financial Measures” section. |
| 2 | This is a capital management measure that includes a non-IFRS component. See the “Non-IFRS Financial Measures” and “Other Financial Measures” sections. |
| 3 | Net of cash acquired. |
| 4 | This is a non-IFRS financial measure. See the “Non-IFRS Financial Measures” section. |
OVERVIEW | MANAGEMENT’S DISCUSSION & ANALYSIS | FOUR-YEAR HIGHLIGHTS FINANCIAL STATEMENTS OTHER INFORMATION
Nutrien Annual Report 2021 | 15
 | ||
| What we’ve done | What we’ll do | |||
| Invested in our assets to achieve industry-leading utilization rates and safety records. In 2021, we utilized our existing capacity to produce record potash volumes and completed two major turnarounds in nitrogen that will enhance the long-term reliability of our assets. | Deliver on our long-term operating targets through continuous improvement initiatives and investments that enhance reliability and efficiency of our assets. | |||
Maintained investment-grade credit ratings.
In 2021, we repositioned the balance sheet by reducing long-term debt by $2.1 billion. | Expect to maintain adjusted net debt/adjusted EBITDA leverage ratios below 3 times through the cycle and do not anticipate the need to materially reduce our total debt any further in the near-term. | |||
Executed several initiatives that generate high returns.
• Completed Phase 1 Nitrogen brownfield and commenced Phase 2, which together add approximately 1.4 million tonnes of low-cost production capacity.
• Closed 5 Retail transactions in Brazil since the start of 2020 that are generating $400 million in run-rate revenue and attractive returns on investment.
• Invested in digital and ESG-related capability to grow the business and improve our footprint. | We are focused on higher return Retail growth opportunities in Brazil, selective tuck-in acquisitions in other core markets, and investing in our proprietary products and digital capabilities. We expect to enhance our Nitrogen business through brownfield expansion and decarbonization projects. | |||
| Returned a total of $2.1B to shareholders in 2021 by repurchasing 15 million shares and increasing our annualized dividend to $1.84 per share, with an average dividend yield of 3.0 percent throughout 2021. | Target a sustainable and growing dividend supported by the stability of Retail. We expect to allocate at a minimum $2 billion to share repurchases in 2022 on a balanced cadence throughout the year. | |||
OVERVIEW | MANAGEMENT’S DISCUSSION & ANALYSIS | FOUR-YEAR HIGHLIGHTS FINANCIAL STATEMENTS OTHER INFORMATION
16 | Nutrien Annual Report 2021
INTEGRATION OF STRATEGY AND SUSTAINABILITY COMMITMENTS
Our Feeding the Future Plan will help advance our industry and world forward for generations to come. By the year 2030, we aim to make key transformations through ambitious commitments that drive systemic change and lead the next wave of agricultural evolution.
We believe that managing sustainability topics contributes to long-term value creation, protects our reputation, enhances our resilience and creates future opportunities.
In 2021, we established several ESG goals and targets that support our sustainability strategy and 2030 commitments, which are tied directly to our Executive compensation. These commitments contribute to the United Nations Sustainable Development Goals (“UN SDGs”) and have resulted in significant improvement in our ratings from key ESG rating firms.
Our strategy and targets are related to many of the UN SDGs but our primary focus is SDG 2: Zero Hunger through 2.4.1 sustainable and productive agriculture. We continue to see significant improvement in our overall ratings year-over-year, and improvement versus our peers as well.
Nutrien ESG Rating Profile
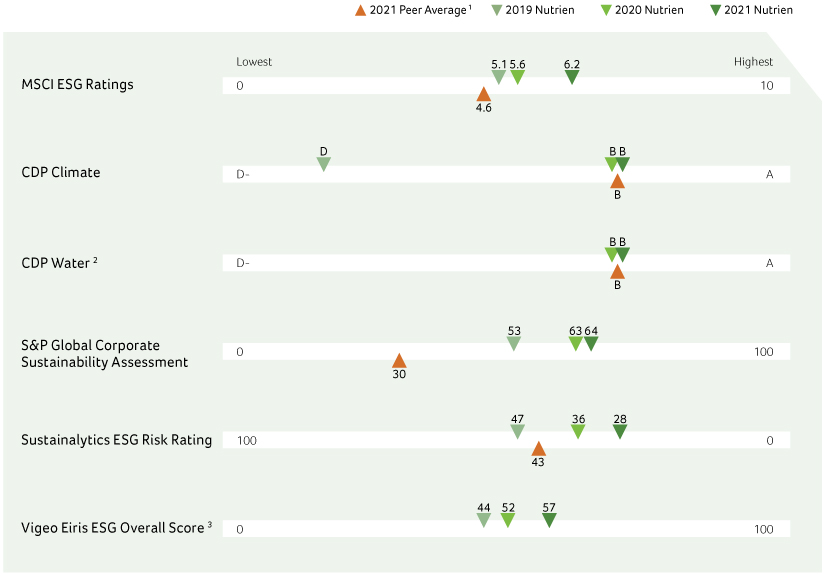
| 1 | Peer groups: MSCI = Specialty Chemicals; CDP and S&P = Chemicals; Sustainalytics = Agricultural Chemicals; Vigeo Eiris = Chemicals North America |
| 2 | CDP Water not scored in 2019 |
| 3 | Peer average not available |
OVERVIEW | MANAGEMENT’S DISCUSSION & ANALYSIS | FOUR-YEAR HIGHLIGHTS FINANCIAL STATEMENTS OTHER INFORMATION
Nutrien Annual Report 2021 | 17
Our Global Impact

Feeding the Planet Sustainably | Environment and Climate Action | Inclusive Agriculture | ||||||||
Strengthen food security by scaling sustainable and productive agriculture. | Provide solutions and platforms to achieve emissions reductions in alignment with climate science. | Support rural livelihoods and increase participation of underrepresented stakeholders in agriculture. | ||||||||
Nutrien’s 2030 Commitments
We have a number of pathways and opportunities to advance our long-term sustainability commitments and expect to invest $500–$700 million to achieve our emissions reduction targets. In 2021, we began our journey towards meeting our Feeding the Future Plan with the launch of several initiatives.
Nutrien Commitments
FEEDING THE PLANET SUSTAINABLY
| ENVIRONMENT AND CLIMATE ACTION | INCLUSIVE AGRICULTURE | ||||||||
Enable growers to adopt sustainable and productive agricultural products and practices on 75 million acres globally by 2030. | Launch & Scale a comprehensive Carbon Program, empowering growers and our industry to accelerate climate- smart agriculture practices to reduce GHG emissions and improve soil carbon sequestration, while rewarding growers for outcomes achieved. | Achieve a 30 percent reduction in Scope 1 and 2 GHG emissions per tonne of our products produced by 2030 (from a 2018 baseline). | Invest in new technologies and pursue transition to low-carbon fertilizers, including blue and green ammonia. | Leverage our farm-focused technology partnerships and investments to drive positive impact in industry and grower innovation and inclusion. | Create new grower financial solutions to strengthen social, economic and environmental outcomes in agriculture. | |||||
Our Progress
| ||||||||||
• Measured and documented 545,000 sustainable and productive acres in North America
• Carbon Program pilots launched with approximately 225,000 acres subscribed and working with more than 10 suppliers and downstream partners. We are building the frameworks to effectively scale the program | • Progressed decarbonization projects that are expected to reduce CO2 equivalent emissions by approximately 1 million tonnes by the end of 2023
• Launched Phase 2 energy-efficient brownfield nitrogen projects that increase ESN® production
• Entered into partnership with EXMAR to jointly develop and build a low- carbon, ammonia-fueled marine vessel | • Leveraged our network of research farms, Ag-tech partnerships and investments to field trial leading-edge Ag technology and innovations
• Equity, Diversity & Inclusion program accelerated to support target achievement
• Evaluated new inclusive financing offerings to our customers through Nutrien Financial, as well as potential financial collaborations with partners | ||||||||
OVERVIEW | MANAGEMENT’S DISCUSSION & ANALYSIS | FOUR-YEAR HIGHLIGHTS FINANCIAL STATEMENTS OTHER INFORMATION
18 | Nutrien Annual Report 2021
 | Agriculture and Retail |
Operating Environment
Global crop prices were supported by strong demand and less than expected supply in recent growing seasons, resulting in historically low global inventory and strong grower margins in 2021. This led to an increase in global planted acreage and higher crop input demand in the core markets we serve.
Favorable weather conditions in the spring and fall were also supportive of strong fertilizer and crop protection applications in most regions of North America. US crop yields were near trend levels, while drought conditions significantly impacted crop production in Western Canada.
Brazilian growers increased total plantings by 5 million acres due to record profitability and this resulted in higher crop input spending through the growing season. Australian growers experienced favorable weather conditions and harvested record wheat production.
The availability of crop inputs, including fertilizer and certain herbicides, was | impacted by global production and supply-chain issues in 2021. We utilized the scale of our global supply chain and strategic partnerships to ensure our customers had the product they needed, when they needed it.
Outlook
Agriculture fundamentals remain very strong as inventory for key global grains and oilseeds is below historical average levels, despite record production in 2021. Corn and soybean prices in the US and Brazil are very strong and prospective crop margins are well above the 10-year average.
We expect overall US planted area of major crops to be similar to 2021 levels, with corn and soybean acreage in the range of 91 to 93 million and 87 to 89 million, respectively. We expect strong crop economics will support total Brazilian planted acreage and crop input demand in 2022. Australian growers continue to experience favorable weather, which is expected to support planted acreage and crop input use. | Nutrien is well-positioned on fertilizer and crop protection product inventory to begin the North American planting season. We expect Retail fertilizer margins will return to historical average levels after increasing in 2021 due to strategic procurement in a rising price environment.
| ||

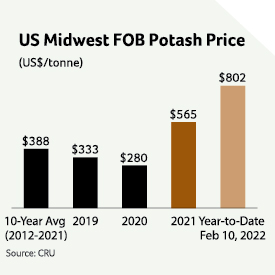
 | Potash |
Operating Environment
We estimate global potash shipments reached a record of approximately 70 million tonnes in 2021. This was driven by record demand in the US, Brazil and Southeast Asian countries. Global potash prices increased in response to record global demand and tightness of supply due to competitor mine flooding, new project delays and uncertainty around sanctions imposed on Belarus by the US and Europe. Global potash production increased by an estimated 1.2 million tonnes in 2021 with Nutrien accounting for nearly all the net increase. | Global potash consumption exceeded shipment levels resulting in a drawdown of inventories, in particular in China and India due to lower contract volumes. China reportedly accessed its strategic potash reserves in the fourth quarter to meet domestic demand.
Outlook
We believe that supply issues will continue into 2022, including due to the additional restrictions imposed on Belarus potash transported through Lithuania. Additional supply is expected to come online during the year from new projects in Canada and Russia. | We forecast 2022 global shipments in a range of 68 to 71 million tonnes, similar to 2021. We expect demand
| ||
OVERVIEW | MANAGEMENT’S DISCUSSION & ANALYSIS | FOUR-YEAR HIGHLIGHTS FINANCIAL STATEMENTS OTHER INFORMATION
Nutrien Annual Report 2021 | 19
 | Potash continued... |
| growth in China and India due to their low inventory levels, and the potential for temporary reductions in North America and Latin America, following a record year. | Nutrien expects record potash sales volumes between 13.7 and 14.3 million tonnes in 2022. This forecast assumes sanctions on Belarus have a temporary impact on global supply. If there was a more significant long-term impact on global supply, Nutrien has the capability to | further ramp up production by hiring additional employees and incurring some small incremental capital expenditures. | ||
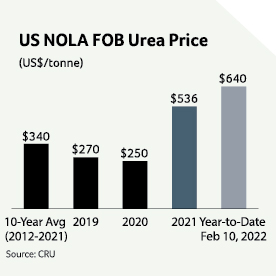
 | Nitrogen |
Operating Environment
Global nitrogen consumption grew by approximately one percent in 2021 driven by increased fertilizer demand for agricultural production as well as strong industrial demand in the US and Asia.
Natural gas prices surged in Europe and Asia due to tight supplies and stronger-than-expected energy demand. North American gas prices increased but to a much lesser extent than other major nitrogen producing regions. Record European natural gas prices in the second half contributed to a significant curtailment of nitrogen capacity. Weather-related outages, | export restrictions and project delays also contributed to tight supply.
Nitrogen benchmark prices increased significantly as a result of the tightening fundamentals and higher global energy costs.
Outlook
Nitrogen prices are expected to be supported by strong demand, high energy prices in Europe, government restrictions and geopolitical risks in key export markets. North American natural gas prices increased in early 2022 but we expect Henry Hub prices to average between $3.75 and $4.25 per MMBtu in 2022, well below import pricing levels in Europe and Asia. | Nutrien expects to increase Nitrogen sales volumes to between 10.8 and 11.3 million tonnes in 2022 with the completion of Phase 1 brownfield expansion projects in 2021 and higher expected anticipated rates.
| ||
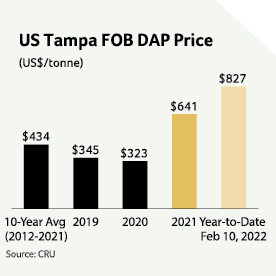
 | Phosphate |
| Operating Environment | Outlook |
| ||
| Global phosphate prices trended higher in 2021 supported by strong demand and limited new supply. Global trade flows continued to adjust to US countervailing duties on imports from Morocco and Russia. Sulfur and ammonia input costs increased significantly in 2021, however higher phosphate prices supported increased production margins. | We expect phosphate fertilizer prices will be supported by a reduction in supply from China due to export restrictions and elevated raw material input cost. This is compounded by tight inventories in key import markets such as India.
Industrial and feed phosphate product prices are expected to increase but higher sulfur input costs could offset a significant portion of this increase. | |||
We report our results in four reportable operating segments: Nutrien Ag Solutions (“Retail”), Potash, Nitrogen and Phosphate.
| • | Adjusted EBITDA is the primary profit measure used to evaluate the segments’ performance as it excludes the impact of non-cash impairments and other costs that are centrally managed by our corporate function. Refer to Note 3 to the consolidated financial statements for details. |
| • | Net sales (sales revenues less freight, transportation and distribution expenses) is the primary revenue measure used in planning and forecasting in the Potash, Nitrogen and Phosphate operating segments. |
OVERVIEW | MANAGEMENT’S DISCUSSION & ANALYSIS | FOUR-YEAR HIGHLIGHTS FINANCIAL STATEMENTS OTHER INFORMATION
20 | Nutrien Annual Report 2021

| NUTRIEN AG SOLUTIONS (“RETAIL”) | ||||||||||||||||
$1.9B | 10.9% | $1.0B | >800K | |||||||
Record Adjusted EBITDA | Total Adjusted EBITDA Margin1 | Proprietary Products Gross Margin | US Soil Sample Tests Performed | |||||||
Our Business
Nutrien Ag Solutions is the world’s largest retailer of crop inputs and services, with over 2,000 Retail locations across the globe providing whole-acre solutions to approximately 500,000 grower accounts in North America, South America and Australia. Our focus is to help our customers meet the ever-growing demand for food, and advance the efficiency, profitability, and sustainability of their operations.
Our world-class network provides unparalleled access to growers with more than 1,500 locations in North America, over 400 locations in Australia and now more than 125 locations in South America, including a growing business in Brazil. Our supply chain and strategic partnerships, including over 1,000 crop input suppliers, ensure reliable delivery of crop inputs when our grower customers need them, where they need them.
We have approximately 3,900 agronomists and field experts who provide critical advice from the crop planning stage right through to harvest. This supports our grower customers in the ever-increasing challenge to increase yields and maximize returns, while improving on sustainability practices and outcomes.
Our Retail digital platform works seamlessly across Field Planning, Digital Agronomy, Ecommerce and Sustainability, providing an end-to-end experience for the grower, leveraging data to better serve our customers. We have also professionalized our long-standing finance offering to growers, providing a flexible and competitive option to finance their crop inputs.
We produce approximately 2,000 proprietary products that span the crop input chain, including seed, crop nutrients and crop protection. Key brands such as our Loveland Products and Dyna-Gro seed aim to give growers an advantage in producing the highest crop outcomes, while at the same time including a portfolio of specialty products that enhance sustainability practices. Our proprietary products generate meaningfully higher margins compared to third-party products, and we produce and distribute them from over 30 formulation facilities located in all key markets where we operate.
We are committed to supporting the increase of global food production, including the adoption of sustainable agricultural products and practices on 75 million acres globally. Our agricultural Carbon Program is a key initiative we have rolled out to provide farmers with the tools and practices that can help improve their environmental footprint, while providing a financial vehicle to monetize those improvements, creating a win-win situation for our industry and society in the pursuit of feeding a growing world.
| 1 | This is a supplementary financial measure. See the “Other Financial Measures” section. |
OVERVIEW | MANAGEMENT’S DISCUSSION & ANALYSIS | FOUR-YEAR HIGHLIGHTS FINANCIAL STATEMENTS OTHER INFORMATION
Nutrien Annual Report 2021 | 21
Competitive Landscape
The Ag retail industry is highly fragmented in most of our major markets, but evolving to best meet grower needs, with a variety of ownership structures and varying degrees of access to capital.
The major markets where we operate are primarily comprised of many small Ag retailers along with a small number of mid-sized competitors.
The US market remains fragmented, including cooperatives of various sizes, and continues to be a key focus area to grow our leading position through tuck-in acquisitions. In Western Canada, Nutrien continues to lead the market and grow organically through our proprietary products offering, including the Proven seed brand.
The Australian market is unique in that growers require a full suite of crop production inputs, but also solutions for livestock, water and irrigation services.
In Brazil, the market Nutrien is strategically targeting is characterized by small to medium-sized independent retail locations. There is an opportunity for Nutrien to enhance the product, service and solution offerings to growers in these select regions.
Growers want whole-acre solutions that can include a full suite of products, services and solutions, rooted in sound unbiased agronomic advice and analytics, stressing the importance of timely delivery and reliability of supply.
We believe scale, reliability and innovative solutions, including a focus on digital offerings and sustainability, will be required in the future in order to meet evolving grower needs and drive long-term growth and profitability for Retail.
Our Strategy
We are growing our world-class Retail network through organic growth initiatives and accretive acquisitions that enhance our ability to provide leading whole-acre solutions for farmers around the world.
We have opportunity to further realize benefits from an integrated business model, improve scalability and efficiency, and build on the trusted relationships with our agronomists and field consultants that have served growers through many agricultural cycles. We are committed to growing our business through five key organic pillars, while expanding our footprint through strategic acquisitions in our core markets.
Driving Organic Growth

| 1 |
Network
|
We are focused on enhancing the utilization of upstream products, cross-company supply chain optimization, building on the strong relationships with our external suppliers and optimizing our network efficiency in order to further build on our supply chain strength.

| 2 |
Proprietary Products
|
These higher-margin products give us differentiation and play a key role in providing leading crop inputs to our grower customers. They cater to specific geographic conditions and variability, including biologicals and nutritional solutions that boost yields and address soil health and agricultural sustainability.
| 3 |
Digital Platform
|
The platform is strengthening the customer/agronomist relationship and providing key agronomic data and insights to help our grower customers optimize their crop input decisions. We continue to add functionality and plan to expand the offering to Australia and South America in 2022.

| 4 |
Nutrien Financial
|
Our financing solutions provide competitive product financing for our customers, supporting customer retention and business growth. We are building new partnerships with diverse grower groups, and are exploring new finance program opportunities to promote sustainable agriculture and support positive environmental outcomes.

| 5 |
Sustainability
|
We are playing a leading role in providing the products, services and solutions that growers need to increase production and profitability, while minimizing their environmental footprint. Our end-to-end Carbon Program is a key initiative that supports delivering on this commitment.

R
OVERVIEW | MANAGEMENT’S DISCUSSION & ANALYSIS | FOUR-YEAR HIGHLIGHTS FINANCIAL STATEMENTS OTHER INFORMATION
22 | Nutrien Annual Report 2021
Executing on Accretive Acquisitions
Nutrien Ag Solutions has a solid track record of strategic acquisitions in our core markets, which we believe is key to best meeting grower needs. Our tuck-in strategy continues to add value as we access new customers, further expand our higher-margin proprietary products, and integrate the business with our digital platform, world-class supply chain, and sustainability initiatives. Our primary focus will be on selective acquisitions in the US where we have room to grow.
We have made significant progress towards growing our business in Brazil, which is one of the largest and fastest-growing agriculture markets in the world. Our strategy is to provide leading whole-acre solutions to growers, similar to our other key markets, but with a more asset-lite model and a very targeted approach to the customers and regions we serve.
2021 Performance
Our Retail team effectively navigated a number of global supply chain challenges by utilizing the scale of our world-class network and strategic partnerships to drive market share gains and margin growth.
We achieved record Retail adjusted EBITDA of $1.9 billion, exceeded our 2023 adjusted EBITDA margin target and geographically diversified our Retail earnings further with 34 percent of adjusted EBITDA generated outside the US. Our ability to respond to a surge in customer demand also resulted in market share gains in all major product categories, including record crop nutrient sales volumes of 13.4 million tonnes.
We progressed on a number of organic growth initiatives, which yielded strong results, including record adjusted EBITDA per US selling location1 of $1.5 million and normalized comparable store sales2 reaching 7 percent. We improved our operating and working capital metrics with our cash operating coverage ratio2 of 58 percent and our average adjusted working capital to sales2 ratio declining to 13 percent. Our proprietary products portfolio contributed 23 percent of total Retail gross margin, and sales through our digitally enabled platform increased to $2.1 billion, representing 17 percent of retail sales in North America. Nutrien Financial generated growth in US finance offerings and program adoption and continued its expansion into Australia.
Acquisitions continue to be a significant part of our growth strategy. We completed 12 tuck-in acquisitions in the US and Australia in 2021, but were more selective given the stage of the agricultural cycle. We have deployed ~$300 million in Brazil since the start of 2020 through 5 transactions. We are on track to achieve our 2023 target of a run-rate EBITDA of $100 million in Brazil, generating over $65 million of EBITDA in 2021. We have a strong pipeline of acquisition targets and an exceptional local team in place to deliver on our strategy.
Nutrien also made progress advancing our Carbon Program in 2021. We doubled our initial target acreage sign-ups, with approximately 225,000 acres committed across our pilot portfolio. There was great interest from a diverse group of stakeholders including growers, supply chain partners, prospective buyers, NGOs and governments. 2021 was a key year of learning, providing valuable insights into how best to position and scale our comprehensive Carbon Program to drive impact. As we look forward into 2022, we plan to begin to scale portions of our North American portfolio, with meaningful increases in acreage, and launch pilots in South America and Australia.
| 1 | These are supplementary financial measures. See “Other Financial Measures” section. Excludes acquisitions. |
| 2 | These are non-IFRS financial measures. See the “Non-IFRS Financial Measures” section. |
R
OVERVIEW | MANAGEMENT’S DISCUSSION & ANALYSIS | FOUR-YEAR HIGHLIGHTS FINANCIAL STATEMENTS OTHER INFORMATION
Nutrien Annual Report 2021 | 23
RETAIL FINANCIAL PERFORMANCE
| Dollars | Gross Margin | Gross Margin (%) | ||||||||||||||||||||||||||||||||||||||||||||||||||||||||||||||
(millions of US dollars, except as otherwise noted) |
| 2021 |
| 2020 |
| % Change |
| 2021 |
| 2020 |
| % Change |
| 2021 |
| 2020 | ||||||||||||||||||||||||||||||||||||||||||||||||
Sales | ||||||||||||||||||||||||||||||||||||||||||||||||||||||||||||||||
Crop nutrients |
| 7,290 |
|
| 5,200 |
|
| 40 |
|
| 1,597 |
|
| 1,130 |
|
| 41 |
|
| 22 |
|
| 22 |
| ||||||||||||||||||||||||||||||||||||||||
Crop protection products |
| 6,333 |
|
| 5,602 |
|
| 13 |
|
| 1,551 |
|
| 1,303 |
|
| 19 |
|
| 24 |
|
| 23 |
| ||||||||||||||||||||||||||||||||||||||||
Seed |
| 2,008 |
|
| 1,790 |
|
| 12 |
|
| 419 |
|
| 363 |
|
| 15 |
|
| 21 |
|
| 20 |
| ||||||||||||||||||||||||||||||||||||||||
Merchandise |
| 1,033 |
|
| 943 |
|
| 10 |
|
| 172 |
|
| 157 |
|
| 10 |
|
| 17 |
|
| 17 |
| ||||||||||||||||||||||||||||||||||||||||
Nutrien Financial |
| 189 |
|
| 129 |
|
| 47 |
|
| 189 |
|
| 129 |
|
| 47 |
|
| 100 |
|
| 100 |
| ||||||||||||||||||||||||||||||||||||||||
Services and other |
| 1,051 |
|
| 1,241 |
|
| (15) |
|
| 842 |
|
| 774 |
|
| 9 |
|
| 80 |
|
| 62 |
| ||||||||||||||||||||||||||||||||||||||||
Nutrien Financial elimination 1 |
|
|
|
| (170 | ) |
|
|
|
| (120 | ) |
|
|
|
| 42 |
|
|
|
|
| (170 | ) |
|
|
|
| (120 | ) |
|
|
|
| 42 |
|
|
|
|
| 100 |
|
|
|
|
| 100 |
| ||||||||||||||||
|
17,734 |
|
|
14,785 |
|
|
20 |
|
|
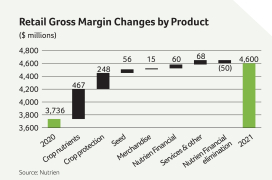
4,600 |
|
|
3,736 |
|
|
23 |
|
|
26 |
|
|
25 |
| |||||||||||||||||||||||||||||||||||||||||
Cost of goods sold |
| 13,134 |
|
| 11,049 |
|
| 19 |
|
|
|
| ||||||||||||||||||||||||||||||||||||||||||||||||||||
Gross margin |
|
4,600 |
|
|
3,736 |
|
|
23 |
| |||||||||||||||||||||||||||||||||||||||||||||||||||||||
Expenses 2 |
|
|
|
| 3,378 |
|
|
|
|
| 2,974 |
|
|
|
|
| 14 |
|
|
|
| |||||||||||||||||||||||||||||||||||||||||||
Earnings before finance costs and taxes (“EBIT”) |
| 1,222 |
|
| 762 |
|
| 60 |
| |||||||||||||||||||||||||||||||||||||||||||||||||||||||
Depreciation and amortization |
|
|
|
| 706 |
|
|
|
|
| 668 |
|
|
|
|
| 6 |
|
|
|
| |||||||||||||||||||||||||||||||||||||||||||
EBITDA |
|
1,928 |
|
|
1,430 |
|
|
35 |
| |||||||||||||||||||||||||||||||||||||||||||||||||||||||
Adjustments 3 |
|
|
|
| 11 |
|
|
|
|
| – |
|
|
|
|
| n/m |
|
|
|
| |||||||||||||||||||||||||||||||||||||||||||
Adjusted EBITDA |
|
|
|
|
1,939 |
|
|
|
|
|
1,430 |
|
|
|
|
|
36 |
|
|
|
| |||||||||||||||||||||||||||||||||||||||||||
1 Represents elimination for the interest and service fees charged by Nutrien Financial to Retail branches. 2 Includes selling expenses of $3,124 million (2020 – $2,795 million). 3 See Note 3 to the consolidated financial statements. |
| |||||||||||||||||||||||||||||||||||||||||||||||||||||||||||||||
The most significant contributors to the changes in our Retail financial performance were as follows:
2021 vs 2020 | ||
Crop nutrients | Sales and gross margin increased in 2021 due to higher global sales volumes and higher selling prices from strong agriculture fundamentals. Gross margin percentage was flat as increases in selling prices were offset by higher purchasing costs. | |
Crop protection products | Sales and gross margin increased in 2021 primarily due to higher selling prices, market share growth and higher proprietary product sales. Gross margin percentage increased by 1 percentage point compared to 2020 due to strategic procurement in a rising pricing environment, higher proprietary product sales and product mix. | |
Seed | Sales and gross margin increased in 2021 due to significant organic growth achieved in South America and Australia following recent expansion initiatives and acquisitions, higher planted acreage in key regions where we operate, and strong grower margins leading to increased purchases. Gross margin percentage increased by 1 percentage point due to price increases, including from our proprietary products. | |
Merchandise | Sales and gross margin increased in 2021 due to strong grower and rancher purchasing in Australia. | |
Nutrien Financial | Gross margin increased in 2021 due to higher utilization and adoption of our programs, including from the expansion of Nutrien Financial. | |
Services and other | Gross margin increased in 2021, despite lower sales due to the divestment of an Australian livestock export business, which more than offset higher Australian livestock and real estate sales and higher US custom application sales. | |
Selling expenses | Expenses increased in 2021 due to higher sales activity, while selling expenses as a percentage of sales decreased. | |
Adjusted EBITDA | Adjusted EBITDA increased in 2021 primarily due to higher sales and gross margin from strong crop prices driving demand for crop input products, while improving cash expense levels as a percentage of sales compared to 2020. | |
OVERVIEW | MANAGEMENT’S DISCUSSION & ANALYSIS | FOUR-YEAR HIGHLIGHTS FINANCIAL STATEMENTS OTHER INFORMATION
24 | Nutrien Annual Report 2021
SELECTED RETAIL MEASURES
|
|
| 2021 |
| 2020 | ||||||||||||
Proprietary products margin as a percentage of product line margin (%) | ||||||||||||||||
Crop nutrients |
| 21 |
|
| 25 |
| ||||||||||
Crop protection products |
| 34 |
|
| 32 |
| ||||||||||
Seed |
| 44 |
|
| 46 |
| ||||||||||
All products |
| 23 |
|
| 23 |
| ||||||||||
Crop nutrients sales volumes (tonnes – thousands) | ||||||||||||||||
North America |
| 9,848 |
|
| 9,746 |
| ||||||||||
International |
| 3,535 |
|
| 2,986 |
| ||||||||||
Total |
| 13,383 |
|
| 12,732 |
| ||||||||||
Crop nutrients selling price per tonne | ||||||||||||||||
North America |
| 556 |
|
| 421 |
| ||||||||||
International |
| 512 |
|
| 367 |
| ||||||||||
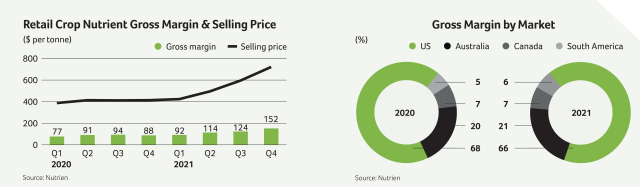
Total |
| 545 |
|
| 408 |
| ||||||||||
Crop nutrients gross margin per tonne | ||||||||||||||||
North America |
| 133 |
|
| 99 |
| ||||||||||
International |
| 82 |
|
| 55 |
| ||||||||||
Total |
|
|
|
| 119 |
|
|
|
|
| 89 |
| ||||
| Financial performance measures |
|
|
| 2023 Target |
|
|
| 2021 Actuals |
|
|
| 2020 Actuals | ||||||||||||
Retail adjusted EBITDA margin (%) 1 |
| 11 |
|
| 11 |
|
| 10 |
| |||||||||||||||
Retail adjusted EBITDA per US selling location (thousands of US dollars) 1,2 |
| 1,100 |
|
| 1,481 |
|
| 1,075 |
| |||||||||||||||
Retail adjusted average working capital to sales (%) 3 |
| 17 |
|
| 13 |
|
| 15 |
| |||||||||||||||
Retail adjusted average working capital to sales excluding Nutrien Financial (%) 3,4 |
| – |
|
| 5 |
| ||||||||||||||||||
Nutrien Financial adjusted net interest margin (%) 3,4 |
| 6.6 |
|
| 5.3 |
| ||||||||||||||||||
Retail cash operating coverage ratio (%) 3 |
| 60 |
|
| 58 |
|
| 62 |
| |||||||||||||||
Retail normalized comparable store sales (%) 3,4 |
| 7 |
|
| 6 |
| ||||||||||||||||||
Retail digital platform sales to total sales (%) 1 |
| 50 |
|
| 17 |
|
| 11 |
| |||||||||||||||
Retail grower engagement (%) 4,5 |
|
|
|
|
|
|
|
|
|
| 11 |
|
|
|
|
| 10 |
| ||||||
| 1 | These are supplementary financial measures. See the “Other Financial Measures” section. |
| 2 | Excluding acquisitions. |
| 3 | These are non-IFRS financial measures. See the “Non-IFRS Financial Measures” section. |
| 4 | No target was provided. |
| 5 | Percent of North American Retail growers doing one or more significant activities on the digital platform, such as ordering products and making payments. |
Nutrien Financial
We offer flexible financing solutions to our customers in support of Nutrien’s agricultural product and service sales. Qualifying retail customers in the US and Australia are offered extended payment terms, typically up to one year, to facilitate the alignment of grower crop cycles with cash flows. Nutrien Financial revenues are primarily earned through interest and service fees that are charged to our Retail branches.
We hold a significant portion of receivables from customers that have historically experienced a low-default rate. We manage our credit portfolio based on a combination of review of customer credit metrics, past experience with the customer and exposure to any single customer. Nutrien Financial, which is our wholly owned finance captive, monitors and services the portfolio of our high-quality receivables from customers that have the lowest risk of default among Retail’s receivables from customers. We monitor the results of this portfolio of receivables separately because we calculate the cost of capital attributable to the high-quality receivables from customers differently from our other receivables. Specifically, we assume a debt to equity ratio of 7:1 in funding Nutrien Financial receivables, based on the underlying credit quality of the assets.
Nutrien Financial relies on corporate capital for funding. We estimate the deemed interest expense using an average borrowing rate of 1.25 percent applied to the notional debt required to fund the portfolio of receivables from customers monitored and serviced by Nutrien Financial. The balance of our Retail receivables (outside of Nutrien Financial) are subject to marginally higher credit risk.
|
|
|
|
|
|
|
| As at December 31, | |||||||||||||||||||||||||
| (millions of US dollars) | Current | | <31 days past due | | | 31–90 days past due | | | >90 days past due | | | Gross Receivables | | Allowance | 1 | | 2021 Net Receivables | | | 2020 Net Receivables | | |||||||||||
North America |
| 1,410 |
|
| 45 |
|
| 12 |
|
| 47 |
|
| 1,514 |
|
| (26 | ) |
| 1,488 |
|
| 1,150 |
| ||||||||
International |
| 537 |
|
| 47 |
|
| 26 |
|
| 54 |
|
| 664 |
|
| (2 | ) |
| 662 |
|
| 242 |
| ||||||||
Nutrien Financial receivables 2 |
| 1,947 |
|
| 92 |
|
| 38 |
|
| 101 |
|
| 2,178 |
|
| (28 | ) |
| 2,150 |
|
| 1,392 |
| ||||||||
| 1 | Bad debt expense on the above receivables for the year ended December 31, 2021 was $10 million (2020 – $26 million) in the Retail segment. |
| 2 | Gross receivables include $1,792 million (2020 – $1,147 million) of very low risk of default and $386 million (2020 – $270 million) of low risk of default. |
OVERVIEW | MANAGEMENT’S DISCUSSION & ANALYSIS | FOUR-YEAR HIGHLIGHTS FINANCIAL STATEMENTS OTHER INFORMATION
Nutrien Annual Report 2021 | 25
POTASH
| $2.7B Record Adjusted EBITDA | 13.6Mmt Record Sales Volume | 1Mmt Potash Produced Using Tele-remote and Autonomous Methods |
Our Business
Nutrien is well-positioned to create long-term value due to our flexible, low-cost network of 6 mines, and significant volume growth optionality.
As the world’s largest soft rock miner and producer of potash, with approximately 21 percent of global capacity, our mines are positioned to provide the world with decades of low-cost production. Situated in the best potash geology in the world, we employ world-class technology, processes and decades of experience, enabling our assets to reliably and safely produce potash.
We have 4 million tonnes of available potash capacity that can be brought online with limited time and capital in response to increasing global demand or due to supply interruptions. In addition, we have line of sight to 5 million tonnes of additional brownfield expansions, which can be incrementally developed at a much lower cost and shorter timeline than a greenfield mine.
We operate 6 mines as part of a diverse and flexible network that allows us to optimize our assets to cost-effectively supply the market and minimize the risk of lost production and sales due to unforeseen production downtime. Our product diversity allows us to serve customers in all major markets around the globe.
Our extensive transportation and distribution network is built to serve global markets and withstand even the most
disruptive weather or market-driven events. Our North American assets alone consist of approximately 6,200 railcars and 300 distribution points. Canpotex provides us access to 4 marine terminals in Canada and the US for delivery to over 40 international markets, providing the highest level of reliability for our customers.
Safety is paramount to Nutrien’s culture and actions, and in Potash is supported by actions such as our investment in maintaining our production network, decades of developing best practices in potash mining and the adoption of new technologies.
We are also committed to supporting the communities we live in, and with our 6 mines situated in the province of Saskatchewan, engaging with Indigenous communities is vital to our long-term success. This priority is carried out through employment, supply chain and investment that provides for the opportunity to build meaningful relationships in our communities.
OVERVIEW | MANAGEMENT’S DISCUSSION & ANALYSIS | FOUR-YEAR HIGHLIGHTS FINANCIAL STATEMENTS OTHER INFORMATION
26 | Nutrien Annual Report 2021
Competitive Landscape
High quality potash reserves in significant quantities are limited to a small number of countries globally. Canada has the largest known global potash reserves, accounting for approximately 38 percent of the total.
More than 75 percent of the world’s potash capacity is held by the six largest producers. Our primary competitors are located in Russia, Belarus, Canada, Germany, Israel and Jordan. Building new production capacity requires significant capital and time to bring online. Geological and geopolitical events can result in short-term disruptions to global supply.
Most major potash-consuming countries in Asia and Latin America have limited or no indigenous production capability and rely on imports to meet their needs. This is an important difference between potash and other major crop nutrients. Trade typically accounts for approximately three-quarters of demand for potash, resulting in a globally diversified marketplace.
The global demand growth rate for potash has outpaced that of other primary nutrients, averaging approximately 2.9 percent cumulative annual growth rate (“CAGR”) since 2015, with the expectation of an additional 18 million tonnes of new demand added by 2030.
Potash demand growth will be driven by increasing nutrient requirements of higher-yielding crops and improving soil fertility practices, particularly in emerging markets where potash has been historically under-applied and crop yields lag.
Our Strategy
We will utilize our world-class network to respond quickly to changes in market supply and demand dynamics. We will continue to focus on efficiency and new technologies to lower our costs, optimize our asset base, and preserve the reliability and safety of our operations.
 |
|
|


1
Production
Capacity
2
Network
Optimization
3
Next Generation
Potash
| In addition to being the world’s largest potash producer, our 4 million tonnes of available capacity positions us to bring on significant additional low-cost production that no other existing producer has the capability to deliver. Our world-class mine network and transportation and distribution system reliably provides tonnes to key markets around the world. We continuously assess market needs, preserving the ability to flex our mine network and increase production as needed to meet demand growth and industry supply disruptions. | We are focused on achieving the optimal production mix, which maximizes the benefits of our low-cost position and a leading domestic and offshore distribution network. At the same time, we regularly undertake preventative maintenance to ensure the high quality, reliability and safety of our operations. | We are investing in initiatives focused on self-generated power (including solar and wind), autonomous and tele-remote mining, and other advanced technologies to continue to lower our production costs, optimize throughput, and improve our environmental footprint and safety performance. These are being made from the mine face right through to the mill. | ||||||
| ||||||||
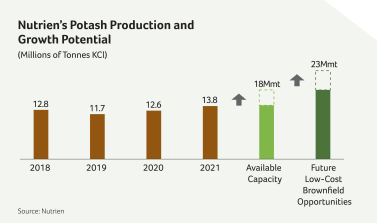

K
OVERVIEW | MANAGEMENT’S DISCUSSION & ANALYSIS | FOUR-YEAR HIGHLIGHTS FINANCIAL STATEMENTS OTHER INFORMATION
Nutrien Annual Report 2021 | 27
2021 Performance
Our Potash network demonstrated its scale, flexibility and reliability this year by significantly increasing production, while progressing on innovation initiatives to further optimize our production capability and cost profile, and ensuring our workers’ safety remained a top priority.
In response to strong global demand and supply constraints, Nutrien stepped up in 2021 and produced nearly 1 million tonnes of additional potash compared to what was planned at the start of the year. That decision was made to ensure our customers around the world received the product they needed and highlighted the capability of our flexible 6-mine network. We increased production of granular potash in response to increased demand for this premium product, showcasing our product mix agility. This production increase contributed to record potash sales volumes of 13.6 million tonnes, and record Potash adjusted EBITDA of $2.7 billion.
Our performance was also largely attributable to the strength of our supply chain, where we were able to deliver on our sales commitments despite two major weather-related rail interruptions in British Columbia. Having access to 6 mines and 4 marine terminals is a significant advantage for Nutrien and underscores our leadership position in the potash business. Despite headwinds from a stronger Canadian dollar, raw material cost inflation, and higher royalties, our average cost of goods sold per tonne was up by only 2 percent, due to mine network optimization and focus on cost control.
We advanced autonomous and tele-remote mining initiatives, which allow us to remove our operators from the active mining face. We are now able to operate mining machines from surface at our Lanigan and Cory mines. In 2021, we produced more than 1 million tonnes of product using autonomous and tele-remote methods. Within the scope of our Predictive Maintenance program, many of our key assets utilize machine vision capabilities to monitor and predict failures, inform maintenance strategies, and minimize downtime of our mines and mills. The Next Generation Potash program highlights the power of Nutrien’s Potash production network, relying on a broad spectrum of internal expertise and experience and partnering with local and international partners.
Progress was made on our self-generation initiatives that aim to produce power using wind and solar energy at our potash production facilities, and construction of a natural gas facility at our Rocanville mine site that is expected to meet the majority of power demand with lower-emission electricity than available from the public grid.

K
OVERVIEW | MANAGEMENT’S DISCUSSION & ANALYSIS | FOUR-YEAR HIGHLIGHTS FINANCIAL STATEMENTS OTHER INFORMATION
28 | Nutrien Annual Report 2021
POTASH FINANCIAL PERFORMANCE
| Dollars | Tonnes (thousands) | Average per Tonne | ||||||||||||||||||||||||||||||||||||||||||||||||||||||||||||||||||||||||||||
(millions of US dollars, except as otherwise noted) |
| 2021 |
| 2020 |
| % Change |
|
| 2021 |
| 2020 |
| % Change |
|
| 2021 |
| 2020 |
| % Change | ||||||||||||||||||||||||||||||||||||||||||||||||||||||||||
Manufactured product | ||||||||||||||||||||||||||||||||||||||||||||||||||||||||||||||||||||||||||||||
Net sales | ||||||||||||||||||||||||||||||||||||||||||||||||||||||||||||||||||||||||||||||
North America |
| 1,638 |
|
| 908 |
|
| 80 |
|
| 5,159 |
|
| 4,815 |
|
| 7 |
|
| 317 |
|
| 189 |
|
| 68 |
| |||||||||||||||||||||||||||||||||||||||||||||||||||
Offshore |
|
|
|
| 2,398 |
|
|
|
|
| 1,238 |
|
|
|
|
| 94 |
|
|
|
|
|
| 8,466 |
|
|
|
|
| 8,009 |
|
|
|
|
| 6 |
|
|
|
|
|
|
|
| 283 |
|
|
|
|
| 155 |
|
|
|
|
| 83 |
| ||||||||||||||||||||
| 4,036 |
|
| 2,146 |
|
| 88 |
|
| 13,625 |
|
| 12,824 |
|
| 6 |
|
| 296 |
|
| 167 |
|
| 77 |
| ||||||||||||||||||||||||||||||||||||||||||||||||||||
Cost of goods sold |
|
|
|
| 1,285 |
|
|
|
|
| 1,183 |
|
|
|
|
| 9 |
|
|
|
|
|
|
|
|
|
|
|
|
|
|
|
|
|
|
|
|
|
|
|
|
|
|
| 94 |
|
|
|
|
| 92 |
|
|
|
|
| 2 |
| ||||||||||||||||||||
Gross margin – total |
| 2,751 |
|
| 963 |
|
| 186 |
|
| 202 |
|
| 75 |
|
| 169 |
| ||||||||||||||||||||||||||||||||||||||||||||||||||||||||||||
Expenses 1 |
|
|
|
| 512 |
|
|
|
|
| 248 |
|
|
|
|
| 106 |
|
|
|
|
|
| Depreciation and amortization |
|
|
|
|
| 36 |
|
|
|
|
| 35 |
|
|
|
|
| 2 |
| |||||||||||||||||||||||||||||||||||
EBIT |
| 2,239 |
|
| 715 |
|
| 213 |
|
| Gross margin excluding depreciation |
| ||||||||||||||||||||||||||||||||||||||||||||||||||||||||||||||||||
Depreciation and amortization |
|
|
|
| 488 |
|
|
|
|
| 452 |
|
|
|
|
| 8 |
|
|
|
|
|
| and amortization – manufactured 3 |
|
|
|
|
| 238 |
|
|
|
|
| 110 |
|
|
|
|
| 116 |
| |||||||||||||||||||||||||||||||||||
EBITDA |
| 2,727 |
|
| 1,167 |
|
| 134 |
|
| Potash cash cost of product |
| ||||||||||||||||||||||||||||||||||||||||||||||||||||||||||||||||||
Adjustments 2 |
|
|
|
| 9 |
|
|
|
|
| 23 |
|
|
|
|
| (61 | ) |
|
|
|
|
| manufactured 3 |
|
|
|
|
| 63 |
|
|
|
|
| 59 |
|
|
|
|
| 7 |
| |||||||||||||||||||||||||||||||||||
Adjusted EBITDA |
|
|
|
| 2,736 |
|
|
|
|
| 1,190 |
|
|
|
|
| 130 |
|
|
|
|
|
|
|
|
|
|
|
|
|
|
|
|
|
|
|
|
|
|
|
|
|
|
|
|
|
|
|
|
|
|
|
|
|
|
|
|
| ||||||||||||||||||||
| 1 | Includes provincial mining taxes of $466 million (2020 – $201 million). |
| 2 | See Note 3 to the consolidated financial statements. |
| 3 | These are non-IFRS financial measures. See the “Non-IFRS Financial Measures” section. |
The most significant contributors to the changes in our Potash financial performance were as follows:
2021 vs 2020 | ||
Sales volumes | North America and Offshore sales volumes increased in 2021 due to very strong global demand, tight global supply caused by outages from other potash producers, and our ability to increase production from our flexible, low-cost network of six mines and integrated transportation and logistics system. | |
Net realized selling price | Average selling prices increased in 2021 compared to 2020 due to higher global benchmark prices and tighter global supply caused by competitor outages and project delays as well as uncertainty regarding future sanctions on Belarus. | |
Cost of goods sold per tonne | Costs increased in 2021 due to the stronger Canadian dollar, higher royalties resulting from increased selling prices, higher input costs resulting from inflation, higher natural gas costs and changes in mine production mix. | |
Provincial mining taxes | We are subject to Saskatchewan provincial resource taxes, including the potash production tax and the resource surcharge. Expenses increased in 2021 primarily due to higher average potash selling prices, which are the basis for certain taxes. | |
Adjusted EBITDA | Adjusted EBITDA increased in 2021 due to the impact of higher net realized selling prices, which was partially offset by higher cash cost of goods sold per tonne and higher provincial mining taxes. | |
OVERVIEW | MANAGEMENT’S DISCUSSION & ANALYSIS | FOUR-YEAR HIGHLIGHTS FINANCIAL STATEMENTS OTHER INFORMATION
Nutrien Annual Report 2021 | 29
CANPOTEX SALES BY MARKET
| (percentage of sales volumes except as otherwise noted) | 2021 | 2020 | Change | |||||||||||||||||||||
Latin America |
| 38 |
|
| 32 |
|
| 6 |
| |||||||||||||||
Other Asian markets 1 |
| 35 |
|
| 25 |
|
| 10 |
| |||||||||||||||
China |
| 11 |
|
| 22 |
|
| (11 | ) | |||||||||||||||
Other markets |
| 10 |
|
| 7 |
|
| 3 |
| |||||||||||||||
India |
|
|
|
| 6 |
|
|
|
|
| 14 |
|
|
|
|
| (8 | ) | ||||||
| 1 | All Asian markets except China and India. |
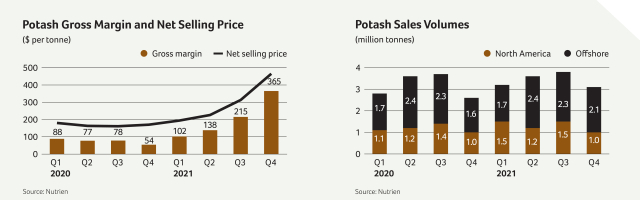
POTASH PRODUCTION
|
|
|
|
| Operational Capability 2 |
|
| Production | |||||||||||||||||||||||||||||||||||||
| (million tonnes KCI) |
|
|
| | Nameplate Capacity | 1 |
|
|
| 2022 |
|
|
| 2021 |
|
|
|
|
|
| 2021 |
|
|
| 2020 | |||||||||||||||||||
Rocanville Potash |
| 6.5 |
|
|
|
|
| 5.2 |
|
|
|
|
| 5.2 |
|
|
|
|
| 5.00 |
|
|
|
|
| 5.29 |
| |||||||||||||||||
Allan Potash |
| 4.0 |
|
| 3.0 |
|
| 3.0 |
|
| 2.78 |
|
| 2.79 |
| |||||||||||||||||||||||||||||
Vanscoy Potash |
| 3.0 |
|
| 1.1 |
|
| 1.0 |
|
| 1.05 |
|
| 0.51 |
| |||||||||||||||||||||||||||||
Lanigan Potash |
| 3.8 |
|
| 2.7 |
|
| 2.8 |
|
| 2.91 |
|
| 2.33 |
| |||||||||||||||||||||||||||||
Cory Potash |
| 3.0 |
|
| 2.0 |
|
| 1.8 |
|
| 1.77 |
|
| 1.40 |
| |||||||||||||||||||||||||||||
Patience Lake Potash |
|
|
|
| 0.3 |
|
|
|
|
| 0.3 |
|
|
|
|
| 0.3 |
|
|
|
|
|
|
|
| 0.28 |
|
|
|
|
| 0.27 |
| |||||||||||
Total |
|
|
|
| 20.6 |
|
|
|
|
| 14.3 |
|
|
|
|
| 14.1 |
|
|
|
|
|
|
|
| 13.79 |
|
|
|
|
| 12.59 |
| |||||||||||
Shutdown weeks 3 |
|
|
|
|
|
|
|
|
|
|
|
|
|
|
|
|
|
|
|
|
|
|
|
|
| 14 |
|
|
|
|
| 38 |
| |||||||||||
| 1 | Represents estimates of capacity as at December 31, 2021. Estimates based on capacity as per design specifications or Canpotex entitlements once determined. In the case of Patience Lake, estimate reflects current operational capability. Estimates for all other facilities do not necessarily represent operational capability. |
| 2 | Estimated annual achievable production level at current staffing and operational readiness (estimated at the beginning of the year, and may vary during the year, and year-to-year, including between our facilities). Estimate does not include inventory-related shutdowns and unplanned downtime. In 2021, in response to strong global demand and supply constraints, we produced nearly 1 million tonnes of additional potash compared to what was planned. |
| 3 | Represents weeks of full production shutdown, excluding the impact of any periods of reduced operating rates and planned routine annual maintenance shutdowns and announced workforce reductions. |
OVERVIEW | MANAGEMENT’S DISCUSSION & ANALYSIS | FOUR-YEAR HIGHLIGHTS FINANCIAL STATEMENTS OTHER INFORMATION
30 | Nutrien Annual Report 2021

NITROGEN
| $2.3B | 500K | 1.1M | ||||||
Record Adjusted EBITDA | Tonnes Expected Production Capacity from Phase 2 Brownfield Projects Started in 2021 | Tonnes CO2e Captured |
Our Business
Nutrien has a large, low-cost nitrogen business that supplies a diverse set of agricultural and industrial end markets. We play a leading role in providing solutions to the sustainable production and use of nitrogen products.
Our 9 nitrogen production facilities across North America and Trinidad possess significant advantages. Nutrien is one of the largest producers of nitrogen products in the world, including ammonia capacity of 7.1 million tonnes. Our sales portfolio represents a well-balanced combination of agricultural and industrial products, providing flexibility to optimize our product mix during changing market conditions. Agriculture sales represent approximately 60 percent of our nitrogen sales.
Our North American operations are situated in close proximity to major consuming markets, providing selling and delivery advantages. Our operations in Canada and the US have access to some of the lowest cost natural gas feedstock supply in the world, which represents approximately 80 percent of our total nitrogen sales volume. We have an extensive network of approximately 220 distribution points with over 1.3 million tonnes of storage capacity, providing the ability to place product and service customers very efficiently.
Our Trinidad operations are situated on tide water, where we deliver to approximately 30 countries, with a focus on industrial end markets. We have gas supply contracts in Trinidad with gas costs indexed to ammonia prices. We also have an investment in a world-scale nitrogen facility in Argentina, which serves the growing agricultural markets in South America.
Nutrien is playing a leading role in sustainably feeding the world, including improvements to the environmental footprint of nitrogen production and agricultural use. We have two active carbon sequestration projects and are a leader in low-carbon ammonia production, with 1 million tonnes of production capability. We also have many nitrogen-based fertilizer products that play an innovative and effective role in reducing farming’s environmental footprint, including over 450 thousand tonnes of our proprietary enhanced efficiency ESN® product.
OVERVIEW | MANAGEMENT’S DISCUSSION & ANALYSIS | FOUR-YEAR HIGHLIGHTS FINANCIAL STATEMENTS OTHER INFORMATION
Nutrien Annual Report 2021 | 31
Competitive Landscape
Production of nitrogen is the most geographically diverse of the three primary crop nutrients due to the widespread availability of hydrogen sources, with low-cost and reliable energy feedstock being a key competitive advantage.
Ammonia is primarily consumed close to the regions in which it is produced due to the cost of transportation, whereas urea and nitrogen solutions are more widely transported and traded. We compete with other producers in Canada and the US and several offshore suppliers.
Access to reliable and competitively priced energy feedstock supply has become an increasingly important driver of profitability, as recent weather, political and economic events have created additional volatility in certain global energy markets.
The US remains one of the largest importers of nitrogen and a key driver of global trade despite a significant increase in domestic capacity and production over the past decade.
In developed regions of the world, nitrogen producers are focused on reducing CO2e emissions. In addition, the scope of industrial uses for low-carbon ammonia has expanded, including marine fuels and as a hydrogen carrier for power generation, with the potential to significantly increase global demand for ammonia. These changes present an opportunity for Nutrien, due to the location of our assets, existing supply chain and customer relationships.
Our Strategy
Nutrien is growing the nitrogen business through strategic investment projects that improve the reliability and energy efficiency of our plants, while increasing capacity and product flexibility. We are also taking steps to reduce GHG emissions and are evaluating opportunities to further enhance our capability to produce low-carbon ammonia.

1
Reliability, Efficiency
and Productivity
We are investing in short-payback projects that improve the safety and efficiency of our plants. These initiatives reduce production costs, help to prevent unplanned downtime and provide a safer environment for our employees. We will continue to optimize our nitrogen network to best leverage the production flexibility of our low-cost facilities and extensive distribution network.

2
Brownfield
Capacity Expansions
Nutrien is growing and improving the position of our assets through low-risk, high return projects that enhance our product mix, improve our energy efficiency and expand our North American capacity. We expect to invest $260 million in a second phase of brownfield projects that will add approximately 500 thousand tonnes of annualized, low-cost and environmentally efficient production capacity over the next few years.

3
Sustainability
Leader
We are reducing the carbon footprint of our nitrogen operations through energy efficiency and N2O abatement initiatives, as well as evaluating additional opportunities to expand our capability to produce low-carbon ammonia. We are working on a number of innovative projects and partnerships, such as a pilot with the US Department of Energy assessing the feasibility of green ammonia, and a partnership with EXMAR to develop an ammonia-fueled vessel. We are also supporting our grower customers reduce their footprint by expanding our portfolio of sustainable products including ESN®, and sales of urea solutions into the DEF market.

N
OVERVIEW | MANAGEMENT’S DISCUSSION & ANALYSIS | FOUR-YEAR HIGHLIGHTS FINANCIAL STATEMENTS OTHER INFORMATION
32 | Nutrien Annual Report 2021
2021 Performance
We provided outstanding service to our customers in the wake of strong global demand and impacts of weather-related production outages and rising global energy feedstock costs.
We delivered record Nitrogen adjusted EBITDA of $2.3 billion highlighting the advantage of our low-cost assets, in-market production and extensive distribution network. Despite weather-related production downtime, we were able to utilize our geographically diversified network to meet our sales commitments. We completed two large turnarounds at Borger and Redwater, ensuring continued safety, reliability and efficiency at our sites.
Phase 1 of our brownfield expansion projects, which started in 2018, was completed in 2021 on time and on budget, and we expect to fully realize the benefits of these projects in 2022. We initiated Phase 2 of our brownfield expansion projects in 2021, which will increase production volume and improve energy efficiency and are expected to generate attractive returns on investment.
We captured 1.1 million tonnes of CO2 equivalent in 2021. Sales of our ESN® product and urea solutions product into DEF markets in 2021 were over 1 million tonnes, representing a combined 6 percent growth rate from 2020. In addition, we have approved and commenced with the first tranche of decarbonization projects in Nitrogen, allocating $50 million towards projects that will reduce our CO2 equivalent emissions by approximately 1 million tonnes by the end of 2023 and provide a significant step towards our 2030 GHG emissions reduction targets.

N
OVERVIEW | MANAGEMENT’S DISCUSSION & ANALYSIS | FOUR-YEAR HIGHLIGHTS FINANCIAL STATEMENTS OTHER INFORMATION
Nutrien Annual Report 2021 | 33
NITROGEN FINANCIAL PERFORMANCE
| Dollars | Tonnes (thousands) | Average per Tonne | ||||||||||||||||||||||||||||||||||||||||||||||||||||||||||||||||||||||||||||
(millions of US dollars, except as otherwise noted) |
| 2021 |
| 2020 |
| % Change |
|
| 2021 |
| 2020 |
| % Change |
|
| 2021 |
| 2020 |
| % Change | ||||||||||||||||||||||||||||||||||||||||||||||||||||||||||
Manufactured product | ||||||||||||||||||||||||||||||||||||||||||||||||||||||||||||||||||||||||||||||
Net sales | ||||||||||||||||||||||||||||||||||||||||||||||||||||||||||||||||||||||||||||||
Ammonia |
| 1,393 |
|
| 621 |
|
| 124 |
|
| 2,919 |
|
| 2,778 |
|
| 5 |
|
| 477 |
|
| 224 |
|
| 113 |
| |||||||||||||||||||||||||||||||||||||||||||||||||||
Urea |
| 1,463 |
|
| 933 |
|
| 57 |
|
| 3,059 |
|
| 3,475 |
|
| (12 | ) |
| 478 |
|
| 268 |
|
| 78 |
| |||||||||||||||||||||||||||||||||||||||||||||||||||
Solutions, nitrates and sulfates |
|
|
|
| 1,128 |
|
|
|
|
| 668 |
|
|
|
|
| 69 |
|
|
|
|
|
| 4,747 |
|
|
|
|
| 4,713 |
|
|
|
|
| 1 |
|
|
|
|
|
|
|
| 238 |
|
|
|
|
| 142 |
|
|
|
|
| 68 |
| ||||||||||||||||||||
| 3,984 |
|
| 2,222 |
|
| 79 |
|
| 10,725 |
|
| 10,966 |
|
| (2 | ) |
| 371 |
|
| 203 |
|
| 83 |
| ||||||||||||||||||||||||||||||||||||||||||||||||||||
Cost of goods sold |
|
|
|
| 2,353 |
|
|
|
|
| 1,804 |
|
|
|
|
| 30 |
|
|
|
|
|
|
|
|
|
|
|
|
|
|
|
|
|
|
|
|
|
|
|
|
|
|
| 219 |
|
|
|
|
| 165 |
|
|
|
|
| 33 |
| ||||||||||||||||||||
Gross margin – manufactured |
| 1,631 |
|
| 418 |
|
| 290 |
|
| 152 |
|
| 38 |
|
| 300 |
| ||||||||||||||||||||||||||||||||||||||||||||||||||||||||||||
Gross margin – other 1 |
|
|
|
| 95 |
|
|
|
|
| 57 |
|
|
|
|
| 67 |
|
|
|
|
|
| Depreciation and amortization |
|
|
|
|
| 52 |
|
|
|
|
| 55 |
|
|
|
|
| (5 | ) | |||||||||||||||||||||||||||||||||||
Gross margin – total |
| 1,726 |
|
| 475 |
|
| 263 |
|
| Gross margin excluding depreciation |
| ||||||||||||||||||||||||||||||||||||||||||||||||||||||||||||||||||
Income |
|
|
|
| (3 | ) |
|
|
|
| (225 | ) |
|
|
|
| (99 | ) |
|
|
|
|
| and amortization – manufactured 3 |
|
|
|
|
| 204 |
|
|
|
|
| 93 |
|
|
|
|
| 120 |
| |||||||||||||||||||||||||||||||||||
EBIT |
| 1,729 |
|
| 700 |
|
| 147 |
|
| Ammonia controllable cash cost of |
| ||||||||||||||||||||||||||||||||||||||||||||||||||||||||||||||||||
Depreciation and amortization |
|
|
|
| 557 |
|
|
|
|
| 599 |
|
|
|
|
| (7 | ) |
|
|
|
|
| product manufactured 3 |
|
|
|
|
| 50 |
|
|
|
|
| 43 |
|
|
|
|
| 16 |
| |||||||||||||||||||||||||||||||||||
EBITDA |
| 2,286 |
|
| 1,299 |
|
| 76 |
| |||||||||||||||||||||||||||||||||||||||||||||||||||||||||||||||||||||
Adjustments 2 |
|
|
|
| 22 |
|
|
|
|
| (219 | ) |
|
|
|
| n/m |
|
|
|
|
|
|
|
|
|
|
|
|
|
|
|
|
|
|
|
|
|
|
|
|
|
|
|
|
|
|
|
|
|
|
|
|
|
|
|
|
| ||||||||||||||||||||
Adjusted EBITDA |
|
|
|
| 2,308 |
|
|
|
|
| 1,080 |
|
|
|
|
| 114 |
|
|
|
|
|
|
|
|
|
|
|
|
|
|
|
|
|
|
|
|
|
|
|
|
|
|
|
|
|
|
|
|
|
|
|
|
|
|
|
|
| ||||||||||||||||||||
| 1 | Includes other nitrogen (including ESN® and Rainbow) and purchased products and comprises net sales of $705 million (2020 – $518 million) less cost of goods sold of $610 million (2020 – $461 million). |
| 2 | See Note 3 to the consolidated financial statements. |
| 3 | These are non-IFRS financial measures. See the “Non-IFRS Financial Measures” section. |
The most significant contributors to the changes in our Nitrogen financial performance were as follows:
2021 vs 2020 | ||
Sales volumes | Sales volumes decreased slightly in 2021 due to more planned plant turnaround activity, temporary production outages and lower inventory volumes at the beginning of 2021 compared to 2020. | |
Net realized selling price | Our average selling price for nitrogen products increased in 2021 due to higher benchmark prices resulting from the strength in global demand and tight global supply caused by production outages and higher energy prices in key nitrogen exporting regions. | |
Cost of goods sold per tonne | Costs were higher in 2021 primarily due to higher natural gas prices. Raw material costs and period costs related to plant downtime were also higher in 2021 compared to 2020. | |
Income | Other income decreased in 2021 mainly due to a one-time gain in 2020 of $250 million recognized from the sale of our equity-accounted investment in Misr Fertilizers Production Company S.A.E. (“MOPCO”) and settlement of related legal claims. | |
Adjusted EBITDA | Adjusted EBITDA increased in 2021 primarily due to higher net realized selling prices more than offsetting higher cash cost of goods sold per tonne from higher natural gas costs. | |
NATURAL GAS PRICES IN COST OF PRODUCTION
| (US dollars per MMBtu, except as otherwise noted) | 2021 | 2020 | % Change | |||||||||||||
Overall gas cost excluding realized derivative impact |
| 4.60 |
|
| 2.31 |
|
| 99 |
| |||||||
Realized derivative impact |
|
|
|
| 0.01 |
|
| 0.05 |
|
| (80 | ) | ||||
Overall gas cost |
|
|
|
| 4.61 |
|
| 2.36 |
|
| 95 |
| ||||
Average NYMEX |
| 3.84 |
|
| 2.08 |
|
| 85 |
| |||||||
Average AECO |
|
|
|
| 2.84 |
|
| 1.68 |
|
| 69 |
| ||||
2021 vs 2020 | ||
Overall gas cost | Gas prices in our cost of production increased in 2021 as a result of higher North American gas index prices and increased gas costs in Trinidad, where gas prices are linked to ammonia benchmark prices. | |
OVERVIEW | MANAGEMENT’S DISCUSSION & ANALYSIS | FOUR-YEAR HIGHLIGHTS FINANCIAL STATEMENTS OTHER INFORMATION
34 | Nutrien Annual Report 2021
SELECTED NITROGEN MEASURES
|
|
| 2021 |
| 2020 | ||||||||||||
Sales volumes (tonnes – thousands) | ||||||||||||||||
Fertilizer |
| 6,028 |
|
| 6,750 |
| ||||||||||
Industrial and feed |
| 4,697 |
|
| 4,216 |
| ||||||||||
Net sales (millions of US dollars) | ||||||||||||||||
Fertilizer |
| 2,364 |
|
| 1,467 |
| ||||||||||
Industrial and feed |
| 1,620 |
|
| 755 |
| ||||||||||
Net selling price per tonne | ||||||||||||||||
Fertilizer |
| 392 |
|
| 217 |
| ||||||||||
Industrial and feed |
|
|
|
| 345 |
|
|
|
|
| 179 |
| ||||
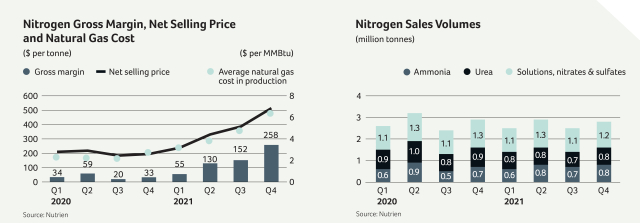
NITROGEN PRODUCTION
|
|
| Ammonia 1 |
|
| Urea 2 | |||||||||||||||||||||||||||||||||||||||||||||||
|
|
|
|
| Production |
|
|
|
| Production | |||||||||||||||||||||||||||||||||||||||||||
| (million tonnes product) |
|
|
| | Annual Capacity | 3 |
|
|
| 2021 |
|
|
| 2020 |
|
|
|
|
|
| | Annual Capacity | 3 |
|
|
| 2021 |
|
|
| 2020 | |||||||||||||||||||||
Trinidad Nitrogen 4 |
| 2.2 |
|
|
|
|
| 1.66 |
|
|
|
|
| 1.57 |
|
| 0.7 |
|
|
|
|
| 0.72 |
|
|
|
|
| 0.73 |
| ||||||||||||||||||||||
Redwater Nitrogen |
| 0.9 |
|
| 0.72 |
|
| 0.85 |
|
| 0.7 |
|
| 0.53 |
|
| 0.75 |
| ||||||||||||||||||||||||||||||||||
Augusta Nitrogen |
| 0.8 |
|
| 0.73 |
|
| 0.66 |
|
| 0.6 |
|
| 0.55 |
|
| 0.46 |
| ||||||||||||||||||||||||||||||||||
Lima Nitrogen |
| 0.7 |
|
| 0.76 |
|
| 0.61 |
|
| 0.5 |
|
| 0.50 |
|
| 0.40 |
| ||||||||||||||||||||||||||||||||||
Geismar Nitrogen |
| 0.5 |
|
| 0.50 |
|
| 0.55 |
|
| 0.4 |
|
| 0.33 |
|
| 0.35 |
| ||||||||||||||||||||||||||||||||||
Carseland Nitrogen |
| 0.5 |
|
| 0.52 |
|
| 0.55 |
|
| 0.8 |
|
| 0.72 |
|
| 0.74 |
| ||||||||||||||||||||||||||||||||||
Fort Saskatchewan Nitrogen |
| 0.5 |
|
| 0.46 |
|
| 0.48 |
|
| 0.4 |
|
| 0.41 |
|
| 0.44 |
| ||||||||||||||||||||||||||||||||||
Borger Nitrogen |
| 0.5 |
|
| 0.25 |
|
| 0.40 |
|
| 0.6 |
|
| 0.31 |
|
| 0.53 |
| ||||||||||||||||||||||||||||||||||
Joffre Nitrogen |
|
|
|
| 0.5 |
|
|
|
|
| 0.40 |
|
|
|
|
| 0.39 |
|
|
|
|
|
|
|
| – |
|
|
|
|
| – |
|
|
|
|
| – |
| |||||||||||||
Total |
|
|
|
| 7.1 |
|
|
|
|
| 6.00 |
|
|
|
|
| 6.06 |
|
|
|
|
|
|
|
| 4.7 |
|
|
|
|
| 4.07 |
|
|
|
|
| 4.40 |
| |||||||||||||
Adjusted total 5 |
|
|
|
|
|
|
|
|
|
| 3.94 |
|
|
|
|
| 4.10 |
|
|
|
|
|
|
|
|
|
|
|
|
|
|
|
|
|
|
|
|
|
| |||||||||||||
Ammonia operating rate 5 |
|
|
|
|
|
|
|
|
|
| 90 |
|
|
|
|
| 93 |
|
|
|
|
|
|
|
|
|
|
|
|
|
|
|
|
|
|
|
|
|
| |||||||||||||
| 1 | All figures are shown on a gross production basis. |
| 2 | Reflects capacity and production of urea liquor prior to final product upgrade. Urea liquor is used in the production of solid urea, UAN and DEF. |
| 3 | Annual capacity estimates include allowances for normal operating plant conditions. |
| 4 | In 2021, we temporarily reopened our previously closed ammonia plant in Trinidad to offset reduced production at one of our other ammonia plants. We expect the plant to operate until mid-2022, after which it will close indefinitely. |
| 5 | Excludes Trinidad and Joffre. |
OVERVIEW | MANAGEMENT’S DISCUSSION & ANALYSIS | FOUR-YEAR HIGHLIGHTS FINANCIAL STATEMENTS OTHER INFORMATION
Nutrien Annual Report 2021 | 35
PHOSPHATE
| $540M | 89% | 2,700 | ||||||||
| Record | P205 | Acres of Land Returned Back to | ||||||||
| Adjusted EBITDA | Operating Rate | Productive Use After Phosphate | ||||||||
| Rock Mining (2019–2021) |
Our Business
We are the second largest phosphate producer in North America and sell approximately 3 million tonnes of fertilizer, feed and industrial phosphate products.
Nutrien has two large integrated phosphate facilities in the US, and 4 regional product upgrade facilities. Due to the high quality of our phosphate rock, we can produce a diverse mix of phosphate products, including solid and liquid fertilizers, feed and industrial acids.
This flexibility allows us to optimize our product mix during changing market conditions. We sell the majority of our product in the North American market and benefit from our
extensive distribution network and customer relationships. Agriculture sales represent approximately 75 percent of our phosphate sales.
We are expanding production of industrial and specialty fertilizer products that have historically provided more stable and higher margins. Our MAP with micronized sulfur content is one example of innovative product lines we continue to bring to the market.
Competitive Landscape
Phosphate rock is found in significant quantity and quality in only a handful of geographic locations, and few with a progressive sustainability record.
We compete with producers primarily from China, Morocco, Russia, Saudi Arabia and the US. To produce finished phosphate products (DAP, MAP), access to low-cost ammonia and sulfur is also an important consideration.
Many factors impact the viability of developing a rock deposit for mining. These include the quality of the phosphate rock deposit, government stability, environmental requirements and proximity to target markets. Given the concentration of deposits in North Africa and the Middle East, government
involvement is a major consideration when evaluating potential phosphate project developments.
Producers in Morocco and Saudi Arabia have added the majority of new capacity over the past decade. The ability of these countries to add low-cost capacity and operate under different environmental regulations resulted in an extended period of oversupply in the global market. As a result, total US phosphate production has declined by 29 percent over this period.
OVERVIEW | MANAGEMENT’S DISCUSSION & ANALYSIS | FOUR-YEAR HIGHLIGHTS FINANCIAL STATEMENTS OTHER INFORMATION
36 | Nutrien Annual Report 2021
Our Strategy
We are focused on optimizing our existing business by lowering our controllable operating costs, increasing plant reliability and further diversifying our product mix.
Phosphate fertilizer remains an essential input for crop nutrition. We will continue to invest in our assets, while focusing on generating positive free cash flow for the business unit.
Industrial and specialty fertilizer products continue to be a focus area as they historically yield higher margins. We will
explore value-enhancing strategic partnerships that develop additional revenue streams from our existing assets, such as our anhydrous hydrogen fluoride (“AHF”) project at Aurora, and our hydrofluorosilicic acid (“HFSA”) business at White Springs.
2021 Performance
We generated record Phosphate adjusted EBITDA of $540 million due to an improvement in market fundamentals and continued improvements to our controllable cost profile and product mix.
Phosphate margins increased significantly as higher selling prices more than offset higher raw material costs and lower sales volume. We were able to increase our phosphoric acid operating rate by 2 percent compared to 2020 and increased our proportion of sales of higher-margin specialty phosphate products. Construction of our AHF plant with our partner Arkema was completed in 2021, and production is expected to start in the first half of 2022. Over the last three years we
returned 2,700 acres of land back to its productive use after phosphate mining. We will continue to invest in the reliability and safety of our assets. Enhancing reliability reduces GHG emissions associated with phosphate production. Additionally, we will continue to advance our reclamation projects that return land back to its production use. Our reclamation process has earned state and national awards in the US.


P
OVERVIEW | MANAGEMENT’S DISCUSSION & ANALYSIS | FOUR-YEAR HIGHLIGHTS FINANCIAL STATEMENTS OTHER INFORMATION
Nutrien Annual Report 2021 | 37
PHOSPHATE FINANCIAL PERFORMANCE
| Dollars | Tonnes (thousands) | Average per Tonne | ||||||||||||||||||||||||||||||||||||||||||||||||||||||||||||||||||||||||||||
| (millions of US dollars, except as otherwise noted) |
| 2021 |
| 2020 |
| % Change |
|
| 2021 |
| 2020 |
| % Change |
|
| 2021 |
| 2020 |
| % Change | ||||||||||||||||||||||||||||||||||||||||||||||||||||||||||
Manufactured product | ||||||||||||||||||||||||||||||||||||||||||||||||||||||||||||||||||||||||||||||
Net sales | ||||||||||||||||||||||||||||||||||||||||||||||||||||||||||||||||||||||||||||||
Fertilizer |
| 1,108 |
|
| 671 |
|
| 65 |
|
| 1,840 |
|
| 2,048 |
|
| (10 | ) |
| 602 |
|
| 328 |
|
| 84 |
| |||||||||||||||||||||||||||||||||||||||||||||||||||
Industrial and feed |
|
|
|
| 520 |
|
|
|
|
| 404 |
|
|
|
|
| 29 |
|
|
|
|
|
| 779 |
|
|
|
|
| 733 |
|
|
|
|
| 6 |
|
|
|
|
|
|
|
| 667 |
|
|
|
|
| 552 |
|
|
|
|
| 21 |
| ||||||||||||||||||||
| 1,628 |
|
| 1,075 |
|
| 51 |
|
| 2,619 |
|
| 2,781 |
|
| (6 | ) |
| 622 |
|
| 387 |
|
| 61 |
| ||||||||||||||||||||||||||||||||||||||||||||||||||||
Cost of goods sold |
|
|
|
| 1,227 |
|
|
|
|
| 1,044 |
|
|
|
|
| 18 |
|
|
|
|
|
|
|
|
|
|
|
|
|
|
|
|
|
|
|
|
|
|
|
|
|
|
| 469 |
|
|
|
|
| 376 |
|
|
|
|
| 25 |
| ||||||||||||||||||||
Gross margin – manufactured |
| 401 |
|
| 31 |
|
| n/m |
|
|
|
|
| 153 |
|
| 11 |
|
| n/m | ||||||||||||||||||||||||||||||||||||||||||||||||||||||||||
Gross margin – other 1 |
|
|
|
| 20 |
|
|
|
|
| 5 |
|
|
|
|
| 300 |
|
|
|
|
|
| Depreciation and amortization |
|
|
|
|
| 58 |
|
|
|
|
| 78 |
|
|
|
|
| (26 | ) | |||||||||||||||||||||||||||||||||||
Gross margin – total |
| 421 |
|
| 36 |
|
| n/m |
|
| Gross margin excluding depreciation |
| ||||||||||||||||||||||||||||||||||||||||||||||||||||||||||||||||||
Expenses |
|
|
|
| 36 |
|
|
|
|
| 791 |
|
|
|
|
| (95 | ) |
|
|
|
|
| and amortization – manufactured 2 |
|
|
|
|
| 211 |
|
|
|
|
| 89 |
|
|
|
|
| 136 |
| |||||||||||||||||||||||||||||||||||
EBIT |
| 385 |
|
| (755 | ) |
| n/m |
| |||||||||||||||||||||||||||||||||||||||||||||||||||||||||||||||||||||
Depreciation and amortization |
|
|
|
| 151 |
|
|
|
|
| 218 |
|
|
|
|
| (31 | ) |
|
|
|
|
|
|
|
|
|
|
|
|
|
|
|
|
|
|
|
|
|
|
|
|
| |||||||||||||||||||||||||||||||||||
EBITDA |
| 536 |
|
| (537 | ) |
| n/m |
| |||||||||||||||||||||||||||||||||||||||||||||||||||||||||||||||||||||
Adjustments 3 |
|
|
|
| 4 |
|
|
|
|
| 769 |
|
|
|
|
| (99 | ) |
|
|
|
|
|
|
|
|
|
|
|
|
|
|
|
|
|
|
|
|
|
|
|
|
|
|
|
|
|
|
|
|
|
|
|
|
|
|
|
| ||||||||||||||||||||
Adjusted EBITDA |
|
|
|
| 540 |
|
|
|
|
| 232 |
|
|
|
|
| 133 |
|
|
|
|
|
|
|
|
|
|
|
|
|
|
|
|
|
|
|
|
|
|
|
|
|
|
|
|
|
|
|
|
|
|
|
|
|
|
|
|
| ||||||||||||||||||||
| 1 | Includes other phosphate and purchased products and comprises net sales of $201 million (2020 – $127 million) less cost of goods sold of $181 million (2020 – $122 million). |
| 2 | This is a non-IFRS financial measure. See the “Non-IFRS Financial Measures” section. |
| 3 | See Note 3 to the consolidated financial statements. |
The most significant contributors to the changes in our Phosphate financial performance were as follows:
2021 vs 2020 | ||
Sales volumes | Sales volumes decreased in 2021 from lower fertilizer volumes due to a slower start to the season and lower inventory volumes at the beginning of 2021, partially offset by higher industrial and feed volumes due to changes in product mix. | |
Net realized selling price | Our average realized phosphate fertilizer selling prices increased in 2021 consistent with higher global benchmark prices driven by higher global demand, tight global supply and higher raw material costs compared to 2020. Industrial and feed selling prices increased to a lesser extent than fertilizer selling prices due to a lag in price realizations relative to spot prices. | |
Cost of goods sold per tonne | Costs increased in 2021 due to higher sulfur and ammonia input costs, partially offset by lower depreciation and amortization from lower depreciable asset values resulting from the asset impairment recorded in the third quarter of 2020. In 2020, costs were also favorably impacted by a change in estimate related to an asset retirement obligation. | |
Impairment of assets | In 2020, we recorded non-cash impairments of assets relating to our property, plant and equipment at Aurora and White Springs of $545 million and $215 million, respectively, primarily due to lower long-term forecasted global phosphate prices. | |
Adjusted EBITDA | Adjusted EBITDA increased in 2021 due to the impact of higher selling prices more than offsetting higher cost of goods sold per tonne. | |
OVERVIEW | MANAGEMENT’S DISCUSSION & ANALYSIS | FOUR-YEAR HIGHLIGHTS FINANCIAL STATEMENTS OTHER INFORMATION
38 | Nutrien Annual Report 2021
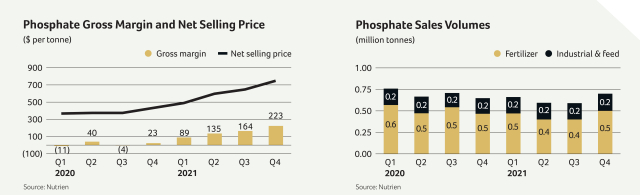
PHOSPHATE PRODUCTION
|
|
| Phosphate Rock |
| Phosphoric Acid (P2O5) |
| Liquid Products |
| Solid Fertilizer Products | ||||||||||||||||||||||||||||||||||||||||||||||||||||||||||||||||||||||||||||||||||||||||
|
|
|
|
| Production |
|
|
| Production |
|
|
| Production |
|
|
| Production | ||||||||||||||||||||||||||||||||||||||||||||||||||||||||||||||||||||||||||||||||
| (million tonnes) |
| Annual Capacity |
| 2021 |
| 2020 |
| Annual Capacity |
| 2021 |
| 2020 |
| Annual Capacity |
| 2021 |
| 2020 |
| Annual Capacity |
| 2021 |
| 2020 | ||||||||||||||||||||||||||||||||||||||||||||||||||||||||||||||||||||||||
Aurora Phosphate |
| 5.4 |
|
| 3.77 |
|
| 3.94 |
|
| 1.2 |
|
| 1.05 |
|
| 0.98 |
|
| 2.7 | 1 |
| 2.12 |
|
| 1.99 |
|
| 0.8 |
|
| 0.80 |
|
| 0.83 |
| ||||||||||||||||||||||||||||||||||||||||||||||||||||||||||||
White Springs Phosphate |
|
|
|
| 2.0 |
|
|
|
|
| 1.62 |
|
|
|
|
| 1.81 |
|
|
|
|
| 0.5 |
|
|
|
|
| 0.47 |
|
|
|
|
| 0.46 |
|
|
|
|
| 0.7 | 2 |
|
|
|
| 0.44 |
|
|
|
|
| 0.43 |
|
|
|
|
| 0.8 |
|
|
|
|
| 0.40 |
|
|
|
|
| 0.35 |
| ||||||||||||||||||||||||
Total |
|
|
|
| 7.40 |
|
|
|
|
| 5.39 |
|
|
|
|
| 5.75 |
|
|
|
|
| 1.70 |
|
|
|
|
| 1.52 |
|
|
|
|
| 1.44 |
|
|
|
|
| 3.40 |
|
|
|
|
| 2.56 |
|
|
|
|
| 2.42 |
|
|
|
|
| 1.60 |
|
|
|
|
| 1.20 |
|
|
|
|
| 1.18 |
| ||||||||||||||||||||||||
P2O5 operating rate |
|
|
|
|
|
|
|
|
|
|
|
|
|
|
|
|
|
|
|
|
|
|
|
|
|
|
|
| 89 |
|
|
|
|
| 85 |
|
|
|
|
|
|
|
|
|
|
|
|
|
|
|
|
|
|
|
|
|
|
|
|
|
|
|
|
|
|
|
|
|
|
|
|
| ||||||||||||||||||||||||
| 1 | A substantial portion is consumed internally in the production of downstream products. The balance is exported to phosphate fertilizer producers or sold domestically to dealers who custom-mix liquid fertilizer. Capacity comprised of 2.0 million tonnes merchant grade acid and 0.7 million tonnes superphosphoric acid. |
| 2 | Represents annual superphosphoric acid capacity. A substantial portion is consumed internally in the production of downstream products. The balance is exported to phosphate fertilizer producers or sold domestically to dealers who custom-mix liquid fertilizer. |
In addition to the production above, annual capacity (in millions of tonnes) for phosphate feed and purified acid was 0.7 and 0.3, respectively. Production in 2021 was 0.31 and 0.24, respectively, and 2020 production was 0.31 and 0.20, respectively.
OVERVIEW | MANAGEMENT’S DISCUSSION & ANALYSIS | FOUR-YEAR HIGHLIGHTS FINANCIAL STATEMENTS OTHER INFORMATION
Nutrien Annual Report 2021 | 39
CORPORATE AND OTHERS FINANCIAL PERFORMANCE
“Corporate and Others” is a non-operating segment comprising corporate and administrative functions that provide support and governance to our operating business units.
| (millions of US dollars, except as otherwise noted) | 2021 | 2020 | % | |||||||||||||||||||||
Sales 1 |
| – |
|
| 82 |
|
| (100 | ) | |||||||||||||||
Cost of goods sold |
|
|
|
| – |
|
|
|
|
| 74 |
|
|
|
|
| (100 | ) | ||||||
Gross margin |
| – |
|
| 8 |
|
| (100 | ) | |||||||||||||||
Selling expenses |
| (21 | ) |
| (24 | ) |
| (13 | ) | |||||||||||||||
General and administrative expenses |
| 275 |
|
| 269 |
|
| 2 |
| |||||||||||||||
Share-based compensation expense |
| 198 |
|
| 69 |
|
| 187 |
| |||||||||||||||
Impairment of assets |
| – |
|
| 5 |
|
| (100 | ) | |||||||||||||||
Other expenses |
|
|
|
| 253 |
|
|
|
|
| 230 |
|
|
|
|
| 10 |
| ||||||
EBIT |
| (705 | ) |
| (541 | ) |
| 30 |
| |||||||||||||||
Depreciation and amortization |
|
|
|
| 49 |
|
|
|
|
| 52 |
|
|
|
|
| (6 | ) | ||||||
EBITDA |
| (656 | ) |
| (489 | ) |
| 34 |
| |||||||||||||||
Adjustments 2 |
|
|
|
| 348 |
|
|
|
|
| 203 |
|
|
|
|
| 71 |
| ||||||
Adjusted EBITDA |
|
|
|
| (308 | ) |
|
|
|
| (286 | ) |
|
|
|
| 8 |
| ||||||
| 1 | Primarily relates to our non-core Canadian business that was sold in 2020. |
| 2 | See Note 3 to the consolidated financial statements. |
The most significant contributors to the changes in our Corporate and Others financial performance were as follows:
2021 vs 2020 | ||
Share-based compensation expense | Share-based compensation expense was higher in 2021 due to higher payout amounts and higher value of share-based awards outstanding. | |
Other expenses | Increase in expenses was primarily due to additional cloud computing related expenses recognized in the first half of 2021 from our change in accounting policy and higher foreign exchange losses. | |
ELIMINATIONS
Eliminations of sales between operating segments in 2021 were $(1,612) million (2020 – $(1,115) million) with gross margin recovery of $(89) million (2020 – $21 million). Eliminations are not part of the Corporate and Others segment.
Eliminations increased due to higher-margin inventories held by our Retail segment as global commodity benchmark prices increased.
OVERVIEW | MANAGEMENT’S DISCUSSION & ANALYSIS | FOUR-YEAR HIGHLIGHTS FINANCIAL STATEMENTS OTHER INFORMATION
40 | Nutrien Annual Report 2021
FINANCE COSTS, INCOME TAX EXPENSE (RECOVERY)
AND OTHER COMPREHENSIVE INCOME
| (millions of US dollars, except as otherwise noted) |
| 2021 |
| 2020 |
| % Change | ||||||||||||||||||
| Finance costs |
| 613 |
| 520 | 18 | |||||||||||||||||||
| Income tax expense (recovery) |
| 989 |
| (77 | ) | n/m | ||||||||||||||||||
| Other comprehensive income |
| 78 |
| 194 | (60 | ) | ||||||||||||||||||
The most significant contributors to the changes in our finance costs, income taxes and other comprehensive income were as follows:
| 2021 vs 2020 | ||||||||||||||||||||
| Finance costs | Finance costs increased mainly due to a loss of $142 million on early extinguishment of long-term debt, which primarily represents interest that we would have paid in future years if the long-term debt was not extinguished. |
| ||||||||||||||||||
| Weighted Average Debt Balances and Rates | ||||||||||||||||||||
|
|
| (millions of US dollars, except as otherwise noted) |
| 2021 |
| 2020 | ||||||||||||||
| Short-term balance 1 | 648 | 2,329 | ||||||||||||||||||
| Short-term rate (%) 1 | 1.0 | 1.7 | ||||||||||||||||||
| Long-term balance (excluding lease obligations) | 9,689 | 9,282 | ||||||||||||||||||
| Long-term rate (excluding lease obligations) (%) | 4.5 | 4.5 | ||||||||||||||||||
| Lease obligations balance | 1,163 | 1,089 | ||||||||||||||||||
| Lease obligations rate (%) | 2.8 | 3.1 | ||||||||||||||||||
|
|
| 1 North American weighted average short-term debt balances were $451 million (2020 – $2,092 million) and rates were 0.2 percent (2020 – 1.4 percent). |
| |||||||||||||||||
| Income tax expense (recovery) | There was an income tax expense in 2021 compared to a recovery in 2020 primarily due to significantly higher earnings in 2021 and discrete tax adjustments in 2020. The discrete tax adjustments in 2020 were primarily related to recoveries of prior year taxes due to US legislative changes. The change in effective tax rate is a result of significantly higher earnings in all jurisdictions. |
| ||||||||||||||||||
| Effective Tax Rates and Discrete Items | ||||||||||||||||||||
| (millions of US dollars, except as otherwise noted) | 2021 | 2020 | ||||||||||||||||||
| Actual effective tax rate on earnings (%) | 24 | 3 | ||||||||||||||||||
| Actual effective tax rate including discrete items (%) | 24 | (20 | ) | |||||||||||||||||
| Discrete tax adjustments that impacted the rate | (15 | ) | (80 | ) | ||||||||||||||||
| Other comprehensive income |
| Other comprehensive income decreased primarily due to a lower gain on translation of our Retail operations in Australia as the Australian dollar weakened relative to the US dollar partially offset by higher fair value gain related to our investment in Sinofert Holdings Ltd. from share price movements. |
| |||||||||||||||||
OVERVIEW | MANAGEMENT’S DISCUSSION & ANALYSIS | FOUR-YEAR HIGHLIGHTS FINANCIAL STATEMENTS OTHER INFORMATION
Nutrien Annual Report 2021 | 41
| (millions of US dollars, except as otherwise noted) | 2021 | 2020 | 2019 | |||||||||||||||||||
| Sales 1 | 27,712 | 20,908 | 20,084 | |||||||||||||||||||
| Net earnings | 3,179 | 459 | 992 | |||||||||||||||||||
| Basic net earnings per share | 5.53 | 0.81 | 1.70 | |||||||||||||||||||
| Diluted net earnings per share | 5.52 | 0.81 | 1.70 | |||||||||||||||||||
| Total assets | 49,954 | 47,192 | 46,799 | |||||||||||||||||||
| Total non-current financial liabilities | 8,455 | 10,947 | 9,431 | |||||||||||||||||||
| Dividends declared per share | 1.84 | 1.80 | 1.33 | |||||||||||||||||||
| 1 | Certain immaterial figures have been reclassified for the year ended December 31, 2019. |
| 2021 vs 2020 | 2020 vs 2019 | |||||||
| Sales |
| Sales increased due to strong demand for global crop inputs and tight global fertilizer supply resulting in higher net realized selling prices across our segments and higher Potash sales volumes. |
| Sales increased as higher Retail sales from acquisitions and strong organic growth, coupled with higher potash and nitrogen sales volumes, more than offset the impact of lower crop nutrient selling prices. | ||||
| Net earnings and earnings per share |
| Net earnings and earnings per share increased in 2021 compared to 2020 due to higher gross margins from higher net realized selling prices. In 2020, we recorded a non-cash impairment of our Phosphate property, plant and equipment at Aurora and White Springs facilities and a net gain from disposal of our investment in MOPCO, which we do not incur in 2021.
The COVID-19 pandemic had a limited impact on our performance in 2021 and 2020. |
| Net earnings and earnings per share decreased compared to 2019 due to a non-cash impairment of our Phosphate property, plant and equipment at our Aurora and White Springs facilities and lower crop nutrient realized selling prices more than offsetting a net gain from disposal of our investment in MOPCO. | ||||
| Assets and non-current financial liabilities |
| Assets increased slightly from 2020. Our working capital assets increased due to higher actual and anticipated sales activity resulting in higher receivables, inventories and prepaid expenses.
Non-current financial liabilities decreased due to the early extinguishment of debt in 2021.
The COVID-19 pandemic had a limited impact on our financial condition as at December 31, 2021 and 2020. |
| Assets increased slightly from 2019. Recent acquisitions and higher cash and cash equivalents offset the non-cash impairment of assets and disposal of our investment in MOPCO in 2020.
Non-current financial liabilities increased due to higher long-term debt from the issuance of new notes. | ||||
| Dividends declared per share |
| Dividends declared per share increased as the dividend per share increased by one cent in 2021 compared to 2020. |
| In 2019, the Board declared three quarterly dividends following five quarterly dividends in 2018. In 2021 and 2020, the Board declared four quarterly dividends each year. | ||||
OVERVIEW | MANAGEMENT’S DISCUSSION & ANALYSIS | FOUR-YEAR HIGHLIGHTS FINANCIAL STATEMENTS OTHER INFORMATION
42 | Nutrien Annual Report 2021
FINANCIAL CONDITION REVIEW
Balance Sheet Analysis
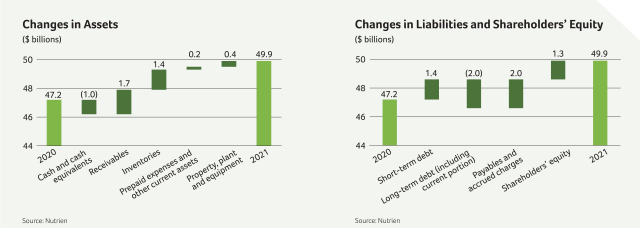
| Assets | Liabilities | |||||
For information regarding changes in cash and cash equivalents, refer to the “Sources and Uses of Cash” section and the consolidated statements of cash flows in our consolidated financial statements.
Receivables increased due to higher sales across all of our segments. This was a result of increased crop nutrient net realized selling prices and strong demand for crop inputs. Certain income tax receivables previously classified as non-current are currently realizable within one year.
Inventories increased due to the higher than average levels of inventory from higher cost to produce or purchase inventory and higher volumes of inventory held to meet anticipated demand and tight global supply.
Prepaid expenses and other current assets increased from higher prepaid inventory resulting from increases in crop input prices.
Property, plant and equipment increased primarily from ongoing capital projects including Next Generation, Nitrogen brownfield projects and recent acquisitions primarily in South America. | Short-term debt increased due to higher commercial paper issuances as part of our working capital management.
Long-term debt (including current portion) decreased due to early extinguishment of $2.1 billion in notes and debentures in 2021.
Payables and accrued charges increased due to higher payables balances from rising inventory costs, higher customer prepayments in anticipation of higher demand in 2022 and higher income tax payable from increased earnings. | |||||
| Shareholders’ Equity | ||||||
Retained earnings increased as net earnings exceeded dividends declared and share repurchases. | ||||||
We do not hold material cash and cash equivalents in currencies other than the US dollar and Canadian dollar. We held approximately $275 million US dollar equivalent in other jurisdictions outside the US and Canada. We do not depend on repatriation of cash from our foreign subsidiaries to meet our liquidity and capital resources needs in North America.
OVERVIEW | MANAGEMENT’S DISCUSSION & ANALYSIS | FOUR-YEAR HIGHLIGHTS FINANCIAL STATEMENTS OTHER INFORMATION
Nutrien Annual Report 2021 | 43
LIQUIDITY AND CAPITAL RESOURCES
Sources and Uses of Liquidity
Liquidity risk arises from our general funding needs and in the management of our assets, liabilities and capital structure. We manage liquidity risk to maintain sufficient liquid financial resources to fund our financial position and meet our commitments and obligations in a cost-effective manner. Our 2021 significant liquidity sources are listed below along with our expected ongoing primary uses of liquidity:
| Primary Uses of Liquidity | Primary Sources of Liquidity | |||||
|
| • inventory purchases and production
• operational expenses
• seasonal working capital requirements
• investing to sustain and grow our safe, reliable and cost-efficient operations through sustaining and investing capital
• business acquisitions
• returning cash to our shareholders through dividends and share repurchases (see Note 23 to the consolidated financial statements)
• principal payments of debt securities (see Note 18 to the consolidated financial statements) |
| • cash from operations (including customer prepayments)
• commercial paper issuances
• increase of credit facility limits and drawdowns
• debt capital markets | |||
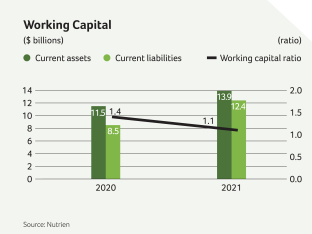
We believe that internally generated cash flow, supplemented by available borrowings under our existing financing sources, if necessary, will be sufficient to meet our anticipated capital expenditures and other cash requirements for the foreseeable future. We do not reasonably expect any presently known trend or uncertainty to affect our ability to access our historical sources of liquidity.
OVERVIEW | MANAGEMENT’S DISCUSSION & ANALYSIS | FOUR-YEAR HIGHLIGHTS FINANCIAL STATEMENTS OTHER INFORMATION
44 | Nutrien Annual Report 2021
Sources and Uses of Cash
Our cash flows from operating, investing and financing activities are summarized in the following table:
| (millions of US dollars, except as otherwise noted) |
| 2021 |
| 2020 |
| % Change | ||||||||||||||||
| Cash provided by operating activities | 3,886 | 3,323 | 17 | |||||||||||||||||||
| Cash used in investing activities | (1,807 | ) | (1,204 | ) | 50 | |||||||||||||||||
| Cash used in financing activities | (3,003 | ) | (1,339 | ) | 124 | |||||||||||||||||
| Effect of exchange rate changes on cash and cash equivalents | (31 | ) | 3 | n/m | ||||||||||||||||||
| (Decrease) increase in cash and cash equivalents | (955 | ) | 783 | n/m | ||||||||||||||||||
Cash provided by operating activities |
| • Higher cash provided by operating activities due to higher earnings from strong demand for crop inputs and tight fertilizer supply in 2021, partially offset by higher working capital needs to meet anticipated demand and tight global supply.
| ||||||||||
Cash used in investing activities |
| • Higher cash used in investing activities due to an increase of $234 million in capital expenditures from higher planned plant turnaround activities in our Nitrogen segment and higher maintenance activities in our Potash segment to maintain safe and reliable operations. We also received proceeds of $540 million in 2020 from the disposal of our investment in MOPCO, resulting in lower cash spend in 2020.
| ||||||||||
Cash used in financing activities |
| • Higher cash used in financing activities due to early extinguishment of debt of $2 billion compared to long-term net debt issuance of $500 million in 2020.
• This is partially offset by an increase of $1.3 billion in short-term net debt proceeds compared to repayment of $892 million in 2020. Short-term debt drawdowns are used to manage working capital requirements and other short-term finance needs. | ||||||||||
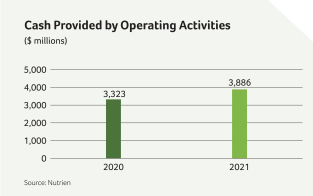
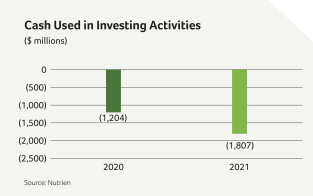
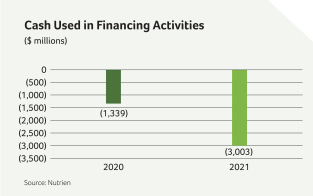
OVERVIEW | MANAGEMENT’S DISCUSSION & ANALYSIS | FOUR-YEAR HIGHLIGHTS FINANCIAL STATEMENTS OTHER INFORMATION
Nutrien Annual Report 2021 | 45
Cash Requirements
The following aggregated information about our contractual obligations and other commitments summarizes our liquidity and capital resource requirements as at December 31, 2021:
| Payments Due by Period | ||||||||||||||||||||||
| (millions of US dollars) at December 31, 2021 | Financial Statement Note Reference | Total | Within 1 Year | 1 to 3 Years | 3 to 5 Years | Over 5 Years | ||||||||||||||||
| Long-term debt | Notes 18, 26 | 7,813 | 544 | 525 | 1,071 | 5,673 | ||||||||||||||||
| Estimated interest payments on long-term debt | Note 26 | 5,258 | 346 | 638 | 607 | 3,667 | ||||||||||||||||
| Lease liabilities | Notes 19, 26 | 1,220 | 286 | 384 | 202 | 348 | ||||||||||||||||
| Estimated interest payments on lease liabilities | Note 26 | 155 | 27 | 39 | 25 | 64 | ||||||||||||||||
| Purchase commitments | Note 26 | 2,732 | 2,091 | 488 | 42 | 111 | ||||||||||||||||
| Capital commitments | Note 26 | 81 | 72 | 9 | – | – | ||||||||||||||||
| Other commitments | Note 26 | 509 | 183 | 138 | 91 | 97 | ||||||||||||||||
| Derivatives | Note 10 | 20 | 20 | – | – | – | ||||||||||||||||
Asset retirement obligations and accrued environmental costs 1 | Note 22 | 3,260 | 150 | 260 | 109 | 2,741 | ||||||||||||||||
| Total |
| 21,048 | 3,719 | 2,481 | 2,147 | 12,701 | ||||||||||||||||
| 1 | Commitments reflect the estimated cash outflows for these obligations. See Note 22 to the consolidated financial statements for details. |
The information presented in the table above excludes:
| • | planned (but not legally committed) cash requirements; |
| • | annual outflows for sustaining capital expenditures, business acquisitions and shareholder returns including share repurchases and dividends; and |
| • | estimated capital investment requirements in the range of $500 to $700 million by 2030 to achieve our 30 percent operational emissions reduction target. |
For information on income taxes and pension and other post-retirement benefit funding, refer to Note 8 and Note 21, respectively, to the consolidated financial statements. Future cash requirements are subject to changes in regulations, actuarial assumptions, and our expected operating results.
On February 16, 2022, our Board approved a share repurchase program of up to a maximum of 55,111,100 or 10 percent of the public float (as defined in the TSX Company Manual) of Nutrien’s common shares. Subject to acceptance by the TSX, the 2022 share repurchase program will commence on March 1, 2022, and will expire on the earlier of February 28, 2023, the date on which we have acquired the maximum number of common shares allowable or the date we determine not to make any further repurchases.
OVERVIEW | MANAGEMENT’S DISCUSSION & ANALYSIS | FOUR-YEAR HIGHLIGHTS FINANCIAL STATEMENTS OTHER INFORMATION
46 | Nutrien Annual Report 2021
CAPITAL STRUCTURE AND MANAGEMENT
We manage our capital structure with a focus on maintaining a strong balance sheet, enabling a strong investment-grade credit rating.
Principal Debt Instruments
We use a combination of cash generated from operations and short-term and long-term debt to finance our operations. As at December 31, 2021, we had the following debt instruments available:
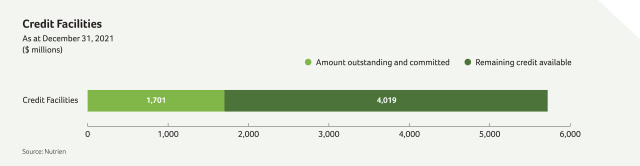
|
|
|
|
|
|
| Outstanding and Committed | ||||||||||||||||||||||||||||||||||||||||||
|
|
|
|
|
|
| Short-Term | Long-Term | |||||||||||||||||||||||||||||||||||||||||
| (millions of US dollars, except as otherwise noted) |
| Rate of Interest (%) |
| Total Facility Limit |
| As at December 31, 2021 |
| As at December 31, |
| As at December 31, 2021 |
| As at December 31, | ||||||||||||||||||||||||||||||||||||
Credit facilities | ||||||||||||||||||||||||||||||||||||||||||||||||
Unsecured revolving term credit facility 1 |
| n/a |
|
| 4,500 |
|
| – |
|
| – |
|
| – |
|
| – |
| ||||||||||||||||||||||||||||||
Uncommitted revolving demand facility |
| n/a |
|
| 500 |
|
| – |
|
| – |
|
| – |
|
| – |
| ||||||||||||||||||||||||||||||
Other credit facilities 2 |
| 0.8 - 13.1 |
|
| 720 |
|
| 313 |
|
| 159 |
|
| 141 |
|
| 67 |
| ||||||||||||||||||||||||||||||
Commercial paper |
| 0.3 - 0.4 |
|
| 1,170 |
|
| – |
|
| – |
|
| – |
| |||||||||||||||||||||||||||||||||
Other short-term debt |
|
|
|
| n/a |
|
|
|
|
|
|
|
|
|
|
| 77 |
|
|
|
|
| – |
|
|
|
|
| – |
|
|
|
|
| – |
| ||||||||||||
Total |
|
|
|
|
|
|
|
|
|
|
|
|
|
|
|
| 1,560 |
|
|
|
|
| 159 |
|
|
|
|
| 141 |
|
|
|
|
| 67 |
| ||||||||||||
| 1 | In 2021, we extended the maturity date from April 10, 2023 to June 4, 2026, subject to extension at the request of Nutrien provided that the resulting maturity date shall not exceed five years from the date of request. |
| 2 | Other credit facilities are unsecured and consist of South American facilities with debt of $211 million (December 31, 2020 – $172 million) and interest rates ranging from 1.8 percent to 13.1 percent, Australian facilities with debt of $211 million (December 31, 2020 – $19 million) and interest rates ranging from 0.8 percent to 0.9 percent, and other facilities with debt of $32 million (December 31, 2020 – $35 million) and interest rates ranging from 1.4 percent to 3.9 percent. |
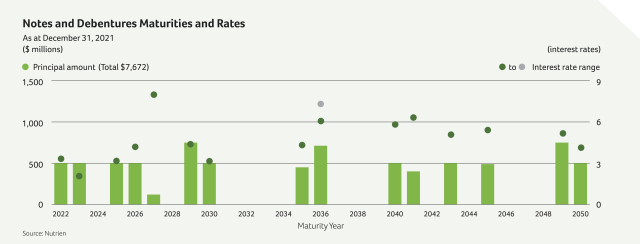
OVERVIEW | MANAGEMENT’S DISCUSSION & ANALYSIS | FOUR-YEAR HIGHLIGHTS FINANCIAL STATEMENTS OTHER INFORMATION
Nutrien Annual Report 2021 | 47
Our commercial paper program is limited to the undrawn availability of backup funds under the $4,500 million unsecured revolving term credit facility and excess cash invested in highly liquid securities. As at December 31, 2021, letters of credit consisted of $132 million outstanding and committed with $407 million remaining credit available.
Our long-term debt consists primarily of notes and debentures with the following maturities and interest rates:
On December 16, 2021, we redeemed $1.8 billion in aggregate principal amount of our long-term debt and completed a tender offer for $203 million in aggregate principal amount of notes and debentures. See Note 18 to the consolidated financial statements. The total cash spend for this repurchase was $2.2 billion and the related loss on debt extinguishment was $142 million. The debt repayment was funded by cash and commercial paper and is expected to result in an annualized interest savings of approximately $60 million.
We also have lease obligations totaling $1,220 million (including current portion) with a weighted average effective interest rate of 2.8 percent as at December 31, 2021.
Following the decision by global regulators to replace Interbank Offered Rates (“IBORs”) with alternative nearly risk-free rates (“RFRs”), in August 2020 the International Accounting Standards Board completed Phase 2 of the Interest Rate Benchmark Reform. We updated existing contracts extending past 2021 that referenced IBORs and there was no material impact on our consolidated financial statements as a result of the transition.
Debt Covenants
Our credit facilities have financial tests and other covenants with which we must comply at each quarter-end. Non-compliance with any such covenants could result in accelerated payment of amounts borrowed and termination of lenders’ further funding obligations under the credit facilities. We were in compliance with all such covenants as at December 31, 2021.
The table below summarizes the limit and result of our key financial covenant:
| At December 31 |
| Limit |
| 2021 | ||||||||||||
Debt to capital ratio 1 |
|
|
|
| 0.65 : 1.00 |
|
|
|
|
| 0.32 : 1.00 |
| ||||
| 1 | Refer to Note 24 to the consolidated financial statements for the detailed calculation. |
Credit Ratings
Our ability to access reasonably priced debt in the capital markets depends, in part, on the quality of our credit ratings. We continue to maintain investment-grade credit ratings for our long-term debt. A downgrade of the credit rating of our long-term debt could increase the interest rates applicable to borrowings under our credit facilities.
Commercial paper markets are normally a source of same-day cash for us. Our access to the US commercial paper market primarily depends on maintaining our current short-term credit ratings as well as general conditions in the money markets.
| Long-Term Debt Rating (Outlook) | Short-Term Debt Rating | |||||||||||||||||||||||||||
| As at December 31, | 2021 |
| 2020 |
|
| 2021 |
| 2020 | ||||||||||||||||||||
Moody’s | Baa2 (stable) | Baa2 (stable) | P-2 | P-2 | ||||||||||||||||||||||||
S&P |
|
|
| BBB (stable) |
|
|
| BBB (stable) |
|
|
|
|
|
| A-2 |
|
|
| A-2 | |||||||||
A security rating is not a recommendation to buy, sell or hold securities. Such ratings may be subject to revision or withdrawal at any time by the respective credit rating agency and each rating should be evaluated independently of any other rating.
OVERVIEW | MANAGEMENT’S DISCUSSION & ANALYSIS | FOUR-YEAR HIGHLIGHTS FINANCIAL STATEMENTS OTHER INFORMATION
48 | Nutrien Annual Report 2021
Outstanding Share Data
|
|
| February 17, 2022 | ||||||
Common shares |
| 551,302,860 |
| |||||
Options to purchase common shares |
|
|
|
| 6,723,663 |
| ||
For more information on our capital structure and management, see Note 24 to the consolidated financial statements.
For more information on our short-term debt and long-term debt, see Note 17 and Note 18 to the consolidated financial statements.
OFF-BALANCE SHEET ARRANGEMENTS
Principal off-balance sheet activities primarily include:
| • | Agreement to reimburse losses of Canpotex (see Note 29 to the consolidated financial statements). |
| • | Issuance of guarantee contracts (see Note 22 and Note 27 to the consolidated financial statements). |
| • | Agency arrangements with financial institutions in relation to certain customer loans (see Note 10 and Note 11 to the consolidated financial statements). |
| • | Certain non-financial derivatives that were entered into and continued to be held for the purpose of the receipt or delivery of a non-financial item in accordance with expected purchase, sale or usage requirements. Other derivatives are included on our balance sheet at fair value (see Note 10 to the consolidated financial statements). |
We do not reasonably expect any presently known trend or uncertainty to affect our ability to continue using these arrangements.
OVERVIEW | MANAGEMENT’S DISCUSSION & ANALYSIS | FOUR-YEAR HIGHLIGHTS FINANCIAL STATEMENTS OTHER INFORMATION
Nutrien Annual Report 2021 | 49
OTHER FINANCIAL INFORMATION
Related Party Transactions
Our most significant related party is Canpotex, which provides us with low-cost marketing and logistics for the offshore potash markets that we serve. Refer to Note 28 to the consolidated financial statements for information on our related party transactions.
Market Risks Associated With Financial Instruments
Market risk is the potential for loss from adverse changes in the market value of financial instruments. The level of market risk to which we are exposed varies depending on the composition of our derivative instrument portfolio, as well as current and expected market conditions. See Note 10 to the consolidated financial statements for information on our financial instruments, including the risks and risk management associated with such instruments.
Critical Accounting Estimates
We prepare our consolidated financial statements in accordance with IFRS, which requires us to make judgments, assumptions and estimates in applying accounting policies. Critical accounting estimates are those which are highly uncertain at the time they are made or where different estimates would be reasonably likely to have a material impact on our financial condition or results of operations. We have discussed the development, selection and application of our key accounting policies, and the critical accounting estimates and assumptions they involve, with the audit committee of the Board.
Refer to the notes to the consolidated financial statements for additional information on the following critical accounting estimates including methodology used for calculating our estimates (when applicable), key assumptions used, and factors considered in our estimates and judgments.
In 2021, we amended our critical accounting estimates to exclude business combinations – measurement of assets acquired and liabilities assumed. Unlike prior years, there were no business acquisitions in 2021 that required critical accounting estimates or judgment that could have a material effect on our consolidated financial statements.
| Financial Statement Reference | Critical Accounting Estimate Description | |||
Note 13 and Note 30 | Long-lived asset impairment and reversals
We review, at each reporting period, for conditions to determine whether there is any indication that an impairment exists that could potentially impact the carrying amount of our long-lived assets to be held and used. When such indicators exist, impairment testing is performed. | |||
We review, at each reporting period, for possible reversal of the impairment for non-financial assets, other than goodwill. | ||||
|
|
| Significant estimates in the testing for potential impairment include determining the discount rate and making assumptions about future sales, market conditions, terminal growth rates and cash flow forecasts over the long-term life of the assets or cash-generating units (“CGUs”). Certain assumptions are driven by external factors that could have a material impact on our analysis and could impact our financial condition and performance. | ||
Note 14 and Note 30 | Goodwill impairment
Operating segments other than Phosphate have goodwill allocated to them that must be assessed for impairment when events or circumstances indicate there could be an impairment, or at least annually. Based on our assumptions at the time of our goodwill impairment testing, the recoverable amount of each of our CGUs or groups of CGUs containing goodwill was in excess of their carrying amounts. Key assumptions in our testing models may change, and changes that could reasonably be expected to occur may cause impairment. Such change in assumptions could be driven by global supply and demand and other market factors and changes in regulations and other future events outside our control. | |||
|
|
| Refer to Note 14 to the consolidated financial statements for the sensitivity of the results of goodwill impairment testing to changes in key assumptions. | ||
OVERVIEW | MANAGEMENT’S DISCUSSION & ANALYSIS | FOUR-YEAR HIGHLIGHTS FINANCIAL STATEMENTS OTHER INFORMATION
50 | Nutrien Annual Report 2021
| Financial Statement Reference | Critical Accounting Estimate Description | |||
Note 8, Note 29 and Note 30 |
| Income taxes – measurement
Significant estimates for the measurement of our income taxes include assessing the probability and measurement of our uncertain tax provisions related to complex global tax regulations, estimating forecasted taxable income and the timing of reversal of temporary differences, and assessing the probability of future taxable income used to recognize deferred tax assets. Although we believe our assumptions and estimates are reasonable, our tax assets are realizable, and our accruals for tax liabilities are adequate for all open tax years based on our interpretation of tax laws and prior experience, actual results could differ. Changes in the income tax legislations, regulations and interpretations may result in a material impact on our consolidated financial statements. Income taxes are recorded in our Corporate and Others segment. | ||
Note 22 and Note 30 | Asset retirement obligations (“AROs”) and accrued environmental costs (“ERLs”) – measurement
The Potash and Phosphate segments have these liabilities (which have a high degree of estimation uncertainty for future costs and estimated timelines) associated with their mining operations while the Corporate and Others segment has AROs and ERLs associated with non-operational mines. | |||
|
|
| For the Nitrogen segment, we have not recorded any asset retirement obligations as no significant asset retirement obligations have been identified or there is no reasonable basis for estimating a date or range of dates of cessation of operations. We considered the historical performance of our facilities as well as our planned maintenance, major upgrades and replacements, which can extend the useful lives of our facilities indefinitely. | ||
QUARTERLY RESULTS
| 2021 | 2020 | |||||||||||||||||||||||||||||||||||||||||||||||||||||||||||
| (millions of US dollars, except as otherwise noted) | Q4 |
| Q3 |
| Q2 |
| Q1 |
| Q4 |
| Q3 |
| Q2 |
| Q1 | |||||||||||||||||||||||||||||||||||||||||||||
Sales 1 |
| 7,267 |
|
| 6,024 |
|
| 9,763 |
|
| 4,658 |
|
| 4,052 |
|
| 4,227 |
|
| 8,431 |
|
| 4,198 |
| ||||||||||||||||||||||||||||||||||||
Net earnings (loss) |
| 1,207 |
|
| 726 |
|
| 1,113 |
|
| 133 |
|
| 316 |
|
| (587 | ) |
| 765 |
|
| (35 | ) | ||||||||||||||||||||||||||||||||||||
Net earnings (loss) attributable to equity holders of Nutrien |
| 1,201 |
|
| 717 |
|
| 1,108 |
|
| 127 |
|
| 316 |
|
| (587 | ) |
| 765 |
|
| (35 | ) | ||||||||||||||||||||||||||||||||||||
Adjusted EBITDA 2 |
| 2,463 |
|
| 1,642 |
|
| 2,215 |
|
| 806 |
|
| 768 |
|
| 670 |
|
| 1,721 |
|
| 508 |
| ||||||||||||||||||||||||||||||||||||
Net earnings (loss) per share attributable to equity holders of Nutrien | ||||||||||||||||||||||||||||||||||||||||||||||||||||||||||||
Basic |
| 2.11 |
|
| 1.26 |
|
| 1.94 |
|
| 0.22 |
|
| 0.55 |
|
| (1.03 | ) |
| 1.34 |
|
| (0.06 | ) | ||||||||||||||||||||||||||||||||||||
Diluted |
| 2.11 |
|
|
|
|
| 1.25 |
|
|
|
|
| 1.94 |
|
|
|
|
| 0.22 |
|
|
|
|
| 0.55 |
|
|
|
|
| (1.03 | ) |
|
|
|
| 1.34 |
|
|
|
|
| (0.06 | ) | |||||||||||||||
| 1 | Certain immaterial figures have been reclassified in the first three quarters of 2020. |
| 2 | This is a non-IFRS financial measure. See the “Non-IFRS Financial Measures” section. |
Seasonality in our business results from increased demand for products during the planting season. Crop input sales are generally higher in the spring and fall application seasons. Crop nutrient inventories are normally accumulated leading up to each application season. Our cash collections generally occur after the application season is complete, while customer prepayments made to us are concentrated in December and January and inventory prepayments paid to our vendors are typically concentrated in the period from November to January. Feed and industrial sales are more evenly distributed throughout the year.
Our earnings are significantly affected by fertilizer benchmark prices, which have been volatile over the last two years and are affected by demand-supply conditions, grower affordability and weather.
In the third quarter of 2020, earnings were impacted by an $823 million non-cash impairment of property, plant and equipment primarily in the Phosphate segment as a result of lower long-term forecasted global phosphate prices. In the fourth quarter of 2020, earnings were impacted by a $250 million net gain from disposal of our MOPCO investment and settlement of related legal claims.
OVERVIEW | MANAGEMENT’S DISCUSSION & ANALYSIS | FOUR-YEAR HIGHLIGHTS FINANCIAL STATEMENTS OTHER INFORMATION
Nutrien Annual Report 2021 | 51
Fourth Quarter Financial Performance
| (millions of US dollars, except as otherwise noted) |
| Sales |
| Gross Margin | ||||||||||||||||||||||||||||||||||||||||||||
| Three months ended December 31 |
| 2021 |
| 2020 |
| % Change |
| 2021 |
| 2020 |
| % Change | ||||||||||||||||||||||||||||||||||||
Retail | ||||||||||||||||||||||||||||||||||||||||||||||||
Crop nutrients | 2,035 | 1,108 | 84 | 428 | 236 | 81 | ||||||||||||||||||||||||||||||||||||||||||
Crop protection products | 1,113 | 828 | 34 | 414 | 343 | 21 | ||||||||||||||||||||||||||||||||||||||||||
Seed | 189 | 152 | 24 | 57 | 58 | (2 | ) | |||||||||||||||||||||||||||||||||||||||||
Merchandise | 270 | 240 | 13 | 45 | 41 | 10 | ||||||||||||||||||||||||||||||||||||||||||
Nutrien Financial | 51 | 37 | 38 | 51 | 37 | 38 | ||||||||||||||||||||||||||||||||||||||||||
Services and other | 267 | 290 | (8 | ) | 225 | 207 | 9 | |||||||||||||||||||||||||||||||||||||||||
Nutrien Financial elimination 1 |
|
|
|
| (47 | ) |
|
|
|
| (37 | ) |
|
|
|
| 27 |
|
|
|
|
| (47 | ) |
|
|
|
| (37 | ) |
|
|
|
| 27 |
| ||||||||||||
Total |
|
|
|
| 3,878 |
|
|
|
|
| 2,618 |
|
|
|
|
| 48 |
|
|
|
|
| 1,173 |
|
|
|
|
| 885 |
|
|
|
|
| 33 |
| ||||||||||||
| 1 | Represents elimination for the interest and service fees charged by Nutrien Financial to Retail branches. |
| (US dollars, except as otherwise noted) |
| Manufactured Product Sales Tonnes (thousands) |
| Manufactured Product Average Net Price per MT | ||||||||||||||||||||||||||||||||||||||||||||
| Three months ended December 31 |
| 2021 |
| 2020 |
| % Change |
| 2021 |
| 2020 |
| % Change | ||||||||||||||||||||||||||||||||||||
Potash | ||||||||||||||||||||||||||||||||||||||||||||||||
North America |
| 1,002 |
|
| 1,041 |
|
| (4 | ) |
| 494 |
|
| 192 |
|
| 157 |
| ||||||||||||||||||||||||||||||
Offshore |
|
|
|
| 2,054 |
|
|
|
|
| 1,613 |
|
|
|
|
| 27 |
|
|
|
|
| 450 |
|
|
|
|
| 156 |
|
|
|
|
| 188 |
| ||||||||||||
Sales |
| 3,056 |
|
| 2,654 |
|
| 15 |
|
| 465 |
|
| 170 |
|
| 174 |
| ||||||||||||||||||||||||||||||
Cost of goods sold |
|
|
|
|
|
|
|
|
|
|
|
|
|
|
|
|
|
|
|
|
|
| 100 |
|
|
|
|
| 116 |
|
|
|
|
| (14 | ) | ||||||||||||
Gross margin |
|
|
|
|
|
|
|
|
|
|
|
|
|
|
|
|
|
|
|
|
|
| 365 |
|
|
|
|
| 54 |
|
|
|
|
| 576 |
| ||||||||||||
Nitrogen | ||||||||||||||||||||||||||||||||||||||||||||||||
Ammonia |
|
|
|
| 790 |
|
|
|
|
| 730 |
|
|
|
|
| 8 |
|
|
|
|
| 656 |
|
|
|
|
| 216 |
|
|
|
|
| 204 |
| ||||||||||||
Urea |
|
|
|
| 824 |
|
|
|
|
| 853 |
|
|
|
|
| (3 | ) |
|
|
|
| 670 |
|
|
|
|
| 270 |
|
|
|
|
| 148 |
| ||||||||||||
Solutions, nitrates and sulfates |
|
|
|
| 1,221 |
|
|
|
|
| 1,262 |
|
|
|
|
| (3 | ) |
|
|
|
| 316 |
|
|
|
|
| 133 |
|
|
|
|
| 138 |
| ||||||||||||
Sales | 2,835 | 2,845 | – | 514 | 195 | 164 | ||||||||||||||||||||||||||||||||||||||||||
Cost of goods sold |
|
|
|
|
|
|
|
|
|
|
|
|
|
|
|
|
|
|
|
|
|
| 256 |
|
|
|
|
| 162 |
|
|
|
|
| 58 |
| ||||||||||||
Gross margin |
|
|
|
|
|
|
|
|
|
|
|
|
|
|
|
|
|
|
|
|
|
| 258 |
|
|
|
|
| 33 |
|
|
|
|
| 682 |
| ||||||||||||
Phosphate | ||||||||||||||||||||||||||||||||||||||||||||||||
Fertilizer |
|
|
|
| 509 |
|
|
|
|
| 466 |
|
|
|
|
| 9 |
|
|
|
|
| 741 |
|
|
|
|
| 387 |
|
|
|
|
| 91 |
| ||||||||||||
Industrial and feed |
|
|
|
| 202 |
|
|
|
|
| 182 |
|
|
|
|
| 11 |
|
|
|
|
| 766 |
|
|
|
|
| 551 |
|
|
|
|
| 39 |
| ||||||||||||
Sales | 711 | 648 | 10 | 749 | 433 | 73 | ||||||||||||||||||||||||||||||||||||||||||
Cost of goods sold |
|
|
|
|
|
|
|
|
|
|
|
|
|
|
|
|
|
|
|
|
|
| 526 |
|
|
|
|
| 410 |
|
|
|
|
| 28 |
| ||||||||||||
Gross margin |
|
|
|
|
|
|
|
|
|
|
|
|
|
|
|
|
|
|
|
|
|
| 223 |
|
|
|
|
| 23 |
|
|
|
|
| 870 |
| ||||||||||||
OVERVIEW | MANAGEMENT’S DISCUSSION & ANALYSIS | FOUR-YEAR HIGHLIGHTS FINANCIAL STATEMENTS OTHER INFORMATION
52 | Nutrien Annual Report 2021
Highlights of our 2021 fourth quarter compared to the 2020 fourth quarter results were as follows:
| Q4 2021 vs Q4 2020 | ||||||
Retail |
| Gross margin increased due to higher sales from strong crop prices driving demand for crop input products. Selling expenses increased due to higher sales activity but decreased as a percentage of sales. | ||||
Potash |
| Gross margin increased due to higher net realized selling prices and record sales volumes in the fourth quarter of 2021. Net realized selling price increased in the fourth quarter of 2021 due to strong global demand supported by higher crop prices and impacts to global supply caused by competitor outages and project delays. Cost of goods sold per tonne decreased in the fourth quarter of 2021 due to lower depreciation and amortization compared to the same period of 2020 that was caused by production mix and from the timing of maintenance projects. | ||||
Nitrogen |
| Gross margin increased due to higher net realized selling prices from higher benchmark prices resulting from the strength in global agriculture markets and tight global nitrogen markets caused by a recovery in industrial nitrogen demand, production outages and higher energy prices. This was partially offset by an increase in cost of goods sold per tonne resulting from higher natural gas costs. Sales volumes decreased slightly as we sold more ammonia in lieu of downstream product with lower nitrogen content and due to production outages in the fourth quarter. Other income decreased mainly due to a gain on disposal of our MOPCO investment and settlement of related legal claims in the fourth quarter of 2020. | ||||
Phosphate |
| Gross margin increased due to higher net realized selling prices from higher global benchmark prices driven by higher global demand and tight global supply. This was partially offset by an increase in cost of goods sold per tonne resulting from higher raw material input costs. | ||||
Other fourth quarter financial highlights |
| Corporate and Others other expenses increased from $76 million to $112 million in 2021 primarily due to higher foreign exchange losses and higher expenses related to asset retirement obligations and accrued environmental costs of our non-operational sites from changes in our cost and discount rate estimates. This was partially offset by lower integration and restructuring related costs.
An income tax expense was recorded in the fourth quarter of 2021 due to higher earnings before income taxes. An income tax recovery was recorded in the fourth quarter of 2020 as the $250 million net gain on disposal of our investment in MOPCO did not increase income tax expense due to available capital losses. We also had discrete tax adjustments primarily related to recoveries of prior year taxes due to US legislative changes. The change in the actual effective tax rate on earnings is a result of a change in the proportionate earnings (loss) between jurisdictions.
We had higher cash flows from operating activities in the fourth quarter of 2021 compared to the same period in 2020 due to higher earnings from strong demand for crop inputs and tight fertilizer supply in 2021. The early repayment of long-term debt and repurchase of common shares in the fourth quarter of 2021 led to a higher use of cash flows from financing activities. This increase was partially offset with an increase in short-term debt proceeds compared to short-term debt repayments in the fourth quarter of 2020. | ||||
OVERVIEW | MANAGEMENT’S DISCUSSION & ANALYSIS | FOUR-YEAR HIGHLIGHTS FINANCIAL STATEMENTS OTHER INFORMATION
Nutrien Annual Report 2021 | 53
2022 GUIDANCE
|
|
| 2022 Guidance Ranges 1 | ||||||||||||||
| (billions of US dollars except as otherwise noted) |
| Low |
| High | ||||||||||||
Adjusted net earnings per share (“Adjusted EPS”) 2,3 |
| 10.20 |
|
| 11.80 |
| ||||||||||
Adjusted EBITDA 2 |
| 10.0 |
|
| 11.2 |
| ||||||||||
Retail adjusted EBITDA |
| 1.7 |
|
| 1.8 |
| ||||||||||
Potash adjusted EBITDA |
| 5.0 |
|
| 5.5 |
| ||||||||||
Nitrogen adjusted EBITDA |
| 3.2 |
|
| 3.6 |
| ||||||||||
Phosphate adjusted EBITDA (in USD millions) |
| 500 |
|
| 600 |
| ||||||||||
Potash sales tonnes (millions) 4 |
| 13.7 |
|
| 14.3 |
| ||||||||||
Nitrogen sales tonnes (millions) 4 |
| 10.8 |
|
| 11.3 |
| ||||||||||
Depreciation and amortization |
| 2.0 |
|
| 2.1 |
| ||||||||||
Effective tax rate on adjusted earnings (%) |
| 25 |
|
| 26 |
| ||||||||||
Sustaining capital expenditures 5 |
|
|
|
| 1.2 |
|
|
|
|
| 1.3 |
| ||||
| 1 | See the “Forward-Looking Statements” section. |
| 2 | These are non-IFRS financial measures. See the “Non-IFRS Financial Measures” section. |
| 3 | Assumes 546 million shares outstanding for all EPS guidance and sensitivities. |
| 4 | Manufactured product only. Nitrogen sales tonnes excludes ESN® products. |
| 5 | This is a supplementary financial measure. See the “Other Financial Measures” section. |
| ASSUMPTIONS |
| |||
2022 Average Canadian to US dollar exchange rate |
| 1.26 |
| |
2022 NYMEX natural gas (US dollars per MMBtu) |
| ~4.00 |
| |
| ||
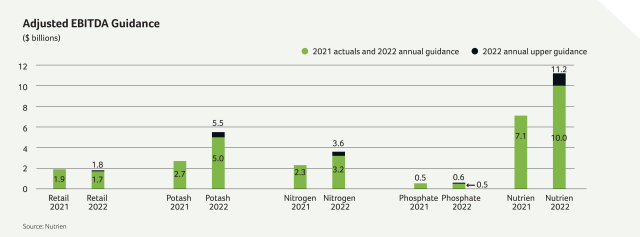
2022 SENSITIVITIES
PRICE AND VOLUME SENSITIVITIES
|
| Effect on | |||||||||||||||
| (millions of US dollars, except EPS amounts) |
| Adjusted EPS |
| Adjusted EBITDA | ||||||||||||
Price |
Potash changes by $25/tonne |
|
±0.40 |
|
|
±290 |
| |||||||||
Ammonia changes by $25/tonne |
| ±0.07 |
|
| ±50 |
| ||||||||||
Urea changes by $25/tonne |
| ±0.11 |
|
| ±80 |
| ||||||||||
Volume |
Potash changes by 100,000 tonnes |
|
±0.05 |
|
|
±40 |
| |||||||||
Nitrogen changes by 50,000 N tonnes |
| ±0.04 |
|
| ±30 |
| ||||||||||
Retail |
Crop nutrients changes by 1% 1 |
|
±0.11 |
|
|
±80 |
| |||||||||
Crop protection changes by 1% 1 |
| ±0.08 |
|
| ±60 |
| ||||||||||
Seed changes by 1% 1 |
| ±0.03 |
|
| ±20 |
| ||||||||||
| 1 | Gross margin as a percentage of sales. |
INPUT COST SENSITIVITIES
|
| Effect on | |||||||||||||||
| (millions of US dollars, except EPS amounts) |
| Adjusted EPS |
| Adjusted EBITDA | ||||||||||||
NYMEX natural gas price changes by $1/MMBtu (impact on Nitrogen) |
| ±0.25 |
|
| ±180 |
| ||||||||||
Canadian to US dollar changes by $0.02 |
| ±0.03 |
|
| ±20 |
| ||||||||||
OVERVIEW | MANAGEMENT’S DISCUSSION & ANALYSIS | FOUR-YEAR HIGHLIGHTS FINANCIAL STATEMENTS OTHER INFORMATION
54 | Nutrien Annual Report 2021
Nutrien integrates risk management into our strategic and business activities to facilitate informed risk taking and responsible management of resources. We manage risk through our enterprise risk management process, which focuses on identifying and managing risks that are critical to achieving our strategic objectives, including those risks related to climate change.
Risk Governance
Risk management is an integral part of our business and is governed by our Board and Board committees, who oversee our Executive Leadership Team in understanding the principal risks to our business and strategy. Nutrien’s Executive Leadership Team has the responsibility of ensuring the Company’s key risks are being appropriately identified, assessed and addressed. With respect to climate-change matters, our Board Safety & Sustainability Committee has responsibility for oversight of our general strategy and policies for mitigating our climate-related risks and pursuing climate-related opportunities.
Responsibility and accountability for risk management are embedded in all levels of our organization, and we strive to integrate risk management into key decision-making processes and strategies. By considering risk throughout our business, we seek to align our strategy with our vision and effectively manage the risks that could have an impact on our ability to deliver our strategy. Nutrien uses the “Three Lines Model” for enterprise risk governance to define relationships and to clarify roles and responsibilities.
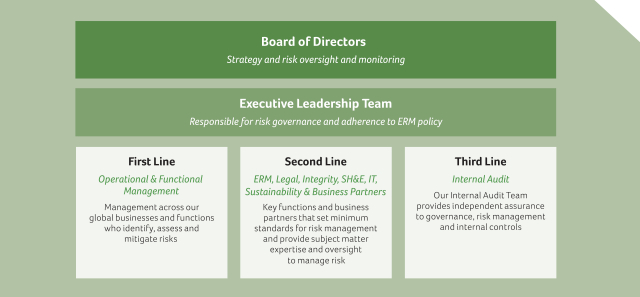
Key Risks
We characterize a key risk as a risk or combination of risks that could threaten the achievement of our vision, our business model, future financial performance or ability to deliver on our strategy. We evaluate and develop responses for those risks that could have significant business, financial, reputational, safety, health or environmental impacts.
We continue to assess and respond to the effects of the COVID-19 pandemic on our business and our stakeholders and evaluate related governmental and public health actions. The implications and related risks of the COVID-19 pandemic are summarized below. Depending on the extent and duration of the pandemic, it may also have the effect of heightening some of our other key risks. A summary of the risks we consider to be key risks at this time are discussed below. While these represent our key risks, we also continue to be exposed to other important general business, operational and climate-related risks. For a more detailed discussion of our key risks and all our risks, refer to Nutrien’s 2021 Annual Information Form.
OVERVIEW | MANAGEMENT’S DISCUSSION & ANALYSIS | FOUR-YEAR HIGHLIGHTS FINANCIAL STATEMENTS OTHER INFORMATION
Nutrien Annual Report 2021 | 55
1 | Agriculture Changes and Trends | Associated Key Priorities | ||
Description
The following factors, in addition to other factors, could impact our strategy, demand for our products and/or services and/or financial performance: farm and industry consolidation; shifting grower demographics; agriculture productivity and development; increasing focus on sustainability in agriculture, including soil health and availability of arable land; diminishing biodiversity; climate change; water management; changes in consumer food preferences; government and climate-related initiatives; and technological innovation and digital business models. | Risk Management Approach
Our integrated business platform and diversified portfolio are designed to respond and adapt to changes in the agriculture industry. Nutrien provides a diverse portfolio of products, services and digital analytics that support growers to produce higher yields in a sustainable manner.
We believe Nutrien’s integrated digital platform positions our Retail business as a leader in agricultural solutions for growers and we are actively involved in the ag technology innovation space through external investments and partnership. Our digital tools allow growers to track their sustainability outcomes, providing transparency to value-chain partners. Our teams have strong industry knowledge and customer relationships.
In 2021, we launched our Feeding the Future Plan, which strives to transform agriculture through six 2030 commitments that address feeding the planet sustainably, supporting environment and climate action, driving inclusive agriculture, and helping meet the United Nations’ Zero Hunger Sustainable Development Goal. | |||

2 | Shifting Market Fundamentals | Associated Key Priorities | ||
Description
Changes in global macro-economic conditions – including trade tariffs and/or other trade restrictions, volatility in global markets, supply chain constraints, increased price competition, or a significant change in agriculture production or consumption trends – could lead to a low crop price environment and reduced demand for our products or increased prices or decreased availability of raw materials used in making our products. | Risk Management Approach
Our diversified business model and portfolio of agricultural products, services and solutions, combined with our global presence, is designed to enable us to respond to changing economic conditions.
We have a favorable cost-to-service position and the flexibility to make operational changes across our portfolio in order to minimize the impact of changing market dynamics. We also engage in market development, education, training and customer relations initiatives that support growth. | |||

3 | Climate Change | Associated Key Priorities | ||
Description
We are subject to risks related to climate change, which are commonly grouped into physical risk and transition risk categories.
Climate change may cause or result in, among other things, more frequent and severe weather events, diminishing biodiversity, changing weather factors such as changing temperatures, precipitation, wind, and water levels, and affect freshwater availability. Physical risks from climate change may also result in operational or supply chain delays, depending on the nature of the event.
Impacts of climate-related transition risks include, among other things, policy constraints on emissions, imposition of carbon pricing mechanisms, water restrictions, land use restrictions or incentives, changing consumer behavior and preferences, and market demand and supply shifts. We are also subject to reputational risks associated with climate change, including our stakeholders’ perception of our role in the transition to a lower-carbon economy. These factors as well as other factors resulting from climate change could adversely impact our business, financial condition, results of operations or liquidity. | Risk Management Approach
We have a sustainability strategy and an active Issues Management Team and have developed commitments supporting environmental and climate action as part of our Feeding the Future Plan. Our 2030 commitments focus on: investing in new technologies and pursuing the transition to low-carbon fertilizers; achieving at least a 30 percent reduction in Scope 1 and 2 GHG emissions per tonne of our products produced (from a baseline year of 2018); launching and scaling a comprehensive Carbon Program, empowering growers and our industry to accelerate climate-smart agriculture and soil carbon sequestration; and enabling growers to adopt sustainable and productive agricultural products and practices on 75 million acres globally.
We focus on research and development to help advance our products and sustainable agriculture and continue to offer growers products and technologies with a lower environmental impact and facilitate the adoption of agronomic best practices.
Learn More Refer to our website at www.nutrien.com for more information on our Feeding the Future Plan and our environment and climate action commitments. | |||

 Sustainability Sustainability |  Growth and Capital Allocation Growth and Capital Allocation |  Innovation and Technology Innovation and Technology |  Employees Employees |
OVERVIEW | MANAGEMENT’S DISCUSSION & ANALYSIS | FOUR-YEAR HIGHLIGHTS FINANCIAL STATEMENTS OTHER INFORMATION
56 | Nutrien Annual Report 2021
4 | Changing Regulations | Associated Key Priorities | ||
Description
Changing laws, regulations and government policies – including those relating to health and safety, taxes and royalties, environment and climate change, including regulation of GHG emissions – could affect our ability to produce or sell certain products, reduce our efficiency and competitive advantage, increase our costs of raw materials, energy, transportation or compliance, or require us to make capital improvements to our operations – all of which could impact our strategy, operations, financial performance or reputation. | Risk Management Approach
We have a Government & Industry Affairs Team and an active engagement strategy with governments and regulators that keeps us current on regulatory developments affecting our business, allowing us to anticipate new or changing laws and regulations and put the Company in the best position for success while leveraging our industry association allies. We have a sustainability strategy and have developed commitments supporting environment and climate action, including GHG emissions reductions as part of our Feeding the Future Plan, to assist in managing the impact of potential regulatory changes. We work to minimize our Canadian, US and other international compliance costs through the implementation of various efficiency and GHG emissions reduction projects such as cogeneration and carbon capture. | |||
5 | COVID-19 Pandemic | Associated Key Priorities | ||
Description
Nutrien’s business, financial condition, results of operations or liquidity could be materially and adversely affected by the outbreak of epidemics, pandemics and other public health crises including the COVID-19 pandemic and any new variations or mutations of the COVID-19 virus.
The COVID-19 pandemic has continued to cause disruption, volatility and uncertainty in economies and markets around the world. The ongoing pandemic, and the actions that have been or may be taken by governments in response thereto, has resulted in, and may continue to result in, among other things, increased volatility in financial markets, commodity prices, and inflation and foreign exchange rates; significant disruptions to global supply chains; labor shortages; challenges in bringing employees back to pre-pandemic work arrangements; travel bans, restrictions and quarantines; temporary operational restrictions and extended shutdowns of certain businesses; and political and economic instability and civil unrest.
The COVID-19 pandemic has had limited effect on our reported financial results to date, but could in the future significantly impact our operations, create significant supply chain challenges and disruptions, and/or limit our ability to timely sell or distribute our products in the future, which would negatively impact our business, financial condition and operating results. | Risk Management Approach
While COVID-19 has had limited impact on our reported results to date, pandemic recovery continues to be a focus for Nutrien. As public health and perception dynamically change, we analyze and adapt our response to safeguard our employees and other key stakeholders while supplying critical agricultural products and solutions to growers.
Our response is focused on ensuring business continuity, providing a safe working environment for our workforce, and supporting our employees and communities. Ongoing activities include critical forecasting for further pandemic disruptions to business and evaluations of employee and community safety protection requirements.
Our operations have been designated as part of critical infrastructure and as essential businesses (or equivalents) in our core markets, allowing us to continue to operate. Our crisis management team and leadership continue to monitor the COVID-19 situation and evaluate governmental and other public health authority actions being taken to curtail its spread. | |||

| Sustainability | Growth and Capital Allocation | Innovation and Technology | Employees |
OVERVIEW | MANAGEMENT’S DISCUSSION & ANALYSIS | FOUR-YEAR HIGHLIGHTS FINANCIAL STATEMENTS OTHER INFORMATION
Nutrien Annual Report 2021 | 57
6 | Cybersecurity Threats | Associated Key Priorities | ||
Description
Cyberattacks, ransomware events, and breaches or exposure to potential computer viruses of our systems, third-party service providers’ systems or cloud-based platforms could lead to disruptions to our operations, loss of data, or the unintended disclosure of confidential information and/or personally identifiable information or property damage. Any of these could result in business disruptions, reputational damage, personal injury or third-party claims, impacting our operations, financial performance or reputation. | Risk Management Approach
We maintain an enhanced focus on cybersecurity and data privacy in conjunction with our cybersecurity strategy, policy and framework. Threat and risk assessments are completed for all new information technology systems, and our cybersecurity incident response processes are backstopped by external response measures.
Nutrien promotes a strong culture of cybersecurity awareness as cyber safety is important to the resiliency of our digital livelihood, both at work and in our personal lives. Regular simulated phishing, global broadcasts and targeted cybersecurity training are components of our comprehensive cybersecurity awareness program. We also share our awareness of cybersecurity fundamentals through training sessions with key customers, suppliers and community members. | |||
7 | Political, Economic and Social Instability | Associated Key Priorities | ||
Description
Political, economic and social instability may affect our business including, for instance, if any of the jurisdictions in which we operate or do business in introduce restrictions on monetary distributions, forced divestitures or changes to or nullification of existing agreements, mining permits or leases, or the imposition of tariffs, exchange controls, international trade restrictions, embargoes, barriers, or other restrictions. Instability in political or regulatory regimes could also affect our ability to do business and could impact our sales and operating results, our reputation, or the value of our assets. | Risk Management Approach
We have a Government & Industry Affairs Team and an active engagement strategy with governments, regulators and other stakeholders in the countries where we operate or plan to operate. We assess capital investments and project decisions against political, country and other related risk factors. Dedicated teams regularly monitor developments and global trends that may impact us. | |||
8 | Stakeholder Support | Associated Key Priorities | ||
Description
Our stakeholders may not support our business plans, structure, strategy or sustainability initiatives, such as ESG initiatives and strategy, climate commitments, and social responsibilities. Loss of stakeholder confidence could impair our ability to execute our business plans, could negatively impact our ability to produce or sell our products, and may lead to reputational damage, increased costs, financial losses, shareholder action or negatively impact our access to or cost of capital.
Our ability to meet our commitments that are part of our Feeding the Future Plan, including reducing our GHG emissions, is subject to several assumptions, risks and uncertainties, and our actions taken in implementing these objectives may expose us to certain additional financial and operational risks. Such risks and our inability to meet our commitments may have an adverse effect on our stakeholder support. | Risk Management Approach
We have an Issues Management Team that continuously monitors stakeholder issues and that regularly engages with our stakeholders to identify and address their concerns and communicate the long-term value opportunities associated with our business plans. We also have an active Community Relations Team and community investment programs.
We recently launched our Feeding the Future Plan as part of our sustainability strategy, which is structured to support what matters most to our stakeholders, which includes supporting environmental and climate action, and equality, diversity, and inclusivity in agriculture. | |||
| Sustainability | Growth and Capital Allocation | Innovation and Technology | Employees |
OVERVIEW | MANAGEMENT’S DISCUSSION & ANALYSIS | FOUR-YEAR HIGHLIGHTS FINANCIAL STATEMENTS OTHER INFORMATION
58 | Nutrien Annual Report 2021
9 | Talent and Organizational Culture | Associated Key Priorities | ||
Description
An inability to attract, develop, engage or retain skilled employees, or establish the right organizational culture or promote and foster a respectful, diverse, and inclusive workplace, could impact productivity, reliability, safety performance, costs, customer relationships, and/or our reputation. | Risk Management Approach
We have a proactive in-house Talent Attraction and Sourcing Team that focuses on efficiently building a diverse and talented workforce with the current and future skills we need. We are committed to the career development of our employees and building a culture grounded in our organizational purpose and the values of safety and integrity. We believe our active listening strategy identifies potential issues employees experience and assists in engagement and our inclusive culture. Our talent succession process focuses on identifying and managing critical roles and the proactive build-up of internal and external bench strength with an eye to diversity. Our incentive programs are competitive and performance-based and support our purpose-driven culture. | |||
10 | Capital Redeployment | Associated Key Priorities | ||||
Description
Our inability to deploy capital to efficiently achieve sustained growth, effectively execute on opportunities or meet investor preferences – whether due to market conditions, lack of options or otherwise, or deploying capital in a manner inconsistent with our strategic priorities – could impact our returns, operations, reputation or access to or cost of capital. | Risk Management Approach
We are focused on creating long-term value and our capital allocation policy prioritizes maintaining safe and reliable operations, a strong balance sheet, creating value through high return growth opportunities and returning capital to shareholders. In addition to increasing our annualized dividend and maintaining a strong balance sheet, during 2021 we repurchased 15 million shares under our share repurchase program, reduced our long-term debt by $2.1 billion and announced capital commitments to reduce our GHG emissions intensity by 2030. | |||||
|
See page 14 of this report for more information on our capital allocation priorities. | |||||
11 | Safety, Health and Environment | Associated Key Priorities | ||
Description
Our operations are subject to safety, health, and environmental risks inherent in the mining, manufacturing, transportation, storage, and distribution of our products. These factors could result in injuries or fatalities, or impact the air quality, biodiversity, water resources, or related ecosystems near our operations, impacting our operations, financial performance or reputation. | Risk Management Approach
We have robust governance processes that ensure we follow all regulatory, industry, and internal standards of safety, health, and environmental responsibility that involve independent audits and assessments. We have structured incident prevention and response systems in place, conduct regular security vulnerability assessments, and maintain protocols for employees working and traveling abroad. Further, we have robust process safety management and preventive maintenance programs. We have developed crisis communication protocols and emergency response programs and personnel can be deployed in the event of a significant incident.
We maintain environmental monitoring and control systems, including third-party reviews of key containment structures. | |||

| Sustainability | Growth and Capital Allocation | Innovation and Technology | Employees |
OVERVIEW | MANAGEMENT’S DISCUSSION & ANALYSIS | FOUR-YEAR HIGHLIGHTS FINANCIAL STATEMENTS OTHER INFORMATION
Nutrien Annual Report 2021 | 59
Disclosure Controls and Procedures
We maintain disclosure controls and procedures designed to provide reasonable assurance that information required to be disclosed by Nutrien in its annual filings, interim filings (as these terms are defined in National Instrument 52-109 – Certification of Disclosure in Issuers’ Annual and Interim Filings (“NI 52-109”)) and other reports filed or submitted by us under securities legislation is recorded, processed, summarized and reported within the required time periods. Our Chief Executive Officer and Chief Financial Officer, after evaluating the effectiveness of our disclosure controls and procedures as of the end of the period covered by the annual filings, being December 31, 2021, have concluded that, as of such date, our disclosure controls and procedures were effective in providing reasonable assurance that information required to be disclosed by Nutrien in its annual filings, interim filings or other reports filed or submitted by it under securities legislation is (a) recorded, processed, summarized and reported within the time periods specified in the securities legislation, and (b) accumulated and communicated to management, including our Chief Executive Officer and Chief Financial Officer, as appropriate, to allow timely decisions regarding required disclosure.
There are inherent limitations to the effectiveness of any system of disclosure controls and procedures, including the possibility of human error and the circumvention or overriding of the controls and procedures. Accordingly, even effective disclosure controls and procedures can only provide reasonable assurance of achieving their control objectives.
Internal Control Over Financial Reporting
Management is responsible for establishing and maintaining adequate internal control over financial reporting, as defined in Rules 13a-15(f) and 15d-15(f) under the Securities Exchange Act of 1934, as amended, and NI 52-109. Internal control over financial reporting is designed to provide reasonable assurance regarding the reliability of financial reporting and preparation of consolidated financial statements for external purposes in accordance with IFRS.
Under the supervision and with the participation of our management, including our Chief Executive Officer and Chief Financial Officer, we conducted an evaluation of the design and effectiveness of our internal control over financial reporting as of the end of the fiscal year covered by this report based on the framework issued by the Committee of Sponsoring Organizations of the Treadway Commission (“COSO”) in Internal Control – Integrated Framework (2013). Based on this evaluation, our Chief Executive Officer and Chief Financial Officer concluded that, as at December 31, 2021, Nutrien Ltd. did maintain effective internal control over financial reporting. There have been no changes that have materially affected, or are reasonably likely to materially affect, our internal control over financial reporting.
The effectiveness of the Company’s internal control over financial reporting as at December 31, 2021 was audited by KPMG LLP, as reflected in their report, which is included in this 2021 Annual Report.
OVERVIEW | MANAGEMENT’S DISCUSSION & ANALYSIS | FOUR-YEAR HIGHLIGHTS FINANCIAL STATEMENTS OTHER INFORMATION
60 | Nutrien Annual Report 2021
FORWARD-LOOKING STATEMENTS
Certain statements and other information included in this document, including within the “2022 Guidance” section, constitute “forward-looking information” or “forward-looking statements” (collectively, “forward-looking statements”) under applicable securities laws (such statements are often accompanied by words such as “anticipate”, “forecast”, “expect”, “believe”, “may”, “will”, “should”, “estimate”, “intend”, “plan” or other similar words). All statements in this document, other than those relating to historical information or current conditions, are forward-looking statements, including, but not limited to: Nutrien’s business strategies, plans, prospects and opportunities; Nutrien’s 2022 annual guidance, including our expectations regarding our adjusted net earnings per share, adjusted EBITDA (consolidated and by segment); expectations regarding our adjusted net debt to adjusted EBITDA leverage ratios; expectations regarding adjusted EBITDA growth; expectations regarding our growth and capital allocation intentions and strategies; capital spending expectations for 2022; expectations regarding performance of our operating segments in 2022, including our operating segment market outlooks and market conditions for 2022, and the anticipated supply and demand for our products and services, expected market and industry conditions with respect to crop nutrient application rates, planted acres, crop mix, prices and the impact of import and export volumes; expectations regarding our operating segment production and capacity, including the anticipated benefits in connection with the Phase 2 brownfield nitrogen expansion project and the timing thereof; expectations regarding global population growth; expectations concerning future product offerings, including the planned expansion of our digital platform to markets in Australia and South America; expectations regarding repurchases of our common shares, including the timing thereof; expectations regarding the sufficiency of Nutrien’s liquidity, including the sources thereof, to meet our anticipated capital expenditures and other cash requirements; the negotiation of sales contracts and the associated prices thereunder; expectations regarding acquisitions and divestitures; expected timing for the indefinite closure of our ammonia plant in Trinidad; expectations regarding our sustainability, climate-change and ESG initiatives, including our GHG emissions reduction strategy and related programs and initiatives, as well as our various ESG performance targets and aspirations as set out in our Feeding the Future Plan; our GHG emissions reduction target, including our plans with respect thereto and estimated capital expenditures required to achieve that target; initiatives to promote sustainable and productive agriculture; expectations regarding contributions to pensions and post-retirement plans; and expectations in connection with our ability to deliver long-term returns to shareholders. These forward-looking statements are subject to a number of assumptions, risks and uncertainties, many of which are beyond our control, which could cause actual results to differ materially from such forward-looking statements. As such, undue reliance should not be placed on these forward-looking statements.
All of the forward-looking statements are qualified by the assumptions that are stated or inherent in such forward-looking statements, including the assumptions referred to below and elsewhere in this document. Although we believe that these assumptions are reasonable, having regard to our experience and our perception of historical trends, the list of assumptions set forth below is not exhaustive of the factors that may affect any of the forward-looking statements and the reader should not place an undue reliance on these assumptions and such forward-looking statements. Current conditions, economic and otherwise, render assumptions, although reasonable when made, subject to greater uncertainty.
In respect of our GHG emissions reduction and other sustainability and climate-related initiatives and targets, we have made assumptions with respect to, among other things: that such target is achievable by deploying capital into nitrous oxide (“N2O”) abatement at our nitric acid production facilities, energy efficiency improvements, carbon capture, utilization and storage, the use of natural gas to generate electricity and waste heat recovery; our ability to successfully deploy capital and pursue other operational measures, including the successful application to our current and future operations of existing and new technologies; the successful implementation by us of proposed or potential plans in respect thereof; projected capital investment levels, the flexibility of our capital spending plans and the associated sources of funding; our ability to otherwise implement all technology necessary to achieve our GHG emissions reduction and other sustainability and climate-related initiatives and targets; and the development, availability and performance of technology and technological innovations and associated expected future results.
Additional key assumptions that have been made in relation to the operation of our business as currently planned and our ability to achieve our business objectives include, among other things, assumptions with respect to our ability to successfully complete, integrate and realize the anticipated benefits of our already completed and future acquisitions and divestitures, and that we will be able to implement our standards, controls, procedures and policies in respect of any acquired businesses and realize the expected synergies; that future business, regulatory and industry conditions will be within the parameters expected by us, including with respect to prices, margins, demand, supply, product availability, supplier agreements, availability and cost of labor and interest, exchange, inflation and effective tax rates; assumptions with respect to global economic conditions and the accuracy of our market outlook expectations for 2022 and in the future; our expectations regarding the impacts, direct and indirect, of the COVID 19 pandemic on our business, customers, business partners, employees, supply chain, other stakeholders and the overall economy; the adequacy of our cash generated from operations and our ability to access our credit facilities or capital markets for additional
OVERVIEW | MANAGEMENT’S DISCUSSION & ANALYSIS | FOUR-YEAR HIGHLIGHTS FINANCIAL STATEMENTS OTHER INFORMATION
Nutrien Annual Report 2021 | 61
sources of financing; our ability to identify suitable candidates for acquisitions and divestitures and negotiate acceptable terms; our ability to maintain investment-grade ratings and achieve our performance targets; our ability to successfully negotiate sales contracts; our ability to successfully implement new initiatives and programs; and our ability to redeploy capital to generate higher returns for shareholders.
Events or circumstances could cause actual results to differ materially from those in the forward-looking statements.
With respect to our GHG emissions reduction and other sustainability and climate-related initiatives and targets, such events or circumstances include, but are not limited to: our ability to deploy sufficient capital to fund the necessary expenditures to implement the necessary operational changes to achieve these initiatives and targets; our ability to implement requisite operational changes; our ability to implement some or all of the technology necessary to efficiently and effectively achieve expected future results, including in respect of such GHG emissions reduction target; the availability and commercial viability and scalability of emission reduction strategies and related technology and products; and the development and execution of implementing strategies to meet such GHG emissions reduction target.
With respect to our business generally and our ability to meet the other targets, commitments, goals, strategies and related milestones and schedules disclosed herein, such events or circumstances include, but are not limited to: general global economic, market and business conditions; failure to complete announced and future acquisitions or divestitures at all or on the expected terms and within the expected timeline; climate-change and weather conditions, including impacts from regional flooding and/or drought conditions; crop planted acreage, yield and prices; the supply and demand and price levels for our products; governmental and regulatory requirements and actions by governmental authorities, including changes in government policy (including tariffs, trade restrictions and climate-change initiatives), government ownership requirements, changes in environmental, tax and other laws or regulations and the interpretation thereof; political risks, including civil unrest, actions by armed groups or conflict and malicious acts including terrorism; the occurrence of a major environmental or safety incident; innovation and cybersecurity risks related to our systems, including our costs of addressing or mitigating such risks; counterparty and sovereign risk; delays in completion of turnarounds at our major facilities; interruptions of or constraints in availability of key inputs, including natural gas and sulfur; any significant impairment of the carrying amount of certain assets; risks related to reputational loss; certain complications that may arise in our mining processes; the ability to attract, engage and retain skilled employees and strikes or other forms of work stoppages; the COVID 19 pandemic, including variants of the COVID-19 virus and the efficacy and distribution of vaccines and treatments in respect thereof, and its resulting effects on economic conditions, restrictions imposed by public health authorities or governments, including vaccine mandates, fiscal and monetary responses by governments and financial institutions and disruptions to global supply chains; and other risk factors detailed from time to time in Nutrien reports filed with the Canadian securities regulators and the Securities and Exchange Commission in the US.
The purpose of our expected adjusted net earnings per share, adjusted EBITDA (consolidated and by segment) and sustaining capital expenditures guidance ranges, as well as our adjusted net earnings per share and adjusted EBITDA price and volume sensitivities ranges, are to assist readers in understanding our expected and targeted financial results, and this information may not be appropriate for other purposes.
The forward-looking statements in this document are made as of the date hereof and Nutrien disclaims any intention or obligation to update or revise any forward-looking statements in this document as a result of new information or future events, except as may be required under applicable Canadian securities legislation or applicable US federal securities laws.
OVERVIEW | MANAGEMENT’S DISCUSSION & ANALYSIS | FOUR-YEAR HIGHLIGHTS FINANCIAL STATEMENTS OTHER INFORMATION
62 | Nutrien Annual Report 2021
APPENDIX A – NON-IFRS FINANCIAL MEASURES
We use both IFRS and certain non-IFRS financial measures to assess performance. Non-IFRS financial measures are financial measures disclosed by a company that (a) depict historical or expected future financial performance, financial position or cash flow of a company, (b) with respect to their composition, exclude amounts that are included in, or include amounts that are excluded from, the composition of the most directly comparable financial measure disclosed in the primary financial statements of the company, (c) are not disclosed in the financial statements of the company and (d) are not a ratio, fraction, percentage or similar representation. Non-IFRS ratios are financial measures disclosed by a company that are in the form of a ratio, fraction, percentage or similar representation that has a non-IFRS financial measure as one or more of its components, and that are not disclosed in the financial statements of the company.
These non-IFRS financial measures and non-IFRS ratios are not standardized financial measures under IFRS and, therefore, are unlikely to be comparable to similar financial measures presented by other companies. Management believes these non-IFRS financial measures and non-IFRS ratios provide transparent and useful supplemental information to help investors evaluate our financial performance, financial condition and liquidity using the same measures as management. These non-IFRS financial measures and non-IFRS ratios should not be considered as a substitute for, or superior to, measures of financial performance prepared in accordance with IFRS.
The following section outlines our non-IFRS financial measures and non-IFRS ratios, their compositions, and why management uses each measure. It includes reconciliations to the most directly comparable IFRS measures. Except as otherwise described herein, our non-IFRS financial measures and non-IFRS ratios are calculated on a consistent basis from period to period and are adjusted for specific items in each period, as applicable. As additional non-recurring or unusual items arise in the future, we generally exclude these items in our calculations.
Adjusted EBITDA (Consolidated)
Most directly comparable IFRS financial measure: Net earnings (loss).
Definition: Adjusted EBITDA is calculated as net earnings (loss) before finance costs, income taxes, depreciation and amortization, share-based compensation and certain foreign exchange gain/loss (net of related derivatives). We also adjust this measure for the following other income and expenses that are excluded when management evaluates the performance of our day-to-day operations: integration and restructuring related costs, impairment or reversal of impairment of assets, COVID-19 related expenses, gain or loss on disposal of certain businesses and investments, and IFRS adoption transition adjustments.
In 2021, we amended our calculation of adjusted EBITDA to adjust for the impact of integration and restructuring and related costs and cloud computing transition adjustment. There were no similar expenses in the comparative period.
Why we use the measure and why it is useful to investors: It is not impacted by long-term investment and financing decisions, but rather focuses on the performance of our day-to-day operations. It provides a measure of our ability to service debt and to meet other payment obligations and as a component of employee remuneration calculations.
| (millions of US dollars) |
| 2021 |
| 2020 | ||||||||||||
Net earnings |
| 3,179 |
|
| 459 |
| ||||||||||
Finance costs |
| 613 |
|
| 520 |
| ||||||||||
Income tax expense (recovery) |
| 989 |
|
| (77 | ) | ||||||||||
Depreciation and amortization |
|
|
|
| 1,951 |
|
|
|
|
| 1,989 |
| ||||
EBITDA1 |
| 6,732 |
|
| 2,891 |
| ||||||||||
Share-based compensation expense |
| 198 |
|
| 69 |
| ||||||||||
Foreign exchange loss, net of related derivatives |
| 39 |
|
| 19 |
| ||||||||||
Integration and restructuring related costs |
| 43 |
|
| 60 |
| ||||||||||
Impairment of assets |
| 33 |
|
| 824 |
| ||||||||||
COVID-19 related expenses 2 |
| 45 |
|
| 48 |
| ||||||||||
Loss on disposal of business |
| – |
|
| 6 |
| ||||||||||
Net gain on disposal of investment in MOPCO |
| – |
|
| (250 | ) | ||||||||||
Cloud computing transition adjustment 3 |
|
|
|
| 36 |
|
|
|
|
| – |
| ||||
Adjusted EBITDA |
|
|
|
| 7,126 |
|
|
|
|
| 3,667 |
| ||||
| 1 | EBITDA is calculated as net earnings (loss) before finance costs, income taxes, and depreciation and amortization. |
| 2 | COVID-19 related expenses primarily consist of increased cleaning and sanitization costs, the purchase of personal protective equipment, discretionary supplemental employee costs, and costs related to construction delays from access limitations and other government restrictions. |
| 3 | Cloud computing transition adjustment relates to cloud computing costs in prior years that no longer qualify for capitalization based on an agenda decision issued by the IFRS Interpretations Committee in April 2021. |
OVERVIEW | MANAGEMENT’S DISCUSSION & ANALYSIS | FOUR-YEAR HIGHLIGHTS FINANCIAL STATEMENTS OTHER INFORMATION
Nutrien Annual Report 2021 | 63
Adjusted Net Earnings and Adjusted Net Earnings Per Share
Most directly comparable IFRS financial measure: Net earnings (loss) and net earnings (loss) per share.
Definition: Adjusted net earnings and related per share information are calculated as net earnings (loss) before share-based compensation and certain foreign exchange gain/loss (net of related derivatives), net of tax. We also adjust this measure for the following other income and expenses (net of tax) that are excluded when management evaluates the performance of our day-to-day operations: certain integration and restructuring related costs, impairment or reversal of impairment of assets, COVID-19 related expenses (including those recorded under finance costs), gain or loss on disposal of certain businesses and investments, IFRS adoption transition adjustments and gain/loss on early extinguishment of debt. We generally apply the annual forecasted effective tax rate to our adjustments during the year and, at year-end, we apply the actual effective tax rate. If the effective tax rate is significantly different from our forecasted effective tax rate due to adjustments or discrete tax impacts, we apply a tax rate that excludes those items. For material adjustments, we apply a tax rate specific to the adjustment. In 2021, we amended our calculation of adjusted net earnings to adjust for the impact of integration and restructuring related costs, cloud computing transition adjustment, and gain/loss on early extinguishment of debt. There were no similar expenses in the comparative period.
Why we use the measure and why it is useful to investors: Focuses on the performance of our day-to-day operations and is used as a component of employee remuneration calculations.
|
| 2021 | 2020 | ||||||||||||||||||||||
| (millions of US dollars, except as otherwise noted) | Increases (Decreases) | Post-Tax | Per Diluted Share | Increases (Decreases) | Post-Tax | Per Diluted Share | ||||||||||||||||||
Net earnings attributable to equity holders of Nutrien |
| 3,153 |
|
| 5.52 |
|
| 459 |
|
| 0.81 |
| ||||||||||||
Adjustments: | ||||||||||||||||||||||||
Share-based compensation expense |
| 198 |
|
| 151 |
|
| 0.27 |
|
| 69 |
|
| 50 |
|
| 0.09 |
| ||||||
Foreign exchange loss, net of related derivatives |
| 39 |
|
| 30 |
|
| 0.05 |
|
| 19 |
|
| 14 |
|
| 0.02 |
| ||||||
Integration and restructuring related costs |
| 43 |
|
| 33 |
|
| 0.06 |
|
| 60 |
|
| 44 |
|
| 0.08 |
| ||||||
Impairment of assets |
| 33 |
|
| 25 |
|
| 0.04 |
|
| 824 |
|
| 657 |
|
| 1.15 |
| ||||||
COVID-19 related expenses |
| 45 |
|
| 34 |
|
| 0.06 |
|
| 67 |
|
| 49 |
|
| 0.09 |
| ||||||
Loss on disposal of business |
| – |
|
| – |
|
| – |
|
| 6 |
|
| 4 |
|
| – |
| ||||||
Net gain on disposal of investment in MOPCO |
| – |
|
| – |
|
| – |
|
| (250 | ) |
| (250 | ) |
| (0.44 | ) | ||||||
Cloud computing transition adjustment |
| 36 |
|
| 27 |
|
| 0.05 |
|
| – |
|
| – |
|
| – |
| ||||||
Loss on early extinguishment of debt |
| 142 |
|
| 104 |
|
| 0.18 |
|
| – |
|
| – |
|
| – |
| ||||||
Adjusted net earnings |
|
|
|
| 3,557 |
|
| 6.23 |
|
|
|
|
| 1,027 |
|
| 1.80 |
| ||||||
Adjusted EBITDA (Consolidated) and Adjusted Net Earnings Per Share Guidance
Adjusted EBITDA and adjusted net earnings per share guidance are forward-looking non-IFRS financial measures. We do not provide a reconciliation of such forward-looking measures to the most directly comparable financial measures calculated and presented in accordance with IFRS due to unknown variables and the uncertainty related to future results. These unknown variables may include unpredictable transactions of significant value that may be inherently difficult to determine without unreasonable efforts. Guidance for adjusted EBITDA and adjusted net earnings per share excludes the impacts of share-based compensation, certain foreign exchange gain/loss (net of related derivatives), integration and restructuring related costs, impairment or reversal of impairment of assets, COVID-19 related expenses (including those recorded under finance costs), gain or loss on disposal of certain businesses and investments, IFRS adoption transition adjustments, and gain/loss on early extinguishment of debt.
Free Cash Flow and Free Cash Flow Including Changes in Non-Cash Operating Working Capital
Most directly comparable IFRS financial measure: Cash provided by (used in) operating activities.
Definition: Free cash flow is calculated as cash provided by (used in) operating activities less sustaining capital expenditures and before changes in non-cash operating working capital. Free cash flow including non-cash operating working capital is calculated as cash provided by operating activities less sustaining capital expenditures.
Why we use the measure and why it is useful to investors: For evaluation of liquidity and financial strength. These are also useful as indicators of our ability to service debt, meet other payment obligations and make strategic investments. These do not represent residual cash flow available for discretionary expenditures.
OVERVIEW | MANAGEMENT’S DISCUSSION & ANALYSIS | FOUR-YEAR HIGHLIGHTS FINANCIAL STATEMENTS OTHER INFORMATION
64 | Nutrien Annual Report 2021
| (millions of US dollars) |
| 2021 |
| 2020 | ||||||||||||
Cash provided by operating activities |
| 3,886 |
|
| 3,323 |
| ||||||||||
Sustaining capital expenditures |
|
|
|
| (1,247 | ) |
|
|
|
| (919 | ) | ||||
Free cash flow including changes in non-cash operating working capital |
| 2,639 |
|
| 2,404 |
| ||||||||||
Changes in non-cash operating working capital |
|
|
|
| (1,661 | ) |
|
|
|
| 574 |
| ||||
Free cash flow |
|
|
|
| 4,300 |
|
|
|
|
| 1,830 |
| ||||
Growth Capital
Most directly comparable IFRS financial measure: Capital expenditures.
Definition: Investing capital expenditures plus business acquisitions, net of cash acquired. Reconciliations are provided in the “Capital Allocation” section.
Why we use the measure and why it is useful to investors: To demonstrate how we allocate our capital to our various priorities including growth and expansion projects and acquisitions.
Gross Margin Excluding Depreciation and Amortization Per Tonne – Manufactured
Most directly comparable IFRS financial measure: Gross margin.
Definition: Gross margin per tonne from manufactured products less depreciation and amortization per tonne. Reconciliations are provided in the “Operating Segment Outlook and Performance” section.
Why we use the measure and why it is useful to investors: Focuses on the performance of our day-to-day operations, which excludes the effects of items that primarily reflect the impact of long-term investment and financing decisions.
Potash Cash Cost of Product Manufactured (“COPM”) Per Tonne
Most directly comparable IFRS financial measure: Cost of goods sold (“COGS”) for the Potash segment.
Definition: Total Potash COGS for the period excluding depreciation and amortization expense and inventory and other adjustments divided by the production tonnes for the period.
Why we use the measure and why it is useful to investors: To assess operational performance. Potash cash COPM excludes the effects of production from other periods and long-term investment decisions, supporting a focus on the performance of our day-to-day operations.
| (millions of US dollars, except as otherwise noted) |
| 2021 |
| 2020 | ||||||||||||
Total COGS – Potash |
| 1,285 |
|
| 1,183 |
| ||||||||||
Change in inventory |
| 22 |
|
| (10 | ) | ||||||||||
Other adjustments 1 |
|
|
|
| (6 | ) |
|
|
|
| (12 | ) | ||||
COPM |
| 1,301 |
|
| 1,161 |
| ||||||||||
Depreciation and amortization included in COPM |
|
|
|
| (430 | ) |
|
|
|
| (424 | ) | ||||
Cash COPM |
| 871 |
|
| 737 |
| ||||||||||
Production tonnes (tonnes – thousands) |
|
|
|
| 13,790 |
|
|
|
|
| 12,595 |
| ||||
Potash cash COPM per tonne |
|
|
|
| 63 |
|
|
|
|
| 59 |
| ||||
| 1 | Other adjustments include unallocated production overhead that is recognized as part of cost of goods sold but is not included in the measurement of inventory and changes in inventory balances. |
OVERVIEW | MANAGEMENT’S DISCUSSION & ANALYSIS | FOUR-YEAR HIGHLIGHTS FINANCIAL STATEMENTS OTHER INFORMATION
Nutrien Annual Report 2021 | 65
Ammonia Controllable Cash COPM Per Tonne
Most directly comparable IFRS financial measure: Total manufactured COGS for the Nitrogen segment.
Definition: The total of COGS for the Nitrogen segment excluding depreciation and amortization expense included in COGS, cash COGS for products other than ammonia, other adjustments, and natural gas and steam costs, divided by net ammonia production tonnes.
Why we use the measure and why it is useful to investors: To assess operational performance. Ammonia controllable cash COPM excludes the effects of production from other periods, the costs of natural gas and steam, and long-term investment decisions, supporting a focus on the performance of our day-to-day operations.
| (millions of US dollars, except as otherwise noted) |
| 2021 |
| 2020 | ||||||||||||
Total Manufactured COGS – Nitrogen |
| 2,353 |
|
| 1,804 |
| ||||||||||
Total Other COGS – Nitrogen |
|
|
|
| 610 |
|
|
|
|
| 461 |
| ||||
Total COGS – Nitrogen |
| 2,963 |
|
| 2,265 |
| ||||||||||
Depreciation and amortization in COGS |
| (473 | ) |
| (522 | ) | ||||||||||
Cash COGS for products other than ammonia |
|
|
|
| (1,740 | ) |
|
|
|
| (1,342 | ) | ||||
Ammonia | ||||||||||||||||
Total cash COGS before other adjustments |
| 750 |
|
| 401 |
| ||||||||||
Other adjustments 1 |
|
|
|
| (96 | ) |
|
|
|
| (52 | ) | ||||
Total cash COPM |
| 654 |
|
| 349 |
| ||||||||||
Natural gas and steam costs included in COPM |
|
|
|
| (515 | ) |
|
|
|
| (235 | ) | ||||
Controllable cash COPM |
| 139 |
|
| 114 |
| ||||||||||
Production tonnes (net tonnes 2 – thousands) |
|
|
|
| 2,769 |
|
|
|
|
| 2,649 |
| ||||
Ammonia controllable cash COPM per tonne |
|
|
|
| 50 |
|
|
|
|
| 43 |
| ||||
| 1 | Other adjustments include unallocated production overhead that is recognized as part of cost of goods sold but is not included in the measurement of inventory and changes in inventory balances. |
| 2 | Ammonia tonnes available for sale, as not upgraded to other Nitrogen products. |
Retail Adjusted Average Working Capital to Sales and Retail Adjusted Average Working Capital to Sales Excluding Nutrien Financial
Definition: Retail adjusted average working capital divided by Retail adjusted sales for the last four rolling quarters. We exclude in our calculations the working capital and sales of certain acquisitions (such as Ruralco Holdings Limited) during the first year following the acquisition. We also look at this metric excluding the sales and working capital of Nutrien Financial.
Why we use the measure and why it is useful to investors: To evaluate operational efficiency. A lower or higher percentage represents increased or decreased efficiency, respectively. The metric excluding Nutrien Financial shows the impact that the working capital of Nutrien Financial has on the ratio.
| (millions of US dollars, except as otherwise noted) |
| 2021 |
| 2020 | ||||||||||||
Average current assets |
| 9,332 |
|
| 7,998 |
| ||||||||||
Average current liabilities |
| (7,093 | ) |
| (5,825 | ) | ||||||||||
Average working capital |
| 2,239 |
|
| 2,173 |
| ||||||||||
Average working capital from certain recent acquisitions |
| – |
|
| (11 | ) | ||||||||||
Adjusted average working capital |
| 2,239 |
|
| 2,162 |
| ||||||||||
Average Nutrien Financial working capital |
| (2,316 | ) |
| (1,502 | ) | ||||||||||
Adjusted average working capital excluding Nutrien Financial |
| (77 | ) |
| 660 |
| ||||||||||
Sales |
| 17,734 |
|
| 14,785 |
| ||||||||||
Sales from certain recent acquisitions |
| – |
|
| (686 | ) | ||||||||||
Adjusted sales |
| 17,734 |
|
| 14,099 |
| ||||||||||
Nutrien Financial revenue |
| (189 | ) |
| (129 | ) | ||||||||||
Adjusted sales excluding Nutrien Financial |
| 17,545 |
|
| 13,970 |
| ||||||||||
Adjusted average working capital to sales (%) |
| 13 |
|
| 15 |
| ||||||||||
Adjusted average working capital to sales excluding Nutrien Financial (%) |
| – |
|
| 5 |
| ||||||||||
OVERVIEW | MANAGEMENT’S DISCUSSION & ANALYSIS | FOUR-YEAR HIGHLIGHTS FINANCIAL STATEMENTS OTHER INFORMATION
66 | Nutrien Annual Report 2021
Nutrien Financial Adjusted Net Interest Margin
Definition: Nutrien Financial revenue less deemed interest expense divided by average Nutrien Financial receivables outstanding for the last four rolling quarters.
Why we use the measure and why it is useful to investors: Used by credit rating agencies and other users to evaluate financial performance of Nutrien Financial.
| (millions of US dollars, except as otherwise noted) |
| 2021 |
| 2020 | ||||||||||||
Nutrien Financial revenue |
| 189 |
|
| 129 |
| ||||||||||
Deemed interest expense 1 |
|
|
|
| (36 | ) |
|
|
|
| (49 | ) | ||||
Net interest |
|
|
|
| 153 |
|
|
|
|
| 80 |
| ||||
Average Nutrien Financial receivables |
|
|
|
| 2,316 |
|
|
|
|
| 1,502 |
| ||||
Nutrien Financial adjusted net interest margin (%) |
|
|
|
| 6.6 |
|
|
|
|
| 5.3 |
| ||||
| 1 | Average borrowing rate applied to the notional debt required to fund the portfolio of receivables from customers monitored and serviced by Nutrien Financial. |
Retail Cash Operating Coverage Ratio
Definition: Retail selling, general and administrative, and other expenses, excluding depreciation and amortization expense, divided by Retail gross margin excluding depreciation and amortization expense in cost of goods sold, for the last four rolling quarters.
Why we use the measure and why it is useful to investors: To understand the costs and underlying economics of our Retail operations and to assess our Retail operating performance and ability to generate free cash flow.
| (millions of US dollars, except as otherwise noted) |
| 2021 |
| 2020 | ||||||||||||
Selling expenses |
| 3,124 |
|
| 2,795 |
| ||||||||||
General and administrative expenses |
| 168 |
|
| 135 |
| ||||||||||
Other expenses |
| 86 |
|
| 44 |
| ||||||||||
Operating expenses |
| 3,378 |
|
| 2,974 |
| ||||||||||
Depreciation and amortization in operating expenses |
|
|
|
| (694 | ) |
|
|
|
| (658 | ) | ||||
Operating expenses excluding depreciation and amortization |
|
|
|
| 2,684 |
|
|
|
|
| 2,316 |
| ||||
Gross margin |
| 4,600 |
|
| 3,736 |
| ||||||||||
Depreciation and amortization in cost of goods sold |
|
|
|
| 12 |
|
|
|
|
| 10 |
| ||||
Gross margin excluding depreciation and amortization |
|
|
|
| 4,612 |
|
|
|
|
| 3,746 |
| ||||
Cash operating coverage ratio (%) |
|
|
|
| 58 |
|
|
|
|
| 62 |
| ||||
Retail Normalized Comparable Store Sales
Most directly comparable IFRS financial measure: Retail sales from comparable base as a component of total Retail sales.
Definition: Prior year comparable store sales adjusted for published potash, nitrogen and phosphate benchmark prices and foreign exchange rates used in the current year. We retain sales of closed locations in the comparable base if the closed location is in close proximity to an existing location, unless we plan to exit the market area or are unable to economically or logistically serve it. We do not adjust for temporary closures, expansions or renovations of stores.
Why we use the measure and why it is useful to investors: To evaluate sales growth by adjusting for fluctuations in commodity prices and foreign exchange rates. Includes locations we have owned for more than 12 months.
| (millions of US dollars, except as otherwise noted) |
| 2021 |
| 2020 | ||||||||||||
Sales from comparable base |
|
|
| |||||||||||||
Prior period |
| 14,785 |
|
| 13,282 |
| ||||||||||
Adjustments 1 |
|
|
|
| (476 | ) |
|
|
|
| – |
| ||||
Revised prior period |
| 14,309 |
|
| 13,282 |
| ||||||||||
Current period |
|
|
|
| 17,511 |
|
|
|
|
| 13,546 |
| ||||
Comparable store sales (%) |
| 22 |
|
| 2 |
| ||||||||||
Prior period normalized for benchmark prices and foreign exchange rates |
|
|
|
| 16,350 |
|
|
|
|
| 12,784 |
| ||||
Normalized comparable store sales (%) |
|
|
|
| 7 |
|
|
|
|
| 6 |
| ||||
| 1 | Adjustments relate to prior period sales related to closed locations or businesses that no longer exist in the current period in order to provide a comparable base in our calculation. |
OVERVIEW | MANAGEMENT’S DISCUSSION & ANALYSIS | FOUR-YEAR HIGHLIGHTS FINANCIAL STATEMENTS OTHER INFORMATION
Nutrien Annual Report 2021 | 67
APPENDIX B – OTHER FINANCIAL MEASURES
Supplementary Financial Measures
Supplementary financial measures are financial measures disclosed by a company that (a) are, or are intended to be, disclosed on a periodic basis to depict the historical or expected future financial performance, financial position or cash flow of a company, (b) are not disclosed in the financial statements of the company, (c) are not non-IFRS financial measures, and (d) are not non-IFRS ratios.
The following section provides an explanation of the composition of those supplementary financial measures if not previously provided.
Retail adjusted EBITDA margin: Retail adjusted EBITDA divided by Retail sales for the last four rolling quarters.
Retail digital platform sales: Grower and employee sales in North America entered directly into the digital platform.
Retail digital platform sales to total sales: Grower and employee sales in North America entered directly into the digital platform as a percentage of total sales in North America.
Sustaining capital expenditures: Represents capital expenditures that are required to sustain operations at existing levels and include major repairs and maintenance and plant turnarounds.
Investing capital expenditures: Represents capital expenditures related to significant expansions of current operations or to create cost savings (synergies). Investing capital excludes capital outlays for business acquisitions and equity-accounted investees.
Mine development and pre-stripping capital expenditures: Represents capital expenditures that are required for activities to open new areas underground and/or develop a mine or ore body to allow for future production mining and activities required to prepare and/or access the ore i.e., removal of an overburden that allows access to the ore.
Retail adjusted EBITDA per US selling location: Calculated as total Retail US adjusted EBITDA for the last four rolling quarters, representing the organic EBITDA component, which excludes acquisitions in those quarters, divided by the number of US locations that have generated sales in the last four rolling quarters, adjusted for acquired locations in those quarters.
Cash used for dividends and share repurchases (shareholder returns): Calculated as dividends paid to Nutrien shareholders plus repurchase of common shares per the consolidated statements of cash flows. This measure is useful as it represents return of capital to shareholders.
Capital Management Measures
Capital management measures are financial measures disclosed by a company that (a) are intended to enable an individual to evaluate a company’s objectives, policies and processes for managing the entity’s capital, (b) are not a component of a line item disclosed in the primary financial statements of the company, (c) are disclosed in the notes of the financial statements of the company, and (d) are not disclosed in the primary financial statements of the company.
The following section outlines our capital management measure, its composition and why management uses the measure.
Adjusted Net Debt to Adjusted EBITDA: Calculated as adjusted net debt to adjusted EBITDA. Both components are non-IFRS financial measures. This ratio measures financial leverage and our ability to pay our debt.
The most directly comparable measure for adjusted net debt is total short-term and long-term debt and lease liabilities less cash and cash equivalents and is defined as the total of short-term and long-term debt plus lease liabilities less cash and cash equivalents and unamortized fair value adjustments. This measure is useful as it adjusts for the unamortized fair value adjustments that arose at the time of the merger and is non-cash by nature.
| (millions of US dollars, except as otherwise noted) |
| 2021 |
| 2020 | ||||||||||||
Short-term debt |
| 1,560 |
|
| 159 |
| ||||||||||
Current portion of long-term debt |
| 545 |
|
| 14 |
| ||||||||||
Current portion of lease liabilities |
| 286 |
|
| 249 |
| ||||||||||
Long-term debt |
| 7,521 |
|
| 10,047 |
| ||||||||||
Lease liabilities |
|
|
|
| 934 |
|
|
|
|
| 891 |
| ||||
Total debt |
|
|
|
| 10,846 |
|
|
|
|
| 11,360 |
| ||||
Cash and cash equivalents |
| (499 | ) |
| (1,454 | ) | ||||||||||
Unamortized fair value adjustments |
|
|
|
| (325 | ) |
|
|
|
| (404 | ) | ||||
Adjusted net debt |
|
|
|
| 10,022 |
|
|
|
|
| 9,502 |
| ||||
OVERVIEW | MANAGEMENT’S DISCUSSION & ANALYSIS | FOUR-YEAR HIGHLIGHTS FINANCIAL STATEMENTS OTHER INFORMATION
68 | Nutrien Annual Report 2021
The following information is not part of our MD&A on SEDAR and EDGAR and is furnished for those readers who may find value in the use of such information over the long term. In future years, we plan to expand the historical data in these tables as the information becomes available.
Summary Financial Information
| (millions of US dollars, except as otherwise noted) |
| 2021 |
| 2020 |
| 2019 |
| 2018 | ||||||||||||||||||||||||
Operations | ||||||||||||||||||||||||||||||||
Sales 1 |
| 27,712 |
|
| 20,908 |
|
| 20,084 |
|
| 19,636 |
| ||||||||||||||||||||
Earnings before finance costs and income taxes |
| 4,781 |
|
| 902 |
|
| 1,862 |
|
| 414 |
| ||||||||||||||||||||
Net earnings (loss) from continuing operations |
| 3,179 |
|
| 459 |
|
| 992 |
|
| (31 | ) | ||||||||||||||||||||
Net earnings |
| 3,179 |
|
| 459 |
|
| 992 |
|
| 3,573 |
| ||||||||||||||||||||
Diluted net earnings per share from continuing operations |
| 5.52 |
|
| 0.81 |
|
| 1.70 |
|
| (0.05 | ) | ||||||||||||||||||||
Diluted net earnings per share |
| 5.52 |
|
| 0.81 |
|
| 1.70 |
|
| 5.72 |
| ||||||||||||||||||||
Finance costs |
| 613 |
|
| 520 |
|
| 554 |
|
| 538 |
| ||||||||||||||||||||
Adjusted EBITDA 2 |
| 7,126 |
|
| 3,667 |
|
| 4,025 |
|
| 3,934 |
| ||||||||||||||||||||
Cash provided by operating activities |
|
|
|
| 3,886 |
|
|
|
|
| 3,323 |
|
|
|
|
| 3,665 |
|
|
|
|
| 2,052 |
| ||||||||
Balance Sheet | ||||||||||||||||||||||||||||||||
Total assets |
| 49,954 |
|
| 47,192 |
|
| 46,799 |
|
| 45,502 |
| ||||||||||||||||||||
Short-term debt and long-term debt (including leases) |
| 10,846 |
|
| 11,360 |
|
| 11,104 |
|
| 9,223 |
| ||||||||||||||||||||
Shareholders’ equity |
|
|
|
| 23,699 |
|
|
|
|
| 22,403 |
|
|
|
|
| 22,907 |
|
|
|
|
| 24,425 |
| ||||||||
Common Share Information | ||||||||||||||||||||||||||||||||
Weighted average common shares (millions) |
| 571 |
|
| 570 |
|
| 583 |
|
| 625 |
| ||||||||||||||||||||
Closing share price on NYSE (USD) |
| 75.20 |
|
| 48.16 |
|
| 47.91 |
|
| 47.00 |
| ||||||||||||||||||||
Total shareholder return percentage (%) |
|
|
|
| 60.8 |
|
|
|
|
| 5.5 |
|
|
|
|
| 5.5 |
|
|
|
|
| (6.6 | ) | ||||||||
Operating Segment Information | ||||||||||||||||||||||||||||||||
Retail net sales 1,3 |
| 17,734 |
|
| 14,785 |
|
| 13,282 |
|
| 12,520 |
| ||||||||||||||||||||
Potash net sales |
| 4,036 |
|
| 2,146 |
|
| 2,604 |
|
| 2,667 |
| ||||||||||||||||||||
Nitrogen net sales 4 |
| 4,689 |
|
| 2,740 |
|
| 2,848 |
|
| 2,965 |
| ||||||||||||||||||||
Phosphate net sales 4 |
| 1,829 |
|
| 1,202 |
|
| 1,368 |
|
| 1,561 |
| ||||||||||||||||||||
Retail adjusted EBITDA |
| 1,939 |
|
| 1,430 |
|
| 1,231 |
|
| 1,206 |
| ||||||||||||||||||||
Potash adjusted EBITDA |
| 2,736 |
|
| 1,190 |
|
| 1,593 |
|
| 1,606 |
| ||||||||||||||||||||
Nitrogen adjusted EBITDA 4 |
| 2,308 |
|
| 1,080 |
|
| 1,239 |
|
| 1,215 |
| ||||||||||||||||||||
Phosphate adjusted EBITDA 4 |
|
|
|
| 540 |
|
|
|
|
| 232 |
|
|
|
|
| 194 |
|
|
|
|
| 255 |
| ||||||||
Capital Allocation | ||||||||||||||||||||||||||||||||
Sustaining capital expenditures 5 |
| 1,247 |
|
| 919 |
|
| 1,018 |
|
| 985 |
| ||||||||||||||||||||
Investing capital expenditures 5 |
| 510 |
|
| 511 |
|
| 772 |
|
| 320 |
| ||||||||||||||||||||
Mine development and pre-stripping expenditures 5 |
| 156 |
|
| 109 |
|
| 96 |
|
| 100 |
| ||||||||||||||||||||
Business acquisitions (net of cash acquired) |
| 88 |
|
| 233 |
|
| 911 |
|
| 433 |
| ||||||||||||||||||||
Dividends paid |
| 1,045 |
|
| 1,030 |
|
| 1,022 |
|
| 952 |
| ||||||||||||||||||||
Payments for share repurchases |
|
|
|
| 1,035 |
|
|
|
|
| 160 |
|
|
|
|
| 1,930 |
|
|
|
|
| 1,800 |
| ||||||||
| 1 | Certain immaterial figures have been reclassified for 2019 and 2018. |
| 2 | This is a non-IFRS financial measure. See the “Non-IFRS Financial Measures” section. Additional information relating to 2019 and 2018 is contained in the “Appendix – Non-IFRS Financial Measures” sections of Nutrien’s MD&A dated February 19, 2020 for the year ended December 31, 2019 and its MD&A dated February 20, 2019 for the year ended December 31, 2018, respectively, which information is incorporated by reference herein. Such MD&A are available on SEDAR at www.sedar.com. |
| 3 | Certain immaterial figures have been reclassified or grouped together for 2018. |
| 4 | Restated 2018 for the reclassification of sulfate from the Phosphate segment to the Nitrogen segment. |
| 5 | These are supplementary financial measures. See the “Other Financial Measures” section. |
OVERVIEW MANAGEMENT’S DISCUSSION & ANALYSIS | FOUR-YEAR HIGHLIGHTS | FINANCIAL STATEMENTS OTHER INFORMATION
Nutrien Annual Report 2021 | 69
Summary Non-Financial Information
| (millions of US dollars, except as otherwise noted) |
| 2021 |
| 2020 |
| 2019 |
| 2018 | ||||||||||||||||||||||||
Safety |
|
|
| |||||||||||||||||||||||||||||
Total recordable injury frequency 1 |
| 1.11 |
|
| 1.13 |
|
| 1.29 |
|
| 1.38 |
| ||||||||||||||||||||
Lost-time injury frequency 1 |
| 0.27 |
|
| 0.26 |
|
| 0.31 |
|
| 0.37 |
| ||||||||||||||||||||
Serious injury and fatality incidents |
|
|
|
| – |
|
|
|
|
| 1 |
|
|
|
|
| 1 |
|
|
|
|
| 2 |
| ||||||||
Environment | ||||||||||||||||||||||||||||||||
Environmental incidents 1 |
|
|
|
| 24 |
|
|
|
|
| 23 |
|
|
|
|
| 24 |
|
|
|
|
| 20 |
| ||||||||
Community | ||||||||||||||||||||||||||||||||
Community investment ($ millions) |
|
|
|
| 19 |
|
|
|
|
| 18 |
|
|
|
|
| 17 |
|
|
|
|
| 17 |
| ||||||||
Employees | ||||||||||||||||||||||||||||||||
Employees at December 31 |
| 23,500 |
|
| 23,100 |
|
| 22,300 |
|
| 20,300 |
| ||||||||||||||||||||
Total employee turnover rate (%) |
| 15 |
|
| 13 |
|
| 13 |
|
| 14 |
| ||||||||||||||||||||
Proportion of women (%) |
| 20 |
|
| 20 |
|
| 19 |
|
| 17 |
| ||||||||||||||||||||
Proportion of women in senior leadership (director level and above) (%) |
|
|
|
| 21 |
|
|
|
|
| 19 |
|
|
|
|
| 15 |
|
|
|
|
| 17 |
| ||||||||
| 1 | Restated 2018-2020 as a result of changes to classification of incidents. |
Summary Production and Sales Volumes Information
|
|
| 2021 |
| 2020 |
| 2019 |
| 2018 | ||||||||||||||||||||||||
Production (thousands) | ||||||||||||||||||||||||||||||||
Potash production (product tonnes) |
| 13,790 |
|
| 12,595 |
|
| 11,700 |
|
| 12,842 |
| ||||||||||||||||||||
Nitrogen production (total ammonia tonnes) 1 |
| 5,996 |
|
| 6,063 |
|
| 6,164 |
|
| 6,372 |
| ||||||||||||||||||||
Phosphate production (P2O5 tonnes) 2 |
|
|
|
| 1,518 |
|
|
|
|
| 1,444 |
|
|
|
|
| 1,514 |
|
|
|
|
| 1,551 |
| ||||||||
Sales of manufactured product tonnes (thousands) | ||||||||||||||||||||||||||||||||
Retail crop nutrient tonnes sold |
| 13,383 |
|
| 12,732 |
|
| 11,048 |
|
| 10,689 |
| ||||||||||||||||||||
Potash tonnes sold |
| 13,625 |
|
| 12,824 |
|
| 11,521 |
|
| 13,019 |
| ||||||||||||||||||||
Nitrogen tonnes sold 3 |
| 10,725 |
|
| 10,966 |
|
| 10,270 |
|
| 10,598 |
| ||||||||||||||||||||
Phosphate tonnes sold 3 |
|
|
|
| 2,619 |
|
|
|
|
| 2,781 |
|
|
|
|
| 2,889 |
|
|
|
|
| 3,272 |
| ||||||||
| 1 | All figures are provided on a gross production basis. |
| 2 | Excludes Redwater. 2018 figures were restated to exclude Redwater. |
| 3 | Restated 2018 for the reclassification of sulfate from the Phosphate segment. |
OVERVIEW MANAGEMENT’S DISCUSSION & ANALYSIS | FOUR-YEAR HIGHLIGHTS | FINANCIAL STATEMENTS OTHER INFORMATION

Nutrien Annual Report 2021 | 71
| 72 | |||||||
73 | Reports of the Independent Registered Public Accounting Firm | |||||||
76 | ||||||||
77 | ||||||||
77 | ||||||||
78 | ||||||||
79 | ||||||||
80 | ||||||||
81 | Note 1 | |||||||
81 | Note 2 | |||||||
82 | Note 3 | |||||||
85 | Note 4 | |||||||
86 | Note 5 | |||||||
88 | Note 6 | |||||||
88 | Note 7 | |||||||
89 | Note 8 | |||||||
91 | Note 9 | |||||||
92 | Note 10 | |||||||
96 | Note 11 | |||||||
97 | Note 12 | |||||||
97 | Note 13 | |||||||
100 | Note 14 | |||||||
102 | Note 15 | |||||||
102 | Note 16 | |||||||
103 | Note 17 | |||||||
104 | Note 18 | |||||||
106 | Note 19 | |||||||
106 | Note 20 | |||||||
107 | Note 21 | |||||||
110 | Note 22 | Asset Retirement Obligations and Accrued Environmental Costs | ||||||
111 | Note 23 | |||||||
113 | Note 24 | |||||||
114 | Note 25 | |||||||
116 | Note 26 | |||||||
117 | Note 27 | |||||||
117 | Note 28 | |||||||
118 | Note 29 | |||||||
120 | Note 30 | |||||||

OVERVIEW MANAGEMENT’S DISCUSSION & ANALYSIS FOUR-YEAR HIGHLIGHTS | FINANCIAL STATEMENTS | OTHER INFORMATION
| 72 | Nutrien Annual Report 2021 | In millions of US dollars unless otherwise noted |
Management’s Responsibility for Financial Reporting
Management’s Report on the Consolidated Financial Statements
The accompanying consolidated financial statements and related financial information are the responsibility of the management of Nutrien Ltd. (the “Company”). They have been prepared in accordance with International Financial Reporting Standards (“IFRS”) as issued by the International Accounting Standards Board and include amounts based on estimates and judgments. Financial information included elsewhere in this report is consistent with the consolidated financial statements.
The consolidated financial statements are approved by the Board of Directors on the recommendation of the audit committee. The audit committee, appointed by the Board of Directors, is composed entirely of independent directors. The audit committee discusses and analyzes the Company’s condensed consolidated financial statements and Management’s Discussion and Analysis (“MD&A”) with management before such information is approved by the committee and submitted to securities commissions or other regulatory authorities. The audit committee and management also analyze the annual consolidated financial statements and MD&A prior to their approval by the Board of Directors.
The audit committee’s duties also include reviewing critical accounting policies and significant estimates and judgments underlying the consolidated financial statements as presented by management and approving the fees of our independent registered public accounting firm.
Our independent registered public accounting firm, KPMG LLP, performs an audit of the consolidated financial statements, the results of which are reflected in their Report of Independent Registered Public Accounting Firm for 2021. KPMG LLP has full and independent access to the audit committee to discuss their audit and related matters.
Management’s Annual Report on Internal Control over Financial Reporting
Management is responsible for establishing and maintaining adequate internal control over financial reporting, as defined in Rules 13a-15(f) and 15d-15(f) of the Securities Exchange Act of 1934, as amended, and National Instrument 52-109 – Certification of Disclosure in Issuers’ Annual and Interim Filings. Internal control over financial reporting is designed to provide reasonable assurance regarding the reliability of financial reporting and preparation of financial statements for external purposes in accordance with IFRS.
Under our supervision and with the participation of management, the Company conducted an evaluation of the design and effectiveness of our internal control over financial reporting as of the end of the fiscal year covered by this report, based on the framework issued by the Committee of Sponsoring Organizations of the Treadway Commission in Internal Control – Integrated Framework (2013). Based on this evaluation, management concluded that, as of December 31, 2021, the Company did maintain effective internal control over financial reporting.
The effectiveness of the Company’s internal control over financial reporting as at December 31, 2021 has been audited by KPMG LLP, as reflected in their Report of Independent Registered Public Accounting Firm for 2021.
 |  | |
Ken Seitz Interim President and Chief Executive Officer February 17, 2022 | Pedro Farah Executive Vice President and Chief Financial Officer February 17, 2022 |
OVERVIEW MANAGEMENT’S DISCUSSION & ANALYSIS FOUR-YEAR HIGHLIGHTS | FINANCIAL STATEMENTS | OTHER INFORMATION
| In millions of US dollars unless otherwise noted | Nutrien Annual Report 2021 | 73 |
REPORT OF INDEPENDENT REGISTERED
PUBLIC ACCOUNTING FIRM
To the Shareholders and Board of Directors of Nutrien Ltd.
Opinion on Internal Control Over Financial Reporting
We have audited Nutrien Ltd. and subsidiaries’ (the “Company”) internal control over financial reporting as of December 31, 2021, based on criteria established in Internal Control – Integrated Framework (2013) issued by the Committee of Sponsoring Organizations of the Treadway Commission. In our opinion, the Company maintained, in all material respects, effective internal control over financial reporting as of December 31, 2021, based on criteria established in Internal Control – Integrated Framework (2013) issued by the Committee of Sponsoring Organizations of the Treadway Commission.
We also have audited, in accordance with the standards of the Public Company Accounting Oversight Board (United States) (“PCAOB”), the consolidated balance sheets of the Company as of December 31, 2021 and 2020, the related consolidated statements of earnings, comprehensive income, cash flows, and changes in shareholders’ equity for the years then ended, and the related notes (collectively, the “consolidated financial statements”), and our report dated February 17, 2022 expressed an unqualified opinion on those consolidated financial statements.
Basis for Opinion
The Company’s management is responsible for maintaining effective internal control over financial reporting and for its assessment of the effectiveness of internal control over financial reporting, included in the accompanying Management’s Annual Report on Internal Control over Financial Reporting. Our responsibility is to express an opinion on the Company’s internal control over financial reporting based on our audit. We are a public accounting firm registered with the PCAOB and are required to be independent with respect to the Company in accordance with the US federal securities laws and the applicable rules and regulations of the Securities and Exchange Commission and the PCAOB.
We conducted our audit in accordance with the standards of the PCAOB. Those standards require that we plan and perform the audit to obtain reasonable assurance about whether effective internal control over financial reporting was maintained in all material respects. Our audit of internal control over financial reporting included obtaining an understanding of internal control over financial reporting, assessing the risk that a material weakness exists, and testing and evaluating the design and operating effectiveness of internal control based on the assessed risk. Our audit also included performing such other procedures as we considered necessary in the circumstances. We believe that our audit provides a reasonable basis for our opinion.
Definition and Limitations of Internal Control Over Financial Reporting
A company’s internal control over financial reporting is a process designed to provide reasonable assurance regarding the reliability of financial reporting and the preparation of financial statements for external purposes in accordance with generally accepted accounting principles. A company’s internal control over financial reporting includes those policies and procedures that (1) pertain to the maintenance of records that, in reasonable detail, accurately and fairly reflect the transactions and dispositions of the assets of the company; (2) provide reasonable assurance that transactions are recorded as necessary to permit preparation of financial statements in accordance with generally accepted accounting principles, and that receipts and expenditures of the company are being made only in accordance with authorizations of management and directors of the company; and (3) provide reasonable assurance regarding prevention or timely detection of unauthorized acquisition, use, or disposition of the company’s assets that could have a material effect on the financial statements.
Because of its inherent limitations, internal control over financial reporting may not prevent or detect misstatements. Also, projections of any evaluation of effectiveness to future periods are subject to the risk that controls may become inadequate because of changes in conditions, or that the degree of compliance with the policies or procedures may deteriorate.
Chartered Professional Accountants
Calgary, Canada
February 17, 2022
OVERVIEW MANAGEMENT’S DISCUSSION & ANALYSIS FOUR-YEAR HIGHLIGHTS | FINANCIAL STATEMENTS | OTHER INFORMATION
| 74 | Nutrien Annual Report 2021 | In millions of US dollars unless otherwise noted |
REPORT OF INDEPENDENT REGISTERED
PUBLIC ACCOUNTING FIRM
To the Shareholders and Board of Directors of Nutrien Ltd.
Opinion on the Consolidated Financial Statements
We have audited the accompanying consolidated balance sheets of Nutrien Ltd. and subsidiaries (the “Company”) as of December 31, 2021 and 2020, the related consolidated statements of earnings, comprehensive income, cash flows, and changes in shareholders’ equity for the years then ended, and the related notes (collectively, the “consolidated financial statements”). In our opinion, the consolidated financial statements present fairly, in all material respects, the financial position of the Company as of December 31, 2021 and 2020, and its financial performance and its cash flows for the years then ended, in conformity with International Financial Reporting Standards as issued by the International Accounting Standards Board.
We also have audited, in accordance with the standards of the Public Company Accounting Oversight Board (United States) (“PCAOB”), the Company’s internal control over financial reporting as of December 31, 2021, based on criteria established in Internal Control – Integrated Framework (2013) issued by the Committee of Sponsoring Organizations of the Treadway Commission, and our report dated February 17, 2022 expressed an unqualified opinion on the effectiveness of the Company’s internal control over financial reporting.
Basis for Opinion
These consolidated financial statements are the responsibility of the Company’s management. Our responsibility is to express an opinion on these consolidated financial statements based on our audits. We are a public accounting firm registered with the PCAOB and are required to be independent with respect to the Company in accordance with the US federal securities laws and the applicable rules and regulations of the Securities and Exchange Commission and the PCAOB.
We conducted our audits in accordance with the standards of the PCAOB. Those standards require that we plan and perform the audit to obtain reasonable assurance about whether the consolidated financial statements are free of material misstatement, whether due to error or fraud. Our audits included performing procedures to assess the risks of material misstatement of the consolidated financial statements, whether due to error or fraud, and performing procedures that respond to those risks. Such procedures included examining, on a test basis, evidence regarding the amounts and disclosures in the consolidated financial statements. Our audits also included evaluating the accounting principles used and significant estimates made by management, as well as evaluating the overall presentation of the consolidated financial statements. We believe that our audits provide a reasonable basis for our opinion.
Critical Audit Matters
The critical audit matters communicated below are matters arising from the current period audit of the consolidated financial statements that were communicated or required to be communicated to the audit committee and that: (1) relate to accounts or disclosures that are material to the consolidated financial statements and (2) involved our especially challenging, subjective, or complex judgments. The communication of critical audit matters does not alter in any way our opinion on the consolidated financial statements, taken as a whole, and we are not, by communicating the critical audit matters below, providing separate opinions on the critical audit matters or on the accounts or disclosures to which they relate.
OVERVIEW MANAGEMENT’S DISCUSSION & ANALYSIS FOUR-YEAR HIGHLIGHTS | FINANCIAL STATEMENTS | OTHER INFORMATION
| In millions of US dollars unless otherwise noted | Nutrien Annual Report 2021 | 75 |
Report of Independent Registered Public Accounting Firm Continued
Goodwill Impairment Assessment of the Retail North America Group of Cash-Generating Units
As discussed in Note 14 to the consolidated financial statements, the carrying amount of goodwill as of December 31, 2021 was $12,220 million, of which $6,898 million of goodwill has been allocated to the Retail North America group of cash-generating units (“Retail North America CGU”). The Retail North America CGU is tested for impairment annually, and whenever events or changes in circumstances may indicate the carrying amount, including goodwill, exceeds its estimated recoverable amount. The calculation of the recoverable amount of the Retail North America CGU involved estimates including forecasted earnings before tax, interest, depreciation and amortization (“EBITDA”), terminal growth rate and the discount rate.
We identified the calculation of the recoverable amount of goodwill for the Retail North America CGU as a critical audit matter. A high degree of auditor judgment was required to evaluate the Company’s forecasted EBITDA, terminal growth rate and discount rate used to calculate the recoverable amount of the Retail North America CGU. Minor changes to these assumptions could have had a significant effect on the Company’s calculation of the recoverable amount of the Retail North America CGU. Additionally, the audit effort associated with this estimate required specialized skills and knowledge.
The following are the primary procedures we performed to address this critical audit matter. We evaluated the design and tested the operating effectiveness of certain internal controls related to the calculation of the recoverable amount of goodwill for the Retail North America CGU. This included controls related to the determination of forecasted EBITDA, terminal growth rate and the discount rate. We evaluated the Company’s forecasted EBITDA for the Retail North America CGU by comparing to historical results and forecasted planted acreage in the United States. We evaluated the terminal growth rate by comparing to the historical growth of the Retail North America CGU and to market information, including forecasted inflation and forecasted gross domestic product in the United States. We evaluated the Company’s historical forecasts of EBITDA by comparing to actual results to assess the Company’s ability to accurately forecast. In addition, we involved valuation professionals with specialized skills and knowledge, who assisted in:
| • | evaluating the Company’s determination of the discount rate by comparing the inputs to the discount rate to publicly available market data for comparable entities and assessing the resulting discount rate, and |
| • | evaluating the Company’s estimate of the recoverable amount of the Retail North America CGU by comparing the results of the Company’s estimate to publicly available market data and valuation metrics for comparable entities. |
Chartered Professional Accountants
We have served as the Company’s auditor since 2018.
Calgary, Canada
February 17, 2022
OVERVIEW MANAGEMENT’S DISCUSSION & ANALYSIS FOUR-YEAR HIGHLIGHTS | FINANCIAL STATEMENTS | OTHER INFORMATION
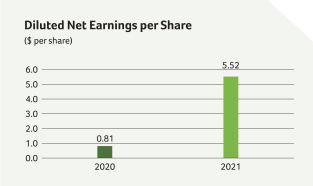
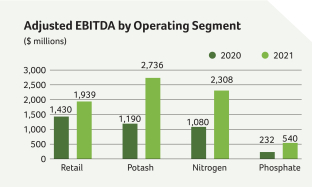
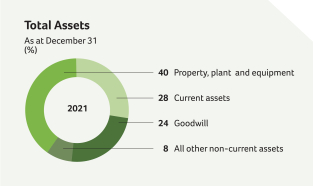
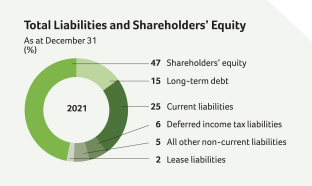
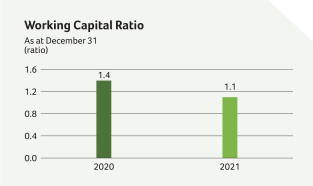
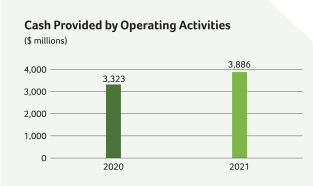
| In millions of US dollars unless otherwise noted | Nutrien Annual Report 2021 | 77 |
CONSOLIDATED FINANCIAL STATEMENTS
CONSOLIDATED STATEMENTS OF EARNINGS
| For the years ended December 31 | NOTE | 2021 | 2020 | |||||||||||||||||||||
Sales |
| 3 |
|
| 27,712 |
|
| 20,908 |
| |||||||||||||||
Freight, transportation and distribution |
| 4 |
|
| 851 |
|
| 855 |
| |||||||||||||||
Cost of goods sold |
| 4, 12 |
|
| 17,452 |
|
| 14,814 |
| |||||||||||||||
| Gross Margin | 9,409 | 5,239 | ||||||||||||||||||||||
| Selling expenses | 4 | 3,142 | 2,813 | |||||||||||||||||||||
| General and administrative expenses | 4 | 477 | 429 | |||||||||||||||||||||
| Provincial mining taxes | 4 | 466 | 204 | |||||||||||||||||||||
| Share-based compensation | 5 | 198 | 69 | |||||||||||||||||||||
| Impairment of assets | 13, 14 | 33 | 824 | |||||||||||||||||||||
Other expenses (income) |
| 6 |
|
| 312 |
|
| (2 | ) | |||||||||||||||
| Earnings before finance costs and income taxes | 4,781 | 902 | ||||||||||||||||||||||
Finance costs |
| 7 |
|
| 613 |
|
| 520 |
| |||||||||||||||
| Earnings before income taxes | 4,168 | 382 | ||||||||||||||||||||||
Income tax expense (recovery) |
| 8 |
|
| 989 |
|
| (77 | ) | |||||||||||||||
Net Earnings |
| 3,179 |
|
| 459 |
| ||||||||||||||||||
Attributable to | ||||||||||||||||||||||||
Equity holders of Nutrien |
| 3,153 |
|
| 459 |
| ||||||||||||||||||
Non-controlling interest | 26 | – | ||||||||||||||||||||||
| Net earnings | 3,179 | 459 | ||||||||||||||||||||||
Net earnings per share attributable to equity holders of nutrien (“EPS”) |
| 9 |
| |||||||||||||||||||||
Basic | 5.53 | 0.81 | ||||||||||||||||||||||
Diluted |
| 5.52 |
|
| 0.81 |
| ||||||||||||||||||
Weighted average shares outstanding for basic EPS |
| 9 |
|
| 569,664,000 |
|
| 569,657,000 |
| |||||||||||||||
Weighted average shares outstanding for diluted EPS |
| 9 |
|
| 571,289,000 |
|
| 569,686,000 |
| |||||||||||||||
COMPREHENSIVE INCOME
| For the years ended December 31 (net of related income taxes) | NOTE | 2021 | 2020 | |||||||||||||||||||||
| Net earnings | 3,179 | 459 | ||||||||||||||||||||||
| Other comprehensive income | ||||||||||||||||||||||||
Items that will not be reclassified to net earnings: | ||||||||||||||||||||||||
Net actuarial gain on defined benefit plans | 21 | 95 | 75 | |||||||||||||||||||||
Net fair value gain (loss) on investments | 15 | 81 | (7 | ) | ||||||||||||||||||||
Items that have been or may be subsequently reclassified to net earnings: | ||||||||||||||||||||||||
(Loss) gain on currency translation of foreign operations |
| (115 | ) |
| 142 |
| ||||||||||||||||||
Other |
| 17 |
|
| (16 | ) | ||||||||||||||||||
Other comprehensive income |
| 78 |
|
| 194 |
| ||||||||||||||||||
Comprehensive income |
| 3,257 |
|
| 653 |
| ||||||||||||||||||
| Attributable to | ||||||||||||||||||||||||
Equity holders of Nutrien |
| 3,232 |
|
| 653 |
| ||||||||||||||||||
Non-controlling interest |
| 25 |
|
| – |
| ||||||||||||||||||
Comprehensive income |
| 3,257 |
|
| 653 |
| ||||||||||||||||||
(See Notes to the Consolidated Financial Statements)
OVERVIEW MANAGEMENT’S DISCUSSION & ANALYSIS FOUR-YEAR HIGHLIGHTS | FINANCIAL STATEMENTS | OTHER INFORMATION
| 78 | Nutrien Annual Report 2021 | In millions of US dollars unless otherwise noted |
CONSOLIDATED STATEMENTS OF CASH FLOWS
| For the years ended December 31 | NOTE | 2021 | 2020 | |||||||||||||||||||||
| Operating activities | ||||||||||||||||||||||||
Net earnings |
| 3,179 |
|
| 459 |
| ||||||||||||||||||
Adjustments for: | ||||||||||||||||||||||||
Depreciation and amortization |
| 1,951 |
|
| 1,989 |
| ||||||||||||||||||
Share-based compensation expense |
| 5 |
|
| 198 |
|
| 69 |
| |||||||||||||||
Impairment of assets |
| 13 |
|
| 33 |
|
| 824 |
| |||||||||||||||
Loss on early extinguishment of debt |
| 142 |
|
| – |
| ||||||||||||||||||
Net gain on disposal of investment in Misr Fertilizers Production Company S.A.E. (“MOPCO”) |
| 6 |
|
| – |
|
| (250 | ) | |||||||||||||||
Recovery of deferred income tax |
| (31 | ) |
| (9 | ) | ||||||||||||||||||
Cloud computing transition adjustment |
| 6 |
|
| 36 |
|
| – |
| |||||||||||||||
Other long-term assets, liabilities and miscellaneous |
| 16 |
|
| 39 |
|
| (333 | ) | |||||||||||||||
Cash from operations before working capital changes |
| 5,547 |
|
| 2,749 |
| ||||||||||||||||||
Changes in non-cash operating working capital: | ||||||||||||||||||||||||
Receivables |
| (1,669 | ) |
| 145 |
| ||||||||||||||||||
Inventories |
| (1,459 | ) |
| 85 |
| ||||||||||||||||||
Prepaid expenses and other current assets |
| (227 | ) |
| (10 | ) | ||||||||||||||||||
Payables and accrued charges |
| 1,694 |
|
| 354 |
| ||||||||||||||||||
| Cash provided by operating activities |
| 3,886 |
|
| 3,323 |
| ||||||||||||||||||
| Investing activities | ||||||||||||||||||||||||
Capital expenditures 1 |
| 13, 14 |
|
| (1,783 | ) |
| (1,549 | ) | |||||||||||||||
Business acquisitions, net of cash acquired |
| 25 |
|
| (88 | ) |
| (233 | ) | |||||||||||||||
Proceeds from disposal of investment in MOPCO |
| 6 |
|
| – |
|
| 540 |
| |||||||||||||||
Other |
| 64 |
|
| 38 |
| ||||||||||||||||||
| Cash used in investing activities |
| (1,807 | ) |
| (1,204 | ) | ||||||||||||||||||
| Financing activities | ||||||||||||||||||||||||
Transaction costs related to debt |
| (7 | ) |
| (15 | ) | ||||||||||||||||||
Proceeds from (repayment of) short-term debt, net |
| 17 |
|
| 1,344 |
|
| (892 | ) | |||||||||||||||
Proceeds from long-term debt |
| 18 |
|
| 86 |
|
| 1,541 |
| |||||||||||||||
Repayment of long-term debt |
| 18 |
|
| (2,212 | ) |
| (509 | ) | |||||||||||||||
Repayment of principal portion of lease liabilities |
| 18, 19 |
|
| (320 | ) |
| (274 | ) | |||||||||||||||
Dividends paid to Nutrien’s shareholders |
| 23 |
|
| (1,045 | ) |
| (1,030 | ) | |||||||||||||||
Repurchase of common shares |
| 23 |
|
| (1,035 | ) |
| (160 | ) | |||||||||||||||
Issuance of common shares |
| 23 |
|
| 200 |
|
| – |
| |||||||||||||||
Other |
| (14 | ) |
| – |
| ||||||||||||||||||
| Cash used in financing activities |
| (3,003 | ) |
| (1,339 | ) | ||||||||||||||||||
| Effect of exchange rate changes on cash and cash equivalents |
| (31 | ) |
| 3 |
| ||||||||||||||||||
| (Decrease) increase in cash and cash equivalents |
| (955 | ) |
| 783 |
| ||||||||||||||||||
| Cash and cash equivalents – beginning of year | �� |
| 1,454 |
|
| 671 |
| |||||||||||||||||
| Cash and cash equivalents – end of year |
| 499 |
|
| 1,454 |
| ||||||||||||||||||
| Cash and cash equivalents comprised of: | ||||||||||||||||||||||||
Cash |
| 428 |
|
| 1,375 |
| ||||||||||||||||||
Short-term investments |
| 71 |
|
| 79 |
| ||||||||||||||||||
| 499 |
|
| 1,454 |
| |||||||||||||||||||
| Supplemental cash flows information | ||||||||||||||||||||||||
Interest paid |
| 491 |
|
| 498 |
| ||||||||||||||||||
Income taxes paid |
| 435 |
|
| 156 |
| ||||||||||||||||||
Total cash outflow for leases |
| 393 |
|
| 345 |
| ||||||||||||||||||
| 1 | Includes additions to property, plant and equipment and intangible assets of $1,676 and $107 (2020 – $1,423 and $126), respectively. |
| (See | Notes to the Consolidated Financial Statements) |
OVERVIEW MANAGEMENT’S DISCUSSION & ANALYSIS FOUR-YEAR HIGHLIGHTS | FINANCIAL STATEMENTS | OTHER INFORMATION
| In millions of US dollars unless otherwise noted | Nutrien Annual Report 2021 | 79 |
CONSOLIDATED STATEMENTS OF CHANGES IN
SHAREHOLDERS’ EQUITY
| Accumulated Other Comprehensive (Loss) Income (“AOCI”)
| ||||||||||||||||||||||||||||||||||||||||||||||||||||||||||||||||
|
|
| Number of Common Shares |
| Share Capital |
| Contributed Surplus |
| Loss on Currency Translation of Foreign Operations |
| Other |
| Total AOCI |
| Retained Earnings |
| Equity Holders of Nutrien (Note 2) |
| Non- Controlling Interest (Note 2) |
| Total Equity | ||||||||||||||||||||||||||||||||||||||||||||
Balance – December 31, 2019 |
| 572,942,809 |
|
| 15,771 |
|
| 248 |
|
| (204 | ) |
| (47 | ) |
| (251 | ) |
| 7,101 |
|
| 22,869 |
|
| 38 |
|
| 22,907 |
| ||||||||||||||||||||||||||||||||||
Net earnings |
| – |
| �� |
| – |
|
| – |
|
| – |
|
| – |
|
| – |
|
| 459 |
|
| 459 |
|
| – |
|
| 459 |
| |||||||||||||||||||||||||||||||||
Other comprehensive income |
| – |
|
| – |
|
| – |
|
| 142 |
|
| 52 |
|
| 194 |
|
| – |
|
| 194 |
|
| – |
|
| 194 |
| ||||||||||||||||||||||||||||||||||
Shares repurchased (Note 23) |
| (3,832,580 | ) |
| (105 | ) |
| (55 | ) |
| – |
|
| – |
|
| – |
|
| – |
|
| (160 | ) |
| – |
|
| (160 | ) | ||||||||||||||||||||||||||||||||||
Dividends declared (Note 23) |
| – |
|
| – |
|
| – |
|
| – |
|
| – |
|
| – |
|
| (1,029 | ) |
| (1,029 | ) |
| – |
|
| (1,029 | ) | ||||||||||||||||||||||||||||||||||
Effect of share-based compensation including issuance of common shares |
| 150,177 |
|
| 7 |
|
| 12 |
|
| – |
|
| – |
|
| – |
|
| – |
|
| 19 |
|
| – |
|
| 19 |
| ||||||||||||||||||||||||||||||||||
Transfer of net loss on cash flow hedges |
| – |
|
| – |
|
| – |
|
| – |
|
| 13 |
|
| 13 |
|
| – |
|
| 13 |
|
| – |
|
| 13 |
| ||||||||||||||||||||||||||||||||||
Transfer of net actuarial gain on defined benefit plans |
| – |
|
| – |
|
| – |
|
| – |
|
| (75 | ) |
| (75 | ) |
| 75 |
|
| – |
|
| – |
|
| – |
| ||||||||||||||||||||||||||||||||||
Balance – December 31, 2020 |
| 569,260,406 |
|
| 15,673 |
|
| 205 |
|
| (62 | ) |
| (57 | ) |
| (119 | ) |
| 6,606 |
|
| 22,365 |
|
| 38 |
|
| 22,403 |
| ||||||||||||||||||||||||||||||||||
Net earnings |
| – |
|
| – |
|
| – |
|
| – |
|
| – |
|
| – |
|
| 3,153 |
|
| 3,153 |
|
| 26 |
|
| 3,179 |
| ||||||||||||||||||||||||||||||||||
Other comprehensive (loss) income |
| – |
|
| – |
|
| – |
|
| (114 | ) |
| 193 |
|
| 79 |
|
| – |
|
| 79 |
|
| (1 | ) |
| 78 |
| ||||||||||||||||||||||||||||||||||
Shares repurchased (Note 23) |
| (15,982,154 | ) |
| (442 | ) |
| (47 | ) |
| – |
|
| – |
|
| – |
|
| (616 | ) |
| (1,105 | ) |
| – |
|
| (1,105 | ) | ||||||||||||||||||||||||||||||||||
Dividends declared (Note 23) |
| – |
|
| – |
|
| – |
|
| – |
|
| – |
|
| – |
|
| (1,046 | ) |
| (1,046 | ) |
| – |
|
| (1,046 | ) | ||||||||||||||||||||||||||||||||||
Non-controlling interest transactions |
| – |
|
| – |
|
| – |
|
| – |
|
| – |
|
| – |
|
| – |
|
| – |
|
| (16 | ) |
| (16 | ) | ||||||||||||||||||||||||||||||||||
Effect of share-based compensation including issuance of common shares |
| 4,424,437 |
|
| 226 |
|
| (9 | ) |
| – |
|
| – |
|
| – |
|
| – |
|
| 217 |
|
| – |
|
| 217 |
| ||||||||||||||||||||||||||||||||||
Transfer of net gain on cash flow hedges |
| – |
|
| – |
|
| – |
|
| – |
|
| (11 | ) |
| (11 | ) |
| – |
|
| (11 | ) |
| – |
|
| (11 | ) | ||||||||||||||||||||||||||||||||||
Transfer of net actuarial gain on defined benefit plans |
| – |
|
| – |
|
| – |
|
| – |
|
| (95 | ) |
| (95 | ) |
| 95 |
|
| – |
|
| – |
|
| – |
| ||||||||||||||||||||||||||||||||||
Share cancellation (Note 23) |
| (210,173 | ) |
| – |
|
| – |
|
| – |
|
| – |
|
| – |
|
| – |
|
| – |
|
| – |
|
| – |
| ||||||||||||||||||||||||||||||||||
Balance – December 31, 2021 |
| 557,492,516 |
|
| 15,457 |
|
| 149 |
|
| (176 | ) |
| 30 |
|
| (146 | ) |
| 8,192 |
|
| 23,652 |
|
| 47 |
|
| 23,699 |
| ||||||||||||||||||||||||||||||||||
(See Notes to the Consolidated Financial Statements)
OVERVIEW MANAGEMENT’S DISCUSSION & ANALYSIS FOUR-YEAR HIGHLIGHTS | FINANCIAL STATEMENTS | OTHER INFORMATION
| 80 | Nutrien Annual Report 2021 | In millions of US dollars unless otherwise noted |
| As at December 31 |
| NOTE |
| 2021 |
| 2020 | ||||||||||||||||||
| Note 2 | ||||||||||||||||||||||||
Assets | ||||||||||||||||||||||||
Current assets | ||||||||||||||||||||||||
Cash and cash equivalents |
| 499 |
|
| 1,454 |
| ||||||||||||||||||
Receivables |
| 11 |
|
| 5,366 |
|
| 3,626 |
| |||||||||||||||
Inventories |
| 12 |
|
| 6,328 |
|
| 4,930 |
| |||||||||||||||
Prepaid expenses and other current assets |
| 1,653 |
|
| 1,460 |
| ||||||||||||||||||
| 13,846 |
|
| 11,470 |
| |||||||||||||||||||
Non-current assets | ||||||||||||||||||||||||
Property, plant and equipment |
| 13 |
|
| 20,016 |
|
| 19,660 |
| |||||||||||||||
Goodwill |
| 14 |
|
| 12,220 |
|
| 12,198 |
| |||||||||||||||
Other intangible assets |
| 14 |
|
| 2,340 |
|
| 2,388 |
| |||||||||||||||
Investments |
| 15 |
|
| 703 |
|
| 562 |
| |||||||||||||||
Other assets |
| 16 |
|
| 829 |
|
| 914 |
| |||||||||||||||
TOTAL ASSETS |
| 49,954 |
|
| 47,192 |
| ||||||||||||||||||
Liabilities | ||||||||||||||||||||||||
Current liabilities | ||||||||||||||||||||||||
Short-term debt |
| 17 |
|
| 1,560 |
|
| 159 |
| |||||||||||||||
Current portion of long-term debt |
| 18 |
|
| 545 |
|
| 14 |
| |||||||||||||||
Current portion of lease liabilities |
| 19 |
|
| 286 |
|
| 249 |
| |||||||||||||||
Payables and accrued charges |
| 20 |
|
| 10,052 |
|
| 8,058 |
| |||||||||||||||
| 12,443 |
|
| 8,480 |
| |||||||||||||||||||
Non-current liabilities | ||||||||||||||||||||||||
Long-term debt |
| 18 |
|
| 7,521 |
|
| 10,047 |
| |||||||||||||||
Lease liabilities |
| 19 |
|
| 934 |
|
| 891 |
| |||||||||||||||
Deferred income tax liabilities |
| 8 |
|
| 3,165 |
|
| 3,149 |
| |||||||||||||||
Pension and other post-retirement benefit liabilities |
| 21 |
|
| 419 |
|
| 454 |
| |||||||||||||||
Asset retirement obligations and accrued environmental costs |
| 22 |
|
| 1,566 |
|
| 1,597 |
| |||||||||||||||
Other non-current liabilities |
| 207 |
|
| 171 |
| ||||||||||||||||||
TOTAL LIABILITIES |
| 26,255 |
|
| 24,789 |
| ||||||||||||||||||
Shareholders’ Equity | ||||||||||||||||||||||||
Share capital |
| 23 |
|
| 15,457 |
|
| 15,673 |
| |||||||||||||||
Contributed surplus |
| 149 |
|
| 205 |
| ||||||||||||||||||
Accumulated other comprehensive loss |
| (146 | ) |
| (119 | ) | ||||||||||||||||||
Retained earnings |
| 8,192 |
|
| 6,606 |
| ||||||||||||||||||
Equity holders of Nutrien |
| 23,652 |
|
| 22,365 |
| ||||||||||||||||||
Non-controlling interest |
| 47 |
|
| 38 |
| ||||||||||||||||||
TOTAL SHAREHOLDERS’ EQUITY |
| 23,699 |
|
| 22,403 |
| ||||||||||||||||||
TOTAL LIABILITIES AND SHAREHOLDERS’ EQUITY |
| 49,954 |
|
| 47,192 |
| ||||||||||||||||||
(See Notes to the Consolidated Financial Statements)
Approved by the Board of Directors,
 |  | |
| Director | Director |
OVERVIEW MANAGEMENT’S DISCUSSION & ANALYSIS FOUR-YEAR HIGHLIGHTS | FINANCIAL STATEMENTS | OTHER INFORMATION
| In millions of US dollars unless otherwise noted | Nutrien Annual Report 2021 | 81 |

| NOTE 1 DESCRIPTION OF BUSINESS |
Nutrien Ltd. (collectively with its subsidiaries, “Nutrien”, “we”, “us”, “our” or “the Company”) is the world’s largest provider of crop inputs and services. Nutrien plays a critical role in helping growers around the globe increase food production in a sustainable manner.
The Company is a corporation organized under the laws of Canada with its registered head office located at Suite 1700, 211 19th Street East, Saskatoon, Saskatchewan, Canada, S7K 5R6. As at December 31, 2021, the Company had assets as follows:
Segment | Description | |
Nutrien Ag Solutions (“Retail”) | • various retail facilities across the US, Canada, Australia and South America
• private label and proprietary crop protection products and nutritionals
• an innovative integrated digital platform for growers and crop consultants
• financing solutions provider in support of Nutrien’s agricultural product and service sales | |
Potash | • 6 operations in the province of Saskatchewan | |
Nitrogen | • 8 production facilities in North America: 4 in Alberta, 1 in Georgia, 1 in Louisiana, 1 in Ohio and 1 in Texas
• 1 large-scale operation in Trinidad
• 5 upgrade facilities in North America: 3 in Alberta, 1 in Missouri and 1 in Washington
• 50 percent investment in Profertil S.A. (“Profertil”), a nitrogen producer based in Argentina | |
Phosphate | • 2 mines and processing plants: 1 in Florida and 1 in North Carolina
• phosphate feed plants in Illinois, Missouri and Nebraska
• 1 industrial phosphoric acid plant in Ohio | |
Corporate and Others | • investment in Canpotex Limited (“Canpotex”), a Canadian potash export, sales and marketing company owned in equal shares by Nutrien and another potash producer
• 22 percent investment in Sinofert Holdings Limited (“Sinofert”), a fertilizer supplier and distributor in China | |
| NOTE 2 BASIS OF PRESENTATION |
We prepared these consolidated financial statements in accordance with International Financial Reporting Standards (“IFRS”) as issued by the International Accounting Standards Board (“IASB”). We have consistently applied the same accounting policies throughout all periods presented, as if these policies had always been in effect, with the exception of the accounting standards adopted effective January 1, 2021, as disclosed in Note 30.
Certain immaterial 2020 figures have been reclassified in the consolidated statements of changes in shareholders’ equity and consolidated balance sheets.
These consolidated financial statements were authorized for issue by the Board of Directors on February 17, 2022.
Sensitivity analyses included throughout the notes should be used with caution as the changes are hypothetical and not reflective of future performance. The sensitivities have been calculated independently of changes in other key variables. Changes in one factor may result in changes in another, which could increase or reduce certain sensitivities. We prepared these consolidated financial statements under the historical cost basis, except for items that IFRS requires to be measured at fair value. Details of our accounting policies are primarily disclosed in Note 30. Reference to n/a indicates information is not applicable.
OVERVIEW MANAGEMENT’S DISCUSSION & ANALYSIS FOUR-YEAR HIGHLIGHTS | FINANCIAL STATEMENTS | OTHER INFORMATION
| 82 | Nutrien Annual Report 2021 | In millions of US dollars unless otherwise noted |
| NOTE 3 SEGMENT INFORMATION |
The Company has four reportable operating segments: Nutrien Ag Solutions (“Retail”), Potash, Nitrogen and Phosphate. The Retail segment distributes crop nutrients, crop protection products, seed and merchandise, and it provides services directly to growers through a network of farm centers in North America, South America and Australia. The Potash, Nitrogen and Phosphate segments are differentiated by the chemical nutrient contained in the products that each produces.
The Executive Leadership Team (“ELT”), comprised of officers at the Executive Vice President level and above, is the Chief Operating Decision Maker (“CODM”). The CODM uses adjusted net earnings (loss) before finance costs, income taxes, and depreciation and amortization (“adjusted EBITDA”) to measure performance and allocate resources to the operating segments. The CODM considers adjusted EBITDA to be a meaningful measure because it is not impacted by long-term investment and financing decisions, but rather focuses on the performance of our day-to-day operations. In addition, it excludes the impact of impairments and other costs that are centrally managed by our corporate function.
We determine the composition of the reportable segments based on factors including risks and returns, internal organization, and internal reports reviewed by the CODM. We allocate certain expenses across segments based on reasonable considerations such as production capacities or historical trends.
| 2021 |
| Retail |
| Potash |
| Nitrogen |
| Phosphate |
| Corporate and Others |
| Eliminations |
| Consolidated | ||||||||||||||||||||||||||||||||||||||||||||
Sales | – third party |
| 17,665 |
|
| 4,021 |
|
| 4,216 |
|
| 1,810 |
|
| – |
|
| – |
|
| 27,712 |
| ||||||||||||||||||||||||||||||||||||
– intersegment |
| 69 |
|
| 386 |
|
| 921 |
|
| 236 |
|
| – |
|
| (1,612 | ) |
| – |
| |||||||||||||||||||||||||||||||||||||
Sales | – total |
| 17,734 |
|
| 4,407 |
|
| 5,137 |
|
| 2,046 |
|
| – |
|
| (1,612 | ) |
| 27,712 |
| ||||||||||||||||||||||||||||||||||||
Freight, transportation and distribution |
| – |
|
| 371 |
|
| 448 |
|
| 217 |
|
| – |
|
| (185 | ) |
| 851 |
| |||||||||||||||||||||||||||||||||||||
Net sales |
| 17,734 |
|
| 4,036 |
|
| 4,689 |
|
| 1,829 |
|
| – |
|
| (1,427 | ) |
| 26,861 |
| |||||||||||||||||||||||||||||||||||||
Cost of goods sold |
| 13,134 |
|
| 1,285 |
|
| 2,963 |
|
| 1,408 |
|
| – |
|
| (1,338 | ) |
| 17,452 |
| |||||||||||||||||||||||||||||||||||||
Gross margin |
| 4,600 |
|
| 2,751 |
|
| 1,726 |
|
| 421 |
|
| – |
|
| (89 | ) |
| 9,409 |
| |||||||||||||||||||||||||||||||||||||
Selling expenses |
| 3,124 |
|
| 9 |
|
| 24 |
|
| 6 |
|
| (21 | ) |
| – |
|
| 3,142 |
| |||||||||||||||||||||||||||||||||||||
General and administrative expenses |
| 168 |
|
| 8 |
|
| 15 |
|
| 11 |
|
| 275 |
|
| – |
|
| 477 |
| |||||||||||||||||||||||||||||||||||||
Provincial mining taxes |
| – |
|
| 466 |
|
| – |
|
| – |
|
| – |
|
| – |
|
| 466 |
| |||||||||||||||||||||||||||||||||||||
Share-based compensation expense |
| – |
|
| – |
|
| – |
|
| – |
|
| 198 |
|
| – |
|
| 198 |
| |||||||||||||||||||||||||||||||||||||
Impairment of assets (Note 13) |
| – |
|
| 7 |
|
| 22 |
|
| 4 |
|
| – |
|
| – |
|
| 33 |
| |||||||||||||||||||||||||||||||||||||
Other expenses (income) |
| 86 |
|
| 22 |
|
| (64 | ) |
| 15 |
|
| 253 |
|
| – |
|
| 312 |
| |||||||||||||||||||||||||||||||||||||
Earnings (loss) before finance costs and income taxes |
| 1,222 |
|
| 2,239 |
|
| 1,729 |
|
| 385 |
|
| (705 | ) |
| (89 | ) |
| 4,781 |
| |||||||||||||||||||||||||||||||||||||
Depreciation and amortization |
| 706 |
|
| 488 |
|
| 557 |
|
| 151 |
|
| 49 |
|
| – |
|
| 1,951 |
| |||||||||||||||||||||||||||||||||||||
EBITDA 1 |
| 1,928 |
|
| 2,727 |
|
| 2,286 |
|
| 536 |
|
| (656 | ) |
| (89 | ) |
| 6,732 |
| |||||||||||||||||||||||||||||||||||||
Integration and restructuring related costs |
| 10 |
|
| – |
|
| – |
|
| – |
|
| 33 |
|
| – |
|
| 43 |
| |||||||||||||||||||||||||||||||||||||
Share-based compensation expense |
| – |
|
| – |
|
| – |
|
| – |
|
| 198 |
|
| – |
|
| 198 |
| |||||||||||||||||||||||||||||||||||||
Impairment of assets (Note 13) |
| – |
|
| 7 |
|
| 22 |
|
| 4 |
|
| – |
|
| – |
|
| 33 |
| |||||||||||||||||||||||||||||||||||||
COVID-19 coronavirus pandemic (“COVID-19”) related expenses |
| – |
|
| – |
|
| – |
|
| – |
|
| 45 |
|
| – |
|
| 45 |
| |||||||||||||||||||||||||||||||||||||
Foreign exchange loss, net of related derivatives |
| – |
|
| – |
|
| – |
|
| – |
|
| 39 |
|
| – |
|
| 39 |
| |||||||||||||||||||||||||||||||||||||
Cloud computing transition adjustment (Note 6) |
| 1 |
|
| 2 |
|
| – |
|
| – |
|
| 33 |
|
| – |
|
| 36 |
| |||||||||||||||||||||||||||||||||||||
Adjusted EBITDA |
| 1,939 |
|
| 2,736 |
|
| 2,308 |
|
| 540 |
|
| (308 | ) |
| (89 | ) |
| 7,126 |
| |||||||||||||||||||||||||||||||||||||
Assets |
| 22,387 |
|
| 13,148 |
|
| 11,093 |
|
| 1,699 |
|
| 2,266 |
|
| (639 | ) |
| 49,954 |
| |||||||||||||||||||||||||||||||||||||
| 1 | EBITDA is calculated as net earnings (loss) before finance costs, income taxes, and depreciation and amortization. |
OVERVIEW MANAGEMENT’S DISCUSSION & ANALYSIS FOUR-YEAR HIGHLIGHTS | FINANCIAL STATEMENTS | OTHER INFORMATION
| In millions of US dollars unless otherwise noted | Nutrien Annual Report 2021 | 83 |
NOTE 3 SEGMENT INFORMATION CONTINUED
| 2020 |
| Retail |
| Potash |
| Nitrogen |
| Phosphate |
| Corporate and Others |
| Eliminations |
| Consolidated | ||||||||||||||||||||||||||||||||||||||||||||
| Sales | – third party | 14,748 | 2,265 | 2,572 | 1,241 | 82 | 1 | – | 20,908 | |||||||||||||||||||||||||||||||||||||||||||||||||
– intersegment |
| 37 |
|
| 248 |
|
| 628 |
|
| 202 |
|
| – |
|
| (1,115 | ) |
| – |
| |||||||||||||||||||||||||||||||||||||
| Sales | – total | 14,785 | 2,513 | 3,200 | 1,443 | 82 | (1,115 | ) | 20,908 | |||||||||||||||||||||||||||||||||||||||||||||||||
Freight, transportation and distribution |
| – |
|
| 367 |
|
| 460 |
|
| 241 |
|
| – |
|
| (213 | ) |
| 855 |
| |||||||||||||||||||||||||||||||||||||
| Net sales | 14,785 | 2,146 | 2,740 | 1,202 | 82 | (902 | ) | 20,053 | ||||||||||||||||||||||||||||||||||||||||||||||||||
Cost of goods sold |
| 11,049 |
|
| 1,183 |
|
| 2,265 |
|
| 1,166 |
|
| 74 |
|
| (923 | ) |
| 14,814 |
| |||||||||||||||||||||||||||||||||||||
Gross margin |
| 3,736 |
|
| 963 |
|
| 475 |
|
| 36 |
|
| 8 |
|
| 21 |
|
| 5,239 |
| |||||||||||||||||||||||||||||||||||||
| Selling expenses | 2,795 | 9 | 27 | 6 | (24 | ) | – | 2,813 | ||||||||||||||||||||||||||||||||||||||||||||||||||
General and administrative expenses |
| 135 |
|
| 7 |
|
| 8 |
|
| 10 |
|
| 269 |
|
| – |
|
| 429 |
| |||||||||||||||||||||||||||||||||||||
| Provincial mining taxes | – | 201 | 1 | – | 2 | – | 204 | |||||||||||||||||||||||||||||||||||||||||||||||||||
Share-based compensation expense |
| – |
|
| – |
|
| – |
|
| – |
|
| 69 |
|
| – |
|
| 69 |
| |||||||||||||||||||||||||||||||||||||
| Impairment of assets (Note 13) | – | 23 | 27 | 769 | 5 | – | 824 | |||||||||||||||||||||||||||||||||||||||||||||||||||
Other expenses (income) |
| 44 |
|
| 8 |
|
| (288 | ) |
| 6 |
|
| 228 |
|
| – |
|
| (2 | ) | |||||||||||||||||||||||||||||||||||||
Earnings (loss) before finance costs and income taxes | 762 | 715 | 700 | (755 | ) | (541 | ) | 21 | 902 | |||||||||||||||||||||||||||||||||||||||||||||||||
| Depreciation and amortization | 668 | 452 | 599 | 218 | 52 | – | 1,989 | |||||||||||||||||||||||||||||||||||||||||||||||||||
| EBITDA | 1,430 | 1,167 | 1,299 | (537 | ) | (489 | ) | 21 | 2,891 | |||||||||||||||||||||||||||||||||||||||||||||||||
| Integration and restructuring related costs | – | – | 4 | – | 56 | – | 60 | |||||||||||||||||||||||||||||||||||||||||||||||||||
| Share-based compensation expense | – | – | – | – | 69 | – | 69 | |||||||||||||||||||||||||||||||||||||||||||||||||||
| Impairment of assets (Note 13) | – | 23 | 27 | 769 | 5 | – | 824 | |||||||||||||||||||||||||||||||||||||||||||||||||||
COVID-19 related expenses |
| – |
|
| – |
|
| – |
|
| – |
|
| 48 |
|
| – |
|
| 48 |
| |||||||||||||||||||||||||||||||||||||
Foreign exchange loss, net of related derivatives | – | – | – | – | 19 | – | 19 | |||||||||||||||||||||||||||||||||||||||||||||||||||
Loss on disposal of business |
| – |
|
| – |
|
| – |
|
| – |
|
| 6 |
|
| – |
|
| 6 |
| |||||||||||||||||||||||||||||||||||||
Net gain on disposal of investment in MOPCO (Note 6) |
| – |
|
| – |
|
| (250 | ) |
| – |
|
| – |
|
| – |
|
| (250 | ) | |||||||||||||||||||||||||||||||||||||
Adjusted EBITDA |
| 1,430 |
|
| 1,190 |
|
| 1,080 |
|
| 232 |
|
| (286 | ) |
| 21 |
|
| 3,667 |
| |||||||||||||||||||||||||||||||||||||
Assets 2 |
| 20,526 |
|
| 12,032 |
|
| 10,612 |
|
| 1,462 |
|
| 2,983 |
|
| (423 | ) |
| 47,192 |
| |||||||||||||||||||||||||||||||||||||
| 1 | Primarily relates to our non-core Canadian business, which was sold in 2020. |
| 2 | In 2021, we reassessed the appropriate segment wherein certain assets related to transportation, distribution and logistics should be categorized. After our evaluation was complete, we determined the assets should be categorized in the Potash, Nitrogen and Phosphate segments. |
Our Retail segment primarily generates revenue from sales of the following:
Crop nutrients | Dry and liquid macronutrient products including potash, nitrogen and phosphate, proprietary liquid micronutrient products, and nutrient application services. | |||
Crop protection products | Various third-party supplier and proprietary products designed to maintain crop quality and manage plant diseases, weeds and other pests. | |||
Seed | Various third-party supplier seed brands and proprietary seed product lines. | |||
Merchandise | Fencing, feed supplements, livestock-related animal health products, storage and irrigation equipment, and other products. | |||
Nutrien Financial | Financing solutions provided to Retail branches and customers in support of Nutrien’s agricultural product and service sales. | |||
Services and other revenues | Product application, soil and leaf testing, crop scouting and precision agriculture services, and water services. | |||
OVERVIEW MANAGEMENT’S DISCUSSION & ANALYSIS FOUR-YEAR HIGHLIGHTS | FINANCIAL STATEMENTS | OTHER INFORMATION
| 84 | Nutrien Annual Report 2021 | In millions of US dollars unless otherwise noted |
NOTE 3 SEGMENT INFORMATION CONTINUED
|
| Products | Sales prices impacted by | ||
Potash | • North American – primarily granular
• Offshore (international) – primarily granular and standard | • North American prices referenced at delivered prices (including transportation and distribution costs)
• International prices pursuant to term and spot contract prices (excluding transportation and distribution costs) | ||
Nitrogen | • Ammonia, urea, urea ammonium nitrate, industrial grade ammonium nitrate and ammonium sulfate | • Global energy costs and supply | ||
Phosphate | • Solid fertilizer, liquid fertilizer, industrial products and feed products | • Global prices and supplies of ammonia and sulfur | ||
|
|
| 2021 |
| 2020 | ||||||||||
Retail sales by product line | ||||||||||||||
Crop nutrients |
| 7,290 |
|
| 5,200 |
| ||||||||
Crop protection products |
| 6,333 |
|
| 5,602 |
| ||||||||
Seed |
| 2,008 |
|
| 1,790 |
| ||||||||
Merchandise |
| 1,033 |
|
| 943 |
| ||||||||
Nutrien Financial |
| 189 |
|
| 129 |
| ||||||||
Services and other |
| 1,051 |
|
| 1,241 |
| ||||||||
Nutrien Financial elimination 1 |
| (170 | ) |
| (120 | ) | ||||||||
| 17,734 |
|
| 14,785 |
| |||||||||
Potash sales by geography | ||||||||||||||
Manufactured product | ||||||||||||||
North America |
| 2,009 |
|
| 1,275 |
| ||||||||
Offshore 2 |
| 2,398 |
|
| 1,238 |
| ||||||||
| 4,407 |
|
| 2,513 |
| |||||||||
Nitrogen sales by product line | ||||||||||||||
Manufactured product | ||||||||||||||
Ammonia |
| 1,556 |
|
| 779 |
| ||||||||
Urea |
| 1,568 |
|
| 1,040 |
| ||||||||
Solutions, nitrates and sulfates |
| 1,274 |
|
| 816 |
| ||||||||
Other nitrogen and purchased products |
| 739 |
|
| 565 |
| ||||||||
| 5,137 |
|
| 3,200 |
| |||||||||
Phosphate sales by product line | ||||||||||||||
Manufactured product | ||||||||||||||
Fertilizer |
| 1,250 |
|
| 838 |
| ||||||||
Industrial and feed |
| 574 |
|
| 454 |
| ||||||||
Other phosphate and purchased products |
| 222 |
|
| 151 |
| ||||||||
| 2,046 |
|
| 1,443 |
| |||||||||
| 1 | Represents elimination for the interest and service fees charged by Nutrien Financial to Retail branches. |
| 2 | Relates to Canpotex (Note 28) and includes other revenue representing provisional pricing adjustments of $282 (2020 – $(32)). |
OVERVIEW MANAGEMENT’S DISCUSSION & ANALYSIS FOUR-YEAR HIGHLIGHTS | FINANCIAL STATEMENTS | OTHER INFORMATION
| In millions of US dollars unless otherwise noted | Nutrien Annual Report 2021 | 85 |
NOTE 3 SEGMENT INFORMATION CONTINUED
|
|
| Sales – Third Party 1 |
| Non-Current Assets 2 | ||||||||||||||||||||||||||||
|
|
| 2021 |
| 2020 |
| 2021 |
| 2020 | ||||||||||||||||||||||||
United States |
| 16,009 |
|
| 12,373 |
|
| 15,095 |
|
| 15,268 |
| ||||||||||||||||||||
Canada |
| 3,094 |
|
| 2,565 |
|
| 17,766 |
|
| 17,435 |
| ||||||||||||||||||||
Australia |
| 3,591 |
|
| 3,231 |
|
| 1,202 |
|
| 1,305 |
| ||||||||||||||||||||
Canpotex (Note 28) |
| 2,398 |
|
| 1,238 |
|
| – |
|
| – |
| ||||||||||||||||||||
Trinidad |
| 258 |
|
| 101 |
|
| 638 |
|
| 644 |
| ||||||||||||||||||||
Brazil |
| 567 |
|
| 284 |
|
| 391 |
|
| 284 |
| ||||||||||||||||||||
Other |
|
|
|
| 1,795 | 3 |
|
|
|
| 1,116 | 3 |
|
|
|
| 340 |
|
|
|
|
| 280 |
| ||||||||
|
|
|
|
|
| 27,712 |
|
|
|
|
| 20,908 |
|
|
|
|
| 35,432 |
|
|
|
|
| 35,216 |
| ||||||||
| 1 | Sales by location of customers. |
| 2 | Excludes financial instruments (other than equity-accounted investees), deferred tax assets and post-employment benefit assets. |
| 3 | Other third-party sales primarily relate to Argentina of $526 (2020 – $372), Europe of $236 (2020 – $183) and Others of $1,033 (2020 – $561). |
| Canpotex Sales by market (%) |
| 2021 |
| 2020 | ||||||||||
Latin America |
| 38 |
|
| 32 |
| ||||||||
China |
| 11 |
|
| 22 |
| ||||||||
India |
| 6 |
|
| 14 |
| ||||||||
Other Asian markets |
| 35 |
|
| 25 |
| ||||||||
Other markets |
| 10 |
|
| 7 |
| ||||||||
| NOTE 4 NATURE OF EXPENSES |
|
|
| 2021 |
| 2020 | ||||||||||||
Purchased and produced raw materials and product for resale 1 |
| 14,711 |
|
| 12,110 |
| ||||||||||
Depreciation and amortization |
| 1,951 |
|
| 1,989 |
| ||||||||||
Employee costs 2 |
| 3,007 |
|
| 2,450 |
| ||||||||||
Freight |
| 1,023 |
|
| 963 |
| ||||||||||
Impairment of assets (Note 13) |
| 33 |
|
| 824 |
| ||||||||||
Provincial mining taxes 3 |
| 466 |
|
| 204 |
| ||||||||||
Integration and restructuring related costs |
| 43 |
|
| 60 |
| ||||||||||
Contract services |
| 590 |
|
| 617 |
| ||||||||||
Lease expense 4 |
| 81 |
|
| 60 |
| ||||||||||
Fleet fuel, repairs and maintenance |
| 302 |
|
| 222 |
| ||||||||||
COVID-19 related expenses (Note 6) |
| 45 |
|
| 48 |
| ||||||||||
Cloud computing transition adjustment (Note 6) |
| 36 |
|
| – |
| ||||||||||
Net gain on disposal of investment in MOPCO (Note 6) |
| – |
|
| (250 | ) | ||||||||||
Other |
| 643 |
|
| 709 |
| ||||||||||
Total cost of goods sold and expenses |
| 22,931 |
|
| 20,006 |
| ||||||||||
| 1 | Significant expenses include: supplies, energy, fuel, purchases of raw material (natural gas – feedstock, sulfur, ammonia and reagents) and product for resale (crop nutrients and protection products, and seed). |
| 2 | Includes salaries and wages, employee benefits, and share-based compensation. |
| 3 | Includes Saskatchewan potash production tax, and Saskatchewan resource surcharge of $341 and $125 (2020 – $86 and $118), respectively, as required under Saskatchewan provincial legislation. |
| 4 | Includes lease expense relating to short-term leases, leases of low value and variable lease payments. |
OVERVIEW MANAGEMENT’S DISCUSSION & ANALYSIS FOUR-YEAR HIGHLIGHTS | FINANCIAL STATEMENTS | OTHER INFORMATION
| 86 | Nutrien Annual Report 2021 | In millions of US dollars unless otherwise noted |
| NOTE 5 SHARE-BASED COMPENSATION |
We have share-based compensation plans for eligible employees and directors as part of their remuneration package, including Stock Options, Performance Share Units (“PSUs”), Restricted Share Units (“RSUs”) and Deferred Share Units (“DSUs”).
Plans | Eligibility | Granted | Vesting Period | Maximum Term | Settlement | |||||
Stock Options | Officers and eligible employees | Annually | 25 percent per year over four years | 10 years | Shares 1 | |||||
PSUs | Officers and eligible employees | Annually | On third anniversary of grant date based on total shareholder return over a three-year performance cycle, compared to average total shareholder return of a peer group of companies over the same period | Not applicable | Cash | |||||
RSUs | Eligible employees | Annually | On third anniversary of grant date and not subject to performance conditions | Not applicable | Cash | |||||
DSUs | Non-executive directors | At the discretion of the Board of Directors | Fully vest upon grant | Not applicable | Cash 2 | |||||
Stock Appreciation Rights (“SARs”) / Tandem Stock Appreciation Rights (“TSARs”) 3 | Awards no longer granted; legacy awards only | Awards no longer granted; legacy awards only | 25 percent per year over four years | 10 years | Cash | |||||
| 1 | Stock options may also be settled by cash settlement or, if approved by the Company, by a broker-assisted “cashless exercise” arrangement or a “net exercise” arrangement. |
| 2 | Directors can redeem their DSUs for cash only when they leave the Board of Directors for an amount equal to the market value of the common shares at the time of redemption or as mandated by the Nutrien DSU Plan. |
| 3 | Holders of TSARs have the ability to choose between (a) receiving in cash the price of our shares on the date of exercise in excess of the exercise price of the right or (b) receiving common shares by paying the exercise price of the right. Our past experience and future expectation is that substantially all TSAR holders will elect to choose the first option. |
The weighted average fair value of stock options granted was estimated as of the date of the grant using the Black-Scholes-Merton option-pricing model. The weighted average grant date fair value of stock options per unit granted in 2021 was $11.77 (2020 – $7.18). The weighted average assumptions by year of grant that impacted current year results are as follows:
|
|
| Year of Grant | ||||||||
| Assumptions | Based On | 2021 | 2020 | |||||||
Exercise price per option | Quoted market closing price of common shares on the last trading day immediately preceding the date of the grant |
| 56.64 |
|
| 42.23 |
| |||
Expected annual dividend yield (%) | Annualized dividend rate as of the date of the grant |
| 3.22 |
|
| 4.36 |
| |||
Expected volatility (%) | Historical volatility of Nutrien’s shares over a period commensurate with the expected life of the grant |
| 29 |
|
| 29 |
| |||
Risk-free interest rate (%) | Zero-coupon government issues implied yield available on equivalent remaining term at the time of the grant |
| 1.11 |
|
| 1.51 |
| |||
Average expected life of options (years) | Historical experience |
| 8.5 |
|
| 8.5 |
| |||
OVERVIEW MANAGEMENT’S DISCUSSION & ANALYSIS FOUR-YEAR HIGHLIGHTS | FINANCIAL STATEMENTS | OTHER INFORMATION
| In millions of US dollars unless otherwise noted | Nutrien Annual Report 2021 | 87 |
NOTE 5 SHARE-BASED COMPENSATION CONTINUED
|
|
| Number of Shares Subject to Option |
| Weighted Average Exercise Price | ||||||||||||||||||||||||||||
|
|
| 2021 | 2020 |
| 2021 | 2020 | ||||||||||||||||||||||||||
Outstanding – beginning of year |
| 10,997,892 |
|
| 9,191,480 |
|
| 53.59 |
|
| 56.88 |
| ||||||||||||||||||||
Granted |
| 1,518,490 |
|
| 2,293,802 |
|
| 56.62 |
|
| 42.23 |
| ||||||||||||||||||||
Exercised |
| (4,336,682 | ) |
| (123,403 | ) |
| 45.24 |
|
| 42.24 |
| ||||||||||||||||||||
Forfeited or cancelled |
| (375,005 | ) |
| (34,506 | ) |
| 50.34 |
|
| 57.45 |
| ||||||||||||||||||||
Expired |
| (1,059,975 | ) |
| (329,481 | ) |
| 85.66 |
|
| 75.92 |
| ||||||||||||||||||||
Outstanding – end of year |
| 6,744,720 |
|
| 10,997,892 |
|
| 54.87 |
|
| 53.59 |
| ||||||||||||||||||||
The aggregate grant date fair value of all stock options granted in 2021 was $18. The average share price in 2021 was $61.26 per share.
The following table summarizes information about our stock options outstanding as at December 31, 2021, with expiry dates ranging from May 2022 to February 2031:
|
|
| Options Outstanding |
| Options Exercisable | ||||||||||||||||||||||||||||||||||||
| Range of Exercise Prices |
| Number | Weighted Average Remaining Life in Years | Weighted Average Exercise Price |
| Number | Weighted Average Exercise Price | |||||||||||||||||||||||||||||||||
$37.84 to $41.77 |
| 564,087 |
|
| 4 |
|
| 39.01 |
|
| 564,087 |
|
| 39.01 |
| |||||||||||||||||||||||||
$41.78 to $43.36 |
| 1,559,353 |
|
| 7 |
|
| 42.23 |
|
| 142,206 |
|
| 42.23 |
| |||||||||||||||||||||||||
$43.37 to $50.22 |
| 1,049,233 |
|
| 5 |
|
| 45.40 |
|
| 820,061 |
|
| 45.65 |
| |||||||||||||||||||||||||
$50.23 to $55.08 |
| 1,178,225 |
|
| 5 |
|
| 53.11 |
|
| 671,391 |
|
| 52.78 |
| |||||||||||||||||||||||||
$55.09 to $67.05 |
| 1,295,328 |
|
| 8 |
|
| 55.62 |
|
| – | 1 |
| – |
| |||||||||||||||||||||||||
$67.06 to $109.45 |
| 1,098,494 |
|
| 2 |
|
| 89.85 |
|
| 1,098,494 |
|
| 89.85 |
| |||||||||||||||||||||||||
| 6,744,720 |
|
| 5 |
|
| 54.87 |
|
| 3,296,239 |
|
| 60.55 |
| ||||||||||||||||||||||||||
| 1 | Options granted in this range of exercise prices have not yet met the vesting period. |
|
|
| Units Granted in 2021 | Units Outstanding as at December 31, 2021 | Compensation Expense | ||||||||||||||||||||||||||||
|
|
|
2021 |
2020 | |||||||||||||||||||||||||||||
Stock Options |
| 1,518,490 |
|
| 6,744,720 |
|
| 14 |
|
| 14 |
| ||||||||||||||||||||
PSUs |
| 757,212 |
|
| 2,174,490 |
|
| 104 |
|
| 31 |
| ||||||||||||||||||||
RSUs |
| 537,867 |
|
| 1,447,292 |
|
| 47 |
|
| 22 |
| ||||||||||||||||||||
DSUs |
| 27,478 |
|
| 373,779 |
|
| 12 |
|
| 2 |
| ||||||||||||||||||||
SARs/TSARs |
| – |
|
| 504,217 |
|
| 21 |
|
| – |
| ||||||||||||||||||||
| 198 |
|
| 69 |
| |||||||||||||||||||||||||||
OVERVIEW MANAGEMENT’S DISCUSSION & ANALYSIS FOUR-YEAR HIGHLIGHTS | FINANCIAL STATEMENTS | OTHER INFORMATION
| 88 | Nutrien Annual Report 2021 | In millions of US dollars unless otherwise noted |
| NOTE 6 OTHER EXPENSES (INCOME) |
|
|
| 2021 |
| 2020 | ||||||||||||
Integration and restructuring related costs |
| 43 |
|
| 60 |
| ||||||||||
Foreign exchange loss, net of related derivatives |
| 42 |
|
| 18 |
| ||||||||||
Earnings of equity-accounted investees |
| (89 | ) |
| (73 | ) | ||||||||||
Bad debt expense |
| 26 |
|
| 6 |
| ||||||||||
COVID-19 related expenses (Note 30) |
| 45 |
|
| 48 |
| ||||||||||
Cloud computing transition adjustment |
| 36 |
|
| – |
| ||||||||||
Loss on disposal of business |
| – |
|
| 6 |
| ||||||||||
Net gain on disposal of investment in MOPCO |
| – |
|
| (250 | ) | ||||||||||
Other expenses |
| 209 |
|
| 183 |
| ||||||||||
| 312 |
|
| (2 | ) | |||||||||||
In 2021, the IFRS Interpretations Committee published a final agenda decision that clarified how to recognize certain configuration and customization expenditures related to cloud computing with retrospective application. Costs that do not meet the capitalization criteria should be expensed as incurred. We changed our accounting policy to align with the interpretation and previously capitalized costs that no longer qualify for capitalization were expensed in the current period since they were not material.
In 2020, as a result of a strategic decision, we disposed our equity-accounted investment in MOPCO, a nitrogen producer based in Egypt. We received cash consideration of $540 for the disposal of the investment and settlement of legal claims that resulted in a gain of $250.
| NOTE 7 FINANCE COSTS |
|
|
| 2021 |
| 2020 | ||||||||||||
Interest expense | ||||||||||||||||
Short-term debt |
| 60 |
|
| 50 |
| ||||||||||
Long-term debt |
| 415 |
|
| 392 |
| ||||||||||
Lease liabilities (Note 19) |
| 33 |
|
| 34 |
| ||||||||||
COVID-19 related |
| – |
|
| 19 |
| ||||||||||
Loss on early extinguishment of debt (Note 18) |
| 142 |
|
| – |
| ||||||||||
Unwinding of discount on asset retirement obligations (Note 22) |
| (9 | ) |
| 33 |
| ||||||||||
Interest on net defined benefit pension and other post-retirement plan obligations (Note 21) |
| 9 |
|
| 13 |
| ||||||||||
Borrowing costs capitalized to property, plant and equipment |
| (29 | ) |
| (20 | ) | ||||||||||
Interest income |
| (8 | ) |
| (1 | ) | ||||||||||
| 613 |
|
| 520 |
| |||||||||||
Borrowing costs capitalized to property, plant and equipment in 2021 were calculated by applying an average capitalization rate of 4.1 percent (2020 – 3.9 percent) to expenditures on qualifying assets.
OVERVIEW MANAGEMENT’S DISCUSSION & ANALYSIS FOUR-YEAR HIGHLIGHTS | FINANCIAL STATEMENTS | OTHER INFORMATION
| In millions of US dollars unless otherwise noted | Nutrien Annual Report 2021 | 89 |
| NOTE 8 INCOME TAXES |
Income Taxes Included in Net Earnings
We operate in a specialized industry and in several tax jurisdictions; as a result, our earnings are subject to various rates of taxation.
|
|
| 2021 |
| 2020 | ||||||||||||
Current income tax | ||||||||||||||||
Tax expense (recovery) for current year |
| 1,033 |
|
| (38 | ) | ||||||||||
Adjustments in respect of prior years |
| (13 | ) |
| (30 | ) | ||||||||||
Total current income tax expense (recovery) |
| 1,020 |
|
| (68 | ) | ||||||||||
Deferred income tax | ||||||||||||||||
Origination and reversal of temporary differences |
| (30 | ) |
| 72 |
| ||||||||||
Adjustments in respect of prior years |
| 6 |
|
| (58 | ) | ||||||||||
Change in recognition of tax losses and deductible temporary differences |
| (6 | ) |
| (20 | ) | ||||||||||
Impact of tax rate changes |
| (1 | ) |
| (3 | ) | ||||||||||
Total deferred income tax recovery |
| (31 | ) |
| (9 | ) | ||||||||||
Income tax expense (recovery) included in net earnings |
| 989 |
|
| (77 | ) | ||||||||||
The provision for income taxes differs from the amount that would have resulted from applying the Canadian statutory income tax rates to earnings (loss) before income taxes as follows:
|
|
| 2021 |
| 2020 | ||||||||||||
Earnings (loss) before income taxes | ||||||||||||||||
Canada |
| 1,884 |
|
| 525 |
| ||||||||||
United States |
| 1,319 |
|
| (506 | ) | ||||||||||
Trinidad |
| 256 |
|
| (44 | ) | ||||||||||
Australia |
| 204 |
|
| 83 |
| ||||||||||
Other |
| 505 |
|
| 324 |
| ||||||||||
| 4,168 |
|
| 382 |
| |||||||||||
Canadian federal and provincial statutory income tax rate (%) |
| 27 |
|
| 27 |
| ||||||||||
Income tax at statutory rates |
| 1,125 |
|
| 103 |
| ||||||||||
Adjusted for the effect of: | ||||||||||||||||
Impact of foreign tax rates |
| (98 | ) |
| (18 | ) | ||||||||||
Production-related deductions |
| (24 | ) |
| (12 | ) | ||||||||||
Non-taxable income |
| (18 | ) |
| (59 | ) | ||||||||||
Change in recognition of tax losses and deductible temporary differences |
| (6 | ) |
| (20 | ) | ||||||||||
Recovery of prior year taxes due to US legislative changes |
| (4 | ) |
| (94 | ) | ||||||||||
Non-deductible expenses |
| 12 |
|
| 13 |
| ||||||||||
Foreign accrual property income |
| 2 |
|
| 7 |
| ||||||||||
Other |
| – |
|
| 3 |
| ||||||||||
Income tax expense (recovery) included in net earnings |
| 989 |
|
| (77 | ) | ||||||||||
OVERVIEW MANAGEMENT’S DISCUSSION & ANALYSIS FOUR-YEAR HIGHLIGHTS | FINANCIAL STATEMENTS | OTHER INFORMATION
| 90 | Nutrien Annual Report 2021 | In millions of US dollars unless otherwise noted |
NOTE 8 INCOME TAXES CONTINUED
Deferred Income Taxes
In respect of each type of temporary difference, unused tax loss and unused tax credit, the amounts of deferred tax assets and liabilities recognized in the consolidated balance sheets as at December 31 and the amount of the deferred tax (recovery) expense recognized in net earnings were:
|
|
| Deferred Income Tax (Assets) Liabilities |
| Deferred Income Tax (Recovery) Expense Recognized in Net | ||||||||||||||||||||||||||||
|
|
| 2021 |
| 2020 |
| 2021 |
| 2020 | ||||||||||||||||||||||||
Deferred income tax assets | ||||||||||||||||||||||||||||||||
Asset retirement obligations and accrued environmental costs |
| (354 | ) |
| (376 | ) |
| 21 |
|
| 20 |
| ||||||||||||||||||||
Tax loss and other carryforwards |
| (297 | ) |
| (370 | ) |
| 75 |
|
| (98 | ) | ||||||||||||||||||||
Pension and other post-retirement benefit liabilities |
| (178 | ) |
| (161 | ) |
| (45 | ) |
| (12 | ) | ||||||||||||||||||||
Lease liabilities |
| (151 | ) |
| (201 | ) |
| 47 |
|
| 26 |
| ||||||||||||||||||||
Long-term debt |
| (140 | ) |
| (102 | ) |
| (39 | ) |
| 3 |
| ||||||||||||||||||||
Inventories |
| (126 | ) |
| (37 | ) |
| (90 | ) |
| 20 |
| ||||||||||||||||||||
Receivables |
| (44 | ) |
| (50 | ) |
| 6 |
|
| 2 |
| ||||||||||||||||||||
Payables and accrued charges |
| (14 | ) |
| – |
|
| (14 | ) |
| 25 |
| ||||||||||||||||||||
Other assets |
| (1 | ) |
| (12 | ) |
| 11 |
|
| 17 |
| ||||||||||||||||||||
Deferred income tax liabilities | ||||||||||||||||||||||||||||||||
Property, plant and equipment |
| 3,765 |
|
| 3,637 |
|
| 132 |
|
| (12 | ) | ||||||||||||||||||||
Goodwill and other intangible assets |
| 404 |
|
| 471 |
|
| (64 | ) |
| (67 | ) | ||||||||||||||||||||
Payables and accrued charges |
| – |
|
| 72 |
|
| (72 | ) |
| 72 |
| ||||||||||||||||||||
Other liabilities |
| 39 |
|
| 36 |
|
| 1 |
|
| (5 | ) | ||||||||||||||||||||
| 2,903 |
|
| 2,907 |
|
| (31 | ) |
| (9 | ) | |||||||||||||||||||||
Reconciliation of net deferred income tax liabilities:
|
|
| 2021 |
| 2020 | ||||||||||||
Balance – beginning of year |
| 2,907 |
|
| 2,896 |
| ||||||||||
Income tax recovery recognized in net earnings |
| (31 | ) |
| (9 | ) | ||||||||||
Income tax charge recognized in other comprehensive income (“OCI”) |
| 30 |
|
| 17 |
| ||||||||||
Other |
| (3 | ) |
| 3 |
| ||||||||||
Balance – end of year |
| 2,903 |
|
| 2,907 |
| ||||||||||
Amounts and expiry dates of unused tax losses and unused tax credits as at December 31, 2021, were:
|
|
| Amount |
| Expiry Date | ||||||||||||
Unused federal operating losses |
| 1,206 |
|
| 2022 – Indefinite |
| ||||||||||
Unused federal capital losses |
|
|
|
| 589 |
|
|
|
|
| Indefinite |
| ||||
Unused investment tax credits |
| 22 |
|
| 2022 – 2040 |
| ||||||||||
The unused tax losses and credits with no expiry dates can be carried forward indefinitely.
OVERVIEW MANAGEMENT’S DISCUSSION & ANALYSIS FOUR-YEAR HIGHLIGHTS | FINANCIAL STATEMENTS | OTHER INFORMATION
| In millions of US dollars unless otherwise noted | Nutrien Annual Report 2021 | 91 |
NOTE 8 INCOME TAXES CONTINUED
As at December 31, 2021, we had $742 of federal tax losses for which we did not recognize deferred tax assets.
We have determined that it is probable that all recognized deferred tax assets will be realized through a combination of future reversals of temporary differences and taxable income.
We did not recognize deferred tax liabilities related to temporary differences associated with investments in subsidiaries and equity-accounted investees amounting to $10,241 as at December 31, 2021 (2020 – $8,911).
In 2021, previously unrecognized operating losses were recognized due to a revised estimate of future taxable profits resulting in an increase in deferred tax assets of $6. In 2020, previously unrecognized capital losses were utilized primarily as a result of the net gain on disposal of investment in MOPCO. In addition, as a result of the non-cash impairment of assets relating to our property, plant and equipment at White Springs, management revised its estimate of future taxable profits and derecognized deferred tax assets related to Florida tax losses and deductible temporary differences. In aggregate, the net decrease in unrecognized deferred tax assets in 2020 was $20.
| NOTE 9 NET EARNINGS PER SHARE |
|
| 2021 | 2020 | ||||||
Weighted average number of common shares |
| 569,664,000 |
|
| 569,657,000 |
| ||
Dilutive effect of stock options |
| 1,625,000 |
|
| 29,000 |
| ||
Weighted average number of diluted common shares |
| 571,289,000 |
|
| 569,686,000 |
| ||
Options excluded from the calculation of diluted net earnings per share due to the option exercise prices being greater than the average market price of common shares were as follows:
|
| 2021 | 2020 | ||||||
Number of options excluded |
| 2,393,822 |
|
| 9,875,797 |
| ||
Performance option plan years fully excluded 1 |
| 2012 – 2015 |
|
| 2011 – 2017 |
| ||
Stock option plan years fully excluded |
| 2021 |
|
| 2015, 2017 – 2020 |
| ||
| 1 | Previously granted under a legacy long-term incentive plan. |
OVERVIEW MANAGEMENT’S DISCUSSION & ANALYSIS FOUR-YEAR HIGHLIGHTS | FINANCIAL STATEMENTS | OTHER INFORMATION
| 92 | Nutrien Annual Report 2021 | In millions of US dollars unless otherwise noted |

| NOTE 10 FINANCIAL INSTRUMENTS AND RELATED RISK MANAGEMENT |
Our ELT, along with the Board of Directors (including Board of Directors committees), is responsible for monitoring our risk exposures and managing our policies to address these risks. Our strategic and risk management processes are integrated to ensure we understand the benefit from the relationship between strategy, risk and value creation. Outlined below are our risk management strategies we have developed to mitigate the financial market risks that we are exposed to.
Credit Risk | Risk Management Strategies | |
Receivables from customers | • establish credit approval policies and procedures for new and existing customers
• extend credit to qualified customers through: • review of credit agency reports, financial statements and/or credit references, as available
• review of existing customer accounts every 12 to 24 months based on the credit limit amounts
• evaluation of customer and country risk for international customers
• establish credit period: • 15 and 30 days for wholesale fertilizer customers
• 30 days for industrial and feed customers
• 30 to 360 days for Retail customers, including Nutrien Financial
• up to 180 days for select export sales customers, including Canpotex
• transact on a cash basis with certain customers who may not meet specified benchmark creditworthiness or cannot provide other evidence of ability to pay
• execute agency arrangements with financial institutions or other partners with which we have only a limited recourse involvement
• sell receivables to financial institutions which substantially transfer the risks and rewards
• set eligibility requirements for Nutrien Financial to limit the risk of the receivables
• may require security over certain crop or livestock inventories
• set up provision using the lifetime expected credit loss method considering all possible default events over the expected life of a financial instrument. Receivables are grouped based on days past due and/or customer credit risk profile. Estimated losses on receivables are based on known troubled accounts and historical experience of losses incurred. Receivables are considered to be in default and are written off against the allowance when it is probable that all remaining contractual payments due will not be collected in accordance with the terms of the agreement. | |
Cash and cash equivalents and other receivables | • require acceptable minimum counterparty credit ratings
• limit counterparty or credit exposure
• select counterparties with investment-grade quality | |
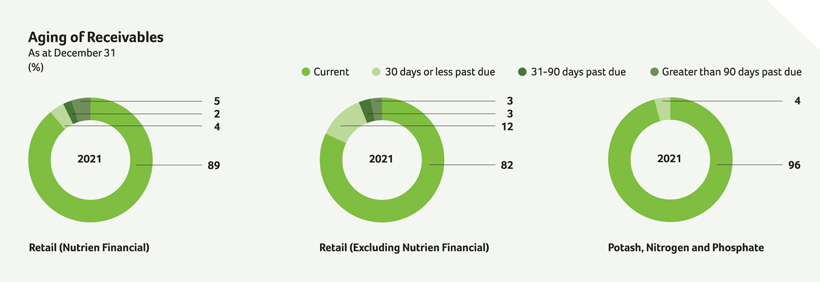
OVERVIEW MANAGEMENT’S DISCUSSION & ANALYSIS FOUR-YEAR HIGHLIGHTS | FINANCIAL STATEMENTS | OTHER INFORMATION
| In millions of US dollars unless otherwise noted | Nutrien Annual Report 2021 | 93 |
NOTE 10 FINANCIAL INSTRUMENTS AND RELATED RISK MANAGEMENT CONTINUED
Maximum exposure to credit risk as at December 31:
|
|
| 2021 |
| 2020 | ||||||||||||
Cash and cash equivalents |
| 499 |
|
| 1,454 |
| ||||||||||
Receivables (excluding income tax receivable) |
| 5,143 |
|
| 3,543 |
| ||||||||||
| 5,642 |
|
| 4,997 |
| |||||||||||
Risk | Risk Management Strategies | |
Liquidity | • establish an external borrowing policy to maintain sufficient liquid financial resources to fund our operations and meet our commitments and obligations in a cost-effective manner
• maintain an optimal capital structure
• maintain investment-grade credit ratings that provide ease of access to the debt capital and commercial paper markets
• maintain sufficient short-term credit availability
• uphold long-term relationships with a sufficient number of high-quality and diverse lenders Refer to Note 17 for our available credit facilities. | |
The following maturity analysis of our financial liabilities and gross settled derivative contracts (for which the cash flows are settled simultaneously) is based on the expected undiscounted contractual cash flows from the date of the consolidated balance sheets to the contractual maturity date.
| 2021 | Carrying Amount of Liability as at December 31 | Contractual Flows | Within 1 Year | 1 to 3 Years | 3 to 5 Years | Over 5 Years | ||||||||||||||||||
Short-term debt 1 |
| 1,560 |
|
| 1,560 |
|
| 1,560 |
|
| – |
|
| – |
|
| – |
| ||||||
Payables and accrued charges 2 |
| 8,861 |
|
| 8,861 |
|
| 8,861 |
|
| – |
|
| – |
|
| – |
| ||||||
Long-term debt, including current portion 1 |
| 8,066 |
|
| 13,071 |
|
| 890 |
|
| 1,163 |
|
| 1,678 |
|
| 9,340 |
| ||||||
Lease liabilities, including current portion 1 |
| 1,220 |
|
| 1,375 |
|
| 313 |
|
| 423 |
|
| 227 |
|
| 412 |
| ||||||
Derivatives |
| 20 |
|
| 20 |
|
| 20 |
|
| – |
|
| – |
|
| – |
| ||||||
| 19,727 |
|
| 24,887 |
|
| 11,644 |
|
| 1,586 |
|
| 1,905 |
|
| 9,752 |
| |||||||
| 1 | Contractual cash flows include contractual interest payments related to debt obligations and lease liabilities. Interest rates on debt with variable rates are based on the prevailing rates as at December 31, 2021. |
| 2 | Excludes non-financial liabilities and includes payables of approximately $1.7 billion related to our prepaid inventory to secure product discounts. We consider these payables to be part of our working capital. For these payables, we participated in arrangements where the vendors sold their right to receive payment to financial institutions without extending the original payment terms. These payables were paid in January 2022. |
Foreign Exchange Risk | Risk Management Strategies | |
Foreign currency denominated accounts | • execute foreign currency derivative contracts within certain prescribed limits for both forecast operating and capital expenditures to manage the earnings impact, including those related to our equity-accounted investees, that could occur from a reasonably possible strengthening or weakening of the US dollar | |
OVERVIEW MANAGEMENT’S DISCUSSION & ANALYSIS FOUR-YEAR HIGHLIGHTS | FINANCIAL STATEMENTS | OTHER INFORMATION
| 94 | Nutrien Annual Report 2021 | In millions of US dollars unless otherwise noted |
NOTE 10 FINANCIAL INSTRUMENTS AND RELATED RISK MANAGEMENT CONTINUED
The fair value of our net foreign exchange currency derivative assets (liabilities) at December 31, 2021 was $1 (2020 – $14). The following table presents the significant foreign currency derivatives that existed at December 31:
|
| 2021 | 2020 | ||||||||||||||||||||||
| Sell/buy | Notional | Maturities | Average contract rate | Notional | Maturities | Average contract rate | ||||||||||||||||||
Derivatives not designated as hedges | ||||||||||||||||||||||||
Forwards | ||||||||||||||||||||||||
USD/CAD 1 |
| 522 |
|
| 2022 |
|
| 1.2799 |
|
| 514 |
|
| 2021 |
|
| 1.2796 |
| ||||||
CAD/USD |
| – |
|
| 2022 |
|
| – |
|
| 126 |
|
| 2021 |
|
| 1.2804 |
| ||||||
USD/AUD 2 |
| 19 |
|
| 2022 |
|
| 1.3841 |
|
| 28 |
|
| 2021 |
|
| 1.3661 |
| ||||||
AUD/USD |
| 113 |
|
| 2022 |
|
| 1.3860 |
|
| 92 |
|
| 2021 |
|
| 1.3640 |
| ||||||
BRL 3/USD |
| 135 |
|
| 2022 |
|
| 5.4519 |
|
| 31 |
|
| 2021 |
|
| 4.2879 |
| ||||||
Options | ||||||||||||||||||||||||
USD/CAD – buy USD puts |
| 20 |
|
| 2022 |
|
| 1.2500 |
|
| 70 |
|
| 2021 |
|
| 1.3147 |
| ||||||
USD/CAD – sell USD calls |
| 20 |
|
| 2022 |
|
| 1.2600 |
|
| 55 |
|
| 2021 |
|
| 1.3665 |
| ||||||
AUD/USD – buy USD calls |
| 71 |
|
| 2022 |
|
| 1.4060 |
|
| 61 |
|
| 2021 |
|
| 1.3216 |
| ||||||
AUD/USD – sell USD puts |
| 72 |
|
| 2022 |
|
| 1.3797 |
|
| – |
|
| – |
|
| – |
| ||||||
Derivatives designated as hedges | ||||||||||||||||||||||||
Forwards | ||||||||||||||||||||||||
USD/CAD |
| 343 |
|
| 2022 |
|
| 1.2547 |
|
| 254 |
|
| 2021 |
|
| 1.3190 |
| ||||||
| 1 | Canadian dollars |
| 2 | Australian dollars |
| 3 | Brazilian real |
| Market Risks | Type | Risk Management Strategies |
| |||
Interest rate | Short-term and long-term debt | • use a portfolio of fixed and floating rate instruments
• align current and long-term assets with demand and fixed-term debt
• monitor the effects of market changes in interest rates
• use interest rate swaps, if desired | We do not believe we have material exposure to interest or price risk on our financial instruments as at December 31, 2021 and 2020. | |||
Price | Natural gas derivative instruments | • diversify our forecast gas volume requirements, including a portion of annual requirements purchased at spot market prices, a portion at fixed prices (up to 10 years) and a portion indexed to the market price of ammonia
• acquire a reliable supply of natural gas feedstock and fuel on a location-adjusted, cost-competitive basis | ||||
Price | Investment at fair value | • ensure the security of principal amounts invested
• provide for an adequate degree of liquidity
• achieve a satisfactory return | ||||
In 2020, we entered into cash flow hedges on our interest rate derivative contracts that matured in the same year and had a total notional amount of $680.
OVERVIEW MANAGEMENT’S DISCUSSION & ANALYSIS FOUR-YEAR HIGHLIGHTS | FINANCIAL STATEMENTS | OTHER INFORMATION
| In millions of US dollars unless otherwise noted | Nutrien Annual Report 2021 | 95 |
NOTE 10 FINANCIAL INSTRUMENTS AND RELATED RISK MANAGEMENT CONTINUED
Fair Value
Financial instruments included in the consolidated balance sheets are measured either at fair value or amortized cost. The following tables explain the valuation methods used to determine the fair value of each financial instrument and its associated level in the fair value hierarchy.
| Financial Instruments at Fair Value | Fair Value Method | |
Cash and cash equivalents | Carrying amount (approximation to fair value assumed due to short-term nature) | |
Equity securities | Closing bid price of the common shares as at the balance sheet date | |
Debt securities | Closing bid price of the debt or other instruments with similar terms and credit risk (Level 2) as at the balance sheet date | |
Foreign currency derivatives not traded in an active market | Quoted forward exchange rates (Level 2) as at the balance sheet date | |
Foreign exchange forward contracts, swaps and options and natural gas swaps not traded in an active market | Based on a discounted cash flow model. Inputs included contractual cash flows based on prices for natural gas futures contracts, fixed prices and notional volumes specified by the swap contracts, the time value of money, liquidity risk, our own credit risk (related to instruments in a liability position) and counterparty credit risk (related to instruments in an asset position). Futures contract prices used as inputs in the model were supported by prices quoted in an active market and therefore categorized in Level 2. | |
| Financial Instruments at Amortized Cost | Fair Value Method | |
Receivables, short-term debt and payables and accrued charges | Carrying amount (approximation to fair value assumed due to short-term nature) | |
Long-term debt | Quoted market prices (Level 1 or 2 depending on the market liquidity of the debt) | |
Other long-term debt instruments | Carrying amount | |
The following table presents our fair value hierarchy for financial instruments carried at fair value on a recurring basis or measured at amortized cost and require fair value disclosure:
|
| 2021 | 2020 | ||||||||||||||||||||||||||
| Financial assets (liabilities) measured at | Carrying Amount | Level 1 | Level 2 | Level 3 | Carrying Amount | Level 1 | Level 2 | |||||||||||||||||||||
Fair value on a recurring basis 1 | ||||||||||||||||||||||||||||
Cash and cash equivalents |
| 499 |
|
| – |
|
| 499 |
|
| – |
|
| 1,454 |
|
| – |
|
| 1,454 |
| |||||||
Derivative instrument assets |
| 19 |
|
| – |
|
| 19 |
|
| – |
|
| 45 |
|
| – |
|
| 45 |
| |||||||
Other current financial assets – marketable securities 2 |
| 134 |
|
| 19 |
|
| 115 |
|
| – |
|
| 161 |
|
| 24 |
|
| 137 |
| |||||||
Investments at fair value through other comprehensive income (“FVTOCI”) (Note 15) |
| 244 |
|
| 234 |
|
| – |
|
| 10 |
|
| 153 |
|
| 153 |
|
| – |
| |||||||
Derivative instrument liabilities |
| (20 | ) |
| – |
|
| (20 | ) |
| – |
|
| (48 | ) |
| – |
|
| (48 | ) | |||||||
Amortized cost | ||||||||||||||||||||||||||||
Current portion of long-term debt | ||||||||||||||||||||||||||||
Notes and debentures |
| (500 | ) |
| (506 | ) |
| – |
|
| – |
|
| – |
|
| – |
|
| – |
| |||||||
Fixed and floating rate debt |
| (45 | ) |
| – |
|
| (45 | ) |
| – |
|
| (14 | ) |
| – |
|
| (14 | ) | |||||||
Long-term debt | ||||||||||||||||||||||||||||
Notes and debentures |
| (7,424 | ) |
| (4,021 | ) |
| (4,709 | ) |
| – |
|
| (9,994 | ) |
| (3,801 | ) |
| (7,955 | ) | |||||||
Fixed and floating rate debt |
| (97 | ) |
| – |
|
| (97 | ) |
| – |
|
| (53 | ) |
| – |
|
| (53 | ) | |||||||
| 1 | During 2021 and 2020, there were no transfers between levelling for financial instruments measured at fair value on a recurring basis. Our policy is to recognize transfers at the end of the reporting period. |
| 2 | Marketable securities consist of equity and fixed income securities. |
OVERVIEW MANAGEMENT’S DISCUSSION & ANALYSIS FOUR-YEAR HIGHLIGHTS | FINANCIAL STATEMENTS | OTHER INFORMATION
| 96 | Nutrien Annual Report 2021 | In millions of US dollars unless otherwise noted |
| NOTE 11 RECEIVABLES |
|
| Segment | 2021 | 2020 | |||||||
Receivables from customers | ||||||||||
Third parties | Retail (Nutrien Financial) 1 |
| 2,178 |
|
| 1,417 |
| |||
Retail |
| 977 |
|
| 1,158 |
| ||||
Potash, Nitrogen, Phosphate |
| 804 |
|
| 391 |
| ||||
Related party – Canpotex | Potash (Note 28) |
| 828 |
|
| 122 |
| |||
Less allowance for expected credit losses of receivables from customers |
|
| (82 | ) |
| (69 | ) | |||
| 4,705 |
|
| 3,019 |
| |||||
Rebates |
| 222 |
|
| 256 |
| ||||
Income taxes (Note 8) |
| 223 |
|
| 83 |
| ||||
Other receivables |
|
| 216 |
|
| 268 |
| |||
| 5,366 |
|
| 3,626 |
| |||||
| 1 | Includes $1,792 of very low risk of default and $386 of low risk of default (2020 – $1,147 of very low risk of default and $270 of low risk of default). |
Qualifying receivables from customers financed by Nutrien Financial represents high-quality receivables from customers that have been rated very low to low risk of default among Retail’s receivables from customers.
Customer credit with a financial institution of $405 at December 31, 2021, related to our agency agreement, is not recognized in our consolidated balance sheets. Through the agency agreement, we only have a limited recourse involvement to the extent of an indemnification of the financial institution to a maximum of 5 percent (2020 – 5 percent) of the qualified customer loans. Historical indemnification losses on this arrangement have been negligible, and the average aging of the customer loans with the financial institution is current.
OVERVIEW MANAGEMENT’S DISCUSSION & ANALYSIS FOUR-YEAR HIGHLIGHTS | FINANCIAL STATEMENTS | OTHER INFORMATION
| In millions of US dollars unless otherwise noted | Nutrien Annual Report 2021 | 97 |
| NOTE 12 INVENTORIES |
|
| 2021 | 2020 | ||||||
Product purchased for resale |
| 4,889 |
|
| 3,655 |
| ||
Finished products |
| 410 |
|
| 384 |
| ||
Intermediate products |
| 206 |
|
| 227 |
| ||
Raw materials |
| 337 |
|
| 215 |
| ||
Materials and supplies |
| 486 |
|
| 449 |
| ||
| 6,328 |
|
| 4,930 |
| |||
Inventories expensed to cost of goods sold during the year were $17,243 (2020 – $14,347).
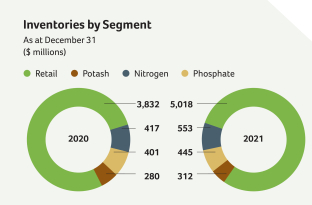
| NOTE 13 PROPERTY, PLANT AND EQUIPMENT |
The majority of our tangible assets are buildings, machinery and equipment used to produce or distribute our products and render our services. Right-of-use (“ROU”) assets primarily include railcars, marine vessels, real estate and mobile equipment.
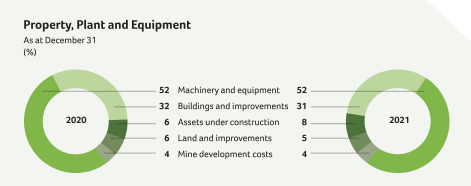
OVERVIEW MANAGEMENT’S DISCUSSION & ANALYSIS FOUR-YEAR HIGHLIGHTS | FINANCIAL STATEMENTS | OTHER INFORMATION
| 98 | Nutrien Annual Report 2021 | In millions of US dollars unless otherwise noted |
NOTE 13 PROPERTY, PLANT AND EQUIPMENT CONTINUED
|
| Land and Improvements | Buildings and Improvements | Machinery and Equipment | Mine Development Costs | Assets Under Construction | Total | ||||||||||||||||||
| Useful life range (years) | 4 – 85 | 1 – 65 | 1 – 80 | 1 –60 | n/a | |||||||||||||||||||
| Carrying amount – December 31, 2020 | 1,090 | 6,305 | 10,336 | 723 | 1,206 | 19,660 | ||||||||||||||||||
| Acquisitions (Note 25) | 2 | 3 | 5 | – | – | 10 | ||||||||||||||||||
| Additions | 7 | 18 | 97 | – | 1,646 | 1,768 | ||||||||||||||||||
| Additions – ROU assets | – | 140 | 238 | – | – | 378 | ||||||||||||||||||
| Disposals | (29 | ) | (21 | ) | (35 | ) | – | (1 | ) | (86 | ) | |||||||||||||
| Transfers | 38 | 142 | 874 | 145 | (1,199 | ) | – | |||||||||||||||||
| Foreign currency translation and other | 2 | (34 | ) | (41 | ) | 55 | (83 | ) | (101 | ) | ||||||||||||||
| Depreciation | (35 | ) | (191 | ) | (991 | ) | (70 | ) | – | (1,287 | ) | |||||||||||||
| Depreciation – ROU assets | (2 | ) | (57 | ) | (248 | ) | – | – | (307 | ) | ||||||||||||||
| Impairment | – | – | (14 | ) | – | (5 | ) | (19 | ) | |||||||||||||||
| Carrying amount – December 31, 2021 | 1,073 | 6,305 | 10,221 | 853 | 1,564 | 20,016 | ||||||||||||||||||
| Balance – December 31, 2021 comprised of: | ||||||||||||||||||||||||
Cost | 1,547 | 8,584 | 20,627 | 2,496 | 1,564 | 34,818 | ||||||||||||||||||
Accumulated depreciation and impairments | (474 | ) | (2,279 | ) | (10,406 | ) | (1,643 | ) | – | (14,802 | ) | |||||||||||||
| Carrying amount – December 31, 2021 | 1,073 | 6,305 | 10,221 | 853 | 1,564 | 20,016 | ||||||||||||||||||
| Balance – December 31, 2021 comprised of: | ||||||||||||||||||||||||
Owned property, plant and equipment | 1,044 | 5,930 | 9,517 | 853 | 1,564 | 18,908 | ||||||||||||||||||
ROU assets | 29 | 375 | 704 | – | – | 1,108 | ||||||||||||||||||
| Carrying amount – December 31, 2021 | 1,073 | 6,305 | 10,221 | 853 | 1,564 | 20,016 | ||||||||||||||||||
| Carrying amount – December 31, 2019 | 1,160 | 6,409 | 10,641 | 747 | 1,378 | 20,335 | ||||||||||||||||||
| Acquisitions (Note 25) | 8 | 27 | 42 | – | – | 77 | ||||||||||||||||||
| Additions | 25 | 91 | 224 | 1 | 1,077 | 1,418 | ||||||||||||||||||
| Additions – ROU assets | – | 24 | 299 | – | – | 323 | ||||||||||||||||||
| Disposals | (5 | ) | (9 | ) | (34 | ) | – | – | (48 | ) | ||||||||||||||
| Transfers | 46 | 58 | 923 | 164 | (1,191 | ) | – | |||||||||||||||||
| Foreign currency translation and other | (15 | ) | – | 30 | 30 | (10 | ) | 35 | ||||||||||||||||
| Depreciation | (39 | ) | (198 | ) | (1,060 | ) | (82 | ) | – | (1,379 | ) | |||||||||||||
| Depreciation – ROU assets | (2 | ) | (55 | ) | (222 | ) | – | – | (279 | ) | ||||||||||||||
| Impairment | (88 | ) | (42 | ) | (507 | ) | (137 | ) | (48 | ) | (822 | ) | ||||||||||||
| Carrying amount – December 31, 2020 | 1,090 | 6,305 | 10,336 | 723 | 1,206 | 19,660 | ||||||||||||||||||
| Balance – December 31, 2020 comprised of: | ||||||||||||||||||||||||
Cost | 1,530 | 8,377 | 19,730 | 2,279 | 1,206 | 33,122 | ||||||||||||||||||
Accumulated depreciation and impairments | (440 | ) | (2,072 | ) | (9,394 | ) | (1,556 | ) | – | (13,462 | ) | |||||||||||||
| Carrying amount – December 31, 2020 | 1,090 | 6,305 | 10,336 | 723 | 1,206 | 19,660 | ||||||||||||||||||
| Balance – December 31, 2020 comprised of: | ||||||||||||||||||||||||
Owned property, plant and equipment | 1,061 | 5,986 | 9,665 | 723 | 1,206 | 18,641 | ||||||||||||||||||
ROU assets | 29 | 319 | 671 | – | – | 1,019 | ||||||||||||||||||
| Carrying amount – December 31, 2020 | 1,090 | 6,305 | 10,336 | 723 | 1,206 | 19,660 | ||||||||||||||||||
OVERVIEW MANAGEMENT’S DISCUSSION & ANALYSIS FOUR-YEAR HIGHLIGHTS | FINANCIAL STATEMENTS | OTHER INFORMATION
| In millions of US dollars unless otherwise noted | Nutrien Annual Report 2021 | 99 |
NOTE 13 PROPERTY, PLANT AND EQUIPMENT CONTINUED
Depreciation of property, plant and equipment was included in the following:
|
| 2021 | 2020 | ||||||
| Freight, transportation and distribution | 133 | 138 | ||||||
| Cost of goods sold | 1,052 | 1,111 | ||||||
| Selling expenses | 416 | 393 | ||||||
| General and administrative expenses | 36 | 56 | ||||||
| Depreciation recorded in earnings | 1,637 | 1,698 | ||||||
| Depreciation recorded in inventory | 112 | 132 | ||||||
Impairment
In 2020, we recorded the following impairments:
| Cash-generating units (“CGUs”) | Aurora | White Springs | ||||||
Segment |
| Phosphate |
| |||||
Impairment indicator |
| Lower long-term forecasted global phosphate prices |
| |||||
Pre-tax impairment loss ($) |
| 545 |
|
| 215 |
| ||
Pre-tax recoverable amount ($) |
| n/a |
|
| 160 |
| ||
Post-tax recoverable amount ($) |
| 995 |
|
| n/a |
| ||
Valuation technique | | Fair value less costs of disposal | |
| Value in use (“VIU” | ) | ||
Key assumptions | ||||||||
End of mine life (proven and probable reserves) (year) |
| 2050 |
|
| 2029 |
| ||
Pre-tax discount rate (%) |
| n/a |
|
| 16.0 |
| ||
Post-tax discount rate (%) |
| 10.5 |
|
| 12.0 |
| ||
For our Aurora CGU, the recoverable amount was based on after-tax discounted cash flows (using a five-year projection and a terminal year thereafter to the expected mine life), which incorporated assumptions an independent market participant would apply. For our White Springs CGU, the recoverable amount was based on pre-tax discounted cash flows until the end of the mine life. There were no reversals of impairment in 2021.
OVERVIEW MANAGEMENT’S DISCUSSION & ANALYSIS FOUR-YEAR HIGHLIGHTS | FINANCIAL STATEMENTS | OTHER INFORMATION
| 100 | Nutrien Annual Report 2021 | In millions of US dollars unless otherwise noted |
| NOTE 14 GOODWILL AND OTHER INTANGIBLE ASSETS |
|
|
| Other Intangibles | ||||||||||||||||||||||
|
| Goodwill | Customer Relationships 2 | Technology | Trade Names | Other | Total | ||||||||||||||||||
Useful life range (years) |
| n/a |
|
| 5 – 15 |
|
| 2 – 24 |
|
| 1 – 20 | 3 |
| 1 – 30 |
| |||||||||
Carrying amount – December 31, 2020 |
| 12,198 |
|
| 1,515 |
|
| 437 |
|
| 75 |
|
| 361 |
|
| 2,388 |
| ||||||
Acquisitions (Note 25) |
| 77 |
|
| 16 |
|
| – |
|
| – |
|
| – |
|
| 16 |
| ||||||
Additions – internally developed |
| – |
|
| – |
|
| 118 |
|
| 19 |
|
| 9 |
|
| 146 |
| ||||||
Foreign currency translation and other |
| (49 | ) |
| (15 | ) |
| 143 |
|
| (3 | ) |
| 13 |
|
| 138 |
| ||||||
Disposals |
| (6 | ) |
| – |
|
| – |
|
| – |
|
| – |
|
| – |
| ||||||
Cloud computing transition adjustment (Note 6) |
| – |
|
| – |
|
| (34 | ) |
| – |
|
| – |
|
| (34 | ) | ||||||
Amortization 1 |
| – |
|
| (166 | ) |
| (69 | ) |
| (11 | ) |
| (68 | ) |
| (314 | ) | ||||||
Carrying amount – December 31, 2021 |
| 12,220 |
|
| 1,350 |
|
| 595 |
|
| 80 |
|
| 315 |
|
| 2,340 |
| ||||||
Balance – December 31, 2021 comprised of: | ||||||||||||||||||||||||
Cost |
| 12,227 |
|
| 1,961 |
|
| 808 |
|
| 127 |
|
| 619 |
|
| 3,515 |
| ||||||
Accumulated amortization and impairment |
| (7 | ) |
| (611 | ) |
| (213 | ) |
| (47 | ) |
| (304 | ) |
| (1,175 | ) | ||||||
| Carrying amount – December 31, 2021 |
| 12,220 |
|
| 1,350 |
|
| 595 |
|
| 80 |
|
| 315 |
|
| 2,340 |
| ||||||
Carrying amount – December 31, 2019 |
| 11,986 |
|
| 1,584 |
|
| 351 |
|
| 62 |
|
| 431 |
|
| 2,428 |
| ||||||
Acquisitions (Note 25) |
| 167 |
|
| 74 |
|
| 2 |
|
| 8 |
|
| 6 |
|
| 90 |
| ||||||
Additions – internally developed |
| – |
|
| – |
|
| 106 |
|
| – |
|
| 16 |
|
| 122 |
| ||||||
Foreign currency translation and other |
| 45 |
|
| 22 |
|
| 20 |
|
| 14 |
|
| (22 | ) |
| 34 |
| ||||||
Disposals |
| – |
|
| – |
|
| (3 | ) |
| – |
|
| – |
|
| (3 | ) | ||||||
Amortization 1 |
| – |
|
| (165 | ) |
| (39 | ) |
| (9 | ) |
| (70 | ) |
| (283 | ) | ||||||
Carrying amount – December 31, 2020 |
| 12,198 |
|
| 1,515 |
|
| 437 |
|
| 75 |
|
| 361 |
|
| 2,388 |
| ||||||
Balance – December 31, 2020 comprised of: |
| |||||||||||||||||||||||
Cost |
| 12,205 |
|
| 1,971 |
|
| 544 |
|
| 111 |
|
| 597 |
|
| 3,223 |
| ||||||
Accumulated amortization and impairment |
| (7 | ) |
| (456 | ) |
| (107 | ) |
| (36 | ) |
| (236 | ) |
| (835 | ) | ||||||
Carrying amount – December 31, 2020 |
| 12,198 |
|
| 1,515 |
|
| 437 |
|
| 75 |
|
| 361 |
|
| 2,388 |
| ||||||
| 1 | Amortization of $260 was included in selling expenses during the year ended December 31, 2021 (2020 – $254). |
| 2 | The average remaining amortization period of customer relationships as at December 31, 2021, was approximately 5 years. |
| 3 | Certain trade names have indefinite useful lives as there are no regulatory, legal, contractual, cooperative, economic or other factors that limit their useful lives. |
OVERVIEW MANAGEMENT’S DISCUSSION & ANALYSIS FOUR-YEAR HIGHLIGHTS | FINANCIAL STATEMENTS | OTHER INFORMATION
| In millions of US dollars unless otherwise noted | Nutrien Annual Report 2021 | 101 |
NOTE 14 GOODWILL AND OTHER INTANGIBLE ASSETS CONTINUED
Goodwill Impairment Testing
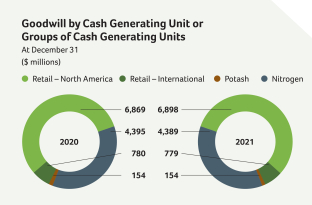
We performed our annual impairment test on goodwill and did not identify any impairment; however, the recoverable amount for Retail – North America did not substantially exceed its carrying amount. In testing for impairment of goodwill, we calculate the recoverable amount for a CGU or groups of CGUs containing goodwill. We used the FVLCD methodology based on after-tax discounted cash flows (five-year projections and a terminal year thereafter) and incorporated assumptions an independent market participant would apply including considerations related to climate-change initiatives. We adjusted discount rates for each CGU or group of CGUs for the risk associated with achieving our forecasts (five-year projections) and for the country risk premium in which we expect to generate cash flows. FVLCD is a Level 3 measurement. We use our market capitalization and comparative market multiples to corroborate discounted cash flow results.
The key assumptions with the greatest influence on the calculation of the recoverable amounts are the discount rates, terminal growth rates and cash flow forecasts. The key forecast assumptions were based on historical data and estimates of future results from internal sources as well as industry and market trends.
|
| Terminal Growth Rate (%) | Discount Rate (%) | ||||||||||||||||||||||||||||||
|
|
| 2021 |
| 2020 |
| 2021 |
| 2020 | ||||||||||||||||||||||||
Retail – North America |
| 2.5 |
|
| 2.5 |
|
| 7.4 |
|
| 7.5 |
| ||||||||||||||||||||
Retail – International 1 |
| 2.0 – 6.2 |
|
| 2.0 |
|
| 8.0 – 15.5 |
|
| 7.8 – 16.0 |
| ||||||||||||||||||||
Potash |
| 2.5 |
|
| 2.5 |
|
| 7.7 |
|
| 8.0 |
| ||||||||||||||||||||
Nitrogen |
| 2.0 |
|
| 2.0 |
|
| 7.8 |
|
| 8.0 |
| ||||||||||||||||||||
| 1 | The discount rates reflect the country risk premium and size for our international groups of CGUs. |
The Retail – North America group of CGUs recoverable amount exceeds its carrying amount by $1.5 billion, which is 12 percent of the carrying amount. Goodwill is more susceptible to impairment risk if business operating results or economic conditions deteriorate and we do not meet our forecasts. A reduction in the terminal growth rate, an increase in the discount rate or a decrease in forecasted EBITDA could cause impairment in the future. The following table indicates the percentage by which key assumptions would need to change individually for the estimated recoverable amount to be equal to the carrying amount:
| Key Assumptions | Change Required for Carrying Amount to Equal Recoverable Amount | Value Used in Impairment Model | ||||||
Terminal growth rate (%) |
| 0.8 percentage point decrease |
|
| 2.5 |
| ||
Forecasted EBITDA over forecast period (in billions of US dollars) |
| 9.8 percent decrease |
|
| 6.8 |
| ||
Discount rate (%) |
| 0.6 percentage point increase |
|
| 7.4 |
| ||
OVERVIEW MANAGEMENT’S DISCUSSION & ANALYSIS FOUR-YEAR HIGHLIGHTS | FINANCIAL STATEMENTS | OTHER INFORMATION
| 102 | Nutrien Annual Report 2021 | In millions of US dollars unless otherwise noted |
| NOTE 15 INVESTMENTS |
| Name | Principal Activity | Principal Place Incorporation | Proportion of Ownership Interest and Voting Rights Held (%) | Carrying Amount | ||||||||||||||||
| 2021 | 2020 | 2021 | 2020 | |||||||||||||||||
Equity-accounted | ||||||||||||||||||||
Profertil | Nitrogen Producer | Argentina |
| 50 |
|
| 50 |
|
| 277 |
|
| 233 |
| ||||||
Canpotex | Marketing and Logistics | Canada |
| 50 |
|
| 50 |
|
| – |
|
| – |
| ||||||
Other associates |
| 182 |
|
| 176 |
| ||||||||||||||
Total equity-accounted |
| 459 |
|
| 409 |
| ||||||||||||||
Investments at FVTOCI | ||||||||||||||||||||
Sinofert | Fertilizer Supplier | China/Bermuda |
| 22 |
|
| 22 |
|
| 234 |
|
| 153 |
| ||||||
Other |
| 10 |
|
| – |
| ||||||||||||||
Total investments |
| 244 |
|
| 153 |
| ||||||||||||||
Total investments |
| 703 |
|
| 562 |
| ||||||||||||||
We continuously assess our ability to exercise significant influence or joint control over our investments. Our 22 percent ownership in Sinofert does not constitute significant influence as we do not have any representation on the board of directors of Sinofert. We elected to account for our investment in Sinofert as FVTOCI as it is held for strategic purposes.
Future conditions related to Profertil may be affected by political, economic and social instability. We are exposed to foreign exchange risk related to fluctuations in the Argentine peso against the US dollar. This may also restrict our ability to obtain dividends from Profertil.
| NOTE 16 OTHER ASSETS |
|
| 2021 | 2020 | ||||||
Deferred income tax assets (Note 8) |
| 262 |
|
| 242 |
| ||
Ammonia catalysts – net of accumulated amortization of $85 (2020 – $76) |
| 88 |
|
| 89 |
| ||
Long-term income tax receivable (Note 8) |
| 166 |
|
| 305 |
| ||
Accrued pension benefit assets (Note 21) |
| 170 |
|
| 109 |
| ||
Other |
| 143 |
|
| 169 |
| ||
| 829 |
|
| 914 |
| |||
OVERVIEW MANAGEMENT’S DISCUSSION & ANALYSIS FOUR-YEAR HIGHLIGHTS | FINANCIAL STATEMENTS | OTHER INFORMATION
| In millions of US dollars unless otherwise noted | Nutrien Annual Report 2021 | 103 |
| NOTE 17 SHORT-TERM DEBT |
We use our $4.5 billion commercial paper program for our short-term cash requirements. The commercial paper program is backstopped by the $4.5 billion unsecured revolving term credit facility (“Nutrien Credit Facility”). Credit facilities are renegotiated periodically.
|
| Rate of Interest (%) | 2021 | 2020 | |||||||||||||||
Other credit facilities 1 |
| 0.8 – 13.1 |
|
| 313 |
|
| 159 |
| |||||||||
Commercial paper 2 |
| 0.3 – 0.4 |
|
| 1,170 |
|
| – |
| |||||||||
Other short-term debt |
| 77 |
|
| – |
| ||||||||||||
| 1,560 |
|
| 159 |
| |||||||||||||
| 1 | Credit facilities are unsecured and consist of South American facilities with debt of $74 (2020 – $109) and interest rates ranging from 1.8 percent to 13.1 percent, Australian facilities with debt of $211 (2020 – $19) and interest rates ranging from 0.8 percent to 0.9 percent, and other facilities with debt of $28 (2020 – $31) and an interest rate of 1.4 percent. |
| 2 | The amount available under the commercial paper program is limited to the availability of backup funds under the Nutrien Credit Facility and excess cash invested in highly liquid securities |
| Credit facilities | Total Facility Limit as at December 31, 2021 | Total Facility Limit as at December 31, 2020 | ||||||
Nutrien Credit Facility 1 |
| 4,500 |
|
| 4,500 |
| ||
Uncommitted revolving demand facility |
| 500 |
|
| 500 |
| ||
Other credit facilities 2 |
| 720 |
|
| 740 |
| ||
| 1 | In 2021, we extended the maturity date from April 10, 2023 to June 4, 2026, subject to extension at the request of Nutrien provided that the resulting maturity date shall not exceed five years from the date of request. |
| 2 | Total facility limit amounts include some facilities with maturities in excess of one year. |
Principal covenants and events of default under the Nutrien Credit Facility include a debt to capital ratio (refer to Note 24) and other customary events of default and covenant provisions. Non-compliance with such covenants could result in accelerated repayment and/or termination of the credit facility. We were in compliance with all covenants as at December 31, 2021.
In 2020, we entered into new committed revolving credit facilities totaling approximately $1,500, all with the same principal covenants and events of default as our existing credit facilities. We closed these credit facilities after the issuance of the new notes in 2020.
OVERVIEW MANAGEMENT’S DISCUSSION & ANALYSIS FOUR-YEAR HIGHLIGHTS | FINANCIAL STATEMENTS | OTHER INFORMATION
| 104 | Nutrien Annual Report 2021 | In millions of US dollars unless otherwise noted |
| NOTE 18 LONG-TERM DEBT |
We source our borrowings for funding purposes primarily through notes, debentures and long-term credit facilities. We have access to the capital markets through our base shelf prospectus.
|
|
| Rate of Interest (%) | Maturity |
| 2021 |
| 2020 | |||||||||||||||||||||
Notes 1 | ||||||||||||||||||||||||||||
| 3.150 |
|
| October 1, 2022 |
|
| 500 |
|
| 500 |
| |||||||||||||||||
| 1.900 |
|
| May 13, 2023 |
|
| 500 |
|
| 500 |
| |||||||||||||||||
| 3.500 |
|
| June 1, 2023 |
|
| – |
|
| 500 |
| |||||||||||||||||
| 3.625 |
|
| March 15, 2024 |
|
| – |
|
| 750 |
| |||||||||||||||||
| 3.375 |
|
| March 15, 2025 |
|
| – |
|
| 550 |
| |||||||||||||||||
| 3.000 |
|
| April 1, 2025 |
|
| 500 |
|
| 500 |
| |||||||||||||||||
| 4.000 |
|
| December 15, 2026 |
|
| 500 |
|
| 500 |
| |||||||||||||||||
| 4.200 |
|
| April 1, 2029 |
|
| 750 |
|
| 750 |
| |||||||||||||||||
| 2.950 |
|
| May 13, 2030 |
|
| 500 |
|
| 500 |
| |||||||||||||||||
| 4.125 |
|
| March 15, 2035 |
|
| 450 |
|
| 450 |
| |||||||||||||||||
| 7.125 |
|
| May 23, 2036 |
|
| 212 |
|
| 300 |
| |||||||||||||||||
| 5.875 |
|
| December 1, 2036 |
|
| 500 |
|
| 500 |
| |||||||||||||||||
| 5.625 |
|
| December 1, 2040 |
|
| 500 |
|
| 500 |
| |||||||||||||||||
| 6.125 |
|
| January 15, 2041 |
|
| 401 |
|
| 500 |
| |||||||||||||||||
| 4.900 |
|
| June 1, 2043 |
|
| 500 |
|
| 500 |
| |||||||||||||||||
| 5.250 |
|
| January 15, 2045 |
|
| 489 |
|
| 500 |
| |||||||||||||||||
| 5.000 |
|
| April 1, 2049 |
|
| 750 |
|
| 750 |
| |||||||||||||||||
| 3.950 |
|
| May 13, 2050 |
|
| 500 |
|
| 500 |
| |||||||||||||||||
Debentures 1 |
| 7.800 |
|
| February 1, 2027 |
|
| 120 |
|
| 125 |
| ||||||||||||||||
Other credit facilities 2 |
| Various |
|
| Various |
|
| 141 |
|
| 67 |
| ||||||||||||||||
| 7,813 |
|
| 9,742 |
| |||||||||||||||||||||||
Add net unamortized fair value adjustments |
| 325 |
|
| 404 |
| ||||||||||||||||||||||
Less net unamortized debt issue costs |
| (72 | ) |
| (85 | ) | ||||||||||||||||||||||
| 8,066 |
|
| 10,061 |
| |||||||||||||||||||||||
Less current maturities |
| (545 | ) |
| (14 | ) | ||||||||||||||||||||||
| 7,521 |
|
| 10,047 |
| |||||||||||||||||||||||
| 1 | Each series of notes and debentures is unsecured and has no sinking fund requirements prior to maturity. Each series is redeemable and has various provisions that allow redemption prior to maturity, at our option, at specified prices. |
| 2 | Other credit facilities are unsecured and consist of South American facilities with debt of $137 (2020 – $63) and interest rates ranging from 1.9 percent to 12.2 percent and other facilities with debt of $4 (2020 – $4) and an interest rate of 3.9 percent. |
OVERVIEW MANAGEMENT’S DISCUSSION & ANALYSIS FOUR-YEAR HIGHLIGHTS | FINANCIAL STATEMENTS | OTHER INFORMATION
| In millions of US dollars unless otherwise noted | Nutrien Annual Report 2021 | 105 |
NOTE 18 LONG-TERM DEBT CONTINUED
In 2021, we redeemed the entire outstanding principal amount of these notes in accordance with the optional redemption provisions provided in the indenture governing these notes:
|
|
| Rate of interest (%) |
| Maturity |
| Redeemed | ||||||||||||||||||
Notes |
| 3.500 |
|
| June 1, 2023 |
|
| 500 |
| |||||||||||||||
Notes |
| 3.625 |
|
| March 15, 2024 |
|
| 750 |
| |||||||||||||||
Notes |
| 3.375 |
|
| March 15, 2025 |
|
| 550 |
| |||||||||||||||
Principal amount |
| 1,800 |
| |||||||||||||||||||||
Add net unamortized fair value adjustments |
| 5 |
| |||||||||||||||||||||
Less net unamortized debt issue costs |
| (5 | ) | |||||||||||||||||||||
Carrying amount |
| 1,800 |
| |||||||||||||||||||||
We also completed a cash tender offer to purchase the following debentures and notes, up to a maximum aggregate purchase price of $300:
|
|
| Rate of interest (%) |
| Maturity |
| Redeemed | ||||||||||||||||||
Debentures |
| 7.800 |
|
| February 1, 2027 |
|
| 5 |
| |||||||||||||||
Notes |
| 7.125 |
|
| May 23, 2036 |
|
| 88 |
| |||||||||||||||
Notes |
| 6.125 |
|
| January 15, 2041 |
|
| 99 |
| |||||||||||||||
Notes |
| 5.250 |
|
| January 15, 2045 |
|
| 11 |
| |||||||||||||||
Principal amount |
| 203 |
| |||||||||||||||||||||
Add net unamortized fair value adjustments |
| 53 |
| |||||||||||||||||||||
Carrying amount |
| 256 |
| |||||||||||||||||||||
The redemption and cash tender offers were funded by using cash on hand and proceeds from the issuance of commercial paper. The total cash spend, including accrued interest, was $2.2 billion. As a result of the early extinguishment of debt, we recorded a loss on extinguishment of debt of $142 (Note 7).
We are subject to certain customary covenants including limitation on liens, merger and change of control covenants, and customary events of default. As calculated in Note 24, we were in compliance with these covenants as at December 31, 2021.
|
|
| Short-Term Debt |
| Long-Term Debt |
| Lease Liabilities |
| Total | ||||||||||||||||||||||||
Balance – December 31, 2020 |
| 159 |
|
| 10,061 |
|
| 1,140 |
|
| 11,360 |
| ||||||||||||||||||||
Cash flows (cash inflows and outflows presented on a net basis) |
| 1,344 |
|
| (2,133 | ) |
| (320 | ) |
| (1,109 | ) | ||||||||||||||||||||
Loss on early extinguishment of debt |
| – |
|
| 142 |
|
| – |
|
| 142 |
| ||||||||||||||||||||
Additions and other adjustments to ROU assets |
| – |
|
| – |
|
| 408 |
|
| 408 |
| ||||||||||||||||||||
Foreign currency translation and other non-cash changes |
| 57 |
|
| (4 | ) |
| (8 | ) |
| 45 |
| ||||||||||||||||||||
Balance – December 31, 2021 |
| 1,560 |
|
| 8,066 |
|
| 1,220 |
|
| 10,846 |
| ||||||||||||||||||||
Balance – December 31, 2019 |
| 976 |
|
| 9,055 |
|
| 1,073 |
|
| 11,104 |
| ||||||||||||||||||||
Cash flows (cash inflows and outflows presented on a net basis) |
| (892 | ) |
| 1,017 |
|
| (274 | ) |
| (149 | ) | ||||||||||||||||||||
Additions and other adjustments to ROU assets |
| – |
|
| – |
|
| 320 |
|
| 320 |
| ||||||||||||||||||||
Foreign currency translation and other non-cash changes |
| 75 |
|
| (11 | ) |
| 21 |
|
| 85 |
| ||||||||||||||||||||
Balance – December 31, 2020 |
| 159 |
|
| 10,061 |
|
| 1,140 |
|
| 11,360 |
| ||||||||||||||||||||
OVERVIEW MANAGEMENT’S DISCUSSION & ANALYSIS FOUR-YEAR HIGHLIGHTS | FINANCIAL STATEMENTS | OTHER INFORMATION
| 106 | Nutrien Annual Report 2021 | In millions of US dollars unless otherwise noted |
| NOTE 19 LEASE LIABILITIES |
|
|
| Average Rate of Interest (%) |
| 2021 |
| 2020 | ||||||||||||||||||
Lease liabilities – non-current |
| 2.9 |
|
| 934 |
|
| 891 |
| |||||||||||||||
Current portion of lease liabilities |
| 2.5 |
|
| 286 |
|
| 249 |
| |||||||||||||||
Total |
| 1,220 |
|
| 1,140 |
| ||||||||||||||||||
| NOTE 20 PAYABLES AND ACCRUED CHARGES |
Payables and accrued charges consist primarily of amounts we owe to suppliers and prepayments made by customers planning to purchase our products for the upcoming growing season.
|
|
| 2021 |
| 2020 | ||||||||
Trade and other payables |
| 5,179 |
|
| 4,415 |
| ||||||
Customer prepayments |
| 2,083 |
|
| 1,800 |
| ||||||
Dividends |
| 257 |
|
| 256 |
| ||||||
Accrued compensation |
| 669 |
|
| 513 |
| ||||||
Current portion of asset retirement obligations and accrued environmental costs (Note 22) |
| 170 |
|
| 162 |
| ||||||
Accrued interest |
| 80 |
|
| 99 |
| ||||||
Current portion of share-based compensation (Note 5) |
| 185 |
|
| 95 |
| ||||||
Current portion of derivatives |
| 20 |
|
| 39 |
| ||||||
Income taxes (Note 8) |
| 606 |
|
| 48 |
| ||||||
Current portion of pension and other post-retirement benefits (Note 21) |
| 16 |
|
| 15 |
| ||||||
Other accrued charges and others |
| 787 |
|
| 616 |
| ||||||
| 10,052 |
|
| 8,058 |
| |||||||
OVERVIEW MANAGEMENT’S DISCUSSION & ANALYSIS FOUR-YEAR HIGHLIGHTS | FINANCIAL STATEMENTS | OTHER INFORMATION
| In millions of US dollars unless otherwise noted | Nutrien Annual Report 2021 | 107 |
| NOTE 21 PENSION AND OTHER POST-RETIREMENT BENEFITS |
We offer the following pension and other post-retirement benefits to qualified employees: defined benefit pension plans; defined contribution pension plans; and health, disability, dental and life insurance (referred to as other defined benefit) plans. Substantially all our employees participate in at least one of these plans.
Description of Defined Benefit Pension Plans
| Plan Type | Contributions | |||||||
United States | • non-contributory,
• guaranteed annual pension payments for life,
• benefits generally depend on years of service and compensation level in the final years leading up to age 65,
• benefits available starting at age 55 at a reduced rate, and
• plans provide for maximum pensionable salary and maximum annual benefit limits.
| • made to meet or exceed minimum funding requirements of the Employee Retirement Income Security Act of 1974 and associated Internal Revenue Service regulations and procedures. | ||||||
Canada | • made to meet or exceed minimum funding requirements based on provincial statutory requirements and associated federal taxation rules.
| |||||||
Supplemental Plans in US and Canada for Senior Management | • non-contributory,
• unfunded, and
• supplementary pension benefits. | • provided for by charges to earnings sufficient to meet the projected benefit obligations, and
• payments to plans are made as plan payments to retirees occur. | ||||||
Our defined benefit pension plans are funded with separate funds that are legally separated from the Company and administered through an employee benefits or management committee in each country, which is composed of our employees. The employee benefits or management committee is required by law to act in the best interests of the plan participants and, in the US and Canada, is responsible for the governance of the plans, including setting certain policies (e.g., investment and contribution) of the funds. The current investment policy for each country’s plans generally does not include any asset/liability matching strategies or currency hedging strategies. Plan assets held in trusts are governed by local regulations and practices in each country, as is the nature of the relationship between the Company and the trustees and their composition.
Description of Other Post-Retirement Plans
We provide health care plans for certain eligible retired employees in the US, Canada and Trinidad. Eligibility for these benefits is generally based on a combination of age and years of service at retirement. Certain terms of the plans include:
| • | coordination with government-provided medical insurance in each country; |
| • | certain unfunded cost-sharing features such as co-insurance, deductibles and co-payments – benefits subject to change; |
| • | for certain plans, maximum lifetime benefits; |
| • | at retirement, the employee’s spouse and certain dependent children may be eligible for coverage; |
| • | benefits are self-insured and are administered through third-party providers; and |
| • | generally, retirees contribute toward annual cost of the plans. |
We provide non-contributory life insurance plans for certain retired employees who meet specific age and service eligibility requirements.
OVERVIEW MANAGEMENT’S DISCUSSION & ANALYSIS FOUR-YEAR HIGHLIGHTS | FINANCIAL STATEMENTS | OTHER INFORMATION
| 108 | Nutrien Annual Report 2021 | In millions of US dollars unless otherwise noted |
NOTE 21 PENSION AND OTHER POST-RETIREMENT BENEFITS CONTINUED
Risks
The defined benefit pension and other post-retirement plans expose us to broadly similar actuarial risks. The most significant risks include investment risk and interest rate risk as discussed below. Other risks include longevity risk and salary risk.
Investment Risk | A deficit will be created if plan assets underperform the discount rate used in the defined benefit obligation valuation. To mitigate investment risk, we employ:
• a total return on investment approach whereby a diversified mix of equities and fixed income investments is used to maximize long-term return for a prudent level of risk; and
• risk tolerance established through careful consideration of plan liabilities, plan funded status and corporate financial condition.
Other assets such as private equity and hedge funds are not used at this time. Our policy is not to invest in commodities, precious metals, mineral rights, bullions or collectibles. Investment risk is measured and monitored on an ongoing basis through quarterly investment portfolio reviews, annual liability measurements and periodic asset/liability studies. | |
Interest Rate Risk | A decrease in bond interest rates will increase the pension liability; however, this is generally expected to be partially offset by an increase in the return on the plan’s debt investments. | |
Financial Information
|
| 2021 | 2020 | ||||||||||||||||||||||
|
| Obligation | Plan Assets | Net | Obligation | Plan Assets | Net | ||||||||||||||||||
Balance – beginning of year |
| (2,066 | ) |
| 1,706 |
|
| (360 | ) |
| (2,044 | ) |
| 1,621 |
|
| (423 | ) | ||||||
Components of defined benefit expense recognized in earnings | ||||||||||||||||||||||||
Current service cost for benefits earned during the year |
| (36 | ) |
| – |
|
| (36 | ) |
| (36 | ) |
| – |
|
| (36 | ) | ||||||
Interest (expense) income |
| (57 | ) |
| 48 |
|
| (9 | ) |
| (66 | ) |
| 53 |
|
| (13 | ) | ||||||
Past service cost, including curtailment gains and settlements 1 |
| (2 | ) |
| – |
|
| (2 | ) |
| 133 |
|
| (132 | ) |
| 1 |
| ||||||
Foreign exchange rate changes and other |
| (7 | ) |
| (1 | ) |
| (8 | ) |
| (3 | ) |
| (1 | ) |
| (4 | ) | ||||||
Subtotal of components of defined benefit expense (recovery) recognized in earnings |
| (102 | ) |
| 47 |
|
| (55 | ) |
| 28 |
|
| (80 | ) |
| (52 | ) | ||||||
Remeasurements of the net defined benefit liability recognized in OCI during the year | ||||||||||||||||||||||||
Actuarial gain arising from: | ||||||||||||||||||||||||
Changes in financial assumptions |
| 6 |
|
| – |
|
| 6 |
|
| (153 | ) |
| – |
|
| (153 | ) | ||||||
Changes in demographic assumptions |
| 83 |
|
| – |
|
| 83 |
|
| 12 |
|
| – |
|
| 12 |
| ||||||
Gain on plan assets (excluding amounts included in net interest) |
| 3 |
|
| 33 |
|
| 36 |
|
| – |
|
| 230 |
|
| 230 |
| ||||||
Subtotal of remeasurements |
| 92 |
|
| 33 |
|
| 125 |
|
| (141 | ) |
| 230 |
|
| 89 |
| ||||||
Cash flows | ||||||||||||||||||||||||
Contributions by plan participants |
| (6 | ) |
| 6 |
|
| – |
|
| (5 | ) |
| 5 |
|
| – |
| ||||||
Employer contributions |
| – |
|
| 25 |
|
| 25 |
|
| – |
|
| 26 |
|
| 26 |
| ||||||
Benefits paid |
| 86 |
|
| (86 | ) |
| – |
|
| 96 |
|
| (96 | ) |
| – |
| ||||||
Subtotal of cash flows |
| 80 |
|
| (55 | ) |
| 25 |
|
| 91 |
|
| (65 | ) |
| 26 |
| ||||||
Balance – end of year 2 |
| (1,996 | ) |
| 1,731 |
|
| (265 | ) |
| (2,066 | ) |
| 1,706 |
|
| (360 | ) | ||||||
Balance comprised of: | ||||||||||||||||||||||||
Non-current assets | ||||||||||||||||||||||||
Other assets (Note 16) |
| 170 |
|
| 109 |
| ||||||||||||||||||
Current liabilities | ||||||||||||||||||||||||
Payables and accrued charges (Note 20) |
| (16 | ) |
| (15 | ) | ||||||||||||||||||
Non-current liabilities | ||||||||||||||||||||||||
Pension and other post-retirement benefit liabilities |
| (419 | ) |
| (454 | ) | ||||||||||||||||||
| 1 | During 2020, we transferred certain pension plan obligations to an insurance company. |
| 2 | Obligations arising from funded and unfunded pension plans are $1,659 and $337 (2020 – $1,690 and $376), respectively. Other post-retirement benefit plans have no plan assets and are unfunded. |
OVERVIEW MANAGEMENT’S DISCUSSION & ANALYSIS FOUR-YEAR HIGHLIGHTS | FINANCIAL STATEMENTS | OTHER INFORMATION
| In millions of US dollars unless otherwise noted | Nutrien Annual Report 2021 | 109 |
NOTE 21 PENSION AND OTHER POST-RETIREMENT BENEFITS CONTINUED
Plan Assets
As at December 31, the fair value of plan assets of our defined benefit pension plans, by asset category, were as follows:
|
| 2021 | 2020 | ||||||||||||||||||||||
|
| Quoted Prices in Active Markets for | Other 1 | Total | Quoted Prices in Active Markets for | Other 1 | Total | ||||||||||||||||||
Cash and cash equivalents |
| 11 |
|
| 7 |
|
| 18 |
|
| 9 |
|
| 33 |
|
| 42 |
| ||||||
Equity securities and equity funds | ||||||||||||||||||||||||
US 2 |
| 22 |
|
| 257 |
|
| 279 |
|
| 19 |
|
| 483 |
|
| 502 |
| ||||||
International |
| – |
|
| 28 |
|
| 28 |
|
| 158 |
|
| – |
|
| 158 |
| ||||||
Debt securities 2, 3 |
| – |
|
| 1,020 |
|
| 1,020 |
|
| – |
|
| 977 |
|
| 977 |
| ||||||
Other 2 |
| – |
|
| 386 |
|
| 386 |
|
| – |
|
| 27 |
|
| 27 |
| ||||||
Total pension plan assets |
| 33 |
|
| 1,698 |
|
| 1,731 |
|
| 186 |
|
| 1,520 |
|
| 1,706 |
| ||||||
| 1 | Approximately 100 percent (2020 – 76 percent) of the Other plan assets are held in funds whose fair values are estimated using their net asset value per share. For the majority of these funds, the redemption frequency is immediate. The Plan Committee manages the asset allocation based upon our current liquidity and income needs. |
| 2 | Certain funds have been reclassified for the year ended December 31, 2020. |
| 3 | Debt securities included US securities of 71 percent (2020 – 60 percent) and International securities of 28 percent (2020 – 40 percent) and Mortgage Backed Securities of 1 percent (2020 – nil). |
We use letters of credit or surety bonds to secure certain Canadian unfunded defined benefit plan liabilities as at December 31, 2021.
We expect to contribute approximately $115 to all pension and post-retirement plans in 2022. Total contributions recognized as expense under all defined contribution plans for 2021 was $111 (2020 – $116).
We used the following significant assumptions to determine the benefit obligations and expense for our significant plans as at and for the year ended December 31. These assumptions are determined by management and are reviewed annually by our independent actuaries.
|
| Pension | Other | ||||||||||||||
|
| 2021 | 2020 | 2021 | 2020 | ||||||||||||
Assumptions used to determine the benefit obligations 1 : | ||||||||||||||||
Discount rate (%) |
| 3.09 |
|
| 2.83 |
|
| 2.97 |
|
| 2.66 |
| ||||
Rate of increase in compensation levels (%) |
| 4.27 |
|
| 4.57 |
|
| n/a |
|
| n/a |
| ||||
Medical cost trend rate – assumed (%) 2 |
| n/a |
|
| n/a |
|
| 4.50 – 6.50 |
|
| 4.50 – 5.80 |
| ||||
Medical cost trend rate – year reaches ultimate trend rate |
| n/a |
|
| n/a |
|
| 2030 |
|
| 2037 |
| ||||
Mortality assumptions (years) 3 | ||||||||||||||||
Life expectancy at 65 for a male member currently at age 65 |
| 20.7 |
|
| 20.6 |
|
| 20.6 |
|
| 20.2 |
| ||||
Life expectancy at 65 for a female member currently at age 65 |
| 22.9 |
|
| 22.8 |
|
| 23.2 |
|
| 22.8 |
| ||||
Average duration of the defined benefit obligations (years) 4 |
| 15.3 |
|
| 15.4 |
|
| 14.9 |
|
| 15.2 |
| ||||
| 1 | The current year’s expense is determined using the assumptions that existed at the end of the previous year. |
| 2 | We assumed a graded medical cost trend rate starting at 6.50 percent in 2021, moving to 4.50 percent by 2030 (2020 – starting at 5.80 percent, moving to 4.50 percent by 2037). |
| 3 | Based on actuarial advice in accordance with the latest available published tables, adjusted where appropriate to reflect future longevity improvements for each country. |
| 4 | Weighted average length of the underlying cash flows. |
OVERVIEW MANAGEMENT’S DISCUSSION & ANALYSIS FOUR-YEAR HIGHLIGHTS | FINANCIAL STATEMENTS | OTHER INFORMATION
| 110 | Nutrien Annual Report 2021 | In millions of US dollars unless otherwise noted |
NOTE 21 PENSION AND OTHER POST-RETIREMENT BENEFITS CONTINUED
Of the most significant assumptions, a change in discount rates has the greatest potential impact on our pension and other post-retirement benefit plans, with sensitivity to change as follows:
|
|
| 2021 |
| 2020 | ||||||||||||||||||
|
| Change in Assumption | Benefit Obligations | Expense in Earnings Before Income Taxes |
| Benefit Obligations | Expense in Earnings Before Income Taxes | ||||||||||||||||
As reported |
| 1,996 |
|
| 55 |
|
| 2,066 |
|
| 52 |
| ||||||||||
Discount rate | 1.0 percentage point decrease |
| 330 |
|
| 20 |
|
| 360 |
|
| 10 |
| |||||||||
1.0 percentage point increase |
| (260 | ) |
| (20 | ) |
| (280 | ) |
| (10 | ) | ||||||||||
| NOTE 22 ASSET RETIREMENT OBLIGATIONS AND ACCRUED ENVIRONMENTAL COSTS |
A provision is an estimated liability with uncertainty over the timing or amount that will be paid. The most significant asset retirement and environmental remediation provisions relate to costs to restore potash and phosphate sites to their original, or another specified, condition.
The pre-tax risk-free discount rate, expected cash flow payments and sensitivity to changes in the discount rate on the recorded liability for asset retirement obligations and accrued environmental costs as at December 31, 2021, were as follows:
|
| Cash Flow Payments (years) 1 | Discounted Cash Flows 2,3 |
| Discount Rate | ||||||||||||||||
|
|
| +0.5% | -0.5% | |||||||||||||||||
Asset retirement obligations |
| (75 | ) |
| 85 |
| ||||||||||||||
Retail |
| 1 – 30 |
|
| 23 |
| ||||||||||||||
Potash |
| 31 – 440 |
|
| 96 |
| ||||||||||||||
Phosphate |
| 1 – 79 |
|
| 496 |
| ||||||||||||||
Corporate and other 4,5 |
| 1 – 485 |
|
| 616 |
| ||||||||||||||
Accrued environmental costs |
| (5 | ) |
| 5 |
| ||||||||||||||
Retail |
| 1 – 30 |
|
| 86 |
| ||||||||||||||
Corporate and other |
| 1 – 24 |
|
| 419 |
| ||||||||||||||
Total |
| 1,736 |
| |||||||||||||||||
| 1 | Time frame in which payments are expected to principally occur from December 31, 2021. Adjustments to the years can result from changes to the mine life and/or changes in the rate of tailings volumes. |
| 2 | Risk-free discount rates used to discount cash flows reflect current market assessments of the time value of money and the risks specific to the timing and jurisdiction of the obligation. Risk-free rates range from 1.9 percent to 5.5 percent. |
| 3 | Total undiscounted cash flows are $3.3 billion. For the Potash segment, this represents total undiscounted cash flows in the first year of decommissioning. This excludes subsequent years of tailings dissolution, fine tails capping, tailings management area reclamation, post-reclamation activities and monitoring, and final decommissioning, which are estimated to take an additional 126 to 409 years. |
| 4 | For nitrogen sites, we have not recorded any asset retirement obligations as no significant asset retirement obligations have been identified or there is no reasonable basis for estimating a date or range of dates of cessation of operations. We considered the historical performance of our facilities as well as our planned maintenance, major upgrades and replacements, which can extend the useful lives of our facilities indefinitely. |
| 5 | Includes certain potash and phosphate sites that are non-operating sites, with the majority of phosphate site payments taking place over the next 18 years. |
OVERVIEW MANAGEMENT’S DISCUSSION & ANALYSIS FOUR-YEAR HIGHLIGHTS | FINANCIAL STATEMENTS | OTHER INFORMATION
| In millions of US dollars unless otherwise noted | Nutrien Annual Report 2021 | 111 |
NOTE 22 ASSET RETIREMENT OBLIGATIONS AND ACCRUED ENVIRONMENTAL COSTS CONTINUED
|
| Asset Retirement Obligations |
| Accrued Environmental Costs |
| Total | |||||||||||||||
Balance – December 31, 2020 |
| 1,209 |
|
| 550 |
|
| 1,759 |
| |||||||||||
Disposals |
| – |
|
| (4 | ) |
| (4 | ) | |||||||||||
Additional provisions |
| 22 |
|
| 1 |
|
| 23 |
| |||||||||||
Change in estimates |
| 78 |
|
| (1 | ) |
| 77 |
| |||||||||||
Settlements |
| (89 | ) |
| (27 | ) |
| (116 | ) | |||||||||||
Accretion |
| 12 |
|
| (21 | ) |
| (9 | ) | |||||||||||
Foreign currency translation and other |
| (1 | ) |
| 7 |
|
| 6 |
| |||||||||||
Balance – December 31, 2021 |
| 1,231 |
|
| 505 |
|
| 1,736 |
| |||||||||||
Balance – December 31, 2021 comprised of: | ||||||||||||||||||||
Current liabilities | ||||||||||||||||||||
Payables and accrued charges (Note 20) |
| 115 |
|
| 55 |
|
| 170 |
| |||||||||||
Non-current liabilities | ||||||||||||||||||||
Asset retirement obligations and accrued environmental costs |
| 1,116 |
|
| 450 |
|
| 1,566 |
| |||||||||||
We are subject to numerous environmental requirements under federal, provincial, state and local laws in the countries in which we operate. We have gypsum stack capping, and closure and post-closure obligations through our subsidiaries, PCS Phosphate Company, Inc. in White Springs, Florida, and PCS Nitrogen Inc. in Geismar, Louisiana, pursuant to the financial assurance regulatory requirements in those states. The recorded provisions may not necessarily reflect our obligations under these financial assurances.
| NOTE 23 SHARE CAPITAL |
Authorized
We are authorized to issue an unlimited number of common shares without par value and an unlimited number of preferred shares. The common shares are not redeemable or convertible. The preferred shares may be issued in one or more series with rights and conditions to be determined by the Board of Directors.
Issued
|
|
| Number of Common Shares |
| Share Capital | ||||||||
| Balance – December 31, 2020 | 569,260,406 | 15,673 | ||||||||||
| Issued under option plans and share-settled plans | 4,424,437 | 226 | ||||||||||
| Repurchased | (15,982,154 | ) | (442 | ) | ||||||||
Shares cancellation |
| (210,173 | ) |
| – |
| ||||||
Balance – December 31, 2021 |
| 557,492,516 |
|
| 15,457 |
| ||||||
OVERVIEW MANAGEMENT’S DISCUSSION & ANALYSIS FOUR-YEAR HIGHLIGHTS | FINANCIAL STATEMENTS | OTHER INFORMATION
| 112 | Nutrien Annual Report 2021 | In millions of US dollars unless otherwise noted |
NOTE 23 SHARE CAPITAL CONTINUED
Share Repurchase Programs
|
| Commencement Date | Expiry | Maximum Shares for Repurchase | Maximum Shares for Repurchase (%) | Number of Shares Repurchased | |||||||||||||||
2019 Normal Course Issuer Bid |
| February 27, 2019 |
|
| February 26, 2020 |
|
| 42,164,420 |
|
| 7 |
|
| 33,256,668 |
| |||||
2020 Normal Course Issuer Bid |
| February 27, 2020 |
|
| February 26, 2021 |
|
| 28,572,458 |
|
| 5 |
|
| 710,100 |
| |||||
2021 Normal Course Issuer Bid 1 |
| March 1, 2021 |
|
| February 28, 2022 |
|
| 28,468,448 |
|
| 5 |
|
| 15,982,154 |
| |||||
2022 Normal Course Issuer Bid 2 |
| March 1, 2022 |
|
| February 28, 2023 |
|
| 55,111,100 |
|
| 10 |
|
| – |
| |||||
| 1 | The 2021 normal course issuer bid will expire earlier than the date above if we acquire the maximum number of common shares allowable or otherwise decide not to make any further repurchases. As of February 15, 2022, an additional 6,204,241 common shares were repurchased for cancellation at a cost of $445 and an average price per share of $71.70. |
| 2 | On February 16, 2022, our Board of Directors approved a share repurchase program, which is subject to the acceptance by the Toronto Stock Exchange. The 2022 normal course issuer bid will expire earlier than the date above if we acquire the maximum number of common shares allowable or otherwise decide not to make any further repurchases. |
Purchases under the normal course issuer bids were, or may be, made through open market purchases at market prices as well as by other means permitted by applicable securities regulatory authorities, including private agreements.
| Summary of share repurchases | 2021 |
| 2020 | |||||||||
Number of common shares repurchased for cancellation |
| 15,982,154 |
|
| 3,832,580 |
| ||||||
Average price per share (US dollars) |
| 69.17 |
|
| 41.96 |
| ||||||
Total cost |
| 1,105 |
|
| 160 |
| ||||||
Dividends Declared
|
| 2021 |
| 2020 | |||||||
| Declared | Per Share | Declared | Per Share | |||||||
February 17, 2021 |
| 0.46 |
| February 19, 2020 |
| 0.45 |
| |||
May 17, 2021 |
| 0.46 |
| May 6, 2020 |
| 0.45 |
| |||
August 9, 2021 |
| 0.46 |
| August 10, 2020 |
| 0.45 |
| |||
November 1, 2021 |
| 0.46 |
| December 10, 2020 |
| 0.45 |
| |||
| 1.84 |
|
| 1.80 |
| |||||
On February 16, 2022, our Board of Directors declared an increase to our quarterly dividend to $0.48 per share payable on April 14, 2022, to shareholders of record on March 31, 2022. The total estimated dividend to be paid is $265.
Share Cancellation
During 2021, we cancelled 210,173 shares due to the expiration of the period when legacy companies’ (Potash Corporation of Saskatchewan Inc. and Agrium Inc.) shares could be exchanged under the plan of arrangement, wherein Nutrien became the parent company of the legacy companies.
OVERVIEW MANAGEMENT’S DISCUSSION & ANALYSIS FOUR-YEAR HIGHLIGHTS | FINANCIAL STATEMENTS | OTHER INFORMATION
| In millions of US dollars unless otherwise noted | Nutrien Annual Report 2021 | 113 |
| NOTE 24 CAPITAL MANAGEMENT |
Our capital allocation policy prioritizes safe and reliable operations, a healthy balance sheet, a sustainable dividend to shareholders and a strategy to allocate remaining cash flow that maximizes shareholder value.
We include total debt, adjusted total debt, adjusted net debt and adjusted shareholders’ equity as components of our capital structure. We monitor our capital structure and, based on changes in economic conditions, may adjust the structure by adjusting the amount of dividends paid to shareholders, repurchasing shares, issuing new shares, issuing new debt or retiring existing debt.
We use a combination of short-term and long-term debt to finance our operations. We typically pay floating rates of interest on short-term debt and credit facilities, and fixed rates on notes and debentures.
We monitor the following measures to evaluate our ability to service debt, make strategic investments and ensure we are in compliance with our debt covenants:
|
|
| 2021 |
| 2020 | ||||||||||||
Adjusted net debt to adjusted EBITDA |
| 1.4 |
|
| 2.6 |
| ||||||||||
Adjusted EBITDA to adjusted finance costs |
| 14.3 |
|
| 7.4 |
| ||||||||||
Debt to capital (calculated as adjusted total debt to adjusted capital) (Limit: 0.65 : 1.00) |
| 0.32 : 1.00 |
|
| 0.34 : 1.00 |
| ||||||||||
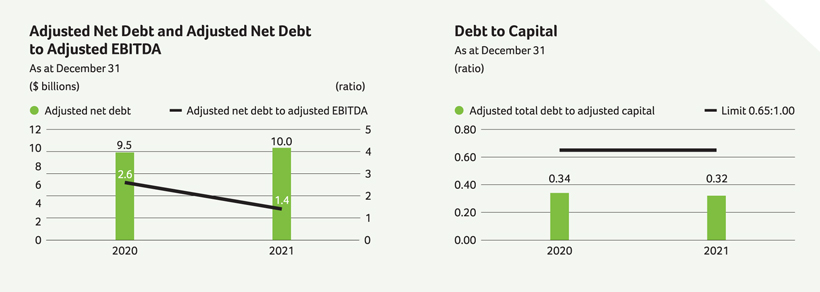
Adjusted EBITDA is calculated in Note 3, while the calculation of the remaining components included in the above ratios are set out in the following tables:
|
|
| 2021 |
| 2020 | ||||||||||||
Short-term debt |
| 1,560 |
|
| 159 |
| ||||||||||
Current portion of long-term debt |
| 545 |
|
| 14 |
| ||||||||||
Current portion of lease liabilities |
| 286 |
|
| 249 |
| ||||||||||
Long-term debt |
| 7,521 |
|
| 10,047 |
| ||||||||||
Lease liabilities |
| 934 |
|
| 891 |
| ||||||||||
Total debt |
| 10,846 |
|
| 11,360 |
| ||||||||||
Letters of credit – financial |
| 114 |
|
| 150 |
| ||||||||||
Adjusted total debt |
| 10,960 |
|
| 11,510 |
| ||||||||||
OVERVIEW MANAGEMENT’S DISCUSSION & ANALYSIS FOUR-YEAR HIGHLIGHTS | FINANCIAL STATEMENTS | OTHER INFORMATION
| 114 | Nutrien Annual Report 2021 | In millions of US dollars unless otherwise noted |
NOTE 24 CAPITAL MANAGEMENT CONTINUED
|
|
| 2021 | 2020 | |||||||||
Total debt |
| 10,846 |
|
| 11,360 |
| ||||||
Cash and cash equivalents |
| (499 | ) |
| (1,454 | ) | ||||||
Unamortized fair value adjustments |
| (325 | ) |
| (404 | ) | ||||||
Adjusted net debt |
|
|
|
| 10,022 |
|
| 9,502 |
| |||
|
|
| 2021 | 2020 | |||||||||
Total shareholders’ equity |
| 23,699 |
|
| 22,403 |
| ||||||
Adjusted total debt |
| 10,960 |
|
| 11,510 |
| ||||||
Adjusted capital 1 |
|
|
|
| 34,659 |
|
| 33,913 |
| |||
| 1 | Restated to reflect 2021 calculation. |
|
|
| 2021 | 2020 | |||||||||
Finance costs |
| 613 |
|
| 520 |
| ||||||
Unwinding of discount on asset retirement obligations |
| 9 |
|
| (33 | ) | ||||||
Borrowing costs capitalized to property, plant and equipment |
| 29 |
|
| 20 |
| ||||||
Interest on net defined benefit pension and other post-retirement plan obligations |
| (9 | ) |
| (13 | ) | ||||||
Loss on early extinguishment of debt |
| (142 | ) |
| – |
| ||||||
Adjusted finance costs |
|
|
|
| 500 |
|
| 494 |
| |||
In 2020, we filed a base shelf prospectus in Canada and the US qualifying the issuance of up to $5 billion of common shares, debt securities and other securities during a period of 25 months from March 16, 2020. In 2020, we filed a prospectus supplement to issue $1,500 of notes.
| NOTE 25 BUSINESS COMBINATIONS |
The Company’s business combinations include various digital agriculture, proprietary products and agricultural services.
|
| Individually Immaterial Acquisitions | |||
Acquisition date | Various | |||
Purchase price, net of cash and cash equivalents acquired | $88 (2020 – $233) | |||
Goodwill and expected benefits of the acquisition | $77 (2020 – $133)
The expected benefits of the acquisitions resulting in goodwill include:
• synergies from expected reduction in operating costs
• wider distribution channel for selling products of acquired businesses
• a larger assembled workforce
• potential increase in customer base
• enhanced ability to innovate | |||
Description | 2021 – 36 Retail locations (2020 – 43 including Tec Agro Group, a leading agriculture retailer in Brazil) | |||
OVERVIEW MANAGEMENT’S DISCUSSION & ANALYSIS FOUR-YEAR HIGHLIGHTS | FINANCIAL STATEMENTS | OTHER INFORMATION
| In millions of US dollars unless otherwise noted | Nutrien Annual Report 2021 | 115 |
NOTE 25 BUSINESS COMBINATIONS CONTINUED
We allocated the following values to the acquired assets and assumed liabilities based upon fair values at their respective acquisition date. The information below represents preliminary fair values. For certain acquisitions, we finalized the purchase price with no material change to the fair values disclosed in prior periods. Refer to Note 30 for details of our valuation technique and judgments applied.
|
|
| 2021 |
| 2020 | ||||||||||||
Receivables |
| 43 |
|
| 68 |
| ||||||||||
Inventories |
| 24 |
|
| 63 |
| ||||||||||
Prepaid expenses and other current assets |
| – |
|
| 4 |
| ||||||||||
Property, plant and equipment |
| 10 |
|
| 73 |
| ||||||||||
Goodwill |
| 77 |
|
| 133 |
| ||||||||||
Other intangible assets |
| 16 |
|
| 47 |
| ||||||||||
Other non-current assets |
| 4 |
|
| 2 |
| ||||||||||
Total assets |
| 174 |
|
| 390 |
| ||||||||||
Short-term debt |
| 11 |
|
| 36 |
| ||||||||||
Payables and accrued charges |
| 50 |
|
| 108 |
| ||||||||||
Long-term debt, including current portion |
| 7 |
|
| – |
| ||||||||||
Lease liabilities, including current portion |
| 1 |
|
| 2 |
| ||||||||||
Other non-current liabilities |
| 17 |
|
| 11 |
| ||||||||||
Total liabilities |
| 86 |
|
| 157 |
| ||||||||||
Total consideration, net of cash and cash equivalents acquired |
| 88 |
|
| 233 |
| ||||||||||
Financial Information Related to the Acquired Operations
| 2021 Proforma (estimated as if acquisitions occurred at the beginning of the year) |
|
| ||||||
Sales |
| 160 |
| |||||
Earnings before finance costs and income taxes |
| 10 |
| |||||
| From date of acquisition |
| 2021 Actuals |
| 2020 Actuals | ||||||||||||
Sales |
| 80 |
|
| 190 |
| ||||||||||
Earnings before finance costs and income taxes |
| 7 |
|
| 12 |
| ||||||||||
OVERVIEW MANAGEMENT’S DISCUSSION & ANALYSIS FOUR-YEAR HIGHLIGHTS | FINANCIAL STATEMENTS | OTHER INFORMATION
| 116 | Nutrien Annual Report 2021 | In millions of US dollars unless otherwise noted |
| NOTE 26 COMMITMENTS |
A commitment is a legally binding and enforceable agreement to purchase goods or services in the future. The amounts below reflect our commitments based on current expected contract prices.
As at December 31, 2021, minimum future commitments under our contractual arrangements were as follows:
|
| Principal Portion and Estimated Interest |
|
|
|
| |||||||||||||||||||
|
| Lease Liabilities | Long-Term Debt | Purchase Commitments | Capital Commitments | Other Commitments | Total | ||||||||||||||||||
Within 1 year |
| 313 |
|
| 890 |
|
| 2,091 |
|
| 72 |
|
| 183 |
|
| 3,549 |
| ||||||
1 to 3 years |
| 423 |
|
| 1,163 |
|
| 488 |
|
| 9 |
|
| 138 |
|
| 2,221 |
| ||||||
3 to 5 years |
| 227 |
|
| 1,678 |
|
| 42 |
|
| – |
|
| 91 |
|
| 2,038 |
| ||||||
Over 5 years |
| 412 |
|
| 9,340 |
|
| 111 |
|
| – |
|
| 97 |
|
| 9,960 |
| ||||||
Total |
| 1,375 |
|
| 13,071 |
|
| 2,732 |
|
| 81 |
|
| 509 |
|
| 17,768 |
| ||||||
Purchase Commitments
We have a long-term natural gas purchase agreement in Trinidad that expires on December 31, 2023. The contract provides for prices that vary primarily with ammonia market prices and annual escalating floor prices. The commitments included in the foregoing table are based on floor prices and minimum purchase quantities.
Profertil has various gas contracts denominated in US dollars that expire in 2022 and 2023 and account for virtually all of Profertil’s gas requirements. YPF S.A., our joint venture partner in Profertil, supplies approximately 70 percent of the gas under these contracts.
The Carseland facility has a power co-generation agreement, expiring on December 31, 2026, which provides 60 megawatt-hours of power per hour. The price for the power is based on a fixed charge adjusted for inflation and a variable charge based on the cost of natural gas provided to the facility for power generation.
Agreements for the purchase of sulfur for use in production of phosphoric acid provide for specified purchase quantities and prices based on market rates at the time of delivery. Commitments included in the foregoing table are based on expected contract prices.
As part of the agreement to sell the Conda Phosphate operations (“CPO”), we entered into long-term strategic supply and offtake agreements that extend to 2023. Under the terms of the supply and offtake agreements, we will supply 100 percent of the ammonia requirements of CPO and purchase 100 percent of the monoammonium phosphate (“MAP”) product produced at CPO. The MAP production is estimated at 330,000 tonnes per year.
Other Commitments
Other commitments consist principally of pipeline capacity, technology service contracts, managed services contracts, throughput and various rail contracts, the latest of which expires in 2027, and mineral lease commitments, the latest of which expires in 2041.
OVERVIEW MANAGEMENT’S DISCUSSION & ANALYSIS FOUR-YEAR HIGHLIGHTS | FINANCIAL STATEMENTS | OTHER INFORMATION
| In millions of US dollars unless otherwise noted | Nutrien Annual Report 2021 | 117 |
| NOTE 27 GUARANTEES |
In the normal course of business, we provide indemnification agreements to counterparties in transactions such as purchase and sale contracts, service agreements, director/officer contracts, and leasing transactions. The terms of these indemnification agreements
| • | may require us to compensate counterparties for costs incurred as a result of various events, including environmental liabilities and changes in (or in the interpretation of) laws and regulations, or as a result of litigation claims or statutory sanctions that may be suffered by a counterparty as a consequence of the transaction; |
| • | will vary based upon the contract, the nature of which prevents us from making a reasonable estimate of the maximum potential amount that we could be required to pay to counterparties; and |
| • | have not historically resulted in any significant payments by Nutrien and, as at December 31, 2021, no amounts have been accrued in the consolidated financial statements (except for accruals relating to certain underlying liabilities). |
We directly guarantee our share of certain commitments of Canpotex (such as railcar leases) under certain agreements with third parties. We would be required to perform on these guarantees in the event of default by the investee. No material loss is anticipated by reason of such agreements and guarantees.
| NOTE 28 RELATED PARTY TRANSACTIONS |
We transact with a number of related parties, the most significant being with our associates and joint ventures, key management personnel, and post-employment benefit plans.
Sale of Goods
We sell potash outside Canada and the US exclusively through Canpotex. Canpotex sells potash to buyers in export markets pursuant to term and spot contracts at agreed upon prices. Our total revenue is recognized at the amount received from Canpotex representing proceeds from their sale of potash, less net costs of Canpotex. Sales to Canpotex are shown in Note 3. The receivable outstanding from Canpotex is shown in Note 11 and arose from sale transactions described above. It is unsecured and bears no interest. There are no provisions held against this receivable.
Key Management Personnel Compensation and Transactions with Post-Employment Benefit Plans
|
|
| 2021 |
| 2020 | ||||||||||||
Salaries and other short-term benefits |
| 16 |
|
| 16 |
| ||||||||||
Share-based compensation |
| 55 |
| �� |
| 26 |
| |||||||||
Post-employment benefits |
| 4 |
|
| 2 |
| ||||||||||
Termination benefits |
| 7 |
|
| – |
| ||||||||||
| 82 |
|
| 44 |
| |||||||||||
Disclosures related to our post-employment benefit plans are shown in Note 21.
OVERVIEW MANAGEMENT’S DISCUSSION & ANALYSIS FOUR-YEAR HIGHLIGHTS | FINANCIAL STATEMENTS | OTHER INFORMATION
| 118 | Nutrien Annual Report 2021 | In millions of US dollars unless otherwise noted |
| NOTE 29 CONTINGENCIES AND OTHER MATTERS |
Contingent liabilities, which are not recognized in the consolidated financial statements but may be disclosed, are possible obligations as a result of uncertain future events outside of our control or present obligations not recognized because the amount cannot be sufficiently measured or payment is not probable.
Accounting Estimates and Judgments
The following judgments are required to determine our exposure to possible losses and gains related to environmental matters and other various claims and lawsuits pending:
| • | prediction of the outcome of uncertain events (i.e., being virtually certain, probable, remote or undeterminable); |
| • | determination of whether recognition or disclosure in the consolidated financial statements is required; and |
| • | estimation of potential financial effects. |
Where no amounts are recognized, such amounts are contingent and disclosure may be appropriate. While the amount disclosed in the consolidated financial statements may not be material, the potential for large liabilities exists and, therefore, these estimates could have a material impact on our consolidated financial statements.
Supporting Information
Canpotex
Nutrien is a shareholder in Canpotex, which markets Canadian potash outside of Canada and the US. Should any operating losses or other liabilities be incurred by Canpotex, the shareholders have contractually agreed to reimburse it in proportion to each shareholder’s productive capacity. Through December 31, 2021, we are not aware of any operating losses or other liabilities.
Mining Risk
The risk of underground water inflows and other underground risks is insured on a limited basis, subject to insurance market availability. Through December 31, 2021, we are not aware of any material losses or other liabilities that we have not accrued for.
Environmental Remediation, Legal and Other Matters
We are engaged in ongoing site assessment and/or remediation activities at a number of facilities and sites. Anticipated costs associated with these matters are added to accrued environmental costs in the manner described in Note 22.
We have established provisions for environmental site assessment and/or remediation matters to the extent that we consider expenses associated with those matters likely to be incurred. Except for the uncertainties described below, we do not believe that our future obligations with respect to these matters are reasonably likely to have a material adverse effect on our consolidated financial statements.
OVERVIEW MANAGEMENT’S DISCUSSION & ANALYSIS FOUR-YEAR HIGHLIGHTS | FINANCIAL STATEMENTS | OTHER INFORMATION
| In millions of US dollars unless otherwise noted | Nutrien Annual Report 2021 | 119 |
NOTE 29 CONTINGENCIES AND OTHER MATTERS CONTINUED
Legal matters with significant uncertainties include the following:
| • | The United States Environmental Protection Agency (“US EPA”) has an ongoing enforcement initiative directed at the phosphate industry related to the scope of an exemption for mineral processing wastes under the US Resource Conservation and Recovery Act (“RCRA”). This initiative affects the Conda Phosphate plant previously owned by Nu-West Industries, Inc. (“Nu-West”), a wholly owned subsidiary of Agrium Inc., and the Nutrien phosphoric acid facilities in Aurora, North Carolina; Geismar, Louisiana; and White Springs, Florida. All of these facilities received US EPA notices of violation (“NOVs”) that remain outstanding for alleged violations of the RCRA and various other environmental laws. Notwithstanding the sale of the Conda Phosphate operations in January 2018, Nu-West remains responsible for environmental liabilities attributable to its historic activities and for resolution of the NOVs. All of the facilities have been and continue to be involved in ongoing discussions with the US EPA, the US Department of Justice and the related state agencies to resolve these matters. Due to the nature of the allegations, we are uncertain as to how the matters will be resolved. Based on settlements with other members of the phosphate industry, we expect that a resolution could involve any or all of the following: 1) penalties, which we currently believe will not be material; 2) modification of certain operating practices; 3) capital improvement projects; 4) providing financial assurance for the future closure, maintenance and monitoring costs for the phosphogypsum stack system; and 5) addressing findings resulting from the RCRA section 3013 site investigations. |
| • | We operate in countries that are parties to the Paris Agreement adopted in December 2015 pursuant to the United Nations Framework Convention on Climate Change. Each country that is a party to the Paris Agreement submitted an Intended Nationally Determined Contribution (“INDC”) toward the control of greenhouse gas emissions. The impacts on our operations of these INDCs and other national and local efforts to limit or tax greenhouse gas emissions cannot be determined with any certainty at this time. |
In addition, various other claims and lawsuits are pending against the Company in the ordinary course of business. While it is not possible to determine the ultimate outcome of such actions at this time, and inherent uncertainties exist in predicting such outcomes, we believe that the ultimate resolution of such actions is not reasonably likely to have a material adverse effect on our consolidated financial statements.
The breadth of our operations and the global complexity of tax regulations require assessments of uncertainties and judgments in estimating the taxes we will ultimately pay. The final taxes paid are dependent upon many factors, including negotiations with taxing authorities in various jurisdictions, outcomes of tax litigation, and resolution of disputes arising from federal, provincial, state and local tax audits. The resolution of these uncertainties and the associated final taxes may result in adjustments to our tax assets and tax liabilities.
We own facilities that have been either permanently or indefinitely shut down. We expect to incur nominal annual expenditures for site security and other maintenance costs at some of these facilities. Should the facilities be dismantled, certain other shutdown-related costs may be incurred. Such costs are not expected to have a material adverse effect on our consolidated financial statements and would be recognized and recorded in the period in which they are incurred.
OVERVIEW MANAGEMENT’S DISCUSSION & ANALYSIS FOUR-YEAR HIGHLIGHTS | FINANCIAL STATEMENTS | OTHER INFORMATION
| 120 | Nutrien Annual Report 2021 | In millions of US dollars unless otherwise noted |
| NOTE 30 ACCOUNTING POLICIES, ESTIMATES AND JUDGMENTS |
The following discusses the significant accounting policies, estimates, judgments and assumptions that we have adopted and applied and how they affect the amounts reported in the consolidated financial statements. Certain of our policies involve accounting estimates and judgments because they require us to make subjective or complex judgments about matters that are inherently uncertain and because of the likelihood that materially different amounts could be reported under different conditions or using different assumptions.
Basis of Consolidation
These consolidated financial statements include the accounts of the Company and entities we control.
| • | Subsidiaries are fully consolidated from the date on which control is transferred to the Company until the date on which control ceases. They are deconsolidated from the date that control ceases. |
| • | Intercompany balances and transactions are eliminated on consolidation. |
Principal (wholly owned) Operating Subsidiaries | Location | Principal Activity | ||||
Potash Corporation of Saskatchewan Inc. |
| Canada | Mining and/or processing of crop nutrients and corporate functions | |||
Agrium Inc. |
| Canada | Manufacturer and distributor of crop nutrients and corporate functions | |||
Agrium Canada Partnership |
|
Canada | Manufacturer and distributor of crop nutrients | |||
Agrium Potash Ltd. |
|
Canada | ||||
Agrium U.S. Inc. |
|
US | ||||
Cominco Fertilizer Partnership |
|
US | ||||
Loveland Products Inc. |
|
US | ||||
Nutrien Ag Solutions Argentina S.A |
| Argentina |
| |||
Nutrien Ag Solutions (Canada) Inc. |
|
Canada | Crop input retailer
| |||
Nutrien Ag Solutions, Inc. |
|
US | ||||
Nutrien Ag Solutions Limited |
|
Australia | ||||
PCS Nitrogen Fertilizer, LP |
| US | Production of nitrogen products in the US | |||
PCS Nitrogen Ohio LP |
| US | Production of nitrogen products in the state of Ohio | |||
PCS Sales (USA) Inc. |
| US | Marketing and sales of the Company’s products | |||
PCS Nitrogen Trinidad Limited |
| Trinidad | Production of nitrogen products in Trinidad | |||
PCS Phosphate Company, Inc. |
| US | Mining and/or processing of phosphate products | |||
Phosphate Holding Company, Inc. |
| US | Mining and/or processing of phosphate products and production of nitrogen products in the US | |||
COVID-19
Due to the impact of the COVID-19 pandemic we have assessed our accounting estimates and other matters that require the use of forecasted financial information. The assessment included estimates of the unknown future impacts of the pandemic using information that is reasonably available at this time. Accounting estimates and other matters assessed include the allowance for expected credit losses of receivables from customers, valuation of inventory, goodwill and other long-lived assets, financial assets, tax assets, pension obligations and assets, and revenue recognition. Based on the current assessment, there was not a material impact on these consolidated financial statements. As a result of the pandemic, we incurred directly attributable and incremental COVID-19 related expenses in other (income) expenses (Note 6).
OVERVIEW MANAGEMENT’S DISCUSSION & ANALYSIS FOUR-YEAR HIGHLIGHTS | FINANCIAL STATEMENTS | OTHER INFORMATION
| In millions of US dollars unless otherwise noted | Nutrien Annual Report 2021 | 121 |
NOTE 30 ACCOUNTING POLICIES, ESTIMATES AND JUDGMENTS CONTINUED
Climate Change
In 2021, we announced our Environmental, Social and Governance (“ESG”) commitment to help address our key climate-related risks related to climate change and reduce our carbon footprint. There were also recent developments in the ESG frameworks and regulatory initiatives and we recognize that these developments could further impact our accounting estimates and judgments including, but not limited to, assessment of our asset useful lives, impairment of other long-lived assets, valuation of inventory, and asset retirement obligations and accrued environmental costs. We have monitored and will continue to monitor these developments as they affect our consolidated financial statements.
Foreign Currency Transactions
The consolidated financial statements are presented in US dollars, which we determined to be the functional currency of the Company and the majority of our subsidiaries. In determining the functional currency of our operations, we primarily considered the currency that determines the pricing of transactions rather than focusing on the currency in which transactions are denominated.
Foreign exchange gains and losses resulting from the settlement of foreign currency transactions, and from the translation at period-end of monetary assets and liabilities denominated in foreign currencies, are recognized and presented in the consolidated statements of earnings within other (income) expenses, as applicable, in the period in which they arise. Non-monetary assets measured at historical cost are translated at the average monthly exchange rate prevailing at the time of the transaction, unless the exchange rate in effect on the date of the transaction is available and it is apparent that such rate is a more suitable measurement.
Assets and liabilities in foreign operations are translated using the period-end rate, while the income and expenses are translated using the average monthly exchange rate. Equity of the foreign operation is translated using the historical rate at the time of the acquisition. Exchange gains and losses resulting from translation are recognized in other comprehensive income and accumulated in a separate reserve within equity. The cumulative amount is reclassified to profit or loss when the foreign operation is disposed of.
Revenue
We recognize revenue when we transfer control over a good or service to a customer.
| Transfer of Control for Sale of Goods | Transfer of Control for Sale of Services | |
At the point in time when the product is
• purchased at our Retail farm center,
• delivered and accepted by customers at their premises, or
• loaded for shipping. | Over time as the promised service is rendered | |
Judgment is used to determine whether we are acting as principal or agent by evaluating who:
| • | has the primary responsibility for fulfilling the promised good; |
| • | bears the inventory risk including if the vendor has the right to have its product returned on demand; and |
| • | has discretion for establishing the price. |
For transactions in which we act as an agent rather than the principal, revenue is recognized net of any commissions earned. The related commissions are recognized as the sales occur or as unconditional contracts are signed.
We recognize profits on sales to Canpotex when there is a transfer of control, either at the time the product is loaded for shipping or delivered, depending on the terms of the contract. Sales are recognized using a provisional price at the time control is transferred to Canpotex, with the final pricing determined upon Canpotex’s final sale to a third party (generally between one to three months from date of sale to Canpotex).
OVERVIEW MANAGEMENT’S DISCUSSION & ANALYSIS FOUR-YEAR HIGHLIGHTS | FINANCIAL STATEMENTS | OTHER INFORMATION
| 122 | Nutrien Annual Report 2021 | In millions of US dollars unless otherwise noted |
NOTE 30 ACCOUNTING POLICIES, ESTIMATES AND JUDGMENTS CONTINUED
Our sales revenue relating to our Potash, Nitrogen and Phosphate segments is generally recorded and measured based on the “freight on board” mine, plant, warehouse or terminal price specified in the contract (except for certain vessel sales or specific product sales that are shipped and recorded on a delivered basis), which reflects the consideration we expect to be entitled to in exchange for the goods or services, net of any variable consideration (e.g., any trade discounts or estimated volume rebates). Our customer contracts may provide certain product quality specification guarantees but do not generally provide for refunds or returns. Sales prices are based on North American and international benchmark market prices, which are subject to global supply and demand, and other market factors.
For our Retail segment, we do not provide general warranties; however, our customer contracts may provide certain product quality specification guarantees. Returns and incentives are estimated based on historical and forecasted data, contractual terms, and current conditions.
Transportation costs are generally recovered from the customer through sales pricing. Where customer contracts include volume rebates, we estimate revenue at the earlier of when the most likely amount of consideration we expect to receive has been determined or when it is highly probable that a significant reversal will not occur.
Due to the nature of goods and services sold, any single estimate would have only a negligible impact on revenue.
As the expected period between when control over a promised good or service is transferred and when the customer pays for that good or service is generally less than 12 months, we apply the practical expedient as provided in IFRS 15, “Revenue from Contracts with Customers,” and do not adjust the promised amount of consideration for the effects of financing.
Intersegment sales are made under terms that approximate market value.
Seasonality in our business results from increased demand for products during planting season. Crop input sales are generally higher in the spring and fall application seasons. Crop nutrient inventories are normally accumulated leading up to each application season. Our cash collections generally occur after the application season is complete, while customer prepayments made to us are typically concentrated in December and January and inventory prepayments paid to our suppliers are typically concentrated in the period from November to January. Feed and industrial sales are more evenly distributed throughout the year.
Share-Based Compensation
For awards with performance conditions that determine the number of options or units to which employees are entitled, measurement of compensation cost is based on our best estimate of the outcome of the performance conditions. Changes to vesting assumptions are reflected in earnings immediately for compensation cost already recognized.
| For Plans Settled Through the Issuance of Equity | For Plans Settled Through Cash | |
• fair value for stock options is determined on grant date using the Black-Scholes-Merton option-pricing model, and
• fair value for PSUs is determined on grant date by projecting the outcome of performance conditions. | • a liability is recorded based on the fair value of the awards each period. | |
Estimation involves determining:
| • | stock option-pricing model assumptions as described in the weighted average assumptions table in Note 5; |
| • | forfeiture rate for options granted based on past experience and future expectations, and adjusted upon actual vesting; |
| • | projected outcome of performance conditions for PSUs, including the relative ranking of our total shareholder return, including expected dividends, compared with a specified peer group using a Monte Carlo simulation option-pricing model; and |
| • | the number of dividend equivalent units expected to be earned. |
OVERVIEW MANAGEMENT’S DISCUSSION & ANALYSIS FOUR-YEAR HIGHLIGHTS | FINANCIAL STATEMENTS | OTHER INFORMATION
| In millions of US dollars unless otherwise noted | Nutrien Annual Report 2021 | 123 |
NOTE 30 ACCOUNTING POLICIES, ESTIMATES AND JUDGMENTS CONTINUED
Income Taxes
Taxation on earnings (loss) is comprised of current and deferred income tax. Taxation is recognized in the statements of earnings unless it relates to items recognized either in OCI or directly in shareholders’ equity.
| Current Income Tax | Deferred Income Tax | |
• is the expected tax payable on the taxable earnings for the year and includes any adjustments to income tax payable or recoverable in respect of previous years
• is calculated using rates enacted or substantively enacted at the dates of the consolidated balance sheets in the countries where our subsidiaries and equity-accounted investees operate and generate taxable earnings
• is the best estimate expected to be paid to (or recovered from) the taxation authorities |
• is recognized using the liability method
• is based on temporary differences between carrying amounts of assets and liabilities and their respective income tax bases
• is determined using tax rates that have been enacted or substantively enacted by the dates of the consolidated balance sheets and are expected to apply when the related deferred income tax asset is realized or the deferred income tax liability is settled | |
Current and deferred income tax assets and liabilities are offset only if certain criteria are met. | ||
The realized and unrealized excess tax benefits from share-based compensation arrangements are recognized in contributed surplus as current and deferred tax, respectively. | ||
The final taxes paid, and potential adjustments to tax assets and liabilities, are dependent upon many factors including
| • | negotiations with taxation authorities in various jurisdictions; |
| • | outcomes of tax litigation; and |
| • | resolution of disputes arising from federal, provincial, state and local tax audits. |
Deferred income tax is not accounted for
| • | with respect to investments in subsidiaries and equity-accounted investees where we are able to control the reversal of the temporary difference and that difference is not expected to reverse in the foreseeable future; and |
| • | if arising from initial recognition of an asset or liability in a transaction, other than a business combination, that at the time of the transaction affects neither accounting nor taxable profit or loss. |
Deferred tax assets are
| • | recognized to the extent it is probable future taxable profit will be available to use deductible temporary differences and could be reduced if projected earnings are not achieved or increased if earnings previously not projected become probable; and |
| • | reviewed at each balance sheet date and amended to the extent that it is no longer probable that the related tax benefit will be realized. |
Financial Instruments
Financial assets are measured at fair value (either through OCI or through profit or loss) or amortized cost depending on the objective of the business model for managing the instrument or group of instruments and the contractual terms of the cash flows.
For equity investments not held for trading, we may make an irrevocable election at initial recognition to recognize changes in fair value through OCI rather than profit or loss.
OVERVIEW MANAGEMENT’S DISCUSSION & ANALYSIS FOUR-YEAR HIGHLIGHTS | FINANCIAL STATEMENTS | OTHER INFORMATION
| 124 | Nutrien Annual Report 2021 | In millions of US dollars unless otherwise noted |
NOTE 30 ACCOUNTING POLICIES, ESTIMATES AND JUDGMENTS CONTINUED
Financial instruments are classified and measured as follows:
Fair Value Classification | Fair Value Through Profit or Loss | FVTOCI | Amortized Cost | |||
Instrument type | Cash and cash equivalents, derivatives, and certain equity investments not held for trading | Certain equity investments not held for trading which an irrevocable election was made | Receivables, short-term debt, payables and accrued charges, long-term debt, lease liabilities, other long-term debt instruments | |||
Fair value gains and losses | Profit or loss | OCI | – | |||
Interest and dividends | Profit or loss | Profit or loss | Profit or loss: effective interest rate | |||
Impairment of assets | – | – | Profit or loss | |||
Foreign exchange | Profit or loss | OCI | Profit or loss | |||
Transaction costs | Profit or loss | OCI | Included in cost of instrument | |||
Financial instruments are recognized at trade date when we commit to purchase or sell the asset. Financial assets are derecognized when the rights to receive cash flow from the investments have expired or we have transferred the rights to receive cash flow and all the risks and rewards of ownership have also been substantially transferred.
Derivatives are used to lock in commodity prices, interest rates and exchange rates. For designated and qualified cash flow hedges
| • | the effective portion of the change in the fair value of the derivative is accumulated in OCI; |
| • | when the hedged forecast transaction occurs, the related gain or loss is removed from AOCI and included in the cost of inventory; |
| • | the hedging gain or loss included in the cost of inventory is recognized in earnings when the product containing the hedged item is sold or becomes impaired; and |
| • | the ineffective portions of hedges are recorded in net earnings in the current period. |
We assess whether our derivatives hedging transactions are expected to be or were highly effective, both at the hedge’s inception and on an ongoing basis, in offsetting changes in fair values of hedged items.
Hedging Transaction | Measurement of Ineffectiveness | Potential Sources of Ineffectiveness | ||
New York Mercantile Exchange (“NYMEX”) natural gas hedges | Assessed on a prospective and retrospective basis using regression analyses | Changes in: • timing of forecast transactions
• volume delivered
• our credit risk or the credit risk of a counterparty | ||
Foreign exchange and interest rate | Comparison of the cumulative changes in fair value and the cumulative change in the fair value of a hypothetical derivative with terms based on the hedged forecast cash flows | Changes in: • timing or amounts of forecasted cash flows
• embedded optionality
• our credit risk or the credit risk of a counterparty | ||
Financial assets and financial liabilities are offset, and the net amount is presented in the consolidated balance sheets when we
| • | currently have a legally enforceable right to offset the recognized amounts; and |
| • | intend either to settle on a net basis, or to realize the assets and settle the liabilities simultaneously. |
Fair Value Measurements
Estimated fair values for financial instruments are designed to approximate amounts for which the instruments could be exchanged in a current arm’s-length transaction between knowledgeable, willing parties. The valuation policies and procedures for financial reporting purposes are determined by our finance department.
OVERVIEW MANAGEMENT’S DISCUSSION & ANALYSIS FOUR-YEAR HIGHLIGHTS | FINANCIAL STATEMENTS | OTHER INFORMATION
| In millions of US dollars unless otherwise noted | Nutrien Annual Report 2021 | 125 |
NOTE 30 ACCOUNTING POLICIES, ESTIMATES AND JUDGMENTS CONTINUED
Fair value measurements are categorized into different levels within a fair value hierarchy based on the degree to which the lowest level inputs are observable and their significance:
Level 1 | Level 2 | Level 3 | ||
Unadjusted quoted prices (in active markets accessible at the measurement date for identical assets or liabilities) | Quoted prices (in markets that are not active or based on inputs that are observable for substantially the full term of the asset or liability) | Prices or valuation techniques that require inputs that are both unobservable and significant to the overall measurement | ||
Fair value estimates
| • | are at a point in time and may change in subsequent reporting periods due to market conditions or other factors; |
| • | can be determined using multiple methods, which can cause values (or a range of reasonable values) to differ; and |
| • | may require assumptions about costs/prices over time, discount and inflation rates, defaults, and other relevant variables. |
Cash and Cash Equivalents
Highly liquid investments with a maturity of three months or less from the date of purchase are considered to be cash equivalents.
Receivables
Receivables from customers are recognized initially at fair value and subsequently measured at amortized cost less allowance for expected credit losses of receivables from customers.
Vendors may offer various incentives to purchase products for resale. Vendor rebates and prepay discounts are accounted for as a reduction of the prices of the suppliers’ products. Rebates based on the amount of materials purchased reduce cost of goods sold as inventory is sold. Rebates earned based on sales volumes of products are offset to cost of goods sold.
Rebates that are probable and can be reasonably estimated are accrued. Rebates that are not probable or estimable are accrued when certain milestones are achieved.
Estimation of rebates can be complex in nature as vendor arrangements are diverse. The amount of the accrual is determined by analyzing and reviewing historical trends to apply negotiated rates to estimated and actual purchase volumes. Estimated amounts accrued throughout the year could also be impacted if actual purchase volumes differ from projected volumes.
Inventories
Inventories are valued monthly at the lower of cost and net realizable value. Costs are allocated to inventory using the weighted average cost method.
Net realizable value is based on
Products and Raw Materials |
| Materials and Supplies | ||
• selling price of the finished product (in ordinary course of business) less the estimated costs of completion and estimated costs to make the sale | • replacement cost | |||
A writedown is recognized if the carrying amount exceeds net realizable value and may be reversed if the circumstances that caused it no longer exist. Various factors impact our estimates of net realizable value, including inventory levels, forecasted prices of key production inputs, global nutrient capacities, crop price trends, climate-change initiatives, and changes in regulations and standards employed.
OVERVIEW MANAGEMENT’S DISCUSSION & ANALYSIS FOUR-YEAR HIGHLIGHTS | FINANCIAL STATEMENTS | OTHER INFORMATION
| 126 | Nutrien Annual Report 2021 | In millions of US dollars unless otherwise noted |
NOTE 30 ACCOUNTING POLICIES, ESTIMATES AND JUDGMENTS CONTINUED
Property, Plant and Equipment
|
| Owned | Right-of-Use (leased) | ||
Measurement | • cost, which includes capitalized borrowing costs, less accumulated depreciation and any accumulated impairment losses
• cost of major inspections and overhauls is capitalized
• maintenance and repair expenditures that do not improve or extend productive life are expensed in the period incurred | • cost less accumulated depreciation and any accumulated impairment losses
• lease payments are allocated between finance costs and a reduction of the liability, and discounted using the interest rate implicit in the lease, if available, or an incremental borrowing rate, being a rate that we would have to pay to borrow the funds required to obtain a similar asset, adjusted for term, security, asset value and the borrower’s economic environment | ||
Depreciation | • certain property, plant and equipment directly related to our Potash, Nitrogen and Phosphate segments uses units-of-production based on the shorter of estimates of reserves or service lives
• pre-stripping costs uses units-of-production over the ore mined from the mineable acreage stripped
• remaining assets uses straight-line | • straight-line over the shorter of the asset’s useful life and the lease term | ||
| Estimated useful lives, expected patterns of consumption, depreciation method and residual values are reviewed at least annually. | ||||
Judgment/practical expedients | Judgment is required in determining
• costs, including income or expenses derived from an asset under construction, that are eligible for capitalization;
• timing to cease cost capitalization, generally when the asset is capable of operating in the manner intended by management, but also considering the circumstances and the industry in which the asset is to be operated, normally predetermined by management with reference to such factors as productive capacity;
• the appropriate level of componentization (for individual components for which different depreciation methods or rates are appropriate);
• repairs and maintenance that qualify as major inspections and overhauls; and
• useful life over which such costs should be depreciated, which may be impacted by changes in our strategy, process or operations as a result of climate-change initiatives. | Judgment is required to determine whether a contract or arrangement includes a lease and if it is reasonably certain that an extension option will be exercised. We seek to maximize operational flexibility in managing our leasing activities by including extension options when negotiating new leases. Extension options are exercisable at our option and not by the lessors. In determining if a renewal period should be included in the lease term, we consider all relevant factors that create an economic incentive for us to exercise a renewal, including
• the location of the asset and the availability of suitable alternatives
• the significance of the asset to operations, and
• our business strategy.
Estimation is used to determine the useful lives of ROU assets, the lease term and the appropriate discount rate applied to the lease payments to calculate the lease liability. | ||
OVERVIEW MANAGEMENT’S DISCUSSION &ANALYSIS FOUR-YEAR HIGHLIGHTS | FINANCIAL STATEMENTS | OTHER INFORMATION
| In millions of US dollars unless otherwise noted | Nutrien Annual Report 2021 | 127 |
NOTE 30 ACCOUNTING POLICIES, ESTIMATES AND JUDGMENTS CONTINUED
|
| Owned | Right-of-Use (leased) | ||
| Uncertainties are inherent in estimating reserve quantities, particularly as they relate to assumptions regarding future prices, the geology of our mines, the mining methods used, and the related costs incurred to develop and mine reserves. Changes in these assumptions could result in material adjustments to reserve estimates, which could result in impairments or changes to depreciation expense in future periods. | We have chosen to
• include the use of a single discount rate for a portfolio of leases with reasonably similar characteristics,
• not separate non-lease components and instead to account for lease and non-lease components as a single arrangement, and
• use exemptions for short-term and low-value leases which allow payments to be expensed as incurred. | |||
Other | Not applicable. | Lease agreements do not contain significant covenants; however, leased assets may be used as security for lease liabilities and other borrowings. | ||
Goodwill and Other Intangible Assets
Goodwill is carried at cost, is not amortized, and represents the excess of the cost of an acquisition over the fair value of the Company’s share of the net identifiable assets of the acquired subsidiary at the date of acquisition. Goodwill is allocated to a CGU or group of CGUs for impairment testing based on the level at which it is monitored by management, and not at a level higher than an operating segment. The allocation is made to the CGU or group of CGUs expected to benefit from the business combination in which the goodwill arose.
Other intangible assets are generally measured at cost less accumulated amortization and any accumulated impairment losses. We use judgment to determine which expenditures are eligible for capitalization as intangible assets. Costs incurred internally from researching and developing a product are expensed as incurred until technological feasibility is established, at which time the costs are capitalized until the product is available for its intended use. Judgment is required in determining when technological feasibility of a product is established. Intangible assets with finite lives are amortized on a straight-line basis over their estimated useful lives. At least annually, the useful lives are reviewed and adjusted if appropriate.
Impairment of Long-Lived Assets
To assess impairment, assets are grouped at the smallest levels for which there are separately identifiable cash inflows that are largely independent of the cash inflows from other assets or groups of assets (this can be at the asset or CGU level).
At the end of each reporting period, we review conditions to determine whether there is any indication that an impairment exists that could potentially impact the carrying amounts of both our long-lived assets to be held and used (including property, plant and equipment, and investments), and our goodwill and other intangible assets. When such indicators exist, impairment testing is performed. Regardless, goodwill is tested at least annually (in the fourth quarter).
We review, at each reporting period, for possible reversal of the impairment for non-financial assets, other than goodwill.
Estimates and judgment involves
| • | identifying the appropriate asset, group of assets, CGU or groups of CGUs; |
| • | determining the appropriate discount rate for assessing the recoverable amount; |
| • | making assumptions about future sales, market conditions, terminal growth rates and cash flow forecasts over the long-term life of the assets or CGUs; and |
| • | evaluating impacts of climate change to our strategy, processes and operations. |
OVERVIEW MANAGEMENT’S DISCUSSION & ANALYSIS FOUR-YEAR HIGHLIGHTS | FINANCIAL STATEMENTS | OTHER INFORMATION
| 128 | Nutrien Annual Report 2021 | In millions of US dollars unless otherwise noted |
NOTE 30 ACCOUNTING POLICIES, ESTIMATES AND JUDGMENTS CONTINUED
We cannot predict if an event that triggers impairment or a reversal of impairment will occur, when it will occur or how it will affect reported asset amounts. Asset impairment amounts previously recorded could be affected if different assumptions were used or if market and other conditions change. Such changes could result in non-cash charges materially affecting our consolidated financial statements.
Pension and Other Post-Retirement Benefits
Employee retirement and other defined benefit plans costs, including current and past service costs, gains or losses on curtailments and settlements, and remeasurements, are actuarially determined on a regular basis using the projected unit credit method.
When a plan amendment occurs before a settlement, we recognize past service cost before any gain or loss on settlement.
Our discount rate assumptions are impacted by:
| • | the weighted average interest rate at which each pension and other post-retirement plan liability could be effectively settled at the measurement date; |
| • | country specific rates; and |
| • | the use of a yield curve approach based on the respective plans’ demographics, expected future pension benefits and medical claims. Payments are measured and discounted to determine the present value of the expected future cash flows. The cash flows are discounted using yields on high-quality AA-rated non-callable bonds with cash flows of similar timing where there is a deep market for such bonds. Where we do not believe there is a deep market for such bonds (such as for terms in excess of 10 years in Canada), the cash flows are discounted using a yield curve derived from yields on provincial bonds rated AA or better to which a spread adjustment is added to reflect the additional risk of corporate bonds. |
Net actuarial gains or loss incurred during the period for defined benefit plans are closed out to retained earnings at each period-end.
Asset Retirement Obligations and Accrued Environmental Costs
Asset retirement obligations and accrued environmental costs include:
| • | reclamation and restoration costs at our potash and phosphate mining operations, including management of materials generated by mining and mineral processing, such as various mine tailings and gypsum; |
| • | land reclamation and revegetation programs; |
| • | decommissioning of underground and surface operating facilities; |
| • | general cleanup activities aimed at returning the areas to an environmentally acceptable condition; and |
| • | post-closure care and maintenance. |
We consider the following factors as we estimate our provisions:
| • | environmental laws and regulations and interpretations by regulatory authorities, including updates on climate change, could change or circumstances affecting our operations could change, either of that could result in significant changes to current plans; |
| • | the nature, extent and timing of current and proposed reclamation and closure techniques in view of present environmental laws and regulations; |
| • | appropriate technical resources, including outside consultants, assist us in developing specific site closure and post-closure plans in accordance with the jurisdiction requirements; and |
| • | timing of settlement of the obligations, which is typically correlated with mine life estimates except for certain land reclamation programs. |
It is reasonably possible that the ultimate costs could change in the future and that changes to these estimates could have a material effect on our consolidated financial statements. We review our estimates for any changes in assumptions at the end of each reporting period.
OVERVIEW MANAGEMENT’S DISCUSSION & ANALYSIS FOUR-YEAR HIGHLIGHTS | FINANCIAL STATEMENTS | OTHER INFORMATION
| In millions of US dollars unless otherwise noted | Nutrien Annual Report 2021 | 129 |
NOTE 30 ACCOUNTING POLICIES, ESTIMATES AND JUDGMENTS CONTINUED
We recognized contingent liabilities related to our business combinations or acquisitions, which represent additional environmental costs that are present obligations although cash outflows of resources are not probable. These contingent liabilities are subsequently measured at the higher of the amount initially recognized and the amount that would be recognized if the liability becomes probable.
Restructuring Charges
Plant shutdowns, sales of business units or other corporate restructurings may trigger restructuring charges. The provision is based on the best estimate of a detailed formal plan, which includes determining the incremental costs for employee termination, contract termination and other exit costs.
Business Combinations
Purchase price allocation involves judgment in identifying assets acquired and liabilities assumed, and estimation of their fair values. Key assumptions include discount rates and revenue growth rates specific to the acquired assets or liabilities assumed. We performed a thorough review of all internal and external sources of information available on circumstances that existed at the acquisition date. We also engaged independent valuation experts on certain acquisitions to assist in determining the fair value of certain assets acquired and liabilities assumed and related deferred income tax impacts. To determine fair values, we generally use the following valuation techniques:
Account | Valuation Technique and Judgments Applied | |
Property, plant and equipment | Market approach for land and certain types of personal property: sales comparison that measures the value of an asset through an analysis of sales and offerings of comparable assets.
Replacement costs for all other depreciable property, plant and equipment: measures the value of an asset by estimating the costs to acquire or construct comparable assets and adjusts for age and condition of the asset. | |
Other intangible assets | Income approach – multi-period excess earnings method: measures the value of an asset based on the present value of the incremental after-tax cash flows attributable to the asset after deducting contributory asset charges (“CACs”). Allocation of CACs is a matter of judgment and based on the nature of the acquired businesses’ operations and historical trends.
We considered several factors in determining the fair value of customer relationships, such as customers’ relationships with the acquired company and its employees, the segmentation of customers, historical customer attrition rates, and revenue growth. | |
Other provisions and contingent liabilities | Decision-tree approach of future costs and a risk premium to capture the compensation sought by risk-averse market participants for bearing the uncertainty inherent in the cash flows of the liability. | |
For each business combination, we elect to measure the non-controlling interest in the acquired entity either at fair value or at the proportionate share of the acquiree’s identifiable net assets. Foreign exchange hedge gains or losses which we designated a cash flow hedge are included in the consideration. The gain or loss from the cash flow hedge is deferred in OCI and subsequently recorded as an adjustment to goodwill when the business combination occurs.
Transaction costs are recorded in integration and restructuring related costs in other (income) expenses.
Standards, Amendments and Interpretations Effective and Applied
The IASB and IFRS Interpretations Committee (“IFRIC”) have issued certain standards and amendments or interpretations to existing standards that were effective, and we have applied.
In 2021, we have adopted the following amended standards and interpretations with no material impact on our consolidated financial statements:
| • | IFRIC Final Agenda, Cloud computing arrangements (refer to Note 6 for further details) |
| • | Interest Rate Benchmark Reform – Phase 2, Amendments to IFRS 9, IAS 39, IFRS 7, IFRS 4 and IFRS 16 |
OVERVIEW MANAGEMENT’S DISCUSSION & ANALYSIS FOUR-YEAR HIGHLIGHTS | FINANCIAL STATEMENTS | OTHER INFORMATION
| 130 | Nutrien Annual Report 2021 | In millions of US dollars unless otherwise noted |
NOTE 30 ACCOUNTING POLICIES, ESTIMATES AND JUDGMENTS CONTINUED
Standards, Amendments and Interpretations Not Yet Effective and Not Applied
The IASB and IFRIC have issued the following standards, amendments or interpretations to existing standards that were not yet effective and not applied as at December 31, 2021.
The following amended standards will be adopted in 2022 and are not expected to have a material impact on our consolidated financial statements:
| • | Amendments |
| • | IFRS 3, “Business Combinations” |
| • | IAS 16, “Property, Plant and Equipment” |
| • | IAS 37, “Provisions, Contingent Liabilities and Contingent Assets” – onerous contracts |
| • | Annual improvements to IFRS 2018 – 2020 |
The following amended standards are being reviewed to determine the potential impact on our consolidated financial statements:
| • | IAS 1, “Presentation of Financial Statements” – classification of liabilities as current or non-current |
| • | IAS 1, “Presentation of Financial Statements” – IFRS Practice Statement 2 – disclosure of accounting policies |
| • | IAS 8, “Accounting Policies, Changes in Accounting Estimates and Errors” – definition of accounting estimates |
| • | IAS 12, “Income Taxes” |
| • | IFRS 17, “Insurance Contracts” |
OVERVIEW MANAGEMENT’S DISCUSSION & ANALYSIS FOUR-YEAR HIGHLIGHTS | FINANCIAL STATEMENTS | OTHER INFORMATION
Nutrien Annual Report 2021 | 131
Terms |
|
| ||
AECO | Alberta Energy Company, Canada | |||
Argus | Argus Media group, UK | |||
Bloomberg | Bloomberg Finance L.P., USA | |||
CDP Climate | CDP Worldwide, England | |||
CDP Water | CDP Worldwide, England | |||
CRU | CRU International limited, UK | |||
ESG | Environmental, social and governance | |||
FTSE Russell | FTSE International Limited, England | |||
ISS Quality Scores | Institutional Shareholder Services Inc., USA | |||
Moody’s | Moody’s Corporation (NYSE: MCO), USA | |||
MSCI ESG Rating | MSCI Inc., USA | |||
NYMEX | New York Mercantile Exchange, USA | |||
NYSE | New York Stock Exchange, USA | |||
S&P/S&P Global Corporate Sustainability Assessment | S&P Global Inc., USA | |||
TSX | Toronto Stock Exchange, Canada | |||
USDA | United States Department of Agriculture, USA | |||
CAD | Canadian dollar | |||
USD | United States dollar | |||
AUD | Australian dollar | |||
Scientific Terms |
|
|
|
| ||||
Potash | KCI | potassium chloride, 60–63.2% K2O (solid) | ||||||
Nitrogen | CO2e | carbon dioxide equivalent | ||||||
DEF | diesel exhaust fluid | |||||||
ESN® | environmentally smart nitrogen, 44% nitrogen | |||||||
NH3 | ammonia (anhydrous), 82.2% N (liquid) | |||||||
P2O5 | phosphorus pentoxide | |||||||
UAN | nitrogen solutions, 28–32% N (liquid) | |||||||
Phosphate | AS | ammonium sulfate (solid) | ||||||
DAP | diammonium phosphate, 46% P2O5 (solid) | |||||||
MAP | monoammonium phosphate, 52% P2O5(solid) | |||||||
MGA | merchant grade acid, 54% P2O5 (liquid) | |||||||
MST | micronized sulfur technology, P + S | |||||||
SPA | superphosphoric acid, 70% P2O5 (liquid) | |||||||
Product Measures |
|
| ||
K2O tonne | Measures the potassium content of products having different chemical analyses | |||
N tonne | Measures the nitrogen content of products having different chemical analyses | |||
P2O5tonne | Measures the phosphorus content of products having different chemical analyses | |||
Product tonne | Standard measure of the weights of all types of potash, nitrogen and phosphate products | |||
OVERVIEW MANAGEMENT’S DISCUSSION & ANALYSIS FOUR-YEAR HIGHLIGHTS FINANCIAL STATEMENTS | OTHER INFORMATION
132 | Nutrien Annual Report 2021
Definitions |
|
| ||
Blue/low-carbon ammonia | Ammonia produced primarily utilizing carbon capture, utilization and storage (“CCUS”) or other low-emission production technologies to significantly reduce the carbon intensity of resultant production. | |||
Brownfield | New project expanding or developing an existing facility or operation. | |||
Community investment | Represents cash disbursements, matching of employee gifts and in-kind contributions of equipment, goods and services and employee volunteerism (on corporate time). | |||
Cumulative annual growth rate | Represents the rate of return that would be required for an investment to grow from its beginning balance to its ending balance assuming the profits were reinvested at the end of each year of the investment’s lifespan. | |||
COVID-19 | COVID-19 coronavirus pandemic | |||
Environmental incidents | Number of incidents includes release quantities that exceed the US Comprehensive Environmental Response, Compensation, and Liability Act limits; in potash facilities any release that exceeds Saskatchewan release limits (based on the Saskatchewan Environmental Code); non-compliance incidents that exceed $10,000 in costs to reach compliance; or enforcement actions with fines exceeding $1,000. | |||
Green ammonia | Ammonia made of hydrogen obtained through a process that uses 100 percent renewable and carbon-free sources such as water electrolysis with renewable power. | |||
Greenhouse gas | Gas that contributes to the greenhouse effect by absorbing infrared radiation. | |||
Latin America | South America, Central America, Caribbean and Mexico | |||
Lost-time injury frequency | Total lost-time injuries for every 200,000 hours worked for all Nutrien employees, contractors and others on site. Calculated as the total lost-time injuries multiplied by 200,000 hours worked divided by the actual number of hours worked. | |||
Merger | The merger of equals transaction between PotashCorp and Agrium completed effective January 1, 2018, pursuant to which PotashCorp and Agrium combined their businesses pursuant to a statutory plan of arrangement under the Canada Business Corporations Act and became wholly owned subsidiaries of Nutrien Ltd. | |||
Mmt | Million metric tonnes | |||
North America | Canada and the US | |||
Offshore | All markets except Canada and the US | |||
Scope 1 | Direct green house gas emissions produced in owned or controlled facilities | |||
Scope 2 | Green house gas emissions that result from the generation of purchased or acquired electricity, heating, cooling and steam consumed by Nutrien | |||
Scope 3 | Indirect green house gas emissions not included in Scope 1 or Scope 2 emissions that occur outside of the organization, including both upstream and downstream emissions | |||
Total employee turnover rate | The number of permanent employees who left the Company due to voluntary and involuntary terminations, including retirements and deaths, as a percentage of average permanent employees for the year. | |||
Total recordable injury frequency | Total recordable injuries for every 200,000 hours worked for all Nutrien employees, contractors and others on site. Calculated as the total recordable injuries multiplied by 200,000 hours worked divided by the actual number of hours worked. | |||
Total shareholder return | Return on investment in Nutrien shares from the time the investment is made based on two components: (1) growth in share price and (2) return from reinvested dividend income on the shares. | |||
Voluntary employee turnover | The number of permanent employees who left the Company due to voluntary terminations as a percentage of average permanent employees for the year. Includes voluntary retirements and resignations. | |||
OVERVIEW MANAGEMENT’S DISCUSSION & ANALYSIS FOUR-YEAR HIGHLIGHTS FINANCIAL STATEMENTS | OTHER INFORMATION
Nutrien Annual Report 2021 | 133

| Russell Girling | Christopher Burley | Maura Clark | Miranda Hubbs | Raj Kushwaha | ||||||||
| Chair | Director | Director | Director | Director |
| Alice Laberge | Consuelo Madere | Keith Martell | Aaron Regent | Nelson L.C. Silva | ||||||||
| Director | Director | Director | Director | Director |
SENIOR MANAGEMENT

| Ken Seitz | Pedro Farah | Noralee Bradley | Brent Poohkay | |||||||
| Interim President and | Executive Vice | Executive Vice | Executive Vice | |||||||
| Chief Executive Officer | President and Chief | President and Chief | President and Chief | |||||||
| Financial Officer | Legal Officer | Information Officer |
| Raef Sully | Mark Thompson | Michael Webb | ||||||||
| Executive Vice President | Executive Vice | Executive Vice | ||||||||
| and CEO of Nitrogen and | President and | President and Chief | ||||||||
| Phosphate | Chief Strategy and | Human Resources and | ||||||||
| Sustainability Officer | Administrative Officer |
OVERVIEW MANAGEMENT’S DISCUSSION & ANALYSIS FOUR-YEAR HIGHLIGHTS FINANCIAL STATEMENTS | OTHER INFORMATION
134 | Nutrien Annual Report 2021
SHAREHOLDER INFORMATION
| Dividends | Ownership | Common Share Prices | ||
Dividend amounts paid to shareholders resident in Canada are adjusted by the exchange rate applicable on the dividend record date. Dividends are normally paid in January, April, July and October with record dates normally set approximately three weeks in advance of the payment date. Future cash dividends will be paid out of, and are conditioned upon, the Company’s available earnings. Shareholders who wish to have their dividends deposited directly to their bank accounts should contact the transfer agent and registrar, Computershare Investor Services Inc.
| On February 17, 2022, there were 906 holders of record of the Company’s common shares. | The Company’s common shares are traded on the Toronto Stock Exchange and the New York Stock Exchange. Nutrien is included in the S&P/TSX 60 and the S&P/TSX Composite indices. | ||
| Offices | ||||
Nutrien’s registered head office is: | It also has corporate offices at: | |||
Suite 1700, 211 19th Street East Saskatoon, Saskatchewan Canada S7K 5R6 | 13131 Lake Fraser Drive SE Calgary, Alberta Canada T2J 7E8 | 5296 Harvest Lake Drive Loveland, Colorado US 80538 | ||
| Investor Relations | ||
| Investor Relations Department | ||
| investors@nutrien.com | ||
| Phone | (403) 225-7451 | |
Transfer Agent
You can contact Computershare Investor Services Inc., the Company’s transfer agent, as follows:
NYSE Corporate Governance
The certifications required by Section 302 of the Sarbanes-Oxley Act of 2002 are filed as exhibits to our 2021 Annual Report on Form 40-F.
| Phone | 1-800-564-6253 | |
| (toll-free within Canada and the US) | ||
| 1-514-982-7555 | ||
| (from any country other than Canada and the US) | ||
| By Fax | 1-888-453-0330 | |
| (all countries) | ||
| By Mail | Computershare | |
| 100 University Ave, | ||
| 8th Floor, North Tower | ||
| Toronto, ON M5J 2Y1 | ||
| Internet | Access your registered account on the Investor | |
| Centre website: | ||
| www.investorcentre.com | ||
OVERVIEW MANAGEMENT’S DISCUSSION & ANALYSIS FOUR-YEAR HIGHLIGHTS FINANCIAL STATEMENTS | OTHER INFORMATION


| Nutrien.com | |
Facebook.com/Nutrienltd | ||
Twitter.com/Nutrienltd |