Exhibit 99.6

1 © 2024 AAR CORP. All rights reserved worldwide. Confidential and proprietary document. Non - GAAP Financial Measures This presentation includes financial results for (i) the Company with respect to adjusted EBITDA, adjusted revenue, adjusted EBI TDA margin, adjusted operating income and adjusted operating margin, and (ii) Triumph Group, Inc.’s Product Support Business with re spect to adjusted EBITDA, adjusted operating income and adjusted operating margin, which are “non - GAAP financial measures” as defined in Regulation G of the Securities Exchange Act of 1934, as amended (the “Exchange Act”). We believe these non - GAAP financial measur es are relevant and useful for investors as they illustrate our actual operating performance unaffected by the impact of certain it ems. When reviewed in conjunction with our and Triumph Group, Inc.'s Product Support business’s GAAP results and the accompanying reconciliations, we believe these non - GAAP financial measures provide additional information that is useful to gain an understan ding of the factors and trends affecting our and Triumph Group, Inc.'s Product Support Business’s and provide a means by which to com par e our operating performance against that of other companies in the industries we compete. These non - GAAP measures should be considered as a supplement to, and not as a substitute for, or superior to, the corresponding measures calculated in accordance with GAA P. Adjusted EBITDA is income from continuing operations before interest income (expense), other income (expense), income taxes, depreciat ion and amortization, stock - based compensation and other items of an unusual nature including but not limited to business divestitures, workforce actions, subsidies and costs, impairment and exit charges, facility consolidation and repositioning costs, investigation and rem ediation compliance costs, significant income tax adjustments, gains on asset sales, purchase accounting and legal settlements, strate gic project costs and significant customer events such as early terminations, contract restructurings, forward loss provisions, bankruptc ies and credit charges. Adjusted operating income is adjusted EBITDA gross of depreciation and amortization and stock - based compensation. Adjus ted sales is sales before contract termination or restructuring and loss provision, net. Pursuant to the requirements of Regulati on G of the Exchange Act, we provide tables that reconcile the above - mentioned non - GAAP financial measures to the most directly comparable GAAP financial measures in the following slides.

2 © 2024 AAR CORP. All rights reserved worldwide. Confidential and proprietary document. ($ in millions) LTM FY22 FY23 Q2 FY24 PF Q2 FY24 Q1 FY22 Q2 FY22 Q3 FY22 Q4 FY22 Q1 FY23 Q2 FY23 Q3 FY23 Q4 FY23 Q1 FY24 Q2 FY24 Sales $1,820.0 $1,990.5 $2,169.5 $2,436.0 $455.1 $436.6 $452.2 $476.1 $446.3 $469.8 $521.1 $553.3 $549.7 $545.4 Contract termination/restructuring & loss provision, net (2.9) 0.1 - - 1.0 (2.5) (0.2) (1.2) 0.1 - - - - - Adjusted Sales $1,817.1 $1,990.6 $2,169.5 $2,436.0 $456.1 $434.1 $452.0 $474.9 $446.4 $469.8 $521.1 $553.3 $549.7 $545.4 Adjusted EBITDA $156.4 $189.8 $210.6 $270.1 $37.0 $37.0 $39.3 $43.1 $41.8 $44.8 $50.2 $53.0 $52.1 $55.3 Adjusted EBITDA Margin 8.6% 9.5% 9.7% 11.1% 8.1% 8.5% 8.7% 9.1% 9.4% 9.5% 9.6% 9.6% 9.5% 10.1% ($ in millions) LTM FY22 FY23 Q1 FY22 Q2 FY22 Q3 FY22 Q4 FY22 Q1 FY23 Q2 FY23 Q3 FY23 Q4 FY23 Q1 FY24 Q2 FY24 Q1 FY23 Q2 FY23 Q3 FY23 Q4 FY23 Q1 FY24 Q2 FY24 PF Q2 FY24 Net Income (loss) $78.7 $90.2 $11.5 $20.8 $22.5 $23.9 $22.7 $22.5 $21.8 $23.2 ($0.6) $23.8 $89.9 $91.6 $90.9 $90.2 $66.9 $68.2 $12.1 (Income) loss from discontinued operations (0.2) (0.4) (0.3) - 0.1 - (0.4) - - - - - (0.3) (0.3) (0.4) (0.4) - - - Income tax expense (benefit) 26.6 31.4 3.9 7.9 8.2 6.6 8.1 8.3 8.0 7.0 (6.9) 7.9 30.8 31.2 31.0 31.4 16.4 16.0 (4.2) Other (income) expense, net (2.2) 0.8 (0.7) (0.3) (1.1) (0.1) (0.2) (0.5) 0.3 1.2 - 0.1 (1.7) (1.9) (0.5) 0.8 1.0 1.6 7.9 Interest expense, net 2.3 11.2 0.7 0.4 0.6 0.6 1.0 2.0 3.5 4.7 5.4 5.6 2.6 4.2 7.1 11.2 15.6 19.2 76.9 Depreciation and intangible amortization 33.1 27.9 8.9 8.9 7.7 7.6 6.8 6.5 6.9 7.7 8.4 8.7 31.0 28.6 27.8 27.9 29.5 31.7 57.2 Investigation and remediation compliance costs 3.7 4.7 0.2 0.8 1.6 1.1 0.8 1.1 1.2 1.6 1.1 2.6 4.3 4.6 4.2 4.7 5.0 6.5 6.5 Pension settlement charge - - - - - - - - - - 26.7 - - - - - 26.7 26.7 26.7 Losses related to sale and exit of business 1.7 0.7 - 1.3 - 0.4 - 0.1 0.4 0.2 0.7 0.9 1.7 0.5 0.9 0.7 1.4 2.2 2.2 Russian bankruptcy court judgment - 1.8 - - - - - - 1.8 - 11.2 - - - 1.8 1.8 13.0 13.0 13.0 Asset impairment and exit charges 3.5 - 2.3 0.6 0.5 0.1 - - - - - - 1.2 0.6 0.1 - - - 1.4 Acquisition-related expenses - 6.2 - - - - - - 1.9 4.3 1.8 2.1 - - 1.9 6.2 8.0 10.1 30.2 Contract termination/restructuring & loss provision, net 0.9 2.0 6.7 (4.4) (1.1) (0.3) (0.3) 2.3 - - - - (6.1) 0.6 1.7 2.0 2.3 - - Facility consolidation and repositioning costs 0.2 - 0.1 0.1 - 0.0 - - - - - - 0.1 - - - - - - Severance and furlough costs 2.0 0.1 0.9 0.8 0.2 0.1 0.1 - - - - - 1.2 0.4 0.2 0.1 - - - Customer bankruptcy and credit charges 1.0 1.5 - 1.0 - 0.0 - (0.3) 1.8 - - - 1.0 (0.3) 1.5 1.5 1.5 1.8 1.8 Government workforce subsidies (4.9) (1.6) (0.3) (2.5) (1.0) (1.1) (0.7) - (0.9) - - - (5.3) (2.8) (2.7) (1.6) (0.9) (0.9) (0.9) Costs related to strategic projects 1.8 (0.2) - - - 1.8 (0.2) - - - - - 1.6 1.6 1.6 (0.2) - - - Stock-based compensation 8.2 13.5 3.1 1.6 1.1 2.4 4.1 2.8 3.5 3.1 4.3 3.6 9.2 10.4 12.8 13.5 13.7 14.5 14.5 Allocated Triumph corporate costs unrelated to the Product Support Business - - - - - - - - - - - - - - - - - - 14.7 Anticipated run-rate synergies - - - - - - - - - - - - - - - - - - 10.1 Adjusted EBITDA $156.4 $189.8 $37.0 $37.0 $39.3 $43.1 $41.8 $44.8 $50.2 $53.0 $52.1 $55.3 $161.2 $169.0 $179.9 $189.8 $200.1 $210.6 $270.1 AAR Reconciliation of GAAP to Non - GAAP Measures Adjusted EBITDA 1 Adjusted Sales and Adjusted EBITDA Margin 2 1 Adjusted EBITDA defined as Net Income + Loss From Discontinued Operations + Income Tax Expense + Other Expense, net + Interes t E xpense + Depreciation and Intangible Amortization + Investigation and Remediation Compliance Costs + Pension Settlement Charg e + Losses Related to Sale and Exit of Business + Russian Bankruptcy Court Judgment + Asset Impairment and Exit Charges + Acquisition - Related Expenses + Contract Termination/Restructuring & Loss Provision, net + Facility Consolidation and Repositioning Costs + Severance and F ur lough Costs + Customer Bankruptcy and Credit Charges + Government Workforce Subsidies + Costs related to Strategic Projects + Stock - Based Compensation + Allocated Triumph Corporate Costs Unrelated to the Product Support Business 2 Adjusted Sales defined as Sales before Contract Termination/Restructuring & Loss Provision, net; Adjusted EBITDA Margin defined as Adjusted EBITDA / Adjusted Sales
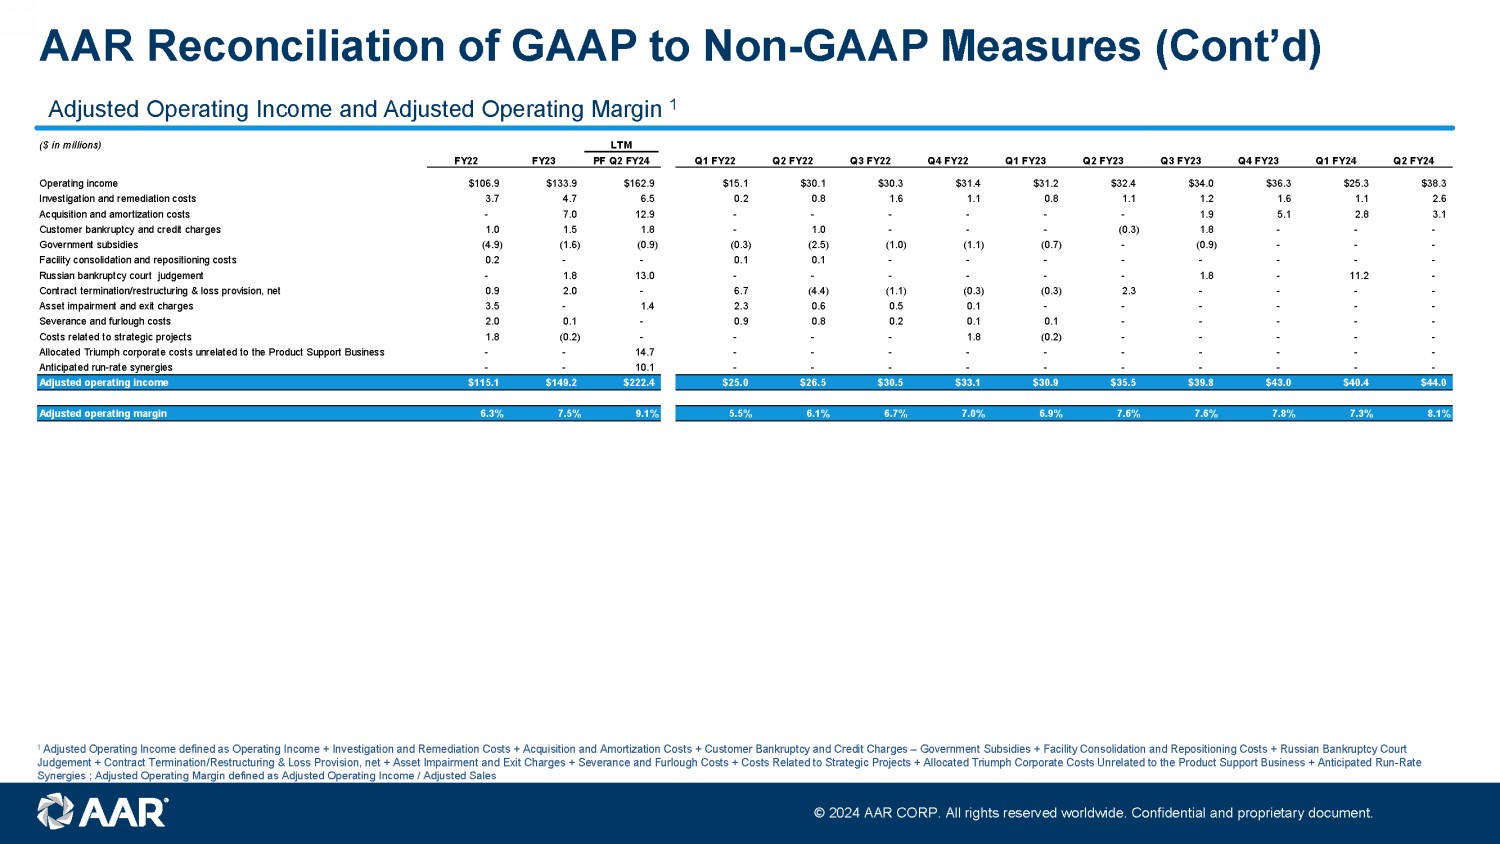
3 © 2024 AAR CORP. All rights reserved worldwide. Confidential and proprietary document. AAR Reconciliation of GAAP to Non - GAAP Measures (Cont’d) Adjusted Operating Income and Adjusted Operating Margin 1 ($ in millions) LTM FY22 FY23 PF Q2 FY24 Q1 FY22 Q2 FY22 Q3 FY22 Q4 FY22 Q1 FY23 Q2 FY23 Q3 FY23 Q4 FY23 Q1 FY24 Q2 FY24 Operating income $106.9 $133.9 $162.9 $15.1 $30.1 $30.3 $31.4 $31.2 $32.4 $34.0 $36.3 $25.3 $38.3 Investigation and remediation costs 3.7 4.7 6.5 0.2 0.8 1.6 1.1 0.8 1.1 1.2 1.6 1.1 2.6 Acquisition and amortization costs - 7.0 12.9 - - - - - - 1.9 5.1 2.8 3.1 Customer bankruptcy and credit charges 1.0 1.5 1.8 - 1.0 - - - (0.3) 1.8 - - - Government subsidies (4.9) (1.6) (0.9) (0.3) (2.5) (1.0) (1.1) (0.7) - (0.9) - - - Facility consolidation and repositioning costs 0.2 - - 0.1 0.1 - - - - - - - - Russian bankruptcy court judgement - 1.8 13.0 - - - - - - 1.8 - 11.2 - Contract termination/restructuring & loss provision, net 0.9 2.0 - 6.7 (4.4) (1.1) (0.3) (0.3) 2.3 - - - - Asset impairment and exit charges 3.5 - 1.4 2.3 0.6 0.5 0.1 - - - - - - Severance and furlough costs 2.0 0.1 - 0.9 0.8 0.2 0.1 0.1 - - - - - Costs related to strategic projects 1.8 (0.2) - - - - 1.8 (0.2) - - - - - Allocated Triumph corporate costs unrelated to the Product Support Business - - 14.7 - - - - - - - - - - Anticipated run-rate synergies - - 10.1 - - - - - - - - - - Adjusted operating income $115.1 $149.2 $222.4 $25.0 $26.5 $30.5 $33.1 $30.9 $35.5 $39.8 $43.0 $40.4 $44.0 Adjusted operating margin 6.3% 7.5% 9.1% 5.5% 6.1% 6.7% 7.0% 6.9% 7.6% 7.6% 7.8% 7.3% 8.1% 1 Adjusted Operating Income defined as Operating Income + Investigation and Remediation Costs + Acquisition and Amortization Co sts + Customer Bankruptcy and Credit Charges – Government Subsidies + Facility Consolidation and Repositioning Costs + Russian Bankruptcy Court Judgement + Contract Termination/Restructuring & Loss Provision , net + Asset Impairment and Exit Charges + Severance and Furlough Costs + Costs Related to Strategic Projects + Allocated Triumph Corporate Costs Unrelated to the Product Support Business + Anticipated Run - Rate Synergies ; Adjusted Operating Margin defined as Adjusted Operating Income / Adjusted Sales
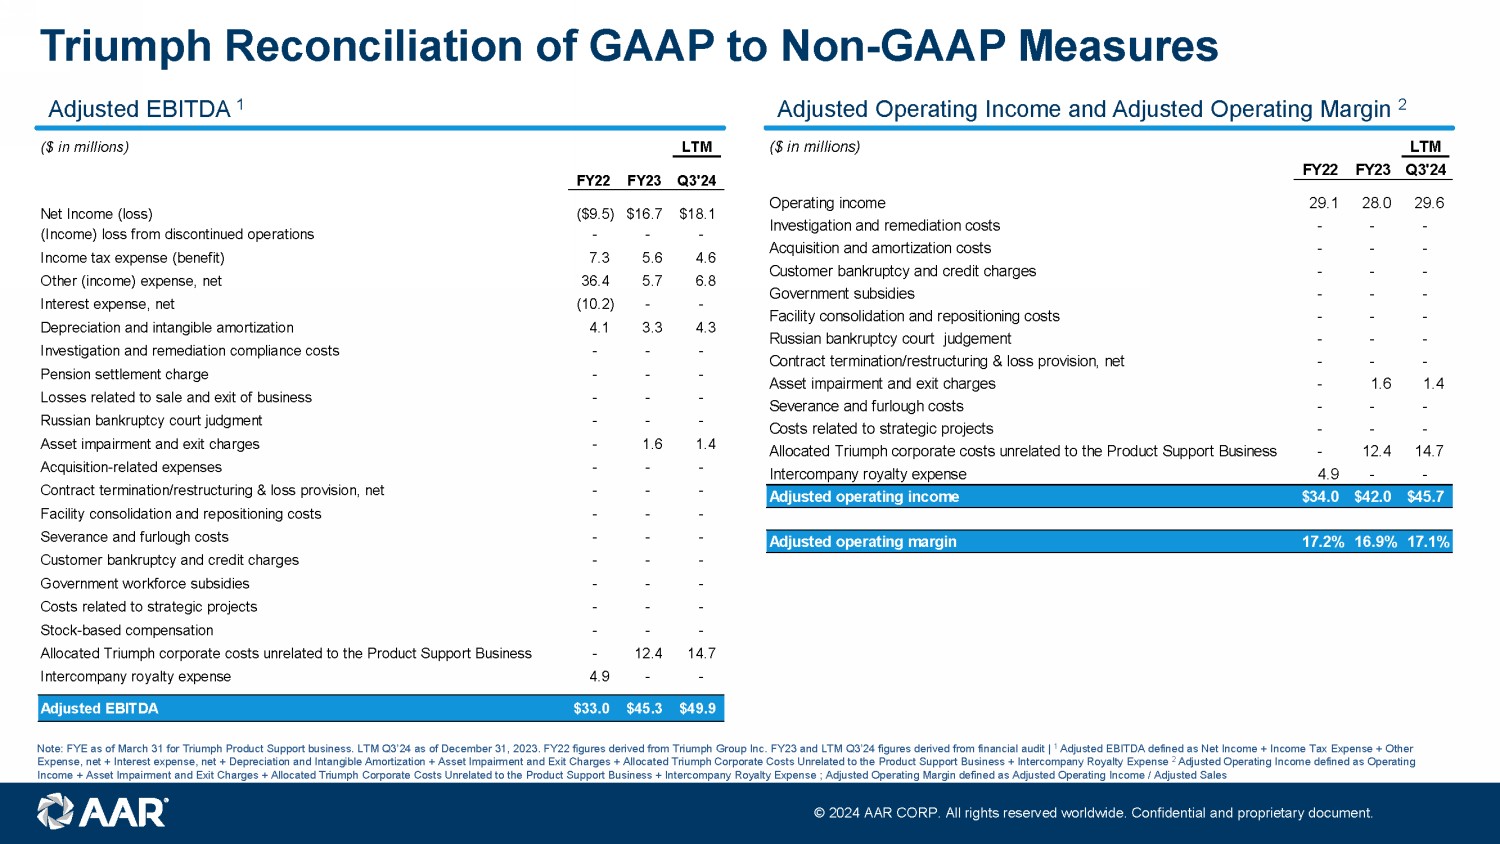
4 © 2024 AAR CORP. All rights reserved worldwide. Confidential and proprietary document. ($ in millions) LTM FY22 FY23 Q3'24 Operating income 29.1 28.0 29.6 Investigation and remediation costs - - - Acquisition and amortization costs - - - Customer bankruptcy and credit charges - - - Government subsidies - - - Facility consolidation and repositioning costs - - - Russian bankruptcy court judgement - - - Contract termination/restructuring & loss provision, net - - - Asset impairment and exit charges - 1.6 1.4 Severance and furlough costs - - - Costs related to strategic projects - - - Allocated Triumph corporate costs unrelated to the Product Support Business - 12.4 14.7 Intercompany royalty expense 4.9 - - Adjusted operating income $34.0 $42.0 $45.7 Adjusted operating margin 17.2% 16.9% 17.1% ($ in millions) LTM FY22 FY23 Q3'24 Net Income (loss) ($9.5) $16.7 $18.1 (Income) loss from discontinued operations - - - Income tax expense (benefit) 7.3 5.6 4.6 Other (income) expense, net 36.4 5.7 6.8 Interest expense, net (10.2) - - Depreciation and intangible amortization 4.1 3.3 4.3 Investigation and remediation compliance costs - - - Pension settlement charge - - - Losses related to sale and exit of business - - - Russian bankruptcy court judgment - - - Asset impairment and exit charges - 1.6 1.4 Acquisition-related expenses - - - Contract termination/restructuring & loss provision, net - - - Facility consolidation and repositioning costs - - - Severance and furlough costs - - - Customer bankruptcy and credit charges - - - Government workforce subsidies - - - Costs related to strategic projects - - - Stock-based compensation - - - Allocated Triumph corporate costs unrelated to the Product Support Business - 12.4 14.7 Intercompany royalty expense 4.9 - - Adjusted EBITDA $33.0 $45.3 $49.9 Triumph Reconciliation of GAAP to Non - GAAP Measures Adjusted EBITDA 1 Adjusted Operating Income and Adjusted Operating Margin 2 Note: FYE as of March 31 for Triumph Product Support business. LTM Q3’24 as of December 31, 2023. FY22 figures derived from Triumph Gr oup Inc. FY23 and LTM Q3’24 figures derived from financial audit | 1 Adjusted EBITDA defined as Net Income + Income Tax Expense + Other Expense, net + Interest expense, net + Depreciation and Intangible Amortization + Asset Impairment and Exit Charges + Allocat ed Triumph Corporate Costs Unrelated to the Product Support Business + Intercompany Royalty Expense 2 Adjusted Operating Income defined as Operating Income + Asset Impairment and Exit Charges + Allocated Triumph Corporate Costs Unrelated to the Product Support Business + Intercompany Royalty Expense ; Adjusted Operating Margin defined as Adjusted Operating Income / Adjusted Sales