Exhibit 99.2

APP LOVIN
4Q 2021
Shareholder
Letter
To Our AppLovin Shareholders:
We are pleased to report a strong finish to an outstanding year and are even more excited to highlight the opportunities to grow our company in 2022 and beyond. With our first-party apps business now at critical mass, the opportunities for us to rapidly grow our Software Platform continue to expand. This includes the accretive merger of MoPub into MAX. As usual, we continue to make meaningful investments across our business with a focus on maximizing our long-term value creation.
Our company achieved a lot in 2021. We successfully scaled our core marketing software solutions based on our AXON machine learning (ML) engine, expanded our first-party app development capabilities, completed several strategic acquisitions of technology and content, accessed the public equity and private debt markets, and grew our outstanding global AppLovin team and Board of Directors. We achieved an all-time high for revenue, improved our net income, and delivered record Adjusted EBITDA. We now have nearly twice as many software platform enterprise clients growing their business with our solutions today than we had last year, with existing clients spending two-times as much on our platform than they spent last year. Given our strong portfolio of scaled software assets, first-party data, and development capabilities, we have an excellent strategic position from which to grow over the long-term.
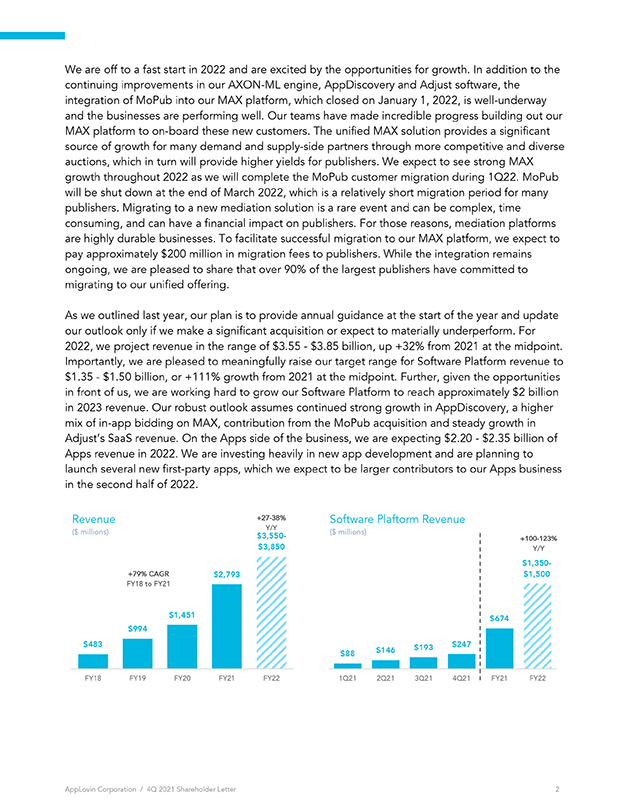
Our outstanding revenue growth exceeded expectations in 2021, increasing +92% to $2.8 billion compared to $2.675 billion at the midpoint of our guidance range. Primarily driven by our AXON ML-engine, our Software Platform revenue achieved outstanding growth, up +225% to $674 million and above our target of $600 million. Our net income improved to $35 million, a 1% net margin, from a loss of $126 million; and our Adjusted EBITDA also exceeded our guidance by growing +110% to $727 million, an Adjusted EBITDA margin of 26%. We exited the year in a much stronger financial position with record revenue, improved net income, and record Adjusted EBITDA. In 4Q21, our total revenue grew +56% to $793 million led by a tripling of our Software Platform revenue to $247 million including +192% growth in SPECs and +204% Net Dollar Based Revenue Retention. Net income in 4Q21 improved to $31 million, a net margin of 4%, while our Adjusted EBITDA grew +60% to $221 million and an improved margin of 28%. Our ability to continue to grow our Software Platform at such a robust rate underscores the value a growing number of advertisers are seeing from our platform’s ML-based marketing software and scaled insights from a large, growing portfolio of first-party apps.
AppLovin Corporation / 4Q 2021 Shareholder Letter 1
We are off to a fast start in 2022 and are excited by the opportunities for growth. In addition to the
continuing improvements in our AXON-ML engine, AppDiscovery and Adjust software, the
integration of MoPub into our MAX platform, which closed on January 1, 2022, is well-underway
and the businesses are performing well. Our teams have made incredible progress building out our
MAX platform to on-board these new customers. The unified MAX solution provides a significant
source of growth for many demand and supply-side partners through more competitive and diverse
auctions, which in turn will provide higher yields for publishers. We expect to see strong MAX
growth throughout 2022 as we will complete the MoPub customer migration during 1022. MoPub
will be shut down at the end of March 2022, which is a relatively short migration period for many
publishers. Migrating to a new mediation solution is a rare event and can be complex, time
consuming, and can have a financial impact on publishers. For those reasons, mediation platforms
are highly durable businesses. To facilitate successful migration to our MAX platform, we expect to
pay approximately $200 million in migration fees to publishers. While the integration remains
ongoing, we are pleased to share that over 90% of the largest publishers have committed to
migrating to our unified offering.
As we outlined last year, our plan is to provide annual guidance at the start of the year and update
our outlook only if we make a significant acquisition or expect to materially underperform. For
2022, we project revenue in the range of $3.55—$3.85 billion, up +32% from 2021 at the midpoint.
Importantly, we are pleased to meaningfully raise our target range for Software Platform revenue to
$1.35—$1.50 billion, or +111% growth from 2021 at the midpoint. Further, given the opportunities
in front of us, we are working hard to grow our Software Platform to reach approximately $2 billion
in 2023 revenue. Our robust outlook assumes continued strong growth in App Discovery, a higher
mix of in-app bidding on MAX, contribution from the MoPub acquisition and steady growth in
Adjust’s SaaS revenue. On the Apps side of the business, we are expecting $2.20—$2.35 billion of
Apps revenue in 2022. We are investing heavily in new app development and are planning to
launch several new first-party apps, which we expect to be larger contributors to our Apps business
in the second half of 2022.
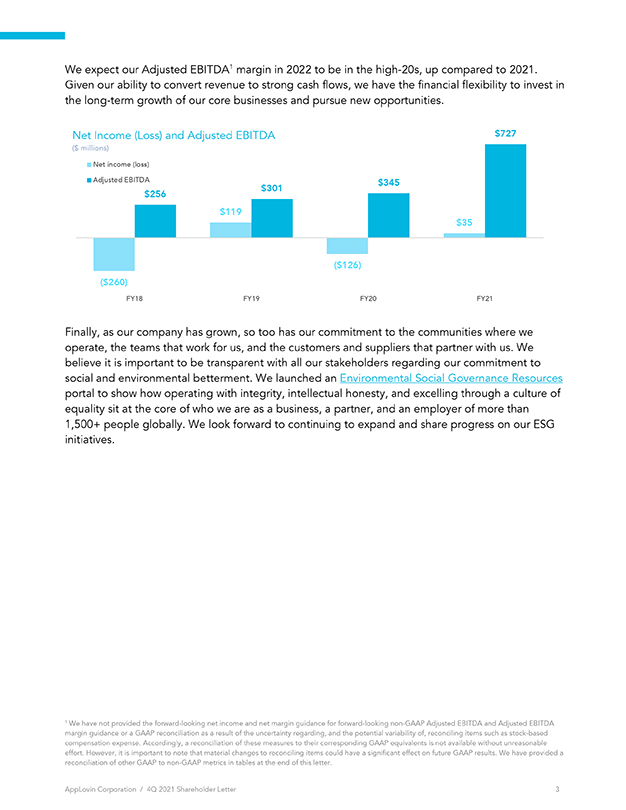
We expect our Adjusted EBITDA1 margin in 2022 to be in the high-20s, up compared to 2021. Given our ability to convert revenue to strong cash flows, we have the financial flexibility to invest in the long-term growth of our core businesses and pursue new opportunities. Net Income (Loss) and Adjusted EBITDA ($ millions) Net income (loss) Adjusted EBITDA $256 $119 $345 $301 $35 $727 ($260)($126)FY18 FY19 FY20 FY21Finally, as our company has grown, so too has our commitment to the communities where we operate, the teams that work for us, and the customers and suppliers that partner with us. We believe it is important to be transparent with all our stakeholders regarding our commitment to social and environmental betterment. We launched an Environmental Social Governance Resources portal to show how operating with integrity, intellectual honesty, and excelling through a culture of equality sit at the core of who we are as a business, a partner, and an employer of more than 1,500+ people globally. We look forward to continuing to expand and share progress on our ESG initiatives. 1 We have not provided the forward-looking net income and net margin guidance for forward-looking non-GAAP Adjusted EBITDA and Adjusted EBITDA margin guidance or a GAAP reconciliation as a result of the uncertainty regarding, and the potential variability of, reconciling items such as stock-based compensation expense. Accordingly, a reconciliation of these measures to their corresponding GAAP equivalents is not available without unreasonable effort. However, it is important to note that material changes to reconciling items could have a significant effect on future GAAP results. We have provided a reconciliation of other GAAP to non-GAAP metrics in tables at the end of this letter. AppLovin Corporation / 4Q 2021 Shareholder Letter 3
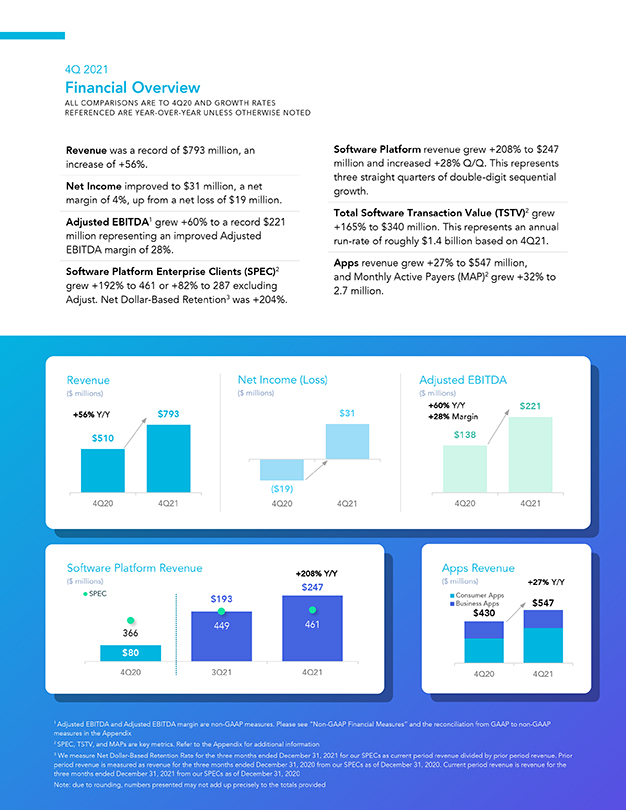
4Q 2021 Financial Overview ALL COMPARISONS ARE TO 4Q20 AND GROWTH RATES REFERENCED ARE YEAR-OVER-YEAR UNLESS OTHERWISE NOTED Revenue was a record of $793 million, an increase of +56%. Software Platform revenue grew +208% to $247 million and increased +28% Q/Q. This represents three straight quarters of double-digit sequential growth. Net Income improved to $31 million, a net margin of 4%, up from a net loss of $19 million. Adjusted EBITDA1 grew +60% to a record $221 million representing an improved Adjusted EBITDA margin of 28%. Software Platform Enterprise Clients (SPEC)2 grew +192% to 461 or +82% to 287 excluding Adjust. Net Dollar-Based Retention3 was +204%. Total Software Transaction Value (TSTV)2 grew +165% to $340 million. This represents an annual run-rate of roughly $1.4 billion based on 4Q21. Apps revenue grew +27% to $547 million, and Monthly Active Payers (MAP)2 grew +32% to 2.7 million. Revenue ($ millions) +56% Y/Y $793 $510 4Q20 4Q21 Net Income (Loss) ($ millions) $31 ($19) 4Q20 4Q21 Adjusted EBITDA ($ millions) +60% Y/Y $221 +28% Margin $138 4Q20 4Q21 Software Platform Revenue ($ millions) +208% Y/Y $247 $245 SPEC $225 $193 $205 $185 $165 $145 449 461 $125 366 $105 $85 $65 $45 $80 $25 0 4Q20 3Q21 4Q21 Apps Revenue ($ millions) +27% Y/Y Consumer Apps Business Apps $547 $430 4Q20 4Q21 1 Adjusted EBITDA and Adjusted EBITDA margin are non-GAAP measures. Please see “Non-GAAP Financial Measures” and the reconciliation from GAAP to non-GAAP measures in the Appendix 2 SPEC, TSTV, and MAPs are key metrics. Refer to the Appendix for additional information 3 We measure Net Dollar-Based Retention Rate for the three months ended December 31, 2021 for our SPECs as current period revenue divided by prior period revenue. Prior period revenue is measured as revenue for the three months ended December 31, 2020 from our SPECs as of December 31, 2020. Current period revenue is revenue for the three months ended December 31, 2021 from our SPECs as of December 31, 2020 Note: due to rounding, numbers presented may not add up precisely to the totals provided AppLovin Corporation / 4Q 2021 Shareholder Letter 4
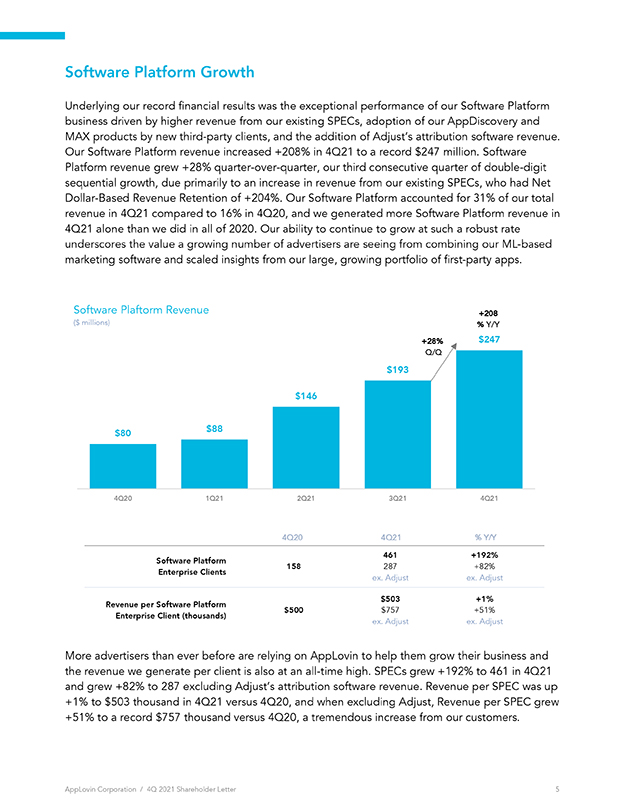
Software Platform Growth Underlying our record financial results was the exceptional performance of our Software Platform business driven by higher revenue from our existing SPECs, adoption of our AppDiscovery and MAX products by new third-party clients, and the addition of Adjust’s attribution software revenue. Our Software Platform revenue increased +208% in 4Q21 to a record $247 million. Software Platform revenue grew +28% quarter-over-quarter, our third consecutive quarter of double-digit sequential growth, due primarily to an increase in revenue from our existing SPECs, who had Net Dollar-Based Revenue Retention of +204%. Our Software Platform accounted for 31% of our total revenue in 4Q21 compared to 16% in 4Q20, and we generated more Software Platform revenue in 4Q21 alone than we did in all of 2020. Our ability to continue to grow at such a robust rate underscores the value a growing number of advertisers are seeing from combining our ML-based marketing software and scaled insights from our large, growing portfolio of first-party apps. Software Plaftorm Revenue ($ millions) +208 % Y/Y $247 +28% Q/Q $193 $146 $80 $88 4Q20 1Q21 2Q21 3Q21 4Q21 4Q20 4Q21 % Y/Y Software Platform 461 +192% Enterprise Clients 158 287 +82% ex. Adjust ex. Adjust Revenue per Software Platform $503 +1% Enterprise Client (thousands) $ 500 $757 +51% ex. Adjust ex. Adjust More advertisers than ever before are relying on AppLovin to help them grow their business and the revenue we generate per client is also at an all-time high. SPECs grew +192% to 461 in 4Q21 and grew +82% to 287 excluding Adjust’s attribution software revenue. Revenue per SPEC was up +1% to $503 thousand in 4Q21 versus 4Q20, and when excluding Adjust, Revenue per SPECgrew +51% to a record $757 thousand versus 4Q20, a tremendous increase from our customers. AppLovin Corporation / 4Q 2021 Shareholder Letter 5
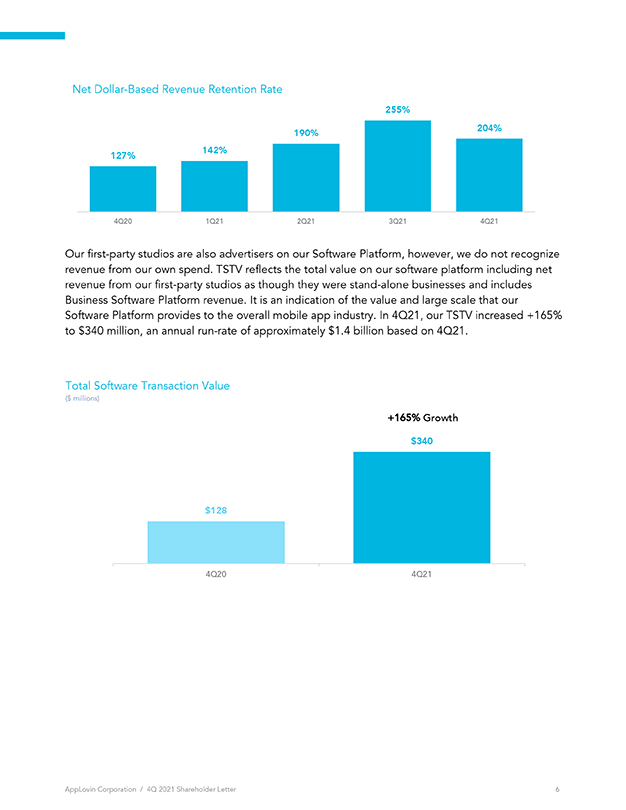
Net Dollar-Based Revenue Retention Rate 255% 190% 204% 127% 142% 1Q21 2Q21 3Q21 4Q21 Our first-party studios are also advertisers on our Software Platform, however, we do not recognize revenue from our own spend. TSTV reflects the total value on our software platform including net revenue from our first-party studies as though they were stand-alone businesses and includes Business Software Platform revenue. It is an indication of the value and large scale that our Software Platform provides to the overall mobile app industry. In 4021, our TSTV increased +165% to $340 million, an annual run-rate of approximately $1.4 billion based on 4021. Total Software Transaction Value ($ millions) +165% Growth 5340 5128 4Q20 4Q21
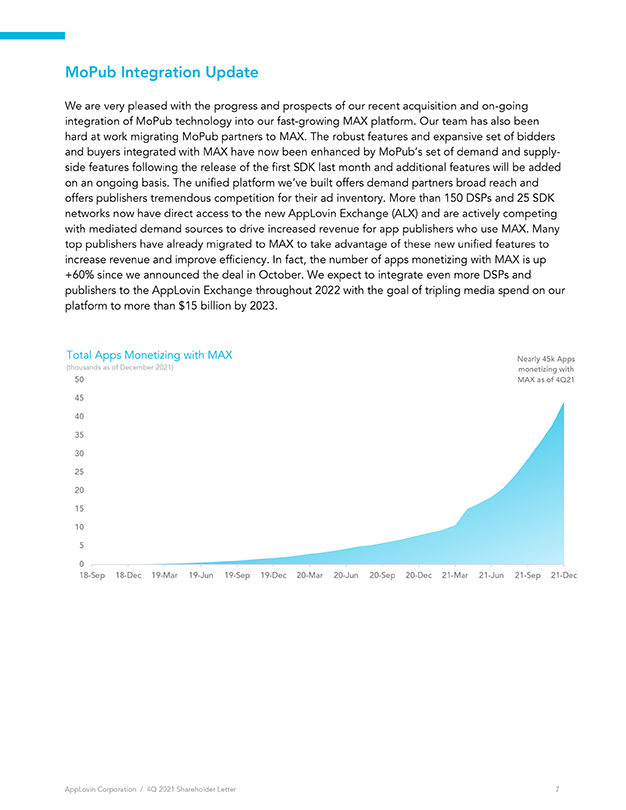
MoPub Integration Update We are very pleased with the progress and prospects of our recent acquisition and on-going integration of MoPub technology into our fast-growing MAX platform. Our team has also been hard at work migrating MoPub partners to MAX. The robust features and expansive set of bidders and buyers integrated with MAX have now been enhanced by MoPub’s set of demand and supply- side features following the release of the first SDK last month and additional features will be added on an ongoing basis. The unified platform we’ve built offers demand partners broad reach and offers publishers tremendous competition for their ad inventory. More than 150 DSP. and 25 SDK networks now have direct access to the new AppLovin Exchange (ADX) and are actively competing with mediated demand sources to drive increased revenue for app publishers who use MAX Many top publishers have already migrated to MAX to take advantage of these new unified features to increase revenue and improve efficiency. In fact, the number of apps monetizing with MAX is up +60% since we announced the deal in October. We expect to integrate even more DSPs and publishers to the AppLovin Exchange throughout 2022 with the goal of tripling media spend on our platform to more than $15 billion by 2023. Total Apps Monetizing with MAX thousands of December 2011 50 Nearly 45k Apps monetizing with MAX of 4021 45 40 35 30 20 15 10 5 0 18 Sep 18 Dec 19-Mar 19 Jun 19-Sep 19-Dec 20-Mar 20-Jun 20-Sep 20-Dec 21-Mar 21-Jun 21- Sep 21-Dec
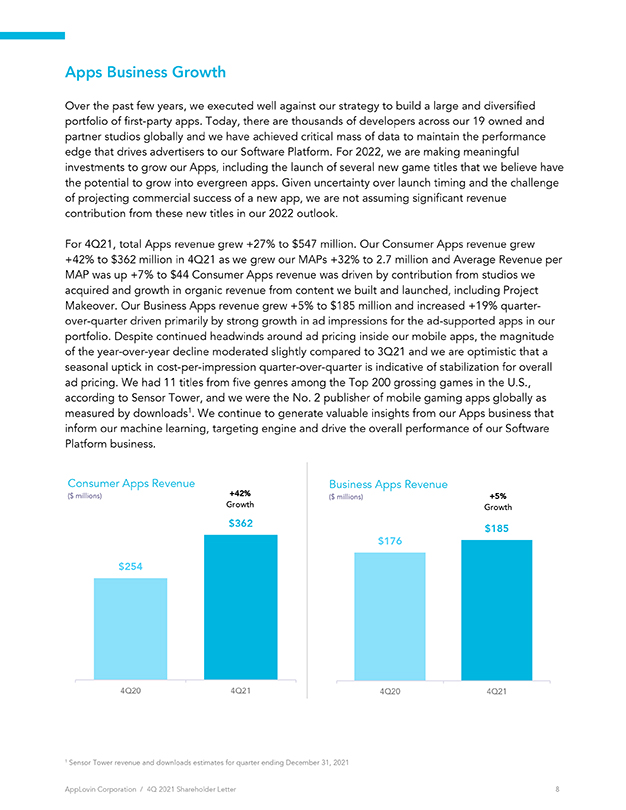
Apps Business Growth Over the past few years, we executed well against our strategy to build a large and diversified portfolio of first-party apps. Today, there are thousands of developers across our 19 owned and partner studios globally and we have achieved critical mass of data to maintain the performance edge that drives advertisers to our Software Platform. For 2022, we are making meaningful investments to grow our Apps, including the launch of several new game titles that we believe have the potential to grow into evergreen apps. Given uncertainty over launch timing and the challenge of projecting commercial success of a new app, we are not assuming significant revenue contribution from these new titles in our 2022 outlook. For 4Q21 total Apps revenue grew +27% to $547 million. Our Consumer Apps revenue grew +42% to $362 million in 4Q21 as we grew our MAP: +32% to 2.7 million and Average Revenue per MAP was up +7% to $44 Consumer Apps revenue was driven by contribution from studios we acquired and growth in organic revenue from content we built and launched, including Project Makeover. Our Business Apps revenue grew +5% to $185 million and increased +19% quarter over-quarter driven primarily by strong growth in ad impressions for the ad-supported apps in our portfolio. Despite continued headwinds around ad pricing inside our mobile apps, the magnitude of the year-over-year decline moderated slightly compared to 3021 and we are optimistic that a seasonal uptick in cost-per-impression quarter-over-quarter is indicative of stabilization for overall ad pricing. We had 11 titles from five genres among the Top 200 grossing games in the U.S., according to Sensor Tower, and we were the No. 2 publisher of mobile gaming apps globally as measured by downloads’. We continue to generate valuable insights from our Apps business that inform our machine learning targeting engine and drive the overall performance of our Software Platform business Consumer Apps Revenue millions Business Apps Revenue millions +42 Growth $362 +5% Growth $185 $176 $254 4Q20 4Q21 02 4Q21 1 Sensor Tower revenue and downloads estimates for quarter ending December 31, 2021
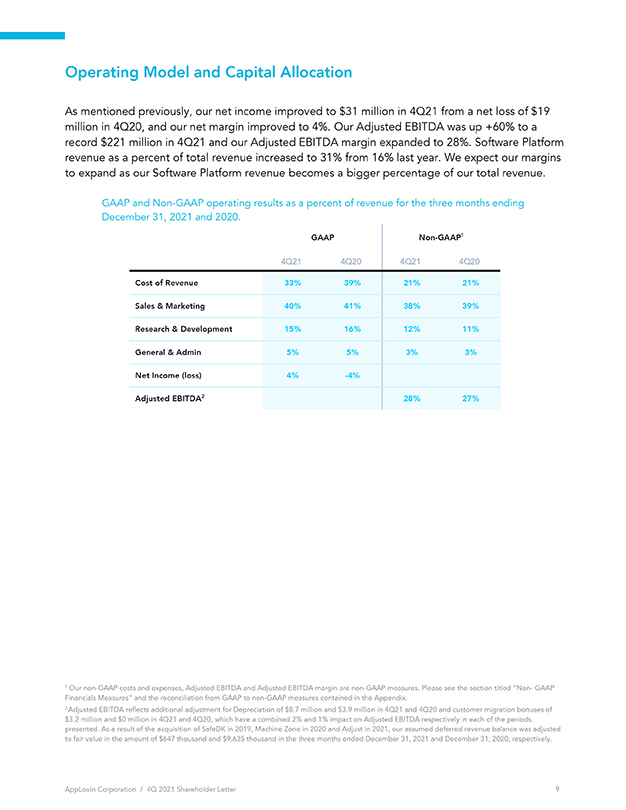
Operating Model and Capital Allocation As mentioned previously, our net income improved to 531 million in 4021 from a net loss of $19 million in 4020, and our net margin improved to 4%. Our Adjusted EBITDA was up +60% to : record $221 million in 4021 and our Adjusted EBITDA margin expanded to 28%. Software Platform revenue as a percent of total revenue increased to 31% from 16% last year. We expect our margins to expand as our Software Platform revenue becomes a bigger percentage of our total revenue. GAAP and Non-GAAP operating results as a percent of revenue for the three months ending December 31, 2021 and 2020 GAAP Non-GAAP 4021 4020 4021 4020 Coat of Revenue 33% 39% 21% 21% Sales & Marketing 40% 41% 38% 3996 15% 16% 12% 1155 Research & Development General & Admin 5% 5% 3% Net Income (loss) 4 Adjusted EBITDA 28% 27 1 Our non-GAAP costs and expenses, Adjusted EBITDA and Adjusted EBITDA margin are non-GAAP measures. Please see the section titled “Non- GAAP Financials Measures” and the reconciliation from GAAP to non-GAAP measures contained in the Appendix. 2 Adjusted EBITDA reflects additional adjustment for Depreciation of $8.7 million and $3.9 million in 4Q21 and 4Q20 and customer migration bonuses of $3.2 million and $0 million in 4Q21 and 4Q20, which have a combined 2% and 1% impact on Adjusted EBITDA respectively in each of the periods. presented. As a result of the acquisition of SafeDK in 2019, Machine Zone in 2020 and Adjust in 2021, our assumed deferred revenue balance was adjusted to fair value in the amount of $647 thousand and $9,635 thousand in the three months ended December 31, 2021 and December 31, 2020, respectively.
Conclusion Our success in 2021 could not have been accomplished without the unwavering support of the talented and growing AppLovin team. We thank all of our stakeholders, customers, partners, and employees for their hard work and trust in our company. We are now very much focused on 2022 and beyond, and could not be more excited by the opportunities that lie ahead for our company. As always, we are focused on long-term shareholder value creation and our goal of long-term +30% cash flow growth through dear strategic direction and sound execution. an Adam Foroughi, CEO Herald Chen, President & CFO
Appendix This Shareholder Letter contains forward-looking statements within the meaning of Section 27A of the Securities Act of 1933 and Section 21E of the Securities Exchange Act of 1934. Forward-looking statements generally relate to future events or our future financial or operating performance. In some cases, you can identify forward-looking statements because they contain words such as “may,” “will,” “should,” “expect,” “plan,” “anticipate,” “going to,” “could,” “intend,” “target,” “project,” “contemplate,” “believe,” “estimate,” “predict,” “potential,” or “continue,” or the negative of these words or other similar terms or expressions that concern our expectations, strategy, priorities, plans, or intentions. Forward-looking statements in this Shareholder Letter include, but are not limited to, statements regarding our future financial performance, including our expected financial results, guidance and growth prospects; our expectations regarding our revenue; our goals regarding media spend on our platform; trends in ad pricing; our expectations regarding future product development, and our expectations regarding our acquisitions, including the impact of our MoPub acquisition. Our expectations and beliefs regarding these matters may not materialize, and actual results in future periods are subject to risks and uncertainties, including changes in our plans or assumptions, that could cause actual results to differ materially from those projected. These risks include our inability to forecast our business due to our limited operating history, fluctuations in our results of operations, the competitive mobile app ecosystem, and our inability to adapt to emerging technologies and business models. The forward-looking statements contained in this letter are also subject to other risks and uncertainties, including those more fully described in our Quarterly Report on Form 10-Q for the fiscal quarter ended September 30, 2021. Additional information will also be set forth in our Annual Report on Form 10-K for the fiscal year ended December 31, 2021. The forward-looking statements in this letter are based on information available to us as of the date hereof, and we disclaim any obligation to update any forward-looking statements, except as required by law.
Non-GAAP Financial Metrics To supplement our financial information presented in accordance with generally accepted accounting principles in the United States (“GAAP”), this letter includes certain financial measures that are not prepared in accordance with GAAP, including Adjusted EBITDA, Adjusted EBITDA margin, and non-GAAP costs and expenses. A reconciliation of each such non-GAAP financial measure to the most directly comparable GAAP measure can be found below. We define Adjusted EBITDA for a particular period as net income (loss) before interest expense and loss on settlement of debt, other (income) expense (excluding certain recurring items), net, provision for (benefit from) income taxes, amortization, depreciation and write-offs and as further adjusted for non-operating foreign exchange (gains) losses, stock-based compensation expense, acquisition-related expense and transaction bonuses, MoPub publisher migration costs, loss (gain) on extinguishments of acquisition-related contingent consideration, lease modification and abandonment of leasehold improvements, and change in the fair value of contingent consideration. We define Adjusted EBITDA margin as Adjusted EBITDA divided by revenue for the same period. We define non-GAAP costs and expenses as total costs and expenses adjusted to exclude stock-based compensation expense, amortization expense related to acquired intangibles and acquisition-related expense and transaction bonuses. We believe that the presentation of these non-GAAP financial measures provides useful information to investors regarding our results of operations and operating performance, as they are similar to measures reported by our public competitors and are regularly used by securities analysts, institutional investors, and other interested parties in analyzing operating performance and prospects. Adjusted EBITDA, Adjusted EBITDA margin, and non-GAAP costs and expenses are key measures we use to assess our financial performance and are also used for internal planning and forecasting purposes. We believe Adjusted EBITDA, Adjusted EBITDA margin, and non-GAAP costs and expenses are helpful to investors, analysts, and other interested parties because they can assist in providing a more consistent and comparable overview of our operations across our historical financial periods. In addition, these measures are frequently used by analysts, investors, and other interested parties to evaluate and assess performance. We use Adjusted EBITDA, Adjusted EBITDA margin, and non-GAAP costs and expenses in conjunction with GAAP measures as part of our overall assessment of our performance, including the preparation of our annual operating budget and quarterly forecasts, to evaluate the effectiveness of our business strategies, and to communicate with our board of directors concerning our financial performance. Our definitions may differ from the definitions used by other companies and therefore comparability may be limited. In addition, other companies may not publish these or similar metrics. Furthermore, these metrics have certain limitations in that they do not include the impact of certain expenses that are reflected in our consolidated statement of operations that are necessary to run our business. Thus, our non-GAAP financial measures should be considered in addition to, not as substitutes for, or in isolation from, measures prepared in accordance with GAAP.
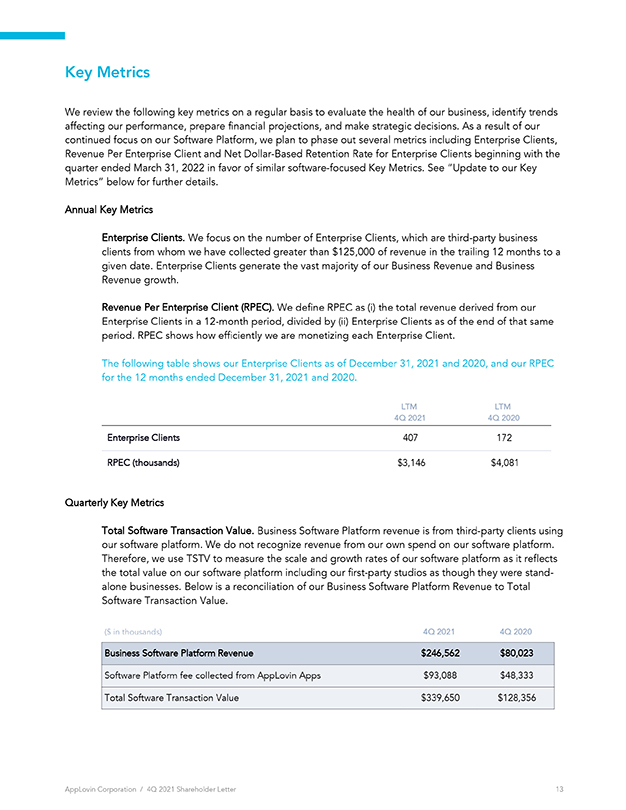
Key Metrics We review the following key metrics on a regular basis to evaluate the health of our business, identify trends affecting our performance, prepare financial projections, and make strategic decisions. As a result of our continued focus on our Software Platform, we plan to phase out several metrics including Enterprise Clients, Revenue Per Enterprise Client and Net Dollar-Based Retention Rate for Enterprise Clients beginning with the quarter ended March 31, 2022 in favor of similar software-focused Key Metrics. See “Update to our Key Metrics” below for further details. Annual Key Metrics Enterprise Clients. We focus on the number of Enterprise Clients, which are third-party business clients from whom we have collected greater than $125,000 of revenue in the trailing 12 months to a given date. Enterprise Clients generate the vast majority of our Business Revenue and Business Revenue growth. Revenue Per Enterprise Client (RPEC). We define RPEC as (i) the total revenue derived from our Enterprise Clients in a 12-month period, divided by (ii) Enterprise Clients as of the end of that same period. RPEC shows how efficiently we are monetizing each Enterprise Client. The following table shows our Enterprise Clients as of December 31, 2021 and 2020, and our RPEC for the 12 months ended December 31, 2021 and 2020. LTM LTM 4Q 2021 4Q 2020 Enterprise Clients 407 172 RPEC (thousands) $3,146 $4,081 Quarterly Key Metrics Total Software Transaction Value. Business Software Platform revenue is from third-party clients using our software platform. We do not recognize revenue from our own spend on our software platform. Therefore, we use TSTV to measure the scale and growth rates of our software platform as it reflects the total value on our software platform including our first-party studios as though they were stand-alone businesses. Below is a reconciliation of our Business Software Platform Revenue to Total Software Transaction Value. ($ in thousands) 4Q 2021 4Q 2020 Business Software Platform Revenue $246,562 $80,023 Software Platform fee collected from AppLovin Apps $93,088 $48,333 Total Software Transaction Value $339,650 $128,356
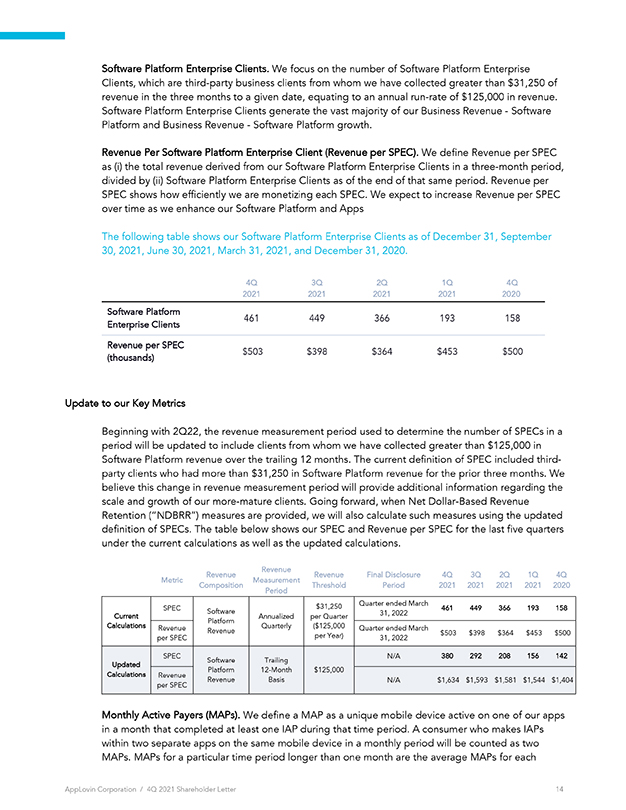
Software Platform Enterprise Clients. We focus on the number of Software Platform Enterprise Clients, which are third-party business clients from whom we have collected greater than $31,250 of revenue in the three months to a given date, equating to an annual run-rate of $125,000 in revenue. Software Platform Enterprise Clients generate the vast majority of our Business Revenue - Software Platform and Business Revenue - Software Platform growth. Revenue Per Software Platform Enterprise Client (Revenue per SPEC). We define Revenue per SPEC as (i) the total revenue derived from our Software Platform Enterprise Clients in a three-month period, divided by (ii) Software Platform Enterprise Clients as of the end of that same period. Revenue per SPEC shows how efficiently we are monetizing each SPEC. We expect to increase Revenue per SPEC over time as we enhance our Software Platform and Apps The following table shows our Software Platform Enterprise Clients as of December 31, September 30, 2021, June 30, 2021, March 31, 2021, and December 31, 2020. 4Q 3Q 2Q 1Q 4Q 2021 2021 2021 2021 2020 Software Platform 461 449 366 193 158 Enterprise Clients Revenue per SPEC $503 $398 $364 $453 $500 (thousands) Update to our Key Metrics Beginning with 2Q22, the revenue measurement period used to determine the number of SPECs in a period will be updated to include clients from whom we have collected greater than $125,000 in Software Platform revenue over the trailing 12 months. The current definition of SPEC included third-party clients who had more than $31,250 in Software Platform revenue for the prior three months. We believe this change in revenue measurement period will provide additional information regarding the scale and growth of our more-mature clients. Going forward, when Net Dollar-Based Revenue Retention (“NDBRR”) measures are provided, we will also calculate such measures using the updated definition of SPECs. The table below shows our SPEC and Revenue per SPEC for the last five quarters under the current calculations as well as the updated calculations. Revenue Revenue Revenue Final Disclosure 4Q 3Q 2Q 1Q 4Q Metric Measurement Composition Threshold Period 2021 2021 2021 2021 2020 Period SPEC $31,250 Quarter ended March 461 449 366 193 158 Current Software Annualized per Quarter 31, 2022 Platform Calculations Revenue Quarterly ($125,000 Quarter ended March Revenue $503 $398 $364 $453 $500 per SPEC per Year) 31, 2022 SPEC N/A 380 292 208 156 142 Updated Software Trailing Platform 12-Month $125,000 Calculations Revenue Revenue Basis N/A $1,634 $1,593 $1,581 $1,544 $1,404 per SPEC Monthly Active Payers (MAPs). We define a MAP as a unique mobile device active on one of our apps in a month that completed at least one IAP during that time period. A consumer who makes IAPs within two separate apps on the same mobile device in a monthly period will be counted as two MAPs. MAPs for a particular time period longer than one month are the average MAPs for each
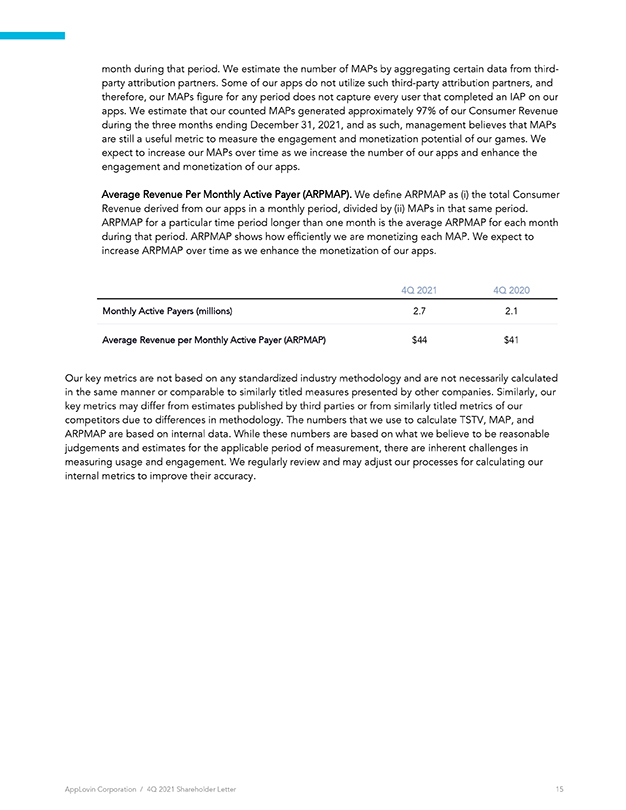
month during that period. We estimate the number of MAPs by aggregating certain data from third-party attribution partners. Some of our apps do not utilize such third-party attribution partners, and therefore, our MAPs figure for any period does not capture every user that completed an IAP on our apps. We estimate that our counted MAPs generated approximately 97% of our Consumer Revenue during the three months ending December 31, 2021, and as such, management believes that MAPs are still a useful metric to measure the engagement and monetization potential of our games. We expect to increase our MAPs over time as we increase the number of our apps and enhance the engagement and monetization of our apps. Average Revenue Per Monthly Active Payer (ARPMAP). We define ARPMAP as (i) the total Consumer Revenue derived from our apps in a monthly period, divided by (ii) MAPs in that same period. ARPMAP for a particular time period longer than one month is the average ARPMAP for each month during that period. ARPMAP shows how efficiently we are monetizing each MAP. We expect to increase ARPMAP over time as we enhance the monetization of our apps. 4Q 2021 4Q 2020 Monthly Active Payers (millions) 2.7 2.1 Average Revenue per Monthly Active Payer (ARPMAP) $44 $41 Our key metrics are not based on any standardized industry methodology and are not necessarily calculated in the same manner or comparable to similarly titled measures presented by other companies. Similarly, our key metrics may differ from estimates published by third parties or from similarly titled metrics of our competitors due to differences in methodology. The numbers that we use to calculate TSTV, MAP, and ARPMAP are based on internal data. While these numbers are based on what we believe to be reasonable judgements and estimates for the applicable period of measurement, there are inherent challenges in measuring usage and engagement. We regularly review and may adjust our processes for calculating our internal metrics to improve their accuracy.
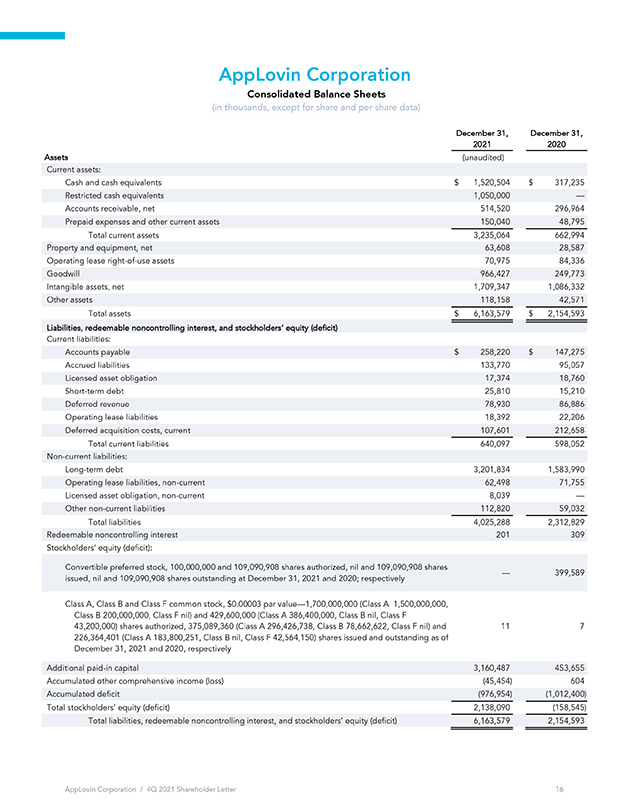
AppLovin Corporation Consolidated Balance Sheets (in thousands, except for share and per share data) December 31, December 31, 2021 2020 Assets (unaudited) Current assets: Cash and cash equivalents $ 1,520,504 $ 317,235 Restricted cash equivalents 1,050,000 — Accounts receivable, net 514,520 296,964 Prepaid expenses and other current assets 150,040 48,795 Total current assets 3,235,064 662,994 Property and equipment, net 63,608 28,587 Operating lease right-of-use assets 70,975 84,336 Goodwill 966,427 249,773 Intangible assets, net 1,709,347 1,086,332 Other assets 118,158 42,571 Total assets $ 6,163,579 $ 2,154,593 Liabilities, redeemable noncontrolling interest, and stockholders’ equity (deficit) Current liabilities: Accounts payable $ 258,220 $ 147,275 Accrued liabilities 133,770 95,057 Licensed asset obligation 17,374 18,760 Short-term debt 25,810 15,210 Deferred revenue 78,930 86,886 Operating lease liabilities 18,392 22,206 Deferred acquisition costs, current 107,601 212,658 Total current liabilities 640,097 598,052 Non-current liabilities: Long-term debt 3,201,834 1,583,990 Operating lease liabilities, non-current 62,498 71,755 Licensed asset obligation, non-current 8,039 — Other non-current liabilities 112,820 59,032 Total liabilities 4,025,288 2,312,829 Redeemable noncontrolling interest 201 309 Stockholders’ equity (deficit): Convertible preferred stock, 100,000,000 and 109,090,908 shares authorized, nil and 109,090,908 shares — 399,589 issued, nil and 109,090,908 shares outstanding at December 31, 2021 and 2020; respectively Class A, Class B and Class F common stock, $0.00003 par value—1,700,000,000 (Class A 1,500,000,000, Class B 200,000,000, Class F nil) and 429,600,000 (Class A 386,400,000, Class B nil, Class F 43,200,000) shares authorized, 375,089,360 (Class A 296,426,738, Class B 78,662,622, Class F nil) and 11 7 226,364,401 (Class A 183,800,251, Class B nil, Class F 42,564,150) shares issued and outstanding as of December 31, 2021 and 2020, respectively Additional paid-in capital 3,160,487 453,655 Accumulated other comprehensive income (loss) (45,454) 604 Accumulated deficit (976,954) (1,012,400) Total stockholders’ equity (deficit) 2,138,090 (158,545) Total liabilities, redeemable noncontrolling interest, and stockholders’ equity (deficit) 6,163,579 2,154,593
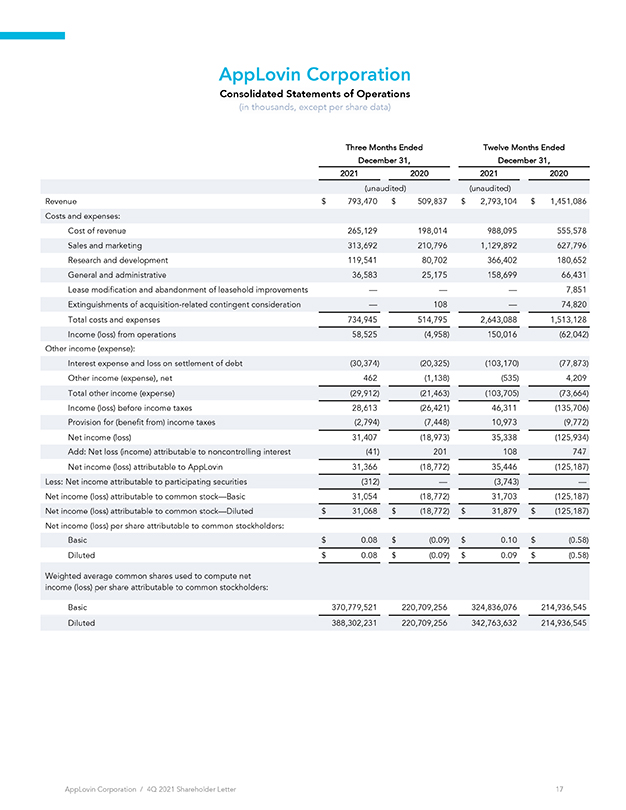
AppLovin Corporation Consolidated Statements of Operations (in thousands, except per share data) Three Months Ended Twelve Months Ended December 31, December 31, 2021 2020 2021 2020 (unaudited) (unaudited) Revenue $ 793,470 $ 509,837 $ 2,793,104 $ 1,451,086 Costs and expenses: Cost of revenue 265,129 198,014 988,095 555,578 Sales and marketing 313,692 210,796 1,129,892 627,796 Research and development 119,541 80,702 366,402 180,652 General and administrative 36,583 25,175 158,699 66,431 Lease modification and abandonment of leasehold improvements — — — 7,851 Extinguishments of acquisition-related contingent consideration — 108 — 74,820 Total costs and expenses 734,945 514,795 2,643,088 1,513,128 Income (loss) from operations 58,525 (4,958) 150,016 (62,042) Other income (expense): Interest expense and loss on settlement of debt (30,374) (20,325) (103,170) (77,873) Other income (expense), net 462 (1,138) (535) 4,209 Total other income (expense) (29,912) (21,463) (103,705) (73,664) Income (loss) before income taxes 28,613 (26,421) 46,311 (135,706) Provision for (benefit from) income taxes (2,794) (7,448) 10,973 (9,772) Net income (loss) 31,407 (18,973) 35,338 (125,934) Add: Net loss (income) attributable to noncontrolling interest (41) 201 108 747 Net income (loss) attributable to AppLovin 31,366 (18,772) 35,446 (125,187) Less: Net income attributable to participating securities (312) — (3,743) — Net income (loss) attributable to common stock—Basic 31,054 (18,772) 31,703 (125,187) Net income (loss) attributable to common stock—Diluted $ 31,068 $ (18,772) $ 31,879 $ (125,187) Net income (loss) per share attributable to common stockholders: Basic $ 0.08 $ (0.09) $ 0.10 $ (0.58) Diluted $ 0.08 $ (0.09) $ 0.09 $ (0.58) Weighted average common shares used to compute net income (loss) per share attributable to common stockholders: Basic 370,779,521 220,709,256 324,836,076 214,936,545 Diluted 388,302,231 220,709,256 342,763,632 214,936,545
AppLovin Corporation
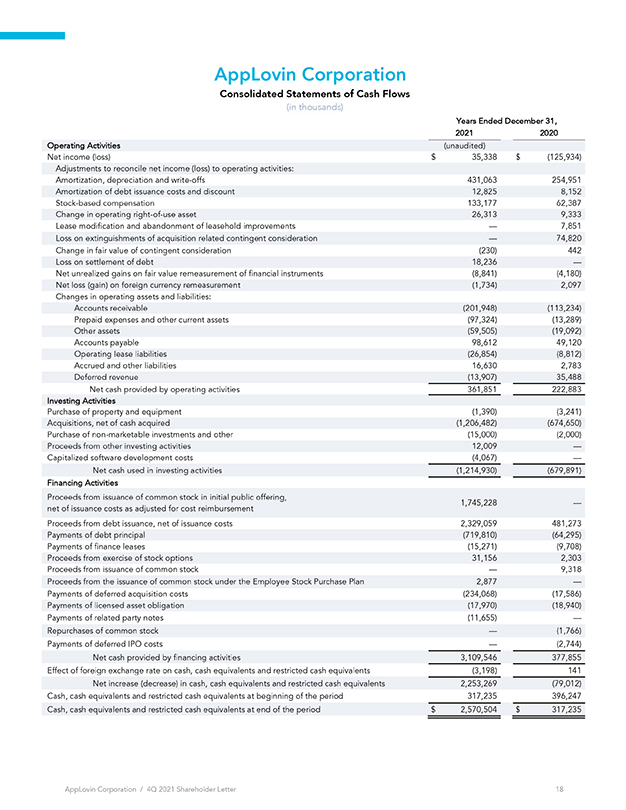
Consolidated Statements of Cash Flows
in thousands)
Years Ended December 31
2021
2020
Lunaudited
35,338
$ (125,934
431,063
12.825
133.177
26,313
254 951
B, 152
62 367
9333
7,851
74 820
442
1230
18.236
(8.841)
(1,734
(4.180
2,097
(113,234)
(13,289)
(19,092)
49,120
(201,948)
(97,324
(59,506
98.612
(26,854
16,630
(12.907)
361 851
9,812
2,783
35.488
Operating Activities
Net income loss)
Adjustments to reconcile net income to operating activities:
Amortization, depreciation and write-offs
Amortization of debt issuance costs and discount
Stock-based compensation
Change in operating right-of-use asset
Lease modification and abandonment of leasehold improvements
Loss on extinguishment of acquisition related contingent consideration
Change in fair value of contingent consideration
Lesson settlement of debt
Net unrealized gains en fair value remeasurement of financial instruments
Neto gain) on foreign currency remeasurement
Changes in operating assets and liabilities
Accounts receivable
Prepaid expenses and other current
Other
Accounts payable
Operating lease abilities
Accrued and other liabilities
Deferred revenue
Net cash provided by operating activities
Investing Activities
Purchase of property and equipment
Acquisition, not of cash acquired
Purchase of non-marketable investments and other
Proceeds from other investing activities
Capitalized software development coats
Netch used in investing activities
Financing Activities
Proceeds from issuance of common stock in initial public offering.
net of issuance costs as adjusted for cost reimbursement
Proceeds from debt issuance, net of issuance costs
Payment of debt principal
Payment of finance leaves
Proceeds from exercise of stock options
Proceeds from issuance of common stock
Proceeds from the issuance of common stock under the Employee Stock Purchase Plan
Payment of deferred acquisition coats
Payment of licensed set obligation
Payment of related party notes
Repurchases of common stock
Payments of deferred IPO costs
Net cash provided by financing activities
Effect of foreign exchange rate on cash, cash equivalents and restricted cash equivalents
Net increase (decrease in cas, cash equivalents and restricted cash equivalent
Cash, cash equivalent and restricted cash equivalents at beginning of the period
Cash, cash equivalents and restricted cash equivalents at end of the period
(1.390
(1.206,482)
(15,000
12.000
2.241)
1674,650
(2,000
(1.214,930)
1679,891)
1,745 228
2.329,059
(719,810
(15.271)
31,156
481,273
(54,295)
(9.700
2 303
9318
2.877
234,068)
(17,970
(11,655
(17,586)
(18,940)
3,109,546
1980
2.25229
317,
235
2.570.504
(1,766)
(2.744
377 855
141
(79,012)
396,
247
317 225
$
$
AppLovin Corporation
Reconciliation of Net Income (Loss) to Adjusted EBITDA
(in thousands)
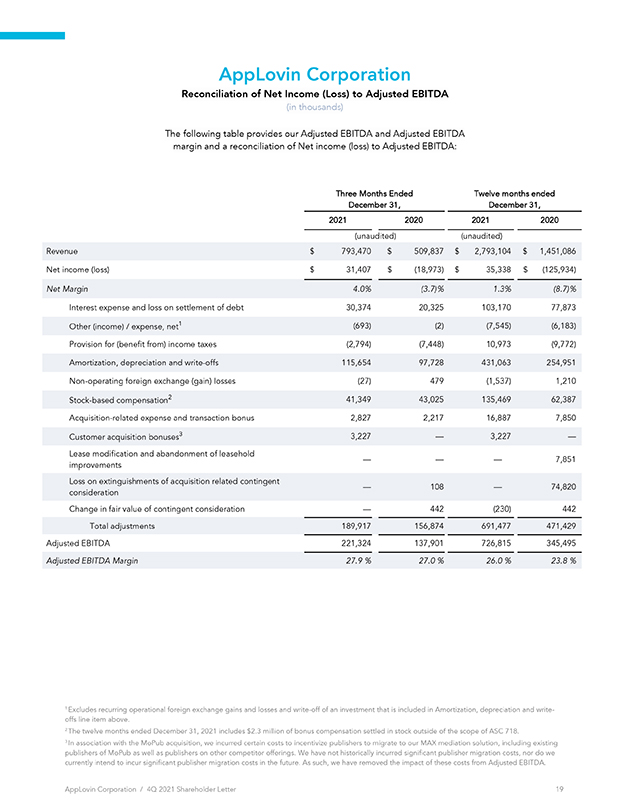
The following table provides our Adjusted EBITDA and Adjusted EBITDA margin and a reconciliation of Net income (loss) to Adjusted EBITDA:
Three Months Ended Twelve months ended December 31, December 31, 2021 2020 2021 2020 (unaudited) (unaudited) Revenue $ 793,470 $ 509,837 $ 2,793,104 $ 1,451,086 Net income (loss) $ 31,407 $ (18,973) $ 35,338 $ (125,934)
Net Margin 4.0% (3.7)% 1.3% (8.7)%
Interest expense and loss on settlement of debt 30,374 20,325 103,170 77,873 Other (income) / expense, net1 (693) (2) (7,545) (6,183) Provision for (benefit from) income taxes (2,794) (7,448) 10,973 (9,772) Amortization, depreciation and write-offs 115,654 97,728 431,063 254,951 Non-operating foreign exchange (gain) losses (27) 479 (1,537) 1,210 Stock-based compensation2 41,349 43,025 135,469 62,387 Acquisition-related expense and transaction bonus 2,827 2,217 16,887 7,850 Customer acquisition bonuses3 3,227 — 3,227 — Lease modification and abandonment of leasehold
— — — 7,851 improvements Loss on extinguishments of acquisition related contingent
— 108 — 74,820 consideration Change in fair value of contingent consideration — 442 (230) 442 Total adjustments 189,917 156,874 691,477 471,429 Adjusted EBITDA 221,324 137,901 726,815 345,495
Adjusted EBITDA Margin 27.9 % 27.0 % 26.0 % 23.8 %
1 Excludes recurring operational foreign exchange gains and losses and write-off of an investment that is included in Amortization, depreciation and write-offs line item above.
2 The twelve months ended December 31, 2021 includes $2.3 million of bonus compensation settled in stock outside of the scope of ASC 718.
3 In association with the MoPub acquisition, we incurred certain costs to incentivize publishers to migrate to our MAX mediation solution, including existing publishers of MoPub as well as publishers on other competitor offerings. We have not historically incurred significant publisher migration costs, nor do we currently intend to incur significant publisher migration costs in the future. As such, we have removed the impact of these costs from Adjusted EBITDA.
AppLovin Corporation / 4Q 2021 Shareholder Letter 19
AppLovin Corporation
Reconciliation of GAAP to Non-GAAP Financial Measures
($ in millions)
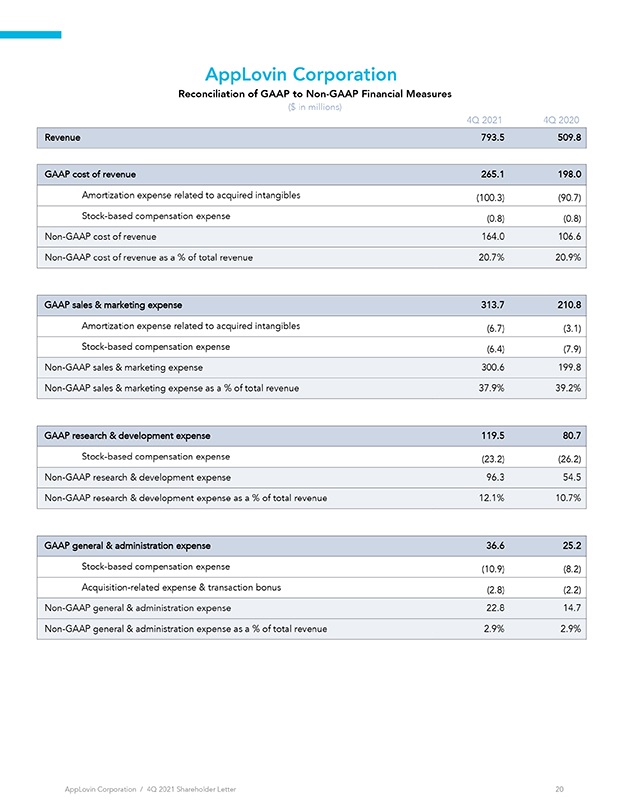
4Q 2021 4Q 2020
Revenue 793.5 509.8
GAAP cost of revenue 265.1 198.0
Amortization expense related to acquired intangibles (100.3) (90.7) Stock-based compensation expense (0.8) (0.8) Non-GAAP cost of revenue 164.0 106.6 Non-GAAP cost of revenue as a % of total revenue 20.7% 20.9%
GAAP sales & marketing expense 313.7 210.8
Amortization expense related to acquired intangibles (6.7) (3.1) Stock-based compensation expense (6.4) (7.9) Non-GAAP sales & marketing expense 300.6 199.8 Non-GAAP sales & marketing expense as a % of total revenue 37.9% 39.2%
GAAP research & development expense 119.5 80.7
Stock-based compensation expense (23.2) (26.2) Non-GAAP research & development expense 96.3 54.5 Non-GAAP research & development expense as a % of total revenue 12.1% 10.7%
GAAP general & administration expense 36.6 25.2
Stock-based compensation expense (10.9) (8.2) Acquisition-related expense & transaction bonus (2.8) (2.2) Non-GAAP general & administration expense 22.8 14.7 Non-GAAP general & administration expense as a % of total revenue 2.9% 2.9%
AppLovin Corporation / 4Q 2021 Shareholder Letter 20