UNITED STATES
SECURITIES AND EXCHANGE COMMISSION
Washington, D.C. 20549
FORM N-CSR
Certified Shareholder Report of
Registered Management Investment Companies
Investment Company Act File Number: 811-23409
American Funds Multi-Sector Income Fund
(Exact Name of Registrant as Specified in Charter)
6455 Irvine Center Drive
Irvine, California 92618
(Address of Principal Executive Offices)
Registrant's telephone number, including area code: (949) 975-5000
Date of fiscal year end: December 31
Date of reporting period: December 31, 2020
Brian C. Janssen
American Funds Multi-Sector Income Fund
6455 Irvine Center Drive
Irvine, California 92618
(Name and Address of Agent for Service)
ITEM 1 – Reports to Stockholders
| American Funds Multi-Sector Income FundSM |  |
| Annual report for the year ended December 31, 2020 |

Pursuing
consistent and
diversified income
American Funds Multi-Sector Income Fund seeks to provide a high level of current income. Its secondary investment objective is capital appreciation.
This fund is one of more than 40 offered by Capital Group, home of American Funds, one of the nation’s largest mutual fund families. For nearly 90 years, Capital Group has invested with a long-term focus based on thorough research and attention to risk.
Fund results shown in this report, unless otherwise indicated, are for Class A shares at net asset value. If a sales charge (maximum 3.75%) had been deducted, the results would have been lower. Results are for past periods and are not predictive of results for future periods. Current and future results may be lower or higher than those shown. Share prices and returns will vary, so investors may lose money. Investing for short periods makes losses more likely. For current information and month-end results, visit capitalgroup.com.
See page 3 for Class A share results with relevant sales charges deducted. For other share class results visit capitalgroup.com and americanfundsretirement.com
Investment results assume all distributions are reinvested and reflect applicable fees and expenses. When applicable, investment results reflect fee waivers, without which results would have been lower. The investment adviser is currently reimbursing a portion of the other expenses. This reimbursement will be in effect through at least March 1, 2022. The adviser may elect at its discretion to extend, modify or terminate the reimbursement at that time. Visit capitalgroup.com for more information.
The fund’s 30-day yield for Class A shares as of January 31, 2021, reflecting the 3.75% maximum sales charge and calculated in accordance with the U.S. Securities and Exchange Commission formula, was 2.95% (2.89% without the reimbursement).
Investing outside the United States may be subject to risks, such as currency fluctuations, periods of illiquidity and price volatility. These risks may be heightened in connection with investments in developing countries. The return of principal for bond funds and for funds with significant underlying bond holdings is not guaranteed. Fund shares are subject to the same interest rate, inflation and credit risks associated with the underlying bond holdings. Investments in mortgage-related securities involve additional risks, such as prepayment risk, as more fully described in the prospectus. Lower rated bonds are subject to greater fluctuations in value and risk of loss of income and principal than higher rated bonds. The use of derivatives involves a variety of risks, which may be different from, or greater than, the risks associated with investing in traditional cash securities, such as stocks and bonds. Refer to the fund prospectus and the Risk Factors section of this report for more information on risks associated with investing in the fund.
Investments are not FDIC-insured, nor are they deposits of or guaranteed by a bank or any other entity, so they may lose value.
Contents
| 1 | Letter to investors |
| 3 | The value of a $10,000 investment |
| 4 | Investment portfolio |
| 25 | Financial statements |
| 50 | Board of trustees and other officers |
Fellow investors:
Credit markets experienced significant declines and volatility due to the coronavirus pandemic before unprecedented monetary and fiscal stimulus helped support markets. For the year ended December 31, 2020, American Funds Multi-Sector Income Fund generated a total return of 11.07%.
The return assumes reinvestment of monthly dividends of 43 cents a share during the period. Shareholders who reinvested dividends earned an income return of 4.34%, while those who elected to take their dividends in cash received an income return of 4.26%.
By way of comparison, the unmanaged Bloomberg Barclays U.S. Aggregate Index recorded a return of 7.51% over the same period. This index measures broad returns across U.S. dollar-denominated investment-grade bonds.
The American Funds Multi-Sector Income Fund provides diversification across income sectors including high-yield corporates, investment-grade corporates, emerging market debt, and securitized debt. The fund also has opportunistic investments in U.S. Treasuries, municipal bonds, and other debt instruments.
The Multi-Sector Income Fund Custom Index provides a secondary benchmark for investors to compare fund results to account for exposure to these four primary credit sectors. The custom index notched gains of 7.48% for the year. The fund’s peer group, as measured by the Morningstar Multisector Bond Category, was up 4.84% over the same period.
At year-end, the fund’s corporate holdings, representing 62.9% of the portfolio (49.2% high-yield corporates, and 13.7% investment-grade corporates) were invested across a variety of industries. The fund’s emerging market holdings represented 14.9% of the portfolio, while the fund’s exposure to securitized credit was 13.1%. Roughly 7.7% of the portfolio was invested in cash and equivalents.
Market overview
After sharp declines during March 2020, credit markets rebounded as fiscal stimulus, accommodative central bank policies, and advances in COVID-19 vaccines dramatically improved the outlook.
The U.S. Federal Reserve cut federal fund rates by a total of 150 basis points
Results at a glance
For periods ended December 31, 2020, with all distributions reinvested
| Cumulative total returns | Average annual total returns | |||||||||||
| 6 months | 1 year | Lifetime (since 3/22/19) | ||||||||||
| American Funds Multi-Sector Income Fund (Class A shares) | 9.25 | % | 11.07 | % | 10.64 | % | ||||||
| Bloomberg Barclays U.S. Aggregate Index* | 1.29 | 7.51 | 7.60 | |||||||||
| American Funds Multi-Sector Income Fund Custom Index† | 8.58 | 7.48 | 8.58 | |||||||||
| * | Source: Bloomberg Index Services Ltd. The market index is unmanaged and, therefore, has no expenses. Investors cannot invest directly in an index. |
| † | Multi-Sector Income Fund Custom Index: 45% Bloomberg Barclays US Corporate High Yield 2% Issuer Capped Index, 30% Bloomberg Barclays U.S. Corporate Investment Grade Index, 15% J.P. Morgan EMBI Global Diversified Index, 8% Bloomberg Barclays CMBS Ex AAA Index, and 2% Bloomberg Barclays ABS Ex AAA Index. |
| American Funds Multi-Sector Income Fund | 1 |
to near-zero and launched a number of programs to help support the market including large-scale purchases of government-backed bonds. And for the first time in its history, the Fed bought corporate bonds including those rated high yield. The yield on the benchmark 10-year Treasury note fell over the course of the year 100 bps to settle at 0.92%.
Central banks worldwide also responded decisively, with the European Central Bank steadily expanding its asset purchase program beginning in March. As dovish monetary policy took hold, negative-yielding debt grew to roughly $18 trillion worldwide versus $11 trillion in January.
With rates at or near record lows globally, investors sought higher yielding assets. This demand for yield was met by a tidal wave of companies across the ratings spectrum issuing debt to provide liquidity during the pandemic’s economic disruption. Corporate bonds produced strong results for the year with those rated investment-grade up 9.89% while high-yield corporate gained 7.05%. Securitized debt notched returns of 4.51% and emerging markets posted a 5.88% gain.
While financial markets have largely bounced back, economic data around unemployment and consumer spending was weak and uneven as surges in COVID-19 cases and renewed lockdown measures limited recovery prospects. Despite near-term headwinds, the approvals of vaccines, the outcome of the U.S. presidential and congressional elections, and passage of another stimulus measure in the U.S. buoyed risk assets.
Inside the portfolio
The fund entered 2020 with a defensively positioned portfolio. Managers believed credit was overpriced and vulnerable to price declines given the outlook for sluggish economic growth. As concerns about a pandemic increased in January and February, managers took additional steps to preserve capital by further reducing exposure to the high-yield and emerging market sectors in favor of more investment-grade exposure, including U.S. Treasuries, municipal credit, and cash.
As the pandemic picked up speed in March, credit repriced sharply lower. Lower rated sectors and countries, as well as industries most impacted by economic shutdowns, saw the biggest price declines.
We used record new issuance volumes in the investment-grade and high-yield sectors to buy many corporate bonds at deeply discounted prices.
The fund’s portfolio managers, relying on extensive fundamental research and a long-term horizon, viewed these declines in credit prices as attractive investment opportunities. Beginning in March, managers began to significantly increase exposure to higher yielding credit sectors, industries, and countries. We used record new issuance volumes in the investment-grade and high-yield sectors to buy many corporate bonds at deeply discounted prices. Managers also increased exposure to emerging markets, and securitized credit, where valuations had improved enough to justify the increased risks from the pandemic and deep recession.
As valuations recovered throughout the year, managers began to gradually and selectively reduce exposure to riskier credits, moving the fund into a more balanced and diversified position.
Important contributors to the fund’s results during 2020 included high-yield pharmaceuticals, telecom, gaming, cruise lines, investment-grade technology, and emerging market commodity companies.
Looking ahead
COVID-19 vaccines will likely play a central role in the path to economic recovery. While economic activity will likely remain subdued in the near-term, an eventual vaccine-fueled rebound could mean strong growth for the economy given pent-up demand.
We expect central bank policy to remain broadly accommodative, and for fiscal stimulus to provide additional support to the economy. Credit valuations, especially for investment-grade corporate debt, have recovered dramatically, and are tempering our appetite for risk-taking.
We continually monitor economic trends, credit fundamentals and valuations, and will adjust the fund’s positioning as the landscape changes. We have relied on our deep, fundamental research capabilities and experience through many different credit cycles to help us find the right balance between risk and reward.
Thank you for making American Funds Multi-Sector Income Fund part of your portfolio. We appreciate your support and look forward to reporting to you again in six months.
Sincerely,

Damien J. McCann
President
February 16, 2021
For current information about the fund, visit capitalgroup.com.
| 2 | American Funds Multi-Sector Income Fund |
The value of a $10,000 investment
How a hypothetical $10,000 investment has fared for the period March 22, 2019, commencement of operations, to December 31, 2020, with all distributions reinvested.
Fund results shown are for Class A shares and reflect deduction of the maximum sales charge of 3.75% on the $10,000 investment.1 Thus, the net amount invested was $9,625. Investing for short periods makes losses more likely.
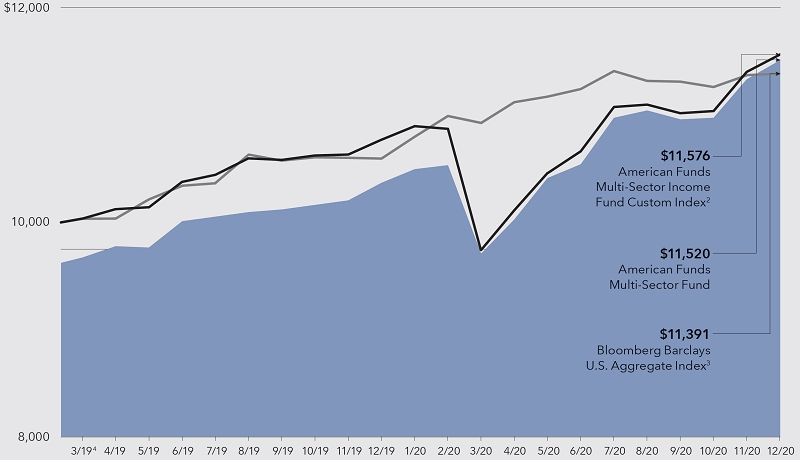
Past results are not predictive of results for future periods. The results shown are before taxes on fund distributions and sale of fund shares.
| 1 | As outlined in the prospectus, the sales charge is reduced for accounts (and aggregated investments) of $100,000 or more and is eliminated for purchases of $1 million or more. There is no sales charge on dividends or capital gain distributions that are invested in additional shares. |
| 2 | The American Funds Multi-Sector Income Fund Custom Index is composed of 45% Bloomberg Barclays US Corporate High Yield 2% Issuer Capped Index, 30% Bloomberg Barclays US Corporate Investment Grade Index, 15% JP Morgan EMBI Global Diversified, 8% Bloomberg Barclays US CMBS ex AAA Index, and 2% Bloomberg Barclays ABS ex AAA Index. The indexes are unmanaged and, therefore, have no expenses. Investors cannot invest directly in an index. Index is rebalanced monthly. |
| 3 | Source: Bloomberg Index Services Ltd. Bloomberg Barclays U.S. Aggregate Index represents the U.S. investment-grade fixed-rate bond market. The index is unmanaged and, therefore, has no expenses. Investors cannot invest directly in an index. |
| 4 | For the period March 22, 2019, commencement of operations, through December 31, 2020. |
Total return based on a $1,000 investment (for the period ended December 31, 2020)*
| Lifetime (since 3/22/2019) | ||||
| Class A shares | 8.28 | % | ||
| * | Assumes reinvestment of all distributions and payment of the maximum 3.75% sales charge. |
The fund’s gross expense ratio for Class A shares is 1.13%, and the net expense ratio is 0.90% as of the prospectus dated March 1, 2021 (unaudited). The expense ratio is restated to reflect current fees.
Investment results assume all distributions are reinvested and reflect applicable fees and expenses. When applicable, investment results reflect fee waivers, without which results would have been lower. The investment adviser is currently reimbursing a portion of the other expenses. This reimbursement will be in effect through at least March 1, 2022. The adviser may elect at its discretion to extend, modify or terminate the reimbursement at that time. Visit capitalgroup.com for more information.
Although the fund has plans of distribution for Class A shares, fees for distribution services are not paid by the fund on amounts invested in the fund by the fund’s investment adviser. Because fees for distribution services were not charged on these assets, total returns were higher. See the “Plans of distribution” section of the prospectus for information on the distribution service fees permitted to be charged by the fund.
| American Funds Multi-Sector Income Fund | 3 |
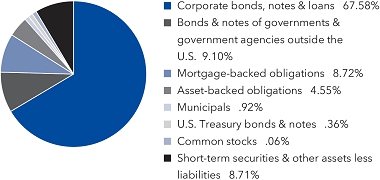
Investment portfolio December 31, 2020
| Portfolio by type of security | Percent of net assets |
| Portfolio quality summary* | Percent of net assets | |||
| U.S. Treasury and agency† | .36 | % | ||
| AAA/Aaa | 3.97 | |||
| AA/Aa | 4.73 | |||
| A/A | 6.75 | |||
| BBB/Baa | 17.55 | |||
| Below investment grade | 57.86 | |||
| Unrated | .07 | |||
| Short-term securities & other assets less liabilities | 8.71 | |||
| * | Bond ratings, which typically range from AAA/Aaa (highest) to D (lowest), are assigned by credit rating agencies such as Standard & Poor’s, Moody’s and/or Fitch as an indication of an issuer’s creditworthiness. In assigning a credit rating to a security, the fund looks specifically to the ratings assigned to the issuer of the security by Standard & Poor’s, Moody’s and/or Fitch. If agency ratings differ, the security will be considered to have received the highest of those ratings, consistent with the fund’s investment policies. Securities in the “unrated” category (above) have not been rated by a rating agency; however, the investment adviser performs its own credit analysis and assigns comparable ratings that are used for compliance with the fund’s investment policies. The ratings are not covered by the Report of Independent Registered Public Accounting Firm. |
| † | These securities are guaranteed by the full faith and credit of the U.S. government. |
| Bonds, notes & other debt instruments 91.23% | Principal amount (000) | Value (000) | ||||||
| Corporate bonds, notes & loans 67.58% | ||||||||
| Energy 9.91% | ||||||||
| Apache Corp. 4.625% 2025 | $ | 985 | $ | 1,035 | ||||
| Apache Corp. 4.875% 2027 | 110 | 117 | ||||||
| Apache Corp. 6.00% 2037 | 55 | 61 | ||||||
| Apache Corp. 4.75% 2043 | 65 | 68 | ||||||
| Apache Corp. 5.35% 2049 | 50 | 51 | ||||||
| Ascent Resources - Utica LLC 7.00% 20261 | 50 | 48 | ||||||
| Ascent Resources - Utica LLC 8.25% 20281 | 492 | 492 | ||||||
| Baker Hughes, a GE Co. 4.486% 2030 | 51 | 61 | ||||||
| Baker Hughes, a GE Co. 3.138% 2029 | 350 | 385 | ||||||
| Baker Hughes, a GE Co. 4.08% 2047 | 13 | 15 | ||||||
| Blue Racer Midstream LLC and Blue Racer Finance Corp. 7.625% 20251 | 1,001 | 1,069 | ||||||
| BP Capital Markets America Inc. 3.633% 2030 | 50 | 58 | ||||||
| BP Capital Markets America Inc. 2.939% 2051 | 30 | 31 | ||||||
| Canadian Natural Resources Ltd. 3.85% 2027 | 70 | 79 | ||||||
| Canadian Natural Resources Ltd. 2.95% 2030 | 697 | 746 | ||||||
| Canadian Natural Resources Ltd. 4.95% 2047 | 75 | 95 | ||||||
| Carrizo Oil & Gas Inc. 6.25% 2023 | 60 | 38 | ||||||
| Cenovus Energy Inc. 5.375% 2025 | 410 | 463 | ||||||
| Centennial Resource Production, LLC 6.875% 20271 | 30 | 22 | ||||||
| Cheniere Energy Partners, LP 5.25% 2025 | 255 | 262 | ||||||
| Cheniere Energy Partners, LP 4.50% 2029 | 427 | 452 | ||||||
| Cheniere Energy, Inc. 4.625% 20281 | 955 | 1,004 | ||||||
| Cheniere Energy, Inc. 3.70% 2029 | 175 | 195 | ||||||
| Chesapeake Energy Corp. 11.50% 20251,2 | 21 | 4 | ||||||
| Chevron Corp. 2.978% 2040 | 12 | 13 | ||||||
| 4 | American Funds Multi-Sector Income Fund |
| Bonds, notes & other debt instruments (continued) | Principal amount (000) | Value (000) | ||||||
| Corporate bonds, notes & loans (continued) | ||||||||
| Energy (continued) | ||||||||
| Chevron USA Inc. 1.018% 2027 | $ | 50 | $ | 50 | ||||
| CITGO Petroleum Corp. 7.00% 20251 | 1,400 | 1,399 | ||||||
| CNX Resources Corp. 7.25% 20271 | 1,625 | 1,741 | ||||||
| CNX Resources Corp. 6.00% 20291 | 80 | 82 | ||||||
| Comstock Resources, Inc. 9.75% 2026 | 640 | 687 | ||||||
| Comstock Resources, Inc. 9.75% 2026 | 425 | 456 | ||||||
| Concho Resources Inc. 4.30% 2028 | 40 | 47 | ||||||
| Concho Resources Inc. 2.40% 2031 | 5 | 5 | ||||||
| DCP Midstream Operating LP 5.375% 2025 | 150 | 165 | ||||||
| DCP Midstream Operating LP 5.625% 2027 | 750 | 833 | ||||||
| Diamond Offshore Drilling, Inc. 7.875% 20252 | 15 | 2 | ||||||
| Diamondback Energy, Inc. 4.75% 2025 | 450 | 507 | ||||||
| Ecopetrol SA 6.875% 2030 | 200 | 259 | ||||||
| Enbridge Energy Partners, LP 7.375% 2045 | 18 | 28 | ||||||
| Endeavor Energy Resources, LP 6.625% 20251 | 785 | 841 | ||||||
| Energy Transfer Operating, LP 5.00% 2050 | 188 | 204 | ||||||
| Energy Transfer Partners, LP 6.125% 2045 | 20 | 24 | ||||||
| Energy Transfer Partners, LP 5.30% 2047 | 175 | 195 | ||||||
| Energy Transfer Partners, LP 6.00% 2048 | 680 | 809 | ||||||
| Energy Transfer Partners, LP 6.25% 2049 | 410 | 496 | ||||||
| Enterprise Products Operating LLC 2.80% 2030 | 188 | 204 | ||||||
| Enterprise Products Operating LLC 3.20% 2052 | 607 | 619 | ||||||
| EOG Resources, Inc. 4.375% 2030 | 14 | 17 | ||||||
| EOG Resources, Inc. 4.95% 2050 | 47 | 64 | ||||||
| EQM Midstream Partners, LP 6.00% 20251 | 550 | 603 | ||||||
| EQM Midstream Partners, LP 6.50% 20271 | 590 | 665 | ||||||
| EQT Corp. 7.875% 2025 | 80 | 91 | ||||||
| EQT Corp. 5.00% 2029 | 1,130 | 1,194 | ||||||
| Exxon Mobil Corp. 3.452% 2051 | 14 | 16 | ||||||
| Genesis Energy, LP 8.00% 2027 | 1,232 | 1,229 | ||||||
| Gray Oak Pipeline, LLC 2.60% 20251 | 606 | 625 | ||||||
| Harvest Midstream I, LP 7.50% 20281 | 1,575 | 1,679 | ||||||
| Kinder Morgan, Inc. 2.00% 2031 | 1,300 | 1,315 | ||||||
| Kinder Morgan, Inc. 5.20% 2048 | 15 | 19 | ||||||
| Kinder Morgan, Inc. 3.25% 2050 | 669 | 673 | ||||||
| Leviathan Bond Ltd. 5.75% 20231 | 245 | 262 | ||||||
| Leviathan Bond Ltd. 6.75% 20301 | 520 | 594 | ||||||
| Magellan Midstream Partners, LP 3.95% 2050 | 1,000 | 1,129 | ||||||
| Magnolia Oil & Gas Operating LLC 6.00% 20261 | 400 | 409 | ||||||
| MPLX LP 1.75% 2026 | 831 | 860 | ||||||
| MPLX LP 2.65% 2030 | 889 | 933 | ||||||
| MPLX LP 5.50% 2049 | 32 | 42 | ||||||
| MV24 Capital BV 6.748% 2034 | 1,732 | 1,901 | ||||||
| Nabors Industries Inc. 5.75% 2025 | 15 | 8 | ||||||
| New Fortress Energy Inc. 6.75% 20251 | 10 | 11 | ||||||
| NGL Energy Partners LP 7.50% 2023 | 149 | 106 | ||||||
| Northriver Midstream Finance LP 5.625% 20261 | 1,250 | 1,293 | ||||||
| NuStar Logistics, LP 5.75% 2025 | 700 | 747 | ||||||
| NuStar Logistics, LP 6.00% 2026 | 225 | 244 | ||||||
| Occidental Petroleum Corp. 2.70% 2023 | 16 | 16 | ||||||
| Occidental Petroleum Corp. 2.90% 2024 | 210 | 202 | ||||||
| Occidental Petroleum Corp. 5.875% 2025 | 1,625 | 1,733 | ||||||
| Occidental Petroleum Corp. 8.00% 2025 | 40 | 46 | ||||||
| Occidental Petroleum Corp. 3.20% 2026 | 16 | 15 | ||||||
| Occidental Petroleum Corp. 3.50% 2029 | 50 | 46 | ||||||
| Occidental Petroleum Corp. 6.625% 2030 | 155 | 169 | ||||||
| Occidental Petroleum Corp. 6.125% 2031 | 1,070 | 1,148 | ||||||
| Oleoducto Central SA 4.00% 20271 | 200 | 217 | ||||||
| ONEOK, Inc. 2.20% 2025 | 18 | 19 | ||||||
| ONEOK, Inc. 5.85% 2026 | 190 | 228 | ||||||
| ONEOK, Inc. 4.00% 2027 | 59 | 66 | ||||||
| ONEOK, Inc. 4.55% 2028 | 20 | 23 | ||||||
| ONEOK, Inc. 4.35% 2029 | 35 | 40 | ||||||
| ONEOK, Inc. 3.10% 2030 | 452 | 482 | ||||||
| ONEOK, Inc. 6.35% 2031 | 715 | 918 | ||||||
| ONEOK, Inc. 5.20% 2048 | 3 | 4 | ||||||
| ONEOK, Inc. 4.50% 2050 | 11 | 12 | ||||||
| American Funds Multi-Sector Income Fund | 5 |
| Bonds, notes & other debt instruments (continued) | Principal amount (000) | Value (000) | ||||||
| Corporate bonds, notes & loans (continued) | ||||||||
| Energy (continued) | ||||||||
| ONEOK, Inc. 7.15% 2051 | $ | 36 | $ | 50 | ||||
| Petrobras Global Finance Co. 5.60% 2031 | 1,270 | 1,462 | ||||||
| Petrobras Global Finance Co. 6.75% 2050 | 1,060 | 1,318 | ||||||
| Petróleos Mexicanos 6.875% 20251 | 1,730 | 1,899 | ||||||
| Petróleos Mexicanos 6.875% 2026 | 120 | 131 | ||||||
| Petróleos Mexicanos 6.49% 2027 | 940 | 994 | ||||||
| Petróleos Mexicanos 5.625% 2046 | 127 | 109 | ||||||
| Petróleos Mexicanos 7.69% 2050 | 46 | 46 | ||||||
| Phillips 66 3.90% 2028 | 45 | 52 | ||||||
| Phillips 66 2.15% 2030 | 9 | 9 | ||||||
| Pioneer Natural Resources Company 1.90% 2030 | 1,447 | 1,434 | ||||||
| Plains All American Pipeline, LP 3.80% 2030 | 179 | 193 | ||||||
| PTT Exploration and Production PCL 2.587% 20271 | 400 | 418 | ||||||
| QEP Resources, Inc. 5.625% 2026 | 60 | 66 | ||||||
| Range Resources Corp. 4.875% 2025 | 40 | 38 | ||||||
| Range Resources Corp. 9.25% 2026 | 300 | 314 | ||||||
| Rattler Midstream Partners LP 5.625% 20251 | 350 | 370 | ||||||
| Sabine Pass Liquefaction, LLC 4.50% 20301 | 94 | 112 | ||||||
| Sanchez Energy Corp. 7.25% 20231,2 | 27 | — | 3 | |||||
| Shell International Finance BV 3.25% 2050 | 27 | 31 | ||||||
| SM Energy Co. 6.625% 2027 | 85 | 68 | ||||||
| Southwestern Energy Co. 6.45% 20254 | 1,075 | 1,117 | ||||||
| Southwestern Energy Co. 7.50% 2026 | 350 | 368 | ||||||
| Southwestern Energy Co. 8.375% 2028 | 200 | 217 | ||||||
| Sunoco LP 6.00% 2027 | 215 | 229 | ||||||
| Sunoco LP 4.50% 20291 | 1,775 | 1,849 | ||||||
| Tallgrass Energy Partners, LP 7.50% 20251 | 355 | 384 | ||||||
| Targa Resources Partners LP 6.50% 2027 | 515 | 560 | ||||||
| Targa Resources Partners LP 6.875% 2029 | 15 | 17 | ||||||
| Targa Resources Partners LP 5.50% 2030 | 655 | 712 | ||||||
| Targa Resources Partners LP 4.875% 20311 | 220 | 239 | ||||||
| Teekay Corp. 9.25% 20221 | 80 | 82 | ||||||
| Total Capital International 3.127% 2050 | 36 | 39 | ||||||
| TransCanada PipeLines Ltd. 4.10% 2030 | 38 | 45 | ||||||
| Transocean Guardian Ltd. 5.875% 20241 | 109 | 92 | ||||||
| Transocean Inc. 6.125% 20251 | 225 | 214 | ||||||
| Transocean Poseidon Ltd. 6.875% 20271 | 247 | 225 | ||||||
| Western Gas Partners LP 5.45% 2044 | 30 | 30 | ||||||
| Western Midstream Operating, LP 4.10% 20254 | 210 | 217 | ||||||
| Western Midstream Operating, LP 4.75% 2028 | 75 | 78 | ||||||
| Western Midstream Operating, LP 4.05% 2030 | 22 | 25 | ||||||
| Western Midstream Operating, LP 5.25% 2050 | 200 | 220 | ||||||
| Williams Companies, Inc. 3.50% 2030 | 257 | 291 | ||||||
| Williams Partners LP 3.90% 2025 | 5 | 6 | ||||||
| Williams Partners LP 6.30% 2040 | 8 | 11 | ||||||
| Williams Partners LP 5.10% 2045 | 6 | 7 | ||||||
| 55,018 | ||||||||
| Consumer discretionary 9.72% | ||||||||
| 99 Escrow Issuer, Inc. 7.50% 20261 | 2,945 | 2,934 | ||||||
| Affinity Gaming 6.875% 20271 | 1,050 | 1,101 | ||||||
| Allied Universal Holdco LLC 6.625% 20261 | 900 | 961 | ||||||
| Allied Universal Holdco LLC 9.75% 20271 | 680 | 742 | ||||||
| Amazon.com, Inc. 2.70% 2060 | 55 | 59 | ||||||
| American Honda Finance Corp. 1.00% 2025 | 80 | 81 | ||||||
| Bayerische Motoren Werke AG 2.95% 20221 | 200 | 207 | ||||||
| Booking Holdings Inc. 4.625% 2030 | 510 | 634 | ||||||
| Boyd Gaming Corp. 8.625% 20251 | 500 | 557 | ||||||
| Boyd Gaming Corp. 4.75% 2027 | 790 | 822 | ||||||
| Caesars Entertainment, Inc. 6.25% 20251 | 715 | 762 | ||||||
| Caesars Resort Collection, LLC 5.75% 20251 | 690 | 732 | ||||||
| Carnival Corp. 7.625% 20261 | 1,000 | 1,091 | ||||||
| Carnival Corp. 10.50% 20261 | 850 | 991 | ||||||
| Cedar Fair LP/Canadas Wonderland Co/Magnum Management Corp/Millennium Operations LLC 5.50% 20251 | 115 | 120 | ||||||
| Cedar Fair, LP 6.50% 20281 | 1,170 | 1,271 | ||||||
| Cedar Fair, LP 5.25% 2029 | 260 | 268 | ||||||
| 6 | American Funds Multi-Sector Income Fund |
| Bonds, notes & other debt instruments (continued) | Principal amount (000) | Value (000) | ||||||
| Corporate bonds, notes & loans (continued) | ||||||||
| Consumer discretionary (continued) | ||||||||
| Churchill Downs Inc. 4.75% 20281 | $ | 120 | $ | 127 | ||||
| Cirsa Gaming Corp. SA 7.875% 20231 | 410 | 414 | ||||||
| Clarios Global LP 6.75% 20251 | 200 | 216 | ||||||
| Dana Inc. 5.625% 2028 | 385 | 415 | ||||||
| Fertitta Entertainment, Inc. 6.75% 20241 | 405 | 403 | ||||||
| Fertitta Entertainment, Inc. 8.75% 20251 | 500 | 518 | ||||||
| Ford Motor Co. 8.50% 2023 | 130 | 147 | ||||||
| Ford Motor Co. 9.00% 2025 | 66 | 81 | ||||||
| Ford Motor Credit Co. 3.81% 2024 | 200 | 205 | ||||||
| Ford Motor Credit Co. 5.584% 2024 | 225 | 243 | ||||||
| Ford Motor Credit Co. 5.125% 2025 | 605 | 659 | ||||||
| Ford Motor Credit Co. 4.125% 2027 | 460 | 482 | ||||||
| Ford Motor Credit Co. 5.113% 2029 | 200 | 223 | ||||||
| Ford Motor Credit Co. 4.00% 2030 | 3,095 | 3,260 | ||||||
| General Motors Financial Co. 5.20% 2023 | 229 | 251 | ||||||
| Hanesbrands Inc. 5.375% 20251 | 15 | 16 | ||||||
| Hanesbrands Inc. 4.875% 20261 | 445 | 484 | ||||||
| Hilton Worldwide Holdings Inc. 5.75% 20281 | 500 | 545 | ||||||
| Hilton Worldwide Holdings Inc. 4.875% 2030 | 20 | 22 | ||||||
| Hilton Worldwide Holdings Inc. 4.00% 20311 | 1,085 | 1,147 | ||||||
| Home Depot, Inc. 2.70% 2030 | 50 | 56 | ||||||
| Home Depot, Inc. 3.35% 2050 | 20 | 24 | ||||||
| Hyundai Capital America 1.80% 20251 | 80 | 82 | ||||||
| International Game Technology PLC 6.50% 20251 | 400 | 448 | ||||||
| International Game Technology PLC 5.25% 20291 | 2,090 | 2,255 | ||||||
| Levi Strauss & Co. 5.00% 2025 | 75 | 77 | ||||||
| Lithia Motors, Inc. 4.375% 20311 | 1,125 | 1,209 | ||||||
| Marriott International, Inc. 5.75% 2025 | 227 | 266 | ||||||
| Marriott International, Inc. 3.50% 2032 | 800 | 877 | ||||||
| Meituan Dianping 3.05% 20301 | 1,200 | 1,249 | ||||||
| Melco International Development Ltd. 5.75% 20281 | 400 | 427 | ||||||
| Merlin Entertainment 5.75% 20261 | 200 | 211 | ||||||
| MGM Growth Properties LLC 4.625% 20251 | 325 | 348 | ||||||
| MGM Growth Properties LLC 3.875% 20291 | 1,120 | 1,147 | ||||||
| MGM Resorts International 7.75% 2022 | 120 | 128 | ||||||
| MGM Resorts International 6.00% 2023 | 150 | 161 | ||||||
| MGM Resorts International 5.50% 2027 | 133 | 148 | ||||||
| Mohegan Tribal Gaming Authority, Term Loan B, (3-month USD-LIBOR + 5.375%) 5.607% 20235,6 | 1,995 | 1,914 | ||||||
| MYT Holding LLC 7.50% 20251,7 | 24 | 24 | ||||||
| NCL Corp. Ltd. 12.25% 20241 | 290 | 348 | ||||||
| NCL Corp. Ltd. 5.875% 20261 | 1,250 | 1,320 | ||||||
| Neiman Marcus Group Ltd. LLC, Term Loan, (3-month USD-LIBOR + 12.00%) 13.00% 20255,6 | 31 | 33 | ||||||
| Newell Rubbermaid Inc. 4.875% 2025 | 200 | 220 | ||||||
| Newell Rubbermaid Inc. 4.70% 2026 | 180 | 199 | ||||||
| Newell Rubbermaid Inc. 5.875% 20364 | 5 | 6 | ||||||
| Nissan Motor Co., Ltd. 3.043% 20231 | 1,119 | 1,171 | ||||||
| Nissan Motor Co., Ltd. 4.81% 20301 | 1,500 | 1,693 | ||||||
| Norwegian Cruise Line Holdings Ltd. 10.25% 20261 | 500 | 586 | ||||||
| Panther BF Aggregator 2, LP 6.25% 20261 | 40 | 43 | ||||||
| Panther BF Aggregator 2, LP 8.50% 20271 | 180 | 196 | ||||||
| Party City Holdings Inc. 6.125% 20231 | 50 | 40 | ||||||
| PetSmart, Inc. 7.125% 20231 | 270 | 270 | ||||||
| PetSmart, Inc. 5.875% 20251 | 660 | 679 | ||||||
| PetSmart, Inc. 8.875% 20251 | 1,610 | 1,656 | ||||||
| Royal Caribbean Cruises Ltd. 9.125% 20231 | 1,040 | 1,130 | ||||||
| Royal Caribbean Cruises Ltd. 10.875% 20231 | 810 | 923 | ||||||
| Sally Holdings LLC and Sally Capital Inc. 5.625% 2025 | 450 | 463 | ||||||
| Sally Holdings LLC and Sally Capital Inc. 8.75% 20251 | 380 | 423 | ||||||
| Sands China Ltd. 4.375% 20301 | 200 | 223 | ||||||
| Scientific Games Corp. 8.625% 20251 | 710 | 778 | ||||||
| Scientific Games Corp. 8.25% 20261 | 50 | 54 | ||||||
| Scientific Games Corp. 7.00% 20281 | 420 | 452 | ||||||
| Scientific Games Corp. 7.25% 20291 | 455 | 500 | ||||||
| Six Flags Entertainment Corp. 4.875% 20241 | 520 | 522 | ||||||
| Six Flags Theme Parks Inc. 7.00% 20251 | 315 | 341 | ||||||
| American Funds Multi-Sector Income Fund | 7 |
| Bonds, notes & other debt instruments (continued) | Principal amount (000) | Value (000) | ||||||
| Corporate bonds, notes & loans (continued) | ||||||||
| Consumer discretionary (continued) | ||||||||
| Toyota Motor Credit Corp. 1.35% 2023 | $ | 150 | $ | 154 | ||||
| Toyota Motor Credit Corp. 0.80% 2025 | 233 | 235 | ||||||
| Toyota Motor Credit Corp. 3.375% 2030 | 57 | 67 | ||||||
| Vail Resorts, Inc. 6.25% 20251 | 110 | 118 | ||||||
| VICI Properties LP 4.25% 20261 | 160 | 166 | ||||||
| VICI Properties LP / VICI Note Co. Inc. 3.50% 20251 | 10 | 10 | ||||||
| VICI Properties LP / VICI Note Co. Inc. 3.75% 20271 | 150 | 154 | ||||||
| VICI Properties LP / VICI Note Co. Inc. 4.125% 20301 | 235 | 248 | ||||||
| Viking Cruises Ltd. 13.00% 20251 | 145 | 174 | ||||||
| Volkswagen Group of America Finance, LLC 3.125% 20231 | 248 | 262 | ||||||
| Volkswagen Group of America Finance, LLC 1.25% 20251 | 200 | 202 | ||||||
| Wyndham Worldwide Corp. 5.375% 20261 | 475 | 493 | ||||||
| Wyndham Worldwide Corp. 4.375% 20281 | 635 | 661 | ||||||
| Wynn Las Vegas, LLC and Wynn Capital Corp. 4.25% 20231 | 60 | 61 | ||||||
| Wynn Las Vegas, LLC and Wynn Capital Corp. 5.25% 20271 | 80 | 83 | ||||||
| Wynn Macau, Ltd. 5.625% 20281 | 1,125 | 1,181 | ||||||
| Wynn Resorts Ltd. 7.75% 20251 | 370 | 401 | ||||||
| Wynn Resorts Ltd. 5.125% 20291 | 660 | 692 | ||||||
| YUM! Brands, Inc. 7.75% 20251 | 88 | 98 | ||||||
| 53,971 | ||||||||
| Communication services 8.07% | ||||||||
| Alphabet Inc. 2.25% 2060 | 30 | 29 | ||||||
| AT&T Inc. 2.25% 2032 | 1,100 | 1,117 | ||||||
| AT&T Inc. 3.30% 2052 | 550 | 545 | ||||||
| AT&T Inc. 3.50% 20531 | 24 | 24 | ||||||
| Axiata SPV5 Labuan Ltd. 3.064% 2050 | 200 | 201 | ||||||
| Cable One, Inc. 4.00% 20301 | 825 | 859 | ||||||
| Cablevision Systems Corp. 5.375% 20281 | 650 | 696 | ||||||
| CCO Holdings LLC and CCO Holdings Capital Corp. 5.00% 20281 | 200 | 212 | ||||||
| CCO Holdings LLC and CCO Holdings Capital Corp. 4.75% 20301 | 350 | 378 | ||||||
| CCO Holdings LLC and CCO Holdings Capital Corp. 4.25% 20311 | 2,910 | 3,070 | ||||||
| CCO Holdings LLC and CCO Holdings Capital Corp. 4.50% 20321 | 2,285 | 2,443 | ||||||
| CCO Holdings LLC and CCO Holdings Capital Corp. 5.125% 2049 | 13 | 16 | ||||||
| CCO Holdings LLC and CCO Holdings Capital Corp. 4.80% 2050 | 20 | 24 | ||||||
| CCO Holdings LLC and CCO Holdings Capital Corp. 3.70% 2051 | 30 | 31 | ||||||
| CenturyLink, Inc. 4.00% 20271 | 365 | 377 | ||||||
| Clear Channel Worldwide Holdings, Inc. 9.25% 2024 | 293 | 297 | ||||||
| Comcast Corp. 2.65% 2030 | 200 | 219 | ||||||
| Comcast Corp. 1.95% 2031 | 32 | 33 | ||||||
| Comcast Corp. 3.75% 2040 | 15 | 18 | ||||||
| Comcast Corp. 4.00% 2048 | 35 | 44 | ||||||
| CSC Holdings, LLC 4.625% 20301 | 400 | 418 | ||||||
| Diamond Sports Group LLC 5.375% 20261 | 138 | 112 | ||||||
| Diamond Sports Group LLC 6.625% 20271 | 435 | 264 | ||||||
| Discovery Communications, Inc. 4.65% 2050 | 28 | 35 | ||||||
| Embarq Corp. 7.995% 2036 | 1,000 | 1,235 | ||||||
| Epicor Software Corp., Term Loan, (3-month USD-LIBOR + 4.25%) 5.25% 20275,6 | 50 | 50 | ||||||
| Epicor Software Corp., Term Loan, (3-month USD-LIBOR + 7.75%) 8.75% 20285,6 | 325 | 340 | ||||||
| Front Range BidCo, Inc. 6.125% 20281 | 2,120 | 2,246 | ||||||
| Frontier Communications Corp. 10.50% 20222 | 130 | 68 | ||||||
| Frontier Communications Corp. 5.875% 20271 | 450 | 487 | ||||||
| Frontier Communications Corp. 5.00% 20281 | 1,075 | 1,123 | ||||||
| Frontier Communications Corp. 6.75% 20291 | 499 | 535 | ||||||
| Gray Television, Inc. 7.00% 20271 | 430 | 471 | ||||||
| Inmarsat PLC 6.75% 20261 | 230 | 248 | ||||||
| Intelsat Jackson Holding Co. 5.50% 20232 | 65 | 44 | ||||||
| Intelsat Jackson Holding Co. 8.00% 20241 | 35 | 36 | ||||||
| Intelsat Jackson Holding Co. 8.50% 20241,2 | 45 | 32 | ||||||
| Intelsat Jackson Holding Co., Term Loan, (3-month USD-LIBOR + 5.50%) 6.50% 20215,6 | 17 | 17 | ||||||
| Intelsat Jackson Holding Co., Term Loan, 6.625% 20245 | 35 | 36 | ||||||
| Lamar Media Corp. 4.875% 2029 | 650 | 692 | ||||||
| Lamar Media Corp. 4.00% 2030 | 100 | 104 | ||||||
| Level 3 Financing, Inc. 4.25% 20281 | 500 | 514 | ||||||
| Live Nation Entertainment, Inc. 4.75% 20271 | 750 | 771 | ||||||
| Live Nation Entertainment, Inc. 6.50% 20271 | 200 | 224 | ||||||
| Live Nation Entertainment, Inc. 3.75% 20281 | 100 | 101 | ||||||
| 8 | American Funds Multi-Sector Income Fund |
| Bonds, notes & other debt instruments (continued) | Principal amount (000) | Value (000) | ||||||
| Corporate bonds, notes & loans (continued) | ||||||||
| Communication services (continued) | ||||||||
| Match Group, Inc. 4.625% 20281 | $ | 150 | $ | 158 | ||||
| Match Group, Inc. 4.125% 20301 | 600 | 624 | ||||||
| MDC Partners Inc. 6.50% 20241 | 335 | 340 | ||||||
| Meredith Corp. 6.875% 2026 | 215 | 210 | ||||||
| Netflix, Inc. 4.875% 20301 | 1,250 | 1,440 | ||||||
| Nexstar Broadcasting, Inc. 4.75% 20281 | 1,350 | 1,415 | ||||||
| Nexstar Escrow Corp. 5.625% 20271 | 70 | 75 | ||||||
| Numericable Group SA 7.375% 20261 | 400 | 422 | ||||||
| OUTFRONT Media Capital LLC 5.00% 20271 | 520 | 530 | ||||||
| OUTFRONT Media Capital LLC 4.625% 20301 | 720 | 737 | ||||||
| PLDT Inc. 2.50% 2031 | 400 | 418 | ||||||
| Scripps Escrow II, Inc. 3.875% 20291 | 500 | 522 | ||||||
| Scripps Escrow II, Inc. 5.375% 20311 | 800 | 843 | ||||||
| Sinclair Television Group, Inc. 4.125% 20301 | 2,025 | 2,078 | ||||||
| Sirius XM Radio Inc. 4.125% 20301 | 185 | 197 | ||||||
| Sprint Corp. 7.25% 2021 | 190 | 198 | ||||||
| Sprint Corp. 6.875% 2028 | 2,080 | 2,746 | ||||||
| Sprint Corp. 8.75% 2032 | 350 | 555 | ||||||
| TEGNA Inc. 4.625% 20281 | 150 | 154 | ||||||
| Tencent Holdings Ltd. 3.975% 2029 | 200 | 228 | ||||||
| Tencent Holdings Ltd. 3.24% 20501 | 200 | 207 | ||||||
| T-Mobile US, Inc. 3.875% 20301 | 300 | 348 | ||||||
| T-Mobile US, Inc. 2.55% 20311 | 1,500 | 1,577 | ||||||
| T-Mobile US, Inc. 3.30% 20511 | 76 | 78 | ||||||
| Univision Communications Inc. 5.125% 20251 | 150 | 151 | ||||||
| Univision Communications Inc. 6.625% 20271 | 3,225 | 3,469 | ||||||
| Verizon Communications Inc. 4.329% 2028 | 74 | 89 | ||||||
| Verizon Communications Inc. 4.016% 2029 | 35 | 42 | ||||||
| Vodafone Group PLC 4.25% 2050 | 25 | 31 | ||||||
| Warner Music Group 5.50% 20261 | 180 | 187 | ||||||
| Warner Music Group 3.875% 20301 | 225 | 239 | ||||||
| Ziggo Bond Co. BV 5.125% 20301 | 100 | 106 | ||||||
| Ziggo Bond Finance BV 5.50% 20271 | 1,190 | 1,244 | ||||||
| Ziggo Bond Finance BV 4.875% 20301 | 2,200 | 2,317 | ||||||
| 44,811 | ||||||||
| Materials 7.64% | ||||||||
| Alcoa Netherlands Holding BV 5.50% 20271 | 300 | 329 | ||||||
| Anglo American Capital PLC 2.625% 20301 | 805 | 843 | ||||||
| Anglo American Capital PLC 3.95% 20501 | 206 | 232 | ||||||
| Arconic Corp. 6.00% 20251 | 115 | 123 | ||||||
| Ardagh Group SA 6.50% 20271,7 | 1,340 | 1,432 | ||||||
| Ardagh Packaging Finance 5.25% 20271 | 400 | 420 | ||||||
| Axalta Coating Systems LLC 4.75% 20271 | 1,085 | 1,156 | ||||||
| Ball Corp. 2.875% 2030 | 1,200 | 1,199 | ||||||
| Braskem Idesa SAPI 7.45% 20291 | 1,450 | 1,363 | ||||||
| Braskem Idesa SAPI 7.45% 2029 | 500 | 470 | ||||||
| Braskem SA 4.50% 20301 | 1,370 | 1,409 | ||||||
| Braskem SA 4.50% 2030 | 1,050 | 1,080 | ||||||
| Braskem SA 5.875% 20501 | 400 | 414 | ||||||
| BWAY Parent Co., Inc. 5.50% 20241 | 135 | 138 | ||||||
| CANPACK SA and Eastern PA Land Investment Holding LLC 3.125% 20251 | 200 | 201 | ||||||
| Cascades Inc. 5.125% 20261 | 100 | 106 | ||||||
| Cascades Inc. 5.375% 20281 | 95 | 101 | ||||||
| Cleveland-Cliffs Inc. 4.875% 20241 | 115 | 117 | ||||||
| Cleveland-Cliffs Inc. 9.875% 20251 | 145 | 171 | ||||||
| Cleveland-Cliffs Inc. 6.75% 20261 | 260 | 281 | ||||||
| Cleveland-Cliffs Inc. 5.875% 2027 | 160 | 163 | ||||||
| CVR Partners, LP 9.25% 20231 | 1,500 | 1,503 | ||||||
| Dow Chemical Co. 4.80% 2049 | 62 | 84 | ||||||
| Element Solutions Inc. 3.875% 20281 | 170 | 175 | ||||||
| First Quantum Minerals Ltd. 7.50% 20251 | 700 | 730 | ||||||
| First Quantum Minerals Ltd. 6.875% 20271 | 2,300 | 2,498 | ||||||
| Freeport-McMoRan Inc. 5.40% 2034 | 225 | 282 | ||||||
| Fresnillo PLC 4.25% 20501 | 200 | 220 | ||||||
| FXI Holdings, Inc. 7.875% 20241 | 1,333 | 1,346 | ||||||
| FXI Holdings, Inc. 12.25% 20261 | 1,491 | 1,702 | ||||||
| American Funds Multi-Sector Income Fund | 9 |
| Bonds, notes & other debt instruments (continued) | Principal amount (000) | Value (000) | ||||||
| Corporate bonds, notes & loans (continued) | ||||||||
| Materials (continued) | ||||||||
| GPC Merger Sub Inc. 7.125% 20281 | $ | 527 | $ | 583 | ||||
| GrafTech Finance Inc. 4.625% 20281 | 1,350 | 1,370 | ||||||
| Graphic Packaging International, Inc. 3.50% 20291 | 285 | 292 | ||||||
| Hexion Inc. 7.875% 20271 | 1,240 | 1,329 | ||||||
| INEOS Group Holdings SA 5.625% 20241 | 200 | 203 | ||||||
| LSB Industries, Inc. 9.625% 20231 | 1,125 | 1,163 | ||||||
| LYB International Finance III, LLC 2.25% 2030 | 1,185 | 1,226 | ||||||
| LYB International Finance III, LLC 3.625% 2051 | 1,091 | 1,194 | ||||||
| Methanex Corp. 5.125% 2027 | 1,860 | 2,024 | ||||||
| Newcrest Finance Pty Ltd. 3.25% 20301 | 62 | 69 | ||||||
| Newcrest Finance Pty Ltd. 4.20% 20501 | 15 | 18 | ||||||
| Nouryon Holding BV 8.00% 20261 | 385 | 410 | ||||||
| Nova Chemicals Corp. 5.25% 20271 | 1,500 | 1,600 | ||||||
| Novelis Corp. 4.75% 20301 | 290 | 313 | ||||||
| Nutrition & Biosciences, Inc. 1.832% 20271 | 24 | 25 | ||||||
| Nutrition & Biosciences, Inc. 2.30% 20301 | 800 | 824 | ||||||
| Nutrition & Biosciences, Inc. 3.468% 20501 | 500 | 543 | ||||||
| Olin Corp. 9.50% 20251 | 445 | 557 | ||||||
| Owens-Illinois, Inc. 5.875% 20231 | 120 | 129 | ||||||
| Owens-Illinois, Inc. 6.625% 20271 | 450 | 488 | ||||||
| Praxair, Inc. 2.00% 2050 | 18 | 17 | ||||||
| Rayonier A.M. Products Inc. 7.625% 20261 | 695 | 726 | ||||||
| S.P.C.M. SA 4.875% 20251 | 200 | 207 | ||||||
| Scotts Miracle-Gro Co. 4.50% 2029 | 105 | 114 | ||||||
| Sealed Air Corp. 5.25% 20231 | 25 | 27 | ||||||
| Sealed Air Corp. 4.00% 20271 | 68 | 73 | ||||||
| Silgan Holdings Inc. 4.125% 2028 | 84 | 88 | ||||||
| Summit Materials, Inc. 6.50% 20271 | 270 | 288 | ||||||
| Summit Materials, Inc. 5.25% 20291 | 320 | 336 | ||||||
| Trivium Packaging BV 5.50% 20261 | 200 | 212 | ||||||
| Trivium Packaging BV 8.50% 20271 | 200 | 219 | ||||||
| Tronox Ltd. 5.75% 20251 | 30 | 31 | ||||||
| Tronox Ltd. 6.50% 20261 | 285 | 297 | ||||||
| Vale Overseas Ltd. 3.75% 2030 | 561 | 625 | ||||||
| Valvoline Inc. 4.375% 2025 | 395 | 408 | ||||||
| Valvoline Inc. 4.25% 20301 | 35 | 37 | ||||||
| Valvoline Inc. 3.625% 20311 | 1,535 | 1,581 | ||||||
| Venator Materials Corp. 5.75% 20251 | 315 | 295 | ||||||
| Venator Materials Corp. 9.50% 20251 | 1,810 | 1,982 | ||||||
| W. R. Grace & Co. 4.875% 20271 | 180 | 191 | ||||||
| 42,402 | ||||||||
| Health care 7.02% | ||||||||
| Abbott Laboratories 3.75% 2026 | 30 | 35 | ||||||
| AstraZeneca PLC 3.375% 2025 | 65 | 73 | ||||||
| Avantor Funding, Inc. 4.625% 20281 | 1,835 | 1,943 | ||||||
| Bausch Health Companies Inc. 9.25% 20261 | 250 | 279 | ||||||
| Bausch Health Companies Inc. 5.75% 20271 | 200 | 215 | ||||||
| Bausch Health Companies Inc. 5.00% 20281 | 660 | 681 | ||||||
| Bausch Health Companies Inc. 7.00% 20281 | 830 | 914 | ||||||
| Bausch Health Companies Inc. 5.00% 20291 | 1,129 | 1,163 | ||||||
| Bausch Health Companies Inc. 6.25% 20291 | 75 | 82 | ||||||
| Bausch Health Companies Inc. 5.25% 20301 | 1,385 | 1,452 | ||||||
| Bausch Health Companies Inc. 5.25% 20311 | 105 | 110 | ||||||
| Becton, Dickinson and Company 2.894% 2022 | 111 | 115 | ||||||
| Becton, Dickinson and Company 3.70% 2027 | 190 | 218 | ||||||
| Becton, Dickinson and Company 2.823% 2030 | 23 | 25 | ||||||
| Becton, Dickinson and Company 3.794% 2050 | 36 | 43 | ||||||
| Boston Scientific Corp. 2.65% 2030 | 150 | 161 | ||||||
| Catalent Pharma Solutions Inc. 5.00% 20271 | 455 | 481 | ||||||
| Catalent, Inc. 4.875% 20261 | 180 | 184 | ||||||
| Centene Corp. 5.375% 20261 | 45 | 48 | ||||||
| Centene Corp. 4.25% 2027 | 465 | 494 | ||||||
| Centene Corp. 4.625% 2029 | 581 | 646 | ||||||
| Centene Corp. 3.00% 2030 | 610 | 647 | ||||||
| Centene Corp. 3.375% 2030 | 644 | 679 | ||||||
| Charles River Laboratories International, Inc. 5.50% 20261 | 45 | 47 | ||||||
| 10 | American Funds Multi-Sector Income Fund |
| Bonds, notes & other debt instruments (continued) | Principal amount (000) | Value (000) | ||||||
| Corporate bonds, notes & loans (continued) | ||||||||
| Health care (continued) | ||||||||
| Charles River Laboratories International, Inc. 4.25% 20281 | $ | 143 | $ | 150 | ||||
| Community Health Systems Inc. 5.625% 20271 | 1,000 | 1,076 | ||||||
| Community Health Systems Inc. 6.00% 20291 | 1,000 | 1,081 | ||||||
| DaVita Inc. 4.625% 20301 | 500 | 530 | ||||||
| Emergent BioSolutions Inc. 3.875% 20281 | 580 | 602 | ||||||
| Encompass Health Corp. 4.50% 2028 | 357 | 374 | ||||||
| Encompass Health Corp. 4.75% 2030 | 280 | 300 | ||||||
| Encompass Health Corp. 4.625% 2031 | 500 | 536 | ||||||
| Endo Dac / Endo Finance LLC / Endo Finco 6.00% 20281 | 1,100 | 936 | ||||||
| HCA Inc. 5.375% 2026 | 425 | 489 | ||||||
| HCA Inc. 5.625% 2028 | 280 | 331 | ||||||
| IMS Health Holdings, Inc. 5.00% 20261 | 600 | 630 | ||||||
| Jaguar Holding Co. II 4.625% 20251 | 105 | 111 | ||||||
| Jaguar Holding Co. II 5.00% 20281 | 1,190 | 1,272 | ||||||
| Molina Healthcare, Inc. 5.375% 2022 | 40 | 42 | ||||||
| Molina Healthcare, Inc. 4.375% 20281 | 1,325 | 1,396 | ||||||
| Novartis Capital Corp. 1.75% 2025 | 41 | 43 | ||||||
| Novartis Capital Corp. 2.00% 2027 | 24 | 26 | ||||||
| Par Pharmaceutical Inc. 7.50% 20271 | 585 | 635 | ||||||
| PAREXEL International Corp. 6.375% 20251 | 215 | 221 | ||||||
| Partners HealthCare System, Inc. 3.192% 2049 | 42 | 46 | ||||||
| Radiology Partners, Inc. 9.25% 20281 | 265 | 299 | ||||||
| Rede D’Or Finance SARL 4.50% 2030 | 200 | 209 | ||||||
| Regeneron Pharmaceuticals, Inc. 1.75% 2030 | 786 | 775 | ||||||
| Regeneron Pharmaceuticals, Inc. 2.80% 2050 | 580 | 564 | ||||||
| RP Escrow Issuer, LLC 5.25% 20251 | 1,635 | 1,712 | ||||||
| Select Medical Holdings Corp. 6.25% 20261 | 196 | 211 | ||||||
| Sotera Health Holdings LLC, Term Loan, (3-months USD-LIBOR + 4.50%) 5.50% 20265,6 | 187 | 188 | ||||||
| Surgery Center Holdings 10.00% 20271 | 235 | 260 | ||||||
| Syneos Health, Inc. 3.625% 20291 | 1,570 | 1,577 | ||||||
| Takeda Pharmaceutical Company, Ltd. 2.05% 2030 | 307 | 314 | ||||||
| Tenet Healthcare Corp. 6.75% 2023 | 365 | 393 | ||||||
| Tenet Healthcare Corp. 4.625% 2024 | 50 | 51 | ||||||
| Tenet Healthcare Corp. 7.50% 20251 | 190 | 208 | ||||||
| Tenet Healthcare Corp. 4.875% 20261 | 160 | 168 | ||||||
| Tenet Healthcare Corp. 5.125% 20271 | 500 | 531 | ||||||
| Tenet Healthcare Corp. 4.625% 20281 | 750 | 787 | ||||||
| Tenet Healthcare Corp. 6.125% 20281 | 410 | 429 | ||||||
| Teva Pharmaceutical Finance Co. BV 3.15% 2026 | 5,310 | 5,114 | ||||||
| Teva Pharmaceutical Finance Co. BV 6.75% 2028 | 1,190 | 1,348 | ||||||
| Thermo Fisher Scientific Inc. 4.497% 2030 | 18 | 23 | ||||||
| UnitedHealth Group Inc. 2.375% 2024 | 15 | 16 | ||||||
| UnitedHealth Group Inc. 1.25% 2026 | 278 | 287 | ||||||
| Upjohn Inc. 2.70% 20301 | 758 | 805 | ||||||
| Upjohn Inc. 4.00% 20501 | 552 | 632 | ||||||
| Valeant Pharmaceuticals International, Inc. 6.125% 20251 | 200 | 206 | ||||||
| Valeant Pharmaceuticals International, Inc. 9.00% 20251 | 200 | 222 | ||||||
| Valeant Pharmaceuticals International, Inc. 8.50% 20271 | 75 | 84 | ||||||
| 38,975 | ||||||||
| Industrials 6.09% | ||||||||
| Allison Transmission Holdings, Inc. 3.75% 20311 | 175 | 179 | ||||||
| Associated Materials, LLC 9.00% 20251 | 328 | 349 | ||||||
| ATS Automation Tooling Systems Inc. 4.125% 20281 | 225 | 230 | ||||||
| Avis Budget Car Rental, LLC 5.75% 20271 | 1,960 | 2,005 | ||||||
| Avis Budget Group, Inc. 6.375% 20241 | 90 | 92 | ||||||
| Avis Budget Group, Inc. 5.75% 20271 | 500 | 506 | ||||||
| Boeing Company 4.875% 2025 | 207 | 236 | ||||||
| Boeing Company 2.75% 2026 | 25 | 26 | ||||||
| Boeing Company 3.10% 2026 | 29 | 31 | ||||||
| Boeing Company 3.25% 2028 | 1,000 | 1,073 | ||||||
| Boeing Company 2.95% 2030 | 14 | 15 | ||||||
| Boeing Company 3.625% 2031 | 719 | 789 | ||||||
| Boeing Company 3.60% 2034 | 30 | 32 | ||||||
| Bombardier Inc. 5.75% 20221 | 35 | 36 | ||||||
| Bombardier Inc. 6.125% 20231 | 139 | 136 | ||||||
| Bombardier Inc. 7.50% 20241 | 75 | 72 | ||||||
| American Funds Multi-Sector Income Fund | 11 |
| Bonds, notes & other debt instruments (continued) | Principal amount (000) | Value (000) | ||||||
| Corporate bonds, notes & loans (continued) | ||||||||
| Industrials (continued) | ||||||||
| Bombardier Inc. 7.50% 20251 | $ | 610 | $ | 567 | ||||
| Bombardier Inc. 7.875% 20271 | 50 | 46 | ||||||
| Booz Allen Hamilton Inc. 3.875% 20281 | 505 | 521 | ||||||
| Burlington Northern Santa Fe, LLC 3.05% 2051 | 30 | 34 | ||||||
| BWX Technologies, Inc. 4.125% 20281 | 1,150 | 1,201 | ||||||
| Carrier Global Corp. 2.242% 2025 | 36 | 38 | ||||||
| Carrier Global Corp. 2.493% 2027 | 18 | 19 | ||||||
| Carrier Global Corp. 2.722% 2030 | 40 | 43 | ||||||
| Covanta Holding Corp. 5.00% 2030 | 105 | 113 | ||||||
| CP Atlas Buyer, Inc. 7.00% 20281 | 350 | 364 | ||||||
| CSX Corp. 4.50% 2049 | 25 | 34 | ||||||
| Dun & Bradstreet Corp. 6.875% 20261 | 108 | 116 | ||||||
| Dun & Bradstreet Corp. 10.25% 20271 | 897 | 1,013 | ||||||
| Empresa de Transporte de Pasajeros Metro SA 4.70% 20501 | 400 | 504 | ||||||
| GFL Environmental Inc. 3.75% 20251 | 980 | 1,001 | ||||||
| GFL Environmental Inc. 4.25% 20251 | 250 | 260 | ||||||
| GFL Environmental Inc. 4.00% 20281 | 2,000 | 2,019 | ||||||
| Harsco Corp. 5.75% 20271 | 395 | 418 | ||||||
| Honeywell International Inc. 2.30% 2024 | 75 | 80 | ||||||
| Honeywell International Inc. 2.70% 2029 | 35 | 39 | ||||||
| Howmet Aerospace Inc. 6.875% 2025 | 85 | 100 | ||||||
| IAA Spinco Inc. 5.50% 20271 | 200 | 212 | ||||||
| JELD-WEN Holding, Inc. 4.875% 20271 | 180 | 191 | ||||||
| Kratos Defense & Security Solutions, Inc. 6.50% 20251 | 70 | 73 | ||||||
| LABL Escrow Issuer, LLC 10.50% 20271 | 45 | 51 | ||||||
| MasTec, Inc. 4.50% 20281 | 1,100 | 1,156 | ||||||
| Mexico City Airport Trust 4.25% 2026 | 200 | 212 | ||||||
| Mexico City Airport Trust 3.875% 2028 | 400 | 414 | ||||||
| Moog Inc. 4.25% 20271 | 101 | 105 | ||||||
| Nielsen Finance LLC and Nielsen Finance Co. 5.625% 20281 | 50 | 54 | ||||||
| Nielsen Finance LLC and Nielsen Finance Co. 5.875% 20301 | 300 | 340 | ||||||
| Norfolk Southern Corp. 3.00% 2022 | 44 | 45 | ||||||
| Norfolk Southern Corp. 3.05% 2050 | 8 | 9 | ||||||
| Northrop Grumman Corp. 2.55% 2022 | 60 | 62 | ||||||
| Pisces Parent LLC, Term Loan B, (3-month USD-LIBOR + 3.75%) 3.904% 20255,6 | 147 | 147 | ||||||
| Rexnord Corp. 4.875% 20251 | 200 | 205 | ||||||
| Rolls-Royce PLC 5.75% 20271 | 1,580 | 1,752 | ||||||
| Sensata Technologies, Inc. 3.75% 20311 | 150 | 156 | ||||||
| Signature Aviation PLC 4.00% 20281 | 500 | 504 | ||||||
| SkyMiles IP Ltd. 4.75% 20281 | 1,140 | 1,245 | ||||||
| SkyMiles IP Ltd., Term Loan, (3-month USD-LIBOR + 3.75%) 4.75% 20275,6 | 750 | 779 | ||||||
| Spirit AeroSystems, Inc. (3-month USD-LIBOR + 0.80%) 1.017% 20216 | 120 | 119 | ||||||
| Spirit Loyalty KY Ltd/IP 8.00% 20251 | 650 | 731 | ||||||
| Stericycle, Inc. 3.875% 20291 | 130 | 134 | ||||||
| The Brink’s Co. 5.50% 20251 | 500 | 535 | ||||||
| TransDigm Inc. 6.25% 20261 | 1,295 | 1,381 | ||||||
| TransDigm Inc. 5.50% 2027 | 875 | 921 | ||||||
| Uber Technologies, Inc. 8.00% 20261 | 555 | 605 | ||||||
| Union Pacific Corp. 4.30% 2049 | 75 | 98 | ||||||
| Union Pacific Corp. 3.25% 2050 | 13 | 15 | ||||||
| United Airlines Holdings, Inc. 6.50% 20271 | 975 | 1,050 | ||||||
| United Rentals, Inc. 5.875% 2026 | 130 | 138 | ||||||
| United Rentals, Inc. 3.875% 2031 | 250 | 263 | ||||||
| Vertical Holdco GMBH 7.625% 20281 | 1,100 | 1,201 | ||||||
| Vertical U.S. Newco Inc. 5.25% 20271 | 1,250 | 1,327 | ||||||
| Wesco Aircraft Holdings, Inc. 8.50% 20241 | 25 | 24 | ||||||
| Wesco Aircraft Holdings, Inc. 9.00% 20261 | 25 | 24 | ||||||
| WESCO Distribution, Inc. 7.125% 20251 | 1,100 | 1,211 | ||||||
| WESCO Distribution, Inc. 7.25% 20281 | 1,465 | 1,668 | ||||||
| Westinghouse Air Brake Technologies Corp. 3.20% 2025 | 323 | 349 | ||||||
| 33,843 | ||||||||
| Financials 5.17% | ||||||||
| Advisor Group Holdings, LLC 6.25% 20281 | 820 | 831 | ||||||
| AG Merger Sub II, Inc. 10.75% 20271 | 568 | 629 | ||||||
| Alliant Holdings Intermediate, LLC 6.75% 20271 | 2,063 | 2,211 | ||||||
| Allstate Corp. 3.85% 2049 | 20 | 25 | ||||||
| 12 | American Funds Multi-Sector Income Fund |
| Bonds, notes & other debt instruments (continued) | Principal amount (000) | Value (000) | ||||||
| Corporate bonds, notes & loans (continued) | ||||||||
| Financials (continued) | ||||||||
| Ally Financial Inc. 8.00% 2031 | $ | 25 | $ | 36 | ||||
| American International Group, Inc. 3.40% 2030 | 120 | 138 | ||||||
| American International Group, Inc. 4.375% 2050 | 50 | 65 | ||||||
| AON Corp. 2.20% 2022 | 48 | 50 | ||||||
| AssuredPartners, Inc. 8.00% 20271 | 320 | 348 | ||||||
| AssuredPartners, Inc. 5.625% 20291 | 310 | 324 | ||||||
| Bangkok Bank PCL 4.45% 2028 | 200 | 232 | ||||||
| Bangkok Bank PCL 3.733% 2034 (UST Yield Curve Rate T Note Constant Maturity 5-year + 1.90% on 9/25/2029)4 | 600 | 626 | ||||||
| Bank of America Corp. 1.898% 2031 (USD-SOFR + 1.53% on 7/23/2030)4 | 240 | 243 | ||||||
| Bank of America Corp. 1.922% 2031 (USD-SOFR + 1.37% on 10/24/2030)4 | 1,230 | 1,247 | ||||||
| Bank of America Corp. 2.831% 2051 (USD-SOFR + 1.88% on 10/24/2050)4 | 80 | 83 | ||||||
| Bank of East Asia, Ltd., subordinated 4.00% 2030 (UST Yield Curve Rate T Note Constant Maturity 5-year + 3.75% on 5/29/2025)4 | 1,000 | 1,051 | ||||||
| China Construction Bank Corp. 2.45% 2030 (UST Yield Curve Rate T Note Constant Maturity 5-year + 2.15% on 6/24/2025)4 | 1,000 | 1,026 | ||||||
| Citigroup Inc. 2.312% 2022 (USD-SOFR + 0.867% on 11/4/2021)4 | 90 | 91 | ||||||
| Compass Diversified Holdings 8.00% 20261 | 1,980 | 2,086 | ||||||
| Credit Suisse Group AG 4.194% 2031 (USD-SOFR + 3.73% on 4/1/2030)1,4 | 400 | 471 | ||||||
| Deutsche Bank AG 2.129% 2026 (USD-SOFR + 1.87% on 11/24/2025)4 | 150 | 153 | ||||||
| Deutsche Bank AG 3.547% 2031 (USD-SOFR + 3.043% on 9/18/2030)4 | 170 | 185 | ||||||
| Fairstone Financial Inc. 7.875% 20241 | 222 | 236 | ||||||
| FS Energy and Power Fund 7.50% 20231 | 2,472 | 2,380 | ||||||
| Goldman Sachs Group, Inc. 1.093% 2026 (USD-SOFR + 0.789% on 12/9/2025)4 | 100 | 101 | ||||||
| Groupe BPCE SA 1.652% 2026 (USD-SOFR + 1.52% on 10/6/2025)1,4 | 250 | 256 | ||||||
| Hartford Financial Services Group, Inc. 2.80% 2029 | 60 | 65 | ||||||
| HSBC Holdings PLC 3.973% 2030 (3-month USD-LIBOR + 1.61% on 5/22/2029)4 | 200 | 231 | ||||||
| HSBC Holdings PLC 2.357% 2031 (USD-SOFR + 1.947% on 8/18/2030)4 | 201 | 208 | ||||||
| HUB International Ltd. 7.00% 20261 | 1,500 | 1,570 | ||||||
| Intercontinental Exchange, Inc. 2.65% 2040 | 575 | 592 | ||||||
| Intercontinental Exchange, Inc. 3.00% 2060 | 55 | 58 | ||||||
| JPMorgan Chase & Co. 2.522% 2031 (USD-SOFR + 2.04% on 4/22/2030)4 | 53 | 57 | ||||||
| JPMorgan Chase & Co. 3.109% 2051 (USD-SOFR + 3.109% on 4/22/2050)4 | 99 | 110 | ||||||
| Kasikornbank PC HK 3.343% 2031 (UST Yield Curve Rate T Note Constant Maturity 5-year + 1.70% on 10/2/2026)4 | 600 | 617 | ||||||
| Ladder Capital Corp. 4.25% 20271 | 1,300 | 1,280 | ||||||
| LPL Financial Holdings Inc. 4.625% 20271 | 140 | 145 | ||||||
| MetLife, Inc. 4.55% 2030 | 40 | 50 | ||||||
| Metropolitan Life Global Funding I 1.95% 20231 | 150 | 155 | ||||||
| Morgan Stanley 3.70% 2024 | 50 | 56 | ||||||
| Morgan Stanley 0.985% 2026 (USD-SOFR + 0.72% on 12/10/2025)4 | 330 | 333 | ||||||
| MSCI Inc. 5.375% 20271 | 200 | 214 | ||||||
| MSCI Inc. 3.875% 20311 | 400 | 424 | ||||||
| National Financial Partners Corp. 6.875% 20281 | 999 | 1,068 | ||||||
| Navient Corp. 6.75% 2026 | 1,225 | 1,338 | ||||||
| Navient Corp. 5.00% 2027 | 1,710 | 1,727 | ||||||
| Navient Corp. 5.625% 2033 | 65 | 63 | ||||||
| New York Life Global Funding 1.20% 20301 | 21 | 20 | ||||||
| New York Life Insurance Company 3.75% 20501 | 11 | 13 | ||||||
| Power Financial Corp Ltd. 6.15% 2028 | 600 | 732 | ||||||
| Progressive Corp. 3.20% 2030 | 30 | 35 | ||||||
| Rede D’Or Finance SARL 4.50% 20301 | 2,060 | 2,152 | ||||||
| Starwood Property Trust, Inc. 5.00% 2021 | 150 | 153 | ||||||
| Travelers Companies, Inc. 4.10% 2049 | 20 | 26 | ||||||
| Travelers Companies, Inc. 2.55% 2050 | 3 | 3 | ||||||
| Wells Fargo & Company 2.572% 2031 (3-month USD-LIBOR + 1.00% on 2/11/2030)4 | 16 | 17 | ||||||
| Wells Fargo & Company 3.068% 2041 (USD-SOFR + 2.53% on 4/30/2040)4 | 57 | 62 | ||||||
| 28,698 | ||||||||
| Consumer staples 4.34% | ||||||||
| Albertsons Companies, Inc. 4.625% 20271 | 500 | 532 | ||||||
| Albertsons Companies, Inc. 3.50% 20291 | 1,810 | 1,831 | ||||||
| Altria Group, Inc. 3.40% 2030 | 800 | 899 | ||||||
| Altria Group, Inc. 4.45% 2050 | 50 | 59 | ||||||
| Anheuser-Busch Co. / InBev Worldwide 4.90% 2046 | 90 | 118 | ||||||
| B&G Foods, Inc. 5.25% 2025 | 245 | 253 | ||||||
| B&G Foods, Inc. 5.25% 2027 | 800 | 851 | ||||||
| American Funds Multi-Sector Income Fund | 13 |
| Bonds, notes & other debt instruments (continued) | Principal amount (000) | Value (000) | ||||||
| Corporate bonds, notes & loans (continued) | ||||||||
| Consumer staples (continued) | ||||||||
| British American Tobacco PLC 2.726% 2031 | $ | 1,000 | $ | 1,037 | ||||
| British American Tobacco PLC 4.54% 2047 | 148 | 164 | ||||||
| CD&R Smokey Buyer, Inc. 6.75% 20251 | 465 | 498 | ||||||
| Central Garden & Pet Co. 4.125% 2030 | 500 | 522 | ||||||
| Coca-Cola Co. 1.375% 2031 | 80 | 80 | ||||||
| Conagra Brands, Inc. 1.375% 2027 | 35 | 35 | ||||||
| Conagra Brands, Inc. 5.30% 2038 | 2 | 3 | ||||||
| Constellation Brands, Inc. 2.875% 2030 | 40 | 44 | ||||||
| Darling Ingredients Inc. 5.25% 20271 | 280 | 298 | ||||||
| Edgewell Personal Care Co. 5.50% 20281 | 150 | 161 | ||||||
| Energizer Holdings, Inc. 7.75% 20271 | 225 | 250 | ||||||
| Energizer Holdings, Inc. 4.375% 20291 | 340 | 353 | ||||||
| H.J. Heinz Co. 3.875% 20271 | 419 | 452 | ||||||
| H.J. Heinz Co. 4.25% 20311 | 556 | 620 | ||||||
| H.J. Heinz Co. 5.50% 20501 | 1,500 | 1,894 | ||||||
| JBS Investments GmbH II 5.75% 20281 | 1,450 | 1,554 | ||||||
| Keurig Dr Pepper Inc. 3.20% 2030 | 150 | 170 | ||||||
| Keurig Dr Pepper Inc. 3.80% 2050 | 39 | 47 | ||||||
| Kimberly-Clark Corp. 3.10% 2030 | 162 | 187 | ||||||
| Kraft Heinz Company 5.20% 2045 | 180 | 214 | ||||||
| Kraft Heinz Company 4.375% 2046 | 55 | 60 | ||||||
| Kronos Acquisition Holdings Inc. 5.00% 20261 | 70 | 73 | ||||||
| Kronos Acquisition Holdings Inc. 7.00% 20271 | 2,060 | 2,161 | ||||||
| MARB BondCo PLC 6.875% 20251 | 1,100 | 1,139 | ||||||
| Molson Coors Brewing Co. 4.20% 2046 | 20 | 23 | ||||||
| NBM US Holdings, Inc. 6.625% 20291 | 500 | 574 | ||||||
| Nestlé Holdings, Inc. 1.00% 20271 | 205 | 206 | ||||||
| Nestle Skin Health SA, Term Loan B1, (3-month USD-LIBOR + 4.00%) 4.254% 20265,6 | 1,083 | 1,087 | ||||||
| PepsiCo, Inc. 3.625% 2050 | 50 | 64 | ||||||
| Philip Morris International Inc. 3.375% 2029 | 85 | 97 | ||||||
| Philip Morris International Inc. 1.75% 2030 | 607 | 615 | ||||||
| Philip Morris International Inc. 2.10% 2030 | 124 | 129 | ||||||
| Post Holdings, Inc. 5.00% 20261 | 425 | 440 | ||||||
| Post Holdings, Inc. 5.50% 20291 | 955 | 1,043 | ||||||
| Post Holdings, Inc. 4.625% 20301 | 1,436 | 1,512 | ||||||
| Prestige Brands International Inc. 6.375% 20241 | 100 | 102 | ||||||
| Procter & Gamble Company 0.55% 2025 | 50 | 51 | ||||||
| TreeHouse Foods, Inc. 4.00% 2028 | 770 | 798 | ||||||
| United Natural Foods, Inc. 6.75% 20281 | 755 | 791 | ||||||
| 24,091 | ||||||||
| Information technology 4.20% | ||||||||
| Adobe Inc. 2.30% 2030 | 105 | 114 | ||||||
| Almonde Inc., Term Loan, (3-month USD-LIBOR + 7.25%) 8.25% 20255,6 | 1,150 | 1,156 | ||||||
| Apple Inc. 1.25% 2030 | 50 | 50 | ||||||
| Apple Inc. 2.40% 2050 | 30 | 31 | ||||||
| Applied Systems, Inc., Term Loan, (3-month USD-LIBOR + 7.00%) 8.00% 20255,6 | 25 | 25 | ||||||
| Austin BidCo Inc. 7.125% 20281 | 650 | 680 | ||||||
| Austin BidCo Inc., Term Loan B, (3-month USD-LIBOR + 4.50%) 4.732% 20275,6 | 25 | 25 | ||||||
| Banff Merger Sub Inc. 9.75% 20261 | 2,680 | 2,898 | ||||||
| Black Knight Inc. 3.625% 20281 | 1,420 | 1,455 | ||||||
| Blue Yonder Group, Inc. 4.25% 20261 | 600 | 616 | ||||||
| BMC Software, Inc. 7.125% 20251 | 800 | 870 | ||||||
| BMC Software, Inc. 9.125% 20261 | 90 | 97 | ||||||
| Broadcom Inc. 4.75% 2029 | 350 | 419 | ||||||
| Broadcom Inc. 4.15% 2030 | 350 | 405 | ||||||
| Broadcom Inc. 5.00% 2030 | 111 | 135 | ||||||
| Broadcom Ltd. 3.875% 2027 | 110 | 124 | ||||||
| Diebold Nixdorf, Inc. 9.375% 20251 | 2,100 | 2,356 | ||||||
| Fair Isaac Corp. 4.00% 20281 | 190 | 200 | ||||||
| Fiserv, Inc. 2.25% 2027 | 150 | 160 | ||||||
| Gartner, Inc. 4.50% 20281 | 625 | 660 | ||||||
| Global Payments Inc. 2.90% 2030 | 116 | 126 | ||||||
| Mastercard Inc. 3.85% 2050 | 100 | 129 | ||||||
| Microsoft Corp. 2.525% 2050 | 48 | 51 | ||||||
| MoneyGram International Inc., Term Loan B, (3-month USD-LIBOR + 6.00%) 7.00% 20235,6 | 299 | 301 | ||||||
| 14 | American Funds Multi-Sector Income Fund |
| Bonds, notes & other debt instruments (continued) | Principal amount (000) | Value (000) | ||||||
| Corporate bonds, notes & loans (continued) | ||||||||
| Information technology (continued) | ||||||||
| Oracle Corp. 3.60% 2050 | $ | 50 | $ | 58 | ||||
| PayPal Holdings, Inc. 2.85% 2029 | 63 | 70 | ||||||
| PayPal Holdings, Inc. 2.30% 2030 | 46 | 49 | ||||||
| Sabre GLBL Inc. 7.375% 20251 | 645 | 701 | ||||||
| ServiceNow, Inc. 1.40% 2030 | 745 | 727 | ||||||
| Shift4 Payments LLC 4.625% 20261 | 975 | 1,016 | ||||||
| Solera Holdings, Inc. 10.50% 20241 | 50 | 52 | ||||||
| Ultimate Software Group Inc., Term Loan, (3-month USD-LIBOR + 4.00%) 4.75% 20265,6 | 1,272 | 1,281 | ||||||
| Ultimate Software Group Inc., Term Loan, (3-month USD-LIBOR + 6.75%) 7.50% 20275,6 | 275 | 284 | ||||||
| Unisys Corp. 6.875% 20271 | 775 | 849 | ||||||
| Veritas Holdings Ltd. 10.50% 20241 | 1,400 | 1,429 | ||||||
| Veritas Holdings Ltd. 7.50% 20251 | 1,980 | 2,034 | ||||||
| Visa Inc. 2.70% 2040 | 120 | 131 | ||||||
| Xerox Corp. 5.00% 20251 | 1,200 | 1,279 | ||||||
| Xerox Corp. 5.50% 20281 | 275 | 292 | ||||||
| 23,335 | ||||||||
| Utilities 3.23% | ||||||||
| AEP Transmission Co. LLC 3.80% 2049 | 20 | 25 | ||||||
| AES Corp. 3.95% 20301 | 1,125 | 1,274 | ||||||
| AES Panama Generation Holdings SRL 4.375% 20301 | 475 | 514 | ||||||
| American Electric Power Company, Inc. 3.65% 2021 | 140 | 144 | ||||||
| American Electric Power Company, Inc. 1.00% 2025 | 25 | 25 | ||||||
| AmeriGas Partners, LP 5.625% 2024 | 175 | 189 | ||||||
| Calpine Corp. 5.125% 20281 | 90 | 95 | ||||||
| Connecticut Light and Power Co. 0.75% 2025 | 50 | 51 | ||||||
| Connecticut Light and Power Co. 3.20% 2027 | 25 | 28 | ||||||
| Consumers Energy Co. 3.10% 2050 | 36 | 42 | ||||||
| DPL Inc. 4.125% 20251 | 390 | 422 | ||||||
| Duke Energy Corp. 2.45% 2030 | 175 | 186 | ||||||
| Edison International 3.55% 2024 | 104 | 112 | ||||||
| Edison International 4.95% 2025 | 130 | 149 | ||||||
| Edison International 5.75% 2027 | 16 | 19 | ||||||
| Edison International 4.125% 2028 | 934 | 1,042 | ||||||
| Empresas Publicas de Medellin ESP 4.25% 20291 | 500 | 538 | ||||||
| Empresas Publicas de Medellin ESP 4.375% 20311 | 1,350 | 1,453 | ||||||
| ENN Energy Holdings Ltd. 2.625% 20301 | 1,200 | 1,208 | ||||||
| ENN Energy Holdings Ltd. 2.625% 2030 | 200 | 201 | ||||||
| FirstEnergy Corp. 3.90% 2027 (4.40% on 1/16/2021)4 | 180 | 199 | ||||||
| FirstEnergy Corp. 2.25% 2030 | 118 | 114 | ||||||
| FirstEnergy Corp. 2.65% 2030 | 1,622 | 1,629 | ||||||
| FirstEnergy Corp. 7.375% 2031 | 177 | 253 | ||||||
| Jersey Central Power & Light Co. 4.30% 20261 | 50 | 56 | ||||||
| NGL Energy Partners LP 7.50% 2026 | 200 | 124 | ||||||
| NRG Energy, Inc. 7.25% 2026 | 235 | 248 | ||||||
| Pacific Gas and Electric Co. 2.95% 2026 | 29 | 31 | ||||||
| Pacific Gas and Electric Co. 2.10% 2027 | 300 | 305 | ||||||
| Pacific Gas and Electric Co. 3.30% 2027 | 37 | 40 | ||||||
| Pacific Gas and Electric Co. 3.75% 2028 | 1,094 | 1,196 | ||||||
| Pacific Gas and Electric Co. 4.65% 2028 | 125 | 143 | ||||||
| Pacific Gas and Electric Co. 2.50% 2031 | 810 | 812 | ||||||
| Pacific Gas and Electric Co. 3.50% 2050 | 570 | 568 | ||||||
| PG&E Corp. 5.00% 2028 | 510 | 544 | ||||||
| PG&E Corp. 5.25% 2030 | 390 | 429 | ||||||
| Public Service Company of Colorado 3.80% 2047 | 10 | 12 | ||||||
| Public Service Electric and Gas Co. 2.05% 2050 | 28 | 26 | ||||||
| San Diego Gas & Electric Co. 1.70% 2030 | 1,375 | 1,392 | ||||||
| San Diego Gas & Electric Co. 3.75% 2047 | 54 | 63 | ||||||
| Sempra Energy 4.875% 2049 (UST Yield Curve Rate T Note Constant Maturity 5-year + 4.55% on 10/15/2025)4 | 750 | 803 | ||||||
| Southern California Edison Co. 2.25% 2030 | 50 | 52 | ||||||
| Southern California Edison Co. 3.65% 2050 | 194 | 221 | ||||||
| Southern California Gas Company 2.55% 2030 | 25 | 27 | ||||||
| State Grid Overseas Investment Ltd. 3.50% 20271 | 200 | 223 | ||||||
| Talen Energy Corp. 10.50% 20261 | 30 | 27 | ||||||
| Talen Energy Corp. 7.25% 20271 | 185 | 197 | ||||||
| Talen Energy Corp. 6.625% 20281 | 190 | 199 | ||||||
| American Funds Multi-Sector Income Fund | 15 |
| Bonds, notes & other debt instruments (continued) | Principal amount (000) | Value (000) | ||||||
| Corporate bonds, notes & loans (continued) | ||||||||
| Utilities (continued) | ||||||||
| Talen Energy Supply, LLC 7.625% 20281 | $ | 165 | $ | 178 | ||||
| Virginia Electric and Power Co. 2.45% 2050 | 25 | 25 | ||||||
| Xcel Energy Inc. 2.60% 2029 | 50 | 54 | ||||||
| Xcel Energy Inc. 3.50% 2049 | 40 | 47 | ||||||
| 17,954 | ||||||||
| Real estate 2.19% | ||||||||
| Alexandria Real Estate Equities, Inc. 1.875% 2033 | 1,489 | 1,490 | ||||||
| American Campus Communities, Inc. 3.30% 2026 | 38 | 42 | ||||||
| American Campus Communities, Inc. 2.85% 2030 | 5 | 5 | ||||||
| American Campus Communities, Inc. 3.875% 2031 | 175 | 198 | ||||||
| Brookfield Property REIT Inc. 5.75% 20261 | 1,975 | 1,952 | ||||||
| Corporate Office Properties LP 2.25% 2026 | 209 | 218 | ||||||
| Equinix, Inc. 2.90% 2026 | 68 | 74 | ||||||
| Equinix, Inc. 1.55% 2028 | 255 | 259 | ||||||
| Equinix, Inc. 3.20% 2029 | 75 | 83 | ||||||
| Equinix, Inc. 2.15% 2030 | 830 | 846 | ||||||
| Hospitality Properties Trust 7.50% 2025 | 142 | 164 | ||||||
| Howard Hughes Corp. 5.375% 20251 | 1,695 | 1,752 | ||||||
| Howard Hughes Corp. 5.375% 20281 | 1,400 | 1,508 | ||||||
| Iron Mountain Inc. 5.00% 20281 | 344 | 366 | ||||||
| Iron Mountain Inc. 5.25% 20281 | 500 | 529 | ||||||
| Iron Mountain Inc. 4.875% 20291 | 1,460 | 1,542 | ||||||
| Iron Mountain Inc. 4.50% 20311 | 360 | 378 | ||||||
| Medical Properties Trust, Inc. 5.00% 2027 | 125 | 133 | ||||||
| Medical Properties Trust, Inc. 3.50% 2031 | 515 | 533 | ||||||
| Service Properties Trust 5.50% 2027 | 65 | 71 | ||||||
| Westfield Corp. Ltd. 3.50% 20291 | 10 | 10 | ||||||
| 12,153 | ||||||||
| Total corporate bonds, notes & loans | 375,251 | |||||||
| Bonds & notes of governments & government agencies outside the U.S. 9.10% | ||||||||
| Abu Dhabi (Emirate of) 2.50% 20291 | 500 | 541 | ||||||
| Abu Dhabi (Emirate of) 1.70% 20311 | 200 | 200 | ||||||
| Angola (Republic of) 8.00% 2029 | 1,640 | 1,546 | ||||||
| Angola (Republic of) 8.00% 20291 | 600 | 566 | ||||||
| Argentine Republic 1.00% 2029 | 133 | 58 | ||||||
| Argentine Republic 0.125% 2030 (0.50% on 7/9/2021)4 | 2,885 | 1,174 | ||||||
| Argentine Republic 0.125% 2035 (1.125% on 7/9/2021)4 | 972 | 357 | ||||||
| Armenia (Republic of) 7.15% 2025 | 200 | 231 | ||||||
| Bahrain (Kingdom of) 6.125% 2022 | 250 | 262 | ||||||
| Bahrain (Kingdom of) 6.125% 2023 | 700 | 755 | ||||||
| Belarus (Republic of) 6.875% 2023 | 400 | 419 | ||||||
| Belarus (Republic of) 5.875% 2026 | 1,400 | 1,440 | ||||||
| Cameroon (Republic of) 9.50% 20251 | 1,220 | 1,362 | ||||||
| Colombia (Republic of) 4.50% 2029 | 300 | 348 | ||||||
| Colombia (Republic of) 7.375% 2037 | 300 | 439 | ||||||
| Colombia (Republic of) 4.125% 2051 | 400 | 446 | ||||||
| Costa Rica (Republic of) 4.375% 2025 | 400 | 374 | ||||||
| Costa Rica (Republic of) 6.125% 2031 | 728 | 682 | ||||||
| Costa Rica (Republic of) 6.125% 20311 | 600 | 562 | ||||||
| Costa Rica (Republic of) 7.00% 2044 | 372 | 344 | ||||||
| Costa Rica (Republic of) 7.158% 2045 | 200 | 186 | ||||||
| Cote d’Ivoire (Republic of) 5.75% 20324 | 1,006 | 1,018 | ||||||
| Dominican Republic 5.50% 2025 | 400 | 451 | ||||||
| Dominican Republic 5.95% 2027 | 750 | 884 | ||||||
| Dominican Republic 4.875% 20321 | 200 | 222 | ||||||
| Dominican Republic 5.875% 2060 | 300 | 331 | ||||||
| Egypt (Arab Republic of) 6.588% 20281 | 200 | 220 | ||||||
| Egypt (Arab Republic of) 7.60% 2029 | 500 | 576 | ||||||
| Egypt (Arab Republic of) 7.625% 20321 | 500 | 568 | ||||||
| Egypt (Arab Republic of) 8.15% 2059 | 200 | 221 | ||||||
| Ethiopia (Federal Democratic Republic of) 6.625% 2024 | 2,400 | 2,448 | ||||||
| Export-Import Bank of India 3.25% 2030 | 600 | 643 | ||||||
| Gabonese Republic 6.375% 2024 | 400 | 417 | ||||||
| Ghana (Republic of) 8.125% 20321 | 700 | 743 | ||||||
| 16 | American Funds Multi-Sector Income Fund |
| Bonds, notes & other debt instruments (continued) | Principal amount (000) | Value (000) | ||||||
| Bonds & notes of governments & government agencies outside the U.S. (continued) | ||||||||
| Ghana (Republic of) 8.95% 2051 | $ | 1,500 | $ | 1,569 | ||||
| Honduras (Republic of) 6.25% 2027 | 400 | 464 | ||||||
| Honduras (Republic of) 5.625% 20301 | 150 | 172 | ||||||
| Indonesia (Republic of) 5.25% 2042 | 300 | 390 | ||||||
| Israel (State of) 3.375% 2050 | 200 | 222 | ||||||
| Jordan (Hashemite Kingdom of) 4.95% 20251 | 400 | 426 | ||||||
| Jordan (Hashemite Kingdom of) 5.85% 20301 | 300 | 332 | ||||||
| Kazakhstan (Republic of) 4.875% 2044 | 400 | 544 | ||||||
| Kenya (Republic of) 6.875% 20241 | 200 | 220 | ||||||
| Kenya (Republic of) 7.25% 2028 | 400 | 450 | ||||||
| Kenya (Republic of) 8.25% 2048 | 200 | 230 | ||||||
| Mozambique (Republic of) 5.00% 2031 (9.00% on 9/15/2023)4 | 1,860 | 1,712 | ||||||
| Pakistan (Islamic Republic of) 8.25% 2024 | 700 | 765 | ||||||
| Pakistan (Islamic Republic of) 6.875% 2027 | 200 | 209 | ||||||
| Panama (Republic of) 7.125% 2026 | 200 | 256 | ||||||
| Panama (Republic of) 3.16% 2030 | 400 | 444 | ||||||
| Panama (Republic of) 4.50% 2050 | 400 | 516 | ||||||
| Paraguay (Republic of) 4.70% 20271 | 400 | 469 | ||||||
| Paraguay (Republic of) 4.95% 2031 | 450 | 546 | ||||||
| Peru (Republic of) 4.125% 2027 | 300 | 354 | ||||||
| Peru (Republic of) 2.783% 2031 | 200 | 220 | ||||||
| Peru (Republic of) 2.78% 2060 | 1,299 | 1,313 | ||||||
| Peru (Republic of) 3.23% 2121 | 1,400 | 1,400 | ||||||
| PETRONAS Capital Ltd. 3.50% 20301 | 300 | 345 | ||||||
| PETRONAS Capital Ltd. 4.55% 20501 | 200 | 268 | ||||||
| Philippines (Republic of) 2.95% 2045 | 600 | 635 | ||||||
| PT Indonesia Asahan Aluminium Tbk 4.75% 20251 | 400 | 442 | ||||||
| Qatar (State of) 3.75% 20301 | 400 | 472 | ||||||
| Qatar (State of) 5.103% 2048 | 200 | 282 | ||||||
| Qatar (State of) 4.40% 20501 | 400 | 522 | ||||||
| Romania 2.75% 2026 | € | 100 | 135 | |||||
| Romania 2.00% 2032 | 200 | 257 | ||||||
| Romania 3.50% 2034 | 30 | 44 | ||||||
| Romania 5.125% 2048 | $ | 400 | 513 | |||||
| Romania 5.125% 20481 | 300 | 385 | ||||||
| Russian Federation 4.375% 2029 | 1,000 | 1,169 | ||||||
| Russian Federation 5.25% 2047 | 400 | 555 | ||||||
| Senegal (Republic of) 4.75% 2028 | € | 200 | 261 | |||||
| Serbia (Republic of) 3.125% 2027 | 200 | 275 | ||||||
| South Africa (Republic of) 5.875% 2030 | $ | 500 | 568 | |||||
| Sri Lanka (Democratic Socialist Republic of) 6.85% 2025 | 600 | 365 | ||||||
| Sri Lanka (Democratic Socialist Republic of) 6.20% 2027 | 1,780 | 1,023 | ||||||
| Sri Lanka (Democratic Socialist Republic of) 7.55% 2030 | 600 | 346 | ||||||
| Tunisia (Republic of) 5.75% 2025 | 990 | 906 | ||||||
| Tunisia (Republic of) 6.375% 2026 | € | 100 | 112 | |||||
| Turkey (Republic of) 6.375% 2025 | $ | 200 | 217 | |||||
| Turkey (Republic of) 7.375% 2025 | 400 | 447 | ||||||
| Turkey (Republic of) 7.625% 2029 | 950 | 1,099 | ||||||
| Turkey (Republic of) 6.00% 2041 | 200 | 198 | ||||||
| Ukraine 7.75% 2026 | 400 | 453 | ||||||
| Ukraine 7.75% 2027 | 200 | 227 | ||||||
| Ukraine 9.75% 2028 | 200 | 247 | ||||||
| Ukraine 7.375% 2032 | 800 | 881 | ||||||
| United Mexican States 3.75% 2028 | 200 | 225 | ||||||
| United Mexican States 4.50% 2029 | 600 | 706 | ||||||
| United Mexican States 2.659% 2031 | 649 | 666 | ||||||
| United Mexican States 6.05% 2040 | 400 | 537 | ||||||
| United Mexican States 4.75% 2044 | 200 | 239 | ||||||
| United Mexican States 5.00% 2051 | 200 | 250 | ||||||
| 50,529 | ||||||||
| Mortgage-backed obligations 8.72% | ||||||||
| Commercial mortgage-backed securities 6.48% | ||||||||
| Banc of America Commercial Mortgage Inc., Series 2017-BNK3, Class A4, 3.574% 20508 | 10 | 11 | ||||||
| Bank Commercial Mortgage Trust, Series 2017-BNK9, Class A4, 3.538% 20548 | 10 | 12 | ||||||
| Benchmark Mortgage Trust, Series 2018-B2, Class A4, 3.615% 20518 | 25 | 29 | ||||||
| Benchmark Mortgage Trust, Series 2018-B3, Class A5, 4.025% 20518 | 10 | 12 | ||||||
| American Funds Multi-Sector Income Fund | 17 |
| Bonds, notes & other debt instruments (continued) | Principal amount (000) | Value (000) | ||||||
| Mortgage-backed obligations (continued) | ||||||||
| Commercial mortgage-backed securities (continued) | ||||||||
| Benchmark Mortgage Trust, Series 2018-B4, Class A5, 4.121% 20516,8 | $ | 10 | $ | 12 | ||||
| Benchmark Mortgage Trust, Series 2019-B13, Class A4, 2.952% 20578 | 20 | 22 | ||||||
| BX Trust, Series 2020-VIV4, Class A, 2.843% 20441,8 | 1,000 | 1,045 | ||||||
| CD Commercial Mortgage Trust, Series 2017-CD6, Class A5, 3.456% 20508 | 10 | 11 | ||||||
| Citigroup Commercial Mortgage Trust, Series 2012-GC8, Class B, 4.285% 20451,8 | 500 | 508 | ||||||
| Citigroup Commercial Mortgage Trust, Series 2013-GC11, Class B, 3.732% 20466,8 | 727 | 765 | ||||||
| Citigroup Commercial Mortgage Trust, Series 2013-GC15, Class D, 5.181% 20461,6,8 | 250 | 243 | ||||||
| Citigroup Commercial Mortgage Trust, Series 2014-GC25, Class AS, 4.017% 20478 | 438 | 482 | ||||||
| Citigroup Commercial Mortgage Trust, Series 2014-GC21, Class B, 4.328% 20476,8 | 1,150 | 1,238 | ||||||
| Citigroup Commercial Mortgage Trust, Series 2015-GC33, Class A3, 3.515% 20588 | 313 | 339 | ||||||
| Commercial Mortgage Trust, Series 2012-LC4, Class AM, 4.063% 20448 | 600 | 615 | ||||||
| Commercial Mortgage Trust, Series 2012-CR4, Class AM, 3.251% 20458 | 55 | 56 | ||||||
| Commercial Mortgage Trust, Series 2012-CR3, Class AM, 3.416% 20451,8 | 500 | 508 | ||||||
| Commercial Mortgage Trust, Series 2012-CR2, Class AM, 3.791% 20458 | 85 | 88 | ||||||
| Commercial Mortgage Trust, Series 2012-CR2, Class B, 4.393% 20458 | 440 | 451 | ||||||
| Commercial Mortgage Trust, Series 2012-CR3, Class C, 4.584% 20451,6,8 | 300 | 268 | ||||||
| Commercial Mortgage Trust, Series 2013-CR7, Class AM, 3.314% 20461,8 | 560 | 589 | ||||||
| Commercial Mortgage Trust, Series 2013-CRE7, Class B, 3.613% 20461,8 | 500 | 519 | ||||||
| Commercial Mortgage Trust, Series 2013-LC6, Class B, 3.739% 20468 | 80 | 83 | ||||||
| Commercial Mortgage Trust, Series 2013-LC6, Class D, 4.311% 20461,6,8 | 113 | 103 | ||||||
| Commercial Mortgage Trust, Series 2013-CR12, Class B, 4.762% 20466,8 | 320 | 328 | ||||||
| Commercial Mortgage Trust, Series 2013-LC13, Class B, 5.009% 20461,6,8 | 200 | 211 | ||||||
| Commercial Mortgage Trust, Series 2014-UBS4, Class AM, 3.968% 20478 | 108 | 118 | ||||||
| Commercial Mortgage Trust, Series 2014-CR19, Class AM, 4.08% 20478 | 500 | 550 | ||||||
| Commercial Mortgage Trust, Series 2014-UBS4, Class B, 4.35% 20478 | 75 | 79 | ||||||
| Commercial Mortgage Trust, Series 2014-UBS6, Class C, 4.446% 20476,8 | 93 | 91 | ||||||
| Commercial Mortgage Trust, Series 2014-LC17, Class B, 4.49% 20476,8 | 250 | 275 | ||||||
| Commercial Mortgage Trust, Series 2014-CR20, Class C, 4.511% 20476,8 | 110 | 117 | ||||||
| Commercial Mortgage Trust, Series 2014-UBS4, Class B, 4.701% 20478 | 1,000 | 1,094 | ||||||
| Commercial Mortgage Trust, Series 2014-CR16, Class C, 4.928% 20476,8 | 460 | 487 | ||||||
| Commercial Mortgage Trust, Series 2015-CR22, Class B, 3.926% 20486,8 | 25 | 27 | ||||||
| Commercial Mortgage Trust, Series 2015-CCRE-26, Class C, 4.48% 20486,8 | 860 | 914 | ||||||
| Commercial Mortgage Trust, Series 2015-CR26, Class B, 4.48% 20486,8 | 600 | 663 | ||||||
| Commercial Mortgage Trust, Series 2015-LC23, Class C, 4.617% 20486,8 | 10 | 10 | ||||||
| Commercial Mortgage Trust, Series 2016-COR1, Class A4, 3.091% 20498 | 25 | 27 | ||||||
| Commercial Mortgage Trust, Series 2015-PC1, Class AM, 4.29% 20506,8 | 250 | 280 | ||||||
| Commercial Mortgage Trust, Series 2013-CR11, Class B, 5.112% 20506,8 | 570 | 621 | ||||||
| CSAIL Commercial Mortgage Trust, Series 2020-C19, Class C, 3.614% 20536,8 | 440 | 467 | ||||||
| Ellington Financial Mortgage Trust, Series 2020-1, Class A1, 2.006% 20651,6,8 | 165 | 167 | ||||||
| GS Mortgage Securities Trust, Series 2013-GC10, Class B, 3.682% 20461,8 | 380 | 393 | ||||||
| GS Mortgage Securities Trust, Series 2013-GC12, Class B, 3.777% 20466,8 | 650 | 681 | ||||||
| GS Mortgage Securities Trust, Series 2013-GC16, Class A3, 4.244% 20468 | 87 | 93 | ||||||
| GS Mortgage Securities Trust, Series 2014-GC18, Class B, 4.885% 20476,8 | 225 | 219 | ||||||
| GS Mortgage Securities Trust, Series 2020-GS1, Class A2, 3.47% 20488 | 200 | 216 | ||||||
| GS Mortgage Securities Trust, Series 2016-GS2, Class A3, 2.791% 20498 | 266 | 285 | ||||||
| JPMBB Commercial Mortgage Securities Trust, Series 2014-C19, Class B, 4.394% 20476,8 | 920 | 978 | ||||||
| JPMBB Commercial Mortgage Securities Trust, Series 2014-C19, Class D, 4.676% 20471,6,8 | 141 | 129 | ||||||
| JPMBB Commercial Mortgage Securities Trust, Series 2015-C-32, Class AS, 3.984% 20488 | 800 | 882 | ||||||
| JPMBB Commercial Mortgage Securities Trust, Series 2015-C28, Class C, 4.152% 20486,8 | 300 | 287 | ||||||
| JPMBB Commercial Mortgage Securities Trust, Series 2015-C32, Class B, 4.389% 20486,8 | 400 | 409 | ||||||
| JPMBB Commercial Mortgage Securities Trust, Series 2015-C-31, Class C, 4.619% 20486,8 | 150 | 153 | ||||||
| JPMorgan Chase Commercial Mortgage Securities Corp., Series 2013-C10, Class B, 3.674% 20476,8 | 650 | 673 | ||||||
| JPMorgan Chase Commercial Mortgage Securities Corp., Series 2013-C10, Class C, 4.11% 20476,8 | 500 | 510 | ||||||
| JPMorgan Chase Commercial Mortgage Securities Trust, Series 2013-LC11, Class D, 4.167% 20466,8 | 435 | 302 | ||||||
| JPMorgan Chase Commercial Mortgage Securities Trust, Series 2011-C5, Class AS, 5.424% 20461,6,8 | 750 | 766 | ||||||
| JPMorgan Chase Commercial Mortgage Securities Trust, Series 2013-C10, Class AS, 3.372% 20478 | 500 | 523 | ||||||
| JPMorgan Chase Commercial Mortgage Securities Trust, Series 2012-LC9, Class C, 3.812% 20471,6,8 | 530 | 515 | ||||||
| L.A. Arena Funding, LLC, Series 1, Class A, 7.656% 20261,8 | 57 | 57 | ||||||
| Morgan Stanley Bank of America Merrill Lynch Trust, Series 2013-C9, Class B, 3.708% 20466,8 | 541 | 559 | ||||||
| 18 | American Funds Multi-Sector Income Fund |
| Bonds, notes & other debt instruments (continued) | Principal amount (000) | Value (000) | ||||||
| Mortgage-backed obligations (continued) | ||||||||
| Commercial mortgage-backed securities (continued) | ||||||||
| Morgan Stanley Bank of America Merrill Lynch Trust, Series 2013-C7, Class B, 3.769% 20468 | $ | 200 | $ | 202 | ||||
| Morgan Stanley Bank of America Merrill Lynch Trust, Series 2013-C7, Class C, 4.12% 20466,8 | 100 | 96 | ||||||
| Morgan Stanley Bank of America Merrill Lynch Trust, Series 2013-C7, Class D, 4.236% 20461,6,8 | 300 | 185 | ||||||
| Morgan Stanley Bank of America Merrill Lynch Trust, Series 2013-C11, Class AS, 4.352% 20466,8 | 40 | 39 | ||||||
| Morgan Stanley Bank of America Merrill Lynch Trust, Series 2013-C12, Class AS, 4.482% 20466,8 | 500 | 541 | ||||||
| Morgan Stanley Bank of America Merrill Lynch Trust, Series 2014-C17, Class A4, 3.443% 20478 | 300 | 316 | ||||||
| Morgan Stanley Bank of America Merrill Lynch Trust, Series 2014-C19, Class B, 4.00% 20476,8 | 15 | 16 | ||||||
| Morgan Stanley Bank of America Merrill Lynch Trust, Series 2014-C18, Class AS, 4.11% 20476,8 | 195 | 213 | ||||||
| Morgan Stanley Bank of America Merrill Lynch Trust, Series 2014-C15, Class B, 4.565% 20476,8 | 100 | 108 | ||||||
| Morgan Stanley Capital I Trust, Series 2011-C1, Class E, 5.563% 20471,6,8 | 565 | 564 | ||||||
| Morgan Stanley Capital I Trust, Series 2017-H1, Class A5, 3.53% 20508 | 45 | 51 | ||||||
| MRA Issuance Trust, Series 2020-10, Class A, (1-month USD-LIBOR + 1.75%) 2.25% 20211,6,8,9 | 1,300 | 1,300 | ||||||
| Multi Family Connecticut Avenue Securities, Series 2019-1, Class M10, (1-month USD-LIBOR + 3.25%) 3.398% 20491,6,8 | 425 | 399 | ||||||
| Multi Family Connecticut Avenue Securities, Series 2020-1, Class M10, (1-month USD-LIBOR + 3.75%) 3.898% 20501,6,8 | 400 | 392 | ||||||
| UBS-Barclays Commercial Mortgage Trust, Series 2013-C5, Class B, 3.649% 20461,6,8 | 25 | 25 | ||||||
| UBS-Barclays Commercial Mortgage Trust, Series 2013-C6, Class B, 3.875% 20461,6,8 | 392 | 391 | ||||||
| Wells Fargo Commercial Mortgage Trust, Series 2012-LC5, Class C, 4.693% 20456,8 | 20 | 21 | ||||||
| Wells Fargo Commercial Mortgage Trust, Series 2012-LC5, Class D, 4.758% 20451,6,8 | 44 | 44 | ||||||
| Wells Fargo Commercial Mortgage Trust, Series 2013-LC12, Class AS, 4.275% 20466,8 | 500 | 537 | ||||||
| Wells Fargo Commercial Mortgage Trust, Series 2013-LC12, Class B, 4.275% 20466,8 | 300 | 288 | ||||||
| Wells Fargo Commercial Mortgage Trust, Series 2016-C34, Class A4, 3.096% 20498 | 25 | 27 | ||||||
| Wells Fargo Commercial Mortgage Trust, Series 2015-NXS3, Class B, 4.50% 20576,8 | 664 | 736 | ||||||
| Wells Fargo Commercial Mortgage Trust, Series 2015-LC22, Class C, 4.537% 20586,8 | 110 | 114 | ||||||
| WF-RBS Commercial Mortgage Trust, Series 2011-C5, Class B, 5.656% 20441,6,8 | 500 | 510 | ||||||
| WF-RBS Commercial Mortgage Trust, Series 2012-C10, Class AS, 3.241% 20458 | 740 | 736 | ||||||
| WF-RBS Commercial Mortgage Trust, Series 2013-C13, Class D, 4.139% 20451,6,8 | 40 | 39 | ||||||
| WF-RBS Commercial Mortgage Trust, Series 2013-C11, Class C, 4.20% 20456,8 | 240 | 249 | ||||||
| WF-RBS Commercial Mortgage Trust, Series 2012-C8, Class B, 4.311% 20458 | 680 | 704 | ||||||
| WF-RBS Commercial Mortgage Trust, Series 2012-C6, Class B, 4.697% 20458 | 40 | 41 | ||||||
| WF-RBS Commercial Mortgage Trust, Series 2012-C7, Class C, 4.81% 20456,8 | 200 | 160 | ||||||
| WF-RBS Commercial Mortgage Trust, Series 2013-C14, Class AS, 3.488% 20468 | 350 | 368 | ||||||
| WF-RBS Commercial Mortgage Trust, Series 2013-C14, Class B, 3.841% 20466,8 | 570 | 595 | ||||||
| WF-RBS Commercial Mortgage Trust, Series 2013-C16, Class B, 5.017% 20466,8 | 1,251 | 1,306 | ||||||
| WF-RBS Commercial Mortgage Trust, Series 2014-C19, Class AS, 4.271% 20478 | 417 | 455 | ||||||
| WF-RBS Commercial Mortgage Trust, Series 2014-C19, Class B, 4.723% 20476,8 | 372 | 405 | ||||||
| WF-RBS Commercial Mortgage Trust, Series 2013-C12, Class B, 3.863% 20486,8 | 500 | 525 | ||||||
| WF-RBS Commercial Mortgage Trust, Series 2014-C22, Class AS, 4.069% 20576,8 | 100 | 111 | ||||||
| 35,974 | ||||||||
| Collateralized mortgage-backed obligations (privately originated) 2.24% | ||||||||
| Angel Oak Mortgage Trust, Series 2019-2, Class A1, FRN 3.628% 20491,6,8 | 34 | 35 | ||||||
| Bellemeade Re Ltd., Series 2019-3A, Class M1B, (1-month USD-LIBOR + 1.60%) 1.748% 20291,6,8 | 400 | 401 | ||||||
| BRAVO Residential Funding Trust, Series 2020-RPL2, Class A1, 2.00% 20591,8 | 292 | 302 | ||||||
| BRAVO Residential Funding Trust, Series 2020-RPL1, Class A2, 3.00% 20591,6,8 | 300 | 319 | ||||||
| Cascade Funding Mortgage Trust, Series 2019-HB1, Class A, 2.386% 20291,6,8 | 439 | 441 | ||||||
| Cascade Funding Mortgage Trust, Series 2020-HB3, Class A, 2.812% 20301,6,8 | 229 | 231 | ||||||
| Cascade Funding Mortgage Trust, Series 2020-HBA, Class A, 3.405% 20301,6,8 | 119 | 121 | ||||||
| Cascade Funding Mortgage Trust, Series 2018-RM2, Class A, 4.00% 20681,6,8 | 103 | 107 | ||||||
| CFCRE Commercial Mortgage Trust, Series 2016-C6, Class AM, 3.502% 20496,8 | 250 | 276 | ||||||
| CFCRE Commercial Mortgage Trust, Series 2016-C7, Class A2, 3.585% 20548 | 200 | 224 | ||||||
| Citigroup Mortgage Loan Trust Inc., Series 2020-EXP1, Class A1A, 1.804% 20601,6,8 | 302 | 304 | ||||||
| Commercial Mortgage Trust, Series 2012-LC4, Class B, 4.934% 20446,8 | 524 | 509 | ||||||
| Consumer Credit Origination Loan Trust, Series 2019-1, Class A1, 3.705% 20491,6,8 | 66 | 67 | ||||||
| Credit Suisse Mortgage Trust, Series 2020-NET, Class A, 2.257% 20371,8 | 113 | 117 | ||||||
| American Funds Multi-Sector Income Fund | 19 |
| Bonds, notes & other debt instruments (continued) | Principal amount (000) | Value (000) | ||||||
| Mortgage-backed obligations (continued) | ||||||||
| Collateralized mortgage-backed obligations (privately originated) (continued) | ||||||||
| Flagstar Mortgage Trust, Series 2018-31, Class A5, 3.50% 20481,6,8 | $ | 10 | $ | 10 | ||||
| Flagstar Mortgage Trust, Series 2019-2, Class A3, 3.50% 20491,6,8 | 38 | 38 | ||||||
| JPMorgan Mortgage Trust, Series 2017-2, Class A5, 3.50% 20471,6,8 | 51 | 51 | ||||||
| JPMorgan Mortgage Trust, Series 2018-3, Class A1, 3.50% 20481,6,8 | 102 | 105 | ||||||
| Legacy Mortgage Asset Trust, Series 2019-GS7, Class A1, 3.25% 20591,6,8 | 282 | 282 | ||||||
| Legacy Mortgage Asset Trust, Series 2020-GS4, Class A1, 3.25% 20601,6,8 | 431 | 439 | ||||||
| Mello Warehouse Securitization Trust, Series 2020-1, Class B, (1-month USD-LIBOR + 1.15%) 1.298% 20531,6,8 | 328 | 329 | ||||||
| Mello Warehouse Securitization Trust, Series 2020-1, Class C, (1-month USD-LIBOR + 1.35%) 1.498% 20531,6,8 | 328 | 329 | ||||||
| Metlife Securitization Trust, Series 2018-1A, Class A, 3.75% 20571,6,8 | 130 | 141 | ||||||
| MFRA Trust, Series 2020-NQM1, Class A1, 1.479% 20651,6,8 | 192 | 194 | ||||||
| Nationstar HECM Loan Trust, Series 2019-2A, Class M2, 2.645% 20291,6,8 | 200 | 199 | ||||||
| New Residential Mortgage Loan Trust, Series 2018-1A, Class A1A, 4.00% 20571,6,8 | 80 | 87 | ||||||
| New Residential Mortgage Loan Trust, Series 2019-2A, Class A1, 4.25% 20571,6,8 | 248 | 268 | ||||||
| New Residential Mortgage Loan Trust, Series 2018-5A, Class A1, 4.75% 20571,6,8 | 236 | 253 | ||||||
| New York Mortgage Trust, Series 2020-SP1, Class A1, 3.962% 20601,8 | 290 | 292 | ||||||
| Progress Residential Trust, Series 2018-SFR1, Class A, 3.255% 20351,8 | 170 | 170 | ||||||
| Progress Residential Trust, Series 2018-SFR2, Class A, 3.712% 20351,8 | 123 | 125 | ||||||
| Progress Residential Trust, Series 2018-SFR3, Class A, 3.88% 20351,8 | 116 | 119 | ||||||
| Progress Residential Trust, Series 2019-SFR3, Class A, 2.271% 20361,8 | 398 | 408 | ||||||
| Progress Residential Trust, Series 2020-SFR2, Class A, 2.078% 20371,8 | 100 | 103 | ||||||
| Progress Residential Trust, Series 2020-SFR2, Class B, 2.578% 20371,8 | 200 | 204 | ||||||
| Progress Residential Trust, Series 2020-SFR2, Class C, 3.077% 20371,8 | 200 | 206 | ||||||
| Reverse Mortgage Investment Trust, Series 2020-1, Class M2, 2.623% 20301,6,8 | 125 | 125 | ||||||
| Reverse Mortgage Investment Trust, Series 2020-1, Class M3, 2.964% 20301,6,8 | 125 | 125 | ||||||
| RMF Proprietary Issuance Trust, Series 2019-1, Class A, 2.75% 20631,6,8 | 170 | 171 | ||||||
| Sequoia Mortgage Trust, Series 2013-1, Class 2A1, 1.855% 20436,8 | 69 | 70 | ||||||
| Sequoia Mortgage Trust, Series 2013-2, Class A, 1.874% 20436,8 | 103 | 105 | ||||||
| Sequoia Mortgage Trust, Series 2017-2, Class A4, 3.50% 20471,6,8 | 60 | 60 | ||||||
| Sequoia Mortgage Trust, Series 2018-CH1, Class A2, 3.50% 20481,6,8 | 317 | 323 | ||||||
| Starwood Mortgage Residential Trust, Series 2020-2, Class A1, 2.718% 20601,6,8 | 153 | 157 | ||||||
| TIF Funding II LLC, Series 2020-1A, Class A, 2.09% 20451,8 | 585 | 593 | ||||||
| TIF Funding II LLC, Series 2020-1A, Class B, 3.82% 20451,8 | 390 | 395 | ||||||
| Tricorn American Homes, Series 2020-SFR1, Class A, 1.499% 20381,8 | 235 | 238 | ||||||
| Tricorn American Homes, Series 2020-SFR1, Class B, 2.049% 20381,8 | 250 | 257 | ||||||
| Tricorn American Homes, Series 2020-SFR1, Class C, 2.249% 20381,8 | 250 | 254 | ||||||
| Tricorn American Homes, Series 2020-SFR2, Class B, 1.832% 20391,8 | 350 | 349 | ||||||
| Tricorn American Homes, Series 2020-SFR2, Class C, 2.032% 20391,8 | 350 | 349 | ||||||
| Tricorn American Homes, Series 2020-SFR2, Class D, 2.281% 20391,8 | 350 | 347 | ||||||
| Verus Securitization Trust, Series 2019-1, Class A1, 3.836% 20591,6,8 | 128 | 129 | ||||||
| Verus Securitization Trust, Series 2020-2, Class A1, 2.743% 20601,2,6,8 | 406 | 415 | ||||||
| Wells Fargo Mortgage-Backed Securities Trust, Series 2020-1, Class A3, 3.00% 20491,6,8 | 94 | 96 | ||||||
| Wells Fargo Mortgage-Backed Securities Trust, Series 2019-4, Class A3, 3.50% 20491,6,8 | 109 | 111 | ||||||
| 12,475 | ||||||||
| Total mortgage-backed obligations | 48,449 | |||||||
| Asset-backed obligations 4.55% | ||||||||
| Aesop Funding LLC, Series 2016-2A, Class A, 2.72% 20221,8 | 279 | 283 | ||||||
| Aesop Funding LLC, Series 2017-1A, Class A, 3.07% 20231,8 | 388 | 401 | ||||||
| Aesop Funding LLC, Series 2017-2A, Class A, 2.97% 20241,8 | 200 | 208 | ||||||
| Aesop Funding LLC, Series 2019-2A, Class A, 3.35% 20251,8 | 750 | 803 | ||||||
| Aesop Funding LLC, Series 2020-1A, Class A, 2.33% 20261,8 | 676 | 700 | ||||||
| Aesop Funding LLC, Series 2019-3A, Class A, 2.36% 20261,8 | 200 | 209 | ||||||
| Aesop Funding LLC, Series 2020-2, Class A, 2.02% 20271,8 | 250 | 255 | ||||||
| Aesop Funding LLC, Series 2020-2A, Class B, 2.96% 20271,8 | 100 | 102 | ||||||
| Aesop Funding LLC, Series 2020-2A, Class C, 4.25% 20271,8 | 128 | 132 | ||||||
| Affirm Asset Securitization Trust, Series 2020-A, Class A, 2.10% 20251,8 | 150 | 151 | ||||||
| American Credit Acceptance Receivables Trust, Series 2020-3, Class C, 1.85% 20261,8 | 100 | 102 | ||||||
| AmeriCredit Automobile Receivables Trust, Series 2020-3, Class D, 1.49% 20268 | 468 | 470 | ||||||
| Bankers Healthcare Group Securitization Trust, Series 2020-A, Class A, 2.56% 20311,8 | 373 | 374 | ||||||
| Bankers Healthcare Group Securitization Trust, Series 2020-A, Class B, 3.59% 20311,8 | 300 | 299 | ||||||
| Bankers Healthcare Group Securitization Trust, Series 2020-A, Class C, 5.17% 20311,8 | 300 | 294 | ||||||
| CF Hippolyta LLC, Series 2020-1, Class A1, 1.69% 20601,8 | 1,632 | 1,667 | ||||||
| CF Hippolyta LLC, Series 2020-1, Class A2, 1.99% 20601,8 | 337 | 343 | ||||||
| CF Hippolyta LLC, Series 2020-1, Class B1, 2.28% 20601,8 | 253 | 258 | ||||||
| 20 | American Funds Multi-Sector Income Fund |
| Bonds, notes & other debt instruments (continued) | Principal amount (000) | Value (000) | ||||||
| Asset-backed obligations (continued) | ||||||||
| CF Hippolyta LLC, Series 2020-1, Class B2, 2.60% 20601,8 | $ | 95 | $ | 97 | ||||
| CLI Funding V LLC, Series 2020-2A, Class A, 2.03% 20451,8 | 382 | 385 | ||||||
| CLI Funding V LLC, Series 2020-1A, Class A, 2.08% 20451,8 | 488 | 495 | ||||||
| CLI Funding V LLC, Series 2020-2A, Class B, 3.56% 20451,8 | 285 | 291 | ||||||
| CLI Funding V LLC, Series 2020-1A, Class B, 3.62% 20451,8 | 350 | 354 | ||||||
| CPS Auto Receivables Trust, Series 2020-B, Class C, 3.30% 20261,8 | 150 | 156 | ||||||
| CPS Auto Receivables Trust, Series 2020-B, Class D, 4.75% 20261,8 | 100 | 108 | ||||||
| Credit Acceptance Auto Loan Trust, Series 2020-2A, Class B, 1.93% 20291,8 | 300 | 304 | ||||||
| Credit Acceptance Auto Loan Trust, Series 2020-2A, Class C, 2.73% 20291,8 | 300 | 308 | ||||||
| Drive Auto Receivables Trust, Series 2020-2, Class C, 2.28% 20268 | 200 | 207 | ||||||
| Drive Auto Receivables Trust, Series 2020-2, Class D, 3.05% 20288 | 200 | 211 | ||||||
| Drivetime Auto Owner Trust, Series 2020-2A, Class C, 3.28% 20261,8 | 250 | 263 | ||||||
| Drivetime Auto Owner Trust, Series 2020-2A, Class D, 4.73% 20261,8 | 850 | 928 | ||||||
| Exeter Automobile Receivables Trust, Series 2020-2A, Class C, 3.28% 20251,8 | 100 | 105 | ||||||
| Exeter Automobile Receivables Trust, Series 2020-2, Class D, 4.73% 20261,8 | 100 | 109 | ||||||
| GCI Funding I LLC, Series 2020-1, Class A, 2.82% 20451,8 | 438 | 440 | ||||||
| GCI Funding I LLC, Series 2020-1, Class B, 3.81% 20451,8 | 155 | 151 | ||||||
| Global SC Finance V SRL, Series 2019-1A, Class B, 4.81% 20391,8 | 430 | 432 | ||||||
| Global SC Finance V SRL, Series 2020-1A, Class A, 2.17% 20401,8 | 740 | 749 | ||||||
| Global SC Finance V SRL, Series 2020-1A, Class B, 3.55% 20401,8 | 487 | 493 | ||||||
| Global SC Finance VII SRL, Series 2020-2A, Class A, 2.26% 20401,8 | 393 | 398 | ||||||
| Global SC Finance VII SRL, Series 2020-2A, Class B, 3.32% 20401,8 | 295 | 299 | ||||||
| GM Financial Automobile Leasing Trust, Series 2020-2, Class B, 1.56% 20248 | 100 | 102 | ||||||
| GM Financial Automobile Leasing Trust, Series 2020-2, Class C, 2.56% 20248 | 100 | 103 | ||||||
| GM Financial Automobile Leasing Trust, Series 2020-2, Class D, 3.21% 20248 | 100 | 104 | ||||||
| GM Financial Automobile Leasing Trust, Series 2020-4, Class C, 1.05% 20268 | 200 | 201 | ||||||
| Hertz Vehicle Financing LLC, Rental Car Asset-Backed Notes, Series 2015-3A, Class A, 2.67% 20211,8 | 54 | 54 | ||||||
| Hertz Vehicle Financing LLC, Rental Car Asset-Backed Notes, Series 2016-4A, Class A, 2.65% 20221,8 | 107 | 108 | ||||||
| Hertz Vehicle Financing LLC, Rental Car Asset-Backed Notes, Series 2018-2A, Class A 3.65% 20221,8 | 50 | 50 | ||||||
| Hertz Vehicle Financing LLC, Rental Car Asset-Backed Notes, Series 2019-1A, Class A, 3.71% 20231,8 | 98 | 99 | ||||||
| Hertz Vehicle Financing LLC, Rental Car Asset-Backed Notes, Series 2019-3A, Class A, 2.67% 20251,8 | 166 | 166 | ||||||
| Hertz Vehicle Financing LLC, Rental Car Asset-Backed Notes, Series 2019-2A, Class A, 3.42% 20251,8 | 913 | 917 | ||||||
| OSW Structured Asset Trust, Series 2020-RPL1, Class A1, 3.072% 20601,6,8 | 740 | 757 | ||||||
| Palmer Square Ltd., Series 2015-1A, Class A2R3, (3-month USD-LIBOR + 1.40%) 1.645% 20291,6,8 | 463 | 463 | ||||||
| Palmer Square Ltd., Series 2015-1A, Class BR3, (3-month USD-LIBOR + 2.00%) 2.245% 20291,6,8 | 500 | 500 | ||||||
| Prestige Auto Receivables Trust, Series 2020-1A, Class C, 1.31% 20261,8 | 500 | 503 | ||||||
| Prestige Auto Receivables Trust, Series 2020-1A, Class D, 1.62% 20261,8 | 750 | 755 | ||||||
| Santander Consumer Auto Receivables Trust, Series 2020-A, Class C, 3.71% 20261,8 | 200 | 215 | ||||||
| Santander Drive Auto Receivables Trust, Series 2020-2, Class C, 1.46% 20258 | 250 | 253 | ||||||
| Santander Drive Auto Receivables Trust, Series 2020-2, Class D, 2.22% 20268 | 250 | 257 | ||||||
| Santander Drive Auto Receivables Trust, Series 2020-4, Class D, 1.48% 20278 | 1,000 | 1,011 | ||||||
| TAL Advantage V LLC, Series 2020-1A, Class A, 2.05% 20451,8 | 195 | 197 | ||||||
| TAL Advantage V LLC, Series 2020-1A, Class B, 3.29% 20451,8 | 170 | 173 | ||||||
| Textainer Marine Containers Ltd., Series 2020-2A, Class A, 2.10% 20451,8 | 201 | 205 | ||||||
| Textainer Marine Containers Ltd., Series 2020-2A, Class B, 3.34% 20451,8 | 475 | 482 | ||||||
| Textainer Marine Containers Ltd., Series 2020-1A, Class B, 4.94% 20451,8 | 579 | 608 | ||||||
| Towd Point Mortgage Trust, Series 2018-4, Class A1, 3.00% 20581,6,8 | 145 | 154 | ||||||
| Triton Container Finance LLC, Series 2020-1A, Class A, 2.11% 20451,8 | 979 | 993 | ||||||
| Triton Container Finance LLC, Series 2020-1, Class B, 3.74% 20451,8 | 431 | 440 | ||||||
| Westlake Automobile Receivables Trust, Series 2020-3A, Class C, 1.24% 20251,8 | 156 | 157 | ||||||
| Westlake Automobile Receivables Trust, Series 2020-2, Class C, 2.01% 20251,8 | 300 | 306 | ||||||
| Westlake Automobile Receivables Trust, Series 2020-3A, Class D, 1.65% 20261,8 | 302 | 306 | ||||||
| Westlake Automobile Receivables Trust, Series 2020-2, Class D, 2.76% 20261,8 | 300 | 311 | ||||||
| 25,284 | ||||||||
| American Funds Multi-Sector Income Fund | 21 |
| Bonds, notes & other debt instruments (continued) | Principal amount (000) | Value (000) | ||||||
| Municipals 0.92% | ||||||||
| California 0.01% | ||||||||
| Regents of the University of California, General Rev. Bonds, Series 2020-BG, 1.614% 2030 | $ | 35 | $ | 35 | ||||
| Florida 0.01% | ||||||||
| County of Broward, Airport System Rev. Ref. Bonds, Series 2019-C, 3.477% 2043 | 75 | 78 | ||||||
| Illinois 0.29% | ||||||||
| City of Chicago, Board of Education, Unlimited Tax G.O. Rev. Ref. Bonds (Dedicated Rev.), Series 2018-A, Assured Guaranty Municipal insured, 5.00% 2034 | 150 | 173 | ||||||
| G.O. Bonds, Pension Funding Series 2003, 5.10% 2033 | 90 | 97 | ||||||
| G.O. Bonds, Series 2017-A, 5.00% 2022 | 270 | 289 | ||||||
| G.O. Bonds, Series 2020, 5.125% 2022 | 500 | 526 | ||||||
| Metropolitan Pier and Exposition Auth., McCormick Place Expansion Project Rev. Ref. Bonds, Capital Appreciation Bonds, Series 2017-A, Assured Guaranty Municipal insured, 0% 2056 | 1,810 | 551 | ||||||
| 1,636 | ||||||||
| Ohio 0.16% | ||||||||
| Higher Educational Facs. Auth., Healthcare Fac. Rev. Bonds (Judson Obligated Group 2020 Project), Series 2020-A, 3.75% 2023 | 895 | 903 | ||||||
| Puerto Rico 0.05% | ||||||||
| Aqueduct and Sewer Auth., Rev. Bonds, Series 2012-B, 5.35% 2027 | 150 | 150 | ||||||
| Sales Tax Fncg. Corp., Sales Tax Rev. Restructured Bonds, Series 2018-A-1, 5.00% 2058 | 100 | 112 | ||||||
| 262 | ||||||||
| South Carolina 0.02% | ||||||||
| Public Service Auth., Rev. Obligations (Santee Cooper), Series 2015-E, 5.25% 2055 | 30 | 36 | ||||||
| Public Service Auth., Rev. Ref. Obligations (Santee Cooper), Series 2016-C, 5.00% 2035 | 50 | 61 | ||||||
| 97 | ||||||||
| Texas 0.02% | ||||||||
| New Hope Cultural Education Facs. Fin. Corp., Retirement Fac. Rev. Bonds (Morningside Ministries Project), Series 2020-B, 3.75% 2022 | 100 | 100 | ||||||
| Washington 0.36% | ||||||||
| Econ. Dev. Fin. Auth., Environmental Facs. Rev. Bonds (North Pacific Paper Co. Recycling Project), Series 2020-B, 9.00% 20361 | 2,000 | 1,976 | ||||||
| Total municipals | 5,087 | |||||||
| U.S. Treasury bonds & notes 0.36% | ||||||||
| U.S. Treasury 0.36% | ||||||||
| U.S. Treasury 0.25% 202510 | 20 | 20 | ||||||
| U.S. Treasury 0.50% 202710 | 118 | 117 | ||||||
| U.S. Treasury 0.875% 203010 | 1,222 | 1,218 | ||||||
| U.S. Treasury 1.375% 205010 | 704 | 659 | ||||||
| 2,014 | ||||||||
| Total bonds, notes & other debt instruments (cost: $481,203,000) | 506,614 | |||||||
| Convertible bonds & notes 0.00% | ||||||||
| Energy 0.00% | ||||||||
| Mesquite Energy Inc., convertible notes, 15.04% 2023 (100% PIK)1,7,9,11 | 2 | 2 | ||||||
| Total convertible bonds & notes (cost: $2,000) | 2 | |||||||
| Common stocks 0.06% | Shares | |||||||
| Industrials 0.03% | ||||||||
| Associated Materials Group Inc.9,11,12 | 23,582 | 148 | ||||||
| ACR III LSC Holdings LLC9,11,12 | 5 | 8 | ||||||
| 156 | ||||||||
| 22 | American Funds Multi-Sector Income Fund |
| Common stocks (continued) | Shares | Value (000) | ||||||
| Energy 0.01% | ||||||||
| Denbury Inc.12 | 1,183 | $ | 30 | |||||
| California Resources Corp.12 | 633 | 15 | ||||||
| Whiting Petroleum Corp.12 | 466 | 12 | ||||||
| Oasis Petroleum Inc.12 | 218 | 8 | ||||||
| Mesquite Energy, Inc.9,11,12 | 126 | 1 | ||||||
| 66 | ||||||||
| Materials 0.01% | ||||||||
| Hexion Holdings Corp., Class B12 | 4,181 | 51 | ||||||
| Consumer discretionary 0.01% | ||||||||
| MYT Holding Co., Class B9,12 | 8,984 | 24 | ||||||
| NMG Parent LLC9,12 | 281 | 19 | ||||||
| NMG Parent LLC1,9,11,12 | 28 | 1 | ||||||
| 44 | ||||||||
| Total common stocks (cost: $439,000) | 317 | |||||||
| Rights & warrants 0.00% | ||||||||
| Consumer discretionary 0.00% | ||||||||
| NMG Parent LLC, warrants, expire 20279,12 | 374 | 1 | ||||||
| Total rights & warrants (cost: $2,000) | 1 | |||||||
| Short-term securities 7.72% | ||||||||
| Money market investments 7.72% | ||||||||
| Capital Group Central Cash Fund 0.12%13,14 | 428,447 | 42,849 | ||||||
| Total short-term securities (cost: $42,849,000) | 42,849 | |||||||
| Total investment securities 99.01% (cost: $524,495,000) | 549,783 | |||||||
| Other assets less liabilities 0.99% | 5,497 | |||||||
| Net assets 100.00% | $ | 555,280 | ||||||
Futures contracts
| Notional | Value at | Unrealized appreciation (depreciation) | ||||||||||||||||
| Number of | amount | 15 | 12/31/2020 | 16 | at 12/31/2020 | |||||||||||||
| Contracts | Type | contracts | Expiration | (000) | (000) | (000) | ||||||||||||
| 2 Year U.S. Treasury Note Futures | Long | 40 | April 2021 | $ | 8,000 | $ | 8,839 | $ | 8 | |||||||||
| 5 Year U.S. Treasury Note Futures | Short | 534 | April 2021 | (53,400 | ) | (67,372 | ) | (141 | ) | |||||||||
| 10 Year U.S. Treasury Note Futures | Long | 83 | March 2021 | 8,300 | 11,461 | 15 | ||||||||||||
| 10 Year Ultra U.S. Treasury Note Futures | Short | 41 | March 2021 | (4,100 | ) | (6,411 | ) | 14 | ||||||||||
| 20 Year U.S. Treasury Bond Futures | Long | 20 | March 2021 | 2,000 | 3,464 | (32 | ) | |||||||||||
| 30 Year Ultra U.S. Treasury Bond Futures | Long | 114 | March 2021 | 11,400 | 24,346 | (135 | ) | |||||||||||
| $ | (271 | ) | ||||||||||||||||
Forward currency contracts
| Contract amount | Unrealized depreciation | ||||||||||
| Purchases (000) | Sales (000) | Counterparty | Settlement date | at 12/31/2020 (000) | |||||||
| USD18 | EUR15 | Bank of New York Mellon | 1/8/2021 | $ | — | 3 | |||||
| USD177 | EUR145 | HSBC Bank | 1/25/2021 | (1 | ) | ||||||
| $ | (1 | ) | |||||||||
| American Funds Multi-Sector Income Fund | 23 |
Swap contracts
Credit default swaps
Centrally cleared credit default swaps on credit indices — buy protection
| Receive | Pay/ Payment frequency | Expiration date | Notional (000) | Value at 12/31/2020 (000) | Upfront premium paid (received) (000) | Unrealized depreciation at 12/31/2020 (000) | ||||||||||||||
| CDX.NA.IG.34 | 1.00%/Quarterly | 6/20/2025 | $ | 2,500 | $ | (41 | ) | $ | 38 | $ | (79 | ) | ||||||||
| CDX.NA.HY.35 | 5.00%/Quarterly | 12/20/2025 | 4,250 | (396 | ) | (167 | ) | (229 | ) | |||||||||||
| $ | (129 | ) | $ | (308 | ) | |||||||||||||||
Investments in affiliates14
| Value of affiliate at 1/1/2020 (000) | Additions (000) | Reductions (000) | Net realized gain (000) | Net unrealized depreciation (000) | Value of affiliate at 12/31/2020 (000) | Dividend income (000) | ||||||||||||||||||||||
| Short-term securities 7.72% | ||||||||||||||||||||||||||||
| Money market investments 7.72% | ||||||||||||||||||||||||||||
| Capital Group Central Cash Fund 0.12%13 | $ | 858 | $ | 219,457 | $ | 177,468 | $ | 5 | $ | (3 | ) | $ | 42,849 | $ | 30 | |||||||||||||
| 1 | Acquired in a transaction exempt from registration under Rule 144A of the Securities Act of 1933. May be resold in the U.S. in transactions exempt from registration, normally to qualified institutional buyers. The total value of all such securities was $300,246,000, which represented 54.07% of the net assets of the fund. |
| 2 | Scheduled interest and/or principal payment was not received. |
| 3 | Amount less than one thousand. |
| 4 | Step bond; coupon rate may change at a later date. |
| 5 | Loan participations and assignments; may be subject to legal or contractual restrictions on resale. The total value of all such loans was $7,663,000, which represented 1.38% of the net assets of the fund. |
| 6 | Coupon rate may change periodically. Reference rate and spread are as of the most recent information available. Some coupon rates are determined by the issuer or agent based on current market conditions; therefore, the reference rate and spread are not available. |
| 7 | Payment in kind; the issuer has the option of paying additional securities in lieu of cash. Most recent payment was 100% cash unless otherwise noted. |
| 8 | Principal payments may be made periodically. Therefore, the effective maturity date may be earlier than the stated maturity date. |
| 9 | Valued under fair value procedures adopted by authority of the board of trustees. The total value of all such securities was $1,504,000, which represented .27% of the net assets of the fund. |
| 10 | All or a portion of this security was pledged as collateral. The total value of pledged collateral was $351,000, which represented .06% of the net assets of the fund. |
| 11 | Value determined using significant unobservable inputs. |
| 12 | Security did not produce income during the last 12 months. |
| 13 | Rate represents the seven-day yield at 12/31/2020. |
| 14 | Part of the same group of investment companies as the fund as defined under the Investment Company Act of 1940. |
| 15 | Notional amount is calculated based on the number of contracts and notional contract size. |
| 16 | Value is calculated based on the notional amount and current market price. |
Key to abbreviations and symbols
Auth. = Authority
Dev. = Development
Econ. = Economic
EUR/€ = Euros
Fac. = Facility
Facs. = Facilities
Fin. = Finance
Fncg. = Financing
G.O. = General Obligation
LIBOR = London Interbank Offered Rate
Ref. = Refunding
Rev. = Revenue
SOFR = Secured Overnight Financing Rate
USD/$ = U.S. dollars
See notes to financial statements.
| 24 | American Funds Multi-Sector Income Fund |
Financial statements
| Statement of assets and liabilities | |
| at December 31, 2020 | (dollars in thousands) |
| Assets: | ||||||||
| Investment securities, at value: | ||||||||
| Unaffiliated issuers (cost: $481,646) | $ | 506,934 | ||||||
| Affiliated issuers (cost: $42,849) | 42,849 | $ | 549,783 | |||||
| Cash | 1,179 | |||||||
| Cash collateral pledged for futures contracts | 919 | |||||||
| Receivables for: | ||||||||
| Sales of investments | 2,326 | |||||||
| Sales of fund’s shares | 4,035 | |||||||
| Dividends and interest | 5,692 | |||||||
| Variation margin on futures contracts | 104 | |||||||
| Other | 1 | 12,158 | ||||||
| 564,039 | ||||||||
| Liabilities: | ||||||||
| Unrealized depreciation on open forward currency contracts | 1 | |||||||
| Payables for: | ||||||||
| Purchases of investments | 7,735 | |||||||
| Repurchases of fund’s shares | 422 | |||||||
| Dividends on fund’s shares | 294 | |||||||
| Investment advisory services | 195 | |||||||
| Services provided by related parties | 68 | |||||||
| Trustees’ deferred compensation | — | * | ||||||
| Variation margin on futures contracts | 34 | |||||||
| Variation margin on swap contracts | 7 | |||||||
| Other | 3 | 8,758 | ||||||
| Net assets at December 31, 2020 | $ | 555,280 | ||||||
| Net assets consist of: | ||||||||
| Capital paid in on shares of beneficial interest | $ | 529,077 | ||||||
| Total distributable earnings | 26,203 | |||||||
| Net assets at December 31, 2020 | $ | 555,280 | ||||||
| * | Amount less than one thousand. |
See notes to financial statements.
| American Funds Multi-Sector Income Fund | 25 |
| Statement of assets and liabilities | |
| at December 31, 2020 (continued) | (dollars and shares in thousands, except per-share amounts) |
Shares of beneficial interest issued and outstanding (no stated par value) —
unlimited shares authorized (51,367 total shares outstanding)
| Net assets | Shares outstanding | Net asset value per share | ||||||||||
| Class A | $ | 356,047 | 32,937 | $ | 10.81 | |||||||
| Class C | 10,032 | 928 | 10.81 | |||||||||
| Class T | 28 | 3 | 10.81 | |||||||||
| Class F-1 | 7,000 | 647 | 10.81 | |||||||||
| Class F-2 | 119,125 | 11,020 | 10.81 | |||||||||
| Class F-3 | 54,992 | 5,087 | 10.81 | |||||||||
| Class 529-A | 2,386 | 221 | 10.81 | |||||||||
| Class 529-C | 137 | 13 | 10.81 | |||||||||
| Class 529-E | 63 | 6 | 10.81 | |||||||||
| Class 529-T | 29 | 3 | 10.81 | |||||||||
| Class 529-F-1 | 29 | 3 | 10.81 | |||||||||
| Class 529-F-2 | 1,238 | 114 | 10.81 | |||||||||
| Class 529-F-3 | 11 | 1 | 10.81 | |||||||||
| Class R-1 | 91 | 8 | 10.81 | |||||||||
| Class R-2 | 142 | 13 | 10.81 | |||||||||
| Class R-2E | 28 | 3 | 10.81 | |||||||||
| Class R-3 | 499 | 46 | 10.81 | |||||||||
| Class R-4 | 1,992 | 184 | 10.81 | |||||||||
| Class R-5E | 95 | 9 | 10.81 | |||||||||
| Class R-5 | 112 | 10 | 10.81 | |||||||||
| Class R-6 | 1,204 | 111 | 10.81 | |||||||||
See notes to financial statements.
| 26 | American Funds Multi-Sector Income Fund |
Financial statements (continued)
| Statement of operations | |
| for the year ended December 31, 2020 | (dollars in thousands) |
| Investment income: | ||||||||
| Income: | ||||||||
| Interest (net of non-U.S. taxes of $1) | $ | 11,450 | ||||||
| Dividends from affiliated issuers | 30 | $ | 11,480 | |||||
| Fees and expenses*: | ||||||||
| Investment advisory services | 1,056 | |||||||
| Distribution services | 573 | |||||||
| Transfer agent services | 105 | |||||||
| Administrative services | 72 | |||||||
| Reports to shareholders | 34 | |||||||
| Registration statement and prospectus | 512 | |||||||
| Trustees’ compensation | — | † | ||||||
| Auditing and legal | 61 | |||||||
| Custodian | 25 | |||||||
| Other | 17 | |||||||
| Total fees and expenses before waiver/reimbursements | 2,455 | |||||||
| Less waiver/reimbursements of fees and expenses: | ||||||||
| Transfer agent services waiver | 6 | |||||||
| Transfer agent services reimbursements | — | † | ||||||
| Miscellaneous fee reimbursement | 551 | |||||||
| Total fees and expenses after waiver/reimbursements | 1,898 | |||||||
| Net investment income | 9,582 | |||||||
| Net realized gain and unrealized appreciation: | ||||||||
| Net realized gain (loss) on: | ||||||||
| Investments: | ||||||||
| Unaffiliated issuers | 4,618 | |||||||
| Affiliated issuers | 5 | |||||||
| Futures contracts | (702 | ) | ||||||
| Forward currency contracts | (14 | ) | ||||||
| Swap contracts | 283 | 4,190 | ||||||
| Net unrealized appreciation (depreciation) on: | ||||||||
| Investments: | ||||||||
| Unaffiliated issuers | 24,021 | |||||||
| Affiliated issuers | (3 | ) | ||||||
| Futures contracts | (293 | ) | ||||||
| Swap contracts | (219 | ) | ||||||
| Currency translations | 1 | 23,507 | ||||||
| Net realized gain and unrealized appreciation | 27,697 | |||||||
| Net increase in net assets resulting from operations | $ | 37,279 | ||||||
| * | Additional information related to class-specific fees and expenses is included in the notes to financial statements. |
| † | Amount less than one thousand. |
See notes to financial statements.
| American Funds Multi-Sector Income Fund | 27 |
Financial statements (continued)
Statements of changes in net assets
(dollars in thousands)
| Year ended December 31, 2020 | For the period March 22, 2019* to December 31, 2019 | |||||||
| Operations: | ||||||||
| Net investment income | $ | 9,582 | $ | 1,835 | ||||
| Net realized gain | 4,190 | 813 | ||||||
| Net unrealized appreciation | 23,507 | 1,202 | ||||||
| Net increase in net assets resulting from operations | 37,279 | 3,850 | ||||||
| Distributions paid or accrued to shareholders | (12,495 | ) | (2,228 | ) | ||||
| Net capital share transactions | 478,874 | 50,000 | ||||||
| Total increase in net assets | 503,658 | 51,622 | ||||||
| Net assets: | ||||||||
| Beginning of period | 51,622 | — | ||||||
| End of period | $ | 555,280 | $ | 51,622 | ||||
| * | Commencement of operations. |
See notes to financial statements.
| 28 | American Funds Multi-Sector Income Fund |
Notes to financial statements
1. Organization
American Funds Multi-Sector Income Fund (the “fund”) is registered under the Investment Company Act of 1940 as an open-end, diversified management investment company. The fund seeks to provide a high level of current income. Its secondary investment objective is capital appreciation.
The fund has 21 share classes consisting of six retail share classes (Classes A, C, T, F-1, F-2 and F-3), seven 529 college savings plan share classes (Classes 529-A, 529-C, 529-E, 529-T, 529-F-1, 529-F-2 and 529-F-3) and eight retirement plan share classes (Classes R-1, R-2, R-2E, R-3, R-4, R-5E, R-5 and R-6). The 529 college savings plan share classes can be used to save for college education. The retirement plan share classes are generally offered only through eligible employer-sponsored retirement plans. The fund’s share classes are described further in the following table:
| Share class | Initial sales charge | Contingent deferred sales charge upon redemption | Conversion feature | ||||
| Classes A and 529-A | Up to 3.75% for Class A; up to 3.50% for Class 529-A1 | None (except 1% for certain redemptions within 18 months of purchase without an initial sales charge) | None | ||||
| Classes C and 529-C | None | 1% for redemptions within one year of purchase | Class C converts to Class A after eight years and Class 529-C converts to Class 529-A after five years2 | ||||
| Class 529-E | None | None | None | ||||
| Classes T and 529-T3 | Up to 2.50% | None | None | ||||
| Classes F-1, F-2, F-3, 529-F-1, 529-F-2 and 529-F-3 | None | None | None | ||||
| Classes R-1, R-2, R-2E, R-3, R-4, R-5E, R-5 and R-6 | None | None | None |
| 1 | Prior to June 30, 2020, the initial sales charge was up to 5.75% for Class 529-A purchases. |
| 2 | Prior to June 30, 2020, Class C converted to Class F-1 and Class 529-C converted to Class 529-A after ten years. |
| 3 | Class T and 529-T shares are not available for purchase. |
Holders of all share classes have equal pro rata rights to the assets, dividends and liquidation proceeds of the fund. Each share class has identical voting rights, except for the exclusive right to vote on matters affecting only its class. Share classes have different fees and expenses (“class-specific fees and expenses”), primarily due to different arrangements for distribution, transfer agent and administrative services. Differences in class-specific fees and expenses will result in differences in net investment income and, therefore, the payment of different per-share dividends by each share class.
2. Significant accounting policies
The fund is an investment company that applies the accounting and reporting guidance issued in Topic 946 by the U.S. Financial Accounting Standards Board. The fund’s financial statements have been prepared to comply with U.S. generally accepted accounting principles (“U.S. GAAP”). These principles require the fund’s investment adviser to make estimates and assumptions that affect reported amounts and disclosures. Actual results could differ from those estimates. Subsequent events, if any, have been evaluated through the date of issuance in the preparation of the financial statements. The fund follows the significant accounting policies described in this section, as well as the valuation policies described in the next section on valuation.
Security transactions and related investment income — Security transactions are recorded by the fund as of the date the trades are executed with brokers. Realized gains and losses from security transactions are determined based on the specific identified cost of the securities. In the event a security is purchased with a delayed payment date, the fund will segregate liquid assets sufficient to meet its payment obligations. Dividend income is recognized on the ex-dividend date and interest income is recognized on an accrual basis. Market discounts, premiums and original issue discounts on fixed-income securities are amortized daily over the expected life of the security.
Class allocations — Income, fees and expenses (other than class-specific fees and expenses) are allocated daily among the various share classes based on the relative value of their settled shares. Realized gains and losses and unrealized appreciation and depreciation are allocated daily among the various share classes based on their relative net assets. Class-specific fees and expenses, such as distribution, transfer agent and administrative services, are charged directly to the respective share class.
| American Funds Multi-Sector Income Fund | 29 |
Distributions paid or accrued to shareholders — Income dividends are declared daily after the determination of the fund’s net investment income and are paid to shareholders monthly. Capital gain distributions are recorded on the ex-dividend date.
Currency translation — Assets and liabilities, including investment securities, denominated in currencies other than U.S. dollars are translated into U.S. dollars at the exchange rates supplied by one or more pricing vendors on the valuation date. Purchases and sales of investment securities and income and expenses are translated into U.S. dollars at the exchange rates on the dates of such transactions. The effects of changes in exchange rates on investment securities are included with the net realized gain or loss and net unrealized appreciation or depreciation on investments in the fund’s statement of operations. The realized gain or loss and unrealized appreciation or depreciation resulting from all other transactions denominated in currencies other than U.S. dollars are disclosed separately.
3. Valuation
Capital Research and Management Company (“CRMC”), the fund’s investment adviser, values the fund’s investments at fair value as defined by U.S. GAAP. The net asset value per share is calculated once daily as of the close of regular trading on the New York Stock Exchange, normally 4 p.m. New York time, each day the New York Stock Exchange is open.
Methods and inputs — The fund’s investment adviser uses the following methods and inputs to establish the fair value of the fund’s assets and liabilities. Use of particular methods and inputs may vary over time based on availability and relevance as market and economic conditions evolve.
Equity securities are generally valued at the official closing price of, or the last reported sale price on, the exchange or market on which such securities are traded, as of the close of business on the day the securities are being valued or, lacking any sales, at the last available bid price. Prices for each security are taken from the principal exchange or market on which the security trades.
Fixed-income securities, including short-term securities, are generally valued at prices obtained from one or more pricing vendors. Vendors value such securities based on one or more of the inputs described in the following table. The table provides examples of inputs that are commonly relevant for valuing particular classes of fixed-income securities in which the fund is authorized to invest. However, these classifications are not exclusive, and any of the inputs may be used to value any other class of fixed-income security.
| Fixed-income class | Examples of standard inputs |
| All | Benchmark yields, transactions, bids, offers, quotations from dealers and trading systems, new issues, spreads and other relationships observed in the markets among comparable securities; and proprietary pricing models such as yield measures calculated using factors such as cash flows, financial or collateral performance and other reference data (collectively referred to as “standard inputs”) |
| Corporate bonds, notes & loans; convertible securities | Standard inputs and underlying equity of the issuer |
| Bonds & notes of governments & government agencies | Standard inputs and interest rate volatilities |
| Mortgage-backed; asset-backed obligations | Standard inputs and cash flows, prepayment information, default rates, delinquency and loss assumptions, collateral characteristics, credit enhancements and specific deal information |
| Municipal securities | Standard inputs and, for certain distressed securities, cash flows or liquidation values using a net present value calculation based on inputs that include, but are not limited to, financial statements and debt contracts |
When the fund’s investment adviser deems it appropriate to do so (such as when vendor prices are unavailable or deemed to be not representative), fixed-income securities will be valued in good faith at the mean quoted bid and ask prices that are reasonably and timely available (or bid prices, if ask prices are not available) or at prices for securities of comparable maturity, quality and type.
Securities with both fixed-income and equity characteristics, or equity securities traded principally among fixed-income dealers, are generally valued in the manner described for either equity or fixed-income securities, depending on which method is deemed most appropriate by the fund’s investment adviser. The Capital Group Central Cash Fund (“CCF”), a fund within the Capital Group Central Fund Series (“Central Funds”), is valued based upon a floating net asset value, which fluctuates with changes in the value of CCF’s portfolio securities. The underlying securities are valued based on the policies and procedures in CCF’s statement of additional information. Exchange-traded futures are generally valued at the official settlement price of the exchange or market on which such instruments are traded, as of the close of business on the day the futures are being valued. Forward currency contracts are valued based on the spot and forward exchange rates obtained from one or more pricing vendors. Interest rate swaps and credit default swaps are generally valued by pricing vendors based on market inputs that include the index and term of index, reset frequency, payer/receiver, currency and pay frequency.
| 30 | American Funds Multi-Sector Income Fund |
Securities and other assets for which representative market quotations are not readily available or are considered unreliable by the fund’s investment adviser are fair valued as determined in good faith under fair valuation guidelines adopted by authority of the fund’s board of trustees as further described. The investment adviser follows fair valuation guidelines, consistent with U.S. Securities and Exchange Commission rules and guidance, to consider relevant principles and factors when making fair value determinations. The investment adviser considers relevant indications of value that are reasonably and timely available to it in determining the fair value to be assigned to a particular security, such as the type and cost of the security; contractual or legal restrictions on resale of the security; relevant financial or business developments of the issuer; actively traded similar or related securities; conversion or exchange rights on the security; related corporate actions; significant events occurring after the close of trading in the security; and changes in overall market conditions. In addition, the closing prices of equity securities that trade in markets outside U.S. time zones may be adjusted to reflect significant events that occur after the close of local trading but before the net asset value of each share class of the fund is determined. Fair valuations and valuations of investments that are not actively trading involve judgment and may differ materially from valuations that would have been used had greater market activity occurred.
Processes and structure — The fund’s board of trustees has delegated authority to the fund’s investment adviser to make fair value determinations, subject to board oversight. The investment adviser has established a Joint Fair Valuation Committee (the “Fair Valuation Committee”) to administer, implement and oversee the fair valuation process, and to make fair value decisions. The Fair Valuation Committee regularly reviews its own fair value decisions, as well as decisions made under its standing instructions to the investment adviser’s valuation teams. The Fair Valuation Committee reviews changes in fair value measurements from period to period and may, as deemed appropriate, update the fair valuation guidelines to better reflect the results of back testing and address new or evolving issues. The Fair Valuation Committee reports any changes to the fair valuation guidelines to the board of trustees. The fund’s board and audit committee also regularly review reports that describe fair value determinations and methods.
The fund’s investment adviser has also established a Fixed-Income Pricing Review Group to administer and oversee the fixed-income valuation process, including the use of fixed-income pricing vendors. This group regularly reviews pricing vendor information and market data. Pricing decisions, processes and controls over security valuation are also subject to additional internal reviews, including an annual control self-evaluation program facilitated by the investment adviser’s compliance group.
Classifications — The fund’s investment adviser classifies the fund’s assets and liabilities into three levels based on the inputs used to value the assets or liabilities. Level 1 values are based on quoted prices in active markets for identical securities. Level 2 values are based on significant observable market inputs, such as quoted prices for similar securities and quoted prices in inactive markets. Certain securities trading outside the U.S. may transfer between Level 1 and Level 2 due to valuation adjustments resulting from significant market movements following the close of local trading. Level 3 values are based on significant unobservable inputs that reflect the investment adviser’s determination of assumptions that market participants might reasonably use in valuing the securities. The valuation levels are not necessarily an indication of the risk or liquidity associated with the underlying investment. For example, U.S. government securities are reflected as Level 2 because the inputs used to determine fair value may not always be quoted prices in an active market. The following tables present the fund’s valuation levels as of December 31, 2020 (dollars in thousands):
| Investment securities | ||||||||||||||||
| Level 1 | Level 2 | Level 3 | Total | |||||||||||||
| Assets: | ||||||||||||||||
| Bonds, notes & other debt instruments: | ||||||||||||||||
| Corporate bonds, notes & loans | $ | — | $ | 375,251 | $ | — | $ | 375,251 | ||||||||
| Bonds & notes of governments & government agencies outside the U.S. | — | 50,529 | — | 50,529 | ||||||||||||
| Mortgage-backed obligations | — | 48,449 | — | 48,449 | ||||||||||||
| Asset-backed obligations | — | 25,284 | — | 25,284 | ||||||||||||
| Municipals | — | 5,087 | — | 5,087 | ||||||||||||
| U.S. Treasury bonds & notes | — | 2,014 | — | 2,014 | ||||||||||||
| Convertible bonds & notes | — | — | 2 | 2 | ||||||||||||
| Common stocks | 116 | 43 | 158 | 317 | ||||||||||||
| Rights & warrants | — | 1 | — | 1 | ||||||||||||
| Short-term securities | 42,849 | — | — | 42,849 | ||||||||||||
| Total | $ | 42,965 | $ | 506,658 | $ | 160 | $ | 549,783 | ||||||||
| American Funds Multi-Sector Income Fund | 31 |
| Other investments* | ||||||||||||||||
| Level 1 | Level 2 | Level 3 | Total | |||||||||||||
| Assets: | ||||||||||||||||
| Unrealized appreciation on futures contracts | $ | 37 | $ | — | $ | — | $ | 37 | ||||||||
| Liabilities: | ||||||||||||||||
| Unrealized depreciation on futures contracts | (308 | ) | — | — | (308 | ) | ||||||||||
| Unrealized depreciation on open forward currency contracts | — | (1 | ) | — | (1 | ) | ||||||||||
| Unrealized depreciation on credit default swaps | — | (308 | ) | — | (308 | ) | ||||||||||
| Total | $ | (271 | ) | $ | (309 | ) | $ | — | $ | (580 | ) | |||||
| * | Futures contracts, forward currency contracts and credit default swaps are not included in the investment portfolio. |
4. Risk factors
Investing in the fund may involve certain risks including, but not limited to, those described below.
Market conditions — The prices of, and the income generated by, the securities held by the fund may decline — sometimes rapidly or unpredictably — due to various factors, including events or conditions affecting the general economy or particular industries; overall market changes; local, regional or global political, social or economic instability; governmental, governmental agency or central bank responses to economic conditions; and currency exchange rate, interest rate and commodity price fluctuations.
Economies and financial markets throughout the world are highly interconnected. Economic, financial or political events, trading and tariff arrangements, wars, terrorism, cybersecurity events, natural disasters, public health emergencies (such as the spread of infectious disease) and other circumstances in one country or region, including actions taken by governmental or quasi-governmental authorities in response to any of the foregoing, could have impacts on global economies or markets. As a result, whether or not the fund invests in securities of issuers located in or with significant exposure to the countries affected, the value and liquidity of the fund’s investments may be negatively affected by developments in other countries and regions.
Issuer risks — The prices of, and the income generated by, securities held by the fund may decline in response to various factors directly related to the issuers of such securities, including reduced demand for an issuer’s goods or services, poor management performance, major litigation, investigations or other controversies related to the issuer, changes in government regulations affecting the issuer or its competitive environment and strategic initiatives such as mergers, acquisitions or dispositions and the market response to any such initiatives.
Investing in debt instruments — The prices of, and the income generated by, bonds and other debt securities held by the fund may be affected by factors such as the interest rates, maturities and credit ratings of these securities.
Rising interest rates will generally cause the prices of bonds and other debt securities to fall. A general rise in interest rates may cause investors to sell debt securities on a large scale, which could also adversely affect the price and liquidity of debt securities and could also result in increased redemptions from the fund. Falling interest rates may cause an issuer to redeem, call or refinance a debt security before its stated maturity, which may result in the fund failing to recoup the full amount of its initial investment and having to reinvest the proceeds in lower yielding securities. Longer maturity debt securities generally have greater sensitivity to changes in interest rates and may be subject to greater price fluctuations than shorter maturity debt securities.
Bonds and other debt securities are also subject to credit risk, which is the possibility that the credit strength of an issuer or guarantor will weaken or be perceived to be weaker, and/or an issuer of a debt security will fail to make timely payments of principal or interest and the security will go into default. A downgrade or default affecting any of the fund’s securities could cause the value of the fund’s shares to decrease. Lower quality debt securities generally have higher rates of interest and may be subject to greater price fluctuations than higher quality debt securities. Credit risk is gauged, in part, by the credit ratings of the debt securities in which the fund invests. However, ratings are only the opinions of the rating agencies issuing them and are not guarantees as to credit quality or an evaluation of market risk. The fund’s investment adviser relies on its own credit analysts to research issuers and issues in seeking to assess credit and default risks.
Investing in lower rated debt instruments — Lower rated bonds and other lower rated debt securities generally have higher rates of interest and involve greater risk of default or price declines due to changes in the issuer’s creditworthiness than those of higher quality debt securities. The market prices of these securities may fluctuate more than the prices of higher quality debt securities and may decline significantly in periods of general economic difficulty. These risks may be increased with respect to investments in junk bonds.
| 32 | American Funds Multi-Sector Income Fund |
Investing outside the U.S. — Securities of issuers domiciled outside the U.S., or with significant operations or revenues outside the U.S., may lose value because of adverse political, social, economic or market developments (including social instability, regional conflicts, terrorism and war) in the countries or regions in which the issuers operate or generate revenue. These securities may also lose value due to changes in foreign currency exchange rates against the U.S. dollar and/or currencies of other countries. Issuers of these securities may be more susceptible to actions of foreign governments, such as nationalization, currency blockage or the imposition of price controls or punitive taxes, each of which could adversely impact the value of these securities. Securities markets in certain countries may be more volatile and/or less liquid than those in the U.S. Investments outside the U.S. may also be subject to different accounting practices and different regulatory, legal and reporting standards and practices, and may be more difficult to value, than those in the U.S. In addition, the value of investments outside the U.S. may be reduced by foreign taxes, including foreign withholding taxes on interest and dividends. Further, there may be increased risks of delayed settlement of securities purchased or sold by the fund. The risks of investing outside the U.S. may be heightened in connection with investments in emerging markets.
Investing in emerging markets — Investing in emerging markets may involve risks in addition to and greater than those generally associated with investing in the securities markets of developed countries. For instance, emerging market countries may have less developed legal and accounting systems than those in developed countries. The governments of these countries may be less stable and more likely to impose capital controls, nationalize a company or industry, place restrictions on foreign ownership and on withdrawing sale proceeds of securities from the country, and/or impose punitive taxes that could adversely affect the prices of securities. In addition, the economies of these countries may be dependent on relatively few industries that are more susceptible to local and global changes. Securities markets in these countries can also be relatively small and have substantially lower trading volumes. As a result, securities issued in these countries may be more volatile and less liquid, and may be more difficult to value, than securities issued in countries with more developed economies and/or markets. Less certainty with respect to security valuations may lead to additional challenges and risks in calculating the fund’s net asset value. Additionally, emerging markets are more likely to experience problems with the clearing and settling of trades and the holding of securities by banks, agents and depositories that are less established than those in developed countries.
Investing in mortgage-related and other asset-backed securities — Mortgage-related securities, such as mortgage-backed securities, and other asset-backed securities, include debt obligations that represent interests in pools of mortgages or other income-bearing assets, such as consumer loans or receivables. While such securities are subject to the risks associated with investments in debt instruments generally (for example, credit, extension and interest rate risks), they are also subject to other and different risks. Mortgage-backed and other asset-backed securities are subject to changes in the payment patterns of borrowers of the underlying debt, potentially increasing the volatility of the securities and the fund’s net asset value. When interest rates fall, borrowers are more likely to refinance or prepay their debt before its stated maturity. This may result in the fund having to reinvest the proceeds in lower yielding securities, effectively reducing the fund’s income. Conversely, if interest rates rise and borrowers repay their debt more slowly than expected, the time in which the mortgage-backed and other asset-backed securities are paid off could be extended, reducing the fund’s cash available for reinvestment in higher yielding securities. Mortgage-backed securities are also subject to the risk that underlying borrowers will be unable to meet their obligations and the value of property that secures the mortgages may decline in value and be insufficient, upon foreclosure, to repay the associated loans. Investments in asset-backed securities are subject to similar risks.
Investing in derivatives — The use of derivatives involves a variety of risks, which may be different from, or greater than, the risks associated with investing in traditional securities, such as stocks and bonds. Changes in the value of a derivative may not correlate perfectly with, and may be more sensitive to market events than, the underlying asset, rate or index, and a derivative instrument may expose the fund to losses in excess of its initial investment. Derivatives may be difficult to value, difficult for the fund to buy or sell at an opportune time or price and difficult, or even impossible, to terminate or otherwise offset. The fund’s use of derivatives may result in losses to the fund, and investing in derivatives may reduce the fund’s returns and increase the fund’s price volatility. The fund’s counterparty to a derivative transaction (including, if applicable, the fund’s clearing broker, the derivatives exchange or the clearinghouse) may be unable or unwilling to honor its financial obligations in respect of the transaction. In certain cases, the fund may be hindered or delayed in exercising remedies against or closing out derivative instruments with a counterparty, which may result in additional losses.
Currency — The prices of, and the income generated by, many debt securities held by the fund may also be affected by changes in relative currency values. If the U.S. dollar appreciates against foreign currencies, the value in U.S. dollars of the fund’s securities denominated in such currencies would generally fall and vice versa. U.S. dollar-denominated securities of foreign issuers may also be affected by changes in relative currency values.
| American Funds Multi-Sector Income Fund | 33 |
Liquidity risk — Certain fund holdings may be or may become difficult or impossible to sell, particularly during times of market turmoil. Liquidity may be impacted by the lack of an active market for a holding, legal or contractual restrictions on resale, or the reduced number and capacity of market participants to make a market in such holding. Market prices for less liquid or illiquid holdings may be volatile, and reduced liquidity may have an adverse impact on the market price of such holdings. Additionally, the sale of less liquid or illiquid holdings may involve substantial delays (including delays in settlement) and additional costs and the fund may be unable to sell such holdings when necessary to meet its liquidity needs or may be forced to sell at a loss.
Management — The investment adviser to the fund actively manages the fund’s investments. Consequently, the fund is subject to the risk that the methods and analyses, including models, tools and data, employed by the investment adviser in this process may be flawed or incorrect and may not produce the desired results. This could cause the fund to lose value or its investment results to lag relevant benchmarks or other funds with similar objectives.
5. Certain investment techniques
Loan transactions — The fund has entered into loan transactions in which the fund acquires a loan either through an agent, by assignment from another holder, or as a participation interest in another holder’s portion of a loan. The loan is often administered by a financial institution that acts as agent for the holders of the loan, and the fund may be required to receive approval from the agent and/or borrower prior to the sale of the investment. The loan’s interest rate and maturity date may change based on the terms of the loan, including potential early payments of principal.
Futures contracts — The fund has entered into futures contracts, which provide for the future sale by one party and purchase by another party of a specified amount of a specific financial instrument for a specified price, date, time and place designated at the time the contract is made. Futures contracts are used to strategically manage the fund’s interest rate sensitivity by increasing or decreasing the duration of the fund or a portion of the fund’s portfolio.
Upon entering into futures contracts, and to maintain the fund’s open positions in futures contracts, the fund is required to deposit with a futures broker, known as a futures commission merchant (“FCM”), in a segregated account in the name of the FCM an amount of cash, U.S. government securities or other liquid securities, known as initial margin. The margin required for a particular futures contract is set by the exchange on which the contract is traded to serve as collateral, and may be significantly modified from time to time by the exchange during the term of the contract.
On a daily basis, the fund pays or receives variation margin based on the increase or decrease in the value of the futures contracts and records variation margin on futures contracts in the statement of assets and liabilities. In addition, the fund segregates liquid assets equivalent to the fund’s outstanding obligations under the contract in excess of the initial margin and variation margin, if any. Futures contracts may involve a risk of loss in excess of the variation margin shown on the fund’s statement of assets and liabilities. The fund records realized gains or losses at the time the futures contract is closed or expires. Net realized gains or losses and net unrealized appreciation or depreciation from futures contracts are recorded in the fund’s statement of operations. The average month-end notional amount of futures contracts while held was $52,888,000.
Forward currency contracts — The fund has entered into forward currency contracts, which represent agreements to exchange currencies on specific future dates at predetermined rates. The fund’s investment adviser uses forward currency contracts to manage the fund’s exposure to changes in exchange rates. Upon entering into these contracts, risks may arise from the potential inability of counterparties to meet the terms of their contracts and from possible movements in exchange rates.
On a daily basis, the fund’s investment adviser values forward currency contracts and records unrealized appreciation or depreciation for open forward currency contracts in the fund’s statement of assets and liabilities. Realized gains or losses are recorded at the time the forward currency contract is closed or offset by another contract with the same broker for the same settlement date and currency.
Closed forward currency contracts that have not reached their settlement date are included in the respective receivables or payables for closed forward currency contracts in the fund’s statement of assets and liabilities. Net realized gains or losses from closed forward currency contracts and net unrealized appreciation or depreciation from open forward currency contracts are recorded in the fund’s statement of operations. The average month-end notional amount of open forward currency contracts while held was $273,000.
Interest rate swaps — The fund has entered into interest rate swap contracts, which are agreements to exchange one stream of future interest payments for another based on a specified notional amount. Typically, interest rate swaps exchange a fixed interest rate for a payment that floats relative to a benchmark or vice versa. The fund’s investment adviser uses interest rate swaps to seek to manage the interest rate sensitivity of the fund by increasing or decreasing the duration of the fund or a portion of the fund’s portfolio. Risks may arise as a result of the fund’s investment adviser incorrectly anticipating changes in interest rates, increased volatility, reduced liquidity and the potential inability of counterparties to meet the terms of their agreements.
| 34 | American Funds Multi-Sector Income Fund |
Upon entering into an interest rate swap contract, the fund is required to deposit cash, U.S. government securities or other liquid securities, which is known as initial margin. Generally, the initial margin required for a particular interest rate swap is set and held as collateral by the clearinghouse on which the contract is cleared. The amount of initial margin required may be significantly modified from time to time by the clearinghouse during the term of the contract.
On a daily basis, the fund’s investment adviser records daily interest accruals related to the exchange of future payments as a receivable and payable in the fund’s statement of assets and liabilities. The fund also pays or receives a variation margin based on the increase or decrease in the value of the interest rate swaps, including accrued interest, and records variation margin on interest rate swaps in the statement of assets and liabilities. The fund records realized gains and losses on both the net accrued interest and any gain or loss recognized at the time the interest rate swap is closed or expires. Net realized gains or losses, as well as any net unrealized appreciation or depreciation, from interest rate swaps are recorded in the fund’s statement of operations. As of December 31, 2020, the fund did not have any interest rate swaps. The average month-end notional amount of interest rate swaps while held was $7,610,000.
Credit default swap indices — The fund has entered into centrally cleared credit default swap agreements on credit indices (“CDSI”) that involve one party (the protection buyer) making a stream of payments to another party (the protection seller) in exchange for the right to receive a specified return upon the occurrence of a credit event, such as a default or restructuring, with respect to any of the underlying issuers (reference obligations) in the referenced index. The fund’s investment adviser uses credit default swaps to assume exposure to a diversified portfolio of credits or to hedge against existing credit risks.
CDSI are portfolios of credit instruments or exposures designed to be representative of some part of the credit market, such as the high-yield or investment-grade credit market. CDSI are generally traded using standardized terms, including a fixed spread and standard maturity dates, and reference all the names in the index. If there is a credit event, it is settled based on that name’s weight in the index. The composition of the underlying issuers or obligations within a particular index may change periodically, usually every six months. A specified credit event may affect all or individual underlying reference obligations included in the index, and will be settled based upon the relative weighting of the affected obligation(s) within the index. The value of each CDSI can be used as a measure of the current payment/performance risk of the CDSI and represents the likelihood of an expected liability or profit should the notional amount of the CDSI be closed or sold as of the period end. An increasing value, as compared to the notional amount of the CDSI, represents a deterioration of the referenced indices’ credit soundness and a greater likelihood of risk of default or other credit event occurring as defined under the terms of the agreement. When the fund provides sell protection, its maximum exposure is the notional amount of the credit default swap agreement.
Upon entering into a centrally cleared CDSI contract, the fund is required to deposit with a derivatives clearing member (“DCM”) in a segregated account in the name of the DCM an amount of cash, U.S. government securities or other liquid securities, which is known as initial margin. Generally, the initial margin required for a particular credit default swap is set and held as collateral by the clearinghouse on which the contract is cleared. The amount of initial margin required may be significantly modified from time to time by the clearinghouse during the term of the contract.
On a daily basis, interest accruals related to the exchange of future payments are recorded as a receivable and payable in the fund’s statement of assets and liabilities. The fund also pays or receives a variation margin based on the increase or decrease in the value of the CDSI, and records variation margin in the statement of assets and liabilities. The fund records realized gains and losses on both the net accrued interest and any gain or loss recognized at the time the swap is closed or expires. Net realized gains or losses, as well as any net unrealized appreciation or depreciation, from credit default swaps are recorded in the fund’s statement of operations. The average month-end notional amount of credit default swaps while held was $6,404,000.
The following tables identify the location and fair value amounts on the fund’s statement of assets and liabilities and the effect on the fund’s statement of operations resulting from the fund’s use of futures contracts, forward currency contracts, interest rate swaps and credit default swaps as of, or for the year ended, December 31, 2020 (dollars in thousands):
| Assets | Liabilities | |||||||||||||
| Contracts | Risk type | Location on statement of assets and liabilities | Value | Location on statement of assets and liabilities | Value | |||||||||
| Futures | Interest | Unrealized appreciation* | $ | 37 | Unrealized depreciation* | $ | 308 | |||||||
| Forward currency | Currency | Unrealized appreciation on open forward currency contracts | — | Unrealized depreciation on open forward currency contracts | 1 | |||||||||
| Swap | Credit | Unrealized appreciation* | — | Unrealized depreciation* | 308 | |||||||||
| $ | 37 | $ | 617 | |||||||||||
See end of table for footnotes.
| American Funds Multi-Sector Income Fund Fund | 35 |
| Net realized (loss) gain | Net unrealized (depreciation) appreciation | |||||||||||||
| Contracts | Risk type | Location on statement of operations | Value | Location on statement of operations | Value | |||||||||
| Futures | Interest | Net realized loss on futures contracts | $ | (702 | ) | Net unrealized depreciation on futures contracts | $ | (293 | ) | |||||
| Forward currency | Currency | Net realized loss on forward currency contracts | (14 | ) | Net unrealized appreciation on forward currency contracts | — | ||||||||
| Swap | Interest | Net realized gain on swap contracts | 66 | Net unrealized appreciation on swap contracts | — | |||||||||
| Swap | Credit | Net realized gain on swap contracts | 217 | Net unrealized depreciation on swap contracts | (219 | ) | ||||||||
| $ | (433 | ) | $ | (512 | ) | |||||||||
| * | Includes cumulative appreciation/depreciation on futures contracts and credit default swaps as reported in the applicable tables following the fund’s investment portfolio. Only current day’s variation margin is reported within the statement of assets and liabilities. |
Collateral — The fund receives or pledges highly liquid assets, such as cash or U.S. government securities, as collateral due to its use of futures contracts, forward currency contracts, interest rate swaps and credit default swaps. For futures contracts, interest rate swaps and credit default swaps, the fund pledges collateral for initial and variation margin by contract. For forward currency contracts, the fund either receives or pledges collateral based on the net gain or loss on unsettled forward currency contracts by counterparty. The purpose of the collateral is to cover potential losses that could occur in the event that either party cannot meet its contractual obligation. Non-cash collateral pledged by the fund, if any, is disclosed in the fund’s investment portfolio, and cash collateral pledged by the fund, if any, is held in a segregated account with the fund’s custodian, which is reflected as pledged cash collateral in the fund’s statement of assets and liabilities.
Rights of offset — The fund has entered into enforceable master netting agreements with certain counterparties for forward currency contracts, where on any date amounts payable by each party to the other (in the same currency with respect to the same transaction) may be closed or offset by each party’s payment obligation. If an early termination date occurs under these agreements following an event of default or termination event, all obligations of each party to its counterparty are settled net through a single payment in a single currency (“close-out netting”). For financial reporting purposes, the fund does not offset financial assets and financial liabilities that are subject to these master netting arrangements in the statement of assets and liabilities.
The following table presents the fund’s forward currency contracts by counterparty that are subject to master netting agreements but that are not offset in the fund’s statement of assets and liabilities. The net amount column shows the impact of offsetting on the fund’s statement of assets and liabilities as of December 31, 2020, if close-out netting was exercised (dollars in thousands):
| Gross amounts not offset in the | ||||||||||||||||||||
| Gross amounts | statement of assets and liabilities and | |||||||||||||||||||
| recognized in the | subject to a master netting agreement | |||||||||||||||||||
| statement of assets | Available | Non-cash | Cash | Net | ||||||||||||||||
| Counterparty | and liabilities | to offset | collateral* | collateral* | amount | |||||||||||||||
| Liabilities: | ||||||||||||||||||||
| Bank of New York Mellon | $ | — | † | $ | — | $ | — | $ | — | $ | — | † | ||||||||
| HSBC Bank | 1 | — | — | — | 1 | |||||||||||||||
| Total | $ | 1 | $ | — | $ | — | $ | — | $ | 1 | ||||||||||
| * | Collateral is shown on a settlement basis. |
| † | Amount less than one thousand. |
6. Taxation and distributions
Federal income taxation — The fund complies with the requirements under Subchapter M of the Internal Revenue Code applicable to mutual funds and intends to distribute substantially all of its net taxable income and net capital gains each year. The fund is not subject to income taxes to the extent such distributions are made. Therefore, no federal income tax provision is required.
As of and during the year ended December 31, 2020, the fund did not have a liability for any unrecognized tax benefits. The fund recognizes interest and penalties, if any, related to unrecognized tax benefits as income tax expense in the statement of operations. During the period, the fund did not incur any significant interest or penalties.
| 36 | American Funds Multi-Sector Income Fund |
The fund’s tax returns are not subject to examination by federal, state and, if applicable, non-U.S. tax authorities after the expiration of each jurisdiction’s statute of limitations, which is generally three years after the date of filing but can be extended in certain jurisdictions.
Non-U.S. taxation — Dividend and interest income are recorded net of non-U.S. taxes paid. The fund may file withholding tax reclaims in certain jurisdictions to recover a portion of amounts previously withheld. These reclaims are recorded when the amount is known and there are no significant uncertainties on collectability. Gains realized by the fund on the sale of securities in certain countries, if any, may be subject to non-U.S. taxes. If applicable, the fund records an estimated deferred tax liability based on unrealized gains to provide for potential non-U.S. taxes payable upon the sale of these securities.
Distributions — Distributions paid to shareholders are based on net investment income and net realized gains determined on a tax basis, which may differ from net investment income and net realized gains for financial reporting purposes. These differences are due primarily to different treatment for items such as currency gains and losses; short-term capital gains and losses; capital losses related to sales of certain securities within 30 days of purchase; cost of investments sold and income on certain investments. The fiscal year in which amounts are distributed may differ from the year in which the net investment income and net realized gains are recorded by the fund for financial reporting purposes. The fund may also designate a portion of the amount paid to redeeming shareholders as a distribution for tax purposes.
During the year ended December 31, 2020, the fund reclassified $203,000 from total distributable earnings to capital paid in on shares of beneficial interest to align financial reporting with tax reporting.
As of December 31, 2020, the tax basis unrealized appreciation (depreciation) and cost of investments were as follows (dollars in thousands):
| Undistributed ordinary income | $ | 1,227 | ||
| Gross unrealized appreciation on investments | 27,419 | |||
| Gross unrealized depreciation on investments | (2,149 | ) | ||
| Net unrealized appreciation on investments | 25,270 | |||
| Cost of investments | 524,062 | |||
Tax-basis distributions paid or accrued to shareholders from ordinary income were as follows (dollars in thousands):
| Share class | Year ended December 31, 2020 | For the period March 22, 20191 to December 31, 2019 | ||||||
| Class A | $ | 9,175 | $ | 2,225 | ||||
| Class C2 | 128 | |||||||
| Class T2 | 1 | |||||||
| Class F-12 | 105 | |||||||
| Class F-2 | 2,036 | 1 | ||||||
| Class F-3 | 939 | 1 | ||||||
| Class 529-A2 | 36 | |||||||
| Class 529-C2 | 2 | |||||||
| Class 529-E2 | 1 | |||||||
| Class 529-T2 | 1 | |||||||
| Class 529-F-12 | 10 | |||||||
| Class 529-F-23 | 12 | |||||||
| Class 529-F-33 | — | 4 | ||||||
| Class R-12 | 2 | |||||||
| Class R-22 | 3 | |||||||
| Class R-2E2 | 1 | |||||||
| Class R-32 | 8 | |||||||
| Class R-42 | 19 | |||||||
| Class R-5E2 | 2 | |||||||
| Class R-52 | 1 | |||||||
| Class R-6 | 13 | 1 | ||||||
| Total | $ | 12,495 | $ | 2,228 | ||||
| 1 | Commencement of operations. |
| 2 | This share class began investment operations on May 1, 2020. |
| 3 | Class 529-F-2 and 529-F-3 shares began investment operations on October 30, 2020. |
| 4 | Amount less than one thousand. |
| American Funds Multi-Sector Income Fund | 37 |
7. Fees and transactions with related parties
CRMC, the fund’s investment adviser, is the parent company of American Funds Distributors®, Inc. (“AFD”), the principal underwriter of the fund’s shares, and American Funds Service Company® (“AFS”), the fund’s transfer agent. CRMC, AFD and AFS are considered related parties to the fund.
Investment advisory services — The fund has an investment advisory and service agreement with CRMC that provides for monthly fees accrued daily. These fees are based on a series of decreasing annual rates beginning with 0.440% on the first $1.5 billion of daily net assets and decreasing to 0.390% on such assets in excess of $1.5 billion. For the year ended December 31, 2020, the investment advisory services fee was $1,056,000, which was equivalent to an annualized rate of 0.440% of average daily net assets.
Class-specific fees and expenses — Expenses that are specific to individual share classes are accrued directly to the respective share class. The principal class-specific fees and expenses are further described below:
Distribution services — The fund has plans of distribution for all share classes, except Class F-2, F-3, 529-F-2, 529-F-3, R-5E, R-5 and R-6 shares. Under the plans, the board of trustees approves certain categories of expenses that are used to finance activities primarily intended to sell fund shares and service existing accounts. The plans provide for payments, based on an annualized percentage of average daily net assets, ranging from 0.30% to 1.00% as noted in this section. In some cases, the board of trustees has limited the amounts that may be paid to less than the maximum allowed by the plans. All share classes with a plan may use up to 0.30% of average daily net assets to pay service fees, or to compensate AFD for paying service fees, to firms that have entered into agreements with AFD to provide certain shareholder services. The remaining amounts available to be paid under each plan are paid to dealers to compensate them for their sales activities.
| Share class | Currently approved limits | Plan limits | |||||||
| Class A | 0.30 | % | 0.30 | % | |||||
| Class 529-A | 0.30 | 0.50 | |||||||
| Classes C, 529-C and R-1 | 1.00 | 1.00 | |||||||
| Class R-2 | 0.75 | 1.00 | |||||||
| Class R-2E | 0.60 | 0.85 | |||||||
| Classes 529-E and R-3 | 0.50 | 0.75 | |||||||
| Classes T, F-1, 529-T, 529-F-1 and R-4 | 0.25 | 0.50 | |||||||
For Class A and 529-A shares, distribution-related expenses include the reimbursement of dealer and wholesaler commissions paid by AFD for certain shares sold without a sales charge. These share classes reimburse AFD for amounts billed within the prior 15 months but only to the extent that the overall annual expense limits are not exceeded. As of December 31, 2020, unreimbursed expenses subject to reimbursement totaled $1,369,000 for Class A shares. There were no unreimbursed expenses subject to reimbursement for Class 529-A shares.
Transfer agent services — The fund has a shareholder services agreement with AFS under which the fund compensates AFS for providing transfer agent services to each of the fund’s share classes. These services include recordkeeping, shareholder communications and transaction processing. In addition, the fund reimburses AFS for amounts paid to third parties for performing transfer agent services on behalf of fund shareholders. For the year ended December 31, 2020, AFS voluntarily waived transfer agent services fees of $6,000 for Class F-3 shares and CRMC reimbursed transfer agent services fees of less than $1,000 for Class 529-F-3, R-5 and R-6 shares. Neither AFS nor CRMC intend to recoup the waiver or reimbursement.
Administrative services — The fund has an administrative services agreement with CRMC under which the fund compensates CRMC for providing administrative services to all share classes. Administrative services are provided by CRMC and its affiliates to help assist third parties providing non-distribution services to fund shareholders. These services include providing in-depth information on the fund and market developments that impact fund investments. Administrative services also include, but are not limited to, coordinating, monitoring and overseeing third parties that provide services to fund shareholders. The agreement provides the fund the ability to charge an administrative services fee at the annual rate of 0.05% of the average daily net assets attributable to each share class of the fund. Currently the fund pays CRMC an administrative services fee at the annual rate of 0.03% of the average daily net assets attributable to each share class of the fund for CRMC’s provision of administrative services.
| 38 | American Funds Multi-Sector Income Fund |
529 plan services — Each 529 share class is subject to service fees to compensate the Virginia College Savings Plan (“Virginia529”) for its oversight and administration of the CollegeAmerica 529 college savings plan. The fee is based on the combined net assets invested in Class 529 and ABLE shares of the American Funds. Class ABLE shares are offered on other American Funds by Virginia529 through ABLEAmerica®, a tax-advantaged savings program for individuals with disabilities. The quarterly fee is based on a series of decreasing annual rates beginning with 0.09% on the first $20 billion of the combined net assets invested in the American Funds and decreasing to 0.03% on such assets in excess of $100 billion. The fee for any given calendar quarter is accrued and calculated on the basis of the average net assets of Class 529 and ABLE shares of the American Funds for the last month of the prior calendar quarter. The fee is included in other expenses in the fund’s statement of operations. Virginia529 is not considered a related party to the fund.
For the year ended December 31, 2020, class-specific expenses under the agreements were as follows (dollars in thousands):
| Distribution | Transfer agent | Administrative | 529 plan | ||||||||||||
| Share class | services | services | services | services | |||||||||||
| Class A | $536 | $62 | $54 | Not applicable | |||||||||||
| Class C1 | 28 | 2 | 1 | Not applicable | |||||||||||
| Class T1 | — | — | 3 | — | 3 | Not applicable | |||||||||
| Class F-11 | 5 | 2 | 1 | Not applicable | |||||||||||
| Class F-2 | Not applicable | 30 | 11 | Not applicable | |||||||||||
| Class F-3 | Not applicable | 9 | 5 | Not applicable | |||||||||||
| Class 529-A1 | 2 | — | 3 | — | 3 | $1 | |||||||||
| Class 529-C1 | — | 3 | — | 3 | — | 3 | — | 3 | |||||||
| Class 529-E1 | — | 3 | — | 3 | — | 3 | — | 3 | |||||||
| Class 529-T1 | — | — | 3 | — | 3 | — | 3 | ||||||||
| Class 529-F-11 | — | — | 3 | — | 3 | — | 3 | ||||||||
| Class 529-F-22 | Not applicable | — | 3 | — | 3 | — | 3 | ||||||||
| Class 529-F-32 | Not applicable | — | 3 | — | 3 | — | 3 | ||||||||
| Class R-11 | — | 3 | — | 3 | — | 3 | Not applicable | ||||||||
| Class R-21 | — | 3 | — | 3 | — | 3 | Not applicable | ||||||||
| Class R-2E1 | — | — | 3 | — | 3 | Not applicable | |||||||||
| Class R-31 | 1 | — | 3 | — | 3 | Not applicable | |||||||||
| Class R-41 | 1 | — | 3 | — | 3 | Not applicable | |||||||||
| Class R-5E1 | Not applicable | — | 3 | — | 3 | Not applicable | |||||||||
| Class R-51 | Not applicable | — | 3 | — | 3 | Not applicable | |||||||||
| Class R-6 | Not applicable | — | 3 | — | 3 | Not applicable | |||||||||
| Total class-specific expenses | $573 | $105 | $72 | $1 | |||||||||||
| 1 | This share class began investment operations on May 1, 2020. |
| 2 | Class 529-F-2 and 529-F-3 shares began investment operations on October 30, 2020. |
| 3 | Amount less than one thousand. |
Miscellaneous fee reimbursement — CRMC has agreed to reimburse a portion of miscellaneous fees and expenses of the fund during its startup period. For the year ended December 31, 2020, total fees and expenses reimbursed by CRMC were $551,000, which CRMC does not intend to recoup. This reimbursement may be adjusted or discontinued, subject to any restrictions in the fund’s prospectus. Fees and expenses in the statement of operations are presented gross of any reimbursement from CRMC.
Trustees’ deferred compensation — Trustees who are unaffiliated with CRMC may elect to defer the cash payment of part or all of their compensation. These deferred amounts, which remain as liabilities of the fund, are treated as if invested in shares of the fund or other American Funds. These amounts represent general, unsecured liabilities of the fund and vary according to the total returns of the selected funds. Trustees’ compensation in the fund’s statement of operations reflects the current fees (either paid in cash or deferred).
Affiliated officers and trustees — Officers and certain trustees of the fund are or may be considered to be affiliated with CRMC, AFD and AFS. No affiliated officers or trustees received any compensation directly from the fund.
Investment in CCF — The fund holds shares of CCF, an institutional prime money market fund managed by CRMC. CCF invests in high-quality, short-term money market instruments. CCF is used as the primary investment vehicle for the fund’s short-term investments. CCF shares are only available for purchase by CRMC, its affiliates, and other funds managed by CRMC or its affiliates, and are not available to the public. CRMC does not receive an investment advisory services fee from CCF.
| American Funds Multi-Sector Income Fund | 39 |
Security transactions with related funds — The fund may purchase securities from, or sell securities to, other funds managed by CRMC (or funds managed by certain affiliates of CRMC) under procedures adopted by the fund’s board of trustees. The funds involved in such transactions are considered related by virtue of having a common investment adviser (or affiliated investment advisers), common trustees and/or common officers. When such transactions occur, each transaction is executed at the current market price of the security and no brokerage commissions or fees are paid in accordance with Rule 17a-7 of the 1940 Act. During the year ended December 31, 2020, the fund did not engage in any such purchase or sale transactions with any related funds.
Interfund lending — Pursuant to an exemptive order issued by the SEC, the fund, along with other CRMC-managed funds (or funds managed by certain affiliates of CRMC), may participate in an interfund lending program. The program provides an alternate credit facility that permits the funds to lend or borrow cash for temporary purposes directly to or from one another, subject to the conditions of the exemptive order. The fund did not lend or borrow cash through the interfund lending program at any time during the year ended December 31, 2020.
8. Capital share transactions
Capital share transactions in the fund were as follows (dollars and shares in thousands):
| Sales1 | Reinvestments of distributions | Repurchases1 | Net increase | |||||||||||||||||||||||||||||
| Share class | Amount | Shares | Amount | Shares | Amount | Shares | Amount | Shares | ||||||||||||||||||||||||
| Year ended December 31, 2020 | ||||||||||||||||||||||||||||||||
| Class A | $ | 310,997 | 30,258 | $ | 7,136 | 679 | $ | (31,582 | ) | (2,993 | ) | $ | 286,551 | 27,944 | ||||||||||||||||||
| Class C2 | 10,057 | 958 | 124 | 11 | (438 | ) | (41 | ) | 9,743 | 928 | ||||||||||||||||||||||
| Class T2 | 25 | 3 | — | — | — | — | 25 | 3 | ||||||||||||||||||||||||
| Class F-12 | 8,687 | 833 | 101 | 10 | (2,029 | ) | (196 | ) | 6,759 | 647 | ||||||||||||||||||||||
| Class F-2 | 131,047 | 12,570 | 2,027 | 191 | (18,203 | ) | (1,743 | ) | 114,871 | 11,018 | ||||||||||||||||||||||
| Class F-3 | 56,397 | 5,403 | 924 | 87 | (4,190 | ) | (405 | ) | 53,131 | 5,085 | ||||||||||||||||||||||
| Class 529-A2 | 2,446 | 233 | 36 | 4 | (169 | ) | (16 | ) | 2,313 | 221 | ||||||||||||||||||||||
| Class 529-C2 | 173 | 17 | 2 | — | 3 | (44 | ) | (4 | ) | 131 | 13 | |||||||||||||||||||||
| Class 529-E2 | 58 | 6 | 1 | — | 3 | — | — | 59 | 6 | |||||||||||||||||||||||
| Class 529-T2 | 25 | 3 | 1 | — | 3 | — | — | 26 | 3 | |||||||||||||||||||||||
| Class 529-F-12 | 1,042 | 101 | 7 | 1 | (1,028 | ) | (99 | ) | 21 | 3 | ||||||||||||||||||||||
| Class 529-F-24 | 1,196 | 114 | 12 | 1 | (10 | ) | (1 | ) | 1,198 | 114 | ||||||||||||||||||||||
| Class 529-F-34 | 10 | 1 | — | 3 | — | 3 | — | — | 10 | 1 | ||||||||||||||||||||||
| Class R-12 | 85 | 8 | 1 | — | 3 | — | 3 | — | 3 | 86 | 8 | |||||||||||||||||||||
| Class R-22 | 135 | 13 | 1 | — | 3 | — | 3 | — | 3 | 136 | 13 | |||||||||||||||||||||
| Class R-2E2 | 25 | 3 | — | 3 | — | 3 | — | 3 | — | 3 | 25 | 3 | ||||||||||||||||||||
| Class R-32 | 476 | 45 | 7 | 1 | — | 3 | — | 3 | 483 | 46 | ||||||||||||||||||||||
| Class R-42 | 1,931 | 182 | 18 | 2 | — | 3 | — | 3 | 1,949 | 184 | ||||||||||||||||||||||
| Class R-5E2 | 147 | 14 | 1 | — | 3 | (59 | ) | (5 | ) | 89 | 9 | |||||||||||||||||||||
| Class R-52 | 108 | 10 | 1 | — | 3 | — | 3 | — | 3 | 109 | 10 | |||||||||||||||||||||
| Class R-6 | 1,161 | 109 | 12 | 1 | (14 | ) | (2 | ) | 1,159 | 108 | ||||||||||||||||||||||
| Total net increase (decrease) | $ | 526,228 | 50,884 | $ | 10,412 | 988 | $ | (57,766 | ) | (5,505 | ) | $ | 478,874 | 46,367 | ||||||||||||||||||
| For the period March 22, 20195 to December 31, 2019 | ||||||||||||||||||||||||||||||||
| Class A | $ | 49,925 | 4,993 | $ | — | — | $ | — | — | $ | 49,925 | 4,993 | ||||||||||||||||||||
| Class F-2 | 25 | 2 | — | — | — | — | 25 | 2 | ||||||||||||||||||||||||
| Class F-3 | 25 | 2 | — | — | — | — | 25 | 2 | ||||||||||||||||||||||||
| Class R-6 | 25 | 3 | — | — | — | — | 25 | 3 | ||||||||||||||||||||||||
| Total net increase | $ | 50,000 | 5,000 | $ | — | — | $ | — | — | $ | 50,000 | 5,000 | ||||||||||||||||||||
| 1 | Includes exchanges between share classes of the fund. |
| 2 | This share class began investment operations on May 1, 2020. |
| 3 | Amount less than one thousand. |
| 4 | Class 529-F-2 and 529-F-3 shares began investment operations on October 30, 2020. |
| 5 | Commencement of operations. |
9. Investment transactions
The fund made purchases and sales of investment securities, excluding short-term securities and U.S. government obligations, if any, of $578,173,000 and $148,409,000, respectively, during the period March 22, 2019 to December 31, 2020.
| 40 | American Funds Multi-Sector Income Fund |
Financial highlights
| Income from investment operations1 | Dividends and distributions | |||||||||||||||||||||||||||||||||||||||||||||||||||
| Period ended | Net asset value, beginning of period | Net investment income | Net gains on securities (both realized and unrealized) | Total from investment operations | Dividends (from net investment income) | Distributions (from capital gains) | Total dividends and distributions | Net asset value, end of period | Total return2,3 | Net assets, end of period (in thousands) | Ratio of expenses to average net assets before waivers/ reimbursements4 | Ratio of expenses to average net assets after waivers/ reimbursements3,4 | Ratio of net income to average net assets3 | |||||||||||||||||||||||||||||||||||||||
| Class A: | ||||||||||||||||||||||||||||||||||||||||||||||||||||
| 12/31/2020 | $ | 10.32 | $ | .41 | $ | .68 | $ | 1.09 | $ | (.43 | ) | $ | (.17 | ) | $ | (.60 | ) | $ | 10.81 | 11.07 | % | $ | 356,047 | 1.09 | % | .85 | % | 3.96 | % | |||||||||||||||||||||||
| 12/31/20195,6 | 10.00 | .37 | .40 | .77 | (.35 | ) | (.10 | ) | (.45 | ) | 10.32 | 7.76 | 7,8 | 51,544 | .60 | 8,9 | .53 | 8,9 | 4.61 | 8,9 | ||||||||||||||||||||||||||||||||
| Class C: | ||||||||||||||||||||||||||||||||||||||||||||||||||||
| 12/31/20205,10 | 9.67 | .22 | 1.20 | 1.42 | (.24 | ) | (.04 | ) | (.28 | ) | 10.81 | 14.78 | 7 | 10,032 | 1.67 | 9 | 1.55 | 9 | 3.12 | 9 | ||||||||||||||||||||||||||||||||
| Class T: | ||||||||||||||||||||||||||||||||||||||||||||||||||||
| 12/31/20205,10 | 9.67 | .29 | 1.19 | 1.48 | (.30 | ) | (.04 | ) | (.34 | ) | 10.81 | 15.45 | 7,8 | 28 | .94 | 8,9 | .62 | 8,9 | 4.22 | 8,9 | ||||||||||||||||||||||||||||||||
| Class F-1: | ||||||||||||||||||||||||||||||||||||||||||||||||||||
| 12/31/20205,10 | 9.67 | .27 | 1.19 | 1.46 | (.28 | ) | (.04 | ) | (.32 | ) | 10.81 | 15.26 | 7 | 7,000 | 1.09 | 9 | .88 | 9 | 3.84 | 9 | ||||||||||||||||||||||||||||||||
| Class F-2: | ||||||||||||||||||||||||||||||||||||||||||||||||||||
| 12/31/2020 | 10.32 | .44 | .67 | 1.11 | (.45 | ) | (.17 | ) | (.62 | ) | 10.81 | 11.26 | 119,125 | .78 | .59 | 4.13 | ||||||||||||||||||||||||||||||||||||
| 12/31/20195,6 | 10.00 | .36 | .40 | .76 | (.34 | ) | (.10 | ) | (.44 | ) | 10.32 | 7.75 | 7,8 | 26 | .62 | 8,9 | .54 | 8,9 | 4.59 | 8,9 | ||||||||||||||||||||||||||||||||
| Class F-3: | ||||||||||||||||||||||||||||||||||||||||||||||||||||
| 12/31/2020 | 10.32 | .44 | .68 | 1.12 | (.46 | ) | (.17 | ) | (.63 | ) | 10.81 | 11.32 | 54,992 | .73 | .53 | 4.18 | ||||||||||||||||||||||||||||||||||||
| 12/31/20195,6 | 10.00 | .36 | .40 | .76 | (.34 | ) | (.10 | ) | (.44 | ) | 10.32 | 7.72 | 7,8 | 26 | .64 | 8,9 | .57 | 8,9 | 4.57 | 8,9 | ||||||||||||||||||||||||||||||||
| Class 529-A: | ||||||||||||||||||||||||||||||||||||||||||||||||||||
| 12/31/20205,10 | 9.67 | .27 | 1.19 | 1.46 | (.28 | ) | (.04 | ) | (.32 | ) | 10.81 | 15.23 | 7 | 2,386 | 1.05 | 9 | .92 | 9 | 3.78 | 9 | ||||||||||||||||||||||||||||||||
See end of table for footnotes.
| American Funds Multi-Sector Income Fund | 41 |
Financial highlights (continued)
| Income from investment operations1 | Dividends and distributions | |||||||||||||||||||||||||||||||||||||||||||||||||||
| Period ended | Net asset value, beginning of period | Net investment income | Net gains on securities (both realized and unrealized) | Total from investment operations | Dividends (from net investment income) | Distributions (from capital gains) | Total dividends and distributions | Net asset value, end of period | Total return2,3 | Net assets, end of period (in thousands) | Ratio of expenses to average net assets before waivers/ reimbursements4 | Ratio of expenses to average net assets after waivers/ reimbursements3,4 | Ratio of net income to average net assets3 | |||||||||||||||||||||||||||||||||||||||
| Class 529-C: | ||||||||||||||||||||||||||||||||||||||||||||||||||||
| 12/31/20205,10 | $ | 9.67 | $ | .24 | $ | 1.20 | $ | 1.44 | $ | (.26 | ) | $ | (.04 | ) | $ | (.30 | ) | $ | 10.81 | 14.97 | %7,8 | $ | 137 | 1.58 | %8,9 | 1.39 | %8,9 | 3.36 | %8,9 | |||||||||||||||||||||||
| Class 529-E: | ||||||||||||||||||||||||||||||||||||||||||||||||||||
| 12/31/20205,10 | 9.67 | .28 | 1.19 | 1.47 | (.29 | ) | (.04 | ) | (.33 | ) | 10.81 | 15.38 | 7,8 | 63 | .99 | 8,9 | .75 | 8,9 | 4.03 | 8,9 | ||||||||||||||||||||||||||||||||
| Class 529-T: | ||||||||||||||||||||||||||||||||||||||||||||||||||||
| 12/31/20205,10 | 9.67 | .29 | 1.19 | 1.48 | (.30 | ) | (.04 | ) | (.34 | ) | 10.81 | 15.40 | 7,8 | 29 | 1.00 | 8,9 | .68 | 8,9 | 4.15 | 8,9 | ||||||||||||||||||||||||||||||||
| Class 529-F-1: | ||||||||||||||||||||||||||||||||||||||||||||||||||||
| 12/31/20205,10 | 9.67 | .30 | 1.18 | 1.48 | (.30 | ) | (.04 | ) | (.34 | ) | 10.81 | 15.43 | 7,8 | 29 | .82 | 8,9 | .59 | 8,9 | 4.29 | 8,9 | ||||||||||||||||||||||||||||||||
| Class 529-F-2: | ||||||||||||||||||||||||||||||||||||||||||||||||||||
| 12/31/20205,11 | 10.41 | .07 | .45 | .52 | (.08 | ) | (.04 | ) | (.12 | ) | 10.81 | 4.96 | 7 | 1,238 | .12 | 7 | .11 | 7 | .65 | 7 | ||||||||||||||||||||||||||||||||
| Class 529-F-3: | ||||||||||||||||||||||||||||||||||||||||||||||||||||
| 12/31/20205,11 | 10.41 | .07 | .45 | .52 | (.08 | ) | (.04 | ) | (.12 | ) | 10.81 | 4.977 | 7 | 11 | .14 | 7 | .10 | 7 | .66 | 7 | ||||||||||||||||||||||||||||||||
| Class R-1: | ||||||||||||||||||||||||||||||||||||||||||||||||||||
| 12/31/20205,10 | 9.67 | .25 | 1.20 | 1.45 | (.27 | ) | (.04 | ) | (.31 | ) | 10.81 | 15.12 | 7,8 | 91 | 1.35 | 8,9 | 1.14 | 8,9 | 3.62 | 8,9 | ||||||||||||||||||||||||||||||||
See end of table for footnotes.
| 42 | American Funds Multi-Sector Income Fund |
Financial highlights (continued)
| Income from investment operations1 | Dividends and distributions | |||||||||||||||||||||||||||||||||||||||||||||||||||
| Period ended | Net asset value, beginning of period | Net investment income | Net gains on securities (both realized and unrealized) | Total from investment operations | Dividends (from net investment income) | Distributions (from capital gains) | Total dividends and distributions | Net asset value, end of period | Total return2,3 | Net assets, end of period (in thousands) | Ratio of expenses to average net assets before waivers/ reimbursements4 | Ratio of expenses to average net assets after waivers/ reimbursements3,4 | Ratio of net income to average net assets3 | |||||||||||||||||||||||||||||||||||||||
| Class R-2: | ||||||||||||||||||||||||||||||||||||||||||||||||||||
| 12/31/20205,10 | $ | 9.67 | $ | .26 | $ | 1.19 | $ | 1.45 | $ | (.27 | ) | $ | (.04 | ) | $ | (.31 | ) | $ | 10.81 | 15.15 | %7,8 | $ | 142 | 1.30 | %8,9 | 1.09 | %8,9 | 3.67 | %8,9 | |||||||||||||||||||||||
| Class R-2E: | ||||||||||||||||||||||||||||||||||||||||||||||||||||
| 12/31/20205,10 | 9.67 | .29 | 1.19 | 1.48 | (.30 | ) | (.04 | ) | (.34 | ) | 10.81 | 15.44 | 7,8 | 28 | .95 | 8,9 | .63 | 8,9 | 4.21 | 8,9 | ||||||||||||||||||||||||||||||||
| Class R-3: | ||||||||||||||||||||||||||||||||||||||||||||||||||||
| 12/31/20205,10 | 9.67 | .26 | 1.20 | 1.46 | (.28 | ) | (.04 | ) | (.32 | ) | 10.81 | 15.24 | 7 | 499 | 1.11 | 9 | .99 | 9 | 3.73 | 9 | ||||||||||||||||||||||||||||||||
| Class R-4: | ||||||||||||||||||||||||||||||||||||||||||||||||||||
| 12/31/20205,10 | 9.67 | .26 | 1.21 | 1.47 | (.29 | ) | (.04 | ) | (.33 | ) | 10.81 | 15.38 | 7 | 1,992 | .85 | 9 | .78 | 9 | 3.69 | 9 | ||||||||||||||||||||||||||||||||
| Class R-5E: | ||||||||||||||||||||||||||||||||||||||||||||||||||||
| 12/31/20205,10 | 9.67 | .29 | 1.19 | 1.48 | (.30 | ) | (.04 | ) | (.34 | ) | 10.81 | 15.45 | 7 | 95 | .76 | 9 | .59 | 9 | 4.17 | 9 | ||||||||||||||||||||||||||||||||
| Class R-5: | ||||||||||||||||||||||||||||||||||||||||||||||||||||
| 12/31/20205,10 | 9.67 | .30 | 1.19 | 1.49 | (.31 | ) | (.04 | ) | (.35 | ) | 10.81 | 15.50 | 7 | 112 | .82 | 9 | .53 | 9 | 4.23 | 9 | ||||||||||||||||||||||||||||||||
| Class R-6: | ||||||||||||||||||||||||||||||||||||||||||||||||||||
| 12/31/2020 | 10.32 | .44 | .68 | 1.12 | (.46 | ) | (.17 | ) | (.63 | ) | 10.81 | 11.32 | 1,204 | .69 | .52 | 4.17 | ||||||||||||||||||||||||||||||||||||
| 12/31/20195,6 | 10.00 | .36 | .40 | .76 | (.34 | ) | (.10 | ) | (.44 | ) | 10.32 | 7.72 | 7,8 | 26 | .64 | 8,9 | .56 | 8,9 | 4.57 | 8,9 | ||||||||||||||||||||||||||||||||
| Year ended December 31, 2020 | For the period 3/22/2019 to 12/31/20195,6 | ||
| Portfolio turnover rate for all share classes12 | 73% | 115% |
| 1 | Based on average shares outstanding. |
| 2 | Total returns exclude any applicable sales charges, including contingent deferred sales charges. |
| 3 | This column reflects the impact, if any, of certain waivers/reimbursements from AFS and/or CRMC. During one of the periods shown, AFS waived a portion of transfer agent services fees for Class F-3 shares. In addition, during one of the periods shown, CRMC reimbursed a portion of transfer agent services fees for certain share classes, and during the periods shown, CRMC reimbursed a portion of miscellaneous fees and expenses. |
| 4 | Ratios do not include expenses of any Central Funds. The fund indirectly bears its proportionate share of the expenses of any Central Funds. |
| 5 | Based on operations for a period that is less than a full year. |
| 6 | For the period March 22, 2019, commencement of operations, through December 31, 2019. |
| 7 | Not annualized. |
| 8 | All or a significant portion of assets in this class consisted of seed capital invested by CRMC and/or its affiliates. Fees for distribution services are not charged or accrued on these seed capital assets. If such fees were paid by the fund on seed capital assets, fund expenses would have been higher and net income and total return would have been lower. |
| 9 | Annualized. |
| 10 | This share class began investment operations on May 1, 2020. |
| 11 | Class 529-F-2 and 529-F-3 shares began investment operations on October 30, 2020. |
| 12 | Rate does not include the fund’s portfolio activity with respect to any Central Funds. |
See notes to financial statements.
| American Funds Multi-Sector Income Fund | 43 |
Report of Independent Registered Public Accounting Firm
To the Shareholders and Board of Trustees of American Funds Multi-Sector Income Fund:
Opinion on the Financial Statements and Financial Highlights
We have audited the accompanying statement of assets and liabilities of American Funds Multi-Sector Income Fund (the “Fund”), including the investment portfolio, as of December 31, 2020, the related statements of operations for the year then ended, the statements of changes in net assets and financial highlights for the year then ended and the period March 22, 2019 (commencement of operations) to December 31, 2019, and the related notes. In our opinion, the financial statements and financial highlights present fairly, in all material respects, the financial position of the Fund as of December 31, 2020, and the results of its operations for the year then ended, the changes in its net assets and the financial highlights for the year then ended and the period March 22, 2019 (commencement of operations) to December 31, 2019, in conformity with accounting principles generally accepted in the United States of America.
Basis for Opinion
These financial statements and financial highlights are the responsibility of the Fund’s management. Our responsibility is to express an opinion on the Fund’s financial statements and financial highlights based on our audit. We are a public accounting firm registered with the Public Company Accounting Oversight Board (United States) (PCAOB) and are required to be independent with respect to the Fund in accordance with the U.S. federal securities laws and the applicable rules and regulations of the Securities and Exchange Commission and the PCAOB.
We conducted our audit in accordance with the standards of the PCAOB. Those standards require that we plan and perform the audit to obtain reasonable assurance about whether the financial statements and financial highlights are free of material misstatement, whether due to error or fraud. The Fund is not required to have, nor were we engaged to perform, an audit of its internal control over financial reporting. As part of our audit we are required to obtain an understanding of internal control over financial reporting but not for the purpose of expressing an opinion on the effectiveness of the Fund’s internal control over financial reporting. Accordingly, we express no such opinion.
Our audit included performing procedures to assess the risks of material misstatement of the financial statements and financial highlights, whether due to error or fraud, and performing procedures that respond to those risks. Such procedures included examining, on a test basis, evidence regarding the amounts and disclosures in the financial statements and financial highlights. Our audit also included evaluating the accounting principles used and significant estimates made by management, as well as evaluating the overall presentation of the financial statements and financial highlights. Our procedures included confirmation of securities owned as of December 31, 2020, by correspondence with the custodian and brokers; when replies were not received from brokers, we performed other auditing procedures. We believe that our audit provides a reasonable basis for our opinion.
Deloitte & Touche LLP
Costa Mesa, California
February 16, 2021
We have served as the auditor of one or more American Funds investment companies since 1956.
| 44 | American Funds Multi-Sector Income Fund |
| Expense example | unaudited |
As a fund shareholder, you incur two types of costs: (1) transaction costs, such as initial sales charges on purchase payments and contingent deferred sales charges on redemptions (loads), and (2) ongoing costs, including management fees, distribution and service (12b-1) fees, and other expenses. This example is intended to help you understand your ongoing costs (in dollars) of investing in the fund so you can compare these costs with the ongoing costs of investing in other mutual funds. The example is based on an investment of $1,000 invested at the beginning of the period and held for the entire six-month period (July 1, 2020, through December 31, 2020).
Actual expenses:
The first line of each share class in the following table provides information about actual account values and actual expenses. You may use the information in this line, together with the amount you invested, to estimate the expenses that you paid over the period. Simply divide your account value by $1,000 (for example, an $8,600 account value divided by $1,000 = 8.6), then multiply the result by the number in the first line under the heading titled “Expenses paid during period” to estimate the expenses you paid on your account during this period.
Hypothetical example for comparison purposes:
The second line of each share class in the following table provides information about hypothetical account values and hypothetical expenses based on the actual expense ratio for the share class and an assumed rate of return of 5.00% per year before expenses, which is not the actual return of the share class. The hypothetical account values and expenses may not be used to estimate the actual ending account balance or expenses you paid for the period. You may use this information to compare the ongoing costs of investing in the fund and other funds. To do so, compare this 5.00% hypothetical example with the 5.00% hypothetical examples that appear in the shareholder reports of the other funds.
Notes:
Retirement plan participants may be subject to certain fees charged by the plan sponsor, and Class F-2 and F-3 shareholders may be subject to fees charged by financial intermediaries, typically ranging from 0.75% to 1.50% of assets annually depending on services offered. You can estimate the impact of these fees by adding the amount of the fees to the total estimated expenses you paid on your account during the period as calculated above. In addition, your ending account value would be lower by the amount of these fees.
Note that the expenses shown in the following table are meant to highlight your ongoing costs only and do not reflect any transactional costs, such as sales charges (loads). Therefore, the second line of each share class in the table is useful in comparing ongoing costs only and will not help you determine the relative total costs of owning different funds. In addition, if these transactional costs were included, your costs would have been higher.
| American Funds Multi-Sector Income Fund | 45 |
Expense example (continued)
| Beginning account value 7/1/2020 | Ending account value 12/31/2020 | Expenses paid during period1 | Annualized expense ratio | |||||||||||||
| Class A – actual return | $ | 1,000.00 | $ | 1,092.47 | $ | 4.69 | .89 | % | ||||||||
| Class A – assumed 5% return | 1,000.00 | 1,020.72 | 4.53 | .89 | ||||||||||||
| Class C – actual return2 | 1,000.00 | 1,088.93 | 8.11 | 1.54 | ||||||||||||
| Class C – assumed 5% return2 | 1,000.00 | 1,017.44 | 7.83 | 1.54 | ||||||||||||
| Class T – actual return2 | 1,000.00 | 1,094.13 | 3.17 | .60 | ||||||||||||
| Class T – assumed 5% return2 | 1,000.00 | 1,022.18 | 3.06 | .60 | ||||||||||||
| Class F-1 – actual return2 | 1,000.00 | 1,092.85 | 4.54 | .86 | ||||||||||||
| Class F-1 – assumed 5% return2 | 1,000.00 | 1,020.87 | 4.38 | .86 | ||||||||||||
| Class F-2 – actual return | 1,000.00 | 1,094.30 | 3.06 | .58 | ||||||||||||
| Class F-2 – assumed 5% return | 1,000.00 | 1,022.28 | 2.96 | .58 | ||||||||||||
| Class F-3 – actual return | 1,000.00 | 1,094.57 | 2.75 | .52 | ||||||||||||
| Class F-3 – assumed 5% return | 1,000.00 | 1,022.58 | 2.65 | .52 | ||||||||||||
| Class 529-A – actual return2 | 1,000.00 | 1,092.34 | 4.85 | .92 | ||||||||||||
| Class 529-A – assumed 5% return2 | 1,000.00 | 1,020.57 | 4.69 | .92 | ||||||||||||
| Class 529-C – actual return2 | 1,000.00 | 1,090.21 | 7.43 | 1.41 | ||||||||||||
| Class 529-C – assumed 5% return2 | 1,000.00 | 1,018.10 | 7.17 | 1.41 | ||||||||||||
| Class 529-E – actual return2 | 1,000.00 | 1,093.49 | 4.01 | .76 | ||||||||||||
| Class 529-E – assumed 5% return2 | 1,000.00 | 1,021.37 | 3.87 | .76 | ||||||||||||
| Class 529-T – actual return2 | 1,000.00 | 1,093.78 | 3.54 | .67 | ||||||||||||
| Class 529-T – assumed 5% return2 | 1,000.00 | 1,021.83 | 3.41 | .67 | ||||||||||||
| Class 529-F-1 – actual return2 | 1,000.00 | 1,094.10 | 3.01 | .57 | ||||||||||||
| Class 529-F-1 – assumed 5% return2 | 1,000.00 | 1,022.33 | 2.91 | .57 | ||||||||||||
| Class 529-F-2 – actual return3 | 1,000.00 | 1,093.84 | 1.14 | .65 | ||||||||||||
| Class 529-F-2 – assumed 5% return3 | 1,000.00 | 1,021.93 | 3.31 | .65 | ||||||||||||
| Class 529-F-3 – actual return3 | 1,000.00 | 1,094.27 | 1.00 | .57 | ||||||||||||
| Class 529-F-3 – assumed 5% return3 | 1,000.00 | 1,022.33 | 2.91 | .57 | ||||||||||||
| Class R-1 – actual return2 | 1,000.00 | 1,090.99 | 6.27 | 1.19 | ||||||||||||
| Class R-1 – assumed 5% return2 | 1,000.00 | 1,019.21 | 6.06 | 1.19 | ||||||||||||
| Class R-2 – actual return2 | 1,000.00 | 1,091.44 | 5.90 | 1.12 | ||||||||||||
| Class R-2 – assumed 5% return2 | 1,000.00 | 1,019.56 | 5.70 | 1.12 | ||||||||||||
| Class R-2E – actual return2 | 1,000.00 | 1,094.09 | 3.22 | .61 | ||||||||||||
| Class R-2E – assumed 5% return2 | 1,000.00 | 1,022.13 | 3.11 | .61 | ||||||||||||
| Class R-3 – actual return2 | 1,000.00 | 1,092.13 | 5.27 | 1.00 | ||||||||||||
| Class R-3 – assumed 5% return2 | 1,000.00 | 1,020.16 | 5.09 | 1.00 | ||||||||||||
| Class R-4 – actual return2 | 1,000.00 | 1,093.50 | 4.12 | .78 | ||||||||||||
| Class R-4 – assumed 5% return2 | 1,000.00 | 1,021.27 | 3.97 | .78 | ||||||||||||
| Class R-5E – actual return2 | 1,000.00 | 1,094.16 | 3.06 | .58 | ||||||||||||
| Class R-5E – assumed 5% return2 | 1,000.00 | 1,022.28 | 2.96 | .58 | ||||||||||||
| Class R-5 – actual return2 | 1,000.00 | 1,094.59 | 2.64 | .50 | ||||||||||||
| Class R-5 – assumed 5% return2 | 1,000.00 | 1,022.68 | 2.55 | .50 | ||||||||||||
| Class R-6 – actual return | 1,000.00 | 1,094.50 | 2.75 | .52 | ||||||||||||
| Class R-6 – assumed 5% return | 1,000.00 | 1,022.58 | 2.65 | .52 | ||||||||||||
| 1 | The “expenses paid during period” are equal to the “annualized expense ratio,” multiplied by the average account value over the period, multiplied by the number of days in the period, and divided by 365 (to reflect the one-half year period). |
| 2 | The period for the “annualized expense ratio” and “actual return” line is based on the number of days since the share class began investment operations on May 1, 2020. The “assumed 5% return” line is based on 184 days. |
| 3 | The period for the “annualized expense ratio” and “actual return” line is based on the number of days since the share class began investment operations on October 30, 2020. The “assumed 5% return” line is based on 184 days. |
| 46 | American Funds Multi-Sector Income Fund |
| Tax information | unaudited |
We are required to advise you of the federal tax status of certain distributions received by shareholders during the fiscal year. The fund hereby designates the following amounts for the fund’s fiscal year ended December 31, 2020:
| Section 163(j) interest dividends | $10,078,000 |
| U.S. government income that may be exempt from state taxation | $21,000 |
Individual shareholders should refer to their Form 1099 or other tax information, which was mailed in January 2021, to determine the calendar year amounts to be included on their 2020 tax returns. Shareholders should consult their tax advisors.
| American Funds Multi-Sector Income Fund | 47 |
This page was intentionally left blank.
| 48 | American Funds Multi-Sector Income Fund |
Liquidity Risk Management Program
The fund has adopted a liquidity risk management program (the “program”). The fund’s board has designated Capital Research and Management Company (“CRMC”) as the administrator of the program. Personnel of CRMC or its affiliates conduct the day-to-day operation of the program pursuant to policies and procedures administered by the Capital Group Liquidity Risk Management Committee.
Under the program, CRMC manages the fund’s liquidity risk, which is the risk that the fund could not meet shareholder redemption requests without significant dilution of remaining shareholders’ interests in the fund. This risk is managed by monitoring the degree of liquidity of the fund’s investments, limiting the amount of the fund’s illiquid investments, and utilizing various risk management tools and facilities available to the fund for meeting shareholder redemptions, among other means. CRMC’s process of determining the degree of liquidity of the fund’s investments is supported by one or more third-party liquidity assessment vendors.
The fund’s board reviewed a report prepared by CRMC regarding the operation and effectiveness of the program for the period October 1, 2019, through September 30, 2020. No significant liquidity events impacting the fund were noted in the report. In addition, CRMC provided its assessment that the program had been effective in managing the fund’s liquidity risk.
| American Funds Multi-Sector Income Fund | 49 |
Board of trustees and other officers
Independent trustees1
| Name and year of birth | Year first elected a trustee of the fund2 | Principal occupation(s) during past five years | Number of portfolios in fund complex overseen by trustee3 | Other directorships4 held by trustee | ||||
| William H. Baribault, 1945 | 2019 | Chairman of the Board and CEO, Oakwood Advisors (private investment and consulting); former CEO and President, Richard Nixon Foundation | 89 | General Finance Corporation | ||||
| James G. Ellis, 1947 | 2019 | Professor of Marketing and former Dean, Marshall School of Business, University of Southern California | 99 | Mercury General Corporation | ||||
| Nariman Farvardin, 1956 | 2019 | President, Stevens Institute of Technology | 87 | None | ||||
| Mary Davis Holt., 1950 | 2019 | Principal, Mary Davis Holt Enterprises, LLC (leadership development consulting); former Partner, Flynn Health Holt Leadership, LLC (leadership consulting); former COO, Time Life Inc. (1993-2003) | 87 | None | ||||
| R. Clark Hooper, 1946 | 2019 | Private investor | 90 | None | ||||
| Merit E. Janow, 1958 | 2019 | Dean and Professor, Columbia University, School of International and Public Affairs | 89 | Mastercard Incorporated; Trimble Inc. | ||||
| Margaret Spellings, 1957 Chairman of the Board (Independent and Non-Executive) | 2019 | President and CEO, Texas 2036; former President, Margaret Spellings & Company (public policy and strategic consulting); former President, The University of North Carolina; former President, George W. Bush Foundation | 91 | None | ||||
| Alexandra Trower, 1964 | 2019 | Executive Vice President, Global Communications and Corporate Officer, The Estée Lauder Companies | 86 | None | ||||
| Paul S. Williams, 1959 | 2020 | Former Partner/Managing Director, Major, Lindsey & Africa (executive recruiting firm) | 86 | Compass Minerals, Inc. (producer of salt and specialty fertilizers); Public Storage, Inc. |
Interested trustees5,6
| Name, year of birth and position with fund | Year first elected a trustee or officer of the fund2 | Principal occupation(s) during past five years and positions held with affiliated entities or the principal underwriter of the fund | Number of portfolios in fund complex overseen by trustee3 | Other directorships4 held by trustee | ||||
| Michael C. Gitlin, 1970 | 2019 | Vice Chairman and Director, Capital Research and Management Company; Partner – Capital Fixed Income Investors, Capital Research and Management Company; Director, The Capital Group Companies, Inc.7; served as Head of Fixed Income at a large investment management firm prior to joining Capital Research and Management Company in 2015 | 86 | None | ||||
| Karl J. Zeile, 1966 | 2019 | Partner — Capital Fixed Income Investors, Capital Research and Management Company | 20 | None |
The fund’s statement of additional information includes further details about fund trustees and is available without charge upon request by calling American Funds Service Company at (800) 421-4225 or by visiting the Capital Group website at capitalgroup.com. The address for all trustees and officers of the fund is 333 South Hope Street, Los Angeles, CA 90071, Attention: Secretary.
| 50 | American Funds Multi-Sector Income Fund |
Other officers6
| Name, year of birth and position with fund | Year first elected an officer of the fund2 | Principal occupation(s) during past five years and positions held with affiliated entities or the Principal Underwriter of the fund | ||
| Damien J. McCann, 1977 President | 2019 | Partner — Capital Fixed Income Investors, Capital Research and Management Company | ||
| Kristine M. Nishiyama, 1970 Executive Vice President | 2019 | Senior Vice President and Senior Counsel — Fund Business Management Group, Capital Research and Management Company; Chair, Senior Vice President, General Counsel and Director, Capital Bank and Trust Company7 | ||
| Kirstie Spence, 1973 Senior Vice President | 2019 | Partner — Capital Fixed Income Investors, Capital International Limited7; Director, Capital Research Company7; Vice President and Director, Capital International Limited7 | ||
| Scott Sykes, 1971 Senior Vice President | 2019 | Partner — Capital Fixed Income Investors, Capital Research and Management Company | ||
| Shannon Ward, 1964 Senior Vice President | 2019 | Partner — Capital Fixed Income Investors, Capital Research and Management Company | ||
| Vincent J. Gonzales, 1984 Vice President | 2019 | Vice President — Capital Fixed Income Investors, Capital Research and Management Company | ||
| Steven I. Koszalka, 1964 Secretary | 2019 | Vice President — Fund Business Management Group, Capital Research and Management Company | ||
| Brian C. Janssen, 1972 Treasurer | 2019 | Vice President — Investment Operations, Capital Research and Management Company | ||
| Jane Y. Chung, 1974 Assistant Secretary | 2019 | Associate — Fund Business Management Group, Capital Research and Management Company | ||
| Sandra Chuon, 1972 Assistant Treasurer | 2019 | Assistant Vice President — Investment Operations, Capital Research and Management Company | ||
| Gregory F. Niland, 1971 Assistant Treasurer | 2019 | Vice President — Investment Operations, Capital Research and Management Company |
| 1 | The term independent trustee refers to a trustee who is not an “interested person” of the fund within the meaning of the Investment Company Act of 1940. |
| 2 | Trustees and officers of the fund serve until their resignation, removal or retirement. |
| 3 | Funds managed by Capital Research and Management Company or its affiliates. |
| 4 | This includes all directorships/trusteeships (other than those in the American Funds or other funds managed by Capital Research and Management Company or its affiliates) that are held by each trustee as a trustee or director of a public company or a registered investment company. |
| 5 | The term interested trustee refers to a trustee who is an “interested person” within the meaning of the Investment Company Act of 1940, on the basis of their affiliation with the fund’s investment adviser, Capital Research and Management Company, or affiliated entities (including the fund’s principal underwriter). |
| 6 | All of the trustees and/or officers listed are officers and/or directors/trustees of one or more of the other funds for which Capital Research and Management Company serves as investment adviser. |
| 7 | Company affiliated with Capital Research and Management Company. |
| American Funds Multi-Sector Income Fund | 51 |
Office of the fund
6455 Irvine Center Drive
Irvine, CA 92618-4518
Investment adviser
Capital Research and
Management Company
333 South Hope Street
Los Angeles, CA 90071-1406
Transfer agent for shareholder accounts
American Funds Service Company
(Write to the address near you.)
P.O. Box 6007
Indianapolis, IN 46206-6007
P.O. Box 2280
Norfolk, VA 23501-2280
Custodian of assets
State Street Bank and Trust Company
One Lincoln Street
Boston, MA 02111
Counsel
Morgan, Lewis & Bockius LLP
One Federal Street
Boston, MA 02110-1726
Independent registered public accounting firm
Deloitte & Touche LLP
695 Town Center Drive
Suite 1000
Costa Mesa, CA 92626-7188
Principal underwriter
American Funds Distributors, Inc.
333 South Hope Street
Los Angeles, CA 90071-1406
| 52 | American Funds Multi-Sector Income Fund |
Investors should carefully consider investment objectives, risks, charges and expenses. This and other important information is contained in the fund prospectus and summary prospectus, which can be obtained from your financial professional and should be read carefully before investing. You may also call American Funds Service Company (AFS) at (800) 421-4225 or visit the Capital Group website at capitalgroup.com.
“American Funds Proxy Voting Procedures and Principles” — which describes how we vote proxies relating to portfolio securities — is available on the American Funds website or upon request by calling AFS. The fund files its proxy voting record with the U.S. Securities and Exchange Commission (SEC) for the 12 months ended June 30 by August 31. The proxy voting record is available free of charge on the SEC website at sec.gov or our website.
American Funds Multi-Sector Income Fund files a complete list of its portfolio holdings with the SEC for the first and third quarters of each fiscal year on Form NPORT-P. The list of portfolio holdings is available free of charge on the SEC website and on our website.
This report is for the information of shareholders of American Funds Multi-Sector Income Fund, but it also may be used as sales literature when preceded or accompanied by the current prospectus or summary prospectus, which gives details about charges, expenses, investment objectives and operating policies of the fund. If used as sales material after March 31, 2021, this report must be accompanied by an American Funds statistical update for the most recently completed calendar quarter.
Bloomberg® is a trademark of Bloomberg Finance L.P. (collectively with its affiliates, “Bloomberg”). Barclays® is a trademark of Barclays Bank Plc (collectively with its affiliates, “Barclays”), used under license. Neither Bloomberg nor Barclays approves or endorses this material, guarantees the accuracy or completeness of any information herein and, to the maximum extent allowed by law, neither shall have any liability or responsibility for injury or damages arising in connection therewith.
American Funds Distributors, Inc., member FINRA.
The Capital Advantage®
Since 1931, Capital Group, home of American Funds, has helped investors pursue long-term investment success. Our consistent approach — in combination with The Capital SystemSM — has resulted in superior outcomes.
| Aligned with investor success | |
| We base our decisions on a long-term perspective, which we believe aligns our goals with the interests of our clients. Our portfolio managers average 28 years of investment industry experience, including 22 years at our company, reflecting a career commitment to our long-term approach.1 | |
| The Capital System | |
| The Capital System combines individual accountability with teamwork. Funds using The Capital System are divided into portions that are managed independently by investment professionals with diverse backgrounds, ages and investment approaches. An extensive global research effort is the backbone of our system. | |
| American Funds’ superior outcomes | |
| Equity funds have beaten their Lipper peer indexes in 92% of 10-year periods and 99% of 20-year periods.2 Fixed income funds have helped investors achieve diversification through attention to correlation between bonds and equities.3 Fund management fees have been among the lowest in the industry.4 |
| 1 | Investment industry experience as of December 31, 2019. | |
| 2 | Based on Class F-2 share results for rolling periods through December 31, 2019. Periods covered are the shorter of the fund’s lifetime or since the comparable Lipper index inception date (except Capital Income Builder and SMALLCAP World Fund, for which the Lipper average was used). Expenses differ for each share class, so results will vary. | |
| 3 | Based on Class F-2 share results as of December 31, 2019. Fifteen of the 17 fixed income American Funds that have been in existence for the three-year period showed a three-year correlation below 0.2. Standard & Poor’s 500 Composite Index was used as an equity market proxy. Correlation based on monthly total returns. Correlation is a statistical measure of how two securities move in relation to each other. A correlation ranges from –1 to 1. A positive correlation close to 1 implies that as one security moves, either up or down, the other security will move in “lockstep,” in the same direction. A negative correlation close to –1 indicates that the securities have moved in the opposite direction. | |
| 4 | On average, our management fees were in the lowest quintile 65% of the time, based on the 20-year period ended December 31, 2019, versus comparable Lipper categories, excluding funds of funds. |
Class F-2 shares were first offered on August 1, 2008. Class F-2 share results prior to the date of first sale are hypothetical based on the results of the original share class of the fund without a sales charge, adjusted for typical estimated expenses. Results for certain funds with an inception date after August 1, 2008, also include hypothetical returns because those funds’ Class F-2 shares sold after the funds’ date of first offering. Please see capitalgroup.com for more information on specific expense adjustments and the actual dates of first sale.
All Capital Group trademarks mentioned are owned by The Capital Group Companies, Inc., an affiliated company or fund. All other company and product names mentioned are the property of their respective companies.

ITEM 2 – Code of Ethics
The Registrant has adopted a Code of Ethics that applies to its Principal Executive Officer and Principal Financial Officer. The Registrant undertakes to provide to any person without charge, upon request, a copy of the Code of Ethics. Such request can be made by calling 800/421-4225 or to the Secretary of the Registrant, 6455 Irvine Center Drive, Irvine, California 92618.
ITEM 3 – Audit Committee Financial Expert
The Registrant’s board has determined that James G. Ellis, a member of the Registrant’s audit committee, is an “audit committee financial expert” and "independent," as such terms are defined in this Item. This designation will not increase the designee’s duties, obligations or liability as compared to his or her duties, obligations and liability as a member of the audit committee and of the board, nor will it reduce the responsibility of the other audit committee members. There may be other individuals who, through education or experience, would qualify as "audit committee financial experts" if the board had designated them as such. Most importantly, the board believes each member of the audit committee contributes significantly to the effective oversight of the Registrant’s financial statements and condition.
ITEM 4 – Principal Accountant Fees and Services
| MSI | ||
| Registrant: | ||
| a) Audit Fees: | ||
| Audit | 2019 | None |
| 2020 | 58,000 | |
| b) Audit-Related Fees: | ||
| 2019 | None | |
| 2020 | None | |
| c) Tax Fees: | ||
| 2019 | None | |
| 2020 | 3,000 | |
| The tax fees consist of professional services relating to the preparation of the Registrant’s tax returns. | ||
| d) All Other Fees: | ||
| 2019 | None | |
| 2020 | None | |
| Adviser and affiliates (includes only fees for non-audit services billed to the adviser and affiliates for engagements that relate directly to the operations and financial reporting of the Registrant and were subject to the pre-approval policies described below): | ||
| a) Audit Fees: | ||
| Not Applicable | ||
| b) Audit-Related Fees: | ||
| 2019 | 1,812,000 | |
| 2020 | 1,477,000 | |
| The audit-related fees consist of assurance and related services relating to the examination of the Registrant’s transfer agent, principal underwriter and investment adviser conducted in accordance with Statement on Standards for Attestation Engagements Number 18 issued by the American Institute of Certified Public Accountants. | ||
| c) Tax Fees: | ||
| 2019 | 46,000 | |
| 2020 | 40,000 |
| The tax fees consist of consulting services relating to the Registrant’s investments. | ||
| d) All Other Fees: | ||
| 2019 | 2,000 | |
| 2020 | None | |
| The other fees consist of subscription services related to an accounting research tool. | ||
| All audit and permissible non-audit services that the Registrant’s audit committee considers compatible with maintaining the independent registered public accounting firm’s independence are required to be pre-approved by the committee. The pre-approval requirement will extend to all non-audit services provided to the Registrant, the investment adviser, and any entity controlling, controlled by, or under common control with the investment adviser that provides ongoing services to the Registrant, if the engagement relates directly to the operations and financial reporting of the Registrant. The committee will not delegate its responsibility to pre-approve these services to the investment adviser. The committee may delegate to one or more committee members the authority to review and pre-approve audit and permissible non-audit services. Actions taken under any such delegation will be reported to the full committee at its next meeting. The pre-approval requirement is waived with respect to non-audit services if certain conditions are met. The pre-approval requirement was not waived for any of the non-audit services listed above provided to the Registrant, adviser and affiliates. | ||
| Aggregate non-audit fees paid to the Registrant’s auditors, including fees for all services billed to the Registrant, adviser and affiliates that provide ongoing services to the Registrant, were $1,860,000 for fiscal year 2019 and $1,519,000 for fiscal year 2020. The non-audit services represented by these amounts were brought to the attention of the committee and considered to be compatible with maintaining the auditors’ independence. |
ITEM 5 – Audit Committee of Listed Registrants
Not applicable to this Registrant, insofar as the Registrant is not a listed issuer as defined in Rule 10A-3 under the Securities Exchange Act of 1934.
ITEM 6 – Schedule of Investments
Not applicable, insofar as the schedule is included as part of the report to shareholders filed under Item 1 of this Form.
ITEM 7 – Disclosure of Proxy Voting Policies and Procedures for Closed-End Management Investment Companies
Not applicable to this Registrant, insofar as the Registrant is not a closed-end management investment company.
ITEM 8 – Portfolio Managers of Closed-End Management Investment Companies
Not applicable to this Registrant, insofar as the Registrant is not a closed-end management investment company.
ITEM 9 – Purchases of Equity Securities by Closed-End Management Investment Company and Affiliated Purchasers
Not applicable to this Registrant, insofar as the Registrant is not a closed-end management investment company.
ITEM 10 – Submission of Matters to a Vote of Security Holders
There have been no material changes to the procedures by which shareholders may recommend nominees to the Registrant’s board of trustees since the Registrant last submitted a proxy statement to its shareholders. The procedures are as follows. The Registrant has a nominating and governance committee comprised solely of persons who are not considered ‘‘interested persons’’ of the Registrant within the meaning of the Investment Company Act of 1940, as amended. The committee periodically reviews such issues as the board’s composition, responsibilities, committees, compensation and other relevant issues, and recommends any appropriate changes to the full board of trustees. While the committee normally is able to identify from its own resources an ample number of qualified candidates, it will consider shareholder suggestions of persons to be considered as nominees to fill future vacancies on the board. Such suggestions must be sent in writing to the nominating and governance committee of the Registrant, c/o the Registrant’s Secretary, and must be accompanied by complete biographical and occupational data on the prospective nominee, along with a written consent of the prospective nominee for consideration of his or her name by the nominating and governance committee.
ITEM 11 – Controls and Procedures
| (a) | The Registrant’s Principal Executive Officer and Principal Financial Officer have concluded, based on their evaluation of the Registrant’s disclosure controls and procedures (as such term is defined in Rule 30a-3 under the Investment Company Act of 1940), that such controls and procedures are adequate and reasonably designed to achieve the purposes described in paragraph (c) of such rule. |
| (b) | There were no changes in the Registrant’s internal controls over financial reporting (as defined in Rule 30a-3(d) under the Investment Company Act of 1940) that occurred during the Registrant’s semi-annual period covered by this report that has materially affected, or is reasonably likely to materially affect, the Registrant’s internal control over financial reporting.
|
ITEM 12 – Exhibits
| (a)(1) | The Code of Ethics that is the subject of the disclosure required by Item 2 is attached as an exhibit hereto. |
| (a)(2) | The certifications required by Rule 30a-2 of the Investment Company Act of 1940 and Sections 302 and 906 of the Sarbanes-Oxley Act of 2002 are attached as exhibits hereto. |
SIGNATURES
Pursuant to the requirements of the Securities Exchange Act of 1934 and the Investment Company Act of 1940, the Registrant has duly caused this report to be signed on its behalf by the undersigned, thereunto duly authorized.
| AMERICAN FUNDS MULTI-SECTOR INCOME FUND | |
| By __/s/ Kristine M. Nishiyama________________ | |
Kristine M. Nishiyama, Principal Executive Officer | |
| Date: February 26, 2021 |
Pursuant to the requirements of the Securities Exchange Act of 1934 and the Investment Company Act of 1940, this report has been signed below by the following persons on behalf of the Registrant and in the capacities and on the dates indicated.
| By _ /s/ Kristine M. Nishiyama_____________ |
Kristine M. Nishiyama, Principal Executive Officer |
| Date: February 26, 2021 |
| By ___/s/ Brian C. Janssen__________________ |
Brian C. Janssen, Treasurer and Principal Financial Officer |
| Date: February 26, 2021 |