UNITED STATES
SECURITIES AND EXCHANGE COMMISSION
Washington, D.C. 20549
FORM N-CSRS
CERTIFIED SHAREHOLDER REPORT OF REGISTERED MANAGEMENT
INVESTMENT COMPANIES
Investment Company Act file number 811-23410
FROST FAMILY OF FUNDS
(Exact name of registrant as specified in charter)
One Freedom Valley Drive
Oaks, PA 19456
(Address of Principal Executive Offices, Zip code)
Michael Beattie
c/o SEI Investments
One Freedom Valley Drive
Oaks, PA 19456
(Name and Address of Agent for Service)
Registrant’s telephone number, including area code: 1-877-713-7678
Date of fiscal year end: July 31, 2020
Date of reporting period: January 31, 2020
| Item 1. | Reports to Stockholders. |
A copy of the report transmitted to stockholders pursuant to Rule 30e-1 under the Investment Company Act or 1940, as amended (the “Act”) (17 CFR § 270.30e-1), is attached hereto.
| | |
| FROST FAMILY OF FUNDS | | F R O S T F U N D S | J A N U A R Y 3 1, 2 0 2 0 |
The Funds file their complete schedule of investments of portfolio holdings with the Securities and Exchange Commission (“Commission”) for the first and third quarters of each fiscal year on Form N-PORT within sixty days after period end. The Funds’ Forms N-PORT are available on the Commission’s website at http://www.sec.gov, and may be reviewed and copied at the Commission’s Public Reference Room in Washington, D.C. Information on the operation of the Public Reference Room may be obtained by calling1-800-SEC-0330.
A description of the policies and procedures that the Funds use to determine how to vote proxies relating to portfolio securities, as well as information relating to how the Funds voted proxies relating to portfolio securities during the most recent12-month period ended June 30, is available (i) without charge, upon request, by calling1-877-71-FROST; and (ii) on the Commission’s website at http://www.sec.gov.
| | |
| FROST FAMILY OF FUNDS | | F R O S T F U N D S | J A N U A R Y 3 1, 2 0 2 0 (U n a u d i t e d) |
| | |
| LETTER TO SHAREHOLDERS (Unaudited) | | |
Dear Shareholders:
Following 2018’s fourth-quarter market relapse, global equity returns for 2019 heralded a broad recovery, easily surpassing investor expectations. Although investors have been generally skeptical since the beginning of the market’s decade-long recovery, this distrust was especially appropriate during the last quarter of 2018 on the heels of Fed rate hikes, trade warflare-ups, anemic corporate earnings and polarizing politics. By the close of 2019, a number of issues that were earlier market concerns had been or were being resolved.
There is now a signed agreement with China which should help mitigate simmering trade tensions in Asia, and reduce cross-tariff threats and investor concerns. This agreement followed a recently approved treaty between the U.S., Canada and Mexico, mitigating some uncertainty facing the manufacturing sector in 2020, perhaps helping counter last year’s downward trend in factory output.
Other positive developments included some resolution for Brexit, with the country’smid-December elections reaffirming that the British were indeed exiting the European Union. While the final economic effect is still an unknown, the exit decision has removed one of the unresolved issues impacting markets globally over the pastthree-and-a-half years. Here at home, investors are factoring in the state of monetary policies, manufacturing and our global trading partners, while also gauging the health of the consumer, the improving jobs markets and housing. The housing slowdown of 2018 has turned the corner courtesy of lower interest rates and we also expect that the recent negative turn in corporate earnings will shortly reverse back into positive territory, given signs that the global economy is gaining some traction.
To date, the momentum carrying the markets last year has continued into 2020, despite headwinds wrought by a new viral outbreak from China (Coronavirus). There are still some unknowns, including the ultimate loss of life but past history has shown the effect of these outbreaks are often short-lived and followed by market recoveries. There are also other distinct concerns globally (Russia, Iran and North Korea) and at home (upcoming elections). We continue to see positive economic data relating to the consumer amid still muted inflation fears. As we’ve noted in past commentaries, Frost Investment Advisors will continue to work to provide shareholders with a slate of quality offerings to manage through these challenging markets and economic volatility.
We appreciate your continued confidence in our team.
Sincerely,

Tom Stringfellow
President, Frost Investment Advisors
Past performance does not guarantee future results. The investment performance and principal value of an investment will fluctuate so that an investor’s shares, when redeemed, may be worth more or less than their original cost, and current performance may be lower or higher than the performance quoted. Investment performance reflects voluntary fee waivers in effect. Absent these waivers, total return and yield would be reduced. There can be no assurance that Frost Investment Advisors, LLC will continue to waive fees. For performance data current to the most recent month end, please call 877.713.7678.
The information provided in this report should not be considered a recommendation to purchase or sell any particular security. These views are subject to change and are not intended to predict or guarantee the future performance of any individual security or the markets in general. There is no assurance that any securities discussed herein will remain in an account’s portfolio at the time you receive this report or that securities sold have not been repurchased. The securities discussed do not represent an account’s entire portfolio and in the aggregate may represent only a small percentage of an account’s portfolio holdings.
Mutual fund investing involves risk including possible loss of principal. International investments may involve risk of capital loss from unfavorable fluctuation in currency values, from differences in generally accepted accounting principles or from social, economic or political instability in other nations. Bond and bond funds are subject to interest rate risk and will decline in value as interest rates rise. REIT investments are subject to changes in economic conditions, credit risk and interest rate fluctuations. Emerging markets involve heightened risks related to the same factors as well as increased volatility and lower trading volume. Derivatives are often more volatile than other investments and may magnify the Fund’s gains or losses. The primary risk of derivative instruments is that changes in the market value of securities held by the fund and of the derivative instruments relating to those securities may not be proportionate. Derivatives are also subject to illiquidity and counter party risk. Diversification does not protect against market loss.
1
| | |
| FROST FAMILY OF FUNDS | | F R O S T F U N D S | J A N U A R Y 3 1, 2 0 2 0 (U n a u d i t e d) |
| † | Percentages are based on total investments. |
| | | | | | | | |
| Description | | Shares | | |
Value | |
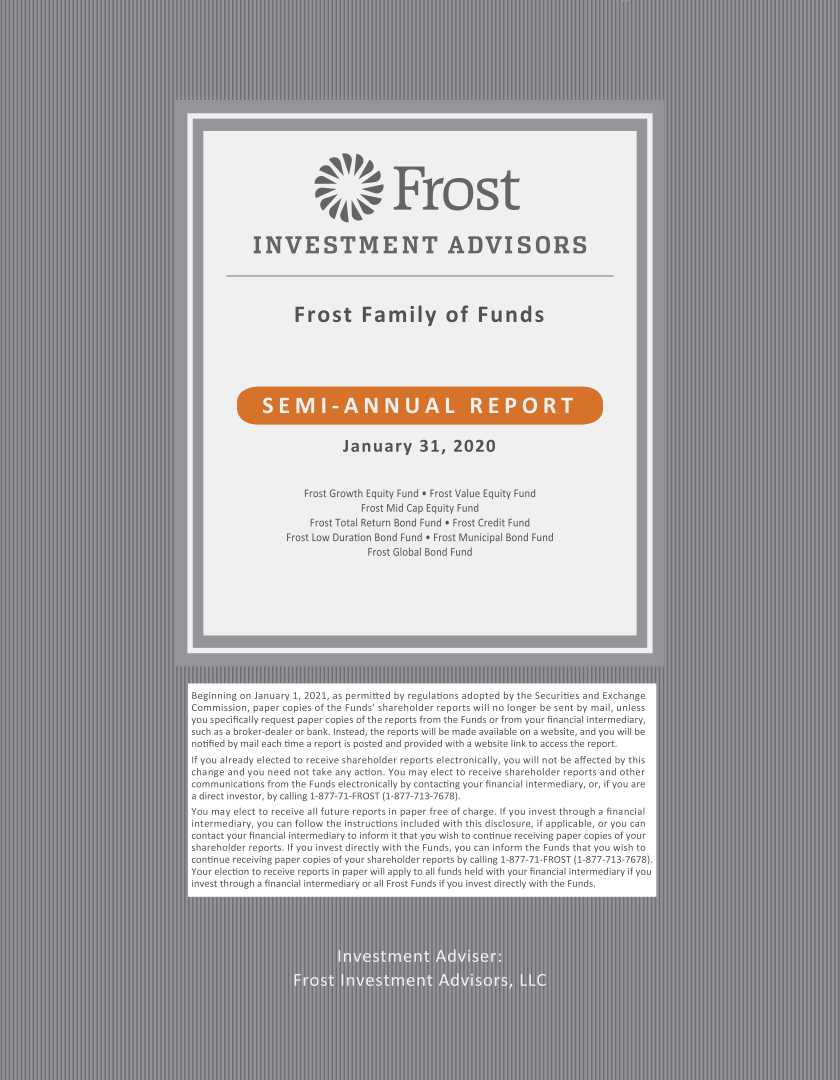
COMMON STOCK§ — 99.0% | |
|
Communication Services — 13.8% | |
| | |
Alphabet, Cl A* | | | 8,254 | | | $ | 11,826,166 | |
| | |
Alphabet, Cl C* | | | 7,720 | | | | 11,072,256 | |
| | |
Comcast, Cl A | | | 131,000 | | | | 5,657,890 | |
| | |
Electronic Arts* | | | 38,000 | | | | 4,100,960 | |
| | |
Facebook, Cl A* | | | 57,690 | | | | 11,648,188 | |
| | |
Netflix* | | | 13,000 | | | | 4,486,170 | |
| | | | | | | | |
| | | | | | | 48,791,630 | |
| | | | | | | | |
|
Consumer Discretionary — 18.5% | |
| | |
Alibaba Group Holding ADR* | | | 25,000 | | | | 5,164,750 | |
| | |
Amazon.com* | | | 13,121 | | | | 26,356,415 | |
| | |
Booking Holdings* | | | 2,170 | | | | 3,972,294 | |
| | |
Home Depot | | | 43,090 | | | | 9,828,829 | |
| | |
Las Vegas Sands | | | 49,000 | | | | 3,200,190 | |
| | |
NIKE, Cl B | | | 40,000 | | | | 3,852,000 | |
| | |
O’Reilly Automotive* | | | 10,000 | | | | 4,061,000 | |
| | |
Starbucks | | | 52,550 | | | | 4,457,816 | |
| | |
TJX | | | 73,000 | | | | 4,309,920 | |
| | | | | | | | |
| | | | | | | 65,203,214 | |
| | | | | | | | |
|
Consumer Staples — 1.5% | |
| | |
Costco Wholesale | | | 17,132 | | | | 5,234,169 | |
| | | | | | | | |
|
Energy — 1.0% | |
| | |
EOG Resources | | | 46,500 | | | | 3,390,315 | |
| | | | | | | | |
|
Financials — 3.1% | |
| | |
JPMorgan Chase | | | 48,500 | | | | 6,419,460 | |
| | |
Moody’s | | | 17,405 | | | | 4,469,430 | |
| | | | | | | | |
| | | | | | | 10,888,890 | |
| | | | | | | | |
| | | | | | | | |
| Description | | Shares | | |
Value | |
|
Health Care — 15.5% | |
| | |
AbbVie | | | 60,000 | | | $ | 4,861,200 | |
| | |
Becton Dickinson | | | 19,750 | | | | 5,434,805 | |
| | |
Boston Scientific* | | | 155,000 | | | | 6,489,850 | |
| | |
Danaher | | | 43,750 | | | | 7,038,063 | |
| | |
Edwards Lifesciences* | | | 9,500 | | | | 2,088,670 | |
| | |
Humana* | | | 16,000 | | | | 5,379,840 | |
| | |
Merck | | | 65,000 | | | | 5,553,600 | |
| | |
UnitedHealth Group | | | 22,800 | | | | 6,211,860 | |
| | |
Vertex Pharmaceuticals* | | | 29,000 | | | | 6,584,450 | |
| | |
Zoetis, Cl A | | | 36,735 | | | | 4,930,204 | |
| | | | | | | | |
| | | | | | | 54,572,542 | |
| | | | | | | | |
|
Industrials — 5.0% | |
| | |
Canadian Pacific Railway | | | 21,540 | | | | 5,725,547 | |
| | |
Fortive | | | 52,000 | | | | 3,896,360 | |
| | |
Northrop Grumman | | | 12,000 | | | | 4,494,840 | |
| | |
Union Pacific | | | 20,000 | | | | 3,588,400 | |
| | | | | | | | |
| | | | | | | 17,705,147 | |
| | | | | | | | |
|
Information Technology — 36.7% | |
| | |
Adobe* | | | 19,000 | | | | 6,671,660 | |
| | |
Apple | | | 58,396 | | | | 18,074,146 | |
| | |
Applied Materials | | | 90,000 | | | | 5,219,100 | |
| | |
Autodesk* | | | 18,000 | | | | 3,543,300 | |
| | |
Mastercard, Cl A | | | 49,410 | | | | 15,610,595 | |
| | |
Microsoft | | | 180,500 | | | | 30,726,515 | |
| | |
PayPal Holdings* | | | 57,520 | | | | 6,550,953 | |
| | |
salesforce.com* | | | 60,635 | | | | 11,054,367 | |
| | |
ServiceNow* | | | 19,000 | | | | 6,426,370 | |
| | |
Visa, Cl A | | | 84,600 | | | | 16,832,862 | |
| | |
Workday, Cl A* | | | 34,000 | | | | 6,277,420 | |
| | |
Xilinx | | | 28,000 | | | | 2,365,440 | |
| | | | | | | | |
| | | | | | | 129,352,728 | |
| | | | | | | | |
|
Materials — 2.6% | |
| | |
Sherwin-Williams | | | 9,000 | | | | 5,012,910 | |
| | |
Vulcan Materials | | | 30,000 | | | | 4,248,900 | |
| | | | | | | | |
| | | | | | | 9,261,810 | |
| | | | | | | | |
|
Real Estate — 1.3% | |
| | |
American Tower‡ | | | 19,500 | | | | 4,518,930 | |
| | | | | | | | |
| | |
Total Common Stock
(Cost $180,238,219) | | | | | | | 348,919,375 | |
| | | | | | | | |
CASH EQUIVALENT — 1.0% | |
| | |
Federated Government Obligations Fund, Cl I,
1.450%**
(Cost $3,430,139) | | | 3,430,138 | | | | 3,430,138 | |
| | | | | | | | |
| | |
Total Investments — 100.0%
(Cost $183,668,358) | | | | | | $ | 352,349,513 | |
| | | | | | | | |
The accompanying notes are an integral part of the financial statements.
2
| | |
| FROST FAMILY OF FUNDS | | F R O S T F U N D S | J A N U A R Y 3 1, 2 0 2 0 (U n a u d i t e d) |
Percentages are based on Net Assets of $352,348,070.
| * | Non-income producing security. |
| ** | Rate shown is the7-day effective yield as of January 31, 2020. |
| § | Narrow industries are utilized for compliance purposes, whereas broad sectors are utilized for reporting. |
| ‡ | Real Estate Investment Trust |
ADR — American Depositary Receipt
Cl — Class
As of January 31, 2020, all of the Fund’s investments in securities were considered Level 1, in accordance with the authoritative guidance on fair value measurements and disclosure under U.S. GAAP.
For the period ended January 31, 2020, there have been no transfers in or out of Level 3.
For more information on valuation inputs, see Note 2 — Significant Accounting Policies in the Notes to Financial Statements.
The accompanying notes are an integral part of the financial statements.
3
| | |
| FROST FAMILY OF FUNDS | | F R O S T F U N D S | J A N U A R Y 3 1, 2 0 2 0 (U n a u d i t e d) |
| † | Percentages are based on total investments. |
| | | | | | | | |
| Description | | Shares | | |
Value | |
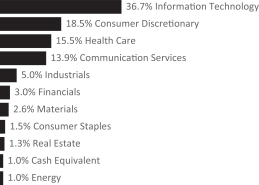
COMMON STOCK — 97.1% | |
|
Communication Services — 6.4% | |
| | |
Comcast, Cl A | | | 4,677 | | | $ | 202,000 | |
| | |
Fox | | | 6,746 | | | | 250,142 | |
| | |
Verizon Communications | | | 5,725 | | | | 340,294 | |
| | |
Walt Disney | | | 779 | | | | 107,743 | |
| | | | | | | | |
| | | | | | | 900,179 | |
| | | | | | | | |
|
Consumer Discretionary — 8.7% | |
| | |
Carnival | | | 5,033 | | | | 219,087 | |
| | |
Expedia Group | | | 1,876 | | | | 203,452 | |
| | |
Las Vegas Sands | | | 2,688 | | | | 175,553 | |
| | |
Lowe’s | | | 2,346 | | | | 272,699 | |
| | |
PVH | | | 1,108 | | | | 96,584 | |
| | |
Sony ADR | | | 3,798 | | | | 266,544 | |
| | | | | | | | |
| | | | | | | 1,233,919 | |
| | | | | | | | |
|
Consumer Staples — 10.1% | |
| | |
Constellation Brands, Cl A | | | 1,174 | | | | 221,064 | |
| | |
CVS Health | | | 4,167 | | | | 282,606 | |
| | |
Ingredion | | | 2,554 | | | | 224,752 | |
| | |
Philip Morris International | | | 2,775 | | | | 229,492 | |
| | |
Procter & Gamble | | | 1,643 | | | | 204,751 | |
| | |
Tyson Foods, Cl A | | | 3,230 | | | | 266,895 | |
| | | | | | | | |
| | | | | | | 1,429,560 | |
| | | | | | | | |
|
Energy — 7.5% | |
| | |
Chevron | | | 3,074 | | | | 329,348 | |
| | |
Occidental Petroleum | | | 7,678 | | | | 304,970 | |
| | |
Royal Dutch Shell ADR, Cl B | | | 4,095 | | | | 218,182 | |
| | | | | | | | |
| Description | | Shares | | |
Value | |
| | |
Valero Energy | | | 2,461 | | | $ | 207,487 | |
| | | | | | | | |
| | | | | | | 1,059,987 | |
| | | | | | | | |
|
Financials — 24.3% | |
| | |
American Express | | | 2,674 | | | | 347,272 | |
| | |
American International Group | | | 3,634 | | | | 182,645 | |
| | |
Aon | | | 686 | | | | 151,092 | |
| | |
Bank of America | | | 11,219 | | | | 368,320 | |
| | |
Berkshire Hathaway, Cl B* | | | 1,621 | | | | 363,801 | |
| | |
Capital One Financial | | | 2,487 | | | | 248,203 | |
| | |
Cboe Global Markets | | | 917 | | | | 112,993 | |
| | |
Chubb | | | 932 | | | | 141,655 | |
| | |
Citigroup | | | 2,942 | | | | 218,914 | |
| | |
Fidelity National Financial | | | 6,658 | | | | 324,577 | |
| | |
JPMorgan Chase | | | 3,260 | | | | 431,494 | |
| | |
KeyCorp | | | 7,271 | | | | 136,040 | |
| | |
Nasdaq | | | 1,667 | | | | 194,139 | |
| | |
Progressive | | | 1,500 | | | | 121,035 | |
| | |
Wells Fargo | | | 2,161 | | | | 101,437 | |
| | | | | | | | |
| | | | | | | 3,443,617 | |
| | | | | | | | |
|
Health Care — 12.9% | |
| | |
AbbVie | | | 1,897 | | | | 153,695 | |
| | |
Anthem | | | 1,232 | | | | 326,825 | |
| | |
AstraZeneca ADR | | | 5,777 | | | | 281,340 | |
| | |
Bristol-Myers Squibb | | | 2,251 | | | | 141,700 | |
| | |
Elanco Animal Health* | | | 7,152 | | | | 220,997 | |
| | |
Johnson & Johnson | | | 1,972 | | | | 293,572 | |
| | |
Medtronic | | | 2,204 | | | | 254,430 | |
| | |
Merck | | | 1,808 | | | | 154,475 | |
| | | | | | | | |
| | | | | | | 1,827,034 | |
| | | | | | | | |
|
Industrials — 10.8% | |
| | |
Delta Air Lines | | | 4,549 | | | | 253,561 | |
| | |
Eaton | | | 2,609 | | | | 246,472 | |
| | |
Johnson Controls International | | | 3,851 | | | | 151,922 | |
| | |
Kansas City Southern | | | 892 | | | | 150,472 | |
| | |
L3Harris Technologies | | | 825 | | | | 182,597 | |
| | |
Raytheon | | | 1,487 | | | | 328,538 | |
| | |
Union Pacific | | | 1,169 | | | | 209,742 | |
| | | | | | | | |
| | | | | | | 1,523,304 | |
| | | | | | | | |
| | |
Information Technology — 7.4% | | | | | | | | |
| | |
Cisco Systems | | | 3,163 | | | | 145,403 | |
| | |
Corning | | | 10,854 | | | | 289,693 | |
| | |
Fidelity National Information Services | | | 2,278 | | | | 327,258 | |
| | |
Microsoft | | | 1,626 | | | | 276,794 | |
| | | | | | | | |
| | | | | | | 1,039,148 | |
| | | | | | | | |
The accompanying notes are an integral part of the financial statements.
4
| | |
| FROST FAMILY OF FUNDS | | F R O S T F U N D S | J A N U A R Y 3 1, 2 0 2 0 (U n a u d i t e d) |
| | | | | | | | |
| Description | | Shares | | |
Value | |
| | |
Materials — 1.4% | | | | | | | | |
| | |
DuPont de Nemours | | | 3,901 | | | $ | 199,652 | |
| | | | | | | | |
| | |
Real Estate — 2.9% | | | | | | | | |
| | |
Healthpeak Properties‡ | | | 4,538 | | | | 163,323 | |
| | |
Weyerhaeuser‡ | | | 8,733 | | | | 252,820 | |
| | | | | | | | |
| | | | | | | 416,143 | |
| | | | | | | | |
| | |
Utilities — 4.7% | | | | | | | | |
| | |
Entergy | | | 1,735 | | | | 228,187 | |
| | |
Evergy | | | 3,045 | | | | 219,727 | |
| | |
FirstEnergy | | | 4,244 | | | | 215,553 | |
| | | | | | | | |
| | | | | | | 663,467 | |
| | | | | | | | |
| | |
Total Common Stock
(Cost $12,615,392) | | | | | | | 13,736,010 | |
| | | | | | | | |
CASH EQUIVALENT — 4.0% | | | | | | | | |
| | |
Federated Government Obligations Fund, Cl I, 1.450%**
(Cost $566,548) | | | 566,548 | | | | 566,548 | |
| | | | | | | | |
| | |
Total Investments — 101.1%
(Cost $13,181,940) | | | | | | $ | 14,302,558 | |
| | | | | | | | |
Percentages are based on Net Assets of $14,151,449.
| * | Non-income producing security. |
| ** | Rate shown is the7-day effective yield as of January 31, 2020. |
| ‡ | Real Estate Investment Trust |
ADR — American Depositary Receipt
Cl — Class
As of January 31, 2020, all of the Fund’s investments in securities were considered Level 1, in accordance with the authoritative guidance on fair value measurements and disclosure under U.S. GAAP.
For the period ended January 31, 2020 , there have been no transfers in or out of Level 3.
For more information on valuation inputs, see Note 2 — Significant Accounting Policies in the Notes to Financial Statements.
The accompanying notes are an integral part of the financial statements.
5
| | |
| FROST FAMILY OF FUNDS | | F R O S T F U N D S | J A N U A R Y 3 1, 2 0 2 0 (U n a u d i t e d) |
| | |
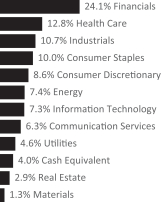
| FROST MID CAP EQUITY FUND | | |
| † | Percentages are based on total investments. |
| | | | | | | | |
| Description | |
Shares | | | Value | |
COMMON STOCK — 98.2% | |
|
Communication Services — 2.9% | |
| | |
Omnicom Group | | | 438 | | | $ | 32,986 | |
| | |
Take-Two Interactive Software* | | | 193 | | | | 24,055 | |
| | | | | | | | |
| | | | | | | 57,041 | |
| | | | | | | | |
|
Consumer Discretionary — 10.5% | |
| | |
Advance Auto Parts | | | 135 | | | | 17,786 | |
| | |
Best Buy | | | 148 | | | | 12,534 | |
| | |
Columbia Sportswear | | | 94 | | | | 8,829 | |
| | |
Darden Restaurants | | | 75 | | | | 8,732 | |
| | |
Dollar Tree* | | | 193 | | | | 16,805 | |
| | |
DR Horton | | | 274 | | | | 16,221 | |
| | |
Expedia Group | | | 68 | | | | 7,375 | |
| | |
Garmin | | | 135 | | | | 13,088 | |
| | |
H&R Block | | | 407 | | | | 9,442 | |
| | |
Hilton Worldwide Holdings | | | 94 | | | | 10,133 | |
| | |
Leggett & Platt | | | 303 | | | | 14,420 | |
| | |
MGM Resorts International | | | 407 | | | | 12,641 | |
| | |
Thor Industries | | | 193 | | | | 15,540 | |
| | |
Tractor Supply | | | 270 | | | | 25,097 | |
| | |
Vail Resorts | | | 25 | | | | 5,863 | |
| | |
VF | | | 126 | | | | 10,454 | |
| | | | | | | | |
| | | | | | | 204,960 | |
| | | | | | | | |
|
Consumer Staples — 3.6% | |
| | |
Archer-Daniels-Midland | | | 578 | | | | 25,871 | |
| | |
Church & Dwight | | | 213 | | | | 15,809 | |
| | |
Clorox | | | 68 | | | | 10,697 | |
| | |
Hormel Foods | | | 400 | | | | 18,904 | |
| | | | | | | | |
| | | | | | | 71,281 | |
| | | | | | | | |
| | | | | | | | |
| Description | |
Shares | | | Value | |
|
Energy — 3.0% | |
| | |
Diamondback Energy | | | 220 | | | $ | 16,368 | |
| | |
Noble Energy | | | 848 | | | | 16,765 | |
| | |
Patterson-UTI Energy | | | 1,123 | | | | 8,917 | |
| | |
Williams | | | 773 | | | | 15,993 | |
| | | | | | | | |
| | | | | | | 58,043 | |
| | | | | | | | |
|
Financials — 12.9% | |
| | |
Cboe Global Markets | | | 185 | | | | 22,796 | |
| | |
Cincinnati Financial | | | 389 | | | | 40,825 | |
| | |
Commerce Bancshares | | | 427 | | | | 28,891 | |
| | |
Discover Financial Services | | | 294 | | | | 22,088 | |
| | |
First Republic Bank | | | 83 | | | | 9,203 | |
| | |
M&T Bank | | | 185 | | | | 31,176 | |
| | |
Progressive | | | 565 | | | | 45,590 | |
| | |
Tradeweb Markets, Cl A | | | 337 | | | | 15,563 | |
| | |
Webster Financial | | | 365 | | | | 16,374 | |
| | |
Western Alliance Bancorp | | | 351 | | | | 19,386 | |
| | | | | | | | |
| | | | | | | 251,892 | |
| | | | | | | | |
|
Health Care — 11.4% | |
| | |
ABIOMED* | | | 74 | | | | 13,785 | |
| | |
BioMarin Pharmaceutical* | | | 135 | | | | 11,272 | |
| | |
Cardinal Health | | | 174 | | | | 8,911 | |
| | |
Centene* | | | 468 | | | | 29,395 | |
| | |
Cerner | | | 295 | | | | 21,190 | |
| | |
Charles River Laboratories International* | | | 137 | | | | 21,177 | |
| | |
DENTSPLY SIRONA | | | 213 | | | | 11,928 | |
| | |
Elanco Animal Health* | | | 759 | | | | 23,453 | |
| | |
Exact Sciences* | | | 165 | | | | 15,391 | |
| | |
Neurocrine Biosciences* | | | 85 | | | | 8,507 | |
| | |
Quest Diagnostics | | | 137 | | | | 15,162 | |
| | |
Sage Therapeutics* | | | 193 | | | | 12,792 | |
| | |
Zimmer Biomet Holdings | | | 193 | | | | 28,545 | |
| | | | | | | | |
| | | | | | | 221,508 | |
| | | | | | | | |
| | |
Industrials — 14.1% | | | | | | | | |
| | |
Hexcel | | | 165 | | | | 12,246 | |
| | |
Huntington Ingalls Industries | | | 123 | | | | 32,103 | |
| | |
Ingersoll-Rand | | | 193 | | | | 25,714 | |
| | |
JB Hunt Transport Services | | | 244 | | | | 26,335 | |
| | |
Macquarie Infrastructure | | | 630 | | | | 27,789 | |
| | |
Masco | | | 687 | | | | 32,646 | |
| | |
Parker-Hannifin | | | 176 | | | | 34,442 | |
| | |
Republic Services, Cl A | | | 303 | | | | 28,800 | |
| | |
Robert Half International | | | 687 | | | | 39,963 | |
| | |
Snap-on | | | 94 | | | | 15,005 | |
| | | | | | | | |
| | | | | | | 275,043 | |
| | | | | | | | |
The accompanying notes are an integral part of the financial statements.
6
| | |
| FROST FAMILY OF FUNDS | | F R O S T F U N D S | J A N U A R Y 3 1, 2 0 2 0 (U n a u d i t e d) |
| | |
| FROST MID CAP EQUITY FUND | | |
| | | | | | | | |
| Description | |
Shares | | | Value | |
| | |
Information Technology — 19.1% | | | | | | | | |
| | |
Advanced Micro Devices* | | | 450 | | | $ | 21,150 | |
| | |
Akamai Technologies* | | | 225 | | | | 21,004 | |
| | |
Amphenol, Cl A | | | 138 | | | | 13,727 | |
| | |
ANSYS* | | | 74 | | | | 20,300 | |
| | |
Atlassian, Cl A* | | | 82 | | | | 12,054 | |
| | |
Coherent* | | | 92 | | | | 13,012 | |
| | |
EPAM Systems* | | | 92 | | | | 20,989 | |
| | |
Fiserv* | | | 245 | | | | 29,059 | |
| | |
Global Payments | | | 108 | | | | 21,109 | |
| | |
IAC/InterActiveCorp* | | | 38 | | | | 9,256 | |
| | |
Keysight Technologies * | | | 138 | | | | 12,833 | |
| | |
KLA | | | 82 | | | | 13,591 | |
| | |
Lam Research | | | 48 | | | | 14,314 | |
| | |
Marvell Technology Group | | | 772 | | | | 18,559 | |
| | |
Motorola Solutions | | | 119 | | | | 21,063 | |
| | |
NortonLifeLock | | | 387 | | | | 10,998 | |
| | |
Palo Alto Networks* | | | 38 | | | | 8,922 | |
| | |
Paycom Software* | | | 33 | | | | 10,499 | |
| | |
Splunk* | | | 133 | | | | 20,650 | |
| | |
Square, Cl A* | | | 297 | | | | 22,183 | |
| | |
Synopsys* | | | 138 | | | | 20,356 | |
| | |
Western Digital | | | 274 | | | | 17,947 | |
| | | | | | | | |
| | | | | | | 373,575 | |
| | | | | | | | |
| | |
Materials — 4.4% | | | | | | | | |
| | |
Celanese, Cl A | | | 244 | | | | 25,254 | |
| | |
Newmont Goldcorp | | | 517 | | | | 23,296 | |
| | |
Packaging Corp of America | | | 101 | | | | 9,671 | |
| | |
Vulcan Materials | | | 193 | | | | 27,334 | |
| | | | | | | | |
| | | | | | | 85,555 | |
| | | | | | | | |
| | |
Real Estate — 9.2% | | | | | | | | |
| | |
Apartment Investment & Management, Cl A‡ | | | 517 | | | | 27,251 | |
| | |
AvalonBay Communities‡ | | | 81 | | | | 17,552 | |
| | |
Boston Properties‡ | | | 193 | | | | 27,667 | |
| | |
Digital Realty Trust‡ | | | 193 | | | | 23,737 | |
| | |
Regency Centers‡ | | | 352 | | | | 21,838 | |
| | |
SBA Communications, Cl A‡ | | | 40 | | | | 9,982 | |
| | |
Welltower‡ | | | 303 | | | | 25,728 | |
| | |
WP Carey‡ | | | 303 | | | | 25,488 | |
| | | | | | | | |
| | | | | | | 179,243 | |
| | | | | | | | |
| | |
Utilities — 7.1% | | | | | | | | |
| | |
CenterPoint Energy | | | 848 | | | | 22,455 | |
| | |
Evergy | | | 352 | | | | 25,400 | |
| | |
FirstEnergy | | | 630 | | | | 31,998 | |
| | |
WEC Energy Group | | | 303 | | | | 30,267 | |
| | | | | | | | |
| Description | |
Shares | | | Value | |
| | |
Xcel Energy | | | 407 | | | $ | 28,160 | |
| | | | | | | | |
| | | | | | | 138,280 | |
| | | | | | | | |
Total Common Stock
(Cost $1,745,558) | | | | | | | 1,916,421 | |
| | | | | | | | |
CASH EQUIVALENT — 1.8% | |
| | |
Federated Government Obligations Fund, Cl I, 1.450%**
(Cost $34,522) | | | 34,522 | | | | 34,522 | |
| | | | | | | | |
| | |
Total Investments — 100.0%
(Cost $1,780,080) | | | | | | $ | 1,950,943 | |
| | | | | | | �� | |
Percentages are based on Net Assets of $1,950,357.
| * | Non-income producing security. |
| ** | Rate shown is the7-day effective yield as of January 31, 2020. |
| ‡ | Real Estate Investment Trust |
Cl — Class
As of January 31, 2020, all of the Fund’s investments in securities were considered Level 1, in accordance with the authoritative guidance on fair value measurements and disclosure under U.S. GAAP.
For the period ended January 31, 2020, there have been no transfers in or out of Level 3.
For more information on valuation inputs, see Note 2 — Significant Accounting Policies in the Notes to Financial Statements.
The accompanying notes are an integral part of the financial statements.
7
| | |
| FROST FAMILY OF FUNDS | | F R O S T F U N D S | J A N U A R Y 3 1, 2 0 2 0 (U n a u d i t e d) |
| | |
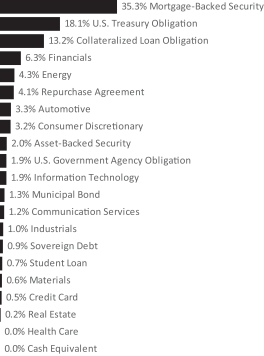
| FROST TOTAL RETURN BOND FUND | | |
| † | Percentages are based on total investments. |
| | | | | | | | |
| Description | | Face Amount | | |
Value | |
MORTGAGE-BACKED SECURITIES — 25.4% | |
|
Agency Mortgage-Backed Obligation — 12.1% | |
| | |
FHLMC | | | | | | | | |
3.084%, VAR ICE LIBOR USD 12 Month+1.620%, 01/01/45 | | $ | 7,181,470 | | | $ | 7,400,347 | |
3.000%, 07/01/34 | | | 90,893,455 | | | | 93,682,269 | |
2.500%, 07/01/34 | | | 51,550,635 | | | | 52,483,788 | |
2.372%, VAR ICE LIBOR USD 12 Month+1.650%, 06/01/43 | | | 7,861,328 | | | | 7,984,707 | |
1.125%, 08/12/21 | | | 1,000,000 | | | | 995,694 | |
| | |
FHLMC REMIC,
Ser 2010-3747, Cl HX
4.500%, 11/15/39 | | | 14,773,000 | | | | 15,673,428 | |
| | |
FHLMC REMIC,
Ser 2011-3898, Cl FC
2.186%, VAR LIBOR USD
1 Month+0.510%, 11/15/36 | | | 2,038,255 | | | | 2,043,147 | |
| | |
FHLMC,
Ser2012-293, Cl IO, IO
4.000%, 11/15/32 | | | 1,445,679 | | | | 206,235 | |
| | |
FHLMC,
Ser 2012-3996, Cl QL
4.000%, 02/15/42 | | | 9,034,408 | | | | 10,144,803 | |
| | | | | | | | |
| Description | | Face Amount | | |
Value | |
| | |
FHLMC,
Ser 2012-4029, Cl LI, IO
3.000%, 01/15/27 | | $ | 6,115,420 | | | $ | 356,841 | |
| | |
FHLMC,
Ser 2012-4054, Cl HI, IO
3.000%, 05/15/26 | | | 3,364,449 | | | | 119,002 | |
| | |
FHLMC,
Ser 2012-4077, Cl AI, IO
3.000%, 01/15/27 | | | 9,270,318 | | | | 486,094 | |
| | |
FHLMC,
Ser 2012-4106, Cl YI, IO
2.500%, 09/15/27 | | | 3,678,823 | | | | 235,597 | |
| | |
FHLMC,
Ser 2012-4116, Cl MI, IO
4.000%, 10/15/42 | | | 33,068,257 | | | | 4,412,999 | |
| | |
FHLMC,
Ser 2012-4116, Cl PI, IO
4.000%, 10/15/42 | | | 10,618,358 | | | | 1,982,152 | |
| | |
FHLMC,
Ser 2012-4134, Cl BI, IO
2.500%, 11/15/27 | | | 10,501,316 | | | | 653,003 | |
| | |
FHLMC,
Ser 2012-4136, Cl PI, IO
3.000%, 11/15/32 | | | 19,416,002 | | | | 2,005,848 | |
| | |
FHLMC,
Ser 2012-4148, Cl LI, IO
2.500%, 12/15/27 | | | 6,311,744 | | | | 403,532 | |
| | |
FHLMC,
Ser 2013-4213, Cl IG, IO
4.000%, 06/15/43 | | | 17,697,191 | | | | 2,235,789 | |
| | |
FHLMC,
Ser 2014-4349, Cl KI, IO
3.000%, 04/15/33 | | | 11,344,707 | | | | 854,678 | |
| | |
FHLMC,
Ser 2015-4457, Cl EI, IO
3.500%, 02/15/45 | | | 2,116,659 | | | | 181,712 | |
| | |
FHLMC,
Ser 2015-4492, Cl MA
4.000%, 07/15/43 | | | 4,416,679 | | | | 4,610,099 | |
| | |
FHLMC,
Ser 2016-4572, Cl LG
2.500%, 08/15/45 | | | 2,975,607 | | | | 3,050,131 | |
| | |
FHLMC,
Ser 2017-4655, Cl HA
3.500%, 01/15/42 | | | 10,155,891 | | | | 10,399,107 | |
| | |
FHLMC,
Ser 2017-4662, Cl VC
3.500%, 08/15/35 | | | 5,000,000 | | | | 5,285,245 | |
| | |
FHLMC,
Ser 2017-4671, Cl ME
3.000%, 02/15/43 | | | 12,726,000 | | | | 13,019,221 | |
| | |
FHLMC,
Ser 2017-4675, Cl VE
3.500%, 08/15/37 | | | 4,707,000 | | | | 5,062,511 | |
The accompanying notes are an integral part of the financial statements.
8
| | |
| FROST FAMILY OF FUNDS | | F R O S T F U N D S | J A N U A R Y 3 1, 2 0 2 0 (U n a u d i t e d) |
| | |
| FROST TOTAL RETURN BOND FUND | | |
| | | | | | | | |
| Description | | Face Amount | | |
Value | |
| | |
FHLMC,
Ser 2017-4679, Cl HA
4.000%, 06/15/44 | | $ | 4,840,129 | | | $ | 5,015,561 | |
| | |
FHLMC,
Ser 2017-4747, Cl HP
3.500%, 02/15/45 | | | 2,445,019 | | | | 2,542,074 | |
| | |
FHLMC,
Ser 2018-4773, Cl DM
4.000%, 09/15/42 | | | 5,000,000 | | | | 5,212,755 | |
| | |
FHLMC,
Ser 2019-4908, Cl AS, IO
4.424%, VAR ICE LIBOR USD
1 Month+6.100%, 01/25/45 | | | 25,667,243 | | | | 4,631,788 | |
| | |
FNMA | | | | | | | | |
5.500%, 04/01/38 to 05/01/44 | | | 7,405,599 | | | | 8,344,826 | |
4.500%, 08/01/41 | | | 5,479,939 | | | | 5,989,659 | |
4.354%, VAR US Treas Yield Curve Rate T Note Const Mat 1 Yr+2.260%, 01/01/38 | | | 1,841,190 | | | | 1,948,716 | |
4.000%, 03/01/47 | | | 1,748,131 | | | | 1,882,145 | |
3.314%, VAR ICE LIBOR USD 12 Month+1.755%, 02/01/42 | | | 3,585,801 | | | | 3,694,781 | |
3.000%, 10/01/32 to 01/01/50 | | | 66,733,719 | | | | 68,089,304 | |
2.875%, 10/30/20 | | | 5,000,000 | | | | 5,049,310 | |
2.810%, VAR ICE LIBOR USD 12 Month+1.700%, 10/01/42 | | | 4,152,889 | | | | 4,255,715 | |
2.710%, 08/01/23 | | | 265,532 | | | | 273,771 | |
2.500%, 11/01/31 | | | 15,644,413 | | | | 16,029,510 | |
2.250%, 10/30/24 | | | 10,000,000 | | | | 10,397,680 | |
| | |
FNMA REMIC,
Ser2017-52, Cl DI, IO
4.500%, 07/25/47 | | | 15,849,456 | | | | 1,994,155 | |
| | |
FNMA STRIPS,
Ser2009-397, Cl 2, IO
5.000%, 09/25/39 | | | 2,680,107 | | | | 474,468 | |
| | |
FNMA STRIPS,
Ser2009-400, Cl 2, IO
4.500%, 11/25/39 | | | 2,197,157 | | | | 287,535 | |
| | |
FNMA STRIPS,
Ser2010-404, Cl 2, IO
4.500%, 05/25/40 | | | 4,171,852 | | | | 606,852 | |
| | |
FNMA STRIPS,
Ser2010-405, Cl 2, IO
4.000%, 10/25/40 | | | 2,974,690 | | | | 375,894 | |
| | |
FNMA STRIPS,
Ser2011-407, Cl 2, IO
4.000%, 03/25/41 | | | 4,563,635 | | | | 600,840 | |
| | |
FNMA,
Ser2010-155, Cl JC
4.000%, 12/25/39 | | | 23,867,925 | | | | 24,936,903 | |
| | |
FNMA,
Ser2011-103, Cl GI, IO
3.500%, 10/25/26 | | | 2,846,202 | | | | 206,929 | |
| | | | | | | | |
| Description | | Face Amount | | |
Value | |
| | |
FNMA,
Ser2011-146, Cl AY
3.500%, 01/25/32 | | $ | 5,000,000 | | | $ | 5,199,459 | |
| | |
FNMA,
Ser2012-31, Cl LI, IO
4.000%, 07/25/40 | | | 4,461,428 | | | | 228,130 | |
| | |
FNMA,
Ser2012-410, Cl C5, IO
3.500%, 05/25/27 | | | 10,612,877 | | | | 707,899 | |
| | |
FNMA,
Ser2012-61, Cl KI, IO
4.000%, 12/25/41 | | | 14,883,424 | | | | 1,414,291 | |
| | |
FNMA,
Ser2012-68, Cl GY
3.000%, 07/25/32 | | | 5,000,000 | | | | 5,287,998 | |
| | |
FNMA,
Ser2013-104, Cl TI, IO
3.000%, 08/25/32 | | | 8,046,914 | | | | 414,185 | |
| | |
FNMA,
Ser2013-36, Cl MH
2.500%, 12/25/36 | | | 7,985,202 | | | | 8,087,772 | |
| | |
FNMA,
Ser2014-40, Cl GI, IO
3.000%, 06/25/33 | | | 10,216,640 | | | | 1,028,355 | |
| | |
FNMA,
Ser2014-59, Cl CI, IO
3.000%, 08/25/40 | | | 2,994,164 | | | | 180,279 | |
| | |
FNMA,
Ser2015-421, Cl C1, IO
3.000%, 05/25/30 | | | 7,091,956 | | | | 615,560 | |
| | |
FNMA,
Ser2017-4, Cl VD
3.500%, 06/25/37 | | | 10,000,000 | | | | 10,453,234 | |
| | |
FNMA,
Ser2017-53, Cl KA
3.500%, 12/25/43 | | | 5,666,572 | | | | 5,848,483 | |
| | |
FNMA,
Ser2019-44, Cl CI, IO
4.000%, 08/25/59 | | | 14,794,971 | | | | 2,748,910 | |
| | |
FNMA,
Ser2019-44, Cl PI, IO
4.000%, 08/25/49 | | | 17,983,821 | | | | 2,378,956 | |
| | |
GNMA REMIC,
Ser2011-125, Cl BI, IO
4.000%, 12/20/30 | | | 3,899,168 | | | | 114,885 | |
| | |
GNMA,
Ser2013-170, Cl QI, IO
5.500%, 11/20/43 (A) | | | 16,280,914 | | | | 3,398,942 | |
| | |
GNMA,
Ser2013-36, Cl GD
3.000%, 03/20/43 | | | 2,000,000 | | | | 2,105,565 | |
| | |
GNMA,
Ser2013-42, Cl MI, IO
3.500%, 04/20/41 | | | 3,265,125 | | | | 244,595 | |
The accompanying notes are an integral part of the financial statements.
9
| | |
| FROST FAMILY OF FUNDS | | F R O S T F U N D S | J A N U A R Y 3 1, 2 0 2 0 (U n a u d i t e d) |
| | |
| FROST TOTAL RETURN BOND FUND | | |
| | | | | | | | |
| Description | | Face Amount | | |
Value | |
| | |
GNMA,
Ser2013-62, Cl NI, IO
4.000%, 08/20/40 | | $ | 7,482,880 | | | $ | 701,636 | |
| | |
GNMA,
Ser2014-151, Cl HI, IO
3.500%, 07/20/39 | | | 4,593,029 | | | | 86,182 | |
| | |
GNMA,
Ser2014-32, Cl CI, IO
4.000%, 03/20/43 | | | 4,503,404 | | | | 468,207 | |
| | |
GNMA,
Ser2014-44, Cl IO, IO
4.000%, 11/16/26 | | | 10,916,079 | | | | 831,112 | |
| | |
GNMA,
Ser2015-17, Cl JI, IO
3.500%, 05/20/28 | | | 10,242,094 | | | | 703,885 | |
| | |
GNMA,
Ser2016-H14, Cl FA
2.494%, VAR ICE LIBOR USD
1 Month+0.800%, 06/20/66 | | | 2,636,665 | | | | 2,654,991 | |
| | |
GNMA,
Ser2017-137, Cl DI, IO
3.000%, 02/20/47 | | | 10,239,165 | | | | 393,137 | |
| | |
GNMA,
Ser 53, Cl A
2.250%, 09/16/44 | | | 4,665,634 | | | | 4,674,632 | |
| | | | | | | | |
| | | | | | | 479,780,430 | |
| | | | | | | | |
|
Commercial Mortgage-Backed Obligation — 10.4% | |
| | |
Banc of America Commercial Mortgage Trust,
Ser2008-1, Cl AJ
6.786%, 02/10/51 (A) | | | 240,943 | | | | 246,203 | |
| | |
Banc of America Commercial Mortgage Trust,
Ser2008-1, Cl B
6.786%, 02/10/51 (A) (B) | | | 4,925,000 | | | | 3,201,250 | |
| | |
BANK,
Ser 2018-BN10, Cl A5
3.688%, 02/15/61 | | | 10,000,000 | | | | 11,117,855 | |
| | |
BANK,
Ser 2018-BN13, Cl A5
4.217%, 08/15/61 (A) | | | 3,000,000 | | | | 3,462,001 | |
| | |
BANK,
Ser 2018-BN14, Cl A3
3.966%, 09/15/60 | | | 10,000,000 | | | | 11,382,164 | |
| | |
BANK,
Ser 2019-BN16, Cl A4
4.005%, 02/15/52 | | | 4,500,000 | | | | 5,147,109 | |
| | |
BBCMS Trust,
Ser2015-STP, Cl D
4.427%, 09/10/28 (A) (B) | | | 5,000,000 | | | | 5,021,806 | |
| | |
Bear Stearns Commercial Mortgage Securities Trust,
Ser2007-T26, Cl AJ
5.561%, 01/12/45 (A) | | | 14,150,000 | | | | 12,217,510 | |
| | | | | | | | |
| Description | | Face Amount | | |
Value | |
| | |
Citigroup Commercial Mortgage Trust,
Ser 2015-GC31, Cl C
4.192%, 06/10/48 (A) | | $ | 5,000,000 | | | $ | 5,269,513 | |
| | |
Citigroup Commercial Mortgage Trust,
Ser2017-P8, Cl A4
3.465%, 09/15/50 | | | 5,000,000 | | | | 5,456,713 | |
| | |
Commercial Mortgage Trust,
Ser 2012- CR2, Cl C
4.992%, 08/15/45 (A) | | | 1,000,000 | | | | 1,037,845 | |
| | |
Commercial Mortgage Trust,
Ser 2012- CR2, Cl D
4.992%, 08/15/45 (A) (B) | | | 224,200 | | | | 231,039 | |
| | |
Commercial Mortgage Trust,
Ser 2014- LC15, Cl D
5.150%, 04/10/47 (A) (B) | | | 9,500,000 | | | | 9,784,747 | |
| | |
Commercial Mortgage Trust,
Ser 2014- UBS6, Cl C
4.597%, 12/10/47 (A) | | | 4,000,000 | | | | 4,154,103 | |
| | |
Commercial Mortgage Trust,
Ser 2015- DC1, Cl D
4.455%, 02/10/48 (A) (B) | | | 9,000,000 | | | | 8,327,981 | |
| | |
Credit Suisse Commercial Mortgage Trust,
Ser2008-C1, Cl D
5.997%, 02/15/41 (A) (B) | | | 4,107,435 | | | | 254,661 | |
| | |
Credit Suisse First Boston Mortgage Securities,
Ser2005-C2, Cl AMFL
1.919%, VAR ICE LIBOR USD
1 Month+0.250%, 04/15/37 | | | 112,303 | | | | 107,731 | |
| | |
Credit Suisse First Boston Mortgage Securities,
Ser2005-C2, Cl AMFX
4.877%, 04/15/37 | | | 10,037 | | | | 9,980 | |
| | |
CSAIL Commercial Mortgage Trust,
Ser2019-C15, Cl A4
4.053%, 03/15/52 | | | 10,000,000 | | | | | |
| | | 11,379,585 | |
| | |
CSMC Trust,
Ser 2019-AFC1, Cl A1
2.573%, 07/25/49 (B) | | | 13,675,030 | | | | 13,738,814 | |
| | |
DBUBS Mortgage Trust,
Ser 2011-LC1A, Cl C
5.878%, 11/10/46 (A) (B) | | | 1,450,000 | | | | 1,484,294 | |
| | |
Deutsche Bank Commercial Mortgage Trust,
Ser2017-C6, Cl A5
3.328%, 06/10/50 | | | 5,000,000 | | | | 5,405,506 | |
| | |
FHLMC Military Housing Bonds Resecuritization Trust Certificates,
Ser2015-R1, Cl C3
8.248%, 11/25/52 (A) (B) | | | 37,278,197 | | | | 37,446,408 | |
The accompanying notes are an integral part of the financial statements.
10
| | |
| FROST FAMILY OF FUNDS | | F R O S T F U N D S | J A N U A R Y 3 1, 2 0 2 0 (U n a u d i t e d) |
| | |
| FROST TOTAL RETURN BOND FUND | | |
| | | | | | | | |
| Description | | Face Amount | | |
Value | |
| | |
FREMF Mortgage Trust,
Ser2011-K15, Cl B
5.129%, 08/25/44 (A) (B) | | $ | 4,000,000 | | | $ | 4,151,494 | |
| | |
FREMF Mortgage Trust,
Ser2012-K21, Cl C
4.068%, 07/25/45 (A) (B) | | | 5,000,000 | | | | 5,194,232 | |
| | |
FREMF Mortgage Trust,
Ser2012-K22, Cl C
3.812%, 08/25/45 (A) (B) | | | 4,500,000 | | | | 4,658,986 | |
| | |
FREMF Mortgage Trust,
Ser2013-K26, Cl C
3.721%, 12/25/45 (A) (B) | | | 5,000,000 | | | | 5,186,688 | |
| | |
FREMF Mortgage Trust,
Ser 2015-K720, Cl B
3.509%, 07/25/22 (A) (B) | | | 5,000,000 | | | | 5,128,831 | |
| | |
FREMF Mortgage Trust,
Ser 2015-K720, Cl C
3.509%, 07/25/22 (A) (B) | | | 8,000,000 | | | | 8,094,055 | |
| | |
FREMF Mortgage Trust,
Ser 2015-K721, Cl C
3.681%, 11/25/47 (A) (B) | | | 14,000,000 | | | | 14,338,337 | |
| | |
FREMF Mortgage Trust,
Ser2016-K54, Cl C
4.189%, 04/25/48 (A) (B) | | | 5,000,000 | | | | 5,285,059 | |
| | |
FREMF Mortgage Trust,
Ser2016-K57, Cl C
4.053%, 08/25/49 (A) (B) | | | 7,840,000 | | | | 8,160,864 | |
| | |
FREMF Mortgage Trust,
Ser2017-K67, Cl B
4.079%, 09/25/49 (A) (B) | | | 2,000,000 | | | | 2,154,546 | |
| | |
FREMF Mortgage Trust,
Ser2017-K70, Cl B
3.934%, 12/25/49 (A) (B) | | | 3,403,000 | | | | 3,650,768 | |
| | |
Galton Funding Mortgage Trust,
Ser 2019- 1, Cl A22
4.000%, 02/25/59 (A) (B) | | | 1,813,196 | | | | 1,849,806 | |
| | |
Galton Funding Mortgage Trust,
Ser 2019- 2, Cl A21
4.000%, 06/25/59 (A) (B) | | | 15,012,805 | | | | 15,358,143 | |
| | |
GS Mortgage Securities Trust,
Ser 2017- G5, Cl AS
3.826%, 03/10/50 (A) | | | 3,500,000 | | | | 3,825,110 | |
| | |
GS Mortgage Securities Trust,
Ser 2017- GS7, Cl A4
3.430%, 08/10/50 | | | 5,000,000 | | | | 5,457,068 | |
| | |
GS Mortgage Securities Trust,
Ser 2018- GS9, Cl A4
3.992%, 03/10/51 (A) | | | 10,000,000 | | | | 11,280,279 | |
| | |
GS Mortgage Securities Trust,
Ser 2019- GC39, Cl A4
3.567%, 05/10/52 | | | 4,000,000 | | | | 4,431,932 | |
| | |
GS Mortgage Securities Trust,
Ser 2019- GC40, Cl A4
3.160%, 07/10/52 | | | 4,000,000 | | | | 4,307,437 | |
| | | | | | | | |
| Description | | Face Amount | | |
Value | |
| | |
GS Mortgage-Backed Securities Trust,
Ser2019-PJ2, Cl A6
4.000%, 11/25/49 (A) (B) | | $ | 5,854,167 | | | $ | 5,886,722 | |
| | |
Homeward Opportunities Fund I Trust,
Ser2019-1, Cl A1
3.454%, 01/25/59 (A) (B) | | | 3,595,854 | | | | 3,638,522 | |
| | |
Homeward Opportunities Fund I Trust,
Ser2019-3, Cl A1
2.675%, 11/25/59 (A) (B) | | | 11,515,442 | | | | 11,600,841 | |
| | |
Hudson Yards Mortgage Trust,
Ser 2019- 30HY, Cl B
3.380%, 07/10/39 (A) (B) | | | 2,500,000 | | | | 2,685,644 | |
| | |
Impact Funding,
Ser2001-AA, Cl C
5.159%, 07/25/33 (A) (B) | | | 56,094 | | | | 55,908 | |
| | |
Impact Funding,
Ser2001-AA, Cl D
5.619%, 07/25/33 (A) (B) | | | 87,994 | | | | 87,642 | |
| | |
JPMDB Commercial Mortgage Securities Trust,
Ser2016-C2, Cl C
3.552%, 06/15/49 (A) | | | 3,328,000 | | | | 3,394,438 | |
| | |
JPMorgan Chase Commercial Mortgage Securities,
Ser 2006-LDP9, Cl AMS
5.337%, 05/15/47 | | | 2,330,460 | | | | 2,270,692 | |
| | |
JPMorgan Chase Commercial Mortgage Securities,
Ser 2007-LD12, Cl AJ
6.651%, 02/15/51 (A) | | | 2,040,761 | | | | 1,942,151 | |
| | |
JPMorgan Chase Commercial Mortgage Securities,
Ser 2007-LD12, Cl J
5.994%, 02/15/51 (A) (B) | | | 111,787 | | | | — | |
| | |
LB-UBS Commercial Mortgage Trust,
Ser2007-C6, Cl AJ
6.470%, 07/15/40 (A) | | | 677,565 | | | | 680,757 | |
| | |
LStar Commercial Mortgage Trust,
Ser2016-4, Cl AS
3.188%, 03/10/49 (B) | | | 3,000,000 | | | | 3,042,893 | |
| | |
Morgan Stanley Bank of America Merrill Lynch Trust,
Ser2016-C29, Cl C
4.907%, 05/15/49 (A) | | | 2,413,000 | | | | 2,594,197 | |
| | |
Morgan Stanley Capital I,
Ser2007-T25, Cl AJ
5.574%, 11/12/49 (A) | | | 118,481 | | | | 119,185 | |
| | |
Morgan Stanley Capital I,
Ser2007-T27, Cl AJ
6.144%, 06/11/42 (A) | | | 6,934,555 | | | | 7,326,594 | |
The accompanying notes are an integral part of the financial statements.
11
| | |
| FROST FAMILY OF FUNDS | | F R O S T F U N D S | J A N U A R Y 3 1, 2 0 2 0 (U n a u d i t e d) |
| | |
| FROST TOTAL RETURN BOND FUND | | |
| | | | | | | | |
| Description | | Face Amount | | |
Value | |
| | |
Morgan Stanley Capital I,
Ser2007-T27, Cl B
6.144%, 06/11/42 (A) (B) | | $ | 500,000 | | | $ | 528,155 | |
| | |
Morgan Stanley Capital I,
Ser2011-C1, Cl C
5.554%, 09/15/47 (A) (B) | | | 2,000,000 | | | | 2,049,205 | |
| | |
UBS Commercial Mortgage Trust,
Ser2012-C1, Cl C
5.756%, 05/10/45 (A) (B) | | | 9,160,000 | | | | 9,653,770 | |
| | |
UBS-Barclays Commercial Mortgage Trust,
Ser2012-C2, Cl D
5.047%, 05/10/63 (A) (B) | | | 7,095,000 | | | | 7,034,901 | |
| | |
UBS-Barclays Commercial Mortgage Trust,
Ser2012-C2, Cl E
5.047%, 05/10/63 (A) (B) | | | 15,339,806 | | | | 12,896,258 | |
| | |
UBS-Barclays Commercial Mortgage Trust,
Ser2012-C3, Cl C
5.198%, 08/10/49 (A) (B) | | | 3,000,000 | | | | 3,176,275 | |
| | |
UBS-Barclays Commercial Mortgage Trust,
Ser2012-C4, Cl D
4.626%, 12/10/45 (A) (B) | | | 13,384,000 | | | | 13,364,364 | |
| | |
Wells Fargo Commercial Mortgage Trust,
Ser2016-C32, Cl C
4.877%, 01/15/59 (A) | | | 5,000,000 | | | | 5,341,207 | |
| | |
Wells Fargo Commercial Mortgage Trust,
Ser2016-C32, Cl D
3.788%, 01/15/59 (A) (B) | | | 2,000,000 | | | | 1,917,915 | |
| | |
Wells Fargo Commercial Mortgage Trust,
Ser2016-C34, Cl B
4.089%, 06/15/49 | | | 5,000,000 | | | | 5,292,128 | |
| | |
Wells Fargo Commercial Mortgage Trust,
Ser2017-C39, Cl A5
3.418%, 09/15/50 | | | 3,500,000 | | | | 3,804,450 | |
| | |
Wells Fargo Commercial Mortgage Trust,
Ser2017-RC1, Cl A4
3.631%, 01/15/60 | | | 3,788,000 | | | | 4,162,244 | |
| | |
Wells Fargo Commercial Mortgage Trust,
Ser2018-AUS, Cl A
4.194%, 08/17/36 (A) (B) | | | 5,000,000 | | | | 5,641,311 | |
| | |
Wells Fargo Commercial Mortgage Trust,
Ser2018-C43, Cl A4
4.012%, 03/15/51 (A) | | | 6,000,000 | | | | 6,763,042 | |
| | |
Wells Fargo Mortgage Backed Securities Trust,
Ser2019-3, Cl A1
3.500%, 07/25/49 (A) (B) | | | 10,115,804 | | | | 10,324,696 | |
| | | | | | | | |
| Description | | Face Amount | | |
Value | |
| | |
WFRBS Commercial Mortgage Trust,
Ser 2013-UBS1, Cl C
4.897%, 03/15/46 (A) | | $ | 3,000,000 | | | $ | 3,198,140 | |
| | |
WFRBS Commercial Mortgage Trust,
Ser2014-C25, Cl D
3.803%, 11/15/47 (A) (B) | | | 7,310,000 | | | | 6,967,012 | |
| | | | | | | | |
| | | | | | | 415,839,712 | |
| | | | | | | | |
|
Non-Agency Residential Mortgage-Backed Obligation — 2.9% | |
| | |
Arroyo Mortgage Trust,
Ser2018-1, Cl A1
3.763%, 04/25/48 (A) (B) | | | 13,514,983 | | | | 13,685,459 | |
| | |
Arroyo Mortgage Trust,
Ser2019-2, Cl A2
3.498%, 04/25/49 (A) (B) | | | 9,387,876 | | | | 9,531,528 | |
| | |
Carrington Mortgage Loan Trust,
Ser 2007-FRE1, Cl M8
2.461%, VAR ICE LIBOR USD
1 Month+2.250%, 02/25/37 | | | 1,000,000 | | | | — | |
| | |
CSAIL Mortgage Trust,
Ser 2018-CX11, Cl A5
4.033%, 04/15/51 | | | 10,000,000 | | | | 11,275,406 | |
| | |
Deephaven Residential Mortgage Trust,
Ser2018-2A, Cl A1
3.479%, 04/25/58 (A) (B) | | | 2,241,683 | | | | 2,262,208 | |
| | |
FirstKey Mortgage Trust,
Ser2015-1, Cl A3
3.500%, 03/25/45 (A) (B) | | | 4,205,948 | | | | 4,284,109 | |
| | |
Flagstar Mortgage Trust,
Ser2018-2, Cl A6
3.500%, 04/25/48 (A) (B) | | | 5,241,568 | | | | 5,336,008 | |
| | |
JPMorgan Mortgage Trust,
Ser2016-4, Cl A3
3.500%, 10/25/46 (A) (B) | | | 1,546,921 | | | | 1,583,661 | |
| | |
JPMorgan Mortgage Trust,
Ser2017-1, Cl A3
3.500%, 01/25/47 (A) (B) | | | 1,647,886 | | | | 1,687,206 | |
| | |
JPMorgan Mortgage Trust,
Ser2019-1, Cl A3
4.000%, 05/25/49 (A) (B) | | | 5,544,011 | | | | 5,651,426 | |
| | |
Sequoia Mortgage Trust,
Ser2013-4, Cl AIO1, IO
0.895%, 04/25/43 (A) (B) | | | 180,545,461 | | | | 4,669,863 | |
| | |
Sequoia Mortgage Trust,
Ser2017-2, Cl A4
3.500%, 02/25/47 (A) (B) | | | 2,579,499 | | | | 2,650,334 | |
| | |
Sequoia Mortgage Trust,
Ser2017-6, Cl A4
3.500%, 09/25/47 (A) (B) | | | 4,974,056 | | | | 5,105,675 | |
| | |
Sequoia Mortgage Trust,
Ser2017-CH1, Cl A2
3.500%, 08/25/47 (A) (B) | | | 1,561,077 | | | | 1,598,053 | |
The accompanying notes are an integral part of the financial statements.
12
| | |
| FROST FAMILY OF FUNDS | | F R O S T F U N D S | J A N U A R Y 3 1, 2 0 2 0 (U n a u d i t e d) |
| | |
| FROST TOTAL RETURN BOND FUND | | |
| | | | | | | | |
| Description | | Face Amount | | |
Value | |
| | |
Sequoia Mortgage Trust,
Ser2018-3, Cl A4
3.500%, 03/25/48 (A) (B) | | $ | 2,987,359 | | | $ | 3,034,253 | |
| | |
Sequoia Mortgage Trust,
Ser2018-CH4, Cl A2
4.000%, 10/25/48 (A) (B) | | | 2,844,749 | | | | 2,902,384 | |
| | |
Sequoia Mortgage Trust,
Ser2019-CH1, Cl A1
4.500%, 03/25/49 (A) (B) | | | 2,799,666 | | | | 2,865,343 | |
| | |
Wells Fargo Mortgage Backed Securities Trust,
Ser2019-1, Cl A1
4.000%, 11/25/48 (A) (B) | | | 9,299,397 | | | | 9,514,445 | |
| | |
Wells Fargo Mortgage Backed Securities Trust,
Ser2019-2, Cl A1
4.000%, 04/25/49 (A) (B) | | | 8,605,828 | | | | 8,804,838 | |
| | |
Wells Fargo Mortgage Backed Securities,
Ser2018-1, Cl A7
3.500%, 07/25/47 (A) (B) | | | 4,816,869 | | | | 4,869,780 | |
| | |
WinWater Mortgage Loan Trust,
Ser 2014- 1, Cl A1
3.835%, 06/20/44 (A) (B) | | | 2,619,042 | | | | 2,688,853 | |
| | |
WinWater Mortgage Loan Trust,
Ser 2014- 2, Cl A1
4.000%, 09/20/44 (A) (B) | | | 1,595,049 | | | | 1,646,140 | |
| | |
WinWater Mortgage Loan Trust,
Ser 2014- 3, Cl A3
3.500%, 11/20/44 (A) (B) | | | 2,239,958 | | | | 2,296,727 | |
| | |
WinWater Mortgage Loan Trust,
Ser 2015- 2, Cl A11
3.500%, 02/20/45 (A) (B) | | | 3,106,938 | | | | 3,184,127 | |
| | |
WinWater Mortgage Loan Trust,
Ser 2015- 3, Cl A3
3.500%, 03/20/45 (A) (B) | | | 3,538,092 | | | | 3,634,284 | |
| | | | | | | | |
| | | | | | | 114,762,110 | |
| | | | | | | | |
| | |
Total Mortgage-Backed Securities
(Cost $1,018,112,847) | | | | | | | 1,010,382,252 | |
| | | | | | | | |
CORPORATE OBLIGATIONS — 18.4% | |
|
Communication Services — 1.2% | |
| | |
AT&T 4.350%, 03/01/29 | | | 5,000,000 | | | | 5,639,716 | |
4.300%, 02/15/30 | | | 12,905,000 | | | | 14,596,649 | |
| | |
Frontier Communications
8.500%, 04/15/20 | | | 54,892,000 | | | | 25,936,470 | |
| | | | | | | | |
| | | | | | | 46,172,835 | |
| | | | | | | | |
|
Consumer Discretionary — 2.8% | |
| | |
Block Financial
4.125%, 10/01/20 | | | 5,000,000 | | | | 5,057,827 | |
| | |
Capitol Investment Merger Sub 2
10.000%, 08/01/24 (B) | | | 13,000,000 | | | | 13,503,750 | |
| | | | | | | | |
| Description | | Face Amount | | |
Value | |
| | |
Choice Hotels International
3.700%, 12/01/29 | | $ | 8,000,000 | | | $ | 8,209,680 | |
| | |
Ford Motor Credit
4.375%, 08/06/23 | | | 2,000,000 | | | | 2,096,018 | |
| | |
General Motors Financial
4.000%, 01/15/25 | | | 15,126,000 | | | | 16,036,008 | |
| | |
Jaguar Land Rover Automotive
4.500%, 10/01/27 (B) | | | 6,000,000 | | | | 5,502,000 | |
| | |
L Brands
6.950%, 03/01/33 | | | 8,150,000 | | | | 7,335,000 | |
| | |
Lear 5.250%, 01/15/25 | | | 1,500,000 | | | | 1,543,411 | |
| | |
McDonald’s MTN
2.625%, 01/15/22 | | | 3,000,000 | | | | 3,053,872 | |
| | |
Panther BF Aggregator 2
8.500%, 05/15/27 (B) | | | 16,000,000 | | | | 17,200,000 | |
| | |
Tupperware Brands
4.750%, 06/01/21 | | | 2,000,000 | | | | 1,974,144 | |
| | |
Under Armour
3.250%, 06/15/26 | | | 3,200,000 | | | | 3,127,779 | |
| | |
VistaJet Malta Finance
10.500%, 06/01/24 (B) | | | 29,129,000 | | | | 27,599,727 | |
| | | | | | | | |
| | | | | | | 112,239,216 | |
| | | | | | | | |
|
Energy — 4.2% | |
| | |
Antero Midstream Partners
5.750%, 01/15/28 (B) | | | 15,000,000 | | | | 11,665,500 | |
| | |
Apache
7.750%, 12/15/29 | | | 4,138,000 | | | | 5,268,669 | |
| | |
Baytex Energy
8.750%, 04/01/27 (B) | | | 4,000,000 | | | | 3,895,000 | |
| | |
Lukoil International Finance BV
4.563%, 04/24/23 | | | 3,000,000 | | | | 3,176,250 | |
| | |
Noble Holding International
6.050%, 03/01/41 | | | 13,462,000 | | | | 4,442,460 | |
4.625%, 03/01/21 | | | 44,470,000 | | | | 37,354,800 | |
| | |
NuStar Logistics
6.000%, 06/01/26 | | | 1,000,000 | | | | 1,052,200 | |
| | |
Petrobras Global Finance BV
8.750%, 05/23/26 | | | 2,000,000 | | | | 2,613,000 | |
| | |
Petroleos Mexicanos
6.840%, 01/23/30 (B) | | | 4,000,000 | | | | 4,334,000 | |
5.350%, 02/12/28 | | | 7,000,000 | | | | 7,063,350 | |
| | |
Seadrill New Finance
12.000% cash/0% PIK, 07/15/25 (B) (C) | | | 51,526,251 | | | | 42,251,526 | |
| | |
Suriname Government International Bond
9.875%, 12/30/23 (B) | | | 8,000,000 | | | | 7,730,000 | |
| | |
Talen Energy Supply
7.250%, 05/15/27 (B) | | | 2,000,000 | | | | 2,050,000 | |
| | |
Teekay
9.250%, 11/15/22 (B) | | | 10,250,000 | | | | 10,660,000 | |
| | |
Transocean
7.250%, 11/01/25 (B) | | | 5,000,000 | | | | 4,712,500 | |
6.500%, 11/15/20 | | | 19,277,000 | | | | 19,566,155 | |
The accompanying notes are an integral part of the financial statements.
13
| | |
| FROST FAMILY OF FUNDS | | F R O S T F U N D S | J A N U A R Y 3 1, 2 0 2 0 (U n a u d i t e d) |
| | |
| FROST TOTAL RETURN BOND FUND | | |
| | | | | | | | |
| Description | | Face Amount | | |
Value | |
| | |
Weatherford International
11.000%, 12/01/24 (B) | | $ | 584,000 | | | $ | 620,074 | |
| | | | | | | | |
| | | | | | | 168,455,484 | |
| | | | | | | | |
| | |
Financials — 6.2% | | | | | | | | |
| | |
Assured Guaranty US Holdings
5.000%, 07/01/24 | | | 7,272,000 | | | | 8,154,962 | |
| | |
Bank of Nova Scotia
3.125%, 04/20/21 | | | 6,300,000 | | | | 6,419,042 | |
| | |
Barclays MTN
4.972%, VAR ICE LIBOR USD
3 Month+1.902%, 05/16/29 | | | 2,000,000 | | | | 2,319,301 | |
| | |
Capital One Financial
3.800%, 01/31/28 | | | 5,000,000 | | | | 5,444,326 | |
| | |
Commonwealth Bank of Australia NY
2.550%, 03/15/21 | | | 10,390,000 | | | | 10,493,012 | |
| | |
Deutsche Bank
7.500%, VAR USD Swap Semi 30/360 5 Yr
Curr+5.003%, 04/30/68 | | | 2,000,000 | | | | 2,082,500 | |
| | |
Deutsche Bank NY
3.150%, 01/22/21 | | | 85,847,000 | | | | 86,578,557 | |
| | |
Enova International
8.500%, 09/15/25 (B) | | | 15,000,000 | | | | 14,884,950 | |
| | |
Farmers Exchange Capital
7.050%, 07/15/28 (B) | | | 6,075,000 | | | | 7,630,139 | |
| | |
First American Financial
4.300%, 02/01/23 | | | 1,000,000 | | | | 1,046,935 | |
| | |
Genworth Holdings
7.625%, 09/24/21 | | | 8,000,000 | | | | 8,440,000 | |
| | |
Navient
5.000%, 03/15/27 | | | 1,000,000 | | | | 997,500 | |
3.914%, VAR CPI
YOY+2.150%, 12/15/20 | | | 3,525,000 | | | | 3,502,969 | |
| | |
PNC Bank
3.250%, 01/22/28 | | | 5,000,000 | | | | 5,385,065 | |
| | |
Royal Bank of Canada MTN
10.000%, 08/14/20 | | | 25,000,000 | | | | 25,875,000 | |
9.000%, 06/10/20 | | | 5,000,000 | | | | 3,992,500 | |
7.375%, 05/29/20 | | | 10,000,000 | | | | 6,570,000 | |
| | |
Royal Bank of Scotland Group
7.500%, VAR USD Swap Semi 30/360 5 Yr
Curr+5.800%, 09/30/68 | | | 4,000,000 | | | | 4,092,000 | |
| | |
Societe Generale
5.000%, 01/17/24 (B) | | | 4,025,000 | | | | 4,392,236 | |
| | |
Synchrony Financial
4.500%, 07/23/25 | | | 9,905,000 | | | | 10,766,698 | |
4.375%, 03/19/24 | | | 1,000,000 | | | | 1,074,248 | |
2.700%, 02/03/20 | | | 10,155,000 | | | | 10,155,000 | |
| | |
TMX Finance
11.125%, 04/01/23 (B) | | | 12,250,000 | | | | 11,438,437 | |
| | |
Wachovia
6.605%, 10/01/25 | | | 5,650,000 | | | | 6,886,572 | |
| | | | | | | | |
| | | | | | | 248,621,949 | |
| | | | | | | | |
| | | | | | | | |
| Description | | Face Amount | | |
Value | |
|
Health Care — 0.0% | |
| | |
CHS
5.125%, 08/01/21 | | $ | 1,000,000 | | | $ | 1,000,800 | |
| | | | | | | | |
|
Industrials — 1.0% | |
| | |
Burlington Northern Santa Fe
7.290%, 06/01/36 | | | 5,000,000 | | | | 7,573,192 | |
| | |
FedEx
3.100%, 08/05/29 | | | 12,000,000 | | | | 12,280,808 | |
| | |
Flowserve
4.000%, 11/15/23 | | | 1,000,000 | | | | 1,046,702 | |
| | |
General Electric MTN
5.875%, 01/14/38 | | | 4,377,000 | | | | 5,614,457 | |
5.300%, 02/11/21 | | | 8,000,000 | | | | 8,244,176 | |
| | |
Great Lakes Dredge & Dock
8.000%, 05/15/22 | | | 1,410,000 | | | | 1,480,500 | |
| | |
Hertz
5.500%, 10/15/24 (B) | | | 1,000,000 | | | | 1,014,580 | |
| | |
Owens Corning
3.950%, 08/15/29 | | | 3,000,000 | | | | 3,253,056 | |
| | | | | | | | |
| | | | | | | 40,507,471 | |
| | | | | | | | |
|
Information Technology — 1.8% | |
| | |
Amkor Technology
6.625%, 09/15/27 (B) | | | 1,900,000 | | | | 2,063,875 | |
| | |
Apple
3.200%, 05/13/25 | | | 17,712,000 | | | | 18,980,459 | |
| | |
Jabil
3.600%, 01/15/30 | | | 3,000,000 | | | | 3,081,509 | |
| | |
Juniper Networks
3.750%, 08/15/29 | | | 10,000,000 | | | | 10,628,144 | |
| | |
Keysight Technologies
4.550%, 10/30/24 | | | 1,000,000 | | | | 1,107,191 | |
3.000%, 10/30/29 | | | 2,000,000 | | | | 2,061,856 | |
| | |
Micron Technology
4.185%, 02/15/27 | | | 10,000,000 | | | | 10,892,803 | |
| | |
Motorola Solutions
4.600%, 05/23/29 | | | 21,435,000 | | | | 24,103,169 | |
| | | | | | | | |
| | | | | | | 72,919,006 | |
| | | | | | | | |
|
Materials — 0.6% | |
| | |
First Quantum Minerals
7.250%, 05/15/22 (B) | | | 20,920,000 | | | | 20,867,700 | |
7.000%, 02/15/21 (B) | | | 1,077,000 | | | | 1,077,969 | |
| | | | | | | | |
| | | | | | | 21,945,669 | |
| | | | | | | | |
| | |
Real Estate — 0.2% | | | | | | | | |
| | |
Brookfield Property
5.750%, 05/15/26‡ (B) | | | 2,000,000 | | | | 2,086,860 | |
| | |
CBL & Associates
5.250%, 12/01/23‡ | | | 4,881,000 | | | | 2,928,600 | |
4.600%, 10/15/24‡ | | | 2,000,000 | | | | 1,080,000 | |
| | | | | | | | |
| | | | | | | 6,095,460 | |
| | | | | | | | |
|
Sovereign — 0.4% | |
| | |
Andina de Fomento
2.750%, 01/06/23 | | | 5,000,000 | | | | 5,095,050 | |
The accompanying notes are an integral part of the financial statements.
14
| | |
| FROST FAMILY OF FUNDS | | F R O S T F U N D S | J A N U A R Y 3 1, 2 0 2 0 (U n a u d i t e d) |
| | |
| FROST TOTAL RETURN BOND FUND | | |
| | | | | | | | |
| Description | | Face Amount | | |
Value | |
| | |
Kreditanstalt fuer Wiederaufbau
2.125%, 01/17/23 | | $ | 10,000,000 | | | $ | 10,215,535 | |
| | | | | | | | |
| | | | | | | 15,310,585 | |
| | | | | | | | |
| | |
Total Corporate Obligations
(Cost $763,428,170) | | | | | | | 733,268,475 | |
| | | | | | | | |
U.S. TREASURY OBLIGATIONS — 18.0% | |
| | |
U.S. Treasury Inflationary Protection Securities
1.125%, 01/15/21 | | | 5,878,950 | | | | 5,922,367 | |
1.000%, 02/15/46 to 02/15/48 | | | 16,943,420 | | | | 20,114,918 | |
0.875%, 01/15/29 | | | 30,559,200 | | | | 33,309,751 | |
| | |
U.S. Treasury Notes
2.875%, 05/15/28 | | | 200,000,000 | | | | 221,781,250 | |
2.375%, 08/15/24 to 05/15/29 | | | 180,000,000 | | | | 192,033,593 | |
2.250%, 11/15/24 to 08/15/49 | | | 80,000,000 | | | | 83,442,383 | |
1.625%, 03/15/20 to 08/15/29 | | | 60,000,000 | | | | 60,424,962 | |
1.500%, 01/15/23 to 08/15/26 | | | 50,000,000 | | | | 50,264,648 | |
1.375%, 02/15/20 | | | 50,000,000 | | | | 49,995,838 | |
| | |
U.S. Treasury STRIPS
3.287%, 02/15/46 (D) | | | 2,000,000 | | | | 1,143,670 | |
| | | | | | | | |
| | |
Total U.S. Treasury Obligations
(Cost $677,120,215) | | | | | | | 718,433,380 | |
| | | | | | | | |
ASSET-BACKED SECURITIES — 16.7% | |
|
Asset Backed Securities — 4.4% | |
| | |
American Credit Acceptance Receivables Trust,
Ser2017-4, Cl C
2.940%, 01/10/24 (B) | | | 515,700 | | | | 516,444 | |
| | |
American Credit Acceptance Receivables Trust,
Ser2017-4, Cl D
3.570%, 01/10/24 (B) | | | 1,952,000 | | | | 1,976,354 | |
| | |
American Credit Acceptance Receivables Trust,
Ser2019-3, Cl C
2.760%, 09/12/25 (B) | | | 6,500,000 | | | | 6,592,947 | |
| | |
Apidos CLO XI,
Ser2019-11A, Cl BRR
3.536%, VAR ICE LIBOR USD
3 Month+1.700%, 10/17/30 (B) | | | 15,000,000 | | | | 15,022,425 | |
| | |
BCC Funding XVI,
Ser2019-1A, Cl B
2.640%, 09/20/24 (B) | | | 6,000,000 | | | | 6,029,125 | |
| | |
BCC Funding XVI,
Ser2019-1A, Cl C
2.950%, 09/20/24 (B) | | | 500,000 | | | | 502,601 | |
| | |
BlueMountain CLO,
Ser2019-2A, Cl A2R
3.699%, VAR ICE LIBOR USD
3 Month+1.800%, 08/20/32 (B) | | | 23,000,000 | | | | 22,976,701 | |
| | | | | | | | |
| Description | | Face Amount | | |
Value | |
| | |
Capital One Prime Auto Receivables Trust,
Ser2019-2, Cl A2
2.060%, 09/15/22 | | $ | 8,000,000 | | | $ | 8,024,638 | |
| | |
Drive Auto Receivables Trust,
Ser2017-3, Cl D
3.530%, 12/15/23 (B) | | | 1,000,000 | | | | 1,010,500 | |
| | |
Drive Auto Receivables Trust,
Ser2018-2, Cl C
3.630%, 08/15/24 | | | 1,548,762 | | | | 1,558,681 | |
| | |
Drive Auto Receivables Trust,
Ser2018-3, Cl D
4.300%, 09/16/24 | | | 7,966,000 | | | | 8,214,848 | |
| | |
Drive Auto Receivables Trust,
Ser2019-1, Cl C
3.780%, 04/15/25 | | | 2,230,000 | | | | 2,274,321 | |
| | |
Drive Auto Receivables Trust,
Ser2019-2, Cl B
3.170%, 11/15/23 | | | 4,750,000 | | | | 4,810,174 | |
| | |
DT Auto Owner Trust,
Ser2017-3A, Cl D
3.580%, 05/15/23 (B) | | | 495,000 | | | | 498,408 | |
| | |
DT Auto Owner Trust,
Ser2018-2A, Cl C
3.670%, 03/15/24 (B) | | | 1,000,000 | | | | 1,009,093 | |
| | |
Exeter Automobile Receivables Trust,
Ser2018-4A, Cl C
3.970%, 09/15/23 (B) | | | 5,350,000 | | | | 5,452,475 | |
| | |
Flagship Credit Auto Trust,
Ser2017-4, Cl C
2.920%, 11/15/23 (B) | | | 4,466,000 | | | | 4,525,510 | |
| | |
Flagship Credit Auto Trust,
Ser2019-2, Cl D
3.530%, 05/15/25 (B) | | | 5,190,000 | | | | 5,355,635 | |
| | |
Master Credit Card Trust II,
Ser2019-2A, Cl B
2.390%, 01/21/23 (B) | | | 5,582,000 | | | | 5,599,309 | |
| | |
Master Credit Card Trust II,
Ser2019-2A, Cl C
2.830%, 01/21/23 (B) | | | 1,509,000 | | | | 1,513,523 | |
| | |
Oaktree CLO,
Ser2019-3A, Cl B
3.819%, VAR ICE LIBOR USD
3 Month+2.000%, 07/20/31 (B) | | | 13,500,000 | | | | 13,520,291 | |
| | |
Oaktree CLO,
Ser2019-4A, Cl B
3.919%, VAR ICE LIBOR USD
3 Month+2.000%, 10/20/32 (B) | | | 25,000,000 | | | | 25,044,750 | |
| | |
Pawnee Equipment Receivables
Series, Ser2019-1, Cl A1
2.294%, 10/15/20 (B) | | | 1,327,889 | | | | 1,328,193 | |
| | |
Pawnee Equipment Receivables
Series, Ser2019-1, Cl E
3.800%, 01/15/26 (B) | | | 2,500,000 | | | | 2,512,319 | |
The accompanying notes are an integral part of the financial statements.
15
| | |
| FROST FAMILY OF FUNDS | | F R O S T F U N D S | J A N U A R Y 3 1, 2 0 2 0 (U n a u d i t e d) |
| | |
| FROST TOTAL RETURN BOND FUND | | |
| | | | | | | | |
| Description | | Face Amount | | |
Value | |
| | |
Pretium Mortgage Credit Partners I,
Ser 2019-NPL3, Cl A1
3.105%, 07/27/59 (B) | | $ | 6,169,066 | | | $ | 6,173,656 | |
| | |
Skopos Auto Receivables Trust,
Ser 2019- 1A, Cl C
3.630%, 09/16/24 (B) | | | 2,300,000 | | | | 2,316,530 | |
| | |
Venture 35 CLO,
Ser2018-35A, Cl BL
3.652%, VAR ICE LIBOR USD
3 Month+1.850%, 10/22/31 (B) | | | 20,000,000 | | | | 20,008,340 | |
| | |
Westlake Automobile Receivables Trust,
Ser2018-1A, Cl C
2.920%, 05/15/23 (B) | | | 310,000 | | | | 310,644 | |
| | | | | | | | |
| | | | | | | 174,678,435 | |
| | | | | | | | |
|
Automotive — 8.7% | |
| | |
Ally Auto Receivables Trust,
Ser2019-2, Cl A2
2.340%, 06/15/22 | | | 2,236,881 | | | | 2,243,496 | |
| | |
American Credit Acceptance Receivables Trust,
Ser2016-3, Cl C
4.260%, 08/12/22 (B) | | | 1,797,021 | | | | 1,802,539 | |
| | |
American Credit Acceptance Receivables Trust,
Ser2017-1, Cl E
5.440%, 03/13/24 (B) | | | 1,000,000 | | | | 1,022,701 | |
| | |
American Credit Acceptance Receivables Trust,
Ser2017-2, Cl C
2.860%, 06/12/23 (B) | | | 852,223 | | | | 852,860 | |
| | |
American Credit Acceptance Receivables Trust,
Ser2017-3, Cl C
2.720%, 06/10/22 (B) | | | 291,785 | | | | 291,837 | |
| | |
American Credit Acceptance Receivables Trust,
Ser2017-3, Cl E
5.170%, 06/10/24 (B) | | | 2,180,000 | | | | 2,220,220 | |
| | |
American Credit Acceptance Receivables Trust,
Ser2018-1, Cl D
3.930%, 04/10/24 (B) | | | 4,200,000 | | | | 4,271,282 | |
| | |
American Credit Acceptance Receivables Trust,
Ser2018-4, Cl D
4.400%, 01/13/25 (B) | | | 17,605,000 | | | | 18,238,440 | |
| | |
American Credit Acceptance Receivables Trust,
Ser2019-1, Cl C
3.500%, 04/14/25 (B) | | | 4,600,000 | | | | 4,683,876 | |
| | |
AmeriCredit Automobile Receivables Trust,
Ser2017-2, Cl D
3.420%, 04/18/23 | | | 8,570,000 | | | | 8,751,768 | |
| | | | | | | | |
| Description | | Face Amount | | |
Value | |
| | |
Canadian Pacer Auto Receivables Trust,
Ser2019-1A, Cl A4
2.960%, 06/19/24 (B) | | $ | 5,000,000 | | | $ | 5,166,416 | |
| | |
CarMax Auto Owner Trust,
Ser2016-4, Cl D
2.910%, 04/17/23 | | | 3,500,000 | | | | 3,522,302 | |
| | |
CarMax Auto Owner Trust,
Ser2017-3, Cl D
3.460%, 10/16/23 | | | 5,250,000 | | | | 5,339,285 | |
| | |
Carnow Auto Receivables Trust,
Ser 2017- 1A, Cl C
5.750%, 10/16/23 (B) | | | 2,000,000 | | | | 2,025,406 | |
| | |
Carnow Auto Receivables Trust,
Ser 2019- 1A, Cl A
2.720%, 11/15/22 (B) | | | 10,283,517 | | | | 10,304,537 | |
| | |
Carvana Auto Receivables Trust,
Ser 2019- 1A, Cl E
5.640%, 01/15/26 (B) | | | 5,000,000 | | | | 5,281,554 | |
| | |
Carvana Auto Receivables Trust,
Ser 2019- 2A, Cl B
2.740%, 12/15/23 (B) | | | 9,000,000 | | | | 9,110,590 | |
| | |
CPS Auto Receivables Trust,
Ser2014-D, Cl E
6.210%, 02/15/22 (B) | | | 4,000,000 | | | | 3,999,662 | |
| | |
CPS Auto Receivables Trust,
Ser2015-C, Cl E
6.540%, 08/16/21 (B) | | | 5,250,000 | | | | 5,383,920 | |
| | |
CPS Auto Receivables Trust,
Ser2016-A, Cl E
7.650%, 12/15/21 (B) | | | 6,000,000 | | | | 6,242,498 | |
| | |
CPS Auto Receivables Trust,
Ser2016-A, Cl F
7.650%, 03/15/23 (B) | | | 10,540,000 | | | | 10,782,248 | |
| | |
CPS Auto Receivables Trust,
Ser2016-B, Cl C
4.220%, 03/15/22 (B) | | | 1,203,155 | | | | 1,207,462 | |
| | |
CPS Auto Receivables Trust,
Ser2016-B, Cl E
8.140%, 05/15/23 (B) | | | 6,500,000 | | | | 6,851,871 | |
| | |
CPS Auto Receivables Trust,
Ser2016-D, Cl E
6.860%, 04/15/24 (B) | | | 8,000,000 | | | | 8,337,604 | |
| | |
CPS Auto Receivables Trust,
Ser2017-B, Cl D
3.950%, 03/15/23 (B) | | | 3,500,000 | | | | 3,553,374 | |
| | |
CPS Auto Receivables Trust,
Ser2019-B, Cl F
7.480%, 06/15/26 (B) | | | 6,055,000 | | | | 6,353,359 | |
| | |
Diamond Resorts Owner Trust,
Ser 2019- 1A, Cl A
2.890%, 02/20/32 (B) | | | 4,234,280 | | | | 4,293,874 | |
| | |
Drive Auto Receivables Trust,
Ser 2016- BA, Cl D
4.530%, 08/15/23 (B) | | | 1,298,643 | | | | 1,312,444 | |
The accompanying notes are an integral part of the financial statements.
16
| | |
| FROST FAMILY OF FUNDS | | F R O S T F U N D S | J A N U A R Y 3 1, 2 0 2 0 (U n a u d i t e d) |
| | |
| FROST TOTAL RETURN BOND FUND | | |
| | | | | | | | |
| Description | | Face Amount | | |
Value | |
| | |
Drive Auto Receivables Trust,
Ser2018-1, Cl D
3.810%, 05/15/24 | | $ | 7,835,000 | | | $ | 7,979,618 | |
| | |
DT Auto Owner Trust,
Ser2016-4A, Cl E
6.490%, 09/15/23 (B) | | | 3,520,000 | | | | 3,604,648 | |
| | |
DT Auto Owner Trust,
Ser2017-2A, Cl E
6.030%, 01/15/24 (B) | | | 2,750,000 | | | | 2,871,283 | |
| | |
DT Auto Owner Trust,
Ser2019-4A, Cl C
2.730%, 07/15/25 (B) | | | 2,000,000 | | | | 2,029,635 | |
| | |
DT Auto Owner Trust,
Ser2020-1A, Cl E
3.480%, 02/16/27 (B) | | | 4,500,000 | | | | 4,513,751 | |
| | |
Exeter Automobile Receivables Trust,
Ser2015-3A, Cl D
6.550%, 10/17/22 (B) | | | 5,000,000 | | | | 5,031,363 | |
| | |
Exeter Automobile Receivables Trust,
Ser2016-1A, Cl C
5.520%, 10/15/21 (B) | | | 404,224 | | | | 405,139 | |
| | |
Exeter Automobile Receivables Trust,
Ser2017-1A, Cl B
3.000%, 12/15/21 (B) | | | 165,025 | | | | 165,094 | |
| | |
Exeter Automobile Receivables Trust,
Ser2018-1A, Cl D
3.530%, 11/15/23 (B) | | | 5,500,000 | | | | 5,616,671 | |
| | |
Exeter Automobile Receivables Trust,
Ser2019-3A, Cl C
2.790%, 05/15/24 (B) | | | 7,000,000 | | | | 7,103,676 | |
| | |
Exeter Automobile Receivables Trust,
Ser2020-1A, Cl D
2.730%, 12/15/25 (B) | | | 2,500,000 | | | | 2,530,306 | |
| | |
First Investors Auto Owner Trust,
Ser2019-1A, Cl D
3.550%, 04/15/25 (B) | | | 1,700,000 | | | | 1,753,447 | |
| | |
Flagship Credit Auto Trust,
Ser2015-3, Cl D
7.120%, 11/15/22 (B) | | | 5,000,000 | | | | 5,111,196 | |
| | |
Flagship Credit Auto Trust,
Ser2016-1, Cl D
8.590%, 05/15/23 (B) | | | 15,380,000 | | | | 16,017,340 | |
| | |
Flagship Credit Auto Trust,
Ser2016-3, Cl D
3.890%, 11/15/22 (B) | | | 5,000,000 | | | | 5,106,169 | |
| | |
Flagship Credit Auto Trust,
Ser2018-2, Cl C
3.890%, 09/16/24 (B) | | | 11,286,000 | | | | 11,642,226 | |
| | | | | | | | |
| Description | | Face Amount | | |
Value | |
| | |
Ford Credit Auto Owner Trust,
Ser2018-A, Cl A3
3.030%, 11/15/22 | | $ | 6,360,447 | | | $ | 6,425,866 | |
| | |
Ford Credit Auto Owner Trust,
Ser2019-A, Cl B
3.020%, 10/15/24 | | | 15,000,000 | | | | 15,572,736 | |
| | |
Foursight Capital Automobile Receivables Trust,
Ser2017-1, Cl C
3.470%, 12/15/22 (B) | | | 2,200,000 | | | | 2,223,630 | |
| | |
Foursight Capital Automobile Receivables Trust,
Ser2018-2, Cl D
4.330%, 07/15/24 (B) | | | 4,650,000 | | | | 4,852,520 | |
| | |
GLS Auto Receivables Trust,
Ser2016-1A, Cl D
9.130%, 01/18/22 (B) | | | 7,075,000 | | | | 7,323,894 | |
| | |
GM Financial Consumer Automobile Receivables Trust,
Ser2019-3, Cl B
2.320%, 12/16/24 | | | 2,250,000 | | | | 2,285,983 | |
| | |
Marlette Funding Trust,
Ser2020-1A, Cl D
3.540%, 03/15/30 (B) | | | 1,500,000 | | | | 1,516,265 | |
| | |
Master Credit Card Trust II,
Ser2020-1A, Cl C
2.590%, 09/23/24 (B) | | | 2,000,000 | | | | 2,015,146 | |
| | |
MelTel Land Funding,
Ser2019-1A, Cl B
4.701%, 04/15/49 (B) | | | 1,300,000 | | | | 1,348,829 | |
| | |
Octane Receivables Trust2019-1,
Ser2019-1A, Cl A
3.160%, 09/20/23 (B) | | | 8,590,938 | | | | 8,607,197 | |
| | |
OSCAR US Funding Trust V,
Ser2016-2A, Cl A4
2.990%, 12/15/23 (B) | | | 12,257,753 | | | | 12,315,645 | |
| | |
Pawnee Equipment Receivables
Series, Ser2019-1, Cl D
2.860%, 10/15/24 (B) | | | 5,500,000 | | | | 5,527,256 | |
| | |
Prestige Auto Receivables Trust,
Ser 2019- 1A, Cl C
2.700%, 10/15/24 (B) | | | 4,000,000 | | | | 4,071,216 | |
| | |
RCO V Mortgage,
Ser2019-2, Cl A1
3.475%, 11/25/24 (B) | | | 9,707,754 | | | | 9,728,943 | |
| | |
SFS Asset Securitization,
Ser2019-1, Cl A
4.238%, 06/10/25 (B) | | | 11,000,000 | | | | 11,217,305 | |
| | |
United Auto Credit Securitization Trust,
Ser2018-1, Cl E
4.840%, 08/10/23 (B) | | | 5,000,000 | | | | 5,078,561 | |
| | |
Westlake Automobile Receivables Trust,
Ser2017-1A, Cl D
3.460%, 10/17/22 (B) | | | 7,100,000 | | | | 7,142,852 | |
The accompanying notes are an integral part of the financial statements.
17
| | |
| FROST FAMILY OF FUNDS | | F R O S T F U N D S | J A N U A R Y 3 1, 2 0 2 0 (U n a u d i t e d) |
| | |
| FROST TOTAL RETURN BOND FUND | | |
| | | | | | | | |
| Description | | Face Amount | | |
Value | |
| | |
Westlake Automobile Receivables Trust,
Ser2018-1A
3.410%, 09/15/22 | | $ | 13,195,000 | | | $ | 13,357,865 | |
| | | | | | | | |
| | | | | | | 345,540,696 | |
| | | | | | | | |
|
Consumer Discretionary — 0.3% | |
| | |
CPS Auto Receivables Trust,
Ser2017-D, Cl B
2.430%, 01/18/22 (B) | | | 3,627,041 | | | | 3,628,574 | |
| | |
CPS Auto Receivables Trust,
Ser2019-D, Cl D
2.720%, 09/15/25 (B) | | | 3,000,000 | | | | 3,024,045 | |
| | |
CPS Auto Receivables Trust,
Ser2019-D, Cl E
3.860%, 10/15/25 (B) | | | 6,000,000 | | | | 6,047,403 | |
| | | | | | | | |
| | | | | | | 12,700,022 | |
| | | | | | | | |
|
Credit Card — 0.5% | |
| | |
Fortiva Retail Credit Master Note Business Trust,
Ser2018-ONE, Cl A
5.540%, 11/15/23 (B) | | | 13,000,000 | | | | 13,269,165 | |
| | |
Synchrony Card Funding,
Ser2019-A2, Cl A
2.340%, 06/15/25 | | | 2,000,000 | | | | 2,035,096 | |
| | |
World Financial Network Credit Card Master Trust,
Ser2016-A, Cl A
2.030%, 04/15/25 | | | 6,000,000 | | | | 6,027,708 | |
| | | | | | | | |
| | | | | | | 21,331,969 | |
| | | | | | | | |
|
Financials — 0.1% | |
| | |
PRPM,
Ser2019-4A, Cl A1
3.351%, 11/25/24 (B) | | | 1,973,504 | | | | 1,981,784 | |
| | | | | | | | |
|
Information Technology — 0.0% | |
| | |
Avid Automobile Receivables Trust,
Ser2019-1, Cl D
4.030%, 07/15/26 (B) | | | 1,300,000 | | | | 1,315,807 | |
| | | | | | | | |
|
Other Asset-Backed Securities — 2.0% | |
| | |
321 Henderson Receivables I,
Ser 2010- 2A, Cl B
7.450%, 01/15/50 (B) | | | 2,264,183 | | | | 2,493,533 | |
| | |
321 Henderson Receivables I,
Ser 2012- 1A, Cl B
7.140%, 02/15/67 (B) | | | 715,277 | | | | 883,016 | |
| | |
321 Henderson Receivables I,
Ser 2012- 2A, Cl B
6.770%, 10/17/61 (B) | | | 1,905,792 | | | | 2,335,341 | |
| | |
Business Jet Securities,
Ser2018-2, Cl A
4.447%, 06/15/33 (B) | | | 5,097,897 | | | | 5,226,772 | |
| | | | | | | | |
| Description | | Face Amount | | |
Value | |
| | |
Business Jet Securities,
Ser2018-2, Cl C
6.656%, 06/15/33 (B) | | $ | 1,888,298 | | | $ | 1,921,474 | |
| | |
CFG Investments,
Ser2019-1, Cl A
5.560%, 08/15/29 (B) | | | 7,800,000 | | | | 7,847,358 | |
| | |
Credibly Asset Securitization,
Ser2018-1A, Cl A
4.800%, 11/15/23 (B) | | | 6,000,000 | | | | 6,137,263 | |
| | |
Credibly Asset Securitization,
Ser2018-1A, Cl C
6.760%, 11/15/23 (B) | | | 5,201,000 | | | | 5,308,104 | |
| | |
Harley Marine Financing,
Ser2018-1A, Cl A2
5.682%, 05/15/43 (B) | | | 10,766,989 | | | | 9,704,793 | |
| | |
Harley Marine Financing,
Ser2018-1A, Cl B
7.869%, 05/15/43 (B) (E) | | | 6,000,000 | | | | 1,763,400 | |
| | |
Harvest SBA Loan Trust,
Ser2018-1, Cl A
3.911%, VAR ICE LIBOR USD
1 Month+2.250%, 08/25/44 (B) | | | 5,992,611 | | | | 5,981,528 | |
| | |
Kabbage Funding,
Ser2019-1, Cl A
3.825%, 03/15/24 (B) | | | 9,600,000 | | | | 9,742,445 | |
| | |
Orange Lake Timeshare Trust,
Ser2019-A, Cl C
3.610%, 04/09/38 (B) | | | 3,901,494 | | | | 3,983,728 | |
| | |
Sapphire Aviation Finance I,
Ser2018-1A, Cl B
5.926%, 03/15/40 (B) | | | 2,331,566 | | | | 2,420,721 | |
| | |
Stack Infrastructure Issuer
Series, Ser2019-1A, Cl A2
4.540%, 02/25/44 (B) | | | 3,567,000 | | | | 3,799,608 | |
| | |
TAL Advantage V,
Ser2014-3A, Cl B
4.150%, 11/21/39 (B) | | | 3,552,500 | | | | 3,515,109 | |
| | |
Trip Rail Master Funding,
Ser2011-1A, Cl A2
6.024%, 07/15/41 (B) | | | 2,995,483 | | | | 3,122,842 | |
| | |
Triton Container Finance V,
Ser2018-1A, Cl A
3.950%, 03/20/43 (B) | | | 2,450,000 | | | | 2,465,718 | |
| | | | | | | | |
| | | | | | | 78,652,753 | |
| | | | | | | | |
|
Student Loan — 0.7% | |
| | |
Brazos Student Finance,
Ser2009-1, Cl B
4.447%, VAR ICE LIBOR USD
3 Month+2.500%, 12/27/39 | | | 5,000,000 | | | | 4,662,475 | |
| | |
College Ave Student Loans,
Ser2018-A, Cl A1
2.861%, VAR ICE LIBOR USD
1 Month+1.200%, 12/26/47 (B) | | | 3,374,420 | | | | 3,323,962 | |
The accompanying notes are an integral part of the financial statements.
18
| | |
| FROST FAMILY OF FUNDS | | F R O S T F U N D S | J A N U A R Y 3 1, 2 0 2 0 (U n a u d i t e d) |
| | |
| FROST TOTAL RETURN BOND FUND | | |
| | | | | | | | |
| Description | | Face Amount | | |
Value | |
| | |
Commonbond Student Loan Trust,
Ser2017-AGS, Cl A1
2.550%, 05/25/41 (B) | | $ | 4,893,596 | | | $ | 4,935,216 | |
| | |
Nelnet Student Loan Trust,
Ser2013-3A, Cl B
3.161%, VAR ICE LIBOR USD
1 Month+1.500%, 07/25/47 (B) | | | 10,000,000 | | | | 9,868,916 | |
| | |
SLM Student Loan Trust,
Ser2012-7, Cl B
3.461%, VAR ICE LIBOR USD
1 Month+1.800%, 09/25/43 | | | 5,000,000 | | | | 4,900,060 | |
| | | | | | | | |
| | | | | | | 27,690,629 | |
| | | | | | | | |
| | |
Total Asset-Backed Securities
(Cost $658,252,060) | | | | | | | 663,892,095 | |
| | | | | | | | |
COLLATERALIZED LOAN OBLIGATIONS — 13.2% | |
|
Collateralized Loan Obligation — 13.2% | |
| | |
Apidos Funding RR Subsidiary,
Ser 2018- 12RR, Cl A
3.361%, VAR ICE LIBOR USD
3 Month+1.530%, 04/15/31 (B) | | | 2,993,565 | | | | 2,995,020 | |
| | |
Apidos XXVIII,
Ser2017-28A, Cl A2
3.219%, VAR ICE LIBOR USD
3 Month+1.400%, 01/20/31 (B) | | | 15,000,000 | | | | 14,816,295 | |
| | |
Avery Point IV CLO,
Ser2017-1A, Cl BR
3.394%, VAR ICE LIBOR USD
3 Month+1.600%, 04/25/26 (B) | | | 7,500,000 | | | | 7,497,607 | |
| | |
BCC Middle Market,
Ser2018-1A, Cl A1A
3.369%, VAR ICE LIBOR USD
3 Month+1.550%, 10/20/30 (B) | | | 21,000,000 | | | | 20,899,284 | |
| | |
Benefit Street Partners CLO IV,
Ser 2019- IVA, Cl A1RR
3.069%, VAR ICE LIBOR USD
3 Month+1.250%, 01/20/29 (B) | | | 10,000,000 | | | | 10,017,030 | |
| | |
Benefit Street Partners III,
Ser 2017-IIIA, Cl A1R
3.069%, VAR ICE LIBOR USD
3 Month+1.250%, 07/20/29 (B) | | | 15,000,000 | | | | 14,995,530 | |
| | |
Benefit Street Partners III,
Ser 2017-IIIA, Cl DR
8.419%, VAR ICE LIBOR USD
3 Month+6.600%, 07/20/29 (B) | | | 5,000,000 | | | | 4,685,585 | |
| | |
Benefit Street Partners VIII,
Ser2018-8A, Cl A1AR
2.919%, VAR ICE LIBOR USD
3 Month+1.100%, 01/20/31 (B) | | | 5,450,000 | | | | 5,451,760 | |
| | |
Carlyle Global Market Strategies,
Ser2018-1A, Cl CR2
3.636%, VAR ICE LIBOR USD
3 Month+1.800%, 04/17/31 (B) | | | 4,500,000 | | | | 4,359,168 | |
| | | | | | | | |
| Description | | Face Amount | | |
Value | |
| | |
Carlyle Global Market Strategies,
Ser2018-3A, Cl A1A2
3.018%, VAR ICE LIBOR USD
3 Month+1.180%, 01/14/32 (B) | | $ | 25,000,000 | | | $ | 24,533,950 | |
| | |
Carlyle Global Market Strategies,
Ser2018-3A, Cl A2A2
3.688%, VAR ICE LIBOR USD
3 Month+1.850%, 01/14/32 (B) | | | 7,000,000 | | | | 7,006,055 | |
| | |
Carlyle Global Market Strategies,
Ser2018-3RA, Cl A1A
2.844%, VAR ICE LIBOR USD
3 Month+1.050%, 07/27/31 (B) | | | 15,000,000 | | | | 14,996,550 | |
| | |
Carlyle Global Market Strategies,
Ser2018-3RA, Cl A2
3.344%, VAR ICE LIBOR USD
3 Month+1.550%, 07/27/31 (B) | | | 5,750,000 | | | | 5,726,546 | |
| | |
Carlyle Global Market Strategies,
Ser2018-5A, Cl A1RR
2.971%, VAR ICE LIBOR USD
3 Month+1.140%, 07/15/31 (B) | | | 15,845,000 | | | | 15,851,465 | |
| | |
Carlyle Global Market Strategies,
Ser2019-2A, Cl A2A
3.581%, VAR ICE LIBOR USD
3 Month+1.750%, 07/15/32 (B) | | | 10,000,000 | | | | 10,011,240 | |
| | |
CIFC Funding,
Ser2018-1A, Cl A
2.819%, VAR ICE LIBOR USD
3 Month+1.000%, 04/18/31 (B) | | | 10,000,000 | | | | 9,937,520 | |
| | |
CIFC Funding,
Ser2018-1A, Cl C
3.569%, VAR ICE LIBOR USD
3 Month+1.750%, 04/18/31 (B) | | | 2,000,000 | | | | 1,929,176 | |
| | |
Dryden 68 CLO,
Ser2019-68A, Cl B
3.571%, VAR ICE LIBOR USD
3 Month+1.740%, 07/15/32 (B) | | | 11,750,000 | | | | 11,763,207 | |
| | |
Emerson Park,
Ser2017-1A, Cl DR
5.231%, VAR ICE LIBOR USD
3 Month+3.400%, 07/15/25 (B) | | | 4,500,000 | | | | 4,516,447 | |
| | |
Fortress Credit Opportunities IX,
Ser 2017- 9A, Cl A1T
3.460%, VAR ICE LIBOR USD
3 Month+1.550%, 11/15/29 (B) | | | 21,000,000 | | | | 20,846,553 | |
| | |
Galaxy XXI,
Ser2015-21A, Cl AR
2.839%, VAR ICE LIBOR USD
3 Month+1.020%, 04/20/31 (B) | | | 5,000,000 | | | | 4,973,235 | |
| | |
GoldenTree Credit Opportunities Financing,
Ser2018-1A, Cl A1R
3.574%, VAR ICE LIBOR USD
3 Month+1.680%, 06/15/34 (B) | | | 15,000,000 | | | | 15,002,670 | |
| | |
GoldentTree Loan Management US,
Ser2017-1A, Cl A
3.039%, VAR ICE LIBOR USD
3 Month+1.220%, 04/20/29 (B) | | | 17,000,000 | | | | 17,014,552 | |
The accompanying notes are an integral part of the financial statements.
19
| | |
| FROST FAMILY OF FUNDS | | F R O S T F U N D S | J A N U A R Y 3 1, 2 0 2 0 (U n a u d i t e d) |
| | |
| FROST TOTAL RETURN BOND FUND | | |
| | | | | | | | |
| Description | | Face Amount | | |
Value | |
| | |
Golub Capital Partners CLO 34M,
Ser2019-34A, Cl AR
3.591%, VAR ICE LIBOR USD
3 Month+1.700%, 03/14/31 (B) | | $ | 7,000,000 | | | $ | 6,973,960 | |
| | |
Golub Capital Partners,
Ser2017-17A, Cl A1R
3.444%, VAR ICE LIBOR USD
3 Month+1.650%, 10/25/30 (B) | | | 9,000,000 | | | | 8,995,068 | |
| | |
Golub Capital Partners,
Ser 2017-19RA, Cl A1A
3.094%, VAR ICE LIBOR USD
3 Month+1.300%, 07/26/29 (B) | | | 20,000,000 | | | | 20,031,540 | |
| | |
Golub Capital Partners,
Ser2017-21A, Cl AR
3.264%, VAR ICE LIBOR USD
3 Month+1.470%, 01/25/31 (B) | | | 11,000,000 | | | | 10,939,115 | |
| | |
Golub Capital Partners,
Ser2017-21A, Cl CR
4.244%, VAR ICE LIBOR USD
3 Month+2.450%, 01/25/31 (B) | | | 2,000,000 | | | | 1,893,708 | |
| | |
Golub Capital Partners,
Ser2017-22A, Cl AR
2.999%, VAR ICE LIBOR USD
3 Month+1.180%, 01/20/31 (B) | | | 9,000,000 | | | | 8,969,157 | |
| | |
Golub Capital Partners,
Ser2017-23A, Cl AR
3.019%, VAR ICE LIBOR USD
3 Month+1.200%, 01/20/31 (B) | | | 20,000,000 | | | | 19,947,840 | |
| | |
Golub Capital Partners,
Ser2017-23A, Cl BR
3.369%, VAR ICE LIBOR USD
3 Month+1.550%, 01/20/31 (B) | | | 4,000,000 | | | | 3,929,232 | |
| | |
Golub Capital Partners,
Ser2017-24A, Cl AR
3.491%, VAR ICE LIBOR USD
3 Month+1.600%, 11/05/29 (B) | | | 9,500,000 | | | | 9,492,875 | |
| | |
Golub Capital Partners,
Ser2017-24A, Cl DR
5.791%, VAR ICE LIBOR USD
3 Month+3.900%, 11/05/29 (B) | | | 3,000,000 | | | | 2,954,745 | |
| | |
Golub Capital Partners,
Ser2018-26A, Cl BR
3.369%, VAR ICE LIBOR USD
3 Month+1.550%, 04/20/31 (B) | | | 12,000,000 | | | | 11,783,004 | |
| | |
Golub Capital Partners,
Ser2018-36A, Cl A
3.191%, VAR ICE LIBOR USD
3 Month+1.300%, 02/05/31 (B) | | | 11,000,000 | | | | 10,822,933 | |
| | |
LCM Loan Income Fund I Income Note Issuer,
Ser2018-27A, Cl A1
2.923%, VAR ICE LIBOR USD
3 Month+1.080%, 07/16/31 (B) | | | 13,000,000 | | | | 13,004,667 | |
| | |
MCF IV,
Ser2017-1A, Cl AR
3.369%, VAR ICE LIBOR USD
3 Month+1.550%, 10/20/29 (B) | | | 10,000,000 | | | | 9,995,160 | |
| | | | | | | | |
| Description | | Face Amount | | |
Value | |
| | |
MCF IV,
Ser2017-1A, Cl CR
4.469%, VAR ICE LIBOR USD
3 Month+2.650%, 10/20/29 (B) | | $ | 3,000,000 | | | $ | 2,960,016 | |
| | |
NewStar Berkeley Fund CLO,
Ser2019-1A, Cl AR
3.394%, VAR ICE LIBOR USD
3 Month+1.600%, 10/25/28 (B) | | | 5,000,000 | | | | 4,983,015 | |
| | |
NXT Capital,
Ser2017-1A, Cl A
3.519%, VAR ICE LIBOR USD
3 Month+1.700%, 04/20/29 (B) | | | 9,000,000 | | | | 9,001,215 | |
| | |
Oak Hill Credit PartnersX-R,
Ser 2018- 10RA, Cl B
3.577%, VAR ICE LIBOR USD
3 Month+1.750%, 12/12/30 (B) | | | 8,000,000 | | | | 8,011,392 | |
| | |
Oak Hill Credit PartnersX-R,
Ser 2018- 10RA, Cl C
4.027%, VAR ICE LIBOR USD
3 Month+2.200%, 12/12/30 (B) | | | 5,100,000 | | | | 5,116,713 | |
| | |
Oaktree EIF II,
Ser 2017-IIIA, Cl A2
3.286%, VAR ICE LIBOR USD
3 Month+1.450%, 07/17/29 (B) | | | 7,250,000 | | | | 7,246,295 | |
| | |
Octagon Investment Partners XX,
Ser2019-4A, Cl B
3.801%, VAR ICE LIBOR USD
3 Month+1.900%, 05/12/31 (B) | | | 9,500,000 | | | | 9,514,269 | |
| | |
OHA Credit Partners VII,
Ser2016-7A, Cl DR
6.099%, VAR ICE LIBOR USD
3 Month+4.200%, 11/20/27 (B) | | | 6,500,000 | | | | 6,486,591 | |
| | |
OZLM Funding IV,
Ser2017-4A, Cl A2R
3.502%, VAR ICE LIBOR USD
3 Month+1.700%, 10/22/30 (B) | | | 5,000,000 | | | | 4,996,570 | |
| | |
OZLM XVI,
Ser2017-16A, Cl A1
3.164%, VAR ICE LIBOR USD
3 Month+1.260%, 05/16/30 (B) | | | 10,000,000 | | | | 10,013,350 | |
| | |
Parallel,
Ser2015-1A, Cl AR
2.669%, VAR ICE LIBOR USD
3 Month+0.850%, 07/20/27 (B) | | | 3,395,780 | | | | 3,392,473 | |
| | |
Parallel,
Ser2017-1A, Cl A1
3.129%, VAR ICE LIBOR USD
3 Month+1.310%, 07/20/29 (B) | | | 8,500,000 | | | | 8,495,750 | |
| | |
Sudbury Mill,
Ser2013-1A, Cl E
6.586%, VAR ICE LIBOR USD
3 Month+4.750%, 01/17/26 (B) | | | 1,500,000 | | | | 1,312,711 | |
| | |
Thayer Park,
Ser2017-1A, Cl B
4.169%, VAR ICE LIBOR USD
3 Month+2.350%, 04/20/29 (B) | | | 9,500,000 | | | | 9,483,850 | |
The accompanying notes are an integral part of the financial statements.
20
| | |
| FROST FAMILY OF FUNDS | | F R O S T F U N D S | J A N U A R Y 3 1, 2 0 2 0 (U n a u d i t e d) |
| | |
| FROST TOTAL RETURN BOND FUND | | |
| | | | | | | | |
| Description | | Face Amount | | |
Value | |
| | |
Venture 37 CLO,
Ser2019-37A, Cl BN
3.731%, VAR ICE LIBOR USD
3 Month+1.900%, 07/15/32 (B) | | $ | 10,000,000 | | | $ | 10,011,200 | |
| | |
Venture XIX,
Ser2018-19A, Cl ARR
3.091%, VAR ICE LIBOR USD
3 Month+1.260%, 01/15/32 (B) | | | 19,250,000 | | | | 19,268,788 | |
| | |
Zais,
Ser2017-1A, Cl A2
3.331%, VAR ICE LIBOR USD
3 Month+1.500%, 07/15/29 (B) | | | 10,000,000 | | | | 9,999,430 | |
| | |
Zais,
Ser2018-1A, Cl B
3.281%, VAR ICE LIBOR USD
3 Month+1.450%, 04/15/29 (B) | | | 5,000,000 | | | | 4,971,435 | |
| | | | | | | | |
| | |
Total Collateralized Loan Obligations
(Cost $526,183,718) | | | | | | | 524,824,512 | |
| | | | | | | | |
U.S. GOVERNMENT AGENCY OBLIGATIONS — 1.9% | |
| | |
FFCB
3.270%, 06/26/34 | | | 20,000,000 | | | | 20,039,269 | |
3.000%, 07/29/32 | | | 5,500,000 | | | | 5,513,337 | |
2.920%, 04/29/26 | | | 5,635,000 | | | | 5,783,252 | |
2.770%, 07/24/28 | | | 10,000,000 | | | | 10,039,452 | |
2.590%, 08/27/29 | | | 5,000,000 | | | | 5,023,687 | |
2.580%, 03/30/28 | | | 10,000,000 | | | | 10,000,142 | |
| | |
FHLB
2.625%, 04/15/24 | | | 5,000,000 | | | | 5,007,933 | |
2.200%, 06/28/24 | | | 15,000,000 | | | | 15,097,905 | |
| | | | | | | | |
| | |
Total U.S. Government Agency Obligations
(Cost $76,107,188) | | | | | | | 76,504,977 | |
| | | | | | | | |
MUNICIPAL BONDS — 1.3% | |
| | |
Allentown, Neighborhood Improvement Zone Development Authority,
Ser B, RB
5.220%, 05/01/20 | | | 2,425,000 | | | | 2,428,759 | |
| | |
California State, Build America Bonds, GO
Callable 03/02/20 @ 100
7.950%, 03/01/36 | | | 3,000,000 | | | | 3,014,610 | |
| | |
Dallas County Schools, Taxable Public Property Finance,
GO (F)
3.450%, 06/01/22 | | | 1,214,550 | | | | 1,159,895 | |
3.200%, 06/01/21 | | | 1,218,588 | | | | 1,163,752 | |
| | |
Dallas County, Schools Tax,
GO (F)
4.000%, 06/01/19 | | | 1,168,142 | | | | 1,156,461 | |
3.000%, 06/01/19 | | | 723,226 | | | | 715,994 | |
| | |
GDB Debt Recovery Authority of Puerto Rico, RB
7.500%, 08/20/40 | | | 8,230,281 | | | | 6,501,922 | |
| | | | | | | | |
| Description | | Face Amount | | |
Value | |
| | |
Mission, Economic Development, RB
Callable 12/01/20 @ 300
10.875%, 12/01/28 (E) | | $ | 3,315,000 | | | $ | 33,150 | |
9.750%, 12/01/25 (E) | | | 3,045,000 | | | | 30,450 | |
8.550%, 12/01/21 (E) | | | 2,125,000 | | | | 1,729,155 | |
| | |
North Texas, Tollway Authority, Build America Bonds, RB (G),Pre-Refunded @ 100
8.910%, 02/01/30 | | | 16,540,000 | | | | 16,540,000 | |
| | |
Rhode Island State, Health & Educational System, Providence Public Schools,
Ser A, RB
Callable 05/15/20 @ 100
8.000%, 05/15/29 | | | 5,000,000 | | | | 5,057,800 | |
| | |
San Juan, Higher Education Finance Authority, RB
Callable 08/15/20 @ 100
8.250%, 08/15/29 | | | 4,400,000 | | | | 4,512,024 | |
| | |
Texas State, Public Finance Authority Charter School, Charter Education New Frontiers,
Ser Q, RB
Callable 08/15/20 @ 100
8.750%, 08/15/27 | | | 1,070,000 | | | | 1,076,816 | |
| | |
Texas State, Public Finance Authority Charter School,
Ser2010-Q, RB
8.125%, 02/15/27 | | | 1,900,000 | | | | 2,385,526 | |
| | |
University of Texas, Build America Bonds,
Ser D, RB
5.134%, 08/15/42 | | | 3,000,000 | | | | 4,016,250 | |
| | | | | | | | |
| | |
Total Municipal Bonds
(Cost $56,134,160) | | | | | | | 51,522,564 | |
| | | | | | | | |
SOVEREIGN DEBT — 0.5% | |
| | |
Government — 0.5% | | | | | | | | |
| | |
Argentine Republic Government International Bond
6.875%, 04/22/21 to 01/11/48 | | | 14,502,000 | | | | 6,712,745 | |
| | |
Brazilian Government International Bond
4.625%, 01/13/28 | | | 2,000,000 | | | | 2,206,020 | |
| | |
Kenya Government International Bond
7.250%, 02/28/28 to 02/28/28 (B) | | | 4,000,000 | | | | 4,317,888 | |
| | |
Oman Government International Bond
6.500%, 03/08/47 (B) | | | 2,000,000 | | | | 1,972,500 | |
| | |
Provincia de Buenos Aires
7.875%, 06/15/27 (B) | | | 300,000 | | | | 111,750 | |
The accompanying notes are an integral part of the financial statements.
21
| | |
| FROST FAMILY OF FUNDS | | F R O S T F U N D S | J A N U A R Y 3 1, 2 0 2 0 (U n a u d i t e d) |
| | |
| FROST TOTAL RETURN BOND FUND | | |
| | | | | | | | |
| Description | | Face Amount | | |
Value | |
| | |
Turkey Government International Bond
6.125%, 10/24/28 | | $ | 1,000,000 | | | $ | 1,059,920 | |
4.250%, 04/14/26 | | | 1,000,000 | | | | 977,500 | |
| | |
Ukraine Government International Bond
7.750%, 09/01/20 | | | 2,000,000 | | | | 2,048,760 | |
| | | | | | | | |
| | |
Total Sovereign Debt
(Cost $22,804,997) | | | | | | | 19,407,083 | |
| | | | | | | | |
COMMON STOCK — 0.0% | |
| | |
Seadrill Ltd.* | | | 206,695 | | | | 279,550 | |
| | |
Seadrill Ltd.* | | | 39,323 | | | | 53,873 | |
| | | | | | | | |
| | |
Total Common Stock
(Cost $536,742) | | | | | | | 333,423 | |
| | | | | | | | |
CASH EQUIVALENT — 0.0% | |
| | |
Federated Government Obligations Fund, Cl I,
1.450%**
(Cost $758,568) | | | 758,568 | | | | 758,568 | |
| | | | | | | | |
REPURCHASE AGREEMENTS (H) — 4.1% | |
| | |
KGS Alpha Overnight***
1.690%, dated 01/06/2020, to be repurchased on 02/06/2020, repurchase price $10,014,553 (collateralized by various SBA obligations, par value $10,258,333, 3.775%, 04/12/2047, with total market value of $11,000,000) | | | 10,000,000 | | | | 10,000,000 | |
| | |
KGS Alpha Overnight***
1.600%, dated 01/31/2020, to be repurchased on 02/03/2020, repurchase price $ 154,020,533(collateralized by various FMAC/FNMA/GNMA/SBA obligations, par value $582,095 - $37,142,857, 0.000% - 9.387%, 09/25/2027 - 10/20/2069, with total market value of $158,736,608) | | | 154,000,000 | | | | 154,000,000 | |
| | | | | | | | |
| | |
Total Repurchase Agreements (Cost $164,000,000) | | | | | | | 164,000,000 | |
| | | | | | | | |
| | |
Total Investments — 99.5%
(Cost $3,963,438,665) | | | | | | $ | 3,963,327,329 | |
| | | | | | | | |
Percentages are based on Net Assets of $3,981,373,905.
| * | Non-income producing security. |
| ** | Rate shown is the7-day effective yield as of January 31, 2020. |
| *** | Repurchase date stated is the termination date of the repurchase agreement. This repurchase agreement is terminable daily upon demand, which is reflective of the repurchase price stated. |
| ‡ | Real Estate Investment Trust |
| (A) | Variable or floating rate security, the interest rate of which adjusts periodically based on changes in current interest rates and prepayments on the underlying pool of assets. |
| (B) | Securities sold within terms of a private placement memorandum, exempt from registration under Section 144A of the Securities Act of 1933, as amended, and may be sold only to dealers in that program or other “accredited investors.” The total value of such securities at January 31, 2020 was $1,669,974,724 and represents 41.9% of Net Assets. |
| (C) | Distributions arepaid-in-kind. |
| (D) | Zero coupon security. The rate reported on the Schedule of Investments is the effective yield at the time of purchase. |
| (E) | Level 3 security in accordance with fair value hierarchy. |
| (F) | Security in default on interest payments. |
| (G) | Pre-Refunded Securities — The maturity date shown is thepre-refunded date. |
| (H) | Tri-Party Repurchase Agreement. |
Cl — Class
CLO — Collateralized Loan Obligation
CPI YOY — Consumer Price Index Year Over Year
FFCB — Federal Farm Credit Bank
FHLB — Federal Home Loan Bank
FHLMC — Federal Home Loan Mortgage Corporation
FMAC — Freddie Mac
FNMA — Federal National Mortgage Association
GNMA — Government National Mortgage Association
GO — General Obligation
ICE — Intercontinental Exchange
IO — Interest Only — face amount represents notional amount
LIBOR — London Interbank Rate
MTN — Medium Term Note
PIK —Payment-in-Kind
RB — Revenue Bond
REMIC — Real Estate Mortgage Investment Conduit
Ser — Series
STRIPS — Separately Traded Registered Interest and Principal Securities
USD — U.S. Dollar
VAR — Variable
The following is a list of the level of inputs used as of January 31, 2020 in valuing the Fund’s investments carried at value:
| | | | | | | | | | | | | | | | |
Investments in
Securities | | Level 1 | | | Level 2 | | | Level 3(1) | | | Total | |
Mortgage-Backed | | | | | | | | | | | | | | | | |
Securities | | $ | — | | | $ | 1,010,382,252 | | | $ | — | | | $ | 1,010,382,252 | |
Corporate
Obligations | | | — | | | | 733,268,475 | | | | — | | | | 733,268,475 | |
U.S. Treasury Obligations | | | 718,433,380 | | | | — | | | | — | | | | 718,433,380 | |
Asset-Backed
Securities | | | — | | | | 662,128,695 | | | | 1,763,400 | | | | 663,892,095 | |
Collateralized Loan Obligations | | | — | | | | 524,824,512 | | | | — | | | | 524,824,512 | |
U.S. Government
Agency Obligations | | | — | | | | 76,504,977 | | | | — | | | | 76,504,977 | |
Municipal Bonds | | | — | | | | 49,729,809 | | | | 1,792,755 | | | | 51,522,564 | |
Sovereign Debt | | | — | | | | 19,407,083 | | | | — | | | | 19,407,083 | |
Common Stock | | | 333,423 | | | | — | | | | — | | | | 333,423 | |
Cash Equivalent | | | 758,568 | | | | — | | | | — | | | | 758,568 | |
Repurchase Agreements | | | — | | | | 164,000,000 | | | | — | | | | 164,000,000 | |
| | | | | | | | | | | | | | | | |
Total Investments in Securities | | $ | 719,525,371 | | | $ | 3,240,245,803 | | | $ | 3,556,155 | | | $ | 3,963,327,329 | |
| | | | | | | | | | | | | | | | |
| (1) | A reconciliation of Level 3 investments, including certain disclosures related to significant inputs used in valuing Level 3 investments is only presented when the Fund has over 1% of Level 3 investments at the beginning and/or end of the period in relation to net assets. |
For the period ended January 31, 2020, there have been no transfers in or out of Level 3.
Amounts designated as “—” are $0 or have been rounded to $0.
For more information on valuation inputs, see Note 2 — Significant Accounting Policies in the Notes to Financial Statements.
The accompanying notes are an integral part of the financial statements.
22
| | |
| FROST FAMILY OF FUNDS | | F R O S T F U N D S | J A N U A R Y 3 1, 2 0 2 0 (U n a u d i t e d) |
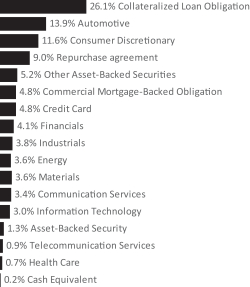
| † | Percentages are based on total investments. |
| | | | | | | | |
| Description | |
Face Amount | | |
Value | |
CORPORATE OBLIGATIONS — 31.8% | |
|
Communication Services — 3.3% | |
| | |
AT&T
4.300%, 02/15/30 | | $ | 2,639,000 | | | $ | 2,984,933 | |
| | |
Frontier Communications
8.500%, 04/15/20 | | | 1,000,000 | | | | 472,500 | |
| | |
Gogo Intermediate Holdings
9.875%, 05/01/24 (A) | | | 375,000 | | | | 403,140 | |
| | |
LCPR Senior Secured Financing
6.750%, 10/15/27 (A) | | | 1,000,000 | | | | 1,057,540 | |
| | |
Photo Holdings Merger Sub
8.500%, 10/01/26 (A) | | | 1,000,000 | | | | 935,000 | |
| | |
Sprint
7.875%, 09/15/23 | | | 1,500,000 | | | | 1,593,585 | |
| | | | | | | | |
| | | | | | | 7,446,698 | |
| | | | | | | | |
|
Consumer Discretionary — 9.4% | |
| | |
Beazer Homes USA
7.250%, 10/15/29 (A) | | | 1,000,000 | | | | 1,092,500 | |
| | |
Choice Hotels International
3.700%, 12/01/29 | | | 2,000,000 | | | | 2,052,420 | |
| | |
Dillard’s
7.000%, 12/01/28 | | | 500,000 | | | | 577,556 | |
| | |
Expedia
3.800%, 02/15/28 | | | 2,000,000 | | | | 2,074,433 | |
| | |
Ford Motor Credit
3.087%, 01/09/23 | | | 1,000,000 | | | | 1,008,616 | |
| | | | | | | | |
| Description | |
Face Amount | | |
Value | |
| | |
Fresenius Medical Care US Finance II
4.750%, 10/15/24 (A) | | $ | 400,000 | | | $ | 441,228 | |
| | |
Guanay Finance
6.000%, 12/15/20 (A) | | | 112,252 | | | | 112,926 | |
| | |
Jaguar Land Rover Automotive
4.500%, 10/01/27 (A) | | | 2,000,000 | | | | 1,834,000 | |
| | |
L Brands
6.950%, 03/01/33 | | | 1,867,000 | | | | 1,680,300 | |
| | |
Neiman Marcus Group
8.000%, 10/25/24 (A) | | | 373,000 | | | | 121,225 | |
| | |
Panther BF Aggregator 2
8.500%, 05/15/27 (A) | | | 3,000,000 | | | | 3,225,000 | |
| | |
QVC
5.450%, 08/15/34 | | | 1,000,000 | | | | 1,013,238 | |
| | |
Staples
10.750%, 04/15/27 (A) | | | 1,500,000 | | | | 1,524,450 | |
| | |
Under Armour
3.250%, 06/15/26 | | | 2,000,000 | | | | 1,954,861 | |
| | |
VistaJet Malta Finance
10.500%, 06/01/24 (A) | | | 2,500,000 | | | | 2,368,750 | |
| | | | | | | | |
| | | | | | | 21,081,503 | |
| | | | | | | | |
|
Energy — 3.6% | |
| | |
Cimarex Energy
4.375%, 06/01/24 | | | 1,000,000 | | | | 1,062,935 | |
| | |
Danske Bank
3.244%, VAR ICE LIBOR USD 3 Month+1.591%, 12/20/25 (A) | | | 1,500,000 | | | | 1,552,425 | |
| | |
Murphy Oil
6.875%, 08/15/24 | | | 500,000 | | | | 521,875 | |
5.750%, 08/15/25 | | | 1,000,000 | | | | 1,029,380 | |
| | |
ONEOK
7.500%, 09/01/23 | | | 1,704,000 | | | | 1,998,380 | |
| | |
Springleaf Finance
5.375%, 11/15/29 | | | 500,000 | | | | 519,950 | |
| | |
Transocean
7.250%, 11/01/25 (A) | | | 1,500,000 | | | | 1,413,750 | |
| | | | | | | | |
| | | | | | | 8,098,695 | |
| | | | | | | | |
|
Financials — 4.1% | |
| | |
Barclays
4.375%, 09/11/24 | | | 1,500,000 | | | | 1,606,181 | |
| | |
Credit Suisse Group
4.282%, 01/09/28 (A) | | | 500,000 | | | | 553,295 | |
| | |
Credit Suisse Group Funding Guernsey
3.750%, 03/26/25 | | | 1,000,000 | | | | 1,071,901 | |
| | |
Deutsche Bank MTN
4.296%, VAR USD Swap Semi 30/360 5 Yr Curr+2.248%, 05/24/28 | | | 500,000 | | | | 495,968 | |
| | |
Deutsche Bank NY
3.950%, 02/27/23 | | | 1,000,000 | | | | 1,037,831 | |
The accompanying notes are an integral part of the financial statements.
23
| | |
| FROST FAMILY OF FUNDS | | F R O S T F U N D S | J A N U A R Y 3 1, 2 0 2 0 (U n a u d i t e d) |
| | | | | | | | |
| Description | |
Face Amount | | |
Value | |
| | |
HSBC Holdings
6.500%, 09/15/37 | | $ | 1,500,000 | | | $ | 2,110,880 | |
| | |
Lloyds Banking Group
4.500%, 11/04/24 | | | 500,000 | | | | 544,484 | |
| | |
UBS
5.125%, 05/15/24 | | | 1,500,000 | | | | 1,618,125 | |
| | | | | | | | |
| | | | | | | 9,038,665 | |
| | | | | | | | |
|
Health Care — 0.7% | |
| | |
Express Scripts Holding
3.400%, 03/01/27 | | | 1,500,000 | | | | 1,555,823 | |
| | | | | | | | |
|
Industrials — 3.7% | |
| | |
General Electric MTN
3.100%, 01/09/23 | | | 1,500,000 | | | | 1,548,551 | |
| | |
Great Lakes Dredge & Dock
8.000%, 05/15/22 | | | 2,010,000 | | | | 2,110,500 | |
| | |
Masco
7.750%, 08/01/29 | | | 1,088,000 | | | | 1,454,068 | |
| | |
Owens Corning
3.950%, 08/15/29 | | | 2,000,000 | | | | 2,168,704 | |
| | |
Resideo Funding
6.125%, 11/01/26 (A) | | | 1,000,000 | | | | 982,450 | |
| | | | | | | | |
| | | | | | | 8,264,273 | |
| | | | | | | | |
|
Information Technology — 2.5% | |
| | |
Avnet
4.625%, 04/15/26 | | | 1,000,000 | | | | 1,097,815 | |
| | |
Diebold Nixdorf
8.500%, 04/15/24 | | | 1,000,000 | | | | 960,000 | |
| | |
Keysight Technologies
4.600%, 04/06/27 | | | 1,000,000 | | | | 1,137,669 | |
| | |
Motorola Solutions
4.600%, 05/23/29 | | | 1,175,000 | | | | 1,321,261 | |
| | |
VeriSign
4.750%, 07/15/27 | | | 1,000,000 | | | | 1,055,000 | |
| | | | | | | | |
| | | | | | | 5,571,745 | |
| | | | | | | | |
|
Materials — 3.6% | |
| | |
First Quantum Minerals
7.250%, 05/15/22 (A) | | | 1,500,000 | | | | 1,496,250 | |
| | |
Georgia-Pacific
7.750%, 11/15/29 | | | 2,221,000 | | | | 3,222,228 | |
| | |
NOVA Chemicals
4.875%, 06/01/24 (A) | | | 1,000,000 | | | | 1,015,000 | |
| | |
Vale Overseas
6.250%, 08/10/26 | | | 1,000,000 | | | | 1,180,500 | |
| | |
WRKCo
3.375%, 09/15/27 | | | 1,000,000 | | | | 1,045,745 | |
| | | | | | | | |
| | | | | | | 7,959,723 | |
| | | | | | | | |
|
Telecommunication Services — 0.9% | |
| | |
Twitter 3.875%, 12/15/27 (A) | | | 2,000,000 | | | | 2,002,500 | |
| | | | | | | | |
| | |
Total Corporate Obligations
(Cost $68,283,904) | | | | | | | 71,019,625 | |
| | | | | | | | |
| | | | | | | | |
| Description | |
Face Amount | | |
Value | |
COLLATERALIZED LOAN OBLIGATIONS — 27.5% | |
|
Automotive — 1.6% | |
| | |
Benefit Street Partners III,
Ser 2017-IIIA, Cl CR 5.719%, VAR ICE LIBOR USD 3 Month+3.900%, 07/20/29 (A) | | $ | 2,000,000 | | | $ | 1,987,608 | |
| | |
LCM XXII,
Ser2018-22A, Cl BR 3.819%, VAR ICE LIBOR USD 3 Month+2.000%, 10/20/28 (A) | | | 1,500,000 | | | | 1,500,891 | |
| | | | | | | | |
| | | | | | | 3,488,499 | |
| | | | | | | | |
|
Collateralized Loan Obligation — 25.9% | |
| | |
BCC Funding XIII,
Ser2016-1, Cl E 6.000%, 11/20/22 (A) | | | 1,500,000 | | | | 1,507,241 | |
| | |
BCC Middle Market,
Ser2018-1A, Cl B 4.819%, VAR ICE LIBOR USD 3 Month+3.000%, 10/20/30 (A) | | | 1,000,000 | | | | 980,605 | |
| | |
Benefit Street Partners III,
Ser 2017-IIIA, Cl DR 8.419%, VAR ICE LIBOR USD 3 Month+6.600%, 07/20/29 (A) | | | 2,500,000 | | | | 2,342,792 | |
| | |
Benefit Street Partners IV,
Ser2016-IVA, Cl DR 9.069%, VAR ICE LIBOR USD 3 Month+7.250%, 01/20/29 (A) | | | 3,000,000 | | | | 2,981,427 | |
| | |
Carlyle Global Market Strategies,
Ser2018-1A, Cl B 3.669%, VAR ICE LIBOR USD 3 Month+1.850%, 04/20/31 (A) | | | 2,000,000 | | | | 1,977,636 | |
| | |
Carlyle Global Market Strategies,
Ser2018-1A, Cl CR2 3.636%, VAR ICE LIBOR USD 3 Month+1.800%, 04/17/31 (A) | | | 1,250,000 | | | | 1,210,880 | |
| | |
Chenango Park,
Ser2018-1A, Cl B 3.681%, VAR ICE LIBOR USD 3 Month+1.850%, 04/15/30 (A) | | | 1,000,000 | | | | 988,785 | |
| | |
CIFC Funding,
Ser2018-1A, Cl C 3.569%, VAR ICE LIBOR USD 3 Month+1.750%, 04/18/31 (A) | | | 500,000 | | | | 482,294 | |
| | |
Fortress Credit Opportunities IX,
Ser 2017- 9A, Cl C 4.560%, VAR ICE LIBOR USD 3 Month+2.650%, 11/15/29 (A) | | | 1,400,000 | | | | 1,364,983 | |
| | |
Galaxy XXIX,
Ser2018-29A, Cl D 4.310%, VAR ICE LIBOR USD 3 Month+2.400%, 11/15/26 (A) | | | 500,000 | | | | 499,184 | |
| | |
Golub Capital Partners,
Ser2017-17A, Cl BR 4.694%, VAR ICE LIBOR USD 3 Month+2.900%, 10/25/30 (A) | | | 1,500,000 | | | | 1,470,111 | |
The accompanying notes are an integral part of the financial statements.
24
| | |
| FROST FAMILY OF FUNDS | | F R O S T F U N D S | J A N U A R Y 3 1, 2 0 2 0 (U n a u d i t e d) |
| | | | | | | | |
| Description | |
Face Amount | | |
Value | |
| | |
Golub Capital Partners,
Ser 2017-19RA, Cl B 4.344%, VAR ICE LIBOR USD 3 Month+2.550%, 07/26/29 (A) | | $ | 2,000,000 | | | $ | 1,996,666 | |
| | |
Golub Capital Partners,
Ser2017-21A, Cl CR 4.244%, VAR ICE LIBOR USD 3 Month+2.450%, 01/25/31 (A) | | | 3,000,000 | | | | 2,840,562 | |
| | |
Golub Capital Partners,
Ser2017-22A, Cl CR 3.669%, VAR ICE LIBOR USD 3 Month+1.850%, 01/20/31 (A) | | | 1,500,000 | | | | 1,422,997 | |
| | |
Golub Capital Partners,
Ser2017-23A, Cl BR 3.369%, VAR ICE LIBOR USD 3 Month+1.550%, 01/20/31 (A) | | | 1,000,000 | | | | 982,308 | |
| | |
Golub Capital Partners,
Ser2017-23A, Cl CR 3.619%, VAR ICE LIBOR USD 3 Month+1.800%, 01/20/31 (A) | | | 2,000,000 | | | | 1,891,102 | |
| | |
Golub Capital Partners,
Ser2017-24A, Cl DR 5.791%, VAR ICE LIBOR USD 3 Month+3.900%, 11/05/29 (A) | | | 2,000,000 | | | | 1,969,830 | |
| | |
Golub Capital Partners,
Ser2018-26A, Cl BR 3.369%, VAR ICE LIBOR USD 3 Month+1.550%, 04/20/31 (A) | | | 1,000,000 | | | | 981,917 | |
| | |
Golub Capital Partners,
Ser2018-36A, Cl B 3.541%, VAR ICE LIBOR USD 3 Month+1.650%, 02/05/31 (A) | | | 2,000,000 | | | | 1,931,338 | |
| | |
Golub Capital Partners,
Ser2018-36A, Cl C 3.991%, VAR ICE LIBOR USD 3 Month+2.100%, 02/05/31 (A) | | | 1,500,000 | | | | 1,392,407 | |
| | |
Jay Park,
Ser2018-1A, Cl BR 3.819%, VAR ICE LIBOR USD 3 Month+2.000%, 10/20/27 (A) | | | 1,000,000 | | | | 1,000,528 | |
| | |
Madison Park Funding XII,
Ser2014-12A, Cl D 5.319%, VAR ICE LIBOR USD 3 Month+3.500%, 07/20/26 (A) | | | 3,000,000 | | | | 3,014,796 | |
| | |
MCF IV,
Ser2017-1A, Cl CR 4.469%, VAR ICE LIBOR USD 3 Month+2.650%, 10/20/29 (A) | | | 1,000,000 | | | | 986,672 | |
| | |
MCF VIII,
Ser2018-1A, Cl B 3.569%, VAR ICE LIBOR USD 3 Month+1.750%, 07/18/30 (A) | | | 3,000,000 | | | | 2,918,697 | |
| | |
Northwoods Capital XV,
Ser2017-15A, Cl C 4.558%, VAR ICE LIBOR USD 3 Month+2.650%, 06/20/29 (A) | | | 1,000,000 | | | | 997,967 | |
| | | | | | | | |
| Description | |
Face Amount | | |
Value | |
| | |
OZLM Funding IV,
Ser2017-4A, Cl BR 4.002%, VAR ICE LIBOR USD 3 Month+2.200%, 10/22/30 (A) | | $ | 2,000,000 | | | $ | 1,978,446 | |
| | |
OZLM XVI,
Ser2017-16A, Cl B 4.454%, VAR ICE LIBOR USD 3 Month+2.550%, 05/16/30 (A) | | | 1,000,000 | | | | 998,709 | |
| | |
Parallel,
Ser2017-1A, Cl C 4.269%, VAR ICE LIBOR USD 3 Month+2.450%, 07/20/29 (A) | | | 1,000,000 | | | | 998,000 | |
| | |
Race Point IX,
Ser2017-9A, Cl BR 3.981%, VAR ICE LIBOR USD 3 Month+2.150%, 10/15/30 (A) | | | 4,000,000 | | | | 3,851,988 | |
| | |
Race Point IX,
Ser2017-9A, Cl DR 8.731%, VAR ICE LIBOR USD 3 Month+6.900%, 10/15/30 (A) | | | 2,000,000 | | | | 1,893,940 | |
| | |
Sudbury Mill,
Ser2013-1A, Cl E 6.586%, VAR ICE LIBOR USD 3 Month+4.750%, 01/17/26 (A) | | | 4,700,000 | | | | 4,113,163 | |
| | |
TCI-Symphony,
Ser2018-1A, Cl BR 3.498%, VAR ICE LIBOR USD 3 Month+1.650%, 10/13/29 (A) | | | 2,000,000 | | | | 2,002,810 | |
| | |
Thayer Park,
Ser2017-1A, Cl D 7.919%, VAR ICE LIBOR USD 3 Month+6.100%, 04/20/29 (A) | | | 1,000,000 | | | | 990,859 | |
| | |
Zais,
Ser2017-1A, Cl C
4.631%, VAR ICE LIBOR USD 3 Month+2.800%, 07/15/29 (A) | | | 1,000,000 | | | | 980,218 | |
| | | | | | | | |
| | | | | | | 57,941,858 | |
| | | | | | | | |
| | |
Total Collateralized Loan Obligations
(Cost $62,182,587) | | | | | | | 61,430,357 | |
| | | | | | | | |
ASSET-BACKED SECURITIES — 26.0% | |
|
Asset Backed Securities — 1.3% | |
| | |
BCC Funding XVI,
Ser2019-1A, Cl C 2.950%, 09/20/24 (A) | | | 1,500,000 | | | | 1,507,803 | |
| | |
Pawnee Equipment Receivables
Series, Ser2019-1, Cl E 3.800%, 01/15/26 (A) | | | 1,500,000 | | | | 1,507,392 | |
| | | | | | | | |
| | | | | | | 3,015,195 | |
| | | | | | | | |
|
Automotive — 12.3% | |
| | |
American Credit Acceptance Receivables Trust,
Ser2017-1, Cl E 5.440%, 03/13/24 (A) | | | 2,000,000 | | | | 2,045,402 | |
The accompanying notes are an integral part of the financial statements.
25
| | |
| FROST FAMILY OF FUNDS | | F R O S T F U N D S | J A N U A R Y 3 1, 2 0 2 0 (U n a u d i t e d) |
| | | | | | | | |
| Description | |
Face Amount | | |
Value | |
| | |
American Credit Acceptance Receivables Trust,
Ser2017-3, Cl C 2.720%, 06/10/22 (A) | | $ | 81,618 | | | $ | 81,633 | |
| | |
American Credit Acceptance Receivables Trust,
Ser2017-3, Cl E 5.170%, 06/10/24 (A) | | | 2,500,000 | | | | 2,546,124 | |
| | |
Carnow Auto Receivables Trust,
Ser 2017- 1A, Cl C 5.750%, 10/16/23 (A) | | | 2,000,000 | | | | 2,025,406 | |
| | |
Carvana Auto Receivables Trust2019-4,
Ser2019-4A, Cl E 4.700%, 10/15/26 (A) | | | 1,000,000 | | | | 1,016,248 | |
| | |
Carvana Auto Receivables Trust,
Ser 2019- 1A, Cl E 5.640%, 01/15/26 (A) | | | 500,000 | | | | 528,155 | |
| | |
CPS Auto Receivables Trust,
Ser2016-B, Cl E 8.140%, 05/15/23 (A) | | | 1,500,000 | | | | 1,581,201 | |
| | |
CPS Auto Receivables Trust,
Ser2016-D, Cl E 6.860%, 04/15/24 (A) | | | 1,155,000 | | | | 1,203,742 | |
| | |
CPS Auto Receivables Trust,
Ser2019-B, Cl F 7.480%, 06/15/26 (A) | | | 500,000 | | | | 524,637 | |
| | |
Drive Auto Receivables Trust,
Ser2018-1, Cl D 3.810%, 05/15/24 | | | 2,000,000 | | | | 2,036,916 | |
| | |
DT Auto Owner Trust,
Ser2016-2A, Cl D 5.430%, 11/15/22 (A) | | | 770,282 | | | | 773,213 | |
| | |
DT Auto Owner Trust,
Ser2017-2A, Cl E 6.030%, 01/15/24 (A) | | | 1,500,000 | | | | 1,566,154 | |
| | |
DT Auto Owner Trust,
Ser2019-4A, Cl E 3.930%, 10/15/26 (A) | | | 2,000,000 | | | | 2,023,753 | |
| | |
Exeter Automobile Receivables Trust,
Ser2015-2A, Cl D 5.790%, 05/16/22 (A) | | | 1,391,218 | | | | 1,392,832 | |
| | |
Exeter Automobile Receivables Trust,
Ser2015-3A, Cl D 6.550%, 10/17/22 (A) | | | 1,500,000 | | | | 1,509,409 | |
| | |
First Investors Auto Owner Trust,
Ser2016-2A, Cl E 5.750%, 09/15/23 (A) | | | 1,250,000 | | | | 1,286,028 | |
| | |
Flagship Credit Auto Trust,
Ser2016-2, Cl D 8.560%, 11/15/23 (A) | | | 900,000 | | | | 958,524 | |
| | |
Ford Credit Auto Owner Trust,
Ser2018-A, Cl A3 3.030%, 11/15/22 | | | 1,817,271 | | | | 1,835,962 | |
| | | | | | | | |
| Description | |
Face Amount | | |
Value | |
| | |
Octane Receivables Trust2019-1,
Ser2019-1A, Cl A 3.160%, 09/20/23 (A) | | $ | 954,549 | | | $ | 956,355 | |
| | |
SFS Asset Securitization,
Ser2019-1, Cl A 4.238%, 06/10/25 (A) | | | 1,500,000 | | | | 1,529,633 | |
| | | | | | | | |
| | | | | | | 27,421,327 | |
| | | | | | | | |
|
Consumer Discretionary — 2.1% | |
| | |
CPS Auto Receivables Trust,
Ser2015-A, Cl E 6.190%, 05/16/22 (A) | | | 1,100,000 | | | | 1,102,104 | |
| | |
CPS Auto Receivables Trust,
Ser2015-C, Cl F 7.510%, 11/15/22 (A) | | | 1,500,000 | | | | 1,533,422 | |
| | |
CPS Auto Receivables Trust,
Ser2019-D, Cl E 3.860%, 10/15/25 (A) | | | 2,000,000 | | | | 2,015,801 | |
| | | | | | | | |
| | | | | | | 4,651,327 | |
| | | | | | | | |
| | |
Credit Card — 4.7% | | | | | | | | |
| | |
American Express Credit Account Master Trust,
Ser2018-5, Cl A
2.016%, VAR ICE LIBOR USD
1 Month+0.340%, 12/15/25 | | | 8,500,000 | | | | 8,491,780 | |
| | |
Fortiva Retail Credit Master Note Business Trust,
Ser2018-ONE, Cl A 5.540%, 11/15/23 (A) | | | 2,000,000 | | | | 2,041,410 | |
| | | | | | | | |
| | | | | | | 10,533,190 | |
| | | | | | | | |
|
Information Technology — 0.5% | |
| | |
Avid Automobile Receivables Trust,
Ser2019-1, Cl E 6.760%, 05/17/27 (A) | | | 1,000,000 | | | | 1,011,196 | |
| | | | | | | | |
|
Other Asset-Backed Securities — 5.1% | |
| | |
Business Jet Securities,
Ser2018-2, Cl A 4.447%, 06/15/33 (A) | | | 527,369 | | | | 540,701 | |
| | |
Business Jet Securities,
Ser2018-2, Cl C 6.656%, 06/15/33 (A) | | | 435,761 | | | | 443,417 | |
| | |
CFG Investments,
Ser2019-1, Cl A 5.560%, 08/15/29 (A) | | | 1,200,000 | | | | 1,207,286 | |
| | |
CLI Funding,
Ser2018-1A, Cl B 4.930%, 04/18/43 (A) | | | 815,307 | | | | 836,257 | |
| | |
Credibly Asset Securitization,
Ser2018-1A, Cl A 4.800%, 11/15/23 (A) | | | 1,500,000 | | | | 1,534,316 | |
| | |
Harley Marine Financing,
Ser2018-1A, Cl A2 5.682%, 05/15/43 (A) | | | 1,888,945 | | | | 1,702,595 | |
The accompanying notes are an integral part of the financial statements.
26
| | |
| FROST FAMILY OF FUNDS | | F R O S T F U N D S | J A N U A R Y 3 1, 2 0 2 0 (U n a u d i t e d) |
| | | | | | | | |
| Description | |
Face Amount | | |
Value | |
| | |
Kabbage Funding,
Ser2019-1, Cl A 3.825%, 03/15/24 (A) | | $ | 1,000,000 | | | $ | 1,014,838 | |
| | |
Kabbage Funding,
Ser2019-1, Cl C 4.611%, 03/15/24 (A) | | | 789,000 | | | | 796,627 | |
| | |
MelTel Land Funding,
Ser2019-1A, Cl C 6.070%, 04/15/49 (A) | | | 500,000 | | | | 521,157 | |
| | |
Mosaic Solar Loans,
Ser2017-2A, Cl B 4.770%, 06/22/43 (A) | | | 409,029 | | | | 425,527 | |
| | |
Sapphire Aviation Finance I,
Ser2018-1A, Cl B 5.926%, 03/15/40 (A) | | | 388,594 | | | | 403,453 | |
| | |
Stack Infrastructure Issuer
Series, Ser2019-1A, Cl A2 4.540%, 02/25/44 (A) | | | 990,833 | | | | 1,055,447 | |
| | |
Vantage Data Centers Issuer,
Ser2018-1A, Cl A2 4.072%, 02/16/43 (A) | | | 980,833 | | | | 1,021,649 | |
| | | | | | | | |
| | | | | | | 11,503,270 | |
| | | | | | | | |
| | |
Total Asset-Backed Securities
(Cost $57,062,294) | | | | | | | 58,135,505 | |
| | | | | | | | |
MORTGAGE-BACKED SECURITIES — 4.7% | |
|
Commercial Mortgage-Backed Obligation — 4.7% | |
| | |
Commercial Mortgage Trust,
Ser 2014- UBS6, Cl C 4.597%, 12/10/47 (B) | | | 1,000,000 | | | | 1,038,526 | |
| | |
Commercial Mortgage Trust,
Ser 2015- DC1, Cl D 4.455%, 02/10/48 (A) (B) | | | 1,517,000 | | | | 1,403,727 | |
| | |
Credit Suisse Commercial Mortgage Trust,
Ser2008-C1, Cl D 5.997%, 02/15/41 (A) (B) | | | 574,219 | | | | 35,602 | |
| | |
FREMF Mortgage Trust,
Ser2016-K54, Cl C 4.189%, 04/25/48 (A) (B) | | | 1,000,000 | | | | 1,057,012 | |
| | |
FREMF Mortgage Trust,
Ser 2016-K722, Cl B 3.975%, 07/25/49 (A) (B) | | | 1,500,000 | | | | 1,566,256 | |
| | |
FREMF Mortgage Trust,
Ser2017-K70, Cl B 3.934%, 12/25/49 (A) (B) | | | 2,000,000 | | | | 2,145,617 | |
| | |
FREMF Mortgage Trust,
Ser2017-K71, Cl B 3.882%, 11/25/50 (A) (B) | | | 1,250,000 | | | | 1,328,772 | |
| | |
UBS Commercial Mortgage Trust,
Ser2012-C1, Cl C 5.756%, 05/10/45 (A) (B) | | | 1,000,000 | | | | 1,053,905 | |
| | | | | | | | |
| Description | |
Face Amount | | |
Value | |
| | |
WFRBS Commercial Mortgage Trust,
Ser2014-C25, Cl D 3.803%, 11/15/47 (A) (B) | | $ | 1,000,000 | | | $ | 953,080 | |
| | | | | | | | |
| | | | | | | 10,582,497 | |
| | | | | | | | |
| | |
Total Mortgage-Backed Securities
(Cost $10,220,440) | | | | | | | 10,582,497 | |
| | | | | | | | |
COMMON STOCK — 0.1% | |
|
Industrials — 0.1% | |
| | |
Erickson* (C) | | | 3,761 | | | | 143,445 | |
| | | | | | | | |
| | |
Total Common Stock
(Cost $1,829,568) | | | | | | | 143,445 | |
| | | | | | | | |
PREFERRED STOCK — 0.0% | |
|
Communication Services — 0.0% | |
| | |
MYT Holding
10.000%, 06/07/29 (A) | | | 76,092 | | | | 68,483 | |
| | | | | | | | |
| | |
Total Preferred Stock
(Cost $76,092) | | | | | | | 68,483 | |
| | | | | | | | |
CASH EQUIVALENT — 0.2% | |
| | |
Federated Government Obligations Fund, Cl I, 1.450%**
(Cost $452,108) | | | 452,108 | | | | 452,108 | |
| | | | | | | | |
REPURCHASE AGREEMENT (D) — 9.0% | |
| | |
KGS Alpha Overnight*** 1.650%, dated 01/31/20, to be repurchased on 02/03/20, repurchase price $20,002,750 (collateralized by various FNMA/GNMA obligations, par value $416,783 - $24,000,000, 2.011% - 5.500%, 06/25/36 - 02/01/50, with total market value of $20,563,572) | | | 20,000,000 | | | | 20,000,000 | |
| | | | | | | | |
| | |
Total Repurchase Agreement
(Cost $20,000,000) | | | | | | | 20,000,000 | |
| | | | | | | | |
| | |
Total Investments — 99.3%
(Cost $220,106,993) | | | | | | $ | 221,832,020 | |
| | | | | | | | |
Percentages are based on Net Assets of $223,489,486.
| * | Non-income producing security. |
| ** | Rate shown is the7-day effective yield as of January 31, 2020. |
| *** | Repurchase date stated is the termination date of the repurchase agreement. This repurchase agreement is terminable daily upon demand, which is reflective of the repurchase price stated. |
| (A) | Securities sold within terms of a private placement memorandum, exempt from registration under Section 144A of the Securities Act of 1933, as amended, and may be sold only to dealers in that program or other “accredited investors.” The total value of such securities at January 31, 2020 was $138,945,087 and represents 62.2% of Net Assets. |
The accompanying notes are an integral part of the financial statements.
27
| | |
| FROST FAMILY OF FUNDS | | F R O S T F U N D S | J A N U A R Y 3 1, 2 0 2 0 (U n a u d i t e d) |
| (B) | Variable or floating rate security, the interest rate of which adjusts periodically based on changes in current interest rates and prepayments on the underlying pool of assets. |
| (C) | Level 3 security in accordance with fair value hierarchy. |
| (D) | Tri-Party Repurchase Agreement. |
Cl — Class
FNMA — Federal National Mortgage Association
GNMA — Government National Mortgage Association
ICE — Intercontinental Exchange
LIBOR — London Interbank Offered Rate
MTN — Medium Term Note
Ser — Series
USD — U.S. Dollar
VAR — Variable Rate Security
The following is a list of the level of inputs used as of January 31, 2020 in valuing the Fund’s investments carried at value:
| | | | | | | | | | | | | | | | |
| Investments in Securities | | Level 1 | | | Level 2 | | | Level 3(1) | | | Total | |
Corporate Obligations | | $ | — | | | $ | 71,019,625 | | | $ | — | | | $ | 71,019,625 | |
Collateralized Loan Obligations | | | — | | | | 61,430,357 | | | | — | | | | 61,430,357 | |
Asset-Backed Securities | | | — | | | | 58,135,505 | | | | — | | | | 58,135,505 | |
Mortgage-Backed Securities | | | — | | | | 10,582,497 | | | | — | | | | 10,582,497 | |
Common Stock | | | — | | | | — | | | | 143,445 | | | | 143,445 | |
Preferred Stock | | | — | | | | 68,483 | | | | — | | | | 68,483 | |
Cash Equivalent | | | 452,108 | | | | — | | | | — | | | | 452,108 | |
Repurchase Agreement | | | — | | | | 20,000,000 | | | | — | | | | 20,000,000 | |
| | | | | | | | | | | | | | | | |
Total Investments in Securities | | $ | 452,108 | | | $ | 221,236,467 | | | $ | 143,445 | | | $ | 221,832,020 | |
| | | | | | | | | | | | | | | | |
| (1) | A reconciliation of Level 3 investments, including certain disclosures related to significant inputs used in valuing Level 3 investments is only presented when the Fund has over 1% of Level 3 investments at the beginning and/or end of the period in relation to net assets. |
For the period ended January 31, 2020, there have been no transfers in or out of Level 3.
Amounts designated as “—” are $0 or have been rounded to $0.
For more information on valuation inputs, see Note 2 — Significant Accounting Policies in the Notes to Financial Statements.
The accompanying notes are an integral part of the financial statements.
28
| | |
| FROST FAMILY OF FUNDS | | F R O S T F U N D S | J A N U A R Y 3 1, 2 0 2 0 (U n a u d i t e d) |
| | |
| FROST LOW DURATION BOND FUND | | |
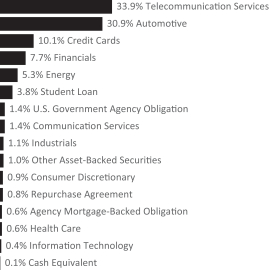
| † | Percentages are based on total investments. |
| | | | | | | | |
| Description | | Face Amount | | |
Value | |
ASSET-BACKED SECURITIES — 45.2% | |
|
Automotive — 30.5% | |
| | |
AccessLex Institute,
Ser2002-A, Cl A2 4.000%, 09/25/37 (A) | | $ | 400,000 | | | $ | 395,544 | |
| | |
Ally Auto Receivables Trust,
Ser2019-2, Cl A2 2.340%, 06/15/22 | | | 1,826,026 | | | | 1,831,426 | |
| | |
American Credit Acceptance Receivables Trust,
Ser2017-2, Cl C 2.860%, 06/12/23 (B) | | | 125,327 | | | | 125,421 | |
| | |
California Republic Auto Receivables Trust,
Ser2016-1, Cl C 4.560%, 12/15/22 | | | 1,000,000 | | | | 1,005,927 | |
| | |
Canadian Pacer Auto Receivables Trust,
Ser2019-1A, Cl C 3.750%, 07/21/25 (B) | | | 2,550,000 | | | | 2,652,008 | |
| | |
Carnow Auto Receivables Trust,
Ser 2019- 1A, Cl A 2.720%, 11/15/22 (B) | | | 2,127,624 | | | | 2,131,973 | |
| | |
CPS Auto Receivables Trust,
Ser2018-D, Cl D 4.340%, 09/16/24 (B) | | | 1,500,000 | | | | 1,552,718 | |
| | |
Credit Acceptance Auto Loan Trust,
Ser2019-1A, Cl B 3.750%, 04/17/28 (B) | | | 2,700,000 | | | | 2,792,922 | |
| | | | | | | | |
| Description | | Face Amount | | |
Value | |
| | |
Diamond Resorts Owner Trust,
Ser 2019- 1A, Cl A 2.890%, 02/20/32 (B) | | $ | 1,693,712 | | | $ | 1,717,549 | |
| | |
Drive Auto Receivables Trust2020-1,
Ser2020-1, Cl C 2.360%, 03/16/26 | | | 2,750,000 | | | | 2,771,425 | |
| | |
DT Auto Owner Trust,
Ser2019-4A, Cl C 2.730%, 07/15/25 (B) | | | 2,000,000 | | | | 2,029,635 | |
| | |
Exeter Automobile Receivables Trust2020-1,
Ser2020-1A, Cl C 2.490%, 01/15/25 (B) | | | 1,500,000 | | | | 1,512,533 | |
| | |
Exeter Automobile Receivables Trust,
Ser2018-1A, Cl D 3.530%, 11/15/23 (B) | | | 3,000,000 | | | | 3,063,639 | |
| | |
Exeter Automobile Receivables Trust,
Ser2019-2A, Cl B 3.060%, 05/15/23 (B) | | | 3,200,000 | | | | 3,233,265 | |
| | |
First Investors Auto Owner Trust,
Ser2017-1A, Cl D 3.600%, 04/17/23 (B) | | | 5,000,000 | | | | 5,094,345 | |
| | |
Flagship Credit Auto Trust,
Ser2016-4, Cl C 2.710%, 11/15/22 (B) | | | 99,000 | | | | 99,224 | |
| | |
Flagship Credit Auto Trust,
Ser2018-4, Cl D 4.330%, 12/16/24 (B) | | | 4,935,000 | | | | 5,187,770 | |
| | |
Ford Credit Auto Owner Trust,
Ser2019-B, Cl B 2.400%, 11/15/24 | | | 1,365,000 | | | | 1,385,731 | |
| | |
GLS Auto Receivables Issuer Trust,
Ser2019-4A, Cl A 2.470%, 11/15/23 (B) | | | 3,234,978 | | | | 3,248,007 | |
| | |
GM Financial Automobile Leasing Trust,
Ser2018-1, Cl A4 2.680%, 12/20/21 | | | 2,000,000 | | | | 2,006,131 | |
| | |
GM Financial Consumer Automobile Receivables Trust,
Ser2018-1, Cl B
2.570%, 07/17/23 | | | 1,240,000 | | | | 1,256,363 | |
| | |
Hertz Vehicle Financing,
Ser2018-2A, Cl A
3.650%, 06/27/22 (B) | | | 3,000,000 | | | | 3,069,835 | |
| | |
Master Credit Card Trust II,
Ser2018-1A, Cl A
2.144%, VAR ICE LIBOR USD
1 Month+0.490%, 07/21/24 (B) | | | 5,000,000 | | | | 5,017,539 | |
| | |
Master Credit Card Trust II,
Ser2019-2A, Cl A
2.044%, VAR ICE LIBOR USD
1 Month+0.390%, 01/21/23 (B) | | | 3,500,000 | | | | 3,503,750 | |
The accompanying notes are an integral part of the financial statements.
29
| | |
| FROST FAMILY OF FUNDS | | F R O S T F U N D S | J A N U A R Y 3 1, 2 0 2 0 (U n a u d i t e d) |
| | |
| FROST LOW DURATION BOND FUND | | |
| | | | | | | | |
| Description | | Face Amount | | |
Value | |
| | |
Master Credit Card Trust,
Ser2019-1A, Cl A
2.134%, VAR ICE LIBOR USD
1 Month+0.480%, 07/21/22 (B) | | $ | 3,000,000 | | | $ | 3,007,737 | |
| | |
NextGear Floorplan Master Owner Trust,
Ser2018-1A, Cl A2
3.220%, 02/15/23 (B) | | | 1,500,000 | | | | 1,522,105 | |
| | |
Nissan Auto Receivables Owner Trust,
Ser2017-C, Cl A3
2.120%, 04/18/22 | | | 2,740,325 | | | | 2,746,826 | |
| | |
OneMain Direct Auto Receivables Trust,
Ser2018-1A, Cl B
3.710%, 04/14/25 (B) | | | 3,750,000 | | | | 3,859,229 | |
| | |
OSCAR US Funding Trust IX,
Ser2018-2A, Cl A3
3.390%, 09/12/22 (B) | | | 1,250,000 | | | | 1,267,469 | |
| | |
OSCAR US Funding Trust VI,
Ser2017-1A, Cl A3
2.820%, 06/10/21 (B) | | | 146,629 | | | | 146,733 | |
| | |
OSCAR US Funding Trust VII,
Ser2017-2A, Cl A3
2.450%, 12/10/21 (B) | | | 1,492,918 | | | | 1,494,865 | |
| | |
Pawnee Equipment Receivables
Series, Ser2019-1, Cl A2
2.290%, 10/15/24 (B) | | | 1,900,000 | | | | 1,900,278 | |
| | |
Pawnee Equipment Receivables
Series, Ser2019-1, Cl D
2.860%, 10/15/24 (B) | | | 5,000,000 | | | | 5,024,779 | |
| | |
Santander Drive Auto Receivables Trust,
Ser2018-3, Cl B
3.290%, 10/17/22 | | | 1,899,483 | | | | 1,904,866 | |
| | |
Santander Drive Auto Receivables Trust,
Ser2018-4, Cl C
3.560%, 07/15/24 | | | 1,250,000 | | | | 1,270,813 | |
| | |
SoFi Consumer Loan Program,
Ser2019-1, Cl B
3.450%, 02/25/28 (B) | | | 2,400,000 | | | | 2,447,483 | |
| | |
Synchrony Card Issuance Trust,
Ser 2018- A1, Cl A
3.380%, 09/15/24 | | | 3,100,000 | | | | 3,186,450 | |
| | |
Synchrony Credit Card Master Note Trust,
Ser2015-1, Cl A
2.370%, 03/15/23 | | | 1,785,000 | | | | 1,786,331 | |
| | |
United Auto Credit Securitization Trust,
Ser2018-2, Cl B
3.560%, 08/10/22 (B) | | | 412,720 | | | | 412,888 | |
| | |
Vantage Data Centers Issuer,
Ser2018-2A, Cl A2
4.196%, 11/16/43 (B) | | | 3,953,333 | | | | 4,132,349 | |
| | | | | | | | |
| Description | | Face Amount | | |
Value | |
| | |
Volvo Financial Equipment,
Ser2018-1A, Cl A4
2.760%, 10/17/22 (B) | | $ | 4,500,000 | | | $ | 4,563,013 | |
| | |
Westlake Automobile Receivables Trust,
Ser2017-1A, Cl D
3.460%, 10/17/22 (B) | | | 2,000,000 | | | | 2,012,071 | |
| | |
Westlake Automobile Receivables Trust,
Ser2019-2A, Cl C
2.840%, 07/15/24 (B) | | | 2,650,000 | | | | 2,688,386 | |
| | |
World Financial Network Credit Card Master Trust,
Ser2016-A, Cl M
2.330%, 04/15/25 | | | 2,000,000 | | | | 2,011,149 | |
| | |
World Omni Auto Receivables Trust,
Ser2018-B, Cl B
3.170%, 01/15/25 | | | 1,520,000 | | | | 1,562,221 | |
| | |
World Omni Auto Receivables Trust,
Ser2018-C, Cl A3
3.130%, 11/15/23 | | | 3,000,000 | | | | 3,058,697 | |
| | |
World Omni Automobile Lease Securitization Trust,
Ser2019-A, Cl A4
3.010%, 07/15/24 | | | 1,750,000 | | | | 1,785,241 | |
| | | | | | | | |
| | | | | | | 110,476,659 | |
| | | | | | | | |
|
Credit Cards — 10.0% | |
| | |
Capital One Multi-Asset Execution Trust,
Ser2017-A2, Cl A2
2.086%, VAR ICE LIBOR USD 1 Month+0.410%, 01/15/25 | | | 5,000,000 | | | | 5,021,918 | |
| | |
Capital One Multi-Asset Execution Trust,
Ser2017-A5, Cl A5
2.256%, VAR ICE LIBOR USD
1 Month+0.580%, 07/15/27 | | | 9,000,000 | | | | 9,056,671 | |
| | |
Citibank Credit Card Issuance Trust,
Ser2017-A5, Cl A5
2.273%, VAR ICE LIBOR USD
1 Month+0.620%, 04/22/26 | | | 7,000,000 | | | | 7,050,875 | |
| | |
Discover Card Execution Note Trust,
Ser2017-A7, Cl A7
2.036%, VAR ICE LIBOR USD
1 Month+0.360%, 04/15/25 | | | 5,000,000 | | | | 5,014,745 | |
| | |
Golden Credit Card Trust,
Ser2019-1A, Cl A
2.126%, VAR ICE LIBOR USD
1 Month+0.450%, 12/15/22 (B) | | | 5,000,000 | | | | 5,010,950 | |
| | |
Trillium Credit Card Trust II,
Ser2019-1A, Cl A
2.141%, VAR ICE LIBOR USD
1 Month+0.480%, 01/26/24 (B) | | | 5,000,000 | | | | 5,013,965 | |
| | | | | | | | |
| | | | | | | 36,169,124 | |
| | | | | | | | |
The accompanying notes are an integral part of the financial statements.
30
| | |
| FROST FAMILY OF FUNDS | | F R O S T F U N D S | J A N U A R Y 3 1, 2 0 2 0 (U n a u d i t e d) |
| | |
| FROST LOW DURATION BOND FUND | | |
| | | | | | | | |
| Description | | Face Amount | | |
Value | |
|
Other Asset-Backed Securities — 1.0% | |
| | |
Mosaic Solar Loans,
Ser2017-1A, Cl A
4.450%, 06/20/42 (B) | | $ | 456,643 | | | $ | 480,866 | |
| | |
SCF Equipment Leasing,
Ser2017-1A, Cl A
3.770%, 01/20/23 (B) | | | 528,603 | | | | 535,341 | |
| | |
SoFi Consumer Loan Program,
Ser2017-5, Cl A2
2.780%, 09/25/26 (B) | | | 1,386,588 | | | | 1,394,638 | |
| | |
TAL Advantage V,
Ser2013-1A, Cl B
3.960%, 02/22/38 (B) | | | 1,233,333 | | | | 1,244,229 | |
| | | | | | | | |
| | | | | | | 3,655,074 | |
| | | | | | | | |
|
Student Loan — 3.7% | |
| | |
Commonbond Student Loan Trust,
Ser2017-AGS, Cl A1
2.550%, 05/25/41 (B) | | | 1,892,657 | | | | 1,908,754 | |
| | |
Nelnet Student Loan Trust,
Ser2012-6A, Cl B
3.161%, VAR ICE LIBOR USD
1 Month+1.500%, 08/26/52 (B) | | | 3,000,000 | | | | 2,886,917 | |
| | |
Nelnet Student Loan Trust,
Ser2013-3A, Cl B
3.161%, VAR ICE LIBOR USD
1 Month+1.500%, 07/25/47 (B) | | | 4,000,000 | | | | 3,947,566 | |
| | |
Nelnet Student Loan Trust,
Ser2015-3A, Cl B
3.161%, VAR ICE LIBOR USD
1 Month+1.500%, 06/25/54 (B) | | | 3,000,000 | | | | 2,882,514 | |
| | |
SLM Student Loan Trust,
Ser2013-2, Cl B
3.161%, VAR ICE LIBOR USD
1 Month+1.500%, 06/25/43 | | | 2,000,000 | | | | 1,922,206 | |
| | | | | | | | |
| | | | | | | 13,547,957 | |
| | | | | | | | |
| | |
Total Asset-Backed Securities
(Cost $160,914,576) | | | | | | | 163,848,814 | |
| | | | | | | | |
U.S. TREASURY OBLIGATIONS — 33.3% | |
| | |
U.S. Treasury Note
1.625%, 11/15/22 to 12/15/22 | | | 80,000,000 | | | | 80,695,313 | |
1.500%, 01/15/23 | | | 40,000,000 | | | | 40,221,875 | |
| | | | | | | | |
| | |
Total U.S. Treasury Obligations
(Cost $119,980,089) | | | | | | | 120,917,188 | |
| | | | | | | | |
CORPORATE OBLIGATIONS — 17.1% | |
|
Communication Services — 1.4% | |
| | |
BellSouth
4.266%, 04/26/20 (B) | | | 5,000,000 | | | | 5,025,150 | |
| | | | | | | | |
|
Consumer Discretionary — 0.8% | |
| | |
BMW US Capital
2.950%, 04/14/22 (B) | | | 3,000,000 | | | | 3,072,276 | |
| | | | | �� | | | |
|
Energy — 5.2% | |
| | |
Barclays
3.200%, 08/10/21 | | | 3,000,000 | | | | 3,051,119 | |
| | | | | | | | |
| Description | | Face Amount | | |
Value | |
| | |
Danske Bank MTN
2.800%, 03/10/21 (B) | | $ | 3,000,000 | | | $ | 3,032,176 | |
| | |
Nationwide Building Society
2.000%, 01/27/23 (B) | | | 9,000,000 | | | | 9,050,597 | |
| | |
Standard Chartered MTN
2.250%, 04/17/20 (B) | | | 2,300,000 | | | | 2,300,713 | |
| | |
Swedbank
2.594%, VAR ICE LIBOR USD
3 Month+0.700%, 03/14/22 (B) | | | 1,600,000 | | | | 1,608,076 | |
| | | | | | | | |
| | | | | | | 19,042,681 | |
| | | | | | | | |
|
Financials — 7.6% | |
| | |
Athene Global Funding
2.500%, 01/14/25 (B) | | | 11,800,000 | | | | 11,909,606 | |
| | |
Bank of America MTN
3.764%, VAR CPI YOY+2.000%, 01/14/21 | | | 1,000,000 | | | | 990,000 | |
| | |
Capital One
2.150%, 09/06/22 | | | 1,350,000 | | | | 1,360,490 | |
| | |
Capital One Financial
3.200%, 01/30/23 | | | 2,000,000 | | | | 2,074,512 | |
| | |
Credit Suisse NY
2.100%, 11/12/21 | | | 1,000,000 | | | | 1,006,656 | |
| | |
Deutsche Bank
3.209%, VAR ICE LIBOR USD
3 Month+1.310%, 08/20/20 | | | 4,400,000 | | | | 4,415,514 | |
| | |
JPMorgan Chase MTN
3.051%, VAR CPI YOY+1.000%, 08/17/22 | | | 1,250,000 | | | | 1,242,375 | |
| | |
Royal Bank of Canada MTN
2.750%, 02/01/22 | | | 2,000,000 | | | | 2,044,989 | |
| | |
Royal Bank of Scotland Group
3.498%, VAR ICE LIBOR USD
3 Month+1.480%, 05/15/23 | | | 2,328,000 | | | | 2,393,665 | |
| | | | | | | | |
| | | | | | | 27,437,807 | |
| | | | | | | | |
|
Health Care — 0.6% | |
| | |
AbbVie
2.150%, 11/19/21 (B) | | | 2,000,000 | | | | 2,012,759 | |
| | | | | | | | |
|
Industrials — 1.1% | |
| | |
Masco
5.950%, 03/15/22 | | | 3,574,000 | | | | 3,868,783 | |
| | | | | | | | |
|
Information Technology — 0.4% | |
| | |
Jabil
4.700%, 09/15/22 | | | 1,365,000 | | | | 1,458,466 | |
| | | | | | | | |
| | |
Total Corporate Obligations
(Cost $61,230,805) | | | | | | | 61,917,922 | |
| | | | | | | | |
U.S. GOVERNMENT AGENCY OBLIGATION — 1.4% | |
| | |
Tennessee Valley Authority
3.875%, 02/15/21 | | | 5,000,000 | | | | 5,116,446 | |
| | | | | | | | |
| | |
Total U.S. Government Agency Obligation
(Cost $5,095,309) | | | | | | | 5,116,446 | |
| | | | | | | | |
The accompanying notes are an integral part of the financial statements.
31
| | |
| FROST FAMILY OF FUNDS | | F R O S T F U N D S | J A N U A R Y 3 1, 2 0 2 0 (U n a u d i t e d) |
| | |
| FROST LOW DURATION BOND FUND | | |
| | | | | | | | |
| Description | | Face Amount | | |
Value | |
MORTGAGE-BACKED SECURITY — 0.6% | |
|
Agency Mortgage-Backed Obligation — 0.6% | |
| | |
FHLMC REMIC,
Ser 2010-3747, Cl UF
2.156%, VAR LIBOR USD
1 Month+0.480%, 10/15/40 | | $ | 2,173,175 | | | $ | 2,166,354 | |
| | | | | | | | |
| | |
Total Mortgage-Backed Security
(Cost $2,170,281) | | | | | | | 2,166,354 | |
| | | | | | | | |
|
CASH EQUIVALENT — 0.1% | |
| | |
Federated Government Obligations Fund, Cl I, 1.450%*
(Cost $287,510) | | | 287,510 | | | | 287,510 | |
| | | | | | | | |
REPURCHASE AGREEMENT (C) — 0.8% | |
| | |
KGS Alpha Overnight** 1.600%, dated 01/31/20, to be repurchased on 02/03/20, repurchase price $3,000,400 (collateralized by various GNMA obligations, par value $2,927,176, 3.500%, 01/20/50, with total market value of $3,060,001) | | | 3,000,000 | | | | 3,000,000 | |
| | | | | | | | |
| | |
Total Repurchase Agreement
(Cost $3,000,000) | | | | | | | 3,000,000 | |
| | | | | | | | |
| | |
Total Investments — 98.5%
(Cost $352,678,570) | | | | | | $ | 357,254,234 | |
| | | | | | | | |
Percentages are based on Net Assets of $362,838,033.
| * | Rate shown is the7-day effective yield as of January 31, 2020. |
| ** | Repurchase date stated is the termination date of the repurchase agreement. This repurchase agreement is terminable daily upon demand, which is reflective of the repurchase price stated. |
| (A) | Variable or floating rate security, the interest rate of which adjusts periodically based on changes in current interest rates and prepayments on the underlying pool of assets. |
| (B) | Securities sold within terms of a private placement memorandum, exempt from registration under Section 144A of the Securities Act of 1933, as amended, and may be sold only to dealers in that program or other “accredited investors.” The total value of such securities at January 31, 2020 was $143,828,611 and represents 39.6% of Net Assets. |
| (C) | Tri-Party Repurchase Agreement. |
Cl — Class
CPI YOY — Consumer Price Index Year Over Year
FHLMC — Federal Home Loan Mortgage Corporation
GNMA — Government National Mortgage Association
ICE — Intercontinental Exchange
LIBOR — London Interbank Offered Rate
MTN — Medium Term Note
REMIC — Real Estate Mortgage Investment Conduit
Ser — Series
USD — U.S. Dollar
VAR — Variable
The following is a list of the level of inputs used as of January 31, 2020 in valuing the Fund’s investments carried at value:
| | | | | | | | | | | | | | | | |
| Investments in Securities | | Level 1 | | | Level 2 | | | Level 3 | | | Total | |
Asset-Backed Securities | | $ | — | | | $ | 163,848,814 | | | $ | — | | | $ | 163,848,814 | |
U.S. Treasury Obligations | | | 120,917,188 | | | | — | | | | — | | | | 120,917,188 | |
Corporate Obligations | | | — | | | | 61,917,922 | | | | — | | | | 61,917,922 | |
U.S. Government Agency Obligation | | | — | | | | 5,116,446 | | | | — | | | | 5,116,446 | |
Mortgage-Backed Security | | | — | | | | 2,166,354 | | | | — | | | | 2,166,354 | |
Cash Equivalent | | | 287,510 | | | | — | | | | — | | | | 287,510 | |
Repurchase Agreement | | | — | | | | 3,000,000 | | | | — | | | | 3,000,000 | |
| | | | | | | | | | | | | | | | |
Total Investments in Securities | | $ | 121,204,698 | | | $ | 236,049,536 | | | $ | — | | | $ | 357,254,234 | |
| | | | | | | | | | | | | | | | |
For the period ended January 31, 2020, there have been no transfers in or out of Level 3.
Amounts designated as “—” are $0 or have been rounded to $0.
For more information on valuation inputs, see Note 2 — Significant Accounting Policies in the Notes to Financial Statements.
The accompanying notes are an integral part of the financial statements.
32
| | |
| FROST FAMILY OF FUNDS | | F R O S T F U N D S | J A N U A R Y 3 1, 2 0 2 0 (U n a u d i t e d) |
| | |
| FROST MUNICIPAL BOND FUND | | |
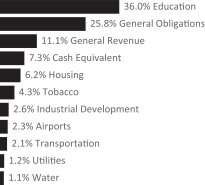
| † | Percentages are based on total investments. |
| | | | | | | | |
| Description | | Face Amount | | |
Value | |
MUNICIPAL BONDS — 92.1% | |
|
Arizona — 1.2% | |
| | |
University of Arizona,
Ser B, RB
4.000%, 06/01/25 | | $ | 1,000,000 | | | $ | 1,157,860 | |
| | | | | | | | |
|
California — 3.3% | |
| | |
California State, Municipal Finance Authority,
Ser A, RB
5.000%, 03/01/25 | | | 1,610,000 | | | | 1,660,683 | |
| | |
California State, School Finance Authority, RB
Callable 02/01/24 @ 100
5.350%, 08/01/24 | | | 450,000 | | | | 481,545 | |
| | |
Golden State, Tobacco Securitization,
Ser A, RB, ST APPROP
4.000%, 06/01/21 | | | 1,000,000 | | | | 1,041,690 | |
| | | | | | | | |
| | | | | | | 3,183,918 | |
| | | | | | | | |
|
Colorado — 2.5% | |
| | |
El Paso County, School District No. 49 Falcon,
Ser A, COP
5.000%, 12/15/24 | | | 525,000 | | | | 624,530 | |
5.000%, 12/15/25 | | | 460,000 | | | | 564,218 | |
| | |
El Paso County, School District No. 49 Falcon,
Ser B, COP
5.000%, 12/15/23 | | | 250,000 | | | | 287,843 | |
5.000%, 12/15/24 | | | 300,000 | | | | 356,874 | |
5.000%, 12/15/26 | | | 500,000 | | | | 627,140 | |
| | | | | | | | |
| | | | | | | 2,460,605 | |
| | | | | | | | |
|
Delaware — 2.4% | |
| | |
University of Delaware, RB
5.000%, 11/01/23 | | | 2,000,000 | | | | 2,305,340 | |
| | | | | | | | |
| | | | | | | | |
| Description | | Face Amount | | |
Value | |
|
District of Columbia — 1.3% | |
| | |
District of Columbia, RB
4.000%, 10/01/20 | | $ | 305,000 | | | $ | 307,089 | |
4.000%, 10/01/22 | | | 895,000 | | | | 926,844 | |
| | | | | | | | |
| | | | | | | 1,233,933 | |
| | | | | | | | |
|
Florida — 2.1% | |
| | |
Florida State, Department of Education,
Ser A, RB
Callable 07/01/20 @ 101
4.375%, 07/01/30 | | | 2,000,000 | | | | 2,048,120 | |
| | | | | | | | |
|
Idaho — 0.6% | |
| | |
Idaho State, Housing & Finance Association, RB
4.000%, 07/01/26 | | | 500,000 | | | | 535,425 | |
| | | | | | | | |
|
Illinois — 4.5% | |
| | |
Chicago, O’Hare International Airport,
Ser B, RBPre-Refunded @ 100
5.500%, 01/01/21 (A) | | | 1,030,000 | | | | 1,073,425 | |
| | |
Lee & Ogle Counties, School District No. 170 Dixon, GO, BAM
4.000%, 01/30/25 | | | 760,000 | | | | 850,334 | |
| | |
Railsplitter, Tobacco Settlement Authority, RB
5.250%, 06/01/20 | | | 2,410,000 | | | | 2,442,077 | |
| | | | | | | | |
| | | | | | | 4,365,836 | |
| | | | | | | | |
|
Kansas — 3.1% | |
| | |
Geary County, GO
5.000%, 09/01/24 | | | 1,240,000 | | | | 1,449,324 | |
5.000%, 09/01/25 | | | 1,300,000 | | | | 1,563,562 | |
| | | | | | | | |
| | | | | | | 3,012,886 | |
| | | | | | | | |
|
Maryland — 2.8% | |
| | |
Maryland State, GO
5.000%, 03/15/29 | | | 2,000,000 | | | | 2,672,720 | |
| | | | | | | | |
|
Massachusetts — 1.1% | |
| | |
City of Fall River Massachussetts, GO, ST AID WITHHLDG
2.000%, 12/01/24 | | | 1,015,000 | | | | 1,060,391 | |
| | | | | | | | |
|
Michigan — 1.3% | |
| | |
Taylor, Brownfield Redevelopment Authority, RB, NATL
Callable 05/01/24 @ 100
4.000%, 05/01/28 | | | 1,175,000 | | | | 1,257,274 | |
| | | | | | | | |
|
Minnesota — 0.6% | |
| | |
Minnesota State, Housing Finance Agency,
Ser A, RB, GNMA
Callable 07/01/22 @ 100
2.600%, 09/01/42 | | | 554,972 | | | | 565,561 | |
| | | | | | | | |
The accompanying notes are an integral part of the financial statements.
33
| | |
| FROST FAMILY OF FUNDS | | F R O S T F U N D S | J A N U A R Y 3 1, 2 0 2 0 (U n a u d i t e d) |
| | |
| FROST MUNICIPAL BOND FUND | | |
| | | | | | | | |
| Description | | Face Amount | | |
Value | |
|
Missouri — 1.8% | |
| | |
Saint Louis, Municipal Finance, RB, AGM
5.000%, 07/15/22 | | $ | 1,575,000 | | | $ | 1,725,302 | |
| | | | | | | | |
|
New Hampshire — 1.2% | |
| | |
Grafton County, GO
3.000%, 07/01/22 | | | 1,140,000 | | | | 1,194,116 | |
| | | | | | | | |
|
New York — 2.2% | |
| | |
Dunkirk City, School District, GO, AGM
4.000%, 06/15/21 | | | 550,000 | | | | 574,744 | |
4.000%, 06/15/22 | | | 835,000 | | | | 898,468 | |
| | |
Niagara County, Tobacco Asset Securitization, RB
5.000%, 05/15/20 | | | 350,000 | | | | 353,108 | |
5.000%, 05/15/21 | | | 300,000 | | | | 311,547 | |
| | | | | | | | |
| | | | | | | 2,137,867 | |
| | | | | | | | |
|
Ohio — 1.1% | |
| | |
Ohio State,
Ser A, GO
Callable 08/01/21 @ 100
5.000%, 02/01/31 | | | 1,000,000 | | | | 1,058,940 | |
| | | | | | | | |
|
Oklahoma — 3.0% | |
| | |
Oklahoma State, Housing Finance Agency, RB, GNMA
Callable 03/01/23 @ 100
3.750%, 03/01/44 | | | 503,889 | | | | 531,346 | |
| | |
University of Oklahoma,
Ser C, RB
Callable 07/01/25 @ 100
5.000%, 07/01/35 | | | 2,000,000 | | | | 2,362,500 | |
| | | | | | | | |
| | | | | | | 2,893,846 | |
| | | | | | | | |
|
Rhode Island — 2.2% | |
| | |
Rhode Island State,
Ser A, GO
Callable 05/01/27 @ 100
3.000%, 05/01/33 | | | 2,000,000 | | | | 2,132,800 | |
| | | | | | | | |
|
South Carolina — 1.6% | |
| | |
Hilton Head Island,
Ser C, GO, ST AID WITHHLDG Callable 03/01/26 @ 100
2.250%, 03/01/33 | | | 530,000 | | | | 537,680 | |
2.125%, 03/01/32 | | | 520,000 | | | | 525,054 | |
2.000%, 03/01/30 | | | 495,000 | | | | 502,603 | |
| | | | | | | | |
| | | | | | | 1,565,337 | |
| | | | | | | | |
|
Texas — 47.4% | |
| | |
Andrews County, Hospital District, GO
2.750%, 03/15/20 | | | 1,250,000 | | | | 1,252,412 | |
| | |
Capital Area, Cultural Education Facilities Finance, Roman Catholic Diocese, RB
5.125%, 04/01/20 | | | 685,000 | | | | 688,939 | |
| | | | | | | | |
| Description | | Face Amount | | |
Value | |
| | |
Central Texas, Turnpike System,
Ser C, RB
5.000%, 08/15/24 | | $ | 750,000 | | | $ | 877,943 | |
| | |
Clifton, Higher Education Finance, Idea Public Schools Project, RB
4.800%, 08/15/21 (B) | | | 215,000 | | | | 222,884 | |
| | |
Clifton, Higher Education Finance, RB, PSF-GTD
5.000%, 08/15/24 | | | 1,185,000 | | | | 1,391,735 | |
| | |
Clifton, Higher Education Finance, RB, PSF-GTD
Callable 08/15/24 @ 100
5.000%, 08/15/25 | | | 700,000 | | | | 822,507 | |
| | |
Clifton, Higher Education Finance,
Ser A, RB
3.375%, 12/01/24 | | | 1,260,000 | | | | 1,301,378 | |
| | |
Clifton, Higher Education Finance,
Ser B, RB
5.000%, 08/15/25 | | | 460,000 | | | | 548,762 | |
4.000%, 08/15/22 | | | 525,000 | | | | 561,115 | |
4.000%, 08/15/23 | | | 500,000 | | | | 545,615 | |
| | |
Cypress-Fairbanks Independent School District,
Ser A,PSF-GTD
Callable 02/15/29 @ 100
5.000%, 02/15/30 | | | 1,500,000 | | | | 1,964,025 | |
| | |
Dallas Area, Rapid Transit,
Ser A, RB
5.000%, 12/01/22 | | | 1,000,000 | | | | 1,114,320 | |
| | |
Downtown Redevelopment Authority, TA, BAM
5.000%, 09/01/25 | | | 1,000,000 | | | | 1,185,550 | |
| | |
Downtown Redevelopment Authority, TA, BAM
Callable 09/01/25 @ 100
5.000%, 09/01/29 | | | 1,000,000 | | | | 1,201,550 | |
| | |
El Paso County, Hospital District, GO
5.000%, 08/15/25 | | | 3,070,000 | | | | 3,601,601 | |
| | |
Georgetown, Utility System Revenue, RB Callable 08/15/26 @ 100
4.000%, 08/15/29 | | | 1,000,000 | | | | 1,154,870 | |
| | |
Houston, Higher Education Finance,
Ser A, RB,PSF-GTD
4.000%, 02/15/22 | | | 1,005,000 | | | | 1,063,149 | |
| | |
La Vernia, Higher Education Finance,
Ser A, RB
4.200%, 08/15/25 | | | 575,000 | | | | 602,853 | |
| | |
La Vernia, Higher Education Finance,
Ser A, RB
Callable 08/15/24 @ 100
5.250%, 08/15/35 | | | 3,435,000 | | | | 3,750,951 | |
| | |
Love Field, Airport Modernization, Southwest Airlines Project, RB Callable 11/01/20 @ 100
5.250%, 11/01/40 | | | 2,500,000 | | | | 2,573,225 | |
The accompanying notes are an integral part of the financial statements.
34
| | |
| FROST FAMILY OF FUNDS | | F R O S T F U N D S | J A N U A R Y 3 1, 2 0 2 0 (U n a u d i t e d) |
| | |
| FROST MUNICIPAL BOND FUND | | |
| | | | | | | | |
| Description | | Face Amount | | |
Value | |
| | |
Love Field, Airport Modernization, AMT, RB
5.000%, 11/01/22 | | $ | 1,000,000 | | | $ | 1,105,540 | |
| | |
New Hope, Cultural Education Facilities, RB
5.000%, 04/01/21 | | | 355,000 | | | | 363,786 | |
4.000%, 04/01/20 | | | 210,000 | | | | 210,405 | |
| | |
North Harris County, Regional Water Authority, RB
3.000%, 12/15/20 | | | 1,000,000 | | | | 1,017,500 | |
| | |
San Antonio, Public Facilities, RB Callable 09/15/22 @ 100
5.000%, 09/15/26 | | | 2,000,000 | | | | 2,201,440 | |
| | |
Seminole, Hospital District, GO Callable 02/15/26 @ 100
4.000%, 02/15/31 | | | 545,000 | | | | 592,802 | |
| | |
Texas A&M University, Permanent University Fund,
Ser B, RB
Callable 07/01/25 @ 100
5.000%, 07/01/34 | | | 1,000,000 | | | | 1,187,810 | |
| | |
Texas State, College Student Loan, GO
Callable 08/01/20 @ 100
5.000%, 08/01/21 | | | 1,000,000 | | | | 1,020,470 | |
| | |
Texas State, Highway Improvement, GO
5.000%, 04/01/22 | | | 2,500,000 | | | | 2,722,050 | |
| | |
Texas State, Public Finance Authority, Financing System, Texas Southern University, RB
5.625%, 05/01/21 | | | 1,440,000 | | | | 1,506,557 | |
5.375%, 05/01/20 | | | 1,365,000 | | | | 1,376,521 | |
| | |
Texas State, Public Finance Authority, New Frontiers School,
Ser A, RB
Callable 08/15/20 @ 100
5.800%, 08/15/40 | | | 1,100,000 | | | | 1,117,479 | |
| | |
Texas State, Public Finance Authority, RB, BAM
5.000%, 11/01/21 | | | 1,400,000 | | | | 1,486,394 | |
| | |
Texas State, University System,
Ser A, RB
5.000%, 03/15/21 | | | 1,000,000 | | | | 1,045,100 | |
| | |
Texas Tech University,
Ser A, RB
Callable 02/15/27 @ 100
5.000%, 02/15/28 | | | 2,000,000 | | | | 2,532,860 | |
| | | | | | | | |
| | | | | | | 45,912,098 | |
| | | | | | | | |
|
Virginia — 3.1% | |
| | |
Virginia Commonwealth, Housing Development Authority,
Sub-SerC-3, RB
2.150%, 04/01/21 | | | 3,000,000 | | | | 3,036,510 | |
| | | | | | | | |
| | | | | | | | |
| Description | | Face Amount | | |
Value | |
|
Wisconsin — 1.7% | |
| | |
Oshkosh City,
Ser H, GO
Callable 08/01/24 @ 100
2.375%, 08/01/30 | | $ | 585,000 | | | $ | 602,737 | |
| | |
Wisconsin State,
Ser B, GOPre-Refunded @ 100
4.500%, 05/01/21 (A) | | | 1,000,000 | | | | 1,044,590 | |
| | | | | | | | |
| | | | | | | 1,647,327 | |
| | | | | | | | |
| | |
Total Municipal Bonds
(Cost $85,417,190) | | | | | | | 89,164,012 | |
| | | | | | | | |
|
CASH EQUIVALENT — 7.2% | |
| | |
Federated Government Obligations Fund, Cl I, 1.450%*
(Cost $7,020,771) | | | 7,020,771 | | | | 7,020,771 | |
| | | | | | | | |
| | |
Total Investments — 99.3%
(Cost $92,437,961) | | | | | | $ | 96,184,783 | |
| | | | | | | | |
Percentages are based on Net Assets of $96,828,953.
| * | Rate shown is the7-day effective yield as of January 31, 2020. |
| (A) | Pre-Refunded Securities — The maturity date shown is thepre-refunded date. |
| (B) | Security is escrowed to maturity. |
AGM — Assured Guaranty Municipal
AMT — Alternative Minimum Tax (subject to)
BAM — Build America Mutual
Cl — Class
COP — Certificate of Participation
GNMA — Government National Mortgage Association
GO — General Obligation
NATL — National Public Finance Guaranty Corporation
PSF-GTD — Texas Permanent School Fund Guarantee
RB — Revenue Bond
Ser — Series
TA — Tax Allocation
The following is a list of the level of inputs used as of January 31, 2020 in valuing the Fund’s investments carried at value:
| | | | | | | | | | | | | | | | |
| Investments in Securities | | Level 1 | | | Level 2 | | | Level 3 | | | Total | |
Municipal Bonds | | $ | — | | | $ | 89,164,012 | | | $ | — | | | $ | 89,164,012 | |
Cash Equivalent | | | 7,020,771 | | | | — | | | | — | | | | 7,020,771 | |
| | | | | | | | | | | | | | | | |
Total Investments in Securities | | $ | 7,020,771 | | | $ | 89,164,012 | | | $ | — | | | $ | 96,184,783 | |
| | | | | | | | | | | | | | | | |
For the period ended January 31, 2020, there have been no transfers in or out of Level 3.
Amounts designated at “—“ are $0 or have been rounded to $0.
For more information on valuation inputs, see Note 2 — Significant Accounting Policies in the Notes to Financial Statements.
The accompanying notes are an integral part of the financial statements.
35
| | |
| FROST FAMILY OF FUNDS | | F R O S T F U N D S | J A N U A R Y 3 1, 2 0 2 0 (U n a u d i t e d) |
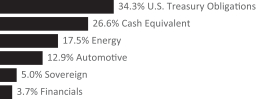
| † | Percentages are based on total investments. |
| | | | | | | | |
| Description | |
Face Amount | | | Value | |
U.S. TREASURY OBLIGATION — 33.9% | |
| | |
U.S. Treasury Note
1.500%, 10/31/21 | | $ | 350,000 | | | $ | 350,779 | |
| | | | | | | | |
| | |
Total U.S. Treasury Obligation
(Cost $349,334) | | | | | | | 350,779 | |
| | | | | | | | |
CORPORATE OBLIGATIONS — 20.9% | |
|
Energy — 17.3% | |
| | |
Barclays MTN
0.750%, VAR
EUSA1+1.050%, 06/09/25 | | | 100,000 | | | | 111,864 | |
| | |
Westpac Banking MTN
1.522%, VAR
BBSW3M+0.620%, 05/16/22 | | | 100,000 | | | | 67,045 | |
| | | | | | | | |
| | | | | | | 178,909 | |
| | | | | | | | |
|
Financials — 3.6% | |
| | |
Royal Bank of Canada
2.410%, VAR
CDOR03+0.360%, 03/23/20 | | | 50,000 | | | | 37,807 | |
| | | | | | | | |
| | |
Total Corporate Obligations
(Cost $217,485) | | | | | | | 216,716 | |
| | | | | | | | |
ASSET-BACKED SECURITY — 12.7% | |
|
Automotive — 12.7% | |
| | |
Penarth Master Issuer,
Ser2018-1X, Cl A2
1.226%, VAR
SONIA1M IR+0.515%, 03/18/25 | | | 100,000 | | | | 131,287 | |
| | | | | | | | |
| | |
Total Asset-Backed Security
(Cost $131,332) | | | | | | | 131,287 | |
| | | | | | | | |
| | |
SOVEREIGN DEBT — 5.0%
| | | | | | | | |
| | |
Mexican Bonos
6.500%, 06/09/22 | | | 974,700 | | | | 51,416 | |
| | | | | | | | |
| | |
Total Sovereign Debt
(Cost $50,970) | | | | | | | 51,416 | |
| | | | | | | | |
| | | | | | | | |
| Description | |
Face Amount | | | Value | |
CASH EQUIVALENT — 26.3% | |
| | |
Union Bank of California,
0.300%*
(Cost $272,319) | | $ | 272,319 | | | $ | 272,319 | |
| | | | | | | | |
| | |
Total Investments — 98.8%
(Cost $1,021,440) | | | | | | $ | 1,022,517 | |
| | | | | | | | |
Percentages are based on Net Assets of $1,034,490.
| * | Rate shown is the7-day effective yield as of January 31, 2020. |
Cl — Class
MTN — Medium Term Note
Ser — Series
VAR — Variable
As of January 31, 2020, all of the Fund’s investments in securities were considered Level 2, in accordance with the authoritative guidance on fair value measurements and disclosure under U.S. GAAP.
For the period ended January 31, 2020, there have been no transfers in or out of Level 3.
For more information on valuation inputs, see Note 2 — Significant Accounting Policies in the Notes to Financial Statements.
The accompanying notes are an integral part of the financial statements.
36
| | |
| FROST FAMILY OF FUNDS | | F R O S T F U N D S | J A N U A R Y 3 1, 2 0 2 0 (U n a u d i t e d) |
|
| STATEMENTS OF ASSETS AND LIABILITIES |
| | | | | | | | | | | | | | | | |
| | | Growth
Equity
Fund | | | Value
Equity
Fund | | | Mid Cap
Equity
Fund | | | Total
Return
Bond
Fund | |
| | | | | | | | | | | | | | | | |
Assets: | | | | | | | | | | | | | | | | |
Investments at Value | | $ | 352,349,513 | | | $ | 14,302,558 | | | $ | 1,950,943 | | | $ | 3,799,327,329 | |
Repurchase Agreements at Value | | | — | | | | — | | | | — | | | | 164,000,000 | |
Receivable for Investment Securities Sold | | | — | | | | — | | | | — | | | | 7,608,077 | |
Receivable for Capital Shares Sold | | | 438,003 | | | | 523 | | | | — | | | | 9,060,069 | |
Receivable Due from Investment Adviser | | | — | | | | — | | | | 3,298 | | | | — | |
Dividends and Interest Receivable | | | 99,990 | | | | 14,451 | | | | 381 | | | | 24,005,669 | |
Receivable from Investment Adviser | | | — | | | | — | | | | — | | | | — | |
Foreign Tax Reclaim Receivable | | | 1,484 | | | | 8,049 | | | | — | | | | — | |
Prepaid Expenses | | | 14,837 | | | | 12,045 | | | | 15,268 | | | | 74,147 | |
| | | | | | | | | | | | | | | | |
| | | | |
Total Assets | | | 352,903,827 | | | | 14,337,626 | | | | 1,969,890 | | | | 4,004,075,291 | |
| | | | | | | | | | | | | | | | |
| | | | |
Liabilities: | | | | | | | | | | | | | | | | |
Payable for Investment Securities Purchased | | | — | | | | 159,631 | | | | — | | | | 17,853,135 | |
Payable for Capital Shares Redeemed | | | 349,632 | | | | 2 | | | | — | | | | 3,035,895 | |
Payable Due to Investment Adviser | | | 149,929 | | | | 6,281 | | | | — | | | | 1,165,093 | |
Shareholder Servicing Fees Payable — A Class Shares | | | — | | | | — | | | | — | | | | 1,010 | |
Professional Fees Payable | | | 10,637 | | | | 10,558 | | | | 10,579 | | | | 23,876 | |
Payable Due to Administrator | | | 21,735 | | | | 911 | | | | 124 | | | | 241,272 | |
Payable Due to Distributor — Investor Class Shares | | | 10,637 | | | | 829 | | | | 87 | | | | 108,869 | |
Payable Due to Distributor — A Class Shares | | | — | | | | — | | | | — | | | | 556 | |
Transfer Agent Fees Payable | | | 3,476 | | | | 7,415 | | | | 7,412 | | | | 124,199 | |
Payable Due to Trustees | | | 1,369 | | | | 68 | | | | 9 | | | | 15,170 | |
Chief Compliance Officer Fees Payable | | | 424 | | | | 33 | | | | 4 | | | | 4,716 | |
Pricing Fees Payable | | | 831 | | | | 449 | | | | 191 | | | | 42,769 | |
Income Distribution Payable | | | — | | | | — | | | | — | | | | 2,180 | |
Other Accrued Expenses | | | 7,087 | | | | — | | | | 1,127 | | | | 82,646 | |
| | | | | | | | | | | | | | | | |
| | | | |
Total Liabilities | | | 555,757 | | | | 186,177 | | | | 19,533 | | | | 22,701,386 | |
| | | | | | | | | | | | | | | | |
| | | | |
Net Assets | | $ | 352,348,070 | | | $ | 14,151,449 | | | $ | 1,950,357 | | | $ | 3,981,373,905 | |
| | | | | | | | | | | | | | | | |
| | | | |
NET ASSETS: | | | | | | | | | | | | | | | | |
Paid-in Capital | | $ | 177,079,117 | | | $ | 12,566,683 | | | $ | 1,611,825 | | | $ | 4,008,637,706 | |
Total Distributable Earnings (Loss) | | | 175,268,953 | | | | 1,584,766 | | | | 338,532 | | | | (27,263,801 | ) |
| | | | | | | | | | | | | | | | |
| | | | |
Net Assets | | $ | 352,348,070 | | | $ | 14,151,449 | | | $ | 1,950,357 | | | $ | 3,981,373,905 | |
| | | | | | | | | | | | | | | | |
| | | | |
Institutional Class Shares: | | | | | | | | | | | | | | | | |
Net Assets | | $ | 301,431,764 | | | $ | 9,489,789 | | | $ | 1,689,094 | | | $ | 3,414,155,723 | |
Outstanding Shares of Beneficial Interest
(unlimited authorization — no par value) | | | 21,739,620 | | | | 1,391,664 | | | | 319,773 | | | | 327,479,001 | |
Net Asset Value, Offering and Redemption Price Per Share | | $ | 13.87 | | | $ | 6.82 | | | $ | 5.28 | | | $ | 10.43 | |
| | | | | | | | | | | | | | | | |
| | | | |
Investor Class Shares: | | | | | | | | | | | | | | | | |
Net Assets | | $ | 50,916,306 | | | $ | 4,661,660 | | | $ | 261,263 | | | $ | 564,519,296 | |
Outstanding Shares of Beneficial Interest
(unlimited authorization — no par value) | | | 3,730,808 | | | | 685,635 | | | | 50,871 | | | | 54,174,371 | |
Net Asset Value, Offering and Redemption Price Per Share | | $ | 13.65 | | | $ | 6.80 | | | $ | 5.14 | | | $ | 10.42 | |
| | | | | | | | | | | | | | | | |
| | | | |
A Class Shares: | | | | | | | | | | | | | | | | |
Net Assets | | $ | — | | | $ | — | | | $ | — | | | $ | 2,698,886 | |
Outstanding Shares of Beneficial Interest
(unlimited authorization — no par value) | | | — | | | | — | | | | — | | | | 259,018 | |
Net Asset Value, Offering and Redemption Price Per Share | | $ | — | | | $ | — | | | $ | — | | | $ | 10.42 | |
| | | | | | | | | | | | | | | | |
| | | | |
Maximum Offering Price Per Share — Class A | | $ | — | | | $ | — | | | $ | — | | | $ | 10.77 | |
| | | | | | | | | | | | | | | | |
Cost of Investments | | $ | 183,668,358 | | | $ | 13,181,940 | | | $ | 1,780,080 | | | $ | 3,963,438,665 | |
| | | | |
Cost of Affiliated Investment | | | — | | | | — | | | | — | | | | — | |
Amounts designated as “—” are $0.
The accompanying notes are an integral part of the financial statements.
37
| | |
| FROST FAMILY OF FUNDS | | F R O S T F U N D S | J A N U A R Y 3 1, 2 0 2 0 (U n a u d i t e d) |
|
| STATEMENTS OF ASSETS AND LIABILITIES |
| | | | | | | | | | | | | | | | |
| | | Credit
Fund | | | Low
Duration
Bond
Fund | | | Municipal
Bond
Fund | | | Global
Bond
Fund | |
| | | | | | | | | | | | | | | | |
| | | | | | | | | | | | | | | | |
| | | | | | | | | | | | | | | | |
| | | | | | | | | | | | | | | | |
Assets: | | | | | | | | | | | | | | | | |
Investments at Value | | $ | 201,832,020 | | | $ | 354,254,234 | | | $ | 96,184,783 | | | $ | 1,022,517 | |
Repurchase Agreements at Value | | | 20,000,000 | | | | 3,000,000 | | | | — | | | | — | |
Receivable for Investment Securities Sold | | | — | | | | 4,878,281 | | | | — | | | | — | |
Receivable for Capital Shares Sold | | | 413,405 | | | | 2,236,672 | | | | — | | | | — | |
Dividends and Interest Receivable | | | 1,539,396 | | | | 1,056,079 | | | | 1,118,598 | | | | 2,360 | |
Receivable from Investment Adviser | | | — | | | | — | | | | — | | | | 22,379 | |
Deferred Offering Costs | | | — | | | | — | | | | — | | | | 16,006 | |
Prepaid Expenses | | | 24,892 | | | | 17,832 | | | | 11,150 | | | | 1,398 | |
| | | | | | | | | | | | | | | | |
| | | | |
Total Assets | | | 223,809,713 | | | | 365,443,098 | | | | 97,314,531 | | | | 1,064,660 | |
| | | | | | | | | | | | | | | | |
| | | | |
Liabilities: | | | | | | | | | | | | | | | | |
Securities Sold Short, at Value | | | — | | | | 2,000,000 | | | | — | | | | — | |
Payable for Capital Shares Redeemed | | | 157,395 | | | | 458,708 | | | | 415,722 | | | | — | |
Payable Due to Investment Adviser | | | 94,450 | | | | 91,167 | | | | 32,181 | | | | 436 | |
Shareholder Servicing Fees Payable — A Class Shares | | | 299 | | | | — | | | | — | | | | — | |
Professional Fee Payable | | | 17,614 | | | | 11,564 | | | | 11,496 | | | | 11,753 | |
Payable Due to Administrator | | | 13,691 | | | | 22,026 | | | | 9,330 | | | | 6,352 | |
Payable Due to Distributor — Investor Class Shares | | | 2,541 | | | | 4,583 | | | | 1,249 | | | | — | |
Payable Due to Distributor — A Class Shares | | | 168 | | | | — | | | | — | | | | — | |
Payable Due to Trustees | | | 839 | | | | 1,374 | | | | 597 | | | | 2 | |
Chief Compliance Officer Fees Payable | | | 266 | | | | 436 | | | | 200 | | | | — | |
Transfer Agent Fees Payable | | | 9,765 | | | | 5,390 | | | | 6,917 | | | | 11,325 | |
Pricing Fees Payable | | | 18,428 | | | | 4,552 | | | | 5,371 | | | | 302 | |
Other Accrued Expenses | | | 4,771 | | | | 5,265 | | | | 2,515 | | | | — | |
| | | | | | | | | | | | | | | | |
| | | | |
Total Liabilities | | | 320,227 | | | | 2,605,065 | | | | 485,578 | | | | 30,170 | |
| | | | | | | | | | | | | | | | |
| | | | |
Net Assets | | $ | 223,489,486 | | | $ | 362,838,033 | | | $ | 96,828,953 | | | $ | 1,034,490 | |
| | | | | | | | | | | | | | | | |
| | | | |
NET ASSETS: | | | | | | | | | | | | | | | | |
Paid-in Capital | | $ | 224,830,936 | | | $ | 359,642,292 | | | $ | 92,181,544 | | | $ | 1,033,333 | |
Distributable Earnings (Loss) | | | (1,341,450 | ) | | | 3,195,741 | | | | 4,647,409 | | | | 1,157 | |
| | | | | | | | | | | | | | | | |
| | | | |
Net Assets | | $ | 223,489,486 | | | $ | 362,838,033 | | | $ | 96,828,953 | | | $ | 1,034,490 | |
| | | | | | | | | | | | | | | | |
| | | | |
Institutional Class Shares: | | | | | | | | | | | | | | | | |
Net Assets | | $ | 210,134,928 | | | $ | 340,086,946 | | | $ | 90,543,593 | | | $ | 1,034,290 | |
Outstanding Shares of Beneficial Interest
(unlimited authorization — no par value) | | | 21,440,788 | | | | 32,853,547 | | | | 8,567,402 | | | | 103,310 | |
Net Asset Value, Offering and Redemption Price Per Share | | $ | 9.80 | | | $ | 10.35 | | | $ | 10.57 | | | $ | 10.01 | |
| | | | | | | | | | | | | | | | |
| | | | |
Investor Class Shares: | | | | | | | | | | | | | | | | |
Net Assets | | $ | 12,765,692 | | | $ | 22,751,087 | | | $ | 6,285,360 | | | $ | 100 | |
Outstanding Shares of Beneficial Interest
(unlimited authorization — no par value) | | | 1,304,363 | | | | 2,197,026 | | | | 594,527 | | | | 10 | |
Net Asset Value, Offering and Redemption Price Per Share | | $ | 9.79 | | | $ | 10.36 | | | $ | 10.57 | | | $ | 10.02 | |
| | | | | | | | | | | | | | | | |
| | | | |
A Class Shares: | | | | | | | | | | | | | | | | |
Net Assets | | $ | 588,866 | | | $ | — | | | $ | — | | | $ | 100 | |
Outstanding Shares of Beneficial Interest
(unlimited authorization — no par value) | | | 60,191 | | | | — | | | | — | | | | 10 | |
Net Asset Value, Offering and Redemption Price Per Share | | $ | 9.78 | | | $ | — | | | $ | — | | | $ | 10.02 | |
| | | | | | | | | | | | | | | | |
| | | | |
Maximum Offering Price Per Share — Class A | | $ | 10.01 | | | $ | — | | | $ | — | | | $ | 10.23 | |
| | | | | | | | | | | | | | | | |
Cost of Investments | | $ | 220,106,993 | | | $ | 352,678,570 | | | $ | 92,437,961 | | | $ | 1,021,440 | |
Cost of Repurchase Agreements | | | — | | | | — | | |
| —
|
| | | — | |
“n/a” designates that the Fund does not offer this class.
Amounts designated as “—” are $0.
The accompanying notes are an integral part of the financial statements.
38
| | |
| FROST FAMILY OF FUNDS | | F R O S T F U N D S | F O R T H E S I X M O N T H S E N D E D J A N U A R Y 3 1, 2 0 2 0 (Unaudited) |
| | | | | | | | | | | | | | | | |
| | | Growth
Equity
Fund | | | Value
Equity
Fund | | | Mid Cap
Equity
Fund | | | Total
Return
Bond
Fund | |
| | | | | | | | | | | | | | | | |
Investment Income: | | | | | | | | | | | | | | | | |
| | | | |
Dividend Income | | $ | 1,553,316 | | | $ | 337,309 | | | $ | 30,039 | | | $ | 9,546 | |
| | | | |
Interest income | | | — | | | | — | | | | 765 | | | | 78,845,062 | |
| | | | |
Foreign Taxes Withheld | | | (2,982 | ) | | | — | | | | — | | | | — | |
| | | | | | | | | | | | | | | | |
| | | | |
Total Investment Income | | | 1,550,334 | | | | 337,309 | | | | 30,804 | | | | 78,854,608 | |
| | | | | | | | | | | | | | | | |
| | | | |
Expenses: | | | | | | | | | | | | | | | | |
| | | | |
Investment Advisory Fees | | | 854,973 | | | | 53,322 | | | | 7,451 | | | | 6,759,307 | |
| | | | |
Administration Fees | | | 124,040 | | | | 7,737 | | | | 1,081 | | | | 1,400,843 | |
| | | | |
Distribution Fees — Investor Class Shares | | | 60,556 | | | | 6,496 | | | | 642 | | | | 679,604 | |
| | | | |
Distribution Fees — A Class Shares | | | — | | | | — | | | | — | | | | 2,553 | |
| | | | |
Trustees’ Fees | | | 4,307 | | | | 305 | | | | 43 | | | | 48,587 | |
| | | | |
Chief Compliance Officer Fees | | | 721 | | | | 48 | | | | 6 | | | | 8,145 | |
| | | | |
Transfer Agent Fees | | | 22,869 | | | | 7,276 | | | | 5,802 | | | | 233,646 | |
| | | | |
Professional Fees | | | 24,586 | | | | 20,080 | | | | 19,766 | | | | 98,519 | |
| | | | |
Registration Fees | | | 19,686 | | | | 13,743 | | | | 14,647 | | | | 107,755 | |
| | | | |
Printing Fees | | | 10,133 | | | | 713 | | | | 121 | | | | 111,709 | |
| | | | |
Custodian Fees | | | 6,809 | | | | 980 | | | | 2,515 | | | | 78,783 | |
| | | | |
Interest Expense on Borrowings | | | — | | | | 300 | | | | 163 | | | | — | |
| | | | |
Insurance and Other Expenses | | | 4,981 | | | | 676 | | | | 405 | | | | 132,889 | |
| | | | | | | | | | | | | | | | |
| | | | |
Total Expenses | | | 1,133,661 | | | | 111,676 | | | | 52,642 | | | | 9,662,340 | |
| | | | |
Less: Investment Advisory Fees Waived | | | — | | | | — | | | | (28,713 | ) | | | — | |
| | | | |
Less: Fees Paid Indirectly | | | (1,077 | ) | | | (481 | ) | | | (190 | ) | | | (33,842 | ) |
| | | | | | | | | | | | | | | | |
| | | | |
Net Expenses | | | 1,132,584 | | | | 111,195 | | | | 23,739 | | | | 9,628,498 | |
| | | | | | | | | | | | | | | | |
| | | | |
Net Investment Income | | | 417,750 | | | | 226,114 | | | | 7,065 | | | | 69,226,110 | |
| | | | | | | | | | | | | | | | |
| | | | |
Net Realized Gain from Investments | | | 16,424,638 | | | | 1,858,254 | | | | 311,215 | | | | 2,475,695 | |
| | | | |
Net Change in Unrealized Appreciation (Depreciation) on Investments | | | 19,333,596 | | | | (1,442,461 | ) | | | (259,289 | ) | | | 2,739,847 | |
| | | | | | | | | | | | | | | | |
| | | | |
Net Realized and Unrealized Gain on Investments | | | 35,758,234 | | | | 415,793 | | | | 51,926 | | | | 5,215,542 | |
| | | | | | | | | | | | | | | | |
| | | | |
Increase in Net Assets Resulting from Operations | | $ | 36,175,984 | | | $ | 641,907 | | | $ | 58,991 | | | $ | 74,441,652 | |
| | | | | | | | | | | | | | | | |
Amounts designated as “—” are $0.
The accompanying notes are an integral part of the financial statements.
39
| | |
| FROST FAMILY OF FUNDS | | F R O S T F U N D S | F O R T H E S I X M O N T H S E N D E D J A N U A R Y 3 1, 2 0 2 0 (Unaudited) |
| | | | | | | | | | | | | | | | |
| | | Credit
Fund | | | Low
Duration
Bond
Fund | | | Municipal
Bond
Fund | | | Global
Bond
Fund* | |
| | | | | | | | | | | | | | | | |
Investment Income: | | | | | | | | | | | | | | | | |
| | | | |
Interest Income | | $ | 5,366,301 | | | $ | 4,367,090 | | | $ | 1,820,964 | | | $ | 3,607 | |
| | | | |
Dividend Income | | | 5,139 | | | | 5,184 | | | | 106,805 | | | | — | |
| | | | | | | | | | | | | | | | |
| | | | |
Total Investment Income | | | 5,371,440 | | | | 4,372,274 | | | | 1,927,769 | | | | 3,607 | |
| | | | | | | | | | | | | | | | |
| | | | |
Expenses: | | | | | | | | | | | | | | | | |
| | | | |
Investment Advisory Fees | | | 553,750 | | | | 526,756 | | | | 277,730 | | | | 1,205 | |
| | | | |
Administration Fees | | | 80,333 | | | | 127,366 | | | | 57,560 | | | | 18,887 | |
| | | | |
Distribution Fees — Investor Class Shares | | | 16,112 | | | | 30,620 | | | | 7,956 | | | | — | |
| | | | |
Distribution Fees — A Class Shares | | | 497 | | | | — | | | | — | | | | — | |
| | | | |
Trustees’ Fees | | | 2,809 | | | | 4,434 | | | | 2,033 | | | | 3 | |
| | | | |
Chief Compliance Officer Fees | | | 471 | | | | 740 | | | | 337 | | | | 1 | |
| | | | |
Transfer Agent Fees | | | 20,236 | | | | 23,931 | | | | 13,926 | | | | 11,338 | |
| | | | |
Registration Fees | | | 22,557 | | | | 20,342 | | | | 13,951 | | | | 148 | |
| | | | |
Professional Fees | | | 34,191 | | | | 27,364 | | | | 24,681 | | | | 11,754 | |
| | | | |
Printing Fees | | | 6,521 | | | | 10,172 | | | | 4,661 | | | | 51 | |
| | | | |
Custodian Fees | | | 4,889 | | | | 8,072 | | | | 3,284 | | | | 632 | |
| | | | |
Offering Costs | | | — | | | | — | | | | — | | | | 24,071 | |
| | | | |
Insurance and Other Expenses | | | 37,711 | | | | 13,535 | | | | 11,094 | | | | 351 | |
| | | | | | | | | | | | | | | | |
| | | | |
Total Expenses | | | 780,077 | | | | 793,332 | | | | 417,213 | | | | 68,441 | |
| | | | |
Less: Investment Advisory Fees Waived | | | — | | | | — | | | | (79,351 | ) | | | (66,033 | ) |
| | | | |
Less: Fees Paid Indirectly | | | (1,233 | ) | | | (1,116 | ) | | | (101 | ) | | | (2 | ) |
| | | | | | | | | | | | | | | | |
| | | | |
Net Expenses | | | 778,844 | | | | 792,216 | | | | 337,761 | | | | 2,406 | |
| | | | | | | | | | | | | | | | |
| | | | |
Net Investment Income | | | 4,592,596 | | | | 3,580,058 | | | | 1,590,008 | | | | 1,201 | |
| | | | | | | | | | | | | | | | |
| | | | |
Net Realized Gain (Loss) from Investments | | | 368,799 | | | | 42,267 | | | | 974,533 | | | | 38 | |
| | | | |
Net Change in Unrealized Appreciation (Depreciation) on Investments | | | 1,803,669 | | | | 2,559,658 | | | | 344,285 | | | | 1,077 | |
| | | | | | | | | | | | | | | | |
| | | | |
Net Realized and Unrealized Loss on Investments | | | 2,172,468 | | | | 2,601,925 | | | | 1,318,818 | | | | 1,115 | |
| | | | | | | | | | | | | | | | |
| | | | |
Increase (Decrease) in Net Assets Resulting from Operations | | $ | 6,765,064 | | | $ | 6,181,983 | | | $ | 2,908,826 | | | $ | 2,316 | |
| | | | | | | | | | | | | | | | |
“n/a” designates that the Fund does not offer this class.
Amounts designated as “—” are $0.
| * | Fund commenced operations on October 31, 2019. |
The accompanying notes are an integral part of the financial statements.
40
This page is intentionally left blank.
|
| STATEMENTS OF CHANGES IN NET ASSETS |
| | | | | | | | | | |
| | | | | Growth Equity Fund | |
| | | | | Six Months Ended
January 31, 2020
(Unaudited) | | | Year Ended
July 31,
2019 | |
Operations: | | | | | | | | | | |
Net Investment Income (Loss) | | | | $ | 417,750 | | | $ | 930,902 | |
Net Realized Gain on Investments | | | | | 16,424,638 | | | | 29,612,815 | |
Net Change in Unrealized Appreciation (Depreciation) on Investments | | | | | 19,333,596 | | | | (1,306,421 | ) |
| | | | | | | | | | |
Net Increase in Net Assets Resulting from Operations | | | | | 36,175,984 | | | | 29,237,296 | |
| | | | | | | | | | |
Distributions: | | | | | | | | | | |
Net Investment Income: | | | | | | | | | | |
Institutional Class Shares | | | | | (859,170 | ) | | | (34,131,973 | ) |
Investor Class Shares | | | | | (35,946 | ) | | | (5,586,562 | ) |
A Class Shares | | | | | — | | | | — | |
Return of Capital: | | | | | | | | | | |
Institutional Class Shares | | | | | (28,648,645 | ) | | | — | |
Investor Class Shares | | | | | (4,792,207 | ) | | | — | |
| | | | | | | | | | |
Total Distributions | | | | | (34,335,968 | ) | | | (39,718,535 | ) |
| | | | | | | | | | |
Capital Share Transactions: | | | | | | | | | | |
Institutional Class Shares: | | | | | | | | | | |
Issued | | | | | 18,190,287 | | | | 49,641,365 | |
Reinvestment of Dividends | | | | | 13,734,711 | | | | 15,323,192 | |
Redeemed | | | | | (22,766,447 | ) | | | (37,485,376 | ) |
| | | | | | | | | | |
Net Increase (Decrease) in Net Assets from
Institutional Class Share Transactions | | | | | 9,158,551 | | | | 27,479,181 | |
| | | | | | | | | | |
Investor Class Shares: | | | | | | | | | | |
Issued | | | | | 1,168,065 | | | | 2,582,372 | |
Reinvestment of Dividends | | | | | 4,729,005 | | | | 5,463,581 | |
Redeemed | | | | | (2,431,818 | ) | | | (5,934,245 | ) |
| | | | | | | | | | |
Net Increase (Decrease) in Net Assets from
Investor Class Share Transactions | | | | | 3,465,252 | | | | 2,111,708 | |
| | | | | | | | | | |
A Class Shares: | | | | | | | | | | |
Issued | | | | | n/a | | | | n/a | |
Reinvestment of Dividends | | | | | n/a | | | | n/a | |
Redeemed | | | | | n/a | | | | n/a | |
| | | | | | | | | | |
Net Increase (Decrease) in Net Assets from
A Class Share Transactions | | | | | n/a | | | | n/a | |
| | | | | | | | | | |
Net Increase (Decrease) in Net Assets from
Capital Share Transactions | | | | | 12,623,803 | | | | 29,590,889 | |
| | | | | | | | | | |
Total Increase (Decrease) in Net Assets | | | | | 14,463,819 | | | | 19,109,650 | |
| | | | | | | | | | |
Net assets: | | | | | | | | | | |
Beginning of Year | | | | | 337,884,251 | | | | 318,774,601 | |
| | | | | | | | | | |
End of Year | | | | $ | 352,348,070 | | | $ | 337,884,251 | |
| | | | | | | | | | |
Share Transactions: | | | | | | | | | | |
Institutional Class Shares: | | | | | | | | | | |
Issued | | | | | 1,314,688 | | | | 3,741,882 | |
Reinvestment of Dividends | | | | | 1,035,347 | | | | 1,321,795 | |
Redeemed | | | | | (1,652,341 | ) | | | (2,831,757 | ) |
| | | | | | | | | | |
Total Increase (Decrease) in Institutional Class Shares | | | | | 697,694 | | | | 2,231,920 | |
| | | | | | | | | | |
Investor Class Shares: | | | | | | | | | | |
Issued | | | | | 85,048 | | | | 196,563 | |
Reinvestment of Dividends | | | | | 362,875 | | | | 478,924 | |
Redeemed | | | | | (178,269 | ) | | | (450,708 | ) |
| | | | | | | | | | |
Total Increase (Decrease) in Investor Class Shares | | | | | 269,654 | | | | 224,779 | |
| | | | | | | | | | |
A Class Shares: | | | | | | | | | | |
Issued | | | | | n/a | | | | n/a | |
Reinvestment of Dividends | | | | | n/a | | | | n/a | |
Redeemed | | | | | n/a | | | | n/a | |
| | | | | | | | | | |
Total Increase (Decrease) in Investor Class Shares | | | | | n/a | | | | n/a | |
| | | | | | | | | | |
Net Increase (Decrease) in Shares Outstanding | | | | | 967,348 | | | | 2,456,699 | |
| | | | | | | | | | |
Amounts designated as “—” are $0.
“n/a” designates that the Fund does not offer this class.
The accompanying notes are an integral part of the financial statements.
42
| | | | | | | | | | | | | | | | | | | | | | | | | | | | |
| Value Equity Fund | | | | | Mid Cap Equity Fund | | | | | | Total Return Bond Fund | |
Six Months Ended
January 31, 2020
(Unaudited) | | | Year Ended
July 31,
2019 | | | | | Six Months Ended
January 31, 2020
(Unaudited) | | | Year Ended
July 31,
2019 | | | | | | Six Months Ended
January 31, 2020
(Unaudited) | | | Year Ended
July 31,
2019 | |
| | | | | | | | | | | | | | | | | | | | | | | | | | | | |
| $ | 226,114 | | | $ | 1,178,014 | | | | | $ | 7,065 | | | $ | 16,649 | | | | | | | $ | 69,226,110 | | | $ | 119,076,528 | |
| | 1,858,254 | | | | 6,592,172 | | | | | | 311,215 | | | | 1,603,969 | | | | | | | | 2,475,695 | | | | (19,700,120 | ) |
| | (1,442,461 | ) | | | (14,708,765 | ) | | | | | (259,289 | ) | | | (1,494,426 | ) | | | | | | | 2,739,847 | | | | 65,485,924 | |
| | | | | | | | | | | | | | | | | | | | | | | | | | | | |
| | 641,907 | | | | (6,938,579 | ) | | | | | 58,991 | | | | 126,192 | | | | | | | | 74,441,652 | | | | 164,862,332 | |
| | | | | | | | | | | | | | | | | | | | | | | | | | | | |
| | | | | | | | | | | | | | | | | | | | | | | | | | | | |
| | | | | | | | | | | | | | | | | | | | | | | | | | | | |
| | (135,976 | ) | | | (7,698,849 | ) | | | | | (3,663 | ) | | | (2,233,008 | ) | | | | | | | (62,106,823 | ) | | | (103,743,506 | ) |
| | (46,087 | ) | | | (2,390,282 | ) | | | | | — | | | | (210,593 | ) | | | | | | | (9,503,333 | ) | | | (14,981,109 | ) |
| | — | | | | — | | | | | | — | | | | — | | | | | | | | (36,222 | ) | | | (39,688 | ) |
| | | | | | | | | | | | | | | | | | | | | | | | | | | | |
| | (1,664,693 | ) | | | — | | | | | | (664,127 | ) | | | — | | | | | | | | — | | | | — | |
| | (781,033 | ) | | | — | | | | | | (116,993 | ) | | | — | | | | | | | | — | | | | — | |
| | | | | | | | | | | | | | | | | | | | | | | | | | | | |
| | (2,627,789 | ) | | | (10,089,131 | ) | | | | | (784,783 | ) | | | (2,443,601 | ) | | | | | | | (71,646,378 | ) | | | (118,764,303 | ) |
| | | | | | | | | | | | | | | | | | | | | | | | | | | | |
| | | | | | | | | | | | | | | | | | | | | | | | | | | | |
| | | | | | | | | | | | | | | | | | | | | | | | | | | | |
| | 78,915 | | | | 2,725,486 | | | | | | — | | | | 217,618 | | | | | | | | 492,483,457 | | | | 1,275,659,383 | |
| | 763,186 | | | | 3,824,810 | | | | | | 258,784 | | | | 304,641 | | | | | | | | 36,279,904 | | | | 52,809,404 | |
| | (13,880,448 | ) | | | (44,219,339 | ) | | | | | (1,709,855 | ) | | | (7,320,407 | ) | | | | | | | (308,445,526 | ) | | | (526,537,951 | ) |
| | | | | | | | | | | | | | | | | | | | | | | | | | | | |
| | | | | | | | | | | | | | | | | | | | | | | | | | | | |
| | (13,038,347 | ) | | | (37,669,043 | ) | | | | | (1,451,071 | ) | | | (6,798,148 | ) | | | | | | | 220,317,835 | | | | 801,930,836 | |
| | | | | | | | | | | | | | | | | | | | | | | | | | | | |
| | | | | | | | | | | | | | | | | | | | | | | | | | | | |
| | 14,198 | | | | 191,873 | | | | | | 73,695 | | | | 91,953 | | | | | | | | 119,337,315 | | | | 234,367,919 | |
| | 509,918 | | | | 2,073,351 | | | | | | 94,883 | | | | 207,521 | | | | | | | | 8,675,985 | | | | 13,491,205 | |
| | (720,552 | ) | | | (20,361,275 | ) | | | | | (454,593 | ) | | | (317,117 | ) | | | | | | | (84,133,313 | ) | | | (107,868,376 | ) |
| | | | | | | | | | | | | | | | | | | | | | | | | | | | |
| | | | | | | | | | | | | | | | | | | | | | | | | | | | |
| | (196,436 | ) | | | (18,096,051 | ) | | | | | (286,015 | ) | | | (17,643 | ) | | | | | | | 43,879,987 | | | | 139,990,748 | |
| | | | | | | | | | | | | | | | | | | | | | | | | | | | |
| | | | | | | | | | | | | | | | | | | | | | | | | | | | |
| | n/a | | | | n/a | | | | | | n/a | | | | n/a | | | | | | | | 1,802,993 | | | | 2,591,910 | |
| | n/a | | | | n/a | | | | | | n/a | | | | n/a | | | | | | | | 15,136 | | | | 22,168 | |
| | n/a | | | | n/a | | | | | | n/a | | | | n/a | | | | | | | | (118,698 | ) | | | (1,831,189 | ) |
| | | | | | | | | | | | | | | | | | | | | | | | | | | | |
| | | | | | | | | | | | | | | | | | | | | | | | | | | | |
| | n/a | | | | n/a | | | | | | n/a | | | | n/a | | | | | | | | 1,699,431 | | | | 782,889 | |
| | | | | | | | | | | | | | | | | | | | | | | | | | | | |
| | | | | | | | | | | | | | | | | | | | | | | | | | | | |
| | (13,234,783 | ) | | | (55,765,094 | ) | | | | | (1,737,086 | ) | | | (6,815,791 | ) | | | | | | | 265,897,253 | | | | 942,704,473 | |
| | | | | | | | | | | | | | | | | | | | | | | | | | | | |
| | (15,220,665 | ) | | | (72,792,804 | ) | | | | | (2,462,878 | ) | | | (9,133,200 | ) | | | | | | | 268,692,527 | | | | 988,802,502 | |
| | | | | | | | | | | | | | | | | | | | | | | | | | | | |
| | | | | | | | | | | | | | | | | | | | | | | | | | | | |
| | 29,372,114 | | | | 102,164,918 | | | | | | 4,413,235 | | | | 13,546,435 | | | | | | | | 3,712,681,378 | | | | 2,723,878,876 | |
| | | | | | | | | | | | | | | | | | | | | | | | | | | | |
| $ | 14,151,449 | | | $ | 29,372,114 | | | | | $ | 1,950,357 | | | $ | 4,413,235 | | | | | | | $ | 3,981,373,905 | | | $ | 3,712,681,378 | |
| | | | | | | | | | | | | | | | | | | | | | | | | | | | |
| | | | | | | | | | | | | | | | | | | | | | | | | | | | |
| | | | | | | | | | | | | | | | | | | | | | | | | | | | |
| | 10,909 | | | | 317,617 | | | | | | — | | | | 26,188 | | | | | | | | 47,340,874 | | | | 123,734,964 | |
| | 110,442 | | | | 503,138 | | | | | | 49,573 | | | | 46,745 | | | | | | | | 3,493,766 | | | | 5,119,434 | |
| | (1,817,909 | ) | | | (5,651,432 | ) | | | | | (235,375 | ) | | | (841,693 | ) | | | | | | | (29,658,198 | ) | | | (51,060,500 | ) |
| | | | | | | | | | | | | | | | | | | | | | | | | | | | |
| | (1,696,558 | ) | | | (4,830,677 | ) | | | | | (185,802 | ) | | | (768,760 | ) | | | | | | | 21,176,442 | | | | 77,793,898 | |
| | | | | | | | | | | | | | | | | | | | | | | | | | | | |
| | | | | | | | | | | | | | | | | | | | | | | | | | | | |
| | 1,901 | | | | 21,988 | | | | | | 13,721 | | | | 14,604 | | | | | | | | 11,477,239 | | | | 22,702,677 | |
| | 73,965 | | | | 270,930 | | | | | | 18,752 | | | | 32,633 | | | | | | | | 835,743 | | | | 1,309,140 | |
| | (95,615 | ) | | | (2,810,677 | ) | | | | | (70,036 | ) | | | (44,857 | ) | | | | | | | (8,099,191 | ) | | | (10,473,089 | ) |
| | | | | | | | | | | | | | | | | | | | | | | | | | | | |
| | (19,749 | ) | | | (2,517,759 | ) | | | | | (37,563 | ) | | | 2,380 | | | | | | | | 4,213,791 | | | | 13,538,728 | |
| | | | | | | | | | | | | | | | | | | | | | | | | | | | |
| | | | | | | | | | | | | | | | | | | | | | | | | | | | |
| | n/a | | | | n/a | | | | | | n/a | | | | n/a | | | | | | | | 173,089 | | | | 251,341 | |
| | n/a | | | | n/a | | | | | | n/a | | | | n/a | | | | | | | | 1,458 | | | | 2,154 | |
| | n/a | | | | n/a | | | | | | n/a | | | | n/a | | | | | | | | (11,415 | ) | | | (176,437 | ) |
| | | | | | | | | | | | | | | | | | | | | | | | | | | | |
| | n/a | | | | n/a | | | | | | n/a | | | | n/a | | | | | | | | 163,132 | | | | 77,058 | |
| | | | | | | | | | | | | | | | | | | | | | | | | | | | |
| | (1,716,307 | ) | | | (7,348,436 | ) | | | | | (223,365 | ) | | | (766,380 | ) | | | | | | | 25,553,365 | | | | 91,409,684 | |
| | | | | | | | | | | | | | | | | | | | | | | | | | | | |
The accompanying notes are an integral part of the financial statements.
43
|
| STATEMENTS OF CHANGES IN NET ASSETS |
| | | | | | | | | | |
| | | | | Credit Fund | |
| | | | | Six Months Ended
January 31, 2020
(Unaudited) | | | Year Ended
July 31,
2019 | |
Operations: | | | | | | | | | | |
Net Investment Income | | | | $ | 4,592,596 | | | $ | 8,805,288 | |
Net Realized Gain (Loss) on Investments | | | | | 368,799 | | | | (1,012,683 | ) |
Net Change in Unrealized Appreciation (Depreciation) on Investments | | | | | 1,803,669 | | | | 2,373,819 | |
| | | | | | | | | | |
Net Increase (Decrease) in Net Assets Resulting from Operations | | | | | 6,765,064 | | | | 10,166,424 | |
| | | | | | | | | | |
Distributions: | | | | | | | | | | |
Institutional Class Shares | | | | | (4,690,538 | ) | | | (10,632,463 | ) |
Investor Class Shares | | | | | (272,317 | ) | | | (695,665 | ) |
A Class Shares | | | | | (8,944 | ) | | | (15,260 | ) |
Return of Capital: | | | | | | | | | | |
Institutional Class Shares | | | | | — | | | | — | |
Investor Class Shares | | | | | — | | | | — | |
A Class Shares | | | | | — | | | | — | |
| | | | | | | | | | |
Total Distributions | | | | | (4,971,799 | ) | | | (11,343,388 | ) |
| | | | | | | | | | |
Capital Share Transactions: | | | | | | | | | | |
Institutional Class Shares: | | | | | | | | | | |
Issued | | | | | 22,021,157 | | | | 32,336,884 | |
Reinvestment of Dividends | | | | | 904,503 | | | | 1,746,933 | |
Redeemed | | | | | (14,279,395 | ) | | | (30,213,513 | ) |
| | | | | | | | | | |
Net Increase in Net Assets from
Institutional Class Share Transactions | | | | | 8,646,265 | | | | 3,870,304 | |
| | | | | | | | | | |
Investor Class Shares: | | | | | | | | | | |
Issued | | | | | 567,918 | | | | 2,631,594 | |
Reinvestment of Dividends | | | | | 266,759 | | | | 623,737 | |
Redeemed | | | | | (1,534,565 | ) | | | (3,577,126 | ) |
| | | | | | | | | | |
Net Increase in Net Assets from
Investor Class Share Transactions | | | | | (699,888 | ) | | | (321,795 | ) |
| | | | | | | | | | |
A Class Shares: | | | | | | | | | | |
Issued | | | | | 255,422 | | | | 215,918 | |
Reinvestment of Dividends | | | | | 8,597 | | | | 15,260 | |
Redeemed | | | | | (69,939 | ) | | | — | |
| | | | | | | | | | |
Net Increase in Net Assets from
A Class Share Transactions | | | | | 194,080 | | | | 231,178 | |
| | | | | | | | | | |
Net Increase in Net Assets from
Capital Share Transactions | | | | | 8,140,457 | | | | 3,779,687 | |
| | | | | | | | | | |
Total Increase (Decrease) in Net Assets | | | | | 9,933,722 | | | | 2,602,723 | |
| | | | | | | | | | |
Net assets: | | | | | | | | | | |
Beginning of Year | | | | | 213,555,764 | | | | 210,953,041 | |
| | | | | | | | | | |
End of Year | | | | $ | 223,489,486 | | | $ | 213,555,764 | |
| | | | | | | | | | |
Share Transactions: | | | | | | | | | | |
Institutional Class Shares: | | | | | | | | | | |
Issued | | | | | 2,265,814 | | | | 3,341,399 | |
Reinvestment of Dividends | | | | | 93,219 | | | | 181,262 | |
Redeemed | | | | | (1,467,709 | ) | | | (3,120,283 | ) |
| | | | | | | | | | |
Total Increase (Decrease) in Institutional Class Shares | | | | | 891,324 | | | | 402,378 | |
| | | | | | | | | | |
Investor Class Shares: | | | | | | | | | | |
Issued | | | | | 58,434 | | | | 271,984 | |
Reinvestment of Dividends | | | | | 27,531 | | | | 64,781 | |
Redeemed | | | | | (158,187 | ) | | | (371,231 | ) |
| | | | | | | | | | |
Total Increase (Decrease) in Investor Class Shares | | | | | (72,222 | ) | | | (34,466 | ) |
| | | | | | | | | | |
A Class Shares: | | | | | | | | | | |
Issued | | | | | 26,313 | | | | 22,266 | |
Reinvestment of Dividends | | | | | 887 | | | | 1,586 | |
Redeemed | | | | | (7,195 | ) | | | — | |
| | | | | | | | | | |
Total Increase in A Class Shares | | | | | 20,005 | | | | 23,852 | |
| | | | | | | | | | |
Net Increase (Decrease) in Shares Outstanding | | | | | 839,107 | | | | 391,764 | |
| | | | | | | | | | |
“n/a” designates that the Fund does not offer this class.
Amounts designated as “—” are $0.
| * | Fund commenced operations on October 31, 2019. |
The accompanying notes are an integral part of the financial statements.
44
| | | | | | | | | | | | | | | | | | | | | | | | |
| Low Duration Bond Fund | | | | | Municipal Bond Fund | | | | | | Global Bond Fund* | |
Six Months Ended
January 31, 2020
(Unaudited) | | | Year Ended
July 31,
2019 | | | | | Six Months Ended
January 31, 2020
(Unaudited) | | | Year Ended
July 31,
2019 | | | | | | Period Ended
January 31, 2020
(Unaudited) | |
| | | | | | | | | | | | | | | | | | | | | | | | |
| $ | 3,580,058 | | | $ | 6,904,478 | | | | | $ | 1,590,008 | | | $ | 3,754,046 | | | | | | | $ | 1,201 | |
| | 42,267 | | | | (47,515 | ) | | | | | 974,533 | | | | 27,584 | | | | | | | | 38 | |
| | 2,559,658 | | | | 4,287,164 | | | | | | 344,285 | | | | 4,748,549 | | | | | | | | 1,077 | |
| | | | | | | | | | | | | | | | | | | | | | | | |
| | 6,181,983 | | | | 11,144,127 | | | | | | 2,908,826 | | | | 8,530,179 | | | | | | | | 2,316 | |
| | | | | | | | | | | | | | | | | | | | | | | | |
| | | | | | | | | | | | | | | | | | | | | | | | |
| | (3,355,325 | ) | | | (6,209,133 | ) | | | | | (1,767,519 | ) | | | (3,702,767 | ) | | | | | | | (1,159 | ) |
| | (219,583 | ) | | | (508,809 | ) | | | | | (72,596 | ) | | | (97,625 | ) | | | | | | | — | |
| | — | | | | — | | | | | | — | | | | — | | | | | | | | — | |
| | | | | | | | | | | | | | | | | | | | | | | | |
| | — | | | | — | | | | | | (26,692 | ) | | | — | | | | | | | | — | |
| | — | | | | — | | | | | | (1,155 | ) | | | — | | | | | | | | — | |
| | — | | | | — | | | | | | — | | | | — | | | | | | | | — | |
| | | | | | | | | | | | | | | | | | | | | | | | |
| | (3,574,908 | ) | | | (6,717,942 | ) | | | | | (1,867,962 | ) | | | (3,800,392 | ) | | | | | | | (1,159 | ) |
| | | | | | | | | | | | | | | | | | | | | | | | |
| | | | | | | | | | | | | | | | | | | | | | | | |
| | | | | | | | | | | | | | | | | | | | | | | | |
| | 52,321,994 | | | | 92,727,991 | | | | | | 4,088,214 | | | | 18,945,654 | | | | | | | | 1,033,112 | |
| | 1,018,043 | | | | 1,740,731 | | | | | | 360,014 | | | | 713,820 | | | | | | | | 30 | |
| | (33,903,147 | ) | | | (60,805,994 | ) | | | | | (70,132,137 | ) | | | (36,122,733 | ) | | | | | | | (9 | ) |
| | | | | | | | | | | | | | | | | | | | | | | | |
| | | | | | |
| | 19,436,890 | | | | 33,662,728 | | | | | | (65,683,909 | ) | | | (16,463,259 | ) | | | | | | | 1,033,133 | |
| | | | | | | | | | | | | | | | | | | | | | | | |
| | | | | | | | | | | | | | | | | | | | | | | | |
| | 2,888,106 | | | | 3,583,916 | | | | | | 136,238 | | | | 2,117,279 | | | | | | | | 100 | |
| | 214,482 | | | | 475,937 | | | | | | 55,872 | | | | 89,852 | | | | | | | | — | |
| | (5,990,580 | ) | | | (7,221,447 | ) | | | | | (236,272 | ) | | | (133,770 | ) | | | | | | | — | |
| | | | | | | | | | | | | | | | | | | | | | | | |
| | | | | | |
| | (2,887,992 | ) | | | (3,161,594 | ) | | | | | (44,162 | ) | | | 2,073,361 | | | | | | | | 100 | |
| | | | | | | | | | | | | | | | | | | | | | | | |
| | | | | | | | | | | | | | | | | | | | | | | | |
| | n/a | | | | n/a | | | | | | n/a | | | | n/a | | | | | | | | 100 | |
| | n/a | | | | n/a | | | | | | n/a | | | | n/a | | | | | | | | — | |
| | n/a | | | | n/a | | | | | | n/a | | | | n/a | | | | | | | | — | |
| | | | | | | | | | | | | | | | | | | | | | | | |
| | | | | | |
| | n/a | | | | n/a | | | | | | n/a | | | | n/a | | | | | | | | 100 | |
| | | | | | | | | | | | | | | | | | | | | | | | |
| | | | | | |
| | 16,548,898 | | | | 30,501,134 | | | | | | (65,728,071 | ) | | | (14,389,898 | ) | | | | | | | 1,033,333 | |
| | | | | | | | | | | | | | | | | | | | | | | | |
| | 19,155,973 | | | | 34,927,319 | | | | | | (64,687,207 | ) | | | (9,660,111 | ) | | | | | | | 1,034,490 | |
| | | | | | | | | | | | | | | | | | | | | | | | |
| | | | | | | | | | | | | | | | | | | | | | | | |
| | 343,682,060 | | | | 308,754,741 | | | | | | 161,516,160 | | | | 171,176,271 | | | | | | | | — | |
| | | | | | | | | | | | | | | | | | | | | | | | |
| $ | 362,838,033 | | | $ | 343,682,060 | | | | | $ | 96,828,953 | | | $ | 161,516,160 | | | | | | | $ | 1,034,490 | |
| | | | | | | | | | | | | | | | | | | | | | | | |
| | | | | | | | | | | | | | | | | | | | | | | | |
| | | | | | | | | | | | | | | | | | | | | | | | |
| | 5,077,840 | | | | 9,066,205 | | | | | | 388,454 | | | | 1,841,451 | | | | | | | | 103,308 | |
| | 98,805 | | | | 170,373 | | | | | | 34,242 | | | | 69,464 | | | | | | | | 3 | |
| | (3,288,317 | ) | | | (5,947,520 | ) | | | | | (6,628,866 | ) | | | (3,525,533 | ) | | | | | | | (1 | ) |
| | | | | | | | | | | | | | | | | | | | | | | | |
| | 1,888,328 | | | | 3,289,058 | | | | | | (6,206,170 | ) | | | (1,614,618 | ) | | | | | | | 103,310 | |
| | | | | | | | | | | | | | | | | | | | | | | | |
| | | | | | | | | | | | | | | | | | | | | | | | |
| | 280,100 | | | | 350,504 | | | | | | 12,965 | | | | 203,466 | | | | | | | | 10 | |
| | 20,805 | | | | 46,595 | | | | | | 5,313 | | | | 8,736 | | | | | | | | — | |
| | (581,327 | ) | | | (704,905 | ) | | | | | (22,436 | ) | | | (12,797 | ) | | | | | | | — | |
| | | | | | | | | | | | | | | | | | | | | | | | |
| | (280,422 | ) | | | (307,806 | ) | | | | | (4,158 | ) | | | 199,405 | | | | | | | | 10 | |
| | | | | | | | | | | | | | | | | | | | | | | | |
| | | | | | | | | | | | | | | | | | | | | | | | |
| | n/a | | | | n/a | | | | | | n/a | | | | n/a | | | | | | | | 10 | |
| | n/a | | | | n/a | | | | | | n/a | | | | n/a | | | | | | | | — | |
| | n/a | | | | n/a | | | | | | n/a | | | | n/a | | | | | | | | — | |
| | | | | | | | | | | | | | | | | | | | | | | | |
| | n/a | | | | n/a | | | | | | n/a | | | | n/a | | | | | | | | 10 | |
| | | | | | | | | | | | | | | | | | | | | | | | |
| | 1,607,906 | | | | 2,981,252 | | | | | | (6,210,328 | ) | | | (1,415,213 | ) | | | | | | | 103,330 | |
| | | | | | | | | | | | | | | | | | | | | | | | |
The accompanying notes are an integral part of the financial statements.
45
| | |
| FROST FAMILY OF FUNDS | | F R O S T F U N D S |
For a Share Outstanding Throughout Each Period
For the Six Months Ended January 31, 2020 (Unaudited) and the Years Ended July 31,
| | | | | | | | | | | | | | | | | | | | | | | | | | | | | | | | | | | | | | | | | | | | | | | | | | | | | | | | |
| | | | | | | | | | | | | | | |
| | | Net Asset
Value,
Beginning
of Year | | | Net
Investment
Income
(Loss)(1) | | | Net Realized
and
Unrealized
Gains
(Losses) on
Investments | | | Total
From
Operations | | | Dividends
From Net
Investment
Income | | | Distributions
From
Realized
Gains | | | Total
Dividends
& Distributions | | | Net Asset
Value, End
of Year | | | Total
Return† | | | Net Assets
End of Year
(000) | | | Ratio of
Expenses
to Average
Net Assets | | | Expenses
to Average
Net Assets
(Excluding
Waivers and
Fees Paid
Indirectly) | | | Ratio of Net
Investment
Income (Loss)
to Average
Net Assets | | | Portfolio
Turnover
Rate | |
| | | | | | | | | | | | | | | | | | | | | | | | | | | | | | | | | | | | | | | | | | | | | | | | | | | | | | | | |
Growth Equity Fund | |
|
Institutional Class Shares | |
2020*** | | $ | 13.82 | | | $ | 0.02 | | | $ | 1.46 | | | $ | 1.48 | | | $ | (0.04 | ) | | $ | (1.39 | ) | | $ | (1.43 | ) | | $ | 13.87 | | | | 11.23 | % | | $ | 301,432 | | | | 0.63 | %* | | | 0.63 | %* | | | 0.28 | %* | | | 11 | %** |
2019 | | | 14.49 | | | | 0.05 | | | | 1.09 | | | | 1.14 | | | | (0.04 | ) | | | (1.77 | ) | | | (1.81 | ) | | | 13.82 | | | | 10.34 | | | | 290,773 | | | | 0.63 | | | | 0.63 | | | | 0.34 | | | | 25 | |
2018 | | | 14.82 | | | | 0.04 | | | | 3.18 | | | | 3.22 | | | | (0.03 | ) | | | (3.52 | ) | | | (3.55 | ) | | | 14.49 | | | | 25.05 | | | | 272,509 | | | | 0.65 | | | | 0.65 | | | | 0.26 | | | | 15 | |
2017 | | | 13.61 | | | | 0.04 | | | | 2.51 | | | | 2.55 | | | | (0.02 | ) | | | (1.32 | ) | | | (1.34 | ) | | | 14.82 | | | | 20.54 | | | | 251,675 | | | | 0.79 | | | | 0.79 | | | | 0.27 | | | | 16 | |
2016 | | | 15.61 | | | | 0.02 | | | | (0.32 | ) | | | (0.30 | ) | | | (0.02 | ) | | | (1.68 | ) | | | (1.70 | ) | | | 13.61 | | | | (1.72 | ) | | | 348,935 | | | | 0.80 | | | | 0.80 | | | | 0.11 | | | | 23 | |
2015 | | | 14.49 | | | | 0.03 | | | | 2.00 | | | | 2.03 | | | | (0.03 | ) | | | (0.88 | ) | | | (0.91 | ) | | | 15.61 | | | | 14.45 | | | | 388,998 | | | | 0.80 | | | | 0.80 | | | | 0.21 | | | | 19 | |
|
Investor Class Shares | |
2020*** | | $ | 13.61 | | | $ | — | | | $ | 1.44 | | | $ | 1.44 | | | $ | (0.01 | ) | | $ | (1.39 | ) | | $ | (1.40 | ) | | $ | 13.65 | | | | 11.09 | % | | $ | 50,916 | | | | 0.88 | %* | | | 0.88 | %* | | | 0.03 | %* | | | 11 | %** |
2019 | | | 14.30 | | | | 0.01 | | | | 1.08 | | | | 1.09 | | | | (0.01 | ) | | | (1.77 | ) | | | (1.78 | ) | | | 13.61 | | | | 10.05 | | | | 47,111 | | | | 0.88 | | | | 0.88 | | | | 0.09 | | | | 25 | |
2018 | | | 14.70 | | | | — | | | | 3.15 | | | | 3.15 | | | | (0.03 | ) | | | (3.52 | ) | | | (3.55 | ) | | | 14.30 | | | | 24.72 | | | | 46,266 | | | | 0.90 | | | | 0.90 | | | | 0.01 | | | | 15 | |
2017 | | | 13.51 | | | | 0.01 | | | | 2.50 | | | | 2.51 | | | | — | | | | (1.32 | ) | | | (1.32 | ) | | | 14.70 | | | | 20.33 | | | | 40,287 | | | | 1.04 | | | | 1.04 | | | | 0.04 | | | | 16 | |
2016 | | | 15.53 | | | | (0.02 | ) | | | (0.32 | ) | | | (0.34 | ) | | | — | | | | (1.68 | ) | | | (1.68 | ) | | | 13.51 | | | | (2.01 | ) | | | 64,238 | | | | 1.05 | | | | 1.05 | | | | (0.14 | ) | | | 23 | |
2015 | | | 14.43 | | | | (0.01 | ) | | | 1.99 | | | | 1.98 | | | | — | | | | (0.88 | ) | | | (0.88 | ) | | | 15.53 | | | | 14.17 | | | | 64,522 | | | | 1.05 | | | | 1.05 | | | | (0.03 | ) | | | 19 | |
| | | | | | | | | | | | | | | | | | | | | | | | | | | | | | | | | | | | | | | | | | | | | | | | | | | | | | | | |
Value Equity Fund | |
|
Institutional Class Shares | |
2020*** | | $ | 7.75 | | | $ | 0.08 | | | $ | 0.28 | | | $ | 0.36 | | | $ | (0.08 | ) | | $ | (1.21 | ) | | $ | (1.29 | ) | | $ | 6.82 | | | | 4.56 | % | | $ | 9,490 | | | | 0.98 | %* | | | 0.98 | %* | | | 2.16 | %* | | | 35 | %** |
2019 | | | 9.17 | | | | 0.15 | | | | (0.34 | ) | | | (0.19 | ) | | | (0.15 | ) | | | (1.08 | ) | | | (1.23 | ) | | | 7.75 | | | | (1.12 | ) | | | 23,922 | | | | 0.74 | | | | 0.74 | | | | 1.79 | | | | 41 | |
2018 | | | 9.11 | | | | 0.14 | | | | 0.70 | | | | 0.84 | | | | (0.14 | ) | | | (0.64 | ) | | | (0.78 | ) | | | 9.17 | | | | 9.37 | | | | 72,653 | | | | 0.70 | | | | 0.70 | | | | 1.50 | | | | 26 | |
2017 | | | 10.02 | | | | 0.19 | | | | 1.19 | | | | 1.38 | | | | (0.19 | ) | | | (2.10 | ) | | | (2.29 | ) | | | 9.11 | | | | 14.48 | | | | 88,541 | | | | 0.80 | | | | 0.80 | | | | 1.90 | | | | 35 | |
2016 | | | 11.20 | | | | 0.15 | | | | (0.16 | )‡ | | | (0.01 | ) | | | (0.15 | ) | | | (1.02 | ) | | | (1.17 | ) | | | 10.02 | | | | 0.55 | | | | 315,388 | | | | 0.80 | | | | 0.80 | | | | 1.54 | | | | 52 | |
2015 | | | 11.18 | | | | 0.15 | | | | 1.04 | | | | 1.19 | | | | (0.16 | ) | | | (1.01 | ) | | | (1.17 | ) | | | 11.20 | | | | 11.14 | | | | 273,297 | | | | 0.80 | | | | 0.80 | | | | 1.37 | | | | 53 | |
|
Investor Class Shares | |
2020*** | | $ | 7.73 | | | $ | 0.08 | | | $ | 0.27 | | | $ | 0.35 | | | $ | (0.07 | ) | | $ | (1.21 | ) | | $ | (1.28 | ) | | $ | 6.80 | | | | 4.44 | % | | $ | 4,661 | | | | 1.26 | %* | | | 1.26 | %* | | | 2.00 | %* | | | 35 | %** |
2019 | | | 9.16 | | | | 0.15 | | | | (0.37 | ) | | | (0.22 | ) | | | (0.13 | ) | | | (1.08 | ) | | | (1.21 | ) | | | 7.73 | | | | (1.46 | ) | | | 5,450 | | | | 0.99 | | | | 0.99 | | | | 1.77 | | | | 41 | |
2018 | | | 9.10 | | | | 0.11 | | | | 0.71 | | | | 0.82 | | | | (0.12 | ) | | | (0.64 | ) | | | (0.76 | ) | | | 9.16 | | | | 9.16 | | | | 29,512 | | | | 0.95 | | | | 0.95 | | | | 1.23 | | | | 26 | |
2017 | | | 10.01 | | | | 0.17 | | | | 1.18 | | | | 1.35 | | | | (0.16 | ) | | | (2.10 | ) | | | (2.26 | ) | | | 9.10 | | | | 14.20 | | | | 28,678 | | | | 1.05 | | | | 1.05 | | | | 1.69 | | | | 35 | |
2016 | | | 11.19 | | | | 0.13 | | | | (0.17 | )‡ | | | (0.04 | ) | | | (0.12 | ) | | | (1.02 | ) | | | (1.14 | ) | | | 10.01 | | | | 0.30 | | | | 60,576 | | | | 1.05 | | | | 1.05 | | | | 1.29 | | | | 52 | |
2015 | | | 11.17 | | | | 0.13 | | | | 1.03 | | | | 1.16 | | | | (0.13 | ) | | | (1.01 | ) | | | (1.14 | ) | | | 11.19 | | | | 10.90 | | | | 57,837 | | | | 1.05 | | | | 1.05 | | | | 1.13 | | | | 53 | |
| | | | | | | | | | | | | | | | | | | | | | | | | | | | | | | | | | | | | | | | | | | | | | | | | | | | | | | | |
Mid Cap Equity Fund | |
|
Institutional Class Shares | |
2020*** | | $ | 7.45 | | | $ | 0.02 | | | $ | 0.22 | | | $ | 0.24 | | | $ | (0.01 | ) | | $ | (2.40 | ) | | $ | (2.41 | ) | | $ | 5.28 | | | | 3.66 | % | | $ | 1,689 | | | | 1.55 | %* | | | 3.47 | %* | | | 0.51 | %* | | | 21 | %** |
2019 | | | 9.97 | | | | 0.02 | | | | 0.14 | | | | 0.16 | | | | (0.02 | ) | | | (2.66 | ) | | | (2.68 | ) | | | 7.45 | | | | 5.67 | | | | 3,767 | | | | 1.55 | | | | 1.90 | | | | 0.25 | | | | 57 | |
2018 | | | 10.65 | | | | 0.01 | | | | 1.41 | | | | 1.42 | | | | — | | | | (2.10 | ) | | | (2.10 | ) | | | 9.97 | | | | 14.09 | | | | 12,701 | | | | 1.34 | | | | 1.34 | | | | 0.08 | | | | 55 | |
2017 | | | 9.85 | | | | (0.01 | ) | | | 1.48 | | | | 1.47 | | | | — | | | | (0.67 | ) | | | (0.67 | ) | | | 10.65 | | | | 15.47 | | | | 10,606 | | | | 1.36 | | | | 1.36 | | | | (0.15 | ) | | | 38 | |
2016 | | | 13.73 | | | | (0.06 | ) | | | (1.30 | ) | | | (1.36 | ) | | | — | | | | (2.52 | ) | | | (2.52 | ) | | | 9.85 | | | | (9.08 | ) | | | 10,576 | | | | 1.45 | | | | 1.45 | | | | (0.57 | ) | | | 102 | |
2015 | | | 14.57 | | | | (0.15 | ) | | | 1.91 | | | | 1.76 | | | | — | | | | (2.60 | ) | | | (2.60 | ) | | | 13.73 | | | | 14.26 | | | | 15,971 | | | | 1.47 | (2) | | | 1.42 | | | | (1.08 | ) | | | 80 | |
|
Investor Class Shares | |
2020*** | | $ | 7.30 | | | $ | 0.01 | | | $ | 0.23 | | | $ | 0.24 | | | $ | — | | | $ | (2.40 | ) | | $ | (2.40 | ) | | $ | 5.14 | | | | 3.78 | % | | $ | 261 | | | | 1.78 | %* | | | 3.86 | %* | | | 0.29 | %* | | | 21 | %** |
2019 | | | 9.82 | | | | — | | | | 0.15 | | | | 0.15 | | | | (0.01 | ) | | | (2.66 | ) | | | (2.67 | ) | | | 7.30 | | | | 5.60 | | | | 646 | | | | 1.80 | | | | 2.25 | | | | (0.01 | ) | | | 57 | |
2018 | | | 10.52 | | | | — | | | | 1.40 | | | | 1.40 | | | | — | | | | (2.10 | ) | | | (2.10 | ) | | | 9.82 | | | | 14.04 | | | | 845 | | | | 1.52 | | | | 1.52 | | | | 0.01 | | | | 55 | |
2017 | | | 9.74 | | | | (0.04 | ) | | | 1.49 | | | | 1.45 | | | | — | | | | (0.67 | ) | | | (0.67 | ) | | | 10.52 | | | | 15.43 | | | | 6,531 | | | | 1.62 | | | | 1.62 | | | | (0.41 | ) | | | 38 | |
2016 | | | 13.65 | | | | (0.04 | ) | | | (1.35 | ) | | | (1.39 | ) | | | — | | | | (2.52 | ) | | | (2.52 | ) | | | 9.74 | | | | (9.38 | ) | | | 3,421 | | | | 1.73 | | | | 1.73 | | | | (0.43 | ) | | | 102 | |
2015 | | | 14.53 | | | | (0.19 | ) | | | 1.91 | | | | 1.72 | | | | — | | | | (2.60 | ) | | | (2.60 | ) | | | 13.65 | | | | 14.01 | | | | 583 | | | | 1.74 | (2) | | | 1.70 | | | | (1.39 | ) | | | 80 | |
| *** | Six Months Ended January 31, 2020. |
| † | Total return is for the period indicated and has not been annualized. Returns shown do not reflect the deduction of taxes that a shareholder would pay on Fund distributions or the redemption of Fund shares. |
| †† | Total return would have been lower had certain expenses not been waived and assumed by the Adviser during the period. |
| ‡ | The amount shown for a share outstanding throughout the period does not accord with the aggregate net gains on investments for that period because of the sales and repurchases of Fund shares in relation to fluctuating market value of the investments of the Fund. |
| (1) | Per share data calculated using the average shares method. |
| (2) | Ratio includes previously waived investment advisory fees recovered. |
Amounts designated as “—” are either $0 or have been rounded to $0.
The accompanying notes are an integral part of the financial statements.
46
| | |
| FROST FAMILY OF FUNDS | | F R O S T F U N D S |
For a Share Outstanding Throughout Each Period
For the Six Months Ended January 31, 2020 (Unaudited) and the Years Ended July 31,
| | | | | | | | | | | | | | | | | | | | | | | | | | | | | | | | | | | | | | | | | | | | | | | | | | | | | | | | |
| | | | | | | | | | | | | | | |
| | | Net Asset
Value,
Beginning
of Period | | | Net
Investment
Income(1) | | | Net Realized
and
Unrealized
Gains
(Losses) on
Investments | | | Total
From
Operations | | | Dividends
From Net
Investment
Income | | | Distributions
From
Realized
Gains | | | Total
Dividends
& Distributions | | | Net Asset
Value, End
of Period | | | Total
Return† | | | Net Assets
End of Period
(000) | | | Ratio of
Expenses
to Average
Net Assets | | | Expenses
to Average
Net Assets
(Excluding
Waivers and
Fees Paid
Indirectly) | | | Ratio of Net
Investment
Income
to Average
Net Assets | | | Portfolio
Turnover
Rate | |
| | | | | | | | | | | | | | | | | | | | | | | | | | | | | | | | | | | | | | | | | | | | | | | | | | | | | | | | |
Total Return Bond Fund | |
|
Institutional Class Shares | |
2020*** | | $ | 10.42 | | | $ | 0.19 | | | $ | 0.02 | | | | 0.21 | | | $ | (0.20 | ) | | $ | — | | | $ | (0.20 | ) | | $ | 10.43 | | | | 1.99 | % | | $ | 3,414,156 | | | | 0.46 | %* | | | 0.46 | %* | | | 3.63 | %* | | | 15 | %** |
2019 | | | 10.28 | | | | 0.39 | | | | 0.13 | | | | 0.52 | | | | (0.38 | ) | | | — | | | | (0.38 | ) | | | 10.42 | | | | 5.19 | % | | | 3,191,392 | | | | 0.47 | | | | 0.48 | | | | 3.77 | | | | 40 | |
2018 | | | 10.50 | | | | 0.37 | | | | (0.20 | ) | | | 0.17 | | | | (0.37 | ) | | | (0.02 | ) | | | (0.39 | ) | | | 10.28 | | | | 1.60 | | | | 2,349,388 | | | | 0.48 | | | | 0.48 | | | | 3.60 | | | | 15 | |
2017 | | | 10.52 | | | | 0.39 | | | | (0.02 | ) | | | 0.37 | | | | (0.38 | ) | | | (0.01 | ) | | | (0.39 | ) | | | 10.50 | | | | 3.63 | | | | 1,918,126 | | | | 0.51 | | | | 0.51 | | | | 3.68 | | | | 24 | |
2016 | | | 10.56 | | | | 0.41 | | | | — | | | | 0.41 | | | | (0.40 | ) | | | (0.05 | ) | | | (0.45 | ) | | | 10.52 | | | | 4.02 | | | | 1,606,097 | | | | 0.52 | | | | 0.52 | | | | 3.90 | | | | 32 | |
2015 | | | 10.90 | | | | 0.38 | | | | (0.21 | ) | | | 0.17 | | | | (0.38 | ) | | | (0.13 | ) | | | (0.51 | ) | | | 10.56 | | | | 1.58 | | | | 1,565,895 | | | | 0.51 | | | | 0.51 | | | | 3.51 | | | | 49 | |
|
Investor Class Shares | |
2020*** | | $ | 10.41 | | | $ | 0.18 | | | $ | 0.01 | | | | 0.19 | | | $ | (0.18 | ) | | $ | — | | | | (0.18 | ) | | $ | 10.42 | | | | 1.86 | % | | $ | 564,519 | | | | 0.71 | %* | | | 0.71 | %* | | | 3.38 | %* | | | 15 | %** |
2019 | | | 10.28 | | | | 0.36 | | | | 0.13 | | | | 0.49 | | | | (0.36 | ) | | | — | | | | (0.36 | ) | | | 10.41 | | | | 4.83 | | | | 520,291 | | | | 0.72 | | | | 0.73 | | | | 3.51 | | | | 40 | |
2018 | | | 10.50 | | | | 0.35 | | | | (0.21 | ) | | | 0.14 | | | | (0.34 | ) | | | (0.02 | ) | | | (0.36 | ) | | | 10.28 | | | | 1.35 | | | | 374,298 | | | | 0.73 | | | | 0.73 | | | | 3.35 | | | | 15 | |
2017 | | | 10.52 | | | | 0.36 | | | | (0.02 | ) | | | 0.34 | | | | (0.35 | ) | | | (0.01 | ) | | | (0.36 | ) | | | 10.50 | | | | 3.37 | | | | 324,772 | | | | 0.76 | | | | 0.76 | | | | 3.43 | | | | 24 | |
2016 | | | 10.56 | | | | 0.38 | | | | — | | | | 0.38 | | | | (0.37 | ) | | | (0.05 | ) | | | (0.42 | ) | | | 10.52 | | | | 3.76 | | | | 260,702 | | | | 0.77 | | | | 0.77 | | | | 3.65 | | | | 32 | |
2015 | | | 10.90 | | | | 0.35 | | | | (0.20 | ) | | | 0.15 | | | | (0.36 | ) | | | (0.13 | ) | | | (0.49 | ) | | | 10.56 | | | | 1.33 | | | | 253,157 | | | | 0.75 | | | | 0.75 | | | | 3.26 | | | | 49 | |
|
A Class Shares | |
2020*** | | $ | 10.41 | | | $ | 0.18 | | | $ | 0.01 | | | | 0.19 | | | $ | (0.18 | ) | | $ | — | | | | (0.18 | ) | | $ | 10.42 | | | | 1.87 | % | | $ | 2,699 | | | | 0.72 | %* | | | 0.72 | %* | | | 3.38 | %* | | | 15 | %** |
2019 | | | 10.28 | | | | 0.36 | | | | 0.11 | | | | 0.47 | | | | (0.34 | ) | | | — | | | | (0.34 | ) | | | 10.41 | | | | 4.69 | | | | 998 | | | | 0.82 | | | | 0.83 | | | | 3.49 | | | | 40 | |
2018(a) | | | 10.29 | | | | 0.05 | | | | (0.01 | ) | | | 0.04 | | | | (0.05 | ) | | | — | | | | (0.05 | ) | | | 10.28 | | | | 0.44 | | | | 193 | | | | 0.88 | * | | | 0.88 | * | | | 3.05 | * | | | 15 | ** |
| | | | | | | | | | | | | | | | | | | | | | | | | | | | | | | | | | | | | | | | | | | | | | | | | | | | | | | | |
Credit Fund | | | | | | | | | | | | | | | | | | | | | | | | | | | | | | | | | | | | | | | | | | | | | |
|
Institutional Class Shares | |
2020*** | | $ | 9.72 | | | $ | 0.20 | | | $ | 0.10 | | | | 0.30 | | | $ | (0.22 | ) | | $ | — | | | | (0.22 | ) | | $ | 9.80 | | | | 3.13 | % | | $ | 210,135 | | | | 0.69 | % | | | 0.69 | % | | | 4.17 | %* | | | 13 | %** |
2019 | | | 9.78 | | | | 0.40 | | | | 0.06 | | | | 0.46 | | | | (0.49 | ) | | | (0.03 | ) | | | (0.52 | ) | | | 9.72 | | | | 4.88 | | | | 199,800 | | | | 0.70 | | | | 0.70 | | | | 4.18 | | | | 19 | |
2018 | | | 9.99 | | | | 0.56 | | | | (0.17 | ) | | | 0.39 | | | | (0.47 | ) | | | (0.13 | ) | | | (0.60 | ) | | | 9.78 | | | | 3.96 | | | | 197,014 | | | | 0.71 | | | | 0.71 | | | | 5.67 | | | | 33 | |
2017 | | | 9.63 | | | | 0.55 | | | | 0.30 | | | | 0.85 | | | | (0.49 | ) | | | — | | | | (0.49 | ) | | | 9.99 | | | | 9.08 | | | | 163,210 | | | | 0.81 | | | | 0.81 | | | | 5.57 | | | | 27 | |
2016 | | | 9.86 | | | | 0.49 | | | | (0.24 | ) | | | 0.25 | | | | (0.48 | )^ | | | — | | | | (0.48 | ) | | | 9.63 | | | | 2.79 | | | | 129,395 | | | | 0.83 | | | | 0.83 | | | | 5.27 | | | | 36 | |
2015 | | | 10.27 | | | | 0.49 | | | | (0.34 | ) | | | 0.15 | | | | (0.49 | ) | | | (0.07 | ) | | | (0.56 | ) | | | 9.86 | | | | 1.45 | | | | 88,349 | | | | 0.84 | | | | 0.84 | | | | 4.83 | | | | 47 | |
|
Investor Class Shares | |
2020*** | | $ | 9.71 | | | $ | 0.19 | | | $ | 0.10 | | | | 0.29 | | | $ | (0.21 | ) | | $ | — | | | | (0.21 | ) | | $ | 9.79 | | | | 3.00 | % | | $ | 12,765 | | | | 0.94 | % | | | 0.94 | % | | | 3.93 | %* | | | 13 | %** |
2019 | | | 9.77 | | | | 0.38 | | | | 0.05 | | | | 0.43 | | | | (0.46 | ) | | | (0.03 | ) | | | (0.49 | ) | | | 9.71 | | | | 4.62 | | | | 13,366 | | | | 0.95 | | | | 0.95 | | | | 3.93 | | | | 19 | |
2018 | | | 9.98 | | | | 0.54 | | | | (0.18 | ) | | | 0.36 | | | | (0.44 | ) | | | (0.13 | ) | | | (0.57 | ) | | | 9.77 | | | | 3.71 | | | | 13,779 | | | | 0.96 | | | | 0.96 | | | | 5.41 | | | | 33 | |
2017 | | | 9.62 | | | | 0.52 | | | | 0.31 | | | | 0.83 | | | | (0.47 | ) | | | — | | | | (0.47 | ) | | | 9.98 | | | | 8.82 | | | | 13,317 | | | | 1.06 | | | | 1.06 | | | | 5.28 | | | | 27 | |
2016 | | | 9.85 | | | | 0.47 | | | | (0.25 | ) | | | 0.22 | | | | (0.45 | )^ | | | — | | | | (0.45 | ) | | | 9.62 | | | | 2.54 | | | | 10,565 | | | | 1.08 | | | | 1.08 | | | | 5.02 | | | | 36 | |
2015 | | | 10.26 | | | | 0.46 | | | | (0.34 | ) | | | 0.12 | | | | (0.46 | ) | | | (0.07 | ) | | | (0.53 | ) | | | 9.85 | | | | 1.19 | | | | 9,671 | | | | 1.08 | | | | 1.08 | | | | 4.58 | | | | 47 | |
|
A Class Shares | |
2020*** | | $ | 9.71 | | | $ | 0.19 | | | $ | 0.09 | | | | 0.28 | | | $ | (0.21 | ) | | $ | — | | | | (0.21 | ) | | $ | 9.78 | | | | 2.91 | % | | $ | 589 | | | | 0.94 | % | | | 0.94 | % | | | 3.91 | %* | | | 13 | %** |
2019 | | | 9.76 | | | | 0.37 | | | | 0.06 | | | | 0.43 | | | | (0.45 | ) | | | (0.03 | ) | | | (0.48 | ) | | | 9.71 | | | | 4.60 | | | | 390 | | | | 1.05 | | | | 1.05 | | | | 3.83 | | | | 19 | |
2018(a) | | | 9.80 | | | | 0.08 | | | | (0.04 | ) | | | 0.04 | | | | (0.08 | ) | | | — | | | | (0.08 | ) | | | 9.76 | | | | 0.36 | | | | 160 | | | | 1.11 | * | | | 1.11 | * | | | 4.68 | * | | | 33 | ** |
| | | | | | | | | | | | | | | | | | | | | | | | | | | | | | | | | | | | | | | | | | | | | | | | | | | | | | | | |
Low Duration Bond Fund | |
|
Institutional Class Shares | |
2020*** | | $ | 10.28 | | | $ | 0.11 | | | $ | 0.07 | | | | 0.18 | | | $ | (0.11 | ) | | $ | — | | | | (0.11 | ) | | $ | 10.35 | | | | 1.73 | % | | $ | 340,087 | | | | 0.43 | %* | | | 0.43 | %* | | | 2.06 | %* | | | 51 | %** |
2019 | | | 10.14 | | | | 0.22 | | | | 0.13 | | | | 0.35 | | | | (0.21 | ) | | | — | | | | (0.21 | ) | | | 10.28 | | | | 3.52 | | | | 318,215 | | | | 0.43 | | | | 0.43 | | | | 2.16 | | | | 23 | |
2018 | | | 10.25 | | | | 0.19 | | | | (0.11 | ) | | | 0.08 | | | | (0.19 | )^ | | | — | | | | (0.19 | ) | | | 10.14 | | | | 0.80 | | | | 280,519 | | | | 0.45 | | | | 0.45 | | | | 1.83 | | | | 20 | |
2017 | | | 10.28 | | | | 0.18 | | | | (0.03 | ) | | | 0.15 | | | | (0.18 | ) | | | — | | | | (0.18 | ) | | | 10.25 | | | | 1.48 | | | | 244,575 | | | | 0.46 | | | | 0.46 | | | | 1.80 | | | | 26 | |
2016 | | | 10.30 | | | | 0.16 | | | | (0.01 | ) | | | 0.15 | | | | (0.17 | ) | | | — | | | | (0.17 | ) | | | 10.28 | | | | 1.43 | | | | 214,708 | | | | 0.51 | | | | 0.51 | | | | 1.58 | | | | 36 | |
2015 | | | 10.30 | | | | 0.13 | | | | — | | | | 0.13 | | | | (0.13 | ) | | | — | | | | (0.13 | ) | | | 10.30 | | | | 1.30 | | | | 214,904 | | | | 0.52 | | | | 0.52 | | | | 1.29 | | | | 52 | |
|
Investor Class Shares | |
2020*** | | $ | 10.28 | | | $ | 0.09 | | | $ | 0.08 | | | | 0.17 | | | $ | (0.09 | ) | | $ | — | | | | (0.09 | ) | | $ | 10.36 | | | | 1.70 | % | | $ | 22,751 | | | | 0.69 | %* | | | 0.69 | %* | | | 1.81 | %* | | | 51 | %** |
2019 | | | 10.14 | | | | 0.19 | | | | 0.14 | | | | 0.33 | | | | (0.19 | ) | | | — | | | | (0.19 | ) | | | 10.28 | | | | 3.26 | | | | 25,467 | | | | 0.68 | | | | 0.68 | | | | 1.90 | | | | 23 | |
2018 | | | 10.25 | | | | 0.16 | | | | (0.10 | ) | | | 0.06 | | | | (0.17 | )^ | | | — | | | | (0.17 | ) | | | 10.14 | | | | 0.54 | | | | 28,236 | | | | 0.70 | | | | 0.70 | | | | 1.58 | | | | 20 | |
2017 | | | 10.28 | | | | 0.16 | | | | (0.03 | ) | | | 0.13 | | | | (0.16 | ) | | | — | | | | (0.16 | ) | | | 10.25 | | | | 1.24 | | | | 28,317 | | | | 0.71 | | | | 0.71 | | | | 1.55 | | | | 26 | |
2016 | | | 10.30 | | | | 0.14 | | | | (0.02 | ) | | | 0.12 | | | | (0.14 | ) | | | — | | | | (0.14 | ) | | | 10.28 | | | | 1.18 | | | | 19,678 | | | | 0.76 | | | | 0.76 | | | | 1.33 | | | | 36 | |
2015 | | | 10.30 | | | | 0.11 | | | | — | | | | 0.11 | | | | (0.11 | ) | | | — | | | | (0.11 | ) | | | 10.30 | | | | 1.05 | | | | 19,026 | | | | 0.77 | | | | 0.77 | | | | 1.04 | | | | 52 | |
| *** | Six Months Ended January 31, 2020. |
| † | Total return is for the period indicated and has not been annualized. Returns shown do not reflect the deduction of taxes that a shareholder would pay on Fund distributions or the redemption of Fund shares. |
| ^ | Includes a return of capital of less than $0.01 per share. |
| (a) | Commenced operations on June 1, 2018. |
| (1) | Per share data calculated using the average shares method. |
Amounts designated as “—” are either $0 or have been rounded to $0.
The accompanying notes are an integral part of the financial statements.
47
| | |
| FROST FAMILY OF FUNDS | | F R O S T F U N D S |
For a Share Outstanding Throughout Each Period
For the Six Months Ended January 31, 2020 (Unaudited) and the Years Ended July 31,
| | | | | | | | | | | | | | | | | | | | | | | | | | | | | | | | | | | | | | | | | | | | | | | | | | | | | | | | |
| | | | | | | | | | | | | | | |
| | | Net Asset
Value,
Beginning
of Year | | | Net
Investment
Income(1) | | | Net Realized
and
Unrealized
Gains
(Losses) on
Investments | | | Total
From
Operations | | | Dividends
From Net
Investment
Income | | | Distributions
From
Realized
Gains | | | Total
Dividends
& Distributions | | | Net Asset
Value, End
of Year | | | Total
Return† | | | Net Assets
End of Year
(000) | | | Ratio of
Expenses
to Average
Net Assets | | | Expenses
to Average
Net Assets
(Excluding
Waivers and
Fees Paid
Indirectly) | | | Ratio of Net
Investment
Income
to Average
Net Assets | | | Portfolio
Turnover
Rate | |
| | | | | | | | | | | | | | | | | | | | | | | | | | | | | | | | | | | | | | | | | | | | | | | | | | | | | | | | |
Municipal Bond Fund | |
|
Institutional Class Shares | |
2020*** | | $ | 10.51 | | | $ | 0.11 | | | $ | 0.08 | | | $ | 0.19 | | | $ | (0.13 | ) | | $ | — | | | $ | (0.13 | ) | | $ | 10.57 | | | | 1.88 | %†† | | $ | 90,544 | | | | 0.42 | %* | | | 0.52 | %* | | | 2.02 | %* | | | 10 | %** |
2019 | | | 10.20 | | | | 0.24 | | | | 0.31 | | | | 0.55 | | | | (0.24 | ) | | | — | ^^ | | | (0.24 | ) | | | 10.51 | | | | 5.49 | %†† | | | 155,224 | | | | 0.41 | | | | 0.51 | | | | 2.31 | | | | 9 | |
2018 | | | 10.46 | | | | 0.24 | | | | (0.21 | ) | | | 0.03 | | | | (0.25 | ) | | | (0.04 | ) | | | (0.29 | ) | | | 10.20 | | | | 0.26 | †† | | | 167,105 | | | | 0.43 | | | | 0.53 | | | | 2.35 | | | | 3 | |
2017 | | | 10.70 | | | | 0.24 | | | | (0.24 | ) | | | — | | | | (0.24 | ) | | | — | | | | (0.24 | ) | | | 10.46 | | | | 0.00 | †† | | | 259,606 | | | | 0.42 | | | | 0.52 | | | | 2.28 | | | | 21 | |
2016 | | | 10.51 | | | | 0.26 | | | | 0.18 | | | | 0.44 | | | | (0.25 | ) | | | — | | | | (0.25 | ) | | | 10.70 | | | | 4.22 | †† | | | 265,697 | | | | 0.42 | | | | 0.52 | | | | 2.45 | | | | 5 | |
2015 | | | 10.52 | | | | 0.26 | | | | 0.01 | | | | 0.27 | | | | (0.27 | ) | | | (0.01 | ) | | | (0.28 | ) | | | 10.51 | | | | 2.52 | †† | | | 234,565 | | | | 0.42 | | | | 0.52 | | | | 2.49 | | | | 9 | |
|
Investor Class Shares | |
2020*** | | $ | 10.51 | | | $ | 0.09 | | | $ | 0.09 | | | $ | 0.18 | | | $ | (0.12 | ) | | $ | — | | | $ | (0.12 | ) | | $ | 10.57 | | | | 1.75 | %†† | | $ | 6,285 | | | | 0.67 | %* | | | 0.77 | %* | | | 1.77 | %* | | | 10 | %** |
2019 | | | 10.20 | | | | 0.21 | | | | 0.31 | | | | 0.52 | | | | (0.21 | ) | | | — | ^^ | | | (0.21 | ) | | | 10.51 | | | | 5.21 | %†† | | | 6,292 | | | | 0.66 | | | | 0.76 | | | | 2.07 | | | | 9 | |
2018 | | | 10.46 | | | | 0.22 | | | | (0.22 | ) | | | — | | | | (0.22 | ) | | | (0.04 | ) | | | (0.26 | ) | | | 10.20 | | | | 0.00 | †† | | | 4,071 | | | | 0.68 | | | | 0.78 | | | | 2.12 | | | | 3 | |
2017 | | | 10.70 | | | | 0.21 | | | | (0.24 | ) | | | (0.03 | ) | | | (0.21 | ) | | | — | | | | (0.21 | ) | | | 10.46 | | | | (0.25 | )†† | | | 5,440 | | | | 0.67 | | | | 0.77 | | | | 2.03 | | | | 21 | |
2016 | | | 10.50 | | | | 0.23 | | | | 0.19 | | | | 0.42 | | | | (0.22 | ) | | | — | | | | (0.22 | ) | | | 10.70 | | | | 4.06 | †† | | | 5,432 | | | | 0.67 | | | | 0.77 | | | | 2.18 | | | | 5 | |
2015 | | | 10.52 | | | | 0.24 | | | | (0.01 | ) | | | 0.23 | | | | (0.24 | ) | | | (0.01 | ) | | | (0.25 | ) | | | 10.50 | | | | 2.16 | †† | | | 3,906 | | | | 0.67 | | | | 0.77 | | | | 2.25 | | | | 9 | |
| | | | | | | | | | | | | | | | | | | | | | | | | | | | | | | | | | | | | | | | | | | | | | | | | | | | | | | | |
Global Bond Fund | |
|
Institutional Class Shares | |
2020**** | | $ | 10.00 | | | $ | 0.01 | | | $ | 0.01 | | | $ | 0.02 | | | $ | (0.01 | ) | | $ | — | | | $ | (0.01 | ) | | $ | 10.01 | | | | 0.22 | %†† | | $ | 1,034 | | | | 1.00 | %* | | | 27.66 | %*(2) | | | 0.50 | %* | | | 87 | %** |
|
Investor Class Shares | |
2020**** | | $ | 10.00 | | | $ | — | | | $ | 0.03 | | | $ | 0.03 | | | $ | (0.01 | ) | | $ | — | | | $ | (0.01 | ) | | $ | 10.02 | | | | 0.32 | %†† | | $ | — | (3) | | | 0.20 | %* | | | 3735.94 | %*(2) | | | (0.08 | )%* | | | 87 | %** |
|
A Class Shares | |
2020**** | | $ | 10.00 | | | $ | — | | | $ | 0.03 | | | $ | 0.03 | | | $ | (0.01 | ) | | $ | — | | | $ | (0.01 | ) | | $ | 10.02 | | | | 0.32 | %†† | | $ | — | (3) | | | 0.04 | %* | | | 3735.78 | %*(2) | | | 0.08 | %* | | | 87 | %** |
| *** | Six Months Ended January 31, 2020. |
| **** | Fund commenced operations on October 31, 2019. |
| † | Total return is for the period indicated and has not been annualized. Returns shown do not reflect the deduction of taxes that a shareholder would pay on Fund distributions or the redemption of Fund shares. |
| †† | Total return would have been lower had certain expenses not been waived and assumed by the Adviser during the period. |
| ^^ | Amount is less than $0.005 per share. |
| (1) | Per share data calculated using the average shares method. |
| (2) | Ratio reflects the impact of the low level of average Net Assets. |
| (3) | Amount is less than $500. |
Amounts designated as “—” are either $0 or have been rounded to $0.
The accompanying notes are an integral part of the financial statements.
48
| | |
| FROST FAMILY OF FUNDS | | F R O S T F U N D S | J A N U A R Y 3 1, 2 0 2 0 |
|
| NOTES TO FINANCIAL STATEMENTS (Unaudited) |
1. Organization:
The Frost Family of Funds (the “Trust”) is anopen-end investment management company established under Delaware law as a Delaware statutory trust under a Declaration of Trust dated December 11, 2018. The Frost Family of Funds include the Frost Growth Equity Fund (the “Growth Equity Fund”), Frost Value Equity Fund (the “Value Equity Fund”), Frost Mid Cap Equity Fund (the “Mid Cap Equity Fund”), Frost Total Return Bond Fund (the “Total Return Bond Fund”), Frost Credit Fund (the “Credit Fund”), Frost Low Duration Bond Fund (the “Low Duration Bond Fund”), Frost Municipal Bond Fund (the “Municipal Bond Fund”), and Frost Global Fund (“Global Bond Fund”) (each a “Fund” and, collectively, the “Funds”). Each Fund is classified as a “diversified” investment company under the 1940 Act. The Growth Equity Fund seeks to achieve long-term capital appreciation. The Value Equity Fund seeks to achieve long-term capital appreciation and current income. The Mid Cap Equity Fund seeks to maximize long-term capital appreciation. The Total Return Bond Fund, Credit Fund and Low Duration Bond Fund seek to maximize total return, consisting of income and capital appreciation, consistent with the preservation of principal. The Municipal Bond Fund seeks to provide a consistent level of current income exempt from federal income tax with a secondary emphasis on maximizing total return through capital appreciation. The Global Bond Fund seeks to maximize total return, consisting of income and capital appreciation. The Funds may change their investment objective without shareholder approval. The assets of each Fund of the Trust are segregated, and a shareholder’s interest is limited to the Fund in which shares are held. Certain of the Funds currently offer Institutional Class Shares, Investor Class Shares and A Class Shares.
Each Fund, except for the Global Bond Fund, is a successor to a corresponding predecessor mutual fund of the same name that was a series of The Advisors’ Inner Circle Fund II (each, a “Predecessor Fund” and, collectively, the “Predecessor Funds”). Each Predecessor Fund was managed by Frost Investment Advisors, LLC (the “Adviser” or “Frost”) using substantially the same investment objectives, strategies, policies and restrictions as those used by its corresponding Fund. Each Predecessor Fund was reorganized into its corresponding Fund on June 24, 2019 in connection with each Fund’s commencement of operations (each, a “Reorganization”). Each Predecessor Fund is treated as the survivor of the relevant Reorganization for accounting and performance reporting purposes. Accordingly, all performance and other information shown for the Funds (excluding the Global Bond Fund) for periods prior to June 24, 2019 is that of the Predecessor Funds.
2. Significant Accounting Policies:
The following are significant accounting policies, which are consistently followed in preparation of the financial statements of the Funds. The Funds are investment companies that apply the accounting and reporting guidance issued in Topic 946 by the U.S. Financial Accounting Standards Board (“FASB”).
Use of Estimates — The preparation of financial statements, in conformity with U.S. generally accepted accounting principles (“U.S. GAAP”), requires management to make estimates and assumptions that affect the reported amounts of assets and liabilities and disclosure of contingent assets and liabilities at the date of the financial statements and the reported amounts of increases and decreases in net assets from operations during the reporting period. Actual results could differ from those estimates and such differences could be material.
Security Valuation — Securities listed on a securities exchange, market or automated quotation system for which quotations are readily available (except for securities traded on NASDAQ), including securities traded over the counter, are valued at the last quoted sale price on an exchange or market (foreign or domestic) on which they are traded on the valuation date (or at approximately 4:00 p.m. Eastern Time if such exchange is normally open at that time), or, if there is no such reported sale on the valuation date, at the most recent quoted bid price. For securities traded on NASDAQ, the NASDAQ Official Closing Price will be used. Debt securities are priced based upon valuations provided by independent, third-party pricing agents, if avail- able. Such values generally reflect the last reported sales price if the security is actively traded. The third-party pricing agents may also value debt securities at an evaluated bid price by employing methodologies that utilize actual market transactions, broker-supplied valuations, or other methodologies designed to identify the market value for such securities. Such methodologies generally consider such factors as security prices, yields, maturities, call features, ratings and developments relating to specific securities in arriving at valuations. On the first day a new debt security purchase is recorded, if a price is not avail- able on the automated pricing feeds from the primary and secondary pricing vendors nor is it available from an independent broker, the security may be valued at its purchase price. Each day thereafter, the debt security will be valued according to the Trust’s fair value procedures until an independent source can be secured. Debt obligations with remaining maturities of sixty days or less may be valued at their amortized cost, which approximates market value provided that it is determined the amortized cost continues to approximate fair value. Should existing credit, liquidity or interest rate conditions in the relevant markets and issuer specific circumstances suggest that amortized cost does not approximate fair value, then the amortized
49
| | |
| FROST FAMILY OF FUNDS | | F R O S T F U N D S | J A N U A R Y 3 1, 2 0 2 0 |
cost method may not be used. The prices for foreign securities are reported in local currency and converted to U.S. dollars using currency exchange rates.
Exchange-traded registered investment companies are valued at the closing price from the primary exchange.
Open-end investment companies held in the Funds’ portfolios are valued at the published net asset value.
Securities for which market prices are not “readily available” are valued in accordance with fair value procedures established by the Funds’ Board of Trustees (the “Board”). The Funds’ fair value procedures are implemented through a fair value pricing committee (the “Committee”) designated by the Board. Some of the more common reasons that may necessitate that a security be valued using fair value procedures include: the security’s trading has been halted or suspended; the security has beende-listed from a national exchange; the security’s primary trading market is temporarily closed at a time when under normal conditions it would be open; the security has not been traded for an extended period of time; the security’s primary pricing source is not able or willing to provide a price; or trading of the security is subject to local government-imposed restrictions. When a security is valued in accordance with the fair value procedures, the Committee will determine its value after taking into consideration relevant information reasonably available to the Committee.
For securities that principally trade on a foreign market or exchange, a significant gap in time can exist between the time of a particular security’s last trade and the time at which a Fund calculates its net asset value. The closing prices of such securities may no longer reflect their market value at the time a Fund calculates net asset value if an event that could materially affect the value of those securities (a “Significant Event”) has occurred between the time of the security’s last close and the time that a Fund calculates net asset value. A Significant Event may relate to a single issuer or to an entire market sector. If the Adviser becomes aware of a Significant Event that has occurred with respect to a security or group of securities after the closing of the exchange or market on which the security or securities principally trade, but before the time at which a Fund calculates net asset value, it may request that a Committee meeting be called. In addition, SEI Investments Global Funds Services (the “Administrator”), a wholly owned subsidiary of SEI Investments Company, monitors price movements among certain selected indices, securities and/or baskets of securities that may be an indicator that the closing prices received earlier from foreign exchanges or markets may not reflect market value at the time a Fund calculates net asset value. If price movements in a monitored index or security exceed levels established by the Administrator, the Administrator notifies the Adviser if a Fund is holding a relevant security that such limits have been exceeded. In such event, the Adviser makes the determination whether a Committee meeting should be called based on the information provided.
In accordance with the authoritative guidance on fair value measurements and disclosure under U.S. GAAP, the Fundsdis- close fair value of their investments in a hierarchy that prioritizes the inputs to valuation techniques used to measure the fair value. The objective of a fair value measurement is to determine the price that would be received to sell an asset or paid to transfer a liability in an orderly transaction between market participants at the measurement date (an exit price). Accordingly, the fair value hierarchy gives the highest priority to quoted prices (unadjusted) in active markets for identical assets or liabilities (Level 1) and the lowest priority to unobservable inputs (Level 3).
The three levels of the fair value hierarchy are described below:
| | • | | Level 1 — Unadjusted quoted prices in active markets for identical, unrestricted assets or liabilities that the Funds have the ability to access at the measurement date; |
| | • | | Level 2 — Quoted prices which are not active, or inputs that are observable (either directly or indirectly) for substantially the full term of the asset or liability; and |
| | • | | Level 3 — Prices, inputs or exotic modeling techniques which are both significant to the fair value measurement and unobservable (supported by little or no market activity). |
Investments are classified within the level of the lowest significant input considered in determining fair value. Investments classified within Level 3 whose fair value measurement considers several inputs may include Level 1 or Level 2 inputs as components of the overall fair value measurement.
For the period ended January 31, 2020, there have been no changes to the Funds’ fair value methodologies.
Federal Income Taxes — It is each Fund’s intention to continue to qualify as a regulated investment company underSub- chapter M of the Internal Revenue Code and to distribute substantially all of its taxable income. Accordingly, no provision for Federal income taxes has been made in the financial statements.
The Funds evaluate tax positions taken or expected to be taken in the course of preparing the Funds’ tax returns to determine whether it is“more-likely-than-not” (i.e., greater than50-percent) that each tax position will be sustained upon
50
| | |
| FROST FAMILY OF FUNDS | | F R O S T F U N D S | J A N U A R Y 3 1, 2 0 2 0 |
examination by a taxing authority based on the technical merits of the position. Tax positions not deemed to meet the more-likely-than-not threshold are recorded as a tax benefit or expense in the current year. The Funds did not record any tax provision in the current period. However, management’s conclusions regarding tax positions taken may be subject to review and adjustment at a later date based on factors including, but not limited to, examination by tax authorities (i.e., the last 3 tax year ends, as applicable),on-going analysis of and changes to tax laws, regulations and interpretations thereof.
As of and during the period ended January 31, 2020, the Funds did not have liabilities for any unrecognized tax benefits. The Funds recognize interest and penalties, if any, related to unrecognized tax benefits as income tax expense on the Statement of Operations. During the period ended January 31, 2020, the Funds did not incur any interest or penalties.
Security Transactions and Investment Income — Security transactions are accounted for on trade date for financial reporting purposes. Costs used in determining realized gains and losses on the sales of investment securities are based on the specific identification method. Dividend income is recognized on theex-dividend date, interest income is recognized on an accrual basis and includes the amortization of premiums and the accretion of discount. Realized gains (losses) on paydowns of mortgage-backed and asset-backed securities are recorded as an adjustment to interest income.
Repurchase Agreements — In connection with transactions involving repurchase agreements, a third party custodian bank takes possession of the underlying securities (“collateral”), the value of which exceeds the principal amount of the repurchase transaction, including accrued interest. Such collateral will be cash, debt securities issued or guaranteed by the U.S. Government, securities that at the time the repurchase agreement is entered into are rated in the highest category by a nationally recognized statistical rating organization (“NRSRO”) or unrated category by an NRSRO, as determined by the Adviser. In the event of default on the obligation to repurchase, the Funds have the right to liquidate the collateral and apply the proceeds in satisfaction of the obligation. In the event of default or bankruptcy by the counterparty to the agreement, realization and/or retention of the collateral or proceeds may be subject to legal proceedings.
Expenses — Expenses of the Trust that can be directly attributed to a particular fund are borne by that fund. Expenses which cannot be directly attributed to a fund are apportioned among the funds of the Trust based on the number of funds and/or relative net assets.
Classes — Class specific expenses are borne by the specific class of shares. Income, realized and unrealized gain (loss), andnon-class specific expenses are allocated to the respective class on the basis of relative daily net assets.
Dividends and Distributions to Shareholders — The Growth Equity Fund and Mid Cap Equity Fund each distribute their net investment income and make distributions of their net realized capital gains, if any, at least annually. The Value Equity Fund, Total Return Bond Fund, Credit Fund, Low Duration Bond Fund, Municipal Bond Fund, and Global Bond Fund each distribute their net investment income monthly, as available, and make distributions of their net realized capital gains, if any, at least annually.
Line of Credit — The Funds entered into an agreement which enables them to participate in a $100 million unsecured committed revolving line of credit on a first come, first serve basis, with MUFG Union Bank, N.A. (the “Custodian”) which expires June 30, 2020. The proceeds from the borrowings shall be used to finance the Funds’ short-term general working capital requirements, including the funding of shareholder redemptions. Interest is charged to the Funds based on their borrowings during the year at the Custodian’s current reference rate. As of January 31, 2020, there were no borrowingsout- standing. Listed below are Funds which had borrowings during the period ended January 31, 2020:
| | | | | | | | | | | | | | | | | | | | |
| | | Maximum
Amount
Borrowed | | | Number
of Days
Outstanding | | | Average
Outstanding
Balance | | | Daily
Weighted
Average
Interest Rate | | | Interest
Paid | |
Value Equity Fund | | $ | 1,339,708 | | | | 15 | | | $ | 127,226 | | | | 4.95 | % | | $ | 300 | |
Mid Cap Equity Fund | | | 246,874 | | | | 9 | | | | 133,433 | | | | 4.94 | | | | 163 | |
3. Transactions with Affiliates:
Certain officers and a trustee of the Trust are also employees of the Administrator, and/or SEI Investments Distribution Co. (the “Distributor”). Such officers and the trustee are paid no fees by the Trust for serving as officers and trustee of the Trust. A portion of the services provided by the Chief Compliance Officer (“CCO”) and his staff, whom are the employees of the Administrator, are paid for by the Trust as incurred. The services include regulatory oversight of the Trust’s advisers and service providers as required by SEC regulations. The CCO’s services have been approved by and are reviewed by the Board.
51
| | |
| FROST FAMILY OF FUNDS | | F R O S T F U N D S | J A N U A R Y 3 1, 2 0 2 0 |
4. Administration, Distribution, Shareholder Servicing, Transfer Agent and Custodian Agreements:
The Funds and the Administrator are parties to an Administration Agreement under which the Administrator provides administrative services to the Fund. For these services, the Administrator is paid an asset-based fee, which will vary depending on the number of share classes and the average daily net assets of the Funds. For the period ended January 31, 2020, the Funds were charged as follows for these services: $124,040 in the Growth Equity Fund, $7,737 in the Value Equity Fund, $1,081 in the Mid Cap Equity Fund, $1,400,843 in the Total Return Bond Fund, $80,333 in the Credit Fund, $127,366 in the Low Duration Bond Fund, $57,560 in the Municipal Bond Fund, and $18,887 in the Global Bond Fund.
The Funds have adopted a Distribution Plan (the “Plan”) for the Investor Class Shares and A Class Shares. Under the Plan, the Distributor, or third parties that enter into agreements with the Distributor, may receive up to 0.25% of each Fund’s average net assets attributable to the Investor Class Shares and A Class Shares as compensation for distribution services.
The Funds have adopted a shareholder servicing plan that provides that the Funds may pay financial intermediaries for share- holder services in an annual amount not to exceed 0.15% based on the average daily net assets of the Funds’ A Class Shares. The services for which financial intermediaries are compensated may include record-keeping, transaction processing for share- holders’ accounts and other shareholder services.
DST Systems, Inc. serves as the transfer agent and dividend disbursing agent for the Funds under a transfer agency agreement with the Trust. The Funds may earn cash management credits which can be used to offset transfer agent expenses. These credit amounts are listed as “Fees Paid Indirectly” on the Statements of Operations.
MUFG Union Bank, N.A. serves as Custodian for the Funds. The Custodian plays no role in determining the investment policies of the Funds or which securities are to be purchased or sold by the Funds.
5. Investment Advisory Agreement:
The Adviser serves as the investment adviser to the Funds. The Adviser is a wholly ownednon-banking subsidiary of Cullen/ Frost Bankers, Inc. (“Frost Bank”). For its services, the Adviser is entitled to a fee, which is calculated daily and paid monthly, at the following annual rates based on the average daily net assets of each Fund. The Adviser has contractually agreed to reduce its fees and/or reimburse expenses for certain Funds to the extent necessary to keep total annual Fund operating expenses from exceeding certain levels as set forth below until June 24, 2021 (the “Contractual Expense Limitation”) for the Growth Equity Fund, Value Equity Fund, Mid Cap Equity Fund, Total Return Bond Fund, Credit Fund and Low Duration Bond Fund. The Adviser is entitled to the same fee for its services to each Predecessor Fund as it is for each Predecessor Fund’s corresponding Fund. In addition, the Adviser agreed to the same Contractual Expense Limitation and Voluntary Expense Limitation, as applicable, for each Predecessor Fund as with its corresponding Fund. The Adviser has also contractually agreed to reduce its fees and/or reimburse expenses for the Global Bond Fund to the extent necessary to keep total annual Fund operating expenses from exceeding certain levels as set forth below until November 30, 2020.
The table below shows the rate of each Fund’s investment advisory fee and the Adviser’s Contractual Expense Limitation for each Fund:
| | | | | | | | |
| Fund | | Advisory Fee
Before
Contractual Fee
Reduction | | Institutional
Class Shares Contractual Expense
Limitation | | Investor
Class Shares
Contractual Expense
Limitation | | A Class Shares
Contractual Expense
Limitation |
| | | | |
Growth Equity Fund† | | 0.50% | | 1.25% | | 1.50% | | N/A |
| | | | |
Value Equity Fund† | | 0.50% | | 1.25% | | 1.50% | | N/A |
| | | | |
Mid Cap Equity Fund† | | 0.50% | | 1.55% | | 1.80% | | N/A |
| | | | |
Total Return Bond Fund | | 0.35% | | 0.95% | | 1.20% | | 1.35% |
| | | | |
Credit Fund†† | | 0.50% | | 1.00% | | 1.25% | | 1.40% |
| | | | |
Low Duration Bond Fund | | 0.30% | | 0.95% | | 1.20% | | N/A |
| | | | |
Global Bond Fund | | 0.50% | | 1.00% | | 1.25% | | 1.40% |
| † | Prior to September 1, 2017, the investment advisory fee was 0.65%. |
| †† | Prior to September 1, 2017, the investment advisory fee was 0.60%. |
The Adviser has voluntarily agreed to reduce its investment advisory fees for the Municipal Bond Fund as set forth below (“Voluntary Fee Reduction”). In addition, the Adviser has voluntarily agreed to further reduce its fees and/or reimburse expenses to the extent necessary to keep from exceeding certain levels as set forth below (“Voluntary Expense Limitation”). The Adviser may discontinue all or part of these fee reductions or reimbursements at any time.
52
| | |
| FROST FAMILY OF FUNDS | | F R O S T F U N D S | J A N U A R Y 3 1, 2 0 2 0 |
The table below shows the rate of the Municipal Bond Fund’s investment advisory fee and the Adviser’s Voluntary Fee Reduction and Voluntary Expense Limitation.
| | | | | | | | |
| Fund | | Advisory Fee
Before
Voluntary Fee
Reduction | | Adviser’s
Voluntary
Fee
Reduction | | Institutional
Class Shares Voluntary Expense
Limitation | | Investor Class Shares
Voluntary Expense
Limitation |
| | | | |
Municipal Bond Fund | | 0.35% | | 0.10% | | 1.05% | | 1.30% |
If at any point it becomes unnecessary for the Adviser to make Expense Limitation reimbursements, the Adviser may retain the difference between the “Total Annual Fund Operating Expenses” and the aforementioned Expense Limitations to recapture all or a portion of its prior Expense Limitation reimbursements made during the preceding three year period up to the expense cap in place at the time the expenses were waived. The Adviser, however, will not be permitted to recapture any amount that is attributable to its Voluntary Fee Reduction. During the period ended January 31, 2020, the Adviser did not recapture previously waived/reimbursed fees for the Funds. As of January 31, 2020, the Mid Cap Equity Fund and Global Bond Fund had $44,469 and $66,033, respectively, of advisory fees waived which may be recouped by the Advisor through their expiration in 2022. A liability was not recorded as of January 31, 2020 due to the Advisor’s assessment this recoupment is unlikely.
6. Investment Transactions:
The cost of security purchases and the proceeds from the sales and maturities of securities, other than short-term investments, for the period ended January 31, 2020 were as follows:
| | | | | | | | | | | | |
| | | U.S. Government | | | Other | | | Total | |
| | | |
Growth Equity Fund | | | | | | | | | | | | |
| Purchases | | $ | — | | | $ | 34,678,550 | | | $ | 34,678,550 | |
| Sales | | | — | | | | 39,240,639 | | | | 39,240,639 | |
| | | |
Value Equity Fund | | | | | | | | | | | | |
| Purchases | | | — | | | | 7,360,620 | | | | 7,360,620 | |
| Sales | | | — | | | | 22,845,586 | | | | 22,845,586 | |
| | | |
Mid Cap Equity Fund | | | | | | | | | | | | |
| Purchases | | | — | | | | 608,198 | | | | 608,198 | |
| Sales | | | — | | | | 2,935,666 | | | | 2,935,666 | |
| | | |
Total Return Bond Fund | | | | | | | | | | | | |
| Purchases | | | 282,647,275 | | | | 480,862,915 | | | | 763,510,190 | |
| Sales | | | 182,918,609 | | | | 332,171,367 | | | | 515,089,976 | |
| | | | | | | | | | | | |
| | | U.S. Government | | | Other | | | Total | |
| | | |
Credit Fund | | | | | | | | | | | | |
| Purchases | | $ | — | | | $ | 31,807,725 | | | $ | 31,807,725 | |
| Sales | | | — | | | | 23,044,312 | | | | 23,044,312 | |
| | | |
Low Duration Bond Fund | | | | | | | | | | | | |
| Purchases | | | 122,977,591 | | | | 64,240,008 | | | | 187,217,599 | |
| Sales | | | 114,343,710 | | | | 46,066,559 | | | | 160,410,269 | |
| | | |
Municipal Bond Fund | | | | | | | | | | | | |
| Purchases | | | — | | | | 12,384,374 | | | | 12,384,374 | |
| Sales | | | — | | | | 60,930,708 | | | | 60,930,708 | |
| | | |
Global Bond Fund | | | | | | | | | | | | |
| Purchases | | | 947,959 | | | | 293,441 | | | | 1,241,400 | |
| Sales | | | 599,285 | | | | — | | | | 599,285 | |
The Funds may purchase or sell investment securities in transactions with affiliated entities under procedures adopted by the Board, pursuant to Rule17a-7 of the 1940 Act. These transactions are effected at market rates without incurring broker commissions. During the period ended January 31, 2020, there were no17a-7 transactions.
7. Federal Tax Information:
The timing and characterization of certain income and capital gains distributions are determined annually in accordance with federal tax regulations which may differ from U.S. generally accepted accounting principles. As a result, net investment income (loss) and net realized gain (loss) on investment transactions for a reporting period may differ significantly from distributions during such period. These book/tax differences may be temporary or permanent in nature. To the extent these differences are permanent, they are charged or credited to distributable earnings orpaid-in capital, as appropriate, in the period that the differences arise. During the year ended July 31, 2019, there were no such permanent reclassifications.
The tax character of dividends and distributions declared during the years ended July 31, 2019 and July 31, 2018 was as follows:
| | | | | | | | | | | | | | | | | | | | |
| | | Tax Exempt | | | Ordinary
Income | | | Long-Term
Capital Gains | | | Return of
Capital | | | Total | |
Growth Equity Fund | | | | | | | | | | | | | | | | | | | | |
2019 | | $ | — | | | $
| 792,945
|
| | $ | 38,925,590 | | | $ | — | | | $ | 39,718,535 | |
2018 | | | — | | | | 2,140,905 | | | | 66,489,932 | | | | — | | | | 68,630,837 | |
Value Equity Fund | | | | | | | | | | | | | | | | | | | | |
2019 | | | — | | | | 1,288,977 | | | | 8,800,154 | | | | — | | | | 10,089,131 | |
2018 | | | — | | | | 1,879,241 | | | | 7,090,261 | | | | — | | | | 8,969,502 | |
53
| | |
| FROST FAMILY OF FUNDS | | F R O S T F U N D S | J A N U A R Y 3 1, 2 0 2 0 |
| | | | | | | | | | | | | | | | | | | | |
| | | Tax Exempt | | | Ordinary
Income | | | Long-Term
Capital Gains | | | Return of
Capital | | | Total | |
Mid Cap Equity Fund | | | | | | | | | | | | | | | | | | | | |
2019 | | $ | — | | | $ | 170,406 | | | $ | 2,273,195 | | | $ | — | | | $ | 2,443,601 | |
2018 | | | — | | | | 106,520 | | | | 2,287,565 | | | | — | | | | 2,394,085 | |
Total Return Bond Fund | | | | | | | | | | | | | | | | | | | | |
2019 | | | — | | | | 118,764,303 | | | | — | | | | — | | | | 118,764,303 | |
2018 | | | — | | | | 89,599,810 | | | | 2,753,642 | | | | — | | | | 92,353,452 | |
Credit Fund | | | | | | | | | | | | | | | | | | | | |
2019 | | | — | | | | 10,589,414 | | | | 753,974 | | | | — | | | | 11,343,388 | |
2018 | | | — | | | | 9,436,328 | | | | 2,211,045 | | | | — | | | | 11,647,373 | |
Low Duration Bond Fund | | | | | | | | | | | | | | | | | | | | |
2019 | | | — | | | | 6,717,942 | | | | — | | | | — | | | | 6,717,942 | |
2018 | | | — | | | | 5,332,442 | | | | — | | | | 123,530 | | | | 5,455,972 | |
Municipal Bond Fund | | | | | | | | | | | | | | | | | | | | |
2019 | | | 3,585,302 | | | | 215,090 | | | | — | | | | — | | | | 3,800,392 | |
2018 | | | 4,691,519 | | | | 71,882 | | | | 866,538 | | | | — | | | | 5,629,939 | |
As of July 31, 2019, the components of distributable earnings (accumulated losses) on a tax basis were as follows:
| | | | | | | | | | | | | | | | | | | | | | | | | | | | | | | | | | | | |
| | | Undistributed
Ordinary Income | | | Undistributed
Tax-Exempt
Income | | | Undistributed
Long-Term
Capital
Gain | | | Capital Loss
Carryforwards | | | Post-October
Loss | | | Late-Year
Losses
Deferral | | | Unrealized
Appreciation
(Depreciation) | | | Other
Temporary
Differences | | | Earnings
(Accumulated
Losses) | |
Growth Equity Fund | | $ | 560,769 | | | $ | — | | | $ | 23,520,604 | | | $ | — | | | $ | — | | | $ | — | | | $ | 149,347,559 | | | $ | 5 | | | $ | 173,428,937 | |
Value Equity Fund | | | 16,695 | | | | — | | | | 1,297,572 | | | | — | | | | — | | | | — | | | | 2,256,378 | | | | 3 | | | | 3,570,648 | |
Mid Cap Equity Fund | | | — | | | | — | | | | 652,227 | | | | — | | | | — | | | | — | | | | 412,095 | | | | 2 | | | | 1,064,324 | |
Total Return Bond Fund | | | 197,689 | | | | — | | | | — | | | | (9,979,178 | ) | | | (17,434,191 | ) | | | — | | | | (2,843,414 | ) | | | 19 | | | | (30,059,075 | ) |
Credit Fund | | | 19,447 | | | | — | | | | — | | | | — | | | | (3,075,517 | ) | | | — | | | | (78,642 | ) | | | (3 | ) | | | (3,134,715 | ) |
Low Duration Bond Fund | | | 171,263 | | | | — | | | | — | | | | (1,560,644 | ) | | | (37,965 | ) | | | — | | | | 2,016,006 | | | | 6 | | | | 588,666 | |
Municipal Bond Fund | | | — | | | | 81,144 | | | | 27,584 | | | | — | | | | — | | | | — | | | | 3,497,820 | | | | (3 | ) | | | 3,606,545 | |
Post-October capital losses represent capital losses realized on investment transactions from November 1, 2018 through July 31, 2019, that, in accordance with Federal income tax regulations, the Funds may elect to defer and treat as having arisen in the following fiscal year.
Deferred late-year losses represent ordinary losses realized on investment transactions from January 1, 2019 through July 31, 2019 and specified losses realized on investment transactions from November 1, 2018 through July 31, 2019, that, in accordance with Federal income tax regulations, the Funds may elect to defer and treat as having arisen in the following fiscal year.
Under the Regulated Investment Company Modernization Act of 2010, the Funds are permitted to carry forward capital losses incurred in taxable years beginning after December 22, 2010 for an unlimited period. Additionally, post-enactment capital losses that are carried forward will retain their character as either short-term or long-term capital losses rather than being considered all short-term as under previous law. Losses carried forward under these new provisions are as follows:
| | | | | | | | | | | | |
| | | Short-Term Loss | | | Long -Term Loss | | | Total | |
Total Return Bond Fund | | $ | — | | | $ | 9,979,178 | | | $ | 9,979,178 | |
Low Duration Bond Fund | | | 1,293,712 | | | | 266,932 | | | | 1,560,644 | |
54
| | |
| FROST FAMILY OF FUNDS | | F R O S T F U N D S | J A N U A R Y 3 1, 2 0 2 0 |
The Federal tax cost and aggregate gross unrealized appreciation and depreciation on investments held by the Funds at January 31, 2020 were as follows:
| | | | | | | | | | | | | | | | |
| | | Federal Tax Cost | | | Appreciated
Securities | | | Depreciated
Securities | | | Net Unrealized
Appreciation
(Depreciation) | |
Growth Equity Fund | | $ | 183,668,358 | | | $ | 168,681,155 | | | $ | — | | | $ | 168,681,155 | |
Value Equity Fund | | | 13,181,940 | | | | 1,559,862 | | | | (439,244 | ) | | | 1,120,618 | |
Mid Cap Equity Fund | | | 1,780,080 | | | | 232,913 | | | | (62,050 | ) | | | 170,863 | |
Total Return Bond Fund | | | 3,963,438,665 | | | | 121,060,732 | | | | (121,172,068 | ) | | | (111,336 | ) |
Credit Fund | | | 220,106,993 | | | | 6,022,472 | | | | (4,297,445 | ) | | | 1,725,027 | |
Low Duration Bond Fund | | | 352,678,570 | | | | 4,596,596 | | | | (20,932 | ) | | | 4,575,664 | |
Municipal Bond Fund | | | 92,437,961 | | | | 3,746,822 | | | | — | | | | 3,746,822 | |
Global Bond Fund | | | 1,021,440 | | | | 2,596 | | | | (1,519 | ) | | | 1,077 | |
8. Risks:
Asset-Backed and Mortgage-Backed Securities Risk (Total Return Bond Fund, Credit Fund, Low Duration Bond Fund, Global Bond Fund): Payment of principal and interest on asset-backed securities is dependent largely on the cash flows generated by the assets backing the securities, and asset-backed securities may not have the benefit of any security interest in the related assets, which raises the possibility that recoveries on repossessed collateral may not be available to support payments on these securities. Asset-backed securities are also subject to the risk that underlying borrowers will be unable to meet their obligations. To lessen the effect of failures by obligors on underlying assets to make payments, the entity administering the pool of assets may agree to ensure the receipt of payments on the underlying pool occurs in a timely fashion (“liquidity protection”). In addition, asset-backed securities may obtain insurance, such as guarantees, policies or letters of credit obtained by the issuer or sponsor from third parties, for some or all of the assets in the pool (“credit support”). Delinquency or loss more than that anticipated or failure of the credit support could adversely affect the return on an investment in such a security.
Mortgage-backed securities are affected by, among other things, interest rate changes and the possibility of prepayment of the underlying mortgage loans. Mortgage-backed securities are also subject to the risk that underlying borrowers will be unable to meet their obligations. In addition, a variety of economic, geographic, social and other factors, such as the sale of the under- lying property, refinancing or foreclosure, can cause investors to repay the loans underlying a mortgage-backed security sooner than expected. If the prepayment rates increase, the Fund may have to reinvest its principal at a rate of interest that is lower than the rate on existing mortgage-backed securities.
Convertible Securities Risk (Mid Cap Equity Fund): The value of a convertible security is influenced by changes in interest rates (with investment value declining as interest rates increase and increasing as interest rates decline) and the credit standing of the issuer. The price of a convertible security will also normally vary in some proportion to changes in the price of the under- lying common stock because of the conversion or exercise feature.
Collateralized Loan Obligations Risk (Credit Fund, Global Bond Fund, Low Duration Bond Fund, Total Return Bond Fund): Collateralized loan obligations are investment vehicles typically collateralized by a pool of loans, which may include, among others, senior secured loans, senior unsecured loans, and subordinate corporate loans, including loans that may be rated below investment grade or equivalent unrated loans. Collateralized loan obligations are subject to the risks of substantial losses due to actual defaults by borrowers of the loans underlying the collateralized loan obligations, which will be greater during periods of economic or financial stress. Collateralized loan obligations may also lose value due to collateral defaults and disappearance of subordinate tranches, market anticipation of defaults, and investor aversion to collateralized loan obligation securities as a class. The Fund may invest in collateralized loan obligations that hold loans of uncreditworthy borrowers or in subordinate tranches of a collateralized loan obligation, which may absorb losses from underlying borrower defaults before senior tranches. Investments in such collateralized loan obligations present a greater risk of loss. In addition, collateralized loan obligations are subject to interest rate risk and credit risk.
Credit Risk (Total Return Bond Fund, Credit Fund, Low Duration Bond Fund, Municipal Bond Fund, Global Bond Fund): The credit rating or financial condition of an issuer may affect the value of a debt security. Generally, the lower the quality rating of a security, the greater the risk that the issuer will fail to pay interest fully and return principal in a timely manner. If an issuer defaults or becomes unable to honor its financial obligations, the security may lose some or all of its value. The issuer of an investment-grade security is more likely to pay interest and repay principal than an issuer of a lower rated bond. Adverse economic conditions or changing circumstances, however, may weaken the capacity of the issuer to pay interest and repay principal.
55
| | |
| FROST FAMILY OF FUNDS | | F R O S T F U N D S | J A N U A R Y 3 1, 2 0 2 0 |
U.S. government securities are not guaranteed against price movements due to changing interest rates. Obligations issued by some U.S. government agencies are backed by the U.S. Treasury, while others are backed solely by the ability of the agency to borrow from the U.S. Treasury or by the government sponsored agency’s own resources. As a result, investments in securities issued by government sponsored agencies that are not backed by the U.S. Treasury are subject to higher credit risk than those that are.
High yield, or “junk,” bonds are highly speculative securities that are usually issued by smaller less credit worthy and/or highly leveraged (indebted) companies. Compared with investment-grade bonds, high yield bonds carry a greater degree of risk and are less likely to make payments of interest and principal. Market developments and the financial and business conditions of the corporation issuing these securities influences their price and liquidity more than changes in interest rates, when compared to investment-grade debt securities. Insufficient liquidity in the junk bond market may make it more difficult to dispose of junk bonds and may cause the Fund to experience sudden and substantial price declines. A lack of reliable, objective data or market quotations may make it more difficult to value junk bonds accurately.
Currency Risk (Global Bond Fund): As a result of the Fund’s investments in securities denominated in, and/or receiving revenues in, foreign currencies, the Fund will be subject to currency risk. Currency risk is the risk that foreign currencies will decline in value relative to the U.S. dollar or, in the case of hedging positions, that the U.S. dollar will decline in value relative to the currency hedged. In either event, the dollar value of an investment in the Fund would be adversely affected. Currency exchange rates may fluctuate in response to, among other things, changes in interest rates, intervention (or failure to intervene) by U.S. or foreign governments, central banks or supranational entities, or by the imposition of currency controls or other political developments in the United States or abroad.
Derivatives Risk (Global Bond Fund): The Fund’s use of options, futures contracts and swaps is subject to market risk, leverage risk, correlation risk and liquidity risk. Market risk, leverage risk and liquidity risk are described elsewhere in this section. Many over-the-counter (OTC) derivative instruments will not have liquidity beyond the counterparty to the instrument. Correlation risk is the risk that changes in the value of the derivative may not correlate perfectly with the underlying asset, rate or index. The Fund’s use of swap agreements is also subject to credit risk and valuation risk. Valuation risk is the risk that the derivative may be difficult to value and/or valued incorrectly. Credit risk is described elsewhere in this section. Each of these risks could cause the Fund to lose more than the principal amount invested in a derivative instrument. Some derivatives have the potential for unlimited loss, regardless of the size of the Fund’s initial investment. The other parties to certain derivative contracts present the same types of credit risk as issuers of fixed income securities. The Fund’s use of derivatives may also increase the amount of taxes payable by shareholders. Both U.S. and non-U.S. regulators are in the process of adopting and implementing regulations governing derivatives markets, the ultimate impact of which remains unclear.
Equity Risk (Growth Equity Fund, Value Equity Fund, Mid Cap Equity Fund): Since they purchase equity securities, the Funds are subject to the risk that stock prices will fall over short or extended periods of time. Historically, the equity markets have moved in cycles, and the value of each Fund’s equity securities may fluctuate drastically from day to day. Individual companies may report poor results or be negatively affected by industry and/or economic trends and developments. The prices of securities issued by such companies may suffer a decline in response. These factors contribute to price volatility, which is the principal risk of investing in each Fund.
Foreign Company/Emerging Markets Risk (Global Bond Fund): Investing in foreign companies poses additional risks since political and economic events unique to a country or region will affect those markets and their issuers. These risks will not necessarily affect the U.S. economy or similar issuers located in the United States. In addition, investments in foreign companies are generally denominated in a foreign currency. As a result, changes in the value of those currencies compared to the U.S. dollar may affect (positively or negatively) the value of the Fund’s investments. These currency movements may occur separately from, and in response to, events that do not otherwise affect the value of the security in the issuer’s home country. Securities of foreign companies may not be registered with the U.S. Securities and Exchange Commission (“SEC”) and foreign companies are generally not subject to the regulatory controls imposed on U.S. issuers and, as a consequence, there is generally less publicly available information about foreign securities than is available about domestic securities. Income from foreign securities owned by the Fund may be reduced by a withholding tax at the source, which tax would reduce income received from the securities comprising the Fund’s portfolio. Foreign securities may also be more difficult to value than securities of U.S. issuers. These additional risks may be heightened with respect to emerging market countries because political turmoil and rapid changes in economic conditions are more likely to occur in these countries.
Foreign Company Risk (Growth Equity Fund, Value Equity Fund, Credit Fund, Global Bond Fund): Investing in foreign companies, whether through investments made in foreign markets or made through the purchase of ADRs, which are traded on U.S. exchanges and represent an ownership in a foreign security, poses additional risks since political and economic events unique
56
| | |
| FROST FAMILY OF FUNDS | | F R O S T F U N D S | J A N U A R Y 3 1, 2 0 2 0 |
to a country or region will affect those markets and their issuers. These risks will not necessarily affect the U.S. economy or similar issuers located in the United States. In addition, investments in foreign companies are generally denominated in a foreign currency. As a result, changes in the value of those currencies compared to the U.S. dollar may affect (positively or negatively) the value of a Fund’s investments. These currency movements may occur separately from, and in response to, events that do not otherwise affect the value of the security in the issuer’s home country. Securities of foreign companies may not be registered with the U.S. Securities and Exchange Commission (“SEC”) and foreign companies are generally not subject to the regulatory controls imposed on U.S. issuers and, as a consequence, there is generally less publically available information about foreign securities than is available about domestic securities. Income from foreign securities owned by a Fund may be reduced by a withholding tax at the source, which tax would reduce income received from the securities comprising the Fund’s portfolio. Foreign securities may also be more difficult to value than securities of U.S. issuers. While ADRs provide an alternative to directly purchasing the underlying foreign securities in their respective national markets and currencies, investments in ADRs continue to be subject to many of the risks associated with investing directly in foreign securities.
Foreign Sovereign Debt Securities Risk (Global Bond Fund): The risks that: (i) the governmental entity that controls the repayment of sovereign debt may not be willing or able to repay the principal and/or interest when it becomes due because of factors such as debt service burden, political constraints, cash flow problems and other national economic factors; (ii) governments may default on their debt securities, which may require holders of such securities to participate in debt rescheduling or additional lending to defaulting governments; and (iii) there is no bankruptcy proceeding by which defaulted sovereign debt may be collected in whole or in part.
Geographic Focus Risk (Global Bond Fund): To the extent that it focuses its investments in a particular country or geographic region, the Fund may be more susceptible to economic, political, regulatory or other events or conditions affecting issuers and countries within that country or geographic region. As a result, the Fund may be subject to greater price volatility and risk of loss than a fund holding more geographically diverse investments.
Growth Style Risk (Growth Equity Fund): The price of equity securities rises and falls in response to many factors, including the historical and prospective earnings of the issuer of the stock, the value of its assets, general economic conditions, interest rates, investor perceptions, and market liquidity. The Fund may invest in securities of companies that the Adviser believes have superior prospects for robust and sustainable growth of revenues and earnings. These may be companies with new, limited or cyclical product lines, markets or financial resources, and the management of such companies may be dependent upon one or a few key people. The stocks of such companies can therefore be subject to more abrupt or erratic market movements than stocks of larger, more established companies or the stock market in general.
High Yield Bond Risk (Municipal Bond Fund, Credit Fund, Low Duration Bond Fund, Total Return Bond Fund, Global Bond Fund): High yield, or “junk,” bonds are highly speculative securities that are usually issued by smaller less credit worthy and/or highly leveraged (indebted) companies. Compared with investment-grade bonds, high yield bonds carry a greater degree of risk and are less likely to make payments of interest and principal. Market developments and the financial and business conditions of the corporation issuing these securities influences their price and liquidity more than changes in interest rates, when compared to investment-grade debt securities. Insufficient liquidity in the junk bond market may make it more difficult to dispose of junk bonds and may cause the Fund to experience sudden and substantial price declines. A lack of reliable, objective data or market quotations may make it more difficult to value junk bonds accurately.
Interest Rate Risk (Total Return Bond Fund, Credit Fund, Low Duration Bond Fund, Municipal Bond Fund, Global Bond Fund): As with most funds that invest in debt securities, changes in interest rates are one of the most important factors that could affect the value of your investment. Rising interest rates tend to cause the prices of debt securities (especially those with longer maturities) and the Fund’s share price to fall. Risks associated with rising interest rates are heightened given that interest rates in the U.S. are at, or near, historic lows.
The concept of duration is useful in assessing the sensitivity of a fixed income fund to interest rate movements, which are usually the main source of risk for most fixed income funds. Duration measures price volatility by estimating the change in price of a debt security for a 1% change in its yield. For example, a duration of five years means the price of a debt security will change about 5% for every 1% change in its yield. Thus, the higher the duration, the more volatile the security.
Debt securities have a stated maturity date when the issuer must repay the principal amount of the bond. Some debt securities, known as callable bonds, may repay the principal earlier than the stated maturity date. Debt securities are most likely to be called when interest rates are falling because the issuer can refinance at a lower rate.
Rising interest rates may also cause investors to pay off mortgage-backed and asset-backed securities later than anticipated, forcing the Fund to keep its money invested at lower rates. Falling interest rates, however, generally cause investors to pay off
57
| | |
| FROST FAMILY OF FUNDS | | F R O S T F U N D S | J A N U A R Y 3 1, 2 0 2 0 |
mortgage-backed and asset-backed securities earlier than expected, forcing the Fund to reinvest the money at a lower interest rate.
Mutual funds that invest in debt securities have no real maturity. Instead, they calculate their weighted average maturity. This number is an average of the effective or anticipated maturity of each debt security held by the mutual fund, with the maturity of each security weighted by the percentage of its assets of the mutual fund it represents.
Issuer Risk (Total Return Bond Fund, Credit Fund, Low Duration Bond Fund, Global Bond Fund): The risk that the value of a security may decline for a reason directly related to the issuer, such as management performance, financial leverage and reduced demand for the issuer’s goods or services.
Leverage Risk (Credit Fund): The use of leverage can amplify the effects of market volatility on the Fund’s share price and may also cause the Fund to liquidate portfolio positions when it would not be advantageous to do so in order to satisfy its obligations.
LIBOR Replacement Risk (Total Return Bond Fund, Credit Fund, Low Duration Bond Fund, Municipal Bond Fund and Global Bond Fund): The elimination of the London Inter-Bank Offered Rate (“LIBOR”) may adversely affect the interest rates on, and value of, certain Fund investments for which the value is tied to LIBOR. The U.K. Financial Conduct Authority has announced that it intends to stop compelling or inducing banks to submit LIBOR rates after 2021. However, it remains unclear if LIBOR will continue to exist in its current, or a modified, form. Alternatives to LIBOR are established or in development in most major currencies, including the Secured Overnight Financing Rate (“SOFR”), which is intended to replace U.S. dollar LIBOR. Markets are slowly developing in response to these new rates. Questions around liquidity impacted by these rates, and how to appropriately adjust these rates at the time of transition, remain a concern for the Fund. Accordingly, it is difficult to predict the full impact of the transition away from LIBOR on the Fund until new reference rates and fallbacks for both legacy and new products, instruments and contracts are commercially accepted.
Liquidity Risk (Total Return Bond Fund, Credit Fund, Low Duration Bond Fund, Global Bond Fund): The risk that certain securities may be difficult or impossible to sell at the time and the price that the Fund would like. The Fund may have to accept a lower price to sell a security, sell other securities to raise cash, or give up an investment opportunity, any of which could have a negative effect on Fund management or performance.
Management Risk (Each Fund): The risk that the investment techniques and risk analyses applied by the Adviser will notpro- duce the desired results and that legislative, regulatory, or tax developments may affect the investment techniques available to the Adviser and the individual portfolio manager in connection with managing each Fund. There is no guarantee that the investment objective of a Fund will be achieved.
Market Risk (Each Fund): The risk that the value of securities owned by the Fund may go up or down, sometimes rapidly or unpredictably, due to factors affecting securities markets generally or particular industries. In addition, the impact of any epidemic, pandemic or natural disaster, or widespread fear that such events may occur, could negatively affect the global economy, as well as the economies of individual countries, the financial performance of individual companies and sectors, and the markets in general in significant and unforeseen ways. Any such impact could adversely affect the prices and liquidity of the securities and other instruments in which the Fund invests, which in turn could negatively impact the Fund’s performance and cause losses on your investment in the Fund.
Mid-Capitalization Company Risk (Mid Cap Equity Fund): Themid-capitalization companies in which the Fund invests may be more vulnerable to adverse business or economic events than larger, more established companies. In particular, investments in thesemid-sized companies may pose additional risks, including liquidity risk, because these companies tend to have limited product lines, markets and financial resources, and may depend upon a relatively small management group. Therefore,mid-capitalization stocks may be more volatile than those of larger companies. These securities may be tradedover-the-counter or listed on an exchange.
Municipal Issuers Risk (Low Duration Bond Fund, Municipal Bond Fund, Total Return Bond Fund, Global Bond Fund): There may be economic or political changes that impact the ability of municipal issuers to repay principal and to make interest payments on municipal securities. Changes in the financial condition or credit rating of municipal issuers also may adversely affect the value of each Fund’s municipal securities. Constitutional or legislative limits on borrowing by municipal issuers may result in reduced supplies of municipal securities. Moreover, certain municipal securities are backed only by a municipal issuer’s ability to levy and collect taxes.
Preferred Stock Risk (Mid Cap Equity Fund): Preferred stocks are sensitive to interest rate changes, and are also subject to equity risk, which is the risk that stock prices will fall over short or extended periods of time. The rights of preferred stocks on
58
| | |
| FROST FAMILY OF FUNDS | | F R O S T F U N D S | J A N U A R Y 3 1, 2 0 2 0 |
the distribution of a company’s assets in the event of a liquidation are generally subordinate to the rights associated with a company’s debt securities.
Prepayment and Extension Risk (Total Return Bond Fund, Credit Fund, Low Duration Bond Fund, Global Bond Fund, Municipal Bond Fund): Prepayment and extension risk is the risk that a loan, bond or other security might be called or otherwise converted, prepaid or redeemed before maturity. This risk is primarily associated with corporate-backed, mortgage-backed and asset-backed securities. If a security is converted, prepaid or redeemed before maturity, particularly during a time of declining interest rates or spreads, the Fund may not be able to invest the proceeds in securities providing as high a level of income, resulting in a reduced yield to the Fund. Conversely, as interest rates rise or spreads widen, the likelihood of prepayment decreases. The Fund may be unable to capitalize on securities with higher interest rates or wider spreads because the Fund’s investments are locked in at a lower rate for a longer period of time.
Repurchase Agreement Risk (Credit Bond Fund, Global Bond Fund, Low Duration Bond Fund, Total Return Bond Fund): Under a repurchase agreement, the seller of a security to the Fund agrees to repurchase the security at a mutually agreed-upon time and price. If the seller in a repurchase agreement transaction defaults on its obligation under the agreement, the Fund may suffer delays and incur costs or lose money in exercising its rights under the agreement.
Rights and Warrants Risk (Mid Cap Equity Fund): The purchase of rights or warrants involves the risk that the Fund could lose the purchase value of a right or warrant if the right to subscribe to additional shares is not executed prior to the right’s orwar- rant’s expiration. Also, the purchase of rights and/or warrants involves the risk that the effective price paid for the right and/or warrant added to the subscription price of the related security may exceed the value of the subscribed security’s market price such as when there is no movement in the level of the underlying security.
Sector Focus Risk (Growth Equity Fund, Mid-Cap Equity Fund, Value Equity Fund, Credit Fund, Global Bond Fund, Low Duration Bond Fund, Total Return Bond Fund): Because the Fund may, from time to time, be more heavily invested in particular sectors, the value of its shares may be especially sensitive to factors and economic risks that specifically affect those sectors. As a result, the Fund’s share price may fluctuate more widely than the value of shares of a mutual fund that invests in a broader range of sectors.
Small- andMid-Capitalization Company Risk (Growth Equity Fund, Value Equity Fund): The small- andmid-capitalization companies in which these Funds may invest may be more vulnerable to adverse business or economic events than larger, more established companies. In particular, investments in these small- andmid-sized companies may pose additional risks, including liquidity risk, because these companies tend to have limited product lines, markets and financial resources, and may depend upon a relatively small management group. Therefore, small- andmid- capitalization stocks may be more volatile than those of larger companies. These securities may be tradedover-the-counter or listed on an exchange.
State-Specific Risk (Municipal Bond Fund): The Fund is subject to the risk that the economy of the states in which it invests, and the revenues underlying state municipal bonds, may decline. Investing primarily in a single state means that the Fund is more exposed to negative political or economic factors in that state than a fund that invests more widely.
Structured Note Risk (Credit Fund): The Fund may invest in fixed income linked structured notes. Structured notes are typically privately negotiated transactions between two or more parties. The fees associated with a structured note may lead to increased tracking error. The Fund also bears the risk that the issuer of the structured note will default. The Fund bears the risk of loss of its principal investment and periodic payments expected to be received for the duration of its investment. In addition, a liquid market may not exist for the structured notes. The lack of a liquid market may make it difficult to sell the structured notes at an acceptable price or to accurately value them.
Value Style Risk (Value Equity Fund): The Fund pursues a “value style” of investing. Value investing focuses on companies with stocks that appear undervalued in light of factors such as the company’s earnings, book value, revenues or cash flow. If the Adviser’s assessment of market conditions or a company’s value or prospects for exceeding earnings expectations is inaccurate, the Fund could suffer losses or produce poor performance relative to other funds. In addition, “value stocks” can continue to be undervalued by the market for long periods of time.
Zero Coupon, Deferred Interest andPay-In-Kind Bond Risk (Credit Fund): These bonds are issued at a discount from their face value because interest payments are typically postponed until maturity.Pay-in-kind securities are securities that have interest payable by the delivery of additional securities. The market prices of these securities generally are more volatile than the market prices of interest-bearing securities and are likely to respond to a greater degree to changes in interest rates than interest- bearing securities having similar maturities and credit quality.
59
| | |
| FROST FAMILY OF FUNDS | | F R O S T F U N D S | J A N U A R Y 3 1, 2 0 2 0 |
In the normal course of business, the Funds enter into contracts that provide general indemnifications. The Funds’ maximum exposure under these arrangements is dependent on future claims that may be made against the Funds and, therefore, cannot be established; however, based on experience, the risk of loss from such claims is considered remote.
9. Other:
On January 31, 2020, the number of shareholders below held the following percentage of the outstanding shares of the Funds:
| | | | | | | | | | |
| | | # of
Shareholders | | % of Outstanding
Shares |
Growth Equity Fund | | | | | | | | | | |
Institutional Class Shares | | | | 3 | | | | | 72.07% | |
Investor Class Shares | | | | 1 | | | | | 84.80% | |
Value Equity Fund | | | | | | | | | | |
Institutional Class Shares | | | | 3 | | | | | 89.39% | |
Investor Class Shares | | | | 1 | | | | | 14.72% | |
Mid Cap Equity Fund | | | | | | | | | | |
Institutional Class Shares | | | | 3 | | | | | 94.50% | |
Investor Class Shares | | | | 2 | | | | | 77.84% | |
Total Return Bond Fund | | | | | | | | | | |
Institutional Class Shares | | | | 4 | | | | | 56.33% | |
Investor Class Shares | | | | 1 | | | | | 16.30% | |
A Class Shares | | | | 2 | | | | | 53.30% | |
Credit Fund | | | | | | | | | | |
Institutional Class Shares | | | | 3 | | | | | 86.94% | |
Investor Class Shares | | | | 1 | | | | | 83.12% | |
A Class Shares | | | | 2 | | | | | 44.42% | |
Low Duration Bond Fund | | | | | | | | | | |
Institutional Class Shares | | | | 3 | | | | | 68.14% | |
Investor Class Shares | | | | 1 | | | | | 53.27% | |
Municipal Bond Fund | | | | | | | | | | |
Institutional Class Shares | | | | 2 | | | | | 62.49% | |
Investor Class Shares | | | | 3 | | | | | 90.26% | |
Global Bond Fund | | | | | | | | | | |
Institutional Class Shares | | | | 1 | | | | | 96.80% | |
Investor Class Shares | | | | 1 | | | | | 100.00% | |
A Class Shares | | | | 1 | | | | | 100.00% | |
These shareholders are comprised of omnibus accounts, which are held on behalf of various individual shareholders.
10. Regulatory Matters:
On August 17, 2018, the SEC adopted amendments to RegulationS-X. These changes are effective for periods after November 5, 2018. The updates to Registered Investment Companies were mainly focused on simplifying the presentation of distributable earnings by eliminating the need to present the components of distributable earnings on a book basis in the Statements of Assets and Liabilities. The update also impacted the presentation of undistributed net investment income and distribution to shareholders on the Statements of Changes in Net Assets. The amounts presented in the current Statements of Changes in Net Assets represent the aggregated total distributions of net investment income and realized capital gains, except for distributions classified as return of capital which are still presented separately.
11. New Accounting Pronouncements:
In August 2018, the FASB issued Accounting Standards Update2018-13, Fair Value Measurement (Topic 820). The new guidance includes additions and modifications to disclosures requirements for fair value measurements. For public entities, the amendments are effective for financial statements issued for fiscal years beginning after December 15, 2019, and interim periods within those fiscal years.
12. Subsequent Events:
The Funds have evaluated the need for additional disclosures and/or adjustments resulting from subsequent events through the date the financial statements were issued. Based on this evaluation, no additional disclosures and/or adjustments were required to the financial statements as of January 31, 2020.
60
| | |
| FROST FAMILY OF FUNDS | | F R O S T F U N D S | J A N U A R Y 3 1, 2 0 2 0 |
|
| DISCLOSURE OF FUND EXPENSES (Unaudited) |
All mutual funds have operating expenses. As a shareholder of a fund, your investment is affected by these ongoing costs, which include (among others) costs for portfolio management, administrative services, and shareholder reports like this one. It is important for you to understand the impact of these costs on your investment returns.
Operating expenses such as these are deducted from a fund’s gross income and directly reduce its final investment return. These expenses are expressed as a percentage of a fund’s average net assets; this percentage is known as a fund’s expense ratio.
The following examples use the expense ratio and are intended to help you understand the ongoing costs (in dollars) of investing in your Fund and to compare these costs with those of other mutual funds. The examples are based on an investment of $1,000 made at the beginning of the period shown and held for the entire period (August 1, 2019 to January 31, 2020).
The table on the next page illustrates your Fund’s costs in two ways:
•Actual fund return. This section helps you to estimate the actual expenses after fee waivers that your Fund incurred over the period. The “Expenses Paid During Period” column shows the actual dollar expense cost incurred by a $1,000 investment in the Fund, and the “Ending Account Value” number is derived from deducting that expense cost from the Fund’s gross investment return.
You can use this information, together with the actual amount you invested in the Fund, to estimate the expenses you paid over that period. Simply divide your actual starting account value by $1,000 to arrive at a ratio (for example, an $8,600 account value divided by $1,000 = 8.6), then multiply that ratio by the number shown for your Fund under “Expenses Paid During Period.”
•Hypothetical 5% return. This section helps you compare your Fund’s costs with those of other mutual funds. It assumes that the Fund had an annual 5% return before expenses during the year, but that the expense ratio (Column 3) is unchanged. This example is useful in making comparisons because the Securities and Exchange Commission requires all mutual funds to make this 5% calculation. You can assess your Fund’s comparative cost by comparing the hypothetical result for your Fund in the “Expenses Paid During Period” column with those that appear in the same charts in the shareholder reports for other funds.
NOTE: Because the return is set at 5% for comparison purposes — NOT your Fund’s actual return — the account values shown do not apply to your specific investment.
61
| | |
| FROST FAMILY OF FUNDS | | F R O S T F U N D S | J A N U A R Y 3 1, 2 0 2 0 |
|
| DISCLOSURE OF FUND EXPENSES (Unaudited) (Continued) |
| | | | | | | | | | | | | | | | |
| | | Beginning
Account
Value
8/1/2019 | | | Ending
Account
Value
1/31/2020 | | | Annualized
Expense
Ratios | | | Expenses
Paid
During
Period* | |
| |
Growth Equity Fund | |
Actual Fund Return | |
Institutional Class Shares | | $ | 1,000.00 | | | $ | 1,112.30 | | | | 0.63 | % | | $ | 3.35 | |
Investor Class Shares | | $ | 1,000.00 | | | $ | 1,110.90 | | | | 0.88 | % | | $ | 4.67 | |
Hypothetical 5% Return | |
Institutional Class Shares | | $ | 1,000.00 | | | $ | 1,021.97 | | | | 0.63 | % | | $ | 3.20 | |
Investor Class Shares | | $ | 1,000.00 | | | $ | 1,020.71 | | | | 0.88 | % | | $ | 4.47 | |
| |
Value Equity Fund | |
Actual Fund Return | |
Institutional Class Shares | | $ | 1,000.00 | | | $ | 1,045.60 | | | | 0.98 | % | | $ | 5.04 | |
Investor Class Shares | | $ | 1,000.00 | | | $ | 1,044.40 | | | | 1.28 | % | | $ | 6.48 | |
Hypothetical 5% Return | |
Institutional Class Shares | | $ | 1,000.00 | | | $ | 1,020.21 | | | | 0.98 | % | | $ | 4.98 | |
Investor Class Shares | | $ | 1,000.00 | | | $ | 1,018.80 | | | | 1.26 | % | | $ | 6.39 | |
| | | | |
Mid Cap Equity Fund | | | | | | | | | | | | | |
Actual Fund Return | |
Institutional Class Shares | | $ | 1,000.00 | | | $ | 1,036.60 | | | | 1.55 | % | | $ | 7.93 | |
Investor Class Shares | | $ | 1,000.00 | | | $ | 1,037.80 | | | | 1.78 | % | | $ | 9.32 | |
Hypothetical 5% Return | |
Institutional Class Shares | | $ | 1,000.00 | | | $ | 1,017.34 | | | | 1.55 | % | | $ | 7.86 | |
Investor Class Shares | | $ | 1,000.00 | | | $ | 1,015.99 | | | | 1.82 | % | | $ | 9.22 | |
| | | | |
Total Return Bond Fund | | | | | | | | | | | | | |
Actual Fund Return | | | | | | | | | | | | | | | | |
Institutional Class Shares | | $ | 1,000.00 | | | $ | 1,019.90 | | | | 0.46 | % | | $ | 2.34 | |
Investor Class Shares | | $ | 1,000.00 | | | $ | 1,018.60 | | | | 0.71 | % | | $ | 3.60 | |
A Class Shares | | $ | 1,000.00 | | | $ | 1,018.70 | | | | 0.72 | % | | $ | 3.65 | |
Hypothetical 5% Return | |
Institutional Class Shares | | $ | 1,000.00 | | | $ | 1,022.82 | | | | 0.46 | % | | $ | 2.34 | |
Investor Class Shares | | $ | 1,000.00 | | | $ | 1,021.57 | | | | 0.71 | % | | $ | 3.61 | |
A Class Shares | | $ | 1,000.00 | | | $ | 1,021.52 | | | | 0.72 | % | | $ | 3.66 | |
| | | | | | | | | | | | | | | | |
| | | Beginning
Account
Value
8/1/2019 | | | Ending
Account
Value
1/31/2020 | | | Annualized
Expense
Ratios | | | Expenses
Paid
During
Period* | |
| |
Credit Fund | |
Actual Fund Return | |
Institutional Class Shares | | $ | 1,000.00 | | | $ | 1,031.30 | | | | 0.69 | % | | $ | 3.52 | |
Investor Class Shares | | $ | 1,000.00 | | | $ | 1,030.00 | | | | 0.94 | % | | $ | 4.80 | |
A Class Shares | | $ | 1,000.00 | | | $ | 1,029.10 | | | | 0.94 | % | | $ | 4.79 | |
Hypothetical 5% Return | |
Institutional Class Shares | | $ | 1,000.00 | | | $ | 1,021.67 | | | | 0.69 | % | | $ | 3.51 | |
Investor Class Shares | | $ | 1,000.00 | | | $ | 1,020.41 | | | | 0.94 | % | | $ | 4.77 | |
A Class Shares | | $ | 1,000.00 | | | $ | 1,020.41 | | | | 0.94 | % | | $ | 4.77 | |
| |
Low Duration Bond Fund | |
Actual Fund Return | |
Institutional Class Shares | | $ | 1,000.00 | | | $ | 1,017.30 | | | | 0.43 | % | | $ | 2.18 | |
Investor Class Shares | | $ | 1,000.00 | | | $ | 1,017.00 | | | | 0.69 | % | | $ | 3.50 | |
Hypothetical 5% Return | |
Institutional Class Shares | | $ | 1,000.00 | | | $ | 1,022.97 | | | | 0.43 | % | | $ | 2.19 | |
Investor Class Shares | | $ | 1,000.00 | | | $ | 1,021.67 | | | | 0.69 | % | | $ | 3.51 | |
| |
Municipal Bond Fund | |
Actual Fund Return | |
Institutional Class Shares | | $ | 1,000.00 | | | $ | 1,018.80 | | | | 0.42 | % | | $ | 2.13 | |
Investor Class Shares | | $ | 1,000.00 | | | $ | 1,017.50 | | | | 0.67 | % | | $ | 3.40 | |
Hypothetical 5% Return | |
Institutional Class Shares | | $ | 1,000.00 | | | $ | 1,023.03 | | | | 0.42 | % | | $ | 2.14 | |
Investor Class Shares | | $ | 1,000.00 | | | $ | 1,021.77 | | | | 0.67 | % | | $ | 3.40 | |
| |
Global Bond Fund** | |
Actual Fund Return | |
Institutional Class Shares | | $ | 1,000.00 | | | $ | 1,002.10 | | | | 1.00 | % | | $ | 2.51 | |
Investor Class Shares | | $ | 1,000.00 | | | $ | 1,003.20 | | | | 0.20 | % | | $ | 0.50 | |
A Class Shares | | $ | 1,000.00 | | | $ | 1,003.20 | | | | 0.04 | % | | $ | 0.10 | |
Hypothetical 5% Return | |
Institutional Class Shares | | $ | 1,000.00 | | | $ | 1,010.05 | | | | 1.00 | % | | $ | 2.53 | |
Investor Class Shares | | $ | 1,000.00 | | | $ | 1,000.00 | | | | 0.20 | % | | $ | 0.50 | |
A Class Shares | | $ | 1,000.00 | | | $ | 1,000.00 | | | | 0.04 | % | | $ | 0.10 | |
| * | Unless otherwise indicated, expenses are equal to the Fund’s annualized expense ratio multiplied by the average account value over the account period, multiplied by 184/366 (to reflect the one-half year period). |
| ** | Fund commenced operations on October 31, 2019. |
62
| | |
| FROST FAMILY OF FUNDS | | F R O S T F U N D S | J A N U A R Y 3 1, 2 0 2 0 |
|
| BOARD CONSIDERATIONS IN APPROVING THE ADVISORY AGREEMENT (Unaudited) |
Frost Global Bond Fund
Pursuant to Section 15 of the Investment Company Act of 1940 (the “1940 Act”), the Fund’s advisory agreement (the “Agreement”) must be approved: (i) by a vote of a majority of the shareholders of the Fund; and (ii) by the vote of a majority of the members of the Board of Trustees (the “Board” or the “Trustees”) of Frost Family of Funds (the “Trust”) who are not parties to the Agreement or “interested persons” of any party thereto, as defined in the 1940 Act (the “Independent Trustees”), cast in person at a meeting called for the purpose of voting on such approval.
A Board meeting was held on August 21, 2019 to decide whether to approve the Agreement for an initialtwo-year term. In preparation for the meeting, the Trustees requested that the Adviser furnish information necessary to evaluate the terms of the Agreement. The Trustees used this information, as well as other information that the Adviser and other service providers of the Fund presented or submitted to the Board at the meeting, to help them decide whether to approve the Agreement for an initialtwo-year term.
Specifically, the Board requested and received written materials from the Adviser and other service providers of the Fund regarding: (i) the nature, extent and quality of the services to be provided by the Adviser; (ii) the Adviser’s investment management personnel; (iii) the Adviser’s operations; (iv) the Adviser’s brokerage practices (including any soft dollar arrangements) and investment strategies; (v) the Fund’s proposed advisory fee to be paid to the Adviser and overall fees and operating expenses compared with a peer group of mutual funds; (vi) the Adviser’s compliance program, including a description of material compliance matters and material compliance violations; (vii) the Adviser’s policies on and compliance procedures for personal securities transactions; (viii) the Adviser’s investment experience; and (ix) the Adviser’s rationale for introducing the Fund as well as the Fund’s proposed objective and strategy.
Representatives from the Adviser, along with other Fund service providers, presented additional information and participated in question and answer sessions at the meeting to help the Trustees evaluate the Adviser’s services, fee and other aspects of the Agreement. The Independent Trustees received advice from independent counsel and met in executive session outside the presence of Fund management and the Adviser.
At the Board meeting, the Trustees, including all of the Independent Trustees, based on their evaluation of the information provided by the Adviser and other service providers of the Fund, approved the Agreement. In considering the approval of the Agreement, the Board considered various factors that they determined were relevant, including: (i) the nature, extent and quality of the services to be provided by the Adviser; and (ii) the fees to be paid to the Adviser, as discussed in further detail below.
Nature, Extent and Quality of Services to be Provided by the Adviser
In considering the nature, extent and quality of the services to be provided by the Adviser, the Board reviewed the portfolio management services to be provided by the Adviser to the Fund, including the quality and continuity of the Adviser’s portfolio management personnel, the resources of the Adviser, and the Adviser’s compliance history and compliance program. The Trustees reviewed the terms of the proposed Agreement. The Trustees also reviewed the Adviser’s proposed investment and risk management approaches for the Fund. The most recent investment adviser registration form (“Form ADV”) for the Adviser was available to the Board, as was the response of the Adviser to a detailed series of questions which included, among other things, information about the investment advisory services to be provided by the Adviser to the Fund.
The Trustees also considered other services to be provided to the Fund by the Adviser such as selecting broker-dealers for executing portfolio transactions, monitoring adherence to the Fund’s investment restrictions, and monitoring compliance with various Fund policies and procedures and with applicable securities laws and regulations. Based on the factors above, as well as those discussed below, the Board concluded, within the context of its full deliberations, that the nature, extent and quality of the services to be provided to the Fund by the Adviser would be satisfactory.
Costs of Advisory Services
In considering the advisory fee payable by the Fund to the Adviser, the Trustees reviewed, among other things, a report of the proposed advisory fee to be paid to the Adviser. The Trustees also reviewed reports prepared by the Fund’s administrator comparing the Fund’s net and gross expense ratios and advisory fees to those paid by a peer group of mutual funds as classified by Lipper, an independent provider of investment company data. The Trustees reviewed pro forma fee and expense information. The Board concluded, within the context of its full deliberations, that the advisory fee was reasonable in light of the nature and quality of the services expected to be rendered by the Adviser. The Board also considered the Adviser’s commitment to managing the Fund and its willingness to enter into an expense limitation and fee waiver arrangement with the Fund.
63
| | |
| FROST FAMILY OF FUNDS | | F R O S T F U N D S | J A N U A R Y 3 1, 2 0 2 0 |
|
| BOARD CONSIDERATIONS IN APPROVING THE ADVISORY AGREEMENT (Unaudited) (Continued) |
Investment Performance, Profitability and Economies of Scale
Because the Fund was new and had not commenced operations, it did not yet have an investment performance record and it was not possible to determine the profitability that the Adviser might achieve with respect to the Fund or the extent to which economies of scale would be realized by the Adviser as the assets of the Fund grow. Accordingly, the Trustees did not make any conclusions regarding the Fund’s investment performance, the Adviser’s profitability, or the extent to which economies of scale would be realized by the Adviser as the assets of the Fund grow, but will do so during future considerations of the Agreement.
Approval of the Agreement
Based on the Board’s deliberations and its evaluation of the information described above and other factors and information it believed relevant in the exercise of its reasonable business judgment, the Board, including all of the Independent Trustees, with the assistance of Fund counsel and Independent Trustees’ counsel, unanimously concluded that the terms of the Agreement, including the fees to be paid thereunder, were fair and reasonable and agreed to approve the Agreement for an initial term of two years. In its deliberations, the Board did not identify any absence of information as material to its decision, or any particular factor (or conclusion with respect thereto) or single piece of information that wasall-important, controlling or determinative of its decision, but considered all of the factors together, and each Trustee may have attributed different weights to the various factors (and conclusions with respect thereto) and information.
64
Frost Family of Funds
Annual Report
Investment Adviser
Frost Investment Advisors, LLC
111 Houston Street, 10th Floor
San Antonio, Texas 78205
Independent Registered Public Accounting Firm
Ernst & Young LLP
111 West Houston St., Suite 1901
San Antonio, Texas 78205
Distributor
SEI Investments Distribution Co.
One Freedom Valley Drive
Oaks, Pennsylvania 19456
Administrator
SEI Investments Global Funds Services
One Freedom Valley Drive
Oaks, Pennsylvania 19456
Legal Counsel
Morgan, Lewis & Bockius, LLP
1701 Market Street
Philadelphia, Pennsylvania 19103-2921

Not applicable for semi-annual report.
| Item 3. | Audit Committee Financial Expert. |
Not applicable for semi-annual report.
| Item 4. | Principal Accountant Fees and Services. |
Not applicable for semi-annual report.
| Item 5. | Audit Committee of Listed Registrants. |
Not applicable to open-end management investment companies.
| Item 6. | Schedule of Investments. |
Schedule of Investments is included as part of the Report to Shareholders filed under Item 1 of this form.
| Item 7. | Disclosure of Proxy Voting Policies and Procedures for Closed-End Management Investment Companies. |
Not applicable to open-end management investment companies.
| Item 8. | Portfolio Managers of Closed-End Management Investment Companies. |
Not applicable to open-end management investment companies. Effective for closed-end management investment companies for fiscal-years-ending on or after December 31, 2005.
| Item 9. | Purchases of Equity Securities by Closed-End Management Company and Affiliated Purchasers. |
Not applicable to open-end management investment companies.
| Item 10. | Submission of Matters to a Vote of Security Holders. |
There have been no changes to the procedures by which shareholders may recommend nominees to the Registrant’s Board of Trustees during the period covered by this report.
| Item 11. | Controls and Procedures. |
(a) The Registrant’s principal executive and principal financial officers, or persons performing similar functions, have concluded that the Registrant’s disclosure controls and procedures (as defined in Rule 30a-3(c) under the Act (17 CFR 270.30a-3(c))) as of a date within 90 days of the filing date of the report, are effective based on the evaluation of these controls and procedures required by Rule 30a-3(b) under the Act (17 CFR 270.30a-3(b)) and Rules 13a-15(b) or 15d-15(b) under the Exchange Act (17 CFR 240.13a-15(b) or 240.15d-15(b)).
(b) There has been no change in the Registrant’s internal control over financial reporting (as defined in Rule 30a-3(d) under the Act (17 CFR 270.30a-3(d)) that occurred during the period covered by this report that has materially affected, or is reasonably likely to materially affect, the Registrant’s internal control over financial reporting.
| Items | 12. Disclosure of Securities Lending Activities for Closed-End Management Investment Companies. |
Not applicable to open-end management investment companies.
(a)(1) Not applicable for semi-annual report.
(a)(2)A separate certification for the principal executive officer and the principal financial officer of the Registrant, as required by Rule 30a-2(a) under the Act (17 CFR § 270.30a-2(a)), is filed herewith.
(b)Officer certifications, as required by Rule 30a-2(b) under the Act (17 CFR § 270.30a-2(b)), also accompany this filing as an exhibit.
SIGNATURES
Pursuant to the requirements of the Securities Exchange Act of 1934 and the Investment Company Act of 1940, the registrant has duly caused this report to be signed on its behalf by the undersigned, thereunto duly authorized.
| | | | | | |
| (Registrant) | | | | | | Frost Family of Funds |
| | | |
| By (Signature and Title) | | | | | | /s/ Michael Beattie |
| | | | | | Michael Beattie |
| | | | | | President |
Date: April 9, 2020
Pursuant to the requirements of the Securities Exchange Act of 1934 and the Investment Company Act of 1940, this report has been signed below by the following persons on behalf of the registrant and in the capacities and on the dates indicated.
| | | | | | |
| By (Signature and Title) | | | | | | /s/ Michael Beattie |
| | | | | | Michael Beattie |
| | | | | | President |
Date: April 9, 2020
| | | | | | |
| By (Signature and Title) | | | | | | /s/ Stephen Connors |
| | | | | | Stephen Connors, |
| | | | | | Treasurer, Controller, and CFO |
Date: April 9, 2020