| 2024 Half Year Results Presentation Douglas Thompson Managing Director & CEO Gerhard Ziems Group Chief Financial Officer 6 August 2024 All units in U.S. dollars and metric tonnes, unless otherwise stated |
| CRN - HY24 Results Presentation 2 Important Notices and Disclaimer The material contained in this presentation is intended to be general background information on Coronado Global Resources (Coronado) and its activities. The information is supplied in summary form and is therefore not necessarily complete. It is not intended that it be relied upon as advice to investors or potential investors, who should consider seeking independent professional advice depending upon their specific investment objectives, financial situation or particular needs. The material contained in this presentation may include information derived from publicly available sources that have not been independently verified. No representation or warranty is made as to the accuracy, completeness or reliability of the information. All amounts are in United States dollars unless otherwise indicated. The presentation of certain financial information may not be compliant with financial captions in the primary financial statements prepared under U.S. GAAP. Refer to Coronado’s 2023 Form 10-K for the year ended 31 December 2023 available at www.coronadoglobal.com for details of the basis primary financial statements prepared under U.S. GAAP. This presentation contains statements that constitute “forward-looking statements” within the meaning of Section 27A of the US Securities Act of 1933 and Section 21E of the US Securities Exchange Act of 1934. Forward looking statements are statements about matters that are not historical facts. Forward-looking statements appear in a number of places in this presentation and include statements regarding our intent, belief or current expectations with respect to our business and operations, market conditions and results of operations. This presentation contains forward-looking statements concerning our business, operations, financial performance and condition, the coal, steel and other industries, as well as our plans, objectives and expectations for our business, operations, financial performance and condition. Forward-looking statements may be identified by words such as “may”, “could”, “believes”, “estimates”, “expects”, “intends”, “plans”, “considers”, “forecasts”, “targets” and other similar words that involve risk and uncertainties. Forward-looking statements provide management's current expectations or predictions of future conditions, events or results. All statements that address operating performance, events or developments that we expect or anticipate will occur in the future are forward-looking statements. They may include estimates of revenues, income, earnings per share, cost savings, capital expenditures, dividends, share repurchases, liquidity, capital structure, market share, industry volume, or other financial items, descriptions of management’s plans or objectives for future operations, or descriptions of assumptions underlying any of the above. All forward-looking statements speak only as of the date they are made and reflect the company's good faith beliefs, assumptions and expectations, but they are not guarantees of future performance or events. Furthermore, the Company disclaims any obligation to publicly update or revise any forward-looking statement, except as required by law. By their nature, forward-looking statements are subject to risks and uncertainties that could cause actual results to differ materially from those suggested by the forward-looking statements. Factors that might cause such differences include, but are not limited to, a variety of economic, competitive and regulatory factors, many of which are beyond the Company's control, that are described in our Annual Report on Form 10-K for the fiscal year ended 31 December 2023 filed with the ASX and SEC on 20 February 2024 (AEST), our Quarterly Report on Form 10-Q filed with the ASX and SEC on 7 May 2024 (AEST) and our Quarterly Report on Form 10-Q filed with the ASX and SEC on 6 August 2024 (AEST), as well as additional factors we may describe from time to time in other filings with the ASX and SEC. You may get such filings for free at our website at www.coronadoglobal.com. You should understand that it is not possible to predict or identify all such factors and, consequently, you should not consider any such list to be a complete set of all potential risks or uncertainties. In this presentation, references to ore reserves (Reserves) are compliant with the Australasian Code for Reporting of Exploration Results, Mineral Resources and Ore Reserves 2012 (JORC Code) and are measured in accordance with the JORC Code. Information in this presentation relating to Coal Reserves and Coal Resources is extracted from information published by Coronado and available on the Coronado and ASX websites (2023 JORC Statement also released to the ASX on 20 February 2024). For details of the Coal Reserves and Coal Resources estimates and the Competent Persons statements, refer to relevant Australian and U.S. Operations sections in the 2023 JORC Statement. As an SEC registrant, our SEC disclosures of resources and reserves follow the requirements of subpart 1300 of Regulation S-K under the US Securities Exchange Act of 1934. Accordingly, our estimates of resources and reserves in this presentation and in our other ASX disclosures may be different than our estimates of resources and reserves as reported in our Annual Report on Form 10-K for the year ended 31 December 2023 and in other reports that we are required to file with the SEC. |
| HY 2024 Highlights Douglas Thompson Managing Director & CEO CRN – HY24 Results Presentation 3 |

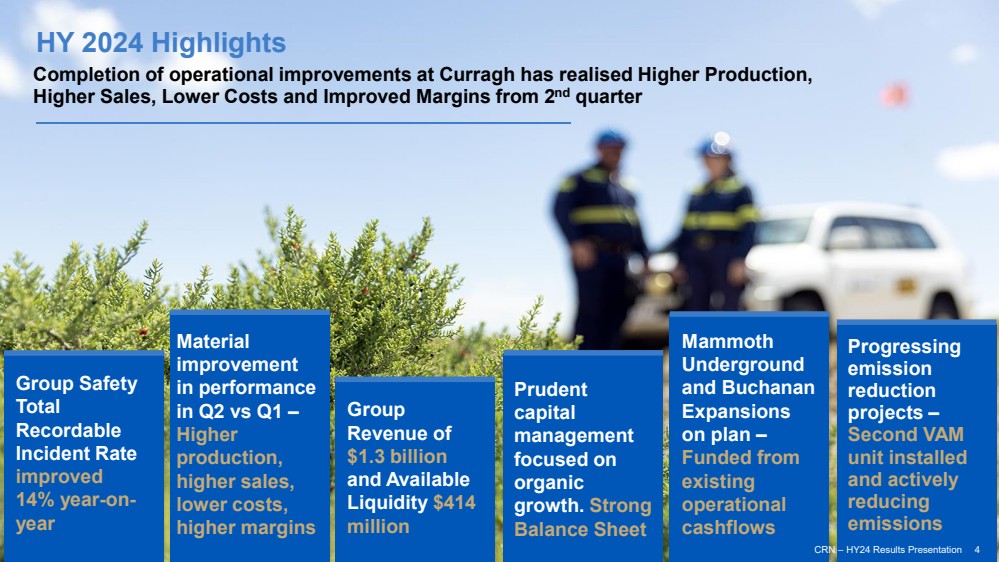
| Material improvement in performance in Q2 vs Q1 – Higher production, higher sales, lower costs, higher margins Prudent capital management focused on organic growth. Strong Balance Sheet Group Revenue of $1.3 billion and Available Liquidity $414 million Progressing emission reduction projects – Second VAM unit installed and actively reducing emissions HY 2024 Highlights Completion of operational improvements at Curragh has realised Higher Production, Higher Sales, Lower Costs and Improved Margins from 2nd quarter 4 Mammoth Underground and Buchanan Expansions on plan – Funded from existing operational cashflows Group Safety Total Recordable Incident Rate improved 14% year-on-year CRN – HY24 Results Presentation |
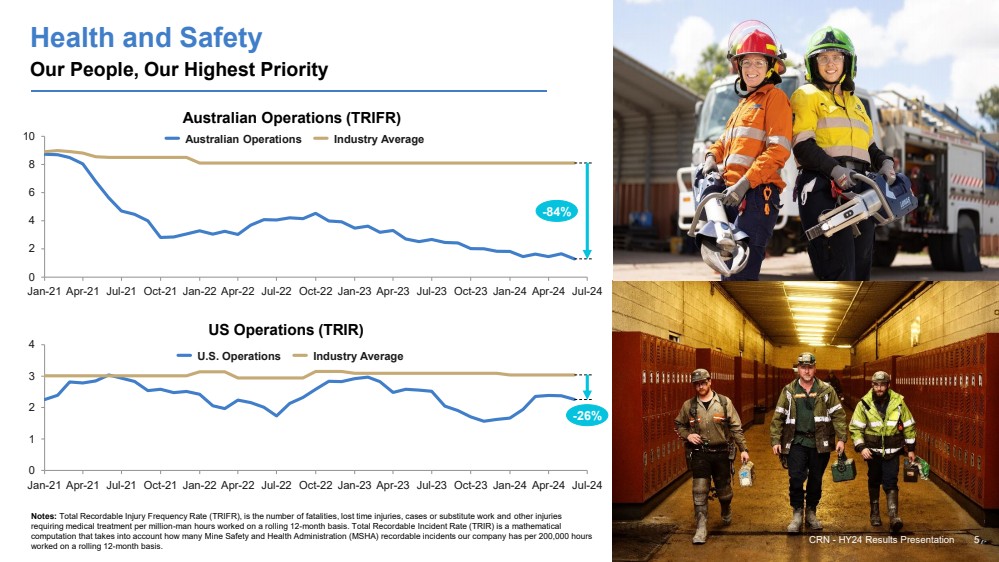
| CRN - HY24 Results Presentation 5 Health and Safety Our People, Our Highest Priority Notes: Total Recordable Injury Frequency Rate (TRIFR), is the number of fatalities, lost time injuries, cases or substitute work and other injuries requiring medical treatment per million-man hours worked on a rolling 12-month basis. Total Recordable Incident Rate (TRIR) is a mathematical computation that takes into account how many Mine Safety and Health Administration (MSHA) recordable incidents our company has per 200,000 hours worked on a rolling 12-month basis. Australian Operations (TRIFR) US Operations (TRIR) 0 2 4 6 8 10 Jan-21 Apr-21 Jul-21 Oct-21 Jan-22 Apr-22 Jul-22 Oct-22 Jan-23 Apr-23 Jul-23 Oct-23 Jan-24 Apr-24 Jul-24 -84% Australian Operations Industry Average 0 1 2 3 4 Jan-21 Apr-21 Jul-21 Oct-21 Jan-22 Apr-22 Jul-22 Oct-22 Jan-23 Apr-23 Jul-23 Oct-23 Jan-24 Apr-24 Jul-24 -26% U.S. Operations Industry Average |
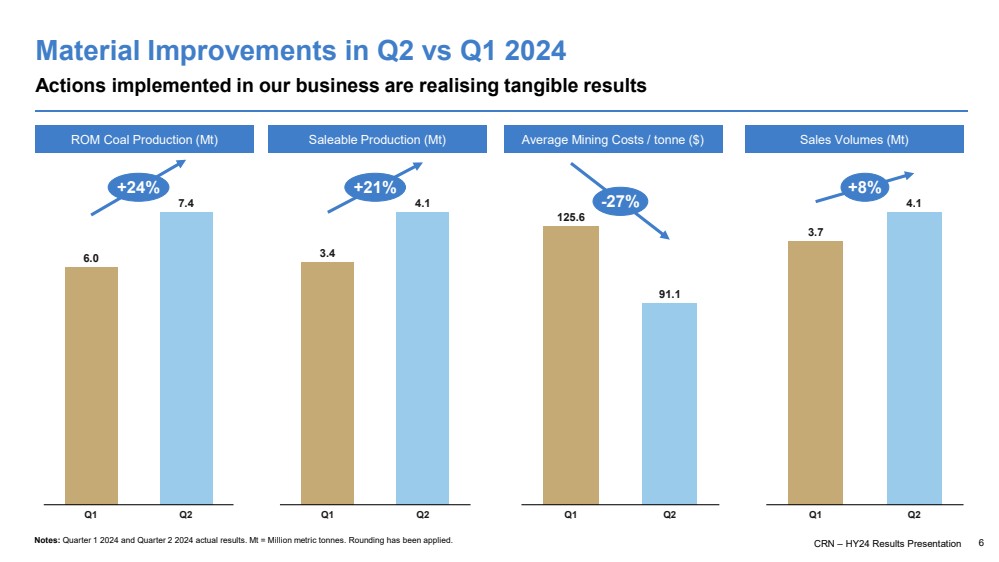
| CRN – HY24 Results Presentation 6 Material Improvements in Q2 vs Q1 2024 Actions implemented in our business are realising tangible results 3.4 4.1 Q1 Q2 +21% Notes: Quarter 1 2024 and Quarter 2 2024 actual results. Mt = Million metric tonnes. Rounding has been applied. ROM Coal Production (Mt) Saleable Production (Mt) Average Mining Costs / tonne ($) 6.0 7.4 Q1 Q2 +24% 3.7 4.1 Q1 Q2 +8% 125.6 91.1 Q1 Q2 -27% Sales Volumes (Mt) |
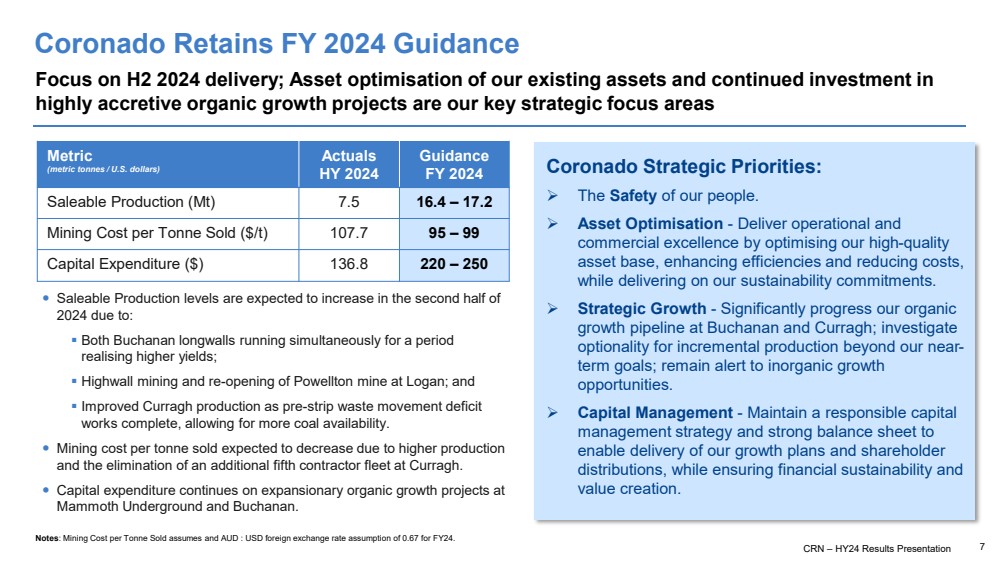
| Coronado Retains FY 2024 Guidance Focus on H2 2024 delivery; Asset optimisation of our existing assets and continued investment in highly accretive organic growth projects are our key strategic focus areas Metric (metric tonnes / U.S. dollars) Actuals HY 2024 Guidance FY 2024 Saleable Production (Mt) 7.5 16.4 – 17.2 Mining Cost per Tonne Sold ($/t) 107.7 95 – 99 Capital Expenditure ($) 136.8 220 – 250 Coronado Strategic Priorities: ➢ The Safety of our people. ➢ Asset Optimisation - Deliver operational and commercial excellence by optimising our high-quality asset base, enhancing efficiencies and reducing costs, while delivering on our sustainability commitments. ➢ Strategic Growth - Significantly progress our organic growth pipeline at Buchanan and Curragh; investigate optionality for incremental production beyond our near-term goals; remain alert to inorganic growth opportunities. ➢ Capital Management - Maintain a responsible capital management strategy and strong balance sheet to enable delivery of our growth plans and shareholder distributions, while ensuring financial sustainability and value creation. Saleable Production levels are expected to increase in the second half of 2024 due to: ▪ Both Buchanan longwalls running simultaneously for a period realising higher yields; ▪ Highwall mining and re-opening of Powellton mine at Logan; and ▪ Improved Curragh production as pre-strip waste movement deficit works complete, allowing for more coal availability. Mining cost per tonne sold expected to decrease due to higher production and the elimination of an additional fifth contractor fleet at Curragh. Capital expenditure continues on expansionary organic growth projects at Mammoth Underground and Buchanan. CRN – HY24 Results Presentation 7 Notes: Mining Cost per Tonne Sold assumes and AUD : USD foreign exchange rate assumption of 0.67 for FY24. |
| CRN - HY24 Results Presentation 8 HY 2024 Financial Performance Gerhard Ziems Group Chief Financial Officer CRN - HY24 Results Presentation 8 |
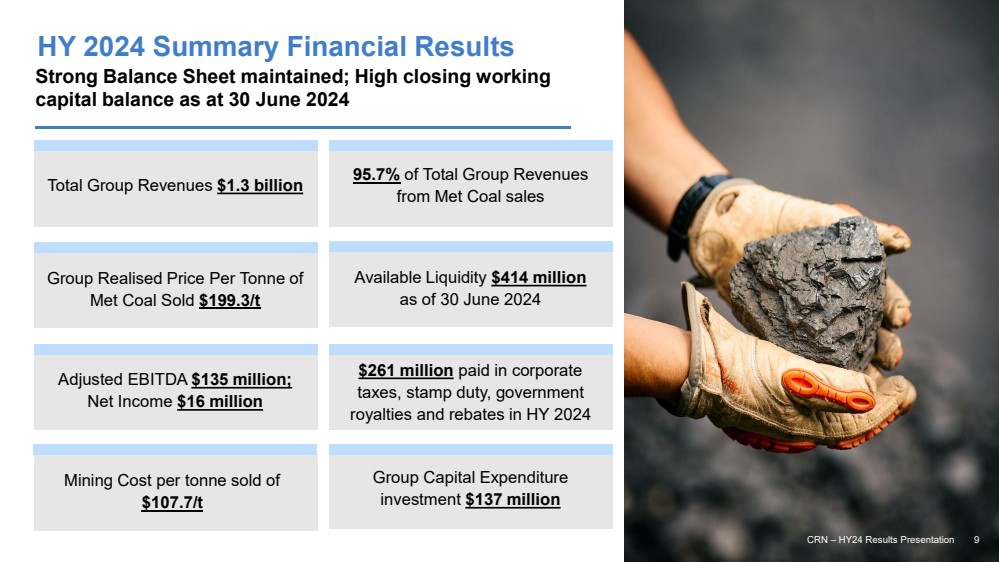
| CRN - HY24 Results Presentation 9 Strong Balance Sheet maintained; High closing working capital balance as at 30 June 2024 HY 2024 Summary Financial Results CRN – HY24 Results Presentation 9 Total Group Revenues $1.3 billion Group Realised Price Per Tonne of Met Coal Sold $199.3/t Adjusted EBITDA $135 million; Net Income $16 million Mining Cost per tonne sold of $107.7/t 95.7% of Total Group Revenues from Met Coal sales Available Liquidity $414 million as of 30 June 2024 $261 million paid in corporate taxes, stamp duty, government royalties and rebates in HY 2024 Group Capital Expenditure investment $137 million |
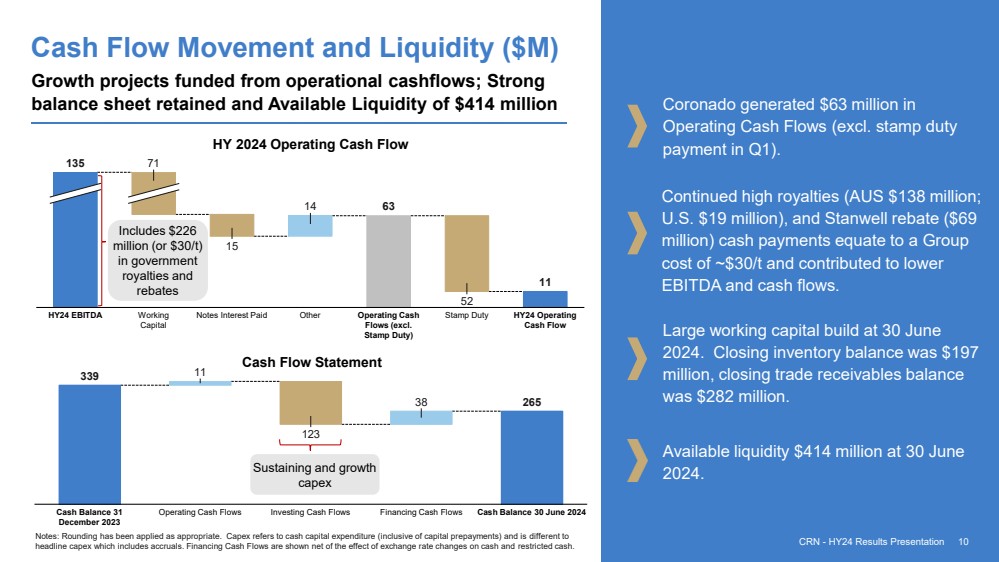
| CRN - HY24 Results Presentation 10 Cash Flow Movement and Liquidity ($M) Coronado generated $63 million in Operating Cash Flows (excl. stamp duty payment in Q1). Continued high royalties (AUS $138 million; U.S. $19 million), and Stanwell rebate ($69 million) cash payments equate to a Group cost of ~$30/t and contributed to lower EBITDA and cash flows. Large working capital build at 30 June 2024. Closing inventory balance was $197 million, closing trade receivables balance was $282 million. Growth projects funded from operational cashflows; Strong balance sheet retained and Available Liquidity of $414 million 63 11 15 14 52 HY24 EBITDA 71 Working Capital Notes Interest Paid Other Operating Cash Flows (excl. Stamp Duty) Stamp Duty HY24 Operating Cash Flow 135 HY 2024 Operating Cash Flow 339 265 11 123 38 Cash Balance 31 December 2023 Operating Cash Flows Investing Cash Flows Financing Cash Flows Cash Balance 30 June 2024 Cash Flow Statement Notes: Rounding has been applied as appropriate. Capex refers to cash capital expenditure (inclusive of capital prepayments) and is different to headline capex which includes accruals. Financing Cash Flows are shown net of the effect of exchange rate changes on cash and restricted cash. Available liquidity $414 million at 30 June 2024. CRN - HY24 Results Presentation 10 Includes $226 million (or $30/t) in government royalties and rebates Sustaining and growth capex |
| CRN - HY24 Results Presentation 11 Coronado’s Capital Management Strategy CRN - HY24 Results Presentation 11 1. Strong Balance Sheet 2. Shareholder Returns 3. Organic Growth Maintaining a strong balance sheet with enhanced liquidity and prudent debt levels. Fundamental strategy is to return funds to Shareholders. Prioritise growth expenditure projects and expansion to increase existing production rates. |
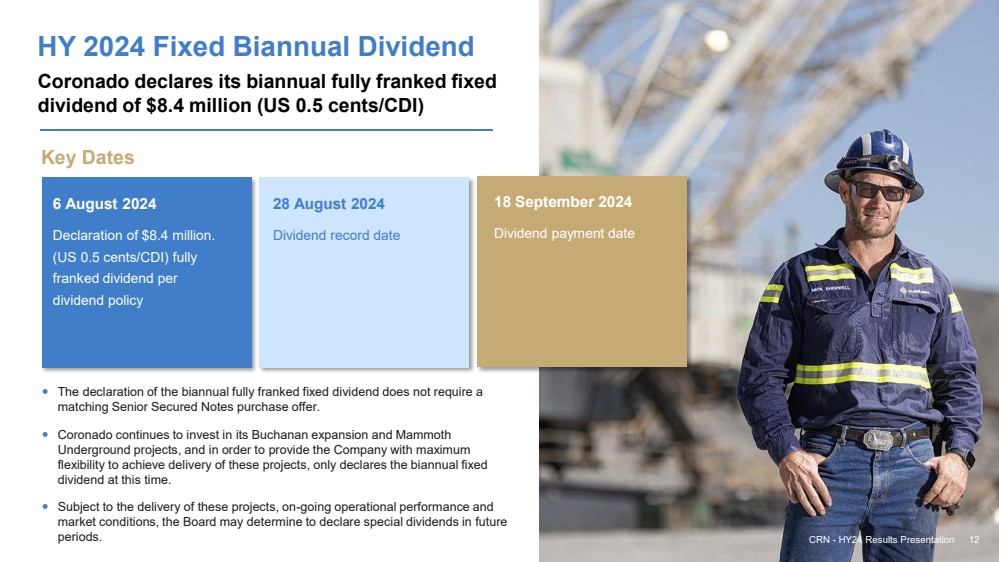
| CRN - HY24 Results Presentation 12 Coronado declares its biannual fully franked fixed dividend of $8.4 million (US 0.5 cents/CDI) The declaration of the biannual fully franked fixed dividend does not require a matching Senior Secured Notes purchase offer. Coronado continues to invest in its Buchanan expansion and Mammoth Underground projects, and in order to provide the Company with maximum flexibility to achieve delivery of these projects, only declares the biannual fixed dividend at this time. Subject to the delivery of these projects, on-going operational performance and market conditions, the Board may determine to declare special dividends in future periods. HY 2024 Fixed Biannual Dividend 6 August 2024 Declaration of $8.4 million. (US 0.5 cents/CDI) fully franked dividend per dividend policy Key Dates 28 August 2024 Dividend record date 18 September 2024 Dividend payment date CRN - HY24 Results Presentation 12 |
| Metallurgical Coal & Steel Markets CRN - HY24 Results Presentation 13 |
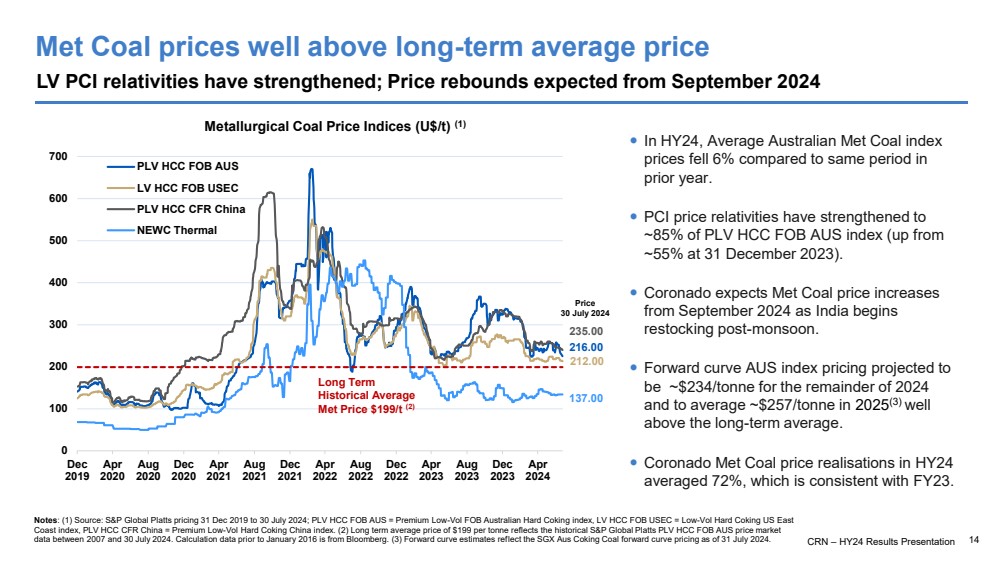
| Met Coal prices well above long-term average price LV PCI relativities have strengthened; Price rebounds expected from September 2024 Notes: (1) Source: S&P Global Platts pricing 31 Dec 2019 to 30 July 2024; PLV HCC FOB AUS = Premium Low-Vol FOB Australian Hard Coking index, LV HCC FOB USEC = Low-Vol Hard Coking US East Coast index, PLV HCC CFR China = Premium Low-Vol Hard Coking China index. (2) Long term average price of $199 per tonne reflects the historical S&P Global Platts PLV HCC FOB AUS price market data between 2007 and 30 July 2024. Calculation data prior to January 2016 is from Bloomberg. (3) Forward curve estimates reflect the SGX Aus Coking Coal forward curve pricing as of 31 July 2024. 216.00 212.00 235.00 137.00 0 100 200 300 400 500 600 700 Dec 2019 Apr 2020 Aug 2020 Dec 2020 Apr 2021 Aug 2021 Dec 2021 Apr 2022 Aug 2022 Dec 2022 Apr 2023 Aug 2023 Dec 2023 Apr 2024 PLV HCC FOB AUS LV HCC FOB USEC PLV HCC CFR China NEWC Thermal Long Term Historical Average Met Price $199/t (2) In HY24, Average Australian Met Coal index prices fell 6% compared to same period in prior year. PCI price relativities have strengthened to ~85% of PLV HCC FOB AUS index (up from ~55% at 31 December 2023). Coronado expects Met Coal price increases from September 2024 as India begins restocking post-monsoon. Forward curve AUS index pricing projected to be ~$234/tonne for the remainder of 2024 and to average ~$257/tonne in 2025(3) well above the long-term average. Coronado Met Coal price realisations in HY24 averaged 72%, which is consistent with FY23. Price 30 July 2024 Metallurgical Coal Price Indices (U$/t) (1) CRN – HY24 Results Presentation 14 |
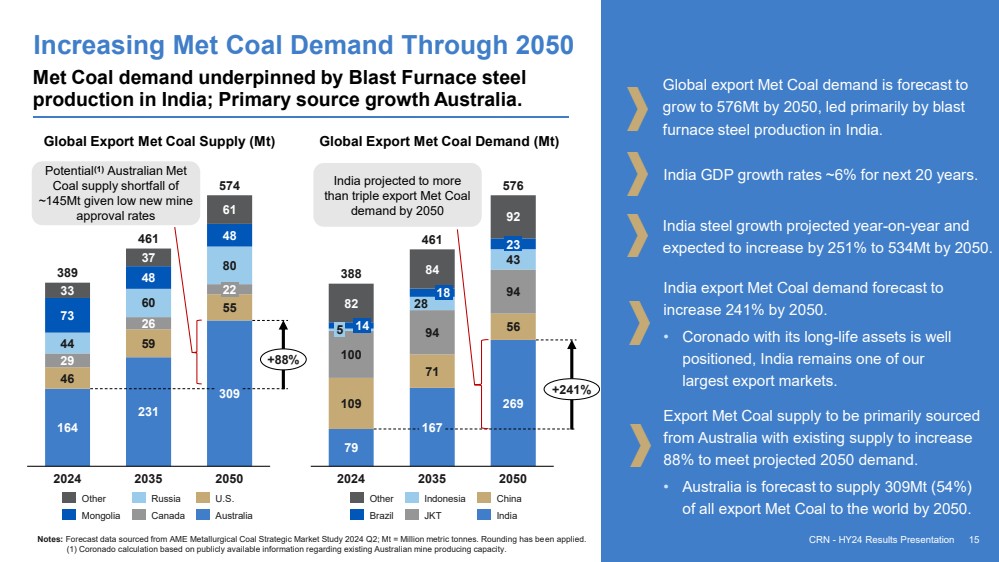
| Increasing Met Coal Demand Through 2050 Global export Met Coal demand is forecast to grow to 576Mt by 2050, led primarily by blast furnace steel production in India. India export Met Coal demand forecast to increase 241% by 2050. • Coronado with its long-life assets is well positioned, India remains one of our largest export markets. Met Coal demand underpinned by Blast Furnace steel production in India; Primary source growth Australia. Export Met Coal supply to be primarily sourced from Australia with existing supply to increase 88% to meet projected 2050 demand. • Australia is forecast to supply 309Mt (54%) of all export Met Coal to the world by 2050. Global Export Met Coal Supply (Mt) Global Export Met Coal Demand (Mt) 164 231 309 46 59 55 29 26 44 60 80 73 48 48 33 37 61 2024 2035 22 2050 389 461 574 +88% Other Mongolia Russia Canada U.S. Australia 79 167 109 269 71 56 100 94 94 28 43 82 84 92 14 5 2024 18 2035 23 2050 388 461 576 +241% Other Brazil Indonesia JKT China India Notes: Forecast data sourced from AME Metallurgical Coal Strategic Market Study 2024 Q2; Mt = Million metric tonnes. Rounding has been applied. (1) Coronado calculation based on publicly available information regarding existing Australian mine producing capacity. 15 Potential(1) Australian Met Coal supply shortfall of ~145Mt given low new mine approval rates India projected to more than triple export Met Coal demand by 2050 CRN - HY24 Results Presentation India GDP growth rates ~6% for next 20 years. India steel growth projected year-on-year and expected to increase by 251% to 534Mt by 2050. |
| Organic Growth Investment Plans Douglas Thompson Managing Director & CEO CRN – HY24 Results Presentation 16 |
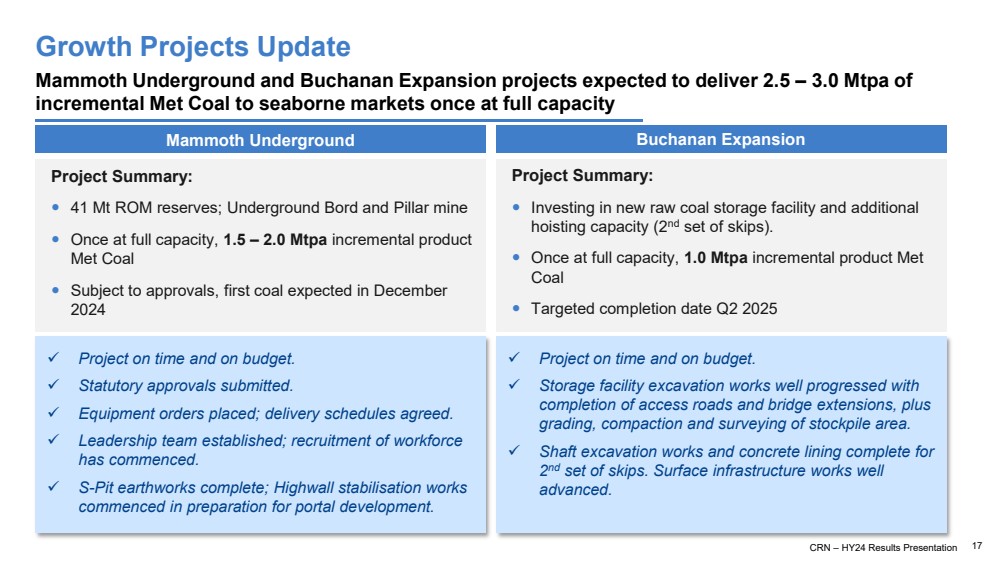
| Growth Projects Update Mammoth Underground and Buchanan Expansion projects expected to deliver 2.5 – 3.0 Mtpa of incremental Met Coal to seaborne markets once at full capacity CRN – FY23 Results Presentation 17 Mammoth Underground Buchanan Expansion ✓ Project on time and on budget. ✓ Statutory approvals submitted. ✓ Equipment orders placed; delivery schedules agreed. ✓ Leadership team established; recruitment of workforce has commenced. ✓ S-Pit earthworks complete; Highwall stabilisation works commenced in preparation for portal development. Project Summary: 41 Mt ROM reserves; Underground Bord and Pillar mine Once at full capacity, 1.5 – 2.0 Mtpa incremental product Met Coal Subject to approvals, first coal expected in December 2024 Project Summary: Investing in new raw coal storage facility and additional hoisting capacity (2nd set of skips). Once at full capacity, 1.0 Mtpa incremental product Met Coal Targeted completion date Q2 2025 ✓ Project on time and on budget. ✓ Storage facility excavation works well progressed with completion of access roads and bridge extensions, plus grading, compaction and surveying of stockpile area. ✓ Shaft excavation works and concrete lining complete for 2 nd set of skips. Surface infrastructure works well advanced. CRN – HY24 Results Presentation 17 |
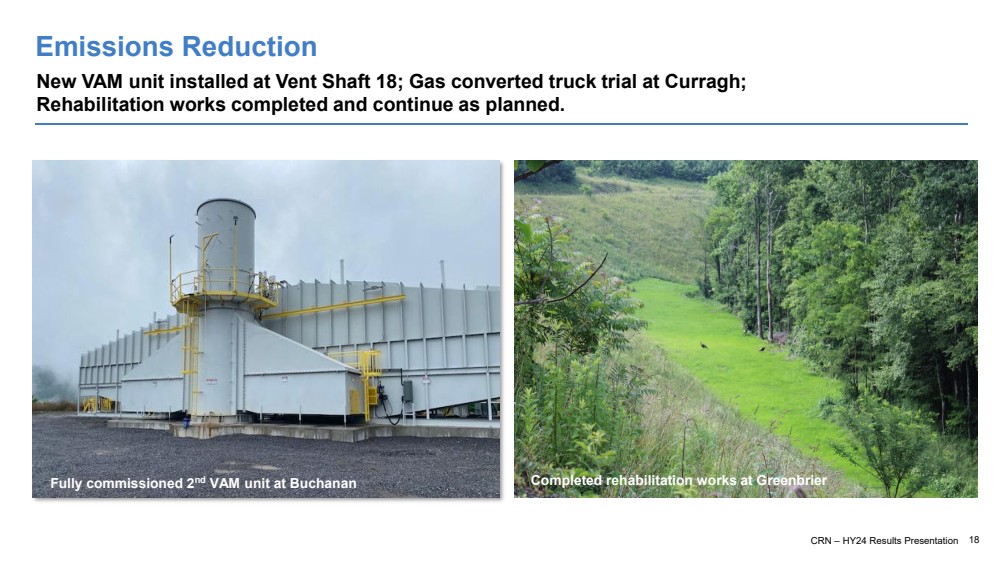
| Emissions Reduction New VAM unit installed at Vent Shaft 18; Gas converted truck trial at Curragh; Rehabilitation works completed and continue as planned. CRN – HY24 Results Presentation 18 Fully commissioned 2nd VAM unit at Buchanan Completed rehabilitation works at Greenbrier |
| Coronado Investment Credentials CRN - HY24 Results Presentation 19 |
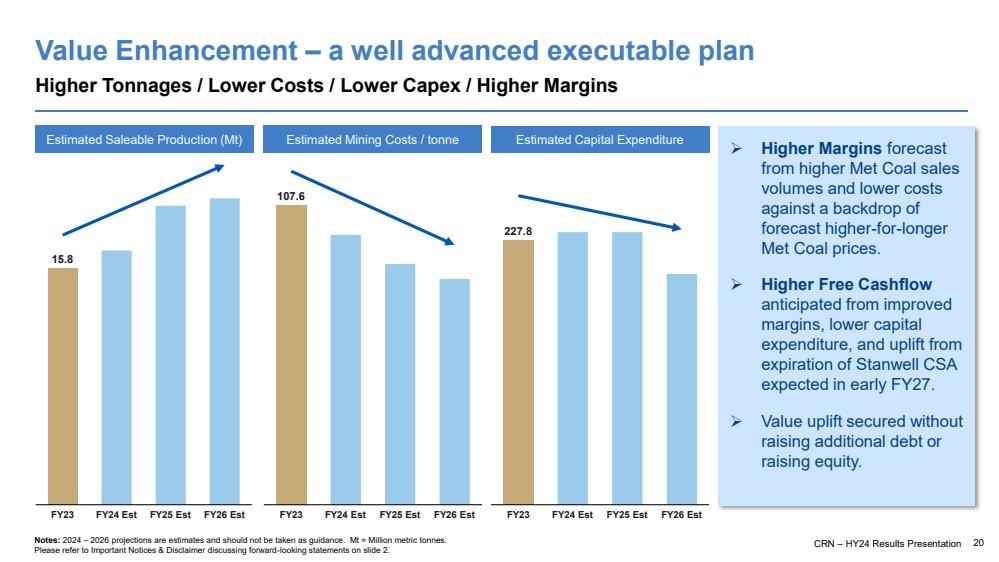
| CRN – HY24 Results Presentation 20 Value Enhancement – a well advanced executable plan Higher Tonnages / Lower Costs / Lower Capex / Higher Margins 15.8 FY23 FY24 Est FY25 Est FY26 Est Notes: 2024 – 2026 projections are estimates and should not be taken as guidance. Mt = Million metric tonnes. Please refer to Important Notices & Disclaimer discussing forward-looking statements on slide 2. Estimated Saleable Production (Mt) 107.6 FY23 FY24 Est FY25 Est FY26 Est 227.8 FY23 FY24 Est FY25 Est FY26 Est Estimated Mining Costs / tonne Estimated Capital Expenditure ➢ Higher Margins forecast from higher Met Coal sales volumes and lower costs against a backdrop of forecast higher-for-longer Met Coal prices. ➢ Higher Free Cashflow anticipated from improved margins, lower capital expenditure, and uplift from expiration of Stanwell CSA expected in early FY27. ➢ Value uplift secured without raising additional debt or raising equity. |
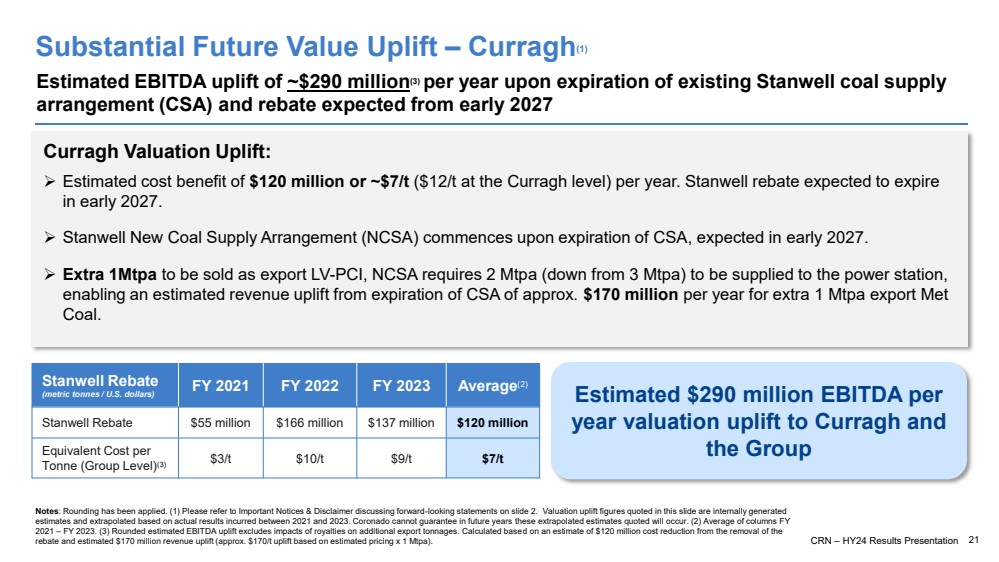
| Substantial Future Value Uplift – Curragh(1) Estimated EBITDA uplift of ~$290 million(3) per year upon expiration of existing Stanwell coal supply arrangement (CSA) and rebate expected from early 2027 21 Notes: Rounding has been applied. (1) Please refer to Important Notices & Disclaimer discussing forward-looking statements on slide 2. Valuation uplift figures quoted in this slide are internally generated estimates and extrapolated based on actual results incurred between 2021 and 2023. Coronado cannot guarantee in future years these extrapolated estimates quoted will occur. (2) Average of columns FY 2021 – FY 2023. (3) Rounded estimated EBITDA uplift excludes impacts of royalties on additional export tonnages. Calculated based on an estimate of $120 million cost reduction from the removal of the rebate and estimated $170 million revenue uplift (approx. $170/t uplift based on estimated pricing x 1 Mtpa). CRN – HY24 Results Presentation Stanwell Rebate (metric tonnes / U.S. dollars) FY 2021 FY 2022 FY 2023 Average(2) Stanwell Rebate $55 million $166 million $137 million $120 million Equivalent Cost per Tonne (Group Level)(3) $3/t $10/t $9/t $7/t Curragh Valuation Uplift: ➢ Estimated cost benefit of $120 million or ~$7/t ($12/t at the Curragh level) per year. Stanwell rebate expected to expire in early 2027. ➢ Stanwell New Coal Supply Arrangement (NCSA) commences upon expiration of CSA, expected in early 2027. ➢ Extra 1Mtpa to be sold as export LV-PCI, NCSA requires 2 Mtpa (down from 3 Mtpa) to be supplied to the power station, enabling an estimated revenue uplift from expiration of CSA of approx. $170 million per year for extra 1 Mtpa export Met Coal. Estimated $290 million EBITDA per year valuation uplift to Curragh and the Group |
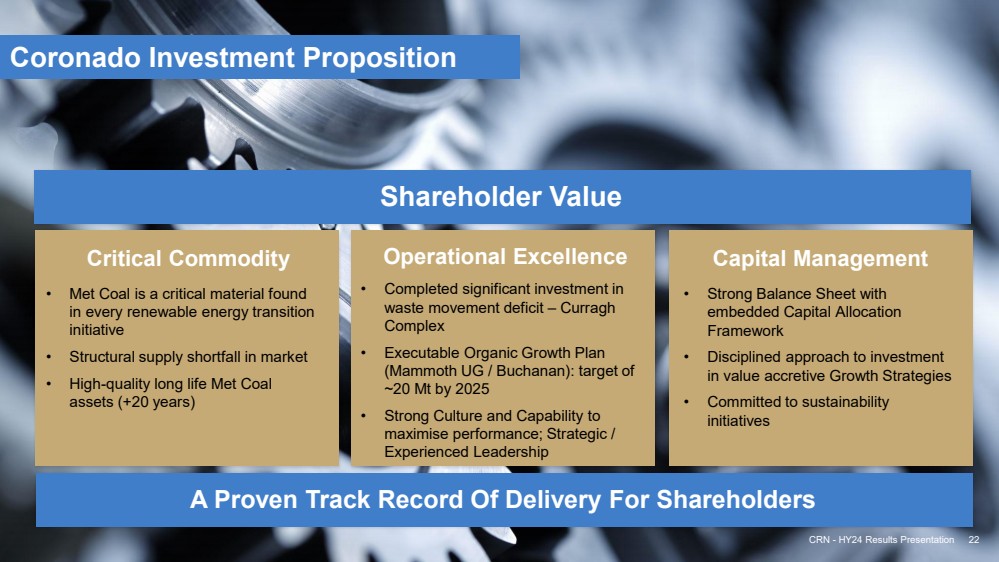
| Critical Commodity Operational Excellence Capital Management • Completed significant investment in waste movement deficit – Curragh Complex • Executable Organic Growth Plan (Mammoth UG / Buchanan): target of ~20 Mt by 2025 • Strong Culture and Capability to maximise performance; Strategic / Experienced Leadership • Met Coal is a critical material found in every renewable energy transition initiative • Structural supply shortfall in market • High-quality long life Met Coal assets (+20 years) A Proven Track Record Of Delivery For Shareholders • Strong Balance Sheet with embedded Capital Allocation Framework • Disciplined approach to investment in value accretive Growth Strategies • Committed to sustainability initiatives CRN - HY24 Results Presentation 22 Shareholder Value Coronado Investment Proposition |
| CRN - HY24 Results Presentation 23 Questions CRN - HY24 Results Presentation 23 |
| CRN - HY24 Results Presentation 24 Reconciliation of Non -GAAP measures This presentation includes a discussion of results of operations and references to and analysis of certain non -GAAP measures (as described below) which are financial measures not recognised in accordance with U .. S .. GAAP .. Non -GAAP financial measures are used by the Company and investors to measure operating performance .. Management uses a variety of financial and operating metrics to analyse performance .. These metrics are significant in assessing operating results and profitability .. These financial and operating metrics include : (i) safety and environmental statistics ; (ii) Adjusted EBITDA ; (iii) total sales volumes and average realised price per Mt sold, which we define as total coal revenues divided by total sales volume ; (iv) Metallurgical coal sales volumes and average realised Metallurgical coal price per tonne sold, which we define as metallurgical coal revenues divided by metallurgical sales volume ; (v) Mining costs per Mt sold, which we define as mining cost of coal revenues divided by sales volumes (excluding non -produced coal) for the respective segment ; (vi) Operating costs per Mt sold, which we define as operating costs divided by sales volumes for the respective segment. Investors should be aware that the Company’s presentation of Adjusted EBITDA and other non -GAAP measures may not be comparable to similarly titled financial measures used by other companies .. We define Net (Debt) / Cash as cash and cash equivalents (excluding restricted cash) less the outstanding aggregate principal amount of the 10.750 % senior secured notes due 2026 and less other interest - bearing liabilities. Reconciliations of certain forward -looking non -GAAP financial measures, including our 2024 Mining Cost per Tonne Sold guidance, to the most directly comparable GAAP financial measures are not provided because the Company is unable to provide such reconciliations without unreasonable effort, due to the uncertainty and inherent difficulty of predicting the occurrence and the financial impact of items impacting comparability and the periods in which such items may be recognised .. For the same reasons, the Company is unable to address the probable significance of the unavailable information, which could be material to future results. CRN - HY24 Results Presentation 24 |
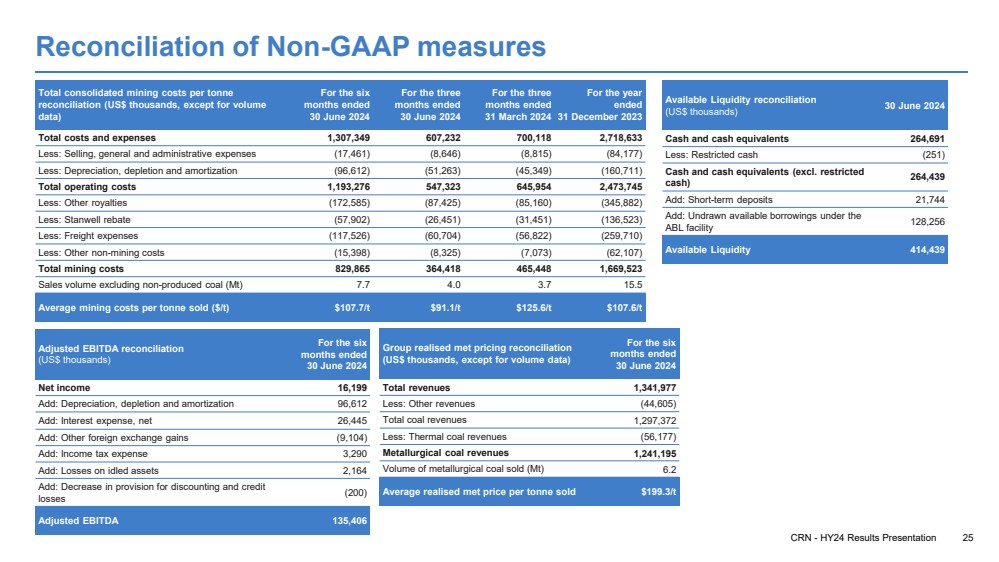
| CRN - HY24 Results Presentation 25 Reconciliation of Non-GAAP measures Total consolidated mining costs per tonne reconciliation (US$ thousands, except for volume data) For the six months ended 30 June 2024 For the three months ended 30 June 2024 For the three months ended 31 March 2024 For the year ended 31 December 2023 Total costs and expenses 1,307,349 607,232 700,118 2,718,633 Less: Selling, general and administrative expenses (17,461) (8,646) (8,815) (84,177) Less: Depreciation, depletion and amortization (96,612) (51,263) (45,349) (160,711) Total operating costs 1,193,276 547,323 645,954 2,473,745 Less: Other royalties (172,585) (87,425) (85,160) (345,882) Less: Stanwell rebate (57,902) (26,451) (31,451) (136,523) Less: Freight expenses (117,526) (60,704) (56,822) (259,710) Less: Other non-mining costs (15,398) (8,325) (7,073) (62,107) Total mining costs 829,865 364,418 465,448 1,669,523 Sales volume excluding non-produced coal (Mt) 7.7 4.0 3.7 15.5 Average mining costs per tonne sold ($/t) $107.7/t $91.1/t $125.6/t $107.6/t Adjusted EBITDA reconciliation (US$ thousands) For the six months ended 30 June 2024 Net income 16,199 Add: Depreciation, depletion and amortization 96,612 Add: Interest expense, net 26,445 Add: Other foreign exchange gains (9,104) Add: Income tax expense 3,290 Add: Losses on idled assets 2,164 Add: Decrease in provision for discounting and credit losses (200) Adjusted EBITDA 135,406 Available Liquidity reconciliation (US$ thousands) 30 June 2024 Cash and cash equivalents 264,691 Less: Restricted cash (251) Cash and cash equivalents (excl. restricted cash) 264,439 Add: Short-term deposits 21,744 Add: Undrawn available borrowings under the ABL facility 128,256 Available Liquidity 414,439 Group realised met pricing reconciliation (US$ thousands, except for volume data) For the six months ended 30 June 2024 Total revenues 1,341,977 Less: Other revenues (44,605) Total coal revenues 1,297,372 Less: Thermal coal revenues (56,177) Metallurgical coal revenues 1,241,195 Volume of metallurgical coal sold (Mt) 6.2 Average realised met price per tonne sold $199.3/t |
| Investors Andrew Mooney Vice President Investor Relations & Communications +61 458 666 639 amooney@coronadoglobal.com investors@coronadoglobal.com Registered Office Coronado Global Resources Inc. Level 33, Central Plaza One 345 Queen Street Brisbane, QLD, Australia, 4000 GPO Box 51, Brisbane QLD, Australia, 4000 +61 7 3031 7777 +61 7 3229 7401 coronadoglobal.com Media Helen McCombie Morrow Sodali +61 411 756 248 helen.mccombie@sodali.com Contacts |