Exhibit 99.1

MANAGEMENT’S DISCUSSION AND ANALYSIS
FOR THE THREE MONTHS ENDED MARCH 31, 2022
Date of Report: May 12, 2022
This Management’s Discussion and Analysis (“MD&A”) is intended to help the reader understand the significant factors that have affected the performance of Maverix Metals Inc. and its subsidiaries (collectively “Maverix”, “we”, “us”, “our” or the “Company”) and such factors that may affect its future performance. This MD&A should be read in conjunction with the Company’s unaudited condensed interim consolidated financial statements for the three months ended March 31, 2022 and related notes thereto which have been prepared in accordance with International Financial Reporting Standards (“IFRS”), applicable to preparation of interim financial statements including International Accounting Standard 34-Interim Financial Reporting, as issued by the International Accounting Standards Board (“IASB”). Readers are encouraged to consult the Company’s audited consolidated financial statements for the year ended December 31, 2021 and related notes thereto, which are available under Maverix’s profile on SEDAR at www.sedar.com or EDGAR at www.sec.gov. All amounts are in U.S. dollars unless otherwise indicated.
Readers are cautioned that the MD&A contains forward-looking statements and that actual events may vary from management’s expectations. Readers are encouraged to read the “Forward-Looking Statements” at the end of this MD&A and to consult Maverix’s unaudited condensed interim consolidated financial statements for the three months ended March 31, 2022 and related notes thereto which are available on SEDAR at www.sedar.com and on Form 6-K filed with the United States Securities and Exchange Commission on EDGAR at www.sec.gov.
Additional information, including the primary risk factors affecting Maverix, are included on our Annual Information Form (“AIF”) and Form 40-F available on SEDAR at www.sedar.com and on EDGAR at www.sec.gov, respectively. These documents contain descriptions of certain of Maverix’s royalty, stream and other interests, as well as a description of risk factors affecting the Company.
Table of Contents
| Description of the Business | 3 | |
| Highlights and Key Accomplishments for the Three Months Ended March 31, 2022 | 3 | |
| Outlook for 2022 | 4 | |
| Portfolio of Royalty, Stream and Other Interests Owned by Maverix | 4 | |
| Summary of Quarterly Results | 9 | |
| Non-IFRS and Other Measures | 14 | |
| Liquidity and Capital Resources | 16 | |
| Outstanding Share Data | 17 | |
| Off-Balance Sheet Arrangements | 17 | |
| Related Party Transactions | 18 | |
| Critical Accounting Judgements and Estimates | 18 | |
| Financial Instruments | 19 | |
| Disclosure Controls and Procedures | 20 | |
| Internal Controls Over Financial Reporting | 20 | |
| Forward-Looking Statements | 21 | |
| Technical and Third-Party Information | 21 |
2
Description of the Business
Maverix is a resource-based company that seeks to acquire and manage royalties and metal purchase agreements (a “Stream” or “Streams”) on projects that are in an advanced stage of development or on operating mines producing precious or other metals. Royalty interests (“Royalty” or collectively, “Royalties”) are non-operating interests in mining projects that provide Maverix with the right to a percentage of the gross revenue from the metals produced from the project (a “Gross Revenue Royalty” or “GRR”) or the net revenue after the deduction of specified costs (a “Net Smelter Returns Royalty” or “NSR” royalty). Under a Stream interest, Maverix makes an upfront payment to acquire the Stream and then receives the right to purchase, at a fixed or variable price per unit based on the spot price of the precious or other metal, a percentage of the life of mine production or a specified time period.
The Company’s business strategy is to acquire existing Royalty and Stream interests, or to finance production, development, or in some circumstances, exploration stage projects in exchange for Royalty or Stream interests. In the ordinary course of business, Maverix engages in a continual review of opportunities to acquire existing Royalty or Stream interests, or to create new Royalties or Streams on operating mines, development projects and exploration projects. The Company currently has over 120 royalties, stream and other interests, of which 14 of the underlying interests are paying, excluding royalty payments from industrial minerals and power assets.
Highlights and Key Accomplishments for the Three Months Ended March 31, 2022
Financial and Operating:
| · | Gold Equivalent Ounces (“GEOs”) sold of 7,7381; |
| · | Total revenue of $14.7 million; |
| · | Operating cash flows of $8.0 million; |
| · | Operating cash flows, excluding working capital changes, of $10.51 million; |
| · | Cash operating margin of $1,7041 per GEO; |
| · | Average cash cost of $1901 per GEO; |
| · | Adjusted net income of $5.71 million; and |
| · | Net income of $3.5 million. |
Acquisition of Gold Royalties in Nevada
In March 2022, the Company acquired three royalties on gold projects located in Nevada in exchange for a $5.0 million cash payment. The royalties include:
| · | A 3.5% to 4% NSR royalty on the Lewis property owned by Gold Standard Ventures Corp. (“Gold Standard”). The royalty ground covers 367 claims immediately adjacent to the high-quality Phoenix gold mine operated by Nevada Gold Mines, which is a joint venture between Barrick Gold Corporation and Newmont Corporation (“Newmont”); |
| · | A 4% royalty on 105 claims, covering approximately 846 hectares, including the Dixie Creek prospect, which are currently leased by Gold Standard and form part of the South Railroad project land package; and |
| · | A 4% royalty on two claims near Railroad prospect area, currently leased by Gold Standard, approximately seven kilometres north of the Pinion deposit on Gold Standard’s South Railroad project. |
Elevation Prepaid Gold Interest
In January 2022, the Company entered into a prepaid gold interest agreement with Elevation Gold Mining (“Elevation”). The Company made a cash payment of $6.0 million to Elevation and in return Elevation will provide the Company six quarterly deliveries of certain amounts of gold plus the equivalent amount of gold equal to $1.0 million beginning in March 2022 (the “Elevation Prepaid Gold Interest”). The Company will make ongoing cash payments equal to 5% of the spot gold price for each gold ounce delivered.
1 Refer to section on non-IFRS and other measures of this MD&A.
3
Quarterly Dividend Declared
On May 12, 2022, the Board of Directors of the Company declared a quarterly dividend of $0.0125 per common share payable on June 15, 2022 to shareholders of record as of the close of business on May 31, 2022.
Outlook for 20221
In 2022, Maverix continues to expect 32,000 to 35,000 attributable GEOs2 at approximately a 90% cash margin2 with approximately 99% of expected revenue derived from gold and silver.
On April 25, 2022, Polymetal International plc (“Polymetal”) announced that the devastating war in Ukraine and immense sanctions put tremendous pressure on Polymetal during the first quarter of 2022. Polymetal has announced it continues to operate safely and profitably and is fully focused on ensuring business continuity and long-term viability. Polymetal also reconfirmed their fiscal 2022 production guidance. Polymetal is the owner and operator of the Omolon Hub where the Company owns a 2.5% GRR.
The conflict between Russia and Ukraine and any restrictive actions that have or may be taken in response thereto, such as sanctions, export and or currency controls, could have negative impacts on Polymetal’s ability to continue operation of the Omolon hub, where the Company owns a 2.5% GRR, and Polymetal’s ability to make payments to the Company. On an annual basis, the Company provides Polymetal certain administrative certifications so that Polymetal may make payments to the Company. Once the administrative certifications are obtained, they will be provided to Polymetal.
For more information, please refer to polymetalinternational.com and see the news release dated April 25, 2022.
Portfolio of Royalty, Stream and Other Interests Owned by Maverix
The Company owns over 120 Royalties, Streams and other interests. Maverix has 14 Royalties and Streams that are currently paying, including three in Australia, three in the United States, three in Mexico, two in Canada, and one in each of Honduras, Burkina Faso and Russia. In addition, the Company owns a number of Royalties and Streams on development and exploration/evaluation stage projects in North America, South America, and Australia, amongst others. The Company uses “evaluation stage” to describe exploration stage properties that contain mineralized material and on which operators are engaged in the search for reserves. We do not conduct mining operations on the properties in which we hold Royalty and Stream interests, and we are not required to contribute to capital costs, exploration costs, environmental costs or other operating costs on those properties.
Primary Properties:
The following table summarizes Maverix’s principal Stream and other interests:
| Asset | Location | Operator | Status | MMX Attributable Production or Relevant Commodity | MMX Purchase Price |
| Auramet | USA | Auramet Capital Partners, L.P. | Paying | 1,250 ounces plus 2% of dividends paid(1) per quarter | 16% of gold spot price |
| El Mochito | Honduras | Kirungu Corporation | Paying | 25% of silver | 25% of silver spot price |
| La Colorada | Mexico | Pan American Silver Corp. | Paying | 100% of gold | Lesser of (i) US$650 per ounce and (ii) spot price |
| Moss | USA | Elevation Gold Mining Corporation | Paying | 100% of silver(2) | 20% of silver spot price |
(1) Amount of gold that is equivalent to all dividends distributed by Auramet International LLC on 2% of its shares.
(2) After 3.5 million ounces of silver are delivered, Maverix’s silver purchase entitlement will be 50% of the remaining life of mine silver production.
1 Statements made in this section contain forward-looking information. Reference should be made to the “Cautionary Statement on Forward-Looking Information” section at the end of this MD&A. For a description of material factors that could cause our actual results to differ materially from the forward-looking statements, please see the “Risk Factors” section in the most recent AIF and Form 40-F available on SEDAR at www.sedar.com and on EDGAR at www.sec.gov, respectively.
2 Refer to section on non-IFRS and other measures of this MD&A.
4
The following table summarizes Maverix’s principal Royalty interests:
| Asset | Location | Operator | Status | Royalty Interest |
| Beta Hunt | Australia | Karora Resources Inc. | Paying | 3.25% GRR, and 1.5% NSR Royalties on all Gold production; and aggregate 1.5% NSR Royalties on all Nickel production |
| Camino Rojo | Mexico | Orla Mining Ltd. | Paying | 2.0% NSR Royalty(1) |
| Cerro Blanco | Guatemala | Bluestone Resources Inc. | Development | 1.0% NSR Royalty |
| Converse | USA | Waterton Global Resource Management | Development | 5.0% NSR Royalty(2) |
| DeLamar | USA | Integra Resources Corp. | Development | 2.5% NSR Royalty(3) |
| Florida Canyon | USA | Argonaut Gold Inc. | Paying | 3.0% NSR Royalty |
| Goldfield | USA | Centerra Gold Inc. | Development | 5.0% NSR Royalty(4) |
| Hasbrouck | USA | West Vault Mining Inc. | Development | 1.25% NSR Royalty |
| Hope Bay | Canada | Agnico Eagle Mines Limited | Development | 1.0% NSR Royalty |
| Karma | Burkina Faso | Néré Mining | Paying | 2.0% NSR Royalty(5) |
| Kensington | USA | Coeur Mining, Inc. | Operating | 2.5% NSR Royalty(6) |
| Koné | Côte d’Ivoire | Montage Gold Corp. | Development | 2.0% NSR Royalty |
| McCoy-Cove | USA | i-80 Gold Corp. | Development | 3.5% NSR Royalty(7) |
| Moose River | Canada | St Barbara Limited | Paying | 1.0% NSR Royalty(8) |
| Mt Carlton | Australia | Navarre Minerals Limited | Paying | 2.5% NSR Royalty |
| Norte Abierto | Chile | Barrick Gold Corporation Newmont Corporation | Development | 1.25% GRR(9) |
| Omolon hub | Russia | Polymetal International plc | Paying | 2.5% GRR |
| Railroad | USA | Gold Standard Ventures Corp. | Development | 2.0% NSR Royalty(2) |
| San Jose | Mexico | Fortuna Silver Mines Inc. | Paying | 1.5% NSR Royalty(10) |
| Silvertip | Canada | Coeur Mining, Inc. | Development | 2.5% NSR Royalty |
| Vivien | Australia | Ramelius Resources Ltd. | Paying | 3.5% GRR |
(1) Royalty is on oxide and transitional ore only.
(2) Royalty covers a portion of the existing mineral resource.
(3) NSR royalty covers a portion of the existing resource and decreases to a 1.0% NSR Royalty after CAD$10 million in royalties have been paid.
(4) Royalty applies to the Gemfield deposit.
(5) Royalty applies to 85.5% of total production.
(6) NSR royalty not payable until after a recoupment period.
(7) 2.0% of the NSR royalty only covers a portion of the deposit.
(8) Royalty applies to the Touquoy deposit.
(9) Royalty applies to 25% of gross revenues from all metals sold from Cerro Casale and Quebrada Seca. Payment commences after $10.0 million is payable under the agreement.
(10) Royalty applies to the Taviche Oeste concessions.
Portfolio Updates - Paying and Operating Assets:
Camino Rojo (2% NSR)
Orla Mining Ltd. (“Orla”) declared commercial production at the Camino Rojo oxide gold mine effective April 1, 2022. The declaration of commercial production at Camino Rojo comes after a successful commissioning period which included the ramp up of mining and processing to sustained throughput levels in excess of 75% of designed nameplate capacity of 18,000 tonnes per day. All major construction activities have now been completed and Camino Rojo has demonstrated its ability to sustain ongoing production levels.
For more information, please refer to orlamining.com and see the news release dated March 31, 2022.
5
Beta Hunt (4.75% Gold Royalty + 1.5% Nickel Royalty)
Karora Resources Inc. (“Karora”) announced an updated consolidated gold mineral resource highlighted by the maiden gold resource for the Larkin Zone at the Beta Hunt mine. Beta Hunt gold measured and indicated mineral resources increased by 7% to 1.12 million ounces and the gold inferred mineral resource increased by 46% to 786,000 ounces. Significant Beta Hunt additions include the maiden Larkin Zone mineral resource comprising gold measured and indicated resources of 1.44 million tonnes at 2.6 grams per tonne (“g/t”) for 119,000 ounces and a gold inferred resource of 2.17 million tonnes at 2.3 g/t for 162,000 ounces. The Larkin Zone has been delineated to a strike length of over 1,000 metres and a depth of 150 metres and remains open along strike and at depth providing significant potential for further expansion as the drill program at Beta Hunt continues. Targeted drilling at Beta Hunt continues to grow the gold mineral resource inventory in support of Karora’s growth plan which is underpinned by an expansion to 2.0 million tonnes per annum production from Beta Hunt by 2024.
For more information, please refer to karoraresources.com and see the news release dated April 7, 2022.
Mt Carlton (2.5% NSR)
Navarre Minerals Limited (“Navarre”) announced high-grade gold, silver and copper drilling intercepts at its Mt Carlton United deposit (“MCU”), part of the recently acquired Mt Carlton Operation (“Mt Carlton”). With drill intercepts of up to 22.9 g/t gold, 1,327 g/t silver and 4.2% copper, the results confirm the outstanding grade and continuity of the mineral inventory at MCU, approximately four kilometres southwest of the Mt Carlton processing facility. While drilling continues in 2022 as part of an ongoing exploration program, Navarre anticipates the drilling results released to date will be incorporated into an updated resource estimate for MCU which is expected to be published in September 2022, along with updated mineral resources for other Mt Carlton deposits such as V2, Telstra Hill and Crush Creek. Navarre also reported its annual mineral resource and ore reserve statement, which contains the maiden mineral resource and reserve estimates for its recently acquired Mt Carlton Operation.
For more information, please refer to navarre.com.au and see the news releases dated March 30, 2022 and April 22, 2022.
Omolon (2.5% GRR)
Polymetal announced that it continues to operate safely and profitably and is fully focused on ensuring business continuity and long-term viability and have reconfirmed its fiscal 2022 production guidance. Polymetal has stated it routinely carries at least three month’s worth of consumption stockpiles of critical materials, consumables and spare parts, while insurance stock levels further increased since the start of the COVID-19 pandemic in 2020. Polymetal announced it has initiated a review of logistics and procurement with the aim to increase its supply chain resilience and potentially shift critical supplies to domestic or Chinese manufactured consumables and equipment. Sales of bullion in Russia have been impacted by sanctions imposed by the United States of America, European Union and United Kingdom and Polymetal has fully adjusted sales to comply with all relevant sanctions.
Polymetal has stated that sanctions announced between March 9, 2022 and April 25, 2022 did not have a material impact on its business and it complies rigorously with all relevant legislation and is implementing comprehensive measures to observe all applicable international sanctions. Polymetal has cautioned the scope and impact of any new potential sanctions or counter sanctions are yet unknown and contingency planning has been initiated to maintain business continuity. Polymetal believes that targeted sanctions on the company remain unlikely but are not impossible.
For more information, please refer to polymetalinternational.com and see the news releases dated March 9, 2022, March 30, 2022 and April 25, 2022.
Karma (2% NSR)
Endeavour Mining plc (“Endeavour”) announced that it had closed the sale of its 90% interest in its Karma mine to Néré Mining. A key consideration of the sales process was the selection of a party that will maintain Endeavour’s trusted partnerships in Burkina Faso, by committing to operate the mine in the best interests of employees and stakeholders. Néré Mining is a Burkina Faso based consortium led by a board member of both Karma and a subsidiary of Endeavour that holds the mining license for the Endeavour Group’s Mana mine.
For more information, please refer to endeavourmining.com and see the news release dated March 11, 2022.
6
Significant Portfolio Updates - Development and Exploration Assets:
Gemfield (5% NSR)
Centerra Gold Inc. (“Centerra”) announced it completed the acquisition of the Goldfield District project (“Goldfield”) for $206.5 million. Goldfield is a conventional open-pit, heap leach project located in Esmeralda County, Nevada. Goldfield is comprised of three known deposits including the Gemfield, Goldfield Main, and McMahon deposits. The Gemfield deposit is fully permitted and shovel ready and was identified by Centerra as the first pit for potential development. In 2019, Waterton Global Resource Management, Inc. (“Waterton”) announced it was completing a feasibility study for the project with project average annual production in excess of 125,000 ounces of gold. Centerra expects to release an updated resource estimate in the first half of 2023 and an updated feasibility study thereafter.
For more information, please refer to centerragold.com and see the news releases dated February 22, 2022 and February 28, 2022.
Koné (2% NSR)
Montage Gold Corp. (“Montage”) announced the results of a definitive feasibility study (“DFS”) for the Koné gold project in Côte d’Ivoire including an after-tax net present value of $746 million and an internal rate of return of 35% at a $1,600 per ounce gold price. The DFS outlined a 14.8 year mine life with average annual gold production of 257,000 ounces in the first nine years and an average of 207,000 ounces over its mine life. The permitting process at Koné is well underway with all requisite approvals expected in the third quarter of 2022 and an advisor has been appointed to assist Montage in the raising of project finance for the development of the project.
For more information, please refer to montagegoldcorp.com and see the news releases dated February 14, 2022 and March 9, 2022.
Cerro Blanco (1% NSR)
Bluestone Resources Inc. (“Bluestone”) announced the results of a feasibility study on its flagship Cerro Blanco project in Guatemala. The feasibility study outlined a robust, high-grade operation with average annual production of 241,000 ounces of gold over the first 10 years of operation and an initial mine life of 14 years with additional opportunities to extend the mine life given the extensive exploration potential of the land package. Bluestone recently submitted the environmental permit amendment application for the change in mining method and based on current estimates Bluestone believes it will be possible to receive approval of the permit amendment in Q3 2022, followed by a construction license and a forestry license.
For more information, please refer to bluestoneresources.ca and see the news release dated February 22, 2022.
South Railroad (2% NSR)
Gold Standard announced the results of a robust feasibility study on its South Railroad project in Elko, Nevada. The feasibility study outlines a 10.5 year mine life with total gold production of over one million ounces and average gold production of 152,000 ounces over the first four years. Gold Standard intends to launch the construction financing process this quarter and anticipates concluding it before the end of the year. Construction of the South Railroad project could commence as early as the second quarter of 2023, with first gold production in the third quarter of 2024.
For more information, please refer to goldstandardv.com and see the news release dated February 23, 2022.
DeLamar (2.5% NSR)
Integra Resources Corp. (“Integra”) announced a simplified strategy to advance the heap leach stage of the project into permitting and development on a standalone basis. Permitting work at DeLamar has been initiated and baseline study work is well underway to support the submittal of a Plan of Operations in H1 2023. Advancing the DeLamar gold-silver project towards permitting and development of the heap leach stage as a standalone mining operation is a lower cost, lower risk option, creating strong economic returns and rapid payback. Non-oxide milling expansion will continued to be optimized through further study work and can be pursued under the right market conditions.
For more information, please refer to integraresources.com and see the news release dated April 21, 2022.
7
Silvertip (2.5% NSR)
Coeur Mining Inc. (“Coeur”) announced that work has commenced to assess the economics of a potential larger expansion and restart of the high-grade Silvertip property in British Columbia. The review is evaluating the potential to target a higher throughput to take advantage of the significant resource growth and on a timetable that would sequence an expansion and restart following completion and commissioning of the Rochester mine expansion. Results from this ongoing work are expected by the end of the year.
Coeur continues to generate positive results from ongoing exploration as highlighted by the silver, zinc and lead measured and indicated resources increasing year-over-year by approximately 51%, 33% and 44%, respectively. Silver, zinc and lead inferred resources also grew by 48%, 37% and 40%, respectively, during the same period. A total of approximately 102,275 metres were drilled in 2021 and up to seven core drill rigs were active during the fourth quarter (five on surface and two underground) focused on expansion drilling at southern portions and deeper extensions of the Southern Silver, Discovery South and Camp Creek zones. In 2022, Coeur plans to continue the resource growth program and follow up drilling activity on the newly discovered zones. Recently, surface and underground drilling led to the discovery of a new high-grade chimney west of the Camp Creek resource located at a shallower depth, called Camp Creek West. Additionally, ongoing metallurgical test work is continuing to validate Coeur’s assumptions on potential recovery rates and concentrate qualities.
For more information, please refer to coeur.com and see the news releases dated February 16, 2022 and April 28, 2022.
Hope Bay (1% NSR)
Agnico Eagle Mines Ltd. (“Agnico Eagle”) announced that production at the Hope Bay mine in Nunavut would remain paused in 2022 and 2023 while they focus on exploration activities to develop an optimal production strategy around the geologic potential of the land package. Internal evaluations are underway regarding the potential to operate a 4,000 tonne per day mine that could produce 250,000 to 300,000 ounces of gold per year. In 2022, Agnico Eagle expects to complete 80,000 metres of drilling in a $32.2 million exploration program that will include $17.9 million to develop new exploration drifts and 29,000 metres of underground drilling at the Doris deposit. Agnico Eagle believes there is excellent potential to increase mineral reserves and mineral resources at all of the deposit areas and regionally.
For more information, please refer to agnicoeagle.com and see the news release dated February 23, 2022.
Mother Lode (1% – 2% NSR)
AngloGold Ashanti Ltd. (“AngloGold”) announced the successful completion of the acquisition of Corvus Gold Inc. The transaction consolidated a large land package in the Beatty District of Nevada, which includes the Mother Lode and Silicon projects, which AngloGold expects to produce more than 300,000 ounces of gold annually over more than a decade.
For more information, please refer to anglogoldashanti.com and see the news release dated January 18, 2022 and the investor presentation dated February 22, 2022.
McCoy-Cove (3.5% NSR)
i-80 Gold Corp. (“i-80”) announced that the underground, advanced-exploration, program at the McCoy-Cove project has commenced. Construction of the decline is now underway and the Phase 1 program will include construction of an initial level with multiple drill bays to provide access for upgrading resources. Approximately 40,000 metres of underground definition and expansion drilling is anticipated to commence in H2 2022 followed by a feasibility study anticipated to be completed in 2023. The Cove deposit represents one of North America’s highest grade gold deposits with grades in excess of 10 g/t gold. The deposit remains open for expansion down-dip.
For more information, please refer to i80gold.com and see the news release dated March 7, 2022.
8
Summary of Quarterly Results
Quarter Ended (in thousands of USD, except for GEO and per share amounts) | March 31, 2022 | December 31, 2021 | September 30, 2021 | June 30, 2021 | ||||||||||||
| Statement of Income and Comprehensive Income | ||||||||||||||||
| Royalty revenue | $ | 6,866 | $ | 12,031 | $ | 7,983 | $ | 7,999 | ||||||||
| Sales | 7,788 | 4,454 | 5,675 | 6,310 | ||||||||||||
| Total revenue | 14,654 | 16,485 | 13,658 | 14,309 | ||||||||||||
| Cash flow from operating activities | 8,019 | 11,634 | 9,278 | 8,813 | ||||||||||||
| Net income | 3,523 | 2,766 | 2,829 | 3,708 | ||||||||||||
| Basic earnings per share | 0.02 | 0.02 | 0.02 | 0.03 | ||||||||||||
| Diluted earnings per share | 0.02 | 0.02 | 0.02 | 0.03 | ||||||||||||
| Dividends declared per share | $ | 0.0125 | $ | 0.0125 | $ | 0.0125 | $ | 0.0125 | ||||||||
| Non-IFRS and Other Measures1 | ||||||||||||||||
| Adjusted net income | $ | 5,661 | $ | 3,734 | $ | 4,709 | $ | 3,739 | ||||||||
| Adjusted basic earnings per share | $ | 0.04 | $ | 0.03 | $ | 0.03 | $ | 0.03 | ||||||||
| Total GEOs sold | 7,738 | 9,173 | 7,671 | 7,880 | ||||||||||||
| Average realized gold price per GEO | $ | 1,894 | $ | 1,797 | $ | 1,780 | $ | 1,816 | ||||||||
| Average cash cost per GEO | 190 | 100 | 164 | 197 | ||||||||||||
| Cash flow from operating activities, excluding changes in non-cash working capital | $ | 10,549 | $ | 13,017 | $ | 9,682 | $ | 9,313 | ||||||||
| Statement of Financial Position | ||||||||||||||||
| Total assets | $ | 394,586 | $ | 392,535 | $ | 400,550 | $ | 367,068 | ||||||||
| Total non-current liabilities | $ | 18,797 | $ | 17,811 | $ | 27,024 | $ | 3,134 | ||||||||
1 Refer to section on non-IFRS and other measures of this MD&A.
9
Quarter Ended (in thousands of USD, except for GEO and per share amounts) | March 31, 2021 | December 31, 2020 | September 30, 2020 | June 30, 2020 | ||||||||||||
| Statement of Income and Comprehensive Income | ||||||||||||||||
| Royalty revenue | $ | 6,883 | $ | 10,140 | $ | 8,689 | $ | 7,784 | ||||||||
| Sales | 6,197 | 6,429 | 6,162 | 3,187 | ||||||||||||
| Total revenue | 13,080 | 16,569 | 14,851 | 10,971 | ||||||||||||
| Cash flow from operating activities | 13,479 | 7,746 | 13,792 | 6,616 | ||||||||||||
| Net income | 14,769 | 5,346 | 14,437 | 3,076 | ||||||||||||
| Basic earnings per share | 0.10 | 0.04 | 0.11 | 0.03 | ||||||||||||
| Diluted earnings per share | 0.10 | 0.04 | 0.11 | 0.02 | ||||||||||||
| Dividends declared per share | $ | 0.01 | $ | 0.01 | $ | 0.01 | $ | 0.01 | ||||||||
| Non-IFRS and Other Measures1 | ||||||||||||||||
| Adjusted net income | $ | 4,959 | $ | 6,282 | $ | 5,336 | $ | 3,010 | ||||||||
| Adjusted basic earnings per share | $ | 0.04 | $ | 0.05 | $ | 0.04 | $ | 0.02 | ||||||||
| Total GEOs sold | 7,302 | 8,836 | 7,797 | 6,412 | ||||||||||||
| Average realized gold price per GEO | $ | 1,791 | $ | 1,875 | $ | 1,905 | $ | 1,711 | ||||||||
| Average cash cost per GEO | 223 | 184 | 195 | 139 | ||||||||||||
| Cash flow from operating activities, excluding changes in non-cash working capital | $ | 8,998 | $ | 11,474 | $ | 10,841 | $ | 8,479 | ||||||||
| Statement of Financial Position | ||||||||||||||||
| Total assets | $ | 362,047 | $ | 379,607 | $ | 325,396 | $ | 340,190 | ||||||||
| Total non-current liabilities | $ | 1,882 | $ | 32,000 | $ | 35,000 | $ | 76,000 | ||||||||
Changes in sales, net income and cash flow from operating activities from quarter to quarter are affected primarily by fluctuations in production at the underlying mines, the timing of shipments, changes in the price of commodities, as well as acquisitions of Royalties, Streams and prepaid gold and other interests and the commencement of operations of mines under construction. For more information, refer to the quarterly commentary below.
Three Months Ended March 31, 2022 Compared to the Three Months March 31, 2021
For the three months ended March 31, 2022, the Company had net income of $3.5 million and cash flow from operations of $8.0 million compared with net income and cash flow from operations of $14.8 million and $13.5 million for the three months ended March 31, 2021. The decrease in net income and cash flows were attributable to a combination of factors including:
| · | During the three months ended March 31, 2021, an $11.0 million gain was recognized in net income related to the partial buyback of the Company’s Hope Bay royalty interest. Upon the buyback, there was also an increase in working capital of $2.5 million from the receipt of previously deferred royalty receivable amounts due which increased cash flow from operations; |
| · | A one-time $2.4 million revaluation adjustment was recognized in net income during the three months ended March 31, 2021 from the conversion of a convertible debenture into an additional 5% silver Stream on the El Mochito mine; |
| · | Decrease in revenue and cash flows of $0.9 million and $3.0 million at Beta Hunt due to royalty amendment completed in September 2020 which reduced the aggregate royalty from 7.5% to 4.75%. During the three months ended March 31, 2021, the Company received $2.5 million of cash flow associated with the remaining amounts that were owing under the Beta Hunt royalty amendment and revenue included the recognition of a portion of the deferred revenue that was previously recognized as part of the royalty amendment; |
| · | Decrease in revenue and cash flows of $0.8 million and $0.5 million from La Colorada due to ventilation constraints which impacted development and mining rates during 2021; |
10
| · | Decrease in revenue and cash flows of $0.8 million and $0.6 million from El Mochito due to lower silver grades currently being mined compared with the prior period; |
| · | Decrease in sales and cash flows of $0.4 million from the Moss mine due to the transition from the Phase 2 leach pad to the Phase 3 leach pad and lower silver grades currently being mined in the West Pit; and |
| · | Net income was reduced in 2022 by non-cash cost of sales of $3.2 million due to the inventory received from the Company’s prepaid gold interests being recorded at fair value, with the difference between the fair value of the gold on the delivery date less the ongoing cost of purchasing the gold being recognized as a non-cash partial settlement of the prepaid gold interests. Cash flow from operations was reduced by $0.5 million in 2022 from the cost of acquiring the gold under the Company’s prepaid gold interests. |
Partially offset by:
| · | The Company entered into prepaid gold agreements with Auramet Capital Partners, L.P (“Auramet”) and Elevation in September 2021 and January 2022, respectively, which provided $3.7 million in sales and cash flows from operations of $3.2 million after deducting the cash cost of acquiring the gold. In addition, a $1.5 million gain on the change in fair value of the prepaid gold interests was recognized in net income for the three months ended March 31, 2022; |
| · | Increase in revenue and cash flows of $0.8 million and $0.1 million from Camino Rojo mine which was ramping up production in the first quarter of 2022 and commercial production was declared effective April 1, 2022; |
| · | Increase in revenue of $0.7 million from Omolon as a result of the Company increasing and expanding its effective interest to a 2.5% GRR that covers all licenses currently comprising the Omolon hub; |
| · | A decrease in deferred income tax expense of $2.0 million due to the tax consequences associated with the partial buyback of the Hope Bay royalty interest and the conversion of the convertible debenture into an additional 5% silver Stream on the El Mochito mine during 2021; and |
| · | A 6% increase in the average realized gold price per GEO. |
11
For the three months ended March 31, 2022, the Company had total revenue of $14.7 million and GEOs of 7,7381 compared with total revenue of $13.1 million and GEOs of 7,3021 for the three months ended March 31, 2021.
The following table summarizes the Company’s total revenues and GEOs for the three months ended March 31, 2022 and 2021:
| Three months ended March 31, 2022 | Three months ended March 31, 2021 | |||||||||||||||||||||||||
| (in thousands of USD, except for GEO amounts) | Primary Product | Royalty Revenue ($) | Sales ($) | GEOs1 | Royalty Revenue ($) | Sales ($) | GEOs1 | |||||||||||||||||||
| Auramet | Gold | - | 2,451 | 1,250 | - | - | - | |||||||||||||||||||
| Beta Hunt | Gold | 1,491 | - | 794 | 2,350 | - | 1,310 | |||||||||||||||||||
| Camino Rojo | Gold | 784 | - | 417 | - | - | - | |||||||||||||||||||
| El Mochito | Silver | - | 1,409 | 750 | - | 2,218 | 1,236 | |||||||||||||||||||
| Elevation | Gold | - | 1,202 | 623 | - | - | - | |||||||||||||||||||
| Florida Canyon | Gold | 582 | - | 310 | 693 | - | 386 | |||||||||||||||||||
| Hope Bay | Gold | 1 | - | 1 | 370 | - | 206 | |||||||||||||||||||
| Karma | Gold | 468 | - | 249 | 677 | - | 377 | |||||||||||||||||||
| La Colorada | Gold | - | 978 | 525 | - | 1,785 | 1,006 | |||||||||||||||||||
| Moose River | Gold | 175 | - | 93 | 316 | - | 176 | |||||||||||||||||||
| Moss | Silver | - | 1,748 | 931 | - | 2,194 | 1,223 | |||||||||||||||||||
| Mt Carlton | Gold | 658 | - | 351 | 374 | - | 209 | |||||||||||||||||||
| Omolon | Gold | 1,499 | - | 799 | 753 | - | 420 | |||||||||||||||||||
| Recuperada | Silver | 334 | - | 178 | - | - | - | |||||||||||||||||||
| San Jose | Silver | 436 | - | 232 | 622 | - | 347 | |||||||||||||||||||
| Vivien | Gold | 355 | - | 189 | 680 | - | 379 | |||||||||||||||||||
| Other | Various | 83 | - | 46 | 48 | - | 27 | |||||||||||||||||||
| Consolidated total | 6,866 | 7,788 | 7,738 | 6,883 | 6,197 | 7,302 | ||||||||||||||||||||
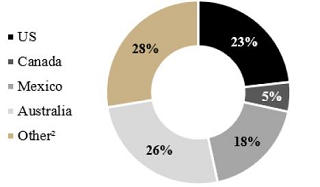
| Q1 2022 Total Revenue by Region | Q1 2021 Total Revenue by Region |
 |  |
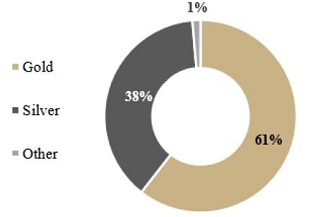
| Q1 2022 GEOs1 by Product | Q1 2021 GEOs1 by Product |
 |  |
1 Refer to section on non-IFRS and other measures of this MD&A.
2 Other includes revenues generated from mines located in Russia, Honduras, Peru and Burkina Faso.
12
For the Three Months Ended March 31, 2022 Compared to Other Quarters Presented
When comparing net income of $3.5 million and cash flow from operations of $8.0 million for the three months ended March 31, 2022 with net income and operating cash flows for other quarters presented in the table of Summary of Quarterly Results above, the following items impact comparability of the analysis:
| · | The Company entered into prepaid gold agreements with Auramet and Elevation in September 2021 and January 2022, respectively, which provided $3.7 million in sales and cash flows from operations of $3.2 million after deducting the cash cost of acquiring the gold. In addition, $3.2 million in non-cash cost of sales were included in cost of sales and a $1.5 million gain on the change in fair value of the prepaid gold interests was recognized in net income for the three months ended March 31, 2022; |
| · | Increase in revenue and cash flows of $0.8 million and $0.1 million during the three months ended March 31, 2022 from Camino Rojo as the mine commenced production in the fourth quarter of 2021; |
| · | In October 2021, the Company increased and expanded its effective interest to a 2.5% GRR that covers all licenses currently comprising the Omolon hub and received a one-time bonus royalty of $3.2 million based on the fourth quarter 2021 production at the Omolon hub; |
| · | In September 2021, the Company acquired the Auramet prepaid gold interest which provided $2.3 million and $2.2 million of sales and cash flows from operations of $1.9 million and $1.8 million during the three months ended December 31, 2021 and September 30, 2021, respectively; |
| · | An $11.0 million gain recognized in net income during the three months ended March 31, 2021 for the partial buyback of the Hope Bay royalty interest; |
| · | An increase in working capital of $2.5 million from previously deferred amounts for a portion of the Hope Bay royalty revenue and $2.5 million of the remaining amount owed under the Beta Hunt royalty amendment completed in September 2020 received during the three months ended March 31, 2021; |
| · | A $2.4 million revaluation adjustment recognized during the three months ended March 31, 2021 from the conversion of the convertible debenture into an additional 5% silver Stream on the El Mochito mine; |
| · | In September 2020, the company completed an amendment of our Beta Hunt royalty interest. As a result, the Company recognized a gain on the amendment of $9.3 million and current income tax expense and taxes paid of $4.3 million during the three months ended December 31, 2020; |
| · | The Company recognized an increase in net income of $2.9 million due to revaluation of warrants held during the three months ended December 31, 2020; and |
| · | A number of underlying mines on which the Company has a Royalty or Stream interest have continued to ramp up or began production over the past years, including the Camino Rojo mine, Recuperada mine, Beta Hunt mine, the Moss mine, and the El Mochito mine. |
Change in Total Assets
Total assets increased by $2.1 million from December 31, 2021 to March 31, 2022 primarily resulting from accrued royalty income and sales during the period and a $1.5 million change in fair value of the Company’s prepaid gold interests. The increase in total assets was partially offset by depletion of the Company’s royalty, stream and other interests.
Total assets decreased by $8.0 million from September 30, 2021 to December 31, 2021 primarily resulting from the $11.0 million repayment of the Company’s credit facility and depletion of the Company’s royalty, stream and other interests. The decrease in total assets was partially offset by royalty revenue and sales and the proceeds from the exercise of warrants.
13
Total assets increased by $33.5 million from June 30, 2021 to September 30, 2021 primarily resulting from the acquisition of the Auramet prepaid gold interest, which was financed by drawing $23.5 million on our credit facility and cash on hand and the proceeds from the exercise of warrants and options. The net increase in total assets from the acquisition of the Auramet prepaid gold interest was partially offset by the cash consideration paid from the Company’s cash on hand and depletion of the Company’s royalty, stream and other interests.
Total assets increased by $5.0 million from March 31, 2021 to June 30, 2021 primarily resulting from the acquisition of a royalty portfolio from Pan American Silver Corp. (“Pan American”), which was financed by the issuance of common shares of the Company and a cash payment of $7.0 million. The net increase in total assets from the acquisition of the royalty portfolio from Pan American was partially offset by the cash consideration paid of $7.0 million and depletion of the Company’s royalty, stream and other interests.
Total assets decreased by $17.6 million from December 31, 2020 to March 31, 2021 primarily resulting from the $32.0 million repayment of the Company’s credit facility, the decrease in the Hope Bay royalty interest from the partial buyback, and depletion of the Company’s royalty, stream and other interests. The decrease in total assets was partially offset from the $50.0 million received from the partial buyback of the Hope Bay royalty interest.
Total assets increased by $54.2 million from September 30, 2020 to December 31, 2020 primarily resulting from the acquisition of a royalty portfolio from Newmont, which was financed by the issuance of common shares of the Company and a cash payment of $15.0 million. The net increase in total assets from the acquisition of the royalty portfolio from Newmont was partially offset by the cash consideration paid of $15.0 million, a $3.0 million repayment under the Company’s credit facility and depletion of the Company’s royalty, stream and other interests.
Total assets decreased by $14.8 million from June 30, 2020 to September 30, 2020 primarily resulting from the repayment of $41.0 million under the Company’s credit facility, depletion of the Company’s royalty, stream and other interests and amendment of the Company’s royalty interest on the Beta Hunt mine. The decrease in total assets was partially offset by funds received on closing of the Beta Hunt royalty amendment and increase in the carrying value of investments due to fair value adjustments.
Non-IFRS and Other Measures
The Company has included, throughout this document, certain performance measures, including (i) adjusted net income and adjusted basic earnings per share, (ii) average realized gold price per GEO, (iii) average cash cost per GEO, (iv) cash operating margin per GEO, and (v) operating cash flows excluding changes in non-cash working capital. The presentation of these non-IFRS and other measures are intended to provide additional information and should not be considered in isolation or as a substitute for measures of performance prepared in accordance with IFRS. These non-IFRS and other measures do not have any standardized meaning prescribed by IFRS, and other companies may calculate these measures differently.
| i. | Adjusted net income and adjusted basic earnings per share are calculated by excluding the effects of the non-cash cost of sales related to the prepaid gold interests, non-cash change in fair value of the prepaid gold interests, gains/(losses) on sale or amendment of royalty and streams, gains/(losses) on conversion of debentures, other income/expenses, and impairment charges. The Company believes that in addition to measures prepared in accordance with IFRS, certain investors use this information to evaluate the results of the underlying business of the Company. Management believes that this is a useful measure of the Company’s performance because it adjusts for items which may not relate to or have a disproportionate effect on the period in which they are recognized, impact the comparability of our core operating results from period to period, are not always reflective of the underlying operating performance of our business and/or are not necessarily indicative of future operating results. The table below provides a reconciliation of net income to adjusted net income and presents adjusted earnings per share: |
14
| Three months ended | ||||||||
| (in thousands of USD, except share and per share amounts) | March 31, 2022 | March 31, 2021 | ||||||
| Net income | $ | 3,523 | $ | 14,769 | ||||
| Non-cash cost of sales – prepaid gold interests | 3,199 | - | ||||||
| Change in fair value of prepaid gold interests | (1,518 | ) | - | |||||
| Gain on royalty transactions | - | (10,983 | ) | |||||
| Gain on conversion of debenture | - | (2,410 | ) | |||||
| Other expense (income) | 64 | (46 | ) | |||||
| Effect of taxes on adjusting items | 393 | 3,629 | ||||||
| Adjusted net income | $ | 5,661 | $ | 4,959 | ||||
| Divided by: | ||||||||
| Basic weighted average number of common shares | 146,898,689 | 140,775,953 | ||||||
| Equals: | ||||||||
| Adjusted basic earnings per share | $ | 0.04 | $ | 0.04 | ||||
| ii. | Average realized gold price per GEO is calculated by dividing the Company’s total revenue by the GEOs sold. The Company presents average realized gold price per GEO as it believes that certain investors use this information to evaluate the Company’s performance in comparison to other royalty and streaming companies in the precious metals mining industry that present results on a similar basis. The table below provides a reconciliation of average realized price per GEO: |
| Three months ended | ||||||||
| (total revenue presented in thousands of USD) | March 31, 2022 | March 31, 2021 | ||||||
| Total revenue | $ | 14,654 | $ | 13,080 | ||||
| Divided by: | ||||||||
| GEOs sold1 | 7,738 | 7,302 | ||||||
| Equals: | ||||||||
| Average realized gold price per GEO | $ | 1,894 | $ | 1,791 | ||||
| iii. | Average cash cost per GEO is calculated by dividing the Company’s cash cost of sales, excluding depletion less the non-cash cost of sales related to the prepaid gold interests, by the GEOs sold. The Company presents average cash cost per GEO as it believes that certain investors use this information to evaluate the Company’s performance in comparison to other royalty and streaming companies in the precious metals mining industry who present results on a similar basis. The table below provides a reconciliation of average cash cost per GEO: |
| Three months ended | ||||||||
| (cost of sales presented in thousands of USD) | March 31, 2022 | March 31, 2021 | ||||||
| Cash cost of sales is comprised of: | ||||||||
| Cost of sales, excluding depletion | $ | 4,669 | $ | 1,629 | ||||
| Non-cash cost of sales – prepaid gold interests | (3,199 | ) | - | |||||
| Cash cost of sales | 1,470 | 1,629 | ||||||
| Divided by: | ||||||||
| GEOs sold | 7,738 | 7,302 | ||||||
| Equals: | ||||||||
| Average cash cost per GEO | $ | 190 | $ | 223 | ||||
1 The Company’s royalty revenue and silver sales are converted to a GEO basis by dividing the royalty revenue plus silver sales for a period by the average gold price based on the LBMA Gold Price PM Fix per ounce for the same respective period. Total GEOs sold includes the GEOs from the Company’s royalty revenue and silver sales plus the gold ounces sold from the Company’s gold Stream and prepaid gold interests.
15
| iv. | Cash operating margin per GEO is calculated by subtracting the average cash cost per GEO from the average realized gold price per GEO. The Company presents cash operating margin as it believes that certain investors use this information to evaluate the Company’s performance in comparison to other royalty and streaming companies in the precious metals mining industry that present results on a similar basis. The table below provides a reconciliation of average realized gold price per GEO: |
| Three months ended | ||||||||
| March 31, 2022 | March 31, 2021 | |||||||
| Average realized gold price per GEO | $ | 1,894 | $ | 1,791 | ||||
| Less: | ||||||||
| Average cost per GEO | (190 | ) | (223 | ) | ||||
| Equals: | ||||||||
| Cash operating margin per GEO | $ | 1,704 | $ | 1,568 | ||||
| v. | The Company has also used the non-IFRS measure of operating cash flows excluding changes in non-cash working capital. This measure is calculated by adding back the decrease or subtracting the increase in changes in non-cash working capital to or from cash provided by operating activities. The table below provides a reconciliation of operating cash flows to operating cash flows excluding changes in non-cash working capital: |
| Three months ended | ||||||||
| (presented in thousands of USD) | March 31, 2022 | March 31, 2021 | ||||||
| Net cash provided by operating activities | $ | 8,019 | $ | 13,479 | ||||
| Changes in non-cash working capital | 2,530 | (4,481 | ) | |||||
| Equals: | ||||||||
| Operating cash flows, excluding changes in non-cash working capital | $ | 10,549 | $ | 8,998 | ||||
Liquidity and Capital Resources
As at March 31, 2022, the Company had cash and cash equivalents of $10.9 million (December 31, 2021: $17.1 million) and working capital of $34.4 million (December 31, 2021: $33.3 million). As at March 31, 2022, the Company had $147.5 million available under its credit facility. Subsequent to March 31, 2022, the Company drew down $5.0 million from its credit facility leaving $142.5 million remaining available.
Cash flow from operations
For the three months ended March 31, 2022, cash flow from operations was $8.0 million, compared with $13.5 million for the three months ended March 31, 2021, with the decrease primarily attributable to the timing of receipt of royalty related receivables. During the three months ended March 31, 2021, the Company received $2.5 million for previously deferred amounts for a portion of the Hope Bay royalty revenue and $2.5 million for the remaining amount owed under the Beta Hunt royalty amendment completed in September 2020. The decrease was partially offset by cash flows from the Company’s growing portfolio of cash flowing Royalties, Streams and prepaid gold interests.
Cash flow used in investing activities
For the three months ended March 31, 2022, the Company had net cash outflow of $13.1 million from investing activities primarily due to the acquisitions of the Elevation Prepaid Gold Interest for $6.0 million, the three royalties on gold projects located in Nevada for $5.0 million and $2.0 million of investments. For the three months ended March 31, 2021, the Company had net cash inflows of $60.6 million from investing activities primarily due to the proceeds received from the partial buyback of the Hope Bay royalty interest and the sale of 19.5 million common shares from the Company’s investment portfolio.
Cash flow used in financing activities
During the three months ended March 31, 2022, the Company had net cash outflows from financing activities of $1.1 million, which was primarily the result of dividend payments of $1.8 million and financing costs associated with our credit facility of $0.2 million. The net cash outflows were partially offset by proceeds from the exercise of stock options of $1.0 million. During the three months ended March 31, 2021, the Company had net cash outflows from financing activities of $32.5 million, which was primarily the result of Company repaying $32.0 million of its credit facility, dividend payments of $1.4 million and financing costs associated with our credit facility of $0.2 million.
16
Liquidity
We believe our current financial resources and funds generated from operations will be adequate to cover anticipated expenditures for general and administration and project evaluation costs and anticipated minimal capital expenditures for the foreseeable future. Our long-term capital requirements are primarily affected by our ongoing activities related to the acquisition or creation of Royalties, Streams, prepaid gold and other interests.
The Company currently, and generally at any time, has acquisition opportunities in various stages of active review. In the event of the acquisition of one or more significant Royalties, Streams, prepaid gold and other interests, we may seek additional debt or equity financing as necessary.
Purchase Commitments:
In connection with its Streams and prepaid gold interests, the Company has committed to purchase the following:
Percent of life of mine production or relevant commodity | Per ounce cash payment: Lesser of amount below and the then prevailing market price (unless otherwise noted) | |||||||
| Gold Stream interests | ||||||||
| La Bolsa | 5 | % | $ | 450 | ||||
| La Colorada | 100 | % | $ | 650 | ||||
| Silver Stream interests | ||||||||
| El Mochito | 25 | % | 25% of silver spot price | |||||
| Moss | 100 | %(1) | 20% of silver spot price | |||||
| Prepaid gold interests | ||||||||
| Auramet | 1,250 ounces plus 2% of dividends paid(2) per quarter | 16% of gold spot price | ||||||
| Elevation | Gold equivalent of $1.0 million plus certain fixed amounts of gold per quarter(3) | 5% of gold spot price | ||||||
| (1) | After 3.5 million ounces of silver are delivered, Maverix’s silver purchase entitlement will be 50% of the remaining life of mine silver production. |
| (2) | Amount of gold that is equivalent to the value of all dividends distributed by Auramet International LLC on 2% of its shares. |
| (3) | Six quarterly deliveries ending in June 2023. |
In connection with the acquisition of the Silvertip Royalty in 2017, the Company may issue an additional 1,400,000 common shares of the Company when the Silvertip mine achieves commercial production and a cumulative throughput of 400,000 tonnes of ore through the processing plant is achieved.
In connection with the acquisition of a portfolio of royalties from Newmont in October 2020, the Company agreed to make certain contingent cash payments of up to $15.0 million if certain production milestones at certain assets are achieved within five years of closing the acquisition.
In connection with increasing and expanding the royalty interest at Omolon, the Company agreed to make an additional $1.5 million cash payment upon sales of 1.2 million gold equivalent ounces.
Outstanding Share Data
As at May 12, 2022, the Company had 147,348,160 outstanding common shares, 4,367,841 outstanding share purchase options outstanding with a weighted average exercise price of CAD$5.42, 540,613 outstanding restricted share units, and 5,000,000 outstanding share purchase warrants with an exercise price of $3.28.
Off-Balance Sheet Arrangements
The Company does not utilize off-balance sheet arrangements.
17
Related Party Transactions
Key management personnel are those persons having authority and responsibility for planning, directing and controlling the activities, including any director of the Company. Compensation for key management personnel of the Company was as follows:
| Three months ended | ||||||||
| March 31 | ||||||||
| 2022 | 2021 | |||||||
| Compensation and benefits | $ | 1,103 | $ | 1,473 | ||||
| Share-based compensation | 334 | 301 | ||||||
| Total compensation | $ | 1,437 | $ | 1,774 | ||||
During the three months ended March 31, 2022 and 2021, the Company purchased $0.3 million and $0.7 million, respectively, of refined gold from Pan American at a price of $650 per ounce purchased under its La Colorada gold Stream agreement. As a consequence of its shareholding and other factors, Pan American is deemed to have significant influence over the Company.
Critical Accounting Judgements and Estimates
The preparation of the consolidated financial statements in conformity with IFRS requires the Company’s management to make judgments, estimates and assumptions that affect the amounts reported in the consolidated financial statements. Estimates and assumptions are based on management’s best knowledge of the relevant facts and circumstances. However, actual results may differ from those estimates included in the consolidated financial statements.
The Company’s significant accounting policies and estimates are disclosed in Notes 2 and 3 of the annual consolidated financial statements for the year ended December 31, 2021.
Estimation Uncertainty
In March 2020, the World Health Organization declared a global pandemic related to COVID-19. The current and expected impacts on global commerce are anticipated to be far reaching. To date there has been significant volatility in the stock market and in the commodity and foreign exchange markets, restrictions on the conduct of business in many jurisdictions and the global movement of people and some goods has become restricted. In the current environment, estimates and assumptions about future production, commodity prices, exchange rates, discount rates, future capital expansion plans and associated production implications at the underlying mines and other interests in which the Company holds a royalty or stream interest are subject to greater variability than normal, which could significantly affect the valuation of our assets, both non-financial and financial.
The conflict between Russia and Ukraine and any restrictive actions that have or may be taken in response thereto, such as sanctions, export and or currency controls, could have negative impacts on Polymetal’s ability to continue operation of the Omolon hub, where the Company owns a 2.5% GRR, and Polymetal’s ability to make payments to the Company. On an annual basis, the Company provides Polymetal certain administrative certifications so that Polymetal may make payments to the Company. Once the administrative certifications are obtained, they will be provided to Polymetal. At March 31, 2022, the carrying amounts related to the Company’s Omolon royalty interests and accounts receivable were $23.4 million and $4.4 million, respectively.
18
Financial Instruments
The Company has exposure to a variety of financial risks from its use of financial instruments. This section presents information about the Company's exposure to each of these risks, the Company's objectives, policies and processes for measuring and managing risk, and the Company's management of capital.
Capital Risk Management
The Company’s primary objective when managing capital is to maximize returns for its shareholders by growing its asset base through accretive acquisitions of royalties, streams and other interests, while optimizing its capital structure by balancing debt and equity. At March 31, 2022, the capital structure of the Company consists of $373.8 million (December 31, 2021: $371.8 million) of total equity, comprising share capital, reserves, accumulated other comprehensive income, and retained earnings, and $12.5 million (December 31, 2021: $12.5 million) drawn under the Company’s credit facility. The Company was not subject to any externally imposed capital requirements with the exception of complying with certain covenants under the credit facility. The Company is in compliance with its debt covenants as at March 31, 2022.
Credit Risk
Credit risk is the risk of potential loss to the Company if the counterparty to a financial instrument fails to meet its contractual obligations. The Company's credit risk is primarily attributable to its liquid financial assets including cash and cash equivalents and accounts receivables in the ordinary course of business. In order to mitigate its exposure to credit risk, the Company maintains its cash and cash equivalents in several high-quality financial institutions and closely monitors its accounts receivable balances. The Company’s accounts receivables are subject to the credit risk of the counterparties who own and operate the mines underlying Maverix’s royalty portfolio. The conflict between Russia and Ukraine and any restrictive actions that have or may be taken in response thereto, such as sanctions, export and or currency controls, could have potential negative impacts on the Company’s ability to receive payments under its royalty interest in the Omolon hub in Russia that is operated by Polymetal. At March 31, 2022, the Company’s accounts receivable related to its Omolon hub royalty interest is $4.4 million.
Currency Risk
Financial instruments that affect the Company’s net income due to currency fluctuations include cash and cash equivalents, accounts receivable, investments, trade and other payables denominated in Canadian and Australian dollars. Based on the Company’s Canadian and Australian dollar denominated monetary assets and liabilities at March 31, 2022, a 10% increase (decrease) of the value of the Canadian and Australian dollar relative to the US dollar would increase (decrease) net income by $0.2 million and other comprehensive income by $0.3 million, respectively.
Liquidity Risk
Liquidity risk is the risk that the Company will not be able to meet its financial obligations as they come due. The Company’s approach to managing liquidity is to ensure it will have sufficient liquidity to meet liabilities when due. In managing liquidity risk, the Company considers anticipated cash flows from operations, its holding of cash and cash equivalents and its revolving credit facility. As at March 31, 2022, the Company had cash and cash equivalents of $10.9 million (December 31, 2021: $17.1 million) and working capital of $34.4 million (December 31, 2021: $33.3 million). In addition, at March 31, 2022 the Company had $147.5 million available under its credit facility. Subsequent to March 31, 2022, the Company drew down $5.0 million from its credit facility leaving $142.5 million remaining available.
Other Risks
The Company is exposed to equity price risk as a result of holding common shares in other mining companies. The combined fair market value as at March 31, 2022 is $3.1 million (December 31, 2021: $2.7 million). The equity prices of investments are impacted by various underlying factors including commodity prices and the volatility in global markets as a result of COVID-19 and the daily exchange traded volume of the equity may not be sufficient for the Company to liquidate its position in a short period of time without potentially affecting the market value of the equity. Based on the Company’s investments held as at March 31, 2022, a 10% increase (decrease) in the equity prices of these investments would increase (decrease) other comprehensive income by $0.3 million.
19
Disclosure Controls and Procedures
Maverix’s disclosure controls and procedures (“DC&P”) are designed to provide reasonable assurance that material information relating to Maverix, including its consolidated subsidiaries, is made known to management by others within those entities, particularly during the period in which this report is prepared and that information required to be disclosed by Maverix in its annual filings, interim filings or other reported filed or submitted by it under securities legislation is recorded, processed, summarized and reported within the time periods specified in the securities legislation. The Chief Executive Officer (“CEO”) and its Chief Financial Officer (“CFO”) have evaluated whether there were changes to the DC&P during the three months ended March 31, 2022 that have materially affected, or are reasonably likely to materially affect, the DC&P. No such changes were identified through their evaluation.
Internal Controls Over Financial Reporting
Management of the Company is responsible for establishing and maintaining effective internal control over financial reporting as such term is defined in National Instrument 52-109 – Certification of Disclosure in Issuer’s Annual and Interim Filings in Canada (“NI 52-109”) and under the Securities Exchange Act of 1934, as amended, in the United States. The Company’s internal control over financial reporting is designed to provide reasonable assurance regarding the reliability of the Company’s financial reporting for external purposes in accordance with IFRS as issued by the IASB. The Company’s internal control over financial reporting includes:
| · | maintaining records, that in reasonable detail, accurately and fairly reflect our transactions and dispositions of the assets of the Company; |
| · | providing reasonable assurance that transactions are recorded as necessary for preparation of the consolidated financial statements in accordance with IFRS as issued by the IASB; |
| · | providing reasonable assurance that receipts and expenditures are made in accordance with authorizations of management and the directors of the Company; and |
| · | providing reasonable assurance that unauthorized acquisition, use or disposition of Company assets that could have a material effect on the Company’s consolidated financial statements would be prevented or detected on a timely basis. |
The Company’s internal control over financial reporting may not prevent or detect all misstatements because of inherent limitations. Additionally, projections of any evaluation of effectiveness to future periods are subject to the risk that controls may become inadequate because of changes in conditions or deterioration in the degree of compliance with the Company’s policies and procedures.
There were no changes to the Company’s internal controls over financial reporting during the three months ended March 31, 2022 that have materially affected, or are likely to materially affect, the Company’s internal control over financial reporting or disclosure controls and procedures.
Limitation of Controls and Procedures
The CEO and CFO, in consultation with management, believe that any disclosure controls and procedures or internal control over financial reporting, no matter how well conceived and operated, can provide only reasonable, not absolute, assurance that the objectives of the control system are met. Further, the design of a control system must reflect the fact that there are resource constraints, and the benefits of controls must be considered relative to their costs. Because of the inherent limitations in all control systems, they cannot provide absolute assurance that all control issues and instances of fraud, if any, within the Company have been prevented or detected. These inherent limitations include the realities that judgments in decision-making can be faulty, and that breakdowns can occur because of simple error or mistake. Additionally, controls can be circumvented by the individual acts of some persons, by collusion of two or more people, or by unauthorized override of the controls. The design of any system of controls also is based in part upon certain assumptions about the likelihood of future events, and there can be no assurance that any design will succeed in achieving its stated goals under all potential future conditions. Accordingly, because of the inherent limitations in a cost-effective control system, misstatements due to error or fraud may occur and not be detected.
20
Forward-Looking Statements
This MD&A contains “forward-looking information” or "forward-looking statements" within the meaning of applicable securities legislation. Forward-looking information is provided as of the date of this MD&A and Maverix does not intend to and does not assume any obligation to update forward-looking information, except as required by applicable law. For this reason and the reasons set forth below, investors should not place undue reliance on forward-looking statements.
Generally, forward-looking information can be identified by the use of forward-looking terminology such as “plans”, “expects” or “does not expect”, “is expected”, “budget”, “scheduled”, “estimates”, “forecasts”, “intends”, “anticipates” or “does not anticipate”, or “believes”, or variations of such words and phrases or statements that certain actions, events or results “may”, “could”, “would”, “might” or “will be taken”, “occur” or “be achieved”. Forward-looking information is based on reasonable assumptions that have been made by Maverix as at the date of such information and is subject to known and unknown risks, uncertainties and other factors that may cause the actual results, level of activity, performance or achievements of Maverix to be materially different from those expressed or implied by such forward-looking information, including but not limited to: the impact of general business and economic conditions; the absence of control over mining operations from which Maverix will purchase precious metals or from which it will receive royalty or stream payments, and risks related to those mining operations, including risks related to international operations, government and environmental regulation, delays in mine construction and operations, actual results of mining and current exploration activities, conclusions of economic evaluations and changes in project parameters as plans are refined; problems related to the ability to market precious metals or other metals; industry conditions, including commodity price fluctuations, interest and exchange rate fluctuations; interpretation by government entities of tax laws or the implementation of new tax laws; the volatility of the stock market; competition; risks related to the Company’s dividend policy; epidemics, pandemics or other public health crises, including the global outbreak of the novel coronavirus (“COVID-19”), geopolitical events and other uncertainties, such as the conflict in Ukraine, and as well as those risk factors discussed in the section entitled “Risk Factors” in Maverix’s annual information form dated March 16, 2022 available at www.sedar.com.
Forward-looking information in this MD&A includes disclosure regarding royalty payments to be paid to Maverix by property owners or operators of mining projects pursuant to its Royalties, and gold and silver deliveries under its Streams, prepaid gold and other interests of Maverix, and the future outlook of Maverix. Forward-looking statements are based on a number of material assumptions, which management of Maverix believe to be reasonable, including, but not limited to, the continuation of mining operations in respect of which Maverix will receive Royalty payments or from which Maverix will purchase precious or other metals, that commodity prices will not experience a material adverse change, mining operations that underlie Royalties or Streams will operate in accordance with disclosed parameters and such other assumptions as may be set out herein.
Maverix has attempted to identify important factors that could cause actual results to differ materially from those contained in forward-looking statements, there may be other factors that cause results not to be as anticipated, estimated or intended. There can be no assurance that such statements will prove to be accurate, as actual results and future events could differ materially from those anticipated in such statements. Accordingly, readers are advised not to place undue reliance on forward-looking statements or information. Maverix undertakes no obligation to update forward-looking information except as required by applicable law. Such forward-looking information represents management's best judgment based on information currently available.
Technical and Third-Party Information
Brendan Pidcock, P.Eng., Vice President Technical Services for Maverix and a qualified person as defined under NI 43-101 has reviewed and approved the written scientific and technical disclosure contained in this document.
Except where otherwise stated, the disclosure in this MD&A relating to properties and operations in which Maverix holds Royalty, Stream or other interests is based on information publicly disclosed by the owners or operators of these properties and information/data available in the public domain as at the date hereof, and none of this information has been independently verified by Maverix. Specifically, as a Royalty or Stream holder, Maverix has limited, if any, access to properties on which it holds Royalties, Streams, or other interests in its asset portfolio. The Company may from time to time receive operating information from the owners and operators of the mining properties, which it is not permitted to disclose to the public. Maverix is dependent on, (i) the operators of the mining properties and their qualified persons to provide information to Maverix, or (ii) on publicly available information to prepare disclosure pertaining to properties and operations on the properties on which the Company holds Royalty, Stream or other interests, and generally has limited or no ability to independently verify such information. Although the Company does not have any knowledge that such information may not be accurate, there can be no assurance that such third-party information is complete or accurate. Some reported public information in respect of a mining property may relate to a larger property area than the area covered by Maverix’s Royalty, Stream or other interest. Maverix’s Royalty, Stream or other interests may cover less than 100% of a specific mining property and may only apply to a portion of the publicly reported mineral reserves, mineral resources and or production from a mining property.
21