UNITED STATES
SECURITIES AND EXCHANGE COMMISSION
Washington, D.C. 20549
FORM 6-K
REPORT OF FOREIGN PRIVATE ISSUER PURSUANT TO RULE 13a-16
OR 15d-16 UNDER THE SECURITIES EXCHANGE ACT OF 1934
For the month of May 2021
Commission File Number: 001-39169
Natura &Co Holding S.A.
(Exact name of registrant as specified in its charter)
Avenida Alexandre Colares, No. 1188, Sala A17-Bloco A
Parque Anhanguera
São Paulo, São Paulo 05106-000, Brazil
(Address of principal executive office)
Indicate by check mark whether the registrant files or will file annual reports under cover of Form 20-F or Form 40-F:
| Form 20-F | ☒ | Form 40-F | ☐ | |
Indicate by check mark if the registrant is submitting the Form 6-K in paper as permitted by Regulation S-T Rule 101(b)(1):
| Yes | ☐ | No | ☒ | |
Indicate by check mark if the registrant is submitting the Form 6-K in paper as permitted by Regulation S-T Rule 101(b)(7):
| Yes | ☐ | No | ☒ | |
NATURA &CO HOLDING S.A.
TABLE OF CONTENTS
| ITEM | |
| 1. | Earnings release of Natura &Co Holding S.A. for the three-month period ended March 31, 2021. |
| 2. | Earnings presentation of Natura &Co Holding S.A. for the three-month period ended March 31, 2021. |
SIGNATURE
Pursuant to the requirements of the Securities Exchange Act of 1934, the registrant has duly caused this report to be signed on its behalf by the undersigned, thereunto duly authorized.
NATURA &CO HOLDING S.A.
| ||
| By: | /s/ José Antonio de Almeida Filippo | |
| Name: | José Antonio de Almeida Filippo | |
| Title: | Principal Financial Officer | |
| By: | /s/ Itamar Gaino Filho | |
| Name: | Itamar Gaino Filho | |
| Title: | Chief Legal and Compliance Officer | |
Date: May 17, 2021
Item 1
Earnings release of Natura &Co Holding S.A. for the three-month period ended March 31, 2021.

São Paulo, May 12, 2021
Q1-21: Natura &Co accelerates growth to +26%, ahead of CFT market1,
with EBITDA increase of over 400%
Avon synergies raised in April to between US$350 million to US$450 million;
improved indebtedness profile with US$ 1 billion ESG bond issuance
| · | Natura &Co’s consolidated net revenue reached R$9.5 billion in Q1, up 25.8% in BRL vs. Q1-20 (+8.1% at constant currency, “CC”), ahead of the global CFT market, supported by direct-to-consumer reach and further ramp-up in online sales. |
| · | Natura &Co Latam’s Q1 net revenue increased by 24.6% in BRL (+15.9% at CC), driven by an outstanding performance in Hispanic Latam by both brands. The Natura brand’s net revenue increased by 29.6% in BRL (+24.6% at CC), with strong +12.6% growth in Brazil and +60.4% in Hispanic Latam (+48.0% at CC), driven by an increase in consultant count, higher volumes and strong online sales growth. The Avon brand’s net revenue increased by 20.0% in BRL (+8.1% at CC), supported by strong growth in Hispanic Latam of +35.1% in BRL (+15.0% at CC). Growth was driven by core markets, with improved representative productivity and strong performance in key beauty categories and the home segment. In Brazil, Avon’s revenue was down -2.8%, impacted by the set-up for the implementation of the new commercial model. Natura &Co’s clear CFT leadership in Latam was confirmed by Euromonitor, reaching market share of 12.5% in FY20, +0.7pp vs. prior year, with a strong 17.0% in Brazil, +1pp vs. 2019. |
| · | Avon International’s Q1 net revenue grew 11.4% in BRL (-10.7% at CC). Avon gained market share2 vs. Q1-20 in Western Europe, driven by the UK, and Asia Pacific, notably the Philippines. All regions improved share month after month, including the top 8 countries, despite the continued impact of the Covid-19 second wave in key European markets and in core beauty categories such as color and fragrance. In the UK, Avon continues to grow market share and became the 3rd brand3 in the beauty market, up from 10th one year earlier. A new commercial model - Avon Growth Plan, is being developed with pilots in place in the Nordics and in South Africa, aiming at increasing representative productivity. The new harmonized earnings structure led to an improvement in the average representative base versus year-end 2020. |
| · | The Body Shop’s Q1 net revenue increased by 47.7% in BRL (+10.7% at CC), driven by the UK and North America, and strong performance of At-Home (+251%) and e-commerce (+119%) versus last year, which more than offset the impact of the pandemic’s second wave in retail. |
| · | Aesop Q1 net revenue grew by an exceptional +71.9% in BRL (+30.6% at CC), driven by online sales growth of 102% vs. Q1-20 and growth in Asia and the Americas. Asia sales grew by a remarkable 67%, supported by online channels, despite a surge in Covid cases in Japan and Malaysia. |
| · | Natura &Co digital sales continued to grow in the quarter. Digitally-enabled sales, which includes online sales (e-commerce + social selling) and relationship selling using our main digital apps reached 48% of total revenue, up from 33% in Q1-20. |
| · | Online sales, which accounted for 12% of total sales in Q1-21, grew by +166% vs. Q1-20, supported by strong growth in all brands. At Natura, online sales grew 253% and at Avon globally, +132% vs. Q1-20. Aesop’s total online sales reached 29% of revenue, up from 18% in the previous year, and The Body Shop’s online and At-Home channels accounted for 51% of total sales, up from 20% in Q1-20. |
| · | Relationship selling using apps advanced vs. Q1-20, with Avon e-brochure sales up by 175% globally. At Natura in Latin America, the average number of consultants sharing content increased by more than 350%, and orders through the 1.3 million+ consultant online stores in the region grew by 80% vs. Q1-20. |
| · | Natura &Co’s Q1 adjusted3 EBITDA was R$963.2 million with margin of 10.2% (+260 bps), driven by margin expansion in Latin America and Aesop. Reported EBITDA was R$829.1 million with margin of 8.8% (+690 bps). |
| · | Natura &Co Latam’s Q1 adjusted EBITDA margin was 12.2% (+530 bps). The Natura brand’s adjusted EBITDA margin increased 630 bps, thanks to revenue growth, operational leverage and synergies captured in both Brazil and Hispanic Latam. The Avon brand’s adjusted EBITDA margin expanded 390 bps, driven by Hispanic Latam, offsetting a contraction in Brazil as the new commercial model was being set up. |
| · | Avon International’s Q1 adjusted EBITDA margin stood at 4.1% (-70 bps), primarily due to lower revenue (at CC) and higher investments in digital and commercial areas as part of the strategy to drive market share and accelerate future growth, in line with its transformation plan. |
| · | The Body Shop’s Q1 EBITDA margin was 14.7% (-30 bps), mainly due to the Japan head franchisee buyback effect. Excluding the Japan buyback, EBITDA margin would have been 15.4%, +110 bps vs. last year, despite the pandemic’s impact on retail sales and channel mix. |
| · | Aesop’s Q1 EBITDA margin reached 26.7% (+390bps), driven by revenue growth, cost efficiency and strong performance of e-commerce. |
| · | Underlying net income reached R$60.2 million in Q1, up from a negative R$264.1 million, driven by strong EBITDA growth. Net income was R$(155.2) million, a strong improvement compared to R$(820.8) million in Q1-20. |
| · | Annual recurring target synergies from the Avon integration were raised in April by $50 million to between US$350 million and US$450 million, driven by cost synergies outside Latin America in manufacturing and distribution, to be achieved by 2024. Non-recurring costs to achieve higher synergies also increased to US$230 million, up from US$190 million, to be incurred over the same period. In the quarter we achieved US$35.5 million in synergies, in line with estimates, related to procurement, distribution and administrative, incurring US$21.0 million in costs to achieve. In addition, recurring EBITDA margin at Avon International is expected to reach low-to-mid-teens by 2024, supported by a Transformation Plan of US$163 million in non-recurring costs to drive growth and improve efficiencies. |
1 Cosmetics, Fragrance and Toiletries market performance: Company estimate based on global peers’ net revenue vs prior year of approximately +10.1% in Q1-21 (in reported FX), as reported by the companies or estimates published on Bloomberg for those who have not yet reported;
2 Sources: Euromonitor / Kantar / Nielsen.
3 Excluding effects that are not considered recurring nor comparable between the periods under analysis.
1
| · | Robust cash position of R$6.6 billion and significant deleveraging in Q1: Consolidated net debt-to-EBITDA ratio of 1.18x, down from 3.93x in Q1-20. Natura Cosméticos S.A. completed a US$1 billion Sustainability-Linked Bond (“ESG Bond”) issue on May 3, with a 4.125% coupon, maturing on May 3, 2028, guaranteed by Natura &Co Holding S.A. The funds raised through this issuance will be used to refinance certain short- and long-term debts of Natura Cosméticos, in line with the Group's liability management plan to improve its capital structure. |
| · | ESG agenda: The US$ 1 billion ESG Bond issued by Natura Cosméticos S.A. (“Natura”) includes two sustainability performance targets (“SPTs”), to be met by year-end 2026: i) reducing scopes 1, 2 and 3 of relative greenhouse gas (“GHG”) emissions intensity by another 13%, and ii) reaching 25% of post-consumer recycled (“PCR”) plastic in plastic product packaging. These SPTs are part of the Commitment to Life - Sustainability Vision 2030 and support Natura &Co’s efforts to address the global climate crisis and adopt full packaging circularity. |
| 1. | Management commentary: |
Roberto Marques, Executive Chairman and CEO of Natura &Co, commented: “Natura &Co turned in another strong performance in the first quarter of 2021 while still operating in a challenging health environment, with lockdowns and restrictions in certain key markets. We continue to place the health and safety of our employees, representatives, consultants and partners at the forefront of our concerns, with initiatives to adapt to a fast-moving situation.
Driven by the resilience of our business model, our direct-to-consumer reach and further ramp-up in online sales, the Group continued to outperform the global CFT market, posting very strong revenue growth of 26%. We saw double-digit growth in Reais across our brands, demonstrating the strength of our multi-channel model. Natura &Co Latam had an outstanding performance, with both Natura and Avon contributing. The Body Shop continued to offset store closures with very strong growth in online and the At-Home channel and Aesop had another spectacular quarter of growth, driven by Asia and online.
Adjusted EBITDA margin was up by a very solid 260 basis points, driven by revenue growth and an improvement in gross margin, underscoring our continued efficiency. Our Underlying Net Income returned to positive territory this quarter.
The Avon transformation journey continues to show progress, with the roll-out of the new commercial model underway and positive advances in market share and representative base, even though key geographies and categories like make-up and fragrance are still heavily impacted by the pandemic, as well as representative activity. We are progressing the new Transformation Plan that we presented at our recent Investor Day, supporting initiatives to drive growth and optimize costs.
Our strong innovation pipeline released exciting launches this quarter across all brands. We relaunched the entire Ekos range at Natura, a unique “bio-beauty” portfolio that underscores our strong commitment to the Amazon. Avon’s R&D expertise in skin care technology is evidenced by the launch of a vitamin D booster face cream in the Anew line. The Body Shop’s rejuvenation is revealed in the new contemporary version of its icon White Musk fragrance, while Aesop launched a fragrance cabinet in Asia to heighten in-store customer experience.
Demonstrating our commitment to achieving the sustainability targets that underpin our Commitment to Life - 2030 sustainability vision, we successfully completed in early May a US$1 billion ESG bond issue that is linked to sustainability targets on greenhouse gas emissions and use of post-consumer recycled plastic in plastic product packaging. This bond issue thus supports Natura &Co’s efforts to address the global climate crisis and move towards full packaging circularity while also contributing to strengthening its balance sheet, which saw continued progress on deleveraging in the quarter. In addition, on the back of international Women´s Day, Natura &Co, in partnership with consultants Mercer, presented a comprehensive study showing that the unexplained pay gap at Group level is very small and we are closing it sooner than we had initially targeted. This study exemplifies our commitment to transparency. In June we will disclose our annual progress on the environmental, social and circular economy pillars and how we evolve on our 31 targets to create the best beauty group FOR the world.
We are extremely proud of and thankful to our entire organization and network of consultants, representatives and partners. Our direct-to-consumer business model has shown resilience once again this quarter. Our approach of putting people first, balancing environmental, social and economic interests for the benefit of all stakeholders and aiming at positive impact while delivering sustainable growth and value creation, will continue to guide and inspire us.”
| 2. | Covid-19 update |
The Company is closely monitoring the evolution of the Covid-19 pandemic worldwide, particularly the recent new lockdown and restrictive measures adopted in parts of Europe. The Crisis Committee created in Q2-20 continuously analyzes the situation and acts to minimize impacts, ensure continuity of operations, protect cash and improve liquidity. Natura &Co also continues to be attentive to the health and safety of its employees, consultants and representatives and customers.
Key impacts on the business
| · | Lockdown restrictions: In the first quarter of 2021, Natura &Co’s businesses were impacted by a second wave of the pandemic in certain markets. The shift to digital continued across all our brands, allowing us to largely offset the impact of store closures, with online sales across the group up 166% vs. Q1-20. |
| · | Natura &Co Latam: 50% of all retail stores, including franchisee stores, were opened in March, albeit with certain restrictions. The adoption of digital assets by consultants continued to drive their performance. |
| · | Avon International: The company was strongly impacted by two effects: i) stricter lockdowns across key markets, especially in Central and Eastern Europe, and ii) a drop in sales of key beauty categories such as fragrances and cosmetics. These effects were partly offset by the acceleration in the adoption of digital assets in key markets such as the UK. |
| · | The Body Shop: Retail sales were impacted in important markets by mandatory store closures, especially in Europe. With only 68% of Company stores open in March, own-store like-for-like sales decreased 54% vs. Q1-20. Strong performance in At Home and online channels more than offset the pandemic’s effect. |
| · | Aesop: The company was also impacted by the new lockdowns in Europe, where retail like-for-like sales were down -1.5%. The shift in consumer behaviour to online more than offset this decrease and total net sales posted remarkable growth in the quarter. Aesop benefited from its greater presence in Asia, which accounted for more than 60% of its business, as the region was impacted earlier than Europe and reported a swifter recovery than other geographies. |
2
| 3. | Results analysis |
The Group segmentation is composed of:
| · | Natura &Co Latam, which includes all the brands in Latin America: Natura, Avon, The Body Shop and Aesop |
| · | Avon international, which includes all markets, excluding Latin America |
| · | The Body Shop ex-Latin America, and |
| · | Aesop ex-Latin America |
In addition, results and analysis for the periods under comparison include the effects of the fair market value assessment as a result of the business combination with Avon as per the Purchase Price Allocation – PPA.
3
Profit and Loss by Business | |||||||||||||||
Consolidated a | Natura &Co Latam b | Avon International | The Body Shop | Aesop | |||||||||||
| R$ million | Q1-21c | Q1-20c | Ch.% | Q1-21c | Q1-20c | Ch.% | Q1-21c | Q1-20c | Ch.% | Q1-21 | Q1-20 | Ch.% | Q1-21 | Q1-20 | Ch.% |
| Gross Revenue | 12,059.2 | 9,719.2 | 24.1 | 6,857.2 | 5,593.2 | 22.6 | 2,835.9 | 2,531.4 | 12.0 | 1,711.1 | 1,213.4 | 41.0 | 654.9 | 381.1 | 71.9 |
| Net Revenue | 9,455.1 | 7,518.0 | 25.8 | 5,185.9 | 4,162.3 | 24.6 | 2,363.5 | 2,121.5 | 11.4 | 1,319.7 | 893.2 | 47.7 | 585.9 | 340.9 | 71.9 |
| COGS | (3,324.4) | (2,878.7) | 15.5 | (2,047.0) | (1,718.1) | 19.1 | (946.2) | (927.2) | 2.0 | (279.0) | (201.2) | 38.7 | (52.1) | (32.2) | 62.1 |
| Gross Profit | 6,130.7 | 4,639.3 | 32.1 | 3,138.9 | 2,444.2 | 28.4 | 1,417.3 | 1,194.3 | 18.7 | 1,040.7 | 692.0 | 50.4 | 533.8 | 308.7 | 72.9 |
| Selling, Marketing and Logistics Expenses | (4,255.0) | (3,523.2) | 20.8 | (2,089.9) | (1,852.4) | 12.8 | (1,068.9) | (935.3) | 14.3 | (799.1) | (540.3) | 47.9 | (297.1) | (195.2) | 52.2 |
| Administrative, R&D, IT and Projects Expenses | (1,506.6) | (1,228.0) | 22.7 | (642.6) | (571.1) | 12.5 | (470.0) | (388.7) | 20.9 | (234.9) | (176.7) | 32.9 | (154.9) | (91.5) | 69.2 |
| Corporate Expenses d | (110.9) | (30.2) | 267.7 | - | - | - | - | - | - | - | - | - | - | - | - |
| Other Operating Income/ (Expenses), Net | 8.7 | (15.1) | (157.8) | 10.6 | 2.7 | 289.9 | (0.1) | (12.0) | (99.5) | (3.1) | (5.9) | (46.3) | 1.5 | 0.1 | - |
| Acquisition Related Expenses e | - | (298.3) | - | - | - | - | - | (0.0) | - | - | - | - | - | - | - |
| Transformation/Integration costs | (134.1) | (25.1) | 435.0 | (55.9) | (10.5) | 430.9 | (75.1) | (14.5) | 416.5 | - | - | - | - | - | - |
| Depreciation | 696.4 | 625.8 | 11.3 | 213.3 | 221.9 | (3.8) | 219.0 | 183.9 | 19.1 | 190.7 | 164.4 | 16.0 | 73.2 | 55.7 | 31.5 |
| EBITDA | 829.1 | 145.3 | 470.7 | 574.4 | 234.7 | 144.7 | 22.3 | 27.7 | (19.5) | 194.2 | 133.6 | 45.4 | 156.5 | 77.8 | 101.3 |
| Depreciation | (696.4) | (625.8) | 11.3 | ||||||||||||
| Financial Income/ (Expenses), Net | (227.9) | (227.6) | 0.1 | ||||||||||||
| Earnings Before Taxes | (95.2) | (708.1) | (86.6) | ||||||||||||
| Income Tax and Social Contribution | (90.1) | (94.8) | (5.0) | ||||||||||||
| Discontinued operations f | 28.7 | (22.0) | (230.7) | ||||||||||||
| Consolidated Net Income | (156.6) | (824.9) | (81.0) | ||||||||||||
| Non-controlling Interest | 1.4 | 4.1 | (66.6) | ||||||||||||
| Net Income attributable to controlling shareholders | (155.2) | (820.8) | (81.1) | ||||||||||||
| Gross Margin | 64.8% | 61.7% | 310 bps | 60.5% | 58.7% | 180 bps | 60.0% | 56.3% | 370 bps | 78.9% | 77.5% | 140 bps | 91.1% | 90.6% | 50 bps |
| Selling , Marketing and Logistics Exp ./ Net Revenue | 45.0% | 46.9% | (190) bps | 40.3% | 44.5% | (420) bps | 45.2% | 44.1% | 110 bps | 60.6% | 60.5% | 10 bps | 50.7% | 57.3% | (600) bps |
| Admin., R&D, IT, and Projects Exp ./ Net Revenue | 15.9% | 16.3% | (40) bps | 12.4% | 13.7% | (130) bps | 19.9% | 18.3% | 160 bps | 17.8% | 19.8% | (200) bps | 26.4% | 26.9% | (50) bps |
| EBITDA Margin | 8.8% | 1.9% | 690 bps | 11.1% | 5.6% | 550 bps | 0.9% | 1.3% | (40) bps | 14.7% | 15.0 % | (30) bps | 26.7% | 22.8% | 390 bps |
| Net Margin | (1.7)% | (11.0)% | 930 bps | - | - | - | - | - | - | - | - | - | - | - | - |
a Consolidated results include Natura &Co Latam, Avon International, The Body Shop and Aesop, as well as the Natura subsidiaries in the U.S., France and the Netherlands.
b Natura &Co Latam: includes Natura, Avon, TBS Brazil and Hispanic Latam and Aesop Brazil
c Includes PPA – Purchase Price Allocation effects
d Expenses related to the management and integration of the Natura &Co Group
e Avon-acquisition-related expenses
f Related to business separation at Avon North America
Consolidated net revenue growth in Q1-21
Q1-21 consolidated net revenue in increased by 25.8% year-on-year (+8.1% at CC), driven by higher revenue across all segments.
| · | Natura &Co Latam: Net revenue rose by 24.6% in BRL in Q1 (+15.9% at CC) |
| · | Avon International: Net revenue increased 11.4% in BRL in Q1 (-10.7% at CC) |
| · | The Body Shop: Net revenue increased 47.7% in BRL in Q1 (+10.7% at CC) |
| · | Aesop: Net revenue growth of 71.9% in BRL in Q4 (+30.6% at CC) |
Gross margin
Consolidated gross margin in Q1-21 increased to 64.8% (+310 bps) vs. Q1-20, supported by margin increase across all business segments:
Including PPA effects at Natura &Co Latam and Avon International
Consolidated | Natura &Co Latam | Avon International | The Body Shop | Aesop | |||||||||||
R$ million | Q 1- 21 | Q 1- 20 | Ch. % | Q 1- 21 a | Q 1- 20 b | Ch. % | Q 1- 21 a | Q 1- 20 b | Ch. % | Q 1- 21 | Q 1- 20 | Ch. % | Q 1- 21 | Q 1- 20 | Ch. % |
| Net Revenue | 9,455.1 | 7,518.0 | 25.8 | 5,185.9 | 4,162.3 | 24.6 | 2,363.5 | 2,121.5 | 11.4 | 1,319.7 | 893.2 | 47.7 | 585.9 | 340.9 | 71.9 |
| COGS | (3,324.4) | (2,878.7) | 15.5 | (2,047.0) | (1,718.1) | 19.1 | (946.2) | (927.2) | 2.0 | (279.0) | (201.2) | 38.7 | (52.1) | (32.2) | 62.1 |
| Gross Profit | 6,130.7 | 4,639.3 | 32.1 | 3,138.9 | 2,444.2 | 28.4 | 1,417.3 | 1,194.3 | 18.7 | 1,040.7 | 692.0 | 50.4 | 533.8 | 308.7 | 72.9 |
| Gross Margin | 64.8% | 61.7% | 310 bps | 60.5% | 58.7% | 180 bps | 60.0% | 56.3% | 370 bps | 78.9% | 77.5% | 140 bps | 91.1% | 90.6% | 50 bps |
Excluding PPA effects on COGS of R$(9.3) million in Q1-21 and R$(105.9) million, adjusted consolidated gross margin reached 64.9% in Q1-21 (+180 bps), as shown below:
Without PPA effects in both periods
Consolidated | Natura &Co Latam | Avon International | The Body Shop | Aesop | |||||||||||
R$ million | Q 1- 21 | Q 1- 20 | Ch. % | Q 1- 21 | Q 1- 20 | Ch. % | Q 1- 21 | Q 1- 20 | Ch. % | Q 1- 21 | Q 1- 20 | Ch. % | Q 1- 21 | Q 1- 20 | Ch. % |
| Net Revenue | 9,455.1 | 7,518.0 | 25.8 | 5,185.9 | 4,162.3 | 24.6 | 2,363.5 | 2,121.5 | 11.4 | 1,319.7 | 893.2 | 47.7 | 585.9 | 340.9 | 71.9 |
| COGS | (3,315.1) | (2,772.8) | 19.6 | (2,043.5) | (1,663.4) | 22.9 | (940.5) | (876.0) | 7.4 | (279.0) | (201.2) | 38.7 | (52.1) | (32.2) | 62.1 |
| Gross Profit | 6,139.9 | 4,745.2 | 29.4 | 3,142.5 | 2,499.0 | 25.8 | 1,423.0 | 1,245.5 | 14.3 | 1,040.7 | 692.0 | 50.4 | 533.8 | 308.7 | 72.9 |
| Gross Margin | 64.9% | 63.1% | 180 bps | 60.6% | 60.0% | 60 bps | 60.2% | 58.7% | 150 bps | 78.9% | 77.5% | 140 bps | 91.1% | 90.6% | 50 bps |
| · | Natura &Co Latam’s adjusted gross margin was 60.6% in Q1-21 (+60 bps), supported by strong increase at both the Natura and Avon brands in Hispanic Latam mainly due to foreign currency tailwinds. These more than offset gross margin decrease at both brands in Brazil, mainly from higher raw material prices and foreign currency headwinds. |
| · | Avon International’s adjusted gross margin was 60.2% in Q1-21 (+150 bps), thanks to favorable price/mix and lower supply chain costs, mainly in Turkey, the UK and South Africa markets, which more than offset foreign currency headwinds in certain markets. |
| · | The Body Shop’s gross margin stood at 78.9% in Q1-21 (+140 bps), supported mainly by reduced discounts. |
| · | Aesop’s gross margin was 91.1% in Q1-21 (+50 bps), supported by online sales growth and regional mix, notably Asia. |
4

Consolidated EBITDA
Reported EBITDA was R$829.1 million in Q1-21 with margin of 8.8% (+690 bps vs. Q1-20). Adjusted EBITDA was R$963.2 million, with an adjusted margin of 10.2% (+260 bps), excluding transformation costs in both years, and Avon-related acquisition costs and non-recurring PPA effects in 2020. The strong increase in adjusted EBITDA and margin resulted from higher sales and operational leverage at Natura &Co Latam and Aesop.
Consolidated EBITDA | |||
R$ million | Q1- 21 | Q1- 20 | Ch. % |
| Consolidated EBITDA | 829.1 | 145.3 | 470.7 |
| Transformation/ Integration costs (1) | 134.1 | 25.1 | 435.0 |
| (i) Transformation costs | 75.6 | 14.5 | 419.9 |
| (ii) Integration costs | 58.6 | 10.5 | 456.0 |
| Avon acquisition-related expenses (2) | - | 298.3 | - |
| Non-recurring PPA impact on EBITDA (3) | - | 102.9 | - |
| Adjusted EBITDA | 963.2 | 571.5 | 68.5 |
| Adjusted EBITDA Margin | 10.2% | 7.6% | 260 bps |
| (1) | Transformation/Integration costs Include: |
| (i) | Transformation Plan costs of R$75.1 million at Avon International and R$0.5 million at corporate level in Q1-21, and Avon International’s Open Up and Grow costs in Q1-20 |
| (ii) | Integration costs (costs to achieve synergies) of R$55.9 million at Natura &Co Latam and R$2.7 million at corporate level |
| (2) | Avon acquisition-related expenses: Non-recurring costs associated with Avon acquisition, in Q1-20 |
| (3) | Non-recurring inventory PPA impacts in Q1-20: Non-cash, non-recurring inventory PPA impact, resulting from a step up in inventory value (in the cost of goods sold), at both Natura &Co Latam and Avon International. |
Financial income and expenses
Net financial expenses were R$227.9 million in Q1-21, stable vs. Q1-20. The quarter saw lower interest expense resulting from the prepayment of Avon’s US$900 million 2022 bonds in November 2020 and lower interest rates in Brazil. These effects were offset by an increase in judicial contingency expenses, due mainly to reversal of tax provisions in 2020.
The following table details the main changes in our financial income and expenses:
5
R$ million | Q 1- 21 | Q 1- 20 | Ch. % |
| 1. Borrowings & Financing , ST Investments and Op. FX Gains/Losses | (153.1) | (197.1) | (22.3) |
| 2. Judicial Contingencies | (4.2) | 38.6 | (110.9) |
| 3. Other Financial Income and Expenses | (70.6) | (69.1) | 2.2 |
| Lease Interest Expenses | (53.7) | (54.4) | (1.2) |
| Other | (16.9) | (14.7) | 14.6 |
| Financial Income and Expenses, Net | (227.9) | (227.6) | 0.1 |
Underlying Net Income (UNI)
Underlying Net Income was R$60.2 million in Q1-21, reversing a loss of R$264.1 million last year, before Avon acquisition-related effects of R$215.3 million, which include: i) transformation/integration costs of R$134.1 million and ii) PPA amortization effect of R$111.3 million; partially offset by iii) positive discontinued operations expenses of R$28.7 million; and iv) positive non-controlling interests of R$1.4 million.
Reported net loss in Q1 decreased sharply to R$155.2 million, a strong improvement from a loss of R$820.8 million in Q1-20, driven by higher EBITDA and lower income tax expense, partially offset by higher depreciation of R$47.0 million and higher financial expenses of R$19.0 million. Income tax expense was down 5.0% in the quarter, despite higher earnings, largely due to a one-off higher expense in Q1-20 from the UK tax rate increase to 19% from 17%.

Free cash flow and cash position
We ended the quarter with a strong cash position of R$6.6 billion (R$4.3 billion in cash, and R$2.3 billion in short-term deposits) in line with projections and well above our minimum thresholds.
Cash flow was an outflow of R$1,204.6 million in Q1-21, consistent with our historical Q1 seasonality and further impacted by Covid-19 effects. Consumption in Q1 is mainly related to working capital investments across all brands. Natura &Co Latam had higher inventory and accounts receivable, partially offset by extended payables. Working capital at Avon International, The Body Shop and Aesop was also further impacted by FX effects from the devaluation of the BRL and higher capex.
6
R$ million | Q1-21 | Q1-20 | Ch. % |
| Net Income (Loss) Reported a | (155.2) | (820.8) | (81.1) |
| Depreciation and Amortization | 696.4 | 625.8 | 11.3 |
| Non-Cash/Others b | (124.0) | (253.0) | (51.0) |
| Internal Cash Generation | 417.2 | (448.0) | (193. 1) |
| Working Capital Decrease / (Increase) | (1,450.5) | (1,127.6) | 28.6 |
| Cash Generation (Use) Before Capex | (1,033.3) | (1,575.6) | (34.4) |
| Capex | (171.3) | (120.3) | 42.4 |
| Sale of Assets | - | - | - |
| Free Cash Flow | (1,204.6) | (1,695.9) | (29.0) |
| a | Attributable to the controlling shareholders |
| b | Includes the effects of deferred income tax, fixed and intangible assets write-offs, FX on translation of working capital, fixed assets, etc. |
Capital structure and liability management
As a subsequent event, the Group successfully concluded on May 3 a US$1 billion Sustainability-Linked Bond (“ESG bond”) issue, with a 4.125% coupon, maturing on May 3, 2028, issued by Natura Cosméticos S.A. and guaranteed by Natura &Co Holding S.A.
The funds raised through this issuance will be used to refinance certain short- and long-term debts of Natura Cosméticos, including its US$ 750 million, 5.375% bond maturing in 2023, in line with the Group's liability management plan to improve its capital structure.
Under the terms of the bond, from and including November 3, 2027, the interest rate payable on the notes shall be increased by 65 basis points per annum unless the Sustainability Performance Targets (“SPTs”) have been satisfied, as confirmed by an external verifier. The year 2019 served as baseline for the SPTs.
On April 21, rating agencies assigned credit ratings to Natura &Co Holding S.A. (previously not rated), on a global and national scale, as follows:
Natura &Co Holding S.A. | |||
Agency | Global Scale | National Scale | Outlook |
| Standard & Poor’s | BB | brAAA | Stable |
| Fitch Ratings | BB | AA+ (bra) | Positive |
| Moody’s | Ba3 | - | Stable |
In addition, Moody’s assigned a Ba2 rating with a positive outlook to the Natura Cosméticos subsidiary, and Fitch Ratings improved the company’s outlook to positive from stable. All other ratings related to the Group companies remained unchanged. A table with all ratings is available in section 8 of this document, Fixed Income.
Strong deleveraging at both Natura &Co Holding and Natura Cosméticos and Leverage Guidance
Natura &Co Holding’s consolidated net debt-to-EBITDA ratio stood at 1.18x in Q1-21, significantly down from 3.93x in Q1-20, including the effects of IFRS-16 (excluding IFRS-16: 1.37x in Q1-21 vs. 4.91x in Q1-20).
On April 15, the Company prepaid R$500 million in promissory notes issued by Natura &Co Holding and R$250 million by Natura Cosméticos.
Also, in April, we published the Group’s guidance on consolidated net debt-to-EBITDA ratio of equal to or less than 1.0x by 2023. This ratio is a cap rather than a target given the expected cash generation and higher EBITDA over the period.
Natura Cosméticos’ net debt-to-EBITDA ratio stood at 0.82x in Q1-21, down from 2.02x in Q1-20, including the effects of IFRS-16 (excluding IFRS-16: 1.08x in Q1-21, down from 2.70x in Q1-20, significantly below pre The Body Shop acquisition levels).
7
Natura Cosmèticos S.A. | Natura &Co Holding S.A. | |||
R$ million | Q1-21 | Q1-20 | Q1-21 | Q1-20 |
| Short-Term | 2,481.4 | 787.2 | 3,234.5 | 1,942.5 |
| Long-Term | 6,460.9 | 8,343.2 | 10,301.9 | 16,610.4 |
| Gross Debt a | 8,942.3 | 9,130.4 | 13,536.4 | 18,553.0 |
| Foreign currency hedging (Swaps) b | (2,006.3) | (1,618.7) | (2,006.3) | (1,618.7) |
| Total Gross Debt | 6,936.0 | 7,511.7 | 11,530.1 | 16,934.3 |
| (-) Cash, Cash Equivalents and Short-Term Investment | (3,818.4) | (2,447.1) | (6,576.4) | (4,566.3) |
| (=) Net Debt | 3,117.6 | 5,064.6 | 4,953.8 | 12,368.0 |
| Indebtedness ratio excluding IFRS 16 effects | ||||
| Net Debt/EBITDA | 1.08x | 2.70x | 1.37x | 4.91x |
| Total Debt/EBITDA | 2.40x | 4.00x | 3.20x | 6.72x |
| Indebtedness ratio including IFRS 16 effects | ||||
| Net Debt/EBITDA | 0.82x | 2.02x | 1.18x | 3.93x |
| Total Debt/EBITDA | 1.82x | 3.00x | 2.75x | 5.37x |
| a Gross debt excludes PPA impacts of R$474.5 million and excludes lease agreements | ||||
| b Foreign currency debt hedging instruments, excluding mark-to-market effects | ||||
| 4. | Performance by segment |
Natura &Co Latam: The Natura brand posts strong double-digit growth in Brazil and Hispanic Latam; The Avon brand grows strongly in Hispanic Latam while a new commercial model is implemented in Brazil
Net revenue at Natura &Co Latam increased by 24.6% in Q1-21 in BRL (+15.9% at CC), driven by the Natura brand‘s strong 29.6% growth (+12.6% Brazil;+60.4% Hispanic Latam), while the Avon brand was up 20.0% (-2.8% in Brazil; +35.1% in Hispanic Latam). Natura &Co’s clear CFT leadership in Latin America was confirmed by Euromonitor, reaching market share of 12.5% in FY20, +0.7pp vs. prior year. In Brazil we maintained our leadership, with a strong 17.0% (+1pp vs. 2019). In the five Hispanic countries where both Natura and Avon brands operate, market share reached 11.2% (+1.3pp).
The Natura brand was valued at US$1.7 billion and ranked as the world’s strongest brand in the cosmetics sector, according to Brand Finance, based on factors such as marketing investment, customer awareness, employee satisfaction, corporate reputation and revenue forecasts.
The Natura brand posted strong performance both in Brazil and in Hispanic Latam, which attests to the strength of our digital social selling model and a robust innovation pipeline. The Avon brand reported a second consecutive quarter of growth in Hispanic Latam, this time with acceleration in sales driven by key markets such as Mexico, its largest single market, as well as Argentina, Chile and Peru. In Brazil, the Avon brand’s revenue was down 2.8%, as the preparation for the new commercial model implementation caused a further reduction in the number of representatives, as occurred at Natura in 2017.
Avon’s integration in Latam is on track, with important progress in procurement, customer and financial services, distribution and digital. There were significant advances in IT systems at Avon Brazil, to enable the set up and implementation of the new commercial model.
The Natura brand in Brazil had a strong quarter, with continued advances in brand preference. Growth was driven by continued digital social selling penetration, an increase in the average number of consultants of +14.2% vs. Q1-20 (and -3.5% vs. Q4-20), reaching 1,184,000, and higher volumes of most categories such as body care, face care, fragrances and soaps. Consultant activity level was stable in the quarter, and volumes increased slightly.
| The Natura consultant loyalty index in Brazil remained strong, and business leader loyalty was also significantly higher vs. last year. Productivity per consultant was down 3.5% in the quarter, after 17 consecutive quarters of growth since the successful implementation of our segmented relationship selling model in mid-2017. This results from an increase in our consultant base since Q3-20 (+14.2% vs Q1-20). This temporarily dilutes productivity as new consultants are in the early stages of building up their activity. Over time, we expect these consultants to progress to higher-productivity segments of our commercial model, such as Silver, Gold and Diamond. In the quarter, the number of consultants in top-tier segments remained strong. | |

Natura relaunched its iconic Ekos line, with formulations that include 3 times more bio-actives from the Amazon forest, substantially improving product performance. This “bio-beauty” line is comprised of 96% natural ingredients and will contribute to increase income of the Amazon supplying communities who help keep the forest standing. Ekos has engaged a new ambassador, Brazilian model and environmental activist Gisele Bündchen, to represent a more conscious beauty and contribute to defending urgent causes related to our planet.
The Natura brand’s strong growth in Hispanic Latam was supported by all markets, notably Argentina, Chile and Peru, with productivity increase and expansion of the consultant base (+19.4%), which reached 850,000. The quarter ended with a significantly higher consultant loyalty index in the region, up 530 bps vs. Q1-20. We also launched Natura’s e-commerce in Mexico, completing the brand’s e-commerce platforms in the region.
Avon’s strong net revenue in Hispanic Latam was supported by a higher activity level and higher representative productivity, which helped offset the 5.5% decline in average number of representatives. Growth was driven by Fashion and Home and most beauty categories, such as body care, fragrances and face care. Color continues to be impacted by the pandemic effects.
The Avon brand’s revenue in Brazil was down 2.8% in Q1-21 vs. Q1-20, as a result of the implementation of the new segmented commercial model. As occurred at the Natura brand when its channel was revitalized in 2017, this structural change caused a further drop in the number of representatives (of
8
4.7% in Q1-21), but once the representative base stabilizes and representatives progress towards higher segment levels based on higher sales, we expect productivity growth to resume. Volume was slightly up in the quarter, picking up in March.
The Avon brand was a major sponsor of the 21st edition of the reality show Big Brother Brazil, which ran from late January through May 4, 2021, strengthening the brand’s power and improving consumer perception. The brand engaged with the show’s audience in various online and offline platforms, to promote social diversity. In the quarter we saw e-commerce sales nearly triple, along with an increase of 400,000 followers on Instagram and nearly 100,000 on Twitter, with record breaking numbers of impressions in both social media channels. The brand reached the number one position in share of social media voice (SOV) on Twitter, with 10 trending topics.
Natura Brazil’s online sales (e-commerce + social selling) were up 150% vs Q1-20, notably driven by consultants’ online stores. At the end of Q1-21 we surpassed 1.3 million Natura consultant online stores (Latin America), with an 80% year-on-year increase in the number of orders. At Avon, e-brochure sales continued to post significant growth, of +96% in Brazil in Q1-21 vs. Q1-20.
In the retail channel, all our Natura and The Body Shop stores faced continued restrictions. We ended the quarter with over 700 stores, including 70 Natura own stores, over 140 The Body Shop stores and over 500 Natura franchised stores.
The &Co Pay platform, rolled-out at Natura Brazil in Q4-20 continued to expand, with an 80% increase in the number of accounts in Q1. We have enabled new features to improve consultant experience, including credit top-up for mobile phones and public transportation passes. &Co Pay is an enabler of digital and financial inclusion for our consultants and reps.
Natura &Co Latam: Financial analysis
Reported EBITDA was R$574.4 million with margin of 11.1% (+550 bps). Adjusted EBITDA, excluding transformation costs, surged 119.2%, to R$630.3 million, vs. R$287.5 million in Q1-20, with adjusted EBITDA margin of 12.2% (+530 bps), thanks to strong revenue growth and operational leverage at the Natura brand in Brazil and in Hispanic Latam, and the Avon brand in Hispanic Latam.
A reconciliation between EBITDA and adjusted EBITDA is presented below:
R$ million | Q1-21 | Q1-20 | Ch. % |
| EBITDA | 574.4 | 234.7 | 144.7 |
| Transformation/Integration costs | 55.9 | 10.5 | 430.9 |
| Non-recurring PPA impacts on EBITDA | - | 42.3 | - |
| Adjusted EBITDA | 630.3 | 287.5 | 119.2 |
| Adjusted EBITDA Margin | 12.2% | 6.9% | 530 bps |
Excluding PPA effects on SG&A expenses, Selling, Marketing & Logistics expenses represented 39.7% of net revenue (-400 bps), mainly resulting from operational leverage from strong revenue increase at both brands.
Excluding PPA effects, Administrative, R&D, IT and Project Expenses reached 12.5% of net revenue (-100 bps) in the quarter, largely driven by net revenue growth at both brands.
R$ million | Q1-21 | PPA impacts | Q1-21 | Q1-20 | PPA | Q1-20 | Ch. % | Ch. % |
| Selling, Marketing and Logistics Expenses | (2,089.9) | (32.9) | (2,057.0) | (1,852.4) | (32.0) | (1,820.5) | 12.8 | 13.0 |
| Administrative, R&D, IT and Projects Expenses | (642.6) | 4.6 | (647.2) | (571.1) | (10.4) | (560.7) | 12.5 | 15.4 |
| SG&A Expenses | (2,732.5) | (28.3) | (2,704.1) | (2,423.6) | (42.4) | (2,381.2) | 12.7 | 13.6 |
| Selling, Marketing and Logistics Exp./ Net Revenue | 40.3% | - | 39.7% | 44.5% | - | 43.7% | (420) bps | (400) bps |
| Admin., R&D, IT, and Projects Exp./ Net Revenue | 12.4% | - | 12.5% | 13.7% | - | 13.5% | (130) bps | (100) bps |
Avon International: Market share gain in Western Europe driven by the UK
Avon gained market share in Q1-21 vs. Q1-20 in Western Europe, driven by the UK, and in Asia Pacific driven by the Philippines. All regions improved share month after month, including Avon’s top 8 countries, despite the continued impact of the Covid-19 second wave in key European markets. Avon UK’s market share increased for the 4th consecutive quarter, this time by nearly 1pp vs. Q1-20, becoming the 3rd brand in the beauty market (last 12 months), up from 10th one year earlier. This strong performance was driven by gains in color, a core category, as well as in fragrance and skin care.
Avon’s revenue in the quarter still reflected the second wave of the pandemic, especially in Central and Eastern Europe, which underwent further lockdowns with a greater impact in color and fragrance categories, as well as in representative offline activity. We continued to see continued representative productivity improvement as result of recovery actions, which was offset by lower activity in Europe and Africa.
9
Gross margin in the period was up by a healthy 150 bps, excluding PPA effects, thanks to favorable price/mix and lower supply chain costs, mainly in Turkey, the UK and South Africa markets, despite volume decline and currency headwinds in certain markets. This attests to the potential operational leverage once the business resumes revenue growth.
Avon actions to strengthen fundamentals continued, and the business is now running on a simplified commercial model, with monthly campaigns across all markets. This has contributed to a 26% reduction in printing of sales catalogue and a 13% decline in catalogue costs, in line with the goal of harmonizing campaign planning and reducing costs.
Launches in the quarter included the Hydra Pro Vita-D Moisturizer, another innovation in the hero skin care line Anew. This “sunshine in a jar” is Avon’s first face cream to harness the skin-boosting power of Vitamin D, which is activated by the Pro Vita-D technology, locking in hydration for a 72-hour moisture. Avon’s Protinol was recognized with an Edison Award™, one of the highest accolades a company can receive in the name of innovation and business success. Protinol™ is a skin science breakthrough that helps strengthen skin with a dual-collagen boost.
Net revenue of the Avon brand, including Latin America and Avon International, grew 15.7% in BRL in Q1 (-1.7% at CC).
Avon International: Financial analysis
Avon International’s reported EBITDA was R$22.3 million in Q1-21 and adjusted EBITDA was R$97.4 million. Reported EBITDA margin was 0.9% and adjusted EBITDA margin was 4.1% (-70 bps), due to the impact of lower revenue (-10.7% at CC) and higher strategic investments in digital and commercial areas to accelerate future growth, which offset higher gross margin.
A reconciliation between EBITDA and adjusted EBITDA is presented below:
R$ million | Q1-21 | Q1-20 | Ch. % |
| EBITDA | 22.3 | 27.7 | (19.5) |
| Transformation/Integration costs | 75.1 | 14.5 | 416.5 |
| Non-recurring PPA impact on EBITDA | - | 60.6 | - |
| Adjusted EBITDA | 97.4 | 102.9 | (5.4) |
| Adjusted EBITDA Margin | 4.1% | 4.8% | (70) bps |
Excluding PPA effects on SG&A expenses, Selling, Marketing & Logistics expenses reached 43.5% of net revenue (+90 bps), largely due to lower revenue and higher investments in the commercial area to accelerate growth.
Excluding PPA effects, Administrative, R&D, IT and Project expenses reached 16.5% of net revenue (+120 bps) in the quarter, mainly due to lower revenue and foreign currency impacts.
R$ million | Q1-21 | PPA impacts | Q1-21 | Q1-20 | PPA | Q1-20 | Ch. % | Ch. % |
| Selling, Marketing and Logistics Expenses | (1,068.9) | (40.6) | (1,028.3) | (935.3) | (31.7) | (903.6) | 14.3 | 13.8 |
| Administrative, R&D, IT and Projects Expenses | (470.0) | (79.1) | (390.8) | (388.7) | (63.2) | (325.5) | 20.9 | 20 1 |
| SG&A Expenses | (1,538.9) | (119.8) | (1,419.1) | (1,323.9) | (94.9) | (1,229.1) | 16.2 | 15.5 |
| Selling, Marketing and Logistics Exp./ Net Revenue | 45.2% | - | 43.5% | 44.1% | - | 42.6% | 110 bps | 90 bps |
| Admin., R&D, IT, and Projects Exp./ Net Revenue | 19.9% | - | 16.5% | 18.3% | - | 15.3% | 160 bps | 120 bps |
The Body Shop: Solid revenue growth driven by At-Home and Online
The Body Shop posted net revenue of R$1,319.7 million in Q1-21, up by 47.7% in BRL (+10.7% at CC), largely driven by direct channels as customers continue to engage and transact with us digitally. At-Home sales grew by 251% and e-commerce grew 119%, coupled with lower discounts. Together, both channels represented 51% of total sales in the period and more than offset lost retail sales. UK and North America were the key drivers of revenue expansion this quarter, followed by APAC, despite lower franchise sales mainly in Indonesia, partially offsetting strong double-digit growth in Australia. Revenue was also supported by the acquisition of The Body Shop head franchisee in Japan, which is now included as own store revenue vs. franchise last year. Excluding the Japan buyback effect, revenue at CC improved by 6%.
Only 68% of own stores were open in March (vs. 78% in December 2020 and 25% by the end of Q1-20), with the UK under lockdown in Q1 and other markets in Europe either re-entering lockdowns or operating with reduced hours. This resulted in strong negative like-for-like retail sales. Online sales were amplified by the new global company website, which enhanced consumer experience and significantly increased the number of new customers. As part of our strategy to expand our omnichannel model in North America, we grew our At-Home channel to over 9,000 consultants.
New launches in the quarter included the Dry Body Oil from the Hemp range. It is enriched with hemp seed oil from France for a fast-absorbing and non-sticky feel, leaving the skin with a natural, healthy-looking glow.
The Body Shop brand joined the Brand Finance Cosmetics Top 50 ranking in 2021, with a valuation of US$725 million, up +22%, and was highlighted as one of the fastest-growing brands.
10
EBITDA in Q1-21 reached R$194.2 million, with EBITDA margin of 14.7% (-30 bps), due to channel mix effects. EBITDA and EBITDA margin improved significantly in At-Home and online channels, driven by higher volumes, offsetting declines in retail. Excluding Japan’s results from both years, Q1-21 pro forma EBITDA margin would have been 70 bps higher than reported margin, and 110 bps higher than Q1-20’s margin.
The quarter ended with 1,019 own stores and 1,557 franchise stores (total of 2,576 stores), with 129 net store closures (own and franchise) since Q1-20. The increase in own stores is mainly explained by the Japan operation buyback. In the last 12 months, we rolled out the new concept store to 12 existing stores, of which 3 within the quarter. The chart below shows the store count evolution:
Store | The Body Shop store count | ||||
Q1-21 | Q4-20 | Q1-20 | Change vs. Q4-20 | Change vs. Q1-20 | |
| Own | 1,019 | 1,049 | 977 | (30) | 42 |
| Franchise | 1,557 | 1,590 | 1,728 | (33) | (171) |
| Total | 2,576 | 2,639 | 2,705 | (63) | (129) |
Aesop: Exceptional growth driven by online and Asia
Aesop posted exceptional net revenue growth of 71.9% in Q1-21 in BRL and +30.6% in constant currency, driven by another quarter of very fast growth in online sales, which increased by 102% vs Q1-20 and represented 29% of total sales. Aesop saw growth in all regions. Performance was particularly strong in Asia, with sales up 67% (at CC). Retail revenue grew by 6% globally, supported by strong like-for-like growth in Asia, while stores remained closed across Europe, in Canada and parts of Australia.
Aesop launched a fragrance cabinet in the Aesop Parnas store in South Korea and will roll out the same concept in other stores and countries to elevate the in-store experience for customers in this key category.
Q1-21 EBITDA more than doubled to R$ 156.5 million with EBITDA margin of 26.7% (+390 bps), driven by sales growth, higher EBITDA, notably in Asia, and cost efficiency.
Signature stores totalled 250 in the quarter, up 3 units vs both Q4-20 and Q1-20 reflecting a slowdown in the store roll out plan due to Covid-19. A store count table is provided below:
Doors | Aesop door count | ||||
Q1-21 | Q4-20 | Q1-20 | Change vs. Q4-20 | Change vs Q1-20 | |
| Signature stores | 250 | 247 | 247 | 3 | 3 |
| Department | 92 | 91 | 91 | 1 | 1 |
| Total | 342 | 338 | 338 | 4 | 4 |
| 5. | Social and environmental performance |
(all actions refer to Natura &Co Group, unless stated otherwise)
On the sustainability front, Natura &Co continued to make strides towards achieving our 31 goals for our 2030 “Commitment to Life” sustainability vision announced last year.
Commitment to Life highlights
| · | To Address the Climate Crisis: |
| o | We are consolidating the organizational footprints for scopes 1 and 2, and calculating the footprint for scope 3. The Carbon Trust consultancy will support us in this task and will also aid us in calculating the science-based targets for the 1.5°C pathway, in line with Science Based Target initiative (SBTi) requirements |
| o | We defined carbon emission reduction targets as part of the KPIs related to the scorecard of our 2021 bonus compensation for the Group and the four brands |
| o | Natura Brazil reduced 72% of scope 2 GHG emissions with the acquisition of renewable electric energy with zero GHG emissions from wind power in all Brazil operations |
| o | The Body Shop has installed automatic meter readers (AMRs) to measure energy consumption in 295 stores and is expanding AMRs across all company sites |
| · | To defend Human Rights and to be Human-Kind: |
11
| o | 13% is our raw gap between the average pay of all women & men, irrespective of role, location and experience according to an equitable pay study carried out with the Mercer consultancy |
| o | 0.9% is our unexplained gap – that which cannot be explained by legitimate factors. We will act to close our gender pay gap this year to achieve this well ahead of our 2023 Commitment to Life goal |
| · | To embrace Circularity and Regeneration: |
| o | Natura has achieved 93% natural ingredients in formulas |
| o | Aesop recycled PET tracking at 85.92% of total PET consumption |
| o | Our 2021 bonus compensation scorecard also includes a target related to increase recycled plastic consumption |
The power of the “&”
| o | Natura was recognized as a “humanized” company top performance, according to Humanizadas, a partner of Conscious Capitalism in Brazil |
| o | B Corp: During B Corp month in March, we celebrated Natura &Co becoming the world’s largest B Corp, showcasing our efforts to balance profit and purpose |
| o | Avon marked International Women’s Day (March 8) with the launch of the My Story Matters gallery - to create a place for women to speak up, share their stories and celebrate their achievements - to unite and inspire each other. The platform was launched to celebrate the achievements of women around the world. So far, the platform has gathered 435,000 stories |
| o | Avon also took part in anti-racism events as part of the March 21 International Day for the Elimination of Racial Discrimination. In association with The Office of the High Commissioner for Human Rights (OHCHR) |
| · | Investments and donations: |
| o | Natura &Co donated 4 million BRL to the Conectar group in Brazil, for hospital supplies and purchase of vaccines |
| o | Natura & Co together with eleven other companies, donated more than 5,000 oxygen concentrators in Brazil |
| o | Aesop awarded of $300,000 AUD to organizations focused on literacy and education |
| 6. | Capital Markets and Stock Performance |
On February 8, the Company concluded a share repurchase program for a total of 631,358 common shares, acquired at market prices in the Brazilian stock exchange, to fulfil its restricted share and stock options programs.
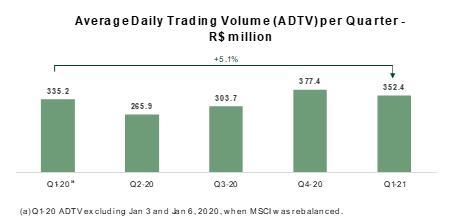
NTCO3 shares traded at R$48.14 at the end of Q1-21 on the B3 stock exchange, -8.3% in the quarter. Average Daily Trading Volume (ADTV) for the quarter was R$352.4 million, +5.1% vs Q1-20. NTCO traded at US$16.99 at the end of Q1-21 on NYSE, -15.1% in the quarter.
On March 31, 2021, the Company’s market capitalization was R$66.3 billion, vs. R$30.5 billion on March 31, 2020, an increase of 116.5%, and the Company’s capital was comprised of 1,376,654,532common shares, vs. 1,188,271,016 in 2020.
Below is the performance of NTCO3 and NTCO in the quarter:
|

12
13
| 7. | Fixed Income |
Below is a table with details of all public debt instruments outstanding per issuer as of March 31, 2021:
Issuer | Type | Issuance | Maturity | Principal (million) | Nominal Cost |
| Natura Cosmèticos S.A. | Bonds - 1st issue | 02/01/2018 | 02/01/2023 | US$ 750.0 (1) | 5.375% |
| Natura Cosmèticos S.A. | Debenture - 7th issue | 09/25/2017 | 09/25/2021 | BRL 1,827.3 | DI + 1.75% per year |
| 09/21/2021 | BRL 308.3 | 110.5% DI tax | |||
| Natura Cosmèticos S.A. | Debenture - 9th issue | 09/21/2018 | 09/21/2022 | BRL 302.7 | 112% DI tax |
| 08/28/2019 | 08/26/2024 | BRL 400.0 | DI + 1.00 per year | ||
| Natura Cosmèticos S.A. | Debenture - 10th issue 1st series | 08/29/2019 | 08/26/2024 | BRL 95.7 BRL 686.2 BRL 394.5 | DI + 1.15 per year DI + 1.15 per year DI + 1.15 per year |
| Natura Cosmèticos S.A. | Promissory Notes - 1st issue | 05/04/2020 | 05/04/2021 | BRL 250.0 | DI + 3.25% per year |
| Avon Products, Inc. | Unsecured Bonds | 03/12/2013 | 03/15/2023 | US$ 461.9 | 6.5000%(2) |
| Avon Products, Inc. | Unsecured Bonds | 03/12/2013 | 03/15/2043 | US$ 216 .1 | 8.450%(2) |
| Natura &Co Holding | Promissory Notes - 2nd issue | 05/04/2020 | 05/04/2021 | BRL 500.0 | DI + 3.25% per year |
| (1) Principal and interests fully hedged (swapped to BRL). For more information, see the explanatory notes to the Company’s financial statements. | |||||
| (2) Coupon based on current credit ratings, governed by interest rate adjustment clause. | |||||
On April 15, the Company prepaid R$500 million in promissory notes issued by Natura &Co Holding and R$250 million by Natura Cosméticos.
Ratings
On April 21, rating agencies assigned credit ratings to Natura &Co Holding S.A. (previously not rated), on a global and national scale. Further, the Natura Cosméticos subsidiary earned a Ba2 rating from Moody’s on global scale, with a stable outlook, and Fitch Ratings improved Natura Cosméticos’ outlook to positive, from stable.
Below is a table with our current credit ratings:
Natura &Co Holding S.A. | |||
Agency | Global Scale | National Scale | Outlook |
| Standard & Poor's | BB | brAAA | Stable |
| Fitch Ratings | BB | AA+ (bra) | Positive |
| Moody's | Ba3 | - | Stable |
Natura Cosmèticos S.A. | |||
Agency | Global Scale | National Scale | Outlook |
| Standard & Poor's | BB | brAAA | Stable |
| Fitch Ratings | BB | AA+ (bra) | Positive |
| Moody's | Ba2 | - | Stable |
Avon International | |||
Agency | Global Scale | National Scale | Outlook |
| Standard & Poor's | BB- | - | Stable |
| Fitch Ratings | BB | - | Positive |
| Moody's | Ba3 | - | Stable |
| Ratings updated on April 21, 2021 | |||
14
| 8. | Appendices |
Consolidated Balance Sheet
ASSETS (R$ million) | Mar-21 | Dec-20 | LIABILITIES AND SHAREHOLDER'S EQUITY (R$ million) | Mar-21 | Dec-20 | |
| CURRENT ASSETS | CURRENT LIABILITIES | |||||
| Cash and cash equivalents | 4,326.4 | 5,821.7 | Loans, financing and debentures | 3,234.5 | 3,805.6 | |
| Securities | 2,249.7 | 2,520.6 | Leasing | 1,120.8 | 1,059.7 | |
| Trade receivables | 3,370.1 | 3,597.5 | Trade payables and forfait operations | 6,555.2 | 6,774.2 | |
| Inventories | 5,342.7 | 4,544.3 | Payroll, profit sharing and social changes | 1,242.5 | 1,340.7 | |
| Recoverable taxes | 1,176.3 | 1,071.3 | Tax liabilities | 658.5 | 785.4 | |
| Income tax and social contribution | 200.4 | 242.1 | Income tax and social contribution | 372.5 | 441.3 | |
| Derivatives | 112.2 | 139.9 | Derivative financial instruments | 40.9 | 61.2 | |
| Other current assets | 800.6 | 616.1 | Provision for tax, civil and labor risks | 59.4 | 58.8 | |
| Other non-current assets held for sale | 160.6 | 181.3 | Other current liabilities | 1,721.9 | 1,832.8 | |
| Total current assets | 17,739.1 | 18,734.8 | Total current liabilities | 15,006.1 | 16,159.6 | |
| NON CURRENT ASSETS | NON CURRENT LIABILITIES | |||||
| Recoverable taxes | 938.6 | 932.2 | Loans, financing and debentures | 10,776.4 | 10,017.3 | |
| Income tax and social contribution | 486.3 | 478.5 | Leasing | 2,799.8 | 2,798.8 | |
| Deferred income tax and social contribution | 1,270.7 | 1,339.7 | Payroll, profit sharing and social changes | 43.8 | 43.8 | |
| Judicial deposits | 558.0 | 566.2 | Tax liabilities | 112.3 | 109.5 | |
| Financial derivatives instruments | 2,116.4 | 1,768.1 | Deferred income tax and social contribution | 1,186.9 | 1,288.0 | |
| Securities | 28.5 | 16.1 | Provision for tax, civil and labor risks | 2,058.6 | 2,000.4 | |
| Other non-current assets | 1,606.5 | 1,527.7 | Other non-current liabilities | 1,120.2 | 1,113.1 | |
| Total long term assets | 7,005.0 | 6,628.5 | Total non-current liabilities | 18,097.8 | 17,370.9 | |
| Property, plant and equipment | 5,380.1 | 5,235.1 | SHAREHOLDERS' EQUITY | |||
| Intangible assets | 28,306.0 | 26,917.1 | Capital stock | 12,395.7 | 12,378.0 | |
| Right of Use | 3,388.0 | 3,402.0 | Treasury shares | (9.7) | (11.7) | |
| Total non-current assets | 44,079.1 | 42,102.8 | Capital reserves | 11,066.1 | 11,052.1 | |
| Retained earnings | 133.8 | 120.2 | ||||
| Accumulated losses | (915.1) | (759.9) | ||||
| Equity valuation adjustment | 6,020.5 | 4,585.6 | ||||
| Equity attributable to owners of the Company | 28,691.3 | 27,364.3 | ||||
| Non-controlling interest on subsidiaries' equity | 22.8 | 22.8 | ||||
| TOTAL ASSETS | 61,818.2 | 60,917.6 | TOTAL LIABILITIES AND SHAREHOLDERS' EQUITY | 61,818.2 | 60,917.6 |
Consolidated Income Statement- Including Purchase Price Allocation (PPA) Amortization
R$ million | Q1-21 | Q1-20 | Ch. % |
| NET REVENUE | 9,455.1 | 7,518.0 | 25.8 |
| Cost of Products Sold | (3,322.5) | (2,878.7) | 15.4 |
| GROSS PRO FIT | 6,132.6 | 4,639.3 | 32.2 |
| OPERATING (EXPENSES) INCOME | |||
| Selling, Marketing and Logistics Expenses | (4,007.4) | (3,299.2) | 21.5 |
| Administrative, R&D, IT and Project Expenses | (1,627.7) | (1,244.1) | 30.8 |
| Impairment losses on trade receivables | (239.3) | (224.0) | 6.9 |
| Other Operating Income (Expenses), Net | (125.4) | (352.6) | (64.4) |
| INCOME (LOSS) FROM OPERATIONS BEFORE FINANCIAL RESULT | 132.7 | (480.5) | (127.6) |
| Financial Income | 1,038.9 | 1,560.2 | (33.4) |
| Financial Expenses | (1,266.9) | (1,787.8) | (29.1) |
| INCOME (LOSS) BEFORE INCOME TAX AND SOCIAL CONTRIBUTION | (95.2) | (708.1) | (86.6) |
| Income Tax and Social Contribution | (90.1) | (94.8) | (5.0) |
| INCOME (LOSS) FROM CONTINUED OPERATIONS | (185.3) | (802.9) | (76.9) |
| Income (Loss) from discontinued operations | 28.7 | (22.0) | (230.7) |
| NET INCOME (LOSS) FOR THE PERIOD | (156.6) | (824.9) | (81.0) |
| Attributable to controlling shareholders | (155.2) | (820.8) | (81.1) |
| Attributable to non-controlling shareholders | (1.4) | (4.1) | (66.6) |
Purchase Price Allocation (PPA) Amortization
R$ million | Q1-21 | Q1-20 |
| NET REVENUE | - | - |
| Cost of Products Sold | (9.3) | (105.9) |
| GROSS PRO FIT | (9.3) | (105.9) |
| Selling, Marketing and Logistics Expenses | (73.5) | (63.6) |
| Administrative, R&D, IT and Project Expenses | (74.6) | (73.6) |
| Impairment losses on trade receivables | - | - |
| Other Operating Income (Expenses), Net | 5.5 | (4.6) |
| Transformation/Integration Costs | - | - |
| Financial Income/(Expenses), net | 12.0 | 34.4 |
| Income Tax and Social Contribution | 45.1 | 38.8 |
| Discontinued operations | - | - |
| INCOME (LOSS) FROM CONTINUED OPERATIONS | (94.8) | (174.5) |
| Depreciation impact | (168.4) | (144.8) |
15
Consolidated Statements of Cash Flow
R$ million | Mar-21 | Mar-20 |
| CASH FLOW FROM OPERATING ACTIVITIES | 1,024.2 | 377.7 |
| Increase (Decrease) in: | ||
| Trade receivables | 312.4 | 346.1 |
| Inventories | (599.5) | (117.7) |
| Recoverable taxes | (16.0) | (184.8) |
| Other assets | (121.1) | 509.0 |
| Domestic and foreign trade payables | (445.1) | (1,872.9) |
| Payroll, profit sharing and social charges, net | (168.2) | 122.0 |
| Tax liabilities | (34.6) | 118.4 |
| Other liabilities | (573.6) | (326.4) |
| OTHER CASH FLOWS FROM OPERATING ACTIVITIES | ||
| Recovery (payment) of income tax and social contribution | (177.1) | (269.5) |
| Accruals (payments) of judicial deposits | 9.6 | 2.8 |
| Payments related to tax, civil and labor lawsuits | (12.8) | (62.0) |
| Payments due to settlement of derivative operations | (33.6) | 9.8 |
| Interest paid on lease | (50.8) | (53.6) |
| Payment of interest on borrowings, financing and debentures | (324.8) | (498.6) |
| NET CASH GENERATED BY (USED IN) OPERATING ACTIVITIES | (1,210.8) | (1,899.8) |
| CASH FLOW FROM INVESTING ACTIVITIES | ||
| Cash from merger of subsidiary | - | 2,636.11 |
| Additions of property, plant and equipment and intangible assets | (332.6) | (174.2) |
| Proceeds from sale of property, plant and equipment and intangible assets | 39.8 | 11.8 |
| Investment in securities | (1,688.4) | (1,766.0) |
| Redemption of securities | 2,055.2 | 1,420.1 |
| Redemption of interest on investments and securities | 9.5 | 10.5 |
| NET CASH GENERATED BY (USED IN) BY INVESTING ACTIVITIES | 83.6 | 2,138.4 |
| CASH FLOW FROM FINANCING ACTIVITIES | ||
| Amortization of lease – principal | (301.4) | (209.7) |
| Amortization of loans, financing and debentures – principal | (623.3) | (1,923.3) |
| New loans, financing and debentures | 134.0 | 451.1 |
| Acquisition of treasury shares, net of option strike price received | 4.1 | (33.0) |
| Payment of dividends and interest on capital for the previous year | 0.0 | (133.9) |
| Receipts (payments) to settle derivative operations | 52.7 | 0.2 |
| Obligation of the acquiree incurred by the acquirer | - | (370.8) |
| NET CASH PROVIDED BY (USED IN) FINANCING ACTIVITIES | (734.0) | (2,219.4) |
| Effect of exchange variation on cash and cash equivalents | 365.9 | 578.7 |
| INCREASE (DECREASE) IN CASH AND CASH EQUIVALENTS | (1,495.3) | (1,402.1) |
| Opening balance of cash and cash equivalents | 5,821.7 | 4,513.6 |
| Closing balance of cash and cash equivalents | 4,326.4 | 3,111.5 |
| INCREASE (DECREASE) IN CASH AND CASH EQUIVALENTS | (1,495.3) | (1,402.1) |
16
| 9. | Conference call and webcast |

Webcast link: ri.naturaeco.com
17
| 10. | Glossary |
Abihpec: Brazilian Association of the Personal Hygiene, Perfumery and Cosmetics Industry
ADR: An American Depositary Receipt is a negotiable certificate issued by a U.S. depository bank representing a specified number of shares of a non-U.S. company stock.
ADS: The individual issuance of shares in a U.S. stock exchange by a non-U.S. company is referred to as American Depositary Shares (ADS)
Adjusted EBITDA: Excludes effects that are not considered usual, recurring or not-comparable between the periods under analysis
APAC: Asia and Pacific
Avon representatives: Self-employed resellers who do not have a formal labor relationship with Avon
B3: Brazilian Stock Exchange
Benefit Sharing: In accordance with Natura’s Policy for the Sustainable Use of Biodiversity and Associated Traditional Knowledge, benefits are shared whenever we perceive various forms of value in the access gained. Therefore, one of the practices that defines the way in which these resources are divided is to associate payments with the number of raw materials produced from each plant as well as the commercial success of the products in which these raw materials are used
BPS: Basis Points; a basis points is equivalent to one percentage point * 100
BRL: Brazilian Reais
CDI: The overnight rate for interbank deposits
CFT: Cosmetics, Fragrances and Toiletries Market (CFT = Fragrances, Body Care and Oil Moisture, Make-up (without Nails), Face Care, Hair Care (without Colorants), Soaps, Deodorants, Men’s Grooming (without Razors) and Sun Protection
COGS: Costs of Goods Sold
Constant currency (“CC) or constant exchange rates: when exchange rates used to convert financial figures into a reporting currency are the same for the years under comparison, excluding foreign currency fluctuation effects
CO2e: Carbon dioxide equivalent; for any quantity and type of greenhouse gas, CO2e signifies the amount of CO2 which
would have the equivalent global warming impact.
EBITDA: Earnings Before Interests, Tax, Depreciation and Amortization
EMEA: Europe, Middle East and Africa
EP&L: Environmental Profit & Loss
Foreign currency translation: conversion of figures from a foreign currency into the currency of the reporting entity
G&A: General and administrative expenses
GHG: Greenhouse gases
ICON: Consumer Stock Index of the B3 stock exchange, designed to track changes in the prices of the more actively traded and better representative cyclical and non-cyclical consumer stocks
Innovation Index: Share in the last 12 months of the sale of products launched in the last 24 months
IBOV: Ibovespa Index is the main performance indicator of the stocks traded in B3 and lists major companies in the Brazilian capital market
IFRS – International Financial Reporting Standards
Kantar: Data, insights and consulting company with global presence
Hispanic Latam: Often used to refer to the countries in Latin America, excluding Brazil
LFL: Like-for-Like, applicable to measure comparable growth
Natura Consultant: Self-employed resellers who do not have a formal labor relationship with Natura
Natura Crer Para Ver Program (CPV): Special line of non-cosmetic products whose profits are transferred to the Natura Institute, in Brazil, and invested by Natura in social initiatives in the other countries where we operate. Our consultants promote these sales to benefit society and do not obtain any gains.
Natura Institute: Is a nonprofit organization created in 2010 to strengthen and expand our Private Social Investment initiatives. The institute has enabled us to leverage our efforts and investments in actions that contribute to the quality of public education
NYSE: New York Stock Exchange
P&L: Profit and loss
PP: Percentage point
PPA: Purchase Price Allocation - effects of the fair market value assessment as a result of a business combination
Profit Sharing: The share of profit allocated to employees under the profit-sharing program
SEC: The U.S. Securities and Exchange Commission (SEC) is an independent federal government regulatory agency responsible for protecting investors, maintaining fair and orderly functioning of the securities markets, and facilitating capital formation
SG&A: Selling, general and administrative expenses
SM&L: Selling, marketing and logistics expenses
SLB: Sustainability Linked Bond
SPT: Sustainability Performance Targets
SSS: Same-Store-Sales
Supplier Communities: The communities of people involved in small–scale farming and extraction activities in a variety of locations in Brazil, especially in the Amazon Region, who extract the inputs used in our products from the social and biodiversity. We form production chains with these communities that are based on fair prices, the sharing of benefits gained from access to the genetic heritage and associated traditional knowledge and support for local sustainable development projects. This business model has proven effective in generating social, economic and environmental value for Natura and for the communities.
Synergies: Synergy is the concept that the value and performance of two companies combined will be greater than the sum of the separate individual parts.
TBS: The Body Shop.
UNI: Underlying Net Income.
18
| 11. | Disclaimer |
EBITDA is not a measure under BR GAAP and does not represent cash flow for the periods presented. EBITDA should not be considered an alternative to net income as an indicator of operating performance or an alternative to cash flow as an indicator of liquidity. EBITDA does not have a standardized meaning and the definition of EBITDA used by Natura may not be comparable with that used by other companies. Although EBITDA does not provide under BR GAAP a measure of cash flow, Management has adopted its use to measure the Company’s operating performance. Natura also believes that certain investors and financial analysts use EBITDA as an indicator of performance of its operations and/or its cash flow.
This report contains forward-looking statements. These forward-looking statements are not historical fact, but rather reflect the wishes and expectations of Natura’s management. Words such as "anticipate," "wish," "expect," "foresee," "intend," "plan," "predict," "project," "desire" and similar terms identify statements that necessarily involve known and unknown risks. Known risks include uncertainties that are not limited to the impact of price and product competitiveness, the acceptance of products by the market, the transitions of the Company’s products and those of its competitors, regulatory approval, currency fluctuations, supply and production difficulties and changes in product sales, among other risks. This report also contains certain pro forma data, which are prepared by the Company exclusively for informational and reference purposes and as such are unaudited. This report is updated up to the present date and Natura does not undertake to update it in the event of new information and/or future events.
Investor Relations Team
Tel.: +55 (11) 4389-7881
ri@natura.net

19
Item 2
Earnings presentation of Natura &Co Holding S.A. for the three-month period ended March 31, 2021.

1 May 13, 2021 First - quarter 2021 results
2 This presentation may contain forward - looking statements. Such statements are not statements of historical fact and reflect the beliefs and expectations of Natura &Co’s management . The words "anticipates," "wishes,“ "expects," "estimates," "intends," "forecasts," "plans," "predicts," "projects," "targets" and similar words are intended to identify these statements, which necessarily involve known and unknown risks and uncertainties . Known risks and uncertainties include, but are not limited to, the impact of competitive products and pricing, market acceptance of products, product transitions by the Company and its competitors, regulatory approval, currency fluctuations, production and supply difficulties, changes in product sales mix, and other risks . This presentation also may include pro - forma and adjusted information prepared by the Company for information and reference purposes only, which has not been audited . Forward - looking statements speak only as of the date they are made, and the Company does not undertake any obligation to update them in light of new information or future developments . https : //ri . naturaeco . com/en/

3 Growth in key markets and strength of our direct - to - consumer reach • Digital social selling and e - commerce sales continued to grow strongly • Strong growth in our core markets Progress on Avon turnaround • Synergies from Avon integration raised in April to between US$350 - 450 million • Roll - out of the new commercial model underway ESG bond issued by Natura Cosméticos • Successful US$1 billion issuance, with Sustainability Performance Targets aligned with our Commitment to Life – 2030 Sustainability Vision Continuous improvement in capital structure • Significant deleveraging: Consolidated net debt - to - EBITDA ratio at 1.18x • Robust cash position of R$6.6 billion Q1 - 21 Highlights Natura &Co accelerates growth to +26%, ahead of CFT market¹, with EBITDA increase of over 400% 1 ) Cosmetics, Fragrance and Toiletries market performance : Company estimate based on global peers’ net revenue vs prior year of approximately 9 . 7 % in Q 1 - 21 (in reported FX), as reported by the companies or estimates published on Bloomberg for those who have not yet reported .

4 Consolidated Financial Performance
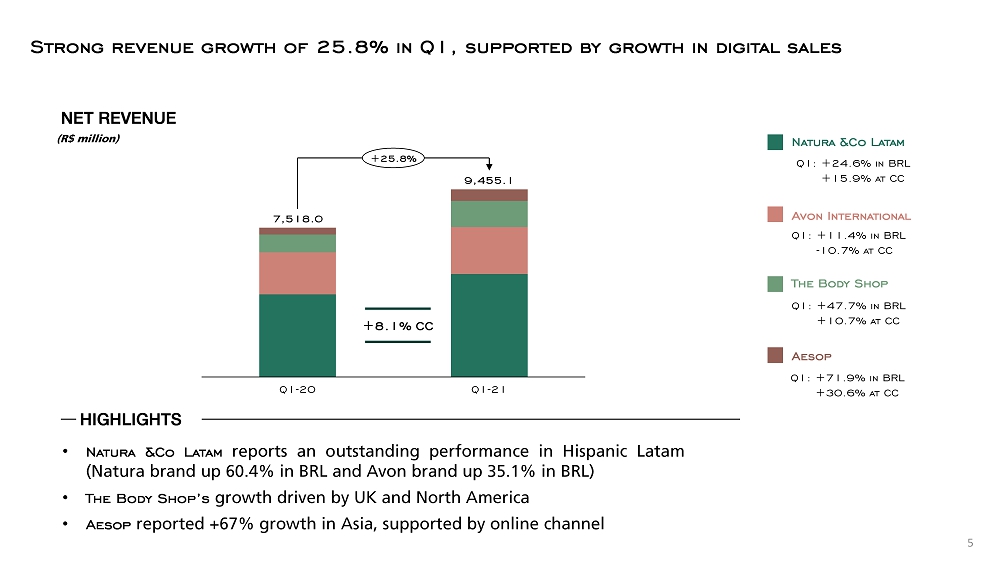
5 NET REVENUE (R$ million) HIGHLIGHTS • Natura &Co Latam reports an outstanding performance in Hispanic Latam (Natura brand up 60 . 4 % in BRL and Avon brand up 35 . 1 % in BRL) • The Body Shop’s growth driven by UK and North America • Aesop reported + 67 % growth in Asia, supported by online channel Strong revenue growth of 25.8% in Q1, supported by growth in digital sales Natura &Co Latam The Body Shop Q1 - 20 Q1 - 21 7,518.0 9,455.1 +25.8% Avon International Aesop Q1: +24.6% in BRL Q4: +15.9% at CC Q1: +11.4% in BRL Q4: - 10.7% at CC Q1: +47.7% in BRL Q4: +10.7% at CC Q1: +71.9% in BRL Q4: +30.6% at CC +8.1% CC

6 Strong growth of +166% in online (e - commerce + social selling) 12% 77% 11% Online (e - commerce + social selling) Relationship Selling Retail Digitally - enabled sales 48% of total sales Total online sales Total online sales² 2) The Body Shop At Home (direct sales ) + e - commerce Growth of online sales Growth of online sales 18% 29% Q1 - 20 Q1 - 21 20% 51% Q1 - 20 Q1 - 21 41% 253% Q1 - 21 Q1 - 20 33% 132% Q1 - 20 Q1 - 21 (%: online sales / total sales) (%: online sales / total sales) (% YoY) (% YoY) 1) Avon globally: growth of total digital sales 108%; e - brochure sales +175% 1

7 Strong increase in adjusted EBITDA and margin Q1 - 21 CONSOLIDATED EBITDA (R$ million) • Adjusted EBITDA margin of 10.2% (+260 bps) • Reported EBITDA margin of 8.8% (+690 bps) 8.8% 342.8 426.3 145.3 Avon International EBITDA Q1 - 20 Adjusted EBITDA (85.1) Avon Acquisition Effects + Transf. Costs (134.1) Natura &Co Latam EBITDA Transformation Costs Q1 - 21 Adjusted EBITDA Q1 - 21 EBITDA 963.2 60.7 The Body Shop EBITDA 78.8 Aesop EBITDA Corporate Expenses Q1 - 20 EBITDA (5.5) 571.5 829.1 +68.5% +470.7% 8.8% 1.9% 14.8 % 7.6% 10.2 %

8 ( a) Net income attributable to controlling shareholders (b) Other includes non - controlling interest and discontinued operations Underlying net income of R$60.2 million, driven by strong EBITDA growth Q1 - 21 UNI 1 (R$ million) • Q1 - 21 reported net loss of R$155.2 million - 400 0 - 1,000 - 200 - 800 - 600 400 200 556.7 Income Tax Depreciation Q1 - 21 Underlying Net Income (19.0) (215.3) (47.0) Avon Acquisition Effects, Transf. Costs and Other Q1 - 21 Net income EBITDA Financial Expenses (820.8) Avon Acquisition Effects, Transf. Costs and Other 60.2 Q1 - 20 Underlying Net Income Q1 - 20 Net income (1.5) 391.7 (264.1) (155.2) 122.8% 81.1% ¹ Underlying net income a b a b

9 Significant deleveraging and strong cash position NET DEBT AND NET - DEBT - TO - EBITDA RATIO (R$ million) -2 -1 0 1 2 3 4 3.93x 9,857 Q2 - 20 Q4 - 20 3.63x 10,622 12,368 3.00x Q1 - 20 Q3 - 20 1.18x 0.97x 3,405 4,954 Q1 - 21 Net - Debt - To - Ebitda Ratio Net Debt AMORTIZATION SCHEDULE R$6.6 bn Cash at quarter - end US$1 bn Sustainability - linked bond issuance ¹ 607 2024 6,576 Cash and short - term deposits 3,208 2021 2022 2023 2043 4,909 1,575 1,231 Q1 - 21 1.18x Group’s net - debt to EBITDA ratio (R$ million) ¹ Natura Cosméticos ’ issuance (May 2021). 2023 Cosméticos Bond to be prepaid

10 Natura &Co Latam Financial Performance

11 NET REVENUE (R$ million) BRL CC Natura +29.6% +24.6% Avon +20.0% +8.1% Q1 - 21 HIGHLIGHTS Outstanding performance in Hispanic Latam for Natura and Avon Natura&Co Latam Q1 - 20 5,185.9 Q1 - 21 4,162.3 +24.6% • Natura: Net revenue increased by 29.6% in BRL (+24.6% at CC), supported by a strong performance in Brazil and Hispanic Latam • Avon: Net revenue increased by 20.0% in BRL (+8.1% at CC), supported by higher activity level and higher reps’ productivity in Hispanic Latam • Natura &Co’s CFT leadership in Latam confirmed by Euromonitor, reaching market share of 12.5% in 2020 (+0.7 pp versus 2019) +15.9 % CC

12 NET REVENUE - BRAZIL (R$ million) Q1 - 21 HIGHLIGHTS NET REVENUE – HISPANIC LATAM (R$ million) Q1 - 20 1,469.7 1,305.3 Q1 - 21 +12.6% Q1 - 20 711.3 Q1 - 21 1,140.9 +60.4% +48.0 % CC • Net revenue growth supported by all markets , notably Argentina, Chile and Peru • Productivity increase and expansion of consultant base • Consultant loyalty index + 530 bps vs . Q 1 - 20 HISPANIC LATAM BRAZIL • Net revenue + 12 . 6 % , driven by continued digital social selling penetration , increase in the number of consultants and higher volumes • Strong consultant loyalty index in Brazil and significantly higher business leader loyalty Double - digit growth in Brazil and Hispanic Latam

13 NET REVENUE – AVON BRAZIL (R$ million) NET REVENUE – AVON HISPANIC LATAM (R$ million) Strong growth in Hispanic Latam , with higher activity level • Integration in Latam is on track, with progress in procurement, customer service, financial services, distribution and digital BRAZIL • Volume grew in the quarter, picking up in March • Revenue contraction as the new commercial model was being set up HISPANIC LATAM • Higher activity level and higher representative productivity • Growth was driven by Fashion and Home and most beauty categories (body care, fragrances and face care) 823.5 Q1 - 20 Q1 - 21 846.8 - 2.8% Q1 - 21 Q1 - 20 1,726.2 1,277.9 +35.1% +15.0 % CC Q1 - 21 HIGHLIGHTS Avon Latam

14 ADJUSTED EBITDA¹ AND EBITDA MARGIN Adjusted EBITDA more than doubles in Q1 - 21 • EBITDA increase mainly driven by strong revenue performance from Natura and Avon brands • Operational leverage at Natura brand In Brazil and Hispanic Latam , and Avon brand in Hispanic Latam (R$ million / %) 630.3 Q1 - 20 Q1 - 21 287.5 +119.2% 6.9% 12.2 % 1 Excluding effects that are not considered recurring nor comparable between the periods under analysis. Q1 - 21 HIGHLIGHTS Margin Natura&Co Latam

15 Avon International Financial Performance

16 NET REVENUE (R$ million) ADJUSTED EBITDA¹ (R$ million) Market share gains; continued strengthening fundamentals • All key regions improved share month after month • UK’s market share increased for the 4th consecutive quarter, becoming the 3rd brand in the beauty market • Sales still impacted by Covid - 19 second wave in key geographies (Europe) and core categories ( color and fragrances) • EBITDA impacted by lower revenue and higher strategic investments in digital and commercial areas to accelerate future growth Q1 - 20 2,121.5 Q1 - 21 2,363.5 +11.4% - 10.7% CC 4.8% Margin 4.1% Q1 - 20 Q1 - 21 97.4 102.9 - 5.4% Q1 - 21 HIGHLIGHTS 1 Excluding effects that are not considered recurring nor comparable between the periods under analysis.

17 The Body Shop Financial Performance
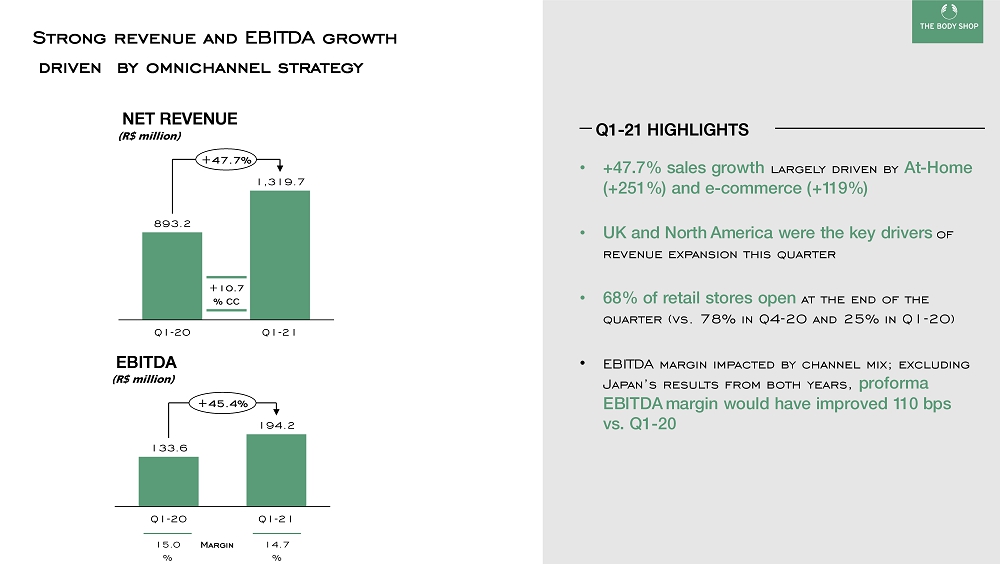
18 NET REVENUE (R$ million) EBITDA (R$ million) Strong revenue and EBITDA growth driven by omnichannel strategy 15.0 % Margin 14.7 % 1,319.7 Q1 - 21 Q1 - 20 893.2 +47.7% Q1 - 20 Q1 - 21 194.2 133.6 +45.4% • +47.7% sales growth largely driven by At - Home (+251%) and e - commerce (+119%) • UK and North America were the key drivers of revenue expansion this quarter • 68% of retail stores open at the end of the quarter (vs. 78% in Q4 - 20 and 25% in Q1 - 20) • EBITDA margin impacted by channel mix; excluding Japan’s results from both years, proforma EBITDA margin would have improved 110 bps vs. Q1 - 20 +10.7 % CC Q1 - 21 HIGHLIGHTS

19 Aesop Financial Performance

20 NET REVENUE (R$ million) EBITDA (R$ million) Margin Outstanding growth driven by online and strong performance in Asia 22.8 % 26.7 % Q1 - 21 Q1 - 20 340.9 585.9 +71.9% 156.5 Q1 - 21 Q1 - 20 77.8 +101.3% • Top line increased by a remarkable +71.9% in BRL, driven by another quarter of very fast growth in online sales • Strong growth of 67% in Asia (in constant currency) • 102% growth in online sales (~29% of total sales) • EBITDA margin improvement of +390 bps, driven by revenue growth and cost efficiency +30.6% CC Q1 - 21 HIGHLIGHTS

21 Closing Remarks Roberto Marques
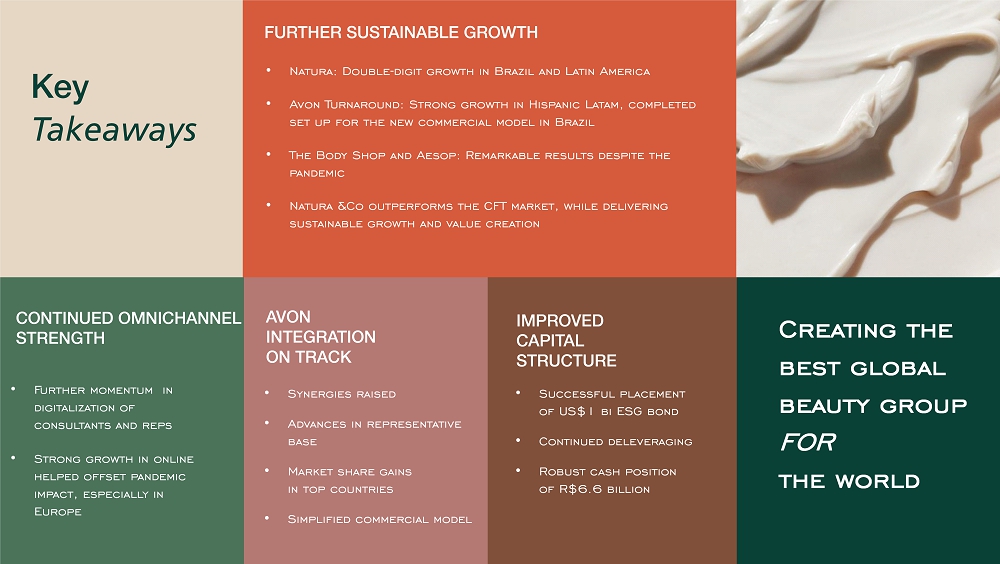
22 • Natura: Double - digit growth in Brazil and Latin America • Avon Turnaround: Strong growth in Hispanic Latam , completed set up for the new commercial model in Brazil • The Body Shop and Aesop: Remarkable results despite the pandemic • Natura &Co outperforms the CFT market, while delivering sustainable growth and value creation FURTHER SUSTAINABLE GROWTH CONTINUED OMNICHANNEL STRENGTH • Further momentum in digitalization of consultants and reps • Strong growth in online helped offset pandemic impact, especially in Europe Key Takeaways AVON INTEGRATION ON TRACK • Synergies raised • Advances in representative base • Market share gains in top countries • Simplified commercial model Creating the best global beauty group FOR the world IMPROVED CAPITAL STRUCTURE • Successful placement of US$1 bi ESG bond • Continued deleveraging • Robust cash position of R$6.6 billion

23 Thank You Thank You

24 Apendix Q1 - 21

25 Adjusted figures exclude the following non - operational effects 1 Avon acquisition costs Non - recurring costs associated with Avon acquisition, in Q1 - 20 2 Transformation/ Integration costs Includes: (i) Transformation Plan costs + Open - Up and Grow at Avon International (ii) Integration costs (costs to achieve synergies) 3 Non - cash, non - recurring inventory PPA Impacts in Q1 - 20 Relate to non - cash adjustments to Avon’s opening balance sheet, resulting from transactions that occurred in 2019

26 Debt profile 5.8% 60.3% 29.7% 4.2% 70.1% 28.5% 1.4% BRL USD Other Bonds Debentures Promissory notes Other Q1 - 21 BY TYPE Q1 - 21 BY CURRENCY

27 NET REVENUE PER BRAND Brand Q1 - 21 Q1 - 20 % (R$) % (CC) 2,615.7 2,017.9 +29.6% +24.6% 4,913.1 4,246.3 +15.7% - 1.7% 1,339.7 912.4 +46.8% +10.4% 586.6 341.4 +71.8% +30.6% Total net revenue 9,455.1 7,518.0 +25.8% +8.1% NET REVENUE BREADKDOWN (BY BRAND) (R$ million) (%) Breakdown of global net revenue by brand 27.7% 52.0% 14.2% 6.2% Natura Avon The Body Shop Aesop Q1 - 21