0001786108Portfolio Company Warrant Investments- United States Consumer Products & Services Madison Reed, Inc.2024-12-310001786108Portfolio Company Debt Securities- Europe Industrials Aledia, Inc.Type of Investment Equipment Financing Investment Date August 5, 2022 Maturity Date September 1, 2025 Interest Rate Fixed interest rate 10.7%; EOT 7.0%2023-12-310001786108us-gaap:RestrictedStockMembertrin:TwoThousandNineteenLongTermIncentivePlanMember2022-01-012022-12-31
-vpstow20112
UNITED STATES
SECURITIES AND EXCHANGE COMMISSION
Washington, D.C. 20549
FORM 10-K
(Mark One)
| |
☒ | ANNUAL REPORT PURSUANT TO SECTION 13 OR 15(d) OF THE SECURITIES EXCHANGE ACT OF 1934 |
For the Fiscal Year Ended December 31, 2024
OR
| |
☐ | TRANSITION REPORT PURSUANT TO SECTION 13 OR 15(d) OF THE SECURITIES EXCHANGE ACT OF 1934 |
Commission file number: 001-39958
TRINITY CAPITAL INC.
(Exact name of registrant as specified in its charter)
| |
Maryland | 35-2670395 |
(State or other jurisdiction of incorporation or
organization) | (IRS Employer Identification No.) |
| |
1 N. 1st Street
Suite 302
Phoenix, Arizona | 85004 |
(Address of principal executive offices) | (Zip Code) |
(480) 374‑5350
(Registrant’s telephone number, including area code)
Securities registered pursuant to Section 12(b) of the Act:
| | | | |
Title of Each Class |
| Trading Symbol(s) |
| Name of each exchange on which registered |
Common Stock, par value $0.001 per share | | TRIN | | Nasdaq Global Select Market |
7.875% Notes Due 2029 | | TRINZ | | Nasdaq Global Select Market |
7.875% Notes Due 2029 | | TRINI | | Nasdaq Global Select Market |
Securities registered pursuant to Section 12(g) of the Act: None
Indicate by check mark if the registrant is a well-known seasoned issuer, as defined in Rule 405 of the Securities Act. Yes ☐ No ☒
Indicate by check mark if the registrant is not required to file reports pursuant to Section 13 or 15(d) of the Act. Yes ☐ No ☒
Indicate by check mark whether the registrant (1) has filed all reports required to be filed by Section 13 or 15(d) of the Securities Exchange Act of 1934 during the preceding 12 months (or for such shorter period that the registrant was required to file such reports), and (2) has been subject to such filing requirements for the past 90 days. Yes No ☐
Indicate by check mark whether the registrant has submitted electronically every Interactive Data File required to be submitted pursuant to Rule 405 of Regulation S-T (§232.405 of this chapter) during the preceding 12 months (or for such shorter period that the registrant was required to submit such files). Yes No ☐
Indicate by check mark whether the registrant is a large accelerated filer, an accelerated filer, a non-accelerated filer, a smaller reporting company, or an emerging growth company. See the definitions of “large accelerated filer,” “accelerated filer”, “smaller reporting company” and “emerging growth company” in Rule 12b‑2 of the Exchange Act:
| | | |
Large accelerated filer | ☐ | Accelerated filer | ☒ |
Non-accelerated filer | ☐ | Smaller reporting company | ☐ |
|
| Emerging growth company | ☒ |
If an emerging growth company, indicate by check mark if the registrant has elected not to use the extended transition period for complying with any new or revised financial accounting standards provided pursuant to Section 13(a) of the Exchange Act. ☐
Indicate by check mark whether the registrant has filed a report on and attestation to its management’s assessment of the effectiveness of its internal control over financial reporting under Section 404(b) of the Sarbanes-Oxley Act (15 U.S.C. 7262(b)) by the registered public accounting firm that prepared or issued its audit report. ¨
If securities are registered pursuant to Section 12(b) of the Act, indicate by check mark whether the financial statements of the registrant included in the filing reflect the correction of an error to previously issued financial statements. ¨
Indicate by check mark whether any of those error corrections are restatements that required a recovery analysis of incentive-based compensation received by any of the registrant’s executive officers during the relevant recovery period pursuant to §240.10D-1(b).¨
Indicate by check mark whether the registrant is a shell company (as defined in Rule 12b‑2 of the Act). Yes ☐ No ☒
The aggregate market value of the registrant’s common stock ($0.001 par value per share) held by non-affiliates of the registrant as of the last business day of the most recently completed second fiscal quarter was approximately $683,412,981, based on the closing sale price on the Nasdaq Global Select Market on that date of $14.14 per share.
As of February 24, 2025, the registrant had 62,831,103 shares of common stock ($0.001 par value per share) outstanding.
DOCUMENTS INCORPORATED BY REFERENCE
Portions of the registrant’s definitive Proxy Statement for its 2025 Annual Meeting of Stockholders, to be filed with the Securities and Exchange Commission within 120 days following the end of the registrant’s fiscal year, are incorporated by reference into Part III of this annual report on Form 10-K.
| | | | | |
PCAOB Firm Id: | 42 | Auditor Name: | Ernst & Young LLP | Auditor Location: | Los Angeles, CA |
TRINITY CAPITAL INC.
FORM 10‑K
TABLE OF CONTENTS
Cautionary Note Regarding Forward-Looking Statements
This annual report on Form 10-K contains forward-looking statements that involve substantial risks and uncertainties. Such statements involve known and unknown risks, uncertainties and other factors, and undue reliance should not be placed thereon. Any statements about our expectations, beliefs, plans, predictions, forecasts, objectives, assumptions or future events or performance are not historical facts and may be forward-looking. These statements are often, but not always, made through the use of words or phrases such as “anticipate,” “believes,” “can,” “could,” “may,” “predicts,” “potential,” “should,” “will,” “estimate,” “plans,” “projects,” “continuing,” “ongoing,” “expects,” “intends” and similar words or phrases. Accordingly, these statements are only predictions and involve estimates, known and unknown risks, assumptions and uncertainties that could cause actual results to differ materially from those expressed in them. Our actual results could differ materially from those anticipated in such forward-looking statements as a result of several factors discussed under Item 1A. “Risk Factors” of Part I of this annual report on Form 10-K, including, but not limited to, the following:
•our future operating results;
•our dependence upon our management team and key investment professionals;
•our ability to manage our business and future growth;
•risks related to investments in growth-oriented companies, other venture capital-backed companies and generally U.S. companies;
•the ability of our portfolio companies to achieve their objectives;
•risks related to the uncertainty of the value of our portfolio investments;
•changes in political, economic or industry conditions, including as a result of supply chain disruptions, the interest rate and inflation rate environments or conditions affecting the financial and capital markets;
•uncertainty surrounding domestic and/or global financial and/or political stability;
•the dependence of our future success on the general economy and its impact on the industries in which we invest;
•risks related to changes in interest rates and inflation rates, our expenses, and other general economic conditions and the effect on our net investment income;
•the impact of changes in laws or regulations (including the interpretation thereof), including tax laws, on our operations and/or the operations of our portfolio companies;
•risks related to market volatility, including general price and volume fluctuations in stock markets;
•our ability to make distributions; and
•our ability to maintain our status as a business development company (“BDC”) under the Investment Company Act of 1940, as amended (the “1940 Act”), and qualify annually for tax treatment as a regulated investment company (“RIC”) under Subchapter M of the Internal Revenue Code of 1986, as amended (the “Code”).
Additionally, there may be other risks that are otherwise described from time to time in the reports that we file with the U.S. Securities and Exchange Commission (the "SEC"). Any forward-looking statements in this Annual Report on Form 10-K should be considered in light of various important factors, including the risks and uncertainties listed above, as well as others. All forward-looking statements are necessarily only estimates of future results, and there can be no assurance that actual results will not differ materially from expectations, and, therefore, you are cautioned not to place undue reliance on such statements. Any forward-looking statements are qualified in their entirety by reference to the risk factors discussed throughout this annual report on Form 10-K. See “Item 1A. Risk Factors.” Further, any forward-looking statement speaks only as of the date on which it is made, and we undertake no obligation to update any forward-looking statement to reflect events or circumstances after the date on which the statement is made or to reflect the occurrence of unanticipated events. Because we are an investment company, the forward-looking statements and projections contained in this annual report on Form 10-K are excluded from the safe harbor protections provided by Section 27A(b)(2)(B) of the Securities Act of 1933, as amended (the "Securities Act"), and Section 21E of the Securities Exchange Act of 1934, as amended (the “Exchange Act”) (the “safe harbor” provisions of the Private Securities Litigation Reform Act of 1995).
PART I
Except where the context suggests otherwise, the terms “we,” “us,” “our,” and “the Company,” refer to Trinity Capital Inc. and its consolidated subsidiaries.
Item 1. Business
Organization
Trinity Capital Inc. (“Trinity Capital”), incorporated in Maryland on August 12, 2019, is an internally managed, closed-end, non-diversified management investment company that has elected to be regulated as a business development company (“BDC”) under the Investment Company Act of 1940, as amended (the “1940 Act”). Because we are internally managed, all of our executive officers and employees are employed by Trinity Capital. Therefore, we do not pay any external investment advisory fees, but instead directly incur the operating costs associated with employing investment and portfolio management professionals.
We have elected to be treated, currently qualify and intend to qualify annually, as a regulated investment company (“RIC”) under Subchapter M of the Internal Revenue Code of 1986, as amended (the “Code”), for U.S. federal income tax purposes. In order to maintain our treatment as a RIC, we are generally required to distribute at least annually to our stockholders at least the sum of 90% of our investment company taxable income (which generally includes our net ordinary taxable income and realized net short-term capital gains in excess of realized net long-term capital losses) and 90% of our net tax-exempt income (if any). We generally will not be subject to U.S. federal income tax on these distributed amounts but will pay U.S. federal income tax at corporate rates tax on any retained amounts.
On January 16, 2020, we completed a private equity offering (the “Private Common Stock Offering”) of shares of our common stock, pursuant to which we issued and sold 8,333,333 shares of our common stock for total aggregate gross proceeds of approximately $125.0 million, inclusive of an over-allotment option that was exercised in full on January 29, 2020.
Concurrent with the closing of the Private Common Stock Offering, we completed a private debt offering (the “144A Note Offering” and together with the Private Common Stock Offering, the “Private Offerings”) of $125.0 million in aggregate principal amount of our unsecured 7.00% Notes due 2025 (the “2025 Notes”), inclusive of an over-allotment option that was exercised in full on January 29, 2020.
On January 16, 2020, through a series of transactions, we acquired Trinity Capital Investment, LLC, Trinity Capital Fund II, L.P., Trinity Capital Fund III, L.P., Trinity Capital Fund IV, L.P. and Trinity Sidecar Income Fund, L.P. (collectively, the “Legacy Funds”) and all of their respective assets, including their respective investment portfolios (the “Legacy Portfolio”), as well as Trinity Capital Holdings, LLC, a holding company whose subsidiaries managed and/or had the right to receive fees from certain of the Legacy Funds. We used a portion of the proceeds from the Private Offerings to complete these transactions.
On February 2, 2021, we completed our initial public offering (“IPO”) of 8,006,291 shares of our common stock at a price of $14.00 per share, inclusive of the underwriters’ option to purchase additional shares, which was exercised in full. Our common stock began trading on the Nasdaq Global Select Market on January 29, 2021 under the symbol “TRIN.” Proceeds from this offering were primarily used to pay down a portion of our existing indebtedness outstanding.
TrinCap Funding, LLC (“TCF”), a Delaware limited liability company, was formed on August 5, 2021 as a wholly owned subsidiary of the Company to serve as a bankruptcy-remote entity for purposes of securing lending in conjunction with a credit agreement, as amended, with KeyBank, National Association (“KeyBank”) (such credit facility, as amended, the “KeyBank Credit Facility”). TCF is included as a consolidated subsidiary of the Company in our consolidated financial statements.
On December 5, 2022, we entered into a joint venture agreement with certain funds and accounts managed by a specialty credit manager to co-manage Senior Credit Corp 2022 LLC, a Delaware limited liability company (the “JV”). The JV invests in secured loans and equipment financings to growth-stage companies that have been originated by us.
On March 16, 2023, we formed an unconsolidated wholly owned subsidiary, Trinity Capital Adviser LLC, a Delaware limited liability company (“Adviser Sub”). We were granted exemptive relief by the SEC that permits us to organize, acquire, wholly own and operate the Adviser Sub as an investment adviser registered under the Investment Advisers Act of 1940, as amended (the “Adviser Act”). The Adviser Sub may provide investment advisory and related services to one or more investment vehicles (the “Adviser Funds”) with ownership by one or more unrelated third-party investors and receive fee income for such services.
On June 28, 2024, we and a specialty credit manager each funded a portion of our respective capital commitments to commence operations of a credit fund, EPT 16 LLC, a Delaware limited liability company (“EPT 16”). EPT 16 has acquired and intends to acquire, hold and, as applicable, dispose of investments that have been originated by us.
Overview
We are a specialty lending company that provides debt, including loans, equipment financings and asset-based lending, to growth-oriented companies, including institutional investor-backed companies. Our investment objective is to generate current income and, to a lesser extent, capital appreciation through our investments across five distinct vertical markets. We seek to achieve our investment objective by making investments consisting of term loans, equipment financings and asset-based lending and, to a lesser extent, working capital loans, equity and equity-related investments. Our equipment financings involve loans for general or specific use, including acquiring equipment, that are secured by the equipment or other assets of the portfolio company. In addition, we may obtain warrants or contingent exit fees at funding from many of our portfolio companies, providing an additional potential source of investment returns. The warrants entitle us to purchase preferred or common ownership shares of a portfolio company, and we typically target the amount of such warrants to scale in proportion to the amount of the debt or equipment financing. Contingent exit fees are cash fees payable upon the consummation of certain trigger events, such as a successful change of control or initial public offering of the portfolio company. In addition, we may obtain rights to purchase additional shares of our portfolio companies in subsequent equity financing rounds.
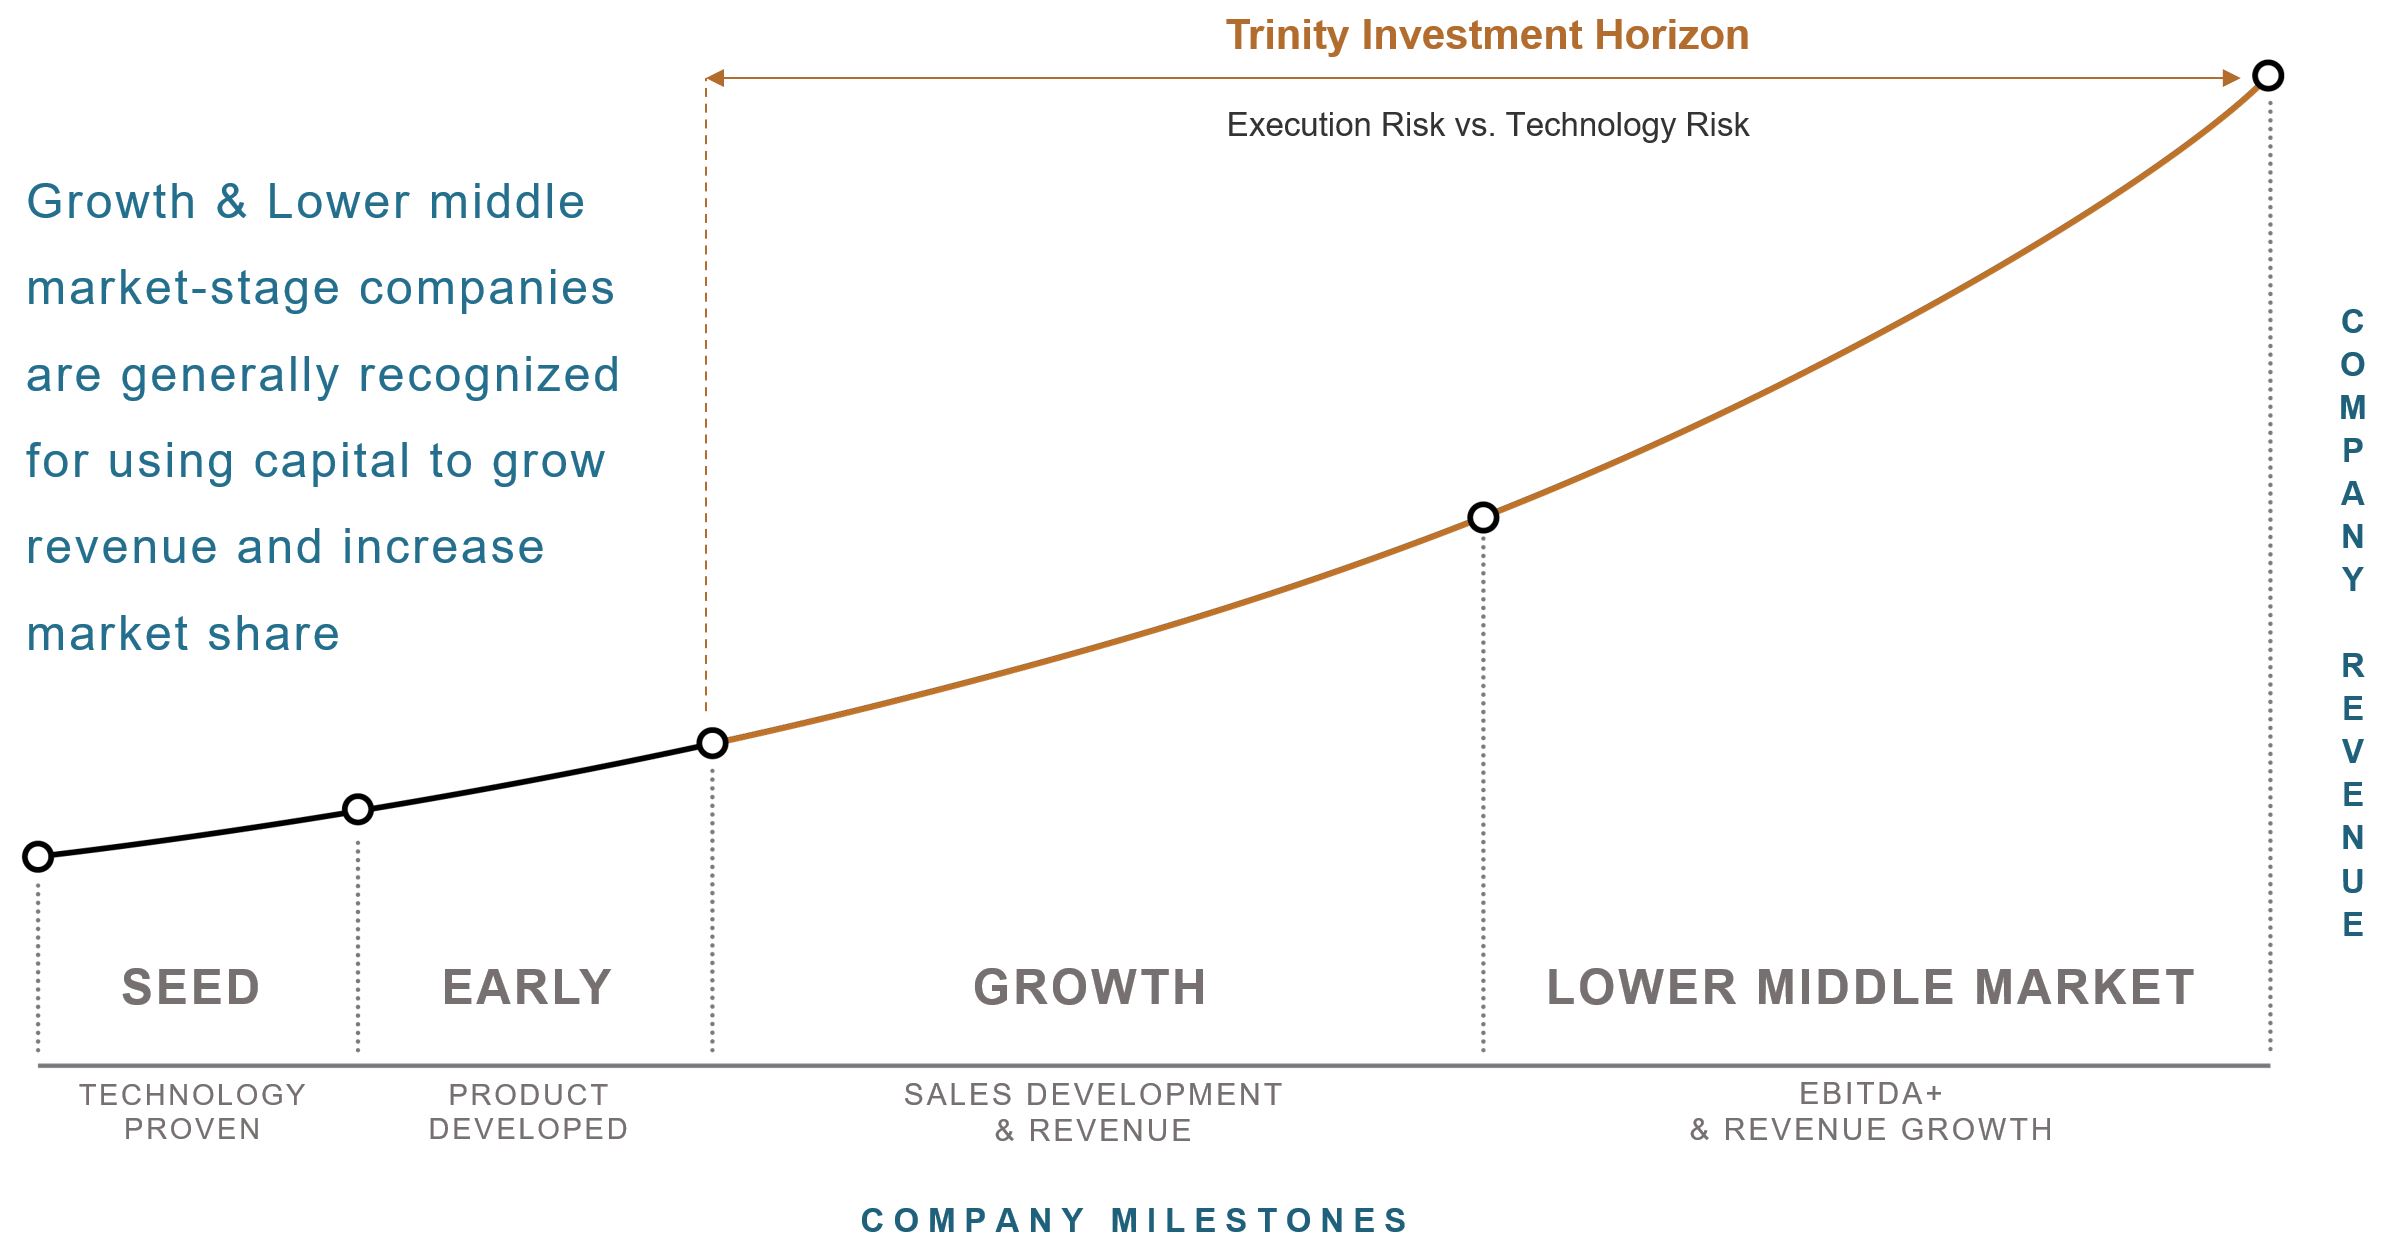
We target investments in growth-oriented companies with institutional investor support, experienced management teams, promising products and offerings, and large expanding markets. We define “growth-oriented companies” as companies that have significant ownership and active participation by sponsors and expected annual revenues of up to $100 million. These companies typically are private companies that have begun to have success selling their products to the market and need additional capital to expand their operations and sales. Despite often achieving growing revenues, these types of companies typically have limited financing options to fund their growth. Equity, being dilutive in nature, is generally the most expensive form of capital available, while traditional bank financing is rarely available, given the lifecycle stage of these companies. Financing from us bridges this financing gap, providing companies with growth capital, which may result in improved profitability, less dilution for all equity investors, and increased enterprise value. Subject to the requirements of the 1940 Act, we are not limited to investing in any particular industry or geographic area and seek to invest in under-financed segments of the private credit markets.
Our loans generally may have initial interest-only periods of up to 24 months, and our equipment financings generally begin amortizing immediately. Our loans and equipment financings generally have a total term of up to 60 months. These investments are typically secured by a blanket first position lien, a specific asset lien on mission-critical assets and/or a blanket second position lien. We may also make a limited number of direct equity and equity-related investments in conjunction with our debt investments. We target growth-oriented companies that have recently issued equity to raise cash to offset potential cash flow needs related to projected growth, have achieved positive cash flow to cover debt service, or have institutional investors committed to providing additional funding. A loan or equipment financing may be structured to tie the amortization of the loan or equipment financing to the portfolio company’s projected cash balances while cash is still available for operations. As such, the loan or equipment financing may have a reduced risk of default. We believe that the amortizing nature of our investments will mitigate risk and significantly reduce the risk of our investments over a relatively short period. We focus on protecting and recovering principal in each investment and structure our investments to provide downside protection.
Our loans and equipment financings generally range from $5 million to $50 million, and we generally limit each loan or equipment financing to approximately five percent or less of our total assets. We believe investments of this scale are generally sufficient to support near-term growth needs of most growth-oriented companies.
The following illustrates the lifecycle stage at which we seek to invest in our portfolio companies, although we may, at our discretion, invest in other lifecycle stages.
Human Capital Resources and Management Team
We are an internally managed BDC employing 88 dedicated professionals as of December 31, 2024, including 58 investment, origination and portfolio management professionals, all of whom have experience working on investment and financing transactions for growth- and early-stage companies. All of our employees are located in the United States.
Our management team has prior management experience, including with early-stage tech startups, and employs a highly systematized investment approach. Our senior management team, led by Kyle Brown, comprises the majority of the senior management team that managed the Legacy Funds and sourced the Legacy Portfolio, and we believe is well positioned to take advantage of potential investment opportunities available in the marketplace.
•Kyle Brown, our Chief Executive Officer, President and Chief Investment Officer, has been with Trinity since 2015 and is responsible for managing Trinity’s investment activities. He has historically managed relationships with potential investment partners, including venture capital firms and technology bank lenders, allowing us to nearly triple the number of investment opportunities reviewed by our senior management after Mr. Brown joined the senior management of Trinity.
•Steven L. Brown, our founder, is our Executive Chairman and has over 25 years of experience in venture equity and venture debt investing and working with growth-stage companies.
•Gerald Harder, our Chief Operating Officer, has been with Trinity since 2016, and we believe his prior 30 years of engineering and operations experience adds significant value in guiding the Company’s operations team and steward strategy.
•Ron Kundich, our Chief Credit Officer, is responsible for overseeing the Company’s lending, underwriting and credit processes.
•Michael Testa, our Chief Financial Officer and Treasurer, has over 20 years of finance and accounting experience, having worked both at a credit-focused asset manager and a large global accounting firm.
All investment decisions are made by our investment committee (the “Investment Committee”), whose members consist of Steven L. Brown, Gerald Harder, Kyle Brown, Ron Kundich and a vertical market leader (on a rotating basis throughout the year). We consider these individuals to be our portfolio managers. The Investment Committee approves proposed investments by majority consent in accordance with investment guidelines and procedures established by the Investment Committee.
Our employees drive the success of our business and investment strategy, including achieving our investment objective. We offer competitive compensation, benefits and training programs to develop our employees’ skills and expertise. We are committed to providing a safe, harassment-free work environment guided by principles of fair and equal treatment and focused on employee engagement.
Potential Competitive Advantages
We believe that we are one of only a select group of specialty lenders that has our depth of knowledge, experience, and track record in lending to growth-oriented companies. Further, we are one of an even smaller subset of specialty lenders that offers both loans and equipment financings. Our other potential competitive advantages include:
· In-house engineering and operations expertise to evaluate growth-oriented companies’ business products and plans.
We have a history of employing technology experts, including those with engineering and operations expertise, who have developed proven technology and hold patents in their names, as well as executives and other employees who have experience with the products and business plans of growth-oriented companies. The expertise, knowledge and experience of these individuals allows them to understand and evaluate the business plans, products and financing needs of growth-oriented companies, including the risks related thereto.
· Direct origination networks that benefit from relationships with venture banks, institutional equity investors and entrepreneurs built during the term of operations of the Legacy Funds, which began in 2008.
We seek to be the first contact for venture bankers who focus on growth-oriented companies and who have a portfolio company that would benefit from term debt or equipment financings. We have established relationships with the major technology banks over the last 10 years in every major market across the United States and have established standard intercreditor and subordination agreements, which we believe make working with technology banks seamless in most regions across the United States. These banks often will provide revolving credit facilities to growth-oriented companies and we seek to provide term debt and/or equipment financings to their portfolio companies.
We also focus on sourcing deals from the partners of growth-oriented institutional investors, including growth-oriented venture capital firms and private equity firms. We focus on building relationships with investors who have raised recent funds and have the ability to provide ongoing support to their portfolio companies.
We receive referrals directly to the executive officers of growth-oriented companies from these various stakeholders. Most of these stakeholders have board seats on the portfolio companies referred to us, are intimately involved in the business of such portfolio companies and generally serve as our advocates when term sheets are negotiated. We also receive introductions to companies for potential investment opportunities from executive officers with whom we have had business relationships at former portfolio companies.
· A dedicated staff of professionals covering credit origination and underwriting, as well as portfolio management functions.
We have a broad team of professionals focused on every aspect of the investment lifecycle. We have a credit origination and underwriting team that manages and oversees our investment process from identification of investment opportunity through negotiations of final term sheet and investment in a portfolio company. Our investment management and oversight activities are separate from our origination and underwriting activities. The team members serving our investment management and oversight functions have significant operating experience and are not associated with our origination function to avoid any biased views of performance. This structure helps our originators focus on identifying investment opportunities and building relationships with our portfolio companies.
· A proprietary credit rating system and regimented process for evaluating and underwriting prospective portfolio companies.
Historically, our management team has received significant prospective investment opportunities. In order to quickly review investment opportunities and evaluate risks, we have developed a detailed and consistent credit rating system. This system allows our analysts to receive a full set of financial statements and projections and quickly fill out a rating sheet for each potential investment, which includes using a series of weighted calculations to provide an initial “pass” or “fail” rating on the potential investment, as well as identifying specific risks for further consideration.
· Scalable software platforms developed during the term of operations of the Legacy Funds, which support our underwriting processes and loan monitoring functions.
We have an internally developed pipeline management tool which gives us a detailed look at our performance in real time. We believe our historical metrics generally predict our quarterly funding needs based upon the number of prospective investment opportunities we have at varying stages of our origination process. We believe this granular look at our underwriting process gives us the ability to increase or decrease marketing efforts in order to manage available capital and achieve our deployment goals.
Market Opportunity
We believe that an attractive market opportunity exists for providing debt and equipment financings to growth-oriented companies for the following reasons:
•growth-oriented companies have generally been underserved by traditional lending sources.
•Unfulfilled demand exists for loans and equipment financings to growth-oriented companies due to the complexity of evaluating risk in these investments.
•Debt investments with warrants are less dilutive than traditional equity financing and complement equity financing from venture capital and private equity funds.
•Equity funding of growth-oriented companies, including venture capital backed companies, has increased steadily over the last ten years, resulting in new lending and equipment financing opportunities.
•The annual venture debt market in the U.S. surpassed $30 billion for the fourth consecutive year in 2024. We believe that the equipment financing market is even more fragmented, with the majority of equipment financing providers unable to fund investments for more than $10 million. We believe there are significant growth opportunities for us to expand our market share in the venture debt market and become a one-stop shop for loans and equipment financings for growth-oriented companies.
Growth-Oriented Companies are Underserved by Traditional Lenders.
We believe many viable growth-oriented companies have been unable to obtain sufficient growth financing from traditional lenders, including financial services companies such as commercial banks and finance companies, because traditional lenders have continued to consolidate and have adopted a more risk-averse approach to lending. More importantly, we believe traditional lenders are typically unable to underwrite the risk associated with these companies effectively.
The cash flow characteristics of many growth-oriented companies include significant research and development expenditures and high projected revenue growth, thus often making such companies difficult to evaluate from a credit perspective. In addition, the balance sheets of many of these companies often include a disproportionately large amount of intellectual property assets, which can be difficult to value. Finally, the speed of innovation in technology and rapid shifts in consumer demand and market share add to the difficulty in evaluating these companies.
Due to the difficulties described above, we believe traditional lenders generally refrain from lending and/or providing equipment financing to growth-oriented companies, instead preferring the risk-reward profile of traditional fixed asset-based lending. We believe traditional lenders generally do not have flexible product offerings that meet the needs of growth-oriented companies. The financing products offered by traditional lenders typically impose restrictive covenants and conditions on borrowers, including limiting cash outflows and requiring a significant depository relationship to facilitate rapid liquidation.
Unfulfilled Demand for Loans and Equipment Financings to Growth-Oriented Companies.
Private capital in the form of loans and equipment financings from specialty finance companies continues to be an important source of funding for growth-oriented companies. We believe that the level of demand for loans and equipment financings is a function of the level of annual venture equity investment activity and can be as much as 20% to 30% of such investment activity. We believe this market is largely served by a handful of venture banks, with whom our products generally do not compete, and a relative few term lenders and lessors.
We believe that demand for loans and equipment financings to growth-oriented companies is currently underserved, given the high level of activity in venture capital equity market for the growth-oriented companies in which we invest. We believe certain venture lending companies have begun to focus on larger investment opportunities, potentially creating additional opportunities for us in the near term. Our senior management team has seen a significant increase in the number of potential investment opportunities over the last ten years.
Debt Investments with Warrants Complement Equity Financing from Venture Capital and Private Equity Funds.
We believe that growth-oriented companies and their financial sponsors will continue to view debt, including loans and equipment financings, as an attractive source of capital because it augments the capital provided by venture capital and private equity funds. We believe that our debt investments, including loans and equipment financings, will provide access to growth capital that otherwise may only be available through incremental equity investments by new or existing equity investors. As such, we intend to provide portfolio companies and their financial sponsors with an opportunity to diversify their capital sources. Generally, we believe many growth-oriented companies target a portion of their capital to be debt and equipment financing in an attempt to minimize ownership dilution to existing investors and company founders. In addition, because growth-oriented companies generally reach a more mature stage prior to reaching a liquidity event, we believe our investments could provide the capital needed to grow or recapitalize during the extended growth period sometimes required prior to liquidity events.
Investment Philosophy, Strategy and Process
Overview
We lend money in the form of term loans and equipment financings and, to a lesser extent, working capital loans to growth-oriented companies. Investors may receive returns from three sources — the loan’s interest payments or equipment financing payments and the associated contractual fees; the final principal payment; and, contingent upon a successful change of control or IPO, proceeds from the equity positions or contingent exit fees obtained at loan or equipment financing origination.
We primarily seek to invest in loans and equipment financings to growth-oriented companies that have generally completed product development and are in need of capital to fund revenue growth. We believe a lack of profitability often limits these companies’ ability to access traditional bank financing and our in-house engineering and operations experience allows us to better understand this risk and earn what we believe to be higher overall returns and better risk-adjusted returns than those associated with traditional bank loans. Leveraging the experience of our investment professionals, we seek to target companies at their growth-oriented of development and seek to identify financing opportunities ignored by the traditional direct lending community.
Subject to the requirements under the 1940 Act, which require that we invest at least 70% of our total assets in qualifying assets, we may also engage in other lending activities by investing in assets that are not qualifying assets under the requirements of the 1940 Act, including asset-backed lending, which may constitute up to 30% of our total assets.
We believe good candidates for loans and equipment financings appear in all business sectors. We are not limited to investing in any particular industry or geographic area and seek to invest in under-financed segments of the private credit markets. We believe in diversification and do not intend to specialize in any one sector. Our portfolio companies are selected from a wide range of industries, technologies and geographic regions. Since we focus on investing in portfolio companies alongside venture capital firms and technology banks, we anticipate that most of our opportunities will come from sectors that those sources finance.
Characteristics of Target Portfolio Companies
We seek to invest in a cross-section of growth-oriented companies. In addition to the criteria discussed in this annual report on Form 10-K, we may consider other factors such as portfolio company size, industry, historical revenue growth, management’s revenue growth projections, relevant operating margins, competition, management capabilities and geographic concentration. We will evaluate prospective portfolio companies quantitatively and qualitatively, and determine investments based on the key factors, including the following items:
•Recent, concurrent, or future funding by a venture capital firm;
•Strong, experienced and flexible management team;
•Successful, market-proven product and/or service with some proprietary characteristics;
•Application of proven technologies that enable their customers to reduce costs, improve strategic positioning or fundamentally change the competitive nature of their industries;
•Detailed business plan with multi-year projections that cover the full term of our investment; and
•A defined exit strategy with identified potential acquirers.
Investment Structure
We seek to structure portfolio investments to mitigate risk and provide attractive risk-adjusted returns for our investors while meeting portfolio companies financing needs. Typically, our loans, equipment financings and equity and equity-related investments take one of the following forms:
•Term Debt and Working Capital Loans. Term debt and working capital loans typically have initial interest-only periods of up to 24 months and may then fully amortize over a total term of up to 60 months. The annual stated interest rate on these loans typically has ranged from 8% to 16%.
•Equipment Financings. Typically, an equipment financing is structured as fully amortizing over a period of up to 60 months. The specific terms of each equipment financing depend on the creditworthiness of the portfolio company and the projected value of the financed assets. Occasionally, we offer an initial period at a lower finance factor to companies with stronger creditworthiness, which is analogous to an interest-only period on a term loan. Annual interest rates on equipment financings typically have ranged from 7% to 16%.
•Additional Deal Considerations. Additional deal considerations typically have included upfront fees of up to 2% of the invested principal, upfront structuring fees of approximately one-half month of finance payments for equipment financings, an upfront deposit of up to three months for equipment financings, and final payments of up to 15% of invested principal.
•Equity and Equity-Related Securities. We may also seek to obtain warrants entitling us to purchase preferred or common ownership shares of a portfolio company. We typically target the amount of such warrants to scale in proportion to the amount of the debt or equipment financing. We also attempt to structure such warrants so that the exercise price of the warrants will either be the price paid by venture capital investors in the most recent financing round or a current option price set by the portfolio company. Our typical exercise period for warrants is seven to 10 years. In addition, we may obtain rights to purchase additional shares of our portfolio companies in subsequent equity financing rounds.
Concentration Limits; Security
We endeavor to maintain reasonable limits of concentration to specific industries, technologies and geographic regions. By their nature, these limits are subjective and are applied solely at the discretion of management.
In all our loans, we seek to take a security position in all of the assets of the portfolio company, including intellectual property, if available. From time to time, we may agree to take a security position in less than the total amount of assets. In the case of equipment financings, for instance, the security interest may extend only to the asset(s) financed.
In addition, we seek to enter into standard intercreditor agreements with the major technology banks that we anticipate engaging with, making workout situations easier and less contentious. Where and when possible, we will execute deposit account control agreements with our portfolio companies for purposes of ensuring access to our collateral in a default. In all cases, we seek to put in place Uniform Commercial Code filings to perfect our security position, and to update these filings as necessary to reflect changes in our collateral.
Investment Process
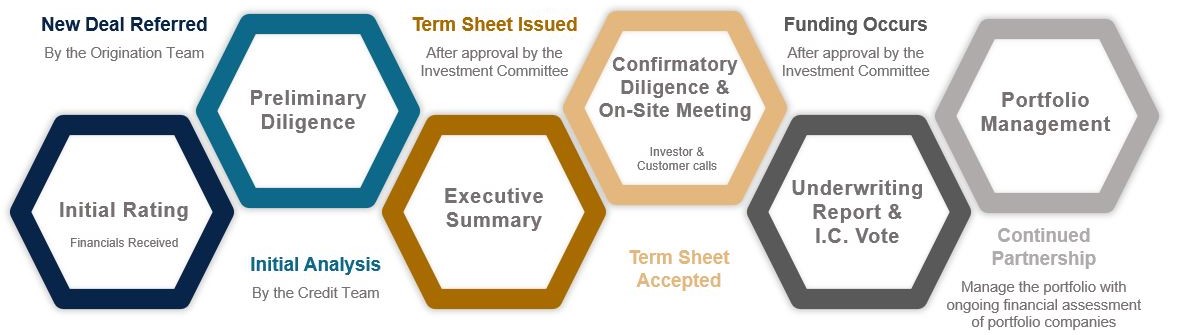
Investment Originations; New Deals Referred
We have a multi-channel sourcing strategy focused primarily on growth-oriented venture capital firms, private equity firms, technology banks and, to a lesser extent, brokers who focus on our business. We have established relationships with the major technology banks and have established standard intercreditor and subordination agreements, which make working with technology banks seamless in most regions across United States.
We continue to expand our originations team internally in order to continue to focus on building relationships with individuals at top-tier venture capital firms as well as building out connections to a nationwide network of technology bankers. We have developed proprietary internal systems and technology to give our originations and marketing team real time information about the broader market and our investment pipeline, which we leverage to attempt to become and maintain our relationship as the first call for our referral sources.
Initial Rating
Our initial rating of every opportunity is primarily based on six factors, as well as other items that are deemed to be relevant by the due diligence team:
•Investor Syndicate: the portfolio company’s investors, specifically their ability and likelihood to provide ongoing financial support as needed;
•Management Team: the experience and strength of the portfolio company’s management team and board of directors;
•Product and Industry: the portfolio company’s products or services and the market needs that they fulfill;
•Financial Performance: the portfolio company’s historical and projected financial performance, including revenue potential, growth, gross margins and other metrics;
•Debt and Debt Structure: capital structure and cash life; and
•Collateral and Security: type and value of collateral (e.g., mission-critical assets), liens and other forms of security.
Investment opportunities that score an acceptable initial rating are moved on for further consideration.
Preliminary Due Diligence and Executive Summary
The next phase of the due diligence process involves a structured call with the management team of the prospective portfolio company. Following the management call, if the opportunity still appears to be worthy of consideration, an executive summary memorandum is prepared by the due diligence team for consideration and voting by the Investment Committee. The executive summary memorandum is distributed to the Investment Committee, and the deal terms for the investment are defined. If approved by the Investment Committee, we issue a term sheet to the prospective portfolio company.
Confirmatory Due Diligence and On-Site Meeting
If the term sheet offered by us is accepted by the prospective portfolio company, the process of obtaining additional confirmatory due diligence begins. The confirmatory due diligence process typically includes calls with the venture capital partners responsible for the equity financing of the portfolio company, as well as key customers, suppliers, partners, or other stakeholders as may be deemed relevant by the due diligence team. Additional financial analysis is performed, in order to confirm the cash life assumptions that were made prior to term sheet issuance. In the case of an equipment financing, or term loan in which fixed assets make up a significant portion of our collateral, the due diligence team completes an analysis of the equipment or fixed assets being financed, which may include calls to the original manufacturer and/or any dealers, resellers, or refurbishing companies, to evaluate the value of the equipment at inception, as well as the useful life and anticipated value throughout the life of our holding period. Occasionally, we may engage the assistance of an appraiser to assist in valuations.
The final step in the confirmatory diligence process generally involves an on-site meeting, at which members of our due diligence team meet with the management team of the prospective portfolio company for a final review of the portfolio company’s financial performance and forward-looking plans. This meeting is typically held at the business offices of the portfolio company; however, occasionally the meeting will be held via video teleconference if travel to the portfolio company is not possible. One or more members of the Investment Committee will attend the on-site meeting if possible.
Underwriting Report and Investment Committee Vote
Assuming that the confirmatory due diligence process reveals no issues that would cause the due diligence team to recommend against the proposed investment, the due diligence team prepares an Investment Underwriting Report (“IUR”), which is distributed to the Investment Committee. The Investment Committee then meets to discuss and review the deal terms and IUR regarding the proposed investment and a vote takes place. A majority of the Investment Committee is required to approve the transaction.
Investment Management and Oversight
Our investment management and oversight activities are separate from our origination and underwriting activities. The team members serving our investment management and oversight functions have significant operating experience and are not associated with our origination function to avoid any biased views of performance. Beyond the dedicated portfolio management team, all of our management team members and investment professionals are typically involved at various times with our portfolio companies and investments. Our portfolio management team reviews our portfolio companies’ monthly or quarterly financial statements and compares actual results to the portfolio companies’ projections. Additionally, the portfolio management team may initiate periodic calls with the portfolio company’s venture capital partners and its management team and may obtain observer rights on the portfolio company’s board of directors. Our management team and investment professionals anticipate potential problems by monitoring reporting requirements and having frequent calls with the management teams of our portfolio companies.
Investment Risk Rating System
Our portfolio management team uses an ongoing investment risk rating system to characterize and monitor our outstanding loans and equipment financings. Our portfolio management team monitors and, when appropriate, recommends changes to the investment risk ratings. Our Investment Committee reviews the recommendations and/or changes to the investment risk ratings, which are submitted on a quarterly basis to the Audit Committee (the “Audit Committee”) of our Board of Directors (the “Board”).
From time to time, we will identify investments that require closer monitoring or become workout assets. We will develop a workout strategy for workout assets and our Investment Committee will monitor the progress against the strategy. We may incur losses from our investing activities; however, we work with our troubled portfolio companies in order to recover as much of our investments as is practicable, including possibly taking control of the portfolio company. The risk rating system allows for early detection of issues and escalation to avoid credit losses.
For our investment risk rating system, we review seven different criteria and, based on our review of such criteria, we assign a risk rating on a scale of 1 to 5, as set forth in the following illustration.
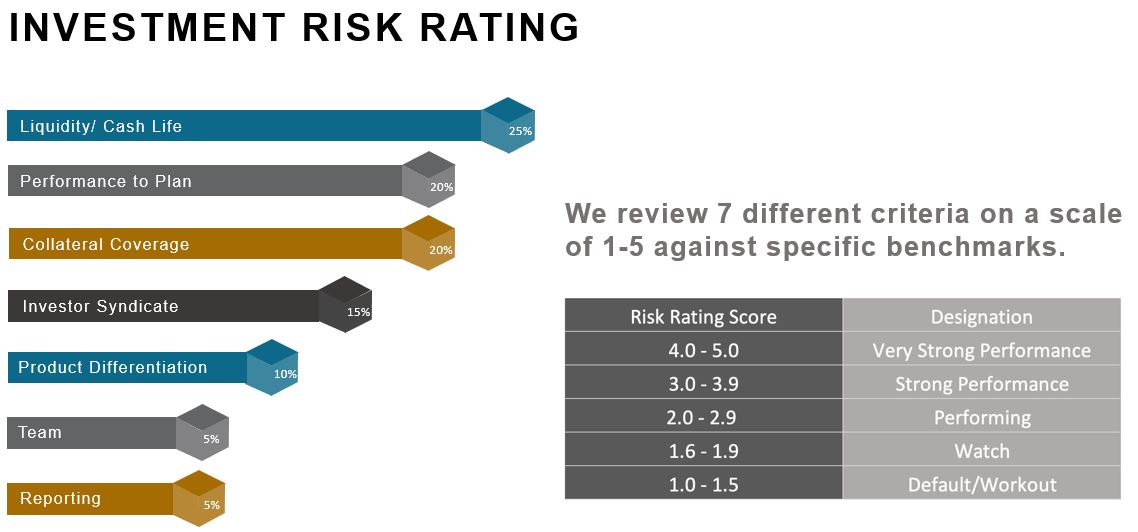
As of December 31, 2024, the Company’s debt investment portfolio had a weighted average risk rating score of 2.9.
Competition
Our prospective markets are highly competitive and are characterized by competitive factors that vary based upon product and geographic region. Competitors vary and may include captive and independent finance companies, other BDCs, equity and debt focused public and private funds, commercial banks and thrift institutions, industrial banks, community banks, leasing companies, hedge funds, insurance companies, mortgage companies, manufacturers and vendors, and other financing providers. There has been substantial competition for attractive investment opportunities in the venture capital business, in particular.
These lenders will typically offer lower finance rates than non-bank finance companies (including us), but will require cash depository relationships, blanket liens and will often have certain performance and cash covenants, all of which make their lending program less flexible and, we believe, less attractive to borrowers. We compete, in part, on the basis of pricing, terms and structure. For additional information concerning the competitive risks we face, refer to “Item 1A. Risk Factors – Risks Relating to Our Business and Structure – We operate in a highly competitive market for investment opportunities, which could reduce returns and result in losses.”
Regulation
Emerging Growth Company
We are an emerging growth company as defined in the Jumpstart Our Business Startups Act of 2012 (the “JOBS Act”) and are eligible to take advantage of certain specified reduced disclosure and other requirements that are otherwise generally applicable to public companies that are not “emerging growth companies” including not being required to comply with the auditor attestation requirements of Section 404 of the Sarbanes-Oxley Act of 2002 (the “Sarbanes-Oxley Act”). Although we have not made a determination whether to take advantage of any or all of these exemptions, we expect to remain an emerging growth company for up to five years following the completion of our IPO or until the earliest of:
•the last day of the first fiscal year in which our annual gross revenues exceed $1.235 billion;
•December 31 of the fiscal year that we become a “large accelerated filer” as defined in Rule 12b-2 under the Exchange Act, which would occur if the market value of the shares of our common stock that is held by non-affiliates exceeds $700.0 million as of the last business day of our most recently completed second fiscal quarter and we have been publicly reporting for at least 12 months; or
•the date on which we have issued more than $1.0 billion in non-convertible debt securities during the preceding three-year period.
In addition, we will take advantage of the extended transition period provided in Section 7(a)(2)(B) of the Securities Act for complying with new or revised accounting standards.
Regulation as a Business Development Company
We have elected to be regulated as a BDC under the 1940 Act. The 1940 Act contains prohibitions and restrictions relating to transactions between BDCs and their affiliates, principal underwriters and affiliates of those affiliates or underwriters. The 1940 Act requires a majority of the members of the board of directors of a BDC be persons other than “interested persons,” as that term is defined in the 1940 Act. In addition, the 1940 Act provides that we may not change the nature of our business so as to cease to be, or to withdraw our election as, a BDC unless approved by a majority of our outstanding voting securities.
The 1940 Act defines “a majority of the outstanding voting securities” as the lesser of (i) 67% or more of the voting securities present at a meeting if the holders of more than 50% of our outstanding voting securities are present or represented by proxy or (ii) more than 50% of our outstanding voting securities.
Qualifying Assets. Under the 1940 Act, a BDC may not acquire any asset other than assets of the type listed in Section 55(a) of the 1940 Act, which are referred to as qualifying assets, unless, at the time the acquisition is made, qualifying assets represent at least 70% of the BDC’s total assets. The principal categories of qualifying assets relevant to our business are any of the following:
(1)Securities purchased in transactions not involving any public offering from the issuer of such securities, which issuer (subject to certain limited exceptions) is an eligible portfolio company, or from any person who is, or has been during the preceding 13 months, an affiliated person of an eligible portfolio company, or from any other person, subject to such rules as may be prescribed by the SEC. An eligible portfolio company is defined in the 1940 Act as any issuer which:
a.is organized under the laws of, and has its principal place of business in, the United States;
b.is not an investment company (other than a small business investment company wholly owned by the BDC) or a company that would be an investment company but for certain exclusions under the 1940 Act; and
c.satisfies any of the following:
i.does not have any class of securities that is traded on a national securities exchange;
ii.has a class of securities listed on a national securities exchange, but has an aggregate market value of outstanding voting and non-voting common equity of less than $250 million;
iii.is controlled by a BDC or a group of companies including a BDC and the BDC has an affiliated person who is a director of the eligible portfolio company; or
iv.is a small and solvent company having total assets of not more than $4 million and capital and surplus of not less than $2 million;
(2)Securities of any eligible portfolio company controlled by us;
(3)Securities purchased in a private transaction from a U.S. issuer that is not an investment company or from an affiliated person of the issuer, or in transactions incident thereto, if the issuer is in bankruptcy and subject to reorganization or if the issuer, immediately prior to the purchase of its securities was unable to meet its obligations as they came due without material assistance other than conventional lending or financing arrangements;
(4)Securities of an eligible portfolio company purchased from any person in a private transaction if there is no ready market for such securities and we already own 60% of the outstanding equity of the eligible portfolio company;
(5)Securities received in exchange for or distributed on or with respect to securities described in (1) through (4) above, or pursuant to the exercise of warrants or rights relating to such securities; or
(6)Cash, cash equivalents, U.S. government securities or high-quality debt securities maturing in one year or less from the time of investment.
In addition, a BDC must be operated for the purpose of making investments in the types of securities described in (1), (2) or (3) above.
Significant Managerial Assistance. A BDC must have been organized and have its principal place of business in the United States and must be operated for the purpose of making investments in the types of securities described above. However, in order to count portfolio securities as qualifying assets for the purpose of the 70% test, the BDC must either control the issuer of the securities or must offer to make available to the issuer of the securities (other than small and solvent companies described above) significant managerial assistance. However, where the BDC purchases such securities in conjunction with one or more other persons acting together, one of the other persons in the group may make available such managerial assistance. Making available significant managerial assistance means, among other things, any arrangement whereby the BDC, through its directors, officers or employees, offers to provide and, if accepted, does so provide, significant guidance and counsel concerning the management, operations or business objectives and policies of a portfolio company through monitoring of portfolio company operations, selective participation in board and management meetings, consulting with and advising a portfolio company’s officers or other organizational or financial guidance. We may, from time to time, receive fees for these services. In the event that such fees are received, we expect that they will be incorporated into our operating income and passed through to our stockholders, given the nature of our structure as an internally managed BDC.
Temporary Investments. Pending investment in other types of qualifying assets, as described above, our investments can consist of cash, cash equivalents, U.S. government securities or high quality debt securities maturing in one year or less from the time of investment, which are referred to herein, collectively, as temporary investments, so that 70% of our assets would be qualifying assets.
Issuance of Derivative Securities. Under the 1940 Act, a BDC is subject to restrictions on the issuance, terms and amount of warrants, options, restricted stock or rights to purchase shares of capital stock that it may have outstanding at any time. In particular, the amount of capital stock that would result from the conversion or exercise of all outstanding warrants, options or rights to purchase capital stock cannot exceed 25% of the BDC’s total outstanding shares of capital stock. This amount is reduced to 20% of the BDC’s total outstanding shares of capital stock if the amount of warrants, options or rights issued pursuant to an executive compensation plan would exceed 15% of the BDC’s total outstanding shares of capital stock. We have received exemptive relief from the SEC to permit us to issue restricted stock and stock options to our employees, officers and directors subject to the above conditions and the conditions of such exemptive relief, among others. See “—SEC Exemptive Application and Relief” below and “Note 8. Equity Incentive Plans” to our consolidated financial statements included with this annual report on Form 10-K for additional information.
Senior Securities; Coverage Ratio. We are generally permitted, under specified conditions, to issue multiple classes of indebtedness and one class of stock senior to our Common Stock if our asset coverage, as defined in the 1940 Act, is at least equal to 150% immediately after each such issuance. In connection with the organization of the Company, the Board and our initial sole stockholder authorized us to adopt the 150% asset coverage ratio. This means we are permitted to borrow $2 for investment purposes for every $1 of investor equity. For a discussion of the risks associated with leverage refer to "Item 1A. Risk Factors — Risks Relating to Our Business and Structure — Regulations governing our operation as a BDC affect our ability to, and the way in which we, raise additional capital.”
Code of Ethics. We have adopted a code of ethics pursuant to Rule 17j-1 under the 1940 Act that establishes procedures for personal investments and restricts certain personal securities transactions. Personnel subject to the code are permitted to invest in securities for their personal investment accounts, including securities that may be purchased or held by us, so long as such investments are made in accordance with the code’s requirements.
Affiliated Transactions. We are prohibited under the 1940 Act from conducting certain transactions with our affiliates without the prior approval of our directors who are not interested persons and, in some cases, the prior approval of the SEC.
Other. We will be periodically examined by the SEC for compliance with the 1940 Act and be subject to the periodic reporting and related requirements of the Exchange Act.
We are also required to provide and maintain a bond issued by a reputable fidelity insurance company to protect against larceny and embezzlement. Furthermore, as a BDC, we are prohibited from protecting any director or officer against any liability to stockholders arising from willful misfeasance, bad faith, gross negligence or reckless disregard of the duties involved in the conduct of such person’s office.
We are also required to designate a chief compliance officer and to adopt and implement written policies and procedures reasonably designed to prevent violation of the federal securities laws and to review these policies and procedures annually for their adequacy and the effectiveness of their implementation.
SEC Exemptive Application and Relief
On May 27, 2021, we received exemptive relief from the SEC that allows us to issue (i) restricted stock and stock options to our employee directors, executive officers and other employees under the 2019 Trinity Capital Inc. Long-Term Incentive Plan and (ii) restricted stock to our non-employee directors under the Trinity Capital Inc. 2019 Non-Employee Director Restricted Stock Plan, subject to the terms and conditions of such exemptive relief and such equity incentive plans. These equity incentive plans were initially approved by our Board on October 17, 2019, and by our stockholders on June 17, 2021 at our 2021 Annual Meeting of Stockholders, and our Board approved amendments to increase the shares available for issuance under each plan on April 23, 2024, and our stockholders approved such amendments on June 12, 2024 at our 2024 Annual Meeting of Stockholders. See “Note 8. Equity Incentive Plans” to our consolidated financial statements included with this annual report on Form 10-K for additional information.
On December 14, 2022, we received exemptive relief from the SEC that allows us to organize, acquire, wholly own and operate the Adviser Sub, as an investment adviser registered under the Investment Advisers Act of 1940, as amended, pursuant to which the Adviser Sub will provide investment management and other services to one or more privately-offered pooled investment vehicles, registered management investment companies, BDCs and/or investment accounts, and receive advisory fees for such services.
Certain U.S. Federal Income Tax Considerations
Taxation as a Regulated Investment Company
We have elected to be treated, currently qualify, and intend to operate in a manner so as to qualify annually, as a RIC for U.S. federal income tax purposes under Subchapter M of the Code. As a RIC, we generally will not be subject to U.S. federal income tax on any net ordinary income or capital gains that we timely distribute to stockholders as distributions. To qualify as a RIC, we must, among other things, meet certain source-of-income and asset diversification requirements (as described below). In addition, in order to obtain RIC tax benefits, we generally must timely distribute to stockholders, for each taxable year, at least 90% of our “investment company taxable income,” which is generally ordinary income plus the excess of realized net short-term capital gains over realized net long-term capital losses (the “Annual Distribution Requirement”).
If we qualify as a RIC and satisfy the Annual Distribution Requirement, then we will not be subject to U.S. federal income tax on the portion of income we timely distribute (or are deemed to distribute) to stockholders. We will be subject to U.S. federal income tax at the regular corporate rates on any income or capital gains not distributed (or deemed distributed) to stockholders.
We will be subject to a 4% nondeductible U.S. federal excise tax on certain undistributed income unless we distribute in a timely manner an amount at least equal to the sum of (i) 98% of net ordinary income for each calendar year, (ii) 98.2% of capital gain net income (adjusted for certain ordinary losses) for the one-year period ending October 31 in that calendar year and (iii) any net ordinary income and capital gain net income that we recognized in preceding years, but were not distributed during such years, and on which we paid no U.S. federal income tax (the “Excise Tax Avoidance Requirement”). While we intend to distribute any net ordinary income and capital gain net income in order to avoid imposition of this 4% U.S. federal excise tax, we may not be successful in avoiding entirely the imposition of this tax. In that case, we will be liable for the tax only on the amount by which we do not meet the foregoing distribution requirement.
In order to qualify as a RIC for U.S. federal income tax purposes, we must, among other things:
•continue to qualify as a BDC under the 1940 Act at all times during each taxable year;
•derive in each taxable year at least 90% of gross income from dividends, interest, payments with respect to loans of certain securities, gains from the sale of stock or other securities or foreign currencies, net income from certain “qualified publicly traded partnerships,” or other income derived with respect to the business of investing in such stock or securities (the “90% Income Test”); and
•diversify our holdings so that at the end of each quarter of the taxable year:
oat least 50% of the value of our assets consists of cash, cash equivalents, U.S. Government securities, securities of other RICs, and other securities if such other securities of any one issuer do not represent more than 5% of the value of our assets or more than 10% of the outstanding voting securities of the issuer; and
ono more than 25% of the value of our assets is invested in the (i) securities, other than U.S. government securities or securities of other RICs, of one issuer, (ii) securities, other than securities of other RICs, of two or more issuers that are controlled, as determined under applicable Code rules, by us and that are engaged in the same or similar or related trades or businesses or (iii) securities of one or more “qualified publicly traded partnerships” (the “Diversification Tests”).
We may be required to recognize taxable income in circumstances in which we do not receive cash. For example, if we hold debt obligations that are treated under applicable tax rules as having original issue discount (such as debt instruments with payment-in-kind, or PIK, interest or, in certain cases, increasing interest rates or issued with warrants), we must include in income each year a portion of the original issue discount that accrues over the life of the obligation, regardless of whether cash representing such income is received by us in the same taxable year. We may also have to include in income other amounts that we have not yet received in cash, such as PIK interest and deferred loan origination fees that are paid after origination of the loan. Because any original issue discount or other amounts accrued will be included in our investment company taxable income for the year of accrual, we may be required to make a distribution to stockholders in order to satisfy the Annual Distribution Requirement, even though we will not have received the corresponding cash amount.
Although we do not presently expect to do so, we are authorized to borrow funds, to sell assets and to make taxable distributions of our stock and debt securities in order to satisfy distribution requirements. Our ability to dispose of assets to meet distribution requirements may be limited by (i) the illiquid nature of our portfolio and/or (ii) other requirements relating to our status as a RIC, including the Diversification Tests. If we dispose of assets in order to meet the Annual Distribution Requirement or the Excise Tax Avoidance Requirement, we may make such dispositions at times that, from an investment standpoint, are not advantageous. If we are unable to obtain cash from other sources to satisfy the Annual Distribution Requirement, we may fail to maintain our qualification for tax treatment as a RIC and become subject to U.S. federal income tax at corporate rates.
Under the 1940 Act, we are not permitted to make distributions to our stockholders while debt obligations and other senior securities are outstanding unless certain “asset coverage” tests are met. In addition, we may be prohibited under the terms of any existing or future credit facilities from making distributions unless certain conditions are satisfied. If we are prohibited from making distributions, we may fail to qualify for tax treatment as a RIC and become subject to U.S. federal income tax at corporate rates.
Certain of our investment practices may be subject to special and complex U.S. federal income tax provisions that may, among other things: (i) disallow, suspend or otherwise limit the allowance of certain losses or deductions; (ii) convert lower taxed long-term capital gain into higher taxed short-term capital gain or ordinary income; (iii) convert an ordinary loss or a deduction into a capital loss (the deductibility of which is more limited); (iv) cause us to recognize income or gain without a corresponding receipt of cash; (v) adversely affect the time as to when a purchase or sale of securities is deemed to occur; (vi) adversely alter the characterization of certain complex financial transactions; and (vii) produce income that will not be qualifying income for purposes of the 90% Income Test described above. We will monitor our transactions and may make certain tax decisions in order to mitigate the potential adverse effect of these provisions.
A RIC is limited in its ability to deduct expenses in excess of its “investment company taxable income” (which is, generally, ordinary income plus the excess of net short-term capital gains over net long-term capital losses). If our expenses in a given year exceed investment company taxable income, we would experience a net operating loss for that year. However, a RIC is not permitted to carry forward net operating losses to subsequent years. In addition, expenses can be used only to offset investment company taxable income, not net capital gain. Due to these limits on the deductibility of expenses, we may, for U.S. federal income tax purposes, have aggregate taxable income for several years that we are required to distribute and that is taxable to stockholders even if such income is greater than the aggregate net income we actually earned during those years. Such required distributions may be made from cash assets or by liquidation of investments, if necessary. We may realize gains or losses from such liquidations. In the event we realize net capital gains from such transactions, a stockholder may receive a larger capital gain distribution than it would have received in the absence of such transactions.
Failure to Qualify as a RIC
If we are unable to qualify for treatment as a RIC in the future, and certain remedial procedures are not satisfied, we would be subject to U.S. federal income tax on such income at regular corporate rates (and also would be subject to any applicable state and local taxes), regardless of whether we make any distributions to stockholders. We would not be able to deduct distributions to stockholders, nor would distributions be required to be made. Distributions, including distributions of net long-term capital gain, would generally be taxable to stockholders as ordinary dividend income to the extent of our current and accumulated earnings and profits. Subject to certain holding period requirements and other limitations under the Code, corporate stockholders may be eligible to claim a dividend received deduction with respect to such dividend; non-corporate stockholders may be able to treat such distributions as “qualified dividend income,” which is subject to reduced rates of U.S. federal income tax. Distributions in excess of current and accumulated earnings and profits would be treated first as a return of capital to the extent of the stockholder’s adjusted tax basis, and any remaining distributions would be treated as a capital gain. In order to requalify as a RIC, in addition to the other requirements discussed above, we would be required to distribute all previously undistributed earnings attributable to the period during which we failed to qualify as a RIC by the end of the first year that we intend to requalify as a RIC. If we fail to requalify as a RIC for a period greater than two taxable years, we may be subject to U.S. federal income tax at regular corporate rates on any net built-in gains with respect to certain assets that we elect to recognize on requalification or when recognized over the next five years.
Corporate Information
Our principal executive offices are located at 1 N 1st Street, Suite 302, Phoenix, AZ 85004. We maintain a website on the Internet at www.trinitycapital.com. We make available, free of charge, on our website our proxy statement, annual report on Form 10-K, quarterly reports on Form 10-Q, current reports on Form 8-K and amendments to those reports as soon as reasonably practicable after we electronically file such material with, or furnish it to, the SEC. Information contained on our website is not incorporated by reference into this annual report on Form 10-K, and you should not consider that information to be part of this annual report on Form 10-K.
We file annual, quarterly and current periodic reports, proxy statements and other information with the SEC under the Exchange Act. In addition, the SEC maintains an Internet website at www.sec.gov that contains reports, proxy and information statements, and other information regarding issuers, including us, who file documents electronically with the SEC.
Item 1A. Risk Factors
You should carefully consider the risks and uncertainties described below, together with all of the other information in this annual report on Form 10-K, including “Item 7. Management’s Discussion and Analysis of Financial Condition and Results of Operations” and our consolidated financial statements and related notes. Our business, operating results, financial condition, or prospects could be materially and adversely affected by any of these risks and uncertainties. If any of these risks occurs, the trading price, if any, of our securities could decline, and you might lose all or part of your investment. Our business, operating results, financial performance, or prospects could also be harmed by risks and uncertainties not currently known to us or that we currently do not believe are material.
Summary of Principal Risk Factors
The following is a summary of the principal risks that you should carefully consider before investing in our securities and is followed by a more detailed discussion of the material risks related to us and an investment in our securities.
We are subject to risks related to our business and structure, including, but not limited to the following:
•We depend upon our senior management team and investment professionals, including the members of our Investment Committee, for our success.
•Our business model depends, to a significant extent, upon strong referral relationships with venture capital sponsors, and our inability to develop or maintain these relationships, or the failure of these relationships to generate investment opportunities, could adversely affect our business.
•Global economic, political and market conditions, including uncertainty about the financial stability of the United States, could have a significant adverse effect on our business, financial condition and results of operations.
•Regulations governing our operations as a BDC affect our ability to and the way in which we raise additional capital.
•Changes in laws or regulations governing our operations may adversely affect our business or cause us to alter our business strategy.
•Provisions in our existing and future credit facilities may limit our operations.
•We are exposed to risks associated with changes in interest rates and inflation rates.
•Most or a substantial portion of our portfolio investments will be recorded at fair value as determined in good faith by the Board and, as a result, there may be uncertainty as to the value of our portfolio investments.
•The Board may change our investment objective, operating policies and strategies without prior notice or stockholder approval, the effects of which may be adverse.
•Internal and external cybersecurity threats, as well as other disasters, may adversely affect our business or the business of our portfolio companies by impairing our ability to conduct business effectively.
We are subject to risks related to our investments, including, but not limited to the following:
•Our investments are very risky and highly speculative and a lack of liquidity in our investments may adversely affect us.
•Our investment strategy focuses on growth-oriented companies which are subject to many risks, including dependence on the need to raise additional capital, volatility, intense competition, shortened product life cycles, changes in regulatory and governmental programs, periodic downturns, below investment grade ratings, which could cause you to lose all or part of your investment in us.
•The equipment financing industry is highly competitive and competitive forces could adversely affect the financing rates and resale prices that we may realize on our equipment financing investment portfolio and the prices that we have to pay to acquire our investments.
•Economic recessions or downturns could impair our portfolio companies and harm our operating results.
•Our investments are geographically concentrated, which may result in a single occurrence in a particular geographic area having a disproportionate negative impact on our investment portfolio.
•We may be subject to risks associated with our investments in senior loans, junior debt securities and covenant-lite loans.
•We are subject to risks associated with investing alongside other third parties.
Risks related to an investment in our securities include, but are not limited to, the following:
•We may not be able to pay distributions, our distributions may not grow over time and/or a portion of our distributions may be a return of capital.
•Investing in our common stock may involve an above-average degree of risk, including the risk of dilution.
•The market value of our securities may fluctuate significantly, which may make it difficult to resell our securities, including at an attractive price.
•We may borrow money, which may magnify the potential for gain or loss and may increase the risk of investing in us.
•Our 4.375% Notes due 2026 (the “August 2026 Notes”), our 4.25% Notes due 2026 (the “December 2026 Notes”), our 7.875% Notes due March 2029 (the “March 2029 Notes”), our 7.875% Notes due September 2029 (the “September 2029 Notes”), and our 7.54% Series A Senior Notes, Tranche A, due October 29, 2027 (the “Series A 2027 Notes”), 7.60% Series A Senior Notes, Tranche B, due October 29, 2028 (the “Series A 2028 Notes”) and our 7.66% Series A Senior Notes, Tranche C, due October 29, 2029 (the “Series A 2029 Notes” and together with the Series A 2027 Notes and Series A 2028 Notes, the “Series A Notes”) are each unsecured and therefore effectively subordinated to any secured indebtedness we currently have outstanding or may incur in the future and rank pari passu, or equal in right of payment, with all outstanding and future unsecured unsubordinated indebtedness issued by us and our general liabilities.
We are subject to risks related to U.S. federal income tax including, but not limited to, the following:
•We will be subject to U.S. federal income tax at corporate rates if we are unable to maintain qualification as a RIC under Subchapter M of the Code.
•We may have difficulty paying our required distributions if we recognize income before, or without, receiving cash representing such income.
Risks Related to Our Business and Structure
We depend upon our senior management team and investment professionals, including the members of the Investment Committee, for our success.
Our ability to achieve our investment objective and to make distributions to our stockholders depends upon the performance of our senior management. We depend on the investment expertise, skill and network of business contacts of our senior management team and investment professionals, including the members of the Investment Committee, who evaluate, negotiate, structure, execute, monitor and service our investments. Our success depends to a significant extent on the continued service and coordination of these individuals. The departure of any of these individuals or competing demands on their time in the future could have a material adverse effect on our ability to achieve our investment objective. Further, if these individuals do not maintain their existing relationships with financial institutions, sponsors and investment professionals and do not develop new relationships with other sources of investment opportunities, we may not be able to grow our investment portfolio or achieve our investment objective. This could have a material adverse effect on our financial condition and results of operations.
Our business model depends to a significant extent upon strong referral relationships with venture capital sponsors, and our inability to develop or maintain these relationships, or the failure of these relationships to generate investment opportunities, could adversely affect our business.
We expect that members of our management team will maintain their relationships with venture capital sponsors, and we will rely to a significant extent upon these relationships to provide us with our deal flow. If we fail to maintain our existing relationships, our relationships become strained as a result of enforcing our rights with respect to non-performing investments in protecting our investments or we fail to develop new relationships with other firms or sources of investment opportunities, then we will not be able to grow our investment portfolio. In addition, persons with whom members of our management team have relationships are not obligated to provide us with investment opportunities and, therefore, there is no assurance that such relationships will lead to the origination of debt or other investments.
Our financial condition and results of operations depend on our ability to manage our business effectively.
Our ability to achieve our investment objective and grow depends on our ability to manage our business. This depends, in turn, on our ability to identify, invest in and monitor companies that meet our investment criteria. The achievement of our investment objective depends upon the execution of our investment process and our access to financing on acceptable terms. Our senior origination professionals and other investment personnel may be called upon to provide managerial assistance to our portfolio companies. These activities may distract them or slow our rate of investment. Any failure to manage our business and our future growth effectively could have a material adverse effect on our business, financial condition, results of operations and prospects. Our results of operations depend on many factors, including the availability of opportunities for investment, readily accessible short and long-term funding alternatives in the financial markets and economic conditions. Furthermore, if we cannot successfully operate our business or implement our investment policies and strategies, it could negatively impact our ability to pay distributions or other distributions and you may lose all or part of your investment.
We are subject to certain regulatory restrictions that may adversely affect our business.
As an internally managed BDC, the size and categories of our assets under management are limited, and we will be unable to offer as wide a variety of financial products to prospective portfolio companies and sponsors (potentially limiting the size and diversification of our asset base). We therefore may not achieve efficiencies of scale and greater management resources available to externally managed BDCs.
Additionally, as an internally managed BDC, our ability to offer more competitive and flexible compensation structures, such as offering both a profit-sharing plan and a long-term incentive plan, is subject to the limitations imposed by the 1940 Act, which may limit our ability to attract and retain talented investment management professionals. As such, these limitations could inhibit our ability to grow, pursue our business plan and attract and retain professional talent, any or all of which may have a negative impact on our business, financial condition and results of operations.
We operate in a highly competitive market for investment opportunities, which could reduce returns and result in losses.
Our competitors include both existing and newly formed equity and debt focused public and private funds, other BDCs, investment banks, venture-oriented commercial banks, commercial financing companies and, to the extent they provide an alternative form of financing, private equity and hedge funds. Many of our competitors are substantially larger and have considerably greater financial, technical and marketing resources than us. For example, some competitors may have a lower cost of capital and access to funding sources (including deposits) that are not available to us. In addition, some of our competitors may have higher risk tolerances or different risk assessments than we have. Furthermore, many of our competitors are not subject to the regulatory restrictions that the 1940 Act imposes on us as a BDC or to the distribution and other requirements we must satisfy to maintain our ability to be subject to tax as a RIC. These characteristics could allow our competitors to consider a wider variety of investments, establish more relationships and offer better pricing and more flexible structuring than we are able to offer.
The competitive pressures we face may have a material adverse effect on our financial condition, results of operations and cash flows. We believe that some competitors may make loans with rates that are comparable or lower than our rates. We may lose some investment opportunities if we do not match our competitors’ pricing, terms and structure. However, if we match our competitors’ pricing, terms and structure, we may experience decreased net interest income, lower yields and increased risk of credit loss. As a result of this competition, we may not be able to take advantage of attractive investment opportunities from time to time, and we may not be able to identify and make investments that are consistent with our investment objective.
In addition, we believe a significant part of our competitive advantage stems from the fact that the market for investments in small, fast-growing, private companies is underserved by traditional commercial banks and other financing sources. A significant increase in the number and/or the size of our competitors in this target market could force us to accept less attractive investment terms.
We may need to raise additional capital to grow because we must distribute most of our income.
We may need additional capital to fund new investments and grow our portfolio of investments through public and/or private offerings of both debt and equity. Unfavorable economic conditions could increase our funding costs or result in a decision by lenders not to amend any outstanding credit facility or extend credit to us. A reduction in the availability of new capital could limit our ability to grow. In addition, we generally are required to distribute each taxable year an amount at least equal to 90% of our “investment company taxable income” (i.e., our net ordinary income and net short-term capital gains in excess of net long-term capital losses, if any) to our stockholders to continue to be taxed as a RIC. As a result, these earnings are not available to fund new investments.
Regulations governing our operation as a BDC affect our ability to and the way in which we raise additional capital.
We issued the August 2026 Notes, the December 2026 Notes, the March 2029 Notes, the September 2029 Notes (collectively, the “Notes”) and the Series A Notes and entered into the KeyBank Credit Facility through our wholly owned subsidiary, TCF, and may issue other debt securities or preferred stock and/or borrow money from other banks or other financial institutions, which we refer to collectively as “senior securities,” up to the maximum amount permitted by the 1940 Act. Under the provisions of the 1940 Act, we are permitted as a BDC to issue senior securities in amounts such that our asset coverage ratio, as defined in the 1940 Act, equals at least 150% (if certain requirements are met) of total assets less all liabilities and indebtedness not represented by senior securities immediately after each issuance of senior securities. We have satisfied the requirements to increase our asset coverage ratio to 150%, including stockholder and Board approval. Under a 150% asset coverage ratio, we could potentially borrow $2 for investment purposes of every $1 of investor equity.
If the value of our assets declines, we may be unable to satisfy this test. If that happens, we may be required to sell a portion of our investments and, depending on the nature of our leverage, repay a portion of our indebtedness at a time when such sales may be disadvantageous. This could have a material adverse effect on our operations, and we may not be able to make distributions in an amount sufficient to be subject to taxation as a RIC, or at all. See “—We may borrow money, which may magnify the potential for gain or loss and may increase the risk of investing in us.” In addition, issuance of securities could dilute the percentage ownership of our current stockholders in us.
No person or entity from which we borrow money will have a veto power or a vote in approving or changing any of our fundamental policies. If we issue preferred stock, the preferred stock would rank “senior” to common stock in our capital structure, preferred stockholders would have separate voting rights on certain matters and might have other rights, preferences or privileges more favorable than those of our common stockholders, and the issuance of preferred stock could have the effect of delaying, deferring or preventing a transaction or a change of control that might involve a premium price for holders of our common stock or otherwise be in your best interest. Holders of our common stock will directly or indirectly bear all of the costs associated with offering and servicing any preferred stock that we issue. In addition, any interests of preferred stockholders may not necessarily align with the interests of holders of our common stock and the rights of holders of shares of preferred stock to receive distributions would be senior to those of holders of shares of our common stock.
In addition, while any senior securities remain outstanding, we will be required to make provisions to prohibit any dividend distribution to our stockholders or the repurchase of such securities or shares unless we meet the applicable asset coverage ratios at the time of the dividend distribution or repurchase. We will also be permitted to borrow amounts up to 5% of the value of our total assets for temporary or emergency purposes, which borrowings would not be considered senior securities.
We may borrow money, which may magnify the potential for gain or loss and may increase the risk of investing in us.
As part of our business strategy, we issued the Notes, the Series A Notes and entered into the KeyBank Credit Facility through our wholly owned subsidiary, TCF, and we may borrow from and issue senior debt securities to banks, insurance companies and other lenders or investors. Holders of these senior securities or other credit facilities will have claims on our assets that are superior to the claims of our stockholders. Leverage magnifies the potential for loss on investments in our indebtedness and on invested equity capital. As we use leverage to partially finance our investments, you will experience increased risks of investing in our securities. If the value of our assets increases, then leveraging would cause the net asset value attributable to our common stock to increase more sharply than it would have had we not leveraged. Conversely, if the value of our assets decreases, leveraging would cause net asset value to decline more sharply than it otherwise would have had we not leveraged our business. Similarly, any increase in our income in excess of interest payable on the borrowed funds would cause our net investment income to increase more than it would without the leverage, while any decrease in our income would cause net investment income to decline more sharply than it would have had we not borrowed. Such a decline could negatively affect our ability to pay common stock distributions, scheduled debt payments or other payments related to our securities. Our ability to service any borrowings that we incur will depend largely on our financial performance and will be subject to prevailing economic conditions and competitive pressures. Leverage is generally considered a speculative investment technique.
The following table illustrates the effect of leverage on returns from an investment in our common stock assuming various annual returns on our portfolio, net of expenses. Leverage generally magnifies the return of stockholders when the portfolio return is positive and magnifies their losses when the portfolio return is negative. The calculations in the table below are hypothetical, and actual returns may be higher or lower than those appearing in the table below.
| | | | | | | | | |
| Assumed Return on Our Portfolio |
| (Net of Expenses) |
| -10% | | -5% | | 0% | | 5% | | 10% |
Corresponding return to common stockholder (1) | (29.8)% | | (19.0)% | | (8.2)% | | 2.6% | | 13.3% |
(1) Assumes (i) $1,774.2 million in total assets, (ii) $888.0 million in outstanding principal indebtedness, (iii) $823.0 million in net assets as of December 31, 2024 and (iv) weighted average interest rate, excluding fees (such as fees on undrawn amounts and amortization of financing costs), of 7.6% as of December 31, 2024.
See “Item 7. Management’s Discussion and Analysis of Financial Condition and Results of Operations — Financial Condition, Liquidity and Capital Resources” for more information regarding our borrowings.
Indebtedness could adversely affect our business, financial condition and results of operations and our ability to meet our payment obligations under outstanding indebtedness.
Currently, we have secured indebtedness outstanding under the KeyBank Credit Facility and unsecured indebtedness outstanding related to the Notes and the Series A Notes, and may incur additional indebtedness in the future. The use of debt could have significant consequences on our future operations, including:
•making it more difficult for us to meet our payment and other our current indebtedness and/or any other outstanding indebtedness we may incur in the future;
•resulting in an event of default if we fail to comply with the financial and other restrictive covenants contained in our debt agreements, which event of default could result in substantially all of our debt becoming immediately due and payable;
•reducing the availability of our cash flow to fund investments, acquisitions and other general corporate purposes, and limiting our ability to obtain additional financing for these purposes;
•subjecting us to the risk of increased sensitivity to interest rate increases on our indebtedness with variable interest rates; and
•limiting our flexibility in planning for, or reacting to, and increasing our vulnerability to, changes in our business, the industry in which we operate and the general economy.
Any of the above-listed factors could have an adverse effect on our business, financial condition and results of operations and our ability to meet our payment obligations under the KeyBank Credit Facility, the Notes, the Series A Notes and/or any other outstanding indebtedness we may incur in the future.
Our ability to meet our payment and other obligations under our debt instruments depends on our ability to generate significant cash flow in the future. This, to some extent, is subject to general economic, financial, competitive, legislative and regulatory factors as well as other factors that are beyond our control.
We cannot assure you that our business will generate sufficient cash flow from operations or that future borrowings will be available to us under our financing arrangements or otherwise in an amount sufficient to enable us to pay our indebtedness, including under the KeyBank Credit Facility, the Notes, the Series A Notes and/or any other outstanding indebtedness we may incur in the future, or to fund our other liquidity needs. We may need to refinance all or a portion of our indebtedness, including under the KeyBank Credit Facility, the Notes, the Series A Notes and/or any other outstanding indebtedness we may incur in the future, on or before the scheduled maturity. The conditions of the financial markets and prevailing interest rates have fluctuated in the past and are likely to fluctuate in the future. We cannot assure you that we will be able to refinance any of our indebtedness on commercially reasonable terms or at all. If we cannot service our indebtedness, we may have to take actions such as selling assets or seeking additional equity. We cannot assure you that any such actions, if necessary, could be effected on commercially reasonable terms or at all, or on terms that would not be disadvantageous to our shareholders or on terms that would not require us to breach the terms and conditions of our existing or future debt agreements, including our payment obligations under the KeyBank Credit Facility, the Notes and/or the Series A Notes.
Provisions in our existing and future credit facilities may limit our operations.
At our discretion, we have utilized and may continue to utilize the leverage available under the KeyBank Credit Facility for investment and operating purposes. Additionally, we may in the future enter into additional credit facilities. To the extent we borrow money to make investments, the applicable credit facility may be backed by all or a portion of our loans and securities on which the lender will have a security interest. We may pledge up to 100% of our assets and may grant a security interest in all of our assets under the terms of any debt instrument we enter into with a lender. We expect that any security interests we grant will be set forth in a pledge and security agreement and evidenced by the filing of financing statements by the agent for the lenders. In addition, we expect that the custodian for our securities serving as collateral for such loan would include in its electronic systems notices indicating the existence of such security interests and, following notice of occurrence of an event of default, if any, and during its continuance, will only accept transfer instructions with respect to any such securities from the lenders or their designee. If we were to default under the terms of any debt instrument, the agent for the applicable lenders would be able to assume control of the timing of disposition of any or all of our assets securing such debt, which would have a material adverse effect on our business, financial condition, results of operations and cash flows.
In addition, any security interests and/or negative covenants required by any credit facility may limit our ability to create liens on assets to secure additional debt and may make it difficult for us to restructure or refinance indebtedness at or prior to maturity or obtain additional debt or equity financing. In addition, if our borrowing base under any credit facility were to decrease, we may be required to secure additional assets in an amount sufficient to cure any borrowing base deficiency. In the event that all of our assets are secured at the time of such a borrowing base deficiency, we could be required to repay advances under the credit facility or make deposits to a collection account, either of which could have a material adverse impact on our ability to fund future investments and to make distributions.
In addition, we may be subject to limitations as to how borrowed funds may be used, which may include restrictions on geographic and industry concentrations, loan size, payment frequency and status, average life, collateral interests and investment ratings, as well as regulatory restrictions on leverage which may affect the amount of funding that may be obtained. There may also be certain requirements relating to portfolio performance, including required minimum portfolio yield and limitations on delinquencies and charge-offs, a violation of which could limit further advances and, in some cases, result in an event of default. An event of default under a credit facility could result in an accelerated maturity date for all amounts outstanding thereunder, which could have a material adverse effect on our business and financial condition. This could reduce our liquidity and cash flow and impair our ability to grow our business.
Any defaults under a credit facility could adversely affect our business.
In the event we default under any credit facility or other borrowings, our business could be adversely affected as we may be forced to sell a portion of our investments quickly and prematurely at what may be disadvantageous prices to us in order to meet our outstanding payment obligations and/or support working capital requirements under the credit facility, any of which would have a material adverse effect on our business, financial condition, results of operations and cash flows. In addition, following any such default, the agent for the lenders under such credit facility could assume control of the disposition of any or all of our assets, including the selection of such assets to be disposed and the timing of such disposition, which would have a material adverse effect on our business, financial condition, results of operations and cash flows.
We are exposed to risks associated with changes in interest rates.
Following a campaign by the U.S. Federal Reserve of raising interest rates to address significant and persistent inflation pricing, the U.S. Federal Reserve made three consecutive benchmark interest rate cuts during the third and fourth quarters of 2024. There can be no assurances that the U.S. Federal Reserve will further reduce benchmark interest rates and will not increase such rates again. Because we may borrow money to make investments, our net investment income will depend, in part, upon the difference between the rate at which we borrow funds and the rate at which we invest those funds. As a result, we can offer no assurance that a significant change in market interest rates will not have a material adverse effect on our net investment income. A reduction in the interest rates on new investments, including relative to interest rates on current investments, and investments with floating rates could have an adverse impact on our net investment income. However, an increase in interest rates could decrease the value of any investments we hold which earn fixed interest rates and also could increase our interest expense, thereby decreasing our net income. Also, an increase in interest rates available to investors could make an investment in our common stock less attractive if we are not able to increase our distribution rate, which could reduce the value of our common stock. Further, rising interest rates could also adversely affect our performance if such increases cause our borrowing costs to rise at a rate in excess of the rate that our investments yield. In periods of rising interest rates, to the extent we borrow money subject to a floating interest rate, our cost of funds would increase, which could reduce our net investment income. Further, rising interest rates could also adversely affect our performance if we hold investments with floating interest rates, subject to specified minimum interest rates (such as Secured Overnight Financing Rate (“SOFR”) floor), while at the same time engaging in borrowings subject to floating interest rates not subject to such minimums. In such a scenario, rising interest rates may increase our interest expense, even though our interest income from investments is not increasing in a corresponding manner as a result of such minimum interest rates.
If general interest rates rise, there is a risk that the portfolio companies in which we hold floating rate securities will be unable to pay escalating interest amounts, which could result in a default under their loan documents with us. Rising interest rates could also cause portfolio companies to shift cash from other productive uses to the payment of interest, which may have a material adverse effect on their business and operations and could, over time, lead to increased defaults. In addition, rising interest rates may increase pressure on us to provide fixed rate loans to our portfolio companies, which could adversely affect our net investment income, as increases in our cost of borrowed funds would not be accompanied by increased interest income from such fixed-rate investments.
If we do not invest a sufficient portion of our assets in qualifying assets, we could fail to qualify as a BDC, which would have a material adverse effect on our business, financial condition and results of operations.
As a BDC, we may not acquire any assets other than “qualifying assets” unless, at the time of and after giving effect to such acquisition, at least 70% of our total assets are qualifying assets. We believe that most of the investments that we may acquire in the future will constitute qualifying assets. However, we may be precluded from investing in what we believe are attractive investments if such investments are not qualifying assets for purposes of the 1940 Act. If we do not invest a sufficient portion of our assets in qualifying assets, we could violate the 1940 Act provisions applicable to BDCs. As a result of such violation, specific rules under the 1940 Act could prevent us, for example, from making follow-on investments in existing portfolio companies which could result in the dilution of our position or could require us to dispose of investments at inappropriate times in order to come into compliance with the 1940 Act. If we need to dispose of investments quickly, it could be difficult to dispose of such investments on favorable terms. We may not be able to find a buyer for such investments and, even if we do find a buyer, we may have to sell the investments at a substantial loss. Any such outcomes would have a material adverse effect on our business, financial condition, results of operations, and cash flows.
Most or a substantial portion of our portfolio investments will be recorded at fair values determined in good faith by the Board and, as a result, there may be uncertainty as to the value of our portfolio investments.
Under the 1940 Act, we are required to carry our portfolio investments at market value or, if there is no readily available market value, at fair value as determined by the Board. Most or a substantial portion of our portfolio investments may take the form of securities that are not publicly traded. The fair value of securities and other investments that are not publicly traded may not be readily determinable, and we value these securities at fair value as determined in good faith by the Board, including to reflect significant events affecting the value of our securities. As part of the valuation process, we may take into account the following types of factors, if relevant, in determining the fair value of our investments:
•a comparison of the portfolio company’s securities to publicly traded securities;
•the enterprise value of a portfolio company;
•the nature and realizable value of any collateral;
•the portfolio company’s ability to make payments and its earnings and discounted cash flow;
•the markets in which the portfolio company does business; and
•changes in the interest rate and inflation rate environments and the credit markets generally that may affect the price at which similar investments may be made in the future and other relevant factors.
We expect that most of our investments (other than cash and cash equivalents) will be classified as Level 3 in the fair value hierarchy and require disclosures about the level of disaggregation along with the inputs and valuation techniques we use to measure fair value. This means that our portfolio valuations are based on unobservable inputs and our own assumptions about how market participants would price the asset or liability in question. Inputs into the determination of fair value of our portfolio investments require significant management judgment or estimation. Even if observable market data is available, such information may be the result of consensus pricing information or broker quotes, which include a disclaimer that the broker would not be held to such a price in an actual transaction. The non-binding nature of consensus pricing and/or quotes accompanied by disclaimers materially reduces the reliability of such information. We employ the services of one or more independent service providers to review the valuation of these securities. The types of factors that the Board may take into account in determining the fair value of our investments generally include, as appropriate, comparison to publicly traded securities including such factors as yield, maturity and measures of credit quality, the enterprise value of a portfolio company, the nature and realizable value of any collateral, the portfolio company’s ability to make payments and its earnings and discounted cash flow, the markets in which the portfolio company does business and other relevant factors. Because such valuations, and particularly valuations of private securities and private companies, are inherently uncertain, may fluctuate over short periods of time and may be based on estimates, our determinations of fair value may differ materially from the values that would have been used if a ready market for these securities existed. Due to this uncertainty in the value of our portfolio investments, a fair value determination may cause net asset value on a given date to materially understate or overstate the value that we may ultimately realize upon one or more of our investments. As a result, investors purchasing shares of our common stock based on an overstated net asset value would pay a higher price than the value of the investments might warrant. Conversely, investors selling shares during a period in which the net asset value understates the value of investments will receive a lower price for their shares than the value the investment portfolio might warrant.
We will adjust quarterly the valuation of our portfolio to reflect the determination of the Board of the fair value of each investment in our portfolio. Any changes in fair value are recorded in our statements of operations as net change in unrealized gain (loss) on investments.
There is no assurance that any share repurchase programs we implement will result in repurchases of our common stock or enhance long-term stockholder value, and repurchases, if any, could affect our stock price and increase its volatility and will diminish our cash reserves.
On November 7, 2024, the Board authorized a 12-month share repurchase program. Under the program, we may repurchase, during the 12-month period commencing on November 7, 2024, up to $30.0 million in the aggregate of our outstanding common stock in the open market at prices from time to time, provided that we comply with applicable policies and laws, including certain price, market, volume, and timing constraints specified in Rule 10b-18 of the Exchange Act. The timing, manner, price and amount of any share repurchases will be determined by us, at our discretion, based upon the evaluation of economic and market conditions, our stock price, applicable legal, contractual and regulatory requirements and other factors. The program does not require us to repurchase any specific number of shares, and we cannot assure stockholders that any shares will be repurchased under the program. The program may be suspended, extended, modified or discontinued at any time.
There can be no assurance that any future share repurchases will occur, or, if they occur, that they will enhance stockholder value. In addition, any future share repurchases could have a material adverse effect on our business for the following reasons:
•Repurchases will diminish our cash reserves, which could impact our ability to finance future growth.
•We may incur debt in connection with our business in the event that we use other cash resources to repurchase shares, which may affect the financial performance of our business during future periods or our liquidity and the availability of capital for other needs of the business.
•Repurchases could affect the trading price of our common stock or increase its volatility and may reduce the market liquidity for our stock.
•Repurchases may not be made at the best possible price and the market price of our common stock may decline below the levels at which we repurchased shares of common stock.
•Any suspension, modification or discontinuance of any future share repurchase plan could result in a decrease in the trading price of our common stock.
•Repurchases may make it more difficult for us to meet the diversification requirements necessary to qualify for tax treatment as a RIC for U.S. federal income tax purposes; failure to qualify for tax treatment as a RIC would render our taxable income subject to corporate-level U.S. federal income taxes.
We may incur lender liability as a result of our lending activities.
In recent years, a number of judicial decisions have upheld the right of borrowers and others to sue lending institutions on the basis of various evolving legal theories, collectively termed “lender liability.” Generally, lender liability is founded on the premise that a lender has either violated a duty, whether implied or contractual, of good faith and fair dealing owed to the borrower or has assumed a degree of control over the borrower resulting in the creation of a fiduciary duty owed to the borrower or its other creditors or stockholders. As a result, we could be subject to lender liability, claims for actions taken by us with respect to a portfolio company’s business or instances where we exercise control over the portfolio company, including as a result of actions taken in rendering significant managerial assistance to the portfolio company or actions to compel and collect payments from the portfolio company outside of the ordinary course of business. Lender liability claims can be time-consuming and expensive to defend and result in significant liability.
Risks Related to Our Investment Management Activities
Our executive officers and employees, through the Adviser Sub, may manage other investment funds that operate in the same or a related line of business as we do, and may invest in such funds, which may result in significant conflicts of interest.
Our executive officers and employees, through the Adviser Sub, a Delaware limited liability, may manage other investment funds or assets for other clients that operate in the same or a related line of business as we do, and which funds may be invested in by us and/or our executive officers and employees. Accordingly, they may have obligations to, or pecuniary interests in, such other entities, and the fulfillment of such obligations may not be in the best interests of us or our stockholders and may create conflicts of interest.
We may make co-investments with other funds or clients advised by the Adviser Sub in accordance with applicable allocation policies, the 1940 Act and any exemptive relief granted by the SEC, if any. We have applied for co-investment exemptive relief from the SEC that would require, among other things, that we and the Adviser Sub consider whether each such investment opportunity is appropriate for us and the Adviser Sub’s advised funds or clients and, if it is appropriate, to propose an allocation of the investment opportunity between us and such other parties. Our relationship with the Adviser Sub may require us to commit resources to achieving the investment objectives of such other funds or clients advised by the Adviser Sub, while such resources were previously solely devoted to achieving our investment objective. Our investment objective and investment strategies may be very similar to those of such funds or clients advised by the Adviser Sub, and it is likely that an investment may be appropriate for both us and such funds or clients advised by the Adviser Sub. As a consequence, it may be more difficult for us to maintain or increase the size of our investment portfolio in the future. Although we will endeavor to allocate investment opportunities in a fair and equitable manner, including in accordance with the conditions set forth in any applicable exemptive order issued by the SEC, we may face conflicts in allocating investment opportunities between us and other funds or clients managed by the Adviser Sub. Because the Adviser Sub may receive performance-based fee compensation from other funds or clients it manages, this may provide the Company and the Adviser Sub an incentive to allocate opportunities to other funds or clients the Adviser Sub manages, instead of us. We and the Adviser Sub have implemented an allocation policy to ensure the equitable distribution of investment opportunities and, as a result, may be unable to participate in certain investments based upon such allocation policy.
Investments in the Adviser Funds in the form of loans may create conflicts of interests.
We may make investments in one or more Adviser Funds in the form of loans, which may create conflicts of interest. For example, prior to the receipt by the Adviser Funds of capital contributions from investors for which a capital call notice has or will be given, we may provide loan financing to such Adviser Funds to fund such amounts on a temporary basis in order to permit the Adviser Funds to invest in a target portfolio company within the applicable time constraints prior to the receipt by the Adviser Funds of a capital call in respect of such investment. In addition, we may provide loan financing to the Adviser Funds to cover start-up and initial operating costs prior to the receipt by the Adviser Funds of a capital call in respect of such expenses. The provision of debt financing to the Adviser Funds may cause conflicts of interest, including in situations where our interest as a lender to the Adviser Funds conflicts with the interest of holders of third-party equity interests.
Through the Adviser Sub, we expect to derive revenues from managing third-party funds pursuant to investment management agreements that may be terminated, which could negatively impact our operating results.
We expect to derive our revenues related to the Adviser Sub primarily from dividend income, which we expect the Adviser Sub to pay from net profits generated from advisory fees charged to the funds advised by the Adviser Sub. Such funds may be established with different fee structures, including management fees payable at varying rates and carried interest or performance fees that are payable at varying hurdle rates. Investment advisory, carried interest, and performance fee revenues can be adversely affected by several factors, including market factors, third-party investor preferences, and our Adviser Sub’s performance and track record. A reduction in revenues of our Adviser Sub, without a commensurate reduction in expenses, could adversely affect our Adviser Sub’s business as well as our revenues and results of operations derived from the Adviser Sub. The terms of fund investment management agreements generally give the manager of the fund and the fund itself the right to terminate the investment management agreement in certain circumstances. With respect to funds that are not exempt from registration under the 1940 Act, the fund’s investment management agreement must be approved annually by (a) such fund’s board of directors or by the vote of a majority of such fund’s stockholders and (b) the majority of the independent members of such fund’s board of directors and, in certain cases, by its stockholders, as required by law. The funds’ investment management agreements can also be terminated by the majority of such fund’s stockholders. Termination of any such investment management agreements would reduce the fees we earn from the relevant funds or other clients through the Adviser Sub, which could have a material adverse effect on our results of operations
Risks Related to Our Investments
Our investment strategy focuses on growth-oriented companies, which are subject to many risks, including dependence on the need to raise additional capital, volatility, intense competition, shortened product life cycles, changes in regulatory and governmental programs, periodic downturns, below investment grade ratings, which could cause you to lose all or part of your investment in us.
We invest primarily in growth-oriented companies, many of which may have narrow product lines and small market shares, which tend to render them more vulnerable to competitors’ actions and market conditions, as well as to general economic downturns, compared to more mature companies. The revenues, income (or losses), and projected financial performance and valuations of growth-oriented companies can and often do fluctuate suddenly and dramatically. For these reasons, investments in our portfolio companies, if rated by one or more ratings agency, would typically be rated below “investment grade,” which refers to securities rated by ratings agencies below the four highest rating categories. Our target growth-oriented companies are geographically concentrated and are therefore highly susceptible to materially negative local, political, natural and economic events. In addition, high growth industries are generally characterized by abrupt business cycles and intense competition. Overcapacity in high growth industries, together with cyclical economic downturns, may result in substantial decreases in the value of many growth-oriented companies and/or their ability to meet their current and projected financial performance to service our debt. Furthermore, growth-oriented companies also typically rely on venture capital and private equity investors, or initial public offerings, or sales for additional capital.
Venture capital firms in turn rely on their limited partners to pay in capital over time in order to fund their ongoing and future investment activities. To the extent that venture capital firms’ limited partners are unable or choose not to fulfill their ongoing funding obligations, the venture capital firms may be unable to continue operationally and/or financially supporting the ongoing operations of our portfolio companies which could materially and adversely impact our financing arrangement with the portfolio company.
These companies, their industries, their products and customer demand and the outlook and competitive landscape for their industries are all subject to change, which could adversely impact their ability to execute their business plans and generate cash flow or raise additional capital that would serve as the basis for repayment of our loans. Therefore, our growth-oriented companies may face considerably more risk of loss than do companies at other stages of development.
The equipment financing industry is highly competitive and competitive forces could adversely affect the financing rates and resale prices that we may realize on our equipment financing investment portfolio and the prices that we have to pay to acquire our investments.
As part of our investment strategy, we engage in equipment financing, through which we finance equipment to growth-oriented companies. Equipment manufacturers, corporations, partnerships and others offer users an alternative to the purchase of most types of equipment with payment terms that vary widely depending on the type of financing, the lease or loan term and the type of equipment. In seeking equipment financing transactions, we will compete with financial institutions, manufacturers and public and private leasing companies, many of which may have greater financial resources than us.
Some types of equipment are under special government regulation which may make the equipment more costly to acquire, own, maintain under equipment financings and sell.
The use, maintenance and ownership of certain types of equipment are regulated by federal, state and/or local authorities. Regulations may impose restrictions and financial burdens on our ownership and operation of equipment. Changes in government regulations, industry standards or deregulation may also affect the ownership, operation and resale value of equipment. For example, certain types of equipment are subject to extensive safety and operating regulations imposed by government and/or industry self- regulatory organizations which may make these types of equipment more costly to acquire, own, maintain under equipment financings and sell. These agencies or organizations may require changes or improvements to equipment, and we may have to spend our own capital to comply. These changes may also require the equipment to be removed from service for a period of time. The terms of equipment financings may provide for payment reductions if the equipment must remain out of service for an extended period or is removed from service. We may then have reduced operating revenues from equipment financings for these items of equipment. If we did not have the capital to make a required change, we might be required to sell the affected equipment or to sell other items of its equipment in order to obtain the necessary cash; in either event, we could suffer a loss on our investment and might lose future revenues, and we might also have adverse tax consequences.
We are subject to risks inherent in the equipment financing business that may adversely affect our ability to finance our portfolio on terms that will permit us to generate profitable rates of return for investors.
A number of economic conditions and market factors, many of which we cannot control, could threaten our ability to operate profitably. These include changes in economic conditions, including fluctuations in demand for equipment, interest rates and inflation rates; the timing of purchases and the ability to forecast technological advances for equipment; technological and economic obsolescence; and increases in our expenses.
Demand for equipment fluctuates, and periods of weak demand could adversely affect equipment financing rates and resale prices that we may realize on our investment portfolio while periods of high demand could adversely affect the prices that we have to pay to acquire our investments. Such fluctuations in demand could therefore adversely affect the ability of a leasing program to invest its capital in a timely and profitable manner.
Equipment lessors have experienced a more difficult market in which to make suitable investments during historical periods of reduced growth and recession in the U.S. economy as a result of the softening demand for capital equipment during these periods. An economic recession resulting in lower levels of capital expenditure by businesses may result in more used equipment becoming available on the market and downward pressure on prices and equipment financing rates due to excess inventory. Periods of low interest rates exert downward pressure on equipment financing rates and may result in less demand for equipment financings. Furthermore, a decline in corporate expansion or demand for capital goods could delay investment of our capital, and its production of financing revenues. There can be no assurance as to what future developments may occur in the economy in general or in the demand for equipment and other asset-based financing in particular.
Economic recessions or downturns could impair our portfolio companies and harm our operating results.
Some of our portfolio companies may be susceptible to economic slowdowns or recessions and may be unable to repay our debt investments during periods of economic recession or downturn. In the past, instability in the global capital markets resulted in disruptions in liquidity in the debt capital markets, significant write-offs in the financial services sector, the re-pricing of credit risk in the broadly syndicated credit market and the failure of major domestic and international financial institutions. In particular, in past periods of instability, the financial services sector was negatively impacted by significant write-offs as the value of the assets held by financial firms declined, impairing their capital positions and abilities to lend and invest.
In an economic downturn, we may have non-performing assets or non-performing assets may increase, and the value of our portfolio is likely to decrease during these periods. Adverse economic conditions may also decrease the value of any collateral securing our loans. A severe recession may further decrease the value of such collateral and result in losses of value in our portfolio and a decrease in our revenues, net income, assets and net worth. Unfavorable economic conditions also could increase our funding costs, limit our access to the capital markets or result in a decision by lenders not to extend credit to us on terms we deem acceptable. These events could prevent us from increasing investments and harm our operating results.
The occurrence of recessionary conditions and/or negative developments in the domestic and international credit markets may significantly affect the markets in which we do business, the value of our investments, and our ongoing operations, costs and profitability. Any such unfavorable economic conditions, including rising interest rates, may also increase our funding costs, limit our access to capital markets or negatively impact our ability to obtain financing, particularly from the debt markets. In addition, any future financial market uncertainty could lead to financial market disruptions and could further impact our ability to obtain financing. These events could limit our investment originations, limit our ability to grow and negatively impact our operating results and financial condition.
Our investments are geographically concentrated, which may result in a single occurrence in a particular geographic area having a disproportionate negative impact on our investment portfolio.
Investments in a particular geographic region may be particularly susceptible to economic conditions and regulatory requirements. To the extent our investments are concentrated in a particular region or group of regions, our investment portfolio may be more volatile than a more geographically investment portfolio. Any deterioration in the economy, or adverse events in such regions, may increase the rate of delinquency and default experience (and as a consequence, losses) with respect to our investments in such region. Our investments are geographically concentrated in the Western and Northeastern part of the United States. As result, we may be more susceptible to being adversely affected by any single occurrence in those regions.
For example, portfolio companies in California may be particularly susceptible to certain types of hazards, such as earthquakes, floods, mudslides, wildfires and other national disasters, which could have a negative impact on their business and negatively impact such company’s ability to meet their obligations under their debt securities that we hold. Additionally, adverse economic conditions or other factors particularly affecting a specific region could increase the risk of loss on our investments.
Our investments in leveraged portfolio companies may be risky, and we could lose all or part of our investment.
Investment in leveraged companies involves a number of significant risks. Leveraged companies in which we invest may have limited financial resources and may be unable to meet their obligations under their debt securities that we hold. Such developments may be accompanied by a deterioration in the value of any collateral and a reduction in the likelihood of our realizing any guarantees that we may have obtained in connection with our investment. In addition, our junior secured loans are generally subordinated to senior loans. As such, other creditors may rank senior to us in the event of an insolvency, bankruptcy or liquidation.
In addition, investing in small, fast-growing, private companies involves a number of significant risks, including the following:
•these companies may have limited financial resources and may be unable to meet their obligations under their debt securities that we hold. This failure to meet obligations may be accompanied by a deterioration in the value of any collateral and a reduction in the likelihood of us realizing any guarantees we may have obtained in connection with our investment;
•they typically have shorter operating histories, narrower product lines and smaller market shares than larger businesses, which tend to render them more vulnerable to competitors’ actions, market conditions, and general economic downturns;
•they are more likely to depend on the management talents and efforts of a small group of persons; therefore, the death, disability, resignation or termination of one or more of these persons could have a material adverse impact on our portfolio company and, in turn, on us;
•they generally have less predictable operating results, may from time to time be parties to litigation, may be engaged in rapidly changing businesses with products subject to a substantial risk of obsolescence, and may require substantial additional capital to support their operations, finance expansion, or maintain their competitive position. In addition, our executive officers and directors may, in the ordinary course of business, be named as defendants in litigation arising from our investments in the portfolio companies; and
•they may have difficulty accessing the capital markets to meet future capital needs, which may limit their ability to grow or to repay their outstanding debt upon maturity.
Our investments are very risky and highly speculative.
We invest primarily in secured loans and select equity and equity-related investments issued by, and provide equipment financing to, small, fast-growing private companies. We invest primarily in secured loans made to companies whose debt has generally not been rated by any rating agency, although we would expect such debt, if rated, to fall below investment grade. Securities rated below investment grade are often referred to as “high yield” securities and “junk bonds,” and are considered “high risk” and speculative in nature compared to debt instruments that are rated above investment grade because of the credit risk of the issuers. Such issuers are more likely than investment grade issuers to default on their payments of interest and principal owed to us, and such defaults could have a material adverse effect on our performance.
Generally, little public information exists about the types of companies in which we invest, and we are required to rely on the ability of our senior management team and investment professionals to obtain adequate information to evaluate the potential returns from investing in these companies. If we are unable to uncover all material information about these companies, we may not make a fully informed investment decision, and we may lose money on our investments. Also, privately held companies frequently have less diverse product lines and smaller market presence than larger competitors. These factors could adversely affect our investment returns as compared to companies investing primarily in the securities of public companies.
Senior Secured Loans. There is a risk that the collateral securing our loans may decrease in value over time, may be difficult to sell in a timely manner, may be difficult to appraise and may fluctuate in value based upon the success of the business and market conditions, including as a result of the inability of the portfolio company to raise additional capital. In some circumstances, our liens on the collateral securing our loans could be subordinated to claims of other creditors. In addition, deterioration in a portfolio company’s financial condition and prospects, including its inability to raise additional capital, may be accompanied by deterioration in the value of the collateral for the loan. The fact that a loan is secured does not guarantee that we will receive principal and interest payments according to the loan’s terms, or at all, or that we will be able to collect on the loan should we be compelled to enforce our remedies. Further, no active trading market may exist or be maintained for certain senior secured loans. Illiquidity and adverse market conditions may mean that we may not be able to sell senior secured loans quickly or at a fair price. To the extent that a secondary market does exist for certain senior secured loans, the market for them may be subject to irregular trading activity, wide bid/ask spreads and extended trade settlement periods.
Second Lien Secured Loans. In structuring our loans, we may subordinate our security interest in certain assets of a borrower to another lender, usually a bank, such that we hold a second lien secured loan. In these situations, all of the risks identified above regarding senior secured loans would be present and additional risks inherent in holding a junior security position would also be present, including that our second lien secured loans generally would be subordinated to senior loans and other creditors may rank senior to us in the event of default, insolvency or liquidation. In addition, these securities may not be protected by all of the financial covenants, such as limitations upon additional indebtedness, typically protecting such senior debt. In the event a portfolio company cannot generate adequate cash flow to meet senior debt service, we may suffer a partial or total loss of our investment in a second lien secured loan.
Equity and Equity-Related Investments. When we invest in secured loans, we may acquire equity and equity-related securities as well. In addition, we may invest directly in the equity and equity-related securities of portfolio companies. The equity and equity-related interests we receive may not appreciate in value and may in fact decline in value. Accordingly, we may not be able to realize gains from our equity and equity-related interests, and any gains that we do realize on the disposition of any equity and equity-related interests may not be sufficient to offset any other losses we experience.
We may be subject to risks associated with our investments in covenant-lite loans.
We have invested in and may in the future invest in or obtain significant exposure to covenant-lite loans, which means the obligations contain fewer maintenance covenants than other obligations, or no maintenance covenants, and may not include terms that allow the lender to monitor the financial performance of the borrower, including financial ratios, and declare a default if certain financial criteria are breached. While these loans may still contain other collateral protections, a covenant-lite loan may carry more risk than a covenant-heavy loan made by the same borrower as it does not require the borrower to provide affirmation that certain specific financial tests have been satisfied on a routine basis as is generally required under a covenant-heavy loan agreement. Generally, covenant-lite loans provide borrowers more freedom to negatively impact lenders because their covenants, if any, tend to be incurrence-based, which means they are only tested and can only be breached following an affirmative action of the borrower, rather than by a deterioration in the borrower’s financial condition. Our investment in or exposure to a covenant-lite loan may potentially hinder our ability to reprice credit risk associated with the issuer and reduce our ability to restructure a problematic loan and mitigate potential loss. As a result, our exposure to losses may be increased, which could result in an adverse impact on our revenues, net income and net asset value.
Second priority liens on collateral securing loans that we make to our portfolio companies may be subject to control by senior creditors with first priority liens. If there is a default, the value of the collateral may not be sufficient to repay in full both the first priority creditors and us.
Certain loans that we make are secured by a second priority security interest in the same collateral pledged by a portfolio company to secure senior debt owed by the portfolio company to commercial banks or other traditional lenders. Often the senior lender has procured covenants from the portfolio company prohibiting the incurrence of additional secured debt without the senior lender’s consent. Prior to and as a condition of permitting the portfolio company to borrow money from us secured by the same collateral pledged to the senior lender, the senior lender will require assurances that it will control the disposition of any collateral in the event of bankruptcy or other default. In many such cases, the senior lender will require us to enter into an intercreditor agreement prior to permitting the portfolio company to borrow from us. Typically the intercreditor agreements we will be requested to execute will expressly subordinate our debt instruments to those held by the senior lender and further provide that the senior lender shall control: (1) the commencement of foreclosure or other proceedings to liquidate and collect on the collateral; (2) the nature, timing, and conduct of foreclosure or other collection proceedings; (3) the amendment of any collateral document; (4) the release of the security interests in respect of any collateral; and (5) the waiver of defaults under any security agreement. Because of the control we may cede to senior lenders under intercreditor agreements we may enter, we may be unable to realize the proceeds of any collateral securing some of our loans.
If the assets securing the loans that we make decrease in value, then we may lack sufficient collateral to cover losses.
There is a risk that the collateral securing our secured loans may decrease in value over time, may be difficult to sell in a timely manner, may be difficult to appraise, may be liquidated at a price lower than what we consider to be fair value and may fluctuate in value based upon the success of the business and market conditions, including as a result of the inability of a borrower to raise additional capital, which could materially and adversely affect our ability to recover our investment.
In addition, a substantial portion of the assets securing our investment may be in the form of intellectual property, inventory and equipment and, to a lesser extent, cash and accounts receivable. Intellectual property, if any, that is securing our loan could lose value if, among other things, the borrower’s rights to the intellectual property are challenged or if the borrower’s license to the intellectual property is revoked or expires. Inventory may not be adequate to secure our loan if our valuation of the inventory at the time that we made the loan was not accurate or if there is a reduction in the demand for the inventory.
Similarly, any equipment securing our loan may not provide us with the anticipated security if there are changes in technology or advances in new equipment that render the particular equipment obsolete or of limited value, or if the borrower fails to adequately maintain or repair the equipment. The residual value of the equipment at the time we would take possession may not be sufficient to satisfy the outstanding debt and we could experience a loss on the disposition of the equipment. Any one or more of the preceding factors could materially impair our ability to recover our investment in a foreclosure.
Our portfolio companies may incur debt that ranks equally with, or senior to, our investments in such companies.
Although our investments are primarily secured, some investments may be unsecured and subordinated to substantive amounts of senior indebtedness. The portfolio companies in which we invest usually have, or may be permitted to incur, other debt that ranks equally with, or senior to, the debt securities in which we invest. By their terms, such debt instruments may provide that the holders are entitled to receive payment of interest or principal on or before the dates on which we are entitled to receive payments in respect of the debt securities in which we invest. Also, in the event of insolvency, liquidation, dissolution, reorganization or bankruptcy of a portfolio company, holders of debt instruments ranking senior to our investment in that portfolio company would typically be entitled to receive payment in full before we receive any distribution in respect of our investment. After paying senior creditors, the portfolio company may not have any remaining assets to use for repaying its obligation to us. In the case of debt ranking equally with debt securities in which we invest, we would have to share any distributions on an equal and ratable basis with other creditors holding such debt in the event of an insolvency, liquidation, dissolution, reorganization or bankruptcy of the relevant portfolio company.
Additionally, certain loans that we make to portfolio companies may be secured on a second-priority basis by the same collateral securing senior secured debt of such companies. The first-priority liens on the collateral will secure the portfolio company’s obligations under any outstanding senior debt and may secure certain other future debt that may be permitted to be incurred by the portfolio company under the agreements governing the loans. The holders of obligations secured by first-priority liens on the collateral will generally control the liquidation of, and be entitled to receive proceeds from, any realization of the collateral to repay their obligations in full before us. In addition, the value of the collateral in the event of liquidation will depend on market and economic conditions, the availability of buyers and other factors. There can be no assurance that the proceeds, if any, from sales of all of the collateral would be sufficient to satisfy the loan obligations secured by the second-priority liens after payment in full of all obligations secured by the first-priority liens on the collateral. If such proceeds were not sufficient to repay amounts outstanding under the loan obligations secured by the second-priority liens, then, to the extent not repaid from the proceeds of the sale of the collateral, we will only have an unsecured claim against the portfolio company’s remaining assets, if any.
The rights we may have with respect to the collateral securing the loans we make to our portfolio companies with senior debt outstanding may also be limited pursuant to the terms of one or more intercreditor agreements that we enter into with the holders of such senior debt, including in unitranche transactions. Under a typical intercreditor agreement, at any time that obligations that have the benefit of the first-priority liens are outstanding, any of the following actions that may be taken in respect of the collateral will be at the direction of the holders of the obligations secured by the first-priority liens:
• the ability to cause the commencement of enforcement proceedings against the collateral;
• the ability to control the conduct of such proceedings;
• the approval of amendments to collateral documents;
• releases of liens on the collateral; and
• waivers of past defaults under collateral documents.
We may not have the ability to control or direct such actions, even if our rights are adversely affected. In addition, a bankruptcy court may choose not to enforce an intercreditor agreement or other agreement with creditors.
We may also make unsecured loans to portfolio companies, meaning that such loans will not benefit from any interest in collateral of such companies. Liens on such portfolio companies’ collateral, if any, will secure the portfolio company’s obligations under its outstanding secured debt and may secure certain future debt that is permitted to be incurred by the portfolio company under its secured loan agreements. The holders of obligations secured by such liens will generally control the liquidation of, and be entitled to receive proceeds from, any realization of such collateral to repay their obligations in full before us. In addition, the value of such collateral in the event of liquidation will depend on market and economic conditions, the availability of buyers and other factors. There can be no assurance that the proceeds, if any, from sales of such collateral would be sufficient to satisfy our unsecured loan obligations after payment in full of all secured loan obligations. If such proceeds were not sufficient to repay the outstanding secured loan obligations, then our unsecured claims would rank equally with the unpaid portion of such secured creditors’ claims against the portfolio company’s remaining assets, if any.
We may also make subordinated investments that rank below other obligations of the obligor in right of payment. Subordinated investments are generally more volatile than secured loans and are subject to greater risk of default than senior obligations as a result of adverse changes in the financial condition of the obligor or in general economic conditions. If we make a subordinated investment in a portfolio company, the portfolio company may be highly leveraged, and its relatively high loan-to-value ratio may create increased risks that its operations might not generate sufficient cash flow to service all of its debt obligations.
Our portfolio may be exposed in part to one or more specific industries, which may subject us to a risk of significant loss in a particular investment or investments if there is a downturn in that particular industry.
Our portfolio may be exposed in part to one or more specific industries. A downturn in any particular industry in which we are invested could significantly impact the aggregate returns we realize. If an industry in which we have significant investments suffers from adverse business or economic conditions, as these industries have to varying degrees, a material portion of our investment portfolio could be affected adversely, which, in turn, could adversely affect our financial position and results of operations.
For example, as of December 31, 2024, our largest industry concentrations of our total investments at fair value were in the Finance and Insurance industry, which represented 18.7%; and Medical Devices industry, which represented approximately 10.0%. Therefore, we are susceptible to the economic circumstances and market conditions in these industries, and a downturn in one or more of these industries could have a material adverse effect on our results of operations and financial condition.
Our investments in the finance and insurance industry may be subject to certain risks, including risks related to complex federal and state laws governing such industry and the risk that regulatory authorities in the jurisdictions in which these products are offered will seek to regulate or restrict these products.
Our investments in the medical device industry may be subject to certain risks, including the risk that new legislation could have a material effect on the business and operations of some of our portfolio companies by increasing their compliance and other costs of doing business, requiring significant systems enhancements, or rendering their products or services less profitable or obsolete. In particular, the Food and Drug Administration (“FDA”), has established regulations, guidelines and policies to govern the development and approval of pharmaceuticals and medical devices, as have foreign regulatory authorities. Any change in regulatory requirements due to the adoption by the FDA and/or foreign regulatory authorities of new legislation, regulations, or policies may require some of our portfolio companies to amend existing clinical trial protocols or add new clinical trials to comply with these changes. Such amendments to existing protocols and/or clinical trial applications or the need for new ones, may significantly impact the cost, timing and completion of the clinical trials. Also, may have adverse effects on certain healthcare sub-sectors due to changes in payer-mix, patient volumes, as well as other changes to the current law.
We may invest in technology-related companies that do not have venture capital or private equity firms as equity investors, and these companies may entail a higher risk of loss than do companies with institutional equity investors, which could increase the risk of loss of our investment.
Our portfolio companies may require substantial additional equity financing to satisfy their continuing working capital and other cash requirements and, in most instances, to service the interest and principal payments on our investment. Portfolio companies that do not have venture capital or private equity investors may be unable to raise any additional capital to satisfy their obligations or to raise sufficient additional capital to reach the next stage of development. Portfolio companies that do not have venture capital or private equity investors may be less financially sophisticated and may not have access to independent members to serve on their boards, which means that they may be less successful than portfolio companies sponsored by venture capital or private equity firms. Accordingly, financing these types of companies may entail a higher risk of loss than would financing companies that are sponsored by venture capital or private equity firms.
We invest through joint ventures.
We hold a portion of our investments through the JV and may, from time to time, hold a portion of our investments through partnerships, joint ventures, securitization vehicles or other entities with third-party investors (collectively, “joint ventures”). Joint venture investments involve various risks, including the risk that we will not be able to implement investment decisions or exit strategies because of limitations on our control under applicable agreements with joint venture partners, the risk that a joint venture partner may become bankrupt or may at any time have economic or business interests or goals that are inconsistent with ours, the risk that a joint venture partner may be in a position to take action contrary to our objectives, the risk of liability based upon the actions of a joint venture partner and the risk of disputes or litigation with such partner and the inability to enforce fully all rights (or the incurrence of additional risk in connection with enforcement of rights) one partner may have against the other, including in connection with foreclosure on partner loans, because of risks arising under state law. In addition, we may, in certain cases, be liable for actions of our joint venture partners. The joint ventures in which we participate may sometimes be allocated investment opportunities that might have otherwise gone entirely to us, which may reduce our return on equity. Additionally, our joint venture investments may be held on an unconsolidated basis and at times may be highly leveraged. Such leverage would not count toward the investment limits imposed on us by the 1940 Act.
We are subject to risks associated with investing alongside other third parties.
We have invested in the JV and other entities and may in the future invest alongside third parties through additional joint ventures, partnerships or other entities. Such investments may involve risks not present in investments where a third party is not involved, including the possibility that such third party may at any time have economic or business interests or goals which are inconsistent with ours, or may be in a position to take action contrary to our investment objectives. In addition, we may in certain circumstances be liable for actions of such third party.
More specifically, joint ventures involve a third party that has approval rights over activity of the joint venture. The third party may take actions that are inconsistent with our interests. For example, the third party may decline to approve an investment for the joint venture that we otherwise want the joint venture to make. A joint venture may also use investment leverage which magnifies the potential for gain or loss on amounts invested. Generally, the amount of borrowing by the joint venture is not included when calculating our total borrowing and related leverage ratios and is not subject to asset coverage requirements imposed by the 1940 Act. If the activities of the joint venture were required to be consolidated with our activities because of a change in rules governing U.S. generally accepted accounting principles (“GAAP”) or SEC staff interpretations, it is likely that we would have to reorganize any such joint venture.
Our relationship with certain portfolio companies may expose us to our portfolio companies’ trade secrets and confidential information which may require us to be parties to non-disclosure agreements and restrict us from engaging in certain transactions.
Our relationship with some of our portfolio companies may expose us to our portfolio companies’ trade secrets and confidential information (including transactional data and personal data about their employees and clients) which may require us to be parties to non-disclosure agreements and restrict us from engaging in certain transactions. Unauthorized access or disclosure of such information may occur, resulting in theft, loss or other misappropriation. Any theft, loss, improper use, such as insider trading or other misappropriation of confidential information could have a material adverse impact on our competitive positions, our relationship with our portfolio companies and our reputation and could subject us to regulatory inquiries, enforcement and fines, civil litigation (which may cause us to incur significant expense or expose us to losses) and possible financial liability or costs.
Our investments in portfolio companies may expose us to environmental risks.
We may invest in portfolio companies that are subject to changing and increasingly stringent environmental and health and safety laws, regulations and permit requirements and environmental costs that could place increasing financial burdens on such portfolio entities. Required expenditures for environmental compliance may adversely impact investment returns on portfolio companies. The imposition of new environmental and other laws, regulations and initiatives could adversely affect the business operations and financial stability of such portfolio companies.
There can be no guarantee that all costs and risks regarding compliance with environmental laws and regulations can be identified. New and more stringent environmental and health and safety laws, regulations and permit requirements or stricter interpretations of current laws or regulations could impose substantial additional costs on our portfolio companies. Compliance with such current or future environmental requirements does not ensure that the operations of the portfolio companies will not cause injury to the environment or to people under all circumstances or that the portfolio companies will not be required to incur additional unforeseen environmental expenditures. Moreover, failure to comply with any such requirements could have a material adverse effect on a portfolio company, and we can offer no assurance that any such portfolio companies will at all times comply with all applicable environmental laws, regulations and permit requirements.
The majority of our portfolio companies will need multiple rounds of additional financing to repay their debts to us and continue operations. Our portfolio companies may not be able to raise additional financing, which could harm our investment returns.
The majority of our portfolio companies will often require substantial additional equity financing to satisfy their continuing working capital and other cash requirements and, in most instances, to service the interest and principal payments on our investment. Each round of venture financing is typically intended to provide a company with only enough capital to reach the next stage of development. We cannot predict the circumstances or market conditions under which our portfolio companies will seek additional capital. It is possible that one or more of our portfolio companies will not be able to raise additional financing or may be able to do so only at a price or on terms unfavorable to us, either of which would negatively impact our investment returns. Some of these companies may be unable to obtain sufficient financing from private investors, public capital markets or traditional lenders. This may have a significant impact if the companies are unable to obtain certain federal, state or foreign agency approval for their products or the marketing thereof, of if regulatory review processes extend longer than anticipated, and the companies need continued funding for their operations during these times. Accordingly, financing these types of companies may entail a higher risk of loss than would financing companies that are able to utilize traditional credit sources.
If our portfolio companies are unable to commercialize their technologies, products, business concepts or services, the returns on our investments could be adversely affected.
The value of our investments in our portfolio companies may decline if they are not able to commercialize their technology, products, business concepts or services. Additionally, although some of our portfolio companies may already have a commercially successful product or product line at the time of our investment, information technology, e-commerce, life science, and energy technology-related products and services often have a more limited market or life span than products in other industries. Thus, the ultimate success of these companies often depends on their ability to continually innovate in increasingly competitive markets. If they are unable to do so, our investment returns could be adversely affected and their ability to service their debt obligations to us over the term of the loan could be impaired. Our portfolio companies may be unable to acquire or develop any new products successfully, and the intellectual property they currently hold may not remain viable. Even if our portfolio companies are able to develop commercially viable products, the market for new products and services is highly competitive and rapidly changing. Neither our portfolio companies nor we will have any control over the pace of technology development. Commercial success is difficult to predict, and the marketing efforts of our portfolio companies may not be successful.
If our portfolio companies are unable to protect their intellectual property rights, our business and prospects could be harmed, and if portfolio companies are required to devote significant resources to protecting their intellectual property rights, the value of our investment could be reduced.
Our future success and competitive position will depend in part upon the ability of our portfolio companies to obtain, maintain and protect proprietary technology used in their products and services. Our portfolio companies will rely, in part, on patent, trade secret, and trademark law to protect that technology, but competitors may misappropriate their intellectual property, and disputes as to ownership of intellectual property may arise. Portfolio companies may, from time to time, be required to institute litigation to enforce their patents, copyrights, or other intellectual property rights; protect their trade secrets; determine the validity and scope of the proprietary rights of others; or defend against claims of infringement. Such litigation could result in substantial costs and diversion of resources. Similarly, if a portfolio company is found to infringe or misappropriate a third-party’s patent or other proprietary rights, it could be required to pay damages to the third-party, alter its products or processes, obtain a license from the third-party, and/or cease activities utilizing the proprietary rights, including making or selling products utilizing the proprietary rights. Any of the foregoing events could negatively affect both the portfolio company’s ability to service our debt investment and the value of any related debt and equity securities that we own, as well as any collateral securing our investment.
The lack of liquidity in our investments may adversely affect our business.
All or a substantial portion of our assets may be invested in illiquid securities, and a substantial portion of our investments in leveraged companies will be subject to legal and other restrictions on resale or will otherwise be less liquid than more broadly traded public securities. The illiquidity of these investments may make it difficult for us to sell such investments when desired. In addition, if we are required to liquidate all or a portion of our portfolio quickly, we may realize significantly less than the value at which we have previously recorded these investments. As a result, we do not expect to achieve liquidity in our investments in the near-term. However, to pay distributions to our stockholders and to maintain the election to be regulated as a BDC and qualify as a RIC, we may have to dispose of investments if we do not satisfy one or more of the applicable criteria under the respective regulatory frameworks. We may also face other restrictions on our ability to liquidate an investment in a portfolio company to the extent that we have material nonpublic information regarding such portfolio company or we become subject to trading restrictions under the internal trading policies of those companies as a result of applicable law or regulations.
Price declines and illiquidity in the corporate debt markets may adversely affect the fair value of our portfolio investments, reducing our net asset value through increased net unrealized depreciation.
As a BDC, we are required to carry our investments at market value or, if no market value is ascertainable, at fair value as determined in good faith by the Board. When an external event such as a purchase transaction, public offering or subsequent equity sale occurs, we use the pricing indicated by the external event to corroborate our valuation. We record decreases in the market values or fair values of our investments as unrealized depreciation. Declines in prices and liquidity in the corporate debt markets may result in significant net unrealized depreciation in our portfolio. The effect of all of these factors on our portfolio may reduce our net asset value by increasing net unrealized depreciation in our portfolio. Depending on market conditions, we could incur substantial realized losses and may suffer additional unrealized losses in future periods, which could have a material adverse effect on our business, financial condition and results of operations.
Our portfolio companies may prepay loans, which prepayment may reduce stated yields if capital returned cannot be invested in transactions with equal or greater expected yields.
The loans that will underlie our portfolio may be callable at any time, and many of them can be repaid with no premium to par. It is not clear at this time when or if any loan might be called. Whether a loan is called will depend both on the continued positive performance of the portfolio company and the existence of favorable financing market conditions that allow such company the ability to replace existing financing with less expensive capital. As market conditions change frequently, it is unknown when, and if, this may be possible for each portfolio company. Risks associated with owning loans include the fact that prepayments may occur at any time, sometimes without premium or penalty, and that the exercise of prepayment rights during periods of declining spreads could cause us to reinvest prepayment proceeds in lower-yielding instruments. In the case of some of these loans, having the loan called early may reduce our achievable yield if the capital returned cannot be invested in transactions with equal or greater expected yields, especially during periods of declining interest rates in the broader market.
To the extent original issue discount (“OID”) and PIK interest constitute a portion of our income, we will be exposed to typical risks associated with such income being required to be included in taxable and accounting income prior to receipt of cash representing such income.
Our investments may include OID and PIK instruments. To the extent OID and PIK constitutes a portion of our income, we will be exposed to typical risks associated with such income being required to be included in taxable and accounting income prior to receipt of cash, including the following:
•We must include in income each year a portion of the OID that accrues over the life of the obligation, regardless of whether cash representing such income is received by us in the same taxable year. Because any OID or other amounts accrued will be included in investment company taxable income for the year of the accrual, we may be required to make a distribution to our stockholders in order to satisfy our annual distribution requirements, even though we will not have received any corresponding cash amount. As a result, we may have to sell some of our investments at times or at prices that would not be advantageous to us, raise additional debt or equity capital or forgo new investment opportunities.
•The higher yield of OID instruments reflects the payment deferral and credit risk associated with these instruments.
•Even if the accounting conditions for income accrual are met, the borrower could still default when our actual collection is supposed to occur at the maturity of the obligation.
•OID instruments may have unreliable valuations because their continuing accruals require continuing judgments about the collectability of the deferred payments and the value of any associated collateral.
•OID instruments generally represent a significantly higher credit risk than coupon loans.
•OID income received by us may create uncertainty about the source of our cash distributions to stockholders. For accounting purposes, any cash distributions to stockholders representing OID or market discount income are not treated as coming from paid-in capital, even though the cash to pay them comes from the offering proceeds. Thus, although a distribution of OID or market discount interest comes from the cash invested by the stockholders, Section 19(a) of the 1940 Act does not require that stockholders be given notice of this fact by reporting it as a return of capital.
•The deferral of PIK interest has a negative impact on liquidity, as it represents non-cash income that may require distribution of cash dividends to shareholders in order to maintain our RIC tax treatment. In addition, the deferral of PIK interest also increases the loan-to-value (“LTV”) ratio at a compounding rate, thus, increasing the risk that we will absorb a loss in the event of foreclosure.
Our failure to make follow-on investments in our portfolio companies could impair the value of our portfolio.
Following an initial investment in a portfolio company, we may make additional investments in that portfolio company as “follow-on” investments in order to attempt to preserve or enhance the value of our initial investment. We have discretion to make follow-on investments, subject to the availability of capital resources and the provisions of the 1940 Act. Failure on our part to make follow-on investments may, in some circumstances, jeopardize the continued viability of a portfolio company and our initial investment, or may result in a missed opportunity for us to increase our participation in a successful operation. Even if we have sufficient capital to make a desired follow-on investment, we may elect not to make a follow-on investment because we may not want to increase our level of risk, because we prefer other opportunities or because we are inhibited by compliance with BDC requirements or the desire to maintain our RIC status.
Because we will not hold controlling equity interests in the majority of our portfolio companies, we may not be able to exercise control over our portfolio companies or prevent decisions by management of our portfolio companies, which could decrease the value of our investments.
We do not expect to hold controlling equity positions in the majority of our portfolio companies. Our debt investments may provide limited control features such as restrictions on the ability of a portfolio company to assume additional debt or to use the proceeds of our investment for other than certain specified purposes. “Control” under the 1940 Act is presumed at more than 25% equity ownership and may also be present at lower ownership levels where we provide managerial assistance. When we do not acquire a controlling equity position in a portfolio company, we may be subject to the risk that a portfolio company may make business decisions with which we disagree, and that the management and/or stockholders of a portfolio company may take risks or otherwise act in ways that are adverse to our interests. Due to the lack of liquidity of the debt and equity and equity-related investments that we typically hold in our portfolio companies, we may not be able to dispose of our investments in the event we disagree with the actions of a portfolio company and may therefore suffer a decrease in the value of our investments.
Loans may become non-performing for a variety of reasons.
A loan or debt obligation may become non-performing for a variety of reasons. Such non-performing loans may require substantial workout negotiations or restructuring that may entail, among other things, a substantial reduction in the interest rate, a substantial write-down of the principal amount of the loan and/or the deferral of payments. In addition, such negotiations or restructuring may be quite extensive and protracted over time, and therefore may result in substantial uncertainty with respect to the ultimate recovery. We may also incur additional expenses to the extent that it is required to seek recovery upon a default on a loan or participate in the restructuring of such obligation. The liquidity for defaulted loans may be limited, and to the extent that defaulted loans are sold, it is highly unlikely that the proceeds from such sale will be equal to the amount of unpaid principal and interest thereon. In connection with any such defaults, workouts or restructuring, although we exercise voting rights with respect to an individual loan, we may not be able to exercise votes in respect of a sufficient percentage of voting rights with respect to such loan to determine the outcome of such vote.
Defaults by our portfolio companies will harm our operating results.
A portfolio company’s failure to satisfy financial or operating covenants imposed by us or other lenders could lead to defaults and, potentially, termination of its loans and foreclosure on its assets. This could trigger cross-defaults under other agreements and jeopardize such portfolio company’s ability to meet its obligations under the debt or equity securities that we hold. We may incur expenses to the extent necessary to seek recovery upon default or to negotiate new terms, which may include the waiver of certain financial covenants, with a defaulting portfolio company. In addition, we have invested in and may in the future invest in or obtain significant exposure to “covenant-lite” loans. Generally, covenant-lite loans provide borrower companies more freedom to negatively impact lenders because their covenants are incurrence-based, which means they are only tested and can only be breached following an affirmative action of the borrower, rather than by a deterioration in the borrower’s financial condition. Accordingly, because we invest in and have exposure to covenant-lite loans, we may have fewer rights against a borrower and may have a greater risk of loss on such investments as compared to investments in or exposure to loans with financial maintenance covenants.
Further, many of our investments will likely have a principal amount outstanding at maturity, which could result in a substantial loss to us if the borrower is unable to refinance or repay.
Inflation may adversely affect the business, results of operations and financial condition of our portfolio companies.
Certain of our portfolio companies may be impacted by inflation. If such portfolio companies are unable to pass any increases in their costs along to their customers, it could adversely affect their results and impact their ability to pay interest and principal on our loans. In addition, any projected future decreases in our portfolio companies’ operating results due to inflation could adversely impact the fair value of those investments. Any decreases in the fair value of our investments could result in future unrealized losses and therefore reduce our net assets resulting from operations. See “—We are exposed to risks associated with changes in interest rates, including the current rising interest rate environment.”
The disposition of our investments may result in contingent liabilities.
A significant portion of our investments may involve private securities. In connection with the disposition of an investment in private securities, we may be required to make representations about the business and financial affairs of the portfolio company typical of those made in connection with the sale of a business. We may also be required to indemnify the purchasers of such investment to the extent that any such representations turn out to be inaccurate or with respect to potential liabilities. These arrangements may result in contingent liabilities that ultimately result in funding obligations that we must satisfy through our return of distributions previously made to us.
We may not realize gains from our equity and equity-related investments.
We have made, and may in the future, make investments that include warrants or other equity or equity-related securities. In addition, we have made, and may from time to time make, non-control, equity co-investments in companies in conjunction with private equity sponsors. Our goal is ultimately to realize gains upon our disposition of such equity and equity-related interests. However, the equity and equity-related interests we receive may not appreciate in value and, in fact, may decline in value. Accordingly, we may not be able to realize gains from our equity and equity-related interests, and any gains that we do realize on the disposition of any equity and equity-related interests may not be sufficient to offset any other losses we experience. We also may be unable to realize any value if a portfolio company does not have a liquidity event, such as a sale of the business, recapitalization or public offering, which would allow us to sell the underlying equity interests. We often seek puts or similar rights to give us the right to sell our equity and equity-related securities back to the portfolio company issuer. We may be unable to exercise these put rights for the consideration provided in our investment documents if the issuer is in financial distress.
We may be subject to additional risks if we engage in hedging transactions and/or invest in foreign securities.
The 1940 Act generally requires that 70% of our investments be in issuers each of whom, in addition to other requirements, is organized under the laws of, and has its principal place of business in, any state of the United States, the District of Columbia, Puerto Rico, the Virgin Islands or any other possession of the United States. Our investment strategy does not contemplate a significant number of investments in securities of non-U.S. companies. We expect that these investments would focus on the same investments that we make in U.S. growth-oriented companies and, accordingly, would be complementary to our overall strategy and enhance the diversity of our holdings.
Investing in foreign companies may expose us to additional risks not typically associated with investing in U.S. companies. These risks include changes in exchange control regulations, political and social instability, expropriation, imposition of foreign taxes (potentially at confiscatory levels), less liquid markets, less available information than is generally the case in the U.S., higher transaction costs, less government supervision of exchanges, brokers and issuers, less developed bankruptcy laws, difficulty in enforcing contractual obligations, lack of uniform accounting and auditing standards and greater price volatility.
Although we expect that all or substantially all of our investments will be U.S. dollar denominated, any investments denominated in a foreign currency will be subject to the risk that the value of a particular currency will change in relation to one or more other currencies. Among the factors that may affect currency values are trade balances, the level of short-term interest rates, differences in relative values of similar assets in different currencies, long-term opportunities for investment and capital appreciation and political developments. As discussed below, we may employ hedging techniques to minimize these risks, but we cannot assure you that such strategies will be effective or without risk to us.
To the extent that these investments are denominated in a foreign currency, we may engage in hedging transactions. Engaging in either hedging transactions or investing in foreign securities would entail additional risks to our stockholders. We may, for example, use instruments such as interest rate swaps, caps, collars and floors, forward contracts or currency options or borrow under a credit facility in foreign currencies to minimize our foreign currency exposure. In each such case, we generally would seek to hedge against fluctuations of the relative values of our portfolio positions from changes in market interest rates or currency exchange rates. Hedging against a decline in the values of our portfolio positions would not eliminate the possibility of fluctuations in the values of such positions or prevent losses if the values of the positions declined. However, such hedging could establish other positions designed to gain from those same developments, thereby offsetting the decline in the value of such portfolio positions. Such hedging transactions could also limit the opportunity for gain if the values of the underlying portfolio positions increased. Moreover, it might not be possible to hedge against an exchange rate or interest rate fluctuation that was so generally anticipated that we would not be able to enter into a hedging transaction at an acceptable price.
While we may enter into such transactions to seek to reduce currency exchange rate and interest rate risks, unanticipated changes in currency exchange rates or interest rates could result in poorer overall investment performance than if we had not engaged in any such hedging transactions. In addition, the degree of correlation between price movements of the instruments used in a hedging strategy and price movements in the portfolio positions being hedged could vary. Moreover, for a variety of reasons, we might not seek to establish a perfect correlation between the hedging instruments and the portfolio holdings being hedged. Any such imperfect correlation could prevent us from achieving the intended hedge and expose us to risk of loss. In addition, it might not be possible to hedge fully or perfectly against currency fluctuations affecting the value of securities denominated in non-U.S. currencies because the value of those securities would likely fluctuate as a result of factors not related to currency fluctuations. In addition, income derived from hedging transactions that is distributed to non-U.S. stockholders may be subject to U.S. federal withholding tax. Changes to the regulations applicable to the financial instruments we use to accomplish our hedging strategy could affect the effectiveness of that strategy. See “—We are exposed to risks associated with changes in interest rates, including the current rising interest rate environment.”
The market structure applicable to derivatives imposed by the Dodd-Frank Act, the U.S. Commodity Futures Trading Commission (“CFTC”) and the SEC may affect our ability to use over-the-counter (“OTC”) derivatives for hedging purposes.
The Dodd-Frank Act and the CFTC enacted and the SEC has issued rules to implement, both broad new regulatory requirements and broad new structural requirements applicable to OTC derivatives markets and, to a lesser extent, listed commodity futures (and futures options) markets. Similar changes are in the process of being implemented in other major financial markets.
The CFTC and the SEC have issued final rules establishing that certain swap transactions are subject to CFTC regulation. Engaging in such swap or other commodity interest transactions such as futures contracts or options on futures contracts may cause us to fall within the definition of “commodity pool” under the Commodity Exchange Act and related CFTC regulations. We have claimed relief from CFTC registration and regulation as a commodity pool operator with respect to our operations, with the result that we are limited in our ability to use futures contracts or options on futures contracts or engage in swap transactions. Specifically, we are subject to strict limitations on using such derivatives other than for hedging purposes, whereby the use of derivatives not used solely for hedging purposes is generally limited to situations where (i) the aggregate initial margin and premiums required to establish such positions does not exceed five percent of the liquidation value of our portfolio, after taking into account unrealized profits and unrealized losses on any such contracts we have entered into; or (ii) the aggregate net notional value of such derivatives does not exceed 100% of the liquidation value of our portfolio.
The Dodd-Frank Act also imposed requirements relating to real-time public and regulatory reporting of OTC derivative transactions, enhanced documentation requirements, position limits on an expanded array of derivatives, and record keeping requirements. Taken as a whole, these changes could significantly increase the cost of using uncleared OTC derivatives to hedge risks, including interest rate and foreign exchange risk; reduce the level of exposure we are able to obtain for risk management purposes through OTC derivatives (including as the result of the CFTC imposing position limits on additional products); reduce the amounts available to us to make non-derivatives investments; impair liquidity in certain OTC derivatives; and adversely affect the quality of execution pricing obtained by us, all of which could adversely impact our investment returns.
Our ability to enter into transactions involving derivatives and financial commitment transactions may be limited.
In August 2022, Rule 18f-4 under the 1940 Act, regarding the ability of a BDC (or a registered investment company) to use derivatives and other transactions that create future payment or delivery obligations, became effective. Under this rule, BDCs that use derivatives will be subject to a value-at-risk (“VaR”) leverage limit, certain other derivatives risk management program and testing requirements and requirements related to board reporting. These requirements will apply unless the BDC qualifies as a “limited derivatives user,” as defined in Rule 18f-4. Under the rule, a BDC may enter into an unfunded commitment agreement that is not a derivatives transaction, such as an agreement to provide financing to a portfolio company, if the BDC has, among other things, a reasonable belief, at the time it enters into such an agreement, that it will have sufficient cash and cash equivalents to meet its obligations with respect to all of its unfunded commitment agreements, in each case as it becomes due. We currently operate as a “limited derivatives user” which may limit our ability to use derivatives and/or enter into certain other financial contracts.
We may be subject to risks related to bank impairments or failures either directly or through our portfolio companies, which, in turn, could indirectly impact our performance and results of operations.
In March 2023, the U.S. Federal Deposit Insurance Corporation (“FDIC”) took control of Silicon Valley Bank and Signature Bank, and in May 2023, the FDIC took control of First Republic Bank due to liquidity concerns. The impairment or failure of one or more banks with whom any of our portfolio companies transact may inhibit the ability of our portfolio companies to access depository accounts, investment accounts or credit facilities at such banks, which, in turn, may cause them to default on their debt obligations to us, resulting in impacts to our performance. In the event of such a failure of a banking institution where one or more of our portfolio companies holds depository accounts, access to such accounts could be restricted and FDIC protection may not be available for balances in excess of amounts insured by the FDIC. In such instances, our affected portfolio companies may not be able to recover such excess, uninsured amounts, and they may not be able to cure any defaults. Additionally, unfavorable economic conditions also could increase our funding costs, limit our access to the capital markets or result in a decision by lenders not to extend credit to us. These events could prevent us from increasing our investments and harm business, financial condition, operating results and prospects. We closely monitor activity in the banking sector as it relates to any of our borrowers and continually assess any potential indirect impact to us as a result of the same.
Risks Related to an Investment in Our Common Stock
Investing in our common stock may involve an above-average degree of risk.
The investments we make in accordance with our investment objective may result in a higher amount of risk than alternative investment options and a higher risk of volatility or loss of principal. Our investments in portfolio companies may be highly speculative and aggressive and, therefore, an investment in our common stock may not be suitable for someone with lower risk tolerance.
We may not be able to pay distributions, our distributions may not grow over time and/or a portion of our distributions may be a return of capital.
We intend to pay distributions to our stockholders out of assets legally available for distribution. We cannot assure you that we will achieve investment results that will allow us to sustain a specified level of cash distributions or make periodic increases in cash distributions. Our ability to pay distributions might be adversely affected by, among other things, the impact of one or more of the risk factors described herein. If we declare a dividend, and if enough stockholders opt to receive cash distributions rather than participate in our distribution reinvestment plan, we may be forced to sell some of our investments in order to make cash dividend payments. In addition, the inability to satisfy the asset coverage test applicable to us as a BDC could limit our ability to pay distributions. All distributions will be paid at the discretion of the Board and will depend on our earnings, our financial condition, maintenance of our RIC status, compliance with applicable BDC regulations and such other factors as the Board may deem relevant from time to time. We cannot assure you that we will pay distributions to our stockholders.
When we make distributions, we will be required to determine the extent to which such distributions are paid out of current or accumulated earnings and profits. Distributions in excess of current and accumulated earnings and profits will be treated as a non-taxable return of capital to the extent of an investor’s adjusted tax basis in our stock and, assuming that an investor holds our stock as a capital asset, thereafter as a capital gain.
Provisions of the Maryland General Corporation Law (the “MGCL”) and our Charter and Bylaws could deter takeover attempts and have an adverse effect on the price of our common stock.
The MGCL and our Charter and Bylaws contain provisions that may discourage, delay or make more difficult a change in control of us or the removal of our directors. We are subject to the Maryland Business Combination Act, subject to any applicable requirements of the 1940 Act. The Board has adopted a resolution exempting from the Maryland Business Combination Act any business combination between us and any other person, subject to prior approval of such business combination by the Board, including approval by a majority of our independent directors. If the resolution exempting business combinations is repealed or the Board does not approve a business combination, the Maryland Business Combination Act may discourage third parties from trying to acquire control of us and increase the difficulty of consummating such an offer. In addition, we may amend our Bylaws to be subject to the Maryland Control Share Acquisition Act, but only if the Board determines that it would be in our best interests, including in light of the Board’s fiduciary obligations, applicable federal and state laws, and the particular facts and circumstances surrounding the Board’s decision. If such conditions are met, and we amend our Bylaws to repeal the exemption from the Maryland Control Share Acquisition Act, the Maryland Control Share Acquisition Act also may make it more difficult for a third party to obtain control of us and increase the difficulty of consummating such a transaction.
We have adopted certain measures that may make it difficult for a third-party to obtain control of us, including provisions of our Charter classifying the Board in three staggered terms and authorizing the Board to classify or reclassify shares of our capital stock in one or more classes or series and to cause the issuance of additional shares of our stock. These provisions, as well as other provisions of our Charter and Bylaws, may delay, defer or prevent a transaction or a change in control that might otherwise be in the best interests of our stockholders.
Our Bylaws include an exclusive forum selection provision, which could limit our stockholders’ ability to obtain a favorable judicial forum for disputes with us or our directors, officers or other agents.
Our Bylaws require that, unless we consent in writing to the selection of an alternative forum, the Circuit Court for Baltimore City (or, if that court does not have jurisdiction, the United States District Court for the District of Maryland, Northern Division) shall be the sole and exclusive forum for (i) any derivative action or proceeding brought on behalf of the Company (ii) any action asserting a claim of breach of any standard of conduct or legal duty owed by any of the Company’s director, officer or other agent to the Company or to its stockholders, (iii) any action asserting a claim arising pursuant to any provision of the MGCL or the Charter or the Bylaws (as either may be amended from time to time), or (iv) any action asserting a claim governed by the internal affairs doctrine.
This exclusive forum selection provision in our Bylaws will not apply to claims arising under the federal securities laws, including the Securities Act and the Exchange Act. There is uncertainty as to whether a court would enforce such a provision, and investors cannot waive compliance with the federal securities laws and the rules and regulations thereunder. In addition, this provision may increase costs for stockholders in bringing a claim against us or our directors, officers or other agents. Any investor purchasing or otherwise acquiring our shares is deemed to have notice of and consented to the foregoing provision.
The exclusive forum selection provision in our Bylaws may limit our stockholders’ ability to obtain a favorable judicial forum for disputes with us or our directors, officers or other agents, which may discourage lawsuits against us and such persons. It is also possible that, notwithstanding such exclusive forum selection provision, a court could rule that such provision is inapplicable or unenforceable. If this occurred, we may incur additional costs associated with resolving such action in another forum, which could materially adversely affect our business, financial condition and results of operations.
We cannot assure you that a market for our common stock will continue, which would adversely affect the liquidity and price of our common stock.
Our common stock began trading on the Nasdaq Global Select Market under the symbol “TRIN” on January 29, 2021. We cannot assure you that an active trading market can be sustained. In addition, we cannot predict the prices at which our common stock will trade. Shares of closed-end investment companies, including BDCs, frequently trade at a discount from their net asset value and our stock may also be discounted in the market. This characteristic of closed-end investment companies is separate and distinct from the risk that our net asset value per share of common stock may decline. We cannot predict whether our common stock will trade at, above or below net asset value. In addition, if our common stock trades below its net asset value, we will generally not be able to sell additional shares of our common stock to the public at its market price without first obtaining the approval of a majority of our stockholders (including a majority of our unaffiliated stockholders) and our independent directors for such issuance.
A stockholder’s interest in us will be diluted if additional shares of our common stock are issued in the future, which could reduce the overall value of an investment in us.
Our stockholders do not have preemptive rights to purchase any shares we issue in the future. Our charter authorizes us to issue up to 200 million shares of common stock. Pursuant to our charter, a majority of our entire Board may amend our charter to increase the number of shares of common stock we may issue without stockholder approval. If we raise additional funds by issuing shares or senior securities convertible into, or exchangeable for, shares, then the percentage ownership of our stockholders at that time will decrease and they will experience dilution, including upon the exercise of such convertible securities. Depending upon the terms and pricing of any future offerings and the value of our investments, stockholders’ may also experience dilution in the book value and fair value of their shares.
Under the 1940 Act, we generally are prohibited from issuing or selling our common stock at a price below net asset value per share, which may be a disadvantage as compared with certain public companies. We may, however, sell our common stock, or warrants, options, or rights to acquire our common stock, at a price below the current net asset value of our common stock if our Board and independent directors determine that such sale is in our best interests and the best interests of our stockholders, and our stockholders, including a majority of those stockholders that are not affiliated with us, approve such sale. We may from time to time seek such approval so that we have the flexibility to issue up to 25% of our then outstanding shares of common stock at a price below the current net asset value per share. In any such case, the price at which our securities are to be issued and sold may not be less than a price that, in the determination of our Board, closely approximates the fair value of such securities (less any distributing commission or discount).
If we were to issue or sell shares of our common stock at a price below our net asset value per share, such sales would result in an immediate dilution to our net asset value per share and pose a risk of dilution to our stockholders. In particular, stockholders who do not purchase additional shares at or below such discounted price in proportion to their current ownership will experience an immediate decrease in net asset value per share (as well as in the aggregate net asset value of their shares if they do not participate at all). These stockholders will also experience a disproportionately greater decrease in their participation in our earnings and assets and their voting power than the increase we experience in our assets, potential earning power and voting interests from such issuance or sale. In addition, such issuances or sales may adversely affect the price at which our common stock trades. Because the number of shares of common stock that could be so issued and the timing of any issuance is not currently known, the actual dilutive effect cannot be predicted.
Sales of substantial amounts of our common stock in the public market may have an adverse effect on the market price of our common stock.
Sales of substantial amounts of our common stock, or the perception that such sales could occur, could adversely affect the prevailing market prices for our common stock. If this occurs, it could impair our ability to raise additional capital through the sale of equity securities should we desire to do so. We cannot predict what effect, if any, future sales of securities, or the availability of securities for future sales, will have on the market price of our common stock prevailing from time to time.
The market value of our common stock may fluctuate significantly.
The market value and liquidity, if any, of the market for shares of our common stock may be significantly affected by numerous factors, some of which are beyond our control and may not be directly related to our operating performance. These factors include:
•changes in the value of our portfolio of investments and derivative instruments as a result of changes in market factors, such as interest rate shifts, and also portfolio specific performance, such as portfolio company defaults, among other reasons;
•changes in regulatory policies or tax guidelines, particularly with respect to RICs or BDCs;
•loss of RIC or BDC status;
•distributions that exceed our net investment income and net income as reported according to GAAP;
•changes in earnings or variations in operating results;
•changes in accounting guidelines governing valuation of our investments;
•any shortfall in revenue or net income or any increase in losses from levels expected by investors;
•departure of key personnel;
•general economic trends and other external factors; and
•loss of a major funding source.
If we issue preferred stock or convertible debt securities, the net asset value of our common stock may become more volatile.
We cannot assure you that the issuance of preferred stock and/or additional convertible debt securities would result in a higher yield or return to the holders of our common stock. The issuance of preferred stock or additional convertible debt would likely cause the net asset value of our common stock to become more volatile. If the dividend rate on the preferred stock, or the interest rate on the convertible debt securities, were to approach the net rate of return on our investment portfolio, the benefit of such leverage to the holders of our common stock would be reduced. If the dividend rate on the preferred stock, or the interest rate on the convertible debt securities, were to exceed the net rate of return on our portfolio, the use of leverage would result in a lower rate of return to the holders of common stock than if we had not issued the preferred stock or convertible debt securities. Any decline in the net asset value of our investment would be borne entirely by the holders of our common stock. Therefore, if the market value of our portfolio were to decline, the leverage would result in a greater decrease in net asset value to the holders of our common stock than if we were not leveraged through the issuance of preferred stock or debt securities. This decline in net asset value would also tend to cause a greater decline in the market price, if any, for our common stock.
There is also a risk that, in the event of a sharp decline in the value of our net assets, we would be in danger of failing to maintain required asset coverage ratios, which may be required by the preferred stock or convertible debt, or our current investment income might not be sufficient to meet the dividend requirements on the preferred stock or the interest payments on the debt securities. In order to counteract such an event, we might need to liquidate investments in order to fund the redemption of some or all of the preferred stock or convertible debt. In addition, we would pay (and the holders of our common stock would bear) all costs and expenses relating to the issuance and ongoing maintenance of the preferred stock, debt securities, convertible debt, or any combination of these securities. Holders of preferred stock or convertible debt may have different interests than holders of common stock and may at times have disproportionate influence over our affairs.
Stockholders may experience dilution in the net asset value of their shares if they do not participate in our distribution reinvestment plan and if our shares are trading at a discount to net asset value.
All distributions declared in cash payable to stockholders that are participants in our distribution reinvestment plan will generally be automatically reinvested in shares of our common stock if the investor does not elect to opt out of the plan. As a result, stockholders that opt out of our distribution reinvestment plan may experience accretion to the net asset value of their shares if our shares are trading at a premium to net asset value and dilution if our shares are trading at a discount to net asset value. The level of accretion or discount would depend on various factors, including the proportion of our stockholders who participate in the plan, the level of premium or discount at which our shares are trading and the amount of the distribution payable to stockholders.
Risks Related to the Notes and the Series A Notes
The Notes and the Series A Notes are unsecured and therefore are effectively subordinated to any secured indebtedness we have currently incurred or may incur in the future.
The Notes and the Series A Notes are not secured by any of our assets or any of the assets of our subsidiaries. As a result, the Notes and the Series A Notes are effectively subordinated, or junior, to any secured indebtedness or other obligations we or our subsidiaries have currently incurred, including under the KeyBank Credit Facility, and may incur in the future (or any indebtedness that is initially unsecured that we later secure) to the extent of the value of the assets securing such indebtedness. In any liquidation, dissolution, bankruptcy or other similar proceeding, the holders of any of our existing or future secured indebtedness and the secured indebtedness of our subsidiaries may assert rights against the assets pledged to secure that indebtedness in order to receive full payment of their indebtedness before the assets may be used to pay other creditors, including the holders of the Notes and the Series A Notes. Secured indebtedness, including the indebtedness under the KeyBank Credit Facility, is effectively senior to the Notes and the Series A Notes to the extent of the value of the assets securing such indebtedness.
The Notes and the Series A Notes are structurally subordinated to the indebtedness and other liabilities of our subsidiaries.
The Notes and the Series A Notes are obligations exclusively of Trinity Capital Inc. and not of any of our existing subsidiaries. None of our existing subsidiaries are a guarantor of the Notes and the Series A Notes, and the Notes are not required to be guaranteed by any subsidiaries we may acquire or create in the future. Although the Series A Notes are not currently guaranteed by any of our subsidiaries, the Series A Notes may be guaranteed by certain subsidiaries that we acquire or create in the future, pursuant to the term of the Note Purchase Agreement, dated October 1, 2024 (the “Note Purchase Agreement”). Any assets of any of our existing subsidiaries will not be directly available to satisfy the claims of our creditors, including the holders of the Notes and the Series A Notes. Except to the extent we are a creditor with recognized claims against our subsidiaries, all claims of creditors (including trade creditors) and holders of preferred stock, if any, of our subsidiaries will have priority over our equity interests in such subsidiaries and therefore the claims of our creditors, including holders of the Notes and the Series A Notes with respect to the assets of such subsidiaries. Even if we are recognized as a creditor of one or more of our subsidiaries, our claims would still be effectively subordinated to any security interests in the assets of any such subsidiary and to any indebtedness or other liabilities of any such subsidiary senior to our claims. Consequently, the Notes and the Series A Notes are structurally subordinated, or junior, to the KeyBank Credit Facility and all existing and future indebtedness and other obligations (including trade payables) incurred by any of our subsidiaries, financing vehicles or similar facilities and any subsidiaries, financing vehicles or similar facilities that we may in the future acquire or establish.
The respective indentures under which the Notes were issued contain limited protection for holders of such notes.
The respective indentures under which the Notes were issued offer limited protection to holders of such notes. The respective terms of such indentures and the Notes do not restrict our or any of our subsidiaries’ ability to engage in, or otherwise be a party to, a variety of corporate transactions, circumstances or events that could have an adverse impact on an investment in the Notes. In particular, the terms of such indentures and the Notes do not place any restrictions on our or our subsidiaries’ ability to:
•issue securities or otherwise incur additional indebtedness or other obligations, including (1) any indebtedness or other obligations that would be pari passu, or equal in right of payment, to the Notes, (2) any indebtedness or other obligations that would be secured and therefore rank effectively senior in right of payment to the Notes to the extent of the value of the assets securing such indebtedness, (3) indebtedness or other obligations of ours that are guaranteed by one or more of our subsidiaries and which therefore are structurally senior to the Notes and (4) securities, indebtedness or other obligations incurred by our subsidiaries that would be senior to our equity interests in our subsidiaries and therefore rank structurally senior to the Notes with respect to the assets of those subsidiaries, in each case other than an incurrence of indebtedness or other obligations that would cause a violation of Section 18(a)(1)(A) as modified by Section 61(a) of the 1940 Act or any successor provisions of the 1940 Act, but giving effect, in either case, to any exemptive relief granted to us by the SEC. Currently, these provisions generally prohibit us from incurring additional borrowings, including through the issuance of additional debt securities, unless our asset coverage, as defined in the 1940 Act, equals at least 150% after such borrowings;
•pay dividends on, or purchase or redeem or make any payments in respect of, capital stock or other securities ranking junior in right of payment to the Notes, including subordinated indebtedness, except that we have agreed that, for the period of time during which each of such notes are outstanding, we will not violate Section 18(a)(1)(B) as modified by such provisions of Section 61(a) of the 1940 Act as may be applicable to us from time to time or any successor provisions. These provisions generally prohibit us from declaring any cash dividend or distribution upon any class of our capital stock, or purchasing any such capital stock if our asset coverage were below 150% at the time of the declaration of the dividend or distribution or the purchase and after deducting the amount of such dividend, distribution, or purchase. Under this covenant, we will be permitted to declare a cash dividend or distribution notwithstanding the prohibition contained in Section 18(a)(1)(B) as modified by such provisions of Section 61(a) of the 1940 Act as may be applicable to us from time to time or any successor provisions, but only up to such amount as is necessary for us to maintain our status as a RIC under Subchapter M of the Code. Furthermore, this covenant will permit us to continue paying dividends or distributions and the restrictions will not apply unless and until such time as our asset coverage (as defined in the 1940 Act, except to the extent modified by this covenant) has not been in compliance with the minimum asset coverage required by Section 18(a)(1)(B) as modified by such provisions of Section 61(a) of the 1940 Act as may be applicable to us from time to time or any successor provisions for more than six consecutive months. For the purposes of determining “asset coverage” as used above, any and all indebtedness of the Company, including any outstanding borrowings under the KeyBank Credit Facility and any successor or additional credit facility, will be deemed a senior security of us;
•sell assets (other than certain limited restrictions on our ability to consolidate, merge or sell all or substantially all of our assets);
•create liens (including liens on the shares of our subsidiaries) or enter into sale and lease back transactions;
•enter into transactions with affiliates;
•create restrictions on the payment of dividends or other amounts to us from our subsidiaries.
In addition, under the indenture governing the March 2029 Notes and September 2029 Notes, we are not required to offer to purchase the March 2029 Notes or September 2029 Notes in connection with a change of control or any other event. See “We may not be able to repurchase either of the August 2026 Notes or the December 2026 Notes upon a Change of Control Repurchase Event.”
Furthermore, the Notes and the terms of their respective indentures do not protect holders of such notes in the event that we experience changes (including significant adverse changes) in our financial condition, results of operations or credit ratings, as they do not require that we or our subsidiaries adhere to any financial tests or ratios or specified levels of net worth, revenues, income, cash flow, or liquidity.
Our ability to recapitalize, incur additional debt and take a number of other actions that are not limited by the terms of the Notes may have important consequences for the holders of such Notes, including making it more difficult for us to satisfy our obligations with respect to the Notes or negatively affecting the trading value of the Notes to the extent such a trading market develops for such Notes.
Certain of our current debt instruments include more protections for their holders than the Notes, including under the respective indentures of such notes. In addition, other debt we issue or incur in the future could contain more protections for its holders than the Notes, including under the respective indentures of such notes, including additional covenants and events of default. The issuance or incurrence of any such debt with incremental protections could affect the market for and trading levels and prices of the Notes to the extent such a market develops for such notes.
If we default on our obligations to pay our other indebtedness, we may not be able to make payments on the Notes and/or the Series A Notes.
Any default under the agreements governing our indebtedness or under other indebtedness to which we may be a party, that is not waived by the required lenders or holders and the remedies sought by the holders of such indebtedness could make us unable to pay principal, premium, if any, and interest on the Notes and/or the Series A Notes and substantially decrease the market value of any such notes.
If we are unable to generate sufficient cash flow and are otherwise unable to obtain funds necessary to meet required payments of principal, premium, if any, and interest on our indebtedness, or if we otherwise fail to comply with the various covenants, including financial and operating covenants, in the instruments governing our indebtedness, we could be in default under the terms of the agreements governing such indebtedness. In the event of such default, the holders of such indebtedness could elect to declare all the funds borrowed thereunder to be due and payable, together with accrued and unpaid interest, the lenders under our current indebtedness or other debt we may incur in the future could elect to terminate their commitments, cease making further loans and institute foreclosure proceedings against our assets, and we could be forced into bankruptcy or liquidation.
If our operating performance declines, we may in the future need to seek to obtain waivers from the required lenders or holders under the agreements governing our indebtedness, or other indebtedness that we may incur in the future, to avoid being in default. If we breach our covenants under the agreements governing our indebtedness and seek a waiver, we may not be able to obtain a waiver from the required lenders or holders. If this occurs, we would be in default and our lenders or debt holders could exercise their rights as described above, and we could be forced into bankruptcy or liquidation.
If we are unable to repay debt, lenders having secured obligations, including under the KeyBank Credit Facility, could proceed against the collateral securing the debt. Because the KeyBank Credit Facility and the Note Purchase Agreement each have, and any future debt will likely have, customary cross-default and cross-acceleration provisions, if the indebtedness thereunder or under any future credit facility is accelerated, we may be unable to repay or finance the amounts due.
The optional redemption provision under the respective indentures of the Notes and the Note Purchase Agreement of the Series A Notes may materially adversely affect a holder’s return on such notes.
The Notes and the Series A Notes are redeemable at our option in accordance with the provisions of the respective indentures or Note Purchase Agreement, as applicable. We may choose to redeem the Notes or the Series A Notes at times when prevailing interest rates are lower than the interest rate paid on such notes. In this circumstance, the holders thereof may not be able to reinvest the redemption proceeds in a comparable security at an effective interest rate as high as that of such notes being redeemed. Refer to “Note 5 – Borrowings” in the notes to our consolidated financial statements included in this Annual Report on Form 10-K for additional information.
We may not be able to repurchase either of the August 2026 Notes, the December 2026 Notes or the Series A Notes upon a Change of Control Repurchase Event.
Upon the occurrence of a Change of Control Repurchase Event (as defined in the respective indenture that governs the August 2026 Notes and the December 2026 Notes or the Note Purchase Agreement that governs the Series A Notes), subject to certain conditions, we will be required to offer to repurchase all outstanding August 2026 Notes, December 2026 Notes or Series A Notes, as applicable, at 100% of their principal amount, plus accrued and unpaid interest. The source of funds for such purchase of such notes, as applicable, will be our available cash or cash generated from our operations or other potential sources, including borrowings, investment repayments, sales of assets or sales of equity. We cannot assure you that sufficient funds from such sources will be available at the time of any Change of Control Repurchase Event to make required repurchases of such notes tendered, as applicable. Before making any such repurchase of such notes, as applicable, we would also have to comply with certain requirements under the KeyBank Credit Facility and/or any future credit facility, as applicable, to the extent such requirements remain in effect at such time, or otherwise obtain consent from the lenders under the KeyBank Credit Facility and/or any future credit facility, as applicable. Our future debt instruments also may contain similar restrictions and provisions. If the holders of the August 2026 Notes, December 2026 Notes and/or the Series A Notes, as applicable, exercise their right to require us to repurchase all of such notes upon a Change of Control Repurchase Event, the financial effect of this repurchase could cause a default under our existing or future debt instruments, even if the Change of Control Repurchase Event itself would not cause a default. It is possible that we will not have sufficient funds at the time of the Change of Control Repurchase Event to make the required repurchase of the August 2026 Notes, the December 2026 Notes, the Series A Notes and/or our other debt, as applicable.
There is no active public trading market for the August 2026 Notes, the December 2026 Notes or the Series A Notes; as a result, a holder may not be able to resell any of such notes.
There currently is no active public trading market for the August 2026 Notes, the December 2026 Notes and the Series A Notes. We do not currently intend to apply for listing of any such notes on any securities exchange or for quotation of any such notes on any automated dealer quotation system. If no active trading market develops, a holder may not be able to resell any at their fair market value or at all. If any of such notes are traded after their initial issuance, they may trade at a discount from their initial offering price depending on prevailing interest rates, the market for similar securities, our credit ratings, general economic conditions, our financial condition, performance and prospects and other factors. If a market is made for any of such notes, any such market-making may be discontinued at any time. In addition, any market-making activity, if any, will be subject to limits imposed by law. Accordingly, we can provide no assurance that a liquid trading market, if any, will develop for such notes, that a holder will be able to sell any of such notes at a particular time, or that the price a holder may receive when it sells any of such notes will be favorable. To the extent an active trading market does not develop, the liquidity and trading price for such notes may be harmed. Accordingly, a holder may be required to bear the financial risk of an investment in such notes for an indefinite period of time.
The March 2029 Notes and September 2029 Notes are listed on the Nasdaq Global Select Market under the symbols “TRINZ” and “TRINI,” respectively. We cannot provide any assurances that an active trading market will be maintained for the March 2029 Notes or September 2029 Notes, that a holder will be able to sell its March 2029 Notes or September 2029 Notes, or that the price a holder may receive when it sells its March 2029 Notes or September 2029 Notes will be favorable. The March 2029 Notes and/or September 2029 Notes may trade at a discount from their initial offering price depending on prevailing interest rates, the market for similar securities, our credit ratings, general economic conditions, our financial condition, performance and prospects and other factors. The underwriters of the public offering of the March 2029 Notes and September 2029 Notes have advised us that they intend to make a market in the March 2029 Notes and September 2029 Notes, but they are not obligated to do so. Such underwriters may discontinue any market-making in the March 2029 Notes or September 2029 Notes at any time at their sole discretion.
A downgrade, suspension or withdrawal of the credit rating assigned by a rating agency to us, the Notes and/or the Series A Notes, if any, or changes in the debt markets, could cause the liquidity and/or market value of the Notes and/or the Series A Notes to decline significantly.
Any credit ratings assigned to us, the Notes and/or the Series A Notes are an assessment by rating agencies of our ability to pay our obligations when due. Consequently, real or anticipated changes to any such credit ratings will generally affect the liquidity and/or market value of the Notes and/or the Series A Notes. These credit ratings, however, may not reflect the potential impact of risks related to market conditions generally or other factors discussed herein that could impact the liquidity and/or market value of the Notes and/or the Series A Notes.
If an investment grade rating is not maintained with respect to the Series A Notes, pursuant to the terms in the Note Purchase Agreement, additional interest of 1.00% per annum will accrue on the Series A Notes until such time that the conditions described in the Note Purchase Agreement are no longer continuing. An explanation of the significance of a credit rating may be obtained from the rating agency.
Generally, rating agencies base their ratings on such material and information, and such of their own investigations, studies and assumptions, as they deem appropriate. Any such credit ratings should be evaluated independently from similar ratings of other securities or companies. Credit ratings are not a recommendation to buy, sell or hold any security, and may be subject to revision or withdrawal at any time by the issuing organization in its sole discretion. There can be no assurance that a credit rating will remain for any given period of time.
U.S. Federal Income Tax Risks
We will be subject to U.S. federal income tax at corporate rates if we are unable to qualify or maintain qualification as a RIC under Subchapter M of the Code.
We have elected to be treated, currently qualify, and intend to qualify annually as, a RIC under Subchapter M of the Code; however, no assurance can be given that we will be able to qualify for and maintain RIC status. To qualify for RIC tax treatment under the Code and to be relieved of U.S. federal taxes on income and gains distributed to our stockholders, we must meet certain requirements, including source-of-income, asset-diversification and annual distribution requirements. The annual distribution requirement applicable to RICs generally is satisfied if we timely distribute at least 90% of our net ordinary income and net short-term capital gains in excess of net long-term capital losses, if any, to our stockholders on an annual basis. To the extent we use debt financing, we will be subject to certain asset coverage ratio requirements under the 1940 Act and may be subject to financial covenants under loan and credit agreements, each of which could, under certain circumstances, restrict us from making annual distributions necessary to receive RIC tax treatment. If we are unable to obtain cash from other sources, we may fail to qualify to be taxed as a RIC and, thus, may be subject to U.S. federal income tax on our entire taxable income at corporate tax rates without regard to any distributions made by us. In order to be taxed as a RIC, we must also meet certain asset-diversification requirements at the end of each calendar quarter. Failure to meet these tests may result in our having to dispose of certain investments quickly in order to prevent the loss of RIC status. Because most of our investments are in private or thinly traded public companies, any such dispositions could be made at disadvantageous prices and may result in substantial losses. If we fail to be taxed as a RIC for any reason and become subject to U.S. federal income tax at corporate rates, the resulting taxes could substantially reduce our net assets, the amount of income available for distributions to stockholders and the amount of our distributions and the amount of funds available for new investments. Such a failure would have a material adverse effect on us and our stockholders.
We cannot predict how new tax legislation will affect us, our investments, or our stockholders, and any such legislation could adversely affect our business.
Legislative or other actions relating to taxes could have a negative effect on us. The rules dealing with U.S. federal income taxation are constantly under review by persons involved in the legislative process and by the Internal Revenue Service and the U.S. Treasury Department. The likelihood of any such legislation being enacted is uncertain, but new legislation and any U.S. Treasury regulations, administrative interpretations or court decisions interpreting such legislation could significantly and negatively affect our ability to qualify for tax treatment as a RIC or the U.S. federal income tax consequences to us and our investors of such qualification or could have other adverse consequences. Investors are urged to consult with their tax advisor regarding tax legislative, regulatory, or administrative developments and proposals and their potential effect on an investment in our common stock.
We may have difficulty paying our required distributions if we recognize income before, or without, receiving cash representing such income.
For U.S. federal income tax purposes, we may be required to recognize taxable income in circumstances in which we do not receive a corresponding payment in cash. For example, since we will likely hold debt obligations that are treated under applicable tax rules as having OID (such as debt instruments with PIK, secondary market purchases of debt securities at a discount to par, interest or, in certain cases, increasing interest rates or debt instruments that were issued with warrants), we must include in income each year a portion of the OID that accrues over the life of the obligation, regardless of whether cash representing such income is received by us in the same taxable year. We may also have to include in income other amounts that we have not yet received in cash, such as unrealized appreciation for foreign currency forward contracts and deferred loan origination fees that are paid after origination of the loan or are paid in non-cash compensation such as warrants or stock. Furthermore, we may invest in non-U.S. corporations (or other non-U.S. entities treated as corporations for U.S. federal income tax purposes) that could be treated under the Code and U.S. Treasury regulations as “passive foreign investment companies” and/or “controlled foreign corporations.” The rules relating to investment in these types of non-U.S. entities are designed to ensure that U.S. taxpayers are either, in effect, taxed currently (or on an accelerated basis with respect to
corporate-level events) or taxed at increased tax rates at distribution or disposition. In certain circumstances this could require us to recognize income where we do not receive a corresponding payment in cash.
Unrealized appreciation on derivatives, such as foreign currency forward contracts, may be included in taxable income while the receipt of cash may occur in a subsequent period when the related contract expires. Any unrealized depreciation on investments that the foreign currency forward contracts are designed to hedge are not currently deductible for tax purposes. This can result in increased taxable income whereby we may not have sufficient cash to pay distributions or we may opt to retain such taxable income and pay a 4% U.S. federal excise tax. In such cases we could still rely upon the “spillback provisions” to maintain RIC tax treatment.
We anticipate that a portion of our income may constitute OID or other income required to be included in taxable income prior to receipt of cash. Further, we may elect to amortize market discounts with respect to debt securities acquired in the secondary market and include such amounts in our taxable income in the current year, instead of upon disposition, as an election not to do so would limit our ability to deduct interest expenses for U.S. federal income tax purposes. Because any OID or other amounts accrued will be included in our investment company taxable income for the year of the accrual, we may be required to make a distribution to our shareholders in order to satisfy the Annual Distribution Requirement, even if we will not have received any corresponding cash amount. As a result, we may have difficulty meeting the Annual Distribution Requirement necessary to maintain RIC tax treatment under the Code. We may have to sell some of our investments at times and/or at prices we would not consider advantageous, raise additional debt or equity capital, make a partial share distribution, or forgo new investment opportunities for this purpose. If we are not able to obtain cash from other sources, and choose not to make a qualifying share distribution, we may fail to qualify for RIC tax treatment and thus become subject to U.S. federal income tax at corporate tax rates.
We may choose to pay a portion of our distributions in our own stock, in which case you may be required to pay tax in excess of the cash you receive.
We may distribute taxable distributions that are payable in part in our stock. In accordance with certain applicable Treasury regulations and a revenue procedure issued by the IRS, a publicly offered RIC may treat a distribution of its own stock as fulfilling its RIC distribution requirements if each stockholder may elect to receive his or her entire distribution in either cash or stock of the RIC, subject to a limitation that the aggregate amount of cash to be distributed to all stockholders must be at least 20% of the aggregate declared distribution. A "publicly offered RIC" is a RIC whose shares are (i) continuously offered pursuant to a public offering, (ii) regularly traded on an established securities market, or (iii) held by at least 500 persons at all times during the taxable year. If too many stockholders elect to receive cash, the cash available for distribution must be allocated among the shareholders electing to receive cash (with the balance of the distribution paid in stock). In no event will any stockholder, electing to receive cash, receive the lesser of (a) the portion of the distribution such shareholder has elected to receive in cash or (b) an amount equal to his or her entire distribution times the percentage limitation on cash available for distribution. If these and certain other requirements are met, for U.S. federal income tax purposes, the amount of the dividend paid in stock will be equal to the amount of cash that could have been received instead of stock. Taxable stockholders receiving such distributions will be required to include the full amount of the dividend as ordinary income (or as long-term capital gain or qualified dividend income to the extent such distribution is properly reported as such) to the extent of our current and accumulated earnings and profits for U.S. federal income tax purposes.
As a result of receiving distributions in the form of our common stock, a U.S. stockholder may be required to pay tax with respect to such distributions in excess of any cash received. If a U.S. stockholder sells the stock such stockholder receives as a dividend in order to pay this tax, the sales proceeds may be less than the amount included in income with respect to the dividend, depending on the market price of our stock at the time of the sale. Furthermore, with respect to non-U.S. stockholders, we may be required to withhold U.S. federal tax with respect to such distributions, including in respect of all or a portion of such dividend that is payable in shares of our common stock. In addition, if a significant number of our stockholders determine to sell shares of our stock in order to pay taxes owed on distributions, it may put downward pressure on the trading price of shares of our common stock.
General Risk Factors
Capital markets may experience periods of disruption and instability, including as recently experienced. Such market conditions may materially and adversely affect debt and equity capital markets in the United States and abroad, which may have a negative impact on our business and operations.
From time-to-time, capital markets may experience periods of disruption and instability, including as experienced during portions of the last four fiscal years. Since 2020, the U.S. capital markets have experienced extreme volatility and disruption, as evidenced by the volatility in global stock markets as a result of, among other things, supply chain disruptions, interest rate and inflation rate environments, and the fluctuating price of commodities such as oil. Despite actions of the U.S. federal government and foreign governments, these types of events contribute to unpredictable general economic conditions that materially and adversely impact the broader financial and credit markets and reduce the availability of debt and equity capital for the market as a whole. These conditions could continue for a prolonged period of time or worsen in the future.
Given the ongoing and dynamic nature of market disruption and instability, it is difficult to predict the full impact of these conditions on our business. The extent of any such impact will depend on future developments, which are highly uncertain.
During any such periods of market disruptions and instabilities, we and other companies in the financial services sector may have limited access, if available, to alternative markets for debt and equity capital. Equity capital may be difficult to raise because, subject to some limited exceptions that apply to us as a BDC, we are generally not be able to issue additional shares of our common stock at a price less than net asset value without first obtaining approval for such issuance from our stockholders and our independent directors. From time to time, we may seek approval from our stockholders so that we have the flexibility to issue up to 25% of our then outstanding shares of our common stock at a price below net asset value.
Volatility and dislocation in the capital markets can also create a challenging environment in which to raise or access debt capital, and our ability to incur indebtedness (including by issuing preferred stock) is limited by applicable regulations such that our asset coverage (as defined in the 1940 Act) must equal at least 150% immediately after each time we incur indebtedness. The reappearance of market disruptions and/or illiquidity for any substantial length of time could make it difficult to extend the maturity of or refinance our existing indebtedness or obtain new indebtedness with similar terms and any failure to do so could have a material adverse effect on our business. The debt capital that will be available to us in the future, if at all, may be at a higher cost and on less favorable terms and conditions than what we currently experience, including being at a higher cost in rising rate environments. If we are unable to raise or refinance debt, then our equity investors may not benefit from the potential for increased returns on equity resulting from leverage and we may be limited in our ability to make new commitments or to fund existing commitments to our portfolio companies. An inability to extend the maturity of, or refinance, our existing indebtedness or obtain new indebtedness could have a material adverse effect on our business, financial condition or results of operations.
Significant disruption or volatility in the capital markets may also have a negative effect on the valuations of our investments and on the potential for liquidity events involving these investments. While most of our investments are not publicly traded, applicable accounting standards require us to assume as part of our valuation process that our investments are sold in a principal market to market participants (even if we plan on holding an investment through its maturity). As a result, volatility in the capital markets can adversely affect our investment valuations.
Significant disruption or volatility in the capital markets may also affect the pace of our investment activity and the potential for liquidity events involving our investments. The illiquidity of our investments may make it difficult for us to sell such investments to access capital if required and to value such investments. Consequently, we may realize significantly less than the value at which we carry our investments. An inability to raise capital, and any required sale of our investments for liquidity purposes, could have a material adverse impact on our business, financial condition or results of operations. In addition, a prolonged period of market illiquidity may cause us to reduce the volume of loans and debt securities we originate and/or fund and adversely affect the value of our portfolio investments, which could have a material and adverse effect on our business, financial condition, results of operations and cash flows.
Global economic, political and market conditions, including uncertainty about the financial stability of the United States, could have a significant adverse effect on our business, financial condition and results of operations.
Downgrades by rating agencies to the U.S. government’s credit rating or concerns about its credit and deficit levels in general could cause interest rates and borrowing costs to rise, which may negatively impact both the perception of credit risk associated with our debt portfolio and our ability to access the debt markets on favorable terms. In addition, a decreased U.S. government credit rating could create broader financial turmoil and uncertainty, which may weigh heavily on our financial performance and the value of our common stock.
Deterioration in the economic conditions in the Eurozone and other regions or countries globally and the resulting instability in global financial markets may pose a risk to our business. Financial markets have been affected at times by a number of global macroeconomic events. Several European Union countries have faced budget issues, some of which may have negative long-term effects for the economies of those countries and other EU countries. In addition, the fiscal policy of large foreign nations, may have a severe impact on the worldwide and U.S. financial markets. Additionally, trade wars and volatility in the U.S. repo market, the U.S. high yield bond markets, the global stock markets and global markets for commodities may affect other financial markets worldwide. In addition, while governments worldwide may use stimulus measures to reduce volatility in the financial markets, volatility may return as such measures phase out, and the long-term impacts of such stimulus on fiscal policy and inflation remain unknown. We cannot predict the effects of these or similar events in the future on the U.S. and global economies and securities markets or on our investments. We monitor developments in economic, political and market conditions and seek to manage our investments in a manner consistent with achieving our investment objective, but there can be no assurance that we will be successful in doing so.
The conflict between Russia and Ukraine and in the Middle East, and resulting market volatility, could also adversely affect the Company’s business, operating results, and financial condition. The extent and duration or escalation of such conflicts, resulting sanctions and resulting future market disruptions are impossible to predict, but could be significant. Any disruptions resulting from such conflicts and any future conflict (including cyberattacks, espionage or the use or threatened use of nuclear weapons) or resulting from actual or threatened responses to such actions could cause disruptions to any of our portfolio companies located in Europe or the Middle East or that have substantial business relationships with companies in affected regions. It is not possible to predict the duration or extent of longer-term consequences of these conflicts, which could include further sanctions, retaliatory and escalating measures, embargoes, regional instability, geopolitical shifts and adverse effects on or involving macroeconomic conditions, the energy sector, supply chains, inflation, security conditions, currency exchange rates and financial markets around the globe. Any such market disruptions could affect our portfolio companies’ operations and, as a result, could have a material adverse effect on our business, financial condition and results of operations.
Any public health emergency, including outbreaks of existing or new epidemic diseases, or the threat thereof, and the resulting financial and economic market uncertainty could have a significant adverse impact on us and the fair value of our investments and our portfolio companies.
The extent of the impact of any public health emergency on our and our portfolio companies’ operational and financial performance will depend on many factors, including the duration and scope of such public health emergency, the actions taken by governmental authorities to contain its financial and economic impact, the extent of any related travel advisories and restrictions implemented, the impact of such public health emergency on overall supply and demand, goods and services, investor liquidity, consumer confidence and levels of economic activity and the extent of its disruption to important global, regional and local supply chains and economic markets, all of which are highly uncertain and cannot be predicted. In addition, our and our portfolio companies’ operations may be significantly impacted, or even temporarily or permanently halted, as a result of government quarantine measures, voluntary and precautionary restrictions on travel or meetings and other factors related to a public health emergency, including its potential adverse impact on the health of any of our or our portfolio companies’ personnel. This could create widespread business continuity issues for us and our portfolio companies.
These factors may also cause the valuation of our investments to differ materially from the values that we may ultimately realize. Our valuations, and particularly valuations of private investments and private companies, are inherently uncertain, may fluctuate over short periods of time and are often based on estimates, comparisons and qualitative evaluations of private information. As a result, our valuations may not show the completed or continuing impact and the resulting measures taken in response thereto. Any public health emergency, including outbreak of existing or new epidemic diseases, or the threat thereof, and the resulting financial and economic market uncertainty could have a significant adverse impact on us and the fair value of our investments and our portfolio companies.
We are subject to risks related to corporate social responsibility.
Our business faces increasing public scrutiny related to environmental, social and governance (“ESG”) activities, which are increasingly considered to contribute to the long-term sustainability of a company’s performance. A variety of organizations measure the performance of companies on ESG topics, and the results of these assessments are widely publicized. In addition, investments in funds that specialize in companies that perform well in such assessments are increasingly popular, and major institutional investors have publicly emphasized the importance of such ESG measures to their investment decisions.
We risk damage to our brand and reputation if we fail to act responsibly in a number of areas, such as environmental stewardship, corporate governance and transparency and considering ESG factors in our investment processes. Adverse incidents with respect to ESG activities could impact the value of our brand, the cost of our operations and relationships with investors, all of which could adversely affect our business and results of operations.
Additionally, new regulatory initiatives related to ESG could adversely affect our business. The SEC has proposed rules that, among other matters, would establish a framework for reporting of climate-related risks. At this time, there is uncertainty regarding the scope of such proposals or when they would become effective (if at all). Compliance with any new laws or regulations increases our regulatory burden and could make compliance more difficult and expensive, affect the manner in which we or our portfolio companies conduct our businesses and adversely affect our profitability.
If we fail to maintain an effective system of internal control over financial reporting, we may not be able to accurately report our financial results or prevent fraud. As a result, stockholders could lose confidence in our financial and other public reporting, which could harm our business and the market price of our common stock.
We are not required to comply with certain requirements of the Sarbanes-Oxley Act, including the internal control evaluation and certification requirements of Section 404 of that statute (“Section 404”), and will not be required to comply with all of those requirements until we have been subject to the reporting requirements of the Exchange Act for a specified period of time or, in the case of the auditor attestation requirements of Section 404 of the Sarbanes-Oxley Act, the date we are no longer an emerging growth company under the JOBS Act. Accordingly, our internal controls over financial reporting do not currently meet all of the standards contemplated by Section 404 that we will eventually be required to meet. We are in the process of addressing our internal controls over financial reporting and are establishing formal procedures, policies, processes and practices related to financial reporting and to the identification of key financial reporting risks, assessment of their potential impact and linkage of those risks to specific areas and activities within the Company.
Additionally, we have begun the process of documenting our internal control procedures to satisfy the requirements of Section 404, which requires annual management assessments of the effectiveness of our internal controls over financial reporting.
Our independent registered public accounting firm will not be required to formally attest to the effectiveness of our internal control over financial reporting until the later of the year following our first annual report required to be filed with the SEC pursuant to the Exchange Act, or the date we are no longer an emerging growth company under the JOBS Act. Therefore, our internal controls over financial reporting will not receive the level of review provided by the process related to the auditor attestation included in annual reports of issuers that are subject to the auditor attestation requirements.
As a public entity, we will be required to complete our initial management assessment of our internal control over financial reporting in a timely manner. If we are not able to implement the requirements of Section 404 in a timely manner or with adequate compliance, our operations, financial reporting, or financial results could be adversely affected. Matters impacting our internal controls may cause us to be unable to report our financial information on a timely basis and thereby subject us to adverse regulatory consequences, including sanctions by the SEC or violations of applicable stock exchange listing rules, and result in a breach of the covenants under the agreements governing any of our financing arrangements. There could also be a negative reaction in the financial markets due to a loss of investor confidence in us and the reliability of our financial statements. Confidence in the reliability of our financial statements could also suffer if we or our independent registered public accounting firm were to report a material weakness in our internal control over financial reporting. This could materially adversely affect us and lead to a decline in the market price of our common stock.
There are significant financial and other resources necessary to comply with the requirements of being a public entity.
We are subject to the reporting requirements of the Exchange Act and certain requirements of the Sarbanes-Oxley Act. These requirements may place a strain on our systems and resources. The Exchange Act requires that we file annual, quarterly and current reports with respect to our business and financial condition. The Sarbanes-Oxley Act requires that we maintain effective disclosure controls and procedures and internal controls over financial reporting, which are discussed below. In order to maintain and improve the effectiveness of our disclosure controls and procedures and internal controls, significant resources and management oversight will be required. We have implemented procedures, processes, policies and practices for the purpose of addressing the standards and requirements applicable to public companies. These activities may divert management’s attention from other business concerns, which could have a material adverse effect on our business, financial condition, results of operations and cash flows. We incur significant additional annual expenses related to these steps and, among other things, directors’ and officers’ liability insurance, director fees, reporting requirements of the SEC, transfer agent fees, additional administrative expenses, increased auditing and legal fees and similar expenses.
The systems and resources necessary to comply with public company reporting requirements will increase further once we cease to be an “emerging growth company” under the JOBS Act. As long as we remain an emerging growth company, we intend to take advantage of certain exemptions from various reporting requirements that are applicable to other public companies, including not being required to comply with the auditor attestation requirements of Section 404 of the Sarbanes-Oxley Act. We will remain an emerging growth company for up to five years following an IPO or until the earliest of (i) the last day of the first fiscal year in which our annual gross revenues exceed $1.235 billion, (ii) December 31 of the fiscal year that we become a “large accelerated filer” as defined in Rule 12b-2 under the Exchange Act which would occur if the market value of our common stock that is held by non-affiliates exceeds $700.0 million as of the last business day of our most recently completed second fiscal quarter and we have been publicly reporting for at least 12 months or (iii) the date on which we have issued more than $1.0 billion in non-convertible debt securities during the preceding three-year period.
We may experience fluctuations in our operating results.
We may experience fluctuations in our operating results due to a number of factors, including our ability or inability to make investments in companies that meet our investment criteria, the interest rate payable on the debt securities we acquire, the default rate on such securities, the level of our expenses, variations in and the timing of the recognition of realized and unrealized gains or losses, the degree to which we encounter competition in our markets and general economic conditions. These occurrences could have a material adverse effect on our results of operations, the value of your investment in us and our ability to pay distributions to you and our other shareholders.
Changes in laws or regulations governing our operations may adversely affect our business or cause us to alter our business strategy.
We and our portfolio companies are subject to laws and regulations at the local, state, and federal levels. These laws and regulations, as well as their interpretation, could change from time to time, including as the result of interpretive guidance or other directives from the U.S. President and others in the executive branch, and new laws, regulations and interpretations could also come into effect.
Changes to the laws and regulations governing our permitted investments may require a change to our investment strategy. Such changes could differ materially from our strategies and plans as set forth in this report and may shift our investment focus from the areas of expertise of our management team and investment professionals. Thus, any such changes, if they occur, could have a material adverse effect on our results of operations and the value of an investment in us.
Over the last several years, there also has been an increase in regulatory attention to the extension of credit outside of the traditional banking sector, raising the possibility that some portion of the non-bank financial sector will be subject to new regulation. While it cannot be known at this time whether any regulation will be implemented or what form it will take, increased regulation of non-bank credit extension could negatively impact our operations, cash flows or financial condition, impose additional costs on us, intensify the regulatory supervision of us or otherwise adversely affect our business, financial condition and results of operations.
Uncertainty about presidential administration initiatives could negatively impact our business, financial condition and results of operations.
There is significant uncertainty with respect to legislation, regulation and government policy at the federal level, as well as the state and local levels. Recent events, including the 2024 U.S. presidential election, have created a climate of heightened uncertainty and introduced new and difficult-to-quantify macroeconomic and political risks with potentially far-reaching implications. The presidential administration’s changes to U.S. policy may impact, among other things, the U.S. and global economy, international trade and relations, unemployment, immigration, taxes, healthcare, the U.S. regulatory environment, inflation and other areas. Although we cannot predict the impact, if any, of these changes to our business, they could adversely affect our business, financial condition, operating results and cash flows. Until we know what policy changes are made and how those changes impact our business and the business of our competitors over the long term, we will not know if, overall, we will benefit from them or be negatively affected by them.
Changes to U.S. tariff and import/export regulations may have a negative effect on our portfolio companies and, in turn, harm us.
There have been ongoing discussion and commentary regarding potential significant changes to U.S. trade policies, treaties and tariffs, creating significant uncertainty about the future relationship between the United States and other countries with respect to trade policies, treaties and tariffs. These developments, or the perception that more of them could occur, may have a material adverse effect on global economic conditions and the stability of global financial markets, and may significantly reduce global trade and, in particular, trade between the impacted nations and the United States. Any of these factors could depress economic activity and restrict our portfolio companies’ access to suppliers or customers and have a material adverse effect on their business, financial condition and results of operations, which in turn would negatively impact us.
Terrorist attacks, acts of war, global health emergencies, or extreme weather conditions or other natural disasters, including as a result of global climate change, may impact the businesses in which we invest and harm our business, operating results and financial condition.
Terrorist acts, acts of war, global health emergencies, or extreme weather conditions or other natural disasters, including as a result of global climate change, may disrupt our operations, as well as the operations of the businesses in which we invest. Such acts have created, and continue to create, economic and political uncertainties and have contributed to global economic instability. Future terrorist activities, military or security operations, global health emergencies, or extreme weather conditions or other natural disasters, including as a result of global climate change, could further weaken the domestic/global economies and create additional uncertainties, which may negatively impact the businesses in which we invest directly or indirectly and, in turn, could have a material adverse impact on our business, operating results and financial condition. Losses from terrorist attacks, global health emergencies, and extreme weather conditions or other natural disasters are generally uninsurable. The nature and level of extreme weather conditions or other natural disasters cannot be predicted and may be exacerbated by global climate change.
Internal and external cybersecurity threats, as well as other disasters, may adversely affect our business or the business of our portfolio companies by impairing the ability to conduct business effectively.
Cybersecurity incidents and cyber-attacks have been occurring globally at a more frequent and severe level, and will likely continue to increase in frequency in the future. The occurrence of a disaster, such as a cyber-attack against us or against a third party that has access to our data or networks, a natural catastrophe, an industrial accident, failure of our disaster recovery systems, or consequential employee error, could have an adverse effect on our ability to communicate or conduct business, negatively impacting our operations and financial condition. This adverse effect can become particularly acute if those events affect our electronic data processing, transmission, storage, and retrieval systems, or impact the availability, integrity, or confidentiality of our data.
We, and our portfolio companies, depend heavily upon computer systems to perform necessary business functions. Despite our implementation of a variety of security measures, our computer systems, networks, and data, like those of other companies, could be subject to cyber-attacks and unauthorized access, use, alteration, or destruction, such as from physical and electronic break-ins or unauthorized tampering. If one or more of these events occurs, it could potentially jeopardize the confidential, proprietary, and other information processed, stored in, and transmitted through our computer systems and networks. Such an attack could cause interruptions or malfunctions in our operations, which could result in financial losses, litigation, regulatory penalties, client dissatisfaction or loss, reputational damage, and increased costs associated with mitigation of damages and remediation.
Third parties with which we do business may also be sources of cybersecurity or other technological risk. We outsource certain functions, and these relationships allow for the storage and processing of our information, as well as client, counterparty, employee, and borrower information. While we engage in actions to reduce our exposure resulting from outsourcing, ongoing threats may result in unauthorized access, loss, exposure, destruction, or other cybersecurity incidents that adversely affects our data, resulting in increased costs and other consequences as described above.
Moreover, the increased use of mobile and cloud technologies due to the proliferation of remote work could heighten these and other operational risks as certain aspects of the security of such technologies may be complex and unpredictable. Reliance on mobile or cloud technology or any failure by mobile technology and cloud service providers to adequately safeguard their systems and prevent cyber-attacks could disrupt our operations, the operations of a portfolio company or the operations of our or their service providers and result in misappropriation, corruption or loss of personal, confidential or proprietary information or the inability to conduct ordinary business operations. In addition, there is a risk that encryption and other protective measures may be circumvented, particularly to the extent that new computing technologies increase the speed and computing power available. An extended period of remote working, whether by us, our portfolio companies, or our third-party providers, could strain technology resources and introduce operational risks, including heightened cybersecurity risk. Remote working environments may be less secure and more susceptible to hacking attacks, including phishing and social engineering attempts. Accordingly, the risks described above are heightened under current conditions.
In addition, cybersecurity has become a top priority for global lawmakers and regulators, and some jurisdictions have proposed or enacted laws requiring companies to notify regulators and individuals of data security breaches involving certain types of personal data. Compliance with such laws and regulations may result in cost increases due to system changes and the development of new administrative processes. If we fail to comply with the relevant and increasing laws and regulations, we could suffer financial losses, a disruption of our businesses, liability to investors, regulatory intervention or reputational damage.
We are subject to risks associated with artificial intelligence and machine learning technology.
Artificial intelligence, including machine learning and similar tools and technologies that collect, aggregate, analyze or generate data or other materials, or collectively, AI, and its current and potential future applications including in the private investment and financial industries, as well as the legal and regulatory frameworks within which AI operates, continue to rapidly evolve. Recent technological advances in AI pose risks to the Company and our portfolio investments. The Company and our portfolio investments could also be exposed to the risks of AI if third-party service providers or any counterparties, whether or not known to the Company, also use AI in their business activities. We and our portfolio companies may not be in a position to control the use of AI technology in third-party products or services. Use of AI could include the input of confidential information in contravention of applicable policies, contractual or other obligations or restrictions, resulting in such confidential information becoming part accessible by other third-party AI applications and users. While we do not currently use AI to make investment recommendations, the use of AI could also exacerbate or create new and unpredictable risks to our business and the business of our portfolio companies, including by potentially significantly disrupting the markets in which we and our portfolio companies operate or subjecting us and our portfolio companies to increased competition and regulation, which could materially and adversely affect business, financial condition or results of operations of us and our portfolio companies. In addition, the use of AI by bad actors could heighten the sophistication and effectiveness of cyber and security attacks experienced by us and our portfolio companies. Independent of its context of use, AI technology is generally highly reliant on the collection and analysis of large amounts of data, and it is not possible or practicable to incorporate all relevant data into the model that AI technology utilizes to operate. Certain data in such models will inevitably contain a degree of inaccuracy and error—potentially materially so—and could otherwise be inadequate or flawed, which would be likely to degrade the effectiveness of AI technology. To the extent that we or our portfolio investments are exposed to the risks of AI use, any such inaccuracies or errors could have adverse impacts on the Company or our investments. AI technology and its applications, including in the private investment and financial sectors, continue to develop rapidly, and it is impossible to predict the future risks that may arise from such developments.
None.
Item 1C. Cybersecurity
Cybersecurity Program Overview
As part of our overall risk management processes and procedures, we have instituted a cybersecurity program designed to identify, assess and manage material risks from cybersecurity threats, including by engaging a third-party cybersecurity service provider, which communicates directly with our management and compliance personnel. The cyber risk management program involves risk assessments, implementation of security measures and ongoing monitoring of systems and networks, including networks on which we rely. Through our cybersecurity program, the current threat landscape is actively monitored in an effort to identify material risks arising from new and evolving cybersecurity threats. We engage external experts, including cybersecurity assessors, consultants and auditors to evaluate cybersecurity measures and risk management processes as needed. We also depend on and engage various third parties, including suppliers, vendors and service providers in connection with our operations. Our risk management, legal, and compliance personnel oversee and identify, including through a third-party cybersecurity service provider, material risks from cybersecurity threats associated with our use of such entities.
Board Oversight of Cybersecurity Risks
Our Board provides strategic oversight on cybersecurity matters, including material risks associated with cybersecurity threats. Our Board receives periodic updates from our Chief Compliance Officer and Chief Operating Officer, and more frequently as needed, regarding the overall state of our cybersecurity program, information on the current threat landscape, and material risks from cybersecurity threats and cybersecurity incidents.
Management's Role in Cybersecurity Risk Management
Our management team, including our Chief Compliance Officer and Chief Operating Officer, is responsible for assessing and managing material risks from cybersecurity threats, including by engaging third-party service providers, as described above. Members of our management team possess relevant expertise in various disciplines that are key to effectively managing such risks, such as technology systems, technology leadership, technological development, cybersecurity, regulatory compliance and corporate governance. Our management team is informed about and monitors the prevention, detection, mitigation, and remediation of cybersecurity incidents, including through the receipt of notifications from third-party service providers and reliance on communications with our risk management, legal, and/or compliance personnel.
Assessment of Cybersecurity Risk
The potential impact of risks from cybersecurity threats are assessed on an ongoing basis, and how such risks could materially affect our business strategy, operational results, and financial condition are regularly evaluated. During the reporting period, we have not identified any risks from cybersecurity threats, including as a result of previous cybersecurity incidents, that we believe have materially affected, or are reasonably likely to materially affect, us, including our business strategy, operational results, and financial condition.
Item 2. Properties
We do not own any real estate or other physical properties materially important to our operations. Currently, we lease office space in Phoenix, Arizona for our corporate headquarters. We also lease office space in San Diego, California. We believe that our office facilities are suitable and adequate for our business as it is contemplated to be conducted.
Item 3. Legal Proceedings
We are not currently subject to any material legal proceedings, nor, to our knowledge, are any material legal proceedings threatened against us. From time to time, we may be a party to certain legal proceedings in the ordinary course of business, including proceedings relating to the enforcement of our rights under contracts with our portfolio companies. Furthermore, third parties may seek to impose liability on us in connection with the activities of our portfolio companies. Our business is also subject to extensive regulation, which may result in regulatory proceedings against us. While the outcome of any future legal or regulatory proceedings cannot be predicted with certainty, we do not expect that any such future proceedings will have a material effect upon our financial condition or results of operations.
Item 4. Mine Safety Disclosures
Not Applicable.
PART II: OTHER INFORMATION
Item 5. Market for Registrant's Common Equity, Related Stockholder Matters and Issuer Purchases of Equity Securities
Common Stock
Our common stock began trading on the Nasdaq Global Select Market (“Nasdaq”) on January 29, 2021 under the symbol “TRIN” in connection with our IPO, which closed on February 2, 2021. Since our IPO, our common stock has traded at prices both above and below our net asset value per share.
The following table sets forth the net asset value per share of our common stock, the range of high and low closing sales prices of our common stock reported on Nasdaq, the closing sales price as a premium (discount) to net asset value and the dividends declared by us in each fiscal quarter since we began trading on Nasdaq. On February 24, 2025, the last reported closing sales price of our common stock on Nasdaq was $15.93 per share, which represented a premium of approximately 19.3% to our net asset value per share of $13.35 as of December 31, 2024. As of February 24, 2025, we had approximately 49 stockholders of record, which does not include stockholders for whom shares are held in nominee or “street” name.
| | | | | | | | | | | | | | | | | | | | | | | | | | | |
| | | | | Price Range | | | | | | | | | | | | | |
Class and Period | | Net Asset Value(1) | | | High | | | Low | | | High Sales Price Premium (Discount) to Net Asset Value(2) | | Low Sales Price Premium (Discount) to Net Asset Value(2) | | Cash Dividend Per Share(3) | | |
Year Ending December 31, 2025 | | | | | | | | | | | | | | | | | | | | | |
First Quarter (through February 24, 2025) | | * | | | $ | 16.21 | | | $ | 14.26 | | | * | | | | * | | | | * | | |
Year Ending December 31, 2024 | | | | | | | | | | | | | | | | | | | | | |
Fourth Quarter | | $ | 13.35 | | | $ | 14.87 | | | $ | 13.11 | | | | 11.4 | | % | | | (1.8 | ) | % | | $ | 0.51 | | |
Third Quarter | | $ | 13.13 | | | $ | 14.74 | | | $ | 13.57 | | | | 12.3 | | % | | | 3.4 | | % | | $ | 0.51 | | |
Second Quarter | | $ | 13.12 | | | $ | 15.26 | | | $ | 14.03 | | | | 16.3 | | % | | | 7.0 | | % | | $ | 0.51 | | |
First Quarter | | $ | 12.88 | | | $ | 15.08 | | | $ | 13.68 | | | | 17.1 | | % | | | 6.2 | | % | | $ | 0.51 | | |
Year Ending December 31, 2023 | | | | | | | | | | | | | | | | | | | | | |
Fourth Quarter | | $ | 13.19 | | | $ | 15.40 | | | $ | 13.33 | | | | 16.7 | | % | | | 1.0 | | % | | $ | 0.50 | | |
Third Quarter | | $ | 13.17 | | | $ | 15.29 | | | $ | 13.75 | | | | 16.1 | | % | | | 4.4 | | % | | $ | 0.54 | | (4) |
Second Quarter | | $ | 13.15 | | | $ | 13.91 | | | $ | 11.36 | | | | 5.8 | | % | | | (13.6 | ) | % | | $ | 0.53 | | (4) |
First Quarter | | $ | 13.07 | | | $ | 14.26 | | | $ | 10.91 | | | | 9.1 | | % | | | (16.5 | ) | % | | $ | 0.47 | | |
(1)Net asset value per share is determined as of the last day in the relevant quarter and therefore may not reflect the net asset value per share on the date of the high and low closing sales prices. The net asset values shown are based on outstanding shares at the end of the relevant quarter.
(2)Calculated as the respective high or low closing sales price less net asset value, divided by net asset value (in each case, as of the applicable quarter).
(3)Represents the dividend or distribution declared in the relevant quarter.
(4)Consists of a quarterly dividend and a supplemental dividend.
| |
* | Not determined at time of filing. |
Shares of BDCs may trade at a market price that is less than the value of the net assets attributable to those shares. At times, our shares of common stock have traded at prices both above and below our net asset value per share. The possibility that our shares of common stock will trade at a discount from net asset value per share or at premiums that are unsustainable over the long term are separate and distinct from the risk that our net asset value per share will decrease. It is not possible to predict whether our common stock will trade at, above, or below net asset value per share.
Distribution Reinvestment Plan
Our amended and restated distribution reinvestment plan (“DRIP”) provides for the reinvestment of distributions in the form of common stock on behalf of our stockholders, unless a stockholder has elected to receive distributions in cash. As a result, if we declare a cash distribution, our stockholders who have not “opted out” of the DRIP by the opt out date will have their cash distribution automatically reinvested into additional shares of our common stock. The share requirements of the DRIP may be satisfied through the issuance of common shares or through open market purchases of common shares by the DRIP plan administrator. Newly issued shares will be valued based upon the final closing price of our common stock on the valuation date determined for each distribution by the Board.
Our DRIP is administered by our transfer agent on behalf of our record holders and participating brokerage firms. Brokerage firms and other financial intermediaries may decide not to participate in our DRIP but may provide a similar distribution reinvestment plan for their clients. Issuances under the plan are not subject to the registration requirements of the Securities Act.
Issuer Purchases of Equity Securities
On November 14, 2022, the Board authorized a stock repurchase plan permitting the Company to repurchase up to $25.0 million of the Company’s common stock (the “2022 Repurchase Program”). Under the 2022 Repurchase Program, the Company did not repurchase common stock during the year ended December 31, 2024 and repurchased $1.0 million of common stock during the year ended December 31, 2023. The 2022 Repurchase Program was not renewed by the Board of Directors, and expired on November 11, 2023.
On November 7, 2024, the Board authorized a stock repurchase plan permitting the Company to repurchase up to $30.0 million of the Company’s common stock (the “2024 Repurchase Program”). Under the 2024 Repurchase Program, the Company did not repurchase common stock during the years ended December 31, 2024 and 2023. The 2024 Share Repurchase Program is expected to be in effect until November 7, 2025, unless extended or until the aggregate repurchase amount that has been approved by the Board has been expended.
Information relating to repurchases of our common stock during the year ended December 31, 2024 is as follows:
| | | | | | | | | | |
| | | | Total Number of | | Approximate Dollar | |
| | | | Shares Purchased as | | Value of Shares that | |
| | | | Part of Publicly | | May Yet Be Purchased | |
| | Average Price | | Announced Plans or | | Under the Stock | |
Period | | Paid per Share | | Programs | | Repurchase Program | |
January 1 through March 31, 2024 | | $ | — | | $ | — | | $ | — | |
April 1 through June 30, 2024 | | | — | | | — | | | — | |
July 1 through September 30, 2024 | | | — | | | — | | | — | |
October 1 through December 31, 2024 | | | — | | | — | | | 30,000,000 | |
Total | | $ | — | | $ | — | | $ | 30,000,000 | |
Distribution Policy
In order to be subject to tax as a RIC, we must distribute to our stockholders, in respect of each taxable year, dividends for U.S. federal income tax purposes of an amount generally at least equal to the Annual Distribution Requirement. Upon satisfying this requirement in respect of a taxable year, we generally will not be subject to corporate taxes on any income we distribute to our stockholders as dividends for U.S. federal income tax purposes.
However, as a RIC we will be subject to a 4% non-deductible U.S. federal excise tax on certain undistributed income and gains unless we make distributions treated as dividends for U.S. federal income tax purposes in a timely manner to our stockholders in respect of each calendar year of an amount at least equal to the Excise Tax Avoidance Requirement. We will not be subject to this excise tax on any amount on which we incurred U.S. federal corporate income tax (such as the tax imposed on a RIC’s retained net capital gains). Depending on the level of taxable income earned in a taxable year, we may choose to carry over taxable income in excess of current taxable year distributions treated as dividends for U.S. federal income tax purposes from such taxable income into the next taxable year and incur a 4% excise tax on such taxable income, as required. The maximum amount of excess taxable income that may be carried over for distribution in the next taxable year under the Code is the total amount of distributions treated as dividends for U.S. federal income tax purposes paid in the following taxable year, subject to certain declaration and payment guidelines. To the extent we choose to carry over taxable income into the next taxable year, distributions declared and paid by us in a taxable year may differ from our taxable income for that taxable year as such distributions may include the distribution of current taxable year taxable income, the distribution of prior taxable year taxable income carried over into and distributed in the current taxable year, or returns of capital.
We can offer no assurance that we will achieve results that will permit the payment of any cash distributions and, if we issue senior securities, we will be prohibited from making distributions if doing so causes us to fail to maintain the asset coverage ratios stipulated by the 1940 Act or if distributions are limited by the terms of any of our borrowings. Our ability to make distributions will be limited by the asset coverage requirements under the 1940 Act. See “Item 1. Business— Regulation.”
Our Board maintains a variable distribution policy with the objective of distributing four quarterly distributions in an amount that approximates 90-100% of our taxable quarterly income or potential annual income for a particular taxable year.
We maintain an “opt-out” dividend reinvestment plan that provides for reinvestment of our distribution on behalf of our stockholders, unless a stockholder elects to receive cash. As a result, if our Board authorizes, and we declare a cash distribution, then our stockholders who have not “opted out” of our dividend reinvestment plan will have their cash distribution automatically reinvested in additional shares of our common stock, rather than receiving the cash distributions. During 2024, 2023, and 2022, we issued 90,245, 165,962 and 187,923 shares, respectively, of common stock to stockholders in connection with the dividend reinvestment plan.
Unregistered Sales of Equity Securities
During the year ended December 31, 2024, we issued 90,245 shares of common stock for a total of approximately $1.3 million under the DRIP. During the year ended December 31, 2023, we issued 165,962 shares of common stock for a total of approximately $2.2 million under the DRIP.
On January 15, 2025, we issued 20,349 shares of our common stock pursuant to our distribution reinvestment plan, which related to the dividend declared on December 12, 2024. These issuances were not subject to the registration requirements of the Securities Act.
Stock Performance Graph
The following stock performance graph compares the cumulative stockholder return of an investment in our common stock, the NASDAQ Financial 100 Index, the S&P 500, the S&P BDC Index and an average of certain of our direct BDC peers. The graph measures total shareholder return, which takes into account both changes in stock price and distributions. It assumes that distributions paid are reinvested in like securities prior to any tax effect.
The stock price performance included in the above performance graph is based on historical data and is not necessarily indicative of future stock performance. The performance graph and other information furnished under Part II. Item 5 of this Form 10-K shall not be deemed to be “soliciting material” or to be “filed” with the SEC or subject to Regulation 14A or 14C, or to the liabilities of Section 18 of the Exchange Act.
Item 6. [Reserved]
Item 7. Management’s Discussion and Analysis of Financial Condition and Results of Operations
Except where the context suggests otherwise, the terms “we,” “us,” “our,” and “the Company” refer to Trinity Capital Inc. and its consolidated subsidiaries. The information contained in this section should be read in conjunction with our consolidated financial statements and related notes thereto appearing elsewhere in this Annual Report on Form 10‑K.
This discussion contained forward-looking statements based upon current expectations that involve risks and uncertainties. Our actual results may differ materially from those anticipated in these forward-looking statements as a result of various factors, including those set forth under the section entitled “Risk Factors.” Please also see the section entitled “Cautionary Note Regarding Forward-Looking Statements.”
Overview
We are a specialty lending company providing debt, including loans, equipment financings and asset-based lending, to growth-oriented companies, including institutional investor-backed companies. We are an internally managed, closed-end, non-diversified management investment company that has elected to be regulated as a BDC under the 1940 Act. We have elected to be treated, and intend to qualify annually, as a RIC under Subchapter M of the Code for U.S. federal income tax purposes. As a BDC and a RIC, we are required to comply with certain regulatory requirements.
Our investment objective is to generate current income and, to a lesser extent, capital appreciation through our investments across five distinct vertical markets. We seek to achieve our investment objective by making investments consisting primarily of term loans, equipment financings and asset-based lending and, to a lesser extent, working capital loans, equity and equity-related investments. In addition, we may obtain warrants or contingent exit fees at funding from many of our portfolio companies, providing an additional potential source of investment returns. We generally are required to invest at least 70% of our total assets in qualifying assets in accordance with the 1940 Act but may invest up to 30% of our total assets in non-qualifying assets, as permitted by the 1940 Act.
We target investments in growth-oriented companies, which are typically private companies, including institutional investor-based companies. We define “growth-oriented companies” as companies that have significant ownership and active participation by sponsors, such as institutional investors or private equity firms, and expected annual revenues of up to $100 million. Subject to the requirements of the 1940 Act, we are not limited to investing in any particular industry or geographic area and seek to invest in under-financed segments of the private credit markets.
Our loans generally may have initial interest-only periods of up to 24 months, and our equipment financings generally begin amortizing immediately. Our loans and equipment financings generally have a total term of up to 60 months. These investments are typically secured by a blanket first position lien, a specific asset lien on mission-critical assets and/or a blanket second position lien. We may also make a limited number of direct equity and equity-related investments in conjunction with our debt investments. We target growth-oriented companies that have recently issued equity to raise cash to offset potential cash flow needs related to projected growth, have achieved positive cash flow to cover debt service, or have institutional investors committed to providing additional funding. A loan or equipment financing may be structured to tie the amortization of the loan or equipment financing to the portfolio company’s projected cash balances while cash is still available for operations. As such, the loan or equipment financing may have a reduced risk of default. We believe that the amortizing nature of our investments will mitigate risk and significantly reduce the risk of our investments over a relatively short period. We focus on protecting and recovering principal in each investment and structure our investments to provide downside protection.
Our History
Trinity Capital Inc. was incorporated under the general corporation laws of the State of Maryland on August 12, 2019 and commenced operations on January 16, 2020. Prior to January 16, 2020, we had no operations, except for matters relating to our formation and organization as a BDC.
On January 16, 2020, through a series of transactions, we acquired Trinity Capital Investment, LLC, Trinity Capital Fund II, L.P., Trinity Capital Fund III, L.P., Trinity Capital Fund IV, L.P., and Trinity Sidecar Income Fund, L.P. (collectively, the “Legacy Funds”) and all of their respective assets, including their respective investment portfolios (the “Legacy Portfolio”), as well as Trinity Capital Holdings, LLC, a holding company whose subsidiaries managed and/or had the right to receive fees from certain of the Legacy Funds. In order to complete these transactions, we used a portion of the proceeds from our private equity offering and private debt offering that occurred on January 16, 2020 (the “Private Offerings”).
On February 2, 2021, we completed our initial public offering of 8,006,291 shares of our common stock at a price of $14.00 per share, inclusive of the underwriters’ option to purchase additional shares, which was exercised in full. Our common stock began trading on the Nasdaq Global Select Market on January 29, 2021 under the symbol “TRIN.” Proceeds from this offering were primarily used to pay down a portion of our existing indebtedness outstanding.
On December 5, 2022, we entered into a joint venture agreement with certain funds and accounts managed by a specialty credit manager to co-manage Senior Credit Corp 2022 LLC, a Delaware limited liability company (the “JV”). The JV invests in secured loans and equipment financings to growth-oriented companies that have been originated by us.
On March 16, 2023, we formed an unconsolidated wholly owned subsidiary, Trinity Capital Adviser LLC, a Delaware limited liability company (“Adviser Sub”). We were granted exemptive relief by the SEC that permits us to organize, acquire, wholly own and operate the Adviser Sub as an investment adviser registered under the Investment Advisers Act of 1940, as amended (the “Adviser Act”). The Adviser Sub may provide investment advisory and related services to one or more investment vehicles (the “Adviser Funds”) with ownership by one or more unrelated third-party investors and receive fee income for such services.
On June 28, 2024, we and a specialty credit manager funded a portion of their respective capital commitments to commence operations of a credit fund, EPT 16 LLC, a Delaware limited liability company (“EPT 16”). EPT 16 has acquired and intends to acquire, hold and, as applicable, dispose of investments that have been originated by us.
Critical Accounting Estimates and Policies
The preparation of our financial statements in accordance with U.S. generally accepted accounting principles (“GAAP”) requires us to make estimates and assumptions that affect the reported amounts of assets, liabilities, revenues and expenses. Changes in the economic environment, financial markets and any other parameters used in determining such estimates could cause actual results to differ materially. Our critical accounting estimates, including those relating to valuation of investments and income recognition, are described below. The critical accounting estimates should be read in conjunction with our risk factors as disclosed in “Item 1A. Risk Factors.” Please refer to “Note 2 — Summary of Significant Accounting Policies” in the notes to the consolidated financial statements included in this Annual Report on Form 10-K for a discussion of our significant accounting policies.
Valuation of Investments
The most significant estimate inherent in the preparation of the Company’s consolidated financial statements is the valuation of investments and the related amounts of unrealized appreciation and depreciation of investments recorded. The Company’s investments are carried at fair value in accordance with the 1940 Act and Accounting Standards Codification (“ASC”) 946, Financial Services — Investment Companies (“ASC 946”) and measured in accordance with ASC 820, Fair Value Measurements and Disclosures (“ASC 820”). ASC 820 defines fair value, establishes a framework for measuring fair value, establishes a fair value hierarchy based on the observability of inputs used to measure fair value, and provides disclosure requirements for fair value measurements. ASC 820 requires the Company to assume that each of the portfolio investments is sold in a hypothetical transaction in the principal or, as applicable, most advantageous market using market participant assumptions as of the measurement date. Market participants are defined as buyers and sellers in the principal market that are independent, knowledgeable and willing and able to transact. The Company values its investments at fair value as determined in good faith by the Company’s Board of Directors (the “Board”) in accordance with the provisions of ASC 820 and the 1940 Act.
The SEC adopted Rule 2a-5 under the 1940 Act (“Rule 2a-5”), which establishes a framework for determining fair value in good faith for purposes of the 1940 Act. As adopted, Rule 2a-5 permits boards of directors to designate certain parties to perform fair value determinations, subject to board oversight and certain other conditions. The SEC also adopted Rule 31a-4 under the 1940 Act (“Rule 31a-4”), which provides the recordkeeping requirements associated with fair value determinations. While the Company's Board has not elected to designate a valuation designee, the Company has adopted certain revisions to its valuation policies and procedures to comply with the applicable requirements of Rule 2a-5 and Rule 31a-4.
While the Board is ultimately and solely responsible for determining the fair value of the Company’s investments, the Company has engaged independent valuation firms to provide the Company with valuation assistance with respect to its investments. The Company engages independent valuation firms on a discretionary basis. Specifically, on a quarterly basis, the Company identifies portfolio investments with respect to which an independent valuation firm assists in valuing certain investments. The Company selects these portfolio investments based on a number of factors, including, but not limited to, the potential for material fluctuations in valuation results, size, credit quality and the time lapse since the last valuation of the portfolio investment by an independent valuation firm.
Investments recorded on our Consolidated Statements of Assets and Liabilities are categorized based on the inputs to the valuation techniques as follows:
Level 1 — Investments whose values are based on unadjusted quoted prices for identical assets in an active market that the Company has the ability to access (examples include investments in active exchange-traded equity securities and investments in most U.S. government and agency securities).
Level 2 — Investments whose values are based on quoted prices in markets that are not active or model inputs that are observable either directly or indirectly for substantially the full term of the investment.
Level 3 — Investments whose values are based on prices or valuation techniques that require inputs that are both unobservable and significant to the overall fair value measurement (for example, investments in illiquid securities issued by privately held companies). These inputs reflect management’s own assumptions about the assumptions a market participant would use in pricing the investment.
Given the nature of lending to venture capital-backed growth-oriented companies, substantially all of the Company’s investments in these portfolio companies are considered Level 3 assets under ASC 820 because there is no known or accessible market or market indexes for these investment securities to be traded or exchanged. The Company uses an internally developed portfolio investment rating system in connection with its investment oversight, portfolio management and analysis and investment valuation procedures. This system takes into account both quantitative and qualitative factors of the portfolio companies. Due to the inherent uncertainty of determining the fair value of investments that do not have a readily available market value, the fair value of the Company’s investments may fluctuate from period to period. Because of the inherent uncertainty of valuation, these estimated values may differ significantly from the values that would have been reported had a ready market for the investments existed, and it is reasonably possible that the difference could be material.
Fair value estimates are made at discrete points in time based on relevant information. These estimates may be subjective in nature and involve uncertainties and matters of significant judgment and, therefore, cannot be determined with precision. The carrying amounts of the Company’s financial instruments, consisting of cash, investments, receivables, payables and other liabilities approximate the fair values of such items due to the short-term nature of these instruments.
Income Recognition
The Company recognizes interest income on an accrual basis and recognizes it as earned in accordance with the contractual terms of the loan agreement to the extent that such amounts are expected to be collected. Original issue discount (“OID”) initially includes the estimated fair value of detachable warrants obtained in conjunction with the origination of debt securities, and is accreted into interest income over the term of the loan as a yield enhancement based on the effective yield method. Interest income from payment-in-kind (“PIK”) represents contractually deferred interest added to the loan balance recorded on an accrual basis to the extent such amounts are expected to be collected.
In addition, the Company may also be entitled to an end-of-term (“EOT”) payment. EOT payments to be paid at the termination of the debt agreement are accreted into interest income over the contractual life of the debt based on the effective yield method. When a portfolio company pre-pays their indebtedness prior to the scheduled maturity date, the acceleration of the unaccreted OID and EOT is recognized as interest income.
Income related to application or origination payments, including facility commitment fees, net of related expenses and generally collected in advance, are accreted into interest income over the contractual life of the loan. The Company recognizes nonrecurring fees and additional OID and EOT received in consideration for contract modifications commencing in the quarter relating to the specific modification.
The Company records dividend income on an accrual basis to the extent amounts are expected to be collected. Dividend income is recorded when dividends are declared by the portfolio company or at such other time that an obligation exists for the portfolio company to make a distribution. The Company recorded $1.6 million and $0.6 million in dividend income during the years ended December 31, 2024 and 2023, respectively.
The Company recognizes one-time fee income, including, but not limited to, structuring fees, prepayment penalties, and exit fees related to a change in ownership of the portfolio company, as other income when earned. These fees are generally earned when the portfolio company enters into an equipment financing arrangement or pays off their outstanding indebtedness prior to the scheduled maturity. In addition, fee income may include fees for originations and administrative agent services rendered by the Company to the JV. Such fees are earned in the period that the services are rendered.
Portfolio Composition and Investment Activity
Portfolio Composition
As of December 31, 2024, our investment portfolio had an aggregate fair value of approximately $1,725.6 million and was comprised of approximately $1,286.7 million in secured loans, $315.5 million in equipment financings, and $123.4 million in equity and warrants, across 151 portfolio companies. As of December 31, 2023, our investment portfolio had an aggregate fair value of approximately $1,275.2 million and was comprised of approximately $885.3 million in secured loans, $336.8 million in equipment financings, and $53.1 million in equity and warrants, across 120 portfolio companies.
A summary of the composition of our investment portfolio at cost and fair value as a percentage of total investments are shown in the following table as of December 31, 2024 and December 31, 2023:
| | | | | | | | | | | | | | | | |
| | December 31, 2024 | | | December 31, 2023 | |
Type | | Cost | | | Fair Value | | | Cost | | | Fair Value | |
Secured Loans | | | 75.1 | % | | | 74.5 | % | | | 69.7 | % | | | 69.5 | % |
Equipment Financings | | | 18.1 | % | | | 18.3 | % | | | 25.5 | % | | | 26.4 | % |
Equity | | | 4.5 | % | | | 4.2 | % | | | 2.5 | % | | | 1.5 | % |
Warrants | | | 2.3 | % | | | 3.0 | % | | | 2.3 | % | | | 2.6 | % |
Total | | | 100.0 | % | | | 100.0 | % | | | 100.0 | % | | | 100.0 | % |
The following table shows the composition of our investment portfolio by geographic region at cost and fair value as a percentage of total investments as of December 31, 2024 and December 31, 2023. The geographic composition is determined by the location of the corporate headquarters of the portfolio company.
| | | | | | | | | | | | | | | | |
| | December 31, 2024 | | | December 31, 2023 | |
Geographic Region | | Cost | | | Fair Value | | | Cost | | | Fair Value | |
United States | | | | | | | | | | | | |
West | | | 30.7 | % | | | 31.5 | % | | | 35.5 | % | | | 36.5 | % |
Northeast | | | 28.1 | % | | | 27.6 | % | | | 29.8 | % | | | 29.9 | % |
Mountain | | | 10.9 | % | | | 10.5 | % | | | 9.0 | % | | | 8.7 | % |
Southeast | | | 10.5 | % | | | 10.4 | % | | | 3.3 | % | | | 3.3 | % |
South | | | 9.2 | % | | | 9.5 | % | | | 12.8 | % | | | 13.5 | % |
Midwest | | | 5.9 | % | | | 5.6 | % | | | 4.9 | % | | | 4.5 | % |
Multi-Sector Holdings (1) | | | 1.6 | % | | | 1.9 | % | | | 0.8 | % | | | 0.9 | % |
International: | | | | | | | | | | | | |
Western Europe | | | 2.4 | % | | | 2.4 | % | | | 1.7 | % | | | 1.8 | % |
Canada | | | 0.7 | % | | | 0.6 | % | | | 2.2 | % | | | 0.9 | % |
Total | | | 100.0 | % | | | 100.0 | % | | | 100.0 | % | | | 100.0 | % |
(1)Multi-Sector Holdings consist of the Company's investments in Senior Credit Corp 2022 LLC, Trinity Capital Adviser LLC and EPT 16 LLC. These entities invest or manage investments in secured loans and equipment financings to growth-oriented companies that have been originated by the Company. The portfolio companies held by the Multi-Sector Holdings represent a diverse set of geographical classifications, which are similar to those in which the Company invests directly. See “Note 12 – Related Party Transactions” in the notes to the consolidated financial statements included in this Annual Report on Form 10-K for further discussion.
Industry classifications have been updated to a preferred presentation. Set forth below is a table showing the industry composition of our investment portfolio at cost and fair value as a percentage of total investments as of December 31, 2024 and December 31, 2023:
| | | | | | | | | | | | | | | | |
| | December 31, 2024 | | | December 31, 2023 | |
Industry | | Cost | | | Fair Value | | | Cost | | | Fair Value | |
Finance and Insurance | | | 18.1 | % | | | 18.7 | % | | | 10.6 | % | | | 10.5 | % |
Medical Devices | | | 9.7 | % | | | 10.0 | % | | | 5.2 | % | | | 5.5 | % |
Green Technology | | | 8.3 | % | | | 9.2 | % | | | 10.5 | % | | | 11.2 | % |
SaaS | | | 8.2 | % | | | 8.5 | % | | | 2.6 | % | | | 2.7 | % |
Other Healthcare Services | | | 8.1 | % | | | 8.3 | % | | | 0.0 | % | | | 0.0 | % |
Space Technology | | | 8.0 | % | | | 8.2 | % | | | 14.1 | % | | | 14.6 | % |
Real Estate Technology | | | 5.8 | % | | | 5.4 | % | | | 7.2 | % | | | 7.2 | % |
Artificial Intelligence & Automation | | | 4.7 | % | | | 4.9 | % | | | 2.6 | % | | | 2.7 | % |
Healthcare Technology | | | 4.5 | % | | | 4.2 | % | | | 6.8 | % | | | 6.6 | % |
Biotechnology | | | 3.2 | % | | | 3.4 | % | | | 4.3 | % | | | 4.4 | % |
Consumer Products & Services | | | 3.2 | % | | | 3.2 | % | | | 6.5 | % | | | 6.6 | % |
Transportation Technology | | | 3.6 | % | | | 2.4 | % | | | 3.4 | % | | | 3.1 | % |
Marketing, Media, and Entertainment | | | 2.2 | % | | | 2.2 | % | | | 3.7 | % | | | 3.7 | % |
Connectivity | | | 2.1 | % | | | 2.0 | % | | | 2.7 | % | | | 2.7 | % |
Multi-Sector Holdings(1) | | | 1.6 | % | | | 1.9 | % | | | 0.8 | % | | | 0.9 | % |
Education Technology | | | 1.9 | % | | | 1.7 | % | | | 1.4 | % | | | 1.2 | % |
Human Resource Technology | | | 1.9 | % | | | 1.7 | % | | | 2.4 | % | | | 2.4 | % |
Supply Chain Technology | | | 1.7 | % | | | 1.7 | % | | | 2.3 | % | | | 1.9 | % |
Food and Agriculture Technologies | | | 1.8 | % | | | 1.4 | % | | | 6.9 | % | | | 7.0 | % |
Industrials | | | 0.7 | % | | | 0.6 | % | | | 1.7 | % | | | 1.8 | % |
Construction Technology | | | 0.5 | % | | | 0.2 | % | | | 1.8 | % | | | 0.5 | % |
Digital Assets Technology and Services | | | 0.2 | % | | | 0.2 | % | | | 2.5 | % | | | 2.8 | % |
Total | | | 100.0 | % | | | 100.0 | % | | | 100.0 | % | | | 100.0 | % |
(1)Multi-Sector Holdings consist of the Company's investments in Senior Credit Corp 2022 LLC, Trinity Capital Adviser LLC and EPT 16 LLC. These entities invest or manage investments in secured loans and equipment financings to growth-oriented companies that have been originated by the Company. The portfolio companies held by the Multi-Sector Holdings represent a diverse set of industry classifications, which are similar to those in which the Company invests directly. See “Note 12 – Related Party Transactions” in the notes to the consolidated financial statements included in this Annual Report on Form 10-K for further discussion.
As of both December 31, 2024 and December 31, 2023, the debt, including loans and equipment financings, in our portfolio had a weighted average time to maturity of approximately 3.2 years and 3.2 years, respectively. Additional information regarding our portfolio is set forth in the Consolidated Schedule of Investments and the related notes thereto included with this Annual Report on Form 10-K.
Concentrations of Credit Risk
Credit risk is the risk of default or non-performance by portfolio companies, equivalent to the investment’s carrying amount. Industry and sector concentrations will vary from period to period based on portfolio activity.
As of December 31, 2024 and December 31, 2023, the Company’s ten largest portfolio companies represented approximately 26.7% and 31.6%, respectively, of the total fair value of the Company’s investments in portfolio companies. As of December 31, 2024 and December 31, 2023, the Company had seven and four portfolio companies, respectively, that represented 5% or more of the Company’s net assets.
Investment Activity
During the year ended December 31, 2024, we invested approximately $969.1 million in 39 new portfolio companies, approximately $244.1 million in 28 existing portfolio companies, and approximately $16.6 million in the Multi-Sector Holdings, excluding deferred fees. During the year ended December 31, 2024, we received an aggregate of $807.9 million in proceeds from repayments and sales of our investments, including proceeds of approximately $313.2 million from early repayments on our debt investments, $45.7 million from warrant and equity exits, $207.3 million from scheduled/amortizing debt payments and $241.7 million from investments sold primarily to Multi-Sector Holdings.
During the year ended December 31, 2023, we invested approximately $414.3 million in 17 new portfolio companies, approximately $216.5 million in 25 existing portfolio companies, and approximately $11.0 million in the Multi-Sector Holdings, excluding deferred fees. During the year ended December 31, 2023, we received an aggregate of $471.9 million in proceeds from repayments and sales of our investments, including proceeds of approximately $326.6 million from early repayments on our debt investments and sales of debt investments.
The following table provides a summary of the changes in the investment portfolio for the years ended December 31, 2024 and 2023 (in thousands):
| | | | | | | | | | | | |
| | | | | | Year Ended | | | Year Ended | |
| | | | | | December 31, 2024 | | | December 31, 2023 | |
Beginning Portfolio, at fair value | | | | | | $ | 1,275,180 | | | $ | 1,094,386 | |
Purchases, net of deferred fees | | | | | | | 1,218,931 | | | | 632,754 | |
Non-cash conversion | | | | | | | — | | | | 21 | |
Principal payments received on investments | | | | | | | (207,328 | ) | | | (142,113 | ) |
Proceeds from early debt repayments | | | | | | | (313,207 | ) | | | (169,745 | ) |
Sales of investments | | | | | | | (287,331 | ) | | | (160,068 | ) |
Accretion of OID, EOT, and PIK payments | | | | | | | 39,574 | | | | 32,953 | |
Net realized gain/(loss) | | | | | | | (9,730 | ) | | | (28,071 | ) |
Net change in unrealized appreciation/(depreciation) | | | | | | | 9,481 | | | | 15,063 | |
Ending Portfolio, at fair value | | | | | | $ | 1,725,570 | | | $ | 1,275,180 | |
The level of our investment activity can vary substantially from period to period depending on many factors, including the amount of debt, including loans and equipment financings, and equity capital required by growth-oriented companies, the general economic environment and market conditions and the competitive environment for the types of investments we make.
Portfolio Asset Quality
Our portfolio management team uses an ongoing investment risk rating system to characterize and monitor our outstanding loans and equipment financings. Our portfolio management team monitors and, when appropriate, recommends changes to the investment risk ratings. Our investment committee reviews the recommendations and/or changes to the investment risk ratings, which are submitted on a quarterly basis to the Board and its audit committee.
For our investment risk rating system, we review seven different criteria and, based on our review of such criteria, we assign a risk rating on a scale of 1 to 5, as set forth in the following illustration.

The following table shows the distribution of our secured loan and equipment financing investments on the 1 to 5 investment risk rating scale range at fair value as of December 31, 2024 and December 31, 2023 (dollars in thousands):
| | | | | | | | | | | | | | | | | | |
| | | | December 31, 2024 | | | December 31, 2023 | |
Investment Risk Rating | | | | Investments at | | | Percentage of | | | Investments at | | | Percentage of | |
Scale Range | | Designation | | Fair Value | | | Total Portfolio | | | Fair Value | | | Total Portfolio | |
4.0 - 5.0 | | Very Strong Performance | | $ | 89,716 | | | | 5.6 | % | | $ | 40,584 | | | | 3.3 | % |
3.0 - 3.9 | | Strong Performance | | | 453,584 | | | | 28.3 | % | | | 277,867 | | | | 22.9 | % |
2.0 - 2.9 | | Performing | | | 972,001 | | | | 60.7 | % | | | 805,730 | | | | 65.9 | % |
1.6 - 1.9 | | Watch | | | 62,883 | | | | 3.9 | % | | | 56,740 | | | | 4.6 | % |
1.0 - 1.5 | | Default/Workout | | | 11,062 | | | | 0.7 | % | | | 33,452 | | | | 2.7 | % |
Total Debt Investments excluding Senior Credit Corp 2022 LLC | | | | | 1,589,246 | | | | 99.2 | % | | | 1,214,373 | | | | 99.4 | % |
. | | Senior Credit Corp 2022 LLC (1) | | | 12,885 | | | | 0.8 | % | | | 7,704 | | | | 0.6 | % |
Total Debt Investments | | | | $ | 1,602,131 | | | | 100.0 | % | | $ | 1,222,077 | | | | 100.0 | % |
(1)An investment risk rating is not applied to Senior Credit Corp 2022 LLC.
At December 2024 and December 31, 2023, our debt investments had a weighted average risk rating score of 2.9 and 2.7, respectively.
Debt Investments on Non-Accrual Status
When a debt security becomes 90 days or more past due, or if our management otherwise does not expect that principal, interest, and other obligations due will be collected in full, we will generally place the debt security on non-accrual status and cease recognizing interest income on that debt security until all principal and interest due has been paid or we believe the borrower has demonstrated the ability to repay its current and future contractual obligations. Any uncollected interest is reversed from income in the period that collection of the interest receivable is determined to be doubtful. However, we may make exceptions to this policy if the investment has sufficient collateral value and is in the process of collection.
As of December 2024, loans to three portfolio companies and equipment financings to two portfolio companies were on non-accrual status with a total cost of approximately $43.3 million, and a total fair value of approximately $12.7 million, or 0.8%, of the fair value of the Company’s debt investment portfolio. As of December 31, 2023, loans to three portfolio companies and equipment financings to two portfolio companies were on non-accrual status with a total cost of approximately $60.8 million, and a total fair value of approximately $43.2 million, or 3.5%, of the fair value of the Company’s debt investment portfolio.
Fiscal Year Ended December 31, 2022
A discussion of our portfolio composition and investment activity for the fiscal year ended December 31, 2022 is available in our Annual Report on Form 10-K for the year ended December 31, 2023, which was filed with the SEC on March 6, 2024 and is available on the SEC’s EDGAR database.
Results of Operations
The following discussion and analysis of our results of operations encompasses our consolidated results for the years ended December 31, 2024 and 2023.
Investment Income
The following table sets forth the components of investment income (in thousands):
| | | | | | | | | | |
| | Year Ended | | | Year Ended | |
| | December 31, 2024 | | | December 31, 2023 | |
Stated interest income | | $ | | 178,988 | | | $ | | 141,850 | |
Amortization of OID and EOT | | | | 27,794 | | | | | 16,665 | |
Acceleration of OID and EOT | | | | 9,317 | | | | | 7,725 | |
PIK interest income | | | | 9,055 | | | | | 7,998 | |
Prepayment penalty and related fees | | | | 3,020 | | | | | 2,118 | |
Dividend income | | | | 1,575 | | | | | 602 | |
Other fee income | | | | 7,942 | | | | | 4,897 | |
Total investment income | | $ | | 237,691 | | | $ | | 181,855 | |
For the year ended December 31, 2024, total investment income was approximately $237.7 million, which represents an approximate effective yield of 16.1% on the average investments during the year. For the year ended December 31, 2023, total investment income was approximately $181.9 million, which represents an approximate effective yield of 16.1% on the average investments during the year. The increase in investment income for the year ended December 31, 2024 is due to higher interest income and amortization of OID and EOT based on an increased principal value of income producing debt investments.
Net Operating Expenses and Excise Taxes
Our operating expenses are comprised of interest and fees on our borrowings, employee compensation, professional fees, general and administrative expenses and excise taxes. Our operating expenses totaled approximately $121.8 million and $92.0 million for the years ended December 31, 2024 and 2023, respectively. The increase in our operating expenses for the year ended December 31, 2024 is discussed with respect to each component of such expenses below.
Interest Expense and Other Debt Financing Costs
Our interest expense and other debt financing costs are primarily comprised of interest and fees related to our secured borrowings, the 7.00% Notes due 2025 (the “2025 Notes”), the 4.375% Notes due 2026 (the “August 2026 Notes”), the 4.25% Notes due 2026 (the “December 2026 Notes”), the 7.875% Notes due March 2029 (the “March 2029 Notes”), the 7.875% Notes due September 2029 (the “September 2029 Notes”), the 7.54% Notes due 2027 (the “Series A 2027 Notes”), the 7.60% Notes due 2028 (the “Series A 2028 Notes”), the 7.66% Notes due 2029 (the “Series A 2029 Notes” and together with the Series A 2027 Notes and Series A 2028 Notes, the “Series A Notes”), and the 6.00% Convertible Notes due 2025 (the “Convertible Notes”). Interest expense and other debt financing costs on our borrowings totaled approximately $61.9 million and $44.3 million for the years ended December 31, 2024 and 2023, respectively. Our weighted average effective interest rate, comprised of interest and amortization of fees and discount, was approximately 7.6% and 7.2% for years ended December 31, 2024 and 2023. The increase in interest expense for the year ended December 31, 2024 was primarily due to the issuance of the March 2029 Notes, September 2029 Notes, Series A Notes and to increased borrowings base rate under our credit facility with KeyBank, National Association (the “KeyBank Credit Facility”).
Employee Compensation and Benefits
Employee compensation and benefits totaled approximately $43.5 million and $33.1 million for the years ended December 31, 2024 and 2023, respectively. The increase in employee compensation expenses for the year ended December 31, 2024 relates primarily to the increased variable compensation related to higher headcount and stock-based compensation. As of December 31, 2024 and 2023, the Company had 88 and 68 employees, respectively.
Professional Fees Expenses
Professional fees expenses, consisting of legal fees, accounting fees, third-party valuation fees, and talent acquisition fees totaled approximately $5.3 million and $5.4 million for the years ended December 31, 2024 and 2023, respectively. The decrease in professional fees expenses for the year ended December 31, 2024, resulted primarily from decreased third-party valuation fees and other consulting fees.
General and Administrative Expenses
General and administrative expenses include insurance premiums, rent, taxes and various other expenses related to our ongoing operations. Our general and administrative expenses totaled approximately $8.9 million and $6.6 million for the years ended December 31, 2024 and 2023, respectively. The increase in general and administrative expenses for the year ended December 31, 2024 was primarily due to additional office rent and related expenses.
Allocated Expenses to Trinity Capital Adviser, LLC
The resource sharing agreement (the “Sharing Agreement”) with the Adviser Sub provides the Adviser Sub with access to the Company's human capital resources, facilities and systems. Under the terms of the Sharing Agreement, we allocate the related expenses of such shared resources to the Adviser Sub based on total assets under management by the Adviser Sub and us. The Company's total expenses are net of such expenses allocated to the Adviser Sub of $0.5 million for the year ended December 31, 2024. As of December 31, 2024, there was $1.8 million receivable due from the Adviser Sub.
Excise Taxes
Our excise taxes totaled approximately $2.7 million and $2.6 million for the years ended December 31, 2024 and 2023, respectively.
Net Investment Income
Net investment income totaled approximately $115.8 million and $89.9 million for the years ended December 31, 2024 and 2023, respectively. The increase in net investment income for the year ended December 31, 2024 resulted from an increase in total investment income as compared to total expenses, including excise tax expense. For the year ended December 31, 2024, we recognized approximately $237.7 million in total investment income as compared to approximately $121.8 million in total expenses including excise tax expense. For the year ended December 31, 2023 we recognized approximately $181.9 million in total investment income as compared to approximately $92.0 million in total expenses including excise tax expense.
Net Realized Gains and Losses
Realized gains or losses are measured by the difference between the net proceeds from the sale or redemption of an investment or a financial instrument and the cost basis of the investment or financial instrument, without regard to unrealized appreciation or depreciation previously recognized, and includes investments written off during the period.
During the year ended December 31, 2024, our gross realized gains primarily consisted of the repayment of three equipment financing positions and the sale of three equity positions. Our gross realized losses primarily consisted of the sale of one equity position, the sale of one debt position, the repayment of one debt position and the conversion of debt positions in four portfolio companies. During the year ended December 31, 2023, our gross realized gains primarily consisted of the sale of our debt or warrant positions in five portfolio companies, and our gross realized losses primarily consisted of the sale of our debt or equity positions in three portfolio companies.
The net realized gains (losses) from the sales, repayments, or exits of investments for the years ended December 31, 2024 and 2023 were comprised of the following (in thousands):
| | | | | | | | | | |
| | | Year Ended | | | | Year Ended | |
| | | December 31, 2024 | | | | December 31, 2023 | |
Net realized gain/(loss) on investments: | | |
| | | |
| |
Gross realized gains | | $ | | 24,474 | | | $ | | 4,977 | |
Gross realized losses | | | | (34,204 | ) | | | | (33,048 | ) |
Total net realized gains/(losses) on investments | | $ | | (9,730 | ) | | $ | | (28,071 | ) |
Net Change in Unrealized Appreciation / (Depreciation) from Investments
Net change in unrealized appreciation/(depreciation) from investments primarily reflects the net change in the fair value of the investment portfolio and financial instruments and the reclassification of any prior period unrealized appreciation or depreciation on exited investments and financial instruments to realized gains or losses.
Net unrealized appreciation and depreciation on investments for the years ended December 31, 2024 and 2023 is comprised of the following (in thousands):
| | | | | | | | | | |
| | Year Ended | | | Year Ended | |
| | December 31, 2024 | | | December 31, 2023 | |
Gross unrealized appreciation | | $ | | 41,496 | | | $ | | 39,347 | |
Gross unrealized depreciation | | | | (58,712 | ) | | | | (57,390 | ) |
Net unrealized appreciation/(depreciation) reclassified related to net realized gains or losses | | | | 26,697 | | | | | 33,106 | |
Total net unrealized gains/(losses) on investments | | $ | | 9,481 | | | $ | | 15,063 | |
During the year ended December 31, 2024, our net unrealized appreciation totaled approximately $9.5 million, which included net unrealized appreciation of $7.5 million from our warrant investments, net unrealized appreciation of $7.1 million from our equity investments and net unrealized depreciation of $5.1 million from our debt investments.
During the year ended December 31, 2023, our net unrealized appreciation totaled approximately $15.1 million, which included net unrealized appreciation of $11.2 million from our equity investments, net unrealized appreciation of $11.0 million from our debt investments and net unrealized depreciation of $7.2 million from our warrant investments.
Net Increase (Decrease) in Net Assets Resulting from Operations
Net increase in net assets resulting from operations during the year ended December 31, 2024, totaled approximately $115.6 million. Net increase in net assets resulting from operations during the year ended December 31, 2023, totaled approximately $76.9 million.
Net Increase (Decrease) in Net Assets Resulting from Operations and Earnings Per Share
For the year ended December 31, 2024, basic and diluted net increase in net assets per common share was $2.19 and $2.10, respectively. For the year ended December 31, 2023, basic and diluted net decrease in net assets per common share was $1.98 and $1.89, respectively.
Fiscal Year Ended December 31, 2022
A discussion of our results of operations for the fiscal year ended December 31, 2022 is available in our Annual Report on Form 10-K for the year ended December 31, 2023, which was filed with the SEC on March 6, 2024 and is available on the SEC’s EDGAR database.
Financial Condition, Liquidity and Capital Resources
Our liquidity and capital resources are generated primarily from the net proceeds of offerings of our securities, including our “at-the-market” offering, the 2025 Notes offering, the Convertible Notes offering, the August 2026 Notes offering, the December 2026 Notes offering, the March 2029 Notes offering, the September 2029 Notes offering and the Series A Notes offering and borrowings under the KeyBank Credit Facility, each of which were outstanding as of December 31, 2024, as well as cash flows from our operations, including investment sales and repayments and income earned on investments and cash equivalents. Our primary use of our funds includes investments in portfolio companies, payments of interest on our outstanding debt, and payments of fees and other operating expenses we incur. We also expect to use our funds to pay distributions to our stockholders. We have used, and expect to continue to use, our borrowings, including under the KeyBank Credit Facility or any future credit facility, as well as proceeds from the turnover of our portfolio to finance our investment objectives and activities.
From time to time, we may enter into additional credit facilities, increase the size of our existing KeyBank Credit Facility, or issue additional securities in private or public offerings. Any such incurrence or issuance would be subject to prevailing market conditions, our liquidity requirements, contractual and regulatory restrictions, and other factors.
For the year ended December 31, 2024, we experienced a net increase in cash and cash equivalents in the amount of $4.9 million, which is the net result of $322.2 million of cash provided by financing activities partially offset by $316.9 million of cash used in operating activities and $0.4 million of cash used in investing activities. During the year ended December 31, 2023, we experienced a net decrease in cash and cash equivalents in the amount of $5.9 million, which is the net result of $96.3 million of cash used in operating activities and $2.7 million of cash used in investing activities partially offset by $93.1 million of cash provided by financing activities.
As of December 2024 and December 31, 2023, we had cash and cash equivalents of $9.6 million and $4.8 million, respectively, of which $3.8 million and $3.1 million, respectively, was held in the Goldman Sachs Financial Square Government Institutional Fund. Cash held in demand deposit accounts may exceed the Federal Deposit Insurance Corporation (“FDIC”) insured limit and therefore is subject to credit risk. All of the Company’s cash deposits are held at large established high credit quality financial institutions, and management believes that the risk of loss associated with any uninsured balances is remote.
As of December 2024 and December 31, 2023, we had approximately $487.0 million and $137.0 million, respectively, of available borrowings under the KeyBank Credit Facility, subject to its terms and regulatory requirements. Cash and cash equivalents, taken together with available borrowings under the KeyBank Credit Facility, as of December 2024, are expected to be sufficient for our investing activities and to conduct our operations in the near term and long term.
Refer to “Note 5 – Borrowings” in the notes to our consolidated financial statements included in this Annual Report on Form 10-K for a discussion of our borrowings.
Asset Coverage Requirements
In accordance with the 1940 Act, with certain limited exceptions, we are only allowed to incur borrowings, issue debt securities or issue preferred stock, if immediately after the borrowing or issuance, the ratio of total assets (less total liabilities other than indebtedness) to total indebtedness plus preferred stock, is at least 150%. On September 27, 2019, the Board, including a “required majority” (as such term is defined in Section 57(o) of the 1940 Act) and our initial stockholder approved the application to us of the 150% minimum asset coverage ratio set forth in Section 61(a)(2) of the 1940 Act. As a result, we are permitted to potentially borrow $2 for investment purposes of every $1 of investor equity. As of December 2024, our asset coverage ratio was approximately 192.7% and our asset coverage ratio per unit was approximately $1,927. As of December 31, 2023, our asset coverage ratio was approximately 194.7% and our asset coverage ratio per unit was approximately $1,947.
Commitments and Off-Balance Sheet Arrangements
The Company has entered into a capital commitment with the JV and EPT 16 in the amount of $21.4 million and $10.0 million, respectively. As of December 31, 2024, unfunded commitments were $3.0 million and $0.8 million for the JV and EPT 16, respectively. As of December 31, 2024, the Company also had unfunded commitments of approximately $31.2 million to two portfolio companies. As of December 31, 2023 unfunded commitments was $10.4 million for the JV and there were no unfunded commitments for EPT 16. The Company did not have any other off-balance sheet financings or liabilities as of December 31, 2024 and December 31, 2023.
The Company’s commitments and contingencies consist primarily of unfunded commitments to extend credit in the form of loans to the Company’s portfolio companies. A portion of these unfunded contractual commitments as of December 31, 2024 and December 31, 2023 are dependent upon the portfolio company reaching certain milestones before the debt commitment becomes available. Furthermore, the Company’s credit agreements with its portfolio companies generally contain customary lending provisions that allow the Company relief from funding obligations for previously made commitments in instances where the underlying portfolio company experiences materially adverse events that affect the financial condition or business outlook for the company. Since a portion of these commitments may expire without being drawn, unfunded contractual commitments do not necessarily represent future cash requirements. As such, the Company’s disclosure of unfunded contractual commitments includes only those which are available at the request of the portfolio company and unencumbered by milestones. The Company will fund future unfunded commitments from the same sources it uses to fund its investment commitments that are funded at the time they are made (which are typically through existing cash and cash equivalents and borrowings under the KeyBank Credit Facility.
In the normal course of business, the Company enters into contracts that provide a variety of representations and warranties, and general indemnifications. Such contracts include those with certain service providers, brokers and trading counterparties. Any exposure to the Company under these arrangements is unknown as it would involve future claims that may be made against the Company; however, based on the Company’s experience, the risk of loss is remote and no such claims are expected to occur. As such, the Company has not accrued any liability in connection with such indemnifications.
Contractual Obligations
A summary of our contractual payment obligations as of December 31, 2024, is as follows:
| | | | | | | | | | | | | | | | | | | | |
| | Payments Due by Period | | | | |
| | Less than 1 | | | | | | | | | | | | | |
| | year | | | 1 - 3 years | | | 4 - 5 years | | | After 5 years | | | Total | |
KeyBank Credit Facility | | $ | — | | | $ | — | | | $ | 113,000 | | | $ | — | | | $ | 113,000 | |
2025 Notes | | | 152,500 | | | | — | | | | — | | | | — | | | | 152,500 | |
Convertible Notes | | | — | | | | 50,000 | | | | — | | | | — | | | | 50,000 | |
August 2026 Notes | | | — | | | | 125,000 | | | | — | | | | — | | | | 125,000 | |
December 2026 Notes | | | — | | | | 75,000 | | | | — | | | | — | | | | 75,000 | |
March 2029 Notes | | | — | | | | — | | | | 115,000 | | | | — | | | | 115,000 | |
September 2029 Notes | | | — | | | | — | | | | 115,000 | | | | — | | | | 115,000 | |
Series A Notes | | | — | | | | 55,500 | | | | 87,000 | | | | — | | | | 142,500 | |
Operating Leases | | | — | | | | 3,343 | | | | 2,131 | | | | 1,565 | | | | 7,039 | |
Total Contractual Obligations | | $ | 152,500 | | | $ | 308,843 | | | $ | 432,131 | | | $ | 1,565 | | | $ | 895,039 | |
Distributions
We intend to pay quarterly distributions to our stockholders out of assets legally available for distribution. All distributions will be paid at the discretion of the Board and will depend on our earnings, financial condition, maintenance of our tax treatment as a RIC, compliance with applicable BDC regulations and such other factors as the Board may deem relevant from time to time.
The following table summarizes distributions declared and/or paid by the Company since inception:
| | | | | | | | | | |
Declaration
Date | | Type | | Record
Date | | Payment
Date | | Per Share
Amount | |
May 7, 2020 | | Quarterly | | May 29, 2020 | | June 5, 2020 | | $ | 0.22 | |
August 10, 2020 | | Quarterly | | August 21, 2020 | | September 4, 2020 | | | 0.27 | |
November 9, 2020 | | Quarterly | | November 20, 2020 | | December 4, 2020 | | | 0.27 | |
December 22, 2020 | | Quarterly | | December 30, 2020 | | January 15, 2021 | | | 0.27 | |
March 23, 2021 | | Quarterly | | March 31, 2021 | | April 16, 2021 | | | 0.28 | |
June 15, 2021 | | Quarterly | | June 30, 2021 | | July 15, 2021 | | | 0.29 | |
September 13, 2021 | | Quarterly | | September 30, 2021 | | October 15, 2021 | | | 0.33 | |
December 16, 2021 | | Quarterly | | December 31, 2021 | | January 14, 2022 | | | 0.36 | |
March 15, 2022 | | Quarterly | | March 31, 2022 | | April 15, 2022 | | | 0.40 | |
March 15, 2022 | | Supplemental | | March 31, 2022 | | April 15, 2022 | | | 0.15 | |
June 15, 2022 | | Quarterly | | June 30, 2022 | | July 15, 2022 | | | 0.42 | |
June 15, 2022 | | Supplemental | | June 30, 2022 | | July 15, 2022 | | | 0.15 | |
September 15, 2022 | | Quarterly | | September 30, 2022 | | October 14, 2022 | | | 0.45 | |
September 15, 2022 | | Supplemental | | September 30, 2022 | | October 14, 2022 | | | 0.15 | |
December 15, 2022 | | Quarterly | | December 30, 2022 | | January 13, 2023 | | | 0.46 | |
December 15, 2022 | | Supplemental | | December 30, 2022 | | January 13, 2023 | | | 0.15 | |
March 14, 2023 | | Quarterly | | March 31, 2023 | | April 14, 2023 | | | 0.47 | |
June 14, 2023 | | Quarterly | | June 30, 2023 | | July 14, 2023 | | | 0.48 | |
June 14, 2023 | | Supplemental | | June 30, 2023 | | July 14, 2023 | | | 0.05 | |
September 13, 2023 | | Quarterly | | September 30, 2023 | | October 13, 2023 | | | 0.49 | |
September 13, 2023 | | Supplemental | | September 30, 2023 | | October 13, 2023 | | | 0.05 | |
December 14, 2023 | | Quarterly | | December 29, 2023 | | January 12, 2024 | | | 0.50 | |
March 14, 2024 | | Quarterly | | March 28, 2024 | | April 15, 2024 | | | 0.51 | |
June 13, 2024 | | Quarterly | | June 28, 2024 | | July 15, 2024 | | | 0.51 | |
September 18, 2024 | | Quarterly | | September 30, 2024 | | October 15, 2024 | | | 0.51 | |
December 12, 2024 | | Quarterly | | December 31, 2024 | | January 15, 2025 | | | 0.51 | |
| | | | | | Total | | $ | 8.70 | |
Fiscal Year Ended December 31, 2022
A discussion of our financial condition, liquidity and capital resource for the fiscal year ended December 31, 2022 is available in our Annual Report on Form 10-K for the year ended December 31, 2023, which was filed with the SEC on March 6, 2024 and is available on the SEC’s EDGAR database.
Related Party Transactions
Certain members of management as well as employees of the Company hold shares of the Company’s stock.
We have entered into indemnification agreements with our directors and executive officers. The indemnification agreements are intended to provide our directors and executive officers with the maximum indemnification permitted under Maryland law and the 1940 Act. Each indemnification agreement provides that we shall indemnify the director or executive officer who is a party to the agreement, or an “Indemnitee,” including the advancement of legal expenses, if, by reason of his or her corporate status, the Indemnitee is, or is threatened to be, made a party to or a witness in any threatened, pending, or completed proceeding, to the maximum extent permitted by Maryland law and the 1940 Act.
Refer to “Note 12 – Related Party Transactions” included in the notes to our consolidated financial statements included in this Annual Report on Form 10-K for additional information.
Recent Developments
2025 Notes Maturity
On January 16, 2025, the 2025 Notes matured pursuant to their terms and were repaid in full. The 2025 Notes are no longer outstanding or listed on Nasdaq Global Select Market.
Debt ATM Program
On February 10, 2025, we entered into an open market sale agreement (the “Sales Agreement”) with B. Riley Securities, Inc. (the “Sales Agent”), as sales agent and/or principal thereunder. Under the Sales Agreement, we may, but have no obligation to, issue and sell, from time to time, up to $100,000,000 aggregate principal amount of the March 2029 Notes (the “ATM March 2029 Notes”) and/or September 2029 Notes (the “ATM September 2029 Notes” and together with the ATM March 2029 Notes, the “ATM Notes”), through the Sales Agent or to the Sale Agent, as principal for its own account.
The ATM Notes will be issued as additional notes under the Base Indenture, dated January 16, 2020, between us and U.S. Bank National Association, as trustee (together with its successor in interest, U.S. Bank Trust Company, National Association, the “Trustee”), as supplemented by the Fifth Supplemental Indenture, dated March 28, 2024, with respect to the March 2029 Notes, and the Sixth Supplemental Indenture, dated as of July 19, 2024, with respect to the September 2029 Notes. The ATM March 2029 Notes and the ATM September 2029 Notes are treated as a single series with, have the same terms and CUSIP number as, and are fungible and rank equally with, the March 2029 Notes and the September 2029 Notes, respectively.
The March 2029 Notes bear interest at a rate of 7.875% per year payable quarterly in arrears on March 30, June 30, September 30 and December 30 of each year, which commenced on June 30, 2024. The March 2029 Notes will mature on March 30, 2029 and may be redeemed in whole or in part at any time, or from time to time, at our option on or after March 30, 2026, at a redemption price equal to 100% of the outstanding principal amount thereof, plus accrued and unpaid interest to, but excluding, the date of redemption. The existing March 2029 Notes are currently listed Nasdaq and trade on Nasdaq under the trading symbol “TRINZ.” The ATM March 2029 Notes are expected to be listed on Nasdaq and to trade on Nasdaq under the existing trading symbol “TRINZ.”
The September 2029 Notes bear interest at a rate of 7.875% per year payable quarterly in arrears on March 30, June 30, September 30 and December 30 of each year, which commenced on September 30, 2024. The September 2029 Notes will mature on September 30, 2029 and may be redeemed in whole or in part at any time, or from time to time, at our option on or after September 30, 2026, at a redemption price equal to 100% of the outstanding principal amount thereof, plus accrued and unpaid interest to, but excluding, the date of redemption. The existing September 2029 Notes are currently listed on Nasdaq and trade on Nasdaq under the existing trading symbol “TRINI.” The ATM September 2029 Notes are expected to be listed on Nasdaq and to trade on Nasdaq under the existing trading symbol “TRINI.”
Convertible Notes Redemption
On February 20, 2025, the holders of the Convertible Notes exercised their right to convert all of the outstanding principal amount of the Convertible Notes, pursuant to the terms of conditions of the Convertible Notes. At our election, we paid $66.2 million in cash to satisfy in full our obligation to pay the principal amount of the Convertible Notes, such settlement amount being determined based on the then existing conversion rate of 81.6439 per $1,000 principal amount of the Convertible Notes. As a result, the Convertible Notes are no longer outstanding.
Equity ATM Program
For the period from January 1, 2025 to February 24, 2025, the Company issued and sold 1,141,695 shares of its common stock at a weighted-average price of $15.24 per share and raised $17.2 million of net proceeds after deducting commissions to the sales agents on shares sold under the ATM Program.
Item 7A. Quantitative and Qualitative Disclosures About Market Risk
We are subject to financial market risks, including valuation risk and interest rate risk. Uncertainty with respect to the economic effects of the overall market conditions has introduced significant volatility in the financial markets, and the effect of the volatility could materially impact our market risks, including those listed below.
Valuation Risk
Our investments may not have readily available market quotations (as such term is defined in Rule 2a-5), and those investments which do not have readily available market quotations are valued at fair value as determined in good faith by our Board of Directors in accordance with our valuation policy. There is no single standard for determining fair value in good faith. As a result, determining fair value requires that judgment be applied to the specific facts and circumstances of each portfolio investment while employing a consistently applied valuation process for the types of investments we make. Due to the inherent uncertainty of determining the fair value of investments that do not have a readily available market value, the fair value of our investments may fluctuate from period to period. Because of the inherent uncertainty of valuation, these estimated values may differ significantly from the values that would have been used had a ready market for the investments existed, and it is possible that the difference could be material.
In accordance with Rule 2a-5, our Board periodically assesses and manages material risks associated with the determination of the fair value of our investments.
Interest Rate Risk
Interest rate sensitivity and risk refer to the change in earnings that may result from changes in the level of interest rates. To the extent that we borrow money to make investments, including under the KeyBank Credit Facility or any future financing arrangement, our net investment income will be affected by the difference between the rate at which we borrow funds and the rate at which we invest these funds. In periods of rising interest rates, our cost of borrowing funds would increase, which may reduce our net investment income. As a result, there can be no assurance that a significant change in market interest rates, including as a result of inflation, will not have a material adverse effect on our net investment income. Inflation is likely to continue in the near to medium-term, particularly in the United States and Europe, with the possibility that monetary policy may tighten in response. Persistent inflationary pressures could affect our portfolio companies’ profit margins.
As of December 31, 2024, approximately 77.1% of our debt investments based on outstanding principal balance represented floating-rate investments based on U.S. Prime Rate (“Prime”) or SOFR, and approximately 22.9% of our debt investments based on outstanding principal balance represented fixed rate investments. In addition, borrowings under the KeyBank Credit Facility are subject to floating interest rates based on SOFR, generally bearing interest at a rate of the Adjusted Term SOFR Reference Rate plus 2.85% to 3.25%, subject to the number of eligible debt investments in the collateral pool.
Based on our Consolidated Statements of Operations as of December 31, 2024, the following table shows the annualized impact on net income of hypothetical base rate changes in the Prime Rate on our debt investments (considering interest rate floors for floating-rate instruments) and the hypothetical base rate changes in the SOFR on our KeyBank Credit Facility, assuming that there are no changes in our investment and borrowing structure (in thousands):
| | | | | | | | | | | | |
| | Interest | | | Interest | | | Net | |
| | Income | | | Expense | | | Income/(Loss) | |
Up 300 basis points | | $ | 36,705 | | | $ | 3,390 | | | $ | 33,315 | |
Up 200 basis points | | | 24,469 | | | | 2,260 | | | | 22,209 | |
Up 100 basis points | | | 12,235 | | | | 1,130 | | | | 11,105 | |
Down 100 basis points | | | (4,617 | ) | | | (1,130 | ) | | | (3,487 | ) |
Down 200 basis points | | | (8,951 | ) | | | (2,260 | ) | | | (6,691 | ) |
Down 300 basis points | | | (10,510 | ) | | | (3,390 | ) | | | (7,120 | ) |
Currency Risk
Any investments we make that are denominated in a foreign currency will be subject to risks associated with changes in currency exchange rates. These risks include the possibility of significant fluctuations in the foreign currency markets, the imposition or modification of foreign exchange controls and potential illiquidity in the secondary market. These risks will vary depending upon the currency or currencies involved. As of December 31, 2024, we had five foreign domiciled portfolio companies. Our exposure to currency risk related to these debt investments is minimal as payments from such portfolio companies are received in U.S. dollars. No other investments as of December 31, 2024 were subject to currency risk.
Hedging
We do not currently engage in any hedging activities. However, we may, in the future, hedge against interest rate and currency exchange rate fluctuations by using standard hedging instruments such as futures, options and forward contracts subject to the requirements of the 1940 Act. While hedging activities may insulate us against adverse changes in interest rates, they may also limit our ability to participate in benefits of lower interest rates with respect to our portfolio of investments with fixed interest rates. We may also borrow funds in local currency as a way to hedge our non-U.S. denominated investments.
Item 8. Consolidated Financial Statements and Supplementary Data
INDEX TO CONSOLIDATED FINANCIAL STATEMENTS
Report of Independent Registered Public Accounting Firm
To the Shareholders and the Board of Directors of Trinity Capital Inc.
Opinion on the Financial Statements
We have audited the accompanying consolidated statements of assets and liabilities of Trinity Capital Inc. (the Company), including the consolidated schedules of investments, as of December 31, 2024 and 2023, the related consolidated statements of operations, changes in net assets, and cash flows for each of the three years in the period ended December 31, 2024, and the related notes (collectively referred to as the “consolidated financial statements”). In our opinion, the consolidated financial statements present fairly, in all material respects, the financial position of the Company at December 31, 2024 and 2023, and the results of its operations, changes in its net assets, and its cash flows for each of the three years in the period ended December 31, 2024, in conformity with U.S. generally accepted accounting principles.
Basis for Opinion
These financial statements are the responsibility of the Company’s management. Our responsibility is to express an opinion on the Company’s financial statements based on our audits. We are a public accounting firm registered with the Public Company Accounting Oversight Board (United States) (PCAOB) and are required to be independent with respect to the Company in accordance with the U.S. federal securities laws and the applicable rules and regulations of the Securities and Exchange Commission and the PCAOB.
We conducted our audits in accordance with the standards of the PCAOB. Those standards require that we plan and perform the audit to obtain reasonable assurance about whether the financial statements are free of material misstatement, whether due to error or fraud. The Company is not required to have, nor were we engaged to perform, an audit of its internal control over financial reporting. As part of our audits, we are required to obtain an understanding of internal control over financial reporting but not for the purpose of expressing an opinion on the effectiveness of the Company’s internal control over financial reporting. Accordingly, we express no such opinion.
Our audits included performing procedures to assess the risks of material misstatement of the financial statements, whether due to error or fraud, and performing procedures that respond to those risks. Such procedures included examining, on a test basis, evidence regarding the amounts and disclosures in the financial statements. Our procedures included confirmation of investments owned as of December 31, 2024 and 2023, by correspondence with the underlying investee companies, borrowers and others; when replies were not received from the underlying investee companies, borrowers and others, we performed other auditing procedures. Our audits also included evaluating the accounting principles used and significant estimates made by management, as well as evaluating the overall presentation of the financial statements. We believe that our audits provide a reasonable basis for our opinion.
/s/ Ernst & Young LLP
We have served as the Company’s auditor since 2019.
Los Angeles, California
February 26, 2025
TRINITY CAPITAL INC.
Consolidated Statements of Assets and Liabilities
(In thousands, except share and per share data)
| | | | | | | | |
| | December 31, | | | December 31, | |
| | 2024 | | | 2023 | |
ASSETS | |
| | |
| |
Investments at fair value: | |
| | |
| |
Control investments (cost of $82,391 and $43,807, respectively) | | $ | 89,249 | | | $ | 32,861 | |
Affiliate investments (cost of $34,309 and $11,006, respectively) | | | 34,727 | | | | 11,335 | |
Non-Control / Non-Affiliate investments (cost of $1,643,526 and $1,264,503, respectively) | | | 1,601,594 | | | | 1,230,984 | |
Total investments (cost of $1,760,226 and $1,319,316, respectively) | | | 1,725,570 | | | | 1,275,180 | |
Cash and cash equivalents | | | 9,627 | | | | 4,761 | |
Interest receivable | | | 16,542 | | | | 11,206 | |
Deferred credit facility costs | | | 6,586 | | | | 2,144 | |
Other assets | | | 15,916 | | | | 17,691 | |
Total assets | | $ | 1,774,241 | | | $ | 1,310,982 | |
| |
| | |
| |
LIABILITIES | |
| | |
| |
KeyBank Credit Facility | | $ | 113,000 | | | $ | 213,000 | |
2025 Notes, net of $81 and $2,015, respectively, of unamortized deferred financing costs | | | 152,419 | | | | 180,485 | |
Series A Notes, net of $1,650 and $0, respectively, of unamortized deferred financing costs | | | 140,850 | | | | — | |
August 2026 Notes, net of $950 and $1,526, respectively, of unamortized deferred financing costs | | | 124,050 | | | | 123,474 | |
September 2029 Notes, net of $3,433 and $0, respectively, of unamortized deferred financing costs | | | 111,567 | | | | — | |
March 2029 Notes, net of $2,879 and $0, respectively, of unamortized deferred financing costs | | | 112,121 | | | | — | |
December 2026 Notes, net of $729 and $1,102, respectively, of unamortized deferred financing costs | | | 74,271 | | | | 73,898 | |
Convertible Notes, net of $605 and $1,243, respectively, of unamortized deferred financing costs and discount | | | 49,395 | | | | 48,757 | |
Distribution payable | | | 31,451 | | | | 23,162 | |
Security deposits | | | 8,472 | | | | 12,287 | |
Accounts payable, accrued expenses and other liabilities | | | 33,663 | | | | 24,760 | |
Total liabilities | | | 951,259 | | | | 699,823 | |
| |
| | |
| |
Commitments and contingencies (Note 6) | | | | | | |
| |
| | |
| |
NET ASSETS | |
| | |
| |
Common stock, $0.001 par value per share (200,000,000 authorized, 61,669,059 and 46,323,712 shares issued and outstanding as of December 31, 2024 and December 31, 2023, respectively) | | | 62 | | | | 46 | |
Paid-in capital in excess of par | | | 829,626 | | | | 633,740 | |
Distributable earnings/(accumulated deficit) | | | (6,706 | ) | | | (22,627 | ) |
Total net assets | | | 822,982 | | | | 611,159 | |
Total liabilities and net assets | | $ | 1,774,241 | | | $ | 1,310,982 | |
NET ASSET VALUE PER SHARE | | $ | 13.35 | | | $ | 13.19 | |
See accompanying notes to consolidated financial statements.
TRINITY CAPITAL INC.
Consolidated Statements of Operations
(In thousands, except share and per share data)
| | | | | | | | | | | | | | |
| Year Ended | | | Year Ended | | | Year Ended | |
| December 31, 2024 | | | December 31, 2023 | | | December 31, 2022 | |
INVESTMENT INCOME: | |
| | | |
| | | |
| |
Interest and dividend income: | |
| | | |
| | | |
| |
Control investments | $ | | 8,764 | | | $ | | 4,179 | | | $ | | 5,418 | |
Affiliate investments | | | 2,903 | | | | | 1,025 | | | | | 862 | |
Non-Control / Non-Affiliate investments | | | 215,062 | | | | | 169,636 | | | | | 132,556 | |
Total interest and dividend income | | | 226,729 | | | | | 174,840 | | | | | 138,836 | |
Fee and other income: | | | | | | | | | | | |
Affiliate investments | | | 3,196 | | | | | 2,158 | | | | | — | |
Non-Control / Non-Affiliate investments | | | 7,766 | | | | | 4,857 | | | | | 6,664 | |
Total fee and other income | | | 10,962 | | | | | 7,015 | | | | | 6,664 | |
Total investment income | | | 237,691 | | | | | 181,855 | | | | | 145,500 | |
| |
| | | |
| | | |
| |
EXPENSES: | |
| | | |
| | | |
| |
Interest expense and other debt financing costs | | | 61,948 | | | | | 44,296 | | | | | 34,148 | |
Compensation and benefits | | | 43,517 | | | | | 33,093 | | | | | 27,189 | |
Professional fees | | | 5,318 | | | | | 5,407 | | | | | 4,113 | |
General and administrative | | | 8,858 | | | | | 6,598 | | | | | 6,075 | |
Total gross expenses | | | 119,641 | | | | | 89,394 | | | | | 71,525 | |
Allocated expenses to Trinity Capital Adviser, LLC | | | (473 | ) | | | | — | | | | | — | |
Total net expenses | | | 119,168 | | | | | 89,394 | | | | | 71,525 | |
| | | | | | | | | | | |
NET INVESTMENT INCOME/(LOSS) BEFORE TAXES | | | 118,523 | | | | | 92,461 | | | | | 73,975 | |
| |
| | | |
| | | |
| |
Excise tax expense | | | 2,678 | | | | | 2,560 | | | | | 2,389 | |
| |
| | | |
| | | |
| |
NET INVESTMENT INCOME | | | 115,845 | | | | | 89,901 | | | | | 71,586 | |
| |
| | | |
| | | |
| |
NET REALIZED GAIN/(LOSS) FROM INVESTMENTS: | |
| | | |
| | | |
| |
Control investments | | | (4,226 | ) | | | | — | | | | | (4,210 | ) |
Affiliate investments | | | — | | | | | (26,251 | ) | | | | (10,241 | ) |
Non-Control / Non-Affiliate investments | | | (5,504 | ) | | | | (1,820 | ) | | | | 47,304 | |
Net realized gain/(loss) from investments | | | (9,730 | ) | | | | (28,071 | ) | | | | 32,853 | |
| |
| | | |
| | | |
| |
NET CHANGE IN UNREALIZED APPRECIATION/(DEPRECIATION) FROM INVESTMENTS: | |
| | | |
| | | |
| |
Control investments | | | 18,997 | | | | | (4,884 | ) | | | | 719 | |
Affiliate investments | | | 89 | | | | | 27,380 | | | | | (17,635 | ) |
Non-Control / Non-Affiliate investments | | | (9,605 | ) | | | | (7,433 | ) | | | | (117,898 | ) |
Net change in unrealized appreciation/(depreciation) from investments | | | 9,481 | | | | | 15,063 | | | | | (134,814 | ) |
| | | | | | | | | | | |
NET INCREASE/(DECREASE) IN NET ASSETS RESULTING FROM OPERATIONS | $ | | 115,596 | | | $ | | 76,893 | | | $ | | (30,375 | ) |
| |
| | | |
| | | |
| |
NET INVESTMENT INCOME PER SHARE - BASIC | $ | | 2.20 | | | $ | | 2.31 | | | $ | | 2.26 | |
NET INVESTMENT INCOME PER SHARE - DILUTED | $ | | 2.11 | | | $ | | 2.19 | | | $ | | 2.14 | |
| |
| | | |
| | | |
| |
NET CHANGE IN NET ASSETS RESULTING FROM OPERATIONS PER SHARE - BASIC | $ | | 2.19 | | | $ | | 1.98 | | | $ | | (0.96 | ) |
NET CHANGE IN NET ASSETS RESULTING FROM OPERATIONS PER SHARE - DILUTED (1) | $ | | 2.10 | | | $ | | 1.89 | | | $ | | (0.96 | ) |
| |
| | | |
| | | |
| |
WEIGHTED AVERAGE SHARES OUTSTANDING - BASIC | | | 52,705,732 | | | | | 38,910,150 | | | | | 31,672,089 | |
WEIGHTED AVERAGE SHARES OUTSTANDING - DILUTED | | | 56,728,848 | | | | | 42,705,875 | | | | | 35,189,709 | |
(1) For the year ended December 31, 2022, the impact of the hypothetical conversion of Convertible Notes was antidilutive (see Note 9).
See accompanying notes to consolidated financial statements.
TRINITY CAPITAL INC.
Consolidated Statements of Changes in Net Assets
(In thousands, except share and per share data)
| | | | | | | | | | | | | | | | | | | | |
| | | | | | | | | | Distributable | | | | |
| | | | | | | Paid In Capital | | Earnings / | | | | |
| | Common Stock | | in Excess of | | (Accumulated | | Total | |
| | Shares | | Par Value | | Par Value | | Loss) | | Net Assets | |
Balance as of December 31, 2021 | | | 27,229,541 | | | $ | 27 | | | $ | 368,609 | | | $ | 77,897 | | | $ | 446,533 | |
Issuance of common stock pursuant to distribution reinvestment plan | | | 187,923 | | | | — | | | | 2,982 | |
| | — | | | | 2,982 | |
Stock-based compensation | | | — | | | | — | | | | 6,062 | | | | — | | | | 6,062 | |
Issuance of restricted stock awards | | | 741,656 | | | | 1 | | | | — | | | | — | | | | 1 | |
Issuance of common stock, net of issuance costs | | | 7,064,118 | | | | 7 | | | | 113,134 | | | | — | | | | 113,141 | |
Retired and forfeited shares of restricted stock | | | (76,844 | ) | | | — | | | | (1,028 | ) | | | — | | | | (1,028 | ) |
Stock repurchase and cancellation of shares | | | (185,722 | ) | | | — | | | | (2,006 | ) | | | — | | | | (2,006 | ) |
Distributions to stockholders | | | — | | | | — | | | | — | | | | (75,661 | ) | | | (75,661 | ) |
Tax reclassification | | | — | | | | — | | | | (7,221 | ) | | | 7,221 | | | | — | |
Net increase/(decrease) in net assets resulting from operations | | | — | | | | — | |
| | — | |
| | (30,375 | ) |
| | (30,375 | ) |
Balance as of December 31, 2022 | | | 34,960,672 | | | | 35 | | | | 480,532 | | | | (20,918 | ) | | | 459,649 | |
Issuance of common stock pursuant to distribution reinvestment plan | | | 165,962 | | | | — | | | | 2,194 | | | | — | | | | 2,194 | |
Stock-based compensation | | | — | | | | — | | | | 8,799 | | | | — | | | | 8,799 | |
Issuance of restricted stock awards | | | 827,723 | | | | — | | | | — | | | | — | | | | — | |
Issuance of common stock, net of issuance costs | | | 10,666,373 | | | | 11 | | | | 150,268 | | | | — | | | | 150,279 | |
Retired and forfeited shares of restricted stock | | | (205,327 | ) | | | — | | | | (2,821 | ) | | | — | | | | (2,821 | ) |
Stock repurchase and cancellation of shares | | | (91,691 | ) | | | — | | | | (1,003 | ) | | | — | | | | (1,003 | ) |
Distributions to stockholders | | | — | | | | — | | | | — | | | | (82,831 | ) | | | (82,831 | ) |
Tax reclassification | | | — | | | | — | | | | (4,229 | ) | | | 4,229 | | | | — | |
Net increase/(decrease) in net assets resulting from operations | | | — | | | | — | | | | — | | | | 76,893 | | | | 76,893 | |
Balance as of December 31, 2023 | | | 46,323,712 | | | | 46 | | | | 633,740 | | | | (22,627 | ) | | | 611,159 | |
Issuance of common stock pursuant to distribution reinvestment plan | | | 90,245 | | | | — | | | | 1,279 | | | | — | | | | 1,279 | |
Stock-based compensation | | | — | | | | — | | | | 10,543 | | | | — | | | | 10,543 | |
Issuance of restricted stock awards | | | 1,354,192 | | | | 1 | | | | (1 | ) | | | — | | | | — | |
Issuance of common stock, net of issuance costs | | | 14,161,064 | | | | 15 | | | | 200,216 | | | | — | | | | 200,231 | |
Retired and forfeited shares of restricted stock | | | (260,154 | ) | | | — | | | | (3,726 | ) | | | — | | | | (3,726 | ) |
Distributions to stockholders | | | — | | | | — | | | | — | | | | (112,100 | ) | | | (112,100 | ) |
Tax reclassification | | | — | | | | — | | | | (12,425 | ) | | | 12,425 | | | | — | |
Net increase/(decrease) in net assets resulting from operations | | | — | | | | — | | | | — | | | | 115,596 | | | | 115,596 | |
Balance as of December 31, 2024 | | | 61,669,059 | | | $ | 62 | | | $ | 829,626 | | | $ | (6,706 | ) | | $ | 822,982 | |
See accompanying notes to consolidated financial statements.
TRINITY CAPITAL INC.
Consolidated Statements of Cash Flows
(In thousands)
| | | | | | | | | | | | |
| | Year Ended | | | Year Ended | | | Year Ended | |
| | December 31, 2024 | | | December 31, 2023 | | | December 31, 2022 | |
Cash flows provided by/(used in) operating activities: | |
| | |
| | | | |
Net increase/(decrease) in net assets resulting from operations | | $ | 115,596 | | | $ | 76,893 | | | $ | (30,375 | ) |
Adjustments to reconcile net increase/(decrease) in net assets resulting from operation to net cash provided by/(used in) operating activities: | |
| | |
| | | | |
Purchase of investments, net of deferred fees | | | (1,218,931 | ) | | | (632,754 | ) | | | (627,211 | ) |
Proceeds from sales and paydowns of investments | | | 807,866 | | | | 471,926 | | | | 336,554 | |
Net change in unrealized (appreciation)/depreciation from investments | | | (9,481 | ) | | | (15,063 | ) | | | 134,814 | |
Net realized (gain)/loss from investments | | | 9,730 | | | | 28,071 | | | | (32,853 | ) |
Accretion of original issue discounts and end of term payments on investments | | | (39,574 | ) | | | (32,953 | ) | | | (32,220 | ) |
Amortization of deferred financing costs | | | 5,395 | | | | 4,281 | | | | 3,796 | |
Stock-based compensation | | | 10,543 | | | | 8,799 | | | | 6,062 | |
Change in operating assets and liabilities | | | | | | | | | |
(Increase)/Decrease in interest receivable | | | (5,336 | ) | | | (1,256 | ) | | | (4,420 | ) |
(Increase)/Decrease in other assets | | | 2,195 | | | | (6,380 | ) | | | 674 | |
Increase/(Decrease) in security deposits | | | (3,815 | ) | | | (2,813 | ) | | | 4,260 | |
Increase/(Decrease) in accounts payable, accrued expenses and other liabilities | | | 8,903 | | | | 4,989 | | | | 5,177 | |
Net cash provided by/(used in) operating activities | | | (316,909 | ) | | | (96,260 | ) | | | (235,742 | ) |
| | | | |
| | | | |
Cash flows provided by/(used in) investing activities: | | | | | | | | | |
Disposal/(Acquisition) of fixed assets | | | (420 | ) | | | (2,744 | ) | | | (194 | ) |
Net cash provided by/(used in) investing activities | | | (420 | ) | | | (2,744 | ) | | | (194 | ) |
| |
| | |
| | | | |
Cash flows provided by/(used in) financing activities | |
| | |
| | | | |
Issuance of common stock, net of issuance costs | | | 200,231 | | | | 150,279 | | | | 113,141 | |
Stock repurchase and cancellation of shares, net of costs | | | — | | | | (1,003 | ) | | | (2,006 | ) |
Retirement of employee shares | | | (3,726 | ) | | | (2,821 | ) | | | (1,028 | ) |
Cash distributions paid | | | (102,532 | ) | | | (78,802 | ) | | | (61,155 | ) |
Issuance of debt, net of issuance costs | | | 358,222 | | | | — | | | | 54,354 | |
Repayment of debt | | | (30,000 | ) | | | — | | | | — | |
Borrowings under Credit Facilities | | | 829,400 | | | | 420,000 | | | | 326,000 | |
Repayments under Credit Facilities | | | (929,400 | ) | | | (394,500 | ) | | | (229,500 | ) |
Net cash provided by/(used in) financing activities | | | 322,195 | | | | 93,153 | | | | 199,806 | |
| |
| | |
| | | | |
Net increase/(decrease) in cash, cash equivalents and restricted cash | | | 4,866 | | | | (5,851 | ) | | | (36,130 | ) |
Cash, cash equivalents and restricted cash at beginning of period | | | 4,761 | | | | 10,612 | | | | 46,742 | |
Cash, cash equivalents and restricted cash at end of period | | $ | 9,627 | | | $ | 4,761 | | | $ | 10,612 | |
| | | | | | | | | | | | |
| | Year Ended | | | Year Ended | | | Year Ended | |
| | December 31, 2024 | | | December 31, 2023 | | | December 31, 2022 | |
Supplemental and non-cash investing and financing activities: | | | | | | | | | |
Cash paid for interest | | $ | 54,539 | | | $ | 39,884 | | | $ | 29,051 | |
Income tax, including excise tax, paid | | | 2,600 | | | | 2,304 | | | | 283 | |
Non-cash settlement of investments | | | — | | | | 21 | | | | — | |
Accrued but unpaid distributions | | | 31,451 | | | | 23,162 | | | | 21,326 | |
Distributions reinvested | | | 1,279 | | | | 2,194 | | | | 2,982 | |
The following table provides a reconciliation of cash and cash equivalents and restricted cash reported within the Consolidated Statements of Assets and Liabilities that sum to the total of the same such amounts on the Consolidated Statements of Cash Flows:
| | | | | | | | | | | | |
| | December 31, 2024 | | | December 31, 2023 | | | December 31, 2022 | |
Cash and cash equivalents | | $ | 9,627 | | | $ | 4,761 | | | $ | 10,612 | |
Restricted cash | | | — | | | | — | | | | — | |
Total cash, cash equivalents and restricted cash shown in the Consolidated Statements of Cash Flows | | $ | 9,627 | | | $ | 4,761 | | | $ | 10,612 | |
See accompanying notes to consolidated financial statements.
TRINITY CAPITAL INC.
Consolidated Schedule of Investments
December 31, 2024
(In thousands, except share and per share data)
| | | | | | | | | | | | | | | | | | | | | | |
Portfolio Company (1) | | Type of Investment (2) | | Investment Date (3) | | Maturity Date | | Interest Rate (4) | | Principal
Amount (5) | | | Cost | | | Fair Value (6) | | | Footnotes |
Debt Securities- United States | | | | | | | | | | | | | |
| | | | | | | | | | | | | | | | | | | |
Artificial Intelligence & Automation | | | | | | | | | |
| | |
| | |
| | | |
Ambient Photonics, Inc. | | Secured Loan | | July 28, 2022 | | July 1, 2025 | | Variable interest rate Prime + 6.0% or Floor rate 9.5%; EOT 4.0% | | $ | 1,003 | | | $ | 1,175 | | | $ | 1,184 | | | (8) |
| | Secured Loan | | November 17, 2022 | | May 1, 2025 | | Variable interest rate Prime + 6.0% or Floor rate 9.5%; EOT 4.0% | | | 947 | | | | 1,131 | | | | 939 | | | (8) |
| | Secured Loan | | December 20, 2022 | | June 1, 2025 | | Variable interest rate Prime + 6.0% or Floor rate 9.5%; EOT 4.0% | | | 175 | | | | 204 | | | | 177 | | | (8) |
Total Ambient Photonics, Inc. | | | | | | | | | | | 2,125 | | | | 2,510 | | | | 2,300 | | | |
| | | | | | | | | | | | | | | | | | | |
Applied Digital Corporation | | Equipment Financing | | March 13, 2024 | | October 1, 2025 | | Fixed interest rate 19.0%; EOT 0.0% | | $ | 4,190 | | | $ | 4,191 | | | $ | 4,270 | | | (9)(10)(14) |
| | Equipment Financing | | March 25, 2024 | | March 1, 2026 | | Fixed interest rate 19.0%; EOT 0.0% | | | 6,975 | | | | 6,978 | | | | 7,162 | | | (9)(10)(14)(19) |
| | Equipment Financing | | April 24, 2024 | | April 1, 2026 | | Fixed interest rate 19.0%; EOT 0.0% | | | 3,711 | | | | 3,714 | | | | 3,814 | | | (9)(10)(14)(19) |
| | Equipment Financing | | May 28, 2024 | | May 1, 2026 | | Fixed interest rate 16.0%; EOT 0.0% | | | 1,657 | | | | 1,657 | | | | 1,700 | | | (9)(10)(14) |
| | Equipment Financing | | June 21, 2024 | | April 1, 2026 | | Fixed interest rate 19.0%; EOT 0.0% | | | 6,011 | | | | 6,016 | | | | 6,178 | | | (9)(10)(14)(19) |
Total Applied Digital Corporation | | | | | | | | | | | 22,544 | | | | 22,556 | | | | 23,124 | | | |
| | | | | | | | | | | | | | | | | | | |
Augmented Reality Concepts, Inc. | | Secured Loan | | June 17, 2024 | | June 18, 2029 | | Variable interest rate SOFR 3 Month Term + 7.3%; EOT 0.0% | | $ | 19,270 | | | $ | 18,894 | | | $ | 19,404 | | | (8)(19) |
| | | | | | | | | | | | | | | | | | | |
Cirrascale Cloud Services, LLC | | Equipment Financing | | June 27, 2024 | | September 1, 2026 | | Fixed interest rate 12.7%; EOT 4.0% | | $ | 18,771 | | | $ | 19,170 | | | $ | 19,371 | | | (9)(19) |
| | Equipment Financing | | October 22, 2024 | | April 1, 2027 | | Fixed interest rate 10.2%; EOT 5.0% | | | 19,838 | | | | 20,041 | | | | 20,041 | | | (19) |
Total Cirrascale Cloud Services, LLC | | | | | | | | | | | 38,609 | | | | 39,211 | | | | 39,412 | | | |
| | | | | | | | | | | | | | | | | | | |
Sub-total: Artificial Intelligence & Automation (10.2%)* | | | | | | $ | 82,548 | | | $ | 83,171 | | | $ | 84,240 | | | |
| | | | | | | | | | | | | | | | | | | |
Biotechnology | | | | |
| | |
| | |
| | | |
Pendulum Therapeutics, Inc. | | Secured Loan | | December 31, 2021 | | July 1, 2026 | | Variable interest rate Prime + 6.8% or Floor rate 10.0%; EOT 4.0% | | $ | 4,292 | | | $ | 4,468 | | | $ | 4,453 | | | (8)(14) |
| | Secured Loan | | February 28, 2022 | | July 1, 2026 | | Variable interest rate Prime + 6.8% or Floor rate 10.0%; EOT 4.0% | | | 4,581 | | | | 4,757 | | | | 4,747 | | | (8)(14) |
| | Secured Loan | | March 30, 2022 | | July 1, 2026 | | Variable interest rate Prime + 6.8% or Floor rate 10.0%; EOT 4.0% | | | 4,722 | | | | 4,899 | | | | 4,891 | | | (8)(14) |
| | Secured Loan | | May 6, 2022 | | July 1, 2026 | | Variable interest rate Prime + 6.8% or Floor rate 10.0%; EOT 4.0% | | | 5,000 | | | | 5,177 | | | | 5,173 | | | (8)(14) |
| | Secured Loan | | June 17, 2022 | | July 1, 2026 | | Variable interest rate Prime + 6.8% or Floor rate 10.0%; EOT 4.0% | | | 5,000 | | | | 5,177 | | | | 5,173 | | | (8)(14) |
| | Secured Loan | | February 1, 2024 | | July 1, 2026 | | Variable interest rate Prime + 6.8% or Floor rate 10.0%; EOT 4.0% | | | 1,405 | | | | 1,089 | | | | 1,053 | | | (8)(14) |
Total Pendulum Therapeutics, Inc. | | | | | | | | | | | 25,000 | | | | 25,567 | | | | 25,490 | | | |
| | | | | | | | | | | | | | | | | | | |
Taysha Gene Therapies, Inc. | | Secured Loan | | November 13, 2023 | | December 1, 2028 | | Variable interest rate Prime + 4.5% or Floor rate 12.8%; EOT 5.0% | | $ | 30,000 | | | $ | 30,195 | | | $ | 30,949 | | | (8)(9)(14) |
| | | | | | | | | | | | | | | | | | | |
Sub-total: Biotechnology (6.9%)* | | | | | | | | | | $ | 55,000 | | | $ | 55,762 | | | $ | 56,439 | | | |
TRINITY CAPITAL INC.
Consolidated Schedule of Investments
December 31, 2024
(In thousands, except share and per share data)
| | | | | | | | | | | | | | | | | | | | | | |
Portfolio Company (1) | | Type of Investment (2) | | Investment Date (3) | | Maturity Date | | Interest Rate (4) | | Principal
Amount (5) | | | Cost | | | Fair Value (6) | | | Footnotes |
Debt Securities- United States, Continued | | | | | | | | | | | | | |
| | | | | | | | | | | | | | | | | | | |
Connectivity | | | | |
| | |
| | |
| | | |
Tarana Wireless, Inc. | | Secured Loan | | September 23, 2024 | | October 1, 2029 | | Variable interest rate Prime + 4.5% or Floor rate 12.5%; EOT 4.0% | | $ | 14,800 | | | $ | 14,058 | | | $ | 14,283 | | | (8)(9)(19) |
| | | | | | | | | | | | | | | | | | | |
Vertical Communications, Inc. | | Secured Loan | | August 23, 2021 | | March 1, 2026 | | Variable interest rate Prime + 4.0% or Floor rate 11.0%; EOT 23.8% | | $ | 12,600 | | | $ | 15,521 | | | $ | 15,521 | | | (8)(21) |
| | | | | | | | | | | | | | | | | | | |
Sub-total: Connectivity (3.6%)* | | | | | | | | | | $ | 27,400 | | | $ | 29,579 | | | $ | 29,804 | | | |
| | | | | | | | | | | | | | | | | | | |
Consumer Products & Services | | | | | | | | | | | | | | | | | | | |
Eterneva, Inc. | | Equipment Financing | | November 24, 2021 | | June 1, 2026 | | Fixed interest rate 7.8%; EOT 11.5% | | $ | 227 | | | $ | 250 | | | $ | 223 | | |
|
| | Equipment Financing | | March 16, 2022 | | October 1, 2026 | | Fixed interest rate 8.1%; EOT 11.5% | | | 376 | | | | 392 | | | | 353 | | | (14) |
| | Equipment Financing | | June 17, 2022 | | January 1, 2027 | | Fixed interest rate 11.9%; EOT 11.5% | | | 1,139 | | | | 1,141 | | | | 1,014 | | | (14) |
Total Eterneva, Inc. | | | | | | | | | | | 1,742 | | | | 1,783 | | | | 1,590 | | | |
| | | | | | | | | | | | | | | | | | | |
Molekule Group, Inc. | | Equipment Financing | | June 19, 2020 | | March 31, 2025 | | Fixed interest rate 8.8%; EOT 10.0% | | $ | 312 | | | $ | 595 | | | $ | 218 | | | (18) |
| | Equipment Financing | | September 29, 2020 | | March 31, 2025 | | Fixed interest rate 12.3%; EOT 10.0% | | | 273 | | | | 347 | | | | 191 | | | (18) |
| | Equipment Financing | | December 18, 2020 | | March 31, 2025 | | Fixed interest rate 11.9%; EOT 10.0% | | | 473 | | | | 584 | | | | 331 | | | (18) |
| | Equipment Financing | | August 25, 2021 | | March 31, 2025 | | Fixed interest rate 11.3%; EOT 10.0% | | | 385 | | | | 454 | | | | 270 | | | (18) |
Total Molekule Group, Inc. | | | | | | | | | | | 1,443 | | | | 1,980 | | | | 1,010 | | | |
| | | | | | | | | | | | | | | | | | | |
Ogee, Inc. | | Secured Loan | | February 14, 2023 | | March 1, 2027 | | Variable interest rate Prime + 5.8% or Floor rate 12.0%; EOT 3.8% | | $ | 4,700 | | | $ | 4,752 | | | $ | 4,736 | | | (8)(14)(19) |
| | Secured Loan | | September 29, 2023 | | March 1, 2027 | | Variable interest rate Prime + 5.8% or Floor rate 12.0%; EOT 3.8% | | | 4,700 | | | | 4,722 | | | | 4,751 | | | (8)(14)(19) |
| | Secured Loan | | August 1, 2024 | | March 1, 2027 | | Variable interest rate Prime + 5.8% or Floor rate 12.0%; EOT 3.8% | | | 4,700 | | | | 4,612 | | | | 4,620 | | | (8)(14)(19) |
Total Ogee, Inc. | | | | | | | | | | | 14,100 | | | | 14,086 | | | | 14,107 | | | |
| | | | | | | | | | | | | | | | | | | |
Portofino Labs, Inc. | | Secured Loan | | April 1, 2021 | | November 1, 2025 | | Variable interest rate Prime + 8.3% or Floor rate 11.5%; EOT 6.0% | | $ | 1,064 | | | $ | 1,150 | | | $ | 1,176 | | | (8)(14) |
| | | | | | | | | | | | | | | | | | | |
Quip NYC, Inc. | | Secured Loan | | March 9, 2021 | | April 1, 2026 | | Variable interest rate Prime + 8.0% or Floor rate 11.3%; EOT 3.0% | | $ | 7,778 | | | $ | 8,237 | | | $ | 8,264 | | | (8)(14) |
| | Secured Loan | | February 10, 2022 | | April 1, 2026 | | Variable interest rate Prime + 8.0% or Floor rate 11.3%; EOT 3.0% | | | 1,111 | | | | 1,179 | | | | 1,185 | | | (8)(14) |
Total Quip NYC, Inc. | | | | | | | | | | | 8,889 | | | | 9,416 | | | | 9,449 | | | |
| | | | | | | | | | | | | | | | | | | |
Rinse, Inc. | | Secured Loan | | May 10, 2022 | | June 1, 2027 | | Variable interest rate Prime + 8.0% or Floor rate 11.3%; EOT 3.8% | | $ | 3,849 | | | $ | 3,954 | | | $ | 3,984 | | | (8)(14) |
| | Secured Loan | | September 22, 2023 | | October 1, 2028 | | Variable interest rate Prime + 8.0% or Floor rate 11.3%; EOT 3.8% | | | 4,000 | | | | 3,997 | | | | 4,068 | | | (8)(14) |
Total Rinse, Inc. | | | | | | | | | | | 7,849 | | | | 7,951 | | | | 8,052 | | | |
| | | | | | | | | | | | | | | | | | | |
SI Tickets, Inc. | | Secured Loan | | May 11, 2022 | | September 1, 2026 | | Variable interest rate Prime + 8.3% or Floor rate 11.5%; EOT 3.0% | | $ | 1,928 | | | $ | 1,986 | | | $ | 1,939 | | | (8)(14) |
| | | | | | | | | | | | | | | | | | | |
UnTuckIt, Inc. | | Secured Loan | | January 16, 2020 | | December 1, 2025 | | Fixed interest rate 12.0%; EOT 5.0% | | $ | 5,051 | | | $ | 5,951 | | | $ | 5,859 | | |
|
| | | | | | | | | | | | | | | | | | | |
VitaCup, Inc. | | Secured Loan | | June 23, 2021 | | January 1, 2026 | | Variable interest rate Prime + 7.5% or Floor rate 11.5%; EOT 5.0% | | $ | 6,000 | | | $ | 6,128 | | | $ | 5,842 | | | (8)(14) |
| | | | | | | | | | | | | | | | | | | |
Sub-total: Consumer Products & Services (6.0%)* | | | | | | | | | | $ | 48,066 | | | $ | 50,431 | | | $ | 49,024 | | | |
TRINITY CAPITAL INC.
Consolidated Schedule of Investments
December 31, 2024
(In thousands, except share and per share data)
| | | | | | | | | | | | | | | | | | | | | | |
Portfolio Company (1) | | Type of Investment (2) | | Investment Date (3) | | Maturity Date | | Interest Rate (4) | | Principal
Amount (5) | | | Cost | | | Fair Value (6) | | | Footnotes |
Debt Securities- United States, Continued | | | | | | | | | | | | | |
| | | | | | | | | | | | | | | | | | | |
Digital Assets Technology and Services | |
| | | | | | | |
| | |
| | |
| | | |
Cleanspark, Inc. | | Equipment Financing | | April 22, 2022 | | May 1, 2025 | | Fixed interest rate 10.3%; EOT 5.0% | | $ | 2,522 | | | $ | 3,511 | | | $ | 3,493 | | | (10)(14) |
| | | | | | | | | | | | | | | | | | | |
Sub-total: Digital Assets Technology and Services (0.4%)* | | | | | | | | | | $ | 2,522 | | | $ | 3,511 | | | $ | 3,493 | | | |
| | | | | | | | | | | | | | | | | | | |
Education Technology | | | | | | | | | | | | | | | | | | | |
Edblox, Inc. | | Secured Loan | | March 19, 2024 | | April 1, 2029 | | Variable interest rate Prime + 4.5% or Floor rate 11.8%; EOT 2.5% | | $ | 15,000 | | | $ | 14,848 | | | $ | 13,712 | | | (8)(9)(14) |
| | | | | | | | | | | | | | | | | | | |
Medical Sales Training Holding Company | | Secured Loan | | March 18, 2021 | | April 1, 2025 | | Variable interest rate Prime + 8.8% or Floor rate 12.0%; EOT 6.3% | | $ | 5,175 | | | $ | 5,531 | | | $ | 5,300 | | | (8) |
| | Secured Loan | | July 21, 2021 | | August 1, 2025 | | Variable interest rate Prime + 8.8% or Floor rate 12.0%; EOT 6.3% | | | 1,825 | | | | 1,938 | | | | 1,759 | | | (8) |
Total Medical Sales Training Holding Company | | | | | | | | | | | 7,000 | | | | 7,469 | | | | 7,059 | | | |
| | | | | | | | | | | | | | | | | | | |
Yellowbrick Learning, Inc. | | Secured Loan | | February 1, 2021 | | March 1, 2026 | | Fixed interest rate 2.0%; EOT 5.0% | | $ | 7,500 | | | $ | 7,876 | | | $ | 6,683 | | |
|
| | Secured Loan | | August 10, 2021 | | March 1, 2026 | | Fixed interest rate 2.0%; EOT 5.0% | | | 2,500 | | | | 2,625 | | | | 2,229 | | |
|
Total Yellowbrick Learning, Inc. | | | | | | | | | | | 10,000 | | | | 10,501 | | | | 8,912 | | | |
| | | | | | | | | | | | | | | | | | | |
Sub-total: Education Technology (3.6%)* | | | | | | | | | | $ | 32,000 | | | $ | 32,818 | | | $ | 29,683 | | | |
TRINITY CAPITAL INC.
Consolidated Schedule of Investments
December 31, 2024
(In thousands, except share and per share data)
| | | | | | | | | | | | | | | | | | | | | | |
Portfolio Company (1) | | Type of Investment (2) | | Investment Date (3) | | Maturity Date | | Interest Rate (4) | | Principal
Amount (5) | | | Cost | | | Fair Value (6) | | | Footnotes |
Debt Securities- United States, Continued | | | | | | | | | | | | | |
| | | | | | | | | | | | | | | | | | | |
Finance and Insurance | | | | | | | | | |
| | |
| | |
| | | |
Beam Technologies, Inc. | | Secured Loan | | August 30, 2024 | | April 1, 2027 | | Variable interest rate PRIME + 2.8% or Floor rate 11.0%+PIK Fixed Interest Rate 1.5%; EOT 2.0% | | $ | 34,956 | | | $ | 34,130 | | | $ | 34,579 | | | (8)(15)(19) |
| | | | | | | | | | | | | | | | | | | |
Bestow, Inc. | | Secured Loan | | August 1, 2024 | | December 1, 2027 | | Variable interest rate Prime + 6.0% or Floor rate 13.0%; EOT 1.5% | | $ | 40,000 | | | $ | 38,342 | | | $ | 38,122 | | | (8)(14) |
| | | | | | | | | | | | | | | | | | | |
Busbot, Inc. | | Secured Loan | | April 1, 2024 | | October 1, 2026 | | Variable interest rate SOFR 30 Day Forward + 11.5% or Floor rate 13.5%; EOT 0.0% | | $ | 8,630 | | | $ | 8,482 | | | $ | 8,482 | | | (8)(10)(12) |
| | | | | | | | | | | | | | | | | | | |
Centivo Corporation | | Secured Loan | | July 31, 2024 | | August 1, 2029 | | Variable interest rate PRIME + 4.5% or Floor rate 11.3%+PIK Fixed Interest Rate 1.0%; EOT 2.0% | | $ | 3,765 | | | $ | 3,677 | | | $ | 3,735 | | | (8)(9)(15)(19) |
| | Secured Loan | | December 20, 2024 | | August 1, 2029 | | Variable interest rate PRIME + 4.5% or Floor rate 11.3%+PIK Fixed Interest Rate 1.0%; EOT 2.0% | | | 3,751 | | | | 3,528 | | | | 3,528 | | | (8)(9)(15)(19) |
Total Centivo Corporation | | | | | | | | | | | 7,516 | | | | 7,205 | | | | 7,263 | | | |
| | | | | | | | | | | | | | | | | | | |
Cherry Technologies, Inc. | | Secured Loan | | March 29, 2024 | | April 1, 2029 | | Variable interest rate PRIME + 4.5% or Floor rate 12.0%+PIK Fixed Interest Rate 1.0%; EOT 2.0% | | $ | 14,577 | | | $ | 14,504 | | | $ | 15,000 | | | (8)(9)(14)(15)(19) |
| | Secured Loan | | July 31, 2024 | | April 1, 2029 | | Variable interest rate PRIME + 4.5% or Floor rate 12.0%+PIK Fixed Interest Rate 1.0%; EOT 2.0% | | | 14,530 | | | | 14,437 | | | | 14,924 | | | (8)(9)(14)(15)(19) |
Total Cherry Technologies, Inc. | | | | | | | | | | | 29,107 | | | | 28,941 | | | | 29,924 | | | |
| | | | | | | | | | | | | | | | | | | |
Empower Financial, Inc. | | Secured Loan | | October 13, 2023 | | May 1, 2028 | | Variable interest rate Prime + 4.8% or Floor rate 11.5%; EOT 3.8% | | $ | 11,622 | | | $ | 11,514 | | | $ | 11,663 | | | (8)(9)(14)(19) |
| | Secured Loan | | January 5, 2024 | | May 1, 2028 | | Variable interest rate Prime + 4.8% or Floor rate 11.5%; EOT 3.8% | | | 2,902 | | | | 2,809 | | | | 2,856 | | | (8)(9)(14)(19) |
| | Secured Loan | | February 8, 2024 | | May 1, 2028 | | Variable interest rate Prime + 4.8% or Floor rate 11.5%; EOT 3.8% | | | 4,353 | | | | 4,210 | | | | 4,281 | | | (8)(9)(14)(19) |
| | Secured Loan | | April 9, 2024 | | May 1, 2028 | | Variable interest rate Prime + 4.8% or Floor rate 11.5%; EOT 3.8% | | | 4,348 | | | | 4,078 | | | | 4,142 | | | (8)(9)(14)(19) |
| | Secured Loan | | May 15, 2024 | | May 1, 2028 | | Variable interest rate Prime + 4.8% or Floor rate 11.5%; EOT 3.8% | | | 14,495 | | | | 14,591 | | | | 14,895 | | | (8)(14)(19) |
Total Empower Financial, Inc. | | | | | | | | | | | 37,720 | | | | 37,202 | | | | 37,837 | | | |
TRINITY CAPITAL INC.
Consolidated Schedule of Investments
December 31, 2024
(In thousands, except share and per share data)
| | | | | | | | | | | | | | | | | | | | | | |
Portfolio Company (1) | | Type of Investment (2) | | Investment Date (3) | | Maturity Date | | Interest Rate (4) | | Principal
Amount (5) | | | Cost | | | Fair Value (6) | | | Footnotes |
Debt Securities- United States, Continued | | | | | | | | | | | | | |
| | | | | | | | | | | | | | | | | | | |
Eqis Capital Management, Inc. | | Secured Loan | | June 15, 2022 | | July 1, 2026 | | Variable interest rate Prime + 7.5% or Floor rate 10.8%; EOT 3.0% | | $ | 6,809 | | | $ | 7,019 | | | $ | 6,610 | | | (8)(14) |
| | | | | | | | | | | | | | | | | | | |
Gravie, Inc. | | Secured Loan | | June 4, 2024 | | July 1, 2029 | | Variable interest rate Prime + 4.5% or Floor rate 13.0%; EOT 2.5% | | $ | 15,980 | | | $ | 15,662 | | | $ | 15,796 | | | (8)(9)(14)(19) |
| | | | | | | | | | | | | | | | | | | |
Kafene, Inc. | | Secured Loan | | January 5, 2024 | | February 1, 2029 | | Variable interest rate Prime + 4.0% or Floor rate 12.0%; EOT 1.0% | | $ | 12,500 | | | $ | 12,403 | | | $ | 12,582 | | | (8)(14) |
| | | | | | | | | | | | | | | | | | | |
Mesa Financial, Inc. | | Secured Loan | | August 29, 2024 | | February 28, 2027 | | Variable interest rate SOFR 30 Day Forward + 10.3% or Floor rate 12.3%; EOT 0.0% | | $ | 9,861 | | | $ | 9,665 | | | $ | 9,665 | | | (8)(10)(12) |
| | | | | | | | | | | | | | | | | | | |
Pagaya Structured Products LLC | | Secured Loan | | August 23, 2024 | | August 23, 2025 | | Fixed interest rate 20.0%; EOT 0.0% | | $ | 13,814 | | | $ | 13,712 | | | $ | 13,712 | | | (10) |
| | | | | | | | | | | | | | | | | | | |
Parafin SPV 2, LLC | | Secured Loan | | February 22, 2024 | | December 21, 2026 | | Variable interest rate SOFR 1 Month Term + 10.8% or Floor rate 12.8%; EOT 0.0% | | $ | 24,600 | | | $ | 24,252 | | | $ | 24,252 | | | (8)(10)(12) |
| | | | | | | | | | | | | | | | | | | |
Parafin SPV 3, LLC | | Secured Loan | | July 25, 2024 | | January 25, 2027 | | Variable interest rate SOFR 1 Month Term + 10.8% or Floor rate 13.8%; EOT 0.0% | | $ | 16,452 | | | $ | 16,220 | | | $ | 16,220 | | | (8)(10)(12) |
| | | | | | | | | | | | | | | | | | | |
Slope Tech, Inc. | | Secured Loan | | October 5, 2022 | | February 27, 2026 | | Variable interest rate SOFR 1 Month Term + 11.8% or Floor rate 11.8%; EOT 0.0% | | $ | 1,823 | | | $ | 1,742 | | | $ | 1,742 | | | (8)(10)(12) |
| | | | | | | | | | | | | | | | | | | |
Under Technologies, Inc. | | Secured Loan | | September 13, 2024 | | June 1, 2029 | | Variable interest rate PRIME + 3.8% or Floor rate 12.0%; EOT 4.3% | | $ | 9,400 | | | $ | 9,223 | | | $ | 9,369 | | | (8)(19) |
| | Secured Loan | | November 27, 2024 | | June 1, 2029 | | Variable interest rate PRIME + 3.8% or Floor rate 12.0%; EOT 4.3% | | | 9,400 | | | | 9,191 | | | | 9,191 | | | (8)(19) |
Total Under Technologies, Inc. | | | | | | | | | | | 18,800 | | | | 18,414 | | | | 18,560 | | | |
| | | | | | | | | | | | | | | | | | | |
Wisetack, Inc. | | Secured Loan | | November 14, 2024 | | December 1, 2029 | | Variable interest rate Prime + 5.0% or Floor rate 12.5%; EOT 2.5% | | $ | 14,100 | | | $ | 13,862 | | | $ | 13,862 | | | (8)(19) |
| | | | | | | | | | | | | | | | | | | |
Sub-total: Finance and Insurance (35.1%)* | | | | | |
| | | | $ | 292,668 | | | $ | 287,253 | | | $ | 289,208 | | | |
TRINITY CAPITAL INC.
Consolidated Schedule of Investments
December 31, 2024
(In thousands, except share and per share data)
| | | | | | | | | | | | | | | | | | | | | | |
Portfolio Company (1) | | Type of Investment (2) | | Investment Date (3) | | Maturity Date | | Interest Rate (4) | | Principal
Amount (5) | | | Cost | | | Fair Value (6) | | | Footnotes |
Debt Securities- United States, Continued | | | | | | | | | | | | | |
| | | | | | | | | | | | | | | | | | | |
Food and Agriculture Technologies | | | | | |
| | | |
| | |
| | |
| | | |
Bowery Farming, Inc. | | Secured Loan | | September 10, 2021 | | September 10, 2026 | | Variable interest rate SOFR 1 Month Term + 10.0% or Floor rate 1.0%; EOT 0.0% | | $ | 7,652 | | | $ | 6,938 | | | $ | 57 | | | (8)(18) |
| | | | | | | | | | | | | | | | | | | |
Daring Foods, Inc. | | Equipment Financing | | March 8, 2022 | | April 1, 2025 | | Fixed interest rate 9.5%; EOT 7.5% | | $ | 215 | | | $ | 385 | | | $ | 381 | | | (14) |
| | Equipment Financing | | April 29, 2022 | | May 1, 2025 | | Fixed interest rate 10.2%; EOT 7.5% | | | 126 | | | | 201 | | | | 199 | | | (14) |
| | Equipment Financing | | July 6, 2022 | | August 1, 2025 | | Fixed interest rate 10.9%; EOT 7.5% | | | 99 | | | | 132 | | | | 131 | | | (14) |
| | Equipment Financing | | August 25, 2022 | | September 1, 2025 | | Fixed interest rate 12.1%; EOT 7.5% | | | 267 | | | | 342 | | | | 341 | | | (14) |
Total Daring Foods, Inc. | | | | | | | | | | | 707 | | | | 1,060 | | | | 1,052 | | | |
| | | | | | | | | | | | | | | | | | | |
DrinkPak, LLC | | Equipment Financing | | February 17, 2023 | | September 1, 2026 | | Fixed interest rate 12.9%; EOT 7.0% | | $ | 7,274 | | | $ | 8,033 | | | $ | 8,074 | | | (9)(14)(19) |
| | | | | | | | | | | | | | | | | | | |
Emergy, Inc. | | Equipment Financing | | December 15, 2021 | | July 1, 2026 | | Fixed interest rate 11.2%; EOT 11.5% | | $ | 3,711 | | | $ | 4,520 | | | $ | 3,668 | | | (14) |
| | Equipment Financing | | December 13, 2022 | | July 1, 2027 | | Fixed interest rate 8.8%; EOT 11.5% | | | 6,744 | | | | 7,531 | | | | 5,930 | | | (9)(14) |
Total Emergy, Inc. | | | | | | | | | | | 10,455 | | | | 12,051 | | | | 9,598 | | | |
| | | | | | | | | | | | | | | | | | | |
Sub-total: Food and Agriculture Technologies (2.3%)* | | | | | |
| | | | $ | 26,088 | | | $ | 28,082 | | | $ | 18,781 | | | |
TRINITY CAPITAL INC.
Consolidated Schedule of Investments
December 31, 2024
(In thousands, except share and per share data)
| | | | | | | | | | | | | | | | | | | | | | |
Portfolio Company (1) | | Type of Investment (2) | | Investment Date (3) | | Maturity Date | | Interest Rate (4) | | Principal
Amount (5) | | | Cost | | | Fair Value (6) | | | Footnotes |
Debt Securities- United States, Continued | | | | | | | | | | | | | |
| | | | | | | | | | | | | | | | | | | |
Green Technology | | | | | |
| | | |
| | |
| | |
| | | |
Commonwealth Fusion Systems, LLC | | Equipment Financing | | June 16, 2023 | | July 1, 2030 | | Fixed interest rate 13.0%; EOT 10.0% | | $ | 3,450 | | | $ | 3,565 | | | $ | 3,665 | | | (9)(14)(19) |
| | Equipment Financing | | June 27, 2024 | | July 1, 2030 | | Fixed interest rate 13.2%; EOT 10.0% | | | 9,979 | | | | 10,021 | | | | 10,333 | | | (9)(14)(19) |
Total Commonwealth Fusion Systems, LLC | | | | | | | | | 13,429 | | | | 13,586 | | | | 13,998 | | | |
| | | | | | | | | | | | | | | | | | | |
Crusoe Energy Systems LLC | | Equipment Financing | | March 1, 2024 | | March 1, 2029 | | Fixed interest rate 12.7%; EOT 0.0% | | $ | 8,098 | | | $ | 8,034 | | | $ | 8,237 | | | (9)(14)(19) |
| | | | | | | | | | | | | | | | | | | |
Dandelion Energy, Inc. | | Equipment Financing | | June 25, 2024 | | July 1, 2025 | | Fixed interest rate 15.9%; EOT 0.0% | | $ | 1,361 | | | $ | 1,349 | | | $ | 1,378 | | | (9)(14) |
| | | | | | | | | | | | | | | | | | | |
Electric Hydrogen Co. | | Equipment Financing | | September 12, 2022 | | April 1, 2026 | | Fixed interest rate 9.0%; EOT 10.0% | | $ | 797 | | | $ | 974 | | | $ | 956 | | | (14) |
| | Equipment Financing | | December 22, 2023 | | January 1, 2029 | | Fixed interest rate 12.5%; EOT 15.0% | | | 3,908 | | | | 4,125 | | | | 4,125 | | | (9)(14)(19) |
| | Equipment Financing | | June 27, 2024 | | January 1, 2029 | | Fixed interest rate 12.6%; EOT 15.0% | | | 3,203 | | | | 3,276 | | | | 3,321 | | | (9)(14)(19) |
| | Equipment Financing | | September 19, 2024 | | October 1, 2028 | | Fixed interest rate 12.5%; EOT 15.0% | | | 1,967 | | | | 1,989 | | | | 2,004 | | | (9)(14)(19) |
| | Equipment Financing | | November 14, 2024 | | December 1, 2028 | | Fixed interest rate 11.9%; EOT 15.0% | | | 870 | | | | 874 | | | | 874 | | | (14)(19) |
Total Electric Hydrogen Co. | | | | | | | | | | | 10,745 | | | | 11,238 | | | | 11,280 | | | |
| | | | | | | | | | | | | | | | | | | |
Form Energy Inc. | | Equipment Financing | | October 21, 2024 | | November 1, 2027 | | Fixed interest rate 12.7%; EOT 3.0% | | $ | 35,626 | | | $ | 34,946 | | | $ | 34,946 | | | (19) |
| | Equipment Financing | | December 12, 2024 | | January 1, 2028 | | Fixed interest rate 12.5%; EOT 3.0% | | | 9,400 | | | | 9,185 | | | | 9,185 | | | (19) |
Total Form Energy Inc. | | | | | | | | | 45,026 | | | | 44,131 | | | | 44,131 | | | |
| | | | | | | | | | | | | | | | | | | |
Hi-Power, LLC | | Equipment Financing | | September 30, 2021 | | April 1, 2025 | | Fixed interest rate 12.4%; EOT 1.0% | | $ | 601 | | | $ | 670 | | | $ | 680 | | | (14) |
| | Equipment Financing | | September 30, 2022 | | April 1, 2026 | | Fixed interest rate 14.7%; EOT 1.0% | | | 1,737 | | | | 1,769 | | | | 1,779 | | | (14) |
Total Hi-Power, LLC | | | | | | | | | | | 2,338 | | | | 2,439 | | | | 2,459 | | | |
| | | | | | | | | | | | | | | | | | | |
SeaOn Global, LLC | | Equipment Financing | | June 16, 2022 | | July 1, 2026 | | Fixed interest rate 9.3%; EOT 11.0% | | $ | 2,817 | | | $ | 3,450 | | | $ | 3,332 | | |
|
| | Equipment Financing | | August 17, 2022 | | September 1, 2026 | | Fixed interest rate 9.3%; EOT 11.0% | | | 1,496 | | | | 1,788 | | | | 1,737 | | |
|
Total SeaOn Global, LLC | | | | | | | | | | | 4,313 | | | | 5,238 | | | | 5,069 | | | |
| | | | | | | | | | | | | | | | | | | |
Footprint International Holding, Inc. | | Secured Loan | | February 18, 2022 | | March 1, 2027 | | Variable interest rate Prime + 7.3% or Floor rate 10.5%; EOT 3.5% | | $ | 15,838 | | | $ | 15,722 | | | $ | 15,382 | | | (8)(14) |
| | Secured Loan | | April 20, 2022 | | March 1, 2027 | | Variable interest rate Prime + 7.3% or Floor rate 10.5%; EOT 3.5% | | | 15,838 | | | | 15,689 | | | | 15,345 | | | (8)(14) |
Total Footprint International Holding, Inc. | | | | | | | | | 31,676 | | | | 31,411 | | | | 30,727 | | | |
| | | | | | | | | | | | | | | | | | | |
Mainspring Energy, Inc. | | Secured Loan | | March 18, 2022 | | October 1, 2026 | | Fixed interest rate 11.0%; EOT 3.8% | | $ | 19,488 | | | $ | 20,347 | | | $ | 20,126 | | | (14) |
| | | | | | | | | | | | | | | | | | | |
Sub-total: Green Technology (16.7%)* | | | | | | | | | | $ | 136,474 | | | $ | 137,773 | | | $ | 137,405 | | | |
TRINITY CAPITAL INC.
Consolidated Schedule of Investments
December 31, 2024
(In thousands, except share and per share data)
| | | | | | | | | | | | | | | | | | | | | | |
Portfolio Company (1) | | Type of Investment (2) | | Investment Date (3) | | Maturity Date | | Interest Rate (4) | | Principal
Amount (5) | | | Cost | | | Fair Value (6) | | | Footnotes |
Debt Securities- United States, Continued | | | | | | | | | | | | | |
| | | | | | | | | | | | | | | | | | | |
Healthcare Technology | | | | | | | | | | | | | | | | | | | |
Lark Technologies, Inc. | | Secured Loan | | September 30, 2020 | | April 1, 2025 | | Variable interest rate Prime + 8.3% or Floor rate 11.5% or ceiling rate of 13.5%; EOT 4.0% | | $ | 659 | | | $ | 856 | | | $ | 853 | | | (8)(14) |
| | Secured Loan | | June 30, 2021 | | January 1, 2026 | | Variable interest rate Prime + 8.3% or Floor rate 11.5% or ceiling rate of 13.5%; EOT 4.0% | | | 2,041 | | | | 2,212 | | | | 2,187 | | | (14) |
| | Secured Loan | | July 7, 2023 | | January 1, 2028 | | Variable interest rate Prime + 8.3% or Floor rate 11.5% or ceiling rate of 13.5%; EOT 4.0% | | | 5,000 | | | | 5,039 | | | | 5,094 | | | (8)(14) |
Total Lark Technologies, Inc. | | | | | | | | | | | 7,700 | | | | 8,107 | | | | 8,134 | | | |
| | | | | | | | | | | | | | | | | | | |
Moxe Health Corporation | | Secured Loan | | December 29, 2023 | | January 1, 2028 | | Variable interest rate Prime + 5.5% or Floor rate 13.0%; EOT 4.8% | | $ | 12,500 | | | $ | 12,512 | | | $ | 12,439 | | | (8) |
| | | | | | | | | | | | | | | | | | | |
RXAnte, Inc. | | Secured Loan | | November 21, 2022 | | December 1, 2027 | | Variable interest rate Prime + 4.48% or Floor rate 9.98%+PIK Fixed Interest Rate 1.5%; EOT 3.5% | | $ | 8,516 | | | $ | 8,601 | | | $ | 8,658 | | | (8)(9)(14)(15)(19) |
| | Secured Loan | | April 14, 2023 | | December 1, 2027 | | Variable interest rate Prime + 4.48% or Floor rate 9.98%+PIK Fixed Interest Rate 1.5%; EOT 3.5% | | | 2,831 | | | | 2,832 | | | | 2,932 | | | (8)(9)(14)(15)(19) |
| | Secured Loan | | October 19, 2023 | | December 1, 2027 | | Variable interest rate Prime + 4.48% or Floor rate 9.98%+PIK Fixed Interest Rate 1.5%; EOT 3.5% | | | 2,803 | | | | 2,797 | | | | 2,873 | | | (8)(9)(14)(15)(19) |
| | Secured Loan | | September 9, 2024 | | December 1, 2027 | | Variable interest rate Prime + 4.48% or Floor rate 9.98%+PIK Fixed Interest Rate 1.5%; EOT 3.5% | | | 2,767 | | | | 2,756 | | | | 2,830 | | | (8)(9)(14)(15)(19) |
Total RXAnte, Inc. | | | | | | | | | | | 16,917 | | | | 16,986 | | | | 17,293 | | | |
| | | | | | | | | | | | | | | | | | | |
TMRW Life Sciences, Inc. | | Secured Loan | | April 29, 2022 | | May 1, 2027 | | Variable interest rate Prime + 5.0% or Floor rate 8.8%; EOT 4.0% | | $ | 5,000 | | | $ | 5,127 | | | $ | 4,799 | | | (8)(14) |
| | Secured Loan | | March 3, 2023 | | May 1, 2027 | | Variable interest rate Prime + 5.0% or Floor rate 8.8%; EOT 4.0% | | | 15,000 | | | | 15,309 | | | | 15,007 | | | (8)(14) |
| | Secured Loan | | December 8, 2023 | | May 1, 2027 | | Variable interest rate Prime + 5.0% or Floor rate 8.8%; EOT 4.0% | | | 10,000 | | | | 10,131 | | | | 10,129 | | | (8)(14) |
Total TMRW Life Sciences, Inc. | | | | | | | | | | | 30,000 | | | | 30,567 | | | | 29,935 | | | |
| | | | | | | | | | | | | | | | | | | |
WorkWell Prevention & Care Inc. | | Secured Loan | | December 31, 2022 | | January 1, 2027 | | Variable interest rate Prime + 5.0% or Floor rate 6.0%; EOT 0.0% | | $ | 500 | | | $ | 500 | | | $ | 500 | | | (8)(21) |
| | | | | | | | | | | | | | | | | | | |
Sub-total: Healthcare Technology (8.3%)* | | | | | | | | | | $ | 67,617 | | | $ | 68,672 | | | $ | 68,301 | | | |
TRINITY CAPITAL INC.
Consolidated Schedule of Investments
December 31, 2024
(In thousands, except share and per share data)
| | | | | | | | | | | | | | | | | | | | | | |
Portfolio Company (1) | | Type of Investment (2) | | Investment Date (3) | | Maturity Date | | Interest Rate (4) | | Principal
Amount (5) | | | Cost | | | Fair Value (6) | | | Footnotes |
Debt Securities- United States, Continued | | | | | | | | | | | | | |
| | | | | | | | | | | | | | | | | | | |
Human Resource Technology | |
| | | | | | | |
| | |
| | |
| | | |
Nomad Health, Inc. | | Secured Loan | | March 29, 2022 | | December 1, 2026 | | Variable interest rate Prime + 5.5% or Floor rate 9.3%; EOT 4.0% | | $ | 31,416 | | | $ | 32,287 | | | $ | 28,390 | | | (8)(14)(15) |
| | Secured Loan | | June 12, 2024 | | December 1, 2026 | | Fixed interest rate 10.0%; EOT 0.0% | | | 500 | | | | 500 | | | | 478 | | |
|
Total Nomad Health, Inc. | | | | | | | | | | | 31,916 | | | | 32,787 | | | | 28,868 | | | |
| | | | | | | | | | | | | | | | | | | |
Sub-total: Human Resource Technology (3.5%)* | |
| | | | | | | | $ | 31,916 | | | $ | 32,787 | | | $ | 28,868 | | | |
| | | | | | | | | | | | | | | | | | | |
Industrials | | | | | | | | | | | | | | | | | | | |
3DEO, Inc. | | Equipment Financing | | February 23, 2022 | | February 1, 2025 | | Fixed interest rate 0.0%; EOT 9.0% | | $ | 1,256 | | | $ | 1,567 | | | $ | 1,517 | | | (14) |
| | Equipment Financing | | April 12, 2022 | | February 1, 2025 | | Fixed interest rate 0.0%; EOT 9.0% | | | 675 | | | | 816 | | | | 796 | | | (14) |
Total 3DEO, Inc. | | | | | | | | | | | 1,931 | | | | 2,383 | | | | 2,313 | | | |
| | | | | | | | | | | | | | | | | | | |
Formlogic Corporation | | Equipment Financing | | December 28, 2023 | | January 1, 2028 | | Fixed interest rate 12.1%; EOT 1.5% | | $ | 4,017 | | | $ | 4,014 | | | $ | 1,718 | | | (9)(14)(18) |
| | Equipment Financing | | April 25, 2024 | | May 1, 2028 | | Fixed interest rate 12.1%; EOT 1.5% | | | 350 | | | | 347 | | | | 149 | | | (9)(14)(18) |
Total Formlogic Corporation | | | | | | | | | | | 4,367 | | | | 4,361 | | | | 1,867 | | | |
| | | | | | | | | | | | | | | | | | | |
Sub-total: Industrials (0.5%)* | | | | | | | | | | $ | 6,298 | | | $ | 6,744 | | | $ | 4,180 | | | |
| | | | | | | | | | | | | | | | | | | |
Marketing, Media, and Entertainment | |
| | | | | | | |
| | |
| | | | | | |
Drone Racing League, Inc. | | Secured Loan | | October 17, 2022 | | December 1, 2025 | | Variable interest rate Prime + 7.5% or Floor rate 11.0%; EOT 2.5% | | $ | 8,360 | | | $ | 8,449 | | | $ | 8,123 | | | (8) |
| | | | | | | | | | | | | | | | | | | |
Grabit Interactive Media, Inc. | | Secured Loan | | April 8, 2022 | | November 1, 2026 | | Variable interest rate Prime + 7.5% or Floor rate 10.8%; EOT 2.5% | | $ | 3,115 | | | $ | 3,193 | | | $ | 3,130 | | | (8)(14) |
| | | | | | | | | | | | | | | | | | | |
Incontext Solutions, Inc. | | Secured Loan | | January 16, 2020 | | September 1, 2025 | | Fixed interest rate 11.8%; EOT 11.4% | | $ | 1,388 | | | $ | 2,538 | | | $ | 2,332 | | |
|
| | | | | | | | | | | | | | | | | | | |
PebblePost, Inc. | | Secured Loan | | May 7, 2021 | | June 1, 2026 | | Variable interest rate Prime + 8.8% or Floor rate 11.5%; EOT 3.8% | | $ | 7,478 | | | $ | 7,886 | | | $ | 7,871 | | | (8)(14) |
| | | | | | | | | | | | | | | | | | | |
Vox Media Holdings, Inc. | | Secured Loan | | October 18, 2022 | | November 1, 2027 | | Variable interest rate Prime + 6.3% or Floor rate 11.8%; EOT 2.5% | | $ | 10,506 | | | $ | 10,599 | | | $ | 10,768 | | | (8)(9)(14)(19) |
| | Secured Loan | | December 29, 2022 | | January 1, 2028 | | Variable interest rate Prime + 6.3% or Floor rate 11.8%; EOT 2.5% | | | 5,251 | | | | 5,286 | | | | 5,371 | | | (8)(9)(14)(19) |
Total Vox Media Holdings, Inc. | | | | | | | | | | | 15,757 | | | | 15,885 | | | | 16,139 | | | |
| | | | | | | | | | | | | | | | | | | |
Sub-total: Marketing, Media, and Entertainment (4.6%)* | | | | $ | 36,098 | | | $ | 37,951 | | | $ | 37,595 | | | |
TRINITY CAPITAL INC.
Consolidated Schedule of Investments
December 31, 2024
(In thousands, except share and per share data)
| | | | | | | | | | | | | | | | | | | | | | |
Portfolio Company (1) | | Type of Investment (2) | | Investment Date (3) | | Maturity Date | | Interest Rate (4) | | Principal
Amount (5) | | | Cost | | | Fair Value (6) | | | Footnotes |
Debt Securities- United States, Continued | | | | | | | | | | | | | |
| | | | | | | | | | | | | | | | | | | |
Medical Devices | |
| | | | | | | |
| | |
| | | | | | |
Apiject Holdings, Inc. | | Equipment Financing | | June 24, 2024 | | July 1, 2028 | | Fixed interest rate 12.6%; EOT 7.5% | | $ | 17,847 | | | $ | 17,773 | | | $ | 17,982 | | | (9)(14)(19) |
| | Equipment Financing | | September 30, 2024 | | October 1, 2028 | | Fixed interest rate 12.7%; EOT 7.5% | | | 7,438 | | | | 7,314 | | | | 7,371 | | | (9)(14)(19) |
Total Apiject Holdings, Inc. | | | | | | | | | | | 25,285 | | | | 25,087 | | | | 25,353 | | | |
| | | | | | | | | | | | | | | | | | | |
Convergent Dental, Inc. | | Secured Loan | | April 21, 2023 | | May 1, 2027 | | Variable interest rate Prime + 5.8% or Floor rate 13.5%; EOT 5.5% | | $ | 12,000 | | | $ | 12,074 | | | $ | 12,215 | | | (8)(9)(14) |
| | Secured Loan | | February 29, 2024 | | May 1, 2027 | | Variable interest rate Prime + 5.8% or Floor rate 13.5%; EOT 5.5% | | | 6,000 | | | | 5,997 | | | | 6,137 | | | (8)(9)(14) |
Total Convergent Dental, Inc. | | | | | | | | | | | 18,000 | | | | 18,071 | | | | 18,352 | | | |
| | | | | | | | | | | | | | | | | | | |
Elucent Medical, Inc. | | Secured Loan | | October 31, 2024 | | November 30, 2029 | | Variable interest rate PRIME + 3.8% or Floor rate 11.3%; EOT 3.3% | | $ | 14,100 | | | $ | 13,822 | | | $ | 13,822 | | | (8)(19) |
| | | | | | | | | | | | | | | | | | | |
Lightforce Orthodontics, Inc. | | Secured Loan | | August 6, 2024 | | August 6, 2029 | | Variable interest rate Prime + 4.3% or Floor rate 11.8%; EOT 4.0% | | $ | 28,200 | | | $ | 27,803 | | | $ | 28,052 | | | (8)(19) |
| | Secured Loan | | September 25, 2024 | | August 6, 2029 | | Variable interest rate Prime + 4.3% or Floor rate 11.8%; EOT 4.0% | | | 4,700 | | | | 4,633 | | | | 4,675 | | | (8)(19) |
Total Lightforce Orthodontics, Inc. | | | | | | | | | | | 32,900 | | | | 32,436 | | | | 32,727 | | | |
| | | | | | | | | | | | | | | | | | | |
Neurolens, Inc. | | Secured Loan | | September 29, 2023 | | October 1, 2028 | | Variable interest rate Prime + 3.5% or Floor rate 11.5%; EOT 3.0% | | $ | 20,000 | | | $ | 20,000 | | | $ | 20,706 | | | (8) |
| | | | | | | | | | | | | | | | | | | |
Neuros Medical, Inc. | | Secured Loan | | August 10, 2023 | | September 1, 2027 | | Variable interest rate Prime + 6.0% or Floor rate 14.3%; EOT 4.5% | | $ | 6,000 | | | $ | 6,034 | | | $ | 6,032 | | | (8)(9)(14) |
| | Secured Loan | | August 30, 2024 | | September 1, 2027 | | Variable interest rate Prime + 6.0% or Floor rate 14.3%; EOT 4.5% | | | 3,000 | | | | 2,961 | | | | 2,926 | | | (8)(9)(14) |
Total Neuros Medical, Inc. | | | | | | | | | | | 9,000 | | | | 8,995 | | | | 8,958 | | | |
| | | | | | | | | | | | | | | | | | | |
Restor3d, Inc. | | Secured Loan | | June 4, 2024 | | July 4, 2028 | | Variable interest rate Prime + 4.8% or Floor rate 12.3%; EOT 3.3% | | $ | 11,985 | | | $ | 11,895 | | | $ | 12,006 | | | (8)(9)(19) |
| | | | | | | | | | | | | | | | | | | |
Shoulder Innovations, Inc. | | Secured Loan | | August 7, 2023 | | September 1, 2028 | | Variable interest rate Prime + 3.5% or Floor rate 11.5%; EOT 3.0% | | $ | 11,250 | | | $ | 11,245 | | | $ | 11,426 | | | (8)(9)(14) |
| | | | | | | | | | | | | | | | | | | |
Vital Connect, Inc. | | Secured Loan | | July 3, 2024 | | July 3, 2029 | | Variable interest rate Prime + 4.0% or Floor rate 11.5%; EOT 4.0% | | $ | 27,650 | | | $ | 27,504 | | | $ | 27,745 | | | (8)(9)(19) |
| | | | | | | | | | | | | | | | | | | |
Sub-total: Medical Devices (20.8%)* | | | | $ | 170,170 | | | $ | 169,055 | | | $ | 171,095 | | | |
TRINITY CAPITAL INC.
Consolidated Schedule of Investments
December 31, 2024
(In thousands, except share and per share data)
| | | | | | | | | | | | | | | | | | | | | | |
Portfolio Company (1) | | Type of Investment (2) | | Investment Date (3) | | Maturity Date | | Interest Rate (4) | | Principal
Amount (5) | | | Cost | | | Fair Value (6) | | | Footnotes |
Debt Securities- United States, Continued | | | | | | | | | | | | | |
| |
| | | | | | | |
| | |
| | |
| | | |
Multi-Sector Holdings | |
| | | | | | | |
| | |
| | |
| | | |
Senior Credit Corp 2022 LLC | | Secured Loan | | January 30, 2023 | | December 5, 2028 | | Fixed interest rate 8.5%; EOT 0.0% | | $ | 12,885 | | | $ | 12,885 | | | $ | 12,885 | | | (10)(14)(21) |
| |
| | | | | | | |
| | |
| | |
| | | |
Sub-total: Multi-Sector Holdings (1.6%)* | | | | $ | 12,885 | | | $ | 12,885 | | | $ | 12,885 | | | |
| |
| | | | | | | |
| | |
| | |
| | | |
Other Healthcare Services | |
| | | | | | | |
| | |
| | | | | | |
Cellares Corporation | | Equipment Financing | | August 2, 2024 | | September 1, 2029 | | Fixed interest rate 12.0%; EOT 4.5% | | $ | 4,467 | | | $ | 4,477 | | | $ | 4,555 | | | (19) |
| | Secured Loan | | August 2, 2024 | | February 1, 2027 | | Variable interest rate Prime + 3.3% or Floor rate 11.8%; EOT 4.0% | | | 47,000 | | | | 46,411 | | | | 47,219 | | | (8)(19) |
Total Cellares Corporation | | | | | | | | | | | 51,467 | | | | 50,888 | | | | 51,774 | | | |
| | | | | | | | | | | | | | | | | | | |
Metabolon, Inc. | | Secured Loan | | March 28, 2024 | | April 1, 2029 | | Variable interest rate PRIME + 2.5% or Floor rate 10.0%+PIK Fixed Interest Rate 3.0%; EOT 4.8% | | $ | 43,141 | | | $ | 42,389 | | | $ | 42,382 | | | (8)(15) |
| | Secured Loan | | October 1, 2024 | | April 1, 2029 | | Variable interest rate PRIME + 2.5% or Floor rate 10.0%+PIK Fixed Interest Rate 3.0%; EOT 4.8% | | | 5,038 | | | | 4,972 | | | | 4,972 | | | (8)(15) |
Total Metabolon, Inc. | | | | | | | | | | | 48,179 | | | | 47,361 | | | | 47,354 | | | |
| | | | | | | | | | | | | | | | | | | |
Upward Health, Inc. | | Secured Loan | | August 6, 2024 | | September 1, 2029 | | Variable interest rate Prime + 4.3% or Floor rate 12.8%; EOT 3.0% | | $ | 5,875 | | | $ | 5,707 | | | $ | 5,833 | | | (8)(9)(19) |
| |
| | | | | | | |
| | |
| | |
| | | |
Velentium, Inc. | | Secured Loan | | May 24, 2024 | | May 24, 2029 | | Variable interest rate Prime + 5.0% or Floor rate 12.5%; EOT 4.0% | | $ | 8,500 | | | $ | 8,379 | | | $ | 8,445 | | | (8)(9)(14) |
| | | | | | | | | | | | | | | | | | | |
Sub-total: Other Healthcare Services (13.8%)* | | | | $ | 114,021 | | | $ | 112,335 | | | $ | 113,406 | | | |
| | | | | | | | | | | | | | | | | | | |
Real Estate Technology | |
| | | | | | | |
| | |
| | | | | | |
Homelight Lending, Inc. | | Secured Loan | | October 15, 2021 | | June 1, 2026 | | Variable interest rate Prime + 8.3% or Floor rate 11.5%; EOT 4.5% | | $ | 3,900 | | | $ | 4,129 | | | $ | 3,999 | | | (8)(14) |
| | | | | | | | | | | | | | | | | | | |
Knockaway, Inc. | | Secured Loan | | September 29, 2023 | | September 1, 2028 | | Fixed interest rate 10.2%; EOT 0.0% | | $ | 23,644 | | | $ | 19,920 | | | $ | 19,159 | | | (8)(14)(21) |
| | | | | | | | | | | | | | | | | | | |
Knockaway Trinity Holdings, LLC | | Secured Loan | | December 6, 2023 | | December 27, 2026 | | Variable interest rate SOFR 30 Day Forward + 9.0% or Floor rate 13.5%; EOT 0.0% | | $ | 25,000 | | | $ | 24,981 | | | $ | 24,981 | | | (8)(10)(12)(21) |
| | | | | | | | | | | | | | | | | | | |
Maxwell Financial Labs, Inc. | | Secured Loan | | September 30, 2021 | | April 1, 2026 | | Variable interest rate Prime + 6.0% or Floor rate 10.0%; EOT 5.0% | | $ | 15,000 | | | $ | 15,486 | | | $ | 15,052 | | | (8)(14) |
| | Secured Loan | | October 2, 2024 | | October 2, 2026 | | Fixed interest rate 6.0%; EOT 0.0% | | | 187 | | | | 187 | | | | 187 | | |
|
Total Maxwell Financial Labs, Inc. | | | | | | | | | | | 15,187 | | | | 15,673 | | | | 15,239 | | | |
| | | | | | | | | | | | | | | | | | | |
Orchard Technologies, Inc. | | Secured Loan | | January 1, 2024 | | January 1, 2029 | | Variable interest rate Prime + 8.0% or Floor rate 15.0%; EOT 3.0% | | $ | 28,540 | | | $ | 28,765 | | | $ | 24,662 | | | (8)(14) |
| | | | | | | | | | | | | | | | | | | |
Sub-total: Real Estate Technology (10.7%)* | | | | $ | 96,271 | | | $ | 93,468 | | | $ | 88,040 | | | |
TRINITY CAPITAL INC.
Consolidated Schedule of Investments
December 31, 2024
(In thousands, except share and per share data)
| | | | | | | | | | | | | | | | | | | | | | |
Portfolio Company (1) | | Type of Investment (2) | | Investment Date (3) | | Maturity Date | | Interest Rate (4) | | Principal
Amount (5) | | | Cost | | | Fair Value (6) | | | Footnotes |
Debt Securities- United States, Continued | | | | | | | | | | | | | |
| | | | | | | | | | | | | | | | | | | |
Software as a Service ("SaaS") | |
| | | | | | | |
| | |
| | |
| | | |
BackBlaze, Inc. | | Equipment Financing | | March 29, 2021 | | April 1, 2025 | | Fixed interest rate 7.5%; EOT 11.5% | | $ | 198 | | | $ | 518 | | | $ | 510 | | | (14) |
| | | | | | | | | | | | | | | | | | | |
Cpacket Networks, Inc. | | Secured Loan | | January 29, 2024 | | February 1, 2029 | | Variable interest rate PRIME + 4.8% or Floor rate 12.0%+PIK Fixed Interest Rate 1.3%; EOT 3.0% | | $ | 20,478 | | | $ | 20,316 | | | $ | 20,532 | | | (8)(9)(14)(15) |
| | | | | | | | | | | | | | | | | | | |
Eyelit Technologies, Inc. | | Secured Loan | | November 4, 2024 | | November 4, 2029 | | Variable interest rate SOFR 1 Month Term + 5.8%; EOT 0.0% | | $ | 4,500 | | | $ | 4,413 | | | $ | 4,413 | | | (8)(19)(20) |
| | Secured Loan | | December 27, 2024 | | November 4, 2029 | | Variable interest rate SOFR 1 Month Term + 5.8%; EOT 0.0% | | | 7,920 | | | | 7,764 | | | | 7,764 | | | (8)(19)(20) |
Total Eyelit Technologies, Inc. | | | | | | | | | | | 12,420 | | | | 12,177 | | | | 12,177 | | | |
| | | | | | | | | | | | | | | | | | | |
Hometown Ticketing, Inc. | | Secured Loan | | November 25, 2024 | | November 25, 2029 | | Variable interest rate SOFR 3 Month Term + 7.7%; EOT 0.0% | | $ | 24,910 | | | $ | 24,422 | | | $ | 24,422 | | | (8)(19) |
| | | | | | | | | | | | | | | | | | | |
ServiceTrade, Inc. | | Secured Loan | | August 15, 2024 | | August 15, 2029 | | Variable interest rate SOFR 3 Month Term + 5.5%; EOT 0.0% | | $ | 23,500 | | | $ | 23,091 | | | $ | 23,720 | | | (8)(19)(20) |
| | | | | | | | | | | | | | | | | | | |
Silk Technologies, Inc. | | Secured Loan | | November 4, 2024 | | December 1, 2029 | | Variable interest rate Prime + 4.0% or Floor rate 11.3%; EOT 1.5% | | $ | 18,800 | | | $ | 18,309 | | | $ | 18,309 | | | (8)(19) |
| | | | | | | | | | | | | | | | | | | |
SOCi, Inc. | | Secured Loan | | October 3, 2024 | | October 3, 2029 | | Variable interest rate SOFR 3 Month Term + 7.9%; EOT 0.0% | | $ | 36,100 | | | $ | 35,326 | | | $ | 35,326 | | | (8)(19) |
| | Secured Loan | | December 30, 2024 | | October 3, 2029 | | Variable interest rate SOFR 3 Month Term + 7.9%; EOT 0.0% | | | 3,290 | | | | 3,216 | | | | 3,216 | | | (8)(19) |
Total SOCi, Inc. | | | | | | | | | | | 39,390 | | | | 38,542 | | | | 38,542 | | | |
| | | | | | | | | | | | | | | | | | | |
Steno Agency, Inc. | | Secured Loan | | June 21, 2024 | | July 1, 2029 | | Variable interest rate Prime + 4.0% or Floor rate 12.5%; EOT 2.5% | | $ | 3,740 | | | $ | 3,621 | | | $ | 3,744 | | | (8)(9)(14)(19) |
| | | | | | | | | | | | | | | | | | | |
Sub-total: SaaS (17.2%)* | |
| | | | | | | | $ | 143,436 | | | $ | 140,996 | | | $ | 141,956 | | | |
| | | | | | | | | | | | | | | | | | | |
Space Technology | | | | | | | | | | | | | | | | | | | |
Astranis Space Technology Corporation | | Equipment Financing | | April 13, 2023 | | November 1, 2026 | | Fixed interest rate 12.1%; EOT 5.0% | | $ | 7,611 | | | $ | 8,099 | | | $ | 8,201 | | | (9)(14)(19) |
| | Equipment Financing | | September 27, 2024 | | April 1, 2028 | | Fixed interest rate 12.4%; EOT 5.5% | | | 10,911 | | | | 10,388 | | | | 10,557 | | | (9)(14)(19) |
| | Equipment Financing | | September 27, 2024 | | October 1, 2027 | | Fixed interest rate 12.6%; EOT 4.0% | | | 2,693 | | | | 2,563 | | | | 2,603 | | | (9)(14)(19) |
Total Astranis Space Technology Corporation | | | | | | | | | | | 21,215 | | | | 21,050 | | | | 21,361 | | | |
| | | | | | | | | | | | | | | | | | | |
Axiom Space, Inc. | | Secured Loan | | May 28, 2021 | | June 1, 2026 | | Variable interest rate Prime + 6.0% or Floor rate 9.3%; EOT 2.5% | | $ | 15,000 | | | $ | 15,641 | | | $ | 15,530 | | | (8)(14) |
| | | | | | | | | | | | | | | | | | | |
Hadrian Automation, Inc. | | Equipment Financing | | March 2, 2022 | | September 1, 2025 | | Fixed interest rate 12.6%; EOT 0.0% | | $ | 126 | | | $ | 126 | | | $ | 129 | | | (14) |
| | Equipment Financing | | May 6, 2022 | | November 1, 2025 | | Fixed interest rate 12.9%; EOT 0.0% | | | 1,497 | | | | 1,495 | | | | 1,522 | | | (14) |
| | Equipment Financing | | July 15, 2022 | | January 1, 2026 | | Fixed interest rate 14.3%; EOT 0.0% | | | 1,192 | | | | 1,191 | | | | 1,215 | | | (14) |
| | Equipment Financing | | September 30, 2022 | | March 1, 2026 | | Fixed interest rate 15.2%; EOT 0.0% | | | 2,290 | | | | 2,289 | | | | 2,347 | | | (9)(14) |
| | Equipment Financing | | December 22, 2022 | | June 1, 2026 | | Fixed interest rate 16.1%; EOT 0.0% | | | 612 | | | | 608 | | | | 632 | | | (9)(14) |
| | Equipment Financing | | December 22, 2022 | | December 1, 2026 | | Fixed interest rate 16.4%; EOT 0.0% | | | 274 | | | | 273 | | | | 284 | | | (9)(14)(19) |
| | Equipment Financing | | March 29, 2023 | | March 1, 2027 | | Fixed interest rate 15.7%; EOT 0.0% | | | 877 | | | | 875 | | | | 903 | | | (9)(14)(19) |
| | Equipment Financing | | September 28, 2023 | | September 1, 2027 | | Fixed interest rate 17.7%; EOT 0.0% | | | 468 | | | | 467 | | | | 485 | | | (9)(14)(19) |
| | Equipment Financing | | June 27, 2024 | | June 1, 2028 | | Fixed interest rate 17.6%; EOT 0.0% | | | 1,273 | | | | 1,268 | | | | 1,307 | | | (9)(14)(19) |
Total Hadrian Automation, Inc. | | | | | | | | | | | 8,609 | | | | 8,592 | | | | 8,824 | | | |
| | | | | | | | | | | | | | | | | | | |
TRINITY CAPITAL INC.
Consolidated Schedule of Investments
December 31, 2024
(In thousands, except share and per share data)
| | | | | | | | | | | | | | | | | | | | | | |
Portfolio Company (1) | | Type of Investment (2) | | Investment Date (3) | | Maturity Date | | Interest Rate (4) | | Principal
Amount (5) | | | Cost | | | Fair Value (6) | | | Footnotes |
Debt Securities- United States, Continued | | | | | | | | | | | | | |
| | | | | | | | | | | | | | | | | | | |
Impulse Space, Inc. | | Equipment Financing | | June 18, 2024 | | July 1, 2027 | | Fixed interest rate 12.7%; EOT 3.0% | | $ | 1,143 | | | $ | 1,133 | | | $ | 1,155 | | | (9)(14)(19) |
| | Equipment Financing | | September 13, 2024 | | October 1, 2027 | | Fixed interest rate 12.5%; EOT 3.0% | | | 901 | | | | 887 | | | | 907 | | | (9)(14)(19) |
| | Equipment Financing | | December 27, 2024 | | January 1, 2028 | | Fixed interest rate 12.9%; EOT 3.0% | | | 1,077 | | | | 1,051 | | | | 1,051 | | | (14)(19) |
Total Impulse Space, Inc. | | | | | | | | | | | 3,121 | | | | 3,071 | | | | 3,113 | | | |
| | | | | | | | | | | | | | | | | | | |
Kymeta Corporation | | Secured Loan | | July 3, 2024 | | August 1, 2029 | | Variable interest rate Prime + 4.0% or Floor rate 12.5%; EOT 3.0% | | $ | 7,900 | | | $ | 7,575 | | | $ | 7,783 | | | (8)(9)(19) |
| | | | | | | | | | | | | | | | | | | |
Rocket Lab USA, Inc. | | Equipment Financing | | December 29, 2023 | | January 1, 2029 | | Fixed interest rate 12.8%; EOT 1.0% | | $ | 45,649 | | | $ | 44,992 | | | $ | 46,466 | | | (9)(10)(14) |
| | | | | | | | | | | | | | | | | | | |
Slingshot Aerospace, Inc. | | Secured Loan | | July 12, 2024 | | August 1, 2029 | | Variable interest rate Prime + 5.5% or Floor rate 14.0%; EOT 3.0% | | $ | 23,700 | | | $ | 23,233 | | | $ | 23,750 | | | (8)(9)(19) |
| | Secured Loan | | August 7, 2024 | | April 30, 2025 | | Fixed interest rate 10.0%; EOT 0.0% | | | 500 | | | | 500 | | | | 524 | | |
|
Total Slingshot Aerospace, Inc. | | | | | | | | | | $ | 24,200 | | | $ | 23,733 | | | $ | 24,274 | | | |
| | | | | | | | | | | | | | | | | | | |
Space Perspective, Inc. | | Secured Loan | | March 3, 2022 | | July 1, 2026 | | Variable interest rate Prime + 7.8% or Floor rate 11.0%; EOT 5.0% | | $ | 2,936 | | | $ | 3,021 | | | $ | 1,637 | | | (8)(14)(18) |
| | | | | | | | | | | | | | | | | | | |
Sub-total: Space Technology (15.7%)* | | | | | | | | | | $ | 128,630 | | | $ | 127,675 | | | $ | 128,988 | | | |
| | | | | | | | | | | | | | | | | | | |
Supply Chain Technology | | | | | | | | | | | | | | | | | | | |
Macrofab, Inc. | | Secured Loan | | July 21, 2023 | | August 1, 2027 | | Variable interest rate Prime + 5.5% or Floor rate 13.3%; EOT 4.0% | | $ | 19,495 | | | $ | 19,448 | | | $ | 19,220 | | | (8)(14) |
| | | | | | | | | | | | | | | | | | | |
Nucleus RadioPharma, Inc. | | Equipment Financing | | June 4, 2024 | | June 1, 2027 | | Fixed interest rate 11.8%; EOT 4.0% | | $ | 364 | | | $ | 366 | | | $ | 373 | | | (9)(14) |
| | Equipment Financing | | December 23, 2024 | | January 1, 2028 | | Fixed interest rate 12.3%; EOT 4.0% | | | 2,000 | | | | 1,980 | | | | 1,980 | | |
|
Total Nucleus RadioPharma, Inc. | | | | | | | | | | $ | 2,364 | | | $ | 2,346 | | | $ | 2,353 | | | |
| | | | | | | | | | | | | | | | | | | |
| | | | | | | | | | | | | | | | | | | |
Sub-total: Supply Chain Technology (2.6%)* | |
| | | | | | | | $ | 21,859 | | | $ | 21,794 | | | $ | 21,573 | | | |
TRINITY CAPITAL INC.
Consolidated Schedule of Investments
December 31, 2024
(In thousands, except share and per share data)
| | | | | | | | | | | | | | | | | | | | | | |
Portfolio Company (1) | | Type of Investment (2) | | Investment Date (3) | | Maturity Date | | Interest Rate (4) | | Principal
Amount (5) | | | Cost | | | Fair Value (6) | | | Footnotes |
Debt Securities- United States, Continued | | | | | | | | | | | | | |
| | | | | | | | | | | | | | | | | | | |
Transportation Technology | |
| | | | | | | |
| | |
| | |
| | | |
NextCar Holding Company, Inc. | | Secured Loan | | December 14, 2021 | | March 31, 2025 | | Variable interest rate Prime + 5.8% or Floor rate 9.0%; EOT 2.0% | | $ | 2,927 | | | $ | 3,188 | | | $ | 926 | | | (8) |
| | Secured Loan | | December 15, 2021 | | March 31, 2025 | | Variable interest rate Prime + 5.8% or Floor rate 9.0%; EOT 2.0% | | | 2,274 | | | | 2,379 | | | | 720 | | | (8)(18) |
| | Secured Loan | | February 23, 2022 | | March 31, 2025 | | Variable interest rate Prime + 5.8% or Floor rate 9.0%; EOT 2.0% | | | 2,843 | | | | 2,974 | | | | 900 | | | (8)(18) |
| | Secured Loan | | March 16, 2022 | | March 31, 2025 | | Variable interest rate Prime + 5.8% or Floor rate 9.0%; EOT 2.0% | | | 3,411 | | | | 3,569 | | | | 1,080 | | | (8)(18) |
| | Secured Loan | | April 18, 2022 | | March 31, 2025 | | Variable interest rate Prime + 5.8% or Floor rate 9.0%; EOT 2.0% | | | 2,843 | | | | 2,974 | | | | 900 | | | (8)(18) |
| | Secured Loan | | April 18, 2022 | | March 31, 2025 | | Variable interest rate Prime + 5.8% or Floor rate 9.0%; EOT 2.0% | | | 2,843 | | | | 2,974 | | | | 900 | | | (8)(18) |
| | Secured Loan | | May 17, 2022 | | March 31, 2025 | | Variable interest rate Prime + 5.8% or Floor rate 9.0%; EOT 2.0% | | | 5,685 | | | | 5,948 | | | | 1,800 | | | (8)(18) |
| | Secured Loan | | June 22, 2022 | | March 31, 2025 | | Variable interest rate Prime + 5.8% or Floor rate 9.0%; EOT 2.0% | | | 2,843 | | | | 2,974 | | | | 900 | | | (8)(18) |
Total NextCar Holding Company, Inc. | | | | | | | | | | | 25,669 | | | | 26,980 | | | | 8,126 | | | |
| |
| | | | | | | |
| | |
| | |
| | | |
Get Spiffy, Inc. | | Secured Loan | | July 14, 2023 | | January 14, 2028 | | Variable interest rate Prime + 4.5% or Floor rate 12.3%; EOT 6.0% | | $ | 9,000 | | | $ | 9,127 | | | $ | 7,763 | | | (8)(9)(14) |
| | Equipment Financing | | July 14, 2023 | | February 1, 2027 | | Fixed interest rate 12.1%; EOT 4.0% | | | 291 | | | | 292 | | | | 274 | | | (9)(14) |
Total Get Spiffy, Inc. | | | | | | | | | | | 9,291 | | | | 9,419 | | | | 8,037 | | | |
| | | | | | | | | | | | | | | | | | | |
Uveye, Inc. | | Equipment Financing | | December 26, 2024 | | January 1, 2028 | | Fixed interest rate 11.9%; EOT 1.0% | | $ | 20,217 | | | $ | 20,011 | | | $ | 20,011 | | |
|
| | | | | | | | | | | | | | | | | | | |
Zuum Transportation, Inc. | | Secured Loan | | December 17, 2021 | | January 1, 2027 | | Variable interest rate Prime + 6.0% or Floor rate 10.8%; EOT 2.5% | | $ | 5,000 | | | $ | 5,065 | | | $ | 4,737 | | | (8)(14) |
| | | | | | | | | | | | | | | | | | | |
Sub-total: Transportation Technology (5.0%)* | |
| | | | | | | | $ | 60,177 | | | $ | 61,475 | | | $ | 40,911 | | | |
| | | | | | | | | | | | | | | | | | | |
Total: Debt Securities- United States (189.1%)* | | | | | | | | | | $ | 1,592,144 | | | $ | 1,594,217 | | | $ | 1,555,875 | | | |
TRINITY CAPITAL INC.
Consolidated Schedule of Investments
December 31, 2024
(In thousands, except share and per share data)
| | | | | | | | | | | | | | | | | | | | | | |
Portfolio Company (1) | | Type of Investment (2) | | Investment Date (3) | | Maturity Date | | Interest Rate (4) | | Principal
Amount (5) | | | Cost | | | Fair Value (6) | | | Footnotes |
Debt Securities- Canada | | | | | | | | | | | | | | | | | | | |
| | | | | | | | | | | | | | | | | | | |
Construction Technology | | | | | | | | | | | | | | | | | | | |
Nexii, Inc. | | Secured Loan | | July 24, 2024 | | July 1, 2027 | | Fixed interest rate 10.0%; EOT 0.0% | | $ | 365 | | | $ | 365 | | | $ | 375 | | | (10) |
| | | | | | | | | | | | | | | | | | | |
Sub-total: Construction Technology (0.0%)* | | | | $ | 365 | | | $ | 365 | | | $ | 375 | | | |
| | | | | | | | | | | | | | | | | | | |
Supply Chain Technology | |
| | | | | | | |
| | |
| | |
| | | |
GoFor Delivers, Inc. | | Secured Loan | | June 28, 2024 | | July 1, 2028 | | Variable interest rate Prime + 3.5% or Floor rate 12.0%; EOT 2.5% | | $ | 6,000 | | | $ | 6,027 | | | $ | 5,769 | | | (8)(10)(21) |
| | | | | | | | | | | | | | | | | | | |
Sub-total: Supply Chain Technology (0.7%)* | | $ | 6,000 | | | $ | 6,027 | | | $ | 5,769 | | | |
| | | | | | | | | | | | | | | | | | | |
Total: Debt Securities- Canada (0.7%)* | | | | | | | | $ | 6,365 | | | $ | 6,392 | | | $ | 6,144 | | | |
Debt Securities- Europe | | | | | | | | | | |
| | | | | | | | | | | | | | | | | | | |
Industrials | | | | | |
| | | |
| | |
| | |
| | | |
Aledia, Inc. | | Equipment Financing | | March 31, 2022 | | April 1, 2025 | | Fixed interest rate 9.0%; EOT 7.0% | | $ | 1,701 | | | $ | 2,971 | | | $ | 2,947 | | | (10)(14) |
| | Equipment Financing | | June 30, 2022 | | July 1, 2025 | | Fixed interest rate 9.7%; EOT 7.0% | | | 218 | | | | 298 | | | | 297 | | | (10)(14) |
| | Equipment Financing | | August 5, 2022 | | September 1, 2025 | | Fixed interest rate 10.7%; EOT 7.0% | | | 379 | | | | 480 | | | | 478 | | | (10)(14) |
| | Equipment Financing | | September 30, 2022 | | October 1, 2025 | | Fixed interest rate 12.0%; EOT 7.0% | | | 680 | | | | 838 | | | | 838 | | | (10)(14) |
Total Aledia, Inc. | | | | | | | | | | | 2,978 | | | | 4,587 | | | | 4,560 | | | |
| | | | | | | | | | | | | | | | | | | |
Sub-total: Industrials (0.6%)* | |
| | | | | | | | $ | 2,978 | | | $ | 4,587 | | | $ | 4,560 | | | |
| | | | | | | | | | | | | | | | | | | |
Other Healthcare Services | |
| | | | | | | |
| | |
| | | | | | |
Zandivio PLC | | Secured Loan | | October 30, 2024 | | May 1, 2029 | | Variable interest rate PRIME + 5.3% or Floor rate 13.8%; EOT 2.5% | | $ | 28,200 | | | $ | 27,426 | | | $ | 27,426 | | | (8)(10)(19) |
| | | | | | | | | | | | | | | | | | | |
Sub-total: Other Healthcare Services (3.3%)* | | | | $ | 28,200 | | | $ | 27,426 | | | $ | 27,426 | | | |
| | | | | | | | | | | | | | | | | | | |
Space Technology | |
| | | | | | | |
| | |
| | |
| | | |
All.Space Networks, Limited. | | Secured Loan | | August 22, 2022 | | September 1, 2027 | | Variable interest rate Prime + 7.0% or Floor rate 11.5%; EOT 2.5% | | $ | 8,219 | | | $ | 8,339 | | | $ | 8,126 | | | (8)(10) |
| | | | | | | | | | | | | | | | | | | |
Sub-total: Space Technology (1.0%)* | | | | | | | | $ | 8,219 | | | $ | 8,339 | | | $ | 8,126 | | | |
| | | | | | | | | | | | | | | | | | | |
Total: Debt Securities- Europe (4.9%)* | | | | | | | | $ | 39,397 | | | $ | 40,352 | | | $ | 40,112 | | | |
| | | | | | | | | | | | | | | | | | | |
Total: Debt Securities (194.7%)* | | | | | | | | $ | 1,637,906 | | | $ | 1,640,961 | | | $ | 1,602,131 | | | |
TRINITY CAPITAL INC.
Consolidated Schedule of Investments
December 31, 2024
(In thousands, except share and per share data)
| | | | | | | | | | | | | | | | | | | | | | | | | | |
Portfolio Company (1) | | Type of
Investment (2) | | Investment Date (3) | | Expiration Date | | Series | | Shares | | | Strike Price | | | Cost | | | Fair Value (6) | | | Footnotes |
Warrant Investments- United States | | | | | | | | | | | | | | | | | | | | | | |
| | | | | | | | | | | | | | | | | | | | | | |
Artificial Intelligence & Automation | | | | | | | | | | | | | | | | | | | | |
| | | | | | | | | | | | | | | | | | | | | | |
Ambient Photonics, Inc. | | Warrant | | July 27, 2022 | | July 27, 2032 | | Common Stock | | | 15,976 | | | $ | 5.50 | | | $ | 47 | | | $ | 1 | | |
|
| | | | | | | | | | | | | | | | | | | | | | |
Everalbum, Inc. | | Warrant | | January 16, 2020 | | July 29, 2026 | | Preferred Class A Common Stock | | | 851,063 | | | $ | 0.10 | | | $ | 25 | | | $ | 19 | | | (17) |
| | | | | | | | | | | | | | | | | | | | | | |
Hologram, Inc. | | Warrant | | January 31, 2020 | | January 27, 2030 | | Common Stock | | | 193,054 | | | $ | 0.26 | | | $ | 49 | | | $ | 188 | | |
|
| | | | | | | | | | | | | | | | | | | | | | |
Presto Automation, Inc. | | Warrant | | January 16, 2020 | | April 28, 2027 | | Preferred Series A | | | 402,679 | | | $ | 0.37 | | | $ | 185 | | | $ | — | | | (7)(17) |
| | Warrant | | January 16, 2020 | | July 28, 2027 | | Common Stock | | | 170,993 | | | $ | 5.85 | | | | 28 | | | | — | | | (7) |
Total Presto Automation, Inc. | | | | | | | | | | | | | | | | | 213 | | | | — | | | |
| | | | | | | | | | | | | | | | | | | | | | |
Sub-Total: Artificial Intelligence & Automation (0.0%)* | | | | | | | | | | | $ | 334 | | | $ | 208 | | | |
| | | | | | | | | | | | | | | | | | | | | | |
Biotechnology | | | | | |
| | | | |
| | |
| | |
| | | |
| | | | | | | | | | | | | | | | | | | | | | |
Pendulum Therapeutics, Inc. | | Warrant | | January 16, 2020 | | October 9, 2029 | | Preferred Series B | | | 55,263 | | | $ | 1.90 | | | $ | 43 | | | $ | 44 | | | (17) |
| | Warrant | | June 1, 2020 | | July 15, 2030 | | Preferred Series B | | | 36,842 | | | $ | 1.90 | | | | 36 | | | | 30 | | | (17) |
| | Warrant | | December 31, 2021 | | December 31, 2031 | | Preferred Series C | | | 322,251 | | | $ | 3.24 | | | | 118 | | | | 194 | | | (17) |
| | Warrant | | February 5, 2024 | | February 5, 2034 | | Common Stock | | | 1,143,690 | | | $ | 1.03 | | | | 588 | | | | 1,129 | | |
|
Total Pendulum Therapeutics, Inc. | | | | | | | | | | | | | | | | | 785 | | | | 1,397 | | | |
| | | | | | | | | | | | | | | | | | | | | | |
Sub-Total: Biotechnology (0.2%)* | | | | | | | | | | | $ | 785 | | | $ | 1,397 | | | |
| | | | | | | | | | | | | | | | | | | | | | |
Connectivity | | | | | |
| | | | |
| | |
| | |
| | | |
Tarana Wireless, Inc. | | Warrant | | June 30, 2021 | | June 30, 2031 | | Common Stock | | | 5,027,629 | | | $ | 0.19 | | | $ | 967 | | | $ | 2,701 | | |
|
| | Warrant | | September 23, 2024 | | September 23, 2034 | | Common Stock | | | 2,094,922 | | | $ | 0.51 | | | | 695 | | | | 722 | | | (9)(19) |
Total Tarana Wireless, Inc. | | | | | | | | | | | | | | | | | 1,662 | | | | 3,423 | | | |
| | | | | | | | | | | | | | | | | | | | | | |
Vertical Communications, Inc. | | Warrant | | January 16, 2020 | | July 11, 2026 | | Preferred Series A | | | 828,479 | | | $ | 1.00 | | | $ | — | | | $ | — | | | (11)(17)(21) |
| | | | | | | | | | | | | | | | | | | | | | |
viaPhoton, Inc. | | Warrant | | March 31, 2022 | | March 31, 2032 | | Common Stock | | | 15,839 | | | $ | 0.60 | | | $ | 22 | | | $ | 1 | | |
|
| | | | | | | | | | | | | | | | | | | | | | |
Sub-Total: Connectivity (0.4%)* | | | | | | | | | | | $ | 1,684 | | | $ | 3,424 | | | |
| | | | | | | | | | | | | | | | | | | | | | |
Construction Technology | | | | | | | | | | | | | | | | | | | | |
Project Frog, Inc. | | Warrant | | January 16, 2020 | | February 28, 2027 | | Preferred Series AA-1 | | | 211,649 | | | $ | 0.19 | | | $ | 9 | | | $ | — | | | (17)(21) |
| | Warrant | | January 16, 2020 | | February 28, 2027 | | Common Stock | | | 180,340 | | | $ | 0.19 | | | | 9 | | | | — | | | (21) |
| | Warrant | | August 3, 2021 | | December 31, 2031 | | Preferred Series CC | | | 250,000 | | | $ | 0.01 | | | | 20 | | | | 2 | | | (17)(21) |
Total Project Frog, Inc. | | | | | | | | | | | | | | | | | 38 | | | | 2 | | | |
| | | | | | | | | | | | | | | | | | | | | | |
Sub-total: Construction Technology (0.0%)* | | | | | | | | | | | | | | | | $ | 38 | | | $ | 2 | | | |
TRINITY CAPITAL INC.
Consolidated Schedule of Investments
December 31, 2024
(In thousands, except share and per share data)
| | | | | | | | | | | | | | | | | | | | | | | | | | |
Portfolio Company (1) | | Type of
Investment (2) | | Investment Date (3) | | Expiration Date | | Series | | Shares | | | Strike Price | | | Cost | | | Fair Value (6) | | | Footnotes |
Warrant Investments- United States, Continued | | | | | | | | | | | | | | | | | | | | | | |
| | | | | | | | | | | | | | | | | | | | | | |
Consumer Products & Services | | | | | | | | | | | | | | | |
| | |
| | | |
BaubleBar, Inc. | | Warrant | | January 16, 2020 | | March 29, 2027 | | Preferred Series C | | | 531,806 | | | $ | 1.96 | | | $ | 638 | | | $ | 33 | | | (17) |
| | Warrant | | January 16, 2020 | | April 20, 2028 | | Preferred Series C | | | 60,000 | | | $ | 1.96 | | | | 72 | | | | 4 | | | (17) |
Total BaubleBar, Inc. | | | | | | | | | | | | | | | | | 710 | | | | 37 | | | |
| | | | | | | | | | | | | | | | | | | | | | |
Boosted eCommerce, Inc. | | Warrant | | December 14, 2020 | | December 14, 2030 | | Preferred Series A-1 | | | 759,263 | | | $ | 0.84 | | | $ | 259 | | | $ | — | | | (17) |
| | | | | | | | | | | | | | | | | | | | | | |
Eterneva, Inc. | | Warrant | | September 30, 2024 | | September 30, 2034 | | Common Stock | | | 833,333 | | | $ | 0.48 | | | $ | 421 | | | $ | 477 | | |
|
| | | | | | | | | | | | | | | | | | | | | | |
Happiest Baby, Inc. | | Warrant | | January 16, 2020 | | May 16, 2029 | | Common Stock | | | 182,554 | | | $ | 0.33 | | | $ | 193 | | | $ | 35 | | |
|
| | | | | | | | | | | | | | | | | | | | | | |
Madison Reed, Inc. | | Warrant | | January 16, 2020 | | March 23, 2027 | | Preferred Series C | | | 194,553 | | | $ | 2.57 | | | $ | 185 | | | $ | 169 | | | (17) |
| | Warrant | | January 16, 2020 | | July 18, 2028 | | Common Stock | | | 43,158 | | | $ | 0.99 | | | | 71 | | | | 59 | | |
|
| | Warrant | | January 16, 2020 | | June 30, 2029 | | Common Stock | | | 36,585 | | | $ | 1.23 | | | | 56 | | | | 47 | | |
|
Total Madison Reed, Inc. | | | | | | | | | | | | | | | | | 312 | | | | 275 | | | |
| | | | | | | | | | | | | | | | | | | | | | |
Ogee, Inc. | | Warrant | | February 14, 2023 | | February 14, 2033 | | Preferred Series A-3 | | | 243,668 | | | $ | 0.68 | | | $ | 54 | | | $ | 303 | | | (17)(19) |
| | Warrant | | September 29, 2023 | | September 29, 2033 | | Preferred Series A-3 | | | 243,668 | | | $ | 0.68 | | | | 49 | | | | 303 | | | (17)(19) |
| | Warrant | | August 1, 2024 | | August 1, 2034 | | Preferred Series A-3 | | | 243,668 | | | $ | 0.68 | | | | 104 | | | | 303 | | | (17)(19) |
Total Ogee, Inc. | | | | | | | | | | | | | | | | | 207 | | | | 909 | | | |
| | | | | | | | | | | | | | | | | | | | | | |
Portofino Labs, Inc. | | Warrant | | December 31, 2020 | | December 31, 2030 | | Common Stock | | | 99,148 | | | $ | 1.53 | | | $ | 160 | | | $ | 62 | | |
|
| | Warrant | | April 1, 2021 | | April 1, 2031 | | Common Stock | | | 39,912 | | | $ | 1.46 | | | | 99 | | | | 26 | | |
|
Total Portofino Labs, Inc. | | | | | | | | | | | | | | | | | 259 | | | | 88 | | | |
| | | | | | | | | | | | | | | | | | | | | | |
Quip NYC, Inc. | | Warrant | | March 9, 2021 | | March 9, 2031 | | Common Stock | | | 10,833 | | | $ | 48.46 | | | $ | 203 | | | $ | — | | |
|
| | | | | | | | | | | | | | | | | | | | | | |
Rinse, Inc. | | Warrant | | May 10, 2022 | | May 10, 2032 | | Preferred Series C | | | 278,761 | | | $ | 1.13 | | | $ | 118 | | | $ | 454 | | | (17) |
| | | | | | | | | | | | | | | | | | | | | | |
SI Tickets, Inc. | | Warrant | | May 11, 2022 | | May 11, 2032 | | Common Stock | | | 53,029 | | | $ | 2.52 | | | $ | 162 | | | $ | — | | |
|
| | | | | | | | | | | | | | | | | | | | | | |
Super73, Inc. | | Warrant | | December 31, 2020 | | December 31, 2030 | | Common Stock | | | 177,305 | | | $ | 3.16 | | | $ | 105 | | | $ | 58 | | |
|
| | | | | | | | | | | | | | | | | | | | | | |
Trendly, Inc. | | Warrant | | January 16, 2020 | | August 10, 2026 | | Preferred Series A | | | 245,506 | | | $ | 1.14 | | | $ | 222 | | | $ | 1 | | | (17) |
| | | | | | | | | | | | | | | | | | | | | | |
VitaCup, Inc. | | Warrant | | June 23, 2021 | | June 23, 2031 | | Preferred Series C | | | 68,996 | | | $ | 2.79 | | | $ | 9 | | | $ | — | | | (17) |
| | Warrant | | November 22, 2023 | | November 22, 2033 | | Common Stock | | | 51,225 | | | $ | 0.41 | | | | — | | | | — | | |
|
Total VitaCup, Inc. | | | | | | | | | | | | | | | | | 9 | | | | — | | | |
| | | | | | | | | | | | | | | | | | | | | | |
Whoop, Inc. | | Warrant | | May 17, 2023 | | May 17, 2033 | | Common Stock | | | 2,393,845 | | | $ | 0.43 | | | $ | 1,099 | | | $ | 2,275 | | | (9)(19) |
| | | | | | | | | | | | | | | | | | | | | | |
Sub-total: Consumer Products & Services (0.6%)* | | | | | | | | | | | | | | | | $ | 4,279 | | | $ | 4,609 | | | |
| | | | | | | | | | | | | | | | | | | | | | |
Education Technology | | | | | | | | | | | | | | | |
| | |
| | | |
Edblox, Inc. | | Warrant | | March 19, 2024 | | March 19, 2034 | | Common Stock | | | 111,458 | | | $ | 1.71 | | | $ | 152 | | | $ | 24 | | |
|
| | | | | | | | | | | | | | | | | | | | | | |
Medical Sales Training Holding Company | | Warrant | | March 18, 2021 | | March 18, 2031 | | Common Stock | | | 130,853 | | | $ | 7.74 | | | $ | 108 | | | $ | 23 | | |
|
| | Warrant | | April 17, 2024 | | April 17, 2034 | | Common Stock | | | 32,493 | | | $ | 7.74 | | | | 73 | | | | 6 | | |
|
| | Warrant | | December 18, 2024 | | December 18, 2034 | | Common Stock | | | 21,444 | | | $ | 7.74 | | | | 4 | | | | 4 | | |
|
Total Medical Sales Training Holding Company | | | | | | | | | | | | | | | | | 185 | | | | 33 | | | |
| | | | | | | | | | | | | | | | | | | | | | |
Yellowbrick Learning, Inc. | | Warrant | | January 16, 2020 | | September 30, 2028 | | Common Stock | | | 222,222 | | | $ | 0.90 | | | $ | 120 | | | $ | — | | |
|
| | | | | | | | | | | | | | | | | | | | | | |
Sub-Total: Education Technology (0.0%)* | | | | | | | | | | | | | | | | $ | 457 | | | $ | 57 | | | |
TRINITY CAPITAL INC.
Consolidated Schedule of Investments
December 31, 2024
(In thousands, except share and per share data)
| | | | | | | | | | | | | | | | | | | | | | | | | | |
Portfolio Company (1) | | Type of
Investment (2) | | Investment Date (3) | | Expiration Date | | Series | | Shares | | | Strike Price | | | Cost | | | Fair Value (6) | | | Footnotes |
Warrant Investments- United States, Continued | | | | | | | | | | | | | | | | | | | | | | |
| | | | | | | | | | | | | | | | | | | | | | |
Finance and Insurance | | | | | | | | | | | | | | | | | | | | | | |
Beam Technologies, Inc. | | Warrant | | August 30, 2024 | | August 30, 2034 | | Common Stock | | | 56,494 | | | $ | 17.28 | | | $ | 749 | | | $ | 702 | | | (19) |
| | | | | | | | | | | | | | | | | | | | | | |
Bestow, Inc. | | Warrant | | August 1, 2024 | | August 1, 2034 | | Preferred Series C-2 | | | 349,793 | | | $ | 0.01 | | | $ | 1,987 | | | $ | 1,624 | | | (17) |
| | | | | | | | | | | | | | | | | | | | | | |
Busbot, Inc. | | Warrant | | April 1, 2024 | | April 1, 2034 | | Common Stock | | | 44,133 | | | $ | 0.96 | | | $ | 85 | | | $ | 31 | | |
|
| | | | | | | | | | | | | | | | | | | | | | |
Centivo Corporation | | Warrant | | July 31, 2024 | | July 31, 2034 | | Common Stock | | | 161,155 | | | $ | 0.76 | | | $ | 256 | | | $ | 369 | | | (9)(19) |
| | | | | | | | | | | | | | | | | | | | | | |
DailyPay, Inc. | | Warrant | | September 30, 2020 | | September 30, 2030 | | Common Stock | | | 89,264 | | | $ | 3.00 | | | $ | 151 | | | $ | 1,516 | | |
|
| | | | | | | | | | | | | | | | | | | | | | |
Empower Financial, Inc. | | Warrant | | October 13, 2023 | | October 13, 2033 | | Common Stock | | | 404,893 | | | $ | 1.43 | | | $ | 953 | | | $ | 1,534 | | | (9)(19) |
| | | | | | | | | | | | | | | | | | | | | | |
Eqis Capital Management, Inc. | | Warrant | | June 15, 2022 | | June 15, 2032 | | Preferred Class B | | | 904,000 | | | $ | 0.01 | | | $ | 10 | | | $ | 87 | | | (17) |
| | | | | | | | | | | | | | | | | | | | | | |
Gravie, Inc. | | Warrant | | June 4, 2024 | | June 4, 2034 | | Common Stock | | | 123,816 | | | $ | 2.68 | | | $ | 293 | | | $ | 257 | | | (9)(19) |
| | | | | | | | | | | | | | | | | | | | | | |
Kafene, Inc. | | Warrant | | January 5, 2024 | | January 5, 2034 | | Common Stock | | | 44,448 | | | $ | 4.03 | | | $ | 58 | | | $ | 429 | | |
|
| | | | | | | | | | | | | | | | | | | | | | |
Mesa Financial, Inc. | | Warrant | | August 29, 2024 | | August 29, 2034 | | Common Stock | | | 62,422 | | | $ | 0.73 | | | $ | 28 | | | $ | 27 | | | (10) |
| | | | | | | | | | | | | | | | | | | | | | |
Parafin, Inc. | | Warrant | | February 16, 2024 | | February 16, 2034 | | Common Stock | | | 24,616 | | | $ | 7.09 | | | $ | 118 | | | $ | 321 | | | (10) |
| | Warrant | | July 25, 2024 | | July 25, 2034 | | Common Stock | | | 24,641 | | | $ | 7.09 | | | | 108 | | | | 321 | | | (10) |
| | Warrant | | December 23, 2024 | | December 23, 2034 | | Common Stock | | | 3,657 | | | $ | 11.14 | | | | 49 | | | | 43 | | | (10) |
Total Parafin, Inc. | | | | | | | | | | | | | | | | | 275 | | | | 685 | | | |
| | | | | | | | | | | | | | | | | | | | | | |
RealtyMogul, Co. | | Warrant | | January 16, 2020 | | December 18, 2027 | | Preferred Series B | | | 954,979 | | | $ | 0.95 | | | $ | 285 | | | $ | 1,386 | | | (17) |
| | | | | | | | | | | | | | | | | | | | | | |
Slope Tech, Inc. | | Warrant | | September 14, 2022 | | September 14, 2032 | | Common Stock | | | 90,971 | | | $ | 0.88 | | | $ | 109 | | | $ | 476 | | | (10) |
| | Warrant | | August 30, 2023 | | August 30, 2033 | | Common Stock | | | 21,303 | | | $ | 0.88 | | | | 112 | | | | 112 | | | (10) |
Total Slope Tech, Inc. | | | | | | | | | | | | | | | | | 221 | | | | 588 | | | |
| | | | | | | | | | | | | | | | | | | | | | |
Under Technologies, Inc. | | Warrant | | May 3, 2024 | | May 3, 2034 | | Common Stock | | | 96,710 | | | $ | 2.90 | | | $ | 267 | | | $ | 243 | | | (19) |
| | | | | | | | | | | | | | | | | | | | | | |
Wisetack, Inc. | | Warrant | | November 14, 2024 | | November 14, 2034 | | Common Stock | | | 128,992 | | | $ | 1.58 | | | $ | 119 | | | $ | 118 | | | (19) |
| | | | | | | | | | | | | | | | | | | | | | |
Sub-Total: Finance and Insurance (1.2%)* | | | | | | | | | | | | | | | | $ | 5,737 | | | $ | 9,596 | | | |
TRINITY CAPITAL INC.
Consolidated Schedule of Investments
December 31, 2024
(In thousands, except share and per share data)
| | | | | | | | | | | | | | | | | | | | | | | | | | |
Portfolio Company (1) | | Type of
Investment (2) | | Investment Date (3) | | Expiration Date | | Series | | Shares | | | Strike Price | | | Cost | | | Fair Value (6) | | | Footnotes |
Warrant Investments- United States, Continued | | | | | | | | | | | | | | | | | | | | | | |
| | | | | | | | | | | | | | | | | | | | | | |
Food and Agriculture Technologies | | | | | | | | | | | | | | | |
| | |
| | | |
Athletic Brewing Company, LLC | | Warrant | | October 28, 2022 | | October 28, 2032 | | Preferred Class B | | | 3,741 | | | $ | 140.21 | | | $ | 287 | | | $ | 490 | | | (17) |
| | | | | | | | | | | | | | | | | | | | | | |
Bowery Farming, Inc. | | Warrant | | January 16, 2020 | | June 10, 2029 | | Common Stock | | | 68,863 | | | $ | 5.08 | | | $ | 410 | | | $ | — | | |
|
| | Warrant | | December 22, 2020 | | December 22, 2030 | | Common Stock | | | 29,925 | | | $ | 6.24 | | | | 160 | | | | — | | |
|
| | Warrant | | September 10, 2021 | | September 10, 2028 | | Common Stock | | | 21,577 | | | $ | 0.01 | | | | 617 | | | | — | | |
|
| | Warrant | | December 29, 2023 | | December 29, 2030 | | Common Stock | | | 114,725 | | | $ | 0.01 | | | | 29 | | | | — | | |
|
Total Bowery Farming, Inc. | | | | | | | | | | | | | | | | | 1,216 | | | $ | — | | | |
| | | | | | | | | | | | | | | | | | | | | | |
Daring Foods, Inc. | | Warrant | | April 8, 2021 | | April 8, 2031 | | Common Stock | | | 68,100 | | | $ | 0.27 | | | $ | 106 | | | $ | 55 | | |
|
| | | | | | | | | | | | | | | | | | | | | | |
DrinkPak, LLC | | Warrant | | September 13, 2022 | | September 13, 2032 | | Common Stock | | | 2,387 | | | $ | 19.12 | | | $ | 7 | | | $ | 59 | | | (9) |
| | Warrant | | February 17, 2023 | | February 17, 2033 | | Common Stock | | | 12,010 | | | $ | 18.89 | | | | 26 | | | | 296 | | | (9)(19) |
Total DrinkPak, LLC | | | | | | | | | | | | | | | | | 33 | | | | 355 | | | |
| | | | | | | | | | | | | | | | | | | | | | |
Emergy, Inc. | | Warrant | | October 5, 2022 | | October 5, 2032 | | Common Stock | | | 4,051 | | | $ | 39.60 | | | $ | 181 | | | $ | — | | | (9) |
| | | | | | | | | | | | | | | | | | | | | | |
GrubMarket, Inc. | | Warrant | | June 15, 2020 | | June 15, 2030 | | Common Stock | | | 405,000 | | | $ | 1.10 | | | $ | 115 | | | $ | 4,256 | | |
|
| | | | | | | | | | | | | | | | | | | | | | |
Intelligent Brands, Inc. (f.k.a. PSB Holdings, Inc.) | | Warrant | | January 16, 2020 | | October 5, 2027 | | Common Stock | | | 103,636 | | | $ | 14.47 | | | $ | 111 | | | $ | — | | |
|
| | Warrant | | December 31, 2020 | | December 29, 2032 | | Common Stock | | | 33,348 | | | $ | 3.17 | | | | 546 | | | | — | | |
|
Total Intelligent Brands, Inc. | | | | | | | | | | | | | | | | | 657 | | | | — | | | |
| | | | | | | | | | | | | | | | | | | | | | |
The Fynder Group, Inc. | | Warrant | | October 14, 2020 | | October 14, 2030 | | Common Stock | | | 36,445 | | | $ | 0.49 | | | $ | 68 | | | $ | 23 | | |
|
| | | | | | | | | | | | | | | | | | | | | | |
Zero Acre Farms, Inc. | | Warrant | | December 23, 2022 | | December 23, 2032 | | Class A Common Stock | | | 20,181 | | | $ | 2.13 | | | $ | 79 | | | $ | 8 | | | (17) |
| | | | | | | | | | | | | | | | | | | | | | |
Sub-Total: Food and Agriculture Technologies (0.6%)* | | | | | | | | | | | | | | $ | 2,742 | | | $ | 5,187 | | | |
TRINITY CAPITAL INC.
Consolidated Schedule of Investments
December 31, 2024
(In thousands, except share and per share data)
| | | | | | | | | | | | | | | | | | | | | | | | | | |
Portfolio Company (1) | | Type of
Investment (2) | | Investment Date (3) | | Expiration Date | | Series | | Shares | | | Strike Price | | | Cost | | | Fair Value (6) | | | Footnotes |
Warrant Investments- United States, Continued | | | | | | | | | | | | | | | | | | | | | | |
| | | | | | | | | | | | | | | | | | | | | | |
Green Technology | | | | | | | | | | | | | | | |
| | |
| | | |
Bolb, Inc. | | Warrant | | October 12, 2021 | | October 12, 2031 | | Common Stock | | | 181,784 | | | $ | 0.07 | | | $ | 35 | | | $ | — | | |
|
| | | | | | | | | | | | | | | | | | | | | | |
Edeniq, Inc. | | Warrant | | January 16, 2020 | | December 23, 2026 | | Preferred Series B | | | 2,685,501 | | | $ | 0.22 | | | $ | — | | | $ | 506 | | | (11)(17)(21) |
| | Warrant | | January 16, 2020 | | December 23, 2026 | | Preferred Series B | | | 2,184,672 | | | $ | 0.01 | | | | — | | | | 855 | | | (11)(17)(21) |
| | Warrant | | January 16, 2020 | | June 29, 2027 | | Preferred Series C | | | 5,106,972 | | | $ | 0.44 | | | | — | | | | 149 | | | (11)(17)(21) |
| | Warrant | | January 16, 2020 | | November 2, 2028 | | Preferred Series C | | | 3,850,294 | | | $ | 0.01 | | | | — | | | | 1,709 | | | (11)(17)(21) |
| | Warrant | | November 29, 2021 | | November 29, 2031 | | Preferred Series D | | | 154,906,320 | | | $ | 0.01 | | | | 7 | | | | 4,529 | | | (17)(21) |
Total Edeniq, Inc. | | | | | | | | | | | | | | | | | 7 | | | | 7,748 | | | |
| | | | | | | | | | | | | | | | | | | | | | |
Footprint International Holding, Inc. | | Warrant | | February 14, 2020 | | February 14, 2030 | | Common Stock | | | 38,171 | | | $ | 0.31 | | | $ | 9 | | | $ | — | | |
|
| | Warrant | | February 18, 2022 | | February 18, 2032 | | Common Stock | | | 77,524 | | | $ | 0.01 | | | | 4,246 | | | | — | | |
|
| | Warrant | | June 23, 2022 | | June 23, 2032 | | Common Stock | | | 14,624 | | | $ | 0.01 | | | | 359 | | | | — | | |
|
| | Warrant | | October 31, 2024 | | October 31, 2034 | | Preferred Class F | | | 250 | | | $ | 25,000.00 | | | | — | | | | — | | | (17) |
Total Footprint International Holding, Inc. | | | | | | | | | | | | | | | | | 4,614 | | | | — | | | |
| | | | | | | | | | | | | | | | | | | | | | |
Form Energy Inc. | | Warrant | | October 21, 2024 | | October 21, 2034 | | Common Stock | | | 99,287 | | | $ | 8.03 | | | $ | 925 | | | $ | 891 | | | (19) |
| | | | | | | | | | | | | | | | | | | | | | |
Mainspring Energy, Inc. | | Warrant | | January 16, 2020 | | July 9, 2029 | | Common Stock | | | 140,186 | | | $ | 1.15 | | | $ | 283 | | | $ | 224 | | |
|
| | Warrant | | November 20, 2020 | | November 20, 2030 | | Common Stock | | | 81,294 | | | $ | 1.15 | | | | 226 | | | | 130 | | |
|
| | Warrant | | March 18, 2022 | | March 18, 2032 | | Common Stock | | | 137,692 | | | $ | 1.66 | | | | 344 | | | | 210 | | |
|
Total Mainspring Energy, Inc. | | | | | | | | | | | | | | | | | 853 | | | | 564 | | | |
| | | | | | | | | | | | | | | | | | | | | | |
RTS Holding, Inc. | | Warrant | | December 10, 2021 | | December 10, 2031 | | Preferred Series C | | | 2,314 | | | $ | 205.28 | | | $ | 75 | | | $ | 99 | | | (9)(17) |
| | Warrant | | October 10, 2022 | | October 10, 2032 | | Preferred Series D | | | 917 | | | $ | 196.50 | | | | 87 | | | | 44 | | | (9)(17) |
| | Warrant | | January 19, 2024 | | January 19, 2034 | | Preferred Series D-1 | | | 2,876 | | | $ | 203.47 | | | | 418 | | | | 137 | | | (9)(17) |
Total RTS Holding, Inc. | | | | | | | | | | | | | | | | | 580 | | | | 280 | | | |
| | | | | | | | | | | | | | | | | | | | | | |
Sub-Total: Green Technology (1.2%)* | |
| | | | | | | | | | | | | | $ | 7,014 | | | $ | 9,483 | | | |
| | | | | | | | | | | | | | | | | | | | | | |
Healthcare Technology | | | | | | | | | | | | | | | | | | | | | | |
Dentologie Enterprises, Inc. | | Warrant | | October 14, 2022 | | October 14, 2034 | | Common Stock | | | 51,632 | | | $ | 0.76 | | | $ | 66 | | | $ | 147 | | | (9) |
| | | | | | | | | | | | | | | | | | | | | | |
Exer Holdings, LLC | | Warrant | | November 19, 2021 | | November 19, 2031 | | Common Stock | | | 281 | | | $ | 527.51 | | | $ | 93 | | | $ | 14 | | |
|
| | | | | | | | | | | | | | | | | | | | | | |
Hospitalists Now, Inc. | | Warrant | | January 16, 2020 | | March 30, 2026 | | Preferred Series D-2 | | | 135,807 | | | $ | 5.89 | | | $ | 71 | | | $ | 390 | | | (17) |
| | Warrant | | January 16, 2020 | | December 6, 2026 | | Preferred Series D-2 | | | 750,000 | | | $ | 5.89 | | | | 391 | | | | 2,152 | | | (17) |
Total Hospitalists Now, Inc. | | | | | | | | | | | | | | | | | 462 | | | | 2,542 | | | |
| | | | | | | | | | | | | | | | | | | | | | |
Lark Technologies, Inc. | | Warrant | | September 30, 2020 | | September 30, 2030 | | Common Stock | | | 76,231 | | | $ | 1.76 | | | $ | 177 | | | $ | 4 | | |
|
| | Warrant | | June 30, 2021 | | June 30, 2031 | | Common Stock | | | 79,325 | | | $ | 1.76 | | | | 258 | | | | 4 | | |
|
| | Warrant | | December 22, 2022 | | December 22, 2032 | | Common Stock | | | 97,970 | | | $ | 2.49 | | | | 58 | | | | 4 | | |
|
Total Lark Technologies, Inc. | | | | | | | | | | | | | | | | | 493 | | | | 12 | | | |
| | | | | | | | | | | | | | | | | | | | | | |
Moxe Health Corporation | | Warrant | | December 29, 2023 | | December 29, 2033 | | Preferred Series B | | | 155,438 | | | $ | 3.62 | | | $ | 135 | | | $ | 48 | | | (17) |
| | | | | | | | | | | | | | | | | | | | | | |
RXAnte, Inc. | | Warrant | | November 21, 2022 | | November 21, 2032 | | Preferred A | | | 16,517 | | | $ | 10.00 | | | $ | 89 | | | $ | 121 | | | (9)(17)(19) |
| | Warrant | | April 7, 2023 | | November 21, 2032 | | Preferred A | | | 5,518 | | | $ | 10.00 | | | | 25 | | | | 41 | | | (9)(17)(19) |
| | Warrant | | October 17, 2023 | | November 21, 2032 | | Preferred A | | | 5,506 | | | $ | 10.00 | | | | 37 | | | | 40 | | | (9)(17)(19) |
Total RXAnte, Inc. | | | | | | | | | | | | | | | | | 151 | | | | 202 | | | |
| | | | | | | | | | | | | | | | | | | | | | |
TMRW Life Sciences, Inc. | | Warrant | | April 29, 2022 | | April 29, 2032 | | Preferred Class A | | | 268,983 | | | $ | 2.09 | | | $ | 80 | | | $ | 6 | | | (17) |
| | Warrant | | March 3, 2023 | | April 29, 2032 | | Preferred Class A | | | 268,983 | | | $ | 2.09 | | | | 80 | | | | 6 | | | (17) |
Total TMRW Life Sciences, Inc. | | | | | | | | | | | | | | | | | 160 | | | | 12 | | | |
| | | | | | | | | | | | | | | | | | | | | | |
Sub-Total: Healthcare Technology (0.4%)* | | | | | | | | | | | | | | | | $ | 1,560 | | | $ | 2,977 | | | |
TRINITY CAPITAL INC.
Consolidated Schedule of Investments
December 31, 2024
(In thousands, except share and per share data)
| | | | | | | | | | | | | | | | | | | | | | | | | | |
Portfolio Company (1) | | Type of
Investment (2) | | Investment Date (3) | | Expiration Date | | Series | | Shares | | | Strike Price | | | Cost | | | Fair Value (6) | | | Footnotes |
Warrant Investments- United States, Continued | | | | | | | | | | | | | | | | | | | | | | |
| | | | | | | | | | | | | | | | | | | | | | |
Human Resource Technology | | | | | | | | | | | | | | | |
| | |
| | | |
BetterLeap, Inc. | | Warrant | | April 20, 2022 | | April 20, 2032 | | Common Stock | | | 88,435 | | | $ | 2.26 | | | $ | 38 | | | $ | 6 | | |
|
| | | | | | | | | | | | | | | | | | | | | | |
Qwick, Inc. | | Warrant | | December 31, 2021 | | December 31, 2031 | | Common Stock | | | 16,964 | | | $ | 2.79 | | | $ | 48 | | | $ | 9 | | |
|
| | Warrant | | August 8, 2022 | | August 8, 2032 | | Common Stock | | | 16,964 | | | $ | 2.79 | | | | 48 | | | | 8 | | | |
Total Qwick, Inc. | |
| | | | | | | | | | | | | | | 96 | | | | 17 | | | |
| | | | | | | | | | | | | | | | | | | | | | |
Sub-Total: Human Resource Technology (0.0%)* | | | | | | | | | | | | | | | | $ | 134 | | | $ | 23 | | | |
| | | | | | | | | | | | | | | | | | | | | | |
Industrials | | | | | | | | | | | | | | | | | | | | | | |
3DEO, Inc. | | Warrant | | February 23, 2022 | | February 23, 2032 | | Common Stock | | | 37,218 | | | $ | 1.81 | | | $ | 93 | | | $ | — | | |
|
| | | | | | | | | | | | | | | | | | | | | | |
Digilens, Inc. | | Warrant | | January 16, 2020 | | March 24, 2025 | | Preferred Series A-1 | | | 12,155 | | | $ | 0.70 | | | $ | 4 | | | $ | 12 | | | (17) |
| | Warrant | | January 16, 2020 | | March 26, 2025 | | Preferred Series A-1 | | | 200,000 | | | $ | 0.70 | | | | 65 | | | | 204 | | | (17) |
Total Digilens, Inc. | |
| | | | | | | | | | | | | | | 69 | | | | 216 | | | |
| | | | | | | | | | | | | | | | | | | | | | |
Sub-total: Industrials (0.0%)* | | | | | | | | | | | | | | | | $ | 162 | | | $ | 216 | | | |
| | | | | | | | | | | | | | | | | | | | | | |
Marketing, Media, and Entertainment | | | | | | | | | | | | | | | |
| | |
| | | |
Drone Racing League, Inc. | | Warrant | | October 17, 2022 | | October 17, 2032 | | Common Stock | | | 253,824 | | | $ | 6.76 | | | $ | 375 | | | $ | — | | |
|
| | | | | | | | | | | | | | | | | | | | | | |
Firefly Systems, Inc. | | Warrant | | January 31, 2020 | | January 29, 2030 | | Common Stock | | | 133,147 | | | $ | 1.14 | | | $ | 281 | | | $ | 121 | | |
|
| | | | | | | | | | | | | | | | | | | | | | |
Grabit Interactive Media, Inc. | | Warrant | | April 8, 2022 | | April 8, 2034 | | Preferred Series A | | | 142,828 | | | $ | 1.00 | | | $ | 40 | | | $ | 28 | | | (17) |
| | | | | | | | | | | | | | | | | | | | | | |
Incontext Solutions, Inc. | | Warrant | | January 16, 2020 | | September 28, 2028 | | Common Stock | | | 2,219 | | | $ | 220.82 | | | $ | 34 | | | $ | — | | |
|
| | | | | | | | | | | | | | | | | | | | | | |
PebblePost, Inc. | | Warrant | | May 7, 2021 | | May 7, 2031 | | Common Stock | | | 657,343 | | | $ | 0.52 | | | $ | 68 | | | $ | 735 | | |
|
| | | | | | | | | | | | | | | | | | | | | | |
Sub-Total: Marketing, Media, and Entertainment (0.1%)* | | | | | | | | | | | $ | 798 | | | $ | 884 | | | |
| | | | | | | | | | | | | | | | | | | | | | |
Medical Devices | | | | | | | | | | | | |
| | |
| | |
| | | |
Apiject Holdings, Inc. | | Warrant | | June 24, 2024 | | June 24, 2034 | | Common Stock | | | 937,604 | | | $ | 0.99 | | | $ | 612 | | | $ | 352 | | | (9)(19) |
| | | | | | | | | | | | | | | | | | | | | | |
Convergent Dental, Inc. | | Warrant | | April 21, 2023 | | April 21, 2033 | | Preferred Series D | | | 446,982 | | | $ | 1.61 | | | $ | 493 | | | $ | 103 | | | (9)(17) |
| | | | | | | | | | | | | | | | | | | | | | |
Delphinus, Inc. | | Warrant | | June 27, 2023 | | June 27, 2033 | | Preferred Series E | | | 294,289 | | | $ | 0.69 | | | $ | 29 | | | $ | 19 | | | (9)(17) |
| | | | | | | | | | | | | | | | | | | | | | |
Elucent Medical, Inc. | | Warrant | | October 31, 2024 | | October 31, 2034 | | Preferred Series C-2 | | | 1,889,448 | | | $ | 0.30 | | | $ | 167 | | | $ | 210 | | | (17)(19) |
| | | | | | | | | | | | | | | | | | | | | | |
Lightforce Orthodontics, Inc. | | Warrant | | August 6, 2024 | | August 6, 2034 | | Preferred Series D | | | 73,065 | | | $ | 18.01 | | | $ | 286 | | | $ | 285 | | | (17)(19) |
| | | | | | | | | | | | | | | | | | | | | | |
Neuros Medical, Inc. | | Warrant | | August 10, 2023 | | August 10, 2033 | | Preferred Series C | | | 1,197,127 | | | $ | 0.38 | | | $ | 110 | | | $ | 100 | | | (9)(17) |
| | | | | | | | | | | | | | | | | | | | | | |
Restor3d, Inc. | | Warrant | | June 4, 2024 | | June 4, 2034 | | Preferred Series A | | | 95,688 | | | $ | 5.01 | | | $ | 51 | | | $ | 77 | | | (9)(17)(19) |
| | | | | | | | | | | | | | | | | | | | | | |
Shoulder Innovations, Inc. | | Warrant | | August 7, 2023 | | August 7, 2033 | | Preferred Series D | | | 623,615 | | | $ | 0.54 | | | $ | 120 | | | $ | 154 | | | (9)(17) |
| | | | | | | | | | | | | | | | | | | | | | |
Sub-Total: Medical Devices (0.2%)* | | | | | | | | | | | | | | | | $ | 1,868 | | | $ | 1,300 | | | |
| | | | | | | | | | | | | | | | | | | | | | |
Other Healthcare Services | | | | | | | | | | | | |
| | |
| | |
| | | |
Cellares Corporation | | Warrant | | August 2, 2024 | | August 2, 2034 | | Common Stock | | | 243,868 | | | $ | 4.77 | | | $ | 841 | | | $ | 809 | | | (19) |
| | | | | | | | | | | | | | | | | | | | | | |
Upward Health, Inc. | | Warrant | | August 6, 2024 | | August 6, 2034 | | Preferred Class A Common Stock | | | 763,137 | | | $ | 0.28 | | | $ | 251 | | | $ | 260 | | | (9)(17)(19) |
| | | | | | | | | | | | | | | | | | | | | | |
Metabolon, Inc. | | Warrant | | March 28, 2024 | | March 28, 2034 | | Preferred Series 3 | | | 2,288,461 | | | $ | 0.65 | | | $ | 644 | | | $ | 245 | | | (17) |
| | Warrant | | October 1, 2024 | | March 28, 2034 | | Preferred Series 3 | | | 384,615 | | | $ | 0.65 | | | | 33 | | | | 41 | | | (17) |
Total Metabolon, Inc. | |
| | | | | | | | | | | | | | | 677 | | | | 286 | | | |
| | | | | | | | | | | | | | | | | | | | | | |
Velentium, Inc. | | Warrant | | May 24, 2024 | | May 24, 2034 | | Preferred Class B | | | 7,958 | | | $ | 53.40 | | | $ | 129 | | | $ | 154 | | | (9)(17) |
| | | | | | | | | | | | | | | | | | | | | | |
Sub-Total: Other Healthcare Services (0.2%)* | | | | | | | | | | | | | | | | $ | 1,898 | | | $ | 1,509 | | | |
TRINITY CAPITAL INC.
Consolidated Schedule of Investments
December 31, 2024
(In thousands, except share and per share data)
| | | | | | | | | | | | | | | | | | | | | | | | | | |
Portfolio Company (1) | | Type of
Investment (2) | | Investment Date (3) | | Expiration Date | | Series | | Shares | | | Strike Price | | | Cost | | | Fair Value (6) | | | Footnotes |
Warrant Investments- United States, Continued | | | | | | | | | | | | | | | | | | | | | | |
| | | | | | | | | | | | | | | | | | | | | | |
Real Estate Technology | | | | | | | | | | | | | | | |
| | |
| | | |
Homelight Lending, Inc. | | Warrant | | June 23, 2022 | | June 23, 2032 | | Common Stock | | | 5,434 | | | $ | 18.40 | | | $ | 1 | | | $ | 16 | | |
|
| | | | | | | | | | | | | | | | | | | | | | |
Knockaway, Inc. | | Warrant | | January 16, 2020 | | May 24, 2029 | | Common Stock | | | 880 | | | $ | 85.27 | | | $ | 209 | | | $ | — | | | (21) |
| | Warrant | | November 10, 2021 | | November 10, 2031 | | Common Stock | | | 16,350 | | | $ | 2.20 | | | | 265 | | | | — | | | (21) |
| | Warrant | | September 29, 2023 | | September 29, 2033 | | Common Stock | | | 2,804,355 | | | $ | 0.01 | | | | — | | | | 18 | | | (21) |
| | Warrant | | December 6, 2023 | | December 6, 2033 | | Preferred Series AA | | | 457,778 | | | $ | 0.01 | | | | — | | | | 6 | | | (17)(21) |
| | Warrant | | September 16, 2024 | | September 16, 2034 | | Preferred Series BB | | | 93,951,849 | | | $ | 0.00 | | | | 2,391 | | | | 2,401 | | | (17)(21) |
| | Warrant | | September 23, 2023 | | September 23, 2033 | | Preferred Series AA-1 | | | 5,084,804 | | | $ | 0.09 | | | | — | | | | — | | | (17)(21) |
Total Knockaway, Inc. | | | | | | | | | | | | | | | | | 2,865 | | | | 2,425 | | | |
| | | | | | | | | | | | | | | | | | | | | | |
Maxwell Financial Labs, Inc. | | Warrant | | October 7, 2020 | | October 7, 2030 | | Common Stock | | | 106,735 | | | $ | 0.29 | | | $ | 20 | | | $ | 9 | | |
|
| | Warrant | | December 22, 2020 | | December 22, 2030 | | Common Stock | | | 110,860 | | | $ | 0.29 | | | | 34 | | | | 9 | | |
|
| | Warrant | | September 30, 2021 | | September 30, 2031 | | Common Stock | | | 79,135 | | | $ | 1.04 | | | | 148 | | | | 5 | | |
|
| | Warrant | | May 10, 2024 | | May 10, 2034 | | Common Stock | | | 303,562 | | | $ | 0.27 | | | | 83 | | | | 26 | | |
|
| | Warrant | | July 1, 2024 | | May 10, 2034 | | Common Stock | | | 303,562 | | | $ | 0.27 | | | | 91 | | | | 26 | | |
|
Total Maxwell Financial Labs, Inc. | | | | | | | | | | | | | | | | | 376 | | | | 75 | | | |
| | | | | | | | | | | | | | | | | | | | | | |
Orchard Technologies, Inc. | | Warrant | | February 12, 2024 | | February 12, 2034 | | Preferred Series 1 | | | 228,000 | | | $ | 0.01 | | | $ | — | | | $ | 111 | | | (17) |
| | | | | | | | | | | | | | | | | | | | | | |
Sub-Total: Real Estate Technology (0.3%)* | | | | | | | | | | | | | | | | $ | 3,242 | | | $ | 2,627 | | | |
| | | | | | | | | | | | | | | | | | | | | | |
SaaS | | | | | | | | | | | | | | | |
| | |
| | | |
All Seated, Inc. | | Warrant | | February 28, 2022 | | February 28, 2032 | | Common Stock | | | 5,101 | | | $ | 15.72 | | | $ | 20 | | | $ | — | | |
|
| | | | | | | | | | | | | | | | | | | | | | |
Cart.com, Inc. | | Warrant | | November 17, 2023 | | November 17, 2033 | | Common Stock | | | 31,572 | | | $ | 15.87 | | | $ | 441 | | | $ | 697 | | | (9) |
| | | | | | | | | | | | | | | | | | | | | | |
Cpacket Networks, Inc. | | Warrant | | January 29, 2024 | | January 29, 2034 | | Preferred Class B Common | | | 499,366 | | | $ | 0.36 | | | $ | 166 | | | $ | 133 | | | (9)(17) |
| | | | | | | | | | | | | | | | | | | | | | |
Crowdtap, Inc. | | Warrant | | January 16, 2020 | | December 16, 2025 | | Preferred Series B | | | 442,233 | | | $ | 1.09 | | | $ | 42 | | | $ | 860 | | | (17) |
| | Warrant | | January 16, 2020 | | December 11, 2027 | | Preferred Series B | | | 100,000 | | | $ | 1.09 | | | | 9 | | | | 194 | | | (17) |
Total Crowdtap, Inc. | | | | | | | | | | | | | | | | | 51 | | | | 1,054 | | | |
| | | | | | | | | | | | | | | | | | | | | | |
Gtxcel, Inc. | | Warrant | | January 16, 2020 | | September 24, 2025 | | Preferred Series C | | | 1,000,000 | | | $ | 0.21 | | | $ | 83 | | | $ | 16 | | | (17) |
| | Warrant | | January 16, 2020 | | September 24, 2025 | | Preferred Series D | | | 1,000,000 | | | $ | 0.21 | | | | 83 | | | | 22 | | | (17) |
Total Gtxcel, Inc. | | | | | | | | | | | | | | | | | 166 | | | | 38 | | | |
| | | | | | | | | | | | | | | | | | | | | | |
Lucidworks, Inc. | | Warrant | | January 16, 2020 | | June 27, 2026 | | Preferred Series D | | | 619,435 | | | $ | 0.77 | | | $ | 806 | | | $ | 686 | | | (17) |
| | | | | | | | | | | | | | | | | | | | | | |
Reciprocity, Inc. | | Warrant | | September 25, 2020 | | September 25, 2030 | | Common Stock | | | 114,678 | | | $ | 4.17 | | | $ | 99 | | | $ | — | | |
|
| | Warrant | | April 29, 2021 | | April 29, 2031 | | Common Stock | | | 57,195 | | | $ | 4.17 | | | | 54 | | | | — | | |
|
Total Reciprocity, Inc. | | | | | | | | | | | | | | | | | 153 | | | | — | | | |
| | | | | | | | | | | | | | | | | | | | | | |
Silk Technologies, Inc. | | Warrant | | November 4, 2024 | | November 4, 2034 | | Common Stock | | | 237,623 | | | $ | 1.98 | | | $ | 503 | | | $ | 491 | | | (19) |
| | | | | | | | | | | | | | | | | | | | | | |
Smartly, Inc. | | Warrant | | May 16, 2022 | | May 16, 2034 | | Common Stock | | | 48,097 | | | $ | 1.10 | | | $ | 84 | | | $ | 90 | | |
|
| | | | | | | | | | | | | | | | | | | | | | |
Steno Agency, Inc. | | Warrant | | June 21, 2024 | | June 21, 2034 | | Common Stock | | | 55,818 | | | $ | 1.98 | | | $ | 136 | | | $ | 147 | | | (9)(19) |
| | | | | | | | | | | | | | | | | | | | | | |
The Tomorrow Companies, Inc. | | Warrant | | December 14, 2022 | | December 14, 2032 | | Common Stock | | | 26,124 | | | $ | 1.70 | | | $ | 49 | | | $ | 25 | | | (9) |
| | | | | | | | | | | | | | | | | | | | | | |
Sub-Total: SaaS (0.4%)* | | | | | | | | | | | | | | | | $ | 2,575 | | | $ | 3,361 | | | |
TRINITY CAPITAL INC.
Consolidated Schedule of Investments
December 31, 2024
(In thousands, except share and per share data)
| | | | | | | | | | | | | | | | | | | | | | | | | | |
Portfolio Company (1) | | Type of
Investment (2) | | Investment Date (3) | | Expiration Date | | Series | | Shares | | | Strike Price | | | Cost | | | Fair Value (6) | | | Footnotes |
Warrant Investments- United States, Continued | | | | | | | | | | | | | | | | | | | | | | |
| | | | | | | | | | | | | | | | | | | | | | |
Space Technology | | | | | | | | | | | | | | | |
| | |
| | | |
Astranis Space Technology Corporation | | Warrant | | April 13, 2023 | | April 13, 2033 | | Common Stock | | | 85,644 | | | $ | 7.89 | | | $ | 83 | | | $ | 279 | | | (9)(19) |
| | Warrant | | September 27, 2024 | | September 27, 2034 | | Common Stock | | | 156,677 | | | $ | 2.27 | | | | 683 | | | | 683 | | | (9)(19) |
Total Astranis Space Technology Corporation | | | | | | | | | | | | | | | | | 766 | | | | 962 | | | |
| | | | | | | | | | | | | | | | | | | | | | |
Axiom Space, Inc. | | Warrant | | May 28, 2021 | | May 28, 2031 | | Common Stock | | | 1,773 | | | $ | 169.24 | | | $ | 121 | | | $ | 23 | | |
|
| | Warrant | | May 28, 2021 | | May 28, 2031 | | Common Stock | | | 882 | | | $ | 340.11 | | | | 39 | | | | 4 | | |
|
Total Axiom Space, Inc. | | | | | | | | | | | | | | | | | 160 | | | | 27 | | | |
| | | | | | | | | | | | | | | | | | | | | | |
Hermeus Corporation | | Warrant | | August 9, 2022 | | August 9, 2032 | | Common Stock | | | 19,286 | | | $ | 6.24 | | | $ | 144 | | | $ | 47 | | | (9)(19) |
| | | | | | | | | | | | | | | | | | | | | | |
Impulse Space, Inc. | | Warrant | | June 18, 2024 | | June 18, 2034 | | Common Stock | | | 64,087 | | | $ | 1.91 | | | $ | 258 | | | $ | 564 | | | (9)(19) |
| | | | | | | | | | | | | | | | | | | | | | |
Slingshot Aerospace, Inc. | | Warrant | | July 12, 2024 | | July 12, 2034 | | Common Stock | | | 328,416 | | | $ | 0.46 | | | $ | 400 | | | $ | 389 | | | (9)(19) |
| | | | | | | | | | | | | | | | | | | | | | |
Kymeta Corporation | | Warrant | | July 3, 2024 | | July 3, 2034 | | Common Stock | | | 3,995,407 | | | $ | 0.11 | | | $ | 331 | | | $ | 354 | | | (9)(19) |
| | | | | | | | | | | | | | | | | | | | | | |
Space Perspective, Inc. | | Warrant | | March 3, 2022 | | March 3, 2032 | | Preferred Series A | | | 221,280 | | | $ | 2.75 | | | $ | 256 | | | $ | — | | | (17) |
| | | | | | | | | | | | | | | | | | | | | | |
Sub-Total: Space Technology (0.3%)* | | | | | | | | | | | | | | | | $ | 2,315 | | | $ | 2,343 | | | |
| | | | | | | | | | | | | | | | | | | | | | |
Supply Chain Technology | | | | | | | | | | | | | | | | | | | | | | |
Macrofab, Inc. | | Warrant | | July 21, 2023 | | July 21, 2033 | | Common Stock | | | 622,353 | | | $ | 2.02 | | | $ | 332 | | | $ | 67 | | |
|
| | Warrant | | April 11, 2024 | | April 11, 2034 | | Common Stock | | | 392,157 | | | $ | 0.01 | | | | 254 | | | | 107 | | |
|
| | Warrant | | January 29, 2024 | | January 29, 2034 | | Common Stock | | | 322,013 | | | $ | 2.02 | | | | 128 | | | | 35 | | |
|
Total Macrofab, Inc. | | | | | | | | | | | | | | | | | 714 | | | | 209 | | | |
| | | | | | | | | | | | | | | | | | | | | | |
Nucleus RadioPharma, Inc. | | Warrant | | June 4, 2024 | | June 4, 2034 | | Common Stock | | | 44,303 | | | $ | 1.99 | | | $ | 70 | | | $ | 63 | | | (9) |
| | | | | | | | | | | | | | | | | | | | | | |
Sub-Total: Supply Chain Technology (0.0%)* | |
| | | | | | | | | | | | | | $ | 784 | | | $ | 272 | | | |
| | | | | | | | | | | | | | | | | | | | | | |
Transportation Technology | | | | | | | | | | | | | | | | | | | | | | |
Get Spiffy, Inc. | | Warrant | | July 14, 2023 | | July 14, 2033 | | Common Stock | | | 874,527 | | | $ | 0.70 | | | $ | 408 | | | $ | 2 | | | (9) |
| | | | | | | | | | | | | | | | | | | | | | |
NextCar Holding Company, Inc. | | Warrant | | December 14, 2021 | | December 14, 2026 | | Class A Common | | | 6,211 | | | $ | 64.42 | | | $ | 35 | | | $ | — | | | (13) |
| | Warrant | | February 23, 2022 | | February 23, 2027 | | Class A Common | | | 486 | | | $ | 64.42 | | | | 3 | | | | — | | | (13) |
| | Warrant | | March 16, 2022 | | March 16, 2027 | | Class A Common | | | 583 | | | $ | 64.42 | | | | 3 | | | | — | | | (13) |
| | Warrant | | April 18, 2022 | | April 18, 2027 | | Class A Common | | | 5,336 | | | $ | 64.42 | | | | 7 | | | | — | | | (13) |
| | Warrant | | September 29, 2022 | | September 29, 2027 | | Preferred Stock | | | 1,224,752 | | | $ | 0.22 | | | | 170 | | | | — | | | (13)(17) |
Total NextCar Holding Company, Inc. | | | | | | | | | | | | | | | | | 218 | | | | — | | | |
| | | | | | | | | | | | | | | | | | | | | | |
Uveye, Inc. | | Warrant | | December 26, 2024 | | December 26, 2034 | | Preferred Ordinary | | | 476,031 | | | $ | 2.36 | | | $ | 539 | | | $ | 523 | | | (17) |
| | | | | | | | | | | | | | | | | | | | | | |
Zuum Transportation, Inc. | | Warrant | | April 30, 2024 | | April 30, 2034 | | Common Stock | | | 41,271 | | | $ | 4.34 | | | $ | 95 | | | $ | 111 | | |
|
| | | | | | | | | | | | | | | | | | | | | | |
Sub-Total: Transportation Technology (0.1%)* | | | | | | | | | | | | | | | | $ | 1,260 | | | $ | 636 | | | |
| | | | | | | | | | | | | | | | | | | | | | |
Total: Warrant Investments- United States (6.1%)* | | | | | | | | | | | | | | | | $ | 39,666 | | | $ | 50,111 | | | |
TRINITY CAPITAL INC.
Consolidated Schedule of Investments
December 31, 2024
(In thousands, except share and per share data)
| | | | | | | | | | | | | | | | | | | | | | | | | | |
Portfolio Company (1) | | Type of
Investment (2) | | Investment Date (3) | | Expiration Date | | Series | | Shares | | | Strike Price | | | Cost | | | Fair Value (6) | | | Footnotes |
Warrant Investments- Europe | | | | | | | | | | | | | | | | | | | | | | |
| | | | | | | | | | | | | | | | | | | | | | |
Industrials | | | | | | | | | | | | | | | | | | | | | | |
Aledia, Inc. | | Warrant | | March 31, 2022 | | March 31, 2032 | | Preferred Ordinary | | | 11,771 | | | € | 149.02 | | | $ | 130 | | | $ | 498 | | | (17) |
| | | | | | | | | | | | | | | | | | | | | | |
Sub-Total: Industrials (0.1%)* | |
| | | | | | | | | | | | | | $ | 130 | | | $ | 498 | | | |
| | | | | | | | | | | | | | | | | | | | | | |
Other Healthcare Services | | | | | | | | | | | | | | | |
| | |
| | | |
Zandivio PLC | | Warrant | | October 29, 2024 | | October 29, 2034 | | Common Stock | | | 132,042 | | | € | 0.01 | | | $ | 771 | | | $ | 845 | | | (19) |
| | | | | | | | | | | | | | | | | | | | | | |
Sub-Total: Other Healthcare Services (0.1%)* | |
| | | | | | | | | | | | | | $ | 771 | | | $ | 845 | | | |
| | | | | | | | | | | | | | | | | | | | | | |
Space Technology | | | | | | | | | | | | | | | |
| | |
| | | |
All.Space Networks, Limited. | | Warrant | | August 22, 2022 | | August 22, 2032 | | Common Stock | | | 71,203 | | | $ | 21.79 | | | $ | 113 | | | $ | — | | |
|
| | | | | | | | | | | | | | | | | | | | | | |
Sub-Total: Space Technology (0.0%)* | |
| | | | | | | | | | | | | | $ | 113 | | | $ | — | | | |
| | | | | | | | | | | | | | | | | | | | | | |
Total: Warrant Investments- Europe (0.2%)* | | | | | | | | | | | | | | | | $ | 1,014 | | | $ | 1,343 | | | |
| | | | | | | | | | | | | | | | | | | | | | |
Total: Warrant Investments- (6.3%)* | | | | | | | | | | | | | | | | $ | 40,680 | | | $ | 51,454 | | | |
TRINITY CAPITAL INC.
Consolidated Schedule of Investments
December 31, 2024
(In thousands, except share and per share data)
| | | | | | | | | | | | | | | | | | | | |
Portfolio Company (1) | | Type of
Investment (2) | | Investment Date (3) | | Shares / Principal | | | Series | | Cost | | | Fair Value (6) | | | Footnotes |
Equity Investments- United States | | | | | | | | | | | | | | | | | |
| | | | | | | | | | | | | | | | | |
Connectivity | | | | | | | | | | | | | | | | | |
Tarana Wireless, Inc. | | Equity | | March 16, 2022 | | | 611,246 | | | Preferred Series 6 | | $ | 500 | | | $ | 564 | | | (17) |
| | | | | | | | | | | | | | | | | |
Vertical Communications, Inc. | | Equity | | January 16, 2020 | | | 3,892,485 | | | Preferred Series 1 | | $ | — | | | $ | — | | | (11)(17)(21) |
| | Equity | | January 16, 2020 | | $ | 5,500 | | | Convertible Note | | | 3,966 | | | | 1,087 | | | (16)(21) |
Total Vertical Communications, Inc. | | | | | | | | | | | | 3,966 | | | | 1,087 | | | |
| | | | | | | | | | | | | | | | | |
viaPhoton Inc. | | Equity | | May 23, 2024 | | $ | 740,000 | | | SAFE Note | | $ | 370 | | | $ | 370 | | | |
| | | | | | | | | | | | | | | | | |
Sub-Total: Connectivity (0.2%)* | | | | | | | | | | | $ | 4,836 | | | $ | 2,021 | | | |
| | | | | | | | | | | | | | | | | |
Construction Technology | | | | | | | | | | | | | | | | | |
Project Frog, Inc. | | Equity | | January 16, 2020 | | | 4,383,497 | | | Preferred Series AA-1 | | $ | 351 | | | $ | — | | | (17)(21) |
| | Equity | | January 16, 2020 | | | 3,401,678 | | | Preferred Series BB | | | 1,333 | | | | — | | | (17)(21) |
| | Equity | | August 3, 2021 | | | 6,633,486 | | | Common Stock | | | 1,684 | | | | — | | | (21) |
| | Equity | | August 3, 2021 | | | 3,129,887 | | | Preferred Series CC | | | 1,253 | | | | 43 | | | (17)(21) |
Total Project Frog, Inc. | | | | | | | | | | | | 4,621 | | | | 43 | | | |
| | | | | | | | | | |
| | |
| | | |
Sub-Total: Construction Technology (0.0%)* | | | | | | | | | | | $ | 4,621 | | | $ | 43 | | | |
| | | | | | | | | | | | | | | | | |
Consumer Products & Services | | | | | | | | | | | | | | | | | |
Portofino Labs, Inc. | | Equity | | November 1, 2021 | | | 256,291 | | | Preferred Series B-1 | | $ | 500 | | | $ | 477 | | | (17) |
| | | | | | | | | | | | | | | | | |
Quip NYC, Inc. | | Equity | | August 17, 2021 | | | 3,321 | | | Common Stock | | $ | 500 | | | $ | 1 | | |
|
| | | | | | | | | | | | | | | | | |
Rinse, Inc. | | Equity | | December 30, 2024 | | | 290,242 | | | Preferred Series D | | $ | 500 | | | $ | 496 | | | (17) |
| | | | | | | | | | | | | | | | | |
Sub-Total: Consumer Products & Services (0.1%)* | | | | | | | | | | | $ | 1,500 | | | $ | 974 | | | |
| | | | | | | | | | |
| | |
| | | |
Finance and Insurance | | | | | | | | | | |
| | |
| | | |
Busbot, Inc. | | Equity | | October 18, 2024 | | | 539,490 | | | Preferred Series B-1 | | $ | 500 | | | $ | 501.000 | | | (10)(17) |
| | | | | | | | | | |
| | |
| | | |
Centivo Corporation | | Equity | | December 20, 2024 | | | 128,393 | | | Preferred Series B-1 | | $ | 375 | | | $ | 368.000 | | | (9)(17)(19) |
| | | | | | | | | | |
| | |
| | | |
Dynamics, Inc. | | Equity | | January 16, 2020 | | | 17,726 | | | Preferred Series A | | $ | 390 | | | $ | — | | | (17) |
| | | | | | | | | | |
| | |
| | | |
Empower Financial, Inc. | | Equity | | May 15, 2024 | | | 2,810,235 | | | Preferred Series C Preferred | | $ | 20,000 | | | $ | 20,549 | | |
|
| | Equity | | May 15, 2024 | | | 300,285 | | | Common Stock | | | 4,023 | | | | 1,424 | | |
|
Total Empower Financial, Inc. | | | | | | | | | | | | 24,023 | | | | 21,973 | | | |
| | | | | | | | | | | | | | | | | |
Openly Holdings Corp. | | Equity | | May 9, 2023 | | | 44,725 | | | Preferred Series D-1 | | $ | 500 | | | $ | 569 | | | (17) |
| | | | | | | | | | |
| | |
| | | |
Slope Tech, Inc. | | Equity | | June 20, 2023 | | | 64,654 | | | Preferred Series A-3 | | $ | 500 | | | $ | 520 | | | (10)(17) |
| | | | | | | | | | |
| | |
| | | |
Sub-Total: Finance and Insurance (2.9%)* | | | | | | | | | | | $ | 26,288 | | | $ | 23,931 | | | |
| | | | | | | | | | |
| | |
| | | |
Food and Agriculture Technologies | | | | | | | | | | |
| | |
| | | |
Emergy, Inc. | | Equity | | June 28, 2021 | | | 7,595 | | | Common Stock | | $ | 500 | | | $ | — | | |
|
| | | | | | | | | | | | | | | | | |
Athletic Brewing Company, LLC | | Equity | | August 1, 2024 | | | 2,144 | | | Preferred Class B | | $ | 500 | | | $ | 501 | | | (17) |
| | | | | | | | | | | | | | | | | |
Sub-Total: Food and Agriculture Technologies (0.1%)* | | | | | | | | | | | $ | 1,000 | | | $ | 501 | | | |
TRINITY CAPITAL INC.
Consolidated Schedule of Investments
December 31, 2024
(In thousands, except share and per share data)
| | | | | | | | | | | | | | | | | | | | |
Portfolio Company (1) | | Type of
Investment (2) | | Investment Date (3) | | Shares / Principal | | | Series | | Cost | | | Fair Value (6) | | | Footnotes |
Equity Investments- United States, Continued | | | | | | | | | | | | | | | | | |
| | | | | | | | | | | | | | | | | |
Green Technology | | | | | | | | | | | | | | | | | |
Crusoe Energy Systems LLC | | Equity | | November 6, 2024 | | | 11,140 | | | Preferred Series D-1 | | $ | 325 | | | $ | 326 | | | (9)(17)(19) |
| | | | | | | | | | | | | | | | | |
Edeniq, Inc. | | Equity | | January 16, 2020 | | | 7,807,499 | | | Preferred Series B | | $ | — | | | $ | 3,129 | | | (11)(17)(21) |
| | Equity | | January 16, 2020 | | | 3,657,487 | | | Preferred Series C | | | — | | | | 1,658 | | | (11)(17)(21) |
| | Equity | | January 16, 2020 | | | 133,766,138 | | | Preferred Series D | | | — | | | | 5,569 | | | (11)(17)(21) |
Total Edeniq, Inc. | | | | | | | | | | | | — | | | | 10,356 | | | |
| | | | | | | | | | | | | | | | | |
Electric Hydrogen Co. | | Equity | | April 6, 2023 | | | 87,112 | | | Preferred Series C | | $ | 500 | | | $ | 304 | | | (17) |
| | | | | | | | | | | | | | | | | |
Mainspring Energy, Inc. | | Equity | | March 30, 2022 | | | 65,614 | | | Preferred Series E-1 | | $ | 500 | | | $ | 291 | | | (17) |
| | | | | | | | | | | | | | | | | |
RTS Holding, Inc. | | Equity | | July 5, 2022 | | | 2,035 | | | Preferred Series D | | $ | 334 | | | $ | 345 | | | (9)(17) |
| | Equity | | February 15, 2023 | | | 1,966 | | | Preferred Series D-1 | | | 405 | | | | 342 | | | (9)(17) |
Total RTS Holding, Inc. | | | | | | | | | | | | 739 | | | | 687 | | | |
| | | | | | | | | | | | | | | | | |
Sub-Total: Green Technology (1.5%)* | | | | | | | | | | | $ | 2,064 | | | $ | 11,964 | | | |
| | | | | | | | | | | | | | | | | |
Healthcare Technology | | | | | | | | | | |
| | |
| | | |
Dentologie Enterprises, Inc. | | Equity | | August 3, 2023 | | | 72,338 | | | Preferred Series B-1 | | $ | 300 | | | $ | 302 | | | (9)(17) |
| | | | | | | | | | | | | | | | | |
Emerald Cloud Lab, Inc. | | Equity | | June 3, 2022 | | | 499,999 | | | Preferred Series A | | $ | 500 | | | $ | 103 | | | (17) |
| | Equity | | April 29, 2024 | | | 617,890 | | | Preferred Series B-1 | | | 129 | | | | 116 | | | (17) |
Total Emerald Cloud Lab, Inc. | | | | | | | | | | | | 629 | | | | 219 | | | |
| | | | | | | | | | | | | | | | | |
Lark Technologies, Inc. | | Equity | | August 19, 2021 | | | 32,416 | | | Preferred Series D | | $ | 500 | | | $ | 54 | | | (17) |
| | | | | | | | | | | | | | | | | |
WorkWell Prevention & Care Inc. | | Equity | | January 16, 2020 | | | 7,000,000 | | | Common Stock | | $ | 51 | | | $ | — | | | (21) |
| | Equity | | January 16, 2020 | | | 3,450 | | | Preferred Series P | | | 3,450 | | | | — | | | (17)(21) |
| | Equity | | January 16, 2020 | | $ | 3,170 | | | Convertible Note | | | 3,219 | | | | — | | | (16)(21) |
Total WorkWell Prevention & Care Inc. | | | | | | | | | | | | 6,720 | | | | — | | | |
| | | | | | | | | | | | | | | | | |
Sub-Total: Healthcare Technology (0.1%)* | | | �� | | | | | | | | $ | 8,149 | | | $ | 575 | | | |
TRINITY CAPITAL INC.
Consolidated Schedule of Investments
December 31, 2024
(In thousands, except share and per share data)
| | | | | | | | | | | | | | | | | | | | |
Portfolio Company (1) | | Type of
Investment (2) | | Investment Date (3) | | Shares / Principal | | | Series | | Cost | | | Fair Value (6) | | | Footnotes |
Equity Investments- United States, Continued | | | | | | | | | | | | | | | | | |
| | | | | | | | | | | | | | | | | |
Human Resource Technology | | | | | | | | | | | | | | | | | |
Nomad Health, Inc. | | Equity | | May 27, 2022 | | | 37,920 | | | Common Stock | | $ | 500 | | | $ | — | | |
|
| | | | | | | | | | | | | | | | | |
Sub-Total: Human Resource Technology (0.0%)* | | | | | | | | | | | $ | 500 | | | $ | — | | | |
| | | | | | | | | | | | | | | | | |
Industrials | | | | | | | | | | | | | | | | | |
Digilens, Inc. | | Equity | | July 29, 2023 | | | 21,730 | | | Preferred Series A-1 | | $ | 14 | | | $ | 26 | | | (17) |
| | Equity | | September 18, 2024 | | | 9,498 | | | Preferred Series A-1 | | | 8 | | | | 12 | | | (17) |
| | Equity | | October 10, 2023 | | | 6,332 | | | Preferred Series A-1 | | | 4 | | | | 8 | | | (17) |
| | Equity | | January 12, 2024 | | | 12,205 | | | Preferred Series A-1 | | | 7 | | | | 15 | | | (17) |
| | Equity | | May 6, 2024 | | | 4,117 | | | Preferred Series A-1 | | | 4 | | | | 5 | | | (17) |
| | Equity | | June 9, 2024 | | | 2,617 | | | Preferred Series A-1 | | | 2 | | | | 3 | | | (17) |
| | Equity | | May 20, 2024 | | | 126,641 | | | Preferred Series A-1 | | | 110 | | | | 154 | | | (17) |
Total Digilens, Inc. | | | | | | | | | | | | 149 | | | | 223 | | | |
| | | | | | | | | | | | | | | | | |
Sub-Total: Industrials (0.0%)* | | | | | | | | | | | $ | 149 | | | $ | 223 | | | |
| | | | | | | | | | | | | | | | | |
Multi-Sector Holdings | | | | | | | | | | | | | | | | | |
Senior Credit Corp 2022 LLC | | Equity | | January 30, 2023 | | | — | | | Preferred | | $ | 5,522 | | | $ | 6,186 | | | (7)(10)(21) |
| | | | | | | | | | | | | | | | | |
EPT 16 LLC | | Equity | | June 28, 2024 | | | — | | | Preferred | | $ | 9,215 | | | $ | 9,215 | | | (7)(10)(17)(21) |
| | | | | | | | | | | | | | | | | |
Trinity Capital Adviser, LLC | | Equity | | June 28, 2024 | | | — | | | Preferred | | $ | 1 | | | $ | 4,851 | | | (10)(17)(21) |
| | | | | | | | | | | | | | | | | |
Sub-Total: Multi-Sector Holdings (2.5%)* | | | | | | | | | | | $ | 14,738 | | | $ | 20,252 | | | |
| | | | | | | | | | | | | | | | | |
Real Estate Technology | | | | | | | | | | | | | | | | | |
Knockaway, Inc. | | Equity | | March 30, 2022 | | | 30,458 | | | Common Stock | | $ | 500 | | | $ | — | | | (21) |
| | Equity | | September 29, 2023 | | | 2,956,224 | | | Preferred Series AA | | | 250 | | | | 45 | | | (17)(21) |
| | Equity | | September 16, 2024 | | | 97,866,510 | | | Preferred Series BB | | | 2,500 | | | | 2,510 | | | (17)(21) |
| | Equity | | September 7, 2023 | | | 3,409,997 | | | Preferred Series AA-1 | | | — | | | | 19 | | | (17)(21) |
Total Knockaway Inc. | | | | | | | | | | | | 3,250 | | | | 2,574 | | | |
| | | | | | | | | | | | | | | | | |
Orchard Technologies, Inc. | | Equity | | August 6, 2021 | | | 2,938 | | | Preferred Series 2 | | $ | 29 | | | $ | — | | | (17) |
| | Equity | | March 16, 2023 | | | 97,060 | | | Preferred Series 1 | | | 971 | | | | 50 | | | (17) |
Total Orchard Technologies, Inc. | | | | | | | | | | | | 1,000 | | | | 50 | | | |
| | | | | | | | | | | | | | | | | |
Maxwell Financial Labs, Inc | | Equity | | January 22, 2021 | | | 84,998 | | | Preferred Series B | | $ | 313 | | | $ | 38 | | | (17) |
| | Equity | | May 10, 2024 | | | 229,972 | | | Preferred Series B-1 | | | 365 | | | | 155 | | | (17) |
| | Equity | | October 2, 2024 | | | 32,839 | | | Preferred Series B-2 | | | 121 | | | | 101 | | | (17) |
| | Equity | | October 2, 2024 | | | 17,804 | | | Common Stock | | | 66 | | | | 2 | | |
|
Total Maxwell Financial Labs, Inc | | | | | | | | | | | | 865 | | | | 296 | | | |
| | | | | | | | | | | | | | | | | |
Sub-Total: Real Estate Technology (0.4%)* | | | | | | | | | | | $ | 5,115 | | | $ | 2,920 | | | |
| | | | | | | | | | | | | | | | | |
SaaS | | | | | | | | | | | | | | | | | |
Cart.com, Inc. | | Equity | | April 17, 2024 | | | 11,533 | | | Preferred Series C | | $ | 500 | | | $ | 541 | | | (9)(17) |
| | | | | | | | | | | | | | | | | |
Smartly, Inc. | | Equity | | March 29, 2023 | | | 136,388 | | | Preferred Series B | | $ | 500 | | | $ | 689 | | | (17) |
| | | | | | | | | | | | | | | | | |
The Tomorrow Companies, Inc. | | Equity | | July 5, 2023 | | | 108,088 | | | Preferred Series E-1 | | $ | 325 | | | $ | 231 | | | (9)(17) |
| | | | | | | | | | | | | | | | | |
Sub-total: SaaS (0.2%)* | | | | | | | | | | | $ | 1,325 | | | $ | 1,461 | | | |
TRINITY CAPITAL INC.
Consolidated Schedule of Investments
December 31, 2024
(In thousands, except share and per share data)
| | | | | | | | | | | | | | | | | | | | |
Portfolio Company (1) | | Type of
Investment (2) | | Investment Date (3) | | Shares / Principal | | | Series | | Cost | | | Fair Value (6) | | | Footnotes |
Equity Investments- United States, Continued | | | | | | | | | | | | | | | | | |
| | | | | | | | | | | | | | | | | |
Space Technology | | | | | | | | | | | | | | | | | |
Astranis Space Technology Corporation | | Equity | | April 5, 2023 | | | 13,685 | | | Series C Prime Preferred | | $ | 300 | | | $ | 133 | | | (9)(17) |
| | Equity | | March 19, 2024 | | | 64,223 | | | Preferred Series D | | | 600 | | | | 592 | | | (9)(17) |
Total Astranis Space Technology Corporation | | | | | | | | | | | | 900 | | | | 725 | | | |
| | | | | | | | | | | | | | | | | |
Axiom Space, Inc. | | Equity | | August 11, 2021 | | | 3,624 | | | Preferred Series C-1 | | $ | 521 | | | $ | 449 | | |
|
| | | | | | | | | | | | | | | | | |
Hadrian Automation, Inc. | | Equity | | March 29, 2022 | | | 53,154 | | | Preferred A-4 | | $ | 500 | | | $ | 570 | | | (17) |
| | Equity | | December 11, 2023 | | | 31,831 | | | Preferred B-1 | | | 300 | | | | 341 | | | (9)(17) |
Total Hadrian Automation, Inc. | | | | | | | | | | | | 800 | | | | 911 | | | |
| | | | | | | | | | | | | | | | | |
Impulse Space, Inc. | | Equity | | August 30, 2024 | | | 35,754 | | | Preferred Series B | | $ | 500 | | | $ | 492 | | | (17) |
| | | | | | | | | | | | | | | | | |
Sub-total: Space Technology (0.3%)* | | | | | | | | | | | $ | 2,721 | | | $ | 2,577 | | | |
| | | | | | | | | | | | | | | | | |
Supply Chain Technology | | | | | | | | | | | | | | | | | |
Macrofab, Inc. | | Equity | | January 30, 2024 | | | 247,173 | | | Preferred C-1 Preferred | | $ | 500 | | | $ | 248 | | | (17) |
| | | | | | | | | | | | | | | | | |
Sub-total: Supply Chain Technology (0.0%)* | | | | | | | | | | | $ | 500 | | | $ | 248 | | | |
| | | | | | | | | | | | | | | | | |
Transportation Technology | | | | | | | | | | | | | | | | | |
NextCar Holding Company, Inc. | | Equity | | April 18, 2023 | | | 2,688,971 | | | Preferred Series A-6 | | $ | — | | | $ | — | | | (17) |
| | | | | | | | | | | | | | | | | |
Sub-total: Transportation Technology (0.0%)* | | | | | | | | | | | $ | — | | | $ | — | | | |
| | | | | | | | | | | | | | | | | |
Total: Equity Investments- United States (8.2%)* | | | | | |
| | | | | $ | 73,506 | | | $ | 67,690 | | | |
TRINITY CAPITAL INC.
Consolidated Schedule of Investments
December 31, 2024
(In thousands, except share and per share data)
| | | | | | | | | | | | | | | | | | | | |
Portfolio Company (1) | | Type of
Investment (2) | | Investment Date (3) | | Shares / Principal | | | Series | | Cost | | | Fair Value (6) | | | Footnotes |
Equity Investments- Canada | | | | | | | | | | | | | | | | | |
| | | | | | | | | | | | | | | | | |
Construction Technology | | | | | | | | | | | | | | | | | |
Nexii, Inc. | | Equity | | July 24, 2024 | | | 250 | | | Preferred Series A | | $ | 3,049 | | | $ | 2,614 | | | (10)(17) |
| | Equity | | July 24, 2024 | | | 50,000 | | | Common Stock | | | 1,370 | | | | 1,008 | | | (10) |
Total Nexii, Inc. | | | | | | | | | | | | 4,419 | | | | 3,622 | | | |
| | | | | | | | | | | | | | | | | |
Sub-Total: Construction Technology (0.4%)* | | | | | | | | | | | $ | 4,419 | | | $ | 3,622 | | | |
| | | | | | | | | | | | | | | | | |
Supply Chain Technology | | | | | | | | | | | | | | | | | |
GoFor Delivers, Inc. | | Equity | | June 28, 2024 | | | 194,329 | | | Series 2 Seed | | $ | 660 | | | $ | 673 | | | (10)(21) |
| | | | | | | | | | | | | | | | | |
Sub-total: Supply Chain Technology (0.1%)* | | | | | | | | | | | $ | 660 | | | $ | 673 | | | |
| | | | | | | | | | | | | | | | | |
Total: Equity Investments- Canada (0.5%)* | | | | | | | | | | | $ | 5,079 | | | $ | 4,295 | | | |
| | | | | | | | | | | | | | | | | |
Total: Equity Investments (8.7%)* | | | | | | | | | | | $ | 78,585 | | | $ | 71,985 | | | |
| | | | | |
| | | | | | | | | | | |
Total Investment in Securities (209.7%)* | | | | | |
| | | | | $ | 1,760,226 | | | $ | 1,725,570 | | | |
| | | | | |
| | | | | | | | | | | |
Cash and Cash Equivalents | | | | | |
| | | | | | | | | | | |
Goldman Sachs Financial Square Government Institutional Fund | | | | | |
| | | | | $ | 3,750 | | | $ | 3,750 | | | |
Other cash accounts | | | | | |
| | | | | | 5,877 | | | | 5,877 | | | |
Cash and Cash Equivalents (1.2%)* | | | | | |
| | | | | | 9,627 | | | | 9,627 | | | |
| | | | | |
| | | | | | | | | | | |
Total Portfolio Investments and Cash and Cash Equivalents (210.8%) of net assets) | | | | | |
| | | | | $ | 1,769,853 | | | $ | 1,735,197 | | | |
* Value as a percent of net assets
(1)All portfolio companies are located in North America or Europe. As of December 31, 2024, Trinity Capital Inc. (the “Company”) had five foreign domiciled portfolio companies, two of which are based in Canada and three of which are based in Europe. In total, these foreign domiciled portfolio investments represent 6.3% of total net asset value based on fair value. The Company generally acquires its investments in private transactions exempt from registration under the Securities Act of 1933, as amended (the “Securities Act”). These investments are generally subject to certain limitations on resale and may be deemed to be “restricted securities” under the Securities Act.
(2)All debt investments are income producing unless otherwise noted. All equity and warrant investments are non-income producing unless otherwise noted. Equipment financed under our equipment financing investments relates to operational equipment essential to revenue production for the portfolio company in the industry noted.
(3)Investment date represents the date of initial investment date, either purchases or funding, not adjusted for modifications. For assets purchased from the Legacy Funds as part of the Formation Transactions (both terms as defined in “Note 1 – Organization and Basis of Presentation”), the investment date is January 16, 2020, the date of the Formation Transactions.
(4)Interest rate is the fixed or variable rate of the debt investments and does not include any original issue discount, end-of-term (“EOT”) payment, or additional fees related to such investments, such as deferred interest, commitment fees, prepayment fees or exit fees. EOT payments are contractual payments due in cash at the maturity date of the loan, including upon prepayment, and are a fixed rate determined at the inception of the loan. At the end of the term of certain equipment financings, the borrower has the option to purchase the underlying assets at fair value, generally subject to a cap, or return the equipment and pay a restocking fee. The fair values of the financed assets have been estimated as a percentage of original cost for purpose of the EOT payment value. The EOT payment is amortized and recognized as non-cash income over the term of the loan or equipment financing prior to its payment and is included as a component of the cost basis of the Company’s current debt securities.
(5)Principal is net of repayments, if any, as per the terms of the debt instrument’s contract.
TRINITY CAPITAL INC.
Consolidated Schedule of Investments
December 31, 2024
(In thousands, except share and per share data)
(6)Except as noted, all investments were valued at fair value as determined in good faith by the Company’s Board of Directors (the “Board”) using Level 3 inputs.
(7)Asset is valued at fair value as determined in good faith by the Company's Board using Level 1 and Level 2 inputs.
(8)The interest rate on variable interest rate investments represents a benchmark rate plus spread. The benchmark interest rate is subject to an interest rate floor. As of December 31, 2024, the U.S. Prime Rate (“Prime”) was 7.50% and the Secured Overnight Financing Rate (“SOFR”) 30 Day Forward Rate and 3-Month Term Rate were 4.33% and 4.31%, respectively.
(9)Senior Credit Corp 2022 LLC owns an additional portion of this security. See “Note 12 – Related Party Transactions” for further discussion.
(10)Indicates a “non-qualifying asset” under section 55(a) of the Investment Company Act of 1940, as amended (the “1940 Act”). The Company’s percentage of non-qualifying assets at fair value represents 14.6% of the Company’s total assets as of December 31, 2024. Qualifying assets must represent at least 70% of the Company’s total assets at the time of acquisition of any additional non-qualifying assets.
(11)Investment has zero cost basis as it was purchased at a fair value of zero as part of the Formation Transactions (as defined in “Note 1 – Organization and Basis of Presentation”).
(12)Investment is a secured loan warehouse facility collateralized by interest in specific assets that meet the eligibility requirements under the facility during the warehouse period. Repayment of the facility will occur over the amortizing period unless otherwise prepaid.
(13)Company has been issued warrants with pricing and number of shares dependent upon a future round of equity issuance by the portfolio company.
(14)Investment is pledged as collateral supporting amounts outstanding under the Company's credit facility with KeyBank, National Association (the “KeyBank Credit Facility”). See “Note 5 – Borrowings” for more information.
(15)Interest on this loan includes a payment-in-kind (“PIK”) provision. Contractual PIK interest, which represents contractually deferred interest added to the loan balance that is generally collected through amortization, is recorded on an accrual basis to the extent such amounts are expected to be collected.
(16)Convertible notes represent investments through which the Company will participate in future equity rounds at preferential rates. There are no principal or interest payments made against the note unless conversion does not occur.
(17)Preferred stock represents investments through which the Company will have preference in liquidation rights and do not contain any cumulative preferred dividends.
(18)Investment is on non-accrual status as of December 31, 2024 and is therefore considered non-income producing.
(19)EPT 16 LLC owns an additional portion of this security. See “Note 12 – Related Party Transactions” for further discussion.
(20)Investment has an unfunded commitment as of December 31, 2024 (see “Note 6 – Commitments and Contingencies”). The fair value of the investment includes the impact of the fair value of any unfunded commitments.
TRINITY CAPITAL INC.
Consolidated Schedule of Investments
December 31, 2024
(In thousands, except share and per share data)
(21)This investment is deemed to be a “Control Investment” or an “Affiliate Investment.” The Company classifies its investment portfolio in accordance with the requirements of the 1940 Act. The 1940 Act defines Control Investments as investments in companies in which the Company owns beneficially, either directly or indirectly, more than 25% of the voting securities, or maintains greater than 50% of the board representation. Affiliate Investments are defined by the 1940 Act as investments in companies in which the Company owns beneficially, either directly or indirectly, between 5% and 25% (inclusive) of the voting securities and does not have rights to maintain greater than 50% of the board representation. Fair value as of December 31, 2024, along with transactions during the year ended December 31, 2024 in these control and affiliate investments are as follows:
| | | | | | | | | | | | | | | | | | | | | | | | | | | | |
| | | | | | | | | | | | | | Net change in | | | | | | | |
| | | | | | | | | | | | | | Unrealized | | | | | | | |
| | Fair Value at | | | Gross | | | Gross | | | Realized | | | (Depreciation)/ | | | Fair Value at | | | Interest and | |
| | December 31, 2023 | | | Additions (1) | | | Reductions (2) | | | Gain/(Loss) | | | Appreciation | | | December 31, 2024 | | | Dividend Income | |
For the Year Ended December 31, 2024 | | | | | | | | | | | | | | | | | | | | | |
Control Investments | |
| | |
| | | | | | | | | | | |
| | |
| |
Edeniq, Inc. | | $ | 11,386 | | | $ | 873 | | | $ | (3,036 | ) | | $ | — | | | $ | 8,882 | | | $ | 18,105 | | | $ | 1,075 | |
3Q GoFor Holdings, LP | | | 4,222 | | | | 988 | | | | (7,148 | ) | | | (4,226 | ) | | | 6,164 | | | | — | | | | — | |
Project Frog, Inc. | | | 8 | | | | — | | | | — | | | | — | | | | 36 | | | | 44 | | | | — | |
Vertical Communications, Inc. | | | 16,745 | | | | 264 | | | | (150 | ) | | | — | | | | (251 | ) | | | 16,608 | | | | 1,819 | |
WorkWell Prevention and Care Inc. | | | 500 | | | | — | | | | — | | | | — | | | | — | | | | 500 | | | | 67 | |
Knockaway, Inc. | | | 22,989 | | | | 29,252 | | | | (2,416 | ) | | | — | | | | (684 | ) | | | 49,141 | | | | 5,803 | |
Trinity Capital Adviser, LLC | | | — | | | | 1 | | | | — | | | | — | | | | 4,850 | | | | 4,851 | | | | — | |
Total Control Investments | | $ | 55,850 | | | $ | 31,378 | | | $ | (12,750 | ) | | $ | (4,226 | ) | | $ | 18,997 | | | $ | 89,249 | | | $ | 8,764 | |
| |
| | |
| | |
| | |
| | |
| | |
| | |
| |
Affiliate Investments | |
| | |
| | |
| | |
| | |
| | |
| | |
| |
EPT 16 LLC | | $ | — | | | $ | 9,215 | | | $ | — | | | $ | — | | | $ | — | | | $ | 9,215 | | | $ | — | |
GoFor Delivers, Inc. | | | — | | | | 6,687 | | | | — | | | | — | | | | (246 | ) | | | 6,441 | | | | 393 | |
Senior Credit Corp 2022 LLC | | | 11,335 | | | | 7,401 | | | | — | | | | — | | | | 335 | | | | 19,071 | | | | 2,510 | |
Total Affiliate Investments | | $ | 11,335 | | | $ | 23,303 | | | $ | — | | | $ | — | | | $ | 89 | | | $ | 34,727 | | | $ | 2,903 | |
| |
| | |
| | |
| | |
| | |
| | |
| | |
| |
Total Control and Affiliate Investments | | $ | 67,185 | | | $ | 54,681 | | | $ | (12,750 | ) | | $ | (4,226 | ) | | $ | 19,086 | | | $ | 123,976 | | | $ | 11,667 | |
(1)Gross additions may include increases in the cost basis of investments resulting from new portfolio investments, PIK interest, the accretion of discounts, the exchange of one or more existing securities for one or more new securities and the movement of an existing portfolio company into this category from a different category.
(2)Gross reductions may include decreases in the cost basis of investments resulting from principal collections related to investment repayments or sales, the exchange of one or more existing securities for one or more new securities and the movement of an existing portfolio company out of this category into a different category.
TRINITY CAPITAL INC.
Consolidated Schedule of Investments
December 31, 2023
(In thousands, except share and per share data)
| | | | | | | | | | | | | | | | | | | | | | |
Portfolio Company (1) | | Type of Investment (2) | | Investment Date (3) | | Maturity Date | | Interest Rate (4) | | Principal
Amount (5) | | | Cost | | | Fair Value (6) | | | Footnotes |
Debt Securities- United States | | | | | | | | | | | | | |
| | | | | | | | | | | | | | | | | | | |
Artificial Intelligence & Automation | | | | | | | | | |
| | |
| | |
| | | |
Ambient Photonics, Inc. | | Secured Loan | | July 28, 2022 | | July 1, 2025 | | Variable interest rate Prime + 6.0% or Floor rate 9.5%; EOT 4.0% | | $ | 2,383 | | | $ | 2,502 | | | $ | 2,528 | | | (8)(14) |
| | Secured Loan | | November 17, 2022 | | May 1, 2025 | | Variable interest rate Prime + 6.0% or Floor rate 9.5%; EOT 4.0% | | | 2,684 | | | | 2,803 | | | | 2,832 | | | (8)(14) |
| | Secured Loan | | December 20, 2022 | | June 1, 2025 | | Variable interest rate Prime + 6.0% or Floor rate 9.5%; EOT 4.0% | | | 450 | | | | 467 | | | | 473 | | | (8)(14) |
Total Ambient Photonics, Inc. | | | | | | | | | | | 5,517 | | | | 5,772 | | | | 5,833 | | | |
| | | | | | | | | | | | | | | | | | | |
Rigetti & Co, Inc. | | Secured Loan | | March 10, 2021 | | April 1, 2025 | | Variable interest rate Prime + 7.5% or Floor rate 11.0%; EOT 2.8% | | $ | 6,964 | | | $ | 7,220 | | | $ | 7,202 | | | (8) |
| | Secured Loan | | May 18, 2021 | | June 1, 2025 | | Variable interest rate Prime + 7.5% or Floor rate 11.0%; EOT 2.8% | | | 5,164 | | | | 5,320 | | | | 5,303 | | | (8) |
| | Secured Loan | | November 10, 2021 | | December 1, 2025 | | Variable interest rate Prime + 7.5% or Floor rate 11.0%; EOT 2.8% | | | 5,812 | | | | 5,905 | | | | 5,876 | | | (8) |
| | Secured Loan | | January 27, 2022 | | February 1, 2026 | | Variable interest rate Prime + 7.5% or Floor rate 11.0%; EOT 2.8% | | | 4,442 | | | | 4,527 | | | | 4,507 | | | (8) |
Total Rigetti & Co, Inc. | | | | | | | | | | | 22,382 | | | | 22,972 | | | | 22,888 | | | |
| | | | | | | | | | | | | | | | | | | |
Stratifyd, Inc. | | Secured Loan | | September 3, 2021 | | March 1, 2026 | | Variable interest rate Prime + 7.8% or Floor rate 11.0%; EOT 4.8% | | $ | 4,457 | | | $ | 4,592 | | | $ | 4,369 | | | (8) |
| | | | | | | | | | | | | | | | | | | |
Sub-total: Artificial Intelligence & Automation (2.5%)* | | | | | | $ | 32,356 | | | $ | 33,336 | | | $ | 33,090 | | | |
| | | | | | | | | | | | | | | | | | | |
Biotechnology | | | | |
| | |
| | |
| | | |
Greenlight Biosciences Inc. | | Equipment Financing | | March 29, 2021 | | April 1, 2024 | | Fixed interest rate 11.4%; EOT 8.0% | | $ | 268 | | | $ | 469 | | | $ | 496 | | | (14) |
| | Equipment Financing | | June 17, 2021 | | July 1, 2024 | | Fixed interest rate 14.9%; EOT 8.0% | | | 562 | | | | 767 | | | | 849 | | | (14) |
| | Equipment Financing | | August 31, 2021 | | September 1, 2024 | | Fixed interest rate 22.6%; EOT 8.0% | | | 280 | | | | 348 | | | | 423 | | | (14) |
| | Equipment Financing | | August 31, 2021 | | September 1, 2024 | | Fixed interest rate 18.3%; EOT 8.0% | | | 165 | | | | 207 | | | | 247 | | | (14) |
Total Greenlight Biosciences Inc. | | | | | | | | | | | 1,275 | | | | 1,791 | | | | 2,015 | | | |
| | | | | | | | | | | | | | | | | | | |
Pendulum Therapeutics, Inc. | | Equipment Financing | | July 15, 2020 | | February 1, 2024 | | Fixed interest rate 9.8%; EOT 6.0% | | $ | 28 | | | $ | 88 | | | $ | 87 | | | |
| | Secured Loan | | December 31, 2021 | | July 1, 2026 | | Variable interest rate Prime + 6.8% or Floor rate 10.0%; EOT 4.0% | | | 4,292 | | | | 4,442 | | | | 4,355 | | | (8) |
| | Secured Loan | | February 28, 2022 | | July 1, 2026 | | Variable interest rate Prime + 6.8% or Floor rate 10.0%; EOT 4.0% | | | 4,581 | | | | 4,731 | | | | 4,648 | | | (8) |
| | Secured Loan | | March 30, 2022 | | July 1, 2026 | | Variable interest rate Prime + 6.8% or Floor rate 10.0%; EOT 4.0% | | | 4,722 | | | | 4,872 | | | | 4,792 | | | (8) |
| | Secured Loan | | May 6, 2022 | | July 1, 2026 | | Variable interest rate Prime + 6.8% or Floor rate 10.0%; EOT 4.0% | | | 5,000 | | | | 5,150 | | | | 5,073 | | | (8) |
| | Secured Loan | | June 17, 2022 | | July 1, 2026 | | Variable interest rate Prime + 6.8% or Floor rate 10.0%; EOT 4.0% | | | 5,000 | | | | 5,150 | | | | 5,073 | | | (8) |
Total Pendulum Therapeutics, Inc. | | | | | | | | | | | 23,623 | | | | 24,433 | | | | 24,028 | | | |
| | | | | | | | | | | | | | | | | | | |
Taysha Gene Therapies, Inc. | | Secured Loan | | November 13, 2023 | | December 1, 2028 | | Variable interest rate Prime + 4.5% or Floor rate 12.8%; EOT 5.0% | | $ | 30,000 | | | $ | 29,752 | | | $ | 29,752 | | | (8)(9)(10)(14) |
| | | | | | | | | | | | | | | | | | | |
Sub-total: Biotechnology (4.3%)* | | | | | | | | | | $ | 54,898 | | | $ | 55,976 | | | $ | 55,795 | | | |
TRINITY CAPITAL INC.
Consolidated Schedule of Investments
December 31, 2023
(In thousands, except share and per share data)
| | | | | | | | | | | | | | | | | | | | | | |
Portfolio Company (1) | | Type of Investment (2) | | Investment Date (3) | | Maturity Date | | Interest Rate (4) | | Principal
Amount (5) | | | Cost | | | Fair Value (6) | | | Footnotes |
Debt Securities- United States, Continued | | | | | | | | | | | | | | | | | | | |
| | | | | | | | | | | | | | | | | | | |
Connectivity | | | | |
| | |
| | |
| | | |
Vertical Communications, Inc. | | Secured Loan | | August 23, 2021 | | November 1, 2026 | | Variable interest rate Prime + 4.0% or Floor rate 11.0%; EOT 23.8% | | $ | 12,750 | | | $ | 15,406 | | | $ | 15,406 | | | (8)(14)(20) |
| | | | | | | | | | | | | | | | | | | |
viaPhoton, Inc. | | Secured Loan | | March 31, 2022 | | April 1, 2027 | | Variable interest rate Prime + 6.6% or Floor rate 9.9%; EOT 5.0% | | $ | 15,000 | | | $ | 15,330 | | | $ | 14,209 | | | (14) |
| | | | | | | | | | | | | | | | | | | |
Sub-total: Connectivity (2.3%)* | | | | | | | | | | $ | 27,750 | | | $ | 30,736 | | | $ | 29,615 | | | |
| | | | | | | | | | | | | | | | | | | |
Consumer Products & Services | | | | | | | | | | | | | | | | | | | |
Eterneva, Inc. | | Equipment Financing | | November 24, 2021 | | December 1, 2025 | | Fixed interest rate 10.6%; EOT 11.5% | | $ | 294 | | | $ | 343 | | | $ | 325 | | | (14) |
| | Equipment Financing | | March 16, 2022 | | April 1, 2026 | | Fixed interest rate 10.4%; EOT 11.5% | | | 462 | | | | 521 | | | | 497 | | | (14) |
| | Equipment Financing | | June 17, 2022 | | July 1, 2026 | | Fixed interest rate 16.2%; EOT 11.5% | | | 1,315 | | | | 1,441 | | | | 1,402 | | | (14) |
Total Eterneva, Inc. | | | | | | | | | | | 2,071 | | | | 2,305 | | | | 2,224 | | | |
| | | | | | | | | | | | | | | | | | | |
Happiest Baby, Inc. | | Equipment Financing | | January 22, 2021 | | May 1, 2024 | | Fixed interest rate 8.4%; EOT 9.5% | | $ | 116 | | | $ | 210 | | | $ | 207 | | | |
| | | | | | | | | | | | | | | | | | | |
Molekule, Inc. | | Equipment Financing | | June 19, 2020 | | January 1, 2024 | | Fixed interest rate 8.8%; EOT 10.0% | | $ | 312 | | | $ | 595 | | | $ | 266 | | | (18) |
| | Equipment Financing | | September 29, 2020 | | April 1, 2025 | | Fixed interest rate 12.3%; EOT 10.0% | | | 273 | | | | 347 | | | | 233 | | | (18) |
| | Equipment Financing | | December 18, 2020 | | July 1, 2025 | | Fixed interest rate 11.9%; EOT 10.0% | | | 473 | | | | 584 | | | | 403 | | | (18) |
| | Equipment Financing | | August 25, 2021 | | March 1, 2026 | | Fixed interest rate 11.3%; EOT 10.0% | | | 385 | | | | 454 | | | | 329 | | | (18) |
Total Molekule, Inc. | | | | | | | | | | | 1,443 | | | | 1,980 | | | | 1,231 | | | |
| | | | | | | | | | | | | | | | | | | |
Ogee, Inc. | | Secured Loan | | February 14, 2023 | | March 1, 2027 | | Variable interest rate Prime + 5.8% or Floor rate 12.0%; EOT 3.8% | | $ | 5,000 | | | $ | 4,975 | | | $ | 4,967 | | | (8)(14) |
| | Secured Loan | | September 29, 2023 | | March 1, 2027 | | Variable interest rate Prime + 5.8% or Floor rate 12.0%; EOT 3.8% | | | 5,000 | | | | 4,921 | | | | 5,010 | | | (8)(14) |
Total Ogee, Inc. | | | | | | | | | | | 10,000 | | | | 9,896 | | | | 9,977 | | | |
| | | | | | | | | | | | | | | | | | | |
Portofino Labs, Inc. | | Secured Loan | | April 1, 2021 | | November 1, 2025 | | Variable interest rate Prime + 8.3% or Floor rate 11.5%; EOT 4.0% | | $ | 1,531 | | | $ | 1,610 | | | $ | 1,588 | | | (8) |
| | | | | | | | | | | | | | | | | | | |
Quip NYC, Inc. | | Secured Loan | | March 9, 2021 | | April 1, 2026 | | Variable interest rate Prime + 8.0% or Floor rate 11.3%; EOT 3.0% | | $ | 13,611 | | | $ | 13,919 | | | $ | 14,023 | | | (8) |
| | Secured Loan | | February 10, 2022 | | April 1, 2026 | | Variable interest rate Prime + 8.0% or Floor rate 11.3%; EOT 3.0% | | | 1,944 | | | | 1,996 | | | | 2,015 | | | (8) |
Total Quip NYC, Inc. | | | | | | | | | | | 15,555 | | | | 15,915 | | | | 16,038 | | | |
| | | | | | | | | | | | | | | | | | | |
Rinse, Inc. | | Secured Loan | | May 10, 2022 | | June 1, 2027 | | Variable interest rate Prime + 8.0% or Floor rate 11.3%; EOT 3.8% | | $ | 5,000 | | | $ | 5,031 | | | $ | 5,099 | | | (8) |
| | Secured Loan | | September 22, 2023 | | October 1, 2028 | | Variable interest rate Prime + 8.0% or Floor rate 11.3%; EOT 3.8% | | | 4,000 | | | | 3,928 | | | | 4,033 | | | (8) |
Total Rinse, Inc. | | | | | | | | | | | 9,000 | | | | 8,959 | | | | 9,132 | | | |
| | | | | | | | | | | | | | | | | | | |
SI Tickets, Inc. | | Secured Loan | | May 11, 2022 | | September 1, 2026 | | Variable interest rate Prime + 8.3% or Floor rate 11.5%; EOT 3.0% | | $ | 2,803 | | | $ | 2,817 | | | $ | 2,719 | | | (8) |
| | | | | | | | | | | | | | | | | | | |
UnTuckIt, Inc. | | Secured Loan | | January 16, 2020 | | June 1, 2025 | | Fixed interest rate 12.0%; EOT 3.8% | | $ | 8,170 | | | $ | 8,928 | | | $ | 8,721 | | | (14) |
| | | | | | | | | | | | | | | | | | | |
VitaCup, Inc. | | Secured Loan | | June 23, 2021 | | January 1, 2026 | | Variable interest rate Prime + 7.5% or Floor rate 11.5%; EOT 5.0% | | $ | 6,000 | | | $ | 5,772 | | | $ | 5,515 | | | (8) |
| | | | | | | | | | | | | | | | | | | |
Whoop, Inc. | | Secured Loan | | May 17, 2023 | | June 1, 2028 | | Variable interest rate Prime + 5.3% or Floor rate 13.0%; EOT 2.5% | | $ | 23,625 | | | $ | 23,106 | | | $ | 23,226 | | | (8)(9)(14) |
| | | | | | | | | | | | | | | | | | | |
Sub-total: Consumer Products & Services (6.1%)* | | | | | | | | | | $ | 80,314 | | | $ | 81,498 | | | $ | 80,578 | | | |
TRINITY CAPITAL INC.
Consolidated Schedule of Investments
December 31, 2023
(In thousands, except share and per share data)
| | | | | | | | | | | | | | | | | | | | | | |
Portfolio Company (1) | | Type of Investment (2) | | Investment Date (3) | | Maturity Date | | Interest Rate (4) | | Principal
Amount (5) | | | Cost | | | Fair Value (6) | | | Footnotes |
Debt Securities- United States, Continued | | | | | | | | | | | | | |
| | | | | | | | | | | | | | | | | | | |
Digital Assets Technology and Services | |
| | | | | | | |
| | |
| | |
| | | |
Cleanspark, Inc. | | Equipment Financing | | April 22, 2022 | | May 1, 2025 | | Fixed interest rate 10.3%; EOT 5.0% | | $ | 9,591 | | | $ | 10,376 | | | $ | 10,137 | | | (10) |
| | | | | | | | | | | | | | | | | | | |
Core Scientific, Inc. | | Equipment Financing | | August 31, 2021 | | October 1, 2024 | | Fixed interest rate 10.3%; EOT 5.0% | | $ | 674 | | | $ | 700 | | | $ | 759 | | | (18) |
| | Equipment Financing | | November 19, 2021 | | December 1, 2024 | | Fixed interest rate 10.7%; EOT 5.0% | | | 10,132 | | | | 10,437 | | | | 11,406 | | | (18) |
| | Equipment Financing | | December 13, 2021 | | January 1, 2025 | | Fixed interest rate 10.5%; EOT 5.0% | | | 3,753 | | | | 3,853 | | | | 4,225 | | | (18) |
| | Equipment Financing | | February 9, 2022 | | March 1, 2025 | | Fixed interest rate 10.5%; EOT 5.0% | | | 8,018 | | | | 8,179 | | | | 9,026 | | | (18) |
Total Core Scientific, Inc. | | | | | | | | | | | 22,577 | | | | 23,169 | | | | 25,416 | | | |
| | | | | | | | | | | | | | | | | | | |
Sub-total: Digital Assets Technology and Services (2.7%)* | | | | | | | | | | $ | 32,168 | | | $ | 33,545 | | | $ | 35,553 | | | |
| | | | | | | | | | | | | | | | | | | |
Education Technology | | | | | | | | | | | | | | | | | | | |
Medical Sales Training Holding Company | | Secured Loan | | March 18, 2021 | | April 1, 2025 | | Variable interest rate Prime + 8.8% or Floor rate 12.0%; EOT 6.3% | | $ | 5,834 | | | $ | 6,144 | | | $ | 5,841 | | | (8)(14) |
| | Secured Loan | | July 21, 2021 | | August 1, 2025 | | Variable interest rate Prime + 8.8% or Floor rate 12.0%; EOT 6.3% | | | 2,000 | | | | 2,103 | | | | 1,971 | | | (8)(14) |
Total Medical Sales Training Holding Company | | | | | | | | | | | 7,834 | | | | 8,247 | | | | 7,812 | | | |
| | | | | | | | | | | | | | | | | | | |
Yellowbrick Learning, Inc. | | Secured Loan | | February 1, 2021 | | March 1, 2026 | | Fixed interest rate 2.0%; EOT 5.0% | | $ | 7,500 | | | $ | 7,875 | | | $ | 5,581 | | | (14) |
| | Secured Loan | | August 10, 2021 | | March 1, 2026 | | Fixed interest rate 2.0%; EOT 5.0% | | | 2,500 | | | | 2,625 | | | | 1,863 | | | (14) |
Total Yellowbrick Learning, Inc. | | | | | | | | | | | 10,000 | | | | 10,500 | | | | 7,444 | | | |
| | | | | | | | | | | | | | | | | | | |
Sub-total: Education Technology (1.2%)* | | | | | | | | | | $ | 17,834 | | | $ | 18,747 | | | $ | 15,256 | | | |
TRINITY CAPITAL INC.
Consolidated Schedule of Investments
December 31, 2023
(In thousands, except share and per share data)
| | | | | | | | | | | | | | | | | | | | | | |
Portfolio Company (1) | | Type of Investment (2) | | Investment Date (3) | | Maturity Date | | Interest Rate (4) | | Principal
Amount (5) | | | Cost | | | Fair Value (6) | | | Footnotes |
Debt Securities- United States, Continued | | | | | | | | | | | | | |
| | | | | | | | | | | | | | | | | | | |
Finance and Insurance | | | | | | | | | |
| | |
| | |
| | | |
Bestow, Inc. | | Secured Loan | | April 25, 2022 | | May 1, 2027 | | Variable interest rate Prime + 6.5% or Floor rate 10.0%; EOT 1.5% | | $ | 25,000 | | | $ | 25,130 | | | $ | 24,993 | | | (8) |
| | Secured Loan | | May 12, 2022 | | June 1, 2027 | | Variable interest rate Prime + 6.5% or Floor rate 10.0%; EOT 1.5% | | | 15,000 | | | | 15,071 | | | | 15,096 | | | (8) |
Total Bestow, Inc. | | | | | | | | | | | 40,000 | | | | 40,201 | | | | 40,089 | | | |
| | | | | | | | | | | | | | | | | | | |
Empower Financial, Inc. | | Secured Loan | | October 13, 2023 | | May 1, 2028 | | Variable interest rate Prime + 4.8% or Floor rate 11.5%; EOT 3.8% | | $ | 12,000 | | | $ | 11,686 | | | $ | 11,686 | | | (8)(9)(14) |
| | | | | | | | | | | | | | | | | | | |
Eqis Capital Management, Inc. | | Secured Loan | | June 15, 2022 | | July 1, 2026 | | Variable interest rate Prime + 7.5% or Floor rate 10.8%; EOT 3.0% | | $ | 7,000 | | | $ | 7,210 | | | $ | 7,012 | | | (8) |
| | | | | | | | | | | | | | | | | | | |
Openly Holdings Corp. | | Secured Loan | | November 18, 2022 | | December 1, 2027 | | Variable interest rate Prime + 6.3% or Floor rate 10.5%; EOT 2.8% | | $ | 3,125 | | | $ | 3,141 | | | $ | 3,153 | | | (8)(9)(14) |
| | Secured Loan | | January 31, 2023 | | December 1, 2027 | | Variable interest rate Prime + 6.3% or Floor rate 10.5%; EOT 2.8% ⁽⁸⁾ | | | 6,250 | | | | 6,270 | | | | 6,356 | | | (8)(9)(14) |
| | Secured Loan | | June 22, 2023 | | December 1, 2027 | | Variable interest rate Prime + 6.3% or Floor rate 10.5%; EOT 2.8% | | | 15,625 | | | | 15,637 | | | | 16,105 | | | (8)(9)(14) |
Total Openly Holdings Corp. | | | | | | | | | | | 25,000 | | | | 25,048 | | | | 25,614 | | | |
| | | | | | | | | | | | | | | | | | | |
Petal Card, Inc. | | Secured Loan | | January 16, 2020 | | July 1, 2026 | | Variable interest rate Prime + 7.5% or Floor rate 11.0%+PIK Interest Rate 1.0%; EOT 11.0% | | $ | 10,358 | | | $ | 9,372 | | | $ | 8,256 | | | (8)(15) |
| | Secured Loan | | August 6, 2021 | | July 1, 2026 | | Variable interest rate Prime + 7.5% or Floor rate 11.0%+PIK Interest Rate 1.0%; EOT 11.0% | | | 7,250 | | | | 6,560 | | | | 5,779 | | | (8)(15) |
| | Secured Loan | | July 27, 2023 | | August 1, 2026 | | Variable interest rate Prime + 7.5% or Floor rate 11.75%+PIK Interest Rate 4.25%; EOT 0.0% | | | 20,853 | | | | 17,203 | | | | 15,068 | | | (8)(15) |
Total Petal Card, Inc. | | | | | | | | | | | 38,461 | | | | 33,135 | | | | 29,103 | | | |
| | | | | | | | | | | | | | | | | | | |
Slope Tech, Inc. | | Secured Loan | | October 5, 2022 | | March 14, 2025 | | Variable interest rate SOFR 30 Day Forward + 11.8% or Floor rate 11.8%; EOT 0.0% | | $ | 1,235 | | | $ | 1,099 | | | $ | 1,265 | | | (8)(12)(14) |
| | | | | | | | | | | | | | | | | | | |
ZenDrive, Inc. | | Secured Loan | | July 16, 2021 | | August 1, 2026 | | Variable interest rate Prime + 7.0% or Floor rate 10.3%; EOT 3.0% | | $ | 13,655 | | | $ | 13,901 | | | $ | 13,898 | | | (8) |
| | | | | | | | | | | | | | | | | | | |
Sub-total: Finance and Insurance (9.8%)* | | | | | |
| | | | $ | 137,351 | | | $ | 132,280 | | | $ | 128,667 | | | |
TRINITY CAPITAL INC.
Consolidated Schedule of Investments
December 31, 2023
(In thousands, except share and per share data)
| | | | | | | | | | | | | | | | | | | | | | |
Portfolio Company (1) | | Type of Investment (2) | | Investment Date (3) | | Maturity Date | | Interest Rate (4) | | Principal
Amount (5) | | | Cost | | | Fair Value (6) | | | Footnotes |
Debt Securities- United States, Continued | | | | | | | | | | | | | |
| | | | | | | | | | | | | | | | | | | |
Food and Agriculture Technologies | | | | | |
| | | |
| | |
| | |
| | | |
Athletic Brewing Company, LLC | | Equipment Financing | | December 7, 2021 | | September 1, 2026 | | Fixed interest rate 11.1%; EOT 7.0% | | $ | 19,878 | | | $ | 20,510 | | | $ | 20,166 | | | |
| | Equipment Financing | | March 16, 2022 | | September 1, 2026 | | Fixed interest rate 11.2%; EOT 7.0% | | | 4,964 | | | | 5,105 | | | | 5,032 | | | |
| | Equipment Financing | | December 15, 2023 | | January 1, 2028 | | Fixed interest rate 11.2%; EOT 8.0% | | | 10,000 | | | | 9,992 | | | | 9,992 | | | |
Total Athletic Brewing Company, LLC | | | | | | | | | | | 34,842 | | | | 35,607 | | | | 35,190 | | | |
| | | | | | | | | | | | | | | | | | | |
Bowery Farming, Inc. | | Secured Loan | | September 10, 2021 | | September 10, 2026 | | Variable interest rate SOFR 30 Day Forward + 10.0% or Floor rate 1.0% | | $ | 8,660 | | | $ | 7,947 | | | $ | 5,521 | | | (8)(14)(15)(18) |
| | | | | | | | | | | | | | | | | | | |
Daring Foods, Inc. | | Equipment Financing | | April 8, 2021 | | May 1, 2024 | | Fixed interest rate 9.6%; EOT 7.5% | | $ | 63 | | | $ | 100 | | | $ | 99 | | | |
| | Equipment Financing | | August 31, 2021 | | September 1, 2024 | | Fixed interest rate 10.0%; EOT 7.5% | | | 150 | | | | 194 | | | | 191 | | | |
| | Equipment Financing | | November 1, 2021 | | December 1, 2024 | | Fixed interest rate 9.4%; EOT 7.5% | | | 356 | | | | 427 | | | | 421 | | | |
| | Equipment Financing | | March 8, 2022 | | April 1, 2025 | | Fixed interest rate 9.5%; EOT 7.5% | | | 1,026 | | | | 1,162 | | | | 1,141 | | | |
| | Equipment Financing | | April 29, 2022 | | May 1, 2025 | | Fixed interest rate 10.2%; EOT 7.5% | | | 480 | | | | 537 | | | | 528 | | | |
| | Equipment Financing | | July 6, 2022 | | August 1, 2025 | | Fixed interest rate 10.9%; EOT 7.5% | | | 255 | | | | 279 | | | | 276 | | | |
| | Equipment Financing | | August 25, 2022 | | September 1, 2025 | | Fixed interest rate 12.1%; EOT 7.5% | | | 629 | | | | 682 | | | | 678 | | | |
Total Daring Foods, Inc. | | | | | | | | | | | 2,959 | | | | 3,381 | | | | 3,334 | | | |
| | | | | | | | | | | | | | | | | | | |
DrinkPak, LLC | | Equipment Financing | | February 17, 2023 | | September 1, 2026 | | Fixed interest rate 12.9%; EOT 7.0% | | $ | 12,414 | | | $ | 12,816 | | | $ | 13,002 | | | (9)(14) |
| | | | | | | | | | | | | | | | | | | |
Emergy, Inc. | | Equipment Financing | | January 8, 2021 | | May 1, 2024 | | Fixed interest rate 9.1%; EOT 8.5% | | $ | 68 | | | $ | 117 | | | $ | 114 | | | (14) |
| | Equipment Financing | | December 15, 2021 | | July 1, 2025 | | Fixed interest rate 9.3%; EOT 11.5% | | | 5,176 | | | | 6,143 | | | | 5,771 | | | (14) |
| | Equipment Financing | | December 13, 2022 | | July 1, 2026 | | Fixed interest rate 12.6%; EOT 11.5% | | | 8,101 | | | | 8,652 | | | | 8,244 | | | (9)(14) |
Total Emergy, Inc. | | | | | | | | | | | 13,345 | | | | 14,912 | | | | 14,129 | | | |
| | | | | | | | | | | | | | | | | | | |
Intelligent Brands, Inc. (f.k.a. Sun Basket, Inc.) | | Secured Loan | | December 31, 2020 | | June 30, 2024 | | Variable interest rate Prime + 9.5% or Floor rate 11.8%; EOT 5.8% | | $ | 9,518 | | | $ | 10,609 | | | $ | 10,545 | | | (8) |
| | | | | | | | | | | | | | | | | | | |
The Fynder Group, Inc. | | Equipment Financing | | October 14, 2020 | | May 1, 2024 | | Fixed interest rate 9.1%; EOT 10.0% | | $ | 76 | | | $ | 137 | | | $ | 135 | | | |
| | Equipment Financing | | March 31, 2022 | | October 1, 2025 | | Fixed interest rate 9.3%; EOT 10.0% | | | 1,600 | | | | 1,776 | | | | 1,718 | | | |
Total The Fynder Group, Inc. | | | | | | | | | | | 1,676 | | | | 1,913 | | | | 1,853 | | | |
| | | | | | | | | | | | | | | | | | | |
Sub-total: Food and Agriculture Technologies (6.4%)* | | | | | |
| | | | $ | 83,414 | | | $ | 87,185 | | | $ | 83,574 | | | |
TRINITY CAPITAL INC.
Consolidated Schedule of Investments
December 31, 2023
(In thousands, except share and per share data)
| | | | | | | | | | | | | | | | | | | | | | |
Portfolio Company (1) | | Type of Investment (2) | | Investment Date (3) | | Maturity Date | | Interest Rate (4) | | Principal
Amount (5) | | | Cost | | | Fair Value (6) | | | Footnotes |
Debt Securities- United States, Continued | | | | | | | | | | | | | |
| | | | | | | | | | | | | | | | | | | |
Green Technology | | | | | |
| | | |
| | |
| | |
| | | |
Bolb, Inc. | | Equipment Financing | | October 12, 2021 | | November 1, 2024 | | Fixed interest rate 10.3%; EOT 6.0% | | $ | 527 | | | $ | 621 | | | $ | 606 | | | |
| | | | | | | | | | | | | | | | | | | |
Commonwealth Fusion Systems, LLC | | Equipment Financing | | September 10, 2021 | | October 1, 2024 | | Fixed interest rate 9.5%; EOT 8.5% | | $ | 648 | | | $ | 835 | | | $ | 818 | | | (14) |
| | Equipment Financing | | October 20, 2021 | | November 1, 2024 | | Fixed interest rate 9.7%; EOT 8.5% | | | 208 | | | | 261 | | | | 255 | | | (14) |
| | Equipment Financing | | June 16, 2023 | | July 1, 2030 | | Fixed interest rate 13.0%; EOT 10.0% | | | 5,181 | | | | 5,202 | | | | 5,442 | | | (9)(14) |
Total Commonwealth Fusion Systems, LLC | | | | | | | | | 6,037 | | | | 6,298 | | | | 6,515 | | | |
| | | | | | | | | | | | | | | | | | | |
Dandelion Energy, Inc. | | Equipment Financing | | March 17, 2020 | | April 1, 2024 | | Fixed interest rate 9.0%; EOT 12.5% | | $ | 40 | | | $ | 109 | | | $ | 106 | | | (14) |
| | Equipment Financing | | October 27, 2020 | | November 1, 2024 | | Fixed interest rate 9.2%; EOT 12.5% | | | 135 | | | | 203 | | | | 195 | | | (14) |
| | Equipment Financing | | November 19, 2020 | | December 1, 2024 | | Fixed interest rate 9.1%; EOT 12.5% | | | 180 | | | | 261 | | | | 250 | | | (14) |
| | Equipment Financing | | December 29, 2020 | | January 1, 2025 | | Fixed interest rate 9.2%; EOT 12.5% | | | 224 | | | | 317 | | | | 302 | | | (14) |
| | Equipment Financing | | March 25, 2021 | | April 1, 2025 | | Fixed interest rate 9.1%; EOT 12.5% | | | 520 | | | | 687 | | | | 651 | | | (14) |
| | Equipment Financing | | December 1, 2021 | | January 1, 2026 | | Fixed interest rate 8.8%; EOT 12.5% | | | 737 | | | | 865 | | | | 811 | | | (14) |
| | Equipment Financing | | April 8, 2022 | | May 1, 2026 | | Fixed interest rate 8.9%; EOT 12.5% | | | 1,400 | | | | 1,581 | | | | 1,481 | | | (14) |
| | Equipment Financing | | May 27, 2022 | | June 1, 2026 | | Fixed interest rate 9.2%; EOT 12.5% | | | 651 | | | | 729 | | | | 686 | | | (14) |
| | Equipment Financing | | June 13, 2022 | | July 1, 2026 | | Fixed interest rate 9.5%; EOT 12.5% | | | 999 | | | | 1,110 | | | | 1,045 | | | (14) |
| | Equipment Financing | | August 24, 2022 | | September 1, 2026 | | Fixed interest rate 11.1%; EOT 12.5% | | | 391 | | | | 426 | | | | 409 | | | (9)(14) |
| | Equipment Financing | | November 10, 2022 | | December 1, 2026 | | Fixed interest rate 11.6%; EOT 12.5% | | | 364 | | | | 392 | | | | 383 | | | (9)(14) |
| | Equipment Financing | | April 12, 2023 | | May 1, 2027 | | Fixed interest rate 12.1%; EOT 12.5% | | | 835 | | | | 868 | | | | 858 | | | (9)(14) |
| | Equipment Financing | | June 29, 2023 | | July 1, 2027 | | Fixed interest rate 12.7%; EOT 12.5% | | | 694 | | | | 711 | | | | 709 | | | (9)(14) |
Total Dandelion Energy, Inc. | | | | | | | | | | | 7,170 | | | | 8,259 | | | | 7,886 | | | |
| | | | | | | | | | | | | | | | | | | |
Electric Hydrogen Co. | | Equipment Financing | | September 12, 2022 | | April 1, 2026 | | Fixed interest rate 9.0%; EOT 10.0% | | $ | 1,373 | | | $ | 1,492 | | | $ | 1,469 | | | (14) |
| | Equipment Financing | | December 22, 2023 | | January 1, 2029 | | Fixed interest rate 12.5%; EOT 15.0% | | | 10,000 | | | | 9,965 | | | | 9,965 | | | (14) |
Total Electric Hydrogen Co. | | | | | | | | | | | 11,373 | | | | 11,457 | | | | 11,434 | | | |
| | | | | | | | | | | | | | | | | | | |
Hi-Power, LLC | | Equipment Financing | | September 30, 2021 | | April 1, 2025 | | Fixed interest rate 12.4%; EOT 1.0% | | $ | 2,826 | | | $ | 2,884 | | | $ | 2,885 | | | |
| | Equipment Financing | | September 30, 2022 | | April 1, 2026 | | Fixed interest rate 14.7%; EOT 1.0% | | | 2,916 | | | | 2,921 | | | | 2,934 | | | |
Total Hi-Power, LLC | | | | | | | | | | | 5,742 | | | | 5,805 | | | | 5,819 | | | |
| | | | | | | | | | | | | | | | | | | |
SeaOn Global, LLC | | Equipment Financing | | June 16, 2022 | | July 1, 2026 | | Fixed interest rate 9.3%; EOT 11.0% | | $ | 4,489 | | | $ | 4,926 | | | $ | 4,695 | | | (14) |
| | Equipment Financing | | August 17, 2022 | | September 1, 2026 | | Fixed interest rate 9.3%; EOT 11.0% | | | 2,288 | | | | 2,478 | | | | 2,383 | | | (14) |
Total SeaOn Global, LLC | | | | | | | | | | | 6,777 | | | | 7,404 | | | | 7,078 | | | |
| | | | | | | | | | | | | | | | | | | |
Edeniq, Inc. | | Secured Loan | | November 30, 2021 | | June 1, 2025 | | Fixed interest rate 11.0%; EOT 5.7% | | $ | 2,849 | | | $ | 2,163 | | | $ | 2,993 | | | (14)(20) |
| | | | | | | | | | | | | | | | | | | |
Footprint International Holding, Inc. | | Secured Loan | | February 18, 2022 | | March 1, 2027 | | Variable interest rate Prime + 7.3% or Floor rate 10.5%; EOT 3.5% | | $ | 20,000 | | | $ | 19,061 | | | $ | 19,434 | | | (8) |
| | Secured Loan | | April 20, 2022 | | March 1, 2027 | | Variable interest rate Prime + 7.3% or Floor rate 10.5%; EOT 3.5% | | | 20,000 | | | | 18,995 | | | | 19,364 | | | (8) |
Total Footprint International Holding, Inc. | | | | | | | | | 40,000 | | | | 38,056 | | | | 38,798 | | | |
| | | | | | | | | | | | | | | | | | | |
Mainspring Energy, Inc. | | Secured Loan | | March 18, 2022 | | October 1, 2026 | | Fixed interest rate 11.0%; EOT 3.8% | | $ | 28,579 | | | $ | 29,068 | | | $ | 28,286 | | | |
| | | | | | | | | | | | | | | | | | | |
RTS Holding, Inc. | | Secured Loan | | December 31, 2021 | | January 1, 2027 | | Variable interest rate Prime + 7.3% or Floor rate 10.5% + PIK Interest Rate 4.3%; EOT 3.0% | | $ | 13,800 | | | $ | 14,766 | | | $ | 14,871 | | | (9)(14)(15) |
| | Secured Loan | | October 21, 2022 | | November 1, 2027 | | Variable interest rate Prime + 7.25% or Floor rate 13.5%; EOT 3.0% | | | 7,200 | | | | 7,202 | | | | 7,232 | | | (9)(14) |
Total RTS Holding, Inc. | | | | | | | | | | | 21,000 | | | | 21,968 | | | | 22,103 | | | |
| | | | | | | | | | | | | | | | | | | |
Sub-total: Green Technology (10.0%)* | | | | | | | | | | $ | 130,054 | | | $ | 131,099 | | | $ | 131,518 | | | |
TRINITY CAPITAL INC.
Consolidated Schedule of Investments
December 31, 2023
(In thousands, except share and per share data)
| | | | | | | | | | | | | | | | | | | | | | |
Portfolio Company (1) | | Type of Investment (2) | | Investment Date (3) | | Maturity Date | | Interest Rate (4) | | Principal
Amount (5) | | | Cost | | | Fair Value (6) | | | Footnotes |
Debt Securities- United States, Continued | | | | | | | | | | | | | |
| | | | | | | | | | | | | | | | | | | |
Healthcare Technology ** | | | | | | | | | | | | | | | | | | | |
Emerald Cloud Lab, Inc. | | Equipment Financing | | July 13, 2021 | | August 1, 2024 | | Fixed interest rate 9.7%; EOT 7.0% | | $ | 2,302 | | | $ | 3,018 | | | $ | 2,953 | | | |
| | | | | | | | | | | | | | | | | | | |
Dentologie Enterprises, Inc. | | Secured Loan | | October 14, 2022 | | October 1, 2027 | | Variable interest rate Prime + 6.9% or Floor rate 10.9%; EOT 3.0% | | $ | 3,000 | | | $ | 3,010 | | | $ | 3,075 | | | (8)(9)(14) |
| | Secured Loan | | December 15, 2023 | | October 1, 2027 | | Variable interest rate Prime + 6.9% or Floor rate 10.9%; EOT 3.0% | | | 4,200 | | | | 4,107 | | | | 4,107 | | | (8)(9)(14) |
Dentologie Enterprises, Inc. | | | | | | | | | | | 7,200 | | | | 7,117 | | | | 7,182 | | | |
| | | | | | | | | | | | | | | | | | | |
| | | | | | | | | | | | | | | | | | | |
Lark Technologies, Inc. | | Secured Loan | | September 30, 2020 | | April 1, 2025 | | Variable interest rate Prime + 8.3% or Floor rate 11.5% or ceiling rate of 13.5%; EOT 4.0% | | $ | 2,467 | | | $ | 2,623 | | | $ | 2,575 | | | (8) |
| | Secured Loan | | June 30, 2021 | | January 1, 2026 | | Variable interest rate Prime + 8.3% or Floor rate 11.5% or ceiling rate of 13.5%; EOT 4.0% | | | 3,680 | | | | 3,768 | | | | 3,670 | | | (8) |
| | Secured Loan | | July 7, 2023 | | January 1, 2028 | | Variable interest rate Prime + 8.3% or Floor rate 11.5% or ceiling rate of 13.5%; EOT 4.0% | | | 5,000 | | | | 4,942 | | | | 5,029 | | | (8) |
Total Lark Technologies, Inc. | | | | | | | | | | | 11,147 | | | | 11,333 | | | | 11,274 | | | |
| | | | | | | | | | | | | | | | | | | |
Moxe Health Corporation | | Secured Loan | | December 29, 2023 | | January 1, 2028 | | Variable interest rate Prime + 5.5% or Floor rate 13.0%; EOT 3.8% | | $ | 12,500 | | | $ | 12,316 | | | $ | 12,315 | | | (8)(14) |
| | | | | | | | | | | | | | | | | | | |
RXAnte, Inc. | | Secured Loan | | November 21, 2022 | | December 1, 2027 | | Variable interest rate Prime + 4.48% or Floor rate 9.98% +PIK Fixed Interest Rate 1.5%; EOT 3.5% | | $ | 9,144 | | | $ | 9,146 | | | $ | 9,324 | | | (9)(14)(15) |
| | Secured Loan | | April 14, 2023 | | December 1, 2027 | | Variable interest rate Prime + 4.48% or Floor rate 9.98% + PIK Fixed Interest Rate 1.5%; EOT 3.5% | | | 3,033 | | | | 2,985 | | | | 3,170 | | | (9)(14)(15) |
| | Secured Loan | | October 19, 2023 | | December 1, 2027 | | Variable interest rate Prime + 4.48% or Floor rate 9.98% + PIK Fixed Interest Rate 1.5%; EOT 3.5% | | | 3,009 | | | | 2,948 | | | | 2,948 | | | (9)(14)(15) |
Total RXAnte, Inc. | | | | | | | | | | | 15,186 | | | | 15,079 | | | | 15,442 | | | |
| | | | | | | | | | | | | | | | | | | |
TMRW Life Sciences, Inc. | | Secured Loan | | April 29, 2022 | | May 1, 2027 | | Variable interest rate Prime + 5.0% or Floor rate 8.8%; EOT 4.0% | | $ | 5,000 | | | $ | 5,072 | | | $ | 4,785 | | | (8) |
| | Secured Loan | | March 3, 2023 | | May 1, 2027 | | Variable interest rate Prime + 5.0% or Floor rate 8.8%; EOT 4.0% | | | 15,000 | | | | 15,086 | | | | 15,160 | | | (8) |
| | Secured Loan | | December 8, 2023 | | May 1, 2027 | | Variable interest rate Prime + 5.0% or Floor rate 8.8%; EOT 4.0% | | | 10,000 | | | | 9,924 | | | | 9,924 | | | (8) |
Total TMRW Life Sciences, Inc. | | | | | | | | | | | 30,000 | | | | 30,082 | | | | 29,869 | | | |
| | | | | | | | | | | | | | | | | | | |
WorkWell Prevention & Care Inc. | | Secured Loan | | December 31, 2022 | | January 1, 2027 | | Variable interest rate Prime + 5.0% or Floor rate 6.0%; EOT 0.0% | | $ | 500 | | | $ | 500 | | | $ | 500 | | | (8)(14) |
| | | | | | | | | | | | | | | | | | | |
Sub-total: Healthcare Technology (6.1%)* | | | | | | | | | | $ | 78,835 | | | $ | 79,445 | | | $ | 79,535 | | | |
TRINITY CAPITAL INC.
Consolidated Schedule of Investments
December 31, 2023
(In thousands, except share and per share data)
| | | | | | | | | | | | | | | | | | | | | | |
Portfolio Company (1) | | Type of Investment (2) | | Investment Date (3) | | Maturity Date | | Interest Rate (4) | | Principal
Amount (5) | | | Cost | | | Fair Value (6) | | | Footnotes |
Debt Securities- United States, Continued | | | | | | | | | | | | | |
| | | | | | | | | | | | | | | | | | | |
Human Resource Technology | |
| | | | | | | |
| | |
| | |
| | | |
Nomad Health, Inc. | | Secured Loan | | March 29, 2022 | | October 1, 2026 | | Variable interest rate Prime + 5.5% or Floor rate 9.3%; EOT 4.0% | | $ | 30,000 | | | $ | 30,508 | | | $ | 30,120 | | | (8) |
| | | | | | | | | | | | | | | | | | | |
Sub-total: Human Resource Technology (2.3%)* | |
| | | | | | | | $ | 30,000 | | | $ | 30,508 | | | $ | 30,120 | | | |
| | | | | | | | | | | | | | | | | | | |
Industrials | | | | | | | | | | | | | | | | | | | |
3DEO, Inc. | | Equipment Financing | | February 23, 2022 | | March 1, 2025 | | Fixed interest rate 9.1%; EOT 9.0% | | $ | 1,453 | | | $ | 1,763 | | | $ | 1,593 | | | |
| | Equipment Financing | | April 12, 2022 | | May 1, 2025 | | Fixed interest rate 9.0%; EOT 9.0% | | | 754 | | | | 896 | | | | 801 | | | |
Total 3DEO, Inc. | | | | | | | | | | | 2,207 | | | | 2,659 | | | | 2,394 | | | |
| | | | | | | | | | | | | | | | | | | |
Formlogic Corporation | | Equipment Financing | | December 22, 2023 | | January 1, 2028 | | Fixed interest rate 12.1%; EOT 1.5% | | $ | 6,500 | | | $ | 6,469 | | | $ | 6,469 | | | (14) |
| | | | | | | | | | | | | | | | | | | |
Sub-total: Industrials (0.7%)* | | | | | | | | | | $ | 8,707 | | | $ | 9,128 | | | $ | 8,863 | | | |
| | | | | | | | | | | | | | | | | | | |
Marketing, Media, and Entertainment | |
| | | | | | | |
| | |
| | | | | | |
Drone Racing League, Inc. | | Secured Loan | | October 17, 2022 | | April 17, 2027 | | Variable interest rate Prime + 7.5% or Floor rate 11.0%; EOT 2.5% | | $ | 10,000 | | | $ | 9,919 | | | $ | 9,021 | | | (8)(14) |
| | | | | | | | | | | | | | | | | | | |
Grabit Interactive Media, Inc. | | Secured Loan | | April 8, 2022 | | November 1, 2026 | | Variable interest rate Prime + 7.5% or Floor rate 10.8%; EOT 2.5% | | $ | 4,402 | | | $ | 4,437 | | | $ | 4,463 | | | (8) |
| | | | | | | | | | | | | | | | | | | |
Incontext Solutions, Inc. | | Secured Loan | | January 16, 2020 | | September 1, 2025 | | Fixed interest rate 11.8%; EOT 11.4% | | $ | 3,059 | | | $ | 4,209 | | | $ | 3,557 | | | (14) |
| | | | | | | | | | | | | | | | | | | |
PebblePost, Inc. | | Secured Loan | | May 7, 2021 | | June 1, 2026 | | Variable interest rate Prime + 8.8% or Floor rate 11.5%; EOT 3.8% | | $ | 11,500 | | | $ | 11,804 | | | $ | 11,644 | | | (8) |
| | | | | | | | | | | | | | | | | | | |
Vox Media Holdings, Inc. | | Secured Loan | | October 18, 2022 | | November 1, 2027 | | Variable interest rate Prime + 6.3% or Floor rate 11.8%; EOT 2.5% | | $ | 12,000 | | | $ | 11,995 | | | $ | 12,264 | | | (8)(9)(14) |
| | Secured Loan | | December 29, 2022 | | January 1, 2028 | | Variable interest rate Prime + 6.3% or Floor rate 11.8%; EOT 2.5% | | | 6,000 | | | | 5,983 | | | | 6,114 | | | (8)(9)(14) |
Total Vox Media Holdings, Inc. | | | | | | | | | | | 18,000 | | | | 17,978 | | | | 18,378 | | | |
| | | | | | | | | | | | | | | | | | | |
Sub-total: Marketing, Media, and Entertainment (3.6%)* | | | | $ | 46,961 | | | $ | 48,347 | | | $ | 47,063 | | | |
TRINITY CAPITAL INC.
Consolidated Schedule of Investments
December 31, 2023
(In thousands, except share and per share data)
| | | | | | | | | | | | | | | | | | | | | | |
Portfolio Company (1) | | Type of Investment (2) | | Investment Date (3) | | Maturity Date | | Interest Rate (4) | | Principal
Amount (5) | | | Cost | | | Fair Value (6) | | | Footnotes |
Debt Securities- United States, Continued | | | | | | | | | | | | | |
| | | | | | | | | | | | | | | | | | | |
Medical Devices | |
| | | | | | | |
| | |
| | | | | | |
Convergent Dental, Inc. | | Secured Loan | | April 21, 2023 | | May 1, 2027 | | Variable interest rate Prime + 5.8% or Floor rate 13.5%; EOT 5.5% | | $ | 12,000 | | | $ | 11,719 | | | $ | 11,842 | | | (8)(9)(14) |
| | | | | | | | | | | | | | | | | | | |
Delphinus Medical Technologies, Inc. | | Secured Loan | | June 22, 2023 | | June 22, 2027 | | Variable interest rate Prime + 5.8% or Floor rate 13.5%; EOT 4.0% | | $ | 4,500 | | | $ | 4,470 | | | $ | 4,680 | | | (8)(9)(14) |
| | | | | | | | | | | | | | | | | | | |
Neurolens, Inc. | | Secured Loan | | September 29, 2023 | | October 1, 2028 | | Variable interest rate Prime + 3.0% or Floor rate 11.0%; EOT 3.0% | | $ | 20,000 | | | $ | 19,845 | | | $ | 20,461 | | | (8)(14) |
| | | | | | | | | | | | | | | | | | | |
Neuros Medical, Inc. | | Secured Loan | | August 10, 2023 | | September 1, 2027 | | Variable interest rate Prime + 6.0% or Floor rate 14.3%; EOT 4.0% | | $ | 6,000 | | | $ | 5,909 | | | $ | 6,161 | | | (8)(9)(14) |
| | | | | | | | | | | | | | | | | | | |
Revelle Aesthetics, Inc. | | Secured Loan | | May 30, 2023 | | May 30, 2028 | | Variable interest rate Prime + 5.8% or Floor rate 13.5%; EOT 4.0% | | $ | 15,000 | | | $ | 14,888 | | | $ | 15,062 | | | (8)(14) |
| | | | | | | | | | | | | | | | | | | |
Shoulder Innovations, Inc. | | Secured Loan | | August 7, 2023 | | September 1, 2028 | | Variable interest rate Prime + 3.5% or Floor rate 11.5%; EOT 3.0% | | $ | 11,250 | | | $ | 11,138 | | | $ | 11,650 | | | (8)(9)(14) |
| | | | | | | | | | | | | | | | | | | |
Sub-total: Medical Devices (5.3%)* | | | | $ | 68,750 | | | $ | 67,969 | | | $ | 69,856 | | | |
| |
| | | | | | | |
| | |
| | |
| | | |
Multi-Sector Holdings | |
| | | | | | | |
| | |
| | |
| | | |
Senior Credit Corp 2022 LLC | | Secured Loan | | January 30, 2023 | | December 5, 2028 | | Fixed interest rate 8.5%; EOT 0.0% | | $ | 7,704 | | | $ | 7,704 | | | $ | 7,704 | | | (10)(14)(20) |
| |
| | | | | | | |
| | |
| | |
| | | |
Sub-total: Multi-Sector Holdings (0.6%)* | | | | $ | 7,704 | | | $ | 7,704 | | | $ | 7,704 | | | |
| |
| | | | | | | |
| | |
| | |
| | | |
Real Estate Technology | |
| | | | | | | |
| | |
| | | | | | |
BlueGround US, Inc. | | Equipment Financing | | June 6, 2022 | | January 1, 2026 | | Fixed interest rate 9.6%; EOT 8.0% | | $ | 2,717 | | | $ | 2,928 | | | $ | 2,913 | | | |
| | Equipment Financing | | July 26, 2022 | | February 1, 2026 | | Fixed interest rate 11.1%; EOT 8.0% | | | 3,896 | | | | 4,168 | | | | 4,182 | | | |
| | Equipment Financing | | August 12, 2022 | | March 1, 2026 | | Fixed interest rate 11.6%; EOT 8.0% | | | 3,119 | | | | 3,321 | | | | 3,360 | | | |
| | Equipment Financing | | September 26, 2022 | | April 1, 2026 | | Fixed interest rate 11.9%; EOT 8.0% | | | 3,831 | | | | 4,056 | | | | 4,140 | | | |
| | Equipment Financing | | October 25, 2022 | | May 1, 2026 | | Fixed interest rate 12.6%; EOT 8.0% | | | 3,224 | | | | 3,397 | | | | 3,472 | | | |
| | Equipment Financing | | November 30, 2022 | | June 1, 2026 | | Fixed interest rate 12.7%; EOT 8.0% | | | 2,140 | | | | 2,244 | | | | 2,319 | | | |
Total BlueGround US, Inc. | | | | | | | | | | | 18,927 | | | | 20,114 | | | | 20,386 | | | |
| | | | | | | | | | | | | | | | | | | |
| | | | | | | | | | | | | | | | | | | |
BoardRE, Inc. | | Secured Loan | | October 15, 2021 | | June 1, 2026 | | Variable interest rate Prime + 8.3% or Floor rate 11.5%; EOT 4.5% | | $ | 5,000 | | | $ | 5,234 | | | $ | 4,433 | | | (8) |
| | | | | | | | | | | | | | | | | | | |
Knockaway, Inc. | | Secured Loan | | September 29, 2023 | | September 1, 2028 | | Variable interest rate Prime + 6.8% or Floor rate 15.3%; EOT 0.0% | | $ | 23,644 | | | $ | 21,222 | | | $ | 21,253 | | | (8) |
| | Secured Loan | | December 6, 2023 | | January 31, 2024 | | Variable interest rate SOFR 30 Day Forward + 10.0% or Floor rate 11.8%; EOT 0.0% ⁽⁸⁾ | | | 1,742 | | | | 1,736 | | | | 1,736 | | | (8) |
Total Knockaway, Inc. | | | | | | | | | | | 25,386 | | | | 22,958 | | | | 22,989 | | | |
| | | | | | | | | | | | | | | | | | | |
Maxwell Financial Labs, Inc. | | Secured Loan | | September 30, 2021 | | April 1, 2026 | | Variable interest rate Prime + 6.0% or Floor rate 10.0%; EOT 5.0% | | $ | 14,843 | | | $ | 15,160 | | | $ | 14,909 | | | (8) |
| | | | | | | | | | | | | | | | | | | |
Orchard Technologies, Inc. | | Secured Loan | | March 11, 2021 | | April 1, 2026 | | Variable interest rate Prime + 7.5% or Floor rate 11.0%; EOT 4.0% | | $ | 4,083 | | | $ | 4,230 | | | $ | 4,156 | | | (8) |
| | Secured Loan | | July 23, 2021 | | April 1, 2026 | | Variable interest rate Prime + 7.5% or Floor rate 11.0%; EOT 4.0% | | | 11,211 | | | | 11,554 | | | | 11,368 | | | (8) |
| | Secured Loan | | August 2, 2022 | | April 1, 2026 | | Variable interest rate Prime + 7.5% or Floor rate 11.0%; EOT 4.0% | | | 12,500 | | | | 12,701 | | | | 12,569 | | | (8) |
Total Orchard Technologies, Inc. | | | | | | | | | | | 27,794 | | | | 28,485 | | | | 28,093 | | | |
| | | | | | | | | | | | | | | | | | | |
Sub-total: Real Estate Technology (6.9%)* | | | | $ | 91,950 | | | $ | 91,951 | | | $ | 90,810 | | | |
TRINITY CAPITAL INC.
Consolidated Schedule of Investments
December 31, 2023
(In thousands, except share and per share data)
| | | | | | | | | | | | | | | | | | | | | | |
Portfolio Company (1) | | Type of Investment (2) | | Investment Date (3) | | Maturity Date | | Interest Rate (4) | | Principal
Amount (5) | | | Cost | | | Fair Value (6) | | | Footnotes |
Debt Securities- United States, Continued | | | | | | | | | | | | | |
| | | | | | | | | | | | | | | | | | | |
Software as a Service ("SaaS") | |
| | | | | | | |
| | |
| | |
| | | |
BackBlaze, Inc. | | Equipment Financing | | January 20, 2020 | | February 1, 2024 | | Fixed interest rate 7.4%; EOT 11.5% | | $ | 22 | | | $ | 128 | | | $ | 128 | | | |
| | Equipment Financing | | February 1, 2020 | | March 1, 2024 | | Fixed interest rate 7.2%; EOT 11.5% | | | 37 | | | | 127 | | | | 125 | | | |
| | Equipment Financing | | March 26, 2020 | | April 1, 2024 | | Fixed interest rate 7.4%; EOT 11.5% | | | 17 | | | | 43 | | | | 42 | | | |
| | Equipment Financing | | April 17, 2020 | | May 1, 2024 | | Fixed interest rate 7.3%; EOT 11.5% | | | 139 | | | | 306 | | | | 300 | | | |
| | Equipment Financing | | July 27, 2020 | | August 1, 2024 | | Fixed interest rate 7.4%; EOT 11.5% | | | 242 | | | | 409 | | | | 399 | | | |
| | Equipment Financing | | September 4, 2020 | | October 1, 2024 | | Fixed interest rate 7.2%; EOT 11.5% | | | 53 | | | | 81 | | | | 79 | | | |
| | Equipment Financing | | March 29, 2021 | | April 1, 2025 | | Fixed interest rate 7.5%; EOT 11.5% | | | 955 | | | | 1,245 | | | | 1,204 | | | |
Total BackBlaze, Inc. | | | | | | | | | | | 1,465 | | | | 2,339 | | | | 2,277 | | | |
| | | | | | | | | | | | | | | | | | | |
Cart.com, Inc. | | Secured Loan | | November 17, 2023 | | November 1, 2028 | | Variable interest rate Prime + 4.0% or Floor rate 12.5%; EOT 0.0% | | $ | 30,000 | | | $ | 29,030 | | | $ | 29,030 | | | (8)(14) |
| | | | | | | | | | | | | | | | | | | |
Sub-total: SaaS (2.4%)* | |
| | | | | | | | $ | 31,465 | | | $ | 31,369 | | | $ | 31,307 | | | |
| | | | | | | | | | | | | | | | | | | |
Space Technology | | | | | | | | | | | | | | | | | | | |
Astranis Space Technology Corporation | | Equipment Financing | | April 13, 2023 | | November 1, 2026 | | Fixed interest rate 12.1%; EOT 5.0% | | $ | 12,558 | | | $ | 12,744 | | | $ | 12,904 | | | (9)(14) |
| | | | | | | | | | | | | | | | | | | |
Axiom Space, Inc. | | Secured Loan | | May 28, 2021 | | June 1, 2026 | | Variable interest rate Prime + 6.0% or Floor rate 9.3%; EOT 2.5% | | $ | 25,000 | | | $ | 25,439 | | | $ | 25,306 | | | (8) |
| | | | | | | | | | | | | | | | | | | |
Hadrian Automation, Inc. | | Equipment Financing | | March 2, 2022 | | September 1, 2025 | | Fixed interest rate 12.6%; EOT 0.0% | | $ | 277 | | | $ | 277 | | | $ | 278 | | | (14) |
| | Equipment Financing | | May 6, 2022 | | November 1, 2025 | | Fixed interest rate 12.9%; EOT 0.0% | | | 2,940 | | | | 2,933 | | | | 2,955 | | | (14) |
| | Equipment Financing | | July 15, 2022 | | January 1, 2026 | | Fixed interest rate 14.3%; EOT 0.0% | | | 2,141 | | | | 2,135 | | | | 2,163 | | | (14) |
| | Equipment Financing | | September 30, 2022 | | March 1, 2026 | | Fixed interest rate 15.2%; EOT 0.0% | | | 3,835 | | | | 3,828 | | | | 3,923 | | | (9)(14) |
| | Equipment Financing | | December 22, 2022 | | June 1, 2026 | | Fixed interest rate 16.1%; EOT 0.0% | | | 945 | | | | 935 | | | | 983 | | | (9)(14) |
| | Equipment Financing | | December 22, 2022 | | December 1, 2026 | | Fixed interest rate 16.4%; EOT 0.0% | | | 870 | | | | 867 | | | | 912 | | | (9)(14) |
| | Equipment Financing | | March 29, 2023 | | March 1, 2027 | | Fixed interest rate 16.4%; EOT 0.0% | | | 2,696 | | | | 2,687 | | | | 2,808 | | | (9)(14) |
| | Equipment Financing | | September 28, 2023 | | September 1, 2027 | | Fixed interest rate 15.7%; EOT 0.0% | | | 1,361 | | | | 1,355 | | | | 1,398 | | | (9)(14) |
Total Hadrian Automation, Inc. | | | | | | | | | | | 15,065 | | | | 15,017 | | | | 15,420 | | | |
| | | | | | | | | | | | | | | | | | | |
Hermeus Corporation | | Equipment Financing | | August 9, 2022 | | March 1, 2026 | | Fixed interest rate 9.6%; EOT 6.0% | | $ | 715 | | | $ | 755 | | | $ | 728 | | | (9)(14) |
| | Equipment Financing | | October 11, 2022 | | May 1, 2026 | | Fixed interest rate 11.8%; EOT 6.0% | | | 1,311 | | | | 1,364 | | | | 1,333 | | | (9)(14) |
| | Equipment Financing | | April 12, 2023 | | November 1, 2026 | | Fixed interest rate 12.6%; EOT 6.0% | | | 1,806 | | | | 1,815 | | | | 1,808 | | | (9)(14) |
| | Equipment Financing | | October 24, 2023 | | May 1, 2027 | | Fixed interest rate 14.0%; EOT 6.0% | | | 1,020 | | | | 998 | | | | 998 | | | (9)(14) |
Total Hermeus Corporation | | | | | | | | | | | 4,852 | | | | 4,932 | | | | 4,867 | | | |
| | | | | | | | | | | | | | | | | | | |
Rocket Lab USA, Inc. | | Equipment Financing | | December 29, 2023 | | January 1, 2029 | | Fixed interest rate 12.5%; EOT 1.0% | | $ | 70,000 | | | $ | 68,422 | | | $ | 68,422 | | | (10)(14) |
| | Equipment Financing | | December 29, 2023 | | December 1, 2028 | | Fixed interest rate 12.5%; EOT 0.0% | | | 40,000 | | | | 39,999 | | | | 39,999 | | | (10)(14) |
Total Rocket Lab USA, Inc. | | | | | | | | | | | 110,000 | | | | 108,421 | | | | 108,421 | | | |
| | | | | | | | | | | | | | | | | | | |
Space Perspective, Inc. | | Secured Loan | | March 3, 2022 | | July 1, 2026 | | Variable interest rate Prime + 7.8% or Floor rate 11.0%; EOT 5.0% | | $ | 4,441 | | | $ | 4,531 | | | $ | 4,403 | | | (8) |
| | | | | | | | | | | | | | | | | | | |
Sub-total: Space Technology (13.1%)* | | | | $ | 171,916 | | | $ | 171,084 | | | $ | 171,321 | | | |
TRINITY CAPITAL INC.
Consolidated Schedule of Investments
December 31, 2023
(In thousands, except share and per share data)
| | | | | | | | | | | | | | | | | | | | | | |
Portfolio Company (1) | | Type of Investment (2) | | Investment Date (3) | | Maturity Date | | Interest Rate (4) | | Principal
Amount (5) | | | Cost | | | Fair Value (6) | | | Footnotes |
Debt Securities- United States, Continued | | | | | | | | | | | | | |
| | | | | | | | | | | | | | | | | | | |
Supply Chain Technology | | | | | | | | | | | | | | | | | | | |
Macrofab, Inc. | | Secured Loan | | July 21, 2023 | | August 1, 2027 | | Variable interest rate Prime + 5.5% or Floor rate 13.3%; EOT 4.0% | | $ | 20,000 | | | $ | 19,696 | | | $ | 19,990 | | | (8)(14) |
| | | | | | | | | | | | | | | | | | | |
Sub-total: Supply Chain Technology (1.5%)* | |
| | | | | | | | $ | 20,000 | | | $ | 19,696 | | | $ | 19,990 | | | |
| | | | | | | | | | | | | | | | | | | |
Transportation Technology | |
| | | | | | | |
| | |
| | |
| | | |
NextCar Holding Company, Inc. | | Secured Loan | | December 14, 2021 | | March 31, 2024 | | Variable interest rate Prime + 5.8% or Floor rate 9.0%; EOT 5.3% | | $ | 6,012 | | | $ | 6,014 | | | $ | 5,053 | | | (8)(15) |
| | Secured Loan | | December 15, 2021 | | March 31, 2024 | | Variable interest rate Prime + 5.8% or Floor rate 9.0%; EOT 5.3% | | | 2,405 | | | | 2,405 | | | | 2,022 | | | (8)(15) |
| | Secured Loan | | February 23, 2022 | | March 31, 2024 | | Variable interest rate Prime + 5.8% or Floor rate 9.0%; EOT 5.3% | | | 3,006 | | | | 3,006 | | | | 2,528 | | | (8)(15) |
| | Secured Loan | | March 16, 2022 | | March 31, 2024 | | Variable interest rate Prime + 5.8% or Floor rate 9.0%; EOT 5.3% | | | 3,607 | | | | 3,607 | | | | 3,033 | | | (8)(15) |
| | Secured Loan | | April 18, 2022 | | March 31, 2024 | | Variable interest rate Prime + 5.8% or Floor rate 9.0%; EOT 5.3% | | | 3,006 | | | | 3,006 | | | | 2,528 | | | (8)(15) |
| | Secured Loan | | April 18, 2022 | | March 31, 2024 | | Variable interest rate Prime + 5.8% or Floor rate 9.0%; EOT 5.3% | | | 3,006 | | | | 3,006 | | | | 2,528 | | | (8)(15) |
| | Secured Loan | | May 17, 2022 | | March 31, 2024 | | Variable interest rate Prime + 5.8% or Floor rate 9.0%; EOT 5.3% | | | 6,012 | | | | 6,012 | | | | 5,055 | | | (8)(15) |
| | Secured Loan | | June 22, 2022 | | March 31, 2024 | | Variable interest rate Prime + 5.8% or Floor rate 9.0%; EOT 5.3% | | | 3,006 | | | | 3,006 | | | | 2,528 | | | (8)(15) |
Total NextCar Holding Company, Inc. | | | | | | | | | | | 30,060 | | | | 30,062 | | | | 25,275 | | | |
| |
| | | | | | | |
| | |
| | |
| | | |
Get Spiffy, Inc. | | Secured Loan | | July 14, 2023 | | January 14, 2028 | | Variable interest rate Prime + 4.5% or Floor rate 12.3%; EOT 6.0% | | $ | 9,000 | | | $ | 8,900 | | | $ | 8,785 | | | (8)(9)(14) |
| | Equipment Financing | | July 14, 2023 | | February 1, 2027 | | Fixed interest rate 12.1%; EOT 4.0% | | | 406 | | | | 400 | | | | 321 | | | (9)(14) |
Total Get Spiffy, Inc. | | | | | | | | | | | 9,406 | | | | 9,300 | | | | 9,106 | | | |
| | | | | | | | | | | | | | | | | | | |
Zuum Transportation, Inc. | | Secured Loan | | December 17, 2021 | | January 1, 2027 | | Variable interest rate Prime + 6.0% or Floor rate 10.8%; EOT 2.5% | | $ | 5,000 | | | $ | 5,061 | | | $ | 4,757 | | | (8) |
| | | | | | | | | | | | | | | | | | | |
Sub-total: Transportation Technology (3.0%)* | |
| | | | | | | | $ | 44,466 | | | $ | 44,423 | | | $ | 39,138 | | | |
| | | | | | | | | | | | | | | | | | | |
Total: Debt Securities- United States (90.8%)* | | | | | | | | | | $ | 1,196,893 | | | $ | 1,206,026 | | | $ | 1,189,353 | | | |
TRINITY CAPITAL INC.
Consolidated Schedule of Investments
December 31, 2023
(In thousands, except share and per share data)
| | | | | | | | | | | | | | | | | | | | | | |
Portfolio Company (1) | | Type of Investment (2) | | Investment Date (3) | | Maturity Date | | Interest Rate (4) | | Principal
Amount (5) | | | Cost | | | Fair Value (6) | | | Footnotes |
Debt Securities- Canada | | | | | | | | | | | | | | | | | | | |
| | | | | | | | | | | | | | | | | | | |
Construction Technology | | | | | | | | | | | | | | | | | | | |
Nexii Building Solutions, Inc. | | Secured Loan | | August 27, 2021 | | August 27, 2025 | | Variable interest rate Prime + 7.0% or Floor rate 10.3%; EOT 2.5% | | $ | 10,659 | | | $ | 11,055 | | | $ | 4,091 | | | (8)(10)(15)(18) |
| | Secured Loan | | June 8, 2022 | | June 8, 2026 | | Variable interest rate Prime + 7.0% or Floor rate 10.3%; EOT 2.5% | | | 5,329 | | | | 5,527 | | | | 2,045 | | | (8)(10)(15)(18) |
| | Secured Loan | | June 21, 2023 | | March 31, 2024 | | Variable interest rate Prime + 7.0% or Floor rate 10.3% | | | 1,785 | | | | 1,785 | | | | 669 | | | (8)(10)(14)(15)(18) |
Total Nexii Building Solutions, Inc. | | | | | | | | | | | 17,773 | | | | 18,367 | | | | 6,805 | | | |
| | | | | | | | | | | | | | | | | | | |
Sub-total: Construction Technology (0.5%)* | | | | $ | 17,773 | | | $ | 18,367 | | | $ | 6,805 | | | |
| | | | | | | | | | | | | | | | | | | |
Supply Chain Technology | |
| | | | | | | |
| | |
| | |
| | | |
GoFor Industries, Inc. | | Secured Loan | | January 21, 2022 | | February 1, 2026 | | Variable interest rate Prime + 8.8% or Floor rate 12.0%; EOT 2.5% | | $ | 9,570 | | | $ | 9,385 | | | $ | 4,222 | | | (8)(10)(18)(20) |
| | | | | | | | | | | | | | | | | | | |
Sub-total: Supply Chain Technology (0.3%)* | | $ | 9,570 | | | $ | 9,385 | | | $ | 4,222 | | | |
| | | | | | | | | | | | | | | | | | | |
Total: Debt Securities- Canada (0.8%)* | | | | | | | | $ | 27,343 | | | $ | 27,752 | | | $ | 11,027 | | | |
| | | | | | | | | | | | | | | | | | | |
Debt Securities- Europe | | | | | | | | | | | | | | | | | | | |
| | | | | | | | | | | | | | | | | | | |
Industrials | | | | | |
| | | |
| | |
| | |
| | | |
Aledia, Inc. | | Equipment Financing | | March 31, 2022 | | April 1, 2025 | | Fixed interest rate 9.0%; EOT 7.0% | | $ | 8,139 | | | $ | 9,171 | | | $ | 8,981 | | | (10)(14) |
| | Equipment Financing | | June 30, 2022 | | July 1, 2025 | | Fixed interest rate 9.7%; EOT 7.0% | | | 625 | | | | 684 | | | | 673 | | | (10)(14) |
| | Equipment Financing | | August 5, 2022 | | September 1, 2025 | | Fixed interest rate 10.7%; EOT 7.0% | | | 899 | | | | 970 | | | | 958 | | | (10)(14) |
| | Equipment Financing | | September 30, 2022 | | October 1, 2025 | | Fixed interest rate 12.0%; EOT 7.0% | | | 1,498 | | | | 1,602 | | | | 1,590 | | | (10)(14) |
Total Aledia, Inc. | | | | | | | | | | | 11,161 | | | | 12,427 | | | | 12,202 | | | |
| | | | | | | | | | | | | | | | | | | |
Sub-total: Industrials (0.9%)* | |
| | | | | | | | $ | 11,161 | | | $ | 12,427 | | | $ | 12,202 | | | |
| | | | | | | | | | | | | | | | | | | |
Space Technology | |
| | | | | | | |
| | |
| | |
| | | |
All.Space Networks, Limited. | | Secured Loan | | August 22, 2022 | | September 1, 2027 | | Variable interest rate Prime + 7.0% or Floor rate 11.5%; EOT 2.5% | | $ | 9,539 | | | $ | 9,565 | | | $ | 9,495 | | | (8)(10)(14) |
| | | | | | | | | | | | | | | | | | | |
Sub-total: Space Technology (0.7%)* | | | | | | | | $ | 9,539 | | | $ | 9,565 | | | $ | 9,495 | | | |
| | | | | | | | | | | | | | | | | | | |
Total: Debt Securities- Europe (1.7%)* | | | | | | | | $ | 20,700 | | | $ | 21,992 | | | $ | 21,697 | | | |
| | | | | | | | | | | | | | | | | | | |
Total: Debt Securities (93.3%)(19)* | | | | | | | | $ | 1,244,936 | | | $ | 1,255,770 | | | $ | 1,222,077 | | | |
TRINITY CAPITAL INC.
Consolidated Schedule of Investments
December 31, 2023
(In thousands, except share and per share data)
| | | | | | | | | | | | | | | | | | | | | | | | | | |
Portfolio Company (1) | | Type of
Investment (2)(14) | | Investment Date (3) | | Expiration Date | | Series | | Shares | | | Strike Price | | | Cost | | | Fair Value (6) | | | Footnotes |
Warrant Investments- United States | | | | | | | | | | | | | | | | | | | | | | |
| | | | | | | | | | | | | | | | | | | | | | |
Artificial Intelligence & Automation | | | | | | | | | | | | | | | | | | | | |
| | | | | | | | | | | | | | | | | | | | | | |
Ambient Photonics, Inc. | | Warrant | | July 27, 2022 | | July 27, 2032 | | Common Stock | | | 159,760 | | | $ | 0.55 | | | $ | 47 | | | $ | 220 | | | |
| | | | | | | | | | | | | | | | | | | | | | |
Everalbum, Inc. | | Warrant | | January 16, 2020 | | July 29, 2026 | | Preferred Series A | | | 851,063 | | | $ | 0.10 | | | $ | 25 | | | $ | 2 | | | (17) |
| | | | | | | | | | | | | | | | | | | | | | |
Hologram, Inc. | | Warrant | | January 31, 2020 | | January 27, 2030 | | Common Stock | | | 193,054 | | | $ | 0.26 | | | $ | 49 | | | $ | 257 | | | |
| | | | | | | | | | | | | | | | | | | | | | |
Presto Automation, Inc. | | Warrant | | January 16, 2020 | | April 28, 2027 | | Preferred Series A | | | 402,679 | | | $ | 0.37 | | | $ | 185 | | | $ | 71 | | | (7)(17) |
| | Warrant | | January 16, 2020 | | July 28, 2027 | | Common Stock | | | 170,993 | | | $ | 5.85 | | | | 28 | | | | — | | | (7) |
Total Presto Automation, Inc. | | | | | | | | | | | | | | | | | 213 | | | | 71 | | | |
| | | | | | | | | | | | | | | | | | | | | | |
Stratifyd, Inc. | | Warrant | | September 3, 2021 | | September 3, 2031 | | Preferred Series B-2 | | | 106,719 | | | $ | 2.53 | | | $ | 56 | | | $ | — | | | (17) |
| | | | | | | | | | | | | | | | | | | | | | |
Sub-Total: Artificial Intelligence & Automation (0.0%)* | | | | | | | | | | | $ | 390 | | | $ | 550 | | | |
| | | | | | | | | | | | | | | | | | | | | | |
Biotechnology | | | | | |
| | | | |
| | |
| | |
| | | |
| | | | | | | | | | | | | | | | | | | | | | |
Pendulum Therapeutics, Inc. | | Warrant | | January 16, 2020 | | October 9, 2029 | | Preferred Series B | | | 55,263 | | | $ | 1.90 | | | $ | 43 | | | $ | 4 | | | (17) |
| | Warrant | | June 1, 2020 | | July 15, 2030 | | Preferred Series B | | | 36,842 | | | $ | 1.90 | | | | 36 | | | | 2 | | | (17) |
| | Warrant | | December 31, 2021 | | December 31, 2031 | | Preferred Series C | | | 322,251 | | | $ | 3.24 | | | | 118 | | | | 9 | | | (17) |
Total Pendulum Therapeutics, Inc. | | | | | | | | | | | | | | | | | 197 | | | | 15 | | | |
| | | | | | | | | | | | | | | | | | | | | | |
Sub-Total: Biotechnology (0.0%)* | | | | | | | | | | | $ | 197 | | | $ | 15 | | | |
| | | | | | | | | | | | | | | | | | | | | | |
Connectivity | | | | | |
| | | | |
| | |
| | |
| | | |
Tarana Wireless, Inc. | | Warrant | | June 30, 2021 | | June 30, 2031 | | Common Stock | | | 5,027,629 | | | $ | 0.19 | | | $ | 967 | | | $ | 2,673 | | | |
| | | | | | | | | | | | | | | | | | | | | | |
Vertical Communications, Inc. | | Warrant | | January 16, 2020 | | July 11, 2026 | | Preferred Series A | | | 828,479 | | | $ | 1.00 | | | $ | — | | | $ | — | | | (11)(17)(20) |
| | | | | | | | | | | | | | | | | | | | | | |
viaPhoton, Inc. | | Warrant | | March 31, 2022 | | March 31, 2032 | | Common Stock | | | 15,839 | | | $ | 0.60 | | | $ | 22 | | | $ | 24 | | | |
| | | | | | | | | | | | | | | | | | | | | | |
Sub-Total: Connectivity (0.2%)* | | | | | | | | | | | $ | 989 | | | $ | 2,697 | | | |
| | | | | | | | | | | | | | | | | | | | | | |
Construction Technology | | | | | | | | | | | | | | | | | | | | |
Project Frog, Inc. | | Warrant | | January 16, 2020 | | February 28, 2027 | | Preferred Series AA-1 | | | 211,649 | | | $ | 0.19 | | | $ | 9 | | | $ | — | | | (17)(20) |
| | Warrant | | January 16, 2020 | | February 28, 2027 | | Common Stock | | | 180,340 | | | $ | 0.19 | | | | 9 | | | | — | | | (20) |
| | Warrant | | August 3, 2021 | | December 31, 2031 | | Preferred Series CC | | | 250,000 | | | $ | 0.01 | | | | 20 | | | | — | | | (17)(20) |
Total Project Frog, Inc. | | | | | | | | | | | | | | | | | 38 | | | | — | | | |
| | | | | | | | | | | | | | | | | | | | | | |
Sub-total: Construction Technology (0.0%)* | | | | | | | | | | | | | | | | $ | 38 | | | $ | — | | | |
TRINITY CAPITAL INC.
Consolidated Schedule of Investments
December 31, 2023
(In thousands, except share and per share data)
| | | | | | | | | | | | | | | | | | | | | | | | | | |
Portfolio Company (1) | | Type of
Investment (2)(14) | | Investment Date (3) | | Expiration Date | | Series | | Shares | | | Strike Price | | | Cost | | | Fair Value (6) | | | Footnotes |
Warrant Investments- United States, Continued | | | | | | | | | | | | | | | | | | | | | | |
| | | | | | | | | | | | | | | | | | | | | | |
Consumer Products & Services | | | | | | | | | | | | | | | | | | | | | | |
BaubleBar, Inc. | | Warrant | | January 16, 2020 | | March 29, 2027 | | Preferred Series C | | | 531,806 | | | $ | 1.96 | | | $ | 639 | | | $ | 58 | | | (17) |
| | Warrant | | January 16, 2020 | | April 20, 2028 | | Preferred Series C | | | 60,000 | | | $ | 1.96 | | | | 72 | | | | 7 | | | (17) |
Total BaubleBar, Inc. | | | | | | | | | | | | | | | | | 711 | | | | 65 | | | |
| | | | | | | | | | | | | | | | | | | | | | |
Boosted eCommerce, Inc. | | Warrant | | December 18, 2020 | | December 14, 2030 | | Preferred Series A-1 | | | 759,263 | | | $ | 0.84 | | | $ | 259 | | | $ | 40 | | | (17) |
| | | | | | | | | | | | | | | | | | | | | | |
Happiest Baby, Inc. | | Warrant | | January 16, 2020 | | May 16, 2029 | | Common Stock | | | 182,554 | | | $ | 0.33 | | | $ | 193 | | | $ | 84 | | | |
| | | | | | | | | | | | | | | | | | | | | | |
Madison Reed, Inc. | | Warrant | | January 16, 2020 | | March 23, 2027 | | Preferred Series C | | | 194,553 | | | $ | 2.57 | | | $ | 185 | | | $ | 375 | | | (17) |
| | Warrant | | January 16, 2020 | | July 18, 2028 | | Common Stock | | | 43,158 | | | $ | 0.99 | | | | 71 | | | | 116 | | | |
| | Warrant | | January 16, 2020 | | June 30, 2029 | | Common Stock | | | 36,585 | | | $ | 1.23 | | | | 56 | | | | 94 | | | |
Total Madison Reed, Inc. | | | | | | | | | | | | | | | | | 312 | | | | 585 | | | |
| | | | | | | | | | | | | | | | | | | | | | |
Ogee, Inc. | | Warrant | | February 14, 2023 | | February 14, 2033 | | Preferred Series A-3 | | | 259,221 | | | $ | 0.68 | | | $ | 57 | | | $ | 47 | | | (17) |
| | Warrant | | September 29, 2023 | | September 29, 2033 | | Preferred Series A-3 | | | 259,221 | | | $ | 0.68 | | | | 52 | | | | 47 | | | (17) |
Total Ogee, Inc. | | | | | | | | | | | | | | | | | 109 | | | | 94 | | | |
| | | | | | | | | | | | | | | | | | | | | | |
Portofino Labs, Inc. | | Warrant | | December 31, 2020 | | December 31, 2030 | | Common Stock | | | 99,148 | | | $ | 1.53 | | | $ | 160 | | | $ | 41 | | | |
| | Warrant | | April 1, 2021 | | April 1, 2031 | | Common Stock | | | 39,912 | | | $ | 1.46 | | | | 99 | | | | 17 | | | |
Total Portofino Labs, Inc. | | | | | | | | | | | | | | | | | 259 | | | | 58 | | | |
| | | | | | | | | | | | | | | | | | | | | | |
Quip NYC, Inc. | | Warrant | | March 9, 2021 | | March 9, 2031 | | Preferred Series A-1 | | | 10,833 | | | $ | 48.46 | | | $ | 203 | | | $ | 42 | | | (17) |
| | | | | | | | | | | | | | | | | | | | | | |
Rinse, Inc. | | Warrant | | May 10, 2022 | | May 10, 2032 | | Preferred Series C | | | 278,761 | | | $ | 1.13 | | | $ | 118 | | | $ | 185 | | | (17) |
| | | | | | | | | | | | | | | | | | | | | | |
SI Tickets, Inc. | | Warrant | | May 11, 2022 | | May 11, 2032 | | Common Stock | | | 53,029 | | | $ | 2.52 | | | $ | 162 | | | $ | 11 | | | |
| | | | | | | | | | | | | | | | | | | | | | |
Super73, Inc. | | Warrant | | December 31, 2020 | | December 31, 2030 | | Common Stock | | | 177,305 | | | $ | 3.16 | | | $ | 105 | | | $ | 455 | | | |
| | | | | | | | | | | | | | | | | | | | | | |
Trendly, Inc. | | Warrant | | January 16, 2020 | | August 10, 2026 | | Preferred Series A | | | 245,506 | | | $ | 1.14 | | | $ | 222 | | | $ | 4 | | | (17) |
| | | | | | | | | | | | | | | | | | | | | | |
VitaCup, Inc. | | Warrant | | June 23, 2021 | | June 23, 2031 | | Preferred Series C | | | 68,996 | | | $ | 2.79 | | | $ | 9 | | | $ | — | | | (17) |
| | Warrant | | November 22, 2023 | | November 22, 2033 | | Common Stock | | | 51,225 | | | $ | 0.41 | | | | — | | | | — | | | |
Total VitaCup, Inc. | | | | | | | | | | | | | | | | | 9 | | | | — | | | |
| | | | | | | | | | | | | | | | | | | | | | |
Whoop, Inc. | | Warrant | | May 17, 2023 | | May 17, 2033 | | Common Stock | | | 1,741,313 | | | $ | 0.43 | | | $ | 516 | | | $ | 799 | | | (9) |
| | | | | | | | | | | | | | | | | | | | | | |
Sub-Total: Consumer Products & Services (0.2%)* | | | | | | | | | | | | | | | | $ | 3,178 | | | $ | 2,422 | | | |
TRINITY CAPITAL INC.
Consolidated Schedule of Investments
December 31, 2023
(In thousands, except share and per share data)
| | | | | | | | | | | | | | | | | | | | | | | | | | |
Portfolio Company (1) | | Type of
Investment (2)(14) | | Investment Date (3) | | Expiration Date | | Series | | Shares | | | Strike Price | | | Cost | | | Fair Value (6) | | | Footnotes |
Warrant Investments- United States, Continued | | | | | | | | | | | | | | | | | | | | | | |
| | | | | | | | | | | | | | | | | | | | | | |
Education Technology | | | | | | | | | | | | | | | | | | | | | | |
Medical Sales Training Holding Company | | Warrant | | March 18, 2021 | | March 18, 2031 | | Common Stock | | | 28,732 | | | $ | 7.74 | | | $ | 108 | | | $ | 29 | | | |
| | | | | | | | | | | | | | | | | | | | | | |
Yellowbrick Learning, Inc. | | Warrant | | January 16, 2020 | | September 30, 2028 | | Common Stock | | | 222,222 | | | $ | 0.90 | | | $ | 120 | | | $ | — | | | |
| | | | | | | | | | | | | | | | | | | | | | |
Sub-Total: Education Technology (0.0%)* | | | | | | | | | | | | | | | | $ | 228 | | | $ | 29 | | | |
| | | | | | | | | | | | | | | | | | | | | | |
Finance and Insurance | | | | | | | | | | | | | | | | | | | | | | |
DailyPay, Inc. | | Warrant | | September 30, 2020 | | September 30, 2030 | | Common Stock | | | 89,264 | | | $ | 3.00 | | | $ | 151 | | | $ | 998 | | | |
| | | | | | | | | | | | | | | | | | | | | | |
Dynamics, Inc. | | Warrant | | January 16, 2020 | | March 10, 2024 | | Common Stock | | | 17,000 | | | $ | 10.59 | | | $ | 86 | | | $ | — | | | |
| | | | | | | | | | | | | | | | | | | | | | |
Empower Financial, Inc. | | Warrant | | October 13, 2023 | | October 13, 2033 | | Common Stock | | | 209,198 | | | $ | 1.43 | | | $ | 268 | | | $ | 342 | | | (9) |
| | | | | | | | | | | | | | | | | | | | | | |
Eqis Capital Management, Inc. | | Warrant | | June 15, 2022 | | June 15, 2032 | | Preferred Class B | | | 904,000 | | | $ | 0.55 | | | $ | 10 | | | $ | 29 | | | (17) |
| | | | | | | | | | | | | | | | | | | | | | |
Petal Card, Inc. | | Warrant | | January 16, 2020 | | November 27, 2029 | | Common Stock | | | 250,268 | | | $ | 1.32 | | | $ | 147 | | | $ | — | | | |
| | Warrant | | January 11, 2021 | | January 11, 2031 | | Common Stock | | | 135,835 | | | $ | 0.01 | | | | 312 | | | | — | | | |
| | Warrant | | August 6, 2021 | | August 6, 2031 | | Common Stock | | | 111,555 | | | $ | 1.60 | | | | 197 | | | | — | | | |
| | Warrant | | June 20, 2023 | | June 20, 2033 | | Preferred Series C | | | 402,434 | | | $ | 0.01 | | | | 1,523 | | | | — | | | (17) |
| | Warrant | | July 27, 2023 | | July 27, 2033 | | Preferred Series C | | | 1,760,651 | | | $ | 0.01 | | | | 2,500 | | | | — | | | (17) |
Total Petal Card, Inc. | | | | | | | | | | | | | | | | | 4,679 | | | | — | | | |
| | | | | | | | | | | | | | | | | | | | | | |
RealtyMogul, Co. | | Warrant | | January 16, 2020 | | December 18, 2027 | | Preferred Series B | | | 234,421 | | | $ | 3.88 | | | $ | 285 | | | $ | 1,706 | | | (17) |
| | | | | | | | | | | | | | | | | | | | | | |
Slope Tech, Inc. | | Warrant | | September 14, 2022 | | September 14, 2032 | | Common Stock | | | 90,971 | | | $ | 0.88 | | | $ | 109 | | | $ | 484 | | | |
| | Warrant | | August 30, 2023 | | August 30, 2033 | | Common Stock | | | 21,303 | | | $ | 0.88 | | | | 112 | | | | 113 | | | |
Total Slope Tech, Inc. | | | | | | | | | | | | | | | | | 221 | | | | 597 | | | |
| | | | | | | | | | | | | | | | | | | | | | |
ZenDrive, Inc. | | Warrant | | July 16, 2021 | | July 16, 2031 | | Common Stock | | | 30,466 | | | $ | 2.46 | | | $ | 29 | | | $ | — | | | |
| | | | | | | | | | | | | | | | | | | | | | |
Sub-Total: Finance and Insurance (0.2%)* | | | | | | | | | | | | | | | | $ | 5,729 | | | $ | 3,672 | | | |
| | | | | | | | | | | | | | | | | | | | | | |
Food and Agriculture Technologies | | | | | | | | | | | | | | | |
| | |
| | | |
Athletic Brewing Company, LLC | | Warrant | | October 28, 2022 | | October 28, 2032 | | Preferred Class B | | | 3,741 | | | $ | 140.21 | | | $ | 287 | | | $ | 196 | | | (17) |
| | | | | | | | | | | | | | | | | | | | | | |
Bowery Farming, Inc. | | Warrant | | January 16, 2020 | | June 10, 2029 | | Common Stock | | | 68,863 | | | $ | 5.08 | | | $ | 410 | | | $ | 12 | | | |
| | Warrant | | December 22, 2020 | | December 22, 2030 | | Common Stock | | | 29,925 | | | $ | 6.24 | | | | 160 | | | | 5 | | | |
| | Warrant | | September 10, 2021 | | September 10, 2028 | | Common Stock | | | 21,577 | | | $ | 0.01 | | | | 617 | | | | 5 | | | |
| | Warrant | | December 29, 2023 | | December 29, 2030 | | Common Stock | | | 114,725 | | | $ | 0.01 | | | | 29 | | | | 29 | | | |
Total Bowery Farming, Inc. | | | | | | | | | | | | | | | | | 1,216 | | | | 51 | | | |
| | | | | | | | | | | | | | | | | | | | | | |
Daring Foods, Inc. | | Warrant | | April 8, 2021 | | April 8, 2031 | | Common Stock | | | 68,100 | | | $ | 0.27 | | | $ | 106 | | | $ | 174 | | | |
| | | | | | | | | | | | | | | | | | | | | | |
DrinkPak, LLC | | Warrant | | September 13, 2022 | | September 13, 2032 | | Common Stock | | | 2,387 | | | $ | 19.12 | | | $ | 7 | | | $ | 102 | | | (9) |
| | Warrant | | February 17, 2023 | | February 17, 2033 | | Common Stock | | | 13,618 | | | $ | 18.89 | | | | 29 | | | | 586 | | | (9) |
Total DrinkPak, LLC | | | | | | | | | | | | | | | | $ | 36 | | | $ | 688 | | | |
| | | | | | | | | | | | | | | | | | | | | | |
Emergy, Inc. | | Warrant | | October 5, 2022 | | October 5, 2032 | | Common Stock | | | 40,516 | | | $ | 3.96 | | | $ | 181 | | | $ | 29 | | | (9) |
| | | | | | | | | | | | | | | | | | | | | | |
GrubMarket, Inc. | | Warrant | | June 15, 2020 | | June 15, 2030 | | Common Stock | | | 405,000 | | | $ | 1.10 | | | $ | 115 | | | $ | 3,535 | | | |
| | | | | | | | | | | | | | | | | | | | | | |
Intelligent Brands, Inc. (f.k.a. PSB Holdings, Inc.) | | Warrant | | January 16, 2020 | | October 5, 2027 | | Common Stock | | | 103,636 | | | $ | 14.47 | | | $ | 111 | | | $ | — | | | |
| | Warrant | | December 31, 2020 | | December 29, 2032 | | Common Stock | | | 33,348 | | | $ | 3.17 | | | | 546 | | | | 35 | | | |
Total Intelligent Brands, Inc. | | | | | | | | | | | | | | | | | 657 | | | | 35 | | | |
| | | | | | | | | | | | | | | | | | | | | | |
The Fynder Group, Inc. | | Warrant | | October 14, 2020 | | October 14, 2030 | | Common Stock | | | 36,445 | | | $ | 0.49 | | | $ | 68 | | | $ | 28 | | | |
| | | | | | | | | | | | | | | | | | | | | | |
Zero Acre Farms, Inc. | | Warrant | | December 23, 2022 | | December 23, 2032 | | Common Stock | | | 20,181 | | | $ | 2.13 | | | $ | 79 | | | $ | 73 | | | |
| | | | | | | | | | | | | | | | | | | | | | |
Sub-Total: Food and Agriculture Technologies (0.4%)* | | | | | | | | | | | | | | $ | 2,745 | | | $ | 4,809 | | | |
TRINITY CAPITAL INC.
Consolidated Schedule of Investments
December 31, 2023
(In thousands, except share and per share data)
| | | | | | | | | | | | | | | | | | | | | | | | | | |
Portfolio Company (1) | | Type of
Investment (2)(14) | | Investment Date (3) | | Expiration Date | | Series | | Shares | | | Strike Price | | | Cost | | | Fair Value (6) | | | Footnotes |
Warrant Investments- United States, Continued | | | | | | | | | | | | | | | | | | | | |
| | | | | | | | | | | | | | | | | | | | | | |
Green Technology | | | | | | | | | | | | | | | |
| | |
| | | |
Bolb, Inc. | | Warrant | | October 12, 2021 | | October 12, 2031 | | Common Stock | | | 181,784 | | | $ | 0.07 | | | $ | 36 | | | $ | 1 | | | |
| | | | | | | | | | | | | | | | | | | | | | |
Edeniq, Inc. | | Warrant | | January 16, 2020 | | December 23, 2026 | | Preferred Series B | | | 2,685,501 | | | $ | 0.22 | | | $ | — | | | $ | 205 | | | (11)(17)(20) |
| | Warrant | | January 16, 2020 | | December 23, 2026 | | Preferred Series B | | | 2,184,672 | | | $ | 0.01 | | | | — | | | | 416 | | | (11)(17)(20) |
| | Warrant | | January 16, 2020 | | June 29, 2027 | | Preferred Series C | | | 5,106,972 | | | $ | 0.44 | | | | — | | | | 35 | | | (11)(17)(20) |
| | Warrant | | January 16, 2020 | | November 2, 2028 | | Preferred Series C | | | 3,850,294 | | | $ | 0.01 | | | | — | | | | 1,326 | | | (11)(17)(20) |
| | Warrant | | November 29, 2021 | | November 29, 2031 | | Preferred Series D | | | 154,906,320 | | | $ | 0.01 | | | | 7 | | | | 1,047 | | | (11)(17)(20) |
Total Edeniq, Inc. | | | | | | | | | | | | | | | | | 7 | | | | 3,029 | | | |
| | | | | | | | | | | | | | | | | | | | | | |
Footprint International Holding, Inc. | | Warrant | | February 14, 2020 | | February 14, 2030 | | Common Stock | | | 38,171 | | | $ | 0.31 | | | $ | 9 | | | $ | — | | | |
| | Warrant | | February 18, 2022 | | February 18, 2032 | | Common Stock | | | 77,524 | | | $ | 0.01 | | | | 4,246 | | | | — | | | |
| | Warrant | | June 23, 2022 | | June 23, 2032 | | Common Stock | | | 14,624 | | | $ | 0.01 | | | | 359 | | | | — | | | |
Total Footprint International Holding, Inc. | | | | | | | | | | | | | | | | | 4,614 | | | | — | | | |
| | | | | | | | | | | | | | | | | | | | | | |
Mainspring Energy, Inc. | | Warrant | | January 16, 2020 | | July 9, 2029 | | Common Stock | | | 140,186 | | | $ | 1.15 | | | $ | 283 | | | $ | 350 | | | |
| | Warrant | | November 20, 2020 | | November 20, 2030 | | Common Stock | | | 81,294 | | | $ | 1.15 | | | | 226 | | | | 203 | | | |
| | Warrant | | March 18, 2022 | | March 18, 2032 | | Common Stock | | | 137,692 | | | $ | 1.66 | | | | 344 | | | | 338 | | | |
Total Mainspring Energy, Inc. | | | | | | | | | | | | | | | | | 853 | | | | 891 | | | |
| | | | | | | | | | | | | | | | | | | | | | |
RTS Holding, Inc. | | Warrant | | December 10, 2021 | | December 10, 2031 | | Preferred Series C | | | 2,314 | | | $ | 205.28 | | | $ | 75 | | | $ | 310 | | | (9)(17) |
| | Warrant | | October 10, 2022 | | October 10, 2032 | | Preferred Series D | | | 917 | | | $ | 196.50 | | | | 87 | | | | 134 | | | (9)(17) |
Total RTS Holding, Inc. | | | | | | | | | | | | | | | | | 162 | | | | 444 | | | |
| | | | | | | | | | | | | | | | | | | | | | |
Sub-Total: Green Technology (0.4%)* | |
| | | | | | | | | | | | | | $ | 5,672 | | | $ | 4,365 | | | |
| | | | | | | | | | | | | | | | | | | | | | |
Healthcare Technology ** | | | | | | | | | | | | | | | | | | | | | | |
Dentologie Enterprises, Inc. | | Warrant | | October 14, 2022 | | October 14, 2034 | | Common Stock | | | 51,632 | | | $ | 0.76 | | | $ | 66 | | | $ | 123 | | | (9) |
| | | | | | | | | | | | | | | | | | | | | | |
Exer Holdings, LLC | | Warrant | | November 19, 2021 | | November 19, 2031 | | Common Stock | | | 281 | | | $ | 527.51 | | | $ | 93 | | | $ | 103 | | | |
| | | | | | | | | | | | | | | | | | | | | | |
Hospitalists Now, Inc. | | Warrant | | January 16, 2020 | | March 30, 2026 | | Preferred Series D-2 | | | 135,807 | | | $ | 5.89 | | | $ | 71 | | | $ | 628 | | | (17) |
| | Warrant | | January 16, 2020 | | December 6, 2026 | | Preferred Series D-2 | | | 750,000 | | | $ | 5.89 | | | | 391 | | | | 3,467 | | | (17) |
Total Hospitalists Now, Inc. | | | | | | | | | | | | | | | | | 462 | | | | 4,095 | | | |
| | | | | | | | | | | | | | | | | | | | | | |
Lark Technologies, Inc. | | Warrant | | September 30, 2020 | | September 30, 2030 | | Common Stock | | | 76,231 | | | $ | 1.76 | | | $ | 177 | | | $ | 5 | | | |
| | Warrant | | June 30, 2021 | | June 30, 2031 | | Common Stock | | | 79,325 | | | $ | 1.76 | | | | 258 | | | | 6 | | | |
| | Warrant | | December 22, 2022 | | December 22, 2032 | | Common Stock | | | 97,970 | | | $ | 2.49 | | | | 58 | | | | 6 | | | |
Total Lark Technologies, Inc. | | | | | | | | | | | | | | | | | 493 | | | | 17 | | | |
| | | | | | | | | | | | | | | | | | | | | | |
Moxe Health Corporation | | Warrant | | December 29, 2023 | | December 29, 2033 | | Preferred Series B | | | 155,438 | | | $ | 3.62 | | | $ | 135 | | | $ | 135 | | | (17) |
| | | | | | | | | | | | | | | | | | | | | | |
RXAnte, Inc. | | Warrant | | November 21, 2022 | | November 21, 2032 | | Preferred A | | | 18,000 | | | $ | 10.00 | | | $ | 95 | | | $ | 102 | | | (9) |
| | Warrant | | April 7, 2023 | | April 6, 2033 | | Preferred A | | | 6,000 | | | $ | 10.00 | | | | 29 | | | | 35 | | | (9) |
| | Warrant | | October 17, 2023 | | October 16, 2033 | | Preferred A | | | 6,000 | | | $ | 10.00 | | | | 40 | | | | 35 | | | (9) |
Total RXAnte, Inc. | | | | | | | | | | | | | | | | | 164 | | | | 172 | | | |
| | | | | | | | | | | | | | | | | | | | | | |
TMRW Life Sciences, Inc. | | Warrant | | April 29, 2022 | | April 29, 2032 | | Preferred Class A | | | 268,983 | | | $ | 2.09 | | | $ | 80 | | | $ | 11 | | | (17) |
| | Warrant | | March 3, 2023 | | March 3, 2033 | | Preferred Class A | | | 268,983 | | | $ | 2.09 | | | | 80 | | | | 11 | | | (17) |
Total TMRW Life Sciences, Inc. | | | | | | | | | | | | | | | | | 160 | | | | 22 | | | |
| | | | | | | | | | | | | | | | | | | | | | |
Sub-Total: Healthcare Technology (0.1%)* | | | | | | | | | | | | | | | | $ | 1,573 | | | $ | 4,667 | | | |
| | | | | | | | | | | | | | | | | | | | | | |
Human Resource Technology | | | | | | | | | | | | | | | |
| | |
| | | |
BetterLeap, Inc. | | Warrant | | April 20, 2022 | | April 20, 2032 | | Common Stock | | | 88,435 | | | $ | 2.26 | | | $ | 38 | | | $ | 39 | | | |
| | | | | | | | | | | | | | | | | | | | | | |
Qwick, Inc. | | Warrant | | December 31, 2021 | | December 31, 2031 | | Common Stock | | | 33,928 | | | $ | 2.79 | | | $ | 96 | | | $ | 291 | | | |
| | | | | | | | | | | | | | | | | | | | | | |
Sub-Total: Human Resource Technology (0.0%)* | | | | | | | | | | | | | | | | $ | 134 | | | $ | 330 | | | |
TRINITY CAPITAL INC.
Consolidated Schedule of Investments
December 31, 2023
(In thousands, except share and per share data)
| | | | | | | | | | | | | | | | | | | | | | | | | | |
Portfolio Company (1) | | Type of
Investment (2)(14) | | Investment Date (3) | | Expiration Date | | Series | | Shares | | | Strike Price | | | Cost | | | Fair Value (6) | | | Footnotes |
Warrant Investments- United States, Continued | | | | | | | | | | | | | | | | | | | | | | |
| | | | | | | | | | | | | | | | | | | | | | |
Industrials | | | | | | | | | | | | | | | | | | | | | | |
3DEO, Inc. | | Warrant | | February 23, 2022 | | February 23, 2032 | | Common Stock | | | 37,218 | | | $ | 1.81 | | | $ | 93 | | | $ | — | | | |
| | | | | | | | | | | | | | | | | | | | | | |
SBG Labs, Inc. | | Warrant | | January 16, 2020 | | September 18, 2024 | | Preferred Series A-1 | | | 25,714 | | | $ | 0.70 | | | $ | 8 | | | $ | 57 | | | (17) |
| | Warrant | | January 16, 2020 | | January 14, 2024 | | Preferred Series A-1 | | | 21,492 | | | $ | 0.70 | | | | 7 | | | | 47 | | | (17) |
| | Warrant | | January 16, 2020 | | March 24, 2025 | | Preferred Series A-1 | | | 12,155 | | | $ | 0.70 | | | | 4 | | | | 27 | | | (17) |
| | Warrant | | January 16, 2020 | | May 6, 2024 | | Preferred Series A-1 | | | 11,145 | | | $ | 0.70 | | | | 4 | | | | 24 | | | (17) |
| | Warrant | | January 16, 2020 | | June 9, 2024 | | Preferred Series A-1 | | | 7,085 | | | $ | 0.70 | | | | 2 | | | | 15 | | | (17) |
| | Warrant | | January 16, 2020 | | May 20, 2024 | | Preferred Series A-1 | | | 342,857 | | | $ | 0.70 | | | | 110 | | | | 750 | | | (17) |
| | Warrant | | January 16, 2020 | | March 26, 2025 | | Preferred Series A-1 | | | 200,000 | | | $ | 0.70 | | | | 65 | | | | 437 | | | (17) |
Total SBG Labs, Inc. | |
| | | | | | | | | | | | | | | 200 | | | | 1,357 | | | |
| | | | | | | | | | | | | | | | | | | | | | |
Sub-total: Industrials (0.1%)* | | | | | | | | | | | | | | | | $ | 293 | | | $ | 1,357 | | | |
| | | | | | | | | | | | | | | | | | | | | | |
Marketing, Media, and Entertainment | | | | | | | | | | | | | | | |
| | |
| | | |
Drone Racing League, Inc. | | Warrant | | October 17, 2022 | | October 17, 2032 | | Common Stock | | | 253,824 | | | $ | 6.76 | | | $ | 374 | | | $ | 1 | | | |
| | | | | | | | | | | | | | | | | | | | | | |
Firefly Systems, Inc. | | Warrant | | January 31, 2020 | | January 29, 2030 | | Common Stock | | | 133,147 | | | $ | 1.14 | | | $ | 282 | | | $ | 201 | | | |
| | | | | | | | | | | | | | | | | | | | | | |
Grabit Interactive Media, Inc. | | Warrant | | April 8, 2022 | | April 8, 2034 | | Preferred Series A | | | 142,828 | | | $ | 1.00 | | | $ | 40 | | | $ | 71 | | | (17) |
| | | | | | | | | | | | | | | | | | | | | | |
Incontext Solutions, Inc. | | Warrant | | January 16, 2020 | | September 28, 2028 | | Common Stock | | | 2,219 | | | $ | 220.82 | | | $ | 34 | | | $ | — | | | |
| | | | | | | | | | | | | | | | | | | | | | |
PebblePost, Inc. | | Warrant | | May 7, 2021 | | May 7, 2031 | | Common Stock | | | 657,343 | | | $ | 0.75 | | | $ | 68 | | | $ | 190 | | | |
| | | | | | | | | | | | | | | | | | | | | | |
Sub-Total: Marketing, Media, and Entertainment (0.0%)* | | | | | | | | | | | $ | 798 | | | $ | 463 | | | |
| | | | | | | | | | | | | | | | | | | | | | |
Medical Devices | | | | | | | | | | | | |
| | |
| | |
| | | |
Convergent Dental, Inc. | | Warrant | | April 21, 2023 | | April 21, 2033 | | Preferred Series D | | | 297,988 | | | $ | 1.61 | | | $ | 377 | | | $ | 217 | | | (9)(17) |
| | | | | | | | | | | | | | | | | | | | | | |
Delphinus, Inc. | | Warrant | | June 27, 2023 | | June 27, 2033 | | Preferred Series E | | | 294,289 | | | $ | 0.69 | | | $ | 29 | | | $ | 25 | | | (9)(17) |
| | | | | | | | | | | | | | | | | | | | | | |
Neuros Medical, Inc. | | Warrant | | August 10, 2023 | | August 10, 2033 | | Preferred Series C | | | 798,085 | | | $ | 0.38 | | | $ | 71 | | | $ | 70 | | | (9)(17) |
| | | | | | | | | | | | | | | | | | | | | | |
Revelle Aesthetics, Inc. | | Warrant | | May 30, 2023 | | May 30, 2033 | | Preferred Series A-2 | | | 549,056 | | | $ | 2.16 | | | $ | 151 | | | $ | 47 | | | (17) |
| | | | | | | | | | | | | | | | | | | | | | |
Shoulder Innovations, Inc. | | Warrant | | August 7, 2023 | | August 7, 2033 | | Preferred Series D | | | 623,615 | | | $ | 0.54 | | | $ | 120 | | | $ | 105 | | | (9)(17) |
| | | | | | | | | | | | | | | | | | | | | | |
Sub-Total: Medical Devices (0.0%)* | | | | | | | | | | | | | | | | $ | 748 | | | $ | 464 | | | |
TRINITY CAPITAL INC.
Consolidated Schedule of Investments
December 31, 2023
(In thousands, except share and per share data)
| | | | | | | | | | | | | | | | | | | | | | | | | | |
Portfolio Company (1) | | Type of
Investment (2)(14) | | Investment Date (3) | | Expiration Date | | Series | | Shares | | | Strike Price | | | Cost | | | Fair Value (6) | | | Footnotes |
Warrant Investments- United States, Continued | | | | | | | | | | | | | | | | | | | | | | |
| | | | | | | | | | | | | | | | | | | | | | |
Real Estate Technology | | | | | | | | | | | | | | | |
| | |
| | | |
Homelight, Inc. | | Warrant | | June 23, 2022 | | June 23, 2032 | | Common Stock | | | 5,434 | | | $ | 18.40 | | | $ | 1 | | | $ | 3 | | | |
| | | | | | | | | | | | | | | | | | | | | | |
Knockaway, Inc. | | Warrant | | January 16, 2020 | | May 24, 2029 | | Common Stock | | | 880 | | | $ | 852.70 | | | $ | 208 | | | $ | — | | | |
| | Warrant | | November 10, 2021 | | November 10, 2031 | | Common Stock | | | 16,350 | | | $ | 2.20 | | | | 265 | | | | — | | | |
| | Warrant | | September 29, 2023 | | September 29, 2033 | | Common Stock | | | 2,804,355 | | | $ | 0.01 | | | | — | | | | — | | | (11) |
Total Knockaway, Inc. | | | | | | | | | | | | | | | | | 473 | | | | — | | | |
| | | | | | | | | | | | | | | | | | | | | | |
Maxwell Financial Labs, Inc. | | Warrant | | October 7, 2020 | | October 7, 2030 | | Common Stock | | | 106,735 | | | $ | 0.29 | | | $ | 21 | | | $ | 12 | | | |
| | Warrant | | December 22, 2020 | | December 22, 2030 | | Common Stock | | | 110,860 | | | $ | 0.29 | | | | 34 | | | | 14 | | | |
| | Warrant | | September 30, 2021 | | September 30, 2031 | | Common Stock | | | 79,135 | | | $ | 1.04 | | | | 148 | | | | 7 | | | |
Total Maxwell Financial Labs, Inc. | | | | | | | | | | | | | | | | | 203 | | | | 33 | | | |
| | | | | | | | | | | | | | | | | | | | | | |
Sub-Total: Real Estate Technology (0.0%)* | | | | | | | | | | | | | | | | $ | 677 | | | $ | 36 | | | |
| | | | | | | | | | | | | | | | | | | | | | |
SaaS | | | | | | | | | | | | | | | |
| | |
| | | |
All Seated, Inc. | | Warrant | | February 28, 2022 | | February 28, 2032 | | Common Stock | | | 5,101 | | | $ | 15.72 | | | $ | 21 | | | $ | — | | | |
| | | | | | | | | | | | | | | | | | | | | | |
Cart.com, Inc. | | Warrant | | November 17, 2023 | | November 17, 2033 | | Common Stock | | | 51,110 | | | $ | 15.87 | | | $ | 733 | | | $ | 730 | | | |
| | | | | | | | | | | | | | | | | | | | | | |
Crowdtap, Inc. | | Warrant | | January 16, 2020 | | December 16, 2025 | | Preferred Series B | | | 442,233 | | | $ | 1.09 | | | $ | 42 | | | $ | 484 | | | (17) |
| | Warrant | | January 16, 2020 | | December 11, 2027 | | Preferred Series B | | | 100,000 | | | $ | 1.09 | | | | 9 | | | | 109 | | | (17) |
Total Crowdtap, Inc. | | | | | | | | | | | | | | | | | 51 | | | | 593 | | | |
| | | | | | | | | | | | | | | | | | | | | | |
Gtxcel, Inc. | | Warrant | | January 16, 2020 | | September 24, 2025 | | Preferred Series C | | | 1,000,000 | | | $ | 0.21 | | | $ | 83 | | | $ | 14 | | | (17) |
| | Warrant | | January 16, 2020 | | September 24, 2025 | | Preferred Series D | | | 1,000,000 | | | $ | 0.21 | | | | 83 | | | | 19 | | | (17) |
Total Gtxcel, Inc. | | | | | | | | | | | | | | | | | 166 | | | | 33 | | | |
| | | | | | | | | | | | | | | | | | | | | | |
Lucidworks, Inc. | | Warrant | | January 16, 2020 | | June 27, 2026 | | Preferred Series D | | | 619,435 | | | $ | 0.77 | | | $ | 806 | | | $ | 861 | | | (17) |
| | | | | | | | | | | | | | | | | | | | | | |
Reciprocity, Inc. | | Warrant | | September 25, 2020 | | September 25, 2030 | | Common Stock | | | 114,678 | | | $ | 4.17 | | | $ | 99 | | | $ | 34 | | | |
| | Warrant | | April 29, 2021 | | April 29, 2031 | | Common Stock | | | 57,195 | | | $ | 4.17 | | | | 54 | | | | 17 | | | |
Total Reciprocity, Inc. | | | | | | | | | | | | | | | | | 153 | | | | 51 | | | |
| | | | | | | | | | | | | | | | | | | | | | |
Smartly, Inc. | | Warrant | | May 16, 2022 | | May 16, 2034 | | Common Stock | | | 48,097 | | | $ | 1.10 | | | $ | 84 | | | $ | 86 | | | |
| | | | | | | | | | | | | | | | | | | | | | |
The Tomorrow Companies, Inc. | | Warrant | | December 14, 2022 | | December 14, 2032 | | Common Stock | | | 26,124 | | | $ | 1.70 | | | $ | 49 | | | $ | 52 | | | (9) |
| | | | | | | | | | | | | | | | | | | | | | |
Sub-Total: SaaS (0.2%)* | | | | | | | | | | | | | | | | $ | 2,063 | | | $ | 2,406 | | | |
TRINITY CAPITAL INC.
Consolidated Schedule of Investments
December 31, 2023
(In thousands, except share and per share data)
| | | | | | | | | | | | | | | | | | | | | | | | | | |
Portfolio Company (1) | | Type of
Investment (2)(14) | | Investment Date (3) | | Expiration Date | | Series | | Shares | | | Strike Price | | | Cost | | | Fair Value (6) | | | Footnotes |
Warrant Investments- United States, Continued | | | | | | | | | | | | | | | | | | | | |
| | | | | | | | | | | | | | | | | | | | | | |
Space Technology | | | | | | | | | | | | | | | |
| | |
| | | |
Astranis Space Technology Corporation | | Warrant | | April 13, 2023 | | April 13, 2033 | | Common Stock | | | 96,847 | | | $ | 7.89 | | | $ | 93 | | | $ | 1,122 | | | (9) |
| | | | | | | | | | | | | | | | | | | | | | |
Axiom Space, Inc. | | Warrant | | May 28, 2021 | | May 28, 2031 | | Common Stock | | | 1,773 | | | $ | 169.24 | | | $ | 121 | | | $ | 49 | | | |
| | Warrant | | May 28, 2021 | | May 28, 2031 | | Common Stock | | | 882 | | | $ | 340.11 | | | | 39 | | | | 9 | | | |
Total Axiom Space, Inc. | | | | | | | | | | | | | | | | | 160 | | | | 58 | | | |
| | | | | | | | | | | | | | | | | | | | | | |
Hermeus Corporation | | Warrant | | August 9, 2022 | | August 9, 2032 | | Common Stock | | | 31,398 | | | $ | 6.24 | | | $ | 237 | | | $ | 146 | | | (9) |
| | | | | | | | | | | | | | | | | | | | | | |
Rocket Lab USA, Inc. | | Warrant | | December 29, 2023 | | December 29, 2027 | | Common Stock | | | 728,835 | | | $ | 4.87 | | | $ | 2,255 | | | $ | 2,255 | | | |
| | | | | | | | | | | | | | | | | | | | | | |
Space Perspective, Inc. | | Warrant | | March 3, 2022 | | March 3, 2032 | | Preferred Series A | | | 221,280 | | | $ | 2.75 | | | $ | 256 | | | $ | 223 | | | (17) |
| | | | | | | | | | | | | | | | | | | | | | |
Sub-Total: Space Technology (0.3%)* | | | | | | | | | | | | | | | | $ | 3,001 | | | $ | 3,804 | | | |
| | | | | | | | | | | | | | | | | | | | | | |
Supply Chain Technology | | | | | | | | | | | | | | | | | | | | | | |
Macrofab, Inc. | | Warrant | | July 21, 2023 | | July 21, 2033 | | Common Stock | | | 622,353 | | | $ | 2.02 | | | $ | 333 | | | $ | 344 | | | |
| | | | | | | | | | | | | | | | | | | | | | |
Sub-Total: Supply Chain Technology (0.0%)* | |
| | | | | | | | | | | | | | $ | 333 | | | $ | 344 | | | |
| | | | | | | | | | | | | | | | | | | | | | |
Transportation Technology | | | | | | | | | | | | | | | | | | | | | | |
Get Spiffy, Inc. | | Warrant | | July 14, 2023 | | July 14, 2033 | | Common Stock | | | 795,785 | | | $ | 0.70 | | | $ | 383 | | | $ | 394 | | | (9) |
| | | | | | | | | | | | | | | | | | | | | | |
NextCar Holding Company, Inc. | | Warrant | | December 14, 2021 | | December 14, 2026 | | Preferred Stock | | | 328,369 | | | $ | 1.29 | | | $ | 35 | | | $ | — | | | (13)(17) |
| | Warrant | | February 23, 2022 | | February 23, 2027 | | Preferred Stock | | | 25,653 | | | $ | 1.29 | | | | 3 | | | | — | | | (13)(17) |
| | Warrant | | March 16, 2022 | | March 16, 2027 | | Preferred Stock | | | 30,784 | | | $ | 1.29 | | | | 3 | | | | — | | | (13)(17) |
| | Warrant | | April 18, 2022 | | April 18, 2027 | | Preferred Stock | | | 282,192 | | | $ | 1.29 | | | | 7 | | | | — | | | (13)(17) |
| | Warrant | | September 29, 2022 | | September 29, 2027 | | Preferred Stock | | | 410,462 | | | $ | 1.29 | | | | 170 | | | | — | | | (13)(17) |
Total NextCar Holding Company, Inc. | | | | | | | | | | | | | | | | | 218 | | | | — | | | |
| | | | | | | | | | | | | | | | | | | | | | |
Sub-Total: Transportation Technology (0.0%)* | | | | | | | | | | | | | | | | $ | 601 | | | $ | 394 | | | |
| | | | | | | | | | | | | | | | | | | | | | |
Total: Warrant Investments- United States (2.4%)* | | | | | | | | | | | | | | | | $ | 29,387 | | | $ | 32,824 | | | |
TRINITY CAPITAL INC.
Consolidated Schedule of Investments
December 31, 2023
(In thousands, except share and per share data)
| | | | | | | | | | | | | | | | | | | | | | | | | | |
Portfolio Company (1) | | Type of
Investment (2)(14) | | Investment Date (3) | | Expiration Date | | Series | | Shares | | | Strike Price | | | Cost | | | Fair Value (6) | | | Footnotes |
Warrant Investments- Canada | | | | | | | | | | | | | | | | | | | | | | |
| | | | | | | | | | | | | | | | | | | | | | |
Construction Technology | | | | | | | | | | | | | | | |
| | |
| | | |
Nexii Building Solutions, Inc. | | Warrant | | August 27, 2021 | | August 27, 2026 | | Common Stock | | | 63,175 | | | $ | 15.83 | | | $ | 410 | | | $ | — | | | (10)(13) |
| | Warrant | | June 8, 2022 | | June 8, 2027 | | Common Stock | | | 24,123 | | | $ | 20.73 | | | | 204 | | | | — | | | (10)(13) |
Total Nexii Building Solutions, Inc. | | | | | | | | | | | | | | | | | 614 | | | | — | | | |
| | | | | | | | | | | | | | | | | | | | | | |
Sub-Total: Construction Technology (0.0%)* | | | | | | | | | | | | | | | | $ | 614 | | | $ | — | | | |
| | | | | | | | | | | | | | | | | | | | | | |
Total: Warrant Investments- Canada (0.0%)* | | | | | | | | | | | | | | | | $ | 614 | | | $ | — | | | |
| | | | | | | | | | | | | | | | | | | | | | |
Warrant Investments- Europe | | | | | | | | | | | | | | | | | | | | | | |
| | | | | | | | | | | | | | | | | | | | | | |
Industrials | | | | | | | | | | | | | | | | | | | | | | |
Aledia, Inc. | | Warrant | | March 31, 2022 | | March 31, 2032 | | Preferred Series D-3 | | | 11,573 | | | $ | 149.01 | | | $ | 130 | | | $ | 622 | | | (10)(13)(17) |
| | | | | | | | | | | | | | | | | | | | | | |
Sub-Total: Information (0.0%)* | |
| | | | | | | | | | | | | | $ | 130 | | | $ | 622 | | | |
| | | | | | | | | | | | | | | | | | | | | | |
Space Technology | | | | | | | | | | | | | | | |
| | |
| | | |
All.Space Networks, Limited. | | Warrant | | August 22, 2022 | | August 22, 2032 | | Common Stock | | | 71,203 | | | $ | 21.79 | | | $ | 113 | | | $ | 81 | | | (10) |
| | | | | | | | | | | | | | | | | | | | | | |
Sub-Total: Space Technology (0.0%)* | |
| | | | | | | | | | | | | | $ | 113 | | | $ | 81 | | | |
| | | | | | | | | | | | | | | | | | | | | | |
Total: Warrant Investments- Europe (0.1%)* | | | | | | | | | | | | | | | | $ | 243 | | | $ | 703 | | | |
| | | | | | | | | | | | | | | | | | | | | | |
Total: Warrant Investments- (2.4%)* | | | | | | | | | | | | | | | | $ | 30,244 | | | $ | 33,527 | | | |
TRINITY CAPITAL INC.
Consolidated Schedule of Investments
December 31, 2023
(In thousands, except share and per share data)
| | | | | | | | | | | | | | | | | | | | |
Portfolio Company (1) | | Type of
Investment (2)(14) | | Investment Date (3) | | Shares / Principal | | | Series | | Cost | | | Fair Value (6) | | | Footnotes |
Equity Investments- United States | | | | | | | | | | | | | | | | | |
| | | | | | | | | | | | | | | | | |
Artificial Intelligence & Automation | | | | | | | | | | | | | | | | | |
Rigetti & Co, Inc. | | Equity | | February 25, 2022 | | | 50,000 | | | Common Stock | | $ | 500 | | | $ | 49 | | | (7) |
| | Equity | | May 18, 2021 | | | 757,297 | | | Common Stock | | | 506 | | | | 746 | | | (7) |
Total Rigetti & Co, Inc. | | | | | | | | | | | | 1,006 | | | | 795 | | | |
| | | | | | | | | | | | | | | | | |
Sub-Total: Artificial Intelligence & Automation (0.1%)* | | | | | | | | | | | $ | 1,006 | | | $ | 795 | | | |
| | | | | | | | | | | | | | | | | |
Connectivity | | | | | | | | | | | | | | | | | |
Tarana Wireless, Inc. | | Equity | | March 16, 2022 | | | 611,246 | | | Preferred Series 6 | | $ | 500 | | | $ | 569 | | | (17) |
| | | | | | | | | | |
| | |
| | | |
Vertical Communications, Inc. | | Equity | | January 16, 2020 | | | 3,892,485 | | | Preferred Series 1 | | $ | — | | | $ | — | | | (11)(17)(20) |
| | Equity | | January 16, 2020 | | $ | 5,500 | | | Convertible Note | | | 3,966 | | | | 1,338 | | | (16)(20) |
Total Vertical Communications, Inc. | | | | | | | | | | | | 3,966 | | | | 1,338 | | | |
| | | | | | | | | | |
| | |
| | | |
Sub-Total: Connectivity (0.1%)* | | | | | | | | | | | $ | 4,466 | | | $ | 1,907 | | | |
| | | | | | | | | | | | | | | | | |
Construction Technology | | | | | | | | | | |
| | |
| | | |
Project Frog, Inc. | | Equity | | January 16, 2020 | | | 4,383,497 | | | Preferred Series AA-1 | | $ | 352 | | | $ | — | | | (17)(20) |
| | Equity | | January 16, 2020 | | | 3,401,678 | | | Preferred Series BB | | | 1,333 | | | | — | | | (17)(20) |
| | Equity | | August 3, 2021 | | | 6,633,486 | | | Common Stock | | | 1,684 | | | | — | | | (20) |
| | Equity | | August 3, 2021 | | | 3,129,887 | | | Preferred Series CC | | | 1,253 | | | | 8 | | | (17)(20) |
Total Project Frog, Inc. | | | | | | | | | | | | 4,622 | | | | 8 | | | |
| | | | | | | | | | |
| | |
| | | |
Sub-Total: Construction Technology (0.0%)* | | | | | | | | | | | $ | 4,622 | | | $ | 8 | | | |
| | | | | | | | | | | | | | | | | |
Consumer Products & Services | | | | | | | | | | | | | | | | | |
Molekule, Inc. | | Equity | | January 12, 2023 | | | 2,361 | | | Common Stock | | $ | 7 | | | $ | — | | | (7) |
| | | | | | | | | | | | | | | | | |
Portofino Labs, Inc. | | Equity | | November 1, 2021 | | | 256,291 | | | Preferred Series B-1 | | $ | 500 | | | $ | 445 | | | (17) |
| | | | | | | | | | | | | | | | | |
Quip NYC, Inc. | | Equity | | August 17, 2021 | | | 3,321 | | | Preferred Series B-1 | | $ | 500 | | | $ | 277 | | | (17) |
| | | | | | | | | | | | | | | | | |
Sub-Total: Consumer Products & Services (0.1%)* | | | | | | | | | | | $ | 1,007 | | | $ | 722 | | | |
| | | | | | | | | | |
| | |
| | | |
Finance and Insurance | | | | | | | | | | |
| | |
| | | |
Dynamics, Inc. | | Equity | | January 16, 2020 | | | 17,726 | | | Preferred Series A | | $ | 390 | | | $ | — | | | (17) |
| | | | | | | | | | |
| | |
| | | |
Openly Holdings Corp. | | Equity | | May 9, 2023 | | | 44,725 | | | Series D | | $ | 500 | | | $ | 501 | | | |
| | | | | | | | | | |
| | |
| | | |
Slope Tech, Inc. | | Equity | | June 20, 2023 | | | 64,654 | | | Preferred | | $ | 500 | | | $ | 504 | | | (17) |
| | | | | | | | | | |
| | |
| | | |
Sub-Total: Finance and Insurance (0.1%)* | | | | | | | | | | | $ | 1,390 | | | $ | 1,005 | | | |
| | | | | | | | | | |
| | |
| | | |
Food and Agriculture Technologies | | | | | | | | | | |
| | |
| | | |
Emergy, Inc. | | Equity | | June 28, 2021 | | | 75,958 | | | Preferred Series B | | $ | 500 | | | $ | 230 | | | (17) |
| | | | | | | | | | | | | | | | | |
Intelligent Brands, Inc. (f.k.a. Pruvit Ventures, Inc.) | | Equity | | January 16, 2020 | | | 30,357 | | | Common Stock | | $ | 537 | | | $ | 94 | | | |
| | | | | | | | | | | | | | | | | |
Sub-Total: Food and Agriculture Technologies (0.0%)* | | | | | $ | 1,037 | | | $ | 324 | | | |
| | | | | | | | | | | | | | | | | |
Green Technology | | | | | | | | | | | | | | | | | |
Edeniq, Inc. | | Equity | | January 16, 2020 | | | 7,807,499 | | | Preferred Series B | | $ | — | | | $ | 1,530 | | | (11)(17)(20) |
| | Equity | | January 16, 2020 | | | 3,657,487 | | | Preferred Series C | | | — | | | | 1,293 | | | (11)(17)(20) |
| | Equity | | January 16, 2020 | | | 133,766,138 | | | Preferred Series D | | | — | | | | 2,542 | | | (11)(17)(20) |
Total Edeniq, Inc. | | | | | | | | | | | | — | | | | 5,365 | | | |
| | | | | | | | | | | | | | | | | |
Electric Hydrogen Co. | | Equity | | April 6, 2023 | | | 87,087 | | | Preferred Series C | | $ | 500 | | | $ | 521 | | | (17) |
| | | | | | | | | | | | | | | | | |
Mainspring Energy, Inc. | | Equity | | March 30, 2022 | | | 65,614 | | | Preferred Series E-1 | | $ | 500 | | | $ | 318 | | | (17) |
| | | | | | | | | | | | | | | | | |
RTS Holding, Inc. | | Equity | | July 5, 2022 | | | 2,035 | | | Preferred Series D | | $ | 334 | | | $ | 602 | | | (9)(17) |
| | Equity | | February 15, 2023 | | | 1,966 | | | Preferred Series D-1 | | | 405 | | | | 590 | | | (9)(17) |
Total RTS Holding, Inc. | | | | | | | | | | | | 739 | | | | 1,192 | | | |
| | | | | | | | | | | | | | | | | |
Sub-Total: Green Technology (0.6%)* | | | | | | | | | | | $ | 1,739 | | | $ | 7,396 | | | |
TRINITY CAPITAL INC.
Consolidated Schedule of Investments
December 31, 2023
(In thousands, except share and per share data)
| | | | | | | | | | | | | | | | | | | | |
Portfolio Company (1) | | Type of
Investment (2)(14) | | Investment Date (3) | | Shares / Principal | | | Series | | Cost | | | Fair Value (6) | | | Footnotes |
Equity Investments- United States, Continued | | | | | | | | | | | | | |
| | | | | | | | | | | | | | | | | |
Healthcare Technology ** | | | | | | | | | | |
| | |
| | | |
Dentologie Enterprises, Inc. | | Equity | | August 3, 2023 | | | 72,338 | | | Preferred Series B | | $ | 300 | | | $ | 304 | | | (9)(17) |
| | | | | | | | | | | | | | | | | |
Emerald Cloud Lab, Inc. | | Equity | | June 3, 2022 | | | 199,537 | | | Preferred Series C | | $ | 500 | | | $ | 327 | | | (17) |
| | | | | | | | | | | | | | | | | |
Lark Technologies, Inc. | | Equity | | August 19, 2021 | | | 32,416 | | | Preferred Series D | | $ | 500 | | | $ | 84 | | | (17) |
| | | | | | | | | | |
| | |
| | | |
WorkWell Prevention & Care Inc. | | Equity | | January 16, 2020 | | | 7,000,000 | | | Common Stock | | $ | 51 | | | $ | — | | | (20) |
| | Equity | | January 16, 2020 | | | 3,450 | | | Preferred Series P | | | 3,450 | | | | — | | | (17)(20) |
| | Equity | | January 16, 2020 | | $ | 3,170 | | | Convertible Note | | | 3,219 | | | | — | | | (16)(20) |
Total WorkWell Prevention & Care Inc. | | | | | | | | | | | | 6,720 | | | | — | | | |
| | | | | | | | | | | | | | | | | |
Sub-Total: Healthcare Technology (0.1%)* | | | | | | | | | | | $ | 8,020 | | | $ | 715 | | | |
| | | | | | | | | | | | | | | | | |
Human Resource Technology | | | | | | | | | | | | | | | | | |
Nomad Health, Inc. | | Equity | | May 27, 2022 | | | 37,920 | | | Preferred Series D-1 | | $ | 500 | | | $ | 145 | | | (17) |
| | | | | | | | | | | | | | | | | |
Sub-Total: Human Resource Technology (0.0%)* | | | | | | | | | | | $ | 500 | | | $ | 145 | | | |
| | | | | | | | | | | | | | | | | |
Industrials | | | | | | | | | | | | | | | | | |
SBG Labs, Inc. | | Equity | | July 29, 2023 | | | 21,730 | | | Preferred Series A-1 | | $ | 13 | | | $ | 53 | | | (7)(17) |
| | Equity | | October 10, 2023 | | | 6,332 | | | Preferred Series A-1 | | | 4 | | | | 16 | | | (7)(17) |
Total SBG Labs, Inc. | | | | | | | | | | | | 17 | | | | 69 | | | |
| | | | | | | | | | | | | | | | | |
Sub-Total: Industrials (0.0%)* | | | | | | | | | | | $ | 17 | | | $ | 69 | | | |
| | | | | | | | | | | | | | | | | |
Multi-Sector Holdings | | | | | | | | | | | | | | | | | |
Senior Credit Corp 2022 LLC | | Equity | | January 30, 2023 | | | — | | | Preferred | | $ | 3,302 | | | $ | 3,631 | | | (7)(10)(17)(20) |
| | | | | | | | | | | | | | | | | |
Sub-Total: Multi-Sector Holdings (0.3%)* | | | | | | | | | | | $ | 3,302 | | | $ | 3,631 | | | |
| | | | | | | | | | | | | | | | | |
Real Estate Technology | | | | | | | | | | | | | | | | | |
Knockaway, Inc. | | Equity | | March 30, 2022 | | | 30,458 | | | Common Stock | | $ | 500 | | | $ | — | | | |
| | Equity | | September 29, 2023 | | | 2,956,224 | | | Preferred Series AA | | | 250 | | | | — | | | (17) |
Total Knockaway Inc. | | | | | | | | | | | | 750 | | | | — | | | |
| | | | | | | | | | | | | | | | | |
Orchard Technologies, Inc. | | Equity | | August 6, 2021 | | | 74,406 | | | Preferred Series D | | $ | 500 | | | $ | 12 | | | (17) |
| | Equity | | March 16, 2023 | | | 50,000 | | | Preferred Series 1 | | | 500 | | | | 343 | | | (17) |
Total Orchard Technologies, Inc. | | | | | | | | | | | | 1,000 | | | | 355 | | | |
| | | | | | | | | | | | | | | | | |
Maxwell Financial Labs, Inc | | Equity | | January 22, 2021 | | | 135,641 | | | Preferred Series B | | $ | 500 | | | $ | 143 | | | (17) |
| | | | | | | | | | | | | | | | | |
Sub-Total: Real Estate Technology (0.0%)* | | | | | | | | | | | $ | 2,250 | | | $ | 498 | | | |
TRINITY CAPITAL INC.
Consolidated Schedule of Investments
December 31, 2023
(In thousands, except share and per share data)
| | | | | | | | | | | | | | | | | | | | |
Portfolio Company (1) | | Type of
Investment (2)(14) | | Investment Date (3) | | Shares / Principal | | | Series | | Cost | | | Fair Value (6) | | | Footnotes |
Equity Investments- United States, Continued | | | | | | | | | | | | | |
| | | | | | | | | | | | | | | | | |
SaaS | | | | | | | | | | | | | | | | | |
Smartly, Inc. | | Equity | | March 29, 2023 | | | 136,388 | | | Preferred Series B | | $ | 500 | | | $ | 516 | | | (17) |
| | | | | | | | | | |
| | |
| | | |
The Tomorrow Companies, Inc. | | Equity | | July 5, 2023 | | | 108,088 | | | Preferred Series E-1 | | $ | 325 | | | $ | 211 | | | (9)(17) |
| | | | | | | | | | |
| | |
| | | |
Sub-total: SaaS (0.1%)* | | | | | | | | | | | $ | 825 | | | $ | 727 | | | |
| | | | | | | | | | | | | | | | | |
Space Technology | | | | | | | | | | | | | | | | | |
Astranis Space Technology Corporation | | Equity | | April 5, 2023 | | | 13,685 | | | Preferred Series C Prime | | $ | 300 | | | $ | 306 | | | (9)(17) |
| | | | | | | | | | | | | | | | | |
Axiom Space, Inc. | | Equity | | August 11, 2021 | | | 3,624 | | | Preferred Series C | | $ | 521 | | | $ | 572 | | | (17) |
| | | | | | | | | | | | | | | | | |
Hadrian Automation, Inc. | | Equity | | March 29, 2022 | | | 53,154 | | | Preferred A-4 | | $ | 500 | | | $ | 456 | | | (17) |
| | Equity | | December 11, 2023 | | | 31,831 | | | Preferred B-1 | | | 300 | | | | 300 | | | (9)(17) |
Total Hadrian Automation, Inc. | | | | | | | | | | | | 800 | | | | 756 | | | |
| | | | | | | | | | | | | | | | | |
Sub-total: Space Technology (0.1%)* | | | | | | | | | | | $ | 1,621 | | | $ | 1,634 | | | |
| | | | | | | | | | | | | | | | | |
Supply Chain Technology | | | | | | | | | | | | | | | | | |
3Q GoFor Holdings, LP | | Equity | | August 25, 2022 | | | — | | | Preferred | | $ | 500 | | | $ | — | | | (14)(17)(20) |
| | Equity | | January 17, 2023 | | | — | | | Preferred | | | 500 | | | | — | | | (14)(17)(20) |
Total 3Q GoFor Holdings, LP | | | | | | | | | | | | 1,000 | | | | — | | | |
| | | | | | | | | | | | | | | | | |
Sub-total: Supply Chain Technology (0.0%)* | | | | | | $ | 1,000 | | | $ | — | | | |
| | | | | | | | | | | | | | | | | |
Total: Equity Investments- United States (1.5%)* | | | | | |
| | | | | $ | 32,802 | | | $ | 19,576 | | | |
| | | | | | | | | | | | | | | | | |
Equity Investments- Canada | | | | | | | | | | | | | | | | | |
| | | | | | | | | | | | | | | | | |
Construction Technology | | | | | | | | | | |
| | |
| | | |
Nexii Building Solutions, Inc. | | Equity | | February 28, 2022 | | | 24,418 | | | Common Stock | | $ | 500 | | | $ | — | | | (10) |
| | | | | | | | | | | | | | | | | |
Sub-Total: Construction Technology (0.0%)* | | | | | | | | | | | $ | 500 | | | $ | — | | | |
| | | | | | | | | | | | | | | | | |
Total: Equity Investments- Canada (0.0%)* | | | | | | | | | | | $ | 500 | | | $ | — | | | |
| | | | | | | | | | | | | | | | | |
Total: Equity Investments (1.5%)* | | | | | | | | | | | $ | 33,302 | | | $ | 19,576 | | | |
| | | | | |
| | | | |
| | |
| | | |
Total Investment in Securities (97.3%)* | | | | | |
| | | | | $ | 1,319,316 | | | $ | 1,275,180 | | | |
| | | | | |
| | | | |
| | |
| | | |
Cash and Cash Equivalents | | | | | |
| | | | |
| | |
| | | |
Goldman Sachs Financial Square Government Institutional Fund |
| | | | | $ | 3,088 | | | $ | 3,088 | | | |
Other cash accounts | | | | | |
| | | | | | 1,673 | | | | 1,673 | | | |
Cash and Cash Equivalents (0.4%)* | | | | | |
| | | | | | 4,761 | | | | 4,761 | | | |
| | | | | |
| | | | |
| | |
| | | |
Total Portfolio Investments and Cash and Cash Equivalents (97.6% of total assets) | | | | | |
| | | | | $ | 1,324,077 | | | $ | 1,279,941 | | | |
** Where appropriate, certain current year industry classifications may have been revised to more precisely reflect the business of the Company's investments.
(1)All portfolio companies are located in North America or Europe. As of December 31, 2023, Trinity Capital Inc. (the “Company”) had four foreign domiciled portfolio companies, two of which are based in Canada and two of which are based in Europe. In total, these foreign domiciled portfolio investments represent 5.5% of total net asset value based on fair value. The Company generally acquires its investments in private transactions exempt from registration under the Securities Act of 1933, as amended (the “Securities Act”). These investments are generally subject to certain limitations on resale and may be deemed to be “restricted securities” under the Securities Act.
(2)All debt investments are income producing unless otherwise noted. All equity and warrant investments are non-income producing unless otherwise noted. Equipment financed under our equipment financing investments relates to operational equipment essential to revenue production for the portfolio company in the industry noted.
(3)Investment date represents the date of initial investment date, either purchases or funding, not adjusted for modifications. For assets purchased from the Legacy Funds as part of the Formation Transactions (both terms as defined in “Note 1 – Organization and Basis of Presentation”), the investment date is January 16, 2020, the date of the Formation Transactions.
TRINITY CAPITAL INC.
Consolidated Schedule of Investments
December 31, 2023
(In thousands, except share and per share data)
(4)Interest rate is the fixed or variable rate of the debt investments and does not include any original issue discount, end-of-term (“EOT”) payment, or additional fees related to such investments, such as deferred interest, commitment fees, prepayment fees or exit fees. EOT payments are contractual payments due in cash at the maturity date of the loan, including upon prepayment, and are a fixed rate determined at the inception of the loan. At the end of the term of certain equipment financings, the borrower has the option to purchase the underlying assets at fair value, generally subject to a cap, or return the equipment and pay a restocking fee. The fair values of the financed assets have been estimated as a percentage of original cost for purpose of the EOT payment value. The EOT payment is amortized and recognized as non-cash income over the term of the loan or equipment financing prior to its payment and is included as a component of the cost basis of the Company’s current debt securities.
(5)Principal is net of repayments, if any, as per the terms of the debt instrument’s contract.
(6)Except as noted, all investments were valued at fair value as determined in good faith by the Company’s Board of Directors (the “Board”) using Level 3 inputs.
(7)Asset is valued at fair value as determined in good faith by the Company's Board using Level 1 and Level 2 inputs.
(8)The interest rate on variable interest rate investments represents a benchmark rate plus spread. The benchmark interest rate is subject to an interest rate floor. The Prime Rate was 8.5% and the Secured Overnight Financing Rate (“SOFR”) 30 Day Forward Rate was 5.35% as of December 31, 2023.
(9)Senior Credit Corp 2022 LLC owns an additional portion of this security. See “Note 12 – Related Party Transactions” for further discussion.
(10)Indicates a “non-qualifying asset” under section 55(a) of the Investment Company Act of 1940, as amended (the “1940 Act”). The Company’s percentage of non-qualifying assets at fair value represents 12.8% of the Company's total assets as of December 31, 2023. Qualifying assets must represent at least 70% of the Company’s total assets at the time of acquisition of any additional non-qualifying assets.
(11)Investment has zero cost basis as it was purchased at a fair value of zero as part of the Formation Transactions (as defined in “Note 1 – Organization and Basis of Presentation”).
(12)Investment is a secured loan warehouse facility collateralized by interest in specific assets that meet the eligibility requirements under the facility during the warehouse period. Repayment of the facility will occur over the amortizing period unless otherwise prepaid.
(13)Company has been issued warrants with pricing and number of shares dependent upon a future round of equity issuance by the portfolio company.
(14)Investment is not pledged as collateral supporting amounts outstanding under the Company's credit facility with KeyBank, National Association (the “KeyBank Credit Facility”). See “Note 5 – Borrowings” for more information.
(15)Interest on this loan includes a payment-in-kind (“PIK”) provision. Contractual PIK interest, which represents contractually deferred interest added to the loan balance that is generally collected through amortization, is recorded on an accrual basis to the extent such amounts are expected to be collected.
(16)Interest on this loan includes a payment-in-kind (“PIK”) provision. Contractual PIK interest, which represents contractually deferred interest added to the loan balance that is generally collected through amortization, is recorded on an accrual basis to the extent such amounts are expected to be collected.
(17)Preferred stock represents investments through which the Company will have preference in liquidation rights and do not contain any cumulative preferred dividends.
(18)Investment is on non-accrual status as of December 31, 2023, and is therefore considered non-income producing.
(19)All of the Company’s debt securities are pledged as collateral supporting the amounts outstanding under the KeyBank Credit Facility (see “Note 5 – Borrowings”), except as noted.
TRINITY CAPITAL INC.
Consolidated Schedule of Investments
December 31, 2023
(In thousands, except share and per share data)
(20)This investment is deemed to be a “Control Investment” or an “Affiliate Investment.” The Company classifies its investment portfolio in accordance with the requirements of the 1940 Act. The 1940 Act defines Control Investments as investments in companies in which the Company owns beneficially, either directly or indirectly, more than 25% of the voting securities, or maintains greater than 50% of the board representation. Affiliate Investments are defined by the 1940 Act as investments in companies in which the Company owns beneficially, either directly or indirectly, between 5% and 25% (inclusive) of the voting securities and does not have rights to maintain greater than 50% of the board representation. Fair value as of December 31, 2023, along with transactions during the year ended December 31, 2023 in these control or affiliated investments are as follows:
| | | | | | | | | | | | | | | | | | | | | | | | | | | | |
| | | | | | | | | | | | | | Net change in | | | | | | | |
| | | | | | | | | | | | | | Unrealized | | | | | | | |
| | Fair Value at | | | Gross | | | Gross | | | Realized | | | (Depreciation)/ | | | Fair Value at | | | Interest and | |
| | December 31, 2022 | | | Additions (1) | | | Reductions (2) | | | Gain/(Loss) | | | Appreciation | | | December 31, 2023 | | | Dividend Income | |
For the Year Ended December 31, 2023 | | | | | | | | | | | | | | | | | | | | | |
Control Investments | |
| | |
| | | | | | | | | | | |
| | |
| |
Edeniq, Inc. | | $ | 11,879 | | | $ | 1,717 | | | $ | (1,655 | ) | | $ | — | | | $ | (555 | ) | | $ | 11,386 | | | $ | 2,116 | |
3Q GoFor Holdings, LP | | | 7,521 | | | | 500 | | | | — | | | | — | | | | (3,799 | ) | | | 4,222 | | | | — | |
Project Frog, Inc. | | | 139 | | | | — | | | | — | | | | — | | | | (131 | ) | | | 8 | | | | — | |
Vertical Communications, Inc. | | | 17,274 | | | | 420 | | | | (550 | ) | | | — | | | | (399 | ) | | | 16,745 | | | | 1,997 | |
WorkWell Prevention and Care Inc. | | | 500 | | | | — | | | | — | | | | — | | | | — | | | | 500 | | | | 66 | |
Total Control Investments | | $ | 37,313 | | | $ | 2,637 | | | $ | (2,205 | ) | | $ | — | | | $ | (4,884 | ) | | $ | 32,861 | | | $ | 4,179 | |
| |
| | |
| | |
| | |
| | |
| | |
| | |
| |
Affiliate Investments | |
| | |
| | |
| | |
| | |
| | |
| | |
| |
FemTec Health, Inc. | | $ | 1,528 | | | $ | — | | | $ | (2,328 | ) | | $ | (26,251 | ) | | $ | 27,051 | | | $ | — | | | $ | — | |
Senior Credit Corp 2022 LLC | | | — | | | | 11,006 | | | | — | | | | — | | | | 329 | | | | 11,335 | | | | 1,025 | |
Total Affiliate Investments | | $ | 1,528 | | | $ | 11,006 | | | $ | (2,328 | ) | | $ | (26,251 | ) | | $ | 27,380 | | | $ | 11,335 | | | $ | 1,025 | |
| |
| | |
| | |
| | |
| | |
| | |
| | |
| |
Total Control and Affiliate Investments | | $ | 38,841 | | | $ | 13,643 | | | $ | (4,533 | ) | | $ | (26,251 | ) | | $ | 22,496 | | | $ | 44,196 | | | $ | 5,204 | |
(1)Gross additions may include increases in the cost basis of investments resulting from new portfolio investments, PIK interest, the accretion of discounts, the exchange of one or more existing securities for one or more new securities and the movement of an existing portfolio company into this category from a different category.
(2)Gross reductions may include decreases in the cost basis of investments resulting from principal collections related to investment repayments or sales, the exchange of one or more existing securities for one or more new securities and the movement of an existing portfolio company out of this category into a different category.
TRINITY CAPITAL INC.
NOTES TO CONSOLIDATED FINANCIAL STATEMENTS
Note 1. Organization and Basis of Presentation
Trinity Capital Inc. (“Trinity Capital” and, together with its subsidiaries, the “Company”) is a specialty lending company focused on providing debt, including loans, equipment financings and asset-based lending, to growth-oriented companies, including institutional investor-backed companies. Trinity Capital was formed on August 12, 2019 as a Maryland corporation and commenced operations on January 16, 2020. Prior to January 16, 2020, Trinity Capital had no operations, except for matters relating to its formation and organization as a business development company (“BDC”).
Trinity Capital is an internally managed, closed-end, non-diversified management investment company that has elected to be regulated as a BDC under the Investment Company Act of 1940, as amended (the “1940 Act”). Trinity Capital has elected to be treated, currently qualifies, and intends to continue to qualify annually as a regulated investment company (“RIC”) under Subchapter M of the Internal Revenue Code of 1986, as amended (the “Code”), for U.S. federal income tax purposes.
On September 27, 2019, Trinity Capital was initially capitalized with the issuance of 10 shares of its common stock for $150 to its sole stockholder.
On January 16, 2020, Trinity Capital completed a private offering of shares of its common stock (the “Private Common Stock Offering”) pursuant to which it issued and sold 8,333,333 shares of its common stock for total aggregate gross proceeds of approximately $125.0 million, inclusive of an over-allotment option that was exercised in full on January 29, 2020.
Concurrent with the initial closing of the Private Common Stock Offering, the Company completed a private debt offering (the “144A Note Offering” and together with the Private Common Stock Offering, the “Private Offerings”), pursuant to which it issued and sold $125.0 million in aggregate principal amount of the Company’s unsecured 7.00% Notes due 2025 (the “2025 Notes”), inclusive of the over-allotment option that was exercised in full on January 29, 2020.
On January 16, 2020, Trinity Capital completed a series of transactions, the Private Offerings, and the acquisition of Trinity Capital Investment, LLC, Trinity Capital Fund II, L.P. (“Fund II”), Trinity Capital Fund III, L.P., Trinity Capital Fund IV, L.P., and Trinity Sidecar Income Fund, L.P. (collectively the “Legacy Funds”) through mergers of the Legacy Funds with and into Trinity Capital as well as Trinity Capital’s acquisition of Trinity Capital Holdings, LLC (“Trinity Capital Holdings”) (collectively, the “Formation Transactions”).
Trinity Capital’s common stock began trading on the Nasdaq Global Select Market on January 29, 2021, under the symbol “TRIN” in connection with its initial public offering of shares of its common stock (“IPO”).
On December 5, 2022, the Company entered into a joint venture agreement with certain funds and accounts managed by a specialty credit manager to co-manage Senior Credit Corp 2022 LLC (the “JV”), a Delaware limited liability company. The JV invests in secured loans and equipment financings to growth-oriented companies that have been originated by the Company. Refer to “Note 12 – Related Party Transactions” for additional information.
On March 16, 2023, the Company formed an unconsolidated wholly owned subsidiary, Trinity Capital Adviser LLC (“Adviser Sub”), a Delaware limited liability company. The Company was granted exemptive relief by the SEC that permits the Company to organize, acquire, wholly own and operate the Adviser Sub as an investment adviser registered under the Investment Advisers Act of 1940, as amended (the “Adviser Act”). The Adviser Sub may provide investment advisory and related services to one or more investment vehicles (the “Adviser Funds”) with ownership by one or more unrelated third-party investors and receive fee income for such services. Refer to “Note 12 – Related Party Transactions” for additional information.
On June 28, 2024, the Company and a specialty credit manager funded a portion of their respective capital commitments to commence operations of a credit fund, EPT 16 LLC (“EPT 16”), a Delaware limited liability company. EPT 16 has acquired and intends to acquire, hold and, as applicable, dispose of investments that have been originated by the Company. Refer to “Note 12 – Related Party Transactions” for additional information.
Basis of Presentation
The Company’s consolidated financial statements are prepared in accordance with generally accepted accounting principles in the United States of America (“GAAP”) for financial information and pursuant to the requirements for reporting on Form 10-K and Articles 6, 10 and 12 of Regulation S-X. As an investment company, the Company follows accounting and reporting guidance determined by the Financial Accounting Standards Board (“FASB”), in Accounting Standards Codification, as amended (“ASC”) 946, Financial Services – Investment Companies (“ASC 946”).
Principles of Consolidation
Under ASC 946, the Company is precluded from consolidating portfolio company investments, including those in which it has a controlling interest, unless the portfolio company is another investment company. An exception to this general principle occurs if the Company holds a controlling interest in an operating company that provides all or substantially all of its services directly to the Company or to its portfolio companies. None of the portfolio investments made by the Company qualify for this exception. Therefore, the Company’s investment portfolio is carried on the Consolidated Statements of Assets and Liabilities at fair value, as discussed further in “Note 3 - Investments,” with any adjustments to fair value recognized as “Net change in unrealized appreciation/(depreciation) from investments” on the Consolidated Statements of Operations.
The Company’s consolidated operations include the activities of its wholly owned subsidiaries, Trinity Funding 1, LLC (“TF1”), and TrinCap Funding, LLC (“TCF”). TF1 was formed on August 14, 2019, as a Delaware limited liability company with Fund II as its sole equity member. On January 16, 2020, in connection with the Formation Transactions, Trinity Capital acquired TF1 through Fund II and became a party to, and assumed, a credit agreement with Credit Suisse AG (the “Credit Suisse Credit Facility”) through TF1 which matured on January 8, 2022 in accordance with its terms. TCF was formed on August 5, 2021, as a Delaware limited liability company with Trinity Capital as its sole equity member for purposes of securing lending in conjunction with a credit agreement with KeyBank National Association (“KeyBank”) (such credit facility, as amended, the “KeyBank Credit Facility”). TF1 and TCF are special purpose bankruptcy-remote entities and are separate legal entities from Trinity Capital. Any assets conveyed to TF1 or TCF are not available to creditors of the Company or any other entity other than TF1’s or TCF’s respective lenders. TF1 and TCF are consolidated for financial reporting purposes and in accordance with GAAP, and the portfolio investments held by these subsidiaries, if any, are included in the Company’s consolidated financial statements and recorded at fair value. All intercompany balances and transactions have been eliminated. As part of the Formation Transactions, Trinity Capital acquired 100% of the equity interests of Trinity Capital Holdings. There has been no activity in Trinity Capital Holdings since acquisition.
As permitted under Regulation S-X and consistent with the guidance in ASC 946-810-45-3, the Company will generally not consolidate its investment in a company other than an investment company subsidiary or a controlled operating company whose business consists of providing services to the Company. The Company does not consolidate the Adviser Sub because it is not an investment company as defined in ASC 946 and provides investment advisory services exclusively to the Adviser Funds with ownership by one or more unrelated third-party investors ("External Parties"). The Company does not consolidate the JV or EPT 16 as the Company does not hold a majority of the ownership or economic interests of such entities, and the Company's representatives do not comprise the majority of the board of managers of the JV. Pursuant to ASC 946, the Adviser Sub, JV, and EPT 16 are each accounted for as a portfolio investment of the Company held at fair value and are not included as a consolidated subsidiary in the Company's financial statements. Refer to “Note 12 – Related Party Transactions” for additional information.
In accordance with Rule 10‑01(b)(1) of Regulation S-X, as amended, the Company must determine which of its unconsolidated controlled subsidiaries, if any, are considered “significant subsidiaries.” In evaluating these unconsolidated controlled subsidiaries, there are two significance tests utilized per Rule 1‑02(w) of Regulation S-X to determine if any of the Company’s investments or unconsolidated controlled subsidiaries are considered significant: the investment test and the income test. As of December 31, 2024 and December 31, 2023, none of the Company’s investments or unconsolidated controlled subsidiaries met either of these two significance tests.
Note 2. Summary of Significant Accounting Policies
Use of Estimates
The preparation of financial statements in conformity with GAAP requires management to make estimates and assumptions that affect the reported amounts of assets and liabilities and disclosure of contingent assets and liabilities at the date of the financial statements. These estimates and assumptions also affect the reported amounts of revenues, costs and expenses during the reporting period. Management evaluates these estimates and assumptions on a regular basis. Actual results could differ materially from these estimates.
Investment Transactions
Loan originations are recorded on the date of the legally binding commitment. Realized gains or losses are recorded using the specific identification method as the difference between the net proceeds received, excluding prepayment fees, if any, and the amortized cost basis of the investment without regard to unrealized gains or losses previously recognized, and include investments written off during the period, net of recoveries. The net change in unrealized gains or losses primarily reflects the change in investment fair values as of the last business day of the reporting period and also includes the reversal of previously recorded unrealized gains or losses with respect to investments realized during the period.
Valuation of Investments
The most significant estimate inherent in the preparation of the Company’s consolidated financial statements is the valuation of investments and the related amounts of unrealized appreciation and depreciation of investments recorded.
The Company’s investments are carried at fair value in accordance with the 1940 Act and ASC 946 and measured in accordance with ASC 820, Fair Value Measurements and Disclosures (“ASC 820”). ASC 820 defines fair value, establishes a framework for measuring fair value, establishes a fair value hierarchy based on the observability of inputs used to measure fair value, and provides disclosure requirements for fair value measurements. ASC 820 requires the Company to assume that each of the portfolio investments is sold in a hypothetical transaction in the principal or, as applicable, most advantageous market using market participant assumptions as of the measurement date. Market participants are defined as buyers and sellers in the principal market that are independent, knowledgeable and willing and able to transact. The Company values its investments at fair value as determined in good faith pursuant to a consistent valuation policy by the Company’s Board of Directors (the “Board”) in accordance with the provisions of ASC 820 and the 1940 Act.
The SEC adopted Rule 2a-5 under the 1940 Act (“Rule 2a-5”), which establishes a framework for determining fair value in good faith for purposes of the 1940 Act. As adopted, Rule 2a-5 permits boards of directors to designate certain parties to perform fair value determinations, subject to board oversight and certain other conditions. The SEC also adopted Rule 31a-4 under the 1940 Act (“Rule 31a-4”), which provides the recordkeeping requirements associated with fair value determinations. While the Company's Board has not elected to designate a valuation designee, the Company has adopted certain revisions to its valuation policies and procedures to comply with the applicable requirements of Rule 2a-5 and Rule 31a-4.
While the Board is ultimately and solely responsible for determining the fair value of the Company’s investments, the Company has engaged independent valuation firms, on a discretionary basis, to provide the Company with valuation assistance with respect to its investments. Specifically, on a quarterly basis, the Company identifies portfolio investments with respect to which an independent valuation firm assists in valuing such investments. The Company selects these portfolio investments based on a number of factors, including, but not limited to, the potential for material fluctuations in valuation results, size, credit quality and the time lapse since the last valuation of the portfolio investment by an independent valuation firm.
Investments recorded on the Company’s Consolidated Statements of Assets and Liabilities are categorized based on the inputs to the valuation techniques as follows:
Level 1 — Investments whose values are based on unadjusted quoted prices for identical assets in an active market that the Company has the ability to access (examples include investments in active exchange-traded equity securities and investments in most U.S. government and agency securities).
Level 2 — Investments whose values are based on quoted prices in markets that are not active or model inputs that are observable either directly or indirectly for substantially the full term of the investment.
Level 3 — Investments whose values are based on prices or valuation techniques that require inputs that are both unobservable and significant to the overall fair value measurement (for example, investments in illiquid securities issued by privately held companies). These inputs reflect management’s own assumptions about the assumptions a market participant would use in pricing the investment.
Given the nature of lending to venture capital-backed growth-oriented companies, 99.1%, based on fair value, of the Company’s investments in these portfolio companies are considered Level 3 assets under ASC 820 because there is no known or accessible market or market index for these investment securities to be traded or exchanged. Transfers between levels, if any, are recognized at the beginning of the period in which the transfers occur. The Company uses an internally developed portfolio investment rating system in connection with its investment oversight, portfolio management and analysis, and investment valuation procedures. This system takes into account both quantitative and qualitative factors of the portfolio companies. Due to the inherent uncertainty of determining the fair value of investments that do not have a readily available market value, the fair value of the Company’s investments may fluctuate from period to period. Because of the inherent uncertainty of valuation, these estimated values may differ significantly from the values that would have been reported had a ready market for the investments existed, and it is reasonably possible that the difference could be material.
Debt Securities
The debt securities identified on the Consolidated Schedule of Investments are secured loans and equipment financings made to growth-oriented companies. For portfolio investments in debt securities for which the Company has determined that third-party quotes or other independent pricing are not available, the Company generally estimates the fair value based on the assumptions that hypothetical market participants would use to value the investment in a current hypothetical sale using an income approach.
In its application of the income approach to determine the fair value of debt securities, the Company bases its assessment of fair value on projections of the discounted future free cash flows that the security will likely generate, including analyzing the discounted cash flows of interest and principal amounts for the security, as set forth in the associated loan and equipment financing agreements, as well as market yields and the financial position and credit risk of the portfolio company (the “Hypothetical Market Yield Method”). The discount rate applied to the future cash flows of the security is based on the calibrated yield implied by the terms of the Company’s investment adjusted for changes in market yields and performance of the subject company. The Company’s estimate of the expected repayment date of its loans and equipment financings securities is either the maturity date of the instrument or the anticipated pre-payment date, depending on the facts and circumstances. The Hypothetical Market Yield Method also considers changes in leverage levels, credit quality, portfolio company performance, market yield movements, and other factors. If there is deterioration in credit quality or if a security is in workout status, the Company may consider other factors in determining the fair value of the security, including, but not limited to, the value attributable to the security from the enterprise value of the portfolio company or the proceeds that would most likely be received in a liquidation analysis.
Equity Securities and Warrants
Often the Company is issued warrants by issuers as yield enhancements. These warrants are recorded as assets at estimated fair value on the grant date. The Company determines the cost basis of the warrants or other equity securities received based upon their respective fair values on the date of receipt in proportion to the total fair value of the debt and warrants or other equity securities received. Depending on the facts and circumstances, the Company generally utilizes a combination of one or several forms of the market approach and contingent claim analyses (a form of option analysis) to estimate the fair value of the securities as of the measurement date and determines the cost basis using a relative fair value methodology. As part of its application of the market approach, the Company estimates the enterprise value of a portfolio company utilizing customary pricing multiples, based on the development stage of the underlying issuers, or other appropriate valuation methods, such as considering recent transactions in the equity securities of the portfolio company or third-party valuations that are assessed to be indicative of fair value of the respective portfolio company. If appropriate, based on the facts and circumstances, the Company performs an allocation of the enterprise value to the equity securities utilizing a contingent claim analysis and/or other waterfall calculation by which it allocates the enterprise value across the portfolio company’s securities in order of their preference relative to one another.
Fair value estimates are made at discrete points in time based on relevant information. These estimates may be subjective in nature and involve uncertainties and matters of significant judgment and, therefore, cannot be determined with precision. The carrying amounts of the Company’s financial instruments, consisting of cash, investments, receivables, payables, and other liabilities, approximate the fair values of such items due to the short-term nature of these instruments. Refer to “Note 4 – Fair Value of Financial Instruments” for further discussion.
Cash and Cash Equivalents
Cash, cash equivalents and restricted cash consist of funds deposited with financial institutions and short-term (original maturity of three months or less) liquid investments in money market deposit accounts. Cash equivalents are classified as Level 1 assets and are valued using the net asset value (“NAV”) per share of the money market fund. As of December 31, 2024 and December 31, 2023, cash and cash equivalents consisted of $9.6 million and $4.8 million, respectively, of which $3.8 million and $3.1 million, respectively, was held in the Goldman Sachs Financial Square Government Institutional Fund with a yield between 3% - 6%. Cash held in demand deposit accounts may exceed the Federal Deposit Insurance Corporation (“FDIC”) insured limit and therefore is subject to credit risk. All of the Company’s cash deposits are held at large, established, high credit quality financial institutions, and management believes that the risk of loss associated with any uninsured balances is remote. As of December 31, 2024 and December 31, 2023, the Company did not have any restricted cash.
Other Assets
Other assets generally consist of fixed assets net of accumulated depreciation, leasehold improvements net of accumulated depreciation, right-of-use assets, prepaid expenses, escrow receivables, deferred offering costs, and security deposits for operating leases.
Escrow Receivables
Escrow receivables are collected in accordance with the terms and conditions of the escrow agreement. Escrow balances are typically distributed over a period of one year and may accrue interest during the escrow period. Escrow balances are measured for collectability on at least a quarterly basis and fair value is determined based on the amount of the estimated recoverable balances and the contractual maturity date. As of December 31, 2024, and December 31, 2023, there were no material past due escrow receivables. As of December 31, 2024, the Company did not have any escrow receivables. The escrow receivable balance as of December 31, 2023 totaled $2.4 million and was measured at fair value and held in accordance with ASC 820.
Equity Offering Costs
Equity offering costs consist of fees and costs incurred in connection with the sale of the Company’s common stock, including legal, accounting and printing fees. These costs are deferred at the time of incurrence and are subsequently charged as a reduction to capital when the offering takes place or as shares are issued. Equity offering costs are periodically reviewed and expensed if the related registration is no longer active.
Security Deposits
Security deposits are collected upon funding equipment financings and are applied in lieu of regular payments at the end of the term.
Debt Financing Costs
The Company records costs related to the issuance of debt obligations as deferred debt financing costs. These costs are deferred and amortized using the straight-line method over the stated maturity life of the obligations. Debt financing costs related to secured or unsecured notes are netted with the outstanding principal balance on the Company’s Consolidated Statements of Assets and Liabilities. Debt financing costs related to the KeyBank Credit Facility are recorded as deferred credit facility costs on the Company’s Consolidated Statements of Assets and Liabilities.
Income Recognition
Interest and Dividend Income
The Company recognizes interest income on an accrual basis and recognizes it as earned in accordance with the contractual terms of the loan agreement to the extent that such amounts are expected to be collected. Original issue discount (“OID”) initially includes the estimated fair value of detachable warrants obtained in conjunction with the origination of debt securities and is accreted into interest income over the term of the loan as a yield enhancement based on the effective yield method. In addition, the Company may also be entitled to an end-of-term (“EOT”) payment. EOT payments to be paid at the termination of the debt agreements are accreted into interest income over the contractual life of the debt based on the effective yield method. When a portfolio company pre-pays their indebtedness prior to the scheduled maturity date, the acceleration of the unaccreted OID and EOT payment is recognized as interest income.
The Company has a limited number of debt investments in its portfolio that contain a payment-in-kind (“PIK”) provision. Contractual PIK interest, which represents contractually deferred interest added to the loan balance that is generally due at the end of the loan term, is generally recorded on an accrual basis to the extent such amounts are expected to be collected. The Company will generally cease accruing PIK interest if there is insufficient value to support the accrual or management does not expect the portfolio company to be able to pay all principal and interest due. The Company recorded $9.1 million, $8.0 million, and $0.3 million in PIK interest income during the years ended December 31, 2024, December 31, 2023, and December 31, 2022, respectively.
Income related to application or origination payments, including facility commitment fees, net of related expenses and generally collected in advance, is amortized into interest income over the contractual life of the loan. The Company recognizes nonrecurring fees and additional OID and EOT payment received in consideration for contract modifications commencing in the quarter relating to the specific modification.
The Company records dividend income on an accrual basis to the extent amounts are expected to be collected. Dividend income is recorded when dividends are declared by the portfolio company or at such other time that an obligation exists for the portfolio company to make a distribution. The Company recorded $1.6 million and $0.6 million in dividend income during the year ended December 31, 2024 and December 31, 2023, respectively, and no dividend income was recorded during the year ended December 31, 2022.
Fee and Other Income
The Company recognizes one-time fee income, including, but not limited to, structuring fees, prepayment penalties, and exit fees related to a change in ownership of the portfolio company, as other income when earned. These fees are generally earned when the portfolio company enters into an equipment financing arrangement or pays off their outstanding indebtedness prior to the scheduled maturity. In addition, fee income may include fees for originations and administrative agent services rendered by the Company to the JV. Such fees are earned in the period that the services are rendered.
Non-Accrual Policy
When a debt security becomes 90 days or more past due, or if management otherwise does not expect that principal, interest, and other obligations due will be collected in full, the Company will generally place the debt security on non-accrual status and cease recognizing interest income on that debt security until all principal and interest due has been paid or the Company believes the borrower has demonstrated the ability to repay its current and future contractual obligations. Any uncollected interest is reversed from income in the period that collection of the interest receivable is determined to be doubtful. However, the Company may make exceptions to this policy if the investment has sufficient collateral value and is in the process of collection.
As of December 31, 2024, loans to three portfolio companies and equipment financings to two portfolio companies were on non-accrual status, with a total cost of approximately $43.3 million, and a total fair value of approximately $12.7 million, or 0.8%, of the fair value of the Company’s debt investment portfolio. As of December 31, 2023, loans to three portfolio companies and equipment financings to two portfolio companies were on non-accrual status with a total cost of approximately $60.8 million, and a total fair value of approximately $43.2 million, or 3.5%, of the fair value of the Company’s debt investment portfolio.
Net Realized Gains / (Losses)
Realized gains / (losses) are measured by the difference between the net proceeds from the sale or redemption of an investment or a financial instrument and the cost basis of the investment or financial instrument, without regard to unrealized appreciation or depreciation previously recognized, and includes investments written off during the period net of recoveries and realized gains or losses from in-kind redemptions. Net proceeds exclude any prepayment penalties, exit fees, and OID and EOT acceleration. Prepayment penalties and exit fees received at the time of sale or redemption are included in fee income on the Consolidated Statements of Operations. OID and EOT acceleration is included in interest income on the Consolidated Statements of Operations.
Net Change in Unrealized Appreciation / (Depreciation)
Net change in unrealized appreciation / (depreciation) reflects the net change in the fair value of the investment portfolio and financial instruments and the reclassification of any prior period unrealized appreciation or depreciation on exited investments and financial instruments to realized gains or losses.
Stock-Based Compensation
The Company has issued and may, from time to time, issue restricted stock to its officers and employees under the 2019 Trinity Capital Inc. Long Term Incentive Plan, as amended, and to its non-employee directors under the Trinity Capital Inc. 2019 Non-Employee Director Restricted Stock Plan, as amended. The Company accounts for its stock-based compensation plans using the fair value method, as prescribed by ASC 718, Compensation – Stock Compensation. Accordingly, for restricted stock awards, the Company measures the grant date fair value based upon the market price of its common stock on the date of the grant and amortizes the fair value of the awards as stock-based compensation expense over the requisite service period, which is generally the vesting term.
The Company has also adopted Accounting Standards Update (“ASU”) 2016-09, Compensation—Stock Compensation: Improvements to Employee Share-Based Payment Accounting, which requires that all excess tax benefits and tax deficiencies (including tax benefits of dividends on stock-based payment awards) be recognized as income tax expense or benefit in the income statement and not delay recognition of a tax benefit until the tax benefit is realized through a reduction to taxes payable. Accordingly, the tax effects of exercised or vested awards are treated as discrete items in the reporting period in which they occur. Additionally, the Company has elected to account for forfeitures as they occur.
Earnings Per Share
The Company's earnings per share (“EPS”) amounts have been computed based on the weighted-average number of shares of common stock outstanding for the period. Basic earnings per share is computed by dividing net increase (decrease) in net assets resulting from operations by the weighted-average number of common shares outstanding for the period. In accordance with ASC 260, Earnings Per Share, the unvested shares of restricted stock awarded pursuant to Trinity Capital’s equity compensation plans are participating securities and, therefore, are included in the basic earnings per share calculation. Diluted EPS is computed by dividing net increase (decrease) in net assets resulting from operations by the weighted average number of shares of common stock assuming all potential shares had been issued and the additional shares of common stock were dilutive. Diluted EPS, if any, reflects the potential dilution from the assumed conversion of the Company’s 6.00% Convertible Notes due 2025 (the “Convertible Notes”).
Income Taxes
The Company has elected to be treated, currently qualifies, and to intends to continue to qualify annually, as a RIC under Subchapter M of the Code for U.S. federal tax purposes. In order to maintain its treatment as a RIC, the Company is generally required to distribute at least annually to its stockholders at least the sum of 90% of its investment company taxable income (which generally includes its net ordinary taxable income and realized net short-term capital gains in excess of realized net long-term capital losses) and 90% of its net tax-exempt income (if any). The Company generally will not be subject to U.S. federal income tax on these distributed amounts but will pay U.S. federal income tax at corporate rates on any retained amounts.
The Company evaluates tax positions taken in the course of preparing the Company’s tax returns to determine whether the tax positions are “more-likely-than-not” to be sustained by the applicable tax authority in accordance with ASC 740, Income Taxes (“ASC 740”), as modified by ASC 946. Tax benefits of positions not deemed to meet the more-likely-than-not threshold, or uncertain tax positions, would be recorded as tax expense in the current year. It is the Company’s policy to recognize accrued interest and penalties related to uncertain tax benefits in income tax expense. The Company has no material uncertain tax positions as of December 31, 2024 and December 31, 2023. All the Company’s tax returns remain subject to examination by U.S. federal and state tax authorities.
Based on federal excise distribution requirements applicable to RICs, the Company will be subject to a 4% nondeductible federal excise tax on undistributed taxable income and gains unless the Company distributes in a timely manner an amount at least equal to the sum of (1) 98% of its ordinary income for each calendar year, (2) 98.2% of capital gain net income (both long-term and short-term) for the one-year period ending October 31 in that calendar year and (3) any income or gain realized, but not distributed, in the preceding years. For this purpose, however, any ordinary income or capital gain net income retained by the Company and on which the Company paid corporate income tax is considered to have been distributed. The Company, at its discretion, may determine to carry forward taxable income or gain and pay a 4% excise tax on the amount by which it falls short of this calendar-year distribution requirement. If the Company chooses to do so, this generally will increase expenses and reduce the amount available to be distributed to stockholders. The Company will accrue excise tax on estimated undistributed taxable income and capital gains as required on an annual basis.
Distributions
Distributions to common stockholders are recorded on the record date. The amount of taxable income to be paid out as a distribution is determined by the Board each quarter and is generally based upon the earnings estimated by management. Capital gains, if any, are distributed at least annually, although the Company may decide to retain all or some of those capital gains for investment and pay U.S. federal income tax at corporate rates on those retained amounts. If the Company chooses to do so, this generally will increase expenses and reduce the amount available to be distributed to stockholders.
Note 3. Investments
The Company provides debt, including loans and equipment financings, to growth-oriented companies, including venture capital-backed companies and companies with institutional equity investors, primarily in the United States. The Company’s investment strategy includes making investments consisting primarily of term loans and equipment financings, and, to a lesser extent, working capital loans, equity, and equity-related investments. In addition, the Company may obtain warrants or contingent exit fees at funding from many of its portfolio companies.
Debt Securities
The Company’s debt securities primarily consist of direct investments in interest-bearing secured loans and equipment financings to privately held companies based in the United States. Secured loans are generally secured by a blanket first lien or a blanket second lien on the assets of the portfolio company. Equipment financings typically include a specific asset lien on mission-critical assets as well as a second lien on the assets of the portfolio company. These debt securities typically have a term of between three and five years from the original investment date. Certain of the debt securities are “covenant-lite” loans, which generally are loans that do not have a complete set of financial maintenance covenants and have covenants that are incurrence-based, meaning they are only tested and can only be breached following an affirmative action of the borrower rather than by a deterioration in the borrower’s financial condition. The equipment financings in the investment portfolio generally have fixed interest rates. The secured loans in the investment portfolio generally have floating interest rates subject to interest rate floors. Both equipment financings and secured loans generally include an EOT payment.
The specific terms of each debt security vary depending on the creditworthiness of the portfolio company and the projected value of the financed assets. Companies with stronger creditworthiness may receive an initial period of lower financing factor, which is analogous to an interest-only period on a traditional term loan. Equipment financings may include upfront interim payments and security deposits. Equipment financing arrangements have various structural protections, including customary default penalties, information and reporting rights, material adverse change or investor abandonment provisions, consent rights for any additions or changes to senior debt, and, as needed, intercreditor agreements with cross-default provisions to protect the Company’s second lien positions.
Warrant Investments
In connection with the Company’s debt investments, the Company may receive warrants in the portfolio company. Warrants received in connection with a debt investment typically include a potentially discounted contract price to exercise, and thus, as a portfolio company appreciates in value, the Company may achieve additional investment return from this equity interest. The warrants typically contain provisions that protect the Company as a minority-interest holder, as well as secured or unsecured put rights, or rights to sell such securities back to the portfolio company, upon the occurrence of specified events. In certain cases, the Company may also obtain follow-up rights in connection with these equity interests, which allow the Company to participate in future financing rounds.
Equity Investments
In specific circumstances, the Company may seek to make direct equity investments in situations where it is appropriate to align the interests of the Company with key management and stockholders of the portfolio company, and to allow for participation in the appreciation in the equity values of the portfolio company. These equity investments are generally made in connection with debt investments. The Company seeks to maintain fully diluted equity positions in its portfolio companies of 5% to 50% and may have controlling equity interests in some instances.
Portfolio Composition
The Company’s portfolio investments are in companies conducting business in a variety of industries. Industry classifications have been updated to a preferred presentation and the prior year has been amended to conform with the new preferred presentation. The following table summarizes the composition of the Company’s portfolio investments by industry at cost and fair value and as a percentage of the total portfolio as of December 31, 2024 and December 31, 2023 (dollars in thousands):
| | | | | | | | | | | | | | | | | | | | | | | | | | | | | | | | |
| | December 31, 2024 | | | December 31, 2023 | |
| | Cost | | | Fair Value | | | Cost | | | Fair Value | |
Industry | | Amount | | | % | | | Amount | | | % | | | Amount | | | % | | | Amount | | | % | |
Finance and Insurance | | $ | 319,278 | | | | 18.1 | % | | $ | 322,735 | | | | 18.7 | % | | $ | 139,399 | | | | 10.6 | % | | $ | 133,344 | | | | 10.5 | % |
Medical Devices | | | 170,923 | | | | 9.7 | % | | | 172,395 | | | | 10.0 | % | | | 68,717 | | | | 5.2 | % | | | 70,320 | | | | 5.5 | % |
Green Technology | | | 146,851 | | | | 8.3 | % | | | 158,852 | | | | 9.2 | % | | | 138,510 | | | | 10.5 | % | | | 143,279 | | | | 11.2 | % |
SaaS | | | 144,896 | | | | 8.2 | % | | | 146,778 | | | | 8.5 | % | | | 34,257 | | | | 2.6 | % | | | 34,440 | | | | 2.7 | % |
Other Healthcare Services | | | 142,430 | | | | 8.1 | % | | | 143,186 | | | | 8.3 | % | | | — | | | | — | | | | — | | | | — | |
Space Technology | | | 141,163 | | | | 8.0 | % | | | 142,034 | | | | 8.2 | % | | | 185,384 | | | | 14.1 | % | | | 186,335 | | | | 14.6 | % |
Real Estate Technology | | | 101,825 | | | | 5.8 | % | | | 93,587 | | | | 5.4 | % | | | 94,878 | | | | 7.2 | % | | | 91,344 | | | | 7.2 | % |
Artificial Intelligence & Automation | | | 83,505 | | | | 4.7 | % | | | 84,448 | | | | 4.9 | % | | | 34,732 | | | | 2.6 | % | | | 34,435 | | | | 2.7 | % |
Healthcare Technology | | | 78,381 | | | | 4.5 | % | | | 71,853 | | | | 4.2 | % | | | 89,038 | | | | 6.8 | % | | | 84,917 | | | | 6.6 | % |
Biotechnology | | | 56,547 | | | | 3.2 | % | | | 57,836 | | | | 3.4 | % | | | 56,173 | | | | 4.3 | % | | | 55,810 | | | | 4.4 | % |
Consumer Products & Services | | | 56,210 | | | | 3.2 | % | | | 54,607 | | | | 3.2 | % | | | 85,683 | | | | 6.5 | % | | | 83,722 | | | | 6.6 | % |
Transportation Technology | | | 62,735 | | | | 3.6 | % | | | 41,547 | | | | 2.4 | % | | | 45,024 | | | | 3.4 | % | | | 39,532 | | | | 3.1 | % |
Marketing, Media, and Entertainment | | | 38,749 | | | | 2.2 | % | | | 38,479 | | | | 2.2 | % | | | 49,145 | | | | 3.7 | % | | | 47,526 | | | | 3.7 | % |
Connectivity | | | 36,099 | | | | 2.1 | % | | | 35,249 | | | | 2.0 | % | | | 36,191 | | | | 2.7 | % | | | 34,219 | | | | 2.7 | % |
Multi-Sector Holdings(1) | | | 27,623 | | | | 1.6 | % | | | 33,137 | | | | 1.9 | % | | | 11,006 | | | | 0.8 | % | | | 11,335 | | | | 0.9 | % |
Education Technology | | | 33,275 | | | | 1.9 | % | | | 29,740 | | | | 1.7 | % | | | 18,975 | | | | 1.4 | % | | | 15,285 | | | | 1.2 | % |
Human Resource Technology | | | 33,421 | | | | 1.9 | % | | | 28,891 | | | | 1.7 | % | | | 31,142 | | | | 2.4 | % | | | 30,595 | | | | 2.4 | % |
Supply Chain Technology | | | 29,765 | | | | 1.7 | % | | | 28,535 | | | | 1.7 | % | | | 30,414 | | | | 2.3 | % | | | 24,556 | | | | 1.9 | % |
Food and Agriculture Technologies | | | 31,824 | | | | 1.8 | % | | | 24,469 | | | | 1.4 | % | | | 90,967 | | | | 6.9 | % | | | 88,707 | | | | 7.0 | % |
Industrials | | | 11,772 | | | | 0.7 | % | | | 9,677 | | | | 0.6 | % | | | 21,995 | | | | 1.7 | % | | | 23,113 | | | | 1.8 | % |
Construction Technology | | | 9,443 | | | | 0.5 | % | | | 4,042 | | | | 0.2 | % | | | 24,141 | | | | 1.8 | % | | | 6,813 | | | | 0.5 | % |
Digital Assets Technology and Services | | | 3,511 | | | | 0.2 | % | | | 3,493 | | | | 0.2 | % | | | 33,545 | | | | 2.5 | % | | | 35,553 | | | | 2.8 | % |
Total | | $ | 1,760,226 | | | | 100.0 | % | | $ | 1,725,570 | | | | 100.0 | % | | $ | 1,319,316 | | | | 100.0 | % | | $ | 1,275,180 | | | | 100.0 | % |
(1)Multi-Sector Holdings consist of the Company's investments in Senior Credit Corp 2022 LLC, Trinity Capital Adviser LLC and EPT 16 LLC. These entities invest or manage investments in secured loans and equipment financings to growth-oriented companies that have been originated by the Company. The portfolio companies held by the Multi-Sector Holdings represent a diverse set of industry classifications, which are similar to those in which the Company invests directly. See “Note 12 – Related Party Transactions” in the notes to the consolidated financial statements for further discussion.
The geographic composition of the Company's investment portfolio is determined by the location of the corporate headquarters of the portfolio company. The following table summarizes the composition of the Company’s portfolio investments by geographic region of the United States and other countries at cost and fair value and as a percentage of the total portfolio as of December 31, 2024 and December 31, 2023 (dollars in thousands):
| | | | | | | | | | | | | | | | | | | | | | | | | | | | | | | | |
| | December 31, 2024 | | | December 31, 2023 | |
| | Cost | | | Fair Value | | | Cost | | | Fair Value | |
Geographic Region | | Amount | | | % | | | Amount | | | % | | | Amount | | | % | | | Amount | | | % | |
United States: | | | | | | | | | | | | | | | | | | | | | | | | |
West | | $ | 543,501 | | | | 30.7 | % | | $ | 543,102 | | | | 31.5 | % | | $ | 468,917 | | | | 35.5 | % | | $ | 464,909 | | | | 36.5 | % |
Northeast | | | 494,131 | | | | 28.1 | % | | | 475,944 | | | | 27.6 | % | | | 392,739 | | | | 29.8 | % | | | 383,008 | | | | 29.9 | % |
Mountain | | | 191,244 | | | | 10.9 | % | | | 180,644 | | | | 10.5 | % | | | 118,126 | | | | 9.0 | % | | | 110,681 | | | | 8.7 | % |
Southeast | | | 184,636 | | | | 10.5 | % | | | 180,002 | | | | 10.4 | % | | | 43,878 | | | | 3.3 | % | | | 42,129 | | | | 3.3 | % |
South | | | 162,180 | | | | 9.2 | % | | | 164,654 | | | | 9.5 | % | | | 169,014 | | | | 12.8 | % | | | 172,746 | | | | 13.5 | % |
Midwest | | | 104,074 | | | | 5.9 | % | | | 96,193 | | | | 5.6 | % | | | 64,535 | | | | 4.9 | % | | | 56,945 | | | | 4.5 | % |
Multi-Sector Holdings (1) | | | 27,623 | | | | 1.6 | % | | | 33,137 | | | | 1.9 | % | | | 11,006 | | | | 0.8 | % | | | 11,335 | | | | 0.9 | % |
International: | | | | | | | | | | | | | | | | | | | | | | | | |
Western Europe | | | 41,366 | | | | 2.4 | % | | | 41,455 | | | | 2.4 | % | | | 22,235 | | | | 1.7 | % | | | 22,400 | | | | 1.8 | % |
Canada | | | 11,471 | | | | 0.7 | % | | | 10,439 | | | | 0.6 | % | | | 28,866 | | | | 2.2 | % | | | 11,027 | | | | 0.9 | % |
Total | | $ | 1,760,226 | | | | 100.0 | % | | $ | 1,725,570 | | | | 100.0 | % | | $ | 1,319,316 | | | | 100.0 | % | | $ | 1,275,180 | | | | 100.0 | % |
(1)Multi-Sector Holdings consist of the Company's investments in Senior Credit Corp 2022 LLC, Trinity Capital Adviser LLC and EPT 16 LLC. These entities invest or manage investments in secured loans and equipment financings to growth-oriented companies that have been originated by the Company. The portfolio companies held by the Multi-Sector Holdings represent a diverse set of geographical classifications, which are similar to those in which the Company invests directly. See “Note 12 – Related Party Transactions” in the notes to the consolidated financial statements for further discussion.
The following table summarizes the composition of the Company’s portfolio investments by investment type at cost and fair value and as a percentage of the total portfolio as of December 31, 2024 and December 31, 2023 (dollars in thousands):
| | | | | | | | | | | | | | | | | | | | | | | | | | | | | | | | |
| | December 31, 2024 | | | December 31, 2023 | |
| | Cost | | | Fair Value | | | Cost | | | Fair Value | |
Investment | | Amount | | | % | | | Amount | | | % | | | Amount | | | % | | | Amount | | | % | |
Secured Loans | | $ | 1,322,999 | | | | 75.1 | % | | $ | 1,286,668 | | | | 74.5 | % | | $ | 918,836 | | | | 69.7 | % | | $ | 885,299 | | | | 69.5 | % |
Equipment Financings | | | 317,962 | | | | 18.1 | % | | | 315,463 | | | | 18.3 | % | | | 336,934 | | | | 25.5 | % | | | 336,778 | | | | 26.4 | % |
Equity | | | 78,585 | | | | 4.5 | % | | | 71,985 | | | | 4.2 | % | | | 33,302 | | | | 2.5 | % | | | 19,576 | | | | 1.5 | % |
Warrants | | | 40,680 | | | | 2.3 | % | | | 51,454 | | | | 3.0 | % | | | 30,244 | | | | 2.3 | % | | | 33,527 | | | | 2.6 | % |
Total | | $ | 1,760,226 | | | | 100.0 | % | | $ | 1,725,570 | | | | 100.0 | % | | $ | 1,319,316 | | | | 100.0 | % | | $ | 1,275,180 | | | | 100.0 | % |
Certain Risk Factors
In the ordinary course of business, the Company manages a variety of risks, including market risk, credit risk and liquidity risk. The Company identifies, measures and monitors risk through various control mechanisms, including investment limits and diversifying exposures and activities across a variety of instruments, markets and counterparties.
Market risk is the risk of potential adverse changes to the value of financial instruments because of changes in market conditions, including as a result of changes in the credit quality of a particular issuer, credit spreads, interest rates, and other movements and volatility in security prices or commodities. In particular, the Company may invest in issuers that are experiencing or have experienced financial or business difficulties (including difficulties resulting from the initiation or prospect of significant litigation or bankruptcy proceedings), which involves significant risks. The Company manages its exposure to market risk through the use of risk management strategies and various analytical monitoring techniques.
The Company’s investments are generally comprised of securities and other financial instruments or obligations that are illiquid or thinly traded, making purchase or sale of such securities and financial instruments at desired prices or in desired quantities difficult. Furthermore, the sale of any such investments may be possible only at substantial discounts, and it may be extremely difficult to value any such investments accurately.
The Company’s investments consist of growth-oriented companies, many of which have relatively limited operating histories and may experience variation in operating results. Many of these companies conduct business in regulated industries and could be affected by changes in government regulations. Most of the Company’s borrowers will need additional capital to satisfy their continuing working capital needs and other requirements, and in many instances, to service the interest and principal payments on the debt.
Note 4. Fair Value of Financial Instruments
ASC 820 defines fair value, establishes a framework for measuring fair value, establishes a fair value hierarchy based on the observability of inputs used to measure fair value, and provides disclosure requirements for fair value measurements. The Company accounts for its investments at fair value in accordance with ASC 820. As of December 31, 2024 and December 31, 2023, the Company’s portfolio investments consisted primarily of investments in secured loans and equipment financings. The fair value amounts have been measured as of the reporting date and have not been reevaluated or updated for purposes of these financial statements subsequent to that date. As such, the fair values of these financial instruments subsequent to the reporting date may be different than amounts reported.
In accordance with ASC 820, the Company has categorized its investments based on the priority of the inputs to the valuation technique into a three-level fair value hierarchy. The fair value hierarchy gives the highest priority to quoted prices in active markets for identical investments (Level 1) and the lowest priority to unobservable inputs (Level 3). See “Note 2 – Summary of Significant Accounting Policies.”
As required by ASC 820, when the inputs used to measure fair value fall within different levels of the hierarchy, the level within which the fair value measurement is categorized is based on the lowest level input that is significant to the fair value measurement in its entirety. For example, a Level 3 fair value measurement may include inputs that are observable (Levels 1 and 2) and unobservable (Level 3). Therefore, unrealized appreciation and depreciation related to such investments categorized within the Level 3 tables below may include changes in fair value that are attributable to both observable inputs (Levels 1 and 2) and unobservable inputs (Level 3).
The fair value determination of each portfolio investment categorized as Level 3 requires one or more of the following unobservable inputs:
•Financial information obtained from each portfolio company, including unaudited statements of operations and balance sheets for the most recent period available as compared to budgeted numbers;
•Current and projected financial condition of the portfolio company;
•Current and projected ability of the portfolio company to service its debt obligations;
•Type and amount of collateral, if any, underlying the investment;
•Current financial ratios (e.g., fixed charge coverage ratio, interest coverage ratio and net debt/EBITDA ratio) applicable to the investment;
•Current liquidity of the investment and related financial ratios (e.g., current ratio and quick ratio);
•Pending debt or capital restructuring of the portfolio company;
•Projected operating results of the portfolio company;
•Current information regarding any offers to purchase the investment;
•Current ability of the portfolio company to raise any additional financing as needed;
•Changes in the economic environment, which may have a material impact on the operating results of the portfolio company;
•Internal occurrences that may have an impact (both positive and negative) on the operating performance of the portfolio company;
•Qualitative assessment of key management;
•Contractual rights, obligations or restrictions associated with the investment; and
The use of significant unobservable inputs creates uncertainty in the measurement of fair value as of the reporting date. The significant unobservable inputs used in the fair value measurement of the Company’s investments, are (i) earnings before interest, tax, depreciation, and amortization (“EBITDA”) and revenue multiples (both projected and historic), and (ii) volatility assumptions. Significant increases (decreases) in EBITDA and revenue multiple inputs in isolation would result in a significantly higher (lower) fair value measurement. Similarly, significant increases (decreases) in volatility inputs in isolation would result in a significantly higher (lower) fair value assessment. Conversely, significant increases (decreases) in weighted average cost of capital inputs in isolation would result in a significantly lower (higher) fair value measurement. However, due to the nature of certain investments, fair value measurements may be based on other criteria, such as third-party appraisals of collateral and fair values as determined by independent third parties, which are not presented in the tables below.
The Company’s assets measured at fair value by investment type on a recurring basis as of December 31, 2024 were as follows (in thousands):
| | | | | | | | | | | | | | | | | | | | |
| | Fair Value Measurements at Reporting Date Using | | | | | | | |
| | Quoted Prices | | | Significant | | | | | | | | | | |
| | in Active | | | Other | | | Significant | | | | | | | |
| | Markets for | | | Observable | | | Unobservable | | | | | | | |
| | Identical Assets | | | Inputs | | | Inputs | | | Measured at | | | | |
Assets | | (Level 1) | | | (Level 2) | | | (Level 3) | | | Net Asset Value(1) | | | Total | |
Secured Loans | | $ | — | | | $ | — | | | $ | 1,286,668 | | | $ | — | | | $ | 1,286,668 | |
Equipment Financings | | | — | | | | — | | | | 315,463 | | | | — | | | | 315,463 | |
Warrants | | | — | | | | — | | | | 51,454 | | | | — | | | | 51,454 | |
Equity | | | — | | | | — | | | | 56,584 | | | | 15,401 | | | | 71,985 | |
Total Investments at fair value | | | — | | | | — | | | | 1,710,169 | | | | 15,401 | | | | 1,725,570 | |
Cash and cash equivalents | | | 9,627 | | | | — | | | | — | | | | — | | | | 9,627 | |
Total | | $ | 9,627 | | | $ | — | | | $ | 1,710,169 | | | $ | 15,401 | | | $ | 1,735,197 | |
(1)In accordance with ASC 820, the Company's equity investments in Senior Credit Corp 2022 LLC and EPT 16 LLC are measured using the net asset value per share (or its equivalent) as a practical expedient for fair value, and thus has not been classified in the fair value hierarchy.
The Company’s assets measured at fair value by investment type on a recurring basis as of December 31, 2023 were as follows (in thousands):
| | | | | | | | | | | | | | | | | | | | |
| | Fair Value Measurements at Reporting Date Using | | | | | | | |
| | Quoted Prices | | | Significant | | | | | | | | | | |
| | in Active | | | Other | | | Significant | | | | | | | |
| | Markets for | | | Observable | | | Unobservable | | | | | | | |
| | Identical Assets | | | Inputs | | | Inputs | | | Measured at | | | | |
Assets | | (Level 1) | | | (Level 2) | | | (Level 3) | | | Net Asset Value(1) | | | Total | |
Secured Loans | | $ | — | | | $ | — | | | $ | 885,299 | | | $ | — | | | $ | 885,299 | |
Equipment Financings | | | — | | | | — | | | | 336,778 | | | | — | | | | 336,778 | |
Warrants | | | — | | | | 2,326 | | | | 31,201 | | | | — | | | | 33,527 | |
Equity | | | 795 | | | | — | | | | 15,150 | | | | 3,631 | | | | 19,576 | |
Total Investments at fair value | | | 795 | | | | 2,326 | | | | 1,268,428 | | | | 3,631 | | | | 1,275,180 | |
Escrow Receivables (2) | | | — | | | | — | | | | 2,441 | | | | — | | | | 2,441 | |
Cash and cash equivalents | | | 4,761 | | | | — | | | | — | | | | — | | | | 4,761 | |
Total | | $ | 5,556 | | | $ | 2,326 | | | $ | 1,270,869 | | | $ | 3,631 | | | $ | 1,282,382 | |
(1)In accordance with ASC 820, the Company's equity investment in Senior Credit Corp 2022 LLC is measured using the net asset value per share (or its equivalent) as a practical expedient for fair value, and thus has not been classified in the fair value hierarchy.
(2)Escrow receivables is included in other assets on the Consolidated Statements of Assets and Liabilities.
The methodology for determining the fair value of the Company’s investments is discussed in “Note 2 – Summary of Significant Accounting Policies”. The following table provides a summary of the significant unobservable inputs used to measure the fair value of the Level 3 portfolio investments as of December 31, 2024.
| | | | | | | | | | | | | | | |
| | Fair Value as of | | | | | | | | | | | |
| | December 31, 2024 | | | Valuation Techniques/ | | Unobservable | | | | Weighted | | |
Investment Type | | (in thousands) | | | Methodologies | | Inputs (1) | | Range | | Average (2) | | |
| | | | | | | | | | | | | |
Debt investments | | $ | 1,206,947 | | | Discounted Cash Flows | | Hypothetical Market Yield | | 9.6% - 56.3% | | | 16.3 | | % |
| | | | |
| | | | | |
| | |
| | | 369,600 | | | Cost approximates fair value (6) | | n/a | | n/a | | n/a | | |
| | | | | | | | | | | | | |
| | | — | | | Transaction Precedent (7) | | Transaction Price | | n/a | | n/a | | |
| | | | | | | | | | | | | |
| | | 12,699 | | | Scenario Analysis | | Probability Weighting of Alternative Outcomes | | 1.0% - 100.0% | | n/a | | |
| | | | | | | | | | | | | |
Debt investment in the JV | | | 12,885 | | | Enterprise Value (8) | | n/a | | n/a | | n/a | | |
| | | | | | | | | | | | | |
Equity investments | | | 56,584 | | | Market Approach | | Revenue Multiple (3) | | 0.5x - 34.9x | | | 3.4 | | x |
| | | | | | | Volatility (5) | | 40.1% - 118.8% | | | 55.4 | | % |
| | | | | | | Risk-Free Interest Rate | | 4.2% - 4.3% | | | 4.3 | | % |
| |
| | |
| | Estimated Time to Exit (in years) | | 1.0 - 4.5 | | | 2.8 | | |
| | | | | | | | | | | | | |
Warrants | | | 51,454 | | | Market Approach | | Revenue Multiple (3) | | 0.2x - 34.9x | | | 4.1 | | x |
| | | | | | | Company Specific Adjustment (4) | | n/a | | n/a | | |
| | | | | | | Volatility (5) | | 35.4% - 127.9% | | | 61.0 | | % |
| | | | |
| | Risk-Free Interest Rate | | 4.2% - 4.4% | | | 4.3 | | % |
| | | | |
| | Estimated Time to Exit (in years) | | 0.7 - 5.0 | | | 2.4 | | |
| | | | | | | | | | | | | |
Total Level 3 Investments | | $ | 1,710,169 | | |
| |
| | | | | | |
(1)The significant unobservable inputs used in the fair value measurement of the Company’s debt securities are hypothetical market yields and premiums/(discounts). The hypothetical market yield is defined as the exit price of an investment in a hypothetical market to hypothetical market participants where buyers and sellers are willing participants. The significant unobservable inputs used in the fair value measurement of the Company’s equity and warrant securities are revenue multiples and portfolio company specific adjustment factors. Additional inputs used in the option pricing model (“OPM”) include industry volatility, risk free interest rate and estimated time to exit. Significant increases (decreases) in the inputs in isolation would result in a significantly higher (lower) fair value measurement, depending on the materiality of the investment. For some investments, additional consideration may be given to data from the last round of financing, merger or acquisition events near the measurement date.
(2)Weighted averages are calculated based on the fair value of each investment.
(3)Represents amounts used when the Company has determined that market participants would use such multiples when pricing the investments.
(4)Represents amounts used when the Company has determined market participants would take into account these discounts when pricing the investments.
(5)Represents the range of industry volatility used by market participants when pricing the investment.
(6)Includes debt investments originated within the past three months, for which cost approximates fair value, unless events have occurred during the period that would indicate a different valuation is warranted.
(7)Represents investments where there is an observable transaction or pending event for the investment.
(8)Under the enterprise value technique, the significant unobservable inputs used in the fair value measurement of the Company's investment in debt or equity securities are: (i) EBITDA, (ii) revenue or (iii) asset multiple; as applicable. Increases or decreases in the valuation multiples in isolation may result in a higher or lower fair value measurement, respectively.
The significant unobservable input used in the fair value measurement of the Company’s escrow receivables is the amount recoverable at the contractual maturity date of the escrow receivable. The following table provides a summary of the significant unobservable inputs used to fair value the Level 3 portfolio investments as of December 31, 2023.
| | | | | | | | | | | | | | | | |
| | Fair Value as of | | | | | | | | | | | |
| | December 31, 2023 | | | Valuation Techniques/ | | Unobservable | | | | Weighted | | |
Investment Type | | (in thousands) | | | Methodologies | | Inputs (1) | | Range | | Average (2) | | |
| | | | | | | | | | | | | | |
Debt investments | | $ | | 858,870 | | | Discounted Cash Flows | | Hypothetical Market Yield | | 11.6% - 34.6% | | | 17.3 | | % |
| | | | | |
| | | | | |
| | |
| | | | 253,250 | | | Cost approximates fair value (6) | | n/a | | n/a | | n/a | | |
| | | | | | | | | | | | | | |
| | | | 4,680 | | | Transaction Precedent (7) | | Transaction Price | | n/a | | n/a | | |
| | | | | | | | | | | | | | |
| | | | 97,573 | | | Scenario Analysis | | Probability Weighting of Alternative Outcomes | | 5.0% - 100.0% | | n/a | | |
| | | | | | | | | | | | | | |
Debt investment in the JV | | | | 7,704 | | | Enterprise Value (8) | | n/a | | n/a | | n/a | | |
| | | | | |
| | | | | |
| | |
Equity investments | | | | 15,150 | | | Market Approach | | Revenue Multiple (3) | | 0.4x - 15.0x | | | 3.7 | | x |
| | | | | | | | Volatility (5) | | 44.2% - 131.3% | | | 62.5 | | % |
| | | | | | | | Risk-Free Interest Rate | | 3.0% - 4.8% | | | 4.0 | | % |
| | |
| | |
| | Estimated Time to Exit (in years) | | 1.0 - 4.0 | | | 1.7 | | |
| | | | | | | | | | | | | | |
Warrants | | | | 31,201 | | | Market Approach | | Revenue Multiple (3) | | 0.4x - 15.0x | | | 2.7 | | x |
| | | | | | | | Company Specific Adjustment (4) | | n/a | | n/a | | |
| | | | | | | | Volatility (5) | | 33.3% - 131.3% | | | 68.8 | | % |
| | | | | | | | Risk-Free Interest Rate | | 2.9% - 4.8% | | | 4.3 | | % |
| | | | | |
| | Estimated Time to Exit (in years) | | 1.0 - 4.8 | | | 2.2 | | |
| | | | | |
| | | | | | | | |
Total Level 3 Investments | | | $ | 1,268,428 | | |
| | | | | |
| | |
(1)The significant unobservable inputs used in the fair value measurement of the Company’s debt securities are hypothetical market yields and premiums/(discounts). The hypothetical market yield is defined as the exit price of an investment in a hypothetical market to hypothetical market participants where buyers and sellers are willing participants. The significant unobservable inputs used in the fair value measurement of the Company’s equity and warrant securities are revenue multiples and portfolio company specific adjustment factors. Additional inputs used in the option pricing model (“OPM”) include industry volatility, risk free interest rate and estimated time to exit. Significant increases (decreases) in the inputs in isolation would result in a significantly higher (lower) fair value measurement, depending on the materiality of the investment. For some investments, additional consideration may be given to data from the last round of financing or merger acquisition events near the measurement date.
(2)Weighted averages are calculated based on the fair value of each investment.
(3)Represents amounts used when the Company has determined that market participants would use such multiples when pricing the investments.
(4)Represents amounts used when the Company has determined market participants would take into account these discounts when pricing the investments.
(5)Represents the range of industry volatility used by market participants when pricing the investment.
(6)Includes debt investments originated within the past three months, for which cost approximates fair value, unless events have occurred during the period that would indicate a different valuation is warranted.
(7)Represents investments where there is an observable transaction or pending event for the investment.
(8)Under the enterprise value technique, the significant unobservable inputs used in the fair value measurement of the Company's investment in debt or equity securities are: (i) EBITDA, (ii) revenue or (iii) asset multiple; as applicable. Increases or decreases in the valuation multiples in isolation may result in a higher or lower fair value measurement, respectively.
The following table provides a summary of changes in the fair value of the Company’s Level 3 debt, including loans and equipment financings (collectively “Debt”), equity, warrant and escrow receivables portfolio investments for the year ended December 31, 2024 (in thousands):
| | | | | | | | | | | | | | | | | | | | |
| | Type of Investment | |
| | Debt | | | Equity | | | Warrants | | | Escrow Receivables | | | Total | |
Fair Value as of December 31, 2023 | | $ | 1,222,077 | | | $ | 15,150 | | | $ | 31,201 | | | $ | 2,441 | | | $ | 1,270,869 | |
Purchases, net of deferred fees | | | 1,180,013 | | | | 6,709 | | | | 20,774 | | | | — | | | | 1,207,496 | |
Non-cash conversions (1) | | | (25,674 | ) | | | 31,802 | | | | (6,128 | ) | | | — | | | | — | |
Transfers into/(out of) Level 3 (2) | | | (28,315 | ) | | | — | | | | — | | | | — | | | | (28,315 | ) |
Proceeds from sales and paydowns | | | (759,113 | ) | | | (11,477 | ) | | | 8,006 | | | | (2,441 | ) | | | (765,025 | ) |
Accretion of OID, EOT, and PIK payments | | | 39,574 | | | | — | | | | — | | | | — | | | | 39,574 | |
Net realized gain/(loss) | | | (21,294 | ) | | | 7,826 | | | | (9,962 | ) | | | — | | | | (23,430 | ) |
Net change in unrealized appreciation/(depreciation) | | | (5,137 | ) | | | 6,574 | | | | 7,563 | | | | — | | | | 9,000 | |
Fair Value as of December 31, 2024 | | $ | 1,602,131 | | | $ | 56,584 | | | $ | 51,454 | | | $ | — | | | $ | 1,710,169 | |
| | | | | | | | | | | | | | | |
Net change in unrealized appreciation/(depreciation) on Level 3 investments still held as of December 31, 2024 | | $ | (24,105 | ) | | $ | 4,631 | | | $ | 1,996 | | | $ | — | | | $ | (17,478 | ) |
(1)The non-cash conversion includes the exercise of debt and warrant positions to equity positions during the period.
(2)Transfers out of Level 3 during the year ended December 31, 2024, were related to the conversion of debt to equity in one publicly-traded portfolio company. During the year ended December 31, 2024, there were no transfers into Level 3.
The following table provides a summary of changes in the fair value of the Company’s Level 3 Debt, equity, warrant and escrow receivables portfolio investments for the year ended December 31, 2023 (in thousands):
| | | | | | | | | | | | | | | | | | | | |
| | Type of Investment | |
| | Debt | | | Equity | | | Warrants | | | Escrow Receivables | | | Total | |
Fair Value as of December 31, 2022 | | $ | 1,048,829 | | | $ | 13,245 | | | $ | 30,989 | | | $ | 2,441 | | | $ | 1,095,504 | |
Purchases, net of deferred fees | | | 613,853 | | | | 4,676 | | | | 8,670 | | | | — | | | | 627,199 | |
Non-cash conversion (1) | | | (500 | ) | | | 538 | | | | (17 | ) | | | — | | | | 21 | |
Transfers into/(out of) of Level 3 (2) | | | — | | | | — | | | | (7 | ) | | | — | | | | (7 | ) |
Proceeds from sales and paydowns | | | (468,760 | ) | | | (461 | ) | | | (2,705 | ) | | | — | | | | (471,926 | ) |
Accretion of OID and EOT payments | | | 32,953 | | | | — | | | | — | | | | — | | | | 32,953 | |
Net realized gain/(loss) | | | (15,292 | ) | | | (13,546 | ) | | | 767 | | | | — | | | | (28,071 | ) |
Net change in unrealized appreciation/(depreciation) | | | 10,994 | | | | 10,698 | | | | (6,496 | ) | | | — | | | | 15,196 | |
Fair Value as of December 31, 2023 | | $ | 1,222,077 | | | $ | 15,150 | | | $ | 31,201 | | | $ | 2,441 | | | $ | 1,270,869 | |
| | | | | | | | | | | | | | | |
Net change in unrealized appreciation/(depreciation) on Level 3 investments still held as of December 31, 2023 | | $ | (8,420 | ) | | $ | (2,501 | ) | | $ | (6,987 | ) | | $ | — | | | $ | (17,908 | ) |
(1)The non-cash conversion includes restructuring of a convertible note position to preferred equity and an exercise of a warrant to an equity position during the period.
(2)During the year ended December 31, 2023, there were no transfers into Level 3.
Fair Value of Financial Instruments Carried at Cost
As of December 31, 2024 and December 31, 2023, the carrying value of the KeyBank Credit Facility was approximately $113.0 million and $213.0 million, respectively. The carrying value of the KeyBank Credit Facility as of December 31, 2024 and December 31, 2023 approximates the fair value, which was estimated using a relative market yield approach with Level 3 inputs.
As of December 31, 2024 and December 31, 2023, the carrying value of the 2025 Notes was approximately $152.4 million and $180.5 million, respectively, net of unamortized deferred financing costs of $0.1 million and $2.0 million, respectively. The 2025 Notes have a fixed interest rate as discussed in “Note 5 – Borrowings.” The fair value of the 2025 Notes as of December 31, 2024 and December 31, 2023 was approximately $152.9 million and $183.4 million, respectively, based on the market closing price of the 2025 Notes, which trade on the Nasdaq Global Select Market under the symbol “TRINL”.
As of December 31, 2024 and December 31, 2023, the carrying value of the Convertible Notes was approximately $49.4 million and $48.8 million, respectively, net of unamortized deferred financing costs and discount of $0.6 million and $1.2 million, respectively. The Convertible Notes have a fixed interest rate as discussed in “Note 5 – Borrowings.” The fair value of the Company’s Convertible Notes as of December 31, 2024 and December 31, 2023 was approximately $66.2 million and $50.6 million, respectively, which was estimated using a relative market yield approach with Level 3 inputs.
As of December 31, 2024 and December 31, 2023, the carrying value of the 4.375% Notes due 2026 (the “August 2026 Notes”) was approximately $124.1 million and $123.5 million, respectively, net of unamortized deferred financing costs and discount of $1.0 million and $1.5 million, respectively. The August 2026 Notes have a fixed interest rate as discussed in “Note 5 – Borrowings.” The fair value of the Company’s August 2026 Notes as of December 31, 2024, and December 31, 2023, was approximately $114.1 million and $111.5 million, respectively, which was estimated using a relative market yield approach with Level 3 inputs.
As of December 31, 2024, and December 31, 2023, the carrying value of the 4.25% Notes due 2026 (the “December 2026 Notes”) was approximately $74.3 million, and $73.9 million, respectively, net of unamortized deferred financing fees of $0.7 million and $1.1 million, respectively. The December 2026 Notes have a fixed interest rate as discussed in “Note 5 - Borrowings.” The fair value of the Company’s December 2026 Notes as of December 31, 2024 and December 31, 2023 was approximately $68.6 million and $66.8 million, respectively, which was estimated using a relative market yield approach with Level 3 inputs.
As of December 31, 2024, the carrying value of the Company's 7.875% Notes due 2029 (the “March 2029 Notes”) was approximately $112.1 million, net of unamortized deferred financing fees of $2.9 million. The March 2029 Notes have a fixed interest rate as discussed “Note 5 – Borrowings.” The fair value of the Company's March 2029 Notes as of December 31, 2024 was approximately $116.2 million, based on the market closing price of the March 2029 Notes, which trade on the Nasdaq Global Select Market under the symbol “TRINZ”. The March 2029 Notes began trading on July 1, 2024 and there was no fair value as of December 31, 2023.
As of December 31, 2024, the carrying value of the Company's 7.875% Notes due September 2029 (the “September 2029 Notes”) was approximately $111.6 million, net of unamortized deferred financing fees of $3.4 million. The September 2029 Notes have a fixed interest rate as discussed in “Note 5 – Borrowings.” The fair value of the Company's September 2029 Notes as of December 31, 2024 was approximately $118.0 million, based on the market closing price of the September 2029 Notes, which trade on the Nasdaq Global Select Market under the symbol “TRINI”. The September 2029 Notes began trading on July 22, 2024 and there was no fair value as of December 31, 2023.
As of December 31, 2024, the carrying value of the Series A Senior Notes (the “Series A Notes”) was approximately $140.9 million, net of unamortized deferred financing costs and discount of $1.7 million. The Series A Notes have a fixed interest rate as discussed in “Note 5 – Borrowings.” The fair value of the Company’s Series A Notes as of December 31, 2024 was approximately $142.5 million, which was estimated using a relative market yield approach with Level 3 inputs.
Note 5. Borrowings
KeyBank Credit Facility
On October 27, 2021, TCF, a wholly owned subsidiary of the Company, as borrower, and the Company, as servicer, entered into a credit agreement (as amended, the “KeyBank Credit Agreement”) with the lenders from time-to-time party thereto, KeyBank, as administrative agent and syndication agent, and Wells Fargo, National Association, as collateral custodian and paying agent.
The KeyBank Credit Facility includes a commitment of $600.0 million from KeyBank and other banks and allows the Company, through TCF, to borrow up to $690.0 million. Borrowings under the KeyBank Credit Agreement generally bear interest at a rate equal to Adjusted Term SOFR plus 2.85% to 3.25%, subject to the number of eligible loans in the collateral pool. The KeyBank Credit Facility provides for a variable advance rate of up to 62% on eligible first lien loans and up to 47% on eligible second lien loans.
The KeyBank Credit Facility includes a three-year revolving period and a two-year amortization period and matures on July 27, 2029, unless extended. Such credit facility is collateralized by all investment assets held by TCF. The KeyBank Credit Agreement contains representations and warranties and affirmative and negative covenants customary for secured financings of this type, including certain financial covenants such as a consolidated tangible net worth requirement and a required asset coverage ratio.
The KeyBank Credit Agreement also contains customary events of default (subject to certain grace periods, as applicable), including but not limited to the nonpayment of principal, interest or fees; breach of covenants; inaccuracy of representations or warranties in any material respect; voluntary or involuntary bankruptcy proceedings; and change of control of the borrower without the prior written consent of KeyBank.
During the year ended December 31, 2024, the Company borrowed $829.4 million and made repayments of $929.4 million under the KeyBank Credit Facility.
The Company incurred approximately $9.0 million of initial and additional financing costs in connection with the KeyBank Credit Facility that were capitalized and deferred using the straight-line method over the life of the facility. As of December 31, 2024, and December 31, 2023, unamortized deferred financing costs related to the KeyBank Credit Facility were $6.6 million and $2.1 million, respectively. As of December 31, 2024 and December 31, 2023, the Company had a borrowing availability of approximately $487.0 million and $137.0 million, respectively.
The summary information regarding the KeyBank Credit Facility is as follows (dollars in thousands):
| | | | | | | | | | | | | | | | | |
| | Year Ended | | | | | Year Ended | | | | | Year Ended | | |
| | December 31, 2024 | | | | | December 31, 2023 | | | | | December 31, 2022 | | |
Stated interest expense | $ | | 20,492 | | | | $ | | 15,468 | | | | $ | | 8,033 | | |
Amortization of deferred financing costs | | | 1,061 | | | | | | 817 | | | | | | 766 | | |
Total interest and amortization of deferred financing costs | $ | | 21,553 | | | | $ | | 16,285 | | | | $ | | 8,799 | | |
| | | | | | | | | | | | | | |
Weighted average effective interest rate | | | 9.1 | | % | |
| | 9.0 | | % | |
| | 5.9 | | % |
Weighted average outstanding balance | $ | | 235,705 | | | | $ | | 180,399 | | | | $ | | 149,911 | | |
2025 Notes
Concurrent with the completion of the Private Common Stock Offering, on January 16, 2020, the Company completed its offering of $105.0 million in aggregate principal amount of the unsecured 2025 Notes in reliance upon the available exemptions from the registration requirements of the Securities Act (the “144A Note Offering”). Keefe, Bruyette & Woods, Inc. (“KBW”), as the initial purchaser, exercised in full its option to purchase or place additional 2025 Notes and on January 29, 2020, the Company issued and sold an additional $20.0 million in aggregate principal amount of the 2025 Notes. As a result, the Company issued and sold a total of $125.0 million in aggregate principal amount of the 2025 Notes pursuant to the 144A Note Offering.
Concurrent with the closing of the 144A Note Offering, on January 16, 2020, the Company entered into a registration rights agreement for the benefit of the purchasers of the 2025 Notes in the 144A Note Offering. Pursuant to the terms of this registration rights agreement, the Company filed with the SEC a registration statement, which was initially declared effective on October 20, 2020, registering the public resale of the 2025 Notes by the holders thereof that elected to include their 2025 Notes in such registration statement.
The 2025 Notes were issued pursuant to an Indenture dated as of January 16, 2020 (the “Base Indenture”), between the Company and U.S. Bank National Association, as trustee (together with its successor in interest, U.S. Bank Trust Company, National Association, the “Trustee”), and a First Supplemental Indenture, dated as of January 16, 2020 (the “First Supplemental Indenture” and together with the Base Indenture, the “2025 Notes Indenture”), between the Company and the Trustee. The 2025 Notes mature on January 16, 2025 (the “Maturity Date”), unless repurchased or redeemed in accordance with their terms prior to such date. The 2025 Notes are redeemable, in whole or in part, at any time, or from time to time, at the Company’s option, on or after January 16, 2023 at a redemption price equal to 100% of the outstanding principal amount thereof, plus accrued and unpaid interest to, but excluding, the date of redemption. The holders of the 2025 Notes do not have the option to have the notes repaid or repurchased by the Company prior to the Maturity Date.
On July 22, 2022, the Company issued $50.0 million in aggregate principal amount of the 2025 Notes in an additional issuance of such 2025 Notes. On July 27, 2022, the underwriters exercised, in full, their option to purchase from the Company an additional $7.5 million in aggregate principal amount of the 2025 Notes solely to cover over-allotments in accordance with the Underwriting Agreement. The 2025 Notes issued pursuant to this offering are treated as a single series with the existing 2025 Notes under the 2025 Notes Indenture (the “Existing 2025 Notes”) and have the same terms as the Existing 2025 Notes (other than issue date and issue price). The 2025 Notes have the same CUSIP number and are fungible and rank equally.
In connection with the additional issuance of the 2025 Notes, the 2025 Notes began trading on the Nasdaq Global Select Market under the symbol “TRINL” on July 29, 2022.
The 2025 Notes bear interest at a fixed rate of 7.00% per year payable quarterly on March 15, June 15, September 15, and December 15 of each year, commencing on March 15, 2020. The 2025 Notes are direct, general unsecured obligations of the Company and rank pari passu, or equal in right of payment, with all of the Company’s existing and future unsecured indebtedness or other obligations that are not so subordinated.
On May 17, 2024 (the “May Redemption”), the Company redeemed $30.0 million in aggregate principal amount of the $182.5 million in aggregate principal amount of the then outstanding 2025 Notes. As of December 31, 2024, the outstanding aggregate principal amount of the 2025 Notes was $152.5 million.
Aggregate offering costs in connection with the 2025 Notes issuance, including the underwriters’ discount and commissions, were approximately $7.8 million, which were capitalized and deferred. As of December 31, 2024 and December 31, 2023, unamortized deferred financing costs related to the 2025 Notes were $0.1 million and $2.0 million, respectively.
The components of interest expense and related fees for the 2025 Notes are as follows (in thousands):
| | | | | | | | | | | | | | | | | |
| | Year Ended | | | | | Year Ended | | | | | Year Ended | | |
| | December 31, 2024 | | | | | December 31, 2023 | | | | | December 31, 2022 | | |
Stated interest expense | $ | | 11,468 | | | | $ | | 12,775 | | | | $ | | 10,527 | | |
Amortization of deferred financing costs | | | 1,948 | | | | | | 1,990 | | | | | | 1,584 | | |
Total interest and amortization of deferred financing costs | $ | | 13,416 | | | | $ | | 14,765 | | | | $ | | 12,111 | | |
| | | | | | | | | | | | | | |
Weighted average effective interest rate | | | 8.2 | | % | | | | 8.1 | | % | | | | 8.0 | | % |
Weighted average outstanding balance | $ | | 163,730 | | | | $ | | 182,500 | | | | $ | | 150,575 | | |
For additional information regarding the 2025 Notes, see “Note 15 – Subsequent Events.”
6.00% Convertible Notes due 2025
On December 11, 2020, the Company completed a private offering (the “Private Convertible Note Offering”) of $50.0 million in aggregate principal amount of its unsecured Convertible Notes in reliance upon the available exemptions from the registration requirements of the Securities Act. KBW acted as the initial purchaser and placement agent in connection with the Private Convertible Note Offering pursuant to a purchase/placement agreement dated December 4, 2020, by and between the Company and KBW.
The Convertible Notes were issued pursuant to the Base Indenture and a Second Supplemental Indenture, dated as of December 11, 2020 (the “Second Supplemental Indenture” and together with the Base Indenture, the “Convertible Notes Indenture”), between the Company and the Trustee. Concurrent with the closing of the Convertible Note Offering, on December 11, 2020, the Company entered into a registration rights agreement for the benefit of the holders of the Convertible Notes and the shares of common stock issuable upon conversion thereof. Aggregate offering costs in connection with the Convertible Note Offering, including the initial purchaser and placement agent discount and commissions, were approximately $1.9 million which were capitalized and deferred.
The Convertible Notes bear interest at a fixed rate of 6.00% per year, subject to additional interest upon certain events, payable semiannually in arrears on May 1 and November 1 of each year, beginning on May 1, 2021. If an investment grade rating is not maintained with respect to the Convertible Notes, additional interest of 0.75% per annum will accrue on the Convertible Notes until such time as the Convertible Notes have received an investment grade rating of “BBB-” (or its equivalent) or better. The rating remained at investment grade as of December 31, 2024. The Convertible Notes mature on December 11, 2025 (the “Convertible Notes Maturity Date”), unless earlier converted or repurchased in accordance with their terms.
Holders may convert their Convertible Notes, at their option, at any time on or prior to the close of business on the business day immediately preceding the Convertible Notes Maturity Date. The conversion rate was initially 66.6667 shares of the Company’s common stock, per $1,000 principal amount of the Convertible Notes (equivalent to an initial conversion price of approximately $15.00 per share of common stock). Effective immediately after the close of business on December 31, 2024, the conversion rate changed to 81.6439 shares of the Company’s common stock, per $1,000 principal amount of the Convertible Notes (equivalent to a conversion price of approximately $12.25 per share of common stock) as a result of a certain cash dividend of the Company. The conversion rate will be subject to adjustment in some events but will not be adjusted for any accrued and unpaid interest. In addition, following certain corporate events, further described in the Convertible Note Indenture, that occur prior to the Convertible Notes Maturity Date, the Company will increase the conversion rate for a holder who elects to convert its Convertible Notes in connection with such a corporate event in certain circumstances. Upon conversion of the Convertible Notes, the Company will pay or deliver, as the case may be, cash, shares of common stock, or a combination of cash and shares of common stock, at the Company’s election, per $1,000 principal amount of the Convertible Notes, equal to the then existing conversion rate.
At the Company’s option, it may cause holders to convert all or a portion of the then outstanding principal amount of the Convertible Notes plus accrued but unpaid interest, at any time on or prior to the close of business on the business day immediately preceding the Convertible Notes Maturity Date, if the closing sale price of the Company’s common stock for any 30 consecutive trading days exceeds 120% of the conversion price, as may be adjusted. Upon such conversion, the Company will pay or deliver, as the case may be, cash, shares of common stock, or a combination of cash and shares of common stock, at the Company’s election, per $1,000 principal amount of the Convertible Notes, equal to the then existing conversion rate, and a forced conversion make-whole payment (as defined in the Second Supplemental Indenture), if any, in cash. Otherwise, the Company may not redeem the Convertible Notes at its option prior to maturity.
In addition, if the Company undergoes a fundamental change (as defined in the Second Supplemental Indenture), holders may require the Company to repurchase for cash all or part of such holders’ Convertible Notes at a repurchase price equal to 100% of the principal amount of the Convertible Notes to be repurchased, plus accrued and unpaid interest to, but excluding, the fundamental change repurchase date.
The Convertible Notes are direct unsecured obligations of the Company and rank pari passu, or equal in right of payment, with all of the Company’s existing and future unsecured indebtedness or other obligations that are not so subordinated, and senior in right of payment to all of the Company’s future indebtedness or other obligations that are expressly subordinated, or junior, in right of payment to the Convertible Notes.
The Convertible Notes are accounted for in accordance with ASC 470-20, Debt Instruments with Conversion and Other Options. In accounting for the Convertible Notes, the Company estimated at the time of issuance that the values of the debt and the embedded conversion feature of the Convertible Notes were approximately 99.1% and 0.9%, respectively. The original issue discount of 0.9%, or approximately $0.5 million, attributable to the conversion feature of the Convertible Notes was recorded in “capital in excess of par value” in the Consolidated Statements of Assets and Liabilities as of December 31, 2020.
The components of the carrying value of the Convertible Notes were as follows (in thousands):
| | | | | | | | | | |
| | December 31, 2024 | | | December 31, 2023 | |
Principal amount of debt | | $ | | 50,000 | | | $ | | 50,000 | |
Unamortized debt financing cost | | | | (356 | ) | | | | (733 | ) |
Original issue discount, net of accretion | | | | (249 | ) | | | | (510 | ) |
Carrying value of Convertible Notes | | $ | | 49,395 | | | $ | | 48,757 | |
The components of interest expense and related fees for the Convertible Notes were as follows (in thousands):
| | | | | | | | | | | | | | | | | |
| | Year Ended | | | | | Year Ended | | | | | Year Ended | | |
| | December 31, 2024 | | | | | December 31, 2023 | | | | | December 31, 2022 | | |
Stated interest expense | $ | | 3,000 | | | | $ | | 3,000 | | | | $ | | 3,000 | | |
Amortization of deferred financing costs and original issue discount | | | 645 | | | | | | 639 | | | | | | 639 | | |
Total interest and amortization of deferred financing costs and original issue discount | $ | | 3,645 | | | | $ | | 3,639 | | | | $ | | 3,639 | | |
| | | | | | | | | | | | | | |
Weighted average effective interest rate | | | 7.3 | | % | | | | 7.3 | | % | | | | 7.3 | | % |
Weighted average outstanding balance | $ | | 50,000 | | | | $ | | 50,000 | | | | $ | | 50,000 | | |
For additional information regarding the Convertible Notes, see “Note 15 – Subsequent Events.”
August 2026 Notes
On August 24, 2021, the Company issued and sold $125.0 million in aggregate principal amount of its unsecured August 2026 Notes under its shelf Registration Statement on Form N-2. The August 2026 Notes were issued pursuant to the Base Indenture and a Third Supplemental Indenture, dated as of August 24, 2021 (together with the Base Indenture, the “August 2026 Notes Indenture”), between the Company and the Trustee. The August 2026 Notes mature on August 24, 2026, unless repurchased or redeemed in accordance with their terms prior to such date. The August 2026 Notes are redeemable, in whole or in part, at any time, or from time to time, at the Company’s option, at a redemption price equal to the greater of (1) 100% of the principal amount of the August 2026 Notes to be redeemed or (2) the sum of the present values of the remaining scheduled payments of principal and interest (exclusive of accrued and unpaid interest to the date of redemption) on the August 2026 Notes to be redeemed, discounted to the redemption date on a semi-annual basis (assuming a 360-day year consisting of twelve 30-day months) using the applicable treasury rate plus 50 basis points, plus, in each case, accrued and unpaid interest to the redemption date; provided, however, that if the Company redeems any August 2026 Notes on or after July 24, 2026, the redemption price for the August 2026 Notes will be equal to 100% of the principal amount of the August 2026 Notes to be redeemed, plus accrued and unpaid interest, if any, to, but excluding, the date of redemption. In addition, if a change of control repurchase event (as defined in the August 2026 Notes Indenture) occurs prior to the maturity date of the August 2026 Notes or the Company’s redemption of all outstanding August 2026 Notes, the Company will be required, subject to certain conditions, to make an offer to the holders thereof to repurchase for cash some or all of the August 2026 Notes at a repurchase price equal to 100% of the principal amount of the August 2026 Notes to be repurchased, plus accrued and unpaid interest, if any, to, but excluding, the date of repurchase.
The August 2026 Notes bear interest at a fixed rate of 4.375% per year payable semiannually on February 15 and August 15 of each year, commencing on February 15, 2022. The August 2026 Notes are direct, general unsecured obligations of the Company and rank pari passu, or equal in right of payment, with all of the Company’s existing and future unsecured indebtedness or other obligations that are not so subordinated.
Aggregate offering costs in connection with the August 2026 Notes issuance, including the underwriters’ discount and commissions, were approximately $2.9 million, which were capitalized and deferred. As of December 31, 2024 and December 31, 2023, unamortized deferred financing costs related to the August 2026 Notes were $1.0 million and $1.5 million, respectively.
The components of interest expense and related fees for the 2026 Notes are as follows (in thousands):
| | | | | | | | | | | | | | | | | |
| | Year Ended | | | | | Year Ended | | | | | Year Ended | | |
| | December 31, 2024 | | | | | December 31, 2023 | | | | | December 31, 2022 | | |
Stated interest expense | $ | | 5,469 | | | | $ | | 5,469 | | | | $ | | 5,453 | | |
Amortization of deferred financing costs | | | 582 | | | | | | 577 | | | | | | 577 | | |
Total interest and amortization of deferred financing costs | $ | | 6,051 | | | | $ | | 6,046 | | | | $ | | 6,030 | | |
| | | | | | | | | | | | | | |
Weighted average effective interest rate | | | 4.8 | | % | | | | 4.8 | | % | | | | 4.8 | | % |
Weighted average outstanding balance | $ | | 125,000 | | | | $ | | 125,000 | | | | $ | | 125,000 | | |
December 2026 Notes
On December 15, 2021, the Company issued and sold $75.0 million in aggregate principal amount of its unsecured December 2026 Notes under its shelf Registration Statement on Form N-2. The December 2026 Notes were issued pursuant to the Base Indenture and a Fourth Supplemental Indenture, dated as of December 15, 2021 (together with the Base Indenture, the “December 2026 Notes Indenture”), between the Company and the Trustee. The December 2026 Notes mature on December 15, 2026, unless repurchased or redeemed in accordance with their terms prior to such date. The December 2026 Notes are redeemable, in whole or in part, at any time, or from time to time, at the Company’s option, at a redemption price equal to the greater of (1) 100% of the principal amount of the December 2026 Notes to be redeemed or (2) the sum of the present values of the remaining scheduled payments of principal and interest (exclusive of accrued and unpaid interest to the date of redemption) on the December 2026 Notes to be redeemed, discounted to the redemption date on a semi-annual basis (assuming a 360-day year consisting of twelve 30-day months) using the applicable treasury rate plus 50 basis points, plus, in each case, accrued and unpaid interest to the redemption date; provided, however, that if the Company redeems any December 2026 Notes on or after November 15, 2026, the redemption price for the December 2026 Notes will be equal to 100% of the principal amount of the December 2026 Notes to be redeemed, plus accrued and unpaid interest, if any, to, but excluding, the date of redemption. In addition, if a change of control repurchase event (as defined in the December 2026 Notes Indenture) occurs prior to the maturity date of the December 2026 Notes or the Company’s redemption of all outstanding December 2026 Notes, the Company will be required, subject to certain conditions, to make an offer to the holders thereof to repurchase for cash some or all of the December 2026 Notes at a repurchase price equal to 100% of the principal amount of the December 2026 Notes to be repurchased, plus accrued and unpaid interest, if any, to, but excluding, the date of repurchase.
The December 2026 Notes bear interest at a fixed rate of 4.25% per year payable semiannually on June 15 and December 15 of each year, commencing on June 15, 2022. The December 2026 Notes are direct, general unsecured obligations of the Company and rank pari passu, or equal in right of payment, with all of the Company’s existing and future unsecured indebtedness or other obligations that are not so subordinated.
Aggregate offering costs in connection with the December 2026 Notes issuance, including the underwriters’ discount and commissions, were approximately $1.9 million, which were capitalized and deferred. As of December 31, 2024 and December 31, 2023, unamortized deferred financing costs related to the December 2026 Notes were $0.7 million and $1.1 million, respectively.
The components of interest expense and related fees for the December 2026 Notes are as follows (in thousands):
| | | | | | | | | | | | | | | | | |
| | Year Ended | | | | | Year Ended | | | | | Year Ended | | |
| | December 31, 2024 | | | | | December 31, 2023 | | | | | December 31, 2022 | | |
Stated interest expense | $ | | 3,188 | | | | $ | | 3,188 | | | | $ | | 3,188 | | |
Amortization of deferred financing costs | | | 379 | | | | | | 373 | | | | | | 372 | | |
Total interest and amortization of deferred financing costs | $ | | 3,567 | | | | $ | | 3,561 | | | | $ | | 3,560 | | |
| | | | | | | | | | | | | | |
Weighted average effective interest rate | | | 4.8 | | % | | | | 4.7 | | % | | | | 4.7 | | % |
Weighted average outstanding balance | $ | | 75,000 | | | | $ | | 75,000 | | | | $ | | 75,000 | | |
March 2029 Notes
On March 28, 2024, the Company issued and sold $115.0 million in aggregate principal amount of its unsecured March 2029 Notes under its shelf Registration Statement on Form N-2, which amount includes the underwriters' exercise, in full, of their option to purchase an additional $15.0 million in aggregate principal amount of the March 2029 Notes.
The March 2029 Notes were issued pursuant to the Base Indenture and a Fifth Supplemental Indenture, dated as of March 28, 2024 (together with the Base Indenture, the “March 2029 Notes Indenture”), between the Company and the Trustee. The March 2029 Notes mature on March 30, 2029, unless repurchased or redeemed in accordance with their terms prior to such date. The March 2029 Notes are redeemable, in whole or in part, at any time, or from time to time, at the Company's option on or after March 30, 2026 upon not less than 30 days’ nor more than 60 days’ written notice prior to the date fixed for redemption thereof, at a redemption price equal to 100% of the outstanding principal amount of the March 2029 Notes, plus accrued and unpaid interest payments otherwise payable for the then-current quarterly interest period accrued to, but excluding, the date fixed for redemption. In addition, if a change of control repurchase event (as defined in the March 2029 Notes Indenture) occurs prior to the maturity date of the March 2029 Notes, unless the Company has exercised its right to redeem the March 2029 Notes in full, holders will have the right, at their option, to require the Company to repurchase for cash some or all of the March 2029 Notes at a repurchase price equal to 100% of the principal amount of the March 2029 Notes being repurchased, plus accrued and unpaid interest, if any, to, but not including, the repurchase date.
The March 2029 Notes bear interest at a fixed rate of 7.875% per year payable quarterly on March 30, June 30, September 30 and December 30 of each year, commencing on June 30, 2024. The March 2029 Notes are direct, general unsecured obligations of the Company and rank pari passu, or equal in right of payment, with all of the Company’s existing and future unsecured indebtedness or other obligations that are not so subordinated.
The March 2029 Notes began trading on the Nasdaq Global Select Market under the symbol “TRINZ” on April 1, 2024.
Aggregate offering costs in connection with the March 2029 Notes issuance, including the underwriters’ discount and commissions, were approximately $3.4 million, which were capitalized and deferred. As of December 31, 2024, unamortized deferred financing costs related to the March 2029 Notes were $2.9 million. There were no unamortized deferred financing costs as of December 31, 2023.
The components of interest expense and related fees for the March 2029 Notes are as follows (in thousands):
| | | | | | | | | | | | | | | | | |
| | Year Ended | | | | | Year Ended | | | | | Year Ended | | |
| | December 31, 2024 | | | | | December 31, 2023 | | | | | December 31, 2022 | | |
Stated interest expense | $ | | 6,868 | | | | $ | | — | | | | $ | | — | | |
Amortization of deferred financing costs | | | 511 | | | | | | — | | | | | | — | | |
Total interest and amortization of deferred financing costs | $ | | 7,379 | | | | $ | | — | | | | $ | | — | | |
| | | | | | | | | | | | | | |
Weighted average effective interest rate | | | 8.4 | | % | | | | — | | % | | | | — | | % |
Weighted average outstanding balance | $ | | 87,350 | | | | $ | | — | | | | $ | | — | | |
September 2029 Notes
On July 19, 2024, the Company issued and sold $115.0 million in aggregate principal amount of its unsecured Notes due 2029 (the “September 2029 Notes”) under its shelf Registration Statement on Form N-2, which amount includes the underwriters' exercise, in full, of their option to purchase an additional $15.0 million in aggregate principal amount of additional September 2029 Notes.
The September 2029 Notes were issued pursuant to the Base Indenture and a Sixth Supplemental Indenture, dated as of July 19, 2024, between the Company and the Trustee (together with the Base Indenture, the "September 2029 Notes Indenture"). The September 2029 Notes mature on September 30, 2029, unless repurchased or redeemed in accordance with their terms prior to such date. The September 2029 Notes are redeemable, in whole or in part, at any time, or from time to time, at the Company's option on or after September 30, 2026 upon not less than 30 days’ nor more than 60 days’ written notice prior to the date fixed for redemption thereof, at a redemption price equal to 100% of the outstanding principal amount of the September 2029 Notes, plus accrued and unpaid interest payments otherwise payable for the then-current quarterly interest period accrued to, but excluding, the date fixed for redemption. In addition, if a change of control repurchase event (as defined in the September 2029 Notes Indenture) occurs prior to maturity date of the September 2029 Notes, unless the Company has exercised its right to redeem the September 2029 Notes in full, holders will have the right, at their option, to require the Company to repurchase for cash some or all of the September 2029 Notes at a repurchase price equal to 100% of the principal amount of the September 2029 Notes being repurchased, plus accrued and unpaid interest, if any, to, but not including, the repurchase date.
The September 2029 Notes bear interest at a fixed rate of 7.875% per year payable quarterly on March 30, June 30, September 30 and December 30 of each year, commencing on September 30, 2024. The September 2029 Notes are direct, general unsecured obligations of the Company and rank pari passu, or equal in right of payment, with all of the Company’s existing and future unsecured indebtedness or other obligations that are not so subordinated.
The September 2029 Notes began trading on the Nasdaq Global Select Market under the symbol “TRINI” on July 22, 2024.
Aggregate offering costs in connection with the September 2029 Notes issuance, including the underwriters’ discount and commissions, were approximately $3.8 million, which were capitalized and deferred. As of December 31, 2024, unamortized deferred financing costs related to the September 2029 Notes were $3.4 million. There were no unamortized deferred financing costs as of December 31, 2023.
The components of interest expense and related fees for the September 2029 Notes are as follows (in thousands):
| | | | | | | | | | | | | | | | | |
| | Year Ended | | | | | Year Ended | | | | | Year Ended | | |
| | December 31, 2024 | | | | | December 31, 2023 | | | | | December 31, 2022 | | |
Stated interest expense | $ | | 4,075 | | | | $ | | — | | | | $ | | — | | |
Amortization of deferred financing costs | | | 320 | | | | | | — | | | | | | — | | |
Total interest and amortization of deferred financing costs | $ | | 4,395 | | | | $ | | — | | | | $ | | — | | |
| | | | | | | | | | | | | | |
Weighted average effective interest rate | | | 8.5 | | % | | | | — | | % | | | | — | | % |
Weighted average outstanding balance | $ | | 51,844 | | | | $ | | — | | | | $ | | — | | |
Series A Notes
On October 29, 2024, the Company entered into a note purchase agreement (the “Note Purchase Agreement”) governing the issuance of (i) $55.5 million in aggregate principal amount of Series A Senior Notes, Tranche A, due October 29, 2027 (the “Series A 2027 Notes”), (ii) $73.0 million in aggregate principal amount of Series A Senior Notes, Tranche B, due October 29, 2028 (the “Series A 2028 Notes”) and (iii) $14.0 million in aggregate principal amount of Series A Senior Notes, Tranche C, due October 29, 2029 (the “Series A 2029 Notes” and, together with the Series A 2027 Notes and Series A 2028 Notes, collectively, the “Series A Notes”) to certain qualified institutional investors in a private placement.
The Series A Notes were delivered and paid for on October 29, 2024, subject to certain customary closing conditions. The Series A 2027 Notes have a fixed interest rate of 7.54% per year, the Series A 2028 Notes have a fixed interest rate of 7.60% per year and the Series A 2029 Notes have a fixed interest rate of 7.66% per year, subject to a step up to the extent a Below Investment Grade Event (as defined in the Note Purchase Agreement) or a Secured Debt Ratio Event (as defined in the Note Purchase Agreement) occurs. The Series A 2027 Notes will mature on October 29, 2027, the Series A 2028 Notes will mature on October 29, 2028 and the Series A 2029 Notes will mature on October 29, 2029, unless redeemed, purchased or prepaid prior to such date by us in accordance with the terms of the Note Purchase Agreement. Interest on the Series A Notes will be due semiannually in April and October of each year, beginning in April 2025. In addition, the Company is obligated to offer to repay the Series A Notes at par (plus accrued and unpaid interest to, but not including, the date of prepayment) if certain change in control events occur. Subject to the terms of the Note Purchase Agreement, the Company may redeem the Series A Notes in whole or in part at any time or from time to time at our option at par plus accrued interest to the prepayment date and, if the Series A 2027 Notes are redeemed on or before August 31, 2027, the Series A 2028 Notes are redeemed on or before August 31, 2028 or the Series A 2029 Notes are redeemed on or before August 1, 2029, a make-whole premium.
The Series A Notes were offered in reliance on Section 4(a)(2) of the Securities Act. The Series A Notes have not and will not be registered under the Securities Act or any state securities laws and, unless so registered, may not be offered or sold in the United States except pursuant to an exemption from, or in a transaction not subject to, the registration requirements of the Securities Act, as applicable.
Aggregate offering costs in connection with the Series A Notes issuance, including the underwriters’ discount and commissions, were approximately $1.7 million, which were capitalized and deferred. As of December 31, 2024, unamortized deferred financing costs related to the Series A Notes were $1.7 million. There were no unamortized deferred financing costs as of December 31, 2023.
The components of interest expense and related fees for the Series A Notes are as follows (in thousands):
| | | | | | | | | | | | | | | | | |
| | Year Ended | | | | | Year Ended | | | | | Year Ended | | |
| | December 31, 2024 | | | | | December 31, 2023 | | | | | December 31, 2022 | | |
Stated interest expense | $ | | 1,861 | | | | $ | | — | | | | $ | | — | | |
Amortization of deferred financing costs | | | 81 | | | | | | — | | | | | | — | | |
Total interest and amortization of deferred financing costs | $ | | 1,942 | | | | $ | | — | | | | $ | | — | | |
| | | | | | | | | | | | | | |
Weighted average effective interest rate | | | 7.9 | | % | | | | — | | % | | | | — | | % |
Weighted average outstanding balance | $ | | 24,529 | | | | $ | | — | | | | $ | | — | | |
As of December 31, 2024 and December 31, 2023, the Company was in compliance with the terms of the KeyBank Credit Agreement, the 2025 Notes Indenture, the Convertible Notes Indenture, the August 2026 Notes Indenture, the December 2026 Notes Indenture, the March 2029 Notes Indenture, the September 2029 Notes Indenture and the Note Purchase Agreement.
Note 6. Commitments and Contingencies
Unfunded Commitments
The Company’s commitments and contingencies consist primarily of unused commitments to extend credit in the form of loans or equipment financings to the Company’s portfolio companies. A portion of these unfunded contractual commitments as of December 31, 2024 and December 31, 2023 are generally dependent upon the portfolio company reaching certain milestones before the debt commitment becomes available. Furthermore, the Company’s credit agreements contain customary lending provisions that allow the Company relief from funding obligations for previously made commitments in instances where the underlying portfolio company experiences materially adverse events that affect the financial condition or business outlook for the Company. Since a portion of these commitments may expire without being drawn, unfunded contractual commitments do not necessarily represent future cash requirements. As such, the Company’s disclosure of unfunded contractual commitments as of December 31, 2024 and December 31, 2023 includes only those commitments that are available at the request of the portfolio company and are unencumbered by milestones or additional lending provisions.
As of December 31, 2024, the Company had aggregate unfunded commitments of $31.2 million to two portfolio companies, as well as unfunded commitments of $3.0 million and $0.8 million for the JV and EPT 16, respectively, which represented the Company's uncalled capital commitments. As of December 31, 2023, the Company had unfunded commitments of $10.4 million for the JV.
The Company did not have any other off-balance sheet financings or liabilities as of December 31, 2024 and December 31, 2023. The Company will fund its unfunded commitments, if any, from the same sources it uses to fund its investment commitments that are funded at the time they are made (which are typically through existing cash and cash equivalents and borrowings under its KeyBank Credit Facility) and maintains adequate liquidity to fund its unfunded commitments through these sources.
In the normal course of business, the Company enters into contracts that provide a variety of representations and warranties, and general indemnifications. Such contracts include those with certain service providers, brokers and trading counterparties. Any exposure to the Company under these arrangements is unknown as it would involve future claims that may be made against the Company; however, based on the Company’s experience, the risk of loss is remote and no such claims are expected to occur. As such, the Company has not accrued any liability in connection with such indemnifications.
Leases
ASU No. 2016‑02, Leases (Topic 842) (“ASU 2016‑02”) requires that a lessee evaluate its leases to determine whether they should be classified as operating or finance leases. The Company identified significant operating leases for its headquarters in Phoenix, AZ and office spaces in San Diego, CA. The lease for the Company's Phoenix headquarters commenced on July 10, 2021, and was most recently amended on September 17, 2024. Amendments since commencement include (i) additional office space and (ii) an extension to the term of the lease through May 31, 2031. The lease for Suite 200 in the Company's San Diego office commenced on March 10, 2023, and expires on January 31, 2026. The Company entered into a second lease in San Diego for Suite 203, which commenced on June 1, 2024, and expires on November 14, 2025. As of December 31, 2024, the weighted-average remaining lease term for the operating leases was 6.1 years.
The total lease expense incurred for the years ended December 31, 2024, 2023 and 2022 was approximately $1.3 million, $0.6 million and $0.5 million, respectively. As of December 2024 and December 31, 2023, the right-of-use assets related to the office operating leases were $5.4 million and $5.3 million, respectively, and the lease liabilities were $5.7 million and $5.4 million, respectively. As of December 31, 2024 and December 31, 2023, the weighted-average discount rate determined for the operating lease liabilities was 8.53% and 8.66%, respectively.
The following table shows future minimum payments under the Company’s operating leases as of December 31, 2024 (in thousands):
| | | | |
For the Years Ended December 31, | | Total | |
2025 | | $ | 1,314 | |
2026 | | | 1,008 | |
2027 | | | 1,021 | |
2028 | | | 1,051 | |
2029 | | | 1,080 | |
Thereafter | | | 1,565 | |
Total | | $ | 7,039 | |
Legal Proceedings
The Company may, from time to time, be involved in litigation arising out of its operations in the normal course of business or otherwise. Furthermore, third parties may try to seek to impose liability on the Company in connection with the activities of its portfolio companies. As of December 2024, there were no material legal matters or material litigation pending of which the Company is aware.
Note 7. Stockholders' Equity
The Company authorized 200,000,000 shares of its common stock with a par value of $0.001 per share. On September 27, 2019, the Company was initially capitalized by the issuance of 10 shares of its common stock for an aggregate purchase price of $150 to its sole stockholder.
Private Common Stock Offerings
On January 16, 2020, the Company completed the Private Common Stock Offering in reliance upon the available exemptions from the registration requirements of the Securities Act. As a result, the Company issued and sold a total of 7,000,000 shares of its common stock for aggregate net proceeds of approximately $105.0 million. The related over-allotment option was exercised in full on January 29, 2020, pursuant to which the Company issued and sold an additional 1,333,333 shares of its common stock for gross proceeds of approximately $20.0 million. As a result, the Company issued and sold a total of 8,333,333 shares of its common stock pursuant to the Private Common Stock Offering for aggregate net proceeds of approximately $114.4 million, net of offering costs of approximately $10.6 million.
Concurrent with the closing of the Private Common Stock Offering, on January 16, 2020, the Company entered into a registration rights agreement for the benefit of the purchasers of shares of its common stock in such offering and the certain of the investors in the Legacy Funds (the “Legacy Investors”) that received shares of its common stock in connection with the Formation Transactions that were not the Company’s directors, officers and affiliates. Pursuant to the terms of this registration rights agreement, the Company no longer has any registration obligations with respect to such shares because (i) such shares may be sold by any such stockholder in a single transaction without registration pursuant to Rule 144 under the Securities Act, (ii) the Company has been subject to the reporting requirements of Section 13 or 15(d) of the Securities Exchange Act of 1934, as amended, for a period of at least 90 days and is current in the filing of all such required reports and (iii) such shares have been listed for trading on the Nasdaq Global Select Market.
Formation Transactions
On January 16, 2020, immediately following the initial closings of the Private Offerings, the Company used the proceeds from the Private Offerings to complete the Formation Transactions, pursuant to which the Company acquired the Legacy Funds and Trinity Capital Holdings. As consideration for the Legacy Funds, the Company issued 9,183,185 shares of common stock at $15.00 per share for a total value of approximately $137.7 million and paid approximately $108.7 million in cash to certain of the Legacy Investors. As consideration for all of the equity interests in Trinity Capital Holdings, the Company issued 533,332 shares of its common stock at $15.00 per share for a total value of approximately $8.0 million and paid approximately $2.0 million in cash.
Initial Public Offering
On February 2, 2021, the Company completed its initial public offering of 8,006,291 shares of common stock at a price of $14.00 per share, inclusive of the underwriters’ option to purchase additional shares, which was exercised in full. The Company’s common stock began trading on the Nasdaq Global Select Market on January 29, 2021, under the symbol “TRIN.” Proceeds from this offering were primarily used to pay down a portion of the Company's existing indebtedness outstanding under the Credit Suisse Credit Facility.
Equity ATM Program
On November 9, 2021, the Company established an at-the-market equity program (the “ATM Program”), pursuant to which the Company can issue and sell, from time to time, up to $50.0 million in aggregate offering price of shares of its common stock by any method permitted by law and deemed to be part of an “at-the-market” offering (as defined in Rule 415 under the Securities Act). On December 1, 2023, the Company entered into new equity distribution agreements to (i) increase the maximum aggregate offering price of shares of its common stock to be sold through the ATM Program to $145.7 million and (ii) add one additional sales agent to the ATM Program. On August 23, 2024, the Company entered into new equity distribution agreements to (i) increase the maximum aggregate offering price of shares of its common stock to be sold through the ATM Program to $250.0 million and (ii) add one additional sales agent to the ATM Program.
The Company generally uses net proceeds from the ATM Program to make investments in accordance with its investment objective and investment strategy and for general corporate purposes.
During the year ended December 31, 2024, the Company issued and sold 14,161,064 shares of its common stock at a weighted-average price of $14.35 per share and raised $200.2 million of net proceeds after deducting deferred offering costs and commissions to the sales agents on shares sold under the ATM Program.
During the year ended December 31, 2023, the Company issued and sold 4,976,061 shares of its common stock at a weighted-average price of $14.53 per share and raised $70.8 million of net proceeds after deducting deferred offering costs and commissions to the sales agent on shares sold under the ATM Program.
For additional information regarding the ATM Program, see “Note 15 – Subsequent Events.”
Stock Repurchase Program
On November 14, 2022, the Company and its Board authorized a program for the purpose of repurchasing up to $25.0 million of the Company's common stock (the “2022 Repurchase Program”). Under the 2022 Repurchase Program, the Company may, but is not obligated to, repurchase its outstanding common stock in the open market from time to time, provided that the Company complies with the prohibitions under its Rule 38a-1 Compliance Manual and Rule 17j-1 Code of Ethics and the guidelines specified in Rule 10b-18 of the Securities Exchange Act of 1934, as amended, including certain price, market, volume, and timing constraints. In addition, any repurchases will be conducted in accordance with the 1940 Act, as amended. The 2022 Repurchase Program was not renewed by the Board and expired on November 11, 2023.
On November 7, 2024, the Board authorized a program permitting the Company to repurchase up to $30.0 million of the Company’s common stock (the “2024 Repurchase Program”). Under the 2024 Repurchase Program, the Company may, but is not obligated to, repurchase its outstanding common stock in the open market from time to time, provided that the Company complies with guidelines specified in Rule 10b-18 of the Securities Exchange Act of 1934, as amended, including certain price, market, volume, and timing constraints. The 2024 Share Repurchase Program is expected to be in effect until November 7, 2025, unless extended or until the aggregate repurchase amount that has been approved by the Board has been expended.
The Board authorized the 2024 Repurchase Program because it believes sustained macroeconomic pressures and other market factors may cause the Company’s common stock to be undervalued from time to time, especially relative to the Company’s performance and its peers, and that such repurchase demonstrates the Company’s stability and strength, including the resilience and creditworthiness of its portfolio. The timing and number of shares to be repurchased will depend on a number of factors, including market conditions and alternative investment opportunities. In addition, any repurchases will be conducted in accordance with the 1940 Act, as amended.
The Company did not repurchase shares of its outstanding common stock during the year ended December 31, 2024. During the year ended December 31, 2023, the Company repurchased 91,691 shares of its outstanding common stock at a weighted average price of $10.91. The repurchased shares were immediately canceled and thus the Company holds no treasury stock.
Equity Offerings
On April 7, 2022, the Company issued 2,754,840 shares of the Company’s common stock, par value $0.001 per share, at a public offering price of $18.15 per share, resulting in net proceeds to the Company of approximately $47.9 million, after deducting discounts and commissions and offering expenses. In addition, the underwriters exercised their option to purchase an additional 413,226 shares of common stock, resulting in additional net proceeds to the Company of $7.2 million, after deducting discounts, commissions and offering expenses.
On August 18, 2022, the Company issued 3,587,736 shares of the Company’s common stock, par value $0.001 per share, at a public offering price of $15.33 per share, resulting in net proceeds to the Company of approximately $53.3 million, after deducting discounts and commissions and offering expenses. In addition, the underwriters exercised their option in part to purchase an additional 132,168 shares of common stock, resulting in additional net proceeds to the Company of $2.0 million, after deducting discounts, commissions and offering expenses.
On August 8, 2023, the Company issued 5,190,312 shares of the Company’s common stock, par value $0.001 per share, at a public offering price of $14.45 per share, resulting in net proceeds to the Company of approximately $72.5 million, after deducting discounts and commissions and offering expenses. In addition, the underwriters exercised their option in part to purchase an additional 500,000 shares of common stock, resulting in additional net proceeds to the Company of $6.9 million, after deducting discounts, commissions and offering expenses.
Distribution Reinvestment Plan
The Company’s amended and restated distribution reinvestment plan (“DRIP”) provides for the reinvestment of distributions in the form of common stock on behalf of its stockholders, unless a stockholder has elected to receive distributions in cash. As a result, if the Company declares a cash distribution, its stockholders who have not “opted out” of the DRIP by the opt-out date will have their cash distribution automatically reinvested into additional shares of the Company’s common stock. The share requirements of the DRIP may be satisfied through the issuance of common shares or through open market purchases of common shares by the DRIP plan administrator. Newly issued shares will be valued based upon the final closing price of the Company’s common stock on the valuation date determined for each distribution by the Board.
The Company’s DRIP is administered by its transfer agent on behalf of the Company’s record holders and participating brokerage firms. Brokerage firms and other financial intermediaries may decide not to participate in the Company’s DRIP but may provide a similar distribution reinvestment plan for their clients. During the year ended December 31, 2024, the Company issued 90,245 shares of common stock for a total of approximately $1.3 million under the DRIP. During the year ended December 31, 2023, the Company issued 165,962 shares of common stock for a total of approximately $2.2 million under the DRIP.
Distributions
The following table summarizes distributions declared and/or paid by the Company since inception:
| | | | | | | | | | |
Declaration
Date | | Type | | Record
Date | | Payment
Date | | Per Share
Amount | |
May 7, 2020 | | Quarterly | | May 29, 2020 | | June 5, 2020 | | $ | 0.22 | |
August 10, 2020 | | Quarterly | | August 21, 2020 | | September 4, 2020 | | | 0.27 | |
November 9, 2020 | | Quarterly | | November 20, 2020 | | December 4, 2020 | | | 0.27 | |
December 22, 2020 | | Quarterly | | December 30, 2020 | | January 15, 2021 | | | 0.27 | |
March 23, 2021 | | Quarterly | | March 31, 2021 | | April 16, 2021 | | | 0.28 | |
June 15, 2021 | | Quarterly | | June 30, 2021 | | July 15, 2021 | | | 0.29 | |
September 13, 2021 | | Quarterly | | September 30, 2021 | | October 15, 2021 | | | 0.33 | |
December 16, 2021 | | Quarterly | | December 31, 2021 | | January 14, 2022 | | | 0.36 | |
March 15, 2022 | | Quarterly | | March 31, 2022 | | April 15, 2022 | | | 0.40 | |
March 15, 2022 | | Supplemental | | March 31, 2022 | | April 15, 2022 | | | 0.15 | |
June 15, 2022 | | Quarterly | | June 30, 2022 | | July 15, 2022 | | | 0.42 | |
June 15, 2022 | | Supplemental | | June 30, 2022 | | July 15, 2022 | | | 0.15 | |
September 15, 2022 | | Quarterly | | September 30, 2022 | | October 14, 2022 | | | 0.45 | |
September 15, 2022 | | Supplemental | | September 30, 2022 | | October 14, 2022 | | | 0.15 | |
December 15, 2022 | | Quarterly | | December 30, 2022 | | January 13, 2023 | | | 0.46 | |
December 15, 2022 | | Supplemental | | December 30, 2022 | | January 13, 2023 | | | 0.15 | |
March 14, 2023 | | Quarterly | | March 31, 2023 | | April 14, 2023 | | | 0.47 | |
June 14, 2023 | | Quarterly | | June 30, 2023 | | July 14, 2023 | | | 0.48 | |
June 14, 2023 | | Supplemental | | June 30, 2023 | | July 14, 2023 | | | 0.05 | |
September 13, 2023 | | Quarterly | | September 30, 2023 | | October 13, 2023 | | | 0.49 | |
September 13, 2023 | | Supplemental | | September 30, 2023 | | October 13, 2023 | | | 0.05 | |
December 14, 2023 | | Quarterly | | December 29, 2023 | | January 12, 2024 | | | 0.50 | |
March 14, 2024 | | Quarterly | | March 28, 2024 | | April 15, 2024 | | | 0.51 | |
June 13, 2024 | | Quarterly | | June 28, 2024 | | July 15, 2024 | | | 0.51 | |
September 18, 2024 | | Quarterly | | September 30, 2024 | | October 15, 2024 | | | 0.51 | |
December 12, 2024 | | Quarterly | | December 31, 2024 | | January 15, 2025 | | | 0.51 | |
| | | | | | Total | | $ | 8.70 | |
Note 8. Equity Incentive Plans
2019 Long Term Incentive Plan
The Company’s Board initially adopted and approved the 2019 Trinity Capital Inc. Long Term Incentive Plan (as amended, the “2019 Long Term Incentive Plan”) on October 17, 2019 and the Company’s stockholders approved the 2019 Long Term Incentive Plan on June 17, 2021 at the Company’s 2021 Annual Meeting of Stockholders, with the 2019 Long Term Incentive Plan becoming effective on June 17, 2021. The Company’s Board adopted and approved Amendment No. 1 to the 2019 Trinity Capital Inc. Long-Term Incentive Plan on April 23, 2024 to, among other things, increase the total number of shares available for issuance under the 2019 Long Term Incentive Plan by 5,800,000 shares (from 3,600,000 shares to 9,400,000 shares) and the Company’s stockholders approved such amendment on June 12, 2024 at the Company’s 2024 Annual Meeting of Stockholders, with such amendment becoming effective on June 12, 2024. Under the 2019 Long Term Incentive Plan, awards of restricted stock, incentive stock options and non-statutory stock options (together with incentive stock options, “Options”) may be granted to certain of the Company’s executive officers, employee directors and other employees (collectively, the “Employee Participants”) in accordance with the SEC exemptive order the Company received on May 27, 2021 (the “SEC Exemptive Order”). While the 2019 Long Term Incentive Plan contemplates grants of restricted stock, restricted stock units, Options, dividend equivalent rights, performance awards and other stock-based awards to the Employee Participants, the Company only sought and received exemptive relief from the SEC pursuant to the SEC Exemptive Order to grant awards of restricted stock and Options. As a result, the Company will only grant awards of such securities under the 2019 Long Term Incentive Plan. The Employee Participants will have the right to receive dividends on such awarded restricted stock, unless and until the restricted stock is forfeited.
Subject to certain adjustments under the 2019 Long Term Incentive Plan, the maximum aggregate number of shares of the Company’s common stock authorized for issuance under the 2019 Long Term Incentive Plan is 9,400,000 shares. The 2019 Long Term Incentive Plan is to be administered by the Compensation Committee of the Board (the “Compensation Committee”) in accordance with the terms of the 2019 Long Term Incentive Plan. The 2019 Long Term Incentive Plan will terminate on the day prior to the tenth anniversary of the date it was initially adopted by the Board, unless terminated sooner by action of the Board or the Compensation Committee, as applicable.
For additional information regarding the 2019 Long Term Incentive Plan, please refer to the Company’s Current Reports on Form 8-K filed with the SEC on June 23, 2021 and June 14, 2024, and the Company’s definitive proxy statement filed with the SEC on April 26, 2024. The following table summarizes issuances, vesting, and retirement of shares under the plan as well as the fair value of granted stock for the years ended December 31, 2024, 2023 and 2022 (dollars in thousands).
| | | | | | | | | | | | | | | | | | | | | | | | |
| | Year Ended | | | Weighted Average | | | Year Ended | | | Weighted Average | | | Year Ended | | | Weighted Average | |
| | December 31, 2024 | | | Grant Date Fair Value | | | December 31, 2023 | | | Grant Date Fair Value | | | December 31, 2022 | | | Grant Date Fair Value | |
Unvested as of Beginning of Period | | | 1,326,891 | | | $ | 14.56 | | | | 1,041,721 | | | $ | 16.98 | | | | 536,552 | | | $ | 16.48 | |
Shares Granted | | | 1,340,852 | | | | 14.63 | | | | 812,527 | | | | 12.92 | | | | 722,336 | | | | 17.22 | |
Shares Vested and Forfeited | | | (674,284 | ) | | | 14.77 | | | | (527,357 | ) | | | 16.81 | | | | (217,167 | ) | | | 16.55 | |
Unvested as of Ending of Period | | | 1,993,459 | | | $ | 14.53 | | | | 1,326,891 | | | $ | 14.56 | | | | 1,041,721 | | | $ | 16.98 | |
| | | | | | | | | | | | | | | | | | |
Fair Value of Granted Stock | $ | | 19,615 | | | | | $ | | 10,498 | | | | | $ | | 12,442 | | | | |
Compensation Cost Recognized | $ | | 10,342 | | | | | $ | | 8,594 | | | | | $ | | 5,747 | | | | |
As of December 2024, there was approximately $26.3 million of total unrecognized compensation costs related to the non-vested restricted stock awards. These costs are expected to be recognized over a weighted average period of 3.0 years. As of December 31, 2023, there was approximately $17.1 million of total unrecognized compensation costs related to non-vested restricted stock awards. These costs were expected to be recognized over a weighted average period of 2.5 years. As of December 31, 2022, there was approximately $15.3 million of total unrecognized compensation costs related to non-vested restricted stock awards. These costs were expected to be recognized over a weighted average period of 2.7 years. Shares vested and forfeited primarily relate to shares acquired of common stock held by employees who tendered owned shares to satisfy tax withholding obligations.
2019 Restricted Stock Plan
The Company’s Board initially adopted and approved the Trinity Capital Inc. 2019 Non-Employee Director Restricted Stock Plan (as amended, the “2019 Restricted Stock Plan”) on October 17, 2019 and the Company’s stockholders approved the 2019 Restricted Stock Plan on June 17, 2021 at the Company’s 2021 Annual Meeting of Stockholders, with the 2019 Restricted Stock Plan becoming effecting on June 17, 2021. The Company’s Board adopted and approved Amendment No. 1 to the Trinity Capital Inc. 2019 Non-Employee Director Restricted Stock Plan on April 23, 2024 to increase the total number of shares available for issuance under the 2019 Restricted Stock Plan by 60,000 shares (from 60,000 shares to 120,000 shares) and the Company’s stockholders approved such amendment on June 12, 2024 at the Company’s 2024 Annual Meeting of Stockholders, with such amendment becoming effective on June 12, 2024. The 2019 Restricted Stock Plan provides for grants of restricted stock awards (“Non-Employee Director Awards”) to the Company’s non-employee directors (the “Non-Employee Director Participants”), which are directors who are not “interested persons” of the Company (as such term is defined in Section 2(a)(19) of the 1940 Act) in accordance with the SEC Exemptive Order. The Non-Employee Director Participants will have the right to receive dividends on such awarded restricted stock, unless and until the restricted stock is forfeited.
Subject to certain adjustments under the 2019 Restricted Stock Plan, the total number of shares of the Company’s common stock that may be subject to Non-Employee Director Awards is 120,000 shares. The 2019 Restricted Stock Plan is to be administered by the Compensation Committee, subject to the discretion of the Board. The 2019 Restricted Stock Plan will terminate on the day prior to the tenth anniversary of the date it was approved by the Company’s stockholders, unless terminated sooner by action of the Board.
For additional information regarding the 2019 Restricted Stock Plan, please refer to the Company’s Current Reports on Form 8-K, filed with the SEC on June 23, 2021 and June 14, 2024, and the Company’s definitive proxy statement filed with the SEC on April 26, 2024. The following table summarizes issuances, vesting, and retirement of shares under the plan as well as the fair value of granted stock for the years ended December 31, 2024, 2023 and 2022 (dollars in thousands).
| | | | | | | | | | | | | | | | | | | | | | | | |
| | Year Ended | | | Weighted Average | | | Year Ended | | | Weighted Average | | | Year Ended | | | Weighted Average | |
| | December 31, 2024 | | | Grant Date Fair Value | | | December 31, 2023 | | | Grant Date Fair Value | | | December 31, 2022 | | | Grant Date Fair Value | |
Unvested as of Beginning of Period, | | | 15,196 | | | $ | 13.16 | | | | 13,540 | | | $ | 14.77 | | | | 6,066 | | | $ | 16.48 | |
Shares Granted | | | 13,340 | | | | 14.99 | | | | 15,196 | | | | 13.16 | | | | 19,320 | | | | 15.53 | |
Shares Vested and Forfeited | | | (15,196 | ) | | | 13.16 | | | | (13,540 | ) | | | 14.77 | | | | (11,846 | ) | | | 16.88 | |
Unvested as of Ending of Period, | | | 13,340 | | | $ | 14.99 | | | | 15,196 | | | $ | 13.16 | | | | 13,540 | | | $ | 14.77 | |
| | | | | | | | | | | | | | | | | | |
Fair Value of Granted Stock | $ | | 200 | | | | | $ | | 200 | | | | | $ | | 300 | | | | |
Compensation Cost Recognized | $ | | 201 | | | | | $ | | 200 | | | | | $ | | 236 | | | | |
As of December 2024, there was approximately $0.1 million of total unrecognized compensation costs related to non-vested restricted stock awards. These costs are expected to be recognized over a six-month period. As of December 31, 2023, there was approximately $0.1 million of total unrecognized compensation costs related to non-vested restricted stock awards. These costs were recognized over a six-month period. As of December 31, 2022, there was approximately $0.1 million of total unrecognized compensation costs related to non-vested restricted stock awards. These costs were recognized over a six-month period.
Note 9. Earnings Per Share
The following table sets forth the computation of the basic and diluted earnings per common share for the years ended December 31, 2024, 2023 and 2022 (in thousands except shares and per share information):
| | | | | | | | | | | | |
| | Year Ended | | | Year Ended | | | Year Ended | |
| | December 31, 2024 | | | December 31, 2023 | | | December 31, 2022 | |
Earnings per common share - basic | | | | | | | | | |
Numerator for basic earnings per share | | $ | 115,596 | | | $ | 76,893 | | | $ | (30,375 | ) |
Denominator for basic weighted average shares | | | 52,705,732 | | | | 38,910,150 | | | | 31,672,089 | |
Earnings/(Loss) per common share - basic | | $ | 2.19 | | | $ | 1.98 | | | $ | (0.96 | ) |
Earnings per common share - diluted | | | | | | | | | |
Numerator for increase in net assets per share | | | 115,596 | | | | 76,893 | | | | (30,375 | ) |
Adjustment for interest expense, fees, and deferred financing costs on Convertible Notes(1) | | | 3,645 | | | | 3,639 | | | | — | |
Numerator for diluted earnings per share | | | 119,241 | | | | 80,532 | | | | (30,375 | ) |
Denominator for basic weighted average shares | | | 52,705,732 | | | | 38,910,150 | | | | 31,672,089 | |
Adjustment for dilutive effect of Convertible Notes(1) | | | 4,023,116 | | | | 3,795,725 | | | | — | |
Denominator for diluted weighted average shares | | | 56,728,848 | | | | 42,705,875 | | | | 31,672,089 | |
Earnings/(Loss) per common share - diluted | | $ | 2.10 | | | $ | 1.89 | | | $ | (0.96 | ) |
(1)No adjustments for interest or incremental shares were included for the year ended December 31, 2022 because the effect would be antidilutive.
In certain circumstances, at the Company's election, the Convertible Notes will be convertible into cash, shares of the Company’s common stock or a combination of cash and shares of the Company’s common stock, which can be dilutive to common stockholders. Diluted earnings (loss) available to each share of common stock outstanding during the reporting period included any additional shares of common stock that would be issued if all potentially dilutive securities were exercised. In accordance with ASU 2020-06, the Company is required to disclose diluted EPS using the if-converted method that assumes conversion of convertible securities at the beginning of the reporting period and is intended to show the maximum dilution effect to common stockholders regardless of how the conversion can occur.
For additional information, see “Note 15 – Subsequent Events.”
Note 10. Income Taxes
The Company has elected to be treated, currently qualifies, and intends to continue to qualify annually as, a RIC under Subchapter M of the Code for U.S. federal tax purposes. In order to maintain its treatment as a RIC, the Company is generally required to distribute at least annually to its stockholders at least the sum of 90% of its investment company taxable income (which generally includes its net ordinary taxable income and realized net short-term capital gains in excess of realized net long-term capital losses) and 90% of its net tax-exempt income (if any). The Company generally will not be subject to U.S. federal income tax on these distributed amounts, but will pay U.S. federal income tax at corporate rates on any retained amounts.
The amount of taxable income to be paid out as a distribution is determined by the Board each quarter and is generally based upon the annual earnings estimated by management of the Company. Net capital gains, if any, are distributed at least annually, although the Company may decide to retain all or some of those capital gains for investment and pay U.S. federal income tax at corporate rates on those retained amounts. If the Company chooses to do so, this generally will increase expenses and reduce the amount available to be distributed to stockholders. In the event the Company’s taxable income (including any net capital gains) for a fiscal year falls below the amount of distributions declared and paid with respect to that year, however, a portion of the total amount of those distributions may be deemed a return of capital for tax purposes to the Company’s stockholders.
Because federal income tax regulations differ from GAAP, distributions in accordance with tax regulations may differ from net investment income and realized gains recognized for financial reporting purposes. Differences may be permanent or temporary in nature. Permanent differences are reclassified among capital accounts in the financial statements to reflect their appropriate tax character. Temporary differences arise when certain items of income, expense, gain or loss are recognized at some time in the future.
The following table sets for the amounts the Company reclassified for book purposes arising from permanent book to tax differences primarily related to nondeductible expenses for income tax purposes (in thousands):
| | | | | | | | |
| | Year Ended | | | Year Ended | |
| | December 31, 2024 | | | December 31, 2023 | |
Additional paid-in capital | | $ | (12,425 | ) | | $ | (4,229 | ) |
Distributable earnings/(accumulated loss) | | | 12,425 | | | | 4,229 | |
For income tax purposes, distributions paid to shareholders are reported as ordinary income, return of capital, long-term capital gains, or a combination thereof. The tax character of distributions paid for the year ended December 31, 2024 was from ordinary income with no distributions made from long-term capital gains. The tax character of distributions paid for December 31, 2023 was from ordinary income with no distributions made from long-term capital gains.
For the years ended December 31, 2024, 2023 and 2022, $2.7 million, $2.6 million and $2.4 million, respectively, was recorded for U.S. federal excise tax.
As of December 31, 2024 and December 31, 2023, the components of distributable earnings on a tax basis detailed below differ from the amounts reflected in the Company’s Consolidated Statements of Assets and Liabilities by temporary book or tax differences primarily arising from the tax treatment of costs related to the issuance of stock-based compensation and certain loan modifications as well as ongoing differences related to the treatment of the acquisition of Trinity Capital Holdings and the Legacy Funds.
| | | | | | | | |
| | Year Ended | | | Year Ended | |
| | December 31, 2024 | | | December 31, 2023 | |
Accumulated capital gains/(losses) | | $ | (20,815 | ) | | $ | (20,346 | ) |
Other temporary differences | | | — | | | | (20,350 | ) |
Undistributed ordinary income | | | 66,765 | | | | 62,202 | |
Undistributed long-term capital gains | | | — | | | | — | |
Unrealized appreciation/(depreciation) | | | (52,656 | ) | | | (45,066 | ) |
Components of distributable earnings | | $ | (6,706 | ) | | $ | (23,560 | ) |
The following table sets forth the tax cost basis and the estimated aggregate gross unrealized appreciation and depreciation from investments for federal income tax purposes as of and for the years ended December 31, 2024 and 2023 (in thousands):
| | | | | | | | |
| | December 31, 2024 | | | December 31, 2023 | |
Tax Cost of Investments | | $ | 1,763,183 | | | $ | 1,325,006 | |
| | | | | | | | |
| | December 31, 2024 | | | December 31, 2023 | |
Unrealized appreciation | | $ | 60,872 | | | $ | 36,468 | |
Unrealized depreciation | | | (113,528 | ) | | | (81,534 | ) |
Net change in unrealized appreciation/(depreciation) from investments | | $ | (52,656 | ) | | $ | (45,066 | ) |
Note 11. Financial Highlights
The following presents financial highlights for the years ended December 31, 2024, 2023, 2022, 2021, and 2020 (in thousands except share and per share information):
| | | | | | | | | | | | | | | | | | | | | | | | | |
| | Year Ended | | | | Year Ended | | | | Year ended | | | | Year ended | | | | Year ended | | |
| | December 31, 2024 | | | | December 31, 2023 | | | | December 31, 2022 | | | | December 31, 2021 | | | | December 31, 2020 | | |
Per Share Data: (1) | |
| | | |
| | | |
| | | |
| | | |
| | |
Net asset value, beginning of period | | $ | 13.19 | | | | $ | 13.15 | | | | $ | 16.40 | | | | $ | 13.03 | | | | $ | 14.97 | | (9) |
| | | | | | | | | | | | | | | | | | | | |
Net investment income | | | 2.20 | | | | | 2.31 | | | | | 2.26 | | | | | 1.50 | | | | | 1.29 | | |
Net realized and unrealized gains/(losses) on investments (2) | | | (0.01 | ) | | | | (0.33 | ) | | | | (3.22 | ) | | | | 3.59 | | | | | (0.81 | ) | |
Costs related to acquisition of Trinity Capital Holdings and Legacy Funds | | | — | | | | | — | | | | | — | | | | | — | | | | | (0.82 | ) | |
Net increase/(decrease) in net assets resulting from operations | | | 2.19 | | | | | 1.98 | | | | | (0.96 | ) | | | | 5.09 | | | | | (0.34 | ) | |
| | | | | | | | | | | | | | | | | | | | |
Offering costs | | | (0.05 | ) | | | | (0.09 | ) | | | | (0.12 | ) | | | | (0.29 | ) | | | | (0.58 | ) | |
Effect of shares issued and repurchased (3) | | | 0.06 | | | | | 0.19 | | | | | 0.16 | | | | | (0.15 | ) | | | | (0.02 | ) | |
Equity component of convertible notes | | | — | | | | | — | | | | | — | | | | | (0.02 | ) | | | | 0.03 | | |
Distributions (4) | | | (2.04 | ) | | | | (2.04 | ) | | | | (2.33 | ) | | | | (1.26 | ) | | | | (1.03 | ) | |
Total increase/(decrease) in net assets | | | 0.16 | | | | | 0.04 | | | | | (3.25 | ) | | | | 3.37 | | | | | (1.94 | ) | |
| | | | | | | | | | | | | | | | | | | | |
Net asset value, end of period | | $ | 13.35 | | | | $ | 13.19 | | | | $ | 13.15 | | | | $ | 16.40 | | | | $ | 13.03 | | |
| | | | | | | | | | | | | | | | | | | | |
Shares outstanding, end of period | | | 61,669,059 | | | | | 46,323,712 | | | | | 34,960,672 | | | | | 27,229,541 | | | | | 18,321,274 | | |
Weighted average shares outstanding | | | 52,705,732 | | | | | 38,910,150 | | | | | 31,672,089 | | | | | 25,980,797 | | | | | 18,092,494 | | (10) |
Total return based on net asset value (5) | | | 16.7 | | % | | | 15.8 | | % | | | (5.6 | ) | % | | | 35.5 | | % | | | (6.1 | ) | % (11) (12) |
Total return based on market value (6) | | | 14.7 | | % | | | 55.8 | | % | | | (29.0 | ) | % | | | 33.2 | | % | | n/a | | |
| | | | | | | | | | | | | | | | | | | | |
Ratio/Supplemental Data: | |
| | | |
| | | |
| | | |
| | | |
| | |
Per share market value at end of period | | $ | 14.47 | | | | $ | 14.53 | | | | $ | 10.93 | | | | $ | 17.58 | | | | n/a | | |
Net assets, end of period | | $ | 822,982 | | | | $ | 611,159 | | | | $ | 459,649 | | | | $ | 446,533 | | | | $ | 238,748 | | |
Ratio of total expenses to average net assets | | | 17.5 | | % | | | 17.9 | | % | | | 16.3 | | % | | | 11.6 | | % | | | 14.3 | | % (13) |
Ratio of net investment income to average net assets | | | 16.7 | | % | | | 17.5 | | % | | | 15.7 | | % | | | 10.5 | | % | | | 10.5 | | % (13) |
Ratio of interest and credit facility expenses to average net assets | | | 8.9 | | % | | | 8.6 | | % | | | 7.5 | | % | | | 5.5 | | % | | | 7.6 | | % (13) |
Portfolio turnover rate (7) | | | 53.8 | | % | | | 41.7 | | % | | | 33.7 | | % | | | 47.9 | | % | | | 36.5 | | % (11) |
Asset coverage ratio (8) | | | 192.7 | | % | | | 194.7 | | % | | | 174.1 | | % | | | 195.8 | | % | | | 177.0 | | % |
(1)Based on actual number of shares outstanding at the end of the corresponding period or the weighted average shares outstanding for the period, unless otherwise noted, as appropriate.
(2)Net realized and unrealized gains/(losses) on investments include rounding adjustments to reconcile the change in net asset value per share.
(3)Includes the impact of the different share amounts as a result of calculating certain per share data based on the weighted-average basic shares outstanding during the period and certain per share data based on the shares outstanding as of a period end or transaction date. Also includes the impact of the issuance of shares related to the equity incentive plans, the accretive effect of DRIP issuance and stock offerings (issuing shares above NAV per share), and the impact of share repurchases under the 2022 Repurchase Program and 2024 Repurchase Program.
(4)The per share data reflects the actual amount of distributions declared per share for the applicable period.
(5)Total return based on net asset value is calculated as the change in net asset value per share during the period plus declared distributions per share during the period, divided by the beginning net asset value per share.
(6)Total return based on market value is calculated as the change in market value per share during the period, taking into account dividends. For the year ended December 31, 2021, the beginning market value per share is based on the market price of $14.00 per share on January 29, 2021, the date of the Company’s listing on the Nasdaq Global Select Market.
(7)Portfolio turnover rate is calculated using the lesser of year-to-date cash sales/repayments or year-to-date cash purchases over the average of the total investments at fair value.
(8)Based on outstanding debt of $888.0 million, $645.5 million, $620.0 million, $466.0 million, and $310.0 million as of December 31, 2024, 2023, 2022, 2021, and 2020, respectively.
(9)The net asset value as of January 16, 2020 (commencement of operations) is calculated based on the initial common stock purchase price of $15.00 per share less the accumulated loss of $0.03 per share from August 12, 2019 (the date of inception) through December 31, 2019.
(10)Calculated based upon weighted average shares outstanding for the period from January 16, 2020 (commencement of operations) through December 31, 2020.
(12)Total return excluding costs related to acquisition of Trinity Capital Holdings and the Legacy Funds would have been (0.6%) for the year ended December 31, 2020.
Senior Securities
Information about the Company’s senior securities (including debt securities and other indebtedness) is shown in the following table as of December 2024, 2023, 2022, 2021, and 2020. No senior securities were outstanding as of December 31, 2019.
| | | | | | | | | | | | | | | | |
Class and Period | Total
Amount
Outstanding
Exclusive of
Treasury
Securities (1) (in thousands) | | Asset
Coverage
per Unit (2) | | | Involuntary
Liquidating
Preference
per Unit (3) | | | Average
Market Value
per Unit (4) | |
Credit Suisse Credit Facility | | | | | | | | | | | | |
December 31, 2024(5) | | $ | — | | | | — | | | | — | | | $ | — | |
December 31, 2023(5) | | | — | | | | — | | | | — | | | | — | |
December 31, 2022(5) | | | — | | | | — | | | | — | | | | — | |
December 31, 2021 | | | 10,000 | | | | 1,958 | | | | — | | | | — | |
December 31, 2020 | | | 135,000 | | | | 1,770 | | | | — | | | | — | |
| | | | | | | | | | | | |
KeyBank Credit Facility | | | | | | | | | | | | |
December 31, 2024 | | $ | 113,000 | | | | 1,927 | | | | — | | | $ | — | |
December 31, 2023 | | | 213,000 | | | | 1,947 | | | | — | | | | — | |
December 31, 2022 | | | 187,500 | | | | 1,741 | | | | — | | | | — | |
December 31, 2021 | | | 81,000 | | | | 1,958 | | | | — | | | | — | |
December 31, 2020 | | | — | | | | — | | | | — | | | | — | |
| | | | | | | | | | | | |
2025 Notes | | | | | | | | | | | | |
December 31, 2024 | | $ | 152,500 | | | | 1,927 | | | | — | | | $ | 1,009 | |
December 31, 2023 | | | 182,500 | | | | 1,947 | | | | — | | | | 1,006 | |
December 31, 2022 | | | 182,500 | | | | 1,741 | | | | — | | | | 1,006 | |
December 31, 2021 | | | 125,000 | | | | 1,958 | | | | — | | | | — | |
December 31, 2020 | | | 125,000 | | | | 1,770 | | | | — | | | | — | |
| | | | | | | | | | | | |
Convertible Notes | | | | | | | | | | | | |
December 31, 2024 | | $ | 50,000 | | | | 1,927 | | | | — | | | $ | — | |
December 31, 2023 | | | 50,000 | | | | 1,947 | | | | — | | | | — | |
December 31, 2022 | | | 50,000 | | | | 1,741 | | | | — | | | | — | |
December 31, 2021 | | | 50,000 | | | | 1,958 | | | | — | | | | — | |
December 31, 2020 | | | 50,000 | | | | 1,770 | | | | — | | | | — | |
| | | | | | | | | | | | |
August 2026 Notes | | | | | | | | | | | | |
December 31, 2024 | | $ | 125,000 | | | | 1,927 | | | | — | | | $ | — | |
December 31, 2023 | | | 125,000 | | | | 1,947 | | | | — | | | | — | |
December 31, 2022 | | | 125,000 | | | | 1,741 | | | | — | | | | — | |
December 31, 2021 | | | 125,000 | | | | 1,958 | | | | — | | | | — | |
December 31, 2020 | | | — | | | | — | | | | — | | | | — | |
| | | | | | | | | | | | |
December 2026 Notes | | | | | | | | | | | | |
December 31, 2024 | | $ | 75,000 | | | | 1,927 | | | | — | | | $ | — | |
December 31, 2023 | | | 75,000 | | | | 1,947 | | | | — | | | | — | |
December 31, 2022 | | | 75,000 | | | | 1,741 | | | | — | | | | — | |
December 31, 2021 | | | 75,000 | | | | 1,958 | | | | — | | | | — | |
December 31, 2020 | | | — | | | | — | | | | — | | | | — | |
| | | | | | | | | | | | | | | | |
Class and Period, Continued | Total
Amount
Outstanding
Exclusive of
Treasury
Securities (1) (in thousands) | | Asset
Coverage
per Unit (2) | | | Involuntary
Liquidating
Preference
per Unit (3) | | | Average
Market Value
per Unit (4) | |
March 2029 Notes | | | | | | | | | | | | |
December 31, 2024 | | $ | 115,000 | | | | 1,927 | | | | — | | | $ | 1,012 | |
December 31, 2023 | | | — | | | | — | | | | — | | | | — | |
December 31, 2022 | | | — | | | | — | | | | — | | | | — | |
December 31, 2021 | | | — | | | | — | | | | — | | | | — | |
December 31, 2020 | | | — | | | | — | | | | — | | | | — | |
| | | | | | | | | | | | |
September 2029 Notes | | | | | | | | | | | | |
December 31, 2024 | | $ | 115,000 | | | | 1,927 | | | | — | | | $ | 1,014 | |
December 31, 2023 | | | — | | | | — | | | | — | | | | — | |
December 31, 2022 | | | — | | | | — | | | | — | | | | — | |
December 31, 2021 | | | — | | | | — | | | | — | | | | — | |
December 31, 2020 | | | — | | | | — | | | | — | | | | — | |
| | | | | | | | | | | | |
Series A Notes | | | | | | | | | | | | |
December 31, 2024 | | $ | 142,500 | | | | 1,927 | | | | — | | | $ | — | |
December 31, 2023 | | | — | | | | — | | | | — | | | | — | |
December 31, 2022 | | | — | | | | — | | | | — | | | | — | |
December 31, 2021 | | | — | | | | — | | | | — | | | | — | |
December 31, 2020 | | | — | | | | — | | | | — | | | | — | |
| | | | | | | | | | | | |
Total | | | | | | | | | | | | |
December 31, 2024 | | $ | 888,000 | | | | 1,927 | | | | — | | | $ | — | |
December 31, 2023 | | | 645,500 | | | | 1,947 | | | | — | | | | — | |
December 31, 2022 | | | 620,000 | | | | 1,741 | | | | — | | | | — | |
December 31, 2021 | | | 466,000 | | | | 1,958 | | | | — | | | | — | |
December 31, 2020 | | | 310,000 | | | | 1,770 | | | | — | | | | — | |
(1)Total amount of each class of senior securities outstanding at the end of the period presented.
(2)Asset coverage per unit is the ratio of the carrying value of total assets, less all liabilities excluding indebtedness represented by senior securities in this table to the aggregate amount of senior securities representing indebtedness. Asset coverage per unit is expressed in terms of dollar amounts per $1,000 of indebtedness and is calculated on a consolidated basis.
(3)The amount to which such class of senior security would be entitled upon the Company’s involuntary liquidation in preference to any security junior to it. The “—” in this column indicates information that the SEC expressly does not require to be disclosed for certain types of senior securities.
(4)Not applicable because the senior securities are not registered for public trading, with the exception of the 2025 Notes, March 2029 Notes and September 2029 Notes. The average market value per unit calculated for the 2025 Notes, March 2029 Notes and September 2029 Notes are based on the average daily price of such notes and are expressed in terms of dollar amounts per $1,000 of indebtedness.
(5)The Credit Suisse Credit Facility matured on January 8, 2022, in accordance with its terms, and all outstanding indebtedness thereunder was repaid.
Note 12. Related Party Transactions
During the years ended December 31, 2024 and 2023, certain related parties received distributions from the Company relating to their shares held. Refer to “Note 7 – Stockholder’s Equity” for further details on the Company’s DRIP and the distributions declared. During the years ended December 31, 2024 and 2023, the Company’s directors and executive officers and certain employees received restricted stock awards under the 2019 Long Term Incentive Plan and the 2019 Restricted Stock Plan. Refer to “Note 8 – Equity Incentive Plans” for further details on the Company’s stock-based compensation plans.
The Company has entered into indemnification agreements with its directors and executive officers. The indemnification agreements are intended to provide the Company’s directors and executive officers the maximum indemnification permitted under Maryland law and the 1940 Act. Each indemnification agreement provides that the Company shall indemnify the director or executive officer who is a party to the agreement, or an “Indemnitee,” including the advancement of legal expenses, if, by reason of his or her corporate status, the Indemnitee is, or is threatened to be, made a party to or a witness in any threatened, pending, or completed proceeding, to the maximum extent permitted by Maryland law and the 1940 Act.
The Company and its executives and directors are covered by directors and officers insurance. In addition, each of our directors and officers have entered into an indemnification agreement with us pursuant to which our directors and officers are indemnified by us to the maximum extent permitted by Maryland law subject to the restrictions of the 1940 Act.
Senior Credit Corp 2022 LLC
As disclosed in “Note 1 – Organization and Basis of Presentation”, the Company entered into a joint venture agreement with certain funds and accounts managed by a specialty credit manager (collectively, the “JV Partner”) on December 5, 2022 to co-manage the JV. The JV invests in secured loans and equipment financings to growth-oriented companies that have been originated by the Company. The Company and the JV Partner committed to initially contribute $21.4 million and $150.0 million, respectively, of capital in the form of 8.5% notes and preferred equity in the JV. The JV is capitalized as investment transactions are completed and all portfolio decisions and generally all other actions in respect of the JV must be approved by the board of managers of the JV consisting of an equal number of representatives of the Company and the JV Partner. Capital contributions are called from each JV member on a pro-rata basis based on their total capital commitments, with 70% of each such capital contribution invested in the JV’s 8.5% notes and the remaining 30% invested in the JV's preferred equity. As of December 31, 2024, the Company’s and the JV Partner's ownership of the JV was 12.5% and 87.5%, respectively.
The Company has agreed to offer the JV the opportunity to purchase up to 40% in dollar amount, but not less than 25% in dollar amount, of the entire amount of each secured loan and equipment financing advance originated by the Company during the period commencing on September 1, 2022 and ending on June 5, 2026. The JV is required to pay the Company a fee equal to 100 basis points of the total principal amount of each loan or equipment financing advance acquired by the JV from the Company, with 50% of the fee for each such particular loan or advance payable by the JV to the Company within two business days of the date of such acquisition or advance and the remaining 50% payable in equal monthly installments over 24 months following the date of such acquisition or advance. In addition, the JV shall pay the Company an administrative agent fee equal to 75 basis points of the daily average aggregate value of the JV's outstanding loans and equipment financings.
As of December 31, 2024, the Company contributed $18.4 million of capital to the JV, which consisted of a debt investment of $12.9 million and an equity investment of $5.5 million. As of December 31, 2023, the Company contributed $11.0 million of capital to the JV, which consisted of a debt investment of $7.7 million and an equity investment of $3.3 million. As of December 31, 2024 and December 31, 2023, the Company's unfunded commitment of capital to the JV was $3.0 million and $10.4 million, respectively.
As of December 31, 2024 and December 31, 2023, the JV's total investment portfolio on a fair value basis was $219.1 million and $151.6 million, respectively. During the year ended December 31, 2024 and December 31, 2023, the Company received $157.3 million and $146.2 million, respectively, in net proceeds from the sale of investments to the JV.
During the year ended December 31, 2024 and December 31, 2023, the Company earned approximately $3.2 million and $2.2 million, respectively, for originations and administrative agent fees from the JV, which are recognized as fee income on the Consolidated Statements of Operations. As of December 31, 2024 and December 31, 2023, the Company had approximately $1.1 million and $0.8 million, respectively, in unsettled receivables due from the JV that were included in other assets in the accompanying Consolidated Statements of Assets and Liabilities.
Trinity Capital Adviser LLC
As disclosed in “Note 1 – Organization and Basis of Presentation”, the Company formed the Adviser Sub on March 16, 2023 as a wholly owned subsidiary of the Company. The Company was granted exemptive relief by the SEC that permits the Company to organize, acquire, wholly own and operate the Adviser Sub as an investment adviser registered under the Advisers Act. The Adviser Sub may provide investment advisory and related services to the Adviser Funds with ownership by one or more External Parties and receives fee income for such services. The Adviser Sub commenced operations on June 28, 2024.
The Company has entered into a resource sharing agreement (“Sharing Agreement”) with the Adviser Sub, through which the Adviser Sub has access to the Company's human capital resources, facilities and systems. Under the terms of Sharing Agreement, the Company allocates the related expenses of such shared resources to the Adviser Sub pro rata based on total assets under management by the Adviser Sub and the Company. The Company's total expenses for the year ended December 31, 2024 are net of such expenses allocated to the Adviser Sub of $0.5 million. As of December 31, 2024, there was $1.8 million receivable from the Adviser Sub.
The Adviser Sub has entered into an investment management agreement with EPT 16 and may enter into additional investment management agreements with other Adviser Funds in the future, pursuant to which the Adviser Sub receives management fees and/or incentive fees based on the assets under management and the performance of the Adviser Funds, respectively. With respect to such fee income, the Adviser Sub expects to declare and pay dividend distributions to the Company. During the year ended December 31, 2024, no dividend distributions were declared and paid by the Adviser Sub to the Company.
EPT 16 LLC
As disclosed in “Note 1 – Organization and Basis of Presentation”, the Company and a specialty credit manager (the “Class A Member”) funded a portion of their respective capital commitments on June 28, 2024 to commence the operations of a credit fund, EPT 16. EPT 16 has acquired and intends to acquire, hold and, as applicable, dispose of investments that have been originated by the Company. The Company and the Class A Member had capital commitments to EPT 16 in the amount of $10.0 million and $50.0 million, respectively. As of December 31, 2024, the Company's and the Class A Member’s ownership percentages were 16.7% and 83.3%, respectively. EPT 16 has entered into an investment management agreement with the Adviser Sub, pursuant to which the Adviser Sub will earn certain base management and incentive fees in exchange for providing advisory services to EPT 16.
As of December 31, 2024, the Company had contributed $9.2 million of capital to EPT 16. As of December 31, 2024, the Company's unfunded commitment was $0.8 million. During the year ended December 31, 2024, the Company sold $74.7 million of investments to EPT 16. During the year ended December 31, 2024, the Company recorded a $0.7 million realized gain on the sale of investments. As of December 31, 2024, EPT 16’s total investment portfolio on a fair value basis was $66.9 million.
Note 13. Segment Reporting
The Company has determined that is has a single operating segment in accordance with Topic 280, Segment Reporting (“ASC 280”). The Company’s Chief Operating Decision Maker (“CODM”) is the Chief Executive Officer (“CEO”). While the Company derives income and capital appreciation by providing debt to growth-oriented companies across various industries, the Company and the CODM evaluate and monitor performance of the business on a consolidated basis. Further, each investment is evaluated and managed using similar processes and shared operations support functions such as deal origination, underwriting, loan servicing in addition to the administrative functions of human resources, legal, finance and information technology. The accounting policies of the segment align with those outlined in “Note 2 - Summary of Significant Accounting Policies” included in the notes of the consolidated financial statements.
The CODM uses consolidated net investment income and net increase/(decrease) in net assets resulting from operations when allocating resources and assessing the Company’s performance. Net investment income is comprised of consolidated total investment income (“segment revenues” and consolidated total net operating expenses (“significant segment expenses”). The net increase/(decrease) in net assets is comprised of consolidated net investment income and consolidated net realized gain/(loss) from investments and consolidated net change in unrealized appreciation/(depreciation) from investments. These performance metrics are considered the key segment measure of profit or loss received by the CODM. As the Company’s operations comprise of a single reporting segment, the segment assets are reflected on the accompanying Consolidated Statements of Assets and Liabilities as Total Assets, investments held on the Consolidated Statements of Investments, and the significant segment expenses are listed on the accompanying Consolidated Statements of Operations.
Note 14. Recent Accounting Pronouncements
In November 2023, the FASB issued ASU 2023-07, Segment Reporting (Topic 280): Improvements to Reportable Segment Disclosures (“ASU 2023-07”). This change is intended to improve reportable segment disclosure requirements, primarily through enhanced disclosures about significant segment expenses, allowing financial statement users to better understand the components of a segment's profit or loss and assess potential future cash flows for each reportable segment and the entity as a whole. The amendments expand a public entity's segment disclosures by requiring disclosure of significant segment expenses that are regularly provided to the chief operating decision maker (“CODM”), clarifying when an entity may report one or more additional measures to assess segment performance, requiring enhanced interim disclosures and providing new disclosure requirements for entities with a single reportable segment, among other new disclosure requirements. The amendments are effective for fiscal years beginning after December 15, 2023, and interim periods within fiscal years beginning after December 15, 2024, and early adoption is permitted. The Company adopted the guidance during the year ended December 31, 2024 and its adoption did not have a material impact on the Company’s financial statements. See “Note 13 - Segment Reporting” for more information.
In November 2024, the Financial Accounting Standards Board (“FASB”) issued ASU 2024-03—Income Statement—Reporting Comprehensive Income—Expense Disaggregation Disclosures (Subtopic 220-40): Disaggregation of Income Statement Expenses (“ASU 2024-03”) related to expense disclosures. The amendments in ASU 2024-03 require public entities to provide disaggregated disclosure of expenses included within relevant income statement expense captions, as well as additional disclosures about selling expenses. This update is effective for annual periods beginning after December 15, 2026, and interim periods within fiscal years beginning after December 15, 2027. The Company is currently evaluating the impact of adopting this guidance with respect to the consolidated financial statements.
Note 15. Subsequent Events
The Company’s management evaluated subsequent events through the date of issuance of the consolidated financial statements included herein. There have been no subsequent events that occurred during such period that would require recognition or disclosure, except those disclosed below.
2025 Notes Maturity
On January 16, 2025, the 2025 Notes matured pursuant to their terms and were repaid in full. The 2025 Notes are no longer outstanding or listed on Nasdaq Global Select Market.
Debt ATM Program
On February 10, 2025, the Company entered into an open market sale agreement (the “Sales Agreement”) with B. Riley Securities, Inc. (the “Sales Agent”), as sales agent and/or principal thereunder. Under the Sales Agreement, the Company may, but has no obligation to, issue and sell, from time to time, up to $100,000,000 aggregate principal amount of the March 2029 Notes (the “ATM March 2029 Notes”) and/or September 2029 Notes (the “ATM September 2029 Notes” and together with the ATM March 2029 Notes, the “ATM Notes”), through the Sales Agent or to the Sale Agent, as principal for its own account.
The ATM Notes will be issued as additional notes under the Base Indenture, dated January 16, 2020, between the Company and U.S. Bank National Association, as trustee (together with its successor in interest, U.S. Bank Trust Company, National Association, the “Trustee”), as supplemented by the Fifth Supplemental Indenture, dated March 28, 2024, with respect to the March 2029 Notes, and the Sixth Supplemental Indenture, dated as of July 19, 2024, with respect to the September 2029 Notes. The ATM March 2029 Notes and the ATM September 2029 Notes are treated as a single series with, have the same terms and CUSIP number as, and are fungible and rank equally with, the March 2029 Notes and the September 2029 Notes, respectively.
The March 2029 Notes bear interest at a rate of 7.875% per year payable quarterly in arrears on March 30, June 30, September 30 and December 30 of each year, which commenced on June 30, 2024. The March 2029 Notes will mature on March 30, 2029 and may be redeemed in whole or in part at any time, or from time to time, at our option on or after March 30, 2026, at a redemption price equal to 100% of the outstanding principal amount thereof, plus accrued and unpaid interest to, but excluding, the date of redemption. The existing March 2029 Notes are currently listed Nasdaq and trade on Nasdaq under the trading symbol “TRINZ.” The ATM March 2029 Notes are expected to be listed on Nasdaq and to trade on Nasdaq under the existing trading symbol “TRINZ.”
The September 2029 Notes bear interest at a rate of 7.875% per year payable quarterly in arrears on March 30, June 30, September 30 and December 30 of each year, which commenced on September 30, 2024. The September 2029 Notes will mature on September 30, 2029 and may be redeemed in whole or in part at any time, or from time to time, at our option on or after September 30, 2026, at a redemption price equal to 100% of the outstanding principal amount thereof, plus accrued and unpaid interest to, but excluding, the date of redemption. The existing September 2029 Notes are currently listed on Nasdaq and trade on Nasdaq under the existing trading symbol “TRINI.” The ATM September 2029 Notes are expected to be listed on Nasdaq and to trade on Nasdaq under the existing trading symbol “TRINI.”
Convertible Notes Redemption
On February 20, 2025, the holders of the Convertible Notes exercised their right to convert all of the outstanding principal amount of the Convertible Notes, pursuant to the terms of conditions of the Convertible Notes. At its election, the Company paid $66.2 million in cash to satisfy in full its obligation to pay the principal amount of the Convertible Notes, such settlement amount being determined based on the then existing conversion rate of 81.6439 per $1,000 principal amount of the Convertible Notes. As a result, the Convertible Notes are no longer outstanding.
Equity ATM Program
For the period from January 1, 2025 to February 24, 2025, the Company issued and sold 1,141,695 shares of its common stock at a weighted-average price of $15.24 per share and raised $17.2 million of net proceeds after deducting commissions to the sales agents on shares sold under the ATM Program.
Item 9. Changes in and Disagreements with Accountants on Accounting and Financial Disclosure
None.
Item 9A. Controls and Procedures
Evaluation of Disclosure Controls and Procedures
In accordance with Rules 13a-15(b) and 15d-15(b) under the Exchange Act, we, under the supervision and with the participation of our Chief Executive Officer and Chief Financial Officer, carried out an evaluation of the effectiveness of our disclosure controls and procedures (as defined in Rule 13a-15(e) and Rule 15d-15(e) under the Exchange Act) as of the end of the period covered by this annual report on Form 10-K and determined that our disclosure controls and procedures are effective as of the end of the period covered by this annual report on Form 10-K.
Management’s Report on Internal Control Over Financial Reporting
Our management is responsible for establishing and maintaining adequate internal control over financial reporting (as defined in Rules 13a-15(f) and 15d-15(f) of the Exchange Act). Under the supervision and with the participation of management, including the Chief Executive Officer and Chief Financial Officer, we conducted an evaluation of the effectiveness of our internal control over financial reporting based on the criteria established in Internal Control—Integrated Framework (2013) issued by the Committee of Sponsoring Organizations of the Treadway Commission (2013 COSO Framework). Based on our evaluation under the framework in Internal Control—Integrated Framework, management concluded that our internal control over financial reporting was effective as of December 31, 2024.
Because of its inherent limitations, internal control over financial reporting may not prevent or detect misstatements. Also, projections of any evaluation of effectiveness to future periods are subject to the risk that controls may become inadequate because of changes in conditions, or that the degree of compliance with the policies or procedures may deteriorate.
This annual report on Form 10-K does not include an attestation report of the company’s registered public accounting firm pursuant to the rules of the SEC.
Changes in Internal Control Over Financial Reporting
There have been no changes in our internal control over financial reporting (as defined in Rules 13a-15(f) and 15d-15(f) under the Exchange Act) that occurred during the year ended December 31, 2024 that have materially affected, or are reasonably likely to materially affect, our internal control over financial reporting.
Item 9B. Other Information
Fees and Expenses
The following table is intended to assist you in understanding the various costs and expenses that an investor in our common stock will bear directly or indirectly. However, we caution you that some of the percentages indicated in the table below are estimates and may vary. The footnotes to the fee table state which items are estimates. The following table should not be considered a representation of our future expenses; actual expenses may be greater or less than shown. Except where the context suggests otherwise, whenever this annual report on Form 10-K contains a reference to fees or expenses paid by “you,” “us” or “the Company” or that “we” will pay fees or expenses, stockholders will indirectly bear such fees or expenses as investors in Trinity Capital Inc.
| | | | | |
Stockholder transaction expenses: | | | | |
Sales load (as a percentage of offering price) | | | — | | (1) |
Offering expenses (as a percentage of offering price) | | | — | | (2) |
Distribution reinvestment plan expenses | | $ | 15.00 | | (3) |
Total stockholder transaction expenses (as a percentage of offering price) | | | — | | |
| | | | |
Annual expenses (as a percentage of net assets attributable to common stock): | | | | |
Operating expenses | | | 7.28 | % | (4) |
Interest payments on borrowed funds | | | 7.53 | % | (5) |
Acquired fund fees and expenses | | | 0.22 | % | (6) |
Total annual expenses | | | 15.03 | % | (7) |
(1)In the event that the securities are sold to or through underwriters, a related prospectus will disclose the applicable sales load (underwriting discount or commission).
(2)A related prospectus will disclose the estimated amount of offering expenses, the offering price and the estimated amount of offering expenses borne by the Company as a percentage of the offering price.
(3)The expenses of our distribution reinvestment plan are included in “Operating expenses.” The plan administrator’s fees will be paid by us. There will be no brokerage charges or other charges to stockholders who participate in our distribution reinvestment plan except that, if a participant elects by written notice to the plan administrator prior to termination of the participant’s account to have the plan administrator sell part or all of the shares held by the plan administrator in the participant’s account and remit the proceeds to the participant, the plan administrator is authorized to deduct a $15.00 transaction fee plus a $0.12 per share brokerage commission from the proceeds.
(4)Operating expenses represent the annual operating expenses of the Company and its consolidated subsidiaries for the year ended December 31, 2024. We do not have an investment adviser and are internally managed by our executive officers under the supervision of the Board. As a result, we do not pay investment advisory fees, but instead we pay the operating costs associated with employing investment management professionals including, without limitation, compensation expenses related to salaries, discretionary bonuses and grants of options and restricted stock, if any.
(5)Interest payments on borrowed funds represents an estimate of our annualized interest expense incurred based on estimated borrowings outstanding under the KeyBank Credit Facility, the August 2026 Notes, the December 2026 Notes, the March 2029 Notes, the September 2029 Notes and the Series A Notes over the next twelve months. The assumed weighted average interest rate on our total debt outstanding was 7.8%. Assumes we had $315.5 million outstanding under the KeyBank Credit Agreement, $125.0 million in aggregate principal amount of the August 2026 Notes outstanding, $75.0 million in aggregate principal amount of the December 2026 Notes outstanding, $115.0 million in aggregate principal amount of the March 2029 Notes outstanding, $115.0 million in aggregate principal amount of the September 2029 Notes outstanding and $142.5 million in aggregate principal amount of the Series A Notes outstanding. We may borrow additional funds from time to time to make investments to the extent we determine that it is in our best interest in doing so. We may also issue additional debt securities or preferred stock, subject to our compliance with applicable requirements under the 1940 Act.
(6)Acquired fund fees and expenses represent the estimated indirect expense incurred due to investments in other investment companies and private funds.
(7)The holders of shares of our common stock indirectly bear the cost associated with our annual expenses.
The following example demonstrates the projected dollar amount of total cumulative expenses over various periods with respect to a hypothetical investment in our common stock. In calculating the following expense amounts, we have assumed we would have no additional leverage and that our annual operating expenses would remain at the levels set forth in the table above. The stockholder transaction expenses described above are included in the following example.
| | | | | | | | | | | | | | | | |
| | 1 year | | | 3 years | | | 5 years | | | 10 years | |
You would pay the following expenses on a $1,000
investment, assuming a 5% annual return from
realized capital gains | | $ | 143 | | | $ | 387 | | | $ | 584 | | | $ | 929 | |
The foregoing table is to assist you in understanding the various costs and expenses that an investor in our common stock will bear directly or indirectly. While the example assumes, as required by the SEC, a 5% annual return, our performance will vary and may result in a return greater or less than 5%. In addition, while the example assumes reinvestment of all dividends and distributions at net asset value, if our Board authorizes and we declare a cash dividend, participants in our distribution reinvestment plan who have not otherwise elected to receive cash will receive a number of shares of our common stock, determined by dividing the total dollar amount of the dividend payable to a participant by the market price per share of our common stock at the close of trading on the valuation date for the dividend.
This example and the expenses in the table above should not be considered a representation of our future expenses, and actual expenses (including the cost of debt, if any, and other expenses) may be greater or less than those shown.
Rule 10b5-1 Trading Plans
During the quarter ended December 31, 2024, none of the Company's directors or executive officers adopted or terminated any contract, instruction or written plan for the purchase or sale of Company securities that was intended to satisfy the affirmative defense conditions of Rule 10b5-1(c) or any “non-Rule 10b5-1 trading arrangement.”
Item 9C. Disclosure Regarding Foreign Jurisdictions that Prevent Inspections.
Not applicable.
PART III
Item 10. Directors, Executive Officers and Corporate Governance
The information required by Item 10 is hereby incorporated by reference from our definitive Proxy Statement relating to our 2025 Annual Meeting of Stockholders, to be filed with the Securities and Exchange Commission within 120 days following the end of our fiscal year.
The Company has adopted a code of business conduct and ethics that applies to directors, officers and employees. The code of business conduct and ethics is available on the Company’s website at www.ir.trinitycap.com/governance/governance-documents. The Company will report any amendments to or waivers of a required provision of the code of business conduct and ethics on the Company’s website or in a Current Report on Form 8-K.
The Company has also adopted an insider trading policy that applies to directors, officers and employees, a copy of which is included as an exhibit to this Annual Report on Form 10-K. The insider trading policy has been reasonably designed to promote compliance with insider trading laws, rules and regulations, and any listing standards applicable to the Company.
Item 11. Executive Compensation
The information required by Item 11 is hereby incorporated by reference from our definitive Proxy Statement relating to our 2025 Annual Meeting of Stockholders, to be filed with the Securities and Exchange Commission within 120 days following the end of our fiscal year.
The Company did not grant awards of stock options, stock appreciation rights or similar option-like instruments during the fiscal year ended December 31, 2024. Accordingly, we have nothing to report under Item 402(x) of Regulation S-K.
Item 12. Security Ownership of Certain Beneficial Owners and Management and Related Stockholder Matters
The information required by Item 12 is hereby incorporated by reference from our definitive Proxy Statement relating to our 2025 Annual Meeting of Stockholders, to be filed with the Securities and Exchange Commission within 120 days following the end of our fiscal year.
Item 13. Certain Relationships and Related Transactions and Director Independence
The information required by Item 13 is hereby incorporated by reference from our definitive Proxy Statement relating to our 2025 Annual Meeting of Stockholders, to be filed with the Securities and Exchange Commission within 120 days following the end of our fiscal year.
Item 14. Principal Accountant Fees and Services
The information required by Item 14 is hereby incorporated by reference from our definitive Proxy Statement relating to our 2025 Annual Meeting of Stockholders, to be filed with the Securities and Exchange Commission within 120 days following the end of our fiscal year.
PART IV
Item 15. Exhibits and Financial Statement Schedules
The following financial statements of the "Company" are filed herewith:
The following exhibits are filed as part of this Annual Report on Form 10‑K or hereby incorporated by reference to exhibits previously filed with the SEC:
| | |
| | |
Exhibit
Number |
| Description of Exhibits |
3.1 |
| Articles of Amendment and Restatement (incorporated by reference to Exhibit 3.1 to the Company’s Current Report on Form 8-K filed on June 30, 2023). |
3.2 |
| Bylaws (incorporated by reference to Exhibit 3.2 to the Company’s Registration Statement on Form 10 filed on January 16, 2020). |
4.1 | | Indenture, dated January 16, 2020, by and between Trinity Capital Inc. and U.S. Bank National Association, as trustee (incorporated by reference to Exhibit 4.3 to the Company’s Registration Statement on Form 10 filed January 16, 2020). |
4.2 | | First Supplemental Indenture, dated January 16, 2020, relating to the 7.00% Notes due 2025, by and between Trinity Capital Inc. and U.S. Bank National Association, as trustee (incorporated by reference to Exhibit 4.4 to the Company’s Registration Statement on Form 10 filed January 16, 2020). |
4.3 | | Form of 7.00% Notes due 2025 (included as part of and incorporated by reference to Exhibit 4.2 hereto). |
4.4 | | Third Supplemental Indenture, dated August 24, 2021, relating to the 4.375% Notes due 2026, by and between Trinity Capital Inc. and U.S. Bank National Association, as trustee (incorporated by reference to Exhibit 4.2 to the Company’s Current Report on Form 8-K filed August 24, 2021). |
4.5 | | Form of 4.375% Notes due 2026 (included as part of and incorporated by reference to Exhibit 4.4 hereto). |
4.6 | | Fourth Supplemental Indenture, dated December 15, 2021, relating to the 4.25% Notes due 2026, by and between Trinity Capital Inc. and U.S. Bank National Association, as trustee (incorporated by reference to Exhibit 4.2 to the Company’s Current Report on Form 8-K filed December 15, 2021). |
4.7 | | Form of 4.25% Notes due 2026 (included as part of and incorporated by reference to Exhibit 4.6 hereto). |
4.8 | | Fifth Supplemental Indenture, dated as of March 28, 2024, between the Company and U.S. Bank Trust Company, National Association, as trustee (incorporated by reference to Exhibit 4.2 to the Company’s Current Report on Form 8-K filed March 28, 2024). |
4.9 | | Form of 7.875% Note due 2029 (included as part of and incorporated by reference to Exhibit 4.8 hereto). |
| | |
4.10 | | Sixth Supplemental Indenture, dated as of July 19, 2024, between the Company and U.S. Bank Trust Company, National Association, as trustee (incorporated by reference to Exhibit 4.2 to the Company's Current Report on Form 8-K filed July 19, 2024). |
4.11 | | Form of 7.875% Note due 2029 (included as part of and incorporated by reference to Exhibit 4.10 hereto). |
4.12* | | Description of Registrant’s Securities. |
10.1 | | Amended and Restated Distribution Reinvestment Plan (incorporated by reference to Exhibit 10.1 to the Company’s Current Report on Form 8-K filed March 29, 2021). |
10.2 | | Custody and Account Agreement, dated January 8, 2020, by and between the Company and Wells Fargo Bank, National Association (incorporated by reference to Exhibit 10.14 to the Company’s Registration Statement on Form 10 filed January 16, 2020). |
10.3 | | Credit Agreement, dated as of October 27, 2021, relating to the KeyBank Credit Facility, by and among Trinity Capital Inc., as servicer, TrinCap Funding, LLC, as borrower, KeyBank National Association, as administrative agent and syndication agent, Wells Fargo, National Association, as collateral custodian and paying agent, and the lenders party thereto (incorporated by reference to Exhibit 10.1 to the Company’s Current Report on Form 8-K filed November 1, 2021). |
10.4 | | First Amendment to Credit Agreement, dated as of December 22, 2021, relating to the KeyBank Credit Facility, by and among Trinity Capital Inc., as servicer, TrinCap Funding, LLC, as borrower, KeyBank National Association, as administrative agent and syndication agent, Wells Fargo, National Association, as collateral custodian and paying agent, and the lenders party thereto (incorporated by reference to Exhibit (k)(9) to the Company’s Registration Statement on Form N-2 (File No. 333-261782) filed January 26, 2022). |
10.5 | | Second Amendment to Credit Agreement, dated as of April 13, 2022, relating to the KeyBank Credit Facility, by and among Trinity Capital Inc., as servicer, TrinCap Funding, LLC, as borrower, KeyBank National Association, as administrative agent and syndication agent, Wells Fargo, National Association, as collateral custodian and paying agent, and the lenders party thereto (incorporated by reference to Exhibit 10.1 to the Company’s Current Report on Form 8-K filed April 19, 2022). |
10.6 | | Third Amendment to Credit Agreement, dated as of November 21, 2022, relating to the KeyBank Credit Facility, by and among Trinity Capital Inc., as servicer, TrinCap Funding, LLC, as borrower, KeyBank National Association, as administrative agent and syndication agent, Wells Fargo, National Association, as collateral custodian and paying agent, and the lenders party thereto (incorporated by reference to Exhibit 10.1 to the Company’s Quarterly Report on Form 10-Q filed May 4, 2023). |
10.7 | | Fourth Amendment to Credit Agreement, dated as of March 2, 2023, relating to the KeyBank Credit Facility, by and among Trinity Capital Inc., as servicer, TrinCap Funding, LLC, as borrower, KeyBank National Association, as administrative agent and syndication agent, Wells Fargo, National Association, as collateral custodian and paying agent, and the lenders party thereto (incorporated by reference to Exhibit 10.2 to the Company’s Quarterly Report on Form 10-Q filed May 4, 2023). |
10.8 | | Fifth Amendment to Credit Agreement, dated as of February 13, 2024, relating to the KeyBank Credit Facility, by and among Trinity Capital Inc., as servicer, TrinCap Funding, LLC, as borrower, KeyBank National Association, as administrative agent and syndication agent, Wells Fargo, National Association, as collateral custodian and paying agent, and the lenders party thereto (incorporated by reference to Exhibit 10.8 to the Company’s Annual Report on Form 10-K filed March 6, 2024). |
10.9 | | Sixth Amendment to Credit Agreement, dated as of August 2, 2024, relating to the KeyBank Credit Facility, by and among Trinity Capital Inc., as servicer, TrinCap Funding, LLC, as borrower, KeyBank National Association, as administrative agent and syndication agent, Wells Fargo, National Association, as collateral custodian and paying agent, and the lenders party thereto (incorporated by reference to Exhibit 10.1 to the Company’s Current Report on Form 8-K filed August 5, 2024). |
10.10 | | Joinder Agreement, dated September 19, 2024, by and between TrinCap Funding, LLC, as Borrower, Trinity Capital Inc., as Servicer, KeyBank National Association, as the Administrative Agent, and the Lenders party thereto (incorporated by reference to Exhibit 10.5 to the Company’s Quarterly Report on Form 10-Q filed October 30, 2024). |
10.11* | | Joinder Agreement, dated December 10, 2024, by and between TrinCap Funding, LLC, as Borrower, Trinity Capital Inc., as Servicer, KeyBank National Association, as the Administrative Agent, and the Lenders party thereto. |
10.12 | | Sale and Contribution Agreement, dated as of October 27, 2021, between the Company and TrinCap |
| | |
| | Funding, LLC (incorporated by reference to Exhibit 10.2 to the Company’s Current Report on Form 8-K filed November 1, 2021). |
10.13# | | Employment Offer Letter, dated January 16, 2020, by and between the Company and Steven L. Brown (incorporated by reference to Exhibit 10.6 to the Company’s Registration Statement on Form 10 filed January 16, 2020). |
10.14# | | Employment Offer Letter, dated January 16, 2020, by and between the Company and Kyle Brown (incorporated by reference to Exhibit 10.7 to the Company’s Registration Statement on Form 10 filed January 16, 2020). |
10.15# | | Employment Offer Letter, dated January 16, 2020, by and between the Company and Gerald Harder (incorporated by reference to Exhibit 10.8 to the Company’s Registration Statement on Form 10 filed January 16, 2020). |
10.16# | | 2019 Trinity Capital Inc. Long-Term Incentive Plan (incorporated by reference to Exhibit 10.1 to the Company’s Current Report on Form 8-K filed June 23, 2021). |
10.17# | | Form of Restricted Stock Agreement (2019 Trinity Capital Inc. Long Term Incentive Plan) (incorporated by reference to Exhibit 4.4 to the Company’s Registration Statement on Form S-8 filed September 14, 2021). |
10.18# | | Trinity Capital Inc. 2019 Non-Employee Director Restricted Stock Plan (incorporated by reference to Exhibit 10.2 to the Company’s Current Report on Form 8-K filed June 23, 2021). |
10.19# | | Form of Restricted Stock Agreement (Trinity Capital Inc. 2019 Non-Employee Director Restricted Stock Plan) (incorporated by reference to Exhibit 4.6 to the Company’s Registration Statement on Form S-8 filed September 14, 2021). |
10.20# | | Amendment No. 1 to the 2019 Trinity Capital Inc. Long-Term Incentive Plan (incorporated by reference to Exhibit 10.1 to the Company’s Current Report on Form 8-K filed on June 14, 2024). |
10.21# | | Amendment No. 1 to the Trinity Capital Inc. 2019 Non-Employee Director Restricted Stock Plan (incorporated by reference to Exhibit 10.2 to the Company’s Current Report on Form 8-K filed on June 14, 2024). |
10.22 | | Form of Indemnification Agreement (Directors) (incorporated by reference to Exhibit 10.12 to the Company’s Registration Statement on Form 10 filed January 16, 2020). |
10.23 | | Form of Indemnification Agreement (Officers) (incorporated by reference to Exhibit 10.13 to the Company’s Registration Statement on Form 10 filed January 16, 2020). |
10.24 | | Transfer Agency Agreement and Registrar Services Agreement, dated November 1, 2019, by and between the Company and American Stock Transfer & Trust Company, LLC (incorporated by reference to Exhibit 10.15 to the Company’s Registration Statement on Form 10 filed January 16, 2020). |
10.25 | | Open Market Sale Agreement, dated December 1, 2023, by and between Trinity Capital Inc. and Jefferies LLC (incorporated by reference to Exhibit 10.1 to the Company’s Current Report on Form 8-K filed December 1, 2023). |
10.26 | | Open Market Sale Agreement, dated December 1, 2023, by and between Trinity Capital Inc. and B. Riley Securities, Inc (incorporated by reference to Exhibit 10.2 to the Company’s Current Report on Form 8-K filed December 1, 2023). |
10.27 | | Open Market Sale Agreement, dated August 23, 2024, by and between Trinity Capital Inc. and Keefe, Bruyette & Woods, Inc. (incorporated by reference to Exhibit 10.3 to the Company’s Current Report on Form 8-K filed August 23, 2024). |
10.28 | | Note Purchase Agreement by and between Trinity Capital Inc. and the purchasers party thereto, dated October 29, 2024 (incorporated by reference to Exhibit 10.6 to the Company’s Quarterly Report on Form 10-Q filed October 30, 2024). |
10.29 | | Open Market Sale Agreement, dated February 10, 2025, by and between Trinity Capital Inc. and B. Riley Securities, Inc. (incorporated by reference to Exhibit 10.1 to the Company’s Current Report on Form 8-K filed on February 10, 2025). |
19.1* | | Insider Trading Policy. |
21.1 | | List of Subsidiaries |
| | Trinity Capital Holdings, LLC (Delaware) |
| | Trinity Funding 1, LLC (Delaware) |
| | TrinCap Funding, LLC (Delaware) |
| | Trinity Capital Adviser, LLC (Delaware) |
23.1* | | Consent of Ernst & Young LLP. |
* Filed herewith
** Furnished herewith
# Management contract or compensatory plan or arrangement
Item 16. Form 10-K Summary
Not applicable.
SIGNATURES
Pursuant to the requirements of Section 13 or 15(d) of the Securities Exchange Act of 1934, as amended, the registrant has duly caused this report to be signed on its behalf by the undersigned, thereunto duly authorized.
| | |
| TRINITY CAPITAL INC. |
| |
Dated: February 26, 2025 | By: | /s/ Kyle Brown |
| | Kyle Brown |
| | Chief Executive Officer, President and Chief |
| | Investment Officer, and Director |
| | (Principal Executive Officer) |
Each person whose signature appears below constitutes and appoints Kyle Brown, Michael Testa, and Sarah Stanton, and each of them, such person’s true and lawful attorney-in-act and agent, with full power of substitution and revocation, for such person and in such person’s name, place and stead, in any and all capacities, to sign one or more Annual Reports on Form 10-K for the year ended December 31, 2024, and any and all amendments thereto, and to file same with all exhibits thereto, and other documents in connection therewith, with the Securities and Exchange Commission, granting unto said attorneys-in-fact and agents, and each of them, full power and authority to do and perform each and every act and thing requisite and necessary to be done in connection therewith, as fully to all intents and purposes as such person might or could do in person, hereby ratifying and confirming all that said attorneys-in-fact and agents and each of them, or their or his substitutes, may lawfully do or cause to be done hereof.
Pursuant to the requirements of the Securities Exchange Act of 1934, as amended, this report has been signed below by the following persons on behalf of the registrant in the capacities indicated on February 26, 2025.
| | |
/s/ Kyle Brown | | /s/ Michael Testa |
Kyle Brown | | Michael Testa |
Chief Executive Officer, President and Chief | | Chief Financial Officer and Treasurer |
Investment Officer, and Director | | (Principal Financial and Accounting Officer) |
(Principal Executive Officer) | | |
| | |
/s/ Steven L. Brown | | /s/ Michael E. Zacharia |
Steven L. Brown | | Michael E. Zacharia |
Executive Chairman | | Director |
| | |
/s/ Irma Lockridge | | /s/ Richard Hamada |
Irma Lockridge | | Richard Hamada |
Director | | Director |
| | |
/s/ Ronald E. Estes | | |
Ronald E. Estes | | |
Director | | |
| | |