UNITED STATES SECURITIES AND EXCHANGE COMMISSION
Washington, D.C. 20549
FORM 10-K
| |
☒ | ANNUAL REPORT PURSUANT TO SECTION 13 OR 15(d) OF THE SECURITIES EXCHANGE ACT OF 1934 |
For the fiscal year ended December 31, 2024
or
| |
☐ | TRANSITION REPORT PURSUANT TO SECTION 13 OR 15(d) OF THE SECURITIES EXCHANGE ACT OF 1934 |
Commission file number 001-39191

Ovintiv Inc.
(Exact name of registrant as specified in its charter)
| | |
| | |
Delaware | | 84-4427672 |
(State or other jurisdiction of incorporation or organization) |
| (I.R.S. Employer Identification No.) |
Suite 1700, 370 17th Street, Denver, Colorado, 80202, U.S.A.
(Address of principal executive offices)
Registrant’s telephone number, including area code (303) 623-2300
Securities registered pursuant to Section 12(b) of the Act:
| | |
| | |
Title of each class | Trading Symbol | Name of each exchange on which registered |
Common Shares | OVV | New York Stock Exchange |
Securities registered pursuant to Section 12(g) of the Act: None
Indicate by check mark if the registrant is a well-known seasoned issuer, as defined in Rule 405 of the Securities Act.
Yes ☒ No ☐
Indicate by check mark if the registrant is not required to file reports pursuant to Section 13 or Section 15(d) of the Act.
Yes ☐ No ☒
Indicate by check mark whether the registrant (1) has filed all reports required to be filed by Section 13 or 15(d) of the Securities Exchange Act of 1934 during the preceding 12 months (or for such shorter period that the registrant was required to file such reports), and (2) has been subject to such filing requirements for the past 90 days.
Yes ☒ No ☐
Indicate by check mark whether the registrant has submitted electronically every Interactive Data File required to be submitted pursuant to Rule 405 of Regulation S-T (§ 232.405 of this chapter) during the preceding 12 months (or for such shorter period that the registrant was required to submit such files).
Yes ☒ No ☐
Indicate by check mark whether the registrant is a large accelerated filer, an accelerated filer, a non-accelerated filer, a smaller reporting company, or an emerging growth company. See the definitions of “large accelerated filer,” “accelerated filer”, “smaller reporting company” and “emerging growth company” in Rule 12b-2 of the Exchange Act.
| | | | |
Large accelerated filer | ☒ | | Accelerated filer | ☐ |
Non-accelerated filer | ☐ | | Smaller reporting company | ☐ |
| | | Emerging growth company | ☐ |
If an emerging growth company, indicate by check mark if the registrant has elected not to use the extended transition period for complying with any new or revised financial accounting standards provided pursuant to Section 13(a) of the Exchange Act. ☐
Indicate by check mark whether the registrant has filed a report on and attestation to its management’s assessment of the effectiveness of its internal control over financial reporting under Section 404(b) of the Sarbanes-Oxley Act (15 U.S.C. 7262(b)) by the registered public accounting firm that prepared or issued its audit report. ☒
If securities are registered pursuant to Section 12(b) of the Act, indicate by check mark whether the financial statements of the registrant included in the filing reflect the correction of an error to previously issued financial statements. ☐
Indicate by check mark whether any of those error corrections are restatements that required a recovery analysis of incentive-based compensation received by any of the registrant’s executive officers during the relevant recovery period pursuant to §240.10D-1(b). ☐
Indicate by check mark whether the registrant is a shell company (as defined in Rule 12b-2 of the Exchange Act):
Yes ☐ No ☒
| | | | |
| | | | |
Aggregate market value of the voting and non-voting common equity held by non-affiliates of registrant as of June 28, 2024 |
| $ | 12,376,088,462 |
|
Number of registrant’s shares of common stock outstanding as of February 21, 2025, at $0.01 par value |
|
| 260,324,464 |
|
Documents Incorporated by Reference
The information required by Part III of this Annual Report on Form 10-K, to the extent not set forth herein, is incorporated herein by reference from the registrant’s definitive proxy statement relating to the Annual Meeting of Shareholders to be held in 2025, which definitive proxy statement shall be filed with the Securities and Exchange Commission within 120 days after the end of the fiscal year to which this Annual Report on Form 10-K relates.
Auditor Firm ID: 271 Auditor Name: PricewaterhouseCoopers LLP Auditor Location: Calgary, Alberta, Canada
OVINTIV INC.
FORM 10-K
TABLE OF CONTENTS
DEFINITIONS
Unless the context otherwise requires or otherwise expressly stated, all references in this Annual Report on Form 10‑K to “Ovintiv,” the “Company,” “us,” “we,” “our” and “ours,” refer to Ovintiv Inc. and its consolidated subsidiaries. In addition, the following are other abbreviations and definitions of certain terms used within this Annual Report on Form 10-K:
“AECO” means Alberta Energy Company and is the Canadian benchmark price for natural gas.
“ASC” means Accounting Standards Codification.
“ASU” means Accounting Standards Update.
“bbl” or “bbls” means barrel or barrels.
“bbls/d” means barrels per day.
“Bcf” means billion cubic feet.
“Bcf/d” means billion cubic feet per day.
“BOE” means barrels of oil equivalent.
“BOE/d” means barrels of oil equivalent per day.
“Btu” means British thermal units, a measure of heating value.
“CORRA” means Canadian Overnight Repo Rate Average.
“DD&A” means depreciation, depletion and amortization expenses.
“FASB” means Financial Accounting Standards Board.
“GHG” means greenhouse gas.
“Mbbls” means thousand barrels.
“Mbbls/d” means thousand barrels per day.
“MBOE” means thousand barrels of oil equivalent.
“MBOE/d” means thousand barrels of oil equivalent per day.
“Mcf” means thousand cubic feet.
“Mcf/d” means thousand cubic feet per day.
“MD&A” means Management’s Discussion and Analysis of Financial Condition and Results of Operations.
“MMbbls” means million barrels.
“MMbbls/d” means million barrels per day.
“MMBOE” means million barrels of oil equivalent.
“MMBOE/d” means million barrels of oil equivalent per day.
“MMBtu” means million Btu.
“MMcf” means million cubic feet.
“MMcf/d” means million cubic feet per day.
“NCIB” means normal course issuer bid.
“NGL” or “NGLs” means natural gas liquids.
“NYMEX” means New York Mercantile Exchange.
“NYSE” means New York Stock Exchange.
“OPEC” means Organization of the Petroleum Exporting Countries.
“SCOOP” means South Central Oklahoma Oil Province.
“SEC” means United States Securities and Exchange Commission.
“SOFR” means Secured Overnight Financial Rate.
“STACK” means Sooner Trend, Anadarko basin, Canadian and Kingfisher counties.
“Standardized measure” means the present value of after-tax future net revenues discounted at 10% per annum.
“S&P 400” means Standard and Poor’s MidCap 400 index.
“TSX” means Toronto Stock Exchange.
“U.S.”, “United States” or “USA” means United States of America.
“U.S. GAAP” means U.S. Generally Accepted Accounting Principles.
“WTI” means West Texas Intermediate.
CONVERSIONS
In this Annual Report on Form 10-K, a conversion of natural gas volumes to BOE is on the basis of six Mcf to one bbl. BOE is based on a generic energy equivalency conversion method primarily applicable at the burner tip and does not represent economic value equivalency at the wellhead. Given that the value ratio based on the current price of oil as compared to natural gas is significantly different from the energy equivalency of 6:1, utilizing a conversion on a 6:1 basis may be misleading as an indication of value, particularly if used in isolation.
CONVENTIONS
Unless otherwise specified, all dollar amounts are expressed in U.S. dollars, all references to “dollars”, “$” or “US$” are to U.S. dollars and all references to “C$” are to Canadian dollars. All amounts are provided on a before tax basis, unless otherwise stated. In addition, all information provided herein is presented on an after royalties basis.
The terms “include”, “includes”, “including” and “included” are to be construed as if they were immediately followed by the words “without limitation”, except where explicitly stated otherwise.
The term “liquids” is used to represent oil, NGLs and condensate. The term “liquids rich” is used to represent natural gas streams with associated liquids volumes. The term “play” is used to describe an area in which hydrocarbon accumulations or prospects of a given type occur. Ovintiv’s focus of development is on hydrocarbon accumulations known to exist over a large areal expanse and/or thick vertical section and are developed using hydraulic fracturing. This type of development typically has a lower geological and/or commercial development risk and lower average decline rate, when compared to conventional development.
References to information contained on the Company’s website at www.ovintiv.com are not incorporated by reference into, and does not constitute a part of, this Annual Report on Form 10-K.
FORWARD-LOOKING STATEMENTS AND RISK
This Annual Report on Form 10-K contains certain forward-looking statements or information (collectively, “forward-looking statements”) within the meaning of applicable securities legislation, including Section 27A of the Securities Act of 1933, as amended (the “Securities Act”), and Section 21E of the Securities Exchange Act of 1934, as amended (the “Exchange Act”). All statements, except for statements of historical fact, that relate to the anticipated future activities, plans, strategies, objectives or expectations of the Company are forward-looking statements. When used in this Annual Report on Form 10‑K, and the other documents incorporated herein by reference, the use of words and phrases including “anticipates,” “believes,” “continue,” “could,” “estimates,” “expects,” “focused on,” “forecast,” “aims,” “strives,” “seeks,” “guidance,” “intends,” “maintain,” “may,” “opportunities,” “outlook,” “plans,” “potential,” “strategy,” “targets,” “will,” “would” and other similar terminology is intended to identify forward-looking statements, although not all forward-looking statements contain such identifying words or phrases. Without limiting the generality of the foregoing, forward-looking statements contained in this Annual Report on Form 10‑K include: expectations of plans, strategies and objectives of the Company, including anticipated reserves development; drilling plans and programs, including the amount and availability of capital to complete these plans and programs; the composition of the Company’s assets and the anticipated capital returns associated with its assets; anticipated oil, NGL and natural gas prices; the anticipated success of, and benefits from, technology and innovation, including the cube development model, trimulfrac and simulfrac techniques and other new or advanced drilling techniques or well completion designs; anticipated drilling and completions activity, including the number of drilling rigs and frac crews utilized; anticipated proceeds and future benefits from various joint venture, partnership and other agreements; anticipated or desired benefits from acquisitions; anticipated oil, NGLs and natural gas production and commodity mix; the Company’s ability to access capital markets, credit facilities and other sources of liquidity; the impact of changes in federal, state, provincial, local and tribal laws, rules and regulations; anticipated compliance with current or proposed environmental legislation; the Company’s goals, targets and initiatives related to ESG matters; the declaration and payment of future dividends and the anticipated repurchase the Company’s outstanding common shares; the Company’s ability to manage cost inflation and expected cost structures, including expected operating, transportation, processing and labor expenses; and the outlook of the oil and natural gas industry generally, including impacts from changes to the geopolitical environment.
The forward-looking statements included in this Annual Report on Form 10-K involve risks and uncertainties that could cause actual results to differ materially from projected results. Accordingly, investors should not place undue reliance on forward-looking statements as a prediction of actual results. We have based these forward-looking statements on current expectations and assumptions about future events, taking into account all information currently known by us. While we consider these expectations and assumptions to be reasonable, they are inherently subject to significant business, economic, competitive, regulatory and other risks and uncertainties, many of which are difficult to predict and beyond our control. The risks and uncertainties that may affect the operations, performance and results of our business and forward-looking statements include, but are not limited to, those set forth in Item 1A. Risk Factors of this Annual Report on Form 10‑K; and other risks and uncertainties impacting the Company’s business as described from time to time in the Company’s other periodic filings with the SEC or Canadian securities regulators.
Although the Company believes the expectations represented by its forward-looking statements are reasonable based on the information available to it as of the date such statements are made, forward-looking statements are only predictions and statements of our current beliefs and there can be no assurance that such expectations will prove to be correct. All forward-looking statements contained in this Annual Report on Form 10‑K are made as of the date of this document (or in the case of a document incorporated herein by reference, the date of such document) and, except as required by law, the Company undertakes no obligation to update publicly or revise any forward-looking statements. The forward-looking statements contained or incorporated by reference in this Annual Report on Form 10‑K, and all subsequent forward-looking statements attributable to the Company, whether written or oral, are expressly qualified by these cautionary statements.
The reader should carefully read the risk factors described in Item 1A. Risk Factors of this Annual Report on Form 10‑K for a description of certain risks that could, among other things, cause actual results to differ from these forward-looking statements.
PART I
Items 1 and 2. Business and Properties
GENERAL
Ovintiv is a leading North American oil and natural gas exploration and production company that is focused on developing its multi-basin portfolio of high-quality assets located in the United States and Canada. Ovintiv's operations also include the marketing of oil, NGLs and natural gas. As at December 31, 2024, all of the Company’s reserves and production were located in North America.
Ovintiv’s principal office is located at 370 – 17th Street, Suite 1700, Denver, Colorado 80202, U.S.A. Ovintiv’s shares of common stock are listed and posted for trading on the NYSE and the TSX under the symbol “OVV”.
Available Information
Ovintiv is subject to the informational requirements of the Exchange Act and, in accordance with the Exchange Act, it also files reports with and furnishes other information to the SEC. The public may obtain any document Ovintiv files with or furnishes to the SEC from the SEC's Electronic Document Gathering, Analysis, and Retrieval system (“EDGAR”), which can be accessed at www.sec.gov, or via the System for Electronic Document Analysis and Retrieval (“SEDAR”), which can be accessed at www.sedar.com, as well as from commercial document retrieval services.
Copies of this Annual Report on Form 10-K and the documents incorporated herein by reference may be obtained on request without charge from Ovintiv’s Corporate Secretary, 370 – 17th Street, Suite 1700, Denver, Colorado 80202, U.S.A., telephone: (303) 623-2300. Ovintiv also provides access without charge to all of the Company’s SEC filings, including copies of this Annual Report on Form 10-K, Quarterly Reports on Form 10-Q, current reports on Form 8-K and amendments to those reports filed or furnished pursuant to Section 13(a) or 15(d) of the Exchange Act, as soon as reasonably practicable after filing or furnishing, on Ovintiv’s website located at www.ovintiv.com.
STRATEGY AND APPROACH
Ovintiv aims to be a leading producer of oil and natural gas in North America. The Company strives to be at the forefront of driving innovation to both profitably and sustainably provide safe, reliable and affordable energy that makes modern life possible. Ovintiv is committed to delivering quality returns on the capital it invests in its multi-basin portfolio, anchored by its positions in the two largest remaining undeveloped oil basins in North America, the Permian in Texas and the Montney in Western Canada. Ovintiv is focused on generating significant cash flows and providing durable cash returns to its shareholders through the commodity price cycle.
The Company seeks to maximize returns by harnessing innovation to drive efficiency gains across its business, leveraging optionality from its high-quality multi-basin and multi-product portfolio, building flexibility into commercial agreements and actively managing commodity price risk.
In support of the Company’s commitment to enhancing shareholder value, Ovintiv utilizes its capital allocation framework to provide competitive returns to shareholders while strengthening its balance sheet.
The pillars that support the execution of the Company’s strategy include:
•Execution Excellence - The Company is a leader in the responsible multi-zone development of North American shale plays. A commitment to continuously pursue efficiency gains through innovation and technology enable Ovintiv to enhance well productivity, reduce risks, capture capital and operating cost savings, and sustainably enhance margins and returns while minimizing its environmental footprint.
•Disciplined Capital Allocation - Ovintiv’s capital investment strategy focuses on a limited number of high-quality assets to generate cash flows and quality returns. Ovintiv’s investment strategy is flexible, allowing for capital programs to be quickly optimized in response to changes in the macro commodity-price environment, which helps to preserve excess cash flows to return to shareholders and to maintain balance sheet strength.
•Commercial Acumen & Risk Management - The Company leverages its innovative supply chain and market fundamentals expertise to support capital allocation decisions and quickly respond in a dynamic commodity-price environment. The Company actively monitors and seeks to manage market volatility through diversification of price exposures and market access with the aim of enhancing margins and returns.
•Environmental, Social and Corporate Governance Progress - Ovintiv embraces stakeholder and societal expectations as it continues to evolve in response to the changing landscape with respect to environmental, social and governance matters. Ovintiv believes that strong business practices increase efficiency, economic performance, value creation and sustainability. Since 2005, the Company has published an annual Sustainability Report, which communicates Ovintiv’s performance and tracks progress on key issues important to stakeholders. Additional information can be found on the Company’s sustainability website at sustainability.ovintiv.com.
Ovintiv’s foundational values of integrity, safety, sustainability, trust and respect guide the organization’s behavior and define expectations in the workplace. Ovintiv takes pride not only in what the Company achieves, but also in how its goals are accomplished.
REPORTING SEGMENTS
Ovintiv’s operations are focused on the exploration and development of oil, NGLs and natural gas reserves as well as creating and capturing additional value through market optimization activities. Ovintiv’s operating and reportable segments are:
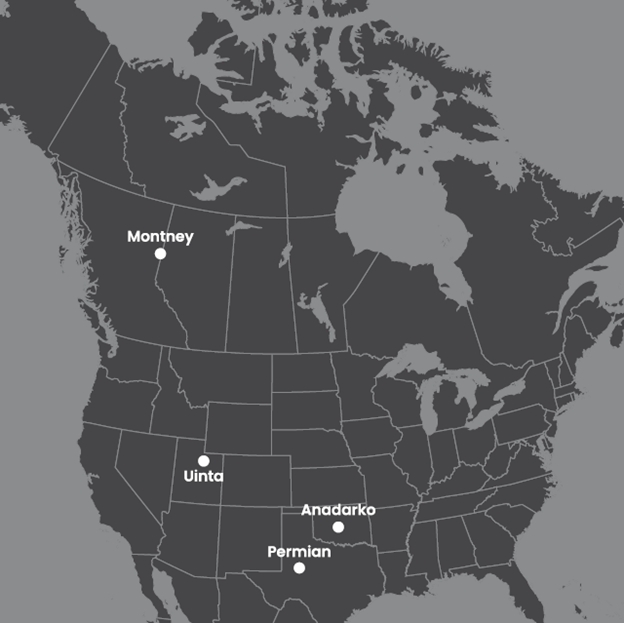
•USA Operations includes the exploration for, development of, and production and marketing of oil, NGLs, natural gas and other related activities within the United States. Plays in the U.S. include Permian in west Texas, Anadarko in west-central Oklahoma and Uinta in northeastern Utah.
•Canadian Operations includes the exploration for, development of, and production and marketing of oil, NGLs, natural gas and other related activities within Canada. Plays in Canada include Montney in northeast British Columbia and northwest Alberta and Horn River in northeast British Columbia.
During the year ended December 31, 2024, Ovintiv reassessed its reportable segments and reclassified its Market Optimization segment to present the Company’s market optimization activities in their respective USA and Canadian operating segments, which they support.
For additional information regarding the reporting segments, see Note 2 to Ovintiv’s audited Consolidated Financial Statements under Item 8 of this Annual Report on Form 10-K.
OIL AND NATURAL GAS PROPERTIES AND ACTIVITIES
The following map reflects the location of Ovintiv’s North American landholdings and assets, as of December 31, 2024. On January 22, 2025, the Company closed the divestiture of substantially all of its Uinta assets.
USA Operations
Overview: In 2024, the USA Operations had total capital investment of approximately $1,868 million, drilled 204 net wells primarily in Permian and total production averaged approximately 167.9 Mbbls/d of oil, approximately 87.0 Mbbls/d of NGLs and approximately 537 MMcf/d of natural gas. As of December 31, 2024, the USA Operations had an established land position of approximately 852,000 net acres, including approximately 148,000 net undeveloped acres. The USA Operations accounted for 76 percent of upstream production revenues, excluding the impacts of hedging, and 79 percent of total proved reserves as of December 31, 2024.
On January 22, 2025, the Company closed the divestiture of substantially all of its Uinta assets to FourPoint Resources, LLC, for approximately $2.0 billion, before closing adjustments. For additional information regarding the divestiture, see Note 28 to Ovintiv’s audited Consolidated Financial Statements under Item 8 of this Annual Report on Form 10‑K.
The following tables summarize the USA Operations landholdings, producing wells and daily production as of and for the periods indicated.
| | | | | | | |
Landholdings (1) | Developed Acreage | Undeveloped Acreage | Total Acreage | Average Working Interest |
(thousands of acres as of December 31, 2024) | Gross | Net | Gross | Net | Gross | Net | |
Permian | 180 | 167 | 38 | 23 | 218 | 190 | 87% |
Anadarko | 550 | 346 | 17 | 7 | 567 | 353 | 62% |
Uinta | 129 | 120 | 21 | 17 | 150 | 137 | 91% |
Other (2) | 168 | 71 | 227 | 101 | 395 | 172 | 44% |
Total USA Operations | 1,027 | 704 | 303 | 148 | 1,330 | 852 | 64% |
(1)Excludes interests in royalty acreage.
(2)Other comprises assets that are not part of the Company’s current focus.
| | | | | | | |
Producing Wells | | Oil | Natural Gas | Total |
(number of wells as of December 31, 2024) (1) | | Gross | Net | Gross | Net | Gross | Net |
Permian | | 2,520 | 2,369 | 1 | 1 | 2,521 | 2,370 |
Anadarko | | 2,108 | 823 | 119 | 76 | 2,227 | 899 |
Uinta | | 624 | 497 | - | - | 624 | 497 |
Other (2) | | 34 | 1 | 29 | 21 | 63 | 22 |
Total USA Operations | | 5,286 | 3,690 | 149 | 98 | 5,435 | 3,788 |
(1)Figures exclude wells mechanically capable of producing, but not producing.
(2)Other comprises assets that are not part of the Company’s current focus.
| | | | | | | | | | |
| | NGLs | |
Production | Oil (Mbbls/d) | Plant Condensate (Mbbls/d) | Other (Mbbls/d) | Total (Mbbls/d) | Natural Gas (MMcf/d) |
(average daily) | 2024 | 2023 | 2024 | 2023 | 2024 | 2023 | 2024 | 2023 | 2024 | 2023 |
Permian | 119.6 | 99.5 | 5.2 | 4.1 | 42.1 | 33.0 | 47.3 | 37.1 | 236 | 185 |
Anadarko | 21.9 | 30.6 | 5.6 | 5.9 | 31.9 | 36.3 | 37.5 | 42.2 | 265 | 283 |
Uinta | 26.2 | 19.1 | 0.4 | 0.3 | 1.7 | 1.2 | 2.1 | 1.5 | 33 | 22 |
Other (1) (2) | 0.2 | 9.6 | - | 0.6 | 0.1 | 4.1 | 0.1 | 4.7 | 3 | 27 |
Total USA Operations | 167.9 | 158.8 | 11.2 | 10.9 | 75.8 | 74.6 | 87.0 | 85.5 | 537 | 517 |
(1)Other comprises assets that are not part of the Company’s current focus.
(2)Other includes volumes associated with Bakken, which was divested during the second quarter of 2023.
Permian
Permian is an oil play located in west Texas primarily in Midland, Martin, Howard, Glasscock, Andrews and Upton counties. The properties within the play are characterized by exposure of up to 10 potential producing horizons spanning approximately 3,000 feet of stratigraphy or stacked pay, an extensive production history and developed infrastructure. As of December 31, 2024, the Company’s acreage comprises approximately 190,000 net acres in the play. The current focus of development is on the Spraberry and Wolfcamp formations in the Midland basin, where Ovintiv holds a large position. During 2024, the Company drilled 167 horizontal net wells. In 2024, production averaged approximately 119.6 Mbbls/d of oil, approximately 47.3 Mbbls/d of NGLs and approximately 236 MMcf/d of natural gas.
The Company has primarily developed the play using its cube development model and multi-frac techniques. Cube development utilizes multi-well pads and frac spreads running in parallel to simultaneously access multiple layers of stacked pay to maximize product recovery. Multi-frac technology is the process of fracing multiple wells at the same time instead of a single well, such as simulfrac and trimulfrac techniques which is the process of fracing two or three wells, respectively, at the same time. These advanced development approaches enable the Company to optimize cycle times and increase capital efficiency, while minimizing the surface footprint. During 2024, the Company continued to improve the rig to frac ratio which maximized capital efficiency, centralized geo steering which resulted in less downtime and faster cycle time, and drilled longer laterals which increased value. Further multi-frac efficiencies were achieved through holding wet sand and large water storage strategically close to acreage development to eliminate downtime. The Company also focused on innovative completions design improving well productivity and returns.
Oil and natural gas facilities include field gathering systems, storage batteries, saltwater disposal systems, separation equipment and pumping units. The majority of Ovintiv’s acreage and associated oil production is dedicated under multiple pipeline gathering agreements, with varying remaining terms of less than 10 years with optional renewal terms. In the event of pipeline capacity constraints, Ovintiv’s oil production is trucked by various third parties. Natural gas is delivered by the Company to the purchaser’s meter and pipeline interconnection point in the field.
Anadarko
Anadarko is a liquids-rich play located in west-central Oklahoma in Blaine, Canadian, Custer, Dewey, Garvin, Grady, Kingfisher, Major, McClain and Stephens counties. The majority of the Anadarko properties are located in the black oil window of the STACK which comprises the Woodford, Meramec and Osage formations spanning up to 800 feet of stratigraphy, while the remaining properties located in the SCOOP comprises the Woodford, Sycamore, Caney and Springer formations spanning up to 1,150 feet of stratigraphy. The play is characterized by silt, shale and carbonate formations which provide multiple potential oil and natural gas targets making the play ideal for cube development and long laterals. As of December 31, 2024, the Company’s acreage comprises approximately 353,000 net acres in the play, with development currently targeting liquids-rich prospects. During 2024, the Company drilled 17 horizontal net wells. In 2024, production averaged approximately 21.9 Mbbls/d of oil, approximately 37.5 Mbbls/d of NGLs and approximately 265 MMcf/d of natural gas.
The Company is developing the play using its cube development model. During 2024, Ovintiv focused on reducing base decline by five percent compared to the prior year and increasing capital efficiency and well economics by drilling longer laterals which reduced drilling and completions cost per foot by 23 percent in the STACK compared to the prior year.
The play has significant existing infrastructure and ample access to major pricing hubs, including Cushing, Oklahoma, the U.S. Gulf Coast, Mont Belvieu, Texas and Conway, Kansas, and a number of Mid-Continent natural gas pipelines. The Company’s oil and natural gas production is gathered at various production facilities, with the majority of oil subsequently transported to sales points by pipeline or sold at and trucked from tank batteries. The majority of Ovintiv’s acreage and associated production is dedicated to long-term gathering and processing agreements with various third parties, which have remaining terms of less than seven years.
Uinta
Uinta is an oil play located in northeastern Utah primarily in Duchesne and Uintah counties. The Uinta basin provides a deep inventory of multiple stacked oil horizons with approximately 2,600 feet of oil saturated reservoir rock. The Company developed the play using its cube development model. As of December 31, 2024, the Company’s acreage comprises approximately 137,000 net acres in the play. During 2024, the Company drilled 20 horizontal net wells. Production averaged approximately 26.2 Mbbls/d of oil, approximately 2.1 Mbbls/d of NGLs and approximately 33 MMcf/d of natural gas.
During 2024, the Company drilled 20 gross wells on five pads utilizing multi-well pad development which captured capital cost savings.
Oil production from Uinta is waxy, ranging from yellow to black, and is transported from the lease by truck due to the high heat pour point characteristics of the oil. Oil production that was not subject to sales commitments was sold monthly in spot markets or transported by rail to other markets such as the Gulf Coast.
On January 22, 2025, the Company closed the divestiture of substantially all of its Uinta assets.
Canadian Operations
Overview: In 2024, the Canadian Operations had total capital investment of approximately $428 million, drilled 64 horizontal net wells in Montney and production averaged approximately 47.1 Mbbls/d of oil and NGLs and approximately 1,161 MMcf/d of natural gas. As of December 31, 2024, the Canadian Operations had an established land position of approximately 995,000 net acres including approximately 590,000 net undeveloped acres. The Canadian Operations accounted for 24 percent of upstream production revenues, excluding the impacts of hedging, and 21 percent of total proved reserves as of December 31, 2024.
On January 31, 2025, the Company closed the acquisition of certain Montney assets from Paramount Resources Ltd. in an all-cash transaction of approximately $2.307 billion before closing adjustments. The acquisition will add approximately 109,000 net acres in the core of the liquids-rich Alberta Montney. For additional information regarding the acquisition, see Note 28 to Ovintiv’s audited Consolidated Financial Statements under Item 8 of this Annual Report on Form 10-K.
The following tables summarize the Canadian Operations landholdings, producing wells and daily production as of and for the periods indicated.
| | | | | | | |
Landholdings (1) | Developed Acreage | Undeveloped Acreage | Total Acreage | Average Working Interest |
(thousands of acres as of December 31, 2024) | Gross | Net | Gross | Net | Gross | Net | |
Montney | 548 | 366 | 570 | 356 | 1,118 | 722 | 65% |
Other (2) | 80 | 39 | 361 | 234 | 441 | 273 | 62% |
Total Canadian Operations | 628 | 405 | 931 | 590 | 1,559 | 995 | 64% |
(1)Excludes interests in royalty acreage.
(2)Other comprises assets that are not part of the Company’s current focus.
| | | | | | | |
Producing Wells (1) | | Oil | Natural Gas | Total |
(number of wells as of December 31, 2024) | | Gross | Net | Gross | Net | Gross | Net |
Montney | | 6 | 5 | 1,888 | 1,492 | 1,894 | 1,497 |
Other (2) | | 2 | 1 | 111 | 51 | 113 | 52 |
Total Canadian Operations | | 8 | 6 | 1,999 | 1,543 | 2,007 | 1,549 |
(1)Figures exclude wells mechanically capable of producing, but not producing.
(2)Other comprises assets that are not part of the Company’s current focus.
| | | | | | | | | | |
| | NGLs | |
Production | Oil (Mbbls/d) | Plant Condensate (Mbbls/d) | Other (Mbbls/d) | Total (Mbbls/d) | Natural Gas (MMcf/d) |
(average daily) | 2024 | 2023 | 2024 | 2023 | 2024 | 2023 | 2024 | 2023 | 2024 | 2023 |
Montney | 0.4 | 0.1 | 31.6 | 32.0 | 15.0 | 15.6 | 46.6 | 47.6 | 1,152 | 1,095 |
Other (1) | - | - | 0.1 | - | - | - | 0.1 | - | 9 | 30 |
Total Canadian Operations | 0.4 | 0.1 | 31.7 | 32.0 | 15.0 | 15.6 | 46.7 | 47.6 | 1,161 | 1,125 |
(1)Other comprises assets that are not part of the Company’s current focus.
Montney
Montney is a condensate and natural gas play located in northwest Alberta and northeast British Columbia. The play includes properties that are located in the Montney formation where Ovintiv is primarily targeting the development of condensate-rich locations, but also includes landholdings with incremental producing formations such as Cadomin and Doig. The Montney formation is characterized by up to six stacked horizons spanning over 1,000 feet of stratigraphy and is being developed through horizontal drilling and completion operations. During 2024, the Company drilled 64 horizontal net wells, and total production from the play averaged approximately 47.0 Mbbls/d of oil and NGLs and approximately 1,152 MMcf/d of natural gas. As of December 31, 2024, the Company’s acreage comprises approximately 722,000 net acres and 356,000 net undeveloped acres in the play.
Ovintiv utilizes leading development execution and customized cube development to maximize value and resource extraction within the Company’s acreage position. During 2024, Ovintiv continued to focus on capital efficiency by maximizing lateral length and increasing drilling and completion speeds, resulting in reduced surface footprint requirements and shorter cycle times. Further innovative advancements, including equipment optimization, automation, and utilization of real-time frac monitoring techniques, increased efficiency and lowered costs. These cost savings advancements included digitization of workflows which reduced water and pumping times, promoted customized well design and overall pad efficiency through centralized decision making and troubleshooting. Ovintiv also continued to focus on reducing its emissions footprint through converting natural gas instrumentation to nitrogen, leak detection and repair inspections, and utilizing natural gas powered drilling rigs and frac fleets to minimize diesel consumption.
Ovintiv has access to natural gas processing capacity of approximately 1,547 MMcf/d, of which approximately 1,336 MMcf/d is under contract with third parties under varying terms and duration and approximately 211 MMcf/d of processing capacity which is owned by the Company. In addition, Ovintiv has access to liquids handling capacity of approximately 124 Mbbls/d of which approximately 93 Mbbls/d is contracted with third parties under varying terms and duration, and approximately 31 Mbbls/d is owned by the Company.
PROVED RESERVES AND OTHER OIL AND NATURAL GAS INFORMATION
The process of estimating oil, NGLs and natural gas reserves is complex and requires significant judgment. The Company’s estimates of proved reserves and associated future net cash flows were evaluated and prepared by the Company’s internal qualified reserves evaluators (“QREs”) and are the responsibility of management. As a result, Ovintiv has developed internal policies that prescribe procedures and standards to be followed for preparing, estimating and recording reserves in compliance with SEC definitions and regulations. Ovintiv’s policies assign responsibilities for compliance in booking reserves and require that reserve estimates be made by its QREs. A QRE is an individual who has a minimum of five years practical experience, with at least three recent years of experience in the evaluation of reserves, and has a degree in petroleum engineering, geology, or other discipline of engineering or physical science.
Ovintiv’s Reserves and Depletion Group, which consists of eight staff, report into the Vice-President, Exploration, Subsurface, Chief G&G who reports to the Executive Vice-President & Chief Operating Officer. The Reserves and Depletion Group is responsible for the internal preparation, review and approval of the reserves estimates, and maintains Ovintiv’s internal policies that prescribe procedures and standards to be followed for preparing, estimating and recording reserves. This includes the Company’s reserves manual and conducting internal audits of the procedures, records and controls relating to the preparation of reserves estimates. Ovintiv’s QREs receive ongoing education on the fundamentals of SEC definitions and reserves reporting through the review of the Company’s reserves manual and internal training programs. The Reserves and Depletion Group also oversees the engagement of independent qualified reserves evaluators (“IQREs”) or independent qualified reserves auditors (“IQRAs”), if any, retained by the Company.
As a member of the Reserves and Depletion Group, the Company’s Senior Manager, Analytics and Reserves is primarily responsible for overseeing the preparation of proved reserves estimates. The Senior Manager, Analytics and Reserves has a Bachelor of Petroleum Engineering from Texas A&M University and is a member of the Society of Petroleum Engineers. The Senior Manager, Analytics and Reserves has over 22 years of experience in upstream oil and gas and has held numerous positions in reservoir, development and production engineering.
Annually, each play is reviewed in detail by the QREs, subject matter experts and the Company’s executive officers, as appropriate. The Reserves and Depletion Group also conducts a separate review to ensure the effectiveness of the disclosure controls and that the reserves estimates are free from material misstatement. The final reserves estimates are reviewed by Ovintiv’s Reserves Committee of the Board of Directors (the “Reserves Committee”), for approval by the Board of Directors. The Reserves Committee comprises directors that are independent and familiar with estimating oil and natural gas reserves and disclosure requirements. The Reserves Committee provides additional oversight to the Company’s reserves process, meeting with management periodically to review the reserves process, the portfolio of properties, results and related disclosures. The Reserves Committee is also responsible for reviewing the qualifications and appointment of IQREs or IQRAs, if any, retained by the Company, including recommending the selection of such IQREs or IQRAs to the Board of Directors for its approval, and meets with such IQREs or IQRAs to review their reports.
For year-ended December 31, 2024, the Company involved IQRAs to audit the Company’s internal oil and natural gas reserve estimates for certain properties. In 2024, Netherland, Sewell & Associates, Inc. audited 36 percent of the Company’s estimated U.S. proved reserve volumes. McDaniel & Associates Consultants Ltd. audited 18 percent of the Company’s estimated Canadian proved reserve volumes as of January 1, 2024, however, due to reduced gas prices and economic conditions, the estimated proved reserves volumes at year end reflect zero percent of the Company’s Canadian proved reserve volumes. An audit of reserves is an examination of a company’s oil and natural gas reserves by an independent petroleum consultant that is conducted for the purpose of expressing an opinion as to whether such estimates, in aggregate, are reasonable and have been estimated and presented in conformity with generally accepted petroleum engineering and evaluation methods and procedures.
Proved oil and natural gas reserves are those quantities of oil, natural gas and NGLs which, by analysis of geoscience and engineering data, can be estimated with reasonable certainty to be economically producible from known reservoirs under existing economic conditions, operating methods and government regulations. To be considered proved, oil and natural gas reserves must be economically producible before contracts providing the right to operate expire, unless evidence indicates that renewal is reasonably certain. Also, the project to extract the hydrocarbons must have commenced or the operator must be reasonably certain that it will commence the project within a reasonable time.
Undrilled locations can be classified as having undeveloped reserves only if a development plan has been adopted indicating that they are scheduled to be drilled within five years.
The Company’s reserve estimates are conducted from fundamental petrophysical, geological, engineering, financial and accounting data. Data used in reserves assessments may include information obtained directly from the subsurface through wellbores such as well logs, reservoir core samples, fluid samples, static and dynamic pressure information, production test data, and surveillance and performance information. Reserves are estimated based on production decline analysis, analogy to producing offsets, detailed reservoir modeling, volumetric calculations or a combination of these methods, based on the unique circumstances of each reservoir and the dataset available at the time of the estimate. The tools used to interpret the data may include proprietary and commercially available reservoir modeling and simulation software. Reservoir parameters from analogous reservoirs may be used as appropriate. In the case of producing reserves, the emphasis is on decline analysis where volumetric analysis is considered to limit forecasts to reasonable levels. Undeveloped reserves are estimated by analogy to producing offsets, with consideration of volumetric estimates of in place quantities. All locations to which proved undeveloped reserves have been assigned are subject to a development plan adopted by the Company’s management. In all cases, the Company’s reserve estimates consider technologies that have been demonstrated in the field to yield repeatable and consistent results, having regard to economic considerations, as defined in the SEC regulations.
In general, estimates of economically recoverable reserves and the future net cash flows therefrom are based on a number of variable factors and assumptions, such as historical production from the properties, production rates, ultimate reserve recovery, timing and amount of capital expenditures, marketability of oil and natural gas, royalty rates, the assumed effects of regulation by governmental agencies, and operating costs, all of which may vary materially from actual results. For those reasons, among others, estimates of the economically recoverable oil and natural gas reserves attributable to any group of properties and estimates of future net revenues associated with reserves may vary and such variations may be material. The actual production, revenues, taxes, and development and operating expenditures with respect to the reserves associated with the Company’s properties may vary from the information presented herein, and such variations could be material.
SEC regulations require that proved reserves be estimated using existing economic conditions (constant pricing). Based on this methodology, the Company’s reserves have been calculated utilizing the 12-month average trailing historical price for each of the years presented prior to the effective date of the report. The 12-month average is calculated as an unweighted average of the first-day-of-the-month price for each month. The reserve estimates provided herein are estimates only and there is no guarantee that the estimated reserves will be recovered.
Ovintiv does not file any estimates of total net proved reserves with any U.S. federal authority or agency other than the SEC. Reserve estimates filed with the SEC correspond with the estimates of the Company’s reserves contained in its reports. For the Company’s U.S. assets, reserves estimates are filed with the Department of Energy (“DOE”) and are based upon the same underlying technical and economic assumptions as the estimates of Ovintiv’s reserves that are filed with the SEC; however, the DOE requires reserves reports to include the interests of all owners in wells that Ovintiv operates and to exclude all interests in wells that Ovintiv does not operate.
The reserves and other oil and natural gas information set forth below has an effective date of December 31, 2024 and was prepared as of January 13, 2025. The audit reports prepared by the IQRAs are attached in Exhibits 99.1 and 99.2 of this Annual Report on Form 10-K.
The following table is a summary of the Company’s proved reserves. Estimates of future net cash flows and discounted future net cash flows derived from proved reserves information can be found in Note 29 to Ovintiv’s audited Consolidated Financial Statements under Item 8 of this Annual Report on Form 10-K.
Proved Reserves
The table below summarizes the Company’s total proved reserves by oil, NGLs and natural gas and by geographic area for the year ended December 31, 2024 and other summary operating data.
| | | | | | |
| | 2024 |
| | U.S. | | Canada |
| Total |
Proved Reserves: (1) | | | | | | |
Oil (MMbbls): | | | | | | |
Developed | | 273.7 | | 0.2 | | 274.0 |
Undeveloped | | 306.0 | | - | | 306.0 |
Total | | 579.8 | | 0.2 | | 580.0 |
| | | | | | |
Natural Gas Liquids (MMbbls): | | | | | | |
Developed | | 336.2 | | 59.9 | | 396.1 |
Undeveloped | | 198.4 | | 39.8 | | 238.2 |
Total | | 534.5 | | 99.7 | | 634.2 |
| | | | | | |
Natural Gas (Bcf): | | | | | | |
Developed | | 1,953 | | 1,269 | | 3,222 |
Undeveloped | | 1,099 | | 736 | | 1,835 |
Total | | 3,052 | | 2,005 | | 5,057 |
| | | | | | |
Total Proved Reserves (MMBOE): | | | | | | |
Developed | | 935.4 | | 271.7 | | 1,207.1 |
Undeveloped | | 687.6 | | 162.4 | | 850.0 |
Total | | 1,623.0 | | 434.1 | | 2,057.1 |
| | | | | | |
Percent Proved Developed | | 58% | | 63% | | 59% |
Percent Proved Undeveloped | | 42% | | 37% | | 41% |
| | | | | | |
Production (MBOE/d) | | 344.4 | | 240.6 | | 585.0 |
Capital Investments (US$ millions) | | 1,868 | | 428 | | 2,296 |
Total Net Productive Wells (2) | | 3,865 | | 1,572 | | 5,437 |
(1)Numbers may not add due to rounding.
(2)Total net productive wells includes producing wells and wells mechanically capable of production.
Changes to the Company’s proved reserves during 2024 are summarized in the table below:
| | | | | | | | | | | | |
| 2024 (1) |
|
| Oil (MMbbls) |
| NGLs (MMbbls) |
| Natural Gas (Bcf) |
| Total (MMBOE) |
|
Beginning of year |
| 518.9 | | | 525.3 | | | 6,850 | | | 2,185.9 |
|
Revisions and improved recovery (2) |
| 2.9 | | | 85.4 | | | (1,837 | ) | | (217.9 | ) |
Extensions and discoveries |
| 118.3 | | | 71.8 | | | 660 | | | 300.1 |
|
Purchase of reserves in place |
| 1.8 | | | 1.0 | | | 7 | | | 4.0 |
|
Sale of reserves in place |
| (0.3 | ) | | (0.4 | ) | | (2 | ) | | (1.0 | ) |
Production |
| (61.5 | ) | | (48.9 | ) | | (621 | ) | | (214.1 | ) |
End of year |
| 580.0 | | | 634.2 | | | 5,057 | | | 2,057.1 |
|
Developed |
| 274.0 | | | 396.1 | | | 3,222 | | | 1,207.1 |
|
Undeveloped |
| 306.0 | | | 238.2 | | | 1,835 | | | 850.0 |
|
Total |
| 580.0 | | | 634.2 | | | 5,057 | | | 2,057.1 |
|
(1)Numbers may not add due to rounding.
(2)Changes in reserve estimates resulting from application of improved recovery techniques are included in revisions of previous estimates.
In 2024, the Company’s proved reserves decreased by 128.8 MMBOE from 2023. Revisions and improved recovery of oil and NGLs were positive primarily due to positive revisions other than price of 97.5 MMBOE, and changes in the approved development plan of 17.9 MMBOE, partially offset by lower 12-month average trailing prices of 27.1 MMBOE. Revisions and improved recovery of natural gas were negative primarily due to lower 12-month average trailing prices of 1,914 Bcf (319.1 MMBOE), and changes in the approved development plan of 239 Bcf (39.8 MMBOE), partially offset by positive revisions other than price of 316 Bcf (52.7 MMBOE). Extensions and
discoveries of 300.1 MMBOE were the result of successful drilling leading to increased technical delineation, as well as new proved undeveloped locations resulting from updated development plans primarily in Permian and Anadarko. Extensions and discoveries include 37.7 MMBOE as a result of drilling wells in 2024 that were not previously classified as proved undeveloped reserves. Approximately 63 percent of the 2024 extensions and discoveries were oil, condensate and NGLs. Production for 2024 was 214.1 MMBOE.
Proved reserves are estimated based on the average first-day-of-month prices during the 12-month period for the respective year. The average prices used to compute proved reserves as of December 31, 2024 were WTI: $75.48 per bbl, Edmonton Condensate: C$99.60 per bbl, Henry Hub: $2.13 per MMBtu, and AECO: C$1.26 per MMBtu. Prices for oil, NGLs and natural gas are inherently volatile.
Proved Undeveloped Reserves
Changes to the Company’s proved undeveloped reserves during 2024 are summarized in the table below:
| | | | | | | | | | | | |
(MMBOE) | | | | | | | 2024 |
|
Beginning of year | | | | | | | | | | | 840.2 |
|
Revisions of prior estimates | | | | | | | | | | | (74.7 | ) |
Extensions and discoveries | | | | | | | | | | | 262.4 |
|
Conversions to developed | | | | | | | | | | | (180.2 | ) |
Purchase of reserves in place | | | | | | | | | | | 2.2 | |
Sale of reserves in place | | | | | | | | | | | - | |
End of Year (1) | | | | | | | | | | | 850.0 | |
(1)Numbers may not add due to rounding.
As of December 31, 2024, there are no proved undeveloped reserves that are expected to remain undeveloped for five years or more.
Extensions and discoveries of 262.4 MMBOE of proved undeveloped reserves were the result of successful drilling leading to increased technical delineation, as well as new proved undeveloped locations resulting from updated development plans primarily in Permian and Anadarko. Development plan changes are driven by portfolio optimization and changing commodity prices as compared to the prior year. Revisions of prior estimates of proved undeveloped reserves were negative 74.7 MMBOE primarily due to lower 12-month average trailing price of 126.1 MMBOE and development plan changes of 21.9 MMBOE, partially offset by revisions other than price of 73.3 MMBOE.
Conversions of proved undeveloped reserves to proved developed status were 180.2 MMBOE, equating to 21 percent of the total prior year-end proved undeveloped reserves. U.S. Operations converted 22 percent of proved undeveloped reserves and Canadian Operations converted 21 percent of proved undeveloped reserves. The Company spent approximately $1,500 million to develop proved undeveloped reserves in 2024, of which approximately 79 percent related to the U.S. properties and 21 percent related to the Canadian properties.
Purchases of proved undeveloped reserves of 2.2 MMBOE relate to Anadarko. There were no sales of proved undeveloped reserves in 2024.
Sales Volumes, Prices and Production Costs
The following table summarizes the Company’s production by final product sold, average sales price, and production cost per BOE for each of the last three years by geographic area:
| | | | | | | | | | |
| | Production | | Average Sales Price (1) | | Average Production Cost (2) |
| | Oil (MMbbls) | NGLs (MMbbls) | Natural Gas (Bcf) | | Oil ($/bbl) | NGLs ($/bbl) | Natural Gas ($/Mcf) | | ($/BOE) |
2024 | | | | | | | | | | |
USA (3) | | 61.5 | 31.8 | 196.5 | | 73.90 | 23.15 | 1.62 | | 10.38 |
Canada (4) | | 0.1 | 17.1 | 425.0 | | 70.38 | 57.69 | 1.73 | | 13.17 |
Total | | 61.6 | 48.9 | 621.5 | | 73.90 | 35.21 | 1.70 | | 11.53 |
| | | | | | | | | | |
2023 | | | | | | | | | | |
USA (3) | | 58.0 | 31.2 | 188.7 | | 76.46 | 21.66 | 2.43 | | 10.69 |
Canada (4) | | - | 17.4 | 410.6 | | 81.59 | 58.89 | 2.89 | | 13.43 |
Total | | 58.0 | 48.6 | 599.3 | | 76.46 | 34.98 | 2.74 | | 11.83 |
| | | | | | | | | | |
2022 | | | | | | | | | | |
USA (3) | | 48.0 | 29.9 | 180 | | 94.25 | 34.88 | 6.18 | | 11.79 |
Canada (4) | | - | 17.3 | 366 | | 87.28 | 78.44 | 5.75 | | 14.52 |
Total | | 48.0 | 47.2 | 546 | | 94.25 | 50.84 | 5.89 | | 12.94 |
(1)Excludes the impact of commodity derivatives.
(2)Excludes ad valorem, severance and property taxes.
(3)During 2024, annual production from fields that comprise greater than 15 percent of the Company’s total proved reserves related to Midland in the Permian of 9.0 MMbbls of oil, 5.8 MMbbls of NGLs and 32 Bcf of natural gas. During 2023 and 2022, there was no production from fields that comprise greater than 15 percent of the Company’s total reserves.
(4)During 2024, there was no production from fields that comprise greater than 15 percent of the Company’s total reserves. During 2023 and 2022, annual production from fields that comprise greater than 15 percent of the Company’s total proved reserves related to B.C. Montney: 2023 ‑ 7.7 MMbbls of NGLs and 306 Bcf of natural gas; and 2022 - 7.2 MMbbls of NGLs and 267 Bcf of natural gas.
Drilling and other exploratory and development activities (1, 2)
The following tables summarize the Company’s gross participation and net interest in wells drilled for the periods indicated by geographic area.
| | | | | | | | | | | | |
| Exploratory | Development | Total |
| Productive | Dry | Productive | Dry | Productive | Dry |
| Gross | Net | Gross | Net | Gross | Net | Gross | Net | Gross | Net | Gross | Net |
2024 | | | | | | | | | | | | |
USA | 1 | 1 | - | - | 226 | 202 | - | - | 227 | 203 | - | - |
Canada | - | - | - | - | 92 | 64 | - | - | 92 | 64 | - | - |
Total | 1 | 1 | - | - | 318 | 266 | - | - | 319 | 267 | - | - |
| | | | | | | | | | | | |
2023 | | | | | | | | | | | | |
USA | - | - | - | - | 215 | 168 | - | - | 215 | 168 | - | - |
Canada | - | - | - | - | 125 | 96 | - | - | 125 | 96 | - | - |
Total | - | - | - | - | 340 | 264 | - | - | 340 | 264 | - | - |
| | | | | | | | | | | | |
2022 | | | | | | | | | | | | |
USA | - | - | - | - | 194 | 153 | - | - | 194 | 153 | - | - |
Canada | 4 | 3 | - | - | 65 | 52 | - | - | 69 | 55 | - | - |
Total | 4 | 3 | - | - | 259 | 205 | - | - | 263 | 208 | - | - |
(1)“Gross” wells are the total number of wells in which the Company has a working interest.
(2)“Net” wells are the number of wells obtained by aggregating the Company’s working interest in each of its gross wells.
Drilling and other exploratory and development activities (1, 2)
The following table summarizes the number of wells in the process of drilling or in active completion stages and the number of wells suspended or waiting on completion by geographic area as of December 31, 2024.
| | | | | | | | |
| Wells in the Process of Drilling or in Active Completion | Wells Suspended or Waiting on Completion (3) |
| Exploratory | Development | Exploratory | Development |
| Gross | Net | Gross | Net | Gross | Net | Gross | Net |
USA | - | - | 28 | 27 | - | - | 43 | 39 |
Canada | - | - | 9 | 5 | - | - | 18 | 11 |
Total | - | - | 37 | 32 | - | - | 61 | 50 |
(1)“Gross” wells are the total number of wells in which the Company has a working interest.
(2)“Net” wells are the number of wells obtained by aggregating the Company’s working interest in each of its gross wells.
(3)Wells suspended or waiting on completion include exploratory and development wells where drilling has occurred.
Oil and natural gas properties, wells, operations, and acreage
The following table summarizes the number of producing wells and wells mechanically capable of production by geographic area as of December 31, 2024.
| | | | | | |
Productive Wells (1, 2) | Oil (3) | Natural Gas (4) | Total |
| Gross | Net | Gross | Net | Gross | Net |
USA | 6,131 | 3,759 | 170 | 106 | 6,301 | 3,865 |
Canada | 8 | 6 | 2,034 | 1,566 | 2,042 | 1,572 |
Total | 6,139 | 3,765 | 2,204 | 1,672 | 8,343 | 5,437 |
(1)“Gross” wells are the total number of wells in which the Company has a working interest.
(2)“Net” wells are the number of wells obtained by aggregating the Company’s working interest in each of its gross wells.
(3)Includes 4 gross oil wells (4 net oil wells) containing multiple completions.
(4)Includes 375 gross natural gas wells (296 net natural gas wells) containing multiple completions.
The following table summarizes the Company’s developed, undeveloped and total landholdings by geographic area as of December 31, 2024.
| | | | | | | |
Landholdings (1 - 8) | | Developed | Undeveloped | Total |
(thousands of acres) | | Gross | Net | Gross | Net | Gross | Net |
United States | | | | | | | |
| — Freehold | 845 | 586 | 31 | 22 | 876 | 608 |
| — Federal | 21 | 7 | 17 | 14 | 38 | 21 |
| — Fee | 59 | 13 | 230 | 89 | 289 | 102 |
| — Tribal/Allotted | 74 | 71 | 18 | 16 | 92 | 87 |
| — State | 28 | 27 | 7 | 7 | 35 | 34 |
Total United States | | 1,027 | 704 | 303 | 148 | 1,330 | 852 |
Canada | | | | | | | |
| — Crown | 614 | 398 | 905 | 575 | 1,519 | 973 |
| — Freehold | 13 | 6 | 23 | 12 | 36 | 18 |
| — Fee | 1 | 1 | 3 | 3 | 4 | 4 |
Total Canada | | 628 | 405 | 931 | 590 | 1,559 | 995 |
Total | | 1,655 | 1,109 | 1,234 | 738 | 2,889 | 1,847 |
(1)Fee lands are those lands in which the Company has a fee simple interest in the mineral rights and has either: (a) not leased out all the mineral zones; (b) retained a working interest; or (c) one or more substances or products that have not been leased. The current fee lands acreage summary includes all fee titles owned by the Company that have one or more zones that remain unleased or available for development.
(2)Crown/Federal/State/Tribal/Allotted lands are those owned by the federal, provincial or state government or First Nations, in which the Company has purchased a working interest lease.
(3)Freehold lands are owned by individuals (other than a government or the Company), in which the Company holds a working interest lease.
(4)Excludes interests in royalty acreage.
(5)Gross acres are the total area of properties in which the Company has a working interest.
(6)Net acres are the sum of the Company’s fractional working interest in gross acres.
(7)Undeveloped acreage refers to those acres on which wells have not been drilled or completed to a point that would permit the production of economic quantities of oil or gas regardless of whether such acreage contains proved reserves.
(8)Developed acreage refers to the number of acres which are allocated or assignable to producing wells or wells capable of production. Acreage included in spacing units of infill wells is classified as developed acreage at the time production commences from the initial well in the spacing unit.
Of the total 1.8 million net acres, approximately 1.7 million net acres is held by production. The table above includes acreage subject to leases that will expire over the next three years: 2025 - approximately 27,000 net acres; 2026 ‑ approximately 7,000 net acres; and 2027 - approximately 5,000 net acres, if the Company does not establish production or take any other action to extend the terms. For acreage that the Company intends to further develop, Ovintiv will perform operational and administrative actions to continue the lease terms that are set to expire. As a result, it is not expected that a significant portion of the Company’s net acreage will expire before such actions occur.
Title to Properties
As is customary in the oil and natural gas industry, a preliminary review of title records, which may include opinions or reports of appropriate professionals or counsel, is made at the time Ovintiv acquires properties. The Company believes that title to all of the various interests set forth in the above table is satisfactory and consistent with the standards generally accepted in the oil and natural gas industry, subject only to immaterial exceptions that do not detract substantially from the value of the interests or materially interfere with their use in Ovintiv’s operations. The interests owned by Ovintiv may be subject to one or more royalty, overriding royalty, or other outstanding interests (including disputes related to such interests) customary in the industry. The interests may additionally be subject to obligations or duties under applicable laws, ordinances, rules, regulations, and orders of arbitral or governmental authorities. In addition, the interests may be subject to burdens such as production payments, net profits interests, liens incident to operating agreements and current taxes, development obligations under oil and natural gas leases, and other encumbrances, easements, and restrictions, none of which detract substantially from the value of the interests or materially interfere with their use in the Company’s operations.
DELIVERY AND TRANSPORTATION COMMITMENTS
Market optimization activities are undertaken to facilitate the sale of the Company’s proprietary production and enhancing the associated netback price. In marketing its production, Ovintiv looks to minimize market related curtailment, maximize realized prices and manage concentration of credit-risk exposure. Market optimization activities include third-party purchases and sales of product to provide operational flexibility and cost mitigation for transportation commitments, product type, delivery points and customer diversification.
Ovintiv’s produced oil, NGLs and natural gas, are primarily marketed to refiners, local distributing companies, energy marketing companies and aggregators. Prices received by Ovintiv are based primarily upon prevailing market index prices in the region in which it is sold. Prices are impacted by regional and global supply and demand and by competing fuels in such markets.
Ovintiv’s oil production is sold under short-term and long-term contracts that range up to two years or under dedication agreements, for which prices received by Ovintiv are based primarily upon the prevailing index prices in the relevant region where the product is sold. The Company also has firm transport contracts to deliver oil to other downstream markets. Ovintiv’s NGLs production is sold under evergreen contracts and short-term contracts that range up to one year, or under dedication arrangements at the relevant market price at the time the product is sold. Ovintiv’s natural gas production is sold under short-term and long-term delivery contracts with terms ranging up to one year in duration, at the relevant monthly or daily market price at the time the product is sold. The Company also has firm transport contracts to deliver natural gas production to other downstream markets, including Dawn and Chicago.
Ovintiv also seeks to mitigate the market risk associated with future cash flows by entering into various financial derivative instruments used to manage price risk relating to produced oil, NGLs and natural gas. Details of contracts related to Ovintiv’s various financial risk management positions are found in Note 25 to Ovintiv’s audited Consolidated Financial Statements under Item 8 of this Annual Report on Form 10-K.
The Company enters into various contractual agreements to sell oil, NGLs and natural gas, some of which require the delivery of fixed and determinable quantities. As of December 31, 2024, the Company was committed to deliver approximately 18.9 MMbbls of oil and NGLs and approximately 35.5 MMcf of natural gas in the USA Operations and approximately 7.8 MMbbls of oil and NGLs and approximately 66.9 MMcf of natural gas in the Canadian Operations with varying contract terms.
Certain transportation and processing commitments result in the following financial commitments:
| | | | | | | | | |
| | | | | | | | | |
($ millions) | 1 Year | | 2-3 Years | | 4-5 Years | | > 5 years | | Total |
Transportation & Processing | | | | | | | | | |
USA Operations | | | | | | | | | |
Oil & NGLs | 58 | | 118 | | 15 | | - | | 191 |
Natural Gas | 51 | | 119 | | 90 | | 114 | | 374 |
Total USA Operations | 109 | | 237 | | 105 | | 114 | | 565 |
| | | | | | | | | |
Canadian Operations | | | | | | | | | |
Oil & NGLs | 76 | | 131 | | 74 | | 81 | | 362 |
Natural Gas | 470 | | 826 | | 653 | | 1,588 | | 3,537 |
Total Canadian Operations | 546 | | 957 | | 727 | | 1,669 | | 3,899 |
Total USA and Canadian Operations | 655 | | 1,194 | | 832 | | 1,783 | | 4,464 |
In general, Ovintiv expects to fulfill its delivery commitments with oil, NGLs and natural gas production from proved developed reserves, with longer term delivery commitments to be filled from the Company’s proved undeveloped reserves. Where proved reserves are not sufficient to satisfy the Company’s delivery commitments, Ovintiv can and may use spot market purchases to satisfy the respective commitments. In addition, for the Company’s long-term transportation and processing agreements, Ovintiv also expects to fulfill delivery commitments from the future development of resources not yet characterized as proved reserves. Where delivery commitments are not transferred along with property divestitures, Ovintiv may market and transport certain portions of the acquirer’s production to meet the delivery requirements.
In addition, oil, NGLs and natural gas production from the Company’s reserves are not subject to any priorities or curtailments that may affect quantities delivered to its customers or any priority allocations or price limitations
imposed by federal or state regulatory agencies, or any other factors beyond the Company’s control that may affect Ovintiv’s ability to meet contractual obligations other than those discussed in Item 1A. Risk Factors of this Annual Report on Form 10-K.
MAJOR CUSTOMERS
In connection with the marketing and sale of the Company’s oil, NGLs and natural gas production and purchased product for the year ended December 31, 2024, the Company had one customer, which individually accounted for more than 10 percent of the Company’s consolidated revenues (2023 and 2022 - one customer). Ovintiv does not believe that the loss of any single customer would have a material adverse effect on the Company’s financial condition or results of operations. Further information on Ovintiv’s major customers is found in Note 2 to Ovintiv’s audited Consolidated Financial Statements under Item 8 of this Annual Report on Form 10-K.
COMPETITION
The Company’s competitors include national, integrated and independent oil and natural gas companies, as well as oil and natural gas marketers and participants in other industries supplying energy and fuel to industrial, commercial and individual consumers. All aspects of the oil and natural gas industry are highly competitive and Ovintiv actively competes with other companies in the industry, particularly in the following areas:
•Exploration for and development of new sources of oil, NGLs and natural gas reserves;
•Reserves and property acquisitions;
•Transportation and marketing of oil, NGLs, natural gas and diluents;
•Access to services and equipment to carry out exploration, development and operating activities; and
•Attracting and retaining experienced industry personnel.
The oil and natural gas industry also competes with other industries focused on providing alternative forms of energy to consumers. Competitive forces can lead to cost increases or result in an oversupply of oil, NGLs or natural gas.
HUMAN CAPITAL
Ovintiv strives to be one of the most competitive energy companies in North America, bringing together the brightest minds and best technologies to fuel innovation and maximize operational performance and results. Ovintiv has a history of hiring top industry talent and recruiting individuals from within and outside of the oil and natural gas industry who will thrive in the Company’s unique culture. The Company’s core values of one, agile, innovative and driven, along with its foundational values of integrity, safety, sustainability, trust and respect guide behavior and define what Ovintiv expects of its employees in the workplace. These values support the Company’s corporate strategy and organizational priorities and reflect the Company’s culture. The Company’s Board chair and the Human Resources and Compensation Committee provide strategic oversight to key social issues that affect Company culture as well as the compensation program and its alignment with the Company’s strategic and business objectives, shareholder interests and governance developments. Ovintiv is committed to fair labor practices in its operations and adherence to all applicable workplace and employment standards.
As of December 31, 2024, the Company employed 1,623 employees. The following table outlines our employees by geographic area.
| |
| Employees |
U.S. | 925 |
Canada | 698 |
Total | 1,623 |
The Company also engages a number of contractors and service providers.
Employee Development and Retention
Ovintiv’s success is the direct result of a talented workforce and the Company’s approach to idea sharing and collaborative work to achieve company goals. Ovintiv’s culture is defined by continuous innovation, promoting internal collaboration as a way for employees to implement successful strategies and best practices across the Company’s business. Opportunities are provided for Ovintiv’s employees to further develop leadership, technical and business skills through on-the-job work experiences and job rotations, development opportunities, networking and mentoring, as well as formal learning programs and instructor led workshops. The Company also offers new graduate and intern opportunities in both technical and professional disciplines to support the recruitment of top talent, hiring an average of 23 new graduates and 51 interns per year over the past three years. In addition, the Company has a robust approach to succession planning for key personnel which assesses the competencies, experience, leadership capabilities, and development opportunities of identified succession candidates.
Ovintiv’s compensation and benefits program is designed to attract and retain the talent necessary to achieve the Company’s business strategy by rewarding individual performance as well as company performance. The Company’s compensation model is tied to financial, operational and environmental metrics that align to Ovintiv’s strategic plan. In addition, the compensation philosophy is anchored by two key objectives: a) delivering competitive base salaries and benefits and b) rewarding short and long-term performance through the grant of an annual cash bonus and long-term incentive awards (“LTI awards”). LTI awards are primarily performance-based and are designed to incentivize delivery of the Company’s strategy and long-term value creation with the payout of these awards correlating to Ovintiv’s stock price performance. Settlement of certain awards can be either in shares of common stock or cash at the discretion of the Human Resources and Compensation Committee. See Note 22 Compensation Plans and Note 23 Pensions and Other Post-Employment Benefits to Ovintiv’s audited Consolidated Financial Statements under Item 8 of this Annual Report on Form 10-K.
As of December 31, 2024, the average tenure of our employees is over nine years, and voluntary turnover is approximately four percent.
Inclusive Workforce
The Company fosters a culture of equity and inclusion, believing that diverse perspectives and experience enhance Ovintiv’s overall effectiveness and performance. The Company’s approach to building an inclusive workforce is nested within the Company’s social commitment. The Company takes an integrated approach to this work by inviting perspectives from various internal functions in order to amplify the impact. Ovintiv has an employee resource group called Leveraging Inclusion, Networking and Knowledge, which helps provide opportunities for all employees to engage, collaborate, learn and grow, in addition to fostering an environment where diverse perspectives are celebrated.
Ovintiv strives to provide equity of opportunity in recruitment, career development, promotion, training and rewards for its employees.
Employee Safety & Wellness
Safety is a foundational value at Ovintiv. Providing a safe workplace for employees, contractors, suppliers, and the community is a tenet of managing the Company’s operations. Strong safety performance reflects a well-run business and builds confidence in the communities where Ovintiv operates. Ovintiv promotes workplace safety with regular comprehensive training and orientation programs for employees and contractors. Employees and contractors are expected to comply with Ovintiv’s process safety protocols, regulatory compliance, and are required to report incidents and near-miss events.
Our operations are subject to a number of federal and state laws and regulations, including the federal Occupational Safety and Health Act (“OSHA”), and comparable state and provincial laws, rules and regulations and have established a variety of standards related to workplace exposure to hazardous substances, whose purpose is to protect the health and safety of workers. In addition, in the U.S. the OSHA hazard communication standard, the EPA community right-to-know regulations under Title III of the federal Superfund Amendments and Reauthorization Act and comparable state and provincial statutes require that information be maintained concerning hazardous materials used or produced in operations and that this information be provided to employees, state, provincial and local government authorities and citizens.
As a result, certain safety metrics are included in the Company’s scorecard and are tied into the Company’s compensation program. Environmental, Health and Safety (“EH&S”) metrics reflected in the scorecard include Injury Severity, Total Recordable Injuries Frequency, Spill Intensity, GHG Intensity, all of which are described in the Proxy Statement relating to the Company’s 2024 annual meeting of shareholders.
REGULATORY MATTERS
As Ovintiv is an operator of oil and natural gas properties and facilities in the United States and Canada, the Company is subject to numerous federal, state, provincial, local, tribal and foreign country laws and regulations. These laws and regulations relate to matters that include: acquisition of seismic data; issuance of permits; well locations, drilling and casing of wells; well design; hydraulic fracturing; well production; use, transportation, storage and disposal of fluids and materials incidental to oil and natural gas operations; surface usage and the restoration of properties upon which wells have been drilled and facilities have been constructed; plugging and abandoning of wells; pollution, protection of the environment and the handling of hazardous materials; transportation of production; periodic report submittals during operations; and calculation and disbursement of royalty payments and production and other taxes. The following are significant areas of government control and regulation affecting Ovintiv’s operations:
Exploration and Development Activities
Certain of our U.S. oil and natural gas leases are granted or approved by the federal government and administered by the Bureau of Indian Affairs, the Office of Natural Resources Revenue (“ONRR”) or the Bureau of Land Management (“BLM”), all of which are federal agencies. BLM leases contain relatively standardized terms and require compliance with detailed regulations. Many onshore leases contain stipulations limiting activities that may be conducted on the lease. Under certain circumstances, the BLM may require that our operations on federal leases be suspended or terminated. Any such suspension or termination could materially and adversely affect Ovintiv’s interests.
In addition, former President Biden and certain members of his administration have expressed support for, and have taken steps to implement, additional regulation of oil and gas leasing and permitting on federal lands. As a result, in June 2024, a new rule became effective, known as the “Fluid Mineral Leases and Leasing Process” rule, which modernizes the BLM’s oil and gas leasing program. The rule largely implements the reform agenda from the Department of the Interior’s “Report on the Federal Oil and Gas Leasing Program”, and its response to recommendations for improvement from the Government Accountability Office and the Department of the Interior’s Office of Inspector General. The rule updated royalty rates, rental rates, and minimum bids on BLM-managed public lands; and modernized bonding requirements for leasing, development and production. These additional restrictions or burdens on our ability to operate on federal lands could adversely impact our business in areas where we operate under federal leases.
In Canada, oil and natural gas mineral rights may be held by individuals, corporations or governments that have jurisdiction over the area in which such mineral rights are located. Generally, parties holding these mineral rights grant licenses or leases to third parties to facilitate the exploration and development of these mineral rights. The terms of these leases and licenses are generally established to require timely development. Notwithstanding the ownership of mineral rights, the government of the jurisdiction in which the mineral rights are located generally retains authority over the drilling and operation of oil and natural gas wells.
Drilling and Production
The Company’s operations also are subject to conservation regulations, including the regulation of the location of wells, size of drilling and spacing units or proration units; the number of wells that may be drilled in a unit; the rate of production allowable from oil and natural gas wells; and the unitization or pooling of oil and natural gas properties. In the U.S., some states allow the forced pooling or integration of tracts to facilitate exploration while other states rely on voluntary pooling of lands and leases, which make it more difficult to develop oil and natural gas properties. In addition, conservation laws generally limit the venting or flaring of natural gas and impose certain requirements regarding the ratable purchase of production.
Royalties
Operations on U.S. federal or Indian oil and natural gas leases must comply with numerous regulatory restrictions, including various non-discrimination statutes, and certain of such operations must be conducted pursuant to certain on-site security regulations and other permits issued by various tribal and federal agencies, including the BLM and the ONRR. The basis for royalty payments due under federal oil and natural gas leases are through regulation issued under the applicable statutory authority. State regulatory authorities establish similar standards for royalty payments due under state oil and natural gas leases. The basis for royalty payments established by ONRR and the state regulatory authorities is generally applicable to all federal and state oil and natural gas leases.
The royalty calculation in Canada is a significant factor in the profitability of Canadian oil and natural gas production. Oil and natural gas crown royalties are determined by provincial and territorial government regulation and are generally calculated as a percentage of the value of the gross production, net of allowed deductions. The royalty rate is dependent in part on prescribed reference prices, well productivity, geographical locations, recovery methods, as well as type and quality of the hydrocarbon produced. For pre-payout oil and natural gas projects, the regulations prescribe lower royalty rates for oil and natural gas projects until allowable incentive programs have been depleted and capital costs have been recovered. The calculation for wells post payout is based on a percentage of production net of allowed deductions and varies with commodity price. The Province of British Columbia introduced a new oil and gas royalty framework which will take effect January 1, 2027. The proposed new framework is based on revenue-minus-cost royalty system with price-sensitive royalty rates designed to reflect the value of the resource and achieve a return of 50 percent of profits after production cost are accounted for. New wells will pay a flat royalty rate of five percent until the capital spent on drilling and completions is recovered, then they will move to a price-sensitive royalty rate (between five percent and 40 percent). The specific range of price sensitivity varies by commodity type. New wells drilled after September 1, 2024, are subject to a transition system where new oil wells spud will be subject to a five percent royalty rate for the first six production months after which these wells will revert and pay royalties under the current royalty system. New gas wells are subject to a five percent royalty rate for the first 12 production months after which period the wells are evaluated and categorized based on a ratio of petroleum to raw wellhead natural gas produced during the period. The condensate ratio will determine how soon the royalty rate reverts to the current royalty system, as such the five percent rate period could last up to 17 months.
Royalties payable on production from lands other than federal, state or provincial government lands are determined through negotiations between the parties.
Sales and Transportation
Although oil and natural gas prices are currently unregulated in the U.S., Congress historically has been active in oil and natural gas regulation. As a result, the Company cannot predict whether new regulations might be proposed.
The availability, terms and transportation significantly affect sales of oil and natural gas. The interstate transportation and sale for resale of oil and natural gas is subject to U.S. federal regulation, including regulation of terms, conditions and rates for interstate transportation, storage and various other matters, primarily by the Federal Energy Regulatory Commission (“FERC”). Federal and state regulations govern the price and terms of access to oil and natural gas pipeline transportation. FERC’s regulations for oil and natural gas transmission in some circumstances may also affect the intrastate transportation of oil as the transportation of oil in common carrier pipelines is also subject to rate regulation by the FERC under the Intrastate Commerce Act. To the extent that effective interstate and intrastate rates are equally applicable to all comparable shippers, the Company believes that the regulation of oil transportation rates will not affect our operations in any way that is of material difference from those of our competitors.
Project Approvals
Approvals and licenses from relevant state, provincial or federal government or regulatory bodies are required to carryout or make modifications to the Company’s oil and natural gas activities. The project approval process can involve environmental assessment, stakeholder and indigenous consultation and inputs regarding project concerns and public hearings and may included various conditions and commitments which may arise throughout the process.
In 2019, the Canadian government implemented a new environmental assessment framework in Canada under Bill C‑69, the Federal Impact Assessment Act (“IAA”), which may impact the way large energy projects are approved. Though the Company does not typically own, operate, permit or construct projects which fall under the scope of the IAA, some of the Company’s business may rely on these projects owned, operated, permitted and constructed by others. Subsequently, in October of 2023, the Supreme Court of Canada ruled that many parts of the Impact Assessment Act and subsequent regulations were unconstitutional and overreaching. The Supreme Court decided that a province, not the federal parliament, decides when such developments are in the public interest. The federal parliament does not have a veto over provincially regulated activities, including developments within a province related to conventional oil and gas, oilsands (mining and in-situ), hard rock mining, coal and other similar non-renewable resource developments. In April 2024, amendments to the federal IAA were released receiving royal assent in June 2024. The amendments are intended to ensure the IAA is more efficient and constitutionally sound, and are aimed to address the Supreme Court’s concerns, including by clarifying that an impact assessment is only required when a project may have adverse effects within federal jurisdiction and promotes substitution of the federal impact assessment process with other equivalent provincial assessment processes.
A historic Supreme Court of British Columbia decision in mid-2021 which declared, among other things, that the province of British Columbia has unjustifiably infringed on the rights of the Blueberry River First Nation (“BRFN”) by permitting the cumulative impacts of industrial development (activities which include forestry, mining, oil and natural gas, agriculture, land clearing, hydroelectric infrastructure, roads and other industrial developments) to diminish the BRFN’s ability to meaningfully exercise its treaty rights within an area comprising approximately 9,400,000 acres in northeast British Columbia. This has impacted regulatory processes and timelines for natural resource development in northeast British Columbia, however the province of British Columbia subsequently reached agreements with BRFN and five other Treaty 8 First Nations in 2023 which improved permitting outcomes in the region. These agreements were negotiated to advance a collaborative approach to land and resource planning and the province has indicated that agreements with the remaining two Treaty 8 First Nations are moving towards a resolution. The agreements will transform how the province and First Nations steward land, water and resources together, and address cumulative effects in BRFN’s Claim Area through restoration measures to heal the land, establish new areas protected from industrial development, and constrain development activities while a new long-term cumulative effects management regime is implemented. More importantly, the new development constraints are land disturbance focused and are not intended to cap or constrain production. The new requirements do not apply to existing production, to private lands, or to lands outside of the claim area identified in the court case. However, authorizations on private lands will be subject to an enhanced Indigenous consultation process. Ovintiv’s landholdings in Montney that are located in northeast British Columbia are within the ‘Blueberry Claim Area’ subject to the agreement, however, the majority of the Company’s current land holdings and operations are on private land. While it is not anticipated the new agreements will materially impact the Company’s development plans in Montney, final details of the agreements have yet to be released. Should the agreements impose new, onerous approval requirements, the Company may be unable to conduct exploration and development activities on a portion of its landholdings in Montney that are located within northeast British Columbia.
Investment Canada Act
The Investment Canada Act requires Government of Canada approval, in certain cases, of the acquisition of control of a Canadian business by an entity that is not controlled by Canadians. In certain circumstances, the acquisition of oil and natural gas properties may be considered to be a transaction requiring such approval.
Environmental and Occupational Health and Safety Regulations
The Company is subject to many federal, state, provincial, local and tribal environmental and occupational health and safety laws and regulations. These environmental and occupational health and safety laws and regulations include, but are not limited to, legal requirements relating to:
•the discharge of pollutants into federal, provincial and state waters;
•assessing the environmental impact of seismic acquisition, drilling or construction activities;
•the generation, storage, transportation and disposal of waste materials, including hazardous substances;
•the emission of certain gases into the atmosphere, including any laws or regulations in connection with a response to climate change;
•the protection of private and public surface and ground water supplies;
•the sourcing and disposal of water;
•the protection of endangered species and habitat;
•the monitoring, abandonment, reclamation and remediation of well and other sites, including former operating sites;
•the development of emergency response and spill contingency plans; and
•the establishment of workplace standards for the protection of the health and safety of employees, including the implementation of hazard communications programs designed to inform employees about hazardous substances in the workplace, potential harmful effects of these substances, and appropriate control measures.
Failure to comply with these laws and regulations may result in the assessment of sanctions, including administrative, civil, and criminal penalties; the imposition of investigatory, remedial, and corrective action obligations or the incurrence of capital expenditures; the occurrence of delays in the permitting, development or expansion of projects; and the issuance of injunctions restricting or prohibiting some or all of the Company’s activities in a particular area. Further, certain environmental and occupational health and safety laws and regulations contain citizen suit provisions which allow private parties, including environmental organizations, to directly sue alleged violators or government agencies to enforce applicable requirements. To address climate change, the United States, Canada, and other signatories to the Paris Agreement and the Glasgow Climate Pact have agreed to voluntary and non-binding commitments to limit GHG emissions and fossil fuel subsidies. In June 2021, Canada passed the Net-Zero Emissions Accountability Act, which formally establishes the country’s 2050 net-zero emissions target. In the United States, no comprehensive climate change legislation has been implemented at the federal level. However, the U.S. Environmental Protection Agency (the “EPA”) has determined that GHG emissions present a danger to public health and the environment and has promulgated regulations to address methane and volatile organic compound emissions from oil and natural gas sources. Although environmental requirements have a substantial impact upon the energy industry as a whole, Ovintiv does not believe that these requirements affect the Company differently, to any material degree, as compared to other companies in the oil and natural gas industry. For further information regarding regulations relating to environmental protection, see Item 1A. Risk Factors of this Annual Report on Form 10-K.
Monitoring and reporting programs for environmental, health and safety performance in day-to-day operations, as well as inspections and assessments, are designed to provide assurance that environmental and regulatory standards are met. The Company has established operating procedures and training programs designed to limit the environmental impact of the Company’s field facilities and identify, communicate and comply with changes in existing laws and regulations. Contingency plans are in place for a timely response to an environmental event and remediation/reclamation programs are in place and utilized to restore the environment. In addition, the Environmental, Health and Safety Committee of the Board of Directors reviews and recommends environmental policy to the Board of Directors for approval and oversees compliance with government laws and regulations. The Board of Directors is advised of significant contraventions thereof, and receives updates on trends, issues or events which could have a significant impact on the Company.
The Company believes that the cost of maintaining compliance with these existing laws and regulations will not have a material adverse effect on its business, financial condition or results of operations. In addition, Ovintiv maintains insurance coverage for insurable risks against certain environmental and occupational health and safety risks that is consistent with insurance coverage held by other similarly situated industry participants, but the Company is not fully insured against all such risks. However, it is possible that developments, such as new or more stringently applied existing laws and regulations as well as claims for damages to property or persons resulting from the Company’s
operations, could result in substantial costs and liabilities to the Company. As a result, Ovintiv is unable to predict with any reasonable degree of certainty future exposures concerning such matters.
INFORMATION ABOUT OUR EXECUTIVE OFFICERS
The Company’s Executive Officers are set out in the table below:
| | | |
Name | Age (1) | Years Served as Executive Officer | Corporate Office |
| | | |
Brendan M. McCracken | 49 | 6 | President & Chief Executive Officer |
Corey D. Code | 51 | 6 | Executive Vice-President & Chief Financial Officer |
Meghan N. Eilers | 43 | 3 | Executive Vice-President, Midstream & Marketing & General Counsel |
Gregory D. Givens | 51 | 6 | Executive Vice-President & Chief Operating Officer |
Rachel M. Moore | 53 | 5 | Executive Vice-President, Corporate Services |
(1)As of February 21, 2025.
Mr. McCracken was appointed President & Chief Executive Officer in August 2021. Mr. McCracken joined one of the Company’s predecessor companies in 1997 and assumed a variety of leadership roles, including his previous positions as President in December 2020, Executive Vice-President, Corporate Development & External Affairs in September 2019 and Vice-President & General Manager of Canadian Operations in 2017.
Mr. Code was appointed Executive Vice-President & Chief Financial Officer of the Company in May 2019. Mr. Code joined one of the Company’s predecessor companies in 1999 and assumed a variety of leadership roles, including his previous position as Vice-President, Investor Relations and Strategy in 2018, Vice-President, Investor Relations in 2017, and Treasurer and Vice President, Portfolio Management in 2013.
Ms. Eilers was appointed Executive Vice-President, Midstream & Marketing & General Counsel in March 2022. Ms. Eilers joined the Company in 2019, serving as Vice-President, Legal Operations. Prior to joining the Company, Ms. Eilers served as the Assistant General Counsel at Newfield Exploration from 2018 to 2019, and served in various legal roles, including Managing Counsel – Domestic Operations, at Noble Energy, Inc. from 2007 to 2018.
Mr. Givens was appointed Executive Vice-President & Chief Operating Officer of the Company in September 2019. Mr. Givens joined the Company in 2018 serving as Vice-President and General Manager of Texas Operations. Prior to joining the Company, Mr. Givens was Vice-President Eagle Ford of EP Energy (a public oil and natural gas company) from 2012 to 2017 and worked in various technical and leadership roles from 1996 onwards for El Paso Exploration & Production Company and Sonat Exploration Company which were predecessor companies to EP Energy.
Ms. Moore was appointed Executive Vice-President, Corporate Services of the Company in June 2020. Ms. Moore joined the Company in 2015 serving as Vice-President, Human Resources. Prior to joining the Company, Ms. Moore was Executive Vice-President, Human Resources of Savanna Energy Services Corporation (a privately held oil and natural gas services company) from 2010 to 2015 and was Vice President, Human Resources of Enerflex Ltd. (a public oil and natural gas services company) from 2003 to 2010.
ITEM 1A. Risk Factors
Our business and operations, and our industry in general, are subject to a variety of risks. If any event arising from the risk factors set forth below occurs, our business, financial condition, results of operations, liquidity, the trading prices of our securities and in some cases our reputation could be materially and adversely affected. When assessing the materiality of the foregoing risk factors, we consider several qualitative and quantitative factors, including, but not limited to, financial, operational, environmental, regulatory, reputational and safety aspects of the identified risk factor. The risks described below may not be the only risks we face, as our business, operations and industry may also be subject to risks that we do not yet know of, or that we currently believe are immaterial.
The Company’s risk factors are summarized as market; operational; environmental; financial; regulatory; tax and general risks associated with business and industry.
Market Risks
•A substantial or extended decline in oil, NGLs or natural gas prices, or a substantial increase in oil, NGLs and natural gas price differentials, could have a material adverse effect on our business, financial condition, results of operations, and the trading prices of our securities.
•The trading price of our securities, including our common stock, is subject to volatility.
•Fluctuations in exchange rates could affect expenses or result in realized and unrealized losses.
Operational Risks
•Our ability to operate and complete projects is dependent on numerous factors outside of our control.
•Our operations involve many risks, some of which could result in unforeseen interruptions and expose us to substantial losses and liabilities, for which our insurance may not fully protect us.
•Oil and natural gas exploration, development and production activities involve substantial costs and risks and may not result in commercially productive reserves.
•The proved reserves data provided in this Annual Report on Form 10-K is an estimate only and any inaccuracies in the methodology or assumptions underlying our proved reserves estimates could cause the quantity and net present value of our oil, NGLs, and natural gas reserves to be materially overstated or understated.
•If we fail to find, develop or acquire additional oil, NGLs and natural gas reserves, our reserves and production will decline materially from their current levels.
•Horizontal multi-well pad drilling involves certain risks which may cause volatility in our operating results.
•We are subject to risks and liabilities from acquisitions and any anticipated or desired benefits from such acquisitions may not be realized.
•We are dependent on partners to fund certain projects conducted through joint ventures and partnerships.
•We do not operate all of our assets, and, in such instances, we may have a limited ability to exercise influence over the operation and development of such assets.
•Our customers, counterparties and lenders may be unable to satisfy their contractual or legal obligations.
•We retain certain indemnification obligations related to our corporate reorganization in November of 2009.
•We may be unable to dispose of certain assets and may be required to retain liabilities for certain matters.
•Our operations may be affected by indigenous treaty, title and other rights.
Environmental Risks and Risks Associated with Climate Change
•We are subject to risks and uncertainties associated with increased environmental regulations in all jurisdictions in which we operate.
•We are subject to risks and uncertainties arising out of government, investor and consumer action in response to concerns over climate change and the transition to a lower-carbon economy that could reduce demand for the oil, NGLs and natural gas we produce; increase our operating costs; and limit the areas in which we may explore for, develop, and produce oil, NGLs and natural gas.
•Estimates used in various scenario planning analyses could differ materially from actual results as the policy and regulatory environment evolves.
•Enhanced scrutiny on sustainability matters could have an adverse effect on our operations.
Financial and Liquidity Risk
•Downgrades in our credit ratings could increase our cost of capital and limit our access to capital, suppliers or counterparties.
•Our level of indebtedness may limit our financial flexibility.
•Our risk management activities may prevent us from fully benefiting from an increase in oil, NGLs and natural gas prices and expose us to certain other risks.
•The decision to return capital to shareholders, whether through cash dividends, share buybacks or otherwise, and the amount and timing of such capital returns is subject to the discretion of the Board of Directors and will vary from time to time.
Regulation and Litigation Risk
•We are subject to extensive federal, state, provincial and local government laws, rules and regulations that can adversely affect the cost, manner and feasibility of our business, and increased regulation in the future could increase costs, impose additional operating restrictions and cause delays.
•We currently are, and from time to time in the future may be, subject to claims, litigation, administrative proceedings and regulatory actions that may not be resolved in our favor.
•The ability of Canadian and other non-resident shareholders to effect service of process or enforce remedies against Ovintiv, its directors, officers, experts, and assets may be limited.
Tax Risks
•U.S. and Canadian tax laws and regulations may change over time, and such changes may result in increased taxes on our business.
•Our corporate reorganization in January of 2020 may result in material Canadian and/or U.S. federal income taxes.
General Risks
•The oil and natural gas industry is highly competitive and many of our competitors have available resources in excess of our own.
•We could be adversely affected by security threats, including cyber-security threats and related disruptions.
•A pandemic, epidemic or other widespread outbreak of an infectious disease could materially and adversely affect the operation of our business.
The following risk factors should be read in conjunction with the other information contained herein, including the consolidated financial statements and the related notes. Unless the context requires otherwise, “we,” “us,” “our” and “Ovintiv” refer to Ovintiv Inc. and its subsidiaries.
Market Risks
A substantial or extended decline in oil, NGLs or natural gas prices, or a substantial increase in oil, NGLs and natural gas price differentials, could have a material adverse effect on our business, financial condition, results of operations, and the trading prices of our securities.
Our financial performance and condition are substantially dependent on the prevailing prices we receive for the oil, NGLs and natural gas which we produce. Prices for oil, NGLs and natural gas are inherently volatile and fluctuate in response to changes in a variety of factors beyond our control, including:
•the international and domestic supply and demand for oil, NGLs and natural gas;
•volatility and trading patterns in the commodity futures market, including trading by commodity price speculators and others;
•global economic conditions;
•production levels of members of OPEC, Russia, the United States or other hydrocarbon producing nations;
•geopolitical risks, including political and civil unrest in oil and natural gas producing regions;
•adverse weather conditions, natural disasters and other catastrophic events, such as tornadoes, flooding, severe heat or cold, earthquakes and hurricanes;
•the price and level of North American oil, NGLs and natural gas imports and exports;
•the level of global oil, NGLs and natural gas inventories;
•the economic and financial impact of epidemics or other public health issues;
•differing quality of production, including the gravity and sulphur content of our oil, the Btu and sulphur content of our natural gas, and the quantity of NGLs associated with our natural gas;
•the price and availability of, and demand for, alternative sources of energy (including coal, biofuels, nuclear, hydroelectric, solar and wind);
•the effect of energy conservation efforts and technological advances in energy consumption and production, including with respect to transportation and power generation;
•the availability and proximity of gathering, transportation, processing, refining, storage and other infrastructure facilities;
•changes in trade relations and policies, including the imposition of tariffs by the United States or Canada;
•conservation and environmental protection efforts, including activities by non-governmental organizations to restrict the exploration, development and production of oil, NGLs and natural gas; and
•the nature and extent of governmental regulations, including any changes or other actions with respect to emissions, climate change, tariffs or tax laws.
Prices for oil, NGLs and natural gas are particularly sensitive to actual and perceived threats to geopolitical stability and to changes in production from OPEC+ member states. For example, the ongoing conflict between Russia and Ukraine, and the continuation of, or any increase in the severity of, this conflict or conflict in the Gaza region, has led and may continue to lead to an increase in the volatility of global oil and gas prices.
We also may receive discounted prices for our oil, NGLs and natural gas production relative to certain benchmark prices (such as Brent and WTI for oil and Henry Hub and AECO for natural gas) due to constraints on our ability to transport and sell such production to certain markets. A failure to resolve such regional pricing differentials may result in our continued realization of discounted or reduced oil, NGLs and natural gas prices relative to such benchmarks.
A substantial or extended decline in oil, NGLs and natural gas prices, or a substantial increase in oil, NGLs and natural gas price differentials with respect to certain benchmarks, could result in, among other things, (a) a delay or cancellation of existing or future drilling, development or construction programs; (b) the curtailment or shut-in of production at some or all of our properties; (c) unutilized long-term transportation and drilling commitments; or (d) a decrease in the value of our oil, NGLs and natural gas reserves, each of which could have a material adverse effect on our business, financial condition, results of operations and the trading prices of our securities. Additionally, on at least an annual basis, we assess the carrying value of our oil and natural gas properties in accordance with applicable accounting standards. If oil, NGLs and natural gas prices decline significantly for a sufficient period, the carrying value of our properties could be subject to financial impairment, and our net earnings could be materially and adversely affected.
The trading price of our securities, including our common stock, is subject to volatility.
The trading price of our securities, including our common stock, may be volatile. The value of an investment in our securities may decrease or increase abruptly, and such volatility may bear little or no relation to our financial or operational performance. The price of our securities may fall in response to market appraisal of our strategy or if our results of operations and/or prospects are below the expectations of market analysts or stakeholders, as well as a result of the factors described above under “A substantial or extended decline in oil, NGLs or natural gas prices, or a substantial increase in oil, NGLs and natural gas price differentials, could have a material adverse effect on our business, financial condition, results of operations and the trading prices of our securities”. In addition, equity and debt markets have, from time to time, experienced significant price and volume fluctuations that have affected the market price of securities, and may, in the future, experience similar fluctuations which may be unrelated to our operating performance and prospects but nevertheless affect the price of our securities. Broad equity and debt market fluctuations resulting from general economic and industry-specific conditions, as well as our ability to meet or exceed market expectations, may materially and adversely affect the trading prices of our securities, including our common stock.
Fluctuations in exchange rates could affect expenses or result in realized and unrealized losses.
We currently have operations in Canada and, as a result, a portion of our revenues and expenses are denominated in Canadian dollars. In addition, our subsidiaries that are domiciled in Canada may hold U.S. dollar denominated assets and liabilities. Fluctuations in the exchange rate between the U.S. dollar and the Canadian dollar have resulted in and could in the future result in realized and unrealized losses, which has impacted and could in the future impact our revenue and expenses and have a material adverse effect on our business, financial condition and results of operations.
Operational Risks
Our ability to operate and complete projects is dependent on numerous factors outside of our control.
We undertake a variety of projects including exploration and development projects and the construction or expansion of facilities and pipelines. Our ability to operate, generate sufficient cash flows, and timely complete projects depends upon numerous factors largely beyond our control. These factors include:
•oil, NGLs and natural gas prices;
•global supply and demand for oil, NGLs and natural gas;
•the overall state of the financial markets, including investor appetite for debt and equity securities issued by oil and natural gas companies and the effects of economic recessions or depressions;
•the ability to secure and maintain financing on acceptable terms;
•legislative, environmental and regulatory matters;
•oil and natural gas reservoir quality;
•the availability of drilling rigs, completions equipment and other facilities and equipment;
•the ability to access lands;
•the ability to access water for hydraulic fracturing operations;
•reliance on vendors, suppliers, contractors and service providers;
•shortages of sufficiently skilled labor, or labor disagreements resulting in unplanned work stoppages;
•changes to free trade agreements;
•inflation and other unexpected cost increases, including with respect to materials and labor;
•prevailing interest and foreign exchange rates;
•physical impacts from adverse weather conditions and natural disasters;
•transportation and processing interruptions or constraints, including the availability and proximity of pipeline and processing capacity;
•technology failures or cyber attacks; and
In addition, part of our corporate strategy is focused on a limited number of high-quality assets which results in a concentration of development capital and production. Some of the foregoing risks may be magnified due to the concentrated nature of our development activities and may result in a relatively greater impact on our financial condition and results of operations compared to other companies that may have more geographically diversified operations. Any material delays in a project or project cost overruns could result in delayed revenues and some projects becoming uneconomic, each of which could have a material and adverse effect on our business, financial condition and results of operations.
Our operations involve many risks, some of which could result in unforeseen interruptions and expose us to substantial losses and liabilities, for which our insurance may not fully protect us.
Our business is subject to the operating risks normally associated with (a) the exploration, development and production of oil, NGLs and natural gas and (b) the operation of midstream facilities, including the gathering, transportation, processing, storing and marketing of oil, NGLs and natural gas. These risks include:
•blowouts, cratering, explosions and fires;
•environmental hazards, such as the uncontrollable release or spill of oil, natural gas, toxic gases (such as hydrogen sulfide), produced water (brine), drilling or completion fluids, or other pollutants into the environment, including the surface, subsurface, air and groundwater;
•pipeline ruptures, vessel ruptures and other equipment malfunctions, failures or accidents;
•mechanical difficulties, such as stuck oilfield drilling and service tools, pipe or cement failures and casing collapses;
•adverse weather conditions, such as severe heat or cold, wildfire, flooding, tornados and other natural disasters;
•encountering unexpected or abnormally pressured formations;
•premature declines of reservoir pressure or productivity;
•acts of vandalism and terrorism, including attacks targeting oil, NGLs and natural gas facilities and infrastructure; and
•cyber attacks targeting oil and gas infrastructure.
If any of the foregoing risks were to materialize, we could sustain material losses as a result of:
•damage to, or destruction of, property, natural resources or equipment, including the costs of repair or replacement;
•pollution or other environmental harm, including the costs associated with remediation, reclamation and plugging and abandonment;
•interruptions to our ongoing operations, including the reduction or shutting-in of existing production;
•regulatory investigations and administrative, civil and criminal penalties; and
•injunctions resulting in limitation or suspension of current or future operations.
To the extent such weather events or natural disasters become more frequent or more severe, disruptions to our business and costs to repair damaged facilities could increase.
While we maintain insurance against some, but not all, of these risks and losses described above, our insurance may not be adequate to cover all casualty losses or liabilities, and our insurance does not cover penalties or fines that may be assessed by a governmental authority. We cannot predict the continued availability of insurance at premium levels that justify its purchase. The occurrence of a significant event for which we are not fully insured may have a material adverse effect on our business, financial position and results of operations.
Oil and natural gas exploration, development and production activities involve substantial costs and risks and may not result in commercially productive reserves.
Oil and natural gas exploration, development and production activities involve numerous risks, including the risk that no commercially productive oil or natural gas reservoirs will be encountered. The cost of drilling and completing wells is often uncertain and operations may be curtailed, delayed or canceled, or become costlier, as a result of a variety of factors, including:
•unexpected drilling conditions, including abnormal pressures or irregularities in formations;
•equipment failures or accidents;
•fracture stimulation accidents or failures;
•adverse weather conditions or natural disasters;
•title defects or restricted access to land;
•lack of available gathering, transportation, processing, fractionation, storage, refining or export facilities;
•lack of available capacity on interconnecting transmission pipelines;
•access to, and the cost and availability of, the equipment, services, resources and personnel required to complete our drilling, completion and production activities, including as a result of increased inflation, labor shortages or supply chain issues; and
•delays imposed by or resulting from compliance with or changes in environmental and other governmental, regulatory or contractual requirements.
Additionally, our operations involve utilizing some of the latest horizontal drilling and completion techniques as developed internally and by our service providers. Risks that we face while drilling and completing horizontal oil and natural gas wells include the following:
•landing the wellbore in the desired zone within the target formation;
•staying in the desired zone within the target formation while drilling horizontally for extended lengths;
•controlling formation pressures during drilling;
•running casing the entire length of the wellbore;
•being able to run tools and other equipment consistently through the horizontal wellbore;
•the ability to effectively fracture stimulate the reservoir with the desired number of stages; and
•the ability to successfully clean out the wellbore after completion of the final fracture stimulation stage.
Our future exploration and development activities may not be successful as a result of, among other things, the risks set forth above and, if unsuccessful, our proved oil, NGLs and natural gas reserves and production would decline, which could have a material and adverse effect on our business, financial condition and results of operation. While all development activities involve these risks, exploratory and extension development activities involve a greater risk of dry holes or failure to find commercial quantities of hydrocarbons.
The proved reserves data provided in this Annual Report on Form 10-K is an estimate only and any inaccuracies in the methodology or assumptions underlying our proved reserves estimates could cause the quantity and net present value of our oil, NGLs, and natural gas reserves to be materially overstated or understated.
There are numerous uncertainties inherent in estimating economically recoverable quantities of oil, NGLs and natural gas reserves, including many factors beyond our control. All oil, NGLs and natural gas reserve estimates are uncertain to some degree, and classifications of oil, NGLs and natural gas reserves are only attempts to define the degree of uncertainty involved. For those reasons, estimates of the quantity of oil, NGLs and natural gas economically recoverable from a group of properties and the classification of such oil, NGLs and natural gas reserves, when prepared by different engineers or by the same engineers at different times, may vary substantially. Additionally, estimates with respect to oil, NGLs and natural gas reserves can be based upon volumetric calculations and upon analogy to similar types of reserves, rather than upon actual production history. Oil, NGLs and natural gas reserve estimates based on these methods are generally less reliable than those based on actual production history. Subsequent evaluation of the same reserves based upon production history will result in variations in the estimated reserves and these variations may be material.
Proved reserves data in this Annual Report on Form 10-K and other publications we make publicly available represent estimates only. In general, estimates of our oil, NGLs and natural gas reserves, and the future net cash flows therefrom, are based upon a number of factors and assumptions, including commodity prices, operating and capital costs, availability of future capital, historical production from the same or similar properties and the assumed effects of regulation by governmental agencies, including with respect to royalty payments, all of which may vary considerably from actual results. Our actual production, revenues, taxes and development and operating expenditures with respect to our proved reserves may vary materially from such estimates.
The estimates of proved reserves included in this Annual Report on Form 10-K are prepared in accordance with SEC regulations. Subject to limited exceptions, oil, NGLs and natural gas reserves may only be classified as proved undeveloped reserves if the wells developing such reserves are scheduled to be drilled within five years after the date of classification. The development timing of our oil, NGLs and natural gas reserves is based upon numerous expectations and assumptions, including the allocation of development capital; anticipated costs to drill, complete and operate our wells; and anticipated commodity prices. Our development expectations and assumptions are subject to change and proved undeveloped reserves may be reclassified to unproved reserves at any time. Additionally, commodity prices used to estimate proved reserves included in this Annual Report on Form 10-K are calculated as the unweighted arithmetic average of the price on the first day of each month within the preceding 12-month period. Significant future price changes can have a material effect on the quantity and value of our proved reserves. The standardized measure of discounted future net cash flows included in this Annual Report on Form 10-K will not represent the current market value of our estimated proved reserves. In addition, these proved reserve estimates do not include any value for probable or possible reserves that may exist, nor do they include any value for unproved undeveloped acreage.
If we fail to find, develop or acquire additional oil, NGLs and natural gas reserves, our reserves and production will decline materially from their current levels.
Our future oil, NGLs and natural gas reserves and production, and therefore our future cash flows, are highly dependent upon our success in developing our current reserves base and exploring for, developing or acquiring additional oil, NGLs and natural gas reserves. Typically, to maintain an oil and natural gas lease in the United States, we are required to drill at least one well that is commercially productive within the primary term of the lease and, once drilled, maintain oil or natural gas production in paying quantities from the lease. If we are unsuccessful in drilling a commercially productive well during the primary term of the lease or, once drilled, in maintaining oil or natural gas production in paying quantities from the lease, we could lose our rights to explore for and develop oil and natural gas under such lease and our right to any oil, NGLs and natural gas reserves associated with the lease. In some cases, the initial commercially productive well will only maintain the lease as to a portion of the lands covered thereby and further oil and natural gas development activities are required to maintain the entirety of the lease.
The business of exploring for, developing and acquiring oil and natural gas reserves is capital intensive. Acquisition opportunities in the oil and natural gas industry are inherently competitive, which can increase the cost of, or cause us to refrain from, completing acquisitions. To the extent that cash flows from our operations are insufficient and external sources of capital become limited or undesirable, our ability to make the necessary capital investments to maintain and expand our oil, NGLs and natural gas reserves and production will be impaired. In addition, there can be no certainty that we will be able to find, develop or acquire additional oil, NGLs and natural gas reserves to replace current reserves and production at acceptable costs. Without additions through exploration, development or acquisition activities, our oil, NGLs and natural gas reserves and production will decline over time as the reserves are depleted, which may materially and adversely affect our business, financial condition and results of operations.
Horizontal multi-well pad drilling involves certain risks which may cause volatility in our operating results.
Our operations utilize horizontal multi-well pad drilling. In this type of development, multiple wells are drilled based upon spacing and completions techniques that evolve over time as learnings are captured and applied. Wells drilled on a multi-well pad are generally not placed on production until all wells on the pad are drilled and completed. While the use of this development technique can accelerate the production of our oil, NGLs and natural gas reserves and increase our observed recovery factor from the reservoir, it can also result in production delays as problems with a single well can adversely affect the production of all wells on the pad. Additionally, horizontal multi-well pad drilling increases the risk of unintentional communication or pressure interference between wells which may adversely affect our production. As a result, multi-well pad drilling can both cause delays in our production schedule and result in oil, NGLs and natural gas production below expectations. These delays or production interruptions may reduce our anticipated production volumes from both new and existing wells and this volatility could have a material and adverse effect on our business, financial condition and results of operations.
We are subject to risks and liabilities from acquisitions and any anticipated or desired benefits from such acquisitions may not be realized.
Historically, acquisitions of oil and natural gas properties, including through acreage trades, farm-ins and asset- or corporate-level acquisitions, have contributed to our growth. This includes our recent acquisition of Montney assets in Alberta from Paramount Resources Ltd. Acquisition opportunities in the oil and natural gas industry are inherently competitive, which can increase the cost of, or cause us to refrain from, completing acquisitions. The success of any acquisition will depend on several factors and involves potential risks and uncertainties, including, among other things:
•the inability to accurately forecast and estimate oil, NGLs and natural gas reserves, production volumes, development costs and the net cash flows attributable to such properties;
•the inability to accurately forecast commodity prices;
•the assumption of unknown liabilities, including environmental liabilities, for which we may not be indemnified or for which the indemnity may not be adequate;
•the anticipated growth opportunities, cost savings and synergies from combining the acquired businesses and operations;
•the ability to integrate operations and internal controls, including those related to financial reporting, disclosure and cybersecurity and data protection;
•the effect on our liquidity or financial leverage when using available cash or debt to finance the acquisition or from the amount of debt assumed as part of the acquisition;
•the impact to existing shareholders of the issuance of equity to finance the acquisition;
•the diversion of management’s attention from other business concerns; and
•the inability to hire, train or retain qualified personnel to manage and operate the acquired assets or business.
All of these factors, among others, affect whether an acquisition will ultimately generate cash flows sufficient to provide a suitable return on investment. Even though we assess and review the properties we seek to acquire in a manner consistent with what we believe to be industry practice, such reviews are limited in scope, inexact and not capable of identifying all existing or potentially adverse conditions. This risk is magnified when the acquired properties are in a geographic area where we have not historically operated. As a result, the anticipated and desired benefits of an acquisition may not materialize, and this may have a material and adverse effect on our business, financial performance and results of operations.
We are dependent on partners to fund certain projects conducted through joint ventures and partnerships.
Some of our projects are conducted through joint ventures, partnerships or other arrangements, where we are dependent on our partners to fund their contractual share of the project’s capital and operating expenditures. If our partners do not approve their contractual share of capital or operating expenditures, are unable to fulfill their contractual obligations, or suspend or terminate their contractual arrangements with us, the projects may become delayed or we may be forced to absorb additional capital or operating expenditures, each of which may materially and adversely affect the viability of such projects and our business, financial condition and results of operations.
These partners may also have strategic plans, objectives and interests that do not coincide, and may conflict, with our plans, objectives and interests. While certain operational decisions may be made solely at our discretion in our capacity as the operator of certain projects, major capital and strategic decisions affecting such projects may require agreement among the partners. No assurance can be provided that future demands or expectations of any party, including our demands and expectations, relating to such project will be met satisfactorily or in a timely manner. Failure to satisfactorily meet such demands or expectations may affect our or our partners’ participation in the operation of such project or the timing for undertaking various activities, which could materially and adversely affect the viability of such project and our business, financial condition and results of operations. Further, we are involved from time to time in disputes with our partners and, as such, we may be unable to dispose of certain assets or interests in certain arrangements if such disputes cannot be resolved in a satisfactory or timely manner.
We do not operate all of our assets, and, in such instances, we may have a limited ability to exercise influence over the operation and development of such assets.
Third parties operate a portion of the assets in which we have an ownership interest, and, in such instances, we may have a limited ability to exercise influence over the operation and development of such assets. The success and timing of our activities on these assets is therefore dependent upon factors that are largely outside of our control. These factors include (a) the timing and amount of capital, operating and maintenance expenditures related to the project; (b) the third-party operator’s expertise and financial resources; (c) the third-party operator’s ability to obtain required approvals from other non-operating partners; and (d) the third-party operator’s selection and implementation of adequate technology and risk management practices. The failure of one or more third-party operators to effectively and efficiently operate assets in which we have an ownership interest could result in the inefficient deployment of capital and the loss of production volumes, each of which could have a material and adverse effect on our business, financial condition and results of operations.
Our customers, counterparties and lenders may be unable to satisfy their contractual or legal obligations.
We are exposed to certain risks associated with our customers, contractual counterparties and lenders. These risks include (a) credit risks associated with (i) customers who purchase our oil, NGLs and natural gas production, (ii) the collection of receivables from our joint interest partners for their proportionate share of expenditures made on projects we operate, and (iii) counterparties to our derivative financial contracts; (b) performance risks associated with the non-delivery, or delayed delivery, of contracted products or services, including the transportation and processing of our oil, NGLs and natural gas production; and (c) liquidity risk in the event one or more lenders under our existing credit facilities are unable to perform their funding obligations. We utilize a variety of mechanisms to limit our exposure to
these and similar risks, including requiring guarantees, letters of credit, credit insurance or prepayments under certain conditions. Despite these mechanisms, in the event a customer, contractual counterparty or lender fails to satisfy their obligations, our business, financial condition and results of operations could be materially and adversely affected.
We retain certain indemnification obligations related to our corporate reorganization in November of 2009.
As part of our November 2009 corporate reorganization that split our predecessor, Encana Corporation (“Encana”), into two independent publicly traded energy companies, Encana and Cenovus Energy Inc. (“Cenovus”), Encana and Cenovus each agreed to indemnify the other for certain liabilities and obligations associated with, among other things, in the case of Encana’s indemnity, the business and assets retained by Encana, and in the case of Cenovus’s indemnity, the business and assets transferred to Cenovus. We are unable to predict whether we will be required to indemnify, or seek indemnity from, Cenovus for any obligations and the magnitude of such obligations. Any indemnification claims against us pursuant to the various agreements entered with Cenovus, or our failure to obtain indemnity from Cenovus for any claims we may hold, could have a material and adverse effect on our business, financial condition and results of operations.
We may be unable to dispose of certain assets and may be required to retain liabilities for certain matters.
We may identify certain assets for disposition, the proceeds of which could reduce the amount of our existing indebtedness and/or increase the amount of capital available for other business purposes, including shareholder returns and acquisitions. Various factors could materially affect our ability to dispose of the identified assets or complete any announced transactions, including commodity price volatility; the availability of counterparties willing to acquire oil and natural gas assets at prices and on terms acceptable to us; approval by our Board of Directors; associated asset retirement obligations; due diligence; general market conditions; the assignability of any associated contract, joint venture, partnership or other arrangements; and required stock exchange, governmental or third-party approvals. These factors may also reduce the value of our assets or the proceeds of any asset disposition.
We (including our predecessor entities) have retained, or in the future may retain, liabilities or indemnification obligations in connection with certain asset dispositions. While we are unable to predict the magnitude of any retained liabilities or indemnification obligations, any liabilities or indemnification obligations retained could ultimately be material. For example, under state and federal law, once an oil or natural gas well has permanently ceased production of oil or natural gas, the operator of such well is obligated to plug and abandon (“P&A”) the well, decommission production facilities and restore the well site to pre-operating conditions. U.S. state and federal regulations allow the government to call upon predecessors in interest of oil and natural gas leases associated with such well to pay for P&A, decommissioning and restoration obligations (together, “P&A Obligations”) if the current operator fails to fulfill those obligations. If purchasers of any assets previously owned by us or our predecessors (including any offshore wells or facilities), or any successor owners of those assets, are unable to meet their P&A Obligations due to bankruptcy, dissolution or other liquidity issues, we may be unable to rely on our arrangements with them, if any, to fulfill (or provide reimbursement for) those obligations. In those circumstances, the government may seek to impose the bankrupt entity’s P&A Obligations on us and any other predecessors in interest, and such payments could have a material adverse effect on our business, financial condition and results of operations.
Further, certain third parties may be unwilling to release us from guarantees or other credit support provided prior to the disposition of an asset. In those cases, after the asset disposition, we may remain secondarily liable for the obligations guaranteed or supported to the extent that the acquirer of the assets fails to perform their obligations.
Our operations may be affected by indigenous treaty, title and other rights.
Indigenous peoples have claimed indigenous treaty, title and other rights in respect of areas within the United States and Canada. The legal basis of an indigenous land claim, such as the BRFN case in 2021, is a matter of considerable legal complexity and we cannot predict the impact of such a claim, or the possible effects of a settlement of such claim, with any degree of certainty. In addition, no assurance can be given that any recognition of indigenous rights or claims whether by way of a negotiated settlement or by judicial pronouncement (or through the grant of an injunction prohibiting exploration, development or production activities pending resolution of any such claim) would not delay or even prevent our exploration, development and production activities. If a material claim were to arise and be successful, such claim could have a material and adverse effect on our business, financial condition and results of operations. In addition, the process of addressing such claim, regardless of the outcome, could be expensive and time
consuming and could result in delays which could have a material and adverse effect on our business, financial condition and results of operations. For more information on the BRFN case refer to “Regulatory Matters” under Items 1 and 2 of this Annual Report on Form 10-K.
In addition to the foregoing, we may become subject to various laws and regulations that apply to operators and other parties operating within the boundaries of Indian reservations in the United States. These laws and regulations may result in the imposition of certain fees, taxes, environmental standards, lease conditions or requirements to employ specified contractors or service providers. Any one of these requirements, or any delay in obtaining the approvals or permits necessary to operate within the boundaries of Indian reservations or tribal lands, could adversely impact our operations and ability to explore, develop and produce new properties.
Further, in Canada, the province of British Columbia enacted legislation to implement the United Nations Declaration on the Rights of Indigenous Peoples (“UNDRIP”) in the fall of 2019 and the Canadian federal government has followed suit by adopting the UNDRIP Act on June 21, 2021. The UNDRIP legislation adopted by both British Columbia and the Canadian federal government provide frameworks for recognizing the constitutional and human rights of indigenous peoples and aligning their respective provincial and federal laws with the internationally recognized standards of UNDRIP. Both pieces of UNDRIP legislation are at an early stage of implementation and we are unable to predict the total impact of the potential regulations upon our business. Although we do not anticipate any near-term impacts to our business as a result of such legislation, the implementation of the standards of UNDRIP has the potential to increase permitting times and change the processes and costs associated with project development and operations.
Environmental Risks and Risks Associated with Climate Change
We are subject to risks and uncertainties associated with increased environmental regulations in all jurisdictions in which we operate.
Our operations and properties are subject to numerous existing laws, rules and regulations governing our interactions with the environment that are enacted by U.S. and Canadian federal, state, provincial, territorial, tribal, and municipal governments (collectively, “Environmental Regulations”). Environmental Regulations impose, among other things, restrictions, liabilities and obligations in connection with (a) discharges and emissions of various substances into the environment; (b) the hydraulic fracturing of wells; (c) the handling, use, storage, transportation, treatment and disposal of chemicals, hazardous substances and waste associated with finding, producing, transmitting and storing oil, NGLs and natural gas; (d) the availability and management of fresh, potable or brackish water sources that are being used, or whose use is contemplated, in oil and natural gas operations; and (e) requirements that well sites and other properties associated with our operations be constructed, operated, maintained, abandoned and reclaimed to the satisfaction of applicable regulatory authorities. In addition, certain types of operations, including new exploration and development projects and certain changes to existing exploration and development projects, may require the submission and approval of environmental impact assessments or permit applications. Expenditures required to institute and maintain compliance with new or existing Environmental Regulations can be significant. Failure to comply with Environmental Regulations may result in substantial clean-up and remediation costs arising from damaged or contaminated properties, the imposition of significant fines and penalties by regulators and costly litigation or administrative proceedings. Examples of recently proposed and final Environmental Regulations or other regulatory initiatives include the following:
Emissions - Greenhouse gases (which include, among other things, methane, carbon dioxide, nitrous oxide and various fluorinated gases; “GHGs”) are typically emitted throughout all phases of the oil and natural gas supply chain, including production, transportation, processing, refining and storage operations. Additionally, although beyond our control, end user consumption of oil and natural gas in activities such as power generation and motorized transportation also results in GHG emissions. In the United States, the EPA under the Biden Administration determined that GHG emissions present a danger to public health and the environment and has adopted Environmental Regulations that, among other things, restrict GHG emissions and require the monitoring and annual reporting of GHG emissions from specified sources. For example, in 2024, the EPA finalized the New Source Performance Standard Subpart OOOOb, which will impose more stringent methane and volatile organic compound emission standards for new, modified or reconstructed sources in the oil and natural gas industry. The EPA also finalized New Source Performance Standard Subpart OOOOc, which create, for the first-time, emission guidelines for existing oil and natural gas sources included in individual states’ implementation plans. These Subpart OOOOb and OOOOc standards
expand upon previously issued New Source Performance Standards, Subpart OOOO and Subpart OOOOa published by the EPA in 2012 and 2016, respectively. Furthermore, in November 2022, the BLM proposed regulations limiting the waste of natural gas from venting, flaring and leaks during operations on existing and new federal and tribal leases. In addition, in August 2022, former President Biden signed the IRA creating a first-ever, phased-in methane fee (also known as the waste emission charge) that applies to certain oil and gas facilities. The first anticipated methane fee is due in 2025 for reporting year 2024. These and other Environmental Regulations that went into effect under the Biden Administration may be modified or reversed under the Trump Administration.
In December 2023, the Government of Canada published draft amendments to the federal regulations respecting reduction in the release of methane and certain volatile organic compounds concerning the upstream oil and gas sector. If implemented, the amendments would require the oil and gas sector to achieve a 75 percent reduction in methane emissions from 2012 levels by 2030. The draft amendments would, among other things, prohibit flaring and venting with limited exceptions, require high levels of equipment efficiency and require inspections for all producing and non-producing wells. Alberta and British Columbia have equivalency agreements in place with the Government of Canada, such that the current federal methane regulations generally do not apply in these provinces. However, in the event that the draft amendments are passed, regulatory changes in Alberta and British Columbia may be required to maintain equivalency. Publication of the finalized amendments is expected in 2025 and new requirements would come into force between 2027 and 2030. In December 2023, the Government of Canada announced plans to implement a national emissions cap-and-trade system for GHG emissions from the oil and gas sector through regulations to be made under the Canadian Environmental Protection Act, 1999 ("CEPA"). The cap-and-trade system is expected to be phased in between 2026 and 2030 and apply to, among other things, all direct GHG emissions from upstream oil and gas facilities, while also accounting for indirect emissions and emissions that are captured and permanently stored. It is currently proposed that the 2030 emissions cap (which will inform the number of emission allowances issued to regulated facilities) will be set at 35 percent to 38 percent below 2019 emission levels. The regulatory framework was published in December 2023 and was open for comment until February 2024. The draft regulatory framework was published in November of 2024 and the Government of Canada has stated it will continue to deliberate to inform the final regulations, which will be published in 2025.
In June 2024, the Government of Canada passed amendments to the Competition Act which outlined new provisions aimed at preventing greenwashing. These provisions require that companies be able to substantiate environmental claims made to promote a product or business interest. The Competition Bureau released draft guidelines in December 2024 to provide clarity on compliance, and they are open for comment until the end of February 2025. This may increase Ovintiv’s exposure to claims of greenwashing by third party organizations.
On January 1, 2023, material amendments to Alberta's Technology, Innovation and Emissions Reduction Regulation (“TIER”) came into force. The amendments align TIER with Canada's federal Greenhouse Gas Pollution Pricing Act, provide price certainty and seek to address a potential surplus of provincial carbon credits in the coming years. As a result of the amendments, flaring emissions are now included in the total regulated emissions for the Company's aggregate oil and gas facilities that are subject to TIER.
In British Columbia, the government released a series of GHG reduction intention papers that target methane emissions, carbon pricing mechanisms, permitting of new infrastructure and mechanisms to cap future emissions. These proposed mechanisms include: an oil and gas sector emissions cap to achieve a 33-38 percent reduction in emissions below 2007 levels by 2030; the requirement for all new, large industrial facilities to achieve net-zero emissions by 2050 (2030 for LNG projects) showing how they align with interim 2030 and 2040; and, a new Output Based Pricing System for large industrial emitters to ensure equivalency with the federal carbon pricing regime. Implementation will likely take effect on April 1, 2024. While Ovintiv’s proactive approach to electrification in our Montney operations will shelter its exposure to the Output-Based Pricing System, there is the potential for additional burden associated with the other proposed policy items.
The U.S. and Canadian federal governments, along with several provincial and state governments, have also announced intentions to adhere to certain international protocols regarding GHG emissions and regulate GHGs and certain air pollutants. In addition to federal action, many state and provincial officials have stated their intent to intensify efforts to regulate GHG emissions, including methane, from the oil and natural gas industry. These governments are currently developing and/or implementing regulatory and policy frameworks to deliver on their announcements. For example, in Canada, the Government of Canada (a) has committed to cutting Canada’s net GHG emissions by 40-45 percent below 2005 levels by 2030 in accordance with its pledge under the Paris Agreement; (b)
is gradually raising the federal carbon tax to C$170/tonne CO2e by 2030; and (c) has announced its intention to impose a hard cap on GHG emissions from the oil and natural gas industry, seek to reduce methane emissions from the oil and natural gas industry by 75 percent below 2012 levels by 2030 and ensure GHG emission reductions are on a pace and scale sufficient to reach net-zero by 2050. In November 2021, the Unites States, Canada, and other countries entered into the Glasgow Climate Pact, which includes a range of measures designed to address climate change, including but not limited to the phase-out of fossil fuel subsidies, reducing methane emissions 30 percent by 2030, and cooperating toward the advancement of the development of clean energy. Similar regulatory and policy framework efforts were committed to at the 2023 UN Climate Change Conference (COP28) in late 2023. We actively participate in certain provincial industrial emission programs offered by both Alberta and British Columbia that allow for the generation of offsets and other rebates to incentivize emission reduction projects and mitigate carbon tax costs. We expect to continue to be able to utilize these provincial programs in the future to migrate our carbon tax costs.
Hydraulic Fracturing Operations - Certain governments in jurisdictions where we do not currently operate have considered or implemented moratoriums on hydraulic fracturing until further studies can be completed and some governments have adopted, and others have considered adopting, Environmental Regulations that could impose more stringent permitting, disclosure and well construction requirements on hydraulic fracturing operations or result in an outright ban of hydraulic fracturing in oil and natural gas operations.
Seismic Activity - Some areas of North America are experiencing an increased frequency of localized seismic activity which has been associated with oil and natural gas operations. Although the occurrence and risk of seismicity in relation to oil and natural gas operations is generally very low, it has been linked to the underground disposal of produced water and, in some instances, has been correlated with hydraulic fracturing activities. This has prompted legislative and regulatory initiatives intended to address these concerns. These initiatives have the potential to (a) require additional seismic monitoring; (b) restrict the volume of produced water injected in certain disposal wells; (c) restrict the injection of produced water in certain underground formations; and (d) modify or curtail hydraulic fracturing operations in certain areas.
The cost and effects of complying with existing and emerging Environmental Regulations (including those with respect to emissions, hydraulic fracturing operations and seismic activity) and proposed carbon taxes are not currently anticipated to be material to our operations, however federal, state, provincial and local regulations and programs are either under development or in the early stages of implementation and we are unable to accurately predict the total future impact of such regulations and programs. Increased Environmental Regulations and/or carbon taxes could (a) materially increase our cost of compliance and other operating costs; and/or (b) impede or prevent development of our oil, NGLs and natural gas assets, reducing (i) the amount of oil, NGLs and natural gas we are ultimately able to produce from our reserves and (ii) our overall quantity of oil, NGLs and natural gas reserves. The occurrence of any of the foregoing could have a material adverse effect on our business, financial condition and results of operations.
We are subject to risks and uncertainties arising from changing weather conditions as well as government, investor and consumer action in response to concerns over climate change and the transition to a lower-carbon economy that could reduce demand for the oil, NGLs and natural gas we produce; increase our operating costs; and limit the areas in which we may explore for, develop, and produce oil, NGLs and natural gas.
Policy and Legal Risks - Policy risks include actions seeking to address concerns over climate change, such as the enactment of climate change-related regulations, policies and initiatives addressing alternative energy requirements, new fuel consumption standards, energy conservation and emissions reductions measures or responsible energy development, among other measures that seek to promote adaptation to climate change or lessen activities that contribute to adverse effects of climate change. Internationally this has resulted in existing and pending international agreements to reduce GHG emissions globally, while in Canada and the United States, this has resulted in both national, regional and local legislation and regulatory programs. Additionally, an increasing number of states, local municipalities and other groups have made claims in federal and state courts against oil and natural gas companies, including Ovintiv, alleging that GHG emissions from oil and natural gas produced by such companies has contributed, and continues to contribute, to climate change. These allegations have included claims of public and private nuisance, trespass, negligence, strict liability and civil conspiracy.
Market Risks - Shifts in supply and demand for certain commodities, including oil and gas (as well as products dependent on oil and gas) due to concerns over climate change could affect markets. Lower demand for oil and gas production or products that use oil and gas as fuel or increased demand for lower-emission products and services could
result in lower prices and lower revenues. Market risk may also take the form of limited access to capital as some in the investment community (including, among others, shareholders, bondholders, institutional lenders, investment advisors, pension and sovereign wealth funds and endowments) have also become increasing concerned with the causes of climate change and the role oil and natural gas companies play in any of its purported effects. This has led some in the investment community to shift all or part of their investment or funding allocations away from the oil and natural gas industry and others to modify the terms upon which funding is made available to the oil and natural gas industry. In other instances, it has led shareholders to initiate lawsuits against the directors and management of oil and natural gas companies and/or bring shareholder proposals demanding that oil and natural gas companies increase climate disclosure; change business practices or operations; or appoint new board representation.
Reputation Risk - Public attention to issues concerning the existence and extent of climate change, and the role of human activity in it, continues to increase, with the oil and natural gas industry receiving heightened scrutiny regarding GHG emissions. These changing perceptions could lower demand for our oil and gas production, resulting in lower prices and lower revenues as consumers avoid carbon-intensive industries and could also pressure banks and investment managers to shift investments and reduce lending as described above.
Technology Risk - The development and deployment of alternative energy sources and emerging technologies in renewable energy, battery storage and energy efficiency could lower demand for oil and gas, potentially resulting in decreased revenues within the oil and gas industry and accelerate alternative energy technology.
Physical Risk - Adverse weather conditions such as severe heat or cold, flooding, tornados and other natural disasters could affect our operations. If any such effects were to occur, they could adversely affect or delay demand for the oil or natural gas produced or cause us to incur significant costs in preparing for or responding to the effects of climatic events themselves. Potential adverse effects could include disruption of our and our customers’ operations, including, for example, damages to our facilities from winds or floods, increases in our costs of operation, or reductions in the efficiency of our operations, impacts on our personnel, supply chain, or distribution chain, as well as potentially increased costs for insurance coverages in the aftermath of such effects. Any of these events could have an adverse effect on our assets and operations.
If initiatives and actions brought by private parties or additional governmental regulations with respect to climate change intensify, we could experience (a) a reduction in demand for the oil and natural gas we produce and sell; (b) a material increase in our cost of compliance and other operating costs; (c) constraints around developing our oil and natural gas assets, reducing (i) the amount of oil, NGLs and natural gas we are ultimately able to produce from our reserves and (ii) our overall quantity of oil, NGLs and natural gas reserves; (d) limitations on our ability to access capital markets and raise capital on satisfactory terms, or at all; and (e) potential for costly and time consuming litigation. While we are unable to accurately assess the probability and impact of potential climate change regulations, initiatives and actions, the occurrence of any one or more of the foregoing could have a material adverse effect on our business, financial condition and results of operations.
Estimates used in various scenario planning analyses could differ materially from actual results as the policy and regulatory environment evolves.
Given the dynamic nature of the Company’s business, the Company performs scenario analyses with five-year time horizons. When analyzing longer-term scenarios, we rely on external analysis for demand scenarios, carbon pricing, and comparison-pricing scenarios, which are then compared to our internally prepared base-case pricing analysis. Given the numerous estimates that are required to run these scenarios, our estimates could differ materially from actual results. Additionally, the scenario analyses we currently perform may not be comparable to scenario analyses performed by our peers or frameworks established as a result of any future regulatory requirements. By electing to set and share publicly these metrics in our sustainability report and our commitment to expand upon its disclosures, our business may also face increased scrutiny related to sustainability initiatives.
Enhanced scrutiny on sustainability matters could have an adverse effect on our operations.
Our efforts to research, establish, accomplish and accurately report on our emissions goals, targets and strategies expose us to numerous operational, reputational, financial, legal and other risks. Our ability to reach our target emissions is subject to a multitude of factors and conditions, many of which are out of our control. Examples of such factors include evolving government regulation, the pace of changes in technology, the successful development and
deployment of existing or new technologies and business solutions on a commercial scale, the availability, timing and cost of equipment, manufactured goods and services, and the availability of requisite financing and federal and state incentive programs.
Enhanced scrutiny on sustainability matters related to, among other things, concerns raised by advocacy groups about climate change, hydraulic fracturing, waste disposal, oil spills, and explosions of natural gas transmission pipelines may lead to increased regulatory scrutiny, which may, in turn, lead to new state, provincial and federal safety and environmental laws, regulations, guidelines, and enforcement interpretations. These actions may cause operational delays or restrictions, increased operating costs, additional regulatory burdens, increased risk of litigation, and adverse impacts on our access to capital. Moreover, governmental authorities exercise considerable discretion in the timing and scope of permit issuance, and the public may engage in the permitting process, including through intervention in the courts. Negative public perception could cause the permits we require to conduct our operations to be withheld, delayed, or burdened by requirements that restrict our ability to profitably conduct our business.
We may face increased scrutiny from the investment community, other stakeholders and the media related to our emissions goals and strategies. As a result, we could damage our reputation if we fail to act responsibly in the areas in which we report. Any harm to our reputation resulting from setting these metrics, expanding our disclosures, or our failure or perceived failure to meet such metrics or disclosures could adversely affect our business, financial performance, and growth. If our emissions goals and strategies to achieve them do not meet evolving investor or other stakeholder expectations or standards, our reputation, ability to attract and retain employees and attractiveness as an investment, business partner or acquirer could be negatively impacted. At the same time, some stakeholders and regulators in the United States have increasingly expressed or pursued opposing views, legislation, and investment expectations with respect to sustainability matters, including the enactment or proposal of “anti-ESG” legislation or policies. As a result, our sustainability practices and disclosures may be subject to increased scrutiny and may not satisfy all stakeholders.
Additionally, concerns over climate change and other sustainability matters have resulted in, and are expected to continue to result in, the adoption of regulatory requirements such as Canada’s Fall Economic Statement Implementation Act, which could increase our compliance burden and costs. Our failure or perceived failure to fulfill emissions goals and targets, to comply with ethical or other standards, regulations, or expectations, or to satisfy various reporting standards with respect to these matters effectively could have the same negative impacts and further expose us to government enforcement actions and private litigation. Even if we achieve our goals, targets and objectives, we may not realize all of the benefits that were expected at the time the goals were established.
Financial and Liquidity Risk
Downgrades in our credit ratings could increase our cost of capital and limit our access to capital, suppliers or counterparties.
Rating agencies regularly evaluate our credit, basing their credit ratings for our long-term and short-term debt securities on a variety of factors, including factors over which we have some control (e.g., our financial strength), as well as factors not entirely within our control (e.g., general macroeconomic trends and conditions affecting the oil and natural gas industry generally). There is no assurance that one or more of the Company’s credit ratings will not be downgraded in the future, including below investment grade.
Our borrowing costs and ability to raise funds are directly impacted by our credit ratings. A credit rating downgrade may increase the cost of borrowing under our existing credit facilities, limit access to our current commercial paper programs, limit our access to private and public markets to raise short-term and long-term debt capital, and negatively impact our overall cost of capital. Credit ratings may also be important to suppliers or counterparties when they seek to engage in certain transactions. If we experience downgrades in one or more of our credit ratings, we may be required to post collateral, letters of credit, cash or other forms of security as financial assurance for our performance under certain contractual arrangements with various counterparties including marketing, midstream (including gathering, processing and transportation providers), over-the-counter derivative, and construction counterparties. Additionally, certain of these arrangements contain financial assurance language that may, under certain circumstances, permit our counterparties to request additional collateral based on our credit rating. The occurrence of any of the foregoing could adversely affect our ability to execute portions of our business strategy, including hedging, and could have a material adverse effect on our liquidity and capital position.
Our level of indebtedness may limit our financial flexibility.
As of December 31, 2024, we had outstanding long-term unsecured senior notes of $5,476 million and our revolving credit facilities remain unused. The terms of our various financing arrangements, including but not limited to the indentures relating to our outstanding senior notes and the credit agreements relating to our revolving credit facilities, impose restrictions on our ability to take a number of actions that we may otherwise desire to take, including incurring additional debt (including guarantees of indebtedness) and selling or creating liens on certain assets.
Our level of indebtedness could affect our operations by:
•requiring us to dedicate a portion of our cash flows from operations to service indebtedness, thereby reducing the availability of cash flow for other purposes, including share buybacks;
•reducing our competitiveness compared to similar oil and natural gas companies that have less debt;
•limiting our ability to obtain additional financing for working capital, capital investments and acquisitions;
•limiting our flexibility in planning for, or reacting to, changes in our business and industry; and
•increasing our vulnerability to general adverse economic and industry conditions.
Our ability to meet and service our debt obligations depends on our future operational performance. General economic conditions; oil, NGLs or natural gas prices; and financial, business and other factors may affect our operational performance. Many of these factors are beyond our control. If we are unable to satisfy our debt obligations with cash on hand, we may attempt to refinance or repay portions of our indebtedness, including with proceeds from a public securities offering or the sale of certain assets. No assurance can be given that we will be able to generate sufficient cash flows to pay the interest on our debt, or that funds from future borrowings, equity financings or asset sales will be available to pay or refinance our debt on terms that we consider favorable. Further, if we incur additional debt to finance asset or business acquisitions, we may decrease our liquidity by using a significant portion of our available cash or borrowing capacity to finance such acquisitions, and such acquisitions could result in a significant increase in our interest expense or financial leverage. The occurrence of any of the foregoing could adversely affect our ability to execute portions of our business strategy and could have a material adverse effect on our liquidity and capital position.
Our risk management activities may prevent us from fully benefiting from an increase in oil, NGLs and natural gas prices and expose us to certain other risks.
We are exposed to, among other things, fluctuations in oil, NGLs and natural gas prices and foreign currency exchange rates. We actively monitor such exposures and, where we deem appropriate, utilize derivative financial instruments and physical delivery contracts to mitigate the potential impact of declines in oil, NGLs and natural gas prices and fluctuations in foreign currency exchange rates. Under U.S. GAAP, derivative financial instruments that do not qualify or are not designated as hedges for accounting purposes are fair valued with the resulting changes recognized in current period net earnings. The utilization of derivative financial instruments may therefore introduce significant volatility into our reported net earnings.
The terms of our various risk management agreements and the amount of estimated production hedged may limit the benefits we receive from an increase in oil, NGLs and natural gas prices. We may also suffer financial loss if (a) we fail to produce anticipated volumes of oil, NGLs and natural gas, particularly during periods of increasing commodity prices; or (b) counterparties to our risk management agreements fail to fulfill their obligations under the agreements, particularly during periods of declining commodity prices. The occurrence of any of the foregoing could adversely affect our ability to execute portions of our business strategy and could have a material adverse effect on our liquidity and capital position.
The decision to return capital to shareholders, whether through cash dividends, share buybacks or otherwise, and the amount and timing of such capital returns is subject to the discretion of the Board of Directors and will vary from time to time.
Although we currently intend to return capital to shareholders in the form of (a) a base quarterly cash dividend; (b) variable cash dividends; and/or (c) repurchases of our outstanding common stock (commonly known as share buybacks), the amount and timing of these returns of capital to shareholders may vary from time to time. The decision whether to return capital to shareholders, as well as the timing and amount of any return of capital to shareholders, is subject to the discretion of the Board of Directors, which regularly evaluates our proposed capital returns to
shareholders and the requirements, if any, under Delaware General Corporation Law (“DGCL”). Additionally, in the case of share buybacks, we may be limited in our ability to repurchase shares of our common stock by various governmental laws, rules and regulations which prevent us from purchasing our common stock during periods when we are in possession of material non-public information. Our repurchases may also be impacted by a one percent excise tax on corporate stock repurchases under the IRA. The level of dividends per share of common stock will also be affected by the number of outstanding shares of our common stock and our other securities that may be entitled to receive cash dividends or other payments.
The amount of cash available to return to shareholders, if any, can vary significantly from period to period for a number of reasons, including, among other things: our operational and financial performance; fluctuations in the costs to produce oil, NGLs and natural gas; the amount of cash required or retained for debt service or repayment; amounts required to fund acquisitions, capital expenditures and working capital requirements; our ability to access capital markets; foreign currency exchange rates and interest rates; any agreements relating to our indebtedness that restrict our ability to return capital to shareholders and the other risks set forth in this Item 1A. Risk Factors of this Annual Report on Form 10‑K. The trading price of our securities, including our common stock, may deteriorate if we are unable to meet investor expectations with respect to the timing and amount of capital returns to shareholders, and such deterioration may be material.
Regulation and Litigation Risk
We are subject to extensive federal, state, provincial and local government laws, rules and regulations that can adversely affect the cost, manner and feasibility of our business, and increased regulation in the future could increase costs, impose additional operating restrictions and cause delays.
All of our operations are subject to extensive federal, state, provincial, local and other laws, rules and regulations, including with respect to drilling operations; completion operations, including the use of hydraulic fracturing; the production of oil, NGLs and natural gas; the disposal of produced water and other hazardous waste; the gathering and transportation of oil, NGLs and natural gas; the imposition of taxes; royalty payments; environmental matters, including air and water emissions or discharges; free trade agreements; worker health and safety; and conservation policies, including policies related to environmentally sensitive areas and protected species. These laws, rules and regulations may impose substantial liabilities for our failure to comply, including the assessment of administrative, civil and criminal penalties and the issuance of injunctions restricting or prohibiting some or all of our activities in a particular area.
In the normal course of our business, we may be required to make large expenditures to comply with applicable governmental laws, rules, regulations, permits or orders. While we cannot predict the actions that future laws, rules and regulations may require or prohibit, our business could be subject to increased operating and other compliance costs and our operations may be delayed if existing laws, rules and regulations are revised or reinterpreted, or if new laws, rules and regulations become applicable to our operations. Any such increases or delays could have a material and adverse effect on our business, financial condition and results of operations.
We currently are, and from time to time in the future may be, subject to claims, litigation, administrative proceedings and regulatory actions that may not be resolved in our favor.
We currently are, and from time to time in the future may be, subject to claims, litigation, administrative proceedings and regulatory actions. The outcome of these matters may be difficult to assess or quantify, and there cannot be any assurance that such matters will be resolved in our favor. If we are unable to resolve such matters favorably, we or our directors, officers or employees may become involved in legal proceedings that could result in an onerous or unfavorable decision, including fines, sanctions, monetary damages or the inability to engage in certain operations or transactions. The defence of such matters may also be costly, time consuming and could divert the attention of management and key personnel away from our operations. We may also be subject to adverse publicity associated with such matters, regardless of whether such allegations are valid or whether we are ultimately found liable. As a result, such matters could have a material adverse effect on our business, reputation, financial condition, results of operations or liquidity. See Item 3 of this Annual Report on Form 10-K.
The ability of Canadian and other non-resident shareholders to effect service of process or enforce remedies against Ovintiv, its directors, officers, experts, and assets may be limited.
We are incorporated in the State of Delaware and our principal place of business is in the United States. Most of our directors and officers are residents of the United States and many of the experts who provide us with services are residents of the United States. Additionally, a majority of our oil and natural gas assets and production are located in the United States. It may be difficult for our shareholders in Canada or other non-U.S. jurisdictions (each a “Foreign Jurisdiction”) to (a) effect service of process within such Foreign Jurisdiction upon Ovintiv or certain of our directors, officers and representatives of experts who are not residents of the Foreign Jurisdiction (together, “Non-Residents”) and (b) enforce the judgments of courts in an applicable Foreign Jurisdiction against Ovintiv and other Non-Residents based upon liability under the laws of such Foreign Jurisdiction, including the securities laws of any province within Canada.
Tax Risks
U.S. and Canadian tax laws and regulations may change over time, and such changes may result in increased taxes on our business.
From time to time, legislation has been proposed that, if enacted into law, would make significant changes to U.S. and Canadian tax laws and regulations, including those specifically applicable to the oil and natural gas industry (such as the intangible drilling and development costs deduction under U.S. federal income tax law). While we are unable to predict the timing, scope and effect of any proposed or enacted tax law changes, elimination of certain tax deductions, as well as any other changes to, or the imposition of new, federal, state or local U.S. or Canadian taxes (including the imposition of, or increases in, production, severance or similar taxes), could materially and adversely affect our business, financial condition and results of operations. We will continue to monitor and assess any proposed or enacted tax law changes to determine the impact on our business, financial condition and results of operations and take appropriate actions, where necessary.
Additionally, U.S. and Canadian tax authorities could detrimentally change their administrative practices or may disagree with the way we calculate our tax liabilities or structure our arrangements and there are certain tax matters under governmental review for which the timing of resolution is uncertain. While we believe that our current provision for income taxes is adequate, certain tax authorities may reassess our taxes and such reassessments may be material.
Our corporate reorganization in January of 2020 may result in material Canadian and/or U.S. federal income taxes.
On January 24, 2020, Encana completed a corporate reorganization (the “Reorganization”), which included among other things, our acquisition of all of the issued and outstanding shares of Encana common stock in exchange for shares of Ovintiv common stock on a one-for-one basis and becoming the parent company of Encana and its subsidiaries and our subsequent migration from Canada to the United States, becoming a Delaware corporation (the “U.S. Domestication”). The Reorganization and U.S. Domestication involved multiple complex U.S. and Canadian tax issues, including numerous assumptions and estimates of fair market value. While we believe that our analysis and
application of both U.S. and Canadian tax laws to the Reorganization was correct, certain tax authorities may challenge our positions which could materially and adversely affect our business, financial condition and results of operations.
General Risks
The oil and natural gas industry is highly competitive and many of our competitors have available resources in excess of our own.
The oil and natural gas industry is highly competitive. Many of our competitors, including major integrated and independent oil and natural gas companies, as well as national oil companies, are larger and have substantially greater resources at their disposal than we do and may have a competitive advantage when responding to factors that affect demand and prices for oil, NGLs and natural gas. We compete with these companies in the development and also acquisition of oil and natural gas leases and other properties. Such competition can significantly increase costs and affect the availability of resources, which could provide our larger competitors a competitive advantage when acquiring equipment, leases and other properties.
We also compete with these companies for the personnel, including petroleum engineers, geologists, geophysicists and other key personnel, required to both (a) find, acquire, develop and operate our properties and (b) market our oil, NGLs and natural gas production. The experience, knowledge and contributions of our existing management team and directors to our immediate and near-term operations is of central importance for the foreseeable future. As such, the unexpected loss of services from, or retirement of any, of our key operations or management personnel could have a material adverse effect on our business and results of operation. To help attract, retain, and motivate qualified employees, we deliver competitive base salaries and benefits and reward short and long-term performance through the grant of an annual cash bonus and LTI awards. Sustained declines in our stock price, or lower stock price performance relative to competitors, can reduce the retention value of our LTI awards, which can impact the competitiveness of our compensation. The competition for qualified personnel in the oil and natural gas industry means there can be no assurance that we will be able to attract and retain key personnel with the required specialized skills necessary for our business.
We could be adversely affected by security threats, including cyber-security threats and related disruptions.
We have become increasingly dependent upon information technology systems to conduct our daily operations. We depend on a variety of information technology systems to estimate oil, NGLs and natural gas reserve quantities; process and record financial and operating data; analyze seismic and drilling information; and communicate with employees and third-party partners. This growing dependence on technology is accompanied by a greater sensitivity to cyber-attacks and information systems breaches. Unauthorized access to information systems by employees or third parties could corrupt or expose confidential, fiduciary, or proprietary information; interrupt our communications or operations; disrupt our business activities; or interfere with our competitive position. Cybersecurity threat actors are becoming more sophisticated and coordinated in their attempts to access a company’s information technology systems and data, including the information technology systems of cloud providers. Furthermore, geopolitical tensions or conflicts, such as Russia’s invasion of Ukraine or conflict in the Gaza region, may further heighten the risk of cybersecurity attacks. In addition, our vendors, suppliers and other business partners may separately suffer disruptions as a result of such security breaches which may directly or indirectly affect our business activities or our competitive position.
To protect our information assets and systems, we apply technical and process controls; however, there can be no assurances that the procedures and controls that we implement will be sufficient to protect such information assets and systems. Such controls may not adequately prevent cyber-security breaches and we may not adopt all controls utilized by our peers. Moreover, we have no control over the information technology systems of our customers, suppliers, and others with which our systems may connect and communicate. As a result, the occurrence of a cyber incident could go unnoticed for a period of time. Even when an incident has been detected, it is not always immediately apparent what the full nature and scope of any potential harm may be, or how best to remediate it. As cyber-attacks continue to evolve, we may be required to expend additional resources to investigate, mitigate and remediate any potential vulnerabilities. We may also be subject to regulatory investigations or litigation relating to cyber-security issues.
Although we have not suffered any material losses related to a cyber-security breach to date, there is no assurance that we will not suffer material losses associated with cyber-security breaches in the future. If a cyber-attack were to successfully breach our information or operating systems, we could incur substantial remediation costs and suffer other negative consequences, including exposure to significant litigation risks. The potential for such occurrences subjects our operations to increased risks that could have a material adverse effect on our business, financial condition and results of operations.
A pandemic, epidemic or other widespread outbreak of an infectious disease, could materially and adversely affect the operation of our business.
Global or national health concerns, including a pandemic, epidemic or other widespread outbreak of an infectious disease, can, among other impacts, negatively impact the global economy and business prospects, reduce demand for crude oil, NGLs and natural gas, increase volatility in commodity prices, lead to operational disruptions and limit our ability to execute on our business plan, any of which could reduce our spending and operating plans, reduce the value and amount of our oil, NGLs or natural gas reserves and production, cause substantial fluctuations in our stock price and credit ratings, or otherwise materially and adversely affect our business, financial condition, results of operations, and access to liquidity. Furthermore, uncertainty regarding the impact of any outbreak of contagious disease could also lead to substantial fluctuations in currency exchange rates, inflation rates and interest rates, increased counterparty credit and performance risk, and reduced levels of general investing and consumption.
A pandemic, epidemic or other widespread outbreak of an infectious disease, and resulting restrictive measures implemented by governments in the jurisdictions in which we operate, could in the future prevent our employees, contractors or suppliers from accessing our properties or performing critical services.
None.
Item 1C. Cybersecurity
Governance
Board of Directors
Ovintiv’s Board of Directors is responsible for the oversight of the Company’s enterprise risk management processes, and the Board’s committees help discharge this responsibility by managing issues under their purview. The Board has delegated the primary responsibility to oversee and monitor cybersecurity risks to the Audit Committee and the Audit Committee has direct oversight, and regularly reviews, the Company’s cybersecurity risks and related mitigations. The Audit Committee receives periodic updates from the Company’s Vice-President and Chief Information Officer (the “CIO”) concerning a wide range of topics, including risks from cybersecurity threats, evolving standards, vulnerability assessments, third-party and independent reviews, the threat environment, technological trends and information security considerations arising with respect to the Company’s peers and third parties. As part of the enterprise risk management process, the Audit Committee provides regular updates to the full Board on the risk categories for which it is responsible, which includes cybersecurity. The Company has processes by which certain cybersecurity incidents are escalated and where appropriate, reported in a timely manner to the Audit Committee and the Board.
Management
The Company’s Cybersecurity Group coordinates with business and legal functions to assess and manage the Company’s risks from cybersecurity threats, including those relating to information systems owned or operated by third parties that are used by the Company. The Cybersecurity Group is led by the Director, Cybersecurity (the “Cybersecurity Director”). The Cybersecurity Director has extensive cybersecurity knowledge and skills gained from over 30 years of relevant work experience. The Cybersecurity Director is a Certified Information Systems Auditor, Chartered Professional Accountant and a Certified Fraud Examiner.
The Cybersecurity Group designs and implements the Company’s administrative and technical controls against risks from cybersecurity threats. The Cybersecurity Group also maintains the Company’s policies that prescribe procedures and standards for assessing, identifying and managing cybersecurity threats, which includes the Company’s Cybersecurity Incident Response Program. The Company’s Internal Audit Group conducts periodic independent audits of the Company’s cybersecurity procedures, systems, and controls, and also provides independent oversight into the engagement of cybersecurity resources.
The Cybersecurity Group reports to the CIO, who reports to the Executive Vice-President, Corporate Services. The CIO is responsible for overseeing the Company’s information technology and cybersecurity, and, in conjunction with executive leadership, regularly reviews risk management measures implemented by the Company to identify and mitigate cybersecurity risk. The CIO receives reports from the Cybersecurity Group regarding cybersecurity matters on an ongoing basis and administers the Company’s Cybersecurity Incident Response Program. The CIO is primarily responsible for reporting cybersecurity matters, including cybersecurity incidents, to executive leadership and the Audit Committee. The CIO has 30 years of relevant information technology work experience with 10 years of cybersecurity oversight at the Company and elsewhere.
Risk Management and Strategy
Ovintiv’s risk management strategy includes identifying risks, and developing and implementing risk management practices that include mitigation activities, systems, controls and business continuity plans for specific risks, which are aligned with, and complementary to, Ovintiv’s corporate risk management policy. The identification, analysis and mitigation strategy of cybersecurity risk is incorporated into the Company’s risk practices and is a component of an internal Risk Network that is comprised of senior leadership responsible for understanding and reporting each of Ovintiv’s entity-level risks.
Our cybersecurity program is aligned with the NIST Cybersecurity Framework and is designed to assess, identify, and manage material risks from cybersecurity threats, and protect and preserve the confidentiality, integrity, and continued availability of all information owned by, or in the care of, the Company. The Company maintains an Information Management Policy, which applies to both employees and third-party service providers, for the protection of the Company’s information. Our information systems are monitored by automated tools and the Cybersecurity Group. The Cybersecurity Group conducts an initial assessment of cybersecurity incidents and determines whether escalation is warranted. The Company’s Cybersecurity Incident Response Program (“CIRP”) provides guidelines to assist the Company in identifying and mitigating cyber risk effectively and efficiently, and sets out a coordinated approach to investigating, containing, documenting and mitigating incidents, including reporting findings and keeping executive leadership and other key stakeholders informed and involved as appropriate. The Company has implemented an incident response team and incident assessment team that includes internal leadership representatives from the executive, information technology, operational, legal, and corporate teams, as well as third-party experts as appropriate. Our processes and procedures also encompass oversight and identification of risks from cybersecurity threats associated with our use of third-party service providers, which includes engagement of a managed security service provider that performs a security review and ongoing monitoring of our third-party service providers.
The cybersecurity program, including the CIRP, undergoes periodic internal and external review. The Company engages qualified external auditors and cybersecurity risk assessors to provide independent assessments of our cybersecurity program and response preparedness along with reviews and audits by the Company’s Internal Audit Group. The Company conducts annual internal training for employees, and internal and external teams, including the Cybersecurity Group, as well as periodic penetration testing, red teaming, tabletop exercises and phishing drills. The results of these tests are measured and assessed for potential improvements.
The Company is not aware of having experienced any risks from cybersecurity threats or incidents through the date of this Annual Report on Form 10-K that have materially affected or are reasonably likely to materially affect the Company, its business strategy, results of operation or financial condition. This does not guarantee that future incidents or threats will not have a material impact or that we are not currently the subject of an undetected incident or threat that may have such an impact.
Additional information on cybersecurity risks we face is discussed in Item 1A. Risk Factors of this Annual Report on Form 10-K, which should be read in conjunction with the foregoing information.
Item 3. Legal Proceedings
Ovintiv is involved in various legal claims and actions arising in the normal course of the Company’s operations. Although the outcome of these claims cannot be predicted with certainty, the Company does not expect these matters to have a material adverse effect on Ovintiv’s financial position, cash flows or results of operations. If an unfavorable outcome were to occur, there exists the possibility of a material impact on the Company’s consolidated net earnings or loss for the period in which the effect becomes reasonably estimable. See Item 1A. Risk Factors of this Annual Report on Form 10-K, “We currently are, and from time to time in the future may be, subject to claims, litigation, administrative proceedings and regulatory actions that may not be resolved in our favor”.
In July 2020, the Company received a Notice of Violation (“NOV”) from the EPA and the Utah Department of Environmental Quality, Division of Air Quality (“UDAQ”). The NOV alleges violations under the federal Clean Air Act, the State of Utah’s State Implementation Plan, and the State of Utah’s air quality regulations for the oil and natural gas industry, at certain of the Company facilities located in the Uinta Basin. The Company exchanged information with the EPA and UDAQ and engaged in discussions aimed at resolving the allegations. On January 6, 2025, the United States District Court for the District of Utah approved a settlement and consent decree resolving the matter. The Company paid $5.5 million under the terms of the settlement and consent decree.
For additional information, see Note 27 to Ovintiv’s audited Consolidated Financial Statements under Item 8 of this Annual Report on Form 10-K.
Item 4. Mine Safety Disclosures
Not applicable.
PART II
Item 5. Market for Registrant’s Common Equity, Related Shareholder Matters and Issuer Purchases of Equity Securities
Market Information
Ovintiv’s shares of common stock are listed and posted for trading on the NYSE and TSX under the symbol “OVV”.
Shareholders
The Company is authorized to issue up to 775,000,000 shares of stock consisting of: (a) 750,000,000 shares of common stock, par value $0.01 per share, and (b) 25,000,000 shares of preferred stock, par value $0.01 per share. As of February 21, 2025, there were 260,324,464 shares of common stock outstanding held by 4,650 shareholders of record, and no shares of preferred stock outstanding.
Capital Return Information
In 2024, the Company paid a quarterly dividend of $0.30 per share of common stock (2023: $0.25 per share of common stock for the first quarter and $0.30 per share of common stock for each of the second, third and fourth quarters) and $1.20 per share of common stock annually (2023: $1.15 per share of common stock annually). On February 26, 2025, the Board of Directors declared a dividend of $0.30 per share of Ovintiv common stock payable on March 31, 2025, to common shareholders of record as of March 14, 2025. The Company typically pays dividends quarterly to shareholders of record as of the 15th day (or the previous business day) of the last month of each calendar quarter, with the last business day of the same month being the corresponding payment date; however, the timing and amount of dividends, if any, is subject to the discretion of the Board of Directors.
Although we currently intend to return capital to shareholders in the form of (a) a base quarterly cash dividend; (b) variable cash dividends; and/or (c) repurchases of our outstanding common stock (commonly known as share buybacks), the amount and timing of these returns of capital to shareholders may vary from time to time. The decision whether to return capital to shareholders, as well as the timing and amount of any return of capital to shareholders, is subject to the discretion of the Board of Directors, which regularly evaluates our proposed capital returns to shareholders and the requirements, if any, under DGCL. See Item 1A. Risk Factors of this Annual Report on Form 10‑K, “The decision to return capital to shareholders, whether through cash dividends, share buybacks or otherwise, and the amount and timing of such capital returns is subject to the discretion of the Board of Directors and will vary from time to time”.
PURCHASES OF EQUITY SECURITIES BY THE ISSUER AND AFFILIATED PERSONS
On September 26, 2024, Ovintiv announced it had received regulatory approval to purchase, for cancellation or return to treasury, up to approximately 25.9 million shares of common stock pursuant to a NCIB over a 12-month period from October 3, 2024 to October 2, 2025. The number of shares of common stock authorized for purchase represents approximately 10 percent of Ovintiv's issued and outstanding shares of common stock as of such time.
During the three months ended December 31, 2024, the Company made no purchases of equity securities.
In the first quarter of 2022, Ovintiv obtained an exemption order (the “NCIB Exemption”) from the Alberta Securities Commission and the Ontario Securities Commission, which permits Ovintiv to make repurchases (the “Proposed Bids”), under its current and any future normal course issuer bids, through the facilities of the NYSE and other U.S.-based trading systems (collectively, “U.S. Markets”), in excess of the maximum allowable purchases under applicable Canadian securities laws. The NCIB Exemption applies to any Proposed Bid commenced within 36 months of the date of the exemption order and is subject to several other conditions, including that Ovintiv remain a U.S. and SEC foreign issuer under applicable Canadian securities laws. The purchases of common stock under a Proposed Bid must also be made in compliance with other applicable Canadian securities laws and applicable U.S. rules. Additionally, the NCIB Exemption imposes restrictions on the number of shares of common stock that may be acquired under the exemption, including that: (a) Ovintiv may not acquire common stock in reliance upon the exemption under subsection 4.8(3) of Canadian National Instrument 62-104 – Take-Over Bids and Issuer Bids (“NI 62-104”) from the requirements applicable to issuer bids (the “Other Published Markets Exemption”) if the aggregate number of shares of common stock purchased by Ovintiv, and any person or company acting jointly or in concert with Ovintiv, in
reliance on the NCIB Exemption and the Other Published Markets Exemption within any period of 12 months exceeds 5 percent of the outstanding common stock on the first day of such 12-month period; and (b) the aggregate number of shares of common stock purchased pursuant to a Proposed Bid in reliance on the NCIB Exemption, exempt issuer bid purchases made in the normal course through the facilities of the TSX, and the Other Published Markets Exemption does not exceed, over the 12-month period of its current NCIB, 10 percent of Ovintiv’s public float. As a result, the NCIB Exemption effectively allows Ovintiv to purchase up to 10 percent of its public float on U.S. Markets under its NCIB. Without the NCIB Exemption this amount would be limited to 5 percent of Ovintiv’s outstanding common stock within a 12-month period under applicable Canadian securities law.
RECENT SALES OF UNREGISTERED EQUITY SECURITIES
None.
PERFORMANCE GRAPH
The following performance graph and related information shall not be deemed “soliciting material” or to be “filed” with the SEC, nor shall information be incorporated by reference into any future filing under the Securities Act or the Exchange Act, except to the extent that the Company specifically incorporates it by reference into such filing.
The following graph compares the cumulative five-year total return to shareholders of the Company’s common stock relative to the cumulative total returns of the S&P 400 and the SPDR Oil & Gas Exploration & Production ETF (“XOP U.S. Equity”). The graph was prepared assuming $100 was invested on December 31, 2019 in the Company’s common stock, the S&P 400 and the XOP U.S. Equity, and dividends have been reinvested subsequent to the initial investment. The graph is included for historical comparative purposes only and should not be considered indicative of future performance.
Comparison of 5-Year Cumulative Total Return Among
Ovintiv, the S&P 400 and XOP U.S. Equity
(US$100 Invested in Base Period)
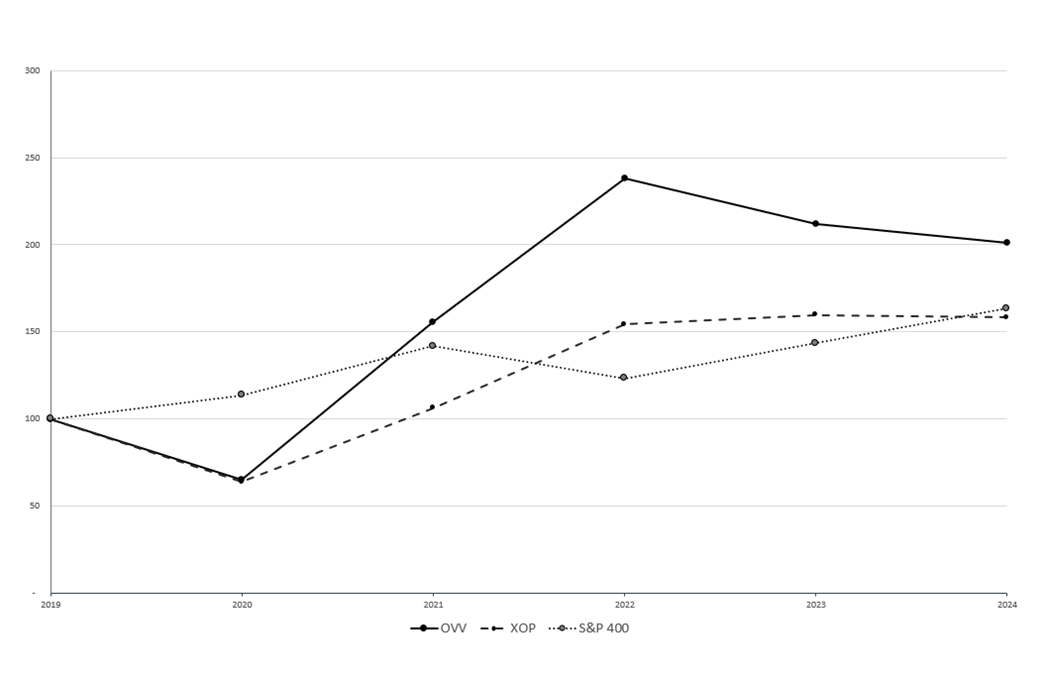
| | | | | | | | | | | | | | | | | |
Fiscal Year Ended December 31 |
| 2019 |
|
| 2020 |
|
| 2021 |
|
| 2022 |
|
| 2023 |
|
| 2024 |
Ovintiv | $ | 100.00 |
| $ | 65.19 |
| $ | 155.40 |
| $ | 238.24 |
| $ | 212.18 |
| $ | 201.11 |
XOP U.S. Equity |
| 100.00 |
|
| 63.69 |
|
| 106.21 |
|
| 154.35 |
|
| 159.83 |
|
| 158.18 |
S&P 400 |
| 100.00 |
|
| 113.65 |
|
| 141.76 |
|
| 123.19 |
|
| 143.38 |
|
| 163.30 |
Item 6. [Reserved]
Not Applicable.
Item 7. Management’s Discussion and Analysis of Financial Condition and Results of Operations
The MD&A is intended to provide a narrative description of the Company’s business from management’s perspective, which includes an overview of Ovintiv’s consolidated 2024 results and year-over-year comparisons between 2024 and 2023 results. This MD&A should be read in conjunction with the audited Consolidated Financial Statements and accompanying notes for the year ended December 31, 2024 (“Consolidated Financial Statements”), which are included in Item 8 of this Annual Report on Form 10-K. Discussion and analysis of 2022 results and year-over-year comparisons between 2023 and 2022 results that are not included in this Form 10-K, can be found in Item 7 of the 2023 Annual Report on Form 10-K.
Common industry terms and abbreviations are used throughout this MD&A and are defined in the Definitions, Conversions and Conventions sections of this Annual Report on Form 10-K. This MD&A includes the following sections:
Strategy
Ovintiv aims to be a leading North American energy producer and is focused on developing its high-quality multi-basin portfolio of oil and natural gas producing plays as part of its strategy outlined in Items 1 and 2 of this Annual Report on Form 10-K.
Ovintiv is committed to delivering quality returns from its capital investment, generating significant cash flows and providing durable cash returns to its shareholders through the commodity price cycle. The Company aims to achieve its strategic priorities through execution excellence, disciplined capital allocation, and commercial acumen and risk management. In addition, the Company is dedicated to driving progress in areas of environmental, social, and governance, aligning with its commitment to corporate responsibility.
In support of the Company’s commitment to enhancing shareholder value, Ovintiv utilizes its capital allocation framework to provide competitive returns to shareholders while strengthening its balance sheet.
Ovintiv continually monitors and evaluates changing market conditions to maximize cash flows, mitigate risks and renew its premium well inventory. The Company’s high-quality assets, located in the United States and Canada, form a multi-basin, multi-product portfolio which enables flexible and efficient investment of capital that supports the Company’s strategy.
Ovintiv seeks to deliver results in a socially and environmentally responsible manner. Best practices are deployed across its assets, allowing the Company to capitalize on operational efficiencies and decrease emissions intensity. The Company’s sustainability reporting, which outlines its key metrics, targets and relative progress achieved, can be found in the Company Outlook section of this MD&A and on the Company’s sustainability website.
Underpinning Ovintiv’s strategy are core values of one, agile, innovative and driven, which guide the organization to be collaborative, responsive, flexible and determined. The Company is committed to excellence with a passion to drive corporate financial performance and shareholder value.
For additional information on Ovintiv’s strategy, its reporting segments and the plays in which the Company operates, refer to Items 1 and 2 of this Annual Report on Form 10-K. For additional information on the segmented results, refer to Note 2 to the Consolidated Financial Statements included in Item 8 of this Annual Report on Form 10‑K.
In evaluating its operations and assessing its leverage, Ovintiv reviews performance-based measures such as Non‑GAAP Cash Flow and debt-based metrics such as Debt to Adjusted Capitalization, Debt to EBITDA and Debt to Adjusted EBITDA, which are non-GAAP measures and do not have any standardized meaning under U.S. GAAP. These measures may not be similar to measures presented by other issuers and should not be viewed as a substitute for measures reported under U.S. GAAP. Additional information regarding these measures, including reconciliations to the closest GAAP measure, can be found in the Non-GAAP Measures section of this MD&A.
Highlights
During 2024, the Company focused on executing its capital investment plan aimed at maximizing profitability through operational and capital efficiencies, and delivering cash from operating activities.
The Company had lower upstream product revenues in 2024 compared to 2023, which primarily resulted from lower average realized natural gas prices, excluding the impact of risk management activities, partially offset by higher total production volumes. Decreases in average realized natural gas prices of 38 percent, were primarily due to lower benchmark prices. Ovintiv continues to focus on optimizing realized prices from the diversification of the Company’s downstream markets.
Significant Developments and Subsequent Events
•On January 31, 2025, the Company closed its previously announced acquisition of certain Montney assets from Paramount Resources Ltd. (“Paramount”), in an all-cash transaction of approximately $2.307 billion (C$3.325 billion) before closing adjustments (“Montney Acquisition”). The acquisition will add approximately 109,000 net acres in the core of the liquids-rich Alberta Montney. The transaction had an effective date of October 1, 2024.
•On January 22, 2025, the Company closed its previously announced divestiture of substantially all of its Uinta assets, comprising approximately 126,000 net acres in the Uinta Basin of Utah, to FourPoint Resources, LLC, for approximately $2.0 billion before closing adjustments. The transaction had an effective date of October 1, 2024.
•On September 26, 2024, the Company announced it had received regulatory approval for the renewal of its NCIB program, which enables the Company to purchase, for cancellation or return to treasury, up to approximately 25.9 million shares of common stock over a 12-month period from October 3, 2024 to October 2, 2025. The number of shares authorized for purchase represents 10 percent of Ovintiv’s public float as at September 20, 2024. In conjunction with the announced transactions discussed above, the Company has temporarily paused its share buyback program, starting in October 2024, and expects to resume the buybacks in the second quarter of 2025.
Financial Results
•Reported net earnings of $1,125 million, or $4.21 per share diluted, including a non-cash ceiling test impairment of $350 million, after tax, or $1.31 per share diluted, and net gains of $156 million, or $0.58 per share diluted, from net settlement proceeds related to previous dispositions of certain legacy assets.
•Recognized net gains on risk management in revenues of $135 million, before tax.
•Generated cash from operating activities of $3,721 million and Non-GAAP Cash Flow of $4,042 million. Cash from operating activities exceeded capital expenditures by $1,418 million.
•Purchased for cancellation, approximately 12.7 million shares of common stock for total consideration of approximately $597 million.
•Paid dividends of $1.20 per share of common stock totaling $316 million.
•Had approximately $3.6 billion in total liquidity as at December 31, 2024, which included available credit facilities of $3.5 billion, available uncommitted demand lines of $91 million, and cash and cash equivalents of $42 million.
•Reported Debt to EBITDA of 1.3 times and Non-GAAP Debt to Adjusted EBITDA of 1.2 times.
Capital Investment
•Reported total capital spending of $2,303 million, which was within the full year 2024 investment guidance range of approximately $2,275 million to $2,325 million.
•Focused on highly efficient capital activity to benefit from short-cycle high margin and/or low-cost projects which provide flexibility to respond to fluctuations in commodity prices, as discussed in the Company Outlook section of this MD&A.
Production
•Produced average liquids volumes of 302.0 Mbbls/d, which accounted for 52 percent of total production volumes. Average oil and plant condensate volumes of 211.2 Mbbls/d, or 70 percent of total liquids production volumes, exceeded full year 2024 guidance range of 209.0 Mbbls/d to 211.0 Mbbls/d.
•Produced average natural gas volumes of 1,698 MMcf/d, which accounted for 48 percent of total production volumes. Average natural gas volumes were slightly below the full year 2024 guidance range of 1,700 MMcf/d to 1,715 MMcf/d.
•Produced average total volumes of 585.0 MBOE/d, which was within full year 2024 guidance range of 583.0 MBOE/d to 587.0 MBOE/d.
Operating Expenses
•Incurred upstream transportation and processing expenses of $1,553 million or $7.25 per BOE, a decrease of $50 million compared to 2023, primarily due to the impact of new downstream contracts in Uinta, the sale of the Bakken assets in the second quarter of 2023, lower flow-through rates in Montney and lower production volumes in Anadarko. The decrease was partially offset by higher production volumes in Permian, Uinta and Montney, and increased minimum volume commitments associated with certain gathering and processing assets in Montney. Upstream transportation and processing expenses of $7.25 per BOE was below the full year 2024 guidance range of $7.50 per BOE to $8.00 per BOE primarily due to lower than expected natural gas commodity prices. The full year 2024 guidance range was based on commodity price assumptions of $75.00 per barrel for WTI oil and $2.50 per MMBtu for NYMEX natural gas.
•Incurred upstream operating expenses of $908 million or $4.24 per BOE, an increase of $77 million compared to 2023, primarily due to the Permian Acquisition in the second quarter of 2023, partially offset by the sale of the Bakken assets in the second quarter of 2023. Upstream operating expenses of $4.24 per BOE was slightly below the full year 2024 guidance range of $4.25 per BOE to $4.75 per BOE.
•Incurred total production, mineral and other taxes of $333 million. This represents approximately 4.5 percent of upstream product revenues which was within the full year 2024 guidance range of four percent to five percent of upstream product revenues. Total production, mineral and other taxes decreased by $9 million compared to 2023, primarily due to the sale of the Bakken assets in the second quarter of 2023, lower production volumes in Anadarko and lower natural gas commodity prices, partially offset by higher production volumes in Permian and Uinta.
Additional information on the items above and other expenses can be found in the Results of Operations section of this MD&A.
During the year ended December 31, 2024, Ovintiv reassessed its reportable segments and reclassified its Market Optimization segment to present the Company’s market optimization activities in their respective USA and Canadian operating segments, which they support (“Segment Reclassification”). Additional information on the Segment Reclassification can be found in Note 2 to the Consolidated Financial Statements included in Item 8 of this Annual Report on Form 10-K.
2025 Outlook
Industry Outlook
Oil and Natural Gas Markets
The oil and gas industry is cyclical and commodity prices are inherently volatile. Oil prices reflect global supply and demand dynamics as well as the geopolitical and macroeconomic environment.
Oil prices for 2025 are expected to be impacted by the interplay between the pace of global economic growth and demand for oil, OPEC+ and non-OPEC+ production levels and continued supply uncertainties resulting from geopolitical events. Supply and the accumulation of global oil inventories are expected to be impacted by changes in OPEC+ and non-OPEC+ production levels, consumer demand behavior and geopolitical volatility.
Natural gas prices are primarily impacted by structural changes in supply and demand, deviations from seasonally normal weather, as well as volatility in regional markets.
Natural gas prices for 2025 are expected to be impacted by the interplay between natural gas production and associated natural gas from oil production, changes in demand from the power generation sector, changes in export levels of U.S. liquefied natural gas, impacts from seasonal weather, as well as supply chain constraints or other disruptions resulting from geopolitical events.
U.S. sanctions and tariffs on certain products could impact supply and demand within global markets and are likely to contribute to commodity price volatility as markets continue to evaluate and respond to these impacts.
Company Outlook
The Company will continue to exercise discretion and discipline, and intends to optimize capital allocation throughout 2025 as the commodity price environment evolves. Ovintiv pursues innovative ways to maximize cash flows, and to reduce operating and administrative expenses.
Markets for oil and natural gas are exposed to different price risks and are inherently volatile. The Company enters into derivative financial instruments to mitigate price volatility and provide more certainty around cash flows. As at December 31, 2024, in conjunction with the Company’s Uinta disposition, Ovintiv hedged, on behalf of the purchaser, approximately 11.6 Mbbls/d to 17.6 Mbbls/d of expected oil and condensate production and 14 MMcf/d to 19 MMcf/d of expected natural gas production over three years with terms extending to 2027. Upon closing of the Uinta disposition on January 22, 2025, these risk management contracts were novated to the purchaser.
As at February 14, 2025, the Company has hedged approximately 50.0 Mbbls/d of expected oil and condensate production and 500 MMcf/d of expected natural gas production for the remainder of the year. In addition, Ovintiv proactively utilizes transportation contracts to diversify the Company’s sales markets, thereby reducing significant exposure to any given market and regional pricing.
Additional information on Ovintiv’s hedging program can be found in Note 25 to the Consolidated Financial Statements included in Item 8 of this Annual Report on Form 10-K.
Capital Investment
The Company plans to spend approximately $2,150 million to $2,250 million on its full year 2025 capital investment program, focusing on maximizing returns from high-margin oil and condensate. In 2025, the Company expects to generate cash flows in excess of capital expenditures.
Ovintiv continually strives to improve well performance and lower costs through innovative techniques. Ovintiv’s large-scale cube development model utilizes multi-well pads and advanced completion designs to maximize returns and resource recovery from its reservoirs. Ovintiv’s disciplined capital program and continuous innovation create flexibility to allocate capital in changing commodity markets to maximize cash flows while preserving the long-term value of the Company’s multi-basin portfolio.
Production
In 2025, the Company expects full year average total production volumes of approximately 595 MBOE/d to 615 MBOE/d, including oil and plant condensate production volumes of approximately 202.0 Mbbls/d to 208.0 Mbbls/d, other NGLs production volumes of approximately 87.0 Mbbls/d to 92.0 Mbbls/d and natural gas production volumes of approximately 1,825 MMcf/d to 1,875 MMcf/d.
Operating Expenses
Ovintiv promotes a collaborative culture that values knowledge exchange, open communication, continuous improvement and learning. This culture stimulates innovation and fosters the creation of best practices resulting in efficiency improvements and enhanced operational performance for the Company.
In 2025, the Company expects to incur full year upstream transportation and processing costs of approximately $7.50 per BOE to $8.00 per BOE, upstream operating expenses of approximately $3.75 per BOE to $4.25 per BOE, and total production, mineral and other taxes of approximately 3.75 to 4.50 percent of upstream revenues.
Additional information on Ovintiv’s 2025 Corporate Guidance can be accessed on the Company’s website at www.ovintiv.com.
Environmental, Social and Governance
Ovintiv recognizes the importance of implementing and maintaining sustainable practices to reduce its environmental footprint. The Company voluntarily participates in emission reduction programs and has adopted a range of strategies to help reduce emissions from its operations. These strategies include incorporating new and proven technologies, optimizing processes in its operations and working closely with third-party providers to develop best practices. The Company continues to look for innovative techniques and efficiencies in support of its commitment to emission reductions.
In May 2024, Ovintiv published its 2023 Sustainability Report. The report highlights the Company’s 2023 environmental, social and governance results, and its progress in emissions intensity reductions with the goal to meet its Scope 1&2 GHG emissions target by 2030. As at the end of 2024, the Company had achieved a greater than 45 percent reduction in the Scope 1&2 GHG emissions intensity from 2019 levels and is on track to meet its emissions intensity reduction target of 50 percent by 2030 measured against the 2019 baseline. Ovintiv remains committed to its GHG emissions reduction target and has tied the target to the Company’s annual compensation program for all employees. In addition, Ovintiv continues to work towards eliminating routine flaring in its operations.
In conjunction with the Company’s strategy, Ovintiv may acquire assets to strengthen its multi-basin portfolio. All acquisitions are thoroughly assessed and evaluated for environmental impacts and alignment with the Company’s GHG emissions target. Ovintiv works to integrate sustainable practices within the acquired operations to support company-wide sustainability objectives.
The Company’s social commitment framework, which is rooted in the Company’s foundational values of integrity, safety, sustainability, trust and respect, reflects Ovintiv’s positive contributions to the communities where it operates and highlights the Company’s approach to enabling an inclusive culture that embraces diversity of thought, background and experience.
Ovintiv remains committed to protecting the health and safety of its workforce. Safety is a foundational value at Ovintiv and plays a critical role in the Company’s belief that a safe workplace is a strong indicator of a well-managed business. This safety-oriented mindset enables the Company to quickly respond to emergencies and minimize any impacts to employees and business continuity. Safety performance goals are incorporated into the Company’s annual compensation program. Additional information on talent management and employee safety can be found in the Human Capital section of Items 1 and 2 of this Annual Report on Form 10-K.
Further information on Ovintiv’s sustainable business practices are outlined in Items 1 and 2 of this Annual Report on Form 10-K, and on the Company’s sustainability website at sustainability.ovintiv.com.
Selected Financial Information
| | | | | | | | |
($ millions) | | 2024 | | | 2023 | |
| | | | | | |
Product and Service Revenues | | | | | | |
Upstream product revenues (1) | | $ | 7,350 | | | $ | 7,805 | |
Service revenues (2) | | | 8 | | | | 7 | |
Total Product and Service Revenues | | | 7,358 | | | | 7,812 | |
| | | | | | |
Sales of Purchased Product (1) | | | 1,585 | | | | 2,849 | |
Gains (Losses) on Risk Management, Net | | | 135 | | | | 151 | |
Sublease Revenues | | | 74 | | | | 71 | |
Total Revenues | | | 9,152 | | | | 10,883 | |
| | | | | | |
Total Operating Expenses (3) | | | 7,573 | | | | 8,019 | |
Operating Income (Loss) | | | 1,579 | | | | 2,864 | |
Total Other (Income) Expenses | | | 228 | | | | 354 | |
Net Earnings (Loss) Before Income Tax | | | 1,351 | | | | 2,510 | |
Income Tax Expense (Recovery) | | | 226 | | | | 425 | |
| | | | | | |
Net Earnings (Loss) | | $ | 1,125 | | | $ | 2,085 | |
(1)In conjunction with the Segment Reclassification as discussed in the Highlights section of this MD&A, prior period results have been reclassified for comparative purposes.
(2)Service revenues comprise third-party gathering and processing fees.
(3)Total Operating Expenses include non-cash items such as DD&A, impairments, accretion of asset retirement obligations and long-term incentive costs.
Revenues
Ovintiv’s revenues are substantially derived from sales of oil, NGLs and natural gas production. Increases or decreases in Ovintiv’s revenue, profitability and future production are highly dependent on the commodity prices the Company receives. Prices are market driven and fluctuate due to factors beyond the Company’s control, such as supply and demand, seasonality and geopolitical and economic factors. The Company’s realized prices generally reflect WTI, NYMEX, Edmonton Condensate and AECO benchmark prices, as well as other downstream benchmarks, including Houston and Dawn. The Company proactively mitigates price risk and optimizes margins by entering into firm transportation contracts to diversify market access to different sales points. Realized prices, excluding the impact of risk management activities, may differ from the benchmarks for many reasons, including quality, location, or production being sold at different market hubs.
Benchmark prices relevant to the Company are shown in the table below.
Benchmark Prices
| | | | | | | | |
(average for the period) | | 2024 | | | 2023 | |
| | | | | | |
Oil & NGLs | | | | | | |
WTI ($/bbl) | | $ | 75.72 | | | $ | 77.62 | |
Houston ($/bbl) | | | 77.24 | | | | 78.95 | |
Edmonton Condensate (C$/bbl) | | | 100.34 | | | | 103.76 | |
| | | | | | |
Natural Gas | | | | | | |
NYMEX ($/MMBtu) | | $ | 2.27 | | | $ | 2.74 | |
AECO (C$/Mcf) | | | 1.44 | | | | 2.93 | |
Dawn (C$/MMBtu) | | | 2.79 | | | | 3.15 | |
Production Volumes and Realized Prices
| | | | | | | | | | | | | | | | | | |
| | Production Volumes (1) | | | | Realized Prices (2) |
| | 2024 | | | 2023 | | | | 2024 | | | 2023 | | |
| | | | | | | | | | | | | | |
Oil (Mbbls/d, $/bbl) | | | | | | | | | | | | | | |
USA Operations | | | 167.9 | | | | 158.8 | | | | $ | 73.90 | | | $ | 76.46 | | |
Canadian Operations | | | 0.4 | | | | 0.1 | | | | | 70.38 | | | | 81.59 | | |
Total | | | 168.3 | | | | 158.9 | | | | | 73.90 | | | | 76.46 | | |
| | | | | | | | | | | | | | |
NGLs – Plant Condensate (Mbbls/d, $/bbl) | | | | | | | | | | | | | | |
USA Operations | | | 11.2 | | | | 10.9 | | | | | 57.83 | | | | 58.53 | | |
Canadian Operations | | | 31.7 | | | | 32.0 | | | | | 71.97 | | | | 74.52 | | |
Total | | | 42.9 | | | | 42.9 | | | | | 68.28 | | | | 70.46 | | |
| | | | | | | | | | | | | | |
NGLs – Other (Mbbls/d, $/bbl) | | | | | | | | | | | | | | |
USA Operations | | | 75.8 | | | | 74.6 | | | | | 18.02 | | | | 16.27 | | |
Canadian Operations | | | 15.0 | | | | 15.6 | | | | | 27.45 | | | | 26.78 | | |
Total | | | 90.8 | | | | 90.2 | | | | | 19.57 | | | | 18.09 | | |
| | | | | | | | | | | | | | |
Total Oil & NGLs (Mbbls/d, $/bbl) | | | | | | | | | | | | | | |
USA Operations | | | 254.9 | | | | 244.3 | | | | | 56.57 | | | | 57.29 | | |
Canadian Operations | | | 47.1 | | | | 47.7 | | | | | 57.80 | | | | 58.93 | | |
Total | | | 302.0 | | | | 292.0 | | | | | 56.76 | | | | 57.55 | | |
| | | | | | | | | | | | | | |
Natural Gas (MMcf/d, $/Mcf) | | | | | | | | | | | | | | |
USA Operations | | | 537 | | | | 517 | | | | | 1.62 | | | | 2.43 | | |
Canadian Operations | | | 1,161 | | | | 1,125 | | | | | 1.73 | | | | 2.89 | | |
Total | | | 1,698 | | | | 1,642 | | | | | 1.70 | | | | 2.74 | | |
| | | | | | | | | | | | | | |
Total Production (MBOE/d, $/BOE) | | | | | | | | | | | | | | |
USA Operations | | | 344.4 | | | | 330.4 | | | | | 44.39 | | | | 46.15 | | |
Canadian Operations | | | 240.6 | | | | 235.2 | | | | | 19.67 | | | | 25.76 | | |
Total | | | 585.0 | | | | 565.6 | | | | | 34.22 | | | | 37.67 | | |
| | | | | | | | | | | | | | |
Production Mix (%) | | | | | | | | | | | | | | |
Oil & Plant Condensate | | | 36 | | | | 36 | | | | | | | | | |
NGLs – Other | | | 16 | | | | 16 | | | | | | | | | |
Total Oil & NGLs | | | 52 | | | | 52 | | | | | | | | | |
Natural Gas | | | 48 | | | | 48 | | | | | | | | | |
| |
| | | | | | | | | | | | |
Production Change – Year Over Year (%) (3) | | | | | | | | | | | | | | |
Total Oil & NGLs | | | 3 | | | | 12 | | | | | | | | | |
Natural Gas | | | 3 | | | | 10 | | | | | | | | | |
Total Production | | | 3 | | | | 11 | | | | | | | | | |
(2)Average per-unit prices, excluding the impact of risk management activities.
(3)Includes production impacts of acquisitions and divestitures. See Notes 8 and 9 to the Consolidated Financial Statements included in Item 8 of this Annual Report on Form 10-K.
Upstream Product Revenues, Excluding Realized Gains (Losses) on Risk Management
| | | | | | | | | | | | | | | | | | | | |
($ millions) | | Oil | | | NGLs - Plant Condensate | | | NGLs - Other | | | Natural
Gas | | | Total | |
| | | | | | | | | | | | | | | |
2023 Upstream Product Revenues (1) (2) | | $ | 4,447 | | | $ | 1,110 | | | $ | 598 | | | $ | 1,649 | | | $ | 7,804 | |
Increase (decrease) due to: | | | | | | | | | | | | | | | |
Sales prices | | | (167 | ) | | | (31 | ) | | | 51 | | | | (650 | ) | | | (797 | ) |
Production volumes | | | 279 | | | | 1 | | | | 3 | | | | 60 | | | | 343 | |
2024 Upstream Product Revenues | | $ | 4,559 | | | $ | 1,080 | | | $ | 652 | | | $ | 1,059 | | | $ | 7,350 | |
(1)Revenues for 2023 exclude certain other revenue and royalty adjustments with no associated production volumes of $1 million.
(2)In conjunction with the Segment Reclassification as discussed in the Highlights section of this MD&A, prior period results have been reclassified for comparative purposes.
Oil Revenues
2024 versus 2023
Oil revenues were higher by $112 million compared to 2023 primarily due to:
•Higher average oil production volumes of 9.4 Mbbls/d increased revenues by $279 million. Higher volumes were primarily due to the Permian assets acquired in the second quarter of 2023 (21.1 Mbbls/d) and successful drilling in Uinta (7.5 Mbbls/d), partially offset by the sale of the Bakken assets in the second quarter of 2023 (9.3 Mbbls/d) and natural declines in Anadarko (8.7 Mbbls/d); and
•A decrease of $2.56 per bbl, or three percent, in the average realized oil prices which decreased revenues by $167 million. The decrease reflected lower WTI and Houston benchmark prices which were both down two percent and the lower regional pricing relative to benchmark prices.
NGL Revenues
2024 versus 2023
NGL revenues were higher by $24 million compared to 2023 primarily due to:
•An increase of $1.48 per bbl, or eight percent, in the average realized other NGL prices which increased revenues by $51 million. The increase reflected higher other NGL benchmark prices and higher regional pricing; and
•A decrease of $2.18 per bbl, or three percent, in the average realized plant condensate prices which decreased revenues by $31 million. The decrease reflected the lower Edmonton Condensate benchmark price which was down three percent.
Natural Gas Revenues
2024 versus 2023
Natural gas revenues were lower by $590 million compared to 2023 primarily due to:
•A decrease of $1.04 per Mcf, or 38 percent, in the average realized natural gas prices which decreased revenues by $650 million. The decrease reflected lower AECO, NYMEX and Dawn benchmark prices which were down 51 percent, 17 percent and 11 percent, respectively, and lower regional pricing relative to benchmark prices in the USA Operations; and
•Higher average natural gas production volumes of 56 MMcf/d increased revenues by $60 million. Higher volumes were primarily due to successful drilling in Permian and Montney (73 MMcf/d), lower effective royalty rates resulting from lower commodity prices in Montney (46 MMcf/d), and the Permian assets acquired in the second quarter of 2023 (12 MMcf/d). The higher production volumes were partially offset by the sale of the Bakken assets in the second quarter of 2023 (23 MMcf/d), the shut-in of production in Other Canadian Operations in 2024 due to low commodity prices (20 MMcf/d), natural declines in Anadarko (17 MMcf/d), and third-party plant outages in Montney and Permian (15 MMcf/d).
Gains (Losses) on Risk Management, Net
As a means of managing commodity price volatility, Ovintiv enters into commodity derivative financial instruments on a portion of its expected oil, NGLs and natural gas production volumes. Additional information on the Company’s commodity price positions as at December 31, 2024 can be found in Note 25 to the Consolidated Financial Statements included in Item 8 of this Annual Report on Form 10-K.
The following table provides the effects of the Company’s risk management activities on revenues.
| | | | | | | | | | | | | | | | | | |
| | $ millions | | | Per-Unit | |
| | 2024 | | | 2023 | | | | | 2024 | | | 2023 | |
| | | | | | | | | | | | | | |
Realized Gains (Losses) on Risk Management | | | | | | | | | | | | | | |
Commodity Price | | | | | | | | | | | | | | |
Oil ($/bbl) | | $ | (34 | ) | | $ | (24 | ) | | | | $ | (0.55 | ) | | $ | (0.40 | ) |
NGLs - Plant Condensate ($/bbl) | | | (1 | ) | | | 1 | | | | | $ | (0.04 | ) | | $ | 0.05 | |
NGLs - Other ($/bbl) | | | 4 | | | | - | | | | | $ | 0.13 | | | $ | - | |
Natural Gas ($/Mcf) | | | 298 | | | | (21 | ) | | | | $ | 0.47 | | | $ | (0.03 | ) |
Other (1) | | | 4 | | | | 1 | | | | | $ | - | | | $ | - | |
Total ($/BOE) | | | 271 | | | | (43 | ) | | | | $ | 1.25 | | | $ | (0.21 | ) |
| | | | | | | | | | | | | | |
Unrealized Gains (Losses) on Risk Management | | | (136 | ) | | | 194 | | | | | | | | | |
Total Gains (Losses) on Risk Management, Net | | $ | 135 | | | $ | 151 | | | | | | | | | |
(1)Other primarily includes realized gains or losses from other derivative contracts with no associated production volumes.
Ovintiv recognizes fair value changes from its risk management activities each reporting period. The changes in fair value result from new positions and settlements that occur during each period, as well as the relationship between contract prices and the associated forward curves. Realized gains or losses on risk management activities related to commodity price mitigation are included in the USA and Canadian Operations’ revenues as the contracts are cash settled. Unrealized gains or losses on fair value changes of unsettled contracts are included in the Corporate and Other segment. Additional information on fair value changes can be found in Note 24 to the Consolidated Financial Statements included in Item 8 of this Annual Report on Form 10-K.
Sales of Purchased Product
Revenues from the sale of purchased product relate to activities that provide operational flexibility and cost mitigation for transportation commitments, product type, delivery points and customer diversification within the USA and Canadian Operations segments.
| | | | | | | | |
($ millions) | | 2024 | | | 2023 (1) | |
| | | | | | |
Sales of Purchased Product | | $ | 1,585 | | | $ | 2,849 | |
(1)In conjunction with the Segment Reclassification as discussed in the Highlights section in this MD&A, prior period results have been reclassified for comparative purposes.
2024 versus 2023
Sales of purchased product decreased $1,264 million compared to 2023 primarily due to:
•Lower sales of third-party purchased volumes in the USA Operations ($1,170 million) and lower natural gas benchmark prices ($114 million);
partially offset by:
•Higher realized third-party prices on sales of purchased oil volumes ($20 million).
Sublease Revenues
Sublease revenues primarily include amounts related to the sublease of office space in The Bow office building recorded in the Corporate and Other segment. Additional information on office sublease income can be found in Note 14 to the Consolidated Financial Statements included in Item 8 of this Annual Report on Form 10-K.
Operating Expenses
Production, Mineral and Other Taxes
Production, mineral and other taxes include production and property taxes. Production taxes are generally assessed as a percentage of oil, NGLs and natural gas production revenues. Property taxes are generally assessed based on the value of the underlying assets.
| | | | | | | | | | | | | | | | | | |
| | $ millions | | | $/BOE | |
| | 2024 | | | 2023 | | | | | 2024 | | | 2023 | |
| | | | | | | | | | | | | | |
USA Operations | | $ | 319 | | | $ | 327 | | | | | $ | 2.53 | | | $ | 2.71 | |
Canadian Operations | | | 14 | | | | 15 | | | | | $ | 0.16 | | | $ | 0.18 | |
Total | | $ | 333 | | | $ | 342 | | | | | $ | 1.56 | | | $ | 1.66 | |
2024 versus 2023
Production, mineral and other taxes decreased $9 million compared to 2023 primarily due to:
•The sale of the Bakken assets in the second quarter of 2023 ($26 million), lower production volumes in Anadarko ($18 million), lower production tax rates ($9 million) and lower natural gas commodity prices ($6 million);
partially offset by:
•Higher volumes in Permian and Uinta ($42 million) and higher property taxes in Permian primarily due to the assets acquired in the second quarter of 2023 ($11 million).
Transportation and Processing
Transportation and processing expense includes transportation costs incurred to move product from production points to sales points including gathering, compression, pipeline tariffs, trucking and storage costs. Ovintiv also incurs costs related to processing provided by third parties or through ownership interests in processing facilities.
| | | | | | | | | | | | | | | | | | |
| | $ millions | | | $/BOE | |
| | 2024 | | | 2023 | | | | | 2024 | | | 2023 | |
| | | | | | | | | | | | | | |
Upstream | | | | | | | | | | | | | | |
USA Operations | | $ | 510 | | | $ | 547 | | | | | $ | 4.04 | | | $ | 4.54 | |
Canadian Operations | | | 1,043 | | | | 1,056 | | | | | $ | 11.85 | | | $ | 12.29 | |
Upstream Transportation and Processing | | | 1,553 | | | | 1,603 | | | | | $ | 7.25 | | | $ | 7.76 | |
| | | | | | | | | | | | | | |
Other (1) | | | 86 | | | | 163 | | | | | | | | | |
Total | | $ | 1,639 | | | $ | 1,766 | | | | | | | | | |
(1)Other includes pipeline transportation fees associated with previously divested assets in the USA Operations of approximately $50 million (2023 - $136 million) and other third-party transportation and processing fees in the Canadian Operations of approximately $36 million (2023 - $27 million).
2024 versus 2023
Transportation and processing expense decreased $127 million compared to 2023 primarily due to:
•An expired pipeline transportation contract ($86 million), the impact of new downstream contracts in Uinta ($53 million), the sale of the Bakken assets in the second quarter of 2023 ($46 million), lower flow-through rates in Montney ($20 million), lower production volumes in Anadarko ($18 million), a higher U.S./Canadian dollar exchange rate ($17 million), the shut-in of production in Other Canadian Operations in 2024 due to low commodity prices ($11 million) and lower variable contract rates in Permian ($4 million);
partially offset by:
•Higher volumes in Permian, Uinta and Montney ($87 million), increased minimum volume commitments associated with certain gathering and processing assets in Montney ($20 million) and higher downstream transportation costs in Montney ($12 million).
Operating
Operating expense includes costs paid by the Company, net of amounts capitalized, on oil and natural gas properties in which Ovintiv has a working interest. These costs primarily include labor, service contract fees, chemicals, fuel, water hauling, electricity and workovers.
| | | | | | | | | | | | | | | | | | |
| | $ millions | | | $/BOE | |
| | 2024 | | | 2023 | | | | | 2024 | | | 2023 | |
| | | | | | | | | | | | | | |
Upstream | | | | | | | | | | | | | | |
USA Operations | | $ | 799 | | | $ | 743 | | | | | $ | 6.34 | | | $ | 6.15 | |
Canadian Operations | | | 109 | | | | 88 | | | | | $ | 1.24 | | | $ | 1.04 | |
Upstream Operating Expense | | | 908 | | | | 831 | | | | | $ | 4.24 | | | $ | 4.03 | |
| | | | | | | | | | | | | | |
Other (1) | | | 23 | | | | 28 | | | | | | | | | |
Total | | $ | 931 | | | $ | 859 | | | | | | | | | |
(1)Other includes indirect internal costs of $11 million and $12 million in the USA and Canadian Operations, respectively (2023 - $14 million and $14 million, respectively).
2024 versus 2023
Operating expense increased $72 million compared to 2023 primarily due to:
•Higher activity in Permian primarily related to the assets acquired in the second quarter of 2023 ($98 million), updates to operating contract terms, including a recovery of prior years’ costs in 2023 ($31 million), increased activity in Uinta primarily due to workovers ($10 million) and lower capitalization of directly attributable internal costs in Montney ($8 million);
partially offset by:
•The sale of the Bakken assets in the second quarter of 2023 ($41 million) and decreased activity in Anadarko ($24 million).
Purchased Product
Purchased product expense includes purchases of oil, NGLs and natural gas from third parties that are used to provide operational flexibility and cost mitigation for transportation commitments, product type, delivery points and customer diversification within the USA and Canadian Operations segments.
| | | | | | | | |
($ millions) | | 2024 | | | 2023 | |
| | | | | | |
Purchased Product | | $ | 1,546 | | | $ | 2,815 | |
2024 versus 2023
Purchased product expense decreased $1,269 million compared to 2023 primarily due to:
•Lower third-party purchased volumes in the USA Operations ($1,169 million) and lower natural gas benchmark prices ($119 million);
partially offset by:
•Higher purchase prices on third-party oil volumes ($19 million).
Depreciation, Depletion & Amortization
Proved properties within each country cost center are depleted using the unit-of-production method based on proved reserves as discussed in Note 1 to the Consolidated Financial Statements included in Item 8 of this Annual Report on Form 10-K. Depletion rates are impacted by impairments, acquisitions, divestitures and foreign exchange rates, as well as fluctuations in 12-month average trailing prices which affect proved reserves volumes. Corporate assets are carried at cost and depreciated on a straight-line basis over the estimated service lives of the assets.
Additional information can be found under Upstream Assets and Reserve Estimates in the Critical Accounting Estimates section of this MD&A.
| | | | | | | | | | | | | | | | | | |
| | $ millions | | | $/BOE | |
| | 2024 | | | 2023 | | | | | 2024 | | | 2023 | |
| | | | | | | | | | | | | | |
Upstream | | | | | | | | | | | | | | |
USA Operations | | $ | 1,971 | | | $ | 1,519 | | | | | $ | 15.64 | | | $ | 12.60 | |
Canadian Operations | | | 297 | | | | 286 | | | | | $ | 3.37 | | | $ | 3.33 | |
Upstream DD&A | | | 2,268 | | | | 1,805 | | | | | $ | 10.60 | | | $ | 8.74 | |
| | | | | | | | | | | | | | |
Corporate & Other | | | 22 | | | | 20 | | | | | | | | | |
Total | | $ | 2,290 | | | $ | 1,825 | | | | | | | | | |
2024 versus 2023
DD&A increased $465 million compared to 2023 primarily due to:
•Higher depletion rates and production volumes in the USA Operations ($384 million and $68 million, respectively).
The depletion rate in the USA Operations increased $3.04 per BOE compared to 2023 primarily due to a higher depletable base.
Ceiling Test Impairment
Under full cost accounting, the carrying amount of Ovintiv’s oil and natural gas properties within each country cost center is subject to a ceiling test performed quarterly. Ceiling test impairments are recognized when the capitalized costs, net of accumulated depletion and the related deferred income taxes, exceed the sum of the estimated after-tax future net cash flows from proved reserves as calculated under SEC requirements using the 12-month average trailing prices and discounted at 10 percent. The 12‑month average trailing price is calculated as the average of the price on the first day of each month within the trailing 12‑month period.
In 2024, the Company recognized a before-tax non-cash ceiling test impairment of $450 million in the Canadian Operations. The non-cash ceiling test impairment primarily resulted from the decline in the 12-month average trailing prices, which reduced proved reserves.
The 12-month average trailing prices used in the ceiling test calculations were based on the benchmark prices below. The benchmark prices were adjusted for basis differentials to determine local reference prices, transportation costs and tariffs, heat content and quality.
| | | | | | | | | | | | | | | | | |
| | Oil & NGLs | | | | Natural Gas | |
| | WTI
($/bbl) | | | Edmonton
Condensate
(C$/bbl) | | | | Henry Hub
($/MMBtu) | | | AECO
(C$/MMBtu) | |
| | | | | | | | | | | | | |
12-Month Average Trailing Reserves Pricing (1) | | | | | | | | | | | | | |
2024 | | | 75.48 | | | | 99.60 | | | | | 2.13 | | | | 1.26 | |
2023 | | | 78.22 | | | | 104.61 | | | | | 2.64 | | | | 2.78 | |
(1)All prices were held constant in all future years when estimating net revenues and reserves.
Further declines in the 12‑month average trailing commodity prices could further reduce proved reserves values and result in the recognition of future ceiling test impairments. Future ceiling test impairments can also result from changes to reserves estimates, future development costs, capitalized costs and unproved property costs. Moreover, acquisitions
of oil and natural gas assets are transacted at market prices, which may be higher than the SEC average trailing prices at the reporting date and could result in the recognition of a ceiling test impairment. Proceeds received from oil and natural gas divestitures are typically deducted from the Company’s capitalized costs and can reduce the risk of ceiling test impairments.
On January 31, 2025, the Company closed its previously announced Montney Acquisition, as discussed in the Significant Developments and Subsequent Events section of this MD&A. The acquisition was recognized at its purchased value using market prices. On March 31, 2025, when Ovintiv performs its required ceiling test for the Canadian cost center, the Company expects the 12-month average trailing prices used in the ceiling test calculation to be lower than the market prices used in the valuation of the Montney Acquisition. Accordingly, the Company expects to recognize an after-tax impairment in the Canadian cost center between approximately $400 million to $600 million for the three months ended March 31, 2025. No impairment is expected in the U.S. cost center.
The additional estimated after-tax ceiling test impairment is not expected to impact proved undeveloped reserves for the Canadian Operations. Due to uncertainties in estimating proved reserves, the additional after-tax ceiling test impairment described above and resulting implications may not be indicative of Ovintiv’s future development plans, operating or financial results.
The Company believes that the discounted after-tax future net cash flows from proved reserves required to be used in the ceiling test calculation are not indicative of the fair market value of Ovintiv’s oil and natural gas properties or the future net cash flows expected to be generated from such properties. The discounted after-tax future net cash flows do not consider the fair market value of unamortized unproved properties, or probable or possible liquids and natural gas reserves. In addition, there is no consideration given to the effect of future changes in commodity prices. Ovintiv manages its business using estimates of reserves and resources based on forecast prices and costs. Additional information on the ceiling test calculation can be found in Note 10 to the Consolidated Financial Statements included in Item 8 of this Annual Report on Form 10-K.
Administrative
Administrative expense represents costs associated with corporate functions provided by Ovintiv staff. These expenses primarily include salaries and benefits, operating leases, office, information technology, transaction, restructuring and long-term incentive costs.
| | | | | | | | | | | | | | | | | | |
| | $ millions | | | | | $/BOE | |
| | 2024 | | | 2023 | | | | | 2024 | | | 2023 | |
| | | | | | | | | | | | | | |
Administrative, excluding Long-Term Incentive Costs, Restructuring | | | | | | | | | | | | | | |
Costs, Transaction and Legal Costs (1) | | $ | 283 | | | $ | 278 | | | | | $ | 1.32 | | | $ | 1.35 | |
Long-term incentive costs | | | 40 | | | | 22 | | | | | | 0.19 | | | | 0.11 | |
Restructuring costs | | | 27 | | | | - | | | | | | 0.13 | | | | - | |
Transaction and legal costs | | | 15 | | | | 93 | | | | | | 0.07 | | | | 0.45 | |
Total Administrative | | $ | 365 | | | $ | 393 | | | | | $ | 1.71 | | | $ | 1.91 | |
(1)Includes costs related to The Bow office lease of $116 million (2023 - $114 million), half of which is recovered from sublease revenues.
2024 versus 2023
Administrative expense decreased $28 million compared to 2023 primarily due to:
•Transaction costs incurred mainly related to the Permian assets acquired in the second quarter of 2023 ($83 million);
partially offset by:
•Restructuring costs incurred in 2024 ($27 million), higher long-term incentive costs resulting from changes in the Company’s share price in 2023 ($18 million), and increases in travel and legal costs ($9 million).
In October 2024, Ovintiv undertook a plan to reduce its workforce by approximately 10 percent as part of a corporate reorganization. Additional information on restructuring charges and long-term incentive costs can be found in Notes 21 and 22 to the Consolidated Financial Statements included in Item 8 of this Annual Report on Form 10-K.
Other (Income) Expenses
| | | | | | | | |
($ millions) | | 2024 | | | 2023 | |
| | | | | | |
Interest | | $ | 412 | | | $ | 355 | |
Foreign Exchange (Gain) Loss, Net | | | (19 | ) | | | 19 | |
Other (Gains) Losses, Net | | | (165 | ) | | | (20 | ) |
Total Other (Income) Expenses | | $ | 228 | | | $ | 354 | |
Interest
Interest expense primarily includes interest on Ovintiv’s short-term and long-term debt. Additional information on changes in interest can be found in Note 4 to the Consolidated Financial Statements included in Item 8 of this Annual Report on Form 10-K.
2024 versus 2023
Interest expense increased $57 million compared to 2023 primarily due to:
•Interest expense related to the senior unsecured notes issued in May 2023 ($57 million) and bridge loan financing fees related to the Montney Acquisition as discussed in the Highlights section in this MD&A ($12 million);
partially offset by:
•Decreased amounts drawn from the Company’s short-term borrowings ($9 million).
Foreign Exchange (Gain) Loss, Net
Foreign exchange gains and losses primarily result from the impact of fluctuations in the Canadian to U.S. dollar exchange rate. Additional information on changes in foreign exchange gains or losses can be found in Notes 5 and 25 to the Consolidated Financial Statements included in Item 8 of this Annual Report on Form 10-K. Additional information on foreign exchange rates and the effects of foreign exchange rate changes can be found in Item 7A of this Annual Report on Form 10-K.
2024 versus 2023
Net foreign exchange gain of $19 million compared to a loss of $19 million in 2023 primarily due to:
•Unrealized foreign exchange gains on the translation of intercompany notes compared to losses in 2023 ($71 million), realized foreign exchange gains on the settlement of intercompany notes compared to losses in 2023 ($49 million) and gains on other monetary revaluations compared to losses in 2023 ($26 million);
partially offset by:
•Unrealized foreign exchange losses on the translation of U.S. dollar risk management contracts issued from Canada compared to gains in 2023 ($112 million).
Other (Gains) Losses, Net
Other (gains) losses, net, primarily includes other non-recurring revenues or expenses and may also include items such as interest income, reclamation charges related to decommissioned assets, proceeds related to previously divested assets and adjustments related to other assets.
During 2024, the Company received settlement proceeds of approximately $156 million related to the previous dispositions of certain legacy assets. Accordingly, the Company recognized total net proceeds of $156 million as a gain within Other (gains) losses, net. Additional information on the net settlement proceeds can be found in Note 8 to the Consolidated Financial Statements included in Item 8 of this Annual Report on Form 10-K.
Other gains in 2024 also includes interest income of $7 million primarily generated from short-term investments (2023 ‑ $11 million).
Income Tax
In 2024, current income tax expense in the U.S. of $8 million is lower than 2023 primarily due to the impact of the corporate alternative minimum tax and lower state income tax expense. In Canada, the current income tax expense in 2024 of $74 million is lower than 2023 primarily due to the recognition of prior year deferred income in 2023.
The determination of income and other tax liabilities of the Company and its subsidiaries requires interpretation of complex domestic and foreign tax laws and regulations, that are subject to change. The Company’s interpretation of tax laws may differ from the interpretation of the tax authorities. As a result, there are tax matters under review for which the timing of resolution is uncertain. The Company believes that the provision for income taxes is adequate.
On June 20, 2024, Canada enacted its Global Minimum Tax Act (“GMTA”), which implements the Organization for Economic Cooperation and Development Pillar II framework, providing a global minimum tax rate of 15 percent. The GMTA did not have a material impact to the Company’s Consolidated Financial Statements in 2024.
Additional information on income taxes can be found in Note 6 to the Consolidated Financial Statements included in Item 8 of this Annual Report on Form 10-K.
|
Liquidity and Capital Resources |
Sources of Liquidity
The Company has the flexibility to access cash equivalents and a range of funding alternatives at competitive rates through committed revolving credit facilities as well as debt and equity capital markets. Ovintiv closely monitors the accessibility of cost-effective credit and ensures that sufficient liquidity is in place to fund capital expenditures and dividend payments. In addition, the Company may use cash and cash equivalents, cash from operating activities, or proceeds from asset divestitures to fund its operations and capital allocation framework or to manage its capital structure as discussed below. At December 31, 2024, $38 million in cash and cash equivalents was held by Canadian subsidiaries. The cash held by Canadian subsidiaries is accessible and may be subject to additional U.S. income taxes and Canadian withholding taxes if repatriated.
The Company’s capital structure consists of total shareholders’ equity plus long-term debt, including any current portion. The Company’s objectives when managing its capital structure are to maintain financial flexibility to preserve Ovintiv’s access to capital markets and its ability to meet financial obligations and finance internally generated growth, as well as potential acquisitions. Ovintiv has a practice of maintaining capital discipline and strategically managing its capital structure by adjusting capital spending, adjusting dividends paid to shareholders, issuing new shares of common stock, purchasing shares of common stock for cancellation or return to treasury, issuing new debt and repaying or repurchasing existing debt.
| | | | | | | | |
($ millions, except as indicated) | | 2024 | | | 2023 | |
| | | | | | |
Cash and Cash Equivalents | | $ | 42 | | | $ | 3 | |
Available Credit Facilities | | | 3,500 | | | | 3,486 | |
Available Uncommitted Demand Lines (1) | | | 91 | | | | 234 | |
Issuance of U.S. Commercial Paper | | | - | | | | (270 | ) |
Total Liquidity | | $ | 3,633 | | | $ | 3,453 | |
| | | | | | |
Long-Term Debt, including current portion | | $ | 5,453 | | | $ | 5,737 | |
Total Shareholders’ Equity | | $ | 10,331 | | | $ | 10,370 | |
| | | | | | |
Debt to Capitalization (%) (2) | | | 35 | | | | 36 | |
Debt to Adjusted Capitalization (%) (2) | | | 23 | | | | 24 | |
(1)Includes three uncommitted demand lines totaling $295 million, net of $204 million in related undrawn letters of credit (2023 - $289 million and $55 million, respectively).
(2)These measures are defined in the Non-GAAP Measures section of this MD&A.
In December 2024, the Company renewed its committed revolving credit facilities, extending the maturity dates to December 2029. The Company continues to have full access to two committed revolving U.S. dollar denominated credit facilities totaling $3.5 billion, which include a $2.2 billion revolving credit facility for Ovintiv Inc. and a $1.3 billion revolving credit facility for a Canadian subsidiary (collectively, the “Credit Facilities”). The Credit Facilities provide financial flexibility and allow the Company to fund its operations or capital investment program. At December 31, 2024, there were no outstanding amounts under the revolving Credit Facilities.
Depending on the Company’s credit rating and market demand, the Company may issue from its two U.S. commercial paper (“CP”) programs, which include a $1.5 billion program for Ovintiv Inc. and a $1.0 billion program for a Canadian subsidiary. As at December 31, 2024, the Company had no balance outstanding under its U.S. CP program. All of Ovintiv’s credit ratings are investment grade as at December 31, 2024 and were reaffirmed following the announcement of the Montney Acquisition.
As at December 31, 2024, the available Credit Facilities, uncommitted demand lines, and cash and cash equivalents provide Ovintiv with total liquidity of approximately $3.6 billion. Ovintiv also had approximately $204 million in undrawn letters of credit issued in the normal course of business as collateral security, primarily related to sales arrangements.
On December 10, 2024, to facilitate its previously announced Montney Acquisition, the Company entered into two term facilities which consist of a $1.5 billion 364-day Asset Sale Term Facility and a $1.0 billion 2-year Term Facility. As at December 31, 2024, the Company had no outstanding borrowings under the two term facilities.
On January 22, 2025, the Company closed its previously announced Uinta divestiture and received net proceeds of approximately $2.0 billion which was used to fund the majority of the Montney Acquisition as discussed above. In conjunction with the closing of the Uinta divestiture, the 364-day Asset Sale Term Facility was terminated.
On January 31, 2025, the Company closed its Montney Acquisition. Ovintiv funded the Montney Acquisition through a combination of cash proceeds received from the sale of the Uinta assets, cash on hand, as well as short-term borrowings. Following the closing of the Montney Acquisition, the 2-year Term Facility was terminated.
Additional information on the term facilities, and the Uinta divestiture and Montney Acquisition can be found in Notes 15 and 28, respectively, to the Consolidated Financial Statements included in Item 8 of this Annual Report on Form 10-K.
Ovintiv has a U.S. shelf registration statement under which the Company may issue from time to time, debt securities, common stock, preferred stock, warrants, units, share purchase contracts and share purchase units in the U.S. The U.S. shelf registration statement expires in March 2026.
The obligations under the Company’s existing debt securities are fully and unconditionally guaranteed on a senior unsecured basis by Ovintiv Canada ULC, an indirect wholly-owned subsidiary of the Company. Additional information on the Company’s Canadian Operations segment and the Bow office lease can be found in the Results of Operations section in this MD&A and in the Consolidated Financial Statements included in Item 8 of this Annual Report on Form 10-K.
Ovintiv is currently in compliance with all financial covenants under the Credit Facilities. Management monitors Debt to Adjusted Capitalization, which is a non-GAAP measure defined in the Non-GAAP Measures section of this MD&A, as a proxy for Ovintiv’s financial covenant under the Credit Facilities, which requires Debt to Adjusted Capitalization to be less than 60 percent. As at December 31, 2024, the Company’s Debt to Adjusted Capitalization was 23 percent. The definitions used in the covenant under the Credit Facilities adjust capitalization for cumulative historical ceiling test impairments recorded in conjunction with the Company’s January 1, 2012 adoption of U.S. GAAP. Additional information on financial covenants can be found in Note 15 to the Consolidated Financial Statements included in Item 8 of this Annual Report on Form 10-K.
Sources and Uses of Cash
The following table summarizes the sources and uses of the Company’s cash and cash equivalents.
| | | | | | | | | | |
($ millions) | Activity Type | | | 2024 | | | 2023 | |
| | | | | | | | |
Sources of Cash, Cash Equivalents and Restricted Cash | | | | | | | | |
Cash from operating activities | Operating | | | $ | 3,721 | | | $ | 4,167 | |
Proceeds from divestitures | Investing | | | | 163 | | | | 772 | |
Corporate acquisition | Investing | | | | 12 | | | | - | |
Issuance of long-term debt | Financing | | | | - | | | | 2,278 | |
| | | | | 3,896 | | | | 7,217 | |
| | | | | | | | |
Uses of Cash and Cash Equivalents | | | | | | | | |
Capital expenditures | Investing | | | | 2,303 | | | | 2,744 | |
Acquisitions | Investing | | | | 205 | | | | 277 | |
Corporate acquisition, net of cash acquired | Investing | | | | - | | | | 3,225 | |
Net repayment of revolving debt | Financing | | | | 284 | | | | 109 | |
Purchase of shares of common stock | Financing | | | | 597 | | | | 426 | |
Dividends on shares of common stock | Financing | | | | 316 | | | | 307 | |
Other | Financing/Investing | | | | 158 | | | | 122 | |
| | | | | 3,863 | | | | 7,210 | |
Foreign Exchange Gain (Loss) on Cash, Cash Equivalents
and Restricted Cash Held in Foreign Currency | | | | | 6 | | | | (9 | ) |
Increase (Decrease) in Cash, Cash Equivalents and Restricted Cash | | | | $ | 39 | | | $ | (2 | ) |
Operating Activities
Net cash from operating activities in 2024 was $3,721 million and was primarily a reflection of the impacts from average realized commodity prices, production volumes, changes in non‑cash working capital and realized gains/losses on risk management.
Additional detail on changes in non-cash working capital can be found in Note 26 to the Consolidated Financial Statements included in Item 8 of this Annual Report on Form 10-K. Ovintiv expects it will continue to meet the payment terms of its suppliers.
Non-GAAP Cash Flow in 2024 was $4,042 million and was primarily impacted by the items affecting cash from operating activities which are discussed below and in the Results of Operations section of this MD&A.
2024 versus 2023
Net cash from operating activities decreased $446 million compared to 2023 primarily due to:
•Lower realized commodity prices ($797 million), changes in non-cash working capital ($577 million), higher operating expense, excluding non-cash long-term incentive costs ($80 million) and higher interest expense ($56 million);
partially offset by:
•Higher production volumes ($343 million), realized gains on risk management in revenues compared to losses in 2023 ($314 million), a decrease in current income tax expense ($199 million), lower transportation and processing expense ($127 million), and lower administrative expense, excluding non-cash long-term incentive costs ($58 million).
Investing Activities
The Company’s primary investing activities are capital expenditures, acquisitions and proceeds from divestitures, which are summarized in Notes 2 and 8 to the Consolidated Financial Statements included in Item 8 of this Annual Report on Form 10‑K.
2024 and 2023
Net cash used in investing activities in 2024 was $2,457 million primarily due to capital expenditures and acquisitions in the USA Operations. Capital expenditures decreased $441 million compared to 2023 primarily due to decreased completions activity in Montney, Anadarko and Permian, drilling efficiencies in Uinta, and the sale of the Bakken assets in the second quarter of 2023, partially offset by increased capital inventory.
Acquisitions in 2024 were $205 million, which primarily included property purchases with oil and liquids-rich potential in the USA Operations (2023 - $277 million).
Corporate acquisitions in 2024 included the final cash settlements of $12 million related to the Permian Acquisition in the second quarter of 2023. Corporate acquisitions in 2023 were $3,225 million, which related to the Permian Acquisition. Additional information regarding the Permian Acquisition can be found in Note 9 to the Consolidated Financial Statements included in Item 8 of this Annual Report on Form 10-K.
Proceeds from divestitures in 2024 were $7 million, which included certain properties that did not complement Ovintiv’s existing portfolio of assets. Proceeds from divestitures also included total net settlement proceeds of approximately $156 million related to the previous dispositions of certain legacy assets. Divestitures in 2023 were $772 million, which primarily included the sale of the Bakken assets in North Dakota and certain properties that did not complement Ovintiv’s existing portfolio of assets.
Financing Activities
Net cash from and/or used in financing activities has been impacted by Ovintiv’s strategic objective to return value to shareholders by repaying existing debt, purchasing shares of common stock and paying dividends.
2024 versus 2023
Net cash used in financing activities in 2024 was $1,231 million compared to net cash from financing activities of $1,359 million in 2023. The change was primarily due to the net issuance of long-term debt in 2023 of $2,278 million, increased net repayment of revolving debt ($175 million) and increased purchases of shares of common stock in 2024 compared to 2023 ($171 million).
The Company’s long-term debt, including the current portion of $600 million, totaled $5,453 million at December 31, 2024. The Company has $600 million of fixed rate long-term debt due in May 2025 and expects to have a total long-term debt balance of less than $5.0 billion by the end of 2025. The Company’s long-term debt at December 31, 2023 totaled $5,737 million, including the current portion of $284 million.
In support of the Company’s commitment to enhancing shareholder value, Ovintiv utilizes its capital allocation framework to provide competitive returns to shareholders while strengthening its balance sheet. In conjunction with the announced transactions as discussed in the Significant Developments and Subsequent Events section of this MD&A, the Company has temporarily paused its share buyback program, starting in October 2024, and expects to resume the buybacks in the second quarter of 2025. Dividends declared and paid by the Company are expected to remain unchanged.
For additional information on long-term debt, refer to Note 15 to the Consolidated Financial Statements included in Item 8 of this Annual Report on Form 10-K.
Dividends
The Company pays quarterly dividends to common shareholders at the discretion of the Board of Directors.
| | | | | | | | |
($ millions, except as indicated) | | 2024 | | | 2023 | |
| | | | | | |
Dividend Payments | | $ | 316 | | | $ | 307 | |
Dividend Payments ($/share) | | $ | 1.20 | | | $ | 1.15 | |
On February 26, 2025, the Board of Directors declared a dividend of $0.30 per share of common stock payable on March 31, 2025 to common shareholders of record as of March 14, 2025.
Dividends increased $9 million compared to 2023 as a result of Ovintiv increasing its annualized dividend to $1.20 per share of common stock in the second quarter of 2023. The dividend increase reflects the Company’s commitment to returning capital to shareholders.
Normal Course Issuer Bid
On September 26, 2024, the Company announced it had received regulatory approval for the renewal of its NCIB program, which enables the Company to purchase, for cancellation or return to treasury, up to approximately 25.9 million shares of common stock over a 12-month period from October 3, 2024 to October 2, 2025. The number of shares authorized for purchase represents 10 percent of Ovintiv’s public float as at September 20, 2024. The Company expects to execute the renewed NCIB program in conjunction with its capital allocation framework in the second quarter of 2025.
During 2024, the Company purchased for cancellation, approximately 12.7 million shares of common stock for total consideration of approximately $597 million.
For additional information on the NCIB, refer to Note 18 to the Consolidated Financial Statements included in Item 8 of this Annual Report on Form 10-K.
Material Cash Requirements
Ovintiv’s material cash requirements include various contractual obligations arising from long-term debt, operating leases, risk management liabilities and asset retirement obligations which are recognized in the Company’s Consolidated Balance Sheet. The Company expects to fund long-term material cash requirements primarily with cash from operating activities.
Interest payments include scheduled cash payments on finance leases, long-term debt, and other obligations. Additional information can be found in Notes 14 and 15 to the Consolidated Financial Statements included in Item 8 of this Annual Report on Form 10-K.
Operating leases include drilling rigs, compressors, office and buildings, certain land easements and various equipment utilized in the development and production of oil, NGLs and natural gas, as well as The Bow building. As at December 31, 2024, the Company subleased approximately 50 percent of The Bow office space under the lease agreement. Additional information on leases can be found in Note 14 to the Consolidated Financial Statements included in Item 8 of this Annual Report on Form 10-K.
Risk management liabilities represent Ovintiv’s net liability positions with counterparties. Additional information can be found in Note 25 to the Consolidated Financial Statements included in Item 8 of this Annual Report on Form 10‑K.
Contractual commitments relating to transportation and processing commitments, and drilling and field services can be found in Note 27 to the Consolidated Financial Statements included in Item 8 of this Annual Report on Form 10‑K.
Further to the commitments discussed above, Ovintiv also has various obligations that become payable if certain future events occur relating to take or pay arrangements and payout of minimum costs as described in Notes 20 and 27 to the Consolidated Financial Statements included in Item 8 of this Annual Report on Form 10-K.
In addition, the Company has obligations to fund the disposal of long-lived assets upon their abandonment as well as its obligations to fund its defined benefit pension and other post-employment benefit plans as described in Notes 17 and 23, respectively, to the Consolidated Financial Statements included in Item 8 of this Annual Report on Form 10‑K.
Other than the items discussed above, there are no other transactions, arrangements, or relationships with unconsolidated entities or persons that are reasonably likely to materially affect the Company’s liquidity or the availability of, or requirements for, capital resources.
Contingencies
For information on contingencies, refer to Note 27 to the Consolidated Financial Statements included in Item 8 of this Annual Report on Form 10-K.
|
Accounting Policies and Estimates |
Critical Accounting Estimates
The preparation of financial statements in conformity with U.S. GAAP requires management to make informed judgments and estimates that affect the reported amounts of assets, liabilities, revenues, and expenses. For a discussion of the Company’s significant accounting policies refer to Note 1 to the Consolidated Financial Statements included in Item 8 of this Annual Report on Form 10-K. Changes in facts and circumstances or additional information may result in revised estimates, and actual results may differ from these estimates. Management considers the following to be its most critical accounting estimates that involve judgment. The following discussion outlines the accounting policies and practices involving the use of estimates that are critical to determining Ovintiv’s financial results. Changes in the estimates and assumptions discussed below could materially affect the amount or timing of the financial results of the Company.
| | |
Description | | Judgments and Uncertainties |
Upstream Assets and Reserve Estimates As Ovintiv follows full cost accounting for oil, NGLs and natural gas activities, reserves estimates are a key input to the Company’s depletion, gain or loss on divestitures and ceiling test impairment calculations. In addition, these reserves are the basis for the Company’s supplemental oil and gas disclosures. | | Due to the inter-relationship of various judgments made to reserve estimates and the volatile nature of commodity prices, it is generally not possible to predict the timing or magnitude of ceiling test impairments. |
Ovintiv estimates its proved oil and natural gas reserves according to the definition of proved reserves provided by the SEC. The Company’s estimates of proved reserves are made using available geological and reservoir data as well as production performance data and must demonstrate with reasonable certainty to be economically producible in future periods from known reservoirs under existing economic conditions, operating methods and government regulations. The estimation of reserves is a subjective process. | | Revisions to significant reserve estimates are necessary due to changes in and among other things, development plans, projected future rates of production, the timing of future expenditures, reservoir performance, economic conditions, governmental restrictions as well as changes in the expected recovery associated with infill drilling, all of which are subject to numerous uncertainties and various interpretations. Downward revisions in proved reserve estimates due to changes in reserve estimates may increase depletion expense and may also result in a ceiling test impairment. |
Reserves are calculated using an unweighted arithmetic average of commodity prices in effect on the first day of each of the previous 12 months, held flat for the life of the production, except where prices are defined by contractual arrangements (“SEC Average Trailing Prices”). | | Decreases in prices may result in reductions in certain proved reserves due to reaching economic limits at an earlier projected date and impact earnings through depletion expense and ceiling test impairments. Moreover, acquisitions of oil and natural gas assets are transacted at market prices, which may be higher than the SEC Average Trailing Prices at the reporting date and could result in the recognition of a ceiling test impairment. |
Ovintiv manages its business using estimates of reserves and resources based on forecast prices and costs as it gives consideration to probable and possible reserves and future changes in commodity prices. | | Ovintiv believes that the discounted after-tax future net cash flows from proved reserves required to be used in the ceiling test calculation are not indicative of the fair market value of Ovintiv’s oil and natural gas properties or the future net cash flows expected to be generated from such properties. |
Business Combinations Ovintiv follows the acquisition method of accounting for business combinations. Assets acquired and liabilities assumed are recognized at the date of acquisition at their respective estimated fair values. Any excess of the purchase price over the fair value amounts assigned to assets and liabilities is recorded as goodwill. Any deficiency of the purchase price over the estimated fair values of the net assets acquired is recorded as a gain in net earnings. | | The most significant assumptions relate to the estimated fair values assigned to proved and unproved oil and natural gas properties. The assumptions made in performing these valuations include discount rates, future commodity prices and costs, the timing of development activities, projections of oil and gas reserves, and estimates to abandon and reclaim producing wells. Changes in key assumptions may cause the acquisition accounting to be revised, including the recognition of additional goodwill or discount on acquisition. There is no assurance the underlying assumptions or estimates associated with the valuation will occur as initially expected. |
| | |
Description | | Judgments and Uncertainties |
Fair value estimates are determined based on information that existed at the time of the acquisition, utilizing expectations and assumptions that would be available to and made by a market participant. When market-observable prices are not available to value assets and liabilities, the Company may use the cost, income, or market valuation approaches depending on the quality of information available to support management’s assumptions. | | Estimated fair values assigned to assets acquired can have a significant effect on results of operations in the future through impairments of goodwill. In addition, differences between the future commodity prices when acquiring assets and the historical 12-month average trailing price to calculate ceiling test impairments of upstream assets may impact net earnings. |
Goodwill Impairments Goodwill is assessed for impairment at least annually in December, at the reporting unit level which are Ovintiv’s country cost centers. To assess impairment, the carrying amount of each reporting unit is determined and compared to the fair value of each respective reporting unit. Any excess of the carrying value of the reporting unit, including goodwill, over its fair value is recognized as an impairment and charged to net earnings. The impairment charge measured is limited to the total amount of goodwill allocated to that reporting unit. Subsequent measurement of goodwill is at cost less any accumulated impairments. | | The most significant assumptions used to determine a reporting unit’s fair value include estimations of oil and natural gas reserves, including both proved reserves and risk-adjusted unproved reserves, estimates of market prices considering forward commodity price curves as of the measurement date, market discount rates and estimates of operating, administrative, and capital costs adjusted for inflation. In addition, management may support fair value estimates determined with comparable companies that are actively traded in the public market, recent comparable asset transactions, and transaction premiums. This would require management to make certain judgments about the selection of comparable companies utilized. |
Because quoted market prices for the Company’s reporting units are not available, management applies judgment in determining the estimated fair value of reporting units for purposes of performing goodwill impairment tests. Ovintiv may use a combination of the income and the market valuation approaches. | | Downward revisions of estimated reserves quantities, increases in future cost estimates, sustained decreases in oil or natural gas prices, or divestiture of a significant component of the reporting unit could reduce expected future cash flows and fair value estimates of the reporting units and possibly result in an impairment of goodwill in future periods. |
The Company has assessed its goodwill for impairment at December 31, 2024 and no impairment was recognized. The reporting units’ fair values were substantially in excess of the carrying values and as a result were not at risk of failing the impairment test as at December 31, 2024. | | |
Asset Retirement Obligation Asset retirement obligations are those legal obligations where the Company will be required to retire tangible long-lived assets such as producing well sites, processing plants, and restoring land at the end of oil and natural gas production operations. The fair value of estimated asset retirement obligations is recognized in the Consolidated Balance Sheet when incurred and a reasonable estimate of fair value can be made. The asset retirement cost, equal to the initially estimated fair value of the asset retirement obligation, is capitalized as part of the cost of the related long-lived asset. Changes in the estimated obligation are recognized as a change in the asset retirement obligation and the related asset retirement cost. Actual expenditures incurred are charged against the accumulated asset retirement obligation. Accretion expense is recognized over time as the discounted liability is accreted to its expected settlement value. | | Asset removal technologies and costs are constantly changing, as are regulatory, political, environmental, safety, and public relations considerations. The asset retirement obligation is estimated by discounting the expected future cash flows of the settlement. The discounted cash flows are based on estimates of such factors as reserves lives, retirement costs, timing of settlements, credit-adjusted risk-free rates and inflation rates. Changes in these estimates impact net earnings through accretion of the asset retirement obligation in addition to depletion of the asset retirement cost included in property, plant and equipment. |
| | |
Description | | Judgments and Uncertainties |
Derivative Financial Instruments Ovintiv uses derivative financial instruments to manage its exposure to market risks relating to commodity prices, foreign currency exchange rates and interest rates. The Company’s policy is not to utilize derivative financial instruments for speculative purposes. Realized gains or losses from financial derivatives are recognized in net earnings as the contracts are settled. Unrealized gains and losses are recognized in net earnings at the end of each respective reporting period based on the changes in fair value of the contracts. Derivative financial instruments are measured at fair value with changes in fair value recognized in net earnings. Fair value estimates are determined using quoted prices in active markets, inferred based on market prices of similar assets and liabilities or valued using internally developed estimates. The Company may use various valuation techniques including the discounted cash flow or option valuation models. | | Ovintiv’s derivative financial instruments primarily relate to commodities including oil, NGLs and natural gas. The most significant assumptions used in determining the fair value to the Company’s commodity derivatives financial instruments include estimates of future commodity prices, implied volatilities of commodity prices, discount rates and estimates of counterparty credit risk. These pricing and discounting variables are sensitive to the period of the contract and market volatility as well as regional price differentials. These inputs may also be observable and corroborated by market data or unobservable and sourced from limited market activity, internally generated estimates or corroborated by third parties. Changes in these estimates and assumptions can impact net earnings, revenues and expenses. |
As Ovintiv has chosen not to elect hedge accounting treatment for the Company’s derivative financial instruments, changes in the fair values of derivative financial instruments can have a significant impact on Ovintiv’s results of operations. Generally, changes in fair values of derivative financial instruments do not impact the Company’s liquidity or capital resources. Settlements of derivative financial instruments do have an impact on the Company’s liquidity and results of operation. | | |
Income Taxes Ovintiv follows the liability method of accounting for income taxes. Under this method, deferred income taxes are recorded for the effect of any temporary difference between the accounting and income tax basis of an asset or liability, using the enacted income tax rates and laws expected to apply when the assets are realized and liabilities are settled. Current income taxes are measured at the amount expected to be recoverable from or payable to the taxing authorities based on the income tax rates and laws enacted at the end of the reporting period. The effect of a change in the enacted tax rates or laws is recognized in net earnings in the period of enactment. | | Tax interpretations, regulations, legislation and potential Treasury Department guidance, in the various jurisdictions in which the Company and its subsidiaries operate are subject to change and interpretation. As such, income taxes are subject to measurement uncertainty and the interpretations can impact net earnings through the income tax expense arising from the changes in deferred income tax assets or liabilities. |
Deferred income tax assets are assessed routinely for realizability. If it is more likely than not that deferred tax assets will not be realized, a valuation allowance is recorded to reduce the deferred tax assets. | | Ovintiv considers available positive and negative evidence when assessing the realizability of deferred tax assets, including historic and expected future taxable earnings, available tax planning strategies and carry forward periods. Numerous judgments and assumptions are inherent in the determination of future taxable income, including factors such as future operating conditions, particularly related to oil and natural gas prices. As a result, the assumptions used in determining expected future taxable earnings are consistent with those used in the goodwill impairment assessment. |
Ovintiv recognizes the financial statement effects of a tax position when it is more likely than not, based on the technical merits, that the position will be sustained upon examination by a taxing authority. A recognized tax position is initially and subsequently measured as the largest amount of tax benefit that is greater than 50 percent likely of being realized upon settlement with a taxing authority. Liabilities for unrecognized tax benefits that are not expected to be settled within the next 12 months are included in other liabilities and provisions. | | The Company routinely assesses potential uncertain tax positions and, if required, establishes accruals for such amounts. The accruals are adjusted based on changes in facts and circumstances. Material changes to Ovintiv’s income tax accruals may occur in the future based on the progress of ongoing audits, changes in legislation or resolution of pending matters. |
| | |
Description | | Judgments and Uncertainties |
The Company is required to assess whether the unremitted earnings from its Canadian subsidiaries are considered to be permanently reinvested. Changes in repatriation plans are evaluated based on the specific facts and circumstances to determine how those changes affect the recognition and measurement of income tax liabilities and whether those changes in plans affect Ovintiv’s ongoing assertions related to the indefinite reinvestment of basis differences. If the indefinite reinvestment assertion can no longer be made, a deferred tax liability is generally required for a book-over-tax outside basis difference attributable to the foreign subsidiaries. | | Ovintiv has assessed that its unremitted earnings from its Canadian subsidiaries are permanently reinvested. As at December 31, 2024, the Company has a taxable temporary difference of approximately $137 million in respect of unremitted earnings that continue to be permanently reinvested for which a deferred income tax liability of $7 million has not been recognized and becomes subject to taxation upon the remittance of dividends. The deferred tax liability considers U.S. federal, state and foreign withholding tax implications. |
Contingent Liabilities Ovintiv is subject to various legal proceedings, environmental remediation, commercial and regulatory claims and liabilities that arise in the ordinary course of business. The Company accrues losses when such losses are probable and reasonably estimable, except for contingencies acquired in a business combination which are recorded at fair value at the time of the acquisition. If a loss is probable but the Company cannot estimate a specific amount for that loss, the best estimate within the range is accrued and if no amount is better within the range, the minimum amount is accrued. | | The establishment and evaluation of a contingent loss is based on advice from legal counsel, advisors or consultants and management’s judgment. Actual costs can vary from such estimates for various reasons including: i) differing interpretation of the law, opinions on responsibility and assessments on the amount of damages; ii) changes in status of litigation or claims and information available; iii) differing interpretation of regulations by regulators or the courts; iv) changes in laws and regulations; and v) additional or developing information relating to extent and nature of environmental remediation and technology improvements. The Company monitors known and potential legal, environmental and other claims or contingencies based on available information. Future changes in facts and circumstances not currently foreseeable could result in the actual liabilities recorded exceeding the estimated amounts accrued. |
Certain measures in this document do not have any standardized meaning as prescribed by U.S. GAAP and, therefore, are considered non-GAAP measures. These measures may not be comparable to similar measures presented by other issuers and should not be viewed as a substitute for measures reported under U.S. GAAP. These measures are commonly used in the oil and gas industry and by Ovintiv to provide shareholders and potential investors with additional information regarding the Company’s liquidity and its ability to generate funds to finance its operations. Non-GAAP measures include: Non-GAAP Cash Flow, Debt to Adjusted Capitalization, Debt to EBITDA and Debt to Adjusted EBITDA. Management’s use of these measures is discussed further below.
Cash from Operating Activities and Non-GAAP Cash Flow
Non-GAAP Cash Flow is a non-GAAP measure defined as cash from (used in) operating activities excluding net change in other assets and liabilities, and net change in non-cash working capital.
Management believes this measure is useful to the Company and its investors as a measure of operating and financial performance across periods and against other companies in the industry, and is an indication of the Company’s ability to generate cash to finance capital investment programs, to service debt and to meet other financial obligations. This measure is used, along with other measures, in the calculation of certain performance targets for the Company’s management and employees.
| | | | | | | | |
($ millions, except as indicated) | | 2024 | | | 2023 | |
| | | | | | |
Cash From (Used in) Operating Activities | | $ | 3,721 | | | $ | 4,167 | |
(Add back) deduct: | | | | | | |
Net change in other assets and liabilities | | | (74 | ) | | | (62 | ) |
Net change in non-cash working capital | | | (247 | ) | | | 330 | |
Non-GAAP Cash Flow | | $ | 4,042 | | | $ | 3,899 | |
Debt to Capitalization and Debt to Adjusted Capitalization
Debt to Adjusted Capitalization is a non-GAAP measure which adjusts capitalization for historical ceiling test impairments that were recorded as at December 31, 2011. Management monitors Debt to Adjusted Capitalization as a proxy for the Company’s financial covenant under the Credit Facilities which require Debt to Adjusted Capitalization to be less than 60 percent. Adjusted Capitalization includes debt, total shareholders’ equity and an equity adjustment for cumulative historical ceiling test impairments recorded as at December 31, 2011 in conjunction with the Company’s January 1, 2012 adoption of U.S. GAAP.
| | | | | | | | |
($ millions, except as indicated) | | December 31, 2024 | | | December 31, 2023 | |
| | | | | | |
Debt (Long-Term Debt, including Current Portion) | | $ | 5,453 | | | $ | 5,737 | |
Total Shareholders’ Equity | | | 10,331 | | | | 10,370 | |
Capitalization | | $ | 15,784 | | | $ | 16,107 | |
Debt to Capitalization | | 35% | | | 36% | |
| | | | | | |
Debt (Long-Term Debt, including Current Portion) | | $ | 5,453 | | | $ | 5,737 | |
Total Shareholders’ Equity | | | 10,331 | | | | 10,370 | |
Equity Adjustment for Impairments at December 31, 2011 | | | 7,746 | | | | 7,746 | |
Adjusted Capitalization | | $ | 23,530 | | | $ | 23,853 | |
Debt to Adjusted Capitalization | | 23% | | | 24% | |
Debt to EBITDA and Debt to Adjusted EBITDA
Debt to EBITDA and Debt to Adjusted EBITDA are non-GAAP measures. EBITDA is defined as trailing 12‑month net earnings (loss) before income taxes, depreciation, depletion and amortization, and interest. Adjusted EBITDA is EBITDA adjusted for impairments, accretion of asset retirement obligation, unrealized gains/losses on risk management, foreign exchange gains/losses, gains/losses on divestitures and other gains/losses.
Management believes these measures are useful to the Company and its investors as a measure of financial leverage and the Company’s ability to service its debt and other financial obligations. These measures are used, along with other measures, in the calculation of certain financial performance targets for the Company’s management and employees.
| | | | | | | | |
($ millions, except as indicated) | | December 31, 2024 | | | December 31, 2023 | |
| | | | | | |
Debt (Long-Term Debt, including Current Portion) | | $ | 5,453 | | | $ | 5,737 | |
| | | | | | |
Net Earnings (Loss) | | | 1,125 | | | | 2,085 | |
Add back (deduct): | | | | | | |
Depreciation, depletion and amortization | | | 2,290 | | | | 1,825 | |
Interest | | | 412 | | | | 355 | |
Income tax expense (recovery) | | | 226 | | | | 425 | |
EBITDA | | $ | 4,053 | | | $ | 4,690 | |
Debt to EBITDA (times) | | | 1.3 | | | | 1.2 | |
| | | | | | |
Debt (Long-Term Debt, including Current Portion) | | $ | 5,453 | | | $ | 5,737 | |
| | | | | | |
Net Earnings (Loss) | | | 1,125 | | | | 2,085 | |
Add back (deduct): | | | | | | |
Depreciation, depletion and amortization | | | 2,290 | | | | 1,825 | |
Impairments | | | 450 | | | | - | |
Accretion of asset retirement obligation | | | 19 | | | | 19 | |
Interest | | | 412 | | | | 355 | |
Unrealized (gains) losses on risk management | | | 136 | | | | (194 | ) |
Foreign exchange (gain) loss, net | | | (19 | ) | | | 19 | |
Other (gains) losses, net | | | (165 | ) | | | (20 | ) |
Income tax expense (recovery) | | | 226 | | | | 425 | |
Adjusted EBITDA | | $ | 4,474 | | | $ | 4,514 | |
Debt to Adjusted EBITDA (times) | | | 1.2 | | | | 1.3 | |
Item 7A: Quantitative and Qualitative Disclosures About Market Risk
The primary objective of the following information is to provide forward-looking quantitative and qualitative information about Ovintiv’s potential exposure to market risks. The term “market risk” refers to the Company’s risk of loss arising from adverse changes in oil, NGL and natural gas prices, foreign currency exchange rates and interest rates. The following disclosures are not meant to be precise indicators of expected future losses but rather indicators of reasonably possible losses. The forward-looking information provides indicators of how the Company views and manages ongoing market risk exposures.
COMMODITY PRICE RISK
Commodity price risk arises from the effect fluctuations in future commodity prices, including oil, NGLs and natural gas, may have on future revenues, expenses and cash flows. Realized pricing is primarily driven by the prevailing worldwide price for oil and spot market prices applicable to the Company’s natural gas production. Pricing for oil, NGLs and natural gas production is volatile and unpredictable as discussed in Item 1A. “Risk Factors” of this Annual Report on Form 10-K. To partially mitigate exposure to commodity price risk, the Company may enter into various derivative financial instruments including futures, forwards, swaps, options and costless collars. The use of these derivative instruments is governed under formal policies and is subject to limits established by the Board of Directors and may vary from time to time. Both exchange traded and over-the-counter traded derivative instruments may be subject to margin-deposit requirements, and the Company may be required from time to time to deposit cash or provide letters of credit with exchange brokers or counterparties to satisfy these margin requirements. For additional information relating to the Company’s derivative and financial instruments, see Note 25 under Item 8 of this Annual Report on Form 10-K.
The table below summarizes the sensitivity of the fair value of the Company’s risk management positions to fluctuations in commodity prices, with all other variables held constant. The Company has used a 10 percent variability to assess the potential impact of commodity price changes. Fluctuations in commodity prices could have resulted in unrealized gains (losses) impacting pre-tax net earnings as follows:
| | | | | | | | |
| | December 31, 2024 | |
| | 10% Price | | | 10% Price | |
(US$ millions) | | Increase | | | Decrease | |
Oil price | | $ | (161 | ) | | $ | 164 | |
Natural gas price | | | (18 | ) | | | 16 | |
FOREIGN EXCHANGE RISK
Foreign exchange risk arises from changes in foreign exchange rates that may affect the fair value or future cash flows of the Company’s financial assets or liabilities. The following table presents the foreign exchange rates for the respective years ended December 31.
| | | | | | | | | | | | | |
| | | | | | | | 2024 | | | | 2023 | |
Foreign Exchange Rates (C$ per US$1) | | | | | | | | | | | |
Average | | | | | | | | 1.370 | | | | 1.350 | |
Period End | | | | | | | | 1.439 | | | | 1.323 | |
As Ovintiv operates primarily in the United States and Canada, fluctuations in the exchange rate between the U.S. and Canadian dollars can have a significant effect on the Company’s reported results. The table below summarizes selected foreign exchange impacts on Ovintiv’s financial results when compared to the same periods in the prior years.
| | | | | | | | | | | | | | | | | |
| 2024 | | | 2023 | |
| $ millions | | | $/BOE | | | $ millions | | | $/BOE | |
Increase (Decrease) in: | | | | | | | | | | | | | |
Capital Investment | | $ | (8 | ) | | | | | | $ | (13 | ) | | | |
Transportation and Processing Expense (1) | | | (16 | ) | | $ | (0.07 | ) | | | | (34 | ) | | $ | (0.17 | ) |
Operating Expense (1) | | | (1 | ) | | | (0.01 | ) | | | | (5 | ) | | | (0.02 | ) |
Administrative Expense | | | (1 | ) | | | (0.01 | ) | | | | (9 | ) | | | (0.04 | ) |
Depreciation, Depletion and Amortization (1) | | | (4 | ) | | | (0.02 | ) | | | | (8 | ) | | | (0.04 | ) |
(1)Reflects upstream operations.
Foreign exchange gains and losses also arise when monetary assets and monetary liabilities denominated in foreign currencies are translated and settled, and primarily include:
•U.S. dollar denominated financing debt issued from Canada
•U.S. dollar denominated risk management assets and liabilities held in Canada
•U.S. dollar denominated cash and short-term investments held in Canada
•Foreign denominated intercompany loans
To partially mitigate the effect of foreign exchange fluctuations on future commodity revenues and expenses, the Company may enter into foreign currency derivative contracts. As at December 31, 2024, Ovintiv has entered into $100 million notional U.S. dollar denominated currency swaps at an average exchange rate of C$1.3875 to US$1, which mature monthly throughout the first half of 2025.
To manage the foreign exchange risk associated with purchasing an asset denominated in Canadian dollars, the Company entered into $2.4 billion notional U.S. dollar denominated currency swaps at an average exchange rate of C$1.3825 to US$1. These swaps were settled ahead of the transaction close on January 31, 2025.
As at December 31, 2024, Ovintiv did not have any U.S. dollar denominated financing debt issued from Canada that was subject to foreign exchange exposure.
The table below summarizes the sensitivity to foreign exchange rate fluctuations, with all other variables held constant. The Company has used a 10 percent variability to assess the potential impact from Canadian to U.S. foreign currency exchange rate changes. Fluctuations in foreign currency exchange rates could have resulted in unrealized gains (losses) impacting pre-tax net earnings as follows:
| | | | | | | | |
| | December 31, 2024 | |
(US$ millions) | | 10% Rate
Increase | | | 10% Rate
Decrease | |
Foreign currency exchange | | $ | 131 | | | $ | (160 | ) |
INTEREST RATE RISK
Interest rate risk arises from changes in market interest rates that may affect the fair value or future cash flows from the Company’s financial assets or liabilities. The Company may partially mitigate its exposure to interest rate changes by holding a mix of both fixed and floating rate debt and may also enter into interest rate derivatives to partially mitigate effects of fluctuations in market interest rates.
As at December 31, 2024, Ovintiv did not have any floating rate revolving credit and term loan borrowings outstanding. Accordingly, on a before-tax basis, the sensitivity for each one percent change in interest rates on floating rate revolving credit and term loan borrowings was nil (2023 - $3 million).
Item 8: Financial Statements and Supplementary Data
Management Report
Management’s Responsibility for Consolidated Financial Statements
The accompanying Consolidated Financial Statements of the Company are the responsibility of Management. The Consolidated Financial Statements have been prepared by Management in United States dollars in accordance with generally accepted accounting principles in the United States and include certain estimates that reflect Management’s best judgments.
Ovintiv’s Board of Directors has approved the information contained in the Consolidated Financial Statements. The Board of Directors fulfills its responsibility regarding the financial statements mainly through its Audit Committee, which has a written mandate that complies with the requirements of United States and Canadian securities legislation and the Audit Committee guidelines of the New York Stock Exchange. The Audit Committee meets at least on a quarterly basis.
Management’s Assessment of Internal Control over Financial Reporting
Management is also responsible for establishing and maintaining adequate internal control over the Company’s financial reporting. The internal control system was designed to provide reasonable assurance to the Company’s Management regarding the preparation and presentation of the Consolidated Financial Statements.
Internal control systems, no matter how well designed, have inherent limitations. Therefore, even those systems determined to be effective can provide only reasonable assurance with respect to financial statement preparation and presentation. Also, projections of any evaluation of effectiveness to future periods are subject to the risk that controls may become inadequate because of changes in conditions, or that the degree of compliance with the policies or procedures may deteriorate.
Management has assessed the design and effectiveness of the Company’s internal control over financial reporting as at December 31, 2024. In making its assessment, Management has used the Internal Control - Integrated Framework (2013) issued by the Committee of Sponsoring Organizations of the Treadway Commission to evaluate the effectiveness of the Company’s internal control over financial reporting. Based on our evaluation, Management has concluded that the Company’s internal control over financial reporting was effective as at that date.
PricewaterhouseCoopers LLP, an independent registered public accounting firm, was appointed by a vote of shareholders at the Company’s last annual meeting to audit and provide independent opinions on both the Consolidated Financial Statements and the Company’s internal control over financial reporting as at December 31, 2024, as stated in their Auditor’s Report. PricewaterhouseCoopers LLP has provided such opinions.
| |
/s/ Brendan M. McCracken Brendan M. McCracken President & Chief Executive Officer February 26, 2025 | /s/ Corey D. Code Corey D. Code Executive Vice-President & Chief Financial Officer |
Auditor’s Report
Report of Independent Registered Public Accounting Firm
To the Board of Directors and Shareholders of Ovintiv Inc.
Opinions on the Financial Statements and Internal Control over Financial Reporting
We have audited the accompanying consolidated balance sheets of Ovintiv Inc. and its subsidiaries (the “Company”) as of December 31, 2024 and 2023, and the related consolidated statements of earnings, comprehensive income, changes in shareholders’ equity and cash flows for each of the three years in the period ended December 31, 2024, including the related notes (collectively referred to as the “Consolidated Financial Statements”). We also have audited the Company’s internal control over financial reporting as of December 31, 2024, based on criteria established in Internal Control – Integrated Framework (2013) issued by the Committee of Sponsoring Organizations of the Treadway Commission (“COSO”).
In our opinion, the Consolidated Financial Statements referred to above present fairly, in all material respects, the financial position of the Company as of December 31, 2024 and 2023, and the results of its operations and its cash flows for each of the three years in the period ended December 31, 2024 in conformity with accounting principles generally accepted in the United States of America. Also in our opinion, the Company maintained, in all material respects, effective internal control over financial reporting as of December 31, 2024, based on criteria established in Internal Control – Integrated Framework (2013) issued by the COSO.
Basis for Opinions
The Company’s management is responsible for these Consolidated Financial Statements, for maintaining effective internal control over financial reporting, and for its assessment of the effectiveness of internal control over financial reporting, included in the accompanying Management’s Assessment of Internal Control over Financial Reporting. Our responsibility is to express opinions on the Company’s Consolidated Financial Statements and on the Company’s internal control over financial reporting based on our audits. We are a public accounting firm registered with the Public Company Accounting Oversight Board (United States) (“PCAOB”) and are required to be independent with respect to the Company in accordance with the U.S. federal securities laws and the applicable rules and regulations of the Securities and Exchange Commission (“SEC”) and the PCAOB.
We conducted our audits in accordance with the standards of the PCAOB. Those standards require that we plan and perform the audits to obtain reasonable assurance about whether the Consolidated Financial Statements are free of material misstatement, whether due to error or fraud, and whether effective internal control over financial reporting was maintained in all material respects.
Our audits of the Consolidated Financial Statements included performing procedures to assess the risks of material misstatement of the Consolidated Financial Statements, whether due to error or fraud, and performing procedures that respond to those risks. Such procedures included examining, on a test basis, evidence regarding the amounts and disclosures in the Consolidated Financial Statements. Our audits also included evaluating the accounting principles used and significant estimates made by management, as well as evaluating the overall presentation of the Consolidated Financial Statements. Our audit of internal control over financial reporting included obtaining an understanding of internal control over financial reporting, assessing the risk that a material weakness exists, and testing and evaluating the design and operating effectiveness of internal control based on the assessed risk. Our audits also included performing such other procedures as we considered necessary in the circumstances. We believe that our audits provide a reasonable basis for our opinions.
Definition and Limitations of Internal Control over Financial Reporting
A company’s internal control over financial reporting is a process designed to provide reasonable assurance regarding the reliability of financial reporting and the preparation of financial statements for external purposes in accordance with generally accepted accounting principles. A company’s internal control over financial reporting includes those policies and procedures that (i) pertain to the maintenance of records that, in reasonable detail, accurately and fairly reflect the transactions and dispositions of the assets of the company; (ii) provide reasonable assurance that transactions are recorded as necessary to permit preparation of financial statements in accordance with generally
accepted accounting principles, and that receipts and expenditures of the company are being made only in accordance with authorizations of management and directors of the company; and (iii) provide reasonable assurance regarding prevention or timely detection of unauthorized acquisition, use, or disposition of the company’s assets that could have a material effect on the financial statements.
Because of its inherent limitations, internal control over financial reporting may not prevent or detect misstatements. Also, projections of any evaluation of effectiveness to future periods are subject to the risk that controls may become inadequate because of changes in conditions, or that the degree of compliance with the policies or procedures may deteriorate.
Critical Audit Matters
The critical audit matter communicated below is a matter arising from the current period audit of the Consolidated Financial Statements that was communicated or required to be communicated to the audit committee and that (i) relates to accounts or disclosures that are material to the Consolidated Financial Statements and (ii) involved our especially challenging, subjective, or complex judgments. The communication of critical audit matters does not alter in any way our opinion on the Consolidated Financial Statements, taken as a whole, and we are not, by communicating the critical audit matter below, providing a separate opinion on the critical audit matter or on the accounts or disclosures to which it relates.
The impact of estimates of proved oil, natural gas liquids (“NGL”) and natural gas reserves on net oil and natural gas proved properties
As described in Notes 1 and 10 to the Consolidated Financial Statements, the Company has a net oil and natural gas proved properties balance of $13,418 million as of December 31, 2024 and depreciation, depletion, and amortization (“DD&A”) expense of $2,290 million for the year ended December 31, 2024. The Company also recognized a before-tax non-cash ceiling test impairment of $450 million for the year ended December 31, 2024. The Company uses the full cost method of accounting for its acquisition, exploration, and development activities. Capitalized costs accumulated within each cost center are depleted using the unit-of-production method based on proved oil, NGL and natural gas reserves. Proved oil, NGL and natural gas reserve estimates are key inputs to the Company’s depletion and ceiling test impairment calculations. A ceiling test impairment is recognized in net earnings when the carrying amount of a country cost center exceeds the country cost center ceiling. Management estimates its proved oil, NGL and natural gas reserves according to the definition of proved reserves provided by the SEC. Proved oil, NGL and natural gas reserves are those quantities of oil, NGL and natural gas, which can be estimated with reasonable certainty to be economically producible in future periods from known reservoirs under existing economic conditions, operating methods and government regulations. The assumptions used by management to determine estimates of the proved oil, NGL and natural gas reserves and the ceiling test impairment calculation include the average beginning-of-the-month prices during the 12-month period for the year, future production estimates and future production and development costs. The estimation of reserves is a subjective process. In determining the estimates of the proved oil, NGL and natural gas reserves, management utilizes the services of specialists, specifically internal reservoir engineers.
The principal considerations for our determination that performing procedures relating to the impact of estimates of proved oil, NGL and natural gas reserves on net oil and natural gas proved properties is a critical audit matter are (i) the judgment used by management, including the use of specialists, when developing the estimates of the proved oil, NGL and natural gas reserves and performing the ceiling test impairment calculation and (ii) a high degree of auditor judgment, effort and subjectivity in performing procedures to evaluate the significant assumptions used in developing those estimates including the average beginning-of-the-month prices during the 12-month period for the year, future production estimates and future production and development costs.
Addressing the matter involved performing procedures and evaluating audit evidence in connection with forming our overall opinion on the Consolidated Financial Statements. These procedures included testing the effectiveness of controls relating to management’s estimates of proved oil, NGL and natural gas reserves, the calculation of the full cost ceiling test and the calculation of DD&A expense. These procedures also included, among others, evaluating management’s ceiling test impairment calculation and testing the unit-of-production depletion rate used to calculate depletion expense, testing the completeness, accuracy and relevance of underlying data and evaluating the reasonableness of the significant assumptions used by management in developing these estimates, including assumptions related to the average beginning-of-the-month prices during the 12-month period for the year, future production estimates and future production and development costs. The work of management’s specialists was used
in performing procedures to evaluate the reasonableness of the estimates of proved oil, NGL and natural gas reserves. As a basis for using this work, the specialists’ qualifications were understood and the Company’s relationship with the specialists was assessed. The procedures performed also included evaluating the methods and assumptions used by the specialists, testing the completeness and accuracy of the data used by the specialists and evaluating the specialists’ findings. Evaluating the significant assumptions also involved evaluating whether the assumptions used were reasonable considering the current and past performance of the Company, external market and industry data and whether they were consistent with evidence obtained in other areas of the audit, as applicable.
/s/ PricewaterhouseCoopers LLP
Chartered Professional Accountants
Calgary, Canada
February 26, 2025
We have served as the Company’s or its predecessors’ auditor since 1958.
Consolidated Statement of Earnings
| | | | | | | | | | | | | | |
For the years ended December 31 (US$ millions, except per share amounts) | | 2024 | | | 2023 | | | 2022 | |
| | | | | | | | | | | |
Revenues | | (Note 2) | | | | | | | | | |
Product and service revenues (1) | | (Note 3) | | $ | 7,358 | | | $ | 7,812 | | | $ | 10,183 | |
Sales of purchased product (1) | | (Note 3) | | | 1,585 | | | | 2,849 | | | | 4,080 | |
Gains (losses) on risk management, net | | (Note 25) | | | 135 | | | | 151 | | | | (1,867 | ) |
Sublease revenues | | (Note 14) | | | 74 | | | | 71 | | | | 68 | |
Total Revenues | | | | | 9,152 | | | | 10,883 | | | | 12,464 | |
| | | | | | | | | | | |
Operating Expenses | | (Note 2) | | | | | | | | | |
Production, mineral and other taxes | | | | | 333 | | | | 342 | | | | 415 | |
Transportation and processing | | | | | 1,639 | | | | 1,766 | | | | 1,786 | |
Operating | (Notes 14, 22, 23) | | | 931 | | | | 859 | | | | 802 | |
Purchased product | | | | | 1,546 | | | | 2,815 | | | | 4,055 | |
Depreciation, depletion and amortization | | | | | 2,290 | | | | 1,825 | | | | 1,113 | |
Impairments | | (Note 10) | | | 450 | | | | - | | | | - | |
Accretion of asset retirement obligation | | (Note 17) | | | 19 | | | | 19 | | | | 18 | |
Administrative | (Notes 9, 14, 21, 22, 23) | | | 365 | | | | 393 | | | | 422 | |
Total Operating Expenses | | | | | 7,573 | | | | 8,019 | | | | 8,611 | |
Operating Income (Loss) | | | | | 1,579 | | | | 2,864 | | | | 3,853 | |
Other (Income) Expenses | | | | | | | | | | | |
Interest | | (Notes 4, 15) | | | 412 | | | | 355 | | | | 311 | |
Foreign exchange (gain) loss, net | | (Notes 5, 25) | | | (19 | ) | | | 19 | | | | 15 | |
Other (gains) losses, net | (Notes 8, 23) | | | (165 | ) | | | (20 | ) | | | (33 | ) |
Total Other (Income) Expenses | | | | | 228 | | | | 354 | | | | 293 | |
Net Earnings (Loss) Before Income Tax | | | | | 1,351 | | | | 2,510 | | | | 3,560 | |
Income tax expense (recovery) | | (Note 6) | | | 226 | | | | 425 | | | | (77 | ) |
Net Earnings (Loss) | | | | $ | 1,125 | | | $ | 2,085 | | | $ | 3,637 | |
| | | | | | | | | | | |
Net Earnings (Loss) per Share of Common Stock | | (Note 18) | | | | | | | | | |
Basic | | | | $ | 4.25 | | | $ | 8.02 | | | $ | 14.34 | |
Diluted | | | | | 4.21 | | | | 7.90 | | | | 14.08 | |
Weighted Average Shares of Common Stock Outstanding (millions) | (Note 18) | | | | | | | | | |
Basic | | | | | 264.6 | | | | 259.9 | | | | 253.6 | |
Diluted | | | | | 267.4 | | | | 263.9 | | | | 258.4 | |
(1)See Note 2 regarding the reclassification of the Company’s previously reported Market Optimization segment.
Consolidated Statement of Comprehensive Income
| | | | | | | | | | | | | | |
For the years ended December 31 (US$ millions) | | | | 2024 | | | 2023 | | | 2022 | |
| | | | | | | | | | | |
Net Earnings (Loss) | | | | $ | 1,125 | | | $ | 2,085 | | | $ | 3,637 | |
Other Comprehensive Income (Loss), Net of Tax | | | | | | | | | | | |
Foreign currency translation adjustment | | (Note 19) | | | (269 | ) | | | 63 | | | | (107 | ) |
Pension and other post-employment benefit plans | | (Notes 19, 23) | | | (4 | ) | | | (4 | ) | | | 6 | |
Other Comprehensive Income (Loss) | | | | | (273 | ) | | | 59 | | | | (101 | ) |
Comprehensive Income (Loss) | | | | $ | 852 | | | $ | 2,144 | | | $ | 3,536 | |
See accompanying Notes to Consolidated Financial Statements
Consolidated Balance Sheet
| | | | | | | | | | |
As at December 31 (US$ millions) | | | | 2024 | | | 2023 | |
| | | | | | | | |
Assets | | | | | | | | |
Current Assets | | | | | | | | |
Cash and cash equivalents | | | | $ | 42 | | | $ | 3 | |
Accounts receivable and accrued revenues (net of allowances | | | | | | | | |
of $5 million (2023: $5 million)) | | (Notes 3, 7) | | | 1,183 | | | | 1,442 | |
Risk management | (Notes 24, 25) | | | 108 | | | | 214 | |
Income tax receivable | | (Note 6) | | | 36 | | | | 17 | |
| | | | | 1,369 | | | | 1,676 | |
Property, Plant and Equipment, at cost: | | (Note 10) | | | | | | |
Oil and natural gas properties, based on full cost accounting | | | | | | | | |
Proved properties | | | | | 66,009 | | | | 64,084 | |
Unproved properties | | | | | 764 | | | | 1,486 | |
Other | | | | | 865 | | | | 907 | |
Property, plant and equipment | | | | | 67,638 | | | | 66,477 | |
Less: Accumulated depreciation, depletion and amortization | | | | | (53,274 | ) | | | (51,837 | ) |
Property, plant and equipment, net | | (Note 2) | | | 14,364 | | | | 14,640 | |
Other Assets | (Notes 11, 14) | | | 965 | | | | 1,015 | |
Risk Management | (Notes 24, 25) | | | - | | | | 4 | |
Deferred Income Taxes | | (Note 6) | | | 10 | | | | 53 | |
Goodwill | (Notes 2, 12) | | | 2,546 | | | | 2,599 | |
| | (Note 2) | | $ | 19,254 | | | $ | 19,987 | |
| | | | | | | | |
Liabilities and Shareholders’ Equity | | | | | | | | |
Current Liabilities | | | | | | | | |
Accounts payable and accrued liabilities | | (Note 13) | | $ | 1,883 | | | $ | 2,209 | |
Current portion of operating lease liabilities | | (Note 14) | | | 82 | | | | 87 | |
Income tax payable | | (Note 6) | | | 9 | | | | 232 | |
Risk management | (Notes 24, 25) | | | 107 | | | | - | |
Current portion of long-term debt | | (Note 15) | | | 600 | | | | 284 | |
| | | | | 2,681 | | | | 2,812 | |
Long-Term Debt | | (Note 15) | | | 4,853 | | | | 5,453 | |
Operating Lease Liabilities | | (Note 14) | | | 737 | | | | 832 | |
Other Liabilities and Provisions | (Notes 14, 16) | | | 114 | | | | 132 | |
Risk Management | (Notes 24, 25) | | | 21 | | | | 2 | |
Asset Retirement Obligation | | (Note 17) | | | 315 | | | | 276 | |
Deferred Income Taxes | | (Note 6) | | | 202 | | | | 110 | |
| | | | | 8,923 | | | | 9,617 | |
Commitments and Contingencies | | (Note 27) | | | | | | |
Shareholders’ Equity | | | | | | | | |
Share capital - authorized 775 million shares of stock | | | | | | | | |
2024 issued and outstanding: 260.4 million shares (2023: 271.7 million shares) | (Note 18) | | | 3 | | | | 3 | |
Paid in surplus | (Note 18) | | | 8,045 | | | | 8,620 | |
Retained earnings | | | | | 1,506 | | | | 697 | |
Accumulated other comprehensive income | | (Note 19) | | | 777 | | | | 1,050 | |
Total Shareholders’ Equity | | | | | 10,331 | | | | 10,370 | |
| | | | $ | 19,254 | | | $ | 19,987 | |
See accompanying Notes to Consolidated Financial Statements
Consolidated Statement of Changes in Shareholders’ Equity
| | | | | | | | | | | | | | | | | | | | | | | | | | |
For the year ended December 31, 2024 (US$ millions) | | | | Share
Capital | | | Paid in
Surplus | | Retained
Earnings | | Accumulated
Other
Comprehensive
Income | | Total
Shareholders’
Equity | |
| | | | | | | | | | | | | | | | | |
Balance, December 31, 2023 | | | | $ | 3 | | | $ | 8,620 | | | $ | 697 | |
| $ | 1,050 | | | $ | 10,370 | |
Net Earnings (Loss) | | | | | - | | | | - | | | | 1,125 | | | | - | | | | 1,125 | |
Dividends on Shares of Common Stock ($1.20 per share) | (Note 18) | | | - | | | | - | | | | (316 | ) | | | - | | | | (316 | ) |
Shares of Common Stock Purchased | | (Note 18) | | | - | | | | (597 | ) | | | - | | | | - | | | | (597 | ) |
Equity-Settled Compensation Costs | | | | | - | | | | 22 | | | | - | | | | - | | | | 22 | |
Other Comprehensive Income (Loss) | | (Note 19) | | | - | | | | - | | | | - | | | | (273 | ) | | | (273 | ) |
Balance, December 31, 2024 | | | | $ | 3 | | | $ | 8,045 | | | $ | 1,506 | |
| $ | 777 | | | $ | 10,331 | |
| | | | | | | | | | | | | | | | | | | | | |
For the year ended December 31, 2023 (US$ millions) | | | | Share
Capital | | | Paid in
Surplus | | Retained
Earnings
(Accumulated
Deficit) | | Accumulated
Other
Comprehensive
Income | | Total
Shareholders’
Equity | |
| | | | | | | | | | | | | | | | | |
Balance, December 31, 2022 | | | | $ | 3 | | | $ | 7,776 | | | $ | (1,081 | ) |
| $ | 991 | | | $ | 7,689 | |
Net Earnings (Loss) | | | | | - | | | | - | | | | 2,085 | | | | - | | | | 2,085 | |
Dividends on Shares of Common Stock ($1.15 per share) | (Note 18) | | | - | | | | - | | | | (307 | ) | | | - | | | | (307 | ) |
Shares of Common Stock Purchased | | (Note 18) | | | - | | | | (426 | ) | | | - | | | | - | | | | (426 | ) |
Shares of Common Stock Issued | (Notes 9, 18, 26) | | | - | | | | 1,169 | | | | - | | | | - | | | | 1,169 | |
Equity-Settled Compensation Costs | | | | | - | | | | 101 | | | | - | | | | - | | | | 101 | |
Other Comprehensive Income (Loss) | | (Note 19) | | | - | | | | - | | | | - | | | | 59 | | | | 59 | |
Balance, December 31, 2023 | | | | $ | 3 | | | $ | 8,620 | | | $ | 697 | | | $ | 1,050 | | | $ | 10,370 | |
| | | | | | | | | | | | | | | | | | | | | |
For the year ended December 31, 2022 (US$ millions) | | | | Share
Capital | | | Paid in
Surplus | | Retained
Earnings
(Accumulated
Deficit) | | Accumulated
Other
Comprehensive
Income | | Total
Shareholders’
Equity | |
| | | | | | | | | | | | | | | | | |
Balance, December 31, 2021 | | | | $ | 3 | | | $ | 8,458 | | | $ | (4,479 | ) |
| $ | 1,092 | | | $ | 5,074 | |
Net Earnings (Loss) | | | | | - | | | | - | | | | 3,637 | | | | - | | | | 3,637 | |
Dividends on Shares of Common Stock ($0.95 per share) | (Note 18) | | | - | | | | - | | | | (239 | ) | | | - | | | | (239 | ) |
Shares of Common Stock Purchased | | (Note 18) | | | - | | | | (719 | ) | | | - | | | | - | | | | (719 | ) |
Equity-Settled Compensation Costs | | | | | - | | | | 37 | | | | - | | | | - | | | | 37 | |
Other Comprehensive Income (Loss) | | (Note 19) | | | - | | | | - | | | | - | | | | (101 | ) | | | (101 | ) |
Balance, December 31, 2022 | | | | $ | 3 | | | $ | 7,776 | | | $ | (1,081 | ) | | $ | 991 | | | $ | 7,689 | |
See accompanying Notes to Consolidated Financial Statements
Consolidated Statement of Cash Flows
| | | | | | | | | | | | | | |
For the years ended December 31 (US$ millions) | | | | 2024 | | | 2023 | | | 2022 | |
| | | | | | | | | | | |
Operating Activities | | | | | | | | | | | |
Net earnings (loss) | | | | $ | 1,125 | | | $ | 2,085 | | | $ | 3,637 | |
Depreciation, depletion and amortization | | | | | 2,290 | | | | 1,825 | | | | 1,113 | |
Impairments | | (Note 10) | | | 450 | | | | - | | | | - | |
Accretion of asset retirement obligation | | (Note 17) | | | 19 | | | | 19 | | | | 18 | |
Deferred income taxes | | (Note 6) | | | 144 | | | | 144 | | | | (87 | ) |
Unrealized (gain) loss on risk management | | (Note 25) | | | 136 | | | | (194 | ) | | | (741 | ) |
Unrealized foreign exchange (gain) loss | | (Note 5) | | | 35 | | | | (6 | ) | | | 14 | |
Foreign exchange (gain) loss on settlements | | (Note 5) | | | (42 | ) | | | 6 | | | | 8 | |
Other | | | | | (115 | ) | | | 20 | | | | 148 | |
Net change in other assets and liabilities | | | | | (74 | ) | | | (62 | ) | | | (57 | ) |
Net change in non-cash working capital | | (Note 26) | | | (247 | ) | | | 330 | | | | (187 | ) |
Cash From (Used in) Operating Activities | | | | | 3,721 | | | | 4,167 | | | | 3,866 | |
| | | | | | | | | | | |
Investing Activities | | | | | | | | | | | |
Capital expenditures | | (Note 2) | | | (2,303 | ) | | | (2,744 | ) | | | (1,831 | ) |
Acquisitions | | (Note 8) | | | (205 | ) | | | (277 | ) | | | (286 | ) |
Corporate acquisition, net of cash acquired | | (Note 9) | | | 12 | | | | (3,225 | ) | | | - | |
Proceeds from divestitures | | (Note 8) | | | 163 | | | | 772 | | | | 228 | |
Net change in investments and other | | | | | (124 | ) | | | (45 | ) | | | 103 | |
Cash From (Used in) Investing Activities | | | | | (2,457 | ) | | | (5,519 | ) | | | (1,786 | ) |
| | | | | | | | | | | |
Financing Activities | | | | | | | | | | | |
Net issuance (repayment) of revolving debt | | (Note 15) | | | (284 | ) | | | (109 | ) | | | 393 | |
Issuance of long-term debt | | (Note 15) | | | - | | | | 2,278 | | | | - | |
Repayment of long-term debt | | (Note 15) | | | - | | | | - | | | | (1,634 | ) |
Purchase of shares of common stock | | (Note 18) | | | (597 | ) | | | (426 | ) | | | (719 | ) |
Dividends on shares of common stock | | (Note 18) | | | (316 | ) | | | (307 | ) | | | (239 | ) |
Finance lease payments and other | | | | | (34 | ) | | | (77 | ) | | | (69 | ) |
Cash From (Used in) Financing Activities | | | | | (1,231 | ) | | | 1,359 | | | | (2,268 | ) |
| | | | | | | | | | | |
Foreign Exchange Gain (Loss) on Cash, Cash Equivalents | | | | | | | | | | | |
and Restricted Cash Held in Foreign Currency | | | | | 6 | | | | (9 | ) | | | (2 | ) |
| | | | | | | | | | | |
Increase (Decrease) in Cash, Cash Equivalents and Restricted Cash | | | | | 39 | | | | (2 | ) | | | (190 | ) |
Cash, Cash Equivalents and Restricted Cash, Beginning of Year | | | | | 3 | | | | 5 | | | | 195 | |
Cash, Cash Equivalents and Restricted Cash, End of Year | | | | $ | 42 | | | $ | 3 | | | $ | 5 | |
| | | | | | | | | | | |
Cash, End of Year | | | | $ | 4 | | | $ | 3 | | | $ | 5 | |
Cash Equivalents, End of Year | | | | | 38 | | | | - | | | | - | |
Restricted Cash, End of Year | | | | | - | | | | - | | | | - | |
Cash, Cash Equivalents and Restricted Cash, End of Year | | | | $ | 42 | | | $ | 3 | | | $ | 5 | |
| | | | | | | | | | | |
Supplementary Cash Flow Information | | (Note 26) | | | | | | | | | |
See accompanying Notes to Consolidated Financial Statements
| |
1. | Summary of Significant Accounting Policies |
Ovintiv Inc. and its subsidiaries (collectively, “Ovintiv”) are in the business of the exploration for, the development of, and the production and marketing of oil, NGLs and natural gas.
The Consolidated Financial Statements include the accounts of Ovintiv and are presented in conformity with U.S. GAAP and the rules and regulations of the SEC.
In these Consolidated Financial Statements, unless otherwise indicated, all dollar amounts are expressed in U.S. dollars. Ovintiv’s financial results herein are consolidated and reported in U.S. dollars. All references to US$ or to $ are to United States dollars and references to C$ are to Canadian dollars.
C)PRINCIPLES OF CONSOLIDATION
The Consolidated Financial Statements include the accounts of Ovintiv and entities in which it holds a controlling interest. All intercompany balances and transactions are eliminated on consolidation. Undivided interests in oil and natural gas exploration and production joint ventures and partnerships are consolidated on a proportionate basis. Investments in non-controlled entities over which Ovintiv has the ability to exercise significant influence are accounted for using the equity method.
D)FOREIGN CURRENCY TRANSLATION
Monetary assets and liabilities of the Company that are denominated in foreign currencies are translated at the rates of exchange in effect at the period end date. Any gains or losses are recorded in the Consolidated Statement of Earnings. Foreign currency revenues and expenses are translated at the rates of exchange in effect at the time of the transaction.
Assets and liabilities of foreign operations are translated at period end exchange rates, while the related revenues and expenses are translated using average rates during the period. Translation gains and losses relating to foreign operations are included in accumulated other comprehensive income (“AOCI”). Recognition of Ovintiv’s accumulated translation gains and losses into net earnings occurs upon complete or substantially complete liquidation of the Company’s investment in the foreign operation.
Preparation of the Consolidated Financial Statements in conformity with U.S. GAAP requires Management to make informed estimates and assumptions and use judgments that affect reported amounts of assets and liabilities and disclosures of contingent assets and liabilities at the date of the Consolidated Financial Statements and the reported amounts of revenues and expenses during the period. Such estimates primarily relate to unsettled transactions and events as of the date of the Consolidated Financial Statements. Accordingly, actual results may differ from estimated amounts as future events occur.
Significant items subject to estimates and assumptions are:
•Estimates of proved reserves used for depletion and ceiling test impairment calculations
•Estimated fair value of long-term assets used for impairment calculations
•Fair value of reporting units used for the assessment of goodwill
•Estimates of future taxable earnings used to assess the realizable value of deferred tax assets
•Estimates of incremental borrowing rates and lease terms used in the measurement of right-of-use (“ROU”) assets and lease liabilities
•Fair value of asset retirement costs and related obligations
•Fair value of derivative instruments
•Fair value attributed to assets acquired and liabilities assumed in business combinations
•Tax interpretations, regulations and legislation in the various jurisdictions in which the Company and its subsidiaries operate
•Accruals for long-term performance-based compensation arrangements, including whether or not the performance criteria will be met and measurement of the ultimate payout amount
•Recognized values of pension assets and obligations, as well as the pension costs charged to net earnings, depend on certain actuarial and economic assumptions
•Accruals for legal claims, environmental risks and exposures
F)REVENUES FROM CONTRACTS WITH CUSTOMERS
Revenues from contracts with customers associated with Ovintiv’s oil, NGLs and natural gas, sales of purchased product and third-party processing and gathering are recognized when control of the good or service is transferred to the customer, and title or risk of loss transfers to the customer. Transaction prices are determined at inception of the contract and allocated to the performance obligations identified. Variable consideration is estimated and included in the transaction price, unless the variable consideration is constrained.
For product sales, the performance obligations are satisfied at a point in time when the product is delivered to the customer and control is transferred. Payment from the customer is due when the product is delivered to the custody point. Revenues for product sales are presented on an after-royalties basis. For arrangements to gather and process natural gas for third parties, performance obligations are satisfied over time as the service is provided to the customer. Payment from the customer is due when the customer receives the benefit of the service and the product is delivered to the custody point or plant tailgate. Revenues associated with services provided where Ovintiv acts as agent are recorded on a net basis.
G)PRODUCTION, MINERAL AND OTHER TAXES
Costs paid by Ovintiv for taxes based on production or revenues from oil, NGLs and natural gas are recognized when the product is produced. Costs paid by Ovintiv for taxes on the valuation of upstream assets and reserves are recognized when incurred.
H)TRANSPORTATION AND PROCESSING
Costs paid by Ovintiv for the transportation and processing of oil, NGLs and natural gas are recognized when the product is delivered and the services made available or provided.
Operating costs paid by Ovintiv, net of amounts capitalized, are recognized for oil and natural gas properties in which the Company has a working interest.
The Company sponsors defined contribution and defined benefit plans, providing pension and other post-employment benefits to its employees in the U.S. and Canada. As of January 1, 2003, the defined benefit pension plan was closed to new entrants.
Pension expense for the defined contribution pension plan is recorded as the benefits are earned by the employees covered by the plans. Ovintiv accrues for its obligations under its employee defined benefit plans, net of plan assets. The cost of defined benefit pensions and other post-employment benefits is actuarially determined using the projected benefit method based on length of service and reflects Management’s best estimate of salary escalation, mortality rates, retirement ages of employees and expected future health care costs. The expected return on plan assets is based on historical and projected rates of return for assets in the investment plan portfolio. The actual return is based on the fair value of plan assets. The projected benefit obligation is discounted using the market interest rate on high-quality corporate debt instruments as at the measurement date.
Defined benefit pension plan expenses include the cost of pension benefits earned during the current year, the interest cost on pension obligations, the expected return on pension plan assets, the amortization of adjustments arising from pension plan amendments, the amortization of net prior service costs, and the amortization of the excess of the net
actuarial gains or losses over 10 percent of the greater of the benefit obligation and the fair value of plan assets. Amortization is on a straight-line basis over a period covering the expected average remaining service lives of employees covered by the plans. All components of the net defined periodic benefit cost, excluding the service cost component, are included in other (gains) losses, net.
Ovintiv follows the liability method of accounting for income taxes. Under this method, deferred income taxes are recorded for the effect of any temporary difference between the accounting and income tax basis of an asset or liability, using the enacted income tax rates and laws expected to apply when the assets are realized and liabilities are settled. Current income taxes are measured at the amount expected to be recoverable from or payable to the taxing authorities based on the income tax rates and laws enacted at the end of the reporting period. The effect of a change in the enacted tax rates or laws is recognized in net earnings in the period of enactment. Income taxes are recognized in net earnings except to the extent that they relate to items recognized directly in shareholders’ equity, in which case the income taxes are recognized directly in shareholders’ equity.
Deferred income tax assets are assessed routinely for realizability. If it is more likely than not that deferred tax assets will not be realized, a valuation allowance is recorded to reduce the deferred tax assets. Ovintiv considers available positive and negative evidence when assessing the realizability of deferred tax assets including historic and expected future taxable earnings, available tax planning strategies and carry forward periods. The assumptions used in determining expected future taxable earnings are consistent with those used in the goodwill impairment assessment.
Ovintiv recognizes the financial statement effects of a tax position when it is more likely than not, based on the technical merits, that the position will be sustained upon examination by a taxing authority. A recognized tax position is initially and subsequently measured as the largest amount of tax benefit that is greater than 50 percent likely of being realized upon settlement with a taxing authority. Liabilities for unrecognized tax benefits that are not expected to be settled within the next 12 months are included in other liabilities and provisions. Interest related to unrecognized tax benefits is recognized in interest expense.
L)EARNINGS PER SHARE AMOUNTS
Basic net earnings per share of common stock is computed by dividing the net earnings by the weighted average number of shares of common stock outstanding during the period. Diluted net earnings per share of common stock is calculated giving effect to the potential dilution that would occur if stock options were exercised or other contracts to issue shares of common stock were exercised, fully vested, or converted to shares of common stock. The treasury stock method is used to determine the dilutive effect of stock options and other dilutive instruments. The treasury stock method assumes that proceeds received from the exercise of in-the-money stock options and other dilutive instruments are used to repurchase shares of common stock at the average market price.
M)CASH AND CASH EQUIVALENTS
Cash and cash equivalents include cash on hand and short-term investments, such as money market deposits or similar type instruments, with a maturity of three months or less when purchased. Outstanding disbursements issued in excess of applicable bank account balances are excluded from cash and cash equivalents and are recorded in accounts payable and accrued liabilities.
N)PROPERTY, PLANT AND EQUIPMENT
UPSTREAM
Ovintiv uses the full cost method of accounting for its acquisition, exploration and development activities. Accordingly, all costs directly associated with the acquisition of, the exploration for, and the development of oil, NGLs and natural gas reserves, including costs of undeveloped leaseholds, dry holes and related equipment, are capitalized on a country-by-country cost center basis. Capitalized costs exclude costs relating to production, general overhead or similar activities.
Capitalized costs accumulated within each cost center are depleted using the unit-of-production method based on proved reserves. Depletion is calculated using the capitalized costs, including estimated retirement costs, plus the undiscounted future expenditures, based on current costs, to be incurred in developing proved reserves.
Costs associated with unproved properties are excluded from the depletion calculation until it is determined that proved reserves are attributable or impairment has occurred. Unproved properties are assessed separately for impairment on a quarterly basis. Costs that have been impaired are included in the costs subject to depletion within the full cost pool.
Under the full cost method of accounting, the carrying amount of Ovintiv’s oil and natural gas properties within each of the USA and Canadian country cost centers is subject to a ceiling test at the end of each quarter. A ceiling test impairment is recognized in net earnings when the carrying amount of the country cost center exceeds the respective country cost center’s ceiling. The carrying amount of a country cost center includes capitalized costs of proved oil and natural gas properties, net of accumulated depletion and the related deferred income taxes.
The country cost center ceiling is the sum of the estimated after-tax future net cash flows from proved reserves, using the 12‑month average trailing prices and unescalated future development and production costs, discounted at 10 percent, plus unproved property costs. The 12-month average trailing price is calculated as the average of the price on the first day of each month within the trailing 12-month period. Any excess of the carrying amount over the calculated ceiling amount is recognized as an impairment in net earnings.
Proceeds from the divestiture of properties are normally deducted from the full cost pool without recognition of a gain or loss unless the deduction significantly alters the relationship between capitalized costs and proved reserves in the cost center, in which case a gain or loss is recognized in net earnings. Generally, a gain or loss on a divestiture would be recognized when 25 percent or more of the Company’s proved reserves quantities are sold in a particular country cost center. For divestitures that result in the recognition of a gain or loss on the sale and constitute a business, goodwill is allocated to the divestiture.
CORPORATE
Costs associated with office furniture, fixtures, leasehold improvements, information technology and aircraft are carried at cost and depreciated on a straight-line basis over the estimated service lives of the assets, which range from three to 25 years. Land is carried at cost.
O)CAPITALIZATION OF COSTS
Expenditures related to renewals or betterments that improve the productive capacity or extend the life of an asset are capitalized. Maintenance and repairs are expensed as incurred. Interest on borrowings associated with development projects is capitalized during the development phase.
Business combinations are accounted for using the acquisition method. The acquired identifiable net assets are measured at fair value at the date of acquisition. Deferred taxes are recognized for any differences between the fair value of net assets acquired and the related tax bases. Any excess of the purchase price over the fair value of the net assets acquired is recognized as goodwill. Any deficiency of the purchase price below the fair value of the net assets acquired is recorded as a gain in net earnings. Associated transaction costs are expensed when incurred.
Goodwill represents the excess of purchase price over fair value of net assets acquired and is assessed for impairment at least annually at December 31. Goodwill and all other assets and liabilities are allocated to reporting units, which are Ovintiv’s country cost centers. To assess impairment, the carrying amount of each reporting unit is determined and compared to the fair value of each respective reporting unit. Any excess of the carrying value of the reporting unit, including goodwill, over its fair value is recognized as an impairment and charged to net earnings. The impairment charge measured is limited to the total amount of goodwill allocated to that reporting unit. Subsequent measurement of goodwill is at cost less any accumulated impairments.
R)IMPAIRMENT OF LONG-TERM ASSETS
The carrying value of long-term assets, excluding goodwill and upstream assets included in property, plant and equipment, is assessed for impairment when indicators suggest that the carrying value of an asset or asset group may not be recoverable. Individual assets are grouped for impairment purposes at the lowest level for which there are identifiable cashflows that are largely independent of the cashflows of other groups of assets. If the carrying amount exceeds the sum of the undiscounted cash flows expected to result from the continued use and eventual disposition of the asset or asset group, an impairment is recognized for the excess of the carrying amount over its estimated fair value.
S)ASSET RETIREMENT OBLIGATION
Asset retirement obligations are those legal obligations where the Company will be required to retire tangible long-lived assets such as producing well sites, processing plants, and restoring land at the end of oil and gas production operations. The asset retirement obligation is initially measured at its fair value and recorded as a liability with an offsetting retirement cost that is capitalized as part of the related long-lived asset in the Consolidated Balance Sheet. The estimated fair value is measured by reference to the expected future cash flows required to satisfy the obligation, discounted at the Company’s credit-adjusted risk-free rate. Changes in the estimated obligation resulting from revisions to estimated timing or amount of future cash flows are recognized as a change in the asset retirement obligation and the related asset retirement cost.
Amortization of asset retirement costs are included in depreciation, depletion and amortization in the Consolidated Statement of Earnings. Increases in the asset retirement obligations resulting from the passage of time are recorded as accretion of asset retirement obligation in the Consolidated Statement of Earnings. Actual expenditures incurred are charged against the accumulated asset retirement obligation.
T)STOCK-BASED COMPENSATION
Stock-based compensation arrangements are accounted for at fair value. Fair values are determined using observable share prices and/or pricing models such as the Black-Scholes-Merton option-pricing model. For equity-settled stock-based compensation plans, fair values are determined at the grant date and are recognized over the vesting period as compensation costs with a corresponding credit to shareholders’ equity. For cash-settled stock-based compensation plans, fair values are determined at each reporting date and periodic changes are recognized as compensation costs, with a corresponding change to liabilities. Compensation costs are recognized over the vesting period using the accelerated attribution method for awards with a graded vesting feature. Forfeitures are estimated based on the Company’s historical turnover rates.
Leases for the right to use an asset are classified as either an operating or finance lease. Upon commencement of the lease, a ROU asset and corresponding lease liability are recognized in the Consolidated Balance Sheet for all operating and finance leases. Ovintiv has elected the short-term lease exemption, which does not require a ROU asset or lease liability to be recognized in the Consolidated Balance Sheet when the lease term is 12 months or less and does not include an option to purchase the underlying asset that the lessee is reasonably certain to exercise.
Upon commencement of the lease, ROU assets are recognized based on the initial measurement of the lease liability and adjusted for any lease payments made before the commencement date of the lease, less any lease incentives and including any initial direct costs incurred. Lease liabilities are initially measured at the present value of future minimum lease payments over the lease term. The discount rate used to determine the present value is the rate implicit in the lease unless that rate cannot be determined, in which case Ovintiv’s incremental borrowing rate is used.
Rights to extend or terminate a lease are included in the lease term when there is reasonable certainty the right will be exercised. Factors used to assess reasonable certainty of rights to extend or terminate a lease include current and forecasted drilling plans, anticipated changes in development strategies, historical practice in extending similar contracts and current market conditions.
Operating lease ROU assets and liabilities are subsequently measured at the present value of the lease payments not yet paid and discounted at the initial discount rate at commencement of the lease, less any impairments to the ROU
asset. Operating lease expense and revenue from subleases are recognized in the Consolidated Statement of Earnings on a straight-line basis over the lease term. Finance lease ROU assets are amortized on a straight-line basis over the estimated useful life of the asset if the lessee is reasonably certain to exercise a purchase option or ownership of the leased asset transfers at the end of the lease term, otherwise the leased assets are amortized over the lease term. Amortization of finance lease ROU assets is included in depreciation, depletion and amortization in the Consolidated Statement of Earnings.
Variable lease payments include changes in index rates, mobilization and demobilization costs related to oil and gas equipment and certain costs associated with office and building leases. Variable lease payments are recognized when incurred. Lease and non-lease components are accounted for as a single lease component for compression, coolers and office subleases.
V)FAIR VALUE MEASUREMENTS
Fair value is defined as the price that would be received to sell an asset or paid to transfer a liability in an orderly transaction between market participants at the measurement date. Valuation techniques include the market, income and cost approach. The market approach uses information generated by market transactions involving identical or comparable assets or liabilities; the income approach converts estimated future cash flows to a present value; the cost approach is based on the amount that currently would be required to replace an asset.
Inputs used in determining fair value are characterized according to a hierarchy that prioritizes those inputs based on the degree to which they are observable. The three input levels of the fair value hierarchy are as follows:
•Level 1 - Inputs represent quoted prices in active markets for identical assets or liabilities, such as exchange-traded commodity derivatives.
•Level 2 - Inputs other than quoted prices included within Level 1 that are observable for the asset or liability, either directly or indirectly, such as quoted market prices for similar assets or liabilities in active markets or other market corroborated inputs.
•Level 3 - Inputs that are not observable from objective sources, such as forward prices supported by little or no market activity or internally developed estimates of future cash flows used in a present value model.
In determining fair value, the Company utilizes the most observable inputs available. If a fair value measurement reflects inputs at multiple levels within the hierarchy, the fair value measurement is characterized based on the lowest level of input that is significant to the fair value measurement.
The carrying amount of cash and cash equivalents, accounts receivable and accrued revenues, and accounts payable and accrued liabilities reported in the Consolidated Balance Sheet approximates fair value. The fair value of long-term debt is disclosed in Note 15. Fair value information related to pension plan assets is included in Note 23. Recurring fair value measurements are performed for risk management assets and liabilities and other derivative contracts as discussed in Note 24.
Certain non-financial assets and liabilities are initially measured at fair value, such as asset retirement obligations and assets and liabilities acquired in business combinations or certain non-monetary exchange transactions.
W)RISK MANAGEMENT ASSETS AND LIABILITIES
Risk management assets and liabilities are derivative financial instruments used by Ovintiv to manage economic exposure to market risks relating to commodity prices, foreign currency exchange rates and interest rates. The use of these derivative instruments is governed under formal policies and is subject to limits established by the Board of Directors.
Derivative instruments that do not qualify for the normal purchases and sales exemption are measured at fair value with changes in fair value recognized in net earnings. The fair values recorded in the Consolidated Balance Sheet reflect netting the asset and liability positions where counterparty master netting arrangements contain provisions for net settlement.
Realized gains or losses from financial derivatives related to oil, NGLs and natural gas commodity prices are presented in revenues as the contracts are settled. Realized gains or losses from foreign currency exchange swaps are presented in foreign exchange (gain) loss as the contracts are settled. Realized gains or losses recognized from other derivative contracts are presented in revenues as the obligations are settled.
Unrealized gains and losses are recognized based on the changes in fair value of the contracts and are presented in revenues and foreign exchange (gain) loss.
X)COMMITMENTS AND CONTINGENCIES
Liabilities for loss contingencies arising from claims, assessments, litigation, environmental and other sources are recorded when it is probable that a liability has been incurred and the amount can be reasonably estimated. These accruals are adjusted as additional information becomes available or circumstances change.
Y)RECENT ACCOUNTING PRONOUNCEMENTS
Changes in Accounting Policies and Practices
•On January 1, 2024, Ovintiv adopted ASU 2023-07 “Improvements to Reportable Segment Disclosures”, issued by the FASB. The amendments enhance annual disclosure requirements about significant segment expenses that are regularly provided to the Chief Operating Decision Makers (“CODMs”) and included within reported measures of segment profit or loss. The amendments do not change how an entity identifies its operating segments. The amendments have been applied retrospectively to all prior periods presented in these annual disclosures and did not have a material impact on the Company’s Consolidated Financial Statements. In addition, these annual disclosures will be presented in all future interim periods beginning in the first quarter of 2025.
New Standards Issued Not Yet Adopted
•As of January 1, 2025, Ovintiv will be required to adopt ASU 2023-09 “Improvements to Income Tax Disclosures”. The standard requires disaggregated information about the Company’s effective tax rate reconciliation as well as information on income taxes paid. The amendment requires the tabular rate reconciliation to be presented using both percentages and amounts, with additional separate disclosure for any reconciling items within certain categories equal to or greater than five percent of net earnings or loss before income tax and the applicable statutory federal income tax rate. The amendment also requires the disaggregation of income taxes paid by federal, state, and foreign jurisdictions, as well as additional disaggregated information on income taxes paid to an individual jurisdiction equal to or greater than five percent of total income taxes paid. Amendments will be applied prospectively at the date of adoption and are not expected to have a material impact on the Company’s Consolidated Financial Statements.
•As of January 1, 2027, Ovintiv will be required to adopt ASU 2024-03 “Disaggregation of Income Statement Expenses” for annual disclosures with interim disclosures required beginning in the first quarter of 2028. The new standard requires that an entity disclose tabular information about certain expenses including, but not limited to, purchases of inventory, employee compensation, and depreciation, depletion, and amortization expense that are presented within expense line captions reported on the statement of earnings. A qualitative description of the remaining other amounts within those expense line captions will be required. The Company will also be required to determine and disclose its definition of selling expenses and the total amount of selling expenses. The amendments are to be applied prospectively, with the option for retrospective application, and are not expected to have a material impact on the Company’s Consolidated Financial Statements.
Ovintiv’s exploration and production activities are subdivided into two geographic segments, including the USA Operations and Canadian Operations. These segments’ activities also include third-party purchases and sales of product to provide operational flexibility and cost mitigation for transportation commitments, product type, delivery points and customer diversification. The Company considers sales of purchased commodities as ancillary to its oil and gas development, exploration and producing activities and manages them to support such activities. In addition, the Company has a single, company-wide management team that allocates capital resources to maximize profitability and measures financial performance as a single enterprise.
Corporate and Other mainly includes unrealized gains or losses recorded on derivative financial instruments. Once the instruments are settled, the realized gains and losses are recorded in the reporting segment to which the derivative instruments relate. Corporate and Other also includes amounts related to sublease rentals and administrative costs not allocated to the operating segments.
During the year ended December 31, 2024, Ovintiv reassessed its reportable segments and determined the CODMs no longer separately review the Market Optimization operational results and activities. Accordingly, Ovintiv’s Market Optimization segment was reclassified to present the Company’s market optimization activities in their respective USA and Canadian operating segments, which they support. The Market Optimization revenues, which were previously included in Product and service revenues, are presented as Sales of purchased product in the Consolidated Statement of Earnings. In conjunction with this segment reclassification, intercompany marketing fees formerly transacted between operating segments are now excluded from Product and service revenues, and Sales of purchased product. Prior periods have been reclassified for comparative purposes. Additionally, intersegment eliminations are no longer required in this Segmented Information note as marketing activities are now reflected in the corresponding operating segment they relate to.
The tables below summarize the results of operations and total assets by segment that are provided to the CODMs which have been identified as the Company’s President & Chief Executive Officer, Executive Vice President & Chief Operating Officer, and the Executive Vice President & Chief Financial Officer. The CODMs evaluate the performance of each of the reportable segments based on Operating Income (Loss) which is also used to assess performance and allocate capital for these segments.
The Company evaluates the effects of debt financing, interest expense and/or interest income, foreign exchange gains (losses) and other gains (losses) at a consolidated level.
Results of Operations
Segment Information
| | | | | | | | | | | | | | | | | | | | | | | | | | | | | | |
| | | | | | | | USA Operations | | | Canadian Operations | |
For the years ended December 31 | | | | | | | | 2024 | | | 2023 | | | 2022 | | | 2024 | | | 2023 | | | 2022 | |
| | | | | | | | | | | | | | | | | | | | | | | | |
Revenues | | | | | | | | | | | | | | | | | | | | | | | | |
Product and service revenues (1) (2) | | | | | | | | $ | 5,612 | | | $ | 5,586 | | | $ | 6,696 | | | $ | 1,746 | | | $ | 2,226 | | | $ | 3,487 | |
Sales of purchased product (1) | | | | | | | | | 1,449 | | | | 2,590 | | | | 3,650 | | | | 136 | | | | 259 | | | | 430 | |
Gains (losses) on risk management, net | | | | | | | | | 119 | | | | 10 | | | | (1,123 | ) | | | 152 | | | | (53 | ) | | | (1,485 | ) |
Sublease revenues | | | | | | | | | - | | | | - | | | | - | | | | - | | | | - | | | | - | |
Total Revenues | | | | | | | | | 7,180 | | | | 8,186 | | | | 9,223 | | | | 2,034 | | | | 2,432 | | | | 2,432 | |
| | | | | | | | | | | | | | | | | | | | | | | | |
Operating Expenses | | | | | | | | | | | | | | | | | | | | | | | | |
Production, mineral and other taxes | | | | | | | | | 319 | | | | 327 | | | | 401 | | | | 14 | | | | 15 | | | | 14 | |
Transportation and processing (1) | | | | | | | | | 560 | | | | 683 | | | | 765 | | | | 1,079 | | | | 1,083 | | | | 1,021 | |
Operating (1) | | | | | | | | | 810 | | | | 757 | | | | 665 | | | | 121 | | | | 102 | | | | 137 | |
Purchased product (1) | | | | | | | | | 1,446 | | | | 2,587 | | | | 3,645 | | | | 100 | | | | 228 | | | | 410 | |
Depreciation, depletion and amortization | | | | | | | | | 1,971 | | | | 1,519 | | | | 861 | | | | 297 | | | | 286 | | | | 235 | |
Impairments | | | | | | | | | - | | | | - | | | | - | | | | 450 | | | | - | | | | - | |
Total Operating Expenses | | | | | | | | | 5,106 | | | | 5,873 | | | | 6,337 | | | | 2,061 | | | | 1,714 | | | | 1,817 | |
Operating Income (Loss) | | | | | | | | $ | 2,074 | | | $ | 2,313 | | | $ | 2,886 | | | $ | (27 | ) | | $ | 718 | | | $ | 615 | |
| | | | | | | | | | | | | | | | | | | | | | | | |
| | | | | | | | Corporate & Other | | | Consolidated | |
| | | | | | | | 2024 | | | 2023 | | | 2022 | | | 2024 | | | 2023 | | | 2022 | |
| | | | | | | | | | | | | | | | | | | | | | | | |
Revenues | | | | | | | | | | | | | | | | | | | | | | | | |
Product and service revenues (1) (2) | | | | | | | | $ | - | | | $ | - | | | $ | - | | | $ | 7,358 | | | $ | 7,812 | | | $ | 10,183 | |
Sales of purchased product (1) | | | | | | | | | - | | | | - | | | | - | | | | 1,585 | | | | 2,849 | | | | 4,080 | |
Gains (losses) on risk management, net | | | | | | | | | (136 | ) | | | 194 | | | | 741 | | | | 135 | | | | 151 | | | | (1,867 | ) |
Sublease revenues | | | | | | | | | 74 | | | | 71 | | | | 68 | | | | 74 | | | | 71 | | | | 68 | |
Total Revenues | | | | | | | | | (62 | ) | | | 265 | | | | 809 | | | | 9,152 | | | | 10,883 | | | | 12,464 | |
| | | | | | | | | | | | | | | | | | | | | | | | |
Operating Expenses | | | | | | | | | | | | | | | | | | | | | | | | |
Production, mineral and other taxes | | | | | | | | | - | | | | - | | | | - | | | | 333 | | | | 342 | | | | 415 | |
Transportation and processing (1) | | | | | | | | | - | | | | - | | | | - | | | | 1,639 | | | | 1,766 | | | | 1,786 | |
Operating (1) | | | | | | | | | - | | | | - | | | | - | | | | 931 | | | | 859 | | | | 802 | |
Purchased product (1) | | | | | | | | | - | | | | - | | | | - | | | | 1,546 | | | | 2,815 | | | | 4,055 | |
Depreciation, depletion and amortization | | | | | | | | | 22 | | | | 20 | | | | 17 | | | | 2,290 | | | | 1,825 | | | | 1,113 | |
Impairments | | | | | | | | | - | | | | - | | | | - | | | | 450 | | | | - | | | | - | |
Accretion of asset retirement obligation | | | | | | | | | 19 | | | | 19 | | | | 18 | | | | 19 | | | | 19 | | | | 18 | |
Administrative | | | | | | | | | 365 | | | | 393 | | | | 422 | | | | 365 | | | | 393 | | | | 422 | |
Total Operating Expenses | | | | | | | | | 406 | | | | 432 | | | | 457 | | | | 7,573 | | | | 8,019 | | | | 8,611 | |
Operating Income (Loss) | | | | | | | | $ | (468 | ) | | $ | (167 | ) | | $ | 352 | | | | 1,579 | | | | 2,864 | | | | 3,853 | |
| | | | | | | | | | | | | | | | | | | | | | | | |
Other (Income) Expenses | | | | | | | | | | | | | | | | | | | | | | | | |
Interest | | | | | | | | | | | | | | | | | | 412 | | | | 355 | | | | 311 | |
Foreign exchange (gain) loss, net | | | | | | | | | | | | | | | | | | (19 | ) | | | 19 | | | | 15 | |
Other (gains) losses, net | | | | | | | | | | | | | | | | | | (165 | ) | | | (20 | ) | | | (33 | ) |
Total Other (Income) Expenses | | | | | | | | | | | | | | | | | | 228 | | | | 354 | | | | 293 | |
Net Earnings (Loss) Before Income Tax | | | | | | | | | | | | | | | | | | 1,351 | | | | 2,510 | | | | 3,560 | |
Income tax expense (recovery) | | | | | | | | | | | | | | | | | | 226 | | | | 425 | | | | (77 | ) |
Net Earnings (Loss) | | | | | | | | | | | | | | | | | $ | 1,125 | | | $ | 2,085 | | | $ | 3,637 | |
(1)See above regarding the reclassification of the Company’s previously reported Market Optimization segment.
(2)Product and service revenues are split by product in Note 3.
Corporate & Other Revenues by Geographic Region
| | | | | | | | | | | | | | | | | | | | | | | | | | | | | | | | | | | | |
| | United States | | | Canada | | | Total | |
For the years ended December 31 | 2024 | | | 2023 | | | 2022 | | | 2024 | | | 2023 | | | 2022 | | | 2024 | | | 2023 | | | 2022 | |
| | | | | | | | | | | | | | | | | | | | | | | | | | | |
Corporate & Other Revenues | | | | | | | | | | | | | | | | | | | | | | | | | | | |
Gains (losses) on risk | | | | | | | | | | | | | | | | | | | | | | | | | | | |
management, net | | $ | (133 | ) | | $ | 94 | | | $ | 327 | | | $ | (3 | ) | | $ | 100 | | | $ | 414 | | | $ | (136 | ) | | $ | 194 | | | $ | 741 | |
Sublease revenues | | | 8 | | | | 8 | | | | 10 | | | | 66 | | | | 63 | | | | 58 | | | | 74 | | | | 71 | | | | 68 | |
Total Corporate &
Other Revenues | | $ | (125 | ) | | $ | 102 | | | $ | 337 | | | $ | 63 | | | $ | 163 | | | $ | 472 | | | $ | (62 | ) | | $ | 265 | | | $ | 809 | |
Major Customers
In connection with the marketing and sale of Ovintiv’s own and purchased oil, NGLs and natural gas for the year ended December 31, 2024, the Company had one customer which individually accounted for more than 10 percent of Ovintiv’s product revenues. Sales to this customer, secured by a financial institution with an investment grade credit rating, totaled approximately $1,997 million which comprised $1,989 million in the United States and $8 million in Canada (2023 - one customer with sales of approximately $1,976 million; 2022 - one customer with sales of approximately $2,231 million).
Capital Expenditures by Segment
| | | | | | | | | | | | | | | | | | |
For the years ended December 31 | | | | | | | | 2024 | | | 2023 | | | 2022 | |
| | | | | | | | | | | | | | | |
USA Operations | | | | | | | | $ | 1,868 | | | $ | 2,189 | | | $ | 1,493 | |
Canadian Operations | | | | | | | | | 428 | | | | 549 | | | | 334 | |
Corporate & Other | | | | | | | | | 7 | | | | 6 | | | | 4 | |
| | | | | | | | $ | 2,303 | | | $ | 2,744 | | | $ | 1,831 | |
Goodwill, Property, Plant and Equipment and Total Assets by Segment
| | | | | | | | | | | | | | | | | | | | | | | | |
| | Goodwill | | | Property, Plant and Equipment | | | Total Assets | |
As at December 31 | | 2024 | | | 2023 | | | 2024 | | | 2023 | | | 2024 | | | 2023 | |
| | | | | | | | | | | | | | | | | | |
USA Operations (1) | | $ | 1,938 | | | $ | 1,938 | | | $ | 13,263 | | | $ | 13,129 | | | $ | 16,233 | | | $ | 16,248 | |
Canadian Operations (1) | | | 608 | | | | 661 | | | | 970 | | | | 1,357 | | | | 1,917 | | | | 2,421 | |
Corporate & Other | | | - | | | | - | | | | 131 | | | | 154 | | | | 1,104 | | | | 1,318 | |
| | $ | 2,546 | | | $ | 2,599 | | | $ | 14,364 | | | $ | 14,640 | | | $ | 19,254 | | | $ | 19,987 | |
(1)See above regarding the reclassification of the Company’s previously reported Market Optimization segment.
Goodwill, Property, Plant and Equipment and Total Assets by Geographic Region
| | | | | | | | | | | | | | | | | | | | | | | | |
| | Goodwill | | | Property, Plant and Equipment | | | Total Assets | |
As at December 31 | | 2024 | | | 2023 | | | 2024 | | | 2023 | | | 2024 | | | 2023 | |
| | | | | | | | | | | | | | | | | | |
United States | | $ | 1,938 | | | $ | 1,938 | | | $ | 13,302 | | | $ | 13,178 | | | $ | 16,320 | | | $ | 16,500 | |
Canada | | | 608 | | | | 661 | | | | 1,062 | | | | 1,462 | | | | 2,934 | | | | 3,487 | |
| | $ | 2,546 | | | $ | 2,599 | | | $ | 14,364 | | | $ | 14,640 | | | $ | 19,254 | | | $ | 19,987 | |
| |
3. | Revenues from Contracts with Customers |
The following table summarizes Ovintiv’s revenues from contracts with customers.
Revenues
| | | | | | | | | | | | | | | | | | | | | | | | | | | | | | |
| | | | | | | | USA Operations | | | Canadian Operations | |
For the years ended December 31 | | | | | | | | 2024 | | | 2023 | | | 2022 | | | 2024 | | | 2023 | | | 2022 | |
| | | | | | | | | | | | | | | | | | | | | | | | |
Revenues from Customers | | | | | | | | | | | | | | | | | | | | | | | | |
Product revenues (1) | | | | | | | | | | | | | | | | | | | | | | | | |
Oil | | | | | | | | $ | 4,549 | | | $ | 4,444 | | | $ | 4,537 | | | $ | 10 | | | $ | 3 | | | $ | 3 | |
NGLs | | | | | | | | | 740 | | | | 679 | | | | 1,049 | | | | 992 | | | | 1,029 | | | | 1,363 | |
Natural gas | | | | | | | | | 318 | | | | 458 | | | | 1,107 | | | | 741 | | | | 1,192 | | | | 2,119 | |
Sales of purchased product (1) | | | | | | | | | 1,449 | | | | 2,590 | | | | 3,650 | | | | 136 | | | | 259 | | | | 430 | |
Service revenues | | | | | | | | | | | | | | | | | | | | | | | | |
Gathering and processing | | | | | | | | | 5 | | | | 5 | | | | 3 | | | | 3 | | | | 2 | | | | 2 | |
| | | | | | | | $ | 7,061 | | | $ | 8,176 | | | $ | 10,346 | | | $ | 1,882 | | | $ | 2,485 | | | $ | 3,917 | |
| | | | | | | | | | | | | | | | | | | | | | | | |
| | | | Corporate & Other | | | Consolidated | |
| | | | | | | | 2024 | | | 2023 | | | 2022 | | | 2024 | | | 2023 | | | 2022 | |
| | | | | | | | | | | | | | | | | | | | | | | | |
Revenues from Customers | | | | | | | | | | | | | | | | | | | | | | | | |
Product revenues (1) | | | | | | | | | | | | | | | | | | | | | | | | |
Oil | | | | | | | | $ | - | | | $ | - | | | $ | - | | | $ | 4,559 | | | $ | 4,447 | | | $ | 4,540 | |
NGLs | | | | | | | | | - | | | | - | | | | - | | | | 1,732 | | | | 1,708 | | | | 2,412 | |
Natural gas | | | | | | | | | - | | | | - | | | | - | | | | 1,059 | | | | 1,650 | | | | 3,226 | |
Sales of purchased product (1) | | | | | | | | | - | | | | - | | | | - | | | | 1,585 | | | | 2,849 | | | | 4,080 | |
Service revenues | | | | | | | | | | | | | | | | | | | | | | | | |
Gathering and processing | | | | | | | | | - | | | | - | | | | - | | | | 8 | | | | 7 | | | | 5 | |
| | | | | | | | $ | - | | | $ | - | | | $ | - | | | $ | 8,943 | | | $ | 10,661 | | | $ | 14,263 | |
(1)See Note 2 regarding the reclassification of the Company’s previously reported Market Optimization segment.
The Company’s revenues from contracts with customers consists of product sales including oil, NGLs and natural gas, sales of purchased product, as well as the provision of gathering and processing services to third parties. Ovintiv had no contract asset or liability balances during the periods presented. As at December 31, 2024, receivables and accrued revenues from contracts with customers were $921 million (2023 - $1,070 million).
Ovintiv’s product sales are sold under short-term contracts with terms that are less than one year at either fixed or market index prices or under long-term contracts exceeding one year at market index prices.
The Company’s gathering and processing services are provided on an interruptible basis with transaction prices that are for fixed prices and/or variable consideration. Variable consideration received is related to recovery of plant operating costs or escalation of the fixed price based on a consumer price index. As the service contracts are interruptible, with service provided on an “as available” basis, there are no unsatisfied performance obligations remaining at December 31, 2024.
As at December 31, 2024, all remaining performance obligations are priced at market index prices or are variable volume delivery contracts. As such, the variable consideration is allocated entirely to the wholly unsatisfied performance obligation or promise to deliver units of production, and revenue is recognized at the amount for which the Company has the right to invoice the product delivered. As the period between when the product sales are transferred and Ovintiv receives payments is generally 30 to 60 days, there is no financing element associated with customer contracts. In addition, Ovintiv does not disclose unsatisfied performance obligations for customer contracts with terms less than 12 months or for variable consideration related to unsatisfied performance obligations.
| | | | | | | | | | | | |
For the years ended December 31 | | 2024 | | | 2023 | | | 2022 | |
| | | | | | | | | |
Interest Expense on: | | | | | | | | | |
Debt | | $ | 403 | | | $ | 343 | | | $ | 297 | |
Finance leases (See Note 14) | | | 1 | | | | 2 | | | | 2 | |
Other | | | 8 | | | | 10 | | | | 12 | |
| | $ | 412 | | | $ | 355 | | | $ | 311 | |
For the year ended December 31, 2024, interest expense on debt includes $12 million related to bridge loan financing fees incurred in contemplation of the announced Montney Acquisition as defined in Note 15.
For the year ended December 31, 2022, interest expense on debt includes $22 million related to premiums paid to repurchase certain of the Company’s senior notes in the open market as discussed in Note 15. Additionally, interest expense on debt for the year ended December 31, 2022, includes a make-whole interest payment of $47 million resulting from the early redemption of certain of the Company's senior notes and $30 million in non-cash fair value amortization related to the redemption of those senior notes which were previously acquired through a business combination (see Note 15).
| |
5. | Foreign Exchange (Gain) Loss, Net |
| | | | | | | | | | | | |
For the years ended December 31 | | 2024 | | | 2023 | | | 2022 | |
| | | | | | | | | |
Unrealized Foreign Exchange (Gain) Loss on: | | | | | | | | | |
Translation of U.S. dollar risk management contracts issued from Canada | | $ | 92 | | | $ | (20 | ) | | $ | 14 | |
Translation of intercompany notes | | | (57 | ) | | | 14 | | | | - | |
| | | 35 | | | | (6 | ) | | | 14 | |
Foreign Exchange (Gain) Loss on Settlements of: | | | | | | | | | |
U.S. dollar financing debt issued from Canada | | | (1 | ) | | | (2 | ) | | | 8 | |
U.S. dollar risk management contracts issued from Canada | | | 3 | | | | 8 | | | | 5 | |
Intercompany notes | | | (41 | ) | | | 8 | | | | - | |
Other Monetary Revaluations | | | (15 | ) | | | 11 | | | | (12 | ) |
| | $ | (19 | ) | | $ | 19 | | | $ | 15 | |
The provision for income taxes is as follows:
| | | | | | | | | | | | |
For the years ended December 31 | | 2024 | | | 2023 | | | 2022 | |
| | | | | | | | | |
Current Tax | | | | | | | | | |
United States | | $ | 8 | | | $ | 12 | | | $ | 10 | |
Canada | | | 74 | | | | 269 | | | | - | |
Total Current Tax Expense (Recovery) | | | 82 | | | | 281 | | | | 10 | |
| | | | | | | | | |
Deferred Tax | | | | | | | | | |
United States | | | 228 | | | | 248 | | | | (275 | ) |
Canada | | | (84 | ) | | | (104 | ) | | | 188 | |
Total Deferred Tax Expense (Recovery) | | | 144 | | | | 144 | | | | (87 | ) |
Income Tax Expense (Recovery) | | $ | 226 | | | $ | 425 | | | $ | (77 | ) |
During the year ended December 31, 2024, the current income tax expense was primarily due to the Canadian earnings subject to current tax and the impact of the corporate alternative minimum tax (“CAMT”) in the U.S. During the year ended December 31, 2023, the current income tax expense was primarily due to the full utilization of Ovintiv’s operating losses in Canada and recognition of prior year deferred income, resulting in current tax in 2023. During the year ended December 31, 2022, the current income tax expense was primarily due to state taxes.
During the year ended December 31, 2024, the deferred tax expense was primarily due to taxes on U.S. earnings, partially offset by deferred tax recovery in Canada due to ceiling test impairments.
During the year ended December 31, 2023, the deferred tax expense was primarily due to taxes on U.S. earnings, offset by the recognition of U.S. research and development credits of $136 million. In addition, the deferred tax recovery in Canada was primarily from the recognition of prior year deferred income as discussed above.
The following table reconciles income taxes calculated at the applicable statutory rate with the actual income taxes:
| | | | | | | | | | | | |
For the years ended December 31 | | 2024 | | | 2023 | | | 2022 | |
| | | | | | | | | |
Net Earnings (Loss) Before Income Tax | | $ | 1,351 | | | $ | 2,510 | | | $ | 3,560 | |
United States Federal Statutory Rate | | | 21.0 | % | | | 21.0 | % | | | 21.0 | % |
Expected Income Tax Expense (Recovery) | | | 284 | | | | 527 | | | | 748 | |
Effect on Taxes Resulting From: | | | | | | | | | |
State income tax | | | 15 | | | | 23 | | | | 26 | |
Income tax related to foreign operations | | | (14 | ) | | | 20 | | | | 60 | |
Research & development credits | | | (67 | ) | | | (128 | ) | | | - | |
Non-taxable items | | | (5 | ) | | | 10 | | | | 246 | |
Amounts in respect of prior periods | | | 5 | | | | (19 | ) | | | 101 | |
U.S. international tax | | | 40 | | | | 8 | | | | 22 | |
Change in valuation allowance | | | (45 | ) | | | (18 | ) | | | (1,299 | ) |
Other | | | 13 | | | | 2 | | | | 19 | |
| | $ | 226 | | | $ | 425 | | | $ | (77 | ) |
Effective Tax Rate | | | 16.7 | % | | | 16.9 | % | | | (2.2 | %) |
During the year ended December 31, 2024, a valuation allowance of $45 million was reversed primarily related to utilization of Canadian net capital losses. During the year ended December 31, 2023, a valuation allowance of $18 million was reversed primarily related to operating losses and utilization of Canadian net capital losses. During the year ended December 31, 2022, a valuation allowance of $1,299 million was reversed of which $1,028 million was recognized as a result of positive earnings in the U.S. and Canada. Deferred income tax assets are routinely assessed for realizability, and consequently, after weighing both positive and negative evidence, the Company reversed an additional $271 million of the valuation allowance primarily due to positive forecasted earnings in the U.S.
The effective tax rate of 16.7 percent for the year ended December 31, 2024 is lower than the U.S. federal statutory tax rate of 21 percent primarily due the recognition of U.S. research and development credits.
The effective tax rate of 16.9 percent for the year ended December 31, 2023 is lower than the U.S. federal statutory tax rate of 21 percent primarily due to the recognition of U.S. research and development credits described above. The effective tax rate of (2.2) percent for the year ended December 31, 2022 is lower than the U.S. federal statutory tax rate of 21 percent primarily due to reductions in valuation allowances offset by certain non-taxable items.
The net deferred income tax asset (liability) consists of:
| | | | | | | | | | |
As at December 31 | | | | 2024 | | | 2023 | |
| | | | | | | | |
Deferred Income Tax Assets | | | | | | | | |
Property, plant and equipment | | | | $ | 27 | | | $ | - | |
Risk management | | | | | 6 | | | | - | |
Interest and other deferred deductions | | | | | 40 | | | | - | |
Net operating and net capital losses carried forward | | | | | 1,665 | | | | 1,874 | |
General business credits | | | | | 200 | | | | 146 | |
CAMT credits | | | | | 40 | | | | - | |
Compensation plans | | | | | 45 | | | | 60 | |
Other | | | | | - | | | | 15 | |
Less: valuation allowance | | | | | (1,204 | ) | | | (1,340 | ) |
| | | | | | | | |
Deferred Income Tax Liabilities | | | | | | | | |
Property, plant and equipment | | | | | (971 | ) | | | (744 | ) |
Risk management | | | | | (17 | ) | | | (49 | ) |
Other | | | | | (23 | ) | | | (19 | ) |
Net Deferred Income Tax Asset (Liability) | | | | $ | (192 | ) | | $ | (57 | ) |
As at December 31, 2024, Ovintiv has a valuation allowance against certain U.S. state losses in the amount of $29 million (2023 - $39 million) and Canadian net capital losses in the amount of $1,175 million (2023 - $1,301 million) as it is more likely than not that these benefits will not be realized based on expected future taxable earnings as determined in accordance with the Company’s accounting policies.
The net deferred income tax asset (liability) for the following jurisdictions is reflected in the Consolidated Balance Sheet as follows:
| | | | | | | | | | |
As at December 31 | | | | 2024 | | | 2023 | |
| | | | | | | | |
Deferred Income Tax Assets | | | | | | | | |
United States | | | | $ | - | | | $ | 53 | |
Canada | | | | | 10 | | | | - | |
| | | | | 10 | | | | 53 | |
| | | | | | | | |
Deferred Income Tax Liabilities | | | | | | | | |
United States | | | | $ | (202 | ) | | $ | (28 | ) |
Canada | | | | | - | | | | (82 | ) |
| | | | | (202 | ) | | | (110 | ) |
Net Deferred Income Tax Asset (Liability) | | | | $ | (192 | ) | | $ | (57 | ) |
Tax basis, loss carryforwards and credits available are as follows:
| | | | | | | | | |
As at December 31 | | | | 2024 | | Expiration Date | |
| | | | | | | | |
United States | | | | | | | | |
Tax basis | | | | $ | 8,831 | | | Indefinite | |
Net operating losses (federal) | | | | | 2,103 | | | 2025 - 2038 (1) | |
General business credits | | | | | 200 | | | 2032 - 2044 | |
CAMT credits | | | | | 40 | | | Indefinite | |
Canada | | | | | | | | |
Tax basis | | | | $ | 1,013 | | | Indefinite | |
Net capital losses | | | | | 4,957 | | | Indefinite | |
(1) Includes net operating losses of $1,187 million which have an indefinite expiration date.
The Company has recorded a deferred income tax liability of $11 million on the undistributed earnings from its foreign investments. As at December 31, 2024, the Company had a taxable temporary difference of approximately $137 million (2023 ‑ $705 million) in respect of unremitted earnings that continue to be permanently reinvested for which a deferred income tax liability of $7 million (2023 - $35 million) has not been recognized and becomes subject
to taxation upon the remittance of dividends. The deferred tax liability considers U.S. federal, state and foreign withholding tax implications.
The following table presents changes in the balance of Ovintiv’s unrecognized tax benefits excluding interest:
| | | | | | | | | | |
For the years ended December 31 | | | | 2024 | | | 2023 | |
| | | | | | | | |
Balance, Beginning of Year | | | | $ | (187 | ) | | $ | (9 | ) |
Additions for tax positions taken in the current year | | | | | (39 | ) | | | (184 | ) |
Additions for tax positions of prior years | | | | | (24 | ) | | | - | |
Reductions for tax positions of prior years | | | | | 4 | | | | - | |
Settlements | | | | | - | | | | 6 | |
Balance, End of Year | | | | $ | (246 | ) | | $ | (187 | ) |
The unrecognized tax benefit is reflected in the Consolidated Balance Sheet as follows:
| | | | | | | | | | |
As at December 31 | | | | 2024 | | | 2023 | |
| | | | | | | | |
Income Tax Payable | | | | $ | (2 | ) | | $ | (2 | ) |
Other Liabilities and Provisions | | | | | (12 | ) | | | (16 | ) |
Deferred Income Tax Liability | | | | | (232 | ) | | | (169 | ) |
Balance, End of Year | | | | $ | (246 | ) | | $ | (187 | ) |
The Company recognizes tax benefits from uncertain tax positions only if it is more likely than not the tax position will be sustained upon audit by the taxing authorities. During the year ended December 31, 2024, the Company recorded unrecognized tax benefits of $59 million (2023 - $184 million).
If recognized, all of Ovintiv’s unrecognized tax benefits as at December 31, 2024, would affect Ovintiv’s effective income tax rate. The nature of the unrecognized tax benefits is highly uncertain. As at December 31, 2024, Ovintiv does not anticipate that the amount of unrecognized tax benefits will significantly change during the next 12 months.
Ovintiv may recognize interest accrued in respect of unrecognized tax benefits in interest expense. During 2024, Ovintiv recognized an expense of $1 million (2023 - nil; 2022 - nil) in interest expense. As at December 31, 2024, Ovintiv had a liability of $1 million (2023 - nil) for interest accrued in respect of unrecognized tax benefits.
Included below is a summary of the tax years, by jurisdiction, that remain statutorily open for examination by the taxing authorities.
| | | | | | | |
Jurisdiction | | | | | | Taxation Year | |
| | | | | | | |
United States - Federal | | | | | | 2020 - 2024 | |
United States - State | | | | | | 2019 - 2024 | |
Canada - Federal | | | | | | 2016 - 2024 | |
Canada - Provincial | | | | | | 2016 - 2024 | |
Ovintiv and its subsidiaries file income tax returns in the U.S. and Canada. Issues in dispute for audited years and audits for subsequent years are ongoing and in various stages of completion.
| |
7. | Accounts Receivable and Accrued Revenues |
| | | | | | | | | | |
As at December 31 | | | | 2024 | | | 2023 | |
| | | | | | | | |
Trade Receivables and Accrued Revenues | | | | | | | | |
Production accruals | | | | $ | 747 | | | $ | 900 | |
Purchased product accruals | | | | | 174 | | | | 170 | |
Joint interest and trade receivables | | | | | 132 | | | | 244 | |
Corporate and other | | | | | 37 | | | | 19 | |
Total Trade Receivables and Accrued Revenues | | | | | 1,090 | | | | 1,333 | |
Prepaids | | | | | 56 | | | | 55 | |
Deposits and Other | | | | | 42 | | | | 59 | |
| | | | | 1,188 | | | | 1,447 | |
Expected Credit Loss Allowance | | | | | (5 | ) | | | (5 | ) |
| | | | $ | 1,183 | | | $ | 1,442 | |
Ovintiv’s trade receivables and accrued revenues primarily consist of production sales of oil, NGLs and natural gas, product optimization from marketing and recoveries from joint working interest partners. The Company’s receivables are short dated with payments generally due within 30 to 60 days, with no financing element.
Trade receivables and accrued revenues are subject to credit risk which is the risk of loss from the potential of a counterparty failing to meet its obligation in accordance with agreed terms. Ovintiv’s credit exposure related to product sales and derivative financial instruments are mitigated through the use of credit policies approved by the Board of Directors which govern credit practices that limit transactions according to counterparties’ credit quality, and regular monitoring and review of counterparties’ credit worthiness. The Company may also request collateral support, including standby letters of credit, from customers that purchase production. Receivables due from joint working interest partners include numerous counterparties ranging from large public companies to small private companies within the oil and gas industry. In the event of non-payment, Ovintiv may be able to mitigate losses through requiring prepayment of future costs and netting outstanding receivables against associated revenue payables to the interest owner. The Company monitors ongoing credit exposure through active review of counterparty balances against contract terms and due dates, timely dispute resolution, payment confirmation, consideration of the customers’ financial condition and general industry market conditions.
Ovintiv’s estimated credit loss allowance is estimated using historical loss information, current industry conditions and payment practices, as well as reasonable and supportable forecasts of future economic conditions. Credit risk is assessed based on days outstanding and utilizes both internal credit assessments and publicly available credit information. As at December 31, 2024, the current period expected credit loss allowance was $5 million (2023 ‑ $5 million). See Note 25 for more information on credit risk exposures.
| |
8. | Acquisitions and Divestitures |
| | | | | | | | | | | | |
For the years ended December 31 | | 2024 | | | 2023 | | | 2022 | |
| | | | | | | | | |
Acquisitions | | | | | | | | | |
USA Operations | | $ | 200 | | | $ | 271 | | | $ | 277 | |
Canadian Operations | | | 5 | | | | 6 | | | | 9 | |
Total Acquisitions | | | 205 | | | | 277 | | | | 286 | |
| | | | | | | | | |
Divestitures | | | | | | | | | |
USA Operations | | | (7 | ) | | | (771 | ) | | | (230 | ) |
Canadian Operations | | | - | | | | (1 | ) | | | 2 | |
Total Divestitures | | | (7 | ) | | | (772 | ) | | | (228 | ) |
Net Acquisitions & (Divestitures) | | $ | 198 | | | $ | (495 | ) | | $ | 58 | |
ACQUISITIONS
Acquisitions in the USA Operations in 2024 primarily included property purchases in Permian with oil and liquids‑rich potential. Acquisitions in the USA Operations in 2023 primarily included property purchases in Permian and Uinta with oil and liquids‑rich potential. Acquisitions in the USA Operations in 2022 primarily included property purchases in Permian with oil and liquids‑rich potential.
DIVESTITURES
In 2024, divestitures in the USA Operations primarily included the sale of certain properties that did not complement Ovintiv’s existing portfolio of assets.
In 2023, divestitures in the USA Operations primarily included the sale of Bakken located in North Dakota for proceeds of approximately $734 million, after closing and other adjustments.
In 2022, divestitures in the USA Operations primarily included the sales of portions of Uinta located in northeastern Utah and Bakken located in northeastern Montana for combined proceeds of approximately $215 million, after closing and other adjustments.
Amounts received from the Company’s divestiture transactions have been deducted from the respective U.S. and Canadian full cost pools.
During 2024, Ovintiv also received settlement proceeds of approximately $156 million related to the previous dispositions of certain legacy assets. Accordingly, the total net proceeds of $156 million has been recognized as a gain within Other (gains) losses, net in the Company’s Consolidated Statement of Earnings and is included in Proceeds from divestitures in the Company’s Consolidated Statement of Cash Flows for the year ended December 31, 2024.
Acquisition of Midland Basin Assets (“Permian Acquisition”)
On June 12, 2023, Ovintiv completed a business combination to purchase all of the outstanding equity interests in seven Delaware limited liability companies (“Permian LLCs”) pursuant to the purchase agreement with Black Swan Oil & Gas, LLC, PetroLegacy II Holdings, LLC, Piedra Energy III Holdings, LLC and Piedra Energy IV Holdings, LLC, which were portfolio companies of funds managed by EnCap Investments L.P (“EnCap”). The Company paid aggregate cash consideration of approximately $3.2 billion and issued approximately 31.8 million shares of Ovintiv common stock, representing a value of approximately $1.2 billion. The cash portion of the consideration was funded through a combination of net proceeds from the Company’s May 2023 senior notes offering (see Note 15), net proceeds from the sale of Bakken during the second quarter of 2023 (see Note 8), cash on hand and proceeds from short-term borrowings. During the period from June 12, 2023 to December 31, 2023, transaction costs of approximately $76 million were included in administrative expense.
The acquisition was strategically located in close proximity to Ovintiv’s current Permian operations and added approximately 1,050 net well locations to Ovintiv’s Permian inventory and approximately 65,000 net acres. The results of operations from the acquired Permian assets have been included in Ovintiv’s consolidated financial statements since June 12, 2023.
Purchase Price Allocation
The Permian LLCs have been accounted for under the acquisition method and as a single transaction because the purchase agreement was entered into at the same time with EnCap and in contemplation of one another to achieve an overall economic effect. The purchase price allocations represent the consideration paid and the fair values of the assets acquired, and liabilities assumed as of the acquisition date. The purchase price allocation was finalized during the first quarter of 2024.
| | | | | | | | | |
Purchase Price Allocation | | | | | | | | |
| | | | | | | | |
Consideration: | | | | | | | | |
Fair value of shares of Ovintiv common stock issued (1) | | | | | | | $ | 1,169 | |
Consideration paid in cash (2) | | | | | | | | 3,229 | |
Total Consideration | | | | | | | $ | 4,398 | |
| | | | | | | | |
Assets Acquired: | | | | | | | | |
Cash and cash equivalents | | | | | | | $ | 16 | |
Accounts receivable and accrued revenues (3) | | | | | | | | 202 | |
Proved properties (3) | | | | | | | | 3,727 | |
Unproved properties (3) | | | | | | | | 914 | |
Other property, plant and equipment (3) | | | | | | | | 17 | |
| | | | | | | | |
Liabilities Assumed: | | | | | | | | |
Accounts payable and accrued liabilities (3) | | | | | | | | (446 | ) |
Asset retirement obligation | | | | | | | | (28 | ) |
Other liabilities and provisions (3) | | | | | | | | (4 | ) |
Total Purchase Price | | | | | | | $ | 4,398 | |
(1)The fair value was based on the issuance of 31.8 million shares of common stock using the NYSE price of $36.78 on June 12, 2023.
(2)Cash consideration paid includes final cash settlements of $12 million which were completed during the first quarter of 2024.
(3)Since the completion of the business combination on June 12, 2023, additional information related to pre-acquisition assets and liabilities was obtained resulting in measurement period adjustments. Changes in the fair value estimates comprised an increase in accounts receivable and accrued revenues of $22 million, an increase in proved properties of $134 million, a decrease in unproved properties of $227 million, a decrease in other property, plant and equipment of $16 million, a decrease in accounts payable and accrued liabilities of $73 million and a decrease in other liabilities and provisions of $2 million.
The Company used the income approach valuation technique for the fair value of assets acquired and liabilities assumed. The carrying amounts of cash, accounts receivable and accounts payable approximate their fair values due to their nature and/or short-term maturity of the instruments. The fair value of tubular inventory in other property, plant and equipment was based on the fair value approach, which utilized subsequent sales of inventory, asset listings and cost records with consideration for the relative age, condition, utilization and economic support of the inventory. The fair values of the proved properties, unproved properties and asset retirement obligation were categorized within Level 3 and were determined using relevant market assumptions, including discount rates, future commodity prices and costs, timing of development activities, projections of oil and gas reserves, and estimates to abandon and reclaim producing wells. Level 3 inputs require significant judgment and estimates to be made.
For income tax purposes, the Permian Acquisition was treated as an asset purchase, and as a result, the tax basis in the assets and liabilities reflect their allocated fair value.
Unaudited Pro Forma Financial Information
The following unaudited pro forma financial information combines the historical financial results of Ovintiv with the Permian LLCs and has been prepared as though the acquisition and the associated debt issuance described in Note 15 had occurred on January 1, 2023. The pro forma information is not intended to reflect the actual results of operations that would have occurred if the Permian Acquisition had been completed at the date indicated. In addition, the pro forma information is not intended to be a projection of Ovintiv’s results of operations for any future period.
Additionally, pro forma earnings were adjusted to exclude acquisition-related costs incurred of approximately $76 million for the year ended December 31, 2023. The pro forma financial information does not include any cost savings or other synergies that may result from the acquisition or any estimated costs that have been incurred to integrate the assets. The pro forma financial data does not include the results of operations for any other acquisitions made during the period presented, as they were primarily acreage acquisitions, and their results were not deemed material. Ovintiv’s consolidated results for the year ended December 31, 2024, include the results from the Permian LLCs.
| | | | |
For the year ended December 31 (US$ millions, except per share amounts) | | 2023 | |
| | | |
Revenues | | $ | 11,485 | |
Net Earnings (Loss) | | $ | 2,315 | |
| | | |
Net Earnings (Loss) per Share | | | |
Basic | | $ | 8.43 | |
Diluted | | | 8.31 | |
| |
10. | Property, Plant and Equipment, Net |
| | | | | | | | | | | | | | | | | | | | | | | | | |
As at December 31 | | 2024 | | | | 2023 | |
| | Cost | | | Accumulated
DD&A | | | Net | | | | Cost | | | Accumulated
DD&A | | | Net | |
| | | | | | | | | | | | | | | | | | | |
USA Operations | | | | | | | | | | | | | | | | | | | |
Proved properties | | $ | 50,246 | | | $ | (37,770 | ) | | $ | 12,476 | | | | $ | 47,440 | | | $ | (35,799 | ) | | $ | 11,641 | |
Unproved properties | | | 741 | | | | - | | | | 741 | | | | | 1,449 | | | | - | | | | 1,449 | |
Other (1) | | | 48 | | | | (2 | ) | | | 46 | | | | | 41 | | | | (2 | ) | | | 39 | |
| | | 51,035 | | | | (37,772 | ) | | | 13,263 | | | | | 48,930 | | | | (35,801 | ) | | | 13,129 | |
| | | | | | | | | | | | | | | | | | | |
Canadian Operations | | | | | | | | | | | | | | | | | | | |
Proved properties | | | 15,763 | | | | (14,821 | ) | | | 942 | | | | | 16,644 | | | | (15,332 | ) | | | 1,312 | |
Unproved properties | | | 23 | | | | - | | | | 23 | | | | | 37 | | | | - | | | | 37 | |
Other (1) | | | 10 | | | | (5 | ) | | | 5 | | | | | 13 | | | | (5 | ) | | | 8 | |
| | | 15,796 | | | | (14,826 | ) | | | 970 | | | | | 16,694 | | | | (15,337 | ) | | | 1,357 | |
| | | | | | | | | | | | | | | | | | | |
Corporate & Other | | | 807 | | | | (676 | ) | | | 131 | | | | | 853 | | | | (699 | ) | | | 154 | |
| | $ | 67,638 | | | $ | (53,274 | ) | | $ | 14,364 | | | | $ | 66,477 | | | $ | (51,837 | ) | | $ | 14,640 | |
(1)See Note 2 regarding the reclassification of the Company’s previously reported Market Optimization segment.
USA and Canadian Operations’ property, plant and equipment include internal costs directly related to exploration, development and construction activities of $181 million, which have been capitalized during the year ended December 31, 2024 (2023 - $177 million).
For the year ended December 31, 2024, Ovintiv recognized a before-tax non-cash ceiling test impairment of $450 million in the Canadian Operations (2023 - nil; 2022 - nil). The non-cash ceiling test impairment is included with accumulated DD&A in the table above and primarily resulted from the decline in the 12-month average trailing prices, which reduced proved reserves.
The 12-month average trailing prices used in the ceiling test calculations reflect benchmark prices adjusted for basis differentials to determine local reference prices, transportation costs and tariffs, heat content and quality. The benchmark prices are disclosed in Note 29.
| | | | | | | | | | |
As at December 31 | | | | 2024 | | | 2023 | |
| | | | | | | | |
Operating Lease ROU Assets (See Note 14) | | | | $ | 788 | | | $ | 894 | |
Long-Term Investments | | | | | 33 | | | | 26 | |
Long-Term Receivables | | | | | 2 | | | | 37 | |
Deferred Charges | | | | | 49 | | | | 44 | |
Other (1) | | | | | 93 | | | | 14 | |
| | | | $ | 965 | | | $ | 1,015 | |
(1)Includes funds paid by the Company and held in escrow related to the Company’s previously announced Montney Acquisition (as defined in Note 15) at December 31, 2024.
| | | | | | | | | | |
As at December 31 | | | | 2024 | | | 2023 | |
| | | | | | | | |
United States | | | | | | | | |
Balance, beginning and end of year | | | | $ | 1,938 | | | $ | 1,938 | |
| | | | | | | | |
Canada | | | | | | | | |
Balance, beginning of year | | | | | 661 | | | | 646 | |
Foreign currency translation adjustment | | | | | (53 | ) | | | 15 | |
Balance, end of year | | | | | 608 | | | | 661 | |
Total Goodwill | | | | $ | 2,546 | | | $ | 2,599 | |
The Company had no additions or dispositions relating to goodwill during 2024 or 2023. The change in the Canada goodwill balance reflects movement due to foreign currency translation.
Goodwill was assessed for impairment as at December 31, 2024, and December 31, 2023. The fair values of the United States and Canada reporting units were determined to be greater than the respective carrying values of the reporting units. Accordingly, no goodwill impairments were recognized.
| |
13. | Accounts Payable and Accrued Liabilities |
| | | | | | | | | | |
As at December 31 | | | | 2024 | | | 2023 | |
| | | | | | | | |
Trade Payables | | | | $ | 435 | | | $ | 586 | |
Capital Accruals | | | | | 193 | | | | 239 | |
Royalty and Production Accruals | | | | | 696 | | | | 775 | |
Purchased Product Accruals | | | | | 155 | | | | 179 | |
Outstanding Disbursements | | | | | 47 | | | | 45 | |
Payroll & Other Accruals | | | | | 188 | | | | 191 | |
Interest Payable | | | | | 107 | | | | 115 | |
Derivative Settlements | | | | | 3 | | | | - | |
Current Portion of Long-Term Incentive Costs (See Note 22) | | | | | 10 | | | | 14 | |
Other Derivative Contracts (See Notes 24, 25) | | | | | - | | | | 4 | |
Current Portion of Finance Lease Obligations (See Note 14) | | | | | 8 | | | | 7 | |
Current Portion of Asset Retirement Obligation (See Note 17) | | | | | 41 | | | | 54 | |
| | | | $ | 1,883 | | | $ | 2,209 | |
Payables and accruals are non-interest bearing. Interest payable represents amounts accrued related to Ovintiv’s unsecured notes as disclosed in Note 15.
Operating leases include drilling rigs, compressors, office and buildings, certain land easements and various equipment utilized in the development and production of oil, NGLs and natural gas. The Company has an office building that is accounted for as a finance lease. Subleases relate to office and building leases.
The tables below summarize Ovintiv’s operating and finance lease costs and include ROU assets and lease liabilities, amounts recognized in net earnings (loss) during the year and other lease information.
| | | | | | | | | | |
As at December 31 (US$ millions, unless otherwise specified) | | | | 2024 | | | 2023 | |
| | | | | | | | |
Consolidated Balance Sheet (1): | | | | | | | | |
Operating Lease ROU Assets, in Other Assets | | | | $ | 788 | | | $ | 894 | |
Finance Lease ROU Assets, in Other Property Plant and Equipment | | | | | 12 | | | | 17 | |
| | | | | | | | |
Operating Lease Liabilities: | | | | | | | | |
Current | | | | | 82 | | | | 87 | |
Long-term | | | | | 737 | | | | 832 | |
| | | | | | | | |
Finance Lease Liabilities: | | | | | | | | |
Current, in accounts payable and accrued liabilities | | | | | 8 | | | | 7 | |
Long-term, in other liabilities and provisions | | | | | 12 | | | | 20 | |
| | | | | | | | |
Weighted Average Discount Rate | | | | | | | | |
Operating leases | | | | 5.42% | | | 5.45% | |
Finance leases | | | | 6.11% | | | 6.11% | |
Weighted Average Remaining Lease Term | | | | | | | | |
Operating leases | | | | 12.1 years | | | 12.8 years | |
Finance leases | | | | 2.5 years | | | 3.5 years | |
(1)Total ROU assets and liabilities are recorded at the gross contractual amount. A portion of the future lease payments will be recovered from other working interest owners based on their proportionate share when incurred.
| | | | | | | | | | |
For the years ended December 31 | | | | 2024 | | | 2023 | |
| | | | | | | | |
Lease Costs (1): | | | | | | | | |
Operating Lease Costs, Excluding Short-Term Leases | | | | $ | 271 | | | $ | 180 | |
| | | | | | | | |
Finance Lease Costs: | | | | | | | | |
Amortization of ROU assets | | | | | 5 | | | | 5 | |
Interest on lease liabilities | | | | | 1 | | | | 2 | |
Total Finance Lease Costs | | | | | 6 | | | | 7 | |
| | | | | | | | |
Short-Term Lease Costs | | | | | 259 | | | | 232 | |
Variable Lease Costs | | | | | 117 | | | | 41 | |
| | | | | | | | |
Sublease Income: | | | | | | | | |
Operating lease income | | | | | 53 | | | | 50 | |
Variable lease income | | | | | 21 | | | | 21 | |
| | | | | | | | |
Other Information (2): | | | | | | | | |
Cash Paid for Amounts Included in the Measurement of Lease Liabilities: | | | | | | | | |
Operating cash outflows from operating leases | | | | | 198 | | | | 182 | |
Investing cash outflows from operating leases | | | | | 326 | | | | 225 | |
Operating cash outflows from finance leases | | | | | 1 | | | | 2 | |
Financing cash outflows from finance leases | | | | | 7 | | | | 6 | |
| | | | | | | | |
Supplemental Non-Cash Information: | | | | | | | | |
New ROU operating lease assets and liabilities | | | | | 46 | | | | 113 | |
(1)Lease costs include amounts capitalized into property, plant and equipment in the Consolidated Balance Sheet and lease expense recognized in the Consolidated Statement of Earnings.
(2)Rights to extend or terminate a lease are included in the lease term when there is reasonable certainty the right will be exercised. Lease contracts include rights to extend leases after the initial term, ranging from month-to-month to less than 10 years.
Operating lease expense is reflected in the Consolidated Statement of Earnings as follows:
| | | | | | | | | | |
For the years ended December 31 | | | | 2024 | | | 2023 | |
| | | | | | | | |
Operating Lease Expense | | | | | | | | |
Transportation and processing | | | | $ | 2 | | | $ | 4 | |
Operating | | | | | 101 | | | | 82 | |
Administrative | | | | | 101 | | | | 101 | |
Total Operating Lease Expense | | | | $ | 204 | | | $ | 187 | |
The following table outlines the Company’s future lease payments and lease liabilities related to the Company’s operating and finance leases as at December 31, 2024:
| | | | | | | | | | | | | | | | | | | | | | | | | | | | |
| | 2025 | | | 2026 | | | 2027 | | | 2028 | | | 2029 | | | Thereafter | | | Total | |
| | | | | | | | | | | | | | | | | | | | | |
Operating Leases (1) | | | | | | | | | | | | | | | | | | | | | |
Expected Future Lease Payments | | $ | 124 | | | $ | 98 | | | $ | 87 | | | $ | 85 | | | $ | 81 | | | $ | 652 | | | $ | 1,127 | |
Less: Discounting | | | | | | | | | | | | | | | | | | | | | 308 | |
Present Value of Future Operating | | | | | | | | | | | | | | | | | | | | | |
Lease Payments | | | | | | | | | | | | | | | | | | | | $ | 819 | |
| | | | | | | | | | | | | | | | | | | | | |
Sublease Income (undiscounted) | | $ | (40 | ) | | $ | (41 | ) | | $ | (41 | ) | | $ | (39 | ) | | $ | (36 | ) | | $ | (311 | ) | | $ | (508 | ) |
| | | | | | | | | | | | | | | | | | | | | |
Finance Leases | | | | | | | | | | | | | | | | | | | | | |
Expected Future Lease Payments | | $ | 9 | | | $ | 9 | | | $ | 4 | | | $ | - | | | $ | - | | | $ | - | | | $ | 22 | |
Less: Discounting | | | | | | | | | | | | | | | | | | | | | 2 | |
Present Value of Future Finance | | | | | | | | | | | | | | | | | | | | | |
Lease Payments | | | | | | | | | | | | | | | | | | | | $ | 20 | |
| | | | | | | | | | | | | | | | | | | | | |
Sublease Income (undiscounted) (2) | | $ | (8 | ) | | $ | (8 | ) | | $ | (3 | ) | | $ | - | | | $ | - | | | $ | - | | | $ | (19 | ) |
(1)Lease payments are presented based on the gross contractual amount. A portion of the future lease payments will be recovered from other working interest owners based on their proportionate share when incurred.
(2)Classified as operating lease.
There are no material commitments for leases with terms greater than one year that have not yet commenced at December 31, 2024.
| | | | | | | | | | |
As at December 31 | | Note | | 2024 | | | 2023 | |
| | | | | | | | |
U.S. Dollar Denominated Debt | | | | | | | | |
Revolving credit and term loan borrowings | | A | | $ | - | | | $ | 284 | |
U.S. Unsecured Notes: | | B | | | | | | |
5.65% due May 15, 2025 | | | | | 600 | | | | 600 | |
5.375% due January 1, 2026 | | | | | 459 | | | | 459 | |
5.65% due May 15, 2028 | | | | | 700 | | | | 700 | |
8.125% due September 15, 2030 | | | | | 300 | | | | 300 | |
7.20% due November 1, 2031 | | | | | 350 | | | | 350 | |
7.375% due November 1, 2031 | | | | | 500 | | | | 500 | |
6.25% due July 15, 2033 | | | | | 600 | | | | 600 | |
6.50% due August 15, 2034 | | | | | 599 | | | | 599 | |
6.625% due August 15, 2037 | | | | | 390 | | | | 390 | |
6.50% due February 1, 2038 | | | | | 430 | | | | 430 | |
5.15% due November 15, 2041 | | | | | 148 | | | | 148 | |
7.10% due July 15, 2053 | | | | | 400 | | | | 400 | |
Total Principal | | F | | | 5,476 | | | | 5,760 | |
| | | | | | | | |
Increase in Value of Debt Acquired | | C | | | 16 | | | | 22 | |
Unamortized Debt Discounts and Issuance Costs | | D | | | (39 | ) | | | (45 | ) |
Total Long-Term Debt | | | | $ | 5,453 | | | $ | 5,737 | |
| | | | | | | | |
Current Portion | | E | | $ | 600 | | | $ | 284 | |
Long-Term Portion | | | | | 4,853 | | | | 5,453 | |
| | | | $ | 5,453 | | | $ | 5,737 | |
A)REVOLVING CREDIT AND TERM LOAN BORROWINGS
At December 31, 2024, Ovintiv had in place committed revolving U.S. dollar denominated bank credit facilities totaling $3.5 billion, which included $2.2 billion on a revolving bank credit facility for Ovintiv Inc. and $1.3 billion on a revolving bank credit facility for a Canadian subsidiary. The facilities are extendible from time to time, but not more than once per year, for a period not longer than five years plus 90 days from the date of the extension request, at the option of the lenders and upon notice from Ovintiv. The facilities were renewed in 2024, mature in December 2029, and are fully revolving up to maturity. In conjunction with the renewal, the Company incurred $9 million in fees which were capitalized within Other Assets in the Consolidated Balance Sheet and will be amortized over the life of the credit facilities.
The Ovintiv Inc. facility, which remained unused as at December 31, 2024, is unsecured and bears interest at either the lenders’ U.S. base rate or SOFR, plus applicable margins. The Canadian subsidiary facility, which remained unused as at December 31, 2024, is unsecured and bears interest at the lenders’ rates for Canadian prime, U.S. base rate, SOFR or CORRA, plus applicable margins.
Ovintiv is subject to a financial covenant in its credit facility agreements whereby financing debt to adjusted capitalization cannot exceed 60 percent. Financing debt primarily includes total long-term debt and finance lease obligations. Adjusted capitalization is calculated as the sum of total financing debt, shareholders’ equity and a $7.7 billion equity adjustment for cumulative historical ceiling test impairments recorded in conjunction with the Company’s January 1, 2012 adoption of U.S. GAAP. As at December 31, 2024, the Company is in compliance with all financial covenants.
On November 14, 2024, the Company announced it had entered into a definitive purchase agreement, valued at approximately $2.377 billion (C$3.325 billion), to acquire certain Montney assets from Paramount Resources Ltd. (“Montney Acquisition”). On December 10, 2024, the Company entered into two term facilities which consist of a $1.5 billion 364‑day Asset Sale Term Facility and a $1.0 billion 2‑year Term Facility, to be available to fund the Montney Acquisition. As at December 31, 2024, the Company had no outstanding borrowings under the term facilities. On January 22, 2025, following the closing of the Company’s previously announced Uinta disposition, the $1.5 billion 364‑day Asset Sale Term Facility was terminated and on January 31, 2025, following the closing of the Montney Acquisition, the $1.0 billion 2‑year Term Facility was terminated (See Note 28).
Standby fees paid in 2024 relating to revolving credit and term loan agreements were approximately $8 million (2023 ‑ $8 million; 2022 - $8 million) and were included in interest expense in the Consolidated Statement of Earnings.
Shelf Prospectus
Ovintiv has a U.S. shelf registration statement under which the Company may issue from time to time, debt securities, common stock, preferred stock, warrants, units, share purchase contracts and share purchase units in the United States. The U.S. shelf registration statement expires in March 2026. The ability to issue securities under the U.S. shelf registration statement is dependent upon market conditions and securities law requirements.
U.S. Unsecured Notes
Unsecured notes include medium-term notes and senior notes that are issued from time to time under trust indentures and have equal priority with respect to the payment of both principal and interest.
On May 31, 2023, Ovintiv completed a public offering of senior unsecured notes of $600 million with a coupon rate of 5.65 percent due May 15, 2025, $700 million with a coupon rate of 5.65 percent due May 15, 2028, $600 million with a coupon rate of 6.25 percent due July 15, 2033, and $400 million with a coupon rate of 7.10 percent due July 15, 2053. The net proceeds of the offering, totaling $2,278 million, were used to fund a portion of the Company’s Permian Acquisition. See Note 9 for further information on the business combination.
On June 10, 2022, Ovintiv redeemed the Company’s $1,000 million, 5.625 percent senior notes due July 1, 2024, using cash on hand and proceeds from short-term borrowings. Ovintiv paid approximately $1,072 million in cash including accrued and unpaid interest of $25 million and a make-whole payment of $47 million, which is included in interest expense as discussed in Note 4.
During the year ended December 31, 2022, the Company repurchased approximately $565 million in principal amount of its senior notes in the open market. The aggregate cash payments related to the note repurchases were $587 million, plus accrued interest, and premiums of approximately $22 million were recognized in interest expense as discussed in Note 4.
C)INCREASE IN VALUE OF DEBT ACQUIRED
Certain of the notes and debentures of the Company were acquired in business combinations and were accounted for at their fair value at the dates of acquisition. The difference between the fair value and the principal amount of the debt is being amortized over the remaining life of the outstanding debt acquired, which has a weighted average remaining life of approximately four years.
D)UNAMORTIZED DEBT DISCOUNTS AND ISSUANCE COSTS
Long-term debt premiums and discounts are capitalized within long-term debt and are being amortized using the effective interest method. During 2024, no debt discounts or issuance costs were incurred related to long term-debt. During 2023, $22 million in debt discounts and issuance costs were capitalized related to the U.S. unsecured notes issued in May 2023. Issuance costs are amortized over the term of the related debt.
E)CURRENT PORTION OF LONG-TERM DEBT
As at December 31, 2024, the current portion of long-term debt was $600 million (2023 - $284 million).
F)PROJECTED DEBT PAYMENTS
| | | | | | | | | | |
| | | | Principal | | | Interest | |
As at December 31 | | | | Amount | | | Amount | |
| | | | | | | | |
2025 | | | | $ | 600 | | | $ | 334 | |
2026 | | | | | 459 | | | | 305 | |
2027 | | | | | - | | | | 292 | |
2028 | | | | | 700 | | | | 272 | |
2029 | | | | | - | | | | 253 | |
Thereafter | | | | | 3,717 | | | | 1,711 | |
Total | | | | $ | 5,476 | | | $ | 3,167 | |
As at December 31, 2024, total long-term debt had a carrying value of $5,453 million and a fair value of $5,649 million (2023 - carrying value of $5,737 million and a fair value of $5,989 million). The estimated fair value of long-term borrowings is categorized within Level 2 of the fair value hierarchy and has been determined based on market information of long-term debt with similar terms and maturity, or by discounting future payments of interest and principal at interest rates expected to be available to the Company at period end.
| |
16. | Other Liabilities and Provisions |
| | | | | | | | | | |
As at December 31 | | | | 2024 | | | 2023 | |
| | | | | | | | |
Finance Lease Obligations (See Note 14) | | | | $ | 12 | | | $ | 20 | |
Unrecognized Tax Benefits (See Note 6) | | | | | 12 | | | | 16 | |
Pensions and Other Post-Employment Benefits (See Note 23) | | | | | 74 | | | | 74 | |
Other | | | | | 16 | | | | 22 | |
| | | | $ | 114 | | | $ | 132 | |
| |
17. | Asset Retirement Obligation |
| | | | | | | | | | |
As at December 31 | | | | 2024 | | | 2023 | |
| | | | | | | | |
Asset Retirement Obligation, Beginning of Year | | | | $ | 330 | | | $ | 326 | |
Liabilities Incurred | | | | | 9 | | | | 6 | |
Liabilities Acquired (See Note 9) | | | | | - | | | | 28 | |
Liabilities Settled and Divested | | | | | (52 | ) | | | (66 | ) |
Change in Estimated Future Cash Outflows | | | | | 64 | | | | 13 | |
Accretion Expense | | | | | 19 | | | | 19 | |
Foreign Currency Translation | | | | | (14 | ) | | | 4 | |
Asset Retirement Obligation, End of Year | | | | $ | 356 | | | $ | 330 | |
| | | | | | | | |
Current Portion (See Note 13) | | | | $ | 41 | | | $ | 54 | |
Long-Term Portion | | | | | 315 | | | | 276 | |
| | | | $ | 356 | | | $ | 330 | |
AUTHORIZED
Ovintiv is authorized to issue 750 million shares of common stock, par value $0.01 per share, and 25 million shares of preferred stock, par value $0.01 per share. No shares of preferred stock are outstanding.
ISSUED AND OUTSTANDING
| | | | | | | | | | | | | | | | | | | | | | | | |
As at December 31 | | 2024 | | | 2023 | | | 2022 | |
| | Number
(millions) | | | Amount | | | Number
(millions) | | | Amount | | | Number
(millions) | | | Amount | |
| | | | | | | | | | | | | | | | | | |
Shares of Common Stock Outstanding, Beginning of Year | | | 271.7 | | | $ | 3 | | | | 245.7 | | | $ | 3 | | | | 258.0 | | | $ | 3 | |
Shares of Common Stock Purchased | | | (12.7 | ) | | | - | | | | (9.9 | ) | | | - | | | | (14.7 | ) | | | - | |
Shares of Common Stock Issued | | | 1.4 | | | | - | | | | 35.9 | | | | - | | | | 2.4 | | | | - | |
Shares of Common Stock Outstanding, End of Year | | | 260.4 | | | $ | 3 | | | | 271.7 | | | $ | 3 | | | | 245.7 | | | $ | 3 | |
On June 12, 2023, in accordance with the terms of the Permian Acquisition agreement, Ovintiv issued approximately 31.8 million shares of common stock as a component of the consideration paid to EnCap as discussed in Note 9. In conjunction with the share issuance, the Company recognized share capital of $318 thousand and paid in surplus of $1,169 million.
NORMAL COURSE ISSUER BID AND OTHER SHARE BUYBACKS
On September 26, 2024, Ovintiv announced it had received regulatory approval for the renewal of its NCIB program, which enables the Company to purchase, for cancellation or return to treasury, up to approximately 25.9 million shares of common stock over a 12-month period from October 3, 2024 to October 2, 2025.
During the year ended December 31, 2024, under its 2023 NCIB program which extended from October 3, 2023 to October 2, 2024, the Company purchased approximately 12.7 million shares for total consideration of approximately $597 million. Of the amount paid, $127 thousand was charged to share capital and $597 million was charged to paid in surplus.
During the year ended December 31, 2023, under its 2022 NCIB program which extended from October 3, 2022 to October 2, 2023, the Company purchased approximately 7.7 million shares for total consideration of approximately $328 million. Of the amount paid, $77 thousand was charged to share capital and $328 million was charged to paid in surplus.
In addition to the NCIB purchases, during the year ended December 31, 2023, the Company purchased approximately 2.2 million shares of common stock for total consideration of approximately $98 million. Of the amount paid, $22 thousand was charged to share capital and $98 million was charged to paid in surplus.
During the year ended December 31, 2022, the Company purchased approximately 3.5 million shares under its 2022 NCIB program and 11.2 million shares under its 2021 NCIB program, which extended from October 1, 2021 to September 30, 2022. Total consideration of approximately $719 million was paid to complete the share repurchases, of which $147 thousand was charged to share capital and $719 million was charged to paid in surplus.
All NCIB purchases were made in accordance with their respective programs at prevailing market prices plus brokerage fees, with consideration allocated to share capital up to the par value of the shares, with any excess allocated to paid in surplus.
DIVIDENDS
During the year ended December 31, 2024, the Company declared and paid dividends of $1.20 per share of common stock, totaling $316 million (2023 - $1.15 per share of common stock, totaling $307 million; 2022 - $0.95 per share of common stock, totaling $239 million).
The quarterly dividend payment in 2024 was $0.30 per share of common stock. Ovintiv’s quarterly dividend payment in 2023 was $0.25 per share of common stock in the first quarter and $0.30 per share of common stock for each of the second, third and fourth quarters. Ovintiv’s quarterly dividend payment in 2022 was $0.20 per share of common stock in the first quarter and $0.25 per share of common stock for each of the second, third and fourth quarters.
On February 26, 2025, the Board of Directors declared a dividend of $0.30 per share of common stock payable on March 31, 2025, to shareholders of record as of March 14, 2025.
EARNINGS PER SHARE OF COMMON STOCK
The following table presents the calculation of net earnings (loss) per share of common stock:
| | | | | | | | | | | | |
For the years ended December 31 (US$ millions, except per share amounts) | | 2024 | | | 2023 | | | 2022 | |
| | | | | | | | | |
Net Earnings (Loss) | | $ | 1,125 | | | $ | 2,085 | | | $ | 3,637 | |
| | | | | | | | | |
Number of Shares of Common Stock: | | | | | | | | | |
Weighted average shares of common stock outstanding - Basic | | | 264.6 | | | | 259.9 | | | | 253.6 | |
Effect of dilutive securities | | | 2.8 | | | | 4.0 | | | | 4.8 | |
Weighted Average Shares of Common Stock Outstanding - Diluted | | | 267.4 | | | | 263.9 | | | | 258.4 | |
| | | | | | | | | |
Net Earnings (Loss) per Share of Common Stock | | | | | | | | | |
Basic | | $ | 4.25 | | | $ | 8.02 | | | $ | 14.34 | |
Diluted | | | 4.21 | | | | 7.90 | | | | 14.08 | |
STOCK-BASED COMPENSATION PLANS
Ovintiv’s Performance Share Unit (“PSU”) and Restricted Share Unit (“RSU”) stock-based compensation plans allow the Company to settle the awards either in cash or in the Company’s common stock. Accordingly, Ovintiv issued 1.4 million shares of common stock during the year ended December 31, 2024 (2023 - 4.1 million shares of common stock) as certain PSU and RSU grants vested during the year. Certain PSUs and RSUs are classified as equity-settled if the Company has sufficient common stock held in reserve for issuance. These awards are included in the calculation of fully diluted net earnings (loss) per share of common stock, using the treasury stock method, if dilutive.
Ovintiv’s stock options with associated Tandem Stock Appreciation Rights (“TSARs”) give the employee the right to purchase shares of common stock of the Company or receive cash. Historically, most holders of options have elected to exercise their TSARs in exchange for a cash payment. As a result, outstanding options are not considered potentially dilutive securities.
An aggregate of 7.4 million shares of common stock is authorized and held in reserve for issuance, of which 2.9 million shares of common stock remain available for issuance under the Company’s stock-based compensation plans as at December 31, 2024. Shares issued as a result of awards granted from stock-based compensation plans are generally funded out of the common stock authorized for issuance as approved by the Company’s shareholders. As at December 31, 2024, there were no changes to Ovintiv’s compensation plans and the Company has sufficient common stock held in reserve for issuance in accordance with its equity-settled stock-based compensation plans.
See Note 22 for further information on Ovintiv’s outstanding and exercisable TSARs, PSUs and RSUs.
| |
19. | Accumulated Other Comprehensive Income |
| | | | | | | | | | | | |
For the years ended December 31 | | 2024 | | | 2023 | | | 2022 | |
| | | | | | | | | |
Foreign Currency Translation Adjustment | | | | | | | | | |
Balance, Beginning of Year | | $ | 1,000 | | | $ | 937 | | | $ | 1,044 | |
Change in Foreign Currency Translation Adjustment | | | (269 | ) | | | 63 | | | | (107 | ) |
Balance, End of Year | | $ | 731 | | | $ | 1,000 | | | $ | 937 | |
| | | | | | | | | |
Pension and Other Post-Employment Benefit Plans | | | | | | | | | |
Balance, Beginning of Year | | $ | 50 | | | $ | 54 | | | $ | 48 | |
| | | | | | | | | |
Other Comprehensive Income Before Reclassifications: | | | | | | | | | |
Net actuarial gains and (losses) (See Note 23) | | | 2 | | | | 3 | | | | 13 | |
Income taxes | | | - | | | | (1 | ) | | | (3 | ) |
| | | | | | | | | |
Amounts Reclassified from Other Comprehensive Income: | | | | | | | | | |
Reclassification of net actuarial (gains) and losses to net earnings (See Note 23) | | | (7 | ) | | | (8 | ) | | | (6 | ) |
Income taxes | | | 1 | | | | 2 | | | | 2 | |
| | | | | | | | | |
Balance, End of Year | | $ | 46 | | | $ | 50 | | | $ | 54 | |
Total Accumulated Other Comprehensive Income | | $ | 777 | | | $ | 1,050 | | | $ | 991 | |
| |
20. | Variable Interest Entities |
Veresen Midstream Limited Partnership
Veresen Midstream Limited Partnership (“VMLP”) provides gathering, compression and processing services under various agreements related to the Company’s development of liquids and natural gas production in the Montney play. As at December 31, 2024, VMLP provides approximately 1,153 MMcf/d of natural gas gathering and compression and 913 MMcf/d of natural gas processing under long-term service agreements with remaining terms ranging from seven to 21 years and have various renewal terms providing up to a potential maximum of 10 years.
Ovintiv has determined that VMLP is a variable interest entity and that Ovintiv holds variable interests in VMLP. Ovintiv is not the primary beneficiary as the Company does not have the power to direct the activities that most significantly impact VMLP’s economic performance. These key activities relate to the construction, operation, maintenance and marketing of the assets owned by VMLP. The variable interests arise from certain terms under the various long-term service agreements and include: i) a take or pay for volumes in certain agreements; ii) an operating fee of which a portion can be converted into a fixed fee once VMLP assumes operatorship of certain assets; and iii) a potential payout of minimum costs in certain agreements. The potential payout of minimum costs will be assessed in the eighth year of the assets’ service period and is based on whether there is an overall shortfall of total system cash flows from natural gas gathered and compressed under certain agreements. The potential payout amount can be reduced in the event VMLP markets unutilized capacity to third-party users. Ovintiv is not required to provide any financial support or guarantees to VMLP.
As a result of Ovintiv’s involvement with VMLP, the maximum total exposure to loss related to the commitments under the agreements is estimated to be $940 million as at December 31, 2024. The estimate comprises the take or pay volume commitments and the potential payout of minimum costs. The take or pay volume commitments associated with certain gathering and processing assets are included in Note 27 under Transportation and Processing. The potential payout requirement is highly uncertain as the amount is contingent on future production estimates, pace of development and downstream transportation constraints. As at December 31, 2024, accounts payable and accrued liabilities included $20 million related to the take or pay commitment and payout of minimum costs.
In October 2024, Ovintiv undertook a plan to reduce its workforce by approximately 10 percent as part of a corporate reorganization. The Company incurred total restructuring charges of $27 million, before tax, related to severance costs. As at December 31, 2024, $19 million remained accrued and is expected to be paid in 2025.
Restructuring charges are included in administrative expense presented in the Corporate and Other segment in the Consolidated Statement of Earnings.
| | | | | | | | | | | | |
For the years ended December 31 | | 2024 | | | 2023 | | | 2022 | |
| | | | | | | | | |
Severance and Outplacement | | $ | 27 | | | $ | - | | | $ | - | |
Restructuring Expenses | | $ | 27 | | | $ | - | | | $ | - | |
| | | | | | | | | | | | |
As at December 31 | | 2024 | | | 2023 | | | 2022 | |
| | | | | | | | | |
Outstanding Restructuring Accrual, Beginning of Year | | $ | - | | | $ | - | | | $ | 3 | |
Restructuring Expenses Incurred | | | 27 | | | | - | | | | - | |
Restructuring Costs Paid | | | (8 | ) | | | - | | | | (3 | ) |
Outstanding Restructuring Accrual, End of Year (1) | | $ | 19 | | | $ | - | | | $ | - | |
(1) Included in accounts payable and accrued liabilities in the Consolidated Balance Sheet.
Ovintiv has a number of compensation arrangements under which the Company awards various types of long-term incentive grants to eligible employees and Directors. They may include Stock Appreciation Rights (“SARs”), TSARs, PSUs, Deferred Share Units (“DSUs”) and RSUs.
Ovintiv accounts for certain PSUs and RSUs as equity-settled stock-based payment transactions provided there is sufficient common stock held in reserve for issuance. SARs, TSARs and DSUs are accounted for as cash-settled stock-based payment transactions. The Company accrues compensation costs over the vesting period based on the fair value of the rights determined using the Black-Scholes-Merton or other appropriate fair value models.
During the first quarter of 2023, Ovintiv’s Board of Directors resolved to settle certain PSU awards and RSU awards with the issuance of the Company’s common stock. Accordingly, these awards were modified and reclassified as equity-settled share-based payment transactions at the modification date. There was no incremental compensation cost recognized at the modification date.
As at December 31, 2024, there were no changes to Ovintiv’s compensation plans and the Company has sufficient common stock held in reserve for issuance in accordance with its equity-settled stock-based compensation plans.
The Company has recognized the following share-based compensation costs:
| | | | | | | | | | | | |
For the years ended December 31 | | 2024 | | | 2023 | | | 2022 | |
| | | | | | | | | |
Total Compensation Costs of Transactions Classified as Cash-Settled | | $ | (1 | ) | | $ | (22 | ) | | $ | 152 | |
Total Compensation Costs of Transactions Classified as Equity-Settled | | | 92 | | | | 98 | | | | 82 | |
Less: Total Share-Based Compensation Costs Capitalized | | | (25 | ) | | | (29 | ) | | | (32 | ) |
Total Share-Based Compensation Expense (Recovery) | | $ | 66 | | | $ | 47 | | | $ | 202 | |
| | | | | | | | | |
Recognized in the Consolidated Statement of Earnings in: | | | | | | | | | |
Operating | | $ | 26 | | | $ | 25 | | | $ | 38 | |
Administrative | | | 40 | | | | 22 | | | | 164 | |
| | $ | 66 | | | $ | 47 | | | $ | 202 | |
As at December 31, 2024, the liability for cash-settled share-based payment transactions totaled $10 million (2023 ‑ $14 million), which is recognized in accounts payable and accrued liabilities in the Consolidated Balance Sheet.
The following sections outline certain information related to Ovintiv’s compensation plans as at December 31, 2024.
A)STOCK APPRECIATION RIGHTS
U.S. dollar denominated SARs were historically granted to eligible U.S.-based employees, which entitle the employee to receive a cash payment equal to the excess of the market price of Ovintiv’s shares of common stock at the time of exercise over the original grant price of the right. SARs granted vest and are exercisable at 30 percent of the number granted after one year, an additional 30 percent of the number granted after two years, are fully exercisable after three years and expire seven years after the date granted. SARs are classified as a liability and remeasured at the end of each reporting period.
The following table summarizes information related to the U.S. dollar denominated SARs:
| | | | | | | | | | | | | | | | | | | | | | | | |
As at December 31 | | 2024 | | | 2023 | |
| | Outstanding
SARs
(thousands
of units) | | | Weighted
Average
Exercise
Price (US$) | | | Weighted
Average
Remaining
Contractual
Life (Years) | | | Outstanding
SARs
(thousands
of units) | | | Weighted
Average
Exercise
Price (US$) | | | Weighted
Average
Remaining
Contractual
Life (Years) | |
| | | | | | | | | | | | | | | | | | |
Outstanding, Beginning of Year | | | 496 | | | | 44.77 | | | | 1.5 | | | | 530 | | | | 44.17 | | | | |
Granted | | | - | | | | - | | | | | | | - | | | | - | | | | |
Exercised (1) | | | (31 | ) | | | 35.80 | | | | | | | (20 | ) | | | 20.91 | | | | |
Forfeited | | | (5 | ) | | | 54.35 | | | | | | | (14 | ) | | | 56.95 | | | | |
Expired | | | (112 | ) | | | 58.75 | | | | | | | - | | | | - | | | | |
Outstanding, End of Year (2) | | | 348 | | | | 40.91 | | | | 0.9 | | | | 496 | | | | 44.77 | | | | 1.5 | |
Vested and Exercisable, End of Year (3) | | | 348 | | | | 40.91 | | | | 0.9 | | | | 496 | | | | 44.77 | | | | 1.5 | |
(1)The intrinsic value of option awards exercised and cash-settled during 2024 was nil (2023 - $1 million; 2022 - $11 million).
(2)The intrinsic value of option awards outstanding at December 31, 2024, was $2 million (2023 - $5 million).
(3)The intrinsic value of option awards vested and exercisable at December 31, 2024, was $2 million (2023 - $5 million).
The following weighted average assumptions were used to determine the fair value of SARs outstanding:
| | | | | | |
| | US$ Share Units |
As at December 31 | | 2024 | | 2023 | | 2022 |
| | | | | | |
Risk Free Interest Rate | | 2.92% | | 3.95% | | 4.02% |
Dividend Yield | | 2.96% | | 2.73% | | 1.97% |
Expected Volatility Rate (1) | | 46.02% | | 52.32% | | 107.80% |
Expected Term | | 0.7 yrs | | 1.1 yrs | | 1.6 yrs |
Market Share Price | | US$40.50 | | US$43.92 | | US$50.71 |
Weighted Average Grant Date Fair Value | | US$40.91 | | US$44.77 | | US$44.17 |
(1)Volatility was estimated using historical rates.
As at December 31, 2024, and 2023, there were no unvested SARs outstanding and no associated unrecognized compensation costs.
B)TANDEM STOCK APPRECIATION RIGHTS
All options to purchase shares of common stock historically issued to eligible Canadian-based employees under Ovintiv’s Stock Option Plan have associated TSARs attached. In lieu of exercising the option, the associated TSARs give the option holder the right to purchase shares of common stock of the Company or receive a cash payment equal to the excess of the market price of Ovintiv’s shares of common stock at the time of exercise over the original grant price. TSARs granted vest and are exercisable at 30 percent of the number granted after one year, an additional 30 percent of the number granted after two years, are fully exercisable after three years and expire seven years after the date granted. TSARs are classified as a liability and remeasured at the end of each reporting period.
The following table summarizes information related to the TSARs:
| | | | | | | | | | | | | | | | | | | | | | | | |
As at December 31 | | 2024 | | | 2023 | |
| | Outstanding
TSARs
(thousands
of units) | | | Weighted
Average
Exercise
Price (C$) | | | Weighted
Average
Remaining
Contractual
Life (Years) | | | Outstanding
TSARs
(thousands
of units) | | | Weighted
Average
Exercise
Price (C$) | | | Weighted
Average
Remaining
Contractual
Life (Years) | |
| | | | | | | | | | | | | | | | | | |
Outstanding, Beginning of Year | | | 262 | | | | 62.45 | | | | 1.3 | | | | 290 | | | | 60.31 | | | | |
Granted | | | - | | | | - | | | | | | | - | | | | - | | | | |
Exercised - SARs (1) | | | (20 | ) | | | 63.06 | | | | | | | (23 | ) | | | 32.67 | | | | |
Exercised - Options (1) | | | - | | | | - | | | | | | | - | | | | - | | | | |
Forfeited | | | - | | | | - | | | | | | | (5 | ) | | | 72.77 | | | | |
Expired | | | (82 | ) | | | 77.15 | | | | | | | - | | | | - | | | | |
Outstanding, End of Year (2) | | | 160 | | | | 54.84 | | | | 0.8 | | | | 262 | | | | 62.45 | | | | 1.3 | |
Vested and Exercisable, End of Year (3) | | | 160 | | | | 54.84 | | | | 0.8 | | | | 262 | | | | 62.45 | | | | 1.3 | |
(1)The intrinsic value of option awards exercised and cash-settled during 2024 was nil (2023 - nil; 2022 - $6 million).
(2)The intrinsic value of option awards outstanding at December 31, 2024, was $1 million (2023 - $2 million).
(3)The intrinsic value of option awards vested and exercisable at December 31, 2024, was $1 million (2023 - $2 million).
The following weighted average assumptions were used to determine the fair value of TSARs outstanding:
| | | | | | |
| | C$ Share Units |
As at December 31 | | 2024 | | 2023 | | 2022 |
| | | | | | |
Risk Free Interest Rate | | 2.92% | | 3.95% | | 4.02% |
Dividend Yield | | 2.82% | | 2.78% | | 1.90% |
Expected Volatility Rate (1) | | 42.83% | | 48.87% | | 106.16% |
Expected Term | | 0.6 yrs | | 0.9 yrs | | 1.5 yrs |
Market Share Price | | C$58.23 | | C$58.16 | | C$68.56 |
Weighted Average Grant Date Fair Value | | C$54.84 | | C$62.45 | | C$60.31 |
(1)Volatility was estimated using historical rates.
As at December 31, 2024, and 2023, there were no unvested TSARs outstanding and no associated unrecognized compensation costs.
C)PERFORMANCE SHARE UNITS
PSUs are granted to eligible employees, which entitle the employee to receive, upon vesting, one share of Ovintiv common stock for each PSU held or a cash equivalent, at the discretion of the Company. PSUs vest three years from the date granted, provided the employee remains actively employed with Ovintiv on the vesting date. Based on the performance assessment, up to a maximum of two times the original PSU grant may be eligible to vest in respect of the year being measured.
The ultimate value of the PSUs will depend upon Ovintiv’s performance relative to predetermined strategic milestones as well as the performance of a specified peer group over a three-year period.
The following tables summarize information related to the PSUs:
| | | | | | | | | | | | | | | | | |
As at December 31 | | 2024 | | | | 2023 (1) | |
U.S. Dollar Denominated Outstanding PSUs
| | Units
(thousands) | | | Weighted Average
Grant Date
Fair Value (US$) | | | | Units
(thousands) | | | Weighted Average
Grant Date
Fair Value (US$) | |
| | | | | | | | | | | | | |
Unvested and Outstanding, Beginning of Year | | | 1,307 | | | | 33.91 | | | | | 2,261 | | | | 20.17 | |
Granted | | | 416 | | | | 43.90 | | | | | 1,248 | | | | 21.38 | |
Vested and Released (2) | | | (761 | ) | | | 23.08 | | | | | (2,202 | ) | | | 12.65 | |
Units, in Lieu of Dividends | | | 28 | | | | 46.13 | | | | | 37 | | | | 33.41 | |
Forfeited | | | (47 | ) | | | 44.80 | | | | | (37 | ) | | | 36.59 | |
Unvested and Outstanding, End of Year | | | 943 | | | | 46.86 | | | | | 1,307 | | | | 33.91 | |
| | | | | | | | | | | | | | | | | |
As at December 31 | | 2024 | | | | 2023 (1) | |
Canadian Dollar Denominated Outstanding PSUs
| | Units
(thousands) | | | Weighted Average
Grant Date
Fair Value (C$) | | | | Units
(thousands) | | | Weighted Average
Grant Date
Fair Value (C$) | |
| | | | | | | | | | | | | |
Unvested and Outstanding, Beginning of Year | | | 487 | | | | 45.30 | | | | | 1,048 | | | | 24.74 | |
Granted | | | 149 | | | | 59.49 | | | | | 614 | | | | 26.20 | |
Vested and Released (2) | | | (259 | ) | | | 29.04 | | | | | (1,176 | ) | | | 16.95 | |
Units, in Lieu of Dividends | | | 10 | | | | 62.10 | | | | | 14 | | | | 43.74 | |
Forfeited | | | (22 | ) | | | 62.40 | | | | | (13 | ) | | | 48.70 | |
Unvested and Outstanding, End of Year | | | 365 | | | | 62.10 | | | | | 487 | | | | 45.30 | |
(1)During the first quarter of 2023, Ovintiv’s Board of Directors resolved to settle certain PSU awards and RSU awards with the issuance of the Company’s common stock. Accordingly, these awards were modified and reclassified as equity-settled awards. The modification date fair value of the awards was US$43.80 per share and C$59.47 per share for the U.S. dollar denominated and Canadian dollar denominated PSUs, respectively.
(2)During the year ended December 31, 2024, performance shares that vested and were cash-settled resulted in payments of $36 million (2023 ‑ $22 million; 2022 - $22 million).
As at December 31, 2024, there were approximately $22 million of unrecognized compensation costs (2023 ‑ $25 million) related to unvested PSUs. The costs are expected to be recognized over a weighted average period of 1.7 years.
The Company has in place a program whereby Directors and certain key employees are issued DSUs, which vest immediately, are equivalent in value to a share of Ovintiv common stock and are settled in cash. DSUs are classified as a liability and remeasured at the end of each reporting period based on the change in fair value of the Company’s common stock.
Under the DSU Plan, employees have the option to convert either 25 or 50 percent of their annual bonus award into DSUs. The number of DSUs converted is based on the value of the award divided by the closing value of Ovintiv’s share price at the end of the performance period of the bonus award.
For both Directors and employees, DSUs can only be redeemed following departure from Ovintiv in accordance with the terms of the respective DSU Plan and must be redeemed prior to December 15th of the year following the departure from Ovintiv.
The following table summarizes information related to the DSUs:
| | | | | | | | | | | | | | | | |
(thousands of units)
| | U.S. Dollar Denominated
Outstanding DSUs | | | Canadian Dollar Denominated
Outstanding DSUs | |
As at December 31 | | 2024 | | | 2023 | | | 2024 | | | 2023 | |
| | | | | | | | | | | | |
Vested and Outstanding, Beginning of Year | | | 18 | | | | 10 | | | | 147 | | | | 188 | |
Granted | | | 5 | | | | 7 | | | | 2 | | | | - | |
Converted from Bonus Awards | | | - | | | | - | | | | - | | | | - | |
Units, in Lieu of Dividends | | | 1 | | | | 1 | | | | 4 | | | | 5 | |
Redeemed (1) | | | - | | | | - | | | | (7 | ) | | | (46 | ) |
Vested and Outstanding, End of Year (2) | | | 24 | | | | 18 | | | | 146 | | | | 147 | |
(1)During the year ended December 31, 2024, deferred shares that vested and were cash-settled resulted in payments of nil (2023 ‑ $2 million, 2022 ‑ $1 million).
(2)The intrinsic value of deferred shares outstanding at December 31, 2024, was $7 million (2023 - $7 million).
RSUs are granted to eligible employees and Directors. An RSU is a conditional grant to receive a share of Ovintiv common stock or a cash equivalent at the Company’s discretion upon vesting of the RSUs and in accordance with the terms and conditions of the RSU Plans and grant agreements.
RSUs issued to employees vest over their three-year service period. RSUs issued to Directors fully vest on the grant date and have no required term of service. RSUs issued to Directors before May 2022 are settled three years from the date granted or following the Director’s departure from Ovintiv, whichever is earlier. Beginning with the RSUs issued in May 2022, all RSU awards issued to Directors are equity-settled immediately upon issuance.
The following tables summarize information related to the RSUs:
| | | | | | | | | | | | | | | | | |
As at December 31 | | 2024 | | | | 2023 (1) | |
U.S. Dollar Denominated Outstanding RSUs
| | Units
(thousands) | | | Weighted Average
Grant Date
Fair Value (US$) | | | | Units
(thousands) | | | Weighted Average
Grant Date
Fair Value (US$) | |
| | | | | | | | | | | | | |
Unvested and Outstanding, Beginning of Year | | | 2,225 | | | | 39.11 | | | | | 3,369 | | | | 25.48 | |
Granted | | | 1,050 | | | | 49.30 | | | | | 1,155 | | | | 43.72 | |
Units, in Lieu of Dividends | | | 55 | | | | 47.06 | | | | | 64 | | | | 38.74 | |
Vested and Released (2) | | | (1,269 | ) | | | 34.87 | | | | | (2,200 | ) | | | 20.61 | |
Forfeited | | | (183 | ) | | | 46.61 | | | | | (163 | ) | | | 39.61 | |
Unvested and Outstanding, End of Year | | | 1,878 | | | | 47.24 | | | | | 2,225 | | | | 39.11 | |
| | | | | | | | | | | | | | | | | |
As at December 31 | | 2024 | | | | 2023 (1) | |
Canadian Dollar Denominated Outstanding RSUs
| | Units
(thousands) | | | Weighted Average
Grant Date
Fair Value (C$) | | | | Units
(thousands) | | | Weighted Average
Grant Date
Fair Value (C$) | |
| | | | | | | | | | | | | |
Unvested and Outstanding, Beginning of Year | | | 982 | | | | 51.93 | | | | | 1,540 | | | | 32.65 | |
Granted | | | 420 | | | | 67.13 | | | | | 463 | | | | 60.28 | |
Units, in Lieu of Dividends | | | 23 | | | | 63.43 | | | | | 28 | | | | 51.65 | |
Vested and Released (2) | | | (550 | ) | | | 45.80 | | | | | (1,002 | ) | | | 26.23 | |
Forfeited | | | (77 | ) | | | 63.12 | | | | | (47 | ) | | | 50.16 | |
Unvested and Outstanding, End of Year | | | 798 | | | | 63.47 | | | | | 982 | | | | 51.93 | |
(1)During the first quarter of 2023, Ovintiv’s Board of Directors resolved to settle certain PSU awards and RSU awards with the issuance of the Company’s common stock. Accordingly, these awards were modified and reclassified as equity-settled awards. The modification date fair value of the awards was US$43.80 per share and C$59.47 per share for the U.S. dollar denominated and Canadian dollar denominated RSUs, respectively.
(2)During the year ended December 31, 2024, restricted shares that vested and were cash-settled resulted in payments of $7 million (2023 ‑ $18 million; 2022 - $51 million).
As at December 31, 2024, there were approximately $40 million of unrecognized compensation costs (2023 ‑ $43 million) related to unvested RSUs. The costs are expected to be recognized over a weighted average period of 1.4 years.
| |
23. | Pension and Other Post-Employment Benefits |
Ovintiv sponsors defined benefit and defined contribution plans, providing pension and other post-employment benefits (“OPEB”) to its employees in the U.S. and Canada. As of January 1, 2003, the defined benefit pension plan was closed to new entrants. The average remaining service period of active employees participating in the defined benefit pension plan is five years and the average remaining life expectancy of inactive employees is 13 years. The average remaining service period of the active employees participating in the OPEB plan is 10 years.
The Company is required to file an actuarial valuation of its pension plans with the provincial regulator at least every three years, or more frequently if directed by the regulator. The most recent filing was dated December 31, 2023, and the next required filing is expected to be as at December 31, 2026.
The following tables set forth changes in the benefit obligations and fair value of plan assets for the Company’s defined benefit pension and other post-employment benefit plans for the years ended December 31, 2024 and 2023, as well as the funded status of the plans and amounts recognized in the Consolidated Financial Statements as at December 31, 2024 and 2023.
| | | | | | | | | | | | | | | | |
| | Defined Benefits | | | OPEB | |
As at December 31 | | 2024 | | | 2023 | | | 2024 | | | 2023 | |
| | | | | | | | | | | | |
Change in Benefit Obligations | | | | | | | | | | | | |
Projected Benefit Obligation, Beginning of Year | | $ | 138 | | | $ | 140 | | | $ | 48 | | | $ | 50 | |
Service Cost | | | - | | | | - | | | | 2 | | | | 2 | |
Interest Cost | | | 6 | | | | 7 | | | | 2 | | | | 2 | |
Actuarial (Gains) Losses | | | 3 | | | | 3 | | | | (1 | ) | | | 1 | |
Exchange Differences | | | (11 | ) | | | 4 | | | | (1 | ) | | | - | |
Employee Contributions | | | - | | | | - | | | | 1 | | | | 1 | |
Benefits Paid | | | (12 | ) | | | (13 | ) | | | (6 | ) | | | (8 | ) |
Settlement | | | - | | | | (3 | ) | | | - | | | | - | |
Projected Benefit Obligation, End of Year | | $ | 124 | | | $ | 138 | | | $ | 45 | | | $ | 48 | |
| | | | | | | | | | | | |
Change in Plan Assets | | | | | | | | | | | | |
Fair Value of Plan Assets, Beginning of Year | | $ | 123 | | | $ | 124 | | | $ | - | | | $ | - | |
Actual Return on Plan Assets | | | 9 | | | | 12 | | | | - | | | | - | |
Exchange Differences | | | (10 | ) | | | 3 | | | | - | | | | - | |
Employee Contributions | | | - | | | | - | | | | 1 | | | | 1 | |
Employer Contributions | | | - | | | | - | | | | 5 | | | | 7 | |
Benefits Paid | | | (12 | ) | | | (13 | ) | | | (6 | ) | | | (8 | ) |
Settlement | | | - | | | | (3 | ) | | | - | | | | - | |
Fair Value of Plan Assets, End of Year | | $ | 110 | | | $ | 123 | | | $ | - | | | $ | - | |
| | | | | | | | | | | | |
Funded Status of Plan Assets, End of Year | | $ | (14 | ) | | $ | (15 | ) | | $ | (45 | ) | | $ | (48 | ) |
| | | | | | | | | | | | |
Total Recognized Amounts in the | | | | | | | | | | | | |
Consolidated Balance Sheet Consist of: | | | | | | | | | | | | |
Other Assets | | $ | 6 | | | $ | 5 | | | $ | - | | | $ | - | |
Current Liabilities | | | - | | | | - | | | | (5 | ) | | | (6 | ) |
Non-Current Liabilities | | | (20 | ) | | | (20 | ) | | | (40 | ) | | | (42 | ) |
Total | | $ | (14 | ) | | $ | (15 | ) | | $ | (45 | ) | | $ | (48 | ) |
| | | | | | | | | | | | |
Total Recognized Amounts in Accumulated | | | | | | | | | | | | |
Other Comprehensive Income Consist of: | | | | | | | | | | | | |
Net Actuarial (Gains) Losses | | $ | 13 | | | $ | 15 | | | $ | (73 | ) | | $ | (79 | ) |
Net Prior Service Costs | | | (7 | ) | | | (8 | ) | | | 7 | | | | 7 | |
Total Recognized in Accumulated Other Comprehensive | | | | | | | | | | | | |
Income, Before Tax | | $ | 6 | | | $ | 7 | | | $ | (66 | ) | | $ | (72 | ) |
The accumulated defined benefit obligation for all defined benefit plans was $169 million as at December 31, 2024 (2023 - $186 million).
The following table sets forth the defined benefit plans where the accumulated benefit obligation and projected benefit obligation are in excess of the fair value of the plan assets:
| | | | | | | | | | | | | | | | |
| | Defined Benefits | | | OPEB | |
As at December 31 | | 2024 | | | 2023 | | | 2024 | | | 2023 | |
| | | | | | | | | | | | |
Projected Benefit Obligation | | $ | (40 | ) | | $ | (44 | ) | | $ | (45 | ) | | $ | (48 | ) |
Accumulated Benefit Obligation | | | (40 | ) | | | (44 | ) | | | (45 | ) | | | (48 | ) |
Fair Value of Plan Assets (1) | | | 20 | | | | 24 | | | | - | | | | - | |
(1)The Company does not aggregate benefit plans.
Following are the weighted average assumptions used by the Company in determining the defined benefit pension and other post-employment benefit obligations:
| | | | | | | | | | | | | | | | |
| | Defined Benefits | | | OPEB | |
For the years ended December 31 | | 2024 | | | 2023 | | | 2024 | | | 2023 | |
| | | | | | | | | | | | |
Discount Rate | | | 4.50 | % | | | 4.60 | % | | | 5.12 | % | | | 4.90 | % |
Rates of Increase in Compensation Levels | | | 3.37 | % | | | 3.24 | % | | | 4.93 | % | | | 4.93 | % |
The following sets forth the total benefit plans expense recognized by the Company:
| | | | | | | | | | | | | | | | | | | | | | | | |
| | Pension Benefits | | | OPEB | |
For the years ended December 31 | | 2024 | | | 2023 | | | 2022 | | | 2024 | | | 2023 | | | 2022 | |
| | | | | | | | | | | | | | | | | | |
Net Defined Periodic Benefit Cost | | $ | 1 | | | $ | 2 | | | $ | - | | | $ | (3 | ) | | $ | (4 | ) | | $ | (3 | ) |
Defined Contribution Plan Expense | | | 26 | | | | 25 | | | | 24 | | | | - | | | | - | | | | - | |
Total Benefit Plans Expense | | $ | 27 | | | $ | 27 | | | $ | 24 | | | $ | (3 | ) | | $ | (4 | ) | | $ | (3 | ) |
Of the total benefit plans expense, $23 million (2023 - $22 million; 2022 - $22 million) was included in operating expense and $5 million (2023 - $5 million; 2022 - $4 million) was included in administrative expense. Excluding service costs, net defined periodic benefit gains of $4 million (2023 - $4 million; 2022 - $5 million) were recorded in other (gains) losses, net.
The net defined periodic benefit cost is as follows:
| | | | | | | | | | | | | | | | | | | | | | | | |
| | Defined Benefits | | | OPEB | |
For the years ended December 31 | | 2024 | | | 2023 | | | 2022 | | | 2024 | | | 2023 | | | 2022 | |
| | | | | | | | | | | | | | | | | | |
Service Cost | | $ | - | | | $ | - | | | $ | - | | | $ | 2 | | | $ | 2 | | | $ | 2 | |
Interest Cost | | | 6 | | | | 7 | | | | 5 | | | | 2 | | | | 2 | | | | 2 | |
Expected Return on Plan Assets | | | (5 | ) | | | (5 | ) | | | (6 | ) | | | - | | | | - | | | | - | |
Amounts Reclassified from Accumulated | | | | | | | | | | | | | | | | | | |
Other Comprehensive Income: | | | | | | | | | | | | | | | | | | |
Amortization of net actuarial (gains) and losses | | | - | | | | - | | | | 1 | | | | (7 | ) | | | (8 | ) | | | (7 | ) |
Total Net Defined Periodic Benefit Cost (1) | | $ | 1 | | | $ | 2 | | | $ | - | | | $ | (3 | ) | | $ | (4 | ) | | $ | (3 | ) |
(1)The components of total net defined periodic benefit cost, excluding the service cost component, are included in other (gains) losses, net.
Actuarial losses related to changes in the projected benefit obligations for the Company’s defined benefit pension plans were due to a decrease in the discount rate used to measure the obligations. Actuarial gains related to changes in projected benefit obligations for the Company’s OPEB plans were due to an increase in the discount rate used to measure the obligations.
The amounts recognized in other comprehensive income are as follows:
| | | | | | | | | | | | | | | | | | | | | | | | |
| | Defined Benefits | | | OPEB | |
For the years ended December 31 | | 2024 | | | 2023 | | | 2022 | | | 2024 | | | 2023 | | | 2022 | |
| | | | | | | | | | | | | | | | | | |
Net Actuarial (Gains) Losses | | $ | (1 | ) | | $ | (4 | ) | | $ | - | | | $ | (1 | ) | | $ | 1 | | | $ | (13 | ) |
Amortization of Net Actuarial Gains and (Losses) | | | - | | | | - | | | | (1 | ) | | | 7 | | | | 8 | | | | 7 | |
Total Amounts Recognized in Other Comprehensive | | | | | | | | | | | | | | | | | | |
(Income) Loss, Before Tax | | $ | (1 | ) | | $ | (4 | ) | | $ | (1 | ) | | $ | 6 | | | $ | 9 | | | $ | (6 | ) |
Total Amounts Recognized in Other Comprehensive | | | | | | | | | | | | | | | | | | |
(Income) Loss, After Tax | | $ | (1 | ) | | $ | (3 | ) | | $ | (1 | ) | | $ | 5 | | | $ | 7 | | | $ | (5 | ) |
Following are the weighted average assumptions used by the Company in determining the net periodic pension and other post-retirement benefit costs:
| | | | | | | | | | | | | | | | | | | | | | | | |
| | Defined Benefits | | | OPEB | |
For the years ended December 31 | | 2024 | | | 2023 | | | 2022 | | | 2024 | | | 2023 | | | 2022 | |
| | | | | | | | | | | | | | | | | | |
Discount Rate | | | 4.50 | % | | | 5.10 | % | | | 5.10 | % | | | 4.96 | % | | | 5.30 | % | | | 2.46 | % |
Long-Term Rate of Return on Plan Assets | | | 4.00 | % | | | 3.85 | % | | | 3.85 | % | | | - | | | | - | | | | - | |
Rates of Increase in Compensation Levels | | | 3.37 | % | | | 3.24 | % | | | 3.24 | % | | | 4.93 | % | | | 4.93 | % | | | 4.83 | % |
The Company’s assumed health care cost trend rates are as follows:
| | | | | | | | | | | | | | | | | | |
For the years ended December 31 | | | | | | | | 2024 | | | 2023 | | | 2022 | |
| | | | | | | | | | | | | | | |
Health Care Cost Trend Rate for Next Year | | | | | | | | | 7.04 | % | | | 6.96 | % | | | 6.16 | % |
Rate to Which the Cost Trend Rate is Assumed to Decline (Ultimate Trend Rate) | | | | | 5.00 | % | | | 5.00 | % | | | 5.00 | % |
Year that the Rate Reaches the Ultimate Trend Rate | | | | | | | | 2032 | | | 2030 | | | 2027 | |
The Company does not expect to contribute to its defined benefit pension plans in 2025. The Company’s OPEB plans are funded on an as required basis.
The following provides an estimate of benefit payments for the next 10 years. These estimates reflect benefit increases due to continuing employee service.
| | | | | | | | | | | | |
| | | | | Defined Benefit
Pension Payments | | | Other Benefit
Payments | |
| | | | | | | | | | |
2025 | | | | | | $ | 12 | | | $ | 5 | |
2026 | | | | | | | 12 | | | | 4 | |
2027 | | | | | | | 11 | | | | 4 | |
2028 | | | | | | | 11 | | | | 4 | |
2029 | | | | | | | 11 | | | | 4 | |
2030 - 2034 | | | | | | | 48 | | | | 17 | |
The Company’s registered and other defined benefit pension plan assets are presented by investment asset category and input level within the fair value hierarchy as follows:
| | | | | | | | | | | | | | | | |
As at December 31 | | 2024 | |
| | Level 1 | | | Level 2 | | | Level 3 | | | Total | |
| | | | | | | | | | | | |
Investments: | | | | | | | | | | | | |
Cash and Cash Equivalents | | $ | 13 | | | $ | - | | | $ | - | | | $ | 13 | |
Fixed Income | | | - | | | | 61 | | | | - | | | | 61 | |
Equity | | | - | | | | 36 | | | | - | | | | 36 | |
Fair Value of Plan Assets, End of Year | | $ | 13 | | | $ | 97 | | | $ | - | | | $ | 110 | |
| | | | | | | | | | | | |
As at December 31 | | 2023 | |
| | Level 1 | | | Level 2 | | | Level 3 | | | Total | |
| | | | | | | | | | | | |
Investments: | | | | | | | | | | | | |
Cash and Cash Equivalents | | $ | 15 | | | $ | 2 | | | $ | - | | | $ | 17 | |
Fixed Income | | | - | | | | 68 | | | | - | | | | 68 | |
Equity | | | - | | | | 38 | | | | - | | | | 38 | |
Fair Value of Plan Assets, End of Year | | $ | 15 | | | $ | 108 | | | $ | - | | | $ | 123 | |
Fixed Income investments consist of Canadian bonds issued by investment grade companies. Equity investments consist of international securities and securities held in the U.S. The fair values of these securities are based on dealer quotes, quoted market prices and net asset values.
Registered pension plan assets were invested by the Company in the following as at December 31, 2024: 66 percent Bonds (2023 - 68 percent), 31 percent U.S. and Foreign Equity (2023 - 31 percent) and three percent Cash and Cash Equivalents (2023 ‑ one percent). The expected long-term rate of return is 5.0 percent. The expected rate of return on pension plan assets is based on historical and projected rates of return for each asset class in the plan investment portfolio. The actual return on plan assets was $9 million (2023 ‑ $12 million). The asset allocation structure is subject to diversification requirements and constraints, which reduce risk by limiting exposure to individual equity investment, credit rating categories and foreign currency exposure.
| |
24. | Fair Value Measurements |
The fair values of cash and cash equivalents, accounts receivable and accrued revenues, and accounts payable and accrued liabilities approximate their carrying amounts due to the short-term maturity of those instruments. The fair values of restricted cash and marketable securities included in other assets approximate their carrying amounts due to the nature of the instruments held. Fair value information related to pension plan assets is included in Note 23.
Recurring fair value measurements are performed for risk management assets and liabilities and other derivative contracts, as discussed further in Note 25. These items are carried at fair value in the Consolidated Balance Sheet and are classified within the three levels of the fair value hierarchy in the following tables.
Fair value changes and settlements for amounts related to risk management assets and liabilities are recognized in revenues and foreign exchange gains and losses according to their purpose.
| | | | | | | | | | | | | | | | | | | | | | | | |
As at December 31, 2024 | | Level 1
Quoted
Prices in
Active
Markets | | | Level 2
Other
Observable
Inputs | | | Level 3
Significant
Unobservable
Inputs | | | Total Fair
Value | | | Netting (1) | | | Carrying
Amount | |
| | | | | | | | | | | | | | | | | | |
Risk Management Assets | | | | | | | | | | | | | | | | | | |
Commodity Derivatives: | | | | | | | | | | | | | | | | | | |
Current assets | | $ | - | | | $ | 116 | | | $ | - | | | $ | 116 | | | $ | (6 | ) | | $ | 110 | |
Foreign Currency Derivatives: | | | | | | | | | | | | | | | | | | |
Current assets | | | - | | | | - | | | | - | | | | - | | | | (2 | ) | | | (2 | ) |
| | | | | | | | | | | | | | | | | | |
Risk Management Liabilities | | | | | | | | | | | | | | | | | | |
Commodity Derivatives: | | | | | | | | | | | | | | | | | | |
Current liabilities | | $ | - | | | $ | 26 | | | $ | - | | | $ | 26 | | | $ | (6 | ) | | $ | 20 | |
Long-term liabilities | | | - | | | | 21 | | | | - | | | | 21 | | | | - | | | | 21 | |
Foreign Currency Derivatives: | | | | | | | | | | | | | | | | | | |
Current liabilities | | | - | | | | 89 | | | | - | | | | 89 | | | | (2 | ) | | | 87 | |
| | | | | | | | | | | | | | | | | | |
As at December 31, 2023 | | Level 1
Quoted
Prices in
Active
Markets | | | Level 2
Other
Observable
Inputs | | | Level 3
Significant
Unobservable
Inputs | | | Total Fair
Value | | | Netting (1) | | | Carrying
Amount | |
| | | | | | | | | | | | | | | | | | |
Risk Management Assets | | | | | | | | | | | | | | | | | | |
Commodity Derivatives: | | | | | | | | | | | | | | | | | | |
Current assets | | $ | - | | | $ | 188 | | | $ | 16 | | | $ | 204 | | | $ | (1 | ) | | $ | 203 | |
Long-term assets | | | - | | | | 5 | | | | - | | | | 5 | | | | (1 | ) | | | 4 | |
Foreign Currency Derivatives: | | | | | | | | | | | | | | | | | | |
Current assets | | | - | | | | 11 | | | | - | | | | 11 | | | | - | | | | 11 | |
| | | | | | | | | | | | | | | | | | |
Risk Management Liabilities | | | | | | | | | | | | | | | | | | |
Commodity Derivatives: | | | | | | | | | | | | | | | | | | |
Current liabilities | | $ | - | | | $ | 1 | | | $ | - | | | $ | 1 | | | $ | (1 | ) | | $ | - | |
Long-term liabilities | | | - | | | | 3 | | | | - | | | | 3 | | | | (1 | ) | | | 2 | |
| | | | | | | | | | | | | | | | | | |
Other Derivative Contracts (2) | | | | | | | | | | | | | | | | | | |
Current in accounts payable and accrued liabilities | | $ | - | | | $ | 4 | | | $ | - | | | $ | 4 | | | $ | - | | | $ | 4 | |
(1)Netting to offset derivative assets and liabilities where the legal right and intention to offset exists, or where counterparty master netting arrangements contain provisions for net settlement.
(2)Includes credit derivatives associated with certain prior years' divestitures.
The Company’s Level 2 risk management assets and liabilities consist of commodity fixed price contracts, NYMEX three-way options, WTI three-way options, foreign currency swaps and basis swaps with terms to 2027. Level 2 also included financial guarantee contracts before they expired in June 2024 as discussed in Note 25. The Company uses discounted cash flow and option-pricing models for fair valuing commodity derivatives. The fair value models use inputs such as contracted notional volumes, market future prices, maturities, credit adjusted risk free rates, and market-based implied volatility factors. The fair values of these contracts are estimated using inputs which are either directly or indirectly observable from active markets, such as exchange and other published prices, broker quotes and observable trading activity throughout the term of the instruments.
During 2024, the Company transferred all remaining WTI three-way options from Level 3 into Level 2 as a result of the availability of more observable inputs, such as volatility and comparable contract terms, from independent active markets.
The three-way options are a combination of a sold call, a bought put and a sold put. These contracts allow the Company to participate in the upside of commodity prices to the ceiling of the call option and provide the Company with partial downside price protection through the put options.
Level 3 Fair Value Measurements
A summary of changes in Level 3 fair value measurements for risk management positions is presented below:
| | | | | | | | | | | | |
| | | | | | Risk Management | |
| | | | | | 2024 | | | 2023 | |
| | | | | | | | | | |
Balance, Beginning of Year | | | | | | $ | 16 | | | $ | 12 | |
Total Gains (Losses) | | | | | | | 14 | | | | 2 | |
Purchases, Sales, Issuances and Settlements: | | | | | | | | | | |
Purchases, sales and issuances | | | | | | | - | | | | - | |
Settlements | | | | | | | 9 | | | | 2 | |
Transfers Out of Level 3 (1) | | | | | | | (39 | ) | | | - | |
Balance, End of Year | | | | | | $ | - | | | $ | 16 | |
| | | | | | | | | | |
Change in Unrealized Gains (Losses) During the | | | | | | | | | | |
Year Included in Net Earnings (Loss) | | | | | | $ | 23 | | | $ | 4 | |
(1)During 2024, the Company transferred all remaining WTI three-way options from Level 3 into Level 2 as a result of the availability of more observable inputs, such as volatility and comparable contract terms, from independent active markets.
| |
25. | Financial Instruments and Risk Management |
Ovintiv’s financial assets and liabilities are recognized in cash and cash equivalents, accounts receivable and accrued revenues, other assets, accounts payable and accrued liabilities, risk management assets and liabilities, long-term debt, and other liabilities and provisions.
B)RISK MANAGEMENT ACTIVITIES
Ovintiv uses derivative financial instruments to manage its exposure to fluctuating commodity prices and foreign currency exchange rates. The Company does not apply hedge accounting to any of its derivative financial instruments. As a result, gains and losses from changes in the fair value are recognized in net earnings (loss).
COMMODITY PRICE RISK
Commodity price risk arises from the effect that fluctuations in future commodity prices may have on revenues from production. To partially mitigate exposure to commodity price risk, the Company has entered into various derivative financial instruments. The use of these derivative instruments is governed under formal policies and is subject to limits established by the Board of Directors.
Oil and NGLs - To partially mitigate oil and NGL commodity price risk, the Company uses WTI- and NGL-based contracts such as fixed price contracts and options.
Natural Gas - To partially mitigate natural gas commodity price risk, the Company uses NYMEX-based contracts such as fixed price contracts and options. Ovintiv has also entered into basis swaps to manage against widening price differentials between various production areas and benchmark price points.
FOREIGN EXCHANGE RISK
Foreign exchange risk arises from changes in foreign currency exchange rates that may affect the fair value or future cash flows from the Company’s financial assets or liabilities. To partially mitigate the effect of foreign exchange fluctuations on future commodity revenues and expenses, the Company may enter into foreign currency derivative contracts. As at December 31, 2024, the Company has entered into $100 million notional U.S. dollar denominated currency swaps at an average exchange rate of C$1.3875 to US$1, which mature monthly throughout the first half of 2025.
Additionally, on November 14, 2024, the Company announced the Montney Acquisition (see Note 15). To manage the foreign exchange risk associated with purchasing an asset denominated in Canadian dollars, the Company entered into $2.4 billion notional U.S. dollar denominated currency swaps at an average exchange rate of C$1.3825 to US$1. These swaps were settled ahead of the transaction close on January 31, 2025 (see Note 28).
RISK MANAGEMENT POSITIONS AS AT DECEMBER 31, 2024
| | | | | | | | | | |
| | Notional Volumes | | Term | | Average Price | | Fair Value | |
| | | | | | | | | |
Oil and NGL Contracts | | | | | | US$/bbl | | | |
| | | | | | | | | |
Fixed Price Contracts | | | | | | | | | |
WTI Fixed Price (1) | | 15.6 Mbbls/d | | 2025 | | 66.61 | | $ | (17 | ) |
WTI Fixed Price (1) | | 17.6 Mbbls/d | | 2026 | | 64.55 | | | (11 | ) |
WTI Fixed Price (1) | | 11.6 Mbbls/d | | 2027 | | 63.45 | | | (5 | ) |
| | | | | | | | | |
WTI Three-Way Options | | | | | | | | | |
Sold call / bought put / sold put | | 48.2 Mbbls/d | | 2025 | | 82.31 / 65.00 / 50.00 | | | 12 | |
Oil and NGLs Fair Value Position | | | | | | | | | (21 | ) |
| | | | | | | | | |
Natural Gas Contracts | | | | | | US$/Mcf | | | |
| | | | | | | | | |
Fixed Price Contracts | | | | | | | | | |
NYMEX Fixed Price (1) | | 19 MMcf/d | | 2025 | | 3.38 | | | (1 | ) |
NYMEX Fixed Price (1) | | 19 MMcf/d | | 2026 | | 3.38 | | | (3 | ) |
NYMEX Fixed Price (1) | | 14 MMcf/d | | 2027 | | 3.40 | | | (2 | ) |
| | | | | | | | | |
NYMEX Three-Way Options | | | | | | | | | |
Sold call / bought put / sold put | | 500 MMcf/d | | 2025 | | 4.54 / 3.00 / 2.25 | | | (5 | ) |
| | | | | | | | | |
Basis Contracts (2) | | | | 2025 | | | | | 101 | |
Natural Gas Fair Value Position | | | | | | | | | 90 | |
| | | | | | | | | |
Foreign Currency Contracts | | | | | | | | | |
Fair Value Position (3) | | | | 2025 | | | | | (89 | ) |
Total Fair Value Position | | | | | | | | $ | (20 | ) |
(1)The WTI and NYMEX fixed price contracts at December 31, 2024, were executed on behalf of the purchaser for the Company’s previously announced Uinta divestiture and were novated to the purchaser upon close of the transaction on January 22, 2025 (see Note 28).
(2)Ovintiv has entered into natural gas basis swaps associated with AECO and NYMEX.
(3)Ovintiv has entered into U.S. dollar denominated fixed-for-floating average currency swaps to protect against fluctuations between the Canadian and U.S. dollars.
EARNINGS IMPACT OF REALIZED AND UNREALIZED GAINS (LOSSES) ON RISK MANAGEMENT POSITIONS
| | | | | | | | | | | | | | |
For the years ended December 31 | | | | 2024 | | | 2023 | | | 2022 | |
| | | | | | | | | | | |
Realized Gains (Losses) on Risk Management | | | | | | | | | | | |
Commodity and Other Derivatives: | | | | | | | | | | | |
Revenues (1) | | | | $ | 271 | | | $ | (43 | ) | | $ | (2,608 | ) |
Foreign Currency Derivatives: | | | | | | | | | | | |
Foreign exchange | | | | | (3 | ) | | | (8 | ) | | | (5 | ) |
Interest Rate Derivatives: | | | | | | | | | | | |
Interest rate (2) | | | | | - | | | | 1 | | | | - | |
| | | | $ | 268 | | | $ | (50 | ) | | $ | (2,613 | ) |
| | | | | | | | | | | |
Unrealized Gains (Losses) on Risk Management | | | | | | | | | | | |
Commodity and Other Derivatives: | | | | | | | | | | | |
Revenues (3) | | | | $ | (136 | ) | | $ | 194 | | | $ | 741 | |
Foreign Currency Derivatives: | | | | | | | | | | | |
Foreign exchange | | | | | (100 | ) | | | 21 | | | | (15 | ) |
| | | | $ | (236 | ) | | $ | 215 | | | $ | 726 | |
| | | | | | | | | | | |
Total Realized and Unrealized Gains (Losses) on Risk Management, net | | | | | | | | | |
Commodity and Other Derivatives: | | | | | | | | | | | |
Revenues (1) (3) | | | | $ | 135 | | | $ | 151 | | | $ | (1,867 | ) |
Foreign Currency Derivatives: | | | | | | | | | | | |
Foreign exchange | | | | | (103 | ) | | | 13 | | | | (20 | ) |
Interest Rate Derivatives: | | | | | | | | | | | |
Interest rate (2) | | | | | - | | | | 1 | | | | - | |
| | | | $ | 32 | | | $ | 165 | | | $ | (1,887 | ) |
(1)Includes a realized gain of $4 million for the year ended December 31, 2024 (2023 - gain of $1 million; 2022 - gain of $6 million) related to other derivative contracts.
(2)The interest rate swap in 2023 was executed and settled in relation to the senior notes issuance described in Note 15. The gain was recognized in interest expense.
(3)There were no unrealized gains or losses related to other derivative contracts for the year ended December 31, 2024 (2023 - nil; 2022 - loss of $2 million).
RECONCILIATION OF UNREALIZED RISK MANAGEMENT POSITIONS FROM JANUARY 1 TO DECEMBER 31
| | | | | | | | | | | | | | | | |
| | 2024 | | | 2023 | | | 2022 | |
| | Fair Value | | | Total Unrealized Gain (Loss) | | | Total Unrealized Gain (Loss) | | | Total Unrealized Gain (Loss) | |
| | | | | | | | | | | | |
Fair Value of Contracts, Beginning of Year | | $ | 212 | | | | | | | | | | |
Change in Fair Value of Contracts in Place at Beginning of Year | | | | | | | | | | | | |
and Contracts Entered into During the Year | | | 32 | | | $ | 32 | | | $ | 165 | | | $ | (1,887 | ) |
Settlement of Other Derivative Contracts | | | 4 | | | | | | | | | | |
Fair Value of Contracts Realized During the Year | | | (268 | ) | | | (268 | ) | | | 50 | | | | 2,613 | |
Fair Value of Contracts, End of Year | | $ | (20 | ) | | $ | (236 | ) | | $ | 215 | | | $ | 726 | |
Risk management assets and liabilities arise from the use of derivative financial instruments and are measured at fair value. See Note 24 for a discussion of fair value measurements.
UNREALIZED RISK MANAGEMENT POSITIONS
| | | | | | | | | | |
As at December 31 | | | | 2024 | | | 2023 | |
| | | | | | | | |
Risk Management Assets | | | | | | | | |
Current | | | | $ | 108 | | | $ | 214 | |
Long-term | | | | | - | | | | 4 | |
| | | | | 108 | | | | 218 | |
| | | | | | | | |
Risk Management Liabilities | | | | | | | | |
Current | | | | | 107 | | | | - | |
Long-term | | | | | 21 | | | | 2 | |
| | | | | 128 | | | | 2 | |
| | | | | | | | |
Other Derivative Contract Liabilities | | | | | | | | |
Current in accounts payable and accrued liabilities | | | | | - | | | | 4 | |
| | | | | - | | | | 4 | |
Net Risk Management Assets (Liabilities) and Other Derivative Contracts | | | | $ | (20 | ) | | $ | 212 | |
Credit risk arises from the potential that the Company may incur a loss if a counterparty to a financial instrument fails to meet its obligation in accordance with agreed terms. While exchange-traded contracts are subject to nominal credit risk due to the financial safeguards established by the exchanges and clearing agencies, over-the-counter traded contracts expose Ovintiv to counterparty credit risk. Counterparties to the Company’s derivative financial instruments consist primarily of major financial institutions and companies within the energy industry. This credit risk exposure is mitigated through the use of credit policies approved by the Board of Directors governing the Company’s credit portfolio including credit practices that limit transactions according to counterparties’ credit quality. Mitigation strategies may include master netting arrangements, requesting collateral, purchasing credit insurance, and/or transacting credit derivatives. The Company executes commodity derivative financial instruments under master agreements that have netting provisions that provide for offsetting payables against receivables. Ovintiv actively evaluates the creditworthiness of its counterparties, assigns appropriate credit limits and monitors credit exposures against those assigned limits. As at December 31, 2024, Ovintiv’s maximum exposure of loss due to credit risk from derivative financial instrument assets on a gross and net fair value basis was $116 million and $108 million, respectively, as disclosed in Note 24. The Company had no significant credit derivatives in place and held no collateral at December 31, 2024.
Any cash equivalents include high-grade, short-term securities, placed primarily with financial institutions with investment grade ratings. Any foreign currency agreements entered into are with major financial institutions that have investment grade credit ratings.
A substantial portion of the Company’s accounts receivable are with customers and working interest owners in the oil and gas industry and are subject to normal industry credit risks. As at December 31, 2024, approximately 94 percent (2023 - 91 percent) of Ovintiv’s accounts receivable and financial derivative credit exposures were with investment grade counterparties.
During 2015 and 2017, the Company entered into agreements resulting from divestitures, which required Ovintiv to fulfill certain payment obligations on the take or pay volume commitments assumed by the purchasers. The circumstances that would require Ovintiv to perform under the agreements included events where a purchaser failed to make payment to the guaranteed party and/or a purchaser was subject to an insolvency event. The agreements had a fair value of $4 million as at December 31, 2023, and expired in June 2024.
| |
26. | Supplementary Information |
Supplemental disclosures to the Consolidated Statement of Cash Flows are presented below:
A)NET CHANGE IN NON-CASH WORKING CAPITAL
| | | | | | | | | | | | |
For the years ended December 31 | | 2024 | | | 2023 | | | 2022 | |
| | | | | | | | | |
Operating Activities | | | | | | | | | |
Accounts receivable and accrued revenues | | $ | 256 | | | $ | 352 | | | $ | (304 | ) |
Accounts payable and accrued liabilities | | | (247 | ) | | | (304 | ) | | | 50 | |
Current portion of operating lease liabilities | | | (6 | ) | | | 11 | | | | 14 | |
Income tax receivable and payable | | | (250 | ) | | | 271 | | | | 53 | |
| | $ | (247 | ) | | $ | 330 | | | $ | (187 | ) |
| | | | | | | | | | | | |
For the years ended December 31 | | 2024 | | | 2023 | | | 2022 | |
| | | | | | | | | |
Non-Cash Operating Activities | | | | | | | | | |
ROU operating lease assets and liabilities (See Note 14) | | $ | (46 | ) | | $ | (113 | ) | | $ | (75 | ) |
Non-Cash Investing Activities | | | | | | | | | |
Asset retirement obligation incurred (See Note 17) | | $ | 9 | | | $ | 6 | | | $ | 4 | |
Asset retirement obligation change in estimated future cash outflows (See Note 17) | | | 64 | | | | 13 | | | | 58 | |
Property, plant and equipment accruals | | | (34 | ) | | | 26 | | | | 35 | |
Capitalized long-term incentives | | | (8 | ) | | | (3 | ) | | | 4 | |
Property additions/dispositions, including swaps | | | 122 | | | | 29 | | | | 126 | |
Non-Cash Financing Activities | | | | | | | | | |
Shares of common stock issued in conjunction with the Permian
Acquisition (See Note 9) | | $ | - | | | $ | (1,169 | ) | | $ | - | |
C)SUPPLEMENTARY CASH FLOW INFORMATION
| | | | | | | | | | | | |
For the years ended December 31 | | 2024 | | | 2023 | | | 2022 | |
| | | | | | | | | |
Interest Paid | | $ | 426 | | | $ | 308 | | | $ | 376 | |
Income Taxes (Recovered), net of Amounts Paid | | $ | 295 | | | $ | (19 | ) | | $ | (38 | ) |
| |
27. | Commitments and Contingencies |
COMMITMENTS
The following table outlines the Company’s commitments as at December 31, 2024:
| | | | | | | | | | | | | | | | | | | | | | | | | | | | |
| | Expected Future Payments | |
(undiscounted) | | 2025 | | | 2026 | | | 2027 | | | 2028 | | | 2029 | | | Thereafter | | | Total | |
| | | | | | | | | | | | | | | | | | | | | |
Transportation and Processing | | $ | 655 | | | $ | 642 | | | $ | 552 | | | $ | 444 | | | $ | 388 | | | $ | 1,783 | | | $ | 4,464 | |
Drilling and Field Services | | | 260 | | | | 9 | | | | - | | | | - | | | | - | | | | - | | | | 269 | |
Building Leases & Other Commitments | | | 13 | | | | 7 | | | | 6 | | | | 6 | | | | 4 | | | | 8 | | | | 44 | |
Total | | $ | 928 | | | $ | 658 | | | $ | 558 | | | $ | 450 | | | $ | 392 | | | $ | 1,791 | | | $ | 4,777 | |
Operating leases with terms greater than one year are not included in the commitments table above. The table above includes short-term leases with contract terms less than 12 months, such as drilling rigs and field office leases, as well as non-lease operating cost components associated with building leases. See Note 14 for additional disclosures on leases.
Included within transportation and processing in the table above are certain commitments associated with midstream service agreements with VMLP as described in Note 20. Divestiture transactions can reduce certain commitments disclosed above.
CONTINGENCIES
Ovintiv is involved in various legal claims and actions arising in the normal course of the Company’s operations. Although the outcome of these claims cannot be predicted with certainty, the Company does not expect these matters to have a material adverse effect on Ovintiv’s financial position, cash flows or results of operations. Management’s assessment of these matters may change in the future as these matters are subject to a number of uncertainties. For any material matters that the Company believes an unfavorable outcome is reasonably possible, the Company discloses the nature and a range of potential exposures, if reasonably estimable. If an unfavorable outcome were to occur, there exists the possibility of a material impact on the Company’s consolidated net earnings or loss for the period in which the effect becomes reasonably estimable. The Company accrues for such items when a liability is both probable and the amount can be reasonably estimated. Such accruals are based on the Company’s information known about the matters, estimates of the outcomes of such matters and experience in handling similar matters.
Divestiture of Uinta
On January 22, 2025, the Company closed its previously announced Uinta divestiture for proceeds of approximately $2.0 billion, before closing and other adjustments. Ovintiv also announced the termination of the $1.5 billion 364‑day Asset Sale Term Facility, which was anticipated to partially finance the Company’s Montney Acquisition (see Note 15). In conjunction with the Uinta divestiture, the WTI- and NYMEX-based fixed price contracts that Ovintiv held at December 31, 2024, were novated to the purchaser (see Note 25).
Montney Acquisition
On January 31, 2025, the Company closed its previously announced Montney Acquisition for cash consideration of approximately $2.307 billion (C$3.325 billion), before closing and other adjustments. Ovintiv funded the acquisition using proceeds from the divestiture of Uinta, cash on hand and proceeds from short-term borrowings. Accordingly, the Company also announced the termination of the $1.0 billion Two Year Term Facility (see Note 15). In conjunction with the closing of the Montney Acquisition, the Company settled its $2.4 billion notional U.S. dollar denominated currency swaps (see Note 25), and recognized a realized foreign exchange loss of approximately $97 million.
| |
29. | Supplementary Oil and Gas Information (unaudited) |
The unaudited supplementary information on oil and natural gas exploration and production activities for 2024, 2023 and 2022 has been presented in accordance with the FASB’s ASC Topic 932, “Extractive Activities - Oil and Gas” and the SEC’s final rule, “Modernization of Oil and Gas Reporting”. Disclosures by geographic area include the United States and Canada.
Proved Oil and Natural Gas Reserves
The following reserves disclosures reflect estimates of proved reserves, proved developed reserves, and proved undeveloped reserves, net of third-party royalty interests of oil, NGLs and natural gas owned at each year end and changes in proved reserves during each of the last three years.
The Company’s estimates of proved reserves are made using available geological and reservoir data as well as production performance data. These estimates are reviewed annually by internal reservoir engineers and revised, either upward or downward, as warranted by additional data. The results of infill drilling are treated as positive revisions due to increases to expected recovery. Other revisions are due to changes in, among other things, development plans, reservoir performance, commodity prices, economic conditions, and government restrictions. Estimates of proved reserves are inherently imprecise and are continually subject to revision based on production history, results of additional exploration and development, price changes and other factors.
The following reference prices were utilized in the determination of reserves and future net revenue:
| | | | | | | | | | | | | | | | |
| | Oil & NGLs | | | Natural Gas | |
| | WTI
($/bbl) | | | Edmonton
Condensate
(C$/bbl) | | | Henry Hub
($/MMBtu) | | | AECO
(C$/MMBtu) | |
| | | | | | | | | | | | |
Reserves Pricing (1) | | | | | | | | | | | | |
2024 | | $ | 75.48 | | | $ | 99.60 | | | $ | 2.13 | | | $ | 1.26 | |
2023 | | | 78.22 | | | | 104.61 | | | | 2.64 | | | | 2.78 | |
2022 | | | 93.82 | | | | 121.18 | | | | 6.36 | | | | 5.65 | |
(1)All prices were held constant in all future years when estimating net revenues and reserves.
PROVED RESERVES (1)
(12-MONTH AVERAGE TRAILING PRICES)
| | | | | | | | | | | | | | | | | | | | | | | | | | | | | | | | | | | | | | | |
| Oil
(MMbbls) | | | NGLs
(MMbbls) | | | Natural Gas
(Bcf) | | | Total
(MMBOE) | |
| United
States | | | Canada | | | Total | | | United
States | | | Canada | | | Total | | | United
States | | | Canada | | | Total | | | | |
2022 | | | | | | | | | | | | | | | | | | | | | | | | | | | | | |
Beginning of year | | 557.5 | | | | 1.1 | | | | 558.6 | | | | 434.7 | | | | 170.0 | | | | 604.7 | | | | 2,536 | | | | 4,033 | | | | 6,570 | | | | 2,258.2 | |
Revisions and improved recovery (2) | | (65.1 | ) | | | (0.3 | ) | | | (65.5 | ) | | | 2.9 | | | | (36.0 | ) | | | (33.2 | ) | | | 38 | | | | (582 | ) | | | (544 | ) | | | (189.2 | ) |
Extensions and discoveries | | 95.2 | | | | - | | | | 95.2 | | | | 37.2 | | | | 31.3 | | | | 68.5 | | | | 237 | | | | 1,005 | | | | 1,241 | | | | 370.6 | |
Purchase of reserves in place | | 15.8 | | | | - | | | | 15.8 | | | | 13.7 | | | | 1.7 | | | | 15.4 | | | | 72 | | | | 16 | | | | 88 | | | | 45.9 | |
Sale of reserves in place | | (20.2 | ) | | | (0.6 | ) | | | (20.8 | ) | | | (0.7 | ) | | | (0.6 | ) | | | (1.3 | ) | | | (5 | ) | | | (16 | ) | | | (22 | ) | | | (25.7 | ) |
Production | | (48.0 | ) | | | - | | | | (48.0 | ) | | | (29.9 | ) | | | (17.3 | ) | | | (47.3 | ) | | | (180 | ) | | | (366 | ) | | | (545 | ) | | | (186.2 | ) |
End of year | | 535.2 | | | | 0.1 | | | | 535.3 | | | | 457.8 | | | | 149.0 | | | | 606.9 | | | | 2,698 | | | | 4,090 | | | | 6,789 | | | | 2,273.6 | |
Developed | | 257.2 | | | | 0.1 | | | | 257.3 | | | | 288.3 | | | | 71.2 | | | | 359.5 | | | | 1,755 | | | | 2,276 | | | | 4,031 | | | | 1,288.7 | |
Undeveloped | | 278.0 | | | | - | | | | 278.0 | | | | 169.5 | | | | 77.8 | | | | 247.4 | | | | 943 | | | | 1,814 | | | | 2,757 | | | | 984.9 | |
Total | | 535.2 | | | | 0.1 | | | | 535.3 | | | | 457.8 | | | | 149.0 | | | | 606.9 | | | | 2,698 | | | | 4,090 | | | | 6,789 | | | | 2,273.6 | |
2023 | | | | | | | | | | | | | | | | | | | | | | | | | | | | | |
Beginning of year | | 535.2 | | | | 0.1 | | | | 535.3 | | | | 457.8 | | | | 149.0 | | | | 606.9 | | | | 2,698 | | | | 4,090 | | | | 6,789 | | | | 2,273.6 | |
Revisions and improved recovery (2) | | (134.0 | ) | | | - | | | | (134.0 | ) | | | (89.1 | ) | | | (6.2 | ) | | | (95.4 | ) | | | (460 | ) | | | (21 | ) | | | (482 | ) | | | (309.6 | ) |
Extensions and discoveries | | 64.7 | | | | - | | | | 64.7 | | | | 23.3 | | | | 20.4 | | | | 43.6 | | | | 146 | | | | 916 | | | | 1,061 | | | | 285.3 | |
Purchase of reserves in place | | 160.0 | | | | - | | | | 160.0 | | | | 46.6 | | | | 1.1 | | | | 47.7 | | | | 201 | | | | 17 | | | | 218 | | | | 243.9 | |
Sale of reserves in place | | (49.1 | ) | | | - | | | | (49.1 | ) | | | (28.9 | ) | | | - | | | | (28.9 | ) | | | (137 | ) | | | - | | | | (137 | ) | | | (100.8 | ) |
Production | | (58.0 | ) | | | - | | | | (58.0 | ) | | | (31.2 | ) | | | (17.4 | ) | | | (48.6 | ) | | | (189 | ) | | | (411 | ) | | | (599 | ) | | | (206.5 | ) |
End of year | | 518.8 | | | | 0.1 | | | | 518.9 | | | | 378.4 | | | | 146.9 | | | | 525.3 | | | | 2,259 | | | | 4,591 | | | | 6,850 | | | | 2,185.9 | |
Developed | | 277.6 | | | | 0.1 | | | | 277.7 | | | | 275.7 | | | | 78.0 | | | | 353.7 | | | | 1,695 | | | | 2,590 | | | | 4,286 | | | | 1,345.6 | |
Undeveloped | | 241.2 | | | | - | | | | 241.2 | | | | 102.7 | | | | 68.9 | | | | 171.6 | | | | 564 | | | | 2,000 | | | | 2,565 | | | | 840.2 | |
Total | | 518.8 | | | | 0.1 | | | | 518.9 | | | | 378.4 | | | | 146.9 | | | | 525.3 | | | | 2,259 | | | | 4,591 | | | | 6,850 | | | | 2,185.9 | |
2024 | | | | | | | | | | | | | | | | | | | | | | | | | | | | | |
Beginning of year | | 518.8 | | | | 0.1 | | | | 518.9 | | | | 378.4 | | | | 146.9 | | | | 525.3 | | | | 2,259 | | | | 4,591 | | | | 6,850 | | | | 2,185.9 | |
Revisions and improved recovery (2) | | 2.9 | | | | 0.1 | | | | 2.9 | | | | 129.1 | | | | (43.7 | ) | | | 85.4 | | | | 639 | | | | (2,476 | ) | | | (1,837 | ) | | | (217.9 | ) |
Extensions and discoveries | | 118.0 | | | | 0.3 | | | | 118.3 | | | | 58.2 | | | | 13.6 | | | | 71.8 | | | | 346 | | | | 315 | | | | 660 | | | | 300.1 | |
Purchase of reserves in place | | 1.8 | | | | - | | | | 1.8 | | | | 1.0 | | | | - | | | | 1.0 | | | | 6 | | | | 1 | | | | 7 | | | | 4.0 | |
Sale of reserves in place | | (0.3 | ) | | | - | | | | (0.3 | ) | | | (0.4 | ) | | | - | | | | (0.4 | ) | | | (2 | ) | | | - | | | | (2 | ) | | | (1.0 | ) |
Production | | (61.4 | ) | | | (0.1 | ) | | | (61.5 | ) | | | (31.8 | ) | | | (17.1 | ) | | | (48.9 | ) | | | (197 | ) | | | (425 | ) | | | (621 | ) | | | (214.1 | ) |
End of year | | 579.8 | | | | 0.2 | | | | 580.0 | | | | 534.5 | | | | 99.7 | | | | 634.2 | | | | 3,052 | | | | 2,005 | | | | 5,057 | | | | 2,057.1 | |
Developed | | 273.7 | | | | 0.2 | | | | 274.0 | | | | 336.2 | | | | 59.9 | | | | 396.1 | | | | 1,953 | | | | 1,269 | | | | 3,222 | | | | 1,207.1 | |
Undeveloped | | 306.0 | | | | - | | | | 306.0 | | | | 198.4 | | | | 39.8 | | | | 238.2 | | | | 1,099 | | | | 736 | | | | 1,835 | | | | 850.0 | |
Total | | 579.8 | | | | 0.2 | | | | 580.0 | | | | 534.5 | | | | 99.7 | | | | 634.2 | | | | 3,052 | | | | 2,005 | | | | 5,057 | | | | 2,057.1 | |
(1)Numbers may not add due to rounding.
(2)Changes in reserve estimates resulting from application of improved recovery techniques are included in revisions of previous estimates.
Definitions:
a.“Proved” oil and gas reserves are those quantities of oil and gas which, by analysis of geoscience and engineering data, can be estimated with reasonable certainty to be economically producible from a given date forward, from known reservoirs, and under existing economic conditions, operating methods and government regulations.
b.“Developed” oil and gas reserves are reserves of any category that are expected to be recovered through existing wells with existing equipment and operating methods or in which the cost of the required equipment is relatively minor compared to the cost of a new well.
c.“Undeveloped” oil and gas reserves are reserves of any category that are expected to be recovered from new wells on undrilled acreage, or from existing wells where a relatively major expenditure is required for recompletion.
Total Proved reserves decreased 128.8 MMBOE including production of 214.1 MMBOE in 2024 due to the following:
•Revisions and improved recovery of oil and NGLs were positive primarily due to positive revisions other than price of 97.5 MMBOE, and changes in the approved development plan of 17.9 MMBOE, partially offset by lower 12-month average trailing prices of 27.1 MMBOE. Revisions and improved recovery of natural gas were negative primarily due to lower 12-month average trailing prices of 1,914 Bcf (319.1 MMBOE), and changes in the approved development plan of 239 Bcf (39.8 MMBOE), partially offset by positive revisions other than price of 316 Bcf (52.7 MMBOE).
•Extensions and discoveries of oil, NGLs and natural gas increased proved reserves by 300.1 MMBOE due to successful drilling leading to increased technical delineation, as well as new proved undeveloped locations resulting from updated development plans in Permian, Montney and Uinta.
Total Proved reserves decreased 87.7 MMBOE including production of 206.5 MMBOE in 2023 due to the following:
•Revisions and improved recovery of oil, NGLs and natural gas were negative primarily due to changes in the approved development plan of 330.0 MMBOE and revisions other than price of 9.2 MMBOE, partially offset by positive price revisions of 29.6 MMBOE from lower royalties in Canada due to lower 12-month average trailing prices.
•Extensions and discoveries of oil, NGLs and natural gas increased proved reserves by 285.3 MMBOE due to successful drilling leading to increased technical delineation, as well as new proved undeveloped locations resulting from updated development plans in Montney, Permian and Uinta.
•Purchases of 243.9 MMBOE were primarily from the Permian Acquisition.
•Sale of reserves in place decreased proved developed reserves by 100.8 MMBOE primarily due to the divestiture of the Bakken.
Total Proved reserves increased 15.4 MMBOE including production of 186.2 MMBOE in 2022 due to the following:
•Revisions and improved recovery of oil, NGLs and natural gas were negative primarily due to changes in the approved development plan of 142.5 MMBOE, negative price revisions of 49.6 MMBOE from higher royalties in Canada due to higher 12-month average trailing prices, and 1.5 MMBOE from revisions other than price, partially offset by 4.4 MMBOE from infill drilling locations.
•Extensions and discoveries of oil, NGLs and natural gas increased proved reserves by 370.6 MMBOE due to successful drilling leading to increased technical delineation, as well as new proved undeveloped locations resulting from updated development plans in Montney and Permian.
•Purchases of 45.9 MMBOE were primarily properties with oil and liquids-rich potential in Permian.
•Sale of reserves in place decreased proved developed reserves by 25.7 MMBOE primarily due to the divestiture of properties held in Uinta.
STANDARDIZED MEASURE OF DISCOUNTED FUTURE NET CASH FLOWS RELATING TO PROVED OIL AND GAS RESERVES
In calculating the standardized measure of discounted future net cash flows, constant price and cost assumptions were applied to Ovintiv’s annual future production from proved reserves to determine cash inflows. Estimates of future net cash flows from proved reserves are computed based on the average beginning-of-the-month prices during the 12-month period for the year. Future production and development costs include estimates for abandonment and dismantlement costs associated with asset retirement obligations and assume the continuation of existing economic, operating and regulatory conditions. Future income taxes are calculated by applying statutory income tax rates to future pre-tax cash flows after provision for the tax cost of the oil and natural gas properties based upon existing laws and regulations. The effect of tax credits is also considered in determining the income tax expense. The discount was computed by application of a 10 percent discount factor to the future net cash flows.
Ovintiv cautions that the discounted future net cash flows relating to proved oil and gas reserves are an indication of neither the fair market value of Ovintiv’s oil and natural gas properties, nor the future net cash flows expected to be generated from such properties. The discounted future net cash flows do not include the fair market value of exploratory properties and probable or possible oil and gas reserves, nor is consideration given to the effect of anticipated future changes in oil and natural gas prices, development, asset retirement and production costs, and possible changes to tax and royalty regulations. The prescribed discount rate of 10 percent may not appropriately reflect future interest rates.
| | | | | | | | | | | | | | | | | | | | | | | | |
| | United States | | | Canada | |
| | 2024 | | | 2023 | | | 2022 | | | 2024 | | | 2023 | | | 2022 | |
| | | | | | | | | | | | | | | | | | |
Future Cash Inflows | | $ | 52,682 | | | $ | 47,946 | | | $ | 74,567 | | | $ | 6,562 | | | $ | 19,697 | | | $ | 29,149 | |
Less Future: | | | | | | | | | | | | | | | | | | |
Production costs | | | 15,122 | | | | 14,405 | | | | 17,043 | | | | 3,959 | | | | 8,147 | | | | 8,173 | |
Development costs | | | 10,269 | | | | 8,849 | | | | 8,951 | | | | 1,537 | | | | 2,264 | | | | 2,142 | |
Income taxes | | | 3,690 | | | | 2,735 | | | | 9,333 | | | | 94 | | | | 2,016 | | | | 4,182 | |
Future Net Cash Flows | | | 23,601 | | | | 21,957 | | | | 39,240 | | | | 972 | | | | 7,270 | | | | 14,652 | |
Less 10% annual discount for estimated | | | | | | | | | | | | | | | | | | |
timing of cash flows | | | 10,741 | | | | 10,182 | | | | 20,272 | | | | 160 | | | | 2,963 | | | | 6,121 | |
Discounted Future Net Cash Flows | | $ | 12,860 | | | $ | 11,775 | | | $ | 18,968 | | | $ | 812 | | | $ | 4,307 | | | $ | 8,531 | |
| | | | | | | | | | | | | | | | | | |
| | | | | | | | | | | Total | |
| | | | | | | | | | | 2024 | | | 2023 | | | 2022 | |
| | | | | | | | | | | | | | | | | | |
Future Cash Inflows | | | | | | | | | | | $ | 59,244 | | | $ | 67,643 | | | $ | 103,716 | |
Less Future: | | | | | | | | | | | | | | | | | | |
Production costs | | | | | | | | | | | | 19,081 | | | | 22,552 | | | | 25,216 | |
Development costs | | | | | | | | | | | | 11,806 | | | | 11,113 | | | | 11,093 | |
Income taxes | | | | | | | | | | | | 3,784 | | | | 4,751 | | | | 13,515 | |
Future Net Cash Flows | | | | | | | | | | | | 24,573 | | | | 29,227 | | | | 53,892 | |
Less 10% annual discount for estimated | | | | | | | | | | | | | | | | | | |
timing of cash flows | | | | | | | | | | | | 10,901 | | | | 13,145 | | | | 26,393 | |
Discounted Future Net Cash Flows | | | | | | | | | | | $ | 13,672 | | | $ | 16,082 | | | $ | 27,499 | |
CHANGES IN STANDARDIZED MEASURE OF DISCOUNTED FUTURE NET CASH FLOWS RELATING TO PROVED OIL AND GAS RESERVES
| | | | | | | | | | | | | | | | | | | | | | | | |
| | United States | | | Canada | |
| | 2024 | | | 2023 | | | 2022 | | | 2024 | | | 2023 | | | 2022 | |
| | | | | | | | | | | | | | | | | | |
Balance, Beginning of Year | | $ | 11,775 | | | $ | 18,968 | | | $ | 14,291 | | | $ | 4,307 | | | $ | 8,531 | | | $ | 4,484 | |
Changes Resulting From: | | | | | | | | | | | | | | | | | | |
Sales of oil and gas produced during the year (1) | | | (3,984 | ) | | | (3,969 | ) | | | (5,023 | ) | | | (580 | ) | | | (1,067 | ) | | | (2,344 | ) |
Discoveries and extensions, net of related costs | | | 2,106 | | | | 1,141 | | | | 2,735 | | | | 152 | | | | 1,059 | | | | 2,635 | |
Purchases of proved reserves in place | | | 34 | | | | 2,440 | | | | 661 | | | | - | | | | 24 | | | | 58 | |
Sales and transfers of proved reserves in place | | | (11 | ) | | | (1,765 | ) | | | (278 | ) | | | - | | | | - | | | | (28 | ) |
Net change in prices and production costs (1) | | | (1,704 | ) | | | (5,730 | ) | | | 9,075 | | | | (1,700 | ) | | | (6,867 | ) | | | 5,543 | |
Revisions to quantity estimates | | | 2,148 | | | | (5,250 | ) | | | (712 | ) | | | (3,073 | ) | | | (143 | ) | | | (961 | ) |
Accretion of discount | | | 1,286 | | | | 2,290 | | | | 1,630 | | | | 549 | | | | 1,094 | | | | 545 | |
Development costs incurred during the year | | | 1,850 | | | | 2,184 | | | | 1,475 | | | | 441 | | | | 575 | | | | 339 | |
Changes in estimated future development costs | | | (67 | ) | | | (1,384 | ) | | | (2,965 | ) | | | (393 | ) | | | (120 | ) | | | (303 | ) |
Other | | | - | | | | 1 | | | | (2 | ) | | | (1 | ) | | | - | | | | - | |
Net change in income taxes | | | (573 | ) | | | 2,849 | | | | (1,919 | ) | | | 1,110 | | | | 1,221 | | | | (1,437 | ) |
Balance, End of Year | | $ | 12,860 | | | $ | 11,775 | | | $ | 18,968 | | | $ | 812 | | | $ | 4,307 | | | $ | 8,531 | |
| | | | | | | | | | | | | | | | | | |
| | | | | | | | | | | Total | |
| | | | | | | | | | | 2024 | | | 2023 | | | 2022 | |
| | | | | | | | | | | | | | | | | | |
Balance, Beginning of Year | | | | | | | | | | | $ | 16,082 | | | $ | 27,499 | | | $ | 18,775 | |
Changes Resulting From: | | | | | | | | | | | | | | | | | | |
Sales of oil and gas produced during the year (1) | | | | | | | | | | | | (4,564 | ) | | | (5,036 | ) | | | (7,367 | ) |
Discoveries and extensions, net of related costs | | | | | | | | | | | | 2,258 | | | | 2,200 | | | | 5,370 | |
Purchases of proved reserves in place | | | | | | | | | | | | 34 | | | | 2,464 | | | | 719 | |
Sales and transfers of proved reserves in place | | | | | | | | | | | | (11 | ) | | | (1,765 | ) | | | (306 | ) |
Net change in prices and production costs (1) | | | | | | | | | | | | (3,404 | ) | | | (12,597 | ) | | | 14,618 | |
Revisions to quantity estimates | | | | | | | | | | | | (925 | ) | | | (5,393 | ) | | | (1,673 | ) |
Accretion of discount | | | | | | | | | | | | 1,835 | | | | 3,384 | | | | 2,175 | |
Development costs incurred during the year | | | | | | | | | | | | 2,291 | | | | 2,759 | | | | 1,814 | |
Changes in estimated future development costs | | | | | | | | | | | | (460 | ) | | | (1,504 | ) | | | (3,268 | ) |
Other | | | | | | | | | | | | (1 | ) | | | 1 | | | | (2 | ) |
Net change in income taxes | | | | | | | | | | | | 537 | | | | 4,070 | | | | (3,356 | ) |
Balance, End of Year | | | | | | | | | | | $ | 13,672 | | | $ | 16,082 | | | $ | 27,499 | |
(1)See Note 2 regarding the reclassification of the Company’s previously reported Market Optimization segment.
RESULTS OF OPERATIONS
The following table sets forth revenue and direct cost information relating to the Company’s oil and natural gas exploration and production activities.
| | | | | | | | | | | | | | | | | | | | | | | | |
| | United States | | | Canada | |
| | 2024 | | | 2023 | | | 2022 | | | 2024 | | | 2023 | | | 2022 | |
| | | | | | | | | | | | | | | | | | |
Oil, NGL and Natural Gas Revenues (1) | | $ | 5,612 | | | $ | 5,586 | | | $ | 6,696 | | | $ | 1,746 | | | $ | 2,226 | | | $ | 3,487 | |
Less: | | | | | | | | | | | | | | | | | | |
Production, mineral and other taxes | | | 319 | | | | 327 | | | | 401 | | | | 14 | | | | 15 | | | | 14 | |
Transportation and processing (2) | | | 510 | | | | 547 | | | | 626 | | | | 1,043 | | | | 1,056 | | | | 1,002 | |
Operating (2) | | | 799 | | | | 743 | | | | 646 | | | | 109 | | | | 88 | | | | 127 | |
Depreciation, depletion and amortization | | | 1,971 | | | | 1,519 | | | | 861 | | | | 297 | | | | 286 | | | | 235 | |
Impairments | | | - | | | | - | | | | - | | | | 450 | | | | - | | | | - | |
Accretion of asset retirement obligation | | | 9 | | | | 8 | | | | 8 | | | | 10 | | | | 11 | | | | 10 | |
Operating Income (Loss) | | | 2,004 | | | | 2,442 | | | | 4,154 | | | | (177 | ) | | | 770 | | | | 2,099 | |
Income Taxes | | | 436 | | | | 531 | | | | 955 | | | | (42 | ) | | | 182 | | | | 502 | |
Results of Operations | | $ | 1,568 | | | $ | 1,911 | | | $ | 3,199 | | | $ | (135 | ) | | $ | 588 | | | $ | 1,597 | |
| | | | | | | | | | | | | | | | | | |
| | | | | Total | |
| | | | | | | | | | | 2024 | | | 2023 | | | 2022 | |
| | | | | | | | | | | | | | | | | | |
Oil, NGL and Natural Gas Revenues (1) | | | | | | | | | | | $ | 7,358 | | | $ | 7,812 | | | $ | 10,183 | |
Less: | | | | | | | | | | | | | | | | | | |
Production, mineral and other taxes | | | | | | | | | | | | 333 | | | | 342 | | | | 415 | |
Transportation and processing (2) | | | | | | | | | | | | 1,553 | | | | 1,603 | | | | 1,628 | |
Operating (2) | | | | | | | | | | | | 908 | | | | 831 | | | | 773 | |
Depreciation, depletion and amortization | | | | | | | | | | | | 2,268 | | | | 1,805 | | | | 1,096 | |
Impairments | | | | | | | | | | | | 450 | | | | - | | | | - | |
Accretion of asset retirement obligation | | | | | | | | | | | | 19 | | | | 19 | | | | 18 | |
Operating Income (Loss) | | | | | | | | | | | | 1,827 | | | | 3,212 | | | | 6,253 | |
Income Taxes | | | | | | | | | | | | 394 | | | | 713 | | | | 1,457 | |
Results of Operations | | | | | | | | | | | $ | 1,433 | | | $ | 2,499 | | | $ | 4,796 | |
(1)Excludes gains (losses) on risk management and sales of volumes purchased from third-parties. See Note 2 regarding the reclassification of the Company’s previously reported Market Optimization segment.
(2)Excludes costs related to the purchase and sale of third-party volumes.
CAPITALIZED COSTS
Capitalized costs include the cost of properties, equipment and facilities for oil and natural gas producing activities. Capitalized costs for proved properties include costs for oil and natural gas leaseholds where proved reserves have been identified, development wells and related equipment and facilities, including development wells in progress. Capitalized costs for unproved properties include costs for acquiring oil and natural gas leaseholds where no proved reserves have been identified.
| | | | | | | | | | | | | | | | | | | | | | | | |
| | United States | | | Canada | |
| | 2024 | | | 2023 | | | 2022 | | | 2024 | | | 2023 | | | 2022 | |
| | | | | | | | | | | | | | | | | | |
Proved Oil and Gas Properties | | $ | 50,246 | | | $ | 47,440 | | | $ | 41,382 | | | $ | 15,763 | | | $ | 16,644 | | | $ | 15,672 | |
Unproved Oil and Gas Properties | | | 741 | | | | 1,449 | | | | 1,127 | | | | 23 | | | | 37 | | | | 45 | |
Total Capital Cost | | | 50,987 | | | | 48,889 | | | | 42,509 | | | | 15,786 | | | | 16,681 | | | | 15,717 | |
Accumulated DD&A | | | 37,770 | | | | 35,799 | | | | 34,280 | | | | 14,821 | | | | 15,332 | | | | 14,687 | |
Net Capitalized Costs | | $ | 13,217 | | | $ | 13,090 | | | $ | 8,229 | | | $ | 965 | | | $ | 1,349 | | | $ | 1,030 | |
| | | | | | | | | | | | | | | | | | |
| | | | | Total | |
| | | | | | | | | | | 2024 | | | 2023 | | | 2022 | |
| | | | | | | | | | | | | | | | | | |
Proved Oil and Gas Properties | | | | | | | | | | | $ | 66,009 | | | $ | 64,084 | | | $ | 57,054 | |
Unproved Oil and Gas Properties | | | | | | | | | | | | 764 | | | | 1,486 | | | | 1,172 | |
Total Capital Cost | | | | | | | | | | | | 66,773 | | | | 65,570 | | | | 58,226 | |
Accumulated DD&A | | | | | | | | | | | | 52,591 | | | | 51,131 | | | | 48,967 | |
Net Capitalized Costs | | | | | | | | | | | $ | 14,182 | | | $ | 14,439 | | | $ | 9,259 | |
COSTS INCURRED
Costs incurred includes both capitalized costs and costs charged to expense when incurred. Costs incurred also includes internal costs directly related to acquisition, exploration, and development activities, new asset retirement costs established in the current year as well as increases or decreases to the asset retirement obligations resulting from changes to cost estimates during the year.
| | | | | | | | | | | | | | | | | | | | | | | | |
| | United States | | | Canada | |
| | 2024 | | | 2023 | | | 2022 | | | 2024 | | | 2023 | | | 2022 | |
| | | | | | | | | | | | | | | | | | |
Acquisition Costs | | | | | | | | | | | | | | | | | | |
Unproved | | $ | - | | | $ | 1,063 | | | $ | 154 | | | $ | - | | | $ | - | | | $ | - | |
Proved | | | 200 | | | | 3,868 | | | | 123 | | | | 5 | | | | 6 | | | | 9 | |
Total Acquisition Costs | | | 200 | | | | 4,931 | | | | 277 | | | | 5 | | | | 6 | | | | 9 | |
Exploration Costs | | | 6 | | | | 3 | | | | 5 | | | | - | | | | - | | | | 7 | |
Development Costs | | | 1,925 | | | | 2,224 | | | | 1,530 | | | | 467 | | | | 562 | | | | 376 | |
Total Costs Incurred | | $ | 2,131 | | | $ | 7,158 | | | $ | 1,812 | | | $ | 472 | | | $ | 568 | | | $ | 392 | |
| | | | | | | | | | | | | | | | | | |
| | | | | | | | | | | Total | |
| | | | | | | | | | | 2024 | | | 2023 | | | 2022 | |
| | | | | | | | | | | | | | | | | | |
Acquisition Costs | | | | | | | | | | | | | | | | | | |
Unproved | | | | | | | | | | | $ | - | | | $ | 1,063 | | | $ | 154 | |
Proved | | | | | | | | | | | | 205 | | | | 3,874 | | | | 132 | |
Total Acquisition Costs | | | | | | | | | | | | 205 | | | | 4,937 | | | | 286 | |
Exploration Costs | | | | | | | | | | | | 6 | | | | 3 | | | | 12 | |
Development Costs | | | | | | | | | | | | 2,392 | | | | 2,786 | | | | 1,906 | |
Total Costs Incurred | | | | | | | | | | | $ | 2,603 | | | $ | 7,726 | | | $ | 2,204 | |
COSTS NOT SUBJECT TO DEPLETION OR AMORTIZATION
Upstream costs in respect of significant unproved properties are excluded from the country cost center’s depletable base as follows:
| | | | | | | | | | |
As at December 31 | | | | 2024 | | | 2023 | |
| | | | | | | | |
United States | | | | $ | 741 | | | $ | 1,449 | |
Canada | | | | | 23 | | | | 37 | |
| | | | $ | 764 | | | $ | 1,486 | |
The following is a summary of the costs related to Ovintiv’s unproved properties as at December 31, 2024:
| | | | | | | | | | | | | | | | | | | | |
| | 2024 | | | 2023 | | | 2022 | | Prior to 2022 | | | Total | |
| | | | | | | | | | | | | | | |
Acquisition Costs | | $ | - | | | $ | 539 | | | $ | 79 | | | $ | 99 | | | $ | 717 | |
Exploration Costs | | | 6 | | | | 3 | | | | 5 | | | | 33 | | | | 47 | |
| | $ | 6 | | | $ | 542 | | | $ | 84 | | | $ | 132 | | | $ | 764 | |
Acquisition costs primarily include costs incurred to acquire or lease properties. Exploration costs primarily include costs related to geological and geophysical studies and unevaluated costs associated with drilling and equipping exploratory wells. Ultimate recoverability of these costs and the timing of inclusion within the applicable country cost center’s depletable base is dependent upon either the finding of proved oil, NGL and natural gas reserves, expiration of leases or recognition of impairments.
The $764 million of oil and natural gas properties not subject to depletion or amortization primarily includes leasehold and mineral costs related to acquisitions in Permian. These acquisition costs are associated with acquired acreage for which proved reserves have yet to be assigned from future development. The Company continually assesses the development timeline of the acquired acreage. The timing and amount of the transfer of property acquisition costs into the depletable base are based on several factors and may be subject to changes over time from drilling plans, drilling results, availability of capital, project economics and other assessments of the property. The inclusion of these acquisition costs in the depletable base is expected to occur within two years. The remaining costs excluded from depletion are related to properties which are not individually significant.
Item 9: Changes in and Disagreements with Accountants on Accounting and Financial Disclosure
None.
Item 9A: Controls and Procedures
EVALUATION AND DISCLOSURE CONTROLS AND PROCEDURES
The Company’s Chief Executive Officer and Chief Financial Officer performed an evaluation of the effectiveness of the Company’s disclosure controls and procedures as defined in Rules 13a-15(e) and 15d-15(e) of the Exchange Act. The Company’s disclosure controls and procedures are designed to ensure that information required to be disclosed by the Company in reports it files or submits under the Exchange Act is recorded, processed, summarized, and reported within the time periods specified in the rules and forms of the SEC, and to ensure that the information required to be disclosed by the Company in reports that it files or submits under the Exchange Act, is accumulated and communicated to the Company’s management, including the principal executive officer and principal financial officer, as appropriate, to allow timely decisions regarding required disclosure. Based on this evaluation, the Chief Executive Officer and Chief Financial Officer have concluded that the Company’s disclosure controls and procedures are effective as of December 31, 2024.
MANAGEMENT’S ANNUAL REPORT ON INTERNAL CONTROL OVER FINANCIAL REPORTING
See “Management’s Assessment of Internal Control Over Financial Reporting” under Item 8 of this Annual Report on Form 10-K.
ATTESTATION REPORT OF THE REGISTERED PUBLIC ACCOUNTING FIRM
See “Report of Independent Registered Public Accounting Firm” under Item 8 of this Annual Report on Form 10-K.
CHANGES IN INTERNAL CONTROL OVER FINANCIAL REPORTING
There were no changes in the Company’s internal control over financial reporting during the fourth quarter of 2024 that have materially affected, or are reasonably likely to materially affect, the Company’s internal control over financial reporting. See “Management’s Assessment of Internal Control over Financial Reporting” under Item 8 of this Annual Report on Form 10-K.
Item 9B. Other Information
None.
Item 9C. Disclosure Regarding Foreign Jurisdictions that Prevent Inspections
Not applicable.
PART III
Item 10. Directors, Executive Officers and Corporate Governance
DIRECTORS AND EXECUTIVE OFFICERS
Information regarding the Company’s executive officers is set forth in the section entitled “Information About Our Executive Officers” under Items 1 and 2 of this Annual Report on Form 10-K.
Other information required by this Item 10 is set forth in the section entitled “Corporate Governance” included in the Proxy Statement relating to the Company’s 2025 annual meeting of shareholders, which is incorporated herein by reference.
CODE OF ETHICS
Ovintiv has adopted a code of ethics entitled the “Business Code of Conduct” (the “Code of Ethics”), that applies to its principal executive officer, principal financial officer, principal accounting officer or controller, and persons performing similar functions. The Code of Ethics is available for viewing on Ovintiv’s website at www.ovintiv.com/policies-and-practices. Any person may request, without charge, a copy of the Code of Ethics by contacting Ovintiv’s Corporate Secretary by mail at Suite 1700, 370 17th Street, Denver, Colorado, 80202, U.S.A. or by telephone at (303) 623‑2300. Ovintiv intends to disclose and summarize any amendment to, or waiver from, any provision of the Code of Ethics that is required to be so disclosed and summarized, on its website at www.ovintiv.com/policies-and-practices.
INSIDER TRADING POLICY
Ovintiv has adopted an insider trading policy (the “Insider Trading Policy”) governing the purchase, sale, and/or other dispositions of our securities by our directors, officers, employees and other covered persons, as well as Welltower itself, that we believe is reasonably designed to promote compliance with insider trading laws, rules and regulations and the exchange listing standards applicable to us. The Insider Trading Policy applies to all directors, officers, employees and other covered persons, as well as Ovintiv and any subsidiaries, and is filed as Exhibit 19 to this Annual Report on Form 10-K.
Item 11. Executive Compensation
The information required by this Item 11 is set forth in the section entitled “Executive Compensation” included in the Proxy Statement relating to the Company’s 2025 annual meeting of shareholders, which is incorporated herein by reference.
Item 12. Security Ownership of Certain Beneficial Owners and Management and Related Shareholder Matters
The information required by this Item 12 is set forth in the sections entitled “Securities Ownership” and “Securities Authorized for Issuance Under Equity Compensation Plans” included in the Proxy Statement relating to the Company’s 2025 annual meeting of shareholders, which is incorporated herein by reference.
Item 13. Certain Relationships and Related Transactions, and Director Independence
The information required by this Item 13 is set forth in the section entitled “Corporate Governance” included in the Proxy Statement relating to the Company’s 2025 annual meeting of shareholders, which is incorporated herein by reference.
Item 14. Principal Accountant Fees and Services
The information required by this Item 14 is set forth in the section entitled “Audit Matters” included in the Proxy Statement relating to the Company’s 2025 annual meeting of shareholders, which is incorporated herein by reference.
PART IV
Item 15. Exhibits and Financial Statement Schedules
The following documents are filed as part of this Annual Report on Form 10-K or incorporated by reference:
1. Consolidated Financial Statements
Reference is made to the Consolidated Financial Statements and notes thereto appearing in Item 8 of this Annual Report on Form 10-K.
2. Consolidated Financial Statement Schedules
All financial statement schedules are omitted as they are inapplicable, or the required information has been included in the Consolidated Financial Statements or notes thereto.
3. Exhibits
The following documents are included as exhibits to this Form 10-K. Exhibits incorporated by reference are duly noted as such.
| |
Exhibit No | Description |
2.1** | Agreement of Purchase and Sale, dated as of November 13, 2024, by and among Paramount Resources Ltd., Ovintiv Canada ULC and Ovintiv Inc. |
3.1 | Ovintiv Certificate of Incorporation (incorporated by reference to Exhibit 3.1 to Ovintiv’s Current Report on Form 8-K12B filed on January 24, 2020, SEC File No. 001-39191). |
3.2 | Ovintiv Amended and Restated Bylaws (incorporated by reference to Exhibit 3.1 to Ovintiv's Current Report on Form 8-K filed on December 19, 2022, SEC File No. 001-39191). |
4.1 | Specimen Common Stock Certificate (incorporated by reference to Exhibit 4.1 to Ovintiv’s Current Report on Form 8-K12B filed on January 24, 2020, SEC File No. 001-39191). |
4.2 | 8.125% Notes due 2030 (incorporated by reference to Exhibit 4.5 to Encana’s Annual Report on Form 10-K filed on February 27, 2017, SEC File No. 001-15226). |
4.3 | 7.2% Notes due 2031 (incorporated by reference to Exhibit 4.6 to Encana’s Annual Report on Form 10-K filed on February 27, 2017, SEC File No. 001-15226). |
4.4 | 7.375% Notes due 2031 (incorporated by reference to Exhibit 4.7 to Encana’s Annual Report on Form 10-K filed on February 27, 2017, SEC File No. 001-15226). |
4.5 | 6.50% Notes due 2034 (incorporated by reference to Exhibit 4.8 to Encana’s Annual Report on Form 10-K filed on February 27, 2017, SEC File No. 001-15226). |
4.6 | 6.625% Notes due 2037 (incorporated by reference to Exhibit 4.9 to Encana’s Annual Report on Form 10-K filed on February 27, 2017, SEC File No. 001-15226). |
4.7 | 6.50% Notes due 2038 (incorporated by reference to Exhibit 4.10 to Encana’s Annual Report on Form 10-K filed on February 27, 2017, SEC File No. 001-15226). |
4.8 | 5.15% Notes due 2041 (incorporated by reference to Exhibit 4.11 to Encana’s Annual Report on Form 10-K filed on February 27, 2017, SEC File No. 001-15226). |
4.9 | Indenture dated as of August 13, 2007 between Encana Corporation and The Bank of New York (incorporated by reference to Exhibit 4.12 to Encana’s Annual Report on Form 10-K filed on February 27, 2017, SEC File No. 001-15226). |
4.10 | First Supplemental Indenture, dated as of March 1, 2019, among Newfield Exploration Company, as Guarantor, Encana Corporation, as Issuer, and The Bank of New York Mellon to the Indenture, dated as of August 13, 2007, between Encana Corporation and The Bank of New York Mellon, as Trustee (incorporated by reference to Exhibit 4.9 to Encana’s Current Report on Form 8-K filed on March 1, 2019, SEC File No. 001-15226). |
4.11 | Second Supplemental Indenture, dated as of January 24, 2020, among Ovintiv Inc., as successor issuer, Encana Corporation, Newfield Exploration Company, as Guarantor, and The Bank of New York Mellon to the Indenture, dated as of August 13, 2007, between Encana Corporation and The Bank of New York Mellon, as Trustee (incorporated by reference to Exhibit 4.4 to Ovintiv’s Current Report on Form 8-K filed on January 28, 2020, SEC File No. 001-39191). |
| |
4.12 | Third Supplemental Indenture, dated as of January 27, 2020, among Ovintiv Canada ULC, as Guarantor, Ovintiv Inc., as Issuer, Newfield Exploration Company, as Guarantor, and The Bank of New York Mellon to the Indenture, dated as of August 13, 2007, between Ovintiv Inc. (as successor issuer) and The Bank of New York Mellon, as Trustee (incorporated by reference to Exhibit 4.5 to Ovintiv’s Current Report on Form 8-K filed on January 28, 2020, SEC File No. 001-39191). |
4.13 | Indenture dated as of November 14, 2011 between Encana Corporation and The Bank of New York Mellon (incorporated by reference to Exhibit 7.1 to Encana’s Registration Statement on Form F-10 filed on May 7, 2012, SEC File No. 333-181196). |
4.14 | First Supplemental Indenture, dated as of March 1, 2019, among Newfield Exploration Company, as Guarantor, Encana Corporation, as Issuer, and The Bank of New York Mellon to the Indenture, dated as of November 14, 2011, between Encana Corporation and The Bank of New York Mellon, as Trustee (incorporated by reference to Exhibit 4.10 to Encana’s Current Report on Form 8-K filed on March 1, 2019, SEC File No. 001-15226). |
4.15 | Second Supplemental Indenture, dated as of January 24, 2020, among Ovintiv Inc., as successor issuer, Encana Corporation, Newfield Exploration Company, as Guarantor, and The Bank of New York Mellon to the Indenture, dated as of November 14, 2011, between Encana Corporation and The Bank of New York Mellon, as Trustee (incorporated by reference to Exhibit 4.5 to Ovintiv’s Current Report on Form 8-K filed on January 28, 2020, SEC File No. 001-39191). |
4.16 | Third Supplemental Indenture, dated as of January 27, 2020, among Ovintiv Canada ULC, as Guarantor, Ovintiv Inc., as Issuer, Newfield Exploration Company, as Guarantor, and The Bank of New York Mellon to the Indenture, dated as of November 14, 2011, between Ovintiv Inc. (as successor issuer) and The Bank of New York Mellon, as Trustee (incorporated by reference to Exhibit 4.6 to Ovintiv’s Current Report on Form 8-K filed on January 28, 2020, SEC File No. 001-39191). |
4.17 | Indenture dated as of September 15, 2000 between Encana Corporation (as successor by amalgamation to Alberta Energy Company Ltd.) and The Bank of New York (incorporated by reference to Exhibit 4.14 to Encana’s Annual Report on Form 10-K filed on February 27, 2017, SEC File No. 001-15226). |
4.18 | First Supplemental Indenture dated as of January 1, 2003 to the Indenture dated as of September 15, 2000 between Encana Corporation and The Bank of New York (incorporated by reference to Exhibit 4.15 to Encana’s Annual Report on Form 10-K filed on February 27, 2017, SEC File No. 001-15226). |
4.19 | Second Supplemental Indenture dated as of November 20, 2012 to the Indenture dated as of September 15, 2000 between Encana Corporation and The Bank of New York (incorporated by reference to Exhibit 4.16 to Encana’s Annual Report on Form 10-K filed on February 27, 2017, SEC File No. 001-15226). |
4.20 | Third Supplemental Indenture, dated as of March 1, 2019, among Newfield Exploration Company, as Guarantor, Encana Corporation, as Issuer, and The Bank of New York Mellon to the Indenture, dated as of September 15, 2000, between Encana Corporation (as successor by amalgamation to Alberta Energy Company Ltd.) and The Bank of New York Mellon (formerly known as The Bank of New York), as Trustee (incorporated by reference to Exhibit 4.6 to Encana’s Current Report on Form 8-K filed on March 1, 2019, SEC File No. 001-15226). |
4.21 | Fourth Supplemental Indenture, dated as of January 24, 2020, among Ovintiv Inc., as successor issuer, Encana Corporation, Newfield Exploration Company, as Guarantor, and The Bank of New York Mellon to the Indenture, dated as of September 15, 2000, between Encana Corporation (as successor by amalgamation to Alberta Energy Company Ltd.) and The Bank of New York Mellon (formerly known as The Bank of New York), as Trustee (incorporated by reference to Exhibit 4.1 to Ovintiv’s Current Report on Form 8-K filed on January 28, 2020, SEC File No. 001-39191). |
4.22 | Fifth Supplemental Indenture, dated as of January 27, 2020, among Ovintiv Canada ULC, as Guarantor, Ovintiv Inc., as Issuer, Newfield Exploration Company, as Guarantor, and The Bank of New York Mellon to the Indenture, dated as of September 15, 2000, between Ovintiv Inc. (as successor issuer) and The Bank of New York Mellon (formerly known as The Bank of New York), as Trustee (incorporated by reference to Exhibit 4.2 to Ovintiv’s Current Report on Form 8-K filed on January 28, 2020, SEC File No. 001-39191). |
4.23 | Indenture dated as of November 5, 2001 between Encana Corporation (as successor by amalgamation to PanCanadian Petroleum Limited) and The Bank of Nova Scotia Trust Company of New York (incorporated by reference to Exhibit 4.17 to Encana’s Annual Report on Form 10-K filed on February 27, 2017, SEC File No. 001-15226). |
4.24 | First Supplemental Indenture dated as of January 1, 2002 to the Indenture dated as of November 5, 2001 between Encana Corporation (as successor by amalgamation to PanCanadian Petroleum Limited) and The Bank of Nova Scotia Trust Company of New York (incorporated by reference to Exhibit 4.18 to Encana’s Annual Report on Form 10-K filed on February 27, 2017, SEC File No. 001-15226). |
4.25 | Second Supplemental Indenture dated as of January 1, 2003 to the Indenture dated as of November 5, 2001 between Encana Corporation and The Bank of Nova Scotia Trust Company of New York (incorporated by reference to Exhibit 4.19 to Encana’s Annual Report on Form 10-K filed on February 27, 2017, SEC File No. 001-15226). |
| |
4.26 | Third Supplemental Indenture dated as of November 20, 2012 to the Indenture dated as of November 5, 2001 between Encana Corporation and The Bank of Nova Scotia Trust Company of New York (incorporated by reference to Exhibit 4.20 to Encana’s Annual Report on Form 10-K filed on February 27, 2017, SEC File No. 001-15226). |
4.27 | Fourth Supplemental Indenture dated as of July 24, 2013 to the Indenture dated as of November 5, 2001 between Encana Corporation and The Bank of Nova Scotia Trust Company of New York (incorporated by reference to Exhibit 4.21 to Encana’s Annual Report on Form 10-K filed on February 27, 2017, SEC File No. 001-15226). |
4.28 | Fifth Supplemental Indenture, dated as of March 1, 2019, among Newfield Exploration Company, as Guarantor, Encana Corporation, as Issuer, and The Bank of New York Mellon to the Indenture, dated as of November 5, 2001, between Encana Corporation (as successor by amalgamation to PanCanadian Petroleum Limited) and The Bank of New York Mellon, as successor Trustee to The Bank of Nova Scotia Trust Company of New York (incorporated by reference to Exhibit 4.8 to Encana’s Current Report on Form 8-K filed on March 1, 2019, SEC File No. 001-15226). |
4.29 | Sixth Supplemental Indenture, dated as of January 24, 2020, among Ovintiv Inc., as successor issuer, Encana Corporation, Newfield Exploration Company, as Guarantor, and The Bank of New York Mellon to the Indenture, dated as of November 5, 2001, between Encana Corporation (as successor by amalgamation to PanCanadian Petroleum Limited) and The Bank of New York Mellon, as successor Trustee to The Bank of Nova Scotia Trust Company of New York (incorporated by reference to Exhibit 4.3 to Ovintiv’s Current Report on Form 8-K filed on January 28, 2020, SEC File No. 001-39191). |
4.30 | Seventh Supplemental Indenture, dated as of January 27, 2020, among Ovintiv Canada ULC, as Guarantor, Ovintiv Inc., as Issuer, Newfield Exploration Company, as Guarantor, and The Bank of New York Mellon to the Indenture, dated as of November 5, 2001, between Ovintiv Inc. (as successor issuer) and The Bank of New York Mellon, as successor Trustee to The Bank of Nova Scotia Trust Company of New York (incorporated by reference to Exhibit 4.4 to Ovintiv’s Current Report on Form 8-K filed on January 28, 2020, SEC File No. 001-39191). |
4.31 | Indenture dated as of October 2, 2003 between Encana Corporation and The Bank of New York (incorporated by reference to Exhibit 4.22 to Encana’s Annual Report on Form 10-K filed on February 27, 2017, SEC File No. 001-15226). |
4.32 | First Supplemental Indenture, dated as of March 1, 2019, among Newfield Exploration Company, as Guarantor, Encana Corporation, as Issuer, and The Bank of New York Mellon to the Indenture, dated as of October 2, 2003, between Encana Corporation and The Bank of New York Mellon, as Trustee (incorporated by reference to Exhibit 4.7 to Encana’s Current Report on Form 8-K filed on March 1, 2019, SEC File No. 001-15226). |
4.33 | Second Supplemental Indenture, dated as of January 24, 2020, among Ovintiv Inc., as successor issuer, Encana Corporation, Newfield Exploration Company, as Guarantor, and The Bank of New York Mellon to the Indenture, dated as of October 2, 2003, between Encana Corporation and The Bank of New York Mellon, as Trustee (incorporated by reference to Exhibit 4.2 to Ovintiv’s Current Report on Form 8-K filed on January 28, 2020, SEC File No. 001-39191). |
4.34 | Third Supplemental Indenture, dated as of January 27, 2020, among Ovintiv Canada ULC, as Guarantor, Ovintiv Inc., as Issuer, Newfield Exploration Company, as Guarantor, and The Bank of New York Mellon to the Indenture, dated as of October 2, 2003, between Ovintiv Inc. (as successor issuer) and The Bank of New York Mellon, as Trustee (incorporated by reference to Exhibit 4.3 to Ovintiv’s Current Report on Form 8-K filed on January 28, 2020, SEC File No. 001-39191). |
4.35 | Senior Indenture, dated as of February 28, 2001 between Newfield Exploration Company, as Issuer, and First Union National Bank, as Trustee (the “Senior Indenture”) (incorporated by reference to Exhibit 4.1 to Newfield’s Current Report on Form 8-K filed on February 28, 2001, SEC File No. 001-12534). |
4.36 | Fourth Supplemental Indenture, dated as of March 10, 2015, to Senior Indenture between Newfield Exploration Company, as Issuer, and U.S. Bank National Association (as successor to Wachovia Bank, National Association (formerly First Union National Bank)), as Trustee, to the Senior Indenture dated as of February 28, 2001 (incorporated by reference to Exhibit 4.2 to Newfield’s Current Report on Form 8-K filed on March 12, 2015, SEC File No. 001-12534). |
4.37 | Fifth Supplemental Indenture, dated as of March 1, 2019, among Encana Corporation, as Guarantor, Newfield Exploration Company, as Issuer, and U.S. Bank National Association (as successor to Wachovia Bank, National Association (formerly First Union National Bank)), as Trustee, to the Senior Indenture dated as of February 28, 2001 (incorporated by reference to Exhibit 4.5 to Encana’s Current Report on Form 8-K filed on March 1, 2019, SEC File No. 001-15226). |
4.38 | Sixth Supplemental Indenture, dated as of January 27, 2020, among Ovintiv Inc., as Guarantor, Newfield Exploration Company, as Issuer, Ovintiv Canada ULC, as Guarantor, and U.S. Bank National Association (as successor to Wachovia Bank, National Association (formerly First Union National Bank)), as Trustee, to the Senior Indenture dated as of February 28, 2001 (incorporated by reference to Exhibit 4.1 to Ovintiv’s Current Report on Form 8-K filed on January 28, 2020, SEC File No. 001-39191). |
| |
4.39 | Seventh Supplemental Indenture, dated as of April 26, 2021, among Ovintiv Exploration Inc. (formerly Newfield Exploration Company), as Issuer, Ovintiv Inc., as Guarantor and Successor Issuer, Ovintiv Canada ULC, as Guarantor, and U.S. Bank National Association (as successor to Wachovia Bank, National Association (formerly First Union National Bank)), as Trustee, to the Senior Indenture dated as of February 28, 2001 (incorporated by reference to Exhibit 4.1 to Ovintiv’s Current Report on Form 8-K filed on April 28, 2021, SEC File No. 001-39191). |
4.40 | Indenture, dated as of May 31, 2023, between Ovintiv Inc. and the Bank of New York Mellon, as trustee (incorporated by reference to Exhibit 4.1 to Ovintiv’s Current Report on Form 8-K filed on May 31, 2023, SEC File No. 001-39191). |
4.41 | First Supplemental Indenture, dated as of May 31, 2023, among Ovintiv Inc., Ovintiv Canada ULC and the Bank of New York Mellon, as trustee (incorporated by reference to Exhibit 4.2 to Ovintiv’s Current Report on Form 8-K filed on May 31, 2023, SEC File No. 001-39191). |
4.42 | Form of 5.650% Senior Notes due 2025 (incorporated by reference to Exhibit 4.3 to Ovintiv’s Current Report on Form 8-K filed on May 31, 2023, SEC File No. 001-39191). |
4.43 | Form of 5.650% Senior Notes due 2028 (incorporated by reference to Exhibit 4.4 to Ovintiv’s Current Report on Form 8-K filed on May 31, 2023, SEC File No. 001-39191). |
4.44 | Form of 6.250% Senior Notes due 2033 (incorporated by reference to Exhibit 4.5 to Ovintiv’s Current Report on Form 8-K filed on May 31, 2023, SEC File No. 001-39191). |
4.45 | Form of 7.100% Senior Notes due 2053 (incorporated by reference to Exhibit 4.6 to Ovintiv’s Current Report on Form 8-K filed on May 31, 2023, SEC File No. 001-39191). |
4.46 | Description of Capital Stock (incorporated by reference to Exhibit 99.1 to Ovintiv’s Current Report on Form 8-K12B filed on January 24, 2020, SEC File No. 001-39191). |
10.1 | Amended and Restated Credit Agreement, dated as of April 1, 2022, between Ovintiv Inc., as Borrower, JPMorgan Chase Bank, N.A., as Administrative Agent, and the initial lenders and initial issuing banks named therein (incorporated by reference to Exhibit 4.1 to Ovintiv’s Current Report on Form 8-K filed on April 7, 2022, SEC File No. 001-39191). |
10.2 | Guarantee of the U.S. Credit Agreement, made as of April 1, 2022, by Ovintiv Canada ULC (incorporated by reference to Exhibit 4.2 to Ovintiv’s Current Report on Form 8-K filed on April 7, 2022, SEC File No. 001-39191). |
10.3 | Amendment No. 1 to Amended and Restated Credit Agreement, dated as of December 10, 2024, among Ovintiv Inc., as Borrower, Ovintiv Canada ULC, as Guarantor, JPMorgan Chase Bank, N.A., as Administrative Agent, and the lenders party thereto (incorporated by reference to Exhibit 10.3 to Ovintiv’s Current Report on Form 8-K filed on December 12, 2024, SEC File No. 001-39191). |
10.4 | Amended and Restated Credit Agreement, dated as of April 1, 2022, among Ovintiv Canada ULC, as Borrower, Ovintiv Inc., as Guarantor, the financial institutions party thereto, as lenders, and Royal Bank of Canada, as administrative agent (incorporated by reference to Exhibit 4.3 to Ovintiv’s Current Report on Form 8-K filed on April 7, 2022, SEC File No. 001-39191). |
10.5 | First Amending Agreement to Amended and Restated Credit Agreement, dated as of June 26, 2024, among Ovintiv Canada ULC, as Borrower, Ovintiv Inc., as Guarantor, the financial institutions party thereto, as lenders, and Royal Bank of Canada, as Administrative Agent (incorporated by reference to Exhibit 10.1 to Ovintiv’s Quarterly Report on Form 10-Q filed on July 30, 2024, SEC File No. 001-39191). |
10.6 | Second Amending Agreement to Amended and Restated Credit Agreement, dated as of December 10, 2024, among Ovintiv Canada ULC, as Borrower, Ovintiv Inc., as Guarantor, the financial institutions party thereto, as lenders, and Royal Bank of Canada, as Administrative Agent (incorporated by reference to Exhibit 10.4 to Ovintiv’s Current Report on Form 8-K filed on December 12, 2024, SEC File No. 001-39191). |
10.7 | Form of Commercial Paper Dealer Agreement between Ovintiv Inc., as Issuer, and the Dealer party thereto (incorporated by reference to Exhibit 10.1 to Ovintiv’s Current Report on Form 8-K filed on January 29, 2020, SEC File No. 001-39191). |
10.8 | Form of Commercial Paper Dealer Agreement among Ovintiv Canada ULC, as Issuer, Ovintiv Inc., as Guarantor, and the Dealer party thereto (incorporated by reference to Exhibit 10.2 to Ovintiv’s Current Report on Form 8-K filed on January 29, 2020, SEC File No. 001-39191). |
10.9* | Encana Corporation Employee Stock Option Plan reflective with amendments made as of April 27, 2005, as of April 25, 2007, as of April 22, 2008, as of October 22, 2008, as of November 30, 2009, as of July 20, 2010, as of February 24, 2015 and as of February 22, 2016 (incorporated by reference to Exhibit 10.6 to Encana’s Annual Report on Form 10-K filed on February 27, 2017, SEC File No. 001-15226). |
10.10* | Form of Executive Stock Option Grant Agreement for stock options granted under the Encana Corporation Employee Stock Option Plan (incorporated by reference to Exhibit 10.7 to Encana’s Annual Report on Form 10-K filed on February 26, 2018, SEC File No. 001-15226). |
| |
10.11* | Encana Corporation Employee Stock Appreciation Rights Plan, adopted with effect from February 12, 2008, as amended December 9, 2008, November 30, 2009, April 20, 2010, July 20, 2010, February 24, 2015, February 22, 2016 and February 14, 2018 (incorporated by reference to Exhibit 10.8 to Encana’s Annual Report on Form 10-K filed on February 26, 2018, SEC File No. 001-15226). |
10.12* | Form of Executive Stock Appreciation Rights Grant Agreement for stock appreciation rights granted under the Encana Corporation Employee Stock Appreciation Rights Plan (incorporated by reference to Exhibit 10.9 to Encana’s Annual Report on Form 10-K filed on February 27, 2017, SEC File No. 001-15226). |
10.13* | Deferred Share Unit Plan for Employees of Encana Corporation adopted with effect from December 18, 2002 and reflective of amendments made as of October 23, 2007, October 22, 2008, and July 20, 2010 (incorporated by reference to Exhibit 10.16 to Encana’s Annual Report on Form 10-K filed on February 27, 2017, SEC File No. 001-15226). |
10.14* | Deferred Share Unit Plan for Directors of Encana Corporation adopted with effect from December 18, 2002 and reflective with amendments made as of April 26, 2005, October 22, 2008, December 8, 2009, July 20, 2010, February 13, 2013, December 1, 2014 and February 14, 2018 (incorporated by reference to Exhibit 10.17 to Encana’s Annual Report on Form 10-K filed on February 26, 2018, SEC File No. 001-15226). |
10.15* | Omnibus Incentive Plan of Encana Corporation adopted with effect from February 13, 2019 (incorporated by reference to Exhibit 10.44 to Encana’s Annual Report on Form 10-K filed on February 28, 2019, SEC File No. 001-15226). |
10.16* | Form of Stock Option Grant Agreement for stock options granted under the Omnibus Incentive Plan of Encana Corporation (incorporated by reference to Exhibit 10.45 to Encana’s Annual Report on Form 10-K filed on February 28, 2019, SEC File No. 001-15226). |
10.17* | Form of RSU Grant Agreement for restricted share units granted to employees under the Omnibus Incentive Plan of Encana Corporation (incorporated by reference to Exhibit 10.46 to Encana’s Annual Report on Form 10-K filed on February 28, 2019, SEC File No. 001-15226). |
10.18* | Form of Director RSU Grant Agreement for restricted share units granted to directors under the Omnibus Incentive Plan of Encana Corporation (incorporated by reference to Exhibit 10.47 to Encana’s Annual Report on Form 10-K filed on February 28, 2019, SEC File No. 001-15226). |
10.19* | Form of PSU Grant Agreement for performance share units granted under the Omnibus Incentive Plan of Encana Corporation (incorporated by reference to Exhibit 10.48 to Encana’s Annual Report on Form 10-K filed on February 28, 2019, SEC File No. 001-15226). |
10.20* | Form of Stock Appreciation Rights Grant Agreement for stock appreciation rights granted under the Omnibus Incentive Plan of Encana Corporation (incorporated by reference to Exhibit 10.49 to Encana’s Annual Report on Form 10-K filed on February 28, 2019, SEC File No. 001-15226). |
10.21* | Encana (USA) Deferred Compensation Plan (“U.S. Deferred Compensation Plan”) amended and restated effective April 1, 2018 (incorporated by reference to Exhibit 10.2 to Encana’s Quarterly Report on Form 10-Q filed on August 2, 2018, SEC File No. 001-15226). |
10.22* | Change in Control Agreement between Ovintiv Inc. and Corey D. Code effective January 24, 2020 (incorporated by reference to Exhibit 10.48 to Ovintiv’s Annual Report on Form 10-K filed on February 21, 2020, SEC File No. 001-39191). |
10.23* | Change in Control Agreement between Ovintiv Inc. and Gregory D. Givens effective January 24, 2020 (incorporated by reference to Exhibit 10.49 to Ovintiv’s Annual Report on Form 10-K filed on February 21, 2020, SEC File No. 001-39191). |
10.24* | Form of Director and Officer Indemnification Agreement effective as of January 24, 2020 between Ovintiv Inc. and each of its directors and officers (incorporated by reference to Exhibit 10.1 to Ovintiv’s Current Report on Form 8-K filed on January 24, 2020, SEC File No. 001-39191). |
10.25* | Amending Agreement to Omnibus Incentive Plan of Encana Corporation (incorporated by reference to Exhibit 99.9 to Ovintiv’s Post-Effective Amendment No. 1 filed on January 27, 2020, SEC File No. 333-231248). |
10.26* | Amending Agreement to Encana Corporation Employee Stock Option Plan (incorporated by reference to Exhibit 99.10 to Ovintiv’s Post-Effective Amendment No. 1 filed on January 27, 2020, SEC File No. 333-231248). |
10.27* | Amending Agreement to Encana Corporation Employee Stock Appreciation Rights Plan (incorporated by reference to Exhibit 99.11 to Ovintiv’s Post-Effective Amendment No. 1 filed on January 27, 2020, SEC File No. 333-231248). |
10.28* | Amending Agreement to Deferred Share Unit Plan for Employees of Encana Corporation (incorporated by reference to Exhibit 99.14 to Ovintiv’s Post-Effective Amendment No. 1 filed on January 27, 2020, SEC File No. 333-231248). |
10.29* | Amending Agreement to Deferred Share Unit Plan for Directors of Encana Corporation (incorporated by reference to Exhibit 99.16 to Ovintiv’s Post-Effective Amendment No. 1 filed on January 27, 2020, SEC File No. 333-231248). |
| |
10.30* | First Amendment to U.S. Deferred Compensation Plan amended and restated effective April 1, 2018, dated effective January 24, 2020 (incorporated by reference to Exhibit 10.1 to Ovintiv’s Quarterly Report on Form 10-Q filed on May 8, 2020, SEC File No. 001-39191). |
10.31 | Second Amendment to Omnibus Incentive Plan of Ovintiv Inc. (incorporated by reference to Exhibit 10.1 to Ovintiv’s Quarterly Report on Form 10-Q filed on August 4, 2022, SEC File No. 001-39191). |
10.32* | Change in Control Agreement between Ovintiv Inc. and Rachel M. Moore effective June 30, 2020 (incorporated by reference to Exhibit 10.1 to Ovintiv’s Quarterly Report on Form 10-Q filed on July 31, 2020, SEC File No. 001-39191). |
10.33* | Ovintiv Canadian Pension Plan amended and restated effective January 24, 2020 (incorporated by reference to Exhibit 10.49 to Ovintiv’s Annual Report on Form 10-K filed on February 18, 2021, SEC File No. 001-39191). |
10.34* | Ovintiv Canadian Supplemental Pension Plan amended and restated effective January 24, 2020 (incorporated by reference to Exhibit 10.50 to Ovintiv’s Annual Report on Form 10-K filed on February 18, 2021, SEC File No. 001-39191). |
10.35* | Second Amendment to U.S. Deferred Compensation Plan amended and restated effective April 1, 2018, dated effective January 1, 2021 (incorporated by reference to Exhibit 10.53 to Ovintiv’s Annual Report on Form 10-K filed on February 18, 2021, SEC File No. 001-39191). |
10.36* | Second Amending Agreement to Deferred Share Unit Plan for Employees of Ovintiv Inc. (incorporated by reference to Exhibit 10.54 to Ovintiv’s Annual Report on Form 10-K filed on February 18, 2021, SEC File No. 001-39191). |
10.37* | Letter Agreement between Ovintiv Inc. and Brendan M. McCracken dated June 8, 2021 (incorporated by reference to Exhibit 10.1 to Ovintiv’s Current Report on Form 8-K filed on June 11, 2021, SEC File No. 001-39191). |
10.38* | Change in Control Agreement between Ovintiv Inc. and Brendan McCracken effective August 1, 2021 (incorporated by reference to Exhibit 10.1 to Ovintiv’s Quarterly Report on Form 10-Q filed on November 4, 2021, SEC File No. 001-39191). |
10.39* | First Amendment to Change in Control Agreement between Ovintiv Inc. and Corey D. Code effective November 1, 2021 (incorporated by reference to Exhibit 10.2 to Ovintiv’s Quarterly Report on Form 10-Q filed on November 4, 2021, SEC File No. 001-39191). |
10.40* | First Amendment to Change in Control Agreement between Ovintiv Inc. and Gregory D. Givens effective November 1, 2021 (incorporated by reference to Exhibit 10.3 to Ovintiv’s Quarterly Report on Form 10-Q filed on November 4, 2021, SEC File No. 001-39191). |
10.41* | First Amendment to Change in Control Agreement between Ovintiv Inc. and Rachel M. Moore effective November 1, 2021 (incorporated by reference to Exhibit 10.5 to Ovintiv’s Quarterly Report on Form 10-Q filed on November 4, 2021, SEC File No. 001-39191). |
10.42* | Change in Control Agreement between Ovintiv Inc. and Meghan N. Eilers effective March 1, 2022 (incorporated by reference to Exhibit 10.40 to Ovintiv’s Annual Report on Form 10-K filed on February 27, 2023, SEC File No. 001-39191). |
10.43* | First Amendment to Change in Control Agreement between Ovintiv Inc. and Brendan M. McCracken effective February 27, 2024 (incorporated by reference to Exhibit 10.43 to Ovintiv’s Annual Report on Form 10-K filed on February 27, 2024, SEC File No. 001-39191). |
10.44* | Second Amendment to Change in Control Agreement between Ovintiv Inc. and Corey D. Code effective February 27, 2024 (incorporated by reference to Exhibit 10.44 to Ovintiv’s Annual Report on Form 10-K filed on February 27, 2024, SEC File No. 001-39191). |
10.45* | Second Amendment to Change in Control Agreement between Ovintiv Inc. and Gregory D. Givens effective February 27, 2024 (incorporated by reference to Exhibit 10.45 to Ovintiv’s Annual Report on Form 10-K filed on February 27, 2024, SEC File No. 001-39191). |
10.46* | Second Amendment to Change in Control Agreement between Ovintiv Inc. and Rachel M. Moore effective February 27, 2024 (incorporated by reference to Exhibit 10.46 to Ovintiv’s Annual Report on Form 10-K filed on February 27, 2024, SEC File No. 001-39191). |
10.47* | First Amendment to Change in Control Agreement between Ovintiv Inc. and Meghan N. Eilers effective February 27, 2024 (incorporated by reference to Exhibit 10.48 to Ovintiv’s Annual Report on Form 10-K filed on February 27, 2024, SEC File No. 001-39191). |
10.48 | Asset-Sale Term Credit Agreement, dated as of December 10, 2024, among Ovintiv, as Borrower, JPMorgan Chase Bank, N.A., as Administrative Agent, and the lenders party thereto (incorporated by reference to Exhibit 10.1 to Ovintiv’s Current Report on Form 8-K filed on December 12, 2024, SEC File No. 001-39191). |
10.49 | Two-Year Term Credit Agreement, dated as of December 10, 2024, among Ovintiv, as Borrower, JPMorgan Chase Bank, N.A., as Administrative Agent, and the lenders party thereto (incorporated by reference to Exhibit 10.2 to Ovintiv’s Current Report on Form 8-K filed on December 12, 2024, SEC File No. 001-39191). |
19.1 | Securities Trading and Insider Reporting Policy of Ovintiv Inc. |
21.1 | List of Subsidiaries. |
* Management contract or compensatory arrangement.
** Certain annexes, schedules and exhibits have been omitted pursuant to Item 601(a)(5) of Regulation S-K. Ovintiv Inc. hereby undertakes to furnish supplemental copies of any of the omitted annexes, schedules and exhibits upon request by the SEC.
Item 16. Form 10-K Summary
None.
SIGNATURES
Pursuant to the requirements of Section 13 or 15(d) of the Securities Exchange Act of 1934, the registrant has duly caused this report to be signed on its behalf by the undersigned, hereunto duly authorized.
| | | |
| | |
|
| OVINTIV INC. |
| | By: | /s/ Corey D. Code |
|
|
| Name: Corey D. Code |
|
|
| Title: Executive Vice-President & Chief Financial Officer |
Dated: February 26, 2025
POWERS OF ATTORNEY
Each person whose signature appears below hereby constitutes and appoints Brendan M. McCracken and Corey D. Code, and each of them, any of whom may act without the joinder of the other, the true and lawful attorney-in-fact and agent of the undersigned, with full power of substitution and resubstitution, for and in the name, place and stead of the undersigned, in any and all capacities, to sign any and all amendments to this Annual Report on Form 10-K, and to file the same, with all exhibits thereto, and other documents in connection therewith, with the Commission, and hereby grants to such attorney-in-fact and agent, full power and authority to do and perform each and every act and thing requisite and necessary to be done, as fully to all intents and purposes as the undersigned might or could do in person, hereby ratifying and confirming all that said attorney-in-fact and agent, or his substitute or substitutes, may lawfully do or cause to be done by virtue hereof.
Pursuant to the requirements of the Securities Exchange Act of 1934, as amended, this Annual Report on Form 10-K has been signed by the following persons in the capacities and on the dates indicated.
| | |
Signature | Capacity | Date |
/s/ Peter A. Dea
Peter A. Dea | Chairman of the Board
of Directors | February 26, 2025 |
/s/ Brendan M. McCracken
Brendan M. McCracken | President & Chief Executive Officer and Director (Principal Executive Officer) | February 26, 2025 |
/s/ Corey D. Code
Corey D. Code | Executive Vice-President
& Chief Financial Officer (Principal Financial Officer and Principal Accounting Officer) | February 26, 2025 |
/s/ Sippy Chhina
Sippy Chhina | Director | February 26, 2025 |
/s/ Meg A. Gentle
Meg A. Gentle | Director | February 26, 2025 |
/s/ Ralph Izzo
Ralph Izzo | Director | February 26, 2025 |
/s/ Terri G. King
Terri G. King | Director | February 26, 2025 |
/s/ Howard J. Mayson
Howard J. Mayson | Director | February 26, 2025 |
/s/ Steven W. Nance
Steven W. Nance | Director | February 26, 2025 |
/s/ Suzanne P. Nimocks
Suzanne P. Nimocks | Director | February 26, 2025 |
/s/ George L. Pita
George L. Pita | Director | February 26, 2025 |
/s/ Thomas G. Ricks Thomas G. Ricks | Director | February 26, 2025 |
/s/ Brian G. Shaw Brian G. Shaw | Director | February 26, 2025 |