Free signup for more
- Track your favorite companies
- Receive email alerts for new filings
- Personalized dashboard of news and more
- Access all data and search results
Filing tables
Filing exhibits
Related financial report
GRND similar filings
- 14 Aug 23 Grindr Inc. Reports Second Quarter 2023 Revenue Growth of 32%, Raises Guidance
- 26 Jun 23 Submission of Matters to a Vote of Security Holders
- 17 May 23 Entry into a Material Definitive Agreement
- 15 May 23 Grindr Inc. Reports First Quarter 2023 Earnings Results
- 5 May 23 Departure of Directors or Certain Officers
- 29 Mar 23 Departure of Directors or Certain Officers
- 6 Mar 23 Grindr Reports Revenue Growth of 34% in Fiscal Year 2022 Results
Filing view
External links
Exhibit 99.2

Shareholder Letter First Quarter 2023 May 15, 2023
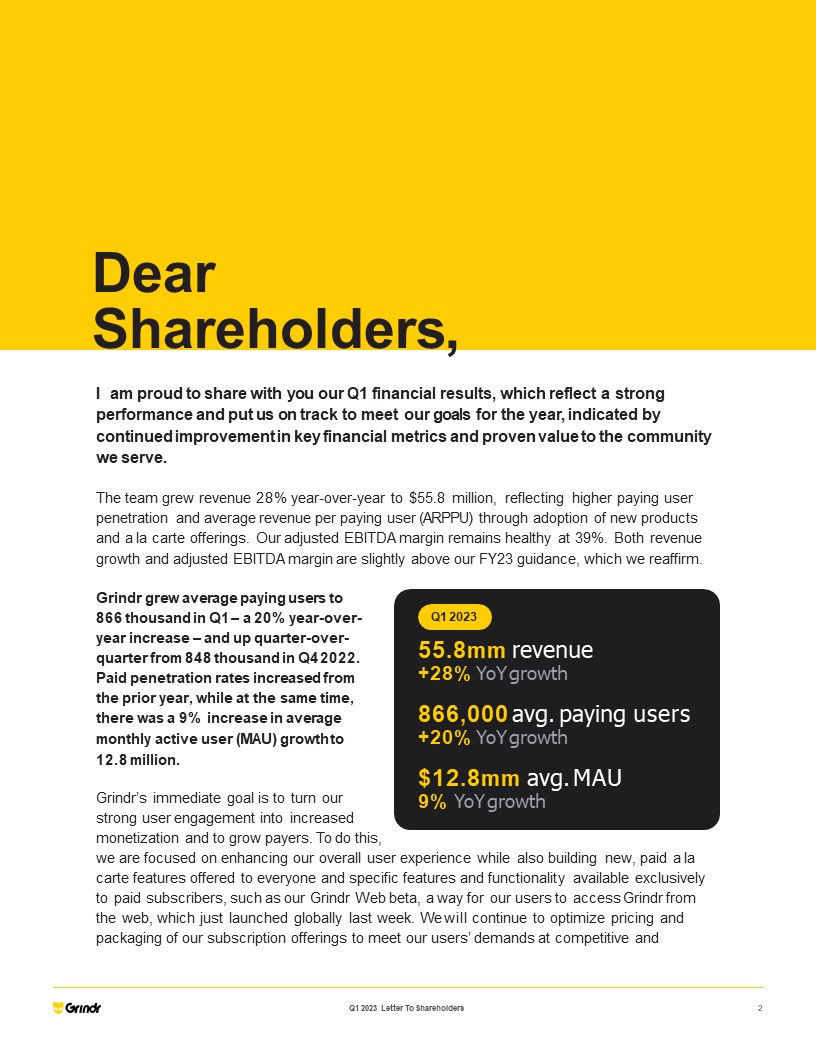
I am proud to share with you our Q1 financial results, which reflect a strong performance and put us on track to meet our goals for the year, indicated by continued improvement in key financial metrics and proven value to the community we serve. The team grew revenue 28% year-over-year to $55.8 million, reflecting higher paying user penetration and average revenue per paying user (ARPPU) through adoption of new products and a la carte offerings. Our adjusted EBITDA margin remains healthy at 39%. Both revenue growth and adjusted EBITDA margin are slightly above our FY23 guidance, which we reaffirm. Grindr grew average paying users to 866 thousand in Q1 – a 20% year-over- year increase – and up quarter-over- quarter from 848 thousand in Q4 2022. Paid penetration rates increased from the prior year, while at the same time, there was a 9% increase in average monthly active user (MAU) growth to 12.8 million. Grindr’s immediate goal is to turn our strong user engagement into increased monetization and to grow payers. To do this, we are focused on enhancing our overall user experience while also building new, paid a la carte features offered to everyone and specific features and functionality available exclusively to paid subscribers, such as our Grindr Web beta, a way for our users to access Grindr from the web, which just launched globally last week. We will continue to optimize pricing and packaging of our subscription offerings to meet our users’ demands at competitive and Dear Shareholders, Q1 2023 55.8mm revenue +28% YoY growth 866,000 avg. paying users +20% YoY growth $12.8mm avg. MAU 9% YoY growth Q1 2023 Letter To Shareholders 2
attractive price points. Further out, we will explore a variety of use cases outside casual dating that we know are already taking place organically in the Grindr app, but for which we have not built specific product offerings to date. We’re also focused on ensuring that Grindr has a fantastic group of people to help us execute on this strategy over the long term. Over the last several months, we have been successful in hiring exceptional business leaders with deep, relevant experience in product management, monetization, and finance. Each of these additions will allow us to more effectively execute on our strategy, and I am proud to call them my colleagues. One other of the many things I am incredibly proud of is how Grindr has been able to show up and stand up for the LGBTQ community, both in the U.S. and abroad, proving the power of our platform to improve the lives of our users. Among many other things, this past quarter Grindr served as a primary marketing partner for a free at-home HIV test kit program called Take Me Home, which we launched in partnership with Emory University and Building Healthy Online Communities, and with support from the U.S. Centers for Disease Control and Prevention. As we have said, as Grindr grows, we will continue to advocate for the rights and freedoms of our users and the LGBTQ community around the world, as not only does it make good business sense – it’s simply the right thing to do. Below, please find updates on our business and financial performance. Thank you, George Arison, CEO Q1 2023 Letter To Shareholders 2
Q1 Accomplishments + Strategic Progress We have previously highlighted four strategic priorities for 2023 and continued to make progress on each of them: Improve the User Experience In Q1, we introduced an important and popular feature to support users’ desire to share, by expanding Albums functionality to allow for video uploads in addition to photos. Growth of video in Albums has been significant, with over 1.1 million videos uploaded since we launched this functionality as a beta in February. Additionally, over the last year, a small team has been working on an innovative new product we call Grindr Web, which we launched in beta in Q1 and rolled out globally last week for our Xtra and Unlimited subscribers. While the feature set on Grindr Web is still limited, it will form a foundation for creating unique, web specific features in 2024 and beyond. We look forward to telling you more about Grindr Web in coming quarters. Driving Monetization Through Conversions + New Offerings Efforts to convert our free users to paying customers are in full swing. We are focused on identifying ways to most effectively monetize, with different value models matching price points with varying levels of access to our compelling feature sets, and testing weekly, monthly and multi-month subscriptions. We are excited to tell you in the coming quarters more about several plans we are currently incubating. While we continue to introduce new features and test new subscription tiers and paid offerings, we’re mindful that our free product offers extensive functionality and we are evaluating the right dividing line between what is free and what is for pay. Finding and maintaining this balance will also help us improve paid user churn. Q1 2023 Letter To Shareholders 2
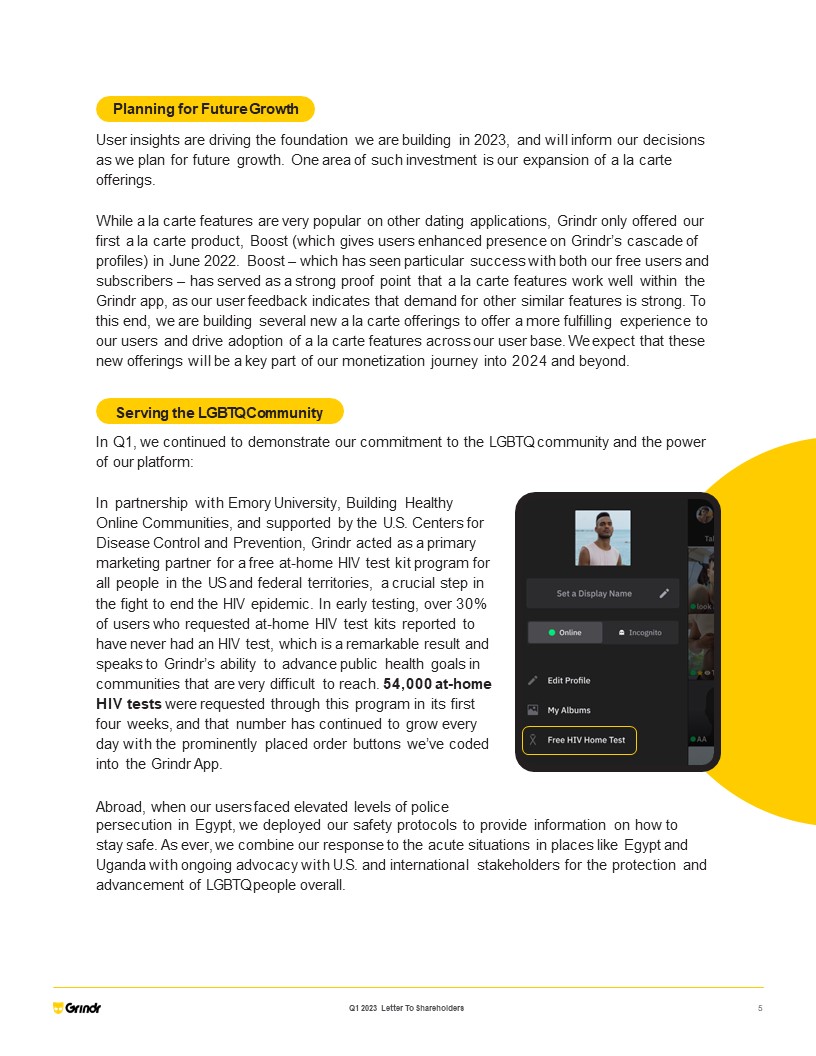
Planning for Future Growth User insights are driving the foundation we are building in 2023, and will inform our decisions as we plan for future growth. One area of such investment is our expansion of a la carte offerings. While a la carte features are very popular on other dating applications, Grindr only offered our first a la carte product, Boost (which gives users enhanced presence on Grindr’s cascade of profiles) in June 2022. Boost – which has seen particular success with both our free users and subscribers – has served as a strong proof point that a la carte features work well within the Grindr app, as our user feedback indicates that demand for other similar features is strong. To this end, we are building several new a la carte offerings to offer a more fulfilling experience to our users and drive adoption of a la carte features across our user base. We expect that these new offerings will be a key part of our monetization journey into 2024 and beyond. Serving the LGBTQ Community In Q1, we continued to demonstrate our commitment to the LGBTQ community and the power of our platform: In partnership with Emory University, Building Healthy Online Communities, and supported by the U.S. Centers for Disease Control and Prevention, Grindr acted as a primary marketing partner for a free at-home HIV test kit program for all people in the US and federal territories, a crucial step in the fight to end the HIV epidemic. In early testing, over 30% of users who requested at-home HIV test kits reported to have never had an HIV test, which is a remarkable result and speaks to Grindr’s ability to advance public health goals in communities that are very difficult to reach. 54,000 at-home HIV tests were requested through this program in its first four weeks, and that number has continued to grow every day with the prominently placed order buttons we’ve coded into the Grindr App. Abroad, when our users faced elevated levels of police persecution in Egypt, we deployed our safety protocols to provide information on how to stay safe. As ever, we combine our response to the acute situations in places like Egypt and Uganda with ongoing advocacy with U.S. and international stakeholders for the protection and advancement of LGBTQ people overall. Q1 2023 Letter To Shareholders 2

We had a successful quarter financially, with strong results. Our user base continued to grow as Average Paying Users were up 20% year-over-year. Average MAU for the quarter reached 12.8 million, representing a growth of 9% and ARPPU was up $1.76 year-over- year. While ARPPU for the quarter is up on both a year-over-year and quarter-over-quarter basis, we expect this metric to fluctuate in the near-term as we continue to test different subscription options across different price points and durations. Q1 Financial + Operating Performance $55.8mm revenue +28% YoY growth ($32.9mm) net income $22mm EBITDA 8% YoY growth 12.8mm avg. MAU +9% YoY growth Q1 2023 Highlights Q1 2023 Letter To Shareholders 2

Revenue Overall, Q1 revenue of $55.8 million was up 28% year-over-year from $43.5 million in the same period from the prior year. Direct Revenue increased $11.7 million to $48.1 million, up 32% year over year, as a result of an increase in ARPPU and paying users, primarily led by subscription revenue growth as well as growth from premium a la carte purchases. Advertising, or Indirect Revenue, was up 8% year-over-year to $7.7 million, primarily driven by growth in advertising revenue due to an increase in our number of advertising partners. Gross Profit (Revenue less Cost of Revenues) Gross profit, defined as revenue less cost of revenue, for Q1 grew to $41.0 million, up 29% from $31.8 million in the same period from the prior year. The year-over-year increase in gross profit was due to revenue growth, partially offset by an increase in cost of revenue, which was driven by growth in distribution fees and infrastructure costs. Operating Expenses Operating expenses, excluding cost of revenue, increased by $9.4 million in Q1 2023 as Grindr operates as a public company with the commensurate people costs and infrastructure costs. The increase also reflects higher stock-based compensation expense, professional fees in connection with public company infrastructure, audit/tax service services, legal fees, higher branding and marketing costs and other general and administrative expenses, including D&O insurance. Product Development Expenses for the first quarter of 2023 were $5.5 million, representing a $1.9 million or 53% increase from the prior year, primarily driven by increased people costs for employees in our Engineering and Product departments. Operating Income As a result, Operating Income for Q1 was $8.6 million at a 15% margin, down from $8.8 million in the same period from the prior year. Net Income (Loss) Net Loss for Q1 was ($32.9) million, down from net income of $4.5 million in the same period from the prior year. The swing to a net loss primarily reflects the following three factors: a gain on fair value measurement of our outstanding warrants based on the change in stock price from $4.65 at December 31, 2022 to $6.22 on March 31, 2023, an income tax provision of $15.5 million, and net interest expense of $10.8 million. The tax provision is high in Q1 due to timing differences, and we expect it to be largely offset on a full-year basis due to anticipated tax benefits in the remaining quarters of 2023. Adjusted EBITDA Adjusted EBITDA for Q1 was $22.0 million, or 39% of total quarterly Revenue, up from $20.3 million in the same period from the prior year. The increase in Adjusted EBITDA from the prior year period was primarily driven by revenue growth, partially offset by higher operating expenses on a normalized basis. Q1 2023 Letter To Shareholders 2

Performance Metrics Q1 2023 Average Paying Users 866k Average Paying User Penetration 6.7% Average MAU 12.8m ARPPU $18.52 All figures given in thousands, except paying user penetration and ARPPU. Conference Call Grindr will host a conference call to discuss these results at 2:00 p.m. Pacific Time (5:00 p.m. Eastern Time), Monday, May 15, 2023. To access the conference call, participants should dial +1 (888) 575-5167 and enter the conference ID number 99203756. The live audio webcast along with the press release will be accessible at https://investors.grindr.com/. A recording of the webcast will also be available on our website following the conference call. Guidance 2023 Full Year Q1 2023 Letter To Shareholders 2 25%+ revenue growth 38%+ adjusted EBITDA margin
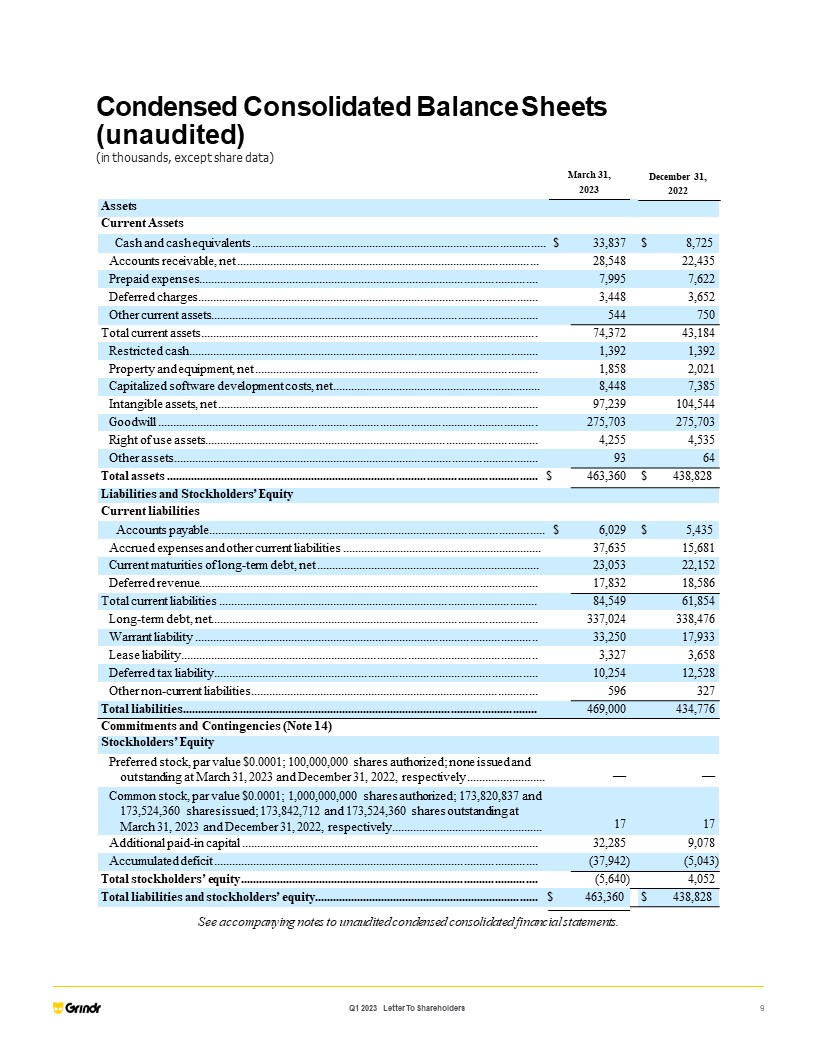
December 31, 2022 Assets Current Assets Cash and cash equivalents ................................................................................................. $ 33,837 $ 8,725 Accounts receivable, net .................................................................................................... 28,548 22,435 Prepaid expenses................................................................................................................ 7,995 7,622 Deferred charges ................................................................................................................ 3,448 3,652 Other current assets............................................................................................................ 544 750 Total current assets ............................................................................................................... 74,372 43,184 Restricted cash ................................................................................................................... 1,392 1,392 Property and equipment, net .............................................................................................. 1,858 2,021 Capitalized software development costs, net ..................................................................... 8,448 7,385 Intangible assets, net .......................................................................................................... 97,239 104,544 Goodwill ............................................................................................................................ 275,703 275,703 Right of use assets.............................................................................................................. 4,255 4,535 Other assets ........................................................................................................................ 93 64 Total assets .......................................................................................................................... $ 463,360 $ 438,828 Liabilities and Stockholders’ Equity Current liabilities Accounts payable ............................................................................................................... $ 6,029 $ 5,435 Accrued expenses and other current liabilities .................................................................. 37,635 15,681 Current maturities of long-term debt, net .......................................................................... 23,053 22,152 Deferred revenue................................................................................................................ 17,832 18,586 Total current liabilities ......................................................................................................... 84,549 61,854 Long-term debt, net............................................................................................................ 337,024 338,476 Warrant liability ................................................................................................................. 33,250 17,933 Lease liability..................................................................................................................... 3,327 3,658 Deferred tax liability .......................................................................................................... 10,254 12,528 Other non-current liabilities............................................................................................... 596 327 Total liabilities..................................................................................................................... 469,000 434,776 Commitments and Contingencies (Note 14) Stockholders’ Equity Preferred stock, par value $0.0001; 100,000,000 shares authorized; none issued and outstanding at March 31, 2023 and December 31, 2022, respectively .......................... — — Common stock, par value $0.0001; 1,000,000,000 shares authorized; 173,820,837 and 173,524,360 shares issued; 173,842,712 and 173,524,360 shares outstanding at March 31, 2023 and December 31, 2022, respectively .................................................. 17 17 Additional paid-in capital .................................................................................................. 32,285 9,078 Accumulated deficit ........................................................................................................... (37,942) (5,043) Total stockholders’ equity .................................................................................................. (5,640) 4,052 Total liabilities and stockholders’ equity.......................................................................... $ 463,360 $ 438,828 See accompanying notes to unaudited condensed consolidated financial statements. Q1 2023 Letter To Shareholders 9 Condensed Consolidated Balance Sheets (unaudited) (in thousands, except share data) March 31, 2023
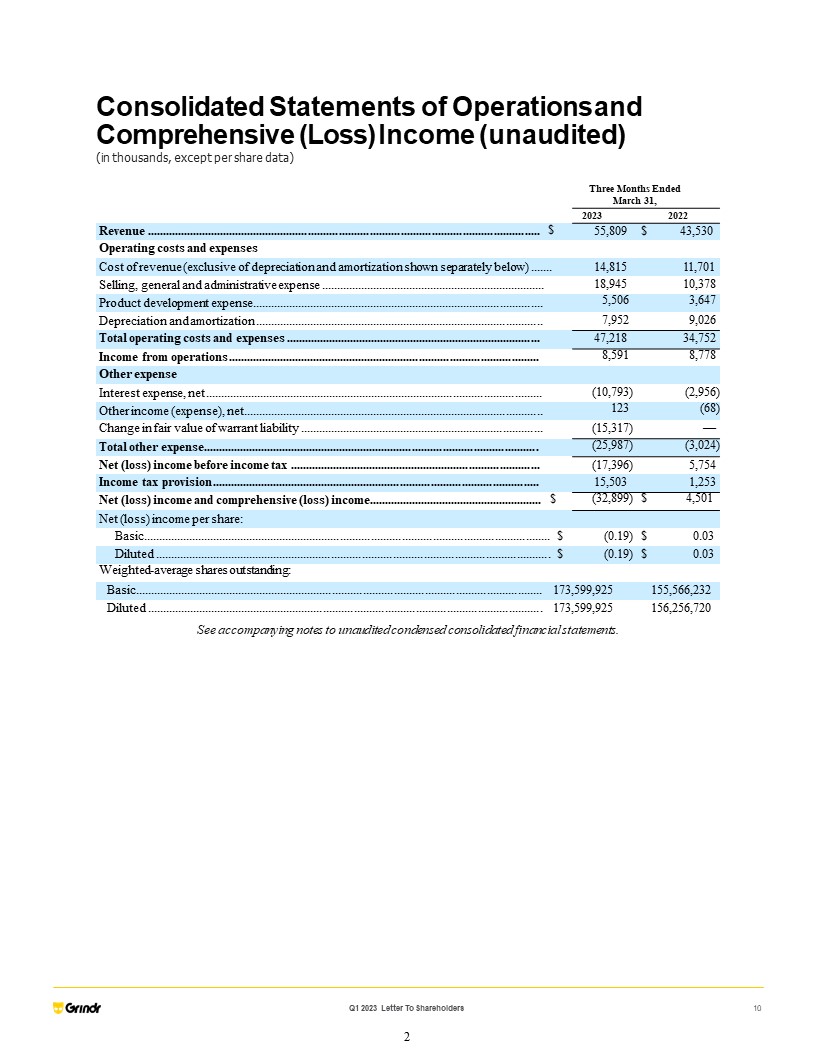
10 Q1 2023 Letter To Shareholders 2 Three Months Ended March 31, . . . . . . . 2023 2022 Revenue ................................................................................................................................ $ 55,809 $ 43,530 Operating costs and expenses Cost of revenue (exclusive of depreciation and amortization shown separately below) ....... 14,815 11,701 Selling, general and administrative expense .......................................................................... 18,945 10,378 Product development expense ................................................................................................ 5,506 3,647 Depreciation and amortization ............................................................................................... 7,952 9,026 Total operating costs and expenses .................................................................................... 47,218 34,752 Income from operations ...................................................................................................... 8,591 8,778 Other expense Interest expense, net ............................................................................................................... (10,793) (2,956) Other income (expense), net................................................................................................... 123 (68) Change in fair value of warrant liability ................................................................................ (15,317) — Total other expense.............................................................................................................. (25,987) (3,024) Net (loss) income before income tax .................................................................................. (17,396) 5,754 Income tax provision ........................................................................................................... 15,503 1,253 Net (loss) income and comprehensive (loss) income......................................................... $ (32,899) $ 4,501 Net (loss) income per share: Basic..................................................................................................................................... $ (0.19) $ 0.03 Diluted ................................................................................................................................. $ (0.19) $ 0.03 Weighted-average shares outstanding: Basic..................................................................................................................................... 173,599,925 155,566,232 Diluted ................................................................................................................................. 173,599,925 156,256,720 See accompanying notes to unaudited condensed consolidated financial statements. Consolidated Statements of Operations and Comprehensive (Loss) Income (unaudited) (in thousands, except per share data)
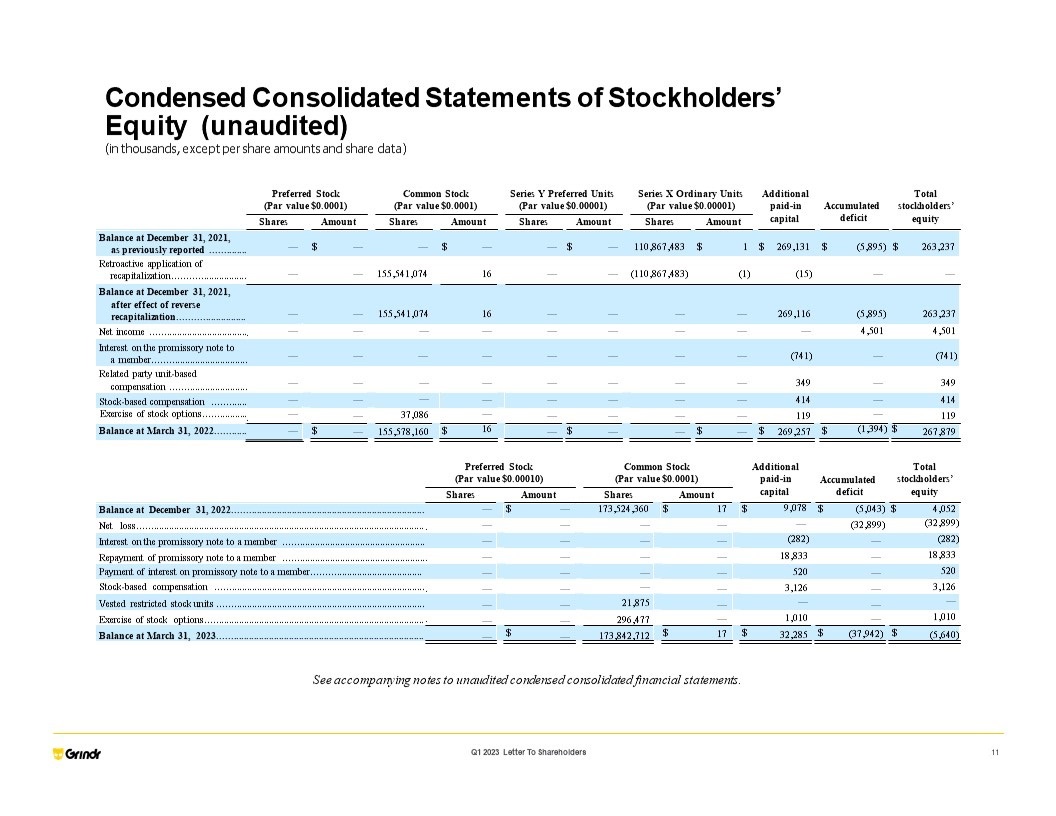
11 Q1 2023 Letter To Shareholders Preferred Stock (Par value $0.0001) Common Stock (Par value $0.0001) Series Y Preferred Units (Par value $0.00001) Series X Ordinary Units (Par value $0.00001) Additional paid-in capital Accumulated deficit Total stockholders’ equity Shares Amount Shares Amount Shares Amount Shares Amount . — $ — — $ — — $ — 110,867,483 $ 1 $ 269,131 $ (5,895) $ 263,237 . — — 155,541,074 16 — — (110,867,483) (1) (15) — — . . — — — — 155,541,074 — 16 — — — — — — — — — 269,116 — (5,895) 4,501 263,237 4,501 . — — — — — — — — (741) — (741) . Balance at December 31, 2021, as previously reported .............. Retroactive application of recapitalization............................ Balance at December 31, 2021, after effect of reverse recapitalization.......................... Net income ...................................... Interest on the promissory note to a member..................................... Related party unit-based compensation .............................. Stock-based compensation ............. . — — . . $ — — — — — — 37,086 155,578,160 $ — — — 16 — — — — $ — — — — — — — — $ — — — — $ 349 414 119 269,257 $ — — — (1,394) $ 349 414 119 267,879 Balance at March 31, 2022............ Exercise of stock options................. — — Preferred Stock (Par value $0.00010) Common Stock (Par value $0.0001) Accumulated deficit Total stockholders’ equity Shares Amount Amount . $ $ $ $ $ . . . . . . . Balance at December 31, 2022............................................................................ Net loss.................................................................................................................. Interest on the promissory note to a member ........................................................ Repayment of promissory note to a member ........................................................ Payment of interest on promissory note to a member........................................... Stock-based compensation ................................................................................... Vested restricted stock units .................................................................................. Exercise of stock options....................................................................................... Balance at March 31, 2023.................................................................................. . — — — — — — — — — $ — — — — — — — — — Shares 173,524,360 — — — — — 21,875 296,477 173,842,712 $ 17 — — — — — — — 17 $ Additional paid-in capital 9,078 — (282) 18,833 520 3,126 — 1,010 32,285 $ (5,043) (32,899) — — — — — — (37,942) $ 4,052 (32,899) (282) 18,833 520 3,126 — 1,010 (5,640) See accompanying notes to unaudited condensed consolidated financial statements. Condensed Consolidated Statements of Stockholders’ Equity (unaudited) (in thousands, except per share amounts and share data)

2023 2022 Operating activities Net (loss) income .................................................................................................................. $ (32,899) $ 4,501 Adjustments to reconcile net (loss) income to net cash provided by operating activities: .. Share-based compensation .................................................................................................... 3,341 734 Fair value change in warrant liability.................................................................................... 15,317 — Amortization of debt issuance costs...................................................................................... 512 228 Interest income on promissory note from member ............................................................... (282) (741) Depreciation and amortization .............................................................................................. 7,952 9,026 Provision for doubtful accounts ............................................................................................ 206 49 Deferred income taxes........................................................................................................... (2,274) (1,285) Non-cash lease expense......................................................................................................... 280 253 Changes in operating assets and liabilities:........................................................................... Accounts receivable ....................................................................................................... (6,319) 754 Prepaid expenses and deferred charges.......................................................................... (169) (1,142) Other current assets ........................................................................................................ 206 954 Other assets .................................................................................................................... (29) 20 Accounts payable ........................................................................................................... 1,790 388 Accrued expenses and other current liabilities .............................................................. 21,954 1,645 Deferred revenue............................................................................................................ (754) (456) Lease liability ................................................................................................................. (331) (1,055) Other liabilities............................................................................................................... — 89 Net cash provided by operating activities ......................................................................... $ 8,501 $ 13,962 Investing activities Purchase of property and equipment.............................................................................. $ (32) $ (103) Additions to capitalized software................................................................................... (1,461) (1,012) Net cash used in investing activities................................................................................... $ (1,493) $ (1,115) Financing activities Transaction costs paid in connection with the Business Combination .......................... $ (1,196) $ — Proceeds from the repayment of promissory note to a member including interest........ 19,353 — Proceeds from exercise of stock options........................................................................ 1,010 119 Principal payment on debt.............................................................................................. (1,063) (960) Net cash provided by (used in) financing activities .......................................................... $ 18,104 $ (841) Net increase in cash, cash equivalents and restricted cash.............................................. 25,112 12,006 Cash, cash equivalents and restricted cash, beginning of the period ............................. 10,117 17,170 Cash, cash equivalents and restricted cash, end of the period ........................................ $ 35,229 $ 29,176 Reconciliation of cash, cash equivalents and restricted cash Cash and cash equivalents.............................................................................................. $ 33,837 $ 27,784 Restricted cash ............................................................................................................... 1,392 1,392 Cash, cash equivalents and restricted cash..................................................................... $ 35,229 $ 29,176 Supplemental disclosure of cash flow information: Cash interest paid ........................................................................................................... $ 5,172 $ 3,329 Income taxes paid........................................................................................................... $ 725 $ 63 See accompanying notes to unaudited condensed consolidated financial statements. Q1 2023 Letter To Shareholders 12 Consolidated Statements of Cash Flows (unaudited) (in thousands) Three Months Ended March 31,
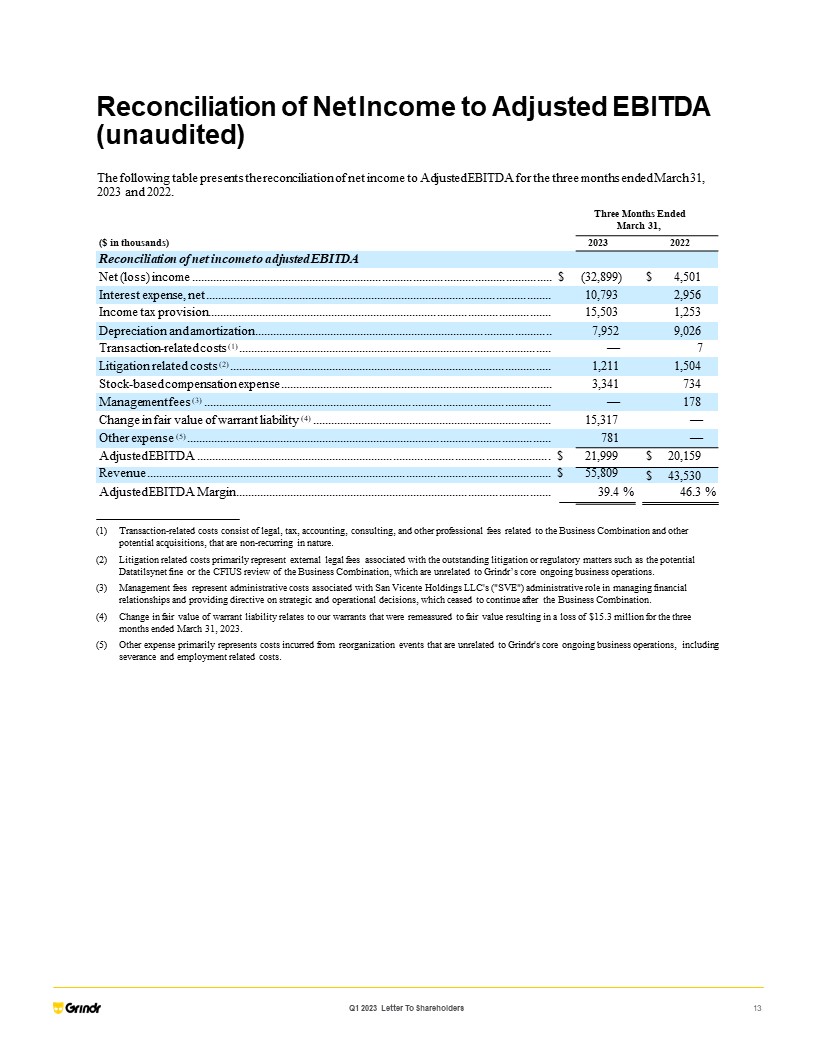
Reconciliation of Net Income to Adjusted EBITDA (unaudited) The following table presents the reconciliation of net income to Adjusted EBITDA for the three months ended March 31, 2023 and 2022. Three Months Ended March 31, ($ in thousands) 2023 2022 Reconciliation of net income to adjusted EBITDA Net (loss) income ...................................................................................................................... $ (32,899) $ 4,501 Interest expense, net .................................................................................................................. 10,793 2,956 Income tax provision ................................................................................................................. 15,503 1,253 Depreciation and amortization .................................................................................................. 7,952 9,026 Transaction-related costs (1) ....................................................................................................... — 7 Litigation related costs (2) .......................................................................................................... 1,211 1,504 Stock-based compensation expense .......................................................................................... 3,341 734 Management fees (3) .................................................................................................................. — 178 Change in fair value of warrant liability (4) ............................................................................... 15,317 — Other expense (5) ........................................................................................................................ 781 — Adjusted EBITDA .................................................................................................................... $ 21,999 $ 20,159 Revenue ..................................................................................................................................... $ 55,809 $ 43,530 Adjusted EBITDA Margin ........................................................................................................ 39.4 % 46.3 % Transaction-related costs consist of legal, tax, accounting, consulting, and other professional fees related to the Business Combination and other potential acquisitions, that are non-recurring in nature. Litigation related costs primarily represent external legal fees associated with the outstanding litigation or regulatory matters such as the potential Datatilsynet fine or the CFIUS review of the Business Combination, which are unrelated to Grindr’s core ongoing business operations. Management fees represent administrative costs associated with San Vicente Holdings LLC's ("SVE") administrative role in managing financial relationships and providing directive on strategic and operational decisions, which ceased to continue after the Business Combination. Change in fair value of warrant liability relates to our warrants that were remeasured to fair value resulting in a loss of $15.3 million for the three months ended March 31, 2023. Other expense primarily represents costs incurred from reorganization events that are unrelated to Grindr's core ongoing business operations, including severance and employment related costs. Q1 2023 Letter To Shareholders 13

Forward Looking Statements This press release contains “forward looking statements” within the meaning of the “safe harbor” provisions of the United States Private Securities Litigation Reform Act of 1995 regarding Grindr’s current views with respect to our industry, operations and future business plans and performance. These forward-looking statements can generally be identified by the use of forward-looking terminology, including the terms “believes,” “estimates,” “anticipates,” “expects,” “seeks,” “projects,” “intends,” “plans,” “may,” “will” or “should” or, in each case, their negative or other variations or comparable terminology, but the absence of these words does not mean that a statement is not forward-looking. These forward-looking statements include, among others, statements about our growth opportunities, expectations regarding new product launches, our 2023 strategic priorities, our plan to generate sustainable double-digit revenue growth and strong profitability and our full year 2023 guidance. Forward-looking statements, including guidance related to Revenue Growth and Adjusted EBITDA Margin, are predictions, projections and other statements about future events that are based on current expectations and assumptions and, as a result, are not guarantees of future performance and are subject to risks and uncertainties that may cause actual results to differ materially from our expectations discussed in the forward-looking statements. Many factors could cause actual future events to differ materially from the forward-looking statements in this press release, including but not limited to: (i) our reliance on historical data, which may be of limited reliability, in providing revenue guidance; (ii) the impact of the regulatory environment and complexities with compliance related to such environment; (iii) our ability to respond to general economic conditions; (iv) factors relating to the business, operations and financial performance of Grindr and its subsidiaries, including: (a) competition in the dating and social networking products and services industry; (b) the ability to maintain and attract users; and (c) fluctuation in quarterly and yearly results; (v) natural disasters, outbreaks and pandemics, including the COVID-19 pandemic and MPox; (vi) our ability to adapt to changes in technology and user preferences in a timely and cost-effective manner; (vii) our ability to maintain compliance with privacy and data protection laws and regulations; (viii) our ability to protect systems and infrastructures from cyber-attacks and prevent unauthorized data access; (ix) our dependence on the integrity of third-party systems and infrastructure; and (x) our ability to protect our intellectual property rights from unauthorized use by third parties. The foregoing list of factors is not exhaustive. Further information on these and additional risks, uncertainties and other factors that could cause actual outcomes and results to differ materially from those included in or contemplated by the forward-looking statements contained in this press release are included under the caption “Risk Factors” in our Annual Report on Form 10-K filed by Grindr with the SEC on March 17, 2023 as well as other filings that we make with the SEC from time to time. Forward-looking statements speak only as of the date they are made. Readers are cautioned not to put undue reliance on forward-looking statements, and the Company assumes no obligation and does not intend to update or revise these forward-looking statements, whether as a result of new information, future events, or otherwise. Q1 2023 Letter To Shareholders 14
About Non-GAAP Grindr uses Adjusted EBITDA and Adjusted EBITDA margin, which are non-GAAP measures, to understand and evaluate its core operating performance. These non-GAAP financial measures, which may differ from similarly titled measures used by other companies, are presented to enhance investors’ overall understanding of Grindr’s financial performance and should not be considered as a substitute for, or superior to, the financial information prepared and presented in accordance with GAAP. Grindr defines Adjusted EBITDA as net (loss) income excluding income tax provision, interest expense, net of interest income from the related party loan to Catapult GP II, depreciation and amortization, stock-based compensation expense and non-core expenses/losses (gains). Non-core expenses/losses (gains) include transaction-related costs, litigation-related costs, management fees, change in fair value of warrant liability and other expense, which includes asset impairments. Adjusted EBITDA Margin represents Adjusted EBITDA as a percentage of revenue. Grindr’s management uses Adjusted EBITDA and Adjusted EBITDA margin internally to evaluate the performance of our business and this measure is one of the primary metrics by which our internal budgets are based and by which management is compensated. Grindr believes Adjusted EBITDA and Adjusted EBITDA Margin are also helpful to investors, analysts, and other interested parties because they can assist in providing a more consistent and comparable overview of our operations across our historical financial periods. Grindr excludes the above items as some are non-cash in nature, and others are non-recurring that they may not be representative of normal operating results. Adjusted EBITDA and Adjusted EBITDA margin adjust for the impact of items that Grindr does not consider indicative of the operational performance of our business. While Grindr believes that these non-GAAP financial measures are useful in evaluating our business, this information should be considered as supplemental in nature and is not meant as a substitute for the related financial information prepared and presented in accordance with GAAP. About Grindr With nearly 13 million monthly active users in virtually every country in the world, Grindr has grown to become a fundamental part of the queer community since its launch in 2009. The company continues to expand its ecosystem to enable gay, bi, trans and queer people to connect, express themselves, and discover the world around them. Grindr is headquartered in West Hollywood, California. The Grindr app is available on the App Store and Google Play. Q1 2023 Letter To Shareholders 15