united states
securities and exchange commission
washington, d.c. 20549
form n-csr
certified shareholder report of registered management
investment companies
Investment Company Act file number 811-23611
James Alpha Funds Trust
(Exact name of registrant as specified in charter)
515 Madison Avenue, 24th Floor, New York, NY 10022
(Address of principal executive offices) (Zip code)
Emile R. Molineaux, Gemini Fund Services, LLC
80 Arkay Drive, Suite 110, Hauppauge, NY 11788
(Name and address of agent for service)
Registrant's telephone number, including area code: 623-266-4567
Date of fiscal year end: 11/30
Date of reporting period: 11/30/22
Amended to update trust name.
Item 1. Reports to Stockholders.
 |
| JAMES ALPHA FUNDS TRUST d/b/a EASTERLY FUNDS TRUST |
| CLASS A, C, I AND R6 SHARES |
| ANNUAL REPORT |
| November 30, 2022 |
| THIS REPORT IS AUTHORIZED FOR DISTRIBUTION ONLY TO SHAREHOLDERS AND TO OTHERS WHO |
| HAVE RECEIVED A COPY OF THE PROSPECTUS. |
James Alpha Funds Trust d/b/a Easterly Funds Trust
ANNUAL REPORT TO SHAREHOLDERS
January 9, 2023
Dear Shareholder:
We are pleased to provide you with this annual report on the investment strategies and performance of the funds in the James Alpha Funds Trust d/b/a Easterly Funds Trust (the “Trust”). This report covers the twelve months from December 1, 2021 through November 30, 2022.
We believe that successful investing requires discipline and patience. Try to stay focused on your long-term investment goals. Don’t let short-term stock and bond market fluctuations or investment manias change your long-term investment strategy. In our opinion, the Easterly Funds are managed by some of the world’s leading institutional investment advisory firms. It is our belief that combining the strength of the Trust’s performance with a well-designed asset allocation plan can help you to achieve your long-term investment goals.
ECONOMIC OVERVIEW
As measured by Real Gross Domestic Product (GDP), the value of the production of goods and services in the United States slowed to an annualized growth rate (AGR) of 1.9% during the third quarter of 2022, with both the first and second quarter showing negative real GDP growth (a classic recessionary signal). The primary driver of the sluggish performance in the economy and markets in the past 12 months has been the tightening of monetary and fiscal support as well as rampant inflation that has begun to materially affect the psychology of the consumer. New Home Sales were sharply down from their high in the past year (around 840 thousand) to an annualized 632 thousand units as of October 2022, just slightly above the average from the past decade (around 610 thousand). The slowdown in New Home Sales is largely attributable to the steep rise in mortgage rates (moving from 3.2% twelve months ago to 6.6% today), severely straining affordability. Despite a few grim macro data points, the labor market has held up strongly. The unemployment rate declined in the past twelve months from 4.2% to 3.7%, one of the lowest rates recorded in the past 50 years. The unemployment claims is an important leading indicator in our work, specifically the 4-week sum of weekly Initial Claims data. That number has dropped to 915 thousand from a pandemic peak of over 21 million claims. For perspective, the historic average from 1967 to present is about 1.5 million. The overall economy in 2022 has been shaky with growing macro headwinds, contracting equity valuations, rising interest rates, and shortages of goods and services across the economy driven by robust consumer demand and lingering supply chain issues that have been morphing since the beginning of the pandemic. This market has been largely controlled by the Federal Reserve, who have signaled their commitment to tightening financial conditions in order to get inflation under control. This is a material break from decades long precedent where the Fed has been there to provide support during market turmoil. Time will tell whether the Fed is able to engineer its desired ’soft landing’ or if their actions will induce an economic recession.
Monetary Policy: The past twelve months have seen a historically fast pivot at the Federal Reserve from extraordinarily accommodative policy to the most hawkish positioning in decades. With a robust labor market and low unemployment, the Fed is in full force to tackle the other half of their dual mandate: price stability. Inflation has remained stubbornly high and has become a major issue facing the average consumer. In a recent FOMC statement, the Committee stated that “with inflation remaining well above the Committee’s objective, participants judged that moving to a restrictive stance of policy was required to meet the Committee’s legislative mandate to promote maximum employment and price stability.” During Jay Powell’s Jackson Hole speech, he affirmed that the central bank will “use [their] tools forcefully” to attack inflation, and that raising interest rates will cause “some pain” to the economy. This
1
constitutes a major pivot as investors now face the most hawkish Fed seen in decades. In terms of the benchmark Fed Funds rate, the futures market is pricing additional hikes up to 4.5% by the end of the year, and for the rates to remain high through 2023 (potentially hitting a peak terminal rate of 5.25% by March).
Interest Rates: Treasury yields have been increasing over the last two years to rates not seen since before the 2008 Financial Crisis. In the twelve months since the end of November 2021, yields have risen dramatically, and the yield curve has inverted as front-end rates have risen much faster than longer term rates (due to expectations of Fed actions). The 2-year treasury rate spiked from 0.57% to 4.31%, the 5-year rate moved from 1.16% to 3.74%, 10-year rate went from 1.44% to 3.61%, and the 30-year rate went from 1.79% to 3.74%. There are now multiple inversions in the curve (i.e., short term rates have moved above longer-term rates), which has historically been a signal for impending recession. With the Fed continuing to hike rates and aggressively reducing its balance sheet, we believe the environment is supportive for higher interest rates, and yields will remain steady to higher over the next 12 months.
Equity Valuations: Equity markets in 2022 have been highly volatile with the S&P 500 ending November down 13.1% year-to-date, and an intra-year peak-to-trough decline of 24.5%. A key theme this year has been a rotation from growth to value as investors are putting greater weight on corporate fundamentals over speculative growth stocks. However, the selloff has been prolonged and broad based with 8 out of 11 of the S&P sectors being down on the year (only consumer staples, energy and utilities have posted positive returns). Despite the turmoil in equities, valuations continue to remain anywhere from fairly valued to strongly overvalued depending on the metric. As an example, Warren Buffett’s favorite indicator is the ratio of total equity market cap to GDP (termed “the Buffett Indicator”) that is still at a highly elevated level of 158%, down from a record shattering 207% from August 2021, but still above the 143% set at the peak of the tech bubble in March 2000 which could indicate the market remains strongly overvalued. However, the S&P 500 is currently trading at a forward P/E ratio of approximately 20.4 times, which is modestly below its 30-year average of 21.2 times.
Inflation: Inflation, as measured by the consumer price index (CPI) was up 7.7% y-o-y based on the latest release of the report. While the figure is down slightly from its record 9.1% earlier in the summer, it still represents a rate of inflation not seen since the early 1980’s. Since the summer of 2020, the Fed’s objective was to run the economy hot through ultra-easy monetary policy with the intention of spurring inflation above their target to achieve a long-term average of 2%. Inflation data has come in materially and persistently higher than the Fed projected, which has spurred them to take aggressive action by tightening policy and removing excess liquidity.
FUND SPECIFIC OVERVIEW
Income Opportunities (JSVIX)
Easterly Income Opportunity Fund posted -6.58% for the period from November 30, 2021 to November 30, 2022, outperforming the Bloomberg Aggregate Index by 6.26%. Contributing factors to the overall performance were higher than normal Cash/Treasuries, CDO/CLO allocation and allocation to legacy RMBS. The main detractor was the fund’s Corporate Structured Note position due to its steepening bias.
November 2021 to November 2022 included some of the most dramatic events in the history of financial markets as a 40-year bond bull market came to a crashing end. The Federal Reserve and its Chairman Jerome Powell were at first forced to admit that the inflationary spike was not due to transitory factors such as supply bottlenecks and Covid-related shortages but had something to do with unprecedented amounts of monetary and fiscal stimulus since the beginning of global pandemic. With CPI rising to 5.3%
2
by Q3 2021, the Fed announced a tapering of its $120 billion monthly QE purchases and then with CPI rising further to 7% and then to 8% in Q4 2021 and Q1 2022 respectively, the Fed finally ended QE, raised its benchmark rate by 0.25% and announced a Quantitative Tightening program starting in June 2022 to further tighten monetary conditions. Headline CPI reached 9.1% YOY in Q2 with services inflation, primarily rents and housing related expenses, supplanting energy and food inflation as the main driver of cost-of-living crisis in the US. The Federal Reserve ended up raising its benchmark fed funds rate to 3.75% by the end of November after 4 consecutive 75bp hikes. The Treasury yield curve underwent an extreme inversion over the last 12 months with the 2-year rate higher by 3.7% while the 10-year rate increased by 2.2% and the long-end 30-year rate was higher by 1.9%. As a result of the Fed’s uber-aggressive shift from monetary accommodation to monetary tightening, all risk assets posted negative returns. Most fixed income sectors saw negative double digit returns in what has been called the worst bond market since 1949. IG Corporates were down -15.5% while High Yield was down -9.0%. Structured credit sectors outperformed Corporates and High Yield sectors due to lower duration and spread exposure but nonetheless saw significant spread widening across the credit curve with AAAs wider by 60-120bp and BBBs widening anywhere between 150bp and 350bp. The Easterly Income Opportunities Fund focused on maintaining a defensive positioning in terms of lower effective and spread duration relative to most fixed income credit sectors. We benefited from our highly liquid cash/Treasuries portion of the portfolio that was higher relative to previous periods going into 2022 as we expected significant amount of spread volatility amidst inflationary pressures and uncertainty regarding the Fed’s actions. Our RMBS short duration carry bucket also helped offset some of the spread widening in other credit markets. At the same time, our corporate structured note position underperformed IG Corporates due to its inherent steepening bias. We hedged some of corporate structured note duration exposure with a 2-year interest rate swap in 2022.
The fund deployed interest rate swaps to hedge the effective duration of its Corporate Structured Note position and entered into a CDS contract to hedge some of the credit spread risk of its Corporate Structure Note position. Hedges contributed +1.38% to overall return. The Fund did not have a policy or practice of maintaining a specified level of distribution or yield payout to shareholders.
Total Hedge (JTHIX)
For the twelve months ending November 30, 2022, the Total Hedge Strategy (JTHIX) was down 7.47% on a total return basis largely attributable to declines in the equity and bond market over that time. The largest detractor was long equity positions, which contributed approximately -6.1% to the total return. The second largest detractor was long fixed income positions, which contributed -2.7% to the return. This was partially offset by forward currency, commodity ETP, and swap positions, among other investments.
The Fund’s core strategy is to provide investors with a total alternative allocation vehicle that attempts to provide similar allocation profile and returns to the broad hedge fund universe. To achieve this goal, the team utilizes its depth of hedge fund knowledge and advanced quantitative techniques. The team starts with the HFR database, which tracks thousands of hedge funds and is the main source of sub-segment replication and classification. Then a proprietary replication engine is used to convert hedge fund strategies into over 100 liquid instruments. Under normal market conditions, the portfolio is rebalanced monthly.
The Fund utilizes various derivatives during the implementation of the strategy. The primary derivatives used are swaps to make investments directly into hedge funds and related alternative strategies. In the past 12 months, these swaps contributed approximately 0.5% to the total return of the Fund. The usage of these derivatives is consistent with the Fund’s stated objective. The Fund does not use derivatives to meet a target distribution yield for shareholders.
3
COMPARING THE FUND PERFORMANCE TO BENCHMARKS
When reviewing the performance of the funds against their benchmarks, it is important to note that the Trust is designed to help investors to implement an asset allocation strategy to meet their individual needs as well as select individual investments within each asset category among the myriad of choices available. Each Easterly Fund was formed to represent an asset class, and each portfolio’s institutional money manager was selected based on their its to manage money within that class.
Therefore, the Easterly Funds may be able to help investors to properly implement their asset allocation decisions and keep their investments within the risk parameters that they establish with their investment consultants. Without the intended asset class consistency of the Easterly Funds, even the most carefully crafted allocation strategy could be negated. Furthermore, we believe the benchmarks do not necessarily provide precise standards against which to measure the portfolios, in that the characteristics of the benchmarks can vary widely at different points in time from the Easterly Funds (e.g., characteristics such as average market capitalizations, price-to-earnings and price-to-book ratios, bond quality ratings and maturities, etc.). In addition, the benchmarks can potentially have a survivor bias built into them (i.e., the performance of only funds that are still in existence may remain part of the benchmark’s performance while funds that do not exist anymore may be removed from the benchmark’s performance).
ELECTRONIC DELIVERY AVAILABLE
This report can be delivered to you electronically. Electronic delivery can help simplify your record keeping. With electronic delivery, you’ll receive an email with a link to your James Alpha Funds Trust quarterly statement, daily confirmations and/or semi-annual and annual reports each time one is available. You have the ability to choose which items you want delivered electronically. Choose one item or all items. It’s up to you. Please call our Customer Service Department toll-free at (833) 999-2636 for instructions on how to establish electronic delivery.
Investors should consider the investment objectives, risks, charges and expenses of the Easterly Funds carefully. This and other information about the Easterly Funds is contained in your prospectus, which should be read carefully. To obtain an additional copy of the prospectus, please call 888.814.8180. Past performance is not indicative of future results. Investments in stocks, bonds and mutual funds are not guaranteed and the principal value and investment return can fluctuate. Consequently, investors may receive back less than invested.
The S&P 500 is an unmanaged, capitalization-weighted index. It is not possible to invest directly in the S&P 500.
The security holdings discussed may not be representative of the Funds’ current or future investments. Fund holdings are subject to change and should not be considered to be investment advice. Any statements not of a factual nature constitute opinions which are subject to change without notice. Information contained herein was obtained from recognized statistical services and other sources believed to be reliable and we therefore cannot make any representation as to its completeness or accuracy. The Easterly Funds are distributed by Ultimus Fund Distributors, LLC, member FINRA/SIPC.
15777604-UFD 10/11/2022
4
| Easterly Total Hedge Portfolio |
| PORTFOLIO REVIEW (Unaudited) |
| November 30, 2022 |
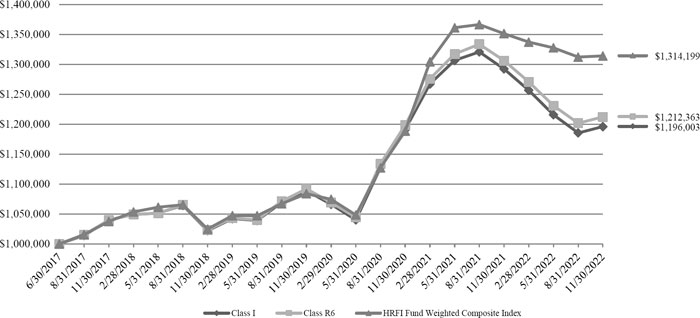
The Fund’s performance figures* for each of the periods ended November 30, 2022, compared to its benchmarks:
| Annualized | Annualized | ||
| 1 Year Return | 5 Year Return | Since Inception* | |
| Class I | (7.47)% | 2.83% | 3.36% |
| Class R6 | (7.20)% | 3.11% | 3.62% |
| HFRI Fund Weighted Composite Index(a) | (2.76)% | 4.72% | 5.05% |
Performance data quoted above is historical. Past performance does not guarantee future results and current performance may be lower or higher than the performance data quoted. The investment return and principal value of an investment will fluctuate, so that shares when redeemed, may be worth more or less than their original cost. For more performance numbers current to the most recent month-end please call (800) 807-FUND. The total operating expense ratio as stated in the fee table to the Portfolio’s prospectus dated April 1, 2022, is 2.05% and 1.68% for the I and R6 Classes, respectively. (a) The HFRI Fund Weighted Composite Index is a global, equal-weighted index of appx. 1,900 single-manager funds that report to HFR Database. Constituent funds report monthly net of all fees performance in US Dollar and have a minimum of $50 Million under management or a twelve (12) month track record of active performance. The HFRI Fund Weighted Composite Index does not include Funds of Hedge Funds.
| * | Inception date is June 30, 2017. |
A HYPOTHETICAL COMPARISON OF THE GROWTH OF $1,000,000 INVESTED IN THE
EASTERLY TOTAL HEDGE PORTFOLIO VS. BENCHMARKS
| Top 10 Holdings by Industry * | % of Net Assets | |||
| Fixed Income | 46.0 | % | ||
| Equity | 31.3 | % | ||
| Alternative | 12.8 | % | ||
| Commodity | 1.4 | % | ||
| Mixed Allocation | 0.8 | % | ||
| Specialty | 0.4 | % | ||
| Other/Cash & Equivalents | 7.3 | % | ||
| 100 | % | |||
| * | Does not include derivative holdings |
Please refer to the Consolidated Schedule of Investments for a more detailed breakdown of the Fund’s assets.
5
| Easterly Income Opportunities Fund (Formerly, Easterly Structured Credit Value Fund) |
| PORTFOLIO REVIEW (Unaudited) |
| November 30, 2022 |
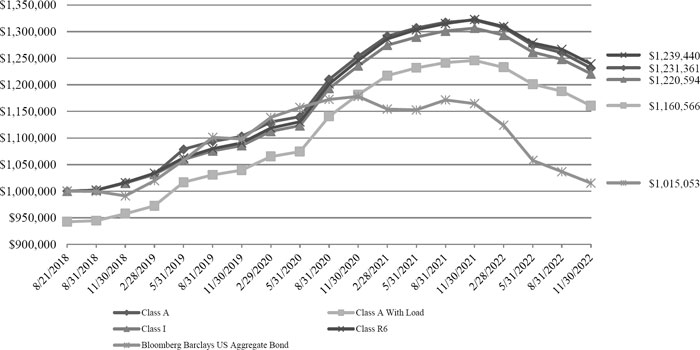
The Fund’s performance figures* for each of the periods ended November 30, 2022, compared to its benchmarks:
| Annualized | |||
| 1 Year Return | 3 Year Return | Since Inception* | |
| Class A | (6.84)% | 3.74% | 4.99% |
| Class A With Load | (8.71)% | 1.71% | 3.54% |
| Class C | (7.50)% | 2.94% | 3.90% |
| Class I | (6.58)% | 3.98% | 4.77% |
| Class R6 | (6.30)% | 4.35% | 5.15% |
| Bloomberg US Aggregate Bond Index(a) | (12.84)% | (2.59)% | 0.35% |
Performance data quoted above is historical. Past performance does not guarantee future results and current performance may be lower or higher than the performance data quoted. The investment return and principal value of an investment will fluctuate, so that shares when redeemed, may be worth more or less than their original cost. For more performance numbers current to the most recent month-end please call (800) 807-FUND. The total operating expense ratio as stated in the fee table to the Portfolio’s prospectus dated April 1, 2022, is 1.76%, 2.51%, 1.51%%, and 1.14% for the A, C, I and R6 Classes, respectively.
| (a) | The Bloomberg U.S. Aggregate Bond Index is an unmanaged index which represents the U.S. investmen-grade fixed-rate bond market (including government and corporate securities, mortgage pass-through securities and asset-backed securities). Investors cannot invest directly in an index or benchmark. |
| * | Inception date is August 21, 2018. |
A HYPOTHETICAL COMPARISON OF THE GROWTH OF $1,000,000 INVESTED IN THE
EASTERLY STRUCTURED CREDIT VALUE FUND VS. BENCHMARKS
| Top 10 Holdings by Industry * | % of Net Assets | |||
| Collateralized Mortgage Obligations | 39.7 | % | ||
| Non Agency CMBS | 18.5 | % | ||
| CLO | 4.9 | % | ||
| Specialty Finance | 4.4 | % | ||
| Institutional Financial Services | 4.2 | % | ||
| Banking | 3.6 | % | ||
| Home Equity | 3.6 | % | ||
| CDO | 3.5 | % | ||
| Other ABS | 3.2 | % | ||
| Residential Mortgage | 2.6 | % | ||
| Other/Cash & Equivalents | 11.8 | % | ||
| 100.0 | % | |||
| * | Does not include derivative holdings |
Please refer to the Schedule of Investments for a more detailed breakdown of the Fund’s assets.
6
| EASTERLY TOTAL HEDGE PORTFOLIO |
| CONSOLIDATED SCHEDULE OF INVESTMENTS |
| November 30, 2022 |
| Shares | Fair Value | |||||||
| EXCHANGE-TRADED FUNDS — 75.7% | ||||||||
| ALTERNATIVE - 3.0% | ||||||||
| 8,761 | iMGP DBi Managed Futures Strategy ETF | $ | 273,694 | |||||
| 2,753 | IQ Merger Arbitrage ETF(a) | 86,720 | ||||||
| 13,378 | ProShares Merger ETF | 524,150 | ||||||
| 799 | Simplify Managed Futures Strategy ETF | 21,980 | ||||||
| 906,544 | ||||||||
| COMMODITY - 1.4% | ||||||||
| 6 | Invesco DB Agriculture Fund(a) | 120 | ||||||
| 1,742 | iShares Gold Trust(d) | 58,531 | ||||||
| 7,670 | iShares S&P GSCI Commodity Indexed Trust (d) | 165,595 | ||||||
| 550 | KraneShares Global Carbon Strategy ETF | 24,904 | ||||||
| 740 | ProShares UltraShort Bloomberg Crude Oil(a) | 17,871 | ||||||
| 115 | ProShares UltraShort Bloomberg Natural Gas(a) | 1,610 | ||||||
| 315 | SPDR Gold Shares(d) | 51,915 | ||||||
| 1,631 | United States Commodity Index Fund(a) | 90,562 | ||||||
| 411,108 | ||||||||
| EQUITY - 31.3% | ||||||||
| 3,936 | AdvisorShares Pure Cannabis ETF | 20,216 | ||||||
| 552 | AdvisorShares STAR Global Buy-Write ETF | 19,876 | ||||||
| 1,999 | Alerian MLP ETF | 80,060 | ||||||
| 7,265 | ALPS Medical Breakthroughs ETF(a) | 227,031 | ||||||
| 229 | ARK Innovation ETF | 8,583 | ||||||
| 903 | Columbia India Consumer ETF | 47,877 | ||||||
| 1,094 | Consumer Discretionary Select Sector SPDR Fund | 159,910 | ||||||
| 219 | Core Alternative ETF | 7,131 | ||||||
| 4 | Direxion NASDAQ-100 Equal Weighted Index Shares | 274 | ||||||
| 748 | Energy Select Sector SPDR Fund | 68,180 | ||||||
| 313 | ETFMG Alternative Harvest ETF | 1,812 | ||||||
| 3,173 | First Trust DJ Global Select Dividend Index Fund | 70,631 | ||||||
| 296 | First Trust Dow Jones Internet Index Fund(a) | 39,193 | ||||||
| 2,653 | First Trust Financial AlphaDEX Fund | 116,626 | ||||||
| 1,851 | First Trust MultiCap Growth AlphaDEX Fund | 188,154 | ||||||
| 566 | FlexShares Morningstar Emerging Markets Factor | 27,208 | ||||||
| 72 | Global SuperDividend US ETF | 1,410 | ||||||
| 1,378 | Global X MSCI Argentina ETF | 45,322 | ||||||
See accompanying notes to consolidated financial statements
7
| EASTERLY TOTAL HEDGE PORTFOLIO |
| CONSOLIDATED SCHEDULE OF INVESTMENTS (Continued) |
| November 30, 2022 |
| Shares | Fair Value | |||||||
| EXCHANGE-TRADED FUNDS — 75.7% (Continued) | ||||||||
| EQUITY - 31.3% (Continued) | ||||||||
| 2,480 | Global X MSCI Nigeria ETF | $ | 19,294 | |||||
| 772 | Global X MSCI Norway ETF | 20,744 | ||||||
| 3,544 | Global X Uranium ETF | 76,161 | ||||||
| 1,826 | Goldman Sachs Hedge Industry VIP ETF | 135,712 | ||||||
| 24 | Invesco DWA Consumer Cyclicals Momentum ETF | 1,643 | ||||||
| 162 | Invesco DWA Energy Momentum ETF | 7,826 | ||||||
| 384 | Invesco DWA Financial Momentum ETF | 16,781 | ||||||
| 300 | Invesco DWA SmallCap Momentum ETF | 23,358 | ||||||
| 533 | Invesco FTSE RAFI Canadian Fundamental Index | 13,983 | ||||||
| 22,759 | Invesco FTSE RAFI Emerging Markets ETF | 411,255 | ||||||
| 531 | Invesco KBW Bank ETF | 29,725 | ||||||
| 97 | Invesco KBW High Dividend Yield Financial ETF | 1,586 | ||||||
| 131 | Invesco KBW Property & Casualty ETF | 11,646 | ||||||
| 1,484 | Invesco S&P 500 BuyWrite ETF | 30,303 | ||||||
| 5,730 | Invesco S&P 500 Downside Hedge ETF | 197,284 | ||||||
| 3,478 | Invesco S&P 500 Equal Weight ETF | 517,596 | ||||||
| 1,174 | Invesco S&P 500 Pure Value ETF | 97,571 | ||||||
| 5,602 | Invesco S&P SmallCap Energy ETF | 61,062 | ||||||
| 213 | Invesco S&P SmallCap Financials ETF | 11,056 | ||||||
| 283 | Invesco S&P SmallCap Health Care ETF(a) | 39,824 | ||||||
| 393 | Invesco S&P SmallCap Information Technology ETF(a) | 50,693 | ||||||
| 22 | Invesco S&P SmallCap Utilities & Communication Services ETF | 1,257 | ||||||
| 30 | Invesco Solar ETF(a) | 2,519 | ||||||
| 211 | Invesco Water Resources ETF | 11,259 | ||||||
| 729 | IQ US Real Estate Small Cap ETF | 14,621 | ||||||
| 1,889 | iShares Biotechnology ETF | 257,905 | ||||||
| 89 | iShares China Large-Cap ETF | 2,506 | ||||||
| 186 | iShares Core S&P/TSX Capped Composite Index ETF | 4,510 | ||||||
| 20 | iShares Currency Hedged MSCI EAFE ETF | 682 | ||||||
| 3 | iShares Dow Jones Asia Pacific Select Dividend 50 UCIT ETF | 72 | ||||||
| 5,163 | iShares EURO STOXX Banks 30-15 UCITS ETF DE, EUR DIST Class | 49,430 | ||||||
| 160 | iShares EURO STOXX Mid UCITS ETF | 10,013 | ||||||
| 288 | iShares Global Materials ETF | 23,976 | ||||||
| 48 | iShares Global Timber & Forestry ETF | 3,647 | ||||||
See accompanying notes to consolidated financial statements
8
| EASTERLY TOTAL HEDGE PORTFOLIO |
| CONSOLIDATED SCHEDULE OF INVESTMENTS (Continued) |
| November 30, 2022 |
| Shares | Fair Value | |||||||
| EXCHANGE-TRADED FUNDS — 75.7% (Continued) | ||||||||
| EQUITY - 31.3% (Continued) | ||||||||
| 925 | iShares Latin America 40 ETF | $ | 24,189 | |||||
| 1,729 | iShares Micro-Cap ETF | 194,668 | ||||||
| 265 | iShares Mortgage Real Estate ETF | 6,760 | ||||||
| 35 | iShares MSCI All Country Asia ex Japan ETF | 2,335 | ||||||
| 927 | iShares MSCI Australia ETF | 21,961 | ||||||
| 678 | iShares MSCI Brazil ETF | 21,343 | ||||||
| 589 | iShares MSCI China Small-Cap ETF | 20,038 | ||||||
| 74 | iShares MSCI EAFE ETF | 4,967 | ||||||
| 15 | iShares MSCI Emerging Markets ETF | 593 | ||||||
| 1,086 | iShares MSCI Emerging Markets Small-Cap ETF | 54,278 | ||||||
| 5,294 | iShares MSCI Frontier and Select EM ETF | 139,338 | ||||||
| 213 | iShares MSCI Global Multifactor ETF | 7,225 | ||||||
| 56 | iShares MSCI India ETF(a) | 2,477 | ||||||
| 3,430 | iShares MSCI India Small-Cap ETF | 187,072 | ||||||
| 796 | iShares MSCI Indonesia ETF | 18,921 | ||||||
| 57 | iShares MSCI Ireland ETF | 2,649 | ||||||
| 2,416 | iShares MSCI Japan ETF | 134,813 | ||||||
| 80 | iShares MSCI Japan Small-Cap ETF | 5,156 | ||||||
| 742 | iShares MSCI Saudi Arabia ETF | 29,257 | ||||||
| 443 | iShares MSCI Taiwan ETF | 22,513 | ||||||
| 427 | iShares MSCI Thailand ETF | 31,406 | ||||||
| 1,280 | iShares MSCI UAE ETF | 20,378 | ||||||
| 23 | iShares MSCI United Kingdom ETF | 725 | ||||||
| 2,238 | iShares MSCI United Kingdom Small-Cap ETF | 71,258 | ||||||
| 2,027 | iShares MSCI USA Momentum Factor ETF | 309,645 | ||||||
| 1,889 | iShares Russell 2000 ETF | 353,942 | ||||||
| 700 | iShares Russell 2000 Growth ETF | 160,629 | ||||||
| 4,539 | iShares Russell 2000 Value ETF | 678,308 | ||||||
| 2,969 | iShares Russell Mid-Cap Growth ETF | 264,835 | ||||||
| 4,980 | iShares Russell Mid-Cap Value ETF | 555,768 | ||||||
| 277 | iShares S&P Mid-Cap 400 Growth ETF | 20,199 | ||||||
| 269 | iShares S&P/TSX Capped Materials Index ETF | 3,712 | ||||||
| 447 | iShares S&P/TSX SmallCap Index ETF | 6,018 | ||||||
| 144 | iShares STOXX Europe 600 Basic Resources UCITS ETF | 9,691 | ||||||
See accompanying notes to consolidated financial statements
9
| EASTERLY TOTAL HEDGE PORTFOLIO |
| CONSOLIDATED SCHEDULE OF INVESTMENTS (Continued) |
| November 30, 2022 |
| Shares | Fair Value | |||||||
| EXCHANGE-TRADED FUNDS — 75.7% (Continued) | ||||||||
| EQUITY - 31.3% (Continued) | ||||||||
| 653 | iShares STOXX Europe 600 Insurance UCITS ETF | $ | 21,652 | |||||
| 110 | iShares U.S. Financial Services ETF | 18,611 | ||||||
| 32 | iShares US Financials ETF | 2,572 | ||||||
| 38 | iShares US Infrastructure ETF | 1,450 | ||||||
| 3,852 | KraneShares CSI China Internet ETF | 109,435 | ||||||
| 421 | Materials Select Sector SPDR Fund | 34,838 | ||||||
| 12 | SPDR EURO STOXX 50 ETF | 481 | ||||||
| 745 | SPDR FactSet Innovative Technology ETF | 76,467 | ||||||
| 113 | SPDR S&P 1500 Value Tilt ETF | 16,710 | ||||||
| 144 | SPDR S&P 500 ETF Trust | 58,706 | ||||||
| 3,012 | SPDR S&P Emerging Asia Pacific ETF | 299,754 | ||||||
| 982 | SPDR S&P Emerging Markets Dividend ETF | 23,892 | ||||||
| 361 | SPDR S&P Insurance ETF | 15,389 | ||||||
| 740 | SPDR S&P Metals & Mining ETF | 39,908 | ||||||
| 3 | SPDR S&P Oil & Gas Exploration & Production ETF | 456 | ||||||
| 751 | SPDR S&P Regional Banking ETF | 48,455 | ||||||
| 1,096 | SPDR S&P Retail ETF | 73,739 | ||||||
| 1,860 | VanEck Africa Index ETF | 32,569 | ||||||
| 2,824 | VanEck Brazil Small-Cap ETF | 41,997 | ||||||
| 4,911 | VanEck ChiNext ETF | 152,499 | ||||||
| 1,517 | VanEck Egypt Index ETF | 28,808 | ||||||
| 465 | VanEck Israel ETF | 17,997 | ||||||
| 415 | VanEck Mortgage REIT Income ETF | 5,432 | ||||||
| 6,095 | VanEck Russia ETF | 2,316 | ||||||
| 1,504 | VanEck Russia Small-Cap ETF | 722 | ||||||
| 1,076 | VanEck Vietnam ETF | 13,751 | ||||||
| 3,988 | Vanguard Extended Market ETF | 570,244 | ||||||
| 80 | Vanguard FTSE Canadian High Dividend Yield Index | 2,574 | ||||||
| 3,842 | Vanguard FTSE Emerging Markets ETF | 155,678 | ||||||
| 437 | Vanguard Real Estate ETF | 38,491 | ||||||
| 1,669 | Vanguard Total World Stock ETF | 151,645 | ||||||
| 3,067 | VictoryShares US EQ Income Enhanced Volatility Weighted ETF | 198,742 | ||||||
| 150 | WisdomTree Emerging Markets SmallCap Dividend Fund | 6,737 | ||||||
| 1,270 | WisdomTree Europe SmallCap Dividend Fund | 70,142 | ||||||
See accompanying notes to consolidated financial statements
10
| EASTERLY TOTAL HEDGE PORTFOLIO |
| CONSOLIDATED SCHEDULE OF INVESTMENTS (Continued) |
| November 30, 2022 |
| Shares | Fair Value | |||||||
| EXCHANGE-TRADED FUNDS — 75.7% (Continued) | ||||||||
| EQUITY - 31.3% (Continued) | ||||||||
| 799 | WisdomTree India Earnings Fund | $ | 27,142 | |||||
| 85 | WisdomTree International SmallCap Dividend Fund | 4,992 | ||||||
| 1,942 | WisdomTree Japan Hedged SmallCap Equity Fund | 90,614 | ||||||
| 7,262 | Xtrackers Harvest CSI 300 China A-Shares ETF | 205,660 | ||||||
| 1,359 | �� | Xtrackers Harvest CSI 500 China A-Shares ETF | 43,678 | |||||
| 2,811 | Xtrackers MSCI All China Equity ETF | 81,216 | ||||||
| 9,460,222 | ||||||||
| FIXED INCOME - 38.8% | ||||||||
| 5,490 | BlackRock Ultra Short-Term Bond ETF | 274,939 | ||||||
| 38,913 | CI Canadian Convertible Bond ETF | 275,396 | ||||||
| 243 | First Trust Emerging Markets Local Currency Bond ETF | 6,342 | ||||||
| 17,540 | First Trust Low Duration Opportunities ETF | 829,993 | ||||||
| 577 | First Trust Municipal High Income ETF | 26,894 | ||||||
| 10,460 | First Trust Preferred Securities and Income ETF | 177,297 | ||||||
| 37,828 | First Trust Senior Loan ETF | 1,704,529 | ||||||
| 2 | Global X SuperIncome Preferred ETF | 20 | ||||||
| 25,274 | High Yield ETF | 674,689 | ||||||
| 3,239 | Highland/iBoxx Senior Loan ETF | 47,743 | ||||||
| 55,090 | Invesco Global Short Term High Yield Bond ETF | 1,064,339 | ||||||
| 74 | Invesco Senior Loan ETF | 1,541 | ||||||
| 1,084 | Invesco Variable Rate Preferred ETF | 24,303 | ||||||
| 20,812 | iShares 0-3 Month Treasury Bond ETF | 2,088,899 | ||||||
| 4,432 | iShares 0-5 Year TIPS Bond ETF | 432,918 | ||||||
| 379 | iShares 7-10 Year Treasury Bond ETF | 36,994 | ||||||
| 4,038 | iShares Agency Bond ETF | 433,035 | ||||||
| 23,069 | iShares Barclays USD Asia High Yield Bond Index ETF | 143,951 | ||||||
| 68 | iShares CMBS ETF | 3,138 | ||||||
| 9 | iShares Core U.S. Aggregate Bond ETF | 885 | ||||||
| 873 | iShares Floating Rate Bond ETF | 44,017 | ||||||
| 2,442 | iShares iBoxx $ High Yield Corporate Bond ETF | 184,762 | ||||||
| 948 | iShares J.P. Morgan EM High Yield Bond ETF | 33,474 | ||||||
| 2,491 | iShares JP Morgan USD Emerging Markets Bond ETF | 215,297 | ||||||
| 31 | iShares MBS ETF | 2,914 | ||||||
| 413 | iShares Preferred & Income Securities ETF | 13,154 | ||||||
See accompanying notes to consolidated financial statements
11
| EASTERLY TOTAL HEDGE PORTFOLIO |
| CONSOLIDATED SCHEDULE OF INVESTMENTS (Continued) |
| November 30, 2022 |
| Shares | Fair Value | |||||||
| EXCHANGE-TRADED FUNDS — 75.7% (Continued) | ||||||||
| FIXED INCOME - 38.8% (Continued) | ||||||||
| 3 | PIMCO Enhanced Short Maturity Active ETF | $ | 296 | |||||
| 2,823 | PIMCO Short Term Municipal Bond Active ETF | 139,390 | ||||||
| 5,372 | ProShares Short 20+ Year Treasury(a) | 119,097 | ||||||
| 10,599 | SPDR Blackstone Senior Loan ETF | 439,647 | ||||||
| 40,429 | SPDR Blbg Investment Grade Floating Rate ETF | 1,229,042 | ||||||
| 6,051 | SPDR Bloomberg Convertible Securities ETF | 403,239 | ||||||
| 3,602 | SPDR Bloomberg Euro High Yield Bond UCITS ETF | 187,778 | ||||||
| 35 | SPDR Bloomberg High Yield Bond ETF | 3,249 | ||||||
| 132 | SPDR Doubleline Total Return Tactical ETF | 5,345 | ||||||
| 3,169 | VanEck Emerging Markets High Yield Bond ETF | 57,010 | ||||||
| 85 | VanEck Fallen Angel High Yield Bond ETF | 2,336 | ||||||
| 539 | VanEck J. P. Morgan EM Local Currency Bond ETF | 13,065 | ||||||
| 4,156 | Vanguard Long-Term Treasury ETF | 263,324 | ||||||
| 1,429 | Vanguard Total International Bond ETF | 70,092 | ||||||
| 50 | WisdomTree Emerging Markets Local Debt Fund | 1,278 | ||||||
| 2,895 | WisdomTree Interest Rate Hedged High Yield Bond | 60,998 | ||||||
| 11,736,649 | ||||||||
| MIXED ALLOCATION - 0.8% | ||||||||
| 265 | First Trust Dorsey Wright Dynamic Focus 5 ETF | 9,471 | ||||||
| 1,812 | Gadsden Dynamic Multi-Asset ETF | 56,371 | ||||||
| 6,253 | SPDR SSgA Multi-Asset Real Return ETF | 183,901 | ||||||
| 249,743 | ||||||||
| SPECIALTY - 0.4% | ||||||||
| 574 | Invesco DB US Dollar Index Bullish Fund(a) | 16,422 | ||||||
| 4,127 | WisdomTree Bloomberg U.S. Dollar Bullish Fund(a) | 117,537 | ||||||
| 133,959 | ||||||||
| TOTAL EXCHANGE-TRADED FUNDS (Cost $24,885,638) | 22,898,225 | |||||||
See accompanying notes to consolidated financial statements
12
| EASTERLY TOTAL HEDGE PORTFOLIO |
| CONSOLIDATED SCHEDULE OF INVESTMENTS (Continued) |
| November 30, 2022 |
| Shares | Fair Value | |||||||
| EXCHANGE-TRADED NOTES — 0.0%(b) | ||||||||
| SPECIALTY - 0.0%(b) | ||||||||
| 4 | iPath Series B Bloomberg Coffee Subindex Total Return ETN (d) | $ | 195 | |||||
| 12 | iPath Series B Bloomberg Grains Subindex Total Return ETN (d) | 913 | ||||||
| 39 | iPath Series B S&P 500 VIX Short-Term Futures ETN(a) | 582 | ||||||
| TOTAL EXCHANGE-TRADED NOTES (Cost $2,064) | 1,690 | |||||||
| OPEN END FUNDS — 17.0% | ||||||||
| ALTERNATIVE - 9.8% | ||||||||
| 15,935 | AQR Managed Futures Strategy Fund, Class I | 153,776 | ||||||
| 88,200 | Easterly Hedged Equity Fund, Class R6 (c) | 953,447 | ||||||
| 86,124 | Kellner Merger Fund, Institutional Class | 935,311 | ||||||
| 52,212 | Merger Fund (The), Class V | 907,959 | ||||||
| 2,950,493 | ||||||||
| FIXED INCOME - 7.2% | ||||||||
| 23,974 | American Beacon Sound Point Floating Rate Income, Class Y | 198,027 | ||||||
| 200,773 | Easterly Income Opportunities Fund, Class R6(c) | 1,993,677 | ||||||
| 2,191,704 | ||||||||
| TOTAL OPEN END FUNDS (Cost $5,430,262) | 5,142,197 | |||||||
| TOTAL INVESTMENTS — 92.7% (Cost $30,317,964) | $ | 28,042,112 | ||||||
| OTHER ASSETS IN EXCESS OF LIABILITIES - 7.3% | 2,208,094 | |||||||
| NET ASSETS - 100.0% | $ | 30,250,206 | ||||||
| Unrealized Appreciation/ | ||||||||||||||||
| Foreign Currency | Settlement Date | Counterparty | Local Currency | U.S. Dollar Value | (Depreciation) | |||||||||||
| To Buy: | ||||||||||||||||
| Mexican Peso | 12/22/2022 | Brown Brothers Harriman | 73,941 | $ | 3,819 | $ | 16 | |||||||||
| $ | 3,819 | $ | 16 | |||||||||||||
| To Sell: | ||||||||||||||||
| Australian Dollar | 12/22/2022 | Brown Brothers Harriman | 91,961 | $ | 62,482 | $ | (378 | ) | ||||||||
| British Pound | 12/22/2022 | Brown Brothers Harriman | 197,963 | 238,861 | (3,426 | ) | ||||||||||
See accompanying notes to consolidated financial statements
13
| EASTERLY TOTAL HEDGE PORTFOLIO |
| CONSOLIDATED SCHEDULE OF INVESTMENTS (Continued) |
| November 30, 2022 |
| Unrealized Appreciation/ | ||||||||||||||||
| Foreign Currency | Settlement Date | Counterparty | Local Currency | U.S. Dollar Value | (Depreciation) | |||||||||||
| To Sell: (continued) | ||||||||||||||||
| Canadian Dollar | 12/22/2022 | Brown Brothers Harriman | 560,011 | $ | 416,482 | $ | 4,302 | |||||||||
| Euro | 12/22/2022 | Brown Brothers Harriman | 655,719 | 684,471 | (279 | ) | ||||||||||
| Japanese Yen | 12/22/2022 | Brown Brothers Harriman | 37,181,974 | 270,062 | (2,395 | ) | ||||||||||
| Swiss Franc | 12/22/2022 | Brown Brothers Harriman | 3,240 | 3,434 | 13 | |||||||||||
| $ | 1,675,792 | $ | (2,163 | ) | ||||||||||||
| Total | $ | (2,147 | ) | |||||||||||||
| EAFE | - Europe, Australasia and Far East |
| ETF | - Exchange-Traded Fund |
| MSCI | - Morgan Stanley Capital International |
| REIT | - Real Estate Investment Trust |
| SPDR | - Standard & Poor’s Depositary Receipt |
| BBH | Brown Brothers Harriman |
| DB | Deutsche Bank |
| GS | Goldman Sachs |
| (a) | Non-income producing security. |
| (b) | Percentage rounds to less than 0.1%. |
| (c) | Affiliated Issuer |
| (d) | All or a portion of this investment is a holding of the ETHCF Ltd. |
See accompanying notes to consolidated financial statements
14
| EASTERLY TOTAL HEDGE PORTFOLIO |
| SCHEDULE OF INVESTMENTS (Continued) |
| November 30, 2022 |
| TOTAL RETURN SWAP - 0.1% | ||||||||||||||||
| Unrealized | ||||||||||||||||
| Appreciation/ | ||||||||||||||||
| Notional Amount | Description and Payment Frequency | Shares | Counterparty | Maturity Date | Pay/Receive Fixed Rate | Variable Rate | (Depreciation) | |||||||||
| 357,115 | Monthly - S&P 500 Equal Weighted Index | 63 | Goldman Sachs | 5/22/2023 | Pay | 0.7800 | $ | — | ||||||||
| $ | — | |||||||||||||||
| Unrealized | ||||
| Appreciation/ | ||||
| (Depreciation) | ||||
| TOTAL RETURN SWAP - 0.8% | ||||
| The Deutsche Bank Total Return Swap with a payment frequency of maturity, provides exposure to the daily, total returns of the Easterly Index, a proprietary index of the London Branch of Deutsche Bank AG. The number of shares is 58,245 and requires the fund to pay interest at the rate of 0.38% on the Notional Value outstanding. The Easterly Index features a basket of commodity trading advisor (“CTA”) programs selected by Easterly Funds, LLC from an approved list of third-party managers offered through Deutsche Bank AG on its DB Select platform. The Easterly Index comprises a diversified collection of strategy and style types, including trend following, short-term trading, discretionary, global macro, and sector specialists. According to the terms of the swap, Easterly Funds, LLC can modify the Easterly Index as frequently as daily, on a T+1 basis, by adjusting the notional value of the Easterly Index, or by adding, deleting, or re-weighting the constituent CTA programs. The swap became effective on August 2, 2018, and expires on July 30, 2024. (Notional Value $6,487,613) | $ | 251,260 | ||
| $ | 251,260 | |||
| TOTAL RETURN SWAP - 0.0% | ||||
| The Goldman Sachs Calls-vs-Calls US Series 2 Total Return Strategy with a quarterly payment frequency, is designed to extract dislocated call premiums from S&P 500 constituents; the strategy sells call options on a daily basis across top 100 constituents of the SPX where the term structure is most inverted. The stocks are picked with constraints on leverage, beta towards SPX and tracking error. The strategy also purchases an ATM call option on SPX to mitigate market risk. The number of shares is 5,891 and requires the fund to pay interest at the rate of 0.20% on the Notional Value outstanding. The swap became effective on November 1, 2022 and expires on February 8, 2023. (Notional Value $676,049) | $ | 7,786 | ||
| $ | 7,786 | |||
| TOTAL RETURN SWAP - (0.2)% | ||||
| The Goldman Sachs i-Select III Series 88 Excess Return Strategy (“GS i-Select”) with an annual payment frequency, is a synthetic rules-based proprietary strategy created by Goldman Sachs International as strategy sponsor. The GS i-Select Index includes strategies of the GS Risk Premia Universe that were selected by Easterly. The GS i-Select Index is actively managed by Easterly. The Index features 15 Portfolio Constituents that Easterly Funds, LLC determines the daily waiting of each constituent within the GS i- Select Index. The GS i-Select Index is comprised a diversified collection of strategy and style types, including equity, interest rates, FX, commodities, and credit based strategies such as imbalance, volatility carry, carry, momentum, low beta, and quality. According to the terms of the GS i-Select Index, Easterly Funds, LLC can modify the GS i-Select Index as frequently as daily, by adjusting the notional value of the GS i-Select Index, or by adding, deleting, or re-weighting the constituent Indexes in the GS i-Select Index.The number of shares is 18,117 and requires the fund to pay interest at the rate of 0.25% on the Notional Value outstanding. The swap became effective on November 1, 2022 and expires on February 8, 2023. (Notional Value $1,926,042) | $ | (47,285 | ) | |
| $ | (47,285 | ) | ||
| TOTAL RETURN SWAP - (0.0)% | ||||
| The Goldman Sachs Systematic Skew US Series 1D Total Return Strategy with a quarterly payment frequency, is designed to capture the spot-volatility covariance risk premium in equity markets, while minimizing exposure to volatility risk. The strategy sells 3m 15d puts and buys 3m 40d calls (delta and gamma hedged) that target a constant exposure to skew, with performance driven by Vanna. The strategy also buys 5d tail puts for added risk management. The number of shares is 4,802 and requires the fund to pay interest at the rate of 0.20% on the Notional Value outstanding. The swap became effective on November 1, 2022 and expires on February 8, 2023. (Notional Value $843,853) | $ | (4,606 | ) | |
| $ | (4,606 | ) | ||
| TOTAL RETURN SWAP - 0.0% | ||||
| The Goldman Sachs Credit Volatility Carry Y Series Excess Return Strategy (“GS Credit Vol Carry”) with a quarterly payment frequency, is designed to harvest the volatility risk premium in credit markets via the HYG ETF. The strategy sells 3x levered ATM calls and puts on the HYG ETF and also buys back 3x levered 5 and 10 delta puts. The delta is hedged intraday every 30 minutes. The swap became effective on March 24, 2022, and has a maturity date of March 28, 2023. The number of shares is 3,491. (Notional Value $412,216) | $ | 6,692 | ||
| $ | 6,692 | |||
| TOTAL RETURN SWAP - 0.0% | ||||
| The Goldman Sachs Volatility Carry US Series 107 Excess Return Strategy (“GS Eq Intra-Weekly Vol Carry”) with a quarterly payment frequency, is designed to benefit from the fact that on average, equity implied volatility tends to trade at a premium to subsequent realized volatility as investors demand a risk premium for selling optionality and being short volatility, especially on the short-dated low-delta options. The strategy sells ultra-short dated put options (~2 days maturity) low delta (5 delta) that are priced relatively rich due to excess demand for these options. Options are delta-hedged intraday in order to single out the volatility premium opportunity. The swap became effective on September 26, 2022, and has a maturity date of March 28, 2023. The number of shares is 3,616. (Notional Value $378,555) | $ | 2,629 | ||
| $ | 2,629 | |||
| TOTAL RETURN SWAP - 0.0% | ||||
| The Goldman Sachs Volatility Carry US Series 97 Excess Return Strategy (“GS Eq Weekly Vol Carry”) with an annual payment frequency, is designed to benefit from the fact that on average, equity implied volatility tends to trade at a premium to subsequent realized volatility as investors demand a risk premium for selling optionality and being short volatility, especially on the short-dated low-delta options. The strategy sells short dated put options (~1 week maturity) low delta (5 delta) that are priced relatively rich due to excess demand for these options. Options are delta-hedged intraday in order to single out the volatility premium opportunity. The swap became effective on September 26, 2022, and has a maturity date of March 28, 2023. The number of shares is 2,746. (Notional Value $339,644) | $ | 3,457 | ||
| $ | 3,457 | |||
| TOTAL RETURN SWAP - 0.1% | ||||
| The Goldman Sachs VX Volatility Carry Series 11 Excess Return Strategy (“GS VIX Vol Carry”) with a quarterly payment frequency, is a synthetic rules-based propriety strategy created by Goldman Sachs International as Strategy Sponsor. The Strategy aims to benefit from capturing the premium associated with near-the-money VIX options. Each day, the Strategy sells one month, 35- to 45-delta strangles on the VIX index, providing short exposure to Put and Call options on the VIX. The Strategy is then delta hedged intraday at 30 minute intervals (subject to hedging threshold parameters). The number of shares is 2,197 and requires the fund to pay interest at the rate of 0.00% on the Notional Value outstanding. The swap became effective on September 15, 2022 and expires on September 20, 2023. (Notional Value $380,000) | $ | 26,071 | ||
| $ | 26,071 | |||
See accompanying notes to consolidated financial statements.
15
| EASTERLY TOTAL HEDGE PORTFOLIO |
| SCHEDULE OF INVESTMENTS (Continued) |
| November 30, 2022 |
Easterly Deutsche Bank Swap Top 50 Holdings
FUTURES CONTRACTS*
| Value and Unrealized | Percentage of Total | |||||||||||||
| Number of | Notional Value at | Appreciation/ | Return Swap | |||||||||||
| Contracts | Open Long Future Contracts | Expiration | November 30, 2022 | (Depreciation) | Unrealized Gain/Loss | |||||||||
| 1 | 10 year Italian Bond | 12/8/2022 | 160,080 | $ | (4,914 | ) | (1.96 | )% | ||||||
| 0 | DAX Index Future | 12/16/2022 | 64,663 | (266 | ) | (0.11 | )% | |||||||
| 1 | E-Mini S&P 500 | 12/16/2022 | 186,439 | 1,163 | 0.46 | % | ||||||||
| 2 | Mini Japanese Goverment Bond Future | 12/12/2022 | 179,720 | (206 | ) | (0.08 | )% | |||||||
| 1 | Ultra Long-Term T Bond | 3/22/2023 | 89,889 | (766 | ) | (0.30 | )% | |||||||
| (4,989 | ) | |||||||||||||
| Unrealized | Percentage of Total | |||||||||||||
| Number of | Notional Value at | Appreciation/ | Return Swap | |||||||||||
| Contracts | Open Short Future Contracts | Expiration | November 30, 2022 | (Depreciation) | Unrealized Gain | |||||||||
| (2) | 2 year Euro-Schatz | 12/8/2022 | 211,049 | (423 | ) | (0.17 | )% | |||||||
| (1) | 2 year US Treasury Notes | 3/31/2023 | 144,197 | 72 | 0.03 | % | ||||||||
| (0) | 3 month Euro (EURIBOR) | 3/18/2024 | 84,994 | (235 | ) | (0.09 | )% | |||||||
| (0) | 3 month Euro (EURIBOR) | 9/18/2023 | 111,503 | (115 | ) | (0.05 | )% | |||||||
| (0) | 3 Month SONIA Index Futures | 12/19/2023 | 79,034 | 59 | 0.02 | % | ||||||||
| (0) | 3 Month SONIA Index Futures | 9/19/2023 | 84,411 | (127 | ) | (0.05 | )% | |||||||
| (1) | 5 year US Treasury Notes | 3/31/2023 | 153,401 | 179 | 0.07 | % | ||||||||
| (2) | AUD/USD | 12/19/2022 | 114,980 | (4,623 | ) | (1.84 | )% | |||||||
| (0) | E-Mini Nasdaq-100 | 12/16/2022 | 69,636 | 2,704 | 1.08 | % | ||||||||
| (1) | EUR/USD | 12/19/2022 | 152,464 | (4,722 | ) | (1.88 | )% | |||||||
| (1) | Euro-BOBL | 12/8/2022 | 170,648 | (1,854 | ) | (0.74 | )% | |||||||
| (1) | Euro-BUND | 12/8/2022 | 105,020 | 974 | 0.39 | % | ||||||||
| (1) | Eurodollar | 3/13/2023 | 302,251 | (242 | ) | (0.10 | )% | |||||||
| (2) | JPY/USD | 12/19/2022 | 170,875 | (4,502 | ) | (1.79 | )% | |||||||
| (1) | Light Sweet Crude Oil (WTI) Future | 12/20/2022 | 86,874 | (977 | ) | (0.39 | )% | |||||||
| (0) | SOFR 3month Futures | 6/18/2024 | 84,525 | (28 | ) | (0.01 | )% | |||||||
| (0) | SOFR 3month Futures | 3/19/2024 | 97,457 | 109 | 0.04 | % | ||||||||
| (0) | SOFR 3month Futures | 12/19/2023 | 101,265 | 135 | 0.05 | % | ||||||||
| (0) | SOFR 3month Futures | 6/17/2025 | 64,467 | (197 | ) | (0.08 | )% | |||||||
| (0) | Three Month Canadian Bankers Acceptance | 6/19/2023 | 70,154 | 160 | 0.06 | % | ||||||||
| (13,653 | ) | |||||||||||||
| TOTAL FUTURES CONTRACTS | $ | (18,642 | ) | |||||||||||
| PURCHASED CALL OPTIONS* |
| Percentage of Total | ||||||||||||||||
| Notional Value at | Return Swap | |||||||||||||||
| Description | Counterparty | November 30, 2022 | Exercise Price | Expiration | Fair Value | Unrealized Gain | ||||||||||
| CNH/USD | Deutsche Bank | 67,342 | 6.95 | 1/5/2023 | $ | 1,873 | 0.75% | |||||||||
| 1,873 | ||||||||||||||||
| PURCHASED PUT OPTIONS* | ||||||||||||||||
| Percentage of Total | ||||||||||||||||
| Notional Value at | Unrealized | Return Swap | ||||||||||||||
| Description | Counterparty | November 30, 2021 | Expiration | Strike Price | Appreciation | Unrealized Gain | ||||||||||
| JPY/AUD | Deutsche Bank | 134,194 | 88.88 | 12/2/2022 | $ | — | 0.00% | |||||||||
| — | ||||||||||||||||
| FORWARD CURRENCY CONTRACTS +* |
| Unrealized | Percentage of Total | |||||||||||||||||||
| Units to | Appreciation / | Return Swap | ||||||||||||||||||
| Receive/Deliver | In Exchange For | Counterparty | Settlement Date | US Dollar Value | (Depreciation) | Unrealized Gain/Loss | ||||||||||||||
| To Buy: | ||||||||||||||||||||
| 1,061,752 | CNH | 150,432 | USD | Deutsche Bank | 2/15/2023 | 151,315 | 883 | 0.35 | % | |||||||||||
| 734,444 | CNH | 103,754 | USD | Deutsche Bank | 12/12/2022 | 104,610 | 856 | 0.34 | % | |||||||||||
| 500,535 | CNH | 70,360 | USD | Deutsche Bank | 1/30/2023 | 70,318 | (42 | ) | (0.02 | )% | ||||||||||
| 5,008,652 | HKD | 640,362 | USD | Deutsche Bank | 5/31/2023 | 638,868 | (1,494 | ) | (0.59 | )% | ||||||||||
| 5,003,145 | HKD | 640,362 | USD | Deutsche Bank | 6/2/2023 | 639,552 | (810 | ) | (0.32 | )% | ||||||||||
| 2,572,199 | HKD | 329,364 | USD | Deutsche Bank | 7/10/2023 | 329,033 | (331 | ) | (0.13 | )% | ||||||||||
| 1,572,690 | HKD | 201,291 | USD | Deutsche Bank | 2/2/2023 | 201,291 | — | 0.00 | % | |||||||||||
| 9,558,661 | JPY | 66,944 | USD | Deutsche Bank | 12/21/2022 | 65,190 | (1,754 | ) | (0.70 | )% | ||||||||||
| 108,559,838 | KRO | 90,384 | USD | Deutsche Bank | 12/21/2022 | 98,453 | 8,069 | 3.21 | % | |||||||||||
| 4,110,430 | PHO | 72,373 | USD | Deutsche Bank | 1/30/2023 | 72,174 | (199 | ) | (0.08 | )% | ||||||||||
| 365,261 | SGO | 268,389 | USD | Deutsche Bank | 11/29/2023 | 268,296 | (92 | ) | (0.04 | )% | ||||||||||
| 3,210,135 | TWO | 105,265 | USD | Deutsche Bank | 2/24/2023 | 104,555 | (710 | ) | (0.28 | )% | ||||||||||
| 44,858 | USD | 67,281 | AUD | Deutsche Bank | 1/19/2023 | 67,613 | 333 | 0.13 | % | |||||||||||
| 87,394 | USD | 83,815 | EUR | Deutsche Bank | 1/19/2023 | 83,161 | (654 | ) | (0.26 | )% | ||||||||||
| 63,986 | USD | 102,890 | NZD | Deutsche Bank | 1/31/2023 | 102,892 | 1 | 0.00 | % | |||||||||||
| 4,056 | ||||||||||||||||||||
| To Sell: | ||||||||||||||||||||
| 1,572,429 | HKD | 201,291 | USD | Deutsche Bank | 3/2/2023 | 201,286 | (6 | ) | (0.00 | )% | ||||||||||
| 3,139,452 | HKD | 400,304 | USD | Deutsche Bank | 12/14/2022 | 402,217 | 1,913 | 0.76 | % | |||||||||||
| 4,015,945 | HKD | 513,463 | USD | Deutsche Bank | 1/31/2023 | 513,402 | (61 | ) | (0.02 | )% | ||||||||||
| 4,477,194 | HKD | 570,717 | USD | Deutsche Bank | 12/8/2022 | 573,626 | 2,909 | 1.16 | % | |||||||||||
| 113,772,232 | KRO | 94,991 | USD | Deutsche Bank | 3/21/2023 | 86,708 | (8,283 | ) | (3.30 | )% | ||||||||||
| 210,107 | SGO | 150,002 | USD | Deutsche Bank | 12/14/2022 | 153,273 | 3,272 | 1.30 | % | |||||||||||
| 367,270 | SGO | 268,391 | USD | Deutsche Bank | 5/30/2023 | 268,391 | — | 0.00 | % | |||||||||||
| 124,940 | USD | 119,269 | EUR | Deutsche Bank | 1/30/2023 | 120,680 | 1,411 | 0.56 | % | |||||||||||
| 1,155 | ||||||||||||||||||||
| TOTAL FORWARD CURRENCY CONTRACTS | ||||||||||||||||||||
| All Other Investments | 262,818 | |||||||||||||||||||
| Total Unrealized Appreciation of Swap | $ | 251,260 | ||||||||||||||||||
| + | Foreign currency transactions are done by notional and not by contracts |
| * | Non-income producing securities |
Currency Abbreviations:
| AUD - Australian Dollar | HKD - Hong Kong Dollar | PHO - Phillipine Peso |
| CNH - Chinese Yuan Renminbi | JPY - Japanese Yen | SGO - Singapore Dollar |
| EUR - Euro | KRO - South Korean Won | USD - U.S. Dollar |
See accompanying notes to consolidated financial statements.
16
| EASTERLY TOTAL HEDGE PORTFOLIO |
| SCHEDULE OF INVESTMENTS (Continued) |
| November 30, 2022 |
Goldman Sachs Calls-vs-Calls US Series 2 Total Return Strategy Top 50 Holdings
| PURCHASED CALL OPTIONS |
| Number of | Notional Value at | |||||||||||||||
| Contracts | Open Purchased Call Options | Counterparty | November 30, 2022 | Expiration | Exercise Price | Fair Value | ||||||||||
| 2 | S&P 500 Index | Goldman Sachs | 9,591 | 12/16/2022 | $ | 3,615 | $ | 1,108 | ||||||||
| 4 | S&P 500 Index | Goldman Sachs | 17,495 | 12/16/2022 | $ | 3,625 | 1,979 | |||||||||
| 5 | S&P 500 Index | Goldman Sachs | 19,648 | 12/16/2022 | $ | 3,695 | 1,890 | |||||||||
| 2 | S&P 500 Index | Goldman Sachs | 9,409 | 12/16/2022 | $ | 3,710 | 871 | |||||||||
| 2 | S&P 500 Index | Goldman Sachs | 9,909 | 1/20/2023 | $ | 3,720 | 978 | |||||||||
| 2 | S&P 500 Index | Goldman Sachs | 9,471 | 12/16/2022 | $ | 3,725 | 843 | |||||||||
| 5 | S&P 500 Index | Goldman Sachs | 18,715 | 12/16/2022 | $ | 3,740 | 1,600 | |||||||||
| 9 | S&P 500 Index | Goldman Sachs | 35,075 | 12/16/2022 | $ | 3,765 | 2,794 | |||||||||
| 6 | S&P 500 Index | Goldman Sachs | 23,112 | 12/16/2022 | $ | 3,780 | 1,759 | |||||||||
| 3 | S&P 500 Index | Goldman Sachs | 13,246 | 12/16/2022 | $ | 3,785 | 994 | |||||||||
| 4 | S&P 500 Index | Goldman Sachs | 16,530 | 12/16/2022 | $ | 3,790 | 1,221 | |||||||||
| 2 | S&P 500 Index | Goldman Sachs | 10,183 | 1/20/2023 | $ | 3,790 | 854 | |||||||||
| 10 | S&P 500 Index | Goldman Sachs | 39,274 | 12/16/2022 | $ | 3,825 | 2,587 | |||||||||
| 5 | S&P 500 Index | Goldman Sachs | 21,707 | 12/16/2022 | $ | 3,830 | 1,406 | |||||||||
| 5 | S&P 500 Index | Goldman Sachs | 19,804 | 12/16/2022 | $ | 3,835 | 1,261 | |||||||||
| 7 | S&P 500 Index | Goldman Sachs | 30,414 | 12/16/2022 | $ | 3,845 | 1,870 | |||||||||
| 5 | S&P 500 Index | Goldman Sachs | 20,967 | 1/20/2023 | $ | 3,850 | 1,504 | |||||||||
| 4 | S&P 500 Index | Goldman Sachs | 18,025 | 12/16/2022 | $ | 3,860 | 1,049 | |||||||||
| 2 | S&P 500 Index | Goldman Sachs | 9,508 | 1/20/2023 | $ | 3,860 | 663 | |||||||||
| 3 | S&P 500 Index | Goldman Sachs | 13,407 | 12/16/2022 | $ | 3,880 | 722 | |||||||||
| 4 | S&P 500 Index | Goldman Sachs | 16,294 | 12/16/2022 | $ | 3,890 | 843 | |||||||||
| 4 | S&P 500 Index | Goldman Sachs | 15,127 | 12/16/2022 | $ | 3,895 | 767 | |||||||||
| 2 | S&P 500 Index | Goldman Sachs | 9,967 | 12/16/2022 | $ | 3,925 | 445 | |||||||||
| 3 | S&P 500 Index | Goldman Sachs | 12,571 | 12/16/2022 | $ | 3,945 | 511 | |||||||||
| 11 | S&P 500 Index | Goldman Sachs | 45,824 | 12/16/2022 | $ | 3,960 | 1,733 | |||||||||
| 17 | S&P 500 Index | Goldman Sachs | 70,431 | 12/16/2022 | $ | 3,965 | 2,599 | |||||||||
| 36 | S&P 500 Index | Goldman Sachs | 147,386 | 12/16/2022 | $ | 3,975 | 5,167 | |||||||||
| 12 | S&P 500 Index | Goldman Sachs | 50,912 | 12/16/2022 | $ | 3,980 | 1,738 | |||||||||
| 4 | S&P 500 Index | Goldman Sachs | 15,194 | 1/20/2023 | $ | 3,985 | 710 | |||||||||
| 9 | S&P 500 Index | Goldman Sachs | 35,708 | 1/20/2023 | $ | 3,990 | 1,639 | |||||||||
| 5 | S&P 500 Index | Goldman Sachs | 22,390 | 1/20/2023 | $ | 3,995 | 1,008 | |||||||||
| 11 | S&P 500 Index | Goldman Sachs | 44,367 | 1/20/2023 | $ | 4,000 | 1,961 | |||||||||
| 10 | S&P 500 Index | Goldman Sachs | 39,963 | 12/16/2022 | $ | 4,005 | 1,189 | |||||||||
| 4 | S&P 500 Index | Goldman Sachs | 17,198 | 2/17/2023 | $ | 4,005 | 919 | |||||||||
| 10 | S&P 500 Index | Goldman Sachs | 41,136 | 12/16/2022 | $ | 4,010 | 1,189 | |||||||||
| 5 | S&P 500 Index | Goldman Sachs | 20,487 | 2/17/2023 | $ | 4,010 | 1,078 | |||||||||
| 9 | S&P 500 Index | Goldman Sachs | 38,454 | 12/16/2022 | $ | 4,015 | 1,079 | |||||||||
| 4 | S&P 500 Index | Goldman Sachs | 14,777 | 2/17/2023 | $ | 4,020 | 754 | |||||||||
| 5 | S&P 500 Index | Goldman Sachs | 20,578 | 1/20/2023 | $ | 4,030 | 809 | |||||||||
| 17 | S&P 500 Index | Goldman Sachs | 69,420 | 12/16/2022 | $ | 4,035 | 1,724 | |||||||||
| 4 | S&P 500 Index | Goldman Sachs | 16,823 | 1/20/2023 | $ | 4,040 | 635 | |||||||||
| 3 | S&P 500 Index | Goldman Sachs | 12,273 | 2/17/2023 | $ | 4,050 | 569 | |||||||||
| 10 | S&P 500 Index | Goldman Sachs | 38,901 | 1/20/2023 | $ | 4,060 | 1,349 | |||||||||
| 4 | S&P 500 Index | Goldman Sachs | 16,956 | 2/17/2023 | $ | 4,075 | 722 | |||||||||
| 59,090 | ||||||||||||||||
| WRITTEN CALL OPTIONS |
| Number of | Notional Value at | |||||||||||||||
| Contracts | Open Written Call Options | Counterparty | November 30, 2022 | Expiration | Exercise Price | Fair Value | ||||||||||
| 128 | Apple, Inc. | Goldman Sachs | 18,918 | 12/16/2022 | $ | 150 | 394 | |||||||||
| 37 | Accenture plc | Goldman Sachs | 10,994 | �� | 12/16/2022 | $ | 290 | 587 | ||||||||
| 205 | Cisco Systems, Inc. | Goldman Sachs | 10,209 | 1/20/2023 | $ | 45 | 1,064 | |||||||||
| 653 | Cisco Systems, Inc. | Goldman Sachs | 32,474 | 12/16/2022 | $ | 45 | 3,173 | |||||||||
| 45 | Lowe’s Companies, Inc. | Goldman Sachs | 9,472 | 12/16/2022 | $ | 210 | 362 | |||||||||
| 155 | Southern Co. | Goldman Sachs | 10,505 | 12/16/2022 | $ | 65 | 491 | |||||||||
| 6,071 | ||||||||||||||||
See accompanying notes to consolidated financial statements.
17
| EASTERLY TOTAL HEDGE PORTFOLIO |
| SCHEDULE OF INVESTMENTS (Continued) |
| November 30, 2022 |
Goldman Sachs i-Select III Series 88 Excess Return Strategy Top 50 Holdings
| FUTURES CONTRACTS* |
| Number of | Notional Value at | |||||||
| Contracts | Open Long Future Contracts | Expiration | November 30, 2022 | |||||
| 0 | 5-year Bobl Future | 12/8/2022 | 28,529 | |||||
| 0 | 5-year Treasury Future | 3/31/2023 | 29,876 | |||||
| 1 | CBOT Corn Future 03/14/2023 | 3/14/2023 | 37,456 | |||||
| 3 | NYBOT CSC Number 11 World Sugar Future 04/28/2023 | 4/28/2023 | 60,923 | |||||
| 1 | S&P GSCI Coffee | 5/18/2023 | 53,395 | |||||
| 0 | S&P GSCI Copper 3 Month Forward (ER) | 5/15/2023 | 29,911 | |||||
| 0 | TSE Japanese 10 Year Bond Futures 12/13/2022 | 12/9/2022 | 115,088 | |||||
| Number of | Notional Value at | |||||||
| Contracts | Open Short Future Contracts | Expiration | November 30, 2022 | |||||
| 0 | 3 Month Sterling (Short Sterling) Future | 3/14/2023 | 26,325 | |||||
| 0 | 3 Month Sterling (Short Sterling) Future | 3/19/2024 | 26,390 | |||||
| 0 | 3 Month Sterling (Short Sterling) Future | 12/19/2023 | 26,350 | |||||
| 0 | 2 - Year Schatz Future | 12/8/2022 | 29,939 | |||||
| 1 | 2 - Year Schatz Future | 3/8/2023 | 59,673 | |||||
| 1 | 2 - Year Treasury Future | 3/31/2023 | 229,872 | |||||
| 0 | 5 - Year Treasury Future | 3/31/2023 | 50,698 | |||||
| 0 | 10 - year Treasury Future | 3/22/2023 | 28,648 | |||||
| 1 | CBOT Corn Future 05/12/2023 | 5/12/2023 | 39,862 | |||||
| 0 | Euribor Future | 3/13/2023 | 45,458 | |||||
| 0 | Euribor Future | 6/19/2023 | 45,448 | |||||
| 0 | Euribor Future | 9/18/2023 | 45,455 | |||||
| 0 | Euribor Future | 3/18/2024 | 45,534 | |||||
| 0 | Euribor Future | 12/18/2023 | 45,493 | |||||
| 0 | Euribor Future | 3/13/2023 | 52,773 | |||||
| 0 | Euribor Future | 6/19/2023 | 52,762 | |||||
| 0 | Euribor Future | 9/18/2023 | 52,770 | |||||
| 0 | Euribor Future | 3/18/2024 | 52,862 | |||||
| 0 | Euribor Future | 12/18/2023 | 52,814 | |||||
| 0 | LME Copper Future | 2/13/2023 | 29,520 | |||||
| 1 | S&P GSCI Coffee | 3/21/2023 | 51,270 | |||||
| 0 | Three-Month SOFR Futures | 3/14/2023 | 82,445 | |||||
| 0 | Three-Month SOFR Futures | 3/19/2024 | 83,246 | |||||
| 0 | Three-Month SOFR Futures | 12/19/2023 | 83,020 | |||||
| 0 | Three-Month SOFR Futures | 6/20/2023 | 82,599 | |||||
| 0 | Three-Month SOFR Futures | 9/19/2023 | 82,794 | |||||
| 1 | Three-Month SOFR Futures | 3/14/2023 | 155,721 | |||||
| 1 | Three-Month SOFR Futures | 3/19/2024 | 157,235 | |||||
| 1 | Three-Month SOFR Futures | 12/19/2023 | 156,807 | |||||
| 1 | Three-Month SOFR Futures | 6/20/2023 | 156,012 | |||||
| 1 | Three-Month SOFR Futures | 9/19/2023 | 156,380 | |||||
| 3 | World Sugar # 11 | 2/28/2023 | 55,300 | |||||
| PURCHASED CALL OPTIONS |
| Number of | Notional Value at | Exercise | ||||||||||||||
| Contracts | Open Written Put Options | Counterparty | November 30, 2022 | Price | Expiration | Market Value | ||||||||||
| 15 | S&P 500 Index | Goldman Sachs | 62,153 | $ | 4,080 | 12/16/2022 | $ | 1,053 | ||||||||
| 11 | S&P 500 Index | Goldman Sachs | 44,357 | $ | 4,080 | 1/20/2023 | 1,187 | |||||||||
| 9 | S&P 500 Index | Goldman Sachs | 35,513 | $ | 4,080 | 2/17/2023 | 1,227 | |||||||||
| 3,467 | ||||||||||||||||
| WRITTEN CALL OPTIONS |
| Number of | Notional Value at | Exercise | ||||||||||||||
| Contracts | Open Written Put Options | Counterparty | November 30, 2022 | Price | Expiration | Market Value | ||||||||||
| 15 | S&P 500 Index | Goldman Sachs | 62,153 | $ | 4,080 | 12/16/2022 | $ | (1,130 | ) | |||||||
| 11 | S&P 500 Index | Goldman Sachs | 44,357 | $ | 4,080 | 1/20/2023 | (1,413 | ) | ||||||||
| 9 | S&P 500 Index | Goldman Sachs | 35,513 | $ | 4,080 | 2/17/2023 | (1,490 | ) | ||||||||
| (4,033 | ) | |||||||||||||||
| CREDIT DEFAULT SWAPS |
| Number of | Notional Value at | |||||||||||
| Contracts | Open Credit Default Swaps | Counterparty | November 30, 2022 | Expiration | Value | |||||||
| 80,568 | Markit iTraxx Europe 5 Year Long Mid Total Return Index | Goldman Sachs | 82,957 | 12/20/2027 | $ | 497 | ||||||
| 147,579 | Markit CDX.NA.IG 5 Year Long Mid Total Return Index | Goldman Sachs | 147,579 | 12/20/2027 | 1,907 | |||||||
| 30,624 | Markit CDX.NA.HY 5 Year Long Mid Total Return Index | Goldman Sachs | 30,624 | 12/20/2027 | 883 | |||||||
| 3,287 | ||||||||||||
| EQUITY SWAPS | ||||||||||||
| Number of | Notional Value at | |||||||||||
| Contracts | Open Equity Swaps | Counterparty | November 30, 2022 | Value | ||||||||
| 237 | Goldman Sachs RP Equity World Long Short Series 79 Excess Return Strategy | Goldman Sachs | 312,960 | $ | 312,960 | |||||||
| 176 | Goldman Sachs RP Equity World Long Short Series 79 Excess Return Strategy | Goldman Sachs | 310,098 | 310,098 | ||||||||
| 623,058 | ||||||||||||
| * | The GS i-Select invests in 15 Portfolio Constituents which do not trade individual futures, therefore the Futures do not have any individual value and unrealized appreciation/depreciation. |
See accompanying notes to consolidated financial statements.
18
| EASTERLY TOTAL HEDGE PORTFOLIO |
| SCHEDULE OF INVESTMENTS (Continued) |
| November 30, 2022 |
Goldman Sachs Systematic Skew US Series 1D Total Return Strategy Top 50 Holdings
| EQUITY FORWARDS |
| Number of | Notional Value at | |||||||||||||||
| Contracts | Open Short Equity Forwards | Counterparty | November 30, 2022 | Exercise Price | Expiration | Fair Value | ||||||||||
| 415 | S&P 500 Index | Goldman Sachs | 1,694,292 | $ | 3,960 | 12/16/2022 | $ | (51,642 | ) | |||||||
| 324 | S&P 500 Index | Goldman Sachs | 1,322,487 | $ | 3,960 | 1/20/2023 | (45,073 | ) | ||||||||
| 152 | S&P 500 Index | Goldman Sachs | 620,233 | $ | 3,960 | 2/17/2023 | (22,499 | ) | ||||||||
| (119,214 | ) | |||||||||||||||
| PURCHASED PUT OPTIONS |
| Number of | Notional Value at | |||||||||||||||
| Contracts | Open Purchased Put Options | Counterparty | November 30, 2022 | Exercise Price | Expiration | Fair Value | ||||||||||
| 182 | S&P 500 Index | Goldman Sachs | 741,944 | $ | 1,900 | 1/20/2023 | $ | 44 | ||||||||
| 93 | S&P 500 Index | Goldman Sachs | 378,162 | $ | 1,900 | 2/17/2023 | 65 | |||||||||
| 98 | S&P 500 Index | Goldman Sachs | 398,590 | $ | 2,000 | 1/20/2023 | 31 | |||||||||
| 65 | S&P 500 Index | Goldman Sachs | 264,352 | $ | 2,000 | 2/17/2023 | 58 | |||||||||
| 93 | S&P 500 Index | Goldman Sachs | 379,941 | $ | 2,100 | 2/17/2023 | 101 | |||||||||
| 92 | S&P 500 Index | Goldman Sachs | 377,298 | $ | 2,100 | 1/20/2023 | 35 | |||||||||
| 76 | S&P 500 Index | Goldman Sachs | 308,947 | $ | 2,150 | 12/16/2022 | 3 | |||||||||
| 67 | S&P 500 Index | Goldman Sachs | 272,689 | $ | 2,175 | 12/16/2022 | 3 | |||||||||
| 54 | S&P 500 Index | Goldman Sachs | 222,062 | $ | 2,200 | 2/17/2023 | 75 | |||||||||
| 95 | S&P 500 Index | Goldman Sachs | 386,138 | $ | 2,225 | 12/16/2022 | 4 | |||||||||
| 165 | S&P 500 Index | Goldman Sachs | 673,703 | $ | 2,300 | 2/17/2023 | 279 | |||||||||
| 68 | S&P 500 Index | Goldman Sachs | 278,774 | $ | 2,325 | 12/16/2022 | 3 | |||||||||
| 133 | S&P 500 Index | Goldman Sachs | 542,055 | $ | 2,350 | 1/20/2023 | 96 | |||||||||
| 69 | S&P 500 Index | Goldman Sachs | 281,496 | $ | 2,400 | 12/16/2022 | 3 | |||||||||
| 51 | S&P 500 Index | Goldman Sachs | 207,076 | $ | 2,400 | 2/17/2023 | 104 | |||||||||
| 96 | S&P 500 Index | Goldman Sachs | 390,548 | $ | 2,500 | 2/17/2023 | 235 | |||||||||
| 60 | S&P 500 Index | Goldman Sachs | 243,869 | $ | 2,500 | 1/20/2023 | 60 | |||||||||
| 139 | S&P 500 Index | Goldman Sachs | 567,310 | $ | 2,525 | 12/16/2022 | 6 | |||||||||
| 249 | S&P 500 Index | Goldman Sachs | 1,017,256 | $ | 2,550 | 1/20/2023 | 284 | |||||||||
| 146 | S&P 500 Index | Goldman Sachs | 595,467 | $ | 2,725 | 12/16/2022 | 14 | |||||||||
| 92 | S&P 500 Index | Goldman Sachs | 374,177 | $ | 2,800 | 1/20/2023 | 172 | |||||||||
| 90 | S&P 500 Index | Goldman Sachs | 365,949 | $ | 3,020 | 12/16/2022 | 23 | |||||||||
| 92 | S&P 500 Index | Goldman Sachs | 375,871 | $ | 3,030 | 12/16/2022 | 24 | |||||||||
| 107 | S&P 500 Index | Goldman Sachs | 438,101 | $ | 3,040 | 12/16/2022 | 29 | |||||||||
| 188 | S&P 500 Index | Goldman Sachs | 765,181 | $ | 3,050 | 12/16/2022 | 53 | |||||||||
| 1,804 | ||||||||||||||||
| WRITTEN PUT OPTIONS |
| Number of | Notional Value at | |||||||||||||||
| Contracts | Open Written Put Options | Counterparty | November 30, 2022 | Exercise Price | Expiration | Fair Value | ||||||||||
| 50 | S&P 500 Index | Goldman Sachs | 203,274 | $ | 3,140 | 12/16/2022 | 19 | |||||||||
| 53 | S&P 500 Index | Goldman Sachs | 216,709 | $ | 3,240 | 1/20/2023 | 235 | |||||||||
| 69 | S&P 500 Index | Goldman Sachs | 282,109 | $ | 3,330 | 12/16/2022 | 52 | |||||||||
| 59 | S&P 500 Index | Goldman Sachs | 241,437 | $ | 3,350 | 1/20/2023 | 349 | |||||||||
| 69 | S&P 500 Index | Goldman Sachs | 281,496 | $ | 3,385 | 12/16/2022 | 62 | |||||||||
| 70 | S&P 500 Index | Goldman Sachs | 286,907 | $ | 3,440 | 12/16/2022 | 77 | |||||||||
| 69 | S&P 500 Index | Goldman Sachs | 280,403 | $ | 3,455 | 12/16/2022 | 80 | |||||||||
| 57 | S&P 500 Index | Goldman Sachs | 231,715 | $ | 3,480 | 2/17/2023 | 1,210 | |||||||||
| 75 | S&P 500 Index | Goldman Sachs | 305,294 | $ | 3,500 | 2/17/2023 | 1,720 | |||||||||
| 74 | S&P 500 Index | Goldman Sachs | 301,965 | $ | 3,510 | 12/16/2022 | 105 | |||||||||
| 72 | S&P 500 Index | Goldman Sachs | 293,502 | $ | 3,525 | 12/16/2022 | 107 | |||||||||
| 58 | S&P 500 Index | Goldman Sachs | 237,301 | $ | 3,540 | 1/20/2023 | 665 | |||||||||
| 60 | S&P 500 Index | Goldman Sachs | 243,869 | $ | 3,550 | 1/20/2023 | 712 | |||||||||
| 87 | S&P 500 Index | Goldman Sachs | 354,735 | $ | 3,560 | 1/20/2023 | 1,079 | |||||||||
| 122 | S&P 500 Index | Goldman Sachs | 496,549 | $ | 3,580 | 1/20/2023 | 1,644 | |||||||||
| 64 | S&P 500 Index | Goldman Sachs | 263,065 | $ | 3,595 | 2/17/2023 | 2,029 | |||||||||
| 90 | S&P 500 Index | Goldman Sachs | 365,949 | $ | 3,650 | 12/16/2022 | 226 | |||||||||
| 92 | S&P 500 Index | Goldman Sachs | 375,871 | $ | 3,665 | 12/16/2022 | 251 | |||||||||
| 107 | S&P 500 Index | Goldman Sachs | 438,101 | $ | 3,675 | 12/16/2022 | 310 | |||||||||
| 92 | S&P 500 Index | Goldman Sachs | 374,177 | $ | 3,685 | 1/20/2023 | 1,954 | |||||||||
| 90 | S&P 500 Index | Goldman Sachs | 366,367 | $ | 3,695 | 12/16/2022 | 292 | |||||||||
| 98 | S&P 500 Index | Goldman Sachs | 398,814 | $ | 3,700 | 12/16/2022 | 326 | |||||||||
| 13,504 | ||||||||||||||||
See accompanying notes to consolidated financial statements.
19
| EASTERLY TOTAL HEDGE PORTFOLIO |
| SCHEDULE OF INVESTMENTS (Continued) |
| November 30, 2022 |
Goldman Sachs Credit Volatility Carry Y Series Excess Return Strategy Top 50 Holdings
| EQUITY FORWARDS |
| Number of | Notional Value at | |||||||||||||
| Contracts | Open Long Equity Forwards | Counterparty | November 30, 2022 | Exercise Price | Expiration | Fair Value | ||||||||
| 2,044 | iShares iBoxx $ High Yield Corporate Bond ETF | Goldman Sachs | 154,623 | 75 | 12/1/2022 | 1,767 | ||||||||
| PURCHASED PUT OPTIONS |
| Number of | Notional Value at | |||||||||||||
| Contracts | Open Purchased Put Options | Counterparty | November 30, 2022 | Exercise Price | Expiration | Fair Value | ||||||||
| 294 | iShares iBoxx $ High Yield Corporate Bond ETF | Goldman Sachs | 22,279 | 55 | 12/16/2022 | — | ||||||||
| 755 | iShares iBoxx $ High Yield Corporate Bond ETF | Goldman Sachs | 57,087 | 60 | 12/16/2022 | 3 | ||||||||
| 371 | iShares iBoxx $ High Yield Corporate Bond ETF | Goldman Sachs | 28,083 | 61 | 12/16/2022 | 2 | ||||||||
| 259 | iShares iBoxx $ High Yield Corporate Bond ETF | Goldman Sachs | 19,570 | 61 | 1/20/2023 | 8 | ||||||||
| 530 | iShares iBoxx $ High Yield Corporate Bond ETF | Goldman Sachs | 40,075 | 62 | 12/16/2022 | 3 | ||||||||
| 193 | iShares iBoxx $ High Yield Corporate Bond ETF | Goldman Sachs | 14,572 | 62 | 1/20/2023 | 7 | ||||||||
| 446 | iShares iBoxx $ High Yield Corporate Bond ETF | Goldman Sachs | 33,729 | 63 | 12/16/2022 | 3 | ||||||||
| 265 | iShares iBoxx $ High Yield Corporate Bond ETF | Goldman Sachs | 20,050 | 63 | 1/20/2023 | 11 | ||||||||
| 1,665 | iShares iBoxx $ High Yield Corporate Bond ETF | Goldman Sachs | 125,959 | 64 | 12/16/2022 | 13 | ||||||||
| 554 | iShares iBoxx $ High Yield Corporate Bond ETF | Goldman Sachs | 41,901 | 64 | 1/20/2023 | 28 | ||||||||
| 466 | iShares iBoxx $ High Yield Corporate Bond ETF | Goldman Sachs | 35,223 | 65 | 12/16/2022 | 4 | ||||||||
| 677 | iShares iBoxx $ High Yield Corporate Bond ETF | Goldman Sachs | 51,209 | 65 | 1/20/2023 | 41 | ||||||||
| 1,264 | iShares iBoxx $ High Yield Corporate Bond ETF | Goldman Sachs | 95,656 | 66 | 12/16/2022 | 15 | ||||||||
| 318 | iShares iBoxx $ High Yield Corporate Bond ETF | Goldman Sachs | 24,029 | 66 | 1/20/2023 | 23 | ||||||||
| 1,614 | iShares iBoxx $ High Yield Corporate Bond ETF | Goldman Sachs | 122,122 | 67 | 12/16/2022 | 24 | ||||||||
| 784 | iShares iBoxx $ High Yield Corporate Bond ETF | Goldman Sachs | 59,353 | 67 | 1/20/2023 | 71 | ||||||||
| 141 | iShares iBoxx $ High Yield Corporate Bond ETF | Goldman Sachs | 10,699 | 68 | 12/16/2022 | 3 | ||||||||
| 536 | iShares iBoxx $ High Yield Corporate Bond ETF | Goldman Sachs | 40,556 | 68 | 1/20/2023 | 62 | ||||||||
| 350 | iShares iBoxx $ High Yield Corporate Bond ETF | Goldman Sachs | 26,499 | 69 | 12/16/2022 | 8 | ||||||||
| 389 | iShares iBoxx $ High Yield Corporate Bond ETF | Goldman Sachs | 29,465 | 69 | 12/16/2022 | 10 | ||||||||
| 283 | iShares iBoxx $ High Yield Corporate Bond ETF | Goldman Sachs | 21,413 | 69 | 1/20/2023 | 43 | ||||||||
| 348 | iShares iBoxx $ High Yield Corporate Bond ETF | Goldman Sachs | 26,328 | 70 | 12/16/2022 | 11 | ||||||||
| 139 | iShares iBoxx $ High Yield Corporate Bond ETF | Goldman Sachs | 10,548 | 71 | 12/16/2022 | 7 | ||||||||
| 400 | ||||||||||||||
| WRITTEN CALL OPTIONS |
| Number of | Notional Value at | |||||||||||||
| Contracts | Open Written Call Options | Counterparty | November 30, 2022 | Exercise Price | Expiration | Fair Value | ||||||||
| 589 | iShares iBoxx $ High Yield Corporate Bond ETF | Goldman Sachs | 44,527 | 72 | 12/16/2022 | (1,879 | ) | |||||||
| 1,843 | iShares iBoxx $ High Yield Corporate Bond ETF | Goldman Sachs | 139,477 | 73 | 12/16/2022 | (4,249 | ) | |||||||
| 116 | iShares iBoxx $ High Yield Corporate Bond ETF | Goldman Sachs | 8,801 | 73 | 1/20/2023 | (328 | ) | |||||||
| 2,605 | iShares iBoxx $ High Yield Corporate Bond ETF | Goldman Sachs | 197,120 | 74 | 12/16/2022 | (3,949 | ) | |||||||
| 312 | iShares iBoxx $ High Yield Corporate Bond ETF | Goldman Sachs | 23,619 | 74 | 1/20/2023 | (651 | ) | |||||||
| 260 | iShares iBoxx $ High Yield Corporate Bond ETF | Goldman Sachs | 19,694 | 75 | 12/16/2022 | (304 | ) | |||||||
| 2,727 | iShares iBoxx $ High Yield Corporate Bond ETF | Goldman Sachs | 206,345 | 75 | 12/16/2022 | (2,360 | ) | |||||||
| 1,470 | iShares iBoxx $ High Yield Corporate Bond ETF | Goldman Sachs | 111,219 | 75 | 1/20/2023 | (2,115 | ) | |||||||
| 112 | iShares iBoxx $ High Yield Corporate Bond ETF | Goldman Sachs | 8,446 | 75 | 2/17/2023 | (188 | ) | |||||||
| 417 | iShares iBoxx $ High Yield Corporate Bond ETF | Goldman Sachs | 31,533 | 76 | 12/16/2022 | (254 | ) | |||||||
| 422 | iShares iBoxx $ High Yield Corporate Bond ETF | Goldman Sachs | 31,891 | 76 | 12/16/2022 | (170 | ) | |||||||
| 1,350 | iShares iBoxx $ High Yield Corporate Bond ETF | Goldman Sachs | 102,163 | 76 | 1/20/2023 | (1,224 | ) | |||||||
| (17,671 | ) | |||||||||||||
| WRITTEN PUT OPTIONS |
| Number of | Notional Value at | |||||||||||||
| Contracts | Open Written Put Options | Counterparty | November 30, 2022 | Exercise Price | Expiration | Fair Value | ||||||||
| 350 | iShares iBoxx $ High Yield Corporate Bond ETF | Goldman Sachs | 26,484 | 70 | 1/20/2023 | $ | (73 | ) | ||||||
| 1,109 | iShares iBoxx $ High Yield Corporate Bond ETF | Goldman Sachs | 83,890 | 70 | 12/16/2022 | (42 | ) | |||||||
| 524 | iShares iBoxx $ High Yield Corporate Bond ETF | Goldman Sachs | 39,632 | 71 | 1/20/2023 | (155 | ) | |||||||
| 1,098 | iShares iBoxx $ High Yield Corporate Bond ETF | Goldman Sachs | 83,075 | 71 | 12/16/2022 | (66 | ) | |||||||
| 1,039 | iShares iBoxx $ High Yield Corporate Bond ETF | Goldman Sachs | 78,623 | 72 | 1/20/2023 | (451 | ) | |||||||
| 3,040 | iShares iBoxx $ High Yield Corporate Bond ETF | Goldman Sachs | 229,979 | 72 | 12/16/2022 | (327 | ) | |||||||
| 392 | iShares iBoxx $ High Yield Corporate Bond ETF | Goldman Sachs | 29,638 | 73 | 12/16/2022 | (60 | ) | |||||||
| 1,428 | iShares iBoxx $ High Yield Corporate Bond ETF | Goldman Sachs | 108,079 | 73 | 1/20/2023 | (891 | ) | |||||||
| 2,688 | iShares iBoxx $ High Yield Corporate Bond ETF | Goldman Sachs | 203,360 | 73 | 12/16/2022 | (587 | ) | |||||||
| 808 | iShares iBoxx $ High Yield Corporate Bond ETF | Goldman Sachs | 61,171 | 74 | 12/16/2022 | (250 | ) | |||||||
| 1,235 | iShares iBoxx $ High Yield Corporate Bond ETF | Goldman Sachs | 93,471 | 74 | 1/20/2023 | (1,088 | ) | |||||||
| 1,599 | iShares iBoxx $ High Yield Corporate Bond ETF | Goldman Sachs | 121,000 | 74 | 12/16/2022 | (683 | ) | |||||||
| 268 | iShares iBoxx $ High Yield Corporate Bond ETF | Goldman Sachs | 20,277 | 75 | 12/16/2022 | (155 | ) | |||||||
| 217 | iShares iBoxx $ High Yield Corporate Bond ETF | Goldman Sachs | 16,433 | 75 | 1/20/2023 | (267 | ) | |||||||
| (5,095 | ) | |||||||||||||
See accompanying notes to consolidated financial statements.
20
| EASTERLY TOTAL HEDGE PORTFOLIO |
| SCHEDULE OF INVESTMENTS (Continued) |
| November 30, 2022 |
Goldman Sachs Volatility Carry US Series 107 Total Return Strategy Top 50 Holdings
| EQUITY FORWARDS |
| Number of | Notional Value at | |||||||||||||||
| Contracts | Open Short Equity Forwards | Counterparty | November 30, 2022 | Exercise Price | Expiration | Fair Value | ||||||||||
| 4 | S&P 500 Index | Goldman Sachs | 16,069 | $ | 3,960 | 12/2/2022 | $ | (457 | ) | |||||||
| WRITTEN PUT OPTIONS |
| Number of | Notional Value at | |||||||||||||||
| Contracts | Open Written Put Options | Counterparty | November 30, 2022 | Exercise Price | Expiration | Fair Value | ||||||||||
| 73 | S&P 500 Index | Goldman Sachs | 295,885 | $ | 3,810 | 12/2/2022 | $ | (29 | ) | |||||||
| 145 | S&P 500 Index | Goldman Sachs | 593,064 | $ | 3,840 | 12/2/2022 | (74 | ) | ||||||||
| (103 | ) | |||||||||||||||
See accompanying notes to consolidated financial statements.
21
| EASTERLY TOTAL HEDGE PORTFOLIO |
| SCHEDULE OF INVESTMENTS (Continued) |
| November 30, 2022 |
Goldman Sachs Volatility Carry US Series 97 Total Return Strategy Top 50 Holdings
| EQUITY FORWARDS |
| Number of | Notional Value at | |||||||||||||||
| Contracts | Open Short Equity Forwards | Counterparty | November 30, 2022 | Exercise Price | Expiration | Fair Value | ||||||||||
| 7 | S&P 500 Index | Goldman Sachs | 28,927 | $ | 4,080 | 12/2/2022 | $ | 27 | ||||||||
| 0 | S&P 500 Index | Goldman Sachs | 1,770 | $ | 4,080 | 12/9/2022 | 1 | |||||||||
| WRITTEN PUT OPTIONS |
| Number of | Notional Value at | |||||||||||||||
| Contracts | Open Written Put Options | Counterparty | November 30, 2022 | Exercise Price | Expiration | Fair Value | ||||||||||
| 26 | S&P 500 Index | Goldman Sachs | 106,335 | $ | 3,725 | 12/9/2022 | $ | 30 | ||||||||
| 32 | S&P 500 Index | Goldman Sachs | 131,216 | $ | 3,800 | 12/2/2022 | 12 | |||||||||
| 155 | S&P 500 Index | Goldman Sachs | 631,771 | $ | 3,810 | 12/2/2022 | 62 | |||||||||
| 78 | S&P 500 Index | Goldman Sachs | 319,006 | $ | 3,820 | 12/2/2022 | 35 | |||||||||
| 139 | ||||||||||||||||
See accompanying notes to consolidated financial statements.
22
| EASTERLY TOTAL HEDGE PORTFOLIO |
| SCHEDULE OF INVESTMENTS (Continued) |
| November 30, 2022 |
Goldman Sachs VX Volatility Carry Series 11 Excess Return Strategy Top 50 Holdings
| FUTURES CONTRACTS* |
| Number of | Notional Value at | |||||||
| Contracts | Open Short Future Contracts | Expiration | November 30, 2022 | |||||
| 3,407 | CBOE Volatility Index Future | 12/21/2022 | 75,366 | |||||
| 311 | CBOE Volatility Index Future | 1/18/2023 | 7,667 | |||||
| WRITTEN CALL OPTIONS |
| Number of | Notional Value at | |||||||||||||||
| Contracts | Open Purchased Put Options | Counterparty | November 30, 2022 | Exercise Price | Expiration | Fair Value | ||||||||||
| 487 | CBOE Volatility Index Future | Goldman Sachs | 10,025 | $ | 24 | 12/21/2022 | $ | (566 | ) | |||||||
| 492 | CBOE Volatility Index Future | Goldman Sachs | 10,126 | $ | 25 | 12/21/2022 | (474 | ) | ||||||||
| 530 | CBOE Volatility Index Future | Goldman Sachs | 10,908 | $ | 26 | 12/21/2022 | (426 | ) | ||||||||
| 1,041 | CBOE Volatility Index Future | Goldman Sachs | 21,426 | $ | 27 | 12/21/2022 | (707 | ) | ||||||||
| 84 | CBOE Volatility Index Future | Goldman Sachs | 1,735 | $ | 27 | 1/18/2023 | (159 | ) | ||||||||
| 1,048 | CBOE Volatility Index Future | Goldman Sachs | 21,561 | $ | 28 | 12/21/2022 | (600 | ) | ||||||||
| 183 | CBOE Volatility Index Future | Goldman Sachs | 3,759 | $ | 28 | 1/18/2023 | (307 | ) | ||||||||
| 1,027 | CBOE Volatility Index Future | Goldman Sachs | 21,128 | $ | 29 | 12/21/2022 | (502 | ) | ||||||||
| 155 | CBOE Volatility Index Future | Goldman Sachs | 3,181 | $ | 29 | 1/18/2023 | (232 | ) | ||||||||
| 905 | CBOE Volatility Index Future | Goldman Sachs | 18,635 | $ | 30 | 12/21/2022 | (380 | ) | ||||||||
| 122 | CBOE Volatility Index Future | Goldman Sachs | 2,508 | $ | 30 | 1/18/2023 | (165 | ) | ||||||||
| 460 | CBOE Volatility Index Future | Goldman Sachs | 9,459 | $ | 31 | 12/21/2022 | (168 | ) | ||||||||
| 61 | CBOE Volatility Index Future | Goldman Sachs | 1,253 | $ | 31 | 1/18/2023 | (75 | ) | ||||||||
| 227 | CBOE Volatility Index Future | Goldman Sachs | 4,668 | $ | 32 | 12/21/2022 | (74 | ) | ||||||||
| 28 | CBOE Volatility Index Future | Goldman Sachs | 580 | $ | 32 | 1/18/2023 | (31 | ) | ||||||||
| 100 | CBOE Volatility Index Future | Goldman Sachs | 2,057 | $ | 33 | 12/21/2022 | (30 | ) | ||||||||
| 60 | CBOE Volatility Index Future | Goldman Sachs | 1,235 | $ | 33 | 12/21/2022 | (17 | ) | ||||||||
| 80 | CBOE Volatility Index Future | Goldman Sachs | 1,649 | $ | 34 | 12/21/2022 | (20 | ) | ||||||||
| 20 | CBOE Volatility Index Future | Goldman Sachs | 412 | $ | 35 | 12/21/2022 | (5 | ) | ||||||||
| 27 | CBOE Volatility Index Future | Goldman Sachs | 550 | $ | 36 | 12/21/2022 | (5 | ) | ||||||||
| 33 | CBOE Volatility Index Future | Goldman Sachs | 686 | $ | 37 | 12/21/2022 | (6 | ) | ||||||||
| 7 | CBOE Volatility Index Future | Goldman Sachs | 137 | $ | 38 | 12/21/2022 | (1 | ) | ||||||||
| (4,950 | ) | |||||||||||||||
| WRITTEN PUT OPTIONS | ||||||||||||||||
| Number of | Notional Value at | |||||||||||||||
| Contracts | Open Written Put Options | Counterparty | November 30, 2022 | Exercise Price | Expiration | Fair Value | ||||||||||
| 164 | CBOE Volatility Index Future | Goldman Sachs | 3,372 | $ | 21 | 12/21/2022 | (167 | ) | ||||||||
| 721 | CBOE Volatility Index Future | Goldman Sachs | 14,845 | $ | 22 | 12/21/2022 | (1,147 | ) | ||||||||
| 699 | CBOE Volatility Index Future | Goldman Sachs | 14,381 | $ | 23 | 12/21/2022 | (1,585 | ) | ||||||||
| 28 | CBOE Volatility Index Future | Goldman Sachs | 578 | $ | 23 | 1/18/2023 | (43 | ) | ||||||||
| 1,330 | CBOE Volatility Index Future | Goldman Sachs | 27,362 | $ | 24 | 12/21/2022 | (4,014 | ) | ||||||||
| 215 | CBOE Volatility Index Future | Goldman Sachs | 4,434 | $ | 24 | 1/18/2023 | (452 | ) | ||||||||
| 1,832 | CBOE Volatility Index Future | Goldman Sachs | 37,693 | $ | 25 | 12/21/2022 | (7,000 | ) | ||||||||
| 234 | CBOE Volatility Index Future | Goldman Sachs | 4,822 | $ | 25 | 1/18/2023 | (643 | ) | ||||||||
| 1,091 | CBOE Volatility Index Future | Goldman Sachs | 22,460 | $ | 26 | 12/21/2022 | (5,078 | ) | ||||||||
| 127 | CBOE Volatility Index Future | Goldman Sachs | 2,604 | $ | 26 | 1/18/2023 | (436 | ) | ||||||||
| 380 | CBOE Volatility Index Future | Goldman Sachs | 7,823 | $ | 27 | 12/21/2022 | (2,103 | ) | ||||||||
| 28 | CBOE Volatility Index Future | Goldman Sachs | 580 | $ | 27 | 1/18/2023 | (118 | ) | ||||||||
| 187 | CBOE Volatility Index Future | Goldman Sachs | 3,843 | $ | 28 | 12/21/2022 | (1,200 | ) | ||||||||
| 73 | CBOE Volatility Index Future | Goldman Sachs | 1,511 | $ | 29 | 12/21/2022 | (539 | ) | ||||||||
| 67 | CBOE Volatility Index Future | Goldman Sachs | 1,374 | $ | 30 | 12/21/2022 | (552 | ) | ||||||||
| (25,077 | ) | |||||||||||||||
See accompanying notes to consolidated financial statements.
23
| EASTERLY INCOME OPPORTUNITIES FUND |
| SCHEDULE OF INVESTMENTS |
| November 30, 2022 |
| Principal | Coupon Rate | |||||||||||||
| Amount ($) | Spread | (%) | Maturity | Fair Value | ||||||||||
| ASSET BACKED SECURITIES — 82.2% | ||||||||||||||
| AGENCY CMBS — 1.8% | ||||||||||||||
| 847,054 | Freddie Mac Multifamily Structured Pass Through Series (a),(b) | 2.2490 | 05/25/47 | $ | 96,317 | |||||||||
| 2,848,068 | FREMF 2017-KF37 Mortgage Trust Series (c),(d) | US0001M + 2.750% | 6.5550 | 06/25/27 | 2,761,988 | |||||||||
| 1,889,649 | FREMF 2018-KF46 Series (c),(d) | US0001M + 1.950% | 5.7550 | 03/25/28 | 1,848,799 | |||||||||
| 69,397 | Government National Mortgage Association Series 2019 (a),(b) | 0.2910 | 04/16/53 | 246 | ||||||||||
| 951,040 | Multifamily Connecticut Avenue Securities Trust -01 (c),(d) | US0001M + 3.250% | 7.2940 | 10/15/49 | 880,569 | |||||||||
| 5,587,919 | ||||||||||||||
| AUTO LOAN — 2.1% | ||||||||||||||
| 1,645,527 | CPS Auto Receivables Trust 2018-B (c) | 5.6100 | 12/16/24 | 1,643,403 | ||||||||||
| 334,000 | Flagship Credit Auto Trust 2020-3 (c) | 4.9800 | 12/15/27 | 290,989 | ||||||||||
| 3,500,000 | US Auto Funding 2021-1 (c) | 4.3600 | 03/15/27 | 3,168,770 | ||||||||||
| 1,650,000 | USASF Receivables 2020-1, LLC(c) | 9.3500 | 03/15/27 | 1,650,071 | ||||||||||
| 6,753,233 | ||||||||||||||
| CDO — 3.5% | ||||||||||||||
| 486,101 | Aspen Funding I Ltd. | 9.0600 | 07/10/37 | 491,448 | ||||||||||
| 7,294,617 | DWRS 2016-1 (c) | 1.0440 | 04/23/32 | 2,078,966 | ||||||||||
| 5,640,297 | Galleria CDO V Ltd. (c),(d) | US0003M + 2.400% | 5.9270 | 09/19/37 | 5,417,567 | |||||||||
| 3,521,755 | Mid Ocean CBO 2001-1 Ltd. (d) | US0003M + 0.500% | 2.3910 | 11/05/36 | 673,226 | |||||||||
| 3,000,000 | Tropic CDO IV Ltd. (c),(d) | US0003M + 1.000% | 5.0790 | 04/15/35 | 2,445,798 | |||||||||
| 11,107,005 | ||||||||||||||
| CLO — 4.9% | ||||||||||||||
| 750,000 | BlueMountain CLO 2013-2 Ltd. (c),(d) | US0003M + 1.300% | 5.6250 | 10/22/30 | 731,959 | |||||||||
| 1,000,000 | Deerpath Capital CLO 2020-1 LTD (c),(d) | US0003M + 3.900% | 7.9790 | 04/17/32 | 950,285 | |||||||||
| 2,500,000 | Ellington Clo II Ltd. (c),(d) | US0003M + 2.900% | 7.5060 | 02/15/29 | 2,423,505 | |||||||||
| 500,000 | Ellington Clo III Ltd. (c),(d) | US0003M + 3.740% | 7.9830 | 07/20/30 | 453,627 | |||||||||
| 200,000 | GC FTPYME Pastor 4 FTA | EUR003M + 2.400% | 4.1620 | 07/15/45 | 124,523 | |||||||||
| 368,556 | Halcyon Loan Advisors Funding 2013-1 Ltd. c),(d) | US0003M + 3.500% | 7.5790 | 04/15/25 | 365,171 | |||||||||
| 1,715,905 | Halcyon Loan Advisors Funding 2013-2 Ltd.(c),(d) | US0003M + 3.800% | 8.2400 | 08/01/25 | 1,390,948 | |||||||||
| 619,600 | Halcyon Loan Advisors Funding 2014-2 Ltd. (c),(d) | US0003M + 3.500% | 7.8740 | 04/28/25 | 608,590 | |||||||||
| 1,500,425 | Halcyon Loan Advisors Funding 2014-3 Ltd. (c),(d) | US0003M + 3.650% | 7.9750 | 10/22/25 | 1,462,523 | |||||||||
| 250,000 | Nassau 2018-I Ltd. (c),(d) | US0003M + 5.850% | 9.9290 | 07/15/31 | 200,744 | |||||||||
| 500,000 | Peaks CLO 2 Ltd.(c),(d) | US0003M + 3.600% | 7.8430 | 07/20/31 | 468,008 | |||||||||
| 2,750,000 | Peaks CLO 2 Ltd.(c),(d) | US0003M + 5.000% | 9.2430 | 07/20/31 | 2,439,308 | |||||||||
| 500,000 | Steele Creek Clo 2018-2 Ltd.(c),(d) | US0003M + 3.400% | 8.0740 | 08/18/31 | 436,107 | |||||||||
See accompanying notes to consolidated financial statements
24
| EASTERLY INCOME OPPORTUNITIES FUND |
| SCHEDULE OF INVESTMENTS (Continued) |
| November 30, 2022 |
| Principal | Coupon Rate | |||||||||||||
| Amount ($) | Spread | (%) | Maturity | Fair Value | ||||||||||
| ASSET BACKED SECURITIES — 82.2% (Continued) | ||||||||||||||
| CLO — 4.9% (Continued) | ||||||||||||||
| 3,000,000 | Z Capital Credit Partners CLO 2018-1 Ltd.(c),(d) | US0003M + 2.450% | 6.5290 | 01/16/31 | $ | 2,953,481 | ||||||||
| 500,000 | Zais Clo 13 Ltd.(c),(d) | US0003M + 4.520% | 8.5990 | 07/15/32 | 417,770 | |||||||||
| 15,426,549 | ||||||||||||||
| COLLATERALIZED MORTGAGE OBLIGATIONS — 39.6% | ||||||||||||||
| 151,393 | ABN Amro Mortgage Corporation | 5.5000 | 10/25/33 | 142,276 | ||||||||||
| 574,035 | Adjustable Rate Mortgage Trust 2005-6A (d) | US0001M + 0.840% | 4.8840 | 11/25/35 | 173,749 | |||||||||
| 39,240 | Alternative Loan Trust 1998-4 (e) | 6.0810 | 08/25/28 | 37,179 | ||||||||||
| 20,069 | Alternative Loan Trust 2003-22CB | 5.7500 | 12/25/33 | 19,428 | ||||||||||
| 120,054 | Alternative Loan Trust 2003-J2 | 6.0000 | 10/25/33 | 110,764 | ||||||||||
| 144,024 | Alternative Loan Trust 2003-J3 | 5.2500 | 11/25/33 | 138,037 | ||||||||||
| 41,779 | Alternative Loan Trust 2003-J3 | 6.2500 | 12/25/33 | 40,550 | ||||||||||
| 55,816 | Alternative Loan Trust 2004-15 (b) | 4.2410 | 09/25/34 | 51,559 | ||||||||||
| 10,742 | Alternative Loan Trust 2004-16CB | 5.5000 | 07/25/34 | 10,221 | ||||||||||
| 437,058 | Alternative Loan Trust 2004-28CB | 5.7500 | 01/25/35 | 398,001 | ||||||||||
| 88,193 | Alternative Loan Trust 2004-28CB | 6.0000 | 01/25/35 | 77,605 | ||||||||||
| 43,211 | Alternative Loan Trust 2004-28CB | 6.0000 | 01/25/35 | 39,104 | ||||||||||
| 87,951 | Alternative Loan Trust 2004-J10 | 6.0000 | 09/25/34 | 83,635 | ||||||||||
| 663,496 | Alternative Loan Trust 2004-J10 | 5.5000 | 11/25/34 | 616,084 | ||||||||||
| 25,449 | Alternative Loan Trust 2004-J10 | 5.0000 | 10/25/53 | 25,323 | ||||||||||
| 46,861 | Alternative Loan Trust 2004-J11 | 7.2500 | 08/25/32 | 45,547 | ||||||||||
| 136,991 | Alternative Loan Trust 2004-J8 | 7.0000 | 08/25/34 | 123,160 | ||||||||||
| 82,902 | Alternative Loan Trust 2005-14 (d) | US0001M + 0.420% | 4.4640 | 05/25/35 | 68,915 | |||||||||
| 205,685 | Alternative Loan Trust 2005-27 (d) | 12MTA + 1.350% | 3.0390 | 08/25/35 | 168,631 | |||||||||
| 36,094 | Alternative Loan Trust 2005-3CB | 5.0000 | 03/25/35 | 30,154 | ||||||||||
| 36,454 | Alternative Loan Trust 2005-54CB | 5.5000 | 11/25/35 | 28,526 | ||||||||||
| 107,033 | Alternative Loan Trust 2005-61 (d) | US0001M + 0.560% | 4.6040 | 12/25/35 | 93,599 | |||||||||
| 145,473 | Alternative Loan Trust 2005-6CB | 5.5000 | 04/25/35 | 123,798 | ||||||||||
| 149,690 | Alternative Loan Trust 2005-72 (d) | US0001M + 0.600% | 4.6440 | 01/25/36 | 131,051 | |||||||||
| 42,085 | Alternative Loan Trust 2005-J11 | 6.0000 | 10/25/35 | 22,410 | ||||||||||
| 52,993 | Alternative Loan Trust 2005-J11 | 5.5000 | 11/25/35 | 31,899 | ||||||||||
| 142,295 | Alternative Loan Trust 2005-J8 | 5.5000 | 07/25/35 | 108,680 | ||||||||||
| 105,076 | Alternative Loan Trust 2006-40T1 | 6.0000 | 12/25/36 | 31,521 | ||||||||||
| 45,887 | Alternative Loan Trust Resecuritization 2005-12R | 6.0000 | 11/25/34 | 40,219 | ||||||||||
See accompanying notes to consolidated financial statements
25
| EASTERLY INCOME OPPORTUNITIES FUND |
| SCHEDULE OF INVESTMENTS (Continued) |
| November 30, 2022 |
| Principal | Coupon Rate | |||||||||||||
| Amount ($) | Spread | (%) | Maturity | Fair Value | ||||||||||
| ASSET BACKED SECURITIES — 82.2% (Continued) | ||||||||||||||
| COLLATERALIZED MORTGAGE OBLIGATIONS — 39.6% (Continued) | ||||||||||||||
| 94,388 | American Home Mortgage Investment Trust 2004-1 (d) | US0006M + 2.000% | 6.9310 | 04/25/44 | $ | 81,023 | ||||||||
| 1,500,000 | Angel Oak Mortgage Trust 2021-6 (b),(c) | 2.7720 | 09/25/66 | 889,327 | ||||||||||
| 3,000,000 | Angel Oak Mortgage Trust I, LLC 2019-2 | 6.2860 | 03/25/49 | 2,897,954 | ||||||||||
| 3,000,000 | Angel Oak Mortgage Trust I, LLC 2019-4 (b),(c) | 4.4120 | 07/26/49 | 2,689,883 | ||||||||||
| 344,844 | APS Resecuritization Trust 2016- (c),(d) | US0001M + 2.850% | 6.8940 | 09/27/46 | 344,757 | |||||||||
| 226,509 | Banc of America Alternative Loan Trust 2003-8 | 5.5000 | 10/25/33 | 214,337 | ||||||||||
| 110,151 | Banc of America Alternative Loan Trust 2004-6 | 6.0000 | 07/25/34 | 104,373 | ||||||||||
| 65,578 | Banc of America Alternative Loan Trust 2007-1 (b) | 3.9210 | 02/25/57 | 53,561 | ||||||||||
| 232,784 | Banc of America Funding 2005-1 Trust | 5.5000 | 02/25/35 | 204,476 | ||||||||||
| 43,335 | Banc of America Funding 2005-E Trust (d) | 12MTA + 1.430% | 3.1190 | 06/20/35 | 31,788 | |||||||||
| 844,872 | Banc of America Funding 2006-I Trust (b) | 3.4080 | 10/20/46 | 693,734 | ||||||||||
| 94,033 | Banc of America Funding 2007-2 Trust (a) | 6.0000 | 03/25/37 | 17,672 | ||||||||||
| 52,348 | Banc of America Funding 2015-R4 Trust (c),(d) | US0001M + 0.150% | 3.7360 | 10/25/36 | 51,725 | |||||||||
| 27,113 | Banc of America Mortgage 2002-L Trust (b) | 2.7880 | 12/25/32 | 20,140 | ||||||||||
| 55,562 | Banc of America Mortgage 2005-E Trust (b) | 3.3150 | 06/25/35 | 46,097 | ||||||||||
| 53,827 | Banc of America Mortgage 2005-F Trust (b) | 3.9910 | 07/25/35 | 43,776 | ||||||||||
| 28,213 | Banc of America Mortgage 2005-H Trust (b) | 3.9530 | 09/25/35 | 23,169 | ||||||||||
| 2,114,050 | BCAP, LLC 2011-RR5-I Trust (c),(e) | 4.6530 | 03/26/37 | 2,048,848 | ||||||||||
| 1,155,738 | BCAP, LLC 2014-RR2 (c),(d) | US0001M + 0.200% | 4.3350 | 01/26/38 | 1,066,324 | |||||||||
| 4,139 | Bear Stearns ALT-A Trust 2004-11 (b) | 3.2840 | 11/25/34 | 3,867 | ||||||||||
| 58,811 | Bear Stearns ARM Trust 2003-5 (b) | 3.8160 | 08/25/33 | 53,957 | ||||||||||
| 5,238 | Bear Stearns ARM Trust 2003-7 (b) | 3.8210 | 10/25/33 | 4,858 | ||||||||||
| 46,823 | Bear Stearns ARM Trust 2003-8 (b) | 2.0810 | 01/25/34 | 42,389 | ||||||||||
| 127,752 | Bear Stearns ARM Trust 2004-1 (b) | 2.9890 | 04/25/34 | 114,362 | ||||||||||
| 12,842 | Bear Stearns ARM Trust 2004-1 (b) | 3.0000 | 04/25/34 | 11,482 | ||||||||||
| 48,830 | Bear Stearns ARM Trust 2004-10 (b) | 3.6650 | 01/25/35 | 44,819 | ||||||||||
| 101,908 | Bear Stearns ARM Trust 2004-6 (b) | 4.0200 | 09/25/34 | 86,954 | ||||||||||
| 906,753 | Bear Stearns ARM Trust 2004-8 (b) | 3.5900 | 11/25/34 | 813,362 | ||||||||||
| 48,593 | Bear Stearns ARM Trust 2004-8 (b) | 3.8880 | 11/25/34 | 44,457 | ||||||||||
| 998,633 | Bear Stearns ARM Trust 2007-3 (b) | 3.2600 | 05/25/47 | 766,823 | ||||||||||
| 603,442 | Bear Stearns Asset Backed Securities I Trust | 6.0000 | 03/25/36 | 215,709 | ||||||||||
| 624,976 | Bear Stearns Asset Backed Securities Trust (e) | 5.5000 | 01/25/34 | 523,369 | ||||||||||
See accompanying notes to consolidated financial statements
26
| EASTERLY INCOME OPPORTUNITIES FUND |
| SCHEDULE OF INVESTMENTS (Continued) |
| November 30, 2022 |
| Principal | Coupon Rate | |||||||||||||
| Amount ($) | Spread | (%) | Maturity | Fair Value | ||||||||||
| ASSET BACKED SECURITIES — 82.2% (Continued) | ||||||||||||||
| COLLATERALIZED MORTGAGE OBLIGATIONS — 39.6% (Continued) | ||||||||||||||
| 208,805 | Bear Stearns Structured Products Inc Trust 2007-R6 (b) | 3.4530 | 01/26/36 | $ | 126,397 | |||||||||
| 37,237 | Bella Vista Mortgage Trust 2004-1 (d) | US0001M + 0.700% | 4.6390 | 11/20/34 | 35,438 | |||||||||
| 99,409 | BlackRock Capital Finance, L.P. (b),(c) | 3.5020 | 12/25/35 | 71,575 | ||||||||||
| 3,190,246 | Brean Asset Backed Securities Trust 2021-RM1 (c) | 1.6000 | 10/25/63 | 2,128,368 | ||||||||||
| 585,109 | Cascade Funding Mortgage Trust 2018-RM2 (b),(c) | 4.0000 | 10/25/68 | 542,898 | ||||||||||
| 2,743,056 | Cascade Funding Mortgage Trust 2019-RM3 b),(c) | 4.0000 | 06/25/69 | 2,225,409 | ||||||||||
| 98,667 | CDMC Mortgage Pass-Through Certificates Series 2004-4 (b) | 5.4640 | 09/25/34 | 89,472 | ||||||||||
| 83,404 | CDMC Mortgage Pass-Through Certificates Series 2005-1 (b) | 5.1050 | 02/18/35 | 76,163 | ||||||||||
| 1,043,035 | Cendant Mortgage Capital, LLC CDMC Mort Pas Thr Ce | 5.5000 | 02/25/34 | 969,987 | ||||||||||
| 170,988 | Chase Mortgage Finance Trust Series 2004-S2 | 5.5000 | 02/25/34 | 160,095 | ||||||||||
| 495,942 | Chase Mortgage Finance Trust Series 2007-S3 (f) | — | 05/25/37 | 133,080 | ||||||||||
| 275,826 | Chase Mortgage Finance Trust Series 2007-S3 (a) | 6.0000 | 05/25/37 | 59,451 | ||||||||||
| 209,242 | Chevy Chase Funding, LLC Mortgage-Backed (c),(d) | US0001M + 0.250% | 4.2940 | 10/25/36 | 145,678 | |||||||||
| 103,249 | CHL Mortgage Pass-Through Trust 2002-19 | 6.2500 | 11/25/32 | 86,482 | ||||||||||
| 125,455 | CHL Mortgage Pass-Through Trust 2002-39 | 5.7500 | 02/25/33 | 114,742 | ||||||||||
| 121,795 | CHL Mortgage Pass-Through Trust 2003-60 (b) | 2.1160 | 02/25/34 | 101,960 | ||||||||||
| 41,875 | CHL Mortgage Pass-Through Trust 2004-14 (b) | 3.9150 | 08/25/34 | 36,966 | ||||||||||
| 31,950 | CHL Mortgage Pass-Through Trust 2004-3 | 5.7500 | 04/25/34 | 30,354 | ||||||||||
| 76,916 | CHL Mortgage Pass-Through Trust 2004-5 | 5.2500 | 05/25/34 | 73,497 | ||||||||||
| 90,894 | CHL Mortgage Pass-Through Trust 2004-5 | 5.5000 | 05/25/34 | 87,865 | ||||||||||
| 52,605 | CHL Mortgage Pass-Through Trust 2004-6 (b) | 3.3110 | 05/25/34 | 47,142 | ||||||||||
| 59,047 | CHL Mortgage Pass-Through Trust 2004-HYB2 (b) | 2.7410 | 07/20/34 | 54,194 | ||||||||||
| 61,112 | CHL Mortgage Pass-Through Trust 2004-HYB5 (b) | 3.8260 | 04/20/35 | 54,254 | ||||||||||
| 123,245 | CHL Mortgage Pass-Through Trust 2004-J5 | 5.5000 | 07/25/34 | 114,541 | ||||||||||
| 66,094 | CHL Mortgage Pass-Through Trust 2004-J9 | 5.5000 | 01/25/35 | 63,369 | ||||||||||
| 571,141 | CHL Mortgage Pass-Through Trust 2005-J2 | 5.0000 | 08/25/35 | 353,123 | ||||||||||
| 111,240 | CHL Mortgage Pass-Through Trust 2006-J1 | 6.0000 | 02/25/36 | 49,617 | ||||||||||
| 50,751 | CHL Mortgage Pass-Through Trust 2007-15 | 6.5000 | 09/25/37 | 21,906 | ||||||||||
| 491,400 | CHNGE Mortgage Trust 2022-4 (c),(e) | 6.0000 | 10/25/57 | 477,394 | ||||||||||
See accompanying notes to consolidated financial statements
27
| EASTERLY INCOME OPPORTUNITIES FUND |
| SCHEDULE OF INVESTMENTS (Continued) |
| November 30, 2022 |
| Principal | Coupon Rate | |||||||||||||
| Amount ($) | Spread | (%) | Maturity | Fair Value | ||||||||||
| ASSET BACKED SECURITIES — 82.2% (Continued) | ||||||||||||||
| COLLATERALIZED MORTGAGE OBLIGATIONS — 39.6% (Continued) | ||||||||||||||
| 889,229 | CIM Trust 2019-J1 (b),(c) | 3.9480 | 08/25/49 | $ | 673,809 | |||||||||
| 140,801 | Citicorp Mortgage Securities REMIC Pass-Through | 5.5000 | 07/25/35 | 128,476 | ||||||||||
| 17,858 | Citicorp Mortgage Securities Trust Series 2005-7 | 5.0000 | 10/25/55 | 17,438 | ||||||||||
| 42,770 | Citicorp Mortgage Securities Trust Series 2006-6 | 6.0000 | 11/25/36 | 39,366 | ||||||||||
| 78,800 | Citicorp Mortgage Securities Trust Series 2007-2 (f) | — | 02/25/37 | 40,149 | ||||||||||
| 192,390 | Citicorp Mortgage Securities Trust Series 2007-4 | 6.0000 | 05/25/37 | 165,483 | ||||||||||
| 110,578 | Citigroup Global Markets Mortgage Securities VII b) | 5.5310 | 07/25/24 | 11,242 | ||||||||||
| 4,134 | Citigroup Global Markets Mortgage Securities VII (b) | 4.2320 | 09/25/32 | 3,459 | ||||||||||
| 224,526 | Citigroup Mortgage Loan Trust 2009-4 (b),(c) | 5.4780 | 05/25/35 | 201,763 | ||||||||||
| 2,705 | Citigroup Mortgage Loan Trust 2010-9 (c),(e) | 5.7020 | 03/25/37 | 2,612 | ||||||||||
| 82,982 | Citigroup Mortgage Loan Trust 2014-10 (c),(d) | 3.7550 | 02/25/37 | 79,653 | ||||||||||
| 50,945 | Citigroup Mortgage Loan Trust 2015-RP2 (c) | 4.2500 | 01/25/53 | 47,240 | ||||||||||
| 62,486 | Citigroup Mortgage Loan Trust, Inc. | 7.0000 | 06/25/31 | 58,650 | ||||||||||
| 12,281 | Citigroup Mortgage Loan Trust, Inc. | 5.2500 | 09/25/33 | 10,742 | ||||||||||
| 51,190 | Citigroup Mortgage Loan Trust, Inc. | 6.7500 | 08/25/34 | 47,957 | ||||||||||
| 50,955 | Citigroup Mortgage Loan Trust, Inc. | 5.5000 | 05/25/35 | 48,722 | ||||||||||
| 58,495 | Citigroup Mortgage Loan Trust, Inc. (d) | H15T1Y + 2.100% | 6.0800 | 09/25/35 | 52,198 | |||||||||
| 422,000 | COLT 2020-2 Mortgage Loan Trust (b),(c) | 5.2500 | 03/25/65 | 373,449 | ||||||||||
| 46,648 | COLT Funding, LLC(b),(c) | 1.2570 | 12/25/64 | 36,588 | ||||||||||
| 2,125,000 | COLT Funding, LLC(b),(c) | 2.3550 | 12/25/64 | 1,243,848 | ||||||||||
| 152,096 | Credit Suisse First Boston Mortgage Securities (b) | 4.3260 | 11/25/31 | 151,582 | ||||||||||
| 245,492 | Credit Suisse First Boston Mortgage Securities (c),(d) | US0001M + 2.188% | 4.7460 | 11/25/31 | 147,212 | |||||||||
| 139,311 | Credit Suisse First Boston Mortgage Securities (b) | 7.1980 | 01/25/32 | 126,374 | ||||||||||
| 83,739 | Credit Suisse First Boston Mortgage Securities | 5.5000 | 06/25/33 | 79,496 | ||||||||||
| 535,111 | Credit Suisse First Boston Mortgage Securities | 5.2500 | 07/25/33 | 523,766 | ||||||||||
| 32,215 | Credit Suisse First Boston Mortgage Securities | 5.2500 | 09/25/33 | 29,211 | ||||||||||
| 76,160 | Credit Suisse First Boston Mortgage Securities | 5.5000 | 10/25/33 | 69,141 | ||||||||||
| 228,479 | Credit Suisse First Boston Mortgage Securities | 5.5000 | 10/25/33 | 207,711 | ||||||||||
| 181,142 | Credit Suisse First Boston Mortgage Securities | 5.5000 | 10/25/34 | 164,874 | ||||||||||
See accompanying notes to consolidated financial statements
28
| EASTERLY INCOME OPPORTUNITIES FUND |
| SCHEDULE OF INVESTMENTS (Continued) |
| November 30, 2022 |
| Principal | Coupon Rate | |||||||||||||
| Amount ($) | Spread | (%) | Maturity | Fair Value | ||||||||||
| ASSET BACKED SECURITIES — 82.2% (Continued) | ||||||||||||||
| COLLATERALIZED MORTGAGE OBLIGATIONS — 39.6% (Continued) | ||||||||||||||
| 114,081 | Credit Suisse First Boston Mortgage Securities (d) | US0001M + 0.650% | 4.6940 | 09/25/35 | $ | 75,793 | ||||||||
| 297,989 | CSFB Mortgage-Backed Pass-Through Certificates | 7.5000 | 03/25/32 | 276,530 | ||||||||||
| 99,587 | CSFB Mortgage-Backed Pass-Through Certificates (b) | 2.7400 | 10/25/33 | 90,071 | ||||||||||
| 71,896 | CSFB Mortgage-Backed Pass-Through Certificates | 5.7500 | 11/25/33 | 66,608 | ||||||||||
| 21,722 | CSFB Mortgage-Backed Pass-Through Certificates (d) | US0001M + 0.740% | 4.7840 | 06/25/34 | 21,716 | |||||||||
| 516,553 | CSFB Mortgage-Backed Pass-Through Certificates | 6.0000 | 08/25/34 | 468,044 | ||||||||||
| 29,050 | CSFB Mortgage-Backed Pass-Through Certificates | 5.7500 | 07/25/35 | 27,714 | ||||||||||
| 217,171 | CSMC 2017-FHA1 Trust (b),(c) | 3.2500 | 04/25/47 | 187,351 | ||||||||||
| 279,423 | CSMC 2021-RPL2Trust (b),(c) | 3.4940 | 01/25/60 | 180,392 | ||||||||||
| 37,215 | CSMC Series 2010-18R (b),(c) | 2.6230 | 04/26/38 | 35,289 | ||||||||||
| 309,180 | CSMC Trust 2007-5R | 6.5000 | 07/26/36 | 77,940 | ||||||||||
| 1,006,215 | CSMC Trust 2013-IVR5 (b),(c) | 3.6310 | 10/25/43 | 927,020 | ||||||||||
| 1,419,252 | CSMC Trust 2015-1 (b),(c) | 3.9120 | 01/25/45 | 1,118,880 | ||||||||||
| 1,802,038 | CSMLT 2015-2 Trust (b),(c) | 3.8820 | 08/25/45 | 1,382,724 | ||||||||||
| 34,725 | Deutsche Mortgage Sec Inc Mort Loan Tr Ser 2004-1 | 5.5000 | 09/25/33 | 33,139 | ||||||||||
| 969 | DLJ Mortgage Acceptance Corporation | 6.7500 | 01/25/24 | 900 | ||||||||||
| 39,147 | DSLA Mortgage Loan Trust 2004-AR4 (d) | US0001M + 0.720% | 4.6590 | 01/19/45 | 30,303 | |||||||||
| 226,505 | Fannie Mae Trust 2005-W3 (b) | 3.4750 | 04/25/45 | 240,920 | ||||||||||
| 473,000 | Finance of America HECM Buyout 2019-AB1 (b),(c) | 5.0840 | 11/25/25 | 441,128 | ||||||||||
| 74,040 | First Horizon Alternative Mortgage Securities | 6.2500 | 08/25/37 | 32,222 | ||||||||||
| 537,823 | First Horizon Mortgage Pass-Through Trust 2005-AR3 (b) | 3.8750 | 08/25/35 | 369,031 | ||||||||||
| 80,229 | First Horizon Mortgage Pass-Through Trust 2005-AR5 (b) | 4.6250 | 10/25/35 | 41,900 | ||||||||||
| 61,542 | First Horizon Mortgage Pass-Through Trust 2005-AR5 (b) | 4.6250 | 11/25/35 | 53,679 | ||||||||||
| 118,152 | First Horizon Mortgage Pass-Through Trust 2006-AR3 (b) | 3.3910 | 11/25/36 | 81,415 | ||||||||||
| 287,119 | First Horizon Mortgage Pass-Through Trust 2007-AR3 (b) | 3.8700 | 11/25/37 | 150,344 | ||||||||||
| 2,291,954 | Flagstar Mortgage Trust 2018-3 (b),(c) | 4.4770 | 05/25/48 | 1,809,521 | ||||||||||
| 913,409 | Flagstar Mortgage Trust 2018-5 (b),(c) | 4.4680 | 09/25/48 | 668,136 | ||||||||||
See accompanying notes to consolidated financial statements
29
| EASTERLY INCOME OPPORTUNITIES FUND |
| SCHEDULE OF INVESTMENTS (Continued) |
| November 30, 2022 |
| Principal | Coupon Rate | |||||||||||||
| Amount ($) | Spread | (%) | Maturity | Fair Value | ||||||||||
| ASSET BACKED SECURITIES — 82.2% (Continued) | ||||||||||||||
| COLLATERALIZED MORTGAGE OBLIGATIONS — 39.6% (Continued) | ||||||||||||||
| 420,000 | Freddie Mac STACR REMIC Trust 2020-DNA6 (c),(d) | SOFR30A + 3.000% | 6.5210 | 12/25/50 | $ | 380,558 | ||||||||
| 1,000,000 | Freddie Mac STACR REMIC Trust 2022-HQA1 (c),(d) | SOFR30A + 5.250% | 8.7710 | 03/25/42 | 940,133 | |||||||||
| 1,000,000 | Freddie Mac STACR Trust 2019-DNA3 (d) | US0001M + 8.150% | 12.1660 | 07/25/49 | 974,594 | |||||||||
| 22,409 | Freddie Mac Structured Pass-Through Certificates (d) | 12MTA + 1.400% | 3.0890 | 07/25/44 | 22,574 | |||||||||
| 163,022 | Freddie Mac Structured Pass-Through Certificates (d) | 12MTA + 1.200% | 2.8890 | 10/25/44 | 163,394 | |||||||||
| 1,916,067 | Galton Funding Mortgage Trust 2017-1 (b),(c) | 4.2400 | 07/25/56 | 1,732,431 | ||||||||||
| 1,510,919 | GCAT 2021-NQM2 Trust(b),(c) | 1.4990 | 05/25/66 | 1,156,207 | ||||||||||
| 8,089,601 | Global Mortgage Securitization Ltd. (c) | 5.2500 | 11/25/32 | 7,623,433 | ||||||||||
| 1,465,508 | Global Mortgage Securitization Ltd. (c),(d) | 9.5170 | 11/25/32 | 1,485,392 | ||||||||||
| 96,958 | GMACM Mortgage Loan Trust 2004-J2 | 5.7500 | 06/25/34 | 92,766 | ||||||||||
| 15,737 | GMACM Mortgage Loan Trust 2005-AR3 (b) | 3.1690 | 06/19/35 | 13,874 | ||||||||||
| 2,514,327 | GMACM Mortgage Loan Trust 2005-AR5 (b) | 3.4750 | 09/19/35 | 2,209,252 | ||||||||||
| 117,550 | GMACM Mortgage Loan Trust 2006-AR1 (b) | 2.9840 | 04/19/36 | 84,285 | ||||||||||
| 471,608 | Government National Mortgage Association (a),(b) | 1.6330 | 10/20/62 | 12,814 | ||||||||||
| 1,388,105 | Government National Mortgage Association (a),(b) | 0.7300 | 11/20/66 | 75,284 | ||||||||||
| 128,311 | GS Mortgage Securities Corporation II (c),(d) | US0001M + 0.350% | 3.3430 | 03/20/23 | 121,185 | |||||||||
| 401,423 | GS Mortgage-Backed Securities Corp Trust 2019-PJ1 (b),(c) | 4.0790 | 08/25/49 | 307,797 | ||||||||||
| 613,089 | GS Mortgage-Backed Securities Trust (b),(c) | 2.7240 | 07/25/44 | 586,496 | ||||||||||
| 1,323,324 | GSMPS Mortgage Loan Trust (b),(c) | 8.5000 | 06/19/29 | 1,170,679 | ||||||||||
| 1,165,785 | GSMPS Mortgage Loan Trust 2004-4 (c),(d) | US0001M + 0.400% | 4.4440 | 06/25/34 | 1,001,358 | |||||||||
| 1,044,824 | GSMPS Mortgage Loan Trust 2004-4 (c) | 7.5000 | 06/25/34 | 992,444 | ||||||||||
| 346,117 | GSMPS Mortgage Loan Trust 2004-4 (c) | 8.0000 | 06/25/34 | 330,151 | ||||||||||
| 35,010 | GSMPS Mortgage Loan Trust 2005-RP2 (c),(d) | US0001M + 0.350% | 4.3940 | 03/25/35 | 32,848 | |||||||||
| 181,438 | GSMPS Mortgage Loan Trust 2005-RP3 (c),(d) | US0001M + 0.350% | 4.3940 | 09/25/35 | 149,077 | |||||||||
| 135,105 | GSMPS Mortgage Loan Trust 2006-RP1 (c) | 7.5000 | 01/25/36 | 116,688 | ||||||||||
| 798,163 | GSMSC Pass-Through Trust 2008-2R (b),(c) | 7.5000 | 10/25/36 | 178,839 | ||||||||||
| 370,455 | GSR Mortgage Loan Trust 2004-13F | 4.2500 | 11/25/34 | 340,279 | ||||||||||
| 13,937 | GSR Mortgage Loan Trust 2004-7 (b) | 3.0280 | 06/25/34 | 12,171 | ||||||||||
| 47,820 | GSR Mortgage Loan Trust 2005-4F | 6.5000 | 02/25/35 | 44,623 | ||||||||||
| 6,539 | GSR Mortgage Loan Trust 2005-6F | 5.2500 | 07/25/35 | 6,319 | ||||||||||
| 27,685 | GSR Mortgage Loan Trust 2005-8F | 6.0000 | 11/25/35 | 12,066 | ||||||||||
| 46,643 | GSR Mortgage Loan Trust 2005-AR3 (d) | US0001M + 0.440% | 4.4840 | 05/25/35 | 37,504 | |||||||||
See accompanying notes to consolidated financial statements
30
| EASTERLY INCOME OPPORTUNITIES FUND |
| SCHEDULE OF INVESTMENTS (Continued) |
| November 30, 2022 |
| Principal | Coupon Rate | |||||||||||||
| Amount ($) | Spread | (%) | Maturity | Fair Value | ||||||||||
| ASSET BACKED SECURITIES — 82.2% (Continued) | ||||||||||||||
| COLLATERALIZED MORTGAGE OBLIGATIONS — 39.6% (Continued) | ||||||||||||||
| 14,559 | GSR Mortgage Loan Trust 2005-AR3 (d) | US0001M + 0.440% | 4.4840 | 05/25/35 | $ | 11,263 | ||||||||
| 555,193 | GSR Mortgage Loan Trust 2005-AR4 (b) | 3.1570 | 07/25/35 | 314,991 | ||||||||||
| 117,563 | GSR Mortgage Loan Trust 2006-1F | 6.0000 | 02/25/36 | 61,761 | ||||||||||
| 76,442 | GSR Mortgage Loan Trust 2007-AR2 (b) | 3.1540 | 05/25/37 | 47,104 | ||||||||||
| 241,345 | HarborView Mortgage Loan Trust 2003-1 (b) | 3.3460 | 05/19/33 | 194,247 | ||||||||||
| 54,083 | HarborView Mortgage Loan Trust 2005-14 (b) | 3.8380 | 12/19/35 | 42,676 | ||||||||||
| 85,000 | HomeBanc Mortgage Trust 2005-3 (d) | US0001M + 0.765% | 4.8090 | 07/25/35 | 81,520 | |||||||||
| 208,305 | HSI Asset Loan Obligation Trust 2007-1 | 6.5000 | 06/25/37 | 89,770 | ||||||||||
| 199,721 | HSI Asset Loan Obligation Trust 2007-AR1 (b) | 3.9770 | 01/25/37 | 148,515 | ||||||||||
| 200,414 | HSI Asset Loan Obligation Trust 2007-AR2 (b) | 3.3670 | 09/25/37 | 159,805 | ||||||||||
| 790,981 | Hundred Acre Wood Trust 2021-INV3 (b),(c) | 3.3260 | 10/25/51 | 601,893 | ||||||||||
| 64,451 | Impac CMB Trust Series 2003-2F (e) | 6.5700 | 01/25/33 | 61,389 | ||||||||||
| 71,159 | Impac CMB Trust Series 2003-4 (e) | 5.7290 | 07/25/33 | 66,479 | ||||||||||
| 24,571 | Impac CMB Trust Series 2004-10 (d) | US0001M + 1.500% | 5.5440 | 03/25/35 | 21,201 | |||||||||
| 36,452 | Impac CMB Trust Series 2004-7 (d) | US0001M + 1.800% | 5.8160 | 11/25/34 | 34,844 | |||||||||
| 157,801 | Impac CMB Trust Series 2005-4 (d) | US0001M + 0.750% | 5.1410 | 05/25/35 | 127,280 | |||||||||
| 658,767 | Impac CMB Trust Series 2005-8 (d) | US0001M + 0.750% | 4.7940 | 02/25/36 | 562,666 | |||||||||
| 214,764 | Impac Secured Assets CMN Owner Trust | 6.0000 | 08/25/33 | 182,797 | ||||||||||
| 93,787 | Impac Secured Assets Trust 2006-1 (d) | US0001M + 0.700% | 4.7440 | 05/25/36 | 85,648 | |||||||||
| 500,000 | Imperial Fund Mortgage Trust (c),(e) | 6.2500 | 08/25/67 | 444,125 | ||||||||||
| 2,500,000 | Imperial Fund Mortgage Trust 2022-NQM4 (c),(e) | 5.0400 | 06/25/67 | 2,025,000 | ||||||||||
| 19,203 | IndyMac INDX Mortgage Loan Trust 2004-AR11 (b) | 3.0550 | 12/25/34 | 17,025 | ||||||||||
| 286,329 | IndyMac INDX Mortgage Loan Trust 2004-AR15 (b) | 2.8920 | 02/25/35 | 255,251 | ||||||||||
| 246,790 | JP Morgan Alternative Loan Trust (a),(d) | US0001M + 7.150% | 3.1060 | 12/25/35 | 11,976 | |||||||||
| 1,002,600 | JP Morgan Alternative Loan Trust (c) | 6.0000 | 12/27/36 | 538,139 | ||||||||||
| 432,146 | JP Morgan MBS Series 2006-R1 (b),(c) | 4.0090 | 09/28/44 | 329,853 | ||||||||||
| 18,776 | JP Morgan Mortgage Trust 2004-A3 (b) | 3.1600 | 07/25/34 | 15,577 | ||||||||||
| 26,967 | JP Morgan Mortgage Trust 2004-S2 | 6.0000 | 11/25/34 | 23,653 | ||||||||||
| 32,008 | JP Morgan Mortgage Trust 2005-A7 (b) | 4.1030 | 10/25/35 | 30,695 | ||||||||||
| 49,970 | JP Morgan Mortgage Trust 2006-A2 (b) | 3.7110 | 11/25/33 | 44,663 | ||||||||||
| 17,584 | JP Morgan Mortgage Trust 2006-A4 (b) | 3.2530 | 06/25/36 | 12,593 | ||||||||||
| 570,679 | JP Morgan Mortgage Trust 2014-IVR3 (b),(c) | 2.6660 | 09/25/44 | 549,864 | ||||||||||
| 2,291,418 | JP Morgan Mortgage Trust 2014-IVR3 (b),(c) | 2.6660 | 09/25/44 | 2,210,582 | ||||||||||
See accompanying notes to consolidated financial statements
31
| EASTERLY INCOME OPPORTUNITIES FUND |
| SCHEDULE OF INVESTMENTS (Continued) |
| November 30, 2022 |
| Principal | Coupon Rate | |||||||||||||
| Amount ($) | Spread | (%) | Maturity | Fair Value | ||||||||||
| ASSET BACKED SECURITIES — 82.2% (Continued) | ||||||||||||||
| COLLATERALIZED MORTGAGE OBLIGATIONS — 39.6% (Continued) | ||||||||||||||
| 88,173 | JP Morgan Mortgage Trust 2014-IVR6 (b),(c) | 3.7910 | 07/25/44 | $ | 86,203 | |||||||||
| 22,811 | JP Morgan Mortgage Trust 2018-8 (b),(c) | 4.0000 | 01/25/49 | 20,460 | ||||||||||
| 36,858 | JP Morgan Mortgage Trust 2020-LTV1 (c),(d) | US0001M + 1.000% | 4.5860 | 06/25/50 | 36,306 | |||||||||
| 129,370 | JP Morgan Tax-Emept Pass-Through Trust Series 2012-3 (b),(c) | 3.0000 | 10/27/42 | 117,205 | ||||||||||
| 485,341 | JPMorgan Chase Bank NA - CHASE Series 2020-CL1 M1 (d) | US0001M + 2.250% | 6.2940 | 10/25/57 | 445,188 | |||||||||
| 185,538 | JPMorgan Chase Bank NA - CHASE Series 2020-CL1 M3 (d) | US0001M + 3.350% | 7.3940 | 10/25/57 | 178,982 | |||||||||
| 960,640 | La Hipotecaria Panamanian Mortgage Trust 2021-1 (c) | 4.3500 | 06/13/51 | 902,744 | ||||||||||
| 361,161 | Legacy Mortgage Asset Trust 2020-GS5 (c),(e) | 3.2500 | 06/25/60 | 349,287 | ||||||||||
| 149,368 | Lehman Mortgage Trust 2006-2 | 5.7500 | 04/25/36 | 149,446 | ||||||||||
| 173,540 | LSTAR Securities Investment Ltd. 2019-3 (c),(d) | US0001M + 3.500% | 7.2680 | 04/01/24 | 167,527 | |||||||||
| 2,373,686 | LSTAR Securities Investment Ltd. 2019-4 Series 2019-4 A1 (c),(d) | US0001M + 2.500% | 7.2680 | 05/01/24 | 2,318,692 | |||||||||
| 39,884 | MASTR Adjustable Rate Mortgages Trust 2003-1 (b) | 3.5290 | 12/25/32 | 35,608 | ||||||||||
| 16,655 | MASTR Adjustable Rate Mortgages Trust 2003-2 (b) | 5.7510 | 07/25/33 | 15,589 | ||||||||||
| 32,744 | MASTR Adjustable Rate Mortgages Trust 2003-6 (b) | 2.4530 | 12/25/33 | 29,039 | ||||||||||
| 22,225 | MASTR Adjustable Rate Mortgages Trust 2003-6 (b) | 3.1250 | 12/25/33 | 20,598 | ||||||||||
| 185,724 | MASTR Adjustable Rate Mortgages Trust 2004-15 (b) | 1.9870 | 12/25/34 | 173,698 | ||||||||||
| 170,493 | MASTR Alternative Loan Trust 2003-3 (b) | 6.1590 | 05/25/33 | 149,558 | ||||||||||
| 44,046 | MASTR Alternative Loan Trust 2003-5 | 5.5000 | 06/25/33 | 40,749 | ||||||||||
| 56,768 | MASTR Alternative Loan Trust 2003-7 | 6.5000 | 12/25/33 | 55,328 | ||||||||||
| 189,038 | MASTR Alternative Loan Trust 2004-1 | 5.5000 | 02/25/34 | 174,149 | ||||||||||
| 1,467,326 | MASTR Alternative Loan Trust 2004-12 | 5.5000 | 12/25/34 | 1,268,380 | ||||||||||
| 70,589 | MASTR Alternative Loan Trust 2004-3 | 6.2500 | 04/25/34 | 68,760 | ||||||||||
| 471,393 | MASTR Alternative Loan Trust 2004-3 | 6.5000 | 04/25/34 | 434,726 | ||||||||||
| 27,219 | MASTR Alternative Loan Trust 2004-4 | 5.5000 | 05/25/34 | 25,831 | ||||||||||
| 411,277 | MASTR Alternative Loan Trust 2004-6 | 5.5000 | 07/25/34 | 378,151 | ||||||||||
| 55,611 | MASTR Alternative Loan Trust 2004-6 | 6.0000 | 07/25/34 | 51,405 | ||||||||||
| 77,227 | MASTR Alternative Loan Trust 2004-6 | 6.0000 | 07/25/34 | 70,406 | ||||||||||
| 861,013 | MASTR Alternative Loan Trust 2004-6 | 6.2500 | 07/25/34 | 829,654 | ||||||||||
| 770,224 | MASTR Alternative Loan Trust 2004-6 | 6.5000 | 07/25/34 | 731,751 | ||||||||||
| 60,371 | MASTR Alternative Loan Trust 2004-7 | 6.0000 | 06/25/34 | 53,969 | ||||||||||
| 1,133,496 | MASTR Alternative Loan Trust 2004-7 | 6.0000 | 08/25/34 | 1,097,159 | ||||||||||
See accompanying notes to consolidated financial statements
32
| EASTERLY INCOME OPPORTUNITIES FUND |
| SCHEDULE OF INVESTMENTS (Continued) |
| November 30, 2022 |
| Principal | Coupon Rate | |||||||||||||
| Amount ($) | Spread | (%) | Maturity | Fair Value | ||||||||||
| ASSET BACKED SECURITIES — 82.2% (Continued) | ||||||||||||||
| COLLATERALIZED MORTGAGE OBLIGATIONS — 39.6% (Continued) | ||||||||||||||
| 2,258 | MASTR Alternative Loan Trust 2005-1 | 5.5000 | 01/25/23 | $ | 1,902 | |||||||||
| 300,341 | MASTR Alternative Loan Trust 2005-2 | 5.0000 | 03/25/43 | 224,631 | ||||||||||
| 26,646 | MASTR Alternative Loan Trust 2007-1 (f) | — | 10/25/36 | 14,855 | ||||||||||
| 866,093 | MASTR Alternative Loan Trust 2007-HF1 (f) | — | 10/25/47 | 25,952 | ||||||||||
| 58,984 | MASTR Asset Securitization Trust 2003-11 | 5.2500 | 12/25/33 | 55,854 | ||||||||||
| 67,682 | MASTR Asset Securitization Trust 2003-11 | 5.2500 | 12/25/33 | 62,953 | ||||||||||
| 18,525 | MASTR Asset Securitization Trust 2003-11 | 5.5000 | 12/25/33 | 16,075 | ||||||||||
| 47,205 | MASTR Asset Securitization Trust 2003-11 | 5.5000 | 12/25/33 | 43,817 | ||||||||||
| 82,308 | MASTR Asset Securitization Trust 2003-12 | 5.2500 | 12/25/24 | 80,723 | ||||||||||
| 20,403 | MASTR Asset Securitization Trust 2003-12 | 5.0000 | 12/25/33 | 18,810 | ||||||||||
| 49,878 | MASTR Asset Securitization Trust 2003-12 | 5.0000 | 12/25/33 | 41,141 | ||||||||||
| 10,076 | MASTR Asset Securitization Trust 2004-1 | 5.5000 | 02/25/34 | 9,347 | ||||||||||
| 2,874,522 | MASTR Asset Securitization Trust 2004-9 | 6.0000 | 09/25/34 | 2,300,350 | ||||||||||
| 73,978 | MASTR Asset Securitization Trust 2005-1 | 5.5000 | 05/25/35 | 58,008 | ||||||||||
| 4,115,554 | MASTR Asset Securitization Trust 2006-2 (d) | US0001M + 0.500% | 4.5440 | 06/25/36 | 763,719 | |||||||||
| 1,004,760 | MASTR Asset Securitization Trust 2006-3 (d) | US0001M + 0.450% | 4.4940 | 10/25/36 | 157,901 | |||||||||
| 19,501 | MASTR Reperforming Loan Trust 2005-2 (c) | 8.0000 | 05/25/35 | 15,139 | ||||||||||
| 150,454 | MASTR Reperforming Loan Trust 2006-2 (b),(c) | 3.3900 | 05/25/36 | 136,441 | ||||||||||
| 378,871 | MASTR Seasoned Securitization Trust 2003-1 | 6.0000 | 02/25/33 | 346,980 | ||||||||||
| 63,031 | MASTR Seasoned Securitization Trust 2004-1 (b) | 4.2200 | 10/25/32 | 56,231 | ||||||||||
| 32,105 | MASTR Seasoned Securitization Trust 2005-1 (b) | 3.6160 | 10/25/32 | 26,320 | ||||||||||
| 104,327 | Mello Mortgage Capital Acceptance 2018-MTG1 (b),(c) | 3.7450 | 03/25/48 | 86,172 | ||||||||||
| 880,000 | Mello Mortgage Capital Acceptance 2018-MTG2 (b),(c) | 4.3240 | 10/25/48 | 575,897 | ||||||||||
| 575,926 | Mello Mortgage Capital Acceptance 2021-MTG1 (b),(c) | 2.6480 | 04/25/51 | 389,676 | ||||||||||
| 37,072 | Merrill Lynch Mortgage Investors Trust MLMI Series (b) | 2.9690 | 05/25/33 | 32,660 | ||||||||||
| 245,618 | Merrill Lynch Mortgage Investors Trust MLMI Series (b) | 3.0120 | 05/25/33 | 218,982 | ||||||||||
| 166,319 | Merrill Lynch Mortgage Investors Trust MLMI Series(b) | 3.2620 | 07/25/35 | 80,811 | ||||||||||
| 35,165 | Merrill Lynch Mortgage Investors Trust Series (b) | 4.0370 | 09/25/33 | 32,018 | ||||||||||
| 48,652 | Merrill Lynch Mortgage Investors Trust Series MLCC (b) | 2.6410 | 09/25/37 | 36,701 | ||||||||||
| 1,000,000 | MFA 2022-RPL1 Trust Series 2022-RPL1 M1 (b),(c) | 3.4980 | 08/25/61 | 756,664 | ||||||||||
| 104,873 | Morgan Stanley Dean Witter Capital I Inc Trust (b) | 2.7990 | 03/25/33 | 92,279 | ||||||||||
See accompanying notes to consolidated financial statements
33
| EASTERLY INCOME OPPORTUNITIES FUND |
| SCHEDULE OF INVESTMENTS (Continued) |
| November 30, 2022 |
| Principal | Coupon Rate | |||||||||||||
| Amount ($) | Spread | (%) | Maturity | Fair Value | ||||||||||
| ASSET BACKED SECURITIES — 82.2% (Continued) | ||||||||||||||
| COLLATERALIZED MORTGAGE OBLIGATIONS — 39.6% (Continued) | ||||||||||||||
| 25,681 | Morgan Stanley Mortgage Loan Trust 2004-10AR (b) | 3.9500 | 11/25/34 | $ | 23,204 | |||||||||
| 21,996 | Morgan Stanley Mortgage Loan Trust 2004-2AR (b) | 3.2100 | 02/25/34 | 20,377 | ||||||||||
| 25,644 | Morgan Stanley Mortgage Loan Trust 2004-8AR (b) | 1.8980 | 10/25/34 | 22,631 | ||||||||||
| 25,538 | Morgan Stanley Mortgage Loan Trust 2004-8AR (b) | 3.6140 | 10/25/34 | 22,088 | ||||||||||
| 73,978 | Morgan Stanley Mortgage Loan Trust 2005-10 | 6.0000 | 12/25/35 | 30,717 | ||||||||||
| 23,428 | Morgan Stanley Mortgage Loan Trust 2006-8AR (b) | 3.6180 | 06/25/36 | 21,294 | ||||||||||
| 5,862,600 | Mortgage Equity Conversion Asset Trust 2007-FF2 (c),(d) | H15T1Y + 0.470% | 5.2200 | 02/25/42 | 5,599,944 | |||||||||
| 157,091 | MortgageIT Trust 2004-2 (d) | US0001M + 3.225% | 7.2690 | 12/25/34 | 152,228 | |||||||||
| 288,049 | MortgageIT Trust 2005-3 (d) | US0001M + 0.795% | 4.8390 | 08/25/35 | 265,582 | |||||||||
| 188,245 | MRFC Mortgage Pass-Through Trust Series 2000-TBC3 (b),(c) | 3.5530 | 12/15/30 | 163,620 | ||||||||||
| 1,411,640 | N/A Series 2021-1 A1 (b),(c) | 3.2280 | 02/25/52 | 1,353,524 | ||||||||||
| 565,330 | National City Mortgage Capital Trust | 6.0000 | 03/25/38 | 540,908 | ||||||||||
| 27,570 | National City Mortgage Capital Trust | 6.0000 | 03/25/38 | 26,387 | ||||||||||
| 383,791 | New Residential Mortgage Loan Trust 2017-2 (b),(c) | 4.7500 | 03/25/57 | 320,612 | ||||||||||
| 94,451 | New Residential Mortgage Loan Trust 2020-1 (b),(c) | 3.5000 | 10/25/59 | 87,091 | ||||||||||
| 720,000 | New Residential Mortgage Loan Trust 2020-RPL1 (b),(c) | 3.8820 | 11/25/59 | 393,968 | ||||||||||
| 166,548 | Nomura Asset Acceptance Corp Alternative Loan (c) | 7.5000 | 03/25/34 | 143,959 | ||||||||||
| 90,690 | Nomura Asset Acceptance Corp Alternative Loan (e) | 5.9570 | 03/25/47 | 84,111 | ||||||||||
| 3,808,971 | Ocwen Residential MBS Corporation (b),(c) | — | 09/25/38 | 342,807 | ||||||||||
| 467,179 | PHH Mortgage Trust Series 2008-CIM1 | 6.0000 | 05/25/38 | 437,997 | ||||||||||
| 415 | PHH Mortgage Trust Series 2008-CIM1 (d) | US0001M + 2.250% | 6.0180 | 05/25/38 | 384 | |||||||||
| 429,764 | PHHMC Series 2005-4 Trust (b) | 5.9180 | 07/18/35 | 408,102 | ||||||||||
| 391,325 | Prime Mortgage Trust 2003-3 | 5.5000 | 01/25/34 | 366,370 | ||||||||||
| 469,026 | Provident Funding Mortgage Trust 2020-1 (b),(c) | 3.2560 | 02/25/50 | 344,631 | ||||||||||
| 1,773,307 | Provident Funding Mortgage Trust 2021-2 (b),(c) | 2.5000 | 04/25/51 | 1,582,676 | ||||||||||
| 27,764 | RAAC Series 2005-SP1 Trust | 7.0000 | 09/25/34 | 26,287 | ||||||||||
| 223,485 | Radnor RE 2019-1 Ltd. (c),(d) | US0001M + 1.950% | 5.9660 | 02/25/29 | 218,799 | |||||||||
| 113,123 | RALI Series 2005-QA12 Trust (b) | 3.8540 | 12/25/35 | 54,192 | ||||||||||
| 17,139 | RALI Series 2005-QA4 Trust (b) | 3.4860 | 04/25/35 | 16,053 | ||||||||||
See accompanying notes to consolidated financial statements
34
| EASTERLY INCOME OPPORTUNITIES FUND |
| SCHEDULE OF INVESTMENTS (Continued) |
| November 30, 2022 |
| Principal | Coupon Rate | |||||||||||||
| Amount ($) | Spread | (%) | Maturity | Fair Value | ||||||||||
| ASSET BACKED SECURITIES — 82.2% (Continued) | ||||||||||||||
| COLLATERALIZED MORTGAGE OBLIGATIONS — 39.6% (Continued) | ||||||||||||||
| 10,976 | RBSGC Mortgage Loan Trust 2007-B (b) | 5.6210 | 07/25/35 | $ | 10,039 | |||||||||
| 354,119 | RBSGC Structured Trust 2008- (b),(c) | 5.5000 | 11/25/35 | 297,311 | ||||||||||
| 107,679 | Reperforming Loan REMIC Trust 2003-R4 (b),(c) | 4.3160 | 01/25/34 | 82,068 | ||||||||||
| 21,282 | Reperforming Loan REMIC Trust 2004-R1 (c) | 6.5000 | 11/25/34 | 19,166 | ||||||||||
| 19,947 | Reperforming Loan REMIC Trust 2005-R2 (c) | 8.5000 | 06/25/35 | 19,154 | ||||||||||
| 101,923 | Reperforming Loan REMIC Trust 2006-R2 (c),(d) | US0001M + 0.420% | 4.4640 | 07/25/36 | 93,509 | |||||||||
| 149,986 | Resecuritization Pass-Through Trust 2005-8R | 6.0000 | 10/25/34 | 142,062 | ||||||||||
| 128,000 | Residential Asset Securitization Trust 2003-A10 | 5.2000 | 09/25/33 | 117,776 | ||||||||||
| 586,099 | Residential Asset Securitization Trust 2003-A10 | 5.2500 | 09/25/33 | 524,882 | ||||||||||
| 1,560,388 | Residential Asset Securitization Trust 2003-A9 (d) | US0001M + 0.550% | 4.5940 | 08/25/33 | 1,508,280 | |||||||||
| 74,910 | RESIMAC Bastille Trust Series 2019-1NC (c),(d) | US0001M + 0.930% | 4.7770 | 09/05/57 | 75,627 | |||||||||
| 250,000 | RMF Buyout Issuance Trust (b),(c) | 4.5000 | 04/25/32 | 222,851 | ||||||||||
| 1,023,086 | RMF Proprietary Issuance Trust (b),(c) | 2.1250 | 09/25/61 | 814,802 | ||||||||||
| 242,941 | RMF Proprietary Issuance Trust 2022-1 (b),(c) | 3.0000 | 01/25/62 | 209,122 | ||||||||||
| 1,000,000 | RMF Proprietary Issuance Trust 2022-1 (b),(c) | 3.0000 | 01/25/62 | 826,881 | ||||||||||
| 1,000,000 | RMF Proprietary Issuance Trust 2022-2 (b),(c) | 3.7500 | 06/25/62 | 639,131 | ||||||||||
| 1,414 | Ryland Mortgage Securities Corporation (b) | — | 04/29/30 | 262 | ||||||||||
| 739,386 | Saluda Grade Alternative Mortgage Trust 2020-FIG1 (c) | 3.3210 | 09/25/50 | 725,508 | ||||||||||
| 46,964 | Seasoned Credit Risk Transfer Trust Series 2017-3 (f) | — | 07/25/56 | 7,686 | ||||||||||
| 860,000 | Seasoned Credit Risk Transfer Trust Series 2019-1 (b) | 4.7500 | 07/25/58 | 714,657 | ||||||||||
| 3,400,000 | Seasoned Credit Risk Transfer Trust Series 2020-2 (b) | 4.2500 | 11/25/59 | 2,828,443 | ||||||||||
| 36,844 | Sequoia Mortgage Trust 2004-10 (d) | US0001M + 0.620% | 4.5590 | 11/20/34 | 32,522 | |||||||||
| 77,333 | Sequoia Mortgage Trust 2005-2 (d) | US0001M + 0.440% | 4.3790 | 03/20/35 | 64,876 | |||||||||
| 375,995 | Sequoia Mortgage Trust 2005-3 (d) | US0001M + 0.555% | 4.4940 | 05/20/35 | 270,063 | |||||||||
| 315,152 | Sequoia Mortgage Trust 2007-2 (d) | US0001M + 0.600% | 4.5390 | 06/20/36 | 230,100 | |||||||||
| 180,836 | Sequoia Mortgage Trust 2007-4 (d) | US0001M + 0.780% | 4.7190 | 01/20/36 | 135,367 | |||||||||
| 895,864 | Sequoia Mortgage Trust 2013-10 (b),(c) | 3.5320 | 08/25/43 | 827,144 | ||||||||||
| 37,165 | Sequoia Mortgage Trust 2013-8 (b) | 3.4870 | 06/25/43 | 25,114 | ||||||||||
| 288,356 | Sequoia Mortgage Trust 2014-4 (b),(c) | 3.5000 | 11/25/44 | 254,983 | ||||||||||
| 81,605 | Sequoia Mortgage Trust 2017-1 (b),(c) | 3.6110 | 02/25/47 | 53,791 | ||||||||||
| 83,454 | Shellpoint Co-Originator Trust 2017-1 (b),(c) | 3.6050 | 04/25/47 | 53,609 | ||||||||||
See accompanying notes to consolidated financial statements
35
| EASTERLY INCOME OPPORTUNITIES FUND |
| SCHEDULE OF INVESTMENTS (Continued) |
| November 30, 2022 |
| Principal | Coupon Rate | |||||||||||||
| Amount ($) | Spread | (%) | Maturity | Fair Value | ||||||||||
| ASSET BACKED SECURITIES — 82.2% (Continued) | ||||||||||||||
| COLLATERALIZED MORTGAGE OBLIGATIONS — 39.6% (Continued) | ||||||||||||||
| 434,926 | Sofi Mortgage Trust 2016-1 (b),(c) | 3.0910 | 11/25/46 | $ | 278,926 | |||||||||
| 100,000 | Spruce Hill Mortgage Loan Trust 2020-SH1 (b),(c) | 4.6760 | 01/28/50 | 80,048 | ||||||||||
| 61,129 | Structured Adjustable Rate Mortgage Loan Trust (b) | 3.7270 | 03/25/34 | 54,308 | ||||||||||
| 72,974 | Structured Adjustable Rate Mortgage Loan Trust (b) | 3.2330 | 12/25/34 | 62,989 | ||||||||||
| 225,695 | Structured Adjustable Rate Mortgage Loan Trust (b) | 3.5550 | 03/25/35 | 178,697 | ||||||||||
| 363,055 | Structured Adjustable Rate Mortgage Loan Trust (b) | 3.6040 | 07/25/35 | 224,540 | ||||||||||
| 931,167 | Structured Adjustable Rate Mortgage Loan Trust(b) | 3.5890 | 02/25/36 | 780,794 | ||||||||||
| 7,817 | Structured Adjustable Rate Mortgage Loan Trust (d) | US0001M + 0.380% | 4.4240 | 09/25/36 | 6,746 | |||||||||
| 1,181,980 | Structured Asset Mortgage Investments II Trust(d) | US0001M + 0.620% | 4.6640 | 09/25/45 | 1,032,974 | |||||||||
| 188,611 | Structured Asset Sec Corp Mort Passthr Certs Ser(b) | 3.4990 | 01/25/34 | 162,117 | ||||||||||
| 33,284 | Structured Asset Sec Corp Mort Passthr Certs Ser (b) | 3.4990 | 01/25/34 | 31,458 | ||||||||||
| 72,095 | Structured Asset Securities Corp Mortgage Series 2000-5 B3 (b) | 0.4370 | 11/25/30 | 38,179 | ||||||||||
| 2,101,932 | Structured Asset Securities Corp Reverse Mortgage (c),(d) | US0001M + 1.850% | 5.8660 | 05/25/47 | 1,855,346 | |||||||||
| 1,959,583 | Structured Asset Securities Corp Reverse Mortgage (c),(d) | US0001M + 3.000% | 7.0160 | 05/25/47 | 1,710,177 | |||||||||
| 5,533 | Structured Asset Securities Corporation (d) | US0001M + 0.780% | 4.5480 | 12/25/33 | 4,939 | |||||||||
| 15,336 | Structured Asset Securities Corporation (e) | 5.0680 | 02/25/34 | 14,392 | ||||||||||
| 119,330 | Structured Asset Securities Corporation (e) | 5.0680 | 02/25/34 | 111,941 | ||||||||||
| 86,853 | Structured Asset Securities Corporation (c),(d) | US0001M + 0.350% | 4.3940 | 04/25/35 | 80,135 | |||||||||
| 119,645 | Structured Asset Securities Corporation (b),(c) | 3.3730 | 06/25/35 | 102,478 | ||||||||||
| 230,000 | Towd Point Mortgage Trust (b),(c) | 3.5280 | 10/25/53 | 194,723 | ||||||||||
| 100,000 | Verus Securitization Trust 2020-INV1 (b),(c) | 6.0000 | 03/25/60 | 91,043 | ||||||||||
| 593,000 | Verus Securitization Trust 2020-INV1 (b),(c) | 5.5000 | 04/25/60 | 553,378 | ||||||||||
| 481,425 | Verus Securitization Trust 2022-7 (b),(c) | 5.3500 | 07/25/67 | 461,736 | ||||||||||
| 538,000 | Vista Point Securitization Trust 2020-1 (b),(c) | 4.1510 | 03/25/65 | 489,922 | ||||||||||
| 100,000 | Vista Point Securitization Trust 2020-2 (b),(c) | 4.9000 | 04/25/65 | 79,718 | ||||||||||
| 292,251 | Wachovia Mortgage Loan Trust, LLC A (b) | 3.8800 | 05/20/36 | 271,333 | ||||||||||
| 43,751 | WaMu Mortgage Pass-Through Certificates Series 2002-AR14 (b) | 3.8590 | 11/25/32 | 38,130 | ||||||||||
| 47,246 | WaMu Mortgage Pass-Through Certificates Series 2002-AR17 (d) | 12MTA + 1.200% | 2.8890 | 11/25/42 | 39,732 | |||||||||
| 46,290 | WaMu Mortgage Pass-Through Certificates Series 2002-AR18 (b) | 2.6090 | 01/25/33 | 43,605 | ||||||||||
See accompanying notes to consolidated financial statements
36
| EASTERLY INCOME OPPORTUNITIES FUND |
| SCHEDULE OF INVESTMENTS (Continued) |
| November 30, 2022 |
| Principal | Coupon Rate | |||||||||||||
| Amount ($) | Spread | (%) | Maturity | Fair Value | ||||||||||
| ASSET BACKED SECURITIES — 82.2% (Continued) | ||||||||||||||
| COLLATERALIZED MORTGAGE OBLIGATIONS — 39.6% (Continued) | ||||||||||||||
| 26,285 | WaMu Mortgage Pass-Through Certificates Series 2002-AR2 (d) | ECOFC + 1.250% | 2.5970 | 02/27/34 | $ | 22,579 | ||||||||
| 17,876 | WaMu Mortgage Pass-Through Certificates Series 2003-AR9 (b) | 4.1310 | 09/25/33 | 15,723 | ||||||||||
| 37,876 | WaMu Mortgage Pass-Through Certificates Series 2003-S3 | 5.5000 | 06/25/33 | 35,641 | ||||||||||
| 504,438 | WaMu Mortgage Pass-Through Certificates Series 2003-S4 (b) | 5.6590 | 06/25/33 | 462,254 | ||||||||||
| 51,872 | WaMu Mortgage Pass-Through Certificates Series 2003-S5 | 5.5000 | 06/25/33 | 48,993 | ||||||||||
| 88,220 | WaMu Mortgage Pass-Through Certificates Series 2004-S3 | 6.0000 | 07/25/34 | 83,552 | ||||||||||
| 47,518 | WaMu Mortgage Pass-Through Certificates Series 2005-AR1 (d) | US0001M + 0.640% | 4.6840 | 01/25/45 | 43,738 | |||||||||
| 46,264 | WaMu Mortgage Pass-Through Certificates Series 2006-AR2 (b) | 3.0930 | 03/25/36 | 41,269 | ||||||||||
| 132,875 | WaMu Mortgage Pass-Through Certificates Series 2006-AR8 (b) | 3.6760 | 08/25/46 | 96,034 | ||||||||||
| 167,735 | Washington Mutual MSC Mortgage Pass-Through 2003-MS7 | 5.5000 | 03/25/33 | 162,601 | ||||||||||
| 73,228 | Washington Mutual MSC Mortgage Pass-Through 2003-MS9 | 7.5000 | 04/25/33 | 71,954 | ||||||||||
| 13,825 | Washington Mutual MSC Mortgage Pass-Through 2005-RA1 (b),(c) | 3.0290 | 01/25/35 | 10,914 | ||||||||||
| 1,112,441 | Wells Fargo Alternative Loan 2005-1 Trust | 5.5000 | 02/25/35 | 1,083,013 | ||||||||||
| 83,361 | Wells Fargo Mortgage Backed Securities 2007-7 | 6.0000 | 06/25/37 | 67,642 | ||||||||||
| 73,178 | Wells Fargo Mortgage Backed Securities 2019-4 (b),(c) | 3.0000 | 09/25/49 | 60,038 | ||||||||||
| 219,527 | WinWater Mortgage Loan Trust 2015-1 (b),(c) | 3.8780 | 01/20/45 | 191,615 | ||||||||||
| 124,980,645 | ||||||||||||||
| CREDIT CARD — 0.5% | ||||||||||||||
| 1,000,000 | Continental Finance Credit Card A.B.S Master Trust (c) | 6.1900 | 10/15/30 | 956,631 | ||||||||||
| 750,000 | Mercury Financial Credit Card Master Trust (c) | 2.3300 | 03/20/26 | 692,861 | ||||||||||
| 1,649,492 | ||||||||||||||
| HOME EQUITY — 3.6% | ||||||||||||||
| 68,106 | ABFC 2004-OPT2 Trust (d) | US0001M + 0.560% | 4.6040 | 10/25/33 | 64,087 | |||||||||
| 178,005 | AFC Trust Series 1999-3 (d) | US0001M + 0.980% | 5.0240 | 09/28/29 | 122,252 | |||||||||
| 64,604 | American Residential Home Equity Loan Trust 1998-1 (d) | US0001M + 2.175% | 6.2190 | 05/25/29 | 69,928 | |||||||||
| 29,843 | Ameriquest Mortgage Securities, Inc. (e) | 3.8870 | 05/25/34 | 29,370 | ||||||||||
| 557,108 | Bayview Financial Asset Trust 2007-SSR1 (c),(d) | US0001M + 0.450% | 4.4940 | 03/25/37 | 538,881 | |||||||||
See accompanying notes to consolidated financial statements
37
| EASTERLY INCOME OPPORTUNITIES FUND |
| SCHEDULE OF INVESTMENTS (Continued) |
| November 30, 2022 |
| Principal | Coupon Rate | |||||||||||||
| Amount ($) | Spread | (%) | Maturity | Fair Value | ||||||||||
| ASSET BACKED SECURITIES — 82.2% (Continued) | ||||||||||||||
| HOME EQUITY — 3.6% (Continued) | ||||||||||||||
| 3,271,604 | Bayview Financial Mortgage Pass-Through Trust (c),(d) | US0001M + 1.000% | 5.0290 | 05/28/39 | $ | 2,573,568 | ||||||||
| 1,552,318 | Bayview Financial Mortgage Pass-Through Trust (c),(d) | US0001M + 1.500% | 5.5290 | 02/28/40 | 1,429,002 | |||||||||
| 50,276 | Bear Stearns Asset Backed Securities I Trust (d) | US0001M + 2.100% | 4.9490 | 06/25/34 | 45,623 | |||||||||
| 161,299 | Bear Stearns Home Loan Owner Trust 2001-A (e) | 10.5000 | 02/15/31 | 163,387 | ||||||||||
| 269,461 | CHEC Loan Trust 2004-1 (c),(d) | US0001M + 0.975% | 5.0190 | 07/25/34 | 261,296 | |||||||||
| 14,332 | Citigroup Global Markets Mortgage Securities VII (d) | US0001M + 1.350% | 5.3660 | 01/25/32 | 13,692 | |||||||||
| 133,299 | Delta Funding Home Equity Loan Trust 1999-2 (d) | US0001M + 0.320% | 4.5150 | 08/15/30 | 129,033 | |||||||||
| 143,341 | Delta Funding Home Equity Loan Trust 1999-3 (e) | 8.0610 | 09/15/29 | 131,471 | ||||||||||
| 346,146 | Delta Funding Home Equity Loan Trust 2000-1 (e) | 8.0900 | 05/15/30 | 286,584 | ||||||||||
| 255,180 | EMC Mortgage Loan Trust 2001-A (c),(d) | US0001M + 1.050% | 5.0940 | 05/25/40 | 236,533 | |||||||||
| 172,753 | Financial Asset Securities Corp AAA Trust 2005-1 (c),(d) | US0001 + 0.410% | 4.4650 | 02/27/35 | 155,189 | |||||||||
| 39,217 | First Alliance Mortgage Loan Trust 1999-1 (e) | 7.1800 | 06/20/30 | 38,930 | ||||||||||
| 91,561 | GE Capital Mortgage Services Inc 1999-HE1 Trust (b) | 6.7000 | 04/25/29 | 84,538 | ||||||||||
| 1,038,748 | Mastr Asset Backed Securities Trust 2004-FRE1 (d) | US0001M + 2.700% | 6.7440 | 07/25/34 | 946,101 | |||||||||
| 260,563 | Mastr Asset Backed Securities Trust 2005-NC1 (d) | US0001M + 0.750% | 4.7940 | 12/25/34 | 245,368 | |||||||||
| 300,453 | Morgan Stanley A.B.S Capital I Inc Trust Series (d) | US0001M + 3.900% | 7.9440 | 03/25/33 | 266,201 | |||||||||
| 104,990 | Nomura Home Equity Loan Inc 2006-HE2 (d) | US0001M + 0.495% | 4.5390 | 03/25/36 | 90,292 | |||||||||
| 324,933 | NovaStar Mortgage Funding Trust Series 2003-4 (d) | US0001M + 0.740% | 4.7840 | 02/25/34 | 314,184 | |||||||||
| 44,325 | RAAC Series 2004-SP1 Trust (d) | US0001M + 0.700% | 4.7440 | 03/25/34 | 40,797 | |||||||||
| 193,424 | RBSSP Resecuritization Trust 2010-4 (c),(e) | 5.8250 | 02/26/36 | 185,611 | ||||||||||
| 567,175 | Renaissance Home Equity Loan Trust 2002-3 (d) | US0001M + 1.500% | 5.5440 | 12/25/32 | 523,491 | |||||||||
| 128,342 | Renaissance Home Equity Loan Trust 2002-3 (d) | US0001M + 2.550% | 6.5940 | 12/25/32 | 114,344 | |||||||||
| 29,852 | Saxon Asset Securities Trust 2001-2 (e) | 7.1700 | 03/25/29 | 30,263 | ||||||||||
| 35,445 | Saxon Asset Securities Trust 2003-3 (d) | US0001M + 2.400% | 3.6530 | 12/25/33 | 31,478 | |||||||||
| 241,259 | Saxon Asset Securities Trust 2003-3 (e) | 4.2020 | 12/25/33 | 214,318 | ||||||||||
| 1,500,000 | Security National Mortgage Loan Trust 2005-2 (b),(c) | 7.3370 | 02/25/35 | 1,438,717 | ||||||||||
| 406,016 | Security National Mortgage Loan Trust 2005-2 (b),(c) | 6.2130 | 02/25/36 | 395,020 | ||||||||||
| 71,225 | Soundview Home Loan Trust 2006-OPT4 (d) | US0001M + 0.300% | 4.3440 | 06/25/36 | 69,393 | |||||||||
See accompanying notes to consolidated financial statements
38
| EASTERLY INCOME OPPORTUNITIES FUND |
| SCHEDULE OF INVESTMENTS (Continued) |
| November 30, 2022 |
| Principal | Coupon Rate | |||||||||||||
| Amount ($) | Spread | (%) | Maturity | Fair Value | ||||||||||
| ASSET BACKED SECURITIES — 82.2% (Continued) | ||||||||||||||
| HOME EQUITY — 3.6% (Continued) | ||||||||||||||
| 213,328 | Southern Pacific Secured Asset Corporation | 7.3200 | 05/25/27 | $ | 212,435 | |||||||||
| 11,491,377 | ||||||||||||||
| MANUFACTURED HOUSING — 1.1% | ||||||||||||||
| 1,000,000 | Cascade MH Asset Trust 2019-MH1 (b),(c) | 5.9850 | 11/01/44 | 917,191 | ||||||||||
| 234,121 | Conseco Finance Corporation (b) | 7.8500 | 11/15/26 | 232,213 | ||||||||||
| 2,500,000 | Towd Point Mortgage Trust 2019-MH1 (b),(c) | 3.7500 | 11/25/58 | 2,227,737 | ||||||||||
| 3,377,141 | ||||||||||||||
| NON AGENCY CMBS — 18.5% | ||||||||||||||
| 2,700,350 | Angel Oak SB Commercial Mortgage Trust 2020-SBC1 (b),(c) | 3.6530 | 05/25/50 | 1,698,954 | ||||||||||
| 2,124,264 | Angel Oak SB Commercial Mortgage Trust 2020-SBC1 (b),(c) | 5.3780 | 05/25/50 | 1,331,632 | ||||||||||
| 723,000 | Arbor Multifamily Mortgage Securities Trust (c) | 1.7500 | 05/15/53 | 448,901 | ||||||||||
| 1,000,000 | Arbor Multifamily Mortgage Securities Trust (c) | 1.7500 | 05/15/53 | 583,087 | ||||||||||
| 34,568 | Bayview Commercial Asset Trust 2005-2 (c),(d) | US0001M + 0.645% | 4.6890 | 08/25/35 | 29,754 | |||||||||
| 53,489 | Bayview Commercial Asset Trust 2005-2 (c),(d) | US0001M + 1.725% | 5.7690 | 08/25/35 | 49,634 | |||||||||
| 198,634 | Bayview Commercial Asset Trust 2005-3 (c),(d) | US0001M + 0.480% | 4.5240 | 11/25/35 | 176,331 | |||||||||
| 29,621 | Bayview Commercial Asset Trust 2005-4 (c),(d) | US0001M + 0.675% | 4.7190 | 01/25/36 | 25,710 | |||||||||
| 438,714 | Bayview Commercial Asset Trust 2007-3 (c),(d) | US0001M + 0.340% | 4.3840 | 07/25/37 | 369,716 | |||||||||
| 575,118 | Bayview Commercial Asset Trust 2007-3 (c),(d) | US0001M + 0.370% | 4.4140 | 07/25/37 | 480,946 | |||||||||
| 1,084,491 | Bayview Commercial Asset Trust 2007-3 (c),(d) | US0001M + 0.500% | 4.5440 | 07/25/37 | 905,858 | |||||||||
| 2,575,157 | Bayview Commercial Asset Trust 2008-2 (c),(d) | US0001M + 2.500% | 6.5440 | 04/25/38 | 2,493,329 | |||||||||
| 555,000 | BMD2 Re-Remic Trust 2019-FRR1 (b),(c) | 3.4900 | 05/25/52 | 430,311 | ||||||||||
| 1,000,000 | Capital Funding Mortgage Trust 2021-15 (c),(d) | US0001M + 3.150% | 6.9200 | 03/15/24 | 986,331 | |||||||||
| 2,821,650 | CBA Commercial Small Balance Commercial Mortgage (c),(e) | 6.2600 | 07/25/39 | 2,475,614 | ||||||||||
| 72,000 | CD 2017-CD3 Mortgage Trust (c) | 3.2500 | 02/10/50 | 46,942 | ||||||||||
| 385,453 | CFCRE Commercial Mortgage Trust 2011-C2 (b),(c) | 5.2490 | 12/15/47 | 367,625 | ||||||||||
| 100,000 | CFK Trust 2020-MF2 (c) | 2.3870 | 03/15/39 | 82,337 | ||||||||||
| 1,990,236 | CG-CCRE Commercial Mortgage Trust 2014-FL1 (c),(d) | US0001M + 1.150% | 5.0250 | 06/15/31 | 1,968,751 | |||||||||
| 1,494,034 | CG-CCRE Commercial Mortgage Trust 2014-FL2 (c),(d) | US0001M + 1.854% | 5.7290 | 11/15/31 | 1,415,451 | |||||||||
| 100,000 | Citigroup Commercial Mortgage Trust 2016-C2 | 3.1760 | 08/10/49 | 87,229 | ||||||||||
| 50,000 | Citigroup Commercial Mortgage Trust 2018-C5 (b) | 4.4080 | 06/10/51 | 44,215 | ||||||||||
| 482,477 | CNL Commercial Mortgage Loan Trust 2003-1 (c),(d) | US0001M + 0.500% | 4.3750 | 05/15/31 | 468,783 | |||||||||
See accompanying notes to consolidated financial statements
39
| EASTERLY INCOME OPPORTUNITIES FUND |
| SCHEDULE OF INVESTMENTS (Continued) |
| November 30, 2022 |
| Principal | Coupon Rate | |||||||||||||
| Amount ($) | Spread | (%) | Maturity | Fair Value | ||||||||||
| ASSET BACKED SECURITIES — 82.2% (Continued) | ||||||||||||||
| NON AGENCY CMBS — 18.5% (Continued) | ||||||||||||||
| 82,764 | COMM 2012-LC4 Mortgage Trust (b) | 4.9340 | 12/10/44 | $ | 82,621 | |||||||||
| 100,000 | COMM 2013-CCRE12 Mortgage Trust (b) | 4.7620 | 10/10/46 | 93,740 | ||||||||||
| 1,350,000 | Csail 2015-C2 Commercial Mortgage Trust (b) | 4.3160 | 06/15/57 | 1,180,385 | ||||||||||
| 265,000 | CSAIL 2018-C14 Commercial Mortgage Trust (b),(c) | 5.0800 | 11/15/51 | 202,484 | ||||||||||
| 470,000 | CSAIL 2019-C16 Commercial Mortgage Trust (b) | 4.2370 | 06/15/52 | 363,547 | ||||||||||
| 1,390,000 | CSMC 2014-USA OA, LLC (c) | 4.3730 | 09/15/37 | 1,112,177 | ||||||||||
| 1,702,000 | GS Mortgage Securities Trust 2014-GC18 (b) | 4.8850 | 01/10/47 | 1,560,039 | ||||||||||
| 26,000 | GS Mortgage Securities Trust 2014-GC20 (b) | 5.1680 | 04/10/47 | 23,043 | ||||||||||
| 1,000,000 | GS Mortgage Securities Trust 2016-GS4 (b) | 4.0790 | 11/10/49 | 854,582 | ||||||||||
| 1,300,000 | Harvest Commercial Capital Loan Trust 2019-1 (b),(c) | 5.7300 | 11/25/31 | 1,146,142 | ||||||||||
| 700,000 | HMH Trust 2017-NSS (c) | 3.0620 | 07/05/31 | 658,181 | ||||||||||
| 2,366,000 | Hudsons Bay Simon JV Trust 2015-HBS (c) | 3.9140 | 08/05/34 | 2,104,872 | ||||||||||
| 220,809 | Hudsons Bay Simon JV Trust 2015-HBS (c),(d) | US0001M + 1.830% | 5.6770 | 08/05/34 | 194,557 | |||||||||
| 88,525 | Impac CMB Trust Series 2004-8 (d) | US0001M + 2.625% | 6.2110 | 08/25/34 | 73,558 | |||||||||
| 100,000 | J.P. Morgan Chase Commercial Mortgage Securities (b),(c) | 2.9490 | 09/06/38 | 86,290 | ||||||||||
| 339,015 | JP Morgan Chase Commercial Mortgage Securities (c),(d) | US0001M + 3.750% | 7.6250 | 05/15/28 | 313,266 | |||||||||
| 3,068,180 | JP Morgan Chase Commercial Mortgage Securities (c) | 3.9100 | 05/05/30 | 2,472,296 | ||||||||||
| 193,000 | JP Morgan Chase Commercial Mortgage Securities (b),(c) | 5.7090 | 02/15/46 | 86,338 | ||||||||||
| 500,000 | JP Morgan Chase Commercial Mortgage Securities (b),(c) | 3.2500 | 04/15/46 | 343,007 | ||||||||||
| 658,672 | JP Morgan Chase Commercial Mortgage Securities (b) | 6.0140 | 06/15/49 | 171,733 | ||||||||||
| 339,000 | JPMBB Commercial Mortgage Securities Trust (b) | 4.3230 | 05/15/48 | 300,572 | ||||||||||
| 103,829 | Lehman Brothers Small Balance Commercial Mortgage(c),(d) | US0001M + 0.250% | 4.2940 | 03/25/37 | 100,617 | |||||||||
| 4,000,000 | LSTAR Commercial Mortgage Trust 2015-3 (b),(c) | 3.2910 | 04/20/48 | 3,473,123 | ||||||||||
| 37,345 | LSTAR Commercial Mortgage Trust 2015-3 (b),(c) | 3.2910 | 04/20/48 | 35,672 | ||||||||||
| 1,500,000 | LSTAR Commercial Mortgage Trust 2017-5 (b),(c) | 4.8300 | 03/10/50 | 1,190,310 | ||||||||||
| 6,175,000 | Morgan Stanley Bank of America Merrill Lynch Trust (b) | 4.5450 | 08/15/46 | 5,927,290 | ||||||||||
| 420,000 | Morgan Stanley Capital I Trust 2014-150E (c) | 4.0120 | 09/09/32 | 368,234 | ||||||||||
| 347,000 | Morgan Stanley Capital I Trust 2014-150E (b),(c) | 4.4380 | 09/09/32 | 284,345 | ||||||||||
| 200,000 | Morgan Stanley Capital I Trust 2015-MS1 (b),(c) | 4.1580 | 05/15/48 | 165,229 | ||||||||||
| 72,000 | Morgan Stanley Capital I Trust 2018-L1 (b) | 4.8790 | 10/15/51 | 61,707 | ||||||||||
See accompanying notes to consolidated financial statements
40
| EASTERLY INCOME OPPORTUNITIES FUND |
| SCHEDULE OF INVESTMENTS (Continued) |
| November 30, 2022 |
| Principal | Coupon Rate | |||||||||||||
| Amount ($) | Spread | (%) | Maturity | Fair Value | ||||||||||
| ASSET BACKED SECURITIES — 82.2% (Continued) | ||||||||||||||
| NON AGENCY CMBS — 18.5% (Continued) | ||||||||||||||
| 242,836 | Multi Security Asset Trust, L.P. Commercial b),(c) | 4.7800 | 11/28/35 | $ | 206,628 | |||||||||
| 370,000 | Olympic Tower 2017-OT Mortgage Trust (b),(c) | 4.0770 | 05/10/39 | 259,385 | ||||||||||
| 500,000 | Ready Capital Mortgage Trust 2019-5 (b),(c) | 5.4330 | 02/25/52 | 399,180 | ||||||||||
| 7,630,000 | ReadyCap Commercial Mortgage Trust 2018-4 (b),(c) | 5.2170 | 02/27/51 | 6,504,225 | ||||||||||
| 642,500 | SFAVE Commercial Mortgage Securities Trust (b),(c) | 3.8720 | 01/05/43 | 439,308 | ||||||||||
| 332,000 | UBS Commercial Mortgage Trust 2017-C2 (b) | 3.9930 | 08/15/50 | 281,992 | ||||||||||
| 274,500 | UBS-BAMLL Trust (c) | 3.6630 | 06/10/30 | 274,134 | ||||||||||
| 129,428 | UBS-Barclays Commercial Mortgage Trust 2012-C4 (b),(c) | 4.4160 | 12/10/45 | 126,458 | ||||||||||
| 639,842 | UBS-Barclays Commercial Mortgage Trust 2013-C5 (b),(c) | 4.2910 | 03/10/46 | 556,490 | ||||||||||
| 295,079 | Velocity Commercial Capital Loan Trust 2017-2 (b),(c) | 6.4200 | 11/25/47 | 253,228 | ||||||||||
| 481,081 | Velocity Commercial Capital Loan Trust 2018-1 (c) | 7.2600 | 04/25/48 | 372,410 | ||||||||||
| 449,231 | Velocity Commercial Capital Loan Trust 2018-2 (b),(c) | 6.3600 | 10/26/48 | 371,736 | ||||||||||
| 659,031 | Velocity Commercial Capital Loan Trust 2019-3 (b),(c) | 3.3800 | 10/25/49 | 525,405 | ||||||||||
| 96,843 | Velocity Commercial Capital Loan Trust 2020-1 (b),(c) | 2.9800 | 02/25/50 | 82,258 | ||||||||||
| 2,557,721 | Velocity Commercial Capital Loan Trust 2021-2 (b),(c) | 1.8200 | 08/25/51 | 2,056,088 | ||||||||||
| 1,476,373 | Velocity Commercial Capital Loan Trust 2022-2 (b),(c) | 5.4100 | 04/25/52 | 1,410,753 | ||||||||||
| 1,433,830 | Velocity Commercial Capital Loan Trust 2022-3 (b),(c) | 6.1300 | 06/25/52 | 1,366,781 | ||||||||||
| 1,596,956 | Wachovia Bank Commercial Mortgage Trust Series (a),(b),(c) | 0.8540 | 07/15/41 | 3,365 | ||||||||||
| 118,640 | Waterfall Commercial Mortgage Trust 2015-SBC5 (b),(c) | 4.1040 | 12/14/32 | 116,549 | ||||||||||
| 256,000 | Wells Fargo Commercial Mortgage Trust 2013-LC12 (b) | 4.4310 | 07/15/46 | 241,938 | ||||||||||
| 91,559 | WFRBS Commercial Mortgage Trust 2011-C4 (b),(c) | 4.9880 | 06/15/44 | 89,428 | ||||||||||
| 100,000 | WFRBS Commercial Mortgage Trust 2014-C24 (b) | 4.2040 | 11/15/47 | 90,851 | ||||||||||
| 460,148 | WFRBS Commercial Mortgage Trust 2014-C25 (b),(c) | 3.8030 | 11/15/47 | 365,408 | ||||||||||
| 58,391,396 | ||||||||||||||
| OTHER ABS —3.2% | ||||||||||||||
| 591,282 | 321 Henderson Receivables I, LLC (c),(d) | US0001M + 0.350% | 4.2250 | 09/15/45 | 581,751 | |||||||||
| 156,427 | AASET 2020-1 Trust (c) | 3.3510 | 01/16/40 | 125,823 | ||||||||||
See accompanying notes to consolidated financial statements
41
| EASTERLY INCOME OPPORTUNITIES FUND |
| SCHEDULE OF INVESTMENTS (Continued) |
| November 30, 2022 |
| Principal | Coupon Rate | |||||||||||||
| Amount ($) | Spread | (%) | Maturity | Fair Value | ||||||||||
| ASSET BACKED SECURITIES — 82.2% (Continued) | ||||||||||||||
| OTHER ABS — 3.2% (Continued) | ||||||||||||||
| 4,527,469 | Bayview Commercial Asset Trust 2007-4 (c),(d) | US0001M + 0.450% | 4.4660 | 09/25/37 | $ | 4,092,197 | ||||||||
| 15,465,434 | Corevest American Finance 2019-3 Trust (a),(b),(c) | 2.2040 | 10/15/52 | 468,465 | ||||||||||
| 1,000,000 | CoreVest American Finance 2021-2 Trust (c) | 2.8310 | 07/15/54 | 720,900 | ||||||||||
| 1,000,000 | Goldman Home Improvement Trust 2022-GRN1 Issuer (c) | 7.3000 | 06/25/52 | 954,227 | ||||||||||
| 2,215,752 | Goodgreen 2021-1 Trust (c) | 5.7400 | 10/15/56 | 1,755,410 | ||||||||||
| 73,621 | HERO Funding Trust 2015-2 (c) | 3.9900 | 09/20/40 | 67,912 | ||||||||||
| 350,002 | Longtrain Leasing III, LLC 2015-1 (c) | 4.0600 | 01/15/45 | 323,508 | ||||||||||
| 100,000 | Progress Residential 2021-SFR3 (c) | 3.4360 | 05/17/26 | 85,463 | ||||||||||
| 1,010,000 | Tricon American Homes 2017-SFR2 Trust (c) | 5.1040 | 01/17/36 | 976,542 | ||||||||||
| 10,152,198 | ||||||||||||||
| RESIDENTIAL MORTGAGE — 2.6% | ||||||||||||||
| 380,693 | Amresco Residential Securities Corp Mort Loan (d) | US0001M + 0.470% | 4.9840 | 06/25/29 | 343,640 | |||||||||
| 1,510,326 | Belvedere SPV Srl (d) | EUR006M + 3.250% | 3.4750 | 12/31/38 | 1,060,069 | |||||||||
| 8,335 | Chase Funding Trust Series 2002-4 (d) | US0001M + 0.740% | 4.7840 | 10/25/32 | 7,949 | |||||||||
| 66,197 | Chase Funding Trust Series 2004-1 (e) | 3.9850 | 11/25/33 | 61,097 | ||||||||||
| 75,256 | Countrywide Asset-Backed Certificates (c),(d) | US0001M + 4.500% | 8.5440 | 11/25/32 | 73,888 | |||||||||
| 1,000,000 | Credit-Based Asset Servicing and Securitization (d) | US0001M + 3.375% | 7.4190 | 06/25/32 | 977,760 | |||||||||
| 92,241 | Credit-Based Asset Servicing and Securitization (d) | US0001M + 2.775% | 3.3130 | 03/25/34 | 94,617 | |||||||||
| 1,109,926 | Credit-Based Asset Servicing and Securitization (e) | 3.9110 | 05/25/35 | 977,001 | ||||||||||
| 234,660 | CWABS Asset-Backed Certificates Trust 2007-13 (d) | US0001M + 0.900% | 4.9440 | 10/25/47 | 210,867 | |||||||||
| 124,009 | Equity One Mortgage Pass-Through Trust 2002-3 (b) | 6.0390 | 11/25/32 | 119,655 | ||||||||||
| 85,065 | Fannie Mae Grantor Trust 2002-T10 (d) | US0001M + 0.240% | 4.2560 | 06/25/32 | 82,925 | |||||||||
| 362,293 | First Franklin Mortgage Loan Trust 2002-FF1 (d) | US0001M + 1.800% | 5.8440 | 04/25/32 | 329,786 | |||||||||
| 84,159 | GE-WMC Asset-Backed Pass-Through Certificates (d) | US0001M + 0.660% | 4.7040 | 12/25/35 | 64,212 | |||||||||
| 42,151 | GSAMP Trust 2002-WF (d) | US0001M + 1.100% | 5.0390 | 10/20/32 | 41,820 | |||||||||
| 209,056 | Interstar Millennium Series 2004-4E Trust (d) | EUR003M + 0.400% | 2.1980 | 11/14/36 | 202,766 | |||||||||
| 693,448 | Legacy Mortgage Asset Trust 2019-SL2 (b),(c) | 3.3750 | 02/25/59 | 644,592 | ||||||||||
| 78,987 | Long Beach Mortgage Loan Trust 2003-2 (d) | US0001M + 2.850% | 6.8940 | 06/25/33 | 78,512 | |||||||||
| 74,522 | Mastr Specialized Loan Trust (c),(d) | US0001M + 1.125% | 5.1690 | 11/25/35 | 68,588 | |||||||||
| 585,000 | Mill City Mortgage Trust 2015-2 (b),(c) | 3.6390 | 09/25/57 | 527,543 | ||||||||||
See accompanying notes to consolidated financial statements
42
| EASTERLY INCOME OPPORTUNITIES FUND |
| SCHEDULE OF INVESTMENTS (Continued) |
| November 30, 2022 |
| Principal | Coupon Rate | |||||||||||||
| Amount ($) | Spread | (%) | Maturity | Fair Value | ||||||||||
| ASSET BACKED SECURITIES — 82.2% (Continued) | ||||||||||||||
| RESIDENTIAL MORTGAGE — 2.6% (Continued) | ||||||||||||||
| 454,245 | RAAC Series 2005-SP2 Trust (d) | US0001M + 0.600% | 4.6440 | 06/25/44 | $ | 350,347 | ||||||||
| 599,889 | RAAC Series 2007-RP3 Trust (c),(d) | US0001M + 0.380% | 4.8040 | 10/25/46 | 561,238 | |||||||||
| 527,273 | Structured Asset Investment Loan Trust 2003-BC9 (d) | US0001M + 3.150% | 7.1940 | 08/25/33 | 476,984 | |||||||||
| 930,000 | Towd Point Mortgage Trust (b),(c) | 3.5280 | 10/25/53 | 895,021 | ||||||||||
| 8,250,877 | ||||||||||||||
| STUDENT LOANS — 0.5% | ||||||||||||||
| 44,000 | AccessLex Institute Series 2004-2 B(d) | US0003M + 0.700% | 5.0580 | 01/25/43 | 40,028 | |||||||||
| 1,015,000 | EdLinc Student Loan Funding Trust 2012-1 (c),(d) | US0001M + 4.240% | 8.2560 | 11/26/40 | 965,954 | |||||||||
| 109,666 | L2L Education Loan Trust 2006-1 (c),(d) | US0001M + 0.340% | 4.2150 | 06/15/31 | 105,886 | |||||||||
| 37,058 | National Collegiate Trust 2005-GATE (The) (c),(d) | US0001M + 0.450% | 4.4940 | 04/26/23 | 33,394 | |||||||||
| 16,287 | SLM Student Loan Trust 2005-5 (d) | US0003M + 0.250% | 4.6080 | 10/25/40 | 12,834 | |||||||||
| 31,539 | SLM Student Loan Trust 2005-8 (d) | US0003M + 0.310% | 4.6680 | 01/25/55 | 28,241 | |||||||||
| 314,761 | Student Loan A.B.S Repackaging Trust Series 2007-1 (c),(d) | US0003M + 0.215% | 4.9510 | 11/27/30 | 304,771 | |||||||||
| 1,491,108 | ||||||||||||||
| WHOLE BUSINESS — 0.3% | ||||||||||||||
| 132,434 | Business Loan Express Business Loan Trust 2007-A (c),(d) | US0001M + 0.400% | 4.3390 | 10/20/40 | 122,377 | |||||||||
| 24,652 | Business Loan Express SBA Loan Trust 2006-1 (c),(d) | US0001M + 0.950% | 4.8890 | 10/20/38 | 23,070 | |||||||||
| 691,302 | ReadyCap Lending Small Business Loan Trust 2019-2 (c),(d) | PRIME - 0.500% | 6.5000 | 12/27/44 | 656,671 | |||||||||
| 802,118 | ||||||||||||||
| TOTAL ASSET BACKED SECURITIES (Cost $276,236,381) | 259,461,058 | |||||||||||||
| COLLATERALIZED MORTGAGE OBLIGATIONS — 0.1% | ||||||||||||||
| 1,028,992 | Freddie Mac REMICS (a) (Cost $130,046) | 4.0000 | 08/25/49 | 173,470 | ||||||||||
See accompanying notes to consolidated financial statements
43
| EASTERLY INCOME OPPORTUNITIES FUND |
| SCHEDULE OF INVESTMENTS (Continued) |
| November 30, 2022 |
| Principal | Coupon Rate | |||||||||||||
| Amount ($) | Spread | (%) | Maturity | Fair Value | ||||||||||
| CORPORATE BONDS — 12.7% (Continued) | ||||||||||||||
| ASSET MANAGEMENT — 0.2% | ||||||||||||||
| 70,000 | Morgan Stanley & Company, LLC(b) | (5*(USISDA30*USISDA02)) | — | 01/21/26 | $ | 57,750 | ||||||||
| 274,000 | Nomura America Finance, LLC(b) | 4*(USISDA30-USISDA02) | — | 12/31/33 | 163,030 | |||||||||
| 65,000 | Nomura America Finance, LLC(b) | 4*(USISDA30-USISDA02) | — | 02/28/34 | 37,410 | |||||||||
| 890,000 | Nomura America Finance, LLC(b) | 4*(USISDA30 - USISDA02 - 0.25%) | — | 07/29/34 | 516,200 | |||||||||
| 774,390 | ||||||||||||||
| BANKING — 3.6% | ||||||||||||||
| 190,000 | Bank of Nova Scotia (The)(b) | (4*(USISDA30-USISDA02)) | — | 06/27/33 | 109,725 | |||||||||
| 120,000 | Bank of Nova Scotia (The)(b) | 4*(CMS30-CMS2) | — | 01/30/34 | 69,600 | |||||||||
| 100,000 | Bank of Nova Scotia (The)(b) | 4*(CMS30-CMS02 - 0.50%) | — | 08/28/34 | 57,500 | |||||||||
| 75,000 | Barclays Bank plc(b) | — | 01/23/26 | 68,549 | ||||||||||
| 525,000 | Barclays Bank plc(b) | 4.250*(USISDA30- SISDA02) | — | 09/13/28 | 393,750 | |||||||||
| 50,000 | Barclays Bank plc(b) | 4*(USISDA30-USISDA02) | — | 10/18/28 | 37,375 | |||||||||
| 75,000 | Barclays Bank plc(b) | 4*(CMS10-CMS2-0.25%) | — | 08/15/33 | 45,000 | |||||||||
| 58,000 | Barclays Bank plc(b) | 4*(USISDA30-USISDA02- 0.5%) | — | 04/25/34 | 33,350 | |||||||||
| 70,000 | Barclays Bank plc(b) | 8*(USISDA30 - USISDA05 - 0.25%) | — | 07/31/34 | 42,700 | |||||||||
| 177,000 | BNP Paribas S.A.(b) | 4*(CMS30-CMS5) | — | 04/30/33 | 102,660 | |||||||||
| 430,000 | Citigroup, Inc.(b) | 4*([30YR CMS-5YR CMS]- .0.25%) | — | 06/11/33 | 261,225 | |||||||||
| 1,037,000 | Citigroup, Inc.(b) | 4.5*(USISDA30-USISDA05) | — | 11/26/33 | 609,238 | |||||||||
| 507,000 | Citigroup, Inc.(b) | 4*(USISDA30-USISDA02) - 1.000% | — | 12/29/34 | 291,525 | |||||||||
| 55,000 | Citigroup, Inc.(b) | 20*(USISDA30-USISDA02 - 0.875%) | — | 08/31/35 | 31,075 | |||||||||
| 627,000 | Credit Suisse A.G.(b) | 10*(USISDA30-USISDA02) | — | 09/30/30 | 385,605 | |||||||||
| 300,000 | Credit Suisse A.G.(b) | 7.5*(USISDA30-USISDA02) | — | 09/30/30 | 183,000 | |||||||||
| 220,000 | Credit Suisse A.G. | 10*(USISDA30-USISDA02) | — | 01/29/31 | 146,850 | |||||||||
| 766,000 | Credit Suisse A.G.(b) | 12*(USISDA30-USISDA02) | — | 04/29/31 | 486,410 | |||||||||
| 1,024,000 | Credit Suisse A.G.(b) | 15*(USISDA30-USISDA02) | — | 10/31/31 | 697,600 | |||||||||
See accompanying notes to consolidated financial statements
44
| EASTERLY INCOME OPPORTUNITIES FUND |
| SCHEDULE OF INVESTMENTS (Continued) |
| November 30, 2022 |
| Principal | Coupon Rate | |||||||||||||
| Amount ($) | Spread | (%) | Maturity | Fair Value | ||||||||||
| CORPORATE BONDS — 12.7% (Continued) | ||||||||||||||
| BANKING — 3.6% (Continued) | ||||||||||||||
| 120,000 | Deutsche Bank A.G.(b) | 4*(USISDA30-USISDA05-0.550%) | — | 01/31/33 | $ | 68,400 | ||||||||
| 245,000 | Deutsche Bank A.G.(b) | 4*(USISDA30-USISDA02-0.40%) | — | 06/30/34 | 143,325 | |||||||||
| 1,257,000 | Deutsche Bank A.G.(b) | 4*(USISDA30-USISDA02-0.500%) | — | 08/28/34 | 710,205 | |||||||||
| 4,009,000 | Deutsche Bank A.G.(b) | 4.5*(USISDA30 - USISDA02 - 0.25%) | — | 10/31/34 | 2,285,130 | |||||||||
| 961,000 | Deutsche Bank A.G.(b) | 4*(USISDA30 - USISDA02 -0.25%) | — | 11/26/34 | 547,770 | |||||||||
| 738,000 | Deutsche Bank A.G.(b) | 10*(USISDA30-USISDA02) - 8.750% | — | 03/27/35 | 416,970 | |||||||||
| 75,000 | Deutsche Bank A.G.(b) | 15*(USISDA30 - USISDA02- 0.875%) | — | 12/23/35 | 41,625 | |||||||||
| 100,000 | HSBC USA, Inc.(b) | 6.250*(USISDA30- USISDA05) | — | 05/21/29 | 72,750 | |||||||||
| 200,000 | Lloyds Bank plc(b) | (USISDA30-USISDA05+0.500%) -0.500% | — | 01/31/33 | 114,000 | |||||||||
| 136,000 | Lloyds Bank plc(b) | 4*(USISDA30-USISDA02 -0.25%) | — | 10/25/33 | 77,520 | |||||||||
| 655,000 | Lloyds Bank plc(b) | 4*(USISDA30-USISDA02) -1.400% | — | 11/27/33 | 395,722 | |||||||||
| 282,000 | Natixis US Medium-Term Note Program, LLC(b) | 4*(USISDA30-USISDA02) | — | 04/30/34 | 167,790 | |||||||||
| 1,414,000 | Natixis US Medium-Term Note Program, LLC(b) | 7.5*(USISDA30-USISDA5-0.25%) | — | 07/31/34 | 841,330 | |||||||||
| 618,000 | Natixis US Medium-Term Note Program, LLC(b) | 8*(USISDA30-USISDA02) | — | 03/31/36 | 376,980 | |||||||||
| 125,000 | NatWest Markets plc(b) | 4*(30YR CMS-2YR CMS-.25%) | — | 08/18/31 | 76,250 | |||||||||
| 100,000 | NatWest Markets plc(b) | 4*(USISDA30 - USISDA02 -0.50%) | — | 08/26/31 | 60,000 | |||||||||
| 202,000 | SG Structured Products, Inc.(b) | — | 03/31/26 | 166,650 | ||||||||||
| 185,000 | SG Structured Products, Inc.(b) | 4*(USISDA30 - USISDA02 -0.50%) | — | 07/29/31 | 116,550 | |||||||||
| 744,000 | Societe Generale S.A.(b) | 10*(USISDA30-USISDA02) | — | 10/29/32 | 472,440 | |||||||||
| 203,000 | Societe Generale S.A.(b) | 50*(USISDA30-USISDA02) | — | 01/31/35 | 158,340 | |||||||||
| 135,000 | STRATS, LLC(d) | US0006M + 1.000% | 6.0840 | 02/15/34 | 104,409 | |||||||||
| 11,466,893 | ||||||||||||||
| INSTITUTIONAL FINANCIAL SERVICES — 4.2% | ||||||||||||||
| 41,000 | Citigroup Global Markets Holdings, Inc.(b) | 8*(USISDA30-USISDA02) | — | 04/25/32 | 25,778 | |||||||||
See accompanying notes to consolidated financial statements
45
| EASTERLY INCOME OPPORTUNITIES FUND |
| SCHEDULE OF INVESTMENTS (Continued) |
| November 30, 2022 |
| Principal | Coupon Rate | |||||||||||||
| Amount ($) | Spread | (%) | Maturity | Fair Value | ||||||||||
| CORPORATE BONDS — 12.7% (Continued) | ||||||||||||||
| INSTITUTIONAL FINANCIAL SERVICES — 4.2% (Continued) | ||||||||||||||
| 35,000 | Citigroup Global Markets Holdings, Inc.(d) | — | 11/22/32 | $ | 26,250 | |||||||||
| 200,000 | Citigroup Global Markets Holdings, Inc. | — | 03/29/34 | 159,000 | ||||||||||
| 60,000 | Citigroup Global Markets Holdings, Inc.(b) | 50*(USISDA30-USISDA02) | — | 03/29/34 | 45,600 | |||||||||
| 50,000 | Citigroup Global Markets Holdings, Inc.(b) | 5*(USISDA30-USISDA02) -1.250% | — | 12/14/36 | 30,500 | |||||||||
| 365,000 | Goldman Sachs Group, Inc. (The)(b) | 5*(USISDA30-USISDA05) - | — | 03/19/29 | 268,731 | |||||||||
| 500,000 | GS Finance Corporation(b) | 7*(USISDA30-USISDA05) -1.75% | — | 03/24/31 | 295,000 | |||||||||
| 97,000 | Jefferies Group, LLC / Jefferies Group Capital(b) | (7.5*(USISDA30- USISDA02)) | — | 05/31/34 | 56,745 | |||||||||
| 30,000 | Jefferies Group, LLC / Jefferies Group Capital(b) | (8*(USISDA30-USISDA02)) | — | 06/30/37 | 17,475 | |||||||||
| 1,168,000 | Jefferies Group, LLC / Jefferies Group Capital(b) | (9*(USISDA30-USISDA02)) | — | 07/31/37 | 689,120 | |||||||||
| 446,000 | Jefferies Group, LLC / Jefferies Group Capital(b) | (9*(USISDA10-USISDA02)) | — | 08/31/37 | 256,450 | |||||||||
| 150,000 | Jefferies Group, LLC / Jefferies Group Capital(b) | (10*(USISDA10- USISDA02)) | — | 08/31/37 | 87,375 | |||||||||
| 248,000 | Jefferies Group, LLC / Jefferies Group Capital(b) | (10*(USISDA10- USISDA02)) | — | 09/30/37 | 141,980 | |||||||||
| 240,000 | Jefferies Group, LLC / Jefferies Group Capital(b) | (10*(USISDA10- USISDA02)) | — | 10/31/37 | 142,200 | |||||||||
| 110,000 | Jefferies Group, LLC / Jefferies Group Capital(b) | (8*(USISDA30-USISDA02)) | — | 01/31/38 | 63,938 | |||||||||
| 762,000 | Jefferies Group, LLC / Jefferies Group Capital(b) | (7.5*(USISDA30- USISDA02)) + 0.750% | 4.0430 | 02/28/38 | 502,920 | |||||||||
| 280,000 | Jefferies Group, LLC / Jefferies Group Capital(b) | US0003M + 4.000% | 5.0000 | 03/20/40 | 245,990 | |||||||||
| 115,000 | Morgan Stanley(b) | N/A | — | 03/21/27 | 94,013 | |||||||||
| 56,000 | Morgan Stanley(b) | (4*(USISDA30-USISDA05)) | — | 06/28/28 | 40,740 | |||||||||
| 1,015,000 | Morgan Stanley(b) | (8*(USISDA30-USISDA05)) | — | 09/27/28 | 751,100 | |||||||||
| 753,000 | Morgan Stanley(b) | (5*(USISDA30-USISDA02)) | — | 10/15/28 | 557,220 | |||||||||
| 100,000 | Morgan Stanley(b) | — | 06/29/29 | 87,000 | ||||||||||
| 3,588,000 | Morgan Stanley(b) | (10*(USISDA30- USISDA02)) | — | 04/30/30 | 2,511,599 | |||||||||
| 1,388,000 | Morgan Stanley(b) | (10*(USISDA30- USISDA02)) | — | 05/29/30 | 971,600 | |||||||||
| 403,000 | Morgan Stanley(b) | (10*(USISDA30- USISDA02)) | — | 06/30/30 | 282,100 | |||||||||
| 182,000 | Morgan Stanley(b) | (8*(USISDA30-USISDA02)) | — | 07/31/30 | 126,490 | |||||||||
See accompanying notes to consolidated financial statements
46
| EASTERLY INCOME OPPORTUNITIES FUND |
| SCHEDULE OF INVESTMENTS (Continued) |
| November 30, 2022 |
| Principal | Coupon Rate | |||||||||||||
| Amount ($) | Spread | (%) | Maturity | Fair Value | ||||||||||
| CORPORATE BONDS — 12.7% (Continued) | ||||||||||||||
| INSTITUTIONAL FINANCIAL SERVICES — 4.2% (Continued) | ||||||||||||||
| 290,000 | Morgan Stanley(b) | (8.5*(USISDA30- USISDA02)) | — | 08/19/30 | $ | 202,275 | ||||||||
| 216,000 | Morgan Stanley(b) | (8*(USISDA30-USISDA02)) | — | 08/31/30 | 150,120 | |||||||||
| 285,000 | Morgan Stanley(b) | (10*(USISDA30- USISDA02)) | — | 09/30/30 | 199,500 | |||||||||
| 151,000 | Morgan Stanley(b) | (7*(USISDA30-USISDA02)) | — | 10/30/30 | 100,038 | |||||||||
| 171,000 | Morgan Stanley(b) | (5*(USISDA30-USISDA02)) | — | 10/30/30 | 106,935 | |||||||||
| 50,000 | Morgan Stanley(b) | (5*(USISDA30-USISDA02)) | — | 11/30/30 | 32,500 | |||||||||
| 167,000 | Morgan Stanley(b) | — | 03/31/31 | 132,765 | ||||||||||
| 20,000 | Morgan Stanley(b) | — | 03/31/31 | 15,400 | ||||||||||
| 89,000 | Morgan Stanley(b) | — | 05/31/31 | 70,310 | ||||||||||
| 100,000 | Morgan Stanley(b) | — | 06/30/31 | 80,000 | ||||||||||
| 114,000 | Morgan Stanley(b) | — | 07/29/31 | 90,060 | ||||||||||
| 228,200 | Morgan Stanley(b) | (7*(USISDA30-USISDA02)) | — | 09/16/31 | 146,048 | |||||||||
| 117,000 | Morgan Stanley(b) | (6*(USISDA30-USISDA02)) | — | 01/30/34 | 71,955 | |||||||||
| 209,000 | Morgan Stanley(b) | (4*(USISDA30-USISDA02)) | — | 03/31/34 | 117,040 | |||||||||
| 287,000 | Morgan Stanley(b) | (4*(USISDA30-USISDA02)) | — | 05/30/34 | 160,720 | |||||||||
| 220,000 | Morgan Stanley(b) | (4*(USISDA30-USISDA02)) | — | 07/31/34 | 123,750 | |||||||||
| 121,000 | Morgan Stanley(b) | 5*(USISDA30-USISDA02) - | — | 08/29/34 | 70,936 | |||||||||
| 120,000 | Morgan Stanley(b) | (5*(USISDA30-USISDA02)) | — | 09/30/34 | 69,600 | |||||||||
| 238,000 | Morgan Stanley(b) | (5*(USISDA30-USISDA02)) | — | 10/08/34 | 138,040 | |||||||||
| 233,000 | Morgan Stanley(b) | (7*(USISDA30-USISDA02)) | — | 10/31/34 | 139,800 | |||||||||
| 30,000 | Morgan Stanley(b) | (5*(USISDA30-USISDA02)) | — | 11/28/34 | 17,400 | |||||||||
| 230,000 | Morgan Stanley(b) | (4.5*(USISDA30- USISDA02)) | — | 12/31/34 | 131,100 | |||||||||
| 304,000 | Morgan Stanley(b) | (8*(USISDA30-USISDA02)) | — | 01/30/35 | 188,480 | |||||||||
| 473,000 | Morgan Stanley(b) | (4*(USISDA30-USISDA02)) | — | 02/27/35 | 264,880 | |||||||||
| 438,000 | Morgan Stanley(b) | (6*(USISDA30-USISDA02)) | — | 03/31/35 | 260,610 | |||||||||
See accompanying notes to consolidated financial statements
47
| EASTERLY INCOME OPPORTUNITIES FUND |
| SCHEDULE OF INVESTMENTS (Continued) |
| November 30, 2022 |
| Principal | Coupon Rate | |||||||||||||
| Amount ($) | Spread | (%) | Maturity | Fair Value | ||||||||||
| CORPORATE BONDS — 12.7% (Continued) | ||||||||||||||
| INSTITUTIONAL FINANCIAL SERVICES — 4.2% (Continued) | ||||||||||||||
| 532,000 | Morgan Stanley(b) | (9*(USISDA30-USISDA02)) | — | 04/30/35 | $ | 414,960 | ||||||||
| 73,000 | Morgan Stanley(b) | — | 05/29/35 | 56,940 | ||||||||||
| 120,000 | Morgan Stanley(b) | — | 06/30/35 | 93,600 | ||||||||||
| 268,000 | Morgan Stanley(b) | — | 07/31/35 | 209,040 | ||||||||||
| 79,000 | Morgan Stanley(b) | — | 09/30/35 | 61,620 | ||||||||||
| 109,000 | Morgan Stanley(b) | — | 11/30/35 | 86,110 | ||||||||||
| 134,000 | Morgan Stanley(b) | (9*(USISDA30-USISDA02)) | — | 12/23/35 | 104,520 | |||||||||
| 816,000 | Morgan Stanley(b) | (10*(USISDA30- USISDA02)) | — | 02/29/36 | 526,320 | |||||||||
| 13,110,286 | ||||||||||||||
| LEISURE FACILITIES & SERVICES — 0.2% | ||||||||||||||
| 619,366 | Times Square Hotel Trust(c) | 8.5280 | 08/01/26 | 611,128 | ||||||||||
| OIL & GAS PRODUCERS — 0.1% | ||||||||||||||
| 320,000 | Petroleos Mexicanos | 6.7500 | 09/21/47 | 203,823 | ||||||||||
| REAL ESTATE INVESTMENT TRUSTS — 0.0%(g) | ||||||||||||||
| 110,000 | American Tower Trust #1(c) | 3.6520 | 03/23/28 | 100,172 | ||||||||||
| SPECIALTY FINANCE — 4.4% | ||||||||||||||
| 185,987 | Fort Knox Military Housing Privatization Project(d) | US0001M + 0.340% | 4.2150 | 02/15/52 | 130,122 | |||||||||
| 2,548,787 | MM Community Funding III Ltd. / MM Community(c),(d) | US0006M + 2.050% | 6.9810 | 05/01/32 | 2,319,397 | |||||||||
| 498,000 | Morgan Stanley Finance, LLC(b) | 15%*(USISDA30 - USISDA02) | — | 04/30/33 | 336,150 | |||||||||
| 541,000 | Morgan Stanley Finance, LLC(b) | (10*(USISDA30- USISDA02)) | — | 06/30/36 | 359,765 | |||||||||
| 215,000 | Morgan Stanley Finance, LLC(b) | (15*(USISDA30- USISDA02)) | — | 07/29/36 | 148,350 | |||||||||
| 3,474,000 | Morgan Stanley Finance, LLC(b) | (20*(USISDA30- USISDA02)) | — | 08/31/36 | 2,431,799 | |||||||||
| 788,000 | Morgan Stanley Finance, LLC(b) | (20*(USISDA30- USISDA02)) | — | 09/30/36 | 559,480 | |||||||||
| 4,218,000 | Morgan Stanley Finance, LLC(b) | (20*(USISDA30- USISDA02)) | — | 11/29/36 | 2,952,599 | |||||||||
| 1,269,000 | Morgan Stanley Finance, LLC(b) | (20*(USISDA30- USISDA02)) | — | 01/31/37 | 888,300 | |||||||||
See accompanying notes to consolidated financial statements
48
| EASTERLY INCOME OPPORTUNITIES FUND |
| SCHEDULE OF INVESTMENTS (Continued) |
| November 30, 2022 |
| Principal | Coupon Rate | |||||||||||||
| Amount ($) | Spread | (%) | Maturity | Fair Value | ||||||||||
| CORPORATE BONDS — 12.7% (Continued) | ||||||||||||||
| SPECIALTY FINANCE — 4.4% (Continued) | ||||||||||||||
| 361,000 | Morgan Stanley Finance, LLC(b) | (20*(USISDA30- USISDA02)) | — | 04/28/37 | $ | 252,700 | ||||||||
| 267,000 | Morgan Stanley Finance, LLC(b) | (20*(USISDA30- USISDA02)) | — | 07/31/37 | 189,570 | |||||||||
| 158,000 | Morgan Stanley Finance, LLC(b) | (20*(USISDA30- USISDA02)) | — | 09/29/37 | 112,180 | |||||||||
| 2,014,000 | Morgan Stanley Finance, LLC(b) | (10*(USISDA30- USISDA02)) | — | 09/29/37 | 1,258,750 | |||||||||
| 1,000,000 | OWS Cre Funding I, LLC(c),(d) | US0001M + 4.900% | 8.6680 | 09/15/23 | 953,827 | |||||||||
| 267,852 | Preferred Term Securities IV Ltd. / Preferred Term(c),(d) | US0003M + 2.250% | 5.7770 | 12/23/31 | 256,870 | |||||||||
| 80,244 | Preferred Term Securities X Ltd. / Preferred Term(c),(d) | US0003M + 0.860% | 4.5010 | 07/03/33 | 74,844 | |||||||||
| 634,876 | Select Notes Trust LT 2003-1 | 5.9100 | 02/22/33 | 511,232 | ||||||||||
| 13,735,935 | ||||||||||||||
| TOTAL CORPORATE BONDS (Cost $55,057,770) | 40,002,627 | |||||||||||||
| NON U.S. GOVERNMENT & AGENCIES — 0.3% | ||||||||||||||
| SOVEREIGN — 0.1% | ||||||||||||||
| 200,000 | Argentina Bonar Bonds(e) | 0.5000 | 07/09/30 | 43,261 | ||||||||||
| 24,086 | Argentine Republic Government International Bond | 1.0000 | 07/09/29 | 6,190 | ||||||||||
| 1,185,000 | Argentine Republic Government International Bond(e) | 1.5000 | 07/09/35 | 278,516 | ||||||||||
| 327,967 | ||||||||||||||
| SUPRANATIONAL — 0.2% | ||||||||||||||
| 964,000 | International Bank for Reconstruction &(b) | — | 06/30/34 | 578,400 | ||||||||||
| TOTAL NON U.S. GOVERNMENT & AGENCIES (Cost $1,425,432) | 906,367 | |||||||||||||
| U.S. GOVERNMENT & AGENCIES — 0.0%(g) | ||||||||||||||
| AGENCY MBS OTHER — 0.0%(g) | ||||||||||||||
| 37,083 | Fannie Mae Pool 257064 | 4.5000 | 11/01/37 | 36,261 | ||||||||||
| 84,854 | Ginnie Mae II Pool BU6365(b) | 4.6170 | 04/20/70 | 83,878 | ||||||||||
| TOTAL U.S. GOVERNMENT & AGENCIES (Cost $124,569) | 120,139 | |||||||||||||
| TOTAL INVESTMENTS — 95.3% (Cost $332,974,197) | $ | 300,663,661 | ||||||||||||
| OTHER ASSETS IN EXCESS OF LIABILITIES- 4.7% | 14,674,286 | |||||||||||||
| NET ASSETS - 100.0% | $ | 315,337,947 | ||||||||||||
See accompanying notes to consolidated financial statements
49
| EASTERLY INCOME OPPORTUNITIES FUND |
| SCHEDULE OF INVESTMENTS (Continued) |
| November 30, 2022 |
| CREDIT DEFAULT SWAP AGREEMENTS | ||||||||||||||||||||||||
| Payment | Fixed Deal (Pay) | Amortized Upfront | Unrealized | |||||||||||||||||||||
| Description | Frequency | Counterparty | Rate | Maturity Date | Notional Value | Fair Value | Payments Paid | Appreciation | ||||||||||||||||
| Morgan Stanley 3.75% 2/25/23 | Annual | GS | 1.00% | 6/20/2025 | $ | 20,000,000 | (201,654 | ) | (200,785 | ) | $ | (869 | ) | |||||||||||
| INTEREST RATE SWAP | ||||||||||||||||||||||||
| Payment | Fixed Deal (Pay) | Amortized Upfront | Unrealized | |||||||||||||||||||||
| Reference Entity | Frequency | Counterparty | Rate | Maturity Date | Notional Value | Fair Value | Payments Paid | Appreciation | ||||||||||||||||
| 1 Year SOFR Compound Index | Annual | GS | 0.9975% | 1/25/2024 | $ | 100,000,000 | 4,711,000 | — | $ | 4,711,000 | ||||||||||||||
| �� | ||||||||||||||||||||||||
| LLC | - Limited Liability Company |
| LP | - Limited Partnership |
| LTD | - Limited Company |
| PLC | - Public Limited Company |
| REIT | - Real Estate Investment Trust |
| REMIC | - Real Estate Mortgage Investment Conduit |
| S/A | - Société Anonyme |
| GS | Goldman Sachs |
| 12MTA | Federal Reserve US 12 Month Cumulative Avg 1 Year CMT |
| CMS2 | 2 Year Constant Maturity Swap Rate |
| CMS5 | 5 Year Constant Maturity Swap Rate |
| CMS10 | 10 Year Constant Maturity Swap Rate |
| CMS30 | 30 Year Constant Maturity Swap Rate |
| ECOFC | Enterprise 11th District Cost of Funds Index |
| EUR003M | Euribor 3 Month ACT/360 |
| EUR006M | Euribor 6 Month ACT/360 |
| H15T1Y | US Treasury Yield Curve Rate T Note Constant Maturity 1 Year |
| PRIME | Prime Rate by Country United States |
| SOFR30A | United States 30 Day Average SOFR Secured Overnight Financing Rate |
| US0001M | ICE LIBOR USD 1 Month |
| US0003M | ICE LIBOR USD 3 Month |
| US0006M | ICE LIBOR USD 6 Month |
| USISDA02 | 2 Year Swap |
| USISDA05 | 5 Year Swap |
| USISDA30 | 30 Year Swap |
| (a) | Interest only securities. |
| (b) | Variable or floating rate security, the interest rate of which adjusts periodically based on changes in current interest rates and prepayments on the underlying pool of assets. |
| (c) | Security exempt from registration under Rule 144A or Section 4(2) of the Securities Act of 1933. The security may be resold in transactions exempt from registration, normally to qualified institutional buyers. As of November 30, 2022 the total market value of 144A securities is $191,109,837 or 60.6% of net assets. |
| (d) | Variable rate security; the rate shown represents the rate on November 30, 2022. |
| (e) | Step bond. Coupon rate is fixed rate that changes on a specified date. The rate shown is the current rate at November 30, 2022. |
| (f) | Zero coupon bond. |
| (g) | Percentage rounds to less than 0.1%. |
| (h) | Rate disclosed is the seven day effective yield as of November 30, 2022. |
See accompanying notes to consolidated financial statements
50
| EASTERLY FUNDS |
| STATEMENTS OF ASSETS AND LIABILITIES |
| November 30, 2022 |
| Easterly | ||||||||
| Total Hedge | ||||||||
| Portfolio | Easterly Income | |||||||
| (Consolidated) | Opportunities Fund | |||||||
| Assets: | ||||||||
| Investments in Affiliates, at cost | $ | 3,249,182 | $ | — | ||||
| Investments in Unaffiliated securities, at cost | 27,068,782 | 332,974,197 | ||||||
| Total Investments, at cost | $ | 30,317,964 | $ | 332,974,197 | ||||
| Investments in Affiliates, at value | $ | 2,947,124 | $ | — | ||||
| Investments in Unaffiliated securities, at value | 25,094,988 | 300,663,661 | ||||||
| Total Investments, at value | $ | 28,042,112 | $ | 300,663,661 | ||||
| Cash | 28,910 | 8,821,353 | ||||||
| Foreign Cash ($14,262 and $16,192) | 14,262 | 16,248 | ||||||
| Deposit in collateral account for Swaps | 1,923,763 | 1,390,000 | ||||||
| Unrealized appreciation on swaps | 246,004 | 4,710,131 | ||||||
| Unrealized appreciation on forward currency exchange contracts | 4,331 | — | ||||||
| Receivable for securities sold | — | 65,220 | ||||||
| Receivable for open swaps | 22,624 | — | ||||||
| Receivable for fund shares sold | — | 290,301 | ||||||
| Interest and dividends receivable | 2,720 | 1,193,210 | ||||||
| Prepaid expenses and other assets | 34,261 | 241,434 | ||||||
| Total Assets | 30,318,987 | 317,391,558 | ||||||
| Liabilities: | ||||||||
| Line of Credit | — | 1,000,000 | ||||||
| Payable for securities purchased | 13,387 | — | ||||||
| Payable for fund shares redeemed | 1,018 | 423,442 | ||||||
| Premiums received on swaps | — | 200,785 | ||||||
| Interest Payable | — | 5,250 | ||||||
| Administration fees payable | 9,351 | 113,240 | ||||||
| Unrealized depreciation on forward currency exchange contracts | 6,478 | — | ||||||
| Payable to manager | 14,882 | 248,541 | ||||||
| Trustee fees payable | — | 77 | ||||||
| Payable for distribution (12b-1) fees | — | 12,634 | ||||||
| Compliance officer fees payable | 1,771 | 2,652 | ||||||
| Accrued expenses and other liabilities | 21,894 | 46,990 | ||||||
| Total Liabilities | 68,781 | 2,053,611 | ||||||
| Net Assets | $ | 30,250,206 | $ | 315,337,947 | ||||
| Net Assets: | ||||||||
| Par value of shares of beneficial interest | $ | 29,326 | $ | 321,121 | ||||
| Paid in capital | 34,082,661 | 344,469,295 | ||||||
| Accumulated loss | (3,861,781 | ) | (29,452,469 | ) | ||||
| Net Assets | $ | 30,250,206 | $ | 315,337,947 | ||||
| Net Asset Value Per Share | ||||||||
| Class A | ||||||||
| Net Assets | $ | — | $ | 11,247,030 | ||||
| Shares of beneficial interest outstanding | — | 1,124,822 | ||||||
| Net asset value | $ | — | $ | 10.00 | ||||
| Offering price per share (maximum sales charge of 2.00%) | $ | — | $ | 10.20 | ||||
| Class C | ||||||||
| Net Assets | $ | — | $ | 4,467,117 | ||||
| Shares of beneficial interest outstanding | — | 457,685 | ||||||
| Net asset value/offering price per share | $ | — | $ | 9.76 | ||||
| Class I | ||||||||
| Net Assets | $ | 13,416,549 | $ | 206,629,828 | ||||
| Shares of beneficial interest outstanding | 1,311,583 | 21,169,044 | ||||||
| Net asset value/offering price per share | $ | 10.23 | $ | 9.76 | ||||
| Class R6 | ||||||||
| Net Assets | $ | 16,833,657 | $ | 92,993,972 | ||||
| Shares of beneficial interest outstanding | $ | 1,621,058 | $ | 9,360,542 | ||||
| Net asset value/offering price per share | $ | 10.38 | $ | 9.93 | ||||
See accompanying notes to consolidated financial statements.
51
| EASTERLY FUNDS |
| STATEMENTS OF OPERATIONS |
| For the Year Ended November 30, 2022 |
| Easterly | ||||||||
| Total Hedge | ||||||||
| Portfolio | Easterly Income | |||||||
| (Consolidated) | Opportunities Fund | |||||||
| Investment Income: | ||||||||
| Dividend income | $ | 699,804 | $ | — | ||||
| Interest income | 4,440 | 16,289,997 | ||||||
| Dividend income from Affiliates | 273,152 | — | ||||||
| Less: Foreign withholding taxes | (6,463 | ) | — | |||||
| Total Investment Income | 970,933 | 16,289,997 | ||||||
| Operating Expenses: | ||||||||
| Management fees | 311,016 | 4,035,365 | ||||||
| Distribution (12b-1) fees | ||||||||
| Class A Shares | — | 36,580 | ||||||
| Class C Shares | — | 51,997 | ||||||
| Administration fees | 29,565 | 390,244 | ||||||
| Shareholder servicing fees | 27,363 | 280,648 | ||||||
| Interest expenses | 4,163 | 231,018 | ||||||
| Transfer Agent fees | 25,814 | 115,620 | ||||||
| Registration fees | 18,092 | 103,709 | ||||||
| Printing and postage expense | 4,025 | 81,215 | ||||||
| Custodian fees | 52,653 | 63,342 | ||||||
| Legal fees | 47,297 | 54,860 | ||||||
| Audit fees | 13,317 | 22,534 | ||||||
| Trustees’ fees | 15,226 | 15,168 | ||||||
| Compliance officer fees | 7,291 | 7,999 | ||||||
| Insurance expense | 457 | 5,501 | ||||||
| Miscellaneous expenses | 17,566 | 15,819 | ||||||
| Total Operating Expenses | 573,845 | 5,511,619 | ||||||
| Less: Expenses waived | (194,686 | ) | (552,449 | ) | ||||
| Total Waivers | (194,686 | ) | (552,449 | ) | ||||
| Net Operating Expenses | 379,159 | 4,959,170 | ||||||
| Net Investment Income | 591,774 | 11,330,827 | ||||||
| Realized and Unrealized Gain (Loss) on Investments: | ||||||||
| Net realized gain (loss) from: | ||||||||
| Investments and Foreign currency transactions | (1,715,398 | ) | (1,243,145 | ) | ||||
| Distribution of realized gain (loss) by underlying investment companies | 103,964 | — | ||||||
| Affiliated Investments | (182,088 | ) | — | |||||
| Options Purchased | (11,137 | ) | — | |||||
| Options Written | 52,970 | — | ||||||
| Swaps | (74,502 | ) | (202,777 | ) | ||||
| Net realized gain (loss) from: | (1,826,191 | ) | (1,445,922 | ) | ||||
| Net change in unrealized appreciation (depreciation) on: | ||||||||
| Investments and Foreign currency translations | (1,216,042 | ) | (37,823,722 | ) | ||||
| Affiliated Investments | (333,205 | ) | — | |||||
| Options Purchased | (30,741 | ) | — | |||||
| Options Written | 28,106 | — | ||||||
| Swaps | 219,308 | 4,811,464 | ||||||
| Net change in unrealized depreciation | (1,332,574 | ) | (33,012,258 | ) | ||||
| Net Realized and Unrealized Loss on investments | (3,158,765 | ) | (34,458,180 | ) | ||||
| Net decrease in Net Assets Resulting From Operations | $ | (2,566,991 | ) | $ | (23,127,353 | ) | ||
See accompanying notes to consolidated financial statements.
52
| EASTERLY FUNDS |
| STATEMENTS OF CHANGES IN NET ASSETS |
| Easterly Total Hedge Portfolio | Easterly Income Opportunities Fund | |||||||||||||||
| (Consolidated) | ||||||||||||||||
| Year Ended | Year Ended | Year Ended | Year Ended | |||||||||||||
| November 30, 2022 | November 30, 2021 | November 30, 2022 | November 30, 2021 | |||||||||||||
| Operations: | ||||||||||||||||
| Net investment income | $ | 591,774 | $ | 168,172 | $ | 11,330,827 | $ | 8,685,906 | ||||||||
| Net realized gain (loss) on investments | (1,826,191 | ) | 1,774,397 | (1,445,922 | ) | 4,899,093 | ||||||||||
| Net change in unrealized depreciation on investments | $ | (1,332,574 | ) | (1,247,314 | ) | (33,012,258 | ) | (776,595 | ) | |||||||
| Net increase (decrease) in net assets resulting from operations | (2,566,991 | ) | 695,255 | (23,127,353 | ) | 12,808,404 | ||||||||||
| Distributions to Shareholders: | ||||||||||||||||
| Total Distributions: | ||||||||||||||||
| Class I | (452,553 | ) | (86,170 | ) | (11,276,015 | ) | (9,539,450 | ) | ||||||||
| Class A | — | (845 | ) | (694,638 | ) | (838,592 | ) | |||||||||
| Class C | — | (745 | ) | (220,813 | ) | (215,709 | ) | |||||||||
| Class R6 | (1,935,569 | ) | (85,657 | ) | (4,185,637 | ) | (3,808,909 | ) | ||||||||
| Total Dividends and Distributions to Shareholders | (2,388,122 | ) | (173,417 | ) | (16,377,103 | ) | (14,402,660 | ) | ||||||||
| Share Transactions of Beneficial Interest: | ||||||||||||||||
| Net proceeds from shares sold | ||||||||||||||||
| Class I | 10,757,841 | 1,569,771 | ** | 152,840,023 | 164,764,377 | |||||||||||
| Class A | — | 3,700 | 5,758,497 | 15,195,711 | ||||||||||||
| Class C | — | — | 1,295,088 | 3,836,898 | ||||||||||||
| Class R6 | 3,683,761 | 28,113,250 | 65,569,643 | 22,396,032 | ||||||||||||
| Reinvestment of dividends and distributions | ||||||||||||||||
| Class I | 452,554 | 86,170 | 9,641,868 | 7,698,232 | ||||||||||||
| Class A | — | 845 | 595,386 | 746,916 | ||||||||||||
| Class C | — | 457 | 145,951 | 141,008 | ||||||||||||
| Class R6 | 1,288,566 | 67,479 | 3,151,949 | 2,820,353 | ||||||||||||
| Cost of shares redeemed | ||||||||||||||||
| Class I | (3,785,429 | ) | (240,231 | ) | (144,056,411 | ) | (68,480,268 | ) | ||||||||
| Class A | — | (58,467 | ) ** | (9,048,548 | ) | (12,679,013 | ) | |||||||||
| Class C | — | (47,536 | ) ** | (1,958,764 | ) | (1,586,860 | ) | |||||||||
| Class R6 | (14,789,261 | ) | (3,060,040 | ) | (26,663,270 | ) | (26,011,648 | ) | ||||||||
| Net increase (decrease) in net assets from share transactions of beneficial interest | (2,391,968 | ) | 26,435,398 | 57,271,412 | 108,841,738 | |||||||||||
| Total Increase (Decrease) in Net Assets | (7,347,081 | ) | 26,957,236 | 17,766,956 | 107,247,482 | |||||||||||
| Net Assets: | ||||||||||||||||
| Beginning of year | 37,597,287 | 10,640,051 | 297,570,991 | 190,323,509 | ||||||||||||
| End of year | $ | 30,250,206 | $ | 37,597,287 | $ | 315,337,947 | $ | 297,570,991 | ||||||||
| Share Activity | ||||||||||||||||
| Shares sold | ||||||||||||||||
| Class I | 1,039,318 | 135,321 | ** | 14,665,435 | 14,925,443 | |||||||||||
| Class A | — | 325 | 539,809 | 1,346,418 | ||||||||||||
| Class C | — | — | 124,464 | 347,401 | ||||||||||||
| Class R6 | 338,247 | 2,333,709 | 6,108,852 | 2,002,196 | ||||||||||||
| Shares Reinvested | ||||||||||||||||
| Class I | 40,227 | 7,680 | 930,035 | 702,539 | ||||||||||||
| Class A | — | 76 | 55,732 | 66,701 | ||||||||||||
| Class C | — | 41 | 13,964 | 12,887 | ||||||||||||
| Class R6 | 113,231 | 5,972 | 300,790 | 255,138 | ||||||||||||
| Shares redeemed | ||||||||||||||||
| Class I | (365,236 | ) | (20,480 | ) | (13,970,464 | ) | (6,191,715 | ) | ||||||||
| Class A | — | (5,053 | ) ** | (861,927 | ) | (1,120,620 | ) | |||||||||
| Class C | — | (4,148 | ) ** | (191,272 | ) | (143,536 | ) | |||||||||
| Class R6 | (1,391,656 | ) | (254,635 | ) | (2,547,727 | ) | (2,327,404 | ) | ||||||||
| Net Increase (decrease) in shares of beneficial interest | (225,869 | ) | 2,198,808 | 5,167,691 | 9,875,448 | |||||||||||
| * | Less than $1.00. |
| ** | Share Transactions of Beneficial Interest and Share Activity include the Conversion of Class A and C shares into I shares (see note 1). |
| *** | Less than 1 share. |
See accompanying notes to consolidated financial statements.
53
| EASTERLY FUNDS |
| FINANCIAL HIGHLIGHTS (For a share outstanding throughout each year) |
| Easterly Total Hedge Portfolio | ||||||||||||||||||||
| Class I | ||||||||||||||||||||
| For the | For the | For the | For the | For the | ||||||||||||||||
| Year Ended | Year Ended | Year Ended | Year Ended | Year Ended | ||||||||||||||||
| November 30, | November 30, | November 30, | November 30, | November 30, | ||||||||||||||||
| 2022 | 2021 | 2020 | 2019 | 2018 | ||||||||||||||||
| (Consolidated) | ||||||||||||||||||||
| Net Asset Value, Beginning of Year | $ | 11.80 | $ | 11.05 | $ | 10.49 | $ | 10.13 | $ | 10.40 | ||||||||||
| Income (Loss) from Investment Operations: | ||||||||||||||||||||
| Net investment income (1) | 0.15 | 0.08 | 0.21 | 0.18 | 0.12 | |||||||||||||||
| Net realized and unrealized gain (loss) | (0.96 | ) | 0.85 | 0.74 | 0.46 | (0.30 | ) | |||||||||||||
| Total from investment operations | (0.81 | ) | 0.93 | 0.95 | 0.64 | (0.18 | ) | |||||||||||||
| Dividends and Distributions: | ||||||||||||||||||||
| Dividends from net investment income | (0.24 | ) | — | (0.39 | ) | (0.17 | ) | (0.07 | ) | |||||||||||
| Distributions from realized gains | (0.52 | ) | (0.18 | ) | — | (0.11 | ) | (0.02 | ) | |||||||||||
| Total dividends and distributions | (0.76 | ) | (0.18 | ) | (0.39 | ) | (0.28 | ) | (0.09 | ) | ||||||||||
| Net Asset Value, End of Year/Period | $ | 10.23 | $ | 11.80 | $ | 11.05 | $ | 10.49 | $ | 10.13 | ||||||||||
| Total Return* | (7.47 | )% | 8.51 | % | 9.39 | % | 6.54 | % | (1.73 | )% | ||||||||||
| Ratios and Supplemental Data: | ||||||||||||||||||||
| Net assets, end of year (000s) | $ | 13,417 | $ | 7,049 | $ | 5,247 | $ | 5,095 | $ | 4,523 | ||||||||||
| Ratio of gross operating expenses to average net assets including interest expense (2,3) | 1.84 | % | 1.89 | % | 2.25 | % | 2.53 | % | 2.50 | % | ||||||||||
| Ratio of net operating expenses to average net assets including interest expense (2,4) | 1.49 | % | 1.51 | % | 1.52 | % | 1.52 | % | 1.49 | % | ||||||||||
| Ratio of net investment income (loss) after expense reimbursement to average net assets (2,7) | 1.46 | % | 0.70 | % | 2.10 | % | 1.74 | % | 1.19 | % | ||||||||||
| Portfolio Turnover Rate | 186 | % | 127 | % | 117 | % | 114 | % | 195 | % | ||||||||||
| Easterly Total Hedge Portfolio | ||||||||||||||||||||
| Class R6 | ||||||||||||||||||||
| For the | For the | For the | For the | For the | ||||||||||||||||
| Year Ended | Year Ended | Year Ended | Year Ended | Year Ended | ||||||||||||||||
| November 30, | November 30, | November 30, | November 30, | November 30, | ||||||||||||||||
| 2022 | 2021 | 2020 | 2019 | 2018 | ||||||||||||||||
| (Consolidated) | ||||||||||||||||||||
| Net Asset Value, Beginning of Year | $ | 11.93 | $ | 11.12 | $ | 10.52 | $ | 10.14 | $ | 10.40 | ||||||||||
| Income (Loss) from Investment Operations: | ||||||||||||||||||||
| Net investment income (1) | 0.23 | 0.10 | 0.25 | 0.20 | 0.16 | |||||||||||||||
| Net realized and unrealized gain (loss) | (1.02 | ) | 0.89 | 0.74 | 0.46 | (0.33 | ) | |||||||||||||
| Total from investment operations | (0.79 | ) | 0.99 | 0.99 | 0.66 | (0.17 | ) | |||||||||||||
| Dividends and Distributions: | ||||||||||||||||||||
| Dividends from net investment income | (0.24 | ) | — | (0.39 | ) | (0.17 | ) | (0.07 | ) | |||||||||||
| Distributions from realized gains | (0.52 | ) | (0.18 | ) | — | (0.11 | ) | (0.02 | ) | |||||||||||
| Total dividends and distributions | (0.76 | ) | (0.18 | ) | (0.39 | ) | (0.28 | ) | (0.09 | ) | ||||||||||
| Net Asset Value, End of Year/Period | $ | 10.38 | $ | 11.93 | $ | 11.12 | $ | 10.52 | $ | 10.14 | ||||||||||
| Total Return* | (7.20 | )% | 9.01 | % | 9.75 | % | 6.73 | % | (1.63 | )% | ||||||||||
| Ratios and Supplemental Data: | ||||||||||||||||||||
| Net assets, end of year (000s) | $ | 16,834 | $ | 30,549 | $ | 5,297 | $ | 5,565 | $ | 8,233 | ||||||||||
| Ratio of gross operating expenses to average net assets including interest expense (2,5) | 1.84 | % | 1.66 | % | 2.25 | % | 2.53 | % | 2.38 | % | ||||||||||
| Ratio of net operating expenses to average net assets including interest expense (2,6) | 1.12 | % | 1.14 | % | 1.15 | % | 1.35 | % | 1.39 | % | ||||||||||
| Ratio of net investment income after expense reimbursement to average net assets (2,7) | 2.17 | % | 0.83 | % | 2.50 | % | 2.00 | % | 1.54 | % | ||||||||||
| Portfolio Turnover Rate | 186 | % | 127 | % | 117 | % | 114 | % | 195 | % | ||||||||||
| (1) | Per share amounts calculated using the average shares method, which more appropriately presents the per share data for the year. |
| (2) | The ratios of expenses and net investment income (loss) to average net assets do not reflect the Fund’s proportionate share of income and expenses of underlying investment companies in which the Fund invests. |
| (3) | Ratio of gross operating expenses to average net assets excluding interest expense (2) | 1.83 | % | 1.86 | % | 2.22 | % | 2.50 | % | 2.50 | % | ||||||||||
| (4) | Ratio of net operating expenses to average net assets excluding interest expense (2) | 1.48 | % | 1.48 | % | 1.49 | % | 1.49 | % | 1.49 | % | ||||||||||
| (5) | Ratio of gross operating expenses to average net assets excluding interest expense (2) | 1.83 | % | 1.63 | % | 2.22 | % | 2.50 | % | 2.38 | % | ||||||||||
| (6) | Ratio of net operating expenses to average net assets excluding interest expense (2) | 1.11 | % | 1.11 | % | 1.12 | % | 1.32 | % | 1.39 | % |
| (7) | Recognition of net investment income (loss) by the Fund is affected by the timing of the declaration of dividends by the underlying investment companies in which the Fund invests. |
| * | Assumes reinvestment of all dividends and distributions and does not assume the effects of any sales charges. Aggregate (not annualized) total return is shown for any period shorter than one year. Total return does not reflect the deduction of taxes that a shareholder would pay on distributions or on the redemption of shares. |
See accompanying notes to financial statements.
54
| EASTERLY FUNDS |
| FINANCIAL HIGHLIGHTS (For a share outstanding throughout the year/period) |
| Easterly Income Opportunities Fund | ||||||||||||||||||||
| Class A | ||||||||||||||||||||
| For the | For the | For the | For the | For the | ||||||||||||||||
| Year Ended | Year Ended | Year Ended | Year Ended | Period Ended | ||||||||||||||||
| November 30, | November 30, | November 30, | November 30, | November 30, | ||||||||||||||||
| 2022 | 2021 | 2020 | 2019 | 2018 (1) | ||||||||||||||||
| Net Asset Value, Beginning of Year | $ | 11.26 | $ | 11.35 | $ | 10.68 | $ | 10.16 | $ | 10.00 | ||||||||||
| Income (Loss) from Investment Operations: | ||||||||||||||||||||
| Net investment income (2) | 0.32 | 0.36 | 0.42 | 0.41 | 0.10 | |||||||||||||||
| Net realized and unrealized gain | (1.07 | ) | 0.24 | 0.95 | 0.46 | 0.06 | ||||||||||||||
| Total from investment operations | (0.75 | ) | 0.60 | 1.37 | 0.87 | 0.16 | ||||||||||||||
| Dividends and Distributions: | ||||||||||||||||||||
| Dividends from net investment income | (0.34 | ) | (0.38 | ) | (0.52 | ) | (0.34 | ) | — | |||||||||||
| Distributions from realized gains | (0.17 | ) | (0.31 | ) | (0.18 | ) | (0.01 | ) | — | |||||||||||
| Total dividends and distributions | (0.51 | ) | (0.69 | ) | (0.70 | ) | (0.35 | ) | — | |||||||||||
| Redemption Fees | — | — | — | 0.00 | ** | — | ||||||||||||||
| Net Asset Value, End of Year/Period | $ | 10.00 | $ | 11.26 | $ | 11.35 | $ | 10.68 | $ | 10.16 | ||||||||||
| Total Return* | (6.84 | )% | 5.44 | % # | 13.54 | % # | 8.67 | % # | 1.60 | % | ||||||||||
| Ratios and Supplemental Data: | ||||||||||||||||||||
| Net assets, end of year (000s) | $ | 11,247 | $ | 15,664 | $ | 12,466 | $ | 435 | $ | 19 | ||||||||||
| Ratio of gross operating expenses to average net assets including interest expense (5,6) | 1.86 | % | 1.86 | % | 2.01 | % | 2.38 | % | 2.18 | % (3) | ||||||||||
| Ratio of net operating expenses to average net assets including interest expense (5,7) | 1.80 | % | 1.76 | % | 1.79 | % | 1.74 | % | 1.74 | % (3) | ||||||||||
| Ratio of net investment income (loss) after expense reimbursement to average net assets (5,10) | 3.01 | % | 3.18 | % | 3.89 | % | 3.84 | % | 3.27 | % (3) | ||||||||||
| Portfolio Turnover Rate | 77 | % | 84 | % | 132 | % | 111 | % | 37 | % (4) | ||||||||||
| Easterly Income Opportunities Fund | ||||||||||||||||||||
| Class C | ||||||||||||||||||||
| For the | For the | For the | For the | For the | ||||||||||||||||
| Year Ended | Year Ended | Year Ended | Year Ended | Period Ended | ||||||||||||||||
| November 30, | November 30, | November 30, | November 30, | November 30, | ||||||||||||||||
| 2022 | 2021 | 2020 | 2019 | 2018 (1) | ||||||||||||||||
| Net Asset Value, Beginning of Year | $ | 11.00 | $ | 11.10 | $ | 10.45 | $ | 10.16 | $ | 10.00 | ||||||||||
| Income (Loss) from Investment Operations: | ||||||||||||||||||||
| Net investment income (2) | 0.23 | 0.27 | 0.33 | 0.32 | 0.10 | |||||||||||||||
| Net realized and unrealized gain | (1.04 | ) | 0.24 | 0.93 | 0.31 | 0.06 | ||||||||||||||
| Total from investment operations | (0.81 | ) | 0.51 | 1.26 | 0.63 | 0.16 | ||||||||||||||
| Dividends and Distributions: | ||||||||||||||||||||
| Dividends from net investment income | (0.26 | ) | (0.30 | ) | (0.43 | ) | (0.33 | ) | — | |||||||||||
| Distributions from realized gains | (0.17 | ) | (0.31 | ) | (0.18 | ) | (0.01 | ) | — | |||||||||||
| Total dividends and distributions | (0.43 | ) | (0.61 | ) | (0.61 | ) | (0.34 | ) | — | |||||||||||
| Redemption Fees | — | — | — | — | — | |||||||||||||||
| Net Asset Value, End of Year/Period | $ | 9.76 | $ | 11.00 | $ | 11.10 | $ | 10.45 | $ | 10.16 | ||||||||||
| Total Return* | (7.50 | )% | 4.71 | % | 12.62 | % | 6.24 | % # | 1.60 | % | ||||||||||
| Ratios and Supplemental Data: | ||||||||||||||||||||
| Net assets, end of year (000s) | $ | 4,467 | $ | 5,616 | $ | 3,262 | $ | 1,468 | $ | 0 | *** | |||||||||
| Ratio of gross operating expenses to average net assets including interest expense (5,8) | 2.61 | % | 2.61 | % | 2.81 | % | 3.11 | % | 3.01 | % (3) | ||||||||||
| Ratio of net operating expenses to average net assets including interest expense (5,9) | 2.55 | % | 2.51 | % | 2.54 | % | 2.49 | % | 2.49 | % (3) | ||||||||||
| Ratio of net investment income (loss) after expense reimbursement to average net assets (5,10) | 2.28 | % | 2.41 | % | 3.12 | % | 3.09 | % | 3.27 | % (3) | ||||||||||
| Portfolio Turnover Rate | 77 | % | 84 | % | 132 | % | 111 | % | 37 | % (4) | ||||||||||
| (1) | Class A and Class C commenced operations on August 14, 2018. Start of performance is August 21, 2018. |
| (2) | Per share amounts calculated using the average shares method, which more appropriately presents the per share data for the year/period. |
| (3) | Annualized for periods less than one year. |
| (4) | Not annualized. |
| (5) | The ratios of expenses and net investment income (loss) to average net assets do not reflect the Fund’s proportionate share of income and expenses of underlying investment companies in which the Fund invests. |
| (6) | Ratio of gross operating expenses to average net assets excluding interest expense (5) | 1.79 | % | 1.83 | % | 1.96 | % | 2.38 | % | 2.18 | % (3) | ||||||||||
| (7) | Ratio of net operating expenses to average net assets excluding interest expense (5) | 1.73 | % | 1.73 | % | 1.74 | % | 1.74 | % | 1.74 | % (3) | ||||||||||
| (8) | Ratio of gross operating expenses to average net assets excluding interest expense (5) | 2.54 | % | 2.58 | % | 2.76 | % | 3.11 | % | 3.01 | % (3) | ||||||||||
| (9) | Ratio of net operating expenses to average net assets excluding interest expense (5) | 2.48 | % | 2.48 | % | 2.49 | % | 2.49 | % | 2.49 | % (3) |
| (10) | Recognition of net investment income (loss) by the Fund is affected by the timing of the declaration of dividends by the underlying investment companies in which the Fund invests. |
| * | Assumes reinvestment of all dividends and distributions and does not assume the effects of any sales charges. Aggregate (not annualized) total return is shown for any period shorter than one year. Total return does not reflect the deduction of taxes that a shareholder would pay on distributions or on the redemption of shares. |
| ** | Per share amount represents less than $0.01 per share. |
| *** | Less than 1,000. |
| # | Includes adjustments in accordance with accounting principles generally accepted in the United States and, consequently, the net asset value for financial reporting purposes and the returns based upon those net asset values may differ from the net asset values and returns for shareholder transactions. Adjustments may apply to some but not all years and classes. |
See accompanying notes to financial statements.
55
| EASTERLY FUNDS |
| FINANCIAL HIGHLIGHTS (For a share outstanding throughout the year/period) |
| Easterly Income Opportunities Fund | ||||||||||||||||||||
| Class I | ||||||||||||||||||||
| For the | For the | For the | For the | For the | ||||||||||||||||
| Year Ended | Year Ended | Year Ended | Year Ended | Period Ended | ||||||||||||||||
| November 30, | November 30, | November 30, | November 30, | November 30, | ||||||||||||||||
| 2022 | 2021 | 2020 | 2019 | 2018 (1) | ||||||||||||||||
| Net Asset Value, Beginning of Year | $ | 11.00 | $ | 11.10 | $ | 10.46 | $ | 10.15 | $ | 10.00 | ||||||||||
| Income (Loss) from Investment Operations: | ||||||||||||||||||||
| Net investment income (2) | 0.34 | 0.38 | 0.44 | 0.40 | 0.07 | |||||||||||||||
| Net realized and unrealized gain | (1.05 | ) | 0.23 | 0.93 | 0.30 | 0.08 | ||||||||||||||
| Total from investment operations | (0.71 | ) | 0.61 | 1.37 | 0.70 | 0.15 | ||||||||||||||
| Dividends and Distributions: | ||||||||||||||||||||
| Dividends from net investment income | (0.36 | ) | (0.40 | ) | (0.55 | ) | (0.38 | ) | — | |||||||||||
| Distributions from realized gains | (0.17 | ) | (0.31 | ) | (0.18 | ) | (0.01 | ) | — | |||||||||||
| Total dividends and distributions | (0.53 | ) | (0.71 | ) | (0.73 | ) | (0.39 | ) | — | |||||||||||
| Redemption Fees | — | — | — | 0.00 | ** | 0.00 | ** | |||||||||||||
| Net Asset Value, End of Year/Period | $ | 9.76 | $ | 11.00 | $ | 11.10 | $ | 10.46 | $ | 10.15 | ||||||||||
| Total Return* | (6.58 | )% | 5.74 | % | 13.80 | % | 6.97 | % | 1.50 | % | ||||||||||
| Ratios and Supplemental Data: | ||||||||||||||||||||
| Net assets, end of year (000s) | $ | 206,630 | $ | 215,003 | $ | 112,226 | $ | 4,982 | $ | 1,007 | ||||||||||
| Ratio of gross operating expenses to average net assets including interest expense (5,6) | 1.61 | % | 1.61 | % | 1.79 | % | 1.99 | % | 2.01 | % (3) | ||||||||||
| Ratio of net operating expenses to average net assets including interest expense (5,7) | 1.55 | % | 1.51 | % | 1.54 | % | 1.49 | % | 1.49 | % (3) | ||||||||||
| Ratio of net investment income (loss) after expense reimbursement to average net assets (5,10) | 3.29 | % | 3.40 | % | 4.11 | % | 3.88 | % | 2.30 | % (3) | ||||||||||
| Portfolio Turnover Rate | 77 | % | 84 | % | 132 | % | 111 | % | 37 | % (4) | ||||||||||
| Easterly Income Opportunities Fund | ||||||||||||||||||||
| Class R6 | ||||||||||||||||||||
| For the | For the | For the | For the | For the | ||||||||||||||||
| Year Ended | Year Ended | Year Ended | Year Ended | Year Ended | ||||||||||||||||
| November 30, | November 30, | November 30, | November 30, | November 30, | ||||||||||||||||
| 2022 | 2021 | 2020 | 2019 | 2018 (1) | ||||||||||||||||
| Net Asset Value, Beginning of Year | $ | 11.15 | $ | 11.20 | $ | 10.51 | $ | 10.16 | $ | 10.00 | ||||||||||
| Income (Loss) from Investment Operations: | ||||||||||||||||||||
| Net investment income (2) | 0.38 | 0.43 | 0.48 | 0.43 | 0.07 | |||||||||||||||
| Net realized and unrealized gain | (1.07 | ) | 0.23 | 0.94 | 0.31 | 0.08 | ||||||||||||||
| Total from investment operations | (0.69 | ) | 0.66 | 1.42 | 0.74 | 0.15 | ||||||||||||||
| Dividends and Distributions: | ||||||||||||||||||||
| Dividends from net investment income | (0.36 | ) | (0.40 | ) | (0.55 | ) | (0.38 | ) | — | |||||||||||
| Distributions from realized gains | (0.17 | ) | (0.31 | ) | (0.18 | ) | (0.01 | ) | — | |||||||||||
| Total dividends and distributions | (0.53 | ) | (0.71 | ) | (0.73 | ) | (0.39 | ) | — | |||||||||||
| Redemption Fees | — | — | — | 0.00 | ** | 0.01 | ||||||||||||||
| Net Asset Value, End of Year/Period | $ | 9.93 | $ | 11.15 | $ | 11.20 | $ | 10.51 | $ | 10.16 | ||||||||||
| Total Return* | (6.30 | )% | 6.16 | % | 14.23 | % | 7.36 | % | 1.60 | % | ||||||||||
| Ratios and Supplemental Data: | ||||||||||||||||||||
| Net assets, end of year (000s) | $ | 92,994 | $ | 61,289 | $ | 62,369 | $ | 30,209 | $ | 34,604 | ||||||||||
| Ratio of gross operating expenses to average net assets including interest expense (5,8) | 1.61 | % | 1.63 | % | 1.80 | % | 1.93 | % | 1.87 | % (3) | ||||||||||
| Ratio of net operating expenses to average net assets including interest expense (5,9) | 1.18 | % | 1.14 | % | 1.17 | % | 1.13 | % | 1.49 | % (3) | ||||||||||
| Ratio of net investment income (loss) after expense reimbursement to average net assets (5,10) | 3.68 | % | 3.82 | % | 4.51 | % | 4.11 | % | 2.27 | % (3) | ||||||||||
| Portfolio Turnover Rate | 77 | % | 84 | % | 132 | % | 111 | % | 37 | % (4) | ||||||||||
| (1) | Class I and Class R6 commenced operations on August 14, 2018. Start of performance is August 21, 2018. |
| (2) | Per share amounts calculated using the average shares method, which more appropriately presents the per share data for the year/period. |
| (3) | Annualized for periods less than one year. |
| (4) | Not annualized. |
| (5) | The ratios of expenses and net investment income (loss) to average net assets do not reflect the Fund’s proportionate share of income and expenses of underlying investment companies in which the Fund invests. |
| (6) | Ratio of gross operating expenses to average net assets excluding interest expense (5) | 1.54 | % | 1.58 | % | 1.74 | % | 2.00 | % | 2.01 | % (3) | ||||||||||
| (7) | Ratio of net operating expenses to average net assets excluding interest expense (5) | 1.48 | % | 1.48 | % | 1.49 | % | 1.49 | % | 1.49 | % (3) | ||||||||||
| (8) | Ratio of gross operating expenses to average net assets excluding interest expense (5) | 1.54 | % | 1.61 | % | 1.75 | % | 1.93 | % | 1.87 | % (3) | ||||||||||
| (9) | Ratio of net operating expenses to average net assets excluding interest expense (5) | 1.11 | % | 1.11 | % | 1.12 | % | 1.13 | % | 1.49 | % (3) |
| (10) | Recognition of net investment income (loss) by the Fund is affected by the timing of the declaration of dividends by the underlying investment companies in which the Fund invests. |
| * | Assumes reinvestment of all dividends and distributions and does not assume the effects of any sales charges. Aggregate (not annualized) total return is shown for any period shorter than one year. Total return does not reflect the deduction of taxes that a shareholder would pay on distributions or on the redemption of shares. |
| ** | Per share amount represents less than $0.01 per share. |
| # | Includes adjustments in accordance with accounting principles generally accepted in the United States and, consequently, the net asset value for financial reporting purposes and the returns based upon those net asset values may differ from the net asset values and returns for shareholder transactions. Adjustments may apply to some but not all years and classes. |
See accompanying notes to financial statements.
56
| EASTERLY FUNDS |
| NOTES TO FINANCIAL STATEMENTS |
| (Consolidated with respect to the Easterly Total Hedge Portfolio) |
| Year Ended November 30, 2022 |
| 1. | ORGANIZATION AND SIGNIFICANT ACCOUNTING POLICIES |
James Alpha Fund Trust dba Easterly Funds Trust (the “Trust”) was organized in 2020, as a Delaware Statutory Trust and is registered under the Investment Company Act of 1940, as amended, as an open-end management investment company. The Trust currently consists of nine series. These financial statements include the following two series: The Easterly Total Hedge Portfolio and Easterly Income Opportunities Fund (formerly Easterly Structured Credit Value Fund).
The Easterly Total Hedge Portfolio and Easterly Income Opportunities Fund are diversified funds.
Easterly Funds LLC serves as the Funds’ Advisor. Orange Investment Advisors LLC serves as Easterly Income Opportunities Fund’s Sub-Advisor.
| Fund | Primary Objective |
| Easterly Total Hedge | Long-term risk adjusted returns relative to traditional financial market indices. |
| Easterly Income Opportunities | High level of risk adjusted current income and capital appreciation with a secondary objective of capital preservation. |
Currently, Easterly Income Opportunities Fund offers Class A, Class C, Class I and Class R6 shares and Easterly Total Hedge Portfolio offers Class I and Class R6. Class A shares are offered at net asset value plus a maximum sales load of 2.00%. Class C shares are offered subject to a CDSC of 1.00%. Class I and Class R6 shares are offered at net asset value. Each class represents an interest in the same assets of the applicable Fund, and the classes are identical except for differences in their sales charge structures, ongoing service and distribution charges. Class R6 shares are only available to certain qualified investors and the minimum initial investment will vary depending on the type of qualified investor. All classes of shares have equal voting privileges except that each class has exclusive voting rights with respect to its service and/or distribution plans. The Funds’ income, expenses (other than class specific distribution fees) and realized and unrealized gains and losses are allocated proportionately each day based upon the relative net assets of each class.
The following is a summary of significant accounting policies followed by the Funds in preparation of its financial statements. These policies are in conformity with accounting principles generally accepted in the United States of America (“GAAP”). The preparation of financial statements in conformity with GAAP requires management to make estimates and assumptions that affect the reported amounts of assets and liabilities and disclosure of contingent assets and liabilities at the date of the financial statements and the reported amounts of increases and decreases in net assets from operations during the reporting period. Actual results could differ from those estimates. Each Fund is an investment company and accordingly follows the investment company accounting and reporting guidance of the Financial Accounting Standards Board (FASB) Accounting Standard Codification Topic 946 “Financial Services – Investment Companies”.
(a) Valuation of Investments
Investment securities listed on a national securities exchange are valued at the last reported sale price on the valuation date. NASDAQ traded securities are valued at the NASDAQ Official Closing Price (NOCP). If there are no such reported sales, the securities are valued at the mean between current bid and ask. Short-term debt securities having a remaining maturity of sixty days or less may be valued at amortized cost or amortized value, which approximates market value. Debt securities may be valued at prices supplied by the Funds’ pricing services based on broker or dealer supplied valuations or matrix pricing, a method of valuing securities by reference to the value of other securities with similar characteristics, such as rating, interest rate and maturity. Options listed on a securities exchange or board of trade for which market quotations are readily available shall be valued at the last quoted sales price or, in the absence of a sale, at the mean between the last bid and ask price. Options not listed on a securities exchange or board of trade for which over-the-counter market quotations are readily available shall be valued at the mean of the current bid and asked prices. Swap transactions are valued through an independent pricing service or at fair value based on daily price reporting from the swap counterparty issuing the swap. Total return swaps on securities listed on an exchange shall be valued at the last quoted sales price or, in the absence of a sale, at the mean between the current bid and ask prices. Any securities or other assets for which market quotations are not readily available are valued at their fair value as determined in good faith under procedures established by the Board of Trustees (the “Board”). There is no single standard for determining the fair value of such securities. Rather, in determining the fair value of a security, the board-appointed Valuation Designee shall take into account the relevant factors and surrounding circumstances, a few of which may include: (i) the nature and pricing history (if any) of the security; (ii) whether any dealer quotations for the security are available; and (iii) possible valuation methodologies that could be used to determine the fair value of a security. Foreign currency and Forward currency exchange contracts are valued daily at the London close each day. Investments in foreign countries may involve certain considerations and risks not typically associated with domestic investments, including, but not limited to, the possibility of future political and economic developments and the level of government supervision and regulation of foreign securities markets.
Special valuation considerations may apply with respect to “odd-lot” fixed-income transactions which, due to their small size, may receive evaluated prices by pricing services which reflect a large block trade and not what actually could be obtained for the odd-lot position. Easterly and the sub-adviser to the Easterly Income Opportunities Fund may, in their discretion, value an odd lot fixed income security at what Easterly and the sub-adviser believe is a fair price and not the pricing service price if Easterly and the sub-adviser deem the price provided by the pricing service to not represent its fair value.
Valuation of Fund of Funds – The Funds may invest in portfolios of open-end or closed-end investment companies (the “Underlying Funds”). The Underlying Funds value securities in their portfolios for which market quotations are readily available at their market values (generally the last reported sale price) and all other securities and assets at their fair value based upon the methods established by the board of directors of the Underlying Funds.
Open-end investment companies are valued at their respective net asset values as reported by such investment companies. The shares of many closed-end investment companies, after their initial public offering, frequently trade at a price per share, which is different than the net asset value per share. The difference represents a market premium or market discount of such shares. There can be no assurances that the market discount or market premium on shares of any closed-end investment company purchased by the Funds will not change.
The Funds utilize various methods to measure the fair value of most of its investments on a recurring basis. GAAP establishes a hierarchy that prioritizes inputs to valuation methods. The three levels of input are:
Level 1 – Unadjusted quoted prices in active markets for identical assets and liabilities that the Funds have the ability to access.
57
| EASTERLY FUNDS |
| NOTES TO FINANCIAL STATEMENTS |
| (Consolidated with respect to the Easterly Total Hedge Portfolio) |
| Year Ended November 30, 2022 (Continued) |
Level 2 – Observable inputs other than quoted prices included in level 1 that are observable for the asset or liability, either directly or indirectly. These inputs may include quoted prices for the identical instrument on an inactive market, prices for similar instruments, interest rates, prepayment speeds, credit risk, yield curves, default rates and similar data.
Level 3 – Unobservable inputs for the asset or liability, to the extent relevant observable inputs are not available, representing the Funds’ own assumptions about the assumptions a market participant would use in valuing the asset or liability, and would be based on the best information available.
The availability of observable inputs can vary from security to security and is affected by a wide variety of factors, including, for example, the type of security, whether the security is new and not yet established in the marketplace, the liquidity of markets, and other characteristics particular to the security. To the extent that valuation is based on models or inputs that are less observable or unobservable in the market, the determination of fair value requires more judgment. Accordingly, the degree of judgment exercised in determining fair value is greatest for instruments categorized in Level 3.
The inputs used to measure fair value may fall into different levels of the fair value hierarchy. In such cases, for disclosure purposes, the level in the fair value hierarchy within which the fair value measurement falls in its entirety, is determined based on the lowest level input that is significant to the fair value measurement in its entirety.
The inputs or methodology used for valuing securities are not necessarily an indication of the risk associated with investing in those securities. The following tables summarize the inputs used as of November 30, 2022, for the Fund’ assets and liabilities measured at fair value:
| Easterly Total Hedge | ||||||||||||||||
| Assets* | Level 1 | Level 2 | Level 3 | Total | ||||||||||||
| Exchange Traded Funds | $ | 22,898,225 | $ | — | $ | — | $ | 22,898,225 | ||||||||
| Exchange Traded Notes | 1,690 | — | — | 1,690 | ||||||||||||
| Open Ended Funds | 5,142,197 | — | — | 5,142,197 | ||||||||||||
| Total | $ | 28,042,112 | — | — | $ | 28,042,112 | ||||||||||
| Asset Derivatives | ||||||||||||||||
| Forward Currency Contracts | $ | — | $ | 4,331 | $ | — | $ | 4,331 | ||||||||
| Total Return Swap | — | 246,004 | — | 246,004 | ||||||||||||
| Total Assets | $ | 28,042,112 | $ | 250,335 | $ | — | $ | 28,292,447 | ||||||||
| Liability Derivatives | ||||||||||||||||
| Forward Currency Contracts | $ | — | $ | 6,478 | $ | — | $ | 6,478 | ||||||||
| Total Liabilities | $ | — | $ | 6,478 | $ | — | $ | 6,478 | ||||||||
| Easterly Income Opportunities | ||||||||||||||||
| Assets* | Level 1 | Level 2 | Level 3 | Total | ||||||||||||
| Asset Backed Securities | $ | — | $ | 259,461,058 | $ | — | $ | 259,461,058 | ||||||||
| Collateralized Mortgage Obligations | — | 173,470 | — | 173,470 | ||||||||||||
| Corporate Bonds | — | 40,002,627 | — | 40,002,627 | ||||||||||||
| Non U.S. Government & Agencies | — | 906,367 | — | 906,367 | ||||||||||||
| U.S. Government & Agencies | — | 120,139 | — | 120,139 | ||||||||||||
| Interest Rate Swap | — | 4,711,000 | — | 4,711,000 | ||||||||||||
| Total Assets | $ | — | $ | 305,374,661 | $ | — | 305,374,661 | |||||||||
| Liability Derivatives | ||||||||||||||||
| Credit Default Swap | $ | — | $ | 869 | $ | — | $ | 869 | ||||||||
| Total Liabilities | $ | — | $ | 869 | $ | — | $ | 869 | ||||||||
There were no level 3 securities held during the year.
| * | Refer to the Schedules of Investments for industry or category classifications. |
Consolidation of Subsidiaries – James Alpha Total Hedge Cayman Fund Ltd (Easterly Total Hedge-CFC). The Consolidated Portfolios of Investments, Consolidated Statements of Assets and Liabilities, Consolidated Statements of Operations, Consolidated Statements of Changes in Net Assets and the Consolidated Financial Highlights of the Fund include the accounts of Easterly Total Hedge, which include the accounts of Easterly Total Hedge-CFC, which is a wholly-owned and controlled foreign subsidiary. All inter-company accounts and transactions have been eliminated in consolidation. The Fund may invest up to 25% of their total assets in a controlled foreign corporation (“CFC”), which acts as an investment vehicle in order to affect certain investments consistent with the Funds’ investment objectives and policies.
A summary of each Fund’s investment in its respective CFC is as follows:
| Inception Date of | CFC Net Assets as of | % of Net Assets as of | |
| CFC | November 30, 2022 | November 30, 2022 | |
| Easterly Total Hedge - CFC | 10/13/2016 | 278,012 | 0.92% |
For tax purposes, the CFC is an exempted Cayman investment companies. The CFC has received an undertaking from the Government of the Cayman Islands exempting it from all local income, profits and capital gains taxes. No such taxes are levied in the Cayman Islands at the present time. For U.S. income tax purposes, the CFC is a controlled foreign corporation which generates and is allocated no income which is considered effectively connected with U.S. trade of business and as such is not subject
58
| EASTERLY FUNDS |
| NOTES TO FINANCIAL STATEMENTS |
| (Consolidated with respect to the Easterly Total Hedge Portfolio) |
| Year Ended November 30, 2022 (Continued) |
to U.S. income tax. However, as a wholly-owned controlled foreign corporation, the CFCs net income and capital gain, to the extent of its earnings and profits, will be included each year in the respective Fund’s investment company taxable income.
(b) Federal Income Tax
It is each Fund’s policy to continue to qualify as a regulated investment company by complying with the provisions of the Internal Revenue Code that are applicable to regulated investment companies and to distribute substantially all of its taxable income and net realized gains to shareholders. Management has analyzed the Fund’s tax positions and has concluded that no liability for unrecognized tax benefits should be recorded related to uncertain tax positions taken on returns filed for open tax years ended November 30, 2019 to November 30, 2021, or expected to be taken in the Funds’ November 30, 2022 year-end tax returns.
The Funds recognize the tax benefits of uncertain tax positions only when the position is “more likely than not” to be sustained assuming examination by tax authorities. Management has analyzed the Fund’s tax positions and has concluded that no liability for unrecognized tax benefits should be recorded related to uncertain tax positions taken on returns filed for open tax years or expected to be taken in the Funds’ November 30, 2022 year-end tax returns. The Funds identify its major tax jurisdictions as U.S. Federal, New York and foreign jurisdictions where the Funds make significant investments. The Funds recognize interest and penalties, if any, related to unrecognized tax benefits as income tax expense in the Statements of Operations. During the year ended November 30, 2022, the Funds did not incur any interest or penalties.
(c) Security Transactions and Other Income
Security transactions are reflected for financial reporting purposes as of the trade date. Dividend income is recognized on the ex-dividend date, and interest income is recognized on an accrual basis including premium amortized and discount accreted. All paydown gains and losses are classified as interest income in the accompanying Statements of Operations in accordance with U.S. GAAP. Discounts and premiums on securities purchased are accreted and amortized, over the lives of the respective securities with a corresponding increase/decrease in the cost basis of that security using the yield to maturity method, or where applicable, the first call date of the security. Realized gains or losses from sales of securities are determined by comparing the identified cost of the security lot sold with the net sales proceeds. Withholding taxes on foreign dividends have been provided for in accordance with the Trust’s understanding of the applicable country’s tax rules and rates.
(d) Dividends and Distributions
The following table summarizes each Fund’s intended dividend and capital gain declaration policy:
| Fund | Income Dividends | Capital Gains | ||
| Easterly Total Hedge | Annually | Annually | ||
| Easterly Income Opportunities | Monthly | Annually |
Each Fund records dividends and distributions to its shareholders on the ex-dividend date. The amount of dividends and distributions from net investment income and net realized gains are determined in accordance with federal income tax regulations, which may differ from GAAP. These “book-tax” differences are either permanent or temporary in nature. To the extent these differences are permanent in nature, such amounts are reclassified within the net asset accounts based on their federal tax-basis treatment; temporary differences do not require reclassification. To the extent dividends and distributions exceed current and accumulated earnings and profits for federal income tax purposes, they are reported as distributions of paid-in-surplus or tax return of capital. These reclassifications have no effect on net assets, results from operations or net asset value per share of each Fund.
(e) Allocation of Expenses
Expenses of the Trust that are directly identifiable to a specific fund are charged to that fund. Expenses, which are not readily identifiable to a specific fund, are allocated in such a manner as deemed equitable, taking into consideration the nature and type of expense and the relative sizes of the funds in the Trust.
(f) Indemnification
The Trust indemnifies its Officers and Trustees for certain liabilities that may arise from the performance of their duties to the Trust. Additionally, in the normal course of business, the Funds enter into contracts that contain a variety of representations and warranties and which provide general indemnities. The Funds’ maximum exposure under these arrangements is unknown, as this would involve future claims that may be made against the Funds that have not yet occurred. However, based on experience, the risk of loss due to these warranties and indemnities appears to be remote.
(g) Other
The preparation of the financial statements in accordance with accounting principles generally accepted in the United States of America requires management to make estimates and assumptions that affect the reported amounts and disclosures in the financial statements. Actual results could differ from those estimates.
Foreign currency. Investment securities and other assets and liabilities denominated in foreign currencies are translated into U.S. dollar amounts at the date of valuation. Purchases and sales of investment securities and income and expense items denominated in foreign currencies are translated into U.S. dollar amounts on the respective dates of such transactions.
The Trust does not isolate that portion of the results of operations resulting from changes in foreign exchange rates on investments from the fluctuations arising from changes in market prices of securities held. Such fluctuations are included with the net realized and unrealized gain or loss from investments.
Reported net realized foreign exchange gains or losses arise from sales of foreign currencies, currency gains or losses realized between the trade and settlement dates on securities transactions, and the difference between the amounts of dividends, interest, and foreign withholding taxes recorded on the company’s books and the U.S. dollar equivalent of the amounts actually received or paid. Net unrealized foreign exchange gains and losses arise from changes in the fair values of assets and liabilities, other than investments in securities at fiscal period end, resulting from changes in exchange rates.
59
| EASTERLY FUNDS |
| NOTES TO FINANCIAL STATEMENTS |
| (Consolidated with respect to the Easterly Total Hedge Portfolio) |
| Year Ended November 30, 2022 (Continued) |
Foreign currency contracts. Certain Funds may enter into foreign currency exchange contracts. Because various Funds may invest in securities denominated in foreign currencies, they may seek to hedge foreign currency risks by engaging in foreign currency exchange transactions. These may include buying or selling foreign currencies on a spot basis, entering into foreign currency forward contracts, and buying and selling foreign currency options, foreign currency futures, and options on foreign currency futures. Currency exchange rates may fluctuate significantly over short periods and can be subject to unpredictable change based on such factors as political developments and currency controls by foreign governments
Market Disruptions Risk. The Fund is subject to investment and operational risks associated with financial, economic and other global market developments and disruptions, including the recent spread of an infectious respiratory illness caused by a novel strain of coronavirus (known as COVID-19), which can negatively impact the securities markets and cause the Fund to lose value.
The spread of COVID-19 has caused volatility, severe market dislocations and liquidity constraints in many markets, including markets for the securities the Funds hold, and may adversely affect the Funds’ investments and operations. The transmission of COVID-19 and efforts to contain its spread have resulted in travel restrictions and disruptions, closed international borders, enhanced health screenings at ports of entry and elsewhere, disruption of and delays in healthcare service preparation and delivery, quarantines, event and service cancellations or interruptions, disruptions to business operations and supply chains, and a reduction in consumer and business spending, as well as general concern and uncertainty that has negatively affected the economy. These disruptions have led to instability in the marketplace and the jobs market. The impact of COVID-19 could adversely affect the economies of many nations or the entire global economy, the financial well-being and performance of individual issuers, borrowers and sectors and the health of the markets generally in potentially significant and unforeseen ways.
The foregoing could lead to a significant economic downturn or recession, increased market volatility, a greater number of market closures, higher default rates and adverse effects on the values and liquidity of the Funds’ securities or other assets. Such impacts may adversely affect the performance of the Funds.
| 2. | MANAGEMENT FEE, ADMINISTRATION FEE AND OTHER TRANSACTIONS WITH AFFILIATES |
(a) Easterly Funds LLC acts as investment manager for the Funds pursuant to the terms of a Management Agreement with the Trust, on behalf of the Funds (the “Management Agreement”). Under the terms of the Management Agreement, the Manager manages the investment operations of the Funds in accordance with each Fund’s respective investment policies and restrictions. Each investment sub-advisor is responsible for the day-to-day management of its Fund’s portfolios. Easterly Funds LLC serves the Funds in a supervision capacity with responsibility to monitor the performance of the Funds’ outside service providers, assist in the review of financial statements and other regulatory filings and board meeting materials related to each Fund. The management fees are payable to Easterly Funds LLC monthly by each Fund and are computed daily as shown in the table below. The Funds’ subadvisors are paid by the manager, not the Funds.
(b) Pursuant to an operating expense limitation agreement between Easterly Funds LLC and the Funds, Easterly Funds LLC has contractually agreed to waive all or a portion of its advisory fee and/or pay expenses of the Fund so that total annual Fund operating expenses (excluding front-end and contingent deferred sales loads, leverage, interest and tax expenses, dividends and interest on short positions, brokerage commissions, expenses incurred in connection with any merger, reorganization or liquidation, extraordinary or non-routine expenses and Acquired Fund Fees and Expenses) do not exceed the expense limitation shown in the table below, and is based on the Funds’ average daily net assets. This operating expense limitation agreement cannot be terminated during its term. Easterly Funds LLC is permitted to seek reimbursement from the Fund, subject to limitations, for management fees waived and Fund expenses it paid within three (3) years of the end of the fiscal year in which such management fees were waived or expenses paid, as long as the reimbursement does not cause the Fund’s operating expenses to exceed (i) the expense cap in place at the time the fees were waived or the expenses were incurred; or (ii) the current expense cap, whichever is less. The expense limitation agreement will be in effect through March 31, 2024.
| Managament | ||||||||||||||||
| Fee Waived/ | ||||||||||||||||
| Management | Expenses Limitation | Expenses Reimbursed | ||||||||||||||
| Fund | Agreement | Cl A | Cl C | Cl I | CL R6 | Expires | YT D 11/30/22 | |||||||||
| Easterly Total Hedge | 1.00% | N/A | N/A | 1.48% | 1.11% | 3/31/2024 | 194,686 | |||||||||
| Easterly Income Opportunities | 1.20% | 1.73% | 2.48% | 1.48% | 1.11% | 3/31/2024 | 552,449 | |||||||||
The following table shows the available waived expenses and expiration date for each Fund subject to potential recovery.
| Fund | 11/30/2023 | 11/30/2024 | 11/30/2025 | |||||||||
| Easterly T otal Hedge | $ | 96,283 | $ | 101,288 | $ | 194,686 | ||||||
| Easterly Income Opportunities | 441,960 | 472,087 | 552,449 | |||||||||
(c) Ultimus Fund Distributors, LLC (“UFD”) is the Trust’s Distributor. The Trust with respect to Easterly Income Opportunities has adopted a Plan of Distribution pursuant to Rule 12b-1 under the 1940 Act (the “Plan”) with respect to the sale and distribution of Class A and C shares of the Funds. The Plan provides that the Fund will pay UFD and other entities, including a broker-dealer affiliate of the Adviser, are paid pursuant to the Plans provided and the expenses borne by the distributor and others in the distribution of Fund shares a fee, which is accrued daily and paid monthly, at the annual rate of 0.25% of the average daily net assets of Class A shares and 1.00% of the average daily net assets of each of the Funds’ Class C shares. The aggregate of such service fee payments will not exceed 0.25% of average daily net assets.
For the year ended, November 30, 2022, UFD received sales charges on sales of the Funds’ Class A shares.
| Fund | UFD Sales Charges | |||
| Class A | ||||
| Easterly Income Opportunities | 16,188 | |||
60
| EASTERLY FUNDS |
| NOTES TO FINANCIAL STATEMENTS |
| (Consolidated with respect to the Easterly Total Hedge Portfolio) |
| Year Ended November 30, 2022 (Continued) |
(d) Ultimus Fund Solutions, LLC (“UFS”), an affiliate of UFD provides administrative, fund accounting and transfer agency services to the Funds pursuant to agreements with the Trust, for which it receives from each Fund: (i) a minimum annual fee or basis points in decreasing amounts as assets reach certain breakpoints; and (ii) any related out-of-pocket expenses.
(e) Affiliated Investments — The Funds’ transactions with affiliates represent holdings for which the respective Fund and the underlying investee fund have the same investment advisor or where the investee fund’s investment advisor is under common control with the Fund’s investment advisor. Companies which are affiliates of the Funds at November 30, 2022, are noted in the Fund’s Schedule of Investments.
| Change in | ||||||||||||||||||||||||||||||
| Value at | Realized | Dividend | Unrealized | Value at | ||||||||||||||||||||||||||
| Fund | Affiliated Holding | 11/30/21 | Purchases | Sales | Gain/(Loss) | Income | Gain/(Loss) | 11/30/2022 | ||||||||||||||||||||||
| Easterly Total Hedge | Easterly Hedged Equity Fund, Cl R6 | $ | 1,396,321 | $ | 134,257 | $ | (440,000 | ) | $ | (46,392 | ) | $ | 134,257 | $ | (90,739 | ) | $ | 953,447 | ||||||||||||
| Easterly Income Opportunties Fund, Cl R6 | 5,672,814 | 187,025 | (3,488,000 | ) | (135,696 | ) | 138,895 | (242,466 | ) | 1,993,677 | ||||||||||||||||||||
In addition, certain affiliates of the Distributor provide services to the Trust as follows:
Northern Lights Compliance Services, LLC (“NLCS”) - NLCS, an affiliate of UFS and the Distributor, provides a Chief Compliance Officer to the Trust, as well as related compliance services, pursuant to a consulting agreement between NLCS and the Trust. Under the terms of such agreement, NLCS receives customary fees from the Funds.
Blu Giant, LLC (“Blu Giant”) – Blu Giant, an affiliate of UFS and the Distributor, provides EDGAR conversion and filing services as well as print management services for the Trust on an ad-hoc basis. For the provision of these services, Blu Giant receives customary fees from the Funds.
Certain employees of UFS and NLCS are also officers of the Trust, and are not paid any fees directly by the Trust for serving in such capacity.
| 3. | INVESTMENT TRANSACTIONS |
(a) For the year ended November 30, 2022, the cost of purchases and proceeds from sales of investment securities, other than short-term securities, for the Funds were as follows:
| Fund | Purchase | Sales | ||||||
| Easterly Total Hedge | $ | 53,334,900 | $ | 55,767,252 | ||||
| Easterly Income Opportunities | 302,799,996 | 221,430,727 | ||||||
(b) Other Investment Companies or Exchange Traded Funds – Certain Funds may invest up to 100% of their net assets in shares of affiliated and unaffiliated investment companies, including money market mutual funds, other mutual funds or exchange-traded funds (“ETFs”). An ETF generally is an open-end investment company, unit investment trust or a Fund of securities deposited with a depository in exchange for depository receipts. ETFs provide investors the opportunity to buy or sell throughout the day an entire Fund of securities in a single security. Although index mutual funds are similar to index-based ETFs, they are generally sold and redeemed only once per day at market close. The ETFs in which a Fund invests may be subject to liquidity risk. Liquidity risk exists when particular investments are difficult to purchase or sell, possibly preventing the sale of the security at an advantageous time or price. To the extent that the ETFs in which a Fund invests hold securities of companies with smaller market capitalizations or securities with substantial market risk, they will have a greater exposure to liquidity risk. In addition, ETFs are subject to the following risks that do not apply to conventional mutual funds that can be found in “Exchange-Traded Funds” below: (1) the market price of the ETF’s shares may trade at a discount to their net asset value; (2) an active trading market for an ETF’s shares may not develop or be maintained; or (3) trading of an ETF’s shares may be halted if the listing exchange deem such action appropriate, the shares are de-listed from the exchange, or the activation of market-wide “circuit breakers” (which are tied to large decreases in stock prices) halts stock trading generally. Additionally, ETFs have management fees, which increase their cost. In addition to the advisory and operational fees a Fund bears directly in connection with its own operation, the Fund also bears its pro rata portion of the advisory and operational expenses incurred indirectly through investments in other investment companies.
(c) Options Contracts – Certain Funds may enter into options contracts. An option contract is a contract in which the writer of the option grants the buyer of the option the right to purchase from (call option), or sell to (put option), the writer a designated instrument at a specified price within a specified period of time. Certain options, including options on indices, will require cash settlement by the Fund if the option is exercised.
Premiums paid when put or call options are purchased by the Fund, represent investments, which are marked-to-market daily. When a purchase option expires, the Fund will realize a loss in the amount of the premium paid. When the Fund enters into a closing sales transaction, the Fund will realize a gain or loss depending on whether the proceeds from the closing sales transaction are greater or less than the premium paid for the option. When the Fund exercises a put option, it will realize a gain or loss from the sale of the underlying security and the proceeds from such sale will be decreased by the premium originally paid. When the Fund exercises a call option, the cost of the security, which the Fund purchases upon exercise, will be increased by the premium originally paid.
Certain Funds may write covered call options. This means that the Fund will own the security subject to the option or an option to purchase the same underlying security, having an exercise price equal to or less than the exercise price of the covered option, or will establish and maintain with its custodian for the term of the option, an account consisting of cash, U.S. government securities or other liquid securities having a value equal to the fluctuating market value of the securities on which the Fund holds a covered call position.
When a Fund writes a call option, an amount equal to the premium received by the Fund is recorded as a liability, the value of which is marked-to-market daily. When a written option expires, the Fund realizes a gain equal to the amount of the premium received. When the Fund enters into a closing purchase transaction, the Fund
61
| EASTERLY FUNDS |
| NOTES TO FINANCIAL STATEMENTS |
| (Consolidated with respect to the Easterly Total Hedge Portfolio) |
| Year Ended November 30, 2022 (Continued) |
realizes a gain or loss depending upon whether the cost of the closing transaction is greater or less than the premium originally received, without regard to any unrealized gain or loss on the underlying security, and the liability related to such option is eliminated. When a written call option is exercised the proceeds of the security sold will be increased by the premium originally received.
The liability representing a Fund’s obligation under an exchange traded written option or investment in a purchased option is valued at the last sale price or, in the absence of a sale, the last available bid price.
The Funds may enter into options for hedging purposes. The risk associated with purchasing options is limited to the premium originally paid. The risk in writing a covered call option is that the Fund gives up the opportunity to participate in any increase in the price of the underlying security beyond the exercise price.
(d) Swap Agreements – Certain Funds are subject to equity price risk and/or interest rate risk in the normal course of pursuing their respective investment objectives. The Funds may enter into various swap transactions for investment purposes or to manage interest rate, equity, foreign exchange (currency), commodity or credit risk. These would be two-party contracts entered into primarily to exchange the returns (or differentials in rates of returns) earned or realized on particular pre-determined investments or instruments.
The gross returns to be exchanged or “swapped” between parties are calculated with respect to a notional amount, i.e., the return on or increase in value of a particular dollar amount invested at a particular interest rate, in a particular foreign currency, or in a “basket” of securities representing a particular index or market segment. Changes in the value of swap agreements are recognized as unrealized gains or losses in the Statements of Operations by “marking to market” on a daily basis to reflect the value of the swap agreement at the end of each trading day. Payments received or paid at the beginning of the agreement are reflected as such on the Statements of Assets and Liabilities and may be referred to as upfront payments. The Funds amortize upfront payments and/or accrue for the fixed payment stream on swap agreements on a daily basis with the net amount recorded as a component of unrealized gain or loss on the Statements of Operations. A liquidation payment received or made at the termination of the swap agreement is recorded as a realized gain or loss on the Statements of Operations. The Funds segregate liquid securities having a value at least equal to the amount of their current obligation under any swap transaction. Entering into these agreements involves, to varying degrees, lack of liquidity and elements of credit, market, and counterparty risk in excess of amounts recognized on the Statements of Assets and Liabilities. The Funds’ maximum risk of loss from counterparty credit risk is the discounted net value of the cash flows to be received from the counterparty over the contract’s remaining life, to the extent that that amount is positive. The derivatives are not accounted for as hedging instruments under GAAP. The effect of derivative instruments on the Statements of Assets and Liabilities at November 30, 2022, were as follows:
| Location of derivatives on | ||||||||||
| Statements of Assets and | Fair value of asset/liability | |||||||||
| Fund | Derivative | Risk Type | Liabilities | derivatives | ||||||
| Easterly Total Hedge | ||||||||||
| Forward Exchange Contracts | Foreign Exchange | Unrealized appreciation on forward currency exchange contracts | $ | 4,331 | ||||||
| Unrealized depreciation on forward currency exchange contracts | (6,478 | ) | ||||||||
| Swap Contracts | Equity | Unrealized appreciation on swaps | 246,004 | |||||||
| Totals | $ | 243,857 | ||||||||
| Easterly Income Opportunities | ||||||||||
| Swap Contracts | Interest Rate | Unrealized appreciation on swaps | $ | 4,710,131 | ||||||
62
| EASTERLY FUNDS |
| NOTES TO FINANCIAL STATEMENTS |
| (Consolidated with respect to the Easterly Total Hedge Portfolio) |
| Year Ended November 30, 2022 (Continued) |
The effect of derivative instruments on the Statements of Operations for the year ended November 30, 2022, were as follows:
| Realized and unrealized | ||||||||||
| Portfolio | Derivative | Location of gain (loss) on derivatives | Risk Type | gain (loss) on derivatives | ||||||
| Easterly Total Hedge | ||||||||||
| Swap Contracts | ||||||||||
| Net realized loss on swaps | Equity | $ | (74,502 | ) | ||||||
| Net change in unrealized appreciation on swaps | Equity | $ | 219,308 | |||||||
| Options Purchased | ||||||||||
| Net realized loss from options purchased | Equity | $ | (11,137 | ) | ||||||
| Net change in unrealized depreciation on options purchased | Equity | $ | (30,741 | ) | ||||||
| Options Written | ||||||||||
| Net realized gain from options written | Equity | $ | 52,970 | |||||||
| Net change in unrealized appreciation on options written | Equity | $ | 28,106 | |||||||
| Forward Contracts | ||||||||||
| Net realized gain from investments and foreign currency transactions | Foreign Exchange | $ | 190,319 | |||||||
| Net change in unrealized depreciation on investments and foreign currency transactions | Foreign Exchange | $ | (9,220 | ) | ||||||
| Easterly Income Opportunities | ||||||||||
| Swap Contracts | ||||||||||
| Net realized loss on swaps | Interest Rate | $ | (202,777 | ) | ||||||
| Net change in unrealized appreciation on swaps | Interest Rate | $ | 4,811,464 | |||||||
The amounts of realized and changes in unrealized gains and losses on derivative instruments during the period as disclosed in the Statements of Operations serve as indicators of the volume of derivative activity for the Funds.
The following table presents the Funds’ assets and liabilities available for offset under a master netting arrangement net of collateral pledged as of November 30, 2022.
| Gross Amounts not offset in the Statements of Assets | ||||||||||||||||
| and Liabilities | ||||||||||||||||
| Gross Amounts Recognized in | ||||||||||||||||
| Statements of Assets and | Financial Instruments | Net Amount of Assets | ||||||||||||||
| Liabilities | Pledged | Cash Collateral Pledged * | (Liabilities) | |||||||||||||
| Easterly Total Hedge | ||||||||||||||||
| Description of Asset: | ||||||||||||||||
| Forward Foreign | ||||||||||||||||
| Currency Contracts | $ | — | — | $ | — | $ | — | |||||||||
| Total Return Swaps | 246,004 | — | 246,004 | — | ||||||||||||
| Total | $ | 246,004 | $ | — | $ | 246,004 | $ | — | ||||||||
| Description of Liability: | ||||||||||||||||
| Forward Foreign | ||||||||||||||||
| Currency Contracts | $ | (2,147 | ) | $ | — | $ | — | $ | — | |||||||
| $ | (2,147 | ) | $ | — | $ | — | $ | — | ||||||||
| Easterly Income Opportunities | ||||||||||||||||
| Description of Asset: | ||||||||||||||||
| Credit Default Swap | $ | 4,710,131 | — | $ | 4,710,131 | $ | — | |||||||||
| Total | $ | 4,710,131 | $ | — | $ | 4,710,131 | $ | — | ||||||||
| * | Excess collateral not included. |
63
| EASTERLY FUNDS |
| NOTES TO FINANCIAL STATEMENTS |
| (Consolidated with respect to the Easterly Total Hedge Portfolio) |
| Year Ended November 30, 2022 (Continued) |
| 4. | AGGREGATE UNREALIZED APPRECIATION AND DEPRECIATION – TAX BASIS |
| Cost for | Tax Net | |||||||||||||||
| Federal Tax | Unrealized | Unrealized | Unrealized | |||||||||||||
| Port folio | Purposes | Appreciation | Depreciation | App/Dep | ||||||||||||
| Easterly Total Hedge | $ | 30,617,077 | $ | 12,279,698 | $ | (14,854,663 | ) | $ | (2,574,965 | ) | ||||||
| Easterly Income Opportunities | 333,092,353 | 8,473,546 | (40,902,238 | ) | (32,428,692 | ) | ||||||||||
| 5. | DISTRIBUTIONS TO SHAREHOLDERS AND TAX COMPONENTS OF CAPITAL |
The tax character of fund distributions paid for the years ended November 30, 2022, and November 30, 2021, was as follows:
| For the period ended November 30, 2022: | ||||||||||||||||
| Ordinary | Long-Term | Return | ||||||||||||||
| Portfolio | Income | Capital Gains | Of Capital | Total | ||||||||||||
| Easterly Total Hedge | $ | 1,646,505 | $ | 741,617 | $ | — | $ | 2,388,122 | ||||||||
| Easterly Income Opportunities | 13,855,861 | 2,521,242 | — | 16,377,103 | ||||||||||||
| For the period ended November 30, 2021: | ||||||||||||||||
| Ordinary | Long-Term | Return | ||||||||||||||
| Portfolio | Income | Capital Gains | Of Capital | Total | ||||||||||||
| Easterly Total Hedge | $ | — | $ | — | $ | — | $ | — | ||||||||
| Easterly Income Opportunities | 14,323,193 | 79,467 | — | 14,402,660 | ||||||||||||
| * | The difference between ordinary distributions paid from book and ordinary distributions paid from tax relates to allowable foreign tax credits of $11,564 for the Easterly Total Hedge Fund for the fiscal year ended November 30, 2022, and $2,838 for fiscal year ended November 30, 2021, for the Easterly Total Hedge Fund, which have been passed through to the Funds’ underlying shareholders and are deemed dividends for tax purposes. |
As of November 30, 2022, the components of accumulated earnings/ (deficit) on a tax basis were as follows:
| Undistributed | Undistributed | Post October Loss | Capital Loss | Other | Unrealized | Total | ||||||||||||||||||||||
| Ordinary | Long-Term | and | Carry | Book/Tax | Appreciation/ | Accumulated | ||||||||||||||||||||||
| Portfolio | Income | Capital Gains | Late Year Loss | Forwards | Differences | (Depreciation) | Earnings/(Deficits) | |||||||||||||||||||||
| Easterly Total Hedge | $ | 443,176 | $ | — | $ | — | $ | (1,727,794 | ) | $ | — | $ | (2,577,163 | ) | $ | (3,861,781 | ) | |||||||||||
| Easterly Income Opportunities | 5,068,705 | — | — | (2,091,868 | ) | — | (32,429,306 | ) | (29,452,469 | ) | ||||||||||||||||||
The difference between book basis and tax basis undistributed net investment income (loss), accumulated net realized gains (losses), and unrealized appreciation/(depreciation) from investments is primarily attributable to the tax deferral of losses on wash sales, mark-to-market on open forward foreign currency contracts, 1256 options, swaps and passive foreign investment companies, and adjustments for partnerships, contingent convertible debt securities, and C-Corporation return of capital distributions. The unrealized appreciation/(depreciation) in the table above includes unrealized foreign currency gains (losses) of $(2,198) and $(614) for the Easterly Total Hedge and the Easterly Income Opportunities Fund, respectively.
At November 30, 2022, the Funds had capital loss carry forwards for federal income tax purposes available to offset future capital gains, as follows:
| Non- | ||||||||||||||||
| Expiring | Non-Expiring | CLCF | ||||||||||||||
| Portfolio | Short-Term | Long-Term | Total | Utilized | ||||||||||||
| Easterly Total Hedge | $ | 1,583,032 | $ | 144,762 | $ | 1,727,794 | $ | — | ||||||||
| Easterly Income Opportunities | 869,218 | 1,222,650 | 2,091,868 | — | ||||||||||||
64
| EASTERLY FUNDS |
| NOTES TO FINANCIAL STATEMENTS |
| (Consolidated with respect to the Easterly Total Hedge Portfolio) |
| Year Ended November 30, 2022 (Continued) |
| 6. | BENEFICIAL OWNERSHIP (Unaudited) |
The beneficial ownership, either directly or indirectly, of more than 25% of the voting securities of a Fund creates a presumption of control of the Fund under Section 2(a)(9) of the 1940 Act. As of May 31, 2022, the shareholders that own 25% or more of the voting securities are as follows:
| Fund | Shareholder | Ownership % | ||
| Easterly Total Hedge Cl I | Dennis Nayden | 75.09% | ||
| Easterly Total Hedge Cl R6 | National Financial Services, In | 99.59% | ||
| Easterly Income Opportunities Cl A LPL Financial | 48.63% | |||
| Easterly Income Opportunities Cl R SEI Private Investment Comp | 46.00% |
| 7. | LINE OF CREDIT |
Currently, the Easterly Income Opportunities Fund has a $33,000,000 line of credit provided by Cogent Bank (the “Bank”) under an agreement (the “Line of Credit”) and prior to November 18, 2022 the line of credit was $22,000,000. Any advance under the Line of Credit is contemplated primarily for temporary or emergency purposes, including the meeting of redemption requests that otherwise might require the untimely disposition of securities. Interest on borrowings is payable Monthly. Based only on the days borrowed, the average amount of borrowings outstanding were as follows:
| Average Borrowing | Largest Outstanding | Average Borrowing | ||||||||||||||
| Fund | Outstanding | Balance | Loan Outstanding | Rate | ||||||||||||
| Easterly Income Opportunities Fund | $ | 1,000,000 | $ | 1,000,000 | $ | 1,000,000 | 7.00 | % | ||||||||
The Interest expense is included in interest expense on the statement of operations.
| 8. | NEW ACCOUNTING PRONOUNCEMENTS |
In March 2020, FASB issued ASU 2020-04, Reference Rate Reform (Topic 848): Facilitation of the Effects of Reference Rate Reform on Financial Reporting (’‘ASU 2020-04’’). The amendments in ASU 2020-04 provide optional temporary financial reporting relief from the effect of certain types of contract modifications due to the planned discontinuation of LIBOR and other interbank-offered based reference rates as of the end of 2021. ASU 2020-04 is effective for certain reference rate-related contract modifications that occur during the period March 12, 2020 through December 31, 2022. Management is currently evaluating the impact, if any of applying this ASU.
| 9. | SUBSEQUENT EVENTS |
Subsequent events after the date of the Statements of Assets and Liabilities have been evaluated through the date the financial statements were issued. Management has determined that no events or transactions occurred requiring adjustment or disclosure in the financial statements.
65
 | taitweller.com |
REPORT OF INDEPENDENT REGISTERED PUBLIC ACCOUNTING FIRM
To the Shareholders and Board of Trustees
of James Alpha Funds Trust d/b/a Easterly
Funds Trust
Opinion on the Financial Statements
We have audited the accompanying statements of assets and liabilities of Easterly Total Hedge Portfolio, and Easterly Income Opportunities Fund (formerly Easterly Structured Credit Value Fund), (the “Funds”) each a series of the James Alpha Funds Trust d/b/a Easterly Funds Trust (the “Trust”), including the schedules of investments as of November 30, 2022, and the related statements of operations, the statements of changes in net assets, and the financial highlights (consolidated for 2022 with respect to Easterly Total Hedged Portfolio) for each of the periods indicated in the table below, and the related notes (collectively referred to as the “financial statements”). In our opinion, the financial statements present fairly, in all material respects, the financial position of the Funds as of November 30, 2022, the results of their operations, the changes in their net assets, and their financial highlights for each of the periods indicated in the table below (consolidated for 2022 with respect to Easterly Total Hedged Portfolio), in conformity with accounting principles generally accepted in the United States of America.
| Individual Funds constituting James Alpha Funds Trust d/b/a Easterly Funds Trust | Statement of operations | Statements of changes in net assets | Financial highlights | |||
| Easterly Total Hedge Portfolio | For the year ended November 30, 2022 | For each of the two years in the period ended November 30, 2022 | For each of the five years in the period ended November 30, 2022 | |||
| Easterly Income Opportunities | For the year ended November 30, 2022 | For each of the two years in the period ended November 30, 2022 | For each of the four years in the period ended November 30, 2022 and the period from August 14, 2018 (commencement of operations) through November 30, 2018 |
Basis for Opinion
These financial statements are the responsibility of the Funds’ management. Our responsibility is to express an opinion on the Funds’ financial statements based on our audits. We are a public accounting firm registered with the Public Company Accounting Oversight Board (United States) (“PCAOB”) and are required to be independent with respect to the Funds in accordance with the U.S. federal securities laws and the applicable rules and regulations of the Securities and Exchange Commission and the PCAOB. We have served as the auditor of one or more of the funds in the Trust since 2011.
66
| To the Shareholders and Board of Trustees |
| of James Alpha Funds Trust d/b/a Easterly |
| Funds Trust |
| Page Two |
We conducted our audits in accordance with the standards of the PCAOB. Those standards require that we plan and perform the audits to obtain reasonable assurance about whether the financial statements are free of material misstatement, whether due to error or fraud. The Funds are not required to have, nor were we engaged to perform, an audit of the Funds’ internal control over financial reporting. As part of our audits we are required to obtain an understanding of internal control over financial reporting, but not for the purpose of expressing an opinion on the effectiveness of the Funds’ internal control over financial reporting. Accordingly, we express no such opinion.
Our audits included performing procedures to assess the risks of material misstatement of the financial statements, whether due to error or fraud, and performing procedures that respond to those risks. Such procedures included examining, on a test basis, evidence regarding the amounts and disclosures in the financial statements. Our audits also included evaluating the accounting principles used and significant estimates made by management, as well as evaluating the overall presentation of the financial statements. Our procedures included confirmation of securities owned as of November 30, 2022 by correspondence with the custodian and brokers; when replies were not received from brokers, we performed other auditing procedures. We believe that our audits provide a reasonable basis for our opinion.
TAIT, WELLER & BAKER LLP
Philadelphia, Pennsylvania
January 27, 2023
67
| SUPPLEMENTAL INFORMATION (Unaudited) |
Shareholders of funds will pay ongoing expenses, such as advisory fees, distribution and services fees (12b-1 fees), and other fund expenses. The following examples are intended to help the shareholder understand the ongoing cost (in dollars) of investing in a fund and to compare these costs with the ongoing costs of investing in other mutual funds. Please note, the expenses shown in the tables are meant to highlight ongoing costs only and do not reflect any transactional costs, such as sales charges (loads), or contingent deferred sales charges (CDSCs) on redemptions.
This example is based on an investment of $1,000 invested at the beginning of the period and held for the entire period from June 1, 2022 through November 30, 2022.
Actual Expenses: The first table provides information about actual account values and actual expenses. The shareholder may use the information in this line, together with the amount invested, to estimate the expenses that would be paid over the period. Simply divide account value by $1,000 (for example, an $8,600 account value divided by $1,000 = 8.6), then multiply the result by the number under the heading entitled “Expenses Paid” to estimate the expenses paid on the account during the period.
| Beginning Account | Ending Account | Expense Paid | Expense Ratio | |||||
| Value - 06/01/2022 | Value - 11/30/2022 | 06/01/2022-11/30/2022* | [Annualized] | |||||
| Actual Expenses | ||||||||
| Easterly Total Hedge - Class I | 1,000.00 | 983.70 | 7.36 | 1.48% | ||||
| Easterly Total Hedge - Class R6 | 1,000.00 | 984.80 | 5.52 | 1.11% | ||||
| Easterly Income Opportunity (Formerly, Easterly Structured Credit Value) - Class A | 1,000.00 | 966.30 | 8.53 | 1.73% | ||||
| Easterly Income Opportunity (Formerly, Easterly Structured Credit Value) - Class C | 1,000.00 | 962.90 | 12.20 | 2.48% | ||||
| Easterly Income Opportunity (Formerly, Easterly Structured Credit Value) - Class I | 1,000.00 | 967.80 | 7.30 | 1.48% | ||||
| Easterly Income Opportunity (Formerly, Easterly Structured Credit Value) - Class R6 | 1,000.00 | 969.20 | 5.48 | 1.11% |
Hypothetical Examples for Comparison Purposes: The second table below provides information about hypothetical account values and hypothetical expenses based on the fund’s actual expense ratio and an assumed rate of return of 5% per year before expenses, which is not the fund’s actual return. The hypothetical account values and expenses may not be used to estimate the actual ending account balance or expenses paid for the period. This information may be used to compare the ongoing costs of investing in the fund and other mutual funds. To do so, a shareholder would compare this 5% hypothetical example with the 5% hypothetical examples that appear in the shareholder reports of the other mutual funds.
| Beginning Account | Ending Account | Expense Paid | Expense Ratio | |||||
| Hypothetical | Value - 06/01/2022 | Value - 11/30/2022 | 06/01/2022-11/30/2022* | [Annualized] | ||||
| [5% Return Before Expenses] | ||||||||
| Easterly Total Hedge - Class I | 1,000.00 | 1,017.65 | 7.49 | 1.48% | ||||
| Easterly Total Hedge - Class R6 | 1,000.00 | 1,019.50 | 5.62 | 1.11% | ||||
| Easterly Income Opportunity (Formerly, Easterly Structured Credit Value) - Class I | 1,000.00 | 1,017.65 | 7.49 | 1.48% | ||||
| Easterly Income Opportunity (Formerly, Easterly Structured Credit Value) - Class A | 1,000.00 | 1,016.39 | 8.74 | 1.73% | ||||
| Easterly Income Opportunity (Formerly, Easterly Structured Credit Value) - Class C | 1,000.00 | 1,012.63 | 12.51 | 2.48% | ||||
| Easterly Income Opportunity (Formerly, Easterly Structured Credit Value) - Class R6 | 1,000.00 | 1,019.50 | 5.62 | 1.11% |
| * | Expenses are equal to the Funds annualized expense ratio multiplies by the number of days in the period (183) divided by the number of days in the fiscal year (365). |
68
| Supplemental Information (Unaudited) |
| November 30, 2022 |
LIQUIDITY RISK MANAGEMENT PROGRAM
The Funds have adopted and implemented a written liquidity risk management program as required by Rule 22e-4 (the “Liquidity Rule”) under the Investment Company Act. The program is reasonably designed to assess and manage each Fund’s liquidity risk, taking into consideration, among other factors, each respective Fund’s investment strategy and the liquidity of its portfolio investments during normal and reasonably foreseeable stressed conditions; its short and long-term cash flow projections; and its cash holdings and access to other funding sources.
During the fiscal year ended November 30, 2022, the Trust’s Liquidity Risk Management Program Committee (the “Committee”) reviewed the Funds’ investments and determined that the Funds held adequate levels of cash and highly liquid investments to meet shareholder redemption activities in accordance with applicable requirements. Accordingly, the Committee concluded that (i) the Funds’ liquidity risk management program is reasonably designed to prevent violations of the Liquidity Rule and (ii) the Funds’ liquidity risk management program has been effectively implemented.
69
| EASTERLY FUNDS |
| SUPPLEMENTAL INFORMATION (Unaudited) (Continued) |
| Year Ended November 30, 2022 |
| Name, Year of Birth, and Address | Position(s) Held with Trust | Term*/ Length of Time Served | Principal Occupation(s) During Past 5 Years | Number of Funds in Fund Complex Overseen | Other Directorships Held by Trustee During Past 5 Years |
| INTERESTED TRUSTEE: | |||||
| Darrell Crate, Year of Birth: 1967 515 Madison Avenue 24th Floor New York, NY 10022 | President and Chairperson of the Board | Since 2021 | Chief Executive Officer of Easterly Funds LLC (2020 –Present); Managing Principal of Easterly Asset Management LP (2016 –Present) Managing Partner of Easterly Capital LLC (2015 –Present) | 6 | Chairman of the Board and Director of Easterly Government Properties Inc. (2015 –Present); Chairman of the Board and Director of Easterly Acquisition Corp. (2015 to 2018) |
| INDEPENDENT TRUSTEES: | |||||
| David Knowlton, Year of Birth: 1957 515 Madison Avenue 24th Floor New York, NY 10022 | Trustee | Since 2021 | Managing Partner of Three Ocean Partners LLC | 6 | Director of Easterly Acquisition Corp. (2015 to 2018) |
| Neil Medugno, Year of Birth: 1957 515 Madison Avenue 24th Floor New York, NY 10022 | Trustee | Since 2021 | Retired; Partner, Wellington Management Company LLP, Chief Financial Officer, Wellington Funds Group (investment management) (1994 –2017) | 6 | Trustee of Six Circles Trust (2018 –Present) |
| A. Clayton Spencer, Year of Birth: 1954 515 Madison Avenue 24th Floor New York, NY 10022 | Trustee | Since 2023 | President of Bates College (2012 –present). | 6 | Not Applicable |
70
| OFFICERS: | |||||
| Michael Montague, Year of Birth: 1975 515 Madison Avenue 24th Floor New York, NY 10022 | Treasurer | Since 2021 | Chief Operating Officer of Easterly Funds LLC and James Alpha Management, LLC | Not Applicable | Not Applicable |
| Emile Molineaux, Year of Birth: 1962 4221 North 203rd Street, Ste. 100 Elkhorn, NE 68022 | Chief Compliance Officer | Since 2021 | Senior Compliance Officer (2011 –Present) Northern Lights Compliance Services, LLC | Not Applicable | Not Applicable |
| Chad Bitterman, Year of Birth: 1972 4221 North 203rd Street, Ste. 100 Elkhorn, NE 68022 | Anti-Money Laundering Compliance Officer | Since 2021 | Compliance Officer (2010 –Present) Northern Lights Compliance Services, LLC | Not Applicable | Not Applicable |
| Amaris Sahota, Year of Birth: 1992 515 Madison Avenue 24th Floor New York, NY 10022 | Secretary | Since 2021 | Chief Operating Officer, Easterly Asset Management (2021 –Present); Senior Management Consultant, The Poirier Group (2018 –2021); Investment Consultant, Sun Life Financial (2017 –2018) | Not Applicable | Not Applicable |
| Ken Juster, Year of Birth: 1976 515 Madison Avenue 24th Floor New York, NY 10022 | Chief Legal Officer | Since 2022 | General Counsel of Easterly Asset Management LP (2022 –Present); Partner, Cooley LLP (2018 –2022); Partner, White & Case LLP (2017 –2018) | Not Applicable | Not Applicable |
| Erik Naviloff, Year of Birth: 1968 4221 North 203rd Street, Ste. 100 Elkhorn, NE 68022 | Assistant Treasurer | Since 2021 | Vice President, Ultimus Fund Solutions, LLC (2011 –present) | Not Applicable | Not Applicable |
| Timothy Burdick, Year of Birth: 1986 4221 North 203rd Street, Ste. 100 Elkhorn, NE 68022 | Assistant Secretary | Since 2021 | Vice President, Ultimus Fund Solutions, LLC (2022 –present); Assistant Vice President, Ultimus Fund Solutions, LLC (2019 –2022); Senior Program Compliance Manager, CJ Affiliate (2016 –2019). | Not Applicable | Not Applicable |
| * | Each Trustee will serve an indefinite term until they resign or retire and/or their successor, if any, is duly elected and qualified. Officers of the Trust serve at the pleasure of the Board. |
The Funds’ SAI includes additional information about the Trustees and is available free of charge, upon request, by calling toll-free at 1-888-814-8180.
71
PRIVACY NOTICE
JAMES ALPHA FUNDS TRUST dba EASTERLY FUNDS TRUST
March 2021
| FACTS | WHAT DOES JAMES ALPHA FUNDS TRUST dba EASTERLY FUNDS TRUST DO WITH YOUR PERSONAL INFORMATION? | ||
| Why? | Financial companies choose how they share your personal information. Federal law gives consumers the right to limit some, but not all sharing. Federal law also requires us to tell you how we collect, share, and protect your personal information. Please read this notice carefully to understand what we do. | ||
| What? | The types of personal information we collect and share depends on the product or service that you have with us. This information can include:
● Social Security number and wire transfer instructions
● account transactions and transaction history
● investment experience and purchase history
When you are no longer our customer, we continue to share your information as described in this notice. | ||
| How? | All financial companies need to share customers’ personal information to run their everyday business. In the section below, we list the reasons financial companies can share their customers’ personal information; the reasons James Alpha Funds Trust chooses to share; and whether you can limit this sharing. | ||
| Reasons we can share your personal information: | Does James Alpha Funds Trust dba Easterly Funds Trust share information? | Can you limit this sharing? | |
For our everyday business purposes - such as to process your transactions, maintain your account(s), respond to court orders and legal investigations, or report to credit bureaus. | YES | NO | |
For our marketing purposes - to offer our products and services to you. | YES | YES | |
| For joint marketing with other financial companies. | NO | We don’t share | |
For our affiliates’ everyday business purposes - information about your transactions and records. | NO | We don’t share | |
For our affiliates’ everyday business purposes - information about your credit worthiness. | NO | We don’t share | |
| For nonaffiliates to market to you | NO | We don’t share | |
| QUESTIONS? | Call (888) 814-8180 | ||
72
| What we do: | |
| How does James Alpha Funds Trust dba Easterly Funds Trust protect my personal information? | To protect your personal information from unauthorized access and use, we use security measures that comply with federal law. These measures include computer safeguards and secured files and buildings.
Our service providers are held accountable for adhering to strict policies and procedures to prevent any misuse of your nonpublic personal information. |
| How does James Alpha Funds Trust dba Easterly Funds Trust collect my personal information? | We collect your personal information, for example, when you
● open an account or deposit money
● direct us to buy securities or direct us to sell your securities
● seek advice about your investments
We also collect your personal information from others, such as credit bureaus, affiliates, or other companies. |
| Why can’t I limit all sharing? | Federal law gives you the right to limit only:
● sharing for affiliates’ everyday business purposes – information about your creditworthiness.
● affiliates from using your information to market to you.
● sharing for nonaffiliates to market to you.
State laws and individual companies may give you additional rights to limit sharing. |
| Definitions | |
| Affiliates | Companies related by common ownership or control. They can be financial and nonfinancial companies.
● James Alpha Funds Trust dba Easterly Funds Trust does not share with our affiliates. |
| Nonaffiliates | Companies not related by common ownership or control. They can be financial and nonfinancial companies.
● James Alpha Funds Trust dba Easterly Funds Trust does not share with nonaffiliates so they can market to you. |
| Joint marketing | A formal agreement between nonaffiliated financial companies that together market financial products or services to you.
● James Alpha Funds Trust dba Easterly Funds Trust doesn’t jointly market.. |
73
How to Obtain Proxy Voting Information
Information regarding how the Portfolios voted proxies relating to portfolio securities during the most recent twelve month period ended June 30 as well as a description of the policies and procedures that the Portfolios use to determine how to vote proxies is available without charge, upon request, by calling 1-888-672-4839 or by referring to the Securities and Exchange Commission’s (“SEC”) website at http://www.sec.gov.
How to Obtain 1st and 3rd Fiscal Quarter Portfolio Holdings
Funds file a complete schedule of portfolio holdings with the Securities and Exchange Commission (the “SEC”) for the first and third quarters of each fiscal year as an exhibit to its reports on Form N-PORT, within sixty days after the end of the period. Form N-PORT reports are available at the SEC’s website at www.sec.gov.
JAMES ALPHA1130-AR22
Item 2. Code of Ethics.
(a) As of the end of the period covered by this report, the registrant has adopted a code of ethics that applies to the registrant's principal executive officer, principal financial officer, principal accounting officer or controller, or persons performing similar functions, regardless of whether these individuals are employed by the registrant or a third party.
(b) For purposes of this item, “code of ethics” means written standards that are reasonably designed to deter wrongdoing and to promote:
| (1) | Honest and ethical conduct, including the ethical handling of actual or apparent conflicts of interest between personal and professional relationships; |
| (2) | Full, fair, accurate, timely, and understandable disclosure in reports and documents that a registrant files with, or submits to, the Commission and in other public communications made by the registrant; |
(3) Compliance with applicable governmental laws, rules, and regulations;
| (4) | The prompt internal reporting of violations of the code to an appropriate person or persons identified in the code; and |
(5) Accountability for adherence to the code.
(c) Amendments: During the period covered by the report, there have not been any amendments to the provisions of the code of ethics.
(d) Waivers: During the period covered by the report, the registrant has not granted any express or implicit waivers from the provisions of the code of ethics.
Item 3. Audit Committee Financial Expert.
(a) The Registrant’s board of trustees has determined that Neil Medugno is an audit committee financial expert, as defined in Item 3 of Form N-CSR. Mr. Medugno is independent for purposes of this Item 3.
Item 4. Principal Accountant Fees and Services.
| (a) | Audit Fees |
Registrant Advisor
FYE 11/30/22 $32,000 $ 0.00
FYE 11/30/21 $36,500 $0
| (b) | Audit-Related Fees |
Registrant Advisor
FYE 11/30/22 $ 0.00 $ 0.00
FYE 11/30/21 $0 $0
| (c) | Tax Fees |
Registrant Advisor
FYE 11/30/22 $5,000 $ 0.00
FYE 11/30/21 $7,500 $0
Preparation of Federal & State income tax returns, assistance with calculation of required income, capital gain and excise distributions and preparation of Federal excise tax returns.
| (d) | All Other Fees |
Registrant Advisor
FYE 11/30/22 $ 0.00 $ 0.00
FYE 11/30/21 $0 $0
| (e) | (1) Audit Committee’s Pre-Approval Policies |
The registrant’s Audit Committee is required to pre-approve all audit services and, when appropriate, any non-audit services (including audit-related, tax and all other services) to the registrant. The registrant’s Audit Committee also is required to pre-approve, when appropriate, any non-audit services (including audit-related, tax and all other services) to its adviser, or any entity controlling, controlled by or under common control with the adviser that provides ongoing services to the registrant, to the extent that the services may be determined to have an impact on the operations or financial reporting of the registrant. Services are reviewed on an engagement by engagement basis by the Audit Committee.
| (2) | Percentages of Services Approved by the Audit Committee |
Registrant Advisor
Audit-Related Fees: 0.00% 0.00%
Tax Fees: 0.00% 0.00%
All Other Fees: 0.00% 0.00%
| (f) | During the audit of registrant's financial statements for the most recent fiscal year, less than 50 percent of the hours expended on the principal accountant's engagement were attributed to work performed by persons other than the principal accountant's full-time, permanent employees. |
| (g) | All non-audit fees billed by the registrant's principal accountant for services rendered to the registrant for the fiscal year ended November 30, 2022, are disclosed in (b)-(d) above. There were no audit or non-audit services performed by the registrant's principal accountant for the registrant's adviser. |
(h) The registrant's audit committee has considered whether the provision of non-audit services to the registrant's investment adviser (not including any sub-adviser whose role is primarily portfolio management and is subcontracted with or overseen by another investment adviser), and any entity controlling, controlled by, or under common control with the investment adviser that provides ongoing services to the registrant, that were not pre-approved pursuant to paragraph (c)(7)(ii) of Rule 2-01 of Regulation S-X, is compatible with maintaining the principal accountant's independence.
Item 5. Audit Committee of Listed Companies. Not applicable to open-end investment companies.
Item 6. Schedule of Investments. See Item 1.
Item 7. Disclosure of Proxy Voting Policies and Procedures for Closed-End Funds. Not applicable to
open-end investment companies.
Item 8. Portfolio Managers of Closed-End Management Investment Companies. Not applicable to open-end investment companies.
Item 9. Purchases of Equity Securities by Closed-End Management Investment Company and Affiliated Purchasers. Not applicable to open-end investment companies.
Item 10. Submission of Matters to a Vote of Security Holders. None.
Item 11. Controls and Procedures.
(a) Based on an evaluation of the registrant’s disclosure controls and procedures as of November 30, 2020, the disclosure controls and procedures are reasonably designed to ensure that the information required in filings on Forms N-CSR is recorded, processed, summarized, and reported on a timely basis.
(b) There were no significant changes in the registrant’s internal control over financial reporting that occurred during the registrant’s last fiscal half-year that have materially affected, or are reasonably likely to materially affect, the registrant’s internal control over financial reporting.
Item 12. Disclosure of Securities Lending Activities for Closed-End Management Investment Companies. Not applicable to open-end investment companies.
Item 13. Exhibits.
(a)(1) Code of Ethics for Principal Executive and Senior Financial Officers is attached hereto.
(a)(3) Not applicable.
SIGNATURES
Pursuant to the requirements of the Securities Exchange Act of 1934 and the Investment Company Act of 1940, the registrant has duly caused this report to be signed on its behalf by the undersigned, thereunto duly authorized.
(Registrant) The James Alpha Funds Trust
By (Signature and Title)
* /s/ Darrell Crate
Darrell Crate, President and Chief Executive Officer
Date 02/03/2023
Pursuant to the requirements of the Securities Exchange Act of 1934 and the Investment Company Act of 1940, this report has been signed below by the following persons on behalf of the registrant and in the capacities and on the dates indicated.
By (Signature and Title)
* /s/ Darrell Crate
Darrell Crate, President and Chief Executive Officer
Date 02/03/2023
By (Signature and Title)
* /s/ Michael Montague
Michael Montague, Treasurer and Principal Financial Officer
Date 02/03/2023
* Print the name and title of each signing officer under his or her signature.