Exhibit 99.2
MANAGEMENT’S DISCUSSION AND ANALYSIS OF FINANCIAL CONDITION AND RESULTS OF OPERATIONS FOR THE THREE MONTHS ENDED MARCH 31, 2024 AND 2023
This management discussion and analysis (“MD&A”) of the financial condition and results of operations of Cresco Labs Inc. (the “Company,” “Cresco Labs,” “we,” or “our”) is dated May 15, 2024 and has been prepared for the three months ended March 31, 2024 and 2023. It is supplemental to, and should be read in conjunction with, the Company’s audited Consolidated Financial Statements and accompanying notes as of and for the years ended December 31, 2023 and 2022, which were previously filed on SEDAR+ and EDGAR, and the Company's unaudited condensed interim consolidated financial statements and accompanying notes as of and for the three months ended March 31, 2024 and 2023. The Company’s financial statements are prepared in accordance with generally accepted accounting principles in the United States of America (“GAAP”). Financial information presented in this MD&A is presented in United States (“U.S.”) dollars (“USD” or “$”) unless otherwise indicated.
The Company has provided certain supplemental non-GAAP financial measures in this MD&A. Where the Company has provided such non-GAAP financial measures, we have also provided a reconciliation to the most comparable GAAP financial measure. Please see the information under the heading “Non-GAAP Financial Measures” for additional information on the Company’s use of non-GAAP financial measures.
This MD&A contains certain “forward-looking statements” and certain “forward-looking information” as defined under applicable U.S. securities laws and Canadian securities laws. Please refer to the discussion of forward-looking statements and information set out under the heading “Cautionary Statement Regarding Forward-Looking Information,” located at the beginning of the Company’s Annual Information Form for the year ended December 31, 2023, filed on SEDAR+ and EDGAR. As a result of many factors, the Company’s actual results may differ materially from those anticipated in these forward-looking statements and information. Please refer to the discussion of risks and uncertainties set out under the heading “Risk Factors,” located within the Company’s Annual Information Form for the year ended December 31, 2023, filed on SEDAR+ and EDGAR.
OVERVIEW OF THE COMPANY
Cresco Labs was incorporated in the Province of British Columbia on July 6, 1990 and is licensed to cultivate, manufacture and sell cannabis and cannabis-based products. As of March 31, 2024, the Company operates in and/or has subsidiaries located in California, Florida, Illinois, Massachusetts, Michigan, New York, Ohio and Pennsylvania.
Cresco Labs is primarily engaged in the business of cultivating medical-grade cannabis, manufacturing medical- grade products derived from cannabis cultivation and distributing such products to medical or adult-use consumers in legalized cannabis markets. Cresco Labs exists to provide high-quality and consistent cannabis-based products to consumers. Cresco Labs’ business focuses on regulatory compliance while working to develop condition-specific strains of cannabis and non-invasive delivery methods (alternatives to smoke inhalation) to provide controlled-dosage medicinal cannabis relief to qualified patients and consumers in legalized cannabis markets. As of March 31, 2024, the Company was operating three (3) adult-use and medical cannabis cultivation and manufacturing centers, five (5) adult-use and medical dispensary locations and five (5) adult-use dispensary locations in Illinois; two (2) medical cannabis growing and processing facilities and fifteen (15) medical dispensary locations in Pennsylvania; one (1) medical cannabis cultivation and processing center and five (5) medical dispensary locations in Ohio; one (1) adult-use and medical cannabis cultivation facility in California; three (3) adult-use and medical cannabis cultivation and manufacturing centers, one (1) medical dispensary location, one (1) adult-use dispensary location and two (2) adult-use and medical dispensary locations in Massachusetts; one (1) medical cannabis manufacturing facility and four (4) medical dispensary locations in New York; one (1) adult-use and medical cannabis facility and processing center in Michigan; and one (1) medical cannabis cultivation and manufacturing facility and thirty-three (33) medical dispensary locations in Florida.
For additional information on wholly-owned or effectively controlled subsidiaries and affiliates of Cresco Labs, refer to Note 2 “Summary of Significant Accounting Policies” under the heading “Basis of Consolidation” of the Company’s Unaudited Condensed Interim Consolidated Financial Statements for the three months ended March 31, 2024 and 2023.
1
The Company operates its dispensaries under the brand, Sunnyside*®1. Our Sunnyside*dispensaries are home for a judgement-free cannabis shopping experience, where all are welcome to explore, discover and purchase a wide array of high-quality products. During the first quarter of 2024, the Company opened one (1) Sunnyside* dispensary in Pennsylvania. As of March 31, 2024, the Company operated ten (10) Sunnyside* dispensaries in Illinois, fifteen (15) dispensaries in Pennsylvania, five (5) dispensaries in Ohio, four (4) dispensaries in Massachusetts, four (4) dispensaries in New York and thirty-three (33) dispensaries in Florida. In April 2024, the Company acquired two (2) medical dispensaries in Pennsylvania from Keystone Integrated Care, LLC. Please see “Recent Developments” for additional information related to this acquisition. The Company's portfolio of owned cannabis consumer-packaged goods includes Cresco®1, High Supply®2, Mindy’sTM, Good News®2, RemediTM, Wonder Wellness Co.®2 and FloraCal® Farms2. The Company distributes and markets these products both to third-party licensed retail cannabis stores across the U.S. and to Cresco Labs’ owned retail stores.
Cresco Labs’ new corporate headquarters is located at 600 W. Fulton Street, Suite 800, Chicago, IL 60661 and the registered office is located at Suite 2500, 666 Burrard Street, Vancouver, BC V6C 2X8. The Company employs approximately 2,800 people across the organization as of March 31, 2024.
2
1The Sunnyside*® (inclusive of the stand-alone asterisk mark) and Cresco® brands maintain federal trademark registrations for websites pertaining to medical cannabis and cannabis educational services, as well as multiple state trademark registrations.
2 The High Supply®, Good News®, Wonder Wellness Co.® and FloraCal® Farms brands maintain federal trademark registrations for apparel and multiple state trademark registrations.
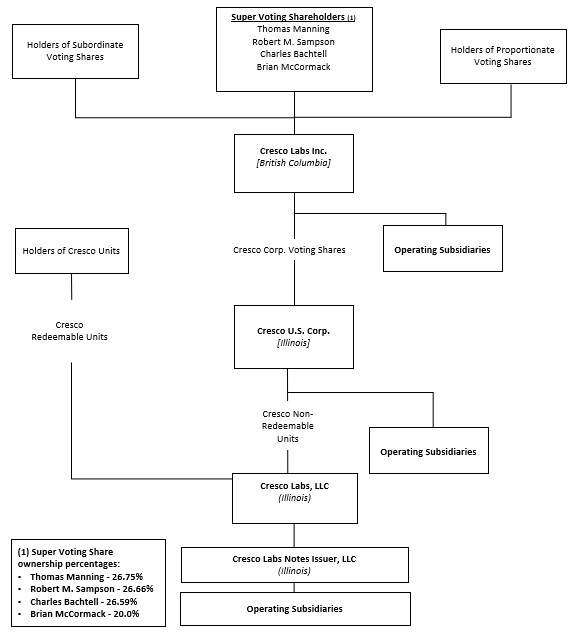
CORPORATE STRUCTURE
Set forth below is the condensed organization chart of the Company as of May 15, 2024.
RECENT DEVELOPMENTS
On April 30, 2024, the U.S. Drug Enforcement Administration’s (“DEA”) recommendation that cannabis be rescheduled from a Schedule I controlled substance to a Schedule III controlled substance became public. The DEA’s recommendation will be reviewed by the White House Office of Management and Budget (“OMB”). Once OMB’s review is complete and the DEA’s proposal is published in the federal register, a formal rule making process will begin during which the DEA will receive public comment on its rescheduling plan. After the public comment period and review by an administrative law judge, the DEA would publish its final rule. The effects of rescheduling cannabis to a Schedule III controlled substance include that Internal Revenue Service Code Section 280E would no longer apply to the legal U.S. cannabis industry.
3
On April 24, 2024, the Company successfully finalized its acquisition of Keystone Integrated Care, LLC for an aggregate total consideration of $9.8 million. This strategic move has added another dispensary license to our portfolio, enabling the operation of three (3) more dispensaries across Pennsylvania. Prior to the acquisition, Keystone Integrated Care, LLC had established two (2) operational dispensaries in Pittsburgh and Greensburg. The Company has the opportunity to open one (1) more dispensary within the Commonwealth, further expanding our presence and reach.
On April 9, 2024, the Company commenced an offer for a one-time stock option exchange program (the “Option Exchange Program”) to certain employee option holders (“Eligible Participants”) who held certain underwater options and remained employed by the Company through the completion of the Option Exchange Program. The Option Exchange Program is pending approval by the Company’s shareholders at the Annual General and Special Meeting. Eligible Participants with an outstanding option that had an exercise price equal to or greater than the higher of $3.36 or 1.5 times the closing price at the expiration date, May 6, 2024, had the option to exchange their existing options for a new option that has an exercise price equal to the higher of the closing price of the Company’s SVS as reported on the OTCQX market (the “OTC”) on the new option grant date or the trading day preceding the new option grant date. Eligible Participants had until May 6, 2024, to elect to exchange their existing shares.
On February 9, 2024, the Company announced that as part of a transfer of Super Voting Shares (“MVS”) by both a current and former director of the Company: (a) Thomas J. Manning acquired from Dominic Sergi 100,000 MVS and from Charles Bachtell 33,760 MVS; and (b) Robert M. Sampson acquired from Charles Bachtell 33,308 MVS. Each purchase and sale of MVS was completed for aggregate consideration of $1.00, which were effected in accordance with the Company’s articles. MVS carry enhanced voting power but have no economic rights. After giving effect to the transactions described above:
•Mr. Bachtell owns or controls, (a) 132,932 MVS (representing approximately 26.59% of the outstanding MVS) and (b) voting securities of the Company representing approximately 19.89% of the votes attaching to all classes of outstanding shares of the Company.
•Mr. Manning owns or controls, (a) 133,760 MVS (representing approximately 26.75% of the outstanding MVS) and (b) voting securities of the Company representing approximately 19.88% of the votes attaching to all classes of outstanding shares of the Company; and
•Mr. Sampson owns or controls, (a) 133,308 MVS (representing approximately 26.66% of the outstanding MVS) and (b) voting securities of the Company representing approximately 19.86% of the votes attaching to all classes of outstanding shares of the Company.
On February 1, 2024, the Company announced the promotion of Greg Bulter to the position of President.
COMPONENTS OF OUR RESULTS OF OPERATIONS
Revenue
For the three months ended March 31, 2024 and 2023, approximately 64.0% and 57.6%, respectively, of our revenue was derived from Company-owned retail dispensary locations. Revenue from the wholesale of cannabis products represents the remaining 36.0% and 42.4%, respectively, for the same periods.
Gross profit
Gross profit is calculated as revenue less cost of goods sold (“COGS”). COGS includes the direct costs attributable to the cultivation and production of the products sold and is comprised of the following:
•Direct labor costs: Include all salaries, benefits and taxes for all employees at the cultivation and manufacturing facilities.
•Direct supplies: Include direct material costs for maintenance of the plant, supplies and nutrients, production expenses, packaging costs and equipment used to process marijuana.
4
•Facility expenses: The facility expenses for the cultivation operations is the cost for the facility, utilities, property taxes, maintenance and costs associated with monitoring the security systems.
•Other operating expenses: Include all costs associated with the facility itself, including insurance, community benefit fees, professional services related to licenses and compliance, uniforms, employee training programs, tracking and inventory management systems, product testing, business development, information technology, license renewal fees and certain excise taxes.
In addition to market fluctuations, cannabis costs are affected by various state regulations that limit the sourcing and procurement of cannabis products. The changes in regulatory environments may create fluctuations in gross profit over comparative periods. Additionally, gross profit may include the cost of inventory required to be marked to fair value as part of purchase accounting in a business combination.
Selling, general and administrative expenses (“SG&A”)
SG&A consist of salary and benefit costs of employees, consulting and professional fees, advertising and marketing, legal, accounting fees, office and retail operation costs, share-based compensation, certain excise taxes, technology, insurance, security, travel and entertainment, and rent expense. SG&A is added to Total operating expenses discussed in the “Selected Financial Information” section below.
For the three months ended March 31, 2024 and 2023, SG&A was comprised of the following:
| ($ in thousands) | March 31, 2024 | March 31, 2023 | ||||||||||||||||||||||||
| Payroll and employee costs | $ | 32,230 | $ | 40,234 | ||||||||||||||||||||||
| Facility expenses | 4,231 | 5,802 | ||||||||||||||||||||||||
| Depreciation and amortization | 5,422 | 4,273 | ||||||||||||||||||||||||
| Excise taxes | 2,590 | 3,712 | ||||||||||||||||||||||||
| Share-based compensation | 3,614 | 6,124 | ||||||||||||||||||||||||
| Rental fees | 3,292 | 3,436 | ||||||||||||||||||||||||
| Consulting and professional fees | 2,706 | 2,012 | ||||||||||||||||||||||||
| Legal | 810 | 2,490 | ||||||||||||||||||||||||
| Selling and marketing expenses | 1,741 | 2,492 | ||||||||||||||||||||||||
| Computer and software expense | 1,937 | 2,480 | ||||||||||||||||||||||||
| Business insurance | 1,085 | 2,510 | ||||||||||||||||||||||||
| Finance and investor relations expenses | 482 | 480 | ||||||||||||||||||||||||
| Accounting | 1,670 | 1,912 | ||||||||||||||||||||||||
| Travel and employee expenses | 527 | 864 | ||||||||||||||||||||||||
| Other expenses | 712 | 3,473 | ||||||||||||||||||||||||
| Total SG&A | $ | 63,049 | $ | 82,294 | ||||||||||||||||||||||
Other income, net
Other income, net consists mainly of reoccurring gains (losses) on investments, foreign currency as well as ad hoc expenses such as gain (loss) on lease termination and gain (loss) on disposition of assets. These gains (losses) do not generally correlate to revenue. Other income, net is added to Interest expense, net, sum to Total other expense, net discussed in the “Selected Financial Information” section below.
5
For the three months ended March 31, 2024 and 2023, Other income, net consisted of the following:
| ($ in thousands) | March 31, 2024 | March 31, 2023 | ||||||||||||||||||||||||
| Realized loss on financial instruments | $ | (81) | $ | — | ||||||||||||||||||||||
| Loss on provision - loan receivable | (67) | (59) | ||||||||||||||||||||||||
| Unrealized gain (loss) on investments held at fair value | 18 | (37) | ||||||||||||||||||||||||
| Gain (loss) on disposal of assets | 110 | (66) | ||||||||||||||||||||||||
| Gain (loss) on foreign currency | 298 | (31) | ||||||||||||||||||||||||
| Gain on lease termination | — | 1,135 | ||||||||||||||||||||||||
| Gain on legal settlement | 266 | — | ||||||||||||||||||||||||
| Gain on exit operations | 125 | — | ||||||||||||||||||||||||
| Other income, net | 187 | 17 | ||||||||||||||||||||||||
| Other income, net | $ | 856 | $ | 959 | ||||||||||||||||||||||
Interest expense, net
Interest expense, net consists mainly of interest on notes and loans payable, financings activities, leases, accretion of debt discount, amortization of deferred financing fees and interest income. Interest expense, net is included in Total other expense, net discussed in the “Selected Financial Information” section below.
Interest expense, net consisted of the following for the three months ended March 31, 2024 and 2023:
| ($ in thousands) | March 31, 2024 | March 31, 2023 | ||||||||||||||||||||||||
| Interest expense – notes and loans payable | $ | (9,606) | $ | (9,500) | ||||||||||||||||||||||
| Interest expense – financing activities | (2,915) | (2,959) | ||||||||||||||||||||||||
| Accretion of debt discount and amortization of deferred financing fees | (1,180) | (1,044) | ||||||||||||||||||||||||
| Interest expense – leases | (797) | (935) | ||||||||||||||||||||||||
| Interest income | 748 | 462 | ||||||||||||||||||||||||
| Other interest expense | (321) | (1,572) | ||||||||||||||||||||||||
| Interest expense, net | $ | (14,071) | $ | (15,548) | ||||||||||||||||||||||
Income Taxes
The Company is classified for U.S. federal income tax purposes as a U.S. corporation under Section 7874 of the Internal Revenue Code (“IRC”). The Company is subject to income taxes in the jurisdictions in which it operates and, consequently, income tax expense is a function of the allocation of taxable income by jurisdiction and the various activities that impact the timing of taxable events. As the Company operates in the cannabis industry, the Company is subject to the limits of IRC Section 280E for U.S. federal income tax purposes as well as state income tax purposes. Under IRC Section 280E, the Company is only allowed to deduct expenses directly related to the cost of goods sold. This results in permanent differences between ordinary and necessary business expenses deemed non-allowable under IRC Section 280E. However, certain states including California, Illinois, Massachusetts, Michigan and New York do not conform to IRC Section 280E and, accordingly, the Company generally deducts all operating expenses on its income tax returns in these states.
6
SELECTED FINANCIAL INFORMATION
The Company reports results of operations of its affiliates from the date that control commences, either through the purchase of the business through a management agreement or through other arrangements that grant such control. The following selected financial information includes only the results of operations after the Company established control of its affiliates. Accordingly, the information included below may not be representative of the results of operations if such affiliates had included their results of operations for the entire reporting period.
Summary of Unaudited Quarterly Results
| ($ in thousands) | 2024 | 2023 | 2022 | ||||||||||||||||||||||||||||||||||||||
| Q1 | Q4 | Q3 | Q2 | Q1 | Q4 | Q3 | Q2 | ||||||||||||||||||||||||||||||||||
| Revenues, net | $ | 184,295 | $ | 188,237 | $ | 190,559 | $ | 197,887 | $ | 194,202 | $ | 199,580 | $210,484 | $218,226 | |||||||||||||||||||||||||||
| Income (loss) from operations | 29,163 | 27,099 | (107,756) | (10,752) | 3,586 | (143,479) | 16,240 | 22,677 | |||||||||||||||||||||||||||||||||
| Net (loss) attributable to Cresco Labs Inc. | (5,193) | 2,635 | (115,572) | (36,534) | (26,051) | (161,337) | (9,788) | (13,541) | |||||||||||||||||||||||||||||||||
| Basic and Diluted EPS | $ | (0.02) | $ | 0.01 | $ | (0.34) | $ | (0.12) | $ | (0.09) | $ | (0.54) | $ | (0.03) | $ | (0.05) | |||||||||||||||||||||||||
Three Months Ended March 31, 2024 Compared to the Three Months Ended March 31, 2023
The following tables set forth selected consolidated financial information for the periods indicated that are derived from our Unaudited Condensed Interim Consolidated Financial Statements and the respective accompanying notes prepared in accordance with GAAP.
The selected consolidated financial information set out below may not be indicative of the Company’s future performance:
| Three Months Ended March 31, | ||||||||||||||||||||||||||
| ($ in thousands) | 2024 | 2023 | $ Change | % Change | ||||||||||||||||||||||
| Revenues, net | $ | 184,295 | $ | 194,202 | $ | (9,907) | (5.1) | % | ||||||||||||||||||
| Costs of goods sold | 92,083 | 108,322 | (16,239) | (15.0) | % | |||||||||||||||||||||
| Gross profit | 92,212 | 85,880 | 6,332 | 7.4 | % | |||||||||||||||||||||
| Total operating expenses | 63,049 | 82,294 | (19,245) | (23.4) | % | |||||||||||||||||||||
| Total other expense, net | (13,215) | (14,589) | 1,374 | (9.4) | % | |||||||||||||||||||||
| Income tax expense | (18,003) | (16,809) | (1,194) | 7.1 | % | |||||||||||||||||||||
Net loss1 | $ | (2,055) | $ | (27,812) | $ | 25,757 | (92.6) | % | ||||||||||||||||||
Revenues, net
Revenue for the three months ended March 31, 2024 decreased $9.9 million, or 5.1%, compared to the three months ended March 31, 2023. The decrease in revenue was primarily driven by increased competition in the Pennsylvania wholesale and Ohio retail markets, price promotions in Illinois, reduced operations in California, along with exiting the Arizona and Maryland markets as compared to the prior year period. This was partially offset by retail growth in Florida and Pennsylvania driven by new store openings and increased market share due to higher quality flower and better cultivation yields.
COGS and Gross profit
COGS for the three months ended March 31, 2024 decreased $16.2 million, or 15.0%, compared to the three months ended March 31, 2023. The decrease was primarily attributable to reduced operations in California, along with exiting the Arizona and Maryland markets.
7
Gross profit increased by $6.3 million, or 7.4%, for the three months ended March 31, 2024, compared to the three months ended March 31, 2023. The increase in gross profit was primarily driven by the restructure of the California operations and production related efficiencies. As a percentage of Revenue, net, Gross profit was 50.0% and 44.2% for the three months ended March 31, 2024 and March 31, 2023, respectively. The increase in gross profit as a percentage of revenue, net was driven by a higher percentage of total sales generated from higher margin states and production related efficiencies.
Total operating expenses
Total operating expenses expenses for the three months ended March 31, 2024 decreased $19.2 million, or 23.4% compared to the three months ended March 31, 2023. The decrease was primarily attributable to reductions in payroll and employee costs, including incentive compensation due to restructuring activities, lower bad debt expense due to increased collections in the Illinois market.
Total other expense, net
Total other expense, net for the three months ended March 31, 2024 decreased $1.4 million, or 9.4%, compared to the three months ended March 31, 2023. The decrease in expense was primarily driven by additional interest expense taken in 2023 related deferred consideration attributable to the Laurel Harvest acquisition.
Provision for income taxes
Income tax expense for the three months ended March 31, 2024, increased $1.2 million, or 7.1%, compared to the three months ended March 31, 2023. The increase was primarily due to an increase in gross profit.
Net loss
Net loss for the three months ended March 31, 2024, decreased $25.8 million compared to the three months ended March 31, 2023. The decrease in net loss was primarily driven by lower operating expenses and increased gross profit.
8
NON-GAAP FINANCIAL MEASURES
Earnings before interest, taxes, depreciation and amortization (“EBITDA”) and Adjusted EBITDA (defined below) are non-GAAP financial measures and do not have standardized definitions under GAAP and may not be comparable to similar measures presented by other issuers. The Company has provided the non-GAAP financial measures, which are not calculated or presented in accordance with GAAP, as supplemental information and in addition to the financial measures that are calculated and presented in accordance with GAAP. These supplemental non-GAAP financial measures are presented because management has evaluated the financial results both including and excluding the adjusted items and believe that the supplemental non-GAAP financial measures presented provide additional perspectives and insights when analyzing the core operating performance of the business. These supplemental non-GAAP financial measures should not be considered superior to, as a substitute for, or as an alternative to and should only be considered in conjunction with, the GAAP financial measures presented herein. Accordingly, the Company has included below reconciliations of the supplemental non-GAAP financial measures to the most directly comparable financial measures calculated and presented in accordance with GAAP.
| Three Months Ended March 31, | |||||||||||||||||||||||||||||||||||||||||||||||
| ($ in thousands) | 2024 | 2023 | $ Change | % Change | |||||||||||||||||||||||||||||||||||||||||||
Net loss1 | $ | (2,055) | $ | (27,812) | $ | 25,757 | (92.6) | % | |||||||||||||||||||||||||||||||||||||||
| Depreciation and amortization | 15,331 | 12,961 | 2,370 | 18.3 | % | ||||||||||||||||||||||||||||||||||||||||||
| Interest expense, net | 14,071 | 15,548 | (1,477) | (9.5) | % | ||||||||||||||||||||||||||||||||||||||||||
| Income tax expense | 18,003 | 16,809 | 1,194 | 7.1 | % | ||||||||||||||||||||||||||||||||||||||||||
| EBITDA (non-GAAP) | $ | 45,350 | $ | 17,506 | $ | 27,844 | 159.1 | % | |||||||||||||||||||||||||||||||||||||||
| Other income, net | (856) | (959) | 103 | (10.7) | % | ||||||||||||||||||||||||||||||||||||||||||
| Adjustments for acquisition and other non-core costs | 4,470 | 5,671 | (1,201) | (21.2) | % | ||||||||||||||||||||||||||||||||||||||||||
| Share-based compensation | 4,197 | 7,062 | (2,865) | (40.6) | % | ||||||||||||||||||||||||||||||||||||||||||
| Adjusted EBITDA (non-GAAP) | $ | 53,161 | $ | 29,280 | $ | 23,881 | 81.6 | % | |||||||||||||||||||||||||||||||||||||||
1Net loss includes amounts attributable to non-controlling interests.
Adjusted EBITDA (non-GAAP)
Adjusted EBITDA, a non-GAAP financial measure, excludes depreciation and amortization; interest expense, net; income taxes; other income, net; share-based compensation; and adjustments for acquisition and other non-core costs. Non-core costs include non-operating costs, such as costs related to restructuring, loss on sale of assets, unique legal expenses and other expenses that are mostly one-time in nature. Adjusted EBITDA was $53.2 million for the three months ended March 31, 2024, compared to $29.3 million for the three months ended March 31, 2023. The increase in adjusted EBITDA of $23.9 million is primarily driven by a reduction in payroll and employee costs due to restructuring activities, along with a decrease in operating expenses due to cost control initiatives.
9
LIQUIDITY AND CAPITAL RESOURCES
Overview
Our primary sources of liquidity are cash and cash equivalents from the operations of our business and debt and equity offerings. Our principal uses of cash include working capital related items, capital expenditures, debt and tax related payments. Additionally, we may use cash for acquisitions and other investing or financing activities.
As of March 31, 2024, the Company held $123.2 million in Cash and cash equivalents and $5.0 million in restricted cash, included in both Restricted cash and Other non-current assets on the Unaudited Condensed Interim Consolidated Balance Sheets compared to December 31, 2023, where the Company held $103.4 million in cash and cash equivalents and $5.1 million in restricted cash.
The Company is generally able to access private and/or public financing through, but not limited to, institutional lenders, such as the Amended Senior Loan of $400.0 million, effective August 12, 2021, and amended on September 22, 2023. JDRC Ellenville, LLC (“Ellenville”), an indirect subsidiary of the Company, entered into a $25.3 million loan on September 26, 2023, secured by real estate and improvements thereto. In addition, the Company has received and has access to private loans through individual investors and private and public equity raises.
The Company expects cash on hand and cash flows from operations, along with the private and/or public financing options discussed above, will be adequate to meet capital requirements and operational needs for the next twelve months. We cannot guarantee this will be the case, or that our assumptions regarding revenues and expenses underlying this belief will be accurate. If, in the future, we require more liquidity than contemplated, we may need to raise additional funds through debt and/or equity offerings. Adequate funds may not be available when needed or may not be available on terms favorable to us. If additional funds are raised by issuing equity securities, dilution to existing shareholders may result. If we raise additional funds by obtaining loans from third parties, the terms of those financing arrangements may include negative covenants or other restrictions on our business that could impair our operational flexibility and would also require us to fund additional interest expense. If funding is insufficient at any time in the future, we may be unable to develop or enhance our products or services, take advantage of business opportunities, or respond to competitive pressures, any of which could have a material adverse effect on our business, financial condition and results of operations.
Cash Flows
Operating Activities
Net cash provided by operating activities was $36.5 million for the three months ended March 31, 2024, an increase of $33.2 million compared to $3.3 million during the three months ended March 31, 2023. The $33.2 million increase was primarily attributable to production efficiencies, along with reductions in payroll and employee costs due to restructuring activities, and overall cost control initiatives.
Investing Activities
Net cash used in investing activities was $5.7 million for the three months ended March 31, 2024, a decrease of $15.0 million compared to $20.7 million during the three months ended March 31, 2023. The decrease in net cash used in investing activities was primarily driven by a decrease in capital expenditures, partially offset by an increase in operating license intangibles expenditures.
Financing Activities
Net cash used in financing activities was $11.1 million for the three months ended March 31, 2024, a decrease of $2.5 million compared to $13.6 million for the three months ended March 31, 2023. The decrease was primarily driven by a decrease in distributions to non-controlling interest redeemable unit holders and other members, including related parties.
10
OFF-BALANCE SHEET ARRANGEMENTS
The Company does not have any off-balance sheet arrangements that have, or are reasonably likely to have a current or future effect on financial performance or financial condition, including without limitation, such considerations as liquidity and capital resources.
CONTRACTUAL OBLIGATIONS
The Company has the following contractual obligations as of March 31, 2024:
| ($ in thousands) | < 1 Year | 1 to 3 Years | 3 to 5 Years | > 5 Years | Total | ||||||||||||||||||||||||
| Accounts payable & Accrued liabilities | $ | 77,832 | $ | — | $ | — | $ | — | $ | 77,832 | |||||||||||||||||||
| Operating leases liabilities | 21,671 | 59,073 | 59,136 | 162,235 | 302,115 | ||||||||||||||||||||||||
| Finance lease liabilities | 3,674 | 10,166 | 10,357 | 18,337 | 42,534 | ||||||||||||||||||||||||
| Deferred consideration, long-term | — | 6,881 | — | — | 6,881 | ||||||||||||||||||||||||
| Long-term notes payable and loans payable and Short-term borrowings | 29,686 | 428,095 | 29,522 | 122,013 | 609,316 | ||||||||||||||||||||||||
| Tax receivable agreement liability | 1,492 | 2,192 | 2,123 | 8,702 | 14,509 | ||||||||||||||||||||||||
| Other long-term liabilities | — | 8,813 | — | — | 8,813 | ||||||||||||||||||||||||
| Total obligations as of March 31, 2024 | $ | 134,355 | $ | 515,220 | $ | 101,138 | $ | 311,287 | $ | 1,062,000 | |||||||||||||||||||
RELATED PARTY TRANSACTIONS
See Note 11 “Related Party Transactions” in the Unaudited Condensed Interim Consolidated Financial Statements for the Company’s disclosures on related party transactions.
FINANCIAL INSTRUMENTS AND FINANCIAL RISK MANAGEMENT
The Company is exposed in varying degrees to a variety of financial instrument related risks. The Board of Directors and Company management mitigate these risks by assessing, monitoring and approving the Company’s risk management processes. See Note 13 “Financial Instruments and Financial Risk Management” in the Unaudited Condensed Interim Consolidated Financial Statements for the Company’s disclosures on financial instruments and financial risk management.
SUMMARY OF OUTSTANDING SHARE AND SHARE-BASED DATA
Cresco Labs has the following securities issued and outstanding, as of March 31, 2024:
| Securities | Number of Shares (in thousands) | |||||||
| Super Voting Shares | 500 | |||||||
Subordinate Voting Shares1 | 324,398 | |||||||
Proportionate Voting Shares2 | 17,781 | |||||||
Special Subordinate Voting Shares3 | 2 | |||||||
| Redeemable Shares | 95,505 | |||||||
1SVS includes shares pending issuance or cancellation
2PVS presented on an “as-converted” basis to SVS (1-to-200)
3SSVS presented on an “as-converted” basis to SVS (1-to-0.00001)
11
FEDERAL REGULATORY ENVIRONMENT
In accordance with the Canadian Securities Administrators Staff Notice 51-352 – Issuers with U.S. Marijuana-Related Activities (“Staff Notice 51-352”), information regarding the current U.S. federal regulatory environment is disclosed in the Company’s 2023 Annual MD&A filed on SEDAR+ and EDGAR under the heading “Federal Regulatory Environment,” which is incorporated by reference herein. The Company will evaluate, monitor and reassess the disclosures contained herein, and incorporated by reference herein, and any related risks, on an ongoing basis and the same will be supplemented, amended and communicated to investors in public filings, including in the event of government policy changes or the introduction of new or amended guidance, laws or regulations regarding marijuana regulation.
THE STATES IN WHICH WE OPERATE, THEIR LEGAL FRAMEWORK AND HOW IT AFFECTS OUR BUSINESS
The Company currently derives a substantial portion of its revenues from the cannabis industry in certain U.S. states, which industry is illegal under U.S. federal law. As of May 15, 2024, the Company believes its operations are in material compliance with all applicable local laws, regulations and licensing requirements in the states in which we operate.
In accordance with Staff Notice 51-352, information regarding the states that the Company operates in, their legal frameworks and how it affects the Company's business, is disclosed in the Company’s 2023 Annual MD&A filed on SEDAR+ and EDGAR under the heading, “The States in Which We Operate, Their Legal Framework and How It Affects Our Business”, which is incorporated by reference herein.
For more information about risks related to the U.S. marijuana operations, refer to the discussion of risks and uncertainties set out under the heading “Risk Factors,” located within the Company’s Annual Information Form for the year ended December 31, 2023, filed on SEDAR+ and EDGAR.
12