FORM 6-K
SECURITIES AND EXCHANGE COMMISSION
Washington, D.C. 20549
Report of Foreign Private Issuer
Pursuant to Rule 13a-16 or 15d-16
under the Securities Exchange Act of 1934
For the month of February 2023
Commission File Number: 001-39966
New Found Gold Corp.
(Exact name of Registrant as specified in its charter)
N/A
(Translation of Registrant’s name)
1430 - 800 West Pender Street
Vancouver, British Columbia
Canada V6C 2V6
604-562-9664
(Address and telephone number of registrant’s principal executive offices)
Indicate by check mark whether the registrant files or will file annual reports under cover Form 20-F or 40-F:
Form 20-F _______ Form 40-F X
Indicate by check mark if the registrant is submitting the Form 6-K in paper as permitted by Regulation S-T Rule 101(b)(1): _______
Indicate by check mark if the registrant is submitting the Form 6-K in paper as permitted by Regulation S-T Rule 101(b)(7): _______
Project centroid: UTM 644204 m Easting, 5400144 m Northing, Zone 21N, NAD83
NI 43-101 TECHNICAL REPORT
JANUARY 2023 EXPLORATION UPDATE AT
NEW FOUND GOLD CORP.’S QUEENSWAY GOLD PROJECT
IN NEWFOUNDLAND AND LABRADOR, CANADA

Prepared For: | New Found Gold Corp. Suite 1430 - 800 West Pender Street Vancouver, BC V6C 2V6 Canada |  |
Prepared by: | APEX Geoscience Ltd. #100, 11450-160 ST NW Edmonton AB T5M 3Y7 Canada |  |
D. Roy Eccles, M.Sc., P. Geol. P. Geo.
Effective Date: 24 January 2023
Signing Date: 16 February 2023
January 2023 Exploration Update: New Found Gold Corp.’s Queensway Gold Project, NL
Contents
1 | Summary | 1 | ||
| 1.1 | Issuer and Purpose | 1 | ||
| 1.2 | Authors and Site Inspection | 1 | ||
| 1.3 | Property Location, Description and Access | 1 | ||
| 1.4 | Property Ownership and Option Agreement | 2 | ||
| 1.5 | Royalties | 2 | ||
| 1.6 | Permits And Environmental Assessment | 3 | ||
| 1.7 | Geology and Mineralization | 4 | ||
| 1.8 | Historical Exploration | 4 | ||
| 1.9 | New Found Gold Corporation Exploration Update | 5 | ||
| 1.10 | Conclusions and Uncertainties | 8 | ||
| 1.11 | Recommendations | 10 | ||
2 | Introduction | 12 | ||
| 2.1 | Issuer and Purpose | 12 | ||
| 2.2 | Author and Site Inspection | 14 | ||
| 2.3 | Sources of Information | 14 | ||
| 2.4 | Units of Measure | 15 | ||
3 | Reliance of Other Experts | 16 | ||
4 | Property Description and Location | 17 | ||
| 4.1 | Description and Location | 17 | ||
| 4.2 | Property Ownership Summary | 24 | ||
| 4.3 | Mineral Tenure Information and Maintenance | 25 | ||
| 4.4 | Access and Surface Rights | 27 | ||
| 4.5 | Option Agreement | 27 | ||
| 4.6 | Royalties | 29 | ||
| 4.7 | Permits | 29 | ||
| 4.8 | Environmental Restrictions and Significant Factors | 31 | ||
5 | Accessibility, Climate, Local Resources, Infrastructure and Physiography | 32 | ||
| 5.1 | Accessibility | 32 | ||
| 5.2 | Site Topography, Elevation and Vegetation | 34 | ||
| 5.3 | Climate | 34 | ||
| 5.4 | Local Resources and Infrastructure | 36 | ||
5.4.1 | Power Supply | 37 | ||
5.4.2 | Water Supply | 37 | ||
6 | History | 37 | ||
| 6.1 | Introduction | 37 | ||
| 6.2 | Historical Exploration by Companies Other Than New Found Gold Corp. | 40 | ||
6.2.1 | Prospecting, Geological Mapping, and Geochemical Surveying | 40 | ||
6.2.2 | Geophysical Surveys | 45 | ||
6.2.2.1 Airborne Geophysics | 50 | |||
6.2.2.2 Ground Geophysics | 50 | |||
6.2.3 | Trenching | 50 | ||
6.2.4 | Drilling | 51 | ||
6.2.5 | Conclusions and Quality of Historical Data | 53 | ||
| 6.3 | Historical Mineral Resource and Mineral Reserve Estimates at the Queensway Property | 56 | ||
| 24 January 2023 | | i |
January 2023 Exploration Update: New Found Gold Corp.’s Queensway Gold Project, NL
| 7 | Geological Setting and Mineralization | 56 | ||
| 7.1 | Regional Geology | 56 | ||
| 7.2 | Property Geology | 61 | ||
| 7.2.1 | Local Geology | 61 | ||
| 7.2.2 | Mineralization | 64 | ||
| 7.2.3 | Alteration | 64 | ||
| 7.2.4 | Structure | 67 | ||
| 7.2.5 | Integrated Geological Interpretations | 69 | ||
| 7.3 | Significant Mineralized Zones | 75 | ||
| 8 | Deposit types | 77 | ||
| 8.1 | Orogenic Gold Deposits | 77 | ||
| 8.2 | Deposit Type Exploration Strategies | 80 | ||
| 9 | Exploration | 80 | ||
| 9.1 | Historical Overview of New Found Gold Exploration Programs | 80 | ||
| 9.2 | Prospecting and Geochemical Rock Samples | 81 | ||
| 9.3 | Geochemistry – Till Samples | 87 | ||
| 9.4 | Geochemistry – Soil Samples | 92 | ||
| 9.5 | Geochemistry – Trench Channel Samples | 98 | ||
| 9.6 | QP Opinion on Representativity and Potential Bias of Exploration Samples | 100 | ||
| 9.7 | Airborne Geophysical Surveys | 102 | ||
| 9.8 | Satellite Imagery | 103 | ||
| 9.9 | Digital Elevation Models | 103 | ||
| 10 | Drilling | 105 | ||
| 10.1 | Drilling Procedures and Core Sampling | 109 | ||
| 10.2 | Queensway North Block Prospects | 129 | ||
| 10.2.1 | 798 Gold Prospect | 131 | ||
| 10.2.2 | 1744 Gold Prospect | 131 | ||
| 10.2.3 | Big Dave Gold Prospect | 134 | ||
| 10.2.4 | Cokes Gold Prospect | 134 | ||
| 10.2.5 | Dome Gold Prospect | 137 | ||
| 10.2.6 | Gander Outflow Gold Prospect | 141 | ||
| 10.2.7 | Glass Gold Prospect | 141 | ||
| 10.2.8 | Golden Bullet Gold Prospect | 142 | ||
| 10.2.9 | Golden Joint Gold Prospect | 142 | ||
| 10.2.10 | Grouse Gold Prospect | 146 | ||
| 10.2.11 | Keats Gold Prospect | 146 | ||
| 10.2.12 | Keats North Gold Prospect | 155 | ||
| 10.2.13 | Keats West Gold Prospect | 156 | ||
| 10.2.14 | Knob Gold Prospect | 160 | ||
| 10.2.15 | Little Zone Gold Prospect | 161 | ||
| 10.2.16 | Lotto Gold Prospect | 162 | ||
| 10.2.17 | Lotto North Gold Prospect | 166 | ||
| 10.2.18 | Max Millions Gold Prospect | 167 | ||
| 10.2.19 | Pocket Pond Gold Prospect | 168 | ||
| 24 January 2023 | | ii |
January 2023 Exploration Update: New Found Gold Corp.’s Queensway Gold Project, NL
| 10.2.20 | Road Gold Prospect | 172 | ||
| 10.2.21 | Rocket Gold Prospect | 172 | ||
| 10.2.22 | Trans-Canada Highway (TCH) Gold Prospect | 173 | ||
| 10.2.23 | Whiskey Pocket Gold Prospect | 174 | ||
| 10.2.24 | Zone 36 Gold Prospect | 175 | ||
| 10.3 | Queensway South Block Prospects | 176 | ||
| 10.3.1 | Aztec Gold Prospect | 176 | ||
| 10.3.2 | Bernards Pond Gold Prospect | 176 | ||
| 10.3.3 | Devil’s Trench Gold Prospect | 177 | ||
| 10.3.4 | Eastern Pond Gold Prospect | 177 | ||
| 10.3.5 | Goose Gold Prospect | 177 | ||
| 10.3.6 | Greenwood Gold Prospect | 179 | ||
| 10.3.7 | Paul’s Pond Gold Prospect | 179 | ||
| 10.4 | Twin Ponds Block | 179 | ||
| 11 | Sample Preparation, Analyses and Security | 182 | ||
| 11.1 | Sample Collection | 182 | ||
| 11.1.1 | Till Samples | 182 | ||
| 11.1.2 | Soil Samples | 182 | ||
| 11.1.3 | Rock Samples | 183 | ||
| 11.1.4 | Drill Core | 183 | ||
| 11.2 | Sample Security | 183 | ||
| 11.3 | Sample Preparation and Analysis | 184 | ||
| 11.3.1 | Introduction | 184 | ||
| 11.3.2 | Laboratory Accreditation | 185 | ||
| 11.3.3 | Laboratory Sample Preparation | 185 | ||
| 11.3.4 | Laboratory Analytical Methodologies | 186 | ||
| 11.3.4.1 | Eastern Analytical: Fire Assay Analysis | 186 | |||
| 11.3.4.2 | ALS Canada Ltd.: Fire Assay and Multi-Element Analysis | 187 | |||
| 11.3.4.3 | ALS Canada Ltd.: Specific Gravity Measurements | 188 | |||
| 11.3.4.4 | MSALABS: PhotonAssayTM Analysis | 188 | |||
| 11.3.4.5 | PhotonAssayTM Versus Conventional Screen Fire Assay Comparisons | 189 | |||
| 11.3.4.6 | Activation Laboratories Ltd.: Multi-Element Analysis | 192 | |||
| 11.3.4.7 | SGS Canada Inc.: Gold Analysis | 192 | |||
| 11.3.4.8 | Overburden Drilling Management: Till Gold Grain Counts | 192 | |||
| 11.3.4.9 | General Comments on Screen Fire Assays | 192 |
| 11.4 | Quality Assurance and Quality Control | 193 | |||
| 11.4.1 | Certified Reference Materials | 193 | |||
| 11.4.1.1 | Certified Reference Materials: Fire Assay, ALS | 193 | |||
| 11.4.1.2 | Certified Reference Materials: Fire Assay, Eastern Analytical | 195 | |||
| 11.4.1.3 | Certified Reference Materials: PhotonAssayTM at MSALABS | 195 | |||
| 11.4.2 | Sample Blanks (Eastern Analytical, ALS, and MSALAMBS) | 196 | |||
| 11.4.3 | Core Duplicates | 196 | |||
| 11.4.4 | Precision of Laboratory Duplicates: By Fire Assay | 199 | |||
| 11.4.5 | Precision of Laboratory Duplicates: By PhotonAssayTM | 200 | |||
| 11.4.6 | Check Assays | 203 | |||
| 11.4.7 | The Percentage of Coarse Gold | 205 | |||
| 11.4.8 | Adequacy of the Sample Collection, Preparation, Security, and Analytical Procedures | 206 | |||
| 24 January 2023 | | iii |
January 2023 Exploration Update: New Found Gold Corp.’s Queensway Gold Project, NL
| 12 | Data Verification | 207 | |
| 12.1 | Data Verification Procedures | 207 | |
| 12.2 | Historical Exploration Information | 207 | |
| 12.3 | New Found Gold Corp.’s Ground Geochemical, Drillhole, and Drill Core Assay Databases | 208 | |
| 12.4 | Qualified Person Site Inspection | 209 | |
| 12.5 | Data Limitations | 211 | |
| 12.6 | Adequacy of the Data | 213 | |
| 13 | Mineral Processing and Metallurgical Testing | 213 | |
| 14 | Mineral Resource Estimates | 213 | |
| 23 | Adjacent Properties | 214 | |
| 24 | Other Relevant Data and Information | 216 | |
| 25 | Interpretation and Conclusions | 216 | |
| 25.1 | Exploration Results and Interpretations | 216 | |
| 25.2 | Qualified Person Opinion on NFG’s 2021-2022 Exploration Programs | 220 | |
| 25.3 | Risks and Uncertainties | 220 | |
| 26 | Recommendations | 221 | |
| 27 | References | 225 | |
| 28 | Certificate of Author | 233 | |
Tables
Table 1.1 | Work recommendations | 11 |
Table 4.1 | Queensway Project mineral licence description and status | 19 |
Table 4.2 | Minimum expenditures for mineral claims in Newfoundland and Labrador | 26 |
Table 4.3 | Renewal fees for mineral claims in Newfoundland and Labrador | 26 |
Table 4.4 | Environmental permits, licences, and approvals | 31 |
Table 6.1 | Summary of select historical exploration work conducted by companies other than NFG | 41 |
Table 6.2 | Summary of historical drilling at Queensway | 53 |
Table 9.1 | Sampling summary from NFG’s exploration at the Queensway Property | 82 |
Table 10.1 | Summary of drillholes from NFG’s diamond drilling program at the Queensway Property | 107 |
Table 10.2 | Summary of drill core sample gold assays that are documented in this drilling section | 108 |
Table 10.3 | Drillhole collar locations and orientations for NFG’s diamond drilling program at the Queensway Property | 110 |
Table 10.4 | Summary of selected drillhole assay results, 1744 prospect | 132 |
Table 10.5 | Summary of selected drillhole assay results, Big Dave prospect | 134 |
Table 10.6 | Summary of selected drillhole assay results, Cokes prospect | 135 |
Table 10.7 | Summary of selected drillhole assay results, Dome prospect | 137 |
Table 10.8 | Summary of selected drillhole assay results, Glass prospect | 141 |
| 24 January 2023 | | iv |
January 2023 Exploration Update: New Found Gold Corp.’s Queensway Gold Project, NL
Table 10.9 | Table 10.9 Summary of selected drillhole assay results, Golden Joint and Golden Joint HW prospects | 145 |
Table 10.10 | Summary of selected drillhole assay results, Keats Main prospect | 151 |
Table 10.11 | Summary of selected drillhole assay results, Keats North prospect | 155 |
Table 10.12 | Summary of selected drillhole assay results, Keats West prospect | 157 |
Table 10.13 | Summary of selected drillhole assay results, Knob prospect | 160 |
Table 10.14 | Summary of selected drillhole assay results, Little Zone prospect | 161 |
Table 10.15 | Summary of selected drillhole assay results, Lotto prospect | 163 |
Table 10.16 | Summary of selected drillhole assay results, Lotto North prospect | 167 |
Table 10.17 | Summary of selected drillhole assay results, Pocket Pond prospect | 171 |
Table 10.18 | Summary of selected drillhole assay results, Road prospect | 172 |
Table 10.19 | Summary of selected drillhole assay results, Rocket prospect | 173 |
Table 10.20 | Summary of selected drillhole assay results, Trans-Canada Highway prospect | 174 |
Table 10.21 | Summary of selected drillhole assay results, Zone 36 prospect | 175 |
Table 11.1 | Analytical methods used by Eastern Analytical | 187 |
Table 11.2 | Analytical methods used by ALS | 188 |
Table 11.3 | MSALABS analytical methods used at the NFG Queensway Project | 189 |
Table 11.4 | Overview of OREAS Certified Reference Materials | 194 |
Table 11.5 | Summary statistics on CRMs at ALS | 194 |
Table 11.6 | Summary statistics on CRMs at Eastern Analytical | 195 |
Table 11.7 | Summary statistics on CRMs at MSALAB | 195 |
Table 11.8 | Jar Duplicates with greater than 2 ppm Au and high relative differences | 203 |
Table 12.1 | Qualified Person validation of 6 random drillhole collar locations | 210 |
Table 12.2 | Summary of QP-collected core samples to validate gold mineralization | 211 |
Table 26.1 | Summary of Phase 1 recommendations and estimated costs | 224 |
Figures
| Figure 2.1 | General location of New Found Gold Corp.’s Queensway Gold Project in Newfoundland, Newfoundland and Labrador, Canada | 13 |
| Figure 4.1 | Queensway Project and six NFG-defined sub-property ‘blocks’ | 18 |
| Figure 4.2 | Queensway North mineral licences, and Twin Ponds, Ten Mile-Duder Lake, South Pond, Bellman’s Pond, and Little Rocky Brook licences | 22 |
| Figure 4.3 | Queensway South mineral licences | 23 |
| Figure 5.1 | Access to the Queensway Property | 33 |
| Figure 5.2 | Shaded relief image for the Queensway Project area | 35 |
| Figure 5.3 | Climate data for Gander International Airport | 36 |
| Figure 6.1 | Historical mineral prospects in the Queensway Property area | 39 |
| Figure 6.2 | Location of historical exploration programs | 42 |
| Figure 6.3 | Historical till gold assay analytical results | 46 |
| Figure 6.4 | Historical soil gold assay analytical results | 47 |
| Figure 6.5 | Historical stream and lake sediment gold assay analytical results | 48 |
| Figure 6.6 | Historical rock gold assay analytical results | 49 |
| Figure 6.7 | Historical trench channel sample gold assay analytical results | 52 |
| Figure 6.8 | Historical drillhole gold assay analytical results | 54 |
| 24 January 2023 | | v |
January 2023 Exploration Update: New Found Gold Corp.’s Queensway Gold Project, NL
Figure 7.1 | Physical relief along the eastern coast of North America | 57 |
| Figure 7.2 | Cambrian to Carboniferous paleoreconstruction of continental dispersion, migration and amalgamation | 57 |
| Figure 7.3 | Correlation of major suture zones across the Atlantic | 59 |
| Figure 7.4 | Newfoundland’s Bedrock geology and major tectonic zones | 60 |
| Figure 7.5 | Bedrock geology of the Queensway Area | 63 |
| Figure 7.6 | Stratigraphic column within the Queensway area | 65 |
| Figure 7.7 | Typical gold-bearing quartz vein styles observed at Queensway | 65 |
| Figure 7.8 | Images of core from mineralized intervals in drillhole NFGC-19-01 | 66 |
| Figure 7.9 | Schematic illustration of mineralogical changes in white micas identified by hyperspectral imaging of core near strong gold mineralization | 67 |
| Figure 7.10 | Interpretation of structure and lithology on a north-facing cross-section through Queensway North block | 68 |
| Figure 7.11 | Interpretation of structural geology over the Queensway Project | 70 |
| Figure 7.12 | Integrated geological map of lithology, shear zones and gold showings in Queensway North | 72 |
| Figure 7.13 | Stereographic plot and schematic plan view at Queensway North | 73 |
| Figure 7.14 | Stereographic and schematic plan view at Queensway North | 73 |
| Figure 7.15 | Stereographic plot and schematic plan view at Queensway North | 73 |
| Figure 7.16 | Plan map of the area between the Keats and Lotto prospects | 74 |
| Figure 7.17 | Gold showings within the Queensway Property | 76 |
| Figure 8.1 | Schematic for orogenic gold deposits at various depths | 78 |
| Figure 8.2 | Comparison of drill core samples from Queensway and the Eagle Zone, Fosterville Mine, Australia | 79 |
| Figure 9.1 | Locations of rock samples collected from NFG’s prospecting programs | 83 |
| Figure 9.2 | Locations of surface rock samples with gold assays above 0.5 ppm | 84 |
| Figure 9.3 | Location of glacial till samples from NFG’s exploration programs | 88 |
| Figure 9.4 | Locations of till samples with 10 or more moderate − pristine gold grains | 89 |
| Figure 9.5 | Till samples at the Queensway Property with gold grades above 1 ppm | 90 |
| Figure 9.6 | Locations of soil samples, colour coded by sampling year | 93 |
| Figure 9.7 | Soil sample locations and gold assay results, Jumbo Brook in QWS | 94 |
| Figure 9.8 | Soil sample locations and gold assay results, Yellow Fox Brook in QWS | 95 |
| Figure 9.9 | Soil sample gold assay results at the Queensway Property | 97 |
| Figure 9.10 | Location of NFG trenches, colour coded by year | 99 |
| Figure 9.11 | Trench channel samples with gold assays above 0.5 ppm | 101 |
| Figure 9.12 | First derivative of chargeability from 2021 geophysical survey | 104 |
| Figure 10.1 | Drill collar locations from NFG’s drilling programs | 106 |
| Figure 10.2 | Gold vein surface intersections for prospects along the Appleton and JBP fault zones in the QWN block | 130 |
| Figure 10.3 | Plan view of 1744 prospect with assays above 0.5 ppm Au | 132 |
| Figure 10.4 | Longitudinal section through the 1744 and Glass prospects | 133 |
| Figure 10.5 | Drill collar locations for drillholes completed at the Cokes, Keats North, and Keats West prospects | 136 |
| Figure 10.6 | Drill collar locations for drillholes completed at the Dome, Golden Joint, Lotto, Lotto North, Road, and Zone 36 prospects | 138 |
| 24 January 2023 | | vi |
January 2023 Exploration Update: New Found Gold Corp.’s Queensway Gold Project, NL
| Figure 10.7 | Plan view of the Road − Dome − Golden Joint − Lotto − Lotto North − Zone 36 prospects with assays above 0.5 ppm Au | 139 |
| Figure 10.8 | Longitudinal section through the Golden Joint, Dome, Lotto, and Lotto North prospects | 140 |
| Figure 10.9 | Plan view of the Keats − TCH − Rocket − Golden Bullet − Knob prospects with assays above 0.5 ppm Au | 143 |
| Figure 10.10 | Cross-section through Golden Joint | 144 |
| Figure 10.11 | Drill collar locations for drillholes completed at the Keats prospect | 148 |
| Figure 10.12 | Plan view of the Keats, Keats North, Keats West and Cokes prospects with assays above 0.5 ppm Au | 149 |
| Figure 10.13 | Core photographs from NFGC-19-01 | 150 |
| Figure 10.14 | TCH, Keats and Keats North zones longitudinal section | 152 |
| Figure 10.15 | Keats 3D plan view map | 153 |
| Figure 10.16 | Keats cross sections | 154 |
| Figure 10.17 | Keats West inclined 3-D view with main veins | 158 |
| Figure 10.18 | Keats West cross-section view | 159 |
| Figure 10.19 | Plan view of the Golden Joint, Dome, Lotto, and Lotto North prospects with assays above 0.5 ppm Au | 164 |
| Figure 10.20 | Lotto cross-section, looking northeast, +/- 20 m | 165 |
| Figure 10.21 | Plan view of Pocket Pond zone with assays above 0.5 ppm Au | 169 |
| Figure 10.22 | Pocket Pond Zone longitudinal section | 170 |
| Figure 10.23 | Example of mineralization at Pocket Pond in NFGC-21-304 | 171 |
| Figure 10.24 | Drillholes completed at QWS | 178 |
| Figure 10.25 | Drill collar locations at the Twin Ponds Block | 181 |
| Figure 10.26 | Core Photo of Twin Ponds drillhole NFGC-TP-22-01 | 181 |
| Figure 11.1 | Comparison of MSALABS PhotonAssayTM vs ALS FA gold assays | 191 |
| Figure 11.2 | Comparison of MSALABS PA vs ALS FA gold assays over 100 ppm | 191 |
| Figure 11.3 | Comparison of two halves of the core for gold | 197 |
| Figure 11.4 | Core duplicate assays compared for larger sample aliquots | 198 |
| Figure 11.5 | Comparison of 30-g and 50-g gold assays on pulps | 200 |
| Figure 11.6 | ALS Internal preparation duplicates | 201 |
| Figure 11.7 | MSALABS analytical duplicates | 201 |
| Figure 11.8 | Duplicate jar assays by PhotonAssayTM | 202 |
| Figure 11.9 | Comparison of 50-g Fire Assays at ALS and SGS | 204 |
| Figure 11.10 | Check Assays for Fine Fractions at SGS | 205 |
| Figure 11.11 | Percentage of gold in the coarse fraction in ALS screen fire assays | 206 |
| Figure 12.1 | Drillhole locations of QP-collected core samples and gold assay results | 211 |
| Figure 23.1 | Adjacent properties to the to the Queensway Gold Property | 215 |
| 24 January 2023 | | vii |
January 2023 Exploration Update: New Found Gold Corp.’s Queensway Gold Project, NL
| 1 | Summary |
| 1.1 | Issuer and Purpose |
This technical report has been prepared for the Issuer, New Found Gold Corp. (NFG), a publicly traded junior mineral exploration company based in Vancouver, BC, Canada. NFG’s current exploration projects include the Queensway Gold Project in Newfoundland, NL, and the Lucky Strike Gold Project in Kirkland Lake, ON, Canada.
The focus of this technical report is on NFG’s Queensway Gold Project (or the Property) located in northeast Newfoundland of the Canadian province Newfoundland and Labrador. Since NFG’s previous Queensway Property technical report, with an effective date of May 31, 2022, NFG has conducted additional prospecting and rock sampling, soil sampling, trench and channel sampling, and diamond drilling. The intent of this report, therefore, is to provide a technical update on NFG’s exploration activities at the Queensway Property.
This technical report has been prepared in accordance with the Canadian Institute of Mining, Metallurgy and Petroleum Mineral Exploration Best Practice Guidelines (2018) and the Canadian Securities Administration’s National Instrument 43-101 Standards of Disclosure for Mineral Projects. This technical report has an Effective Date of 24 January 2023 and supersedes and replaces all previous NFG reports.
| 1.2 | Authors and Site Inspection |
This technical report has been prepared by Mr. Roy Eccles MSc. P. Geol. P. Geo. of APEX Geoscience Ltd. in Edmonton, AB. Mr. Eccles takes responsibility for all report items (Sections 1-14 and 23-27), is a Qualified Person as defined in NI 43-101, and is independent of New Found Gold Corp. and the Queensway Property.
Mr. Eccles performed a personal site inspection at the Queensway Gold Property, on January 12-13, 2023. The site inspection enabled Mr. Eccles to 1) observe the overall geological setting of the Queensway Property, 2) understand and observe the exploration work conducted by NFG including active diamond drilling, and 3) independently validate the gold mineralization that is the subject of this technical report.
| 1.3 | Property Location, Description and Access |
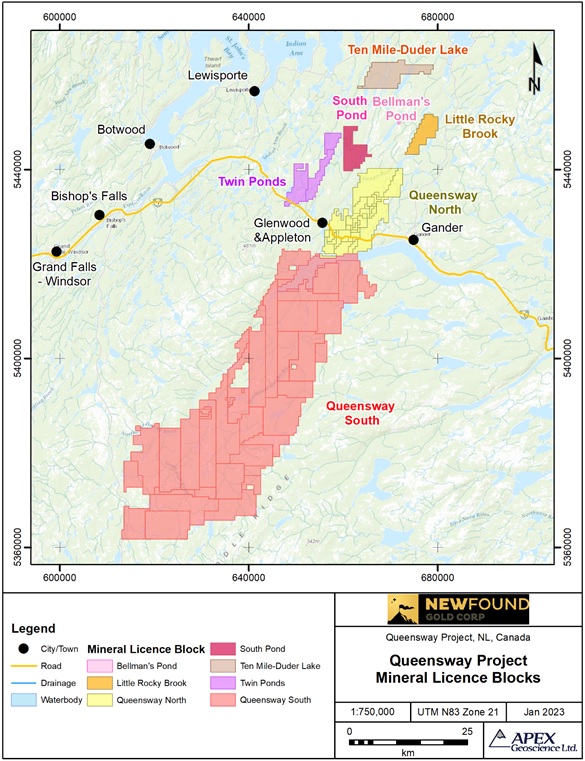
At the Effective Date of this report, the Queensway Property comprises 6,649 claims within 94 mineral licences and encompasses an area of 166,225 ha. The Queensway Property extends from the Trans-Canada Highway approximately 15 km west of the Town of Gander, NL to the Bay d'Espoir Highway (Route 360). The licences can be separated spatially into 5 separate, but contiguous groups of licences, or blocks, that include two large blocks (Queensway North and Queensway South) and 5 smaller blocks (Twin Ponds, Ten Mile-Duder Lake, South Pond, Bellman’s Pond, and Little Rocky Brook).
| 24 January 2023 | | 1 |
January 2023 Exploration Update: New Found Gold Corp.’s Queensway Gold Project, NL
The Queensway Property can be accessed by commercial airlines to the Gander International Airport and by vehicle from the Town of Gander via the Trans-Canada Highway which passes through the Queensway North and the Twin Ponds blocks. The Property can also be accessed by secondary highways and gravel access roads, including the Appleton Fault Zone (Appleton Fault Zone) road, the Joe Batt’s Pond Fault Zone (Joe Batt’s Pond Fault Zone) road to H Pond, and Joe Batt’s Pond Road. All Terrain Vehicle trails, and winter roads, provide access throughout the Queensway Property. In addition to road and ATV access, the mineral licences along the shores of Gander Lake can be accessed by boat. The Property can also be accessed by helicopter from airport bases from the towns of Appleton and Gander, NL, and from small craft float planes based at the international airport in Gander.
The nearest seaports are north of the Trans-Canada Highway at the towns of Lewisporte and Botwood, NL, which are approximately 40 and 70 km, respectively, by road from the Town of Glenwood, NL. Both port locations have excellent harbour facilities and capabilities.
| 1.4 | Property Ownership and Option Agreement |
The Queensway Property was acquired by NFG through 1) online map staking with the Government of Newfoundland and Labrador, 2) the successful completion of nine separate Option Agreements, and 3) as part of a current Option Agreement. Some of the licences were originally acquired by Palisade Resources Corp, who was renamed to NFG in June 2017.
Most of the Queensway Property claims (91.7%) are fully owned by NFG (n=6,098 claims within 89 mineral licences). Additionally, 8.3% of the Queensway Property claims (n=551 claims within 5 mineral licences) are currently owned by separate licence holders: 5.1% of the claims are owned by Aidan O’Neil (n=339 claims within 2 mineral licences), 3.2% by Suraj Amarnani (n=210 claims within 2 mineral licences), and 0.03% by Josh Vann (n=2 claims within 1 mineral licence).
A 100% ownership of the remaining 8.3% of the Queensway Property is subject to NFG satisfying conditions of a single Option Agreement between NFG and Aidan O’Neil, Suraj Amarnani, Josh Vann, and VOA Exploration Inc. The conditions of the Option Agreement include annual cash and stock issuance payments that total $2,350,000 and 487,078 common shares over 5 calendar years from the agreement signing date (November 2, 2022).
| 1.5 | Royalties |
Seventy-seven of the 94 Queensway Property mineral licences (or 82%) are subject to a Net Smelter Return royalty; the other 17 licences are not subject to any royalty. Some royalties were formed within agreements between NFG and the various individuals and companies that optioned their mineral rights to NFG in return for financial compensation that included Net Smelter Return royalties. Others arise from financing provided by GoldSpot Discoveries Corp. (GoldSpot) in 2019. All claims acquired after the NFG-GoldSpot agreement execution date and contiguous to the NFG-GoldSpot agreement original claims are also subject to a 1% Net Smelter Return royalty to GoldSpot less royalties at their time of acquisition.
| 24 January 2023 | | 2 |
January 2023 Exploration Update: New Found Gold Corp.’s Queensway Gold Project, NL
Currently, the Net Smelter Return royalties range from 0.4% to 2.5% for the 77 licences subject to a Net Smelter Return royalty. Many of NFG’s option and financing agreements have included a buy-back provision that allows the company to reduce the Net Smelter Return royalty by making a lump-sum payment to the holder of the royalty. NFG has already exercised the buy-back option on some of its agreements. Were NFG to exercise all its buy-back rights, the Net Smelter Return royalties would range from 0.4% to 1.5% for the 77 licences subject to a Net Smelter Return royalty.
| 1.6 | Permits And Environmental Assessment |
NFG does not own surface rights at the Queensway Property. To conduct ground-destructive and non-ground destructive exploration work, NFG requires exploration approvals, permits, and licences from the Newfoundland and Labrador Department of Industry, Energy and Technology, which includes surface access rights. These specify the activities that are allowed in the area; they are typically valid for one year and can be renewed.
NFG is responsible for obtaining all permits in accordance with the laws of Newfoundland and Labrador to conduct exploration activities at the Queensway Property. Permits, licences and approvals that have currently been granted to NFG include Exploration Approvals, a Water Use Licence, Protected Public Water Supply Area Section 39 Permits, a Section 49 Permit to Alter a Water Body, a Quarry Permit, and other environmental permits. Some of these permits, licences and approvals are subject to renewal in 2023 and others are valid through December 2026.
Mineral licences 024557M, 024558M, 024561M, 024563M, 024568M, and 024570M, all of which lie in the south of Queensway South, are restricted from exploration activities from mid-May to early-July as this area is a spring habitat for Newfoundland caribou. Mineral licence 035198M in Queensway North encloses two known archaeological sites and covers a portion of the Gander River that has high archaeological potential. As such, the Provincial Archaeology Office recommends a 100 m buffer along the Gander River, and 50 m buffers around the two known sites.
To the best of the Qualified Person’s knowledge, there are no environmental liabilities, significant factors or risks that may affect access, or the right or ability of NFG to perform exploration work on the Queensway Property.
| 24 January 2023 | | 3 |
January 2023 Exploration Update: New Found Gold Corp.’s Queensway Gold Project, NL
| 1.7 | Geology and Mineralization |
The rocks that host the gold mineralization at the Queensway Property were deposited on the floor of an ancient ocean known as Iapetus Ocean that existed during the Paleozoic Era of the geologic time scale. Continental plate collisions approximately 430 million years ago closed the Iapetus Ocean and sutured the marine rocks to continental crust on either side of the former ocean. As a result of the tectonic activity and continental collisions and fissures, the Central Zone in Newfoundland is defined by a series of suture zones, including the Humber Zone, the Dunnage Zone, the Gander Zone, and the Avalon Zone, from west to east. The Queensway Property occurs within the Exploits Subzone of the Dunnage Zone. Geologically, the Property is generally bounded:
| • | To the east by the Gander River Ultramafic Belt Line (GRUB Line), which defines the tectono-boundary between the Dunnage Zone and the Gander Zone. |
| • | To the west by the Dog Bay Line, an Iapetus Ocean suture which is situated within the Exploits Subzone of the Dunnage Zone and divides the Cambrian and Ordovician marine siliciclastic sedimentary rocks (Davidsville Group) and Silurian and Devonian shallow marine to non-marine siliciclastic sedimentary rocks (Indian Island Group) to the southeast and northwest, respectively. |
The Queensway gold prospects are classified as orogenic gold deposits. The high pressures and temperatures created during plate collisions caused gold-bearing fluids to propagate upwards from depth and then percolate through cracks and fractures into the uppermost bedrock defined as Cambrian and Ordovician marine siliciclastic sedimentary rocks of the Davidsville Group, which underlies most of the Queensway Property. Gold precipitated from the fluids in places where pressure or temperature dropped, often in open fissures created by faults and in association with quartz-carbonate veins. Gold prospects within the Queensway area are mostly located along the Appleton Fault Zone and the Joe Batt’s Pond Fault Zone, two major fault zones that run southwest-to-northeast through the project area.
Gold at the Queensway Property typically occurs as coarse grains of free visible gold in quartz-carbonate veins that are brecciated, massive-vuggy, laminated, or that have a closely spaced stockwork texture. High-grade gold mineralization, above 10 ppm Au, typically occurs in closely spaced quartz veins associated with fault and fracture zones. High-grade gold mineralization has not been observed outside of the main vein arrays. Gold mineralization is often associated with the mineral arsenopyrite, and high-grade gold mineralization typically occurs with boulangerite, a lead-antimony sulfosalt.
| 1.8 | Historical Exploration |
Historical mineral exploration has occurred in the Queensway Property area since the 1950s with early focus on base metals through to the 1970s. This shifted to gold with the discovery of the gold prospect at Jonathan’s Pond in the early 1980s. From the 1980s through the mid-2010s, dozens of prospectors and companies conducted exploration programs that included prospecting and rock sampling, geological mapping, surface sampling of till, soil, stream sediment and lake sediment, trenching and channel sampling, geophysics, and drilling. Several gold prospects were discovered in the Queensway area because of these historical exploration programs.
| 24 January 2023 | | 4 |
January 2023 Exploration Update: New Found Gold Corp.’s Queensway Gold Project, NL
By 2012, 14 different companies had drilled 246 holes with a total of 29,593 m of drill core on NFG’s Queensway North and Queensway South blocks, and north, south, and west of Gander Lake. The historical exploration campaigns in the Queensway Property area provide ample indications of gold mineralization, with gold grades above 100 ppm in mineralised boulders, till samples, and drillhole intercepts. Fourteen and 25 historical gold prospects were discovered in NFG’s Queensway South and Queensway North blocks, respectively. The historical exploration generally occurred along and adjacent to the two linear mineralized trends associated with the Appleton Fault Zone and the Joe Batt’s Pond Fault Zone.
| 1.9 | New Found Gold Corporation Exploration Update |
Exploration conducted by NFG since 2016 has used all the historical exploration methods together with recent innovations in machine learning to create a single consistent model of the project area that is consistent with all available data. NFG has introduced multi-spectral scanning, which is able to identify the specific types of white mica minerals in the alteration halo around well mineralized veins and has the potential to improve drillhole targeting because the alteration halo presents a broader target than the veins themselves.
NFG’s exploration activities from the Company’s last technical report (May 31, 2022) to this date include prospecting and rock sampling, soil sampling, till sampling, trenching and channel sampling, and diamond drilling programs. Ground geochemical work has resulted in the collection of 1,771 till samples, 12,260 soil samples, 5,282 rock samples, and 498 trench channel samples within the Queensway Property. The samples were analyzed for gold at commercial, independent, and accredited laboratories. Assay results are still pending; however, current analytical result highlights include:
| • | Most rock samples assayed below 1 ppm Au. The highest gold grades recorded for rock samples are 1,131.21 ppm Au and 568.16 ppm Au for two samples collected from the Big Dave prospect along the Appleton Fault Zone in Queensway North. At Queensway South, the highest grade was 29.62 ppm Au. At present, none of the prospecting samples taken from Twin Ponds, Little Rocky Brook and Bellman’s Pond have been assayed above 1 ppm Au. |
| • | Most till samples assayed below 1 ppm Au. The highest gold analytical value from till samples is 30 ppm Au within the Queensway North and Queensway South blocks. |
| 24 January 2023 | | 5 |
January 2023 Exploration Update: New Found Gold Corp.’s Queensway Gold Project, NL
| • | The results of the soil sampling programs have been inconclusive with most samples below 1 ppm Au. Only four analytical results were above 1 ppm Au with a maximum of 2.27 ppm Au. |
| • | Most trench channel samples assayed below 1 ppm Au. The highest grades occur in trench samples from the Queensway North block; these include a channel sample from Trench 36 with a gold grade of 18.9 ppm Au, and two samples from the Glass Trench, with gold grades of 14.6 ppm and 13.3 ppm Au. In the Queensway South block, the highest gold grades in trench channel samples, 4.56 ppm Au, is from the Eastern Pond prospect area. |
To the effective date of this report (24 January 2023), NFG has completed 1,227 diamond drillholes for a total of 330,007 m, all of which is HQ-sized core. Most of the drilling has focused on Queensway North block and since 2019, 24 prospects were drill-tested for a total of 321,244 m across 1,187 holes. Drilling at Queensway South and Twin Ponds were initiated in 2022 with 33 holes totalling 7,255 m within the Queensway South block identifying 7 gold prospects, and 7 drillholes (1,508 m) drilled at Twin Ponds. As of the Effective Date of this report, core samples from 871 out of 1,227 drillholes have assay results as received by NFG from the laboratories. Assay results for the remaining 356 drillholes are still pending, including all drillholes within the Queensway South block.
Recent drilling has intersected significant gold mineralization along the Appleton Fault Zone that extends mineralization at NFG’s most drilled prospects, Keats, Lotto, and Golden Joint, and identified multiple new zones of high-grade mineralization; noteworthy zones include Keats West, Keats North, and Lotto North.
Drilling at the Keats prospect has expanded on the extensive network of high-grade quartz veins that occur within and adjacent to the Keats-Baseline Fault Zone, a second-order brittle fault that trends obliquely to the Appleton Fault Zone and dips moderately to the southeast and has been drill-defined over a strike length of 1.1 km. Two prominent vein orientations have been identified along with a conjugate array of cross-cutting brittle faults and associated veins that are interpreted to control domains of high-grade gold mineralization. The Keats Main vein, which is developed within the Keats-Baseline Fault Zone, has been defined over a strike length of 520 m and remains open to the east and becomes less well defined in the west adjacent to the Appleton Fault Zone.
Systematic and targeted drilling exploring north of the Keats Main zone both on the east and west sides of the Appleton Fault Zone made two significant discoveries, now named Keats West and Keats North prospects. Keats West gold mineralization is characterized by a series of stacked gold-bearing epizonal-style quartz veins hosted by a low-angle south-dipping thrust fault occurring in the hangingwall stratigraphy to the Appleton Fault Zone; initial drilling has identified mineralization over an area of 280 m x 130 m. Mineralization at Keats North is hosted within a complex array of brittle fault zones and associated veins that extend southward and interact with the northeast end of the Keats Main zone; this mineralized vein network has been drill-defined over an area of 150 m x 630 m. Gold grades at Keats prospects include:
| 24 January 2023 | | 6 |
January 2023 Exploration Update: New Found Gold Corp.’s Queensway Gold Project, NL
| • | The Keats Main gold prospect (385 drillholes; 114,065 m and 93,106 assays) has an overall average grade of 0.64 ppm Au. Within the Keats Main assay file, 3,641 analytical results (3.91%) were between 1 and 2,197.25 ppm Au, with an average of 14.78 ppm Au. |
| • | The Keats North gold prospect (103 drillholes; 27,173 m; 18,783 assays) has an overall average grade of 0.26 ppm Au. Within the Keats North assay file, 464 analytical results (2.47%) were between 1 and 738.0 ppm Au, with an average of 7.86 ppm Au. |
| • | Keats West (88 drillholes; 19,947 m; 8,865 assays) has an overall average grade of 0.53 ppm Au with. Within the Keats West assays, 485 analytical results (5.47%) were between 1 and 468 ppm Au, with an average of 8.74 ppm Au. |
At the Lotto prospect, high-grade gold mineralization was discovered within the Lotto Main vein, an approximately north-south striking, steeply east-dipping vein located 200 m east of the Appleton Fault Zone that has been extended to a vertical depth of 225 m and over a strike length of 200 m. The Lotto Main vein has been intersected at a maximum vertical depth of 325 m where it is underexplored and remains open along strike to the south. Recently, systematic grid drilling working north of Lotto has intersected a new gold-bearing structure with a similar orientation as the Lotto Main vein and is likely the offset northern extension, now called Lotto North prospect. Gold grades at the Lotto prospects include:
| • | Lotto gold prospect (106 drillholes; 28,369 m; 25,154 assays) has an overall average grade of 0.42 ppm Au. Within the Lotto assay file, 602 analytical results (2.39%) were between 1 and 1,332.55 ppm Au, with an average of 16.30 ppm Au. |
| • | Lotto North gold prospect (76 drillholes; 19,852 m; 5,913 assays) has an overall average grade of 0.26 ppm Au. Within the Lotto North assay file, 180 analytical results (3.04%) were between 1 and 225 ppm Au, with an average of 7.30 ppm Au. |
At the Golden Joint prospect, exploration has defined an approximately north-south striking, steeply west west-dipping vein in the immediate footwall to the Appleton Fault Zone. This vein carries high-grade gold mineralization and has a vertical depth of 275 m, and a strike length of 225 m. The vein has been intersected at depths as great as 385 m and remains open down-dip. The Golden Joint gold prospect (96 drillholes; 29,686 m and 25,458 core assays) has an overall average grade of 0.36 ppm Au. Within the Golden Joint assay file, 323 analytical results (1.27%) yield between 1 and 2,109.72 ppm Au, with an average of 25.86 ppm Au.
| 24 January 2023 | | 7 |
January 2023 Exploration Update: New Found Gold Corp.’s Queensway Gold Project, NL
Based on data from surface reconnaissance and mapping studies, surface till and grab rock prospecting samples, trench channel rock samples, airborne geophysical surveys, and drilling, NFG has identified 10 well mineralized prospects along the Appleton Fault Zone and the Joe Batt’s Pond Fault Zone. Queensway North drilling focused within a 4.5 km segment of the Appleton Fault Zone and a 3.7 km segment of the Joe Batt’s Pond Fault Zone has allowed NFG to establish the moderate to steeply dipping orientations of mineralization within segments of the fault zones. For most of the drill-tested prospects, the down-dip depth and strike length of the gold mineralization is still unknown and remains to be established by future drill programs.
| 1.10 | Conclusions and Uncertainties |
NFG has completed a significant amount of exploration at the Company’s Queensway Gold Project. Utilizing information from historical and NFG-conducted exploration programs, together with NFG’s 1,227 diamond drillholes (330,007 m), NFG has identified 32 gold prospects along the Appleton Fault Zone and the Joe Batt’s Pond Fault Zone. The prospects occur within the Queensway North block along a strike length of approximately 100 km and are associated with regional-scaled Appleton and Joe Batt’s Pond fault zones. NFG exploration has delineated two distinct segments of high-grade gold mineralization within the fault zones that include:
| • | A semi-contiguous network of high-grade gold veins and related faults is drill-defined to occur along a 4.5 km segment of the Appleton Fault Zone between the Knob and Zone 36 gold prospects in the Queensway North block. The high-grade gold trend is supported by the 1) style of mineralization, or high gold grades in quartz-carbonate veins at various prospects along the trend, 2) structural associations defined by complex networks of brittle fault zones aligned with regional deformation zones, 3) recognition and correlation of unique veins and vein systems, 4) association between gold and accompanying gangue (arsenopyrite, lead-antimony sulfosalt) and alteration minerals (aluminum-rich NH4 white muscovite), and 4) trace element correlations within the veins and discrete host rock Davidsville Group sedimentary horizons. |
| • | A possible 3.7 km segment of high-grade gold occurrences within the Joe Batt’s Pond Fault Zone between the south end of the Pocket Pond prospect and the north end of the 1744 prospect in the Queensway North block. This trend of high-grade mineralization is less well defined in comparison to the Knob to Zone 36 Appleton Fault Zone trend. The high-grade trend is supported by till and soil geochemical anomalies between the two drill-tested prospects, and by a uniquely different style of mineralization in that the gold mineralization associated with the Joe Batt’s Pond Fault Zone typically follows the orientation of the stratigraphy. |
Most of the prospects associated with the high-grade gold segments in the Queensway North block remain open at depth and warrant further drilling to determine their down-dip extent and to refine understanding of local details of orientation.
| 24 January 2023 | | 8 |
January 2023 Exploration Update: New Found Gold Corp.’s Queensway Gold Project, NL
Ongoing surface work, geophysical interpretations, and an inaugural drill program was completed by NFG in Queensway South and Twin Ponds blocks. Assay results are pending for the Queensway South drill program, but the work has visually produced several target areas along the Appleton Fault Zone trends. The observations are supported by till, rock, and soil geochemical anomalies orientated along the extents of the regional-scale structures.
NFG’s studies indicate that gold mineralization throughout the Queensway Project area is hosted in quartz veins hosted within the brittle fault networks adjacent to regional deformation zones that reach deep into the crust.
In May 2022, NFG initiated a trial of the Chrysos PhotonAssayTM non-destructive method for gold analysis at MSALABS in Val-d’Or, QC, in conjunction with follow-on screen metallic fire assay or standard 30-g fire assay method at ALS Canada Ltd. in Vancouver, BC for assay comparison. The results from the trial program demonstrated that the methods agree well, and the Company, its consultants, and the Qualified Person conclude that the PhotonAssayTM method is appropriate for Queensway samples. Since May 2022, NFG only submits core samples for gold assay to ALS and MSALABS.
It is the Qualified Person’s opinion that the exploration work conducted by NFG at the Queensway Property is reasonable and within the standard practices of gold evaluation within the Dunnage Zone of northeast Newfoundland. NFG exploration work results provide a significant update to the geology and mineral potential of northeast Newfoundland and the Qualified Person advocates that the information and data presented in this technical report forms a robust database for future exploration, and potentially, mineral resource estimation studies, at the Queensway Property.
Potential risks and uncertainties toward the advancement of NFG’s Queensway Project include:
| • | NFG mineral rights ownership of licences 035047M and 035197M, 035048M and 035198M, and 035050M are subject to the successful completion of the conditions within a single Option Agreement; hence, there is some uncertainty to completion of the conditions and subsequent acquisition but currently do not cover any known gold prospects within the licences. |
| • | Uncertainties related to validation of information from historical drilling. To mitigate this uncertainty, most historical drillholes can be redrilled with new NFG holes. |
| • | Although NFG’s exploration work is defining broad zones of mineralization, the gold mineralization can be erratic over short distances, which creates difficulties in building local vein network and gold mineralization models. |
| 24 January 2023 | | 9 |
January 2023 Exploration Update: New Found Gold Corp.’s Queensway Gold Project, NL
NFG will attempt to reduce risk/uncertainty through effective project management, engaging technical experts and developing contingency plans. To the best of the Qualified Person’s knowledge, there are no environmental liabilities, significant factors or risks that may affect access, title, or the right or ability of NFG to perform exploration work on the Queensway Property.
Finally, there is no guarantee that NFG can successfully extract gold from the Queensway Property in a commercial capacity. Mineral processing and metallurgical test work has yet to be performed by NFG. Ultimately, there is a risk that the scalability of any future initial bench-scale or pilot-scale mineral processing/metallurgical test work may not translate to a full-scale commercial operation. With respect to metallurgy, potential uncertainties at this stage of the project include methodology of producing saleable products, and handling of by-products and waste materials.
| 1.11 | Recommendations |
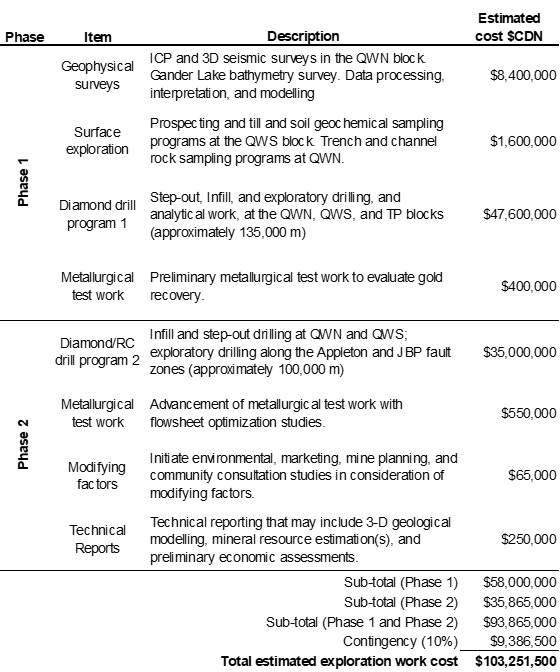
A two-phase work program is recommended with an estimated total cost of CDN$103.25 million with a 10% contingency. A summary of the program with cost estimates is presented in Table 1.1.
Phase 1 work recommendations include 1) geophysical surveys in the Queensway North block, 2) surface exploration work including exploratory work in the Queensway South block and advanced trench rock sampling in the Queensway North block, 3) a Phase 1 drill program that consists of step-out and infill drilling to further define and delineate the gold mineralization at known prospects in the Queensway North block, target delineation drilling at the Queensway South to follow-up on 2022 drill programs that yielded favourable geological interpretations (assays are pending), and exploratory drilling along the Appleton and Joe Batt’s Pond fault zones to test targets identified through surface exploration work program, and 4) preliminary metallurgical test work to define gold recovery functions.
Advancement to the Phase 2 work recommendations is contingent on the positive results of the Phase 1 work programs. The Phase 2 work program includes 1) additional diamond drilling for infill, step-out, and exploration drilling in conjunction with the initiation of Reverse Circulation drilling to expedite higher test material production rates for metallurgical test work and to advance the project toward mine planning, 2) further optimization of the metallurgical test work and recovery flowsheets, 3) initiate environmental, marketing, mine planning, and community consultation studies in consideration of Modifying Factors, and 4) technical reporting that is prepared in accordance with Canadian Institute of Mining, Metallurgy and Petroleum definition standards and best practice guidelines (2014, 2018, 2019) and Canadian Securities Administration’s National Instrument 43-101.
| 24 January 2023 | | 10 |
January 2023 Exploration Update: New Found Gold Corp.’s Queensway Gold Project, NL
Table 1.1 Work recommendations.
| 24 January 2023 | | 11 |
January 2023 Exploration Update: New Found Gold Corp.’s Queensway Gold Project, NL
| 2 | Introduction |
| 2.1 | Issuer and Purpose |
This technical report has been prepared for the Issuer, New Found Gold Corp. (NFG or the Company) by Mr. D. Roy Eccles, M.Sc., P. Geol. P. Geo. of APEX Geoscience Ltd. (APEX). NFG is a publicly traded junior mineral exploration company based in Vancouver, BC, Canada, with a focus on exploration for gold. NFG’s current exploration projects include the Queensway Gold Project in Newfoundland, NL, and the Lucky Strike Gold Project in Kirkland Lake, ON, Canada.
The focus of this technical report is on NFG’s Queensway Gold Project (the Project or the Property) located in northeast Newfoundland of the Canadian province Newfoundland and Labrador (NL; Figure 2.1). NFG started acquiring claims for the Queensway Gold Property in 2016 through option agreements and online map staking. At the Effective Date of this report, the Queensway Property comprises 6,649 claims within 94 mineral licences and encompasses an area of 166,225 ha. The Queensway Property extends from the Trans-Canada Highway near the Town of Gander to the Bay d'Espoir Highway (Route 360).
Most of the Queensway Property claims (91.7%) are fully owned by NFG (n=6,098 claims within 89 mineral licences). Additionally, 8.3% of the Queensway Property claims (n=551 claims within 5 mineral licences) are currently owned by other licence holders: 5.1% of the claims are owned by Aidan O’Neil (n=339 claims within 2 mineral licences), 3.2% by Suraj Amarnani (n=210 claims within 2 mineral licences), and 0.03% by Josh Vann (n=2 claims within 1 mineral licence). NFG is in the process of earning 100% mineral title and interest in all claims provided that the conditions of a single, current Option Agreement are completed.
NFG’s previous NI 43-101 technical report, with an effective date of May 31, 2022, provided information on NFG’s exploration activities at the Queensway Property through to the end of May 2022 (Srivastava, 2022).
Since the previous May 2022 report, NFG has conducted additional prospecting and rock sampling, soil sampling, trenching and channel sampling, and diamond drilling programs. The intent of the present technical report, therefore, is to update the previous technical report and provide technical information on NFG’s exploration activities at the Queensway Property through to an Effective Date of 24 January 2023.
This technical report has been prepared in accordance with the Canadian Institute of Mining, Metallurgy and Petroleum (CIM) Mineral Exploration Best Practice Guidelines (2018) and the Canadian Securities Administration’s (CSA) National Instrument 43-101 (NI 43-101) Standards of Disclosure for Mineral Projects.
| 24 January 2023 | | 12 |
January 2023 Exploration Update: New Found Gold Corp.’s Queensway Gold Project, NL
Figure 2.1 General location of New Found Gold Corp.’s Queensway Gold Project in Newfoundland, Newfoundland and Labrador, Canada.

| 24 January 2023 | | 13 |
January 2023 Exploration Update: New Found Gold Corp.’s Queensway Gold Project, NL
| 2.2 | Author and Site Inspection |
This technical report has been prepared by Mr. Roy Eccles MSc. P. Geol. P. Geo. of APEX in Edmonton, AB. Mr. Eccles takes responsibility for all items (Sections 1-14 and 23-27) of this technical report. Mr. Eccles is a Professional Geologist registered with the Alberta Association of Professional Geologists and Geophysicists (APEGA) and the Professional Engineers and Geoscientists Newfoundland and Labrador (PEGNL) and is a Qualified Person (QP) as defined in NI 43-101. Mr. Eccles has worked as a geologist for more than 35 years since his graduation from university. Mr. Eccles has been involved in all aspects of mineral exploration, mineral research, and mineral resource estimations for metallic, industrial, and specialty mineral projects and deposits, across Canada, United States, Europe, Australia, and other international destinations. Mr. Eccles experience includes Caledonian Orogeny gold mineralization projects in the Dunnage Zone of Newfoundland and Scotland, as well as many other multi-commodity projects. The QP is independent of New Found Gold Corp. and the Queensway Property.
Mr. Eccles performed a personal site inspection at the Queensway Gold Property, on January 12-13, 2023. The site inspection enabled Mr. Eccles to 1) observe the overall geological setting of the Queensway Property, 2) understand and observe the exploration work conducted by NFG including active diamond drilling, and 3) independently validate the gold mineralization that is the subject of this technical report.
| 2.3 | Sources of Information |
The QP, in writing this technical report, used sources of information as listed in Section 27, References.
The author relied immeasurably on the information reported in NFG’s previous technical report (Srivastava, 2022), which was prepared by R. Mohan Srivastava of RedDot3D Inc (RD3D).
The exploration information and data on which this report is based were provided by NFG. Most Figure and Table information was prepared by the QP, NFG, and Srivastava (2022); others were sourced from technical literature and public sources as referenced.
Publicly available information and data include miscellaneous reports, assessment reports, government data, scientific papers, and NFG News Releases (e.g., Kennedy and McGonigal, 1972; Williams, 1972; Blackwood, 1982; Karlstrom et al., 1982; Ermer, 1986; Williams et al., 1988; Williams et al., 1993; Sheppard, 1994; Currie, 1995; Williams, 1995; Harper et al., 1996; Williams, 2004; Dubé and Gosselin, 2007; Pollock et al., 2007; Willman, 2007; Labonte and Piercey, 2012; Piercey et al., 2014; Goldfarb et al., 2015; CGG Canada Services, 2017-2021; Holmes and Michaud, 2017; Robert et al., 2021; Sterk and Kruse, 2021; Srivastava, 2022; New Found Gold Corp 2020 a-e, 2021 a-s, 2022 a-x, 2023 a-c).
| 24 January 2023 | | 14 |
January 2023 Exploration Update: New Found Gold Corp.’s Queensway Gold Project, NL
The QP has reviewed NFG datasets and compilation data, public government and scientific journal reports, Srivastava (2022), company assessment reports, and Company press releases and considers the articles and datasets contain relevant and reasonable geological information in relation to the Queensway Property. The government and journal information and manuscripts were prepared by geologists and engineers that are either professional or have advanced university degrees. Industry assessment reports were vetted by government employees.
Based on the QP review of these documents and data, the QP has deemed that the reports, information, and data, to the best of his knowledge, are valid contributions to this technical report, and therefore takes ownership of the ideas as they pertain to the technical report.
NFG uses, or has used, numerous laboratories: Eastern Analytical Ltd. in Springdale, NL, ALS Canada Ltd. in Vancouver, BC (and sample preparation laboratories in NB, ON, and MB), Activation Laboratories Ltd. in Ancaster, ON, SGS Canada Inc. in Burnaby, BC, Overburden Drilling Management in Nepean, ON, and MSALABS in Val-d’Or, QC. These labs are independent of NFG and represent major commercial, accredited Canadian labs.
With respect to the Queensway Property mineral licences documented in Section 4, the legal information regarding mineral licences and claims has not been independently verified; however, the QP has reviewed the Queensway Property licence status from the Government of Newfoundland and Labrador Mineral Rights Inquiry Portal (https://licensing.gov.nl.ca/mrinquiry/sfjsp?interviewID=MRISearch) and the “Map Staked Claims” GIS file from the Government of Newfoundland and Labrador Geoscience Atlas (https://geoatlas.gov.nl.ca).
The 94 mineral licences that constitute the Queensway Gold Property are active and in good standing as of the Effective Date of this technical report (24 January 2023).
| 2.4 | Units of Measure |
With respect to units of measure, unless otherwise stated, this Technical Report uses:
| • | Abbreviated shorthand consistent with the International System of Units (International Bureau of Weights and Measures, 2006). |
| • | ‘Bulk’ weight is presented in both United States short tons (tons; 2,000 lbs or 907.2 kg) and metric tonnes (tonnes; 1,000 kg or 2,204.6 lbs.). |
| • | Geographic coordinates are projected in the Universal Transverse Mercator (UTM) system relative to Zone 21 of the North American Datum 1983 (NAD83). |
| • | Currency in Canadian dollars (CDN$), unless otherwise specified. |
| 24 January 2023 | | 15 |
January 2023 Exploration Update: New Found Gold Corp.’s Queensway Gold Project, NL
| 3 | Reliance of Other Experts |
The QP for this report is not qualified to give legal opinions. On legal matters, the QP relies on information provided by the Issuer, NFG, specifically, the QP does not have the legal expertise to validate the Option Agreements and royalties described in Sections 4.5 and 4.6. The successful completion of 9 previous Option Agreements were not formally disclosed by NFG because the Issuer was a privately owned corporation to August 2020. At present, 8.3% of the Queensway Property claims are currently owned by other licence holders and are the subject of a single Option Agreement between NFG and various mineral right Optionor’s that is subject to annual payments and common shares.
Hence, the QP relies entirely on Option Agreement and royalty information disclosed by NFG (New Found Gold Corp., 2022a) and in the numerous documents provided by NFG management to the QP during the preparation of this technical report in January 2023. The title and dates of specific Option Agreement and/or confirmation of property transfer reports provided by NFG to the QP include, in no order:
| • | Confirmation of Transfer – Kriask Syndicate (June 23, 2020). |
| • | Termination of the JBP Property Agreement (September 10, 2015). |
| • | Linear and JBP Mining Option Agreement (July 15, 2016). |
| • | Unity Project Mining Option Agreement (November 9, 2016). |
| • | Noreen Kennedy Mining Option Agreement (October 4, 2016). |
| • | Golden Bullet Project Mining Option Agreement (November 11, 2016). |
| • | Blackmore Mining Claim Acquisition Agreement (December 5, 2016). |
| • | Guinchard Claims Mining Option Agreement (April 28, 2017). |
| • | JBP Linear Project Mining Option Agreement (May 27, 2017). |
| • | Quinlan Amending Agreement to Purchase Property Agreement (May 27, 2019). |
| • | P-Pond Project Mining Option Agreement (May 30, 2017). |
| • | Mineral Licence 06821M Mining Claim Purchase Agreement (September 7, 2018). |
| • | Finally, the only current Option Agreement, which is between NFG and Aidan O’Neil, Suraj Amarnani, Josh Vann, and VOA Exploration Inc. (November 2, 2022). |
The title and dates of specific investment agreements provided by NFG to the QP include:
| • | GoldSpot Discoveries Inc. and NFG Investment Agreement (January 29, 2019). |
| • | GoldSpot Discoveries Inc. and NFG Amendment to Investment Agreement (August 2, 2020). |
| • | Allan Keats and NFG Royalty Purchase Agreement (November 9, 2021). |
| • | Kevin Keats and NFG Royalty Purchase Agreement (November 9, 2021). |
| • | Krinor Resources Inc. and NFG Royalty Purchase Agreement (November 9, 2021). |
Finally, an NFG Title Opinion related to NFG’s mineral licences, which was prepared by Stewart McKelvey and dated December 14, 2022, was provided by NFG to the QP.
| 24 January 2023 | | 16 |
January 2023 Exploration Update: New Found Gold Corp.’s Queensway Gold Project, NL
| 4 | Property Description and Location |
| 4.1 | Description and Location |
The Queensway Gold Project is on the northeast portion of the Island of Newfoundland in the Province of Newfoundland and Labrador along the east coast of Canada. The northern portion of the Property is transected by the Trans-Canada Highway approximately 15 km west of the Town of Gander, NL. The mineral licences encompass 166,225 hectares in a land position that is approximately 115 km long and 10-30 km wide, from the Trans-Canada Highway (TCH, Route 1) near the Town of Gander to the Bay d'Espoir Highway (Route 360; Figure 2.1). The approximate centre of the NFG Queensway Project is UTM, Zone 21N, NAD83: 651000 m Easting, 5408000 m Northing.
The Queensway Property is collectively defined by 94 mineral licences that comprise 6,449 claims, with each claim having an area of 25 ha (500 m x 500 m). Collectively, the Property encompasses an area of 166,225 ha (1662.25 km2). The licences can be separated spatially into groups based on their contiguous groupings as described in the text that follows.
The geographic position of the various contiguous licence groupings, and the licence descriptions, are presented in Figure 4.1 and Table 4.1. The licences/claims are divided into 7 NFG-defined sub-properties, or blocks that include:
| • | 2 large contiguous blocks (Queensway North or QWN, and Queensway South or QWS) separated by Gander Lake, and |
| • | 5 smaller blocks of single or multiple contiguous groups of licences (Twin Ponds, Ten Mile-Duder Lake, South Pond, Bellman’s Pond, and Little Rocky Brook). |
The blocks have no specific administrative or legal significance but are helpful in presenting and explaining a variety of exploration activities over a very large area.
The larger QWN and QWS blocks are defined as follows:
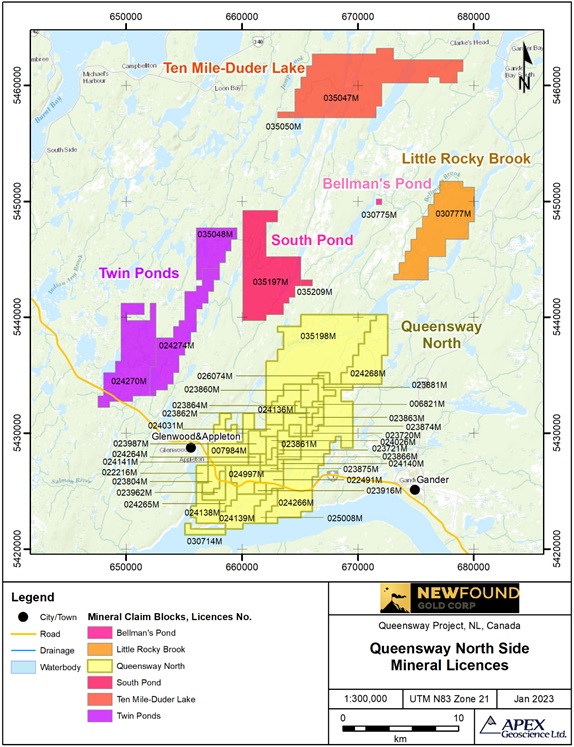
| 1. | Queensway North (QWN), which consists of 35 contiguous mineral licences (684 claims) and is situated north of Gander Lake. QWN encompasses an area of 17,100 ha. The approximate centre of the QWN block is UTM, Zone 21N, NAD83: 664193 m Easting, 5430810 m Northing (Table 4.1; Figure 4.2). |
| 2. | Queensway South (QWS), which consists of 50 contiguous mineral licences (5,281 claims) and is situated south and west of Gander Lake. QWS encompasses an area of 132,025 ha. The approximate centre of the QWN block is UTM, Zone 21N, NAD83: 639028 m Easting, 5389980 m Northing (Table 4.1; Figure 4.3). |
| 24 January 2023 | | 17 |
January 2023 Exploration Update: New Found Gold Corp.’s Queensway Gold Project, NL
Figure 4.1 Queensway Project and six NFG-defined sub-property ‘blocks’, which are composed of contiguous mineral licences.
| 24 January 2023 | | 18 |
January 2023 Exploration Update: New Found Gold Corp.’s Queensway Gold Project, NL
Table 4.1 Queensway Project mineral licence description and status (reported by blocks of contiguous licences/claims).

| 24 January 2023 | | 19 |
January 2023 Exploration Update: New Found Gold Corp.’s Queensway Gold Project, NL

| 24 January 2023 | | 20 |
January 2023 Exploration Update: New Found Gold Corp.’s Queensway Gold Project, NL
| 24 January 2023 | | 21 |
January 2023 Exploration Update: New Found Gold Corp.’s Queensway Gold Project, NL
Figure 4.2 Queensway North mineral licences, and the separate licences of Twin Ponds, Ten Mile-Duder Lake, South Pond, Bellman’s Pond, and Little Rocky Brook.
| 24 January 2023 | | 22 |
January 2023 Exploration Update: New Found Gold Corp.’s Queensway Gold Project, NL
Figure 4.3 Queensway South mineral licences.

| 24 January 2023 | | 23 |
January 2023 Exploration Update: New Found Gold Corp.’s Queensway Gold Project, NL
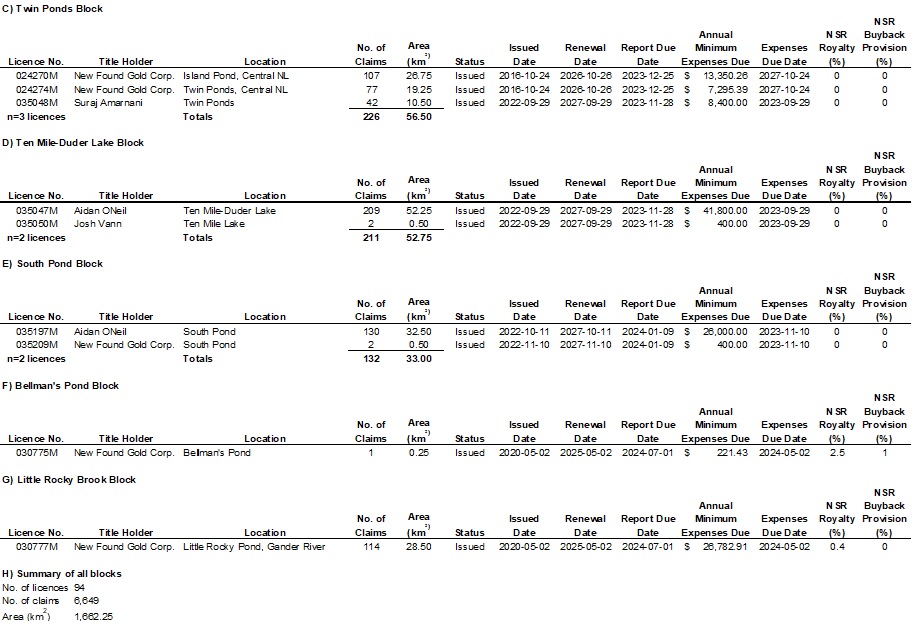
In addition to the larger contiguous QWN and QWS blocks described above, the Queensway Property also includes 5 separated, and smaller, non-contiguous groups of licences that occur north and west of the QWN block. The 5 groups of small block licences are presented spatially on Figure 4.2, defined in Table 4.1, and described as follows:
| 1. | Twin Ponds (TP) block, which consists of 3 contiguous mineral licences (226 claims) and is situated west of the Gander River. TP encompasses an area of 5,650 ha. The approximate centre of the TP block is UTM, Zone 21N, NAD83: 653000 m Easting, 5436500 m Northing. |
| 2. | Ten Mile-Duder Lake (TMDL) block, which consists of 2 contiguous mineral licences (211 claims) and is situated west of the Gander River. TMDL encompasses an area of 5,275 ha. The approximate centre of the TMDL block is UTM, Zone 21N, NAD83: 670000 m Easting, 5460000 m Northing. |
| 3. | South Pond (SP) block, which consists of 2 contiguous mineral licences (132 claims) and is situated west of the Gander River. SP encompasses an area of 3,300 ha. The approximate centre of the SP block is UTM, Zone 21N, NAD83: 662000 m Easting, 5443000 m Northing. |
| 4. | Bellman’s Pond (BP) block, which consists of 1 mineral licence (1 claim) and is situated west of the Gander River. BP encompasses an area of 25 ha. The approximate centre of the BP block is UTM, Zone 21N, NAD83: 671800 m Easting, 5450000 m Northing. |
| 5. | Little Rocky Brook (LRB) block, which consists of 1 mineral licence (114 contiguous claims) and is situated west of the Gander River. LRB encompasses an area of 2,850 ha. The approximate centre of the LRB block is UTM, Zone 21N, NAD83: 6767000 m Easting, 5447500 m Northing. |
| 4.3 | Property Ownership Summary |
Since the 1950s, the Queensway Property area has been prospected by several dozen individuals who have staked claims either in their own name or in the name of the private company through which they conduct their prospecting activities. The Queensway Property claims have been optioned at different times to larger mining companies, many of them public. Private and public companies have worked together in joint ventures and with different groups of individual prospectors, dropped options and entered into new joint ventures and option agreements, sometimes with the same partners and sometimes with new partners.
Following the many changes in claim ownership, Palisade Resources Corp, later renamed to New Found Gold Corp in June 2017 began to consolidate the large land package that now forms the Queensway Project.
| 24 January 2023 | | 24 |
January 2023 Exploration Update: New Found Gold Corp.’s Queensway Gold Project, NL
The licences were acquired through 1) online map staking with the Government of NL, 2) the successful completion of a series of Option Agreements (9 Option Agreements; New Found Gold Corp., pers. comm., 2023), and 3) as part of a current Option Agreement (New Found Gold Corp., 2022a; see Section 4.5). Some licences were acquired via a direct purchase agreement.
With respect to the nature and extent of NFG’s mineral rights interest at the Queensway Property, Table 4.1 shows that the Queensway Property can be separated into 4 general groups based solely on the title of the Licence Holder. Figure 4.2 and Table 4.1 describe the Queensway North groups that includes titles related to Twin Ponds, Ten Mile-Duder Lake, South Pond, Bellman’s Pond, and Little Rocky Brook. Figure 4.3 and Table 4.1 describe the title holder for the Queensway South block. The descriptions of the 4 groups – based on the title of the Licence Holder is further summarized as follows:
| • | 91.7% of the claims that make up the Queensway Property are fully owned by NFG. They consist of 6,098 claims within 89 mineral licences in Queensway North, Queensway South, Twin Ponds, South Pond, Bellman’s Pond, and Little Rocky Brook. |
| • | 5.1% of the claims are owned by Aidan O’Neil. They consist of 339 claims within 2 mineral licences at Ten Mile-Duder Lake and South Pond. |
| • | 3.2% of the claims are owned by Suraj Amarnani. They consist of 210 claims within 2 mineral licences at Twin Ponds and Queensway North. |
| • | 0.03% of the claims are owned by Josh Vann. They consist of 2 claims within 1 mineral licence at Ten Mile-Duder Lake. |
Therefore, a total of 8.3% of the claims that make up the Queensway Property are not owned by NFG but rather by separate licence holders and are subject to a single Option Agreement between NFG and the current property owners (Aidan O’Neil, Suraj Amarnani, and Josh Vann).
| 4.3 | Mineral Tenure Information and Maintenance |
Mineral rights in the Province of Newfoundland and Labrador are managed by the Mineral Lands Division of the Department of Industry, Energy, and Technology, which coordinates map-staking of Crown mineral licences through the online Mineral Lands Administration Portal (MinLAP). Within the area of a mineral licence there are separate mineral claims, up to 256 coterminous claims per licence area.
Mineral licences in Newfoundland and Labrador come with two financial obligations:
1. Minimum expenditures for ongoing assessment, in which the province requires licence-holders to spend a minimum amount on their exploration activities each year. These minimum expenditure commitments increase with time, as summarized in Table 4.2. NFG’s minimum exploration expenditure obligation for the entire Queensway Project will be $1,282,559 in 2023; $2,365,291 in 2024; and $3,337,342 in 2025. With the current drilling program scheduled to continue throughout 2023, and with ongoing surface reconnaissance and mapping activities, the money NFG spends on exploration will easily exceed the required minimum.
| 24 January 2023 | | 25 |
January 2023 Exploration Update: New Found Gold Corp.’s Queensway Gold Project, NL
In each year of the mineral licence validity, the minimum annual assessment work must be completed by the anniversary date with the assessment report submitted within 60 days of the anniversary date. Assessment work submitted above what is required to be completed on the licence in a one-year period is credited to the licence and can be carried forward to satisfy the expenditure requirements in future years.
Any mineral licence holder who intends to conduct an exploration program must obtain an exploration approval from the Newfoundland and Labrador Department of Industry, Energy and Technology before the activity can commence.
2. Licence renewal fees, in which the province issues map staked licences for a maximum of 30 years, if kept in good standing, from the date when the claim was first staked with renewals expected at five-year intervals. Table 4.3 shows the renewal fee per claim for each of the five-year intervals. These fees are due every five years from Year 5 through Year 20, and then annually from Year 21 through to the end of the 30-year period. NFG’s annual renewal fees will be $14,075 for the claims that reach their renewal date in 2023; $15,250 for the claims that reach their renewal date in 2024; and $78,295 for the claims that reach their renewal date in 2025.
Table 4.2 Minimum expenditures for mineral claims in Newfoundland and Labrador.

Table 4.3 Renewal fees for mineral claims in Newfoundland and Labrador.

| 24 January 2023 | | 26 |
January 2023 Exploration Update: New Found Gold Corp.’s Queensway Gold Project, NL
| 4.4 | Access and Surface Rights |
Title to the surface rights in Newfoundland and Labrador are necessary to be obtained only to develop a mineral resource under a mining lease. Surface rights to perform non-ground destructive and/or ground-destructive exploration work in permitted areas is obtained through exploration approvals from the Department of Industry, Energy and Technology, under a mineral licence (Mineral Rights Claim Brochure, Mineral Claims Recorders Office of Newfoundland and Labrador, 2015).
NFG does not own surface rights on the Queensway Project. On an as-needed basis, NFG negotiates agreements that allow exploration activities to be conducted on property owned and administered by others:
| • | The province of Newfoundland and Labrador, which administers Crown Lands, |
| • | The municipalities of Appleton and Glenwood, |
| • | Property owners of residential properties in Appleton and Glenwood and of cottages and cabins outside municipal boundaries. |
In addition to stipulating the times when the company can conduct work, and the nature of the work that is permitted, these agreements also specify the company’s responsibility for restoring land to an acceptable condition following field activities.
For activities on Crown Lands, approval is required from the Mineral Lands Division of the province’s Department of Industry, Energy, and Technology. The primary focus of these applications and approvals is to prevent or minimize adverse impacts on the environment, fish, and wildlife; Section 4.7 of this report summarizes NFG’s environmental permitting activities and the approvals it currently holds.
If the Queensway Project advances to the mine production stage, NFG would need to obtain surface rights by applying for a surface lease to the Department of Industry, Energy and Technology, accompanied by a legal survey. Surface leases are issued by the Minister of Industry, Energy and Technology in consultation with the Minister appointed to administer the Lands Act.
| 4.5 | Option Agreement |
In addition to the mineral licences staked by NFG, the Queensway Project also includes optioned claim packages that were negotiated by NFG from 2016 through 2018 under 9 separate and completed Option Agreements. These Option Agreements granted mineral rights to NFG in return for a combination of scheduled lump-sum payments, NFG shares and NSR royalties to various individual and company optionors.
| 24 January 2023 | | 27 |
January 2023 Exploration Update: New Found Gold Corp.’s Queensway Gold Project, NL
As of September 2021, when the last of the option payments was made with respect to the 9 Option Agreements, NFG had met all the conditions and had earned 100% ownership of the associated mineral licences.
On November 2, 2022, NFG executed a single option agreement (the Option) with Aidan O’Neil, Suraj Amarnani, Josh Vann, and VOA Exploration Inc., collectively referred to as the “Optionors”. The option agreement grants NFG exclusive right and option to acquire a 100% title and interest in a property defined by 5 mineral licences: 035047M and 035197M, 035048M and 035198M, and 035050M, owned by Aidan O’Neil, Suraj Amarnani, and Josh Vann respectively (Figure 4.2; Table 4.1). The claims included in these 5 mineral licences represent 8.3% of the Queensway Property claims (Section 4.2).
In connection with the grant of the Option, NFG shall have the right to enter onto and occupy the optioned property to conduct activities as contemplated in the option agreement.
For NFG to exercise the Option, NFG shall 1) issue an aggregate of 487,078 common shares in capital of NFG (the “Share Issuances”) and 2) make aggregate cash payments of $2,350,000 (the “Cash Payments”) to the Optionors as follows (New Found Gold Corp., 2022a):
| 1. | $200,000 and 39,762 Common Shares on the later of (i) Staking Confirmation Date (as defined in the Option Agreement) and (ii) the receipt of the TSX-Venture Exchange’s (the “TSXV”) approval. |
| 2. | $200,000 and 39,762 common shares on or before November 2, 2023. |
| 3. | $250,000 and 69,583 common shares on or before November 2, 2024. |
| 4. | $300,000 and 89,463 common shares on or before November 2, 2025. |
| 5. | $600,000 and 129,224 common shares on or before November 2, 2026. |
| 6. | $800,000 and 119,284 common shares on or before November 2, 2027. |
NFG shall pay all Cash Payments and register all Common Shares issued under the Agreement to VOA Exploration Inc. unless otherwise instructed in writing by the Optionors. “VOA” Exploration Inc. is the consortium of Vann, O’Neil, and Amarnani.
Upon NFG completing the Cash Payments and the Share Issuances set forth above, NFG will immediately be deemed to have exercised the Option and acquired a 100% interest in the property free and clear of all encumbrances with no further action required by it resulting in the Optionors’ interest in the property being immediately transferred to NFG. The terms of the Option Agreement do not include any mandatory work commitments, advanced royalty payments, or granting of royalties.
| 24 January 2023 | | 28 |
January 2023 Exploration Update: New Found Gold Corp.’s Queensway Gold Project, NL
| 4.6 | Royalties |
77 out of 94 (82%) of the Queensway Property mineral licences are currently subject to a Net Smelter Return (NSR) royalty; the other 17 licences are not subject to any royalty. Some royalties were formed within agreements between NFG and the various individuals and companies that optioned their mineral rights to NFG in return for financial compensation that included NSR royalties. Others arise from financing provided by GoldSpot Discoveries Corp. (GoldSpot) in 2019. All claims acquired after the NFG-GoldSpot agreement execution date and contiguous to the NFG-GoldSpot agreement original claims are subject to a 1% NSR royalty to GoldSpot less royalties at the time of acquisition.
A summary of the royalty structure at the Queensway Property is presented in Table 4.1. Currently, the NSR royalties range from 0.4% to 2.5% for the 77 licences subject to a NSR royalty.
Many of NFG’s option and financing agreements have included a buy-back provision that allows the company to reduce the NSR royalty by making a lump-sum payment to the holder of the royalty. NFG has already exercised the buyback option on some of its agreements (e.g., 0.6% NSR related to Linear and JBP Linear Properties Option). Table 4.1 illustrates the current NSR royalty and the amount that could still be bought back. Were NFG to exercise all its buy-back rights, the NSR royalties would range from 0.4% to 1.5% for the 77 licences subject to a NSR royalty.
| 4.7 | Permits |
NFG is responsible for obtaining all permits in accordance with the laws of Newfoundland and Labrador to conduct exploration activities at the Queensway Property. Exploration activities require approval from the Mineral Lands Division of the province’s Department of Industry, Energy, and Technology. These specify the activities that are allowed in the area; they are typically valid for one year and can be renewed.
The different permits and licence requirements in the province of Newfoundland and Labrador can include:
| 1. | Exploration Approvals: An Exploration Approval Permit enables an exploration company to conduct prospecting, rock and soil geochemistry, line cutting, trenching, bulk sampling, airborne and/or ground geophysical surveys, fuel storage, ATV usage, diamond drilling, etc. |
| 2. | Water Use Licence: Activities that require water to be drawn from surface waterways or from aquifers require a Water Use Licence. These are typically valid for five years and can be renewed. These permits are no longer needed for drilling and trenching activities. |
| 24 January 2023 | | 29 |
January 2023 Exploration Update: New Found Gold Corp.’s Queensway Gold Project, NL
| 3. | Licence to Occupy: Required if a camp location was to be used for a period longer than that which was allowed as part of the Exploration Approval Permit. This permit is obtained from the Provincial Department of Crown lands. These are typically valid for five years and can be renewed. |
| 4. | Section 39 Permit: When field activities occur within a Protected Public Water Supply Area (PPWSA), restoration requirements and constraints on field activities are stipulated in a “Section 39 Permit” that is typically valid for one year and can be renewed. |
| 5. | Section 48 Permit: If exploration activities include stream crossings and/or fording, or any work in and around any body of water, the Water Resources Management Division must be contacted to obtain a Section 48 Permit to Alter a Water Body under the Water Resources Act, 2002. |
| 6. | Forestry Permits: NFG shall contact the nearest Forest Management District Office to obtain the following permits prior to commencing any activity as required. |
| 7. | A commercial harvesting permit before the start of the exploration program if trees must be cut for access to exploration sites on Crown lands. |
| 8. | An operating permit if operations are to take place on forest land during the forest fire season (May-September). |
| 9. | During the forest fire season, a permit to burn must be obtained to ignite a fire on or within 300 m of forest land. NFG has never needed this permit. |
| 10. | Development Permit: Any activity that meets the definition of development under the Urban and Rural Planning Act, 2000, within a municipal planning area/boundary will require application and permit from the Municipality. |
Table 4.4 summarizes the permits, licences and approvals that have currently been granted to NFG:
| • | Exploration Approvals (prefixed with E). |
| • | Water Use Licences (prefixed with WUL). |
| • | PPWSA Section 39 Permits (prefixed with PRO). |
| • | Section 49 Permits to Alter a Water Body (prefixed with ALT). |
| • | Other environmental permits. |
| 24 January 2023 | | 30 |
January 2023 Exploration Update: New Found Gold Corp.’s Queensway Gold Project, NL
Table 4.4 Environmental permits, licences, and approvals.

Applying for exploration permits for new field programs and renewing existing permits for continuing programs are ongoing administrative activities for NFG.
| 4.8 | Environmental Restrictions and Significant Factors |
Mineral licences 024557M, 024558M, 024561M, 024563M, 024568M, and 024570M, all of which lie in the south of Queensway South, are restricted from exploration activities from mid-May to early-July as this area is a spring habitat for Newfoundland caribou.
Mineral licence 035198M in Queensway North encloses two known archaeological sites and covers a portion of the Gander River which has high archaeological potential. As such, the Provincial Archaeology Office recommends a 100 m buffer along the Gander River, and 50 m buffers around the two known sites. The two known archaeological sites in UTM Zone 21N NAD83 are: 1) 662938 m Easting, 5435800.33 m Northing and 2) 670038.33 m Easting, 5439264.60 m Northing.
The QP is not aware of any other restrictions to NFG’s exploration activities, which can generally be conducted year-round once the necessary approvals have been received from the Mineral Lands Division, and/or from the relevant municipal governments and individual property owners.
To conclude and to the best of the QPs knowledge, there are no environmental liabilities, significant factors or risks that may affect access, or the right or ability of NFG to perform exploration work on the Queensway Property.
| 24 January 2023 | | 31 |
January 2023 Exploration Update: New Found Gold Corp.’s Queensway Gold Project, NL
With respect to obtaining additional permits, the QP has no reason to assume that the Company would not be granted additional exploration approvals and other permits to advance the Queensway Gold Project. With respect to title, mineral licences: 035047M and 035197M, 035048M and 035198M, and 035050M are owned by Aidan O’Neil, Suraj Amarnani, and Josh Vann respectively. Hence, NFG mineral rights ownership of these licence areas and the mineral occurrences that may occur within them are subject to successful completion of conditions of a single Option Agreement in place.
| 5 | Accessibility, Climate, Local Resources, Infrastructure and Physiography |
| 5.1 | Accessibility |
The Queensway Property can be accessed by plane to the Gander International Airport and by vehicle from the Town of Gander via the Trans-Canada Highway (TCH, Route 1) which passes through the Queensway North claims and the Twin Ponds claims area (the Property is first accessed approximately 15 km west of the Town of Gander, Figure 5.1).
The Gander International Airport, which is sometimes referred to as the “Crossroads of the World”, is a famous international airport. The airport has served as a strategic Transatlantic refueling stop, military location for the Royal Canadian Air Force, and has the unique ability to handle large aircraft (e.g., Concorde supersonic flight testing, emergency landing runway for NASA's Space Shuttle orbiter, and host airport during the September 11, 2001, terrorist attacks when the United States closed North American airspace).
The Trans-Canada Highway (TCH, Route 1) provides road access across all of Newfoundland with an east-west distance of 928 km. The Trans-Canada Highway passes through 8 licences in the Queensway North block and 1 licence in the Twin Ponds block.
The Property can also be accessed by the road along the Northwest Gander River, which runs on the west portion of the Queensway South claims area from Gander Lake and crosses the river into the Queensway South claims at a steel bridge approximately 15 km south of Gander Lake. Within the claims areas, most of the project is accessible via gravel forest access roads, including the Appleton Fault Zone (AFZ) road, the Joe Batt’s Pond Fault Zone (JBPFZ) road to H Pond, and Joe Batt’s Pond Road. Many quad/harvester trails and winter roads provide excellent access for heavy equipment when required.
The areas in the far south of the Queensway South area are best reached by 4x4 trucks and All Terrain Vehicles (ATV) along forest roads that transect the Bay d’Espoir Highway (Route 360), which spurs off of the Trans-Canada Highway at Town of Bishop’s Falls, NL (Figure 5.1).
| 24 January 2023 | | 32 |
January 2023 Exploration Update: New Found Gold Corp.’s Queensway Gold Project, NL
Figure 5.1 Access to the Queensway Property.

| 24 January 2023 | | 33 |
January 2023 Exploration Update: New Found Gold Corp.’s Queensway Gold Project, NL
In addition to road and ATV access, the mineral licences along the shores of Gander Lake can easily be accessed by boat. The Property can also be accessed by helicopter from the Newfoundland Helicopters base in the towns of Appleton and via Gander International Airport and from small craft float planes based near the international airport in Gander.
The nearest seaports are north of the Trans-Canada Highway at the towns of Lewisporte and Botwood, NL, which are approximately 40 and 70 km, respectively, by road from the Town of Glenwood, NL (Figure 5.1). Both port locations have excellent harbour facilities and capabilities.
| 5.2 | Site Topography, Elevation and Vegetation |
The Queensway Property area is dominated by broad, northeast-trending ridges separated by valleys with linear bogs, brooks, and larger ponds (Figure 5.2). Gander Lake and the Gander River are the most important water bodies in the project area. Within the property, the ground elevation rises to approximately 320 m above sea level at a ridge east of Caribou Lake in the southeast and drops to a low of 15 m above sea level in the north portion of the property, where the Gander River flows toward the North Atlantic coast. Boreal forest covers much of the project area and includes areas that have been logged and re-planted with white and black spruce seedlings.
| 5.3 | Climate |
The climate is blended maritime-humid continental: pleasant in the summer; cool and wet in the spring and autumn; and snowy, often windy, in the winter. Summer temperatures are typically in the 20° C to 25° C range, but highs can peak above 30° C (Figure 5.3). Winter temperatures typically range from −15° C to +5° C. Precipitation is usually in the form of snow from December to April; rainfall is typical the rest of the year, usually as showers to heavy rain, frequently occurring with strong winds. Occasional thunderstorms occur during the late summer and early fall. Weather is dominated by ocean currents, prevailing westerlies, and storms coming from the west over the Maritime provinces and Québec, or from the south along the US Eastern Seaboard. The typical spring/summer exploration season is from May to late November. Winter conditions start early in November and sometimes extend into May.
The Gander area climate is conducive to exploration companies having the capability to conduct year-round exploration work. Geological mapping, prospecting and surface rock sampling programs are typically limited to the summer and summer shoulder months (i.e., spring, or March to May, and fall or September and October) when snow still melts and/or precipitation occurs largely as rainfall. Geophysical surveys and drilling can easily be competed year-round including through the winter months after the snow/ice has either melted or formed ice layers that are thick enough to support equipment. Producing mines in NL operate year-round. With respect to seaports in the general Queensway Property area, the sea ice is typically open year-round; however, sea ice has disrupted winter shipping in some years.
| 24 January 2023 | | 34 |
January 2023 Exploration Update: New Found Gold Corp.’s Queensway Gold Project, NL
Figure 5.2 Shaded relief image for the Queensway Project area, with outline of the Queensway mineral licences and bodies of water.

| 24 January 2023 | | 35 |
January 2023 Exploration Update: New Found Gold Corp.’s Queensway Gold Project, NL
Figure 5.3 Climate data for Gander International Airport. Source: Environment Canada.

| 5.4 | Local Resources and Infrastructure |
The proximity to Gander, NL provides the Queensway Project with the benefits of a local community with an approximate population of nearly 12,000 persons (2021 Census of Population), which includes accommodation, restaurants, hardware, garages, office space, etc. within a short drive from the property and fieldwork. This is made possible by its proximity to the town of Gander, 12 km to the east of the Queensway North claims along the Trans-Canada Highway (Figure 4.2). Gander has many amenities that one would expect to find in a major city: an international airport and most of the equipment and supplies required for exploration. The people of Gander are also a source for much of the labour required for NFG’s exploration programs.
The small Town of Appleton lies just within the Queensway North claims area; the neighbouring Town of Glenwood lies across the Gander River, just to the west of the project’s claims (Figure 4.2). With a combined population of approximately 1,400 individuals many of whom work in the resource sectors, these towns are also a source for workers and support staff. A helicopter base and an environmental remediation company are in Appleton.
In the Appleton Industrial Park, NFG has purchased eight lots that host a fenced-in core yard, an office trailer, a shipping container, and a trailer-style camp for drill crews.
| 24 January 2023 | | 36 |
January 2023 Exploration Update: New Found Gold Corp.’s Queensway Gold Project, NL
Skilled and semi-skilled workers can also be found in Grand Falls−Windsor, a town with a slightly larger population (close to 14,000 persons) in comparison to Gander and is approximately 76 km west of the Queensway North claims along the TransCanada Highway (Figure 5.1).
| 5.4.1 | Power Supply |
Electricity is available from the Newfoundland provincial grid, which has three electricity transmission corridors that cross the Queensway Project lands:
| • | A 350 kV high voltage direct current line, which passes through the approximate centre of the Queensway South licences. This is the line that brings electricity from the hydroelectric dams at Churchill Falls and Muskrat Falls in Labrador across the island of Newfoundland to St. John’s. |
| • | Two 138 kV high voltage alternating current transmission lines to the north of the Trans-Canada Highway on the Queensway North licences. These supply electricity to the towns of Glenwood, Appleton, and Gander from the hydroelectric dams at Grand Falls, Bishop’s Falls and Norris Arm. |
| • | A 69 kV high voltage alternating current transmission line that runs across Queensway North along the Trans-Canada Highway. These also supply electricity to the towns of Glenwood, Appleton, and Gander from hydroelectric dams in north-central Newfoundland. |
| 5.4.2 | Water Supply |
Other than the Water Use Licences described in Section 4.7, there is currently no developed water supply or water right attached to the Queensway Project. However, when the need arises, NFG can apply for permission to draw water from the several bodies of water within, or adjacent to, the Company’s mineral claims (Figure 5.2).
The towns of Appleton, within the Queensway North claims area, and Glenwood, just to the west, have municipal water and sewer systems.
| 6 | History |
| 6.1 | Introduction |
The objective of this section is to discuss historical mineral occurrences and historical exploration work that was conducted on the Queensway Property by mineral exploration companies other than NFG. In instances when the discussion relates to areas, or mineral licences/claims, that occur outside of the current Queensway Property Mineral licences, the reader should know that the QP has been unable to verify information pertaining to the geology and mineralization on these areas, and therefore, the information is not necessarily indicative to geology and the mineralization at the Queensway Gold Property that is the subject of this technical report. This disclaimer is applicable to sub-sections 6.1 and 6.2 where the QP has included ‘within-property’, or ‘off-property’, notices to alert the reader as to the general location that the historical work was completed.
| 24 January 2023 | | 37 |
January 2023 Exploration Update: New Found Gold Corp.’s Queensway Gold Project, NL
Small-scale mining efforts began in the late 1700s in Newfoundland with the first mining developments in the mid-1800s on the northeast and east coasts of the Island. A major iron ore mining operation began in the late 1800s, on Bell Island in Conception Bay near St. John’s. When it closed in 1969, Bell Island was the longest continually operating mine in Canada and had, for decades, served as one of the world’s major suppliers of iron ore. Large copper deposits with high traces of gold were discovered at Tilt Cove in 1857, and between 1864 and1917, on the Baie Verte peninsula northwest of Botwood and Lewisporte (Figures 2.1 and 6.1). The Tilt Cove mine represented one of the world's largest producers of copper.
The historical major mine developments at the Tilt Cove and Bell Island mines – and their associated infrastructure and access – prompted additional exploration work in northeast Newfoundland. In the areas north and south of Gander Lake, and proximal to the Queensway Property, the historical focus was largely on base metal deposit types that might be associated with the rocks of the Gander River Ultramafic Complex. Individual prospectors were historically able to locate gold in surface samples in northeast Newfoundland, but it was not until the early 1980s that government mapping identified a gold prospect at the Jonathan’s Pond prospect, which is located about 10 km north of the Town of Gander, NL and 3.3 km and 5.1 km northeast of NFG’s Little Rocky Brook and Queensway North blocks (Blackwood, 1982; Figure 6.1).
Since the discovery of the gold prospect at Jonathan’s Pond in the early 1980s, numerous historical mineral prospects, including gold, base metals, and sulphide (pyrite and arsenic) have been discovered in the general Queensway Property area (Figure 6.1). Specific within-property gold prospects in the Queensway South and Queensway North blocks include:
| • | QWS historical gold prospects: Aztec, Goose, Greenwood Pond #1 to Greenwood Pond #7, A-Zone Extension, LBNL, Hornet, Road Gabbro, and North Paul's Pond (14 gold prospects). |
| • | QWN historical gold prospects: Cokes 2, Hornet, Zone 26, 538 Zone, Little, Bowater, Lotto Zone, Lake Side No 1, Glass, Grouse, Letha, Golden Joint, Pocket Pond, Grid 69 Gold, Power Line, Baseline Showing, Keats, Road Showing, Lachlan, The Knob, Cokes 1, Bullet, Dome, Logan, and H Pond (25 historical gold prospects). |
The historical exploration generally occurred along and adjacent to the two linear mineralized trends that are orientated in an SSW - NNE direction: the Appleton Fault Zone (AFZ) and the Joe Batt’s Pond Fault Zone (JBPFZ). As shown in Figure 6.1, the fault zones run approximately parallel to one another, about 5 km apart.
| 24 January 2023 | | 38 |
January 2023 Exploration Update: New Found Gold Corp.’s Queensway Gold Project, NL
Figure 6.1 Historical mineral prospects in the Queensway Property area. The inset figures document those prospects that occur within the boundary of the property (by name).

| 24 January 2023 | | 39 |
January 2023 Exploration Update: New Found Gold Corp.’s Queensway Gold Project, NL
| 6.2 | Historical Exploration by Companies Other Than New Found Gold Corp. |
Srivastava (2022) compiled a detailed list of all historical exploration work that took place in the vicinity of the Queensway Property by companies other than NFG. The exploration work was from annual assessment reports that are filed with, and maintained by, the Government of Newfoundland and Labrador.
In this technical report, the QP includes a select summary of those historical exploration work programs that include gold-specific historical gold assays and/or gold-related information (Table 6.1). The compilation includes exploration locations that don’t match with the historical mineral prospects presented in Section 6.1. In addition, the compilation includes historical exploration work that occurs 1) within-property, 2) off-property, and/or 3) may include work that occurred on licences that overlap with the current NFG land position. Hence, and to further assist the reader on deciphering within-property and off-property exploration results, the QP presents the general spatial location of the exploration work programs in Figure 6.2.
Several historical assessment reports filed with the provincial government have historically referred to the Queensway Property area as:
| • | The Linear Property, a reference to the long linear trend formed by many showings and prospects along both the Appleton and Joe Batt’s Pond fault zones. |
| • | The Gander Gold Property, a reference to Gander Lake and Gander River (including its extensions, NW Gander River and SW Gander River, on the south side of Gander Lake) along which much of the early exploration work was done. |
Following the many ownership changes summarized in Table 6.1, and starting in 2016, Palisade Resources Corp (later renamed to New Found Gold Corp.) began to consolidate the large land package that now forms the Queensway Project, through map-staking unclaimed land and negotiating option agreements with others who held mineral licences. New Found Gold Corp disclosed the assembled land package when the Company announced its Initial Public Offering on the TSX Venture Exchange in 2020.
A summary of the historical prospecting, geological mapping, surface rock sampling, geophysical surveys, trenching, and drilling is presented in the text that follows.
| 6.2.1 | Prospecting, Geological Mapping, and Geochemical Surveying |
The earliest prospecting in the area, from the 1950s through to the 1970s, was focused predominantly on identifying base metal prospects including 1) talc, copper, zinc, tungsten, arsenopyrite, and asbestos showings were discovered along Dead Wolf Creek, and around Caribou Lake and Hunt’s Pond, 2) chromite, magnesite, and asbestos were discovered in the Gander River Ultramafic Complex north of Gander Lake, and 3) a pyrite-chalcopyrite-sphalerite showing was identified north of Jonathan’s Pond near the Town of Gander.
| 24 January 2023 | | 40 |
January 2023 Exploration Update: New Found Gold Corp.’s Queensway Gold Project, NL
Table 6.1 Summary of select historical exploration work conducted by companies other than NFG. The compilation is limited to work that includes notable gold assays and results. Within Property work is highlighted in red text on the accompanying Figure 6.2.

| 24 January 2023 | | 41 |
January 2023 Exploration Update: New Found Gold Corp.’s Queensway Gold Project, NL
Figure 6.2 Location of historical exploration programs conducted by companies other than NFG. The location names accompany the names used by various companies and prospectors listed in Table 6.1. Within Property exploration work is highlighted in red text.
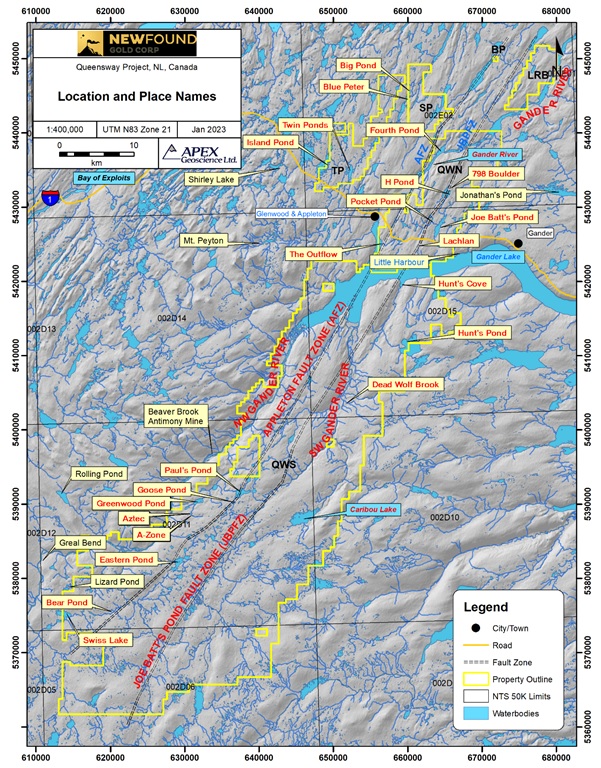
| 24 January 2023 | | 42 |
January 2023 Exploration Update: New Found Gold Corp.’s Queensway Gold Project, NL
In 1980, Frank Blackwood of the Newfoundland Geological Survey identified a gold-arsenopyrite showing near Jonathan’s Pond (Blackwood, 1982). This discovery launched decades of prospecting activity for gold that continues to this day. The association of arsenopyrite with gold yielded a promising prospecting tool, and subsequently, the identification of arsenopyrite in outcrop and float boulders along the Appleton and Joe Batt’s Pond Fault Zones led to new gold prospect discoveries and created target areas for further investigations with trenches and drillholes.
Historical geological mapping identified potential target areas through 1) identification of ice flow directions in relation to mineralized float boulder discoveries, 2) surface traces and 3D orientations of faults and veins that often host strong gold mineralization, and 3) to establish the relative timing of different geological events, leading to a better understanding of where gold prospects might be located.
Elevated gold in the till, soil, stream sediment sample medias, and float, outcrop, and trench channel rock samples can be indicative of gold at depth in proximal, and distal, locations depending on the depth to, and the natural weathering of, the underlying bedrock.
In addition, follow-up exploration work such as the work completed by the Paragon-Rubicon joint venture along the Appleton Fault Zone in 2007-2008 included relogging of historical drill core that had been drilled by previous companies in the area that they had optioned. This created a consistent data base of descriptive logging information that assisted the targeting of new drillholes by improving the joint venture’s ability to interpret geological information and gold assays between drillholes from different companies.
With respect to geochemical survey analytical results, a summary of historical till gold assay analytical results is presented in Figure 6.3 and includes a total of 1,066 till assays within the boundaries of the Queensway Property. Anomalous within-property till gold assays by NFG Queensway block area include:
| • | Queensway South block: 736 till samples yield between 0.0002 and 42.0300 ppm Au with approximately 21 anomalous samples – as defined by samples with >0.5 ppm Au documented in the vicinity of the LBNL, Greenwood Pond #2, and Dead Wolf Brook Junction No 1 mineral prospects. |
| • | Queensway North block: 202 till samples yield between 0.0005 and 23.0000 ppm Au with approximately 20 anomalous samples – as defined by samples with >0.5 ppm Au documented in the vicinity of the Glass and Grid 69 Gold mineral prospects. |
| • | South Pond block: 109 till samples yield between 0.0025 and 8.1530 ppm Au with approximately 10 anomalous samples – as defined by samples with >0.5 ppm Au documented in the vicinity of the Blue Peter area. |
| 24 January 2023 | | 43 |
January 2023 Exploration Update: New Found Gold Corp.’s Queensway Gold Project, NL
| • | Twin Ponds block: 3 till samples yield between 0.0050 and 7.7960 ppm Au with 1 anomalous sample – as defined by samples with >0.5 ppm Au documented in the vicinity of the Twin Ponds area. |
| • | Bellman’s Pond block: 2 till samples yield between 0.0180 and 0.1120 ppm Au with no anomalous sample – as defined by samples with >0.5 ppm Au. |
A summary of historical soil gold assay analytical results is presented in Figure 6.4 and includes a total of 13,409 soil assays within the boundaries of the Queensway Property. Anomalous within-property soil gold assays by NFG Queensway block area include:
| • | Queensway South block: 1,902 soil samples yield between 0.00005 and 2.19 ppm Au with 3 anomalous samples – as defined by samples with >0.5 ppm Au documented in the vicinity of the North Paul’s Pond and Greenwood Pond #1 mineral prospects. |
| • | Queensway North block: 10,354 soil samples yield between 0.0005 and 3.84 ppm Au with approximately 11 anomalous samples – as defined by samples with >0.5 ppm Au documented in the vicinity of the Glass, Little, Letha, and Lachlan mineral prospects. |
| • | Twin Ponds block: 1,028 soil samples yield between 0.00025 and 0.1 ppm Au with no anomalous samples – as defined by samples with >0.5 ppm Au. |
| • | South Pond block: 123 soil samples yield between 0.005 and 0.161 ppm Au with no anomalous samples – as defined by samples with >0.5 ppm Au. |
| • | South Pond block: 2 soil samples yield between 0.0025 and 0.015 ppm Au with no anomalous samples – as defined by samples with >0.5 ppm Au. |
A summary of historical stream and lake sediment gold assay analytical results is presented in Figure 6.5 and includes a total of 554 stream and 73 lake assays within the boundaries of the Queensway Property. Anomalous within-property stream and lake gold assays by NFG Queensway block area include:
| • | Queensway South block: 518 stream and 16 lake samples yield between 0.00025 and 1.897 ppm Au with approximately 13 anomalous samples – as defined by samples with >0.05 ppm Au documented in the vicinity of the Greenwood Pond #1 and North Paul's Pond mineral prospects. |
| • | Queensway North block: 34 stream samples yield between 0.0017 and 1.02 ppm Au with approximately 3 anomalous samples – as defined by samples with >0.05 ppm Au documented in the vicinity of the Grid 69 Gold mineral prospects. |
| 24 January 2023 | | 44 |
January 2023 Exploration Update: New Found Gold Corp.’s Queensway Gold Project, NL
| • | Ten Mile-Duder Lake block: 2 steam samples yield between 0.00025 and 0.0017 ppm Au. |
| • | South Pond block: 9 lake samples yield between 0.0011 and 0.0423 ppm Au. |
| • | Twin Ponds block: 48 lake samples yield between 0.0001 and 0.0056 ppm Au. |
A summary of historical rock gold assay analytical results is presented in Figure 6.6 and includes a total of 3,304 rock assays within the boundaries of the Queensway Property. Anomalous within-property rock gold assays by NFG Queensway block area include:
| • | Queensway South block: 1,071 rock samples yield between 0.00025 and 46.19 ppm Au with approximately 61 anomalous samples – as defined by samples with >1 ppm Au documented in the vicinity of the Greenwood Pond #7, LBNL, and Dead Wolf Brook Junction No 1 mineral prospects. |
| • | Queensway North block: 1,997 rock samples yield between 0.00025 and 798.874 ppm Au with approximately 293 anomalous samples – as defined by samples with >1 ppm Au documented in the vicinity of the Knob, Lachlan, Lake Side No 1, Glass, Pocket Pond, and Lotto Zone mineral prospects. |
| • | Twin Ponds block: 103 rock samples yield between 0.0025 and 2.171 ppm Au with approximately 8 anomalous samples – as defined by samples with >1 ppm Au. |
| • | Ten Mile-Duder Lake block: 70 rock samples yield between 0.00025 and 1.2063 ppm Au with 1 anomalous sample – as defined by samples with >1 ppm Au. |
| • | Little Rocky Brook block: 42 rock samples yield between 0.005 and 7.996 ppm Au with 1 anomalous sample – as defined by samples with >1 ppm Au. |
| • | South Pond block: 18 samples yield between 0.0025 and 0.062 ppm Au with no anomalous sample – as defined by samples with >1 ppm Au. |
| • | Bellman’s Pond block: samples yield between 0.0025 and 0.191 ppm Au with no anomalous sample – as defined by samples with >1 ppm Au. |
| 6.2.2 | Geophysical Surveys |
Historical airborne and ground geophysical surveys have been implemented to identify anomalous drill targets and to improve the understanding of regional structures like the Appleton and Joe Batt’s Pond Fault Zones, and smaller offshoot faults that might form pathways for the mobilization and accumulation of mineralized fluids.
| 24 January 2023 | | 45 |
January 2023 Exploration Update: New Found Gold Corp.’s Queensway Gold Project, NL
Figure 6.3 Historical till gold assay analytical results. Block abbreviations: QWS – Queensway South; QWN – Queensway North; TP – Twins Pond; TMDL – Ten Mile-Duder Lake; LRB – Little Rocky Brook; SP – South Pond; BP – Bellman’s Pond.

| 24 January 2023 | | 46 |
January 2023 Exploration Update: New Found Gold Corp.’s Queensway Gold Project, NL
Figure 6.4 Historical soil gold assay analytical results. Block abbreviations: QWS – Queensway South; QWN – Queensway North; TP – Twins Pond; TMDL – Ten Mile-Duder Lake; LRB – Little Rocky Brook; SP – South Pond; BP – Bellman’s Pond. Bedrock geology legend is in Figure 6.3.

| 24 January 2023 | | 47 |
January 2023 Exploration Update: New Found Gold Corp.’s Queensway Gold Project, NL
Figure 6.5 Historical stream and lake sediment gold assay analytical results. Block abbreviations: QWS – Queensway South; QWN – Queensway North; TP – Twins Pond; TMDL – Ten Mile-Duder Lake; LRB – Little Rocky Brook; SP – South Pond; BP – Bellman’s Pond. Bedrock geology legend is in Figure 6.3.
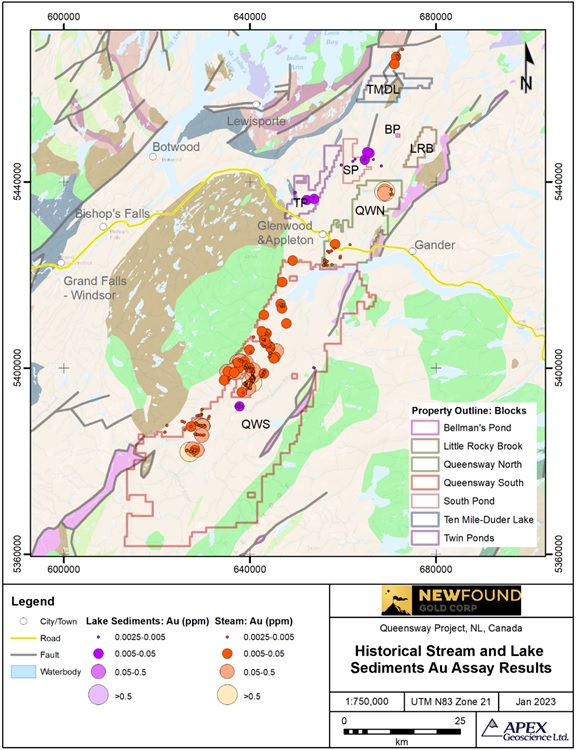
| 24 January 2023 | | 48 |
January 2023 Exploration Update: New Found Gold Corp.’s Queensway Gold Project, NL
Figure 6.6 Historical rock gold assay analytical results. Block abbreviations: QWS – Queensway South; QWN – Queensway North; TP – Twins Pond; TMDL – Ten Mile-Duder Lake; LRB – Little Rocky Brook; SP – South Pond; BP – Bellman’s Pond. Bedrock geology legend is in Figure 6.3.

| 24 January 2023 | | 49 |
January 2023 Exploration Update: New Found Gold Corp.’s Queensway Gold Project, NL
| 6.2.2.1 | Airborne Geophysics |
Late 1970s assessment reports record airborne geophysical surveys that were used to explore for base metals associated with the Gander River Ultramafic Complex. Two airborne known gold exploration surveys were completed prior to the consolidation of the Queensway land package,
| • | In 2003, Fugro conducted a magnetic survey and a separate electromagnetic survey on behalf of Rubicon Minerals over the northern end of the Joe Batt’s Pond Fault Zone to the Twin Ponds area. |
| • | In 2012, Goldak, on behalf of Northern Skye Resources, flew a magnetic survey over both the Appleton Fault Zone and the Joe Batt’s Pond Fault Zone. |
Both surveys identified SSW-NNE to SW-NE linear structures consistent with the broad regional topographic fabric and the orientation of the major fault zones. With high sensitivity magnetometers, the Goldak survey was able to resolve short, narrow linear features that did not follow the dominant regional structural trend. These were interpreted as being either dikes, or as fault crosses; the ability to resolve these types of local structural details improved local geological mapping and assisted with the selection of drill targets.
| 6.2.2.2 | Ground Geophysics |
Historical ground-based geophysical surveys in the Queensway area include very-low frequency electro-magnetic (VLF-EM) surveys and Induced Polarization (IP) surveys. The surveys confirmed the overall structural trends and identified conductive units that are likely graphitic. The mineralized quartz veins, especially when altered by the mineral sericite, have low resistivity. The ability to image these veins with their 3D orientations improves drill targeting.
In some instances, IP surveys helped to elucidate the presence or absence of a continuous zone of mineralization between closely spaced showings (like Aztec and the A-Zone in Queensway South), which improved the ability to interpret them as one continuous zone, with a drilling gap, or two separate zones. IP surveys have also been used to resolve local details in areas where satellite imagery shows complex structure that cannot be well resolved from the satellite images alone.
| 6.2.3 | Trenching |
In areas with prospective mineralized showings at surface, several companies have used heavy equipment to excavate trenches that allow them to test the mineralization to a greater depth, either taking channel samples along the walls of the trench or collecting material from the trench for a small bulk sample. The larger volume and deeper reach of a trench enhances the reliability of information that can be gathered from surface samples alone; they also improve the interpretations that can be made regarding source rocks for till anomalies and orientations of mineralized veins.
| 24 January 2023 | | 50 |
January 2023 Exploration Update: New Found Gold Corp.’s Queensway Gold Project, NL
A summary of historical channel gold assay analytical results is presented in Figure 6.7 and includes a total of 1,198 channel assays within the boundaries of the Queensway Property. Anomalous within-property channel gold assays by NFG Queensway block area include:
| • | Queensway South block: 328 channel samples that contain between 0.0025 and 4.06 ppm Au with approximately 23 anomalous samples – as defined by samples with >1 ppm Au documented in the vicinity of the Goose and Greenwood Pond #5 mineral prospects. |
| • | Queensway North block: 870 channel samples that contain between 0.0025 and 631.34 ppm Au with approximately 224 anomalous samples – as defined by samples with >1 ppm Au documented in the vicinity of the Knob, Cokes 2, Bowater, Dome, and Pocket Pond mineral prospects. |
| 6.2.4 | Drilling |
Table 6.3 summarizes the historical drilling that was conducted by 14 companies that drilled within the Queensway Property prior to NFG. The historical drilling was conducted as diamond drillholes, with core sizes range from narrow diameter BQ core, with a core diameter of 36 mm, to wider HQ core, with a core diameter of 64 mm.
A summary of the historical within Property drilling is presented in Figure 6.8 and Table 6.3 and includes a total of 246 drillholes (totalling 29,593 m). Of these,
| • | 191 of the 246 drillholes (78%) are in the Queensway North block, including all drillholes from the 3 most historically active companies that drill-tested within the Queensway Property: Rubicon Minerals Corp, United Carina Resources, and Paragon Minerals Corp. The 191 historical drillholes are in the vicinity of the Grid 69 Gold, Dome, Bowater, Letha, Keats, H Pond, and Pocket Pond mineral prospects. |
| • | 55 of the 246 drillholes (22%) within the Queensway Property were drilled in the Queensway South block in the vicinity of Aztec, Goose, North Paul’s Pond, and Dead Wolf Brook Junction No 1 mineral prospects. |
| 24 January 2023 | | 51 |
January 2023 Exploration Update: New Found Gold Corp.’s Queensway Gold Project, NL
Figure 6.7 Historical trench channel sample gold assay analytical results. Block abbreviations: QWS – Queensway South; QWN – Queensway North; TP – Twins Pond; TMDL – Ten Mile-Duder Lake; LRB – Little Rocky Brook; SP – South Pond; BP – Bellman’s Pond. Bedrock geology legend is in Figure 6.3.

| 24 January 2023 | | 52 |
January 2023 Exploration Update: New Found Gold Corp.’s Queensway Gold Project, NL
Table 6.2 Summary of historical drilling at Queensway.

| 6.2.5 | Conclusions and Quality of Historical Data |
The historical exploration campaigns in the Queensway Property area provide ample indications of gold mineralization, with gold grades above 100 ppm in mineralized boulders, till samples, and drillhole intercepts. For example, within the boundaries of the Queensway Property,
| • | Queensway South block: Contains anomalous till, soil, lake and stream and lake sediment, rock, and drill core samples in the Greenwood, Goose, LBNL, Dead Wolf Brook Junction No 1, and North Paul’s Pond prospect areas. |
| • | Queensway North block: Contains anomalous till, soil, lake and stream and lake sediment, rock, and drill core samples in the Lotto Zone, Dome, Glass, Pocket Pond, Lachlan, Lake Side No 1, The Knob, Bowater, Little, Letha, and Grid 69 Gold prospect areas. |
| • | Other blocks: Contain anomalous till, soil, lake and stream and lake sediment, rock, and drill core samples in the Blue Peter, Twin Ponds, and Gander River areas. |
| 24 January 2023 | | 53 |
January 2023 Exploration Update: New Found Gold Corp.’s Queensway Gold Project, NL
Figure 6.8 Historical drillhole gold assay analytical results. Block abbreviations: QWS – Queensway South; QWN – Queensway North; TP – Twins Pond; TMDL – Ten Mile-Duder Lake; LRB – Little Rocky Brook; SP – South Pond; BP – Bellman’s Pond. Bedrock geology legend is in Figure 6.3.

| 24 January 2023 | | 54 |
January 2023 Exploration Update: New Found Gold Corp.’s Queensway Gold Project, NL
There are uncertainties on the locations of the historical drillholes, their downhole trajectories, and their gold assay values. Uncertainties on drillhole collars arise from several factors, including:
| • | The changing precision of different surveying methodologies, from the theodolites that were used in the 1950s to handheld GPS equipment that became popular in the 1990s to modern high-precision differential GPS systems in use today. |
| • | Changing horizontal map coordinate systems, from latitude-and-longitude to the imperial system to the metric UTM system. |
| • | Changing vertical datums, from the North American datum of 1927 to the North American datum of 1983, to the Canadian Geodetic Vertical Datum of 2013. |
In 2020, NFG conducted a program of verifying historical collar locations using modern drilling survey methods. Of 125 drillholes that were checked, 60 were not located in the field. Of the remaining 65, 43 had significant discrepancies between the modern survey and the collar locations reported in historical records.
Uncertainties also exist in surveys of down-hole trajectory which, historically, have usually had their azimuths recorded relative to magnetic north and then corrected to true north using the average magnetic declination for the Queensway area. Currently the magnetic declination in the Gander area is approximately 18°W; when NALCO drilled in the mid-1950s, it was approximately 30°W. Although down-hole surveying could be done well at any time in the past 70 years, some of the historical records indicate that certain projects assumed that the magnetic declination had not changed from older studies when, in fact, it drifts by about 1° every five years.
The uncertainties on assay information arise largely from the lack of information on the methods used for sample selection and preparation, on the analytical methods and on the quality assurance and quality control (QA-QC) procedures. Little information on this exists prior to 2000, when about one third of the historical holes were drilled. For the post-2000 drilling, most of the assays were done at Eastern Analytical Laboratory in Springdale, NL, using the fire assay method. Modern data base management procedures appear to have been in place; although records indicate that the QA-QC programs included standards, blanks, and duplicates, none of the data is available to allow a Qualified Person to form an opinion about the reliability of the assay data.
It is the opinion of the QP that data from historical drilling can be useful for assisting with the selection of future drill targets. The data from holes that were well located, and contain QA-QC information, may be useful in potential future resource estimations. Those drillholes that have not been validated should not be considered, until properly validated, in future exploration and resource estimation work.
| 24 January 2023 | | 55 |
January 2023 Exploration Update: New Found Gold Corp.’s Queensway Gold Project, NL
| 6.3 | Historical Mineral Resource and Mineral Reserve Estimates at the Queensway Property |
In 1994, Gander River Minerals optioned the Knob property, including the Knob prospect in the southwestern portion of Queensway North block, from Noranda Exploration. Subsequent drilling by Gander River Minerals enabled a historical mineral resource estimate that was included in a 1994 assessment report filed by Gander River Minerals (Geofile Report 002D_0296; Sheppard, 1994).
The historical mineral resource estimate is referenced here for the readers benefit only. The Sheppard (1994) mineral resource is not compliant with current CIM definition standards and best practice guidelines (2014, 2019). The QP has not been able to verify the historical resource estimate, and therefore the QP, and NFG, do not regard the historical estimate as a current mineral resource estimate.
| 7 | Geological Setting and Mineralization |
Some of the geological information summarized in this section was originally composed by Srivastava (2022). The QP has reviewed the regional geology, local geology, property geology, and mineralization sub-sections and found the information reasonable and reflective of the geological setting and mineralization of NFG’s Queensway Property. New information presented by the QP is cited within the text with complete references provided in Section 27.
| 7.1 | Regional Geology |
The island of Newfoundland lies at the northeastern extension of the Appalachian Mountain Range (or Appalachians) that stretches along the east coast of Canada and the continental United States (Figure 7.1). Newfoundland’s complex geological history is the culmination of multiple episodes of arc formation, sediment deposition and accretion during the Early-Mid Paleozoic (van Staal et al., 2021). Nearly one billion years ago (1,000 Ma), North America was the central land mass of the supercontinent Rodinia, being flanked on all side by smaller cratons (Evans, 2021). Diachronous rifting and break-up of Rodinia over 200 million years (~ 800-600Ma) resulted in the birth of the Iapetus Ocean and subsequent separation of Laurentia, Gondwana, and Baltica continents (Evans, 2021). By the early Paleozoic, paleogeographic reconstructions of these continental landmasses place Gondwana at high southern latitudes, Baltica at mid-latitudes, and Laurentia along the equator (Figure 7.2; Pollock et al., 2012).
Central Newfoundland, which includes the Queensway Property area, is characterized by a Late Cambrian to Mid-Silurian sedimentary succession that transitions from marine to terrestrial siliciclastic units (Pollock et al., 2007; van Staal and Barr, 2012). Furthermore, Central Newfoundland contains the main Iapetus suture (the Red Indian Line; Williams et al., 1988, van Staal et al., 1998, Pollock et al., 2007) that separates Laurentia and associated peri-Laurentian terranes to the west, from the peri-Gondwanan terranes to the east.
| 24 January 2023 | | 56 |
January 2023 Exploration Update: New Found Gold Corp.’s Queensway Gold Project, NL
Figure 7.1 Physical relief along the eastern coast of North America (from Srivastava, 2022).
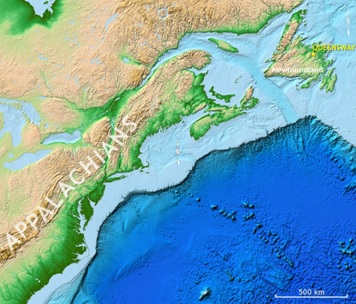
Figure 7.2 Cambrian to Carboniferous paleoreconstruction of continental dispersion, migration, and amalgamation (modified from Pollock et al., 2012)

| 24 January 2023 | | 57 |
January 2023 Exploration Update: New Found Gold Corp.’s Queensway Gold Project, NL
The Red Indian Line and additional suture zones across Newfoundland mark the terrane boundaries of four major tectonostratigraphic zones and can be traced throughout the Appalachians and British Caledonides (Figure 7.3, van Staal et al., 1998).
The four major tectonostratigraphic zones from west to east are (Figure 7.4; Williams, 1979):
| 1. | The Humber Zone: Late Neoproterozoic – early Ordovician Laurentian passive margin (Pollock et al., 2007; Henderson et al., 2018) |
| 2. | The Dunnage Zone: Iapetan ocean sedimentary sequences divided into two subzones (Williams et al., 1988), the peri-Laurentian Notre Dame subzone, and the peri-Gondwanan Exploits subzone which hosts the Queensway stratigraphy. |
The sedimentary succession of the Notre Dame subzone was deposited on the Iapetus floor of the Laurentian passive margin, whereas the Exploits subzone stratigraphy was deposited on the Ganderian passive margin of the Tetagouche-Exploits backarc basin (van Staal et al., 1998).
The Popelogan-Victoria arc separated the depositional environments of both subzones, and resulted in the formation of the Red Indian Line once accreted onto Laurentia in the Late Ordovician (van Staal et al., 1998, Pollock et al., 2012, van Staal et al., 2021)
| 3. | The Gander Zone: passive margin of the peri-Gondwanan microcontinent Ganderia recording distinct Cambrian to Lower Ordovician clastic sedimentation (van Staal et al., 1998; Pollock et al., 2012). |
| 4. | The Avalon Zone: peri-Gondwanan microcontinent comprised of a Lower Paleozoic platformal cover sequence overlying a Precambrian basement (Pollock et al., 2012). |
The Iapetus Ocean was host to numerous volcanic arcs, drifting terranes and accretionary mountain building events that culminated in the formation of the Appalachian Mountain Range. The rift and drift of both the Ganderian and Avalonian micro-continents from Gondwana resulted in the creation and expansion of the Rheic Ocean (Pollock et al., 2012).
By the Carboniferous (300Ma), the Iapetus and Rheic Oceans had both closed following the amalgamation of Laurentia and Gondwana, creating the super continent Pangaea (Pollock et a., 2012, van Staal et al., 2021).
| 24 January 2023 | | 58 |
January 2023 Exploration Update: New Found Gold Corp.’s Queensway Gold Project, NL
Figure 7.3 Correlation of major suture zones across the Atlantic (from Pollock et al., 2007). Abbreviations of suture zones in the vicinity of the Queensway Property include: BBL – Baie Verte-Brompton Line; RIL – Red Indian Line; DBL – Dog Bay Line; GRUB – Gander River Ultramafic Belt; DHF – Dover-Hermitage Fault.
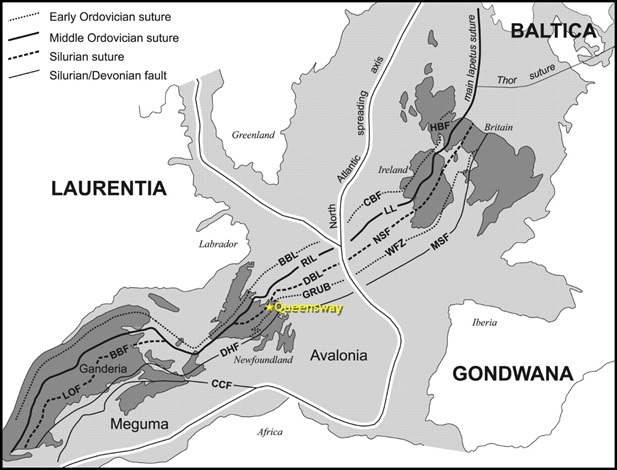
| 24 January 2023 | | 59 |
January 2023 Exploration Update: New Found Gold Corp.’s Queensway Gold Project, NL
Figure 7.4 Newfoundland’s Bedrock geology and major tectonic zones (from Williams, 2004).

| 24 January 2023 | | 60 |
January 2023 Exploration Update: New Found Gold Corp.’s Queensway Gold Project, NL
The following timeline summarizes the major events of Ganderia’s history that resulted in the deposition of much of the Queensway stratigraphy prior to the closure of the Iapetus Ocean (van Staal et al., 2021 and references therein).
| 1. | Formation of the Penobscot Arc and resultant backarc basin outboard of the edge of Ganderia (515-485 Ma). |
| 2. | Closure of Penobscot backarc by 478Ma during the Penobscottian Orogeny. Although poorly understood, the “soft” collision and obduction of the Gander River Ultramafic Complex (GRUC; van Staal et al., 1998) onto the Gander margin may have been related to shallowing of the subducting Iapetan slab between 485-480 Ma. |
| 3. | Creation of Popelogan-Victoria arc over Penobscot arc-backarc system between 478-474Ma. Arc migration likely due to progressive steepening of the Iapetan slab. |
| 4. | Rifting of the Popelogan Victoria arc by 472-470Ma due to slab roll-back. |
| 5. | Formation of the Tetagouche-Exploits backarc basin. |
| 6. | Deposition of Queensway stratigraphy (Davidsville Group). |
| 7. | Accretion of Popelogan-Victoria Arc onto Laurentia between 455-450 Ma during the Taconic Orogeny. |
| 8. | Tetagouche-Exploits basin closure and accretion of Ganderia onto Laurentia during the Salinic Orogeny (Pollock et al., 2012) was caused by either a subduction polarity reversal or a step-back into the backarc basin. |
| 7.2 | Property Geology |
| 7.2.1 | Local Geology |
The Queensway Property occurs within the Exploits Subzone of the Dunnage Zone (Figure 7.5). Geologically, the Property is generally bounded:
| • | To the east by the Gander River Ultramafic Complex (GRUC; renamed from the former Gander River Ultramafic Belt or GRUB), which defines the tectono-boundary between the Dunnage Zone and the Gander Zone (Figure 7.4, Pollock et al., 2007). The stratigraphic base of the Gander River Ultramafic Complex defines this terrane boundary. |
| • | To the west by the Dog Bay Line, which is situated within the Exploits Subzone of the Dunnage Zone and separates Ordovician to early Silurian stratigraphy that was deposited on either side of the Tetagouche-Exploits Basin (Badger and Botwood Groups to the west with the Indian Islands and Davidsville Groups to the east, Pollock et al., 2007). The Dog Bay Line is the suture formed upon the closure of this backarc basin (Valverde-Vaquero et al., 2006), and can be traced through Ireland and the United Kingdom in the British Caledonides (Figure 7.3, Pollock et al., 2007). |
| 24 January 2023 | | 61 |
January 2023 Exploration Update: New Found Gold Corp.’s Queensway Gold Project, NL
The Queensway stratigraphy is largely dominated by the Tremadocian-Silurian marine siliciclastic succession of the Davidsville Group that unconformably overlies the Gander Group and, when preserved, the GRUC (Williams and Piasecki, 1990; Currie, 1995b). Ophiolite obduction and associated deformation during the Penobscot Orogeny terminated the deposition of the Gander Group resulting in its deformation prior to the deposition of the Davidsville Group (Arnott et al., 1985, van Staal et al., 2021).
The Gander River Ultramafic Complex comprises pyroxenite, serpentinite, gabbro, mafic volcanic rocks, trondhjemite and plagioclase porphyry assembled in an intricate zone of fault slivers (Currie, 1995).
Accumulation of the interbedded siltstones, sandstones and turbiditic conglomerates of the Davidsville Group occurred on the continental slope/rise (Currie, 1995b) along the passive Ganderian margin of the Tetagouche-Exploits backarc basin (Pollock et al., 2007). Although part of a backarc basin, the Davidsville Group stratigraphy contains no volcanic components, nor distal associations (Currie, 1995b).
The Davidsville Group is further divided into the Weir’s Pond, Outflow, and Hunts Cove Formations younging upwards from approximately the Arenig (~478Ma) through to the Llandovery (~444Ma) (Currie, 1995b). The exact age of the Davidsville Group is not known due to its unfossiliferous nature; however, it is confined to the underlying and overlying units of known age (GRUC and Indian Islands Group respectively; Currie, 1995b).
Additional studies have different stacking of the three formations of the Davidsville, where the Outflow overlies the Hunts Cove Formation (Pollock et al., 2007), however the stacking used here is that which is reflected around the current drilling in Queensway North, namely on the east side of the Outflow of Gander Lake (Currie, 1995b).
The Weir’s Pond Formation contains two distinct units, a predominantly calcareous sedimentary succession with occasional limestone (O’Neill and Blackwood, 1989), and a turbiditic conglomerate that is sometimes referred to as a separate unit called the Barry’s Pond Formation (Currie, 1995b).
| 24 January 2023 | | 62 |
January 2023 Exploration Update: New Found Gold Corp.’s Queensway Gold Project, NL
Figure 7.5 Bedrock geology of the Queensway Area (modified from Colman-Sadd et al., 1990).

| 24 January 2023 | | 63 |
January 2023 Exploration Update: New Found Gold Corp.’s Queensway Gold Project, NL
The Outflow Formation is characterized by thickly bedded, pebbly conglomerates that grade upwards through sandstones into interbedded siltstones recording a progressive thinning of bedding thickness, and diminishing grain size (Currie, 1995b). The gradational contact between the Outflow Formation and the overlying Hunts Cove formation is marked by the continued thinning of beds and increased ratio of siltstone units (Currie, 1995b). When stratigraphically close to the GRUC, siltstones within the Hunts Cove Formation are pale green with occasional purple siltstone units up to 1m thick (Currie, 1995b).
Conformably overlying the Davidsville Group is the Indian Islands Formation that transitions from Silurian shallow marine shales and carbonates into subaerial red beds (Pollock et al., 2007).
The Mount Peyton Intrusive Suite (Figure 7.5) intrudes the Indian Island Group and shares the boundary with the Davidsville Group.
The entire island of Newfoundland is covered with Laurentide glacial surficial deposits from the last Ice Age (last glacial maximum was 80,000 to 10,000 years ago; McHenry and Dunlop, 2015). The Property is covered by a veneer of glacial till which thickens to the south, reaching 10 m thick in parts of Queensway South block.
| 7.2.2 | Mineralization |
Gold at the Queensway Property typically occurs as coarse grains of free visible gold in quartz-carbonate veins that are brecciated, massive-vuggy, laminated, or that have a closely spaced stockwork texture (Figure 7.7).
Arsenopyrite (AsFeS) is commonly observed to occur in conjunction with gold (Figure 7.8). Boulangerite (Pb5Sb4S11), a lead-antimony sulfosalt, is often associated with chalcopyrite (CuFeS2) in intervals of high-grade gold mineralization, however, it is much less common than arsenopyrite. Fine to coarse-grained disseminated pyrite occurs throughout the mineralized zones (Figure 7.8).
High-grade gold mineralization, above 10 ppm Au, typically occurs in closely spaced quartz veins associated with fault and fracture zones. High-grade gold mineralization has not been observed outside of the main vein arrays.
| 7.2.3 | Alteration |
A visually subtle hydrothermal alteration is present around the gold-bearing veins at the Queensway Property. The alteration is defined by a weak discoloration of the rock adjacent to quartz-carbonate veins, extending 2 to 10 m beyond the veins themselves. At the Keats and Lotto prospects, NFG has used hyperspectral core logging to identify a consistent alteration halo around the mineralized zones.
| 24 January 2023 | | 64 |
January 2023 Exploration Update: New Found Gold Corp.’s Queensway Gold Project, NL
Figure 7.6 Stratigraphic column within the Queensway area (Source: GoldSpot Discoveries Corp.).

Figure 7.7 Typical gold-bearing quartz vein styles observed at Queensway (Source: NFG).

| 24 January 2023 | | 65 |
January 2023 Exploration Update: New Found Gold Corp.’s Queensway Gold Project, NL
Figure 7.8 Images of core from mineralized intervals in drillhole NFGC-19-01 (Source: NFG).

| 24 January 2023 | | 66 |
January 2023 Exploration Update: New Found Gold Corp.’s Queensway Gold Project, NL
A schematic of the mineralogical changes observed in white mica species (Figure 7.9):
| • | From aluminum rich NH4 muscovite near the gold mineralization |
| • | To phengite, a mineral that commonly occurs with hydrothermal alteration, and is more prevalent distally from the mineralized zone. |
NFG continues to investigate methods for quantitative assessment of alteration halos. Because the alteration halo represents a larger target than the veins themselves, the targeting of future drillholes might be improved by utilizing the mineralogy of alteration halos as indicator toward strong gold mineralization.
| 7.2.4 | Structure |
The structural geology at the Queensway Property is dominated by the series of collisions that sutured together rocks from different continental plates into the present-day tectonic configuration of Newfoundland. Hence, compressional events have resulted in thrust faulting, where one package of rocks rides up on top of another, and folding on both sides of the faults as the rocks are squeezed horizontally. An interpretation of the faulting and folding of the major rock units in the northern part of the project area, based on NFG’s structural interpretations from geophysical surveys and surface mapping is presented in Figure 7.10.
Figure 7.9 Schematic illustration of mineralogical changes in white micas identified by hyperspectral imaging of core near strong gold mineralization (from Srivastava, 2022).

| 24 January 2023 | | 67 |
January 2023 Exploration Update: New Found Gold Corp.’s Queensway Gold Project, NL
Figure 7.10 Interpretation of structure and lithology on a north-facing cross-section through Queensway North block (Source: NFG).

| 24 January 2023 | | 68 |
January 2023 Exploration Update: New Found Gold Corp.’s Queensway Gold Project, NL
Structural field measurements indicate NW-SE compression consistent with the overall NE-striking regional geology trend and major suture zones (Figure 7.4). Subordinate to 1st order Dog Bay Line and GRUB Line faults is the NE-striking, regional-scale Appleton Fault Zone (AFZ), a thrust fault that runs the full strike length of the Queensway Project. Trending in a similar orientation and transecting the eastern portion of the project area is the Joe Batt’s Pond Fault Zone (JBPFZ), a deformation corridor consisting of a network of faults that irregularly branch out and reconnect.
The AFZ and the JBPFZ are associated with the main gold prospects discovered to date at the Property. These fault zones may represent crustal-scale, primary conduits that transported gold-bearing fluids from deep orogenic sources upward to the upper crust.
| 7.2.5 | Integrated Geological Interpretations |
As commissioned by, and on behalf of, NFG, GoldSpot Discoveries Corp. (GoldSpot) has integrated the information from numerous sources discussed in Section 9, including prospecting, surface sampling, trenching, geophysics, satellite imagery, digital elevation, surface reconnaissance, multielement chemistry, to create interpretations of structural geology (the faulting and folding) and of lithology (the major rock units).
Highlights from GoldSpot’s regional structural geology interpretation, which was initially constructed in 2017 and updated in 2018 and again in early 2022, are presented in Figure 7.11. The interpretation was based on the electromagnetic (EM) and magnetic surveys derived from a 2021 helicopter-borne time domain electromagnetic system (HELITEM) survey in previous in conjunction with previous interpretations. The structural work has established the regional geological and structural framework for the Queensway project. The EM survey helped to define the stratigraphy especially graphitic sediments that stand out due to their high conductivity. Importantly, regional-scale structures such as the AFZ that are spatially associated with gold mineralization tend to have developed at domain boundaries between blocks of rock with differing geophysical characteristics.
In addition to this, the magnetic data was used to identify volcanic stratigraphy that occurs largely in the southern Queensway South block but also in the northern portion of the project area defining details within the Gander River Ultramafic Complex but also has delineated the mafic dykes that crosscut the project area as well as gabbroic intrusions which have more recently been discovered in segments of the hanging wall to the AFZ. Subtle changes in the magnetic response in the sedimentary rocks in the northern part of the Property (e.g., a low shift) does correlate to some with the gold discoveries made to date along the AFZ including Keats and Lotto zones. The magnetic data is an effective tool for identifying structure within the volcanic stratigraphy in the southern part of the Property, but overall, the magnetic contrast within the Davidsville sediments is minimal.
GoldSpot also utilized the digital terrain model (DTM) derived from the 2020 HeliFALCON survey to identify structures. When paired with the EM, magnetics, and gravity data, the DTM data has been useful for identifying faults, and an important tool for exploration targeting.
| 24 January 2023 | | 69 |
January 2023 Exploration Update: New Found Gold Corp.’s Queensway Gold Project, NL
Figure 7.11 Interpretation of structural geology over the Queensway Project (from interpretation provided by GoldSpot).

| 24 January 2023 | | 70 |
January 2023 Exploration Update: New Found Gold Corp.’s Queensway Gold Project, NL
In late 2021 and early 2022, NFG undertook an extensive review of all data, including geophysics and previous interpretations from historical mapping, and conducted structural field mapping to produce a unified lineament interpretation and updated geology map of Queensway North (Figure 7.12). The review enabled NFG to prepare a revised interpretation of the deformation history and its relationship to gold mineralization. The improved structural interpretation is currently being used as the foundation for the 3D geological models to delineate advanced exploration targets.
A model for the relative timing of deformation and gold mineralization is evolving and draws from contributions made by both NFG and GoldSpot. The following text describes a more recent account produced by NFG based on observations made from 1) detailed mapping of exposed mineralization within the Knob-Lotto Corridor of the AFZ, 2) from interpretation of structural elements in drill core from this same region and 3) with reference to previous structural mapping and interpretation efforts made by GoldSpot.
The work recognizes two distinct phases of deformation, referred to as D1 and D2. Early D1 corresponds with the onset of the Salinic Orogeny (425 million years ago), a NW-SE compressional event resulting from the accretion of the Gondwana plate to the Laurentian margin. This produced a penetrative S1 foliation, upright isoclinal and gently NE-plunging F1 folds and resultant fold-thrust thickening of the strata. During this time, the AFZ was in its early stages of development, and there was an injection of bedding-parallel barren quartz-carbonate veins that are seen across the project area (Figure 7.13).
From continued compression in a NW-SE direction around 423 million years ago, there was a transition to a transpressive regime resulting in the onset of strike-slip tectonics. This shift led to the early development of bedding-discordant dextral shear zones that strike approximately east-west, an example being the Keats-Baseline Fault Zone. To accommodate this strain, a conjugate orientation of sinistral shear zones striking approximately northwest to northeast developed, an example being the Golden Joint host structure. This phase of deformation is interpreted to be a low-grade gold mineralizing event producing the early gold bearing structures that have been found to date adjacent to but trending at oblique angles to the AFZ and the mineralized shear zone network that comprises the JBPFZ (Figure 7.14).
D2 is the result of a north-south compressional event related to the Acadian Orogeny (415 to 400 million years ago), Avalonia’s collision with Laurentia. Field observations suggest that the effects of this event are far field as there is no penetrative regional fabric. Instead, resultant structural features include a conjugate set of northeast-northwest strike-slip faults, a NW-directed spaced cleavage, dextral refolding of the S1 fabric producing steep plunging fold axes and sinistral reactivation of the S1 (NNE) resulting in block faulting of mineralized zones adjacent to the major structures such as the AFZ (Figure 7.15). In summary, this phase of deformation folded, deformed, and offset the mineralization.
| 24 January 2023 | | 71 |
January 2023 Exploration Update: New Found Gold Corp.’s Queensway Gold Project, NL
Figure 7.12 Integrated geological map of lithology, shear zones and gold showings in Queensway North.

The main high-grade gold mineralizing event is believed to coincide with a brittle reactivation of these shear zones that were developed earlier. This is supported by the spatial association between brittle faults and high-grade vuggy massive, stylolitic, and/or brecciated quartz veins that often form within and adjacent to such structures and within the sedimentary stratigraphy surrounding the AFZ and JBPFZ (Figure 7.16).
| 24 January 2023 | | 72 |
Figure 7.13 Left: stereographic plot with D1 structural measurements taken from Queensway North. Right: Schematic cross-section illustrating the S1 and S0 parallel fabrics and an upright isoclinal fold (Source: GoldSpot).

Figure 7.14 Left: Stereographic plot with late D1 structural measurements taken from Queensway North. Right: Schematic plan map illustrating conjugate shear orientations (Source: GoldSpot).

Figure 7.15 Left: stereographic plot with D2 structural measurements taken from Queensway North. Right: Schematic plan map illustrating conjugate strike-slip faults, reactivation and folding of the S1 fabric, off-set of D1 mineralization (Source: GoldSpot).
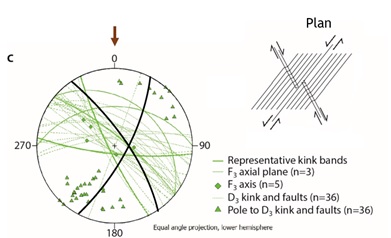
| 24 January 2023 | | 73 |
January 2023 Exploration Update: New Found Gold Corp.’s Queensway Gold Project, NL
Figure 7.16 Plan map of the area between the Keats and Lotto prospects, illustrating the complex network of brittle fault zones and associated high-grade gold veins adjacent to the AFZ (Source: NFG).
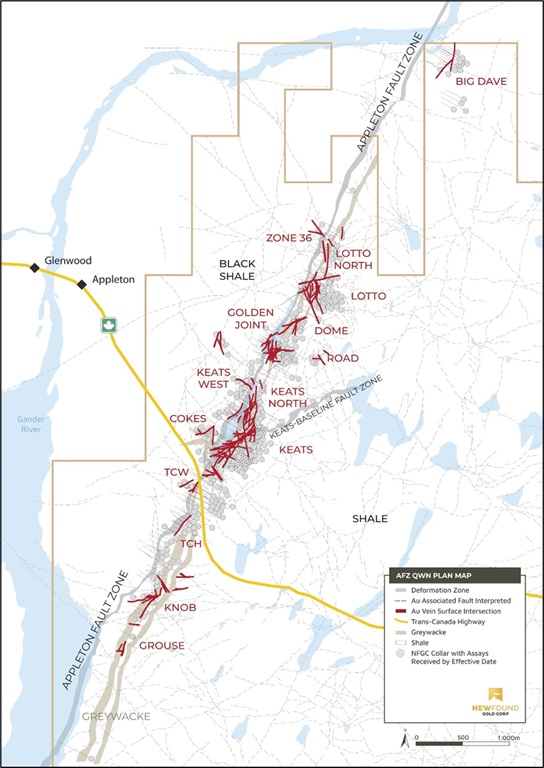
| 24 January 2023 | | 74 |
January 2023 Exploration Update: New Found Gold Corp.’s Queensway Gold Project, NL
NFG’s most recent lithology interpretation for QWN (see Figure 7.12) illustrates a series of interbedded mudstone, siltstone, and sandstone, with the bedding correlating with the overall orientation of the major structural zones, with a NE-SW strike, and a steep dip. These are crosscut, in places, by mafic dykes.
To date, the lithological homogeneity of the rocks in the Queensway Project area has hindered the identification and delineation of distinct marker-horizons (e.g., conglomeratic units or distinctive shale bands) that would enable more detailed interpretation and modelling of the structural and stratigraphic framework and has also made it difficult to discern features in geophysical data. However, there are a few distinctive units that have been identified, one being a domain of graphitic shale that forms the hanging wall to the AFZ and is regularly intersected by drilling but also stands out as an EM anomaly.
A second unit that is geochemically distinct is a bed of greywacke that has been defined over a considerable distance immediately adjacent to the AFZ on the east side, this greywacke unit has a mafic signature defined by high levels of chromium and nickel. Identification of both units has assisted the development of a structural interpretation of the northern project area.
| 7.3 | Significant Mineralized Zones |
NFG’s exploration programs, supplemented by historical work, has identified two significant mineralized trends north of Gander Lake (Figure 7.17):
| 1. | The northern parts of the AFZ (in QWN), where it exploits the contact between a black shale package in the west and a sequence of interbedded shale and greywacke in the east (Figure 7.12). Along the 9.5 km length of this mineralized zone, surface reconnaissance and trenching has established over 20 prospects, 19 of which have been drilled by NFG, including Keats, which is the most extensively drilled of the many Queensway prospects. Mineralization is hosted in a network of brittle faults adjacent to the AFZ and crosscutting the NE-striking stratigraphy. These faults and associated gold-bearing vein arrays tend to strike approximately E-W or N-S and have moderate to steep dips. The full down-dip depth has not yet been established along the entire trend but is at least 300 m as defined by drillholes drilled at the Keats prospect. |
| 2. | The northern parts of the JBPFZ (in QWN), from Gander Lake to north of H-Pond, located approximately 5 km east and running parallel to the AFZ (Figure 7.12). Along the 12.5 km strike length of this mineralized zone, surface reconnaissance and trenching has established 10 prospects, 5 of which have been drilled by NFG. Mineralization is hosted in ductile, brittle deformation zones and associated irregular vein arrays that run parallel to the SW-striking, steeply west-dipping stratigraphy. The full down-dip depth is not established along the trend but is at least 150-200 m as defined by drillholes at the Pocket Pond and 1744 prospects. |
| 24 January 2023 | | 75 |
January 2023 Exploration Update: New Found Gold Corp.’s Queensway Gold Project, NL
Figure 7.17 Gold showings within the Queensway Property.

| 24 January 2023 | | 76 |
January 2023 Exploration Update: New Found Gold Corp.’s Queensway Gold Project, NL
NFG’s drilling had confirmed that both mineralized corridors have the following geological characteristics, as discussed in Section 7.2, and generally include:
| • | Strong gold mineralization occurs in quartz-carbonate veins associated with complex networks of brittle fault zones aligned with regional deformation zones. |
| • | Gold is associated with arsenic-bearing minerals, and with antimony and tungsten. |
| • | There is an alteration halo around most of the gold-rich veins that is associated with the changes in the mineralogy of white micas. |
In addition to the mineralized zones north of Gander Lake that NFG has tested, there are more than 100 showings of gold from surface reconnaissance, trenching and historical drilling that was completed by companies other than NFG. Although many of these represent isolated showings, there is a cluster of gold showings in the Paul’s Pond and Greenwood Pond in Queensway South block. Based on the historical exploration results and the proximity of these showings to the AFZ, NFG’s exploration in this area suggests that the style and orientation of gold mineralization is likely similar to NFG’s drill-tested showings to the north, along the same fault zone.
NFG has completed an inaugural drill program in QWS at the Paul’s Pond and Greenwood Pond showings, as well as at Aztec, Bernard’s Pond, Devil’s Trench, Eastern Pond, and Goose (Section 10.3). Surface reconnaissance and trenching studies were also completed in QWS. Detailed geological interpretations are still ongoing but are expected to show that the geological character, mineralogical associations, and alteration halos in QWS are like what has now been well defined in QWN.
| 8 | Deposit types |
The Queensway Gold Project is classified as an orogenic gold deposit. This deposit type occurs throughout the world and includes some of the richest known gold deposits (Gardner, 2021). Canadian orogenic gold deposit examples include 1) Campbell-Red Lake district in northern Ontario, 2) Porcupine-Destor Fault Zone near Timmins, Ontario, and 3) Cadillac-Larder Lake Fault Zone in eastern Ontario and the Val d’Or mining district in Québec.
| 8.1 | Orogenic Gold Deposits |
Orogenic gold deposits are understood to be created during continental plate collisions, when pressures and temperatures cause rocks to undergo metamorphism and dehydrate (Goldfarb et al., 1991). Gold-bearing fluids are driven from the rocks and percolate through fissures and cracks. As these fluids migrate upwards, their temperature and pressure drop, causing gold, which is hard to keep in solution, to precipitate, often within quartz veins (Fyfe and Henley, 1973; Goldfarb et al., 2015).
| 24 January 2023 | | 77 |
January 2023 Exploration Update: New Found Gold Corp.’s Queensway Gold Project, NL
As presented in the schematic in Figure 8.1, conditions that cause gold to precipitate from fluids can occur deep in the crust, where temperatures and pressures are high, and the rocks are ductile. At these great depths of 20 km or more, the strong metamorphism is described by geologists as being in the granulite facies. Orogenic gold deposits can also form much closer to the surface, only a few kilometres deep, where rocks are brittle and metamorphism is weaker, in the greenschist facies.
The brittle or ductile nature of the host rock and the intensity of metamorphism give rise to different styles of gold mineralization in orogenic gold deposits, with different associated minerals (Goldfarb et al., 2015). The style of mineralization observed at Queensway, with arsenic, antimony and tungsten often being associated with gold, is consistent with greenschist facies metamorphism at depths that are described in the technical literature as being epizonal to mesozonal.
The geological setting and the style of gold mineralization observed at Queensway are like those reported for the Meguma Supergroup, in Nova Scotia, Canada (Kontak et al., 1990; Ryan and Smith, 1998). As shown in Figure 8.2, NFG has also noted striking similarities between drill core samples from Queensway and core from the Fosterville Mine in the Castlemaine - Bendigo region in Australia (Willman, 2007).
Figure 8.1 Schematic for orogenic gold deposits at various depths (modified from Goldfarb et al., 2015).

| 24 January 2023 | | 78 |
Figure 8.2 Comparison of drill core samples from Queensway hole NFGC-19-01 with core from the Eagle Zone of the Fosterville Mine, Australia (Source: NFG).

| 24 January 2023 | | 79 |
January 2023 Exploration Update: New Found Gold Corp.’s Queensway Gold Project, NL
| 8.2 | Deposit Type Exploration Strategies |
Exploration strategies for orogenic quartz-vein-hosted gold mineralization deposits involve bedrock and structural mapping, geophysical surveys, geochemical/heavy mineral analysis of till samples, and geochemical analysis of grab rock and trench channel samples. Target areas are then tested by diamond drill programs. Regional exploration is typically driven by the identification of first order regional--scale structures and related subsidiary fault-structures, as suggested by geophysical and core logging interpretations. Surface mapping and optical televiewer images allow planning of new drillholes to consider information on the geometry of gold-bearing quartz veins and fault zones, with hole collars and orientations designed to intersect planar gold-bearing structures.
| 9 | Exploration |
The exploration studies presented in this section were conducted by, or on behalf of, NFG. Earlier exploration results from other companies and individual prospectors are presented in Section 6 - History. Most of the exploration methods used by NFG are the same as those used by previous companies and individual prospectors when they explored the Queensway area: prospecting, geological mapping, surface sampling, geophysics, satellite imagery, trenching and drilling. This section presents exploration studies other than drilling, which is presented in Section 10.
| 9.1 | Historical Overview of New Found Gold Exploration Programs |
In 2016, NFG initiated gold exploration at the Queensway Project with a till sampling program in the Joe Batt’s Pond (JBP) area (Section 9.3). In 2017, NFG’s exploration work focused on prospecting, with grab samples (Section 9.2), geological mapping, trenching in the JBP area (Section 9.5), a structural study (Section 9.10) of the trenched areas, and an airborne geophysical survey (Section 9.6).
In 2018, exploration included geophysical survey interpretation (Section 9.7), a structural geological survey (Section 9.10), regional till sampling program (Section 9.3), soil surveys at the Yellow Fox and Jumbo Brook showings in Queensway South (QWS; Section 9.4), regional prospecting (Section 9.2), and surface trenching at JBPFZ (Section 9.5). Satellite imagery was collected over the project area in the late Spring and early Summer of 2018 (Section 9.8). In late 2018 and early 2019, a culvert was replaced, and roads were upgraded between North and South Herman’s Pond along the Appleton Fault Zone (AFZ) to improve the ability of diamond drill rigs to access the area.
In 2019, exploration paused while a project-wide review of data was done in preparation for NFG’s first drilling program. With interest generated from this drilling, which began in late 2019, NFG undertook broader and more detailed till sampling programs in QWS and in the Twin Ponds (TP) area (Section 9.3), a property-wide prospecting program (Section 9.2) and a trenching program along the AFZ (Section 9.5). An airborne geophysical survey, using gravity and magnetic methods, was conducted over Queensway North (QWN) in March 2020 (Section 9.6).
| 24 January 2023 | | 80 |
January 2023 Exploration Update: New Found Gold Corp.’s Queensway Gold Project, NL
In 2021, NFG conducted an airborne geophysics survey over newly acquired licences (Section 9.6). Field exploration continued with prospecting programs (Section 9.2) at QWN, QWS, Little Rocky Brook (LRB) and Bellman’s Pond (BP), focused till sampling programs (Section 9.3), and local soil surveys, mostly at Eastern Pond (Section 9.4). Exploration studies in 2021 also included: a LiDAR and photogrammetry survey at QWN (Section 9.9); hyperspectral satellite imagery for the southern parts of QWS (Section 9.8); and trenching in QWS (Section 9.5).
In 2022, NFG continued exploration at the Queensway Property with additional prospecting and rock sampling programs in QWN, QWS and TP (Section 9.2), till sampling in QWS (Section 9.3), soil sampling in QWN and QWS (Section 9.4) and trenching and channel sampling in QWS (Section 9.5). In 2023, up to the Effective Date of this Report (24 January 2023), only additional soil samples have been collected.
A summary of surface sampling activities conducted by NFG at the Queensway Property is presented in Table 9.1. Newly acquired/optioned licences of South Pond (SP) and Ten Mile-Duder Lake (TMDL) have yet to be subject of exploration activities. NFG’s exploration efforts in 2022 led to the discovery of multiple new mineralized zones along the AFZ, including Keats North, the Keats South Extension, Lotto North, and Keats West.
| 9.2 | Prospecting and Geochemical Rock Samples |
NFG’s prospecting programs typically consist of sampling outcrops and collecting samples of float material. Figures 9.1 and 9.2 presents the locations of outcrop and float samples collected, colour-coded by year and by gold grades above 0.5 ppm, respectively. In 2017, a total of 852 rock samples (782 within the Queensway Property) were collected, including:
| • | 581 rock samples from QWN (427 classified as float and 154 as outcrop). |
| • | 171 rock samples from QWS (71 float and 100 outcrop). |
| • | 30 rock samples from TP (4 float and 26 outcrop). |
In 2018, a total of 582 rock samples (510 within the Property) were collected including:
| • | 101 rock samples from QWN (46 float and 55 outcrop). |
| • | 368 rock samples from QWS (132 float and 236 outcrop). |
| • | 41 rock samples from TP (23 float and 18 outcrop). |
| 24 January 2023 | | 81 |
January 2023 Exploration Update: New Found Gold Corp.’s Queensway Gold Project, NL
Table 9.1 Sampling summary from NFG’s exploration at the Queensway Property.
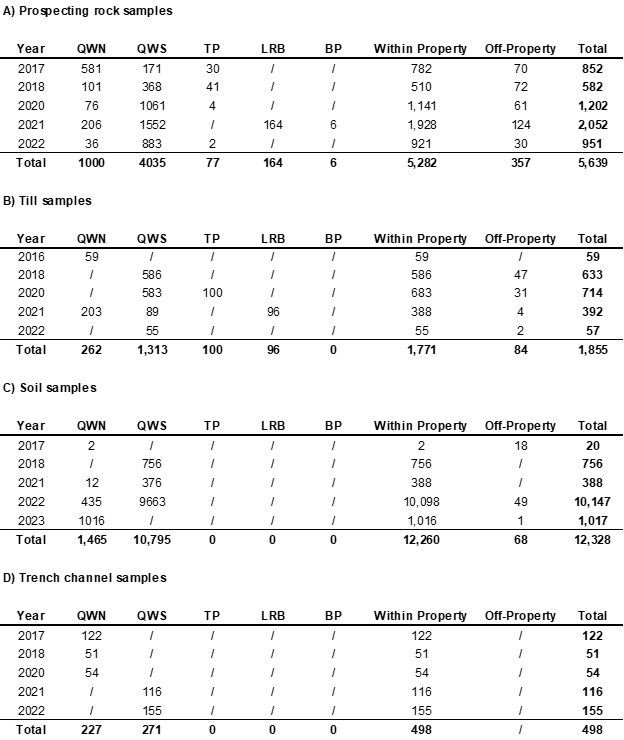
| 24 January 2023 | | 82 |
January 2023 Exploration Update: New Found Gold Corp.’s Queensway Gold Project, NL
Figure 9.1 Locations of rock samples collected from NFG’s prospecting programs at Queensway from 2017 through 2022.

| 24 January 2023 | | 83 |
Figure 9.2 Locations of surface rock samples with gold assays above 0.5 ppm at the Queensway Property.

| 24 January 2023 | | 84 |
January 2023 Exploration Update: New Found Gold Corp.’s Queensway Gold Project, NL
In 2020, a total of 1,202 rock samples (1,141 within the Queensway Property) were collected, including:
| • | 76 rock samples from QWN (39 float and 37 outcrop). |
| • | 1,061 rock samples from QWS (633 float and 428 outcrop). |
| • | 4 rock samples from TP (3 float and 1 outcrop). |
In 2021, a total of 2,052 rock samples (1,928 within the Queensway Property) were collected, including:
| • | 206 rock samples from QWN (129 float and 77 outcrop). |
| • | 1,552 rock samples from QWS (1,199 float and 353 outcrop). |
| • | 164 rock samples from LRB also known as the “777” mineral licence area (57 float and 107 outcrop). |
| • | 6 rock samples from BP (3 float and 3 outcrop). |
In 2022, a total of 951 rock samples (921 within the Queensway Property) were collected, including:
| • | 36 rock samples from QWN (2 float and 34 outcrop). |
| • | 883 rock samples from QWS (613 float and 270 outcrop). |
| • | 2 rock samples from TP (1 float and 1 outcrop). |
Rock samples were shipped by NFG to analytical laboratories for assay. Of the 5,282 rock samples collected within Property (Table 9.1), 5,191 received assay results, and assay results for 91 samples are still pending as of the Effective Date of this Report (24 January 2023). Of the 1,000 rock samples collected from QWN (Table 9.1), 970 received assay results, and 30 assay results are still pending. The QPs review of the gold analytical results for the 970 samples assayed shows:
| • | 887 analytical results (91.44%) were lower than 1 ppm Au, with a maximum of 0.96 ppm Au and an average of 0.06 ppm Au. |
| • | 81 analytical results (8.35%) were between 1 and 83.37 ppm Au, with an average of 8.78 ppm Au. |
| 24 January 2023 | | 85 |
January 2023 Exploration Update: New Found Gold Corp.’s Queensway Gold Project, NL
| • | 2 analytical results (0.21%) were above 560 ppm Au and consisted of 568.16 and 1131.21 ppm Au. |
Of the 4,035 rock samples collected from QWS (Table 9.1), 3,974 received assay results, and 61 assay results are still pending. The QPs review of the gold analytical results for the 3,974 samples assayed shows:
| • | 3,868 analytical results (97.33%) were lower than 1 ppm Au, with a maximum of 0.99 ppm Au and an average of 0.03 ppm Au. |
| • | 106 analytical results (2.67%) were between 1 and 29.62 ppm Au, with an average of 3.65 ppm Au. |
Of the 77 rock samples collected from TP (Table 9.1), all received assay results. The QPs review of the gold analytical results for the 77 samples assayed shows that all analytical results were lower than 1 ppm Au, with a maximum of 0.90 ppm Au and an average of 0.06 ppm Au.
Of the 164 rock samples collected from LRB (Table 9.1), all received assay results. The QPs review of the gold analytical results for the 164 samples assayed shows that all analytical results were lower than 1 ppm Au, with a maximum of 0.97 ppm Au and an average of 0.01 ppm Au.
Of the 6 rock samples collected from BP (Table 9.1), all received assay results. The QPs review of the gold analytical results for the 6 samples assayed shows that all analytical results were lower than 1 ppm Au, with a maximum of 0.03 ppm Au and an average of 0.01 ppm Au.
Within the entire Queensway Property, the highest values recorded are 1,131.21 ppm Au and 568.16 ppm Au for two samples collected from the Big Dave Vein along the AFZ in QWN (Figure 9.2). At present, none of the prospecting samples taken from TP, LRB, and BP have been assayed above 1 ppm Au.
NFG’s prospecting programs include routine quality assurance and quality control samples, standard reference materials inserted into the sample stream in the field at the rate of approximately one standard for every 20 rock samples.
Combined with a steadily improving understanding of the direction in which the last glacial ice sheer advanced and retreated, float samples from NFG’s prospecting programs assist with identification of potential bedrock source areas that should be tested by drilling. Where samples taken from outcropping bedrock show strong mineralization, drill targets can be developed with information from local mapping of the strike and dip of veins and faults, supplemented by interpretations of structure from geophysical surveys.
| 24 January 2023 | | 86 |
January 2023 Exploration Update: New Found Gold Corp.’s Queensway Gold Project, NL
| 9.3 | Geochemistry – Till Samples |
The objective of sampling glacial tills is to detect and delineate dispersal trains of gold grains emanating from undiscovered quartz veins of potential significance. The ice flow direction in the Queensway area is understood to be in the northeast quadrant. Figure 9.3 shows the locations of till samples, colour-coded by year. Figures 9.4 and 9.5 show the locations with abundant gold, either as measured by the count of gold grains (Figure 9.4) or by the gold grade calculated from grain size and grain count (Figure 9.5).
In 2016, a total of 59 samples (Table 9.1) from the C-horizon of the till were collected from hand-dug shovel pits on a portion of QWN along the JBPFZ (Figure 9.3). This study was contracted to Overburden Drilling Management Limited (ODM), who noted in their final report that all the till samples collected from the JBPFZ area that year had abundant gold, with an average of more than 100 grains in the samples. The ODM report also noted that the pristine nature of most of the gold grains indicated that they had been transported over only a short distance, likely less than a kilometre (Holmes and Michaud, 2017).
In 2018, NFG began a program of both regional and detailed scale till sampling at QWS to assist with target generation for future work. Despite Winter conditions, sampling continued, as it does today, throughout the year. The till sample locations were based on two grids designed around property boundaries, lakes, rivers, and boggy areas. Grid 1, the Regional Survey over QWS used a 2 km spacing and a 1 km offset on every second line. Grid 2, the Detailed Survey over QWS, targeted a southwest magnetic anomaly from geophysics surveys, used a 500 m spacing and a 250 m offset on every second line. In both grids, planned sites on the grid were not sampled if they had excessive organic material, were reworked fluvial material, were rocky ground, or were identified as not being true till material. From the samples collected at these sites that were sampled, multielement ICP analyses were used to select 21 that were submitted to ODM for analysis of the gold grains. Late in 2018, NFG collected four additional till samples near the site where a single till sample from the 2016 program produced 1,744 gold grains.
In total, 586 till samples were collected in QWS, and 47 off-Property limits in 2018 (Table 9.1). Based on the results of earlier prospecting and some early till results NFG targeted 10 areas in QWS for more detailed till programs in 2020: Hunt’s Brook, The Narrows, Larsen’s Falls, Pine Tree Hill, Eastern Pond, Eastern Pond Detailed, Eastern Pond Infill, and Great Gull River. In total, 583 till samples were collected in QWS in 2020 (Table 9.1). Till sampling programs were also conducted in the north at TP (100 samples) and at Jonathan’s Pond (31 samples, off-Property; Table 9.1). The till sampling that began in 2020 at Larsen’s Falls and Pine Tree Hill continued into the following year.
In 2021, NFG focused its till sampling programs in QWN (203 samples), specifically along the JBPFZ, in QWS (89 samples) and at LRB (96 samples, Table 9.1a). At JBPFZ, the goal of the 2021 program was to look for the edges of the pervasive anomaly identified there in 2016 by targeting one area north of the 2016 survey (151 samples) and another area west of the original survey (52 samples).
| 24 January 2023 | | 87 |
January 2023 Exploration Update: New Found Gold Corp.’s Queensway Gold Project, NL
Figure 9.3 Location of glacial till samples from NFG’s exploration programs at the Queensway Property, colour coded by sampling year.

| 24 January 2023 | | 88 |
January 2023 Exploration Update: New Found Gold Corp.’s Queensway Gold Project, NL
Figure 9.4 Locations of till samples with 10 or more moderate − pristine gold grains.

| 24 January 2023 | | 89 |
Figure 9.5 Till samples at the Queensway Property with gold grades above 1 ppm.

| 24 January 2023 | | 90 |
January 2023 Exploration Update: New Found Gold Corp.’s Queensway Gold Project, NL
Till sampling continued in 2022 in QWS, with a program that begun at West Narrows along the Mustang Trend west of Gander Lake, around Yellow Fox and Careless Cove Brooks, and was completed with the collection of 55 samples (Table 9.1).
The till samples processed by ODM have been quantitatively assessed using two methods: 1) The count of the number of pristine gold grains and modified gold grains (Figure 9.4), and 2) The gold grade calculated from the size distribution of the gold grains (Figure 9.5).
The till sample with the highest gold grain count (1,744 grains) and the highest calculated gold grade (15.7 ppm) was one of the 2016 till samples from the Joe Batt’s Pond area. This strong showing will be tested by drilling along the JBPFZ. Other target areas for future drill testing are those that show strong mineralization in the tills, both by the grain count (Figure 9.4) and by the calculated gold grade (Figure 9.5). These include the areas in QWS around Hunt’s Pond and between Eastern Pond and Paul’s Pond.
NFG’s till sampling programs include routine quality assurance and quality control samples, field duplicates inserted into the sample stream at the rate of approximately one duplicate for every 20 till samples.
Till samples were shipped by NFG to analytical laboratories for assay. Of the 1,771 till samples collected within Property (Table 9.1), 1,675 received assay results, and assay results for 96 samples from LRB only are still pending as of the Effective Date of this Report (24 January 2023).
Of the 262 till samples collected from QWN (Table 9.1), all received assay results. The QPs review of the gold analytical results for the 262 samples assayed shows:
| • | 119 analytical results (45.42%) were lower than 1 ppm Au, with a maximum of 0.99 ppm Au and an average of 0.17 ppm Au. |
| • | 143 analytical results (54.58%) were between 1 and 30.00 ppm Au, with an average of 5.25 ppm Au. |
Of the 1,313 till samples collected from QWS (Table 9.1), all received assay results. The QPs review of the gold analytical results for the 1,313 samples assayed shows:
| • | 1,199 analytical results (91.32%) were lower than 1 ppm Au, with a maximum of 0.99 ppm Au and an average of 0.10 ppm Au. |
| • | 114 analytical results (8.68%) were between 1 and 30.00 ppm Au, with an average of 4.07 ppm Au. |
Of the 100 till samples collected from TP (Table 9.1), all received assay results. The QPs review of the gold analytical results for the 100 samples assayed shows:
| 24 January 2023 | | 91 |
January 2023 Exploration Update: New Found Gold Corp.’s Queensway Gold Project, NL
| • | 98 analytical results (98%) were lower than 1 ppm Au, with a maximum of 0.76 ppm Au and an average of 0.11 ppm Au. |
| • | 2 analytical results (2%) were 1.06 and 1.72 ppm Au, with an average of 1.39 ppm Au. |
As of the Effective Date of this Report, the highest gold analytical value from till samples (30 ppm Au) is from quartz veins, shale, and siltstone from both QWN and QWS.
| 9.4 | Geochemistry – Soil Samples |
Figure 9.6 shows the locations of the soil sample programs done by NFG from 2017 to 2023.
In 2017, two test soil samples were collected in the Joe Batts Pond area in QWN.
In 2018, anomalous gold and arsenic values in float rock samples from the 2017 prospecting program in QWS were followed up with two gridded soil surveys. Samples were acquired from the B horizon, where possible, using a device known as a “Dutch auger” that is designed to collect soil samples in areas where the soil is dense with roots and fibrous vegetation. Although the 2018 soil programs were done in the winter, and had to auger through ice and snow, acquisition of B-horizon samples was good. 756 samples were collected at QWS in 2018 (Table 9.1) and were analysed at Eastern Analytical in Springdale, NL, by fire assay and by multielement ICP.
The Jumbo Brook soil survey grid in QWS (Figure 9.7) overlies the contact between the Davidsville Group to the east and the Indian Islands Group to the west. It used 11 lines, 1 km long and spaced 100 m apart, with an azimuth of N50°W. 21 of the 373 samples returned gold grades above 0.01 ppm. The better gold grades for soil and float samples appear to be clustered near the forest access road and suggest a possible source to the south-southwest, towards Thumbs-Up Pond or the boggy area west of it.
The Yellow Fox Brook soil survey grid in QWS (Figure 9.8) covers the contact between the Davidsville Group to the east and the Ten Mile Lake Formation to the west. It used 11 lines, 1 km long and spaced 100 m apart, with an azimuth of N40°W. 12 of the 383 samples returned gold grades above 0.01 ppm. Samples along Yellow Fox Brook indicate a possible target to the north of the grid. Three of the 2017 prospecting float samples appear to line up in a northeasterly direction with the better soil samples. It has been difficult to form a definitive interpretation of the Yellow Fox Brook soil data because information on the direction of ice flow points to a south-lying source for the float and soil, opposite the interpretation developed from the soil data.
| 24 January 2023 | | 92 |
January 2023 Exploration Update: New Found Gold Corp.’s Queensway Gold Project, NL
Figure 9.6 Locations of soil samples, colour coded by sampling year.

| 24 January 2023 | | 93 |
January 2023 Exploration Update: New Found Gold Corp.’s Queensway Gold Project, NL
Figure 9.7 Soil sample locations and gold assay results near Jumbo Brook in QWS.

| 24 January 2023 | | 94 |
January 2023 Exploration Update: New Found Gold Corp.’s Queensway Gold Project, NL
Figure 9.8 Soil sample locations and gold assay results near Yellow Fox Brook in QWS.
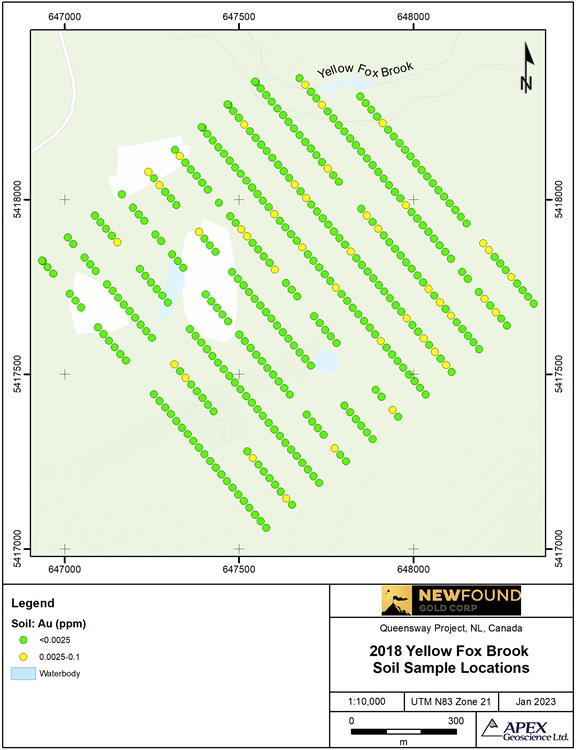
| 24 January 2023 | | 95 |
January 2023 Exploration Update: New Found Gold Corp.’s Queensway Gold Project, NL
In 2021, NFG completed three small soil surveys at Queensway. Two surveys acted as a test of whether soil surveys could recognize an anomalous gold signature in areas where till samples had produced high gold grades. 12 soil samples were collected at QWN, and 376 at QWS. Samples were taken at maximum allowable depths with a standard “Dutch auger” and sieved with a #80 screen, with the fines that passed through the sieve being sent to Eastern Analytical Labs for fire assay.
The 2021 soil programs also included a test of the mass spectrometer Halo mineral identifier on soil samples. The goal of this exercise was to determine if the Halo system could recognize alteration halos. With Halo being able to identify muscovite in 12 soil samples collected from the Cokes Zone, NFG plans to conduct further testing with larger samples to determine if Halo analysis of soil samples should become a routine exploration method in future.
In 2022, 435 soil samples were collected at QWN and 9,663 at QWS (Table 9.1) and in 2023 as of the Effective Date of this Report (24 January 2023), 1,016 additional samples have been collected at QWN.
As of the Effective Date of this Report, soil samples in the Queensway Property have been collected only at QWN (1,465 samples) and QWS (10,795 samples), totaling 12,260 samples (Table 9.1). 68 soil samples lie outside the current Property limits.
All soil samples collected by NFG from 2017 to 2023 were shipped by NFG to analytical laboratories for assay. Of the 12,260 soil samples collected within Property (Table 9.1), 7,020 received assay results, and assay results for 5,240 samples are still pending as of the Effective Date of this Report. Assay results are presented in Figure 9.9.
Of the 1,465 soil samples collected from QWN, 13 received assay results, and 1,452 assay results are still pending. The QPs review of the gold analytical results for the 13 samples assayed shows that assay values vary between 0.0025 and 1.58 ppm Au, with an average of 0.29 ppm Au. Two analytical results were above 1 ppm Au (1.05 and 1.58).
Of the 10,795 soil samples collected from QWS, 7,007 received assay results, and 3,788 assay results are still pending. The QPs review of the gold analytical results for the 7,007 samples assayed shows that assay values vary between 0.00005 and 2.27 ppm Au, with an average of 0.0 1 ppm Au. Two analytical results were above 1 ppm Au (1.04 and 2.27).
A significant amount of assay results from both QWN and QWS are still pending, and the results of the soil sampling programs to date have been inconclusive. Further work will be needed to establish whether soil sampling can improve targeting of drillholes.
| 24 January 2023 | | 96 |
January 2023 Exploration Update: New Found Gold Corp.’s Queensway Gold Project, NL
Figure 9.9 Soil sample gold assay results at the Queensway Property.

| 24 January 2023 | | 97 |
January 2023 Exploration Update: New Found Gold Corp.’s Queensway Gold Project, NL
| 9.5 | Geochemistry – Trench Channel Samples |
NFG’s trench programs in 2017, 2018 and 2020 focused on QWN areas; trenching in QWS was initiated in 2021 and continued throughout 2022 (Figure 9.10; Table 9.1). Channel samples are cut within the trenches using a gas-powered diamond saw, and are typically 2-3 cm wide, 5-10 cm deep and 1 m long. Grab samples are collected to investigate vein differences or to substitute for channel samples where those could not be collected. Trenching has been a successful exploration method at the Queensway Project, with many of the gold zones identified or better defined through trenching. Examples include Dome, Road, Lotto, Little, Cokes, Knob, Bullet, Glass, Aztec, A-Zone, LBNL, and showings in the Greenwood Pond area (Figure 9.10).
The permit application for NFG’s 2017 trenching program included 94 proposed trenches approximately 25 m long and 1 m wide, to various depths, crossing the NE-SW regional trend of the JBPFZ. Ultimately, 24 trenches were dug, with a total of 122 channel samples and 40 grab samples taken from five areas in QWN, including Quartz Pond (19 samples), the 798 Boulder Zone (29 samples), the Glass Showing (23 samples), the Joe Batts Trend (2 samples), and the Logan-Lachlan Zone (89 samples).
The permit application for NFG’s 2018 trenching program included 133 proposed trench locations along the JBPFZ. 12 of the proposed trenches were attempted before attention shifted to the Glass Showing, extending the 2017 trench to 150 m in length and up to 25 m in width. Many quartz veins exposed in the extended and expanded Glass Trench were mapped by drone, and channel sampled. Structural mapping was also carried out by GoldSpot as part of their regional-scale property review. A total of 51 channel samples were collected in 2018. The highest gold grade from the 2018 trench program was 44.7 ppm from a 10-12 cm quartz vein with semi-massive stringers of dark grey to black, pyrite and arsenopyrite, sampled at the northern end of the Glass Trench.
In 2020, 16 trenches were dug, with 54 channel samples collected, mainly on the west side of the AFZ, near the town of Appleton, from the Hornet Zone in the south to Trench 36 in QWN. Half of NFG’s 2020 trenches evaluated areas not previously trenched; the other half were dug to re-expose or extend trenches that had previously shown good results.
A total of 16 trenches were completed in 2021 in QWS, with 116 channel samples collected at Aztec, Bernard’s Camp, Eastern Pond Brook, Junior’s Hook, and Joe’s Feeder and MT (Rattman).
The permit application for NFG’s 2022 trenching program included 25 proposed trench locations in QWS. In 2022, 23 trenches were dug, and 155 channel samples collected in QWS in the Greenwood Pond area.
As of the Effective Date of this Report, channel samples in the Queensway Property have been collected only at QWN and QWS.
| 24 January 2023 | | 98 |
January 2023 Exploration Update: New Found Gold Corp.’s Queensway Gold Project, NL
Figure 9.10 Location of NFG trenches, colour coded by year.

| 24 January 2023 | | 99 |
January 2023 Exploration Update: New Found Gold Corp.’s Queensway Gold Project, NL
Channel samples were shipped by NFG to analytical laboratories for assay. Of the 498 channel samples collected (Table 9.1), all received assay results as of the Effective Date of this Report (24 January 2023)
The QPs review of the gold analytical results for the 227 channel samples collected from QWN (Table 9.1) shows:
| • | 204 analytical results (89.87%) were lower than 1 ppm Au, with a maximum of 0.96 ppm Au and an average of 0.10 ppm Au. |
| • | 23 analytical results (10.13%) were between 1 and 18.90 ppm Au, with an average of 6.57 ppm Au. |
The QPs review of the gold analytical results for the 271 channel samples collected from QWS (Table 9.1) shows:
| • | 258 analytical results (95.20%) were lower than 1 ppm Au, with a maximum of 0.94 ppm Au and an average of 0.10 ppm Au. |
| • | 13 analytical results (4.80%) were between 1 and 4.56 ppm Au, with an average of 2.22 ppm Au. The highest grade of 4.56 ppm Au occurs in a siltstone sample. |
Figure 9.11 shows the locations of channel samples that had gold assays higher than 0.5 ppm. The highest grades seen in trench samples come from QWN; these include a channel sample from Trench 36 with a gold grade of 18.9 ppm, and two samples from the Glass Trench, with gold grades of 14.6 ppm and 13.3 ppm. In QWS, the highest gold grade in trench channel samples, 4.56 ppm, is from the Eastern Pond area.
| 9.6 | QP Opinion on Representativity and Potential Bias of Exploration Samples |
The QP is of the opinion that NFG’s till, soil, rock, and trench channel samples are representative of the regions where they were taken and provide unbiased measurements of the gold grades in those general locations.
Grab samples, by their very nature, often tend to be anomalous: prospectors are looking for gold and are more likely to find a surface sample interesting if it contains visible gold, or if its visible mineralogy suggests that its gold grade might be high. The likely bias in grab samples is not problematic for exploration, however, because anomalous samples can direct future exploration programs. Due to the bias, the QP recommends that grab samples not be used in any future resource estimations.
| 24 January 2023 | | 100 |
January 2023 Exploration Update: New Found Gold Corp.’s Queensway Gold Project, NL
Figure 9.11 Trench channel samples with gold assays above 0.5 ppm.
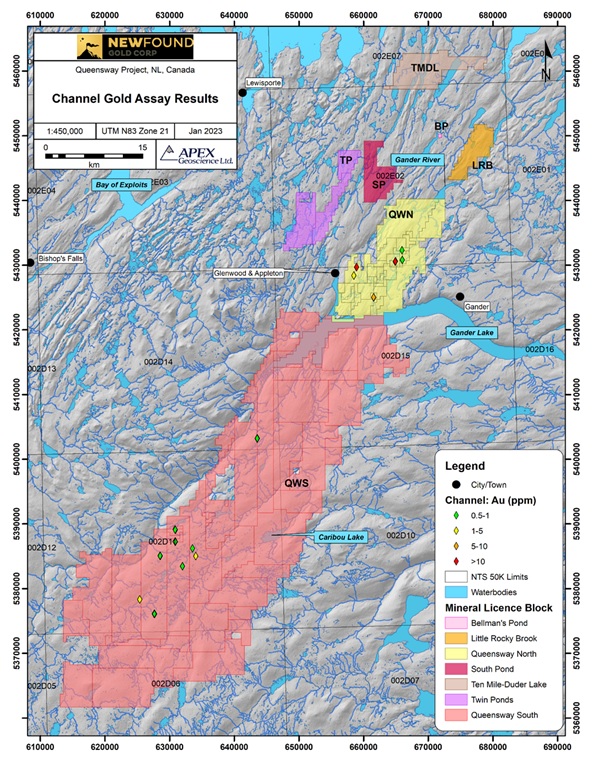
| 24 January 2023 | | 101 |
January 2023 Exploration Update: New Found Gold Corp.’s Queensway Gold Project, NL
| 9.7 | Airborne Geophysical Surveys |
From low altitude flights that track back and forth across a study area on a regular grid, airborne geophysical surveys measure physical properties, like the minor perturbations in the local gravity field caused by density variations in the bedrock or subtle changes in the local magnetic field caused by changes in the mineralogical composition of the rocks beneath. The measurement acquired during an airborne geophysical survey can be mapped directly, can have their slope or gradient displayed (the “first derivative”), or can have the changes in the slope displayed (the “second derivative”). They can also be used in a process known as “inversion” to build a 3D model of the subsurface that is consistent with the observed measurements. Any of these types of displays can enhance the ability to identify areas worthy of more detailed investigation in one of two main ways:
| • | By revealing areas with similar geophysical properties. If an area where strong gold mineralization has already been confirmed has a similar geophysical response as another area that has not yet had the benefit of detailed exploration, that less explored area merits a closer look to better understand if the similarity in its geophysical characteristics also makes it similar in its ability to host strong gold mineralization. |
| • | By revealing areas with anomalous geophysical properties. As discussed in Section 8.1, gold usually precipitates from hydrothermal fluids where either pressure or temperature drop. Anomalies in a map of a geophysical property may point to the type of local change in the bedrock that could be a location where changing pressure or temperature conditions, back at the time when the deposits were forming, favoured gold precipitation. |
| • | By revealing linear structures that may be faults or fractures. With gold in the Queensway area being associated with structural features like fault and fracture zones, and the veins associated with them, linear features on a map of a geophysical measurement, or its derivatives, may reveal fault and fracture zones that are difficult to see on the ground due to overburden, till, lakes, and vegetation. |
On behalf of Palisade (now NFG), CGG Canada Services Ltd. (CGG) flew a survey that measured magnetic and electrical properties over the Queensway Project area in 2017 (CGG Canada Services, 2017). Maps of the 1st and 2nd derivatives of the magnetic field indicated that the geological structures suggested by geophysics do conform to trends identified from surface reconnaissance and sampling.
In 2020, CGG flew a survey that measured the gravity and magnetic fields over QWN (CGG Canada Services, 2020). Broad changes in the gravity field were consistent with mapped geologic features; the higher density of the rocks in the Gander River Ultramafic Complex on the east side of the Queensway area is evident in the gravity response. With finer details being more difficult to resolve, the CGG report suggests that a 3D interpretation of the subsurface is required to better use the data.
| 24 January 2023 | | 102 |
January 2023 Exploration Update: New Found Gold Corp.’s Queensway Gold Project, NL
In 2021, CGG flew a survey that measured the magnetic, radiometric, and electrical properties over QWN and the eastern part of QWS (CGG Canada Services, 2021). Broad changes in magnetic properties were noted to be consistent with large mapped geologic features. The map of the 1st derivative of the electrical chargeability field shows a low (red in Figure 9.12) that runs just to the west of the Gander Lake Ultrabasic Complex. With this image providing considerable local detail, it may assist local mapping of structure.
| 9.8 | Satellite Imagery |
High resolution satellite imagery is useful for supporting the development of a detailed Graphical Information System database for the project, including field mapping activities.
In 2018, NFG contracted Pacific Geomatics Ltd. to use satellite imagery to create natural and false colour infrared images of the entire Queensway Project area with a pixel resolution of 30 cm in QWN and 50 cm in QWS and TP.
In 2021, multispectral satellite imagery for the southern portion of QWS was obtained from Digital Globe by Perry Remote Sensing LLC. The original plan was to acquire multispectral imagery for the entire Queensway Project area; but this was postponed due to cloud cover conditions and the onset of greening of trees and other vegetation in late Spring. Perry Remote Sensing was able to acquire good multispectral images, at a pixel resolution of 50 cm, over the southern half of QWS and is currently analyzing these to define alteration mineral assemblages that can be checked by ground reconnaissance and to generate exploration targets.
The work is currently ongoing and no interpretation or ground truthing has yet occurred.
| 9.9 | Digital Elevation Models |
High resolution models of the ground surface are helpful not only for checking ground survey information, such as drillhole collars, but can also be used to interpret faults and fractures which often manifest themselves as linear features on coloured pixel maps of elevation or its 1st and 2nd derivatives.
When CGG flew its geophysical surveys in 2018, 2020 and 2021, a by-product of the data acquisition done for these studies was a digital terrain model for the area covered by the survey.
In 2021, RPM Aerial Services performed a helicopter-based LiDAR survey of the QWN area and, at the same time, acquired high resolution digital images that will improve the project’s GIS data base and its mapping activities.
| 24 January 2023 | | 103 |
January 2023 Exploration Update: New Found Gold Corp.’s Queensway Gold Project, NL
Figure 9.12 First derivative of chargeability from 2021 geophysical survey.

| 24 January 2023 | | 104 |
January 2023 Exploration Update: New Found Gold Corp.’s Queensway Gold Project, NL
| 10 | Drilling |
During October-December 2019, NFG completed the Company’s initial 10-hole diamond drill program at the Queensway North block (QWN). The program collected 1,985 m of HQ core and targeted the Keats, Dome, Glass and 1744 prospects (Figure 10.1 and Table 10.1). The 2019 NFG drill program identified significant gold mineralization at the historic Keats prospect with one intercept of 75.21 ppm Au over 23.5 m in drillhole NFGC-19-01.
In August 2020, NFG initiated a 200,000 m drill program intended to test 1) the 9.45 km mineralized strike length on the Appleton Fault Zone (AFZ) in QWN, and 2) the 12.4 km mineralized strike length of the Joe Batt’s Pond Fault Zone (JBPFZ) in QWN. As a result of initial follow-up drilling to the 2019 program at Keats, and the additional discoveries of Golden Joint and Lotto nearby, the program was doubled to 400,000 m in October 2021.
From 2019 to 2021, NFG’s drill program focused on the QWN area with a total of 134,797 m drilled within 504 holes.
In 2022, NFG completed an inaugural drill program at the Queensway South block (QWS) drilling 7,255 m across 33 holes, at the Twin Ponds block (TP) with 1,508 m within 7 drillholes and continued drilling at QWN with additional 177,219 m drilled within 635 holes. By the end of 2022, 80% (320,779 m) of the ongoing 400,000 m drill program had been completed within 1,179 drillholes (Table 10.1).
In January 2023, NFG announced a drill program expansion to 500,000 m using an average of 12 drill rigs. The 2023 drill program will reportedly include:
| 1. | Infill and targeted drilling to expand existing prospects. |
| 2. | Exploration drilling to identify new prospects in other prospective areas. |
| 3. | Grid drilling aimed at testing open swaths of prospective strike along main fault structures, with a strong emphasis on the west side of the AFZ. |
| 4. | Drilling is also planned for the parallel JBPFZ at QWN, the newly optioned licence areas to the north (SP and TMDL), and at QWS. |
Up to the Effective Date of this report (24 January 2023), NFG has completed 1,227 diamond holes for a total of 330,007 m (Table 10.1). The location of 2019-2023 drillholes is presented in Figure 10.1. A summary of drill core sample gold assays used to document the text in this section, for each drilled prospect, is presented in Table 10.2.
| 24 January 2023 | | 105 |
January 2023 Exploration Update: New Found Gold Corp.’s Queensway Gold Project, NL
Figure 10.1 Drill collar locations from NFG’s drilling programs completed at the Queensway Property.

| 24 January 2023 | | 106 |
January 2023 Exploration Update: New Found Gold Corp.’s Queensway Gold Project, NL
Table 10.1 Summary of drillholes (with core recovered) from NFG’s diamond drilling program at the Queensway Property, Newfoundland, NL, from 2019 to 24 January 2023. Prospects, by Property block area, are highlighted for the QWN (blue), QWS (grey), and TP (yellow) blocks.

| 24 January 2023 | | 107 |
January 2023 Exploration Update: New Found Gold Corp.’s Queensway Gold Project, NL
Table 10.2 Summary of drill core sample gold assays that are documented in this drilling section (2019 to the Effective Date of this report). Prospects, by Property block area, are highlighted for the QWN (blue), QWS (grey), and TP (yellow) blocks.
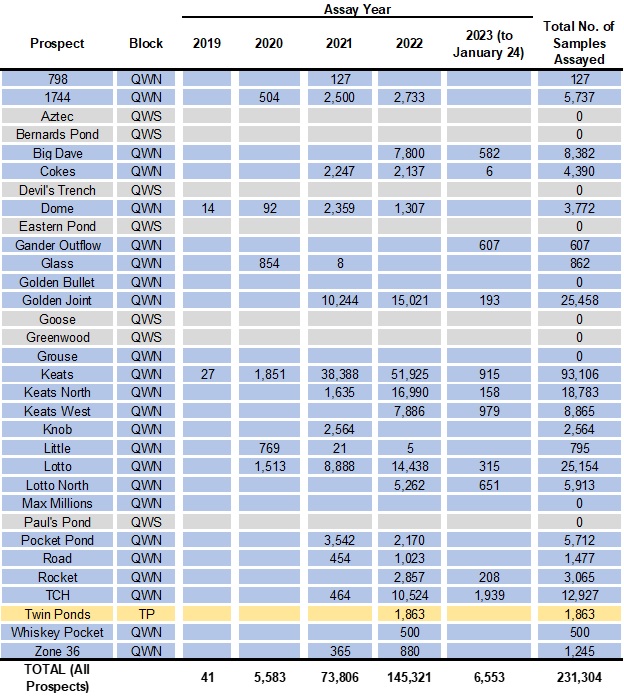
| 24 January 2023 | | 108 |
January 2023 Exploration Update: New Found Gold Corp.’s Queensway Gold Project, NL
| 10.1 | Drilling Procedures and Core Sampling |
In 2019, NFC commissioned New Valley Drilling Co. of Springdale, NL, who utilized four drill rigs that included EF-50 and A5 skid-mounted drill rigs and a track-mounted CS-1000 drill rig. In February 2021, NFG commissioned Rally Drilling Services (Rally) of Sussex, NB to conduct drilling at the Queensway Property in conjunction with New Valley Drilling. Rally utilized HTM2500, B20, EF-50 and U6 skid-mounted Marcotte htm2500 rigs, and a skid-mounted CS-1000 rig. A barge-mounted drill was implemented by NFG on October 8, 2022. The barge drill is currently testing the top portion of Golden Joint prospect that occurs under North Hermans Pond. No assays have been received to date. The barge drill may also test portion of the Keats prospects under the South Hermans Pond. All drill rigs were equipped to, and drilled, HQ size core.
Excavators were used to clear drill sites and move the rigs. Collars were foresighted using RTK GPS receivers and marked with pickets. Drillhole orientations were measured with a TN14 gyrocompass. Core is collected twice daily by NFG personnel. All completed holes were plugged and marked with a metal post to identify the collar locations. Downhole azimuth and dip data were collected by the drill crews, using the Reflex EZ-Trac. Surveying started at 15 m past the drill casing and at 50 m intervals downhole. An exit survey was completed at 15 m intervals upon completion of the hole.
A tabulation of drillhole collar locations, hole orientation at the collar, and depth for all holes drilled by NFG up to Effective Date of this technical report, is presented in Table 10.3. Holes that failed (i.e., no drill core was recovered) were redrilled with the collar slightly offset from the original location. In 2021, 3 drillholes did not yield core, and these failed drillholes are not reported in this report.
Hole locations in Table 10.3 are identified by the mineral prospect, along with the easting, northing, and elevation coordinates of the collar. Hole orientations are identified by the azimuth (clockwise from north) and the dip (downward from horizontal) of the hole at its collar. The azimuth and dip of the drillholes varies between 0 and 359 degrees (averaging 237 degrees) and -90 to -42 degrees (average of -48.2 degrees). A large portion of the drillholes is angled perpendicular to the strike and dip of the major fault zones (AFZ and JBPFZ) and their corresponding offshoot faults. The average length of the drillholes is 269 m with maximum hole depth of 881 m at the Keats Main prospect.
The orientation of the hole relative to the dominant plane of mineralization allows the calculation of the ratio of the true width (perpendicular to mineralization) to the down-hole length. Where the orientation of the faults/veins is known, the ratio of true width to down-hole length is reported. For prospects where the orientation of mineralization has not yet been determined with confidence, the ratio of true width to down-hole length is reported as unknown.
| 24 January 2023 | | 109 |
January 2023 Exploration Update: New Found Gold Corp.’s Queensway Gold Project, NL
Table 10.3 Drillhole collar locations and orientations for NFG’s diamond drilling program at the Queensway Property, Newfoundland, NL, from 2019 to 24 January 2023.

| 24 January 2023 | | 110 |
January 2023 Exploration Update: New Found Gold Corp.’s Queensway Gold Project, NL
Table 10.3, Continued (drillhole collar locations and orientations).

| 24 January 2023 | | 111 |
January 2023 Exploration Update: New Found Gold Corp.’s Queensway Gold Project, NL

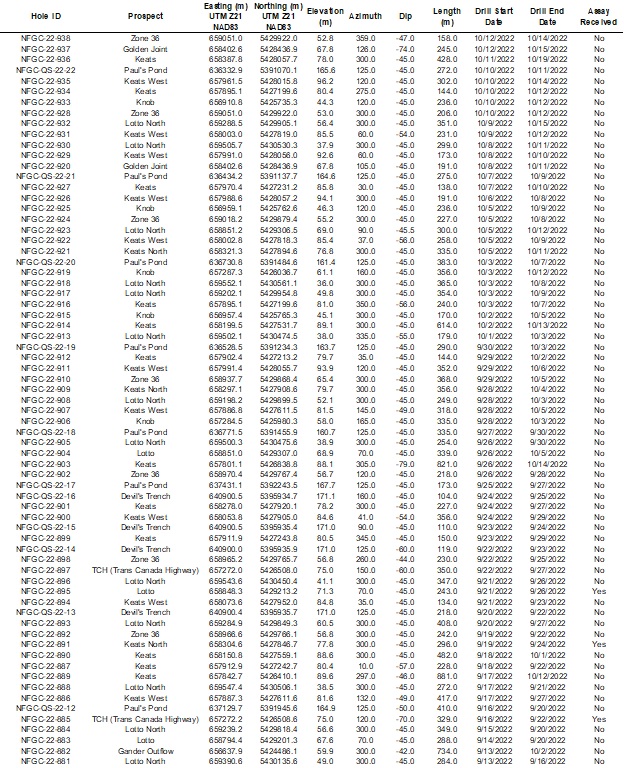
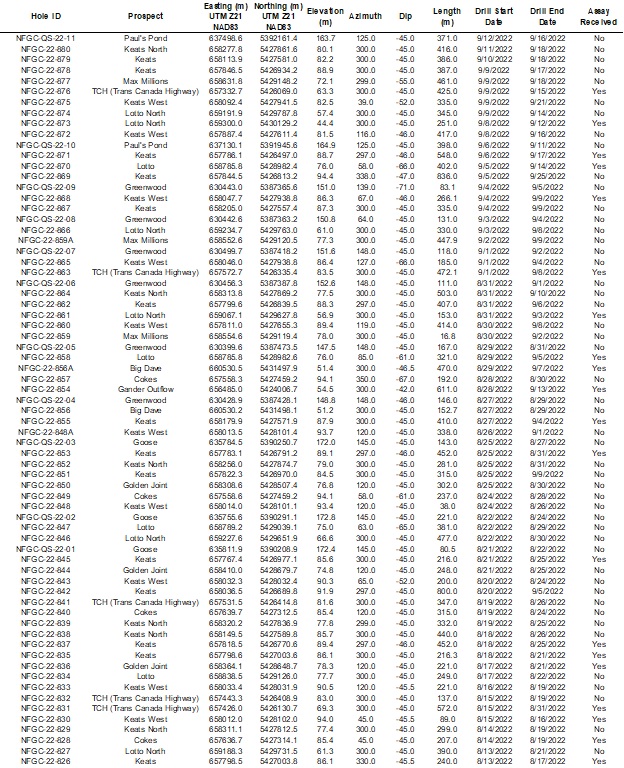


Table 10.3, Continued (drillhole collar locations and orientations).
| 24 January 2023 | | 112 |
January 2023 Exploration Update: New Found Gold Corp.’s Queensway Gold Project, NL
Table 10.3, Continued (drillhole collar locations and orientations).
| 24 January 2023 | | 113 |
January 2023 Exploration Update: New Found Gold Corp.’s Queensway Gold Project, NL
Table 10.3, Continued (drillhole collar locations and orientations).
| 24 January 2023 | | 114 |
January 2023 Exploration Update: New Found Gold Corp.’s Queensway Gold Project, NL
Table 10.3, Continued (drillhole collar locations and orientations).
| 24 January 2023 | | 115 |
January 2023 Exploration Update: New Found Gold Corp.’s Queensway Gold Project, NL
Table 10.3, Continued (drillhole collar locations and orientations).
| 24 January 2023 | | 116 |
January 2023 Exploration Update: New Found Gold Corp.’s Queensway Gold Project, NL
Table 10.3, Continued (drillhole collar locations and orientations).
| 24 January 2023 | | 117 |
January 2023 Exploration Update: New Found Gold Corp.’s Queensway Gold Project, NL
Table 10.3, Continued (drillhole collar locations and orientations).
| 24 January 2023 | | 118 |
January 2023 Exploration Update: New Found Gold Corp.’s Queensway Gold Project, NL
Table 10.3, Continued (drillhole collar locations and orientations).
| 24 January 2023 | | 119 |
January 2023 Exploration Update: New Found Gold Corp.’s Queensway Gold Project, NL
Table 10.3, Continued (drillhole collar locations and orientations).
| 24 January 2023 | | 120 |
January 2023 Exploration Update: New Found Gold Corp.’s Queensway Gold Project, NL
Table 10.3, Continued (drillhole collar locations and orientations).
| 24 January 2023 | | 121 |
January 2023 Exploration Update: New Found Gold Corp.’s Queensway Gold Project, NL
Table 10.3, Continued (drillhole collar locations and orientations).
| 24 January 2023 | | 122 |
January 2023 Exploration Update: New Found Gold Corp.’s Queensway Gold Project, NL
Table 10.3, Continued (drillhole collar locations and orientations).
| 24 January 2023 | | 123 |
January 2023 Exploration Update: New Found Gold Corp.’s Queensway Gold Project, NL
Table 10.3, Continued (drillhole collar locations and orientations).
| 24 January 2023 | | 124 |
January 2023 Exploration Update: New Found Gold Corp.’s Queensway Gold Project, NL
Table 10.3, Continued (drillhole collar locations and orientations).
| 24 January 2023 | | 125 |
January 2023 Exploration Update: New Found Gold Corp.’s Queensway Gold Project, NL
Table 10.3, Continued (drillhole collar locations and orientations).
| 24 January 2023 | | 126 |
January 2023 Exploration Update: New Found Gold Corp.’s Queensway Gold Project, NL
Table 10.3, Continued (drillhole collar locations and orientations).
| 24 January 2023 | | 127 |
January 2023 Exploration Update: New Found Gold Corp.’s Queensway Gold Project, NL
The drill core was logged and sampled by NFG geologists in NFG’s core logging facility in Gander, NL. The core samples were cut or split on-site, and half-core samples were placed into sealed sample bags in preparation for shipment to the laboratories for analytical assay test work, as follows:
| • | Starting with the initial drill program in 2019, the half-core samples were prepared at ALS Minerals (ALS) in Sudbury, ON and Moncton, NB or to Eastern Analytical Ltd. (Eastern Analytical) in Springdale, NL. The pulps prepared by ALS were shipped to ALS Vancouver (ALS), BC, for analysis via standard 30-g fire assay or screen metallic fire assay. The pulps shipped to Eastern Analytical were analyzed via standard 30-g fire assay or screen metallic fire assay. |
| • | In May 2022, NFG initiated a trial of the Chrysos PhotonAssayTM non-destructive method for gold analysis at MSALABS in Val-d’Or, QC, in conjunction with follow-on screen metallic fire assay or standard 30-g fire assay method at ALS Minerals in Vancouver for assay comparison. |
| • | Since May 2022, NFG only submits core samples for gold assay to ALS and MSALABS. In addition to gold assays, all samples prepared at ALS or MSALABS are also analyzed for a multi-element ICP package (ALS method code ME-ICP61) and a specific gravity pycnometry method (ALS method code OA-GRA08b) at ALS Vancouver. Details of analytical methods and quality assurance-quality control procedures are presented in Section 11. |
NFG composite intervals reported in this section have a minimum weighted average of 1 g/t Au diluted over a minimum core length of 2 m with a maximum of 2 m consecutive dilution. Included high-grade intercepts are reported as any consecutive interval with grades greater than 10 g/t Au. Grades have not been capped in the averaging and intervals are reported as drill thickness. The aggregation of closely spaced significant intervals can be done more than once, but always requires that each band of weak mineralization be less than 2 m long (in the down-hole direction). NFG does not cap the data other than no domain can be less than 2 m and/or a grade of less than 1 g/t Au. This threshold represents an NFG-designated threshold as per the Company’s analytical protocols. In some holes, two or more significant intervals occur very close to each other and form part of the same vein, with >1 ppm intervals and intervening weakly mineralized intervals forming a multi-layer sandwich that is one geologic structure.
In March 2021, NFG contracted DGI Geoscience to undertake a downhole wireline logging campaign to collect optical televiewer (OTV) and acoustic televiewer (ATV) images to provide high resolution digital information on the orientations of faults, fractures, and veins. At the Effective Date of this report, 790 holes had OTV and ATV images. Televiewer images could not be acquired in holes in which the hole walls had collapsed or were unstable or the water was too murky. Natural gamma and gamma-gamma density probes were added later during the program, and not run on every hole. By the effective date of this report, natural gamma logs were available for 680 holes and gamma-gamma density logs for 231 holes.
| 24 January 2023 | | 128 |
January 2023 Exploration Update: New Found Gold Corp.’s Queensway Gold Project, NL
Petrophysical hyperspectral logging measurements are completed on drill core using TerraSpec’s HALO mineral identification system to provide information on mica minerals (i.e., muscovite or phengite) as an indication of proximity to veins or mineralized fault zones, and sufficient reason to continue drilling.
The QP has reviewed NFG’s drillhole and drill core gold assay databases. The analytical work was conducted by reputable and accredited laboratories and the QP has validated the assay results versus the laboratory certificates. Hence, the QP is not aware of any drilling, sampling or recovery factors that could materially affect the accuracy and reliability of the drillhole locations or the gold assay data.
As of the Effective Date of this report (24 January 2023), core samples from 871 out of 1,227 drillholes have certified assay results as received by NFG from the labs. Assay results for the remaining 356 drillholes are still pending. Drillholes with assay results are tagged in Table 10.3.
NFG’s drill core assay results are presented in sub-sections 10.2 to 10.4 below for gold prospects within the Queensway North, Queensway South, and Twin Ponds blocks, respectively. For each prospect, the QP has summarized the drilling exploration work that was completed and summarizes the gold assay dataset of each gold prospect.
With respect to core intersections of note, the QP provides a summary of the higher-grade intervals that are reported within the context of a lower grade intersection. These intercepts have been captured from NFG News Releases (New Found Gold Corp 2020 a-e, 2021 a-s, 2022 b-x, 2023 a-c) and verified by the QP in the laboratory certificates. Please note that all relevant assay value analytical results are presented as “core interval apparent widths”. NFG has calculated true widths for most of the Company’s disclosed core lengths.
| 10.2 | Queensway North Block Prospects |
Drilling at QWN was initiated in 2019, with 24 prospects now drill tested as of 24 January 2023. A total of 312,016 m within 1,139 holes have been drilled at QWN from 2019 to 2022 (Table 10.1). An additional 9,228 m within 48 holes have been drilled in 2023 as of the Effective Date of this report (24 January 2023).
The 24 drill-tested prospects at the QWN block include, in alphabetical order: 798, 1744, Big Dave, Cokes, Dome, Gander Outflow, Glass, Golden Bullet, Golden Joint, Grouse, Keats, Keats North, Keats West, Knob, Little Zone, Lotto, Lotto North, Max Millions, Pocket Pond, Road, Rocket, Trans-Canada Highway (TCH), Whiskey Pocket, and Zone 36. These prospects are located either along the AFZ or along the JBPFZ (Figure 10.1; Figure 10.2).
| 24 January 2023 | | 129 |
January 2023 Exploration Update: New Found Gold Corp.’s Queensway Gold Project, NL
Figure 10.2 Gold vein surface intersections for prospects along the Appleton and JBP fault zones in the QWN block with collar locations for drillholes with assay results received.
| 24 January 2023 | | 130 |
January 2023 Exploration Update: New Found Gold Corp.’s Queensway Gold Project, NL
| 10.2.1 | 798 Gold Prospect |
The 798 zone is located at the north end of the JBPFZ in QWN (Figure 10.1). Two HQ-size diamond drillholes were drilled at the 798 zone by NFG in 2021 to test gold mineralization. The two holes totalled 469 m in length (Table 10.1; Table 10.3). A total of 127 core samples were collected at the 798 zone and sent for assay. As of the Effective Date of this report (24 January 2023), all assay results from the 798 zone have been received. The QPs review of the gold analytical results for the 127 assays received shows that all analytical results were lower than 1 ppm Au, with a maximum of 0.297 ppm Au and an average of 0.01 ppm Au.
| 10.2.2 | 1744 Gold Prospect |
The 1744 zone is located at the north end of the JBPFZ in QWN, 2.7 km north-northeast of the Pocket Pond zone and 7.9 km northeast of the Keats prospect (Figure 10.1 and Figure 10.3). Following a two-hole program in 2019, NFG drilled an additional 23 holes in the 1744 area in 2021 to follow-up on the gold-in-till anomaly where one till sample contained 1,744 gold grains and several quartz float boulders had high gold grades. Eight additional holes were drilled in 2022. Thirty-three HQ-size diamond drillholes were drilled in total by NFG at the 1744 zone as of the Effective Date of the report, 10,907 m in length (Table 10.1; Table 10.3).
Further work is needed to define mineralization, but preliminary interpretation suggest that gold may be hosted in two subparallel zones that dip steeply toward the northwest; these zones consist of discrete domains of brittle deformation associated with folding within a green siltstone unit. Gold is hosted in irregular massive to vuggy stylolitic veins with trace pyrite, chalcopyrite, arsenopyrite and boulangerite and has the same NH4 muscovite alteration signature seen elsewhere along the AFZ.
As of the Effective Date of this report (24 January 2023), 5,737 core samples from the 1744 prospect have been assayed. The QPs review of the gold analytical results for the 5,737 samples assayed at the 1744 zone shows:
| • | 5,613 analytical results (97.8%) were lower than 1 ppm Au, with a maximum of 0.99 ppm Au and an average of 0.04 ppm Au, |
| • | 121 analytical results (2.1%) were between 1 and 45 ppm Au, with an average of 4.01 ppm Au, and |
| • | 3 analytical results (0.1%) were between 59.23 and 105.83 ppm Au, with an average of 77.75 ppm Au. |
Significant drill intercepts, as reported by NFG, are presented in Table 10.4. The drilling has defined a zone of gold mineralization with a strike length of 255 m and a depth of at least 210 m (Figure 10.3 and Figure 10.4).
| 24 January 2023 | | 131 |
January 2023 Exploration Update: New Found Gold Corp.’s Queensway Gold Project, NL


| 24 January 2023 | | 132 |
January 2023 Exploration Update: New Found Gold Corp.’s Queensway Gold Project, NL
Figure 10.4 Longitudinal section through the 1744 and Glass prospects, vertically oriented, looking northwest (Source: NFG).

| 24 January 2023 | | 133 |
January 2023 Exploration Update: New Found Gold Corp.’s Queensway Gold Project, NL
| 10.2.3 | Big Dave Gold Prospect |
Big Dave is located east of the AFZ in QWN, 4.5 km west of the 1744 prospect (Figure 10.1). Twenty-four HQ-size diamond drillholes were drilled at Big Dave by NFG in 2022 to test gold mineralization. The 24 holes totalled 7,791 m in length (Table 10.1; Table 10.3; Figure 10.2). As of the Effective Date of this report (24 January 2023), 8,382 core samples from Big Dave have been assayed. The mineralization at Big Dave is hosted in the siltstones to the east of the AFZ and the main gold trend although irregular strikes approximately north-south and dips moderately west at 60°.
The QPs review of the gold analytical results for the 8,382 samples assayed shows:
| • | 8342 analytical results (99.5%) were lower than 1 ppm Au, with a maximum of 0.98 ppm Au and an average of 0.01 ppm Au, and |
| • | 40 analytical results (0.5%) were between 1 and 10.75 ppm Au, with an average of 2.6 ppm Au. |
Significant drill intercepts, as reported by NFG, are presented in Table 10.5.
Table 10.5 Summary of selected relevant drillhole assay results for the Big Dave prospect. Core intervals are apparent widths. Individual core intercepts of high-grade mineralization are denoted by the term, “Including”.
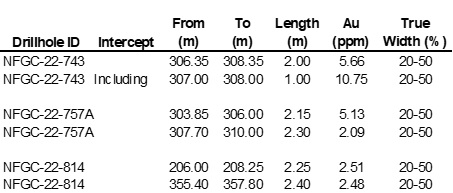
| 10.2.4 | Cokes Gold Prospect |
In 2021, NFG drilled eleven holes at the Cokes target, along the west side of the AFZ and adjacent to the Keats zone in QWN (Figure 10.5). In 2022, 10 additional holes were drilled, and 2 in 2023 as of the Effective Date of this Report (24 January 2023). The 23 drillholes at Cokes total 5,648 m (Table 10.1; Table 10.3).
| 24 January 2023 | | 134 |
January 2023 Exploration Update: New Found Gold Corp.’s Queensway Gold Project, NL
As of the Effective Date of this report (24 January 2023), 4,390 core samples from Cokes have been assayed.
The QPs review of the gold analytical results for the 4,390 samples assayed shows:
| • | 4,265 analytical results (97.15%) were lower than 1 ppm Au, with a maximum of 0.99 ppm Au and an average of 0.04 ppm Au, |
| • | 117 analytical results (2.67%) were between 1 and 4.46 ppm Au, with an average of 1.99 ppm Au, and |
| • | 8 analytical results (0.18%) were between 5.04 and 24.23 ppm Au, with an average of 9.11 ppm Au. |
Significant drill intercepts, as reported by NFG, are presented in Table 10.6.
Although not well constrained, recent 3D modelling work of the Cokes prospect suggests that the main mineralized trend identified to date is at the contact between a massive bed of greywacke and a domain of black siltstone that forms the northwest limb of an open gently southwest plunging syncline (Figure 10.12).
Table 10.6 Summary of selected relevant drillhole assay results for the Cokes prospect. Core intervals are apparent widths. Individual core intercepts of high-grade mineralization are denoted by the term, “Including”.

| 24 January 2023 | | 135 |
January 2023 Exploration Update: New Found Gold Corp.’s Queensway Gold Project, NL
Figure 10.5 Drill collar locations for drillholes completed at the Cokes, Keats North, and Keats West prospects.
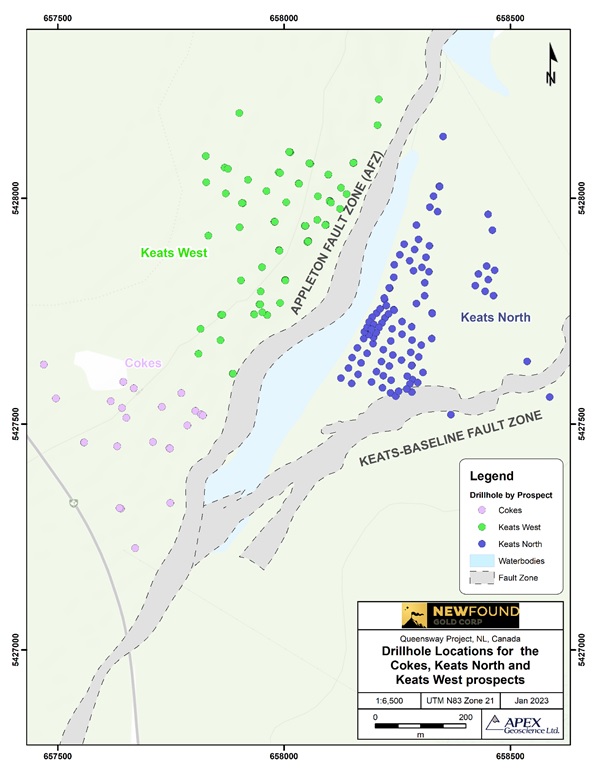
| 24 January 2023 | | 136 |
January 2023 Exploration Update: New Found Gold Corp.’s Queensway Gold Project, NL
| 10.2.5 | Dome Gold Prospect |
Between November 2019 and 2022, NFG drilled 17 holes at the Dome target, located on the east side of the AFZ in QWN between the Golden Joint and Lotto prospects, 3.4 km southwest of Big Dave (Figure 10.1; Figure 10.6). The 17 holes totalled 3,375 m in length (Table 10.1; Table 10.3). As of the Effective Date of this report (24 January 2023), 3,772 core samples from Dome have been assayed. The QPs review of the gold analytical results for the 3,772 samples assayed shows:
| • | 3720 analytical results (98.62%) were lower than 1 ppm Au, with a maximum of 0.99 ppm Au and an average of 0.03 ppm Au, |
| • | 50 analytical results (1.33%) were between 1 and 19.05 ppm Au, with an average of 3.13 ppm Au, and |
| • | 2 analytical results (0.005%) were above 160ppm and consisted of 162.5 ppm Au and 206.95 ppm Au. |
Significant drill intercepts, as reported by NFG, are presented in Table 10.7. The drill results suggest that the mineralized trend dips at 70° in the 160° direction and is associated with brittle faulting and massive to stylolitic vuggy quartz-carbonate veining like the other AFZ prospects. Dome mineralization has been drill tested over a strike length of 370 m and to a depth of 150 m and the mineralization has an apparent plunge of 30° toward the southwest (Figure 10.7; Figure 10.8). Dome mineralization has been traced west toward the AFZ where it appears to interact with the Golden Joint zone. Initial exploration focussed in the top 150 m vertical and follow-up drilling will involve expanding this high-grade gold bearing structure to depth.
Table 10.7 Summary of selected relevant drillhole assay results for the Dome prospect. Core intervals are apparent widths. Individual core intercepts of high-grade mineralization are denoted by the term, “Including”.

| 24 January 2023 | | 137 |
January 2023 Exploration Update: New Found Gold Corp.’s Queensway Gold Project, NL
Figure 10.6 Drill collar locations for drillholes completed at the Dome, Golden Joint, Lotto, Lotto North, Road, and Zone 36 prospects.

| 24 January 2023 | | 138 |
January 2023 Exploration Update: New Found Gold Corp.’s Queensway Gold Project, NL
Figure 10.7 Plan view of the Road - Dome - Golden Joint - Lotto - Lotto North - Zone 36 prospects with assays above 0.5 ppm Au projected to surface (Source: NFG).

| 24 January 2023 | | 139 |
January 2023 Exploration Update: New Found Gold Corp.’s Queensway Gold Project, NL
Figure 10.8 Longitudinal section through the Golden Joint, Dome, Lotto, and Lotto North prospects, vertically oriented, looking northwest (Source: NFG).

| 24 January 2023 | | 140 |
January 2023 Exploration Update: New Found Gold Corp.’s Queensway Gold Project, NL
| 10.2.6 | Gander Outflow Gold Prospect |
Gander Outflow is located along the AFZ in QWN, 8 km southwest of the Big Dave prospect and 3.6 km south-southwest of the Cokes prospect (Figure 10.1). Two HQ-size diamond drillholes were drilled at the Gander Outflow prospect by NFG in 2022 to test gold mineralization and to gain information about the stratigraphy and location of the AFZ in this area. The two holes totalled 1,345 m in length (Table 10.1; Table 10.3). As of the Effective Date of this report (24 January 2023), 607 core samples from Gander Outflow have been assayed.
The QPs review of the gold analytical results for the 607 assays received shows that all analytical results were lower than 1 ppm Au, with a maximum of 0.25 ppm Au and an average of 0.005 ppm Au.
| 10.2.7 | Glass Gold Prospect |
The Glass prospect is located at the north end of the JBPFZ in QWN, directly adjacent to the 1744 prospect (Figure 10.1). Four HQ-size diamond drillholes were drilled at the Glass prospect by NFG in 2019 to test gold mineralization. The four holes totalled 879 m in length (Table 10.1; Table 10.3). A total of 862 core samples were collected at the Glass prospect and sent for assay. As of the Effective Date of this report (24 January 2023), all samples assayed received assay results.
The QPs review of the gold analytical results for the 862 samples assayed shows:
| • | 854 analytical results (99.07%) were lower than 1 ppm Au, with a maximum of 0.97 ppm Au and an average of 0.01 ppm Au, and |
| • | 8 analytical results (0.93%) were between 1 and 10.8 ppm Au, with an average of 4.39 ppm Au. |
Significant drill intercepts, as reported by NFG, are presented in Table 10.8.
Table 10.8 Summary of selected relevant drillhole assay results for the Glass prospect. Core intervals are apparent widths. Individual core intercepts of high-grade mineralization are denoted by the term, “Including”.

| 24 January 2023 | | 141 |
January 2023 Exploration Update: New Found Gold Corp.’s Queensway Gold Project, NL
| 10.2.8 | Golden Bullet Gold Prospect |
Golden Bullet is located along the AFZ in QWN, approximately 2 km south of Cokes and 1.5 km south-southwest of the Keats prospect (Figure 10.1; Figure 10.9). One HQ-size diamond drillhole (167 m-long) was drilled at Golden Bullet by NFG in 2022. As of the Effective Date of the Report (24 January 2023), one additional HQ-size drillhole (308 m-long) has been drilled in 2023. The two holes total 475 m in length (Table 10.1; Table 10.3). A total of 179 core samples were collected at the Golden Bullet prospect and sent for assay. As of the Effective Date of this report (24 January 2023), all assay results are still pending.
Recent modelling working incorporating historic drilling and trench data suggests that the Golden Bullet mineralization trends east-west and is hosted by the siltstones east of the AFZ.
| 10.2.9 | Golden Joint Gold Prospect |
In April 2021, NFG moved a drill into the region between Lotto and Keats along the AFZ in QWN, 0.4 km south-southwest of Dome to target a fault intersection and a vein array identified in historic trenching. The initial hole, NFGC-21-171, intersected several brittle fault zones, including the zones that have become known as “Golden Joint Hanging Wall (HW)” and “Golden Joint Main” which graded 10.12 ppm Au over 4.85 m, including 41.26 ppm Au over 1.00 m (Figure 10.7, Figure 10.8; and Table 10.4).
Subsequent drilling confirmed that mineralization at Golden Joint occurs in two structural settings: in the immediate footwall to the AFZ, and in a more distal setting that is spatially associated with a thick, greywacke unit that has a northeast strike. The first of these is Golden Joint, the second is Golden Joint HW. The Golden Joint Main vein is a massive quartz vein with stylolitic and brecciated textures that lies in the footwall shales adjacent to the AFZ. It strikes approximately north (N5°E) and dips steeply to the west at 82° (Figure 10.7 and Figure 10.10).
This vein is associated with a brittle fault zone and other vein arrays whose orientations and geometries are currently being interpreted. It's true width typically ranges from less than 1 m to 5 m; however, its character can change along strike to zones of brecciation and quartz veinlets. Drilling to date indicates that there is a steeply plunging high-grade domain that is 225 m x 275 m in area, although the host vein has been intersected much deeper; the current interpretation is that this zone of significant high-grade gold occurs at the intersection between the AFZ and the Golden Joint Main vein. 3D modelling also suggests that substantial gold enrichment also occurs where the Golden Joint Main vein intersects other veins.
Ninety-six HQ-size diamond drillholes have been drilled at Golden Joint by NFG from 2021 to the Effective Date of this Report. The 96 holes totalled 29,686 m in length (Table 10.1; Table 10.3). Drillhole collar locations for the Golden Joint prospect are shown in Figure 10.6.
| 24 January 2023 | | 142 |
January 2023 Exploration Update: New Found Gold Corp.’s Queensway Gold Project, NL
Figure 10.9 Plan view of the Keats - TCH - Rocket - Golden Bullet - Knob prospects with assays above 0.5 ppm Au projected to surface (Source: NFG).

| 24 January 2023 | | 143 |
January 2023 Exploration Update: New Found Gold Corp.’s Queensway Gold Project, NL
As of the Effective Date of this report (24 January 2023), 25,458 core samples from Golden Joint have been assayed.
The QPs review of the gold analytical results for the 25,458 samples assayed shows:
| • | 25,135 analytical results (98.73%) were lower than 1 ppm Au, with a maximum of 0.99 ppm Au and an average of 0.04 ppm Au, |
| • | 310 analytical results (1.22%) were between 1 and 96.10 ppm Au, with an average of 6.51 ppm Au, |
| • | 11 analytical results (0.04%) were between 129.5 and 614.36 ppm Au, with an average of 314.20 ppm Au, and |
| • | 2 analytical results (0.01%) were above 760 ppm Au and consisted of 767 ppm Au and 2,109.72 ppm Au. |
Figure 10.10 Cross-section through Golden Joint, looking northwest, +/- 10 m (Source: NFG).
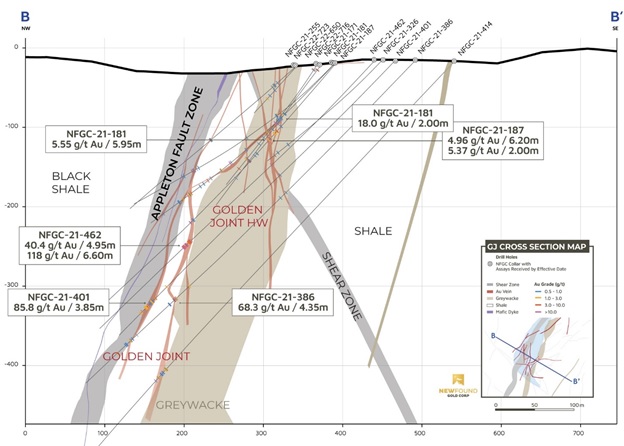
| 24 January 2023 | | 144 |
January 2023 Exploration Update: New Found Gold Corp.’s Queensway Gold Project, NL
The Golden Joint HW zone occurs within a thick bed of greywacke and along the margins of this bed. Mineralization tends to be characterized by stockwork veining that generally trends in an east-northeast orientation and dips moderately to the southeast (Figure 10.10).
Significant drill intercepts at the Golden Joint Main zone, as reported by NFG, are presented in Table 10.9a. The Golden Joint Main vein is drill-defined over a strike length of 225 m and to a depth of 385 m (Figure 10.7, Figure 10.8; Figure 10.10). Significant drill intercepts at the Golden Joint HW, as reported by NFG, are presented in Table 10.9b.
The Golden Joint HW zone is drill-defined over a strike length of 185 m and to a depth of at least 150 m.
Drilling is ongoing at Golden Joint utilizing a barge-mounted drill to access the top 100m vertical of the Golden Joint Main vein that resides under North Hermans Pond.
Table 10.9 Summary of selected relevant drillhole assay results for the Golden Joint and Golden Joint HW prospects. Core intervals are apparent widths. Individual core intercepts of high-grade mineralization are denoted by the term, “Including”.

| 24 January 2023 | | 145 |
January 2023 Exploration Update: New Found Gold Corp.’s Queensway Gold Project, NL
| 10.2.10 | Grouse Gold Prospect |
The Grouse prospect is located along the AFZ in QWN, approximately 70 m north of Gander Outflow and 1.5 km southwest of Golden Bullet (Figure 10.1). Thirteen HQ-size diamond drillholes have been drilled at the Grouse prospect by NFG in 2022. The 13 holes totalled 1,616 m in length (Table 10.1; Table 10.3). A total of 1,583 core samples were collected at the Grouse prospect and sent for assay.
As of the Effective Date of this report (24 January 2023), all assay results are still pending.
| 10.2.11 | Keats Gold Prospect |
The Keats prospect is located at the north end of the AFZ in QWN, along the Keats-Baseline Fault Zone, approximately 0.4 km southeast of the Cokes prospect and 9.6 km southwest of the 798 prospect (Figure 10.1; Figure 10.11).
In August 2020, as follow-up to the 2019 drill program, NFG began incrementally stepping-out with diamond drilling from NFGC-19-01 identifying a brittle fault zone known as the “Keats-Baseline” that has an east-northeast strike (N55°E) and dips to the southeast at approximately 60°. This brittle fault zone lies to the east of the AFZ and runs slightly oblique to it. This fault forms an extensive damage zone that is discordant to the stratigraphy, which has a northeast strike and a steep dip; it controls the development of a complex network of brittle, high-grade gold vein arrays that are epizonal in character (Figure 10.12).
Gold mineralization is characterized by the presence of quartz-carbonate veins with vuggy, stylolitic and/or brecciated textures which often contain trace amounts of arsenopyrite, chalcopyrite, boulangerite or pyrite, and which are associated with a NH4 muscovite alteration (Figure 10.13).
Three hundred eighty-five HQ-size diamond drillholes have been drilled at Keats by NFG from 2019 to the Effective Date of this Report. The 385 holes totalled 114,065 m in length (Table 10.1; Table 10.3). Drillhole collar locations for the Keats prospect are shown on Figure 10.11. As of the Effective Date of this report (24 January 2023), 93,106 core samples from Keats have been assayed.
The QPs review of the gold analytical results for the 93,106 samples assayed shows:
| • | 89,465 analytical results (96.09%) were lower than 1 ppm Au, with a maximum of 0.99 ppm Au and an average of 0.07 ppm Au, |
| • | 3,541 analytical results (3.80%) were between 1 and 97.71 ppm Au, with an average of 5.53 ppm Au, |
| 24 January 2023 | | 146 |
January 2023 Exploration Update: New Found Gold Corp.’s Queensway Gold Project, NL
| • | 81 analytical results (0.09%) were between 100.69 and 483.85 ppm Au, with an average of 217.06 ppm Au, and |
| • | 19 analytical results (0.02%) were between 516 and 2,197.25 ppm Au, with an average of 875.93 ppm Au. |
Significant drill intercepts, as reported by NFG between 2019 and 2022, are presented in Table 10.10. These intercepts occur within the Keats Main Zone which is gold mineralization hosted by the Keats-Baseline fault zone (Figure 10.12; Figure 10.14).
A variety of fault and vein orientations have been encountered within and surrounding the Keats-Baseline fault, forming a complex network of high-grade vein splays bifurcating from the Keats-Baseline Fault Zone and the AFZ and producing several high-grade domains that plunge in varying orientations. Two vein orientations dominate, with the most prominent orientation being approximately parallel to the orientation of the Keats-Baseline fault zone.
The “Keats Main” vein is an example of a vein with this orientation; it has been defined over a strike length of approximately 520 m and a depth of approximately 200 m, with a true width that ranges from less than 1 m to approximately 4 m (Figure 10.15 and Figure 10.16). The Keats Main vein occurs within the Keats-Baseline fault and is accompanied by a complex array of high-grade gold veins of varying widths and orientations.
The second common vein orientation at Keats is a westerly dip of approximately 55°. An example of a vein with this orientation is the Equinox vein which trends adjacent to the Keats Main vein and has been defined over a similar length (Figure 10.16). A thickened domain of high-grade gold mineralization with demonstrated continuity that plunges to the southwest at approximately 30° and has been defined over a length of 660 m (Figure 10.12 and Figure 10.14). This lens of very high-grade gold mineralization occurs within a dilational segment of the Keats-Baseline fault zone and where the Keats Main vein intersects the Equinox vein (Figure 10.16).
New drilling in this zone shows that the control on mineralization associated with this shoot terminates at the solstice cross-fault, the structural relationship of which, is different than that of the high-grade pipe at the intersection between the Keats Main vein and Equinox vein.
| 24 January 2023 | | 147 |
January 2023 Exploration Update: New Found Gold Corp.’s Queensway Gold Project, NL
Figure 10.11 Drill collar locations for drillholes completed at the Keats prospect.

| 24 January 2023 | | 148 |
January 2023 Exploration Update: New Found Gold Corp.’s Queensway Gold Project, NL
Figure 10.12 Plan view of the Keats, Keats North, Keats West and Cokes prospects with assays above 0.5 ppm Au projected to surface (Source: NFG).

| 24 January 2023 | | 149 |
January 2023 Exploration Update: New Found Gold Corp.’s Queensway Gold Project, NL
Figure 10.13 Core photographs from NFGC-19-01: visible gold in A, C and D; vuggy quartz texture in B (Source: NFG).

Cross-cutting the Keats Main zone and forming important constituents of the Keats-Baseline fault network are several conjugate brittle faults that are gold-rich and that create lenses of high-grade gold mineralization. Examples of such structures are the Umbra, Penumbra, Solstice, Eclipse, and 421 zones in Figure 10.15 and Figure 10.16. It is important to note that both the Umbra and Penumbra structures strike north-south and can be traced through the Keats North prospect and play an important role in concentrating gold at Keats North and the northeast end of the Keats Main zone.
At the southern extension of the Keats Main zone (Keats Main South) the Company continues to intersect high-grade gold mineralization as highlighted by intercepts of 25.31 ppm Au over 2.45 m and 72.7 ppm Au over 2.20 m in NFGC-22-774 and 4.59 ppm Au over 14.90 m in NFGC-22-845. The high-grade gold associated with the Keats-Baseline Fault Zone, has now been traced over a strike length of 1.1 km and down to a vertical depth of 400 m.
Drilling is ongoing at the Keats prospect, with the aim of expanding the Keats Main zone both along strike to the south, where it is interpreted to interact with AFZ, and along strike to the east-northeast where it is underexplored.
| 24 January 2023 | | 150 |
Table 10.10 Summary of selected relevant drillhole assay results for the Keats Main prospect. Core intervals are apparent widths. Individual core intercepts of high-grade mineralization are denoted by the term, “Including”.

| 24 January 2023 | | 151 |
January 2023 Exploration Update: New Found Gold Corp.’s Queensway Gold Project, NL
Figure 10.14 TCH, Keats and Keats North zones longitudinal section (Source: NFG).
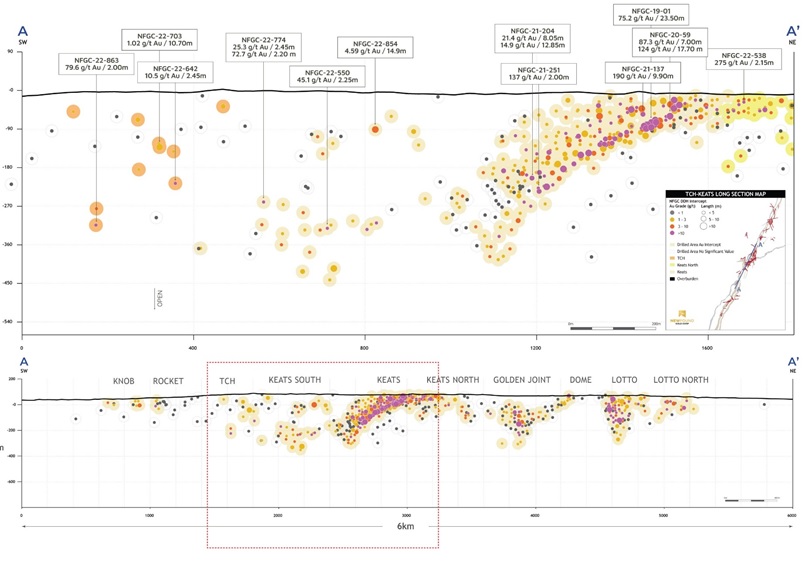
| 24 January 2023 | | 152 |
January 2023 Exploration Update: New Found Gold Corp.’s Queensway Gold Project, NL
Figure 10.15 Keats 3D plan view map, 75 m wide horizontal section with significant veins and showing the B-B’ cross-section trace used in Figure 10.16 (Source: NFG).

| 24 January 2023 | | 153 |
January 2023 Exploration Update: New Found Gold Corp.’s Queensway Gold Project, NL
Figure 10.16 Keats cross sections.
A. Keats cross section, looking northwest, +/- 10 m (Source: NFG).

B. Keats cross section, looking northwest, +/- 12.5 m (Source: NFG).

| 24 January 2023 | | 154 |
January 2023 Exploration Update: New Found Gold Corp.’s Queensway Gold Project, NL
| 10.2.12 | Keats North Gold Prospect |
In QWN, immediately north of Keats and east of the AFZ is Keats North where an extensive array of brittle faults host to high-grade gold have been discovered via reconnaissance grid drilling and has now been traced over an area 150 m wide x 630 m in strike. One hundred and three HQ-size diamond drillholes have been drilled at Keats North by NFG from 2021 to the Effective Date of this Report. The 103 holes totalled 27,173 m in length (Table 10.1; Table 10.3). Drillhole collar locations for the Keats North prospect are shown in Figure 10.5. As of the Effective Date of this report (24 January 2023), 18,783 core samples from Keats North have been assayed.
The QPs review of the gold analytical results for the 18,783 samples assayed shows:
| • | 18,319 analytical results (97.53%) were lower than 1 ppm Au, with a maximum of 0.99 ppm Au and an average of 0.06 ppm Au, |
| • | 457 analytical results (2.43%) were between 1 and 65.60 ppm Au, with an average of 4.11 ppm Au, and |
| • | 7 analytical results (0.04%) were between 105.50 and 738 ppm Au, with an average of 252.22 ppm Au. |
Significant drill intercepts, as reported by NFG, are presented in Table 10.11.
Table 10.11 Summary of selected relevant drillhole assay results for the Keats North prospect. Core intervals are apparent widths. Individual core intercepts of high-grade mineralization are denoted by the term, “Including”.

| 24 January 2023 | | 155 |
January 2023 Exploration Update: New Found Gold Corp.’s Queensway Gold Project, NL
These significant intervals along with many others occur largely within and around the Umbra, Penumbra, and Enigma structures, however, others fall outside into new structural splays; these zones remain open (Figure 10.12; Figure 10.15; Figure10.16). A combination of systematic and targeted drilling is being used to test this area and expand on several gold domains identified to date with a focus on the top 200 m of vertical depth.
| 10.2.13 | Keats West Gold Prospect |
In QWN, adjacent to Keats and across the AFZ to the west is the Keats West prospect. NFG in May 2022 identified significant mineralization in the Keats West prospect area with the intercepts of 8.70 g/t Au over 6.75m in NFGC-22-533 and 10.4 g/t Au over 10.5 m in NFGC-22-686 that were designed to test for mineralization in the footwall of the AFZ and the concept that perhaps the Penumbra vein crosscut the AFZ from the Keats North prospect.
This Keats West prospect became an area of focus to NFG, and subsequent exploration discovered a new high-grade gold bearing structure. Eighty-eight HQ-size diamond drillholes have been drilled at Keats West by NFG from 2021 to the Effective Date of this Report. The 88 holes totalled 19,947 m in length (Table 10.1; Table 10.3. Drillhole collar locations for the Keats West prospect are shown on Figure 10.5. As of the Effective Date of this report (24 January 2023), 8,865core samples from Keats West have been assayed.
The QPs review of the gold analytical results for the 8,865 samples assayed shows:
| • | 8,380 analytical results (94.53%) were lower than 1 ppm Au, with a maximum of 0.99 ppm Au and an average of 0.06 ppm Au, |
| • | 477 analytical results (5.38%) were between 1 and 90.50 ppm Au, with an average of 4.57 ppm Au, and |
| • | 8 analytical results (0.09%) were between 100.50 and 468 ppm Au, with an average of 257.12 ppm Au. |
Significant drill intercepts, as reported by NFG, are presented in Table 10.12. These intercepts all occur near surface and are hosted by the Keats West structure and demonstrate good continuity and the robustness of this gold system.
The Keats West structure is interpreted to be a thrust fault that dips gently to the south-southwest and hosts both low and high-grade gold mineralization over a considerable thickness with cumulative widths ranging from 10-30 m. This fault zone occurs on the west side of the AFZ, is hosted by an interbedded sequence of black siltstone, siltstone, and greywacke, and contains a series of stacked veins that contain the gold mineralization.
| 24 January 2023 | | 156 |
January 2023 Exploration Update: New Found Gold Corp.’s Queensway Gold Project, NL
The mineralization style is epizonal and typical of the other gold prospects found along this segment of the AFZ. Drilling initially focused within a panel of the structure where gold mineralization has been intersected over an area of 280 m x 130 m and ongoing drilling is designed to extend this zone along strike to the west and down-dip (Figure 10.12; Figure 10.17; Figure 10.18).
Table 10.12 Summary of selected relevant drillhole assay results for the Keats West prospect. Core intervals are apparent widths. Individual core intercepts of high-grade mineralization are denoted by the term, “Including”.
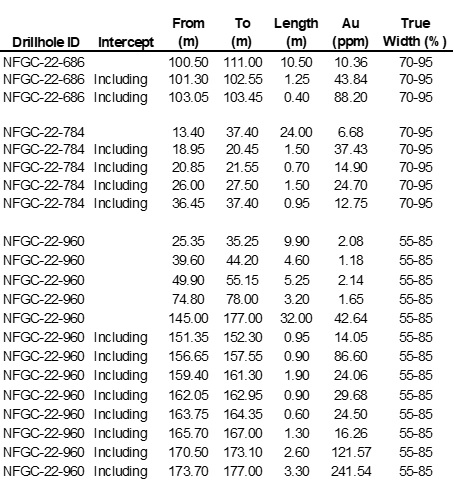
| 24 January 2023 | | 157 |
January 2023 Exploration Update: New Found Gold Corp.’s Queensway Gold Project, NL
Figure 10.17 Keats West inclined 3-D view with main veins (looking south; Source: NFG).

| 24 January 2023 | | 158 |
January 2023 Exploration Update: New Found Gold Corp.’s Queensway Gold Project, NL
Figure 10.18 Keats West cross-section view (+/-12.5m, looking NW; Source: NFG).

| 24 January 2023 | | 159 |
January 2023 Exploration Update: New Found Gold Corp.’s Queensway Gold Project, NL
| 10.2.14 | Knob Gold Prospect |
In February–April 2021, NFG drilled 16 HQ-size diamond drillholes at the Knob target, along the AFZ in QWN, adjacent to the Golden Bullet prospect (Figure 10.1). In 2022, 15 additional holes were drilled. The 31 holes totalled 6,301 m in length (Table 10.1; Table 10.3).
As of the Effective Date of this report (24 January 2023), 2,564 core samples from Knob have been assayed.
The QPs review of the gold analytical results for the 2,564 samples assayed shows:
| • | 2,533 analytical results (98.79%) were lower than 1 ppm Au, with a maximum of 0.99 ppm Au and an average of 0.04 ppm Au, and |
| • | 31 analytical results (1.21%) were between 1 and 22.10 ppm Au, with an average of 3.47 ppm Au. |
Significant drill intercepts, as reported by NFG, are presented in Table 10.13.
Mineralization at Knob is hosted by a thick sequence of greywacke, several vein orientations are present, however the overall trend of the gold mineralized domain is east-west and moderately south-dipping. The network of veining is within the greywacke and along the siltstone-greywacke contact, like the Golden Joint HW zone. Limited drilling has been completed due to access issues and other drilling priorities. No immediate follow-up work is scheduled at this time and is pending suitable access.
Table 10.13 Summary of selected relevant drillhole assay results for the Knob prospect. Core intervals are apparent widths. Individual core intercepts of high-grade mineralization are denoted by the term, “Including”.
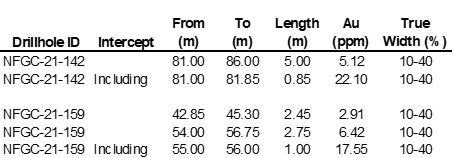
| 24 January 2023 | | 160 |
January 2023 Exploration Update: New Found Gold Corp.’s Queensway Gold Project, NL
| 10.2.15 | Little Zone Gold Prospect |
In August 2020, NFG drilled six holes at the Little Zone target, west of the AFZ, 1 km northwest of the Keats prospect (Figure 10.1). The 6 holes totalled 769 m in length (Table 10.1; Table 10.3).
As of the Effective Date of this report (24 January 2023), 795 core samples from Little Zone have been assayed.
The QPs review of the gold analytical results for the 795 samples assayed shows:
| • | 773 analytical results (97.23%) were lower than 1 ppm Au, with a maximum of 0.91 ppm Au and an average of 0.038 ppm Au, and |
| • | 22 analytical results (2.77%) were between 1 and 10.90 ppm Au, with an average of 3.57 ppm Au. |
Significant drill intercepts, as reported by NFG, are presented in Table 10.14. These results demonstrate significant near-surface mineralization.
Table 10.14 Summary of selected relevant drillhole assay results for the Little Zone prospect. Core intervals are apparent widths. Individual core intercepts of high-grade mineralization are denoted by the term, “Including”.

In addition, NFGC-20-14 returned two intercepts of high-grade silver mineralization of 253.8 ppm Ag over 2.0 m and 94.9 ppm Ag over 1.0 m. The true widths of these high-grade silver intervals have not yet been determined. This is the first instance of high-grade silver being identified on the Queensway property. This high-grade silver mineralization lies adjacent to the gold-bearing faults and veins in the Little-Powerline zone. Further geological investigation is ongoing to determine the significance of these intervals and to develop a follow-up plan for additional drilling.
| 24 January 2023 | | 161 |
January 2023 Exploration Update: New Found Gold Corp.’s Queensway Gold Project, NL
Gold mineralization at the Little Zone is interpreted to be associated with a north-striking fault but the exact relationship remains poorly constrained at this stage. Considering the recent Keats West discovery, and advancements in the understanding of mineralization west of the AFZ, follow-up drilling is planned.
| 10.2.16 | Lotto Gold Prospect |
The Lotto prospect is located approximately 0.7 km north-northeast of Golden Joint in QWN (Figure 10.1; Figure 10.6; Figure 10.19).
The 2020 - 2022 NFG drilling (Figure 10.6) has targeted veins intersected in historic drilling and trenching in the Lotto prospect area. The initial holes that intersected the “Lotto Main” vein targeted the intersection of two vein orientations observed in a historic trench. Since this discovery, most of the exploration drilling has been focused on testing the Lotto Main vein which strikes north (N0°E), and dips steeply to the east at approximately 85°. It ranges in true width from less than 1 m to approximately 3.5 m. This vein occurs approximately 200 m east of the AFZ. (Figure 10.7, Figure 10.8, and Figure 10.20).
One hundred six HQ-size diamond drillholes have been drilled at Lotto by NFG to the Effective Date of this Report. The 106 holes totalled 28,369 m in length (Table 10.1; Table 10.3). Drillhole collar locations for the Lotto prospect are shown on Figure 10.6. As of the Effective Date of this report (24 January 2023), 25,154 core samples from Lotto have been assayed.
The QPs review of the gold analytical results for the 25,154 samples assayed shows:
| • | 24,552 analytical results (97.61%) were lower than 1 ppm Au, with a maximum of 0.99 ppm Au and an average of 0.03 ppm Au, |
| • | 579 analytical results (2.30%) were between 1 and 98.90 ppm Au, with an average of 5.27 ppm Au, |
| • | 22 analytical results (0.09%) were between 107.50 and 442 ppm Au, with an average of 213.08 ppm Au, and |
| • | 2 analytical results (0.01%) were above 740 ppm Au and consisted of 749.67 ppm Au and 1,332.55 ppm Au. |
Significant drill intercepts, as reported by NFG, are presented in Table 10.15. The intercepts demonstrate good continuity of a high-grade lens that is interpreted to plunge steeply to the northeast and is likely controlled by the intersection of the Lotto Main vein with a thin bed of greywacke. More recent drilling has identified additional high-grade domains within the Lotto Main vein which could be attributed to a roll or dip-change that the vein takes.
| 24 January 2023 | | 162 |
January 2023 Exploration Update: New Found Gold Corp.’s Queensway Gold Project, NL
The contained high-grade segment of the Lotto Main vein has been defined over a strike length of approximately 200 m and to a depth of 220 m, but the vein itself has been intersected up to 350 m vertical depth (Figure 10.8 and Figure 10.20). Ongoing exploration will target the deeper vein portions that are poorly tested as they remain open and little drilling has been completed expanding the Lotto Main vein to the south.
Table 10.15 Summary of selected relevant drillhole assay results for the Lotto prospect. Core intervals are apparent widths. Individual core intercepts of high-grade mineralization are denoted by the term, “Including”.

| 24 January 2023 | | 163 |
January 2023 Exploration Update: New Found Gold Corp.’s Queensway Gold Project, NL
Figure 10.19 Plan view of the Golden Joint, Dome, Lotto, and Lotto North prospects with assays above 0.5 ppm Au projected to surface (Source: NFG).
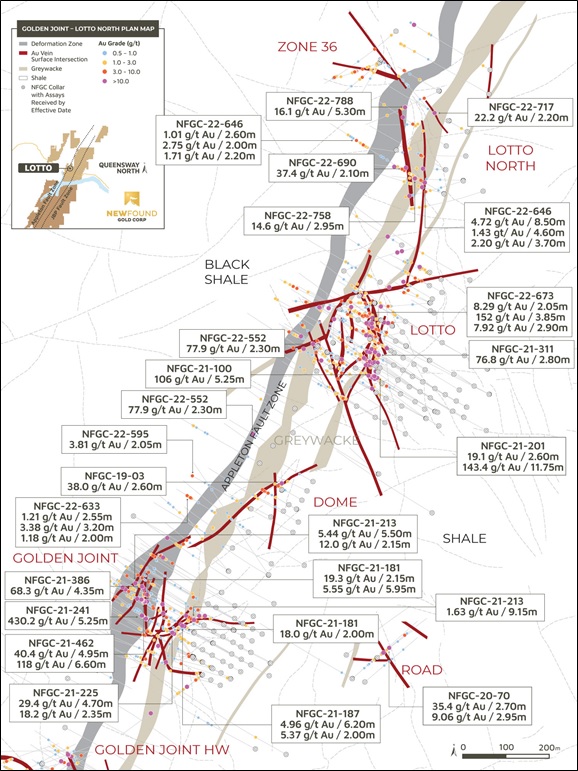
| 24 January 2023 | | 164 |
January 2023 Exploration Update: New Found Gold Corp.’s Queensway Gold Project, NL
Figure 10.20 Lotto cross-section, looking northeast, +/- 20 m (Source: NFG).

| 24 January 2023 | | 165 |
January 2023 Exploration Update: New Found Gold Corp.’s Queensway Gold Project, NL
| 10.2.17 | Lotto North Gold Prospect |
The Lotto North prospect is adjacent (north) to the Lotto prospect in QWN on the east side of the AFZ (Figure 10.6). Systematic grid drilling testing along the eastern side of the AFZ north of Lotto identified this new gold bearing structural zone in November 2022.
Seventy HQ-size diamond drillholes have been drilled at Lotto North by NFG in 2022, and 6 additional in 2023 as of the Effective Date of this Report. The 76 holes totalled 19,852 m in length (Table 10.1; Table 10.3). Drillhole collar locations for the Lotto North prospect are shown on Figure 10.6.
As of the Effective Date of this report (24 January 2023), 5,913 core samples from Lotto North have been assayed.
The QPs review of the gold analytical results for the 5,913 samples assayed shows:
| • | 5,733 analytical results (96.96%) were lower than 1 ppm Au, with a maximum of 0.98 ppm Au and an average of 0.04 ppm Au, |
| • | 178 analytical results (3.01%) were between 1 and 74.20 ppm Au, with an average of 5.50 ppm Au, and |
| • | 2 analytical results (0.03%) were above 100 ppm Au and consisted of 109 and 225 ppm Au. |
Significant drill intercepts, as reported by NFG, are presented in Table 10.16. At Lotto North, gold mineralization is hosted within a series of AFZ-typical epizonal-style veins contained within a north-south striking brittle fault zone immediately north of the Lotto prospect. Gold mineralization contained within this structure has been traced over a strike length of 340 m and to a vertical depth of 180 m; it remains open in all directions and is likely the same structure that hosts the Lotto Main vein but has been offset by late faulting in this region.
When combined with the Lotto Main Zone, these high-grade gold-bearing structures have been drill-defined over a total strike length of 630 m (Figure 10.6; Figure 10.7; Figure 10.8). Exploration is ongoing to expand on this new discovery and is currently focussed from surface to 200 m vertical depth.
| 24 January 2023 | | 166 |
January 2023 Exploration Update: New Found Gold Corp.’s Queensway Gold Project, NL
Table 10.16 Summary of selected relevant drillhole assay results for the Lotto North prospect. Core intervals are apparent widths. Individual core intercepts of high-grade mineralization are denoted by the term, “Including”.
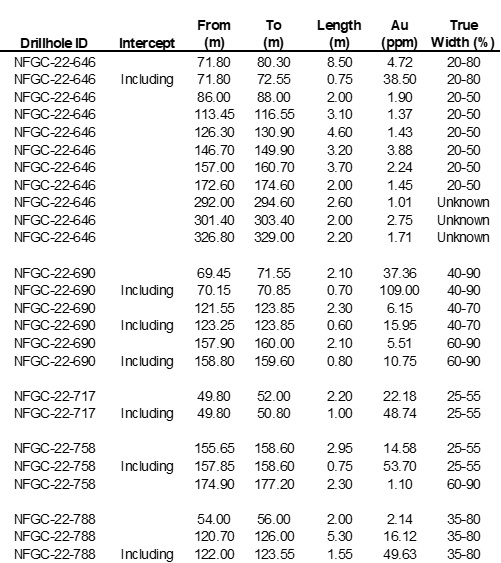
| 10.2.18 | Max Millions Gold Prospect |
The Max Millions prospect is located west of the AFZ in QWN, adjacent to the Lotto prospect (Figure 10.1). This area is currently being targeted in response to the identification of a prominent truncation of a conductive unit (black siltstones) observed in the electromagnetic data and is interpreted to form a lineament having a similar orientation to the Keats-Baseline Fault.
| 24 January 2023 | | 167 |
January 2023 Exploration Update: New Found Gold Corp.’s Queensway Gold Project, NL
In addition to this, low-grade gold mineralization exists in historic drilling in this area. Twenty HQ-size diamond drillholes have been drilled at Max Millions by NFG in 2022, and 7 additional in 2023 as of the Effective Date of this Report. The 27 holes totalled 4,988 m in length (Table 10.1; Table 10.3). A total of 4,068 core samples were collected at the Max Millions prospect and sent for assay.
As of the Effective Date of this report (24 January 2023), all assay results are still pending.
| 10.2.19 | Pocket Pond Gold Prospect |
In May of 2021, NFG initiated a drill program following up on historic drilling and anomalous grab samples at the Pocket Pond prospect located 5.5 km east-northeast of the Keats zone on the JBPFZ in QWN (Figure 10.1). Forty-six HQ-size diamond drillholes were drilled at Pocket Pond by NFG in 2021 and three in 2022. The 49 holes totalled 11,351 m in length (Table 10.1; Table 10.3).
As of the Effective Date of this report (24 January 2023), 5,712 core samples from Pocket Pond have been assayed.
The QPs review of the gold analytical results for the 5,712 samples assayed shows:
| • | 5,599 analytical results (98.02%) were lower than 1 ppm Au, with a maximum of 0.98 ppm Au and an average of 0.05 ppm Au, |
| • | 107 analytical results (1.87%) were between 1 and 18.46 ppm Au, with an average of 2.96 ppm Au, and |
| • | 6 analytical results (0.11%) were between 21.80 and 88.70 ppm Au, with an average of 35.31 ppm Au. |
Drilling has identified mineralization like that seen in the 1744 area, characteristic of the JBP structural trend of epizonal-style, with irregular stylolitic massive to vuggy veins that are spatially associated with brittle faulting and folding in a green siltstone unit (Figure 10.23). Continuity of grade has been difficult to establish; preliminary interpretation suggests that some of the Pocket Pond veins may dip steeply to the northwest.
Significant drill intercepts, as reported by NFG, are presented in Table 10.17. The drilling at Pocket Pond has defined a mineralized trend with a strike length of 160 m and a depth of at least 145 m (Figure 10.21 and Figure 10.22).
| 24 January 2023 | | 168 |
January 2023 Exploration Update: New Found Gold Corp.’s Queensway Gold Project, NL
Figure 10.21 Plan view of Pocket Pond zone with assays above 0.5 ppm Au projected to surface (Source: NFG).

| 24 January 2023 | | 169 |
January 2023 Exploration Update: New Found Gold Corp.’s Queensway Gold Project, NL
Figure 10.22 Pocket Pond Zone longitudinal section, vertically oriented, looking northwest (Source: NFG).

| 24 January 2023 | | 170 |
January 2023 Exploration Update: New Found Gold Corp.’s Queensway Gold Project, NL
Figure 10.23 Example of mineralization at Pocket Pond in NFGC-21-304 from 82 m down-hole depth (Source: NFG).

Table 10.17 Summary of selected relevant drillhole assay results for the Pocket Pond prospect. Core intervals are apparent widths. Individual core intercepts of high-grade mineralization are denoted by the term, “Including”.
| 24 January 2023 | | 171 |
January 2023 Exploration Update: New Found Gold Corp.’s Queensway Gold Project, NL
| 10.2.20 | Road Gold Prospect |
In December 2020, NFG drilled two holes at the Road target, located east of the AFZ and 450 m east of Golden Joint (Figure 10.6). In 2021 and 2022, NFG returned to follow-up on previous drill results, completing an additional 4 holes. The 6 holes totalled 1,532 m in length (Table 10.1; Table 10.3).
As of the Effective Date of this report (24 January 2023), 1,477 core samples from Road have been assayed.
The QPs review of the gold analytical results for the 1,477 samples assayed shows:
| • | 1,463 analytical results (99.05%) were lower than 1 ppm Au, with a maximum of 0.92 ppm Au and an average of 0.02 ppm Au, |
| • | 11 analytical results (0.74%) were between 1 and 9.83 ppm Au, with an average of 3.10 ppm Au, and |
| • | 3 analytical results (0.20%) were between 30.70 and 104.50 ppm Au, with an average of 56.30 ppm Au. |
Significant drill intercepts, as reported by NFG, are presented in Table 10.18. The drill results suggest that gold is associated with a brittle fault that dips at 40° in the 255° direction; the quartz-carbonate veins associated with this fault have massive vuggy, stylolitic and brecciated textures, like other AFZ prospects (Figure 10.7).
Table 10.18 Summary of selected relevant drillhole assay results for the Road prospect. Core intervals are apparent widths. Individual core intercepts of high-grade mineralization are denoted by the term, “Including”.
| 10.2.21 | Rocket Gold Prospect |
In 2022, NFG drilled 23 holes at the Rocket target, along the AFZ in QWN adjacent to Golden Bullet, 2.2 km southwest of the Keats prospect (Figure 10.1; Figure 10.9). The holes totalled 4,249 m in length (Table 10.1; Table 10.3). As of the Effective Date of this report (24 January 2023), 3,065 core samples from Rocket have been assayed.
| 24 January 2023 | | 172 |
January 2023 Exploration Update: New Found Gold Corp.’s Queensway Gold Project, NL
The QPs review of the gold analytical results for the 3,065 samples assayed shows:
| • | 3,057 analytical results (99.74%) were lower than 1 ppm Au, with a maximum of 0.91 ppm Au and an average of 0.01ppm Au, and |
| • | 5 analytical results (0.16%) were between 1 and 118.50 ppm Au, with an average of 16.92 ppm Au. |
Significant drill intercepts, as reported by NFG, are presented in Table 10.19.
Table 10.19 Summary of selected relevant drillhole assay results for the Rocket prospect. Core intervals are apparent widths. Individual core intercepts of high-grade mineralization are denoted by the term, “Including”.

| 10.2.22 | Trans-Canada Highway (TCH) Gold Prospect |
The Trans-Canada Highway (TCH) prospect is located between Cokes and Knob (Figure 10.1). NFG initiated drilling at TCH in 2020 and forty-six HQ-size diamond drillholes have been drilled at TCH as of the Effective Date of this Report. The 46 holes totalled 13,922 m in length (Table 10.1; Table 10.3). As of the Effective Date of this report (24 January 2023), 12,927 core samples from TCH have been assayed.
The QPs review of the gold analytical results for the 12,927 samples assayed shows:
| • | 12,804 analytical results (99.05%) were lower than 1 ppm Au, with a maximum of 0.99 ppm Au and an average of 0.05 ppm Au, |
| • | 122 analytical results (0.94%) were between 1 and 32.43 ppm Au, with an average of 2.54 ppm Au, and |
| • | 1 analytical result (0.01%) was 226.46 ppm Au. |
| 24 January 2023 | | 173 |
January 2023 Exploration Update: New Found Gold Corp.’s Queensway Gold Project, NL
Significant drill intercepts, as reported by NFG, are presented in Table 10.20 and Figure 10.14.
At the TCH prospect, mineralization has been identified in structures located in both the hangingwall (TCW) and footwall (TCH) of the AFZ (Figure 10.9). Epizonal-style veining is associated with significant brittle faulting and silicification in the siltstones. Work is ongoing at TCW targeting Keats-Baseline oriented structures that may exist in the stratigraphy west of the AFZ.
Table 10.20 Summary of selected relevant drillhole assay results for the Trans-Canada Highway prospect. Core intervals are apparent widths. Individual core intercepts of high-grade mineralization are denoted by the term, “Including”.
| 10.2.23 | Whiskey Pocket Gold Prospect |
The Whiskey Pocket prospect is located along the JBPFZ in QWN, 4.5 km southwest of the 798 zone (Figure 10.1 and Figure 10.2).
NFG initiated drilling at Whiskey Pocket in 2022 with 3 HQ-size diamond drillholes. The 3 holes totalled 930 m in length (Table 10.1; Table 10.3).
A total of 500 core samples were collected at Whiskey Pocket and sent for assay. As of the Effective Date of this report (24 January 2023), all samples received assay results.
| 24 January 2023 | | 174 |
January 2023 Exploration Update: New Found Gold Corp.’s Queensway Gold Project, NL
The QPs review of the gold analytical results for the 500 samples assayed shows that all analytical results were lower than 1 ppm Au, with a maximum of 0.37 ppm Au and an average of 0.01 ppm Au.
| 10.2.24 | Zone 36 Gold Prospect |
From August to September 2021, NFG drilled five HQ-size diamond drillholes at the Zone 36 target, along the west side of the AFZ in QWN and 0.8 km north of Lotto (Figure 10.6). The 5 drillholes were 1,129 long in total. In 2022, 17 additional holes were drilled, for a total of 4,477 m (Table 10.1; Table 10.3). As of the Effective Date of this report (24 January 2023), 1,245 core samples from Zone 36 have been assayed.
The QPs review of the gold analytical results for the 1,245 samples assayed shows:
| • | 1,202 analytical results (96.55%) were lower than 1 ppm Au, with a maximum of 0.96 ppm Au and an average of 0.06 ppm Au, and |
| • | 43 analytical results (3.45%) were between 1 and 7.63 ppm Au, with an average of 2.39 ppm Au. |
Significant drill intercepts, as reported by NFG, are presented in Table 10.21. At Zone 36, two prominent veins exist with different orientations, a vein that dips 85° in the 232° direction and a second vein that dips 75° in the 195° direction.
Table 10.21 Summary of selected relevant drillhole assay results for the Zone 36 prospect. Core intervals are apparent widths. Individual core intercepts of high-grade mineralization are denoted by the term, “Including”.

| 24 January 2023 | | 175 |
January 2023 Exploration Update: New Found Gold Corp.’s Queensway Gold Project, NL
Recently, NFG intersected broad gold mineralization west of the AFZ, near the Zone 36 prospect, while working on the Lotto North reconnaissance grid. Considering the recent discovery of high-grade and low-grade gold mineralization at Keats West, this mineralization represents an important new drill target currently being tested. It is also the northernmost intercept to date along the Keats-Golden Joint-Lotto segment of the AFZ and expands the strike length of this high-grade segment of the AFZ to 3.4 km starting from the south end of Keats.
| 10.3 | Queensway South Block Prospects |
Drilling at QWS was initiated in 2022, with 7 prospects now drill tested as of 24 January 2023. A total of 7,255 m across 33 holes have been drilled at QWS in 2022, in its west-central portion (Table 10.1).
The 7 drill-tested prospects at QWS include: Aztec, Bernards Pond, Devil’s Trench, Eastern Pond, Goose, Greenwood, and Paul’s Pond. Drillhole collar locations for the QWS drilled prospects are shown on Figure 10.24.
Core samples from the QWS block prospects have been shipped to the analytical laboratories for assay by NFG, and at the Effective Date of this technical report, the assay results are still pending.
| 10.3.1 | Aztec Gold Prospect |
The Aztec zone is located west of the AFZ in the west-central portion of QWS at the interpreted domain boundary of the Davidsville Group (Figure 10.24). Two HQ-size diamond drillholes were drilled at Aztec by NFG in 2022 to test gold mineralization. The two holes totalled 739 m in length (Table 10.1; Table 10.3). A total of 836 core samples were collected at Aztec and sent for assay. Assay results are still pending.
Aztec is an epithermal target and is defined by a large area of sinter and is associated with a significant fault zone and hydrothermal breccia containing gold that is exposed in a trench and historical drill core. Drilling was designed to test below the sinter and down-dip within the fault-zone and breccia domain.
| 10.3.2 | Bernards Pond Gold Prospect |
The Bernards Pond prospect is located east of the AFZ and west of the JBPFZ in QWS, ~ 5 km northeast of the Aztec prospect (Figure 10.24). Three HQ-size diamond drillholes were drilled at Bernards Pond by NFG in 2022 to test gold mineralization. The three holes totalled 438 m in length (Table 10.1; Table 10.3). A total of 471 core samples were collected at Bernards Pond and sent for assay. Assay results are still pending.
The Bernards Pond target is a gold-in-till anomaly that was subsequently trenched to reveal high contents of arsenopyrite mineralization in a greywacke located in a stratigraphic position akin to the discoveries made along the north segment of the AFZ (Figure 10.24).
| 24 January 2023 | | 176 |
January 2023 Exploration Update: New Found Gold Corp.’s Queensway Gold Project, NL
| 10.3.3 | Devil’s Trench Gold Prospect |
The Devil’s Trench prospect is located east of the AFZ and west of the JBPFZ in the central portion of QWS, ~ 12 km northeast of the Aztec prospect (Figure 10.24). Four HQ-size diamond drillholes were drilled at Devil’s Trench by NFG in 2022 to test gold mineralization. The four holes totalled 551 m in length (Table 10.1; Table 10.3). A total of 637 core samples were collected at Devil’s Trench and sent for assay. Assay results are still pending.
The Devil’s target was identified using soils and is defined by a +1 g/t Au-in-soil anomaly. Subsequent trenching revealed a shear zone with quartz veining and strong arsenopyrite mineralization hosted by a greywacke located similar stratigraphic position to Bernard’s Pond prospect and the QWN AFZ discoveries (Figure 10.24).
| 10.3.4 | Eastern Pond Gold Prospect |
Eastern Pond is located south of the AFZ and west of the JBPFZ in QWS, ~ 5.5 km south of the Aztec prospect and 3 km west-southwest of Bernards Pond (Figure 10.24). One 407 m-long HQ-size diamond drillhole was drilled at Eastern Pond by NFG in 2022 to test gold mineralization (Table 10.1; Table 10.3). A total of 436 core samples were collected at Eastern Pond from the hole drilled and sent for assay. Assay results are still pending.
The Eastern Pond target is defined by high-grade gold in grab samples, largely float, and Au-in-tills which was subsequently trenched to reveal weakly Au-anomalous quartz veins hosted in an interbedded black siltstone domain. This target is locally analogous to the gold discoveries made along the west side of the AFZ at QWN.
| 10.3.5 | Goose Gold Prospect |
The Goose prospect is located west of the AFZ in QWS, ~ 5 km east-northeast of the Aztec showing (Figure 10.24). Five HQ-size diamond drillholes totalling 743 m in length were drilled at Goose by NFG in 2022 to test gold mineralization (Table 10.1; Table 10.3). A total of 882 core samples were collected at Goose and sent for assay. Assay results are still pending.
The Goose target is characterized by high-grade gold previously discovered in drilling that is hosted by a sequence of siltstones that is intruded by a swarm of mafic dykes, largely gabbro. The interpretation is that it occurs west of the AFZ and in a unit that has not been recognized at QWN (Figure 10.24). Based on observations made from the historic drill core, mineralization is commonly hosted within the mafic intrusive rocks.
| 24 January 2023 | | 177 |
January 2023 Exploration Update: New Found Gold Corp.’s Queensway Gold Project, NL
Figure 10.24 Drillhole collar locations in QWS.

| 24 January 2023 | | 178 |
January 2023 Exploration Update: New Found Gold Corp.’s Queensway Gold Project, NL
| 10.3.6 | Greenwood Gold Prospect |
The Greenwood zone is located west of the AFZ in QWS (Figure 10.24). Six HQ-size diamond drillholes were drilled at Greenwood by NFG in 2022. The six holes totalled 756 m in length (Table 10.1; Table 10.3). A total of 872 core samples were collected at Greenwood, but only 870 were sent for assay. 2 field duplicate samples were not sent for assay. Assay results are still pending.
Like the Goose target, Greenwood mineralization is hosted by the siltstone-mafic intrusive unit and the prospect was established by historical grab sampling that identified high-grade gold-in-outcrop.
| 10.3.7 | Paul’s Pond Gold Prospect |
Paul’s Pond is in the central portion of QWS, 7-8 km northeast of the Aztec showing, and is intersected by the AFZ (Figure 10.24). Twelve HQ-size diamond drillholes totalling 3,621 m in length were drilled at the Paul’s Pond prospect by NFG in 2022 to test its gold mineralization (Table 10.1; Table 10.3). A total of 4,305 core samples were collected at Paul’s Pond and sent for assay. Assay results are still pending.
The Paul’s Pond target is defined by a large area with abundant Au-in-float that trends approximately NE following the interpreted trend of the AFZ. Several historical Au + As-in-soil anomalies exist in the area. Initial drilling focused on following up on the float and soil anomalies both in the siltstone-mafic intrusive unit west of the AFZ and in the siltstones east of the AFZ.
| 10.4 | Twin Ponds Block |
Drilling in the Twin Ponds (TP) Block was initiated in 2022. A total of 1,508 m across 7 diamond drillholes have been drilled at TP by NFG in 2022 (Table 10.1; Table 10.3) and as of Effective Date of the report, to test gold mineralization. A total of 1,863 core samples were collected at Twin Ponds and sent for assay. As of the Effective Date of this report (24 January 2023), all assay results from the Twin Ponds 2022 drilling program have been received.
The QPs review of the gold analytical results from Twin Ponds shows:
| • | 1,862 analytical results (99.95%) were lower than 1 ppm Au, with a maximum of 0.8 ppm Au and an average of 0.02 ppm Au, and |
| • | 1 analytical result (1.33 ppm Au, 0.05%) was above between 1 ppm Au. |
The drilling tested three areas of the property (Figure 10.25) with
| 1. | Three drillholes (NFGC-TP-22-01, 02, and 02a) in the northern part on strike, to the northeast, of the Clydesdale showing. |
| 24 January 2023 | | 179 |
January 2023 Exploration Update: New Found Gold Corp.’s Queensway Gold Project, NL
| 2. | One drillhole (NFGC-TP-22-03) in the central part of the property testing the Halley Target where anomalous grab samples were found at the intersection of the Salmon River and North Twin Faults. |
| 3. | Three holes (NFGC-TP-22-04 to 06) in the southern part, just to the north of Twin Ponds testing sections along the Island Pond fault. |
The drilling tested two different stratigraphic areas and the structural contact between the Duder Group in the west and the Ten Mile Lake Formation in the east.
Highlights from this drill program, where assays above 0.1 g/t Au, suggesting anomalous zones, were seen in only 4 holes. Between 165 m to 184.9 m (21.35 m) in hole NFGC-TP-22-01 grades were generally >0.1g/t Au with higher grades >0.2 g/t Au interval between 169 m to 175 m (6 m). This interval was associated with silicified siltstones with a graphitic component and a broad deformation corridor characterized by the presence of a quartz veined zone with breccia, cockade, and banded textures (Figure 10.26). This structure is interpreted to be the Clydesdale Fault, a contact fault between the Duder Group in the west and the Ten Miles Lake Formation in the east.
Hole NFGC-TP-22-02 intercepted similar anomalous >0.1g/t Au grades between 121m to 125.45 m (4.5 m) with a modestly higher-grade zone between 122 m to 124.2 m (2.2 m). Quartz veining in greywacke with boulangerite was seen in this interval.
Hole NFGC-TP-22-05 contained a narrow anomalous zone in altered and silicified gabbro between 104.15 to 107.2 m (3.05 m) and Hole NFGC-TP-22-06 hosted a very narrow interval of elevated gold between 78.5 to 79.95 m (1.45 m) associated with a fault zone.
In general, these anomalous gold intercepts suggest a hydrothermal setting associated with the emplacement of gabbro sills and related bodies where fluids have interacted between mafic intrusive rocks and host sediments. Similar gold showings are seen regionally and in the Duder Lake area are termed, structurally controlled gabbro-hosted gold mineralization (Churchill and Evans 1992).
| 24 January 2023 | | 180 |
January 2023 Exploration Update: New Found Gold Corp.’s Queensway Gold Project, NL
Figure 10.25 Drill collar locations at the Twin Ponds Block.

Figure 10.26 Core Photo of Twin Ponds drillhole NFGC-TP-22-01, 173.3m-183.85 m. Quartz vein zone-breccia, cockade, and banded textures.
| 24 January 2023 | | 181 |
January 2023 Exploration Update: New Found Gold Corp.’s Queensway Gold Project, NL
| 11 | Sample Preparation, Analyses and Security |
Between 2017 and the Effective Date of this technical report (24 January 2023), NFG has collected and assessed a variety of sample types at their Queensway Gold Project in northeast Newfoundland, NL. Sample media includes:
| • | Since 2017, till, soil, surface rock (outcrop and float), and trench channel samples (see Section 9). |
| • | Since 2019, drill core samples (see Section 10). |
The Issuer has commissioned Lynda Bloom (P. Geo.) of Analytical Solutions Ltd. in Mulmur, ON, who specializes in analytical geochemistry, and quality assurance-quality control (QA-QC). Ms. Bloom has provided advice and assistance to NFG, including continuing review of procedures used by the laboratories that prepare and analyse the project’s samples. The QP has reviewed the work prepared by Analytical Solutions, along with protocol sampling and analytical documents provided by NFG and through QP sampling/analytical protocol discussions with NFG. The QP has also considered the work of Srivastava (2022) who reviewed NFG’s sample preparation, analyses, and security as part of NFG’s previous technical report effectively dated May 31, 2022.
Accordingly, this section presents a summary of NFG’s sample collection and preparation, sample security, analytical methodologies, and QA-QC methods adopted by the Issuer during the Company’s 2017-2023 exploration programs at the Queensway Property.
| 11.1 | Sample Collection |
| 11.1.1 | Till Samples |
Till samples were collected and prepared with the goal of analyzing the number and size of gold grains. In the field, samples were screened using an 8 mm sieve to remove pebbles. Approximately 13 kg of the fine material, less than 8 mm, along with 1 kg of the coarse material, the pebbles greater than 8 mm, was packed in a heavy-duty plastic bag and sealed with a cable tie. The -8 mm fraction was used for analysis of gold content, while the +8 mm pebbles were used to log lithology. Till samples were shipped to Overburden Drilling Management (ODM) who created a concentrate.
| 11.1.2 | Soil Samples |
Soil samples were acquired by NFG geologists using a “Dutch Auger” to penetrate down to and sample the B-soil horizon. NFG soil sampling programs also utilized the mass spectrometer Halo mineral identifier on soil samples to determine if the Halo system could recognize alteration halos. Since July 2022, the soil samples were dried and sieved at site. The soil samples were bagged, labelled, and shipped to the laboratories for analysis at Eastern Analytical Ltd. (Eastern Analytical) in Springdale, NL and ALS Canada in Vancouver, BC.
| 24 January 2023 | | 182 |
January 2023 Exploration Update: New Found Gold Corp.’s Queensway Gold Project, NL
| 11.1.3 | Rock Samples |
Rock samples are defined as surface outcrop and float samples, and trench channel samples, that were collected in the field by NFG geologists. Rock grab samples and trench channel samples were placed in heavy duty plastic bags, which were then labelled, sealed, and transported by NFG geologists to NFG’s core facility in Gander, NL.
At the core facility, the samples labels were checked, and the samples were amalgamated into larger bags for transportation of the rock samples by NFG employees to the laboratories that include over the life cycle of the project: Eastern Analytical; ALS Canada Ltd. (ALS), which includes rock preparation labs in multiple Canadian jurisdictions and ALS’ Vancouver analytical laboratory in Vancouver, BC; MSALABS in Val-d’Or, QC; and SGS Canada Inc. (SGS) in Burnaby, BC.
| 11.1.4 | Drill Core |
HQ-sized diamond drill core is transported in sealed core boxes from the NFG prospects and drill sites by NFG employees to the Company’s primary core facility in Gander, NL where the core is logged and analysed by non-destructive mass spectrometer Halo hyperspectral mineral identifier measurements prior to sampling. Once logging is completed, the drill core is transferred to a separate cutting section within the core facility.
The drill core samples are 0.3 to 1 m in core length. The HQ core is sawn in half by diamond saw blades, in which half the core is collected in plastic sample bags for transportation to the laboratories, and the other half is re-orientated into its original position in the core boxes for archival core storage at NFG’s archive core facility in Appleton Business Park in Appleton, NL. Where necessary due to poor core competency, a hydraulic splitter may be used.
At the core facility, the samples labels were checked, and the samples were amalgamated into larger bags for transportation of the core samples by NFG employees to the laboratories: Eastern Analytical, ALS Canada Ltd., MSALABS, and SGS.
| 11.2 | Sample Security |
The procedures for establishing an auditable chain of custody for every sample, and for ensuring the integrity of samples between the project site and the laboratory are the same as in previous years.
The collection, packaging, transport, and receipt of samples were conducted under a strict and traceable chain of custody (CoC). The collection and packaging of samples for shipping was undertaken by contractors of NFG under the supervision of NFG’s Chief Operating Officer, Greg Matheson (P. Geo.). Samples were collected and stored in a dedicated area in the core shack under constant surveillance during the day, which is secured by lock and key at night and under video surveillance. A CoC document was created by the sample processing manager that includes a list of sample numbers and signature lines for the courier and NFG representative confirming the state of the shipment. For shipment, samples were inventoried before being placed in rice bags which were secured with a cable tie. The samples were then placed in shipping bins that were labelled with the shipping information and numbered security seals.
| 24 January 2023 | | 183 |
January 2023 Exploration Update: New Found Gold Corp.’s Queensway Gold Project, NL
All sample transport handling, tracking, and CoC documentation is supervised by NFG personnel. At present, all ALS and MSALABS samples are shipped by commercial courier on a regular basis. NFG contractors delivered the sample bins to the shipping courier along with the CoC form. The CoC was signed and returned to NFG for scanning and cataloguing. The sample shipment was virtually dispatched in the MX Database by NFG sample processing manager for tracking and the laboratory was notified of the incoming shipment. Upon receipt by the laboratory, NFG’s COO and database geologist were informed, and the samples were logged in and checked against NFG’s submittal form and chain of custody document for any discrepancies.
| 11.3 | Sample Preparation and Analysis |
| 11.3.1 | Introduction |
NFG has historically used a variety of independent, commercial, and accredited laboratories that include Eastern Analytical, ALS Canada Ltd., Activation Laboratories Ltd. (ActLabs), SGS Canada Inc. (SGS), ODM, and MSALABS. Chronologically, the general sample preparation and analytical workflow includes:
| • | Prior to May 2018, all NFG samples were transported directly to the Eastern Analytical laboratory in Springdale, NL. |
| • | Since May 2018, and in addition to Eastern Analytical, the samples were also prepared by ALS laboratories in Thunder Bay, ON, Timmins, ON, Sudbury, ON, Winnipeg, MB, and Moncton, NB prior to being analysed at ALS Minerals, in Vancouver B.C. |
| • | NFG stopped sending samples to Eastern Analytical in October 2021. |
| • | At present, and since May 2022, NFG submits rock and drill core samples for gold determination by fire assay at ALS Vancouver and by PhotonAssayTM at MSALABS in Val-d’Or, QC. The rock and core samples are also analysed using a multi-element ICP package (ALS method code ME-ICP61) and a pycnometer for specific gravity (ALS method code OA-GRA08b) for drill core samples only at ALS Vancouver. |
| 24 January 2023 | | 184 |
January 2023 Exploration Update: New Found Gold Corp.’s Queensway Gold Project, NL
| • | Other intermittent analytical work was conducted at ActLabs in Ancaster, ON (till multi-element analysis), ODM in Nepean, ON (till heavy-mineral concentrates), and SGS in Burnaby, BC (check analytical laboratory). |
| 11.3.2 | Laboratory Accreditation |
Eastern Analytical, ActLabs, ALS, MSALABS, ODM, and SGS are commercially accredited labs that are independent of NFG. The predominant labs that performed rock and drill core fire assays (Eastern Analytical and ALS) are both accredited for fire assay determinations to the requirements of ISO/IEC 17025:2017. Eastern Analytical is accredited by the Canadian Association for Laboratory Accreditation Inc. (CALA) and ALS by the Standards Council of Canada (SCC). SGS is also accredited to ISO/IEC 17025:2017. The labs that performed multi-element ICP analyses (Eastern Analytical, ALS and ActLabs) are ISO-accredited for multi-element analytical methods.
MSALABS operates numerous laboratories worldwide and maintains ISO-17025 accreditation for many metal determination methods. The first PhotonAssayTM results for the Queensway Project were released in January 2022, a small set of 69 samples from two drill holes (New Found Gold Corp., 2022e). These were completed at the Intertek Genalysis laboratory in Perth, Australia, where the PhotonAssayTM method is accredited to ISO/IEC 17025 (2017) by the National Association of Testing Authorities, Australia. MSALABS deployed a PhotonAssayTM unit in Val-d’Or, Quebec, in March 2022. While the Company is utilizing and reporting results from the photon assay method at MSA in Val-d'Or, Quebec, the laboratory remains in the accreditation process (MSALABS, pers. comm., 2023).
| 11.3.3 | Laboratory Sample Preparation |
Till samples: ODM created a concentrate of the till samples provided by NFG. Prior to 2019, the concentrates were created using a screening and tabling procedure. After 2019, they were created using ODM’s Heavy Mineral Concentrate (HMC) preparation procedure. The gold content of each sample was estimated from the number of gold grains found in the concentrate and their size. The shape and texture of the grains were also recorded, and the mineralogy of the associated heavy minerals was described.
Soil samples: At Eastern Analytical, the soil samples were dried and sieved through -80 mesh (-180 µm) prior to gold analysis. At NFG, the soil samples were dried and screened through 80 mesh.
Eastern Analytical Rock and Core Sample Preparation:Eastern Analytical crushed to 80% less than 2 mm, pulverized to 95% less than 106 μm, and selected 30 g and 40 g aliquots for analyses by fire assay and screen fire assays, respectively.
ALS Rock and Core Sample Preparation: The NFG samples were prepared at ALS, Sudbury, ON, Thunder Bay, ON, Timmins, ON, Winnipeg, MB or Moncton, NB. A split of the pulp is forwarded to ALS, Vancouver, BC, for routine fire assay and multi-element ICP. For samples submitted for screened fire assay (SFA; ALS method Au-SCR24C), samples are screened in Sudbury; the entire plus fraction is shipped to ALS, Vancouver, BC, along with approximately 200 grams of the fine fraction.
| 24 January 2023 | | 185 |
January 2023 Exploration Update: New Found Gold Corp.’s Queensway Gold Project, NL
For routine or non-mineralized samples (expected less than 1 ppm Au), assay preparation procedures at ALS involved crushing of the entire sample in a Boyd Mk 4 crusher to 70% passing -10 mesh (2 mm; Method Code CRU-31). A 1,000-g aliquot was collected by standard riffle split and the remainder was bagged and stored as coarse reject. This aliquot was pulverized to 85% passing -200 mesh (75 μm) using an LM2 ring-mill pulveriser (PUL-21) and collected in the master pulp bag. From this bag, 100–140 g was scooped using the laboratory split sample envelope and sent to the analytical facility in Vancouver to be analysed by fire assay and multielement analytical method.
For the screen fire assay (SFA) procedure, if the sample was 3 kg or less in weight, the entire sample was crushed in a Boyd Mk 4 or Terminator jaw crusher to 70% passing 10 mesh (2 mm; ALS Method Code CRU-21). Excess material has been stored as a coarse reject. The crushed sample was pulverized in an LM2 pulveriser (ALS Method Code PUL-21) to 85% passing 200 mesh (75 μm) using bowls with a capacity of 1 kg.
MSALABS Rock and Core Sample Preparation: The NFG samples were crushed, distributed into plastic jars, and assayed at MSALABS, Val-d’Or, QC. For all samples, the entire sample is crushed in a TM Terminator jaw crusher to 70% passing -10 mesh (2 mm).
| 11.3.4 | Laboratory Analytical Methodologies |
The analytical methodologies discussed in this sub-section include analytical work conducted between 2019 and the present.
| 11.3.4.1 | Eastern Analytical: Fire Assay Analysis |
The gold and multi-element analytical methods used by Eastern Analytical are summarized in Table 11.1. Fire assay is by lead-collection/fusion in which the silver bead is dissolved in an aqua-regia digestion and analysis is by atomic absorption (AA) finish.
The Eastern Analytical metallic screen fire assay method began with the same crushing and pulverizing steps as they used for their conventional fire assays; all the pulp was sieved using the #150 screen to create a fine fraction (-106 μm) and a coarse fraction (+106 μm). Two fire assays of 40 g aliquots were done on the fine fraction, while the coarse fraction was fire assayed in its entirety. The grade of the original sample was then calculated by weighting the three fire assays by the mass of material each one represented.
Soil samples analysed at Eastern Analytical utilized a fire assay package (code: Au AA30) and by multielement ICP (Au+34 elements).
| 24 January 2023 | | 186 |
January 2023 Exploration Update: New Found Gold Corp.’s Queensway Gold Project, NL
Table 11.1 Analytical methods used by Eastern Analytical.
| Analyte | Method Code | Detection Limit | Type of Method | Finish |
| Au | AA30 | 0.005 ppm | 30 g fire assay | AAS |
| Au | AA40 | 0.005 ppm | 40 g fire assay | AAS |
| Au | Au Met | 0.010 ppm | Screen fire assay | AAS / Gravimetric / Hybrid |
| 11.3.4.2 | ALS Canada Ltd.: Fire Assay and Multi-Element Analysis |
The gold and multi-element analytical methods used by ALS are summarized in Table 11.2. The ICP-21 and AA-26 codes provide gold analyte measurements by fire assay inductively coupled plasma atomic emission spectroscopy (ICP-AES) and atomic-absorption (AA) analysis, respectively. Samples with 30-g fire assay results over 1 ppm Au and samples from expected mineralized zones were evaluated and analysed by screen fire assay.
If the reject weight of the sample was:
| • | 2 kg or less in weight, the reject was added to the master pulp for metallic screen fire assay (SFA). |
| • | Was greater than 3 kg, excess material is stored as a coarse reject. In this case, there are two pulp materials; one is the pulp from the routine fire assay and the other is the minus fraction of screen fire assays. |
The SFA method is used as the primary assay method for samples identified as being in a mineralized zone. The pulverized material was combined on a mat and homogenized by four-corner rolling. Following homogenization, the sample was dry screened using -150 mesh (106 μm) screens. The oversize material, including the screens, were combined forming the coarse, or (+), fraction. The undersize lots were combined on a mat and homogenized by four-corner rolling, forming the fine, or (-), fraction. From the (-) fraction, approximately 300 g was scooped using an envelope. Both the (+) and the (-) fraction were shipped to ALS Vancouver for fire assays. From the (-) fraction shipped to Vancouver, ALS takes a split of less than 50 grams for other analyses.
The multi-element geochemical analysis Code ME-ICP61 utilized a 4-acid digestion (perchloric, nitric, hydrofluoric, and hydrochloric acids) with analysis by Inductively Coupled Plasma - Atomic Emission Spectroscopy (ICP - AES). Note: In 2019, Code ME-ICP41 was implemented by NFG at ALS prior to switching to 61 elements in 2020.
Soil samples analysed at ALS Global utilized a trace gold plus multi-element package (ALS code: AuME-ST44).
| 24 January 2023 | | 187 |
January 2023 Exploration Update: New Found Gold Corp.’s Queensway Gold Project, NL
Table 11.2 Analytical methods used by ALS.
| Analyte | Method Code | Detection Limit | Type of Method | Finish |
| Au | ICP-21 | 0.001 ppm | 30 g fire assay | ICP |
| Au | AA-26 | 0.01 ppm | 50 g fire assay | AAS |
| Au | Au-SCR24C | 0.05 ppm | Screen fire assay | Gravimetric and AAS |
| Multi-element | ME-ICP61 | Variable for 33 elements | 4-acid digestion | ICP |
| Au | AuME-ST44 | 0.0001 ppm | 50 g aqua regia | ICP |
| 11.3.4.3 | ALS Canada Ltd.: Specific Gravity Measurements |
Since May 2022, NFG started collecting specific gravity (“S.G.”) measurements on pulps at ALS using a pycnometer (OA-GRA08b) for about 1 sample every 50 m. The S.G. measurements were conducted only on gold mineralized samples. A prepared pulverized sample (3.0 g) is weighed into an empty pycnometer. The pycnometer is filled with a solvent (either methanol or acetone) and then weighed. From the weight of the sample and the weight of the solvent displaced by the sample, the specific gravity is calculated.
The S.G. of NFG samples ranges from 2.55 to 3.18, with an average of 2.77. Since October 20, 2022, NFG started collecting duplicate S.G. samples at a frequency of 1 in every 20 S.G. samples. Most of the duplicate data agree within ± 5%.
| 11.3.4.4 | MSALABS: PhotonAssayTM Analysis |
NFG conducts gold assays using the Chrysos PhotonAssayTM analytical method, which was originally developed at Australia’s national science agency, CSIRO. The Chrysos PhotonAssayTM method uses high-energy X-ray technology that causes excitation of atomic nuclei which emanate a unique signature that can be measured allowing the rapid analysis of gold in approximately two minutes. The benefits of utilizing the Chrysos PhotonAssayTM method include 1) a more cost-effective analysis of larger samples that are nearly 15 times the size of a standard 30-g fire assay, 2) better turnaround times, 3) the method is non-destructive which allows the same material to be re-assayed by other methods for gold or additional test work, and 4) the method is an environmentally friendly alternative to traditional lead fire assay methods.
A summary of the MSALABS method codes is presented in Table 11.3. Two jars, or approximately 900 grams, were assayed for routine or non-mineralized samples (with an expected assay of less than 1 ppm Au). The crushed sample was riffle-split using a standard riffle (Humboldt H-3987) and material was weighted into two plastic jars up to November 10, 2022. The two jars were assayed for PhotonAssayTM (MSA Method Code CPA-Au1D).
| 24 January 2023 | | 188 |
January 2023 Exploration Update: New Found Gold Corp.’s Queensway Gold Project, NL
Table 11.3 MSALABS analytical methods used at the NFG Queensway Project.
| Analyte | Method Code | Detection Limit | Description |
| Au | CPA-Au1 | 0.015 ppm | Photon assay - single |
| Au | CPA-Au1D | 0.015 ppm | Photon assay - duplicate |
| Au | CPA-Au1E | 0.015 ppm | Photon assay - extinction |
After a review of results for June to November 2022, a change was made so that one 450-g aliquot was collected by standard riffle split and transferred into a plastic jar for PhotonAssayTM (MSA Method Code CPA-Au1). The remainder of the crushed sample material was bagged and stored as coarse reject. If these routine samples had PhotonAssayTM results greater than 1 ppm Au (MSA Method Code CPA-Au1 or CPA-Au1D), this automatically triggered PhotonAssayTM for all remaining material (MSA Method Code CPA-Au1E). The coarse rejects are retrieved and distributed into multiple jars until material depletion for PhotonAssayTM.
For all samples in a mineralized zone, the crushed sample was distributed into plastic jars for PhotonAssayTM (CPA-Au1E) regardless of how many jars were required. All irradiated material is available for re-assays within hours of the process being completed.
The sample vials are then sealed and weighed with each jar having a unique identifier. A reusable reference disc is used to maintain calibration during the activation and measurement processes. The applicable gold range when using the PhotonAssayTM method is 0.015 g/t to 35,000 g/t Au. Activation of the atomic nuclei is achieved using a high-energy linear accelerator x-ray source. The activated gold atoms emit a unique isomerism signature that can be measured to determine gold content. The source x-rays and signature gamma x-rays are extremely penetrating, which implies that a true bulk analysis is determined. The period of irradiation is typically 15-20 seconds. The sample is transferred to a detection station where the excited and emitting gold nuclei relax back to the ground state. During this process, gamma rays are emitted with a characteristic imaging of 279 KeV. The recording system records and counts the gamma rays which are then converted to the gold concentration of the sample.
The assays reported from all jars are combined on a weight-averaged basis.
Note: The first jar of every sample is forwarded to ALS for pulverizing, routine multi-element ICP and specific gravity measurements (see Section 11.4.12).
| 11.3.4.5 | PhotonAssayTM Versus Conventional Screen Fire Assay Comparisons |
To the Effective Date of this technical report, NFG has conducted 17,959 PhotonAssayTM assays. Prior to releasing any PhotonAssayTM results publicly, NFG carried out an extensive test of the PhotonAssayTM assays against gold results from traditional fire assay. Samples were analysed using a minimum of two jars.
| 24 January 2023 | | 189 |
January 2023 Exploration Update: New Found Gold Corp.’s Queensway Gold Project, NL
During the PhotonAssayTM analysis, the first jar of each sample was forwarded to ALS Sudbury for pulverization. For mineralized samples reporting over 100 ppm by PhotonAssayTM, all jars belonging to the samples are forwarded to ALS Sudbury for screen fire assays to validate results. The aliquot was pulverized to 85% passing -200 mesh (75 μm) using an LM2 ring-mill pulveriser (ALS Method Code PUL-21) and collected in the master pulp bag. From this bag, 100–140 g was scooped using the laboratory split sample envelope and sent to the ALS analytical facility in Vancouver to be analysed for multielement ICP (ALS Method Code ME-ICP61).
The same pulp is used for determination of specific gravity (ALS Method Code OA-GRA08b). The OA-GRA08b method is a pycnometer measurement using 3g of sample to determine specific gravity.
For the validation study, 551 single jars of representative material were sent to ALS, Vancouver, for fire assay determinations. All the samples were from early MSALABS batches reported between mid-June and mid-August 2022.
Entire jars of crushed material were sent to ALS, Sudbury for screened metallics assay (ALS Method Code Au-SCR24C) in 293 cases where higher gold grades were expected. Another 258 samples with lower grades were submitted for duplicate 30-g fire assays with ICP finish (ALS Method Code Au-ICP21) where coarse gold was not expected. A total of 83 OREAS CRMs and 22 blanks were inserted with samples. The reported results for the QC samples reported within expectations and show that the ALS assays are suitable for validation of the PhotonAssayTM assays.
The results by PhotonAssayTM and fire assay correspond well above 0.2 ppm Au (Figure 11.1). Most of the results agree within ± 10%.
Gold results were less than 0.2 ppm at ALS for 53% of the samples. Results less than 0.2 ppm Au by PhotonAssayTM are confirmed as less than 0.2 ppm Au at ALS. The detection limit for the ALS fire assays is 0.001 ppm Au and PhotonAssayTM has a quoted detection limit of 0.015 ppm Au. The PhotonAssayTM detection limit is determined by counting statistics of the detector for individual samples.
Further review of the 192 samples with over 1 ppm Au shows that there are 20 samples where ALS and MSALABS results differ by more than ± 15%. Of these samples, 11 differ by more than ± 25%. These are mostly samples with less than 4 ppm Au.
Only two samples greater than 1 ppm Au were assayed by 30-g fire assay at ALS (E603892 and E603945) and the remainder were assayed by screened metallics. There is no apparent bias between the methods as there is a nearly even number of positive and negative differences.
Eleven samples reported Au values of between 140 and 210 ppm Au by PhotonAssayTM (Figure 11.2). All the screened metallics assays are higher than the PhotonAssayTM.
| 24 January 2023 | | 190 |
January 2023 Exploration Update: New Found Gold Corp.’s Queensway Gold Project, NL
Figure 11.1 Comparison of MSALABS PhotonAssayTM vs ALS FA gold assays.

Figure 11.2 Comparison of MSALABS PA vs ALS FA gold assays over 100 ppm.

| 24 January 2023 | | 191 |
January 2023 Exploration Update: New Found Gold Corp.’s Queensway Gold Project, NL
The calculated least squares regression suggests that the differences on average are about 5% higher by screened metallics vs. PhotonAssayTM. This result is anticipated as samples with high grade gold assays are often associated with very large gold grains and clusters. As gold is partially self-attenuating, there is an effective reduction in the gold grades with the PhotonAssayTM method. Based on this study, it was concluded that there has been sufficient test work and quality control results to validate the PhotonAssayTM method for the Queensway samples. It is recommended that gold deportment studies be initiated to define gold grain sizes and determine if additional sample preparation prior to PhotonAssayTM may reduce the low bias for very high-grade samples.
| 11.3.4.6 | Activation Laboratories Ltd.: Multi-Element Analysis |
For some of the till samples, ActLabs used instrumental neutron activation (INAA) to measure multi-element chemistry (ActLabs code: 1H INAA(INAAGEO)/Total Digestion ICP(TOTAL). The method uses a 4-Acid “near total” digestion for total determinations of resistive elements followed by ICP analysis.
| 11.3.4.7 | SGS Canada Inc.: Gold Analysis |
SGS in Burnaby, BC was utilized as a check laboratory by NFG. Gold analysis was conducted using SGS code GE_FAI150V5 (exploration grade gold fire assay by ICP-AES with Pt and Pd) and GO_FAG50V (ore grade gold fire assay with a gravimetric finish).
| 11.3.4.8 | Overburden Drilling Management: Till Gold Grain Counts |
For the till samples that were concentrated and analysed by ODM, the gold grade was established by calculating the size of each grain and summing the gold content of all the grains to get an estimate of the total gold content of the sample, which could be converted to a calculated grade for the mass of the original sample (Holmes and Michaud, 2017). The ODM grain-based estimates of gold grade are not considered to represent precise measurements by the QP, but rather are semi-qualitative information in that they still provide useful information for drill targeting (e.g., areas in which till samples contained a lot of gold compared to those areas that contain no to very little gold).
| 11.3.4.9 | General Comments on Screen Fire Assays |
The SFA method is used as the primary assay method for samples identified as being in a mineralized zone. Since 2019, samples with 30-g fire assay results over 1 ppm Au and samples with expected high Au grade were analysed by screen fire assay (ALS method Au-SCR24C). For the metallic screen fire assay procedure, if the sample was 3 kg or less in weight, the entire sample was crushed in a Boyd Mk 4 or Terminator jaw crusher to 70% passing 10 mesh (2 mm; CRU-21). Up until January 19, 2021, if the received weight was larger than 3 kg, the crushed sample was split into two lots (‘A’ and ‘B’), which were both processed and analysed by the screen fire procedure.
| 24 January 2023 | | 192 |
January 2023 Exploration Update: New Found Gold Corp.’s Queensway Gold Project, NL
As of January 19, 2021, a maximum of 3 kg was pulverized to 85% passing 200 mesh (75 µm) and submitted for screen fire assays with any excess material stored as a coarse reject. Approximately 60% of samples submitted for metallic screen fire assay weigh less than 3 kg and 5% of samples weigh more than 4.45 kg. Since February 2022, NFG changed the preparation procedure for routine samples to crushing to 70% passing 10 mesh (CRU-31) to align with procedures used for screen fire assay samples.
| 11.4 | Quality Assurance and Quality Control |
NFG inserted QA-QC samples once into every 20 NFG samples on average that included Sample Blanks, OREAS Certified Reference Materials (CRMs), and Core Duplicate samples. The Sample Blank material is quartz sandstone from the Botwood Group at Peter’s River Quarry in central Newfoundland. Between 500-600 g of Sample Blank material is submitted to the laboratory for each blank insertion within the sample stream for routine fire assay. Approximately 3 kg of blank material is submitted for each blank insertion of those samples that are submitted for Screen Fire Assays (SFA). The CRMs were purchased from Ore Research and Exploration Pty Ltd. and represent certified, homogenous quality control material that is distributed in sealed packets. In addition, NFG conducted lab-check assays and completed a comparison between conventional screen fire assays and PhotonAssayTM analyses. Finally, the laboratories conducted pulp duplicate and coarse reject duplicate analyses.
NFG has commissioned Analytical Solutions to design and review the QA-QC program at the Queensway Property. The QA-QC protocols and interpretation of results are performed by NFG under the direction of Lynda Bloom, P. Geo. Quality Control data are evaluated on receipt from the laboratories for failures. Appropriate action is taken if assay results for CRMs and blanks fall outside allowed tolerances. All results stated have passed NFG’s quality control protocols. The QP has reviewed the QA-QC work conducted by Analytical Solutions and concludes that NFG’s QA-QC program is consistent with industry best practices.
| 11.4.1 | Certified Reference Materials |
Between 2019 and the present, NFG has utilized 11 different OREAS CRM samples that were developed exclusively for the mining, exploration and analytical industries and are distributed worldwide in over 135 countries. The CRMs are presented in Table 11.4.
| 11.4.1.1 | Certified Reference Materials: Fire Assay at ALS |
The reader can review pre-February 2022 QA-QC CRM data for ALS analyses in Srivastava (2022). A current example of NFG’s CRM sample analysis at ALS (February 2022 to the Effective Date of this report) is presented in Table 11.5. Over this period, NFG inserted 7,827 OREAS CRMs into the sample stream; there were less than 0.6% failures, and all were followed up appropriately. The average reported values for the 11 CRMs used reported within an acceptable ± 2% of the accepted values (Table 11.5). There is no evidence of bias for the reference materials in this period.
| 24 January 2023 | | 193 |
January 2023 Exploration Update: New Found Gold Corp.’s Queensway Gold Project, NL
Table 11.4 Overview of OREAS Certified Reference Materials that were inserted into the analytical sample stream by NFG. Note: NFG utilizes the Pb Fire Assay certified values in their QA-QC workflow; the PhotonAssay certified values are provided to complete the CRM ID information.

Table 11.5 Summary statistics on CRMs assayed at ALS using the fire assay, technique.

| 24 January 2023 | | 194 |
January 2023 Exploration Update: New Found Gold Corp.’s Queensway Gold Project, NL
| 11.4.1.2 | Certified Reference Materials: Fire Assay at Eastern Analytical |
The reader can review pre-February 2022 QA-QC CRM data for Eastern Analytical analyses in Srivastava (2022; i.e., NFG’s previous technical report). To provide a current example of NFG’s CRM sample analysis at Eastern Analytical, a summary of the expected and reported values for the last year (i.e., February 2022 to the Effective Date of this report) – is presented in Table 11.6. NFG stopped using Eastern Analytical in October 2021; however, the Company continued receiving assays from Eastern Analytical until May 5, 2022. Based on 403 CRM analyses, there was no evidence of systematic contamination nor is there any bias of the average concentrations of CRMs.
Table 11.6 Summary statistics on CRMs assayed at Eastern Analytical.

| 11.4.1.3 | Certified Reference Materials: PhotonAssayTM at MSALABS |
NFG inserted a total of 844 OREAS CRMs into the PhotonAssayTM sample stream for an insertion rate of approximately 5% to evaluate QC performance of PhotonAssayTM. The CRMs were not identified to MSALABS. Apart from OREAS 211 CRM, the average reported values for the 9 CRMs used reported within an acceptable ± 3% of the accepted values (Table 11.7). The explanation may be that fire assay certified values may not be as appropriate for PhotonAssayTM.
Table 11.7 Summary statistics on CRMs assayed at MSALAB using the PhotoAssayTM, technique.

| 24 January 2023 | | 195 |
January 2023 Exploration Update: New Found Gold Corp.’s Queensway Gold Project, NL
| 11.4.2 | Sample Blanks (Eastern Analytical, ALS, and MSALABS) |
For Eastern Analytical, none of the 403 blanks exceeded the allowed low background level of 10x the detection limit.
For ALS, the analytical results for 7,341 blanks were reviewed and yielded less than 0.1 ppm Au and are therefore deemed acceptable. Based on these results, neither laboratory has documented sample or laboratory contamination errors within the NFG sample assay streams.
With respect to MSALABS and the PhotonAssayTM analytical work, a total of 751 Sample Blanks were inserted into the analytical sample stream. The allowed upper limit is 0.1 ppm Au for blanks assayed by PhotonAssayTM (CPA-Au). Results for the blanks inserted were reviewed and all passed the quality control limits.
| 11.4.3 | Core Duplicates |
Assays for almost 500 half-core duplicates were available in May 2022 when the previous Technical Report was completed (Srivastava, 2022). Studies of the data were led by two independent consultants: Lynda Bloom and Mo Srivastava. Their conclusion, presented in mid-February 2022, was that there is no systematic bias in the Queensway assays, and that the large differences sometimes seen between half-core duplicates is due to a combination of 3 factors:
| 1. | The inherent short-scale variability common in orogenic gold deposits like Queensway. |
| 2. | The tendency of half-core duplicate studies to select high-grade samples for checking, which creates a selection bias that leads to second assays tending to come back lower than the first high-grade result. |
| 3. | The linkage between variability and grade. With high-grade samples having more erratic distribution of larger gold grains than low-grade ones, fluctuations in the results from high-grade intervals will dominate conventional statistical comparisons like differences between the averages, or correlation coefficients. |
The correlation between the assays for the two halves of the core is good and there is also considerable scatter in the cloud, with several outliers. Many of the erratic samples are those with abundant visible gold (VG), which is consistent with the view that the explanation lies in the natural short scale in situ variability of gold mineralization, and not in sample collection, preparation, or analysis. Other factors that also contributed to variability and uncertainty were poor rock quality and uncertainty in the exact boundaries of the original sample interval.
Between February 2022 and the Effective Date of this report, a total of 7,546 duplicate half core samples were collected. When field duplicates are indicated by geologists on sampling sheet, both sides of the drill core are sampled. The side with tick marks, consistently the right side of the core, is sampled as the parent sample per normal sampling procedures. The left side is sampled as the core duplicate. The duplicate sample is assigned the next subsequent sample number. As no drill core remains in the core box, the core cutting technician sweeps the bottom of the core box using a small brush to remove all remaining material and distributes half to each of the core samples.
| 24 January 2023 | | 196 |
January 2023 Exploration Update: New Found Gold Corp.’s Queensway Gold Project, NL
Sample intervals for duplicates are selected systematically for approximately 1 in 20 samples. Ninety percent of the core duplicates samples were submitted to ALS for sample preparation and analysis and the remainder were analysed by PhotonAssayTM. Overall, there is no apparent bias for the core duplicate data set (Figure 11.3). The differences between assays for the two core halves are almost exactly divided into thirds for positive differences, negative differences, and no differences.
Duplicate results closer to the detection limit have greater disparity than samples with higher concentrations. As general rule, precision for analytical methods improves as concentrations increase. More mineralized samples have higher gold concentrations so that the analytical uncertainty is less, but these samples also likely have more particulate gold so that sampling issues prevail.
Figure 11.3 Comparison of two halves of the core for gold.

| 24 January 2023 | | 197 |
January 2023 Exploration Update: New Found Gold Corp.’s Queensway Gold Project, NL
When samples are analysed by 30-g fire assay (ALS Method Code ICP-21) there is a greater scatter of results than for samples analysed by screened fire assay (ALS Method Code SCR24C), on up to 3 kg of material, and by PhotonAssayTM on large, 450-g samples or to extinction. Ninety percent of the duplicate core samples were analysed by 30-g fire assay. As drill core samples for duplicates were selected systematically, 90% of results are less than 0.3 ppm Au and therefore were assayed by the 30-g fire assay method.
Figure 11.4 shows the comparison of gold assays when the analytical methods use larger samples, or the entire sample is analysed. The precision is significantly improved except for Au grades less than about 0.1 Au ppm for PhotonAssayTM. The lower detection limit for PhotonAssayTM is higher than for the fire assay methods which accounts for the poor precision at very low concentrations.
Figure 11.4 Core duplicate assays compared for larger sample aliquots.

There are 352 core duplicates analysed by screened fire assay or PhotonAssayTM with the average gold grade over 0.3 ppm. About half of the duplicate pair assays agree within ± 25% for both methods (Figure 11.4). A higher percentage of duplicates analysed by PhotonAssayTM agree within ± 50% compared to screened fire assay. The screened fire assay is done on 3 kg of sample material and some reject may not be assayed. One third of the samples assayed by PhotonAssayTM were done to extinction so that the entire sample was assayed for both halves of the core.
| 24 January 2023 | | 198 |
January 2023 Exploration Update: New Found Gold Corp.’s Queensway Gold Project, NL
The study of 7,546 core duplicates demonstrates the effect of inhomogeneous distribution of gold at all levels of sampling. The observations are consistent with the findings of the study of almost 500 core duplicates as reported in the previous technical report. The erratic samples are those with abundant visible gold (VG), which is consistent with the view that the explanation lies in the natural short scale in situ variability of gold mineralization, and not in sample collection, preparation, or analysis.
The precision of assays for pulps and rejects contributes to variability when comparing core duplicate assays. The importance of using large samples to achieve more reliable assays is apparent.
NFG core technicians are provided with detailed core sampling protocols. It is recommended that these procedures be reviewed with all staff on a regular basis and supervision is provided when cutting core for highly mineralized sample intervals.
| 11.4.4 | Precision of Laboratory Duplicates: By Fire Assay |
The internal QA-QC programs conducted by the laboratories included internal checks of duplicates taken from the same prepared pulp. These pulp duplicates provide an estimate of the reproducibility related to the uncertainties inherent in the analytical method and the homogeneity of the pulps. The precision or relative percent difference calculated for the pulp duplicates indicates whether pulverizing specifications should be changed and/or whether alternative methods, such as screen metallics for gold, should be considered.
ALS analysed 5% of sample pulps in duplicate as part of its internal quality control program. Figure 11.5 compares the results for 6,764 duplicates for 30-g fire assays. The low detection limit ICP method (ALS Method Code ICP21) was used for 89% of the samples and the remainder were assayed with an AAS finish (ALS Method Code AA26) that has a higher detection limit and it used primarily for screened metallics assays. The upper limit for the ICP21 method is 10 ppm Au.
The duplicates for the AA26 method tend to show better reproducibility than for the ICP21 method above 0.1 ppm Au. Although the lower detection limit for the ICP21 method is ten times lower than the AA26 method, the AA26 method is primarily used to assay samples after they have been sieved to remove coarse gold, thus accounting for the improvement. In general, assays over 0.1 g/t Au repeated within ± 15 to 20% at both laboratories which is acceptable performance. Of the 454 samples with an average gold grade over 1 ppm, almost all the duplicate results agree within an acceptable ± 20%.
ALS also analyses two splits of the crushed material for 1 in 50 samples as part of its’ internal quality control program. All the 1,720 preparation duplicates were analysed by the ICP21 or AA26 fire assay method (Figure 11.6). The material sampled for the preparation duplicates is -2 mm which is much larger than the expected particle size of 75 microns for pulps. As a result, there is greater scatter in the gold results for preparation duplicates relative to pulp duplicates.
| 24 January 2023 | | 199 |
January 2023 Exploration Update: New Found Gold Corp.’s Queensway Gold Project, NL
| 11.4.5 | Precision of Laboratory Duplicates: By PhotonAssayTM |
MSALABS irradiated every 40th jar of crushed material twice and uses the information as analytical duplicates for its internal QC. A total of 1,379 duplicate analyses were completed for all methods. Of these, there were 1,102 primary analyses that reported less than 0.1 ppm Au and 99% of the assays for the duplicate result also reported below 0.1 ppm Au. The 277 analytical duplicates with more than 0.1 ppm Au agree within ± 20% for 87% of the cases and perform within expectations of the method (Figure 11.7).
Jar duplicate data obtained from analyses (CPA-Au1D) conducted from inception to November 10, 2022, can also be used to establish the precision of the method when comparing two approximately 450-g splits of the -2 mm crushed material. These results incorporate both the analytical uncertainty measured by the analytical duplicates as well as the process for creating splits.
Figure 11.5 Comparison of 30-g and 50-g gold assays on pulps.
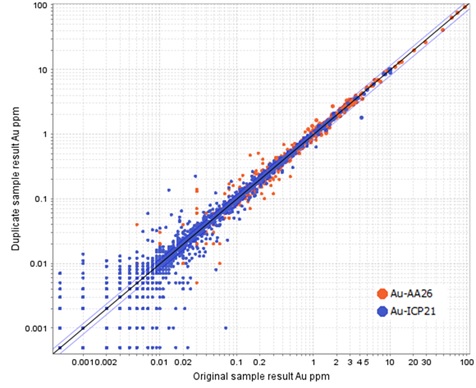
| 24 January 2023 | | 200 |
January 2023 Exploration Update: New Found Gold Corp.’s Queensway Gold Project, NL
Figure 11.6 ALS Internal preparation duplicates (± 20% error bars in blue).

Figure 11.7 MSALABS analytical duplicates.
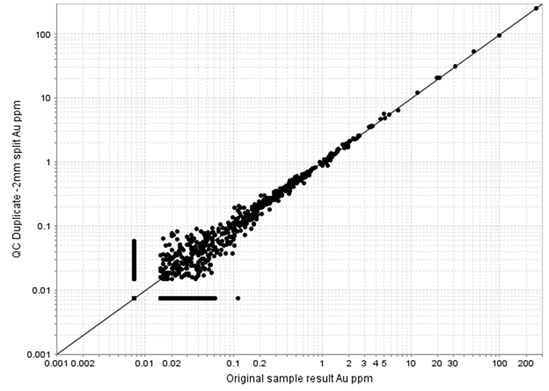
| 24 January 2023 | | 201 |
A total of 13,118 jar duplicates were analysed by MSALABS by PhotonAssayTM. Of the 11,128 samples with the first split reporting below 0.1ppm Au, the duplicate assay also reported below 0.1ppm Au for 98% of the cases (Figure 11.8).
There were 1,990 samples that reported above 0.1 ppm Au and duplicate paired data for 60% of the samples agree within ±20%.
There are 47 cases where the average gold for two jars is over 2 ppm Au. Of these cases, there are 23 examples where the difference between the assays of the two jars, relative to the average, are outside ± 50%. Even with assaying of 450-g sample aliquots, subsampling introduces considerable uncertainty.
The variability is expected for an orogenic gold deposit with visible in gold in mineralized drill core. The samples are listed in Table 11.8 to demonstrate the importance of using assay-to-extinction methods (either multiple jars by PhotonAssayTM or screened metallics of large sample splits) for higher grade samples. The duplicate data are used to optimize the PhotonAssayTM assay strategy and will continue to be monitored.
All the quality control data for assays performed at MSALABS are within expected ranges and data are acceptable for NFG’s exploration programs.
Figure 11.8 Duplicate jar assays by PhotonAssayTM.
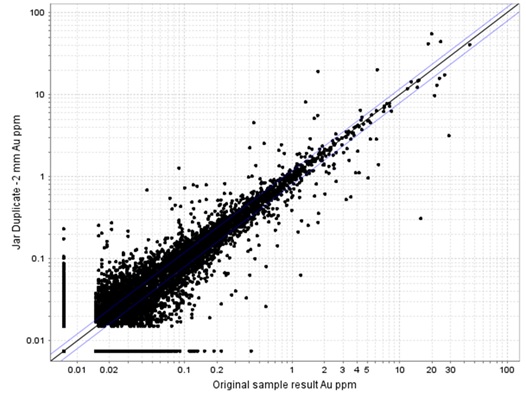
| 24 January 2023 | | 202 |
January 2023 Exploration Update: New Found Gold Corp.’s Queensway Gold Project, NL
Table 11.8 Jar Duplicates with greater than 2 ppm Au and high relative differences.

| 11.4.6 | Check Assays |
A selection of samples is submitted to a secondary laboratory for check assays. In 2022, sample pulps for routine check assays were sent to SGS, Burnaby. SGS is a ISO17025-accredited laboratory with operations worldwide.
Sample pulps are selected randomly for check assays from seven grade bins. A low percentage of samples are selected for lower grades which make up a large proportion of the sample population. Up to 5% of samples from higher grade ranges are selected.
There were eight different OREAS CRMs inserted 20 times with samples submitted to SGS. The gold concentrations ranged from 0.34 to 43 ppm Au. All the assays for CRMs were reported by SGS within -5 to +4% of the expected values for gold except for one of the high-grade CRMs that reported 10% lower than the accepted value. Overall, SGS performed very well, and the assays are suitable for the check assay program.
| 24 January 2023 | | 203 |
January 2023 Exploration Update: New Found Gold Corp.’s Queensway Gold Project, NL
There were 86 low grade samples analysed by 50-g fire assay (ALS Method Code ICP21) and for 50-g fire assay (SGS Method Code GE_FAI50V5) or with a gravimetric finish (SGS Method Code GO_FAG50V) at SGS (Figure 11.9). The results are mostly less than 1 ppm Au and 80% agree within ± 20%. There is no apparent bias and the SGS results support the ALS assays.
Check assays are also performed on the fine fraction that is generated from the screened metallics assays. Higher gold concentrations are best represented by the samples submitted for screened metallics assays. The coarse gold, or (+), fraction is assayed entirely for the screened metallics method and only the fine, or (-), fraction is available for check assays. Using the fine fraction for check assays has the added benefit that pulps are more representative and there are fewer issues with poor homogeneity.
A total of 222 fine fractions prepared and assayed were submitted to SGS, Burnaby, BC, for 50-g fire assay gold determinations. The selected samples provide good coverage of the gold concentration range. About 85% of the results agree within ± 20% and there is no evidence of bias (Figure 11.10). Check assays for PhotonAssayTM are covered under the discussion of 544 single jars of representative material that were sent to ALS, Vancouver, BC, for fire assay determinations as part of the validation of the PhotonAssayTM method. No bias was recognized between PhotonAssayTM and ALS fire assay determinations. Additional check assays from SGS are pending. Samples from ALS and MSALABS are routinely submitted for check assays on a quarterly basis.
Figure 11.9 Comparison of 50-g Fire Assays at ALS and SGS (± 20% error bars in blue).

| 24 January 2023 | | 204 |
January 2023 Exploration Update: New Found Gold Corp.’s Queensway Gold Project, NL
Figure 11.10 Check Assays for Fine Fractions at SGS (± 20% error bars in blue).

| 11.4.7 | The Percentage of Coarse Gold |
An examination of the details of the screen fire assay results helps shed light on why it is difficult to get good repeatability with the Queensway samples that have strong gold mineralization. Figure 11.11 shows the percentage of the total mass of gold in a sample that ended up in the coarse fraction of the screen fire assays, as a function of the sample’s grade. The samples shown in orange were logged as containing visible gold; for the black ones, visible gold was not noted.
Above 10 ppm Au, most of the samples assayed before May 2022 have more than 30% of the gold in the coarse fraction. The presence or absence of a single large grain of gold will have a strong impact on the grade of the sample, that impact getting larger as the size of the gold grains gets larger.
With coarse grains accounting for most of the gold content, assays become more reliable as the size of the analysed sample increases.
| 24 January 2023 | | 205 |
January 2023 Exploration Update: New Found Gold Corp.’s Queensway Gold Project, NL
Figure 11.11 Percentage of gold in the coarse fraction (above 106 microns) in ALS screen fire assays, as a function of sample grade (Source: Lynda Bloom).

| 11.4.8 | Adequacy of the Sample Collection, Preparation, Security, and Analytical Procedures |
The QP has reviewed the adequacy of the sample preparation, security, and analytical procedures conducted by NFG between the start of the Queensway exploration programs (2019) and the Effective Date of this technical report and found no significant issues or inconsistencies that would cause one to question the validity of the data. A reasonable practical level of sample security from the field to the analytical laboratories is maintained by NFG.
The analytical work conducted on behalf of NFG is completed by independent, commercial, and accredited laboratories. NFG has employed reasonable gold standard sampling practices, analytical methods, and QA-QC protocols, the latter of which incudes CRMs, Sample Blanks, core duplicates, pulp duplicates, coarse reject duplicates, and check-laboratory assays. Additionally, NFG has conducted a robust comparison between conventional screen fire assays and PhotonAssayTM analyses that provides a reasonable and sufficient level of confidence in the PhotonAssayTM technique. NFG’s QA-QC work was designed and reviewed by Lynda Bloom, P. Geo., of Analytical Solutions, who specializes in analytical geochemistry, quality assurance and quality control. The QP’s review of the QA-QC results provides the opinion that the data is of reasonable quality, minimal contamination occurred during sample preparation and at the laboratories, and the analytical results are repeatable with good precision and accuracy.
| 24 January 2023 | | 206 |
January 2023 Exploration Update: New Found Gold Corp.’s Queensway Gold Project, NL
The QP is therefore satisfied with the adequacy of the sample preparation, security, and analytical procedures as implemented by NFG. The resulting exploration and drillhole assay databases are reasonable and sufficient for ongoing exploration activities and target generation. The core logging and drill core assay database is of reasonable quality to formulate three-dimensional models, define the geometry of mineralized zones, and for use in potential future mineral resource estimations.
| 12 | Data Verification |
| 12.1 | Data Verification Procedures |
NFG’s Queensway Gold Project is an early-stage exploration project, and this report presents a geological introduction to the project along with a summary of the Company’s exploration programs through to an Effective Date of 24 January 2023. The primary datasets involve 1) historical exploration results, and 2) NFG’s exploration programs including till, soil, rock, and drill core sample collection and analytical work. This section describes the steps taken by the QP to verify the data in this technical report.
| 12.2 | Historical Exploration Information |
Information related to the historical mineral occurrences that was downloaded directly from the Government of Newfoundland and Labrador Geoscience Atlas, predominantly as GIS shapefiles (https://geoatlas.gov.nl.ca). The historical mineral occurrences in Newfoundland and Labrador and compiled and published by Department of Industry, Energy and Technology. The Mineral Occurrence Data System (MODS) includes an inventory of historical mineral occurrences in the province. The digital database contains information on approximately 6,000 mineral occurrences, and a collection of mineral occurrence maps. The QP has not validated all historical mineral occurrences within, and adjacent to, the Queensway Property; rather the QP is dependent on the Government of Newfoundland and Labrador geologists and staff that have meticulously compiled the mineral occurrences through a series of compilation efforts originating in 1976 and maintained to the present.
Historical drillhole information was provided to the QP by NFG’s management team during the onset of the report preparation in December 2022. These data were originally compiled by NFG from numerous assessment reports. The only method currently available for the QP to validate the historical drill locations and complementary information is by comparing the historical drillhole information against the publicly available government GIS database, and hardcopy assessment reports related to the historical projects. The QP downloaded historical drillhole information from the Government of Newfoundland and Labrador Geoscience Atlas as GIS shapefiles (https://geoatlas.gov.nl.ca). Several drillholes reported in the NFG historical drillhole data compilation were not included in the government dataset. The QP confirmed the existence of within-Property historical drillholes using the publicly available assessment reports related to these historical drill programs.
| 24 January 2023 | | 207 |
January 2023 Exploration Update: New Found Gold Corp.’s Queensway Gold Project, NL
Historical soil, rock, till, trench channel, stream sediment and lake sediment sampling and gold assay datasets were provided to the QP by NFG’s management team as csv files during the onset of the report preparation. These data were originally compiled by NFG from numerous assessment reports. The data were only partially validated by the QP by comparing the data in the electronic dataset versus the publicly available, hardcopy assessment reports.
| 12.3 | New Found Gold Corp.’s Ground Geochemical, Drillhole, and Drill Core Assay Databases |
NFG forwarded numerous datasets to the QP including 1) all surface geochemical survey assay digital datasets (till, soil, rock outcrop and float, and trench channel rock sample assays), 2) a “reviewer’s license” for the MX-Deposit system that NFG uses to manage its drillhole and surface sampling data base as well as sample dispatch and assay status and 3) all assay laboratory certificates.
The QP validated the surface geochemical sample assays by comparing all of the NFG electronic assay data against the hard copy laboratory certificates. In addition, the location of some of the anomalous surface geochemical assay data was validated in comparison to the historical mineral occurrences. The QP did discover some errors with NFG’s surface geochemical databases, which include a minor number of
| • | Historical soil and rock data that were mistakenly included within the NFG soil and rock dataset. |
| • | NFG till samples from 2016 that were missing and mistakenly included in an historical dataset (n=59). |
| • | NFG’s till samples that had erroneous Au assay results (n=10). |
| • | Channel samples that did not include sample coordinates (n=5). |
These errors were communicated to NFG who made the appropriate revisions.
The QP validated the NFG drillhole collar database by independently documenting the collar locations of 6 random drillholes during a QP site inspection (see Section 12.4). All drill core assay data were exported from NFG’s MX-Deposit software and divided into smaller assay datasets that were based on individual prospects. The assay files were then validated by the QP against the hardcopy laboratory certificates. There were no gold assay errors. The QP did observe some drillhole IDs that had the wrong year (<5 errors), which was communicated to NFG who made the appropriate revisions to their database.
| 24 January 2023 | | 208 |
January 2023 Exploration Update: New Found Gold Corp.’s Queensway Gold Project, NL
The QP validated the laboratory density measurements by comparing the electronic data file provided by NFG against the hard copy laboratory certificates. No errors were observed.
| 12.4 | Qualified Person Site Inspection |
On January 12-13, 2023, Roy Eccles P. Geol., P. Geo. visited the Queensway Gold Project in northeast Newfoundland on behalf of NFG in accordance with NI 43-101. The QP’s personal inspection at NFG Queensway Gold Project enabled the QP to:
| • | Verify the overall setting of the Queensway Property in terms of licencing, topography, access, facilities (office, core shacks), and proximity of major gold prospects within the Property to the towns of Appleton and Gander, NL. |
| • | Observe the general geological setting of Queensway Property and the gold mineralization at the mineral prospects that are the subject of this technical report. |
| • | Observe and understand the exploration work that has been undertaken by NFG at the Queensway Property including geological mapping, rock sampling, soil sampling, geophysical surveys, and drilling. |
| • | Observe current exploration in the form of a multi-drill, diamond drill coring program. |
| • | Collect independent QP core samples from the Lotto, Keats Main, Keats West, and Keats Main South Extension prospects. |
| • | Discuss program details with NFG staff including 1) sample collection, security, preparation, analytical, and QA-QC procedure, 2) exploration practices, 3) core geology, and 4) ongoing development of a 3D geological modelling. |
The QP documented the coordinate locations of 6 separate and random drillhole collars at the Keats Main and Keats North prospects. A comparison between the QP GPS locations and NFG’s surveyed collars is presented in Table 12.1. The due diligence collar location review showed minimal variation between the QPs GPS collar coordinates and those that were surveyed and documented within NFG’s drillhole database. In metres, the difference between the QP and NFG selected drillhole collars was between 0.4 and 3.4 m, which translates to reasonably low percentage of differences in the collar locations. It is the QPs opinion that the drill collar locations observed are properly documented within NFG’s drillhole database.
| 24 January 2023 | | 209 |
January 2023 Exploration Update: New Found Gold Corp.’s Queensway Gold Project, NL
Table 12.1 Qualified Person validation of 6 random drillhole collar locations at the Keats Main and Keats North prospects.

At NFG’s Appleton Business Park archival drill core facility, the QP reviewed select drill cores from 4 separate drillholes that penetrated, and help to define, the Keats Main, Keats North, Keats West, and Lotto prospects. A total of 4 samples were collected independently by the QP (Table 12.2). In Gander, NL, at NFG’s primary core facility, the QP reviewed drill core from 6 separate drill cores from the Keats West, and Golden Joint prospects. An additional 2 core samples were collected by the QP from the Keats West prospect (Table 12.2).
The QPs review of NFG’s drill core demonstrated the Hunts Cove Formation is defined as a turbiditic package of interlayered grey mudstone-siltstone sequences with basal siltstone-sandstone. The sedimentary rock package along or adjacent to the Appleton Fault Zone includes textures associated with folding and fault zones (fault gouge); however, the most distinguishing textures are related to the injection of carbonate-quartz veins. More specifically, textures include massive vuggy quartz veins, brecciated quartz veining, laminated quartz veins, and randomly orientated stockwork veining.
During the site inspection, gold was observed in cores from most of the drillholes observed by the QP. The gold occurred as 1) finely disseminated grains within distinct patches of silvery-grey sulphide material within the vein presumed to include arsenopyrite and lead-antimony sulfosalt (boulangerite), 2) finely disseminated grains along fracture planes, or 3) as millimetre-sized blebs, particularly within the massive, vuggy quartz veins.
The Keats Main prospect occurs along the Keats Baseline Fault Zone, which splays in a north-easterly direction off the Appleton Fault Zone (Figure 12.1). A fault damage zone, which occurs on both sides of the Keats Baseline Fault Zone, was observed in core, and reportedly extends for approximately 30 to 50 m total across both sides of the fault zone.
| 24 January 2023 | | 210 |
January 2023 Exploration Update: New Found Gold Corp.’s Queensway Gold Project, NL
With respect to geochemical validation of the gold mineralization at the Queensway Property, the QP-collected samples were bagged, labelled, sealed, and placed in a 5-gallon pail for shipping by the QP. The pail was sealed by the QP using packing tape and the pail was couriered via Purolator from Gander, NL to MSALABS in Val-d’or, QC for analysis by Chrysos PhotonAssayTM using the same analytical methodologies used by NFG. With respect to chain of custody the QP managed the QP-collected samples from collection through to sample shipping.
The 6 QP-collected samples yielded between 1.04 and 3.76 ppm Au using the PhotoAssayTM analytical technique (Table 12.2; Figure 12.1). The independent sample collection and analytical work conducted by the QP confirms the gold mineralization that is the subject of the NFG Queensway Property technical report.
Table 12.2 Summary of QP-collected core samples to validate gold mineralization at the Queensway Property.

| 12.5 | Data Limitations |
Due to the lack of QA-QC information pertaining to historical exploration work, and in particular the historical grab rock sample geochemical data, it is the opinion of the QP that these historical gold assay data should not be utilized as part of future work conducted by NFG, including any potential mineral resource estimations.
Only those historical drillholes whose location and assay information can be confirmed to be reliable, and for which the original logging information can be integrated into the NFG logging system, should be considered for incorporation into NFG’s project data base.
| 24 January 2023 | | 211 |
January 2023 Exploration Update: New Found Gold Corp.’s Queensway Gold Project, NL
Figure 12.1 Drillhole collar locations of QP-collected core samples and gold assay results.
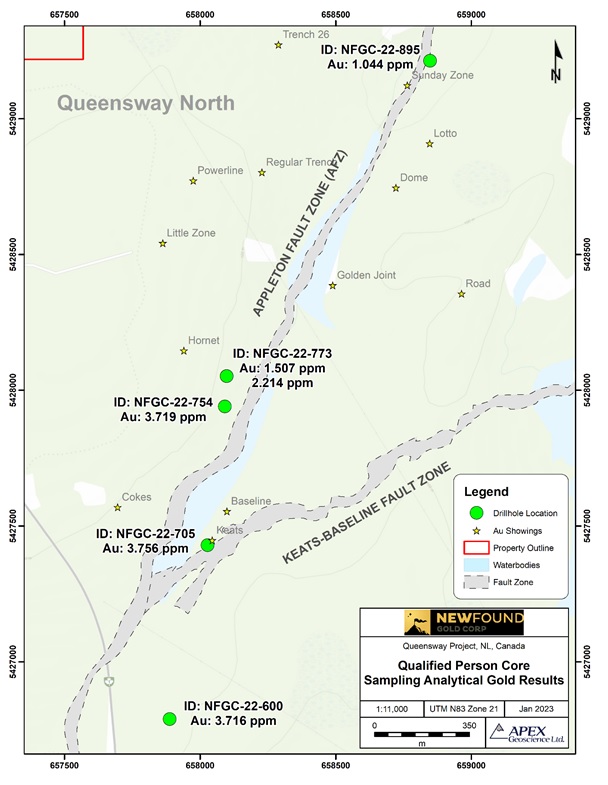
| 24 January 2023 | | 212 |
January 2023 Exploration Update: New Found Gold Corp.’s Queensway Gold Project, NL
| 12.6 | Adequacy of the Data |
The QP has reviewed historical exploration information associated with the Queensway Property, and surrounding area, and concludes that the survey information yields valid information as related to the geology of the Property and are therefore sufficient to be used in background geological interpretations.
The QP has reviewed the adequacy of NFG’s sample preparation, security, and analytical procedures and found no significant issues or inconsistencies that would cause one to question the validity of the data. The exploration work was conducted in accordance with CIM Mineral Exploration Best Practice Guidelines (2018). The analytical work was conducted at independent, commercial, and accredited laboratories that used reasonable gold standard sampling practices and analytical methods.
During the site inspection, the QP discussed logging protocols, density measurements, sampling procedures, and QA-QC measures with the NFG team. All-in-all, the Company, and the on-site team, has used the appropriate methodologies with respect to sample preparation, analyses, and security to ensure the integrity of the data.
With respect to QA-QC work, NFG has properly utilized and interpreted CRMs, Sample Blanks, core duplicates, pulp duplicates, coarse reject duplicates, and check-lab assays. Additionally, NFG has conducted a robust comparison between conventional screen fire assays and PhotonAssayTM analyses that provides a reasonable and sufficient level of confidence in the PhotonAssayTM technique. The review of the QA-QC results enables the QP to form the opinion that the NFG exploration data is of reasonable quality, minimal contamination occurred during sample preparation and at the laboratories, and the analytical results are repeatable with good precision and accuracy.
It is the QPs opinion that the NFG exploration data and resulting datasets provide a reasonable and accurate representation of the Queensway Project and are of sufficient quality to support the technical summary, conclusions, and recommendations presented in this technical report.
| 13 | Mineral Processing and Metallurgical Testing |
The Issuer, New Found Gold Corp, has yet to conduct mineral processing and metallurgical testing at the Company’s Queensway Gold Project.
| 14 | Mineral Resource Estimates |
The Issuer, New Found Gold Corp, has yet to conduct mineral resource estimation work at the Company’s Queensway Gold Project.
*** NI 43-101 Items 15 to 22 not included ***
*** The Queensway Gold Project is not an advanced exploration project ***
| 24 January 2023 | | 213 |
January 2023 Exploration Update: New Found Gold Corp.’s Queensway Gold Project, NL
| 23 | Adjacent Properties |
Please note that the QP has been unable to verify the information in this section that occurs off the Queensway Property, and therefore, the information is not necessarily indicative of the geology or mineralization on the Property that is the subject of this technical report.
Since 2019, mineral exploration interests in central Newfoundland have resulted in a staking rush with over 100,000 claims acquired in 2021. Many of the adjacent properties in the Queensway Property area are hosted within the Exploits Subzone of the central Newfoundland gold belt. Most of the exploration attention is focused on the southwest to northeast trending Dog-Bay-Appleton-GRUB line fault system that extends from central Newfoundland to the north coast.
The Beaver Brook Antimony Mine, which began mining operations in 1998, lies on the western boundary of Queensway South, across the Northwest Gander River. It suspended operations in 2020 (due to the COVID-19 pandemic) and restarted in 2021. In January 2023, the mine entered a period of care and maintenance, and it is not known whether production will resume in the future.
There are approximately 26 exploration companies and prospectors, other than NFG, active in areas adjacent to the Queensway Project (Figure 23.1); some of these occur in areas that lie inside the broad footprint of the Queensway claims, in concessions or small groups of concessions surrounded by Queensway mineral licences. For example, and within the boundaries of the Queensway Project, specifically in QWS, there are 5 enclosed mineral licences held by companies other than NFG. In the southeast portion of QWS, local prospector Clyde McLean has one licence (licence 025520M) with 6 claims.
In the central area of QWS, Roland Quinlan (licence 025767M), Edge Exploration (licence 024195M) and Buchans Minerals Corp. (licence 031341M) each hold one mineral licence with 54, 8, and 4 claims respectively. In the northern end of QWS, Quadro Resources Ltd. Holds one mineral licence (024096M) with 6 claims.
North of Gander Lake, Exploits Discovery Corp. is exploring areas with a substantial claim package. New Rock Mining Inc., C2C Gold Corp., St. James Gold Corp., Puddle Resources Inc., Pearl Resources Inc., and Gossan Resources Limited also have mineral claims.
On the eastern edge of NFG’s Queensway South block, Marvel Discovery Corp., Coast Mountain Geological Ltd., Unity Resources Inc., Rocky Island Gold Corp., and Falcon Gold Corp. have substantial land packages.
To the south of NFG’s Queensway South block, the area is held almost entirely by Exploits Discovery Corp. Other companies exploring the are include Edge Exploration, Coast Mountain Geological Ltd, Falcon Gold Corp. and Crest Resources Inc.
| 24 January 2023 | | 214 |
January 2023 Exploration Update: New Found Gold Corp.’s Queensway Gold Project, NL
Figure 23.1 Adjacent properties to the Queensway Gold Property (Source: Government of Newfoundland and Labrador Geoscience Atlas https://geoatlas.gov.nl.ca).

| 24 January 2023 | | 215 |
January 2023 Exploration Update: New Found Gold Corp.’s Queensway Gold Project, NL
On the western flank of the Queensway Property, active companies and prospectors include Metals Creek Resources Corp., Meguma Gold, Marvel Discovery Corp., Vulcan Minerals Inc., Great Thunder Gold Corp., Quadro Resources Ltd., Rosalind Lannon, Nigel Lewis, Eddy Quinlan, and Shawn A. Ryan.
Other companies with significant exploration activities around Queensway include Canstar Resources Inc. to the south and west, Great Atlantic Resources to the west, Spruce Ridge Resources to the southwest, White Metal Resources to the east, Zonte Metals Inc. to the southwest, and Platoro West Incorporated to the west of the Queensway Property.
| 24 | Other Relevant Data and Information |
None to be reported at this time.
| 25 | Interpretation and Conclusions |
| 25.1 | Exploration Results and Interpretations |
NFG has completed a significant amount of exploration work at its Queensway Gold Project. Exploration work completed by NFG includes:
| • | Regional magnetic, electromagnetic, gravity, LiDAR, and photogrammetry surveys. |
| • | Surface geochemical sample collection consists of 1,771 till samples, 12,260 soil samples, 5,282 rock samples, and 498 trench channel samples. |
| • | 1,227 diamond drillholes for a total of 330,007 m of diamond drill core. |
| • | Identification of 32 gold prospects along a strike length of approximately 100 km associated with regional-scaled Appleton and JBP fault zones. |
| • | A semi-contiguous network of high-grade gold veins and related faults is drill-defined to occur along a 4.5 km segment of the AFZ between the Knob and Zone 36 gold prospects in the Queensway North block. The high-grade gold trend is supported by the 1) style of mineralization, or high gold grades in quartz-carbonate veins at various prospects along the trend, 2) structural associations defined by complex networks of brittle fault zones aligned with regional deformation zones, 3) recognition and correlation of unique veins and vein systems, 4) association between gold and accompanying gangue (arsenopyrite, lead-antimony sulfosalt) and alteration minerals (aluminum-rich NH4 white muscovite), and 4) trace element correlations within the veins and discrete host rock Davidsville Group sedimentary horizons. |
| 24 January 2023 | | 216 |
January 2023 Exploration Update: New Found Gold Corp.’s Queensway Gold Project, NL
| • | A possible 3.7 km segment of high-grade gold occurrences within the JBPFZ between the south end of the Pocket Pond prospect and the north end of the 1744 prospect in the Queensway North block. This trend of high-grade mineralization is less well defined in comparison to the Knob to Zone 36 AFZ trend. The high-grade trend is supported by till and soil geochemical anomalies between the two drill-tested prospects, and by a uniquely different style of mineralization in that the gold mineralization associated with the JBPFZ typically follows the orientation of the stratigraphy. |
| • | Interpretation of the gravity, electromagnetic, magnetics, LiDAR, and surface exploration datasets generated multiple targets for follow-up soil sampling, trenching, prospecting, and drilling along the AFZ and JBPFZ in the north and along their inferred extensions in the southern part of the Queensway Property. |
| • | Ongoing surface work, geophysical interpretations, and an inaugural drill program was completed by NFG in Queensway South and Twin Ponds blocks. Assay results are pending at QWS, but the work has visually produced several target areas along the Appleton and Joe Batt’s Pond fault trends. The observations are supported by till, rock, and soil geochemical anomalies orientated along the extents of the regional-scale structures. |
Gold mineralization at the Queensway Project is defined within the carbonate-quartz-vein-hosted orogenic gold deposit type and occurs within a brittle fault network adjacent to crustal-scale regional deformation zones. The host stratigraphy consists of tight-to-isoclinal folded Cambrian-Silurian metasediments of the Davidsville Group.
Gold typically occurs as coarse grains of free visible gold in quartz-carbonate veins that are brecciated, massive-vuggy, laminated, or that have a closely spaced stockwork texture. The free gold and vein style is characteristic of formation in an epizonal environment. Main mineral associations include arsenopyrite, chalcopyrite, boulangerite, pyrite and NH4 muscovite which corresponds to a classic orogenic pathfinder signature defined by the presence of strongly anomalous arsenic, antimony, and tungsten.
Recent (2020-2022) drilling has intersected significant gold mineralization along the Appleton Fault Zone that extends mineralization at NFG’s most drilled prospects, Keats, Lotto, and Golden Joint prospects, and identified multiple new zones of high-grade mineralization; noteworthy zones include Keats West, Keats North, and Lotto North.
Continued drilling at the Keats Zone has expanded on the extensive network of high-grade quartz veins that occur within and adjacent to the Keats-Baseline Fault Zone, a second-order brittle fault that trends obliquely to the AFZ and dips moderately to the southeast and has been drill-defined over a strike length of 1.1 km. Two prominent vein orientations have been identified along with a conjugate array of cross-cutting brittle faults and associated veins that are interpreted to control domains of high-grade gold mineralization. Strike continuity can be considerable, an example being the Keats Main vein which is developed within the Keats-Baseline Fault Zone and has been defined over a strike length of 520 m and remains open to the east and becomes less well defined in the west adjacent to the AFZ.
| 24 January 2023 | | 217 |
January 2023 Exploration Update: New Found Gold Corp.’s Queensway Gold Project, NL
A segment within the Keats-Baseline Fault Zone, which forms a thickened domain of moderately southwest plunging high-grade gold mineralization, has now been extended to 660 m in a down-plunge direction and remains open at depth. Continued exploration drilling will target the Keats Main zone both along strike to the south, where it is interpreted to interact with AFZ, and along strike to the east-northeast where it is underexplored.
The Keats West prospect is structurally interpreted to represent a thrust fault that dips gently to the south-southwest and hosts both low and high-grade gold mineralization over a considerable thickness with cumulative widths ranging from 10-30 m. This fault zone occurs on the west side of the AFZ and contains a series of stacked veins that contain the gold mineralization. Drilling was initially focused within a panel of the structure where gold mineralization has been intersected over an area of 280 m x 130 m and ongoing drilling is designed to extend this zone along strike to the west and down-dip.
Mineralization at Keats North is located east of the AFZ and is hosted within a complex array of brittle fault zones and associated veins that extend southward and interact with the northeast end of the Keats Main zone; this mineralized vein network has been drill-defined over an area of 150 m x 630 m.
Gold grades at Keats prospects include:
| • | The Keats Main gold prospect (385 drillholes; 114,065 m and 93,106 assays) has an overall average grade of 0.64 ppm Au. Within the Keats Main assay file, 3,641 analytical results (3.91%) were between 1 and 2,197.25 ppm Au, with an average of 14.78 ppm Au. |
| • | The Keats North (103 drillholes; 27,173 m; 18,783 assays) has an overall average grade of 0.26 ppm Au. Within the Keats North assay file, 464 analytical results (2.47%) were between 1 and 738.0 ppm Au, with an average of 7.86 ppm Au. |
| • | Keats West (88 drillholes; 19,947 m; 8,746 assays) has an overall average grade of 0.54 ppm Au with. Within the Keats West assays, 464 analytical results (5.31%) were between 1 and 468 ppm Au, with an average of 9.03 ppm Au. |
At Lotto, high-grade gold mineralization discovered within the Lotto Main vein, an approximately north-south striking, steeply east-dipping vein located 200 m east of the AFZ has been extended to a vertical depth of 220 m and over a strike length of 200 m. Additionally, the vein has been intersected up to 325 m vertical depth where it is underexplored and remains open as well as along strike to the south. Gold grades at the Lotto prospects include:
| 24 January 2023 | | 218 |
January 2023 Exploration Update: New Found Gold Corp.’s Queensway Gold Project, NL
| • | Lotto (106 drillholes; 28,369 m; 25,154 assays) has an overall average grade of 0.42 ppm Au. Within the Lotto assay file, 602 analytical results (2.39%) were between 1 and 1,332.55 ppm Au, with an average of 16.30 ppm Au. |
| • | Lotto North (76 drillholes; 19,852 m; 5,913 assays) has an overall average grade of 0.26 ppm Au. Within the Lotto North assay file, 180 analytical results (3.04%) were between 1 and 225 ppm Au, with an average of 7.30 ppm Au. |
Ongoing exploration at the Lotto prospect will target both the deeper vein portions and the southern extension that are currently poorly tested.
At the Golden Joint, located between the Lotto and Keats prospects, exploration has defined an approximately north-south striking, steeply west-dipping vein in the immediate footwall to the AFZ. This vein carries high-grade gold mineralization and has a vertical depth of 275 m, and a strike length of 225 m, however, the vein has been intersected at depths as great as 385 m and remains open down-dip. The Golden Joint prospect (96 drillholes; 29,686 m and 25,458 core assays) has an overall average grade of 0.36 ppm Au. Within the Golden Joint assay file, 323 analytical results (1.27%) yield between 1 and 2,109.72 ppm Au, with an average of 25.86 ppm Au.
Significant mineralization has also been identified immediately east of this high-grade vein, now known as the Golden Joint HW target, which occurs within and adjacent to a thickened bed of greywacke. Mineralization at this target is characterized by stockwork style-veining with localised domains of high-grade and overall lower-grade gold footprint. This mineralized domain has been defined over a strike length of 185 m, to a vertical depth of 150 m, and remains open in all directions. Drilling is ongoing at Golden Joint utilizing a barge-mounted drill to access the top 100 m vertical of the Golden Joint Main vein that resides under North Hermans Pond.
Drill programs along the JBP Fault Zone at the 1744 and Pocket Pond prospects identified significant gold mineralization related to an anastomosing array of shear structures and associated veins that have similar epizonal character to those veins discovered along the AFZ trend. To date, however, assay results in this area have been generally lower in grade, with an average grade of 0.16 ppm Au and a maximum of 105.83 ppm Au in the 1744 target and an average grade of 0.14 ppm Au and a maximum of 88.70 ppm Au at Pocket Pond; both of these prospects have a similar average thickness of 2 m. Drilling at both targets intersected north-east striking, steeply-east dipping vein sets that span a strike length of approximately 255 m to a vertical depth of 210 m at the 1744 prospect, and a strike length of 160 m strike length with a 145 m vertical depth at Pocket Pond prospect. Both targets are associated with Au-in-till, Au-in-soil, and Au-in-float anomalies and both zones appear to be open in all directions. Several similar anomalies exist along the JBP trend and are within large segments of the fault corridor that are unexplored. Evaluation of the Pocket Pond, 1744, and regional JBP targets is underway for exploration follow-up program planning.
| 24 January 2023 | | 219 |
January 2023 Exploration Update: New Found Gold Corp.’s Queensway Gold Project, NL
Ongoing surface work and geophysical interpretation has produced several targets along both the AFZ and JBP fault trends with programs focused along their extensions into the south property block. Sampling of till, rock, and soil along the extents of these regional-scale structures has produced anomalies with clear spatial associations that when paired with the geologic interpretation made from mapping and geophysics have meaningful orientations. Follow-up till sampling to infill and expand grids is planned along with soil sampling in areas under cover and continued mapping and prospecting to generate and further refine targets in the south property block.
| 25.2 | Qualified Person Opinion on NFG’s 2021-2022 Exploration Programs |
It is the QP’s opinion that the exploration work conducted by NFG at the Queensway Property is reasonable and within the standard practices of gold evaluation within the Dunnage Zone of northeast Newfoundland. This contention is supported by the QPs 1) site inspection enabled understanding of the geological setting and mineralization, and independent validation of the gold mineralization at Queensway, 2) positive review of NFG sample preparation, security, and analytical protocols, 3) review of the QA-QC methodologies employed, and the positive results of the QA-QC analytical work, and 4) review of the analytical results in conjunction with the laboratory certificates.
In November 2021 NFG initiated a trial of the Chrysos PhotonAssayTM non-destructive method for gold analysis at MSALABS, in conjunction with follow-on screen metallic fire assay or standard 30-g fire assay method at ALS for assay comparison. The results from the trial program demonstrated that the methods agree well, and the Company, its consultants, and the Qualified Person conclude that the PhotonAssayTM method is appropriate for Queensway samples. Since June 2022, NFG only submits core samples for gold assay to ALS and MSALABS.
NFG exploration work results provide a significant update to the geology and mineral potential of northeast Newfoundland and the QP advocates that the information and data presented in this technical report forms a robust database for future exploration, and potentially, mineral resource estimation studies, at the Queensway Property.
| 25.3 | Risks and Uncertainties |
Potential risks and uncertainties toward the advancement of NFG’s Queensway Project include:
| • | NFG mineral rights ownership of licences 035047M and 035197M, 035048M and 035198M, and 035050M are subject to the successful completion of the conditions within a single Option Agreement; hence, there is some uncertainty to completion of the conditions and subsequent acquisition of gold prospects within the licences. |
| • | Uncertainties related to validation of information from historical drilling. To mitigate this uncertainty, most historical drillholes can redrilled with new NFG holes. |
| 24 January 2023 | | 220 |
January 2023 Exploration Update: New Found Gold Corp.’s Queensway Gold Project, NL
| • | Although NFG’s exploration work is defining broad zones of mineralization, the gold mineralization can be erratic over short distances, which creates difficulties in building local vein network and gold mineralization models. |
NFG will attempt to reduce risk/uncertainty through effective project management, engaging technical experts and developing contingency plans. To the best of the QPs knowledge, there are no environmental liabilities, significant factors or risks that may affect access, title, or the right or ability of NFG to perform exploration work on the Queensway Property. With respect to obtaining additional permits, the QP has no reason to assume that the Company would not be granted additional exploration approvals and other permits to advance the Queensway Gold Project.
Finally, there is no guarantee that NFG can successfully extract gold from the Queensway Property in a commercial capacity. Mineral processing and metallurgical test work has yet to be performed by NFG. Ultimately, there is a risk that the scalability of any future initial bench-scale or pilot-scale mineral processing/metallurgical test work may not translate to a full-scale commercial operation. With respect to metallurgy, potential uncertainties at this stage of the project include methodology of producing saleable products, and handling of by-products and waste materials.
| 26 | Recommendations |
The Queensway Gold Project is a project of merit and requires additional exploration work to advance individual prospects such as the Keats, Keats West, Keats North Lotto, Lotto North, and Golden Joint prospects in the QWN block, explore newly discovered prospects such as those outlined during 2022 in the SWS block, and continue with exploratory work along the Appleton and JBP fault zones to define new prospects.
A two-phase work program is recommended with an estimated total cost of CDN$103,25 million with a 10% contingency. A summary of the program with cost estimates is presented in Table 26.1.
Phase 1 work recommendations are estimated to cost approximately CDN$63.8 million with a 10% contingency, and include:
| 1. | Geophysical surveys in the QWN block that include 1) a Direct Current resistivity Induced Polarization (DCIP) survey, and 2) a 3D seismic survey. The surveying, data processing, interpretation, and modelling is estimated to cost CDN$8,400,000. |
| 2. | Surface exploration work is recommended at the QWS block in the form of geological mapping, prospecting, and rock sampling along with till and soil geochemical surveys. Advanced surface exploration work in the QWN block consists of trenching and channel geochemical rock surveys at the Keats and Joe Batt’s Pond prospects. The work programs are estimated to cost CDN$1,600,000. |
| 24 January 2023 | | 221 |
January 2023 Exploration Update: New Found Gold Corp.’s Queensway Gold Project, NL
| 3. | A Phase 1 diamond drilling program consists of 1) step-out and infill drilling to further define and delineate the gold mineralization at known prospects in the QWN block (approximately 100,000 m), 2) target delineation drilling at the QWS and TP blocks to follow-up on promising 2022 drill programs that yielded favourable geological interpretations (assays are pending; approximately 25,000 m), 3) exploratory drilling along the Appleton and JBP fault zones to test targets identified through surface exploration work programs (approximately 10,000 m). A total of approximately 135,000 m of drilling is recommended. Assuming a drill cost of approximately CDN$312/m, an all-in cost of CDN$350/m has been estimated, which includes PhotonAssayTM analytical work, density measurements, and gold grain analytical studies. The Phase 1 drill program is estimated to cost CDN$47,600,000. |
| 4. | Preliminary metallurgical test work to define gold recovery functions, which is estimated to cost CDN$400,000. |
Advancement to the Phase 2 work recommendations is contingent on the positive results of the Phase 1 work programs. If additional work is required to advance the Queensway Gold Project, the QP recommends a Phase 2 work program that is estimated to cost approximately CDN$39.50 million with a 10% contingency. The Phase 2 work program includes:
| 1. | A Phase 2 drill program in which the Company continues to collect diamond drill core for baseline geological studies but initiates Reverse Circulation (RC) drilling to expedite higher test material production rates for metallurgical test work and to advance the project toward mine planning. The objective of the drill program is to 1) complete infill and step-out drilling at QWN and QWS blocks, and 2) continue with exploratory drilling along the Appleton and JBP fault zones. Approximately 100,000 m of drilling is recommended. At an all-in cost of CDN$350/m, which includes analytical work, the cost of the drill programs is estimated at CDN$35,000,000. |
| 2. | Further optimize the metallurgical test work and recovery flowsheets in consideration of optimizing potential floatation leach and gravity-leach circuits and suitability of potential tailings solutions. |
| 3. | Initiate environmental, marketing, mine planning, and community consultation studies in consideration of Modifying Factors. Baseline environmental studies should include, and initiate, aquatics, water monitoring, groundwater modelling, flora/sauna, wildlife, and reclamation studies. Mine planning studies should document project specific guidelines that involve numerous approvals, authorisations, and permits required for project advancement and construction. NFG should continue to engage in consultation with community, indigenous, and other stakeholders to identify employment and business opportunities, community investment opportunities, and the protection of community’s environment. |
| 24 January 2023 | | 222 |
January 2023 Exploration Update: New Found Gold Corp.’s Queensway Gold Project, NL
| 4. | Technical reporting that may include 3-D geological modelling, mineral resource estimation(s), and preliminary economic assessment that are prepared in accordance with CIM definition standards and guidelines (2014, 2019) and the disclosure rule, NI 43-101. |
| 24 January 2023 | | 223 |
January 2023 Exploration Update: New Found Gold Corp.’s Queensway Gold Project, NL
Table 26.1 Summary of Phase 1 recommendations and estimated costs.

| 24 January 2023 | | 224 |
January 2023 Exploration Update: New Found Gold Corp.’s Queensway Gold Project, NL
| 27 | References |
Arnott, R.J., McKerrow, W.S., Cocks, L.R.M. (1985): The tectonics and depositional history of the Ordovician and Silurian rocks of Notre Dame Bay, Newfoundland. Canadian Journal of Earth Science. 22, p. 607–618.
Blackwood, R.F. (1982): Geology of the Gander Lake (2D/15) and Gander River (2E/2) Area, Newfoundland Department of Mines and Energy − Mineral Development Division, Report 82−4.
Bloom, L. (2022): Queensway Sample Preparation, Analyses and Security; Internal Report to New Found Gold Corp.
CGG Canada Services (2017): Geophysical Survey Report on the Airborne Magnetic and Helitem35C Survey - Gander Area, NL, Canada; Project 701005, for Palisade Resources.
CGG Canada Services (2020): Logistics and Processing Report on the HeliFALCON™ Airborne Gravity Gradiometer and Aeromagnetic Survey – Gander Area, NL, Canada; Project 900961, for New Found Gold Corp.
CGG Canada Services (2021): Geophysical Survey Report, Airborne Magnetic Helitem2 Survey, Gander, Project 2100084, New Found Gold Corp.
Colman-Sadd, S. P., Dunning, G. R., and Dec, T. (1992): Dunnage-Gander relationships and Ordovician orogeny in central Newfoundland; a sediment provenance and U/Pb age study. American Journal of Science, 292(5), 317-355.
Currie, K.L. (1995): The northeastern end of the Dunnage Zone in Newfoundland; Atlantic Geology, v. 31, p. 25-38.
Currie, K.L. (1995b): A tale of shale-stratigraphic problems in the Gander River map area, Newfoundland; in Current Research 1995-D; Geological Survey of Canada. p. 73-80.
Dubé, B. and Gosselin, P. (2007): Greenstone-hosted quartz-carbonate vein deposits, in Goodfellow, W.D., ed., Mineral Deposits of Canada: A Synthesis of Major Deposit-Types, District Metallogeny, the Evolution of Geological Provinces, and Exploration Methods; Geological Association of Canada, Mineral Deposits Division, Special Publication No. 5, p. 49-73.
Ermer, P. (1986): Geology of the Long-Range Inlier in the Sandy Lake map area: In Current Research, Part B: Geol. Sur. Can., Paper 86-1B, p- 19-29.
Evans, D.A.D. (2021). Chapter 17 - Meso-Neoproterozoic Rodinia supercycle; in Pesonen, L.J., Salminen, J., Elming, S.-Å., Evans, D.A.D., Veikkolainen, T. (Eds.), Ancient Supercontinents and the Paleogeography of Earth. Elsevier, pp. 549–576.
Fyfe, W.S. and Henley, R.W. (1973): Some thoughts on chemical transport processes with particular reference to gold; Mineral Science Engineering, v.5, p. 295-303.
Gardner, M. (2021): Geology Corner: The nuts and bolts of feasibility studies on gold; Canadian Mining Journal, January 14, 2021.
Goldfarb, R., Snee, L. and Miller, L. (1991): Rapid dewatering of the crust deduced from ages of mesothermal gold deposits; Nature, v.354, p.296-298. (https://doi.org/10.1038/354296a0)
Goldfarb, R.J., Richard, J. and Groves, D.I. (2015): Orogenic gold: Common or evolving fluid and metal sources through time; Lithos, v.233, p.2-26. (https://doi.org/10.1016/j.lithos.2015.07.011)
Harper, D.A.T., MacNiocaill, C. and Williams, S.H. (1996): The palaeogeography of Early Ordovician Iapetus terranes: An integration of faunal and palaeomagnetic constraints; Palaeogeography, Palaeoclimatology, Palaeoecology, v.121, p.297-312.
Henderson, B.J., Collins, W.J., Brendan Murphy, J., Hand, M. (2018): A hafnium isotopic record of magmatic arcs and continental growth in the Iapetus Ocean: The contrasting evolution of Ganderia and the peri-Laurentian margin. Gondwana Research. 58, p. 141–160.
| 24 January 2023 | | 225 |
January 2023 Exploration Update: New Found Gold Corp.’s Queensway Gold Project, NL
Holmes, D. and Michaud, M. (2017): Report on November 2016 Till Sampling for Gold; Overburden Drilling Management Limited.
Karlstrom, K.E., van der Pluum, B.A., and Williams, P.F. (1982): Structural interpretation of the eastern Notre Dame Bay area, Newfoundland. Regional post-Middle Silurian thrusting and asymmetrical folding. Canadian Journal of Earth Sciences, 19, pp. 2325-2341.
Kennedy, M.J. and McGonigal, M.H. (1972): The Gander Lake and Davidsville Groups of northeastern Newfoundland: new data and geotectonic implications. Canadian Journal of Earth Sciences 9, pp. 452-459.
Kontak, D.J., O’Reilly, G.A. and Chatterjee, A.K. (1990): The southwest Nova Scotia tin domain, Yarmouth County, Nova Scotia: implications for tin metallogeny in the Meguma Terrane, Nova Scotia; Mines and Minerals Branch Report of Activities, Part B. Edited by D.R. MacDonald. Nova Scotia Department of Mines and Energy, Report 90-1, pp. 13-32.
Labonte, J.A. and Piercey, S. (2012): Thirteenth year assessment report on prospecting, geochemical exploration and petrography for licence 6658M on claims in the Paul’s Pond area, Central Newfoundland, for Cornerstone Resources Incorporated. Geofile Report 002D/11/0771.
McHenry, M. and Dunlop, P. (2015): The subglacial imprint of the last Newfoundland Ice Sheet, Canada; Journal of Maps, v. 12, p. 462-483.
Mineral Claims Recorders Office of Newfoundland and Labrador, May 2015: Acquiring mineral rights and managing your mineral exploration license. https://www.gov.nl.ca/iet/files/mines-exploration-guidelines-claims-brochure-2015.pdf
Natural Resources Canada (2020: Height Reference System Modernization. (https://www.nrcan.gc.ca/sites/nrcan/files/files/pdf/Height_reference_system_modernization_(EN).pdf.)
New Found Gold Corp. (2020a): Mexican Gold To Complete Business Combination with New Found Gold; Intersects 92.86 g/t Au Over 19.0 Metres At Queensway Gold Project In Newfoundland; News Release dated 2020-01-28; < Available on January 17 at: https://newfoundgold.ca/news/mexican-gold-to-complete-business-combination-with-new-found-gold-intersects-92-86-g-t-au-over-19-0-metres-at-queensway-gold-project-in-newfoundland/ >.
New Found Gold Corp. (2020b): New Found Intercepts 41.2 g/t Au over 4.75 m and 25.4 g/t Au over 5.15 m in New High-Grade Discovery at the Lotto Zone, Located 2 km North of the High-Grade Keats Discovery, Queensway Project, Newfoundland; News Release dated 2020-10-02; < Available on January 17 at: https://newfoundgold.ca/news/new-found-intercepts-41-2-g-t-au-over-4-75-m-and-25-4-g-t-au-over-5-15-m-in-new-high-grade-discovery-at-the-lotto-zone-located-2-km-north-of-the-high-grade-keats-discovery-queensway-project-newfoun/ >.
New Found Gold Corp. (2020c): New Found Intercepts 22.3 g/t Au over 41.35m and 31.2 g/t Au over 18.85m in Initial Step-Out Drilling at Keats Zone, Queensway Project, Newfoundland; News Release dated 2020-10-27; < Available on January 17 at: https://newfoundgold.ca/news/new-found-intercepts-22-3-g-t-au-over-41-35m-and-31-2-g-t-au-over-18-85m-in-initial-step-out-drilling-at-keats-zone-queensway-project-newfoundland/ >.
New Found Gold Corp. (2020d): New Found Intercepts 44.5 g/t Au over 6.85m in 60m Step-Out at Keats Zone, Queensway Project, Newfoundland; News Release dated 2020-11-16; < Available on January 17 at: https://newfoundgold.ca/news/new-found-intercepts-44-5-g-t-au-over-6-85m-in-60m-step-out-at-keats-zone-queensway-project-newfoundland/ >.
New Found Gold Corp. (2020e): New Found Gold Intercepts 45.3 g/t Au over 13.1m and 25.0 g/t Au over 16.85m in Step-Out Drilling at Keats Zone, Queensway Project, Newfoundland; News Release dated 2020-12-15; < Available on January 17 at: https://newfoundgold.ca/news/new-found-gold-intercepts-45-3-g-t-au-over-13-1m-and-25-0-g-t-au-over-16-85m-in-step-out-drilling-at-keats-zone-queensway-project-newfoundland/ >.
| 24 January 2023 | | 226 |
January 2023 Exploration Update: New Found Gold Corp.’s Queensway Gold Project, NL
New Found Gold Corp. (2021a): 50 Meter Step-Out Hole at Keats Intercepts Broad, Shallow, High-Grade Intervals: 22.5 g/t Au over 10.4m and 31.4 g/t Au over 15.9m; News Release dated 2021-01-11; < Available on January 17 at: https://newfoundgold.ca/news/50-meter-step-out-hole-at-keats-intercepts-broad-shallow-high-grade-intervals-22-5-g-t-au-over-10-4m-and-31-4-g-t-au-over-15-9m/ >.
New Found Gold Corp. (2021b): New Found Intercepts 18.1 g/t Au over 6.5m including 38.7 g/t Over 2.95m in New “Sunday Zone” Discovery in the Appleton Fault Hanging Wall, 2 km North of Keats Zone; News Release dated 2021-01-14; < Available on January 17 at: https://newfoundgold.ca/news/new-found-intercepts-18-1-g-t-au-over-6-5m-including-38-7-g-t-over-2-95m-in-new-sunday-zone-discovery-in-the-appleton-fault-hanging-wall-2-km-north-of-keats-zone/ >.
New Found Gold Corp. (2021c): New Found Intercepts 28.4 g/t Au over 13.8m and 25.0 g/t Au over 10.3m at Keats, Provides Exploration Overview; News Release dated 2021-02-11; < Available on January 17 at: https://newfoundgold.ca/news/new-found-intercepts-28-4-g-t-au-over-13-8m-and-25-0-g-t-au-over-10-3m-at-keats-provides-exploration-overview/ >.
New Found Gold Corp. (2021d): New Found Intercepts 224.7 g/t Au over 2.45m at Lotto; News Release dated 2021-02-23; < Available on January 17 at: https://newfoundgold.ca/news/new-found-intercepts-224-7-g-t-au-over-2-45m-at-lotto/ >.
New Found Gold Corp. (2021e): Keats Step-Out Returns 29.1 g/t Au over 11.4m, Extends High-Grade Zone to 250m Down Plunge; News Release dated 2021-03-01; < Available on January 17 at: https://newfoundgold.ca/news/keats-step-out-returns-29-1-g-t-au-over-11-4m-extends-high-grade-zone-to-250m-down-plunge/ >.
New Found Gold Corp. (2021f): New Found Intercepts 24.0g/t over 46.0m and 27.0g/t over 30.1m at Keats, High-grade Gold Mineralization Discovered in Footwall Veins; News Release dated 2021-03-10; < Available on January 17 at: https://newfoundgold.ca/news/new-found-intercepts-24-0g-t-over-46-0m-and-27-0g-t-over-30-1m-at-keats-high-grade-gold-mineralization-discovered-in-footwall-veins/ >.
New Found Gold Corp. (2021g): Keats Step-Out Returns 61.8 g/t Au over 13.7m, Extends High-Grade Zone to 285m Down-Plunge; News Release dated 2021-03-16; < Available on January 17 at: https://newfoundgold.ca/news/keats-step-out-returns-61-8-g-t-au-over-13-7m-extends-high-grade-zone-to-285m-down-plunge/ >.
New Found Gold Corp. (2021h): New Found Intercepts 51.3 g/t Au over 3.20m and 53.3 g/t Au over 3.10m in Step-outs to Depth at Lotto; News Release dated 2021-03-23; < Available on January 17 at: https://newfoundgold.ca/news/new-found-intercepts-51-3-g-t-au-over-3-20m-and-53-3-g-t-au-over-3-10m-in-step-outs-to-depth-at-lotto/ >.
New Found Gold Corp. (2021i): Keats Infill Drilling Returns 37.2 g/t Au over 6.45m and 17.9 g/t Au over 8.45m; News Release dated 2021-03-29; < Available on January 17 at: https://newfoundgold.ca/news/keats-infill-drilling-returns-37-2-g-t-au-over-6-45m-and-17-9-g-t-au-over-8-45m/ >.
New Found Gold Corp. (2021j): Keats Infill Drilling Returns 106.5 g/t Au over 9.15m and 45.6 g/t Au over 4.05m; News Release dated 2021-04-07; < Available on January 17 at: https://newfoundgold.ca/news/keats-infill-drilling-returns-106-5-g-t-au-over-9-15m-and-45-6-g-t-au-over-4-05m/ >.
New Found Gold Corp. (2021k): Keats Infill Drilling Returns 261.3 g/t Au over 7.2m, Queensway Program Expanded to 10 Drills; News Release dated 2021-04-20; < Available on January 17 at: https://newfoundgold.ca/news/keats-infill-drilling-returns-261-3-g-t-au-over-7-2m-queensway-program-expanded-to-10-drills/ >.
New Found Gold Corp. (2021l): New Found Intercepts 63.7 g/t Au over 8.45m and 16.9 g/t Au Over 2.5m in 50m Step-out to South at Keats; News Release dated 2021-04-27; < Available on January 17 at: https://newfoundgold.ca/news/new-found-intercepts-63-7-g-t-au-over-8-45m-and-16-9-g-t-au-over-2-5m-in-50m-step-out-to-south-at-keats/ >.
New Found Gold Corp. (2021m): New Found Intercepts 124.4 g/t Au Over 17.7m and 131.1 g/t Au over 4.65m at Keats; News Release dated 2021-05-04; < Available on January 17 at: https://newfoundgold.ca/news/new-found-intercepts-124-4-g-t-au-over-17-7m-and-131-1-g-t-au-over-4-65m-at-keats/ >.
| 24 January 2023 | | 227 |
January 2023 Exploration Update: New Found Gold Corp.’s Queensway Gold Project, NL
New Found Gold Corp. (2021n): New Found Intercepts 146.2 g/t Au over 25.6m in 65m step-out to South at Keats, Extends High-Grade Zone to 425m Down-Plunge; News Release dated 2021-05-21; < Available on January 17 at: https://newfoundgold.ca/news/new-found-intercepts-146-2-g-t-au-over-25-6m-in-65m-step-out-to-south-at-keats-extends-high-grade-zone-to-425m-down-plunge/ >.
New Found Gold Corp. (2021o): New Found Intercepts 21.4 g/t Au over 8.05m and 14.9 g/t Au over 12.9m in 40m step-out at Keats, Extends High-Grade Zone to 465m Down-Plunge; News Release dated 2021-06-15; < Available on January 17 at: https://newfoundgold.ca/news/new-found-intercepts-21-4-g-t-au-over-8-05m-and-14-9-g-t-au-over-12-9m-in-40m-step-out-at-keats-extends-high-grade-zone-to-465m-down-plunge/ >.
New Found Gold Corp. (2021p): New Found Intercepts 150.3 g/t Au over 11.5m at Lotto; News Release dated 2021-06-23; < Available on January 17 at: https://newfoundgold.ca/news/new-found-intercepts-150-3-g-t-au-over-11-5m-at-lotto/ >.
New Found Gold Corp. (2021q): New Found Intercepts 430.2 g/t Au Over 5.25m in New Discovery at Golden Joint Zone, 1km North of Keats; News Release dated 2021-06-30; < Available on January 17 at: https://newfoundgold.ca/news/new-found-intercepts-430-2-g-t-au-over-5-25m-in-new-discovery-at-golden-joint-zone-1km-north-of-keats/ >.
New Found Gold Corp. (2021r): New Found Provides Appleton Fault Zone Exploration Update; News Release dated 2021-07-06; < Available on January 17 at: https://newfoundgold.ca/news/new-found-provides-appleton-fault-zone-exploration-update/ >.
New Found Gold Corp. (2021s): New Found Intercepts 111.4 g/t Au over 2.65 m and 76.8 g/t Au over 2.80 m at Lotto Main Vein: Doubles the Vertical Depth to 200 m; News Release dated 2021-09-08; < Available on January 17 at: https://newfoundgold.ca/news/new-found-intercepts-111-4-g-t-au-over-2-65-m-and-76-8-g-t-au-over-2-80-m-at-lotto-main-vein-doubles-the-vertical-depth-to-200-m/ >.
New Found Gold Corp. (2021t): New Found Intercepts More High-Grade Gold at Keats; Extends Zone 200m Vertically Towards Surface; News Release dated 2021-09-15; < Available on January 17 at: https://newfoundgold.ca/news/new-found-intercepts-more-high-grade-gold-at-keats-extends-zone-200m-vertically-towards-surface/ >.
New Found Gold Corp. (2021q): New Found Intercepts 64.94 g/t Au over 2.10m in Step-Out Drilling at the Golden Joint HW Zone and Extends the Golden Joint Main Vein to 235m Vertical Depth; News Release dated 2021-09-30; < Available on January 17 at: https://newfoundgold.ca/news/new-found-intercepts-64-94-g-t-au-over-2-10m-in-step-out-drilling-at-the-golden-joint-hw-zone-and-extends-the-golden-joint-main-vein-to-235m-vertical-depth/ >.
New Found Gold Corp. (2021r): New Found Discovers New High – Grade Zone at Keats; Intercepts 88.53 g/t Au over 3.35m Below Keats Main Zone; News Release dated 2021-10-13; < Available on January 17 at: https://newfoundgold.ca/news/new-found-discovers-new-high-grade-zone-at-keats-intercepts-88-53-g-t-au-over-3-35m-below-keats-main-zone/ >.
New Found Gold Corp. (2021s): New Found Intercepts 61.50 g/t Au over 5.20m at Keats 65m Step-Out, Extends High-Grade Zone to 530m Down Plunge; News Release dated 2021-10-14; < Available on January 17 at: https://newfoundgold.ca/news/new-found-intercepts-61-50-g-t-au-over-5-20m-at-keats-65m-step-out-extends-high-grade-zone-to-530m-down-plunge/ >.
| 24 January 2023 | | 228 |
January 2023 Exploration Update: New Found Gold Corp.’s Queensway Gold Project, NL
New Found Gold Corp. (2022a): New Found Enters into Definitive Property Option Agreement, Adds 6.1km of Prospective Strike Length Along Appleton Fault at Queensway North. <Available on December 6, 2022 at: https://newfoundgold.ca/news/new-found-enters-into-definitive-property-option-agreement-adds-6-1km-of-prospective-strike-length-along-appleton-fault-at-queensway-north/ >.
New Found Gold Corp. (2022b): New Found Intercepts 70.65 g/t Au Over 5.25m at Golden Joint Main Vein, Extending Zone to 285m Vertical Depth; News Release dated 2022-01-06; < Available on January 17 at: https://newfoundgold.ca/news/new-found-intercepts-70-65-g-t-au-over-5-25m-at-golden-joint-main-vein-extending-zone-to-285m-vertical-depth-2/ >.
New Found Gold Corp. (2022c): New Found Intercepts 56.69 g/t Au Over 2.45m at the New Keats Footwall Zone Discovery; News Release dated 2022-01-13; < Available on January 17 at: https://newfoundgold.ca/news/new-found-intercepts-56-69-g-t-au-over-2-45m-at-the-new-keats-footwall-zone-discovery/ >.
New Found Gold Corp. (2022d): New Found Intercepts 98.13 g/t Au Over 3.85m at Golden Joint, Extending the High-Grade Zone to 305m Vertical Depth; News Release dated 2022-01-19; < Available on January 17 at: https://newfoundgold.ca/news/new-found-intercepts-98-13-g-t-au-over-3-85m-at-golden-joint-extending-the-high-grade-zone-to-305m-vertical-depth/ >.
New Found Gold Corp. (2022e): New Found Makes New Discovery Intercepting 28.20 g/t Au Over 4.50m at Keats Footwall Zone, 145m Below the Keats Main Zone, Reports First Results Using Chrysos PhotonassayTM Method; News Release dated 2022-01-26; < Available on January 17 at: https://newfoundgold.ca/news/new-found-makes-new-discovery-intercepting-28-20-g-t-au-over-4-50m-at-keats-footwall-zone-145m-below-the-keats-main-zone-reports-first-results-using-chrysos-photonassaytm-method/ >.
New Found Gold Corp. (2022f): New Found Intercepts 62.3 g/t Au Over 2.00m at Keats Main, Extends High-Grade Zone to 845m Down Plunge; News Release dated 2022-02-24; < Available on January 17 at: https://newfoundgold.ca/news/new-found-intercepts-62-3-t-au-over-2-00m-at-keats-main-extends-high-grade-zone-to-845m-down-plunge/ >.
New Found Gold Corp. (2022g): New Found Intercepts 47.82 g/t Au over 9.75m at Keats Main, Extends High-Grade Zone to Surface with Interval of 55.61 g/t Au over 3.20m; News Release dated 2022-03-02; < Available on January 17 at: https://newfoundgold.ca/news/new-found-intercepts-47-82-g-t-au-over-9-75m-at-keats-main-extends-high-grade-zone-to-surface-with-interval-of-55-61-g-t-au-over-3-20m/ >.
New Found Gold Corp. (2022h): New Found Intercepts 31.88 g/t Au over 2.05m & 25.4 g/t Au over 2.25m at New Gold Discoveries on the JBP Fault Zone ~10km NE of the Keats/Golden Joint/Lotto Discoveries; News Release dated 2022-03-09; < Available on January 17 at: https://newfoundgold.ca/news/new-found-intercepts-31-88-g-t-au-over-2-05m-25-4-g-t-au-over-2-25m-at-new-gold-discoveries-on-the-jbp-fault-zone-10km-ne-of-the-keats-golden-joint-lotto-discoveries/ >.
New Found Gold Corp. (2022i): New Found Intercepts 69.15 g/t Au over 14.15m at Golden Joint & Extends Lotto High-Grade to 225m Vertical Depth; News Release dated 2022-03-24; < Available on January 17 at: https://newfoundgold.ca/news/new-found-intercepts-69-15-g-t-au-over-14-15m-at-golden-joint-extends-lotto-high-grade-to-225m-vertical-depth/ >.
New Found Gold Corp. (2022j): New Found Intersects 21.12 g/t Au over 7.20m, 79.81 g/t Au over 3.00m & 119.45 g/t over 2.40m at Keats Zone & Identifies New High-Grade Near Surface Mineralization; News Release dated 2022-04-11; < Available on January 17 at: https://newfoundgold.ca/news/new-found-intersects-21-12-g-t-au-over-7-20m-79-81-g-t-au-over-3-00m-119-45-g-t-over-2-40m-at-keats-zone-identifies-new-high-grade-near-surface-mineralization/ >.
| 24 January 2023 | | 229 |
January 2023 Exploration Update: New Found Gold Corp.’s Queensway Gold Project, NL
New Found Gold Corp. (2022k): New Found Makes New Discovery Between Keats and Golden Joint Intersecting 43.9 g/t Au Over 3.85m; News Release dated 2022-04-13; < Available on January 17 at: https://newfoundgold.ca/news/new-found-makes-new-discovery-between-keats-and-golden-joint-intersecting-43-9-g-t-au-over-3-85m/ >.
New Found Gold Corp. (2022l): New Found Makes Two New Near Surface Discoveries North of the Keats Zone Intersecting 275 g/t Au Over 2.15m and 8.70 g/t Au Over 6.75m; News Release dated 2022-05-04; < Available on January 17 at: https://newfoundgold.ca/news/new-found-makes-two-new-near-surface-discoveries-north-of-the-keats-zone-intersecting-275-g-t-au-over-2-15m-and-8-70-g-t-au-over-6-75m/ >.
New Found Gold Corp. (2022m): New Found Intersects 9.12 g/t Au Over 8.20m & 42.6 g/t Au Over 11.75m Starting 9m From Surface & 55.1 g/t Au Over 5.10m at the Keats Main Zone; News Release dated 2022-06-06; < Available on January 17 at: https://newfoundgold.ca/news/new-found-intersects-9-12-g-t-au-over-8-20m-42-6-g-t-au-over-11-75m-starting-9m-from-surface-55-1-g-t-au-over-5-10m-at-the-keats-main-zone/ >.
New Found Gold Corp. (2022n): New Found Intercepts 89.5 g/t Au Over 2.00m in New “Tuesday” Zone Discovery at Lotto Zone; News Release dated 2022-06-08; < Available on January 17 at: https://newfoundgold.ca/news/new-found-intercepts-89-5-g-t-au-over-2-00m-in-new-tuesday-zone-discovery-at-lotto/ >.
New Found Gold Corp. (2022o): Systematic Drilling Outlines New High-Grade Mineralized Vein Sets Over 630m Strike, Connecting Keats and 515 Zones; News Release dated 2022-08-02; < Available on January 17 at: https://newfoundgold.ca/news/systematic-drilling-outlines-new-high-grade-mineralized-vein-sets-over-630m-strike-connecting-keats-and-515-zones/ >.
New Found Gold Corp. (2022p): New Found Intercepts 18.95 g/t Au Over 5.75m in Near-Surface 60m Step-Out at Keats North and Provides Exploration Update; News Release dated 2022-09-01; < Available on January 17 at: https://newfoundgold.ca/news/new-found-intercepts-18-95-g-t-au-over-5-75m-in-near-surface-60m-step-out-at-keats-north-and-provides-exploration-update/ >.
New Found Gold Corp. (2022q): New Found Intercepts 152.1 g/t Au Over 3.85m & 12.98 g/t Au Over 14.95m at Lotto Main Vein, Confirms Continuity of High-Grade Over 220m Strike; News Release dated 2022-09-13; < Available on January 17 at: https://newfoundgold.ca/news/new-found-intercepts-152-1-g-t-au-over-3-85m-12-98-g-t-au-over-14-95m-at-lotto-main-vein-confirms-continuity-of-high-grade-over-220m-strike/ >.
New Found Gold Corp. (2022r): New Found Discovers New High-Grade Gold Zone West of the Appleton Fault Intercepting 10.4 g/t Au Over 10.5m & 17.9 g/t Au Over 4.2m at “Keats West”; News Release dated 2022-09-27; < Available on January 17 at: https://newfoundgold.ca/news/new-found-discovers-new-high-grade-gold-zone-west-of-the-appleton-fault-intercepting-10-4-g-t-au-over-10-5m-17-9-g-t-au-over-4-2m-at-keats-west/ >.
New Found Gold Corp. (2022s): New Found Intercepts 68.19 g/t Au Over 2.05m & 45.05 g/t Au Over 2.25m, Extends Keats Main Zone to Over 1km Along Strike; News Release dated 2022-10-18; < Available on January 17 at: https://newfoundgold.ca/news/new-found-intercepts-68-19-g-t-au-over-2-05m-45-05-g-t-au-over-2-25m-extends-keats-main-zone-to-over-1km-along-strike/ >.
New Found Gold Corp. (2022t): New Found Intercepts 33.8 g/t Au Over 2.35m, 37.4 g/t Au Over 2.10m & 22.8 g/t Au Over 2.20m at New “Lotto North” Discovery; News Release dated 2022-11-02; < Available on January 17 at: https://newfoundgold.ca/news/new-found-intercepts-33-8-g-t-au-over-2-35m-37-4-g-t-au-over-2-10m-22-8-g-t-au-over-2-20m-at-new-lotto-north-discovery/ >.
New Found Gold Corp. (2022u): New Found Intercepts 85.7 g/t Au Over 5.65m & 13.4 g/t Au Over 9.05m at Keats Main Zone, Initiates Use of Chrysos PhotonAssay™ Method; News Release dated 2022-11-16; < Available on January 17 at: https://newfoundgold.ca/news/new-found-intercepts-85-7-g-t-au-over-5-65m-13-4-g-t-au-over-9-05m-at-keats-main-zone-initiates-use-of-chrysos-photonassay-method/ >.
| 24 January 2023 | | 230 |
January 2023 Exploration Update: New Found Gold Corp.’s Queensway Gold Project, NL
New Found Gold Corp. (2022v): New Found Intercepts 18.6 g/t Au Over 15.95m Extending Keats West High-Grade Discovery by 200m Up-Dip & Intersects Broad Domains of Gold Mineralization; News Release dated 2022-11-23; < Available on January 17 at: https://newfoundgold.ca/news/new-found-intercepts-18-6-g-t-au-over-15-95m-extending-keats-west-high-grade-discovery-by-200m-up-dip-intersects-broad-domains-of-gold-mineralization/ >.
New Found Gold Corp. (2022w): New Found Intercepts 42.6 g/t Au Over 32m at Keats West, Includes High-Grade Interval of 171.6 g/t Au Over 6.5m; News Release dated 2022-11-28; < Available on January 17 at: https://newfoundgold.ca/news/new-found-intercepts-42-6-g-t-au-over-32m-at-keats-west-includes-high-grade-interval-of-171-6-g-t-au-over-6-5m/ >.
New Found Gold Corp. (2022x): New Found Reports Several High-Grade Intercepts From Keats North Including 117 g/t Au Over 2.00m, 36.5 g/t Au Over 2.15m & 20.8 g/t Au Over 2.00m; News Release dated 2022-12-05; < Available on January 17 at: https://newfoundgold.ca/news/new-found-reports-several-high-grade-intercepts-from-keats-north-including-117-g-t-au-over-2-00m-36-5-g-t-au-over-2-15m-20-8-g-t-au-over-2-00m/ >.
New Found Gold Corp. (2023a): New Found Intercepts 16.1 g/t Au Over 5.30m at Lotto North; Intercepts Gold Mineralization on West Side of Appleton Fault at “Zone 36”; News Release dated 2023-01-10; < Available on January 17 at: https://newfoundgold.ca/news/new-found-intercepts-16-1-g-t-au-over-5-30m-at-lotto-north-intercepts-gold-mineralization-on-west-side-of-appleton-fault-at-zone-36/ >.
New Found Gold Corp. (2023b): New Found Discovers Multiple New Gold Zones Extending 1.5km South of Keats, Increases Appleton Fault Zone High-Grade Gold Corridor to Over 4km in Strike Length; News Release dated 2023-01-18; < Available on January 17 at: https://newfoundgold.ca/news/new-found-discovers-multiple-new-gold-zones-extending-1-5km-south-of-keats-increases-appleton-fault-zone-high-grade-gold-corridor-to-over-4km-in-strike-length/ >.
New Found Gold Corp. (2023c): New Found Intercepts 6.7 g/t Au Over 24m at Keats West & Discovers New Vein Between Golden Joint and Keats North Intercepting 50.3 g/t Au Over 2.5m; News Release dated 2023-01-24; < Available on January 17 at: https://newfoundgold.ca/news/new-found-intercepts-6-7-g-t-au-over-24m-at-keats-west-discovers-new-vein-between-golden-joint-and-keats-north-intercepting-50-3-g-t-au-over-2-5m/ >.
O’Neill, P., Blackwood, R.F. (1989): A Proposal for revised stratigraphic nomenclature of the Gander and Davidsville Groups and the Gander River Ultrabasic Belt, of Northeastern Newfoundland; in Current Research - Newfoundland Department of Mines. Geological Survey of Newfoundland, (Report 89-1), p. 127–130.
Pollock, J.C., Wilton, D.H.C., van Staal, C.R. and Morrissey, K.D. (2007): U-Pb detrital zircon geochronological constraints on the Early Silurian collision of Ganderia and Laurentia along the Dog Bay Line: The terminal Iapetan suture in the Newfoundland Appalachians; American Journal of Science, v.307, n.2, p.399-433.
Pollock, J.C., Hibbard, J.P., van Staal, C.R. (2012): A paleogeographical review of the peri-Gondwanan realm of the Appalachian orogen. Canadian Journal of Earth Science. 49, p. 1-30.
Ryan, R.J. and Smith, P.K. (1998): A review of mesothermal gold deposits of the Meguma Group, Nova Scotia, Canada; Ore Geology Reviews, v.13, p.153-184.
Sandeman, H.A.I., Peddle, C. and Newman, R. (2018): Beaver Brook Antimony Mine Revisited: An Update on Operations and New Structural and Geological Observations; Newfoundland and Labrador Department of Natural Resources Geological Survey Report 18-1, p.123-152.
| 24 January 2023 | | 231 |
January 2023 Exploration Update: New Found Gold Corp.’s Queensway Gold Project, NL
Sheppard, D. (1994): Eighth Year Assessment Report Summary of Diamond Drilling Activities Conducted Within Licence No. 4344, The ‘Knob’ Prospect N.T.S. 20/15. Geofile Report 002D_0296.
Srivastava, M. R. (2022): Exploration Update Of The Queensway Project Newfoundland And Labrador, Canada (May 31, 2022). Amended and Restated National Instrument 43-101 Technical Report Prepared by RedDot3D Inc. on behalf of New Found Gold Corp. (https://newfoundgold.ca/wp-content/uploads/2022/06/2022-Queensway-43-101-Technical-Report-amended-final.pdf).
Sterk, R. and Kruse, S. (2021): Queensway Project, National Instrument 43-101 Technical Report prepared by RSC Consulting Limited on behalf of New Found Gold Corp. (https://newfoundgold.ca/wp-content/uploads/2022/05/Tech-Report.pdf)
Tickner, J., Ganly, B., Lovric, B. and O'Dwyer, J. (2017): Improving the sensitivity and accuracy of gamma activation analysis for gold; Applied Radiation and Isotopes, v.122, p.28-36.
Valverde-Vaquero, P., van Staal, C.R., McNicoll, V., Dunning, G.R. (2006): Mid–Late Ordovician magmatism and metamorphism along the Gander margin in central Newfoundland. Journal of the Geological Society, London. 163, p. 347–362.
van Staal, C.R., Dewey, J.F., Niocaill, C.M., McKerrow, W.S. (1998). The Cambrian-Silurian tectonic evolution of the northern Appalachians and British Caledonides: history of a complex, west and southwest Pacific-type segment of Iapetus; in Blundell, D.J., and Scott, A.C. (eds) Lyell: the Past is the Key to the Present.Geological Society, London, Special Publications, 143, p. 197–242.
van Staal, C.R., Barr, S.M. (2012): Lithospheric architecture and tectonic evolution of the Canadian Appalachians and associated Atlantic margin; in Tectonic Styles in Canada: The LITHOPROBE Perspective. Geological Association of Canada, Special Paper 49. p. 41–95.
van Staal, C.R., Barr, S.M., Waldron, J.W.F., Schofield, D.I., Zagorevski, A., White, C.E. (2021). Provenance and Paleozoic tectonic evolution of Ganderia and its relationships with Avalonia and Megumia in the Appalachian-Caledonide orogen. Gondwana Research, 98, p. 212–243.
Williams, H. (1972): The Appalachian Structural Province: Special Paper – Geological Association of Canada, v. 11, p. 181-261.
Williams, H. (1979). Appalachian Orogen in Canada. Canadian Journal of Earth Science, 16, p. 792–807.
Williams, H. (1995): Geology of the Appalachian—Caledonian Orogen in Canada and Greenland. Geological Society of America.
Williams, H. (2004): Generalized Interpretive Map - Newfoundland Appalachians, Department of Natural Resources, Geological Survey of Newfoundland and Labrador. Modified from J. P. Hayes (1987): https://www.gov.nl.ca/iet/files/mines-maps-nf.pdf
Williams, H., Colman-Sadd, S. P., & Swinden, H. S. (1988): Tectonic-stratigraphic subdivisions of central Newfoundland. Current Research, Part B. Geological Survey of Canada, Paper, 88, 91-98.
Williams, H., Currie, K. L., & Piasecki, M. A. J. (1993): The Dog Bay Line: a major Silurian tectonic boundary in northeast Newfoundland. Canadian Journal of Earth Sciences, 30(12), 2481-2494.
Williams, H., Piasecki, M.A.J. (1990). The Cold Spring Melange and a possible model for Dunnage-Gander zone interaction in central Newfoundland. Canadian Journal of Earth Science, 27, p. 1129–1134.
Willman, C.E. (2007): Regional structural controls of gold mineralization, Bendigo and Castlemaine goldfields, Central Victoria, Australia; Mineralium Deposita, v.42, p.449-463.
| 24 January 2023 | | 232 |
January 2023 Exploration Update: New Found Gold Corp.’s Queensway Gold Project, NL
| 28 | Certificate of Author |
I, D. Roy Eccles, P. Geol. P. Geo., do hereby certify that:
1. | I am a Senior Consulting Geologist and Chief Operations Officer of APEX Geoscience Ltd., 100 11450-160 Street, Edmonton, Alberta T5M 3Y7. |
2. | I graduated with a B.Sc. in Geology from the University of Manitoba in Winnipeg, Manitoba in 1986 and with a M.Sc. in Geology from the University of Alberta in Edmonton, Alberta in 2004. |
3. | I am and have been registered as a Professional Geologist with the Association of Professional Engineers and Geoscientists of Alberta (APEGA, Membership Number 74150) since 2003, and Newfoundland and Labrador Professional Engineers and Geoscientists (PEGNL, Membership Number 08287) since 2015. |
4. | I have worked as a geologist for more than 35 years since my graduation from university and have been involved in all aspects of mineral exploration, mineral research, and mineral resource estimations for metallic, industrial, and specialty mineral projects and deposits. |
5. | I have read the definition of “Qualified Person”, as set out in National Instrument 43-101 Standards of Disclosure for Mineral Projects (NI 43‐101). By reason of my education, affiliation with a professional association and past relevant work experience, I fulfill the requirements to be a “Qualified Person” for the purposes of NI 43‐101. My technical experience includes Caledonian Orogeny gold mineralization projects (and other multi-commodity projects) in the Dunnage Zone of Newfoundland and Scotland. |
6. | I prepared, and accept, responsibility for all Items (Items 1-14, 23-27) of the NI 43-101 Technical Report, January 2023 Exploration Update at New Found Gold Corp.’s Queensway Gold Project in Newfoundland and Labrador, Canada, with an effective date of 24 January 2023 (the “Technical Report”). I visited the Queensway Property on January 12-13, 2023, and can verify the Property licences/claims, access, infrastructure, active drilling exploration, geological setting, and the gold mineralization that is the subject of this Technical Report. |
| 7. | To the best of my knowledge, information and belief, the Technical Report contains all relevant scientific and technical information that is required to be disclosed, to make the Technical Report not misleading. |
| 8. | I have read NI 43-101 and Form 43-101F1, and the Technical Report has been prepared in compliance with that instrument and form. |
| 9. | I am independent of New Found Gold Corp. and the Queensway Property, applying to all tests in section 1.5 of Companion Policy 43-101CP. |
10. | I have not previously been involved with the Queensway Property that is the subject of the Technical Report. |
Effective date: 24 January 2023
Signing date: 16 February 2023
Edmonton, Alberta, Canada

Roy Eccles MSc. P. Geo. P. Geol.
| 24 January 2023 | | 233 |
SIGNATURES
Pursuant to the requirements of the Securities Exchange Act of 1934, the registrant has duly caused this report to be signed on behalf by the undersigned, thereunto duly authorized.
| NEW FOUND GOLD CORP. | |||
| Date: February 16, 2023 | By: | /s/ Collin Kettell | |
Chief Executive Officer | |||