Exhibit 99.1
Investor Presentation December 2021
Disclosures 2 Note: unless otherwise stated, all values included are in Canadian dollars. This Presentation (together with the information contained herein and the materials accompanying it collectively, this “Prese nta tion”) constitutes confidential information and is provided to you on the condition that you agree that you will hold it in strict confidence and not reproduce, disclose, forward or distribute it in whole or in part to any third party without the pr ior written consent of Telesat Corporation (together, with its direct and indirect subsidiaries, “Telesat” or the “Company”) and is intended for the recipient hereof only. To the maximum extent permitted by law, none of Telesat, its affiliates, directors, officers, employees, agents, advisors or rep resentatives, nor any other person, accepts any liability, including, without limitation, any liability arising out of fault or negligence for any loss arising from the use of the information contained in this Presentation. This Presentation has been prepared solely for informational purposes, and this Presentation is not, and should not be assume d t o be, complete. This presentation is a summary only of certain information in respect of the Company and any recipient hereof should conduct its own independent investigation and analysis of the Company, including legal, accounting an d o ther relevant professional advice. Acceptance of this presentation further constitutes your acknowledgment and agreement that none of Telesat or its affiliates, directors, officers, employees, agents, advisors or representatives (i) mak es any representation or warranty, express or implied, as to the accuracy or completeness of the information contained herein or any other information (whether communicated in written or oral form) transmitted or made available to recipients of th is Presentation or (ii) shall have any liability to the recipient or its representatives relating to or arising from the information contained herein or any omissions from such information, or any other written or oral communication transmitted t o a ny interested party in the course of its evaluation of Telesat. The information contained in this Presentation is provided as at the date hereof and is subject to change without notice. Telesat reserves the right to amend and supplement th is Presentation at any time. This Presentation does not constitute an offer to sell, or a solicitation of an offer to purchase, any securities from any of th e entities discussed herein. Third Party Information Although all information and opinions expressed in this Presentation, including market data and other statistical information (i ncluding estimates and projections relating to the addressable market), were obtained from sources believed to be reliable and are included in good faith, Telesat has not independently verified the information and makes no representation o r w arranty, express or implied, as to its accuracy or completeness. Some data is also based on the good faith estimates of Telesat, which are derived from its review of internal sources as well as the independent sources described abov e. This Presentation contains preliminary information only, is subject to change at any time and, is not, and should not be assumed to be, complete. While Telesat is not aware of any misstatements regarding the industry and market data presented in this Presentation, such data involves risks and uncertainties and are subject to change based on various factors, including those factors discussed under “Forward - Looking Information”. Telesat has no intention and undertakes no obligation to update or revise any information or data contained in this Presentation, whether as a result of new information, future events or otherwise, except as may be required by applicable law. Trademarks This Presentation includes certain trademarks which are protected under applicable intellectual property laws and are the pro per ty of Telesat. Solely for convenience, the trademarks referred to in this Presentation may appear without the ® or Œ symbol, but such references are not intended to indicate, in any way, that Telesat will not assert our rights to these tradem ar ks to the fullest extent under applicable law. All other trademarks used in this Presentation are the property of their respective owners. The use or display of third parties’ trademarks, service marks, trade names or products in this presentati on is not intended to, and does not imply, a relationship with Telesat, or an endorsement or sponsorship by or of Telesat. Non - GAAP Financial Measures Unless otherwise indicated, financial information in this presentation has been prepared in accordance with International Financial Reporting Standards (“IFRS”) as issued by the International Accounting Standards Board . IFRS differs in some respects from United States generally accepted accounting principles (“U . S . GAAP”), and thus our financial statements may not be comparable to the financial statements of United States companies prepared in accordance with U . S . GAAP . The financial information in this presentation may include financial information that is not presented in accordance with IFRS . Non - IFRS financial measures may be considered in addition to IFRS financial information, but should not be used as substitutes for the corresponding IFRS measures . Non - IFRS measures in this presentation may be calculated in a way that is not comparable to similarly titled measures reported by other companies . This Presentation includes certain financial measures not presented in accordance with IFRS or U.S. GAAP, including but not l imi ted to, net debt, EBITDA, Adjusted EBITDA, Free Cash Flow and certain ratios and other metrics and ratios derived therefrom. These measures are not measurements of our financial performance under IFRS or U.S. GAAP and may exclude items tha t a re significant in understanding and assessing Telesat’s financial results, and therefore should not be considered as alternatives to net income or any other measures derived in accordance with IFRS or U.S. GAAP or as alternative s t o cash flow from operating activities as measures of our liquidity. You should be aware that Telesat’s presentation of these measures may not be comparable to similarly - titled measures used by other companies. Reconciliations of these measures to IFRS are included in the Appendix hereto.
Disclosures 3 Forward - Looking Information This presentation may include "forward - looking statements" within the meaning of the Private Securities Litigation Reform Act of 1995 , Section 27 A of the Securities Act of 1933 , as amended and Section 21 E of the Securities Exchange Act of 1934 , as amended, and “forward - looking information” within the meaning of applicable Canadian securities laws (collectively, “forward - looking statements”) regarding Telesat, its financial condition and its results of operations that reflect Telesat’s current views and information currently available . This information is, where applicable, based on estimates, assumptions and analysis that Telesat believes, as of the date hereof, provide a reasonable basis for the information contained herein . Forward - looking statements can generally be identified by the use of forward - looking words such as “believes”, “expects”, “plans”, “may”, “will”, “would”, “could”, “should”, “anticipates”, “estimates”, “aims”, “targets”, “continues”, “objective”, “projects”, “intend” or “outlook” or other variations of these words or other similar expressions, and include statements regarding Telesat’s plans, strategies, objectives and targets . These forward - looking statements involve known and unknown risks, uncertainties and other factors, many of which are outside the control of Telesat and its directors, officers, employees, agents, associates or representatives . Actual results, performance or achievements may differ materially and potentially adversely from any forward - looking statements and the assumptions on which those vary from forward statements are based . There can be no assertion that the information contained in this presentation is reflective of future performance to any degree . All of the forward - looking statements included in this Presentation are qualified by these cautionary statements . Readers are cautioned not to place undue reliance on forward - looking statements as a predictor of future performance . All information herein speaks only as of the date hereof unless otherwise specified . Actual results may differ materially from the expectations expressed or implied in the forward - looking statements as a result of known and unknown risks and uncertainties . Detailed information about some of the known risks and uncertainties is included in the “Risk Factors” section of Telesat's non - offering prospectus filed with the Ontario Securities Commission, which was filed by Telesat with the U . S . Securities and Exchange Commission (the “SEC”) on Form 425 on November 16 , 2021 (the “Non - Offering Prospectus”) . Known risks and uncertainties include but are not limited to : risks associated with operating satellites and providing satellite services, including satellite construction or launch delays, launch failures, in - orbit failures, impaired satellite performance or inability to restore capacity, volatility in exchange rates and risks associated with domestic and foreign government regulation . The foregoing list of important factors is not exhaustive . Telesat undertakes no claim or obligation or undertaking to update or revise the information contained herein, publicly or otherwise whether as a result of new information, future events or otherwise . Forecasts and estimates regarding Telesat’s industry and end markets are based on sources we believe to be reliable, however there can be no assurance these forecasts and estimates will prove accurate in whole or in part . Neither Telesat nor any of its directors, officers, affiliates, employees or advisors accepts any responsibility to inform the recipients of this Presentation of any matter arising or coming to any of their notice which may affect any matter referred to in this Presentation (including but not limited to any error or omission which may become apparent after this Presentation has been issued) or to update or revise any forward - looking statements, whether as a result of new information, future events, or otherwise, except as may be required by applicable law . This Presentation also contains future - oriented financial information (“FOFI”) and information which could be considered to be in the nature of a “financial outlook”, including, but not limited to, revenue backlog projections and compound annual growth rate outlook . All FOFI contained in this Presentation is subject to the same assumptions, risks, limitations and qualifications as set forth herein . FOFI contained in this Presentation is made as of the date hereof, based on information available to Telesat as of the date hereof, and was provided for the purpose of describing the anticipated results of Telesat’s operations . The actual results of operations of Telesat may vary from the amounts set forth herein and such variation may be material . Telesat disclaims any intention or obligation to update or revise any FOFI in this Presentation, whether as a result of new information, future events or otherwise, except as may be required by applicable law . Historical statements contained in this Presentation regarding past trends or activities should not be taken as a representation that such trends or activities will continue in the future . In this regard, certain financial information contained herein has been extracted from, or based upon, information available in the public domain and/or provided by Telesat . In particular, historical results should not be taken as a representation that such trends will be replicated in the future . No statement in this document is intended to be nor may be construed as a profit forecast . The financials measures in this presentation are those of Telesat Canada and are sourced from Telesat and Telesat Partnership’s Registration Statement on Form F - 4 filed with the SEC on June 24 , 2021 , the Non - Offering Prospectus, or Telesat Canada quarterly financials filed with the SEC, as applicable .
Investment highlights 4
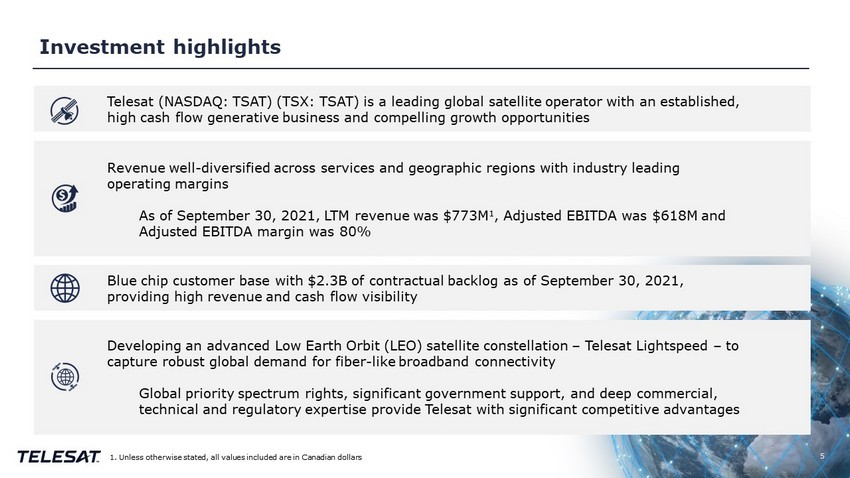
Investment h ighlights Telesat (NASDAQ: TSAT) (TSX: TSAT) is a leading global satellite operator with an established , high cash flow generative business and compelling growth opportunities Revenue well - diversified across services and geographic regions with industry leading operating margins As of September 30, 2021, LTM revenue was $773M 1 , Adjusted EBITDA was $618M and Adjusted EBITDA margin was 80% Blue chip customer base with $2.3B of contractual backlog as of September 30, 2021, providing high revenue and cash flow visibility Developing an advanced Low Earth Orbit (LEO) satellite constellation – Telesat Lightspeed – to capture robust global demand for fiber - like broadband connectivity Global priority spectrum rights, significant government support, and deep commercial, technical and regulatory expertise provide Telesat with significant competitive advantages 5 1. Unless otherwise stated, all values included are in Canadian dollars
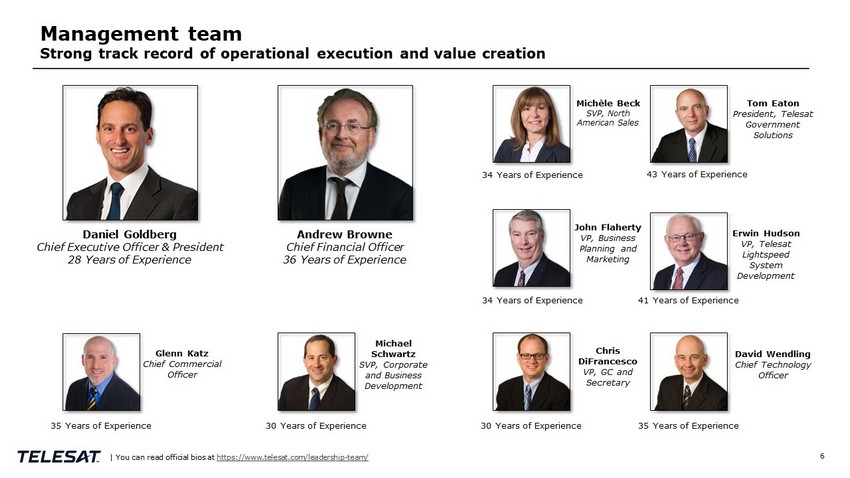
Management team Strong track record of operational execution and value creation 6 Daniel Goldberg Chief Executive Officer & President 28 Years of Experience Andrew Browne Chief Financial Officer 36 Years of Experience Michèle Beck SVP, North American Sales Chris DiFrancesco VP, GC and Secretary Tom Eaton President, Telesat Government Solutions John Flaherty VP, Business Planning and Marketing Erwin Hudson VP, Telesat Lightspeed System Development Michael Schwartz SVP, Corporate and Business Development David Wendling Chief Technology Officer 30 Years of Experience 34 Years of Experience 43 Years of Experience 34 Years of Experience 41 Years of Experience 30 Years of Experience 35 Years of Experience Glenn Katz Chief Commercial Officer 35 Years of Experience | You can read official bios at https://www.telesat.com/leadership - team/
Telesat is a leading global satellite operator 7
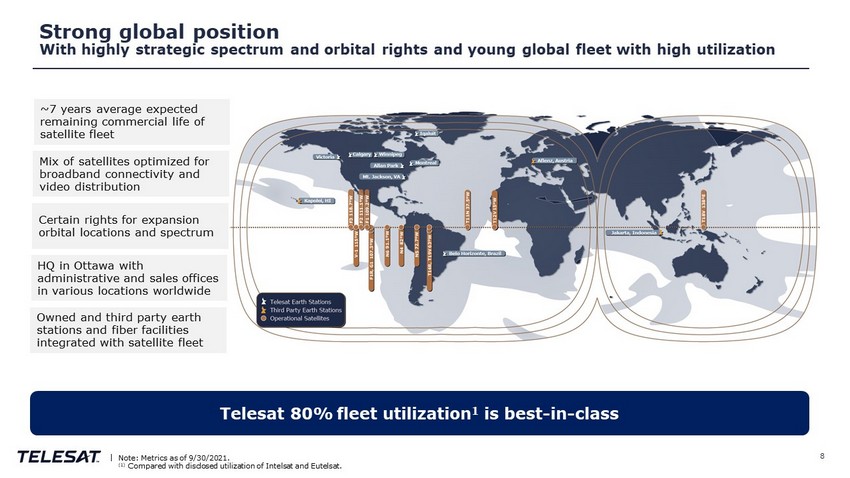
Strong global position With highly strategic spectrum and orbital rights and young global fleet with high utilization 8 | Note: Metrics as of 9/30/2021. (1) Compared with disclosed utilization of Intelsat and Eutelsat. Telesat 80% fleet utilization 1 is best - in - class ~ 7 years average expected remaining commercial life of satellite fleet Mix of satellites optimized for broadband connectivity and video distribution Certain rights for expansion orbital locations and spectrum HQ in Ottawa with administrative and sales offices in various locations worldwide Owned and third party earth stations and fiber facilities integrated with satellite fleet
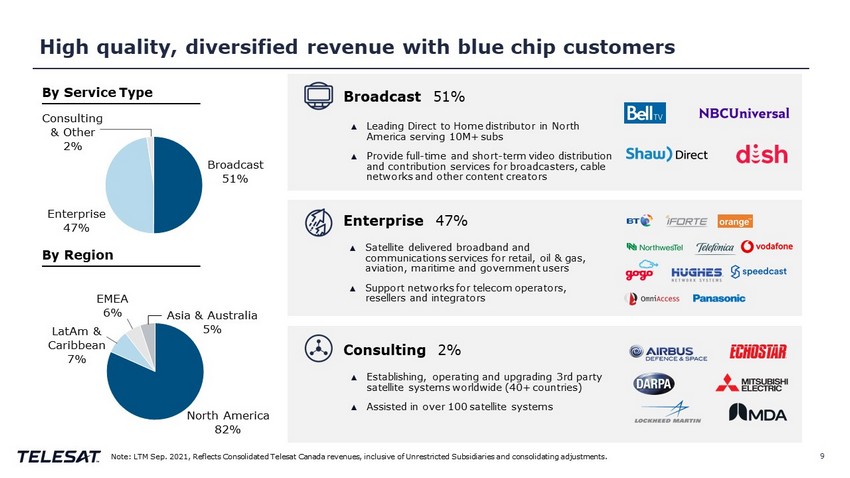
High q uality , diversified r evenue with blue chip customers 9 By Service Type By Region Consulting & Other 2% EMEA 6% Asia & Australia 5% LatAm & Caribbean 7% North America 82% Broadcast 51% Enterprise 47% Note: LTM Sep. 2021, Reflects Consolidated Telesat Canada revenues, inclusive of Unrestricted Subsidiaries and consolidating adj ustments. Broadcast 51% ▲ Leading Direct to Home distributor in North America serving 10M+ subs ▲ Provide full - time and short - term video distribution and contribution services for broadcasters, cable networks and other content creators ▲ Satellite delivered broadband and communications services for retail, oil & gas, aviation, maritime and government users ▲ Support networks for telecom operators, resellers and integrators ▲ Establishing, operating and upgrading 3rd party satellite systems worldwide (40+ countries) ▲ Assisted in over 100 satellite systems Enterprise 47% Consulting 2%
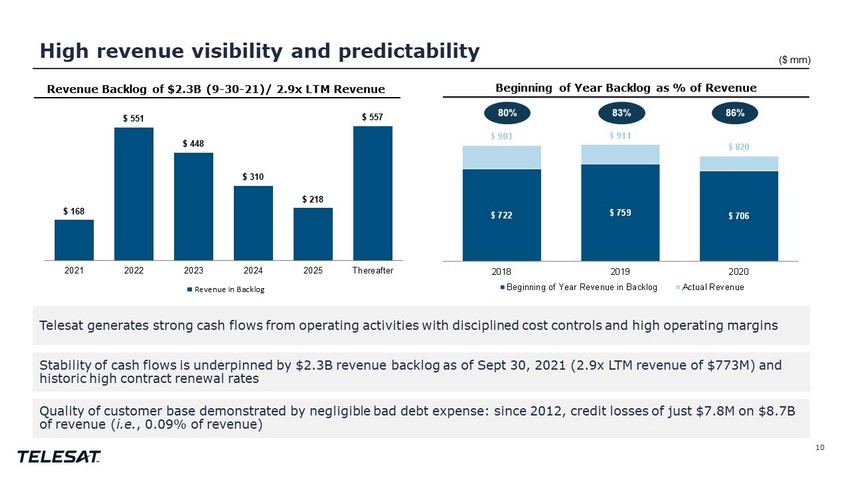
High r evenue v isibility and p redictability 10 Revenue Backlog of $2.3B (9 - 30 - 21)/ 2.9x LTM Revenue Beginning of Year Backlog as % of Revenue ($ mm) 80% 83% 86% $ 722 $ 759 $ 706 $ 903 $ 911 $ 820 2018 2019 2020 Beginning of Year Revenue in Backlog Actual Revenue $ 168 $ 551 $ 448 $ 310 $ 218 $ 557 2021 2022 2023 2024 2025 Thereafter Revenue in Backlog Telesat generates strong cash flows from operating activities with disciplined cost control s and high operating margins Stability of cash flows is underpinned by $2.3 B revenue backlog as of Sept 30, 2021 ( 2.9x LTM revenue of $773 M) and historic high contract renewal rates Quality of customer base demonstrated by negligible bad debt expense: since 2012, credit losses of just $7.8 M on $8.7 B of revenue ( i.e. , 0.09% of revenue)

Global demand for broadband is growing rapidly 11
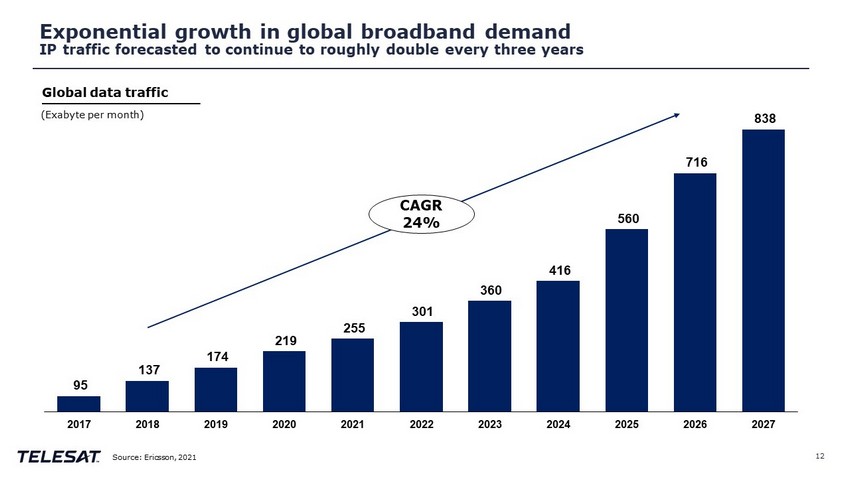
95 137 174 219 255 301 360 416 560 716 838 2017 2018 2019 2020 2021 2022 2023 2024 2025 2026 2027 Exponential growth in global broadband demand IP traffic forecasted to continue to roughly double every three years 12 CAGR 24% (Exabyte per month) Source: Ericsson, 2021 Global data traffic
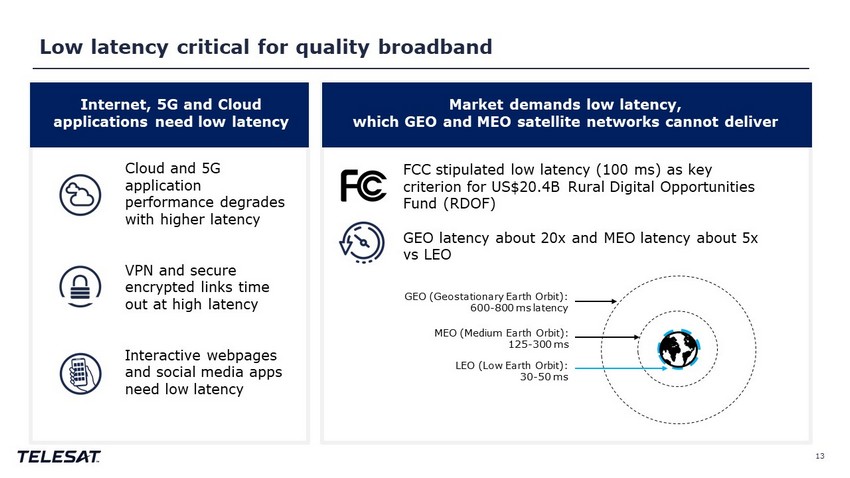
Low latency critical for quality broadband 13 Cloud and 5G application performance degrades with higher latency VPN and secure encrypted links time out at high latency Interactive webpages and social media apps need low latency FCC stipulated low latency (100 ms) as key criterion for US$20.4B Rural Digital Opportunities Fund (RDOF) GEO latency about 20x and MEO latency about 5x vs LEO MEO (Medium Earth Orbit): 125 - 300 ms LEO (Low Earth Orbit): 30 - 50 ms GEO (Geostationary Earth Orbit): 600 - 800 ms latency Internet, 5G and Cloud applications need low latency Market demands low latency, which GEO and MEO satellite networks cannot deliver
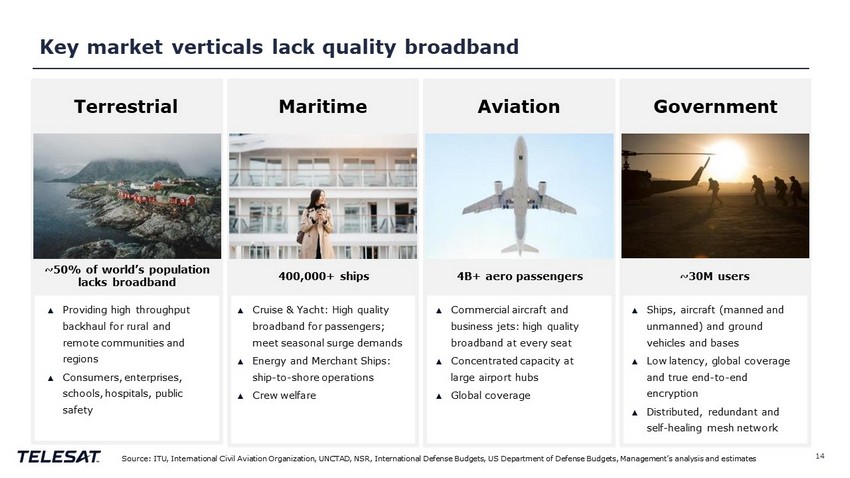
Key market verticals lack quality broadband 14 ▲ Cruise & Yacht: High quality broadband for passengers ; meet seasonal surge demands ▲ Energy and Merchant Ships: ship - to - shore operations ▲ Crew welfare ▲ Ships, aircraft (manned and unmanned) and ground vehicles and bases ▲ Low latency, global coverage and true end - to - end encryption ▲ Distributed, redundant and self - healing mesh network Government Maritime ▲ Commercial aircraft and business jets: high quality broadband at every seat ▲ Concentrated capacity at large airport hubs ▲ Global coverage Aviation ▲ Providing high throughput b ackhaul for rural and remote c ommunities and regions ▲ Consumers, e nterprises, s chools , h ospitals , public safety Terrestrial ~50% of world’s population lacks broadband 400,000+ ships 4B+ aero passengers ~30M users Source: ITU, International Civil Aviation Organization, UNCTAD, NSR, International Defense Budgets, US Department of Defense Bud gets, Management’s a nalysis and e stimates
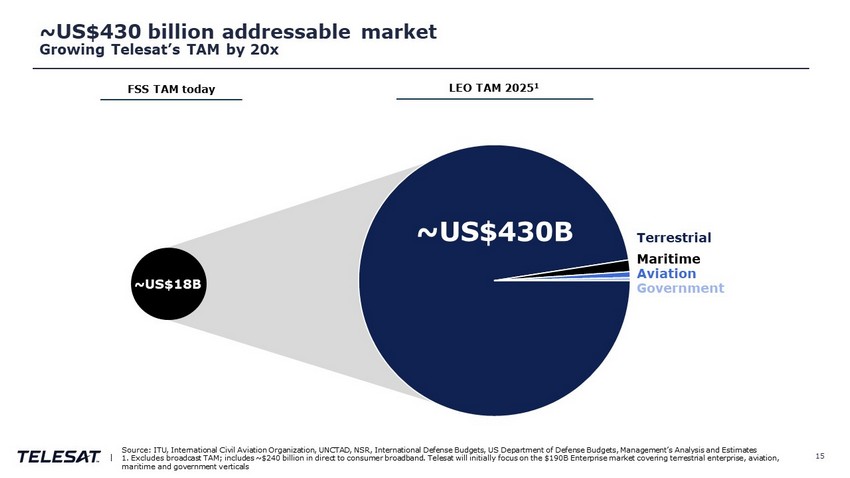
~US$430 billion addressable market Growing Telesat’s TAM by 20x 15 | ~US$18B ~US$430B ~US$430B FSS TAM today LEO TAM 2025 1 Aviation Government Maritime Terrestrial Source: ITU, International Civil Aviation Organization, UNCTAD, NSR, International Defense Budgets, US Department of Defense Bud gets, Management’s Analysis and Estimates 1. Excludes broadcast TAM; includes ~$240 billion in direct to consumer broadband. Telesat will initially focus on the $190B Ent erprise market covering terrestrial enterprise, aviation, maritime and government verticals
Telesat Lightspeed is designed to be the world’s most advanced Low Earth Orbit satellite network 16
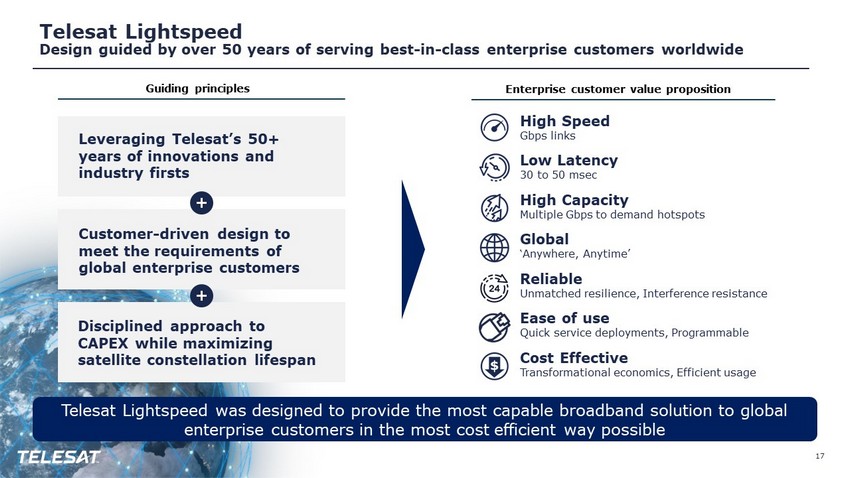
Telesat Lightspeed Design guided by over 50 years of serving best - in - class enterprise customers worldwide 17 Telesat Lightspeed was designed to provide the most capable broadband solution to global enterprise customers in the most cost efficient way possible High Speed Gbps links Low Latency 30 to 50 msec High Capacity Multiple Gbps to demand hotspots Global ‘ Anywhere, Anytime’ Reliable Unmatched resilience, Interference resistance Ease of use Quick service deployments, Programmable Cost Effective Transformational economics, Efficient usage Enterprise customer value proposition Leveraging Telesat’s 50+ years of innovations and industry firsts Customer - driven design to meet the requirements of global enterprise customers Disciplined approach to CAPEX while maximizing satellite constellation lifespan Guiding principles
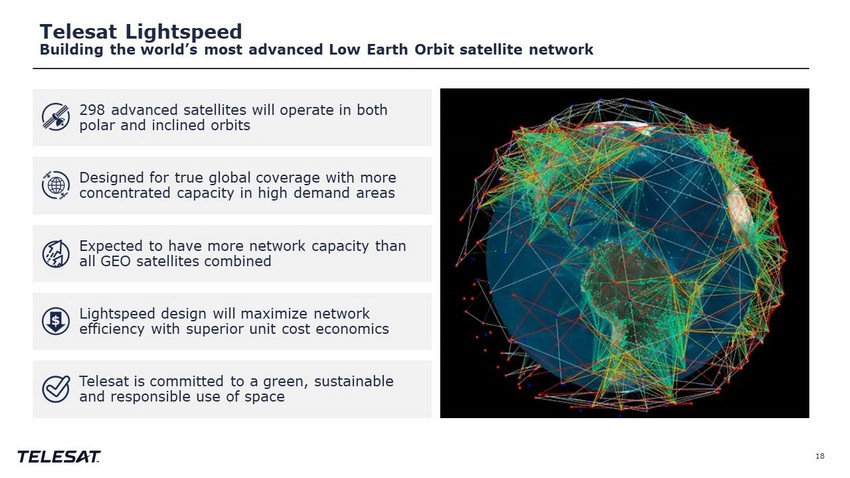
Telesat Lightspeed Building the world’s most advanced Low Earth Orbit satellite network 18 298 advanced satellites will operate in both polar and inclined orbits Designed for true global coverage with more concentrated capacity in high demand areas Expected to have more network capacity than all GEO satellites combined Lightspeed design will maximize network efficiency with superior unit cost economics Telesat is committed to a green, sustainable and responsible use of space
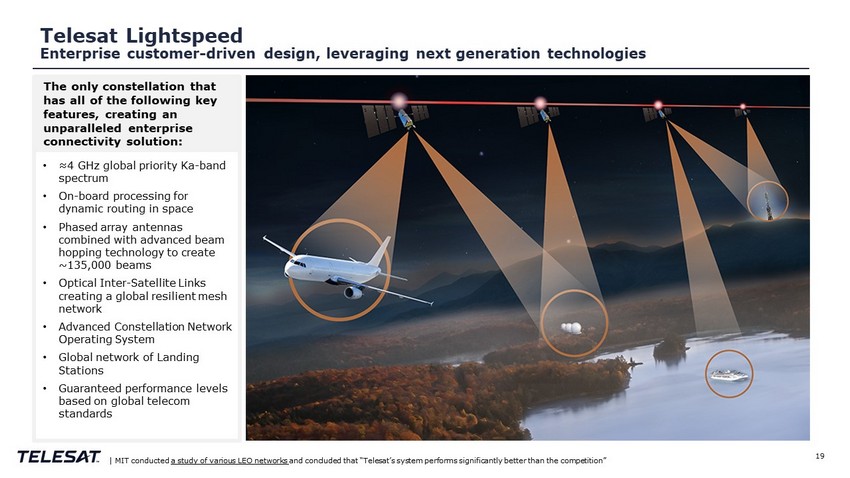
Telesat Lightspeed Enterprise customer - driven design, leveraging next generation technologies 19 | MIT conducted a study of various LEO networks and concluded that “Telesat’s system performs significantly better than the competition” The only constellation that has all of the following key features, creating an unparalleled enterprise connectivity solution: • ≈4 GHz global priority Ka - band spectrum • On - board processing for dynamic routing in space • Phased array antennas combined with advanced beam hopping technology to create ~135,000 beams • Optical Inter - Satellite Links creating a global resilient mesh network • Advanced Constellation Network Operating System • Global network of Landing Stations • Guaranteed performance levels based on global telecom standards The only constellation that has all of the following key features, creating an unparalleled enterprise connectivity solution:
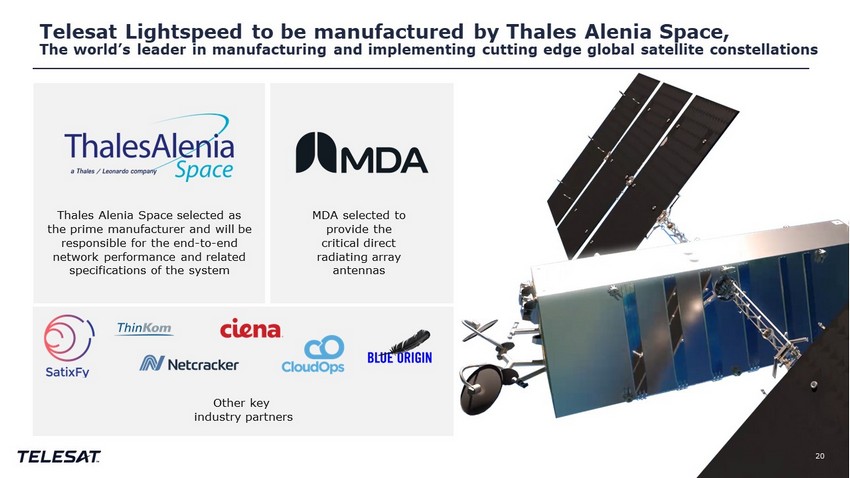
Telesat Lightspeed to be manufactured by Thales Alenia Space, The world’s leader in manufacturing and implementing cutting edge global satellite constellations Thales Alenia Space selected as the prime manufacturer and will be responsible for the end - to - end network performance and related specifications of the system MDA selected to provide the critical direct radiating array antennas Other key industry partners 20
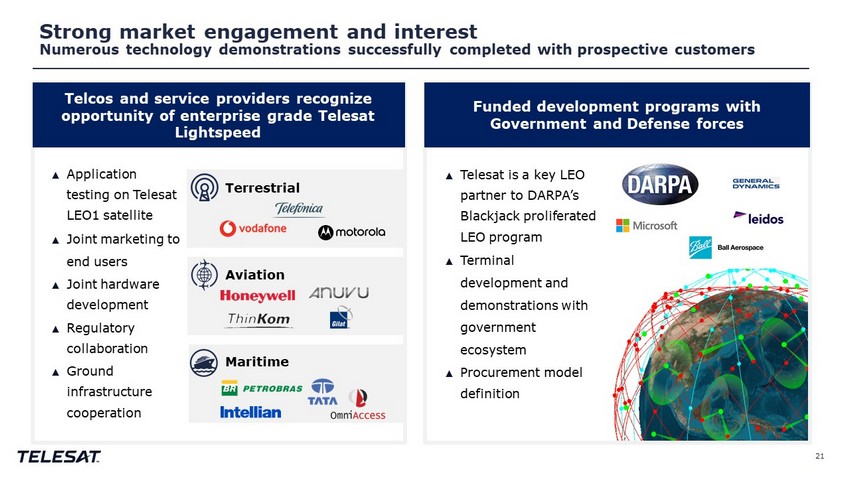
Strong market engagement and interest Numerous technology demonstrations successfully completed with prospective customers 21 ▲ Application testing on Telesat LEO1 satellite ▲ Joint marketing to end users ▲ Joint hardware development ▲ Regulatory collaboration ▲ Ground infrastructure cooperation ▲ Telesat is a key LEO partner to DARPA’s Blackjack proliferated LEO program ▲ Terminal development and demonstrations with government ecosystem ▲ Procurement model definition Telcos and service providers recognize opportunity of enterprise grade Telesat Lightspeed Funded development programs with Government and Defense forces Terrestrial Aviation Maritime
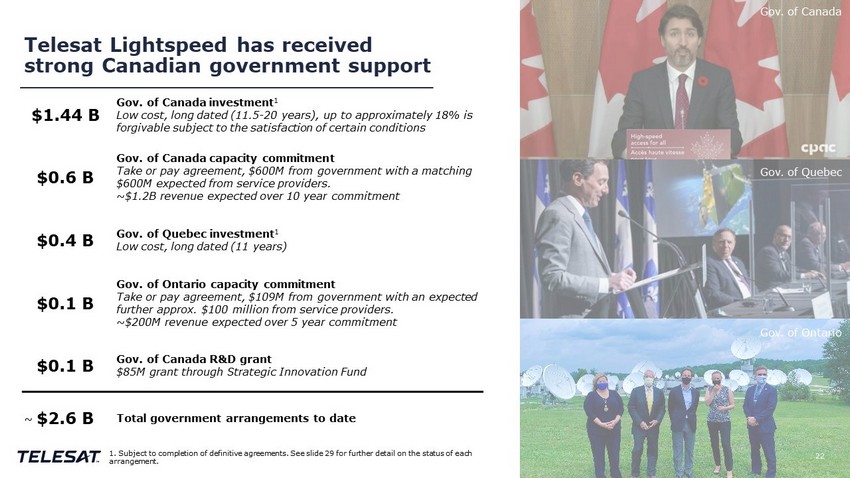
Telesat Lightspeed has received strong Canadian government support $1.44 B Gov. of Canada investment 1 Low cost, long dated (11.5 - 20 years), up to approximately 18% is forgivable subject to the satisfaction of certain conditions $0.6 B Gov. of Canada capacity commitment Take or pay agreement, $600M from government with a matching $600M expected from service providers. ~ $1.2B revenue expected over 10 year commitment $0.4 B Gov. of Quebec investment 1 Low cost, long dated (11 years) $0.1 B Gov. of Ontario capacity commitment Take or pay agreement, $109M from government with an expected further approx. $100 million from service providers. ~ $200M revenue expected over 5 year commitment $0.1 B Gov. of Canada R&D grant $85M grant through Strategic Innovation Fund $2.6 B Total government arrangements to date ~ 1. Subject to completion of definitive agreements. See slide 29 for further detail on the status of each arrangement. 22 Gov. of Canada Gov. of Quebec Gov. of Ontario
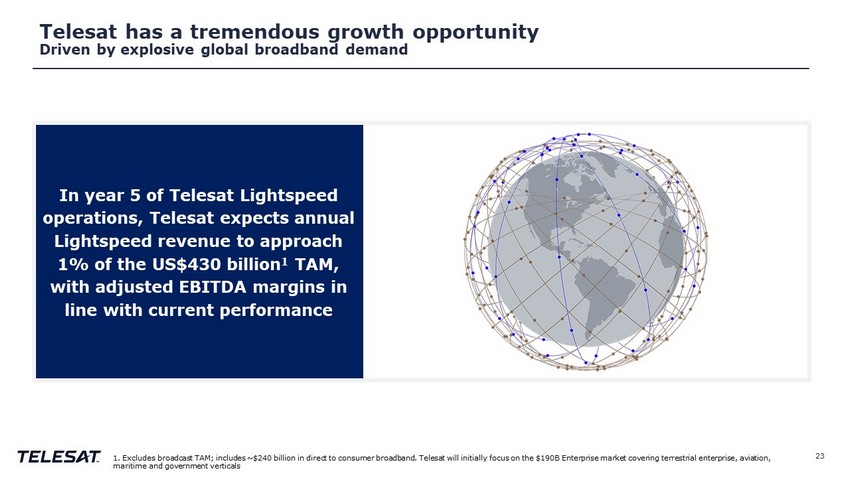
Telesat has a tremendous growth opportunity Driven by explosive global broadband demand 23 In year 5 of Telesat Lightspeed operations, Telesat expects annual Lightspeed revenue to approach 1% of the US$430 billion 1 TAM, with adjusted EBITDA margins in line with current performance 1. Excludes broadcast TAM; includes ~$240 billion in direct to consumer broadband. Telesat will initially focus on the $190B Ent erprise market covering terrestrial enterprise, aviation, maritime and government verticals
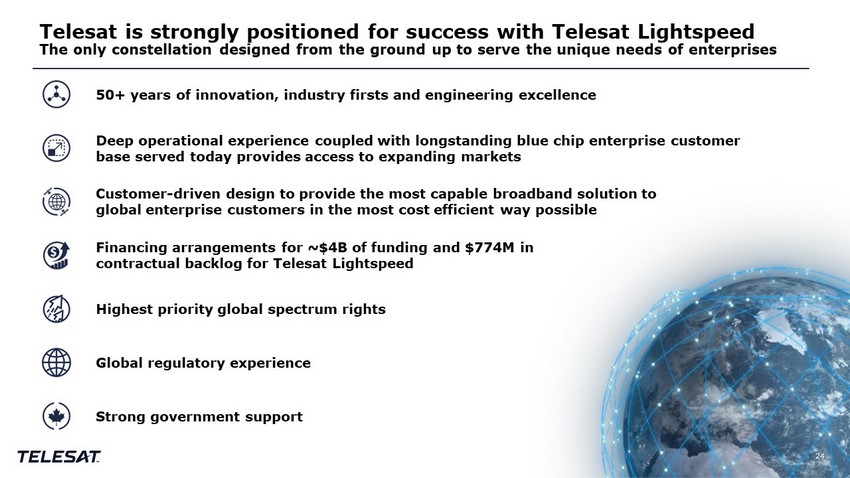
Telesat is strongly positioned for success with Telesat Lightspeed The only constellation designed from the ground up to serve the unique needs of enterprises 24 50+ years of innovation, industry firsts and engineering excellence Highest priority global spectrum rights Deep operational experience coupled with longstanding blue chip enterprise customer base served today provides access to expanding markets Financing arrangements for ~$4B of funding and $774M in contractual backlog for Telesat Lightspeed Global regulatory experience Strong government support Customer - driven design to provide the most capable broadband solution to global enterprise customers in the most cost efficient way possible
Financial highlights 25

Financial h ighlights 26 Metrics referenced are on an LTM basis as of 12/31/2020, unless otherwise stated. 1 Revenue backlog as at 9/30/2021. 2 Simple Free Cash Flow defined as Adj. EBITDA less Capex. Simple Free Cash Flow is a non - IFRS measure. Please refer to the Appen dix for a reconciliation to Simple Free Cash Flow from Adjusted EBITDA. Significant Opportunity for Revenue Growth at Scale with Telesat Lightspeed ~US$430B TAM Strong Client Retention Drives Recurring Demand and Visibility $2.3B Revenue Backlog 1 Strategically Investing for Long - term Growth Telesat Lightspeed Program Capital Efficient FSS Model with High Asset Utilization and Young Fleet $560M Simple Free Cash Flow 2 Demonstrated Operating Leverage and Discipline Enables High Adj. EBITDA Margins ~80%+ Margins (2018 – 2020)

Consistent and s table h istorical f inancial p erformance – h igh o perating m argins and s trong f ree c ash f low 27 Revenue Adj. EBITDA 1 Adj. EBITDA Margins Simple Free Cash Flow 2 3 1 Adjusted EBITDA is a non - IFRS measure. Please refer to the Appendix for a reconciliation of Adjusted EBITDA to net income. 2 Simple Free Cash Flow defined as Adj. EBITDA less Capex. Simple Free Cash Flow is a non - IFRS measure. Please refer to the Appen dix for a reconciliation to Simple Free Cash Flow from Adjusted EBITDA. 80% 83% 86% Beginning of Year Backlog as % of Revenue $ 752 $ 763 $ 653 2018 2019 2020 83 % 84 % 80 % 2018 2019 2020 $ 649 $ 723 $ 560 2018 2019 2020 $ 903 $ 911 $ 820 2018 2019 2020
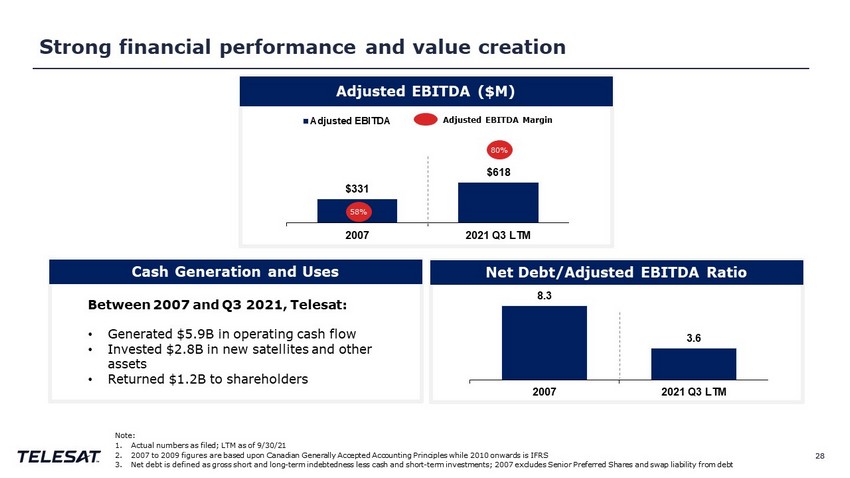
28 8.3 3.6 2007 2021 Q3 LTM S trong f inancial p erformance and v alue c reation 28 $331 $618 2007 2021 Q3 LTM Adjusted EBITDA 58% Adjusted EBITDA Margin Note: 1. Actual numbers as filed; LTM as of 9/30/21 2. 2007 to 2009 figures are based upon Canadian Generally Accepted Accounting Principles while 2010 onwards is IFRS 3. Net debt is defined as gross short and long - term indebtedness less cash and short - term investments; 2007 excludes Senior Preferr ed Shares and swap liability from debt 80 % Between 2007 and Q3 2021, Telesat: • Generated $5.9B in operating cash flow • Invested $2.8B in new satellites and other assets • Returned $1.2B to shareholders Adjusted EBITDA ($M) Cash Generation and Uses Net Debt/Adjusted EBITDA Ratio
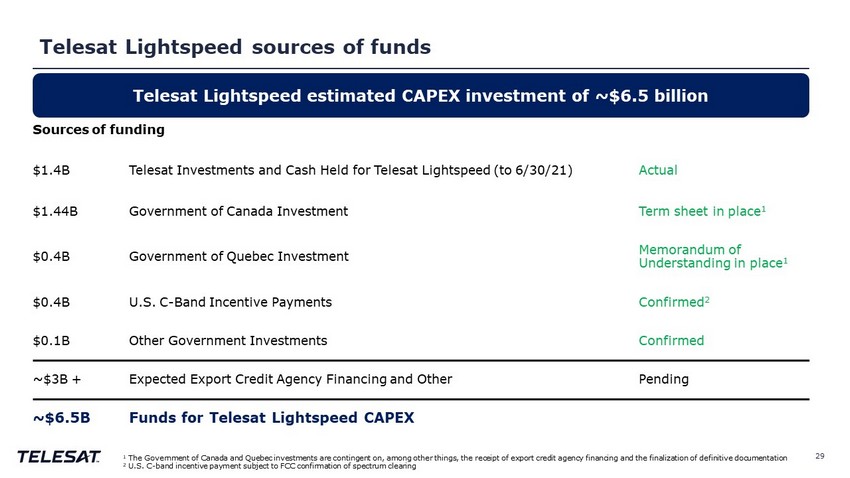
Telesat Lightspeed sources of funds 29 Sources of funding $1.4B Telesat Investments and Cash Held for Telesat Lightspeed (to 6/30/21) Actual $1.44B Government of Canada Investment Term sheet in place 1 $0.4B Government of Quebec Investment Memorandum of Understanding in place 1 $0.4B U.S. C - Band Incentive Payments Confirmed 2 $0.1B Other Government Investments Confirmed ~$3B + Expected Export Credit Agency Financing and Other Pending ~$6.5B Funds for Telesat Lightspeed CAPEX Telesat Lightspeed estimated CAPEX investment of ~$6.5 billion 1 The Government of Canada and Quebec investments are contingent on, among other things, the receipt of export credit agency fi na ncing and the finalization of definitive documentation 2 U.S. C - band incentive payment subject to FCC confirmation of spectrum clearing
Conclusion 30

Telesat is positioned for significant growth and value creation 31 One of the largest and most innovative satellite operators Existing high cash flow generative business underpinned by significant contractual backlog with blue chip customer base, industry - leading operating margins, and young fleet with high capacity utilization Telesat Lightspeed positions Telesat for dramatic growth and value creation in burgeoning market for enterprise - grade global broadband services Highly innovative design, global priority spectrum rights, substantial government support, and deep commercial, technical and regulatory expertise provide Telesat with significant competitive advantages
Appendix 32
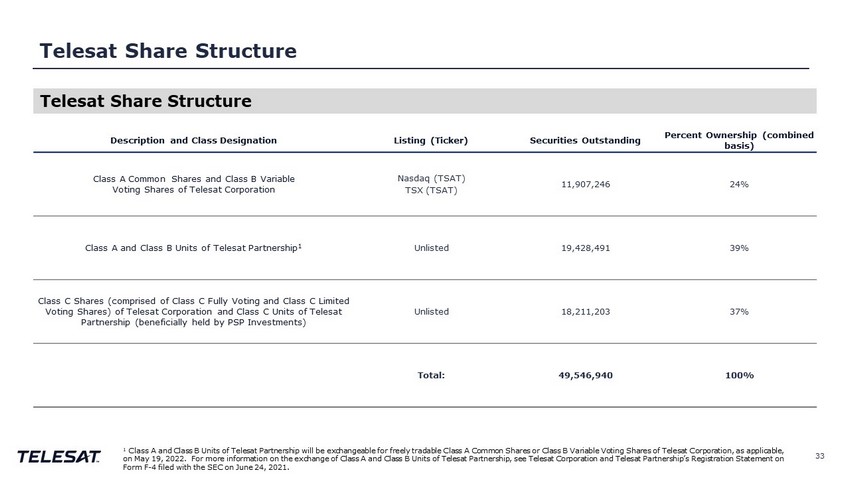
Telesat Share Structure Description and Class Designation Listing (Ticker) Securities Outstanding Percent Ownership (combined basis) Class A Common Shares and Class B Variable Voting Shares of Telesat Corporation Nasdaq (TSAT) TSX (TSAT) 11,907,246 24% Class A and Class B Units of Telesat Partnership 1 Unlisted 19,428,491 39% Class C Shares (comprised of Class C Fully Voting and Class C Limited Voting Shares) of Telesat Corporation and Class C Units of Telesat Partnership (beneficially held by PSP Investments) Unlisted 18,211,203 37% Total: 49,546,940 100% Telesat Share Structure 33 1 Class A and Class B Units of Telesat Partnership will be exchangeable for freely tradable Class A Common Shares or Class B Va ri able Voting Shares of Telesat Corporation, as applicable, on May 19, 2022. For more information on the exchange of Class A and Class B Units of Telesat Partnership, see Telesat Corpo rat ion and Telesat Partnership’s Registration Statement on Form F - 4 filed with the SEC on June 24, 2021.
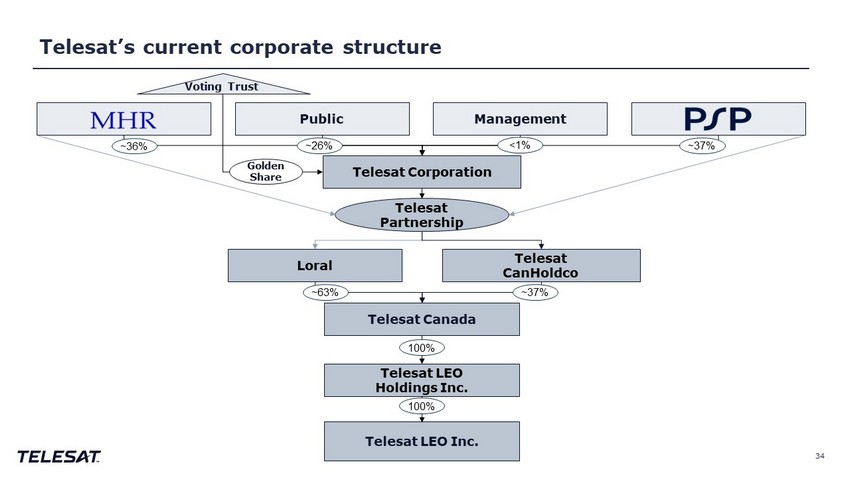
Telesat’s current corporate structure 34 Telesat Corporation Public Management Loral ~36% ~26% <1% ~37% Telesat Partnership Telesat Canada Telesat LEO Holdings Inc. Telesat LEO Inc. Telesat CanHoldco ~63% Voting Trust Golden Share 100% 100% ~37%
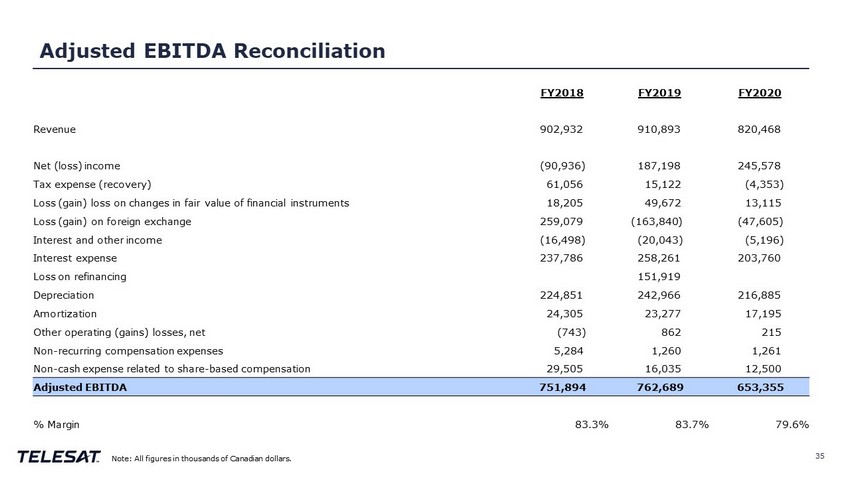
Adjusted EBITDA Reconciliation 35 Note: All figures in thousands of Canadian dollars. FY2018 FY2019 FY2020 Revenue 902,932 910,893 820,468 Net (loss) income (90,936) 187,198 245,578 Tax expense (recovery) 61,056 15,122 (4,353) Loss (gain) loss on changes in fair value of financial instruments 18,205 49,672 13,115 Loss (gain) on foreign exchange 259,079 (163,840) (47,605) Interest and other income (16,498) (20,043) (5,196) Interest expense 237,786 258,261 203,760 Loss on refinancing 151,919 Depreciation 224,851 242,966 216,885 Amortization 24,305 23,277 17,195 Other operating (gains) losses, net (743) 862 215 Non - recurring compensation expenses 5,284 1,260 1,261 Non - cash expense related to share - based compensation 29,505 16,035 12,500 Adjusted EBITDA 751,894 762,689 653,355 % Margin 83.3% 83.7% 79.6%
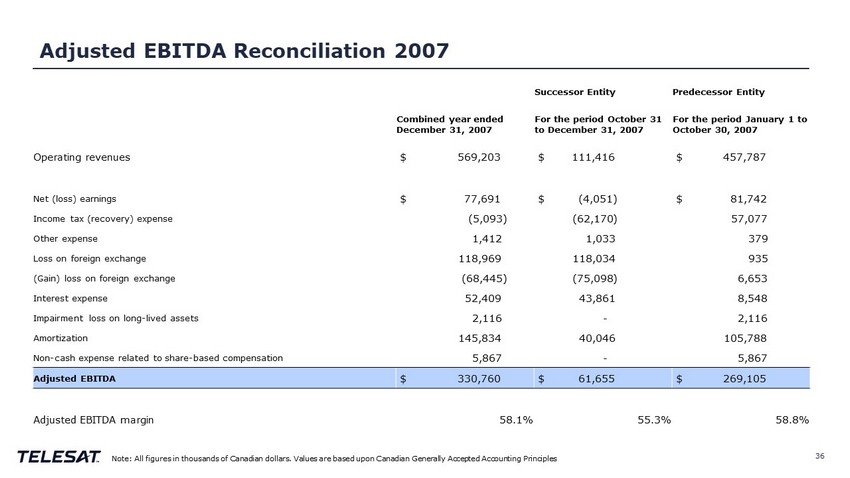
Adjusted EBITDA Reconciliation 2007 36 Note: All figures in thousands of Canadian dollars. Values are based upon Canadian Generally Accepted Accounting Principles Successor Entity Predecessor Entity Combined year ended December 31, 2007 For the period October 31 to December 31, 2007 For the period January 1 to October 30, 2007 Operating revenues $ 569,203 $ 111,416 $ 457,787 Net (loss) earnings $ 77,691 $ (4,051) $ 81,742 Income tax (recovery) expense (5,093) (62,170) 57,077 Other expense 1,412 1,033 379 Loss on foreign exchange 118,969 118,034 935 (Gain) loss on foreign exchange (68,445) (75,098) 6,653 Interest expense 52,409 43,861 8,548 Impairment loss on long - lived assets 2,116 - 2,116 Amortization 145,834 40,046 105,788 Non - cash expense related to share - based compensation 5,867 - 5,867 Adjusted EBITDA $ 330,760 $ 61,655 $ 269,105 Adjusted EBITDA margin 58.1% 55.3% 58.8%
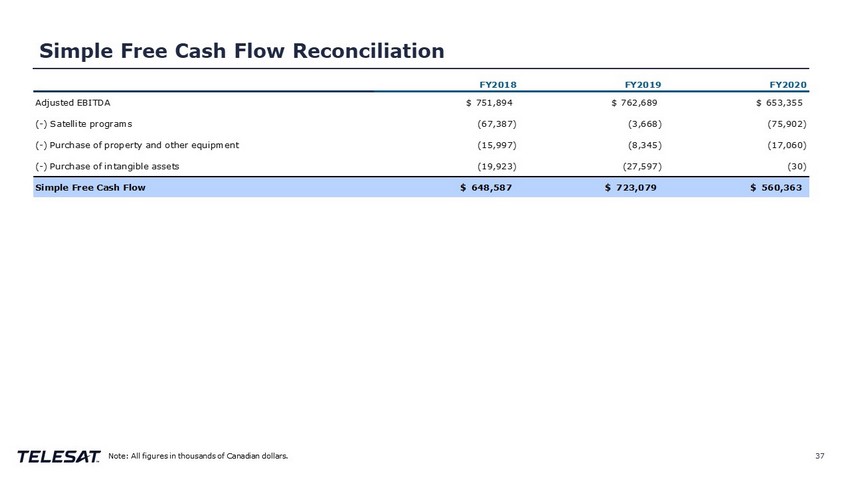
Simple Free Cash Flow Reconciliation 37 Note: All figures in thousands of Canadian dollars. FY2018 FY2019 FY2020 Adjusted EBITDA $751,894 $762,689 $653,355 (-) Satellite programs (67,387) (3,668) (75,902) (-) Purchase of property and other equipment (15,997) (8,345) (17,060) (-) Purchase of intangible assets (19,923) (27,597) (30) Simple Free Cash Flow $648,587 $723,079 $560,363 % Adjusted EBITDA Conversion 71.8% 79.4% 68.3%
Hugh Harley +1 613 748 8424 Michael Bolitho +1 613 748 8828 www.Telesat.com vimeo.com/telesat Investor contacts: IR@Telesat.com