Free Writing Prospectus Filed Pursuant to Rule 433 Registration Statement No. 333-257929 Dated November 16, 2021 |
Investor Presentation November 2021
Disclaimer 2 FinWise Bancorp (“FinWise,” “we,” “us,” or the “Company”) has filed a registration statement (including a prospectus, which is preliminary and subject to completion) with the U.S. Securities and Exchange Commission (the “SEC”) for the offering to which this presentation relates. Before you invest in any securities, you should read the prospectus in that registration statement and other documents FinWise has filed or will file with the SEC for more complete information about FinWise and the offering. You may obtain these documents for free by visiting EDGAR on the SEC website at www.sec.gov. Alternatively, FinWise, any underwriter or any dealer participating in the offering will arrange to send you the prospectus if you request it by contacting Piper Sandler & Co., 1251 Avenue of the Americas, Attn: Syndicate Department, by emailing PSCsyndicate@psc.com or by telephone at 1-866-805-4128 or Stephens Inc. by emailing prospectus@stephens.com or by telephone at 1-800-643-9691. This presentation does not constitute or form a part of the registration statement for the proposed offering to which this presentation relates and does not constitute an offer to sell securities, and FinWise is not soliciting an offer to buy securities in any jurisdiction where such offer or sale is not permitted. Neither the SEC nor any state securities commission has approved or disapproved of the securities of FinWise or passed upon the accuracy or adequacy of this presentation. Any representation to the contrary is a criminal offense. Except as otherwise indicated, this presentation speaks as of the date hereof.FinWise’s common stock is not a deposit or savings account of FinWise’s bank subsidiary and is not insured by the Federal Deposit Insurance Corporation or any other governmental agency or instrumentality.This presentation has been prepared by FinWise solely for informational purposes to assist interested parties in making their own evaluation of FinWise. It does not purport to contain all of the information that may be relevant. In all cases, interested parties should conduct their own investigation and analysis of FinWise and the data set forth in this presentation and other information provided by or on behalf of FinWise. The contents of this presentation should not be construed as investment, legal or tax advice. Forward-looking statements and other informationThis presentation contains forward-looking statements about the Company. These forward-looking statements reflect our current views with respect to, among other things, future events and our financial performance. These statements are often, but not always, made through the use of words or phrases such as “may,” “might,” “should,” “could,” “predict,” “potential,” “believe,” “will likely result,” “expect,” “continue,” “will,” “anticipate,” “seek,” “estimate,” “intend,” “plan,” “project,” “projection,” “forecast,” “goal,” “target,” “would,” “aim” and “outlook,” or the negative version of those words or other comparable words or phrases of a future or forward-looking nature. These forward-looking statements are not historical facts, and are based on current expectations, estimates and projections about our industry and management’s beliefs and certain assumptions made by management, many of which, by their nature, are inherently uncertain and beyond our control. The inclusion of these forward-looking statements should not be regarded as a representation by us, the underwriters or any other person that such expectations, estimates and projections will be achieved. Accordingly, we caution you that any such forward-looking statements are not guarantees of future performance and are subject to risks, assumptions and uncertainties that are difficult to predict. Although we believe that the expectations reflected in these forward-looking statements are reasonable as of the date made, actual results may prove to be materially different from the results expressed or implied by the forward-looking statements. All information contained herein speaks only as of the date of this presentation, except where information is stated to be presented as of a specific date. The information presented or contained in this presentation is subject to change without notice. The Company undertakes no duty to update or revise the information contained herein, publicly or otherwise, including any forward-looking statements, except as required by law. Neither the delivery of this presentation nor any further discussions of the Company, any of its affiliates, shareholders, directors, employees, agents, advisors, representatives or the underwriters with any of the recipients shall, under any circumstances, create any implication that there has been no change in the affairs of the Company since that date. Market and industry dataThis presentation includes estimates regarding market and industry data. Unless otherwise indicated, information concerning our industry and the markets in which we operate, including our general expectations, market positon, market opportunity, and market size, are based on our management’s knowledge and experience in the markets in which we operate, together with currently available information obtained from various sources, including publically available information, industry reports and publications, surveys, our clients, trade and business organizations and other contacts in the markets in which we operate. Certain information is based on management estimates, which have been derived from third-party sources, as well as data from our internal research. In presenting this information, we have made certain assumptions that we believe to be reasonable based on such data and other similar sources and on our knowledge of, and our experience to date in, the markets in which we operate. While we believe the estimated market and industry data included in this presentation are generally reliable, such information, which is derived in part from management’s estimates and beliefs, is inherently uncertain and imprecise.Non-GAAP financial measuresSome of the financial measures included in this presentation are not measures of financial performance recognized by generally accepted accounting principles in the United States (“GAAP”). These non-GAAP financial measures are “tangible shareholders’ equity,” “tangible book value per share,” and “efficiency ratio.” Our management uses these non-GAAP financial measures in its analysis of our performance. We believe these non-GAAP financial measures provide useful information to management and investors that is supplementary to our financial condition, results of operations and cash flows computed in accordance with GAAP; however, we acknowledge that our non-GAAP financial measures have a number of limitations. As such, you should not view these measures as a substitute for results determined in accordance with GAAP, and they are not necessarily comparable to non-GAAP financial measures that other companies use. A reconciliation of such non-GAAP financial measures to the most closely related GAAP financial measures is included in the Appendix to this presentation. Trademarks“FinWise” and its logos and other trademarks referred to and included in this presentation belong to us. Solely for convenience, we refer to our trademarks in this presentation without the ® or the ™ or symbols, but such references are not intended to indicate that we will not fully assert under applicable law our trademark rights. Other service marks, trademarks and trade names referred to in this presentation, if any, are the property of their respective owners, although for presentational convenience we may not use the ® or the ™ symbols to identify such trademarks.
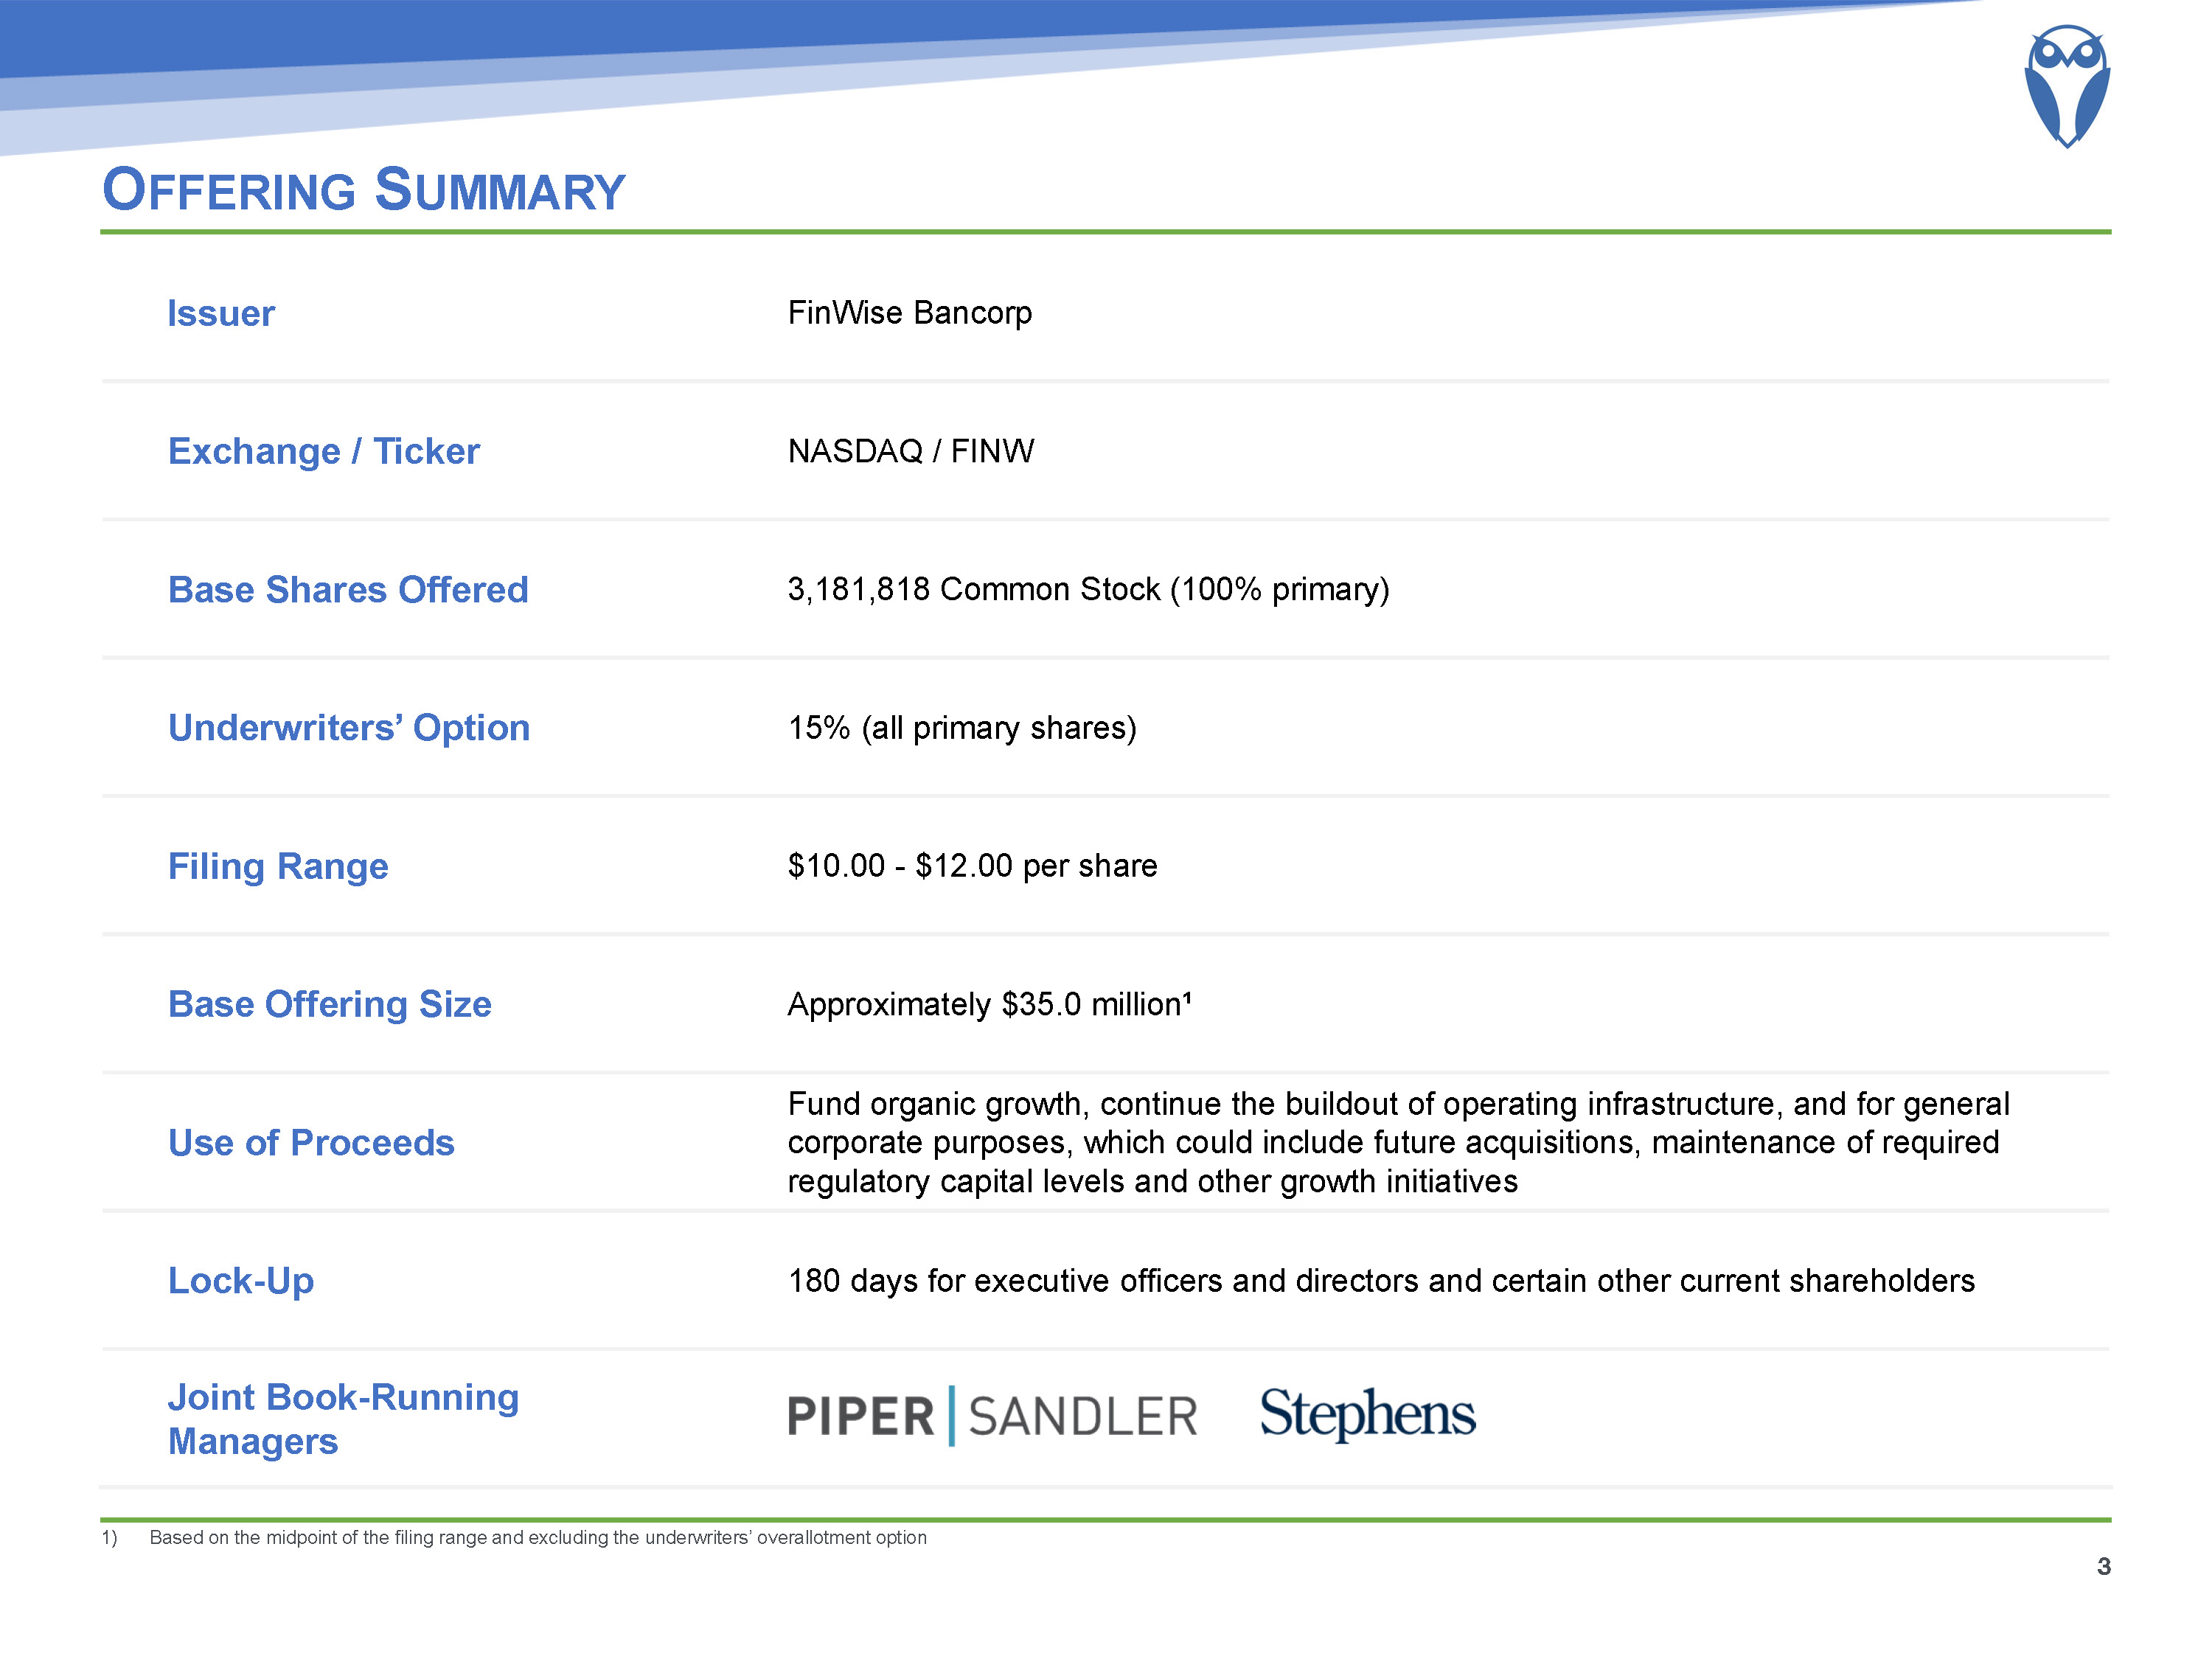
Issuer FinWise Bancorp Exchange / Ticker NASDAQ / FINW Base Shares Offered 3,181,818 Common Stock (100% primary) Underwriters’ Option 15% (all primary shares) Filing Range $10.00 - $12.00 per share Base Offering Size Approximately $35.0 million¹ Use of Proceeds Fund organic growth, continue the buildout of operating infrastructure, and for generalcorporate purposes, which could include future acquisitions, maintenance of requiredregulatory capital levels and other growth initiatives Lock-Up 180 days for executive officers and directors and certain other current shareholders Joint Book-Running Managers Offering Summary Based on the midpoint of the filing range and excluding the underwriters’ overallotment option 3
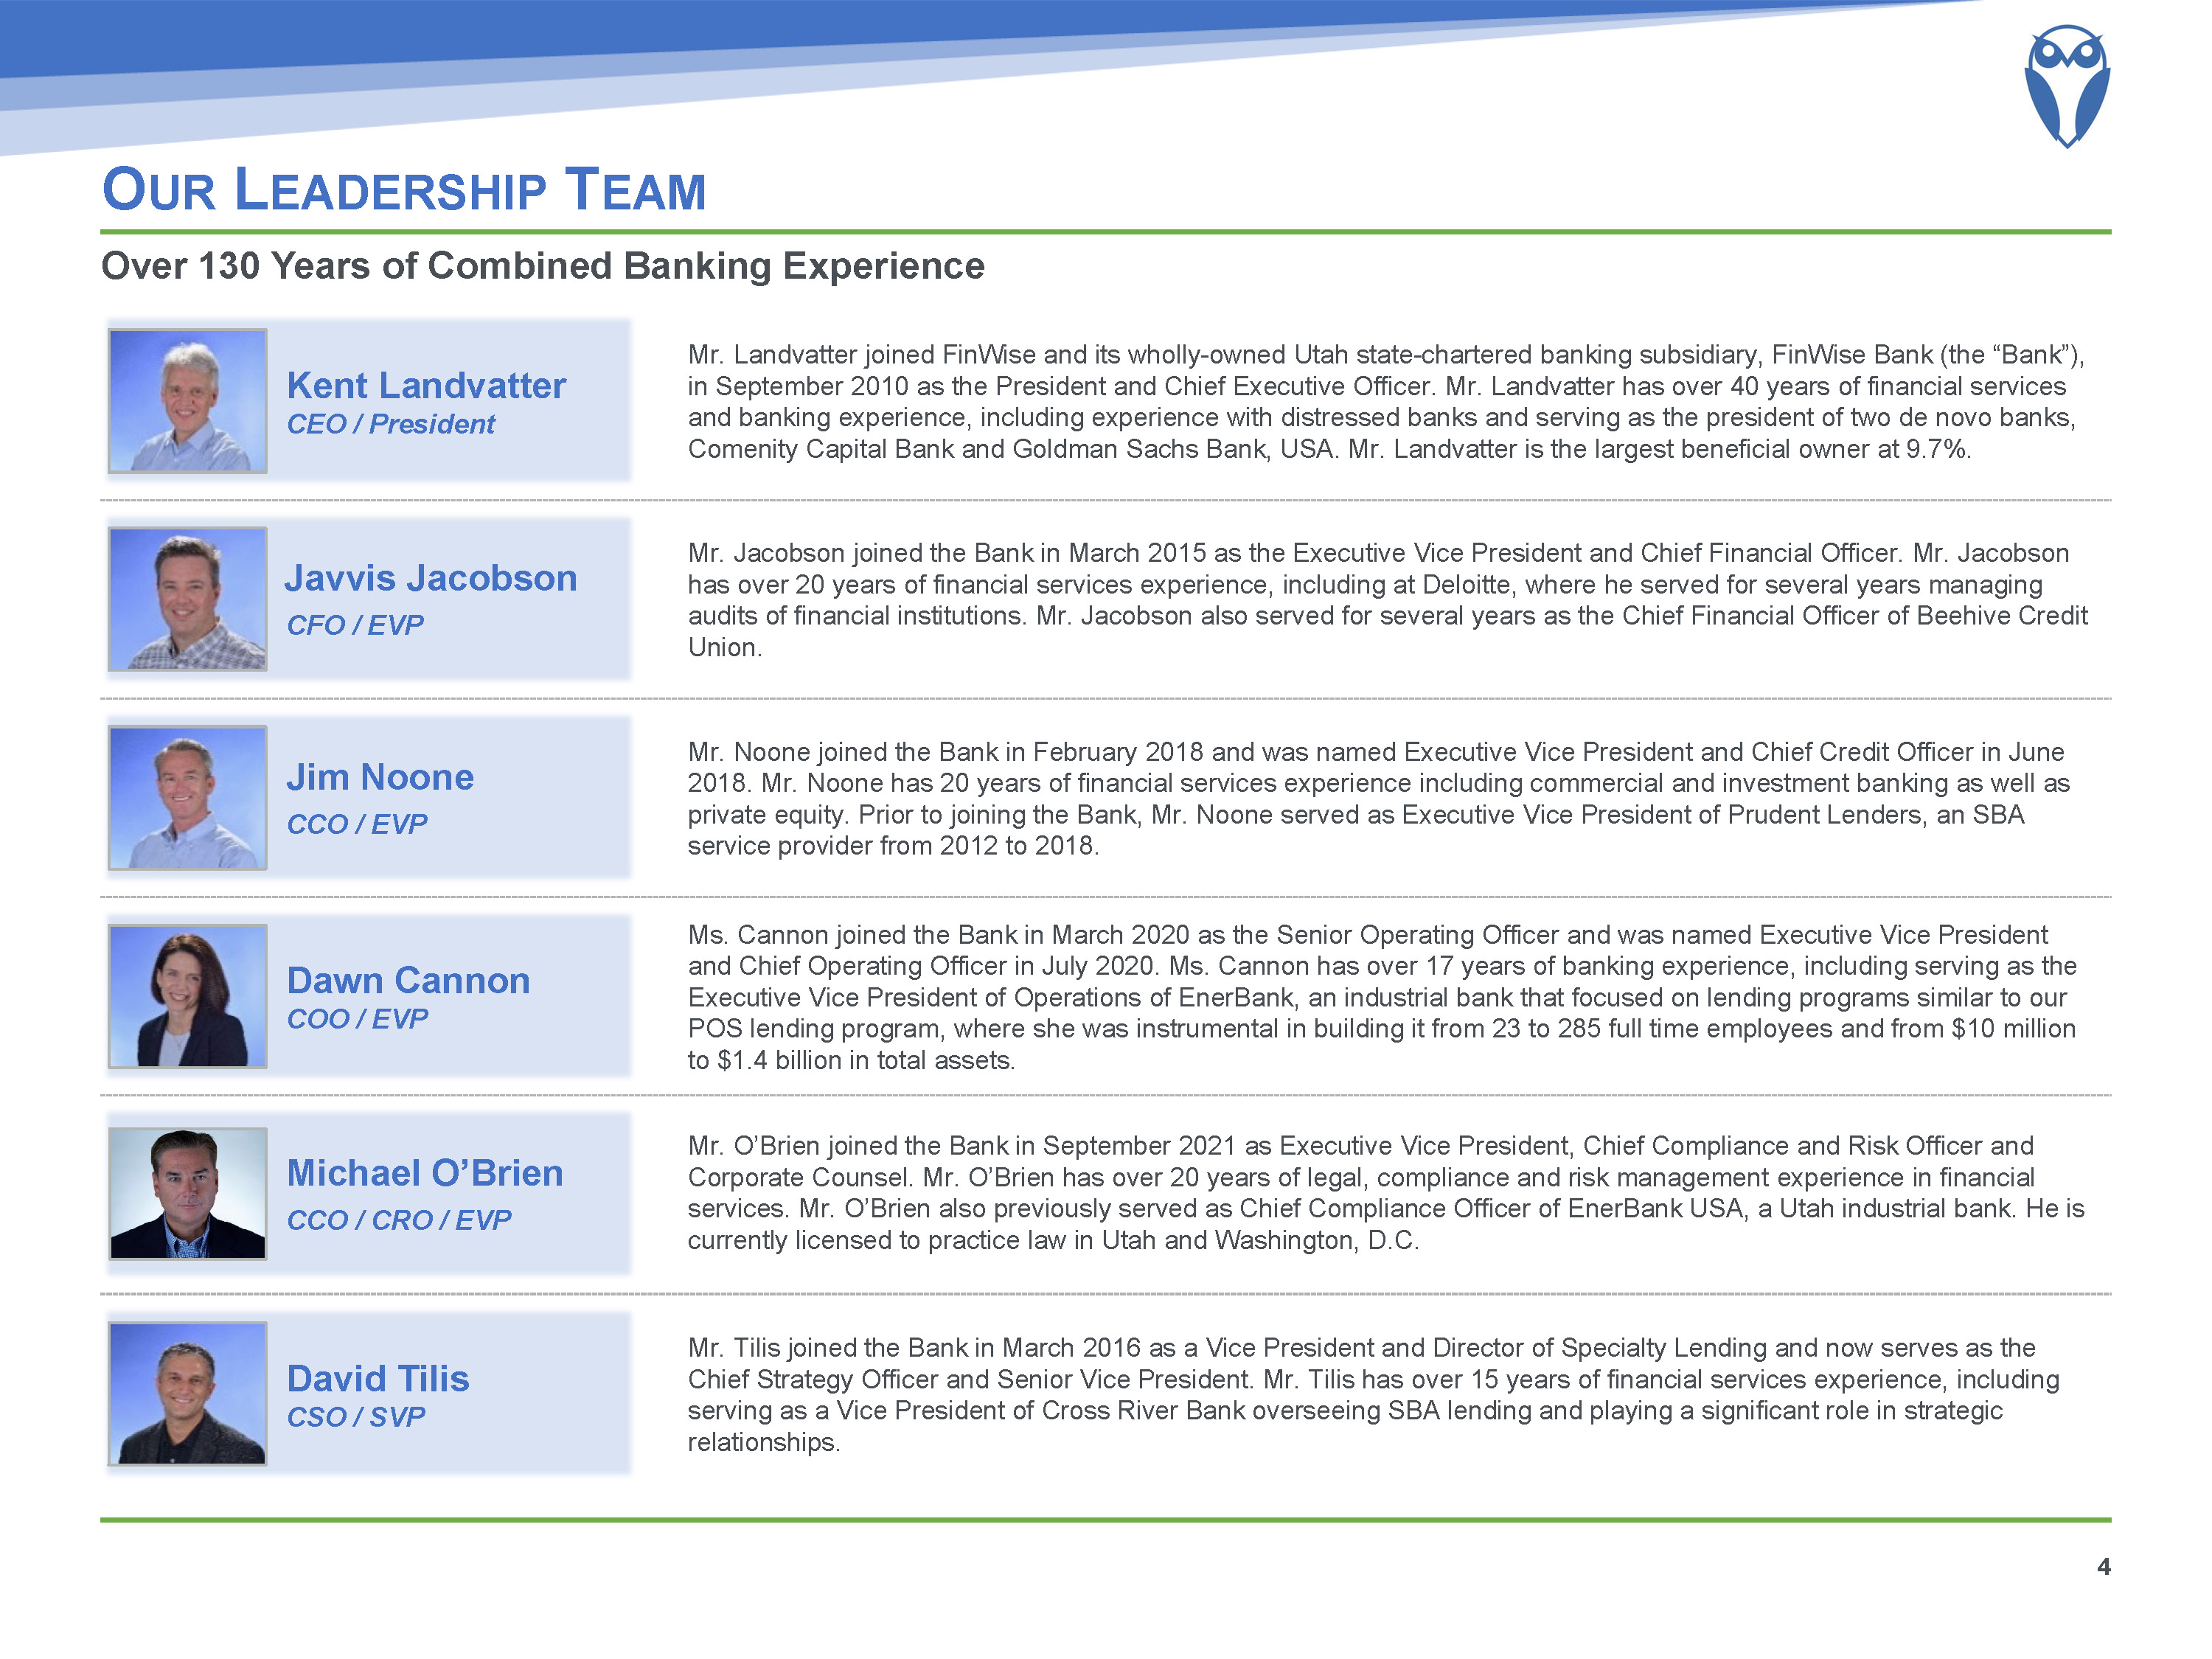
Our Leadership Team 4 Over 130 Years of Combined Banking Experience Kent Landvatter CEO / President Javvis Jacobson CFO / EVP Jim Noone CCO / EVP Dawn Cannon COO / EVP Michael O’Brien CCO / CRO / EVP Mr. Landvatter joined FinWise and its wholly-owned Utah state-chartered banking subsidiary, FinWise Bank (the “Bank”), in September 2010 as the President and Chief Executive Officer. Mr. Landvatter has over 40 years of financial services and banking experience, including experience with distressed banks and serving as the president of two de novo banks, Comenity Capital Bank and Goldman Sachs Bank, USA. Mr. Landvatter is the largest beneficial owner at 9.7%. Mr. Jacobson joined the Bank in March 2015 as the Executive Vice President and Chief Financial Officer. Mr. Jacobson has over 20 years of financial services experience, including at Deloitte, where he served for several years managing audits of financial institutions. Mr. Jacobson also served for several years as the Chief Financial Officer of Beehive Credit Union. Ms. Cannon joined the Bank in March 2020 as the Senior Operating Officer and was named Executive Vice President and Chief Operating Officer in July 2020. Ms. Cannon has over 17 years of banking experience, including serving as the Executive Vice President of Operations of EnerBank, an industrial bank that focused on lending programs similar to our POS lending program, where she was instrumental in building it from 23 to 285 full time employees and from $10 million to $1.4 billion in total assets. Mr. Noone joined the Bank in February 2018 and was named Executive Vice President and Chief Credit Officer in June 2018. Mr. Noone has 20 years of financial services experience including commercial and investment banking as well as private equity. Prior to joining the Bank, Mr. Noone served as Executive Vice President of Prudent Lenders, an SBA service provider from 2012 to 2018. Mr. O’Brien joined the Bank in September 2021 as Executive Vice President, Chief Compliance and Risk Officer and Corporate Counsel. Mr. O’Brien has over 20 years of legal, compliance and risk management experience in financial services. Mr. O’Brien also previously served as Chief Compliance Officer of EnerBank USA, a Utah industrial bank. He is currently licensed to practice law in Utah and Washington, D.C. David Tilis CSO / SVP Mr. Tilis joined the Bank in March 2016 as a Vice President and Director of Specialty Lending and now serves as the Chief Strategy Officer and Senior Vice President. Mr. Tilis has over 15 years of financial services experience, including serving as a Vice President of Cross River Bank overseeing SBA lending and playing a significant role in strategic relationships.
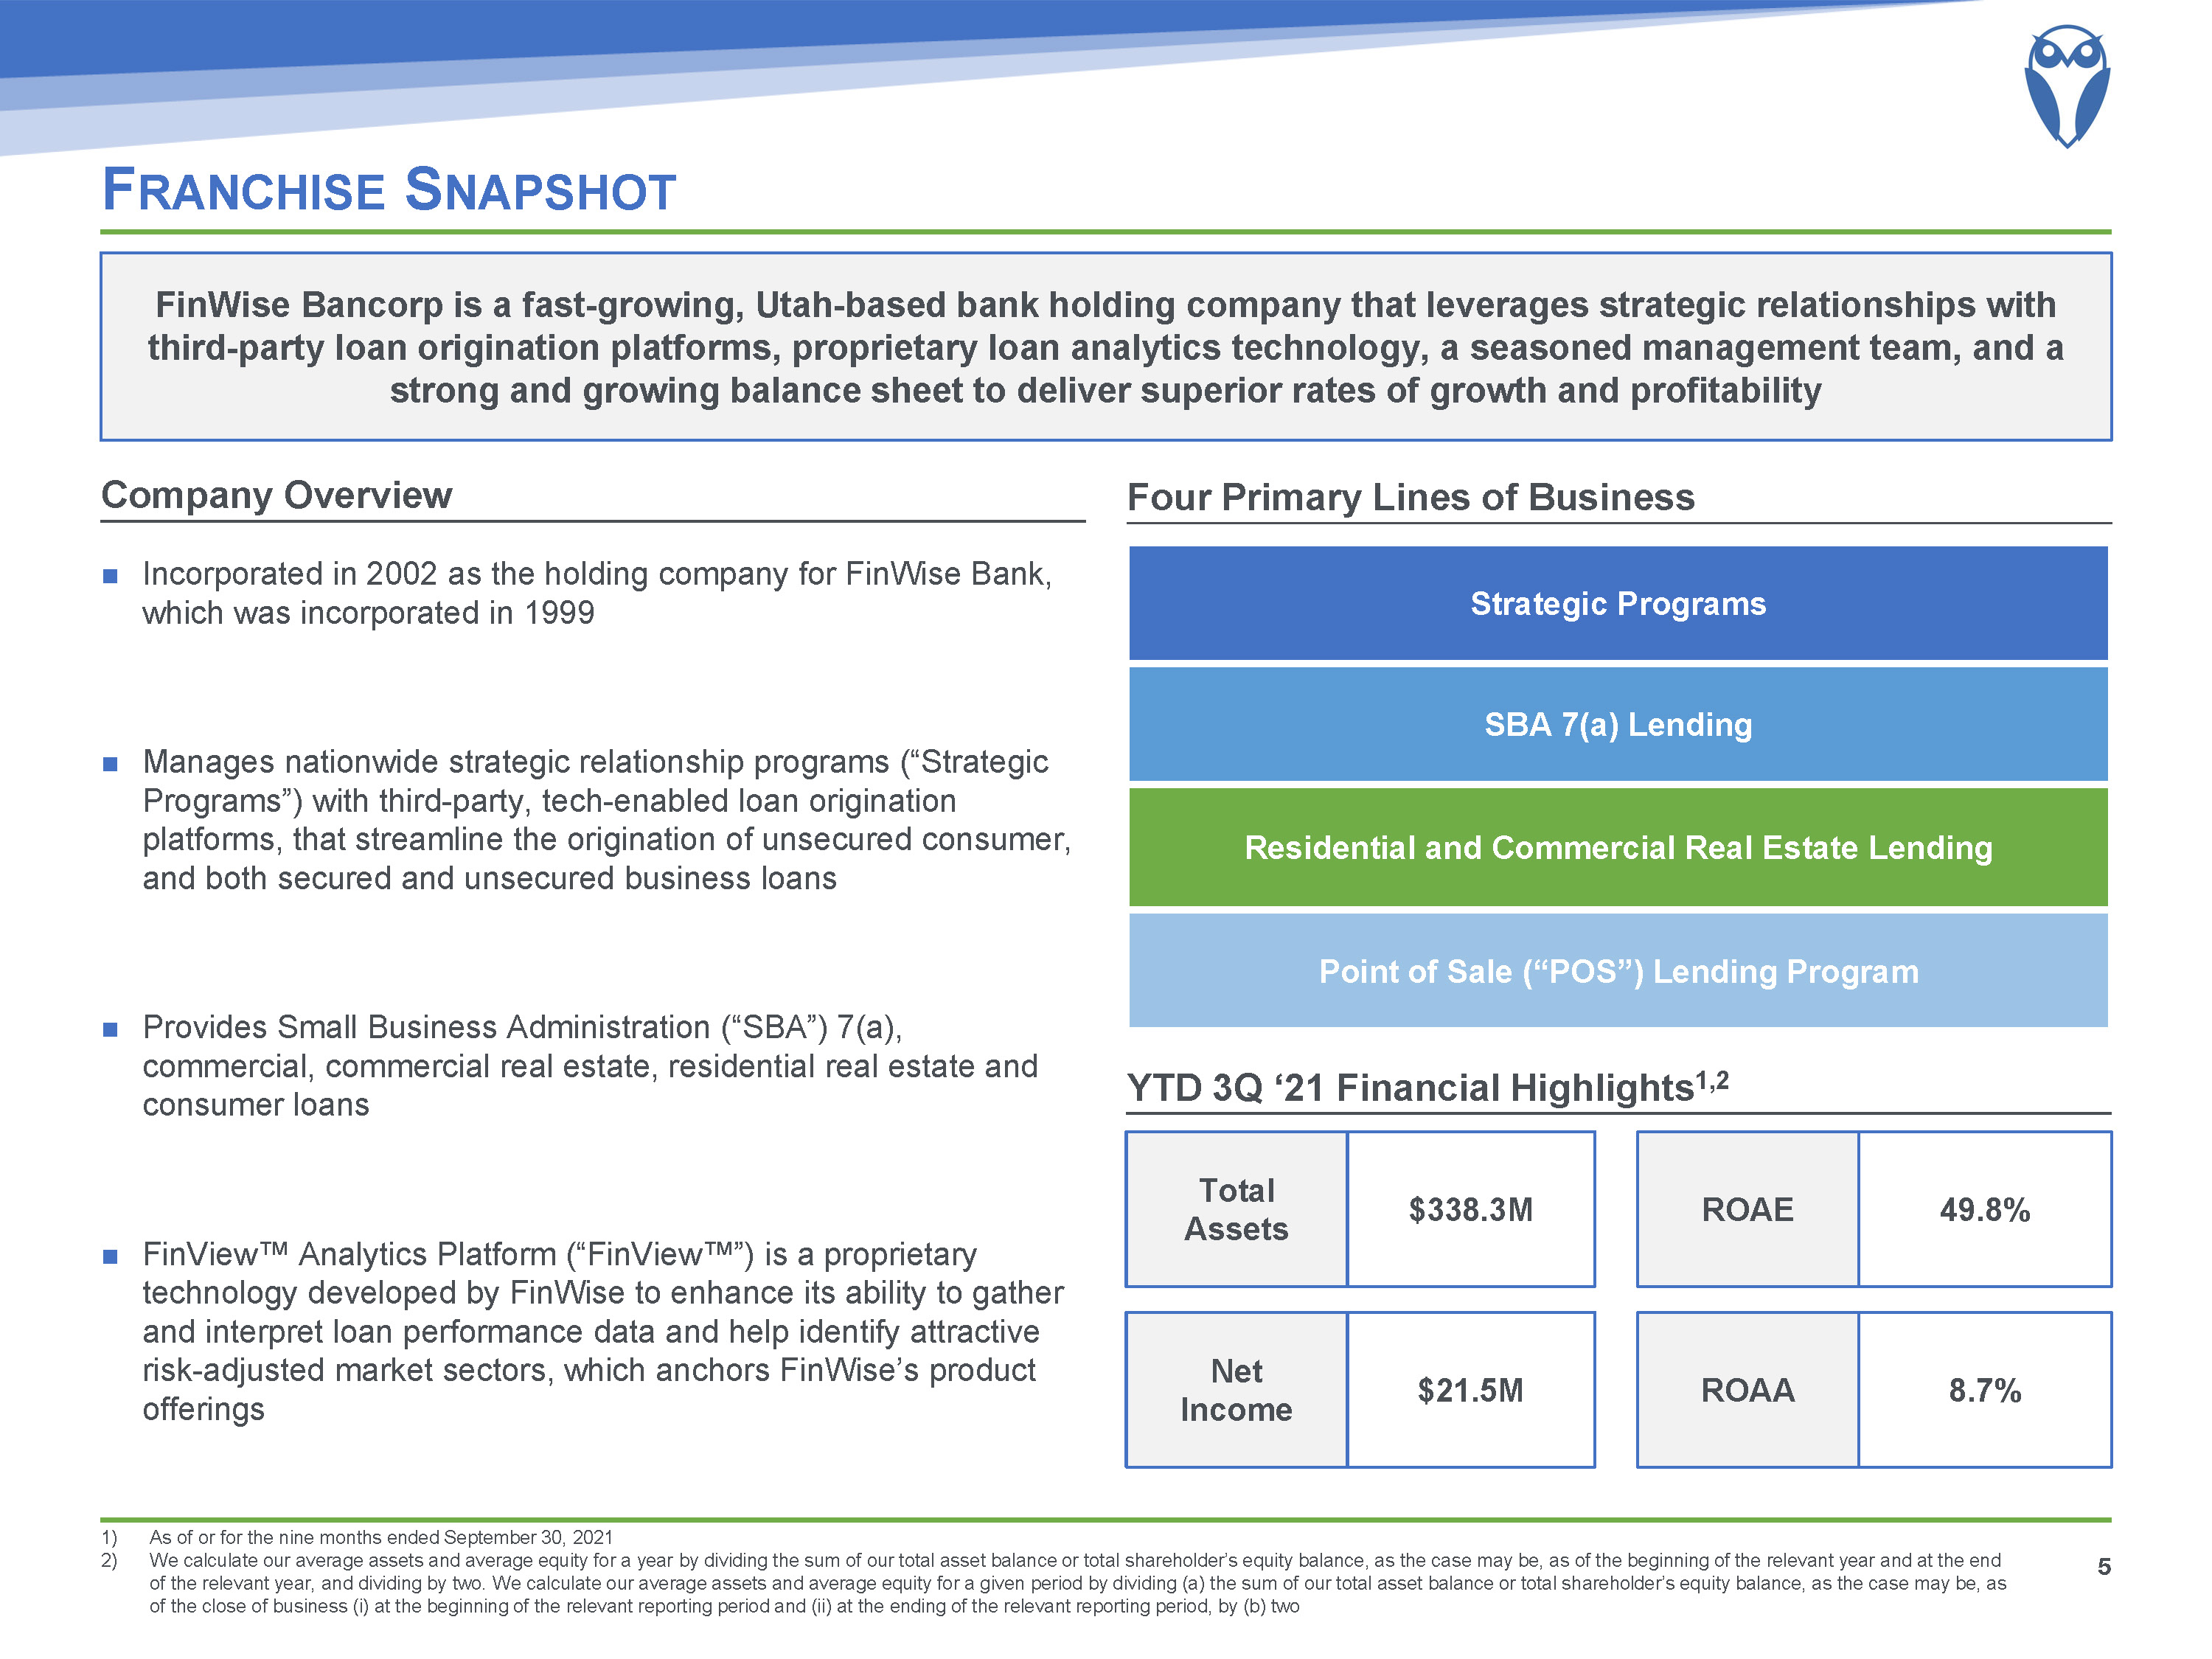
Strategic Programs SBA 7(a) Lending Residential and Commercial Real Estate Lending Point of Sale (“POS”) Lending Program Franchise Snapshot As of or for the nine months ended September 30, 2021We calculate our average assets and average equity for a year by dividing the sum of our total asset balance or total shareholder’s equity balance, as the case may be, as of the beginning of the relevant year and at the end of the relevant year, and dividing by two. We calculate our average assets and average equity for a given period by dividing (a) the sum of our total asset balance or total shareholder’s equity balance, as the case may be, as of the close of business (i) at the beginning of the relevant reporting period and (ii) at the ending of the relevant reporting period, by (b) two 5 Incorporated in 2002 as the holding company for FinWise Bank, which was incorporated in 1999Manages nationwide strategic relationship programs (“Strategic Programs”) with third-party, tech-enabled loan origination platforms, that streamline the origination of unsecured consumer, and both secured and unsecured business loansProvides Small Business Administration (“SBA”) 7(a), commercial, commercial real estate, residential real estate and consumer loans FinView™ Analytics Platform (“FinView™”) is a proprietary technology developed by FinWise to enhance its ability to gather and interpret loan performance data and help identify attractive risk-adjusted market sectors, which anchors FinWise’s product offerings FinWise Bancorp is a fast-growing, Utah-based bank holding company that leverages strategic relationships with third-party loan origination platforms, proprietary loan analytics technology, a seasoned management team, and a strong and growing balance sheet to deliver superior rates of growth and profitability YTD 3Q ‘21 Financial Highlights1,2 $338.3M $21.5M Total Assets Net Income 49.8% 8.7% ROAE ROAA Company Overview Four Primary Lines of Business
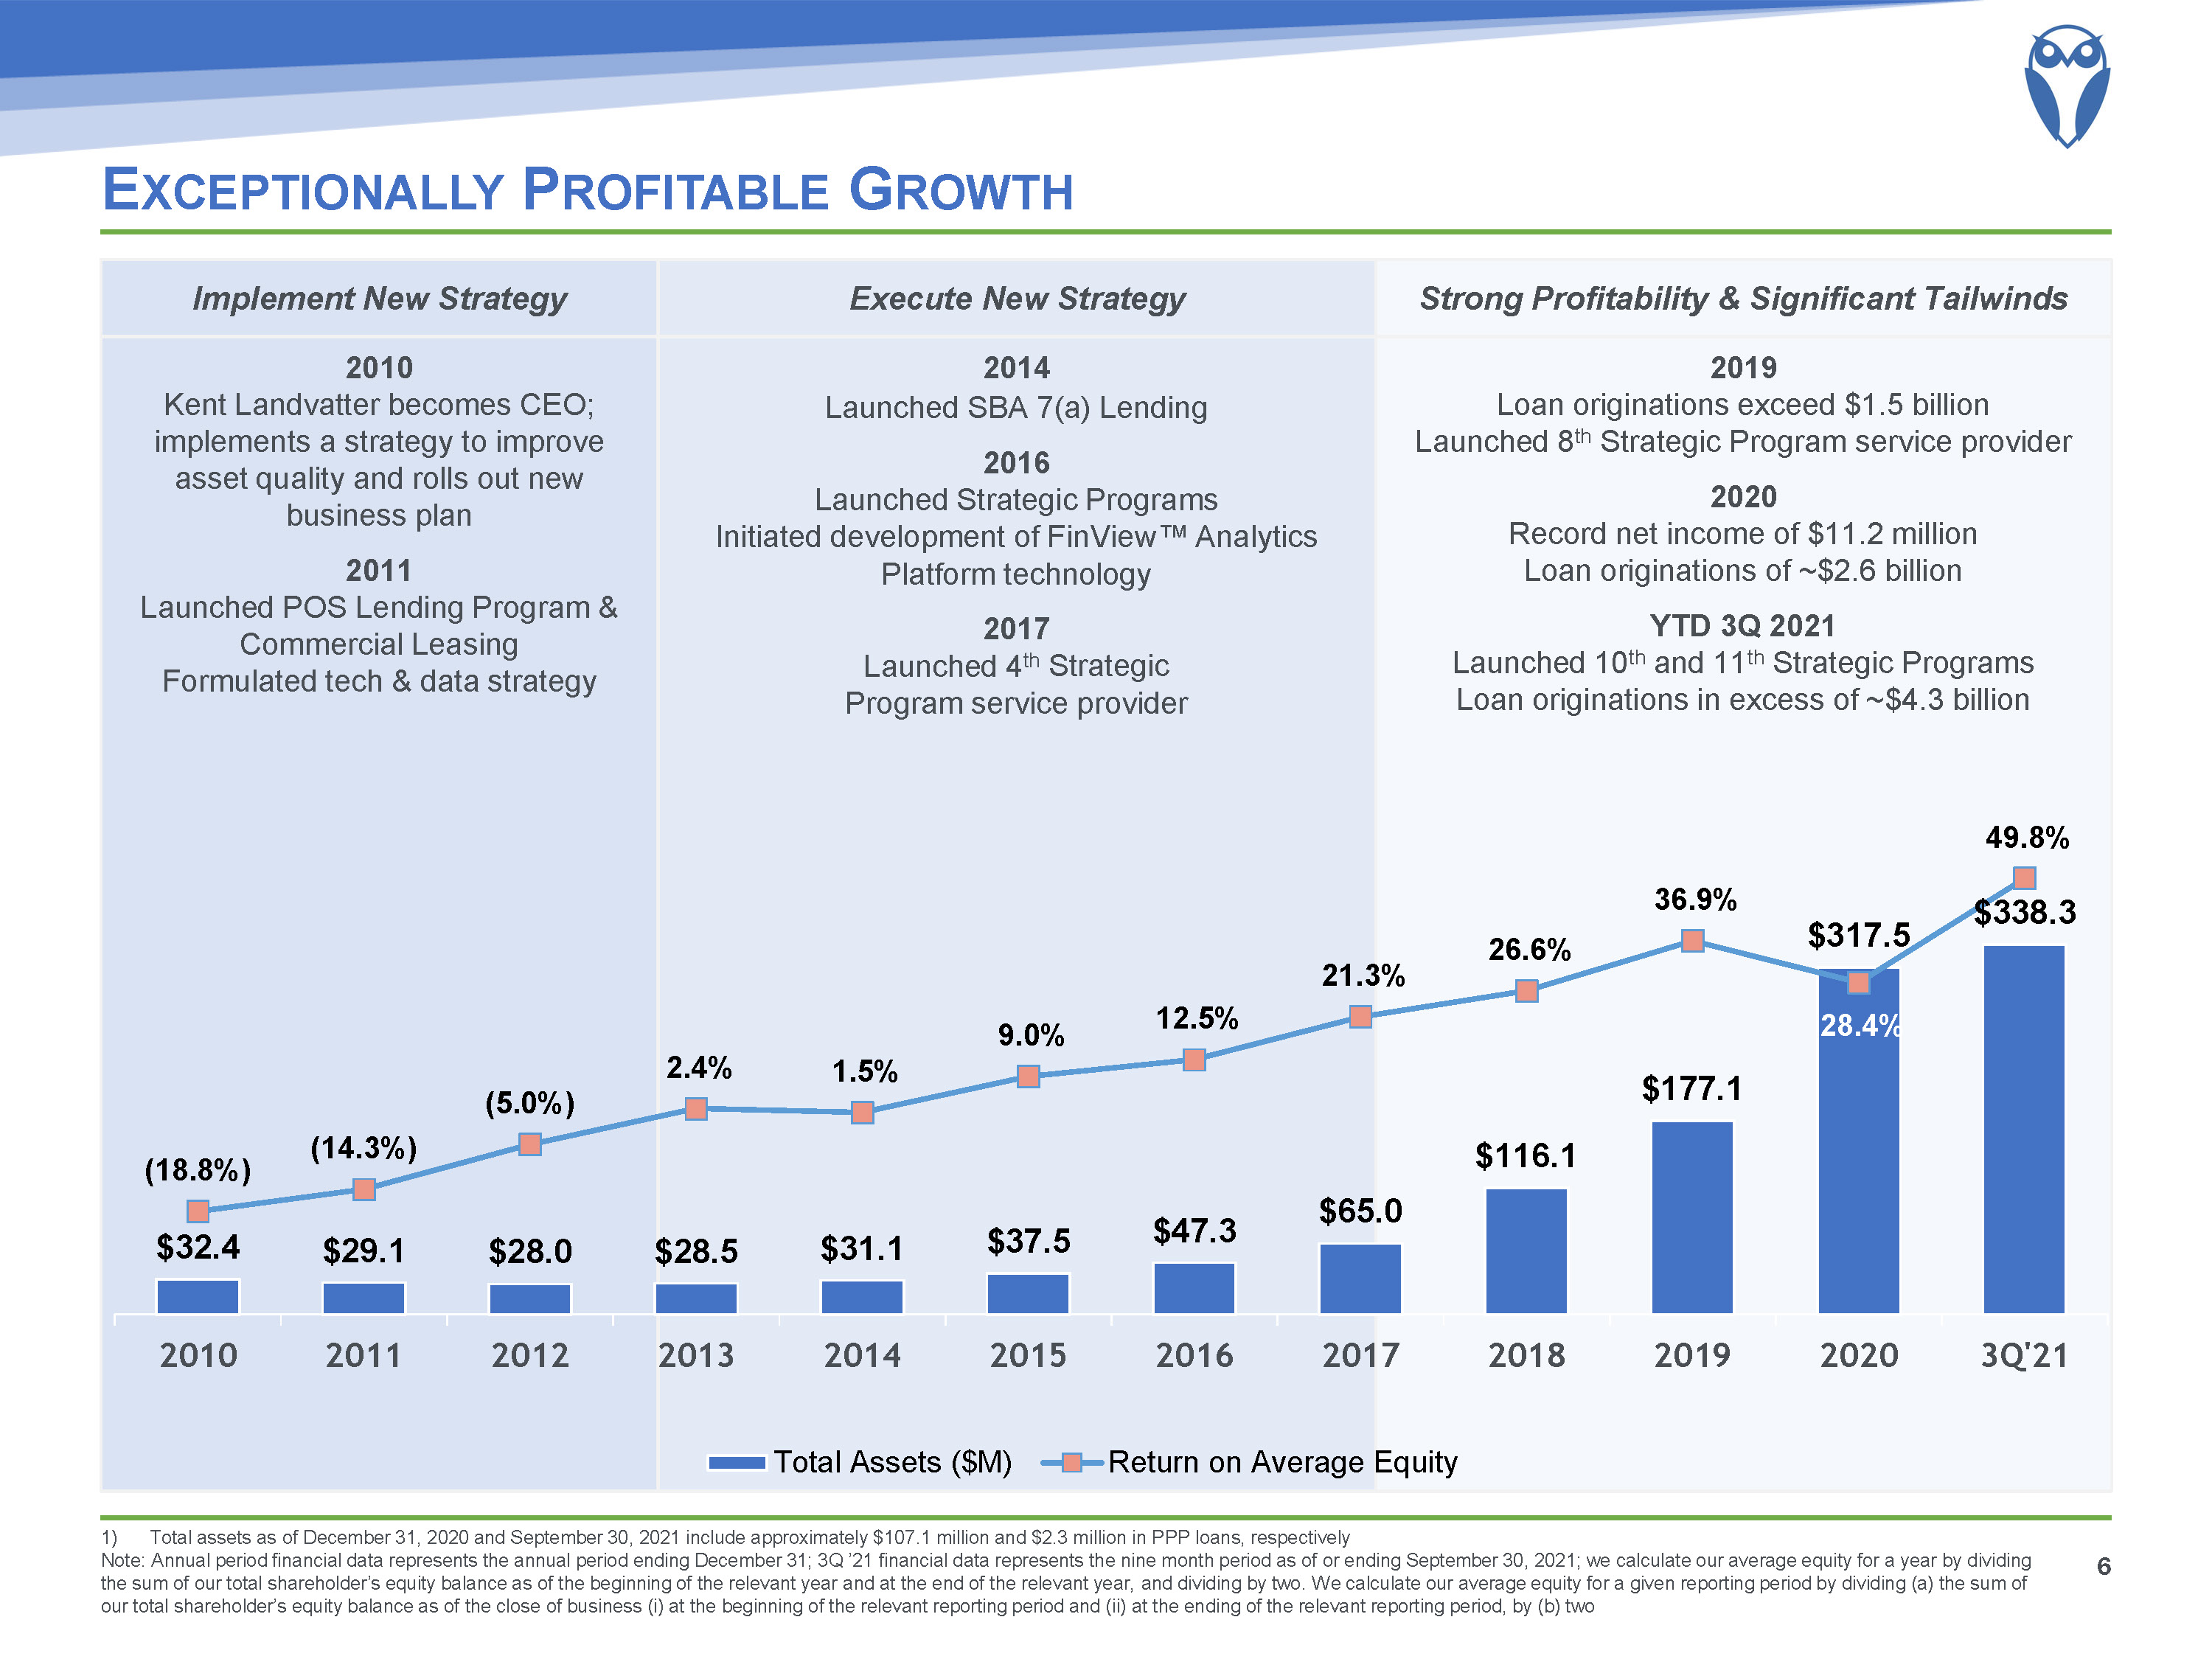
2019Loan originations exceed $1.5 billionLaunched 8th Strategic Program service provider2020Record net income of $11.2 millionLoan originations of ~$2.6 billionYTD 3Q 2021Launched 10th and 11th Strategic ProgramsLoan originations in excess of ~$4.3 billion 2010Kent Landvatter becomes CEO; implements a strategy to improve asset quality and rolls out new business plan2011Launched POS Lending Program & Commercial LeasingFormulated tech & data strategy 2014Launched SBA 7(a) Lending2016Launched Strategic ProgramsInitiated development of FinView™ Analytics Platform technology2017Launched 4th StrategicProgram service provider Exceptionally Profitable Growth 6 Implement New Strategy Execute New Strategy Strong Profitability & Significant Tailwinds Total assets as of December 31, 2020 and September 30, 2021 include approximately $107.1 million and $2.3 million in PPP loans, respectivelyNote: Annual period financial data represents the annual period ending December 31; 3Q ’21 financial data represents the nine month period as of or ending September 30, 2021; we calculate our average equity for a year by dividing the sum of our total shareholder’s equity balance as of the beginning of the relevant year and at the end of the relevant year, and dividing by two. We calculate our average equity for a given reporting period by dividing (a) the sum of our total shareholder’s equity balance as of the close of business (i) at the beginning of the relevant reporting period and (ii) at the ending of the relevant reporting period, by (b) two
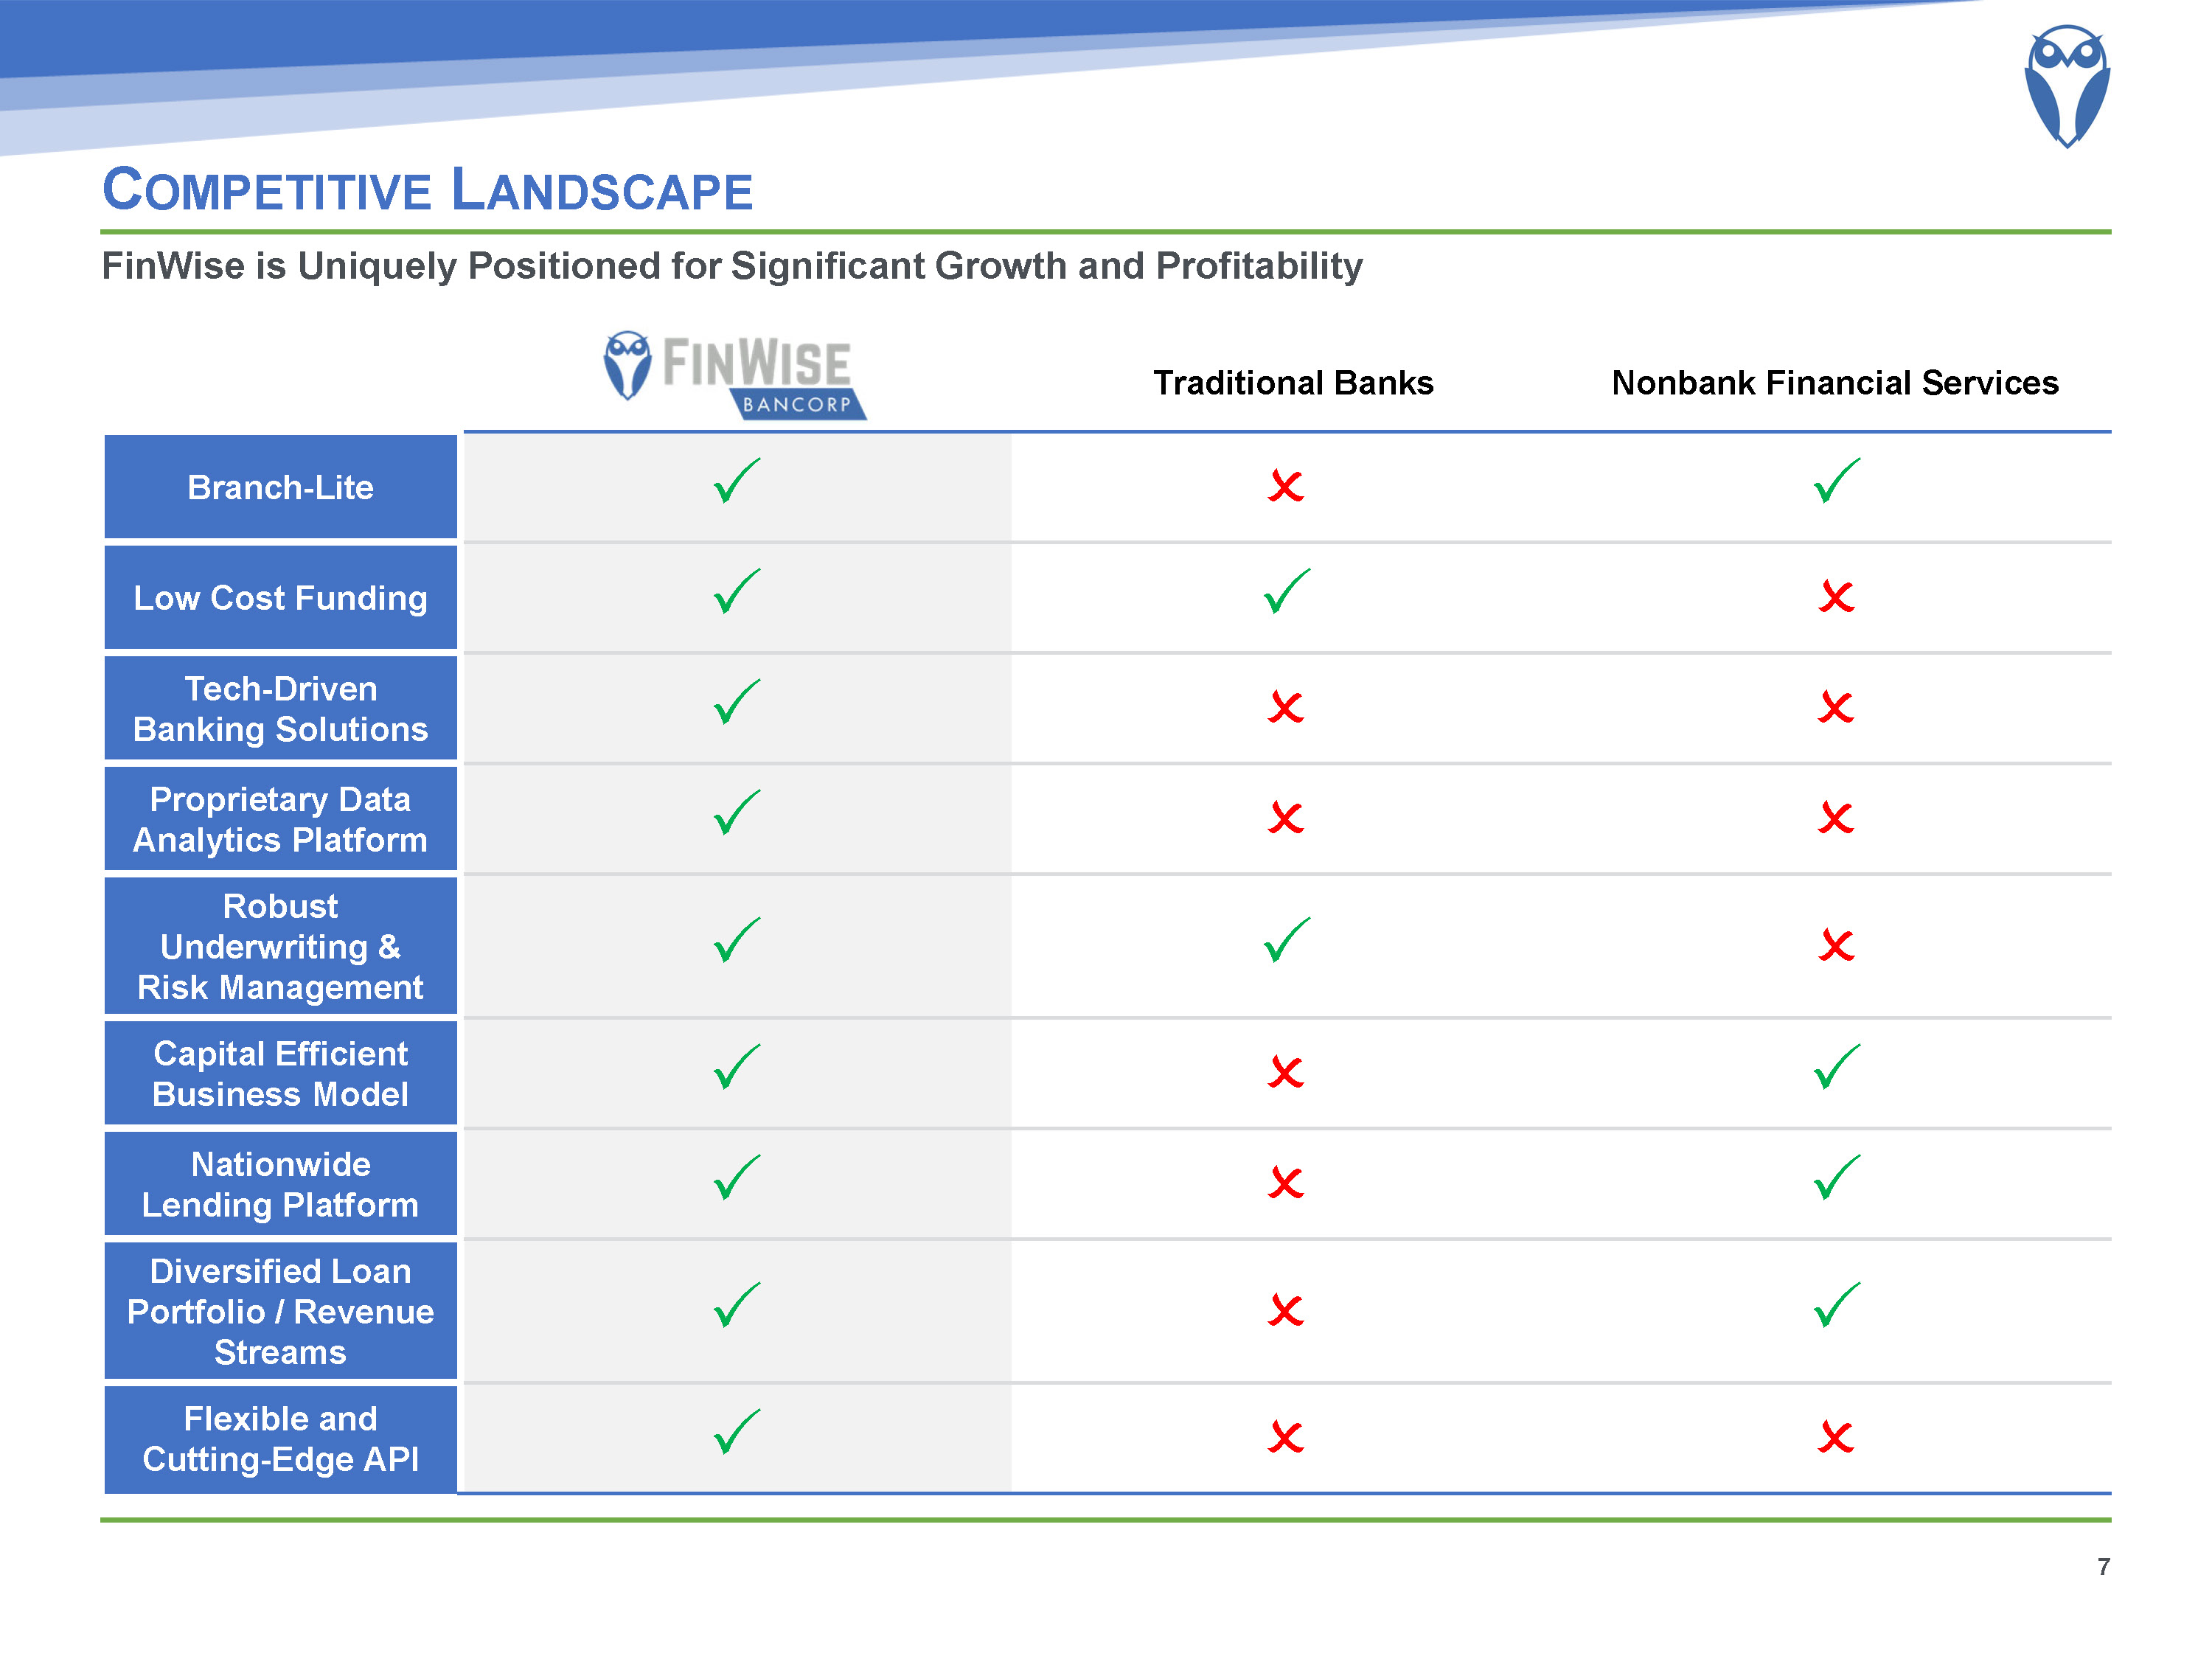
Competitive Landscape FinWise is Uniquely Positioned for Significant Growth and Profitability 7 Branch-Lite P O P Low Cost Funding P P O Tech-Driven Banking Solutions P O O Proprietary Data Analytics Platform P O O Robust Underwriting & Risk Management P P O Capital Efficient Business Model P O P Nationwide Lending Platform P O P Diversified Loan Portfolio / Revenue Streams P O P Flexible and Cutting-Edge API P O O Traditional Banks Nonbank Financial Services
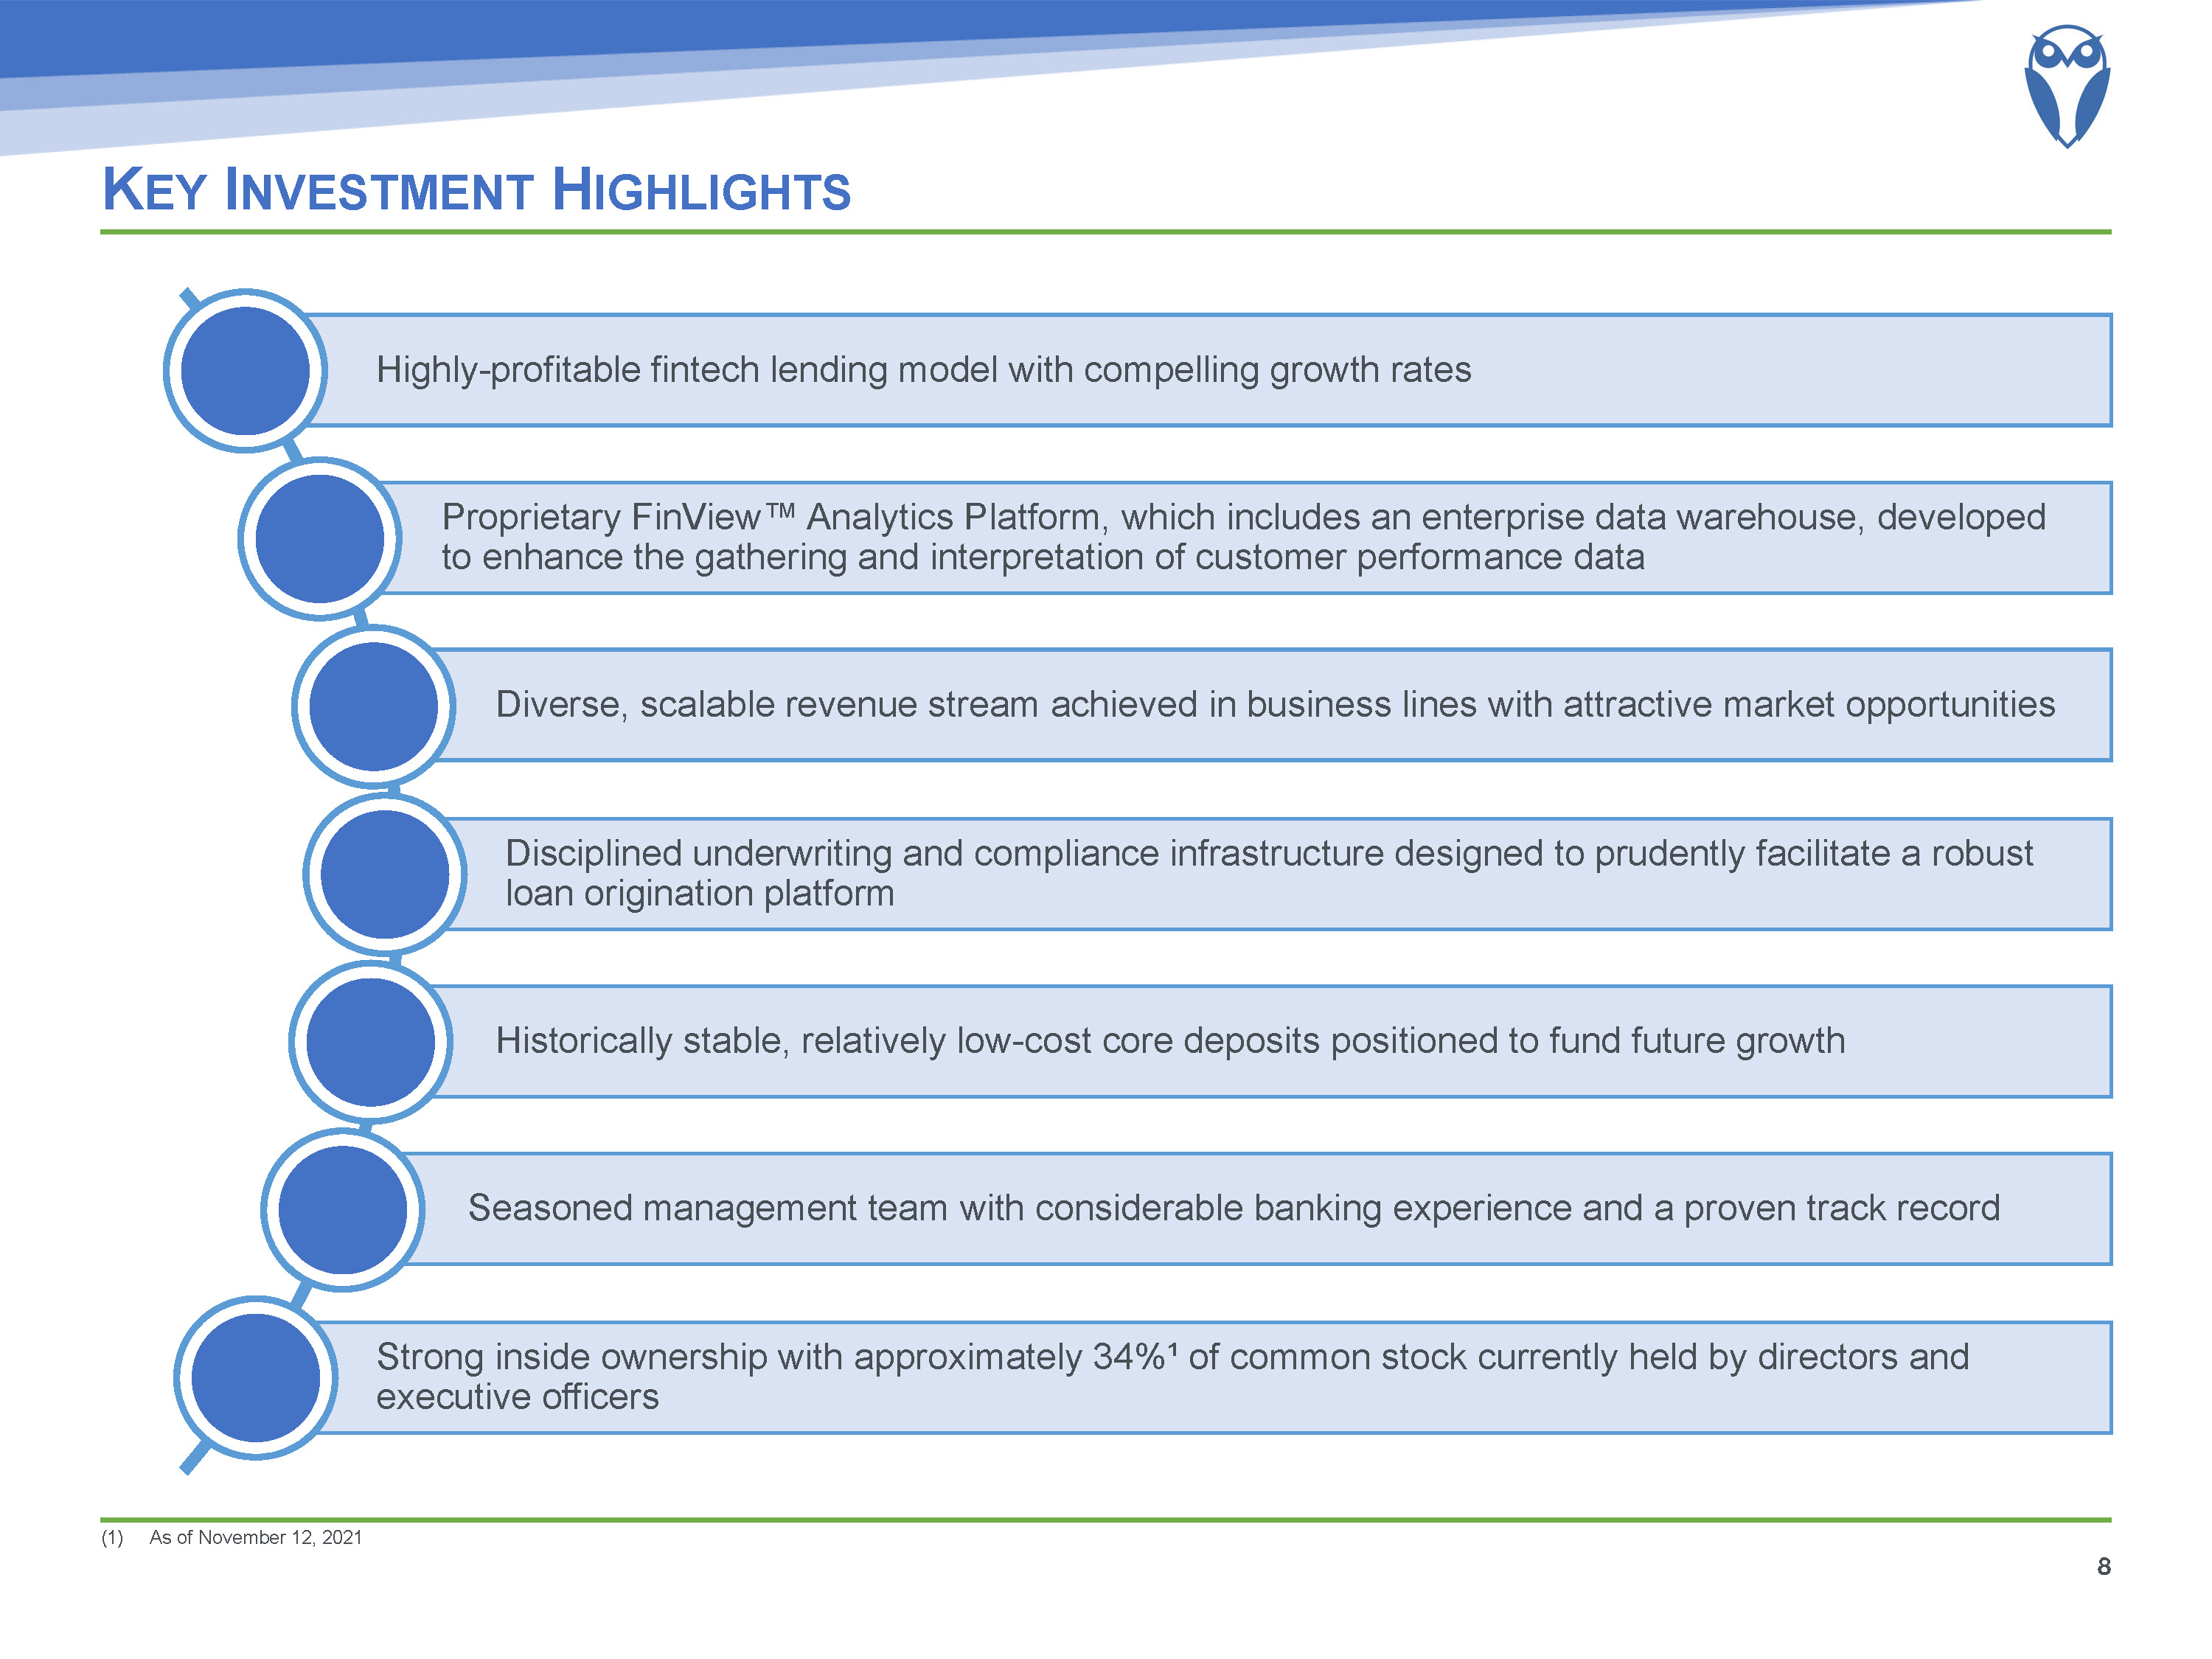
Key Investment Highlights As of November 12, 2021 8 Disciplined underwriting and compliance infrastructure designed to prudently facilitate a robust loan origination platform Highly-profitable fintech lending model with compelling growth rates Seasoned management team with considerable banking experience and a proven track record Historically stable, relatively low-cost core deposits positioned to fund future growth Diverse, scalable revenue stream achieved in business lines with attractive market opportunities Proprietary FinView™ Analytics Platform, which includes an enterprise data warehouse, developed to enhance the gathering and interpretation of customer performance data Strong inside ownership with approximately 34%¹ of common stock currently held by directors and executive officers
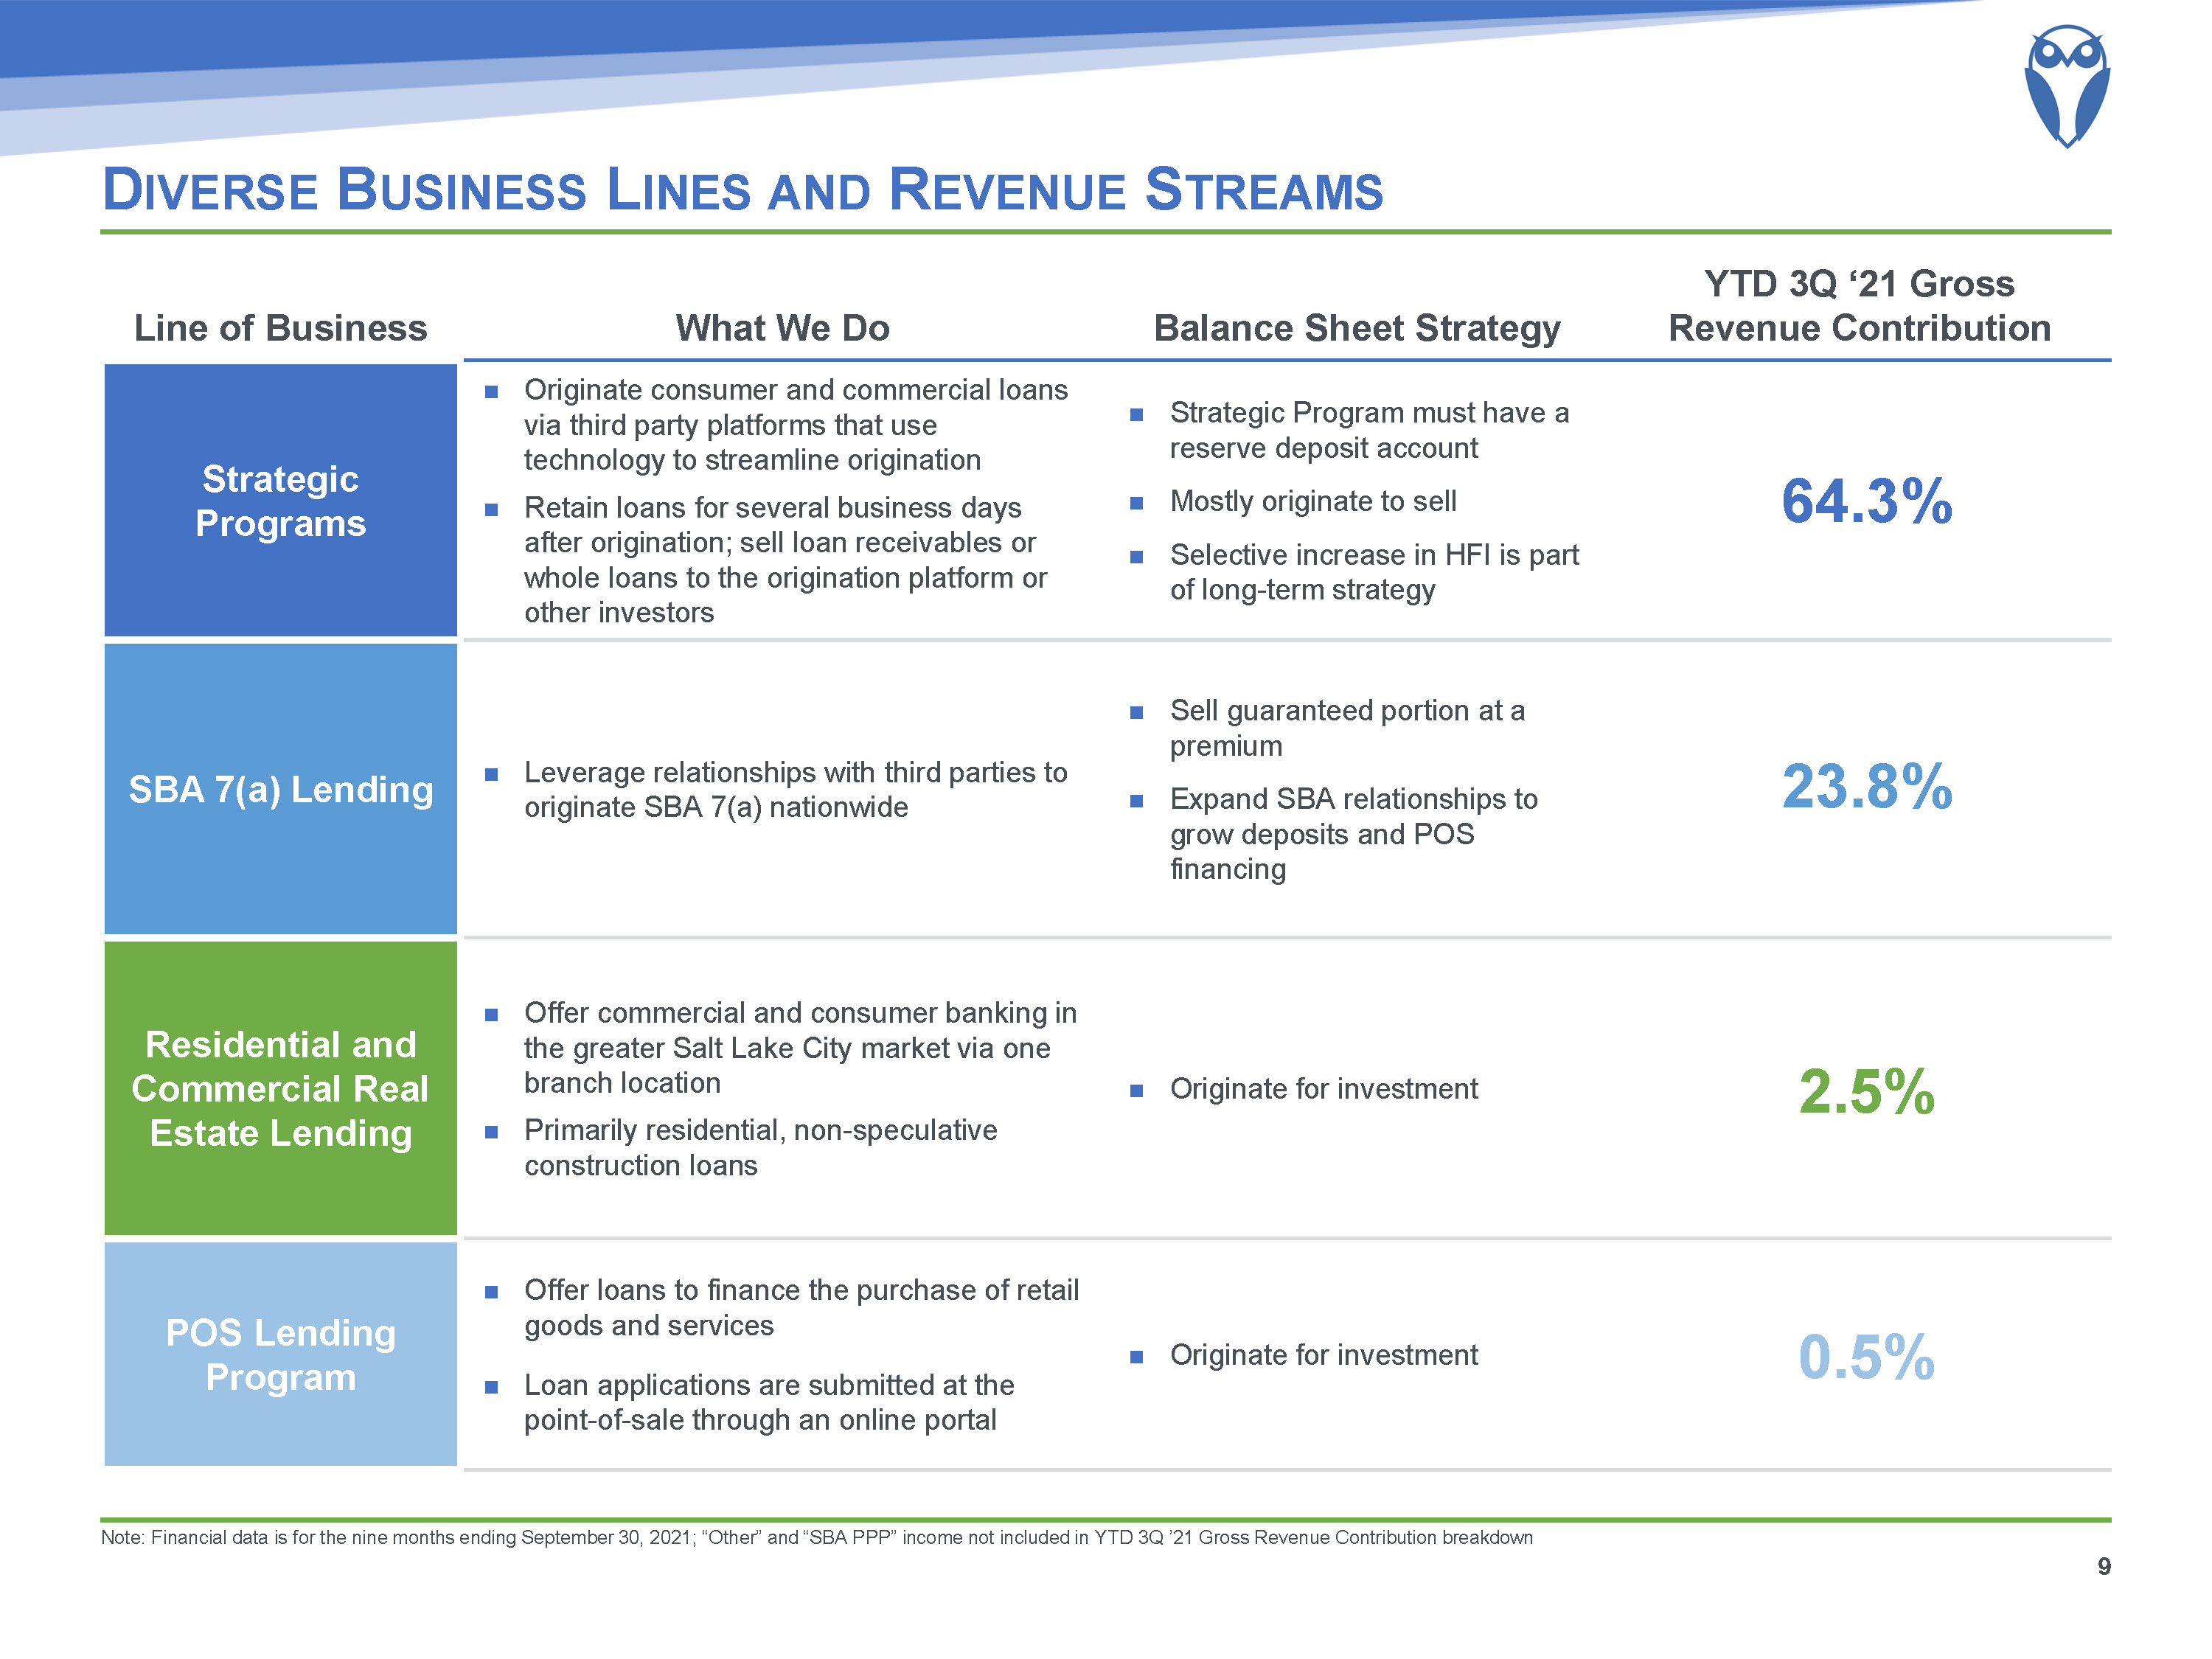
Line of Business What We Do Balance Sheet Strategy YTD 3Q ‘21 Gross Revenue Contribution Strategic Programs Originate consumer and commercial loans via third party platforms that use technology to streamline originationRetain loans for several business days after origination; sell loan receivables or whole loans to the origination platform or other investors Strategic Program must have a reserve deposit account Mostly originate to sellSelective increase in HFI is part of long-term strategy SBA 7(a) Lending Leverage relationships with third parties to originate SBA 7(a) nationwide Sell guaranteed portion at a premiumExpand SBA relationships to grow deposits and POS financing Residential and Commercial Real Estate Lending Offer commercial and consumer banking in the greater Salt Lake City market via one branch locationPrimarily residential, non-speculative construction loans Originate for investment POS Lending Program Offer loans to finance the purchase of retail goods and servicesLoan applications are submitted at the point-of-sale through an online portal Originate for investment 64.3% Diverse Business Lines and Revenue Streams 23.8% 2.5% 0.5% Note: Financial data is for the nine months ending September 30, 2021; “Other” and “SBA PPP” income not included in YTD 3Q ’21 Gross Revenue Contribution breakdown
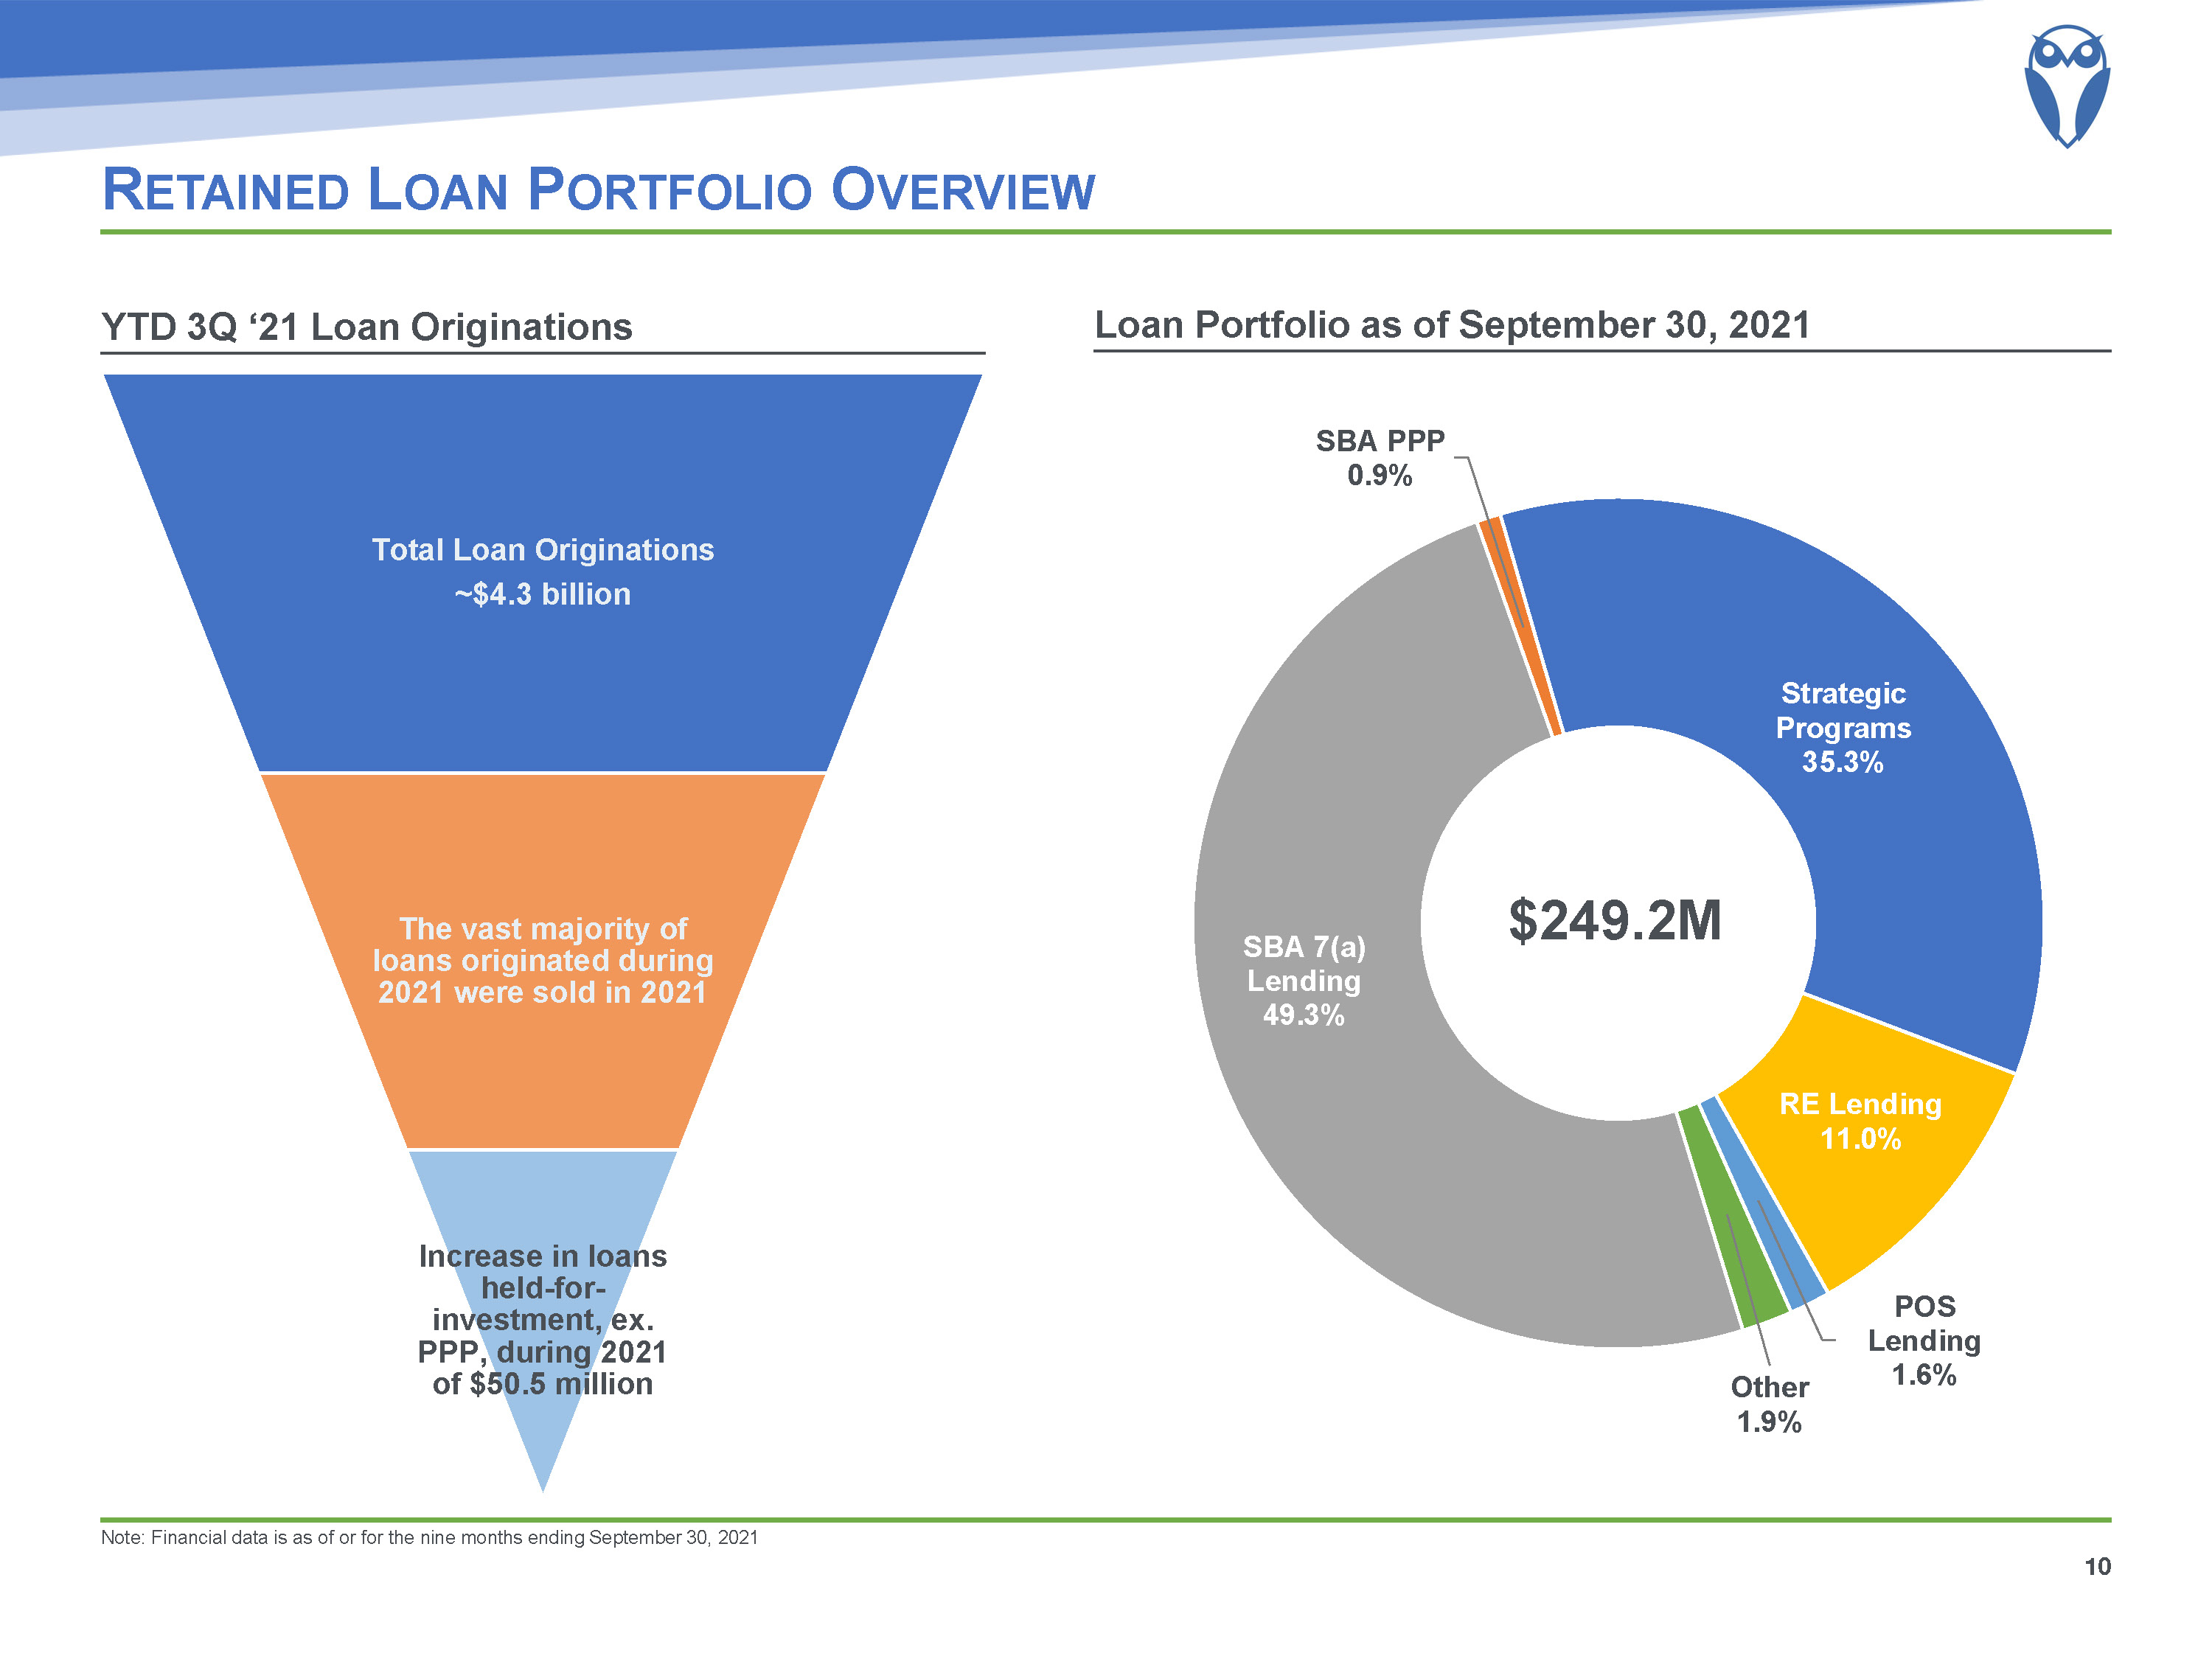
Retained Loan Portfolio Overview Note: Financial data is as of or for the nine months ending September 30, 2021 10 YTD 3Q ‘21 Loan Originations Loan Portfolio as of September 30, 2021 $249.2M
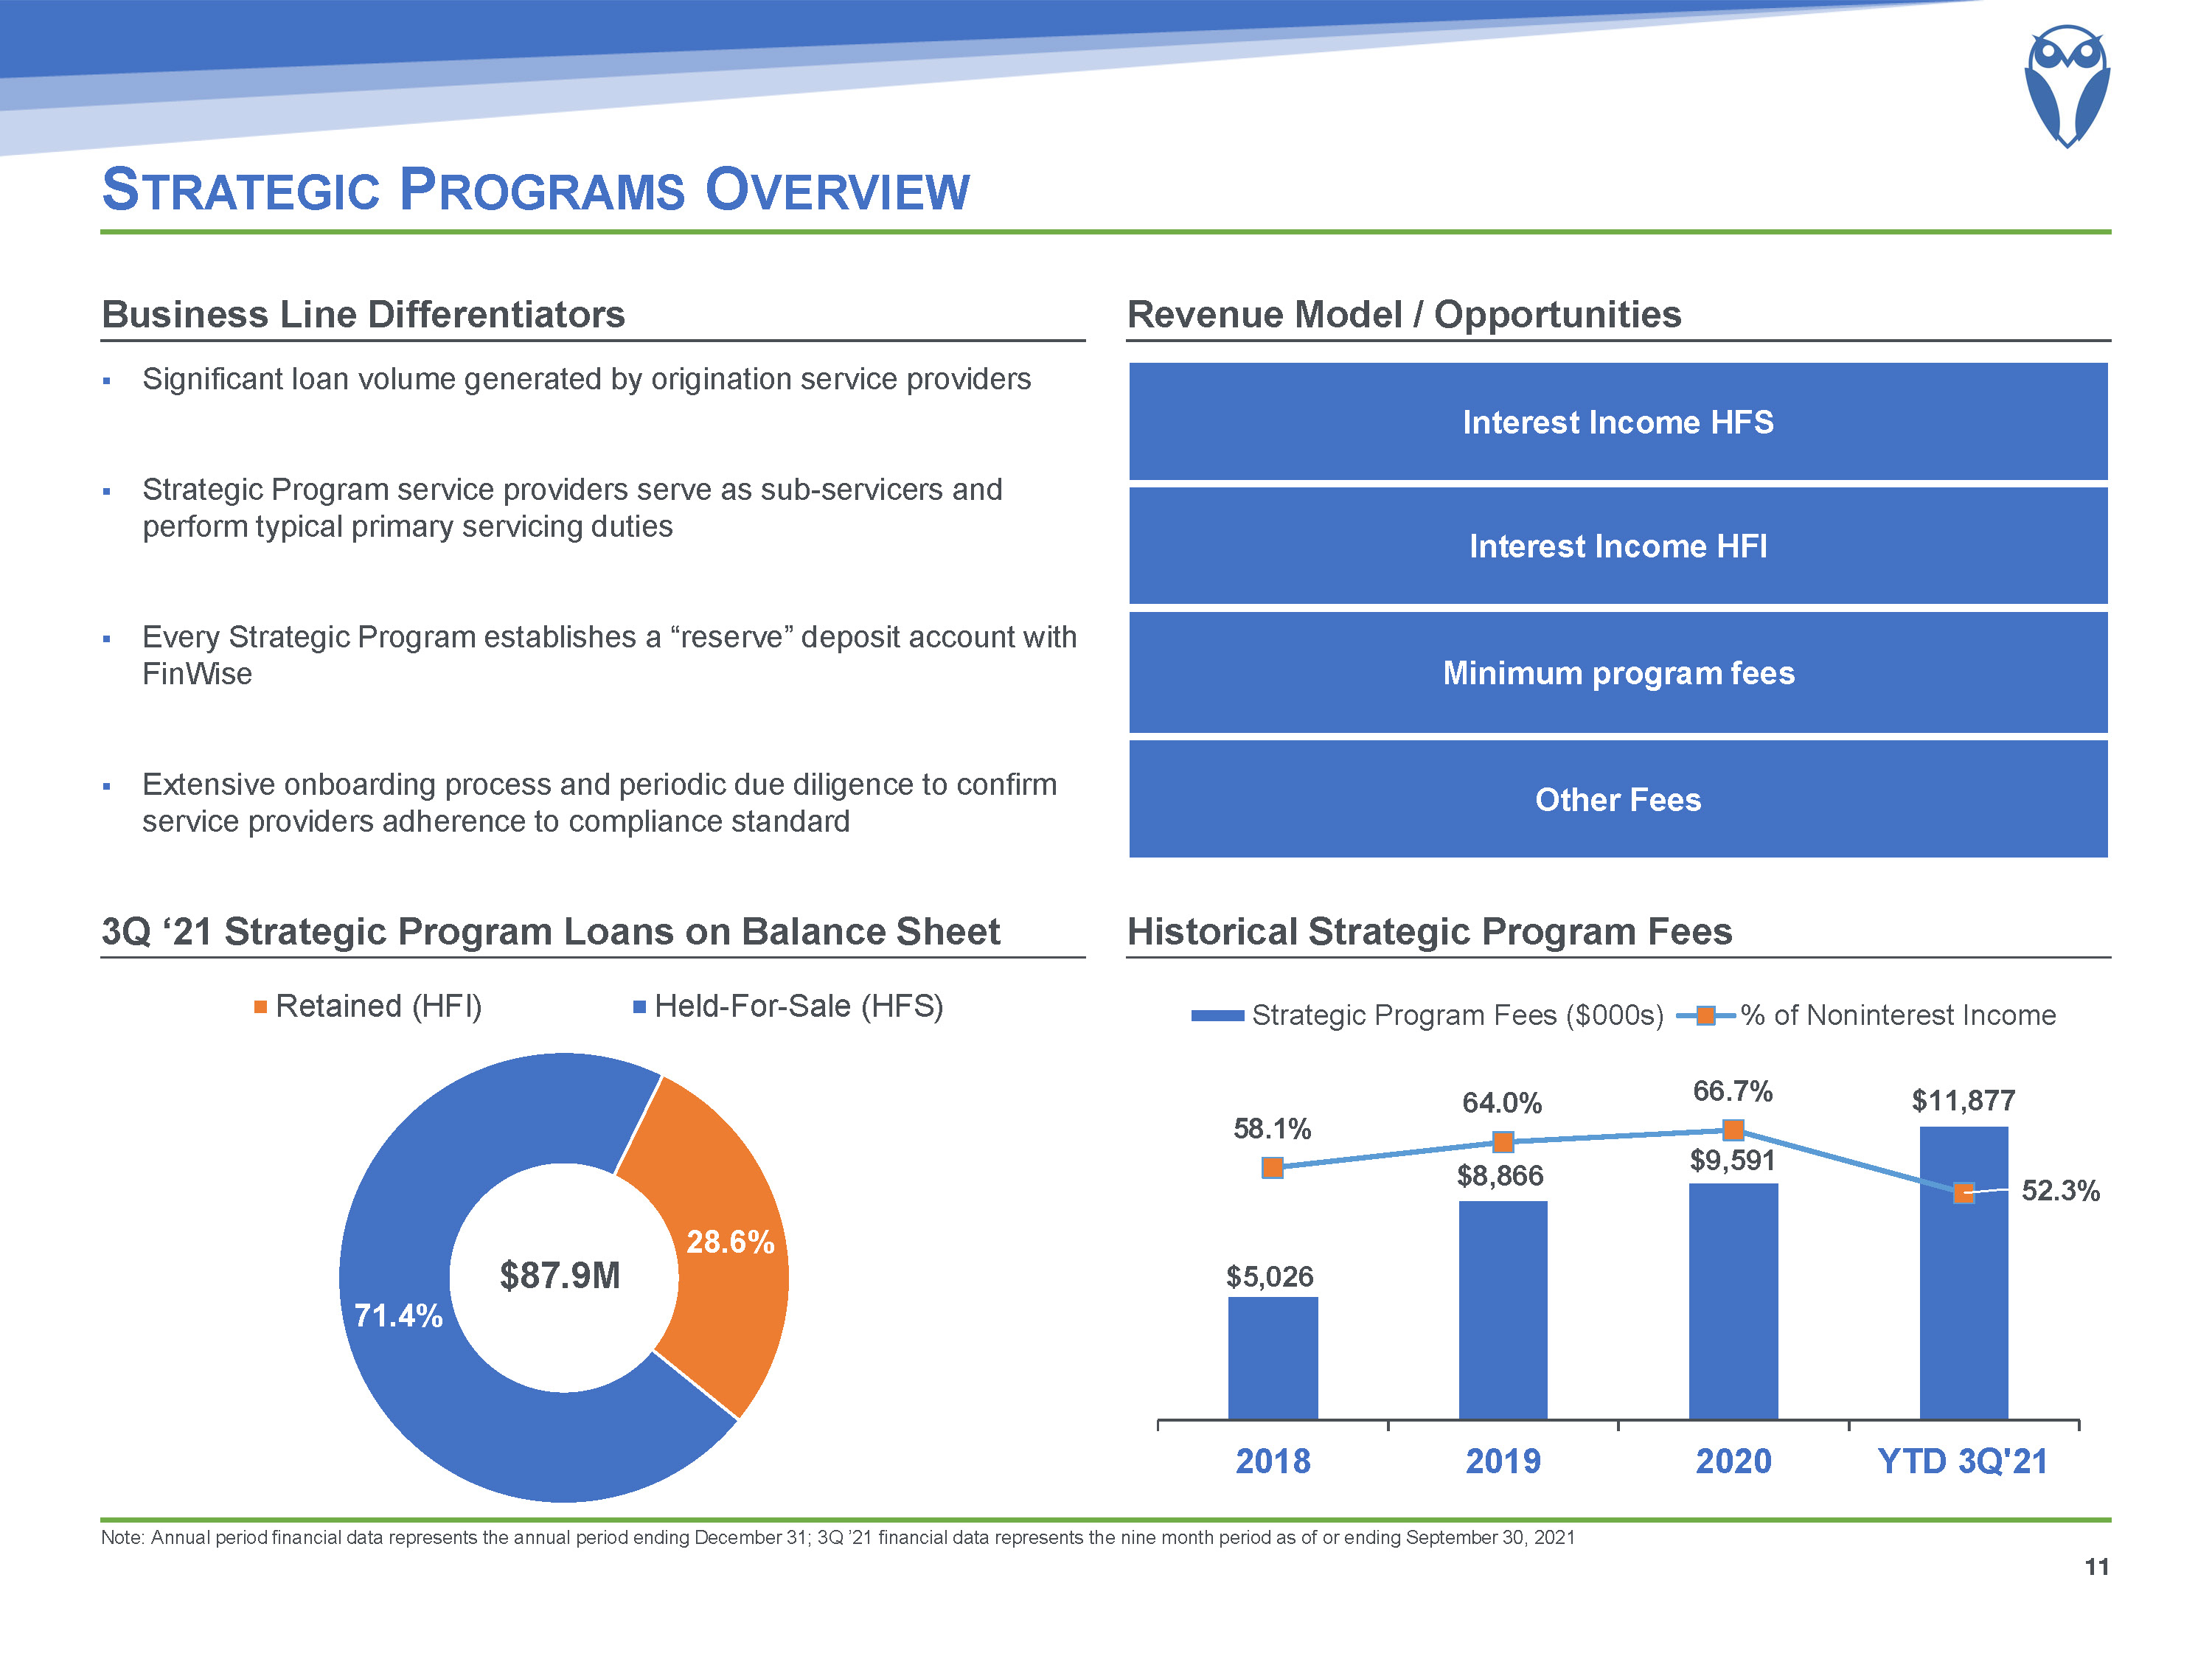
Significant loan volume generated by origination service providersStrategic Program service providers serve as sub-servicers and perform typical primary servicing dutiesEvery Strategic Program establishes a “reserve” deposit account with FinWiseExtensive onboarding process and periodic due diligence to confirm service providers adherence to compliance standard Strategic Programs Overview Note: Annual period financial data represents the annual period ending December 31; 3Q ’21 financial data represents the nine month period as of or ending September 30, 2021 Historical Strategic Program Fees 3Q ‘21 Strategic Program Loans on Balance Sheet Revenue Model / Opportunities Business Line Differentiators 11 $87.9M Interest Income HFS Interest Income HFI Minimum program fees Other Fees
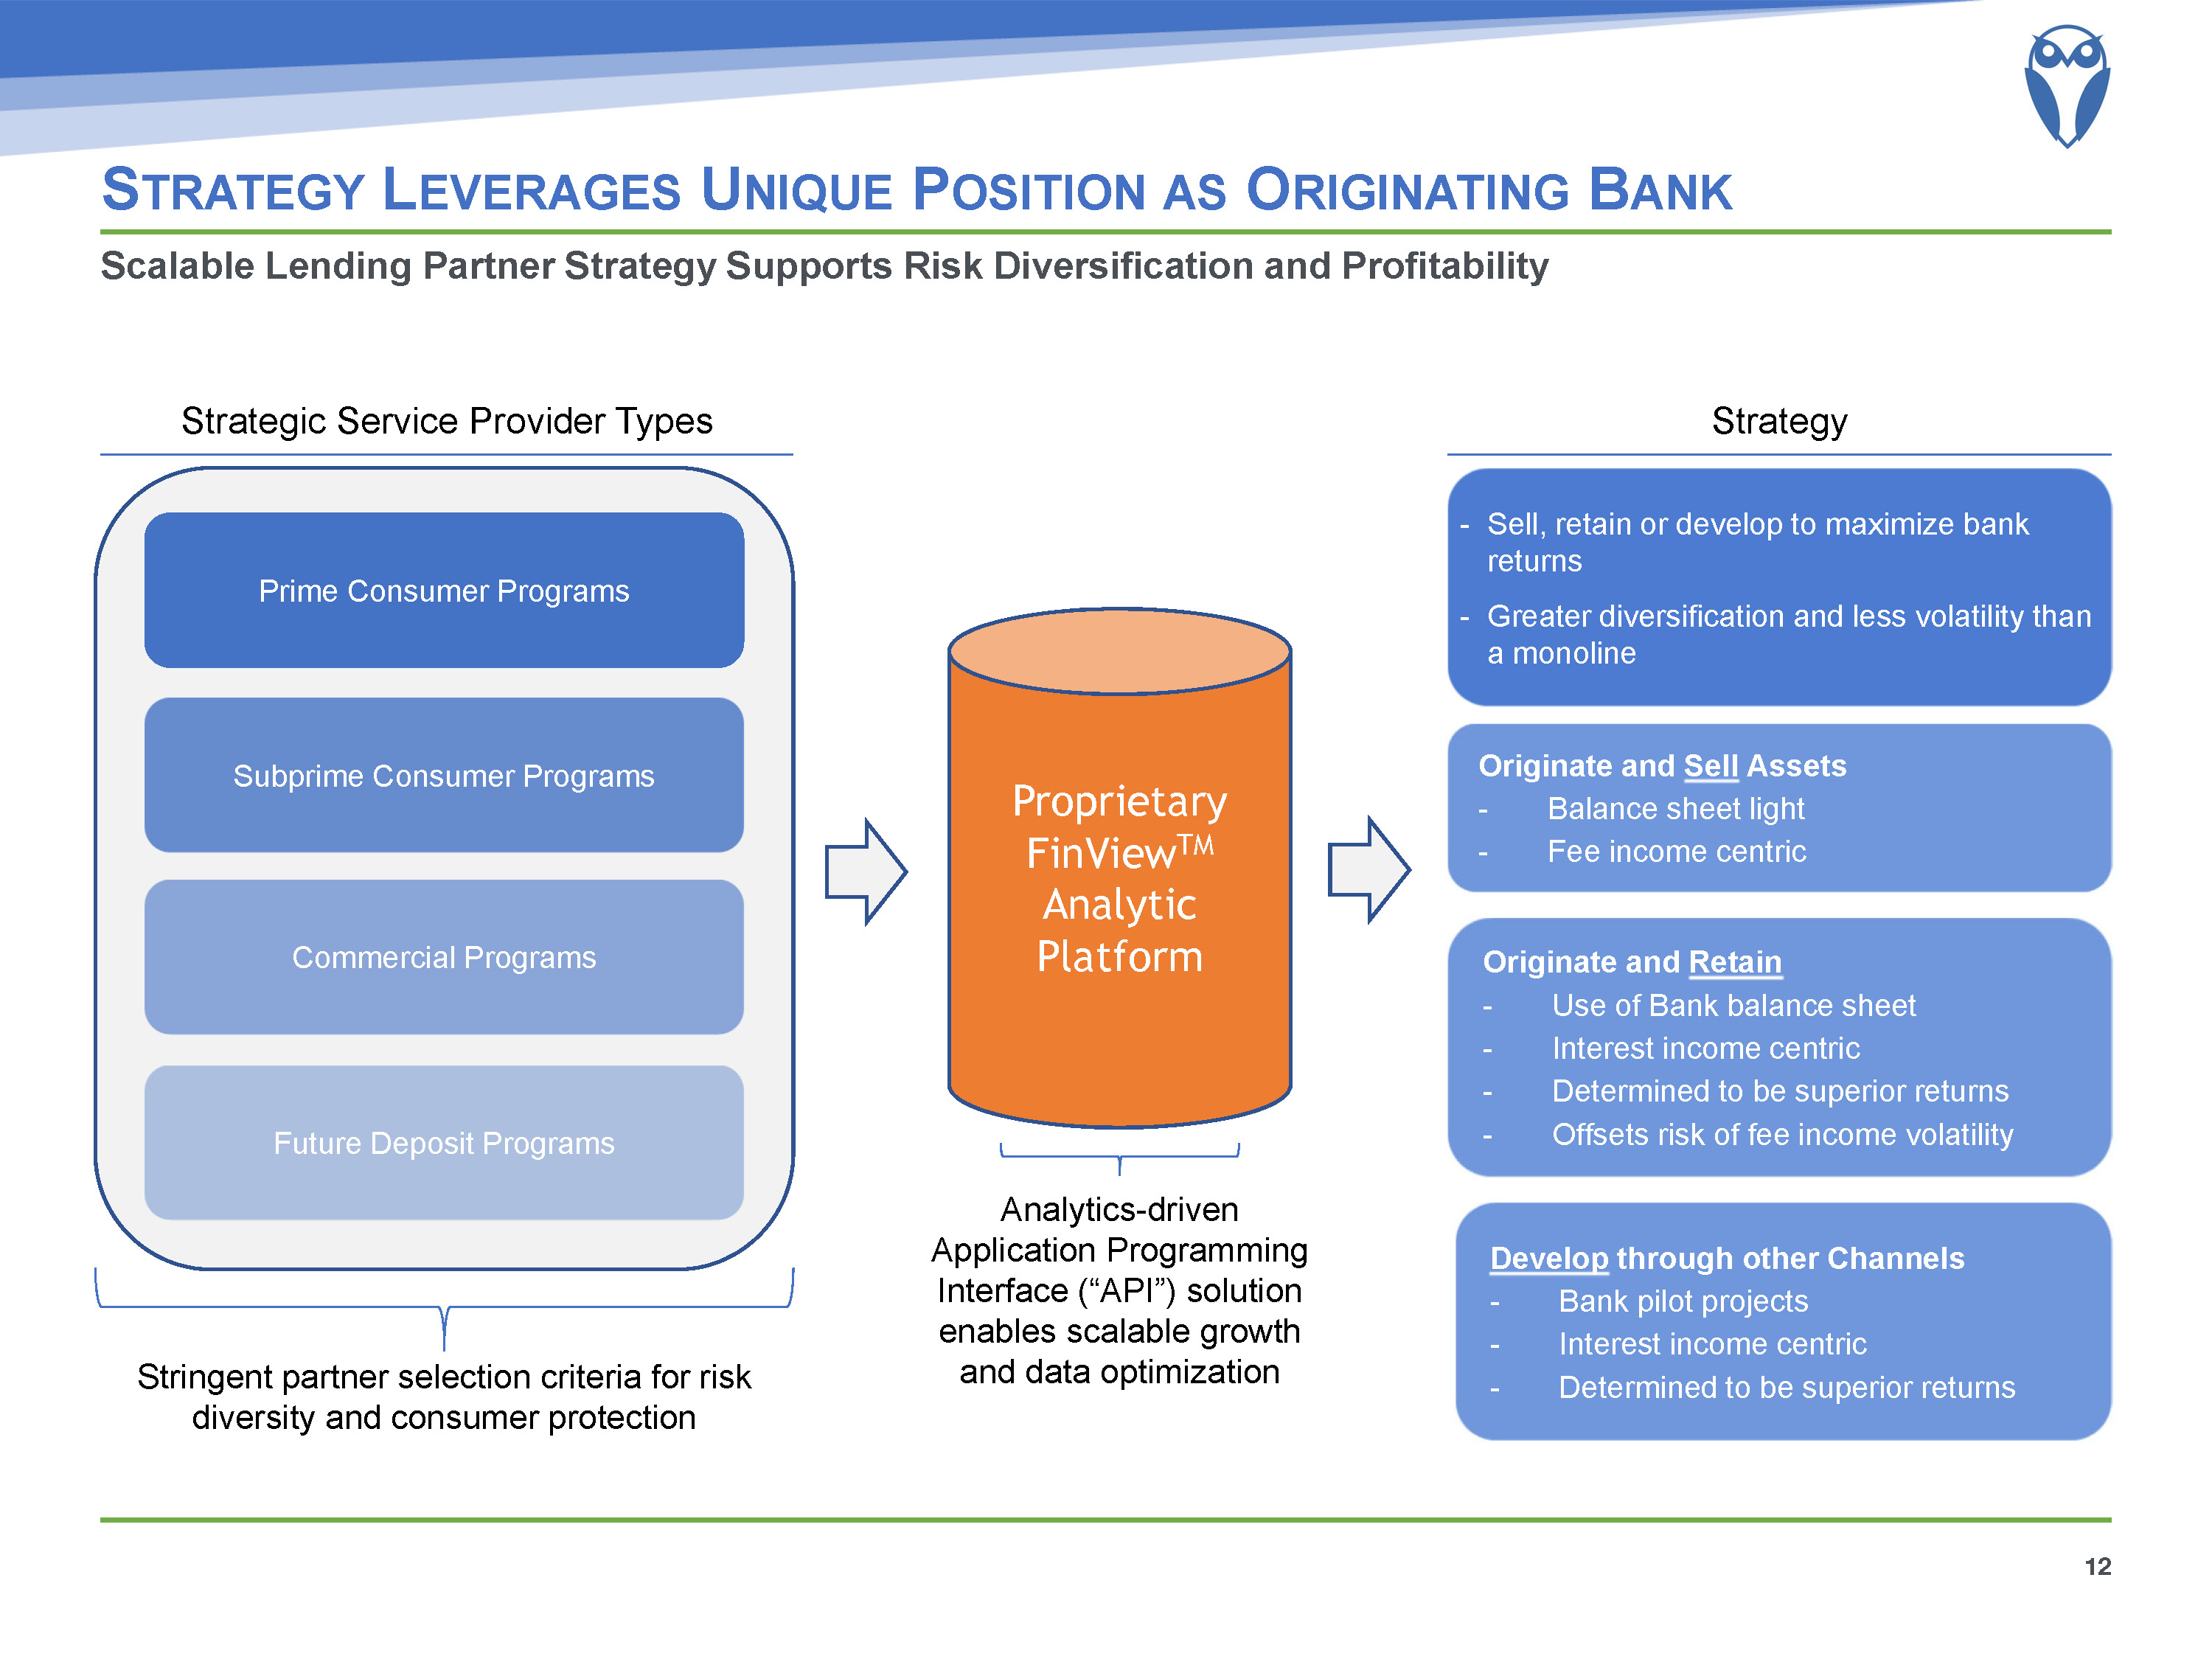
Strategy Leverages Unique Position as Originating Bank 12 Scalable Lending Partner Strategy Supports Risk Diversification and Profitability Strategic Service Provider Types Strategy Prime Consumer Programs Subprime Consumer Programs Commercial Programs Stringent partner selection criteria for risk diversity and consumer protection Future Deposit Programs Develop through other ChannelsBank pilot projectsInterest income centricDetermined to be superior returns Originate and RetainUse of Bank balance sheetInterest income centricDetermined to be superior returnsOffsets risk of fee income volatility Originate and Sell AssetsBalance sheet lightFee income centric Sell, retain or develop to maximize bank returnsGreater diversification and less volatility than a monoline Analytics-driven Application Programming Interface (“API”) solution enables scalable growth and data optimization Proprietary FinViewTM Analytic Platform
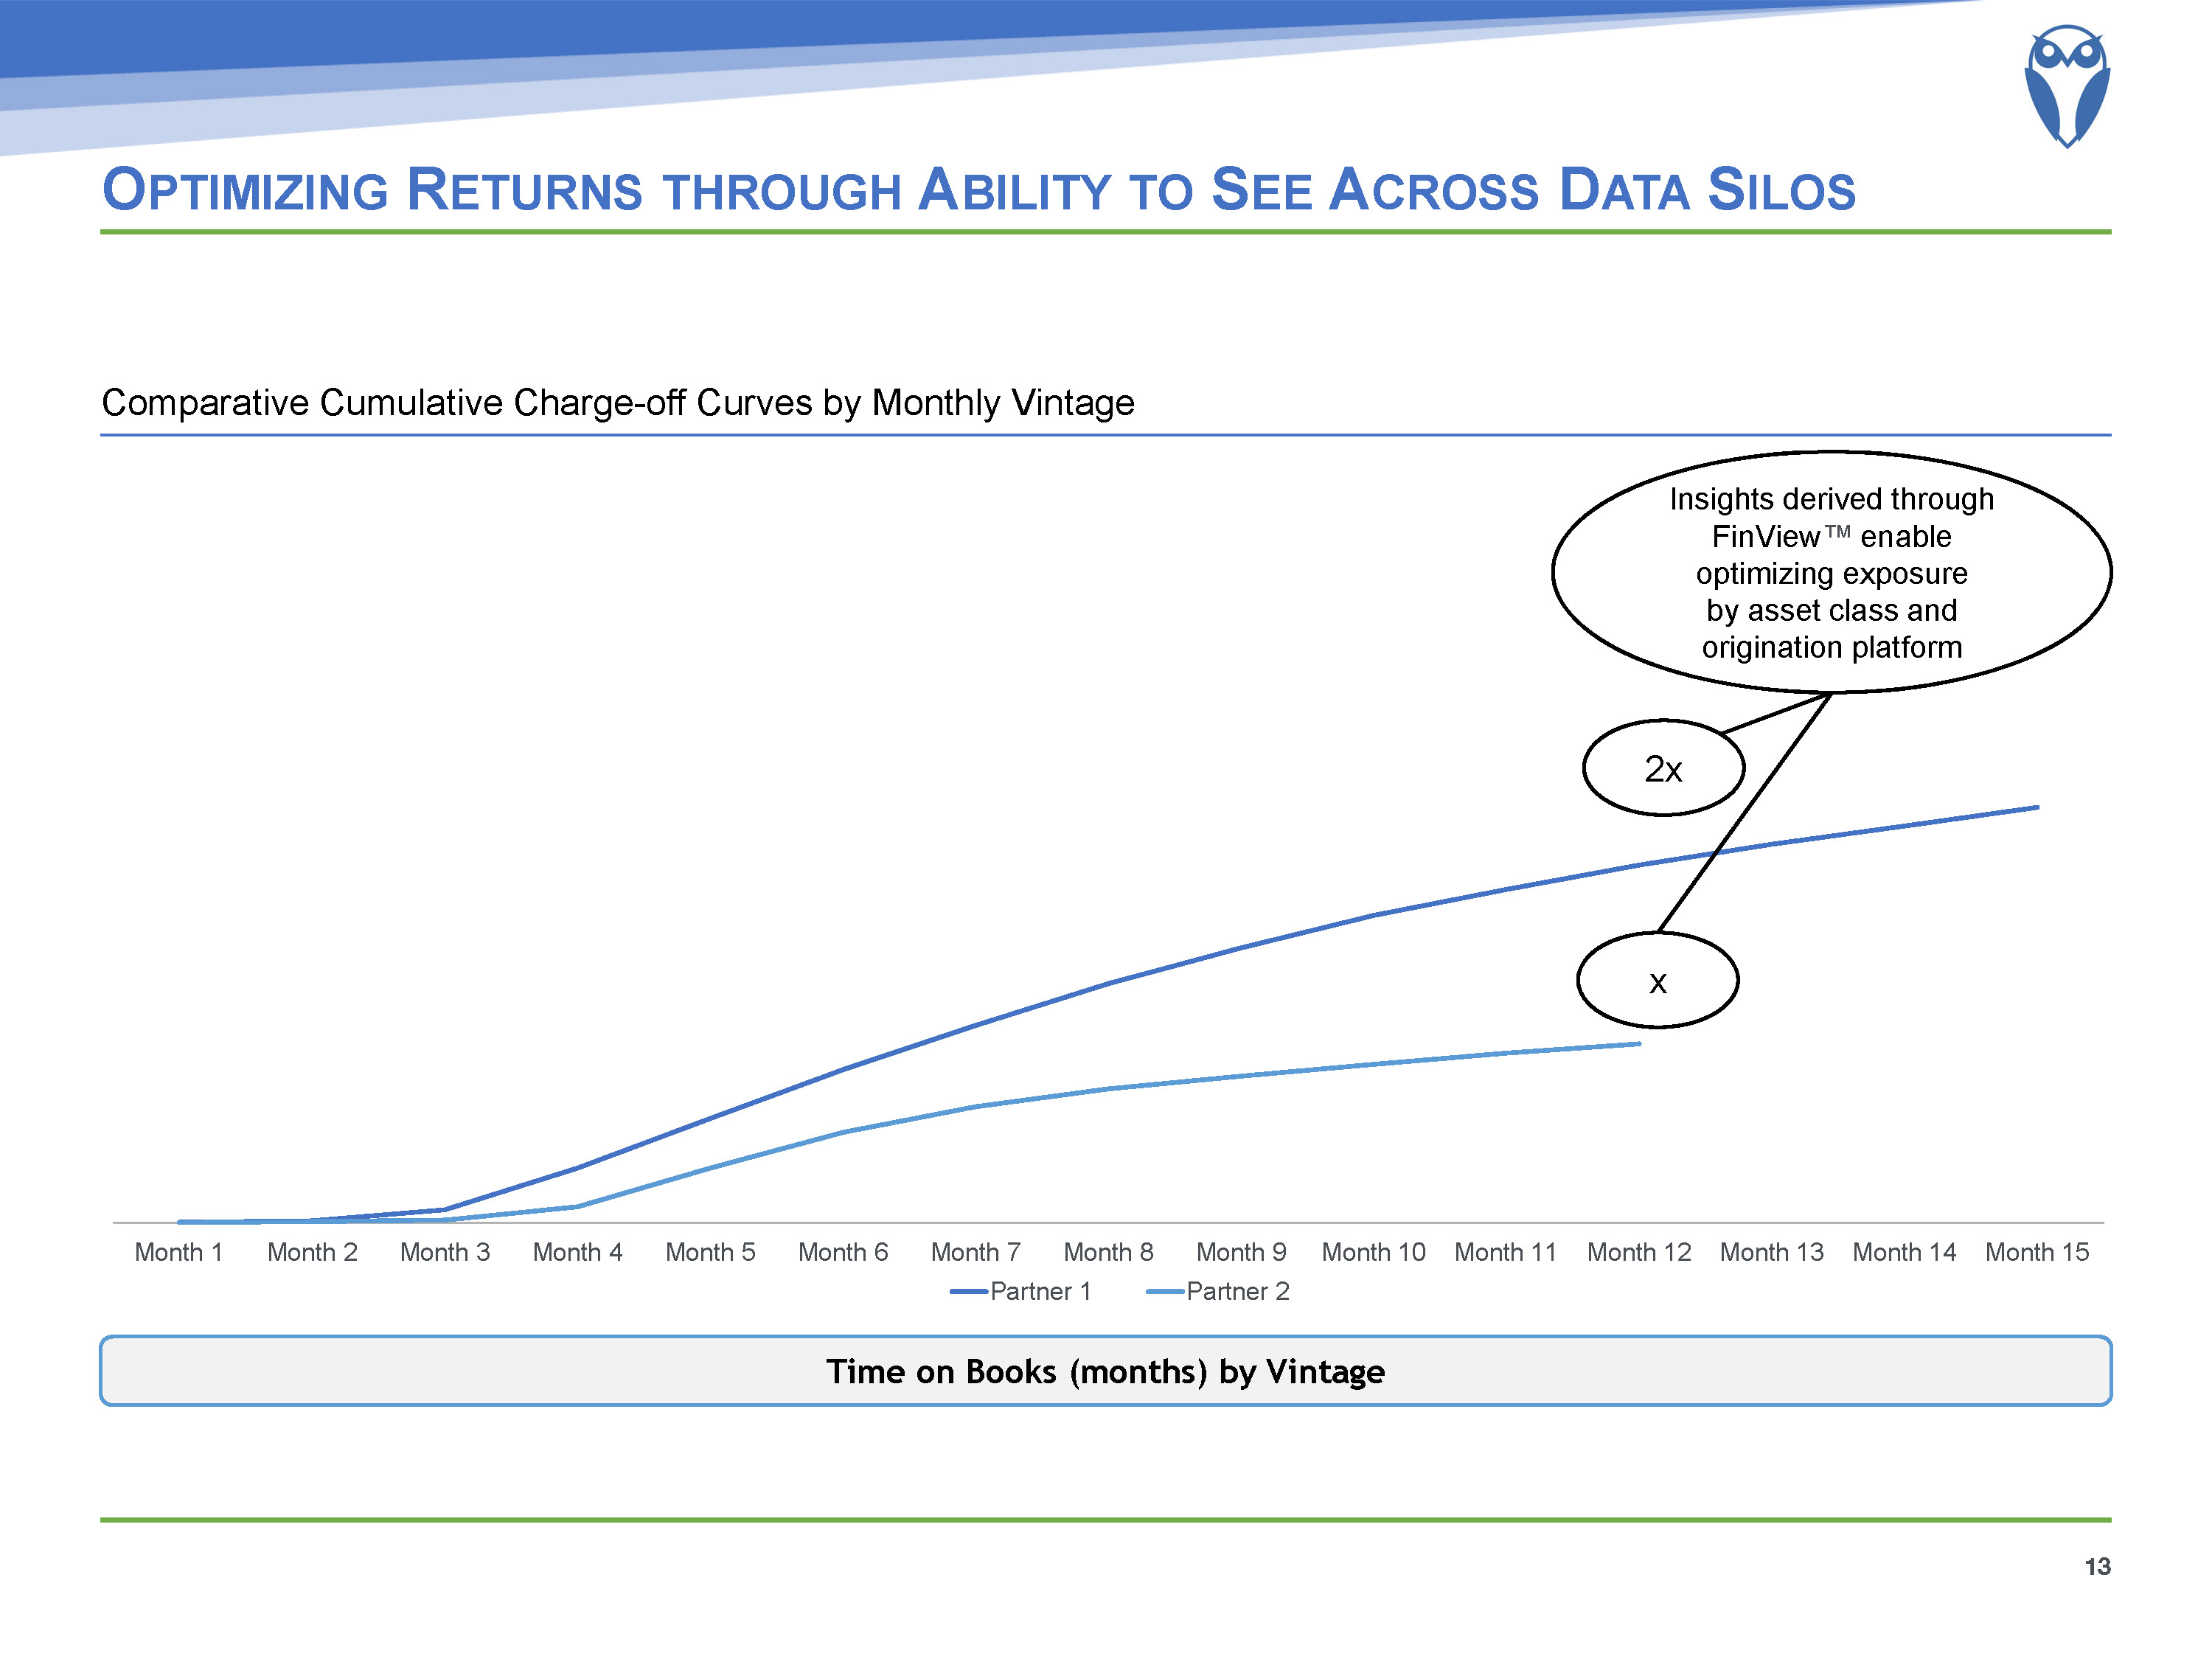
Optimizing Returns through Ability to See Across Data Silos 13 2x Insights derived throughFinView™ enable optimizing exposure by asset class and origination platform x Time on Books (months) by Vintage Comparative Cumulative Charge-off Curves by Monthly Vintage
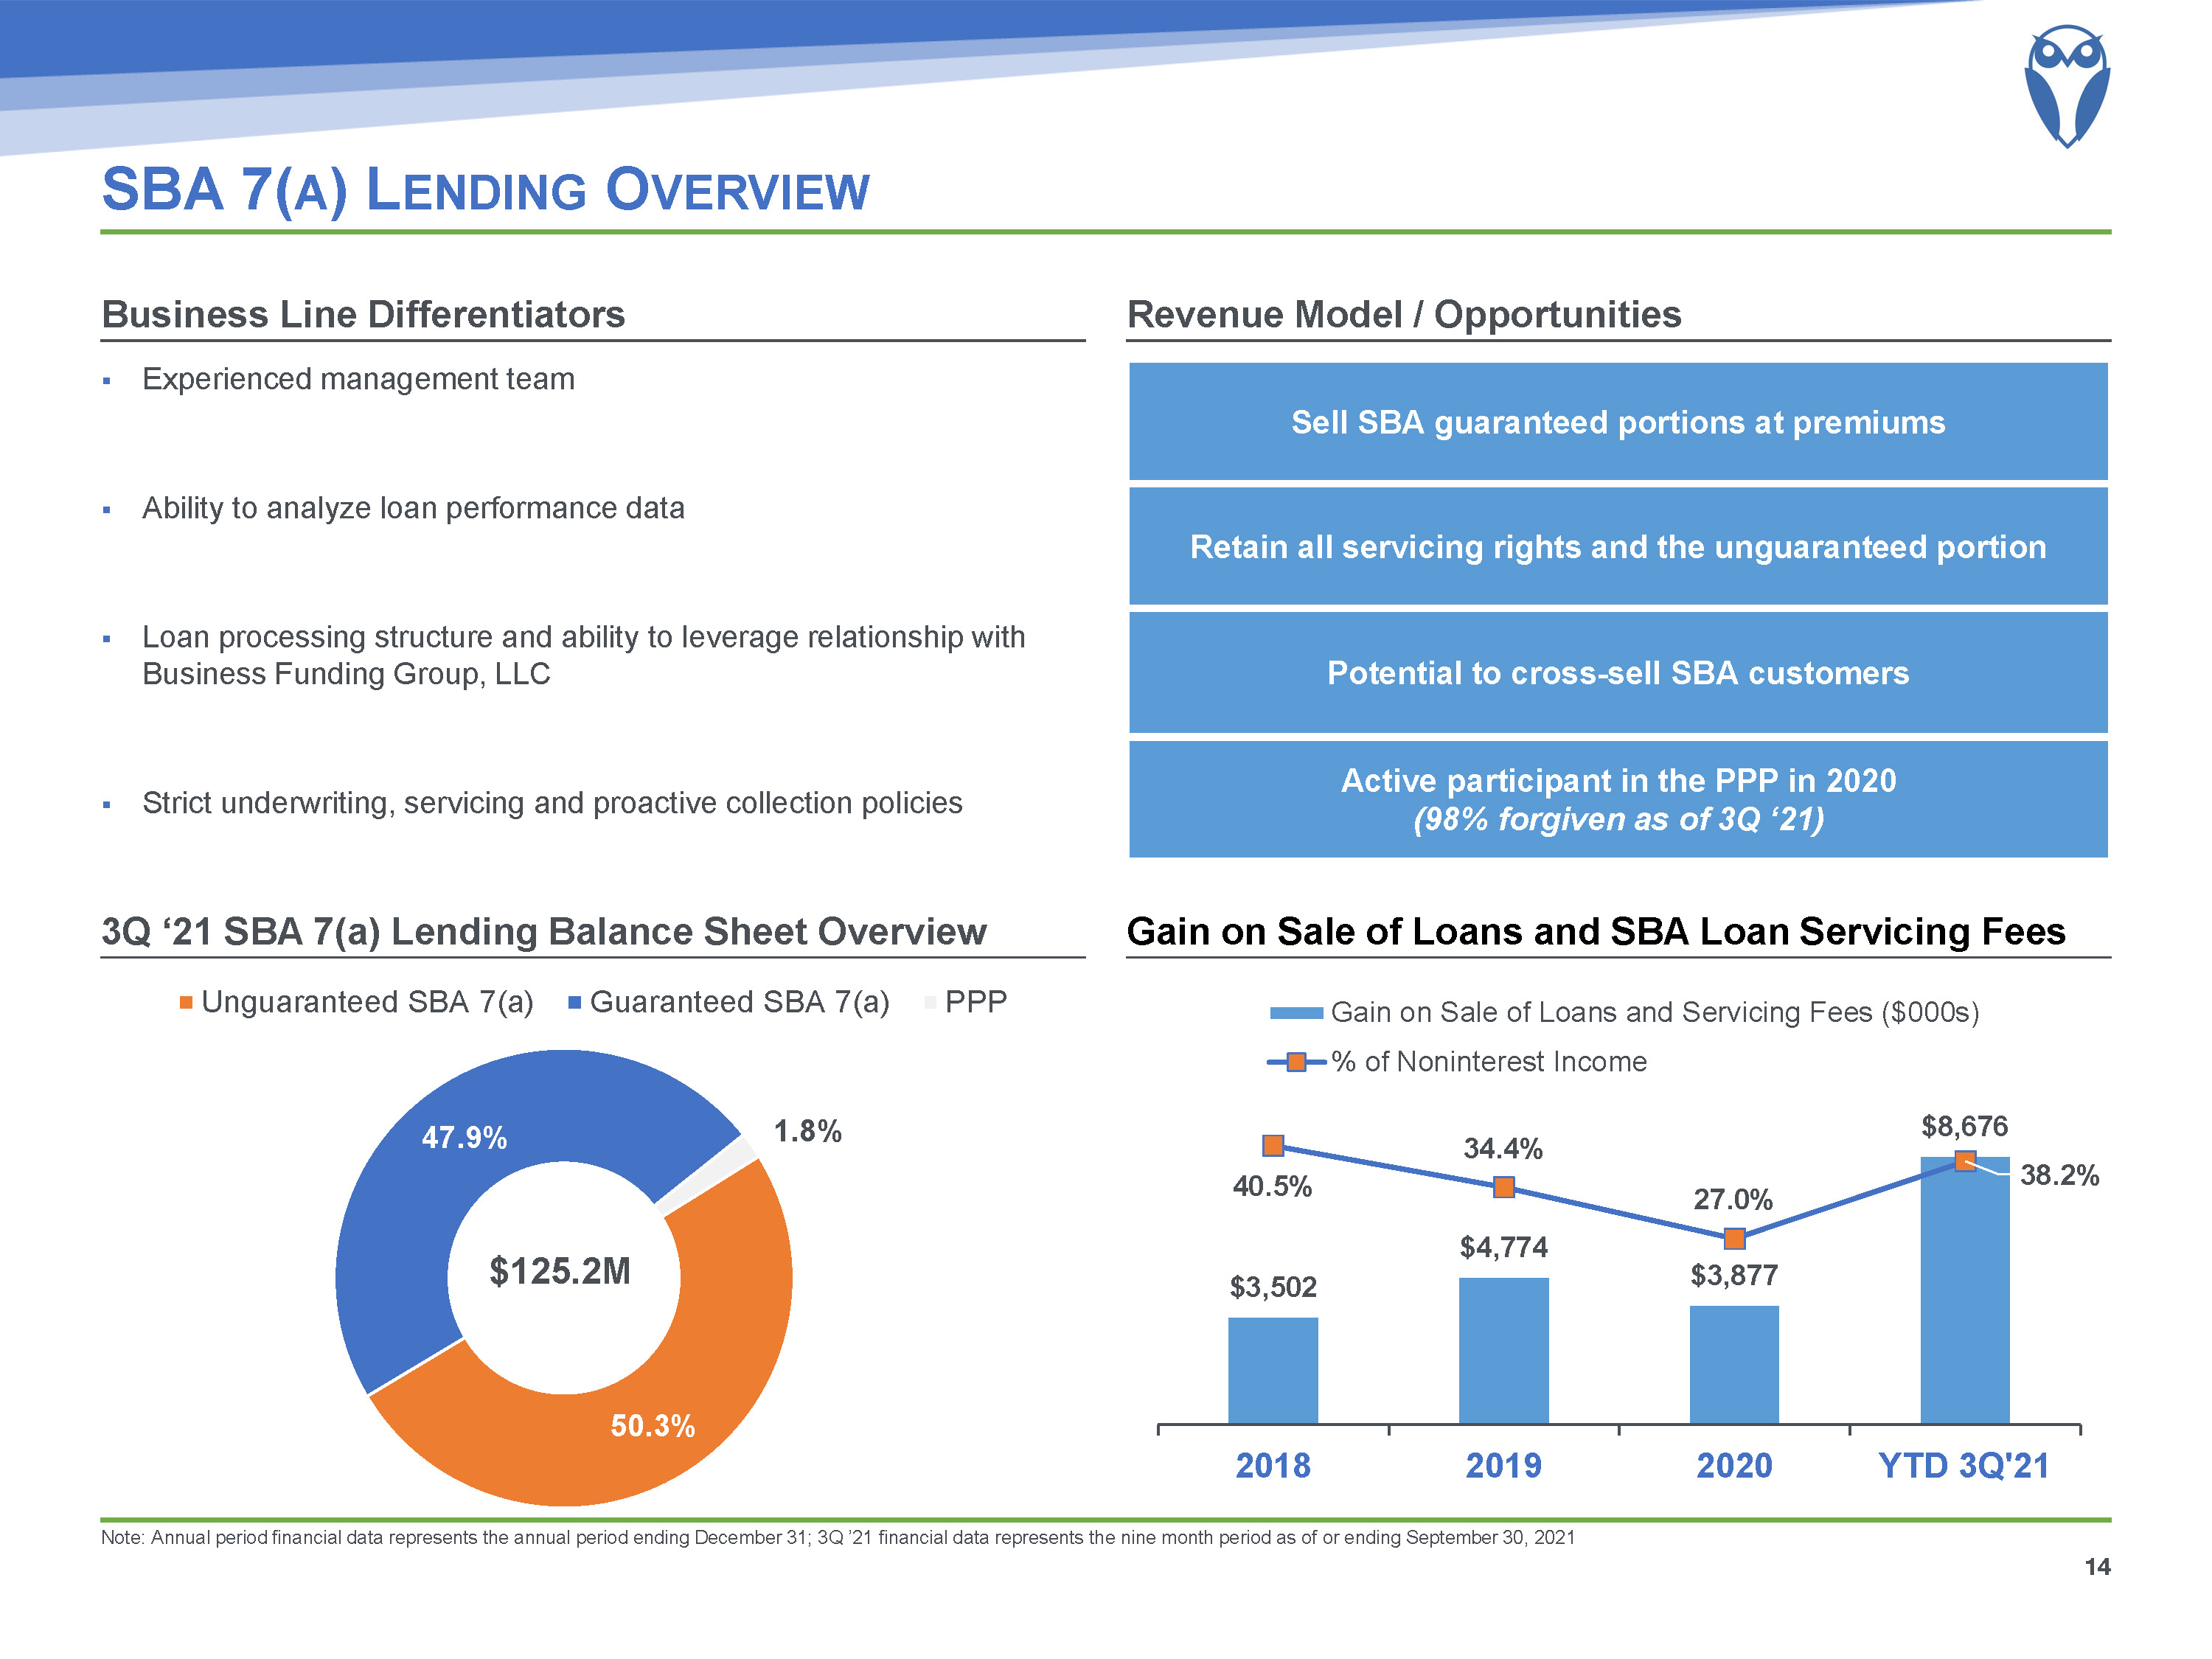
SBA 7(a) Lending Overview Note: Annual period financial data represents the annual period ending December 31; 3Q ’21 financial data represents the nine month period as of or ending September 30, 2021 Gain on Sale of Loans and SBA Loan Servicing Fees 3Q ‘21 SBA 7(a) Lending Balance Sheet Overview Revenue Model / Opportunities Business Line Differentiators 14 Sell SBA guaranteed portions at premiums Retain all servicing rights and the unguaranteed portion Potential to cross-sell SBA customers Active participant in the PPP in 2020(98% forgiven as of 3Q ‘21) Experienced management teamAbility to analyze loan performance dataLoan processing structure and ability to leverage relationship with Business Funding Group, LLCStrict underwriting, servicing and proactive collection policies $125.2M
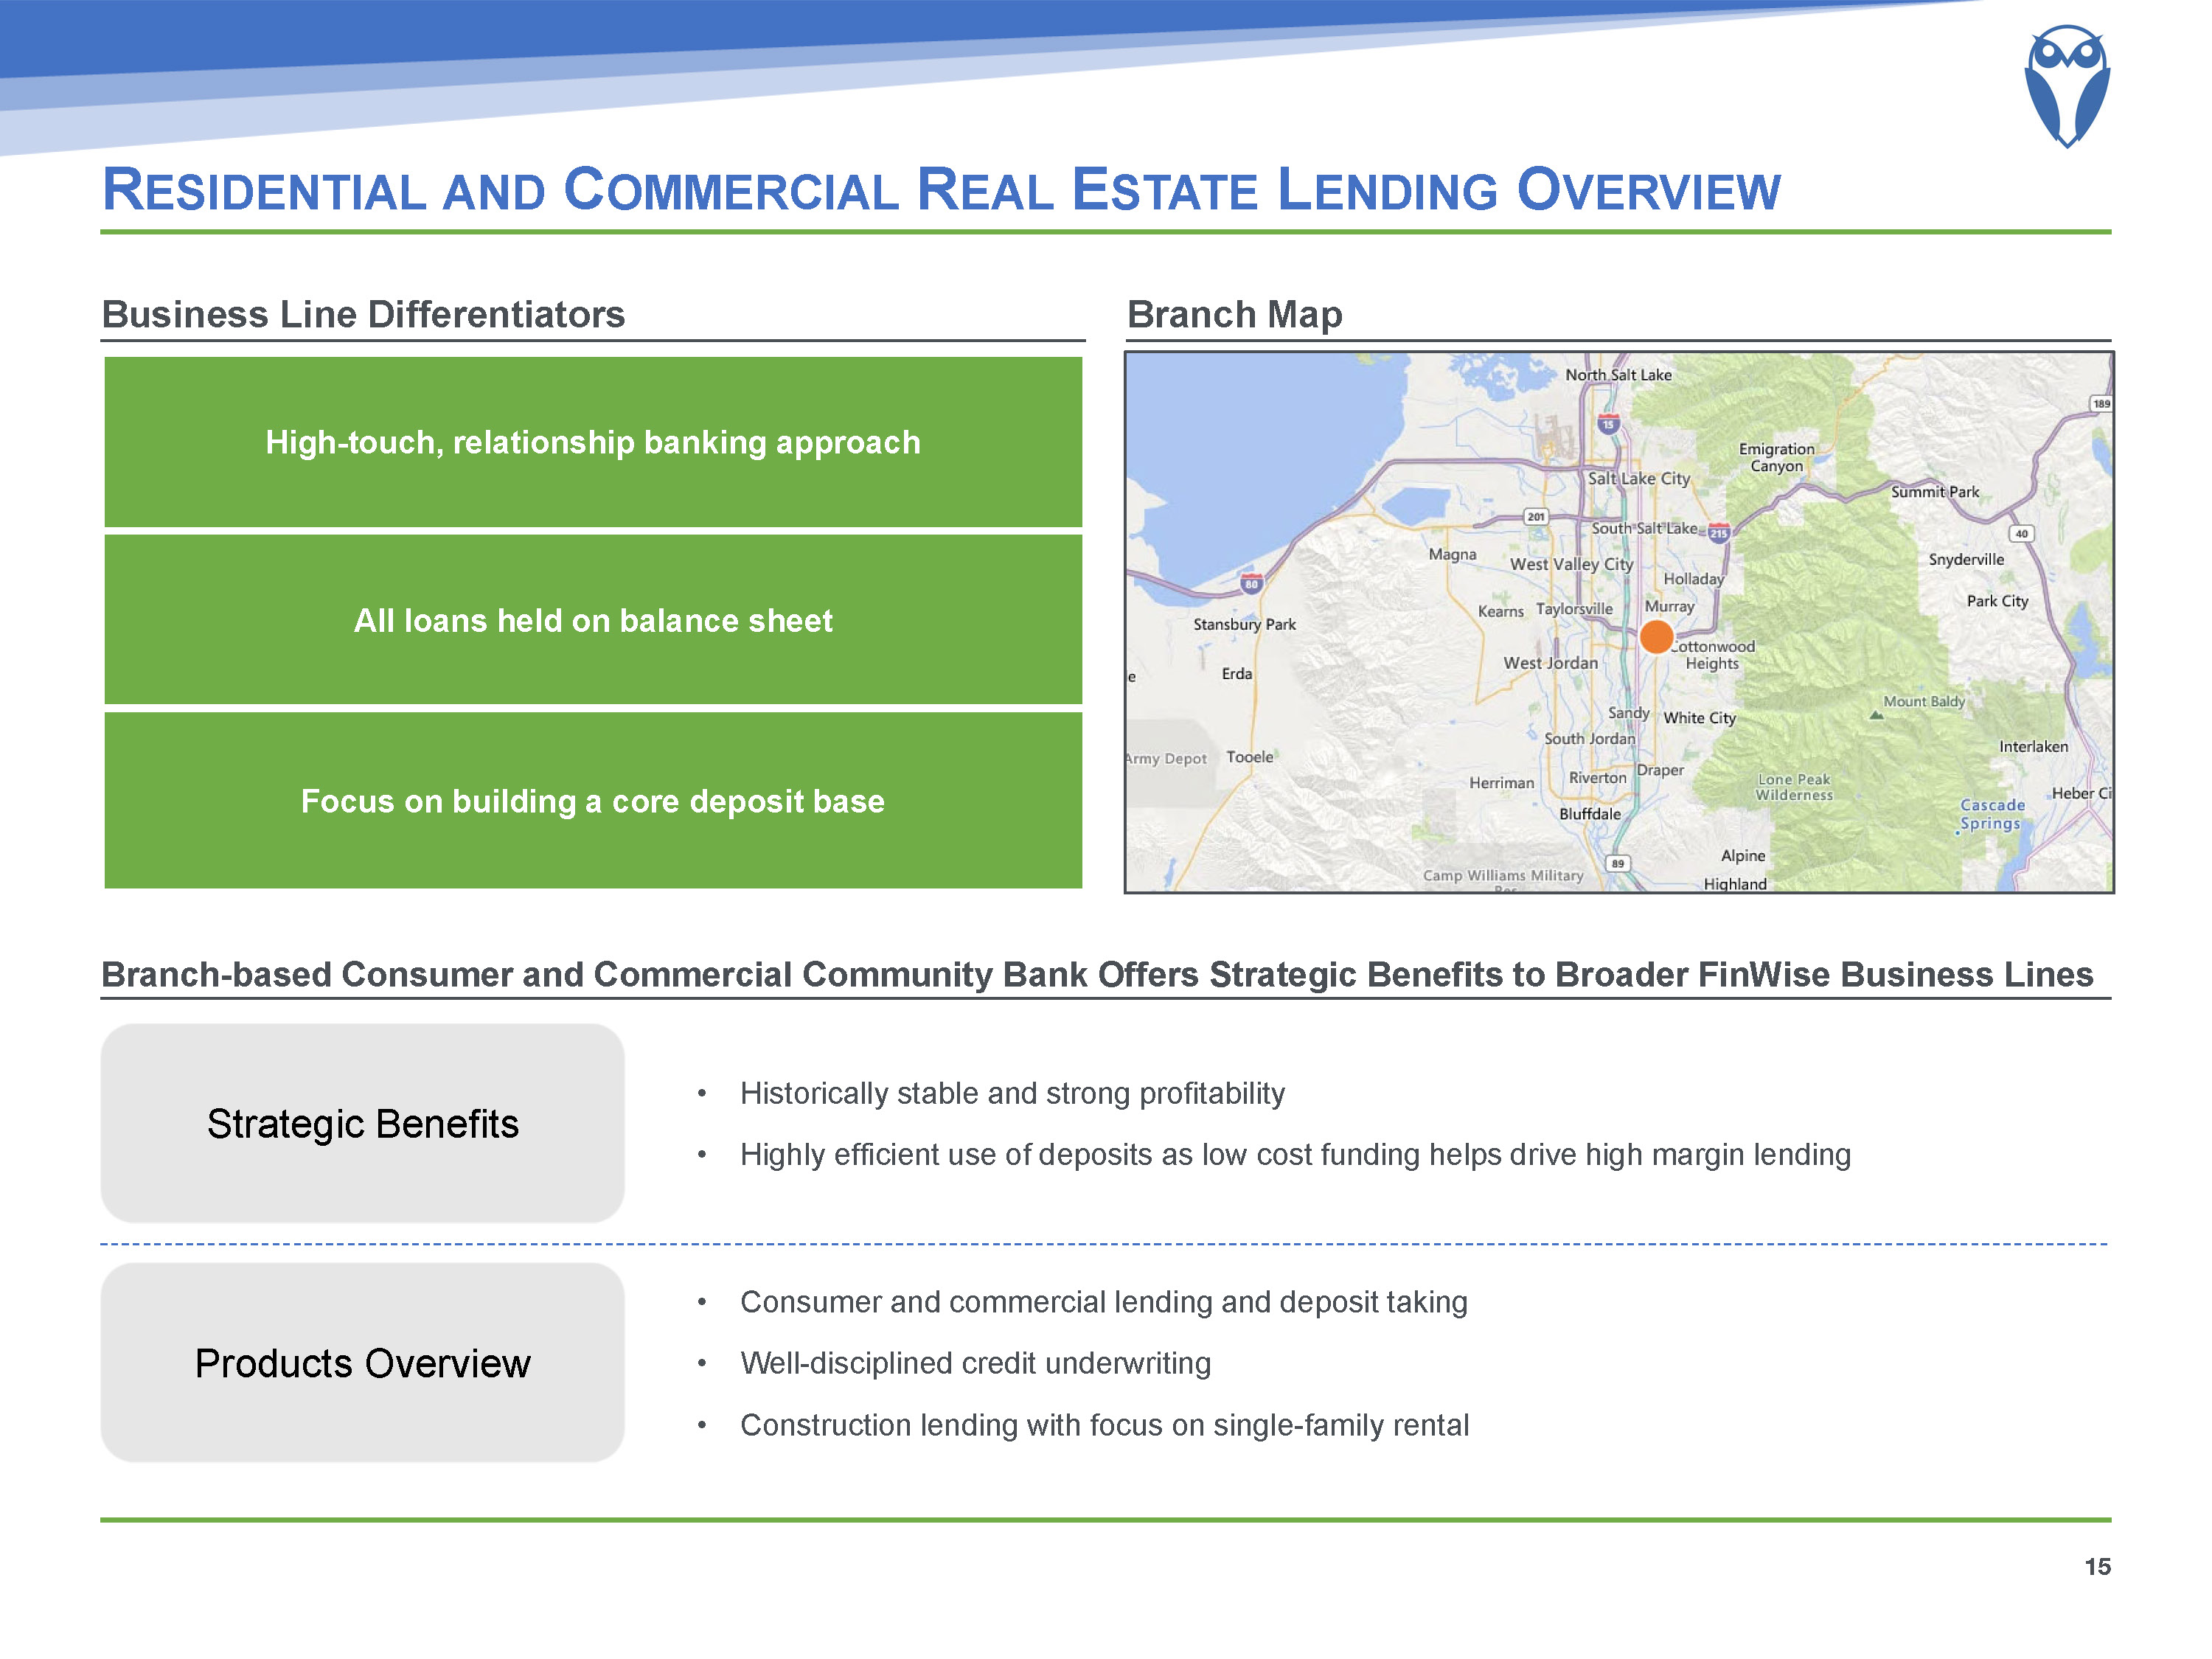
Residential and Commercial Real Estate Lending Overview 15 Products Overview Consumer and commercial lending and deposit takingWell-disciplined credit underwritingConstruction lending with focus on single-family rental Strategic Benefits Historically stable and strong profitabilityHighly efficient use of deposits as low cost funding helps drive high margin lending Branch-based Consumer and Commercial Community Bank Offers Strategic Benefits to Broader FinWise Business Lines Branch Map Business Line Differentiators High-touch, relationship banking approach All loans held on balance sheet Focus on building a core deposit base
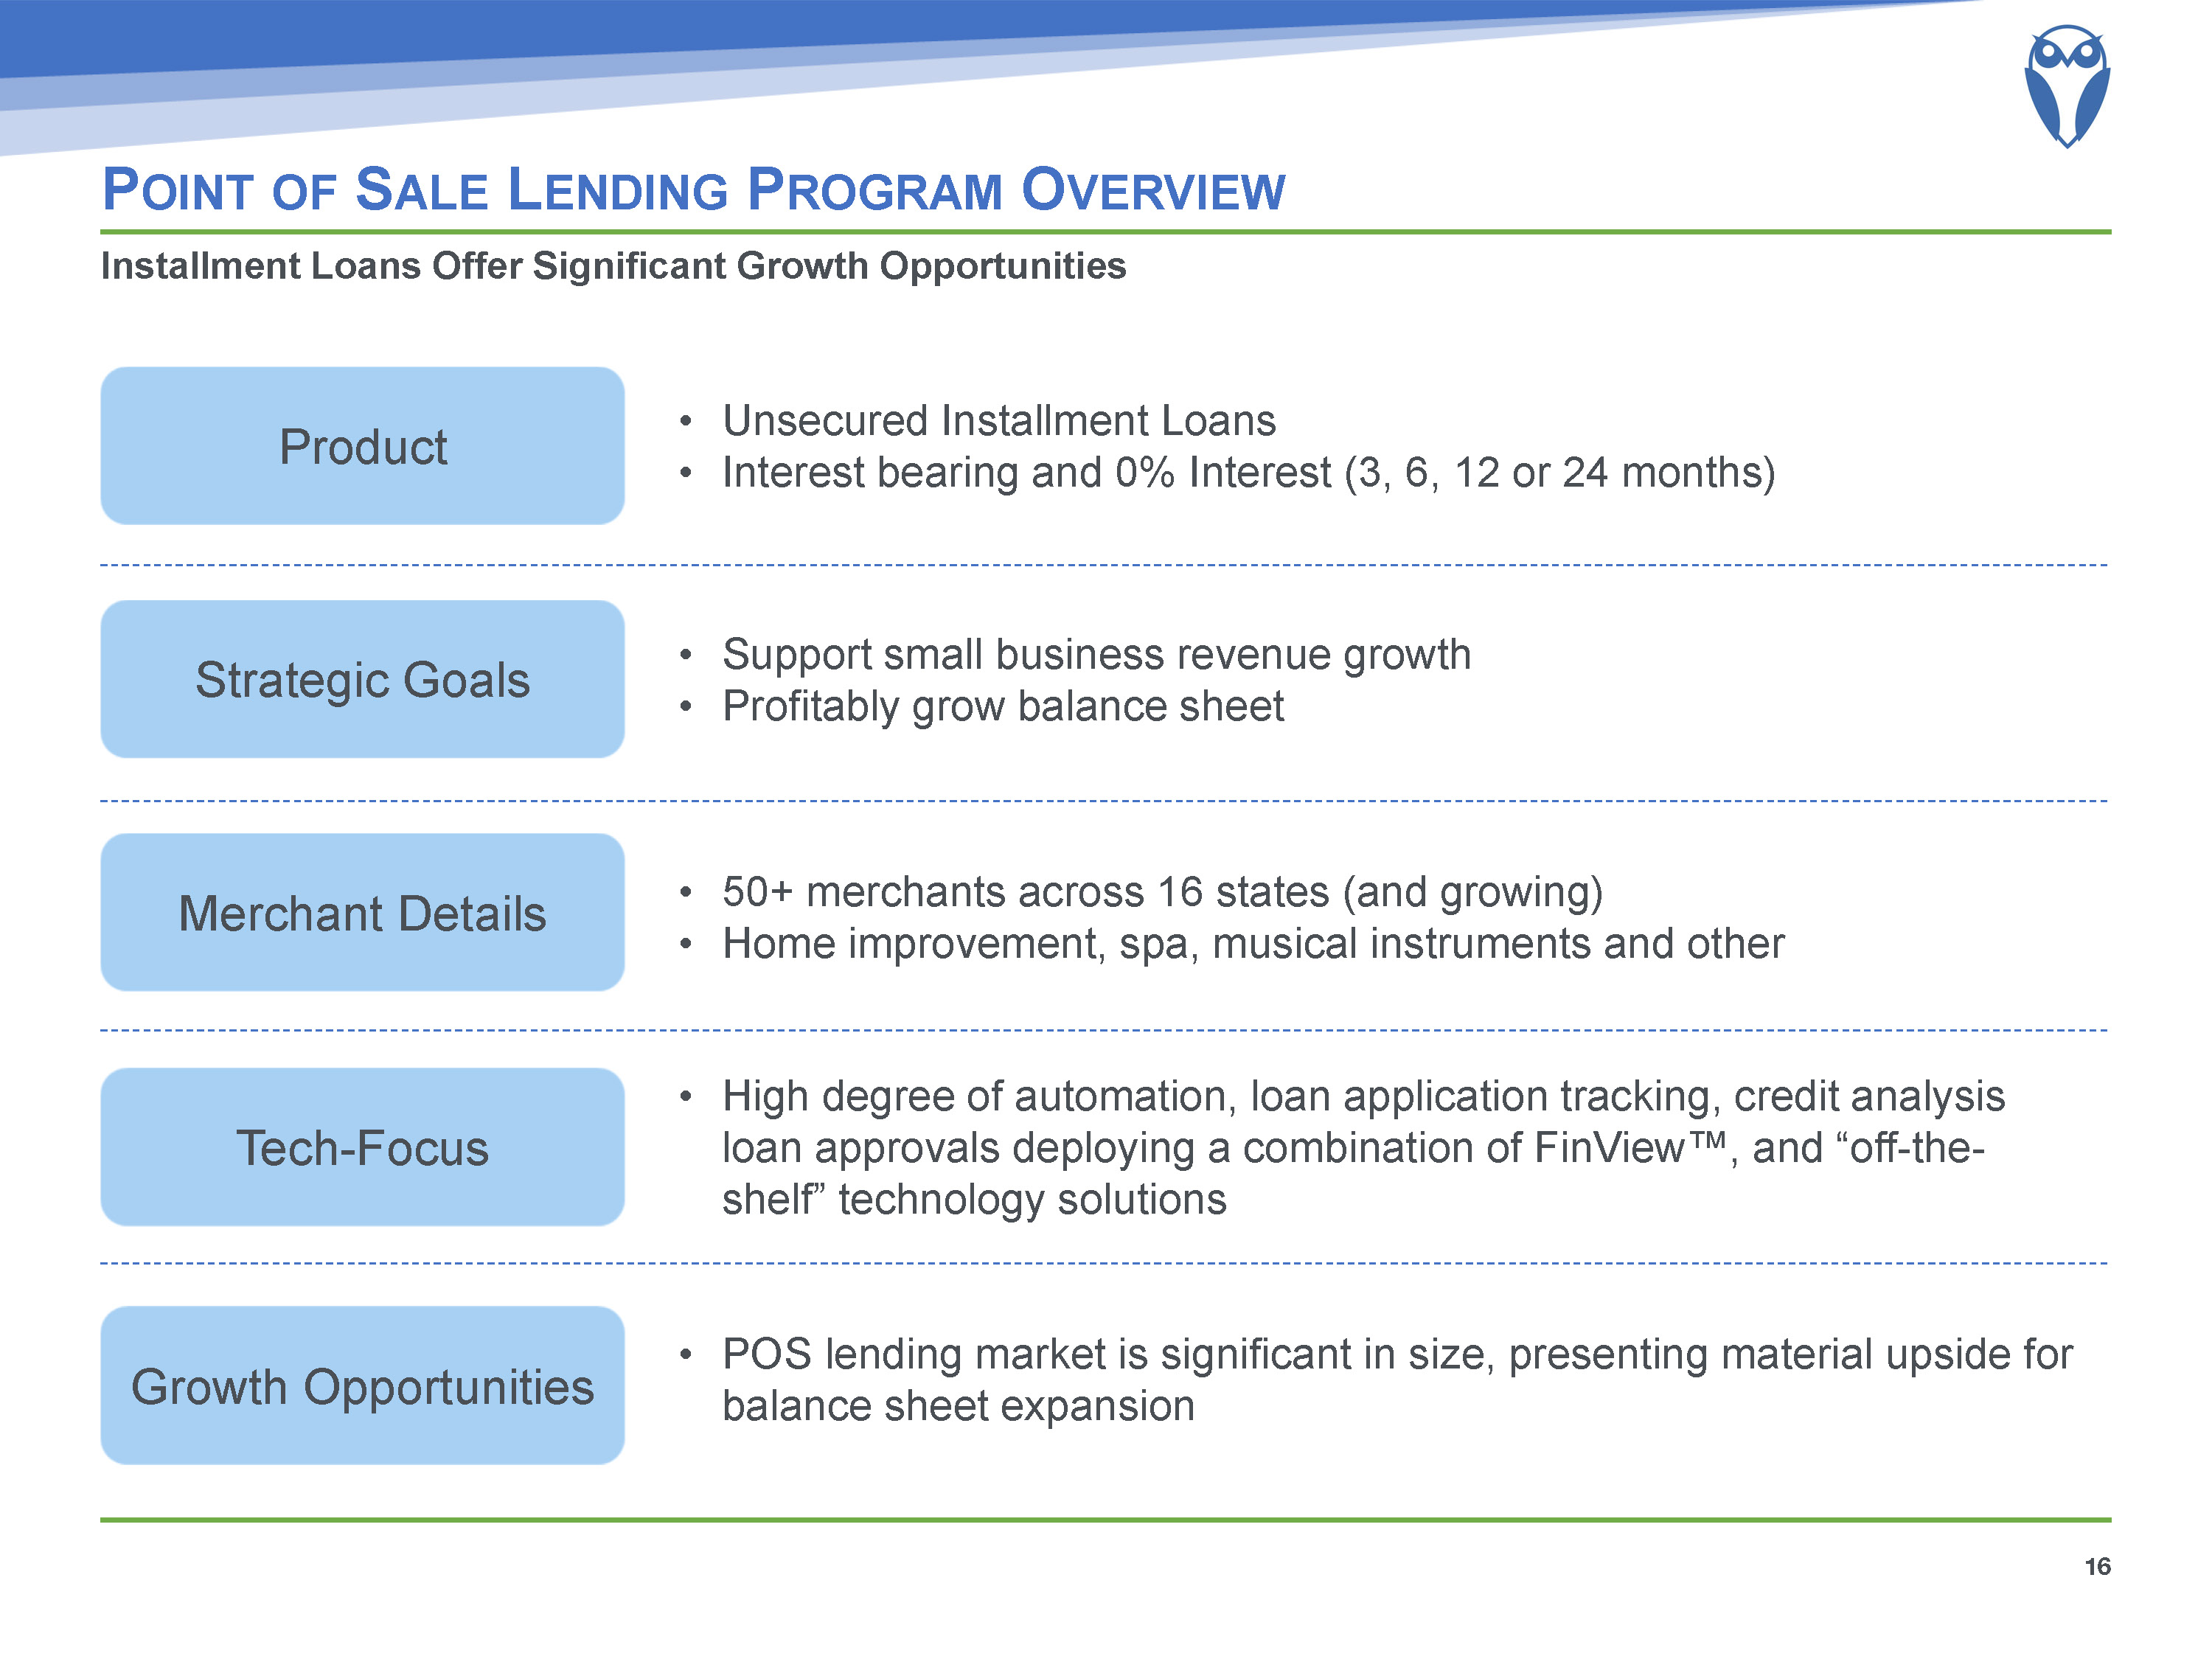
Point of Sale Lending Program Overview 16 Installment Loans Offer Significant Growth Opportunities Product Merchant Details Tech-Focus Growth Opportunities 50+ merchants across 16 states (and growing)Home improvement, spa, musical instruments and other POS lending market is significant in size, presenting material upside for balance sheet expansion Unsecured Installment LoansInterest bearing and 0% Interest (3, 6, 12 or 24 months) Strategic Goals Support small business revenue growthProfitably grow balance sheet High degree of automation, loan application tracking, credit analysis loan approvals deploying a combination of FinView™, and “off-the-shelf” technology solutions
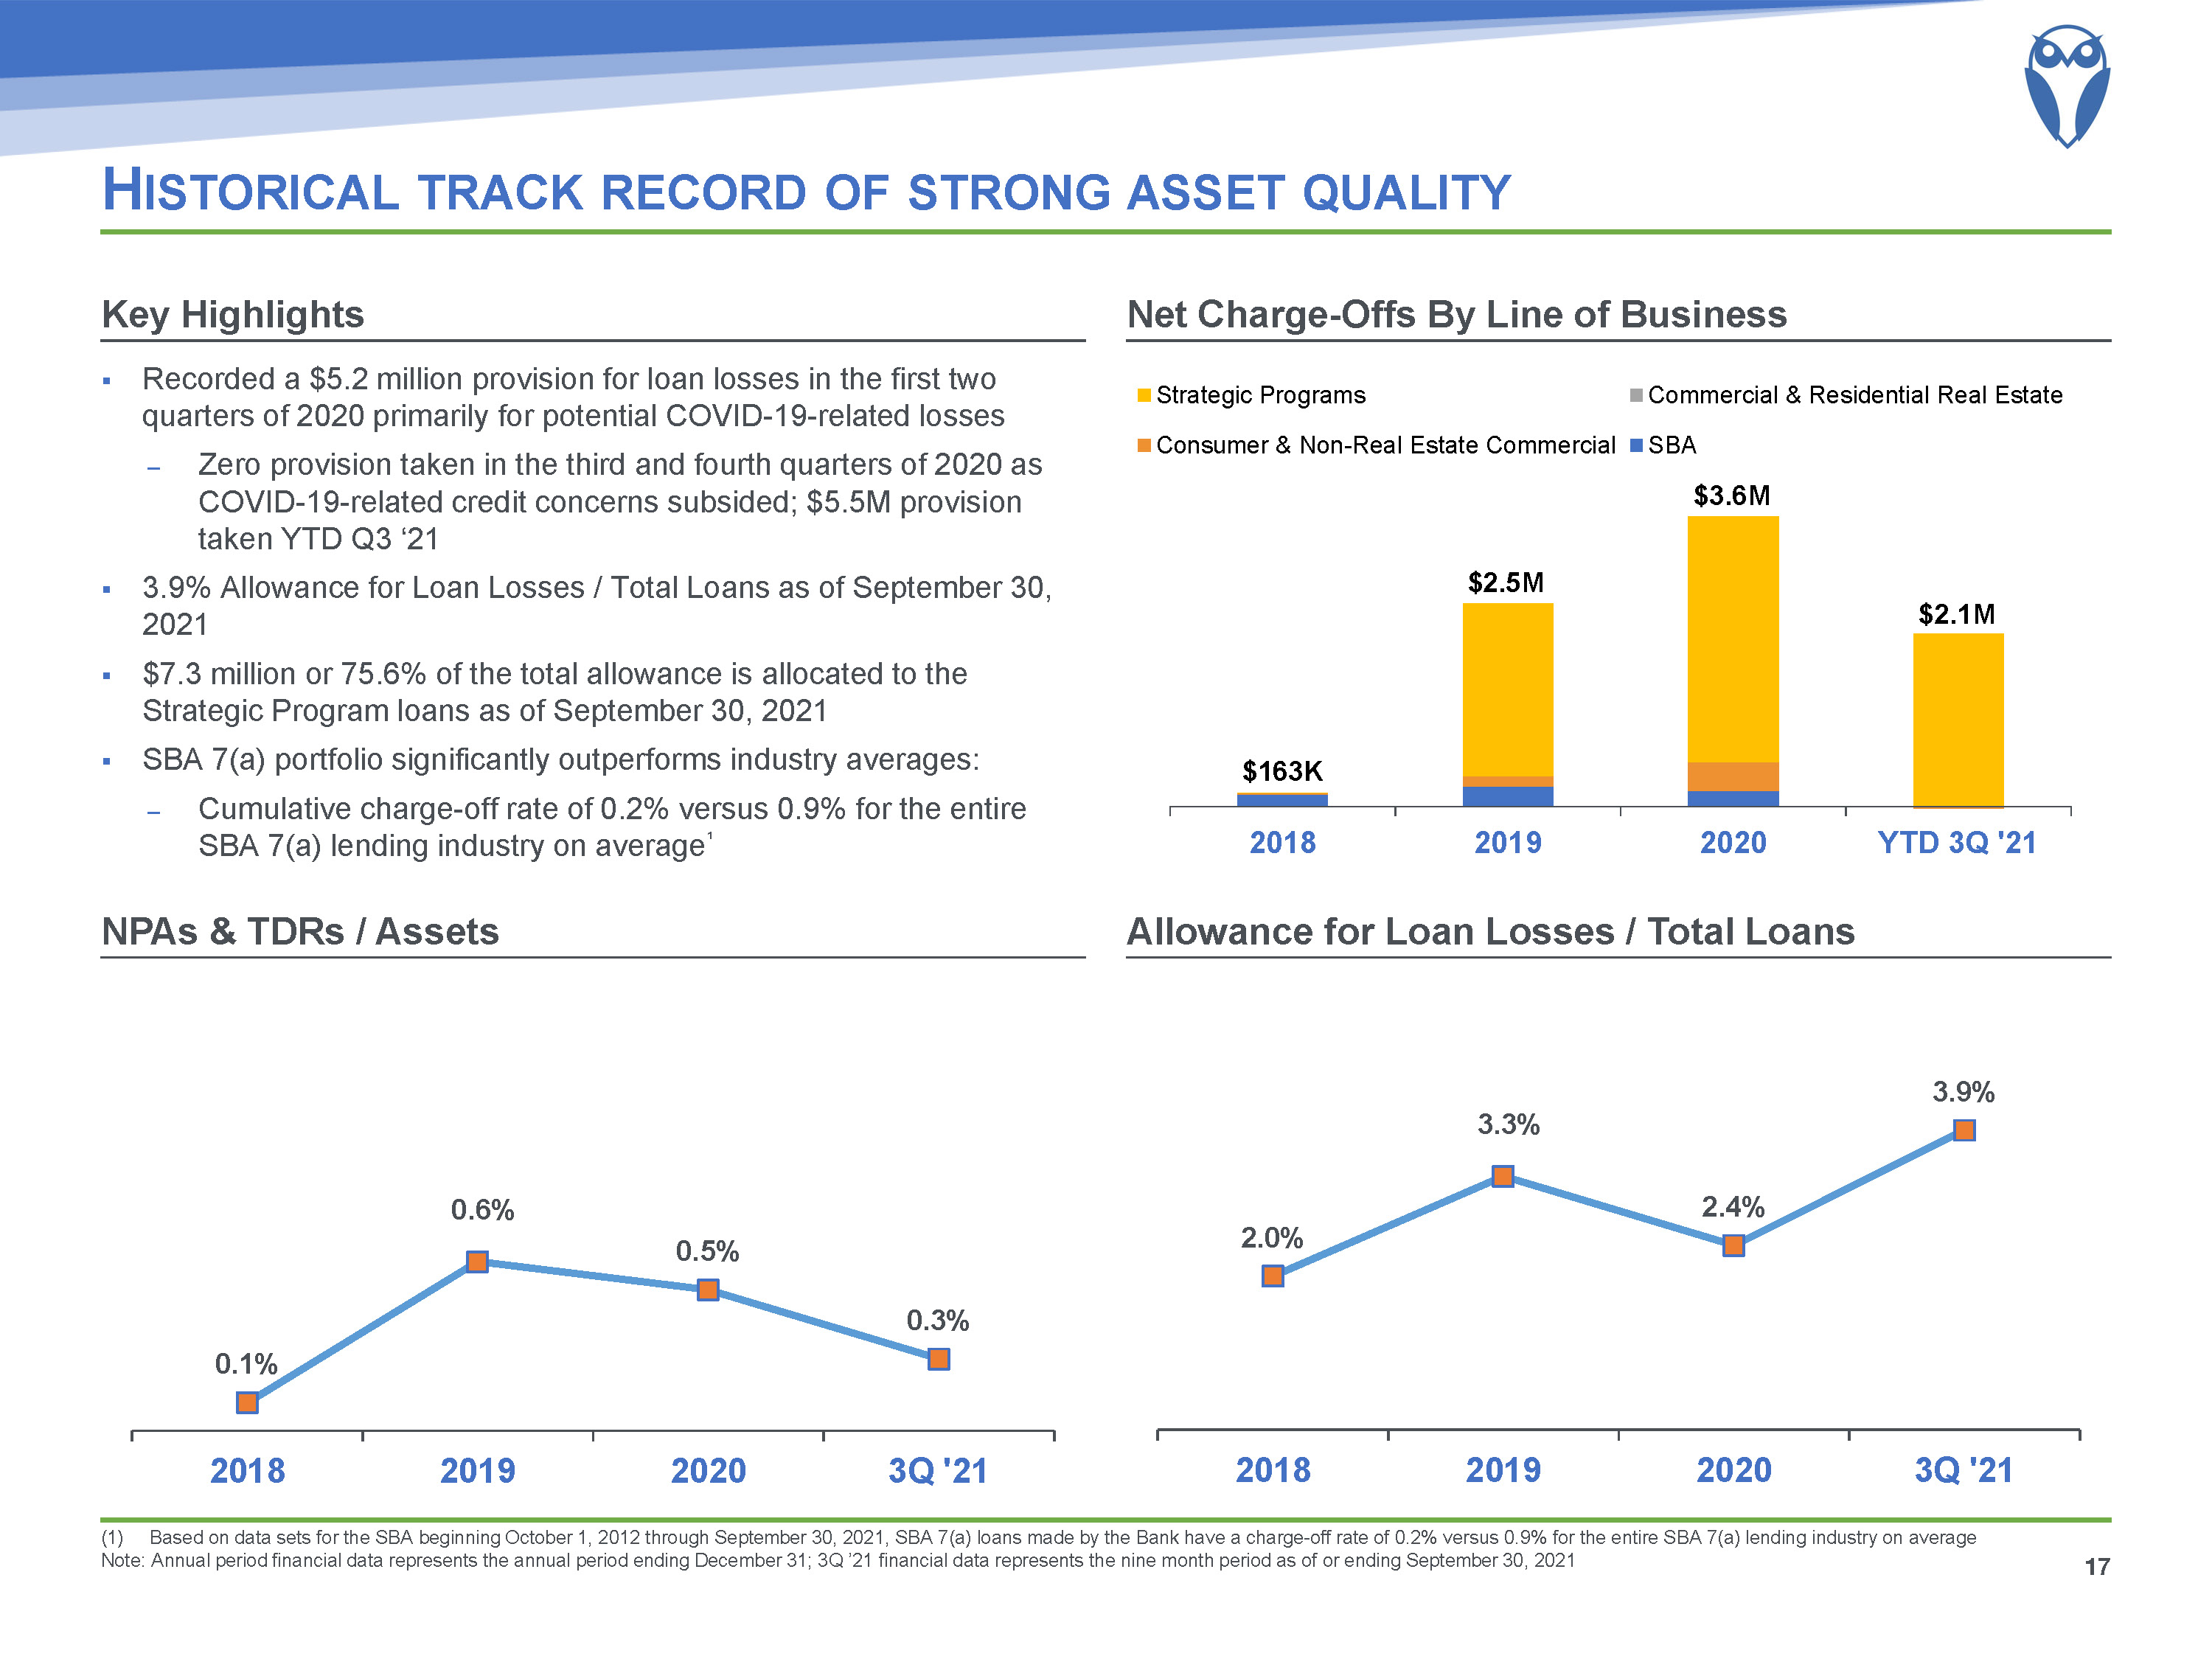
Historical track record of strong asset quality Allowance for Loan Losses / Total Loans NPAs & TDRs / Assets Net Charge-Offs By Line of Business Recorded a $5.2 million provision for loan losses in the first two quarters of 2020 primarily for potential COVID-19-related lossesZero provision taken in the third and fourth quarters of 2020 as COVID-19-related credit concerns subsided; $5.5M provision taken YTD Q3 ‘213.9% Allowance for Loan Losses / Total Loans as of September 30, 2021$7.3 million or 75.6% of the total allowance is allocated to the Strategic Program loans as of September 30, 2021SBA 7(a) portfolio significantly outperforms industry averages: Cumulative charge-off rate of 0.2% versus 0.9% for the entire SBA 7(a) lending industry on average¹ Key Highlights 17 $3.6M $163K $2.5M $2.1M Based on data sets for the SBA beginning October 1, 2012 through September 30, 2021, SBA 7(a) loans made by the Bank have a charge-off rate of 0.2% versus 0.9% for the entire SBA 7(a) lending industry on averageNote: Annual period financial data represents the annual period ending December 31; 3Q ’21 financial data represents the nine month period as of or ending September 30, 2021
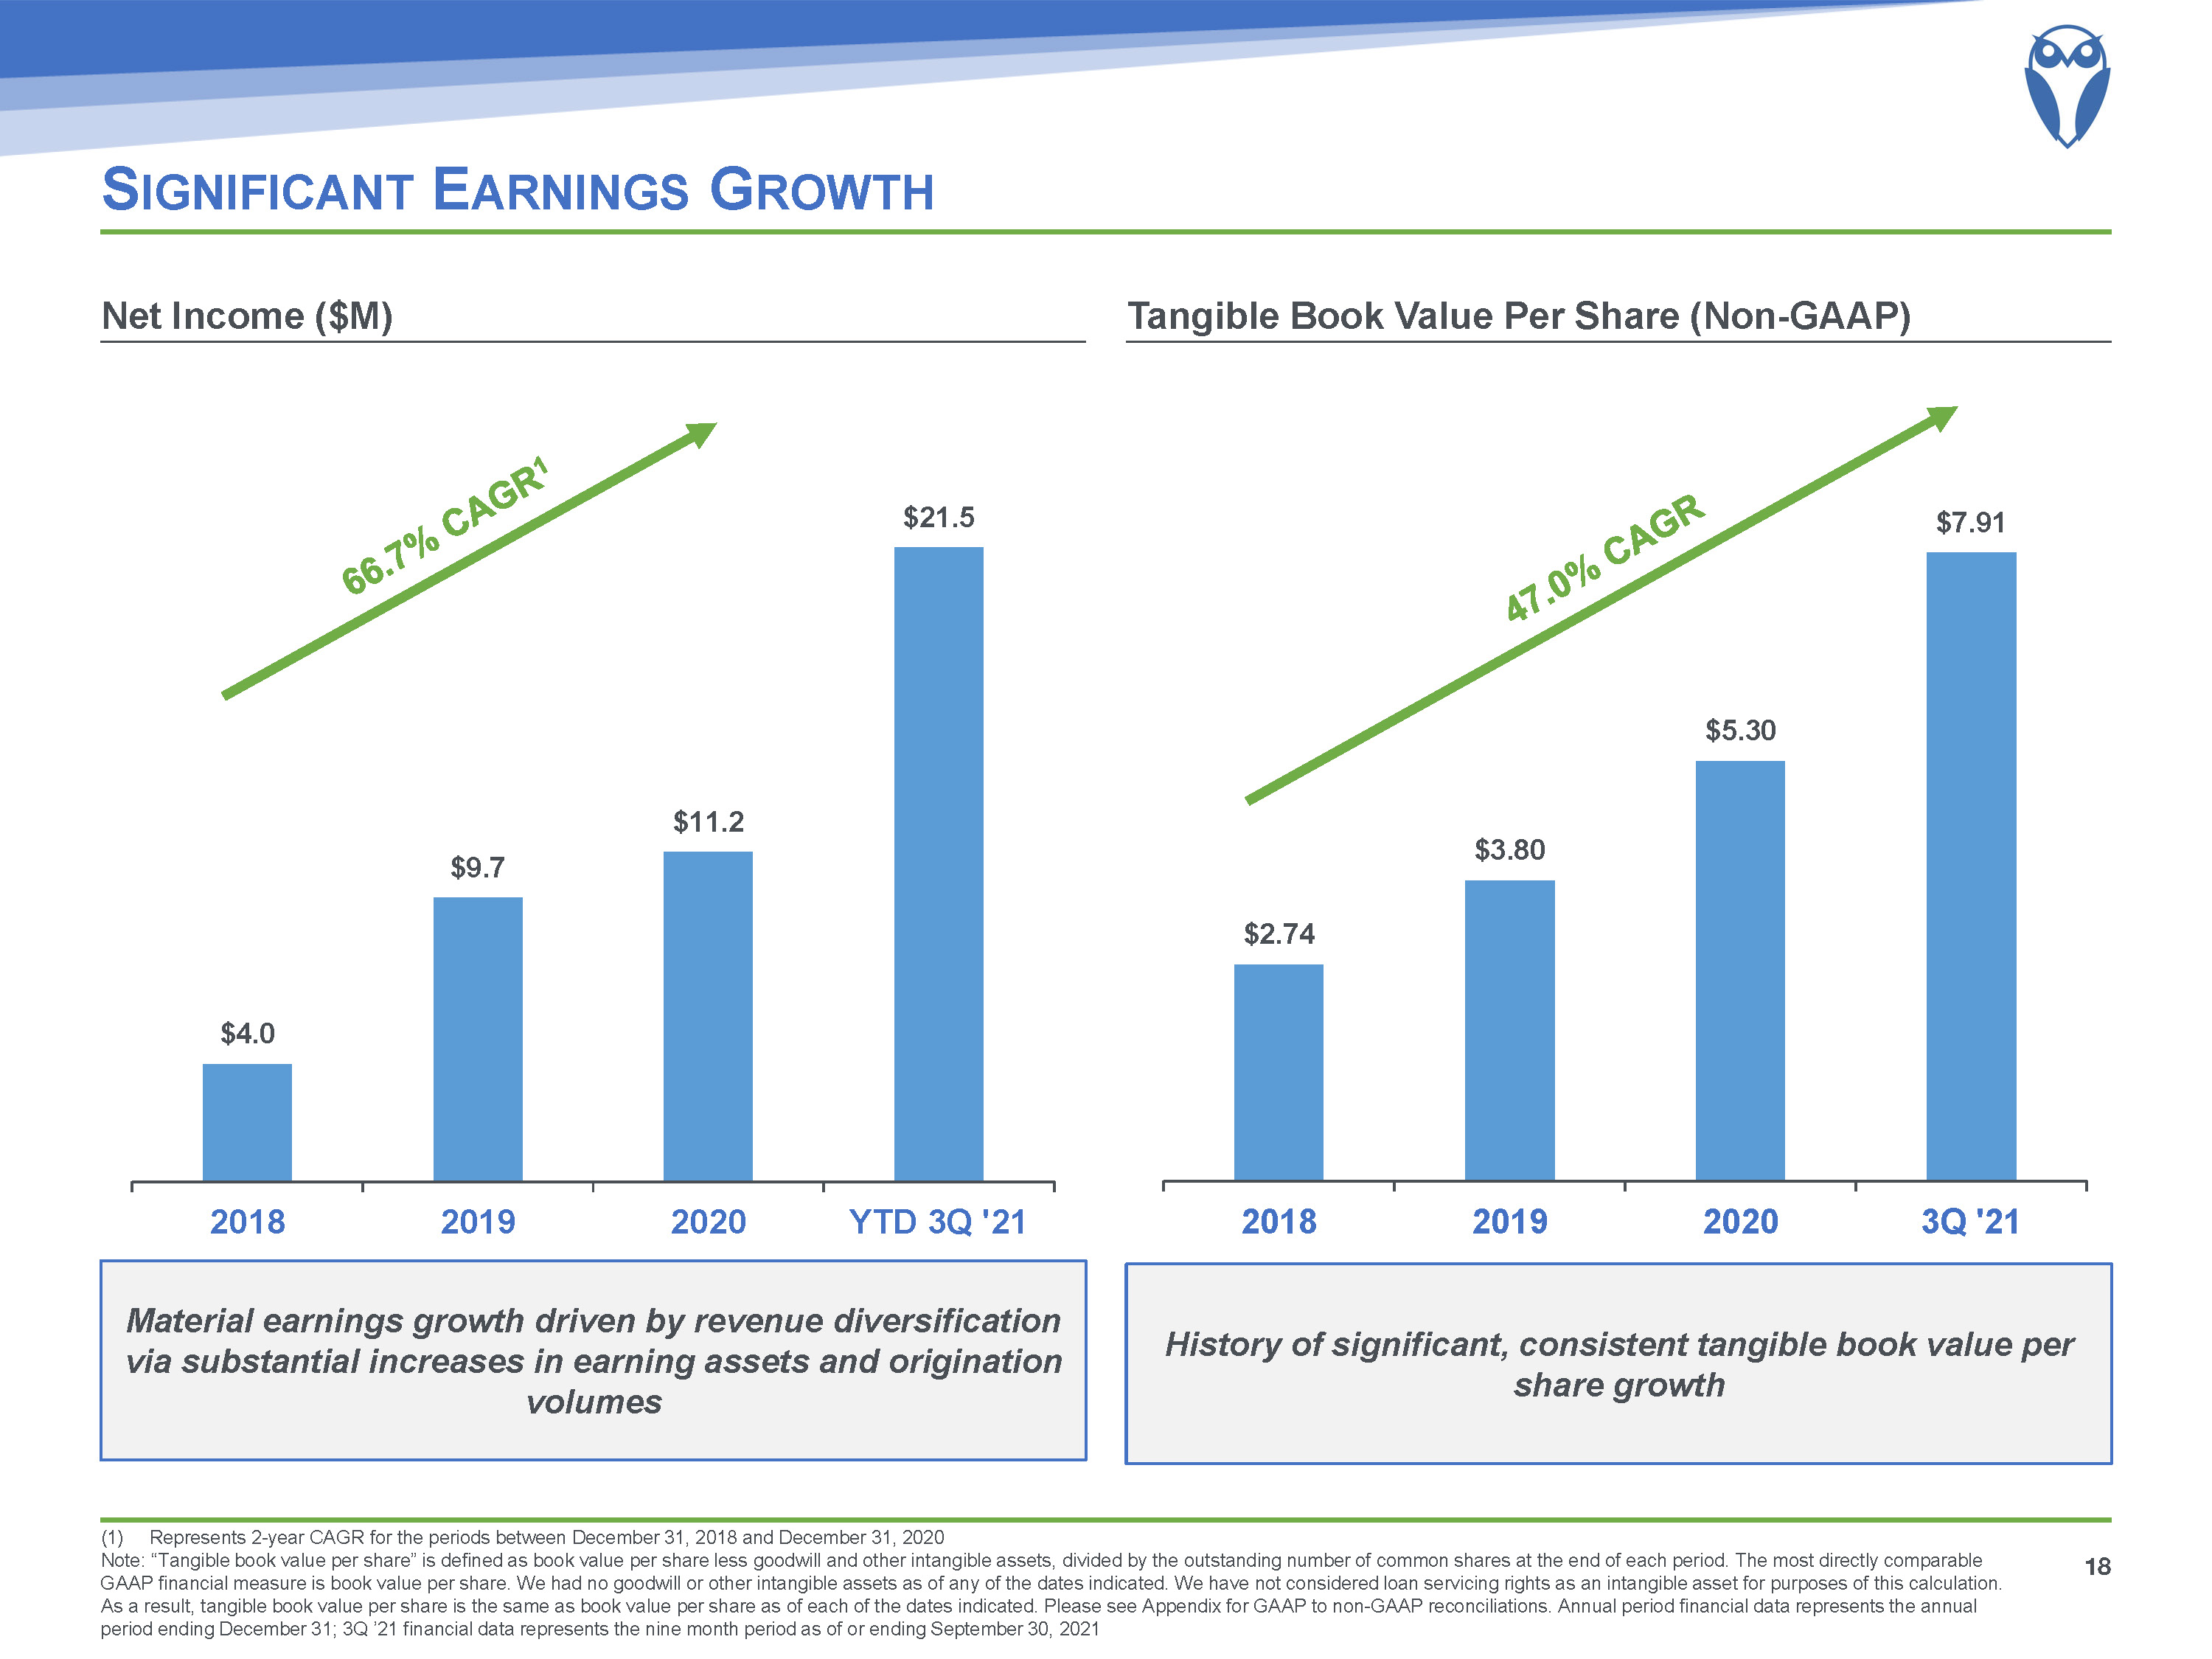
66.7% CAGR1 Significant Earnings Growth Represents 2-year CAGR for the periods between December 31, 2018 and December 31, 2020Note: “Tangible book value per share” is defined as book value per share less goodwill and other intangible assets, divided by the outstanding number of common shares at the end of each period. The most directly comparable GAAP financial measure is book value per share. We had no goodwill or other intangible assets as of any of the dates indicated. We have not considered loan servicing rights as an intangible asset for purposes of this calculation. As a result, tangible book value per share is the same as book value per share as of each of the dates indicated. Please see Appendix for GAAP to non-GAAP reconciliations. Annual period financial data represents the annual period ending December 31; 3Q ’21 financial data represents the nine month period as of or ending September 30, 2021 Tangible Book Value Per Share (Non-GAAP) Net Income ($M) 18 Material earnings growth driven by revenue diversification via substantial increases in earning assets and origination volumes History of significant, consistent tangible book value per share growth 47.0% CAGR
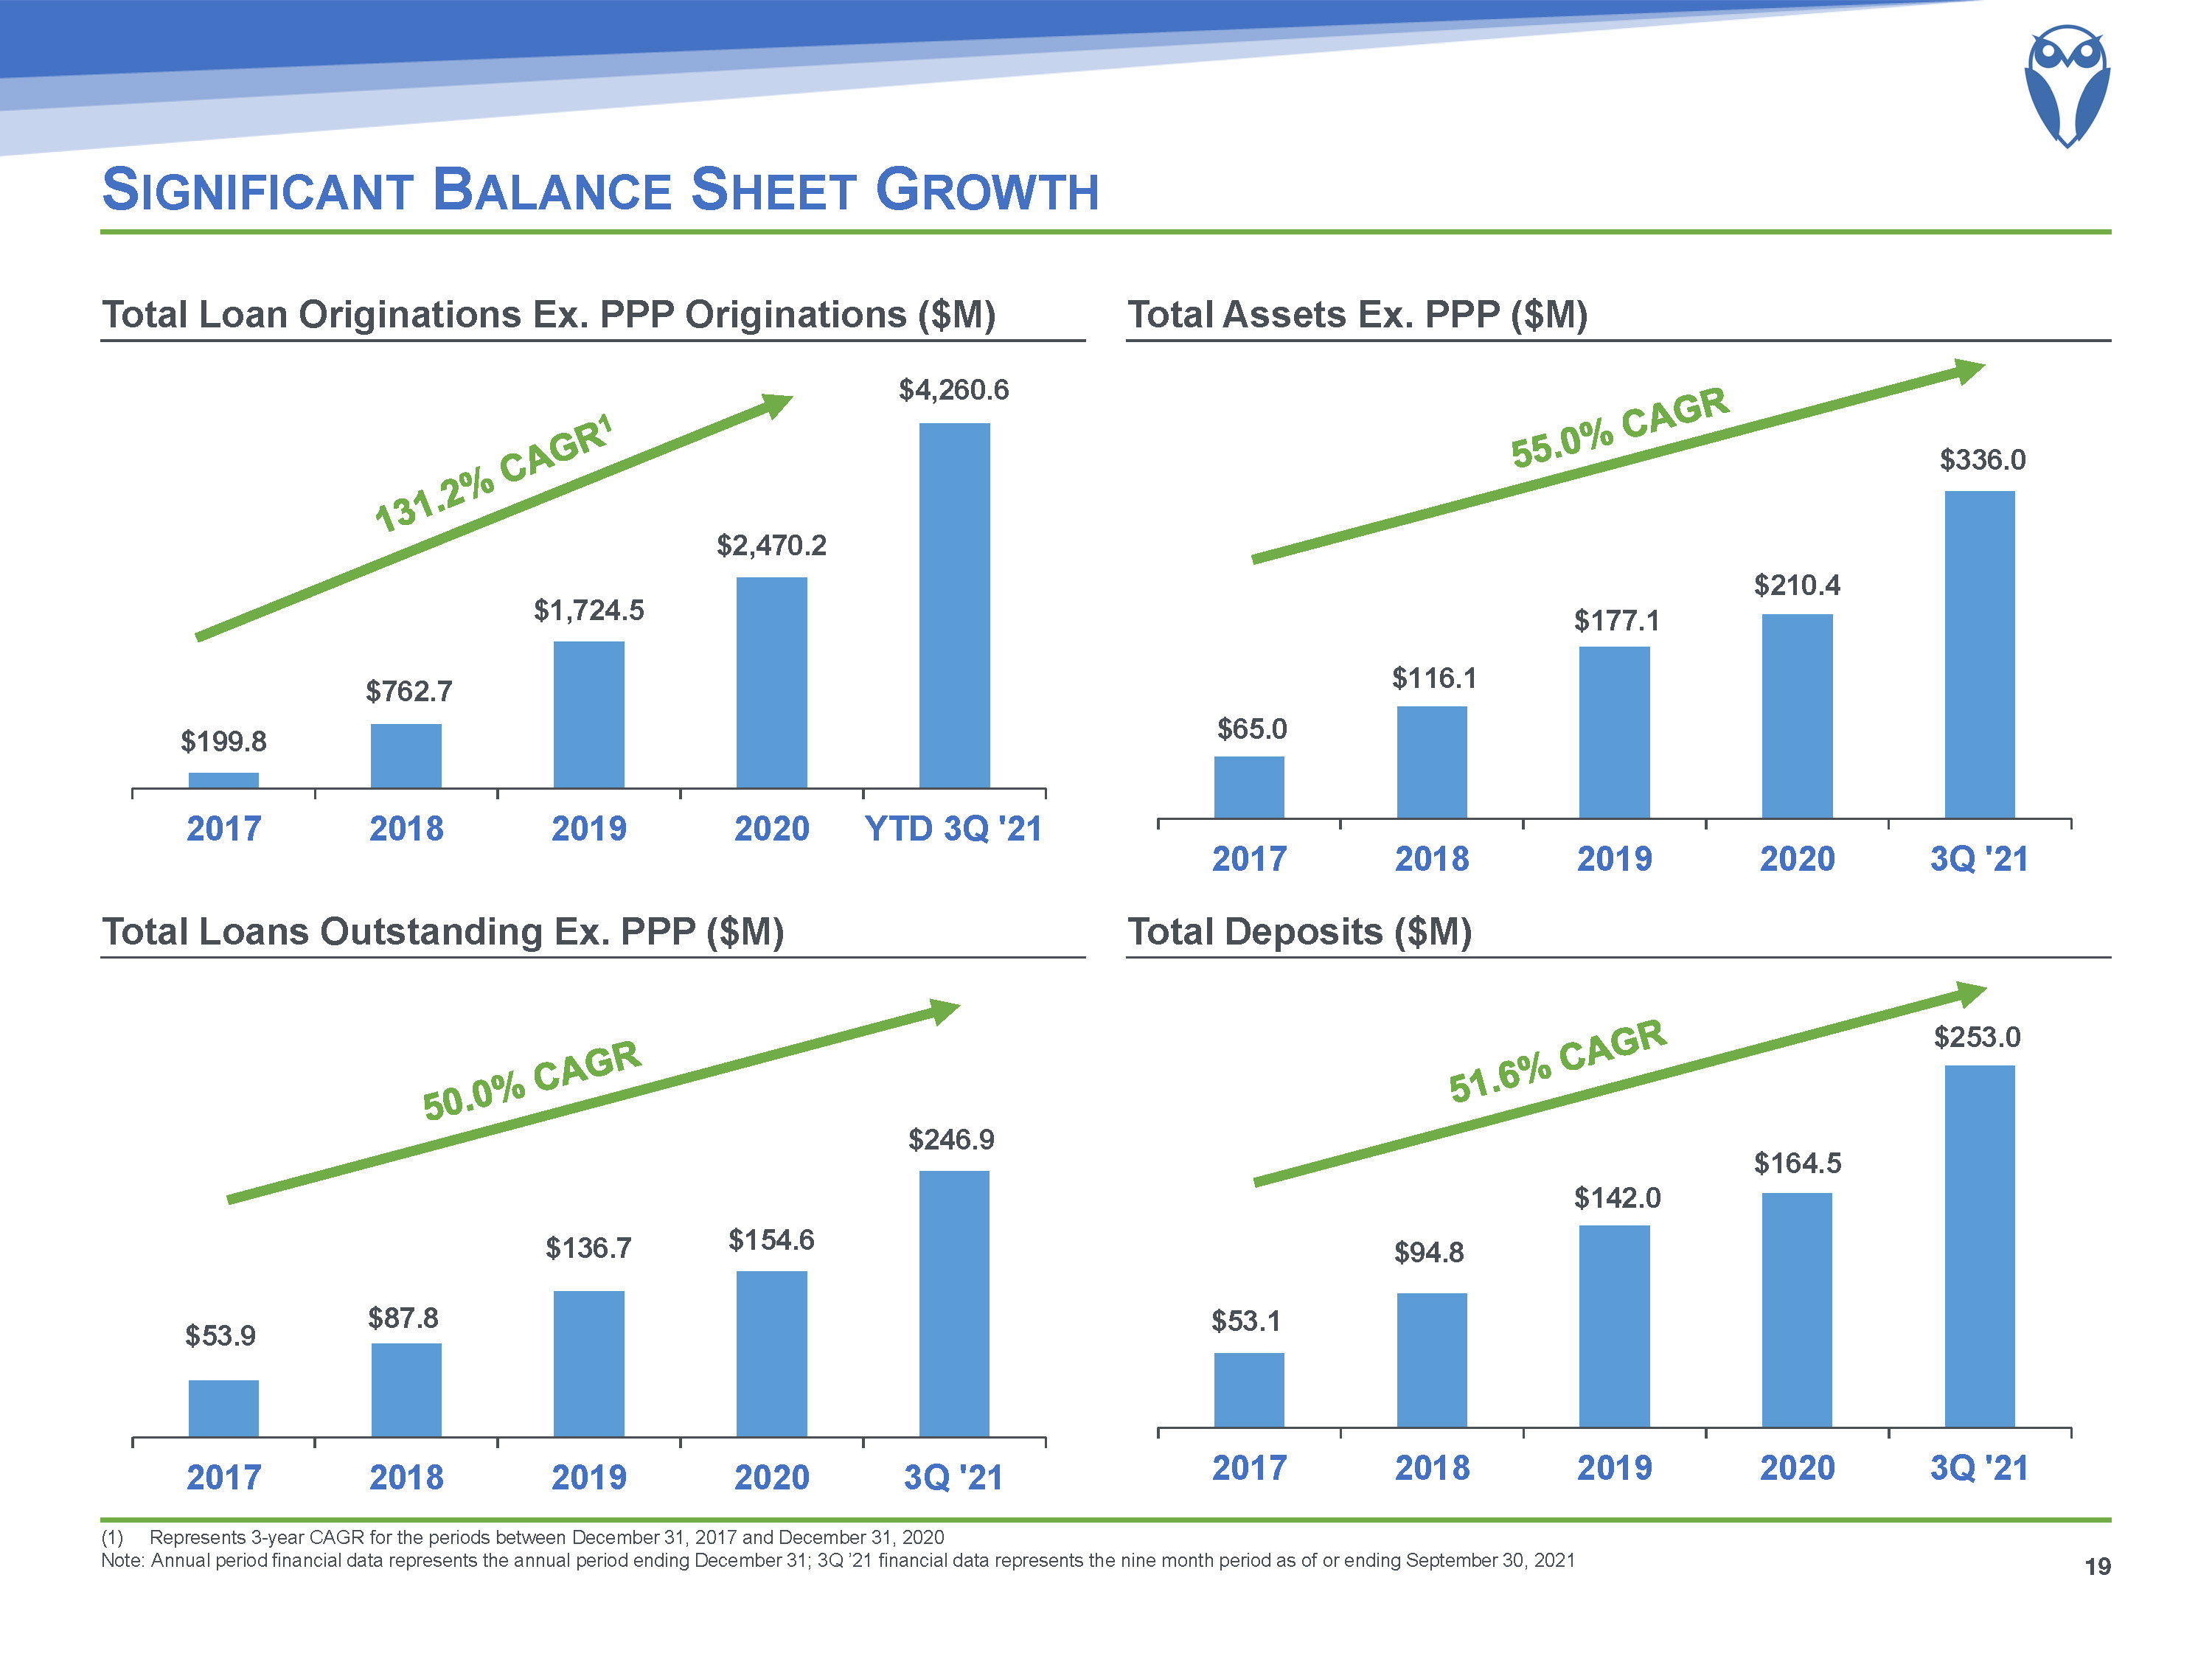
Significant Balance Sheet Growth Represents 3-year CAGR for the periods between December 31, 2017 and December 31, 2020Note: Annual period financial data represents the annual period ending December 31; 3Q ’21 financial data represents the nine month period as of or ending September 30, 2021 Total Deposits ($M) Total Loans Outstanding Ex. PPP ($M) Total Assets Ex. PPP ($M) Total Loan Originations Ex. PPP Originations ($M) 19 51.6% CAGR 50.0% CAGR 55.0% CAGR 131.2% CAGR1
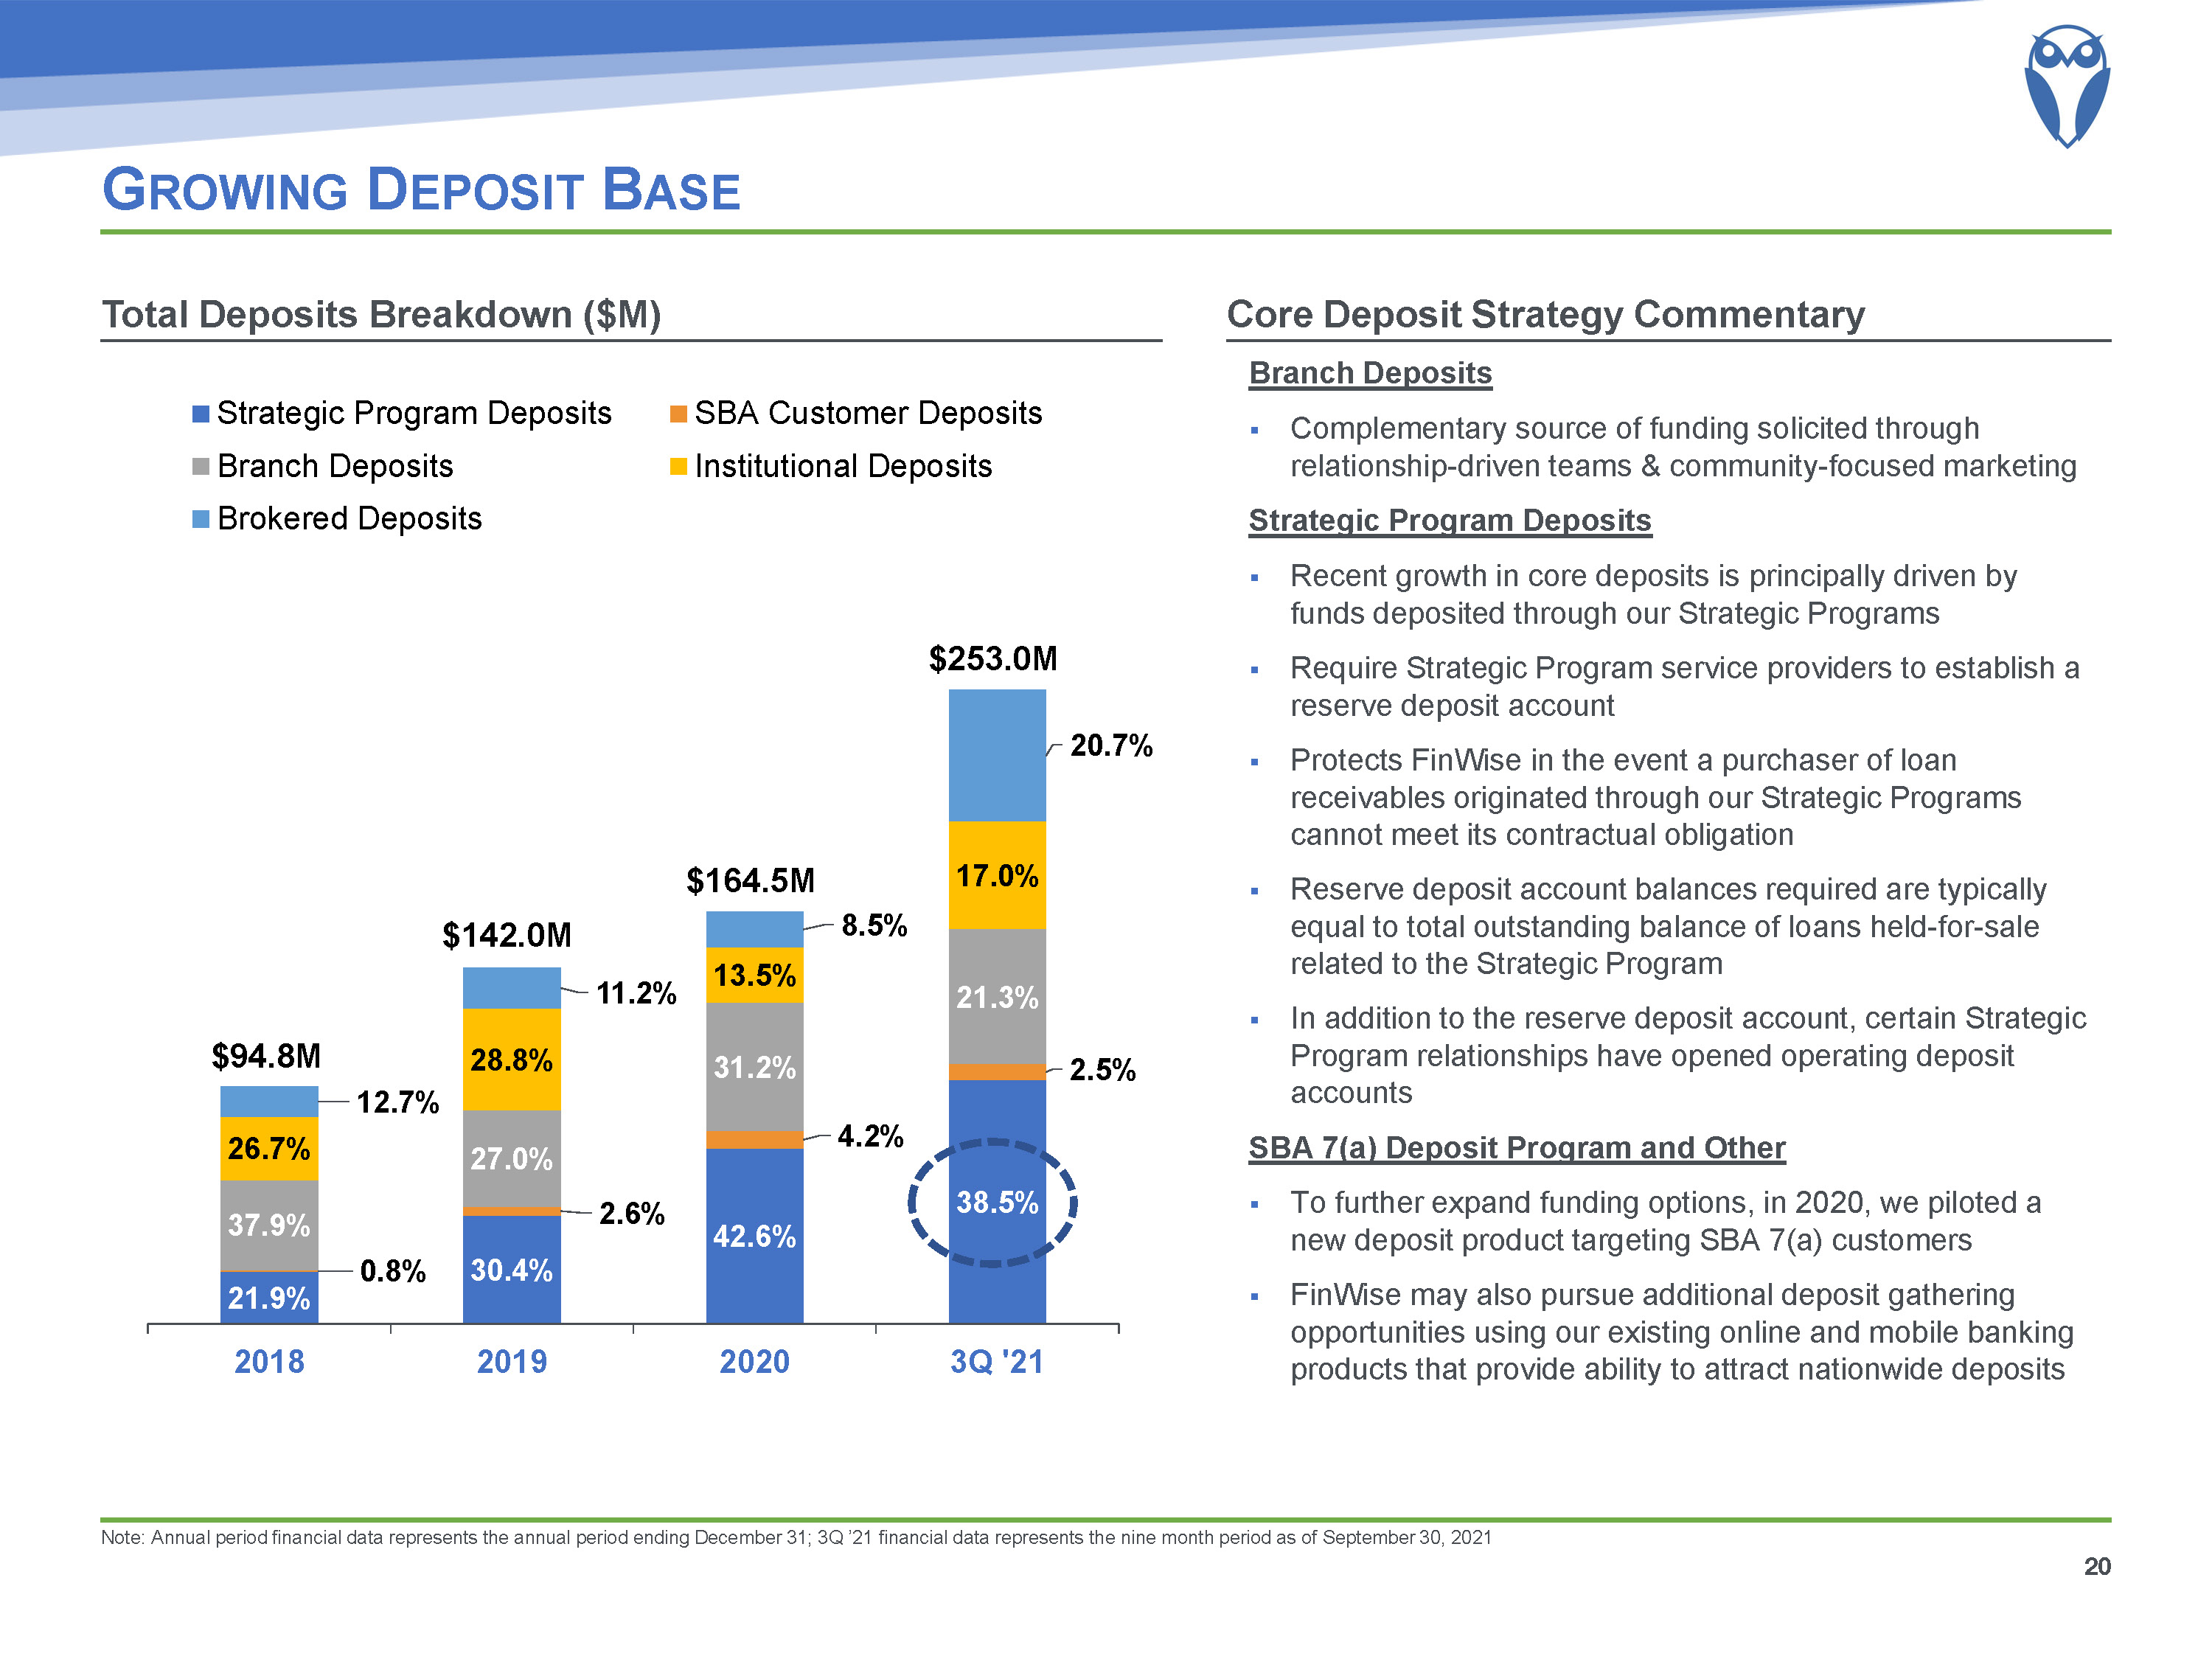
$164.5M Growing Deposit Base Note: Annual period financial data represents the annual period ending December 31; 3Q ’21 financial data represents the nine month period as of September 30, 2021 20 Core Deposit Strategy Commentary Total Deposits Breakdown ($M) Branch DepositsComplementary source of funding solicited through relationship-driven teams & community-focused marketingStrategic Program DepositsRecent growth in core deposits is principally driven by funds deposited through our Strategic ProgramsRequire Strategic Program service providers to establish a reserve deposit accountProtects FinWise in the event a purchaser of loan receivables originated through our Strategic Programs cannot meet its contractual obligationReserve deposit account balances required are typically equal to total outstanding balance of loans held-for-sale related to the Strategic ProgramIn addition to the reserve deposit account, certain Strategic Program relationships have opened operating deposit accountsSBA 7(a) Deposit Program and OtherTo further expand funding options, in 2020, we piloted a new deposit product targeting SBA 7(a) customersFinWise may also pursue additional deposit gathering opportunities using our existing online and mobile banking products that provide ability to attract nationwide deposits $94.8M $142.0M $253.0M

Top-Tier Profitability Performance Note: “Efficiency ratio” is defined as total noninterest expense divided by the sum of net interest income and noninterest income. We believe this measure is important as an indicator of productivity because it shows the amount of revenue generated for each dollar spent. Please see Appendix for GAAP to non-GAAP reconciliations. According to the FDIC website, the data for all US Banks represents 5,406, 5,177 and 5,001 banks for 2018, 2019 and 2020 respectively. Annual period financial data represents the annual period ending December 31; 3Q ’21 financial data represents the nine month period as of or ending September 30, 2021. For ROAE and ROAA, we calculate our average assets and average equity for a given period by dividing the sum of our total asset balance or total shareholder’s equity balance, as the case may be, as of the beginning of the relevant period and at the end of the relevant period, and dividing by two Efficiency Ratio (Non-GAAP) Net Interest Margin Return on Average Equity Return on Average Assets 21
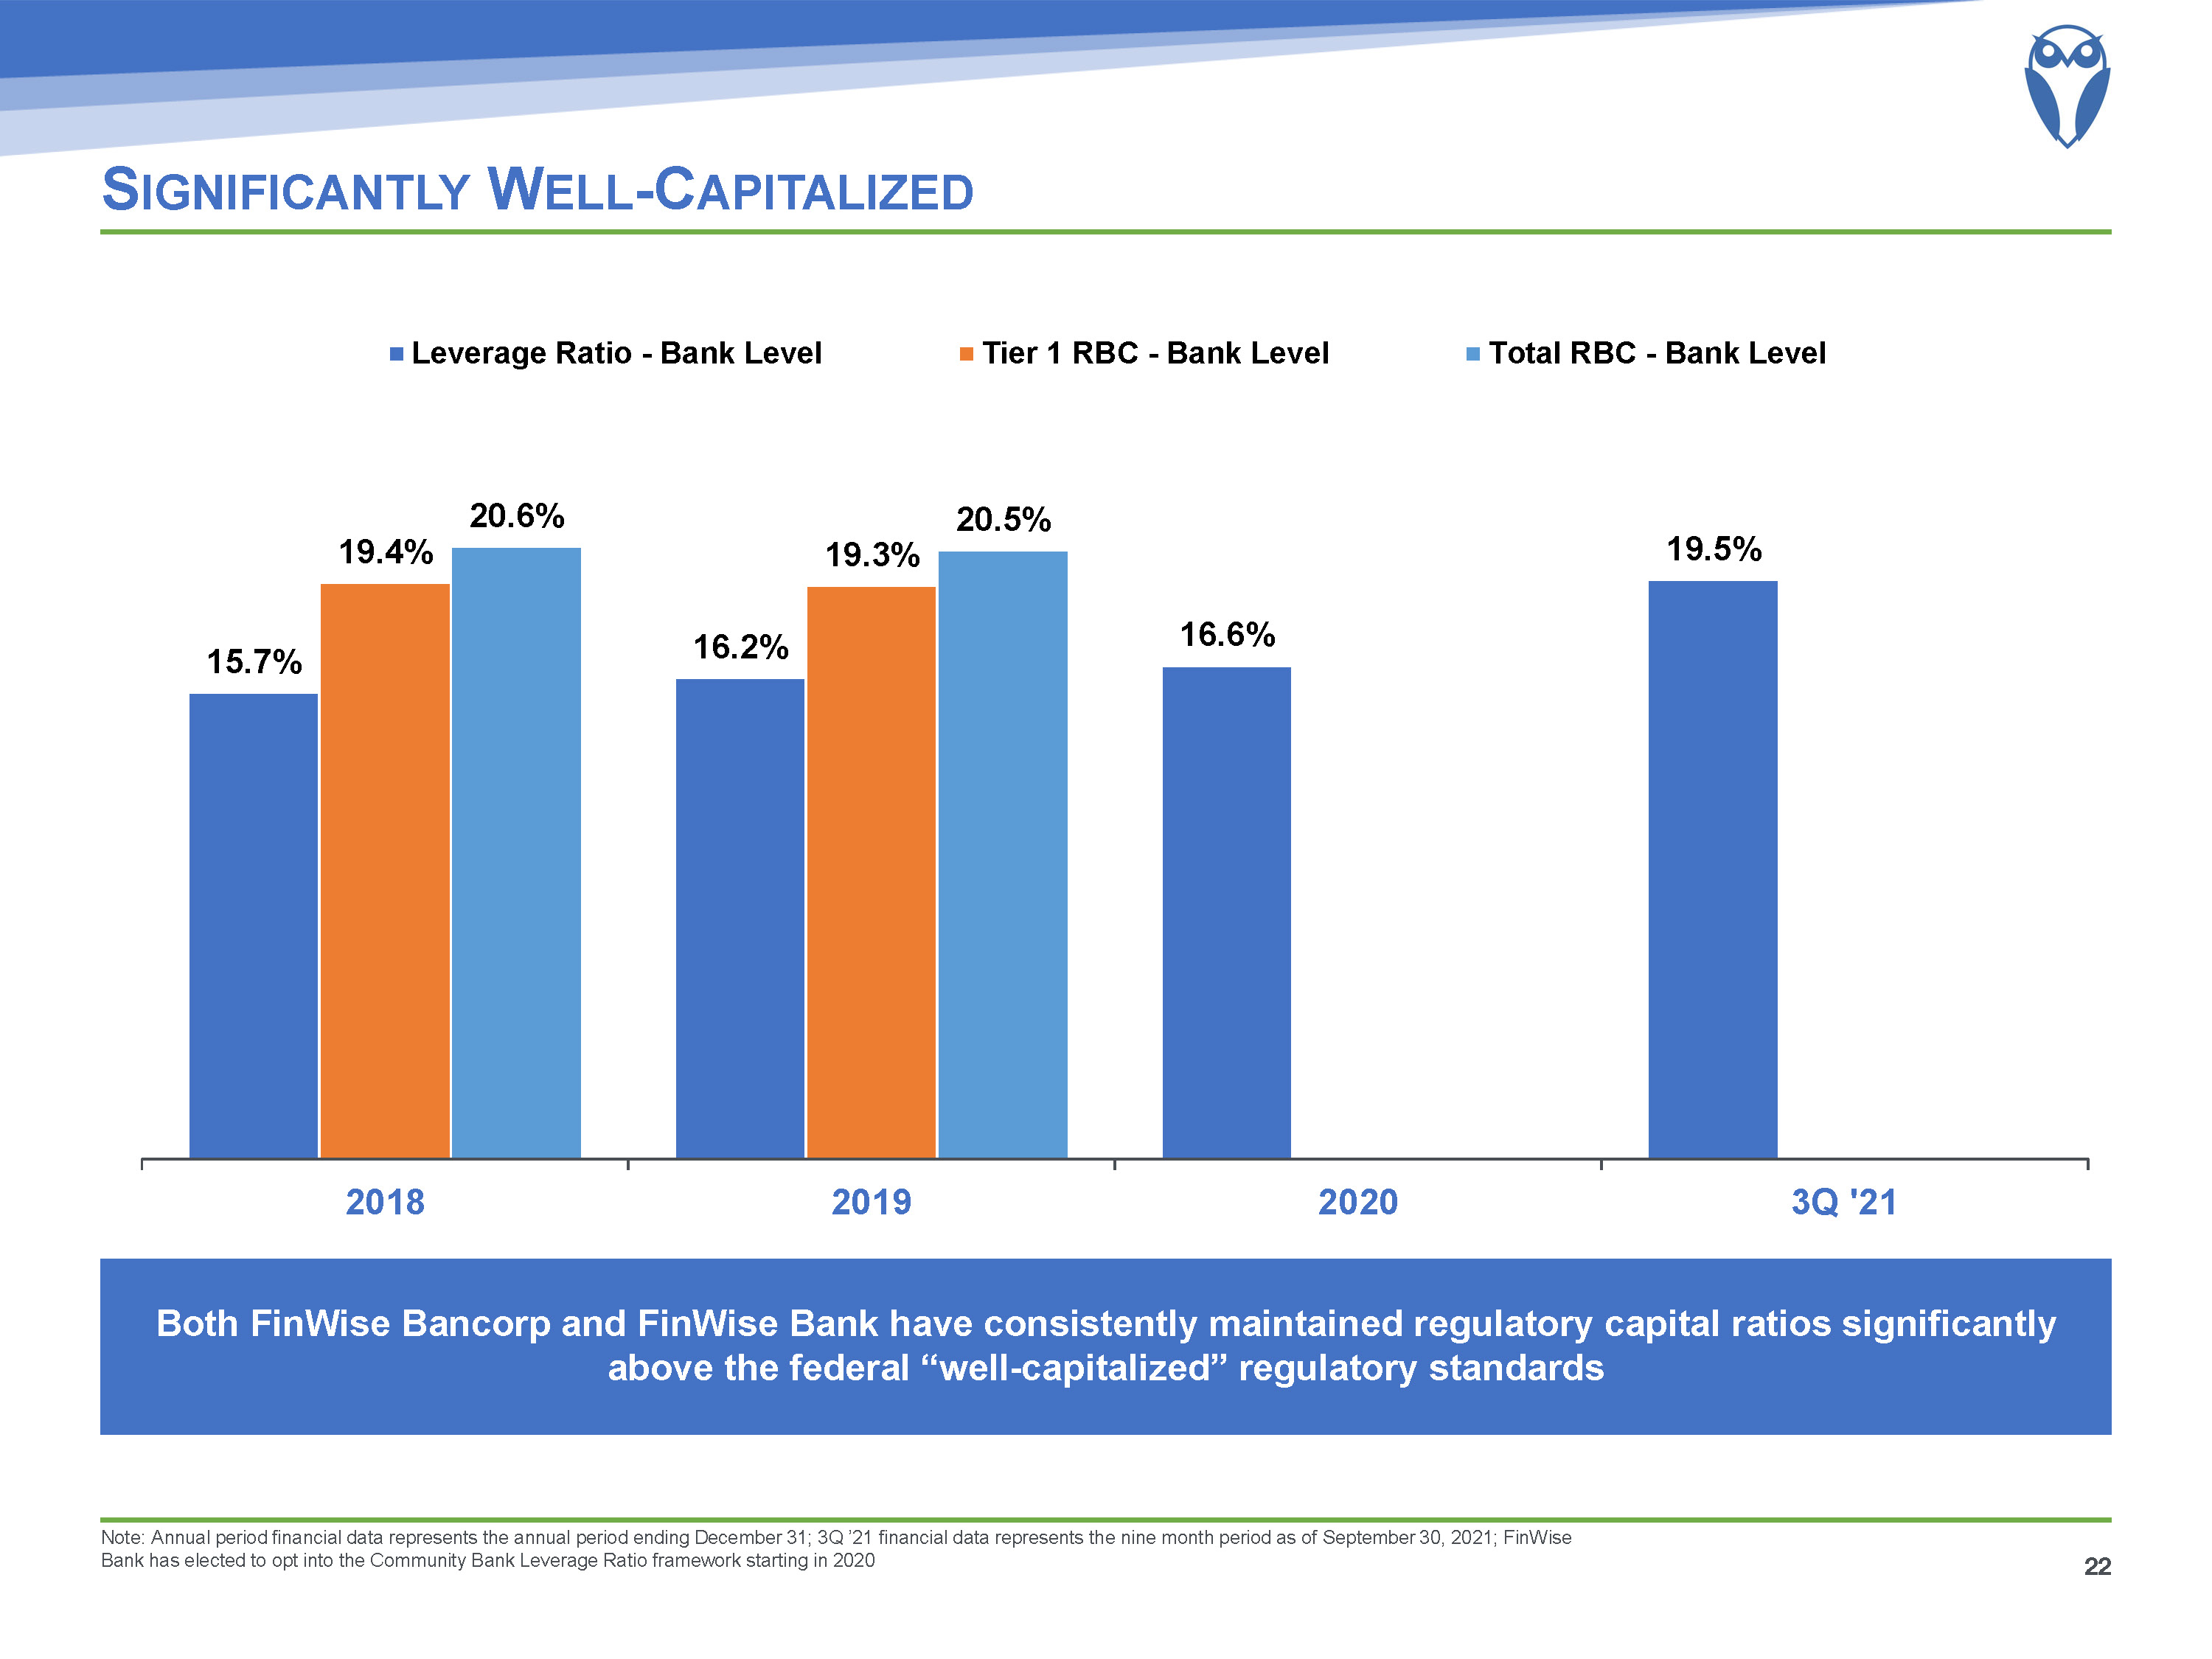
Significantly Well-Capitalized Note: Annual period financial data represents the annual period ending December 31; 3Q ’21 financial data represents the nine month period as of September 30, 2021; FinWise Bank has elected to opt into the Community Bank Leverage Ratio framework starting in 2020 22 Both FinWise Bancorp and FinWise Bank have consistently maintained regulatory capital ratios significantly above the federal “well-capitalized” regulatory standards

Capital Growth Strategy 23 Funding Would Enable Regulatory Capital and Competitive Strength to Fuel Strategic Growth Primary Objectives Business Strategy Examples Growth Capital Supports continued growth and potential acquisitions Competitive StrengthEnables larger balance sheet to attract new partnerships, develop products, and support growth Strategic ProgramsRetain paper on balance sheet for further risk mitigation and future cross-sell opportunities SBA 7(a) LendingGrow organizational resources to increase originations Continued Infrastructure EnhancementEnables scalability, enhanced analytics and reporting FinView™Continue building technology and analytics engine to drive long-term business strategies POS Lending ProgramExplore new verticals

Key Investment Highlights As of November 12, 2021 24 Disciplined underwriting and compliance infrastructure designed to prudently facilitate a robust loan origination platform Highly-profitable fintech lending model with compelling growth rates Seasoned management team with considerable banking experience and a proven track record Historically stable, relatively low-cost core deposits positioned to fund future growth Diverse, scalable revenue stream achieved in business lines with attractive market opportunities Proprietary FinView™ Analytics Platform, which includes an enterprise data warehouse, developed to enhance the gathering and interpretation of customer performance data Strong inside ownership with approximately 34%¹ of common stock currently held by directors and executive officers

Appendix
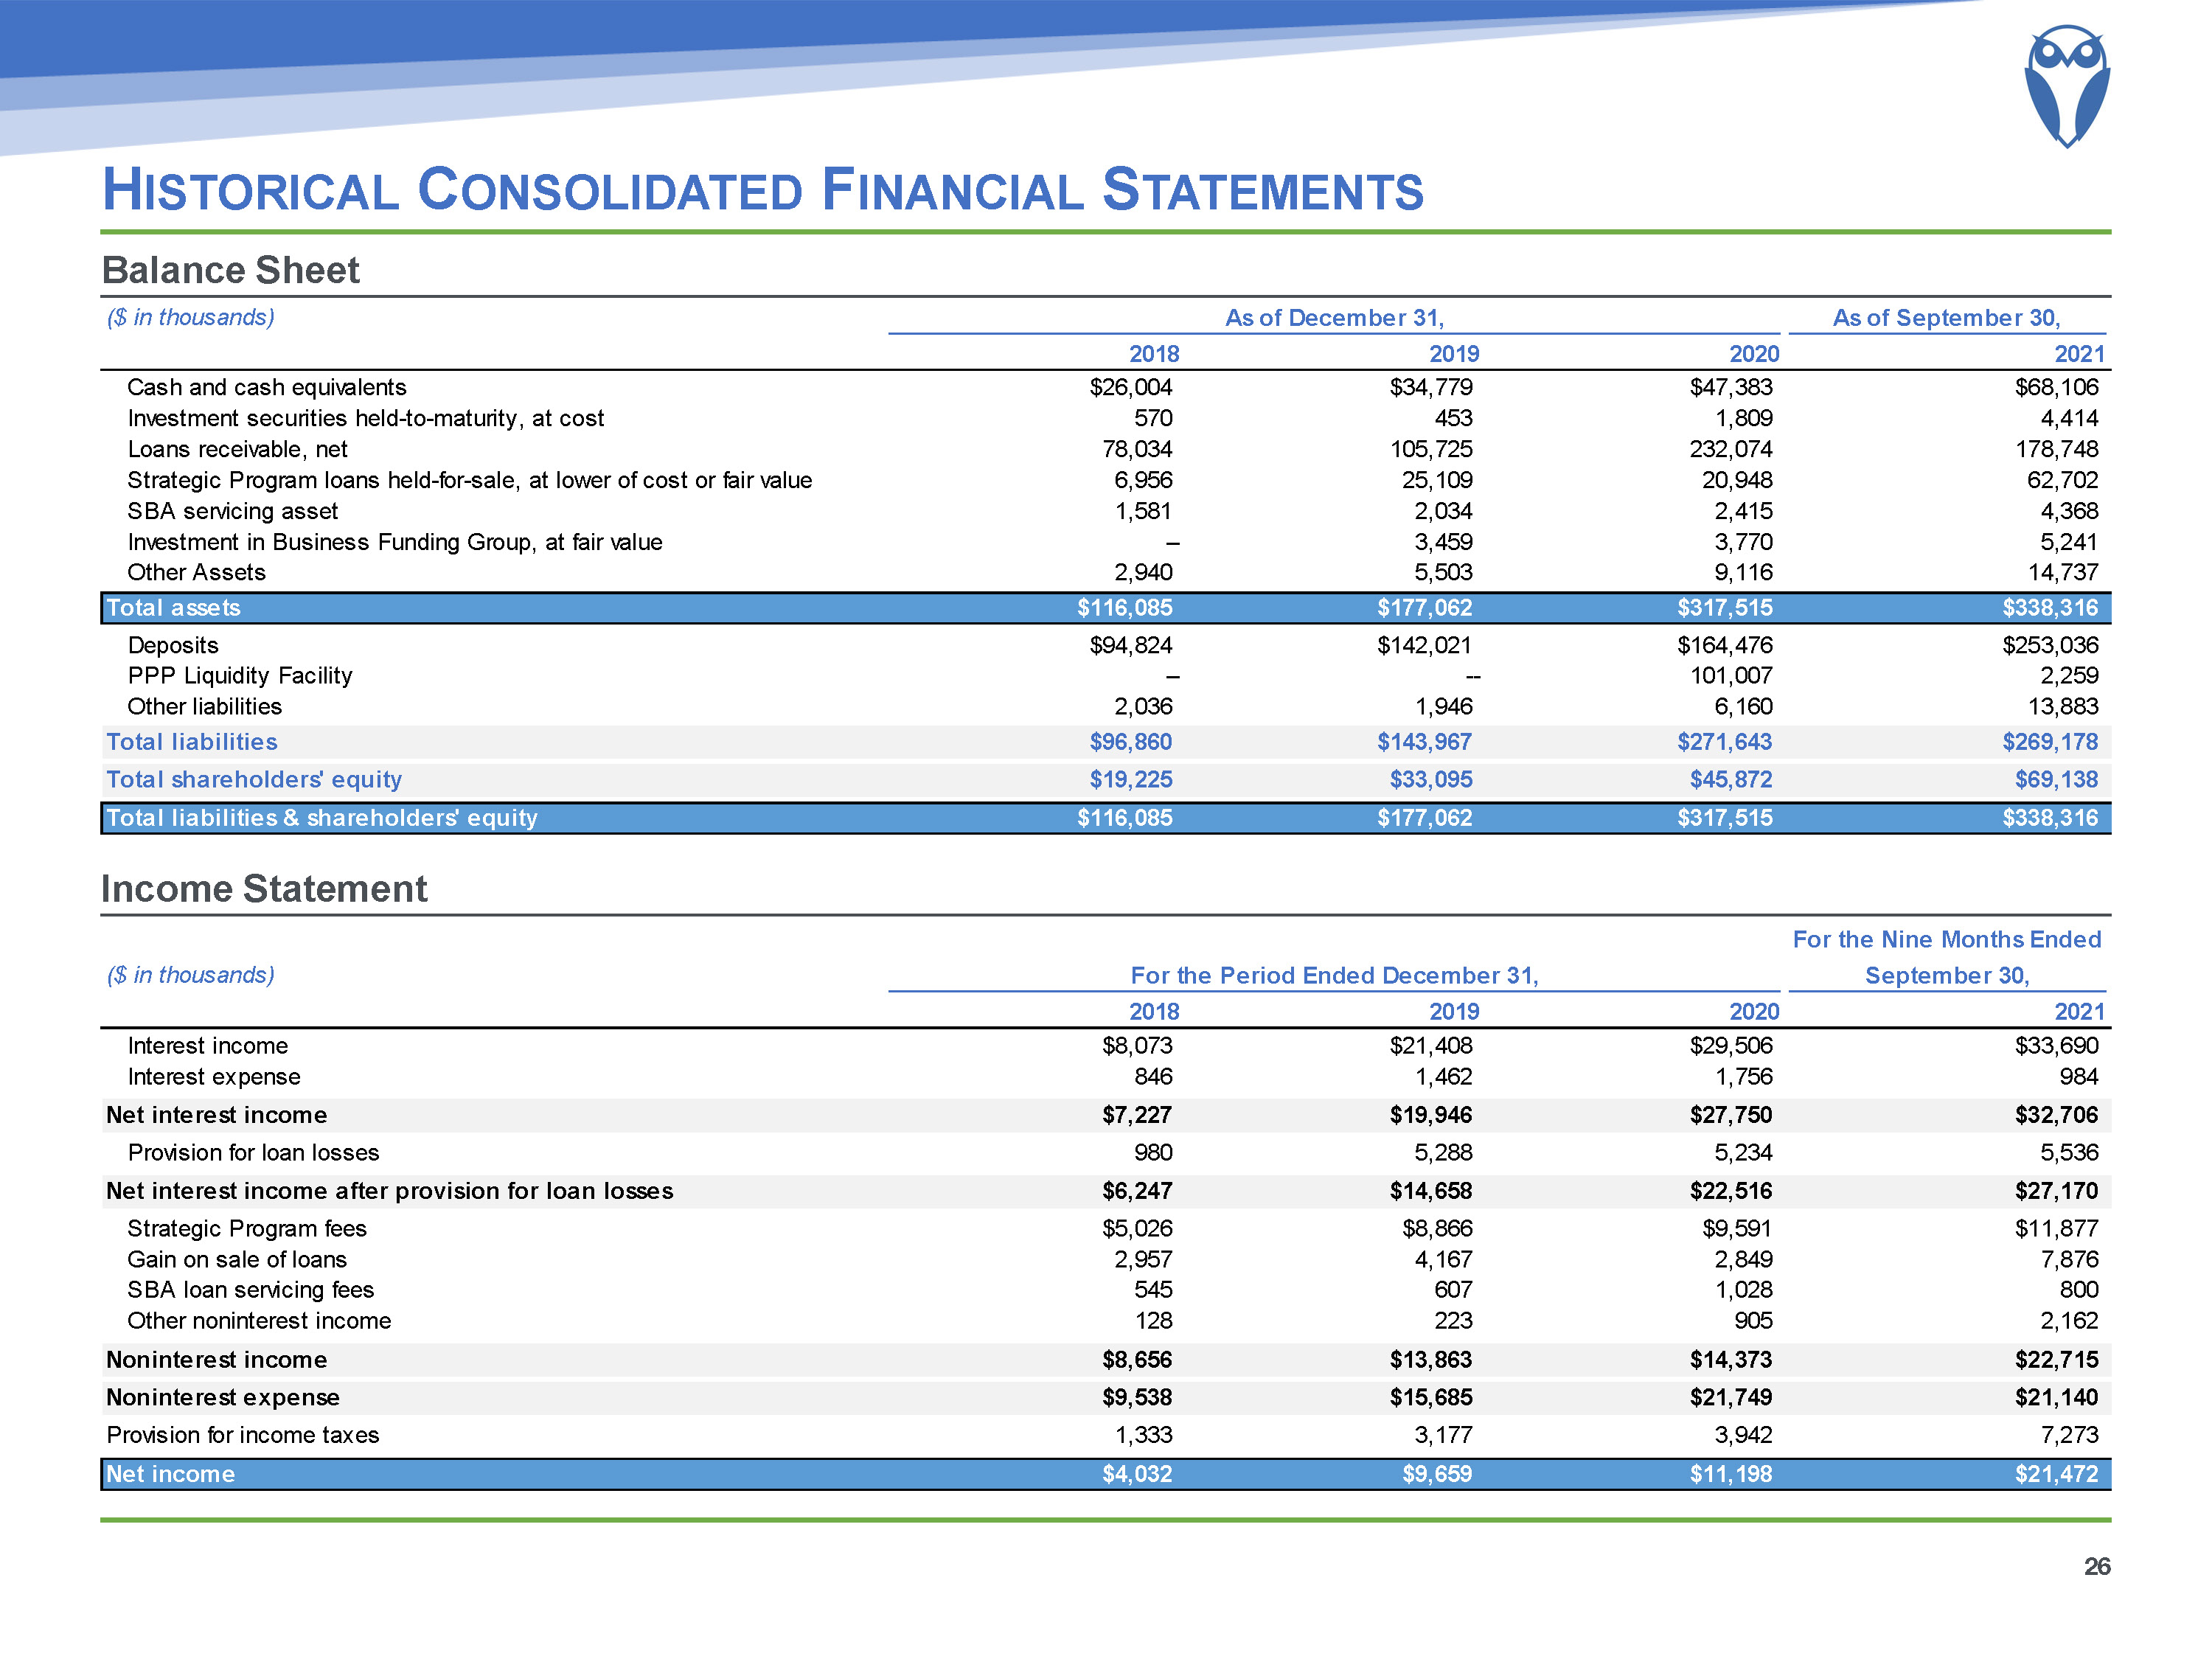
Historical Consolidated Financial Statements 26 Balance Sheet Income Statement
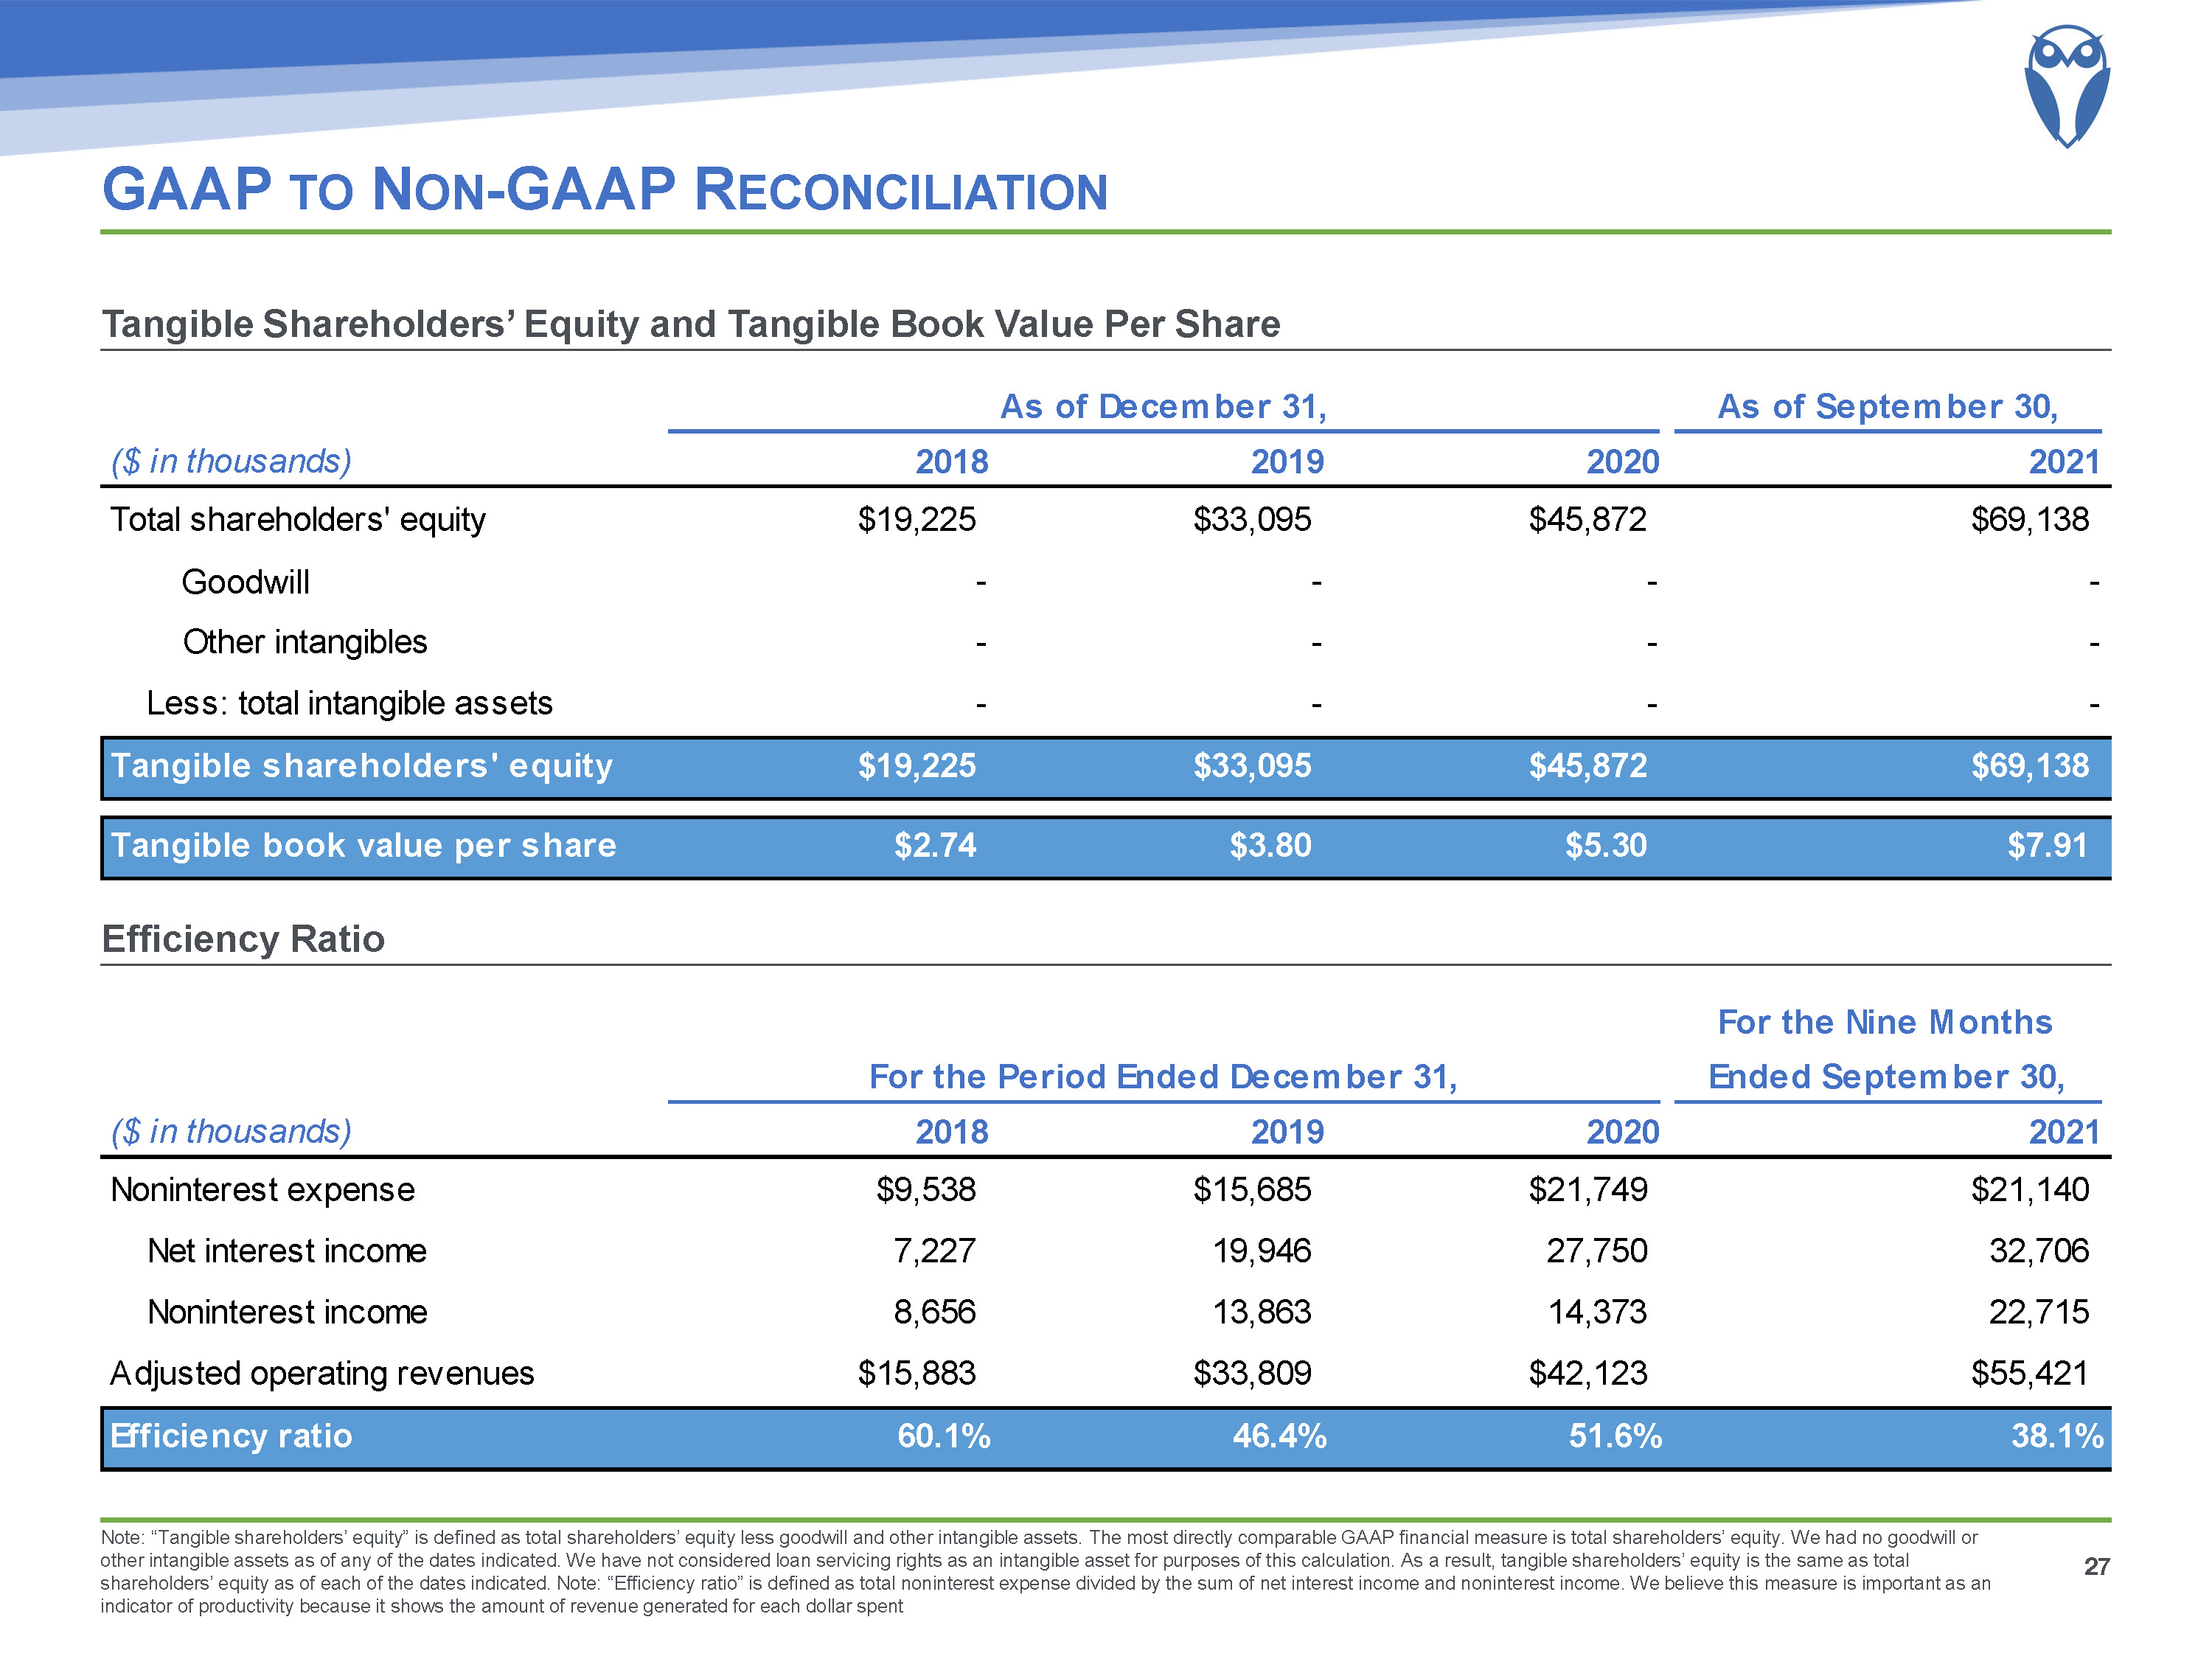
GAAP to Non-GAAP Reconciliation 27 Tangible Shareholders’ Equity and Tangible Book Value Per Share Efficiency Ratio Note: “Tangible shareholders’ equity” is defined as total shareholders’ equity less goodwill and other intangible assets. The most directly comparable GAAP financial measure is total shareholders’ equity. We had no goodwill or other intangible assets as of any of the dates indicated. We have not considered loan servicing rights as an intangible asset for purposes of this calculation. As a result, tangible shareholders’ equity is the same as total shareholders’ equity as of each of the dates indicated. Note: “Efficiency ratio” is defined as total noninterest expense divided by the sum of net interest income and noninterest income. We believe this measure is important as an indicator of productivity because it shows the amount of revenue generated for each dollar spent Goodwill
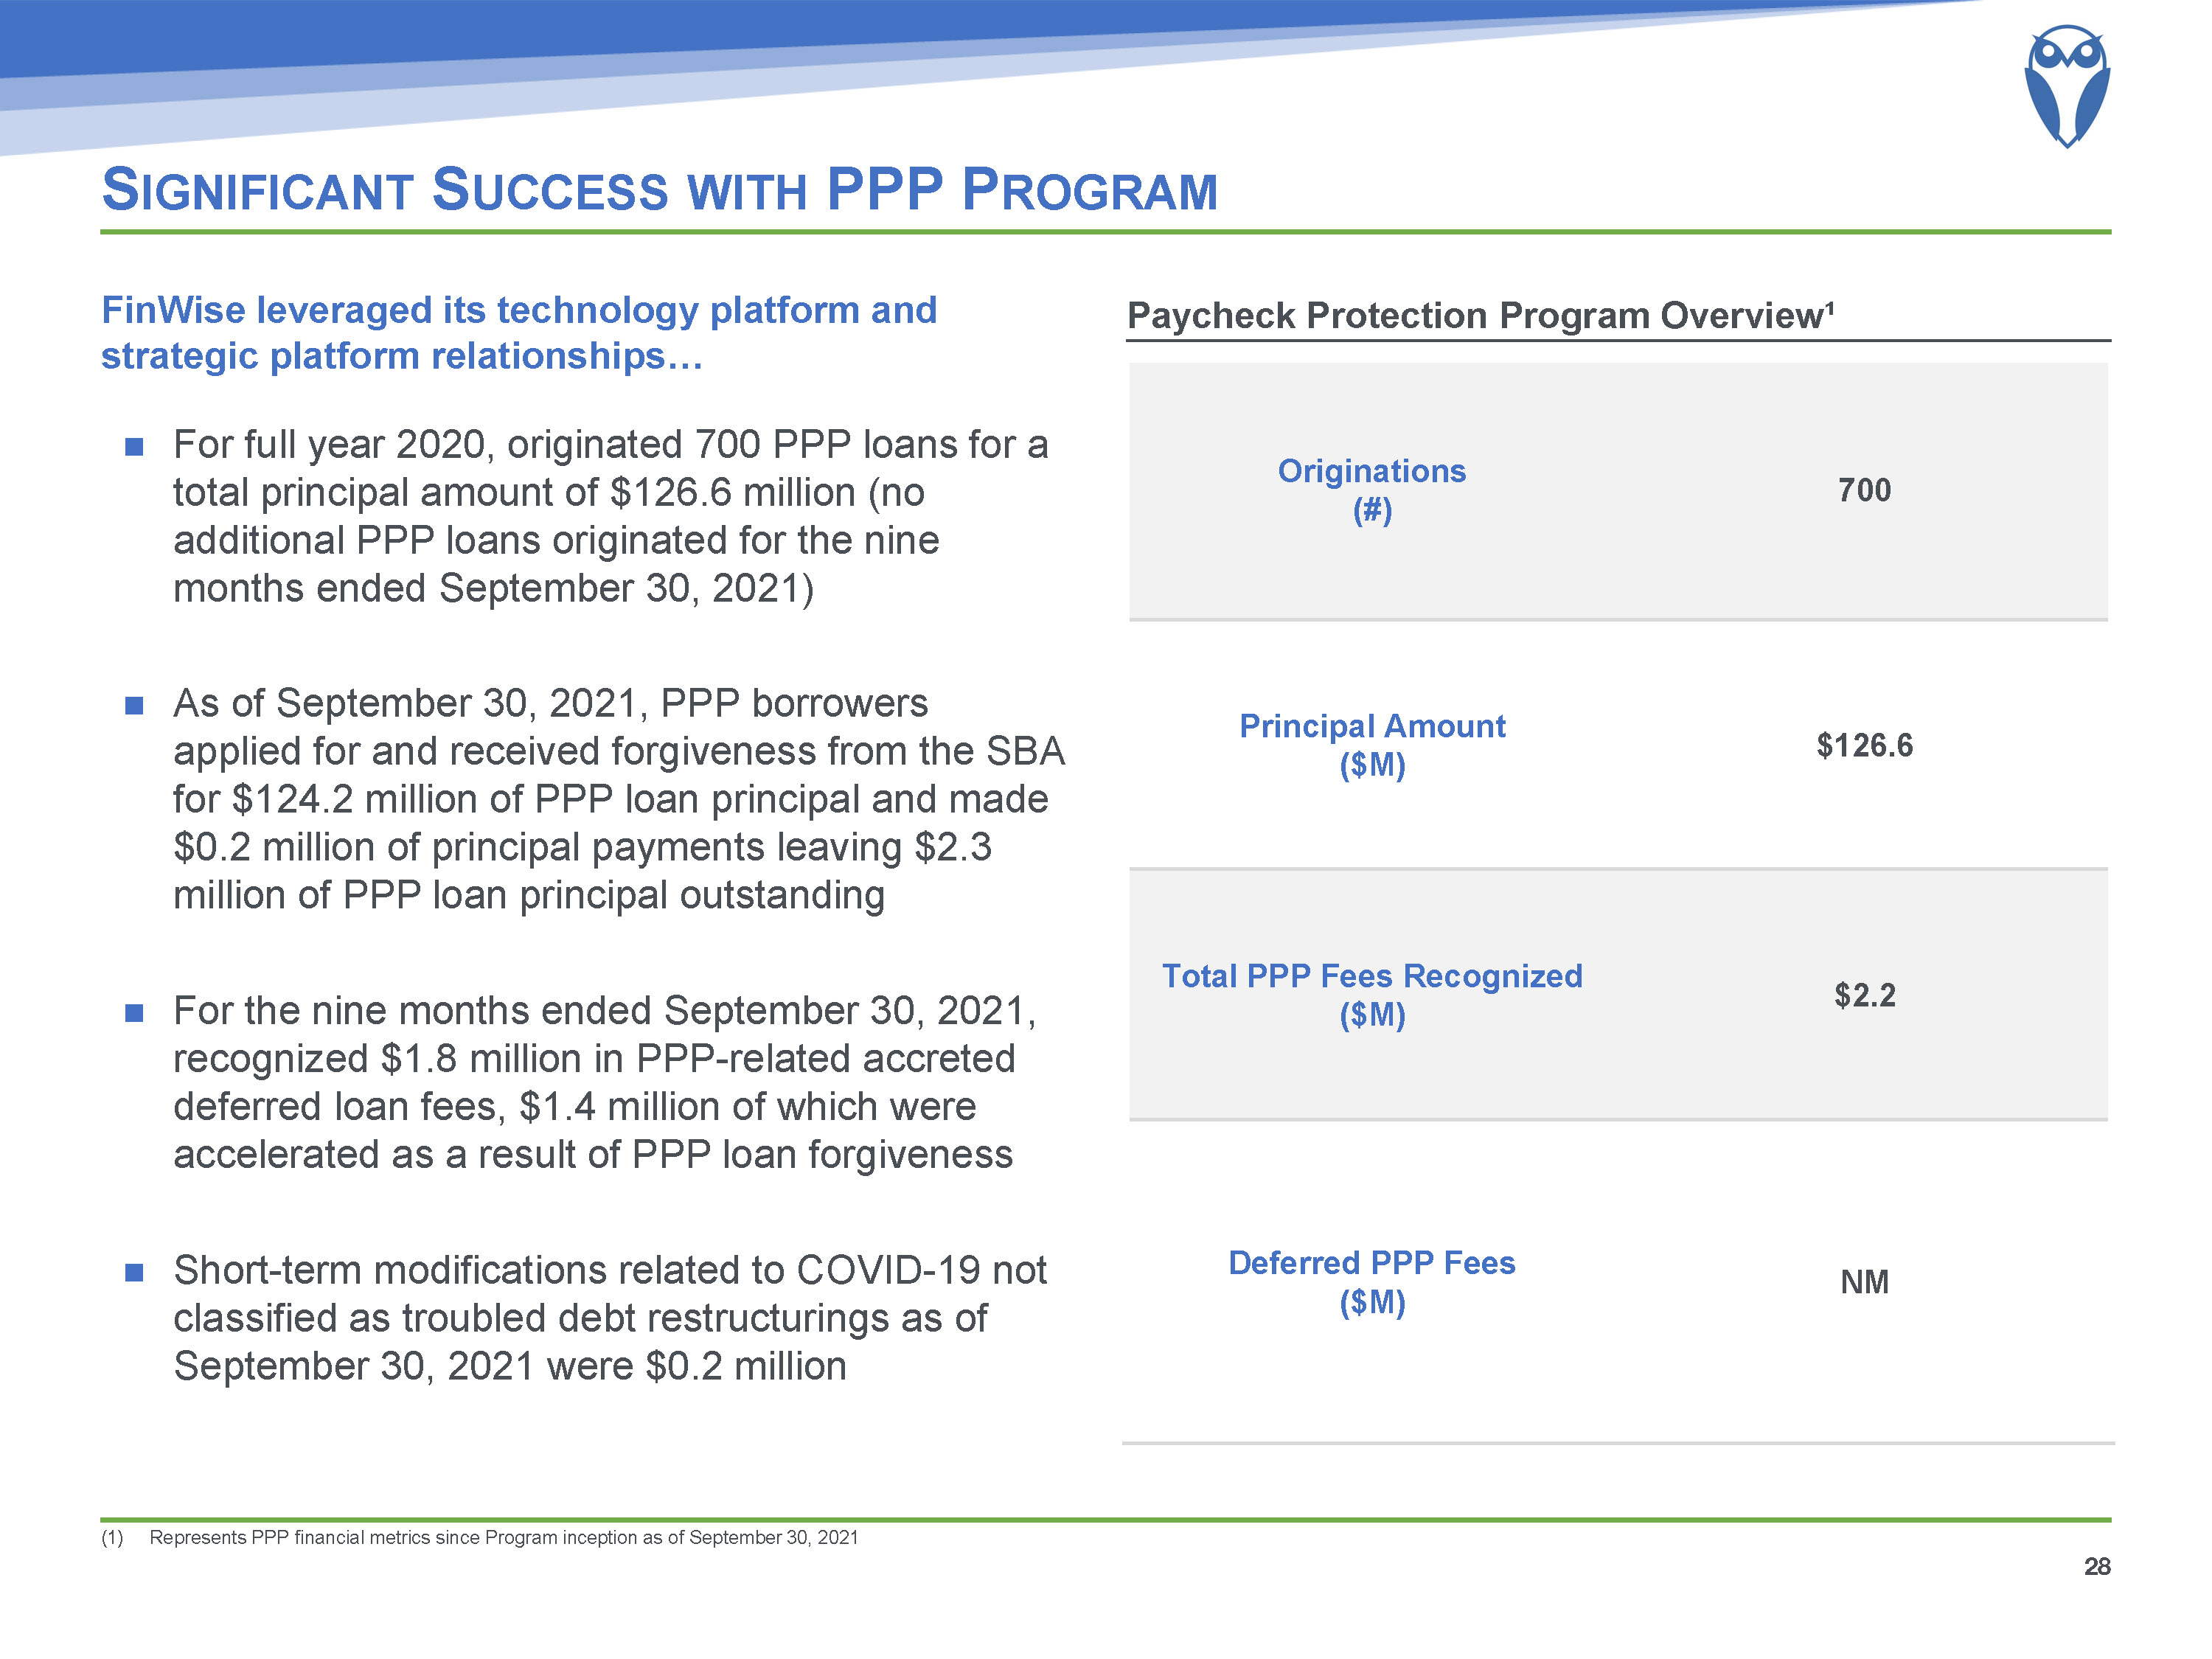
Significant Success with PPP Program Represents PPP financial metrics since Program inception as of September 30, 2021 Paycheck Protection Program Overview¹ For full year 2020, originated 700 PPP loans for a total principal amount of $126.6 million (no additional PPP loans originated for the nine months ended September 30, 2021)As of September 30, 2021, PPP borrowers applied for and received forgiveness from the SBA for $124.2 million of PPP loan principal and made $0.2 million of principal payments leaving $2.3 million of PPP loan principal outstandingFor the nine months ended September 30, 2021, recognized $1.8 million in PPP-related accreted deferred loan fees, $1.4 million of which were accelerated as a result of PPP loan forgivenessShort-term modifications related to COVID-19 not classified as troubled debt restructurings as of September 30, 2021 were $0.2 million FinWise leveraged its technology platform and strategic platform relationships… 28 Originations (#) 700 Principal Amount ($M) $126.6 Total PPP Fees Recognized ($M) $2.2 Deferred PPP Fees($M) NM
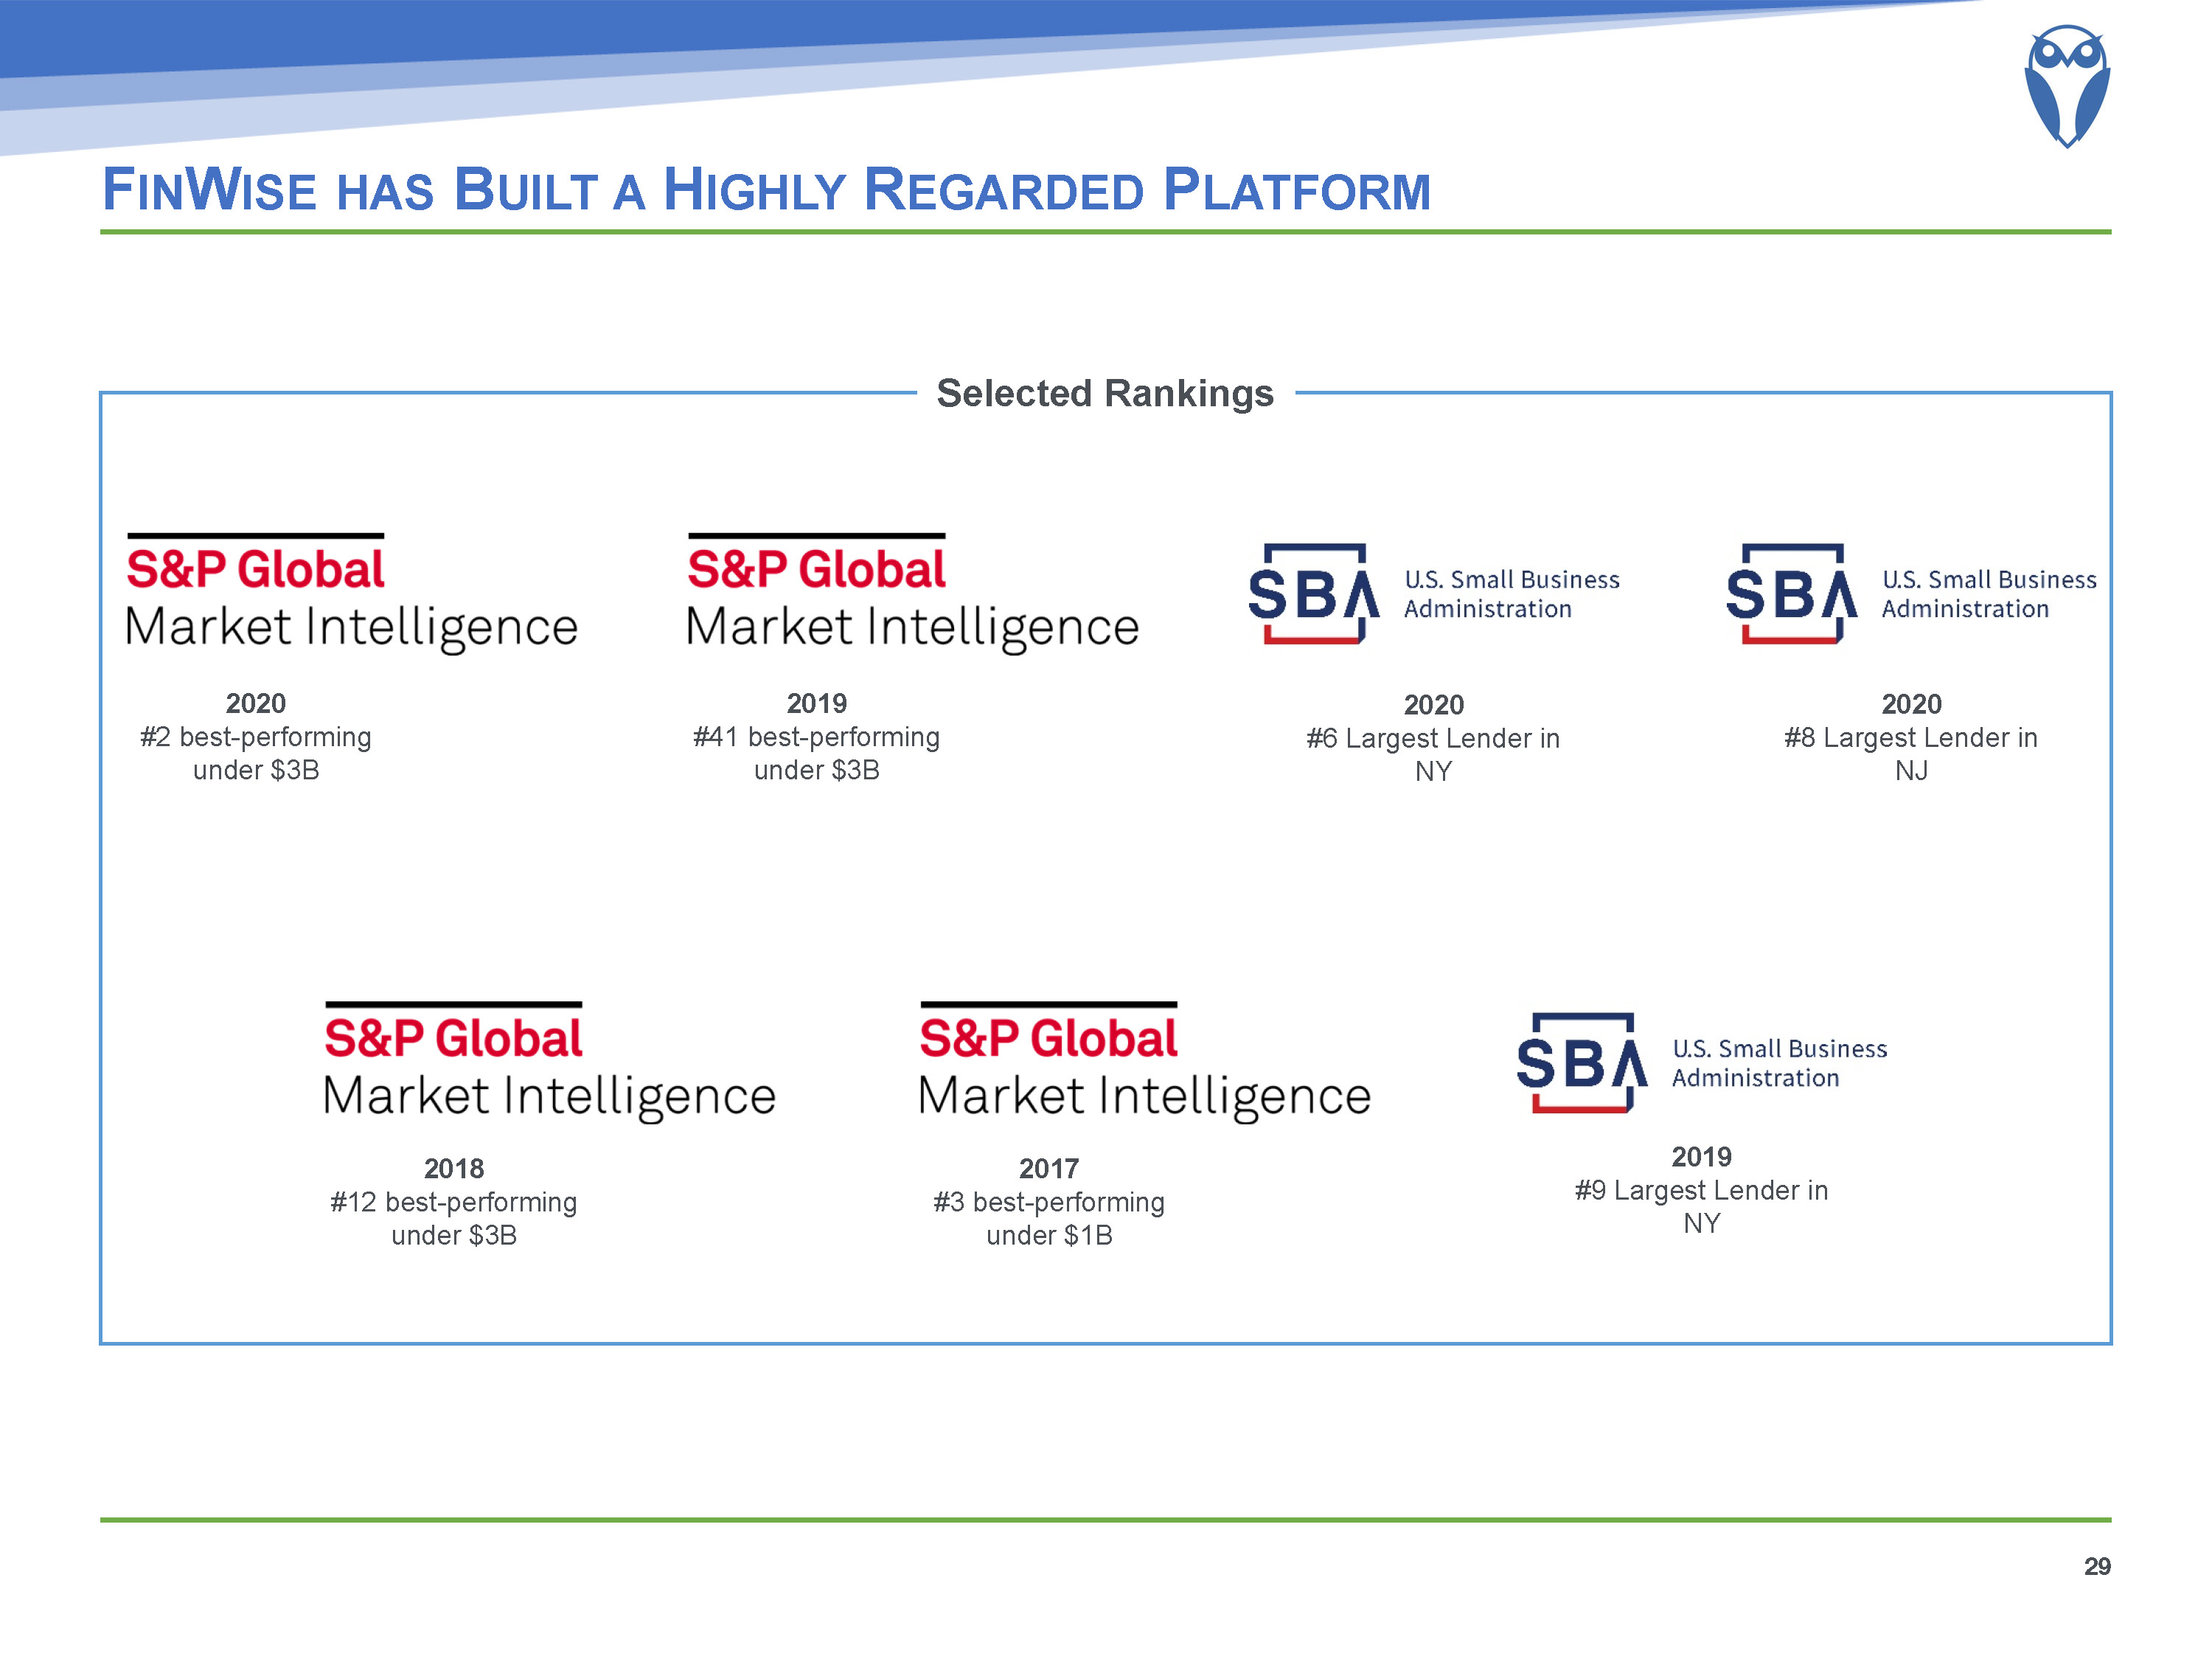
FinWise has Built a Highly Regarded Platform 29 2019#41 best-performing under $3B 2020#2 best-performing under $3B Selected Rankings 2020#6 Largest Lender in NY 2020#8 Largest Lender in NJ 2018#12 best-performing under $3B 2017#3 best-performing under $1B 2019#9 Largest Lender in NY
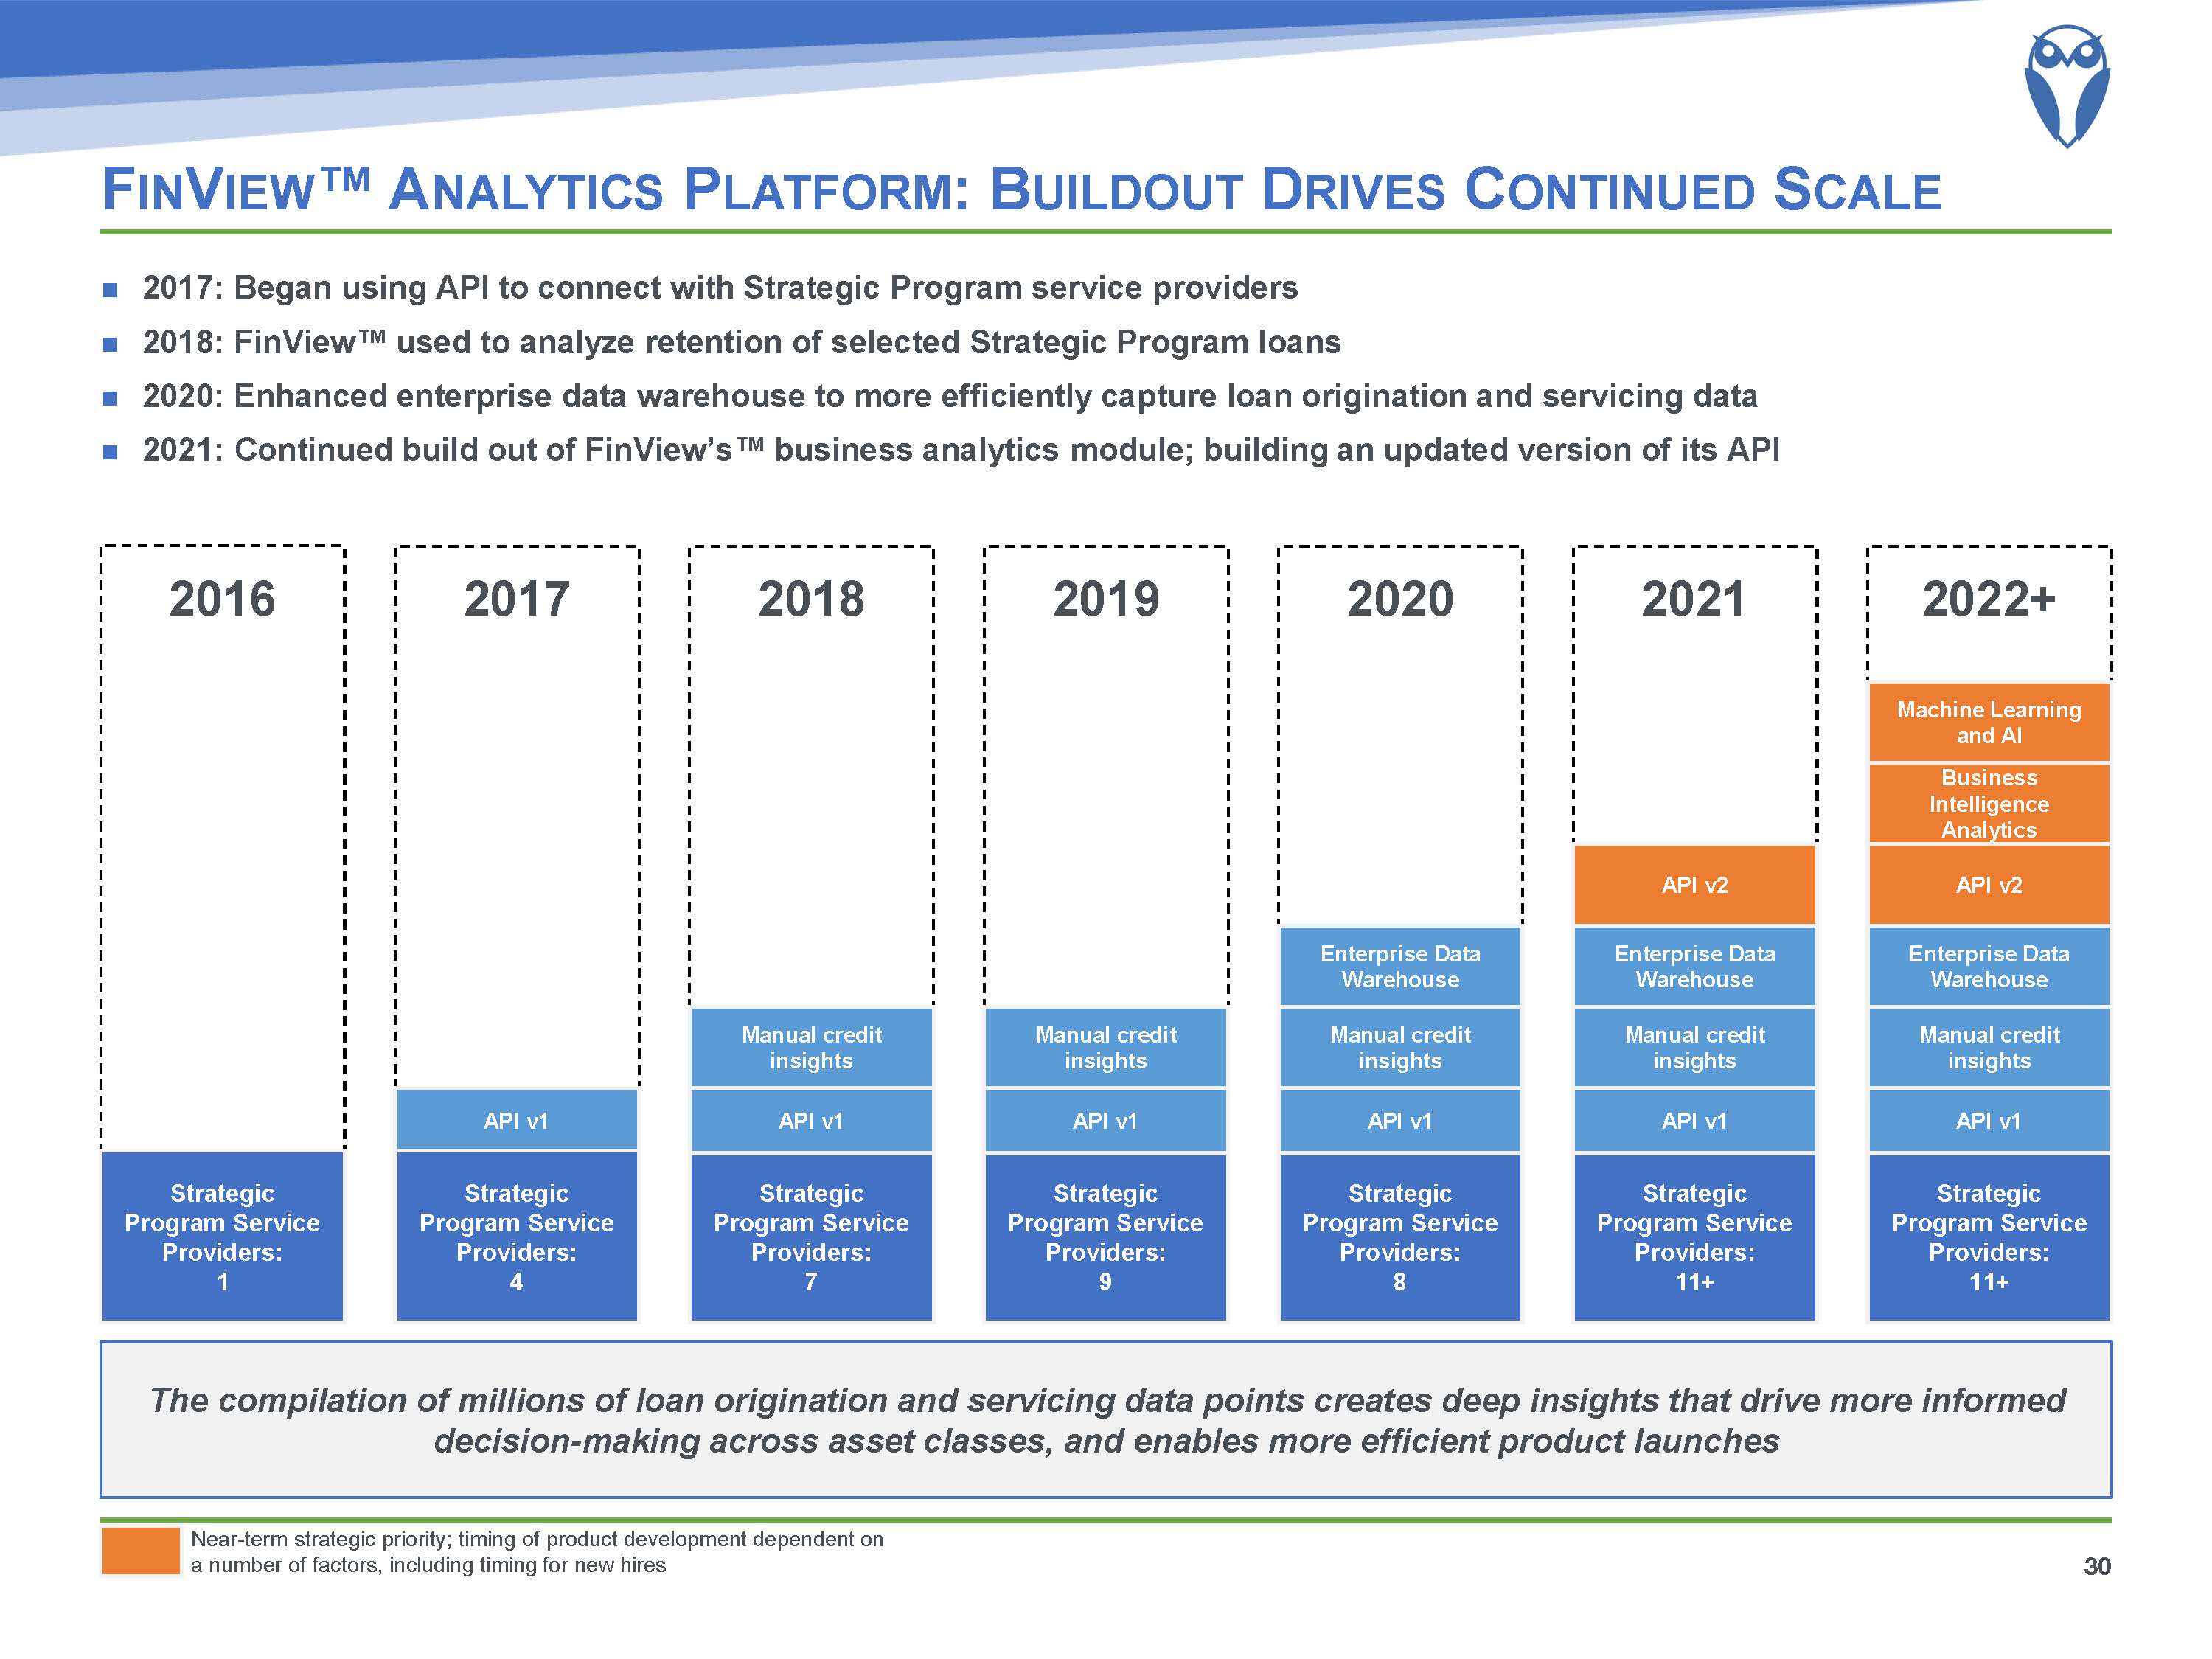
FinView™ Analytics Platform: Buildout Drives Continued Scale Near-term strategic priority; timing of product development dependent on a number of factors, including timing for new hires 30 2017: Began using API to connect with Strategic Program service providers 2018: FinView™ used to analyze retention of selected Strategic Program loans2020: Enhanced enterprise data warehouse to more efficiently capture loan origination and servicing data2021: Continued build out of FinView’s™ business analytics module; building an updated version of its API 2016 Strategic Program Service Providers:1 2017 API v1 Strategic Program Service Providers:4 2018 Manual credit insights Strategic Program Service Providers:7 API v1 2019 Manual credit insights Strategic Program Service Providers:9 API v1 2020 Manual credit insights Strategic Program Service Providers:8 API v1 Enterprise Data Warehouse 2021 Manual credit insights Strategic Program Service Providers:11+ API v1 Enterprise Data Warehouse API v2 2022+ Manual credit insights Strategic Program Service Providers:11+ API v1 Enterprise Data Warehouse Business Intelligence Analytics API v2 Machine Learning and AI The compilation of millions of loan origination and servicing data points creates deep insights that drive more informed decision-making across asset classes, and enables more efficient product launches
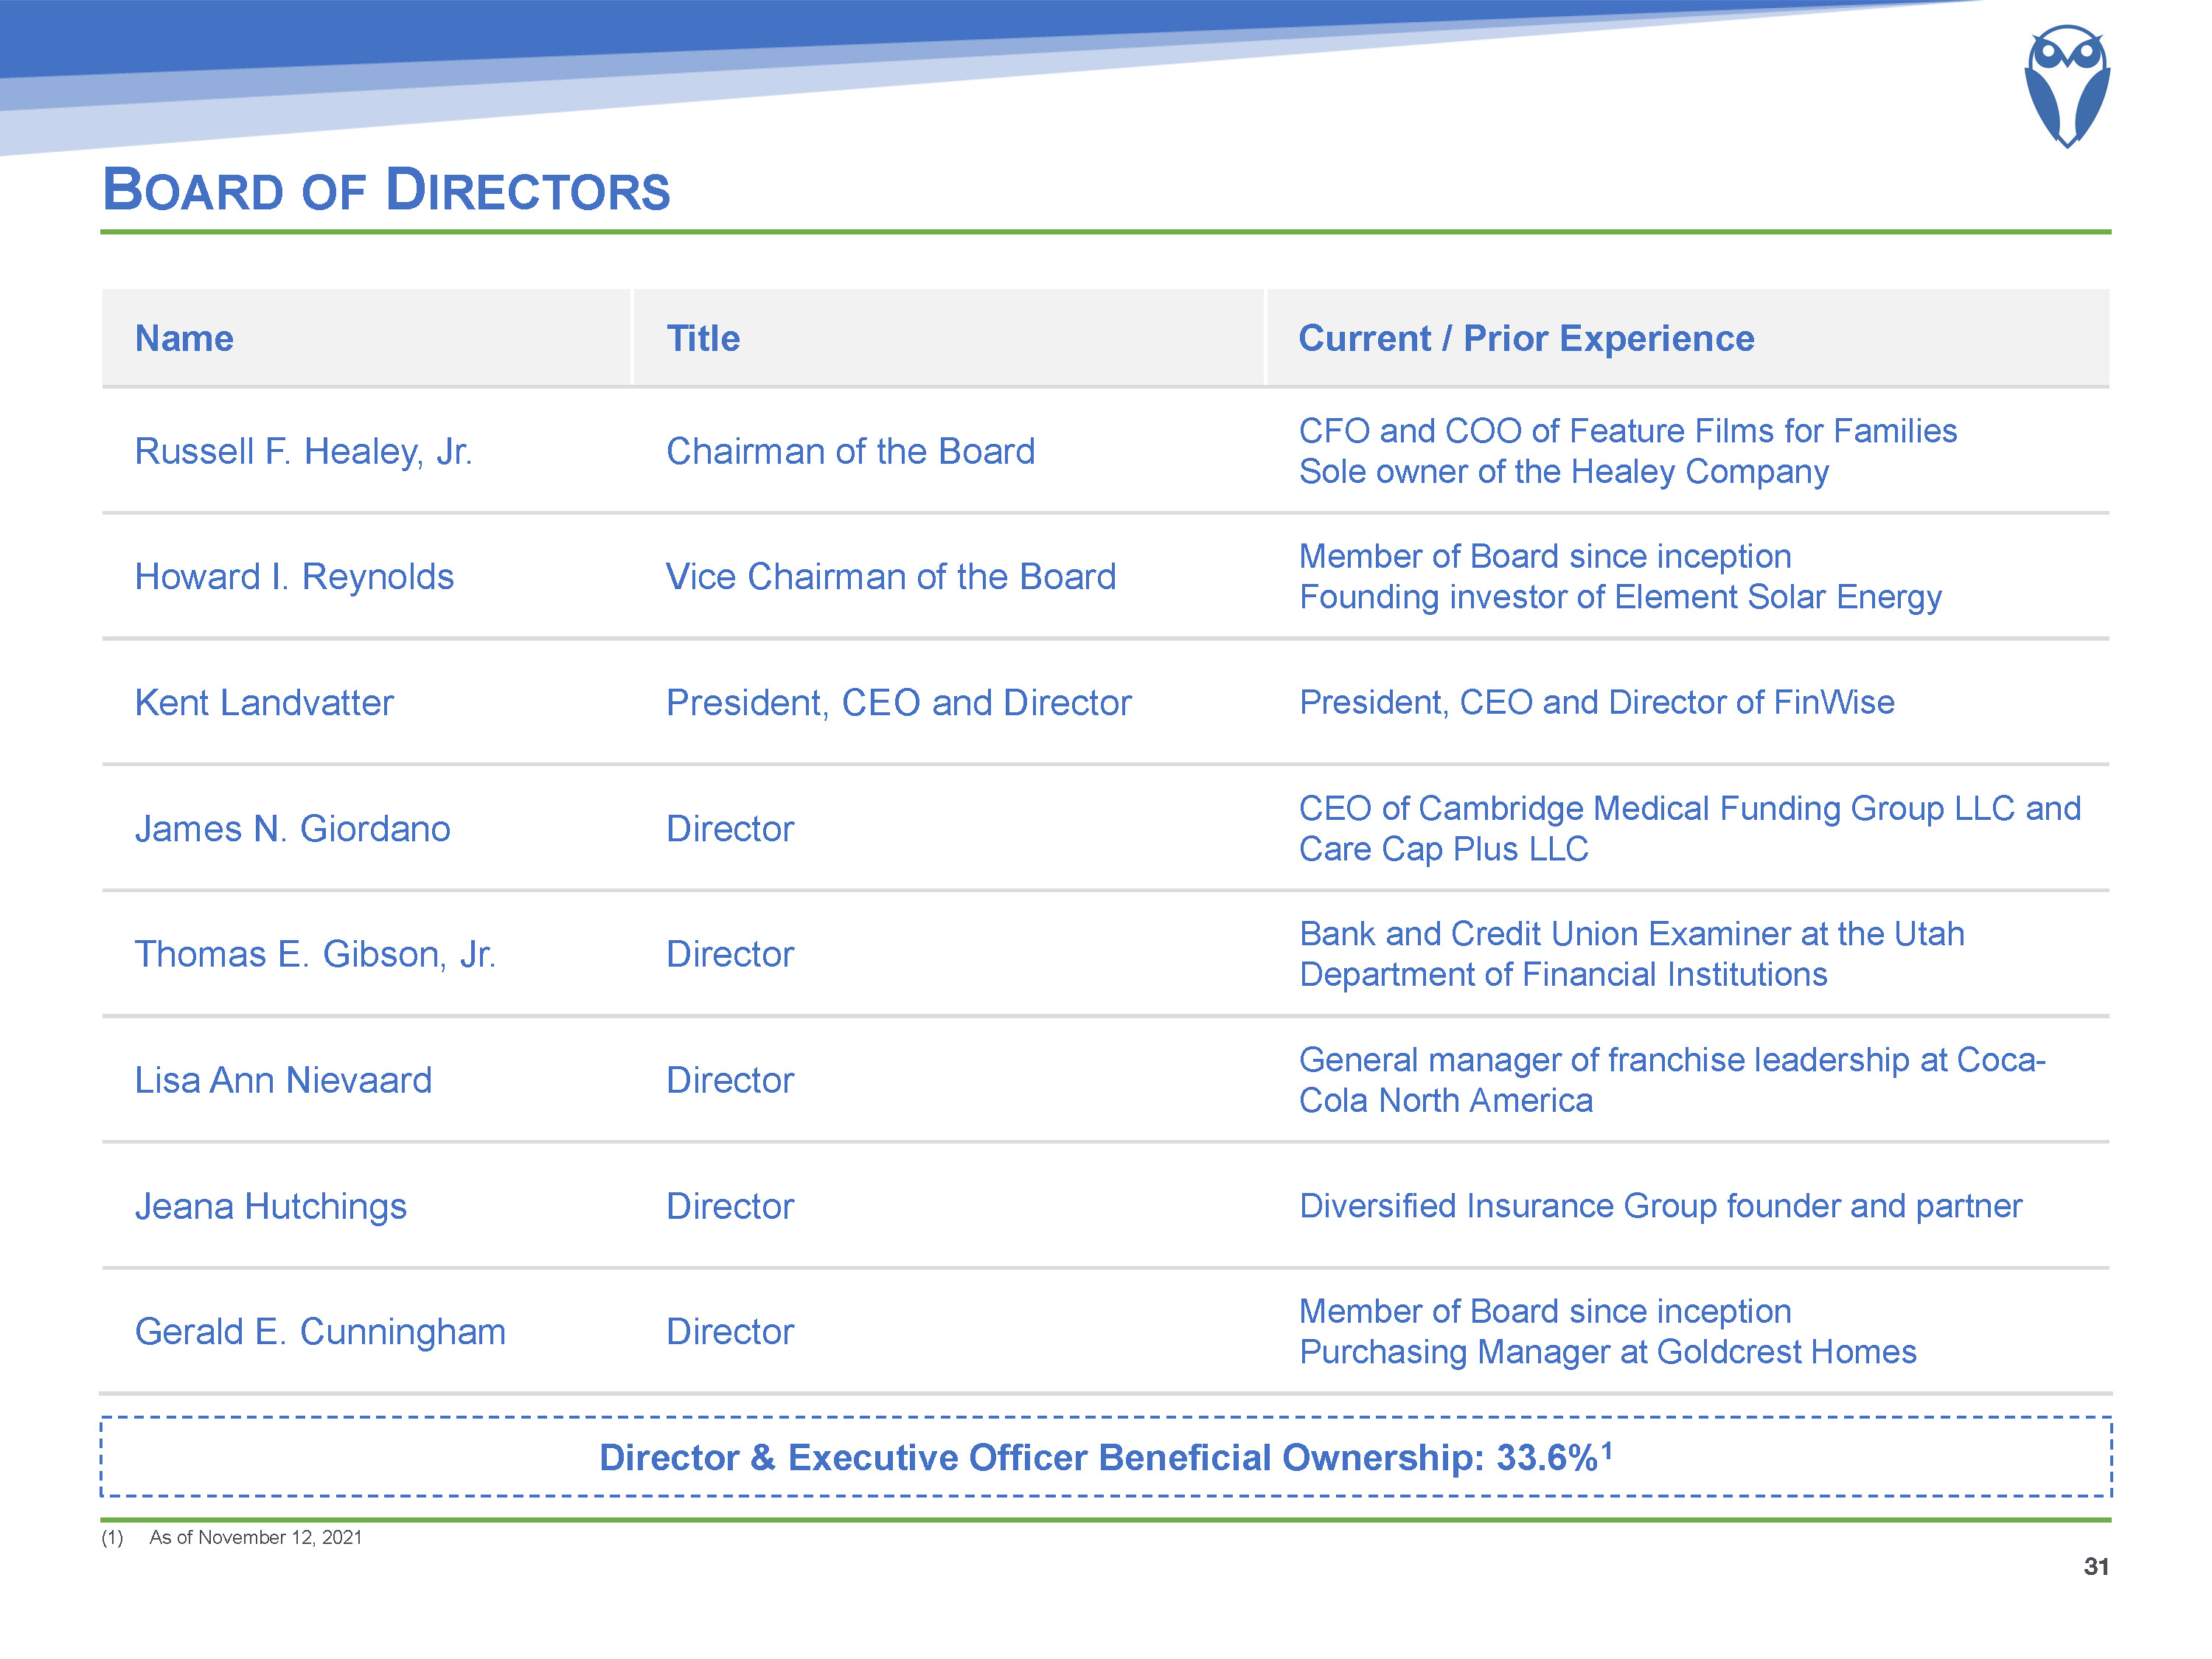
Board of Directors As of November 12, 2021 31 Name Title Current / Prior Experience Russell F. Healey, Jr. Chairman of the Board CFO and COO of Feature Films for FamiliesSole owner of the Healey Company Howard I. Reynolds Vice Chairman of the Board Member of Board since inceptionFounding investor of Element Solar Energy Kent Landvatter President, CEO and Director President, CEO and Director of FinWise James N. Giordano Director CEO of Cambridge Medical Funding Group LLC and Care Cap Plus LLC Thomas E. Gibson, Jr. Director Bank and Credit Union Examiner at the Utah Department of Financial Institutions Lisa Ann Nievaard Director General manager of franchise leadership at Coca-Cola North America Jeana Hutchings Director Diversified Insurance Group founder and partner Gerald E. Cunningham Director Member of Board since inceptionPurchasing Manager at Goldcrest Homes Director & Executive Officer Beneficial Ownership: 33.6%1