UNITED STATES
SECURITIES AND EXCHANGE COMMISSION
Washington, D.C. 20549
FORM N-CSR
CERTIFIED SHAREHOLDER REPORT OF REGISTERED MANAGEMENT
INVESTMENT COMPANIES
Investment Company Act file number 811-23718
Catholic Responsible Investments Funds
(Exact name of registrant as specified in charter)
SEI Investments
One Freedom Valley Drive
Oaks, PA 19456
(Address of principal executive offices) (Zip code)
Michael Beattie
c/o SEI Investments
One Freedom Valley Drive
Oaks, PA 19456
(Name and address of agent for service)
Registrant’s telephone number, including area code: 1-866-348-6466
Date of fiscal year end: October 31, 2022
Date of reporting period: October 31, 2022
Item 1. Reports to Stockholders.
A copy of the report transmitted to stockholders pursuant to Rule 30e-1 under the Investment Company Act of 1940, as amended (the “Act”) (17 CFR § 270.30e-1), is attached hereto.
Catholic Responsible Investments
Annual Report October 31, 2022
CRI Ultra Short Bond Fund Institutional Shares: CRHSX
CRI Short Duration Bond Fund Institutional Shares: CRDSX
CRI Bond Fund Investor Shares: CRBVX Institutional Shares: CRBSX
CRI Opportunistic Bond Fund Investor Shares: CROVX Institutional Shares: CROSX
CRI Equity Index Fund Institutional Shares: CRQSX
CRI Small-Cap Fund Institutional Shares: CRSSX
CRI Multi-Style US Equity Fund Investor Shares: CRTVX Institutional Shares: CRTSX | CRI International Equity Fund Investor Shares: CRLVX Institutional Shares: CRLSX
CRI International Small-Cap Fund Institutional Shares: CRNSX
CRI Magnus 45/55 Fund Investor Shares: CMNVX Institutional Shares: CMNSX
CRI Magnus 60/40 Alpha Plus Fund Investor Shares: CMPVX Institutional Shares: CMPSX
CRI Magnus 60/40 Beta Plus Fund Investor Shares: CMMVX Institutional Shares: CMMSX
CRI Magnus 75/25 Fund Investor Shares: CMUVX Institutional Shares: CMUSX |

Investment Adviser:
Christian Brothers Investment Services
CATHOLIC RESPONSIBLE INVESTMENTS
OCTOBER 31, 2022
| 1 | ||||
| 2 | ||||
| 28 | ||||
| 115 | ||||
| 118 | ||||
| 121 | ||||
| 124 | ||||
| 126 | ||||
| 142 | ||||
| 143 | ||||
| 146 | ||||
| 150 | ||||
| 152 | ||||
| 153 | ||||
The Funds file their complete schedules of investments with the Securities and Exchange Commission (“SEC”) for the first and third quarters of each fiscal year as an exhibit to its reports on Form N-PORT. The Funds’ Form N-PORT reports are available on the SEC’s website at http://www.sec.gov, and may be reviewed and copied at the SEC’s Public Reference Room in Washington, DC. Information on the operation of the Public Reference Room may be obtained by calling 1-800-SEC-0330.
A description of the policies and procedures that the Funds use to determine how to vote proxies relating to fund securities, as well as information relating to how the Fund voted proxies relating to fund securities during the most recent 12-month period ended June 30, is available (i) without charge, upon request, by calling 1- 866-392-2626; and (ii) on the SEC’s website at http://www.sec.gov.
CATHOLIC RESPONSIBLE INVESTMENTS
OCTOBER 31, 2022 (Unaudited)
We are pleased to send you the Annual Report for Catholic Responsible Investments Funds (the “CRI Funds”) for the fiscal year ended October 31, 2022.
For the period ended October 31, 2022, the Funds’ Institutional Class and their underlying benchmarks delivered the following returns:
Fund Return* | Underlying Index Return^ | |||||||||||||
Catholic Responsible Investments Ultra Short Bond Fund, Institutional Class | 0.69 | % | 0.85 | % | ||||||||||
Catholic Responsible Investments Short Duration Bond Fund, Institutional Class | -4.52 | -4.53 | ||||||||||||
Catholic Responsible Investments Bond Fund, Institutional Class | -15.86 | -16.21 | ||||||||||||
Catholic Responsible Investments Opportunistic Bond Fund, Institutional Class | -7.75 | -6.93 | ||||||||||||
Catholic Responsible Investments Equity Index Fund, Institutional Class | -15.01 | -13.50 | ||||||||||||
Catholic Responsible Investments Small-Cap Fund, Institutional Class | -9.88 | -9.67 | ||||||||||||
Catholic Responsible Investments Multi-Style US Equity Fund, Institutional Class | -19.39 | -14.50 | ||||||||||||
Catholic Responsible Investments International Equity Fund, Institutional Class | -24.88 | -21.33 | ||||||||||||
Catholic Responsible Investments International Small-Cap Fund, Institutional Class | -22.99 | -23.72 | ||||||||||||
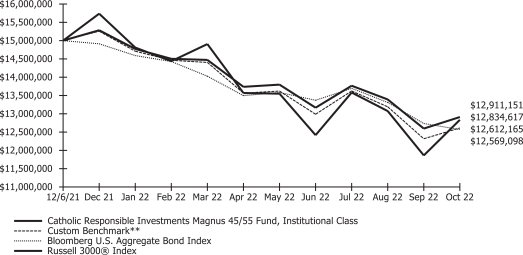
Catholic Responsible Investments Magnus 45/55 Fund, Institutional Class | -13.93 | -15.92 | † | |||||||||||
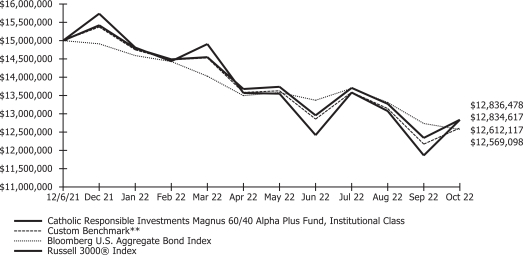
Catholic Responsible Investments Magnus 60/40 Alpha Plus Fund, Institutional Class | -15.63 | -15.92 | † | |||||||||||
Catholic Responsible Investments Magnus 60/40 Beta Plus Fund, Institutional Class | -14.42 | -15.92 | † | |||||||||||
Catholic Responsible Investments Magnus 75/25 Fund, Institutional Class | -15.94 | -15.97 | † | |||||||||||
| * | The Funds commenced operations on December 6, 2021. Returns for periods less than one year are not annualized. |
| ^ | For a definition of each Funds’ benchmark, please refer to each Fund’s Management Discussion and Analysis. |
| † | These Funds’ underlying benchmark is blended. For a definition of each Funds’ blended benchmark, please refer to each Fund’s Management Discussion and Analysis. |
Fiscal Year Report
Fiscal year 2022 witnessed a significant pivot in market dynamics. The initial inflationary pressures that we experienced as the U.S. economy reopened post-Covid became more permanent as wages and unit labor costs increased. The Federal Reserve reacted, in an effort to prevent a self-reinforcing inflationary cycle, by raising the Federal Reserve Funds rate by 300 basis points.
The Russian invasion of Ukraine placed more pricing pressures on global economies as energy prices increased substantially. The invasion also impacted the relative returns across equity market sectors. The energy sector generated strong positive returns over this period due to rising oil prices. Defense stocks also performed well. Other areas of the equity market that performed better were more defensive sectors such as consumer staples, health care, and utilities.
While the increases in interest rates and potential negative effects upon global growth rates impacted the equity markets, the fixed income markets bore the brunt of this action. Given the low levels of interest rates at the beginning of the year, the increase in rates due to Federal Reserve policy resulted in one of the worst years on record for the fixed income market. This was a rare period in which both equities and fixed income generated double digit negative returns.
As we look forward to 2023, we anticipate a moderation in interest rate increases. We believe fixed income returns should be more stable as a result. Despite the prospect of slower economic growth, our projections for earnings within our portfolios remains robust.
We are grateful for the continued confidence you place in CBIS and the CRI Funds. With your continued trust, we will continue to serve Catholic investors who are looking to transform the world.
Jeffery A. McCroy
CEO
John W. Geissinger
CIO
1
CATHOLIC RESPONSIBLE INVESTMENTS
OCTOBER 31, 2022 (Unaudited)
Management’s Discussion and Analysis
Catholic Responsible Investments Ultra Short Bond Fund
The Catholic Responsible Investments Ultra Short Bond Fund (“Fund”) seeks to provide current income consistent with the preservation of capital.
Under normal circumstances, the Ultra Short Bond Fund invests at least 80% of its net assets (plus the amount of any borrowings for investment purposes) in investment grade U.S. dollar-denominated debt instruments, including: (i) commercial paper and other corporate obligations; (ii) certificates of deposit, time deposits, bankers’ acceptances, bank notes, and other obligations of U.S. savings and loan and thrift institutions, U.S. commercial banks (including foreign branches of such banks) and foreign banks that meet certain asset requirements; (iii) U.S. Treasury obligations and obligations issued or guaranteed as to principal and interest by agencies or instrumentalities of the U.S. Government; (iv) mortgage-backed securities; (v) asset-backed securities; (vi) fully-collateralized repurchase agreements involving any of the foregoing obligations; (vii) U.S. dollar-denominated instruments of foreign issuers; and (viii) floating rate securities. In addition, the Fund may enter into dollar roll transactions with selected banks and broker-dealers and invest in to-be-announced mortgage-backed securities, repurchase agreements, and in municipal securities.
CRI Ultra Short Bond Fund Review
Market news has been dominated by inflation concerns, central bank rate hikes, and the increasing probability for a global economic slowdown. The Fed made inflation its priority and raised rates throughout the year. Fixed income returns deteriorated as yields continued to move higher. Short rates rose at a faster pace than the long end of the curve although ultra-short bonds held up relatively well. The fund provided a positive return but slightly underperformed the benchmark due to out-of-benchmark allocations to credit sectors in a risk-off environment.
| AVERAGE ANNUAL TOTAL RETURN FOR INCEPTION THROUGH OCTOBER 31, 2022* | ||
| Catholic Responsible Investments Ultra Short Bond Fund, Institutional Class | 0.69% | |
| Bloomberg US Treasury Bills 1-3 Month Index | 0.85% |
Growth of a $10,000 Investment
(At Net Asset Value)
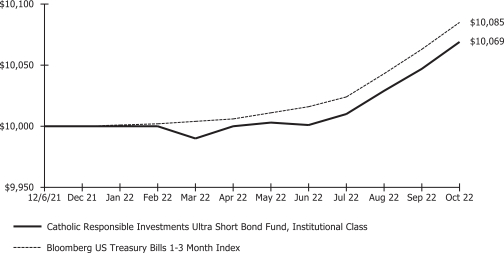
*Fund commenced operations on December 6, 2021. Returns for periods less than one year are not annualized.
The performance data quoted herein represents past performance and the return and value of an investment in the Fund will fluctuate so that, when redeemed, it may be worth less than its original cost. High short term performance of the fund is unusual and investors should not expect such performance to be repeated. Past performance is no guarantee of future performance and
2
CATHOLIC RESPONSIBLE INVESTMENTS
OCTOBER 31, 2022 (Unaudited)
should not be considered as a representation of the future results of the Fund. The Fund’s performance assumes the reinvestment of all dividends and all capital gains. Index returns assume reinvestment of dividends and, unlike the Fund’s returns, do not reflect any fees or expenses. If such fees and expenses were included in the index returns, the performance would have been lower. Please note that one cannot invest directly in an unmanaged index.
Performance figures for the periods shown may reflect contractual fee waivers and/or expense reimbursements. In the absence of fee waivers and/or expense reimbursements (if applicable), returns would have been lower.
Returns shown do not reflect the deduction of taxes that a shareholder would pay on Fund distributions or the redemption of Fund shares.
The Bloomberg US Treasury Bills (1-3M) Index is designed to measure the performance of public obligations of the U.S. Treasury that have a remaining maturity of greater than or equal to 1 month and less than 3 months. The Index includes all publicly issued zero coupon U.S. Treasury Bills that have a remaining maturity of less than 3 months and at least 1 month, are rated investment grade, and have $300 million or more of outstanding face value.
3
CATHOLIC RESPONSIBLE INVESTMENTS
OCTOBER 31, 2022 (Unaudited)
Management’s Discussion and Analysis
Catholic Responsible Investments Short Duration Bond Fund
The Catholic Responsible Investments Short Duration Bond Fund (the “Fund”) seeks maximum current income consistent with the preservation of capital.
Under normal circumstances, the Fund invests at least 80% of its net assets, plus any borrowings for investment purposes, in fixed income securities and other debt instruments. For purposes of the Fund’s 80% investment policy, fixed-income securities and debt instruments include U.S. dollar-denominated fixed income securities; U.S. Treasury securities; governmental agency debt; corporate debt securities; collateralized loan obligations; asset-backed securities; municipal bonds; residential and commercial mortgage-backed securities; floating rate notes and adjustable rate mortgages (“ARMs”). Depending on market conditions, the Fund may invest a substantial portion of its assets in mortgage-backed debt securities issued by the Government National Mortgage Association (“GNMA”), the Federal National Mortgage Association (“FNMA”), and the Federal Home Loan Mortgage Corporation (“FHLMC”). The Fund may also invest in other types of U.S. government securities, including collateralized mortgage obligations (“CMO”) issued by U.S. government agencies or instrumentalities thereof, and may also invest in other mortgage-backed and asset-backed securities, as well as enter into repurchase agreements covering the securities described. The Fund’s fixed income investments are primarily of investment grade (rated in one of the four highest rating categories by at least one rating agency). The Fund may invest up to 10% of its assets in debt securities that are rated below investment grade (commonly referred to as “high-yield” or “junk bonds”). In addition, the Fund’s fixed income securities may include unrated securities, if deemed by the Sub-Adviser to be of comparable quality to allowable investment grade and non-investment grade securities.
CRI Short Duration Bond Fund Review
Market news has been dominated by inflation concerns, central bank rate hikes, and the increasing probability for a global economic slowdown. The Fed made inflation its priority and raised rates throughout the year. Fixed income returns deteriorated as yields continued to move higher and ended negative for the year. Short rates rose at a faster pace than the long end of the curve. Although returns were negative for the year, the fund outperformed its benchmark through effective interest rate management strategies.
| AVERAGE ANNUAL TOTAL RETURN FOR INCEPTION THROUGH OCTOBER 31, 2022* | ||
| Catholic Responsible Investments Short Duration Bond Fund, Institutional Class | -4.52% | |
| Bloomberg US Treasury 1-3 Month Index | -4.73% |
4
CATHOLIC RESPONSIBLE INVESTMENTS
OCTOBER 31, 2022 (Unaudited)
Growth of a $10,000 Investment
(At Net Asset Value)
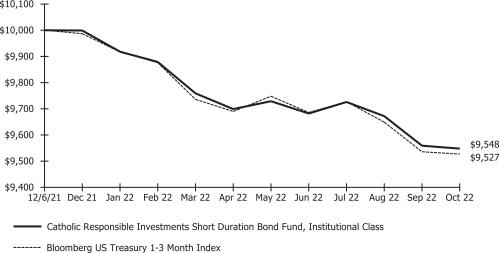
*Fund commenced operations on December 6, 2021. Returns for periods less than one year are not annualized.
The performance data quoted herein represents past performance and the return and value of an investment in the Fund will fluctuate so that, when redeemed, it may be worth less than its original cost. High short term performance of the fund is unusual and investors should not expect such performance to be repeated. Past performance is no guarantee of future performance and should not be considered as a representation of the future results of the Fund. The Fund’s performance assumes the reinvestment of all dividends and all capital gains. Index returns assume reinvestment of dividends and, unlike the Fund’s returns, do not reflect any fees or expenses. If such fees and expenses were included in the index returns, the performance would have been lower. Please note that one cannot invest directly in an unmanaged index.
Performance figures for the periods shown may reflect contractual fee waivers and/or expense reimbursements. In the absence of fee waivers and/or expense reimbursements (if applicable), returns would have been lower.
Returns shown do not reflect the deduction of taxes that a shareholder would pay on Fund distributions or the redemption of Fund shares.
The Bloomberg U.S. Treasury (1-3 Year) Index measures the performance of the US government bond market and includes public obligations of the U.S. Treasury with a maturity between 1 and up to (but not including) 3 years. Certain special issues, such as state and local government series bonds (SLGs), as well as U.S. Treasury TIPS, are excluded. Separate trading of registered interest and principal securities (STRIPS) are excluded from the Index because their inclusion would result in double-counting.
5
CATHOLIC RESPONSIBLE INVESTMENTS
OCTOBER 31, 2022 (Unaudited)
Management’s Discussion and Analysis
Catholic Responsible Investments Bond Fund
The Catholic Responsible Investments Bond Fund (the “Fund”) seeks current income and long-term capital appreciation.
Under normal circumstances, the Fund invests at least 80% of its net assets, plus any borrowings for investment purposes, in fixed income securities and other debt instruments. The Fund’s assets are allocated across different fixed-income market sectors and maturities. For purposes of the Fund’s 80% investment policy, fixed-income securities and debt instruments include mortgage related securities, including mortgage-backed securities (“MBS”) and adjustable rate mortgages (“ARMs”); U.S. and non-U.S. corporate debt securities; Yankee Bonds (dollar- denominated obligations issued in the U.S. by non-U.S. banks and corporations); fixed income securities issued or guaranteed by the U.S. government, non-U.S. governments, or by any U.S. government or non-U.S. government agency or instrumentality; municipal bonds; asset-backed securities; debt issuances of REITs; convertible bonds; preferred stock; covered bonds and bonds issued by U.S. colleges and universities; leveraged bank loans; commercial paper; floating rate notes and other securities included in the Index (defined below). The Fund may enter into repurchase agreements covering the foregoing securities. The Fund may invest up to 10% of its assets in debt securities that are rated below investment grade (commonly referred to as “high-yield” or “junk bonds”). The Fund’s fixed income securities may include unrated securities, if deemed by the Sub-Advisers to be of comparable quality to allowable investment grade and non-investment grade securities. A mortgage dollar roll is a transaction in which the Fund sells mortgage-related securities for immediate settlement and simultaneously purchases the same type of securities for forward settlement at a discount. The Fund may purchase or sell securities which it is eligible to purchase or sell on a when issued and delayed-delivery basis and may make contracts to purchase or sell such securities for a fixed price at a future date beyond normal settlement time (forward commitments), including to be announced MBS (“TBA”). The purchase or sale of securities on a when-issued basis or on a delayed delivery basis or through a forward commitment involves the purchase or sale of securities by the Fund at an established price with payment and delivery taking place in the future. Some of these investments in derivatives will cause the Fund to be, in part, indirectly exposed to companies that would otherwise be screened out by the Adviser’s Catholic Responsible Investments screening criteria. Accordingly, the Fund limits such investments to situations where they (a) do not constitute, in the aggregate, more than 5% of the Fund’s investments at any time, and (b) where the Adviser determines such investments are necessary to achieve the Fund’s investment objective and when the Adviser believes there are no reasonable alternative investments that exist that are consistent with its Catholic Responsible Investing screening criteria.
CRI Bond Fund Review
Market news has been dominated by inflation concerns, central bank rate hikes, and the increasing probability for a global economic slowdown. The Fed made inflation its priority and raised rates throughout the year. Fixed income returns deteriorated as yields continued to move higher. Short rates rose at a faster pace than the long end of the curve. On average throughout the year, the fund’s duration was shorter than the benchmark. This led to the fund outperforming despite resulting in negative returns for the year.
| AVERAGE ANNUAL TOTAL RETURN FOR INCEPTION THROUGH OCTOBER 31, 2022* | ||
| Catholic Responsible Investments Bond Fund, Institutional Class | -15.86% | |
| Catholic Responsible Investments Bond Fund, Investor Class | -15.97% | |
| Bloomberg U.S. Aggregate Bond Index | -16.21% |
6
CATHOLIC RESPONSIBLE INVESTMENTS
OCTOBER 31, 2022 (Unaudited)
Growth of a $5,000,000 Investment
(At Net Asset Value)
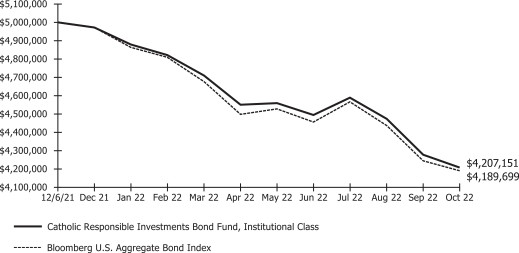
*Fund commenced operations on December 6, 2021. Returns for periods less than one year are not annualized.
The performance data quoted herein represents past performance and the return and value of an investment in the Fund will fluctuate so that, when redeemed, it may be worth less than its original cost. High short term performance of the fund is unusual and investors should not expect such performance to be repeated. Past performance is no guarantee of future performance and should not be considered as a representation of the future results of the Fund. The Fund’s performance assumes the reinvestment of all dividends and all capital gains. Index returns assume reinvestment of dividends and, unlike the Fund’s returns, do not reflect any fees or expenses. If such fees and expenses were included in the index returns, the performance would have been lower. Please note that one cannot invest directly in an unmanaged index.
Performance figures for the periods shown may reflect contractual fee waivers and/or expense reimbursements. In the absence of fee waivers and/or expense reimbursements (if applicable), returns would have been lower.
Returns shown do not reflect the deduction of taxes that a shareholder would pay on Fund distributions or the redemption of Fund shares.
The Bloomberg U.S. Aggregate Bond Index is a broad based index that measures the investment grade, U.S. dollar denominated, fixed rate, taxable bond market.
7
CATHOLIC RESPONSIBLE INVESTMENTS
OCTOBER 31, 2022 (Unaudited)
Management’s Discussion and Analysis
Catholic Responsible Investments Opportunistic Bond Fund
The Catholic Responsible Investments Opportunistic Bond Fund (the “Fund”) seeks current income and to provide relatively low correlation to equity assets.
Under normal circumstances, the Fund invests at least 80% of its net assets, plus any borrowings for investment purposes, in fixed income securities and other debt instruments. For purposes of the Fund’s 80% investment policy, fixed-income securities and debt instruments include mortgage related securities, including mortgage-backed securities and adjustable rate mortgages (“ARMs”); U.S. and non-U.S. corporate debt securities; Yankee Bonds (dollar-denominated obligations issued in the U.S. by non-U.S. banks and corporations); fixed income securities issued or guaranteed by the U.S. government, non-U.S. governments, or by any U.S. government or non-U.S. government agency or instrumentality; municipal bonds; asset-backed securities and floating rate notes. The Fund may enter into repurchase agreements covering the foregoing securities. The Fund may invest up to 20% of its assets in debt securities that are rated below investment grade (commonly referred to as “high-yield” or “junk bonds”). The Fund’s fixed income securities may include unrated securities, if deemed by the Sub-Advisers to be of comparable quality to allowable investment grade and non-investment grade securities. The Fund may invest in futures, primarily U.S. Treasury futures. The Fund may buy or sell U.S. Treasury futures to manage the Fund’s portfolio duration, yield curve positioning, or trade execution on a more cost-effective basis than by use of physical securities alone. The Fund may use credit default swaps on a single issuer (CDS) or a credit default swap index (CDX) to hedge credit risk. Some of these investments will cause the Fund to be, in part, indirectly exposed to companies that would otherwise be screened out by the Adviser’s Catholic Responsible Investments screening criteria. Accordingly, the Fund limits such investments to situations where they (a) do not constitute, in the aggregate, more than 5% of the Fund’s investments at any time, and (b) where the Adviser determines such investments are necessary to achieve the Fund’s investment objective and when the Adviser believes there are no reasonable alternative investments that exist that are consistent with its Catholic Responsible Investing screening criteria.
CRI Opportunistic Bond Fund Review
Market news has been dominated by inflation concerns, central bank rate hikes, and the increasing probability for a global economic slowdown. The Fed made inflation its priority and raised rates throughout the year. Fixed income returns deteriorated as yields continued to move higher. Short rates rose at a faster pace than the long end of the curve. Although returns were negative for the year, the fund outperformed its benchmark through effective interest rate management strategies.
| AVERAGE ANNUAL TOTAL RETURN FOR INCEPTION THROUGH OCTOBER 31, 2022* | ||
| Catholic Responsible Investments Opportunistic Bond Fund, Institutional Class | -7.75% | |
| Catholic Responsible Investments Opportunistic Bond Fund, Investor Class | -7.88% | |
| Bloomberg 1-5 Year Government Credit Index | -6.93% |
8
CATHOLIC RESPONSIBLE INVESTMENTS
OCTOBER 31, 2022 (Unaudited)
Growth of a $5,000,000 Investment
(At Net Asset Value)
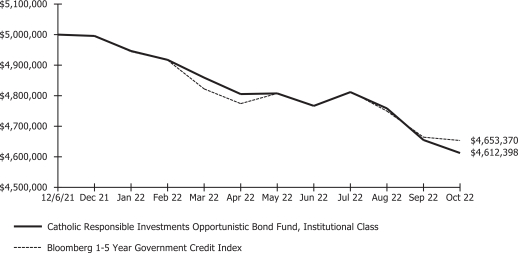
*Fund commenced operations on December 6, 2021. Returns for periods less than one year are not annualized.
The performance data quoted herein represents past performance and the return and value of an investment in the Fund will fluctuate so that, when redeemed, it may be worth less than its original cost. High short term performance of the fund is unusual and investors should not expect such performance to be repeated. Past performance is no guarantee of future performance and should not be considered as a representation of the future results of the Fund. The Fund’s performance assumes the reinvestment of all dividends and all capital gains. Index returns assume reinvestment of dividends and, unlike the Fund’s returns, do not reflect any fees or expenses. If such fees and expenses were included in the index returns, the performance would have been lower. Please note that one cannot invest directly in an unmanaged index.
Performance figures for the periods shown may reflect contractual fee waivers and/or expense reimbursements. In the absence of fee waivers and/or expense reimbursements (if applicable), returns would have been lower.
Returns shown do not reflect the deduction of taxes that a shareholder would pay on Fund distributions or the redemption of Fund shares.
The Bloomberg 1-5 Year Government Credit Index includes all medium and larger issues of U.S. government, investment-grade corporate, and investment-grade international dollar-denominated bonds that have maturities between 1 and 5 years and are publicly issued.
9
CATHOLIC RESPONSIBLE INVESTMENTS
OCTOBER 31, 2022 (Unaudited)
Management’s Discussion and Analysis
Catholic Responsible Investments Equity Index Fund
The Catholic Responsible Investments Equity Index Fund (the “Fund”) seeks to replicate as closely as possible, before expenses, the performance of the S&P 500® Index.
The Fund uses a passive optimization process managed by Rhumbline Advisers, the Fund’s Sub-Adviser (“Sub-Adviser”), which is designed to track the performance of the S&P 500® Index (the “Index”). The Fund is not managed according to traditional methods of “active” investment management, which involve the buying and selling of securities based upon economic, financial and market analysis and investment judgment. Instead, the Fund, using an “indexing” investment approach, attempts to replicate, before expenses, the performance of the Index. The Index is a well-known stock market index that includes common stocks of approximately 500 companies from all major industries representing a significant portion of the market value of all common stocks publicly traded in the United States, most of which are listed on the New York Stock Exchange. Under normal circumstances, the Fund intends to invest at least 95% of its net assets, plus any borrowings for investment purposes, in securities listed in the Index.
CRI Equity Index Fund Review
With increased inflation and the potential for a recession looming for most of 2022, U.S. equity markets were down for the year. In this market environment, defensive sectors such as consumer staples, energy, health care, and utilities were the only areas of the U.S. equity market with positive returns for the year. Information technology, as the largest segment of the equity market, was down significantly and drove much of the negative return of the S&P 500 index. The fund’s performance reflected the performance of the overall market. Additionally, the restrictions on the fund, particularly in health care, resulted in underperformance versus the index.
| AVERAGE ANNUAL TOTAL RETURN FOR INCEPTION THROUGH OCTOBER 31, 2022* | ||
| Catholic Responsible Investments Equity Index Fund, Institutional Class | -15.01% | |
| S&P 500® Index | -13.50% |
Growth of a $3,000,000 Investment
(At Net Asset Value)

*Fund commenced operations on December 6, 2021. Returns for periods less than one year are not annualized.
The performance data quoted herein represents past performance and the return and value of an investment in the Fund will fluctuate so that, when redeemed, it may be worth less than its original cost. High short term performance of the fund is unusual and investors should not expect such performance to be repeated. Past performance is no guarantee of future performance and
10
CATHOLIC RESPONSIBLE INVESTMENTS
OCTOBER 31, 2022 (Unaudited)
should not be considered as a representation of the future results of the Fund. The Fund’s performance assumes the reinvestment of all dividends and all capital gains. Index returns assume reinvestment of dividends and, unlike the Fund’s returns, do not reflect any fees or expenses. If such fees and expenses were included in the index returns, the performance would have been lower. Please note that one cannot invest directly in an unmanaged index.
Performance figures for the periods shown may reflect contractual fee waivers and/or expense reimbursements. In the absence of fee waivers and/or expense reimbursements (if applicable), returns would have been lower.
Returns shown do not reflect the deduction of taxes that a shareholder would pay on Fund distributions or the redemption of Fund shares.
The S&P 500® Index is a free-float capitalization-weighted index, published since 1957, of the prices of 500 large-cap common stocks actively traded in the United States. The stocks included in the Index are those of large publicly held companies that trade on either of the two largest American stock exchanges: the NYSE and the NASDAQ.
11
CATHOLIC RESPONSIBLE INVESTMENTS
OCTOBER 31, 2022 (Unaudited)
Management’s Discussion and Analysis
Catholic Responsible Investments Small-Cap Fund
The Catholic Responsible Investments Small-Cap Fund (the “Fund”) seeks to replicate the performance of the S&P SmallCap 600® Index, an index representing small capitalization companies.
The Fund uses a passive optimization process managed by Rhumbline Advisers, the Fund’s Sub-Adviser (“Sub-Adviser”), which is designed to track the performance of the S&P 600® Index (the “Index”). The Fund is not managed according to traditional methods of “active” investment management, which involve the buying and selling of securities based upon economic, financial and market analysis and investment judgment. Instead, the Fund, using an “indexing” investment approach, attempts to replicate, before expenses, the performance of the Index. The Index is a well-known stock market index that measures the performance of small-capitalization companies in the United States. Under normal circumstances, the Fund intends to invest at least 95% of its net assets, plus any borrowings for investment purposes, in securities listed in the Index.
CRI Small-Cap Fund Review
With increased inflation and the potential for a recession looming for most of 2022, U.S. equity markets were down for the year. In this market environment, defensive sectors such as consumer staples, energy, and utilities had positive returns for the year. In the small cap end of the U.S. equity market, consumer discretionary and health care companies (primarily biotech) were significant negative drivers of performance. The fund’s performance reflected the performance of the overall market. The restrictions on the fund had little impact on performance versus the index.
| AVERAGE ANNUAL TOTAL RETURN FOR INCEPTION THROUGH OCTOBER 31, 2022* | ||
| Catholic Responsible Investments Small-Cap Fund, Institutional Class | -9.88% | |
| S&P SmallCap 600® Index | -9.67% |
Growth of a $3,000,000 Investment
(At Net Asset Value)
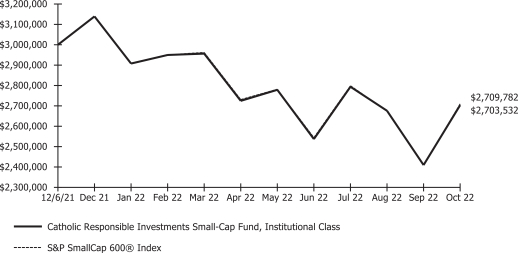
*Fund commenced operations on December 6, 2021. Returns for periods less than one year are not annualized.
The performance data quoted herein represents past performance and the return and value of an investment in the Fund will fluctuate so that, when redeemed, it may be worth less than its original cost. High short term performance of the fund is unusual and investors should not expect such performance to be repeated. Past performance is no guarantee of future performance and should not be considered as a representation of the future results of the Fund. The Fund’s performance assumes the reinvestment of all dividends and all capital gains. Index returns assume reinvestment of dividends and, unlike the Fund’s
12
CATHOLIC RESPONSIBLE INVESTMENTS
OCTOBER 31, 2022 (Unaudited)
returns, do not reflect any fees or expenses. If such fees and expenses were included in the index returns, the performance would have been lower. Please note that one cannot invest directly in an unmanaged index.
Performance figures for the periods shown may reflect contractual fee waivers and/or expense reimbursements. In the absence of fee waivers and/or expense reimbursements (if applicable), returns would have been lower.
Returns shown do not reflect the deduction of taxes that a shareholder would pay on Fund distributions or the redemption of Fund shares.
The S&P SmallCap 600® Index seeks to measure the small-cap segment of the U.S. equity market. The index is designed to track companies that meet specific inclusion criteria to ensure that they are liquid and financially viable.
13
CATHOLIC RESPONSIBLE INVESTMENTS
OCTOBER 31, 2022 (Unaudited)
Management’s Discussion and Analysis
Catholic Responsible Investments Multi-Style US Equity Fund
The Catholic Responsible Investments Multi-Style U.S. Equity Fund (the “Fund”) seeks to achieve long-term capital appreciation.
The Fund seeks to achieve long-term capital appreciation by investing primarily in a broadly diversified portfolio of equity securities of predominantly mid to large capitalization companies included in the Russell 1000® Index (the “Index”) that are believed to have above-average market appreciation potential. Under normal circumstances, the Fund will invest at least 80% of the value of its net assets plus borrowings for investment purposes in equity securities of companies located in the United States. An issuer of a security will be deemed to be located in the United States if: (i) the principal trading market for the security is in the United States, (ii) the issuer is organized under the laws of the United States, or (iii) the issuer derives at least 50% of its revenues or profits from the United States or has at least 50% of its total assets situated in the United States.
CRI Multi-Style U.S. Equity Fund Review
With increased inflation and the potential for a recession looming for most of 2022, U.S. equity markets were down for the year. In this market environment, defensive sectors such as consumer staples, energy, health care, and utilities were the only areas of the U.S. equity market with positive returns for the year. Information technology, as the largest segment of the equity market, was down significantly and drove much of the negative return of the Russell 1000 index. The fund is diversified across various return drivers, but in this market environment, the negative impact of stocks with quality or momentum characteristics outweighed the relatively better performance of value stocks.
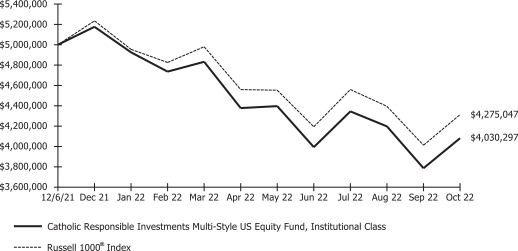
| AVERAGE ANNUAL TOTAL RETURN FOR INCEPTION THROUGH OCTOBER 31, 2022* | ||
| Catholic Responsible Investments Multi-Style US Equity Fund, Institutional Class | -19.39% | |
| Catholic Responsible Investments Multi-Style US Equity Fund, Investor Class | -19.50% | |
| Russell 1000® Index | -14.50% |
Growth of a $5,000,000 Investment
(At Net Asset Value)
*Fund commenced operations on December 6, 2021. Returns for periods less than one year are not annualized.
The performance data quoted herein represents past performance and the return and value of an investment in the Fund will fluctuate so that, when redeemed, it may be worth less than its original cost. High short term performance of the fund is unusual and investors should not expect such performance to be repeated. Past performance is no guarantee of future performance and should not be considered as a representation of the future results of the Fund. The Fund’s performance assumes the reinvestment of all dividends and all capital gains. Index returns assume reinvestment of dividends and, unlike the Fund’s
14
CATHOLIC RESPONSIBLE INVESTMENTS
OCTOBER 31, 2022 (Unaudited)
returns, do not reflect any fees or expenses. If such fees and expenses were included in the index returns, the performance would have been lower. Please note that one cannot invest directly in an unmanaged index.
Performance figures for the periods shown may reflect contractual fee waivers and/or expense reimbursements. In the absence of fee waivers and/or expense reimbursements (if applicable), returns would have been lower.
Returns shown do not reflect the deduction of taxes that a shareholder would pay on Fund distributions or the redemption of Fund shares.
The Russell 1000® Index measures the performance of the large-cap segment of the US equity universe. It is a subset of the Russell 3000® Index and includes approximately 1,000 of the largest securities based on a combination of their market cap and current index membership. The Russell 1000 represents approximately 93% of the Russell 3000® Index, as of the most recent reconstitution. The Russell 1000® Index is constructed to provide a comprehensive and unbiased barometer for the large-cap segment and is completely reconstituted annually to ensure new and growing equities are included.
15
CATHOLIC RESPONSIBLE INVESTMENTS
OCTOBER 31, 2022 (Unaudited)
Management’s Discussion and Analysis
Catholic Responsible Investments International Equity Fund
The Catholic Responsible Investments International Equity Fund (the “Fund”) seeks to achieve long-term capital appreciation.
The Fund seeks to achieve long-term capital appreciation by investing primarily in a broadly diversified portfolio of equity securities of well established companies based in those countries included in the MSCI All Country World Ex USA Index (the “Index”) that are believed to have above average market appreciation potential.
CRI International Equity Fund Review
In a year with rising inflation and geopolitical conflict, non-U.S. equity markets were down significantly with only energy stocks seeing positive results. All major countries were down by double digits, although Canada held up relatively well due to its many energy companies. The strength of the U.S. dollar resulted in even more negative returns for U.S.-based investors. The fund is diversified across various return drivers, but in this market environment, the negative impact of stocks with quality or momentum characteristics outweighed the relatively better performance of value stocks.
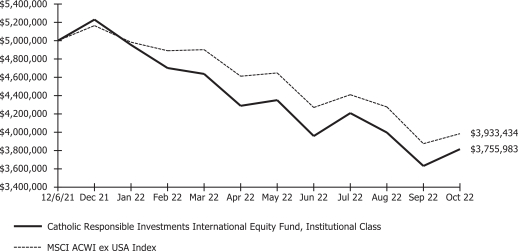
| AVERAGE ANNUAL TOTAL RETURN FOR INCEPTION THROUGH OCTOBER 31, 2022* | ||
| Catholic Responsible Investments International Equity Fund, Institutional Class | -24.88% | |
| Catholic Responsible Investments International Equity Fund, Investor Class | -24.98% | |
| MSCI ACWI ex USA Index | -21.33% |
Growth of a $5,000,000 Investment
(At Net Asset Value)
*Fund commenced operations on December 6, 2021. Returns for periods less than one year are not annualized.
The performance data quoted herein represents past performance and the return and value of an investment in the Fund will fluctuate so that, when redeemed, it may be worth less than its original cost. High short term performance of the fund is unusual and investors should not expect such performance to be repeated. Past performance is no guarantee of future performance and should not be considered as a representation of the future results of the Fund. The Fund’s performance assumes the reinvestment of all dividends and all capital gains. Index returns assume reinvestment of dividends and, unlike the Fund’s returns, do not reflect any fees or expenses. If such fees and expenses were included in the index returns, the performance would have been lower. Please note that one cannot invest directly in an unmanaged index.
Performance figures for the periods shown may reflect contractual fee waivers and/or expense reimbursements. In the absence of fee waivers and/or expense reimbursements (if applicable), returns would have been lower.
16
CATHOLIC RESPONSIBLE INVESTMENTS
OCTOBER 31, 2022 (Unaudited)
Returns shown do not reflect the deduction of taxes that a shareholder would pay on Fund distributions or the redemption of Fund shares.
The MSCI ACWI ex USA Index captures large and mid cap representation across 22 of 23 developed markets countries (excluding the US) and 27 emerging markets countries. With 2,354 constituents, the index covers approximately 85% of the global equity opportunity set outside the US.
17
CATHOLIC RESPONSIBLE INVESTMENTS
OCTOBER 31, 2022 (Unaudited)
Management’s Discussion and Analysis
Catholic Responsible Investments International Small-Cap Fund
The Catholic Responsible Investments International Small-Cap Fund (the “Fund”) seeks to achieve long-term capital appreciation.
The Fund seeks to achieve long-term capital appreciation by investing primarily in a broadly diversified portfolio of equity securities of small capitalization companies based in those countries included in the MSCI All Country World ex USA Small Cap Index (the “Index”) that are believed to have above-average market appreciation potential. Under normal circumstances, the Fund invests at least 80% of the value of its net assets plus borrowings for investment purposes in a broadly diversified portfolio of equity securities of small capitalization companies that are located in countries throughout the world. The Fund generally considers small-cap foreign companies to be those companies with similar market capitalization and located in countries included in the MSCI All Country World ex-U.S. Small Cap Index. For purposes of the Fund’s 80% investment policy, equity securities include international equities traded on recognized global exchanges, private placements of equity securities, rights offerings, warrants, ADRs, new issues of equity securities, ETFs that primarily invest in equity securities, and derivatives, primarily index futures with economic characteristics similar to equity securities. The Fund may at times purchase or sell futures contracts on the Index, or options on those futures, in lieu of investing directly in the stocks making up the Index. The Fund might do so, for example, in order to increase its investment exposure pending investment of cash in the stocks comprising the Index. Alternatively, the Fund might use futures or options on futures to reduce its investment exposure in situations where it intends to sell a portion of the stocks in its portfolio but the sale has not yet been completed. In some circumstances, the Fund may purchase ADRs, rather than foreign shares that are traded on foreign exchanges, because the ADRs have greater liquidity or for other reasons. Some of these investments will cause the Fund to be, in part, indirectly exposed to companies that would otherwise be screened out by the Adviser’s Catholic Responsible Investments screening criteria. Accordingly, the Fund limits such investments to situations where they (a) do not constitute, in the aggregate, more than 5% of the Fund’s investments at any time, and (b) where the Adviser determines such investments are necessary to achieve the Fund’s investment objective and when the Adviser believes there are no reasonable alternative investments that exist that are consistent with its Catholic Responsible Investing screening criteria.
CRI International Small-Cap Fund Review
In a year with rising inflation and geopolitical conflict, non-U.S. equity markets were down significantly with only energy stocks seeing positive results. All major countries were down by double digits, although Canada held up relatively well due to its many energy companies. Non-Asian emerging markets also performed relatively well, as these small companies were less impacted by macroeconomic issues. The strength of the U.S. dollar resulted in even more negative returns for U.S.-based investors. With value stocks outperforming this year, the fund’s specific holdings in undervalued stocks resulted in fund performance that was less negative than the index.
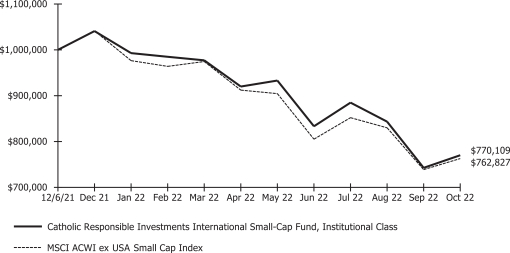
| AVERAGE ANNUAL TOTAL RETURN FOR INCEPTION THROUGH OCTOBER 31, 2022* | ||
| Catholic Responsible Investments International Small-Cap Fund, Institutional Class | -22.99% | |
| MSCI ACWI ex USA Small Cap Index | -23.72% |
18
CATHOLIC RESPONSIBLE INVESTMENTS
OCTOBER 31, 2022 (Unaudited)
Growth of a $1,000,000 Investment
(At Net Asset Value)
*Fund commenced operations on December 6, 2021. Returns for periods less than one year are not annualized.
The performance data quoted herein represents past performance and the return and value of an investment in the Fund will fluctuate so that, when redeemed, it may be worth less than its original cost. High short term performance of the fund is unusual and investors should not expect such performance to be repeated. Past performance is no guarantee of future performance and should not be considered as a representation of the future results of the Fund. The Fund’s performance assumes the reinvestment of all dividends and all capital gains. Index returns assume reinvestment of dividends and, unlike the Fund’s returns, do not reflect any fees or expenses. If such fees and expenses were included in the index returns, the performance would have been lower. Please note that one cannot invest directly in an unmanaged index.
Performance figures for the periods shown may reflect contractual fee waivers and/or expense reimbursements. In the absence of fee waivers and/or expense reimbursements (if applicable), returns would have been lower.
Returns shown do not reflect the deduction of taxes that a shareholder would pay on Fund distributions or the redemption of Fund shares.
The MSCI ACWI ex USA Small Cap Index captures small cap representation across 22 of 23 developed markets countries (excluding the US) and 26 emerging markets countries. With 4,391 constituents, the index covers approximately 14% of the global equity opportunity set outside the US.
19
CATHOLIC RESPONSIBLE INVESTMENTS
OCTOBER 31, 2022 (Unaudited)
Management’s Discussion and Analysis
Catholic Responsible Investments Magnus 45/55 Fund
The Catholic Responsible Investments Magnus 45/55 Fund (the “Fund”) seeks to achieve current income and long-term capital appreciation.
The Fund is a “fund of funds,” meaning that it seeks to achieve its objective by investing in other Catholic Responsible Investments Funds mutual funds (the “Underlying Funds”) that represent a variety of asset classes and investment styles. The Fund’s asset allocation strategy emphasizes investments in equity securities (and certain other instruments described below) in an amount equal to 45% of its assets and exposure to fixed income securities in an amount equal to 55% of its assets. Under normal circumstances, the Fund does not make direct investments into assets other than the underlying Catholic Responsible Investments Funds indicated in the chart below, government securities and short-term paper.
CRI Magnus 45/55 Fund Review
In a year with rising inflation and geopolitical conflict, returns were negative across all asset classes. The Magnus Funds outperformed their benchmarks, and all four funds had similar return drivers. Fixed income performance was slightly better than equity returns for the year, and the Magnus Funds benefitted from being slightly overweight to fixed income. Within the fixed income allocation, the funds’ exposure to the shorter duration bond funds provided most of the fund outperformance. Manager selection was negative for all four funds, particularly in the equity allocation.
| AVERAGE ANNUAL TOTAL RETURN FOR INCEPTION THROUGH OCTOBER 31, 2022* | ||
| Catholic Responsible Investments Magnus 45/55 Fund, Institutional Class | -13.93% | |
| Catholic Responsible Investments Magnus 45/55 Fund, Investor Class | -14.03% | |
| Custom Benchmark** | -15.92% | |
| Bloomberg U.S. Aggregate Bond Index | -16.21% | |
| Russell 3000® Index | -14.44% |
Growth of a $15,000,000 Investment
(At Net Asset Value)
* Fund commenced operations on December 6, 2021. Returns for periods less than one year are not annualized.
**The Custom Benchmark is a blended benchmark composed of 55% of the Bloomberg U.S. Aggregate Bond Index, 33.75% of the Russell 3000® Index, and 11.25% of the MSCI ACWI ex-US Index.
20
CATHOLIC RESPONSIBLE INVESTMENTS
OCTOBER 31, 2022 (Unaudited)
The performance data quoted herein represents past performance and the return and value of an investment in the Fund will fluctuate so that, when redeemed, it may be worth less than its original cost. High short term performance of the fund is unusual and investors should not expect such performance to be repeated. Past performance is no guarantee of future performance and should not be considered as a representation of the future results of the Fund. The Fund’s performance assumes the reinvestment of all dividends and all capital gains. Index returns assume reinvestment of dividends and, unlike the Fund’s returns, do not reflect any fees or expenses. If such fees and expenses were included in the index returns, the performance would have been lower. Please note that one cannot invest directly in an unmanaged index.
Performance figures for the periods shown may reflect contractual fee waivers and/or expense reimbursements. In the absence of fee waivers and/or expense reimbursements (if applicable), returns would have been lower.
Returns shown do not reflect the deduction of taxes that a shareholder would pay on Fund distributions or the redemption of Fund shares.
The Russell 3000® Index measures the performance of the largest 3,000 US companies representing approximately 98% of the investable US equity market. The Russell 3000® Index is constructed to provide a comprehensive, unbiased and stable barometer of the broad market and is completely reconstituted annually to ensure new and growing equities are included.
The Bloomberg U.S. Aggregate Bond Index is a broad based index that measures the investment grade, U.S. dollar denominated, fixed rate, taxable bond market.
21
CATHOLIC RESPONSIBLE INVESTMENTS
OCTOBER 31, 2022 (Unaudited)
Management’s Discussion and Analysis
Catholic Responsible Investments Magnus 60/40 Alpha Plus Fund
The Catholic Responsible Investments Magnus 60/40 Alpha Plus Fund (the “Fund”) seeks to achieve current income and long-term capital appreciation.
The Fund is a “fund of funds,” meaning that it seeks to achieve its objective by investing in other Catholic Responsible Investments Funds mutual funds (the “Underlying Funds”) that represent a variety of asset classes and investment styles. The Fund’s asset allocation strategy emphasizes investments in equity securities (and certain other instruments described below) in an amount equal to 60% of its assets and exposure to fixed income securities in an amount equal to 40% of its assets, with a bias towards “active” management in the equity portion of the portfolio. The portfolios of the Magnus 60/40 Beta Plus Fund and the Magnus 60/40 Alpha Plus Fund reflect the same allocation to stocks and fixed-income securities, but the Magnus 60/40 Beta Plus Fund is more heavily allocated to Underlying Funds that use a “passive” management strategy, and the Magnus 60/40 Alpha Plus Fund is more heavily allocated to Underlying Funds that use an “active” management strategy. Under normal circumstances, the Fund does not make direct investments into assets other than the underlying Catholic Responsible Investments Funds indicated in the chart below, government securities and short-term paper.
CRI Magnus 60/40 Alpha Plus Fund Review
In a year with rising inflation and geopolitical conflict, returns were negative across all asset classes. The Magnus Funds outperformed their benchmarks, and all four funds had similar return drivers. Fixed income performance was slightly better than equity returns for the year, and the Magnus Funds benefitted from being slightly overweight to fixed income. Within the fixed income allocation, the funds’ exposure to the shorter duration bond funds provided most of the fund outperformance. Manager selection was negative for all four funds, particularly in the equity allocation.
| AVERAGE ANNUAL TOTAL RETURN FOR INCEPTION THROUGH OCTOBER 31, 2022* | ||
| Catholic Responsible Investments Magnus 60/40 Alpha Plus Fund, Institutional Class | -15.63% | |
| Catholic Responsible Investments Magnus 60/40 Alpha Plus Fund, Investor Class | -15.74% | |
| Custom Benchmark** | -15.92% | |
| Bloomberg U.S. Aggregate Bond Index | -16.21% | |
| Russell 3000® Index | -14.44% |
22
CATHOLIC RESPONSIBLE INVESTMENTS
OCTOBER 31, 2022 (Unaudited)
Growth of a $15,000,000 Investment
(At Net Asset Value)
*Fund commenced operations on December 6, 2021. Returns for periods less than one year are not annualized.
**The Custom Benchmark is a blended benchmark composed of 40% of the Bloomberg U.S. Aggregate Bond Index, 45% of the Russell 3000® Index, and 15% of the MSCI ACWI ex-US Index.
The performance data quoted herein represents past performance and the return and value of an investment in the Fund will fluctuate so that, when redeemed, it may be worth less than its original cost. High short term performance of the fund is unusual and investors should not expect such performance to be repeated. Past performance is no guarantee of future performance and should not be considered as a representation of the future results of the Fund. The Fund’s performance assumes the reinvestment of all dividends and all capital gains. Index returns assume reinvestment of dividends and, unlike the Fund’s returns, do not reflect any fees or expenses. If such fees and expenses were included in the index returns, the performance would have been lower. Please note that one cannot invest directly in an unmanaged index.
Performance figures for the periods shown may reflect contractual fee waivers and/or expense reimbursements. In the absence of fee waivers and/or expense reimbursements (if applicable), returns would have been lower.
Returns shown do not reflect the deduction of taxes that a shareholder would pay on Fund distributions or the redemption of Fund shares.
The Russell 3000® Index measures the performance of the largest 3,000 US companies representing approximately 98% of the investable US equity market. The Russell 3000® Index is constructed to provide a comprehensive, unbiased and stable barometer of the broad market and is completely reconstituted annually to ensure new and growing equities are included.
The Bloomberg U.S. Aggregate Bond Index is a broad based index that measures the investment grade, U.S. dollar denominated, fixed rate, taxable bond market.
23
CATHOLIC RESPONSIBLE INVESTMENTS
OCTOBER 31, 2022 (Unaudited)
Management’s Discussion and Analysis
Catholic Responsible Investments Magnus 60/40 Beta Plus Fund
The Catholic Responsible Investments Magnus 60/40 Beta Plus Fund (the “Fund”) seeks to achieve current income and long-term capital appreciation.
The Fund is a “fund of funds,” meaning that it seeks to achieve its objective by investing in other Catholic Responsible Investments Funds mutual funds (the “Underlying Funds”) that represent a variety of asset classes and investment styles. The Fund’s asset allocation strategy emphasizes investments in equity securities (and certain other instruments described below) in an amount equal to 60% of its assets and exposure to fixed income securities in an amount equal to 40% of its assets, with a bias towards “passive” management in the equity portion of the portfolio. The portfolios of the Magnus 60/40 Beta Plus Fund and the Magnus 60/40 Alpha Plus Fund reflect the same allocation to stocks and fixed-income securities, but the Magnus 60/40 Beta Plus Fund is more heavily allocated to Underlying Funds that use a “passive” management strategy, and the Magnus 60/40 Alpha Plus Fund is more heavily allocated to Underlying Funds that use an “active” management strategy. Under normal circumstances, the Fund does not make direct investments into assets other than the underlying Catholic Responsible Investments Funds indicated in the chart below, government securities and short-term paper.
CRI Magnus 60/40 Beta Plus Fund Review
In a year with rising inflation and geopolitical conflict, returns were negative across all asset classes. The Magnus Funds outperformed their benchmarks, and all four funds had similar return drivers. Fixed income performance was slightly better than equity returns for the year, and the Magnus Funds benefitted from being slightly overweight to fixed income. Within the fixed income allocation, the funds’ exposure to the shorter duration bond funds provided most of the fund outperformance. Manager selection was negative for all four funds, particularly in the equity allocation.
| AVERAGE ANNUAL TOTAL RETURN FOR INCEPTION THROUGH OCTOBER 31, 2022* | ||
| Catholic Responsible Investments Magnus 60/40 Beta Plus Fund, Institutional Class | -14.42% | |
| Catholic Responsible Investments Magnus 60/40 Beta Plus Fund, Investor Class | -14.63% | |
| Custom Benchmark** | -15.92% | |
| Bloomberg U.S. Aggregate Bond Index | -16.21% | |
| Russell 3000® Index | -14.44% |
24
CATHOLIC RESPONSIBLE INVESTMENTS
OCTOBER 31, 2022 (Unaudited)
Growth of a $15,000,000 Investment
(At Net Asset Value)

*Fund commenced operations on December 6, 2021. Returns for periods less than one year are not annualized.
** The Custom Benchmark is a blended benchmark composed of 40% of the Bloomberg U.S. Aggregate Bond Index, 45% of the Russell 3000® Index, and 15% of the MSCI ACWI ex-US Index.
The performance data quoted herein represents past performance and the return and value of an investment in the Fund will fluctuate so that, when redeemed, it may be worth less than its original cost. High short term performance of the fund is unusual and investors should not expect such performance to be repeated. Past performance is no guarantee of future performance and should not be considered as a representation of the future results of the Fund. The Fund’s performance assumes the reinvestment of all dividends and all capital gains. Index returns assume reinvestment of dividends and, unlike the Fund’s returns, do not reflect any fees or expenses. If such fees and expenses were included in the index returns, the performance would have been lower. Please note that one cannot invest directly in an unmanaged index.
Performance figures for the periods shown may reflect contractual fee waivers and/or expense reimbursements. In the absence of fee waivers and/or expense reimbursements (if applicable), returns would have been lower.
Returns shown do not reflect the deduction of taxes that a shareholder would pay on Fund distributions or the redemption of Fund shares.
The Russell 3000® Index measures the performance of the largest 3,000 US companies representing approximately 98% of the investable US equity market. The Russell 3000® Index is constructed to provide a comprehensive, unbiased and stable barometer of the broad market and is completely reconstituted annually to ensure new and growing equities are included.
The Bloomberg U.S. Aggregate Bond Index is a broad based index that measures the investment grade, U.S. dollar denominated, fixed rate, taxable bond market.
25
CATHOLIC RESPONSIBLE INVESTMENTS
OCTOBER 31, 2022 (Unaudited)
Management’s Discussion and Analysis
Catholic Responsible Investments Magnus 75/25 Fund
The Catholic Responsible Investments Magnus 75/25 Fund (the “Fund”) seeks to achieve current income and long-term capital appreciation.
The Fund is a “fund of funds,” meaning that it seeks to achieve its objective by investing in other Catholic Responsible Investments Funds mutual funds (the “Underlying Funds”) that represent a variety of asset classes and investment styles. The Fund’s asset allocation strategy emphasizes investments in equity securities (and certain other instruments described below) in an amount equal to 75% of its assets and exposure to fixed income securities in an amount equal to 25% of its assets. Under normal circumstances, the Fund does not make direct investments into assets other than the underlying Catholic Responsible Investments Funds indicated in the chart below, government securities and short-term paper.
CRI Magnus 75/25 Fund Review
In a year with rising inflation and geopolitical conflict, returns were negative across all asset classes. The Magnus Funds outperformed their benchmarks, and all four funds had similar return drivers. Fixed income performance was slightly better than equity returns for the year, and the Magnus Funds benefitted from being slightly overweight to fixed income. Within the fixed income allocation, the funds’ exposure to the shorter duration bond funds provided most of the fund outperformance. Manager selection was negative for all four funds, particularly in the equity allocation.
| AVERAGE ANNUAL TOTAL RETURN FOR INCEPTION THROUGH OCTOBER 31, 2022* | ||
| Catholic Responsible Investments Magnus 75/25 Fund, Institutional Class | -15.94% | |
| Catholic Responsible Investments Magnus 75/25 Fund, Investor Class | -16.15% | |
| Custom Benchmark** | -15.97% | |
| Bloomberg U.S. Aggregate Bond Index | -16.21% | |
| Russell 3000® Index | -14.44% |
Growth of a $15,000,000 Investment
(At Net Asset Value)

*Fund commenced operations on December 6, 2021. Returns for periods less than one year are not annualized.
**The Custom Benchmark is a blended benchmark composed of 25% of the Bloomberg U.S. Aggregate Bond Index, 56.25% of the Russell 3000® Index, and 18.75% of the MSCI ACWI ex-US Index.
26
CATHOLIC RESPONSIBLE INVESTMENTS
OCTOBER 31, 2022 (Unaudited)
The performance data quoted herein represents past performance and the return and value of an investment in the Fund will fluctuate so that, when redeemed, it may be worth less than its original cost. High short term performance of the fund is unusual and investors should not expect such performance to be repeated. Past performance is no guarantee of future performance and should not be considered as a representation of the future results of the Fund. The Fund’s performance assumes the reinvestment of all dividends and all capital gains. Index returns assume reinvestment of dividends and, unlike the Fund’s returns, do not reflect any fees or expenses. If such fees and expenses were included in the index returns, the performance would have been lower. Please note that one cannot invest directly in an unmanaged index.
Performance figures for the periods shown may reflect contractual fee waivers and/or expense reimbursements. In the absence of fee waivers and/or expense reimbursements (if applicable), returns would have been lower.
Returns shown do not reflect the deduction of taxes that a shareholder would pay on Fund distributions or the redemption of Fund shares.
The Russell 3000® Index measures the performance of the largest 3,000 US companies representing approximately 98% of the investable US equity market. The Russell 3000® Index is constructed to provide a comprehensive, unbiased and stable barometer of the broad market and is completely reconstituted annually to ensure new and growing equities are included.
The Bloomberg U.S. Aggregate Bond Index is a broad based index that measures the investment grade, U.S. dollar denominated, fixed rate, taxable bond market.
27
CATHOLIC RESPONSIBLE INVESTMENTS ULTRA SHORT BOND FUND
OCTOBER 31, 2022
| SECTOR WEIGHTINGS (unaudited)† |
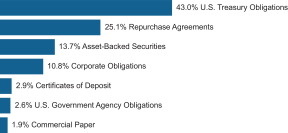
† Percentages are based on total investments. Total investments do not include derivatives such as options, futures contracts, forward contracts, and swap contracts, if applicable.
| ||||||||
U.S. TREASURY OBLIGATIONS — 44.4% |
| |||||||
| Face Amount | Value | |||||||
U.S. Cash Management Bill | ||||||||
3.940%, 02/14/23(A) | $ | 402,500 | $ | 397,679 | ||||
3.236%, 01/10/23(A) | 1,100,000 | 1,091,756 | ||||||
2.714%, 11/29/22(A) | 3,000,000 | 2,991,651 | ||||||
2.247%, 11/08/22(A) | 611,600 | 611,283 | ||||||
U.S. Treasury Bill | ||||||||
4.114%, 04/13/23(A) | 1,050,000 | 1,029,379 | ||||||
3.099%, 12/15/22(A) | 6,155,300 | 6,128,988 | ||||||
2.964%, 01/26/23(A) | 1,650,000 | 1,634,283 | ||||||
2.806%, 12/13/22(A) | 1,500,000 | 1,493,844 | ||||||
2.532%, 01/05/23(A) | 1,200,000 | 1,191,788 | ||||||
2.506%, 11/03/22(A) | 2,500,000 | 2,499,703 | ||||||
0.000%, 02/02/23 (A) | 484,700 | 479,641 | ||||||
0.000%, 02/28/23 (A) | 1,500,000 | 1,479,108 | ||||||
U.S. Treasury Bill - WI Post Auction | ||||||||
3.132%, 01/03/23(A) | 1,100,000 | 1,092,666 | ||||||
2.755%, 12/06/22(A) | 1,500,000 | 1,494,868 | ||||||
|
| |||||||
Total U.S. Treasury Obligations | ||||||||
(Cost $23,635,942) | 23,616,637 | |||||||
|
| |||||||
REPURCHASE AGREEMENTS — 26.0% |
| |||||||
| Face Amount | Value | |||||||
Gold Triparty Mortgage | $ | 7,700,000 | $ | 7,700,000 | ||||
|
| |||||||
REPURCHASE AGREEMENTS — continued |
| |||||||
| Face Amount | Value | |||||||
Socgen Triparty Tsy | $ | 6,100,000 | $ | 6,100,000 | ||||
|
| |||||||
Total Repurchase Agreements | ||||||||
(Cost $13,800,000) | $ | 13,800,000 | ||||||
|
| |||||||
| ASSET-BACKED SECURITIES — 14.1% | ||||||||
| Face Amount | Value | |||||||
Automotive — 12.0% | ||||||||
Ally Auto Receivables Trust, Ser 2022-1, Cl A1 | ||||||||
1.355%, 05/15/23 | $ | 5,519 | $ | 5,513 | ||||
American Credit Acceptance Receivables Trust, Ser 2019-1, Cl D | ||||||||
3.810%, 04/14/25 (B) | 25,089 | 25,069 | ||||||
American Credit Acceptance Receivables Trust, Ser 2020-1, Cl C | ||||||||
2.190%, 03/13/26 (B) | 2,008 | 2,006 | ||||||
American Credit Acceptance Receivables Trust, Ser 2022-2, Cl A | ||||||||
2.660%, 02/13/26 (B) | 126,882 | 125,403 | ||||||
American Credit Acceptance Receivables Trust, Ser 2022-3, Cl A | ||||||||
4.120%, 02/13/26 (B) | 39,223 | 38,877 | ||||||
AmeriCredit Automobile Receivables Trust, Ser 2019-2, Cl B | ||||||||
2.540%, 07/18/24 | 1,458 | 1,456 | ||||||
AmeriCredit Automobile Receivables Trust, Ser 2019-3, Cl B | ||||||||
2.130%, 07/18/25 | 59,319 | 59,147 | ||||||
AmeriCredit Automobile Receivables Trust, Ser 2021-1, Cl A3 | ||||||||
0.370%, 08/18/25 | 199,797 | 195,836 | ||||||
AmeriCredit Automobile Receivables Trust, Ser 2021-3, Cl A2 | ||||||||
0.410%, 02/18/25 | 88,547 | 87,718 | ||||||
The accompanying notes are an integral part of the financial statements.
28
CATHOLIC RESPONSIBLE INVESTMENTS ULTRA SHORT BOND FUND
OCTOBER 31, 2022
| ASSET-BACKED SECURITIES — continued | ||||||||
| Face Amount | Value | |||||||
AmeriCredit Automobile Receivables Trust, Ser 2022-1, Cl A2 | ||||||||
2.050%, 01/20/26 | $ | 147,852 | $ | 145,713 | ||||
AmeriCredit Automobile Receivables Trust, Ser 2022-2, Cl A1 | ||||||||
2.192%, 06/19/23 | 19,560 | 19,540 | ||||||
AmeriCredit Automobile Receivables Trust, Ser 2022-2, Cl A2A | ||||||||
4.200%, 12/18/25 | 100,000 | 99,183 | ||||||
ARI Fleet Lease Trust, Ser 2021-A, Cl A2 | ||||||||
0.370%, 03/15/30 (B) | 206,015 | 201,751 | ||||||
BMW Vehicle Owner Trust, Ser 2022-A, Cl A2B | ||||||||
3.517%, SOFR30A + 0.520%, 12/26/24 (C) | 65,000 | 64,978 | ||||||
CarMax Auto Owner Trust, Ser 2022-2, Cl A2B | ||||||||
3.391%, SOFR30A + 0.600%, 05/15/25 (C) | 55,484 | 55,458 | ||||||
Carvana Auto Receivables Trust, Ser 2019-4A, Cl C | ||||||||
2.720%, 01/15/25 (B) | 66,503 | 66,346 | ||||||
Carvana Auto Receivables Trust, Ser 2021-N2, Cl A1 | ||||||||
0.320%, 03/10/28 | 10,530 | 10,319 | ||||||
Chase Auto Owner Trust, Ser 2022-AA, Cl A1 | ||||||||
2.983%, 08/25/23 (B) | 175,855 | 175,317 | ||||||
Chesapeake Funding II, Ser 2019-1A, Cl A1 | ||||||||
2.940%, 04/15/31 (B) | 373 | 373 | ||||||
CIG Auto Receivables Trust, Ser 2020-1A, Cl B | ||||||||
1.550%, 01/13/25 (B) | 62,368 | 62,245 | ||||||
CPS Auto Receivables Trust, Ser 2022-C, Cl A | ||||||||
4.180%, 04/15/30 (B) | 86,148 | 85,214 | ||||||
Credit Acceptance Auto Loan Trust, Ser 2020-1A, Cl A | ||||||||
2.010%, 02/15/29 (B) | 24,824 | 24,800 | ||||||
Donlen Fleet Lease Funding 2, Ser 2021-2, Cl A1 | ||||||||
3.644%, ICE LIBOR USD 1 Month + 0.330%, 12/11/34 (B)(C) | 140,668 | 139,894 | ||||||
Drive Auto Receivables Trust, Ser 2020-1, Cl C | ||||||||
2.360%, 03/16/26 | 110,423 | 110,146 | ||||||
| ASSET-BACKED SECURITIES — continued | ||||||||
| Face Amount | Value | |||||||
Drive Auto Receivables Trust, Ser 2020-2, Cl C | ||||||||
2.280%, 08/17/26 | $ | 117,907 | $ | 116,856 | ||||
Drive Auto Receivables Trust, Ser 2021-1, Cl B | ||||||||
0.650%, 07/15/25 | 94,022 | 93,758 | ||||||
Drive Auto Receivables Trust, Ser 2021-1, Cl C | ||||||||
1.020%, 06/15/27 | 170,000 | 164,693 | ||||||
Drive Auto Receivables Trust, Ser 2021-2, Cl A3 | ||||||||
0.350%, 03/17/25 | 31,300 | 31,275 | ||||||
Drive Auto Receivables Trust, Ser 2021-3, Cl A2 | ||||||||
0.520%, 01/15/25 | 27,507 | 27,453 | ||||||
DT Auto Owner Trust, Ser 2020-3A, Cl B | ||||||||
0.910%, 12/16/24 (B) | 68,020 | 67,626 | ||||||
DT Auto Owner Trust, Ser 2021-1A, Cl A | ||||||||
0.350%, 01/15/25 (B) | 2,377 | 2,373 | ||||||
DT Auto Owner Trust, Ser 2021-2A, Cl A | ||||||||
0.410%, 03/17/25 (B) | 35,428 | 35,218 | ||||||
DT Auto Owner Trust, Ser 2021-3A, Cl A | ||||||||
0.330%, 04/15/25 (B) | 150,122 | 148,243 | ||||||
Enterprise Fleet Financing, Ser 2019-3, Cl A3 | ||||||||
2.190%, 05/20/25 (B) | 200,000 | 198,547 | ||||||
Exeter Automobile Receivables Trust, Ser 2020-2A, Cl C | ||||||||
3.280%, 05/15/25 (B) | 83,761 | 83,459 | ||||||
Exeter Automobile Receivables Trust, Ser 2021-3A, Cl B | ||||||||
0.690%, 01/15/26 | 100,000 | 98,181 | ||||||
Exeter Automobile Receivables Trust, Ser 2022-1A, Cl A2 | ||||||||
1.150%, 06/17/24 | 120,927 | 120,612 | ||||||
Exeter Automobile Receivables Trust, Ser 2022-3A, Cl A2 | ||||||||
3.450%, 08/15/24 | 82,890 | 82,610 | ||||||
Exeter Automobile Receivables Trust, Ser 2022-4A, Cl A2 | ||||||||
3.990%, 08/15/24 | 60,000 | 59,841 | ||||||
Exeter Automobile Receivables Trust, Ser 2022-5A, Cl A2 | ||||||||
5.290%, 01/15/25 | 175,000 | 174,734 | ||||||
First Investors Auto Owner Trust, Ser 2021-1A, Cl A | ||||||||
0.450%, 03/16/26 (B) | 105,507 | 103,994 | ||||||
The accompanying notes are an integral part of the financial statements.
29
CATHOLIC RESPONSIBLE INVESTMENTS ULTRA SHORT BOND FUND
OCTOBER 31, 2022
| ASSET-BACKED SECURITIES — continued | ||||||||
| Face Amount | Value | |||||||
Flagship Credit Auto Trust, Ser 2018-4, Cl C | ||||||||
4.110%, 10/15/24 (B) | $ | 5,087 | $ | 5,084 | ||||
Flagship Credit Auto Trust, Ser 2020-1, Cl B | ||||||||
2.050%, 02/17/25 (B) | 44,526 | 44,388 | ||||||
Flagship Credit Auto Trust, Ser 2020-3, Cl A | ||||||||
0.700%, 04/15/25 (B) | 34,991 | 34,896 | ||||||
Flagship Credit Auto Trust, Ser 2020-4, Cl A | ||||||||
0.530%, 04/15/25 (B) | 25,342 | 25,271 | ||||||
Flagship Credit Auto Trust, Ser 2021-1, Cl A | ||||||||
0.310%, 06/16/25 (B) | 100,189 | 99,370 | ||||||
Ford Credit Auto Lease Trust, Ser 2022-A, Cl A2B | ||||||||
3.391%, SOFR30A + 0.600%, 10/15/24 (C) | 37,441 | 37,470 | ||||||
Ford Credit Auto Owner Trust, Ser 2022-C, Cl A1 | ||||||||
3.633%, 10/15/23 | 150,246 | 150,038 | ||||||
Foursight Capital Automobile Receivables Trust, Ser 2022-2, Cl A1 | ||||||||
3.312%, 08/15/23 (B) | 91,888 | 91,780 | ||||||
GLS Auto Receivables Issuer Trust, Ser 2020-4A, Cl B | ||||||||
0.870%, 12/16/24 (B) | 3,888 | 3,882 | ||||||
GLS Auto Receivables Issuer Trust, Ser 2022-2A, Cl A1 | ||||||||
1.723%, 06/15/23 (B) | 11,962 | 11,950 | ||||||
GM Financial Automobile Leasing Trust, Ser 2021-1, Cl A3 | ||||||||
0.260%, 02/20/24 | 149,320 | 147,934 | ||||||
Honda Auto Receivables Owner Trust, Ser 2020-1, Cl A3 | ||||||||
1.610%, 04/22/24 | 133,732 | 132,450 | ||||||
Hyundai Auto Lease Securitization Trust, Ser 2022-B, Cl A2B | ||||||||
3.411%, SOFR30A + 0.620%, 10/15/24 (B)(C) | 95,209 | 95,191 | ||||||
Santander Drive Auto Receivables Trust, Ser 2020-2, Cl C | ||||||||
1.460%, 09/15/25 | 141,973 | 141,219 | ||||||
Santander Drive Auto Receivables Trust, Ser 2021-1, Cl C | ||||||||
0.750%, 02/17/26 | 275,000 | 269,864 | ||||||
| ASSET-BACKED SECURITIES — continued | ||||||||
| Face Amount | Value | |||||||
Santander Drive Auto Receivables Trust, Ser 2022-4, Cl A2 | ||||||||
4.050%, 07/15/25 | $ | 160,000 | $ | 158,856 | ||||
Santander Drive Auto Receivables Trust, Ser 2022-5, Cl A2 | ||||||||
3.980%, 01/15/25 | 95,000 | 94,345 | ||||||
Santander Drive Auto Receivables Trust, Ser 2022-6, Cl A2 | ||||||||
4.370%, 05/15/25 | 85,000 | 84,467 | ||||||
United Auto Credit Securitization Trust, Ser 2022-1, Cl A | ||||||||
1.110%, 07/10/24 (B) | 33,372 | 33,119 | ||||||
United Auto Credit Securitization Trust, Ser 2022-2, Cl A | ||||||||
4.390%, 04/10/25 (B) | 128,831 | 127,928 | ||||||
Westlake Automobile Receivables Trust, Ser 2019-1A, Cl E | ||||||||
4.490%, 07/15/24 (B) | 123,181 | 123,150 | ||||||
Westlake Automobile Receivables Trust, Ser 2019-3A, Cl D | ||||||||
2.720%, 11/15/24 (B) | 285,242 | 282,903 | ||||||
Westlake Automobile Receivables Trust, Ser 2021-1A, Cl A2A | ||||||||
0.390%, 10/15/24 (B) | 18,519 | 18,419 | ||||||
Westlake Automobile Receivables Trust, Ser 2021-3A, Cl A2 | ||||||||
0.570%, 09/16/24 (B) | 192,335 | 190,529 | ||||||
Westlake Automobile Receivables Trust, Ser 2022-2A, Cl A1 | ||||||||
1.808%, 06/15/23 (B) | 55,763 | 55,668 | ||||||
Westlake Automobile Receivables Trust, Ser 2022-3A, Cl A1 | ||||||||
4.005%, 10/16/23 (B) | 275,000 | 274,665 | ||||||
World Omni Auto Receivables Trust, Ser 2019-A, Cl A4 | ||||||||
3.220%, 06/16/25 | 160,000 | 159,538 | ||||||
World Omni Auto Receivables Trust, Ser 2022-B, Cl A2B | ||||||||
3.361%, SOFR30A + 0.570%, 10/15/25 (C) | 60,000 | 59,805 | ||||||
|
| |||||||
| 6,365,954 | ||||||||
|
| |||||||
The accompanying notes are an integral part of the financial statements.
30
CATHOLIC RESPONSIBLE INVESTMENTS ULTRA SHORT BOND FUND
OCTOBER 31, 2022
| ASSET-BACKED SECURITIES — continued | ||||||||
| Face Amount | Value | |||||||
Other Asset-Backed Securities — 2.1% |
| |||||||
BHG Securitization Trust, Ser 2022-C, Cl A | ||||||||
5.320%, 10/17/35 (B) | $ | 99,156 | $ | 98,258 | ||||
CCG Receivables Trust, Ser 2022-1, Cl A1 | ||||||||
1.842%, 06/14/23 (B) | 37,365 | 37,285 | ||||||
Cloud Pass-Through Trust, Ser 2019-1A, Cl CLOU | ||||||||
3.554%, 12/05/22 (B)(C) | 84 | 84 | ||||||
Dell Equipment Finance Trust, Ser 2022-2, Cl A1 | ||||||||
3.062%, 07/24/23 (B) | 122,589 | 122,264 | ||||||
DLLAD, Ser 2021-1A, Cl A2 | ||||||||
0.350%, 09/20/24 (B) | 130,621 | 128,060 | ||||||
DLLST, Ser 2022-1A, Cl A1 | ||||||||
1.560%, 05/22/23 (B) | 65,306 | 65,128 | ||||||
FREED ABS Trust, Ser 2022-1FP, Cl A | ||||||||
0.940%, 03/19/29 (B) | 18,777 | 18,612 | ||||||
GreatAmerica Leasing Receivables Funding Series, Ser 2022-1, Cl A1 | ||||||||
4.335%, 10/16/23 (B) | 135,000 | 134,757 | ||||||
Hpefs Equipment Trust, Ser 2022-2A, Cl A1 | ||||||||
1.905%, 05/22/23 (B) | 46,270 | 46,086 | ||||||
Hpefs Equipment Trust, Ser 2022-3A, Cl A1 | ||||||||
4.331%, 10/20/23 (B) | 275,000 | 274,724 | ||||||
Kubota Credit Owner Trust, Ser 2022-2A, Cl A1 | ||||||||
3.052%, 07/17/23 (B) | 92,755 | 92,475 | ||||||
Marlin Receivables, Ser 2022-1A, Cl A1 | ||||||||
3.372%, 07/20/23 (B) | 134,949 | 134,223 | ||||||
|
| |||||||
| 1,151,956 | ||||||||
|
| |||||||
Total Asset-Backed Securities | ||||||||
(Cost $7,546,326) | 7,517,910 | |||||||
|
| |||||||
CORPORATE OBLIGATIONS — 11.2% |
| |||||||
| Face Amount | Value | |||||||
COMMUNICATION SERVICES — 0.4% |
| |||||||
Warnermedia Holdings | ||||||||
4.752%, SOFRINDX + 1.780%, 03/15/24(B)(C) | $ | 215,000 | $ | 214,421 | ||||
|
| |||||||
CONSUMER DISCRETIONARY — 0.3% |
| |||||||
Starbucks | ||||||||
3.107%, SOFRINDX + 0.420%, 02/14/24(C) | 175,000 | 174,270 | ||||||
|
| |||||||
| CORPORATE OBLIGATIONS — continued | ||||||||
| Face Amount | Value | |||||||
CONSUMER STAPLES — 0.3% |
| |||||||
Daimler Trucks Finance North America | ||||||||
4.058%, U.S. SOFR + 1.000%, 04/05/24(B)(C) | $ | 175,000 | $ | 174,520 | ||||
|
| |||||||
ENERGY — 0.5% |
| |||||||
Enbridge | ||||||||
3.342%, SOFRINDX + 0.630%, 02/16/24(C) | 250,000 | 247,236 | ||||||
|
| |||||||
FINANCIALS — 6.2% |
| |||||||
American Express | ||||||||
3.782%, SOFRINDX + 0.720%, 05/03/24(C) | 150,000 | 149,375 | ||||||
Bank of Montreal MTN | ||||||||
3.622%, SOFRINDX + 0.710%, 03/08/24(C) | 300,000 | 298,041 | ||||||
Canadian Imperial Bank of Commerce | ||||||||
3.823%, U.S. SOFR + 0.800%, 03/17/23(C) | 175,000 | 174,934 | ||||||
Cooperatieve Rabobank UA | ||||||||
3.580%, U.S. SOFR + 0.530%, 06/28/23(C) | 300,000 | 299,704 | ||||||
Credit Suisse NY | ||||||||
3.034%, SOFRINDX + 0.380%, 08/09/23(C) | 300,000 | 291,881 | ||||||
Deutsche Bank NY | ||||||||
3.137%, U.S. SOFR + 0.500%, 11/08/23(C) | 225,000 | 222,181 | ||||||
Equitable Financial Life Global Funding | ||||||||
3.449%, U.S. SOFR + 0.390%, 04/06/23(B)(C) | 450,000 | 448,578 | ||||||
Morgan Stanley MTN | ||||||||
3.125%, 01/23/23 | 350,000 | 348,811 | ||||||
New York Life Global Funding MTN | ||||||||
3.302%, SOFRINDX + 0.430%, 06/06/24(B)(C) | 300,000 | 297,887 | ||||||
Nordea Bank Abp NY | ||||||||
3.220%, U.S. SOFR + 0.170%, 11/28/22(C) | 250,000 | 250,004 | ||||||
Toronto-Dominion Bank MTN | ||||||||
3.298%, U.S. SOFR + 0.240%, 01/06/23(C) | 150,000 | 149,910 | ||||||
UBS | ||||||||
3.173%, U.S. SOFR + 0.320%, 06/01/23(B)(C) | 375,000 | 374,171 | ||||||
|
| |||||||
| 3,305,477 | ||||||||
|
| |||||||
The accompanying notes are an integral part of the financial statements.
31
CATHOLIC RESPONSIBLE INVESTMENTS ULTRA SHORT BOND FUND
OCTOBER 31, 2022
| CORPORATE OBLIGATIONS — continued | ||||||||
| Face Amount | Value | |||||||
INDUSTRIALS — 0.7% |
| |||||||
Caterpillar Financial Services MTN | ||||||||
3.229%, U.S. SOFR + 0.170%, 01/10/24(C) | $ | 175,000 | $ | 174,159 | ||||
3.137%, U.S. SOFR + 0.450%, 11/13/23(C) | 200,000 | 199,894 | ||||||
|
| |||||||
| 374,053 | ||||||||
|
| |||||||
INFORMATION TECHNOLOGY — 0.4% |
| |||||||
QUALCOMM | ||||||||
5.145%, ICE LIBOR USD 3 Month + 0.730%, 01/30/23(C) | 194,000 | 194,098 | ||||||
|
| |||||||
UTILITIES — 2.4% |
| |||||||
Florida Power & Light | ||||||||
2.920%, SOFRINDX + 0.250%, 05/10/23(C) | 200,000 | 199,314 | ||||||
National Rural Utilities Cooperative Finance MTN | ||||||||
3.462%, U.S. SOFR + 0.400%, 08/07/23(C) | 225,000 | 224,389 | ||||||
NextEra Energy Capital Holdings | ||||||||
3.393%, SOFRINDX + 0.540%, 03/01/23(C) | 225,000 | 224,700 | ||||||
3.254%, ICE LIBOR USD 3 Month + 0.270%, 02/22/23(C) | 300,000 | 299,462 | ||||||
Southern | ||||||||
3.040%, SOFRINDX + 0.370%, 05/10/23(C) | 300,000 | 298,701 | ||||||
|
| |||||||
| 1,246,566 | ||||||||
|
| |||||||
Total Corporate Obligations | ||||||||
(Cost $5,961,566) | 5,930,641 | |||||||
|
| |||||||
CERTIFICATES OF DEPOSIT — 3.1% |
| |||||||
| Face Amount | Value | |||||||
Bank of Nova Scotia | ||||||||
3.700%, 04/27/23 | $ | 500,000 | $ | 500,000 | ||||
BofA Securities | ||||||||
1.320%, 06/16/23 | 250,000 | 249,706 | ||||||
Commonwealth Bank of Australia | ||||||||
3.380%, 04/27/23 | 375,000 | 374,554 | ||||||
Toronto-Dominion Bank | ||||||||
0.000%, 05/01/23 | 500,000 | 499,945 | ||||||
|
| |||||||
Total Certificates of Deposit | ||||||||
(Cost $1,625,000) | 1,624,205 | |||||||
|
| |||||||
| U.S. GOVERNMENT AGENCY OBLIGATIONS — 2.7% | ||||||||
| Face Amount | Value | |||||||
FFCB | ||||||||
3.085%, U.S. SOFR + 0.035%, 07/12/23(C) | $ | 600,000 | $ | 600,099 | ||||
FHLB | ||||||||
4.375%, 04/27/23 | 850,000 | 848,866 | ||||||
|
| |||||||
Total U.S. Government Agency Obligations | ||||||||
(Cost $1,449,704) | 1,448,965 | |||||||
|
| |||||||
COMMERCIAL PAPER — 1.9% |
| |||||||
| Face Amount | Value | |||||||
Bank of Montreal | ||||||||
2.811%, 05/24/23 (A) | $ | 250,000 | $ | 242,846 | ||||
BofA Securities | ||||||||
5.204%, 05/19/23 (A) | 300,000 | 291,592 | ||||||
Canadian Imperial Holdings | ||||||||
2.871%, 12/16/22 (A) | 250,000 | 248,830 | ||||||
Landesbank Baden-Wuerttemberg NY | ||||||||
2.306%, 01/10/23 (A) | 250,000 | 247,966 | ||||||
|
| |||||||
Total Commercial Paper | ||||||||
(Cost $1,035,763) | $ | 1,031,234 | ||||||
|
| |||||||
Total Investments in Securities— 103.4% |
| |||||||
(Cost $55,054,301) | $ | 54,969,592 | ||||||
|
| |||||||
Percentages are based on Net Assets of $53,159,210.
| (A) | Interest rate represents the security’s effective yield at the time of purchase. |
| (B) | Securities sold within the terms of a private placement memorandum, exempt from registration under section 144A of the Securities Act of 1933, as amended, and maybe sold only to dealers in the program or other “accredited investors”. The total value of these securities at October 31, 2022 was $7,389,813 and represented 13.9% of Net Assets. |
| (C) | Variable or floating rate security. The rate shown is the effective interest rate as of period end. The rates for certain securities are not based on published reference rates and spreads and are either determined by the issuer or agent based on current market conditions; by using a formula based on the rates of underlying loans; or by adjusting periodically based on prevailing interest rates. |
The accompanying notes are an integral part of the financial statements.
32
CATHOLIC RESPONSIBLE INVESTMENTS ULTRA SHORT BOND FUND
OCTOBER 31, 2022
Cl — Class
FFCB — Federal Farm Credit Bank
FHLB — Federal Home Loan Bank
LIBOR — London Interbank Offered Rate
MTN — Medium Term Note
Ser — Series
SOFR — Secured Overnight Financing Rate
SOFR30A — Secured Overnight Financing Rate 30-day Average
SOFRINDX — Secured Overnight Financing Rate
USD — U.S. Dollar
As of October 31, 2022, all of the Fund’s investments in securities were considered Level 2, in accordance with the authoritative guidance of fair value measurements and disclosure under U.S. generally accepted accounting principles.
Amounts designated as “–” are $0.
For more information on valuation inputs, see Note 2 — Significant Accounting Policies in the Notes to Financial Statements.
The accompanying notes are an integral part of the financial statements.
33
CATHOLIC RESPONSIBLE INVESTMENTS SHORT DURATION BOND FUND
OCTOBER 31, 2022
| SECTOR WEIGHTINGS (unaudited)† |
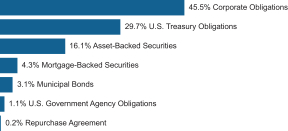
† Percentages are based on total investments. Total investments do not include derivatives such as options, futures contracts, forward contracts, and swap contracts, if applicable.
SCHEDULE OF INVESTMENTS |
| |||||||
| CORPORATE OBLIGATIONS — 43.9% | ||||||||
| Face Amount | Value | |||||||
COMMUNICATION SERVICES — 2.1% |
| |||||||
AT&T | ||||||||
0.000%, 11/27/22(A) | $ | 2,000,000 | $ | 1,993,217 | ||||
Comcast | ||||||||
5.250%, 11/07/25 | 610,000 | 609,835 | ||||||
NTT Finance | ||||||||
4.239%, 07/25/25(A) | 740,000 | 720,100 | ||||||
Sprint Spectrum | ||||||||
4.738%, 03/20/25(A) | 1,600,000 | 1,575,457 | ||||||
Time Warner Cable Enterprises | ||||||||
8.375%, 03/15/23 | 2,400,000 | 2,426,186 | ||||||
Warnermedia Holdings | ||||||||
3.428%, 03/15/24(A) | 2,625,000 | 2,531,310 | ||||||
|
| |||||||
| 9,856,105 | ||||||||
|
| |||||||
CONSUMER DISCRETIONARY — 3.1% |
| |||||||
Dollar General | ||||||||
4.250%, 09/20/24 | 1,000,000 | 981,605 | ||||||
DR Horton | ||||||||
2.600%, 10/15/25 | 2,575,000 | 2,350,588 | ||||||
Ford Motor Credit | ||||||||
2.300%, 02/10/25 | 2,500,000 | 2,277,749 | ||||||
General Motors Financial | ||||||||
4.150%, 06/19/23 | 1,975,000 | 1,958,505 | ||||||
Lennar | ||||||||
4.875%, 12/15/23 | 2,000,000 | 1,980,608 | ||||||
4.750%, 05/30/25 | 1,825,000 | 1,773,680 | ||||||
Lowe’s | ||||||||
4.400%, 09/08/25 | 1,250,000 | 1,224,830 | ||||||
Marriott International | ||||||||
3.125%, 02/15/23 | 780,000 | 775,391 | ||||||
| CORPORATE OBLIGATIONS — continued | ||||||||
| Face Amount | Value | |||||||
| CONSUMER DISCRETIONARY — continued | ||||||||
Mileage Plus Holdings | ||||||||
6.500%, 06/20/27(A) | $ | 1,282,500 | $ | 1,267,886 | ||||
|
| |||||||
| 14,590,842 | ||||||||
|
| |||||||
CONSUMER STAPLES — 1.2% |
| |||||||
Bunge Finance | ||||||||
1.630%, 08/17/25 | 2,200,000 | 1,968,419 | ||||||
CVS Pass-Through Trust | ||||||||
6.036%, 12/10/28 | 2,532,259 | 2,491,551 | ||||||
Mondelez International Holdings Netherlands BV | ||||||||
4.250%, 09/15/25(A) | 1,250,000 | 1,214,614 | ||||||
|
| |||||||
| 5,674,584 | ||||||||
|
| |||||||
ENERGY — 2.4% |
| |||||||
Continental Resources | ||||||||
3.800%, 06/01/24 | 1,695,000 | 1,634,802 | ||||||
Equities | ||||||||
6.125%, 02/01/25 | 1,250,000 | 1,253,088 | ||||||
5.678%, 10/01/25 | 1,000,000 | 989,482 | ||||||
Hydro-Quebec | ||||||||
8.050%, 07/07/24 | 2,000,000 | 2,101,047 | ||||||
MidAmerican Energy | ||||||||
3.100%, 05/01/27 | 2,000,000 | 1,841,859 | ||||||
Petroleos Mexicanos | ||||||||
2.830%, 02/15/24 | 276,750 | 272,141 | ||||||
1.950%, 12/20/22 | 315,000 | 313,732 | ||||||
1.700%, 12/20/22 | 292,000 | 290,729 | ||||||
Plains All American Pipeline | ||||||||
4.650%, 10/15/25 | 2,250,000 | 2,173,915 | ||||||
|
| |||||||
| 10,870,795 | ||||||||
|
| |||||||
FINANCIALS — 25.6% |
| |||||||
ABN AMRO Bank | ||||||||
7.750%, 05/15/23(A) | 1,700,000 | 1,711,975 | ||||||
Aflac | ||||||||
1.125%, 03/15/26 | 900,000 | 787,236 | ||||||
African Development Bank | ||||||||
0.750%, 04/03/23 | 2,700,000 | 2,656,588 | ||||||
AIB Group | ||||||||
7.583%, U.S. SOFR + 3.456%, 10/14/26(A)(B) | 750,000 | 743,769 | ||||||
American Express | ||||||||
3.950%, 08/01/25 | 825,000 | 792,371 | ||||||
Asian Development Bank MTN | ||||||||
1.750%, 08/14/26 | 2,387,000 | 2,154,752 | ||||||
Athene Global Funding | ||||||||
2.800%, 05/26/23(A) | 1,000,000 | 985,955 | ||||||
2.514%, 03/08/24(A) | 1,570,000 | 1,495,920 | ||||||
The accompanying notes are an integral part of the financial statements.
34
CATHOLIC RESPONSIBLE INVESTMENTS SHORT DURATION BOND FUND
OCTOBER 31, 2022
| CORPORATE OBLIGATIONS — continued | ||||||||
| Face Amount | Value | |||||||
| FINANCIALS — continued | ||||||||
Bank of America MTN | ||||||||
3.004%, ICE LIBOR USD 3 MONTH + 0.790%, 12/20/23(B) | $ | 2,075,000 | $ | 2,067,488 | ||||
1.530%, U.S. SOFR + 0.650%, 12/06/25(B) | 1,000,000 | 910,489 | ||||||
0.810%, U.S. SOFR + 0.740%, 10/24/24(B) | 2,000,000 | 1,897,734 | ||||||
Bank of Ireland Group | ||||||||
6.253%, H15T1Y + 2.650%, 09/16/26(A)(B) | 815,000 | 786,158 | ||||||
Bank One Michigan | ||||||||
8.250%, 11/01/24 | 1,925,000 | 2,018,642 | ||||||
Banque Federative du Credit Mutuel | ||||||||
4.524%, 07/13/25(A) | 1,225,000 | 1,184,671 | ||||||
Barclays | ||||||||
5.304%, H15T1Y + 2.300%, 08/09/26(B) | 1,450,000 | 1,377,810 | ||||||
BPCE | ||||||||
4.000%, 04/15/24 | 1,050,000 | 1,021,533 | ||||||
Brighthouse Financial Global Funding MTN | ||||||||
1.200%, 12/15/23(A) | 1,720,000 | 1,637,332 | ||||||
1.000%, 04/12/24(A) | 594,000 | 555,853 | ||||||
Caisse d’Amortissement de la Dette Sociale | ||||||||
3.000%, 05/17/25(A) | 428,000 | 410,663 | ||||||
0.375%, 05/27/24(A) | 1,000,000 | 934,320 | ||||||
Canadian Imperial Bank of Commerce | ||||||||
3.945%, 08/04/25 | 1,000,000 | 959,468 | ||||||
Capital One Financial | ||||||||
4.985%, U.S. SOFR + 2.160%, 07/24/26(B) | 825,000 | 792,454 | ||||||
4.166%, U.S. SOFR + 1.370%, 05/09/25(B) | 1,185,000 | 1,138,566 | ||||||
CDP Financial MTN | ||||||||
1.000%, 05/26/26(A) | 1,000,000 | 876,770 | ||||||
Citigroup | ||||||||
5.610%, U.S. SOFR + 1.546%, 09/29/26(B) | 1,250,000 | 1,232,972 | ||||||
3.754%, U.S. SOFR + 0.694%, 01/25/26(B) | 2,117,000 | 2,052,243 | ||||||
2.014%, U.S. SOFR + 0.694%, 01/25/26(B) | 1,000,000 | 913,310 | ||||||
0.776%, U.S. SOFR + 0.686%, 10/30/24(B) | 1,000,000 | 945,876 | ||||||
Cooperatieve Rabobank UA | ||||||||
3.875%, 08/22/24 | 750,000 | 731,788 | ||||||
| CORPORATE OBLIGATIONS — continued | ||||||||
| Face Amount | Value | |||||||
| FINANCIALS — continued | ||||||||
1.004%, H15T1Y + 0.730%, 09/24/26(A)(B) | $ | 1,000,000 | $ | 862,849 | ||||
Council of Europe Development Bank | ||||||||
3.000%, 06/16/25 | 1,000,000 | 960,892 | ||||||
Credit Agricole MTN | ||||||||
1.907%, U.S. SOFR + 1.676%, 06/16/26(A)(B) | 2,525,000 | 2,235,877 | ||||||
Credit Suisse Group | ||||||||
2.593%, U.S. SOFR + 1.560%, 09/11/25(A)(B) | 3,050,000 | 2,707,886 | ||||||
Credit Suisse NY | ||||||||
4.750%, 08/09/24 | 625,000 | 593,506 | ||||||
Deutsche Bank NY | ||||||||
2.222%, U.S. SOFR + 2.159%, 09/18/24(B) | 2,605,000 | 2,467,745 | ||||||
1.686%, 03/19/26 | 1,000,000 | 857,602 | ||||||
Diageo Capital | ||||||||
5.200%, 10/24/25 | 780,000 | 782,286 | ||||||
Equitable Financial Life Global Funding | ||||||||
1.100%, 11/12/24(A) | 2,670,000 | 2,445,651 | ||||||
European Investment Bank | ||||||||
2.875%, 06/13/25(A) | 2,000,000 | 1,918,864 | ||||||
2.125%, 04/13/26 | 447,000 | 413,075 | ||||||
0.625%, 10/21/27 | 2,000,000 | 1,668,154 | ||||||
Federation des Caisses Desjardins du Quebec | ||||||||
0.700%, 05/21/24(A) | 1,500,000 | 1,390,015 | ||||||
Fifth Third Bank | ||||||||
5.852%, U.S. SOFR + 1.230%, 10/27/25(B) | 1,130,000 | 1,130,899 | ||||||
GATX Financial 2005-1 Pass Through Trust | ||||||||
5.697%, 01/02/25(A) | 217,146 | 215,294 | ||||||
Goldman Sachs Group | ||||||||
5.700%, 11/01/24 | 750,000 | 749,430 | ||||||
4.387%, U.S. SOFR + 1.510%, 06/15/27(B) | 1,000,000 | 939,606 | ||||||
0.855%, U.S. SOFR + 0.609%, 02/12/26(B) | 579,000 | 513,129 | ||||||
HSBC Holdings | ||||||||
7.336%, U.S. SOFR + 3.030%, 11/03/26(B) | 1,000,000 | 1,002,387 | ||||||
3.033%, ICE LIBOR USD 3 Month + 0.923%, 11/22/23(B) | 2,000,000 | 1,995,979 | ||||||
ING Bank | ||||||||
5.800%, 09/25/23(A) | 2,500,000 | 2,490,501 | ||||||
The accompanying notes are an integral part of the financial statements.
35
CATHOLIC RESPONSIBLE INVESTMENTS SHORT DURATION BOND FUND
OCTOBER 31, 2022
| CORPORATE OBLIGATIONS — continued | ||||||||
| Face Amount | Value | |||||||
| FINANCIALS — continued | ||||||||
ING Groep | ||||||||
1.400%, H15T1Y + 1.100%, 07/01/26(A)(B) | $ | 1,000,000 | $ | 875,769 | ||||
Inter-American Development Bank | ||||||||
0.500%, 05/24/23 | 1,550,000 | 1,515,342 | ||||||
International Bank for Reconstruction & Development | ||||||||
3.362%, U.S. SOFR + 0.300%, 08/06/24(B) | 1,500,000 | 1,505,478 | ||||||
3.353%, SOFRINDX + 0.390%, 06/17/24(B) | 1,000,000 | 1,003,050 | ||||||
1.875%, 06/19/23 | 1,000,000 | 982,753 | ||||||
0.625%, 04/22/25 | 1,000,000 | 908,271 | ||||||
International Finance | ||||||||
3.141%, U.S. SOFR + 0.090%, 04/03/24(B) | 2,000,000 | 1,999,432 | ||||||
0.500%, 03/20/23 | 1,000,000 | 985,256 | ||||||
JPMorgan Chase | ||||||||
1.045%, U.S. SOFR + 0.800%, 11/19/26(B) | 1,500,000 | 1,291,568 | ||||||
0.768%, U.S. SOFR + 0.490%, 08/09/25(B) | 1,000,000 | 912,359 | ||||||
0.653%, TSFR3M + 0.600%, 09/16/24(B) | 2,500,000 | 2,386,267 | ||||||
Kansas City Southern | ||||||||
3.850%, 11/15/23 | 1,975,000 | 1,938,071 | ||||||
KeyBank | ||||||||
4.150%, 08/08/25 | 1,165,000 | 1,124,627 | ||||||
Macquarie Group | ||||||||
5.108%, U.S. SOFR + 2.208%, 08/09/26(A)(B) | 1,450,000 | 1,413,673 | ||||||
Massachusetts Mutual Life Insurance | ||||||||
7.625%, 11/15/23(A) | 2,250,000 | 2,281,074 | ||||||
Metropolitan Tower Life Insurance | ||||||||
7.625%, 01/15/24(A) | 2,000,000 | 2,033,636 | ||||||
Mitsubishi UFJ Financial Group | ||||||||
5.063%, H15T1Y + 1.550%, 09/12/25(B) | 1,000,000 | 985,222 | ||||||
4.788%, H15T1Y + 1.700%, 07/18/25(B) | 1,000,000 | 980,694 | ||||||
2.527%, 09/13/23 | 1,000,000 | 974,687 | ||||||
Morgan Stanley MTN | ||||||||
5.000%, 11/24/25 | 3,425,000 | 3,369,921 | ||||||
3.737%, ICE LIBOR USD 3 Month + 0.847%, 04/24/24(B) | 1,000,000 | 990,020 | ||||||
| CORPORATE OBLIGATIONS — continued | ||||||||
| Face Amount | Value | |||||||
| FINANCIALS — continued | ||||||||
0.864%, U.S. SOFR + 0.745%, 10/21/25(B) | $ | 1,000,000 | $ | 901,737 | ||||
National Bank of Canada MTN | ||||||||
0.550%, H15T1Y + 0.400%, 11/15/24(B) | 2,000,000 | 1,895,230 | ||||||
NatWest Group | ||||||||
2.359%, H15T1Y + 2.150%, 05/22/24(B) | 1,000,000 | 972,815 | ||||||
NatWest Markets | ||||||||
3.479%, 03/22/25(A) | 1,585,000 | 1,495,287 | ||||||
New York Life Global Funding MTN | ||||||||
3.600%, 08/05/25(A) | 825,000 | 789,019 | ||||||
PNC Financial Services Group | ||||||||
5.671%, SOFRINDX + 1.090%, 10/28/25(B) | 725,000 | 726,291 | ||||||
Royal Bank of Canada MTN | ||||||||
3.970%, 07/26/24 | 1,025,000 | 1,000,940 | ||||||
Santander Holdings USA | ||||||||
5.807%, U.S. SOFR + 2.328%, 09/09/26(B) | 1,850,000 | 1,791,022 | ||||||
Toronto-Dominion Bank MTN | ||||||||
3.501%, U.S. SOFR + 0.450%, 09/28/23(B) | 2,000,000 | 1,991,333 | ||||||
Truist Financial MTN | ||||||||
4.260%, U.S. SOFR + 1.456%, 07/28/26(B) | 1,025,000 | 987,936 | ||||||
TTX MTN | ||||||||
3.600%, 01/15/25(A) | 2,500,000 | 2,392,718 | ||||||
UBS Group | ||||||||
1.008%, H15T1Y + 0.830%, 07/30/24(A)(B) | 2,500,000 | 2,405,718 | ||||||
US Bancorp | ||||||||
5.727%, U.S. SOFR + 1.430%, 10/21/26(B) | 1,000,000 | 1,002,568 | ||||||
USAA Capital | ||||||||
1.500%, 05/01/23(A) | 1,000,000 | 982,731 | ||||||
0.500%, 05/01/24(A) | 2,500,000 | 2,337,535 | ||||||
Wells Fargo MTN | ||||||||
2.406%, U.S. SOFR + 1.087%, 10/30/25(B) | 4,825,000 | 4,492,687 | ||||||
0.805%, U.S. SOFR + 0.510%, 05/19/25(B) | 1,000,000 | 925,258 | ||||||
|
| |||||||
| 121,664,328 | ||||||||
|
| |||||||
HEALTH CARE — 0.8% | ||||||||
Adventist Health System | ||||||||
2.433%, 09/01/24 | 1,415,000 | 1,335,460 | ||||||
CommonSpirit Health | ||||||||
1.547%, 10/01/25 | 1,000,000 | 888,535 | ||||||
The accompanying notes are an integral part of the financial statements.
36
CATHOLIC RESPONSIBLE INVESTMENTS SHORT DURATION BOND FUND
OCTOBER 31, 2022
| CORPORATE OBLIGATIONS — continued | ||||||||
| Face Amount | Value | |||||||
HEALTH CARE — continued |
| |||||||
Elevance Health | ||||||||
5.350%, 10/15/25 | $ | 330,000 | $ | 330,017 | ||||
GSK Consumer Healthcare Capital UK | ||||||||
3.125%, 03/24/25(A) | 625,000 | 588,413 | ||||||
GSK Consumer Healthcare Capital US | ||||||||
3.024%, 03/24/24(A) | 525,000 | 506,425 | ||||||
|
| |||||||
| 3,648,850 | ||||||||
|
| |||||||
INDUSTRIALS — 2.3% | ||||||||
AerCap Ireland Capital DAC | ||||||||
4.875%, 01/16/24 | 1,000,000 | 981,340 | ||||||
4.125%, 07/03/23 | 1,925,000 | 1,901,294 | ||||||
Burlington Northern and Santa Fe Railway Pass Through Trust, Ser 2006-1 | ||||||||
5.720%, 01/15/24 | 511,660 | 520,101 | ||||||
CNH Industrial | ||||||||
4.500%, 08/15/23 | 2,375,000 | 2,355,879 | ||||||
Lennox International | ||||||||
3.000%, 11/15/23 | 2,000,000 | 1,951,255 | ||||||
Nature Conservancy | ||||||||
0.467%, 07/01/23 | 425,000 | 411,776 | ||||||
Republic Services | ||||||||
4.750%, 05/15/23 | 900,000 | 898,411 | ||||||
Xylem | ||||||||
1.950%, 01/30/28 | 2,155,000 | 1,808,065 | ||||||
|
| |||||||
| 10,828,121 | ||||||||
|
| |||||||
INFORMATION TECHNOLOGY — 1.3% |
| |||||||
Apple | ||||||||
2.850%, 02/23/23 | 2,000,000 | 1,989,794 | ||||||
Fiserv | ||||||||
3.800%, 10/01/23 | 2,015,000 | 1,985,171 | ||||||
Global Payments | ||||||||
4.000%, 06/01/23 | 2,000,000 | 1,983,950 | ||||||
|
| |||||||
| 5,958,915 | ||||||||
|
| |||||||
MATERIALS — 2.4% |
| |||||||
Air Liquide Finance | ||||||||
2.250%, 09/27/23(A) | 2,000,000 | 1,945,802 | ||||||
Berry Global | ||||||||
4.875%, 07/15/26(A) | 1,250,000 | 1,174,375 | ||||||
0.950%, 02/15/24 | 1,300,000 | 1,222,364 | ||||||
Celanese US Holdings | ||||||||
6.050%, 03/15/25 | 1,025,000 | 996,450 | ||||||
Graphic Packaging International | ||||||||
0.821%, 04/15/24(A) | 1,025,000 | 950,749 | ||||||
| CORPORATE OBLIGATIONS — continued | ||||||||
| Face Amount | Value | |||||||
MATERIALS — continued |
| |||||||
LG Chemical | ||||||||
4.375%, 07/14/25(A) | $ | 570,000 | $ | 550,562 | ||||
Nutrien | ||||||||
1.900%, 05/13/23 | 1,175,000 | 1,153,159 | ||||||
Sherwin-Williams | ||||||||
4.250%, 08/08/25 | 465,000 | 452,200 | ||||||
Steel Dynamics | ||||||||
5.000%, 12/15/26 | 1,550,000 | 1,494,202 | ||||||
Union Carbide | ||||||||
7.875%, 04/01/23 | 1,950,000 | 1,967,112 | ||||||
|
| |||||||
| 11,906,975 | ||||||||
|
| |||||||
UTILITIES — 2.7% |
| |||||||
Avangrid | ||||||||
3.200%, 04/15/25 | 2,500,000 | 2,349,335 | ||||||
3.150%, 12/01/24 | 1,000,000 | 950,945 | ||||||
Edison International | ||||||||
4.700%, 08/15/25 | 1,450,000 | 1,399,545 | ||||||
Electricite de France | ||||||||
3.625%, 10/13/25(A) | 500,000 | 471,856 | ||||||
NextEra Energy Capital Holdings | ||||||||
4.255%, 09/01/24 | 1,050,000 | 1,029,299 | ||||||
2.940%, 03/21/24 | 1,300,000 | 1,258,378 | ||||||
NorthWestern | ||||||||
1.000%, 03/26/24 | 2,600,000 | 2,455,104 | ||||||
Pacific Gas and Electric | ||||||||
3.837%, SOFRINDX + 1.150%, 11/14/22(B) | 370,000 | 369,741 | ||||||
Southern | ||||||||
5.150%, 10/06/25 | 750,000 | 746,276 | ||||||
Southern Power | ||||||||
4.150%, 12/01/25 | 1,000,000 | 970,971 | ||||||
0.900%, 01/15/26 | 1,000,000 | 865,235 | ||||||
|
| |||||||
| 12,866,685 | ||||||||
|
| |||||||
Total Corporate Obligations | ||||||||
(Cost $217,097,630) | 207,866,200 | |||||||
|
| |||||||
U.S. TREASURY OBLIGATIONS — 28.6% |
| |||||||
| Face Amount | Value | |||||||
U.S. Treasury Notes | ||||||||
4.375%, 10/31/24 | $ | 5,790,000 | $ | 5,776,203 | ||||
3.000%, 07/31/24 | 3,000,000 | 2,919,141 | ||||||
2.875%, 06/15/25 | 28,000,000 | 26,905,156 | ||||||
2.750%, 02/28/25 | 7,640,000 | 7,348,427 | ||||||
2.625%, 03/31/25 | 3,640,000 | 3,489,566 | ||||||
2.500%, 05/31/24 | 23,750,000 | 22,975,342 | ||||||
2.250%, 11/15/24 | 19,350,000 | 18,498,902 | ||||||
2.250%, 12/31/24 | 2,580,000 | 2,460,272 | ||||||
The accompanying notes are an integral part of the financial statements.
37
CATHOLIC RESPONSIBLE INVESTMENTS SHORT DURATION BOND FUND
OCTOBER 31, 2022
U.S. TREASURY OBLIGATIONS — continued |
| |||||||
| Face Amount | Value | |||||||
1.875%, 08/31/24 | $ | 17,875,000 | $ | 17,023,144 | ||||
1.750%, 12/31/24 | 14,145,000 | 13,361,500 | ||||||
1.125%, 02/28/25 | 3,780,000 | 3,501,225 | ||||||
0.375%, 12/31/25 | 3,500,000 | 3,086,016 | ||||||
0.250%, 06/30/25 | 9,150,000 | 8,204,619 | ||||||
|
| |||||||
Total U.S. Treasury Obligations | ||||||||
(Cost $142,116,163) | 135,549,513 | |||||||
|
| |||||||
ASSET-BACKED SECURITIES — 16.7% |
| |||||||
| Face Amount | Value | |||||||
Automotive — 6.1% | ||||||||
American Credit Acceptance Receivables Trust, Ser 2022-3, Cl A | ||||||||
4.120%, 02/13/26(A) | $ | 257,132 | $ | 254,864 | ||||
ARI Fleet Lease Trust, Ser 2022-A, Cl A2 | ||||||||
3.120%, 01/15/31(A) | 935,000 | 914,008 | ||||||
Avis Budget Rental Car Funding AESOP, Ser 2017-2A, Cl A | ||||||||
2.970%, 03/20/24(A) | 2,541,667 | 2,529,076 | ||||||
Carvana Auto Receivables Trust, Ser 2021-N3, Cl B | ||||||||
0.660%, 06/12/28 | 274,212 | 261,000 | ||||||
Carvana Auto Receivables Trust, Ser 2022-P3, Cl A2 | ||||||||
4.420%, 12/10/25 | 885,000 | 877,392 | ||||||
CPS Auto Receivables Trust, Ser 2022-C, Cl A | ||||||||
4.180%, 04/15/30(A) | 594,418 | 587,998 | ||||||
Drive Auto Receivables Trust, Ser 2021-2, Cl C | ||||||||
0.870%, 10/15/27 | 1,250,000 | 1,180,435 | ||||||
Enterprise Fleet Financing, Ser 2022-3, Cl A2 | ||||||||
4.380%, 07/20/29(A) | 285,000 | 279,744 | ||||||
Exeter Automobile Receivables Trust, Ser 2022-4A, Cl A2 | ||||||||
3.990%, 08/15/24 | 445,000 | 443,821 | ||||||
Flagship Credit Auto Trust, Ser 2022-2, Cl A2 | ||||||||
3.280%, 08/15/25(A) | 2,000,000 | 1,973,720 | ||||||
Flagship Credit Auto Trust, Ser 2022-3, Cl A2 | ||||||||
4.060%, 10/15/25(A) | 890,000 | 880,662 | ||||||
Foursight Capital Automobile Receivables Trust, Ser 2022-2, Cl A2 | ||||||||
4.490%, 03/16/26(A) | 1,895,000 | 1,871,251 | ||||||
ASSET-BACKED SECURITIES — continued |
| |||||||
| Face Amount | Value | |||||||
Hertz Vehicle Financing, Ser 2021-1A, Cl A | ||||||||
1.210%, 12/26/25(A) | $ | 2,575,000 | $ | 2,338,977 | ||||
Hyundai Auto Lease Securitization Trust, Ser 2022-B, Cl A3 | ||||||||
3.350%, 06/16/25(A) | 1,435,000 | 1,394,410 | ||||||
Santander Drive Auto Receivables Trust, Ser 2022-4, Cl A2 | ||||||||
4.050%, 07/15/25 | 1,160,000 | 1,151,701 | ||||||
Santander Drive Auto Receivables Trust, Ser 2022-5, Cl A2 | ||||||||
3.980%, 01/15/25 | 625,000 | 620,687 | ||||||
Tesla Auto Lease Trust, Ser 2021-A, Cl B | ||||||||
1.020%, 03/20/25(A) | 1,000,000 | 949,173 | ||||||
Tesla Auto Lease Trust, Ser 2021-B, Cl A3 | ||||||||
0.600%, 09/22/25(A) | 1,540,000 | 1,440,538 | ||||||
Toyota Auto Receivables Owner Trust, Ser 2022-B, Cl A3 | ||||||||
2.930%, 09/15/26 | 935,000 | 897,733 | ||||||
United Auto Credit Securitization Trust, Ser 2022-2, Cl A | ||||||||
4.390%, 04/10/25(A) | 1,320,709 | 1,311,455 | ||||||
Westlake Automobile Receivables Trust, Ser 2021-3A, Cl A3 | ||||||||
0.950%, 06/16/25 (A) | 1,908,000 | 1,847,914 | ||||||
Westlake Automobile Receivables Trust, Ser 2022-3A, Cl A2 | ||||||||
5.240%, 07/15/25 (A) | 1,250,000 | 1,244,429 | ||||||
World Omni Auto Receivables Trust, Ser 2020-C, Cl A3 | ||||||||
0.480%, 11/17/25 | 1,075,818 | 1,043,339 | ||||||
World Omni Select Auto Trust, Ser 2020-A, Cl B | ||||||||
0.840%, 06/15/26 | 2,500,000 | 2,419,469 | ||||||
|
| |||||||
| 28,713,796 | ||||||||
|
| |||||||
Other Asset-Backed Securities — 10.6% |
| |||||||
American Tower Trust #1, Ser 2013-13, Cl 2A | ||||||||
3.070%, 03/15/48 (A) | 3,265,000 | 3,235,853 | ||||||
Amur Equipment Finance Receivables VII, Ser 2019-1A, Cl A2 | ||||||||
2.630%, 06/20/24 (A) | 109,055 | 108,751 | ||||||
The accompanying notes are an integral part of the financial statements.
38
CATHOLIC RESPONSIBLE INVESTMENTS SHORT DURATION BOND FUND
OCTOBER 31, 2022
ASSET-BACKED SECURITIES — continued |
| |||||||
| Face Amount | Value | |||||||
Amur Equipment Finance Receivables XI, Ser 2022-2A, Cl A2 | ||||||||
5.300%, 06/21/28 (A) | $ | 455,000 | $ | 448,805 | ||||
BANK, Ser 2018-BN10, Cl ASB | ||||||||
3.641%, 02/15/61 | 415,000 | 391,667 | ||||||
BHG Securitization Trust, Ser 2022-C, Cl A | ||||||||
5.320%, 10/17/35 (A) | 366,876 | 363,583 | ||||||
BX Commercial Mortgage Trust, Ser 2022-AHP, Cl A | ||||||||
4.366%, TSFR1M + 0.990%, 01/17/39 (A)(B) | 492,000 | 472,323 | ||||||
CHL Mortgage Pass-Through Trust, Ser 2004-29, Cl 1A1 | ||||||||
5.401%, ICE LIBOR USD 1 Month + 0.540%, 02/25/35 (B) | 11,693 | 10,377 | ||||||
CIFC Funding, Ser 2017-5A, Cl A1 | ||||||||
5.259%, ICE LIBOR USD 3 Month + 1.180%, 11/16/30 (A)(B) | 1,275,000 | 1,254,220 | ||||||
CNH Equipment Trust, Ser 2022-B, Cl A2 | ||||||||
3.940%, 12/15/25 | 540,000 | 531,845 | ||||||
COMM Mortgage Trust, Ser 2013-CR11, Cl A4 | ||||||||
4.258%, 08/10/50 | 1,500,000 | 1,481,400 | ||||||
COMM Mortgage Trust, Ser 2013-WWP, Cl A1 | ||||||||
2.499%, 03/10/31 (A) | 187,835 | 187,350 | ||||||
COMM Mortgage Trust, Ser 2014-UBS5, Cl ASB | ||||||||
3.548%, 09/10/47 | 575,057 | 565,400 | ||||||
Community Program Loan Trust, Ser 1987-A, Cl B | ||||||||
4.500%, 10/01/29 | 6,032 | 5,794 | ||||||
CSAIL Commercial Mortgage Trust, Ser 2015-C1, Cl ASB | ||||||||
3.351%, 04/15/50 | 1,069,791 | 1,043,103 | ||||||
CSAIL Commercial Mortgage Trust, Ser 2018-CX11, Cl A3 | ||||||||
4.095%, 04/15/51 | 1,748,596 | 1,709,801 | ||||||
DBGS Mortgage Trust, Ser 2018-C1, Cl A1 | ||||||||
3.409%, 10/15/51 | 225,093 | 223,804 | ||||||
DBUBS Mortgage Trust, Ser 2017-BRBK, Cl E | ||||||||
3.530%, 10/10/34 (A)(B) | 521,000 | 464,100 | ||||||
ASSET-BACKED SECURITIES — continued |
| |||||||
| Face Amount | Value | |||||||
Dell Equipment Finance Trust, Ser 2022-2, Cl A2 | ||||||||
4.030%, 07/22/27 (A) | $ | 875,000 | $ | 865,353 | ||||
DLLST, Ser 2022-1A, Cl A2 | ||||||||
2.790%, 01/22/24 (A) | 810,000 | 799,531 | ||||||
Evergreen Credit Card Trust Series, Ser 2022-CRT1, Cl B | ||||||||
5.610%, 07/15/26 (A) | 2,000,000 | 1,948,711 | ||||||
Extended Stay America Trust, Ser 2021-ESH, Cl B | ||||||||
4.793%, ICE LIBOR USD 1 Month + 1.380%, 07/15/38 (A)(B) | 1,073,811 | 1,018,689 | ||||||
FCI Funding, Ser 2021-1A, Cl A | ||||||||
1.130%, 04/15/33 (A) | 487,005 | 473,822 | ||||||
Flatiron CLO 17, Ser 2021-1A, Cl AR | ||||||||
3.885%, ICE LIBOR USD 3 Month + 0.980%, 05/15/30 (A)(B) | 1,446,129 | 1,414,965 | ||||||
FREED ABS Trust, Ser 2022-2CP, Cl A | ||||||||
3.030%, 05/18/29 (A) | 1,332,336 | 1,317,554 | ||||||
Golub Capital Partners CLO, Ser 2017-24A, Cl AR | ||||||||
4.432%, ICE LIBOR USD 3 Month + 1.600%, 11/05/29 (A)(B) | 2,600,000 | 2,526,945 | ||||||
GoodLeap Sustainable Home Solutions Trust, Ser 2022-3CS, Cl B | ||||||||
5.500%, 07/20/49 (A) | 500,000 | 423,773 | ||||||
GreatAmerica Leasing Receivables Funding Series, Ser 2022-1, Cl A2 | ||||||||
4.920%, 05/15/25 (A) | 605,000 | 600,563 | ||||||
GS Mortgage Securities II, Ser 2018-GS10, Cl WLSC | ||||||||
4.904%, 03/10/33 (A)(B) | 400,000 | 348,448 | ||||||
GS Mortgage Securities Trust, Ser 2022-SHIP, Cl A | ||||||||
4.107%, TSFR1M + 0.731%, 08/15/36 (A)(B) | 115,000 | 113,085 | ||||||
GSR Mortgage Loan Trust, Ser 2004-9, Cl 3A1 | ||||||||
3.502%, 08/25/34 (B) | 16,867 | 15,696 | ||||||
JP Morgan Mortgage Trust, Ser 2006-A2, Cl 4A1 | ||||||||
4.061%, 08/25/34 (B) | 14,612 | 14,403 | ||||||
The accompanying notes are an integral part of the financial statements.
39
CATHOLIC RESPONSIBLE INVESTMENTS SHORT DURATION BOND FUND
OCTOBER 31, 2022
ASSET-BACKED SECURITIES — continued |
| |||||||
| Face Amount | Value | |||||||
Life Mortgage Trust, Ser 2021-BMR, Cl A | ||||||||
4.112%, ICE LIBOR USD 1 Month + 0.700%, 03/15/38 (A)(B) | $ | 1,867,643 | $ | 1,785,078 | ||||
Mariner Finance Issuance Trust, Ser 2020-AA, Cl A | ||||||||
2.190%, 08/21/34 (A) | 3,250,000 | 3,083,570 | ||||||
Marlette Funding Trust, Ser 2022-2A, Cl A | ||||||||
4.250%, 08/15/32 (A) | 298,677 | 294,147 | ||||||
Marlette Funding Trust, Ser 2022-3A, Cl A | ||||||||
5.180%, 11/15/32 (A) | 568,000 | 562,644 | ||||||
MHC Commercial Mortgage Trust, Ser 2021-MHC, Cl A | ||||||||
4.213%, ICE LIBOR USD 1 Month + 0.801%, 04/15/38 (A)(B) | 4,650,000 | 4,454,882 | ||||||
MMAF Equipment Finance, Ser 2019-A, Cl A3 | ||||||||
2.840%, 11/13/23 (A) | 45,888 | 45,857 | ||||||
Morgan Stanley Bank of America Merrill Lynch Trust, Ser 2015-C20, Cl ASB | ||||||||
3.069%, 02/15/48 | 809,821 | 787,423 | ||||||
Mosaic Solar Loan Trust, Ser 2020-1A, Cl B | ||||||||
3.100%, 04/20/46 (A) | 183,869 | 159,448 | ||||||
OCTAGON INVESTMENT PARTNERS 35, Ser 2018-1A, Cl A1A | ||||||||
5.303%, ICE LIBOR USD 3 Month + 1.060%, 01/20/31 (A)(B) | 1,500,000 | 1,472,412 | ||||||
Octane Receivables Trust, Ser 2021-1A, Cl A | ||||||||
0.930%, 03/22/27 (A) | 843,949 | 812,537 | ||||||
OnDeck Asset Securitization Trust III, Ser 2021-1A, Cl A | ||||||||
1.590%, 05/17/27 (A) | 1,910,000 | 1,758,115 | ||||||
PFS Financing, Ser 2020-A, Cl A | ||||||||
1.270%, 06/15/25 (A) | 4,000,000 | 3,886,513 | ||||||
SCF Equipment Leasing, Ser 2019-2A, Cl B | ||||||||
2.760%, 08/20/26 (A) | 870,000 | 832,127 | ||||||
SCF Equipment Leasing, Ser 2020-1A, Cl A3 | ||||||||
1.190%, 10/20/27 (A) | 1,216,318 | 1,185,966 | ||||||
ASSET-BACKED SECURITIES — continued |
| |||||||
| Face Amount | Value | |||||||
Sequoia Mortgage Trust, Ser 2013-2, Cl A | ||||||||
1.874%, 02/25/43 (B) | $ | 94,698 | $ | 78,808 | ||||
TCI-Flatiron CLO, Ser 2021-1A, Cl AR | ||||||||
3.902%, ICE LIBOR USD 3 Month + 0.960%, 11/18/30 (A)(B) | 785,000 | 763,706 | ||||||
Transportation Finance Equipment Trust, Ser 2019-1, Cl A4 | ||||||||
1.880%, 03/25/24 (A) | 2,360,805 | 2,333,670 | ||||||
UBS Commercial Mortgage Trust, Ser 2017-C6, Cl A3 | ||||||||
3.581%, 12/15/50 | 938,473 | 936,487 | ||||||
Vivint Solar Financing V, Ser 2018-1A, Cl B | ||||||||
7.370%, 04/30/48 (A) | 366,006 | 337,741 | ||||||
WFRBS Commercial Mortgage Trust, Ser 2012-C10, Cl A3 | ||||||||
2.875%, 12/15/45 | 263,126 | 262,564 | ||||||
|
| |||||||
| 50,213,409 | ||||||||
|
| |||||||
Total Asset-Backed Securities | ||||||||
(Cost $81,458,654) | 78,927,205 | |||||||
|
| |||||||
MORTGAGE-BACKED SECURITIES — 3.0% |
| |||||||
| Face Amount | Value | |||||||
Agency Mortgage-Backed Obligation — 1.3% |
| |||||||
FHLMC | ||||||||
5.000%, 07/01/35 | $ | 132,481 | $ | 132,656 | ||||
FNMA | ||||||||
5.000%, 03/01/34 | 106,137 | 106,144 | ||||||
3.500%, 11/01/34 | 1,983,782 | 1,932,870 | ||||||
3.000%, 02/01/35 | 2,245,147 | 2,122,277 | ||||||
FNMA, Ser 2009-62, Cl WA | ||||||||
5.581%, 08/25/39 (B) | 32,904 | 33,011 | ||||||
FNMA, Ser 2013-9, Cl AE | ||||||||
1.750%, 03/25/39 | 97,933 | 96,370 | ||||||
FNMA, Ser 2022-29, Cl MG | ||||||||
4.500%, 11/25/42 | 1,882,656 | 1,818,009 | ||||||
GNMA, Ser 131, Cl A | ||||||||
2.200%, 04/16/57 | 100,156 | 98,922 | ||||||
GNMA, Ser 2011-57, Cl BA | ||||||||
3.000%, 05/20/40 | 30,356 | 29,595 | ||||||
GNMA, Ser 2017-99, Cl WA | ||||||||
4.864%, 12/20/32 (B) | 309,576 | 306,720 | ||||||
|
| |||||||
| 6,676,574 | ||||||||
|
| |||||||
The accompanying notes are an integral part of the financial statements.
40
CATHOLIC RESPONSIBLE INVESTMENTS SHORT DURATION BOND FUND
OCTOBER 31, 2022
MORTGAGE-BACKED SECURITIES — continued |
| |||||||
| Face Amount | Value | |||||||
Non-Agency Mortgage-Backed Obligation — 1.7% |
| |||||||
BX Trust, Ser 2022-CLS, Cl B | ||||||||
6.300%, 10/13/27 (A) | $ | 2,200,000 | $ | 2,176,794 | ||||
COMM Mortgage Trust, Ser 2015-LC19, Cl A4 | ||||||||
3.183%, 02/10/48 | 1,275,000 | 1,203,719 | ||||||
Hudson Yards Mortgage Trust, Ser 2016-10HY, Cl A | ||||||||
2.835%, 08/10/38 (A) | 1,000,000 | 885,342 | ||||||
One Market Plaza Trust, Ser 2017-1MKT, Cl B | ||||||||
3.845%, 02/10/32 (A) | 2,000,000 | 1,903,492 | ||||||
One Market Plaza Trust, Ser 2017-1MKT, Cl C | ||||||||
4.016%, 02/10/32 (A) | 965,000 | 915,215 | ||||||
STWD Mortgage Trust, Ser 2021-LIH, Cl D | ||||||||
5.717%, ICE LIBOR USD 1 Month + 2.305%, 11/15/36 (A)(B) | 450,000 | 416,521 | ||||||
|
| |||||||
| 7,501,083 | ||||||||
|
| |||||||
Total Mortgage-Backed Securities | ||||||||
(Cost $14,451,988) | 14,177,657 | |||||||
|
| |||||||
MUNICIPAL BONDS — 2.9% |
| |||||||
| Face Amount | Value | |||||||
California — 0.4% |
| |||||||
City of Union City California, RB | ||||||||
5.920%, 07/01/24 | $ | 1,730,000 | $ | 1,751,329 | ||||
|
| |||||||
Florida — 0.2% |
| |||||||
Florida Development Finance, RB | ||||||||
7.250%, 07/01/57 (A)(B) | 1,000,000 | 978,668 | ||||||
|
| |||||||
Hawaii — 0.2% |
| |||||||
State of Hawaii Department of Business Economic Development & Tourism, Ser A-2, RB | ||||||||
3.242%, 01/01/31 | 1,152,899 | 1,064,207 | ||||||
|
| |||||||
Illinois — 0.4% |
| |||||||
Chicago Housing Authority, Ser B, RB | ||||||||
3.822%, 01/01/26 | 250,000 | 238,590 | ||||||
Sales Tax Securitization, Ser B, RB | ||||||||
2.225%, 01/01/24 | 1,800,000 | 1,730,947 | ||||||
|
| |||||||
| 1,969,537 | ||||||||
|
| |||||||
MUNICIPAL BONDS — continued |
| |||||||
| Face Amount | Value | |||||||
Louisiana — 0.2% |
| |||||||
Louisiana Local Government Environmental Facilities & Community Development Auth, RB | ||||||||
3.615%, 02/01/29 | $ | 1,145,000 | $ | 1,107,414 | ||||
|
| |||||||
Michigan — 0.1% |
| |||||||
City of Detroit Michigan, Ser B, GO | ||||||||
2.017%, 04/01/23 | 375,000 | 369,290 | ||||||
|
| |||||||
Montana — 0.1% |
| |||||||
County of Gallatin Montana, RB | ||||||||
11.500%, 09/01/27 (A) | 250,000 | 258,235 | ||||||
|
| |||||||
New Jersey — 0.8% |
| |||||||
New Jersey Economic Development Authority, Ser B, RB | ||||||||
0.000%, 02/15/24 (C) | 2,250,000 | 2,099,138 | ||||||
New Jersey State, Transportation Trust Fund Authority, RB | ||||||||
2.551%, 06/15/23 | 1,750,000 | 1,724,702 | ||||||
|
| |||||||
| 3,823,840 | ||||||||
|
| |||||||
New York — 0.5% | ||||||||
New York State Energy Research & Development Authority, Ser A, RB | ||||||||
4.480%, 04/01/25 | 500,000 | 482,052 | ||||||
4.336%, 04/01/24 | 1,000,000 | 977,125 | ||||||
Utility Debt Securitization Authority, Ser T, RB | ||||||||
3.435%, 12/15/25 | 953,000 | 942,931 | ||||||
|
| |||||||
| 2,402,108 | ||||||||
|
| |||||||
South Dakota — 0.0% | ||||||||
South Dakota Housing Development Authority, Ser E, RB | ||||||||
5.460%, 05/01/53 | 250,000 | 248,855 | ||||||
|
| |||||||
Total Municipal Bonds | ||||||||
(Cost $14,363,119) | 13,973,483 | |||||||
|
| |||||||
U.S. GOVERNMENT AGENCY OBLIGATIONS — 1.1% |
| |||||||
| Face Amount | Value | |||||||
Export-Import Bank of the United States | ||||||||
2.628%, 11/12/26 | $ | 2,260,106 | $ | 2,145,821 | ||||
1.900%, 07/12/24 | 757,760 | 736,096 | ||||||
The accompanying notes are an integral part of the financial statements.
41
CATHOLIC RESPONSIBLE INVESTMENTS SHORT DURATION BOND FUND
OCTOBER 31, 2022
U.S. GOVERNMENT AGENCY OBLIGATIONS — continued |
| |||||||
| Face Amount | Value | |||||||
United States International Development Finance | ||||||||
2.820%, 03/20/24 | $ | 1,950,000 | $ | 1,910,099 | ||||
1.790%, 10/15/29 | 402,095 | 356,672 | ||||||
|
| |||||||
Total U.S. Government Agency Obligations | ||||||||
(Cost $5,406,988) | 5,148,688 | |||||||
|
| |||||||
REPURCHASE AGREEMENT — 0.2% |
| |||||||
| Face Amount | Value | |||||||
Socgen Triparty Tsy | $ | 1,000,000 | $ | 1,000,000 | ||||
|
| |||||||
Total Repurchase Agreements | ||||||||
(Cost $1,000,000) | 1,000,000 | |||||||
|
| |||||||
Total Investments in Securities— 96.4% |
| |||||||
(Cost $475,894,542) | $ | 456,642,746 | ||||||
|
| |||||||
Percentages are based on Net Assets of $473,662,820.
A list of the open futures contracts held by the Fund at October 31, 2022, is as follows:
| Type of Contract | Number of Contracts | Expiration Date | Notional Amount | Value | Unrealized Appreciation/ (Depreciation) | |||||||||||||||
| Long Contracts | ||||||||||||||||||||
U.S. 2-Year Treasury Note | 140 | Dec-2022 | $ | 29,042,287 | $ | 28,613,594 | $ | (428,694 | ) | |||||||||||
|
|
|
|
|
| |||||||||||||||
| Short Contracts | ||||||||||||||||||||
U.S. 5-Year Treasury Note | (38 | ) | Dec-2022 | (4,095,868 | ) | (4,050,563 | ) | 45,306 | ||||||||||||
|
|
|
|
|
| |||||||||||||||
| $ | 24,946,419 | $ | 24,563,031 | $ | (383,388 | ) | ||||||||||||||
|
|
|
|
|
| |||||||||||||||
| (A) | Securities sold within the terms of a private placement memorandum, exempt from registration under section 144A of the Securities Act of 1933, as amended, and maybe sold only to dealers in the program or other “accredited investors”. The total value of these securities at October 31, 2022 was $127,595,578 and represented 26.9% of Net Assets. |
| (B) | Variable or floating rate security. The rate shown is the effective interest rate as of period end. The rates for certain securities are not based on published reference rates and spreads and are either determined by the issuer or agent based on current market conditions; by using a formula based on the rates of underlying loans; or by adjusting periodically based on prevailing interest rates. |
| (C) | Zero coupon security. |
Cl — Class
DAC — Designated Activity Company
FHLMC — Federal Home Loan Mortgage Corporation
FNMA — Federal National Mortgage Association
GNMA — Government National Mortgage Association
GO — General Obligation
H15T1Y — US Treasury Yield Curve Rate T Note Constant Maturity 1 Year
LIBOR — London Interbank Offered Rate
MTN — Medium Term Note
RB — Revenue Bond
Ser — Series
SOFR — Secured Overnight Financing Rate
SOFRINDX — Secured Overnight Financing Rate Index
TSFR1M — Term Secured Overnight Financing Rate 1 Month
TSFR3M — Term Secured Overnight Financing Rate 3 Month
USD — U.S. Dollar
The accompanying notes are an integral part of the financial statements.
42
CATHOLIC RESPONSIBLE INVESTMENTS SHORT DURATION BOND FUND
OCTOBER 31, 2022
The following is a summary of the inputs used as of October 31, 2022, in valuing the Fund’s investments carried at market value:
| Investments in Securities | Level 1 | Level 2 | Level 3 | Total | ||||||||||||
Corporate Obligations | $ | — | $ | 207,866,200 | $ | — | $ | 207,866,200 | ||||||||
U.S. Treasury Obligations | — | 135,549,513 | — | 135,549,513 | ||||||||||||
Asset-Backed Securities | — | 78,927,205 | — | 78,927,205 | ||||||||||||
Mortgage-Backed Securities | — | 14,177,657 | — | 14,177,657 | ||||||||||||
Municipal Bonds | — | 13,973,483 | — | 13,973,483 | ||||||||||||
U.S. Government Agency Obligations | — | 5,148,688 | — | 5,148,688 | ||||||||||||
Repurchase Agreement | — | 1,000,000 | — | 1,000,000 | ||||||||||||
|
|
|
|
|
|
|
| |||||||||
Total Investments in Securities | $ | — | $ | 456,642,746 | $ | — | $ | 456,642,746 | ||||||||
|
|
|
|
|
|
|
| |||||||||
| Other Financial Instruments | Level 1 | Level 2 | Level 3 | Total | ||||||||||||
Futures Contracts* | ||||||||||||||||
Unrealized Appreciation | $ | 45,306 | $ | — | $ | — | $ | 45,306 | ||||||||
Unrealized Depreciation | (428,694) | — | — | (428,694 | ) | |||||||||||
|
|
|
|
|
|
|
| |||||||||
Total Other Financial Instruments | $ | (383,388) | $ | — | $ | — | $ | (383,388 | ) | |||||||
|
|
|
|
|
|
|
| |||||||||
Amounts designated as “–” are $0.
For more information on valuation inputs, see Note 2 — Significant Accounting Policies in the Notes to Financial Statements.
The accompanying notes are an integral part of the financial statements.
43
CATHOLIC RESPONSIBLE INVESTMENTS BOND FUND
OCTOBER 31, 2022
| SECTOR WEIGHTINGS (unaudited)† |
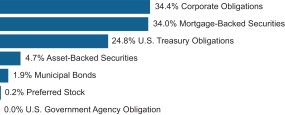
† Percentages are based on total investments. Total investments do not include derivatives such as options, futures contracts, forward contracts, and swap contracts, if applicable.
SCHEDULE OF INVESTMENTS |
| |||||||
CORPORATE OBLIGATIONS — 33.7% |
| |||||||
| Face Amount | Value | |||||||
COMMUNICATION SERVICES — 4.2% |
| |||||||
Alphabet | ||||||||
1.100%, 08/15/30 | $ | 2,500,000 | $ | 1,918,968 | ||||
America Movil | ||||||||
4.375%, 04/22/49 | 1,700,000 | 1,326,586 | ||||||
AT&T | ||||||||
4.500%, 03/09/48 | 471,000 | 363,771 | ||||||
4.350%, 06/15/45 | 2,720,000 | 2,071,018 | ||||||
3.800%, 12/01/57 | 750,000 | 494,231 | ||||||
3.650%, 09/15/59 | 1,861,000 | 1,173,910 | ||||||
3.550%, 09/15/55 | 1,238,000 | 787,816 | ||||||
3.500%, 09/15/53 | 649,000 | 416,548 | ||||||
2.750%, 06/01/31 | 725,000 | 580,034 | ||||||
2.550%, 12/01/33 | 2,890,000 | 2,129,772 | ||||||
CCO Holdings | ||||||||
4.500%, 05/01/32 | 975,000 | 770,250 | ||||||
4.500%, 06/01/33(A) | 975,000 | 739,353 | ||||||
4.250%, 01/15/34(A) | 825,000 | 606,375 | ||||||
Charter Communications Operating | ||||||||
6.484%, 10/23/45 | 3,360,000 | 2,975,045 | ||||||
5.750%, 04/01/48 | 950,000 | 761,977 | ||||||
5.375%, 05/01/47 | 800,000 | 615,376 | ||||||
5.250%, 04/01/53 | 525,000 | 394,747 | ||||||
4.400%, 04/01/33 | 250,000 | 207,687 | ||||||
Comcast | ||||||||
5.500%, 11/15/32 | 350,000 | 347,788 | ||||||
4.400%, 08/15/35 | 2,340,000 | 2,049,073 | ||||||
3.450%, 02/01/50 | 905,000 | 611,122 | ||||||
2.800%, 01/15/51 | 225,000 | 133,752 | ||||||
CommScope | ||||||||
6.000%, 03/01/26(A) | 3,435,000 | 3,313,235 | ||||||
3.850%, 02/01/25(A) | 800,000 | 768,822 | ||||||
3.500%, 08/15/27(A) | 1,025,000 | 929,572 | ||||||
| CORPORATE OBLIGATIONS — continued | ||||||||
| Face Amount | Value | |||||||
COMMUNICATION SERVICES — continued |
| |||||||
Cox Communications | ||||||||
3.350%, 09/15/26(A) | $ | 575,000 | $ | 527,577 | ||||
1.800%, 10/01/30(A) | 650,000 | 475,854 | ||||||
Meta Platforms | ||||||||
4.450%, 08/15/52(A) | 7,820,000 | 5,803,503 | ||||||
Paramount Global | ||||||||
4.950%, 01/15/31 | 1,350,000 | 1,178,264 | ||||||
Prosus | ||||||||
4.987%, 01/19/52(A) | 2,200,000 | 1,365,958 | ||||||
4.850%, 07/06/27(A) | 500,000 | 435,682 | ||||||
4.193%, 01/19/32(A) | 700,000 | 497,931 | ||||||
3.680%, 01/21/30(A) | 1,400,000 | 1,030,297 | ||||||
3.061%, 07/13/31(A) | 3,875,000 | 2,602,627 | ||||||
Rogers Communications | ||||||||
3.800%, 03/15/32(A) | 1,360,000 | 1,157,893 | ||||||
Telecom Italia | ||||||||
5.303%, 05/30/24(A) | 2,300,000 | 2,163,771 | ||||||
Telecom Italia Capital | ||||||||
7.721%, 06/04/38 | 1,345,000 | 1,069,275 | ||||||
7.200%, 07/18/36 | 175,000 | 136,283 | ||||||
Tencent Holdings MTN | ||||||||
3.975%, 04/11/29(A) | 2,000,000 | 1,684,836 | ||||||
Time Warner Cable | ||||||||
6.750%, 06/15/39 | 800,000 | 707,930 | ||||||
T-Mobile USA | ||||||||
5.650%, 01/15/53 | 2,998,000 | 2,764,859 | ||||||
4.500%, 04/15/50 | 475,000 | 376,339 | ||||||
4.375%, 04/15/40 | 300,000 | 244,299 | ||||||
3.875%, 04/15/30 | 3,695,000 | 3,268,594 | ||||||
3.500%, 04/15/31 | 1,000,000 | 840,807 | ||||||
3.400%, 10/15/52 | 100,000 | 64,671 | ||||||
3.375%, 04/15/29 | 1,000,000 | 865,850 | ||||||
Verizon Communications | ||||||||
4.400%, 11/01/34 | 3,130,000 | 2,709,815 | ||||||
4.272%, 01/15/36 | 900,000 | 756,468 | ||||||
3.875%, 03/01/52 | 3,500,000 | 2,462,641 | ||||||
3.550%, 03/22/51 | 460,000 | 310,499 | ||||||
2.987%, 10/30/56 | 345,000 | 198,511 | ||||||
2.850%, 09/03/41 | 2,500,000 | 1,628,715 | ||||||
2.650%, 11/20/40 | 1,905,000 | 1,209,222 | ||||||
2.100%, 03/22/28 | 515,000 | 432,798 | ||||||
1.500%, 09/18/30 | 2,500,000 | 1,853,202 | ||||||
Vodafone Group | ||||||||
7.000%, USD Swap Semi 30/360 5 Yr Curr + 4.873%, 04/04/79(B) | 1,550,000 | 1,472,500 | ||||||
Walt Disney | ||||||||
6.650%, 11/15/37 | 555,000 | 600,980 | ||||||
|
| |||||||
| 69,385,279 | ||||||||
|
| |||||||
The accompanying notes are an integral part of the financial statements.
44
CATHOLIC RESPONSIBLE INVESTMENTS BOND FUND
OCTOBER 31, 2022
| CORPORATE OBLIGATIONS — continued | ||||||||
| Face Amount | Value | |||||||
CONSUMER DISCRETIONARY — 2.6% |
| |||||||
Aptiv | ||||||||
3.250%, 03/01/32 | $ | 1,540,000 | $ | 1,228,387 | ||||
Ford Motor | ||||||||
6.100%, 08/19/32 | 1,000,000 | 918,030 | ||||||
3.250%, 02/12/32 | 3,500,000 | 2,621,080 | ||||||
Ford Motor Credit | ||||||||
5.125%, 06/16/25 | 350,000 | 337,680 | ||||||
4.542%, 08/01/26 | 425,000 | 391,127 | ||||||
4.389%, 01/08/26 | 650,000 | 599,748 | ||||||
4.375%, 08/06/23 | 625,000 | 615,017 | ||||||
4.140%, 02/15/23 | 525,000 | 523,160 | ||||||
4.134%, 08/04/25 | 400,000 | 371,920 | ||||||
4.063%, 11/01/24 | 2,000,000 | 1,917,500 | ||||||
3.810%, 01/09/24 | 700,000 | 675,940 | ||||||
3.375%, 11/13/25 | 450,000 | 408,244 | ||||||
3.350%, 11/01/22 | 925,000 | 925,000 | ||||||
General Motors | ||||||||
5.600%, 10/15/32 | 7,280,000 | 6,604,879 | ||||||
5.400%, 10/15/29 | 2,350,000 | 2,178,487 | ||||||
5.200%, 04/01/45 | 2,370,000 | 1,828,636 | ||||||
General Motors Financial | ||||||||
3.250%, 01/05/23 | 440,000 | 438,716 | ||||||
Lowe’s | ||||||||
5.625%, 04/15/53 | 5,694,000 | 5,127,686 | ||||||
Mileage Plus Holdings | ||||||||
6.500%, 06/20/27(A) | 5,220,250 | 5,160,765 | ||||||
Nordstrom | ||||||||
6.950%, 03/15/28 | 865,000 | 803,256 | ||||||
Southwest Airlines | ||||||||
2.625%, 02/10/30 | 4,545,000 | 3,628,032 | ||||||
Starbucks | ||||||||
4.450%, 08/15/49 | 2,500,000 | 1,987,568 | ||||||
2.550%, 11/15/30 | 2,480,000 | 2,024,958 | ||||||
Warnermedia Holdings | ||||||||
5.050%, 03/15/42(A) | 85,000 | 62,186 | ||||||
3.755%, 03/15/27(A) | 85,000 | 75,614 | ||||||
Whirlpool | ||||||||
2.400%, 05/15/31 | 2,500,000 | 1,882,767 | ||||||
|
| |||||||
| 43,336,383 | ||||||||
|
| |||||||
CONSUMER STAPLES — 0.8% |
| |||||||
Anheuser-Busch Cos LLC / Anheuser-Busch InBev Worldwide Inc | ||||||||
4.900%, 02/01/46 | 400,000 | 343,069 | ||||||
Anheuser-Busch InBev Worldwide | ||||||||
5.550%, 01/23/49 | 650,000 | 612,151 | ||||||
5.450%, 01/23/39 | 1,510,000 | 1,418,595 | ||||||
4.350%, 06/01/40 | 275,000 | 229,896 | ||||||
| CORPORATE OBLIGATIONS — continued | ||||||||
| Face Amount | Value | |||||||
CONSUMER STAPLES — continued |
| |||||||
Coca-Cola | ||||||||
3.450%, 03/25/30 | $ | 350,000 | $ | 316,774 | ||||
1.650%, 06/01/30 | 525,000 | 416,388 | ||||||
1.450%, 06/01/27 | 25,000 | 21,708 | ||||||
Elanco Animal Health | ||||||||
6.400%, 08/28/28 | 1,110,000 | 993,028 | ||||||
Keurig Dr Pepper | ||||||||
4.417%, 05/25/25 | 89,000 | 87,673 | ||||||
Mather Foundation | ||||||||
2.675%, 10/01/31 | 2,500,000 | 2,009,635 | ||||||
PepsiCo | ||||||||
3.900%, 07/18/32 | 3,000,000 | 2,775,293 | ||||||
2.875%, 10/15/49 | 3,340,000 | 2,252,660 | ||||||
RELX Capital | ||||||||
4.000%, 03/18/29 | 375,000 | 340,709 | ||||||
3.000%, 05/22/30 | 50,000 | 41,689 | ||||||
Sysco | ||||||||
2.400%, 02/15/30 | 2,500,000 | 2,021,060 | ||||||
|
| |||||||
| 13,880,328 | ||||||||
|
| |||||||
ENERGY — 2.9% |
| |||||||
Azure Power Energy | ||||||||
3.575%, 08/19/26(A) | 1,861,000 | 1,344,572 | ||||||
BP Capital Markets America | ||||||||
3.060%, 06/17/41 | 1,925,000 | 1,346,860 | ||||||
Cameron LNG | ||||||||
3.701%, 01/15/39(A) | 1,520,000 | 1,141,538 | ||||||
ConocoPhillips | ||||||||
4.150%, 11/15/34 | 455,000 | 384,305 | ||||||
Devon Energy | ||||||||
7.875%, 09/30/31 | 830,000 | 914,843 | ||||||
Diamondback Energy | ||||||||
6.250%, 03/15/33 | 4,050,000 | 4,065,753 | ||||||
Energy Transfer | ||||||||
4.400%, 03/15/27 | 2,945,000 | 2,731,921 | ||||||
2.900%, 05/15/25 | 1,935,000 | 1,796,222 | ||||||
Exxon Mobil | ||||||||
4.227%, 03/19/40 | 650,000 | 556,543 | ||||||
3.452%, 04/15/51 | 50,000 | 35,737 | ||||||
2.610%, 10/15/30 | 575,000 | 486,071 | ||||||
Hess | ||||||||
7.875%, 10/01/29 | 290,000 | 314,276 | ||||||
7.300%, 08/15/31 | 510,000 | 539,879 | ||||||
Hydro-Quebec | ||||||||
8.050%, 07/07/24 | 2,500,000 | 2,626,309 | ||||||
Kinder Morgan | ||||||||
5.550%, 06/01/45 | 3,285,000 | 2,839,318 | ||||||
5.200%, 03/01/48 | 450,000 | 368,529 | ||||||
4.800%, 02/01/33 | 230,000 | 205,426 | ||||||
4.300%, 06/01/25 | 625,000 | 608,166 | ||||||
The accompanying notes are an integral part of the financial statements.
45
CATHOLIC RESPONSIBLE INVESTMENTS BOND FUND
OCTOBER 31, 2022
| CORPORATE OBLIGATIONS — continued | ||||||||
| Face Amount | Value | |||||||
ENERGY — continued |
| |||||||
Kinder Morgan Energy Partners | ||||||||
6.500%, 09/01/39 | $ | 50,000 | $ | 47,256 | ||||
5.500%, 03/01/44 | 370,000 | 312,542 | ||||||
Marathon Petroleum | ||||||||
4.700%, 05/01/25 | 225,000 | 220,197 | ||||||
MPLX | ||||||||
5.500%, 02/15/49 | 1,410,000 | 1,176,582 | ||||||
Occidental Petroleum | ||||||||
2.900%, 08/15/24 | 1,750,000 | 1,683,841 | ||||||
Petrobras Global Finance BV | ||||||||
7.250%, 03/17/44 | 500,000 | 447,630 | ||||||
6.900%, 03/19/49 | 100,000 | 82,600 | ||||||
6.750%, 06/03/50 | 1,450,000 | 1,166,104 | ||||||
5.500%, 06/10/51 | 375,000 | 265,155 | ||||||
5.093%, 01/15/30 | 167,000 | 148,485 | ||||||
Petroleos Mexicanos | ||||||||
7.690%, 01/23/50 | 6,525,000 | 4,250,846 | ||||||
6.700%, 02/16/32 | 2,219,000 | 1,678,119 | ||||||
6.625%, 06/15/35 | 1,200,000 | 833,400 | ||||||
6.375%, 01/23/45 | 655,000 | 384,157 | ||||||
6.350%, 02/12/48 | 306,000 | 175,589 | ||||||
Rio Oil Finance Trust Series 2014-1 | ||||||||
9.250%, 07/06/24(A) | 1,119,813 | 1,126,812 | ||||||
Rio Oil Finance Trust Series 2014-3 | ||||||||
9.750%, 01/06/27(A) | 1,417,610 | 1,456,594 | ||||||
Rio Oil Finance Trust Series 2018-1 | ||||||||
8.200%, 04/06/28(A) | 808,640 | 808,640 | ||||||
Sweihan PV Power PJSC | ||||||||
3.625%, 01/31/49(A) | 2,483,025 | 1,888,340 | ||||||
TransCanada PipeLines | ||||||||
4.625%, 03/01/34 | 1,345,000 | 1,174,661 | ||||||
Transcanada Trust | ||||||||
5.875%, ICE LIBOR USD 3 MONTH + 4.640%, 08/15/76(B) | 975,000 | 907,042 | ||||||
5.625%, ICE LIBOR USD 3 MONTH + 3.528%, 05/20/75(B) | 275,000 | 250,855 | ||||||
5.600%, H15T5Y + 3.986%, 03/07/82(B) | 375,000 | 321,094 | ||||||
5.500%, U.S. SOFR + 4.416%, 09/15/79(B) | 1,100,000 | 921,250 | ||||||
5.300%, ICE LIBOR USD 3 MONTH + 3.208%, 03/15/77(B) | 3,150,000 | 2,552,287 | ||||||
| CORPORATE OBLIGATIONS — continued | ||||||||
| Face Amount | Value | |||||||
ENERGY — continued |
| |||||||
Ultrapar International | ||||||||
5.250%, 06/06/29(A) | $ | 229,000 | $ | 215,833 | ||||
5.250%, 10/06/26(A) | 625,000 | 600,781 | ||||||
Williams | ||||||||
3.500%, 11/15/30 | 575,000 | 484,336 | ||||||
|
| |||||||
| 47,887,296 | ||||||||
|
| |||||||
FINANCIALS — 16.2% |
| |||||||
ABN AMRO Bank | ||||||||
2.470%, H15T1Y + 1.100%, 12/13/29(A)(B) | 2,500,000 | 1,942,032 | ||||||
AerCap Ireland Capital DAC | ||||||||
3.300%, 01/30/32 | 1,655,000 | 1,242,163 | ||||||
3.000%, 10/29/28 | 225,000 | 181,771 | ||||||
Aflac | ||||||||
1.125%, 03/15/26 | 2,500,000 | 2,186,768 | ||||||
African Development Bank | ||||||||
0.750%, 04/03/23 | 2,500,000 | 2,459,804 | ||||||
Alexandria Real Estate Equities | ||||||||
2.950%, 03/15/34 | 2,500,000 | 1,879,312 | ||||||
American Express | ||||||||
4.050%, 05/03/29 | 2,500,000 | 2,270,331 | ||||||
American International Group | ||||||||
3.900%, 04/01/26 | 569,000 | 542,114 | ||||||
Ares Capital | ||||||||
4.250%, 03/01/25 | 1,370,000 | 1,284,261 | ||||||
Aviation Capital Group | ||||||||
4.125%, 08/01/25(A) | 496,000 | 451,149 | ||||||
Avolon Holdings Funding | ||||||||
4.375%, 05/01/26(A) | 1,445,000 | 1,270,283 | ||||||
Bank Hapoalim | ||||||||
3.255%, H15T5Y + 2.155%, 01/21/32(A)(B) | 2,500,000 | 2,043,750 | ||||||
Bank of America MTN | ||||||||
4.875%, 04/01/44 | 50,000 | 41,312 | ||||||
4.450%, 03/03/26 | 1,275,000 | 1,223,068 | ||||||
4.250%, 10/22/26 | 725,000 | 684,824 | ||||||
4.200%, 08/26/24 | 440,000 | 430,270 | ||||||
4.183%, 11/25/27 | 1,275,000 | 1,167,893 | ||||||
4.083%, ICE LIBOR USD 3 Month + 3.150%, 03/20/51(B) | 9,760,000 | 7,250,898 | ||||||
3.846%, H15T5Y + 2.000%, 03/08/37(B) | 1,875,000 | 1,502,238 | ||||||
3.705%, ICE LIBOR USD 3 MONTH + 1.512%, 04/24/28(B) | 1,545,000 | 1,397,683 | ||||||
3.093%, ICE LIBOR USD 3 MONTH + 1.090%, 10/01/25(B) | 1,645,000 | 1,556,891 | ||||||
The accompanying notes are an integral part of the financial statements.
46
CATHOLIC RESPONSIBLE INVESTMENTS BOND FUND
OCTOBER 31, 2022
| CORPORATE OBLIGATIONS — continued | ||||||||
| Face Amount | Value | |||||||
FINANCIALS — continued |
| |||||||
3.004%, ICE LIBOR USD 3 MONTH + 0.790%, 12/20/23(B) | $ | 1,512,000 | $ | 1,506,556 | ||||
2.676%, U.S. SOFR + 1.930%, 06/19/41(B) | 1,870,000 | 1,183,105 | ||||||
2.496%, ICE LIBOR USD 3 Month + 0.990%, 02/13/31(B) | 50,000 | 39,283 | ||||||
1.530%, U.S. SOFR + 0.650%, 12/06/25(B) | 3,000,000 | 2,731,468 | ||||||
Bank of New York Mellon | ||||||||
5.834%, SOFRINDX + 2.074%, 10/25/33(B) | 650,000 | 650,934 | ||||||
Barclays | ||||||||
5.501%, H15T1Y + 2.650%, 08/09/28(B) | 450,000 | 415,383 | ||||||
4.836%, 05/09/28 | 725,000 | 614,464 | ||||||
4.375%, 09/11/24 | 1,375,000 | 1,306,517 | ||||||
2.894%, H15T1Y + 1.300%, 11/24/32(B) | 1,000,000 | 708,056 | ||||||
1.007%, H15T1Y + 0.800%, 12/10/24(B) | 2,540,000 | 2,378,048 | ||||||
Belrose Funding Trust | ||||||||
2.330%, 08/15/30(A) | 1,990,000 | 1,477,393 | ||||||
BGC Partners | ||||||||
5.375%, 07/24/23 | 4,125,000 | 4,102,705 | ||||||
Blackstone Private Credit Fund | ||||||||
2.625%, 12/15/26 | 2,845,000 | 2,335,234 | ||||||
Blue Owl Finance | ||||||||
3.125%, 06/10/31(A) | 2,800,000 | 2,031,847 | ||||||
BNP Paribas | ||||||||
4.625%, 03/13/27(A) | 1,275,000 | 1,149,783 | ||||||
4.375%, 09/28/25(A) | 1,275,000 | 1,185,799 | ||||||
4.375%, 05/12/26(A) | 250,000 | 229,176 | ||||||
4.250%, 10/15/24 | 2,150,000 | 2,070,753 | ||||||
1.675%, U.S. SOFR + 0.912%, 06/30/27(A)(B) | 2,450,000 | 2,052,534 | ||||||
Boston Properties | ||||||||
3.250%, 01/30/31 | 1,450,000 | 1,155,102 | ||||||
3.125%, 09/01/23 | 910,000 | 890,689 | ||||||
BPCE | ||||||||
2.045%, U.S. SOFR + 1.087%, 10/19/27(A)(B) | 2,500,000 | 2,075,897 | ||||||
Brookfield Finance | ||||||||
4.850%, 03/29/29 | 1,435,000 | 1,325,257 | ||||||
Caisse d’Amortissement de la Dette Sociale | ||||||||
2.125%, 01/26/32(A) | 2,500,000 | 2,054,998 | ||||||
1.000%, 10/21/30(A) | 2,500,000 | 1,916,648 | ||||||
0.375%, 05/27/24(A) | 2,500,000 | 2,335,800 | ||||||
| CORPORATE OBLIGATIONS — continued | ||||||||
| Face Amount | Value | |||||||
FINANCIALS — continued |
| |||||||
Cantor Fitzgerald | ||||||||
4.875%, 05/01/24(A) | $ | 215,000 | $ | 209,798 | ||||
Capital One Financial | ||||||||
5.268%, U.S. SOFR + 2.370%, 05/10/33(B) | 1,770,000 | 1,579,807 | ||||||
4.927%, U.S. SOFR + 2.057%, 05/10/28(B) | 675,000 | 626,696 | ||||||
4.200%, 10/29/25 | 1,050,000 | 996,340 | ||||||
3.750%, 04/24/24 | 275,000 | 267,534 | ||||||
3.500%, 06/15/23 | 503,000 | 498,256 | ||||||
2.636%, U.S. SOFR + 1.290%, 03/03/26(B) | 50,000 | 45,838 | ||||||
CDP Financial MTN | ||||||||
1.000%, 05/26/26(A) | 2,500,000 | 2,191,925 | ||||||
Citigroup | ||||||||
8.125%, 07/15/39 | 785,000 | 905,422 | ||||||
6.625%, 06/15/32 | 525,000 | 531,359 | ||||||
4.650%, 07/23/48 | 1,345,000 | 1,079,365 | ||||||
4.600%, 03/09/26 | 40,000 | 38,338 | ||||||
4.450%, 09/29/27 | 1,920,000 | 1,782,081 | ||||||
4.412%, U.S. SOFR + 3.914%, 03/31/31(B) | 600,000 | 535,420 | ||||||
4.281%, ICE LIBOR USD 3 Month + 1.839%, 04/24/48(B) | 380,000 | 290,420 | ||||||
3.785%, U.S. SOFR + 1.939%, 03/17/33(B) | 4,150,000 | 3,437,531 | ||||||
3.754%, U.S. SOFR + 0.694%, 01/25/26(B) | 2,261,000 | 2,191,838 | ||||||
3.700%, 01/12/26 | 55,000 | 51,705 | ||||||
3.400%, 05/01/26 | 330,000 | 305,687 | ||||||
2.666%, U.S. SOFR + 1.146%, 01/29/31(B) | 1,590,000 | 1,264,510 | ||||||
2.014%, U.S. SOFR + 0.694%, 01/25/26(B) | 2,500,000 | 2,283,275 | ||||||
1.281%, U.S. SOFR + 0.528%, 11/03/25(B) | 2,500,000 | 2,264,764 | ||||||
0.776%, U.S. SOFR + 0.686%, 10/30/24(B) | 2,500,000 | 2,364,690 | ||||||
Colombia Government International Bond | ||||||||
5.625%, 02/26/44 | 1,200,000 | 777,092 | ||||||
Community Preservation | ||||||||
2.867%, 02/01/30 | 2,400,000 | 1,957,336 | ||||||
Conservation Fund A Nonprofit | ||||||||
3.474%, 12/15/29 | 2,116,000 | 1,791,913 | ||||||
Cooperatieve Rabobank UA | ||||||||
1.004%, H15T1Y + 0.730%, 09/24/26(A)(B) | 2,879,000 | 2,484,144 | ||||||
The accompanying notes are an integral part of the financial statements.
47
CATHOLIC RESPONSIBLE INVESTMENTS BOND FUND
OCTOBER 31, 2022
| CORPORATE OBLIGATIONS — continued | ||||||||
| Face Amount | Value | |||||||
FINANCIALS — continued |
| |||||||
Corebridge Financial | ||||||||
3.900%, 04/05/32(A) | $ | 80,000 | $ | 66,864 | ||||
Corporate Office Properties | ||||||||
2.750%, 04/15/31 | 1,040,000 | 751,464 | ||||||
Council of Europe Development Bank | ||||||||
3.000%, 06/16/25 | 2,500,000 | 2,402,229 | ||||||
Deutsche Bank NY | ||||||||
1.686%, 03/19/26 | 2,500,000 | 2,144,005 | ||||||
Enel Finance International | ||||||||
7.750%, 10/14/52(A) | 200,000 | 191,677 | ||||||
7.500%, 10/14/32(A) | 600,000 | 600,932 | ||||||
5.000%, 06/15/32(A) | 1,100,000 | 919,666 | ||||||
European Investment Bank | ||||||||
3.250%, 11/15/27 | 1,800,000 | 1,708,172 | ||||||
2.875%, 06/13/25(A) | 2,500,000 | 2,398,580 | ||||||
2.125%, 04/13/26 | 1,000,000 | 924,104 | ||||||
0.875%, 05/17/30 | 3,500,000 | 2,734,711 | ||||||
0.625%, 10/21/27 | 5,000,000 | 4,170,385 | ||||||
Fairfax Financial Holdings | ||||||||
4.850%, 04/17/28 | 900,000 | 827,704 | ||||||
Goldman Sachs Group | ||||||||
5.700%, 11/01/24 | 7,330,000 | 7,330,491 | ||||||
4.387%, U.S. SOFR + 1.510%, 06/15/27(B) | 2,500,000 | 2,349,014 | ||||||
4.017%, ICE LIBOR USD 3 MONTH + 1.373%, 10/31/38(B) | 2,795,000 | 2,176,293 | ||||||
4.000%, 03/03/24 | 1,680,000 | 1,649,246 | ||||||
3.615%, U.S. SOFR + 1.846%, 03/15/28(B) | 3,075,000 | 2,772,091 | ||||||
3.272%, ICE LIBOR USD 3 MONTH + 1.201%, 09/29/25(B) | 1,330,000 | 1,261,507 | ||||||
Golub Capital BDC | ||||||||
2.500%, 08/24/26 | 3,530,000 | 2,938,011 | ||||||
Host Hotels & Resorts | ||||||||
2.900%, 12/15/31 | 1,581,000 | 1,141,766 | ||||||
HSBC Holdings | ||||||||
8.113%, U.S. SOFR + 4.250%, 11/03/33(B) | 1,000,000 | 998,309 | ||||||
6.800%, 06/01/38 | 250,000 | 221,051 | ||||||
6.500%, 09/15/37 | 1,525,000 | 1,332,448 | ||||||
6.500%, 05/02/36 | 510,000 | 449,935 | ||||||
4.950%, 03/31/30 | 725,000 | 649,076 | ||||||
4.762%, U.S. SOFR + 2.530%, 03/29/33(B) | 1,275,000 | 1,019,360 | ||||||
4.375%, 11/23/26 | 420,000 | 381,381 | ||||||
4.300%, 03/08/26 | 2,900,000 | 2,728,996 | ||||||
| CORPORATE OBLIGATIONS — continued | ||||||||
| Face Amount | Value | |||||||
FINANCIALS — continued |
| |||||||
3.950%, ICE LIBOR USD 3 MONTH + 0.987%, 05/18/24(B) | $ | 1,025,000 | $ | 1,008,186 | ||||
2.848%, U.S. SOFR + 2.387%, 06/04/31(B) | 675,000 | 501,268 | ||||||
2.357%, U.S. SOFR + 1.947%, 08/18/31(B) | 700,000 | 498,567 | ||||||
0.976%, U.S. SOFR + 0.708%, 05/24/25(B) | 850,000 | 771,918 | ||||||
ING Groep | ||||||||
1.400%, H15T1Y + 1.100%, 07/01/26(A)(B) | 3,765,000 | 3,297,270 | ||||||
Inter-American Development Bank | ||||||||
3.338%, U.S. SOFR + 0.280%, 04/12/27(B) | 1,500,000 | 1,500,097 | ||||||
1.125%, 01/13/31 | 2,500,000 | 1,954,005 | ||||||
0.500%, 05/24/23 | 2,500,000 | 2,444,100 | ||||||
Intercontinental Exchange | ||||||||
2.650%, 09/15/40 | 2,245,000 | 1,471,798 | ||||||
International Bank for Reconstruction & Development | ||||||||
3.362%, U.S. SOFR + 0.300%, 08/06/24(B) | 2,028,000 | 2,035,407 | ||||||
3.353%, SOFRINDX + 0.390%, 06/17/24(B) | 2,500,000 | 2,507,625 | ||||||
1.875%, 06/19/23 | 1,215,000 | 1,194,045 | ||||||
1.625%, 11/03/31 | 5,000,000 | 4,019,201 | ||||||
0.750%, 08/26/30 | 2,500,000 | 1,908,194 | ||||||
0.625%, 04/22/25 | 2,650,000 | 2,406,917 | ||||||
International Finance | ||||||||
3.141%, U.S. SOFR + 0.090%, 04/03/24(B) | 2,500,000 | 2,499,291 | ||||||
0.500%, 03/20/23 | 2,500,000 | 2,463,140 | ||||||
JPMorgan Chase | ||||||||
8.750%, 09/01/30 | 945,000 | 1,071,125 | ||||||
7.625%, 10/15/26 | 75,000 | 80,878 | ||||||
4.912%, U.S. SOFR + 2.080%, 07/25/33(B) | 4,340,000 | 3,949,031 | ||||||
4.493%, U.S. SOFR + 3.790%, 03/24/31(B) | 850,000 | 768,108 | ||||||
4.260%, ICE LIBOR USD 3 Month + 1.580%, 02/22/48(B) | 470,000 | 364,373 | ||||||
4.250%, 10/01/27 | 699,000 | 656,570 | ||||||
4.125%, 12/15/26 | 300,000 | 284,174 | ||||||
4.032%, ICE LIBOR USD 3 MONTH + 1.460%, 07/24/48(B) | 830,000 | 617,616 | ||||||
The accompanying notes are an integral part of the financial statements.
48
CATHOLIC RESPONSIBLE INVESTMENTS BOND FUND
OCTOBER 31, 2022
| CORPORATE OBLIGATIONS — continued | ||||||||
| Face Amount | Value | |||||||
FINANCIALS — continued |
| |||||||
4.023%, ICE LIBOR USD 3 MONTH + 1.000%, 12/05/24(B) | $ | 1,730,000 | $ | 1,697,326 | ||||
3.900%, 07/15/25 | 260,000 | 251,089 | ||||||
3.897%, ICE LIBOR USD 3 MONTH + 1.220%, 01/23/49(B) | 270,000 | 196,708 | ||||||
3.797%, ICE LIBOR USD 3 MONTH + 0.890%, 07/23/24(B) | 2,235,000 | 2,203,091 | ||||||
3.625%, 12/01/27 | 240,000 | 216,825 | ||||||
3.328%, U.S. SOFR + 1.580%, 04/22/52(B) | 6,835,000 | 4,437,643 | ||||||
3.109%, U.S. SOFR + 2.440%, 04/22/51(B) | 720,000 | 449,447 | ||||||
2.956%, U.S. SOFR + 2.515%, 05/13/31(B) | 3,325,000 | 2,615,889 | ||||||
2.522%, U.S. SOFR + 2.040%, 04/22/31(B) | 725,000 | 571,750 | ||||||
0.768%, U.S. SOFR + 0.490%, 08/09/25(B) | 2,500,000 | 2,280,898 | ||||||
Kreditanstalt fuer Wiederaufbau | ||||||||
1.750%, 09/14/29 | 2,500,000 | 2,122,300 | ||||||
Liberty Utilities Finance GP 1 | ||||||||
2.050%, 09/15/30(A) | 2,500,000 | 1,839,543 | ||||||
Lloyds Banking Group | ||||||||
4.650%, 03/24/26 | 1,000,000 | 919,047 | ||||||
4.582%, 12/10/25 | 1,463,000 | 1,340,929 | ||||||
4.500%, 11/04/24 | 325,000 | 312,506 | ||||||
Macquarie Group | ||||||||
1.340%, U.S. SOFR + 1.069%, 01/12/27(A)(B) | 825,000 | 699,757 | ||||||
Massachusetts Higher Education Assistance | ||||||||
2.673%, 07/01/31 | 500,000 | 405,221 | ||||||
Mitsubishi UFJ Financial Group | ||||||||
1.538%, H15T1Y + 0.750%, 07/20/27(B) | 2,105,000 | 1,777,784 | ||||||
Morgan Stanley MTN | ||||||||
4.431%, ICE LIBOR USD 3 MONTH + 1.628%, 01/23/30(B) | 475,000 | 433,439 | ||||||
3.950%, 04/23/27 | 2,205,000 | 2,034,565 | ||||||
3.875%, 04/29/24 | 1,630,000 | 1,596,376 | ||||||
3.217%, U.S. SOFR + 1.485%, 04/22/42(B) | 940,000 | 638,975 | ||||||
3.125%, 01/23/23 | 220,000 | 219,253 | ||||||
3.125%, 07/27/26 | 250,000 | 228,146 | ||||||
| CORPORATE OBLIGATIONS — continued | ||||||||
| Face Amount | Value | |||||||
FINANCIALS — continued |
| |||||||
0.864%, U.S. SOFR + 0.745%, 10/21/25(B) | $ | 3,000,000 | $ | 2,705,212 | ||||
National Bank of Canada MTN | ||||||||
0.550%, H15T1Y + 0.400%, 11/15/24(B) | 2,500,000 | 2,369,037 | ||||||
NatWest Group | ||||||||
6.125%, 12/15/22 | 785,000 | 784,715 | ||||||
6.000%, 12/19/23 | 2,275,000 | 2,257,849 | ||||||
5.125%, 05/28/24 | 100,000 | 97,463 | ||||||
4.269%, ICE LIBOR USD 3 MONTH + 1.762%, 03/22/25(B) | 1,930,000 | 1,860,885 | ||||||
2.359%, H15T1Y + 2.150%, 05/22/24(B) | 2,500,000 | 2,432,039 | ||||||
1.642%, H15T1Y + 0.900%, 06/14/27(B) | 1,750,000 | 1,453,984 | ||||||
Nederlandse Waterschapsbank | ||||||||
1.000%, 05/28/30(A) | 2,500,000 | 1,955,185 | ||||||
OMERS Finance Trust | ||||||||
4.000%, 04/19/52(A) | 2,000,000 | 1,552,180 | ||||||
Owl Rock Capital | ||||||||
3.400%, 07/15/26 | 1,140,000 | 971,427 | ||||||
2.875%, 06/11/28 | 1,190,000 | 897,741 | ||||||
OWS Cre Funding I | ||||||||
8.028%, ICE LIBOR USD 1 MONTH + 4.900%, 09/01/23(A)(B) | 3,500,000 | 3,480,548 | ||||||
Prudential Financial MTN | ||||||||
1.500%, 03/10/26 | 2,500,000 | 2,214,073 | ||||||
Santander Holdings USA | ||||||||
5.807%, U.S. SOFR + 2.328%, 09/09/26(B) | 1,950,000 | 1,887,834 | ||||||
3.244%, 10/05/26 | 3,020,000 | 2,674,920 | ||||||
Shell International Finance BV | ||||||||
3.750%, 09/12/46 | 945,000 | 705,889 | ||||||
Spirit Realty | ||||||||
3.400%, 01/15/30 | 1,570,000 | 1,253,502 | ||||||
Toronto-Dominion Bank MTN | ||||||||
3.501%, U.S. SOFR + 0.450%, 09/28/23(B) | 1,250,000 | 1,244,583 | ||||||
Truist Bank | ||||||||
2.636%, H15T5Y + 1.150%, 09/17/29(B) | 2,735,000 | 2,531,926 | ||||||
UBS Group | ||||||||
1.494%, H15T5Y + 0.850%, 08/10/27(A)(B) | 495,000 | 407,932 | ||||||
UDR MTN | ||||||||
1.900%, 03/15/33 | 2,500,000 | 1,681,659 | ||||||
The accompanying notes are an integral part of the financial statements.
49
CATHOLIC RESPONSIBLE INVESTMENTS BOND FUND
OCTOBER 31, 2022
| CORPORATE OBLIGATIONS — continued | ||||||||
| Face Amount | Value | |||||||
FINANCIALS — continued |
| |||||||
UniCredit MTN | ||||||||
7.296%, USD ICE Swap 5 Yr + 4.914%, 04/02/34(A)(B) | $ | 2,000,000 | $ | 1,696,879 | ||||
5.459%, H15T5Y + 4.750%, 06/30/35(A)(B) | 925,000 | 689,200 | ||||||
Unum Group | ||||||||
6.750%, 12/15/28 | 465,000 | 467,583 | ||||||
USAA Capital | ||||||||
2.125%, 05/01/30(A) | 2,500,000 | 1,980,276 | ||||||
1.500%, 05/01/23(A) | 1,750,000 | 1,719,780 | ||||||
Wells Fargo MTN | ||||||||
5.013%, U.S. SOFR + 4.502%, 04/04/51(B) | 2,075,000 | 1,758,795 | ||||||
4.897%, U.S. SOFR + 2.100%, 07/25/33(B) | 600,000 | 548,967 | ||||||
4.300%, 07/22/27 | 1,225,000 | 1,145,804 | ||||||
4.100%, 06/03/26 | 425,000 | 401,977 | ||||||
3.068%, U.S. SOFR + 2.530%, 04/30/41(B) | �� | 680,000 | 460,738 | |||||
2.572%, U.S. SOFR + 1.262%, 02/11/31(B) | 50,000 | 39,845 | ||||||
2.188%, U.S. SOFR + 2.000%, 04/30/26(B) | 670,000 | 609,668 | ||||||
2.164%, ICE LIBOR USD 3 MONTH + 0.750%, 02/11/26(B) | 1,010,000 | 927,657 | ||||||
|
| |||||||
| 274,553,959 | ||||||||
|
| |||||||
HEALTH CARE — 0.8% |
| |||||||
Aetna | ||||||||
2.800%, 06/15/23 | 1,760,000 | 1,734,245 | ||||||
Cigna | ||||||||
7.875%, 05/15/27 | 651,000 | 704,098 | ||||||
4.125%, 11/15/25 | 250,000 | 241,671 | ||||||
3.750%, 07/15/23 | 498,000 | 492,862 | ||||||
CVS Health | ||||||||
5.050%, 03/25/48 | 3,725,000 | 3,164,177 | ||||||
4.780%, 03/25/38 | 1,050,000 | 911,356 | ||||||
4.125%, 04/01/40 | 225,000 | 176,086 | ||||||
3.750%, 04/01/30 | 175,000 | 154,529 | ||||||
1.875%, 02/28/31 | 5,530,000 | 4,196,168 | ||||||
Royalty Pharma | ||||||||
1.750%, 09/02/27 | 1,135,000 | 935,469 | ||||||
Zoetis | ||||||||
4.500%, 11/13/25 | 600,000 | 588,836 | ||||||
|
| |||||||
| 13,299,497 | ||||||||
|
| |||||||
INDUSTRIALS — 0.7% |
| |||||||
BNSF Railway 2007-1 Pass Through Trust | ||||||||
5.996%, 04/01/24 | 10,932 | 10,889 | ||||||
| CORPORATE OBLIGATIONS — continued | ||||||||
| Face Amount | Value | |||||||
INDUSTRIALS — continued |
| |||||||
Burlington Northern and Santa Fe Railway Pass Through Trust, Ser 2006-1 | ||||||||
5.720%, 01/15/24 | $ | 14,923 | $ | 15,170 | ||||
Burlington Northern Santa Fe | ||||||||
4.375%, 09/01/42 | 25,000 | 20,919 | ||||||
3.750%, 04/01/24 | 1,025,000 | 1,007,175 | ||||||
Cemex | ||||||||
7.375%, 06/05/27(A) | 1,000,000 | 990,000 | ||||||
5.450%, 11/19/29(A) | 275,000 | 239,903 | ||||||
5.200%, 09/17/30(A) | 1,925,000 | 1,637,302 | ||||||
CRH America | ||||||||
3.875%, 05/18/25(A) | 700,000 | 667,050 | ||||||
CSX Transportation | ||||||||
6.251%, 01/15/23 | 30,928 | 30,977 | ||||||
Family Forest Impact Foundation | ||||||||
5.500%, 07/01/32 | 1,250,000 | 1,206,974 | ||||||
FedEx | ||||||||
5.250%, 05/15/50 | 800,000 | 676,370 | ||||||
Nature Conservancy | ||||||||
3.957%, 03/01/52 | 2,485,000 | 1,886,595 | ||||||
Union Pacific | ||||||||
3.375%, 02/14/42 | 240,000 | 179,260 | ||||||
3.200%, 05/20/41 | 915,000 | 670,372 | ||||||
2.950%, 01/15/23 | 1,150,000 | 1,145,700 | ||||||
Union Pacific Railroad 2002 Pass Through Trust | ||||||||
6.061%, 01/17/23 | 43,678 | 43,607 | ||||||
Union Pacific Railroad 2003 Pass Through Trust | ||||||||
4.698%, 01/02/24 | 1,912 | 1,903 | ||||||
Union Pacific Railroad 2005 Pass Through Trust | ||||||||
5.082%, 01/02/29 | 67,338 | 66,536 | ||||||
Union Pacific Railroad 2007-3 Pass Through Trust | ||||||||
6.176%, 01/02/31 | 23,216 | 23,674 | ||||||
Xylem | ||||||||
2.250%, 01/30/31 | 1,000,000 | 785,765 | ||||||
|
| |||||||
| 11,306,141 | ||||||||
|
| |||||||
INFORMATION TECHNOLOGY — 1.6% |
| |||||||
Apple | ||||||||
3.950%, 08/08/52 | 485,000 | 384,993 | ||||||
3.000%, 06/20/27 | 2,500,000 | 2,325,963 | ||||||
2.650%, 02/08/51 | 680,000 | 423,774 | ||||||
2.400%, 08/20/50 | 1,635,000 | 970,412 | ||||||
Arrow Electronics | ||||||||
3.875%, 01/12/28 | 1,977,000 | 1,758,722 | ||||||
3.250%, 09/08/24 | 1,875,000 | 1,788,978 | ||||||
The accompanying notes are an integral part of the financial statements.
50
CATHOLIC RESPONSIBLE INVESTMENTS BOND FUND
OCTOBER 31, 2022
| CORPORATE OBLIGATIONS — continued | ||||||||
| Face Amount | Value | |||||||
INFORMATION TECHNOLOGY — continued |
| |||||||
Broadcom | ||||||||
4.150%, 11/15/30 | $ | 435,000 | $ | 374,131 | ||||
4.110%, 09/15/28 | 525,000 | 471,042 | ||||||
3.875%, 01/15/27 | 2,030,000 | 1,865,512 | ||||||
Dell International | ||||||||
8.350%, 07/15/46 | 362,000 | 384,292 | ||||||
6.020%, 06/15/26 | 275,000 | 274,495 | ||||||
5.450%, 06/15/23 | 19,000 | 18,969 | ||||||
3.375%, 12/15/41(A) | 3,540,000 | 2,196,989 | ||||||
Intel | ||||||||
4.150%, 08/05/32 | 2,500,000 | 2,231,717 | ||||||
International Business Machines | ||||||||
2.950%, 05/15/50 | 810,000 | 488,429 | ||||||
Mastercard | ||||||||
1.900%, 03/15/31 | 2,500,000 | 1,978,186 | ||||||
Microchip Technology | ||||||||
0.983%, 09/01/24 | 975,000 | 894,784 | ||||||
NXP BV | ||||||||
4.875%, 03/01/24 | 280,000 | 276,860 | ||||||
3.875%, 06/18/26 | 250,000 | 232,553 | ||||||
Oracle | ||||||||
3.950%, 03/25/51 | 650,000 | 425,237 | ||||||
3.900%, 05/15/35 | 2,445,000 | 1,891,871 | ||||||
3.600%, 04/01/40 | 545,000 | 368,761 | ||||||
2.950%, 04/01/30 | 700,000 | 570,010 | ||||||
PayPal Holdings | ||||||||
3.250%, 06/01/50 | 2,940,000 | 1,909,827 | ||||||
VMware | ||||||||
4.650%, 05/15/27 | 1,920,000 | 1,815,603 | ||||||
1.400%, 08/15/26 | 525,000 | 447,882 | ||||||
0.600%, 08/15/23 | 400,000 | 385,107 | ||||||
Western Digital | ||||||||
2.850%, 02/01/29 | 485,000 | 374,992 | ||||||
|
| |||||||
| 27,530,091 | ||||||||
|
| |||||||
MATERIALS — 0.3% |
| |||||||
Dow Chemical | ||||||||
9.400%, 05/15/39 | 166,000 | 206,647 | ||||||
7.375%, 11/01/29 | 430,000 | 465,388 | ||||||
5.550%, 11/30/48 | 35,000 | 30,261 | ||||||
FMG Resources August 2006 Pty | ||||||||
6.125%, 04/15/32(A) | 2,500,000 | 2,194,000 | ||||||
Glencore Funding | ||||||||
1.625%, 09/01/25(A) | 230,000 | 204,632 | ||||||
LG Chemical | ||||||||
4.375%, 07/14/25(A) | 1,150,000 | 1,110,784 | ||||||
LYB International Finance III | ||||||||
4.200%, 05/01/50 | 125,000 | 85,900 | ||||||
3.375%, 10/01/40 | 1,255,000 | 838,150 | ||||||
2.250%, 10/01/30 | 100,000 | 76,328 | ||||||
| CORPORATE OBLIGATIONS — continued | ||||||||
| Face Amount | Value | |||||||
MATERIALS — continued |
| |||||||
Southern Copper | ||||||||
5.875%, 04/23/45 | $ | 340,000 | $ | 315,350 | ||||
5.250%, 11/08/42 | 340,000 | 294,661 | ||||||
|
| |||||||
| 5,822,101 | ||||||||
|
| |||||||
REAL ESTATE — 0.4% |
| |||||||
Equinix | ||||||||
2.500%, 05/15/31 | 2,918,000 | 2,222,013 | ||||||
ERP Operating | ||||||||
4.150%, 12/01/28 | 3,672,000 | 3,340,631 | ||||||
Prologis | ||||||||
2.875%, 11/15/29 | 365,000 | 305,465 | ||||||
|
| |||||||
| 5,868,109 | ||||||||
|
| |||||||
UTILITIES — 3.2% |
| |||||||
Alabama Power | ||||||||
3.700%, 12/01/47 | 1,845,000 | 1,320,604 | ||||||
Avangrid | ||||||||
3.800%, 06/01/29 | 2,500,000 | 2,177,906 | ||||||
3.200%, 04/15/25 | 1,275,000 | 1,198,161 | ||||||
3.150%, 12/01/24 | 2,545,000 | 2,420,154 | ||||||
Berkshire Hathaway Energy | ||||||||
6.125%, 04/01/36 | 74,000 | 75,013 | ||||||
CenterPoint Energy Houston Electric | ||||||||
3.350%, 04/01/51 | 1,100,000 | 751,844 | ||||||
CenterPoint Energy Resources | ||||||||
1.750%, 10/01/30 | 1,320,000 | 1,005,808 | ||||||
Commonwealth Edison | ||||||||
4.000%, 03/01/48 | 570,000 | 437,731 | ||||||
Consolidated Edison of New York | ||||||||
4.450%, 03/15/44 | 965,000 | 775,167 | ||||||
Dominion Energy | ||||||||
5.750%, ICE LIBOR USD 3 MONTH + 3.057%, 10/01/54(B) | 1,450,000 | 1,345,068 | ||||||
Duke Energy Florida | ||||||||
3.850%, 11/15/42 | 520,000 | 391,786 | ||||||
3.200%, 01/15/27 | 710,000 | 658,353 | ||||||
Electricite de France | ||||||||
3.625%, 10/13/25(A) | 1,000,000 | 943,712 | ||||||
Enel Finance International | ||||||||
6.000%, 10/07/39(A) | 850,000 | 692,490 | ||||||
Exelon | ||||||||
3.950%, 06/15/25 | 1,270,000 | 1,222,931 | ||||||
Georgia Power | ||||||||
5.125%, 05/15/52 | 2,500,000 | 2,234,679 | ||||||
3.250%, 03/15/51 | 368,000 | 237,399 | ||||||
The accompanying notes are an integral part of the financial statements.
51
CATHOLIC RESPONSIBLE INVESTMENTS BOND FUND
OCTOBER 31, 2022
| CORPORATE OBLIGATIONS — continued | ||||||||
| Face Amount | Value | |||||||
UTILITIES — continued |
| |||||||
MidAmerican Energy | ||||||||
5.800%, 10/15/36 | $ | 420,000 | $ | 415,884 | ||||
3.950%, 08/01/47 | 2,500,000 | 1,891,843 | ||||||
2.700%, 08/01/52 | 1,588,000 | 950,713 | ||||||
National Rural Utilities Cooperative Finance | ||||||||
4.150%, 12/15/32 | 2,500,000 | 2,241,728 | ||||||
NextEra Energy Capital Holdings | ||||||||
4.625%, 07/15/27 | 100,000 | 96,139 | ||||||
4.255%, 09/01/24 | 500,000 | 490,266 | ||||||
Niagara Mohawk Power | ||||||||
1.960%, 06/27/30(A) | 2,500,000 | 1,894,278 | ||||||
NSTAR Electric | ||||||||
3.100%, 06/01/51 | 175,000 | 111,780 | ||||||
Pacific Gas and Electric | ||||||||
4.950%, 07/01/50 | 1,390,000 | 1,036,171 | ||||||
PacifiCorp | ||||||||
6.350%, 07/15/38 | 720,000 | 735,478 | ||||||
2.900%, 06/15/52 | 3,564,000 | 2,165,076 | ||||||
PECO Energy | ||||||||
4.150%, 10/01/44 | 1,015,000 | 805,445 | ||||||
3.000%, 09/15/49 | 1,005,000 | 640,131 | ||||||
Public Service Electric and Gas MTN | ||||||||
3.100%, 03/15/32 | 2,500,000 | 2,097,498 | ||||||
San Diego Gas & Electric | ||||||||
2.950%, 08/15/51 | 2,500,000 | 1,568,612 | ||||||
Solar Star Funding | ||||||||
3.950%, 06/30/35(A) | 1,017,918 | 940,256 | ||||||
Southern | ||||||||
5.113%, 08/01/27 | 1,025,000 | 997,198 | ||||||
4.475%, 08/01/24 | 700,000 | 688,347 | ||||||
4.000%, H15T5Y + 3.733%, 01/15/51(B) | 1,550,000 | 1,347,710 | ||||||
3.750%, H15T5Y + 2.915%, 09/15/51(B) | 1,450,000 | 1,149,263 | ||||||
Southern California Edison | ||||||||
3.650%, 06/01/51 | 3,000,000 | 2,003,555 | ||||||
3.450%, 02/01/52 | 2,530,000 | 1,645,406 | ||||||
2.750%, 02/01/32 | 2,500,000 | 1,965,515 | ||||||
Southern Power | ||||||||
4.150%, 12/01/25 | 2,500,000 | 2,427,428 | ||||||
0.900%, 01/15/26 | 1,160,000 | 1,003,672 | ||||||
Union Electric | ||||||||
3.900%, 04/01/52 | 2,195,000 | 1,651,730 | ||||||
Virginia Electric and Power | ||||||||
4.650%, 08/15/43 | 775,000 | 642,527 | ||||||
|
| |||||||
| 51,492,455 | ||||||||
|
| |||||||
Total Corporate Obligations | ||||||||
(Cost $630,323,023) | 564,361,639 | |||||||
|
| |||||||
| MORTGAGE-BACKED SECURITIES — 33.3% | ||||||||
| Face Amount | Value | |||||||
Agency Mortgage-Backed Obligation — 26.1% |
| |||||||
FHLMC | ||||||||
7.000%, 11/01/32 | $ | 246,963 | $ | 256,123 | ||||
7.000%, 10/01/32 | 6,859 | 7,123 | ||||||
7.000%, 09/01/32 | 13,864 | 14,378 | ||||||
7.000%, 07/01/32 | 2,940 | 3,083 | ||||||
7.000%, 06/01/32 | 50,143 | 52,637 | ||||||
6.500%, 01/01/38 | 841 | 877 | ||||||
6.500%, 11/01/37 | 1,225 | 1,247 | ||||||
6.500%, 09/01/37 | 25,152 | 25,972 | ||||||
6.500%, 08/01/37 | 2,144 | 2,213 | ||||||
6.500%, 12/01/32 | 79,020 | 81,868 | ||||||
6.500%, 12/01/31 | 2,223 | 2,294 | ||||||
6.000%, 05/01/39 | 40,666 | 42,103 | ||||||
6.000%, 04/01/39 | 15,922 | 16,084 | ||||||
6.000%, 02/01/39 | 16,757 | 17,325 | ||||||
6.000%, 09/01/38 | 9,843 | 10,085 | ||||||
6.000%, 06/01/38 | 3,222 | 3,222 | ||||||
6.000%, 11/01/36 | 29,224 | 30,037 | ||||||
6.000%, 12/01/33 | 11,331 | 11,631 | ||||||
6.000%, 01/01/24 | 10,680 | 10,660 | ||||||
5.500%, 11/01/52 | 20,550,000 | 20,330,249 | ||||||
5.500%, 06/01/37 | 528 | 529 | ||||||
5.500%, 01/01/35 | 85,458 | 87,539 | ||||||
5.000%, 10/01/52 | 2,965,623 | 2,867,957 | ||||||
5.000%, 04/01/34 | 5,910 | 5,719 | ||||||
4.500%, 06/01/52 | 1,628,929 | 1,532,778 | ||||||
4.500%, 09/01/48 | 717,772 | 686,793 | ||||||
4.500%, 03/01/47 | 490,317 | 472,952 | ||||||
4.500%, 03/01/46 | 89,973 | 87,179 | ||||||
4.500%, 11/01/45 | 191,634 | 185,861 | ||||||
4.500%, 02/01/45 | 650,726 | 625,349 | ||||||
4.500%, 10/01/44 | 27,440 | 26,293 | ||||||
4.500%, 08/01/44 | 501,879 | 486,302 | ||||||
4.500%, 07/01/44 | 167,699 | 162,493 | ||||||
4.500%, 03/01/44 | 10,973 | 10,582 | ||||||
4.500%, 01/01/44 | 109,597 | 105,600 | ||||||
4.500%, 12/01/43 | 95,597 | 92,493 | ||||||
4.500%, 11/01/43 | 12,049 | 11,675 | ||||||
4.500%, 05/01/42 | 44,726 | 43,338 | ||||||
4.500%, 09/01/41 | 156,100 | 151,259 | ||||||
4.500%, 07/01/41 | 21,249 | 20,590 | ||||||
4.500%, 05/01/41 | 46,552 | 45,124 | ||||||
4.500%, 04/01/40 | 61,793 | 59,862 | ||||||
4.500%, 12/01/33 | 20,858 | 20,129 | ||||||
4.500%, 06/01/31 | 21,185 | 20,941 | ||||||
4.500%, 06/01/26 | 3,627 | 3,595 | ||||||
4.500%, 02/01/26 | 6,015 | 5,964 | ||||||
4.000%, 08/01/52 | 1,364,214 | 1,245,109 | ||||||
4.000%, 01/01/52 | 1,345,978 | 1,225,972 | ||||||
4.000%, 05/01/46 | 790,308 | 740,077 | ||||||
4.000%, 07/01/34 | 71,677 | 67,098 | ||||||
The accompanying notes are an integral part of the financial statements.
52
CATHOLIC RESPONSIBLE INVESTMENTS BOND FUND
OCTOBER 31, 2022
| MORTGAGE-BACKED SECURITIES — continued | ||||||||
| Face Amount | Value | |||||||
4.000%, 10/01/31 | $ | 42,617 | $ | 40,725 | ||||
3.760%, ICE LIBOR USD 12 MONTH + 1.630%, 07/01/44 (B) | 41,745 | 41,717 | ||||||
3.695%, ICE LIBOR USD 12 MONTH + 1.610%, 10/01/44 (B) | 56,887 | 56,734 | ||||||
3.668%, ICE LIBOR USD 12 MONTH + 1.623%, 12/01/45 (B) | 176,470 | 180,142 | ||||||
3.645%, ICE LIBOR USD 12 MONTH + 1.791%, 08/01/42 (B) | 3,233 | 3,242 | ||||||
3.574%, ICE LIBOR USD 12 MONTH + 1.810%, 10/01/41 (B) | 7,953 | 7,989 | ||||||
3.556%, ICE LIBOR USD 12 MONTH + 1.877%, 01/01/42 (B) | 33,975 | 34,184 | ||||||
3.521%, ICE LIBOR USD 12 Month + 1.969%, 04/01/40 (B) | 4,448 | 4,377 | ||||||
3.500%, 07/01/52 | 10,036,438 | 8,847,323 | ||||||
3.500%, 05/01/52 | 5,658,893 | 4,992,182 | ||||||
3.500%, 04/01/52 | 16,274,482 | 14,340,963 | ||||||
3.500%, 02/01/52 | 605,150 | 532,912 | ||||||
3.500%, 01/01/52 | 1,863,476 | 1,639,975 | ||||||
3.500%, 04/01/37 | 437,519 | 406,166 | ||||||
3.419%, ICE LIBOR USD 12 MONTH + 1.608%, 11/01/44 (B) | 381,026 | 379,379 | ||||||
3.167%, ICE LIBOR USD 12 Month + 1.630%, 02/01/45 (B) | 171,259 | 167,159 | ||||||
3.132%, ICE LIBOR USD 12 Month + 1.614%, 11/01/44 (B) | 33,170 | 32,980 | ||||||
3.074%, ICE LIBOR USD 12 Month + 1.632%, 05/01/46 (B) | 28,292 | 28,664 | ||||||
3.071%, ICE LIBOR USD 12 MONTH + 1.762%, 11/01/39 (B) | 98,608 | 99,318 | ||||||
3.005%, ICE LIBOR USD 12 MONTH + 1.630%, 05/01/44 (B) | 5,607 | 5,614 | ||||||
3.000%, 11/01/51 | 1,999,385 | 1,706,904 | ||||||
3.000%, 02/01/50 | 1,709,176 | 1,469,824 | ||||||
3.000%, 04/01/42 | 2,496,232 | 2,162,446 | ||||||
2.918%, ICE LIBOR USD 12 Month + 1.630%, 01/01/45 (B) | 25,113 | 24,949 | ||||||
| MORTGAGE-BACKED SECURITIES — continued | ||||||||
| Face Amount | Value | |||||||
2.890%, ICE LIBOR USD 12 MONTH + 1.650%, 04/01/43 (B) | $ | 49,416 | $ | 48,370 | ||||
2.867%, ICE LIBOR USD 12 MONTH + 1.654%, 08/01/44 (B) | 257,686 | 255,250 | ||||||
2.528%, ICE LIBOR USD 12 MONTH + 1.702%, 04/01/38 (B) | 96,214 | 96,085 | ||||||
2.500%, 09/01/52 | 8,497,555 | 6,963,384 | ||||||
2.500%, 02/01/51 | 2,596,701 | 2,147,603 | ||||||
2.500%, 11/01/50 | 4,120,662 | 3,403,340 | ||||||
2.500%, 10/01/50 | 3,286,658 | 2,729,023 | ||||||
2.500%, 07/01/50 | 5,425,530 | 4,481,431 | ||||||
2.500%, 01/01/36 | 1,270,145 | 1,148,754 | ||||||
2.285%, ICE LIBOR USD 12 Month + 2.035%, 09/01/37 (B) | 1,959 | 1,916 | ||||||
2.265%, ICE LIBOR USD 12 MONTH + 1.613%, 01/01/44 (B) | 28,101 | 27,778 | ||||||
2.224%, ICE LIBOR USD 12 Month + 1.724%, 04/01/36 (B) | 5,738 | 5,620 | ||||||
2.000%, 06/01/52 | 3,844,633 | 3,035,116 | ||||||
2.000%, 04/01/52 | 1,889,695 | 1,491,092 | ||||||
2.000%, 01/01/52 | 1,566,573 | 1,244,891 | ||||||
2.000%, 12/01/50 | 3,985,176 | 3,175,151 | ||||||
2.000%, 11/01/50 | 1,478,238 | 1,177,958 | ||||||
2.000%, 09/01/50 | 1,334,982 | 1,060,697 | ||||||
2.000%, 07/01/50 | 6,119,578 | 4,883,428 | ||||||
2.000%, 02/01/42 | 1,883,282 | 1,549,572 | ||||||
1.992%, ICE LIBOR USD 12 MONTH + 1.630%, 02/01/45 (B) | 15,347 | 15,102 | ||||||
1.978%, ICE LIBOR USD 12 MONTH + 1.630%, 02/01/45 (B) | 144,241 | 141,967 | ||||||
1.906%, ICE LIBOR USD 12 MONTH + 1.630%, 01/01/45 (B) | 184,166 | 181,455 | ||||||
1.880%, ICE LIBOR USD 12 MONTH + 1.630%, 12/01/44 (B) | 34,970 | 34,471 | ||||||
FHLMC Multifamily Variable Rate Certificate, Ser M069, Cl A | ||||||||
4.013%, 04/15/37 | 1,245,000 | 1,149,956 | ||||||
The accompanying notes are an integral part of the financial statements.
53
CATHOLIC RESPONSIBLE INVESTMENTS BOND FUND
OCTOBER 31, 2022
| MORTGAGE-BACKED SECURITIES — continued | ||||||||
| Face Amount | Value | |||||||
FHLMC STACR REMIC Trust 2021-DNA3, Ser 2021-DNA3, Cl M2 | ||||||||
5.097%, SOFR30A + 2.100%, 10/25/33 (A)(B) | $ | 945,000 | $ | 901,057 | ||||
FHLMC STACR REMIC Trust 2021-DNA6, Ser 2021-DNA6, Cl M2 | ||||||||
4.497%, SOFR30A + 1.500%, 10/25/41 (A)(B) | 2,470,000 | 2,266,892 | ||||||
FHLMC Structured Pass-Through Certificates, Ser 2002-41, Cl 2A | ||||||||
4.815%, 07/25/32(B) | 21,956 | 20,784 | ||||||
FHLMC Structured Pass-Through Certificates, Ser 2002-48, Cl 1A | ||||||||
4.414%, 07/25/33(B) | 197,850 | 187,240 | ||||||
FHLMC Structured Pass-Through Certificates, Ser 2002-51, Cl 1A | ||||||||
6.500%, 09/25/43(B) | 115,366 | 117,091 | ||||||
FHLMC Structured Pass-Through Certificates, Ser 2002-51, Cl 2A | ||||||||
7.500%, 08/25/42(B) | 46,091 | 44,691 | ||||||
FHLMC Structured Pass-Through Certificates, Ser 2003-54, Cl 3A | ||||||||
7.000%, 02/25/43 | 358,698 | 363,772 | ||||||
FHLMC Structured Pass-Through Certificates, Ser 2003-57, Cl 1A2 | ||||||||
7.000%, 07/25/43 | 22,146 | 23,216 | ||||||
FHLMC, Ser 1998-2084, Cl ZC | ||||||||
6.500%, 08/15/28 | 52,280 | 53,178 | ||||||
FHLMC, Ser 2001-2295, Cl BD | ||||||||
6.000%, 03/15/31 | 12,225 | 12,580 | ||||||
FHLMC, Ser 2003-2676, Cl PZ | ||||||||
5.500%, 09/15/33 | 47,097 | 47,050 | ||||||
FHLMC, Ser 2005-2944, Cl OH | ||||||||
5.500%, 03/15/35 | 152,807 | 154,413 | ||||||
FHLMC, Ser 2005-2957, Cl VZ | ||||||||
5.000%, 02/15/35 | 46,657 | 46,091 | ||||||
FHLMC, Ser 2006-3143, Cl BC | ||||||||
5.500%, 02/15/36 | 132,849 | 134,048 | ||||||
| MORTGAGE-BACKED SECURITIES — continued | ||||||||
| Face Amount | Value | |||||||
FHLMC, Ser 2006-3185, Cl GT | ||||||||
6.000%, 07/15/26 | $ | 44,563 | $ | 44,842 | ||||
FHLMC, Ser 2007-3330, Cl GZ | ||||||||
5.500%, 06/15/37 | 2,695 | 2,643 | ||||||
FHLMC, Ser 2013-299, Cl F1 | ||||||||
3.912%, ICE LIBOR USD 1 MONTH + 0.500%, 01/15/43 (B) | 172,068 | 171,586 | ||||||
FHLMC, Ser 2013-4283, Cl EW | ||||||||
4.500%, 12/15/43(B) | 128,855 | 125,287 | ||||||
FHLMC, Ser 2014-4319, Cl MA | ||||||||
4.500%, 03/15/44(B) | 227,977 | 221,115 | ||||||
FHLMC, Ser 2021-5092, Cl BC | ||||||||
2.500%, 06/25/36 | 536,650 | 518,373 | ||||||
FNMA | ||||||||
7.000%, 12/01/37 | 306 | 329 | ||||||
7.000%, 08/01/32 | 144,906 | 150,124 | ||||||
7.000%, 11/01/29 | 44,967 | 46,018 | ||||||
6.500%, 01/01/49 | 6,856 | 7,222 | ||||||
6.500%, 10/01/39 | 43,235 | 44,795 | ||||||
6.500%, 08/01/39 | 17,041 | 17,875 | ||||||
6.500%, 10/01/38 | 14,893 | 15,613 | ||||||
6.500%, 03/01/38 | 5,697 | 5,874 | ||||||
6.500%, 02/01/38 | 3,891 | 4,061 | ||||||
6.500%, 12/01/37 | 16,055 | 16,784 | ||||||
6.500%, 11/01/37 | 1,072 | 1,117 | ||||||
6.500%, 03/01/35 | 188,853 | 195,306 | ||||||
6.500%, 05/01/33 | 2,772 | 2,858 | ||||||
6.500%, 12/01/32 | 9,997 | 10,323 | ||||||
6.500%, 08/01/32 | 24,228 | 24,980 | ||||||
6.000%, 07/01/39 | 68,714 | 69,168 | ||||||
6.000%,��05/01/38 | 34,605 | 35,765 | ||||||
6.000%, 08/01/37 | 94,194 | 96,565 | ||||||
6.000%, 07/01/37 | 21,154 | 21,633 | ||||||
6.000%, 03/01/37 | 11,385 | 11,720 | ||||||
6.000%, 09/01/36 | 72,563 | 74,392 | ||||||
6.000%, 03/01/36 | 9,664 | 9,906 | ||||||
6.000%, 11/01/35 | 13,032 | 13,359 | ||||||
6.000%, 07/01/35 | 5,502 | 5,647 | ||||||
6.000%, 04/01/35 | 55,005 | 56,538 | ||||||
6.000%, 04/01/34 | 13,479 | 13,820 | ||||||
6.000%, 03/01/34 | 193,880 | 198,739 | ||||||
6.000%, 12/01/33 | 3,595 | 3,685 | ||||||
6.000%, 11/01/33 | 3,347 | 3,419 | ||||||
6.000%, 12/01/32 | 4,658 | 4,775 | ||||||
6.000%, 06/01/23 | 238 | 238 | ||||||
The accompanying notes are an integral part of the financial statements.
54
CATHOLIC RESPONSIBLE INVESTMENTS BOND FUND
OCTOBER 31, 2022
| MORTGAGE-BACKED SECURITIES — continued | ||||||||
| Face Amount | Value | |||||||
5.500%, 02/01/38 | $ | 3,022 | $ | 3,036 | ||||
5.500%, 04/01/37 | 126,870 | 129,297 | ||||||
5.500%, 09/01/36 | 10,672 | 10,903 | ||||||
5.500%, 10/01/35 | 54,009 | 55,114 | ||||||
5.500%, 04/01/35 | 178,834 | 181,826 | ||||||
5.500%, 11/01/33 | 6,631 | 6,763 | ||||||
5.500%, 06/01/33 | 37,018 | 37,729 | ||||||
5.500%, 11/01/29 | 6,546 | 6,499 | ||||||
5.500%, 01/01/25 | 1,521 | 1,516 | ||||||
5.500%, 05/01/24 | 501 | 499 | ||||||
5.500%, 03/01/24 | 726 | 723 | ||||||
5.500%, 01/01/24 | 3 | 3 | ||||||
5.500%, 11/01/23 | 11 | 11 | ||||||
5.193%, 11/01/36 | 6,356 | 6,241 | ||||||
5.000%, 11/01/52 | 23,770,000 | 22,970,981 | ||||||
5.000%, 06/01/52 | 1,651,942 | 1,594,837 | ||||||
5.000%, 03/01/49 | 218,563 | 213,009 | ||||||
5.000%, 12/01/48 | 180,747 | 177,877 | ||||||
5.000%, 08/01/40 | 15,170 | 15,186 | ||||||
5.000%, 09/01/39 | 47,765 | 47,813 | ||||||
5.000%, 09/01/25 | 11,801 | 11,750 | ||||||
5.000%, 04/01/25 | 52 | 52 | ||||||
4.500%, 08/01/52 | 3,457,615 | 3,252,376 | ||||||
4.500%, 03/01/52 | 388,806 | 372,708 | ||||||
4.500%, 06/01/48 | 320,726 | 305,970 | ||||||
4.500%, 07/01/47 | 102,697 | 99,387 | ||||||
4.500%, 02/01/46 | 659,215 | 637,499 | ||||||
4.500%, 09/01/45 | 50,853 | 49,213 | ||||||
4.500%, 02/01/45 | 230,016 | 222,598 | ||||||
4.500%, 10/01/44 | 26,394 | 25,542 | ||||||
4.500%, 09/01/43 | 8,777 | 8,494 | ||||||
4.500%, 01/01/43 | 577,658 | 553,582 | ||||||
4.500%, 07/01/42 | 211,760 | 204,934 | ||||||
4.500%, 01/01/42 | 66,320 | 63,810 | ||||||
4.500%, 12/01/41 | 28,586 | 27,582 | ||||||
4.500%, 11/01/41 | 28,891 | 27,959 | ||||||
4.500%, 09/01/41 | 15,152 | 14,514 | ||||||
4.500%, 08/01/41 | 12,892 | 12,476 | ||||||
4.500%, 05/01/41 | 1,073,988 | 1,037,350 | ||||||
4.500%, 06/01/36 | 23,609 | 22,805 | ||||||
4.500%, 09/01/31 | 47,411 | 46,808 | ||||||
4.500%, 06/01/31 | 14,339 | 14,157 | ||||||
4.500%, 01/01/31 | 128,731 | 127,097 | ||||||
4.500%, 08/01/26 | 74,588 | 74,041 | ||||||
4.500%, 10/01/24 | 19,235 | 19,095 | ||||||
4.078%, H15T1Y + 1.999%, 09/01/34 (B) | 901 | 912 | ||||||
4.000%, 08/01/52 | 1,448,325 | 1,317,949 | ||||||
4.000%, 07/01/52 | 1,868,059 | 1,700,338 | ||||||
4.000%, 06/01/52 | 40,236,963 | 36,624,431 | ||||||
4.000%, 04/01/52 | 1,684,462 | 1,540,321 | ||||||
4.000%, 10/01/51 | 1,813,169 | 1,653,573 | ||||||
| MORTGAGE-BACKED SECURITIES — continued | ||||||||
| Face Amount | Value | |||||||
4.000%, 04/01/48 | $ | 1,704,875 | $ | 1,588,038 | ||||
4.000%, 03/01/46 | 4,000,343 | 3,745,750 | ||||||
4.000%, 01/01/37 | 355,470 | 331,347 | ||||||
4.000%, 11/01/35 | 74,540 | 69,547 | ||||||
4.000%, 01/01/35 | 1,194,662 | 1,116,944 | ||||||
4.000%, 10/01/34 | 647,633 | 616,811 | ||||||
4.000%, 06/01/34 | 687,671 | 656,534 | ||||||
4.000%, 03/01/34 | 276,876 | 258,861 | ||||||
4.000%, 11/01/33 | 415,457 | 393,571 | ||||||
4.000%, 10/01/33 | 53,709 | 50,878 | ||||||
4.000%, 10/01/32 | 59,959 | 57,252 | ||||||
4.000%, 09/01/31 | 163,313 | 155,931 | ||||||
4.000%, 12/01/30 | 250,013 | 238,721 | ||||||
4.000%, 11/01/30 | 175,996 | 168,046 | ||||||
3.979%, H15T1Y + 2.290%, 08/01/34 (B) | 12,622 | 12,478 | ||||||
3.872%, ICE LIBOR USD 12 Month + 1.685%, 06/01/42 (B) | 15,782 | 15,743 | ||||||
3.830%, ICE LIBOR USD 12 MONTH + 1.580%, 09/01/44 (B) | 2,310 | 2,309 | ||||||
3.802%, ICE LIBOR USD 12 Month + 1.813%, 07/01/41 (B) | 54,081 | 54,854 | ||||||
3.697%, SOFR30A + 2.237%, 10/01/52 (B) | 3,693,089 | 3,483,478 | ||||||
3.681%, ICE LIBOR USD 12 MONTH + 1.620%, 11/01/48 (B) | 300,540 | 293,442 | ||||||
3.575%, ICE LIBOR USD 12 MONTH + 1.588%, 07/01/44 (B) | 142,047 | 142,378 | ||||||
3.527%, ICE LIBOR USD 12 MONTH + 1.471%, 06/01/35 (B) | 2,873 | 2,821 | ||||||
3.500%, 05/01/52 | 1,234,027 | 1,088,838 | ||||||
3.500%, 04/01/52 | 7,690,163 | 6,813,675 | ||||||
3.500%, 03/01/52 | 2,104,545 | 1,852,056 | ||||||
3.500%, 01/01/52 | 2,412,350 | 2,124,755 | ||||||
3.500%, 11/01/51 | 1,489,596 | 1,312,319 | ||||||
3.500%, 04/01/37 | 387,829 | 360,232 | ||||||
3.500%, 02/01/31 | 582,027 | 558,970 | ||||||
3.500%, 12/01/29 | 226,977 | 218,834 | ||||||
3.296%, ICE LIBOR USD 12 MONTH + 1.789%, 06/01/38 (B) | 5,361 | 5,447 | ||||||
3.218%, ICE LIBOR USD 12 Month + 1.563%, 06/01/44 (B) | 49,545 | 49,479 | ||||||
The accompanying notes are an integral part of the financial statements.
55
CATHOLIC RESPONSIBLE INVESTMENTS BOND FUND
OCTOBER 31, 2022
| MORTGAGE-BACKED SECURITIES — continued | ||||||||
| Face Amount | Value | |||||||
3.124%, ICE LIBOR USD 12 MONTH + 1.699%, 04/01/44 (B) | $ | 87,991 | $ | 88,037 | ||||
3.084%, ICE LIBOR USD 12 Month + 1.603%, 10/01/48 (B) | 129,921 | 125,991 | ||||||
3.030%, ICE LIBOR USD 12 MONTH + 1.576%, 08/01/43 (B) | 3,175 | 3,166 | ||||||
3.000%, 05/01/52 | 1,020,715 | 872,349 | ||||||
3.000%, 03/01/52 | 1,726,425 | 1,476,275 | ||||||
3.000%, 11/01/51 | 2,395,155 | 2,050,441 | ||||||
3.000%, 10/01/51 | 2,990,129 | 2,553,201 | ||||||
3.000%, 07/01/50 | 1,197,596 | 1,031,106 | ||||||
3.000%, 05/01/35 | 1,738,152 | 1,601,148 | ||||||
3.000%, 01/01/31 | 1,407,052 | 1,347,392 | ||||||
2.961%, ICE LIBOR USD 12 MONTH + 1.610%, 10/01/47 (B) | 202,404 | 198,135 | ||||||
2.918%, ICE LIBOR USD 12 Month + 1.459%, 05/01/35 (B) | 24,022 | 24,065 | ||||||
2.913%, ICE LIBOR USD 12 MONTH + 1.580%, 09/01/47 (B) | 227,162 | 222,259 | ||||||
2.880%, ICE LIBOR USD 12 Month + 1.652%, 05/01/46 (B) | 48,501 | 47,737 | ||||||
2.811%, ICE LIBOR USD 12 Month + 1.557%, 01/01/45 (B) | 30,055 | 29,923 | ||||||
2.743%, ICE LIBOR USD 12 MONTH + 1.568%, 05/01/45 (B) | 261,739 | 261,399 | ||||||
2.632%, ICE LIBOR USD 12 MONTH + 1.565%, 05/01/44 (B) | 64,343 | 63,877 | ||||||
2.532%, ICE LIBOR USD 12 MONTH + 1.577%, 10/01/44 (B) | 152,348 | 152,024 | ||||||
2.500%, 04/01/52 | 1,819,664 | 1,494,147 | ||||||
2.500%, 02/01/52 | 5,105,772 | 4,207,756 | ||||||
2.500%, 12/01/51 | 4,312,238 | 3,551,414 | ||||||
2.500%, 08/01/51 | 5,758,468 | 4,749,796 | ||||||
2.500%, 02/01/51 | 8,237,816 | 6,800,874 | ||||||
2.500%, 01/01/51 | 1,533,743 | 1,262,578 | ||||||
2.500%, 11/01/50 | 6,422,209 | 5,313,591 | ||||||
2.500%, 10/01/50 | 6,696,261 | 5,536,477 | ||||||
2.500%, 07/01/50 | 10,309,020 | 8,516,537 | ||||||
2.500%, 10/01/41 | 1,452,529 | 1,237,342 | ||||||
2.500%, 05/01/41 | 1,001,070 | 849,685 | ||||||
| MORTGAGE-BACKED SECURITIES — continued | ||||||||
| Face Amount | Value | |||||||
2.500%, 07/01/36 | $ | 1,244,506 | $ | 1,125,495 | ||||
2.500%, 03/01/35 | 1,831,077 | 1,656,779 | ||||||
2.143%, H15T1Y + 2.143%, 08/01/34 (B) | 901 | 893 | ||||||
2.061%, ICE LIBOR USD 12 Month + 1.580%, 11/01/44 (B) | 24,623 | 24,538 | ||||||
2.050%, ICE LIBOR USD 12 MONTH + 1.550%, 02/01/44 (B) | 671 | 660 | ||||||
2.028%, ICE LIBOR USD 12 MONTH + 1.778%, 12/01/39 (B) | 13,669 | 13,535 | ||||||
2.000%, 04/01/52 | 3,654,621 | 2,894,483 | ||||||
2.000%, 11/01/51 | 3,825,231 | 3,028,099 | ||||||
2.000%, 10/01/51 | 2,086,879 | 1,664,213 | ||||||
2.000%, 09/01/51 | 1,808,501 | 1,438,889 | ||||||
2.000%, 02/01/51 | 1,294,663 | 1,032,471 | ||||||
2.000%, 01/01/51 | 3,411,125 | 2,724,152 | ||||||
2.000%, 12/01/50 | 552,444 | 440,311 | ||||||
2.000%, 08/01/50 | 794,386 | 632,417 | ||||||
2.000%, 09/01/36 | 1,645,414 | 1,446,553 | ||||||
2.000%, 01/01/36 | 1,445,912 | 1,271,212 | ||||||
1.943%, ICE LIBOR USD 12 MONTH + 1.580%, 04/01/44 (B) | 148,869 | 148,122 | ||||||
1.935%, ICE LIBOR USD 12 MONTH + 1.580%, 02/01/44 (B) | 24,437 | 24,151 | ||||||
1.910%, ICE LIBOR USD 12 MONTH + 1.552%, 02/01/44 (B) | 14,820 | 14,638 | ||||||
1.850%, ICE LIBOR USD 12 MONTH + 1.600%, 12/01/44 (B) | 37,750 | 37,524 | ||||||
1.840%, ICE LIBOR USD 12 MONTH + 1.590%, 12/01/44 (B) | 164,700 | 163,337 | ||||||
1.815%, ICE LIBOR USD 12 MONTH + 1.565%, 01/01/44 (B) | 66,855 | 66,255 | ||||||
1.500%, 10/01/50 | 1,946,393 | 1,452,102 | ||||||
FNMA Grantor Trust 2000-T6, Ser 2000-T6, Cl A1 | ||||||||
7.500%, 11/25/40 | 16,646 | 16,452 | ||||||
FNMA Grantor Trust 2001-T1, Ser 2001-T1, Cl A1 | ||||||||
7.500%, 10/25/40 | 142,640 | 145,184 | ||||||
FNMA Grantor Trust 2001-T10, Ser 2001-T10, Cl A1 | ||||||||
7.000%, 12/25/41 | 95,725 | 97,383 | ||||||
The accompanying notes are an integral part of the financial statements.
56
CATHOLIC RESPONSIBLE INVESTMENTS BOND FUND
OCTOBER 31, 2022
| MORTGAGE-BACKED SECURITIES — continued | ||||||||
| Face Amount | Value | |||||||
FNMA Grantor Trust 2001-T12, Ser 2001-T12, Cl A1 | ||||||||
6.500%, 08/25/41 | $ | 3,341 | $ | 3,394 | ||||
FNMA Grantor Trust 2001-T3, Ser 2001-T3, Cl A1 | ||||||||
7.500%, 11/25/40 | 8,909 | 9,064 | ||||||
FNMA Grantor Trust 2001-T4, Ser 2001-T4, Cl A1 | ||||||||
7.500%, 07/25/41 | 40,151 | 39,946 | ||||||
FNMA Grantor Trust 2001-T7, Ser 2001-T7, Cl A1 | ||||||||
7.500%, 02/25/41 | 1,739 | 1,846 | ||||||
FNMA Grantor Trust 2001-T8, Ser 2001-T8, Cl A1 | ||||||||
7.500%, 07/25/41 | 5,288 | 5,284 | ||||||
FNMA Grantor Trust 2004-T1, Ser 2004-T1, Cl 1A2 | ||||||||
6.500%, 01/25/44 | 1,525 | 1,559 | ||||||
FNMA REMIC Trust 2001-W3, Ser 2001-W3, Cl A | ||||||||
7.000%, 09/25/41(B) | 78,618 | 76,799 | ||||||
FNMA REMIC Trust 2002-W6, Ser 2002-W6, Cl 2A | ||||||||
7.500%, 06/25/42(B) | 6,316 | 6,262 | ||||||
FNMA REMIC Trust 2002-W6, Ser 2002-W6, Cl 2A1 | ||||||||
7.000%, 06/25/42(B) | 6,316 | 6,115 | ||||||
FNMA REMIC Trust 2003-W4, Ser 2003-W4, Cl 3A | ||||||||
5.089%, 10/25/42(B) | 68,489 | 69,117 | ||||||
FNMA REMIC Trust 2003-W4, Ser 2003-W4, Cl 4A | ||||||||
5.720%, 10/25/42 (B) | 27,564 | 27,874 | ||||||
FNMA Trust 2003-W2, Ser 2003-W2, Cl 1A3 | ||||||||
7.500%, 07/25/42 | 8,344 | 8,777 | ||||||
FNMA Trust 2004-W2, Ser 2004-W2, Cl 2A2 | ||||||||
7.000%, 02/25/44 | 15,962 | 16,628 | ||||||
FNMA Trust 2004-W2, Ser 2004-W2, Cl 5A | ||||||||
7.500%, 03/25/44 | 6,084 | 6,335 | ||||||
FNMA, Ser 2001-2, Cl ZK | ||||||||
6.500%, 02/25/31 | 41,076 | 41,912 | ||||||
FNMA, Ser 2001-79, Cl BA | ||||||||
7.000%, 03/25/45 | 13,689 | 14,058 | ||||||
FNMA, Ser 2002-33, Cl A1 | ||||||||
7.000%, 06/25/32 | 69,189 | 71,128 | ||||||
FNMA, Ser 2007-104, Cl ZE | ||||||||
6.000%, 08/25/37 | 17,930 | 18,098 | ||||||
FNMA, Ser 2007-21, Cl MT | ||||||||
5.750%, 03/25/37 | 5,202 | 5,209 | ||||||
| MORTGAGE-BACKED SECURITIES — continued | ||||||||
| Face Amount | Value | |||||||
FNMA, Ser 2009-11, Cl MP | ||||||||
7.000%, 03/25/49 | $ | 5,454 | $ | 5,572 | ||||
FNMA, Ser 2010-136, Cl BA | ||||||||
3.500%, 12/25/30 | 208,442 | 199,560 | ||||||
FNMA, Ser 2010-49, Cl ZJ | ||||||||
4.500%, 05/25/40 | 53,192 | 51,551 | ||||||
FNMA, Ser 2013-128, Cl CF | ||||||||
4.186%, ICE LIBOR USD 1 Month + 0.600%, 12/25/43 (B) | 279,477 | 274,276 | ||||||
FNMA, Ser 2014-1, Cl KF | ||||||||
4.186%, ICE LIBOR USD 1 MONTH + 0.600%, 02/25/44 (B) | 412,091 | 405,357 | ||||||
FNMA, Ser M3G, Cl A2 | ||||||||
1.250%, 01/25/31 (B) | 2,000,000 | 1,518,865 | ||||||
Freddie Mac Multifamily ML Certificates | ||||||||
1.219%, 07/25/41 (A) | 10,052,854 | 930,012 | ||||||
FREMF 2016-K55 Mortgage Trust, Ser K55, Cl C | ||||||||
4.167%, 04/25/49 (A)(B) | 1,410,000 | 1,314,004 | ||||||
FREMF 2016-K56 Mortgage Trust, Ser K56, Cl C | ||||||||
3.944%, 06/25/49 (A)(B) | 3,135,000 | 2,867,595 | ||||||
FREMF 2016-K57 Mortgage Trust, Ser K57, Cl C | ||||||||
3.918%, 08/25/49 (A)(B) | 3,470,000 | 3,160,851 | ||||||
FREMF 2017-K69 Mortgage Trust, Ser K69, Cl C | ||||||||
3.727%, 10/25/49 (A)(B) | 2,788,000 | 2,477,698 | ||||||
FREMF 2018-K732 Mortgage Trust, Ser K732, Cl C | ||||||||
4.051%, 05/25/25 (A)(B) | 3,525,000 | 3,326,291 | ||||||
FREMF 2018-K74 Mortgage Trust, Ser K74, Cl C | ||||||||
4.093%, 02/25/51 (A)(B) | 3,095,000 | 2,741,960 | ||||||
FREMF 2018-K83 Mortgage Trust, Ser K83, Cl C | ||||||||
4.278%, 11/25/51 (A)(B) | 2,890,000 | 2,596,534 | ||||||
FREMF 2018-K85 Mortgage Trust, Ser K85, Cl B | ||||||||
4.320%, 12/25/50 (A)(B) | 3,345,000 | 3,035,556 | ||||||
FREMF 2018-K86 Mortgage Trust, Ser K86, Cl C | ||||||||
4.294%, 11/25/51 (A)(B) | 2,062,000 | 1,838,360 | ||||||
FREMF 2019-K89 Mortgage Trust, Ser K89, Cl C | ||||||||
4.287%, 01/25/51 (A)(B) | 5,621,042 | 4,949,358 | ||||||
FREMF 2019-K96 Mortgage Trust, Ser K96, Cl C | ||||||||
3.812%, 08/25/56 (A)(B) | 1,910,000 | 1,623,510 | ||||||
The accompanying notes are an integral part of the financial statements.
57
CATHOLIC RESPONSIBLE INVESTMENTS BOND FUND
OCTOBER 31, 2022
| MORTGAGE-BACKED SECURITIES — continued | ||||||||
| Face Amount | Value | |||||||
FREMF 2020-K737 Mortgage Trust, Ser K737, Cl C | ||||||||
3.305%, 01/25/53 (A)(B) | $ | 640,000 | $ | 566,779 | ||||
FREMF K-100 Mortgage Trust, Ser K100, Cl C | ||||||||
3.494%, 11/25/52 (A)(B) | 130,000 | 107,878 | ||||||
FREMF Mortgage Trust, Ser 2016-K60, Cl C | ||||||||
3.543%, 12/25/49 (A)(B) | 1,630,000 | 1,457,818 | ||||||
FREMF Mortgage Trust, Ser 2017-K62, Cl C | ||||||||
3.880%, 01/25/50 (A)(B) | 2,661,000 | 2,380,232 | ||||||
FREMF Mortgage Trust, Ser 2018-K75, Cl C | ||||||||
3.977%, 04/25/51 (A)(B) | 145,000 | 127,527 | ||||||
GNMA | ||||||||
7.000%, 12/15/29 | 842 | 876 | ||||||
6.500%, 05/15/29 | 1,519 | 1,563 | ||||||
4.500%, 08/20/52 | 6,682,702 | 6,340,949 | ||||||
4.000%, 08/20/52 | 13,469,070 | 12,428,148 | ||||||
4.000%, 04/20/52 | 122,461 | 112,973 | ||||||
4.000%, 03/20/52 | 131,118 | 120,959 | ||||||
4.000%, 02/20/52 | 1,807,394 | 1,667,372 | ||||||
4.000%, 01/20/52 | 1,444,224 | 1,332,474 | ||||||
3.500%, 08/20/52 | 11,658,847 | 10,444,578 | ||||||
3.500%, 07/20/52 | 2,005,099 | 1,797,501 | ||||||
3.500%, 03/20/52 | 2,159,903 | 1,942,372 | ||||||
3.500%, 02/20/52 | 1,595,333 | 1,438,361 | ||||||
3.500%, 01/20/52 | 1,699,334 | 1,532,311 | ||||||
3.500%, 06/20/51 | 1,715,301 | 1,552,202 | ||||||
3.000%, 06/20/52 | 13,911,946 | 12,111,864 | ||||||
3.000%, 10/20/51 | 2,102,092 | 1,832,326 | ||||||
3.000%, 07/20/51 | 2,921,166 | 2,559,294 | ||||||
3.000%, 05/20/51 | 1,339,145 | 1,173,800 | ||||||
2.500%, 07/20/52 | 1,669,678 | 1,416,741 | ||||||
2.500%, 04/20/52 | 9,604,138 | 8,146,402 | ||||||
2.500%, 03/20/52 | 1,798,277 | 1,515,134 | ||||||
2.500%, 05/20/51 | 910,171 | 773,781 | ||||||
2.500%, 03/20/51 | 2,143,766 | 1,822,973 | ||||||
2.000%, 05/20/52 | 8,889,111 | 7,310,035 | ||||||
2.000%, 04/20/52 | 1,499,281 | 1,232,743 | ||||||
2.000%, 10/20/51 | 1,918,244 | 1,581,837 | ||||||
2.000%, 11/20/50 | 3,481,335 | 2,878,322 | ||||||
GNMA, Ser 2002-49, Cl ZG | ||||||||
6.000%, 07/20/32 | 394,281 | 393,381 | ||||||
GNMA, Ser 2012-98, Cl BM | ||||||||
4.903%, 08/20/42 (B) | 203,930 | 196,898 | ||||||
GNMA, Ser 2017-H17, Cl FQ | ||||||||
3.978%, ICE LIBOR USD 12 MONTH + 0.270%, 09/20/67 (B) | 1,491,343 | 1,459,226 | ||||||
| MORTGAGE-BACKED SECURITIES — continued | ||||||||
| Face Amount | Value | |||||||
GNMA, Ser 2017-H22, Cl FH | ||||||||
0.455%, ICE LIBOR USD 12 MONTH + 0.220%, 11/20/67 (B) | $ | 955,248 | $ | 936,769 | ||||
GNMA, Ser 2017-H24, Cl FQ | ||||||||
0.567%, ICE LIBOR USD 12 MONTH + 0.200%, 11/20/67 (B) | 1,029,125 | 1,005,178 | ||||||
GNMA, Ser 2018-H04, Cl FK | ||||||||
0.988%, ICE LIBOR USD 12 MONTH + 0.040%, 03/20/68 (B) | 903,267 | 862,960 | ||||||
GNMA, Ser 2018-H05, Cl CF | ||||||||
1.008%, ICE LIBOR USD 12 MONTH + 0.060%, 03/20/68 (B) | 990,699 | 946,089 | ||||||
GNMA, Ser 2018-H05, Cl FE | ||||||||
1.018%, ICE LIBOR USD 12 Month + 0.070%, 02/20/68 (B) | 379,261 | 366,515 | ||||||
GNMA, Ser 2019-H09, Cl FG | ||||||||
2.522%, ICE LIBOR USD 12 MONTH + 0.350%, 05/20/69 (B) | 410,395 | 397,680 | ||||||
GNMA, Ser 2019-H16, Cl CF | ||||||||
3.238%, ICE LIBOR USD 1 Month + 0.700%, 10/20/69 (B) | 326,135 | 316,211 | ||||||
GNMA, Ser 2020-H01, Cl FV | ||||||||
3.283%, ICE LIBOR USD 1 MONTH + 0.650%, 01/20/70 (B) | 3,663,818 | 3,514,521 | ||||||
GNMA, Ser 2020-H02, Cl FB | ||||||||
1.821%, ICE LIBOR USD 1 Month + 0.600%, 01/20/70 (B) | 484,247 | 464,242 | ||||||
GNMA, Ser 2022-H04, Cl FG | ||||||||
0.883%, SOFR30A + 0.550%, 02/20/67 (B) | 2,232,928 | 2,174,165 | ||||||
GNMA, Ser 2022-H08, Cl FE | ||||||||
3.034%, SOFR30A + 0.750%, 03/20/72 (B) | 1,931,715 | 1,906,017 | ||||||
GNMA, Ser 2022-H09, Cl FA | ||||||||
3.590%, SOFR30A + 0.670%, 04/20/72 (B) | 1,983,418 | 1,946,885 | ||||||
GNMA, Ser 2022-H11, Cl EF | ||||||||
3.890%, SOFR30A + 0.970%, 05/20/72 (B) | 2,616,002 | 2,568,279 | ||||||
Vendee Mortgage Trust 1993-1, Ser 1993-1, Cl ZB | ||||||||
7.250%, 02/15/23 | 1,815 | 1,815 | ||||||
The accompanying notes are an integral part of the financial statements.
58
CATHOLIC RESPONSIBLE INVESTMENTS BOND FUND
OCTOBER 31, 2022
| MORTGAGE-BACKED SECURITIES — continued | ||||||||
| Face Amount | Value | |||||||
Vendee Mortgage Trust 1995-1, Ser 1995-1, Cl 2 | ||||||||
7.793%, 02/15/25 | $ | 2,417 | $ | 2,437 | ||||
Vendee Mortgage Trust 1995-2, Ser 1995-2C, Cl 3A | ||||||||
8.793%, 06/15/25 | 1,680 | 1,740 | ||||||
Vendee Mortgage Trust 1998-2, Ser 1998-2, Cl 2A | ||||||||
8.613%, 08/15/27 (B) | 468 | 476 | ||||||
|
| |||||||
| 439,804,257 | ||||||||
|
| |||||||
Non-Agency Mortgage-Backed Obligation — 7.2% |
| |||||||
BANK 2017-BNK5, Ser BNK5, Cl D | ||||||||
3.078%, 06/15/60 (A)(B) | 386,000 | 283,204 | ||||||
Benchmark 2019-B10 Mortgage Trust, Ser B10, Cl E | ||||||||
3.000%, 03/15/62 (A) | 1,260,000 | 803,219 | ||||||
Benchmark 2020-B16 Mortgage Trust, Ser B16, Cl D | ||||||||
2.500%, 02/15/53 (A) | 5,470,000 | 3,544,582 | ||||||
Benchmark 2022-B35 Mortgage Trust, Ser B35, Cl D | ||||||||
2.500%, 05/15/55 (A) | 4,000,000 | 2,271,636 | ||||||
BIG Commercial Mortgage Trust 2022-BIG, Ser BIG, Cl D | ||||||||
6.415%, TSFR1M + 3.039%, 02/15/39 (A)(B) | 3,800,000 | 3,531,168 | ||||||
BX Trust, Ser 2022-CLS, Cl B | ||||||||
6.300%, 10/13/27 (A) | 2,100,000 | 2,077,849 | ||||||
Century Plaza Towers 2019-CPT, Ser CPT, Cl C | ||||||||
2.997%, 11/13/39 (A)(B) | 500,000 | 365,797 | ||||||
Century Plaza Towers 2019-CPT, Ser CPT, Cl E | ||||||||
2.997%, 11/13/39 (A)(B) | 2,500,000 | 1,703,555 | ||||||
Century Plaza Towers, Ser 2019-CPT, Cl B | ||||||||
2.997%, 11/13/39 (A)(B) | 733,000 | 557,498 | ||||||
CFCRE Commercial Mortgage Trust 2016-C6, Ser C6, Cl D | ||||||||
4.192%, 11/10/49 (A)(B) | 2,525,000 | 1,901,161 | ||||||
Citigroup Commercial Mortgage Trust 2014-GC21, Ser GC21, Cl D | ||||||||
4.945%, 05/10/47 (A)(B) | 3,185,000 | 2,821,635 | ||||||
| MORTGAGE-BACKED SECURITIES — continued | ||||||||
| Face Amount | Value | |||||||
Citigroup Commercial Mortgage Trust 2022-GC48, Ser GC48, Cl C | ||||||||
4.875%, 05/15/54 (B) | $ | 3,000,000 | $ | 2,435,519 | ||||
COMM 2014-CCRE20 Mortgage Trust, Ser CR20, Cl C | ||||||||
4.462%, 11/10/47 (B) | 2,980,000 | 2,740,211 | ||||||
COMM 2015-CCRE24 Mortgage Trust, Ser CR24, Cl D | ||||||||
3.463%, 08/10/48 (B) | 55,000 | 44,954 | ||||||
COMM Mortgage Trust, Ser 2022-HC, Cl C | ||||||||
3.376%, 01/10/39 (A) | 1,570,000 | 1,318,986 | ||||||
Commercial Mortgage Trust 2022-LPFL, Ser LPFL, Cl C | ||||||||
5.770%, TSFR1M + 2.394%, 03/15/39 (A)(B) | 2,560,000 | 2,445,426 | ||||||
Connecticut Avenue Securities Trust 2022-R03, Ser 2022-R03, Cl 1M2 | ||||||||
6.497%, SOFR30A + 3.500%, 03/25/42 (A)(B) | 3,310,000 | 3,148,634 | ||||||
CSMC 2014-USA OA, Ser USA, Cl C | ||||||||
4.336%, 09/15/37 (A) | 3,550,000 | 2,910,870 | ||||||
CSMC 2021-NQM5 Trust, Ser 2021-NQM5, Cl M1 | ||||||||
2.168%, 05/25/66 (A)(B) | 1,310,000 | 740,608 | ||||||
CSMC OA, Ser 2014-USA, Cl A2 | ||||||||
3.953%, 09/15/37 (A) | 3,825,000 | 3,438,946 | ||||||
CSMC Trust, Ser 2016-NXSR, Cl AS | ||||||||
4.049%, 12/15/49 (B) | 4,145,000 | 3,727,580 | ||||||
FASST 2021-JR1 A2 | ||||||||
2.000%, 04/25/51 | 2,607,147 | 2,435,344 | ||||||
FASST 2021-S2 A2 09/2051 | ||||||||
1.750%, 09/25/51 | 2,530,100 | 2,314,552 | ||||||
FASST 21-S1-A2 07/25/2051 | ||||||||
1.750%, 07/25/51 | 5,201,853 | 4,639,793 | ||||||
FIN AMER 19-JR2 06/25/69 | ||||||||
2.000%, 06/25/69 | 3,362 | 3,364 | ||||||
FIN AMER 19-JR3 09/25/69 | ||||||||
2.000%, 09/25/69 | 77,698 | 78,774 | ||||||
GS Mortgage Securities II, Ser 2013-GC10, Cl B | ||||||||
3.682%, 02/10/46 (A) | 6,785,000 | 6,749,372 | ||||||
GS Mortgage Securities Trust 2017-GS8, Ser GS8, Cl D | ||||||||
2.700%, 11/10/50 (A) | 2,570,000 | 1,875,682 | ||||||
The accompanying notes are an integral part of the financial statements.
59
CATHOLIC RESPONSIBLE INVESTMENTS BOND FUND
OCTOBER 31, 2022
| MORTGAGE-BACKED SECURITIES — continued | ||||||||
| Face Amount | Value | |||||||
Hudson Yards 2019-55HY Mortgage Trust, Ser 55HY, Cl A | ||||||||
2.943%, 12/10/41 (A)(B) | $ | 1,000,000 | $ | 825,394 | ||||
Hudson Yards Mortgage Trust, Ser 2016-10HY, Cl A | ||||||||
2.835%, 08/10/38 (A) | 2,085,000 | 1,845,939 | ||||||
JPMBB Commercial Mortgage Securities Trust 2014-C26, Ser C26, Cl D | ||||||||
3.875%, 01/15/48 (A)(B) | 1,200,000 | 1,034,996 | ||||||
JPMBB Commercial Mortgage Securities Trust 2015-C28, Ser C28, Cl C | ||||||||
4.182%, 10/15/48 (B) | 5,170,000 | 4,683,009 | ||||||
JPMBB Commercial Mortgage Securities Trust 2015-C29, Ser C29, Cl C | ||||||||
4.184%, 05/15/48 (B) | 5,750,000 | 5,194,722 | ||||||
JPMBB Commercial Mortgage Securities Trust, Ser 2014-C19, Cl D | ||||||||
4.648%, 04/15/47 (A)(B) | 1,760,000 | 1,596,928 | ||||||
JPMBB Commercial Mortgage Securities Trust, Ser 2014-C26, Cl AS | ||||||||
3.800%, 01/15/48 | 5,885,000 | 5,505,756 | ||||||
NCMF Trust 2022-MFP, Ser MFP, Cl E | ||||||||
7.209%, TSFR1M + 3.833%, 03/15/39 (A)(B) | 2,500,000 | 2,366,504 | ||||||
New Residential Mortgage Loan Trust 2021-NQM2R, Ser 2021-NQ2R, Cl M1 | ||||||||
2.201%, 10/25/58 (A)(B) | 1,954,000 | 1,764,827 | ||||||
NW RE-REMIC TRUST 2021-FRR1, Ser FRR1, Cl AK88 | ||||||||
2.820%, 12/18/51 (A)(B) | 2,500,000 | 2,130,894 | ||||||
OBX 2022-NQM1 Trust, Ser 2022-NQM1, Cl M1 | ||||||||
3.504%, 11/25/61 (A)(B) | 1,010,000 | 658,399 | ||||||
One Bryant Park Trust, Ser 2019-OBP, Cl A | ||||||||
2.516%, 09/15/54 (A) | 2,500,000 | 1,990,675 | ||||||
One Market Plaza Trust, Ser 2017-1MKT, Cl B | ||||||||
3.845%, 02/10/32 (A) | 400,000 | 380,698 | ||||||
One Market Plaza Trust, Ser 2017-1MKT, Cl C | ||||||||
4.016%, 02/10/32 (A) | 1,000,000 | 948,410 | ||||||
| MORTGAGE-BACKED SECURITIES — continued | ||||||||
| Face Amount | Value | |||||||
Onslow Bay Mortgage Loan Trust, Ser 2021-NQM4, Cl M1 | ||||||||
3.248%, 10/25/61 (A) | $ | 1,750,000 | $ | 1,094,442 | ||||
Palisades Center Trust 2016-PLSD, Ser PLSD, Cl A | ||||||||
2.713%, 04/13/33 (A) | 4,705,000 | 3,684,486 | ||||||
Residential Mortgage Loan Trust, Ser 2019-3, Cl A1 | ||||||||
2.633%, 09/25/59 (A)(B) | 529,784 | 511,798 | ||||||
SFAVE Commercial Mortgage Securities Trust 2015-5AVE, Ser 5AVE, Cl A1 | ||||||||
3.872%, 01/05/43 (A)(B) | 3,045,000 | 2,122,696 | ||||||
SFAVE Commercial Mortgage Securities Trust 2015-5AVE, Ser 5AVE, Cl A2B | ||||||||
4.144%, 01/05/43 (A)(B) | 1,995,000 | 1,401,576 | ||||||
Shops at Crystals Trust 2016-CSTL, Ser CSTL, Cl C | ||||||||
3.731%, 07/05/36 (A)(B) | 2,800,000 | 2,283,129 | ||||||
SLG Office Trust 2021-OVA, Ser OVA, Cl C | ||||||||
2.851%, 07/15/41 (A) | 2,500,000 | 1,834,141 | ||||||
SPGN 2022-TFLM Mortgage Trust, Ser TFLM, Cl D | ||||||||
6.876%, TSFR1M + 3.500%, 02/15/39 (A)(B) | 2,500,000 | 2,333,368 | ||||||
Taubman Centers Commercial Mortgage Trust 2022-DPM, Ser DPM, Cl C | ||||||||
7.153%, TSFR1M + 3.777%, 05/15/37 (A)(B) | 1,225,000 | 1,172,926 | ||||||
Taubman Centers Commercial Mortgage Trust 2022-DPM, Ser DPM, Cl D | ||||||||
8.147%, TSFR1M + 4.771%, 05/15/37 (A)(B) | 1,690,000 | 1,598,106 | ||||||
Verus Securitization Trust 2021-2, Ser 2021-2, Cl M1 | ||||||||
2.187%, 02/25/66 (A)(B) | 2,910,000 | 1,926,052 | ||||||
Verus Securitization Trust 2021-3, Ser 2021-3, Cl M1 | ||||||||
2.397%, 06/25/66 (A)(B) | 1,555,000 | 1,053,359 | ||||||
Verus Securitization Trust 2021-4, Ser 2021-4, Cl M1 | ||||||||
2.195%, 07/25/66 (A)(B) | 1,400,000 | 774,453 | ||||||
Verus Securitization Trust 2021-R3, Ser 2021-R3, Cl M1 | ||||||||
2.411%, 04/25/64 (A)(B) | 2,745,000 | 2,232,499 | ||||||
The accompanying notes are an integral part of the financial statements.
60
CATHOLIC RESPONSIBLE INVESTMENTS BOND FUND
OCTOBER 31, 2022
| MORTGAGE-BACKED SECURITIES — continued | ||||||||
| Face Amount | Value | |||||||
Wells Fargo Commercial Mortgage Trust 2015-C28, Ser C28, Cl D | ||||||||
4.083%, 05/15/48 (B) | $ | 1,685,000 | $ | 1,434,383 | ||||
Wells Fargo Commercial Mortgage Trust, Ser 2019-C49, Cl D | ||||||||
3.000%, 03/15/52(A) | 3,100,000 | 2,034,886 | ||||||
|
| |||||||
| 119,329,370 | ||||||||
|
| |||||||
Total Mortgage-Backed Securities | ||||||||
(Cost $623,705,189) | 559,133,627 | |||||||
|
| |||||||
U.S. TREASURY OBLIGATIONS — 24.5% |
| |||||||
| Face Amount | Value | |||||||
U.S. Treasury Bond | ||||||||
3.375%, 08/15/42 | $ | 8,500,000 | $ | 7,332,578 | ||||
3.375%, 11/15/48 | 45,000 | 38,440 | ||||||
3.250%, 05/15/42 | 80,000 | 67,638 | ||||||
3.000%, 02/15/48 | 640,000 | 505,375 | ||||||
3.000%, 08/15/48 | 1,395,000 | 1,107,608 | ||||||
3.000%, 02/15/49 | 985,000 | 785,922 | ||||||
2.875%, 05/15/52 | 56,585,000 | 43,915,265 | ||||||
2.500%, 02/15/45 | 15,310,000 | 11,017,818 | ||||||
2.500%, 02/15/46 | 1,775,000 | 1,269,402 | ||||||
2.500%, 05/15/46 | 1,735,000 | 1,237,950 | ||||||
2.375%, 02/15/42 | 870,000 | 635,236 | ||||||
2.375%, 11/15/49 | 395,000 | 276,053 | ||||||
2.250%, 08/15/46 | 1,805,000 | 1,221,618 | ||||||
2.250%, 02/15/52 | 21,710,000 | 14,559,269 | ||||||
2.000%, 11/15/41 | 1,305,000 | 889,643 | ||||||
2.000%, 02/15/50 | 4,745,000 | 3,018,450 | ||||||
2.000%, 08/15/51 | 11,985,000 | 7,550,082 | ||||||
1.875%, 02/15/41 | 935,000 | 632,075 | ||||||
1.875%, 02/15/51 | 325,000 | 198,974 | ||||||
1.875%, 11/15/51 | 37,060,000 | 22,574,751 | ||||||
1.625%, 11/15/50 | 4,615,000 | 2,639,203 | ||||||
1.375%, 11/15/40 | 2,815,000 | 1,739,032 | ||||||
1.375%, 08/15/50 | 5,490,000 | 2,926,642 | ||||||
1.250%, 05/15/50 | 1,525,000 | 785,792 | ||||||
1.125%, 05/15/40 | 605,000 | 361,133 | ||||||
1.125%, 08/15/40 | 3,655,000 | 2,163,160 | ||||||
U.S. Treasury Bonds | ||||||||
3.000%, 08/15/52 | 19,582,000 | 15,670,966 | ||||||
U.S. Treasury Note | ||||||||
3.966%, US Treasury 3 Month Bill Money Market Yield + 0.075%, 04/30/24(B) | 21,510,000 | 21,477,192 | ||||||
3.000%, 07/15/25 | 5,600,000 | 5,393,500 | ||||||
| U.S. TREASURY OBLIGATIONS — continued | ||||||||
| Face Amount | Value | |||||||
2.875%, 08/15/28 | $ | 490,000 | $ | 455,107 | ||||
2.875%, 05/15/32 | 14,020,000 | 12,703,434 | ||||||
2.750%, 04/30/27 | 2,310,000 | 2,164,723 | ||||||
2.750%, 05/31/29 | 3,860,000 | 3,534,463 | ||||||
2.750%, 08/15/32 | 10,365,000 | 9,272,602 | ||||||
2.625%, 07/31/29 | 520,000 | 472,103 | ||||||
2.375%, 03/31/29 | 5,640,000 | 5,053,528 | ||||||
2.375%, 05/15/29 | 1,575,000 | 1,409,871 | ||||||
1.875%, 02/15/32 | 1,730,000 | 1,438,603 | ||||||
1.750%, 12/31/26 | 3,240,000 | 2,925,745 | ||||||
1.750%, 01/31/29 | 280,000 | 241,981 | ||||||
1.750%, 11/15/29 | 1,050,000 | 901,564 | ||||||
1.625%, 08/15/29 | 1,340,000 | 1,142,088 | ||||||
1.625%, 05/15/31 | 1,485,000 | 1,227,213 | ||||||
1.500%, 01/31/27 | 4,655,000 | 4,148,405 | ||||||
1.500%, 11/30/28 | 700,000 | 597,652 | ||||||
1.500%, 02/15/30 | 265,000 | 222,010 | ||||||
1.375%, 12/31/28 | 6,335,000 | 5,366,685 | ||||||
1.375%, 11/15/31 | 13,805,000 | 11,014,880 | ||||||
1.250%, 03/31/28 | 410,000 | 350,486 | ||||||
1.250%, 08/15/31 | 10,810,000 | 8,591,839 | ||||||
1.125%, 10/31/26 | 555,000 | 489,614 | ||||||
1.125%, 02/29/28 | 4,795,000 | 4,080,995 | ||||||
1.125%, 08/31/28 | 505,000 | 423,707 | ||||||
1.125%, 02/15/31 | 4,625,000 | 3,698,013 | ||||||
0.875%, 09/30/26 | 107,950,000 | 94,515,286 | ||||||
0.875%, 11/15/30 | 16,360,000 | 12,865,606 | ||||||
0.750%, 01/31/28 | 1,450,000 | 1,212,506 | ||||||
0.625%, 11/30/27 | 3,350,000 | 2,797,773 | ||||||
0.625%, 12/31/27 | 7,560,000 | 6,296,358 | ||||||
0.625%, 05/15/30 | 595,000 | 462,334 | ||||||
0.625%, 08/15/30 | 295,000 | 227,865 | ||||||
0.500%, 04/30/27 | 5,860,000 | 4,959,941 | ||||||
0.500%, 05/31/27 | 1,195,000 | 1,008,281 | ||||||
0.500%, 08/31/27 | 890,000 | 745,062 | ||||||
0.375%, 11/30/25 | 300,000 | 265,254 | ||||||
U.S. Treasury Notes | ||||||||
4.375%, 10/31/24 | 4,385,000 | 4,374,551 | ||||||
4.149%, US Treasury 3 Month Bill Money Market Yield + 0.037%, 07/31/24(B) | 24,840,000 | 24,813,726 | ||||||
4.125%, 10/31/27 | 30,000 | 29,834 | ||||||
2.625%, 05/31/27 | 1,260,000 | 1,174,409 | ||||||
|
| |||||||
Total U.S. Treasury Obligations | ||||||||
(Cost $ 478,730,689) | 409,666,864 | |||||||
|
| |||||||
The accompanying notes are an integral part of the financial statements.
61
CATHOLIC RESPONSIBLE INVESTMENTS BOND FUND
OCTOBER 31, 2022
| ASSET-BACKED SECURITIES — 4.6% | ||||||||
| Face Amount | Value | |||||||
Automotive — 2.1% | ||||||||
American Credit Acceptance Receivables Trust, Ser 2022-2, Cl D | ||||||||
4.850%, 06/13/28(A) | $ | 2,555,000 | $ | 2,405,691 | ||||
CAL Receivables 2022-1, Ser 2022-1, Cl B | ||||||||
7.140%, SOFR30A + 4.350%, 10/15/26 (A)(B) | 2,520,000 | 2,413,492 | ||||||
Carmax Auto Owner Trust 2019-2, Ser 2019-2, Cl D | ||||||||
3.410%, 10/15/25 | 2,010,000 | 1,971,749 | ||||||
Carvana Auto Receivables Trust 2019-2, Ser 2019-2A, Cl D | ||||||||
3.280%, 01/15/25(A) | 2,750,159 | 2,722,488 | ||||||
Credit Acceptance Auto Loan Trust 2020-3, Ser 2020-3A, Cl C | ||||||||
2.280%, 02/15/30(A) | 1,200,000 | 1,115,776 | ||||||
Drive Auto Receivables Trust 2019-3, Ser 2019-3, Cl D | ||||||||
3.180%, 10/15/26 | 105,000 | 103,246 | ||||||
Drive Auto Receivables Trust 2020-1, Ser 2020-1, Cl D | ||||||||
2.700%, 05/17/27 | 2,695,000 | 2,640,156 | ||||||
Drive Auto Receivables Trust 2020-2, Ser 2020-2, Cl D | ||||||||
3.050%, 05/15/28 | 2,200,000 | 2,139,101 | ||||||
Exeter Automobile Receivables Trust 2020-2, Ser 2020-2A, Cl D | ||||||||
4.730%, 04/15/26 (A) | 315,000 | 311,703 | ||||||
Exeter Automobile Receivables Trust, Ser 2022-2A, Cl D | ||||||||
4.560%, 07/17/28 | 2,000,000 | 1,852,085 | ||||||
Exeter Automobile Receivables Trust, Ser 2022-5A, Cl D | ||||||||
7.400%, 02/15/29 | 2,890,000 | 2,816,351 | ||||||
Flagship Credit Auto Trust, Ser 2019-3, Cl E | ||||||||
3.840%, 12/15/26 (A) | 3,825,000 | 3,527,686 | ||||||
Ford Credit Auto Owner Trust 2021-REV1, Ser 2021-1, Cl D | ||||||||
2.310%, 10/17/33 (A) | 1,750,000 | 1,501,268 | ||||||
GLS Auto Receivables Issuer Trust, Ser 2022-2A, Cl D | ||||||||
6.150%, 04/17/28 (A) | 2,500,000 | 2,419,046 | ||||||
| ASSET-BACKED SECURITIES — continued | ||||||||
| Face Amount | Value | |||||||
Santander Drive Auto Receivables Trust 2019-1, Ser 2019-1, Cl D | ||||||||
3.650%, 04/15/25 | $ | 856,501 | $ | 855,726 | ||||
Santander Drive Auto Receivables Trust 2020-3, Ser 2020-3, Cl D | ||||||||
1.640%, 11/16/26 | 2,860,000 | 2,733,209 | ||||||
Santander Drive Auto Receivables Trust 2022-6, Ser 2022-6, Cl C | ||||||||
4.960%, 11/15/28 | 1,020,000 | 974,555 | ||||||
Santander Drive Auto Receivables Trust, Ser 2022-5, Cl C | ||||||||
4.740%, 10/16/28 | 2,545,000 | 2,444,914 | ||||||
Tesla Auto Lease Trust, Ser 2021-A, Cl B | ||||||||
1.020%, 03/20/25 (A) | 1,000,000 | 949,174 | ||||||
Westlake Automobile Receivables Trust 2022-1, Ser 2022-1A, Cl D | ||||||||
3.490%, 03/15/27 (A) | 345,000 | 314,544 | ||||||
|
| |||||||
| 36,211,960 | ||||||||
|
| |||||||
Other Asset-Backed Securities — 2.5% |
| |||||||
AEP Texas Central Transition Funding III, Ser 2012-1, Cl A3 | ||||||||
2.845%, 03/01/26 | 74,792 | 72,770 | ||||||
DRIVEN BRANDS FUNDING, Ser 2019-1A, Cl A2 | ||||||||
4.641%, 04/20/49 (A) | 3,522,750 | 3,128,981 | ||||||
Finance of America 2022-S4 | ||||||||
3.000%, 01/25/57 | 3,010,000 | 2,708,398 | ||||||
GoodLeap Sustainable Home Solutions Trust 2021-5, Ser 2021-5CS, Cl B | ||||||||
2.560%, 10/20/48 (A) | 2,412,988 | 1,616,046 | ||||||
GoodLeap Sustainable Home Solutions Trust, Ser 2022-3CS, Cl B | ||||||||
5.500%, 07/20/49 (A) | 1,250,000 | 1,059,431 | ||||||
GoodLeap Sustainable Home Solutions Trust, Ser 2022-4CS, Cl B | ||||||||
5.550%, 11/20/54 (A) | 1,118,000 | 964,191 | ||||||
KKR CLO 41, Ser 2022-41A, Cl C | ||||||||
6.114%, TSFR3M + 2.250%, 04/15/35 (A)(B) | 3,500,000 | 3,100,566 | ||||||
The accompanying notes are an integral part of the financial statements.
62
CATHOLIC RESPONSIBLE INVESTMENTS BOND FUND
OCTOBER 31, 2022
| ASSET-BACKED SECURITIES — continued | ||||||||
| Face Amount | Value | |||||||
Mosaic Solar Loan Trust, Ser 2022-1A, Cl B | ||||||||
3.160%, 01/20/53 (A) | $ | 1,383,246 | $ | 1,098,787 | ||||
Navient Student Loan Trust 2016-1, Ser 2016-1A, Cl A | ||||||||
4.286%, ICE LIBOR USD 1 Month + 0.700%, 02/25/70 (A)(B) | 454,053 | 444,139 | ||||||
Navient Student Loan Trust 2016-5, Ser 2016-5A, Cl A | ||||||||
4.836%, ICE LIBOR USD 1 MONTH + 1.250%, 06/25/65 (A)(B) | 539,695 | 517,835 | ||||||
Navient Student Loan Trust 2016-6, Ser 2016-6A, Cl A3 | ||||||||
4.886%, ICE LIBOR USD 1 Month + 1.300%, 03/25/66 (A)(B) | 115,000 | 114,008 | ||||||
Navient Student Loan Trust 2018-2, Ser 2018-2A, Cl A3 | ||||||||
4.336%, ICE LIBOR USD 1 MONTH + 0.750%, 03/25/67 (A)(B) | 5,898,000 | 5,750,321 | ||||||
Navient Student Loan Trust 2021-1, Ser 2021-1A, Cl A1B | ||||||||
4.186%, ICE LIBOR USD 1 MONTH + 0.600%, 12/26/69 (A)(B) | 3,090,473 | 2,986,408 | ||||||
Neuberger Berman Loan Advisers CLO, Ser 2022-47A, Cl C | ||||||||
5.877%, TSFR3M + 2.050%, 04/14/35 (A)(B) | 6,000,000 | 5,289,960 | ||||||
SBAP 2004-20K 1 | ||||||||
4.880%, 11/01/24 | 2,086 | 2,055 | ||||||
SBAP 2006-20B 1 | ||||||||
5.350%, 02/01/26 | 1,555 | 1,532 | ||||||
SBAP 2006-20C 1 | ||||||||
5.570%, 03/01/26 | 1,400 | 1,383 | ||||||
SBAP 2007-20C 1 | ||||||||
5.230%, 03/01/27 | 1,456 | 1,441 | ||||||
SLM Student Loan Trust 2004-3, Ser 2014-3A, Cl A6B | ||||||||
4.908%, ICE LIBOR USD 3 MONTH + 0.550%, 10/25/64 (A)(B) | 3,364,039 | 3,265,451 | ||||||
SLM Student Loan Trust 2009-3, Ser 2009-3, Cl A | ||||||||
4.336%, ICE LIBOR USD 1 MONTH + 0.750%, 01/25/45 (A)(B) | 2,123,537 | 2,060,336 | ||||||
| ASSET-BACKED SECURITIES — continued | ||||||||
| Face Amount | Value | |||||||
SMB Private Education Loan Trust 2017-B, Ser 2017-B, Cl A2A | ||||||||
2.820%, 10/15/35 (A) | $ | 108,045 | $ | 102,562 | ||||
SMB Private Education Loan Trust 2018-A, Ser 2018-A, Cl A2A | ||||||||
3.500%, 02/15/36 (A) | 1,090,748 | 1,033,719 | ||||||
SOUND POINT CLO XXII, Ser 2021-1A, Cl CR | ||||||||
6.493%, ICE LIBOR USD 3 MONTH + 2.250%, 01/20/32 (A)(B) | 3,480,000 | 3,205,692 | ||||||
United States Small Business Administration | ||||||||
5.090%, 10/01/25 | 7,865 | 7,667 | ||||||
United States Small Business Administration, Ser 2003-20B, Cl 1 | ||||||||
4.840%, 02/01/23 | 512 | 511 | ||||||
United States Small Business Administration, Ser 2003-20J, Cl 1 | ||||||||
4.920%, 10/01/23 | 644 | 637 | ||||||
United States Small Business Administration, Ser 2003-20K, Cl 1 | ||||||||
4.980%, 11/01/23 | 5,091 | 5,058 | ||||||
United States Small Business Administration, Ser 2004-20L, Cl 1 | ||||||||
4.870%, 12/01/24 | 2,067 | 2,055 | ||||||
United States Small Business Administration, Ser 2005-20A, Cl 1 | ||||||||
4.860%, 01/01/25 | 717 | 717 | ||||||
United States Small Business Administration, Ser 2005-20E, Cl 1 | ||||||||
4.840%, 05/01/25 | 608 | 605 | ||||||
United States Small Business Administration, Ser 2005-20G, Cl 1 | ||||||||
4.750%, 07/01/25 | 3,110 | 3,067 | ||||||
United States Small Business Administration, Ser 2005-20H, Cl 1 | ||||||||
5.110%, 08/01/25 | 5,535 | 5,481 | ||||||
United States Small Business Administration, Ser 2006-20F, Cl 1 | ||||||||
5.820%, 06/01/26 | 901 | 885 | ||||||
The accompanying notes are an integral part of the financial statements.
63
CATHOLIC RESPONSIBLE INVESTMENTS BOND FUND
OCTOBER 31, 2022
| ASSET-BACKED SECURITIES — continued | ||||||||
| Face Amount | Value | |||||||
United States Small Business Administration, Ser 2006-20G, Cl 1 | ||||||||
6.070%, 07/01/26 | $ | 2,596 | $ | 2,569 | ||||
United States Small Business Administration, Ser 2006-20H, Cl 1 | ||||||||
5.700%, 08/01/26 | 1,594 | 1,588 | ||||||
United States Small Business Administration, Ser 2007-20D, Cl 1 | ||||||||
5.320%, 04/01/27 | 4,983 | 4,878 | ||||||
United States Small Business Administration, Ser 2007-20E, Cl 1 | ||||||||
5.310%, 05/01/27 | 2,092 | 2,059 | ||||||
United States Small Business Administration, Ser 2007-20F, Cl 1 | ||||||||
5.710%, 06/01/27 | 4,900 | 4,872 | ||||||
Vivint Solar Financing V, Ser 2018-1A, Cl B | ||||||||
7.370%, 04/30/48 (A) | 732,013 | 675,483 | ||||||
Wellfleet CLO X, Ser 2021-XA, Cl BR | ||||||||
6.443%, ICE LIBOR USD 3 MONTH + 2.200%, 07/20/32 (A)(B) | 2,000,000 | 1,832,680 | ||||||
|
| |||||||
| 41,076,824 | ||||||||
|
| |||||||
Total Asset-Backed Securities | ||||||||
(Cost $82,031,837) | 77,288,784 | |||||||
|
| |||||||
MUNICIPAL BONDS — 1.9% |
| |||||||
| Face Amount | Value | |||||||
California — 0.7% | ||||||||
California Health Facilities Financing Authority | ||||||||
3.034%, 06/01/34 | $ | 1,865,000 | $ | 1,444,417 | ||||
2.984%, 06/01/33 | 3,090,000 | 2,437,332 | ||||||
City of Los Angeles California, Ser A | ||||||||
5.000%, 09/01/42 | 2,500,000 | 2,306,903 | ||||||
City of Los Angeles Department of Airports Customer Facility Charge Revenue, RB | ||||||||
3.258%, 05/15/30 | 2,250,000 | 1,934,922 | ||||||
3.158%, 05/15/29 | 1,000,000 | 871,903 | ||||||
| MUNICIPAL BONDS — continued | ||||||||
| Face Amount | Value | |||||||
City of San Francisco California Public Utilities Commission Water Revenue, Ser E | ||||||||
2.825%, 11/01/41 | $ | 1,000,000 | $ | 703,290 | ||||
Los Angeles Unified School District, Ser RY | ||||||||
6.758%, 07/01/34 | 100,000 | 108,085 | ||||||
Regents of the University of California Medical Center Pooled Revenue | ||||||||
4.563%, 05/15/53 | 600,000 | 498,400 | ||||||
State of California | ||||||||
7.625%, 03/01/40 | 40,000 | 47,800 | ||||||
7.550%, 04/01/39 | 100,000 | 119,721 | ||||||
7.500%, 04/01/34 | 675,000 | 785,699 | ||||||
7.300%, 10/01/39 | 625,000 | 721,362 | ||||||
|
| |||||||
| 11,979,834 | ||||||||
|
| |||||||
Connecticut — 0.1% | ||||||||
Connecticut Green Bank | ||||||||
2.900%, 11/15/35 | 2,500,000 | 1,933,008 | ||||||
Hartford County Metropolitan District Clean Water Project Revenue, Ser S | ||||||||
2.952%, 11/01/42 | 270,000 | 182,957 | ||||||
|
| |||||||
| 2,115,965 | ||||||||
|
| |||||||
District of Columbia — 0.1% | ||||||||
District of Columbia | ||||||||
2.932%, 04/01/33 | 1,590,000 | 1,237,692 | ||||||
|
| |||||||
Florida — 0.2% | ||||||||
Florida Development Finance, RB | ||||||||
7.250%, 07/01/57 (A)(B) | 2,500,000 | 2,446,670 | ||||||
|
| |||||||
Hawaii — 0.1% | ||||||||
State of Hawaii Department of Business Economic Development & Tourism, Ser A-2, RB | ||||||||
3.242%, 01/01/31 | 1,152,899 | 1,064,207 | ||||||
|
| |||||||
Illinois — 0.1% | ||||||||
State of Illinois | ||||||||
5.100%, 06/01/33 | 1,850,000 | 1,728,815 | ||||||
|
| |||||||
Montana — 0.0% | ||||||||
County of Gallatin Montana, RB | ||||||||
11.500%, 09/01/27 (A) | 500,000 | 516,470 | ||||||
|
| |||||||
The accompanying notes are an integral part of the financial statements.
64
CATHOLIC RESPONSIBLE INVESTMENTS BOND FUND
OCTOBER 31, 2022
| MUNICIPAL BONDS — continued | ||||||||
| Face Amount | Value | |||||||
New Jersey — 0.2% | ||||||||
New Jersey Housing & Mortgage Finance Agency, Ser C | ||||||||
3.100%, 11/01/40 | $ | 3,100,000 | $ | 2,270,878 | ||||
New Jersey Turnpike Authority | ||||||||
7.414%, 01/01/40 | 275,000 | 323,056 | ||||||
7.102%, 01/01/41 | 925,000 | 1,057,148 | ||||||
|
| |||||||
| 3,651,082 | ||||||||
|
| |||||||
New York — 0.2% | ||||||||
New York State Energy Research & Development Authority, Ser A | ||||||||
4.871%, 04/01/37 | 3,330,000 | 2,928,032 | ||||||
|
| |||||||
Pennsylvania — 0.1% | ||||||||
Redevelopment Authority of the City of Philadelphia, Ser A | ||||||||
3.172%, 09/01/41 | 2,000,000 | 1,392,364 | ||||||
|
| |||||||
South Dakota — 0.0% | ||||||||
South Dakota Housing Development Authority, Ser E, RB | ||||||||
5.460%, 05/01/53 | 300,000 | 298,626 | ||||||
|
| |||||||
Wisconsin — 0.1% | ||||||||
County of Fond Du Lac Wisconsin | ||||||||
5.569%, 11/01/51 (A) | 2,350,000 | 2,122,486 | ||||||
|
| |||||||
Total Municipal Bonds | ||||||||
(Cost $33,920,636) | 31,482,243 | |||||||
|
| |||||||
PREFERRED STOCK — 0.2% |
| |||||||
| Shares | Value | |||||||
PREFERRED STOCK — 0.2% | ||||||||
Citigroup Capital XIII, 10.785%, ICE LIBOR USD 3 MONTH + 6.370%, 10/30/40 (B) | 108,715 | $ | 2,984,227 | |||||
|
| |||||||
Total Preferred Stock | ||||||||
(Cost $2,861,568) | 2,984,227 | |||||||
|
| |||||||
U.S. GOVERNMENT AGENCY OBLIGATION — 0.0% |
| |||||||
| Face Amount | Value | |||||||
United States International Development Finance | ||||||||
1.790%, 10/15/29 | $ | 402,095 | $ | 356,672 | ||||
|
| |||||||
Total U.S. Government Agency Obligations | ||||||||
(Cost $375,095) | 356,672 | |||||||
|
| |||||||
Total Investments in Securities— 98.2% |
| |||||||
(Cost $1,851,948,037) | $ | 1,645,274,056 | ||||||
|
| |||||||
Percentages are based on Net Assets of $1,675,812,870.
| (A) | Securities sold within the terms of a private placement memorandum, exempt from registration under section 144A of the Securities Act of 1933, as amended, and maybe sold only to dealers in the program or other “accredited investors”. The total value of these securities at October 31, 2022 was $286,069,995 and represented 17.1% of Net Assets. |
| (B) | Variable or floating rate security. The rate shown is the effective interest rate as of period end. The rates for certain securities are not based on published reference rates and spreads and are either determined by the issuer or agent based on current market conditions; by using a formula based on the rates of underlying loans; or by adjusting periodically based on prevailing interest rates. |
| (C) | Step coupon security. Coupon rate will either increase (step-up bond) or decrease (step-down bond) at regular intervals until maturity. Interest rate shown reflects the rate currently in effect. |
Cl — Class
CLO — Collateralized Loan Obligation
DAC — Designated Activity Company
FHLMC — Federal Home Loan Mortgage Corporation
FNMA — Federal National Mortgage Association
GNMA — Government National Mortgage Association
H15T1Y— US Treas Yield Curve Rate T Note Const Mat 1 Yr
H15T5Y— US Treas Yield Curve Rate T Note Const Mat 5 Yr
LIBOR— London Interbank Offered Rate
MTN — Medium Term Note
REMIC — Real Estate Mortgage Investment Conduit
RB — Revenue Bond
Ser — Series
SOFR — Secured Overnight Financing Rate
SOFR30A — Secured Overnight Financing Rate 30-day Average
SOFRINDX — Secured Overnight Financing Rate Index
STACR — Structured Agency Credit Risk
TSFR1M — Term Structured Financing Rate 1 Month Average
TSFR3M — Term Structured Financing Rate 3 Month Average
USD — United States Dollar
The accompanying notes are an integral part of the financial statements.
65
CATHOLIC RESPONSIBLE INVESTMENTS BOND FUND
OCTOBER 31, 2022
The following is a summary of the inputs used as of October 31, 2022, in valuing the Fund’s investments carried at market value:
| Investments in Securities | Level 1 | Level 2 | Level 3 | Total | ||||||||||||
Corporate Obligations | $ | — | $ | 564,361,639 | $ | — | $ | 564,361,639 | ||||||||
Mortgage-Backed Securities | — | 559,133,627 | — | 559,133,627 | ||||||||||||
U.S. Treasury Obligations | 52,335,151 | 357,331,713 | — | 409,666,864 | ||||||||||||
Asset-Backed Securities | — | 77,288,784 | — | 77,288,784 | ||||||||||||
Municipal Bonds | — | 31,482,243 | — | 31,482,243 | ||||||||||||
Preferred Stock | 2,984,227 | — | — | 2,984,227 | ||||||||||||
U.S. Government Agency Obligation | — | 356,672 | — | 356,672 | ||||||||||||
|
|
|
|
|
|
|
| |||||||||
Total Investments in Securities | $ | 55,319,378 | $ | 1,589,954,678 | $ | — | $ | 1,645,274,056 | ||||||||
|
|
|
|
|
|
|
| |||||||||
Amounts designated as “—” are $0.
For more information on valuation inputs, see Note 2 — Significant Accounting Policies in the Notes to Financial Statements.
The accompanying notes are an integral part of the financial statements.
66
CATHOLIC RESPONSIBLE INVESTMENTS OPPORTUNISTIC BOND FUND
OCTOBER 31, 2022
| SECTOR WEIGHTINGS (unaudited) † |
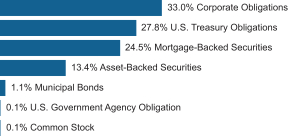
† Percentages are based on total investments. Total investments do not include derivatives such as options, futures contracts, forward contracts, and swap contracts, if applicable.
SCHEDULE OF INVESTMENTS |
| |||||||
| CORPORATE OBLIGATIONS — 32.0% | ||||||||
| Face Amount | Value | |||||||
COMMUNICATION SERVICES — 1.4% |
| |||||||
AT&T | ||||||||
2.550%, 12/01/33 | $ | 1,140,000 | $ | 840,117 | ||||
CommScope | ||||||||
6.000%, 03/01/26(A) | 1,060,000 | 1,022,425 | ||||||
Meta Platforms | ||||||||
4.450%, 08/15/52(A) | 3,114,000 | 2,311,011 | ||||||
Time Warner Cable Enterprises | ||||||||
8.375%, 03/15/23 | 1,500,000 | 1,516,366 | ||||||
T-Mobile USA | ||||||||
5.650%, 01/15/53 | 1,197,000 | 1,103,915 | ||||||
|
| |||||||
| 6,793,834 | ||||||||
|
| |||||||
CONSUMER DISCRETIONARY — 3.1% |
| |||||||
Aptiv | ||||||||
3.250%, 03/01/32 | 540,000 | 430,733 | ||||||
General Motors | ||||||||
5.600%, 10/15/32 | 2,910,000 | 2,640,203 | ||||||
5.400%, 10/15/29 | 1,175,000 | 1,089,243 | ||||||
5.200%, 04/01/45 | 970,000 | 748,429 | ||||||
General Motors Financial | ||||||||
4.300%, 07/13/25 | 1,577,000 | 1,498,507 | ||||||
Lennar | ||||||||
5.250%, 06/01/26 | 1,500,000 | 1,459,441 | ||||||
Lowe’s | ||||||||
5.625%, 04/15/53 | 2,272,000 | 2,046,031 | ||||||
Marriott International | ||||||||
4.650%, 12/01/28 | 1,500,000 | 1,385,612 | ||||||
Mileage Plus Holdings | ||||||||
6.500%, 06/20/27(A) | 3,201,500 | 3,165,019 | ||||||
Starbucks | ||||||||
2.550%, 11/15/30 | 1,030,000 | 841,011 | ||||||
|
| |||||||
| 15,304,229 | ||||||||
|
| |||||||
| CORPORATE OBLIGATIONS — continued | ||||||||
| Face Amount | Value | |||||||
CONSUMER STAPLES — 0.7% |
| |||||||
CVS Pass-Through Trust | ||||||||
6.036%, 12/10/28 | $ | 1,630,650 | $ | 1,604,435 | ||||
Delta Air Lines | ||||||||
4.750%, 10/20/28(A) | 500,000 | 465,011 | ||||||
Kraft Heinz Foods | ||||||||
3.000%, 06/01/26 | 1,388,000 | 1,280,710 | ||||||
|
| |||||||
| 3,350,156 | ||||||||
|
| |||||||
ENERGY — 1.2% |
| |||||||
Continental Resources | ||||||||
3.800%, 06/01/24 | 980,000 | 945,195 | ||||||
Devon Energy | ||||||||
7.875%, 09/30/31 | 340,000 | 374,755 | ||||||
Diamondback Energy | ||||||||
6.250%, 03/15/33 | 1,690,000 | 1,696,573 | ||||||
Equities | ||||||||
5.700%, 04/01/28 | 500,000 | 486,325 | ||||||
5.678%, 10/01/25 | 250,000 | 247,371 | ||||||
Hess | ||||||||
7.875%, 10/01/29 | 120,000 | 130,046 | ||||||
7.300%, 08/15/31 | 210,000 | 222,303 | ||||||
Hydro-Quebec | ||||||||
8.050%, 07/07/24 | 500,000 | 525,262 | ||||||
MidAmerican Energy | ||||||||
3.100%, 05/01/27 | 1,292,000 | 1,189,841 | ||||||
|
| |||||||
| 5,817,671 | ||||||||
|
| |||||||
FINANCIALS — 19.8% |
| |||||||
ABN AMRO Bank | ||||||||
2.470%, H15T1Y+ 1.100%, 12/13/29(A)(B) | 1,000,000 | 776,813 | ||||||
Aflac | ||||||||
1.125%, 03/15/26 | 1,500,000 | 1,312,061 | ||||||
African Development Bank | ||||||||
0.750%, 04/03/23 | 2,700,000 | 2,656,588 | ||||||
American Express | ||||||||
4.050%, 05/03/29 | 1,000,000 | 908,132 | ||||||
Bank of America MTN | ||||||||
4.827%, U.S. SOFR + 1.750%, 07/22/26(B) | 945,000 | 919,951 | ||||||
4.083%, ICE LIBOR USD 3 Month + 3.150%, 03/20/51(B) | 3,890,000 | 2,889,958 | ||||||
3.559%, ICE LIBOR USD 3 Month + 1.060%, 04/23/27(B) | 1,750,000 | 1,611,013 | ||||||
1.530%, U.S. SOFR + 0.650%, 12/06/25(B) | 1,000,000 | 910,489 | ||||||
Blackstone Private Credit Fund | ||||||||
2.625%, 12/15/26 | 2,625,000 | 2,154,084 | ||||||
2.350%, 11/22/24 | 3,000,000 | 2,743,613 | ||||||
The accompanying notes are an integral part of the financial statements.
67
CATHOLIC RESPONSIBLE INVESTMENTS OPPORTUNISTIC BOND FUND
OCTOBER 31, 2022
| CORPORATE OBLIGATIONS — continued | ||||||||
| Face Amount | Value | |||||||
FINANCIALS — continued |
| |||||||
Blue Owl Finance | ||||||||
3.125%, 06/10/31(A) | $ | 845,000 | $ | 613,182 | ||||
BPCE | ||||||||
2.045%, U.S. SOFR + 1.087%, 10/19/27(A)(B) | 1,000,000 | 830,359 | ||||||
Caisse d’Amortissement de la Dette Sociale | ||||||||
3.000%, 05/17/25(A) | 1,000,000 | 959,494 | ||||||
0.375%, 05/27/24(A) | 1,000,000 | 934,320 | ||||||
Cantor Fitzgerald | ||||||||
4.875%, 05/01/24(A) | 1,140,000 | 1,112,190 | ||||||
Capital One Financial | ||||||||
4.166%, U.S. SOFR + 1.370%, 05/09/25(B) | 2,805,000 | 2,695,086 | ||||||
CDP Financial MTN | ||||||||
1.000%, 05/26/26(A) | 1,000,000 | 876,770 | ||||||
Citigroup | ||||||||
4.650%, 07/23/48 | 340,000 | 272,851 | ||||||
4.281%, ICE LIBOR USD 3 Month + 1.839%, 04/24/48(B) | 150,000 | 114,640 | ||||||
3.785%, U.S. SOFR + 1.939%, 03/17/33(B) | 1,380,000 | 1,143,083 | ||||||
3.754%, U.S. SOFR + 0.694%, 01/25/26(B) | 1,000,000 | 969,411 | ||||||
2.014%, U.S. SOFR + 0.694%, 01/25/26(B) | 1,284,000 | 1,172,690 | ||||||
1.281%, U.S. SOFR + 0.528%, 11/03/25(B) | 1,000,000 | 905,905 | ||||||
0.776%, U.S. SOFR + 0.686%, 10/30/24(B) | 1,000,000 | 945,876 | ||||||
Conservation Fund A Nonprofit | ||||||||
3.474%, 12/15/29 | 1,000,000 | 846,840 | ||||||
Cooperatieve Rabobank UA | ||||||||
1.106%, H15T1Y+ 0.550%, 02/24/27(A)(B) | 1,570,000 | 1,325,488 | ||||||
1.004%, H15T1Y+ 0.730%, 09/24/26(A)(B) | 1,000,000 | 862,849 | ||||||
Council of Europe Development Bank | ||||||||
3.000%, 06/16/25 | 1,000,000 | 960,892 | ||||||
Deutsche Bank NY | ||||||||
1.686%, 03/19/26 | 1,000,000 | 857,602 | ||||||
European Investment Bank | ||||||||
3.250%, 11/15/27 | 700,000 | 664,289 | ||||||
2.875%, 06/13/25(A) | 2,000,000 | 1,918,864 | ||||||
2.375%, 05/24/27 | 1,253,000 | 1,149,790 | ||||||
2.125%, 04/13/26 | 500,000 | 462,052 | ||||||
0.625%, 10/21/27 | 2,000,000 | 1,668,154 | ||||||
| CORPORATE OBLIGATIONS — continued | ||||||||
| Face Amount | Value | |||||||
FINANCIALS — continued |
| |||||||
Goldman Sachs Group | ||||||||
5.700%, 11/01/24 | $ | 2,940,000 | $ | 2,940,197 | ||||
4.387%, U.S. SOFR + 1.510%, 06/15/27(B) | 1,000,000 | 939,606 | ||||||
4.250%, 10/21/25 | 1,750,000 | 1,674,007 | ||||||
0.855%, U.S. SOFR + 0.609%, 02/12/26(B) | 1,100,000 | 974,857 | ||||||
Golub Capital BDC | ||||||||
2.500%, 08/24/26 | 960,000 | 799,006 | ||||||
HSBC Holdings | ||||||||
4.292%, ICE LIBOR USD 3 Month + 1.348%, 09/12/26(B) | 1,750,000 | 1,612,824 | ||||||
3.033%, ICE LIBOR USD 3 Month + 0.923%, 11/22/23(B) | 1,415,000 | 1,412,155 | ||||||
ING Groep | ||||||||
1.400%, H15T1Y+ 1.100%, 07/01/26(A)(B) | 1,000,000 | 875,769 | ||||||
Inter-American Development Bank | ||||||||
3.338%, U.S. SOFR + 0.280%, 04/12/27(B) | 1,000,000 | 1,000,065 | ||||||
International Bank for Reconstruction & Development | ||||||||
3.362%, U.S. SOFR + 0.300%, 08/06/24(B) | 1,500,000 | 1,505,479 | ||||||
3.353%, SOFRINDX + 0.390%, 06/17/24(B) | 1,000,000 | 1,003,050 | ||||||
1.875%, 06/19/23 | 1,000,000 | 982,753 | ||||||
0.625%, 04/22/25 | 2,000,000 | 1,816,541 | ||||||
International Finance | ||||||||
3.141%, U.S. SOFR + 0.090%, 04/03/24(B) | 2,000,000 | 1,999,432 | ||||||
0.500%, 03/20/23 | 1,000,000 | 985,256 | ||||||
John Hancock Life Insurance | ||||||||
7.375%, 02/15/24(A) | 1,500,000 | 1,528,364 | ||||||
JPMorgan Chase | ||||||||
4.912%, U.S. SOFR + 2.080%, 07/25/33(B) | 1,760,000 | 1,601,451 | ||||||
4.260%, ICE LIBOR USD 3 Month + 1.580%, 02/22/48(B) | 200,000 | 155,052 | ||||||
3.559%, ICE LIBOR USD 3 Month + 0.730%, 04/23/24(B) | 2,000,000 | 1,980,526 | ||||||
3.328%, U.S. SOFR + 1.580%, 04/22/52(B) | 1,910,000 | 1,240,073 | ||||||
3.109%, U.S. SOFR + 2.440%, 04/22/51(B) | 290,000 | 181,027 | ||||||
The accompanying notes are an integral part of the financial statements.
68
CATHOLIC RESPONSIBLE INVESTMENTS OPPORTUNISTIC BOND FUND
OCTOBER 31, 2022
| CORPORATE OBLIGATIONS — continued | ||||||||
| Face Amount | Value | |||||||
FINANCIALS — continued |
| |||||||
0.768%, U.S. SOFR + 0.490%, 08/09/25(B) | $ | 1,000,000 | $ | 912,359 | ||||
0.563%, U.S. SOFR + 0.420%, 02/16/25(B) | 1,168,000 | 1,088,676 | ||||||
Kansas City Southern | ||||||||
3.850%, 11/15/23 | 435,000 | 426,866 | ||||||
Kreditanstalt fuer Wiederaufbau | ||||||||
1.750%, 09/14/29 | 1,000,000 | 848,920 | ||||||
Liberty Mutual Insurance | ||||||||
7.875%, 10/15/26(A) | 1,250,000 | 1,279,739 | ||||||
Liberty Utilities Finance GP 1 | ||||||||
2.050%, 09/15/30(A) | 1,000,000 | 735,817 | ||||||
Morgan Stanley MTN | ||||||||
5.000%, 11/24/25 | 1,750,000 | 1,721,858 | ||||||
0.864%, U.S. SOFR + 0.745%, 10/21/25(B) | 1,000,000 | 901,737 | ||||||
National Bank of Canada MTN | ||||||||
0.550%, H15T1Y+ 0.400%, 11/15/24(B) | 2,000,000 | 1,895,230 | ||||||
NatWest Group | ||||||||
2.359%, H15T1Y+ 2.150%, 05/22/24(B) | 1,000,000 | 972,815 | ||||||
Nederlandse Waterschapsbank | ||||||||
1.000%, 05/28/30(A) | 1,000,000 | 782,074 | ||||||
Owl Rock Capital | ||||||||
3.750%, 07/22/25 | 2,075,000 | 1,895,097 | ||||||
OWS Cre Funding I | ||||||||
8.668%, ICE LIBOR USD 1 MONTH + 4.900%, 09/01/23(A)(B) | 1,300,000 | 1,292,775 | ||||||
Prudential Financial MTN | ||||||||
5.700%, ICE LIBOR USD 3 Month + 2.665%, 09/15/48(B) | 2,115,000 | 1,937,700 | ||||||
1.500%, 03/10/26 | 1,000,000 | 885,629 | ||||||
Prudential Insurance of America | ||||||||
8.300%, 07/01/25(A) | 800,000 | 846,400 | ||||||
Reliance Standard Life Global Funding II | ||||||||
2.500%, 10/30/24(A) | 1,000,000 | 940,435 | ||||||
Santander Holdings USA | ||||||||
5.807%, U.S. SOFR + 2.328%, 09/09/26(B) | 825,000 | 798,699 | ||||||
Societe Generale | ||||||||
5.000%, 01/17/24(A) | 1,500,000 | 1,457,714 | ||||||
Synchrony Financial | ||||||||
4.875%, 06/13/25 | 1,200,000 | 1,151,608 | ||||||
Toronto-Dominion Bank MTN | ||||||||
3.501%, U.S. SOFR + 0.450%, 09/28/23(B) | 2,000,000 | 1,991,333 | ||||||
| CORPORATE OBLIGATIONS — continued | ||||||||
| Face Amount | Value | |||||||
FINANCIALS — continued |
| |||||||
Truist Bank | ||||||||
2.636%, US Treas Yield Curve Rate T Note Const Mat 5 Yr + 1.150%, 09/17/29(B) | $ | 2,000,000 | $ | 1,850,960 | ||||
TTX MTN | ||||||||
3.600%, 01/15/25(A) | 700,000 | 669,961 | ||||||
UBS Group | ||||||||
4.490%, H15T1Y+ 1.600%, 08/05/25(A)(B) | 765,000 | 738,818 | ||||||
USAA Capital | ||||||||
1.500%, 05/01/23(A) | 1,000,000 | 982,731 | ||||||
|
| |||||||
| 97,358,820 | ||||||||
|
| |||||||
INDUSTRIALS — 2.2% |
| |||||||
AerCap Ireland Capital DAC | ||||||||
1.650%, 10/29/24 | 2,500,000 | 2,268,465 | ||||||
American Airlines Class A Pass Through Trust, Cl A | ||||||||
4.950%, 01/15/23 | 2,394,036 | 2,369,601 | ||||||
Delta Air Lines | ||||||||
4.500%, 10/20/25(A) | 1,500,000 | 1,461,343 | ||||||
Lennox International | ||||||||
3.000%, 11/15/23 | 1,500,000 | 1,463,441 | ||||||
Nature Conservancy | ||||||||
0.467%, 07/01/23 | 425,000 | 411,776 | ||||||
Spirit Airlines Pass Through Trust | ||||||||
3.650%, 02/15/30 | 979,958 | 802,617 | ||||||
Weir Group | ||||||||
2.200%, 05/13/26(A) | 1,000,000 | 855,421 | ||||||
Westinghouse Air Brake Technologies | ||||||||
3.200%, 06/15/25 | 1,075,000 | 997,446 | ||||||
|
| |||||||
| 10,630,110 | ||||||||
|
| |||||||
INFORMATION TECHNOLOGY — 1.1% |
| |||||||
Apple | ||||||||
3.000%, 06/20/27 | 1,665,000 | 1,549,092 | ||||||
2.850%, 02/23/23 | 2,000,000 | 1,989,794 | ||||||
Dell International | ||||||||
3.375%, 12/15/41(A) | 1,370,000 | 850,247 | ||||||
Intel | ||||||||
4.150%, 08/05/32 | 1,000,000 | 892,687 | ||||||
|
| |||||||
| 5,281,820 | ||||||||
|
| |||||||
MATERIALS — 0.6% |
| |||||||
Celanese US Holdings | ||||||||
5.900%, 07/05/24 | 295,000 | 289,815 | ||||||
Dow Chemical | ||||||||
7.375%, 03/01/23 | 600,000 | 604,195 | ||||||
The accompanying notes are an integral part of the financial statements.
69
CATHOLIC RESPONSIBLE INVESTMENTS OPPORTUNISTIC BOND FUND
OCTOBER 31, 2022
| CORPORATE OBLIGATIONS — continued | ||||||||
| Face Amount | Value | |||||||
MATERIALS — continued |
| |||||||
LG Chemical | ||||||||
4.375%, 07/14/25(A) | $ | 570,000 | $ | 550,562 | ||||
3.250%, 10/15/24(A) | 700,000 | 669,291 | ||||||
Vulcan Materials | ||||||||
4.500%, 04/01/25 | 1,215,000 | 1,195,834 | ||||||
|
| |||||||
| 3,309,697 | ||||||||
|
| |||||||
REAL ESTATE — 0.2% |
| |||||||
ERP Operating | ||||||||
4.150%, 12/01/28 | 1,000,000 | 909,758 | ||||||
|
| |||||||
UTILITIES — 1.7% |
| |||||||
Avangrid | ||||||||
3.800%, 06/01/29 | 2,000,000 | 1,742,324 | ||||||
3.150%, 12/01/24 | 1,000,000 | 950,945 | ||||||
Electricite de France | ||||||||
3.625%, 10/13/25(A) | 500,000 | 471,856 | ||||||
Enel Finance International | ||||||||
6.800%, 10/14/25(A) | 2,200,000 | 2,208,316 | ||||||
Solar Star Funding | ||||||||
3.950%, 06/30/35(A) | 736,033 | 679,877 | ||||||
Southern Power | ||||||||
4.150%, 12/01/25 | 1,000,000 | 970,971 | ||||||
0.900%, 01/15/26 | 1,000,000 | 865,235 | ||||||
|
| |||||||
| 7,889,524 | ||||||||
|
| |||||||
Total Corporate Obligations | ||||||||
(Cost $165,694,511) | 156,645,619 | |||||||
|
| |||||||
U.S. TREASURY OBLIGATIONS — 26.9% |
| |||||||
| Face Amount | Value | |||||||
U.S. Treasury Bonds | ||||||||
3.000%, 08/15/52 | $ | 5,930,000 | $ | 4,748,633 | ||||
2.875%, 05/15/52 | 11,800,000 | 9,157,906 | ||||||
2.250%, 02/15/52 | 9,900,000 | 6,639,187 | ||||||
U.S. Treasury Notes | ||||||||
4.375%, 10/31/24 | 4,170,000 | 4,160,064 | ||||||
4.149%, US Treasury 3 Month Bill Money Market Yield + 0.037%, 07/31/24(B) | 10,390,000 | 10,379,010 | ||||||
4.147%, US Treasury 3 Month Bill Money Market Yield + 0.035%, 10/31/23(B) | 6,270,000 | 6,275,302 | ||||||
4.125%, 10/31/27 | 650,000 | 646,395 | ||||||
4.037%, US Treasury 3 Month Bill Money Market Yield + -0.075%, 04/30/24(B) | 55,485,000 | 55,400,371 | ||||||
| U.S. TREASURY OBLIGATIONS — continued | ||||||||
| Face Amount | Value | |||||||
3.250%, 06/30/27 | $ | 915,000 | $ | 875,255 | ||||
3.125%, 08/31/27 | 2,325,000 | 2,212,383 | ||||||
2.750%, 07/31/27 | 11,250,000 | 10,513,037 | ||||||
2.625%, 05/31/27 | 20,050,000 | 18,682,527 | ||||||
2.375%, 05/15/27 | 2,350,000 | 2,163,193 | ||||||
|
| |||||||
Total U.S. Treasury Obligations | ||||||||
(Cost $137,486,374) | 131,853,263 | |||||||
|
| |||||||
MORTGAGE-BACKED SECURITIES — 23.8% |
| |||||||
| Face Amount | Value | |||||||
Agency Mortgage-Backed Obligation — 8.4% |
| |||||||
FHLMC | ||||||||
5.500%, 11/01/52 | $ | 8,170,000 | $ | 8,082,635 | ||||
4.000%, 07/01/52 | 4,309,915 | 3,922,111 | ||||||
FNMA | ||||||||
5.000%, 11/01/52 | 9,480,000 | 9,161,333 | ||||||
4.000%, 10/01/52 | 498,728 | 453,800 | ||||||
4.000%, 07/01/52 | 968,261 | 881,327 | ||||||
4.000%, 06/01/52 | 11,788,553 | 10,730,160 | ||||||
FREMF Mortgage Trust, Ser 2015-K48, Cl C | ||||||||
3.646%, 08/25/48 (A)(B) | 1,500,000 | 1,402,977 | ||||||
FREMF Mortgage Trust, Ser 2016-K58, Cl C | ||||||||
3.738%, 09/25/49 (A)(B) | 1,080,000 | 975,850 | ||||||
FREMF Mortgage Trust, Ser 2016-K60, Cl C | ||||||||
3.543%, 12/25/49 (A)(B) | 1,255,000 | 1,122,000 | ||||||
FREMF Mortgage Trust, Ser 2017-K62, Cl C | ||||||||
3.880%, 01/25/50 (A)(B) | 495,000 | 442,608 | ||||||
FREMF Mortgage Trust, Ser 2017-K63, Cl C | ||||||||
3.877%, 02/25/50 (A)(B) | 1,055,000 | 954,288 | ||||||
FREMF Mortgage Trust, Ser 2017-K729, Cl B | ||||||||
3.673%, 11/25/49 (A)(B) | 1,111,948 | 1,058,484 | ||||||
FREMF Mortgage Trust, Ser 2018-K75, Cl C | ||||||||
3.977%, 04/25/51 (A)(B) | 200,000 | 175,844 | ||||||
FREMF Mortgage Trust, Ser 2018-K80, Cl C | ||||||||
4.231%, 08/25/50 (A)(B) | 270,000 | 242,710 | ||||||
FREMF Mortgage Trust, Ser 2019-K91, Cl C | ||||||||
4.256%, 04/25/51 (A)(B) | 770,000 | 681,335 | ||||||
FREMF Mortgage Trust, Ser 2019-K93, Cl C | ||||||||
4.119%, 05/25/52 (A)(B) | 505,000 | 443,480 | ||||||
|
| |||||||
| 40,730,942 | ||||||||
|
| |||||||
The accompanying notes are an integral part of the financial statements.
70
CATHOLIC RESPONSIBLE INVESTMENTS OPPORTUNISTIC BOND FUND
OCTOBER 31, 2022
| MORTGAGE-BACKED SECURITIES — continued | ||||||||
| Face Amount | Value | |||||||
Non-Agency Mortgage-Backed Obligation — 15.4% |
| |||||||
BBCMS Mortgage Trust, Ser 2018-TALL, Cl A | ||||||||
4.134%, ICE LIBOR USD 1 Month + 0.722%, 03/15/37 (A)(B) | $ | 2,000,000 | $ | 1,879,952 | ||||
BX Commercial Mortgage Trust, Ser 2021-VOLT, Cl C | ||||||||
4.512%, ICE LIBOR USD 1 Month + 1.100%, 09/15/36 (A)(B) | 1,250,000 | 1,153,026 | ||||||
BX Trust, Ser 2022-CLS, Cl B | ||||||||
6.300%, 10/13/27 (A) | 2,200,000 | 2,176,794 | ||||||
Century Plaza Towers, Ser 2019-CPT, Cl A | ||||||||
2.865%, 11/13/39 (A) | 530,000 | 420,350 | ||||||
Century Plaza Towers, Ser 2019-CPT, Cl B | ||||||||
2.997%, 11/13/39 (A)(B) | 1,000,000 | 760,570 | ||||||
CFCRE Commercial Mortgage Trust, Ser 2016-C6, Cl AM | ||||||||
3.502%, 11/10/49 (B) | 3,005,000 | 2,683,542 | ||||||
CFCRE Commercial Mortgage Trust, Ser 2016-C7, Cl A3 | ||||||||
3.839%, 12/10/54 | 1,750,000 | 1,627,451 | ||||||
CHNGE Mortgage Trust, Ser 2022-NQM1, Cl A3 | ||||||||
5.820%, 06/25/67 (A)(B) | 1,107,297 | 1,033,577 | ||||||
Citigroup Commercial Mortgage Trust, Ser 2014-GC21, Cl AS | ||||||||
4.026%, 05/10/47 | 2,365,000 | 2,259,077 | ||||||
Citigroup Commercial Mortgage Trust, Ser 2014-GC21, Cl C | ||||||||
4.780%, 05/10/47 (B) | 3,400,000 | 3,152,765 | ||||||
Citigroup Commercial Mortgage Trust, Ser 2014-GC25, Cl A4 | ||||||||
3.635%, 10/10/47 | 750,000 | 718,989 | ||||||
Citigroup Commercial Mortgage Trust, Ser 2016-P6, Cl AS | ||||||||
4.032%, 12/10/49 (B) | 1,400,000 | 1,274,359 | ||||||
COMM Mortgage Trust, Ser 2013-CR12, Cl AM | ||||||||
4.300%, 10/10/46 | 1,500,000 | 1,443,416 | ||||||
COMM Mortgage Trust, Ser 2015-CR24, Cl B | ||||||||
4.434%, 08/10/48 (B) | 2,500,000 | 2,311,230 | ||||||
COMM Mortgage Trust, Ser 2020-CBM, Cl A2 | ||||||||
2.896%, 02/10/37 (A) | 600,000 | 547,390 | ||||||
COMM Mortgage Trust, Ser 2020-CBM, Cl D | ||||||||
3.633%, 02/10/37 (A)(B) | 275,000 | 243,124 | ||||||
| MORTGAGE-BACKED SECURITIES — continued | ||||||||
| Face Amount | Value | |||||||
COMM Mortgage Trust, Ser 2022-HC, Cl A | ||||||||
2.819%, 01/10/39 (A) | $ | 386,000 | $ | 332,075 | ||||
COMM Mortgage Trust, Ser 2022-HC, Cl C | ||||||||
3.376%, 01/10/39 (A) | 500,000 | 420,059 | ||||||
CSMC OA, Ser 2014-USA, Cl A2 | ||||||||
3.953%, 09/15/37 (A) | 3,000,000 | 2,696,203 | ||||||
CSMC Trust, Ser 2016-NXSR, Cl AS | ||||||||
4.049%, 12/15/49 (B) | 1,455,000 | 1,308,475 | ||||||
Extended Stay America Trust, Ser 2021-ESH, Cl B | ||||||||
4.793%, ICE LIBOR USD 1 Month + 1.380%, 07/15/38 (A)(B) | 439,287 | 416,736 | ||||||
GS Mortgage Securities Corporation Trust, Ser 2021-IP, Cl A | ||||||||
4.362%, ICE LIBOR USD 1 Month + 0.950%, 10/15/36 (A)(B) | 2,000,000 | 1,857,821 | ||||||
GS Mortgage Securities II, Ser 2012-BWTR, Cl A | ||||||||
2.954%, 11/05/34 (A) | 1,750,000 | 1,623,759 | ||||||
GS Mortgage Securities II, Ser 2013-GC10, Cl B | ||||||||
3.682%, 02/10/46 (A) | 2,465,000 | 2,452,056 | ||||||
GS Mortgage Securities II, Ser GS10, Cl WLSA | ||||||||
4.904%, 03/10/33 (A)(B) | 148,000 | 137,283 | ||||||
GS Mortgage Securities II, Ser GS10, Cl WLSB | ||||||||
4.904%, 03/10/33 (A)(B) | 294,000 | 264,134 | ||||||
GS Mortgage Securities Trust, Ser 2013-GC12, Cl A3 | ||||||||
2.860%, 06/10/46 | 704,851 | 697,870 | ||||||
GS Mortgage Securities Trust, Ser 2014-GC22, Cl B | ||||||||
4.391%, 06/10/47 (B) | 2,300,000 | 2,172,355 | ||||||
Hudson Yards Mortgage Trust, Ser 2016-10HY, Cl A | ||||||||
2.835%, 08/10/38 (A) | 1,500,000 | 1,328,013 | ||||||
JP Morgan Chase Commercial Mortgage Securities Trust, Ser 2013-C10, Cl B | ||||||||
3.674%, 12/15/47 (B) | 3,900,000 | 3,783,000 | ||||||
JP Morgan Chase Commercial Mortgage Securities Trust, Ser 2014-C20, Cl AS | ||||||||
4.043%, 07/15/47 | 1,170,000 | 1,122,482 | ||||||
The accompanying notes are an integral part of the financial statements.
71
CATHOLIC RESPONSIBLE INVESTMENTS OPPORTUNISTIC BOND FUND
OCTOBER 31, 2022
| MORTGAGE-BACKED SECURITIES — continued | ||||||||
| Face Amount | Value | |||||||
JPMBB Commercial Mortgage Securities Trust, Ser 2014-C19, Cl D | ||||||||
4.648%, 04/15/47 (A)(B) | $ | 850,000 | $ | 771,252 | ||||
JPMBB Commercial Mortgage Securities Trust, Ser 2014-C26, Cl AS | ||||||||
3.800%, 01/15/48 | 2,089,000 | 1,954,380 | ||||||
JPMBB Commercial Mortgage Securities Trust, Ser 2015-C28, Cl B | ||||||||
3.986%, 10/15/48 | 3,095,000 | 2,846,665 | ||||||
JPMDB Commercial Mortgage Securities Trust, Ser 2017-C5, Cl AS | ||||||||
3.858%, 03/15/50 (B) | 2,500,000 | 2,249,622 | ||||||
Life Mortgage Trust, Ser 2021-BMR, Cl C | ||||||||
4.512%, ICE LIBOR USD 1 Month + 1.100%, 03/15/38 (A)(B) | 737,228 | 691,970 | ||||||
MHC Commercial Mortgage Trust, Ser 2021-MHC, Cl A | ||||||||
4.213%, ICE LIBOR USD 1 Month + 0.801%, 04/15/38 (A)(B) | 2,500,000 | 2,395,098 | ||||||
One Bryant Park Trust, Ser 2019-OBP, Cl A | ||||||||
2.516%, 09/15/54 (A) | 1,000,000 | 796,270 | ||||||
One Market Plaza Trust, Ser 2017-1MKT, Cl A | ||||||||
3.614%, 02/10/32 (A) | 2,372,000 | 2,283,059 | ||||||
One Market Plaza Trust, Ser 2017-1MKT, Cl B | ||||||||
3.845%, 02/10/32 (A) | 250,000 | 237,937 | ||||||
One Market Plaza Trust, Ser 2017-1MKT, Cl C | ||||||||
4.016%, 02/10/32 (A) | 500,000 | 474,205 | ||||||
One Market Plaza Trust, Ser 2017-1MKT, Cl D | ||||||||
4.146%, 02/10/32 (A) | 1,000,000 | 931,871 | ||||||
Residential Mortgage Loan Trust, Ser 2019-3, Cl A1 | ||||||||
2.633%, 09/25/59 (A)(B) | 174,271 | 168,355 | ||||||
STWD Mortgage Trust, Ser 2021-LIH, Cl D | ||||||||
5.717%, ICE LIBOR USD 1 Month + 2.305%, 11/15/36 (A)(B) | 450,000 | 416,520 | ||||||
SUMIT Mortgage Trust, Ser 2022-BVUE, Cl A | ||||||||
2.789%, 02/12/41 (A) | 660,000 | 541,216 | ||||||
| MORTGAGE-BACKED SECURITIES — continued | ||||||||
| Face Amount | Value | |||||||
Wells Fargo Commercial Mortgage Trust, Ser 2016-LC24, Cl A4 | ||||||||
2.942%, 10/15/49 | $ | 1,500,000 | $ | 1,353,857 | ||||
Wells Fargo Commercial Mortgage Trust, Ser 2017-C40, Cl A4 | ||||||||
3.581%, 10/15/50 | 1,500,000 | 1,353,386 | ||||||
Wells Fargo Commercial Mortgage Trust, Ser 2017-RB1, Cl D | ||||||||
3.401%, 03/15/50 (A) | 3,000,000 | 2,142,701 | ||||||
Wells Fargo Commercial Mortgage Trust, Ser 2019-C49, Cl D | ||||||||
3.000%, 03/15/52 (A) | 950,000 | 623,594 | ||||||
WFRBS Commercial Mortgage Trust, Ser 2013-C15, Cl A4 | ||||||||
4.153%, 08/15/46 (B) | 2,000,000 | 1,971,253 | ||||||
WFRBS Commercial Mortgage Trust, Ser 2013-C15, Cl B | ||||||||
4.529%, 08/15/46 (B) | 1,000,000 | 945,819 | ||||||
WFRBS Commercial Mortgage Trust, Ser 2014-C19, Cl B | ||||||||
4.723%, 03/15/47 (B) | 2,093,258 | 1,991,061 | ||||||
WFRBS Commercial Mortgage Trust, Ser 2014-C21, Cl B | ||||||||
4.213%, 08/15/47 (B) | 2,500,000 | 2,327,975 | ||||||
WFRBS Commercial Mortgage Trust, Ser 2014-LC14, Cl D | ||||||||
4.586%, 03/15/47 (A)(B) | 2,000,000 | 1,838,116 | ||||||
|
| |||||||
| 75,604,115 | ||||||||
|
| |||||||
Total Mortgage-Backed Securities | ||||||||
(Cost $122,742,568) | 116,335,057 | |||||||
|
| |||||||
ASSET-BACKED SECURITIES — 12.9% |
| |||||||
| Face Amount | Value | |||||||
Automotive — 8.1% | ||||||||
American Credit Acceptance Receivables Trust, Ser 2021-4, Cl D | ||||||||
1.820%, 02/14/28 (A) | $ | 500,000 | $ | 452,818 | ||||
American Credit Acceptance Receivables Trust, Ser 2022-2, Cl D | ||||||||
4.850%, 06/13/28 (A) | 3,400,000 | 3,200,172 | ||||||
American Credit Acceptance Receivables Trust, Ser 2022-3, Cl D | ||||||||
5.830%, 10/13/28 (A) | 2,895,000 | 2,752,686 | ||||||
The accompanying notes are an integral part of the financial statements.
72
CATHOLIC RESPONSIBLE INVESTMENTS OPPORTUNISTIC BOND FUND
OCTOBER 31, 2022
| ASSET-BACKED SECURITIES — continued | ||||||||
| Face Amount | Value | |||||||
Carvana Auto Receivables Trust, Ser 2019-3A, Cl C | ||||||||
2.710%, 10/15/24 (A) | $ | 28,021 | $ | 27,993 | ||||
Carvana Auto Receivables Trust, Ser 2021-N2, Cl C | ||||||||
1.070%, 03/10/28 | 636,506 | 601,623 | ||||||
CPS Auto Receivables Trust, Ser 2021-D, Cl D | ||||||||
2.310%, 12/15/27 (A) | 1,000,000 | 895,223 | ||||||
CPS Auto Receivables Trust, Ser 2022-C, Cl D | ||||||||
6.450%, 04/15/30 (A) | 500,000 | 476,723 | ||||||
Drive Auto Receivables Trust, Ser 2021-1, Cl D | ||||||||
1.450%, 01/16/29 | 1,520,000 | 1,399,153 | ||||||
Drive Auto Receivables Trust, Ser 2021-2, Cl D | ||||||||
1.390%, 03/15/29 | 2,845,000 | 2,572,459 | ||||||
Exeter Automobile Receivables Trust, Ser 2019-2A, Cl E | ||||||||
4.680%, 05/15/26 (A) | 2,000,000 | 1,970,533 | ||||||
Exeter Automobile Receivables Trust, Ser 2020-1A, Cl E | ||||||||
3.740%, 01/15/27 (A) | 575,000 | 553,189 | ||||||
Exeter Automobile Receivables Trust, Ser 2020-3A, Cl E | ||||||||
3.440%, 08/17/26 (A) | 3,000,000 | 2,847,750 | ||||||
Exeter Automobile Receivables Trust, Ser 2022-2A, Cl D | ||||||||
4.560%, 07/17/28 | 500,000 | 462,845 | ||||||
Exeter Automobile Receivables Trust, Ser 2022-4A, Cl D | ||||||||
5.980%, 12/15/28 | 505,000 | 476,240 | ||||||
Exeter Automobile Receivables Trust, Ser 2022-5A, Cl D | ||||||||
7.400%, 02/15/29 | 1,100,000 | 1,071,575 | ||||||
Flagship Credit Auto Trust, Ser 2019-3, Cl E | ||||||||
3.840%, 12/15/26 (A) | 1,175,000 | 1,083,668 | ||||||
GLS Auto Receivables Issuer Trust, Ser 2021-1A, Cl D | ||||||||
1.680%, 01/15/27 (A) | 1,340,000 | 1,263,083 | ||||||
GLS Auto Receivables Issuer Trust, Ser 2021-1A, Cl E | ||||||||
3.140%, 01/18/28 (A) | 2,000,000 | 1,822,737 | ||||||
GLS Auto Receivables Issuer Trust, Ser 2022-1A, Cl D | ||||||||
3.970%, 01/18/28 (A) | 1,200,000 | 1,087,449 | ||||||
GLS Auto Receivables Issuer Trust, Ser 2022-2A, Cl D | ||||||||
6.150%, 04/17/28 (A) | 1,000,000 | 967,255 | ||||||
| ASSET-BACKED SECURITIES — continued | ||||||||
| Face Amount | Value | |||||||
GM Financial Automobile Leasing Trust, Ser 2020-2, Cl C | ||||||||
2.560%, 07/22/24 | $ | 2,260,000 | $ | 2,245,327 | ||||
Hertz Vehicle Financing III, Ser 2022-1A, Cl A | ||||||||
1.990%, 06/25/26 (A) | 1,000,000 | 906,813 | ||||||
Hertz Vehicle Financing, Ser 2021-1A, Cl B | ||||||||
1.560%, 12/26/25 (A) | 1,500,000 | 1,364,525 | ||||||
Santander Drive Auto Receivables Trust, Ser 2020-4, Cl D | ||||||||
1.480%, 01/15/27 | 2,000,000 | 1,902,110 | ||||||
Santander Drive Auto Receivables Trust, Ser 2021-1, Cl D | ||||||||
1.130%, 11/16/26 | 800,000 | 757,843 | ||||||
Santander Drive Auto Receivables Trust, Ser 2022-4, Cl C | ||||||||
5.000%, 11/15/29 | 2,500,000 | 2,380,299 | ||||||
Santander Drive Auto Receivables Trust, Ser 2022-5, Cl C | ||||||||
4.740%, 10/16/28 | 2,500,000 | 2,400,807 | ||||||
Tesla Auto Lease Trust, Ser 2021-A, Cl B | ||||||||
1.020%, 03/20/25 (A) | 750,000 | 711,880 | ||||||
Westlake Automobile Receivables Trust, Ser 2022-2A, Cl D | ||||||||
5.480%, 09/15/27 (A) | 1,255,000 | 1,175,644 | ||||||
|
| |||||||
| 39,830,422 | ||||||||
|
| |||||||
Other Asset-Backed Securities — 4.8% |
| |||||||
Blackrock Rainier CLO VI, Ser 2021-6A, Cl A | ||||||||
5.943%, ICE LIBOR USD 3 Month + 1.700%, 04/20/33 (A)(B) | 1,500,000 | 1,424,485 | ||||||
Cajun Global, Ser 2021-1, Cl A2 | ||||||||
3.931%, 11/20/51 (A) | 1,483,125 | 1,232,375 | ||||||
CIFC Funding, Ser 2021-4A, Cl C | ||||||||
5.929%, ICE LIBOR USD 3 Month + 1.850%, 07/15/33 (A)(B) | 3,170,000 | 2,883,223 | ||||||
CLI Funding VI, Ser 2020-1A, Cl A | ||||||||
2.080%, 09/18/45 (A) | 1,565,500 | 1,342,850 | ||||||
The accompanying notes are an integral part of the financial statements.
73
CATHOLIC RESPONSIBLE INVESTMENTS OPPORTUNISTIC BOND FUND
OCTOBER 31, 2022
| ASSET-BACKED SECURITIES — continued | ||||||||
| Face Amount | Value | |||||||
Commonbond Student Loan Trust, Ser 2021-AGS, Cl B | ||||||||
1.400%, 03/25/52 (A) | $ | 627,396 | $ | 466,086 | ||||
Golub Capital Partners CLO, Ser 2017-24A, Cl AR | ||||||||
4.432%, ICE LIBOR USD 3 Month + 1.600%, 11/05/29 (A)(B) | 1,600,000 | 1,555,043 | ||||||
GoodLeap Sustainable Home Solutions Trust, Ser 2022-3CS, Cl B | ||||||||
5.500%, 07/20/49 (A) | 500,000 | 423,773 | ||||||
GoodLeap Sustainable Home Solutions Trust, Ser 2022-4CS, Cl B | ||||||||
5.550%, 11/20/54 (A) | 500,000 | 431,212 | ||||||
Guggenheim MM CLO, Ser 2021-3A, Cl A | ||||||||
5.828%, ICE LIBOR USD 3 Month + 1.550%, 01/21/34 (A)(B) | 2,000,000 | 1,880,222 | ||||||
Hardee’s Funding, Ser 2021-1A, Cl A2 | ||||||||
2.865%, 06/20/51 (A) | 1,357,813 | 1,051,696 | ||||||
Home Equity Loan Trust, Ser 2006-HSA2, Cl AI3 | ||||||||
4.752%, 03/25/36 (B) | 40,889 | 2,358 | ||||||
Jersey Mike’s Funding, Ser 2019-1A, Cl A2 | ||||||||
4.433%, 02/15/50 (A) | 1,637,625 | 1,458,005 | ||||||
Maranon Loan Funding, Ser 2021-2RA, Cl A1R | ||||||||
5.769%, ICE LIBOR USD 3 Month + 1.690%, 07/15/33 (A)(B) | 1,750,000 | 1,701,907 | ||||||
ME Funding, Ser 2019-1, Cl A2 | ||||||||
6.448%, 07/30/49 (A) | 1,483,063 | 1,433,433 | ||||||
Mosaic Solar Loan Trust, Ser 2022-1A, Cl B | ||||||||
3.160%, 01/20/53 (A) | 1,383,246 | 1,098,787 | ||||||
Octane Receivables Trust, Ser 2021-2A, Cl A | ||||||||
1.210%, 09/20/28 (A) | 595,918 | 567,377 | ||||||
Oportun Issuance Trust, Ser 2022-3, Cl A | ||||||||
7.451%, 01/08/30 (A) | 1,900,000 | 1,899,989 | ||||||
ServiceMaster Funding, Ser 2020-1, Cl A2I | ||||||||
2.841%, 01/30/51 (A) | 985,000 | 786,308 | ||||||
SERVPRO Master Issuer, Ser 2019-1A, Cl A2 | ||||||||
3.882%, 10/25/49 (A) | 1,746,000 | 1,524,200 | ||||||
| ASSET-BACKED SECURITIES — continued | ||||||||
| Face Amount | Value | |||||||
SOFI PROFESSIONAL LOAN PROGRAM, Ser 2017-F, Cl A2FX | ||||||||
2.840%, 01/25/41 (A) | $ | 505,684 | $ | 486,099 | ||||
Vivint Solar Financing V, Ser 2018-1A, Cl B | ||||||||
7.370%, 04/30/48 (A) | 366,006 | 337,742 | ||||||
|
| |||||||
| 23,987,170 | ||||||||
|
| |||||||
Total Asset-Backed Securities | ||||||||
(Cost $67,621,128) | 63,817,592 | |||||||
|
| |||||||
MUNICIPAL BONDS — 1.0% |
| |||||||
| Face Amount | Value | |||||||
California — 0.2% | ||||||||
City of Los Angeles Department of Airports Customer Facility Charge Revenue, RB | ||||||||
3.258%, 05/15/30 | $ | 1,000,000 | $ | 859,965 | ||||
|
| |||||||
Florida — 0.2% | ||||||||
Florida Development Finance, RB | ||||||||
7.250%, 07/01/57 (A)(B) | 1,000,000 | 978,668 | ||||||
|
| |||||||
Hawaii — 0.2% | ||||||||
State of Hawaii Department of Business Economic Development & Tourism, Ser A-2, RB | ||||||||
3.242%, 01/01/31 | 1,152,899 | 1,064,207 | ||||||
|
| |||||||
Illinois — 0.1% | ||||||||
Chicago Housing Authority, Ser B, RB | ||||||||
3.822%, 01/01/26 | 500,000 | 477,180 | ||||||
|
| |||||||
Montana — 0.0% | ||||||||
County of Gallatin Montana, RB | ||||||||
11.500%, 09/01/27 (A) | 250,000 | 258,235 | ||||||
|
| |||||||
New York — 0.3% | ||||||||
New York State Energy Research & Development Authority, Ser A, RB | ||||||||
4.621%, 04/01/27 | 820,000 | 773,296 | ||||||
4.480%, 04/01/25 | 500,000 | 482,052 | ||||||
|
| |||||||
| 1,255,348 | ||||||||
|
| |||||||
The accompanying notes are an integral part of the financial statements.
74
CATHOLIC RESPONSIBLE INVESTMENTS OPPORTUNISTIC BOND FUND
OCTOBER 31, 2022
| MUNICIPAL BONDS — continued | ||||||||
| Face Amount | Value | |||||||
South Dakota — 0.0% | ||||||||
South Dakota Housing Development Authority, Ser E, RB | ||||||||
5.460%, 05/01/53 | $ | 250,000 | $ | 248,855 | ||||
|
| |||||||
Total Municipal Bonds | ||||||||
(Cost $5,327,162) | 5,142,458 | |||||||
|
| |||||||
COMMON STOCK — 0.1% |
| |||||||
| Shares | Value | |||||||
DIVERSIFIED — 0.1% | ||||||||
North Atlantic Acquisition* | 58,023 | $ | 580,230 | |||||
|
| |||||||
Total Common Stock | ||||||||
(Cost $579,728) | 580,230 | |||||||
|
| |||||||
U.S. GOVERNMENT AGENCY OBLIGATION — 0.1% |
| |||||||
| Face Amount | Value | |||||||
United States International Development Finance | ||||||||
1.790%, 10/15/29 | $ | 321,676 | $ | 285,338 | ||||
|
| |||||||
Total U.S. Government Agency Obligations | ||||||||
(Cost $300,076) | 285,338 | |||||||
|
| |||||||
Total Investments in Securities — 96.8% |
| |||||||
(Cost $499,751,547) | $ | 474,659,557 | ||||||
|
| |||||||
Percentages are based on Net Assets of $489,686,956.
| * | Non-income producing. |
| (A) | Securities sold within the terms of a private placement memorandum, exempt from registration under section 144A of the Securities Act of 1933, as amended, and maybe sold only to dealers in the program or other “accredited investors”. The total value of these securities at October 31, 2022 was $127,387,826 and represented 26.0% of Net Assets. |
| (B) | Variable or floating rate security. The rate shown is the effective interest rate as of period end. The rates for certain securities are not based on published reference rates and spreads and are either determined by the issuer or agent based on current market conditions; by using a formula based on the rates of underlying loans; or by adjusting periodically based on prevailing interest rates. |
Cl — Class
CLO — Collateralized Loan Obligation
DAC — Designated Activity Company
FHLMC — Federal Home Loan Mortgage Corporation
FNMA — Federal National Mortgage Association
FREMF— Freddie Mac Multi-Family
H15T1Y — US Treasury Yield Curve Rate T Note Constant Maturity 1 Year
H15T5Y — US Treasury Yield Curve Rate T Note Constant Maturity 5 Year
LIBOR — London Interbank Offered Rate
MTN — Medium Term Note
RB — Revenue Bond
Ser — Series
SOFR — Secured Overnight Financing Rate
SOFRINDX — Secured Overnight Financing Rate Index
USD — U.S. Dollar
The following is a summary of the inputs used as of October 31, 2022, in valuing the Fund’s investments carried at market value:
| Investments in Securities | Level 1 | Level 2 | Level 3 | Total | ||||||||||||
Corporate Obligations | $ | — | $ | 156,645,619 | $ | — | $ | 156,645,619 | ||||||||
U.S. Treasury Obligations | — | 131,853,263 | — | 131,853,263 | ||||||||||||
Mortgage-Backed Securities | — | 116,335,057 | — | 116,335,057 | ||||||||||||
Asset-Backed Securities | — | 63,817,592 | — | 63,817,592 | ||||||||||||
Municipal Bonds | — | 5,142,458 | — | 5,142,458 | ||||||||||||
Common Stock | 580,230 | — | — | 580,230 | ||||||||||||
U.S. Government Agency Obligation | — | 285,338 | — | 285,338 | ||||||||||||
|
|
|
|
|
|
|
| |||||||||
Total Investments in Securities | $ | 580,230 | $ | 474,079,327 | $ | — | $ | 474,659,557 | ||||||||
|
|
|
|
|
|
|
| |||||||||
Amounts designated as “–” are $0.
For more information on valuation inputs, see Note 2 — Significant Accounting Policies in the Notes to Financial Statements.
The accompanying notes are an integral part of the financial statements.
75
CATHOLIC RESPONSIBLE INVESTMENTS EQUITY INDEX FUND
OCTOBER 31, 2022
| SECTOR WEIGHTINGS † (unaudited) | ||||
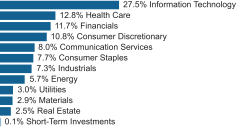
† Percentages are based on total investments. Total investments do not include derivatives such as options, futures contracts, forward contracts, and swap contracts, if applicable.
SCHEDULE OF INVESTMENTS
COMMON STOCK — 99.6% | ||||||||
| Shares | Value | |||||||
COMMUNICATION SERVICES — 8.0% |
| |||||||
Activision Blizzard | 62,015 | $ | 4,514,692 | |||||
Alphabet, Cl A * | 534,547 | 50,520,037 | ||||||
Alphabet, Cl C * | 487,825 | 46,177,514 | ||||||
AT&T | 911,121 | 16,609,736 | ||||||
Charter Communications, Cl A * | 9,664 | 3,552,680 | ||||||
Comcast, Cl A | 383,905 | 12,185,145 | ||||||
DISH Network, Cl A * | 21,836 | 325,575 | ||||||
Electronic Arts | 23,027 | 2,900,481 | ||||||
Fox | 12,242 | 332,982 | ||||||
Fox | 26,686 | 770,425 | ||||||
Interpublic Group of | 34,079 | 1,015,213 | ||||||
Lumen Technologies | 83,077 | 611,447 | ||||||
Match Group * | 24,704 | 1,067,213 | ||||||
Meta Platforms, Cl A * | 198,822 | 18,522,258 | ||||||
Netflix * | 38,768 | 11,315,604 | ||||||
News | 33,632 | 567,372 | ||||||
News | 10,437 | 178,786 | ||||||
Omnicom Group | 17,890 | 1,301,497 | ||||||
Paramount Global, Cl B (A) | 43,980 | 805,713 | ||||||
Take-Two Interactive Software * | 13,660 | 1,618,437 | ||||||
T-Mobile US * | 86,034 | 13,039,313 | ||||||
Verizon Communications | 496,795 | 18,565,229 | ||||||
Walt Disney * | 158,928 | 16,932,189 | ||||||
Warner Bros Discovery * | 192,627 | 2,504,151 | ||||||
|
| |||||||
| 225,933,689 | ||||||||
|
| |||||||
CONSUMER DISCRETIONARY — 10.8% |
| |||||||
Advance Auto Parts | 5,286 | 1,003,917 | ||||||
Amazon.com * | 788,301 | 80,753,554 | ||||||
Aptiv * | 23,626 | 2,151,620 | ||||||
AutoZone * | 1,699 | 4,303,363 | ||||||
| COMMON STOCK — continued | ||||||||
| Shares | Value | |||||||
CONSUMER DISCRETIONARY — continued |
| |||||||
Bath & Body Works | 19,927 | $ | 665,163 | |||||
Best Buy | 17,495 | 1,196,833 | ||||||
Booking Holdings * | 3,461 | 6,470,270 | ||||||
BorgWarner | 20,642 | 774,694 | ||||||
CarMax * | 13,861 | 873,382 | ||||||
Carnival * (A) | 86,022 | 779,359 | ||||||
Chipotle Mexican Grill, Cl A * | 2,420 | 3,625,959 | ||||||
Darden Restaurants | 10,686 | 1,529,594 | ||||||
Dollar General | 19,789 | 5,047,184 | ||||||
Dollar Tree * | 22,733 | 3,603,181 | ||||||
Domino’s Pizza | 3,128 | 1,039,247 | ||||||
DR Horton | 27,516 | 2,115,430 | ||||||
eBay | 47,875 | 1,907,340 | ||||||
Etsy * | 11,037 | 1,036,485 | ||||||
Expedia Group * | 13,254 | 1,238,851 | ||||||
Ford Motor | 347,217 | 4,642,291 | ||||||
Garmin | 13,417 | 1,181,233 | ||||||
General Motors | 127,116 | 4,989,303 | ||||||
Genuine Parts | 12,330 | 2,193,014 | ||||||
Hasbro | 11,285 | 736,346 | ||||||
Hilton Worldwide Holdings | 23,911 | 3,234,202 | ||||||
Home Depot | 89,596 | 26,532,064 | ||||||
Lennar, Cl A | 22,250 | 1,795,575 | ||||||
LKQ | 22,720 | 1,264,141 | ||||||
Lowe’s | 55,717 | 10,862,029 | ||||||
Marriott International, Cl A | 24,049 | 3,850,485 | ||||||
McDonald’s | 64,137 | 17,487,594 | ||||||
Mohawk Industries * | 4,597 | 435,566 | ||||||
NIKE, Cl B | 110,161 | 10,209,722 | ||||||
Norwegian Cruise Line Holdings * | 36,771 | 621,062 | ||||||
NVR * | 269 | 1,139,955 | ||||||
O’Reilly Automotive * | 5,558 | 4,652,991 | ||||||
Pool | 3,451 | 1,049,898 | ||||||
PulteGroup | 20,161 | 806,238 | ||||||
Ralph Lauren, Cl A | 3,696 | 342,582 | ||||||
Ross Stores | 30,504 | 2,918,928 | ||||||
Starbucks | 99,986 | 8,657,788 | ||||||
Tapestry | 21,910 | 694,109 | ||||||
Target | 40,424 | 6,639,642 | ||||||
Tesla * | 234,468 | 53,350,849 | ||||||
TJX | 102,098 | 7,361,266 | ||||||
Tractor Supply | 9,677 | 2,126,714 | ||||||
Ulta Beauty * | 4,517 | 1,894,294 | ||||||
VF | 28,770 | 812,753 | ||||||
Whirlpool | 4,752 | 656,916 | ||||||
Yum! Brands | 24,805 | 2,933,191 | ||||||
|
| |||||||
| 306,188,167 | ||||||||
|
| |||||||
The accompanying notes are an integral part of the financial statements.
76
CATHOLIC RESPONSIBLE INVESTMENTS EQUITY INDEX FUND
OCTOBER 31, 2022
| COMMON STOCK — continued | ||||||||
| Shares | Value | |||||||
CONSUMER STAPLES — 7.6% |
| |||||||
Archer-Daniels-Midland | 65,449 | $ | 6,347,244 | |||||
Brown-Forman, Cl B | 15,973 | 1,086,164 | ||||||
Campbell Soup | 17,587 | 930,528 | ||||||
Clorox | 10,737 | 1,568,031 | ||||||
Coca-Cola | 461,728 | 27,634,421 | ||||||
Colgate-Palmolive | 72,760 | 5,372,598 | ||||||
Conagra Brands | 41,810 | 1,534,427 | ||||||
Constellation Brands, Cl A | 13,890 | 3,431,941 | ||||||
Costco Wholesale | 54,190 | 27,176,285 | ||||||
Estee Lauder, Cl A | 20,208 | 4,051,502 | ||||||
General Mills | 62,660 | 5,111,803 | ||||||
Hershey | 14,958 | 3,571,522 | ||||||
Hormel Foods | 25,217 | 1,171,330 | ||||||
J M Smucker | 9,289 | 1,399,481 | ||||||
Kellogg | 22,194 | 1,704,943 | ||||||
Keurig Dr Pepper | 74,100 | 2,878,044 | ||||||
Kimberly-Clark | 29,433 | 3,663,231 | ||||||
Kraft Heinz | 69,456 | 2,671,972 | ||||||
Kroger | 56,742 | 2,683,329 | ||||||
Lamb Weston Holdings | 12,536 | 1,080,854 | ||||||
McCormick | 21,861 | 1,719,149 | ||||||
Molson Coors Beverage, Cl B | 16,428 | 828,464 | ||||||
Mondelez International, Cl A | 119,528 | 7,348,581 | ||||||
Monster Beverage * | 33,543 | 3,143,650 | ||||||
PepsiCo | 162,982 | 29,594,272 | ||||||
Procter & Gamble | 261,309 | 35,190,483 | ||||||
Sysco | 44,418 | 3,844,822 | ||||||
Tyson Foods, Cl A | 25,277 | 1,727,683 | ||||||
Walgreens Boots Alliance | 62,537 | 2,282,601 | ||||||
Walmart | 180,403 | 25,676,759 | ||||||
|
| |||||||
| 216,426,114 | ||||||||
|
| |||||||
ENERGY — 5.7% |
| |||||||
APA | 28,452 | 1,293,428 | ||||||
Baker Hughes, Cl A | 88,231 | 2,440,470 | ||||||
Chevron | 179,010 | 32,382,909 | ||||||
ConocoPhillips | 110,979 | 13,993,342 | ||||||
Coterra Energy | 69,339 | 2,158,523 | ||||||
Devon Energy | 57,080 | 4,415,138 | ||||||
Diamondback Energy | 15,496 | 2,434,577 | ||||||
EOG Resources | 51,090 | 6,974,807 | ||||||
Equities | 32,100 | 1,343,064 | ||||||
Exxon Mobil | 404,283 | 44,798,599 | ||||||
Halliburton | 79,113 | 2,881,295 | ||||||
Hess | 24,292 | 3,427,115 | ||||||
Kinder Morgan | 172,814 | 3,131,390 | ||||||
Marathon Oil | 59,041 | 1,797,799 | ||||||
Marathon Petroleum | 43,494 | 4,941,788 | ||||||
| COMMON STOCK — continued | ||||||||
| Shares | Value | |||||||
ENERGY — continued |
| |||||||
Occidental Petroleum | 64,987 | $ | 4,718,056 | |||||
ONEOK | 38,996 | 2,313,243 | ||||||
Phillips 66 | 41,897 | 4,369,438 | ||||||
Pioneer Natural Resources | 20,806 | 5,334,866 | ||||||
Schlumberger | 123,342 | 6,417,484 | ||||||
Targa Resources | 25,000 | 1,709,250 | ||||||
Valero Energy | 34,345 | 4,312,015 | ||||||
Williams | 106,247 | 3,477,464 | ||||||
|
| |||||||
| 161,066,060 | ||||||||
|
| |||||||
FINANCIALS — 11.7% |
| |||||||
Aflac | 50,144 | 3,264,876 | ||||||
Allstate | 23,564 | 2,974,955 | ||||||
American Express | 52,288 | 7,762,154 | ||||||
American International Group | 66,326 | 3,780,582 | ||||||
Ameriprise Financial | 9,430 | 2,915,002 | ||||||
Aon, Cl A | 18,388 | 5,176,038 | ||||||
Arch Capital Group * | 30,300 | 1,742,250 | ||||||
Arthur J Gallagher | 18,336 | 3,430,299 | ||||||
Assurant | 4,639 | 630,255 | ||||||
Bank of America | 609,469 | 21,965,263 | ||||||
Bank of New York Mellon | 64,095 | 2,699,040 | ||||||
Berkshire Hathaway, Cl B * | 168,982 | 49,864,898 | ||||||
BlackRock, Cl A | 13,144 | 8,489,841 | ||||||
Brown & Brown | 20,400 | 1,199,316 | ||||||
Capital One Financial | 33,460 | 3,547,429 | ||||||
Cboe Global Markets | 9,246 | 1,151,127 | ||||||
Charles Schwab | 133,149 | 10,607,981 | ||||||
Chubb | 36,409 | 7,823,930 | ||||||
Cincinnati Financial | 13,887 | 1,434,805 | ||||||
Citigroup | 168,881 | 7,744,883 | ||||||
Citizens Financial Group | 43,249 | 1,768,884 | ||||||
CME Group, Cl A | 31,334 | 5,430,182 | ||||||
Comerica | 11,357 | 800,669 | ||||||
Discover Financial Services | 23,814 | 2,487,610 | ||||||
Everest Re Group | 3,436 | 1,108,660 | ||||||
Eversource Energy | 30,169 | 2,301,291 | ||||||
FactSet Research Systems | 3,311 | 1,408,797 | ||||||
Fifth Third Bancorp | 59,826 | 2,135,190 | ||||||
First Republic Bank | 15,929 | 1,913,073 | ||||||
Franklin Resources | 24,760 | 580,622 | ||||||
Globe Life | 7,900 | 912,608 | ||||||
Goldman Sachs Group | 29,758 | 10,251,928 | ||||||
Hartford Financial Services Group | 28,149 | 2,038,269 | ||||||
The accompanying notes are an integral part of the financial statements.
77
CATHOLIC RESPONSIBLE INVESTMENTS EQUITY INDEX FUND
OCTOBER 31, 2022
| COMMON STOCK — continued | ||||||||
| Shares | Value | |||||||
FINANCIALS — continued |
| |||||||
Huntington Bancshares | 125,751 | $ | 1,908,900 | |||||
Intercontinental Exchange | 48,672 | 4,651,583 | ||||||
Invesco | 39,686 | 607,990 | ||||||
JPMorgan Chase | 255,652 | 32,181,474 | ||||||
KeyCorp | 81,267 | 1,452,241 | ||||||
Lincoln National | 13,553 | 730,100 | ||||||
Loews | 17,443 | 994,600 | ||||||
M&T Bank | 15,309 | 2,577,576 | ||||||
MarketAxess Holdings | 3,281 | 800,695 | ||||||
Marsh & McLennan | 43,503 | 7,025,299 | ||||||
MetLife | 58,429 | 4,277,587 | ||||||
Moody’s | 13,757 | 3,643,817 | ||||||
Morgan Stanley | 116,715 | 9,590,471 | ||||||
MSCI, Cl A | 7,018 | 3,290,460 | ||||||
Nasdaq | 29,517 | 1,837,138 | ||||||
Northern Trust | 18,136 | 1,529,772 | ||||||
PNC Financial Services Group | 35,753 | 5,785,908 | ||||||
Principal Financial Group | 20,239 | 1,783,663 | ||||||
Progressive | 58,038 | 7,452,079 | ||||||
Prudential Financial | 32,433 | 3,411,627 | ||||||
Raymond James Financial | 16,933 | 2,000,465 | ||||||
Regions Financial | 81,480 | 1,788,486 | ||||||
S&P Global | 29,701 | 9,541,446 | ||||||
Signature Bank NY | 5,486 | 869,696 | ||||||
State Street | 32,076 | 2,373,624 | ||||||
SVB Financial Group * | 5,150 | 1,189,444 | ||||||
Synchrony Financial | 41,961 | 1,492,133 | ||||||
T Rowe Price Group | 19,675 | 2,088,698 | ||||||
Travelers | 20,688 | 3,816,109 | ||||||
Truist Financial | 115,634 | 5,179,247 | ||||||
US Bancorp | 117,838 | 5,002,223 | ||||||
W R Berkley | 17,845 | 1,327,311 | ||||||
Wells Fargo | 330,635 | 15,205,904 | ||||||
Willis Towers Watson | 9,586 | 2,091,761 | ||||||
Zions Bancorp | 13,109 | 680,881 | ||||||
|
| |||||||
| 331,523,115 | ||||||||
|
| |||||||
HEALTH CARE — 12.8% |
| |||||||
ABIOMED * | 5,615 | 1,415,429 | ||||||
Align Technology * | 6,333 | 1,230,502 | ||||||
AmerisourceBergen, Cl A | 54,933 | 8,636,566 | ||||||
Baxter International | 81,200 | 4,413,220 | ||||||
Boston Scientific * | 259,345 | 11,180,363 | ||||||
Cardinal Health | 71,779 | 5,448,026 | ||||||
Cigna | 64,259 | 20,759,513 | ||||||
CVS Health | 262,008 | 24,812,158 | ||||||
DaVita * | 4,848 | 353,952 | ||||||
DENTSPLY SIRONA | 18,740 | 577,567 | ||||||
Dexcom * | 39,508 | 4,771,776 | ||||||
| COMMON STOCK — continued | ||||||||
| Shares | Value | |||||||
HEALTH CARE — continued |
| |||||||
Edwards Lifesciences * | 93,234 | $ | 6,752,939 | |||||
Elevance Health | 51,496 | 28,156,468 | ||||||
Gilead Sciences | 379,600 | 29,783,416 | ||||||
Henry Schein * | 34,250 | 2,344,755 | ||||||
Hologic * | 67,951 | 4,607,078 | ||||||
Humana | 29,392 | 16,403,087 | ||||||
IDEXX Laboratories * | 8,867 | 3,189,283 | ||||||
Incyte * | 205,858 | 15,303,484 | ||||||
Intuitive Surgical * | 44,220 | 10,898,903 | ||||||
IQVIA Holdings * | 103,231 | 21,644,444 | ||||||
Laboratory Corp of America Holdings | 21,940 | 4,867,608 | ||||||
McKesson | 50,430 | 19,635,929 | ||||||
Medtronic | 202,090 | 17,650,541 | ||||||
Mettler-Toledo International * | 12,522 | 15,839,453 | ||||||
Molina Healthcare * | 20,112 | 7,217,392 | ||||||
Quest Diagnostics | 27,735 | 3,984,133 | ||||||
ResMed | 20,993 | 4,695,924 | ||||||
STERIS | 20,744 | 3,579,999 | ||||||
Stryker | 54,723 | 12,544,700 | ||||||
Teleflex | 4,089 | 877,336 | ||||||
Waters * | 37,798 | 11,308,028 | ||||||
West Pharmaceutical Services | 44,179 | 10,165,588 | ||||||
Zimmer Biomet Holdings | 41,226 | 4,672,967 | ||||||
Zoetis, Cl A | 148,447 | 22,382,839 | ||||||
|
| |||||||
| 362,105,366 | ||||||||
|
| |||||||
INDUSTRIALS — 7.2% |
| |||||||
3M | 65,735 | 8,268,806 | ||||||
A O Smith | 11,156 | 611,126 | ||||||
Alaska Air Group * | 11,023 | 490,082 | ||||||
Allegion | 7,647 | 801,176 | ||||||
American Airlines Group * | 56,676 | 803,666 | ||||||
AMETEK | 23,591 | 3,058,809 | ||||||
Carrier Global | 73,386 | 2,917,827 | ||||||
Caterpillar | 67,067 | 14,517,323 | ||||||
CH Robinson Worldwide | 10,800 | 1,055,376 | ||||||
Cintas | 7,498 | 3,205,770 | ||||||
Copart * | 18,648 | 2,144,893 | ||||||
CoStar Group * | 34,500 | 2,853,840 | ||||||
CSX | 186,682 | 5,424,979 | ||||||
Cummins | 17,370 | 4,247,139 | ||||||
Deere | 37,680 | 14,914,497 | ||||||
Delta Air Lines * | 55,894 | 1,896,483 | ||||||
Dover | 12,514 | 1,635,455 | ||||||
Eaton | 51,379 | 7,710,446 | ||||||
Emerson Electric | 69,683 | 6,034,548 | ||||||
Equifax | 10,670 | 1,808,992 | ||||||
The accompanying notes are an integral part of the financial statements.
78
CATHOLIC RESPONSIBLE INVESTMENTS EQUITY INDEX FUND
OCTOBER 31, 2022
| COMMON STOCK — continued | ||||||||
| Shares | Value | |||||||
INDUSTRIALS — continued |
| |||||||
Expeditors International of Washington | 14,309 | $ | 1,400,136 | |||||
Fastenal | 69,729 | 3,370,002 | ||||||
FedEx | 20,840 | 3,340,235 | ||||||
Fortive | 31,050 | 1,984,095 | ||||||
Fortune Brands Home & Security | 11,276 | 680,168 | ||||||
Generac Holdings * | 5,564 | 644,923 | ||||||
Howmet Aerospace | 32,209 | 1,145,030 | ||||||
IDEX | 6,580 | 1,462,800 | ||||||
Illinois Tool Works | 42,120 | 8,993,884 | ||||||
Ingersoll Rand | 35,143 | 1,774,721 | ||||||
JB Hunt Transport Services | 7,240 | 1,238,547 | ||||||
Johnson Controls International | 60,024 | 3,471,788 | ||||||
Masco | 19,691 | 911,102 | ||||||
Nordson | 4,713 | 1,060,425 | ||||||
Norfolk Southern | 20,476 | 4,669,961 | ||||||
Old Dominion Freight Line | 7,990 | 2,194,054 | ||||||
Otis Worldwide | 36,900 | 2,606,616 | ||||||
PACCAR | 66,067 | 6,397,268 | ||||||
Parker-Hannifin | 17,198 | 4,998,083 | ||||||
Pentair | 14,288 | 613,670 | ||||||
Quanta Services | 18,931 | 2,688,959 | ||||||
Republic Services, Cl A | 22,474 | 2,980,502 | ||||||
Robert Half International | 9,519 | 727,823 | ||||||
Rockwell Automation | 10,063 | 2,569,084 | ||||||
Rollins | 20,170 | 848,754 | ||||||
Snap-on | 4,644 | 1,031,200 | ||||||
Southwest Airlines * | 51,771 | 1,881,876 | ||||||
Stanley Black & Decker | 12,847 | 1,008,361 | ||||||
Trane Technologies | 21,304 | 3,400,757 | ||||||
TransDigm Group | 7,656 | 4,408,018 | ||||||
Union Pacific | 62,114 | 12,245,154 | ||||||
United Airlines Holdings * | 28,438 | 1,225,109 | ||||||
United Parcel Service, Cl B | 70,840 | 11,884,827 | ||||||
United Rentals * | 6,101 | 1,926,147 | ||||||
Verisk Analytics, Cl A | 13,683 | 2,501,663 | ||||||
Waste Management | 42,778 | 6,774,752 | ||||||
Westinghouse Air Brake Technologies | 15,885 | 1,481,753 | ||||||
WW Grainger | 11,511 | 6,726,453 | ||||||
Xylem | 15,755 | 1,613,785 | ||||||
|
| |||||||
| 205,283,718 | ||||||||
|
| |||||||
INFORMATION TECHNOLOGY — 27.4% |
| |||||||
Accenture, Cl A | 55,144 | 15,655,382 | ||||||
Adobe * | 40,799 | 12,994,482 | ||||||
| COMMON STOCK — continued | ||||||||
| Shares | Value | |||||||
INFORMATION TECHNOLOGY — continued |
| |||||||
Advanced Micro Devices * | 140,692 | $ | 8,449,962 | |||||
Akamai Technologies * | 13,892 | 1,227,080 | ||||||
Amphenol, Cl A | 51,864 | 3,932,847 | ||||||
Analog Devices | 46,379 | 6,614,573 | ||||||
ANSYS * | 7,590 | 1,678,604 | ||||||
Apple | 1,395,147 | 213,931,841 | ||||||
Applied Materials | 75,831 | 6,695,119 | ||||||
Arista Networks * | 21,486 | 2,596,798 | ||||||
Autodesk * | 18,941 | 4,059,056 | ||||||
Automatic Data Processing | 37,412 | 9,042,480 | ||||||
Broadcom | 41,817 | 19,659,008 | ||||||
Broadridge Financial Solutions | 10,219 | 1,533,463 | ||||||
Cadence Design Systems * | 23,875 | 3,614,436 | ||||||
CDW | 11,790 | 2,037,430 | ||||||
Ceridian HCM Holding * | 13,370 | 884,960 | ||||||
Cisco Systems | 360,950 | 16,397,959 | ||||||
Cognizant Technology Solutions, Cl A | 45,101 | 2,807,537 | ||||||
DXC Technology * | 20,028 | 575,805 | ||||||
Enphase Energy * | 13,748 | 4,220,636 | ||||||
EPAM Systems * | 5,001 | 1,750,350 | ||||||
F5 * | 5,192 | 741,989 | ||||||
Fidelity National Information Services | 53,027 | 4,400,711 | ||||||
Fiserv * | 55,757 | 5,728,474 | ||||||
FleetCor Technologies * | 6,539 | 1,217,039 | ||||||
Fortinet * | 57,015 | 3,258,977 | ||||||
Gartner * | 6,895 | 2,081,738 | ||||||
Global Payments | 24,162 | 2,760,750 | ||||||
Hewlett Packard Enterprise | 113,319 | 1,617,062 | ||||||
HP | 79,323 | 2,190,901 | ||||||
Intel | 357,966 | 10,176,973 | ||||||
International Business Machines | 78,736 | 10,888,402 | ||||||
Intuit | 24,591 | 10,512,653 | ||||||
Jack Henry & Associates | 6,352 | 1,264,429 | ||||||
Juniper Networks | 28,099 | 859,829 | ||||||
Keysight Technologies * | 15,687 | 2,731,891 | ||||||
KLA | 12,362 | 3,911,955 | ||||||
Lam Research | 11,941 | 4,833,478 | ||||||
Mastercard, Cl A | 76,707 | 25,173,703 | ||||||
Microchip Technology | 48,128 | 2,971,423 | ||||||
Micron Technology | 96,146 | 5,201,499 | ||||||
Microsoft | 711,656 | 165,196,707 | ||||||
Monolithic Power Systems | 3,875 | 1,315,369 | ||||||
Motorola Solutions | 14,548 | 3,632,781 | ||||||
NetApp | 19,115 | 1,324,096 | ||||||
The accompanying notes are an integral part of the financial statements.
79
CATHOLIC RESPONSIBLE INVESTMENTS EQUITY INDEX FUND
OCTOBER 31, 2022
| COMMON STOCK — continued | ||||||||
| Shares | Value | |||||||
INFORMATION TECHNOLOGY — continued |
| |||||||
NortonLifeLock | 51,648 | $ | 1,163,630 | |||||
NVIDIA | 219,385 | 29,610,394 | ||||||
NXP Semiconductors | 22,892 | 3,344,064 | ||||||
ON Semiconductor * | 39,200 | 2,408,056 | ||||||
Oracle | 132,426 | 10,338,498 | ||||||
Paychex | 27,924 | 3,303,689 | ||||||
Paycom Software * | 4,237 | 1,466,002 | ||||||
PayPal Holdings * | 100,799 | 8,424,780 | ||||||
PTC * | 9,216 | 1,085,921 | ||||||
Qorvo * | 9,043 | 778,422 | ||||||
QUALCOMM | 108,929 | 12,816,586 | ||||||
Roper Technologies | 9,242 | 3,831,179 | ||||||
Salesforce * | 86,741 | 14,103,219 | ||||||
Seagate Technology Holdings | 17,013 | 844,866 | ||||||
ServiceNow * | 17,610 | 7,409,231 | ||||||
Skyworks Solutions | 13,987 | 1,203,022 | ||||||
SolarEdge Technologies * | 4,850 | 1,115,646 | ||||||
Synopsys * | 13,335 | 3,901,154 | ||||||
TE Connectivity | 27,883 | 3,408,139 | ||||||
Teledyne Technologies * | 4,086 | 1,626,146 | ||||||
Teradyne | 13,672 | 1,112,217 | ||||||
Texas Instruments | 89,448 | 14,368,032 | ||||||
Trimble * | 21,600 | 1,299,456 | ||||||
Tyler Technologies * | 3,625 | 1,172,071 | ||||||
VeriSign * | 8,137 | 1,631,143 | ||||||
Visa, Cl A | 147,581 | 30,572,880 | ||||||
Western Digital * | 27,347 | 939,916 | ||||||
Zebra Technologies, Cl A * | 4,515 | 1,278,738 | ||||||
|
| |||||||
| 778,909,734 | ||||||||
|
| |||||||
MATERIALS — 2.9% |
| |||||||
Air Products and Chemicals | 22,101 | 5,534,090 | ||||||
Albemarle | 10,211 | 2,857,753 | ||||||
Amcor | 131,035 | 1,517,385 | ||||||
Avery Dennison | 7,084 | 1,201,092 | ||||||
Ball | 27,368 | 1,351,706 | ||||||
Celanese, Cl A | 8,690 | 835,283 | ||||||
CF Industries Holdings | 51,204 | 5,440,937 | ||||||
Corteva | 115,539 | 7,549,318 | ||||||
Dow | 62,628 | 2,927,233 | ||||||
DuPont de Nemours | 43,665 | 2,497,638 | ||||||
Eastman Chemical | 10,737 | 824,709 | ||||||
Ecolab | 21,615 | 3,395,068 | ||||||
FMC | 10,981 | 1,305,641 | ||||||
Freeport-McMoRan | 124,651 | 3,950,190 | ||||||
International Flavors & Fragrances | 22,225 | 2,169,382 | ||||||
International Paper | 31,530 | 1,059,723 | ||||||
| COMMON STOCK — continued | ||||||||
| Shares | Value | |||||||
MATERIALS — continued |
| |||||||
Linde | 51,635 | $ | 15,353,667 | |||||
LyondellBasell Industries, Cl A | 22,162 | 1,694,285 | ||||||
Martin Marietta Materials | 5,438 | 1,827,059 | ||||||
Mosaic | 53,066 | 2,852,298 | ||||||
Newmont | 69,215 | 2,929,179 | ||||||
Nucor | 24,025 | 3,156,405 | ||||||
Packaging Corp of America | 8,172 | 982,356 | ||||||
PPG Industries | 20,486 | 2,339,092 | ||||||
Sealed Air | 12,678 | 603,726 | ||||||
Sherwin-Williams | 20,561 | 4,626,842 | ||||||
Vulcan Materials | 11,586 | 1,896,628 | ||||||
Westrock | 22,141 | 754,122 | ||||||
|
| |||||||
| 83,432,807 | ||||||||
|
| |||||||
REAL ESTATE — 2.5% | ||||||||
Alexandria Real Estate Equities ‡ | 12,944 | 1,880,763 | ||||||
American Tower ‡ | 43,083 | 8,926,367 | ||||||
AvalonBay Communities ‡ | 12,190 | 2,134,713 | ||||||
Boston Properties ‡ | 12,472 | 906,714 | ||||||
Camden Property Trust ‡ | 9,287 | 1,073,113 | ||||||
CBRE Group, Cl A * | 27,968 | 1,984,050 | ||||||
Crown Castle International | 37,751 | 5,030,698 | ||||||
Digital Realty Trust ‡ | 25,055 | 2,511,764 | ||||||
Equinix | 7,940 | 4,497,534 | ||||||
Equity Residential ‡ | 29,482 | 1,857,956 | ||||||
Essex Property Trust ‡ | 5,677 | 1,261,656 | ||||||
Extra Space Storage ‡ | 11,674 | 2,071,435 | ||||||
Federal Realty Investment Trust ‡ | 6,308 | 624,366 | ||||||
Host Hotels & Resorts ‡ | 62,291 | 1,176,054 | ||||||
Invitation Homes ‡ | 50,500 | 1,600,345 | ||||||
Iron Mountain ‡ | 25,360 | 1,269,775 | ||||||
Kimco Realty ‡ | 53,955 | 1,153,558 | ||||||
Mid-America Apartment Communities ‡ | 10,064 | 1,584,577 | ||||||
Prologis ‡ | 87,352 | 9,674,234 | ||||||
Public Storage ‡ | 16,394 | 5,078,041 | ||||||
Realty Income ‡ | 53,830 | 3,351,994 | ||||||
Regency Centers ‡ | 13,387 | 810,047 | ||||||
SBA Communications, Cl A | 9,404 | 2,538,140 | ||||||
Simon Property Group ‡ | 28,569 | 3,113,450 | ||||||
UDR ‡ | 26,583 | 1,056,940 | ||||||
Vornado Realty Trust ‡ | 14,005 | 330,378 | ||||||
Welltower ‡ | 40,412 | 2,466,748 | ||||||
Weyerhaeuser ‡ | 64,569 | 1,997,119 | ||||||
|
| |||||||
| 71,962,529 | ||||||||
|
| |||||||
The accompanying notes are an integral part of the financial statements.
80
CATHOLIC RESPONSIBLE INVESTMENTS EQUITY INDEX FUND
OCTOBER 31, 2022
| COMMON STOCK — continued | ||||||||
| Shares | Value | |||||||
UTILITIES — 3.0% | ||||||||
American Water Works | 15,848 | $ | 2,303,348 | |||||
Atmos Energy | 12,195 | 1,299,377 | ||||||
CenterPoint Energy | 54,886 | 1,570,288 | ||||||
CMS Energy | 25,337 | 1,445,476 | ||||||
Consolidated Edison | 57,385 | 5,047,585 | ||||||
Constellation Energy | 28,504 | 2,694,800 | ||||||
Dominion Energy | 106,327 | 7,439,700 | ||||||
Edison International | 33,287 | 1,998,551 | ||||||
Entergy | 17,733 | 1,899,914 | ||||||
Exelon | 149,713 | 5,777,425 | ||||||
FirstEnergy | 47,357 | 1,785,832 | ||||||
NextEra Energy | 272,928 | 21,151,920 | ||||||
NRG Energy | 20,478 | 909,223 | ||||||
PG&E * | 139,900 | 2,088,707 | ||||||
Pinnacle West Capital | 9,904 | 665,648 | ||||||
Public Service Enterprise Group | 43,446 | 2,436,017 | ||||||
Sempra Energy | 50,304 | 7,592,886 | ||||||
Southern | 254,543 | 16,667,476 | ||||||
|
| |||||||
| 84,774,173 | ||||||||
|
| |||||||
Total Common Stock | 2,827,605,472 | |||||||
|
| |||||||
| SHORT-TERM INVESTMENT — 0.1% | ||||||||
| Face Amount | Value | |||||||
State Street Institutional US Government Money Market Fund, Premier Class, 3.006% (B) | $ | 1,620,447 | $ | 1,620,447 | ||||
|
| |||||||
Total Short-Term Investments (Cost $1,620,447) | 1,620,447 | |||||||
|
| |||||||
Total Investments in Securities — 99.7% |
| |||||||
(Cost $1,983,544,130) | $ | 2,829,225,919 | ||||||
|
| |||||||
Percentages based on Net Assets of $2,837,203,177.
A list of the open futures contracts held by the Fund at October 31, 2022, is as follows:
| Type of Contract | Number of Contracts | Expiration Date | Notional Amount | Value | Unrealized Appreciation | |||||||||||||||
Long Contracts S&P 500 Index E-MINI | 43 | Dec-2022 | $ | 8,409,188 | $ | 8,348,450 | $ | 85,218 | ||||||||||||
|
|
|
|
|
|
|
|
| ||||||||||||
| * | Non-income producing security. |
| ‡ | Real Estate Investment Trust. |
| (A) | This security or a partial position of this security is on loan at October 31, 2022. The total market value of securities on loan at October 31, 2022 was $1,588,164. |
| (B) | This security was purchased with cash collateral received from securities lending. The total was of such securities as of October 31, 2022, was $1,620,447. |
Cl — Class
As of October 31, 2022, all of the Fund’s investments in securities were considered Level 1, in accordance with the authoritative guidance of fair value measurement and disclosure under U.S. generally accepted accounting principles.
The following is a list of the inputs used as of October 31, 2022 in valuing the Fund’s other financial instruments carried at value:
| Other Financial Instruments | Level 1 | Level 2 | Level 3 | Total | ||||||||||||
Futures Contracts* | ||||||||||||||||
Unrealized Appreciation | $ | 85,218 | $ | – | $ | – | $ | 85,218 | ||||||||
|
|
|
|
|
|
|
|
|
|
|
| |||||
Total Other Financial Instruments | $ | 85,218 | $ | – | $ | – | $ | 85,218 | ||||||||
|
|
| ||||||||||||||
* Futures contracts are valued at the unrealized appreciation (depreciation) on the instrument.
Amounts designated as “–” are $0 or have been round to $0.
For more information on valuation inputs, see Note 2 — Significant Accounting Policies in the Notes to Financial Statements.
The accompanying notes are an integral part of the financial statements.
81
CATHOLIC RESPONSIBLE INVESTMENTS SMALL-CAP FUND
OCTOBER 31, 2022
| SECTOR WEIGHTINGS † (unaudited) | ||||
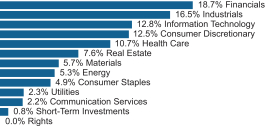
| † | Percentages are based on total investments. Total investments do not include derivatives such as options, futures contracts, forward contracts, and swap contracts, if applicable. |
SCHEDULE OF INVESTMENTS |
| |||||||
| COMMON STOCK — 98.2% | ||||||||
| Shares | Value | |||||||
COMMUNICATION SERVICES — 2.2% |
| |||||||
AMC Networks, Cl A * | 14,853 | $ | 334,341 | |||||
ATN International | 6,003 | 258,849 | ||||||
Cars.com * | 34,079 | 473,017 | ||||||
Cinemark Holdings * | 56,142 | 595,667 | ||||||
Cogent Communications Holdings | 22,224 | 1,166,982 | ||||||
Consolidated Communications Holdings * | 41,503 | 214,571 | ||||||
EW Scripps, Cl A * | 29,834 | 423,344 | ||||||
Gannett * | 75,773 | 109,871 | ||||||
Gogo * | 36,396 | 517,551 | ||||||
Marcus | 13,436 | 202,077 | ||||||
QuinStreet * | 27,348 | 312,041 | ||||||
Scholastic | 15,566 | 593,687 | ||||||
Shenandoah Telecommunications | 26,537 | 601,328 | ||||||
Shutterstock | 12,473 | 624,024 | ||||||
TechTarget * | 14,038 | 906,153 | ||||||
Telephone and Data Systems | 52,072 | 885,224 | ||||||
Thryv Holdings * | 16,351 | 334,542 | ||||||
Yelp, Cl A * | 36,309 | 1,394,629 | ||||||
|
| |||||||
| 9,947,898 | ||||||||
|
| |||||||
CONSUMER DISCRETIONARY — 12.3% |
| |||||||
Aaron’s | 15,715 | 163,750 | ||||||
Abercrombie & Fitch, Cl A * | 25,876 | 454,900 | ||||||
Academy Sports & Outdoors | 43,302 | 1,906,587 | ||||||
Adtalem Global Education * | 23,694 | 988,040 | ||||||
American Axle & Manufacturing Holdings * | 59,838 | 579,830 | ||||||
American Eagle Outfitters | 79,849 | 907,085 | ||||||
America’s Car-Mart * | 3,003 | 205,285 | ||||||
Asbury Automotive Group * | 11,219 | 1,769,797 | ||||||
| COMMON STOCK — continued | ||||||||
| Shares | Value | |||||||
CONSUMER DISCRETIONARY — continued |
| |||||||
Bed Bath & Beyond * (A) | 36,926 | $ | 168,752 | |||||
Big Lots | 14,578 | 275,087 | ||||||
BJ’s Restaurants * | 12,853 | 422,221 | ||||||
Bloomin’ Brands | 47,404 | 1,138,170 | ||||||
Boot Barn Holdings * | 15,170 | 861,656 | ||||||
Brinker International * | 23,640 | 789,340 | ||||||
Buckle | 15,111 | 594,316 | ||||||
Caleres | 19,217 | 525,201 | ||||||
Cato, Cl A | 8,192 | 97,567 | ||||||
Cavco Industries * | 4,498 | 1,019,562 | ||||||
Century Communities | 15,588 | 693,822 | ||||||
Cheesecake Factory | 25,692 | 920,030 | ||||||
Chico’s FAS * | 66,755 | 392,519 | ||||||
Children’s Place * | 6,954 | 281,498 | ||||||
Chuy’s Holdings * | 10,716 | 313,979 | ||||||
Conn’s * | 6,660 | 54,679 | ||||||
Dave & Buster’s Entertainment * | 22,995 | 916,351 | ||||||
Designer Brands, Cl A | 29,589 | 450,640 | ||||||
Dine Brands Global | 8,519 | 614,135 | ||||||
Dorman Products * | 14,364 | 1,172,390 | ||||||
El Pollo Loco Holdings | 10,775 | 108,181 | ||||||
Ethan Allen Interiors | 13,567 | 347,179 | ||||||
Frontdoor * | 42,436 | 936,138 | ||||||
Genesco * | 6,896 | 324,388 | ||||||
Gentherm * | 16,910 | 987,882 | ||||||
G-III Apparel Group * | 24,157 | 471,061 | ||||||
Green Brick Partners * | 16,321 | 377,505 | ||||||
Group 1 Automotive | 8,000 | 1,384,000 | ||||||
Guess? (A) | 17,144 | 291,105 | ||||||
Haverty Furniture | 6,764 | 179,787 | ||||||
Hibbett | 6,648 | 414,968 | ||||||
Installed Building Products | 12,789 | 1,099,854 | ||||||
iRobot * | 14,445 | 816,142 | ||||||
Jack in the Box | 11,263 | 993,734 | ||||||
Kontoor Brands | 26,473 | 945,086 | ||||||
La-Z-Boy, Cl Z | 23,466 | 581,253 | ||||||
LCI Industries | 12,975 | 1,376,777 | ||||||
Leslie’s * (A) | 76,400 | 1,072,656 | ||||||
LGI Homes * | 10,997 | 1,012,274 | ||||||
Liquidity Services * | 14,381 | 247,066 | ||||||
LL Flooring Holdings * | 14,687 | 122,196 | ||||||
M * | 14,787 | 613,513 | ||||||
MarineMax * | 10,873 | 351,307 | ||||||
MDC Holdings | 29,818 | 908,256 | ||||||
Meritage Homes * | 19,265 | 1,467,222 | ||||||
Mister Car Wash * (A) | 42,373 | 374,154 | ||||||
Monro | 16,327 | 779,614 | ||||||
Motorcar Parts of America * | 9,828 | 186,732 | ||||||
Movado Group | 9,450 | 312,511 | ||||||
National Vision Holdings * | 39,972 | 1,480,563 | ||||||
The accompanying notes are an integral part of the financial statements.
82
CATHOLIC RESPONSIBLE INVESTMENTS SMALL-CAP FUND
OCTOBER 31, 2022
| COMMON STOCK — continued | ||||||||
| Shares | Value | |||||||
CONSUMER DISCRETIONARY — continued |
| |||||||
ODP * | 21,968 | $ | 869,274 | |||||
Oxford Industries | 8,453 | 859,924 | ||||||
Patrick Industries | 10,996 | 502,627 | ||||||
Perdoceo Education * | 36,639 | 418,784 | ||||||
PetMed Express | 10,722 | 228,593 | ||||||
Rent-A-Center, Cl A | 27,317 | 569,559 | ||||||
Ruth’s Hospitality Group | 17,829 | 370,487 | ||||||
Sally Beauty Holdings * | 55,005 | 699,113 | ||||||
Shake Shack, Cl A * | 19,556 | 1,086,727 | ||||||
Shoe Carnival | 8,598 | 206,180 | ||||||
Signet Jewelers | 23,792 | 1,552,190 | ||||||
Six Flags Entertainment * | 39,227 | 874,762 | ||||||
Sleep Number * | 11,429 | 317,040 | ||||||
Sonic Automotive, Cl A | 9,352 | 437,206 | ||||||
Sonos * | 67,224 | 1,083,651 | ||||||
Standard Motor Products | 9,405 | 356,732 | ||||||
Steven Madden | 39,510 | 1,180,164 | ||||||
Strategic Education | 11,576 | 798,744 | ||||||
Stride * | 21,370 | 716,109 | ||||||
Tri Pointe Homes * | 53,411 | 894,634 | ||||||
Tupperware Brands * | 24,639 | 190,459 | ||||||
Unifi * | 7,814 | 71,264 | ||||||
Universal Electronics * | 6,984 | 142,543 | ||||||
Urban Outfitters * | 30,566 | 729,305 | ||||||
Winnebago Industries | 16,148 | 963,874 | ||||||
Wolverine World Wide | 42,712 | 731,657 | ||||||
WW International * | 32,800 | 148,256 | ||||||
XPEL * | 10,194 | 705,323 | ||||||
Zumiez * | 7,861 | 176,322 | ||||||
|
| |||||||
| 57,121,796 | ||||||||
|
| |||||||
CONSUMER STAPLES — 4.9% |
| |||||||
Andersons | 17,232 | 607,773 | ||||||
B&G Foods | 37,637 | 616,494 | ||||||
Calavo Growers | 9,960 | 344,516 | ||||||
Cal-Maine Foods | 20,162 | 1,139,355 | ||||||
Central Garden & Pet * | 5,493 | 226,696 | ||||||
Central Garden & Pet, Cl A * | 21,732 | 850,590 | ||||||
Chefs’ Warehouse * | 18,566 | 680,073 | ||||||
Edgewell Personal Care | 27,325 | 1,070,867 | ||||||
elf Beauty * | 27,217 | 1,177,407 | ||||||
Fresh Del Monte Produce | 16,206 | 422,652 | ||||||
Hain Celestial Group * | 46,543 | 870,820 | ||||||
Hostess Brands, Cl A * | 71,576 | 1,895,332 | ||||||
Inter Parfums | 9,772 | 790,359 | ||||||
J & J Snack Foods | 7,892 | 1,164,938 | ||||||
John B Sanfilippo & Son | 4,970 | 414,548 | ||||||
Medifast | 5,910 | 691,411 | ||||||
MGP Ingredients | 8,638 | 967,888 | ||||||
National Beverage | 12,872 | 610,390 | ||||||
PriceSmart | 13,143 | 840,758 | ||||||
| COMMON STOCK — continued | ||||||||
| Shares | Value | |||||||
CONSUMER STAPLES — continued |
| |||||||
Seneca Foods, Cl A * | 3,361 | $ | 212,113 | |||||
Simply Good Foods * | 44,508 | 1,704,656 | ||||||
SpartanNash | 19,705 | 703,666 | ||||||
Tootsie Roll Industries | 10,152 | 410,039 | ||||||
TreeHouse Foods * | 26,387 | 1,325,683 | ||||||
United Natural Foods * | 30,446 | 1,291,215 | ||||||
USANA Health Sciences * | 6,098 | 320,206 | ||||||
WD-40 | 7,080 | 1,133,933 | ||||||
|
| |||||||
| 22,484,378 | ||||||||
|
| |||||||
ENERGY — 5.2% |
| |||||||
Archrock | 68,044 | 511,011 | ||||||
Bristow Group * | 11,847 | 354,699 | ||||||
Callon Petroleum * | 25,975 | 1,141,861 | ||||||
Civitas Resources | 26,451 | 1,849,189 | ||||||
CONSOL Energy | 16,934 | 1,067,181 | ||||||
Core Laboratories | 23,694 | 461,085 | ||||||
DMC Global * | 9,367 | 202,702 | ||||||
Dorian LPG | 16,011 | 289,319 | ||||||
Dril-Quip * | 17,357 | 431,842 | ||||||
Green Plains * | 29,436 | 850,406 | ||||||
Helix Energy Solutions Group * | 72,017 | 504,119 | ||||||
Helmerich & Payne | 53,617 | 2,654,578 | ||||||
Laredo Petroleum * | 8,728 | 564,265 | ||||||
Nabors Industries * | 4,626 | 805,063 | ||||||
Oceaneering International * | 51,178 | 715,980 | ||||||
Oil States International * | 32,265 | 208,755 | ||||||
Par Pacific Holdings * | 28,699 | 656,633 | ||||||
Patterson-UTI Energy | 111,057 | 1,960,156 | ||||||
PBF Energy, Cl A | 55,144 | 2,440,122 | ||||||
ProPetro Holding * | 44,726 | 529,556 | ||||||
Ranger Oil, Cl A | 10,421 | 426,219 | ||||||
REX American Resources * | 7,978 | 239,260 | ||||||
RPC | 44,164 | 491,545 | ||||||
SM Energy | 62,748 | 2,822,405 | ||||||
Talos Energy * | 33,779 | 718,817 | ||||||
US Silica Holdings * | 39,529 | 568,822 | ||||||
World Fuel Services | 31,389 | 800,106 | ||||||
|
| |||||||
| 24,265,696 | ||||||||
|
| |||||||
FINANCIALS — 18.5% |
| |||||||
Ambac Financial Group * | 23,490 | 330,034 | ||||||
American Equity Investment Life Holding | 35,969 | 1,549,544 | ||||||
Ameris Bancorp | 33,036 | 1,701,684 | ||||||
AMERISAFE | 9,803 | 572,593 | ||||||
Apollo Commercial Real Estate Finance ‡ | 65,672 | 739,467 | ||||||
ARMOUR Residential REIT ‡ (A) | 57,884 | 307,943 | ||||||
The accompanying notes are an integral part of the financial statements.
83
CATHOLIC RESPONSIBLE INVESTMENTS SMALL-CAP FUND
OCTOBER 31, 2022
| COMMON STOCK — continued | ||||||||
| Shares | Value | |||||||
FINANCIALS — continued |
| |||||||
Assured Guaranty | 31,368 | $ | 1,856,672 | |||||
Axos Financial * | 26,958 | 1,050,284 | ||||||
B Riley Financial | 8,626 | 350,906 | ||||||
Banc of California | 28,355 | 472,961 | ||||||
BancFirst | 9,167 | 878,382 | ||||||
Bancorp * | 29,039 | 800,896 | ||||||
BankUnited | 39,484 | 1,419,450 | ||||||
Banner | 17,325 | 1,295,044 | ||||||
Berkshire Hills Bancorp | 23,229 | 679,448 | ||||||
Blucora * | 25,639 | 564,827 | ||||||
Brightsphere Investment Group | 16,819 | 316,534 | ||||||
Brookline Bancorp | 38,973 | 535,879 | ||||||
Capitol Federal Financial | 65,560 | 536,281 | ||||||
Central Pacific Financial | 13,827 | 283,730 | ||||||
City Holding | 7,535 | 759,905 | ||||||
Columbia Banking System | 39,852 | 1,333,846 | ||||||
Community Bank System | 27,226 | 1,699,719 | ||||||
Customers Bancorp * | 15,503 | 522,296 | ||||||
CVB Financial | 66,585 | 1,912,321 | ||||||
Dime Community Bancshares | 16,432 | 567,397 | ||||||
Donnelley Financial Solutions * | 13,923 | 562,907 | ||||||
Eagle Bancorp | 16,269 | 736,660 | ||||||
Ellington Financial ‡ | 28,982 | 387,779 | ||||||
Employers Holdings | 13,875 | 605,089 | ||||||
Encore Capital Group * | 12,561 | 639,606 | ||||||
Enova International * | 16,793 | 629,570 | ||||||
EZCORP, Cl A * | 27,903 | 269,543 | ||||||
FB Financial | 17,833 | 748,273 | ||||||
First Bancorp | 18,101 | 806,762 | ||||||
First BanCorp | 95,253 | 1,504,045 | ||||||
First Commonwealth Financial | 47,384 | 679,487 | ||||||
First Financial Bancorp | 48,073 | 1,253,263 | ||||||
First Hawaiian | 64,705 | 1,655,154 | ||||||
Flagstar Bancorp | 27,022 | 1,045,751 | ||||||
Franklin BSP Realty Trust ‡ | 42,584 | 600,009 | ||||||
Genworth Financial, Cl A * | 256,959 | 1,199,998 | ||||||
Granite Point Mortgage Trust ‡ | 26,434 | 207,771 | ||||||
Green Dot, Cl A * | 24,311 | 462,638 | ||||||
Hanmi Financial | 15,393 | 412,225 | ||||||
HCI Group | 3,850 | 141,064 | ||||||
Heritage Financial | 17,837 | 600,929 | ||||||
Hilltop Holdings | 23,274 | 673,782 | ||||||
HomeStreet | 8,978 | 233,069 | ||||||
Hope Bancorp | 60,566 | 821,881 | ||||||
Horace Mann Educators | 20,734 | 818,164 | ||||||
Independent Bank | 23,258 | 2,023,679 | ||||||
| COMMON STOCK — continued | ||||||||
| Shares | Value | |||||||
FINANCIALS — continued |
| |||||||
Independent Bank Group | 17,940 | $ | 1,131,835 | |||||
Invesco Mortgage Capital ‡ (A) | 16,638 | 194,831 | ||||||
James River Group Holdings | 18,931 | 478,386 | ||||||
KKR Real Estate Finance Trust ‡ | 29,560 | 514,935 | ||||||
Lakeland Financial | 12,846 | 1,061,722 | ||||||
LendingTree * | 5,758 | 145,274 | ||||||
Mercury General | 13,420 | 389,180 | ||||||
Mr Cooper Group * | 36,305 | 1,433,684 | ||||||
National Bank Holdings, Cl A | 15,269 | 669,088 | ||||||
NBT Bancorp | 21,710 | 1,028,837 | ||||||
New York Mortgage Trust ‡ | 190,727 | 513,056 | ||||||
NMI Holdings, Cl A * | 42,919 | 941,214 | ||||||
Northfield Bancorp | 21,510 | 345,020 | ||||||
Northwest Bancshares | 64,288 | 968,177 | ||||||
OFG Bancorp | 24,132 | 672,800 | ||||||
Pacific Premier Bancorp | 48,117 | 1,751,940 | ||||||
Palomar Holdings * | 13,062 | 1,161,995 | ||||||
Park National | 7,330 | 1,081,175 | ||||||
Pathward Financial | 14,762 | 620,447 | ||||||
PennyMac Mortgage Investment Trust ‡ | 45,982 | 637,770 | ||||||
Piper Sandler | 7,064 | 903,980 | ||||||
PRA Group * | 19,771 | 662,328 | ||||||
Preferred Bank | 6,926 | 532,402 | ||||||
ProAssurance | 27,375 | 607,999 | ||||||
PROG Holdings * | 26,263 | 433,865 | ||||||
Provident Financial Services | 38,043 | 852,924 | ||||||
Ready Capital ‡ | 51,720 | 626,846 | ||||||
Redwood Trust ‡ | 58,960 | 420,385 | ||||||
Renasant | 28,350 | 1,144,489 | ||||||
S&T Bancorp | 19,868 | 751,209 | ||||||
Safety Insurance Group | 7,480 | 650,386 | ||||||
Seacoast Banking Corp of Florida | 31,117 | 961,515 | ||||||
ServisFirst Bancshares | 24,767 | 1,865,698 | ||||||
Simmons First National, Cl A | 65,019 | 1,552,003 | ||||||
SiriusPoint * | 42,898 | 275,405 | ||||||
Southside Bancshares | 15,484 | 530,172 | ||||||
Stellar Bancorp | 18,560 | 609,508 | ||||||
Stewart Information Services | 13,757 | 535,973 | ||||||
StoneX Group * | 9,046 | 844,173 | ||||||
Tompkins Financial | 6,408 | 530,839 | ||||||
Triumph Bancorp * | 11,928 | 614,292 | ||||||
Trupanion * | 18,253 | 921,229 | ||||||
TrustCo Bank NY | 9,658 | 360,437 | ||||||
The accompanying notes are an integral part of the financial statements.
84
CATHOLIC RESPONSIBLE INVESTMENTS SMALL-CAP FUND
OCTOBER 31, 2022
| COMMON STOCK — continued | ||||||||
| Shares | Value | |||||||
FINANCIALS — continued |
| |||||||
Trustmark | 31,011 | $ | 1,134,072 | |||||
Two Harbors Investment ‡ | 174,786 | 622,238 | ||||||
United Community Banks | 53,742 | 2,069,067 | ||||||
United Fire Group | 11,248 | 304,821 | ||||||
Universal Insurance Holdings | 14,566 | 146,243 | ||||||
Veritex Holdings | 27,368 | 864,281 | ||||||
Virtus Investment Partners | 3,515 | 602,787 | ||||||
Walker & Dunlop | 15,595 | 1,402,926 | ||||||
Westamerica BanCorp | 13,645 | 855,951 | ||||||
WisdomTree Investments | 57,859 | 314,174 | ||||||
World Acceptance * | 2,023 | 164,308 | ||||||
WSFS Financial | 32,182 | 1,498,394 | ||||||
|
| |||||||
| 85,665,826 | ||||||||
|
| |||||||
HEALTH CARE — 10.6% |
| |||||||
AdaptHealth, Cl A * | 40,393 | 920,960 | ||||||
Addus HomeCare * | 8,705 | 891,566 | ||||||
Allscripts Healthcare Solutions * | 59,234 | 870,740 | ||||||
AMN Healthcare Services * | 22,462 | 2,818,981 | ||||||
AngioDynamics * | 21,408 | 301,639 | ||||||
Anika Therapeutics * | 9,862 | 280,278 | ||||||
Apollo Medical Holdings * | 20,691 | 733,703 | ||||||
Arcus Biosciences * | 28,287 | 720,753 | ||||||
Artivion * | 23,077 | 257,539 | ||||||
Avanos Medical * | 24,796 | 549,231 | ||||||
Avid Bioservices * | 34,778 | 589,139 | ||||||
Cara Therapeutics * | 27,418 | 257,729 | ||||||
Cardiovascular Systems * | 22,523 | 325,232 | ||||||
Catalyst Pharmaceuticals * | 54,670 | 758,273 | ||||||
Coherus Biosciences * | 38,322 | 333,401 | ||||||
Collegium Pharmaceutical * | 21,790 | 390,913 | ||||||
Computer Programs and Systems * | 8,691 | 280,719 | ||||||
CONMED | 16,027 | 1,277,833 | ||||||
CorVel * | 5,082 | 834,515 | ||||||
Cross Country Healthcare * | 20,329 | 754,003 | ||||||
Cutera * | 9,875 | 453,954 | ||||||
Cytokinetics * | 49,118 | 2,144,492 | ||||||
Dynavax Technologies * | 65,250 | 747,113 | ||||||
Eagle Pharmaceuticals * | 7,919 | 249,211 | ||||||
Embecta | 30,436 | 941,081 | ||||||
Emergent BioSolutions * | 25,339 | 528,572 | ||||||
Enanta Pharmaceuticals * | 10,749 | 484,887 | ||||||
Enhabit * | 27,186 | 337,650 | ||||||
Ensign Group | 28,981 | 2,601,914 | ||||||
Fulgent Genetics * | 11,083 | 439,219 | ||||||
Glaukos * | 24,933 | 1,397,993 | ||||||
Harmony Biosciences Holdings * | 16,739 | 870,428 | ||||||
| COMMON STOCK — continued | ||||||||
| Shares | Value | |||||||
HEALTH CARE — continued |
| |||||||
HealthStream * | 13,666 | $ | 337,550 | |||||
Heska * | 5,547 | 398,053 | ||||||
Innoviva * | 38,685 | 524,569 | ||||||
Inogen * | 12,688 | 287,510 | ||||||
Integer Holdings * | 17,496 | 1,090,526 | ||||||
Ironwood Pharmaceuticals, Cl A * | 77,908 | 852,314 | ||||||
Joint * | 8,812 | 145,574 | ||||||
LeMaitre Vascular | 10,755 | 466,767 | ||||||
Ligand Pharmaceuticals * | 8,692 | 761,854 | ||||||
Merit Medical Systems * | 29,730 | 2,044,532 | ||||||
Mesa Laboratories | 2,719 | 359,479 | ||||||
ModivCare * | 6,752 | 656,564 | ||||||
Myriad Genetics * | 43,764 | 907,665 | ||||||
Nektar Therapeutics, Cl A * | 108,972 | 409,735 | ||||||
NeoGenomics * | 68,301 | 519,429 | ||||||
NextGen Healthcare * | 31,035 | 621,941 | ||||||
OptimizeRx * | 10,496 | �� | 161,796 | |||||
OraSure Technologies * | 40,901 | 178,328 | ||||||
Organogenesis Holdings, Cl A * | 51,293 | 168,241 | ||||||
Orthofix Medical * | 11,201 | 179,888 | ||||||
Owens & Minor | 40,204 | 683,468 | ||||||
Pacira BioSciences * | 25,164 | 1,302,489 | ||||||
Pediatrix Medical Group * | 44,837 | 869,838 | ||||||
Pennant Group * | 17,179 | 211,473 | ||||||
Phibro Animal Health, Cl A | 15,462 | 227,137 | ||||||
Prestige Consumer Healthcare * | 27,316 | 1,488,176 | ||||||
RadNet * | 26,917 | 514,653 | ||||||
Select Medical Holdings | 54,992 | 1,412,195 | ||||||
Simulations Plus | 8,976 | 372,504 | ||||||
Supernus Pharmaceuticals * | 30,378 | 1,041,054 | ||||||
Surmodics * | 8,094 | 276,329 | ||||||
US Physical Therapy | 7,114 | 631,723 | ||||||
Vanda Pharmaceuticals * | 33,823 | 354,127 | ||||||
Varex Imaging * | 21,873 | 483,612 | ||||||
Vericel * | 26,273 | 706,218 | ||||||
Vir Biotechnology * | 41,148 | 904,433 | ||||||
Xencor * | 33,220 | 930,160 | ||||||
Zimvie * | 13,530 | 118,658 | ||||||
Zynex (A) | 14,974 | 170,704 | ||||||
|
| |||||||
| 49,114,927 | ||||||||
|
| |||||||
INDUSTRIALS — 16.3% |
| |||||||
AAON | 22,560 | 1,454,894 | ||||||
AAR * | 18,867 | 836,185 | ||||||
ABM Industries | 34,196 | 1,522,064 | ||||||
Alamo Group | 5,785 | 879,783 | ||||||
Albany International, Cl A | 16,895 | 1,547,920 | ||||||
Allegiant Travel * | 7,972 | 598,299 | ||||||
The accompanying notes are an integral part of the financial statements.
85
CATHOLIC RESPONSIBLE INVESTMENTS SMALL-CAP FUND
OCTOBER 31, 2022
| COMMON STOCK — continued | ||||||||
| Shares | Value | |||||||
INDUSTRIALS — continued |
| |||||||
American Woodmark * | 9,533 | $ | 432,322 | |||||
Apogee Enterprises | 12,856 | 589,833 | ||||||
Applied Industrial Technologies | 20,563 | 2,557,626 | ||||||
ArcBest | 12,832 | 1,019,246 | ||||||
Arcosa | 25,668 | 1,647,886 | ||||||
Astec Industries | 12,857 | 561,208 | ||||||
Atlas Air Worldwide Holdings * | 13,290 | 1,344,151 | ||||||
AZZ | 14,170 | 569,634 | ||||||
Barnes Group | 27,228 | 963,054 | ||||||
Boise Cascade | 21,930 | 1,464,266 | ||||||
Brady, Cl A | 24,027 | 1,099,235 | ||||||
CIRCOR International * | 12,945 | 267,573 | ||||||
Comfort Systems USA | 19,215 | 2,368,825 | ||||||
CoreCivic * | 61,727 | 646,282 | ||||||
Deluxe | 22,335 | 410,518 | ||||||
DXP Enterprises * | 10,085 | 288,532 | ||||||
Encore Wire | 10,422 | 1,433,963 | ||||||
Enerpac Tool Group, Cl A | 32,789 | 833,169 | ||||||
EnPro Industries | 11,606 | 1,236,039 | ||||||
ESCO Technologies | 14,023 | 1,208,362 | ||||||
Exponent | 26,198 | 2,495,621 | ||||||
Federal Signal | 32,873 | 1,533,525 | ||||||
Forrester Research * | 5,886 | 249,096 | ||||||
Forward Air | 13,937 | 1,475,510 | ||||||
Franklin Electric | 20,928 | 1,714,840 | ||||||
GEO Group * | 65,552 | 554,570 | ||||||
Gibraltar Industries * | 17,316 | 884,501 | ||||||
GMS * | 23,748 | 1,120,906 | ||||||
Granite Construction | 24,229 | 817,244 | ||||||
Greenbrier | 17,955 | 633,991 | ||||||
Griffon | 25,906 | 832,619 | ||||||
Harsco * | 41,315 | 218,556 | ||||||
Hawaiian Holdings * | 27,143 | 391,673 | ||||||
Healthcare Services Group | 38,076 | 531,541 | ||||||
Heartland Express | 23,773 | 353,742 | ||||||
Heidrick & Struggles International | 10,142 | 285,599 | ||||||
Hillenbrand | 37,625 | 1,662,273 | ||||||
HNI | 21,248 | 615,980 | ||||||
Hub Group, Cl A * | 17,511 | 1,358,854 | ||||||
Insteel Industries | 12,215 | 321,865 | ||||||
Interface, Cl A | 32,264 | 364,906 | ||||||
John Bean Technologies | 16,915 | 1,542,648 | ||||||
KAR Auction Services * | 59,624 | 866,337 | ||||||
Kelly Services, Cl A | 17,465 | 285,378 | ||||||
Korn Ferry | 28,183 | 1,566,693 | ||||||
Lindsay | 5,994 | 1,014,784 | ||||||
Marten Transport | 30,372 | 570,082 | ||||||
Matson | 20,147 | 1,482,416 | ||||||
| COMMON STOCK — continued | ||||||||
| Shares | Value | |||||||
INDUSTRIALS — continued |
| |||||||
Matthews International, Cl A | 15,557 | $ | 418,172 | |||||
MillerKnoll | 39,895 | 844,976 | ||||||
Mueller Industries | 31,106 | 1,948,480 | ||||||
MYR Group * | 9,182 | 803,517 | ||||||
NOW * | 62,261 | 792,583 | ||||||
NV5 Global * | 6,887 | 998,271 | ||||||
Park Aerospace | 13,534 | 168,363 | ||||||
PGT Innovations * | 33,802 | 720,321 | ||||||
Pitney Bowes | 89,889 | 279,555 | ||||||
Powell Industries | 6,363 | 156,975 | ||||||
Proto Labs * | 14,953 | 571,055 | ||||||
Quanex Building Products | 20,557 | 455,543 | ||||||
Resideo Technologies * | 76,389 | 1,804,308 | ||||||
Resources Connection | 16,872 | 308,251 | ||||||
SkyWest * | 26,210 | 463,393 | ||||||
SPX Technologies * | 24,332 | 1,602,019 | ||||||
Standex International | 6,866 | 680,077 | ||||||
Sun Country Airlines Holdings * | 16,951 | 275,962 | ||||||
Tennant | 10,572 | 615,819 | ||||||
Titan International * | 31,951 | 477,987 | ||||||
Trinity Industries | 44,624 | 1,273,123 | ||||||
Triumph Group * | 37,445 | 338,877 | ||||||
TrueBlue * | 17,255 | 339,233 | ||||||
UFP Industries | 32,616 | 2,323,238 | ||||||
UniFirst | 7,698 | 1,416,509 | ||||||
Veritiv * | 7,717 | 897,178 | ||||||
Viad * | 11,283 | 420,630 | ||||||
Wabash National | 28,954 | 626,854 | ||||||
|
| |||||||
| 75,547,888 | ||||||||
|
| |||||||
INFORMATION TECHNOLOGY — 12.7% |
| |||||||
8x8 * | 65,563 | 277,331 | ||||||
A10 Networks | 36,196 | 608,093 | ||||||
Adeia | 54,350 | 607,633 | ||||||
ADTRAN Holdings | 37,267 | 837,017 | ||||||
Advanced Energy Industries | 19,327 | 1,520,069 | ||||||
Alarm.com Holdings * | 25,761 | 1,515,777 | ||||||
Alpha & Omega Semiconductor * | 12,146 | 397,782 | ||||||
Arlo Technologies * | 49,006 | 252,381 | ||||||
Avid Technology * | 18,196 | 500,208 | ||||||
Axcelis Technologies * | 17,229 | 999,282 | ||||||
Badger Meter | 15,043 | 1,692,037 | ||||||
Benchmark Electronics | 17,822 | 505,967 | ||||||
Cerence * | 20,813 | 357,984 | ||||||
CEVA * | 11,847 | 327,688 | ||||||
Clearfield * | 6,256 | 759,916 | ||||||
Cohu * | 24,820 | 817,074 | ||||||
Comtech Telecommunications | 14,563 | 160,921 | ||||||
The accompanying notes are an integral part of the financial statements.
86
CATHOLIC RESPONSIBLE INVESTMENTS SMALL-CAP FUND
OCTOBER 31, 2022
| COMMON STOCK — continued | ||||||||
| Shares | Value | |||||||
INFORMATION TECHNOLOGY — continued |
| |||||||
Consensus Cloud Solutions * | 9,487 | $ | 532,600 | |||||
Corsair Gaming * (A) | 20,858 | 287,840 | ||||||
CSG Systems International | 16,979 | 1,098,032 | ||||||
CTS | 16,774 | 662,908 | ||||||
Diebold Nixdorf * | 44,791 | 111,530 | ||||||
Digi International * | 18,855 | 760,422 | ||||||
Digital Turbine * | 47,305 | 690,653 | ||||||
Diodes * | 23,145 | 1,658,802 | ||||||
Ebix | 13,454 | 266,255 | ||||||
ePlus * | 13,915 | 677,939 | ||||||
EVERTEC | 34,345 | 1,229,894 | ||||||
Extreme Networks * | 68,684 | 1,232,191 | ||||||
Fabrinet * | 18,851 | 2,156,554 | ||||||
FARO Technologies * | 9,611 | 280,737 | ||||||
FormFactor * | 39,495 | 798,194 | ||||||
Harmonic * | 55,546 | 858,186 | ||||||
Ichor Holdings * | 15,050 | 382,872 | ||||||
Insight Enterprises * | 15,748 | 1,488,343 | ||||||
InterDigital | 15,566 | 776,276 | ||||||
Itron * | 23,299 | 1,139,088 | ||||||
Knowles * | 46,380 | 637,725 | ||||||
Kulicke & Soffa Industries | 29,821 | 1,250,693 | ||||||
LivePerson * | 36,774 | 388,701 | ||||||
LiveRamp Holdings * | 34,980 | 642,233 | ||||||
MaxLinear, Cl A * | 37,108 | 1,145,895 | ||||||
Methode Electronics | 18,691 | 770,630 | ||||||
NETGEAR * | 14,898 | 292,746 | ||||||
NetScout Systems * | 34,611 | 1,243,227 | ||||||
OneSpan * | 19,252 | 211,579 | ||||||
Onto Innovation * | 25,416 | 1,698,805 | ||||||
OSI Systems * | 8,087 | 664,590 | ||||||
Payoneer Global * | 227,000 | 1,759,250 | ||||||
PC Connection | 5,863 | 311,560 | ||||||
PDF Solutions * | 15,556 | 366,810 | ||||||
Perficient * | 18,058 | 1,209,344 | ||||||
Photronics * | 32,648 | 529,551 | ||||||
Plexus * | 14,218 | 1,399,051 | ||||||
Progress Software | 22,876 | 1,167,362 | ||||||
Rambus * | 56,608 | 1,707,297 | ||||||
Rogers * | 9,666 | 2,274,700 | ||||||
Sanmina * | 29,773 | 1,668,777 | ||||||
ScanSource * | 13,207 | 409,153 | ||||||
SMART Global Holdings * | 26,182 | 354,242 | ||||||
SPS Commerce * | 18,511 | 2,342,012 | ||||||
TTEC Holdings | 10,157 | 451,682 | ||||||
TTM Technologies * | 52,230 | 799,641 | ||||||
Ultra Clean Holdings * | 23,578 | 733,512 | ||||||
Unisys * | 36,627 | 311,329 | ||||||
Veeco Instruments * | 26,320 | 479,814 | ||||||
Viavi Solutions * | 116,415 | 1,757,867 | ||||||
| COMMON STOCK — continued | ||||||||
| Shares | Value | |||||||
INFORMATION TECHNOLOGY — continued |
| |||||||
Xperi * | 21,740 | $ | 303,708 | |||||
|
| |||||||
| 58,509,962 | ||||||||
|
| |||||||
MATERIALS — 5.7% |
| |||||||
AdvanSix | 14,628 | 532,167 | ||||||
American Vanguard | 15,297 | 355,961 | ||||||
Arconic * | 52,489 | 1,089,672 | ||||||
ATI * | 67,060 | 1,995,705 | ||||||
Balchem | 16,276 | 2,275,385 | ||||||
Carpenter Technology | 24,968 | 933,803 | ||||||
Century Aluminum * | 28,090 | 202,529 | ||||||
Clearwater Paper * | 8,520 | 378,970 | ||||||
Compass Minerals International | 17,373 | 686,928 | ||||||
FutureFuel | 12,884 | 88,126 | ||||||
Hawkins | 9,756 | 439,313 | ||||||
Haynes International | 6,458 | 315,861 | ||||||
HB Fuller | 26,938 | 1,877,848 | ||||||
Innospec | 12,615 | 1,261,374 | ||||||
Kaiser Aluminum | 8,154 | 658,762 | ||||||
Koppers Holdings | 10,552 | 263,378 | ||||||
Livent * | 91,860 | 2,900,020 | ||||||
Materion | 10,432 | 894,127 | ||||||
Mativ Holdings | 27,743 | 658,619 | ||||||
Mercer International | 21,742 | 291,778 | ||||||
Minerals Technologies | 16,518 | 908,655 | ||||||
Myers Industries | 19,191 | 389,385 | ||||||
O-I Glass, Cl I * | 79,691 | 1,299,760 | ||||||
Olympic Steel | 5,323 | 144,839 | ||||||
Quaker Chemical | 6,905 | 1,123,029 | ||||||
Rayonier Advanced Materials * | 34,435 | 156,679 | ||||||
Stepan | 10,737 | 1,121,372 | ||||||
SunCoke Energy | 43,365 | 314,830 | ||||||
Sylvamo | 17,602 | 847,888 | ||||||
TimkenSteel * | 22,241 | 387,883 | ||||||
Tredegar | 13,172 | 143,443 | ||||||
Trinseo | 17,812 | 335,222 | ||||||
Warrior Met Coal | 26,926 | 1,000,032 | ||||||
�� |
| |||||||
| 26,273,343 | ||||||||
|
| |||||||
REAL ESTATE — 7.6% |
| |||||||
Acadia Realty Trust ‡ | 49,604 | 692,968 | ||||||
Agree Realty ‡ | 40,739 | 2,798,769 | ||||||
Alexander & Baldwin ‡ | 37,733 | 735,039 | ||||||
American Assets Trust ‡ | 26,938 | 740,256 | ||||||
Anywhere Real Estate * | 58,126 | 431,876 | ||||||
Armada Hoffler Properties ‡ | 35,198 | 411,465 | ||||||
Brandywine Realty Trust ‡ | 87,079 | 571,238 | ||||||
CareTrust REIT ‡ | 51,216 | 956,715 | ||||||
The accompanying notes are an integral part of the financial statements.
87
CATHOLIC RESPONSIBLE INVESTMENTS SMALL-CAP FUND
OCTOBER 31, 2022
| COMMON STOCK — continued | ||||||||
| Shares | Value | |||||||
REAL ESTATE — continued |
| |||||||
Centerspace ‡ | 7,844 | $ | 543,589 | |||||
Chatham Lodging Trust *‡ | 26,452 | 343,082 | ||||||
DiamondRock Hospitality ‡ | 110,965 | 1,036,413 | ||||||
Douglas Elliman | 41,018 | 189,503 | ||||||
Easterly Government Properties, Cl A ‡ | 46,051 | 800,827 | ||||||
Elme Communities ‡ | 44,801 | 855,251 | ||||||
Essential Properties Realty Trust ‡ | 72,387 | 1,557,768 | ||||||
Four Corners Property Trust ‡ | 42,172 | 1,080,447 | ||||||
Franklin Street Properties ‡ (A) | 46,394 | 133,615 | ||||||
Getty Realty ‡ | 22,041 | 694,071 | ||||||
Global Net Lease ‡ | 52,647 | 644,926 | ||||||
Hersha Hospitality Trust, Cl A ‡ | 19,239 | 176,037 | ||||||
Hudson Pacific Properties ‡ | 65,376 | 721,751 | ||||||
Industrial Logistics Properties Trust ‡ | 33,437 | 156,485 | ||||||
Innovative Industrial Properties, Cl A ‡ | 14,440 | 1,560,964 | ||||||
iStar ‡ | 44,679 | 468,236 | ||||||
LTC Properties ‡ | 22,134 | 855,922 | ||||||
LXP Industrial Trust ‡ | 141,823 | 1,372,847 | ||||||
Marcus & Millichap | 13,742 | 506,255 | ||||||
NexPoint Residential Trust ‡ | 12,245 | 558,372 | ||||||
Office Properties Income Trust ‡ | 24,467 | 374,345 | ||||||
Orion Office REIT ‡ | 28,601 | 267,991 | ||||||
Outfront Media ‡ | 76,458 | 1,380,067 | ||||||
RE, Cl A | 9,478 | 184,442 | ||||||
Retail Opportunity Investments ‡ | 64,977 | 940,867 | ||||||
RPT Realty ‡ | 45,339 | 421,653 | ||||||
Safehold ‡ | 9,238 | 270,211 | ||||||
Saul Centers ‡ | 7,427 | 304,136 | ||||||
Service Properties Trust ‡ | 86,900 | 704,759 | ||||||
SITE Centers ‡ | 97,108 | 1,202,197 | ||||||
St. Joe | 18,592 | 660,574 | ||||||
Summit Hotel Properties ‡ | 57,779 | 499,211 | ||||||
Sunstone Hotel Investors ‡ | 110,307 | 1,229,923 | ||||||
Tanger Factory Outlet Centers ‡ | 55,846 | 1,005,786 | ||||||
Uniti Group ‡ | 123,552 | 958,763 | ||||||
Urban Edge Properties ‡ | 61,996 | 875,384 | ||||||
Urstadt Biddle Properties, Cl A ‡ | 16,405 | 307,430 | ||||||
Veris Residential *‡ | 40,474 | 640,703 | ||||||
Whitestone REIT, Cl B ‡ | 25,561 | 240,529 | ||||||
| COMMON STOCK — continued | ||||||||
| Shares | Value | |||||||
REAL ESTATE — continued |
| |||||||
Xenia Hotels & Resorts ‡ | 60,100 | $ | 1,026,508 | |||||
|
| |||||||
| 35,090,166 | ||||||||
|
| |||||||
UTILITIES — 2.2% |
| |||||||
American States Water | 18,813 | 1,701,824 | ||||||
Avista | 36,978 | 1,517,207 | ||||||
California Water Service Group | 27,678 | 1,717,697 | ||||||
Chesapeake Utilities | 9,067 | 1,127,754 | ||||||
Middlesex Water | 9,146 | 818,293 | ||||||
Northwest Natural Holding | 17,647 | 848,644 | ||||||
South Jersey Industries | 63,700 | 2,208,479 | ||||||
Unitil | 8,517 | 448,931 | ||||||
|
| |||||||
| 10,388,829 | ||||||||
|
| |||||||
Total Common Stock (Cost $412,775,603) | 454,410,709 | |||||||
|
| |||||||
| RIGHTS — 0.0% | ||||||||
| Number Of Rights | Value | |||||||
Progenics Pharmaceuticals * (B) (C) | 61,398 | $ | — | |||||
Toriba Therapeutics * (C) | 2,044 | — | ||||||
|
| |||||||
Total Rights | — | |||||||
|
| |||||||
| SHORT-TERM INVESTMENT — 0.7% | ||||||||
| Face Amount | Value | |||||||
State Street Institutional US Government Money Market Fund, Premier Class, 3.006% (D) | $ | 3,468,565 | $ | 3,468,565 | ||||
|
| |||||||
Total Short-Term Investments (Cost $3,468,565) | 3,468,565 | |||||||
|
| |||||||
Total Investments in Securities — 98.9% |
| |||||||
(Cost $416,244,291) | $ | 457,879,274 | ||||||
|
| |||||||
Percentages are based on Net Assets of $462,990,408.
The accompanying notes are an integral part of the financial statements.
88
CATHOLIC RESPONSIBLE INVESTMENTS SMALL-CAP FUND
OCTOBER 31, 2022
A list of the open futures contracts held by the Fund at October 31, 2022, is as follows:
| Type of Contract | Number of Contracts | Expiration Date | Notional Amount | Value | Unrealized Appreciation | |||||
| Long Contracts | ||||||||||
Russell 2000 Index E-MINI | 93 | Dec-2022 | $8,609,940 | $8,616,450 | $ 160,780 | |||||
|
|
|
| * | Non-income producing security. |
| ‡ | Real Estate Investment Trust. |
| (A) | This security or a partial position of this security is on loan at October 31, 2022. The total market value of securities on loan at October 31, 2022 was $3,380,973. |
| (B) | Level 3 security in accordance with fair value hierarchy. |
| (C) | Expiration date not available. |
| (D) | This security was purchased with cash collateral received from securities lending. The total was of such securities as of October 31, 2022, was $3,468,565. |
| Cl — Class |
The following is a list of the inputs used as of October 31, 2022, in valuing the Fund’s investments and other financial instruments carried at value:
| Investments in Securities | Level 1 | Level 2 | Level 3^ | Total | ||||||||||||
| Common Stock | $ | 454,410,709 | $ | — | $ | — | $ | 454,410,709 | ||||||||
Short-Term Investment | 3,468,565 | — | — | 3,468,565 | ||||||||||||
Rights | — | — | — | # | — | |||||||||||
|
|
|
|
|
|
|
| |||||||||
Total Investments in Securities | $ | 457,879,274 | $ | — | $ | — | $ | 457,879,274 | ||||||||
|
|
|
|
|
|
|
| |||||||||
| Other Financial Instruments | Level 1 | Level 2 | Level 3 | Total | ||||||||||||
Futures Contracts* | ||||||||||||||||
Unrealized Appreciation | $ | 160,780 | $ | — | $ | — | $ | 160,780 | ||||||||
|
|
|
|
|
|
|
| |||||||||
Total Other Financial Instruments | $ | 160,780 | $ | — | $ | — | $ | 160,780 | ||||||||
|
| |||||||||||||||
^ A reconciliation of Level 3 investments, including certain disclosures related to significant inputs used in valuing Level 3 investments is only presented when the Fund has over 1% of Level 3 investments at the end of the period in relation to net assets.
# Security or securities with a market value of $0.
Amounts designated as “–” are $0 or have been round to $0.
* Futures contracts are valued at the unrealized appreciation (depreciation) on the instrument.
Amounts designated as “–” are $0 or have been round to $0.
For more information on valuation inputs, see Note 2 — Significant Accounting Policies in the Notes to Financial Statements.
The accompanying notes are an integral part of the financial statements.
89
CATHOLIC RESPONSIBLE INVESTMENTS MULTI-STYLE US EQUITY FUND
OCTOBER 31, 2022
| SECTOR WEIGHTINGS † (unaudited) | ||||
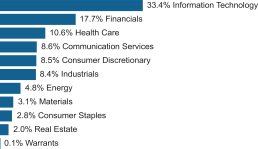
| † | Percentages are based on total investments. Total investments do not include derivatives such as options, futures contracts, forward contracts, and swap contracts, if applicable. |
| SCHEDULE OF INVESTMENTS | ||||||||
| COMMON STOCK — 96.5% | ||||||||
| Shares | Value | |||||||
COMMUNICATION SERVICES — 8.3% |
| |||||||
Alphabet, Cl A * | 16,500 | $ | 1,559,415 | |||||
Alphabet, Cl C * | 233,056 | 22,061,081 | ||||||
Charter Communications, Cl A * | 10,500 | 3,860,010 | ||||||
Comcast, Cl A | 160,000 | 5,078,400 | ||||||
DISH Network, Cl A * | 74,500 | 1,110,795 | ||||||
Electronic Arts | 10,545 | 1,328,248 | ||||||
Fox | 55,033 | 1,496,898 | ||||||
Fox | 63,000 | 1,818,810 | ||||||
Match Group * | 10,722 | 463,190 | ||||||
Meta Platforms, Cl A * | 19,700 | 1,835,252 | ||||||
News | 29,775 | 502,304 | ||||||
T-Mobile US * | 25,000 | 3,789,000 | ||||||
Walt Disney * | 56,994 | 6,072,141 | ||||||
ZoomInfo Technologies, Cl A * | 90,218 | 4,017,408 | ||||||
|
| |||||||
| 54,992,952 | ||||||||
|
| |||||||
CONSUMER DISCRETIONARY — 8.1% |
| |||||||
Airbnb, Cl A * | 35,396 | 3,784,186 | ||||||
Amazon.com * | 169,580 | 17,371,775 | ||||||
Booking Holdings * | 1,400 | 2,617,272 | ||||||
Etsy * | 21,455 | 2,014,839 | ||||||
Gap | 88,000 | 991,760 | ||||||
Hilton Worldwide Holdings | 33,889 | 4,583,826 | ||||||
Honda Motor ADR | 96,000 | 2,190,720 | ||||||
Lululemon Athletica * | 11,031 | 3,629,640 | ||||||
NIKE, Cl B | 73,408 | 6,803,454 | ||||||
Qurate Retail | 128,500 | 300,690 | ||||||
Starbucks | 29,648 | 2,567,220 | ||||||
Tesla * | 10,045 | 2,285,639 | ||||||
TJX | 51,429 | 3,708,031 | ||||||
Wingstop | 6,850 | 1,084,972 | ||||||
|
| |||||||
| 53,934,024 | ||||||||
|
| |||||||
| COMMON STOCK — continued | ||||||||
| Shares | Value | |||||||
CONSUMER STAPLES — 2.8% |
| |||||||
Anheuser-Busch InBev ADR | 49,000 | $ | 2,454,900 | |||||
Constellation Brands, Cl A | 23,865 | 5,896,564 | ||||||
Freshpet * | 16,099 | 949,036 | ||||||
Molson Coors Beverage, Cl B | 55,500 | 2,798,865 | ||||||
PepsiCo | 32,696 | 5,936,940 | ||||||
|
| |||||||
| 18,036,305 | ||||||||
|
| |||||||
ENERGY — 4.6% |
| |||||||
Cheniere Energy | 4,521 | 797,550 | ||||||
ConocoPhillips | 44,000 | 5,547,960 | ||||||
Occidental Petroleum | 142,000 | 10,309,200 | ||||||
Schlumberger | 171,375 | 8,916,641 | ||||||
Williams | 151,600 | 4,961,868 | ||||||
|
| |||||||
| 30,533,219 | ||||||||
|
| |||||||
FINANCIALS — 17.1% |
| |||||||
Aegon | 240,169 | 1,107,179 | ||||||
American Express | 44,204 | 6,562,084 | ||||||
Ares Management, Cl A | 17,380 | 1,317,925 | ||||||
Bank of America | 76,000 | 2,739,040 | ||||||
Bank of New York Mellon | 105,000 | 4,421,550 | ||||||
Berkshire Hathaway, Cl B * | 26,200 | 7,731,358 | ||||||
Brighthouse Financial * | 18,208 | 1,039,131 | ||||||
Capital One Financial | 65,000 | 6,891,300 | ||||||
Charles Schwab | 254,653 | 20,288,204 | ||||||
First Republic Bank | 56,134 | 6,741,693 | ||||||
Goldman Sachs Group | 14,000 | 4,823,140 | ||||||
Hamilton Lane, Cl A | 19,361 | 1,158,175 | ||||||
Lincoln National | 9,000 | 484,830 | ||||||
Markel * | 7,916 | 9,547,488 | ||||||
Marsh & McLennan | 4,346 | 701,836 | ||||||
MetLife | 102,500 | 7,504,025 | ||||||
Moody’s | 26,784 | 7,094,278 | ||||||
S&P Global | 9,331 | 2,997,707 | ||||||
State Street | 44,000 | 3,256,000 | ||||||
Truist Financial | 36,000 | 1,612,440 | ||||||
UBS Group | 87,500 | 1,387,750 | ||||||
US Bancorp | 81,980 | 3,480,051 | ||||||
Wells Fargo | 226,500 | 10,416,735 | ||||||
|
| |||||||
| 113,303,919 | ||||||||
|
| |||||||
HEALTH CARE — 10.2% |
| |||||||
Align Technology * | 2,481 | 482,059 | ||||||
Alnylam Pharmaceuticals * | 18,000 | 3,730,680 | ||||||
BioMarin Pharmaceutical * | 37,000 | 3,205,310 | ||||||
Boston Scientific * | 91,036 | 3,924,562 | ||||||
Cigna | 34,000 | 10,984,040 | ||||||
CVS Health | 45,000 | 4,261,500 | ||||||
The accompanying notes are an integral part of the financial statements.
90
CATHOLIC RESPONSIBLE INVESTMENTS MULTI-STYLE US EQUITY FUND
OCTOBER 31, 2022
| COMMON STOCK — continued | ||||||||
| Shares | Value | |||||||
HEALTH CARE — continued |
| |||||||
Elanco Animal Health * | 100,000 | $ | 1,319,000 | |||||
Elevance Health | 19,456 | 10,637,957 | ||||||
Gilead Sciences | 65,000 | 5,099,900 | ||||||
ICON * | 7,619 | 1,507,343 | ||||||
IDEXX Laboratories * | 2,576 | 926,536 | ||||||
Incyte * | 41,000 | 3,047,940 | ||||||
Medtronic | 94,539 | 8,257,036 | ||||||
Mettler-Toledo International * | 5,213 | 6,594,080 | ||||||
Omnicell * | 11,697 | 904,412 | ||||||
Seagen * | 7,901 | 1,004,691 | ||||||
Zimmer Biomet Holdings | 14,000 | 1,586,900 | ||||||
|
| |||||||
| 67,473,946 | ||||||||
|
| |||||||
INDUSTRIALS — 8.1% |
| |||||||
AMETEK | 43,154 | 5,595,348 | ||||||
Carrier Global | 70,500 | 2,803,080 | ||||||
Equifax | 16,018 | 2,715,692 | ||||||
FedEx | 34,000 | 5,449,520 | ||||||
Fortive | 82,473 | 5,270,025 | ||||||
GXO Logistics * | 128,480 | 4,694,659 | ||||||
Hexcel | 19,888 | 1,107,761 | ||||||
Johnson Controls International | 124,000 | 7,172,160 | ||||||
Mercury Systems * | 28,607 | 1,384,579 | ||||||
Otis Worldwide | 20,000 | 1,412,800 | ||||||
TransDigm Group | 16,275 | 9,370,494 | ||||||
TransUnion | 76,443 | 4,530,776 | ||||||
Uber Technologies * | 88,000 | 2,338,160 | ||||||
|
| |||||||
| 53,845,054 | ||||||||
|
| |||||||
INFORMATION TECHNOLOGY — 32.4% |
| |||||||
Adobe * | 23,989 | 7,640,497 | ||||||
Advanced Micro Devices * | 17,266 | 1,036,996 | ||||||
Amphenol, Cl A | 75,633 | 5,735,250 | ||||||
Apple | 186,005 | 28,522,007 | ||||||
ASML Holding, Cl G | 4,296 | 2,029,517 | ||||||
Autodesk * | 13,691 | 2,933,981 | ||||||
Block, Cl A * | 32,808 | 1,970,777 | ||||||
CDW | 9,133 | 1,578,274 | ||||||
Ceridian HCM Holding * | 66,054 | 4,372,114 | ||||||
Cisco Systems | 88,000 | 3,997,840 | ||||||
Cognizant Technology Solutions, Cl A | 47,000 | 2,925,750 | ||||||
Coherent * | 23,035 | 774,206 | ||||||
Dell Technologies, Cl C | 48,000 | 1,843,200 | ||||||
Fidelity National Information Services | 59,225 | 4,915,083 | ||||||
Fiserv * | 67,300 | 6,914,402 | ||||||
FleetCor Technologies * | 23,765 | 4,423,142 | ||||||
| COMMON STOCK — continued | ||||||||
| Shares | Value | |||||||
INFORMATION TECHNOLOGY — continued |
| |||||||
Gartner * | 7,286 | $ | 2,199,789 | |||||
Global Payments | 43,081 | 4,922,435 | ||||||
Hewlett Packard Enterprise | 155,000 | 2,211,850 | ||||||
HP | 115,000 | 3,176,300 | ||||||
Intuit | 10,432 | 4,459,680 | ||||||
Juniper Networks | 84,000 | 2,570,400 | ||||||
Mastercard, Cl A | 29,516 | 9,686,561 | ||||||
Micro Focus International ADR | 78,792 | 466,449 | ||||||
Microchip Technology | 243,699 | 15,045,976 | ||||||
Microsoft | 154,269 | 35,810,463 | ||||||
MongoDB, Cl A * | 3,070 | 561,902 | ||||||
NVIDIA | 22,111 | 2,984,322 | ||||||
Okta, Cl A * | 14,670 | 823,280 | ||||||
ON Semiconductor * | 9,498 | 583,462 | ||||||
Palo Alto Networks * | 3,165 | 543,082 | ||||||
PayPal Holdings * | 16,300 | 1,362,354 | ||||||
Roper Technologies | 11,518 | 4,774,672 | ||||||
Salesforce * | 58,584 | 9,525,172 | ||||||
SAP ADR | 61,772 | 5,933,818 | ||||||
ServiceNow * | 6,732 | 2,832,422 | ||||||
Shift4 Payments, Cl A * | 20,892 | 960,405 | ||||||
Synaptics * | 5,460 | 483,756 | ||||||
TE Connectivity | 25,000 | 3,055,750 | ||||||
Varonis Systems, Cl B * | 25,453 | 681,377 | ||||||
Visa, Cl A | 52,532 | 10,882,529 | ||||||
VMware, Cl A | 48,501 | 5,457,799 | ||||||
|
| |||||||
| 213,609,041 | ||||||||
|
| |||||||
MATERIALS — 2.9% |
| |||||||
Air Products and Chemicals | 43,166 | 10,808,766 | ||||||
Celanese, Cl A | 16,500 | 1,585,980 | ||||||
Linde | 18,376 | 5,464,103 | ||||||
LyondellBasell Industries, Cl A | 24,000 | 1,834,800 | ||||||
|
| |||||||
| 19,693,649 | ||||||||
|
| |||||||
REAL ESTATE — 2.0% |
| |||||||
American Tower ‡ | 52,084 | 10,791,284 | ||||||
Equinix ‡ | 3,804 | 2,154,738 | ||||||
|
| |||||||
| 12,946,022 | ||||||||
|
| |||||||
Total Common Stock | 638,368,131 | |||||||
|
| |||||||
The accompanying notes are an integral part of the financial statements.
91
CATHOLIC RESPONSIBLE INVESTMENTS MULTI-STYLE US EQUITY FUND
OCTOBER 31, 2022
| WARRANTS — 0.0% | ||||||||
| Number Of Warrants | Value | |||||||
Occidental Petroleum, | 7,000 | $ | 354,200 | |||||
|
| |||||||
Total Warrants | 354,200 | |||||||
|
| |||||||
Total Investments in Securities— 96.5% |
| |||||||
(Cost $686,635,647) | $ | 638,722,331 | ||||||
|
| |||||||
Percentages based on Net Assets of $661,583,684.
| * | Non-income producing security. |
| ‡ | Real Estate Investment Trust. |
| ADR — American Depositary Receipt |
| Cl — Class |
As of October 31, 2022, all of the Fund’s investments in securities were considered Level 1, in accordance with the authoritative guidance of fair value measurement and disclosure under U.S. generally accepted accounting principles.
For more information on valuation inputs, see Note 2 — Significant Accounting Policies in the Notes to Financial Statements.
The accompanying notes are an integral part of the financial statements.
92
CATHOLIC RESPONSIBLE INVESTMENTS INTERNATIONAL EQUITY FUND
OCTOBER 31, 2022
| SECTOR WEIGHTINGS † (unaudited) | ||||
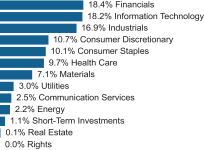
| † | Percentages are based on total investments. Total investments do not include derivatives such as options, futures contracts, forward contracts, and swap contracts, if applicable. |
| SCHEDULE OF INVESTMENTS | ||||||||
| COMMON STOCK — 97.0% | ||||||||
| Shares | Value | |||||||
AUSTRALIA — 1.9% |
| |||||||
CSL | 88,772 | $ | 15,921,559 | |||||
Rio Tinto | 74,269 | 3,879,551 | ||||||
|
| |||||||
| 19,801,110 | ||||||||
|
| |||||||
BELGIUM — 0.4% |
| |||||||
Anheuser-Busch InBev | 86,025 | 4,302,143 | ||||||
|
| |||||||
BRAZIL — 1.4% |
| |||||||
Arezzo Industria e Comercio | 45,800 | 910,283 | ||||||
Banco BTG Pactual | 280,700 | 1,548,671 | ||||||
Banco do Brasil | 291,400 | 2,058,640 | ||||||
Localiza Rent a Car | 175,500 | 2,355,943 | ||||||
Marfrig Global Foods | 254,200 | 517,386 | ||||||
MercadoLibre * | 847 | 763,672 | ||||||
Minerva | 209,000 | 547,270 | ||||||
Petro Rio * | 90,700 | 612,762 | ||||||
Petroleo Brasileiro ADR | 108,404 | 1,389,739 | ||||||
Petroleo Brasileiro ADR, Cl A | 137,614 | 1,583,937 | ||||||
Sao Martinho | 81,300 | 418,024 | ||||||
SLC Agricola | 43,960 | 385,375 | ||||||
Suzano | 61,700 | 626,142 | ||||||
Vale ADR, Cl B | 19,105 | 247,219 | ||||||
Vamos Locacao de Caminhoes Maquinas e Equipamentos | 307,500 | 942,908 | ||||||
|
| |||||||
| 14,907,971 | ||||||||
|
| |||||||
| COMMON STOCK — continued | ||||||||
| Shares | Value | |||||||
CANADA — 5.6% |
| |||||||
Alimentation Couche-Tard | 195,070 | $ | 8,723,485 | |||||
Canadian National Railway | 112,159 | 13,271,114 | ||||||
Canadian Pacific Railway | 215,728 | 16,069,579 | ||||||
Canadian Pacific Railway | 73,500 | 5,472,424 | ||||||
Dollarama | 32,700 | 1,940,592 | ||||||
Franco-Nevada | 26,300 | 3,245,540 | ||||||
Gildan Activewear | 99,900 | 3,148,492 | ||||||
Northland Power | 66,200 | 1,923,806 | ||||||
Nutrien | 44,000 | 3,713,090 | ||||||
TFI International | 15,800 | 1,436,427 | ||||||
|
| |||||||
| 58,944,549 | ||||||||
|
| |||||||
CHINA — 4.8% |
| |||||||
360 DigiTech ADR | 76,989 | 782,208 | ||||||
Alibaba Group Holding ADR * | 33,788 | 2,148,241 | ||||||
Anhui Conch Cement, Cl H | 328,641 | 845,691 | ||||||
Baidu ADR * | 3,123 | 239,128 | ||||||
Bank of China, Cl H | 2,706,000 | 872,141 | ||||||
Beijing New Building Materials, Cl A | 174,400 | 473,838 | ||||||
Bosideng International Holdings | 2,436,000 | 1,052,000 | ||||||
BYD, Cl H | 54,500 | 1,219,851 | ||||||
Chengxin Lithium Group, Cl A | 53,500 | 316,810 | ||||||
China Construction Bank, Cl H | 5,856,921 | 3,111,316 | ||||||
China Everbright Environment Group | 983,000 | 326,838 | ||||||
China Galaxy Securities, Cl H | 806,500 | 302,058 | ||||||
China Petroleum & Chemical, Cl H | 3,014,000 | 1,190,265 | ||||||
China Railway Group, Cl H | 1,943,000 | 844,045 | ||||||
China State Construction Engineering, Cl A | 1,075,086 | 699,676 | ||||||
CITIC | 868,000 | 777,345 | ||||||
COSCO SHIPPING Holdings, Cl H | 1,257,200 | 1,356,521 | ||||||
Daqo New Energy ADR * | 21,269 | 935,623 | ||||||
Dongfeng Motor Group, Cl H | 786,000 | 355,459 | ||||||
FinVolution Group ADR | 91,776 | 398,308 | ||||||
Ganfeng Lithium Group, Cl H (A) | 41,440 | 280,319 | ||||||
Guangzhou Automobile Group, Cl H | 456,000 | 277,672 | ||||||
Guangzhou Tinci Materials Technology, Cl A | 28,800 | 167,703 | ||||||
The accompanying notes are an integral part of the financial statements.
93
CATHOLIC RESPONSIBLE INVESTMENTS INTERNATIONAL EQUITY FUND
OCTOBER 31, 2022
| COMMON STOCK — continued | ||||||||
| Shares | Value | |||||||
CHINA — continued |
| |||||||
Haier Smart Home, Cl H | 650,400 | $ | 1,627,274 | |||||
Industrial & Commercial Bank of China, Cl H | 2,734,000 | 1,187,658 | ||||||
Intco Medical Technology, Cl A | 209,393 | 611,660 | ||||||
JD.com ADR | 26,540 | 989,677 | ||||||
Jiangxi Copper, Cl H | 475,000 | 519,182 | ||||||
Kweichow Moutai, Cl A | 5,300 | 980,325 | ||||||
Lenovo Group | 934,000 | 747,214 | ||||||
Li Ning | 1,242,372 | 6,425,639 | ||||||
Meituan, Cl B * | 65,700 | 1,044,524 | ||||||
NARI Technology, Cl A | 257,659 | 861,382 | ||||||
PetroChina, Cl H | 4,060,000 | 1,551,622 | ||||||
PICC Property & Casualty, Cl H | 1,616,000 | 1,490,454 | ||||||
Pinduoduo ADR * | 16,560 | 907,985 | ||||||
Pop Mart International Group (A) | 148,600 | 192,332 | ||||||
Shenzhou International Group Holdings | 477,900 | 3,311,880 | ||||||
Sinopharm Group, Cl H | 532,400 | 1,014,631 | ||||||
Tencent Holdings | 214,794 | 5,625,795 | ||||||
Tongwei, Cl A | 183,400 | 1,093,073 | ||||||
Want Want China Holdings | 1,029,000 | 676,400 | ||||||
Zhejiang Expressway, Cl H | 634,000 | 393,330 | ||||||
|
| |||||||
| 50,225,093 | ||||||||
|
| |||||||
COLOMBIA — 0.0% |
| |||||||
Bancolombia ADR | 5,059 | 128,347 | ||||||
|
| |||||||
DENMARK — 1.0% |
| |||||||
Coloplast, Cl B | 14,168 | 1,579,959 | ||||||
DSV | 36,719 | 4,972,205 | ||||||
GN Store Nord | 24,425 | 519,463 | ||||||
Pandora | 15,848 | 835,473 | ||||||
Tryg | 66,062 | 1,429,982 | ||||||
Vestas Wind Systems | 62,843 | 1,238,080 | ||||||
|
| |||||||
| 10,575,162 | ||||||||
|
| |||||||
FINLAND — 0.1% |
| |||||||
Nordea Bank Abp | 165,072 | 1,576,261 | ||||||
|
| |||||||
FRANCE — 11.3% |
| |||||||
Air Liquide | 90,554 | 11,840,627 | ||||||
Alstom (A) | 479,631 | 9,888,517 | ||||||
Amundi | 1,925 | 90,905 | ||||||
AXA | 328,034 | 8,105,289 | ||||||
BNP Paribas | 69,364 | 3,256,054 | ||||||
Capgemini | 21,554 | 3,541,597 | ||||||
Carrefour | 260,854 | 4,198,507 | ||||||
| COMMON STOCK — continued | ||||||||
| Shares | Value | |||||||
FRANCE — continued |
| |||||||
Danone | 221,270 | $ | 11,008,937 | |||||
Dassault Systemes | 55,627 | 1,866,530 | ||||||
Hermes International | 3,047 | 3,946,564 | ||||||
Ipsen | 11,460 | 1,177,952 | ||||||
Kering | 30 | 13,749 | ||||||
L’Oreal | 16,549 | 5,202,895 | ||||||
LVMH Moet Hennessy Louis Vuitton | 33,934 | 21,431,153 | ||||||
Pernod Ricard | 72,171 | 12,675,344 | ||||||
Publicis Groupe | 22,321 | 1,251,735 | ||||||
Remy Cointreau | 7,976 | 1,222,662 | ||||||
Teleperformance | 10,915 | 2,926,733 | ||||||
TotalEnergies | 85,137 | 4,636,386 | ||||||
Valeo | 111,042 | 1,831,695 | ||||||
Vinci | 105,044 | 9,673,944 | ||||||
|
| |||||||
| 119,787,775 | ||||||||
|
| |||||||
GERMANY — 4.4% |
| |||||||
Bayerische Motoren Werke | 24,794 | 1,948,644 | ||||||
Carl Zeiss Meditec | 18,408 | 2,229,613 | ||||||
CompuGroup Medical & KgaA | 19,138 | 605,280 | ||||||
Covestro | 19,914 | 677,846 | ||||||
Deutsche Boerse | 15,975 | 2,599,634 | ||||||
Deutsche Telekom | 489,364 | 9,268,892 | ||||||
Muenchener Rueckversicherungs-Gesellschaft in Muenchen | 8,238 | 2,177,172 | ||||||
Nemetschek | 18,299 | 874,628 | ||||||
RWE | 194,862 | 7,509,137 | ||||||
SAP | 132,242 | 12,765,570 | ||||||
Siemens | 29,786 | 3,257,121 | ||||||
Siemens Healthineers | 56,705 | 2,610,541 | ||||||
|
| |||||||
| 46,524,078 | ||||||||
|
| |||||||
GREECE — 0.0% |
| |||||||
FF Group * | 8,921 | 4,232 | ||||||
|
| |||||||
HONG KONG — 2.3% |
| |||||||
AIA Group | 1,416,535 | 10,727,977 | ||||||
China Lumena New Materials *(B) | 15,350 | — | ||||||
Prudential | 1,398,644 | 13,056,480 | ||||||
Skyworth Group | 460,000 | 168,767 | ||||||
WH Group | 998,034 | 504,748 | ||||||
|
| |||||||
| 24,457,972 | ||||||||
|
| |||||||
INDIA — 2.8% |
| |||||||
APL Apollo Tubes | 102,688 | 1,338,470 | ||||||
HDFC Bank ADR | 63,979 | 3,986,532 | ||||||
The accompanying notes are an integral part of the financial statements.
94
CATHOLIC RESPONSIBLE INVESTMENTS INTERNATIONAL EQUITY FUND
OCTOBER 31, 2022
| COMMON STOCK — continued | ||||||||
| Shares | Value | |||||||
INDIA — continued |
| |||||||
ICICI Bank ADR | 456,929 | $ | 10,070,715 | |||||
Infosys ADR | 369,336 | 6,917,663 | ||||||
Kotak Mahindra Bank | 71,634 | 1,645,910 | ||||||
MakeMyTrip * | 41,591 | 1,157,478 | ||||||
Tata Motors ADR * (A) | 106,812 | 2,671,368 | ||||||
Wipro ADR | 218,173 | 1,025,413 | ||||||
WNS Holdings ADR * | 15,405 | 1,326,062 | ||||||
|
| |||||||
| 30,139,611 | ||||||||
|
| |||||||
INDONESIA — 1.0% |
| |||||||
Astra International | 2,995,300 | 1,277,047 | ||||||
Bank Central Asia | 3,382,900 | 1,908,608 | ||||||
Bank Mandiri Persero | 2,400,300 | 1,623,540 | ||||||
Bank Negara Indonesia Persero | 3,152,600 | 1,899,948 | ||||||
Bank Rakyat Indonesia Persero | 12,320,800 | 3,673,135 | ||||||
Indofood Sukses Makmur | 1,056,300 | 436,810 | ||||||
Perusahaan Gas Negara | 1,759,000 | 222,730 | ||||||
|
| |||||||
| 11,041,818 | ||||||||
|
| |||||||
IRELAND — 1.1% |
| |||||||
Bank of Ireland Group | 261,094 | 1,882,744 | ||||||
CRH | 35,990 | 1,297,616 | ||||||
Ryanair Holdings ADR * | 117,264 | 8,078,317 | ||||||
|
| |||||||
| 11,258,677 | ||||||||
|
| |||||||
ISRAEL — 0.2% |
| |||||||
Nice ADR * | 12,385 | 2,351,788 | ||||||
|
| |||||||
ITALY — 4.2% |
| |||||||
Amplifon | 47,150 | 1,171,539 | ||||||
Enel | 2,778,838 | 12,411,240 | ||||||
Ferrari | 76,287 | 15,041,912 | ||||||
UniCredit | 1,249,645 | 15,497,826 | ||||||
|
| |||||||
| 44,122,517 | ||||||||
|
| |||||||
JAPAN — 7.4% |
| |||||||
Daifuku | 22,500 | 1,032,395 | ||||||
Ebara | 48,600 | 1,584,196 | ||||||
FANUC | 85,200 | 11,252,235 | ||||||
GMO Payment Gateway | 10,800 | 779,655 | ||||||
Harmonic Drive Systems | 22,900 | 765,721 | ||||||
Hoya | 42,100 | 3,930,013 | ||||||
Keyence | 33,210 | 12,583,760 | ||||||
Lasertec | 57,500 | 8,236,115 | ||||||
M3 | 39,500 | 1,181,532 | ||||||
Murata Manufacturing | 122,000 | 5,991,859 | ||||||
Nexon | 65,800 | 1,105,410 | ||||||
Nintendo | 102,000 | 4,165,506 | ||||||
| COMMON STOCK — continued | ||||||||
| Shares | Value | |||||||
JAPAN — continued |
| |||||||
Nippon Telegraph & Telephone | 96,300 | $ | 2,652,486 | |||||
Nomura Research Institute | 61,800 | 1,374,165 | ||||||
Obic | 9,600 | 1,444,828 | ||||||
Renesas Electronics * | 186,500 | 1,564,048 | ||||||
Seven & i Holdings | 78,000 | 2,914,603 | ||||||
Shimadzu | 47,900 | 1,264,894 | ||||||
Shimano | 12,300 | 1,909,527 | ||||||
Shin-Etsu Chemical | 22,600 | 2,362,862 | ||||||
Sumitomo Mitsui Financial Group | 179,300 | 5,033,935 | ||||||
Sundrug | 36,000 | 838,026 | ||||||
Tokyo Electron | 11,300 | 3,002,234 | ||||||
TOPPAN INC | 52,900 | 789,754 | ||||||
|
| |||||||
| 77,759,759 | ||||||||
|
| |||||||
LUXEMBOURG — 0.2% |
| |||||||
ArcelorMittal | 84,485 | 1,891,704 | ||||||
|
| |||||||
MEXICO — 0.8% |
| |||||||
Alfa, Cl A | 460,300 | 305,182 | ||||||
Arca Continental | 64,900 | 529,231 | ||||||
Grupo Bimbo, Ser A | 98,800 | 382,328 | ||||||
Grupo Financiero Banorte, Cl O | 313,900 | 2,550,704 | ||||||
Wal-Mart de Mexico | 1,143,066 | 4,407,793 | ||||||
|
| |||||||
| 8,175,238 | ||||||||
|
| |||||||
NETHERLANDS — 6.0% |
| |||||||
Adyen * | 7,572 | 10,870,919 | ||||||
Akzo Nobel | 156,023 | 9,628,555 | ||||||
ASM International | 33,849 | 7,520,587 | ||||||
ASML Holding | 18,699 | 8,833,970 | ||||||
ASML Holding, Cl G | 22,732 | 10,739,051 | ||||||
BE Semiconductor Industries | 18,372 | 939,128 | ||||||
ING Groep | 896,630 | 8,821,055 | ||||||
Koninklijke Philips | 378,322 | 4,792,824 | ||||||
Shell | 38,648 | 1,069,712 | ||||||
|
| |||||||
| 63,215,801 | ||||||||
|
| |||||||
NEW ZEALAND — 0.1% |
| |||||||
Fisher & Paykel Healthcare | 78,823 | 896,611 | ||||||
|
| |||||||
NORWAY — 0.3% |
| |||||||
Equinor | 68,443 | 2,503,864 | ||||||
Nordic Semiconductor * | 50,551 | 714,249 | ||||||
|
| |||||||
| 3,218,113 | ||||||||
|
| |||||||
POLAND — 0.1% |
| |||||||
Dino Polska * | 18,997 | 1,243,016 | ||||||
|
| |||||||
The accompanying notes are an integral part of the financial statements.
95
CATHOLIC RESPONSIBLE INVESTMENTS INTERNATIONAL EQUITY FUND
OCTOBER 31, 2022
| COMMON STOCK — continued | ||||||||
| Shares | Value | |||||||
QATAR — 0.1% |
| |||||||
Industries Qatar QSC | 173,584 | $ | 751,677 | |||||
Ooredoo QPSC | 184,749 | 495,640 | ||||||
|
| |||||||
| 1,247,317 | ||||||||
|
| |||||||
RUSSIA — 0.0% |
| |||||||
Gazprom PJSC (B) | 597,226 | — | ||||||
LUKOIL PJSC ADR (B) | 4,815 | — | ||||||
LUKOIL PJSC ADR (B) | 15,962 | — | ||||||
Sberbank of Russia PJSC ADR * (B) | 55,964 | — | ||||||
|
| |||||||
| — | ||||||||
|
| |||||||
SAUDI ARABIA — 0.6% |
| |||||||
Abdullah Al Othaim Markets | 6,765 | 204,523 | ||||||
Arab National Bank | 39,572 | 339,635 | ||||||
Bawan | 45,292 | 453,215 | ||||||
Etihad Etisalat | 44,132 | 429,863 | ||||||
Riyad Bank | 62,898 | 601,771 | ||||||
SABIC Agri-Nutrients | 22,404 | 948,021 | ||||||
Sahara International Petrochemical | 59,659 | 643,816 | ||||||
Saudi Arabian Oil | 60,417 | 561,147 | ||||||
Saudi Electricity | 84,711 | 608,694 | ||||||
Saudi National Bank | 66,454 | 1,050,516 | ||||||
Saudi Telecom | 72,296 | 777,304 | ||||||
|
| |||||||
| 6,618,505 | ||||||||
|
| |||||||
SINGAPORE — 0.4% |
| |||||||
DBS Group Holdings | 173,500 | 4,193,131 | ||||||
|
| |||||||
SOUTH AFRICA — 0.4% |
| |||||||
Anglo American | 37,407 | 1,123,438 | ||||||
Sasol | 45,367 | 762,901 | ||||||
Sibanye Stillwater | 549,315 | 1,289,183 | ||||||
Truworths International | 299,938 | 852,932 | ||||||
|
| |||||||
| 4,028,454 | ||||||||
|
| |||||||
SOUTH KOREA — 2.1% |
| |||||||
DB Insurance | 5,217 | 206,197 | ||||||
DL E&C | 8,174 | 197,686 | ||||||
GS Holdings | 11,607 | 374,827 | ||||||
Hana Financial Group | 44,977 | 1,302,468 | ||||||
Hyosung TNC | 1,666 | 305,844 | ||||||
Hyundai Marine & Fire Insurance | 12,717 | 297,291 | ||||||
KB Financial Group ADR | 41,725 | 1,399,456 | ||||||
Kia | 64,098 | 2,983,395 | ||||||
LG Innotek | 3,234 | 673,159 | ||||||
LX INTERNATIONAL CORP | 22,342 | 637,581 | ||||||
| COMMON STOCK — continued | ||||||||
| Shares | Value | |||||||
SOUTH KOREA — continued |
| |||||||
LX Semicon | 5,733 | $ | 333,649 | |||||
Mirae Asset Securities | 34,670 | 154,554 | ||||||
Neowiz * | 8,764 | 222,107 | ||||||
POSCO Holdings ADR | 24,482 | 1,062,029 | ||||||
Samsung Electronics | 122,077 | 5,090,648 | ||||||
Samsung Electronics GDR | 4,065 | 4,201,178 | ||||||
Samsung Securities | 7,461 | 166,300 | ||||||
SIMMTECH | 17,171 | 426,126 | ||||||
SK Hynix | 18,741 | 1,088,056 | ||||||
Woori Financial Group | 48,797 | 402,517 | ||||||
Youngone | 10,571 | 351,018 | ||||||
|
| |||||||
| 21,876,086 | ||||||||
|
| |||||||
SPAIN — 3.9% |
| |||||||
Aena SME * | 52,505 | 6,183,072 | ||||||
Amadeus IT Group * | 356,810 | 18,598,879 | ||||||
Bankinter | 190,717 | 1,152,833 | ||||||
CaixaBank | 243,015 | 805,334 | ||||||
Iberdrola (A) | 711,904 | 7,229,577 | ||||||
Industria de Diseno Textil (A) | 320,753 | 7,272,333 | ||||||
|
| |||||||
| 41,242,028 | ||||||||
|
| |||||||
SWEDEN — 1.8% |
| |||||||
AAK | 63,539 | 925,734 | ||||||
Atlas Copco, Cl A | 796,839 | 8,511,769 | ||||||
Boliden | 32,250 | 938,568 | ||||||
Electrolux, Cl B | 128,943 | 1,589,960 | ||||||
Nibe Industrier, Cl B | 229,839 | 1,832,398 | ||||||
Swedbank | 371,725 | 5,538,645 | ||||||
|
| |||||||
| 19,337,074 | ||||||||
|
| |||||||
SWITZERLAND — 3.1% |
| |||||||
Alcon | 240,404 | 14,639,240 | ||||||
Logitech International | 21,648 | 1,078,344 | ||||||
Sika | 48,910 | 11,035,601 | ||||||
Straumann Holding | 12,550 | 1,196,122 | ||||||
Zurich Insurance Group | 10,309 | 4,401,735 | ||||||
|
| |||||||
| 32,351,042 | ||||||||
|
| |||||||
TAIWAN — 2.5% |
| |||||||
Asia Vital Components | 133,000 | 421,010 | ||||||
Evergreen Marine Taiwan | 66,400 | 283,342 | ||||||
Fulgent Sun International Holding | 120,000 | 508,341 | ||||||
Hon Hai Precision Industry | 726,000 | 2,309,411 | ||||||
Lite-On Technology | 315,000 | 625,650 | ||||||
Makalot Industrial | 64,000 | 397,238 | ||||||
MediaTek | 69,000 | 1,263,403 | ||||||
Novatek Microelectronics | 69,000 | 516,068 | ||||||
The accompanying notes are an integral part of the financial statements.
96
CATHOLIC RESPONSIBLE INVESTMENTS INTERNATIONAL EQUITY FUND
OCTOBER 31, 2022
| COMMON STOCK — continued | ||||||||
| Shares | Value | |||||||
TAIWAN — continued |
| |||||||
Primax Electronics | 104,000 | $ | 174,611 | |||||
Sino-American Silicon Products | 69,000 | 265,529 | ||||||
Sitronix Technology | 68,000 | 349,259 | ||||||
Taiwan Semiconductor Manufacturing | 48,000 | 580,961 | ||||||
Taiwan Semiconductor Manufacturing ADR | 252,646 | 15,550,361 | ||||||
Unimicron Technology | 157,000 | 606,610 | ||||||
United Microelectronics ADR (A) | 172,099 | 1,020,547 | ||||||
Yang Ming Marine Transport | 404,000 | 754,777 | ||||||
Zhen Ding Technology Holding | 125,000 | 411,203 | ||||||
|
| |||||||
| 26,038,321 | ||||||||
|
| |||||||
THAILAND — 0.5% |
| |||||||
AP Thailand | 1,583,600 | 407,758 | ||||||
Kasikornbank | 388,200 | 1,489,154 | ||||||
Kiatnakin Phatra Bank | 319,100 | 612,042 | ||||||
Krung Thai Bank | 1,654,200 | 760,602 | ||||||
PTT Exploration & Production | 291,300 | 1,389,147 | ||||||
Thai Union Group, Cl F | 408,800 | 193,337 | ||||||
|
| |||||||
| 4,852,040 | ||||||||
|
| |||||||
TURKEY — 0.1% |
| |||||||
KOC Holding | 117,676 | 351,708 | ||||||
Turk Hava Yollari AO * | 127,615 | 694,913 | ||||||
|
| |||||||
| 1,046,621 | ||||||||
|
| |||||||
UNITED ARAB EMIRATES — 0.3% |
| |||||||
Abu Dhabi Commercial Bank PJSC | 218,172 | 561,312 | ||||||
Abu Dhabi Ports PJSC * | 384,299 | 594,279 | ||||||
Aldar Properties PJSC | 427,571 | 502,881 | ||||||
Dubai Islamic Bank PJSC | 564,086 | 893,802 | ||||||
Emaar Properties PJSC | 130,951 | 216,050 | ||||||
Fertiglobe | 468,746 | 649,574 | ||||||
|
| |||||||
| 3,417,898 | ||||||||
|
| |||||||
UNITED KINGDOM — 9.4% |
| |||||||
3i Group | 250,380 | 3,345,415 | ||||||
Ashtead Group | 33,077 | 1,732,777 | ||||||
Barclays | 5,078,931 | 8,640,411 | ||||||
Berkeley Group Holdings | 48,278 | 1,929,341 | ||||||
BP | 939,804 | 5,191,618 | ||||||
CNH Industrial | 97,071 | 1,257,292 | ||||||
Compass Group | 410,637 | 8,682,688 | ||||||
| COMMON STOCK — continued | ||||||||
| Shares | Value | |||||||
UNITED KINGDOM — continued |
| |||||||
Dechra Pharmaceuticals | 35,893 | $ | 1,082,720 | |||||
Diageo | 98,100 | 4,063,828 | ||||||
Experian | 398,219 | 12,718,433 | ||||||
Halma | 47,506 | 1,156,815 | ||||||
Howden Joinery Group | 125,092 | 740,283 | ||||||
JD Sports Fashion | 1,562,940 | 1,753,415 | ||||||
Lloyds Banking Group | 2,840,118 | 1,374,034 | ||||||
London Stock Exchange Group | 22,714 | 1,978,633 | ||||||
RELX | 175,963 | 4,742,725 | ||||||
RELX | 183,015 | 4,925,428 | ||||||
SSE | 71,399 | 1,279,107 | ||||||
SSP Group * | 3,513,670 | 8,183,932 | ||||||
Tate & Lyle | 695,018 | 5,609,437 | ||||||
Taylor Wimpey | 1,184,954 | 1,279,431 | ||||||
Unilever | 282,768 | 12,939,513 | ||||||
WH Smith * | 327,352 | 4,436,052 | ||||||
|
| |||||||
| 99,043,328 | ||||||||
|
| |||||||
UNITED STATES — 14.4% |
| |||||||
Accenture, Cl A | 40,841 | 11,594,760 | ||||||
Aon, Cl A | 51,375 | 14,461,549 | ||||||
Atlassian, Cl A * | 40,000 | 8,109,200 | ||||||
EPAM Systems * | 28,635 | 10,022,250 | ||||||
Ferguson | 63,215 | 6,921,589 | ||||||
Globant * | 4,648 | 876,984 | ||||||
ICON * | 74,127 | 14,665,286 | ||||||
JBS | 294,200 | 1,400,005 | ||||||
Lululemon Athletica * | 39,280 | 12,924,691 | ||||||
Mettler-Toledo International * | 6,542 | 8,275,172 | ||||||
Nestle | 193,811 | 21,117,313 | ||||||
ResMed | 56,481 | 12,634,235 | ||||||
Schneider Electric | 87,543 | 11,097,427 | ||||||
STERIS | 55,069 | 9,503,808 | ||||||
Tenaris | 80,692 | 1,252,501 | ||||||
Waste Connections | 56,915 | 7,507,658 | ||||||
|
| |||||||
| 152,364,428 | ||||||||
|
| |||||||
Total Common Stock | 1,024,205,619 | |||||||
|
| |||||||
| RIGHTS — 0.0% | ||||||||
| Number Of Rights | ||||||||
Localiza Rent a Car, | 538 | $ | 2,070 | |||||
Thai Union Group (C) | 11,592 | — | ||||||
|
| |||||||
Total Rights | 2,070 | |||||||
|
| |||||||
The accompanying notes are an integral part of the financial statements.
97
CATHOLIC RESPONSIBLE INVESTMENTS INTERNATIONAL EQUITY FUND
OCTOBER 31, 2022
| SHORT-TERM INVESTMENT — 1.1% | ||||||||
| Face Amount | Value | |||||||
State Street Institutional US Government Money Market Fund, Premier Class, 3.006%, (D) | $ | 11,832,868 | $ | 11,832,868 | ||||
|
| |||||||
Total Short-Term Investments | 11,832,868 | |||||||
|
| |||||||
Total Investments in Securities — 98.1% |
| |||||||
(Cost $1,091,747,503) | $ | 1,036,040,557 | ||||||
|
| |||||||
Percentages based on Net Assets of $1,056,173,573.
| * | Non-income producing security. |
| (A) | This security or a partial position of this security is on loan at October 31, 2022. The total market value of securities on loan at October 31, 2022 was $11,224,539 |
| (B) | Level 3 security in accordance with fair value hierarchy. |
| (C) | Expiration date not available. |
| (D) | This security was purchased with cash collateral received from securities lending. The total was of such securities as of October 31, 2022, was $11,832,868 |
| ADR — American Depositary Receipt |
| Cl — Class |
| GDR — Global Depositary Receipt |
| PJSC — Public Joint-Stock Company |
| QPSC — Qatari Joint-Stock Company |
The following is a list of the inputs used as of October 31, 2022, in valuing the Fund’s investments and other financial instruments carried at value:
| Investments in Securities | Level 1 | Level 2 | Level 3^ | Total | ||||||||||||
Common Stock |
| |||||||||||||||
Australia | $ | 19,801,110 | $ | – | $ | – | $ | 19,801,110 | ||||||||
Belgium | 4,302,143 | – | – | 4,302,143 | ||||||||||||
Brazil | 14,907,971 | – | – | 14,907,971 | ||||||||||||
Canada | 58,944,549 | – | – | 58,944,549 | ||||||||||||
China | 50,225,093 | – | – | 50,225,093 | ||||||||||||
Colombia | 128,347 | – | – | 128,347 | ||||||||||||
Denmark | 10,575,162 | – | – | 10,575,162 | ||||||||||||
Finland | 1,576,261 | – | – | 1,576,261 | ||||||||||||
France | 119,787,775 | – | – | 119,787,775 | ||||||||||||
Germany | 46,524,078 | – | – | 46,524,078 | ||||||||||||
Greece | 4,232 | – | – | 4,232 | ||||||||||||
Hong Kong | 24,457,972 | – | –# | 24,457,972 | ||||||||||||
India | 30,139,611 | – | – | 30,139,611 | ||||||||||||
Indonesia | 11,041,818 | – | – | 11,041,818 | ||||||||||||
Ireland | 11,258,677 | – | – | 11,258,677 | ||||||||||||
Israel | 2,351,788 | – | – | 2,351,788 | ||||||||||||
Italy | 44,122,517 | – | – | 44,122,517 | ||||||||||||
Japan | 77,759,759 | – | – | 77,759,759 | ||||||||||||
Luxembourg | 1,891,704 | – | – | 1,891,704 | ||||||||||||
Mexico | 8,175,238 | – | – | 8,175,238 | ||||||||||||
Netherlands | 63,215,801 | – | – | 63,215,801 | ||||||||||||
New Zealand | 896,611 | – | – | 896,611 | ||||||||||||
Norway | 3,218,113 | – | – | 3,218,113 | ||||||||||||
Poland | 1,243,016 | – | – | 1,243,016 | ||||||||||||
Qatar | 1,247,317 | – | – | 1,247,317 | ||||||||||||
Russia | – | – | –# | – | ||||||||||||
Saudi Arabia | 6,618,505 | – | – | 6,618,505 | ||||||||||||
Singapore | 4,193,131 | – | – | 4,193,131 | ||||||||||||
South Africa | 4,028,454 | – | – | 4,028,454 | ||||||||||||
South Korea | 21,653,979 | 222,107 | – | 21,876,086 | ||||||||||||
Spain | 41,242,028 | – | – | 41,242,028 | ||||||||||||
Sweden | 19,337,074 | – | – | 19,337,074 | ||||||||||||
Switzerland | 32,351,042 | – | – | 32,351,042 | ||||||||||||
Taiwan | 26,038,321 | – | – | 26,038,321 | ||||||||||||
Thailand | 4,852,040 | – | – | 4,852,040 | ||||||||||||
Turkey | 1,046,621 | – | – | 1,046,621 | ||||||||||||
United Arab Emirates | 3,417,898 | – | – | 3,417,898 | ||||||||||||
United Kingdom | 99,043,328 | – | – | 99,043,328 | ||||||||||||
United States | 152,364,428 | – | – | 152,364,428 | ||||||||||||
Total Common Stock | 1,023,983,512 | 222,107 | – | 1,024,205,619 | ||||||||||||
Short-Term Investment | 11,832,868 | – | – | 11,832,868 | ||||||||||||
Rights | 2,070 | – | – | 2,070 | ||||||||||||
Total Investments in Securities | $ | 1,035,818,450 | $ | 222,107 | $ | – | $ | 1,036,040,557 | ||||||||
The accompanying notes are an integral part of the financial statements.
98
CATHOLIC RESPONSIBLE INVESTMENTS INTERNATIONAL EQUITY FUND
OCTOBER 31, 2022
^ A reconciliation of Level 3 investments, including certain disclosures related to significant inputs used in valuing Level 3 investments is only presented when the Fund has over 1% of Level 3 investments at the end of the period in relation to net assets.
# Security or securities with a market value of $0.
Amounts designated as “–” are $0 or have been round to $0.
For more information on valuation inputs, see Note 2 — Significant Accounting Policies in the Notes to Financial Statements.
The accompanying notes are an integral part of the financial statements.
99
CATHOLIC RESPONSIBLE INVESTMENTS INTERNATIONAL SMALL-CAP FUND
OCTOBER 31, 2022
| SECTOR WEIGHTINGS † (unaudited) | ||||
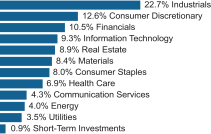
| † | Percentages are based on total investments. Total investments do not include derivatives such as options, futures contracts, forward contracts, and swap contracts, if applicable. |
| SCHEDULE OF INVESTMENTS | ||||||||
| COMMON STOCK — 95.9% | ||||||||
| Shares | Value | |||||||
AUSTRALIA — 6.7% |
| |||||||
29Metals | 37,817 | $ | 44,737 | |||||
Allkem * | 4,042 | 37,322 | ||||||
ALS | 117,534 | 859,800 | ||||||
Alumina | 451,807 | 390,027 | ||||||
Bravura Solutions | 301,616 | 235,300 | ||||||
Charter Hall Group ‡ | 20,409 | 168,874 | ||||||
Cromwell Property Group ‡ | 263,606 | 117,994 | ||||||
Eclipx Group * | 47,099 | 56,621 | ||||||
Elders | 16,993 | 141,261 | ||||||
Emeco Holdings | 78,426 | 39,367 | ||||||
Grange Resources | 339,742 | 134,694 | ||||||
Ingenia Communities Group ‡ | 34,643 | 86,838 | ||||||
JB Hi-Fi | 9,435 | 258,886 | ||||||
Lovisa Holdings | 7,962 | 124,228 | ||||||
Myer Holdings | 163,001 | 66,187 | ||||||
Orora | 260,353 | 504,444 | ||||||
Perenti | 188,753 | 115,870 | ||||||
Pilbara Minerals * | 74,509 | 242,512 | ||||||
Ridley | 160,752 | 214,838 | ||||||
Technology One | 6,418 | 49,453 | ||||||
Vicinity ‡ | 55,695 | 69,270 | ||||||
West African Resources * | 273,822 | 182,100 | ||||||
Westgold Resources * | 346,849 | 161,909 | ||||||
Yancoal Australia | 12,047 | 39,750 | ||||||
|
| |||||||
| 4,342,282 | ||||||||
|
| |||||||
AUSTRIA — 1.7% |
| |||||||
ANDRITZ | 1,047 | 48,698 | ||||||
AT&S Austria Technologie & Systemtechnik | 3,593 | 110,973 | ||||||
Palfinger | 18,840 | 435,719 | ||||||
Schoeller-Bleckmann Oilfield Equipment | 8,860 | 487,751 | ||||||
|
| |||||||
| 1,083,141 | ||||||||
|
| |||||||
| COMMON STOCK — continued | ||||||||
| Shares | Value | |||||||
BELGIUM — 0.3% |
| |||||||
Bekaert | 5,235 | $ | 145,907 | |||||
Telenet Group Holding | 3,780 | 57,646 | ||||||
|
| |||||||
| 203,553 | ||||||||
|
| |||||||
BRAZIL — 1.2% |
| |||||||
Cia de Saneamento do Parana | 50,200 | 182,919 | ||||||
Cury Construtora e Incorporadora | 47,900 | 113,012 | ||||||
Jalles Machado | 51,300 | 67,752 | ||||||
Mills Estruturas e Servicos de Engenharia | 96,300 | 244,638 | ||||||
Petroreconcavo | 12,600 | 75,111 | ||||||
Portobello | 58,500 | 130,663 | ||||||
|
| |||||||
| 814,095 | ||||||||
|
| |||||||
CANADA — 3.1% |
| |||||||
Absolute Software | 3,722 | 44,640 | ||||||
Aritzia * | 2,908 | 112,649 | ||||||
Artis Real Estate Investment Trust ‡ | 20,277 | 141,964 | ||||||
Birchcliff Energy | 5,239 | 40,674 | ||||||
Boardwalk Real Estate Investment Trust ‡ | 2,163 | 76,876 | ||||||
Calibre Mining * | 54,630 | 27,634 | ||||||
Canfor * | 13,203 | 198,135 | ||||||
Cogeco Communications | 395 | 20,120 | ||||||
Crescent Point Energy | 22,183 | 173,197 | ||||||
Element Fleet Management | 13,501 | 179,644 | ||||||
Enerplus | 5,088 | 88,104 | ||||||
H&R Real Estate Investment Trust ‡ | 9,690 | 79,634 | ||||||
iA Financial | 2,320 | 128,956 | ||||||
Interfor * | 1,507 | 26,736 | ||||||
MTY Food Group | 922 | 37,325 | ||||||
Parex Resources | 20,703 | 315,390 | ||||||
Pet Valu Holdings | 2,427 | 65,281 | ||||||
Stelco Holdings | 2,740 | 68,919 | ||||||
Tricon Residential | 16,720 | 140,717 | ||||||
Vermilion Energy | 1,556 | 36,263 | ||||||
Yangarra Resources * | 10,379 | 22,675 | ||||||
|
| |||||||
| 2,025,533 | ||||||||
|
| |||||||
CHINA — 2.1% |
| |||||||
Bairong, Cl B * | 91,000 | 92,625 | ||||||
Beijing Enterprises Holdings | 84,000 | 213,161 | ||||||
China BlueChemical | 228,000 | 43,568 | ||||||
China Modern Dairy Holdings | 1,087,000 | 110,779 | ||||||
China Taiping Insurance Holdings | 44,000 | 30,492 | ||||||
The accompanying notes are an integral part of the financial statements.
100
CATHOLIC RESPONSIBLE INVESTMENTS INTERNATIONAL SMALL-CAP FUND
OCTOBER 31, 2022
| COMMON STOCK — continued | ||||||||
| Shares | Value | |||||||
CHINA — continued |
| |||||||
China World Trade Center, Cl A | 77,100 | $ | 143,560 | |||||
China Yongda Automobiles Services Holdings | 33,500 | 15,022 | ||||||
G-bits Network Technology Xiamen, Cl A | 400 | 13,956 | ||||||
Gemdale Properties & Investment | 938,000 | 51,382 | ||||||
Greattown Holdings, Cl A | 500 | 215 | ||||||
Greattown Holdings, Cl A | 60,600 | 26,071 | ||||||
Jiangsu Bioperfectus Technologies, Cl A | 1,248 | 17,580 | ||||||
Jiutian Chemical Group | 2,233,700 | 123,121 | ||||||
Kerry Logistics Network | 196,023 | 311,146 | ||||||
NetDragon Websoft Holdings | 32,000 | 53,728 | ||||||
Newborn Town * | 160,000 | 24,255 | ||||||
Theme International Holdings * | 450,000 | 42,994 | ||||||
West China Cement | 258,000 | 23,336 | ||||||
|
| |||||||
| 1,336,991 | ||||||||
|
| |||||||
DENMARK — 1.6% |
| |||||||
Bavarian Nordic * | 1,076 | 34,283 | ||||||
D | 6,510 | 337,749 | ||||||
Dfds | 16,600 | 504,222 | ||||||
Per Aarsleff Holding | 1,457 | 40,716 | ||||||
Ringkjoebing Landbobank | 388 | 42,238 | ||||||
Solar A/S, Cl B, Cl B | 1,262 | 95,163 | ||||||
|
| |||||||
| 1,054,371 | ||||||||
|
| |||||||
EGYPT — 0.1% |
| |||||||
Centamin | 62,762 | 64,110 | ||||||
|
| |||||||
FINLAND — 0.1% |
| |||||||
Uponor | 3,742 | 49,707 | ||||||
Valmet | 1,346 | 30,637 | ||||||
|
| |||||||
| 80,344 | ||||||||
|
| |||||||
FRANCE — 5.7% |
| |||||||
Biosynex | 7,736 | 87,086 | ||||||
Coface | 6,660 | 74,183 | ||||||
Elis | 1,859 | 21,332 | ||||||
Genfit * | 10,124 | 40,324 | ||||||
IPSOS | 13,311 | 644,639 | ||||||
LISI | 21,233 | 419,292 | ||||||
Rothschild | 25,714 | 912,376 | ||||||
SCOR | 8,434 | 126,911 | ||||||
Societe BIC | 3,748 | 215,221 | ||||||
Sopra Steria Group | 6,910 | 915,150 | ||||||
Technip Energies | 1,528 | 19,731 | ||||||
| COMMON STOCK — continued | ||||||||
| Shares | Value | |||||||
FRANCE — continued |
| |||||||
Television Francaise 1 | 5,492 | $ | 34,848 | |||||
Verallia | 2,781 | 78,830 | ||||||
Virbac | 418 | 102,456 | ||||||
|
| |||||||
| 3,692,379 | ||||||||
|
| |||||||
GERMANY — 1.8% |
| |||||||
Atoss Software | 363 | 44,272 | ||||||
Aurubis | 5,980 | 377,788 | ||||||
flatexDEGIRO * | 20,620 | 180,524 | ||||||
HUGO BOSS | 802 | 36,969 | ||||||
Immatics * | 6,109 | 69,032 | ||||||
Krones | 1,402 | 129,906 | ||||||
METRO | 9,098 | 69,508 | ||||||
Nemetschek | 1,035 | 49,469 | ||||||
PATRIZIA | 8,272 | 60,745 | ||||||
ProSiebenSat.1 Media | 2,380 | 16,183 | ||||||
Sirius Real Estate | 50,678 | 41,135 | ||||||
Synlab | 5,894 | 75,904 | ||||||
|
| |||||||
| 1,151,435 | ||||||||
|
| |||||||
HONG KONG — 1.3% |
| |||||||
Fufeng Group | 442,000 | 229,169 | ||||||
Morimatsu International Holdings * | 22,000 | 19,142 | ||||||
Tam Jai International | 298,000 | 58,462 | ||||||
United Laboratories International Holdings | 152,000 | 63,706 | ||||||
Vitasoy International Holdings | 272,000 | 464,314 | ||||||
|
| |||||||
| 834,793 | ||||||||
|
| |||||||
INDIA — 1.2% |
| |||||||
Azure Power Global * (A) | 19,649 | 113,768 | ||||||
MakeMyTrip * | 15,490 | 431,086 | ||||||
WNS Holdings ADR * | 2,536 | 218,299 | ||||||
|
| |||||||
| 763,153 | ||||||||
|
| |||||||
INDONESIA — 0.4% |
| |||||||
Ciputra Development | 328,200 | 19,779 | ||||||
Delta Dunia Makmur * | 1,633,300 | 41,049 | ||||||
First Pacific | 322,000 | 85,321 | ||||||
Industri Jamu Dan Farmasi Sido Muncul | 1,345,300 | 63,826 | ||||||
Link Net | 257,800 | 43,304 | ||||||
|
| |||||||
| 253,279 | ||||||||
|
| |||||||
IRELAND — 0.4% |
| |||||||
AIB Group | 32,907 | 95,294 | ||||||
Glenveagh Properties * | 164,175 | 160,639 | ||||||
|
| |||||||
| 255,933 | ||||||||
|
| |||||||
The accompanying notes are an integral part of the financial statements.
101
CATHOLIC RESPONSIBLE INVESTMENTS INTERNATIONAL SMALL-CAP FUND
OCTOBER 31, 2022
| COMMON STOCK — continued | ||||||||
| Shares | Value | |||||||
ISRAEL — 1.7% |
| |||||||
Africa Israel Residences | 3,736 | $ | 150,735 | |||||
AudioCodes | 13,610 | 278,735 | ||||||
Aura Investments | 106,365 | 188,885 | ||||||
Bezeq The Israeli Telecommunication | 67,297 | 119,661 | ||||||
Palram Industries 1990 | 2,913 | 28,811 | ||||||
Plus500 | 15,376 | 319,541 | ||||||
|
| |||||||
| 1,086,368 | ||||||||
|
| |||||||
ITALY — 2.9% |
| |||||||
Autogrill * | 37,813 | 236,567 | ||||||
Banco BPM | 64,878 | 196,277 | ||||||
BPER Banca | 47,605 | 88,102 | ||||||
Buzzi Unicem | 5,204 | 86,383 | ||||||
Carel Industries | 1,110 | 24,190 | ||||||
De’ Longhi | 26,406 | 455,937 | ||||||
doValue | 59,696 | 343,972 | ||||||
El.En. | 16,071 | 196,641 | ||||||
Orsero | 4,277 | 61,294 | ||||||
Stevanato Group | 9,532 | 160,519 | ||||||
Zignago Vetro | 1,971 | 24,818 | ||||||
|
| |||||||
| 1,874,700 | ||||||||
|
| |||||||
JAPAN — 25.3% |
| |||||||
77 Bank | 3,900 | 47,256 | ||||||
Advance Residence Investment ‡ | 218 | 507,471 | ||||||
Aichi Financial Group | 10,323 | 131,959 | ||||||
Ain Holdings | 12,100 | 508,797 | ||||||
Aisan Industry | 4,800 | 22,767 | ||||||
ARCLANDS CORP | 11,000 | 109,160 | ||||||
Ariake Japan | 13,100 | 453,897 | ||||||
Asics | 55,400 | 851,304 | ||||||
ASKA Pharmaceutical Holdings | 2,800 | 22,078 | ||||||
Bell System24 Holdings | 4,800 | 44,662 | ||||||
Charm Care | 40,100 | 283,278 | ||||||
CMIC Holdings | 2,000 | 22,619 | ||||||
Cosmo Energy Holdings | 4,500 | 115,804 | ||||||
Daiken | 2,600 | 34,845 | ||||||
Daiseki | 8,520 | 263,680 | ||||||
Daishinku | 10,400 | 65,002 | ||||||
DMG Mori | 60,700 | 704,461 | ||||||
Electric Power Development | 2,300 | 32,001 | ||||||
Exedy | 13,600 | 159,483 | ||||||
FIDEA Holdings | 2,800 | 24,377 | ||||||
Fuji Seal International | 39,700 | 465,551 | ||||||
Goldcrest | 9,100 | 107,142 | ||||||
Greens | 3,300 | 20,226 | ||||||
H.U. Group Holdings | 10,600 | 197,544 | ||||||
| COMMON STOCK — continued | ||||||||
| Shares | Value | |||||||
JAPAN — continued |
| |||||||
Hito Communications Holdings | 2,300 | $ | 25,795 | |||||
Hokkaido Electric Power | 38,800 | 118,252 | ||||||
Honeys Holdings | 6,400 | 51,972 | ||||||
Horiba | 15,000 | 617,620 | ||||||
Hulic Reit ‡ | 33 | 38,654 | ||||||
IDOM | 4,000 | 20,049 | ||||||
Internet Initiative Japan | 54,000 | 849,410 | ||||||
Inui Global Logistics (A) | 20,700 | 264,887 | ||||||
ISB | 4,700 | 41,392 | ||||||
Ishihara Sangyo Kaisha | 19,200 | 132,534 | ||||||
Itfor | 7,000 | 36,075 | ||||||
Itoham Yonekyu Holdings | 25,000 | 111,851 | ||||||
Iwatani | 14,700 | 541,972 | ||||||
J Trust | 21,200 | 93,281 | ||||||
Jaccs | 2,100 | 51,004 | ||||||
JINUSHI | 5,300 | 73,099 | ||||||
J-Lease | 3,400 | 59,680 | ||||||
JSB | 2,000 | 51,872 | ||||||
JSP | 1,700 | 16,618 | ||||||
Juroku Financial Group | 3,100 | 52,120 | ||||||
JVCKenwood | 116,800 | 169,737 | ||||||
Kawasaki Kisen Kaisha (A) | 5,100 | 77,580 | ||||||
Kobe Steel | 21,200 | 87,005 | ||||||
Komeri | 4,500 | 78,565 | ||||||
Komori | 22,800 | 124,251 | ||||||
Konoike Transport | 2,700 | 28,429 | ||||||
Kosaido Holdings | 4,600 | 47,072 | ||||||
KPP Group Holdings | 15,600 | 85,224 | ||||||
Kurita Water Industries | 7,700 | 282,854 | ||||||
KYB | 1,700 | 37,229 | ||||||
Lawson | 3,200 | 102,264 | ||||||
Leopalace21 * | 22,600 | 43,030 | ||||||
Lintec | 22,800 | 342,380 | ||||||
Look Holdings | 3,000 | 41,377 | ||||||
M&A Capital Partners * | 8,710 | 222,680 | ||||||
Mabuchi Motor | 22,600 | 614,283 | ||||||
Macnica Holdings | 5,100 | 102,182 | ||||||
Maruzen Showa Unyu | 1,600 | 32,724 | ||||||
Menicon | 21,600 | 370,136 | ||||||
Mirai ‡ | 501 | 161,455 | ||||||
Mitsubishi Motors | 6,900 | 23,211 | ||||||
Mitsui-Soko Holdings | 6,200 | 129,310 | ||||||
Mizuho Medy | 2,900 | 61,069 | ||||||
MTG | 6,400 | 48,527 | ||||||
Nachi-Fujikoshi | 2,400 | 62,973 | ||||||
Nihon Chouzai | 2,200 | 19,567 | ||||||
Nihon Dempa Kogyo | 2,000 | 22,000 | ||||||
Nihon Kohden | 2,200 | 49,363 | ||||||
Nippon Sheet Glass | 83,400 | 311,414 | ||||||
Nippon Shokubai | 2,000 | 71,854 | ||||||
The accompanying notes are an integral part of the financial statements.
102
CATHOLIC RESPONSIBLE INVESTMENTS INTERNATIONAL SMALL-CAP FUND
OCTOBER 31, 2022
| COMMON STOCK — continued | ||||||||
| Shares | Value | |||||||
JAPAN — continued |
| |||||||
Nippon Suisan Kaisha | 19,600 | $ | 69,889 | |||||
Nippon Thompson | 29,500 | 105,389 | ||||||
Nishi-Nippon Financial Holdings | 15,000 | 76,496 | ||||||
Nisshinbo Holdings | 45,600 | 316,609 | ||||||
Oita Bank | 1,700 | 20,645 | ||||||
Okamoto Machine Tool Works | 2,000 | 63,713 | ||||||
Pacific Metals | 1,800 | 22,343 | ||||||
Pressance | 4,800 | 49,345 | ||||||
Qol Holdings | 11,100 | 91,632 | ||||||
Remixpoint * | 11,500 | 37,680 | ||||||
Riken | 1,000 | 15,245 | ||||||
Riken Vitamin | 1,900 | 24,096 | ||||||
Rock Field (A) | 4,000 | 38,860 | ||||||
Sakai Chemical Industry | 4,500 | 59,491 | ||||||
Sakata Seed | 13,100 | 431,863 | ||||||
Sanei Architecture Planning | 3,900 | 40,696 | ||||||
SCREEN Holdings | 600 | 33,061 | ||||||
Seikagaku | 12,400 | 75,667 | ||||||
Seiren | 31,600 | 495,999 | ||||||
Seven Bank | 376,000 | 677,956 | ||||||
Shidax | 17,300 | 66,111 | ||||||
Shikoku Bank | 4,600 | 26,863 | ||||||
SK-Electronics | 5,100 | 43,096 | ||||||
SKY Perfect JSAT Holdings | 42,500 | 148,972 | ||||||
Sparx Group | 1,680 | 16,977 | ||||||
Star Asia Investment ‡ | 62 | 23,651 | ||||||
Starts | 1,100 | 19,464 | ||||||
Stella Chemifa | 2,700 | 48,483 | ||||||
Sun Frontier Fudousan | 11,300 | 87,353 | ||||||
Takaoka Toko | 4,000 | 49,437 | ||||||
Takara Leben Real Estate Investment ‡ | 219 | 149,404 | ||||||
Take And Give Needs | 2,200 | 23,253 | ||||||
THK | 14,700 | 256,942 | ||||||
Tomen Devices | 1,400 | 49,073 | ||||||
Toyo Seikan Group Holdings | 10,100 | 115,586 | ||||||
Toyo Tire | 4,400 | 51,598 | ||||||
Transcosmos | 1,700 | 39,173 | ||||||
Unitika * | 12,300 | 22,674 | ||||||
Wealth Management | 3,500 | 29,953 | ||||||
Xebio Holdings | 17,800 | 120,834 | ||||||
Yamaichi Electronics | 1,500 | 21,566 | ||||||
Yamazaki Baking | 5,000 | 50,964 | ||||||
|
| |||||||
| 16,501,348 | ||||||||
|
| |||||||
LUXEMBOURG — 1.3% |
| |||||||
L’Occitane International | 349,000 | 858,067 | ||||||
|
| |||||||
| COMMON STOCK — continued | ||||||||
| Shares | Value | |||||||
MALAYSIA — 0.2% |
| |||||||
Bumi Armada * | 1,155,700 | $ | 95,330 | |||||
Heineken Malaysia | 11,000 | 53,744 | ||||||
|
| |||||||
| 149,074 | ||||||||
|
| |||||||
MAURITIUS — 0.1% |
| |||||||
Capital | 74,154 | 70,009 | ||||||
|
| |||||||
MEXICO — 0.6% |
| |||||||
Alfa, Cl A | 262,800 | 174,238 | ||||||
Bolsa Mexicana de Valores | 38,500 | 69,672 | ||||||
FIBRA Macquarie Mexico ‡ | 61,400 | 81,324 | ||||||
Nemak * | 189,800 | 51,254 | ||||||
|
| |||||||
| 376,488 | ||||||||
|
| |||||||
NETHERLANDS — 0.7% |
| |||||||
ASR Nederland | 4,064 | 179,102 | ||||||
Eurocommercial Properties ‡ | 4,462 | 98,175 | ||||||
Heijmans | 1,731 | 17,553 | ||||||
Ordina | 26,600 | 102,268 | ||||||
Van Lanschot Kempen | 4,065 | 87,785 | ||||||
|
| |||||||
| 484,883 | ||||||||
|
| |||||||
NEW ZEALAND — 0.2% |
| |||||||
Air New Zealand * | 297,485 | 134,803 | ||||||
|
| |||||||
NIGERIA — 0.2% |
| |||||||
Airtel Africa | 85,110 | 110,828 | ||||||
|
| |||||||
NORWAY — 1.8% |
| |||||||
2020 Bulkers | 2,477 | 18,654 | ||||||
Belships | 57,686 | 80,674 | ||||||
DNO | 22,777 | 29,707 | ||||||
Hexagon Composites * | 99,700 | 229,188 | ||||||
Norway Royal Salmon * | 40,733 | 517,152 | ||||||
PhotoCure * | 19,900 | 176,283 | ||||||
Rana Gruber, Cl A | 17,311 | 67,600 | ||||||
Stolt-Nielsen | 3,442 | 82,600 | ||||||
|
| |||||||
| 1,201,858 | ||||||||
|
| |||||||
PHILIPPINES — 0.3% |
| |||||||
DMCI Holdings | 1,021,800 | 168,437 | ||||||
|
| |||||||
SINGAPORE — 0.5% |
| |||||||
CapitaLand Ascott Trust ‡ | 139,200 | 93,941 | ||||||
Golden Energy & Resources * | 54,200 | 33,322 | ||||||
Hour Glass | 23,800 | 32,796 | ||||||
Samudera Shipping Line | 156,300 | 95,541 | ||||||
Sasseur Real Estate Investment Trust ‡ | 136,000 | 68,235 | ||||||
|
| |||||||
| 323,835 | ||||||||
|
| |||||||
The accompanying notes are an integral part of the financial statements.
103
CATHOLIC RESPONSIBLE INVESTMENTS INTERNATIONAL SMALL-CAP FUND
OCTOBER 31, 2022
| COMMON STOCK — continued | ||||||||
| Shares | Value | |||||||
SOUTH AFRICA — 0.4% |
| |||||||
Astral Foods | 5,350 | $ | 51,254 | |||||
Fortress REIT, Cl B ‡ | 242,715 | 55,866 | ||||||
Investec | 13,818 | 67,934 | ||||||
Resilient REIT ‡ | 7,302 | 20,348 | ||||||
Royal Bafokeng Platinum | 9,385 | 75,412 | ||||||
|
| |||||||
| 270,814 | ||||||||
|
| |||||||
SOUTH KOREA — 1.9% |
| |||||||
ABLBio * | 3,521 | 49,560 | ||||||
AfreecaTV | 852 | 47,611 | ||||||
Daewon Pharmaceutical | 3,100 | 36,670 | ||||||
Daewoo Engineering & Construction * | 9,870 | 29,136 | ||||||
DB HiTek | 3,713 | 115,343 | ||||||
DB Insurance | 2,428 | 95,964 | ||||||
Global Standard Technology | 1,336 | 18,571 | ||||||
Hanwha General Insurance | 37,962 | 98,073 | ||||||
Humasis | 2,572 | 37,828 | ||||||
Hwa Shin | 4,258 | 26,664 | ||||||
JB Financial Group | 18,382 | 92,655 | ||||||
JVM | 11,763 | 144,101 | ||||||
LabGenomics | 6,215 | 31,458 | ||||||
LF | 6,095 | 63,541 | ||||||
Lutronic | 3,294 | 41,971 | ||||||
MegaStudyEdu | 1,666 | 100,349 | ||||||
Samchully | 965 | 189,010 | ||||||
SD Biosensor | 1,807 | 37,486 | ||||||
|
| |||||||
| 1,255,991 | ||||||||
|
| |||||||
SPAIN — 2.2% |
| |||||||
Banco de Sabadell | 78,154 | 61,455 | ||||||
Energia Innovacion y Desarrollo Fotovoltaico SA | 1,904 | 141,512 | ||||||
Fluidra | 18,334 | 248,793 | ||||||
Gestamp Automocion | 18,048 | 63,431 | ||||||
Laboratorios Farmaceuticos Rovi | 4,967 | 225,918 | ||||||
Melia Hotels International | 144,477 | 671,129 | ||||||
Viscofan | 391 | 23,283 | ||||||
|
| |||||||
| 1,435,521 | ||||||||
|
| |||||||
SWEDEN — 4.6% |
| |||||||
BioGaia, Cl B | 51,503 | 407,813 | ||||||
Dometic Group | 43,250 | 247,591 | ||||||
Hemnet Group | 11,227 | 139,392 | ||||||
HMS Networks | 1,361 | 35,003 | ||||||
Intrum | 4,813 | 60,585 | ||||||
Inwido | 2,774 | 24,902 | ||||||
Lindab International | 1,121 | 11,920 | ||||||
Loomis, Cl B | 39,444 | 1,101,532 | ||||||
| COMMON STOCK — continued | ||||||||
| Shares | Value | |||||||
SWEDEN — continued |
| |||||||
New Wave Group, Cl B | 6,137 | $ | 85,248 | |||||
Samhallsbyggnadsbolaget i Norden (A) | 32,827 | 45,094 | ||||||
Securitas, Cl B | 3,611 | 29,521 | ||||||
SkiStar | 5,944 | 56,856 | ||||||
SSAB, Cl B | 41,718 | 193,820 | ||||||
Trelleborg, Cl B | 19,552 | 430,480 | ||||||
Truecaller, Cl B * | 29,774 | 108,933 | ||||||
|
| |||||||
| 2,978,690 | ||||||||
|
| |||||||
SWITZERLAND — 2.9% |
| |||||||
Bucher Industries | 1,157 | 390,079 | ||||||
Burkhalter Holding | 815 | 63,522 | ||||||
Comet Holding | 749 | 119,601 | ||||||
Galenica | 723 | 51,945 | ||||||
Implenia | 1,498 | 56,283 | ||||||
IWG * | 280,738 | 426,658 | ||||||
Landis+Gyr Group | 8,666 | 499,654 | ||||||
Leonteq | 1,025 | 41,379 | ||||||
Schweiter Technologies | 298 | 199,808 | ||||||
Zehnder Group | 1,153 | 62,215 | ||||||
|
| |||||||
| 1,911,144 | ||||||||
|
| |||||||
TAIWAN — 3.2% |
| |||||||
Advanced International Multitech | 39,000 | 112,440 | ||||||
Anpec Electronics | 13,000 | 42,563 | ||||||
Asia Vital Components | 68,000 | 215,253 | ||||||
ASPEED Technology | 1,000 | 52,137 | ||||||
Compeq Manufacturing | 51,000 | 69,166 | ||||||
Continental Holdings | 285,000 | 246,769 | ||||||
Depo Auto Parts Industries | 94,000 | 193,995 | ||||||
Faraday Technology | 10,000 | 44,069 | ||||||
Farglory Land Development | 28,000 | 46,229 | ||||||
Fusheng Precision * | 7,000 | 39,429 | ||||||
Global Unichip | 13,000 | 196,679 | ||||||
Grape King Bio | 6,000 | 22,624 | ||||||
Kindom Development | 74,000 | 55,346 | ||||||
Kinik | 28,000 | 88,634 | ||||||
Lotes | 3,000 | 72,248 | ||||||
Macronix International | 45,000 | 41,617 | ||||||
Scientech | 31,000 | 60,225 | ||||||
Sitronix Technology | 36,000 | 184,902 | ||||||
Standard Chemical & Pharmaceutical | 68,000 | 94,121 | ||||||
TaiDoc Technology | 14,000 | 73,861 | ||||||
Via Technologies | 56,000 | 111,400 | ||||||
WinWay Technology | 5,000 | 47,715 | ||||||
|
| |||||||
| 2,111,422 | ||||||||
|
| |||||||
The accompanying notes are an integral part of the financial statements.
104
CATHOLIC RESPONSIBLE INVESTMENTS INTERNATIONAL SMALL-CAP FUND
OCTOBER 31, 2022
| COMMON STOCK — continued | ||||||||
| Shares | Value | |||||||
THAILAND — 0.8% |
| |||||||
AP Thailand NVDR | 883,700 | $ | 227,542 | |||||
Forth | 122,600 | 170,725 | ||||||
Ichitan Group | 496,700 | 138,335 | ||||||
|
| |||||||
| 536,602 | ||||||||
|
| |||||||
TURKEY — 1.1% |
| |||||||
Akbank | 86,698 | 68,136 | ||||||
Aksa Enerji Uretim, Cl B | 48,278 | 107,441 | ||||||
Haci Omer Sabanci Holding | 181,098 | 326,510 | ||||||
Migros Ticaret * | 14,784 | 96,161 | ||||||
Sinpas Gayrimenkul Yatirim Ortakligi *‡ | 179,253 | 52,129 | ||||||
Sok Marketler Ticaret | 74,404 | 94,550 | ||||||
|
| |||||||
| 744,927 | ||||||||
|
| |||||||
UNITED KINGDOM — 12.4% |
| |||||||
4imprint Group | 1,089 | 43,507 | ||||||
ABRDN PROPERTY INCOME TRUST ‡ | 45,237 | 28,854 | ||||||
Assura ‡ | 77,641 | 50,015 | ||||||
Biffa | 299,221 | 1,417,299 | ||||||
Big Yellow Group ‡ | 8,268 | 107,188 | ||||||
Bytes Technology Group * | 30,235 | 125,041 | ||||||
CentralNic Group * | 30,671 | 46,083 | ||||||
Centrica | 99,136 | 87,454 | ||||||
Coats Group | 686,867 | 478,446 | ||||||
Craneware | 15,600 | 332,278 | ||||||
CVS Group | 37,295 | 811,984 | ||||||
Darktrace * | 6,944 | 28,582 | ||||||
Drax Group | 14,495 | 86,948 | ||||||
EnQuest * | 270,050 | 83,949 | ||||||
Frasers Group * | 7,707 | 57,455 | ||||||
Future | 5,921 | 83,032 | ||||||
Global Ship Lease, Cl A | 2,843 | 48,615 | ||||||
Greggs | 4,415 | 102,579 | ||||||
Harbour Energy | 12,765 | 55,540 | ||||||
Howden Joinery Group | 15,706 | 92,947 | ||||||
IMI | 12,482 | 176,477 | ||||||
Investec | 44,164 | 222,969 | ||||||
Man Group | 86,572 | 215,994 | ||||||
Mitie Group | 52,342 | 43,028 | ||||||
Morgan Advanced Materials | 28,785 | 81,528 | ||||||
Next Fifteen Communications Group | 24,361 | 246,261 | ||||||
OSB Group | 125,404 | 598,901 | ||||||
Pagegroup | 4,737 | 23,026 | ||||||
Pets at Home Group | 9,992 | 33,109 | ||||||
Renewi | 5,525 | 33,651 | ||||||
Rightmove | 8,620 | 48,809 | ||||||
RS GROUP | 5,108 | 56,370 | ||||||
| COMMON STOCK — continued | ||||||||
| Shares | Value | |||||||
UNITED KINGDOM — continued |
| |||||||
Safestore Holdings ‡ | 51,067 | $ | 531,219 | |||||
Savills | 84,204 | 800,304 | ||||||
Serco Group | 130,666 | 245,821 | ||||||
Spirent Communications | 29,031 | 86,904 | ||||||
SThree | 20,044 | 85,848 | ||||||
TBC Bank Group | 3,165 | 68,653 | ||||||
Tullow Oil * | 174,783 | 81,500 | ||||||
Watches of Switzerland Group * | 2,971 | 26,493 | ||||||
Wise, Cl A * | 25,842 | 197,858 | ||||||
|
| |||||||
| 8,072,519 | ||||||||
|
| |||||||
UNITED STATES — 2.9% |
| |||||||
BRP | 5,274 | 352,193 | ||||||
Danaos | 434 | 24,608 | ||||||
Ferroglobe * | 10,458 | 60,970 | ||||||
GXO Logistics * | 78 | 2,850 | ||||||
Inmode * | 610 | 20,935 | ||||||
Ormat Technologies | 11,732 | 1,070,364 | ||||||
Samsonite International | 156,600 | 336,746 | ||||||
|
| |||||||
| 1,868,666 | ||||||||
|
| |||||||
Total Common Stock (Cost $74,575,444) | 62,482,386 | |||||||
|
| |||||||
| PREFERRED STOCK — 0.5% | ||||||||
| Shares | Value | |||||||
BRAZIL — 0.2% |
| |||||||
Cia Energetica de Minas Geraism (B) | 10,150 | $ | 21,974 | |||||
Unipar Carbocloro (B) | 7,330 | 148,996 | ||||||
|
| |||||||
| 170,970 | ||||||||
|
| |||||||
GERMANY — 0.3% |
| |||||||
Schaeffler (B) | 36,579 | 188,175 | ||||||
|
| |||||||
Total Preferred Stock | 359,145 | |||||||
|
| |||||||
| SHORT-TERM INVESTMENT — 0.7% | ||||||||
| Face Amount | Value | |||||||
State Street Institutional US Government Money Market Fund, Premier Class, 3.006% (C) | $ | 542,527 | $ | 542,527 | ||||
|
| |||||||
Total Short-Term Investments (Cost $542,527) | 542,527 | |||||||
|
| |||||||
Total Investments in Securities— 97.3% |
| |||||||
(Cost $75,548,762) | $ | 63,384,058 | ||||||
|
| |||||||
The accompanying notes are an integral part of the financial statements.
105
CATHOLIC RESPONSIBLE INVESTMENTS INTERNATIONAL SMALL-CAP FUND
OCTOBER 31, 2022
Percentages based on Net Assets of $65,160,596.
| * | Non-income producing security. |
| ‡ | Real Estate Investment Trust. |
| (A) | This security or a partial position of this security is on loan at October 31, 2022. The total market value of securities on loan at October 31, 2022 was $511,549. |
| (B) | There is currently no rate available. |
| (C) | This security was purchased with cash collateral received from securities lending. The total was of such securities as of October 31, 2022, was $542,527. |
ADR — American Depositary Receipt |
Cl — Class |
NVDR — Non-Voting Depositary Receipt |
The following is a list of the inputs used as of October 31, 2022, in valuing the Fund’s investments and other financial instruments carried at value:
| Investments in Securities | Level 1 | Level 2 | Level 3 | Total | ||||||||||||
Common Stock | ||||||||||||||||
Australia | $ | 4,342,282 | $ | – | $ | – | $ | 4,342,282 | ||||||||
Austria | 1,083,141 | – | – | 1,083,141 | ||||||||||||
Belgium | 203,553 | – | – | 203,553 | ||||||||||||
Brazil | 814,095 | – | – | 814,095 | ||||||||||||
Canada | 2,025,533 | – | – | 2,025,533 | ||||||||||||
China | 1,336,991 | – | – | 1,336,991 | ||||||||||||
Denmark | 1,054,371 | – | – | 1,054,371 | ||||||||||||
Egypt | 64,110 | – | – | 64,110 | ||||||||||||
Finland | 80,344 | – | – | 80,344 | ||||||||||||
France | 3,692,379 | – | – | 3,692,379 | ||||||||||||
Germany | 1,151,435 | – | – | 1,151,435 | ||||||||||||
Hong Kong | 834,793 | – | – | 834,793 | ||||||||||||
India | 763,153 | – | – | 763,153 | ||||||||||||
Indonesia | 253,279 | – | – | 253,279 | ||||||||||||
Ireland | 255,933 | – | – | 255,933 | ||||||||||||
Israel | 1,086,368 | – | – | 1,086,368 | ||||||||||||
Italy | 1,874,700 | – | – | 1,874,700 | ||||||||||||
Japan | 16,501,348 | – | – | 16,501,348 | ||||||||||||
Luxembourg | 858,067 | – | – | 858,067 | ||||||||||||
Malaysia | 149,074 | – | – | 149,074 | ||||||||||||
Mauritius | 70,009 | – | – | 70,009 | ||||||||||||
Mexico | 376,488 | – | – | 376,488 | ||||||||||||
Netherlands | 484,883 | – | – | 484,883 | ||||||||||||
New Zealand | 134,803 | – | – | 134,803 | ||||||||||||
Nigeria | 110,828 | – | – | 110,828 | ||||||||||||
Norway | 1,201,858 | – | – | 1,201,858 | ||||||||||||
Philippines | – | 168,437 | – | 168,437 | ||||||||||||
Singapore | 323,835 | – | – | 323,835 | ||||||||||||
South Africa | 270,814 | – | – | 270,814 | ||||||||||||
South Korea | 1,255,991 | – | – | 1,255,991 | ||||||||||||
Spain | 1,435,521 | – | – | 1,435,521 | ||||||||||||
Sweden | 2,978,690 | – | – | 2,978,690 | ||||||||||||
Switzerland | 1,911,144 | – | – | 1,911,144 | ||||||||||||
Taiwan | 2,111,422 | – | – | 2,111,422 | ||||||||||||
Thailand | 536,602 | – | – | 536,602 | ||||||||||||
Turkey | 744,927 | – | – | 744,927 | ||||||||||||
United Kingdom | 8,072,519 | – | – | 8,072,519 | ||||||||||||
United States | 1,868,666 | – | – | 1,868,666 | ||||||||||||
Total Common Stock | 62,313,949 | 168,437 | – | 62,482,386 | ||||||||||||
Short-Term Investment | 542,527 | – | – | 542,527 | ||||||||||||
Preferred Stock | 359,145 | – | – | 359,145 | ||||||||||||
Total Investments in Securities | $ | 63,215,621 | $ | 168,437 | $ | – | $ | 63,384,058 | ||||||||
Amounts designated as “–” are $0 or have been round to $0.
For more information on valuation inputs, see Note 2 — Significant Accounting Policies in the Notes to Financial Statements.
The accompanying notes are an integral part of the financial statements.
106
CATHOLIC RESPONSIBLE INVESTMENTS MAGNUS 45/55 FUND
OCTOBER 31, 2022
| SECTOR WEIGHTINGS (unaudited)† | ||||

† Percentages are based on total investments. Total investments do not include derivatives such as options, futures contracts, forward contracts, and swap contracts, if applicable.
SCHEDULE OF INVESTMENTS
OPEN-END MUTUAL FUNDS — 99.9% | ||||||||
| Shares | Value | |||||||
Catholic Responsible Investments Bond Fund† | 2,376,825 | $ | 19,561,268 | |||||
Catholic Responsible Investments Equity Index Fund† | 1,855,651 | 15,587,465 | ||||||
Catholic Responsible Investments International Equity Fund† | 707,437 | 5,235,036 | ||||||
Catholic Responsible Investments International Small-Cap Fund† | 176,295 | 1,334,556 | ||||||
Catholic Responsible Investments Multi-Style US Equity Fund† | 559,802 | 4,495,211 | ||||||
Catholic Responsible Investments Opportunistic Bond Fund† | 1,187,632 | 10,736,189 | ||||||
Catholic Responsible Investments Short Duration Bond Fund† | 1,184,789 | 11,148,864 | ||||||
Catholic Responsible Investments Small-Cap Fund† | 362,636 | 3,234,709 | ||||||
|
| |||||||
| 71,333,298 | ||||||||
|
| |||||||
Total Open-End Mutual Funds | 71,333,298 | |||||||
|
| |||||||
Total Investments in Securities— 99.9% | $ | 71,333,298 | ||||||
|
| |||||||
|
| |||||||
Percentages are based on Net Assets of $71,422,161.
† Investment in Affiliated Security.The Fund is invested in the Institutional Class of each underlying fund.
As of October 31, 2022, all of the Fund’s investments in securities were considered Level 1, in accordance with the authoritative guidance of fair value measurements and disclosure under U.S. generally accepted accounting principles.
For more information on valuation inputs, see Note 2 — Significant Accounting Policies in the Notes to Financial Statements.
The accompanying notes are an integral part of the financial statements.
107
CATHOLIC RESPONSIBLE INVESTMENTS MAGNUS 45/55 FUND
OCTOBER 31, 2022
The following is a summary of the transactions with affiliates for the period ended October 31, 2022:
| Security Description | Value 12/3/2021 | Purchases at Cost/Conversion* | Proceeds from Sales | Realized Loss | Change in Unrealized Appreciation/ (Depreciation) | Value 10/31/2022 | Income | Capital Gains | ||||||||||||||||||||||||
Catholic Responsible Investments Bond Fund | $ | — | $ | 27,047,098 | $ | (3,797,420 | ) | $ | (571,406 | ) | $ | (4,067,621 | ) | $ | 19,561,268 | $ | 523,938 | $ | — | |||||||||||||
Catholic Responsible Investments Equity Index Fund | — | 15,930,201 | (3,073,272 | ) | (312,289 | ) | (3,022,943 | ) | 15,587,465 | 213,020 | — | |||||||||||||||||||||
Catholic Responsible Investments International Equity Fund | — | 6,710,610 | (1,243,121 | ) | (368,612 | ) | (1,742,025 | ) | 5,235,036 | 96,226 | — | |||||||||||||||||||||
Catholic Responsible Investments International Small-Cap Fund | — | 1,736,710 | (310,780 | ) | (72,985 | ) | (415,250 | ) | 1,334,556 | 28,902 | — | |||||||||||||||||||||
Catholic Responsible Investments Multi-Style US Equity Fund | — | 6,076,167 | (966,872 | ) | (145,654 | ) | (1,114,492 | ) | 4,495,211 | 19,503 | — | |||||||||||||||||||||
Catholic Responsible Investments Opportunistic Bond Fund | — | 13,198,305 | (1,899,213 | ) | (149,088 | ) | (1,100,170 | ) | 10,736,189 | 249,492 | — | |||||||||||||||||||||
Catholic Responsible Investments Short Duration Bond Fund | — | 13,861,819 | (1,899,213 | ) | (97,850 | ) | (671,929 | ) | 11,148,864 | 182,800 | — | |||||||||||||||||||||
Catholic Responsible Investments Small-Cap Fund | — | 2,926,728 | (621,561 | ) | (70,127 | ) | (373,095 | ) | 3,234,709 | 36,773 | — | |||||||||||||||||||||
Totals | $ | — | $ | 87,487,638 | $ | (13,811,452 | ) | $ | (1,788,011 | ) | $ | (12,507,525 | ) | $ | 71,333,298 | $ | 1,350,654 | $ | — | |||||||||||||
Amounts designated as “–” are $0.
*Amounts do not include unrealized appreciation/depreciation from conversion.
The accompanying notes are an integral part of the financial statements.
108
CATHOLIC RESPONSIBLE INVESTMENTS 60/40 ALPHA PLUS FUND
OCTOBER 31, 2022
| SECTOR WEIGHTINGS (unaudited)† | ||||

† Percentages are based on total investments. Total investments do not include derivatives such as options, futures contracts, forward contracts, and swap contracts, if applicable.
SCHEDULE OF INVESTMENTS
OPEN-END MUTUAL FUNDS — 100.0% | ||||||||
| Shares | Value | |||||||
Catholic Responsible Investments Bond Fund† | 23,736,045 | $ | 195,347,648 | |||||
Catholic Responsible Investments Equity Index Fund† | 19,275,747 | 161,916,277 | ||||||
Catholic Responsible Investments International Equity Fund† | 13,786,581 | 102,020,700 | ||||||
Catholic Responsible Investments International Small-Cap Fund† | 3,510,996 | 26,578,242 | ||||||
Catholic Responsible Investments Multi-Style US Equity Fund† | 29,577,579 | 237,507,961 | ||||||
Catholic Responsible Investments Opportunistic Bond Fund† | 11,661,955 | 105,424,072 | ||||||
Catholic Responsible Investments Short Duration Bond Fund† | 11,497,058 | 108,187,317 | ||||||
Catholic Responsible Investments Small-Cap Fund† | 6,887,528 | 61,436,749 | ||||||
|
| |||||||
| 998,418,966 | ||||||||
|
| |||||||
Total Open-End Mutual Funds | 998,418,966 | |||||||
|
| |||||||
Total Investments in Securities — 100.0% |
| |||||||
(Cost $1,006,804,691) | $ | 998,418,966 | ||||||
|
| |||||||
|
| |||||||
Percentages are based on Net Assets of $998,288,416.
† Investment in Affiliated Security. The Fund is invested in the Institutional Class of each underlying fund.
As of October 31, 2022, all of the Fund’s investments in securities were considered Level 1, in accordance with the authoritative guidance of fair value measurements and disclosure under U.S. generally accepted accounting principles.
For more information on valuation inputs, see Note 2 — Significant Accounting Policies in the Notes to Financial Statements.
The accompanying notes are an integral part of the financial statements.
109
CATHOLIC RESPONSIBLE INVESTMENTS 60/40 ALPHA PLUS FUND
OCTOBER 31, 2022
The following is a summary of the transactions with affiliates for the period ended October 31, 2022:
| Security Description | Value 12/3/2021 | Purchases at Cost/Conversion* | Proceeds from Sales | Realized Loss | Change in Unrealized Appreciation/ (Depreciation) | Value 10/31/2022 | Income | Capital Gains | ||||||||||||||||||||||||
Catholic Responsible Investments Bond Fund | $ — | $ | 228,166,773 | $ | (5,315,045 | ) | $ | (563,206 | ) | $ | (41,204,211 | ) | $ | 195,347,648 | $ | 4,692,037 | $ | — | ||||||||||||||
Catholic Responsible Investments Equity Index Fund | — | 130,480,976 | (3,986,284 | ) | (584,743 | ) | (30,237,321 | ) | 161,916,277 | 1,978,221 | — | |||||||||||||||||||||
Catholic Responsible Investments International Equity Fund | — | 100,672,277 | (3,189,027 | ) | (800,594 | ) | (34,929,579 | ) | 102,020,700 | 1,626,231 | — | |||||||||||||||||||||
Catholic Responsible Investments International Small-Cap Fund | — | 30,019,155 | (797,257 | ) | (149,474 | ) | (8,341,225 | ) | 26,578,242 | 502,934 | — | |||||||||||||||||||||
Catholic Responsible Investments Multi-Style US Equity Fund | — | 271,138,393 | (6,378,054 | ) | (1,355,251 | ) | (57,324,180 | ) | 237,507,961 | 916,260 | — | |||||||||||||||||||||
Catholic Responsible Investments Opportunistic Bond Fund | — | 111,035,249 | (2,657,523 | ) | (148,575 | ) | (10,988,406 | ) | 105,424,072 | 2,219,020 | — | |||||||||||||||||||||
Catholic Responsible Investments Short Duration Bond Fund | — | 117,474,926 | (2,657,523 | ) | (115,938 | ) | (6,652,537 | ) | 108,187,317 | 1,611,270 | — | |||||||||||||||||||||
Catholic Responsible Investments Small-Cap Fund | — | 48,366,807 | (1,594,514 | ) | (256,857 | ) | (7,193,378 | ) | 61,436,749 | 626,819 | — | |||||||||||||||||||||
Totals | $ — | $ | 1,037,354,556 | $ | (26,575,227 | ) | $ | (3,974,638 | ) | $ | (196,870,837 | ) | $ | 998,418,966 | $ | 14,172,792 | $ | — | ||||||||||||||
Amounts designated as “–” are $0.
* Amounts do not include unrealized appreciation/depreciation from conversion.
The accompanying notes are an integral part of the financial statements.
110
CATHOLIC RESPONSIBLE INVESTMENTS 60/40 Beta Plus Fund
OCTOBER 31, 2022
| SECTOR WEIGHTINGS (unaudited)† |

† Percentages are based on total investments. Total investments do not include derivatives such as options, futures contracts, forward contracts, and swap contracts, if applicable.
SCHEDULE OF INVESTMENTS
OPEN-END MUTUAL FUNDS — 100.0% | ||||||||
| Shares | Value | |||||||
Catholic Responsible Investments Bond Fund† | 9,402,333 | $ | 77,381,202 | |||||
Catholic Responsible Investments Equity Index Fund† | 18,008,312 | 151,269,825 | ||||||
Catholic Responsible Investments International Equity Fund† | 5,453,674 | 40,357,185 | ||||||
Catholic Responsible Investments International Small-Cap Fund† | 1,334,307 | 10,100,702 | ||||||
Catholic Responsible Investments Opportunistic Bond Fund† | 4,606,092 | 41,639,070 | ||||||
Catholic Responsible Investments Short Duration Bond Fund† | 4,566,758 | 42,973,197 | ||||||
Catholic Responsible Investments Small-Cap Fund† | 2,676,908 | 23,878,020 | ||||||
|
| |||||||
| 387,599,201 | ||||||||
|
| |||||||
Total Open-End Mutual Funds | 387,599,201 | |||||||
|
| |||||||
Total Investments in Securities — 100.0% |
| |||||||
(Cost $378,143,885) | $ | 387,599,201 | ||||||
|
| |||||||
|
| |||||||
Percentages are based on Net Assets of $387,578,573.
† Investment in Affiliated Security. The Fund is invested in the Institutional Class of each underlying fund.
As of October 31, 2022, all of the Fund’s investments in securities were considered Level 1, in accordance with the authoritative guidance of fair value measurements and disclosure under U.S. generally accepted accounting principles.
For more information on valuation inputs, see Note 2 — Significant Accounting Policies in the Notes to Financial Statements.
The accompanying notes are an integral part of the financial statements.
111
CATHOLIC RESPONSIBLE INVESTMENTS 60/40 Beta Plus Fund
OCTOBER 31, 2022
The following is a summary of the transactions with affiliates for the period ended October 31, 2022:
| Security Description | Value 12/3/2021 | Purchases at | Proceeds from Sales | Realized Loss | Change in Unrealized Appreciation/ (Depreciation) | Value 10/31/2022 | Income | Capital Gains | ||||||||||||||||||||||||
Catholic Responsible Investments Bond Fund | $ | — | $ | 91,734,652 | $ | (3,405,281 | ) | $ | (342,114 | ) | $ | (13,963,169 | ) | $ | 77,381,202 | $ | 1,672,047 | $ | — | |||||||||||||
Catholic Responsible Investments Equity Index Fund | — | 137,045,589 | (6,640,298 | ) | (575,468 | ) | (22,269,101 | ) | 151,269,825 | 1,664,718 | — | |||||||||||||||||||||
Catholic Responsible Investments International Equity Fund | — | 43,521,176 | (2,043,169 | ) | (483,645 | ) | (11,202,052 | ) | 40,357,185 | 597,367 | — | |||||||||||||||||||||
Catholic Responsible Investments International Small-Cap Fund | — | 11,689,650 | (510,792 | ) | (91,342 | ) | (2,747,602 | ) | 10,100,702 | 175,698 | — | |||||||||||||||||||||
Catholic Responsible Investments Opportunistic Bond Fund | — | 45,253,672 | (1,702,640 | ) | (90,657 | ) | (3,792,396 | ) | 41,639,070 | 801,784 | — | |||||||||||||||||||||
Catholic Responsible Investments Short Duration Bond Fund | — | 47,053,261 | (1,702,640 | ) | (68,965 | ) | (2,260,117 | ) | 42,973,197 | 582,859 | — | |||||||||||||||||||||
Catholic Responsible Investments Small-Cap Fund | — | 20,634,592 | (1,021,584 | ) | (110,112 | ) | (2,029,551 | ) | 23,878,020 | 217,364 | — | |||||||||||||||||||||
Totals | $ | — | $ | 396,932,592 | $ | (17,026,404 | ) | $ | (1,762,303 | ) | $ | (58,263,989 | ) | $ | 387,599,201 | $ | 5,711,837 | $ | — | |||||||||||||
Amounts designated as “–” are $0.
| * | Amounts do not include unrealized appreciation/depreciation from conversion. |
The accompanying notes are an integral part of the financial statements.
112
CATHOLIC RESPONSIBLE INVESTMENTS MAGNUS 75/25 FUND
OCTOBER 31, 2022
| SECTOR WEIGHTINGS (unaudited)† | ||||

† Percentages are based on total investments. Total investments do not include derivatives such as options, futures contracts, forward contracts, and swap contracts, if applicable.
SCHEDULE OF INVESTMENTS
OPEN-END MUTUAL FUNDS — 100.0% | ||||||||
| Shares | Value | |||||||
Catholic Responsible Investments Bond Fund† | 3,429,104 | $ | 28,221,528 | |||||
Catholic Responsible Investments Equity Index Fund† | 9,121,030 | 76,616,648 | ||||||
Catholic Responsible Investments International Equity Fund† | 3,872,239 | 28,654,565 | ||||||
Catholic Responsible Investments International Small-Cap Fund† | 956,985 | 7,244,380 | ||||||
Catholic Responsible Investments Multi-Style US Equity Fund† | 3,849,632 | 30,912,545 | ||||||
Catholic Responsible Investments Opportunistic Bond Fund† | 1,689,914 | 15,276,824 | ||||||
Catholic Responsible Investments Short Duration Bond Fund† | 1,677,996 | 15,789,944 | ||||||
Catholic Responsible Investments Small-Cap Fund† | 1,950,965 | 17,402,612 | ||||||
|
| |||||||
| 220,119,046 | ||||||||
|
| |||||||
Total Open-End Mutual Funds | 220,119,046 | |||||||
|
| |||||||
Total Investments in Securities— 100.0% |
| |||||||
(Cost $212,682,955) | $ | 220,119,046 | ||||||
|
| |||||||
|
| |||||||
Percentages are based on Net Assets of $220,224,222.
† Investment in Affiliated Security. The Fund is invested in the Institutional Class of each underlying fund.
As of October 31, 2022, all of the Fund’s investments in securities were considered Level 1, in accordance with the authoritative guidance of fair value measurements and disclosure under U.S. generally accepted accounting principles.
For more information on valuation inputs, see Note 2 — Significant Accounting Policies in the Notes to Financial Statements.
The accompanying notes are an integral part of the financial statements.
113
CATHOLIC RESPONSIBLE INVESTMENTS MAGNUS 75/25 FUND
OCTOBER 31, 2022
The following is a summary of the transactions with affiliates for the period ended October 31, 2022:
| Security Description | Value 12/3/2021 | Purchases | Proceeds from Sales | Realized Gain/(Loss) | Change in Unrealized Appreciation/ (Depreciation) | Value 10/31/2022 | Income | Capital Gains | ||||||||||||||||||||||||
Catholic Responsible Investments Bond Fund | $ — | $ | 39,808,845 | $ | (6,769,842 | ) | $ | (121,812 | ) | $ | (5,864,835 | ) | $ | 28,221,528 | $ | 666,691 | $ | — | ||||||||||||||
Catholic Responsible Investments Equity Index Fund | — | 80,218,399 | (18,278,573 | ) | 1,550,935 | (15,224,439 | ) | 76,616,648 | 920,603 | — | ||||||||||||||||||||||
Catholic Responsible Investments International Equity Fund | — | 36,866,930 | (8,123,810 | ) | (27,056 | ) | (9,434,572 | ) | 28,654,565 | 444,572 | — | |||||||||||||||||||||
Catholic Responsible Investments International Small-Cap Fund | — | 9,725,699 | (2,030,953 | ) | (21,346 | ) | (2,176,321 | ) | 7,244,380 | 134,201 | — | |||||||||||||||||||||
Catholic Responsible Investments Multi-Style US Equity Fund | — | 41,818,817 | (8,123,810 | ) | 420,514 | (7,629,274 | ) | 30,912,545 | 117,576 | — | ||||||||||||||||||||||
Catholic Responsible Investments Opportunistic Bond Fund | — | 19,435,169 | (3,384,921 | ) | (41,902 | ) | (1,550,626 | ) | 15,276,824 | 316,954 | — | |||||||||||||||||||||
Catholic Responsible Investments Short Duration Bond Fund | — | 20,245,728 | (3,384,921 | ) | (52,842 | ) | (922,245 | ) | 15,789,944 | 231,867 | — | |||||||||||||||||||||
Catholic Responsible Investments Small-Cap Fund | — | 16,911,722 | (4,061,905 | ) | 103,890 | (2,021,419 | ) | 17,402,612 | 175,621 | — | ||||||||||||||||||||||
Totals | $ | — | $ | 265,031,309 | $ | (54,158,735 | ) | $ | 1,810,381 | $ | (44,823,731 | ) | $ | 220,119,046 | $ | 3,008,085 | $ | — | ||||||||||||||
Amounts designated as “–” are $0.
| * | Amounts do not include unrealized appreciation/depreciation from conversion. |
The accompanying notes are an integral part of the financial statements.
114
CATHOLIC RESPONSIBLE INVESTMENTS
OCTOBER 31, 2022
| STATEMENTS OF ASSETS AND LIABILITIES |
| Catholic Responsible Investments Ultra Short Bond Fund | Catholic Responsible Investments Short Duration Bond Fund | Catholic Responsible Investments Bond Fund | Catholic Responsible Investments Opportunistic Bond Fund | |||||||||||||
Assets: | ||||||||||||||||
Investments, at Value (Cost $41,254,301, $474,894,542, $1,851,948,037 and $499,751,547) | $ | 41,169,592 | $ | 455,642,746 | $ | 1,645,274,056 | $ | 474,659,557 | ||||||||
Repurchase Agreements, at Value (Cost $13,800,000, $1,000,000, $– and $–) | 13,800,000 | 1,000,000 | – | – | ||||||||||||
Cash and Cash Equivalents | 220,855 | 2,213,361 | 37,157,356 | 17,021,950 | ||||||||||||
Dividend and Interest Receivable | 40,801 | 3,127,035 | 10,491,193 | 2,592,476 | ||||||||||||
Receivable for Capital Shares Sold | 15,000 | 11,446,000 | 1,039 | – | ||||||||||||
Due from Adviser | 1,703 | – | – | – | ||||||||||||
Receivable for Investment Securities Sold | – | 7,215,248 | 18,970,640 | 7,252,457 | ||||||||||||
Variation Margin Receivable | – | 10,688 | – | – | ||||||||||||
Deferred Offering Costs | 5,961 | 5,961 | 7,621 | 7,565 | ||||||||||||
Prepaid Expenses | 5,795 | 9,336 | 14,060 | 10,945 | ||||||||||||
|
| |||||||||||||||
Total Assets | 55,259,707 | 480,670,375 | 1,711,915,965 | 501,544,950 | ||||||||||||
|
| |||||||||||||||
Liabilities: | ||||||||||||||||
Payable for Investment Securities Purchased | 1,958,876 | 5,632,906 | 32,411,618 | 10,077,763 | ||||||||||||
Payable for Capital Shares Redeemed | 100,000 | 1,139,703 | 2,768,405 | 1,519,703 | ||||||||||||
Audit Fees Payable | 14,800 | 14,800 | 18,500 | 17,575 | ||||||||||||
Transfer Agent Fee Payable | 4,642 | 3,321 | 7,430 | 5,899 | ||||||||||||
Chief Compliance Officer Fees Payable | 1,355 | 1,355 | 4,064 | 2,709 | ||||||||||||
Payable Due to Administrator | 895 | 7,979 | 34,606 | 15,028 | ||||||||||||
Trustees Fees Payable | 75 | 75 | 224 | 149 | ||||||||||||
Payable Due to Adviser | – | 97,800 | 420,613 | 99,990 | ||||||||||||
Shareholder Servicing | – | – | – | 36,227 | ||||||||||||
Payable for Variation Margin | – | 41,563 | – | – | ||||||||||||
Other Payables | – | 357 | 129,387 | – | ||||||||||||
Other Accrued Expenses | 19,854 | 67,696 | 308,248 | 82,951 | ||||||||||||
|
| |||||||||||||||
Total Liabilities | 2,100,497 | 7,007,555 | 36,103,095 | 11,857,994 | ||||||||||||
|
| |||||||||||||||
Net Assets | $ | 53,159,210 | $ | 473,662,820 | $ | 1,675,812,870 | $ | 489,686,956 | ||||||||
|
| |||||||||||||||
Net Assets Consist of: | ||||||||||||||||
Paid-in Capital | $ | 53,253,707 | $ | 505,243,595 | $ | 1,959,874,427 | $ | 537,371,822 | ||||||||
Total Accumulated Loss | (94,497 | ) | (31,580,775 | ) | (284,061,557 | ) | (47,684,866 | ) | ||||||||
|
| |||||||||||||||
Net Assets | $ | 53,159,210 | $ | 473,662,820 | $ | 1,675,812,870 | $ | 489,686,956 | ||||||||
|
| |||||||||||||||
Institutional Shares: | ||||||||||||||||
Net Assets | $ | 53,159,210 | $ | 473,662,820 | $ | 1,624,983,112 | $ | 462,248,688 | ||||||||
Outstanding Shares of Beneficial Interest (Unlimited Authorization - No Par Value) | 5,320,971 | 50,346,962 | 197,497,079 | 51,123,591 | ||||||||||||
Net Asset Value, Offering and Redemption Price Per Share | $ | 9 .99 | $ | 9 .41 | $ | 8 .23 | $ | 9 .04 | ||||||||
|
| |||||||||||||||
Investor Shares: | ||||||||||||||||
Net Assets | $ | N/A | $ | N/A | $ | 50,829,758 | $ | 27,438,268 | ||||||||
Outstanding Shares of Beneficial Interest (Unlimited Authorization - No Par Value) | N/A | N/A | 6,178,583 | 3,034,760 | ||||||||||||
Net Asset Value, Offering and Redemption Price Per Share | $ | N/A | $ | N/A | $ | 8 .23 | $ | 9 .04 | ||||||||
|
| |||||||||||||||
Amounts designated as “—” are $0
The accompanying notes are an integral part of the financial statements.
115
CATHOLIC RESPONSIBLE INVESTMENTS
OCTOBER 31, 2022
| STATEMENTS OF ASSETS AND LIABILITIES |
| Catholic Responsible Investments Equity Index Fund | Catholic Responsible Investments Small-Cap Fund | Catholic Responsible Investments Multi-Style US Equity Fund | Catholic Responsible Investments International Equity Fund | Catholic Responsible Investments International Small-Cap Fund | ||||||||||||||||
Assets: | ||||||||||||||||||||
Investments, at Value (Cost $1,983,544,130, $416,244,291, $686,635,647, $1,091,747,503 and $75,548,762) | $ | 2,829,225,919 | * | $ | 457,879,274 | * | $ | 638,722,331 | $ | 1,036,040,557 | * | $ | 63,384,058 | * | ||||||
Foreign Currency, at Value (Cost $–, $–, $–, $687,497 and $566,588) | – | – | – | 786,108 | 606,909 | |||||||||||||||
Cash and Cash Equivalents | 10,470,427 | 8,258,940 | 22,708,499 | 27,479,263 | 1,760,821 | |||||||||||||||
Receivable for Capital Shares Sold | 4,206,530 | 19,541 | 1,200 | 2,723,250 | – | |||||||||||||||
Dividend and Interest Receivable | 2,051,107 | 197,935 | 283,652 | 1,181,331 | 159,279 | |||||||||||||||
Cash Pledged as Collateral for Futures Contracts | 470,250 | 545,509 | – | – | – | |||||||||||||||
Reclaim Receivable | 28,333 | – | 40,115 | 922,822 | 65,945 | |||||||||||||||
Due from Adviser | 23,727 | – | – | – | – | |||||||||||||||
Receivable for Investment Securities Sold | – | 252,516 | 1,114,413 | 3,156,301 | 37,198 | |||||||||||||||
Unrealized Appreciation on Spot Currency Contracts | – | – | – | 7,432 | 294 | |||||||||||||||
Deferred Offering Costs | 5,961 | 5,961 | 7,565 | 7,621 | 5,961 | |||||||||||||||
Prepaid Expenses | 14,181 | 6,988 | 11,018 | 12,414 | 5,835 | |||||||||||||||
|
| |||||||||||||||||||
Total Assets | 2,846,496,435 | 467,166,664 | 662,888,793 | 1,072,317,099 | 66,026,300 | |||||||||||||||
|
| |||||||||||||||||||
Liabilities: | ||||||||||||||||||||
Payable for Capital Shares Redeemed | 5,260,919 | 436,462 | 672,343 | 1,822,924 | 218,231 | |||||||||||||||
Payable for Investment Securities Purchased | 1,742,705 | – | 116,034 | 1,517,052 | 4,492 | |||||||||||||||
Payable Upon Return of Securities Loaned | 1,620,447 | 3,468,565 | – | 11,832,868 | 542,527 | |||||||||||||||
Payable Due to Administrator | 45,729 | 7,309 | 17,498 | 24,145 | 1,078 | |||||||||||||||
Audit Fees Payable | 12,950 | 12,950 | 14,800 | 17,575 | 16,650 | |||||||||||||||
Transfer Agent Fee Payable | 6,030 | 3,438 | 5,702 | 6,786 | 2,572 | |||||||||||||||
Chief Compliance Officer Fees Payable | 1,355 | 1,355 | 4,064 | 4,064 | 2,709 | |||||||||||||||
Trustees Fees Payable | 75 | 75 | 224 | 224 | 149 | |||||||||||||||
Payable Due to Adviser | – | 73,750 | 323,196 | 646,787 | 20,657 | |||||||||||||||
Shareholder Servicing | – | – | 67,049 | 77,481 | – | |||||||||||||||
Other Accrued Expenses | 603,048 | 172,352 | 84,199 | 193,620 | 56,639 | |||||||||||||||
|
| |||||||||||||||||||
Total Liabilities | 9,293,258 | 4,176,256 | 1,305,109 | 16,143,526 | 865,704 | |||||||||||||||
|
| |||||||||||||||||||
Net Assets | $ | 2,837,203,177 | $ | 462,990,408 | $ | 661,583,684 | $ | 1,056,173,573 | $ | 65,160,596 | ||||||||||
|
| |||||||||||||||||||
Net Assets Consist of: | ||||||||||||||||||||
Paid-in Capital | $ | 2,023,992,931 | $ | 409,807,444 | $ | 733,650,887 | $ | 1,131,524,378 | $ | 80,262,083 | ||||||||||
Total Distributable Earnings (Accumulated Loss) | 813,210,246 | 53,182,964 | (72,067,203 | ) | (75,350,805 | ) | (15,101,487 | ) | ||||||||||||
|
| |||||||||||||||||||
Net Assets | $ | 2,837,203,177 | $ | 462,990,408 | $ | 661,583,684 | $ | 1,056,173,573 | $ | 65,160,596 | ||||||||||
|
| |||||||||||||||||||
Institutional Shares: | ||||||||||||||||||||
Net Assets | $ | 2,837,203,177 | $ | 462,990,408 | $ | 618,979,774 | $ | 1,008,309,244 | $ | 65,160,596 | ||||||||||
Outstanding Shares of Beneficial Interest (Unlimited Authorization - No Par Value) | 337,735,721 | 51,910,284 | 77,084,385 | 136,344,454 | 8,604,137 | |||||||||||||||
Net Asset Value, Offering and Redemption Price Per Share | $ | 8 .40 | $ | 8 .92 | $ | 8 .03 | $ | 7 .40 | $ | 7 .57 | ||||||||||
|
| |||||||||||||||||||
Investor Shares: | ||||||||||||||||||||
Net Assets | $ | N/A | $ | N/A | $ | 42,603,910 | $ | 47,864,329 | $ | N/A | ||||||||||
Outstanding Shares of Beneficial Interest (Unlimited Authorization - No Par Value) | N/A | N/A | 5,305,359 | 6,471,392 | N/A | |||||||||||||||
Net Asset Value, Offering and Redemption Price Per Share | $ | N/A | $ | N/A | $ | 8 .03 | $ | 7 .40 | $ | N/A | ||||||||||
|
| |||||||||||||||||||
* Includes Market Value of Securities on Loan | $ | 1,588,164 | $ | 3,380,973 | $ | — | $ | 11,224,539 | $ | 511,549 | ||||||||||
Amounts designated as “—” are $0
The accompanying notes are an integral part of the financial statements.
116
CATHOLIC RESPONSIBLE INVESTMENTS
OCTOBER 31, 2022
| STATEMENTS OF ASSETS AND LIABILITIES |
| Catholic Responsible Investments Magnus 45/55 Fund | Catholic Responsible Investments Magnus 60/40 Alpha Plus Fund | Catholic Responsible Investments Magnus 60/40 Beta Plus Fund | Catholic Responsible Investments Magnus 75/25 Fund | |||||||||||||||||
|
| |||||||||||||||||||
Assets: | ||||||||||||||||||||
Affiliated Investments, at Value (Cost $71,888,175, $1,006,804,691, $378,143,885 and $212,682,955) | $ | 71,333,298 | $ | 998,418,966 | $ | 387,599,201 | $ | 220,119,046 | ||||||||||||
Receivable for Investment Securities Sold | 6,076,348 | 1,024,106 | 1,682,888 | 8,086 | ||||||||||||||||
Cash and Cash Equivalents | 138,431 | 414,067 | 180,966 | 159,028 | ||||||||||||||||
Due from Adviser | 12,326 | 47,239 | 24,656 | 16,638 | ||||||||||||||||
Dividend and Interest Receivable | 220 | 640 | 283 | 250 | ||||||||||||||||
Receivable for Capital Shares Sold | – | – | 50,170 | – | ||||||||||||||||
Deferred Offering Costs | 7,640 | 7,621 | 7,621 | 7,621 | ||||||||||||||||
Prepaid Expenses | 9,202 | 18,771 | 9,978 | 9,672 | ||||||||||||||||
|
| |||||||||||||||||||
Total Assets | 77,577,465 | 999,931,410 | 389,555,763 | 220,320,341 | ||||||||||||||||
|
| |||||||||||||||||||
Liabilities: | ||||||||||||||||||||
Payable for Capital Shares Redeemed | 6,068,483 | 1,015,000 | 1,724,385 | – | ||||||||||||||||
Shareholder Servicing | 56,504 | 510,318 | 191,122 | 51,364 | ||||||||||||||||
Audit Fees Payable | 12,950 | 12,950 | 12,950 | 12,950 | ||||||||||||||||
Transfer Agent Fee Payable | 5,089 | 6,120 | 5,409 | 5,228 | ||||||||||||||||
Chief Compliance Officer Fees Payable | 1,355 | 1,355 | 1,355 | 1,355 | ||||||||||||||||
Trustees Fees Payable | 75 | 75 | 75 | 75 | ||||||||||||||||
Other Accrued Expenses | 10,848 | 97,176 | 41,894 | 25,147 | ||||||||||||||||
|
| |||||||||||||||||||
Total Liabilities | 6,155,304 | 1,642,994 | 1,977,190 | 96,119 | ||||||||||||||||
|
| |||||||||||||||||||
Net Assets | $ | 71,422,161 | $ | 998,288,416 | $ | 387,578,573 | $ | 220,224,222 | ||||||||||||
|
| |||||||||||||||||||
Net Assets Consist of: | ||||||||||||||||||||
Paid-in Capital | $ | 72,546,413 | $ | 997,902,712 | $ | 374,669,230 | $ | 208,227,617 | ||||||||||||
Total Distributable Earnings (Accumulated Loss) | (1,124,252 | ) | 385,704 | 12,909,343 | 11,996,605 | |||||||||||||||
|
| |||||||||||||||||||
Net Assets | $ | 71,422,161 | $ | 998,288,416 | $ | 387,578,573 | $ | 220,224,222 | ||||||||||||
|
| |||||||||||||||||||
Institutional Shares: | ||||||||||||||||||||
Net Assets | $ | 42,016,922 | $ | 702,135,493 | $ | 274,862,318 | $ | 188,298,695 | ||||||||||||
Outstanding Shares of Beneficial Interest (Unlimited Authorization - No Par Value) | 4,883,351 | 83,289,005 | 32,165,996 | 22,425,673 | ||||||||||||||||
Net Asset Value, Offering and Redemption Price Per Share | $ | 8 .60 | $ | 8 .43 | $ | 8 .55 | $ | 8 .40 | ||||||||||||
|
| |||||||||||||||||||
Investor Shares: | ||||||||||||||||||||
Net Assets | $ | 29,405,239 | $ | 296,152,923 | $ | 112,716,255 | $ | 31,925,527 | ||||||||||||
Outstanding Shares of Beneficial Interest (Unlimited Authorization - No Par Value) | 3,421,674 | 35,175,906 | 13,207,124 | 3,807,488 | ||||||||||||||||
Net Asset Value, Offering and Redemption Price Per Share | $ | 8 .59 | $ | 8 .42 | $ | 8 .53 | $ | 8 .38 | ||||||||||||
|
| |||||||||||||||||||
Amounts designated as “—” are $0
The accompanying notes are an integral part of the financial statements.
117
CATHOLIC RESPONSIBLE INVESTMENTS
FOR THE PERIOD ENDED
OCTOBER 31, 2022
* Commenced operations on December 6, 2021.
The accompanying notes are an integral part of the financial statements.
118
CATHOLIC RESPONSIBLE INVESTMENTS
FOR THE PERIOD ENDED
OCTOBER 31, 2022
| STATEMENTS OF OPERATIONS | ||||||||||||||||||||||||||||||
| Catholic Responsible Investments Equity Index Fund* | Catholic Responsible Investments Small-Cap Fund* | Catholic Responsible Investments Multi-Style US Equity Fund* | Catholic Responsible Investments International Equity Fund* | Catholic Responsible Investments International Small-Cap Fund* | ||||||||||||||||||||||||||
|
| |||||||||||||||||||||||||||||
Investment Income: | ||||||||||||||||||||||||||||||
Dividend Income | $ | 39,400,121 | $ | 5,868,633 | $ | 6,653,218 | $ | 28,273,929 | $ | 2,449,614 | ||||||||||||||||||||
Interest Income | 95,846 | 46,743 | 118,389 | 242,473 | 12,761 | |||||||||||||||||||||||||
Income from Securities Lending | 11,765 | 17,469 | 1,620 | 150,556 | 4,652 | |||||||||||||||||||||||||
Less: Foreign Taxes Withheld | (8,600 | ) | (5,212 | ) | (20,125 | ) | (2,320,342 | ) | (281,152) | |||||||||||||||||||||
|
| |||||||||||||||||||||||||||||
Total Investment Income | 39,499,132 | 5,927,633 | 6,753,102 | 26,346,616 | 2,185,875 | |||||||||||||||||||||||||
|
| |||||||||||||||||||||||||||||
Expenses: | ||||||||||||||||||||||||||||||
Investment Advisory Fees | 1,667,676 | 860,074 | 3,831,900 | 7,827,321 | 633,125 | |||||||||||||||||||||||||
Administration Fees | 548,930 | 84,926 | 132,966 | 215,729 | 13,022 | |||||||||||||||||||||||||
Trustees’ Fees | 38,822 | 13,859 | 34,769 | 39,022 | 19,413 | |||||||||||||||||||||||||
Chief Compliance Officer Fees | 2,879 | 2,879 | 8,636 | 8,636 | 5,758 | |||||||||||||||||||||||||
Shareholder Servicing Fees | – | – | 67,049 | 77,481 | – | |||||||||||||||||||||||||
Rating Fees | 377,328 | 119,107 | – | – | – | |||||||||||||||||||||||||
Registration Fees | 190,694 | 38,747 | 67,979 | 101,327 | 9,166 | |||||||||||||||||||||||||
Offering Costs | 44,451 | 44,451 | 59,302 | 59,246 | 44,451 | |||||||||||||||||||||||||
Transfer Agent Fees | 37,314 | 23,468 | 36,924 | 42,789 | 18,816 | |||||||||||||||||||||||||
Custodian Fees | 37,030 | 24,075 | 19,888 | 229,881 | 112,640 | |||||||||||||||||||||||||
Pricing Fees | 26,963 | 8,523 | 8,004 | 15,733 | 13,232 | |||||||||||||||||||||||||
Legal Fees | 25,464 | 10,093 | 26,167 | 29,046 | 15,035 | |||||||||||||||||||||||||
Printing Fees | 23,508 | 5,675 | 5,661 | 10,367 | 3,246 | |||||||||||||||||||||||||
Audit Fees | 12,950 | 12,950 | 14,800 | 17,575 | 16,650 | |||||||||||||||||||||||||
Other Expenses | 35,879 | 14,392 | 15,576 | 24,065 | 13,312 | |||||||||||||||||||||||||
|
| |||||||||||||||||||||||||||||
Total Expenses | 3,069,888 | 1,263,219 | 4,329,621 | 8,698,218 | 917,866 | |||||||||||||||||||||||||
|
| |||||||||||||||||||||||||||||
Less: | ||||||||||||||||||||||||||||||
Waiver of Investment Advisory Fees | (599,749 | ) | – | – | – | (159,201) | ||||||||||||||||||||||||
|
| |||||||||||||||||||||||||||||
Net Expenses | 2,470,139 | 1,263,219 | 4,329,621 | 8,698,218 | 758,665 | |||||||||||||||||||||||||
|
| |||||||||||||||||||||||||||||
Net Investment Income | 37,028,993 | 4,664,414 | 2,423,481 | 17,648,398 | 1,427,210 | |||||||||||||||||||||||||
|
| |||||||||||||||||||||||||||||
Net Realized and Unrealized Gain (Loss): | ||||||||||||||||||||||||||||||
Net Realized Gain (Loss) on Investments | (33,313,417 | ) | 12,191,401 | (24,163,608 | ) | (20,254,373 | ) | (2,961,132 | ) | |||||||||||||||||||||
Net Realized Loss on Futures Contracts | (1,568,637 | ) | (792,975 | ) | – | – | �� | – | ||||||||||||||||||||||
Net Realized Gain (Loss) on Forward Foreign Currency Contracts and Foreign Currency Transactions | – | 73 | – | (692,941 | ) | (233,556 | ) | |||||||||||||||||||||||
|
| |||||||||||||||||||||||||||||
Net Realized Gain (Loss) | (34,882,054 | ) | 11,398,499 | (24,163,608 | ) | (20,947,314 | ) | (3,194,688 | ) | |||||||||||||||||||||
|
| |||||||||||||||||||||||||||||
Net Change in Unrealized | (503,898,531 | ) | (66,727,309 | ) | (130,426,422 | ) | (333,037,477 | ) | (16,996,377 | ) | ||||||||||||||||||||
Net Change in Unrealized | 85,218 | 160,780 | – | – | – | |||||||||||||||||||||||||
Net Change in Unrealized | – | – | – | 11,513 | 32,599 | |||||||||||||||||||||||||
|
| |||||||||||||||||||||||||||||
Net Change in Unrealized Appreciation (Depreciation) | (503,813,313 | ) | (66,566,529 | ) | (130,426,422 | ) | (333,025,964 | ) | (16,963,778 | ) | ||||||||||||||||||||
|
| |||||||||||||||||||||||||||||
Net Realized and Unrealized Loss | (538,695,367 | ) | (55,168,030 | ) | (154,590,030 | ) | (353,973,278 | ) | (20,158,466 | ) | ||||||||||||||||||||
|
|
|
| |||||||||||||||||||||||||||
Net Decrease in Net Assets Resulting from Operations | $ | (501,666,374 | ) | $ | (50,503,616 | ) | $ | (152,166,549 | ) | $ | (336,324,880 | ) | $ | (18,731,256 | ) | |||||||||||||||
|
| |||||||||||||||||||||||||||||
* Commenced operations on December 6, 2021.
The accompanying notes are an integral part of the financial statements.
119
CATHOLIC RESPONSIBLE INVESTMENTS
FOR THE PERIOD ENDED
OCTOBER 31, 2022
| STATEMENTS OF OPERATIONS | |||||||||||||||||||||||||
| Catholic Responsible Investments Magnus 45/55 Fund* | Catholic Responsible Investments Magnus 60/40 Alpha Plus Fund* | Catholic Responsible Investments Magnus 60/40 Beta Plus Fund* | Catholic Responsible Investments Magnus 75/25 Fund* | ||||||||||||||||||||||
|
| ||||||||||||||||||||||||
Investment Income: | |||||||||||||||||||||||||
Affiliated Dividend Income | $ | 1,350,654 | $ | 14,172,792 | $ | 5,711,837 | $ | 3,008,085 | |||||||||||||||||
Interest Income | 785 | 2,418 | 1,048 | 901 | |||||||||||||||||||||
|
| ||||||||||||||||||||||||
Total Investment Income | 1,351,439 | 14,175,210 | 5,712,885 | 3,008,986 | |||||||||||||||||||||
|
| ||||||||||||||||||||||||
Expenses: | |||||||||||||||||||||||||
Shareholder Servicing Fees | 56,504 | 510,318 | 191,122 | 51,364 | |||||||||||||||||||||
Trustees’ Fees | 10,183 | 19,710 | 12,432 | 15,220 | |||||||||||||||||||||
Chief Compliance Officer Fees | 2,879 | 2,879 | 2,879 | 2,879 | |||||||||||||||||||||
Offering Costs | 59,337 | 59,246 | 59,246 | 59,246 | |||||||||||||||||||||
Transfer Agent Fees | 33,682 | 39,121 | 35,173 | 34,343 | |||||||||||||||||||||
Audit Fees | 12,950 | 12,950 | 12,950 | 12,950 | |||||||||||||||||||||
Registration Fees | 10,473 | 89,848 | 37,985 | 18,985 | |||||||||||||||||||||
Legal Fees | 7,825 | 13,846 | 9,253 | 8,699 | |||||||||||||||||||||
Custodian Fees | 4,253 | 10,332 | 7,745 | 3,704 | |||||||||||||||||||||
Printing Fees | 654 | 7,597 | 2,797 | 1,728 | |||||||||||||||||||||
Pricing Fees | 459 | 5,784 | 1,948 | 1,282 | |||||||||||||||||||||
Other Expenses | 10,370 | 19,212 | 13,330 | 12,538 | |||||||||||||||||||||
|
| ||||||||||||||||||||||||
Total Expenses | 209,569 | 790,843 | 386,860 | 222,938 | |||||||||||||||||||||
|
| ||||||||||||||||||||||||
Less: | |||||||||||||||||||||||||
Waiver of Investment Advisory Fees | (153,067 | ) | (280,525 | ) | (195,740 | ) | (171,574 | ) | |||||||||||||||||
|
| ||||||||||||||||||||||||
Net Expenses | 56,502 | 510,318 | 191,120 | 51,364 | |||||||||||||||||||||
|
| ||||||||||||||||||||||||
Net Investment Income | 1,294,937 | 13,664,892 | 5,521,765 | 2,957,622 | |||||||||||||||||||||
|
| ||||||||||||||||||||||||
Net Realized and Unrealized Gain (Loss): | |||||||||||||||||||||||||
Net Realized Gain (Loss) on Affiliated Investments | (1,788,011 | ) | (3,974,638 | ) | (1,762,303 | ) | 1,810,381 | ||||||||||||||||||
|
| ||||||||||||||||||||||||
Net Realized Gain (Loss) | (1,788,011 | ) | (3,974,638 | ) | (1,762,303 | ) | 1,810,381 | ||||||||||||||||||
|
| ||||||||||||||||||||||||
Net Change in Unrealized | (12,507,525 | ) | (196,870,837 | ) | (58,263,989 | ) | (44,823,731 | ) | |||||||||||||||||
|
|
|
|
|
|
|
| ||||||||||||||||||
Net Change in Unrealized Appreciation (Depreciation) | (12,507,525 | ) | (196,870,837 | ) | (58,263,989 | ) | (44,823,731 | ) | |||||||||||||||||
|
| ||||||||||||||||||||||||
Net Realized and Unrealized Loss | (14,295,536 | ) | (200,845,475 | ) | (60,026,292 | ) | (43,013,350 | ) | |||||||||||||||||
|
| ||||||||||||||||||||||||
Net Decrease in Net Assets Resulting from Operations | $ | (13,000,599 | ) | $ | (187,180,583 | ) | $ | (54,504,527 | ) | $ | (40,055,728 | ) | |||||||||||||
|
| ||||||||||||||||||||||||
* Commenced operations on December 6, 2021.
The accompanying notes are an integral part of the financial statements.
120
CATHOLIC RESPONSIBLE INVESTMENTS
FOR THE PERIOD ENDED
OCTOBER 31, 2022
* Commenced operations on December 6, 2021.
† Includes transfer of assets from the Predecessor Funds.
Amounts designated as “—” are $0.
The accompanying notes are an integral part of the financial statements.
121
CATHOLIC RESPONSIBLE INVESTMENTS
FOR THE PERIOD ENDED
OCTOBER 31, 2022
| STATEMENTS OF CHANGES IN NET ASSETS |
| Catholic Responsible Investments Equity Index Fund Period Ended October 31, 2022* | Catholic Responsible Investments Small-Cap Fund Period Ended October 31, 2022* | Catholic Responsible Investments Multi-Style US Equity Fund Period Ended October 31, 2022* | Catholic Responsible Investments International Equity Fund Period Ended October 31, 2022* | Catholic Responsible Investments International Small-Cap Fund Period Ended October 31, 2022* | ||||||||||||||||||||
Operations: | ||||||||||||||||||||||||
Net Investment Income | $ | 37,028,993 | $ | 4,664,414 | $ | 2,423,481 | $ | 17,648,398 | $ | 1,427,210 | ||||||||||||||
Net Realized Gain (Loss) | (34,882,054 | ) | 11,398,499 | (24,163,608 | ) | (20,947,314 | ) | (3,194,688 | ) | |||||||||||||||
Net Change in Unrealized Appreciation/(Depreciation) | (503,813,313 | ) | (66,566,529 | ) | (130,426,422 | ) | (333,025,964 | ) | (16,963,778 | ) | ||||||||||||||
|
|
|
|
|
|
|
|
|
| |||||||||||||||
Net Decrease in Net Assets Resulting from Operations | (501,666,374 | ) | (50,503,616 | ) | (152,166,549 | ) | (336,324,880 | ) | (18,731,256 | ) | ||||||||||||||
|
|
|
|
|
|
|
|
|
| |||||||||||||||
Distributions: | ||||||||||||||||||||||||
Institutional Shares | (34,703,700 | ) | (4,675,712 | ) | (2,308,450 | ) | (15,648,586 | ) | (1,201,904 | ) | ||||||||||||||
Investor Shares | — | — | (105,310 | ) | (707,870 | ) | — | |||||||||||||||||
|
|
|
|
|
|
|
|
|
| |||||||||||||||
Total Distributions | (34,703,700 | ) | (4,675,712 | ) | (2,413,760 | ) | (16,356,456 | ) | (1,201,904 | ) | ||||||||||||||
|
|
|
|
|
|
|
|
|
| |||||||||||||||
Capital Share Transactions: | ||||||||||||||||||||||||
Institutional: | ||||||||||||||||||||||||
Issued † | 3,565,302,235 | 547,307,376 | 791,195,487 | 1,406,729,935 | 88,775,709 | |||||||||||||||||||
Reinvestment of Dividends and Distributions | 33,156,163 | 4,464,695 | 2,187,007 | 14,996,665 | 1,132,107 | |||||||||||||||||||
Redeemed | (224,885,147 | ) | (33,602,335 | ) | (30,492,707 | ) | (77,483,997 | ) | (4,814,060 | ) | ||||||||||||||
|
|
|
|
|
|
|
|
|
| |||||||||||||||
Net Institutional Share Transactions | 3,373,573,251 | 518,169,736 | 762,889,787 | 1,344,242,603 | 85,093,756 | |||||||||||||||||||
|
|
|
|
|
|
|
|
|
| |||||||||||||||
Investor: | ||||||||||||||||||||||||
Issued † | — | — | 62,489,577 | 72,268,339 | — | |||||||||||||||||||
Reinvestment of Dividends and Distributions | — | — | 95,160 | 689,963 | — | |||||||||||||||||||
Redeemed | — | — | (9,310,531 | ) | (8,345,996 | ) | — | |||||||||||||||||
|
|
|
|
|
|
|
|
|
| |||||||||||||||
Net Investor Share Transactions | — | — | 53,274,206 | 64,612,306 | — | |||||||||||||||||||
|
|
|
|
|
|
|
|
|
| |||||||||||||||
Net Increase in Net Assets from Share Transactions | 3,373,573,251 | 518,169,736 | 816,163,993 | 1,408,854,909 | 85,093,756 | |||||||||||||||||||
|
|
|
|
|
|
|
|
|
| |||||||||||||||
Total Increase in Net Assets | 2,837,203,177 | 462,990,408 | 661,583,684 | 1,056,173,573 | 65,160,596 | |||||||||||||||||||
|
|
|
|
|
|
|
|
|
| |||||||||||||||
Net Assets: | ||||||||||||||||||||||||
Beginning of Period | — | — | — | — | — | |||||||||||||||||||
End of Period | $ | 2,837,203,177 | $ | 462,990,408 | $ | 661,583,684 | $ | 1,056,173,573 | $ | 65,160,596 | ||||||||||||||
|
|
|
|
|
|
|
|
|
| |||||||||||||||
Shares Transactions: | ||||||||||||||||||||||||
Institutional: | ||||||||||||||||||||||||
Issued | 358,455,987 | 54,978,253 | 80,122,394 | 143,220,457 | 8,978,038 | |||||||||||||||||||
Reinvestment of Dividends and Distributions | 3,803,238 | 502,810 | 269,252 | 1,907,583 | 135,569 | |||||||||||||||||||
Redeemed | (24,523,504 | ) | (3,570,779 | ) | (3,307,261 | ) | (8,783,586 | ) | (509,470 | ) | ||||||||||||||
|
|
|
|
|
|
|
|
|
| |||||||||||||||
Net Institutional Shares Capital Share Transactions | 337,735,721 | 51,910,284 | 77,084,385 | 136,344,454 | 8,604,137 | |||||||||||||||||||
|
|
|
|
|
|
|
|
|
| |||||||||||||||
Investor: | ||||||||||||||||||||||||
Issued | — | — | 6,264,641 | 7,313,722 | — | |||||||||||||||||||
Reinvestment of Dividends and Distributions | — | — | 12,021 | 87,913 | — | |||||||||||||||||||
Redeemed | — | — | (971,303 | ) | (930,243 | ) | — | |||||||||||||||||
|
|
|
|
|
|
|
|
|
| |||||||||||||||
Net Investor Shares Capital Share Transactions | — | — | 5,305,359 | 6,471,392 | — | |||||||||||||||||||
|
|
|
|
|
|
|
|
|
| |||||||||||||||
Net Increase in Shares Outstanding from Share Transactions | 337,735,721 | 51,910,284 | 82,389,744 | 142,815,846 | 8,604,137 | |||||||||||||||||||
|
|
|
|
|
|
|
|
|
| |||||||||||||||
* Commenced operations on December 6, 2021.
† Includes transfer of assets from the Predecessor Funds.
Amounts designated as “—” are $0.
The accompanying notes are an integral part of the financial statements.
122
CATHOLIC RESPONSIBLE INVESTMENTS
FOR THE PERIOD ENDED
OCTOBER 31, 2022
| STATEMENTS OF CHANGES IN NET ASSETS |
| Catholic Responsible Investments Magnus 45/55 Fund Period Ended October 31, 2022* | Catholic Responsible Investments Magnus 60/40 Alpha Plus Fund Period Ended October 31, 2022* | Catholic Responsible Investments Magnus 60/40 Beta Plus Fund Period Ended October 31, 2022* | Catholic Responsible Investments Magnus 75/25 Fund Period Ended October 31, 2022* | |||||||||||||||||
Operations: | ||||||||||||||||||||
Net Investment Income | $ | 1,294,937 | $ | 13,664,892 | $ | 5,521,765 | $ | 2,957,622 | ||||||||||||
Net Realized Gain (Loss) | (1,788,011 | ) | (3,974,638 | ) | (1,762,303 | ) | 1,810,381 | |||||||||||||
Net Change in Unrealized Appreciation/(Depreciation) | (12,507,525 | ) | (196,870,837 | ) | (58,263,989 | ) | (44,823,731 | ) | ||||||||||||
|
|
|
|
|
|
|
| |||||||||||||
Net Decrease in Net Assets Resulting from Operations | (13,000,599 | ) | (187,180,583 | ) | (54,504,527 | ) | (40,055,728 | ) | ||||||||||||
|
|
|
|
|
|
|
| |||||||||||||
Distributions: | ||||||||||||||||||||
Institutional Shares | (41,794 | ) | (568,966 | ) | (170,102 | ) | (176,258 | ) | ||||||||||||
Investor Shares | (34,507 | ) | (349,859 | ) | (135,333 | ) | (31,231 | ) | ||||||||||||
|
|
|
|
|
|
|
| |||||||||||||
Total Distributions | (76,301 | ) | (918,825 | ) | (305,435 | ) | (207,489 | ) | ||||||||||||
|
|
|
|
|
|
|
| |||||||||||||
Capital Share Transactions: | ||||||||||||||||||||
Institutional: | ||||||||||||||||||||
Issued † | 50,959,239 | 841,029,062 | 315,593,702 | 275,902,150 | ||||||||||||||||
Reinvestment of Dividends and Distributions | 41,794 | 568,966 | 170,102 | 176,258 | ||||||||||||||||
Redeemed | (2,084,687 | ) | (15,371,660 | ) | (8,589,842 | ) | (53,980,882 | ) | ||||||||||||
|
|
|
|
|
|
|
| |||||||||||||
Net Institutional Share Transactions | 48,916,346 | 826,226,368 | 307,173,962 | 222,097,526 | ||||||||||||||||
|
|
|
|
|
|
|
| |||||||||||||
Investor: | ||||||||||||||||||||
Issued † | 50,147,800 | 507,992,930 | 179,250,158 | 51,254,998 | ||||||||||||||||
Reinvestment of Dividends and Distributions | 31,130 | 348,987 | 133,181 | 31,231 | ||||||||||||||||
Redeemed | (14,596,215 | ) | (148,180,461 | ) | (44,168,766 | ) | (12,896,316 | ) | ||||||||||||
|
|
|
|
|
|
|
| |||||||||||||
Net Investor Share Transactions | 35,582,715 | 360,161,456 | 135,214,573 | 38,389,913 | ||||||||||||||||
|
|
|
|
|
|
|
| |||||||||||||
Net Increase in Net Assets from Share Transactions | 84,499,061 | 1,186,387,824 | 442,388,535 | 260,487,439 | ||||||||||||||||
|
|
|
|
|
|
|
| |||||||||||||
Total Increase in Net Assets | 71,422,161 | 998,288,416 | 387,578,573 | 220,224,222 | ||||||||||||||||
|
|
|
|
|
|
|
| |||||||||||||
Net Assets: | ||||||||||||||||||||
Beginning of Period | — | — | — | — | ||||||||||||||||
|
|
|
|
|
|
|
| |||||||||||||
End of Period | $ | 71,422,161 | $ | 998,288,416 | $ | 387,578,573 | $ | 220,224,222 | ||||||||||||
|
|
|
|
|
|
|
| |||||||||||||
Shares Transactions: | ||||||||||||||||||||
Institutional: | ||||||||||||||||||||
Issued | 5,111,968 | 84,948,241 | 33,094,640 | 27,729,598 | ||||||||||||||||
Reinvestment of Dividends and Distributions | 4,106 | 55,455 | 16,547 | 17,030 | ||||||||||||||||
Redeemed | (232,723 | ) | (1,714,691 | ) | (945,191 | ) | (5,320,955 | ) | ||||||||||||
|
|
|
|
|
|
|
| |||||||||||||
Net Institutional Shares Capital Share Transactions | 4,883,351 | 83,289,005 | 32,165,996 | 22,425,673 | ||||||||||||||||
|
|
|
|
|
|
|
| |||||||||||||
Investor: | ||||||||||||||||||||
Issued | 5,043,408 | 50,905,980 | 17,995,975 | 5,158,036 | ||||||||||||||||
Reinvestment of Dividends and Distributions | 3,058 | 34,014 | 12,955 | 3,017 | ||||||||||||||||
Redeemed | (1,624,792 | ) | (15,764,088 | ) | (4,801,806 | ) | (1,353,565 | ) | ||||||||||||
|
|
|
|
|
|
|
| |||||||||||||
Net Investor Shares Capital Share Transactions | 3,421,674 | 35,175,906 | 13,207,124 | 3,807,488 | ||||||||||||||||
|
|
|
|
|
|
|
| |||||||||||||
Net Increase in Shares Outstanding from Share Transactions | 8,305,025 | 118,464,911 | 45,373,120 | 26,233,161 | ||||||||||||||||
|
|
|
|
|
|
|
| |||||||||||||
* Commenced operations on December 6, 2021.
† Includes transfer of assets from the Predecessor Funds.
Amounts designated as “—” are $0.
The accompanying notes are an integral part of the financial statements.
123
CATHOLIC RESPONSIBLE INVESTMENTS
| FINANCIAL HIGHLIGHTS |
Selected Per Share Data & Ratios
For a Share Outstanding
Throughout the Period
| Net Asset Value, Beginning of Period | Net Investment Income* | Net Realized and Unrealized Loss on Investments | Total from Operations | Distributions from Net Investment Income | Total Distributions | Net Asset Value, End of Period | Total Return† | Net Assets End of Period (000) | Ratio of Expenses to Average Net Assets** | Ratio of Expenses to Average Net Assets (excluding waivers)** | Ratio of Net Investment Income to Average Net Assets** | Portfolio Turnover‡ | ||||||||||||||||
Catholic Responsible Investments Ultra Short Bond Fund | ||||||||||||||||||||||||||||
Institutional Shares | ||||||||||||||||||||||||||||
2022(1) | $ 10.00 | $ 0.07 | $ –(a) | $ | 0.07 | $ (0.08) | $ (0.08) | $ 9.99 | 0.69% | $ 53,159 | 0.35% | 0.58% | 0.80% | 14% | ||||||||||||||
Catholic Responsible Investments Short Duration Bond Fund | ||||||||||||||||||||||||||||
Institutional Shares | ||||||||||||||||||||||||||||
2022(1) | $ 10.00 | $ 0.13 | $ (0.58) | $ | (0.45 | ) | $ (0.14) | $ (0.14) | $ 9.41 | (4.52)% | $ 473,663 | 0.35% | 0.37% | 1.54% | 95% | |||||||||||||
Catholic Responsible Investments Bond Fund | ||||||||||||||||||||||||||||
Institutional Shares | ||||||||||||||||||||||||||||
2022(1) | $ 10.00 | $ 0.20 | $ (1.77) | $ | (1.57 | ) | $ (0.20) | $ (0.20) | $ 8.23 | (15.86)% | $1,624,983 | 0.36% | 0.36% | 2.39% | 86% | |||||||||||||
Investor Shares | ||||||||||||||||||||||||||||
2022(1) | $ 10.00 | $ 0.18 | $ (1.76) | $ | (1.58 | ) | $ (0.19) | $ (0.19) | $ 8.23 | (15.97)% | $ 50,830 | 0.51% | 0.51% | 2.23% | 86% | |||||||||||||
Catholic Responsible Investments Opportunistic Bond Fund | ||||||||||||||||||||||||||||
Institutional Shares | ||||||||||||||||||||||||||||
2022(1) | $ 10.00 | $ 0.19 | $ (0.96) | $ | (0.77 | ) | $ (0.19) | $ (0.19) | $ 9.04 | (7.75)% | $ 462,249 | 0.41% | 0.44% | 2.24% | 179% | |||||||||||||
Investor Shares | ||||||||||||||||||||||||||||
2022(1) | $ 10.00 | $ 0.18 | $ (0.96) | $ | (0.78 | ) | $ (0.18) | $ (0.18) | $ 9.04 | (7.88)% | $ 27,438 | 0.56% | 0.60% | 2.10% | 179% | |||||||||||||
Catholic Responsible Investments Equity Index Fund | ||||||||||||||||||||||||||||
Institutional Shares | ||||||||||||||||||||||||||||
2022(1) | $ 10.00 | $ 0.11 | $ (1.61) | $ | (1.50 | ) | $ (0.10) | $ (0.10) | $ 8.40 | (15.01)% | $2,837,203 | 0.09% | 0.11% | 1.34% | 21% | |||||||||||||
Catholic Responsible Investments Small-Cap Fund | ||||||||||||||||||||||||||||
Institutional Shares | ||||||||||||||||||||||||||||
2022(1) | $ 10.00 | $ 0.09 | $ (1.08) | $ | (0.99 | ) | $ (0.09) | $ (0.09) | $ 8.92 | (9.88)% | $ 462,990 | 0.29% | 0.29% | 1.09% | 25% | |||||||||||||
Catholic Responsible Investments Multi-Style US Equity Fund | ||||||||||||||||||||||||||||
Institutional Shares | ||||||||||||||||||||||||||||
2022(1) | $ 10.00 | $ 0.03 | $ (1.97) | $ | (1.94 | ) | $ (0.03) | $ (0.03) | $ 8.03 | (19.39)% | $ 618,980 | 0.67% | 0.67% | 0.39% | 33% | |||||||||||||
Investor Shares | ||||||||||||||||||||||||||||
2022(1) | $ 10.00 | $ 0.02 | $ (1.97) | $ | (1.95 | ) | $ (0.02) | $ (0.02) | $ 8.03 | (19.50)% | $ 42,604 | 0.82% | 0.82% | 0.23% | 33% | |||||||||||||
| * | Per share calculated using average shares. |
| † | Total return is for the period indicated and has not been annualized if less than one year. Returns do not reflect the deduction of taxes the shareholder would pay on fund distributions or redemption of fund shares. |
| ‡ | Portfolio turnover is for the period indicated and has not been annualized if less than one year. Excludes effect of in-kind transfers. |
| (1) | Commenced operations on December 6, 2021. |
| (a) | Amount is less than $0.005 per share. |
| ** | Annualized. |
The accompanying notes are an integral part of the financial statements.
124
CATHOLIC RESPONSIBLE INVESTMENTS
| FINANCIAL HIGHLIGHTS |
Selected Per Share Data & Ratios
For a Share Outstanding
Throughout the Period
| Net Asset Value, Beginning of Period | Net Investment Income* | Net Realized and Unrealized Loss on Investments | Total from Operations | Distributions from Net Investment Income | Total Distributions | Net Asset Value, End of Period | Total Return† | Net Assets End of Period (000) | Ratio of Expenses to Average Net Assets** | Ratio of Expenses to Average Net Assets (excluding waivers)** | Ratio of Net Investment Income to Average Net Assets** | Portfolio Turnover‡ | ||||||||||||||
Catholic Responsible Investments International Equity Fund | ||||||||||||||||||||||||||
Institutional Shares | ||||||||||||||||||||||||||
2022(1) | $ 10.00 | $ 0.13 | $ (2.61) | $ (2.48) | $ (0.12) | $ (0.12) | $ 7.40 | (24.88)% | $1,008,309 | 0.82% | 0.82% | 1.68% | 46% | |||||||||||||
Investor Shares | ||||||||||||||||||||||||||
2022(1) | $ 10.00 | $ 0.12 | $ (2.61) | $ (2.49) | $ (0.11) | $ (0.11) | $ 7.40 | (24.98)% | $ 47,864 | 0.97% | 0.97% | 1.52% | 46% | |||||||||||||
Catholic Responsible Investments International Small-Cap Fund | ||||||||||||||||||||||||||
Institutional Shares | ||||||||||||||||||||||||||
2022(1) | $ 10.00 | $ 0.18 | $ (2.47) | $ (2.29) | $ (0.14) | $ (0.14) | $ 7.57 | (22.99)% | $ 65,161 | 1.15% | 1.40% | 2.17% | 69% | |||||||||||||
Catholic Responsible Investments Magnus 45/55 Fund | ||||||||||||||||||||||||||
Institutional Shares | ||||||||||||||||||||||||||
2022(1) | $ 10.00 | $ 0.15 | $ (1.54) | $ (1.39) | $ (0.01) | $ (0.01) | $ 8.60 | (13.93)% | $ 42,017 | –%(2) | 0.20%(2) | 1.75% | 9% | |||||||||||||
Investor Shares | ||||||||||||||||||||||||||
2022(1) | $ 10.00 | $ 0.13 | $ (1.53) | $ (1.40) | $ (0.01) | $ (0.01) | $ 8.59 | (14.03)% | $ 29,405 | 0.15%(2) | 0.35%(2) | 1.56% | 9% | |||||||||||||
Catholic Responsible Investments Magnus 60/40 Alpha Plus Fund | ||||||||||||||||||||||||||
Institutional Shares | ||||||||||||||||||||||||||
2022(1) | $ 10.00 | $ 0.12 | $ (1.68) | $ (1.56) | $ (0.01) | $ (0.01) | $ 8.43 | (15.63)% | $ 702,135 | –%(2) | 0.03%(2) | 1.49% | 3% | |||||||||||||
Investor Shares | ||||||||||||||||||||||||||
2022(1) | $ 10.00 | $ 0.10 | $ (1.67) | $ (1.57) | $ (0.01) | $ (0.01) | $ 8.42 | (15.74)% | $ 296,153 | 0.15%(2) | 0.18%(2) | 1.20% | 3% | |||||||||||||
Catholic Responsible Investments Magnus 60/40 Beta Plus Fund | ||||||||||||||||||||||||||
Institutional Shares | ||||||||||||||||||||||||||
2022(1) | $ 10.00 | $ 0.15 | $ (1.59) | $ (1.44) | $ (0.01) | $ (0.01) | $ 8.55 | (14.42)% | $ 274,863 | –%(2) | 0.06%(2) | 1.82% | 5% | |||||||||||||
Investor Shares | ||||||||||||||||||||||||||
2022(1) | $ 10.00 | $ 0.12 | $ (1.58) | $ (1.46) | $ (0.01) | $ (0.01) | $ 8.53 | (14.63)% | $ 112,716 | 0.15%(2) | 0.21%(2) | 1.47% | 5% | |||||||||||||
Catholic Responsible Investments Magnus 75/25 Fund | ||||||||||||||||||||||||||
Institutional Shares | ||||||||||||||||||||||||||
2022(1) | $ 10.00 | $ 0.12 | $ (1.71) | $ (1.59) | $ (0.01) | $ (0.01) | $ 8.40 | (15.94)% | $ 188,299 | –%(2) | 0.08%(2) | 1.40% | 5% | |||||||||||||
Investor Shares | ||||||||||||||||||||||||||
2022(1) | $ 10.00 | $ 0.10 | $ (1.71) | $ (1.61) | $ (0.01) | $ (0.01) | $ 8.38 | (16.15)% | $ 31,925 | 0.15%(2) | 0.23%(2) | 1.23% | 5% | |||||||||||||
| * | Per share calculated using average shares. |
| † | Total return is for the period indicated and has not been annualized if less than one year. Returns do not reflect the deduction of taxes the shareholder would pay on fund distributions or redemption of fund shares. |
| ‡ | Portfolio turnover is for the period indicated and has not been annualized if less than one year. Excludes effect of in-kind transfers. |
| (1) | Commenced operations on December 6, 2021. |
| (2) | The expense ratios do not include expenses of the underlying affiliated investment companies. |
| ** | Annualized. |
The accompanying notes are an integral part of the financial statements.
125
CATHOLIC RESPONSIBLE INVESTMENTS
OCTOBER 31, 2022
| NOTES TO FINANCIAL STATEMENTS |
1. Organization:
Catholic Responsible Investments Funds (the “Trust”) is an open-end management investment company that currently offers shares of thirteen active separate diversified portfolios: the Catholic Responsible Investments Ultra Short Bond Fund, Catholic Responsible Investments Short Duration Bond Fund, Catholic Responsible Investments Bond Fund, Catholic Responsible Investments Opportunistic Bond Fund, Catholic Responsible Investments Equity Index Fund, Catholic Responsible Investments Small-Cap Fund, Catholic Responsible Investments Multi-Style US Equity Fund, Catholic Responsible Investments International Equity Fund, Catholic Responsible Investments International Small-Cap Fund, Catholic Responsible Investments Magnus 45/55 Fund, Catholic Responsible Investments Magnus 60/40 Alpha Plus Fund, Catholic Responsible Investments Magnus 60/40 Beta Plus Fund, and Catholic Responsible Investments Magnus 75/25 Fund (each, a “Fund” and together, the “Funds”). The Trust was established as a Delaware statutory trust pursuant to an Agreement and Declaration of Trust dated July 8, 2021 and amended and restated November 17, 2021 (the “Declaration of Trust”). The Declaration of Trust permits the Trust to offer separate series (“portfolios”) of units of beneficial interest (“shares”) and separate classes of shares of such portfolios. Each share of each portfolio represents an equal proportionate interest in that portfolio with each other share of that portfolio. The Funds are successors to the funds of the Catholic United Investment Trust (the “Predecessor Funds”). The Predecessor Funds were managed by Christian Brothers Investment Services, Inc. (“CBIS,” or, the “Adviser”) using investment objectives, strategies, policies and restrictions that were in all material respects equivalent to those used in managing the Funds. The Predecessor Funds dissolved and reorganized into the Investor Shares and Institutional Shares of each Fund on December 6, 2021. All of the assets of the Predecessor Funds were transferred to the Funds in connection with the reorganization.
The investment objective of the Catholic Responsible Investments Ultra Short Bond Fund seeks to provide current income consistent with the preservation of capital.
The investment objective of the Catholic Responsible Investments Short Duration Bond Fund seeks maximum current income consistent with the preservation of capital.
The investment objective of the Catholic Responsible Investments Bond Fund seeks current income and long-term capital appreciation.
The investment objective of the Catholic Responsible Investments Opportunistic Bond Fund seeks current income and to provide relatively low correlation to equity assets.
The investment objective of the Catholic Responsible Investments Equity Index Fund seeks to replicate as closely as possible, before expenses, the performance of the S&P500® Index.
The investment objective of the Catholic Responsible Investments Small-Cap Fund seeks to replicate the performance of the S&P SmallCap 600® Index, an index representing small capitalization companies.
The investment objective of the Catholic Responsible Investments Multi-Style US Equity Fund seeks to achieve long-term capital appreciation.
The investment objective of the Catholic Responsible Investments International Equity Fund seeks to achieve long-term capital appreciation.
The investment objective of the Catholic Responsible Investments International Small-Cap Fund seeks to achieve long-term capital appreciation.
The investment objective of each of the Catholic Responsible Investments Magnus 45/55 Fund, Catholic Responsible Investments Magnus 60/40 Alpha Plus Fund, Catholic Responsible Investments Magnus 60/40 Beta Plus Fund and Catholic Responsible Investments Magnus 75/25 Fund (together, the “Magnus Funds”) seeks to achieve current income and long-term capital appreciation.
126
CATHOLIC RESPONSIBLE INVESTMENTS
OCTOBER 31, 2022
Each Fund’s investment objective is not a fundamental policy and may be changed by the Funds’ Board of Trustees (the “Board”) without shareholder approval.
2. Significant Accounting Policies:
The following are significant accounting policies, which are consistently followed in the preparation of its financial statements of the Funds. The Funds are investment companies that apply the accounting and reporting guidance issued in Topic 946 by the U.S. Financial Accounting Standards Board (“FASB”).
Use of Estimates — The preparation of financial statements in conformity with U.S. generally accepted accounting principles (“U.S. GAAP”) requires management to make estimates and assumptions that affect the reported amount of assets and liabilities, disclosure of contingent assets and liabilities at the date of the financial statements and the reported amounts of increases and decreases in net assets from operations during the reporting period. Actual results could differ from those estimates and such differences could be material.
Security Valuation — Securities listed on a securities exchange, market or automated quotation system for which quotations are readily available (except for securities traded on the NASDAQ Stock Market (the “NASDAQ”)), including securities traded over the counter, are valued at the last quoted sale price on an exchange or market (foreign or domestic) on which they are traded on valuation date (or at approximately 4:00 pm ET if a security’s primary exchange is normally open at that time), or, if there is no such reported sale on the valuation date, at the most recent quoted bid price. For securities traded on NASDAQ, the NASDAQ Official Closing Price will be used. If available, debt securities are priced based upon valuations provided by independent, third-party pricing agents. Such values generally reflect the last reported sales price if the security is actively traded. The third-party pricing agents may also value debt securities at an evaluated bid price by employing methodologies that utilize actual market transactions, broker-supplied valuations, or other methodologies designed to identify the market value for such securities. Such methodologies generally consider such factors as security prices, yields, maturities, call features, ratings and developments relating to specific securities in arriving at valuations. On the first day a new debt security purchase is recorded, if a price is not available on the automated pricing feeds from our primary and secondary pricing vendors nor is it available from an independent broker, the security may be valued at its purchase price. Each day thereafter, the debt security will be valued according to the Trusts’ Fair Value Procedures until an independent source can be secured. Debt obligations with remaining maturities of sixty days or less may be valued at their amortized cost, which approximates market value provided that it is determined the amortized cost continues to approximate fair value. Should existing credit, liquidity or interest rate conditions in the relevant markets and issuer specific circumstances suggest that amortized cost does not approximate fair value, then the amortized cost method may not be used. The prices for foreign securities are reported in local currency and converted to U.S. dollars using currency exchange rates. Futures are valued at the final settled price or in lieu of a settled price at the last sale price on the day of valuation.
Securities for which market prices are not “readily available” are valued in accordance with fair value procedures established by the Board. The Funds’ fair value procedures are implemented through a fair value pricing committee (the “Committee”) designated by the Board. Some of the more common reasons that may necessitate that a security be valued using fair value procedures include: the security’s trading has been halted or suspended; the security has been de-listed from a national exchange; the security’s primary trading market is temporarily closed at a time when under normal conditions it would be open; or the security’s primary pricing source is not able or willing to provide a price. When a security is valued in accordance with the fair value procedures, the Committee will determine the value after taking into consideration relevant information reasonably available to the Committee.
For securities that principally trade on a foreign market or exchange, a significant gap in time can exist between the time of a particular security’s last trade and the time at which a Fund calculates its net asset value. The closing prices of such securities may no longer reflect their market value at the time a Fund calculates net asset value if an event that could materially affect the value of those securities (a “Significant Event”) has occurred between the
127
CATHOLIC RESPONSIBLE INVESTMENTS
OCTOBER 31, 2022
time of the security’s last close and the time that a Fund calculates net asset value. A Significant Event may relate to a single issuer or to an entire market sector. If the Board becomes aware of a Significant Event that has occurred with respect to a security or group of securities after the closing of the exchange or market on which the security or securities principally trade, but before the time at which a Fund calculates net asset value, it may request that a Committee meeting be called.
In December 2020, the SEC adopted Rule 2a-5 under the 1940 Act, establishing requirements to determine fair value in good faith for purposes of the 1940 Act. The rule permits fund boards to designate a fund’s investment adviser to perform fair-value determinations, subject to board oversight and certain other conditions. The rule also defines when market quotations are “readily available” for purposes of the 1940 Act and requires a fund to fair value a portfolio investment when a market quotation is not readily available. The SEC also adopted new Rule 31a-4 under the 1940 Act, which sets forth recordkeeping requirements associated with fair-value determinations. The compliance date for Rule 2a-5 and Rule 31a-4 was September 8, 2022.
Effective September 8, 2022, and pursuant to the requirements of Rule 2a-5, the Board designated the Adviser as the Board’s valuation designee to perform fair-value determinations for the Funds through a Fair Value Committee established by the Adviser and approved new Adviser Fair Value Procedures for the Funds. Prior to September 8, 2022, fair-value determinations were performed in accordance with the Trust’s Fair Value Procedures established by the Board and were implemented through a Fair Value Committee designated by the Board.
In accordance with the authoritative guidance on fair value measurements and disclosure under U.S. GAAP, the Funds disclose the fair value of their investments in a hierarchy that prioritizes the inputs to valuation techniques used to measure the fair value. The objective of a fair value measurement is to determine the price that would be received to sell an asset or paid to transfer a liability in an orderly transaction between market participants at the measurement date (an exit price). Accordingly, the fair value hierarchy gives the highest priority to quoted prices (unadjusted) in active markets for identical assets or liabilities (Level 1) and the lowest priority to unobservable inputs (Level 3). The three levels of the fair value hierarchy under ASC 820 are described below:
Level 1 — Unadjusted quoted prices in active markets for identical, unrestricted assets or liabilities that the Funds have the ability to access at the measurement date;
Level 2 — Other significant observable inputs (includes quoted prices for similar securities, interest rates, prepayment speeds, credit risk, referenced indices, quoted prices in inactive markets, adjusted quoted prices in active markets, adjusted quoted prices on foreign equity securities that were adjusted in accordance with the Adviser’s pricing procedures, etc.)
Level 3 — Significant unobservable prices or inputs (including the Fund’s own assumptions in determining the fair value of investments) where there is little or no market activity for the asset or liability at the measurement date.
Investments are classified within the level of the lowest significant input considered in determining fair value. Investments classified within Level 3 whose fair value measurement considers several inputs may include Level 1 or Level 2 inputs as components of the overall fair value measurement.
The unobservable inputs used to determine fair value of recurring Level 3 assets may have similar or diverging impacts on valuation. Significant increases and decreases in these inputs in isolation and interrelationships between those inputs could result in significantly higher or lower fair value measurement.
For the period ended October 31, 2022, there have been no significant changes to the Funds’ fair value methodologies.
Federal Income Taxes — It is each Fund’s intention to qualify as a regulated investment company for Federal income tax purposes by complying with the appropriate provisions of Subchapter M of the Internal
128
CATHOLIC RESPONSIBLE INVESTMENTS
OCTOBER 31, 2022
Revenue Code of 1986, as amended, and to distribute substantially all of its income to shareholders. Accordingly, no provision for Federal income taxes has been made in the financial statements.
The Funds evaluate tax positions taken or expected to be taken in the course of preparing the Funds’ tax returns to determine whether it is “more likely- than-not” (i.e., greater than 50-percent) that each tax position will be sustained upon examination by a taxing authority based on the technical merits of the position. Tax positions deemed to meet the more-likely-than-not threshold are recorded as a tax benefit in the current period. The Funds did not record any tax provision in the current period. However, management’s conclusions regarding tax positions taken may be subject to review and adjustment at a later date based on factors including, but not limited to, examination by tax authorities (i.e., the open tax year ends, since inception), on-going analysis of and changes to tax laws, regulations and interpretations thereof.
As of and during the period ended October 31, 2022, the Funds did not have a liability for any unrecognized tax benefits. The Funds recognize interest and penalties, if any, related to unrecognized tax benefits as income tax expense in the Statements of Operations. During the period the Funds did not incur any interest or penalties.
Security Transactions and Investment Income — Security transactions are accounted for on trade date for financial reporting purposes. Dividend income is recorded on the ex-dividend date and interest income is recognized on the accrual basis. Costs used in determining realized gains and losses on the sales of investment securities are based on specific identification. Interest income is recognized on an accrual basis from settlement date. Discounts and premiums on securities purchased are accreted and amortized using the effective interest method. Realized gains (losses) on paydowns of mortgage-backed and asset-backed securities are recorded as an adjustment to interest income.
Futures Contracts — A futures contract is an agreement involving the delivery of a particular asset on a specified future date at an agreed upon price. The Funds may invest in exchange traded futures. These contracts are generally used to provide the return of a type of security without purchasing the securities of the underlying futures contract or to manage the Fund’s overall exposure to the market risk of the fixed income and equity markets. Upon entering into futures contracts, the Fund maintains an amount of cash or liquid securities, with a value equal to a percentage of the contract amount, with either a futures commission merchant or with its custodian in an account in the broker’s name. This amount is known as initial margin. During the period the futures contract is open, payments are received from or made to the broker based upon the changes in the value of the contract (the variation margin).
A margin deposit held at one counterparty for the futures contracts is included in “Cash pledged as Collateral for Futures Contracts” on the Statement of Assets and Liabilities and would be noted on the Schedule of Investments, if applicable. Variation margin payments are paid or received, depending upon whether unrealized gains or losses are incurred. When the futures contract is closed, the Fund records a realized gain or loss equal to the difference between the proceeds from (or cost of) the closing transaction and the amount invested in the futures contract.
For the period ended October 31, 2022, the quarterly average notional value of futures contracts held was as follows:
Catholic Responsible Investments Short Duration Bond Fund | ||||
Average Monthly Notional Value Long | $ | 7,260,572 | ||
Average Monthly Notional Value Short | $ | (1,023,967 | ) | |
Catholic Responsible Investments Bond Fund | ||||
Average Monthly Notional Value Long | $ | 11,395,289 | ||
Catholic Responsible Investments Equity Index Fund | ||||
Average Monthly Notional Value Long | $ | 7,780,987 | ||
Catholic Responsible Investments Small-Cap Fund | ||||
Average Monthly Notional Value Long | $ | 6,140,953 |
129
CATHOLIC RESPONSIBLE INVESTMENTS
OCTOBER 31, 2022
The following tables are the exposure by type of risk on derivatives held throughout the period:
Catholic Responsible Investments Short Duration Bond Statements of Assets and Liabilities Location | Asset Derivatives | Liability Derivatives | ||||||||
Equity Risk | Unrealized appreciation/(depreciation) | $ | 45,306 | $ | 428,694 | |||||
|
|
|
| |||||||
| $ | 45,306 | $ | 428,694 | |||||||
|
|
|
| |||||||
| Catholic Responsible Investments Equity Index Fund Statements of Assets and Liabilities Location | Asset Derivatives | Liability Derivatives | ||||||||
Equity Risk | Unrealized appreciation/(depreciation) | $ | 85,218 | $ | — | |||||
|
|
|
| |||||||
| $ | 85,218 | $ | — | |||||||
|
|
|
| |||||||
| Catholic Responsible Investments Small-Cap Fund Statements of Assets and Liabilities Location | Asset Derivatives | Liability Derivatives | ||||||||
Equity Risk | Unrealized appreciation/(depreciation) | $ | 160,780 | $ | — | |||||
|
|
|
| |||||||
| $ | 160,780 | $ | — | |||||||
|
|
|
| |||||||
* Unrealized appreciation/(depreciation) on Futures Contracts is included in distributable earnings/(accumulated loss).
The effect of derivative instruments on the Statements of Operations for the period ended October 31, 2022, was as follows:
| Catholic Responsible Investments Short Duration Bond Fund | Net Realized Gain/(Loss)* | Change in Unrealized (Depreciation)** | ||||||
Equity Risk | ||||||||
Futures contracts | $ | (7,372) | $ | (383,388) | ||||
|
|
|
| |||||
| $ | (7,372) | $ | (383,388) | |||||
|
|
|
| |||||
| Catholic Responsible Investments Bond Fund | Net Realized Gain/(Loss)* | Change in Unrealized (Depreciation)** | ||||||
Equity Risk | ||||||||
Futures contracts | $ | (2,582,101) | $ | — | ||||
|
|
|
| |||||
| $ | (2,582,101) | $ | — | |||||
|
|
|
| |||||
130
CATHOLIC RESPONSIBLE INVESTMENTS
OCTOBER 31, 2022
| Catholic Responsible Investments Opportunistic Bond Fund | Net Realized Gain/(Loss)* | Change in Unrealized (Depreciation)** | ||||||
Equity Risk | ||||||||
Futures contracts | $ | 549,322 | $ | — | ||||
|
|
|
| |||||
| $ | 549,322 | $ | — | |||||
|
|
|
| |||||
| Catholic Responsible Investments Equity Index Fund | Net Realized Gain/(Loss)* | Change in Unrealized (Depreciation)** | ||||||
Equity Risk | ||||||||
Futures contracts | $ | (1,568,637) | $ | 85,218 | ||||
|
|
|
| |||||
| $ | (1,568,637) | $ | 85,218 | |||||
|
|
|
| |||||
| Catholic Responsible Investments Small-Cap Fund | Net Realized Gain/(Loss)* | Change in Unrealized (Depreciation)** | ||||||
Equity Risk | ||||||||
Futures contracts | $ | (792,975) | $ | 160,780 | ||||
|
|
|
| |||||
| $ | (792,975) | $ | 160,780 | |||||
|
|
|
| |||||
* Futures contracts are included in net realized gain (loss) on Futures Contracts.
** Futures contracts are included in change in unrealized appreciation (depreciation) on Futures Contracts.
Cash — Idle cash may be swept into various time deposit accounts and money market sweep accounts and is classified as cash on the Statements of Assets and Liabilities. The Funds maintain cash in bank deposit accounts which, at times, may exceed United States federally insured limits. Amounts invested are available on the same business day.
Expenses — Expenses of the Trust that can be directly attributed to a particular Fund are borne by that Fund. Expenses which cannot be directly attributed to a Fund are apportioned among the Funds of the Trust based on the number of funds and/or relative net assets.
Class-specific expenses are borne by that class of shares. Income, realized and unrealized gains/losses and non class-specific expenses are allocated to the respective class on the basis of relative daily net assets.
Dividends and Distributions to Shareholders — The Catholic Responsible Investments Magnus 45/55 Fund, Catholic Responsible Investments Magnus 60/40 Beta Plus Fund, Catholic Responsible Investments Magnus 60/40 Alpha Plus Fund and Catholic Responsible Investments Magnus 75/25 Fund distribute their net investment income and make distributions of their net realized capital gains, if any, at least annually. The Catholic Responsible Investments Ultra Short Bond Fund, Catholic Responsible Investments Short Duration Bond Fund, Catholic Responsible Investments Opportunistic Bond Fund and Catholic Responsible Investments Bond Fund distribute their net investment income monthly and make distributions of their net realized capital gains, if any, at least annually. The Catholic Responsible Investments Equity Index Fund, Catholic Responsible Investments Multi-Style US Equity Fund, Catholic Responsible Investments International Equity Fund, Catholic Responsible Investments Small-Cap Fund and Catholic Responsible Investments International Small-Cap Fund distribute their net investment income quarterly and make distributions or their net realized capital gains, if any, at least annually. All distributions are recorded on ex-dividend date.
131
CATHOLIC RESPONSIBLE INVESTMENTS
OCTOBER 31, 2022
Investments in REITs — Dividend income from Real Estate Investment Trusts (“REIT”) is recorded based on the income included in distributions received from the REIT investments using published REIT reclassifications, including some management estimates when actual amounts are not available. Distributions received in excess of this estimated amount are recorded as a reduction of the cost of investments or reclassified to capital gains. The actual amounts of income, return of capital, and capital gains are only determined by each REIT after its fiscal year-end, and may differ from the estimated amounts.
Redemption Fees — A redemption fee of 2.00% of the value of the shares sold will be imposed on shares of the Catholic Responsible Investments Opportunistic Bond Fund, Catholic Responsible Investments Bond Fund, Catholic Responsible Investments Equity Index Fund, Catholic Responsible Investments Multi-Style US Equity Fund, Catholic Responsible Investments International Equity Fund, Catholic Responsible Investments Small-Cap Fund and Catholic Responsible Investments International Small-Cap Fund redeemed within 30 days or less after their date of purchase (subject to certain exceptions as discussed below in “Redemption Fees”). Such fees are retained by the Funds for the benefit of the remaining shareholders and are recorded as additions to fund capital.
Deferred Offering Costs — Offering costs of the Funds, including costs of printing the initial prospectus, legal, and registration fees, are amortized to expense over a twelve month period.
Securities Lending — Each Fund may lend portfolio securities to brokers, dealers and other financial organizations that meet capital and other credit requirements or other criteria established by the Board. These loans, if and when made, may not exceed 33 1⁄3% of the total asset value of the Fund (including the loan collateral). Each Fund will not lend portfolio securities to its Adviser or its affiliates unless it has applied for and received specific authority to do so from the SEC. Loans of portfolio securities will be fully collateralized by cash, letters of credit or U.S. Government securities, and the collateral will be maintained in an amount equal to at least 100% of the current market value of the loaned securities by marking to market daily, although the borrower will be required to deliver collateral of 102% and 105% of the market value of borrowed securities for domestic and foreign issuers, respectively. Any gain or loss in the market price of the securities loaned that might occur during the term of the loan would be for the account of the Fund. The investment of cash collateral subjects a Fund to market risk. A Fund remains obligated to return all collateral to the borrower under the terms of its securities lending arrangements even if the value of the investments made with the collateral has declined. Accordingly, if the value of a security in which the cash collateral has been invested declines, the loss would be borne by the Fund, and the Fund may be required to liquidate other investments in order to return collateral to the borrower at the end of a loan. The following table discloses the securities on loan as of October 31, 2022:
Fund | Market Value Securities on Loan | Cash Collateral for Securities on Loan | ||||||||
Catholic Responsible Investments Equity Index Fund | $ | 1,588,164 | $ | 1,620,447 | ||||||
Catholic Responsible Investments Small-Cap Fund | 3,380,973 | 3,468,565 | ||||||||
Catholic Responsible Investments International Equity Fund | 11,224,539 | 11,832,868 | ||||||||
Catholic Responsible Investments International Small-Cap Fund | 511,549 | 542,527 | ||||||||
Repurchase Agreements — A repurchase agreement is an agreement in which one party sells securities to another party in return for cash with an agreement to repurchase equivalent securities at an agreed-upon price and on an agreed-upon future date. A Fund may enter into repurchase agreements with financial institutions and follow certain procedures designed to minimize the risks inherent in such agreements. These procedures include effecting repurchase transactions only with large, well-capitalized and well-established financial institutions deemed creditworthy by the Adviser. The repurchase agreements entered into by a Fund will provide that the underlying collateral shall have a value equal to at least 102% of the resale price stated in the agreement at all times. The Adviser monitors compliance with this requirement as well as the ongoing financial condition and creditworthiness of the counterparty. Under all repurchase agreements entered into by a Fund, the Fund’s custodian or its agent must take possession of the underlying collateral. In the event of a default or bankruptcy by a selling financial institution, a Fund will seek to liquidate such collateral. However, the exercising of each Fund’s right to liquidate such collateral could involve certain costs or delays and, to the extent that proceeds from any sale
132
CATHOLIC RESPONSIBLE INVESTMENTS
OCTOBER 31, 2022
upon a default of the obligation to repurchase were less than the repurchase price, the Fund could suffer a loss. At times, the investments of each of the Funds in repurchase agreements may be substantial when, in the view of the Adviser, liquidity or other considerations so warrant.
3. Transactions with Affiliates:
Certain officers of the Trust are also employees of SEI Investments Global Funds Services (the “Administrator”), a wholly owned subsidiary of SEI Investments Company, and/or SEI Investments Distribution Co. (the “Distributor”). Such officers are paid no fees by the Trust, other than the Chief Compliance Officer (“CCO”) as described below, for serving as officers of the Trust.
A portion of the services provided by the CCO and his staff, whom are employees of the Administrator, are paid for by the Trust as incurred. The services include regulatory oversight of the Trust’s Advisors and service providers as required by SEC regulations. The CCO’s services and fees have been approved by and are reviewed by the Board.
The Magnus Funds invest soley in underlying CRI funds.
4. Administration, Distribution, Shareholder Servicing, Transfer Agent and Custody Agreements:
The Funds and the Administrator are parties to an Administration Agreement under which the Administrator provides management and administrative services to the Funds. For these services, the Administrator is paid an asset-based fee, which will vary depending on the number of share classes and the average daily net assets of the Funds.
For the period ended October 31, 2022, the Funds were charged the following for these services:
| Administration Fees | ||||
Catholic Responsible Investments Ultra Short Bond Fund | $ | 10,445 | ||
Catholic Responsible Investments Short Duration Bond Fund | 92,028 | |||
Catholic Responsible Investments Bond Fund | 309,931 | |||
Catholic Responsible Investments Opportunistic Bond Fund | 95,241 | |||
Catholic Responsible Investments Equity Index Fund | 548,930 | |||
Catholic Responsible Investments Small-Cap Fund | 84,926 | |||
Catholic Responsible Investments Multi-Style US Equity Fund | 132,966 | |||
Catholic Responsible Investments International Equity Fund | 215,729 | |||
Catholic Responsible Investments International Small-Cap Fund | 13,022 | |||
The Trust and the Distributor are parties to a Distribution Agreement. The Distributor receives no fees under the agreement.
The Funds have adopted a shareholder servicing plan that provides that the Funds may pay financial intermediaries for shareholder services in an annual amount not to exceed 0.15% based on the average daily net assets of the Funds’ Investor Shares. The Funds do not pay these service fees on shares purchased directly. In addition to payments made directly to financial intermediaries by the Funds, the Adviser or its affiliates may, at their own expense, pay financial intermediaries for these and other services to the Funds’ shareholders. For the period ended October 31, 2022, these amounts can be found on the Statement of Operations under Shareholder Servicing Fees.
Atlantic Shareholder Services, LLC serves as the Transfer Agent and dividend disbursing agent for the Funds under a transfer agency agreement.
Brown Brothers Harriman & Co. serves as custodian (the “Custodian”) for the Funds. The Custodian plays no role in determining the investment policies of the Funds or which securities are to be purchased and sold by the Funds.
133
CATHOLIC RESPONSIBLE INVESTMENTS
OCTOBER 31, 2022
5. Investment Advisory Agreement:
The Trust and the Adviser have entered into an investment advisory agreement (the “Advisory Agreement”). Pursuant to the Advisory Agreement, the Adviser provides investment advisory services to the Funds and oversees the investment sub-advisory services provided to the Asset Class Funds. Pursuant to separate sub-advisory agreements (the “Sub-Advisory Agreements” and, together with the Advisory Agreement, the “Investment Advisory Agreements”) with the Adviser, and under the supervision of the Adviser and the Board, one or more Sub-Advisers are responsible for the day-to-day investment management of all or a distinct portion of the assets of the Asset Class Funds. The Adviser pays each Fund’s Sub-Advisers out of the fee it receives from such Fund.
After its initial two year term, the continuance of each Investment Advisory Agreement with respect to each Fund must be specifically approved at least annually: (i) by the vote of a majority of the outstanding voting securities of that Fund or by the Trustees; and (ii) by the vote of a majority of the Trustees who are not parties to such Investment Advisory Agreement or “interested persons” (as defined under the 1940 Act) of any party thereto, cast in person at a meeting called for the purpose of voting on such approval. The Advisory Agreement will terminate automatically in the event of its assignment and is terminable at any time without penalty by the Board or, with respect to a Fund, by a majority of the outstanding voting securities of that Fund, or by the Adviser on not less than 30 days’ nor more than 60 days’ written notice to the Trust. Each Sub-Advisory Agreement will terminate automatically in the event of its assignment or in the event of the termination of the Advisory Agreement and is terminable at any time without penalty by the Board or, with respect to a Fund, by a majority of the outstanding voting securities of that Fund, or by the Adviser or Sub-Adviser on not less than 30 days’ nor more than 60 days’ written notice to the other party.
For its services under the Advisory Agreement, the Adviser is entitled to a fee, which is calculated daily and paid monthly, at the following annual rates based on the average daily net assets of each Fund:
Fund | Advisory Fee | |
Catholic Responsible Investments Ultra Short Bond Fund | 0.25% | |
Catholic Responsible Investments Short Duration Bond Fund | 0.30% | |
Catholic Responsible Investments Bond Fund | 0.30% | |
Catholic Responsible Investments Opportunistic Bond Fund | 0.35% | |
Catholic Responsible Investments Equity Index Fund | 0.06% | |
Catholic Responsible Investments Small-Cap Fund | 0.20% | |
Catholic Responsible Investments Multi-Style US Equity Fund | 0.60% | |
Catholic Responsible Investments International Equity Fund | 0.74% | |
Catholic Responsible Investments International Small-Cap | 0.96% | |
Catholic Responsible Investments Magnus 45/55 Fund | 0.00% | |
Catholic Responsible Investments Magnus 60/40 Alpha Plus Fund | 0.00% | |
Catholic Responsible Investments Magnus 60/40 Beta Plus Fund | 0.00% | |
Catholic Responsible Investments Magnus 75/25 Fund | 0.00% |
The Magnus Funds do not pay an advisory fee due to the fact their sole investments are in CRI underlying funds.
For each Fund, the Adviser has contractually agreed to waive fees and reimburse expenses to the extent necessary to keep the Fund’s total annual Fund operating expenses (excluding shareholder servicing fees, interest, taxes, brokerage commissions and other costs and expenses relating to the securities that are purchased and sold by the Fund, dividend and interest expenses on securities sold short, acquired fund fees and expenses, fees and expenses incurred in connection with tax reclaim recovery services, other expenditures which are capitalized in accordance with generally accepted accounting principles, and other non-routine expenses (collectively, “excluded expenses”)) for each of that Fund’s share class(es) from exceeding certain levels as set forth below until October 31, 2023 (each, a “contractual expense limit”). In addition, the Adviser may receive from a Fund the difference between the total annual Fund operating expenses (not including excluded expenses) and the Fund’s contractual expense limit to recoup all or a portion of its prior fee waivers or expense reimbursements made during the rolling three-year period preceding the date of the recoupment if at any point total annual Fund
134
CATHOLIC RESPONSIBLE INVESTMENTS
OCTOBER 31, 2022
operating expenses (not including excluded expenses) are below the contractual expense limit (i) at the time of the fee waiver and/or expense reimbursement and (ii) at the time of the recoupment. This agreement may be terminated: (i) by the Board, for any reason at any time; or (ii) by the Adviser, upon ninety (90) days’ prior written notice to the Trust, effective as of the close of business on October 31, 2023. As of October 31, 2022, the amounts waived on the Statement of Operations under Waiver of Investment Advisory Fees or Waiver of Expenses are open to recoupment.
| Fund | Contractual Expense Limit | |
Catholic Responsible Investments Ultra Short Bond Fund | 0.35% | |
Catholic Responsible Investments Short Duration Bond Fund | 0.35% | |
Catholic Responsible Investments Bond Fund | 0.37% | |
Catholic Responsible Investments Opportunistic Bond Fund | 0.41% | |
Catholic Responsible Investments Equity Index Fund | 0.09% | |
Catholic Responsible Investments Small-Cap Fund | 0.31% | |
Catholic Responsible Investments Multi-Style US Equity Fund | 0.69% | |
Catholic Responsible Investments International Equity Fund | 0.84% | |
Catholic Responsible Investments International Small-Cap | 1.15% | |
Catholic Responsible Investments Magnus 45/55 Fund | 0.00% | |
Catholic Responsible Investments Magnus 60/40 Alpha Plus Fund | 0.00% | |
Catholic Responsible Investments Magnus 60/40 Beta Plus Fund | 0.00% | |
Catholic Responsible Investments Magnus 75/25 Fund | 0.00% |
6. Investment Transactions:
For the period ended October 31, 2022, the purchases and sales of investment securities other than short-term investments and in-kind transactions, were as follows:
| U.S. Government | Other | Total | ||||||||||
Catholic Responsible Investments Ultra Short Bond Fund | ||||||||||||
Purchases | $ | — | $ | 359,269 | $ | 359,269 | ||||||
Sales | — | 3,610,898 | 3,610,898 | |||||||||
Catholic Responsible Investments Short Duration Bond Fund | ||||||||||||
Purchases | 276,135,634 | 176,421,746 | 452,557,380 | |||||||||
Sales | 243,833,284 | 262,349,452 | 506,182,736 | |||||||||
Catholic Responsible Investments Bond Fund | ||||||||||||
Purchases | 1,049,270,912 | 428,941,229 | 1,478,212,141 | |||||||||
Sales | 990,220,081 | 313,870,884 | 1,304,090,965 | |||||||||
Catholic Responsible Investments Opportunistic Bond Fund | ||||||||||||
Purchases | 480,308,187 | 227,930,138 | 708,238,325 | |||||||||
Sales | 437,672,723 | 260,842,857 | 698,515,580 | |||||||||
Catholic Responsible Investments Equity Index Fund | ||||||||||||
Purchases | — | 678,923,376 | 678,923,376 | |||||||||
Sales | — | 634,030,770 | 634,030,770 | |||||||||
Catholic Responsible Investments Small-Cap Fund | ||||||||||||
Purchases | — | 115,861,984 | 115,861,984 | |||||||||
Sales | — | 117,854,774 | 117,854,774 | |||||||||
Catholic Responsible Investments Multi-Style US Equity Fund | ||||||||||||
Purchases | — | 222,433,295 | 222,433,295 | |||||||||
Sales | — | 246,393,065 | 246,393,065 | |||||||||
Catholic Responsible Investments International Equity Fund | ||||||||||||
Purchases | — | 654,404,787 | 654,404,787 | |||||||||
Sales | — | 518,713,558 | 518,713,558 | |||||||||
Catholic Responsible Investments International Small-Cap Fund | ||||||||||||
Purchases | — | 58,231,929 | 58,231,929 | |||||||||
Sales | — | 48,337,118 | 48,337,118 | |||||||||
Catholic Responsible Investments Magnus 45/55 Fund | ||||||||||||
Purchases | — | 7,876,520 | 7,876,520 | |||||||||
Sales | — | 13,812,459 | 13,812,459 | |||||||||
135
CATHOLIC RESPONSIBLE INVESTMENTS
OCTOBER 31, 2022
| U.S. Government | Other | Total | ||||||||||
Catholic Responsible Investments Magnus 60/40 Alpha Plus Fund | ||||||||||||
Purchases | $ | — | $ | 40,098,610 | $ | 40,098,610 | ||||||
Sales | — | 26,575,227 | 26,575,227 | |||||||||
Catholic Responsible Investments Magnus 60/40 Beta Plus Fund | ||||||||||||
Purchases | — | 111,980,614 | 111,980,614 | |||||||||
Sales | — | 17,026,404 | 17,026,404 | |||||||||
Catholic Responsible Investments Magnus 75/25 Fund | ||||||||||||
Purchases | — | 12,593,560 | 12,593,560 | |||||||||
Sales | — | 54,158,735 | 54,158,735 | |||||||||
7. Federal Tax Information:
The amount and character of income and capital gain distributions to be paid, if any, are determined in accordance with Federal income tax regulations, which may differ from U.S. GAAP. As a result, net investment income (loss) and net realized gain/(loss) on investment transactions for a reporting period may differ significantly from distributions during the period. The book/tax differences may be temporary or permanent. To the extent these differences are permanent in nature, they are charged or credited to undistributed net investment income (loss), accumulated net realized gain (loss) or paid-in capital as appropriate, in the period that the difference arises.
During the fiscal period October 31, 2022, there were no permanent differences credited or charged to Paid-in Capital and Distributable Earnings.
The tax character of dividends and distributions declared during the fiscal period ended October 31, 2022 were as follows:
| Ordinary Income | Long-Term Capital Gain | Return of Capital | Total | |||||||||||||
Catholic Responsible Investments Ultra Short Bond Fund | ||||||||||||||||
2022 | $422,750 | $— | $— | $422,750 | ||||||||||||
Catholic Responsible Investments Short Duration Bond Fund | ||||||||||||||||
2022 | 7,441,449 | — | — | 7,441,449 | ||||||||||||
Catholic Responsible Investments Bond Fund | ||||||||||||||||
2022 | 37,408,985 | — | — | 37,408,985 | ||||||||||||
Catholic Responsible Investments Opportunistic Bond Fund | ||||||||||||||||
2022 | 9,891,170 | — | — | 9,891,170 | ||||||||||||
Catholic Responsible Investments Equity Index Fund | ||||||||||||||||
2022 | 34,703,700 | — | — | 34,703,700 | ||||||||||||
Catholic Responsible Investments Small-Cap Fund | ||||||||||||||||
2022 | 4,675,712 | — | — | 4,675,712 | ||||||||||||
Catholic Responsible Investments Multi-Style US Equity Fund | ||||||||||||||||
2022 | 2,413,760 | — | — | 2,413,760 | ||||||||||||
Catholic Responsible Investments International Equity Fund | ||||||||||||||||
2022 | 16,356,456 | — | — | 16,356,456 | ||||||||||||
Catholic Responsible Investments International Small-Cap Fund | ||||||||||||||||
2022 | 1,201,904 | — | — | 1,201,904 | ||||||||||||
Catholic Responsible Investments Magnus 45/55 Fund | ||||||||||||||||
2022 | 76,301 | — | — | 76,301 | ||||||||||||
Catholic Responsible Investments Magnus 60/40 Alpha Plus Fund | ||||||||||||||||
2022 | 918,825 | — | — | 918,825 | ||||||||||||
Catholic Responsible Investments Magnus 60/40 Beta Plus Fund | ||||||||||||||||
2022 | 305,435 | — | — | 305,435 | ||||||||||||
Catholic Responsible Investments Magnus 75/25 Fund | ||||||||||||||||
2022 | 207,489 | — | — | 207,489 | ||||||||||||
136
CATHOLIC RESPONSIBLE INVESTMENTS
OCTOBER 31, 2022
As of October 31, 2022, the components of distributable earnings (accumulated losses) on a tax basis were as follows:
| Undistributed Ordinary Income | Undistributed Long-Term Capital Gain | Capital Loss Carryforwards | Unrealized Appreciation (Depreciation) | Other Temporary Differences | Total Distributable Earnings (Accumulated Losses) | |||||||||||||||||||
Catholic Responsible | $ | 45,758 | $ | — | $ | (15,684 | ) | $ | (84,709 | ) | $ | (39,862 | ) | $ | (94,497 | ) | ||||||||
Catholic Responsible | 172,162 | — | (11,933,982 | ) | (19,779,092 | ) | (39,863 | ) | (31,580,775 | ) | ||||||||||||||
Catholic Responsible | 508,310 | — | (70,106,182 | ) | (214,404,442 | ) | (59,243 | ) | (284,061,557 | ) | ||||||||||||||
Catholic Responsible | 167,646 | — | (22,668,460 | ) | (25,124,882 | ) | (59,170 | ) | (47,684,866 | ) | ||||||||||||||
Catholic Responsible | 2,590,289 | — | (18,891,817 | ) | 829,551,638 | (39,864 | ) | 813,210,246 | ||||||||||||||||
Catholic Responsible | 202,386 | 15,826,441 | — | 37,194,001 | (39,864 | ) | 53,182,964 | |||||||||||||||||
Catholic Responsible | 91,835 | — | (17,018,866 | ) | (55,080,870 | ) | (59,302 | ) | (72,067,203 | ) | ||||||||||||||
Catholic Responsible | 1,438,932 | — | (10,706,396 | ) | (66,014,867 | ) | (68,474 | ) | (75,350,805 | ) | ||||||||||||||
Catholic Responsible | 160,718 | — | (2,778,214 | ) | (12,444,108 | ) | (39,883 | ) | (15,101,487 | ) | ||||||||||||||
Catholic Responsible | 1,277,973 | — | (1,467,696 | ) | (875,192 | ) | (59,337 | ) | (1,124,252 | ) | ||||||||||||||
Catholic Responsible | 12,805,313 | — | (705,213 | ) | (11,655,150 | ) | (59,246 | ) | 385,704 | |||||||||||||||
Catholic Responsible | 5,275,573 | — | (83,980 | ) | 7,776,994 | (59,244 | ) | 12,909,343 | ||||||||||||||||
Catholic Responsible | 4,836,007 | — | ��� | 7,219,842 | (59,244 | ) | 11,996,605 | |||||||||||||||||
137
CATHOLIC RESPONSIBLE INVESTMENTS
OCTOBER 31, 2022
For Federal income tax purposes, capital loss carryforwards may be carried forward and applied against future capital gains. Losses carried forward are as follows:
| Short-Term Loss | Long-Term Loss | Total | ||||||||||
Catholic Responsible Investments Ultra Short Bond Fund | $ | 13,136 | $ | 2,548 | $ | 15,684 | ||||||
Catholic Responsible Investments Short Duration Bond Fund | 5,069,824 | 6,864,158 | 11,933,982 | |||||||||
Catholic Responsible Investments Bond Fund | 41,742,162 | 28,364,020 | 70,106,182 | |||||||||
Catholic Responsible Investments Opportunistic Bond Fund | 11,710,286 | 10,958,174 | 22,668,460 | |||||||||
Catholic Responsible Investments Equity Index Fund | 18,891,817 | — | 18,891,817 | |||||||||
Catholic Responsible Investments Multi-Style US Equity Fund | 8,722,283 | 8,296,583 | 17,018,866 | |||||||||
Catholic Responsible Investments International Equity Fund | 10,706,396 | — | 10,706,396 | |||||||||
Catholic Responsible Investments International Small-Cap Fund | 2,778,214 | — | 2,778,214 | |||||||||
Catholic Responsible Investments Magnus 45/55 Fund | 832,678 | 635,017 | 1,467,695 | |||||||||
Catholic Responsible Investments Magnus 60/40 Alpha Plus Fund | 704,484 | 729 | 705,213 | |||||||||
Catholic Responsible Investments Magnus 60/40 Beta Plus Fund | 83,110 | 870 | 83,980 | |||||||||
The differences between book and tax-basis unrealized appreciation and depreciation are attributable primarily to the tax deferral of losses on wash sales and passive foreign investment companies. The federal tax cost and aggregate gross unrealized appreciation and depreciation on investments held by the Funds at October 31, 2022, were as follows:
| Federal Tax Cost | Aggregate Gross Unrealized Appreciation | Aggregate Gross Unrealized Depreciation | Net Unrealized Appreciation (Depreciation) | |||||||||||||
Catholic Responsible Investments Ultra Short Bond Fund | $ | 55,054,301 | $ | 1,237 | $ | (85,946 | ) | $ | (84,709 | ) | ||||||
Catholic Responsible Investments Short Duration Bond Fund | 476,421,838 | 26,460 | (19,805,552 | ) | (19,779,092 | ) | ||||||||||
Catholic Responsible Investments Bond Fund | 1,859,678,498 | 1,503,518 | (215,907,960 | ) | (214,404,442 | ) | ||||||||||
Catholic Responsible Investments Opportunistic Bond Fund | 499,784,439 | 247,175 | (25,372,057 | ) | (25,124,882 | ) | ||||||||||
Catholic Responsible Investments Equity Index Fund | 1,999,674,281 | 935,670,428 | (106,118,790 | ) | 829,551,638 | |||||||||||
Catholic Responsible Investments Small-Cap Fund | 420,685,273 | 95,898,030 | (58,704,029 | ) | 37,194,001 | |||||||||||
Catholic Responsible Investments Multi-Style US Equity Fund | 693,803,201 | 43,450,946 | (98,531,816 | ) | (55,080,870 | ) | ||||||||||
Catholic Responsible Investments International Equity Fund | 1,102,066,937 | 108,994,309 | (175,009,176 | ) | (66,014,867 | ) | ||||||||||
Catholic Responsible Investments International Small-Cap Fund | 75,860,765 | 3,802,727 | (16,246,835 | ) | (12,444,108 | ) | ||||||||||
Catholic Responsible Investments Magnus 45/55 Fund | 72,208,490 | 4,178,653 | (5,053,845 | ) | (875,192 | ) | ||||||||||
Catholic Responsible Investments Magnus 60/40 Alpha Plus Fund | 1,010,074,116 | 56,265,686 | (67,920,836 | ) | (11,655,150 | ) | ||||||||||
Catholic Responsible Investments Magnus 60/40 Beta Plus Fund | 379,822,207 | 25,815,126 | (18,038,132 | ) | 7,776,994 | |||||||||||
Catholic Responsible Investments Magnus 75/25 Fund | 212,899,204 | 17,574,791 | (10,354,949 | ) | 7,219,842 | |||||||||||
8. Concentration of Shareholders:
At October 31, 2022, the percentage of total shares outstanding held by Institutional Class shareholders for each Fund, which are comprised of individual shareholders and omnibus accounts that are held on behalf of various individual shareholders was as follows:
| No. of Shareholders | % Ownership | |||||||
Catholic Responsible Investments Ultra Short Bond Fund | 3 | 22 | ||||||
Catholic Responsible Investments Short Duration Bond Fund | 3 | 39 | ||||||
Catholic Responsible Investments Bond Fund | 2 | 21 | ||||||
Catholic Responsible Investments Opportunistic Bond Fund | 4 | 45 | ||||||
Catholic Responsible Investments Equity Index Fund | 3 | 23 | ||||||
Catholic Responsible Investments Small-Cap Fund | 3 | 25 | ||||||
Catholic Responsible Investments Multi-Style US Equity Fund | 2 | 44 | ||||||
Catholic Responsible Investments International Equity Fund | 4 | 41 | ||||||
Catholic Responsible Investments International Small-Cap Fund | 4 | 73 | ||||||
138
CATHOLIC RESPONSIBLE INVESTMENTS
OCTOBER 31, 2022
| No. of Shareholders | % Ownership | |||||||
Catholic Responsible Investments Magnus 45/55 Fund | 5 | 61 | ||||||
Catholic Responsible Investments Magnus 60/40 Alpha Plus Fund | 4 | 42 | ||||||
Catholic Responsible Investments Magnus 60/40 Beta Plus Fund | 7 | 55 | ||||||
Catholic Responsible Investments Magnus 75/25 Fund | 6 | 50 | ||||||
In the normal course of business, the Funds enter into contracts that provide general indemnifications. The Funds’ maximum exposure under these arrangements is dependent on future claims that may be made against the Funds and, therefore, cannot be established; however, based on experience, the risk of loss from such claim is considered remote.
9. Concentration of Risks:
The foregoing is not intended to be a complete discussion of the risks associated with investing in a Fund. Please review each Fund’s prospectus for additional disclosures regarding the principal risks associated with investing in a particular Fund.
As with all mutual funds, there is no guarantee that the Funds will achieve their investment objectives. You could lose money by investing in the Funds. A Fund share is not a bank deposit and is not insured or guaranteed by the Federal Deposit Insurance Corporation or any government agency. The principal risk factors affecting shareholders’ investments in the Funds are set forth below.
Derivatives Risk — Derivatives are instruments that derive their value from an underlying security, financial asset or an index. Examples of derivative instruments include futures contracts, forward contracts, options and swaps. Changes in the market value of a security that is a reference asset for a derivative instrument may not be proportionate to changes in the market value of the derivative instrument itself. There may not be a liquid market for a Fund to sell a derivative instrument, which could result in difficulty in closing the position. Moreover, certain derivative instruments can magnify the extent of losses incurred due to changes in the market value of the securities to which they relate. Some derivative instruments are subject to counterparty risk. A default by the counterparty on its payments to a Fund will cause the value of your investment in the Fund to decrease. A Fund’s use of derivatives is also subject to credit risk, leverage risk, lack of availability risk, valuation risk, correlation risk and tax risk. Credit risk and leverage risk are each described elsewhere in this section. A Fund’s counterparties to its derivative contracts present the same types of credit risk as issuers of fixed income securities. Lack of availability risk is the risk that suitable derivative transactions, such as roll-forward contracts, may not be available in all circumstances for risk management or other purposes. Valuation risk is the risk that a particular derivative may be valued incorrectly. Correlation risk is the risk that changes in the value of the derivative may not correlate perfectly with the underlying asset, rate or index. Tax risk is the risk that the use of derivatives may cause a Fund to realize higher amounts of short-term capital gains, thereby increasing the amount of taxes payable by some shareholders. These risks could cause a Fund to lose more than the principal amount invested. Some derivatives have the potential for unlimited loss, regardless of the size of a Fund’s initial investment.
New Fund Risk — Because the Funds are new, investors in the Funds bear the risk that the Funds may not be successful in implementing their investment strategies, may not employ successful investment strategies, or may fail to attract sufficient assets under management to realize economies of scale, any of which could result in the Funds being liquidated at any time without shareholder approval and at a time that may not be favorable for all shareholders. Such liquidation could have negative tax consequences for shareholders and will cause shareholders to incur expenses of liquidation.
Foreign Currency Risk — Because non-U.S. securities are usually denominated in currencies other than the dollar, the value of a Fund’s portfolio may be influenced by currency exchange rates and exchange control regulations. The currencies of emerging market countries may experience significant declines against the U.S. dollar, and devaluation may occur subsequent to investments in these currencies by a Fund. Inflation and rapid fluctuations in
139
CATHOLIC RESPONSIBLE INVESTMENTS
OCTOBER 31, 2022
inflation rates have had, and may continue to have, negative effects on the economies and securities markets of certain emerging market countries.
Investments in Underlying Funds Risk — The value of an investment in the Funds is based primarily on the prices of the Underlying Funds in which the Funds invest. In turn, the price of each Underlying Fund is based on the value of its assets. Each Fund, and thus its shareholders, bears its own direct expenses in addition to bearing a proportionate share of expenses of the Underlying Funds, which may make owning shares of such Fund more costly than owning shares of the Underlying Funds directly. Before investing in the Funds, investors should assess the risks associated with the Underlying Funds and the types of investments made by those Underlying Funds. These risks include any combination of the risks described elsewhere in this section, although a Fund’s exposure to a particular risk will be proportionate to the Fund’s overall asset allocation and Underlying Fund allocation.
Market Risk — The risk that the market value of an investment may move up and down, sometimes rapidly and unpredictably. A Fund’s NAV per share will fluctuate with the market prices of its portfolio securities. Market risk may affect a single issuer, an industry, a sector or the equity or bond market as a whole. Markets for securities in which a Fund invests may decline significantly in response to adverse issuer, political, regulatory, market, economic or other developments that may cause broad changes in market value, public perceptions concerning these developments, and adverse investor sentiment or publicity. Similarly, the impact of any epidemic, pandemic or natural disaster, or widespread fear that such events may occur, could negatively affect the global economy, as well as the economies of individual countries, the financial performance of individual companies and sectors, and the markets in general in significant and unforeseen ways. Any such impact could adversely affect the prices and liquidity of the securities and other instruments in which a Fund invests, which in turn could negatively impact the Fund’s performance and cause losses on your investment in the Fund. Recent examples include pandemic risks related to COVID-19 and aggressive measures taken worldwide in response by governments, including closing borders, restricting international and domestic travel, and the imposition of prolonged quarantines of large populations, and by businesses, including changes to operations and reducing staff. The impact of the COVID-19 pandemic may be short term or may last for an extended period of time, and in either case could result in a substantial economic downturn or recession.
10. In-Kind Transfers of Securities:
The Funds may issue or redeem shares in-kind. These securities and cash, if any, are transferred at their current value on the date of such transactions. Any recognized gain is included on the Statements of Operations under Net Realized Gain (Loss) on Investments. See below for in-kind transfers during the period ended October 31, 2022.
| Shares Issued | Value | Gain | ||||||||||
Catholic Responsible Investments Bond Fund | 16,889,665 | $ | 146,810,988 | $ | – | |||||||
Catholic Responsible Investments Multi-Style US Equity Fund | 4,531,541 | 37,521,159 | – | |||||||||
Due to the Funds’ reorganization on December 6, 2021, the Funds received contributions in-kind of investment securities. The securities were received in a tax-free transaction at their current fair value including unrealized appreciation/depreciation as noted in the table below on the date of the transactions. The Funds made an accounting policy election to carryforward the historical cost basis of the securities transferred given the tax-free
140
CATHOLIC RESPONSIBLE INVESTMENTS
OCTOBER 31, 2022
nature of the transaction. As a result of this contribution, the following units of the Fund were issued for assets valued at:
| Units Issued | Securities At Value | Cash | Income Receivable | Other | Total Assets | Unrealized Appreciation/ (Depreciation) | ||||||||||||||||||||||
Catholic Responsible Investments Ultra Short Bond Fund | 6,167,174 | $ | 50,062,171 | $ | 11,592,443 | $ | 47,908 | $ | — | $ | 61,702,522 | $ | (24,654 | ) | ||||||||||||||
Catholic Responsible Investments Short | 53,069,668 | 508,549,766 | 19,311,957 | 2,597,565 | — | 530,459,288 | (151,761 | ) | ||||||||||||||||||||
Catholic Responsible Investments Bond Fund | 177,862,008 | 1,708,891,087 | 62,494,447 | 6,506,080 | 1,029,109 | 1,778,920,723 | 49,389,396 | |||||||||||||||||||||
Catholic Responsible Investments | 52,152,969 | 502,844,264 | 16,260,246 | 2,412,933 | 2,167 | 521,519,610 | 1,978,291 | |||||||||||||||||||||
Catholic Responsible Investments Equity | 333,201,648 | 3,327,560,433 | 380,171 | 3,833,324 | 27,536 | 3,331,801,464 | 1,349,580,320 | |||||||||||||||||||||
Catholic Responsible Investments Small-Cap Fund | 51,612,440 | 515,226,417 | 485,709 | 417,745 | — | 516,129,871 | 108,362,292 | |||||||||||||||||||||
Catholic Responsible Investments Multi-Style | 79,868,550 | 798,383,041 | 16,731 | 444,471 | 6,437 | 798,850,680 | 82,513,106 | |||||||||||||||||||||
Catholic Responsible Investments | 130,018,252 | 1,262,019,716 | 37,303,994 | 962,979 | 13,670 | 1,300,300,359 | 277,330,531 | |||||||||||||||||||||
Catholic Responsible Investments | 7,670,860 | 72,842,536 | 3,793,960 | 74,782 | — | 76,711,278 | 4,831,673 | |||||||||||||||||||||
Catholic Responsible Investments Magnus | 9,158,563 | 91,564,944 | 1,439 | — | — | 91,566,383 | 11,952,648 | |||||||||||||||||||||
Catholic Responsible Investments Magnus | 118,573,471 | 1,185,789,677 | 114,685 | — | — | 1,185,904,362 | 188,485,112 | |||||||||||||||||||||
Catholic Responsible Investments Magnus | 32,272,630 | 352,671,372 | 17,874 | — | — | 352,689,246 | 67,719,305 | |||||||||||||||||||||
Catholic Responsible Investments Magnus | 30,470,066 | 304,697,617 | 4,988 | — | — | 304,702,605 | 52,259,822 | |||||||||||||||||||||
11. Subsequent Events:
The Funds have evaluated the need for additional disclosures and/or adjustments resulting from subsequent events through the date the financial statements were issued. Based on this evaluation, no additional disclosures and/or adjustments, other than that listed below, were required to the financial statements as of October 31, 2022.
141
CATHOLIC RESPONSIBLE INVESTMENTS
OCTOBER 31, 2022
| REPORT OF INDEPENDENT REGISTERED PUBLIC ACCOUNTING FIRM |

REPORT OF INDEPENDENT REGISTERED PUBLIC ACCOUNTING FIRM
To the Board of Trustees of Catholic Responsible Investments Funds
and the Shareholders of CRI Ultra Short Bond Fund, CRI Short Duration Bond Fund, CRI Opportunistic Bond Fund, CRI Bond Fund, CRI Equity Index Fund, CRI Multi-Style US Equity Fund, CRI International Equity Fund, CRI Small-Cap Fund, CRI International Small-Cap Fund, CRI Magnus 45/55 Fund, CRI Magnus 60/40 Alpha Plus Fund, CRI Magnus 60/40 Beta Plus Fund, and CRI Magnus 75/25 Fund
Opinion on the Financial Statements
We have audited the accompanying statements of assets and liabilities of CRI Ultra Short Bond Fund, CRI Short Duration Bond Fund, CRI Opportunistic Bond Fund, CRI Bond Fund, CRI Equity Index Fund, CRI Multi-Style US Equity Fund, CRI International Equity Fund, CRI Small-Cap Fund, CRI International Small-Cap Fund, CRI Magnus 45/55 Fund, CRI Magnus 60/40 Alpha Plus Fund, CRI Magnus 60/40 Beta Plus Fund, and CRI Magnus 75/25 Fund, each a series of shares of beneficial interest in Catholic Responsible Investments Funds (the “Funds”), including the schedules of investments, as of October 31, 2022, and the related statements of operations, statements of changes in net assets, and the financial highlights for the period December 6, 2021 (commencement of operations) to October 31, 2022, and the related notes (collectively referred to as the “financial statements”). In our opinion, the financial statements present fairly, in all material respects, the financial position of the Funds as of October 31, 2022, and the results of their operations, the changes in their net assets, and their financial highlights for the period December 6, 2021 to October 31, 2022, in conformity with accounting principles generally accepted in the United States of America.
Basis for Opinion
These financial statements are the responsibility of the Funds’ management. Our responsibility is to express an opinion on the Funds’ financial statements based on our audits. We are a public accounting firm registered with the Public Company Accounting Oversight Board (United States) (“PCAOB”) and are required to be independent with respect to the Funds in accordance with the U.S. federal securities law and the applicable rules and regulations of the Securities and Exchange Commission and the PCAOB.
We conducted our audits in accordance with the standards of the PCAOB. Those standards require that we plan and perform the audits to obtain reasonable assurance about whether the financial statements are free of material misstatement, whether due to error or fraud. The Funds are not required to have, nor were we engaged to perform, an audit of their internal control over financial reporting. As part of our audits we are required to obtain an understanding of internal control over financial reporting but not for the purpose of expressing an opinion on the effectiveness of the Funds’ internal control over financial reporting. Accordingly, we express no such opinion.
Our audits included performing procedures to assess the risk of material misstatement of the financial statements, whether due to error or fraud, and performing procedures that respond to those risks. Such procedures included examining, on a test basis, evidence regarding the amounts and disclosures in the financial statements. Our procedures included confirmation of securities owned as of October 31, 2022 by correspondence with the custodian, brokers and other parties, or by other appropriate auditing procedures where replies from brokers were not received. Our audits also included evaluating the accounting principles used and significant estimates made by management, as well as evaluating the overall presentation of the financial statements. We believe that our audits provide a reasonable basis for our opinion.

BBD, LLP
We have served as the auditor of one or more of the Funds in the Catholic Responsible Investments Funds since 2021.
Philadelphia, Pennsylvania
December 29, 2022
142
CATHOLIC RESPONSIBLE INVESTMENTS
OCTOBER 31, 2022 (Unaudited)
| DISCLOSURE OF FUND EXPENSES (Unaudited) |
All mutual funds have operating expenses. As a shareholder of a mutual fund, your investment is affected by these ongoing costs, which include (among others) costs for Fund management, administrative services, and shareholder reports like this one. It is important for you to understand the impact of these costs on your investment returns.
Operating expenses such as these are deducted from the mutual fund’s gross income and directly reduce your final investment return. These expenses are expressed as a percentage of the mutual fund’s average net assets; this percentage is known as the mutual fund’s expense ratio.
The following examples use the expense ratio and are intended to help you understand the ongoing costs (in dollars) of investing in your Fund and to compare these costs with those of other mutual funds. The examples are based on an investment of $1,000 made at the beginning of the period shown and held for the entire period from May 1, 2022 to October 31, 2022.
The table on the next page illustrates your Fund’s costs in two ways:
• Actual Fund Return. This section helps you to estimate the actual expenses after fee waivers that your Fund incurred over the period. The “Expenses Paid During Period” column shows the actual dollar expense cost incurred by a $1,000 investment in the Fund, and the “Ending Account Value” number is derived from deducting that expense cost from the Fund’s gross investment return.
You can use this information, together with the actual amount you invested in the Fund, to estimate the expenses you paid over that period. Simply divide your ending starting account value by $1,000 to arrive at a ratio (for example, an $8,600 account value divided by $1,000 = 8.6), then multiply that ratio by the number shown for your Fund under “Expenses Paid During Period.”
• Hypothetical 5% Return. This section helps you compare your Fund’s costs with those of other mutual funds. It assumes that the Fund had an annual 5% return before expenses during the year, but that the expense ratio (Column 3) for the period is unchanged. This example is useful in making comparisons because the Securities and Exchange Commission requires all mutual funds to make this 5% calculation. You can assess your Fund’s comparative cost by comparing the hypothetical result for your Fund in the “Expenses Paid During Period” column with those that appear in the same charts in the shareholder reports for other mutual funds.
Note: Because the return is set at 5% for comparison purposes — NOT your Fund’s actual return — the account values shown may not apply to your specific investment.
143
CATHOLIC RESPONSIBLE INVESTMENTS
OCTOBER 31, 2022 (Unaudited)
| Beginning Account Value 5/1/22 | Ending Account Value 10/31/22 | Annualized Expense Ratios | Expenses Paid During Period* | |||||||||||||||||
Catholic Responsible Investments Ultra Short Bond Fund | ||||||||||||||||||||
Actual Fund Return | ||||||||||||||||||||
Institutional | $ | 1,000.00 | $ | 1,006.90 | 0.34 | % | $1.72 | |||||||||||||
Hypothetical 5% Return | ||||||||||||||||||||
Institutional | $ | 1,000.00 | $ | 1,023.49 | 0.34 | % | $1.73 | |||||||||||||
Catholic Responsible Investments Short Duration Bond Fund | ||||||||||||||||||||
Actual Fund Return | ||||||||||||||||||||
Institutional | $ | 1,000.00 | $ | 984.50 | 0.35 | % | $1.75 | |||||||||||||
Hypothetical 5% Return | ||||||||||||||||||||
Institutional | $ | 1,000.00 | $ | 1,023.44 | 0.35 | % | $1.79 | |||||||||||||
Catholic Responsible Investments Bond Fund | ||||||||||||||||||||
Actual Fund Return | ||||||||||||||||||||
Institutional | $ | 1,000.00 | $ | 924.50 | 0.37 | % | $1.79 | |||||||||||||
Investor | 1,000.00 | 923.80 | 0.52 | % | 2.52 | |||||||||||||||
Hypothetical 5% Return | ||||||||||||||||||||
Institutional | $ | 1,000.00 | $ | 1,023.34 | 0.37 | % | $1.89 | |||||||||||||
Investor | 1,000.00 | 1,022.58 | 0.52 | % | 2.65 | |||||||||||||||
Catholic Responsible Investments Opportunistic Bond Fund | ||||||||||||||||||||
Actual Fund Return | ||||||||||||||||||||
Institutional | $ | 1,000.00 | $ | 959.90 | 0.42 | % | $2.07 | |||||||||||||
Investor | 1,000.00 | 959.10 | 0.57 | % | 2.81 | |||||||||||||||
Hypothetical 5% Return | ||||||||||||||||||||
Institutional | $ | 1,000.00 | $ | 1,023.09 | 0.42 | % | $2.14 | |||||||||||||
Investor | 1,000.00 | 1,022.33 | 0.57 | % | 2.91 | |||||||||||||||
Catholic Responsible Investments Equity Index Fund | ||||||||||||||||||||
Actual Fund Return | ||||||||||||||||||||
Institutional | $ | 1,000.00 | $ | 939.90 | 0.09 | % | $0.44 | |||||||||||||
Hypothetical 5% Return | ||||||||||||||||||||
Institutional | $ | 1,000.00 | $ | 1,024.75 | 0.09 | % | $0.46 | |||||||||||||
Catholic Responsible Investments Small-Cap Fund | ||||||||||||||||||||
Actual Fund Return | ||||||||||||||||||||
Institutional | $ | 1,000.00 | $ | 992.20 | 0.31 | % | $1.56 | |||||||||||||
Hypothetical 5% Return | ||||||||||||||||||||
Institutional | $ | 1,000.00 | $ | 1,023.64 | 0.31 | % | $1.58 | |||||||||||||
Catholic Responsible Investments Multi-Style US Equity Fund | ||||||||||||||||||||
Actual Fund Return | ||||||||||||||||||||
Institutional | $ | 1,000.00 | $ | 928.00 | 0.67 | % | $3.26 | |||||||||||||
Investor | 1,000.00 | 927.20 | 0.83 | % | 4.03 | |||||||||||||||
Hypothetical 5% Return | ||||||||||||||||||||
Institutional | $ | 1,000.00 | $ | 1,021.83 | 0.67 | % | $3.41 | |||||||||||||
Investor | 1,000.00 | 1,021.02 | 0.83 | % | 4.23 | |||||||||||||||
Catholic Responsible Investments International Equity Fund | ||||||||||||||||||||
Actual Fund Return | ||||||||||||||||||||
Institutional | $ | 1,000.00 | $ | 883.20 | 0.80 | % | $3.80 | |||||||||||||
Investor | 1,000.00 | 882.40 | 0.96 | % | 4.55 | |||||||||||||||
Hypothetical 5% Return | ||||||||||||||||||||
Institutional | $ | 1,000.00 | $ | 1,021.17 | 0.80 | % | $4.08 | |||||||||||||
Investor | 1,000.00 | 1,020.37 | 0.96 | % | 4.89 | |||||||||||||||
144
CATHOLIC RESPONSIBLE INVESTMENTS
OCTOBER 31, 2022 (Unaudited)
| Beginning Account Value 5/1/22 | Ending Account Value 10/31/22 | Annualized Expense Ratios | Expenses Paid During Period* | |||||||||||||||||
Catholic Responsible Investments International Small-Cap Fund | ||||||||||||||||||||
Actual Fund Return | ||||||||||||||||||||
Institutional | $ | 1,000.00 | $ | 837.10 | 1.15 | % | $5.33 | |||||||||||||
Hypothetical 5% Return | ||||||||||||||||||||
Institutional | $ | 1,000.00 | $ | 1,019.41 | 1.15 | % | $5.85 | |||||||||||||
Catholic Responsible Investments Magnus 45/55 Fund | ||||||||||||||||||||
Actual Fund Return | ||||||||||||||||||||
Institutional | $ | 1,000.00 | $ | 939.90 | — | % | $– | |||||||||||||
Investor | 1,000.00 | 938.80 | 0.15 | % | 0.73 | |||||||||||||||
Hypothetical 5% Return | ||||||||||||||||||||
Institutional | $ | 1,000.00 | $ | 1,025.21 | — | % | $– | |||||||||||||
Investor | 1,000.00 | 1,024.45 | 0.15 | % | 0.77 | |||||||||||||||
Catholic Responsible Investments Magnus 60/40 Alpha Plus Fund | ||||||||||||||||||||
Actual Fund Return | ||||||||||||||||||||
Institutional | $ | 1,000.00 | $ | 934.60 | — | % | $– | |||||||||||||
Investor | 1,000.00 | 933.50 | 0.16 | % | 0.78 | |||||||||||||||
Hypothetical 5% Return | ||||||||||||||||||||
Institutional | $ | 1,000.00 | $ | 1,025.21 | — | % | $– | |||||||||||||
Investor | 1,000.00 | 1,024.40 | 0.16 | % | 0.82 | |||||||||||||||
Catholic Responsible Investments Magnus 60/40 Beta Plus Fund | ||||||||||||||||||||
Actual Fund Return | ||||||||||||||||||||
Institutional | $ | 1,000.00 | $ | 938.50 | — | % | $– | |||||||||||||
Investor | 1,000.00 | 936.30 | 0.15 | % | 0.73 | |||||||||||||||
Hypothetical 5% Return | ||||||||||||||||||||
Institutional | $ | 1,000.00 | $ | 1,025.21 | — | % | $– | |||||||||||||
Investor | 1,000.00 | 1,024.45 | 0.15 | % | 0.77 | |||||||||||||||
Catholic Responsible Investments Magnus 75/25 Fund | ||||||||||||||||||||
Actual Fund Return | ||||||||||||||||||||
Institutional | $ | 1,000.00 | $ | 933.30 | — | % | $– | |||||||||||||
Investor | 1,000.00 | 932.10 | 0.15 | % | 0.73 | |||||||||||||||
Hypothetical 5% Return | ||||||||||||||||||||
Institutional | $ | 1,000.00 | $ | 1,025.21 | — | % | $– | |||||||||||||
Investor | 1,000.00 | 1,024.45 | 0.15 | % | 0.77 | |||||||||||||||
| * | Expenses are equal to each Fund’s annualized expense ratio multiplied by the average account value over the period, multiplied by 184/365 (to reflect the one-half year period.) |
145
CATHOLIC RESPONSIBLE INVESTMENTS
OCTOBER 31, 2022
| TRUSTEES AND OFFICERS (Unaudited) |
Set forth below are the names, years of birth, position with the Trust and length of time served, and principal occupations and other directorships held during at least the last five years of each of the persons currently serving as a Trustee. There is no stated term of office for the Trustees. Nevertheless, an independent Trustee must retire from the Board as of the end of the calendar year in which such independent Trustee first attains the age of seventy-five years; provided, however, that, an independent Trustee may continue to serve for one or more additional one calendar year terms after attaining the age of seventy-five years (each calendar year a “Waiver Term”) if, and only if, prior to the beginning of such Waiver Term: (1) the Governance Committee (a) meets to review the performance of the independent Trustee; (b) finds that the continued service of such independent Trustee is in the best interests of the Trust; and (c) unanimously approves excepting the independent Trustee from the general retirement policy set out above; and (2) a majority of the Trustees approves excepting the independent Trustee from the general retirement policy set out above. Unless otherwise noted, the business address of each Trustee is Catholic Responsible Investments Funds, One Freedom Valley Drive, Oaks, Pennsylvania 19456. Each Trustee oversees 13 Funds in the “Fund Complex”.
| Name and Year of Birth | Position with Trust and Length of Time Served | Principal Occupation in the Past Five Years | Other Directorships Held in the Past Five Years | |||
INTERESTED TRUSTEES
| ||||||
| Robert Nesher (Born: 1946) | Chairman of the Board of Trustees (since 2021)1 | SEI employee 1974 to present; currently performs various services on behalf of SEI Investments for which Mr. Nesher is compensated. President, Chief Executive Officer and Trustee of SEI Daily Income Trust, SEI Tax Exempt Trust, SEI Institutional Managed Trust, SEI Institutional International Trust, SEI Institutional Investments Trust, SEI Asset Allocation Trust, Adviser Managed Trust, New Covenant Funds, SEI Insurance Products Trust and SEI Catholic Values Trust. President and Director of SEI Structured Credit Fund, LP. Vice Chairman of O’Connor EQUUS (closed-end investment company) to 2016. President, Chief Executive Officer and Trustee of SEI Liquid Asset Trust to 2016. Vice Chairman of Winton Series Trust to 2017. Vice Chairman of Winton Diversified Opportunities Fund (closed-end investment company), The Advisors’ Inner Circle Fund III, Gallery Trust, Schroder Series Trust and Schroder Global Series Trust to 2018. | Current Directorships: Trustee of The Advisors’ Inner Circle Fund, The Advisors’ Inner Circle Fund II, Bishop Street Funds, Frost Family of Funds, SEI Daily Income Trust, SEI Institutional International Trust, SEI Institutional Investments Trust, SEI Institutional Managed Trust, SEI Asset Allocation Trust, SEI Tax Exempt Trust, Adviser Managed Trust, New Covenant Funds, SEI Insurance Products Trust and SEI Catholic Values Trust. Director of SEI Structured Credit Fund, LP, SEI Global Master Fund plc, SEI Global Assets Fund plc, SEI Global Investments Fund plc, SEI Investments—Global Funds Services, Limited, SEI Investments Global, Limited, SEI Investments (Europe) Ltd., SEI Investments—Unit Trust Management (UK) Limited, SEI Multi-Strategy Funds PLC and SEI Global Nominee Ltd.
Former Directorships: Trustee of SEI Liquid Asset Trust to 2016. Trustee of The KP Funds to 2020.
| |||
| N. Jeffrey Klauder (Born: 1952) | Trustee (since 2021)1 | Senior Advisor of SEI Investments since 2018. Executive Vice President and General Counsel of SEI Investments, 2004 to 2018. | Current Directorships: Trustee of The Advisors’ Inner Circle Fund, The Advisors’ Inner Circle Fund II and Bishop Street Funds. Director of SEI Private Trust Company, SEI Global Fund Services Ltd., SEI Investments Global Limited, SEI Global Master Fund, SEI Global Investments Fund, SEI Global Assets Fund and SEI Investments - Guernsey Limited.
Former Directorships: Trustee of SEI Investments Management Corporation, SEI Trust Company, SEI Investments (South Africa), Limited and SEI Investments (Canada) Company to 2018. Trustee of The KP Funds to 2020.
| |||
| 1 | Denotes Trustees who are deemed to be “interested” persons of the Funds as that term is defined in the 1940 Act by virtue of their affiliation with the Distributor and/or its affiliates. |
146
CATHOLIC RESPONSIBLE INVESTMENTS
OCTOBER 31, 2022 (Unaudited)
| Name and Year of Birth | Position with Trust and Length of Time Served | Principal Occupation in the Past Five Years | Other Directorships Held in the Past Five Years | |||
INDEPENDENT TRUSTEES
| ||||||
| Joseph T. Grause, JR. (Born: 1952) | Trustee Lead Independent Trustee (since 2021) | Self-Employed Consultant since 2012. Director of Endowments and Foundations, Morningstar Investment Management, Morningstar, Inc., 2010 to 2011. Director of International Consulting and Chief Executive Officer of Morningstar Associates Europe Limited, Morningstar, Inc., 2007 to 2010. Country Manager – Morningstar UK Limited, Morningstar, Inc., 2005 to 2007 | Current Directorships: Trustee of The Advisors’ Inner Circle Fund, The Advisors’ Inner Circle Fund II, Bishop Street Funds and Frost Family of Funds. Director of RQSI GAA Systematic Global Macro Fund Ltd.
Former Directorships: Director of The Korea Fund, Inc. to 2019. Trustee of The KP Funds to 2020.
| |||
| Mitchell A. Johnson (Born: 1942) | Trustee (since 2021) | Retired. Private investor since 1994. | Current Directorships: Trustee of The Advisors’ Inner Circle Fund, The Advisors’ Inner Circle Fund II, Bishop Street Funds, SEI Asset Allocation Trust, SEI Daily Income Trust, SEI Institutional International Trust, SEI Institutional Managed Trust, SEI Institutional Investments Trust, SEI Tax Exempt Trust, Adviser Managed Trust, New Covenant Funds, SEI Insurance Products Trust and SEI Catholic Values Trust. Director of Federal Agricultural Mortgage Corporation (Farmer Mac) since 1997 and RQSI GAA Systematic Global Macro Fund Ltd.
Former Directorships: Trustee of SEI Liquid Asset Trust to 2016. Trustee of The KP Funds to 2020.
| |||
| Betty L. Krikorian (Born: 1943) | Trustee (since 2021) | Vice President, Compliance, AARP Financial Inc., from 2008 to 2010. Self-Employed Legal and Financial Services Consultant since 2003. Counsel (in-house) for State Street Bank from 1995 to 2003. | Current Directorships: Trustee of The Advisors’ Inner Circle Fund, The Advisors’ Inner Circle Fund II and Bishop Street Funds. Director of RQSI GAA Systematic Global Macro Fund Ltd.
Former Directorships: Trustee of The KP Funds to 2020.
| |||
| Robert Mulhall (Born: 1958) | Trustee (since 2021) | Partner, Ernst & Young LLP, from 1998 to 2018. | Current Directorships: Trustee of The Advisors’ Inner Circle Fund, The Advisors’ Inner Circle Fund II, Bishop Street Funds and Frost Family of Funds. Director of RQSI GAA Systematic Global Macro Fund Ltd.
Former Directorships: Trustee of Villanova University Alumni Board of Directors to 2018. Trustee of The KP Funds to 2020.
| |||
| Bruce R. Speca (Born: 1956) | Trustee (since 2021) | Global Head of Asset Allocation, Manulife Asset Management (subsidiary of Manulife Financial), 2010 to 2011. Executive Vice President – Investment Management Services, John Hancock Financial Services (subsidiary of Manulife Financial), 2003 to 2010. | Current Directorships: Trustee of The Advisors’ Inner Circle Fund, The Advisors’ Inner Circle Fund II, Bishop Street Funds and Frost Family of Funds. Director of Stone Harbor Investments Funds (8 Portfolios), Stone Harbor Emerging Markets Income Fund (closed-end fund) and Stone Harbor Emerging Markets Total Income Fund (closed-end fund). Director of RQSI GAA Systematic Global Macro Fund Ltd.
Former Directorships: Trustee of The KP Funds to 2020.
| |||
147
CATHOLIC RESPONSIBLE INVESTMENTS
OCTOBER 31, 2022 (Unaudited)
Trust Officers. Set forth below are the names, years of birth, position with the Trust and length of time served, and principal occupations for the last five years of each of the persons currently serving as executive officers of the Trust. There is no stated term of office for the officers of the Trust. Unless otherwise noted, the business address of each officer is SEI Investments Company, One Freedom Valley Drive, Oaks, Pennsylvania 19456. The Chief Compliance Officer is the only officer who receives compensation from the Trust for his services.
Certain officers of the Trust also serve as officers of one or more mutual funds for which SEI Investments or its affiliates act as investment manager, administrator or distributor.
| Name and Year of Birth | Position with Trust and Length of Time Served | Principal Occupation in the Past Five Years | Other Directorships Held in the Past Five Years | |||
OFFICERS
| ||||||
Michael Beattie
| President (since 2021) | Director of Client Service, SEI Investments, since 2004. | None. | |||
| James Bernstein (Born: 1962) | Vice President and Assistant Secretary (since 2021) | Attorney, SEI Investments, since 2017.
Prior Positions: Self-employed consultant, 2017. Associate General Counsel & Vice President, Nationwide Funds Group and Nationwide Mutual Insurance Company, from 2002 to 2016. Assistant General Counsel & Vice President, Market Street Funds and Provident Mutual Insurance Company, from 1999 to 2002.
| None. | |||
John Bourgeois
| Assistant Treasurer (since 2021) | Fund Accounting Manager, SEI Investments, since 2000. | None. | |||
| Russell Emery (Born: 1962) | Chief Compliance Officer (since 2021) | Chief Compliance Officer of SEI Structured Credit Fund, LP since 2007. Chief Compliance Officer of The Advisors’ Inner Circle Fund, The Advisors’ Inner Circle Fund II, Bishop Street Funds, Frost Family of Funds, Catholic Responsible Investments Funds, The Advisors’ Inner Circle Fund III, Gallery Trust, Schroder Series Trust, Delaware Wilshire Private Markets Master Fund, Delaware Wilshire Private Markets Fund, Delaware Wilshire Private Markets Tender Fund, SEI Institutional Managed Trust, SEI Asset Allocation Trust, SEI Institutional International Trust, SEI Institutional Investments Trust, SEI Daily Income Trust, SEI Tax Exempt Trust, Adviser Managed Trust, New Covenant Funds, SEI Insurance Products Trust and SEI Catholic Values Trust. Chief Compliance Officer of O’Connor EQUUS (closed-end investment company) to 2016. Chief Compliance Officer of SEI Liquid Asset Trust to 2016. Chief Compliance Officer of Winton Series Trust to 2017. Chief Compliance Officer of Winton Diversified Opportunities Fund (closed-end investment company) to 2018. Chief Compliance Officer of The KP Funds to 2020. Chief Compliance Officer of Schroder Global Series Trust to 2021.
| None. | |||
| Eric C. Griffith (Born: 1969) | Vice President and
| Counsel at SEI Investments since 2019. Vice President and Assistant General Counsel, JPMorgan Chase & Co., from 2012 to 2018.
| None. | |||
| Matthew M. Maher (Born: 1975) | Vice President
| Counsel at SEI Investments since 2018. Attorney, Blank Rome LLP, from 2015 to 2018. Assistant Counsel & Vice President, Bank of New York Mellon, from 2013 to 2014. Attorney, Dilworth Paxson LLP, from 2006 to 2013.
| None. | |||
148
CATHOLIC RESPONSIBLE INVESTMENTS
OCTOBER 31, 2022 (Unaudited)
| Name and Year of Birth | Position with Trust and Length of Time Served | Principal Occupation in the Past Five Years | Other Directorships Held in the Past Five Years | |||
OFFICERS (continued)
| ||||||
| Andrew Metzger (Born: 1980) | Treasurer, Controller and Chief Financial Officer (since 2021) | Director of Fund Accounting, SEI Investments, since 2020. Senior Director, Embark, from 2019 to 2020. Senior Manager, PricewaterhouseCoopers LLP, from 2002 to 2019. | None. | |||
Robert Morrow
| Vice President
| Account Manager, SEI Investments, since 2007. | None. | |||
| Alexander F. Smith (Born: 1977) | Vice President and Assistant Secretary
| Counsel at SEI Investments since 2020. Associate Counsel & Manager, Vanguard, 2012 to 2020. Attorney, Stradley Ronon Stevens & Young, LLP, 2008 to 2012.
| None. | |||
| Bridget E. Sudall (Born: 1980) | Anti-Money Laundering Compliance Officer and Privacy Officer
| Senior Associate and AML Officer, Morgan Stanley Alternative Investment Partners, from 2011 to 2015. Investor Services Team Lead, Morgan Stanley Alternative Investment Partners, from 2007 to 2011. | None. | |||
149
CATHOLIC RESPONSIBLE INVESTMENTS
OCTOBER 31, 2022 (Unaudited)
| APPROVAL OF INVESTMENT ADVISORY AGREEMENT |
Catholic Responsible Investments Short Duration Bond Fund
Catholic Responsible Investments Opportunistic Bond Fund
Catholic Responsible Investments Bond Fund
The Board’s Considerations in Approving the Agreements
Pursuant to Section 15 of the Investment Company Act of 1940 (the “1940 Act”), the Funds’ sub-advisory agreements (the “Agreements”) must be approved: (i) by a vote of a majority of the shareholders of the Funds; and (ii) by the vote of a majority of the members of the Board of Trustees (the “Board” or the “Trustees”) of Catholic Responsible Investments Funds (the “Trust”) who are not parties to the Agreements or “interested persons” of any party thereto, as defined in the 1940 Act (the “Independent Trustees”), cast in person at a meeting called for the purpose of voting on such approval.
A Board meeting was held on May 23-24, 2022 (the “May 2022 Meeting”) to approve (i) the appointment of Teachers Advisors, LLC (“TAL”) as an investment sub-adviser to the Catholic Responsible Investments Short Duration Bond Fund, the Catholic Responsible Investments Opportunistic Bond Fund, and the Catholic Responsible Investments Bond Fund; (ii) the appointment of Wellington Management Company, LLP (“Wellington Management”) as an investment sub-adviser to the Short Duration Bond Fund; and (iii) the appointment of Sun Life Capital Management (U.S.) LLC (“SLC Management”) as an investment sub-adviser to the Opportunistic Bond Fund.
In preparation for the May 2022 Meeting, the Trustees requested that CBIS and the Sub-Advisers furnish information necessary to evaluate the terms of the Agreements. The Trustees used this information, as well as other information that CBIS, the Sub-Advisers and other service providers of the Funds presented or submitted to the Board at the May 2022 Meeting, as well as at the Board’s meetings held on August 17-18, 2021 and November 15-17, 2021 (the “2021 Meetings”), to help them decide whether to approve the Agreements for an initial two-year term.
Specifically, the Board requested and received written materials from CBIS, the Sub-Advisers and other service providers of the Funds, or considered information previously furnished or presented at the 2021 Meetings, regarding, among other things: (i) the nature, extent and quality of the services to be provided by the Sub-Advisers; (ii) the Sub-Advisers’ investment management personnel; (iii) the Sub-Advisers’ operations and information about their financial condition, capitalization, profitability or financial viability to sub-advise the Funds; (iv) TAL’s and Wellington Management’s brokerage practices (including any soft dollar arrangements) and the Sub-Advisers’ investment strategies; (v) the Funds’ proposed advisory fees to be paid to CBIS and the Sub-Advisers; (vi) the Sub-Advisers’ compliance programs, including a description of any material compliance matters and any material compliance violations; (vii) the Sub-Advisers’ policies on and compliance procedures for personal securities transactions; (viii) the Sub-Advisers’ investment experience; (ix) CBIS’ rationale for recommending the Sub-Advisers; and (x) TAL’s and Wellington Management’s performance in managing similar accounts.
Representatives from CBIS and the Sub-Advisers then presented additional information and participated in question and answer sessions at the May 2022 Meeting to help the Trustees evaluate the Sub-Advisers’ services, fees and other aspects of the Agreements.
Based on their evaluation of the information provided by CBIS and the Sub-Advisers, the Trustees, including all of the trustees who are not parties to the Agreements nor are considered “interested persons” (as such term is defined in the 1940 Act) of any party to the Agreements (the “Independent Trustees”), voting separately, approved the Agreements at the May 2022 Meeting. In considering the approval of the Agreements, the Board considered various factors that it determined were relevant, including: (i) the nature, extent and quality of the services to be
150
CATHOLIC RESPONSIBLE INVESTMENTS
OCTOBER 31, 2022 (Unaudited)
provided by the Sub-Advisers; and (ii) the fees to be paid to CBIS and the Sub-Advisers, as discussed in further detail below.
Nature, Extent and Quality of Services Provided by the Sub-Advisers
In considering the nature, extent and quality of the services to be provided by the Sub-Advisers, the Board reviewed the portfolio management services to be provided by the Sub-Advisers to the Funds, including the quality of the portfolio management personnel, the resources of the Sub-Advisers and each Sub-Adviser’s compliance history and compliance program. The Trustees reviewed the terms of the proposed Agreements. The Trustees also reviewed the Sub-Advisers’ proposed investment and risk management approaches for the Funds. The Trustees considered that CBIS would supervise and monitor the performance of the Sub-Advisers. The responses of the Sub-Advisers to a detailed series of questions which included, among other things, information about the investment advisory services to be provided by the Sub-Advisers to the Funds were available to the Board, as were the most recent investment adviser registration forms (“Form ADV”) for the Sub-Advisers, in the materials or through public disclosure.
The Trustees also considered other services to be provided to the Funds by the Sub-Advisers such as monitoring adherence to the Funds’ investment restrictions, and monitoring compliance with various Fund policies and procedures and with applicable securities laws and regulations. Based on the factors above, as well as those discussed below, the Board concluded, within the context of its full deliberations, that the nature, extent and quality of the services to be provided to the Funds by the Sub-Advisers would be satisfactory.
Investment Performance of the Sub-Advisers
Because the Sub-Advisers are new to the Funds and had not managed the Funds’ assets, they did not yet have investment performance records with respect to the Funds and it was not possible to determine the profitability that the Sub-Advisers might achieve with respect to the Funds or the extent to which economies of scale would be realized by the Sub-Advisers as the assets of the Funds grow. Accordingly, the Trustees did not make any conclusions regarding the Sub-Advisers’ investment performance with respect to the Funds, the Sub-Advisers’ profitability, or the extent to which economies of scale would be realized by the Sub-Advisers as the assets of the Funds grow, but will do so during future considerations of the Agreements.
Costs of Advisory Services
In considering the advisory fees payable by the Funds to CBIS, as well as the fees payable by CBIS to the Sub-Advisers, the Trustees reviewed, among other things, a report of the proposed advisory fees to be paid to CBIS and the Sub-Advisers. The Trustees also considered that CBIS, and not the Funds, would pay the Sub-Advisers pursuant to the Agreements, and that the fees payable to the Sub-Advisers would reflect arms-length negotiations between CBIS and the Sub-Advisers. The Board concluded, within the context of its full deliberations, that the advisory fees were reasonable in light of the nature and quality of the services expected to be rendered by the Sub-Advisers.
Approval of the Agreements
Based on the Board’s deliberations and its evaluation of the information described above and other factors and information it believed relevant in the exercise of its reasonable business judgment, the Board, including all of the Independent Trustees, with the assistance of Fund counsel and Independent Trustees’ counsel, unanimously concluded that the terms of the Agreements, including the fees to be paid thereunder, were fair and reasonable and agreed to approve the Agreements for an initial term of two years. In its deliberations, the Board did not identify any absence of information material to its decision, or any particular factor (or conclusion with respect thereto) or single piece of information that was all-important, controlling or determinative of its decision, but considered all of the factors together, and each Trustee may have attributed different weights to the various factors (and conclusions with respect thereto) and information.
151
CATHOLIC RESPONSIBLE INVESTMENTS
OCTOBER 31, 2022 (Unaudited)
| LIQUIDITY RISK MANAGEMENT PROGRAM (Unaudited) |
Review of Liquidity Risk Management Program
Pursuant to Rule 22e-4 under the 1940 Act, the Funds’ investment adviser has adopted, and the Board has approved, a liquidity risk management program (the “Program”) to govern the Funds’ approach to managing liquidity risk. The Program is overseen by the Funds’ Liquidity Risk Management Program Administrator (the “Program Administrator”), and the Program’s principal objectives include assessing, managing and periodically reviewing each Fund’s liquidity risk, based on factors specific to the circumstances of the Funds.
At a meeting of the Board held on May 24, 2022, the Trustees received a report from the Program Administrator addressing the operations of the Program and assessing its adequacy and effectiveness of implementation for the period from January 1, 2021 through December 31, 2021. The Program Administrator’s report included an assessment of how market conditions caused by the COVID-19 pandemic impacted the Funds’ liquidity risk during the period covered by the report. The Program Administrator’s report noted that the Program Administrator had determined that the Program is reasonably designed to assess and manage each Fund’s liquidity risk and has operated adequately and effectively to manage each Fund’s liquidity risk during the period covered by the report. The Program Administrator’s report noted that during the period covered by the report, there were no liquidity events that impacted the Funds or their ability to timely meet redemptions without dilution to existing shareholders. The Program Administrator’s report further noted that no material changes have been made to the Program during the period covered by the report.
There can be no assurance that the Program will achieve its objectives in the future. Please refer to the prospectus for more information regarding a Fund’s exposure to liquidity risk and other principal risks to which an investment in the Funds may be subject.
152
CATHOLIC RESPONSIBLE INVESTMENTS
OCTOBER 31, 2022 (Unaudited)
| NOTICE TO SHAREHOLDERS (Unaudited) |
For shareholders that do not have an October 31, 2022 tax year end, this notice is for informational purposes only. For shareholders with a tax year end October 31, 2022, please consult your tax advisor as to the pertinence of this notice. For the fiscal year ended October 31, 2022, the Funds are designating the following items with regard to distributions paid during the period.
| Long Term Capital Gain Distribution | Ordinary Income Distributions | Total Distributions | Dividends Qualifying for Corporate Dividend Receivable Deduction(1) | Qualifying Dividend Income(2) | U.S. Government Interest(3) | Qualified Interest Income(4) | Qualified Short Term Capital Gain(5) | Qualifying Business Income(6) | ||||||||||||||||||||||||||||
Catholic Responsible Investments Ultra Short Bond Fund | 0.00 | % | 100.00 | % | 100.00 | % | 0.00 | % | 0.00 | % | 37.63 | % | 88.58 | % | 0.00 | % | 0.00 | % | ||||||||||||||||||
Catholic Responsible Investments Short Duration Bond Fund | 0.00 | % | 100.00 | % | 100.00 | % | 0.00 | % | 0.00 | % | 26.88 | % | 83.22 | % | 0.00 | % | 0.00 | % | ||||||||||||||||||
Catholic Responsible Investments Bond Fund | 0.00 | % | 100.00 | % | 100.00 | % | 100.00 | % | 0.00 | % | 0.00 | % | 22.93 | % | 90.21 | % | 0.00 | % | ||||||||||||||||||
Catholic Responsible Investments Opportunistic Bond Fund | 0.00 | % | 100.00 | % | 100.00 | % | 0.00 | % | 0.00 | % | 26.13 | % | 87.42 | % | 0.00 | % | 0.00 | % | ||||||||||||||||||
Catholic Responsible Investments Equity Index Fund | 0.00 | % | 100.00 | % | 100.00 | % | 93.84 | % | 99.02 | % | 0.00 | % | 0.18 | % | 0.00 | % | 0.00 | % | ||||||||||||||||||
Catholic Responsible Investments Small-Cap Fund | 0.00 | % | 100.00 | % | 100.00 | % | 87.21 | % | 89.96 | % | 0.00 | % | 0.88 | % | 0.00 | % | 0.00 | % | ||||||||||||||||||
Catholic Responsible Investments Multi-Style US Equity Fund | 0.00 | % | 100.00 | % | 100.00 | % | 100.00 | % | 100.00 | % | 0.00 | % | 1.66 | % | 0.00 | % | 0.00 | % | ||||||||||||||||||
Catholic Responsible Investments International Equity Fund | 0.00 | % | 100.00 | % | 100.00 | % | 0.53 | % | 100.00 | % | 0.00 | % | 0.89 | % | 0.00 | % | 0.00 | % | ||||||||||||||||||
Catholic Responsible Investments International Small-Cap Fund | 0.00 | % | 100.00 | % | 100.00 | % | 1.54 | % | 100.00 | % | 0.0 | % | 0.55 | % | 0.00 | % | 0.00 | % | ||||||||||||||||||
Catholic Responsible Investments Magnus 45/55 Fund | 0.00 | % | 100.00 | % | 100.00 | % | 18.44 | % | 28.38 | % | 17.16 | % | 61.83 | % | 0.00 | % | 0.00 | % | ||||||||||||||||||
Catholic Responsible Investments Magnus 60/40 Alpha Plus Fund | 0.00 | % | 100.00 | % | 100.00 | % | 23.85 | % | 39.82 | % | 14.47 | % | 54.26 | % | 0.00 | % | 0.00 | % | ||||||||||||||||||
Catholic Responsible Investments Magnus 60/40 Beta Plus Fund | 0.00 | % | 100.00 | % | 100.00 | % | 30.94 | % | 46.09 | % | 12.91 | % | 46.59 | % | 0.00 | % | 0.00 | % | ||||||||||||||||||
Catholic Responsible Investments Magnus 75/25 Fund | 0.00 | % | 100.00 | % | 100.00 | % | 22.28 | % | 34.54 | % | 5.84 | % | 21.95 | % | 0.00 | % | 0.00 | % | ||||||||||||||||||
153
CATHOLIC RESPONSIBLE INVESTMENTS
OCTOBER 31, 2022 (Unaudited)
| (1) | Qualifying dividends represent dividends which qualify for the corporate dividends received deduction and is reflected as a percentage of ordinary Income distributions (the total of short term capital gain and net investment income distributions). |
| (2) | The percentage in this column represents the amount of “Qualifying Dividend Income” as created by the Jobs and Growth Relief Reconciliation Act of 2003 and is reflected as a percentage of ordinary income distributions (the total of short term capital gain and net investment income distributions). It is the intention of each of the aforementioned funds to designate the maximum amount permitted by law. |
| (3) | “U.S. Government Interest” represents the amount of interest that was derived from U.S. Government obligations and distributed during the fiscal year. This amount is reflected as a percentage of total ordinary income distributions (the total of short term capital gain and net investment income distributions). Generally, interest from direct U.S. Government obligations is exempt from state income tax. However, for shareholders who are residents of California, Connecticut and New York, the statutory threshold requirements were not satisfied to permit exemption of these amounts from state income. |
| (4) | The percentage in this column represents the amount of “Qualifying Interest Income” as created by the American Jobs Creation Act of 2004 and is a percentage of ordinary income distributions that are exempt from U.S. withholding tax when paid for foreign investors. |
| (5) | The percentage in this column represents the amount of “Qualifying Short-Term Capital Gain” as created by the American Jobs Creation Act of 2004 and is reflected as a percentage of short-term capital gain distributions that is exempt from U.S. withholding tax when paid to foreign investors. |
| (6) | The percentage of this column represents that amount of ordinary dividend income that qualified for 20% Business Income Deduction. |
The Funds intend to pass through foreign tax credit to shareholders. For the fiscal year ended October 31, 2022, the amount of foreign source income and foreign tax credit are as follows:
| Foreign Source Income | Foreign Tax Credit Pass Through | |||||||
Catholic Responsible Investments International Equity Fund | $ | 27,648,428 | $ 1,943,158 | |||||
Catholic Responsible Investments International Small Cap Fund | 2,345,488 | 233,733 | ||||||
Catholic Responsible Investments Magnus 45/55 Fund | 121,675 | 14,925 | ||||||
Catholic Responsible Investments Magnus 60/40 Alpha Plus Fund | 2,009,496 | 254,728 | ||||||
Catholic Responsible Investments Magnus 60/40 Beta Plus Fund | 733,020 | 92,122 | ||||||
Catholic Responsible Investments Magnus 75/25 Fund | 562,522 | 69,120 | ||||||
The information reported herein may differ from the information and distributions taxable to the shareholders for the calendar year ending December 31, 2022. Complete information will be computed and reported in conjunction with your 2022 Form 1099-DIV.
154
CATHOLIC RESPONSIBLE INVESTMENTS
OCTOBER 31, 2022 (Unaudited)
N O T E S
155
CATHOLIC RESPONSIBLE INVESTMENTS
OCTOBER 31, 2022 (Unaudited)
N O T E S
156
CATHOLIC RESPONSIBLE INVESTMENTS
OCTOBER 31, 2022 (Unaudited)
N O T E S
157
Catholic Responsible Investments
Investment Adviser:
Christian Brothers Investment Services, Inc.
125 S. Wacker Drive
Suite 2400
Chicago, Illinois 60606
Administrator:
SEI Investments Distribution Co.
One Freedom Valley Drive
Oaks, Pennsylvania 19456
Distributor:
SEI Investments Distribution Co.
One Freedom Valley Drive
Oaks, Pennsylvania 19456
Legal Counsel:
SEI Investments Distribution Co.
One Freedom Valley Drive
Oaks, Pennsylvania 19456
This information must be preceded or accompanied by a current prospectus for the Funds described.
CRI-AR-001-0100
Item 2. Code of Ethics.
The Registrant (also referred to as the “Trust”) has adopted a code of ethics that applies to the Registrant’s principal executive officer, principal financial officer, controller or principal accounting officer, and any person who performs a similar function. There have been no amendments to or waivers granted to this code of ethics during the period covered by this report.
Item 3. Audit Committee Financial Expert.
(a)(1) The Registrant’s board of trustees has determined that the Registrant has at least one audit committee financial expert serving on the audit committee.
(a)(2) The audit committee financial expert is Robert Mulhall. Mr. Mulhall is considered to be “independent,” as that term is defined in Form N-CSR Item 3(a)(2).
Item 4. Principal Accountant Fees and Services.
Fees billed by BBD, LLP (“BBD”) related to the Trust
BBD billed the Trust aggregate fees for services rendered to the Trust for the last two fiscal years as follows:
| 2022 | 2021 | |||||||||||||
All fees and services to the Trust that were pre- approved | All fees and services to service affiliates that were pre- approved | All other fees and services to service affiliates that did not require pre- approval | All fees and services to the Trust that were pre- approved | All fees and services to service affiliates that were pre- approved | All other fees and services to service affiliates that did not require pre- approval | |||||||||
| (a) | Audit Fees(1) | $162,800 | None | None | N/A | N/A | N/A | |||||||
| (b) | Audit-Related Fees | None | None | None | N/A | N/A | N/A | |||||||
| (c) | Tax Fees | None | None | None | N/A | N/A | N/A | |||||||
| (d) | All Other Fees | None | None | None | N/A | N/A | N/A | |||||||
Notes:
| (1) | Audit fees include amounts related to the audit of the Trust’s annual financial statements and services normally provided by the accountant in connection with statutory and regulatory filings. |
(e)(1) The Trust’s Audit Committee has adopted and the Board of Trustees has ratified an Audit and Non-Audit Services Pre-Approval Policy (the “Policy”), which sets forth the procedures and the conditions pursuant to which services proposed to be performed by the independent auditor of the Funds may be pre-approved.
The Policy provides that all requests or applications for proposed services to be provided by the independent auditor must be submitted to the Registrant’s Chief Financial Officer (“CFO”) and must include a detailed description of the services proposed to be rendered. The CFO will determine whether such services:
| 1. | require specific pre-approval; |
| 2. | are included within the list of services that have received the general pre-approval of the Audit Committee pursuant to the Policy; or |
| 3. | have been previously pre-approved in connection with the independent auditor’s annual engagement letter for the applicable year or otherwise. In any instance where services require pre-approval, the Audit Committee will consider whether such services are consistent with SEC’s rules and whether the provision of such services would impair the auditor’s independence. |
Requests or applications to provide services that require specific pre-approval by the Audit Committee will be submitted to the Audit Committee by the CFO. The Audit Committee will be informed by the CFO on a quarterly basis of all services rendered by the independent auditor. The Audit Committee has delegated specific pre-approval authority to either the Audit Committee Chair or financial expert, provided that the estimated fee for any such proposed pre-approved service does not exceed $100,000 and any pre-approval decisions are reported to the Audit Committee at its next regularly-scheduled meeting.
Services that have received the general pre-approval of the Audit Committee are identified and described in the Policy. In addition, the Policy sets forth a maximum fee per engagement with respect to each identified service that has received general pre-approval.
All services to be provided by the independent auditor shall be provided pursuant to a signed written engagement letter with the Registrant, the investment adviser, or applicable control affiliate (except that matters as to which an engagement letter would be impractical because of timing issues or because the matter is small may not be the subject of an engagement letter) that sets forth both the services to be provided by the independent auditor and the total fees to be paid to the independent auditor for those services.
In addition, the Audit Committee has determined to take additional measures on an annual basis to meet the Audit Committee’s responsibility to oversee the work of the independent auditor and to assure the auditor’s independence from the Registrant, such as (a) reviewing a formal written statement from the independent auditor delineating all relationships between the independent auditor and the Registrant, and (b) discussing with the independent auditor the independent auditor’s methods and procedures for ensuring independence.
(e)(2) Percentage of fees billed by BBD applicable to non-audit services pursuant to waiver of pre-approval requirement were as follows:
| 2022 | 2021 | |||
| Audit-Related Fees | None | N/A | ||
| Tax Fees | None | N/A |
All Other Fees | None | N/A |
(f) Not applicable.
(g) The aggregate non-audit fees and services billed by BBD for services rendered to the Registrant, and rendered to the Registrant’s investment adviser (not including any sub-adviser whose role is primarily portfolio management and is subcontracted with or overseen by another investment adviser), and any entity controlling, controlled by, or under common control with the adviser that provides ongoing services to the Registrant for the last two fiscal-years-ended October 31st were $0 and N/A for 2022 and 2021, respectively.
(h) During the past fiscal year, all non-audit services provided by the Registrant’s principal accountant to either the Registrant’s investment adviser or to any entity controlling, controlled by, or under common control with the Registrant’s investment adviser that provides ongoing services to the Registrant were pre-approved by the Audit Committee of Registrant’s Board of Trustees. Included in the Audit Committee’s pre-approval of these non-audit service were the review and consideration as to whether the provision of these non-audit services is compatible with maintaining the principal accountant’s independence.
(i) Not applicable. The Registrant has not retained, for the preparation of the audit report on the financial statements included in the Form N-CSR, a registered public accounting firm that has a branch or office that is located in a foreign jurisdiction and that the Public Company Accounting Oversight Board (the “PCAOB”) has determined that the PCAOB is unable to inspect or investigate completely because of a position taken by an authority in the foreign jurisdiction.
(j) Not applicable. The Registrant is not a “foreign issuer,” as defined in 17 CFR 240.3b-4.
Item 5. Audit Committee of Listed Registrants.
Not applicable to open-end management investment companies.
Item 6. Schedule of Investments.
Schedule of Investments is included as part of the Report to Shareholders filed under Item 1 of this form.
Item 7. Disclosure of Proxy Voting Policies and Procedures for Closed-End Management Investment Companies.
Not applicable to open-end management investment companies.
Item 8. Portfolio Managers of Closed-End Management Investment Companies
Not applicable to open-end management investment companies.
Item 9. Purchases of Equity Securities by Closed-End Management Company and Affiliated Purchasers.
Not applicable to open-end management investment companies.
Item 10. Submission of Matters to a Vote of Security Holders.
There have been no changes to the procedures by which shareholders may recommend nominees to the Registrant’s Board of Trustees during the period covered by this report.
Item 11. Controls and Procedures.
(a) The Registrant’s principal executive and principal financial officers, or persons performing similar functions, have concluded that the Registrant’s disclosure controls and procedures, as defined in Rule 30a-3(c) under the Act (17 CFR § 270.30a-3(c)), as of a date within 90 days of the filing date of the report, are effective based on the evaluation of these controls and procedures required by Rule 30a-3(b) under the Act (17 CFR § 270.30a-3(b)) and Rule 13a-15(b) or Rule 15d-15(b) under the Exchange Act, as amended (17 CFR § 240.13a-15(b) or § 240.15d-15(b)).
(b) There has been no change in the Registrant’s internal control over financial reporting (as defined in Rule 30a-3(d) under the Act (17 CFR § 270.3a-3(d)) that occurred during the period covered by this report that has materially affected, or is reasonably likely to materially affect, the Registrant’s internal control over financial reporting.
Item 12. Disclosure of Securities Lending Activities for Closed-End Management Investment Companies.
Not applicable to open-end management investment companies.
Items 13. Exhibits.
SIGNATURES
Pursuant to the requirements of the Securities Exchange Act of 1934 and the Investment Company Act of 1940, the Registrant has duly caused this report to be signed on its behalf by the undersigned, thereunto duly authorized.
(Registrant) | Catholic Responsible Investments Funds | |||
By (Signature and Title) | ||||
/s/ Michael Beattie Michael Beattie, President | ||||
Date: January 6, 2023 | ||||
Pursuant to the requirements of the Securities Exchange Act of 1934 and the Investment Company Act of 1940, this report has been signed below by the following persons on behalf of the Registrant and in the capacities and on the dates indicated.
By (Signature and Title) | ||||
/s/ Michael Beattie Michael Beattie, President | ||||
Date: January 6, 2023 | ||||
By (Signature and Title) | ||||
/s/ Andrew Metzger Andrew Metzger, | ||||
Treasurer, Controller, and CFO | ||||
Date: January 6, 2023 | ||||