6-KJune 30, 2023FALSEBrookfield Asset Management Ltd000193792612/312023Q200019379262023-01-012023-06-3000019379262023-06-30iso4217:USD00019379262022-12-310001937926us-gaap:CommonClassAMember2023-06-30xbrli:shares0001937926us-gaap:CommonClassAMember2022-12-310001937926us-gaap:CommonClassBMember2022-12-310001937926us-gaap:CommonClassBMember2023-06-3000019379262023-04-012023-06-30iso4217:USDxbrli:shares0001937926us-gaap:CommonStockMemberus-gaap:CommonClassAMember2023-03-310001937926us-gaap:CommonStockMemberus-gaap:CommonClassBMember2023-03-310001937926us-gaap:CommonStockMember2023-03-310001937926us-gaap:TreasuryStockCommonMember2023-03-310001937926us-gaap:AdditionalPaidInCapitalMember2023-03-310001937926us-gaap:RetainedEarningsMember2023-03-310001937926us-gaap:AccumulatedOtherComprehensiveIncomeMember2023-03-310001937926us-gaap:NoncontrollingInterestMember2023-03-3100019379262023-03-310001937926us-gaap:RetainedEarningsMember2023-04-012023-06-300001937926us-gaap:AccumulatedOtherComprehensiveIncomeMember2023-04-012023-06-300001937926us-gaap:CommonStockMemberus-gaap:CommonClassAMember2023-04-012023-06-300001937926us-gaap:CommonStockMember2023-04-012023-06-300001937926us-gaap:AdditionalPaidInCapitalMember2023-04-012023-06-300001937926us-gaap:TreasuryStockCommonMember2023-04-012023-06-300001937926us-gaap:CommonStockMemberus-gaap:CommonClassAMember2023-06-300001937926us-gaap:CommonStockMemberus-gaap:CommonClassBMember2023-06-300001937926us-gaap:CommonStockMember2023-06-300001937926us-gaap:TreasuryStockCommonMember2023-06-300001937926us-gaap:AdditionalPaidInCapitalMember2023-06-300001937926us-gaap:RetainedEarningsMember2023-06-300001937926us-gaap:AccumulatedOtherComprehensiveIncomeMember2023-06-300001937926us-gaap:NoncontrollingInterestMember2023-06-300001937926us-gaap:CommonStockMemberus-gaap:CommonClassAMember2022-12-310001937926us-gaap:CommonStockMemberus-gaap:CommonClassBMember2022-12-310001937926us-gaap:CommonStockMember2022-12-310001937926us-gaap:TreasuryStockCommonMember2022-12-310001937926us-gaap:AdditionalPaidInCapitalMember2022-12-310001937926us-gaap:RetainedEarningsMember2022-12-310001937926us-gaap:AccumulatedOtherComprehensiveIncomeMember2022-12-310001937926us-gaap:NoncontrollingInterestMember2022-12-310001937926us-gaap:RetainedEarningsMember2023-01-012023-06-300001937926us-gaap:AccumulatedOtherComprehensiveIncomeMember2023-01-012023-06-300001937926us-gaap:CommonStockMemberus-gaap:CommonClassAMember2023-01-012023-06-300001937926us-gaap:CommonStockMember2023-01-012023-06-300001937926us-gaap:AdditionalPaidInCapitalMember2023-01-012023-06-300001937926us-gaap:TreasuryStockCommonMember2023-01-012023-06-300001937926us-gaap:NoncontrollingInterestMember2023-01-012023-06-300001937926bam:BrookfieldAssetManagementULCMember2022-12-09xbrli:pure0001937926bam:BrookfieldAssetManagementULCMember2023-06-30bam:director0001937926bam:BrookfieldAssetManagementULCMember2023-06-300001937926bam:BrookfieldAssetManagementULCMember2022-12-310001937926bam:BrookfieldAssetManagementULCMember2023-04-012023-06-300001937926bam:BrookfieldAssetManagementULCMember2023-01-012023-06-300001937926us-gaap:EmployeeStockOptionMember2023-04-012023-06-300001937926us-gaap:EmployeeStockOptionMember2023-01-012023-06-300001937926us-gaap:EmployeeStockOptionMember2023-06-300001937926bam:EscrowedSharesMember2023-04-012023-06-300001937926bam:EscrowedSharesMember2023-01-012023-06-300001937926bam:EscrowedSharesMember2023-06-300001937926bam:EquityClassifiedAwardsMember2023-04-012023-06-300001937926bam:EquityClassifiedAwardsMember2023-01-012023-06-300001937926bam:LiabilityClassifiedAwardsMember2023-04-012023-06-300001937926bam:LiabilityClassifiedAwardsMember2023-01-012023-06-300001937926bam:ManagementShareOptionPlanMemberus-gaap:EmployeeStockOptionMember2023-01-012023-06-300001937926bam:ManagementShareOptionPlanMemberus-gaap:EmployeeStockOptionMember2023-04-012023-06-300001937926bam:EscrowedSharesMemberbam:EscrowedStockPlanMember2023-01-012023-06-300001937926bam:EscrowedSharesMemberbam:EscrowedStockPlanMember2023-04-012023-06-300001937926us-gaap:RestrictedStockMember2023-01-012023-06-300001937926us-gaap:RestrictedStockMember2023-04-012023-06-300001937926us-gaap:RestrictedStockUnitsRSUMember2023-01-012023-06-300001937926bam:DeferredShareUnitMember2023-01-012023-06-300001937926bam:DeferredShareUnitsAndRestrictedShareUnitsMember2023-04-012023-06-300001937926bam:DeferredShareUnitsAndRestrictedShareUnitsMember2023-01-012023-06-300001937926us-gaap:CommonClassAMember2023-04-012023-06-300001937926us-gaap:CommonClassBMember2023-04-012023-06-300001937926us-gaap:CommonClassAMember2023-01-012023-06-300001937926us-gaap:CommonClassBMember2023-01-012023-06-300001937926us-gaap:EmployeeStockOptionMember2023-04-012023-06-300001937926us-gaap:EmployeeStockOptionMember2023-01-012023-06-300001937926bam:EscrowSharesMember2023-04-012023-06-300001937926bam:EscrowSharesMember2023-01-012023-06-300001937926us-gaap:RestrictedStockUnitsRSUMember2023-04-012023-06-300001937926us-gaap:RestrictedStockUnitsRSUMember2023-01-012023-06-300001937926us-gaap:EquityMethodInvesteeMember2023-06-300001937926us-gaap:EquityMethodInvesteeMemberbam:AssetManagementServicesAgreementMember2023-04-012023-06-300001937926us-gaap:EquityMethodInvesteeMemberbam:AssetManagementServicesAgreementMember2023-01-012023-06-300001937926bam:RelationshipAgreementMembersrt:AffiliatedEntityMember2023-04-012023-06-300001937926bam:RelationshipAgreementMembersrt:AffiliatedEntityMember2023-01-012023-06-300001937926srt:AffiliatedEntityMemberbam:TransitionalServicesAgreementMember2023-04-012023-06-300001937926srt:AffiliatedEntityMemberbam:TransitionalServicesAgreementMember2023-01-012023-06-300001937926us-gaap:EquityMethodInvesteeMemberbam:AssetManagementServicesAgreementMember2023-06-300001937926srt:AffiliatedEntityMember2023-06-300001937926srt:AffiliatedEntityMember2022-12-310001937926bam:BrookfieldAssetManagementULCMemberus-gaap:EquityMethodInvesteeMember2023-01-012023-06-300001937926bam:BrookfieldAssetManagementULCMemberus-gaap:EquityMethodInvesteeMember2023-01-012023-03-310001937926bam:BrookfieldAssetManagementULCMemberus-gaap:EquityMethodInvesteeMember2023-04-012023-06-300001937926us-gaap:SubsequentEventMember2023-08-080001937926bam:AmericanEquityInvestmentLifeHoldingCompanyMemberus-gaap:SubsequentEventMemberbam:BrookfieldReinsuranceMember2023-07-052023-07-050001937926us-gaap:SubsequentEventMember2023-07-052023-07-050001937926bam:BrookfieldAssetManagementLtdMemberus-gaap:SubsequentEventMemberbam:BrookfieldReinsuranceMember2023-07-052023-07-05
TABLE OF CONTENTS
| | | | | | | | | | | |
| LETTER TO SHAREHOLDERS | |
| | | |
| PART I | MANAGEMENT'S DISCUSSION & ANALYSIS | |
| | | |
| ITEM 1 | FORWARD-LOOKING STATEMENTS | |
| ITEM 2 | CAUTIONARY STATEMENT REGARDING THE USE OF NON-GAAP MEASURES | |
| ITEM 3 | BUSINESS OVERVIEW | |
| ITEM 4 | KEY FINANCIAL AND OPERATING MEASURES | |
| ITEM 5 | REVIEW OF CONSOLIDATED FINANCIAL RESULTS | |
| ITEM 6 | ANALYSIS OF KEY NON-GAAP FINANCIAL AND OPERATING MEASURES | |
| ITEM 7 | INVESTMENT STRATEGY RESULTS | |
| ITEM 8 | LIQUIDITY AND CAPITAL RESOURCES | |
| ITEM 9 | ACCOUNTING POLICIES | |
| ITEM 10 | QUANTITATIVE AND QUALITATIVE RISK DISCLOSURES | |
| | | |
| PART II | FINANCIAL STATEMENTS | |
| | | |
| ITEM 11 | BROOKFIELD ASSET MANAGEMENT LTD. FINANCIAL STATEMENTS | |
| ITEM 12 | BROOKFIELD ASSET MANAGEMENT ULC FINANCIAL STATEMENTS | |
LETTER TO SHAREHOLDERS
Overview
Results were strong. We generated Fee-Related Earnings (FRE) of $548 million and Distributable Earnings (DE) of $527 million for the second quarter. This brings both our FRE and DE over the last twelve months to $2.2 billion, representing growth of 16% and 14%[1], respectively and highlights the stable and predictable nature of our business. This stability is driven in large part by fee-bearing capital that is 85% attributable to long-term or perpetual funding sources.
We have been one of the most active alternative asset managers year-to-date, leaning into our established investing approach and competitive advantages to put meaningful capital to work and monetize assets for our clients. We committed to $50 billion worth of investments, monetized $15 billion of assets, and grew to $850 billion of assets under management.
The current market environment is an attractive one in which to transact, particularly for those with access to capital and financing, and we are currently fundraising for several of our flagship opportunistic strategies, which should prove to be excellent fund vintages. We expect an acceleration in fundraising in the second half of the year as we progress our efforts on the recently launched funds.
This Will Be a Record Year for Fundraising
Investors have become increasingly selective in establishing partnerships with asset managers who can bring them scale funds, co-investments, and deals across asset classes and market conditions. We stand to benefit from this trend because of our size, global operating capabilities, and diversity of investment mandates.
We continue to see increasing demand from investors for real assets across infrastructure, renewables and transition, private equity, opportunistic real estate, and private credit—all areas in which our franchise is strongly positioned. We raised $37 billion of private capital year-to-date and expect our fundraising to accelerate into the second half of the year, with first closes scheduled for two of our flagship funds as well as additional closes for our remaining three flagships and several complementary funds. With these fundraising efforts we expect to reach our target of close to $100 billion of private capital inflows, and when combined with the $50 billion of insurance capital inflows, we are on track to raise a record $150 billion of capital this year.
The most significant fundraising updates to share with you are:
Infrastructure—Fundraising for our infrastructure business continues to be very strong, with longstanding investors continuing to increase their capital commitments with us and new investors making new ones.
The fifth vintage of our flagship infrastructure fund has now raised $27 billion of capital. We still have some fundraising to go before the final close later this year, but irrespective, this is the largest infrastructure draw-down fund ever raised. The third vintage of our infrastructure debt fund has also received strong support from investors. Relative to a prior vintage of $2.7 billion, this fund has now closed on over $4 billion, surpassing our initial target, and we expect a final close of over $5 billion later this year.
In aggregate, we expect to raise over $35 billion of private capital across the current vintages of our four infrastructure funds—and with capital scarce in the market, we believe the opportunity set for these vintages to be robust.
Renewable Power and Transition—Allocations of capital into energy transition are increasing and becoming more established in the mandates of institutional investors around the world. This is a stark contrast to only a few years ago when we started raising capital for Brookfield Global Transition Fund I (BGTF I) and the concept of transition investing was just being introduced. In that environment, we raised the largest first-time committed capital private fund ever and established ourselves as one of the leading transition investors, allowing us to build out a platform and track record with little competition and set ourselves up for future fundraising success.
Fundraising for the second vintage of our flagship transition fund is off to a strong start. While we are still early in the process, we expect strong re-ups and are broadening our reach to a larger group of clients, as investing in the energy transition is now much more accepted in the market. We are also benefiting from the successful deployment track record of BGTF I, giving us confidence that this vintage will be larger than the first.
Credit—In private credit, our marquee Oaktree brand is well placed to benefit from the market uncertainty, scarcity of capital, rising rates and forced selling. The twelfth vintage of our opportunistic credit fund, along with our newly launched private lending strategy, have raised $7 billion of capital to date, and we expect to raise an additional $20 billion in the next 6-12 months. Pullback by traditional lenders is also opening the window for deploying more capital at strong risk-adjusted returns.
Real Estate—We recently launched fundraising for the fifth vintage of our opportunistic real estate fund and expect a first close later this year. Historically, many of the substantial gains in real estate were made during periods of capital scarcity, so we are confident
that investors will look to deploy meaningful amounts of capital to opportunistic real estate strategies in order to take advantage of the stress in the market, which is our sweet spot. As the funding markets turn, we expect to be a beneficiary.
Private Wealth—Our private wealth business (Brookfield Oaktree Wealth Solutions) continues to gain strength as we package and design investment products for distribution into this channel. Over the past two years, we have meaningfully expanded our footprint in wealth channels globally, and today have a nearly 150-person dedicated client-focused team across 10 countries. Demand for our investment capabilities has grown as clients seek increased exposure to alternative assets. Our capabilities in real estate, infrastructure, renewable power & transition, private equity, and credit are resonating with wealth investors across all regions.
As an example, we recently announced an agreement with Fidelity Investments Canada to manage a newly formed portfolio of high-quality Canadian real estate assets on behalf of Fidelity private wealth clients. Similarly, our open-ended private infrastructure offering continues to receive strong support from investors. We launched the fund in February with a select group of distribution partners outside North America and have raised in excess of $1.3 billion to date. Later this year we will launch in additional jurisdictions and expect a further acceleration of growth. Additionally, year-to-date we have raised nearly $3 billion in various Oaktree strategies in the private wealth channel.
Secondary and Structured Capital Solutions—Allocations of capital into flexible, partnership and solutions-oriented mandates continue to increase and gain prominence in the market. Over the past several years we have focused on building this business across different sectors. Our Special Investment business, which focuses on the private equity and real assets sectors, is an excellent example of this. As an expansion of this line of business, we have recently entered into a joint venture with Sequoia Heritage, with whom we have a long-standing relationship, to set up a new, independent asset management business focused on secondary and structured capital solutions in the technology and venture capital space.
This new business is called Pinegrove Capital, and it focuses on providing dedicated, scalable, and customized product strategies for sponsors and investors in the venture capital and technology sector. Pinegrove will raise an inaugural fund in the first half of 2024. To support this effort, Brookfield Asset Management and Sequoia Heritage will collectively invest $500 million as anchor investors and provide other support as needed to ensure Pinegrove’s success as an independent business that is able to leverage Sequoia Heritage’s considerable expertise in the venture capital and technology sector, and Brookfield’s considerable expertise in secondaries and structured investments.
Size and Scale Matter
Liquidity in the bank market is improving, equity markets have been on a strong, although not broad, run and credit spreads for high-quality borrowers have compressed back to early-2022 levels. These early signs of improvement are encouraging and should be supportive for our business. That being said, credit conditions remain relatively tight, which continues to benefit those with strong balance sheets, high-quality assets, and long-standing relationships, such as us.
During the period of stress in the capital markets in the first half of the year, we strategically invested significant capital, while many investors disappeared from the market due to either lack of confidence, lack of equity, or an inability to secure debt. Year-to-date, we signed agreements to acquire companies and assets valued at more than $50 billion across our core geographies and asset classes, making us one of the most active alternative investment managers globally this year.
| | | | | | | | | | | |
| Investments | Value | Monetizations | Value |
| Power Transformation Platform | $13B | North American Midstream | $5B |
| Global Container Network | $13B | Asia Pacific Telecom | $4B |
| Global Data Center Portfolio | $11B | India Property Portfolio | $1B |
| US Renewable Power | $3B | US Hospitality | $1B |
| European Payments Platform | $3B | Indian Toll Roads | $1B |
| Other Transactions | $8B | Other Dispositions | $3B |
| TOTAL | $51B | TOTAL | $15B |
Each one of these acquisitions is different, but they all have one or more of the following in common: they are large in size, limiting competition; they are diverse in nature, enabling us to leverage our global reach; or they required significant operational enhancements to generate value, which is where our 200,000 operating team members come in. While none of the above guarantees investment performance, we have found that relentlessly focusing on these factors increases our odds of success.
Our ability to successfully deploy capital in this environment stems from several competitive advantages:
•We have access to global scale equity capital from a broad range of sources, including our publicly listed affiliates and private funds across diverse geographies and institutional types.
•The assets we focus on are in favor. They have a unique combination of characteristics that deliver principal safety in uncertain times, inflation-protected cash flows, and the ability for long-term capital appreciation. As a result, clients are looking to increase exposure to these assets and lenders are willing to continue to provide capital backed by these assets.
•As one of the largest asset managers in the world, we have built a longstanding reputation for prudently funding our businesses to ensure success across all market environments and, as such, have built strong relationships with the largest banks and lending institutions around the world, ensuring that we have continued access to capital at scale throughout market cycles.
We also benefit from ±$140 billion of permanent capital on the balance sheet of our parent Brookfield Corporation (BN), which has: no restrictions, no time limits, and no geographic constraints; $50 billion of permanent equity capital of our three listed affiliates; and a large global fundraising organization that raises significant amounts of capital in our private funds annually.
These capital sources are large—but more importantly are very flexible, which allow us to do things differently than most. Our numerous sources of capital enable us to offer permanent capital, structured investments, and traditional private equity-type capital across the risk-reward spectrum to facilitate a transaction. Our goal is to continue establishing ourselves as the go-to firm when a seller of assets looks to transact with size and flexibility. This is very powerful.
Equally important to this strong level of investment is the robust monetization activity we have achieved over the last several months. This again reinforces the ability for us to sell at strong values across market cycles and the increasing demand and strong appetite for high-quality businesses that have been de-risked and simplified through the execution of our business plans.
We Will Triple Our Insurance Assets Under Management
While we have been very active on the deal front sourcing attractive risk-adjusted opportunities for our clients, we have also been exploring prospects for strategic acquisitions to further expand our platform. This includes opportunities that would complement either our asset management businesses or Brookfield’s insurance platform, Brookfield Reinsurance (BNRE). BNRE recently announced an agreement to acquire American Equity Investment Life Holding Company (AEL) in a public-to-private transaction that will significantly expand Brookfield’s insurance strategy. AEL is a large-scale, independent annuity writer in the United States. While Brookfield Asset Management (BAM) is not investing its own capital in the transaction, the asset management business will benefit significantly from this acquisition, underscoring the rationale for our spin-off and highlighting the advantages of its place within the Brookfield ecosystem.
Once closed, BAM is expected to become the investment manager for $50 billion of AEL’s capital, effectively tripling our insurance fee-bearing capital. The transaction increases BAM’s stable fee-related earnings from managing this insurance capital by approximately $125 million annually. In addition, we target allocating approximately 40% of our insurance capital into our private funds, which will generate additional fee revenues consistent with our market fee structures.
As an added benefit to the asset manager, by virtue of its structure, this transaction will increase the public float of BAM by nearly 10% without causing any dilution to BAM shareholders. BNRE will pay for a portion of the consideration for AEL using approximately 30 million shares of BAM, valued at $1 billion, that are currently owned by Brookfield Corporation (BN). BN’s ownership in BAM is currently 75%, and this transaction will reduce its stake by approximately 2%, thereby increasing the public float. The transaction is expected to close by the end of the year or shortly thereafter, subject to regulatory and shareholder approval.
Today, we manage $27 billion of insurance capital, and BNRE’s stated goal is to grow its insurance float to $225 billion by June 2027. With a significant portion of that capital slated for allocation into private credit funds, we see meaningful potential to materially grow and develop our private credit business. Combined with capital raising from clients, we foresee a path to taking our private credit business to $500 billion in the next five to ten years.
The Best Real Estate Opportunities Since 2009 Are Coming
Since we began investing for clients in the early 2000’s, we have acquired nearly $100 billion of properties across cycles and in nearly every real estate sector and strategy, generating an overall average of over 20% annualized gross returns. Throughout our extensive and successful history of investing in real estate, we have repeatedly seen volatile markets generate opportunities to acquire high-quality real estate for exceptional value. Today, higher interest rates, inflation, and tightened lender requirements are creating uncertainty and pockets of stress in real estate markets across the globe, particularly in the U.S. This cycle is evolving largely into a story of capital markets (and the stress within) versus fundamentals in most asset classes, and we think it will ultimately favor managers with experience through cycles, access to large scale capital and strong lender relationships.
Despite the challenges we are seeing today, most real estate fundamentals are strong: multifamily rents in the U.S. are up 15% year over year; premier office rents are at all-time highs, rents for logistics properties grew 11% in 2022; hotel rooms are full, with ADRs ahead of pre-pandemic levels, and high-quality retail centers hit record sales in 2022.
On the supply side, land constraints, high costs of materials and scarce financing will keep new commercial real estate supply to a minimum, allowing continued rent growth that often outpaces inflation.
Since the global financial crisis in 2009, we don’t believe there has been a more fruitful environment to execute our longstanding investment strategy: buy high-quality assets for value when their financial structures are compromised, and drive upside through active asset management.
With boots on the ground across the globe and decades of operating experience in all major real estate sectors, our hands-on approach gives us control over investment outcomes through cycles and is well-suited for today’s environment. Rather than relying on multiple expansion, we leverage our operational expertise built over 50 years of real estate investing, global tenant relationships across our large platform, and the Brookfield ecosystem to make data-driven decisions and create value through leasing, rental appreciation, refurbishment, and redevelopment.
These capabilities have generated significant achievements across our real estate portfolio in recent months, in spite of market disruptions: double-digit rent growth and 2.4 million square feet of leasing year-to-date across our logistics portfolio in the U.S.; revenue at our Indian hotel business exceeding plan by 25% year-to-date; and ±99% occupancy in our Brazilian, South Korean, and Dubai trophy office portfolios, with renewal rates 20% ahead of plan.
With nearly 30,000 operating personnel in 30 countries, we have exceptional insight into the global real estate market. The Brookfield ecosystem enables us to unearth attractive opportunities that others may overlook or cannot undertake, and to react to changing market conditions in real time, on an asset-by-asset basis. Given the turmoil markets across the globe are experiencing, we believe there is tremendous opportunity ahead to acquire some great real estate for value, once again.
Closing
We remain committed to being a world-class asset manager and strive to invest our capital in high-quality assets that earn solid returns, while emphasizing downside protection. The primary objective of the company continues to be to generate increasing cash flows on a per-share basis, and to distribute that cash to you by dividend or share repurchases.
We look forward to seeing you on September 12th in Manhattan at our Investor Day. If you cannot attend in person, our presentation will be webcast live on our website, and also available for replay.
Thank you for your interest in Brookfield, and please do not hesitate to contact any of us should you have suggestions, questions, comments, or ideas you wish to share.
Sincerely,
Bruce Flatt Connor Teskey
Chief Executive Officer President
August 9, 2023
BROOKFIELD ASSET MANAGEMENT LTD.
MANAGEMENT’S DISCUSSION AND ANALYSIS
FORWARD-LOOKING STATEMENTS
In addition to historical information, this management's discussion and analysis ("MD&A") contains “forward-looking statements” within the meaning of applicable U.S. securities laws, including the United States Private Securities Litigation Reform Act of 1995, and “forward-looking information” within the meaning of Canadian securities laws (collectively, “forward-looking information”). Forward-looking information may relate to our outlook and anticipated events or results and may include information regarding the financial position, business strategy, growth strategy, budgets, operations, financial results, taxes, dividends, distributions, plans and objectives of our business. Particularly, information regarding future results, performance, achievements, prospects or opportunities of Brookfield Asset Management Ltd. (the "Manager"), Brookfield Asset Management ULC (the "Asset Management Company", the "asset management business" or the "Company") or the Canadian, U.S. or international markets is forward-looking information. In some cases, forward-looking information can be identified by the use of forward-looking terminology such as “plans”, “targets”, “expects” or “does not expect”, “is expected”, “an opportunity exists”, “budget”, “scheduled”, “estimates”, “forecasts”, “intends”, “anticipates” or “does not anticipate” or “believes”, or variations of such words and phrases or state that certain actions, events or results “may”, “could”, “would”, “might”, “will” or “will be taken”, “occur” or “be achieved”.
Our forward-looking statements are based on our beliefs, assumptions, and expectations of future performance, taking into account all information currently available to us. These beliefs, assumptions and expectations can change as a result of many possible events or factors, not all of which are known to us or within our control. If a change occurs, our business, financial condition, liquidity, and results of operations may vary materially from those expressed in our forward-looking statements. Several factors, including those described in this MD&A, among others, could cause our actual results to vary from our forward-looking statements. These factors include:
•the Manager’s lack of independent means of generating revenue;
•the Manager’s material assets consisting solely of its interest in the Asset Management Company;
•challenges relating to maintaining our relationship with the Corporation and potential conflicts of interest;
•the Manager being a newly formed company;
•our liability for our asset management business;
•our ability to maintain the Manager’s excepted status as a “foreign private issuer” and an “emerging growth company” under U.S. federal securities laws;
•the difficulty for investors to effect service of process and enforce judgments in the United States, Canada and/or other applicable jurisdictions;
•the impact on growth in Fee-Bearing Capital of poor product development or marketing efforts;
•our ability to maintain our global reputation;
•volatility in the trading price of the Class A Shares;
•being subjected to numerous laws, rules and regulatory requirements;
•the potential ineffectiveness of our policies to prevent violations of applicable law;
•meeting our financial obligations due to our cash flow from our asset management business;
•foreign currency risk and exchange rate fluctuations;
•requirement of temporary investments and backstop commitments to support our asset management business;
•rising interest rates;
•revenues impacted by a decline in the size or pace of investments made by our managed assets;
•our earnings growth can vary, which may affect our dividend and the trading price of the Class A Shares;
•exposed risk due to increased amount and type of investment products in our managed assets;
•difficulty in maintaining our culture;
•political instability or changes in government;
•unfavorable economic conditions or changes in the industries in which we operate;
•catastrophic events, such as earthquakes, hurricanes, or pandemics/epidemics;
•deficiencies in public company financial reporting and disclosures;
•ineffective management of ESG considerations;
•failure of our information technology systems;
•the threat of litigation;
•losses not covered by insurance;
•inability to collect on amounts owing to us;
•information barriers that may give rise to conflicts and risks;
•risks related to our renewable power and transition, infrastructure, private equity, real estate, and other alternatives, including credit strategies;
•risks relating to Canadian and United States taxation laws; and
•other factors described in this MD&A.
We caution that the factors that may affect future results described in this MD&A are not exhaustive. The forward-looking statements represent our views as of the date of this MD&A and should not be relied upon as representing our views as of any date subsequent to the date of this MD&A. While we anticipate that subsequent events and developments may cause our views to change, we disclaim any obligation to update the forward-looking statements, other than as required by applicable law. For further information on these known and unknown risks, please refer to our annual report on Form 20-F ("the "20-F"). Copies of our continuous disclosure filings, including the 20-F, are available on our website at www.brookfield.com, on the Canadian Securities Administrators’ (“CSA”) website at www.sedarplus.ca, and on the EDGAR section of the U.S. Securities and Exchange Commission’s (“SEC”) website at www.sec.gov.
These statements and other forward-looking information are based on opinions, assumptions and estimates made by us in light of our experience and perception of historical trends, current conditions and expected future developments, as well as other factors that we believe are appropriate and reasonable in the circumstances, but there can be no assurance that such estimates and assumptions will prove to be correct. Accordingly, readers should not place undue reliance on forward-looking information. We do not undertake to update any forward-looking information contained herein, except as required by applicable securities laws.
In addition to carefully considering the disclosure made in this MD&A, you should carefully consider the disclosure made by Brookfield Corporation (the "Corporation") in its continuous disclosure filings. Copies of the Corporation’s continuous disclosure filings are available on our website at www.brookfield.com, on the CSA’s website at www.sedarplus.ca, and on the EDGAR section of the SEC website at www.sec.gov.
CAUTIONARY STATEMENT REGARDING THE USE OF NON-GAAP MEASURES
The Manager and the Asset Management Company prepare their financial statements in conformity with the accounting principles generally accepted in the United States of America ("U.S. GAAP"). This MD&A discloses a number of non-GAAP financial and supplemental financial measures which are utilized in monitoring the Manager and our asset management business, including for performance measurement, capital allocation and valuation purposes. The Manager believes that providing these performance measures is helpful to investors in assessing the overall performance of our asset management business. These non-GAAP financial measures should not be considered as the sole measure of the Manager’s or our asset management business’ performance and should not be considered in isolation from, or as a substitute for, similar financial measures calculated in conformity with U.S. GAAP financial measures. Non-GAAP measures include Distributable Earnings, Fee Revenues and Fee-Related Earnings. These non-GAAP measures are not standardized financial measures and may not be comparable to similar financial measures used by other issuers. Supplemental financial measures include assets under management, Fee-Bearing Capital, and Uncalled Fund Commitments. The Manager includes the asset management activities of Oaktree (meaning collectively Oaktree Capital II, L.P., Oaktree Capital Management, L.P., Oaktree AIF Investments, L.P., Oaktree Capital Management Cayman L.P. and Oaktree Investment Holdings, L.P. and their consolidated subsidiaries), an equity accounted affiliate, in its key financial and operating measures for the Company.
For further details regarding the use of non-GAAP measures, please see the “Key Financial and Operating Measures” in the MD&A.
MANAGEMENT’S DISCUSSION AND ANALYSIS
Introduction
This management’s discussion and analysis (“MD&A”) included in this Form 6-K presents the financial position of Brookfield Asset Management Ltd. and its consolidated subsidiaries (the "Manager") as at June 30, 2023, and December 31, 2022, and the results of operations for the three and six months ended June 30, 2023. This MD&A also presents the financial position of Brookfield Asset Management ULC and its consolidated subsidiaries (the "Asset Management Company", the "asset management business" or the "Company", "we", "us", or "our") as at June 30, 2023, and December 31, 2022, and the results of operations for the three and six months ended June 30, 2023, and 2022.
The information in this MD&A should be read in conjunction with the following Condensed Consolidated Financial Statements included elsewhere in this Form 6-K: (i) the unaudited Condensed Consolidated Financial Statements of the Manager as at June 30, 2023 and December 31, 2022, and the results of operations for the three and six months ended June 30, 2023 (ii) the unaudited Condensed Consolidated and Combined Financial Statements of the Asset Management Company as at June 30, 2023 and December 31, 2022 and the results of operations for the six months ended June 30, 2023, and 2022.
Business History
The Manager and the Asset Management Company were formed by Brookfield Asset Management Inc. (now known as Brookfield Corporation or the “Corporation”) to facilitate the court approved plan of arrangement (the “Arrangement”) in a tax-efficient manner. The Arrangement, which closed on December 9, 2022, involved the division of Brookfield Asset Management Inc. into two publicly traded companies – the Manager, which is listed on the NYSE and TSX under the ticker symbols “BAM”, is a pure-play asset manager with a leading global alternative asset management business; and the Corporation, focused on deploying capital across its operating businesses and compounding that capital over the long term.
The Manager allows investors to directly access the global alternative asset management business previously carried on by Brookfield Asset Management Inc. and its subsidiaries. This business is now owned and operated through the Asset Management Company, which is owned 75% by the Corporation and 25% by the Manager.
Business Overview
We are one of the world’s leading alternative asset managers, with $850 billion of assets under management ("AUM") as of June 30, 2023, across renewable power and transition, infrastructure, real estate, private equity, and credit. We invest client capital for the long-term with a focus on real assets and essential service businesses that form the backbone of the global economy. We draw on our heritage as an owner and operator to invest for value and generate strong returns for our clients across economic cycles.
To do this, we leverage our exceptional team of over 2,500 investment and asset management professionals, our global reach, deep operating expertise, and access to large-scale capital to identify attractive investment opportunities and invest on a proprietary basis. Our investment approach and strong track record have been the foundation and driver of our growth.
We provide a highly diversified suite of alternative investment strategies to our clients and are constantly seeking to motivate new strategies to meet their needs. We have approximately 50 unique product offerings that span a wide range of risk-adjusted returns, including opportunistic, value-add, core, super-core, and credit. We evaluate the performance of these product offerings and our investment strategies using a number of non-GAAP measures as outlined in "Key Financial and Operating Measures" within this MD&A. The Manager utilizes Distributable Earnings to measure performance, while, in addition to this metric, Fee Revenues and Fee-Related Earnings are utilized in assessing the performance of our asset management business.
We have over 2,000 clients, made up of some of the world’s largest institutional investors, including sovereign wealth funds, pension plans, endowments, foundations, financial institutions, insurance companies, and individual investors.
We are in a fortunate position to be trusted with our clients’ capital and our objective is to meet their financial goals and provide for a better financial future while providing a market leading experience. Our team of 270 client service professionals across 18 global offices are dedicated to ensuring that the business is exceeding their service expectations.
Our guiding principle is to operate our business and conduct our relationships with the highest level of integrity. Our emphasis on diversity and inclusion reinforces our culture of collaboration, allowing us to attract and retain top talent. We strive to embed strong ESG practices throughout our business, underpinning our goal of having a positive impact on the communities and environment within which we operate.
Value Creation
We create shareholder value by increasing the earnings profile of our asset management business. Alternative asset management businesses such as ours are typically valued based on multiples of their Fee-Related Earnings and performance income. Accordingly, we create value by increasing the amount and quality of Fee-Related Earnings and carried interest, net of associated costs. This growth is achieved primarily by expanding the amount of Fee-Bearing Capital we manage, earning performance income such as carried interest through superior investment results and maintaining competitive operating margins.
As at June 30, 2023, we had Fee-Bearing Capital of $440 billion, of which 84% is long-dated or perpetual in nature, providing significant stability to our earnings profile. We consider Fee-Bearing Capital that is long-dated or perpetual in nature to be Fee-Bearing Capital relating to our long-term private funds, which are typically committed for 10 years with two one-year extension options, and Fee-Bearing Capital relating to our perpetual strategies, which include our permanent capital vehicles as well as capital we manage in our perpetual core and core plus private fund strategies. We seek to increase our Fee-Bearing Capital by growing the size of our existing product offerings and developing new strategies that cater to our clients’ investment needs. We also aim to deepen our existing institutional relationships, develop new institutional relationships, and access new distribution channels such as high net worth individuals and retail.
As of June 30, 2023, we had over 2,000 clients with a strong base in North America, Asia, the Middle East and Australia and a growing proportion of third-party commitments from Europe. Our high-net-worth channel also continues to grow and is approximately 5% of current commitments. We have a dedicated team of over 100 people that are focused on distributing and developing catered products to the private wealth channel.
We are also actively progressing new growth strategies, including transition, insurance, secondaries, and technology. These new initiatives, in addition to our existing strategies are expected to have a very meaningful impact on our growth trajectory in the long term.
As we grow our Fee-Bearing Capital, we earn incremental base management fees. In order to support this growth, we have been growing our exceptional team of investment and asset management professionals. Our costs are predominantly in the form of compensation for the over 2,500 professionals we employ globally.
When deploying our clients’ capital, we seek to leverage our competitive advantages to acquire high-quality real assets or businesses that provide essential services that form the backbone of the global economy. We use our global reach and access to scale capital to source attractive investment opportunities and leverage our deep operating expertise to underwrite investments and create value throughout our ownership. Our goal is to deliver superior investment returns to our clients and successfully doing so results in the continued growth of realized carried interest.
We generate robust free cash flows or Distributable Earnings, which is our primary financial performance metric. Distributable Earnings of the Manager represent our share of Distributable Earnings from the Asset Management Company less general and administrative expenses, but excluding equity-based compensation costs of the Manager. The Manager intends to pay out approximately 90% of our Distributable Earnings to shareholders quarterly and reinvest the balance back into the business.
We also monitor the broader markets and occasionally identify attractive, strategic investment opportunities that have the potential to supplement our existing business and add to our organic growth. We expect acquisitions can allow us to achieve immediate scale in a new asset class or grant us access to additional distribution channels. An example of such growth is the partnership we formed with Oaktree in 2019. Such acquisitions may occur from time to time should they be additive to our franchise, attractive to our clients, and accretive to our shareholders.
Products
Our products broadly fall into one of three categories: (i) long-term private funds, (ii) permanent capital vehicles and perpetual strategies, and (iii) liquid strategies. These are invested across five principal strategies: (i) renewable power and transition, (ii) infrastructure, (iii) private equity, (iv) real estate, and (v) credit and other.
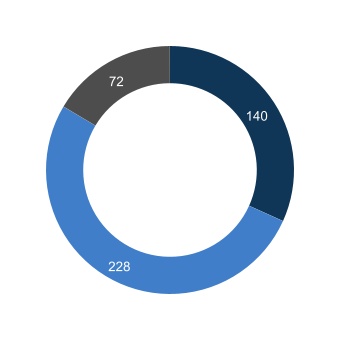
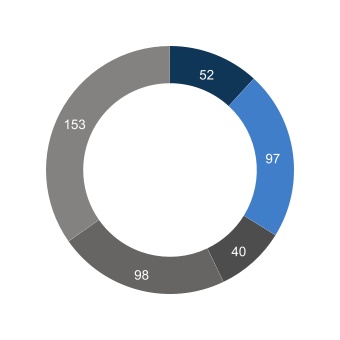
Fee-Bearing Capital Diversification
AS AT JUN. 30, 2023 (BILLIONS)
| | | | | | | | | | | | | | |
| By Fund Type | | | By Business Line | |
| | | | | |
| ■ | Long-term private funds |
| ■ | Permanent capital vehicles and perpetual strategies |
| ■ | Liquid strategies |
| |
| | | | | |
| ■ | Renewable power and transition |
| ■ | Infrastructure |
| ■ | Real estate |
| ■ | Private equity |
| ■ | Credit and other |
For discussion on Fee-Bearing Capital, see “Key Financial and Operating Measures.”
Long-term Private Funds
As of June 30, 2023, we managed approximately $228 billion of Fee-Bearing Capital across a diverse range of long-term private funds that target opportunistic (20%+, gross), value-add (15%-16%, gross), core and core plus (9%-13%, gross) returns. These funds are generally closed-end and have a long duration, typically committed for 10 years with two one-year extension options.
On these products, we earn:
•Diversified and long-term base management fees, typically on committed capital or invested capital, depending on the nature of the fund and where the fund is in its life,
•Transaction and advisory fees on co-investment capital that we raise and deploy alongside our long-term private funds, which vary based on transaction agreements, and
•Carried interest or performance fees, which entitle us to a portion of overall fund profits, provided that investors receive a minimum prescribed preferred return. Carried interest is typically paid towards the end of the life of a fund after capital has been returned to investors and may be subject to “clawback” until all investments have been monetized and minimum investment returns are sufficiently assured. The Corporation is entitled to receive 33.3% of the carried interest on new sponsored funds of our asset management business and will retain all of the carried interest earned on our existing mature funds.
Permanent Capital Vehicles and Perpetual Strategies
As of June 30, 2023, we managed approximately $140 billion of Fee-Bearing Capital across our permanent capital vehicles, perpetual core, and core plus private funds.
On these products, we earn:
•Long-term perpetual base management fees, which are based on the market capitalization or net asset value of our permanent capital vehicles and on the net asset value of our perpetual private funds.
•Stable incentive distribution fees from Brookfield Renewable Partners L.P. ("BEP") and Brookfield Infrastructure Partners L.P. ("BIP"), which are linked to the growth in cash distributions paid to investors above a predetermined hurdle. Both BEP and BIP have a long-standing track record of growing distributions annually within a target range of 5-9%.
•Performance fees from Brookfield Business Partners L.P. ("BBU") are based on unit price performance above a prescribed high-water mark price, which are not subject to clawback, as well as carried interest on our perpetual private funds.
Liquid Strategies
As of June 30, 2023, we managed approximately $72 billion of Fee-Bearing Capital across our liquid strategies, which included capital that we manage on behalf of our publicly listed funds and separately managed accounts, with a focus on fixed income and equity securities across real estate, infrastructure, and natural resources.
On these products, we earn:
•Base management fees, which are based on committed capital or fund net asset value, and
•Performance income based on investment returns above a minimum prescribed return.
Renewable Power and Transition
Overview
•We are a leading global investment manager in renewable power and transition, with $79 billion of AUM as of June 30, 2023.
•Clean energy occupies a uniquely complementary position to the global goals of net-zero emissions, low-cost energy, and energy security. We believe that the growing global demand for low-carbon energy, especially amongst corporate off-takers, will lead to continued growth opportunities for us in the future. The investment environment for renewable power and transition remains favorable and we expect to continue to advance our substantial pipeline of renewable power and transition opportunities on behalf of our clients and managed assets.
•We have approximately 100 investment and asset management professionals globally that are focused on our renewable power and transition strategy, supported by approximately 3,700 employees in the renewable power and transition operating businesses that we manage. Our extensive experience and knowledge in this industry enable us to be a leader in all major technologies with deep operating and development capabilities.
Our Products
Long-term Private Funds
•Brookfield Global Transition Fund ("BGTF") is our flagship transition fund series which is focused on investments aimed at accelerating the global transition to a net-zero carbon economy. The mandate of this product is to assist utility, energy and industrial businesses reduce carbon dioxide emissions, expand low-carbon and renewable energy production levels and advance sustainable solutions.
Permanent Capital Vehicles and Perpetual Strategies
•We also manage BEP, one of the world’s largest publicly traded renewable power platforms, which is listed on the NYSE and TSX and has a market capitalization of over $19.8 billion as of June 30, 2023.
Infrastructure
Overview
•We are one of the world’s largest investment managers in infrastructure, with $161 billion of AUM as of June 30, 2023.
•We focus on acquiring high-quality businesses on behalf of our clients that deliver essential goods and services, diversified across the utilities, transport, midstream and data infrastructure sectors. We partner closely with management teams to enable long-term success through operational and other improvements.
•We have approximately 230 investment and asset management professionals globally that are focused on our infrastructure strategy, supported by approximately 51,400 employees in the infrastructure operating businesses that we manage.
Our Products
Long-term Private Funds
•Brookfield Infrastructure Funds ("BIF") is our flagship infrastructure fund series. In this product offering, we invest on behalf of our clients in high-quality infrastructure assets on a value basis and seek to add value through the investment life cycle by utilizing our operations-oriented approach.
•Brookfield Infrastructure Debt (“BID”) is our infrastructure debt fund series, which invests on behalf of our clients in mezzanine debt investments in high-quality, core infrastructure assets.
Permanent Capital Vehicles and Perpetual Strategies
•We manage BIP, one of the largest, pure play, publicly traded global infrastructure platforms, which is listed on the NYSE and TSX and has a market capitalization of $29 billion as of June 30, 2023. In this product offering, we invest on behalf of our clients in high-quality, long-life assets that provide essential products and services for the global economy.
•We manage Brookfield Super-Core Infrastructure Partners (“BSIP”), which is our perpetual infrastructure private fund strategy. In this product offering, we invest on behalf of our clients in core infrastructure assets in developed markets, with a focus on yield, diversification, and inflation-protection.
•We also recently launched Brookfield Infrastructure Income Fund (“BII”), a semi-liquid infrastructure product strategy, offering private wealth investors access to our best-in-class infrastructure platform.
Real Estate
Overview
•We are one of the world’s largest investment managers in real estate, with over $272 billion of AUM as of June 30, 2023.
•We have invested, on behalf of clients, in iconic properties in the world’s most dynamic markets with the goal of generating stable and growing distributions for our investors while protecting them against downside risk.
•We have approximately 660 investment and asset management professionals that are focused on generating superior returns across our real estate strategies, supported by approximately 29,600 operating employees in the real estate operating businesses that we manage.
Our Products
Long-term Private Funds
•Our opportunistic real estate flagship fund series is Brookfield Strategic Real Estate Partners (“BSREP”). Through this product, we invest globally across various sectors and geographies on behalf of our clients in high-quality real estate with a focus on large, complex, distressed assets, turnarounds, and recapitalizations.
•Our commercial real estate debt fund series, Brookfield Real Estate Finance Fund (“BREF”), targets investments in transactions, predominantly in the U.S., that are senior to traditional equity and subordinate to first mortgages or investment-grade corporate debt.
•We also recently launched our real estate secondaries strategy, Brookfield Real Estate Secondaries (“BRES”), with a focus on providing liquidity solutions for other real estate general partners.
Permanent Capital Vehicles and Perpetual Strategies
•We manage $19 billion of Fee-Bearing Capital in Brookfield Property Group ("BPG") as of June 30, 2023, which we invest, on behalf of the Corporation, directly in real estate assets or through our real estate private fund offerings. BPG owns, operates, and develops iconic properties in the world’s most dynamic markets with a global portfolio of office, retail, multifamily, logistics, hospitality, land and housing, triple net lease, manufactured housing, and student housing assets on five continents.
•We also manage capital in our perpetual private fund real estate strategy, Brookfield Premier Real Estate Partners (“BPREP”). This is a core plus strategy that invests in high-quality, stabilized real assets located primarily in the U.S. with a focus on office, retail, multifamily and logistics real estate assets. We also have two regional BPREP strategies that are dedicated specifically to investments in Australia (“BPREP-A”) and Europe (“BPREP-E”).
•We manage capital across our perpetual real estate debt strategy, Brookfield Senior Mezzanine Real Estate Finance Fund (“BSREF”). We seek to originate, acquire, and actively manage investments in U.S. senior commercial real estate debt for this strategy.
•We also manage a non-traded REIT, Brookfield Real Estate Income Trust (“Brookfield REIT”), which is a semi-liquid strategy catering specifically to the private wealth channel. This product invests in high quality income-producing opportunities globally through equity or real estate-related debt.
Private Equity
Overview
•We are a leading private equity investment manager with $141 billion of AUM as of June 30, 2023.
•We focus on high-quality businesses that provide essential products and services, diversified across the industrial operations and business services sectors. We partner closely with management teams to enable long-term success through operational and other improvements.
•We have approximately 280 investment and asset management professionals globally that are focused on our private equity strategy, supported by approximately 105,400 employees in the operating businesses that we manage.
Our Products
Long-term Private Funds
•Our global opportunistic flagship fund series, Brookfield Capital Partners (“BCP”), is our leading private equity product offering. This series of funds focuses on cash-flowing essential service businesses. We seek investments that benefit from high barriers to entry and enhance their cash flow capabilities by improving strategy and execution.
•Our special investments strategy, Brookfield Special Investments (“BSI”), is focused on large-scale, non-control investments. This product capitalizes on potential transactions that do not fit our traditional control-oriented flagship private equity fund series. These include recapitalizations to strategic growth capital, where we expect to generate equity-like returns while ensuring downside protection through structured investments.
•Our growth equity strategy, Brookfield Growth (“BTG”), was launched in 2016 and has developed into a meaningful business that we expect to continue to scale over time. This strategy focuses on investing in technology-related growth stage companies that surround our broader ecosystem of managed assets.
Permanent Capital Vehicles and Perpetual Strategies
•We manage BBU, which is a publicly traded global business services and industrials partnership focused on owning and operating high-quality providers of essential products and services. BBU is listed on the NYSE and TSX and had a market capitalization of $3.9 billion as at June 30, 2023.
Credit and Other
Overview
•As a result of our 61% investment in Oaktree in 2019, we established ourselves as a leader among global investment managers specializing in alternative credit investments. As of June 30, 2023, our interest in Oaktree is 68%. Oaktree is one of the premier credit franchises globally and an expert in investing across the capital structure with an emphasis on an opportunistic, value-oriented, and risk-controlled approach to investing.
•We provide one of the most comprehensive alternative credit offerings available today, with $153 billion of Fee-Bearing Capital as of June 30, 2023, and an experienced team of investment professionals around the world.
Our Products
•Our credit strategies invest in both liquid and illiquid instruments, sourced directly from borrowers and via public markets. We focus primarily on rated and non-rated debt of sub-investment grade issuers in developed and emerging markets, and we invest in an array of private credit, high yield bonds, convertible securities, leveraged loans, structured credit instruments, and opportunistic credit.
•Our flagship credit strategy, Global Opportunities, focuses on protecting against loss by buying claims on assets at bargain prices. We aim to achieve substantial gains by actively participating in restructurings to restore companies to financial viability and creating value at every stage of the investment process.
•Included in our other strategies is our Insurance Solutions Business; this business manages policy capital and deploys it across liquid credit strategies, direct loans, and private funds.
•Also included amongst our strategies is our Public Securities Group (“PSG”), which manages the Fee-Bearing Capital associated with our liquid strategies. PSG serves institutions and individuals seeking the investment advantages of real assets through actively managed listed equity and debt strategies.
Key Financial and Operating Measures
The Manager and the Asset Management Company prepare their financial statements in conformity with U.S. GAAP. This MD&A discloses a number of non-GAAP financial and supplemental financial measures which are utilized in monitoring our asset management business, including for performance measurement, capital allocation and valuation purposes. The Manager believes that providing these performance measures is helpful to investors in assessing overall performance, as well as the performance of our asset management business. These non-GAAP financial measures should not be considered as the sole measure of the Manager’s or our asset management business’ performance and should not be considered in isolation from, or as a substitute for, similar financial measures calculated in conformity with U.S. GAAP financial measures. These non-GAAP measures are not standardized financial measures and may not be comparable to similar financial measures used by other issuers. The asset management business includes the asset management activities of Oaktree, an equity accounted affiliate, in its key financial and operating measures for our asset management business. See “Reconciliation of U.S. GAAP to Non-GAAP Measures.”
Non-GAAP Measures
Fee Revenues
Fee Revenues is a key metric analyzed by management to determine the growth in recurring cash flows from our asset management business. Fee Revenues include base management fees, incentive distributions, performance fees and transaction fees. Fee Revenues exclude carried interest but include Fee Revenues earned by Oaktree. The most directly comparable measure of Fee Revenues disclosed in the primary financial statements is management fee revenues.
Fee-Related Earnings
Fee-Related Earnings is used to provide additional insight into the operating profitability of our asset management activities. Fee-Related Earnings are recurring in nature and not based on future realization events. Fee-Related Earnings is comprised of Fee Revenues less direct costs associated with earning those fees, which include employee expenses and professional fees as well as business related technology costs, other shared services, and taxes. The most directly comparable measure of Fee-Related Earnings disclosed in the primary financial statements is net income.
Distributable Earnings
Distributable Earnings used by the Manager provides insight into earnings that are available for distribution or to be reinvested by the Manager. Distributable Earnings of the Manager represent its share of Distributable Earnings from our asset management business less general and administrative expenses, but excluding equity-based compensation costs, of the Manager. The most directly comparable measure disclosed in our primary financial statements for Distributable Earnings of the Manager is net income.
The Manager intends to pay out approximately 90% of its Distributable Earnings to shareholders quarterly and reinvest the balance back into the business. The asset management business intends to pay dividends to the Manager on a quarterly basis sufficient to ensure that the Manager can pay its intended dividend.
Distributable Earnings used by our asset management business provides insight into earnings that are available for distribution or to be reinvested by our asset management business. It is calculated as the sum of its Fee-Related Earnings, realized carried interest, interest expense, and general and administrative expenses excluding equity-based compensation costs and depreciation and amortization. The most directly comparable measure disclosed in the primary financial statements of our asset management business for Distributable Earnings is net income.
Supplemental Financial Measures Utilized by Our Asset Management Business
Assets Under Management
AUM refers to the total fair value of assets managed, calculated as follows:
•Investments that Brookfield, which includes the Corporation, the asset management business, or their affiliates, either:
◦Consolidates for accounting purposes (generally, investments in respect of which Brookfield has a significant economic interest and unilaterally directs day-to-day operating, investing and financing activities), or
◦Does not consolidate for accounting purposes but over which Brookfield has significant influence by virtue of one or more attributes (e.g., being the largest investor in the investment, having the largest representation on the investment’s
governance body, being the primary manager and/or operator of the investment, and/or having other significant influence attributes),
◦Are calculated at 100% of the total fair value of the investment taking into account its full capital structure — equity and debt — on a gross asset value basis, even if Brookfield does not own 100% of the investment, with the exception of investments held through our perpetual funds, which are calculated at its proportionate economic share of the investment’s net asset value.
•All other investments are calculated at Brookfield’s proportionate economic share of the total fair value of the investment taking into account its full capital structure — equity and debt — on a gross asset value basis.
Our methodology for determining AUM differs from the methodology that is employed by other alternative asset managers as well as the methodology for calculating regulatory AUM that is prescribed for certain regulatory filings (e.g., Form ADV and Form PF).
Fee-Bearing Capital
Fee-Bearing Capital represents the capital committed, pledged, or invested in our permanent capital vehicles, private funds and liquid strategies that we manage which entitles us to earn Fee Revenues. Fee-Bearing Capital includes both called (“invested”) and uncalled (“pledged” or “committed”) amounts.
When reconciling period amounts, we utilize the following definitions:
•Inflows include capital commitments and contributions to our private and liquid strategies funds, and equity issuances from the permanent capital vehicles.
•Outflows represent distributions and redemptions of capital from within the liquid strategies capital.
•Distributions represent quarterly distributions from the permanent capital vehicles as well as returns of committed capital (excluding market valuation adjustments), redemptions and expiry of uncalled commitments within our private funds.
•Market valuation includes gains (losses) on portfolio investments, the permanent capital vehicles and liquid strategies based on market prices.
•Other includes changes in net non-recourse leverage included in the determination of the permanent capital vehicle capitalizations and the impact of foreign exchange fluctuations on non-U.S. dollar commitments.
Uncalled Fund Commitments
Total Uncalled Fund Commitments includes capital callable from fund investors, including funds outside of their investment period, for which capital is callable for follow-on investments.
Review of Consolidated Financial Results of the Manager
Consolidated Statement of Comprehensive Income
The following table summarizes the financial results of the Manager for the three and six months ended June 30, 2023:
| | | | | | | | | | | |
FOR THE PERIODS ENDED JUNE 30, (MILLIONS) | Three Months Ended | | Six Months Ended |
| 2023 | | 2023 |
| Operating recoveries | $ | 47 | | | $ | 185 | |
| | | |
| Expenses | | | |
| Compensation and benefits | (37) | | | (122) | |
| | | |
| Carried interest allocation compensation | | | |
| Realized | (14) | | | (14) | |
| Unrealized | 1 | | | (55) | |
| Total carried interest allocation compensation | (13) | | | (69) | |
| Interest Expense | (2) | | | (3) | |
| Total expenses | (52) | | | (194) | |
| Share of income from equity method investments | 114 | | | 243 | |
| | | |
| | | |
| Net income | $ | 109 | | | $ | 234 | |
For the three months ended June 30, 2023 and 2022
During the three months ended June 30, 2023, the Manager recorded net income attributable to shareholders of $109 million. Net income consists of the Manager’s equity interest in the earnings of the Asset Management Company less compensation and benefit costs, primarily attributable to executive compensation costs of the Manager and unrealized carried interest compensation expense. A material portion of these costs are reimbursed by the Corporation and the asset management business in accordance with the Asset Management Services Agreement and the Relationship Agreement. Refer to the following discussion for details on the earnings of the Asset Management Company.
For the six months ended June 30, 2023 and 2022
For the six months ended June 30, 2023, the Manager recorded net income attributable to shareholders of $234 million, driven mostly by the income pickup of the Asset Management Company. Refer to the following discussion for details on the earnings of the Asset Management Company.
The following table summarizes the statement of operations for the Asset Management Company for the three and six months ended June 30, 2023, and 2022:
| | | | | | | | | | | | | | | | | | | | | | | |
FOR THE PERIODS ENDED JUNE 30,
(MILLIONS) | Three Months Ended | | Six Months Ended |
| 2023 | | 2022 | | 2023 | | 2022 |
| Revenues | | | | | | | |
| | | | | | | |
| Base management and advisory fees | $ | 770 | | | $ | 665 | | | $ | 1,561 | | | $ | 1,336 | |
| Investment income | | | | | | | |
| Carried interest allocations | | | | | | | |
| Realized | 1 | | | 10 | | | 32 | | | 57 | |
| Unrealized | 113 | | | 153 | | | 141 | | | 105 | |
| Total investment income | 114 | | | 163 | | | 173 | | | 162 | |
| Interest and dividend revenue | 40 | | | 74 | | | 83 | | | 141 | |
| Other revenues | 61 | | | 22 | | | 222 | | | 40 | |
| Total revenues | 985 | | | 924 | | | 2,039 | | | 1,679 | |
| Expenses | | | | | | | |
| Compensation, operating, and general and administrative expenses | | | | | | | |
| Compensation and benefits | (258) | | | (134) | | | (557) | | | (303) | |
| Other operating expenses | (78) | | | (55) | | | (148) | | | (106) | |
| General, administrative and other | (12) | | | (34) | | | (19) | | | (74) | |
| Total compensation, operating, and general and administrative expenses | (348) | | | (223) | | | (724) | | | (483) | |
| Carried interest allocation compensation | | | | | | | |
| Realized | (14) | | | (10) | | | (14) | | | (20) | |
| Unrealized | 17 | | | (8) | | | (71) | | | (111) | |
| Total carried interest allocation compensation | 3 | | | (18) | | | (85) | | | (131) | |
| Interest expense | (5) | | | (43) | | | (7) | | | (85) | |
| Total expenses | (350) | | | (284) | | | (816) | | | (699) | |
| Other income (expenses), net | 72 | | | 269 | | | 50 | | | 726 | |
| Share of income from equity accounted investments | 29 | | | 87 | | | 72 | | | 155 | |
| Income before taxes | 736 | | | 996 | | | 1,345 | | | 1,861 | |
| Income tax expense | (156) | | | (162) | | | (249) | | | (304) | |
| Net income | 580 | | | 834 | | | 1,096 | | | 1,557 | |
| Net (income) loss attributable to redeemable non-controlling interests in consolidated funds | — | | | (166) | | | — | | | (541) | |
| Net (income) loss attributable to preferred share redeemable non-controlling interest | (90) | | | — | | | (71) | | | — | |
| Net (income) loss attributable to non-controlling interest | (35) | | | — | | | (54) | | | — | |
| Net income attributable to the common stockholders | $ | 455 | | | $ | 668 | | | $ | 971 | | | $ | 1,016 | |
For the three months ended June 30, 2023 and 2022
Net income for the three months ended June 30, 2023 was $580 million, of which $455 million was attributable to common stockholders. This compares to net income of $834 million for the three months ended June 30, 2022, of which $668 million was attributable to common stockholders.
Revenues
Revenues for the three months ended were $985 million, which represents an increase of $61 million or 7% compared to $924 million in the three months ended June 30, 2022.
Base Management and Advisory Fees
Base management and advisory fees, excluding incentive distributions, for the three months ended June 30, 2023 were $677 million, which represents an increase of $96 million or 17% compared to the three months ended June 30, 2022. The increase was predominantly driven by incremental contributions from capital raised for our latest flagship funds and capital deployed across our complementary strategies. Incentive distributions for the three months ended June 30, 2023, were $93 million, an increase of $9 million or 11% from the three months ended June 30, 2022, driven by growth in BIP and BEP's dividends of 6% and 5%, respectively.
Carried Interest Allocations
Realized carried interest allocations were $1 million for the three months ended June 30, 2023, which represents a decrease of $9 million compared to the three months ended June 30, 2022. Realized carried interest allocations in the period were primarily driven by movements within our real estate perpetual funds.
Unrealized carried interest allocations were $113 million for the three months ended June 30, 2023, which represents a decrease of $40 million compared to the three months ended June 30, 2022. The unrealized carried interest allocations generated during the quarter were primarily related to growth in valuations in our real estate funds, our flagship transition fund and our sixth flagship private equity fund.
Interest and Dividend Revenue
Interest and dividend revenue for the three months ended June 30, 2023 were $40 million, which represents a decrease of $34 million compared to the three months ended June 30, 2022. The decrease was a result of the transfer of certain investments and loans of the asset management business to the Corporation as part of the Arrangement.
Other Revenue
Other Revenue was $61 million for the three months ended June 30, 2023, an increase of $39 million compared to the three months ended June 30, 2022. The increase is primarily due to amounts recoverable from the Corporation associated with share and performance based compensation as part of the Arrangement.
Expenses
Total expenses for the three months ended were $350 million, an increase of $66 million or 23% compared to the three months ended June 30, 2022.
Compensation and Benefits
Compensation and benefits for the three months ended June 30, 2023 were $258 million, which represents an increase of $124 million compared to the three months ended June 30, 2022. This is primarily attributable to increased compensation costs resulting from increases in the employee population as a result of the Arrangement, as well as increases in headcount as a result of the growth of our business.
Other Operating Expenses
Other operating expenses are comprised of professional fees, facilities, as well as travel costs directly associated with our fundraising and investment functions. Other operating expenses were $78 million for the three months ended June 30, 2023, compared to $55 million for the three months ended June 30, 2022. The increase was primarily attributable to the increase in headcount relative to the prior period.
Carried Interest Allocation Expense
Compensation expenses related to carried interest allocation compensation were $3 million for the three months ended June 30, 2023, which represents a change of $21 million compared to the three months ended June 30, 2022. The change is driven by the relative valuation gains of our funds compared to the three months ended June 30, 2022. As outlined in the Relationship Agreement, the carried interest compensation expense associated with mature funds is fully recoverable from the Corporation.
Other Income (Expenses), net
Other income for the three months ended June 30, 2023 primarily consists of mark-to-market appreciation on our investment in BSREP III as well as mark-to-market adjustments on call and put options associated with our investments in Primary Wave and Oaktree.
Share of Income from Equity Accounted Investments
Our share of income from equity accounted investments was $29 million compared to income of $87 million in the prior period. The prior period contained earnings associated with our interest in Oaktree, including one time items.
Income tax expense
Income tax expense was $156 million for the three months ended June 30, 2023, which represents a decrease of $6 million compared to the three months ended June 30, 2022. This decrease was driven by lower net income before taxes relative to prior period.
Net (Income) Loss Attributable to Preferred Share Redeemable Non-Controlling Interest
Net (income) loss attributable to preferred redeemable non-controlling interest was $90 million for the three months ended June 30, 2023. This balance represents the movement in carried interest net of carried interest allocation expense and taxes associated with mature funds due to the Corporation.
Net (Income) Loss Attributable to Non-Controlling Interest
Net (income) loss attributable to non-controlling interest was $35 million for the three months ended June 30, 2023. This balance largely represents carried interest on new funds that is earned by the Corporation.
For the six months ended June 30, 2023 and 2022
Net income for the six months was $1.1 billion, of which $971 million was attributable to common stockholders. This compares to net income of $1.6 billion for the six months ended June 30, 2022, of which $1.0 billion was attributable to common stockholders.
Revenues
Revenues for the six months were $2 billion, which represents an increase of $360 million or 21% compared to $1.7 billion in the six months ended June 30, 2022.
Base Management and Advisory Fees
Base management and advisory fees, excluding the incentive distributions, for the six months were $1.4 billion, which represents an increase of $206 million or 18% compared to the six months ended June 30, 2022. The increase was predominantly driven by incremental contributions from capital raised for our latest flagship funds and capital deployed across our complementary strategies. Incentive distributions for the six months ended June 30, 2023, were $187 million, an increase of $19 million or 11% from the six months ended June 30, 2022, driven by growth in BIP and BEP's dividends of 6% and 5%, respectively.
Carried Interest Allocations
Realized carried interest allocations were $32 million for the six months ended June 30, 2023, which represents a decrease of $25 million compared to the six months ended June 30, 2022. Realized carried interest allocations in the period were primarily driven by dispositions within our real estate flagship funds.
Unrealized carried interest allocations were $141 million for the six months ended June 30, 2023, which represents an increase of $36 million compared to the six months ended June 30, 2022. The unrealized carried interest allocations were primarily related to growth in valuations in our infrastructure, real estate, private equity flagship funds, and our flagship transition fund, partially offset by realizations in the period.
Interest and Dividend Revenue
Interest and dividend revenue for the six months ended were $83 million, which represents a decrease of $58 million compared to the six months ended June 30, 2022. The decrease was a result of the transfer of certain investments and loans of the asset management business to the Corporation as part of the Arrangement.
Other Revenue
Other Revenue was $222 million for the six months ended June 30, 2023, an increase of $182 million compared to the six months ended June 30, 2022. The increase is due to amounts recoverable from related parties associated with share and performance based compensation.
Expenses
Total expenses for the six months ended were $816 million, an increase of $117 million or 17% compared to the six months ended June 30, 2022.
Compensation and Benefits
Compensation and benefits for the six months ended June 30, 2023 were $557 million, which represents an increase of $254 million compared to the six months ended June 30, 2022. This is primarily attributable to increased compensation costs resulting from increases in the employee population as a result of the Arrangement, as well as increases in headcount as a result of the growth of our business.
Other Operating Expenses
Other operating expenses are comprised of professional fees, facilities, as well as costs directly associated with our fundraising and investment functions. Other operating expenses were $148 million for the six months ended, compared to $106 million for the six months ended June 30, 2022. The increase was primarily attributable to an increase in headcount and the growth in our business relative to the prior period.
Carried Interest Allocation Compensation
Compensation expenses related to carried interest allocation compensation were $85 million for the six months ended June 30, 2023, which represents a decrease of $46 million compared to the six months ended June 30, 2022. This is predominantly driven by a decline in relative valuation gains compared to the six months ended June 30, 2022 across our funds. As outlined in the Relationship Agreement, the carried interest compensation expense associated with mature funds is fully recoverable from the Corporation. For more information on accounting policies, please refer to the "Summary of Significant Accounting Policies of the Manager" in this MD&A.
Other Income (Expenses), net
Other income for the six months ended June 30, 2023 primarily consists of mark-to-market appreciation on our investment in BSREP III as well as mark-to-market adjustments on call and put options associated with our investments in Primary Wave and Oaktree. Other income in the prior period relates to dividend income received from BSREP III.
Share of Income from Equity Accounted Investments
Our share of income from equity accounted investments was $72 million compared to $155 million in the prior period. The prior period contained the earnings associated with our interest in Oaktree which included the recognition of one time items.
Income Tax Expense
Income tax expense was $249 million for the six months ended June 30, 2023, which represents a decrease of $55 million compared to the six months ended June 30, 2022. This decrease was driven by lower net income before taxes in the period.
Net (Income) Loss Attributable to Preferred Share Redeemable Non-Controlling Interest
Net (income) loss attributable to preferred redeemable non-controlling interest was $71 million for the six months ended June 30, 2023. This balance represents the movement in carried interest net of carried interest allocation expense and taxes associated with mature funds owing to the Corporation.
Net (Income) Loss Attributable to Non-Controlling Interest
Net (income) loss attributable to non-controlling interest was $54 million for the six months ended June 30, 2023. This balance represents the carried interest generated on new funds that is attributable to the Corporation.
Consolidated Statement of Financial Condition
The following table summarizes the Condensed and Consolidated Statement of Financial Condition of the Manager as at June 30, 2023 and December 31, 2022:
| | | | | | | | | | | |
AS AT JUNE 30, AND DECEMBER 31, (MILLIONS) | 2023 | | 2022 |
| Assets | | | |
| Cash and cash equivalents | $ | 12 | | | $ | 1 | |
| | | |
| Due from affiliates | 810 | | | 782 | |
| Other assets | 41 | | | — | |
| Investments | 2,305 | | | 2,378 | |
| Total assets | $ | 3,168 | | | $ | 3,161 | |
| | | |
| Liabilities | | | |
| Accounts payable and accrued liabilities | $ | 766 | | | $ | 781 | |
| Due to affiliates | 168 | | | 3 | |
| Total liabilities | 934 | | | 784 | |
| Equity | | | |
| | | |
| Common Stock: | | | |
| Class A (unlimited authorized and 412,586,307 issued and 391,646,691 outstanding) | 2,356 | | | 2,410 | |
| Class B (unlimited authorized and 21,280 issued and outstanding) | — | | | — | |
| Class A held in treasury (20,939,616 shares) | (517) | | | (330) | |
| Additional paid-in-capital | 383 | | | 278 | |
| Retained earnings (deficit) | (1) | | | 19 | |
| Accumulated other comprehensive income | 4 | | | — | |
| Non-controlling interest | 9 | | | — | |
| Total equity | 2,234 | | | 2,377 | |
| Total liabilities and equity | $ | 3,168 | | | $ | 3,161 | |
As at June 30, 2023 and December 31, 2022
As at June 30, 2023, the Manager’s total assets were $3.2 billion, consisting primarily of the 25% interest in the Asset Management Company and reimbursements due from affiliates related to long-term executive compensation programs assumed by the Manager.
As at June 30, 2023, the Manager’s total liabilities were $934 million, an increase of $150 million compared to the prior period. Accounts payable and accrued liabilities decreased by $15 million driven by movements in carried interest compensation due to employees partially offset by increases in stock based compensation costs due to employees. Due to affiliates increased by $165 million due to borrowings on the Manager's credit facility with Brookfield Asset Management ULC.
As at June 30, 2023, the Manager's total equity has decreased by $143 million to $2.2 billion due to the purchase of treasury shares and distributions in the period, partially offset by additional paid-in-capital related to stock based compensation plans.
Refer to the section below for details of the Asset Management Company’s Condensed Consolidated and Combined Statement of Financial Condition as at June 30, 2023 and December 31, 2022:
| | | | | | | | | | | |
AS AT JUNE 30, AND DECEMBER 31,
(MILLIONS) | 2023 | | 2022 |
| Assets | | | |
| Cash and cash equivalents | $ | 2,918 | | | $ | 3,545 | |
| Accounts receivable and other | 510 | | | 429 | |
| Due from affiliates | 2,129 | | | 2,121 | |
| Investments | 7,364 | | | 6,877 | |
| Property, plant and equipment | 65 | | | 68 | |
| Intangible assets | 59 | | | 59 | |
| Goodwill | 265 | | | 249 | |
| Deferred income tax assets | 750 | | | 739 | |
| Total assets | $ | 14,060 | | | $ | 14,087 | |
| | | |
| Liabilities and shareholder’s equity | | | |
| Accounts payable and other | $ | 1,685 | | | $ | 1,842 | |
| Due to affiliates | 890 | | | 811 | |
| Deferred income tax liabilities | 15 | | | 17 |
| Total liabilities | 2,590 | | | 2,670 | |
| | | |
| Preferred shares redeemable non-controlling interest | 2,032 | | | 1,811 | |
| | | |
| Equity | | | |
| Common equity (common shares - unlimited authorized, 1,635,327,858 issued and outstanding) | 9,013 | | | 9,271 | |
| Retained earnings | 3 | | | 84 | |
| Accumulated other comprehensive income | 166 | | | 153 | |
| Additional paid-in capital | 65 | | | — | |
| Total common equity | 9,247 | | | 9,508 | |
| Non-controlling interest | 191 | | | 98 | |
| Total equity | 9,438 | | | 9,606 | |
| Total liabilities, redeemable non-controlling interest and common equity | $ | 14,060 | | | $ | 14,087 | |
As at June 30, 2023 and December 31, 2022
Assets
Total assets were $14.1 billion as at June 30, 2023, a decrease of $27 million compared to December 31, 2022 due to increases in Investments, partially offset by a decrease in cash and cash equivalents.
Cash and Cash Equivalents
Cash and cash equivalents were $2.9 billion, a decrease of $627 million from the prior period, largely due to the acquisition of our incremental 4% ownership interest in Oaktree; prepayments of working capital needs of our managed funds that will be subsequently reimbursed; and settlements of amounts owing to affiliates. Of this balance, $2.7 billion is on deposit with the Corporation.
Accounts Receivable
Accounts receivable of $510 million primarily consists of receivables from third parties, mark-to-market derivative assets and prepaid expenses. The increase over the prior period is largely driven by the prepayments of stock based compensation costs as prescribed by the Asset Management Services Agreement.
Due from Affiliates
Due from affiliates of $2.1 billion primarily relates to management fees earned but not collected from our managed funds, as well as reimbursements due from the Corporation for long-term cash and equity based compensation awards. The decrease of $8 million from the prior period was primarily the result of the timing of settlements.
Investments
Investments are predominantly comprised of our 18% limited partnership interest in BSREP III and a 68% interest in Oaktree. The increase from the prior period of $487 million was primarily a result of income earned from our investment in Oaktree during the period as well as the increase in our ownership interest from 64% to 68%.
Liabilities
Total liabilities were $2.6 billion as at June 30, 2023, a decrease of $80 million compared to the prior period.
Accounts Payable and Other
Accounts payable and other primarily consists of accrued compensation and mark-to-market of derivatives associated with put options in investments. The decrease in the period of $157 million reflects the timing of payments and movements in the mark-to-market derivatives.
Due to Affiliates
Due to affiliates of $890 million reflects amounts owed to affiliates; the increase of $79 million reflects the timing of payments in the normal course of operations.
Preferred Shares Redeemable Non-Controlling Interest
Preferred shares redeemable non-controlling interest was $2.0 billion as at June 30, 2023, an increase of $221 million compared to $1.8 billion as at December 31, 2022. This increase was due to carried interest generated by our mature real estate, infrastructure, and other funds during the period.
Non-Controlling Interest
Non-controlling interest was $191 million as at June 30, 2023, an increase of $93 million compared to $98 million as at December 31, 2022. This increase was primarily due to carried interest generated by new funds during the period and other non-controlling interests associated with various entities within the asset management business.
Review of Consolidated Statement of Cash Flows
The following table summarizes the changes in the Manager’s cash for the three and six months ended June 30, 2023:
| | | | | | | | | | | |
FOR THE PERIODS ENDED JUNE 30,
(MILLIONS) | Three Months Ended | | Six Months Ended |
| 2023 | | 2023 |
| Operating activities before net changes in working capital and other non-cash operating items | $ | 127 | | | $ | 256 | |
| Net changes in working capital | (3) | | | (2) | |
| Other non-cash operating items | 10 | | | 12 | |
| Operating activities | 134 | | | 266 | |
| Investing activities | — | | | (41) | |
| Financing activities | (134) | | | (214) | |
| Change in cash and cash equivalents | $ | — | | | $ | 11 | |
For the three months ended June 30, 2023
The change in cash equivalents for the Manager for the three months ended June 30, 2023 was $nil.
Cashflows from operating activities were a net inflow of $134 million. Excluding net changes in working capital and other non-cash operating items, operating cash inflows were $127 million during the period.
Net cash outflows from financing activities totaled $134 million. This balance is largely comprised of the distributions paid to the Manger's shareholders and the purchase of treasury shares. These outflows were partially offset by cash drawn on the credit facility between the Manager and the Asset Management Company.
For the six months ended June 30, 2023
For the six months ended June 30, 2023, the Manager’s activities generated $11 million of net cashflow.
Cash inflows from operating activities were $266 million during the period. Excluding net changes in working capital and other non-cash operating items, operating cash inflows were $256 million.
Net cash outflows from investing activities totaled $41 million. This balance is comprised of the purchase of the tracking option.
Net cash outflows from financing activities totaled $214 million. This balance is largely comprised of the distributions paid to the Manger's shareholders and the purchase of treasury shares. These outflows were partially offset by cash drawn on the credit facility between the Manager and the Asset Management Company.
Refer to the following table that summarizes our asset management business’ Condensed Consolidated and Combined Statement of Cash Flows for the three and six months ended June 30, 2023.
| | | | | | | | | | | | | | | | | | | | | | | |
FOR THE PERIODS ENDED JUNE 30,
(MILLIONS) | Three Months Ended | | Six Months Ended |
| 2023 | | 2022 | | 2023 | | 2022 |
| Operating activities before net changes in working capital and other non-cash operating items | $ | 413 | | | $ | 365 | | | $ | 999 | | | $ | 986 | |
| Net changes in working capital | 79 | | | 1,870 | | | (473) | | | 1,461 | |
| Other non-cash operating items | 34 | | | 432 | | | (39) | | | (179) | |
| Operating activities | 526 | | | 2,667 | | | 487 | | | 2,268 | |
| Investing activities | (232) | | | (339) | | | (237) | | | (77) | |
| Financing activities | (528) | | | (2,265) | | | (877) | | | (2,043) | |
| Change in cash and cash equivalents | $ | (234) | | | $ | 63 | | | $ | (627) | | | $ | 148 | |
For the three months ended June 30, 2023 and 2022
For the three months ended June 30, 2023, the asset management business experienced net cash outflows of $234 million.
Net cash inflows from operating activities totaled $526 million, compared to net inflows of $2.7 billion in the prior period. Excluding net changes in working capital and other non-cash operating items, operating cash inflows were $413 million, representing an increase of $48 million.
Investing Activities
Net cash outflows from investing activities totaled $232 million, compared to the net outflows of $339 million in the prior period. Outflows in both periods primarily represent our acquisition of an additional 4% in Oaktree. The prior period includes inflows associated with the disposition of financial assets.
Financing Activities
Net cash outflows from financing activities totaled $528 million, compared to the net outflows of $2.3 billion in the prior period. The current period primarily consists of distributions to stockholders of $524 million, partially offset by preferred equity issuances of $63 million. The prior period outflows were primarily the result of capital repaid to parent of $3.1 billion and capital repaid to redeemable non-controlling interest of $266 million, partially offset by cash inflows of $959 million from corporate borrowings.
For the six months ended June 30, 2023 and 2022
For the six months ended June 30, 2023, the Company's activities resulted in net cash outflows of $627 million.
Net cash inflows from operating activities totaled $487 million, compared to the net cashflows of $2.3 billion in the prior period. Excluding net changes in working capital and other non-cash operating items, operating cash inflows were $999 million, representing an increase of $13 million compared to the prior period.
Investing Activities
Net cash outflows from investing activities totaled $237 million, compared to the outflows of $77 million in the prior period. The current period activity primarily consists of $239 million outflow related to the incremental 4% acquisition of Oaktree. The change from prior period cashflows is due to dispositions of investments.
Financing Activities
Net cash outflows from financing activities totaled $877 million, compared to outflows of $2.0 billion in the prior period. The current period primarily consists of distributions to shareholders of $1.1 billion, partially offset by borrowings from related parties of $194 million and preferred equity issuances of $63 million. The prior period outflows were primarily as a result of capital repaid to parent of $2.7 billion, partially offset by inflows from corporate borrowing.
Analysis of Key Non-GAAP Financial and Operating Measures of Our Asset Management Business
The following section contains a discussion and analysis of key financial and operating measures utilized in managing our asset management business, including for performance measurement, capital allocation and valuation purposes. For further detail on our non-GAAP and performance measures, please refer to “Key Financial and Operating Measures.”
Distributable Earnings
| | | | | | | | | | | | | | | | | | | | | | | |
FOR THE PERIODS ENDED JUNE 30,
(MILLIONS) | Three Months Ended | | Six Months Ended |
| 2023 | | 2022 | | 2023 | | 2022 |
| Fee Revenues | $ | 1,086 | | | $ | 993 | | | $ | 2,166 | | | $ | 1,958 | |
| | | | | | | |
Fee-Related Earnings1 | 548 | | | 516 | | | 1,095 | | | 1,008 | |
| Add back: equity-based compensation costs and other income | 47 | | | 16 | | | 100 | | | 36 | |
| | | | | | | |
| Cash taxes | (68) | | | (21) | | | (105) | | | (42) | |
| Distributable Earnings | $ | 527 | | | $ | 511 | | | $ | 1,090 | | | $ | 1,002 | |
| | | | | | | |
| | | | | | | |
| | | | | | | |
| | | | | | | |
| | | | | | | |
| | | | | | | |
| | | | | | | |
| | | | | | | |
| | | | | | | |
| | | | | | | |
| | | | | | | |
1. Fee-Related Earnings include Oaktree’s Fee-Related Earnings at our 68% share (2022 - 64%).
For the three months ended June 30, 2023 and 2022
Distributable Earnings were $527 million for the three months ended June 30, 2023, an increase of $16 million or 3% compared to the prior period. The increase was driven by higher Fee-Related Earnings, primarily attributable to fundraising and capital deployment efforts across our flagship funds, partially offset by an increase in costs as we continue to scale our asset management business. The overall increase in Distributable Earnings was partially offset by an increase in Cash taxes of $47 million.
For the six months ended June 30, 2023 and 2022
Distributable Earnings were $1.1 billion for the six months ended June 30, 2023, an increase of $88 million or 9% compared to the prior period. The increase was driven by higher Fee-Related Earnings, primarily attributable to fundraising and capital deployment efforts. These increases were partially offset by lower fees from our permanent capital vehicles due to a decline in their share prices compared to the prior period and an increase in costs as we continue to scale our asset management business.
Fee-Bearing Capital
The following table summarizes Fee-Bearing Capital as at June 30, 2023 and December 31, 2022:
| | | | | | | | | | | | | | | | | | | | | | | |
AS AT (MILLIONS) | Long-term private funds | | Perpetual strategies | | Liquid strategies | | Total |
| Renewable power and transition | $ | 27,651 | | | $ | 24,270 | | | $ | — | | | $ | 51,921 | |
| Infrastructure | 47,580 | | | 48,994 | | | — | | | 96,574 | |
| Real estate | 67,099 | | | 31,082 | | | — | | | 98,181 | |
| Private equity | 33,051 | | | 7,485 | | | — | | | 40,536 | |
| Credit and other | 52,058 | | | 28,049 | | | 72,429 | | | 152,536 | |
| June 30, 2023 | $ | 227,439 | | | $ | 139,880 | | | $ | 72,429 | | | $ | 439,748 | |
| December 31, 2022 | $ | 218,857 | | | $ | 127,155 | | | $ | 71,851 | | | $ | 417,863 | |
The changes are set out in the following tables for the three and six months ended June 30, 2023:
| | | | | | | | | | | | | | | | | | | | | | | | | | | | | | | | | | | |
AS AT AND FOR THE THREE MONTHS ENDED (MILLIONS) | Renewable power and transition | | Infrastructure | | Real estate | | Private equity | | Credit and other | | Total |
| Balance, March 31, 2023 | $ | 52,484 | | | $ | 92,752 | | | $ | 98,092 | | | $ | 39,472 | | | $ | 148,861 | | | $ | 431,661 | |
| Inflows | 1,269 | | | 2,511 | | | 1,948 | | | 1,088 | | | 6,166 | | | 12,982 | |
| Outflows | — | | | — | | | (144) | | | — | | | (3,754) | | | (3,898) | |
| Distributions | (490) | | | (988) | | | (1,482) | | | (11) | | | (629) | | | (3,600) | |
| Market valuation | (895) | | | 2,361 | | | 200 | | | (1) | | | 1,134 | | | 2,799 | |
| Other | (447) | | | (62) | | | (433) | | | (12) | | | 758 | | | (196) | |
| Change | (563) | | | 3,822 | | | 89 | | | 1,064 | | | 3,675 | | | 8,087 | |
| Balance, June 30, 2023 | $ | 51,921 | | | $ | 96,574 | | | $ | 98,181 | | | $ | 40,536 | | | $ | 152,536 | | | $ | 439,748 | |
Fee-Bearing Capital was $440 billion as at June 30, 2023 compared to $432 billion as at March 31, 2023. The increase of $8.1 billion or 2% was primarily attributable to inflows of $13 billion resulting from deployments within our credit and other funds, including investments within our insurance solutions business as well as fundraising and capital deployments within our infrastructure funds. Additionally, Fee-Bearing Capital increased by $2.8 billion due to an increase in market valuation as a result of increase in BIP's share price. These increases were partially offset by distributions across long-term private funds and perpetual strategies as well as outflows from our liquid strategies.
| | | | | | | | | | | | | | | | | | | | | | | | | | | | | | | | | | | |
AS AT AND FOR THE SIX MONTHS ENDED
(MILLIONS) | Renewable power and transition | | Infrastructure | | Real estate | | Private equity | | Credit and other | | Total |
| Balance, December 31, 2022 | $ | 47,218 | | | $ | 85,887 | | | $ | 103,025 | | | $ | 39,317 | | | $ | 142,416 | | | $ | 417,863 | |
| Inflows | 3,145 | | | 6,455 | | | 3,381 | | | 2,565 | | | 15,516 | | | 31,062 | |
| Outflows | — | | | (6) | | | (276) | | | — | | | (8,368) | | | (8,650) | |
| Distributions | (1,048) | | | (1,902) | | | (3,528) | | | (116) | | | (1,860) | | | (8,454) | |
| Market valuation | 3,070 | | | 4,821 | | | (1,633) | | | (292) | | | 3,419 | | | 9,385 | |
| Other | (464) | | | 1,319 | | | (2,788) | | | (938) | | | 1,413 | | | (1,458) | |
| Change | 4,703 | | | 10,687 | | | (4,844) | | | 1,219 | | | 10,120 | | | 21,885 | |
| Balance, June 30, 2023 | $ | 51,921 | | | $ | 96,574 | | | $ | 98,181 | | | $ | 40,536 | | | $ | 152,536 | | | $ | 439,748 | |
Fee-Bearing Capital was $440 billion as at June 30, 2023 compared to $418 billion as at December 31, 2022. The increase of $21.9 billion was primarily attributable to inflows within our credit and other strategy due to capital deployed within our closed-end funds and other investments in our insurance solutions business as well as fundraising and capital deployments across all other strategies. Additionally, an increase of $9.4 billion is driven by the higher market capitalization of our listed permanent capital vehicles, specifically BEP and BIP. Fundraising and capital deployments across other strategies also contributed to the increase of Fee-Bearing Capital. The overall increase of Fee-Bearing Capital is partially offset by distributions to our unitholders and outflows due to redemptions within our credit funds and liquid strategies.
Fee Revenues and Fee-Related Earnings
| | | | | | | | | | | | | | | | | | | | | | | |
FOR THE PERIODS ENDED JUNE 30,
(MILLIONS) | Three Months Ended | | Six Months Ended |
| 2023 | | 2022 | | 2023 | | 2022 |
Base management fees1 | $ | 983 | | | $ | 894 | | | $ | 1,964 | | | $ | 1,744 | |
| Incentive distributions | 94 | | | 84 | | | 188 | | | 168 | |
| Transaction and advisory fees | 9 | | | 15 | | | 14 | | | 46 | |
| Fee Revenues | $ | 1,086 | | | $ | 993 | | | $ | 2,166 | | | $ | 1,958 | |
Less: direct costs2 | (507) | | | (442) | | | (1,011) | | | (877) | |
| $ | 579 | | | $ | 551 | | | $ | 1,155 | | | $ | 1,081 | |
| Less: Fee-Related Earnings not attributable to the asset management business | (31) | | | (35) | | | (60) | | | (73) | |
| Fee-Related Earnings | $ | 548 | | | $ | 516 | | | $ | 1,095 | | | $ | 1,008 | |
1. Base management fees and direct costs are presented on a 100% basis. Base management fees and direct costs for Oaktree totaled $299 million and $207 million, respectively, for the three months ended June 30, 2023 (2022 - $290 million and $188 million) and $588 million and $408 million respectively, for the six months ended June 30, 2023 (2022 - $568 million and $369 million). Refer to Note 3 - “Investments” of the Condensed Consolidated and Combined Financial Statements included elsewhere in this Form 6-K for additional disclosures related to Oaktree revenues, expenses, and net income.
2. Direct costs include compensation expenses, other operating expenses and general, administrative, and other expenses and related Oaktree direct costs at 100%.
For the three months ended June 30, 2023 and 2022
Fee Revenues for the three months ended June 30, 2023 were $1.1 billion, an increase of $93 million or 9% compared to prior period. This increase was predominantly due to higher base management fees, driven by an increase in Fee-Bearing Capital specifically within our flagship funds.
Base management fees increased by $89 million or 10% compared to the three months ended June 30, 2022 driven by fees earned within our infrastructure and private equity flagship funds. Additionally, fees earned within our credit and other platform increased as a result of higher Fee-Bearing Capital driven by valuation increases and capital deployments across these strategies. The increases were partially offset by a decrease in transaction and advisory fees of $6 million.
Direct costs primarily consist of employee expenses and professional fees, as well as business related technology costs and other shared services. Direct costs increased by $65 million or 15% from prior period as we continue to scale our asset management business, including enhancing our fundraising and client service capabilities and developing new complementary strategies.
Fee-Related Earnings not attributable to the asset management business reflects the non-controlling interest related to Oaktree's earnings and is deducted to arrive at Fee-Related Earnings.
Fee-Related Earnings increased by $32 million, primarily attributable to the aforementioned increase in Fee Revenues, partially offset by direct costs.
For the six months ended June 30, 2023 and 2022
Fee Revenues for the six months ended June 30, 2023 were $2.2 billion, an increase of $208 million or 11% compared to prior period. This increase was predominantly due to an increase in base management fees of $220 million or 13%, driven by fees earned on our infrastructure, real estate and private equity flagship funds and incremental fees earned in our credit and other platform as a result of capital deployed across our opportunistic credit funds. The increase in base management fees was partially offset by lower fees from our listed permanent capital vehicles due to decreases in market capitalizations and our perpetual strategy due to a decline in net asset values of underlying assets.
Direct costs increased by $134 million or 15% from prior period as we continue to scale our asset management business.
Fee-Related Earnings increased by $87 million, primarily attributable to the aforementioned increase in Fee Revenues, partially offset by increased direct costs.
Investment Strategy Results
In each of our product categories, we invest globally in various investment strategies, each benefiting from strong secular tailwinds that provide an expanding multi-trillion dollar investable universe. Our investment strategies are (a) renewable power and transition, (b) infrastructure, (c) real estate, (d) private equity, and (e) credit and other.
The following tables summarize Fee Revenues and Fee-Bearing Capital by investment strategy:
Fee Revenues
| | | | | | | | | | | | | | | | | | | | | | | |
FOR THE PERIODS ENDED JUNE 30,
(MILLIONS) | Three Months Ended | | Six Months Ended |
| 2023 | | 2022 | | 2023 | | 2022 |
| Renewable power and transition | $ | 155 | | | $ | 157 | | | $ | 309 | | | $ | 303 | |
| Infrastructure | 306 | | 248 | | 604 | | 526 |
| Real estate | 248 | | 237 | | 509 | | 451 |
| Private equity | 117 | | 106 | | 234 | | 201 |
| Credit and other | 260 | | 245 | | 510 | | 477 |
| Total Fee Revenues | $ | 1,086 | | | $ | 993 | | | $ | 2,166 | | | $ | 1,958 | |
Fee-Bearing Capital
| | | | | | | | | | | |
AS AT JUNE 30, 2023 AND DECEMBER 31, 2022 (MILLIONS) | 2023 | | 2022 |
| Renewable power and transition | $ | 51,921 | | | $ | 47,218 | |
| Infrastructure | 96,574 | | | 85,887 | |
| Real estate | 98,181 | | | 103,025 | |
| Private equity | 40,536 | | | 39,317 | |
| Credit and other | 152,536 | | | 142,416 | |
| Total Fee-Bearing Capital | $ | 439,748 | | | $ | 417,863 | |
| | | |
| | | | | | | | | | | | | | | | | | | | | | | |
FOR THE PERIODS ENDED JUNE 30,
(MILLIONS) | Three Months Ended | | Six Months Ended |
| 2023 | | 2022 | | 2023 | | 2022 |
| Balance, beginning of period | $ | 431,661 | | | $ | 378,587 | | | $ | 417,863 | | | $ | 364,133 | |
| Inflows | 12,982 | | | 37,846 | | | 31,062 | | | 53,736 | |
| Outflows | (3,898) | | | (5,787) | | | (8,650) | | | (10,609) | |
| Distributions | (3,600) | | | (3,849) | | | (8,454) | | | (7,234) | |
| Market valuation | 2,799 | | | (15,134) | | | 9,385 | | | (10,033) | |
| Other | (196) | | | 93 | | | (1,458) | | | 1,763 | |
| Change | 8,087 | | | 13,169 | | | 21,885 | | | 27,623 | |
| Balance, end of period | $ | 439,748 | | | $ | 391,756 | | | $ | 439,748 | | | $ | 391,756 | |
Renewable Power and Transition
Summary of Key Financial and Operating Measures
The following charts provide the Fee-Bearing Capital of our renewable power and transition investment strategy as at June 30, 2023 and December 31, 2022, and Fee Revenues for the three months ended June 30, 2023 and 2022.
Fee-Bearing Capital Fee Revenues
AS AT JUN 30, 2023 AND DEC 31, 2022 (BILLIONS) FOR THE THREE MONTHS ENDED JUN 30 (MILLIONS)
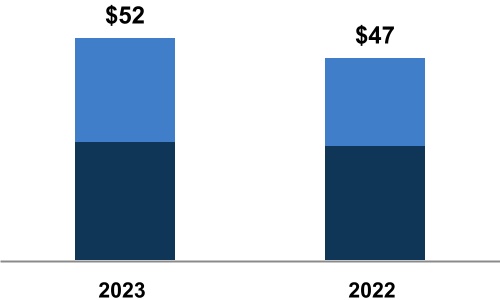
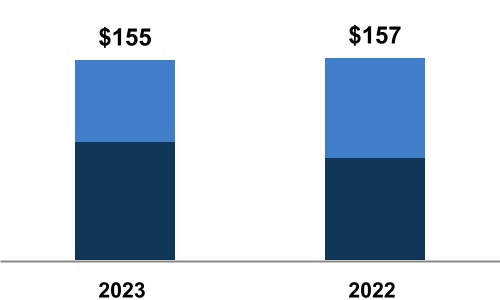
| | |
■ Long-Term Private Funds |
■ Permanent Capital Vehicles and Perpetual Strategies |
| | |
■ Long-term Private Funds |
■ Permanent Capital Vehicles and Perpetual Strategies |
The following provides explanations of significant movements during the presented periods.
Fee-Bearing Capital
| | | | | | | | | | | |
AS AT JUNE 30, 2023 AND DECEMBER 31, 2022
(MILLIONS) | 2023 | | 2022 |
| Long-term private funds | $ | 27,651 | | | $ | 26,708 | |
| Permanent capital vehicles and perpetual strategies | 24,270 | | | 20,510 | |
| Total Fee-Bearing Capital | $ | 51,921 | | | $ | 47,218 | |
| | | | | | | | | | | | | | | | | | | | | | | |
FOR THE PERIODS ENDED JUNE 30,
(MILLIONS) | Three Months Ended | | Six Months Ended |
| 2023 | | 2022 | | 2023 | | 2022 |
| Balance, beginning of period | $ | 52,484 | | | $ | 51,468 | | | $ | 47,218 | | | $ | 47,525 | |
| Inflows | 1,269 | | | 2,916 | | | 3,145 | | | 2,989 | |
| Outflows | — | | | — | | | — | | | — | |
| Distributions | (490) | | | (572) | | | (1,048) | | | (890) | |
| Market valuation | (895) | | | (3,785) | | | 3,070 | | | (72) | |
| Other | (447) | | | 11 | | | (464) | | | 486 | |
| Change | (563) | | | (1,430) | | | 4,703 | | | 2,513 | |
| Balance, end of period | $ | 51,921 | | | $ | 50,038 | | | $ | 51,921 | | | $ | 50,038 | |
For the three months ended June 30, 2023 and 2022
During the three months ended June 30, 2023, Fee-Bearing Capital decreased by $563 million or 1%, to $52 billion, primarily attributable to a decrease in the market capitalization of BEP resulting from a decline in its share price and distributions paid to BEP's unitholders. This decrease was partially offset by inflows related to BEP's completion of a $650 million equity offering during the period and additional capital raised across other fund strategies.
During the three months ended June 30, 2022, Fee-Bearing Capital decreased by $1.4 billion or 3% to $50 billion. The decrease was predominantly due to a decrease in market valuations as a result of the lower market capitalization of BEP as well as distributions to our investors. These decreases were partially offset by inflows due to capital raised for our flagship transition fund.
For the six months ended June 30, 2023 and 2022
During the six months ended June 30, 2023, Fee-Bearing Capital increased by $4.7 billion or 10% to $52 billion driven by an increase in the market capitalization of BEP, resulting from an increase in its share price within the first half of the year. The increase in inflows is attributable to capital deployments across other fund strategies and BEP's $650 million equity offering. These increases were partially offset by distributions paid to BEP’s unitholders and to limited partners of our long-term private funds.
During the six months ended June 30, 2022, Fee-Bearing Capital increased by $2.5 billion or 5% to $50 billion, predominantly due to inflows from capital raised for our transition fund. This increase was partially offset by distributions to our investors and decreased market valuations as a result of lower market capitalization of BEP, due to a decrease in its share price within the first half of the year.
Fee Revenues
| | | | | | | | | | | | | | | | | | | | | | | |
FOR THE PERIODS ENDED JUNE 30,
(MILLIONS) | Three Months Ended | | Six Months Ended |
| 2023 | | 2022 | | 2023 | | 2022 |
| Management and advisory fees | | | | | | | |
| Long-term private funds | | | | | | | |
| Flagship funds | $ | 58 | | | $ | 51 | | | $ | 115 | | | $ | 92 | |
| Co-investment and other funds | 7 | | | 5 | | | 14 | | | 10 | |
| 65 | | | 56 | | | 129 | | | 102 | |
| Perpetual strategies | | | | | | | |
BEP1 | 55 | | | 65 | | | 112 | | | 141 | |
| Co-investment and other funds | 3 | | | — | | | 5 | | | — | |
| 58 | | | 65 | | | 117 | | | 141 | |
| Catch-up fees | 2 | | | 11 | | | 3 | | | 11 | |
| Transaction and advisory fees | 2 | | | 1 | | | 4 | | | 1 | |
| Total management and advisory fees | 127 | | | 133 | | | 253 | | | 255 | |
| Incentive distributions | 28 | | | 24 | | | 56 | | | 48 | |
| Total Fee Revenues | $ | 155 | | | $ | 157 | | | $ | 309 | | | $ | 303 | |
1.BEP Fee-Bearing Capital as at June 30, 2023 is $24 billion (2022 - $21 billion)
For the three months ended June 30, 2023 and 2022
Fee Revenues decreased by $2 million or 1% for the three months ended June 30, 2023 relative to the three months ended June 30, 2022. The decrease was primarily attributable to the decline in fees earned from BEP resulting from the decrease in its market capitalization, as well as catch-up fees earned on our global transition fund in the prior year. The overall decrease was partially offset by increased fees earned by our flagship funds as well as an increase in incentive distributions from BEP due to a 5% increase in distributions compared to the prior period.
For the six months ended June 30, 2023 and 2022
Fee Revenues increased by $6 million or 2% for the six months ended June 30, 2023 relative to the six months ended June 30, 2022. Fees from our long-term private funds increased $27 million relative to prior period due to an increase in fees earned on our global transition fund as well as an increase in fundraising and capital deployments across our other private funds. Incentive distributions from BEP increased by $8 million, due to an increase in distributions compared to the prior period. These increases were partially offset by a decrease in perpetual strategy fees of $24 million predominantly due to lower fees earned from BEP resulting from a decrease in its market capitalization.
Infrastructure
Summary of Key Financial and Operating Measures
The following charts provide the Fee-Bearing Capital of our Infrastructure investment strategy as at June 30, 2023 and December 31, 2022, and Fee Revenues for the three months ended June 30, 2023 and 2022.
Fee-Bearing Capital Fee Revenues
AS AT JUN 30, 2023 AND DEC 31, 2022 (BILLIONS) FOR THE THREE MONTHS ENDED JUN 30 (MILLIONS)
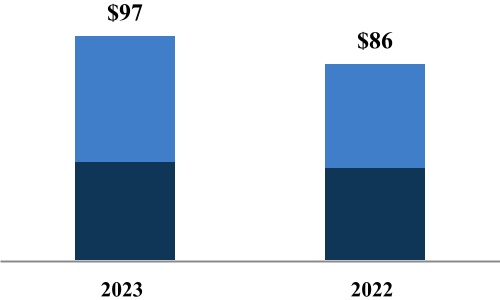
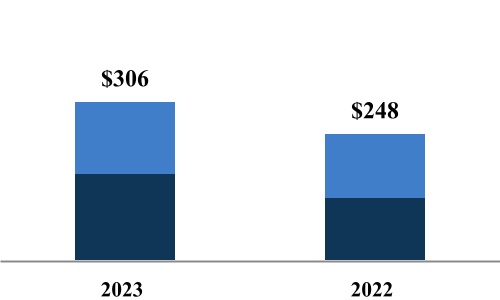
| | |
■ Long-Term Private Funds |
■ Permanent Capital Vehicles and Perpetual Strategies |
| | |
■ Long-term Private Funds |
■ Permanent Capital Vehicles and Perpetual Strategies |
We have provided additional detail below to explain significant movements during the presented periods.
Fee-Bearing Capital
| | | | | | | | | | | |
AS AT JUNE 30, 2023 AND DECEMBER 31, 2022
(MILLIONS) | 2023 | | 2022 |
| Long-term private funds | $ | 47,580 | | | $ | 44,512 | |
| Permanent capital vehicles and perpetual strategies | 48,994 | | | 41,375 | |
| Total Fee-Bearing Capital | $ | 96,574 | | | $ | 85,887 | |
| | | | | | | | | | | | | | | | | | | | | | | |
FOR THE PERIODS ENDED JUNE 30,
(MILLIONS) | Three Months Ended | | Six Months Ended |
| 2023 | | 2022 | | 2023 | | 2022 |
| Balance, beginning of period | $ | 92,752 | | | $ | 75,530 | | | $ | 85,887 | | | $ | 67,736 | |
| Inflows | 2,511 | | | 4,283 | | | 6,455 | | | 9,591 | |
| Outflows | — | | | — | | | (6) | | | — | |
| Distributions | (988) | | | (1,052) | | | (1,902) | | | (2,152) | |
| Market valuation | 2,361 | | | (4,341) | | | 4,821 | | | (1,459) | |
| Other | (62) | | | (256) | | | 1,319 | | | 448 | |
| Change | 3,822 | | | (1,366) | | | 10,687 | | | 6,428 | |
| Balance, end of period | $ | 96,574 | | | $ | 74,164 | | | $ | 96,574 | | | $ | 74,164 | |
For the three months ended June 30, 2023 and 2022
During the three months ended June 30, 2023, Fee-Bearing Capital increased by $3.8 billion or 4% to $97 billion, predominantly due to inflows from fundraising for our fifth flagship fund. Additionally, Fee-Bearing Capital increased by $2.4 billion as a result of the higher market capitalization of BIP, due to the increase in its share price. These increases were partially offset by distributions paid to limited partners in our long-term private funds and to unitholders across our permanent capital vehicles.
During the three months ended June 30, 2022, Fee-Bearing Capital decreased by $1.4 billion or 2% to $74 billion primarily as a result of the lower market capitalization of BIP due to the decline in its share price. Additionally, Fee-Bearing Capital decreased due to distributions to unitholders. These decreases were partially offset by inflows from capital deployed within our perpetual infrastructure fund and follow-on investments within our third flagship fund.
For the six months ended June 30, 2023 and 2022
During the six months ended June 30, 2023, Fee-Bearing Capital increased by $10.7 billion or 12% to $97 billion. This increase was predominantly due to capital raised for our fifth flagship fund, as well as the capital deployed from follow-on investments within our third flagship fund. Additionally, Fee-Bearing Capital increased as a result of the higher market capitalization of BIP driven by an increase in its share price. These increases were partially offset by distributions paid to limited partners in our long-term private funds and to unitholders across our permanent capital vehicles.
During the six months ended June 30, 2022, Fee-Bearing Capital increased by $6.4 billion or 9% to $74 billion, predominantly due to inflows from a capital market issuance, capital deployed within our perpetual strategies, and capital deployed for follow-on investments within our third flagship fund. These increases were partially offset by a decrease in market valuations as a result of the lower market capitalization of BIP and distributions to our investors.
Fee Revenues
| | | | | | | | | | | | | | | | | | | | | | | |
FOR THE PERIODS ENDED JUNE 30,
(MILLIONS) | Three Months Ended | | Six Months Ended |
| 2023 | | 2022 | | 2023 | | 2022 |
| Management and advisory fees | | | | | | | |
| Long-term private funds | | | | | | | |
| Flagship funds | $ | 89 | | | $ | 56 | | | $ | 179 | | | $ | 109 | |
| Co-investment and other funds | 15 | | | 9 | | | 28 | | | 20 | |
| 104 | | | 65 | | | 207 | | | 129 | |
| Perpetual strategies | | | | | | | |
BIP1 | 106 | | | 105 | | | 206 | | | 223 | |
| Co-investment and other funds | 23 | | | 15 | | | 45 | | | 21 | |
| 129 | | | 120 | | | 251 | | | 244 | |
| Catch-up fees | 5 | | | — | | | 10 | | | — | |
| Transaction and advisory fees | 2 | | | 3 | | | 4 | | | 33 | |
| Total management and advisory fees | 240 | | | 188 | | | 472 | | | 406 | |
| Incentive distributions | 66 | | | 60 | | | 132 | | | 120 | |
| Total Fee Revenues | $ | 306 | | | $ | 248 | | | $ | 604 | | | $ | 526 | |
1.BIP Fee-Bearing Capital as at June 30, 2023 is $34 billion (2022 - $29 billion).
For the three months ended June 30, 2023 and 2022
Fee Revenues increased by $58 million or 23% for the three months ended June 30, 2023 relative to the three months ended June 30, 2022. Fees from our long-term private funds increased by $39 million, primarily due to capital raised for our fifth flagship fund. Additionally, Fee Revenues increased by $9 million due to fees earned from our other perpetual strategies resulting from capital deployed in other funds.
For the six months ended June 30, 2023 and 2022
Fee Revenues increased by $78 million or 15% for the six months ended June 30, 2023 relative to the six months ended June 30, 2022. Fees from our long-term private funds increased by $78 million primarily due to capital raised for our fifth flagship fund. Fee Revenues from our perpetual strategies increased by $7 million, driven by capital deployed by BSIP, partially offset by lower fees earned from BIP due to a lower market capitalization from a decline in its stock price. Catch-up fees increased by $10 million due to follow on closes for our fifth flagship fund and incentive distributions increased by $12 million due to an increase in BIP's quarterly dividend. The increases were partially offset by a decrease of $29 million of transaction and advisory fees as the prior year benefited from fees that were one time in nature.
Real Estate
Summary of Key Financial and Operating Measures
The following charts provide the Fee-Bearing Capital for our Real Estate investment strategy as at June 30, 2023 and December 31, 2022, and Fee Revenues for the three months ended June 30, 2023 and 2022.
Fee-Bearing Capital Fee Revenues
AS AT JUN 30, 2023 AND DEC 31, 2022 (BILLIONS) FOR THE THREE MONTHS ENDED JUN 30 (MILLIONS)
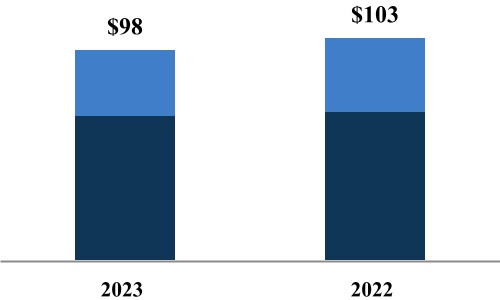
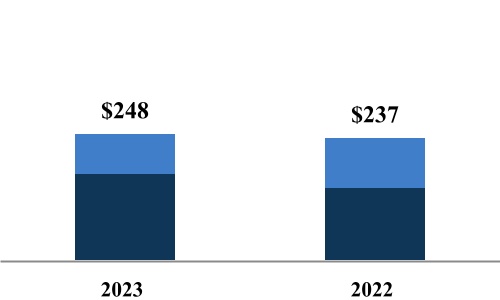
| | |
■ Long-Term Private Funds |
■ Permanent Capital Vehicles and Perpetual Strategies |
| | |
■ Long-term Private Funds |
■ Permanent Capital Vehicles and Perpetual Strategies |
We have provided additional details, where referenced, to explain significant movements from the prior period.
Fee-Bearing Capital
| | | | | | | | | | | |
AS AT JUNE 30, 2023 AND DECEMBER 31, 2022
(MILLIONS) | 2023 | | 2022 |
| Long-term private funds | $ | 67,099 | | | $ | 69,473 | |
| Permanent capital vehicles and perpetual strategies | 31,082 | | | 33,552 | |
| Total Fee-Bearing Capital | $ | 98,181 | | | $ | 103,025 | |
| | | | | | | | | | | | | | | | | | | | | | | |
FOR THE PERIODS ENDED JUNE 30,
(MILLIONS) | Three Months Ended | | Six Months Ended |
| 2023 | | 2022 | | 2023 | | 2022 |
| Balance, beginning of period | $ | 98,092 | | | $ | 84,704 | | | $ | 103,025 | | | $ | 82,282 | |
| Inflows | 1,948 | | | 4,073 | | | 3,381 | | | 6,290 | |
| Outflows | (144) | | | (157) | | | (276) | | | (246) | |
| Distributions | (1,482) | | | (1,144) | | | (3,528) | | | (2,660) | |
| Market valuation | 200 | | | 1,225 | | | (1,633) | | | 2,186 | |
| Other | (433) | | | 645 | | | (2,788) | | | 1,494 | |
| Change | 89 | | | 4,642 | | | (4,844) | | | 7,064 | |
| Balance, end of period | $ | 98,181 | | | $ | 89,346 | | | $ | 98,181 | | | $ | 89,346 | |
For the three months ended June 30, 2023 and 2022
During the three months ended June 30, 2023, Fee-Bearing Capital increased by $89 million to $98 billion, primarily attributable to inflows from capital deployed within our third flagship fund and various other private funds, partially offset by distributions to our Limited Partners.
During the three months ended June 30, 2022, Fee-Bearing Capital increased by $4.6 billion or 5% to $89 billion, predominantly due to inflows from capital raised for our fourth flagship real estate fund, capital deployed across various other fund strategies, and higher market valuations in our perpetual strategies. These increases were partially offset by distributions to our investors.
For the six months ended June 30, 2023 and 2022
During the six months ended June 30, 2023, Fee-Bearing Capital decreased by $4.8 billion or 5% to $98 billion predominantly due to distributions within our perpetual strategies, flagship and other private funds. Our permanent capital vehicles and perpetual strategies decreased due to a decline in the market valuation of certain assets. These decreases were partially offset by inflows attributable to capital deployed by our third flagship fund.
During the six months ended June 30, 2022, Fee-Bearing Capital increased by $7.1 billion or 9% to $89 billion, predominantly due to inflows from capital raised for our fourth flagship real estate fund and capital deployed across various other fund strategies. Additionally, Fee-Bearing Capital increased due to higher market valuations in our perpetual strategies. These increases were partially offset by distributions to our investors.
Fee Revenues
| | | | | | | | | | | | | | | | | | | | | | | |
FOR THE PERIODS ENDED JUNE 30,
(MILLIONS) | Three Months Ended | | Six Months Ended |
| 2023 | | 2022 | | 2023 | | 2022 |
| Management and advisory fees | | | | | | | |
| Long-term private funds | | | | | | | |
| Flagship funds | $ | 95 | | | $ | 87 | | | $ | 192 | | | $ | 172 | |
| Co-investment and other funds | 73 | | | 55 | | | 155 | | | 105 | |
| 168 | | | 142 | | | 347 | | | 277 | |
| Perpetual strategies | | | | | | | |
BPG1 | 50 | | | 58 | | | 100 | | | 113 | |
| Co-investment and other funds | 27 | | | 27 | | | 58 | | | 49 | |
| 77 | | | 85 | | | 158 | | | 162 | |
| Catch-up fees | — | | | 10 | | | 1 | | | 12 | |
| Transaction and advisory fees | 3 | | | — | | | 3 | | | — | |
| Total management and advisory fees | 248 | | | 237 | | | 509 | | | 451 | |
| Incentive distributions | — | | | — | | | — | | | — | |
| Total Fee Revenues | $ | 248 | | | $ | 237 | | | $ | 509 | | | $ | 451 | |
1.BPG Fee-Bearing Capital as at June 30, 2023 is $19 billion (2022 - $21 billion).
For the three months ended June 30, 2023 and 2022
Fee Revenues increased by $11 million or 5% for the three months ended June 30, 2023 relative to the three months ended June 30, 2022. Our long-term private funds contributed $26 million to this increase primarily due to contributions from fundraising our fourth flagship fund as well as fees earned on other fund investments. These increases were partially offset by the decrease in revenues earned from our perpetual vehicle due to a decline in its net asset value.
For the six months ended June 30, 2023 and 2022
During the six months ended June 30, 2023, Fee Revenues increased by $58 million or 13% due to the increase in revenues earned by our fourth flagship fund as a result of increased commitments throughout 2022, as well as an increase in fees earned on other fund investments. These increases were partially offset by catch-up fees recognized on our fourth flagship funds in the prior year and a decrease in fees earned by our perpetual vehicle due to the decrease in Fee-Bearing Capital of BPG as well as disposition of investments within earlier vintages of our flagship funds.
Private Equity
Summary of Key Financial and Operating Measures
The following charts provide the Fee-Bearing Capital of our Private Equity investment strategy as at June 30, 2023 and December 31, 2022, and Fee Revenues for the three months ended June 30, 2023 and 2022.
Fee-Bearing Capital Fee Revenues
AS AT JUN 30, 2023 AND DEC 31, 2022 (BILLIONS) FOR THE THREE MONTHS ENDED JUN 30 (MILLIONS)
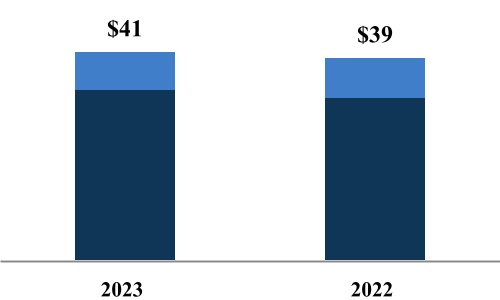
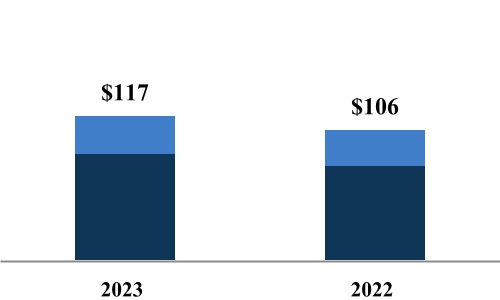
| | |
■ Long-Term Private Funds |
■ Permanent Capital Vehicles and Perpetual Strategies |
| | |
■ Long-term Private Funds |
■ Permanent Capital Vehicles and Perpetual Strategies |
We have provided additional detail below to explain significant movements during the presented periods.
Fee-Bearing Capital
| | | | | | | | | | | |
AS AT JUNE 30, 2023 AND DECEMBER 31, 2022
(MILLIONS) | 2023 | | 2022 |
| Long-term private funds | $ | 33,051 | | | $ | 31,501 | |
| Permanent capital vehicles and perpetual strategies | 7,485 | | | 7,816 | |
| Total Fee-Bearing Capital | $ | 40,536 | | | $ | 39,317 | |
| | | | | | | | | | | | | | | | | | | | | | | |
FOR THE PERIODS ENDED JUNE 30,
(MILLIONS) | Three Months Ended | | Six Months Ended |
| 2023 | | 2022 | | 2023 | | 2022 |
| Balance, beginning of period | $ | 39,472 | | | $ | 35,917 | | | $ | 39,317 | | | $ | 34,395 | |
| Inflows | 1,088 | | | 4,274 | | | 2,565 | | | 6,341 | |
| Outflows | — | | | — | | | — | | | — | |
| Distributions | (11) | | | (594) | | | (116) | | | (605) | |
| Market valuation | (1) | | | (999) | | | (292) | | | (1,544) | |
| Other | (12) | | | 356 | | | (938) | | | 367 | |
| Change | 1,064 | | | 3,037 | | | 1,219 | | | 4,559 | |
| Balance, end of period | $ | 40,536 | | | $ | 38,954 | | | $ | 40,536 | | | $ | 38,954 | |
For the three months ended June 30, 2023 and 2022
During the three months ended June 30, 2023, Fee-Bearing Capital increased by $1.1 billion to $41 billion primarily due to capital raised for our sixth flagship private equity fund and capital deployed across various funds.
During the three months ended June 30, 2022, Fee-Bearing Capital increased by $3 billion or 8% to $39 billion, predominantly due to inflows from our sixth flagship private equity fund and capital deployed across various funds. This increase was partially offset by a decrease in market valuations as a result of the lower market capitalization of BBU and distributions to our investors.
For the six months ended June 30, 2023 and 2022
During the six months ended June 30, 2023, Fee-Bearing Capital increased by $1.2 billion or 3% to $41 billion. Our long-term private funds contributed an increase in inflows of $3 billion. This was largely driven by capital raised for our sixth flagship private equity fund and capital deployed across other strategies. This increase was partially offset by the expiration of the management fee period of a mature flagship fund and distributions to our Limited Partners.
During the six months ended June 30, 2022, Fee-Bearing Capital increased by $4.6 billion or 13% to $39 billion due to inflows associated with our flagship funds and capital deployed in other strategies. This increase was partially offset by distributions to our investors and by a decrease in market valuation resulting from the decline in BBU's share price.
Fee Revenues
| | | | | | | | | | | | | | | | | | | | | | | |
FOR THE PERIODS ENDED JUNE 30,
(MILLIONS) | Three Months Ended | | Six Months Ended |
| 2023 | | 2022 | | 2023 | | 2022 |
| Management and advisory fees | | | | | | | |
| Long-term private funds | | | | | | | |
| Flagship funds | $ | 44 | | | $ | 30 | | | $ | 86 | | | $ | 55 | |
| Co-investment and other funds | 45 | | | 50 | | | 93 | | | 95 | |
| 89 | | | 80 | | | 179 | | | 150 | |
| Perpetual strategies | | | | | | | |
BBU1 | 23 | | | 23 | | | 46 | | | 47 | |
| Co-investment and other funds | — | | | — | | | — | | | — | |
| 23 | | | 23 | | | 46 | | | 47 | |
| Catch-up fees | 3 | | | — | | | 6 | | | — | |
| Transaction and advisory fees | 2 | | | 3 | | | 3 | | | 4 | |
| Total management and advisory fees | 117 | | | 106 | | | 234 | | | 201 | |
| Incentive distributions | — | | | — | | | — | | | — | |
| Total Fee Revenues | $ | 117 | | | $ | 106 | | | $ | 234 | | | $ | 201 | |
1.BBU Fee-Bearing Capital as at June 30, 2023 is $7 billion (2022 - $8 billion).
For the three months ended June 30, 2023 and 2022
Fee Revenues increased by $11 million or 10% for the three months ended June 30, 2023 relative to the three months ended June 30, 2022. This increase is primarily due to a $9 million increase in Fee Revenues from our long-term private funds, specifically due to inflows of new commitments from our sixth flagship private equity fund. This increase is partially offset by a decrease in fees earned within our other funds.
For the six months ended June 30, 2023 and 2022
Fee Revenues increased by $33 million or 16% for the six months ended June 30, 2023 relative to the six months ended June 30, 2022. This increase is primarily due to a $29 million increase in Fee Revenues from our long-term private funds and catch up fees, primarily attributable to fundraising for our sixth flagship private equity fund.
Credit and Other
Summary of Key Financial and Operating Measures
The following charts provide the Fee-Bearing Capital of our credit and other investment strategy as at June 30, 2023 and December 31, 2022 and Fee Revenues for the three months ended June 30, 2023 and 2022.
Fee-Bearing Capital Fee Revenues
AS AT JUN 30, 2023 AND DEC 31, 2022 (BILLIONS) FOR THE THREE MONTHS ENDED JUN 30 (MILLIONS)
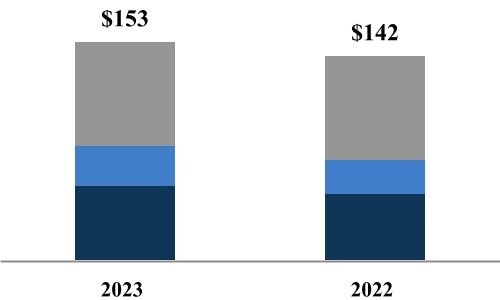
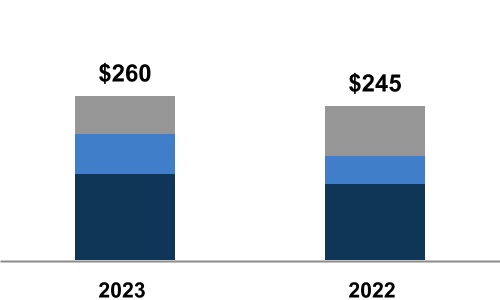
| | |
■ Long-Term Private Funds |
■ Perpetual Strategies |
■ Liquid Strategies |
| | |
■ Long-term Private Funds |
■ Perpetual Strategies |
■ Liquid Strategies |
We have provided additional detail below to explain significant movements during the presented periods.
Fee-Bearing Capital
| | | | | | | | | | | |
AS AT JUNE 30, 2023 AND DECEMBER 31, 2022
(MILLIONS) | 2023 | | 2022 |
| Long-term private funds | $ | 52,058 | | | $ | 46,663 | |
| Perpetual strategies | 28,049 | | | 23,902 | |
| Liquid strategies | 72,429 | | | 71,851 | |
| Total Fee-Bearing Capital | $ | 152,536 | | | $ | 142,416 | |
| | | | | | | | | | | | | | | | | | | | | | | |
FOR THE PERIODS ENDED JUNE 30,
(MILLIONS) | Three Months Ended | | Six Months Ended |
| 2023 | | 2022 | | 2023 | | 2022 |
| Balance, beginning of period | $ | 148,861 | | | $ | 130,968 | | | $ | 142,416 | | | $ | 132,195 | |
| Inflows | 6,166 | | | 22,300 | | | 15,516 | | | 28,525 | |
| Outflows | (3,754) | | | (5,630) | | | (8,368) | | | (10,363) | |
| Distributions | (629) | | | (487) | | | (1,860) | | | (927) | |
| Market valuation | 1,134 | | | (7,234) | | | 3,419 | | | (9,144) | |
| Other | 758 | | | (663) | | | 1,413 | | | (1,032) | |
| Change | 3,675 | | | 8,286 | | | 10,120 | | | 7,059 | |
| Balance, end of period | $ | 152,536 | | | $ | 139,254 | | | $ | 152,536 | | | $ | 139,254 | |
For the three months ended June 30, 2023 and 2022
During the three months ended June 30, 2023, Fee-Bearing Capital increased by $3.7 billion or 2% to $153 billion, primarily due to the inflows driven by capital deployed within our long-term private funds, particularly by deployments within our tenth and eleventh flagship opportunistic credit funds. Additionally, Fee-Bearing Capital increased due to capital deployed within our Insurance Solutions business. This increase was partially offset by outflows related to our Public Securities Group.
During the three months ended June 30, 2022, Fee-Bearing Capital increased by $8.3 billion or 6% to $139 billion, predominantly due to inflows resulting from Brookfield Reinsurance's acquisition of American National and capital deployed within our credit strategies. This was partially offset by lower market valuations in our open-end credit funds, outflows due to redemptions within our liquid and perpetual strategies, and distributions to our investors.
For the six months ended June 30, 2023 and 2022
During the six months ended June 30, 2023, Fee-Bearing Capital increased by $10 billion or 7% to $153 billion, due to growth across all strategies. Our long-term private funds' increase is driven by deployments within our tenth and eleventh flagship opportunistic credit funds. Our perpetual strategies increased primarily due to capital deployments as well as acquisitions within our Insurance Solutions business. This overall increase was partially offset by redemptions and lower market valuations adversely impacting liquid strategies.
During the six months ended June 30, 2022, Fee-Bearing Capital increased by $7.1 billion or 5% to $139 billion, predominantly due to inflows resulting from Brookfield Reinsurance's acquisition of American National and capital deployed within our credit strategies. This was partially offset by outflows due to redemptions within our liquid and perpetual strategies, and distributions to our investors.
Fee Revenues
| | | | | | | | | | | | | | | | | | | | | | | |
FOR THE PERIODS ENDED JUNE 30,
(MILLIONS) | Three Months Ended | | Six Months Ended |
| 2023 | | 2022 | | 2023 | | 2022 |
| Management and advisory fees | | | | | | | |
| Long-term private funds | $ | 141 | | | $ | 127 | | | $ | 274 | | | $ | 247 | |
| Perpetual strategies | 58 | | | 42 | | | 113 | | | 83 | |
Liquid strategies1 | 61 | | | 68 | | | 123 | | | 139 | |
| Transaction and advisory fees | — | | | 8 | | | — | | | 8 | |
| Total Fee Revenues | $ | 260 | | | $ | 245 | | | $ | 510 | | | $ | 477 | |
1.Represents open-end funds within our credit strategies, and Oaktree's investment in a fixed income manager, as well as in publicly listed securities.
For the three months ended June 30, 2023 and 2022
Fee Revenues increased by $15 million or 6% for the three months ended June 30, 2023 relative to the three months ended June 30, 2022. The increase was predominately attributable to incremental fees earned on deployments in our tenth and eleventh flagship opportunistic credit funds. In addition, fees from perpetual strategies increased by $16 million as a result of higher Fee-Bearing Capital driven by valuation increases and capital deployed across these strategies. These increases were partially offset by a $7 million decrease in our liquid strategies due to redemptions.
For the six months ended June 30, 2023 and 2022
Fee Revenues increased by $33 million or 7% for the six months ended June 30, 2023 relative to the six months ended June 30, 2022. The increase was predominately attributable to incremental fees earned on our long-term private funds and perpetual strategies. Fees from our long-term private funds increased due to deployments across our credit flagship funds. In addition, fees from perpetual strategies increased by $30 million as a result of higher Fee-Bearing Capital driven by valuation increases and capital deployed across these strategies. These increases were offset by a $16 million decrease in our liquid strategies due to redemptions.
Reconciliation of U.S. GAAP to Non-GAAP Measures
Reconciliations of Distributable Earnings, Fee-Related Earnings and Fee Revenues to the most directly comparable financial measures calculated and presented in conformity with U.S. GAAP are presented below. In addition to net income and revenue, management assesses the performance of its business based on these non-GAAP financial measures. These non-GAAP financial measures should be considered in addition to, and not as a substitute for or superior to, net income or other financial measures presented in conformity with U.S. GAAP.
Reconciliation of Net Income to Fee-Related Earnings and Distributable Earnings
The following presents a reconciliation of net income to Fee-Related Earnings and Distributable Earnings for the periods presented for the asset management business.
| | | | | | | | | | | | | | | | | | | | | | | |
FOR THE PERIODS ENDED JUNE 30,
(MILLIONS) | Three Months Ended | | Six Months Ended |
| 2023 | | 2022 | | 2023 | | 2022 |
| Net Income | $ | 580 | | $ | 834 | | $ | 1,096 | | $ | 1,557 |
| Add or subtract the following: | | | | | | | |
Provision for taxes(a) | 156 | | | 162 | | | 249 | | | 304 | |
Depreciation, amortization and other(b) | 3 | | 1 | | 7 | | 3 |
Carried interest allocations(c) | (114) | | | (163) | | | (173) | | | (162) | |
Carried interest allocation compensation(c) | (3) | | | 18 | | | 85 | | | 131 | |
Other income and expenses(d) | (72) | | | (269) | | | (50) | | | (726) | |
Interest expense paid to related parties(d) | 5 | | | 43 | | | 7 | | | 85 | |
Interest and dividend revenue(d) | (40) | | | (74) | | | (83) | | | (141) | |
Other revenues(e) | (31) | | | (22) | | | (194) | | | (40) | |
Share of income from equity accounted investments(f) | (29) | | | (87) | | | (72) | | | (155) | |
Fee-related earnings of partly owned subsidiaries at our share(f) | 65 | | | 64 | | | 127 | | | 124 | |
Compensation costs recovered from affiliates(g) | 22 | | | — | | | 96 | | | — | |
Fee Revenues from BSREP III & other(h) | 6 | | | 9 | | | — | | | 28 | |
| Fee-Related Earnings | $ | 548 | | | $ | 516 | | | $ | 1,095 | | | $ | 1,008 | |
| | | | | | | |
Cash taxes(i) | (68) | | | (21) | | | (105) | | | (42) | |
Equity-based compensation expense and other(j) | 47 | | | 16 | | | 100 | | | 36 | |
| Distributable Earnings | $ | 527 | | | $ | 511 | | | $ | 1,090 | | | $ | 1,002 | |
(a)This adjustment removes the impact of income tax provisions (benefit) on the basis that we do not believe this item reflects the present value of the actual tax obligations that we expect to incur over the long-term due to the substantial deferred tax assets of our asset management business.
(b)This adjustment removes the depreciation and amortization on property, plant and equipment and intangible assets, which are non-cash in nature and therefore excluded from Fee-Related Earnings.
(c)These adjustments remove unrealized carried interest allocations and the associated compensation expense, which are excluded from Fee-Related Earnings as these items are unrealized in nature.
(d)These adjustments remove other income and expenses associated with non-cash fair value changes and remove interest and charges paid or received related to intercompany or related party loans.
(e)This adjustment adds back other revenues earned that are non-cash in nature.
(f)These adjustments remove our share of partly owned subsidiaries’ earnings, including items (a) to (e) above and include its share of partly owned subsidiaries’ Fee-Related Earnings.
(g)This item adds back compensation costs that will be borne by affiliates and are non-cash in nature.
(h)This adjustment adds base management fees earned from funds that are eliminated upon consolidation and other items..
(i)Represents the impact of cash taxes paid by the business.
(j)This adjustment adds back equity-based compensation and other income associated with the Company's portion of partly owned subsidiaries’ investment income, realized carried interest and other income and other items..
Reconciliation of Revenues to Fee Revenues
The following presents our reconciliation of management fee revenues to Fee Revenues for the periods presented.
| | | | | | | | | | | | | | | | | | | | | | | |
FOR THE PERIODS ENDED JUNE 30,
(MILLIONS) | Three Months Ended | | Six Months Ended |
| 2023 | | 2022 | | 2023 | | 2022 |
| Total management fee revenues | $ | 770 | | | $ | 665 | | | $ | 1,561 | | | $ | 1,336 | |
Fee Revenues from equity-accounted investments (a) | 310 | | | 302 | | | 603 | | | 580 | |
BSREP III Fees & other(b) | 6 | | | 26 | | | 2 | | | 42 | |
| Fee Revenues | $ | 1,086 | | | $ | 993 | | | $ | 2,166 | | | $ | 1,958 | |
(a)This adjustment adds management fees at 100% ownership.
(b)This adjustment adds base management fees earned from BSREP III and other funds that are eliminated upon consolidation as prior to the Arrangement we consolidated both the entities which earned these base management fees and BSREP III in the combined financial statements. Subsequent to the Arrangement, we include the base management fees associated with BSREP III in Fee Revenues as we no longer consolidate BSREP III and therefore the related base management fees are no longer eliminated.
Liquidity and Capital Resources
Liquidity
The Manager undertakes limited activities, primarily receiving dividends from our asset management business as its main source of income and, in turn, making distributions to shareholders in accordance with its dividend policy. It employs a limited number of resources who provide services to our asset management business and for whom associated costs are largely reimbursed. Additional liquidity is available through a credit facility that is provided by our asset management business.
Manager Credit Facility with the Asset Management Business
On November 8, 2022, the Asset Management Company, as lender, established a five-year revolving credit facility in favor of the Manager for the amount of U.S. $500 million. This is available in U.S. and Canadian dollars, where U.S. dollar borrowings are subject to the U.S. Base Rate or SOFR, and Canadian Dollar borrowings are subject to the Canadian Prime Rate or Canadian dollar bankers' acceptance rate (“CDOR”). As at June 30, 2023, the Manager has drawn $124 million from the credit facility.
Our Asset Management Business Liquidity
Our asset management business maintains sufficient liquidity at all times enabling it to participate in opportunities as they arise, withstand sudden adverse changes in economic conditions, and sustain distributions to the Manager and the Corporation. Its primary sources of liquidity, which we refer to as core liquidity, consist of cash and financial assets, as well as a credit facility with the Corporation.
As at June 30, 2023, core liquidity for our asset management business was $3.0 billion, consisting of $2.9 billion of cash and financial assets, of which $2.7 billion was on deposit with the Corporation. Additionally, the asset management business has a U.S.$300 million revolving credit facility established on November 8, 2022, with the Corporation as lender. The facility is available in U.S. and Canadian dollars, where U.S. dollar borrowings are subject to the U.S. Base Rate or SOFR, while Canadian Dollar borrowings are subject to the Canadian Prime Rate or CDOR. This liquidity is readily available for use without any material tax consequences and can be deployed to support our asset management business in funding strategic transactions as well as seeding new investment products. As at June 30, 2023 the Asset Management Company has drawn $194 million from the credit facility.
The following table presents core liquidity of our asset management business:
| | | | | | | | | | | | | | | | | | | | | | | |
| Manager Liquidity | | Group Liquidity(a) |
AS AT
(MILLIONS) | June 30, | | December 31, | | June 30, | | December 31, |
| 2023 | | 2022 | | 2023 | | 2022 |
| Cash and financial assets | $ | 2,918 | | | $ | 3,545 | | | $ | 25,840 | | | $ | 29,809 | |
| Undrawn committed credit facility | 106 | | | 300 | | | 4,467 | | | 5,438 | |
| Core liquidity | 3,024 | | | 3,845 | | | 30,307 | | | 35,247 | |
| Uncalled private fund commitments | — | | | — | | | 83,075 | | | 87,364 | |
| Total liquidity | $ | 3,024 | | | $ | 3,845 | | | $ | 113,382 | | | $ | 122,611 | |
(a) Group liquidity consists of: (1) core liquidity (cash, financial assets, and undrawn credit facilities) of the Company and the perpetual affiliates, and (2) uncalled private fund commitments, which are third-party commitments available for drawdown in the private funds of our asset management business.
Uncalled Fund Commitments
The following presents our Uncalled Fund Commitments as of June 30, 2023 of each year and December 31, 2022:
| | | | | | | | | | | | | | | | | | | | | | | | | | | | | | | | | | | | | | | | | |
AS AT DECEMBER 31
(MILLIONS) | 2023 | | 2024 | | 2025 | | 2026 | | 2027 + | | Total 2023 | | Dec. 2022 |
| Renewable power and transition | $ | — | | | $ | 64 | | | $ | 113 | | | $ | — | | | $ | 16,031 | | | $ | 16,208 | | | $ | 14,835 | |
| Infrastructure | — | | | 49 | | | 192 | | | — | | | 15,391 | | | 15,632 | | | 21,895 | |
| Real estate | 382 | | | 728 | | | 234 | | | 3,170 | | | 15,105 | | | 19,619 | | | 21,981 | |
| Private equity | 65 | | | — | | | 550 | | | — | | | 10,466 | | | 11,081 | | | 11,003 | |
| Credit and other | 55 | | | 1,129 | | | 450 | | | 579 | | | 18,322 | | | 20,535 | | | 17,650 | |
| $ | 502 | | | $ | 1,970 | | | $ | 1,539 | | | $ | 3,749 | | | $ | 75,315 | | | $ | 83,075 | | | $ | 87,364 | |
Approximately $40 billion of the Uncalled Fund Commitments are not currently earning fees. The remainder will become fee-bearing once the capital is invested.
Capital Resources
Contractual Obligations
On January 31, 2019, a subsidiary of the Company committed $2.8 billion to BSREP III and has funded $2.0 billion of the total commitment as of June 30, 2023 (December 31, 2022 – $1.8 billion).
Clawback Obligations
Performance allocations are subject to clawback to the extent that the performance allocations received to date with respect to a fund exceed the amount due to our asset management business based on cumulative results of that fund. The amounts and nature of our clawback obligations are described in Note 2 “Summary of Significant Accounting Policies” of the Condensed Consolidated and Combined Financial Statements of the Asset Management Company as at June 30, 2023, and December 31, 2022 and for the three and six months ended June 30, 2023 and June 30, 2022.
Capital Requirements
Certain U.S. and non-U.S. entities of our asset management business are subject to various investment advisor and other financial regulatory rules and requirements that may include minimum net capital requirements.
Off-Balance Sheet Arrangements
In the normal course of business, the Company enters into contractual obligations which include commitments to provide guarantees. As at June 30, 2023 the total amount of these guarantees was $700 million.
Related Party Transactions
The Manager and our asset management business entered into a number of related party transactions with the Corporation. See Note 10 "Related Party Transactions" of the Condensed Consolidated and Combined Financial Statements of the Asset Management Company as at June 30, 2023 and December 31, 2022 and for the three and six months ended June 30, 2023 and June 30, 2022.
Recent Developments
On July 5, 2023, Brookfield Reinsurance ("BNRE") and American Equity Investment Life Holding Company (“AEL”) entered into a merger agreement whereby BNRE will acquire all of the outstanding common stock of AEL it does not already own. As part of the agreement, each AEL shareholder will receive $55.00 per AEL share, consisting of $38.85 in cash and 0.49707 of a Class A Share of the Manager, subject to adjustment in certain circumstances.
BNRE, the Corporation and the Manager entered into a share purchase agreement in connection with the transaction pursuant to which the Corporation will facilitate the delivery of Class A Shares of the Manager offered as consideration under the merger agreement.
Subject to this occurring, the Manager’s public float will increase by approximately 10% and the Manager’s interest in the Asset Management Company will increase from 25% to approximately 27%. The Manager will not have any ownership interest in AEL following the completion of the transaction.
For further details refer to Note 9 "Subsequent Events" of the Condensed Consolidated Financial Statements of the Manager.
Summary of Significant Accounting Policies of the Manager
The Manager prepares consolidated financial statements in conformity with U.S. GAAP. The preparation of the consolidated financial statements in conformity with U.S. GAAP requires management to make estimates that affect the amounts reported. Management believes that estimates utilized in the preparation of the consolidated financial statements are presented fairly. Such estimates include those used in the valuation of investments and the measurement of deferred tax balances (including valuation allowances). Actual results could differ from those estimates and such differences could be material. The Manager believes the following critical accounting policies could potentially produce materially different results of the Manager, if underlying assumptions, estimates and/or judgments were to be changed. For a full description of accounting policies, see Note 2 “Summary of Significant Accounting Policies” of the Condensed Consolidated and Combined Financial Statements of the Manager as at June 30, 2023 and December 31, 2022 and for the three and six months ended June 30, 2023 and June 30, 2022.
The Manager entered into several agreements and arrangements resulting from the Arrangement, among which include:
•The Asset Management Services Agreement (the "AMSA") under which the Manager provides the services of its employees and its Chief Executive Officer to Brookfield Asset Management ULC which pays the Manager for the services of these individuals on a cost recovery basis such that neither party receives financial gain nor suffers financial loss. Most of the Manager's employees/executives spend their time discharging their duties as officers and employees of the Manager and towards responsibilities related to Brookfield Asset Management ULC which include investment, corporate and other services. In addition, at the request of Brookfield Asset Management ULC, the Manager may provide options and long term incentive awards to its employees, which will be reimbursed under this agreement. See discussion of the accounting for this agreement in the Operating Recoveries accounting policy in Note 2;
•The Transitional Services Agreement (the "TSA") pursuant to which (i) Brookfield Asset Management ULC will provide the Corporation and the Manager, on a transitional basis, certain services to support day-to-day corporate activities (including services relating to finance, treasury, accounting, legal and regulatory, marketing, communications, human resources, internal audit, information technology), and (ii) the Corporation will provide, on a transitional basis, certain services to Brookfield Asset Management ULC to facilitate the orderly transfer of the asset management business. See discussion of the accounting for this agreement in the Related Parties accounting policy in Note 2; and
•The Relationship Agreement under which certain employee share-based and performance-based compensation costs are recovered from the Corporation. See discussion of the accounting for this agreement in the Operating Recoveries accounting policy in Note 2.
Consolidation
The Manager consolidates all entities that it controls through a majority voting interest and all variable interest entities (“VIE”) for which it is the primary beneficiary. An enterprise is determined to be the primary beneficiary of a VIE if it holds a controlling financial interest. A controlling financial interest is defined as (a) the power to direct the activities of a VIE that most significantly impact the entity’s economic performance and (b) the obligation to absorb losses of the entity or the right to receive benefits from the entity that could potentially be significant to the VIE. The Manager determines whether it is the primary beneficiary of a VIE at the time it becomes involved with a VIE and upon events warranting reconsideration. In determining whether the Manager is the primary beneficiary, the company evaluates its control rights as well as economic interests in the entity held either directly or indirectly by the company. The consolidation analysis can generally be performed qualitatively; however, if it is not readily apparent that the company is not the primary beneficiary, a quantitative analysis may also be performed. Investments and redemptions (either by the Manager, affiliates of the company or third parties) and amendments to governing documents could
affect an entity’s status as a VIE or the determination of the primary beneficiary. As at June 30, 2023, the Manager is not the primary beneficiary of any VIE.
All intercompany balances and transactions have been eliminated on consolidation.
Equity Method Investments
Investments in which the Manager is deemed to exert significant influence, but not control, are accounted for using the equity method of accounting. The Manager has significant influence over Brookfield Asset Management ULC and therefore accounts for its investment under the equity method.
The carrying value of equity method investments is determined based on amounts invested by the company, adjusted for the equity in earnings or losses of the investee allocated based on the relevant agreements, less distributions received. Further, the carrying value of the equity method investment is adjusted as a result of any share-based awards granted by the Manager to employees of Brookfield Asset Management ULC. Under the equity method of accounting, the Manager's share of earnings from equity investments is included in the Share of income from equity investments in the Condensed Consolidated Statements of Comprehensive Income. The Manager evaluates its equity method investments for impairment whenever events or changes in circumstances indicate that the carrying amounts of such investments may not be recoverable.
Refer to Note 3 for further details of the Manager's equity accounted investments.
Quantitative and Qualitative Risk Disclosures
The Manager has limited activities and operations. The Manager’s exposure to market, foreign currency, interest rate and credit risk is driven by its equity interest in our asset management business.
Market Risk
The Company's activities expose it to a variety of financial risks including market risk, credit risk and foreign currency risk. There have been no material changes to the company's financial risk exposure or risk management activities since December 31, 2022. Please refer to the year end MD&A included within the 20-F for further details.
BROOKFIELD ASSET MANAGEMENT LTD.
CONDENSED CONSOLIDATED FINANCIAL STATEMENTS (UNAUDITED)
June 30, 2023
BROOKFIELD ASSET MANAGEMENT LTD.
CONDENSED CONSOLIDATED BALANCE SHEET (UNAUDITED)
| | | | | | | | | | | |
AS AT JUNE 30, AND DECEMBER 31,
(MILLIONS) | 2023 | | 2022 |
| Assets | | | |
| Cash and cash equivalents | $ | 12 | | | $ | 1 | |
| | | |
| Due from affiliates | 810 | | | 782 | |
| Other assets | 41 | | | — | |
| Investments | 2,305 | | | 2,378 | |
| Total assets | $ | 3,168 | | | $ | 3,161 | |
| | | |
| Liabilities | | | |
| Accounts payable and accrued liabilities | $ | 766 | | | $ | 781 | |
| Due to affiliates | 168 | | | 3 | |
| Total liabilities | 934 | | | 784 | |
| Commitment and contingencies | | | |
| Equity | | | |
| Common Stock: | | | |
| Class A (unlimited authorized and 412,586,307 issued and 391,660,962 outstanding) | 2,356 | | | 2,410 | |
| Class B (unlimited authorized and 21,280 issued and outstanding) | — | | | — | |
| Class A held in treasury (20,925,345 shares) | (517) | | | (330) | |
| Additional paid-in-capital | 383 | | | 278 | |
| Retained earnings (deficit) | (1) | | | 19 | |
| Accumulated other comprehensive income | 4 | | | — | |
| Non-controlling interest | 9 | | | — | |
| Total equity | 2,234 | | | 2,377 | |
| Total liabilities and equity | $ | 3,168 | | | $ | 3,161 | |
BROOKFIELD ASSET MANAGEMENT LTD.
CONDENSED CONSOLIDATED STATEMENT OF COMPREHENSIVE INCOME (UNAUDITED)
| | | | | | | | | | | |
FOR THE PERIODS ENDED JUNE 30,
(MILLIONS) | Three Months Ended | | Six Months Ended |
| 2023 | | 2023 |
| Operating recoveries | $ | 47 | | | $ | 185 | |
| | | |
| Expenses | | | |
| Compensation and benefits | (37) | | | (122) | |
| | | |
| Carried interest allocation compensation | | | |
| Realized | (14) | | | (14) | |
| Unrealized | 1 | | | (55) | |
| Total carried interest allocation compensation | (13) | | | (69) | |
| Interest Expense | (2) | | | (3) | |
| Total expenses | (52) | | | (194) | |
| Share of income from equity method investments | 114 | | | 243 | |
| | | |
| | | |
| Net income | $ | 109 | | | $ | 234 | |
| | | |
| Net income per share of common stock | | | |
| Basic | $ | 0.28 | | | $ | 0.59 | |
| Diluted | $ | 0.28 | | | $ | 0.59 | |
| | | |
| Weighted-average shares of common stock outstanding | | | |
| Basic | 392.1 | | | 393.5 | |
| Diluted | 396.3 | | | 399.6 | |
| | | |
| Comprehensive income: | | | |
| Net income | $ | 109 | | | $ | 234 | |
| Other comprehensive income: | | | |
| Currency translation from equity method investments | 4 | | | 4 | |
| Other comprehensive income | 4 | | | 4 | |
| Comprehensive income | $ | 113 | | | $ | 238 | |
BROOKFIELD ASSET MANAGEMENT LTD.
CONDENSED CONSOLIDATED STATEMENT OF CHANGES IN EQUITY (UNAUDITED)
| | | | | | | | | | | | | | | | | | | | | | | | | | | | | | | | | | | | | | | | | | | | | | | | | | | | | |
AS AT
(MILLIONS) | Shares of Brookfield Asset Management Ltd. | | Brookfield Asset Management Ltd. |
| Class A common stock | | Class B common stock | | Common stock | | Treasury stock | | Additional paid-in-capital | | Retained earnings (deficit) | | Accumulated
other
comprehensive
income | | Non-controlling interest | | Total equity |
| Balance at March 31, 2023 | 392,619,562 | | | 21,280 | | | $ | 2,411 | | | $ | (482) | | | $ | 374 | | | $ | 17 | | | $ | — | | | $ | 9 | | | $ | 2,329 | |
| Net income | — | | | — | | | — | | | — | | | — | | | 109 | | | — | | | — | | | 109 | |
| Currency translation | — | | | — | | | — | | | — | | — | | — | | — | | — | | — | | 4 | | | — | | | 4 | |
| Share subscriptions | 158,300 | | | — | | | 1 | | | — | | | (1) | | | — | | | — | | | — | | | — | |
| Purchase of treasury shares, net | (1,116,900) | | | — | | | — | | | (35) | | | — | | | — | | | — | | | — | | | (35) | |
| Contributions | — | | | — | | | — | | | — | | | 10 | | | — | | | — | | | — | | | 10 | |
| Distributions | — | | | — | | | (56) | | | — | | | — | | | (127) | | | — | | | — | | | (183) | |
| Balance at June 30, 2023 | 391,660,962 | | | 21,280 | | | $ | 2,356 | | | $ | (517) | | | $ | 383 | | | $ | (1) | | | $ | 4 | | | $ | 9 | | | $ | 2,234 | |
| | | | | | | | | | | | | | | | | | | | | | | | | | | | | | | | | | | | | | | | | | | | | | | | | | | | | |
AS AT
(MILLIONS) | Shares of Brookfield Asset Management Ltd. | | Brookfield Asset Management Ltd. |
| Class A common stock | | Class B common stock | | Common stock | | Treasury stock | | Additional paid-in-capital | | Retained earnings (deficit) | | Accumulated
other
comprehensive
income | | Non-controlling interest | | Total equity |
| Balance at December 31, 2022 | 396,154,728 | | | 21,280 | | | $ | 2,410 | | | $ | (330) | | | $ | 278 | | | $ | 19 | | | $ | — | | | $ | — | | | $ | 2,377 | |
| Net income | — | | | — | | | — | | | — | | | — | | | 234 | | | — | | | — | | | 234 | |
| Currency translation | — | | | — | | | — | | | — | | — | | — | | — | | — | | — | | 4 | | | — | | | 4 | |
| Share subscriptions | 373,344 | | | — | | | 2 | | | — | | | (2) | | | — | | | — | | | — | | | — | |
| Purchase of treasury shares, net | (4,867,110) | | | — | | | — | | | (187) | | | — | | | — | | | — | | | — | | | (187) | |
| Contributions | — | | | — | | | — | | | — | | | 107 | | | — | | | — | | | 9 | | | 116 | |
| Distributions | — | | | — | | | (56) | | | — | | | — | | | (254) | | | — | | | — | | | (310) | |
| Balance at June 30, 2023 | 391,660,962 | | | 21,280 | | | $ | 2,356 | | | $ | (517) | | | $ | 383 | | | $ | (1) | | | $ | 4 | | | $ | 9 | | | $ | 2,234 | |
BROOKFIELD ASSET MANAGEMENT LTD.
CONDENSED CONSOLIDATED STATEMENT OF CASH FLOWS (UNAUDITED)
| | | | | | | | | | | |
FOR THE PERIODS ENDED JUNE 30,
(MILLIONS) | Three Months Ended | | Six Months Ended |
| 2023 | | 2023 |
| Operating activities | | | |
| Net income | $ | 109 | | | $ | 234 | |
| Non-cash adjustments: | | | |
| | | |
| Share of (income) loss from investments accounted for under the equity method, net | 17 | | | 20 | |
| | | |
| Stock based equity awards | 1 | | | 2 | |
| | | |
| Working capital movements: | | | |
| Due from affiliates | 65 | | | (28) | |
| Due to affiliates | 39 | | | 41 | |
| Accounts payable | (107) | | | (15) | |
| | | |
| Other non-cash operating items | 10 | | | 12 | |
| 134 | | | 266 | |
| Investing activities | | | |
| Acquisitions | | | |
| Purchase of tracking option | — | | | (41) | |
| | | |
| — | | | (41) | |
| Financing activities | | | |
| Stock based compensation prepayment from affiliates | — | | | 104 | |
| Change in due to affiliates | 29 | | | 124 | |
| Proceeds (costs) related to issuance of shares | (1) | | | (1) | |
| Distributions paid to common stockholders | (127) | | | (254) | |
| Purchase of treasury shares | (35) | | | (187) | |
| (134) | | | (214) | |
| Cash and cash equivalents | | | |
| Change in cash and cash equivalents | — | | | 11 | |
| Balance, beginning of period | 12 | | | 1 | |
| Balance, end of period | $ | 12 | | | $ | 12 | |
BROOKFIELD ASSET MANAGEMENT LTD.
NOTES TO THE CONDENSED CONSOLIDATED FINANCIAL STATEMENTS (UNAUDITED)
1. ORGANIZATION
Brookfield Asset Management Ltd. (the “Manager”), through its investment in Brookfield Asset Management ULC ("our asset management business" or the "Company") is an alternative asset manager. The Manager is listed on the New York and Toronto stock exchanges under the symbol BAM. The Manager was incorporated on July 4, 2022 and its head office is located at Suite 100, Brookfield Place, 181 Bay Street, Toronto, Ontario M5J 2T3 and its registered office is located at 1055 West Georgia Street, 1500 Royal Centre, P.O. Box 11117, Vancouver, British Columbia V6E 4N7.
On December 9, 2022, Brookfield Corporation (the "Corporation") completed the partial spin-off of Brookfield Asset Management ULC (the "Arrangement"). The Manager was incorporated for the purpose of holding a 25% interest in Brookfield Asset Management ULC and to facilitate the Arrangement. As part of the Arrangement, the Corporation contributed certain indirect wholly owned asset management subsidiaries to Brookfield Asset Management ULC. The contribution of these entities was considered a common control transaction and was measured at historical cost. Further, the Corporation contributed a 25% interest of Brookfield Asset Management ULC to the Manager, and in exchange, the Manager issued securities of the Manager to the Corporation’s existing shareholders on a pro-rata basis.
The Manager entered into several agreements and arrangements resulting from the Arrangement, among which include:
•The Asset Management Services Agreement (the "AMSA") under which the Manager provides the services of its employees and its Chief Executive Officer to Brookfield Asset Management ULC which pays the Manager for the services of these individuals on a cost recovery basis such that neither party receives financial gain nor suffers financial loss. Most of the Manager's employees/executives spend their time discharging their duties as officers and employees of the Manager and towards responsibilities related to Brookfield Asset Management ULC which include investment, corporate and other services. In addition, at the request of Brookfield Asset Management ULC, the Manager may provide options and long term incentive awards to its employees, which will be reimbursed under this agreement. See discussion of the accounting for this agreement in the Operating Recoveries accounting policy in Note 2;
•The Transitional Services Agreement (the "TSA") pursuant to which (i) Brookfield Asset Management ULC will provide the Corporation and the Manager, on a transitional basis, certain services to support day-to-day corporate activities (including services relating to finance, treasury, accounting, legal and regulatory, marketing, communications, human resources, internal audit, information technology), and (ii) the Corporation will provide, on a transitional basis, certain services to Brookfield Asset Management ULC to facilitate the orderly transfer of the asset management business. See discussion of the accounting for this agreement in the Related Parties accounting policy in Note 2; and
•The Relationship Agreement under which certain employee share-based and performance-based compensation costs are recovered from the Corporation. See discussion of the accounting for this agreement in the Operating Recoveries accounting policy in Note 2.
2. SUMMARY OF SIGNIFICANT ACCOUNTING POLICIES
Basis of Presentation
The accompanying unaudited Condensed Consolidated Financial Statements of the Manager have been prepared in conformity with accounting principles generally accepted in the United States of America (“U.S. GAAP”) for interim financial information and are presented in U.S. Dollars. The Condensed Consolidated Financial Statements, including these notes, are unaudited and exclude some of the disclosures required in annual financial statements. Management believes it has made all necessary adjustments (consisting of only normal recurring items) so that the Condensed Consolidated Financial Statements are presented fairly and that estimates made in preparing its Condensed Consolidated Financial Statements are reasonable. The operating results presented for interim periods are not necessarily indicative of the results that may be expected for any other interim period or for the entire year. These Condensed Consolidated Financial Statements should be read in conjunction with the audited consolidated financial statements included in the Manager's 20-F for the year ended December 31, 2022.
Use of Estimates
The preparation of the Condensed Consolidated Financial Statements in accordance with U.S. GAAP requires management to make estimates that affect the amounts reported in the Condensed Consolidated Financial Statements and accompanying notes. Management believes that estimates utilized in the preparation of the Condensed Consolidated Financial Statements are reasonable. Such estimates include those used in the valuation of investments and financial instruments, the measurement of
deferred tax balances (including valuation allowances) and the accounting for share-based and performance-based compensation. Actual results may differ from those estimates and such differences may be material.
Consolidation
The Manager consolidates all entities that it controls through a majority voting interest and all variable interest entities (“VIE”) for which it is the primary beneficiary. An enterprise is determined to be the primary beneficiary of a VIE if it holds a controlling financial interest. A controlling financial interest is defined as (a) the power to direct the activities of a VIE that most significantly impact the entity’s economic performance and (b) the obligation to absorb losses of the entity or the right to receive benefits from the entity that could potentially be significant to the VIE. The Manager determines whether it is the primary beneficiary of a VIE at the time it becomes involved with a VIE and upon events warranting reconsideration. In determining whether the Manager is the primary beneficiary, the company evaluates its control rights as well as economic interests in the entity held either directly or indirectly by the company. The consolidation analysis can generally be performed qualitatively; however, if it is not readily apparent that the company is not the primary beneficiary, a quantitative analysis may also be performed. Investments and redemptions (either by the Manager, affiliates of the company or third parties) and amendments to governing documents could affect an entity’s status as a VIE or the determination of the primary beneficiary. As at June 30, 2023, the Manager is not the primary beneficiary of any VIE.
All intercompany balances and transactions have been eliminated on consolidation.
Cash and Cash Equivalents
Cash and cash equivalents represent cash on hand and cash held in banks. Interest income from cash and cash equivalents is recorded in the Condensed Consolidated Statements of Comprehensive Income.
Equity Method Investments
Investments in which the Manager is deemed to exert significant influence, but not control are accounted for using the equity method of accounting. The Manager has significant influence over Brookfield Asset Management ULC and therefore accounts for its investment under the equity method.
The carrying value of equity method investments is determined based on amounts invested by the Company, adjusted for the equity in earnings or losses of the investee allocated based on the relevant agreements, less distributions received. Further, the carrying value of the equity method investment is adjusted as a result of any share-based awards granted by the Manager to employees of Brookfield Asset Management ULC. Under the equity method of accounting, the Manager's share of earnings from equity investments is included in the share of income from equity method investments in the Condensed Consolidated Statement of Comprehensive Income. The Manager evaluates its equity method investments for impairment whenever events or changes in circumstances indicate that the carrying amounts of such investments may not be recoverable.
Refer to Note 3 for further details of the Manager's equity accounted investments.
Other Assets
Other assets include investments in options to acquire shares of the Company. The Manager has elected the measurement alternative for equity investments without readily determinable fair values to be measured at cost minus impairment, if any. The carrying amount of these investments as of June 30, 2023 is $41 million. For the six months ended June 30, 2023, there has been no downward or upward adjustments made to the carrying amount of these investments due to impairment or observable price changes in orderly transactions for identical or similar investment of the same issuer.
Operating Recoveries
Operating Recoveries relates to the AMSA between the Manager and Brookfield Asset Management ULC and the Relationship Agreement between the Manager, Brookfield Asset Management ULC and the Corporation.
Under the perpetual AMSA, recoveries are recognized on a cost recovery basis such that neither party receives financial gain nor suffers financial loss. Income generated under the AMSA relating to these services is recognized as Operating Recoveries in the Condensed Consolidated Statement of Comprehensive Income on a gross basis as and when the services are performed by the Manager.
Under the Relationship Agreement, certain employee share-based and performance-based compensation costs are recovered from the Corporation. Income generated under the Relationship Agreement relating to these awards is recognized as Operating Recoveries in the Condensed Consolidated Statement of Comprehensive Income on a gross basis.
Certain liability classified share-based awards covered by the AMSA and Relationship Agreement are required to be revalued at each balance sheet date. As a result, where the revaluation results in an increase in the equity award liability, the Corporation and Brookfield Asset Management ULC will reimburse the Manager while conversely, where the revaluation results in a decrease in the equity award liability, the Manager will be responsible for refunding the difference to the Corporation or Brookfield Asset Management ULC.
Under the TSA, the Manager is responsible for the costs of transitional services provided by Brookfield Asset Management ULC and the Corporation. Such costs are recognized as Operating Recoveries in the Condensed Consolidated Statement of Comprehensive Income when services are performed.
To the extent that Brookfield Asset Management ULC makes payments to the Manager under the AMSA for share-based awards before they vest, such prepayments are recognized by the Manager as deferred income included in Accounts payable and accrued liabilities on the Condensed Consolidated Balance Sheet.
Compensation and Benefits
Compensation consists of (a) salary and bonus, and benefits paid and payable to employees and (b) share-based compensation associated with the grants of share-based awards to employees of the Manager. Compensation cost relating to the issuance of share-based awards to senior management and employees of the Manager is accounted for in accordance with ASC 718, Compensation - Stock Compensation, which measures the equity-classified awards at fair value at the grant date and expensed over the vesting period. Cash settled share-based awards and awards settled in a variable number of shares for a fixed monetary amount are classified as liabilities and are remeasured at the end of each reporting period.
In the normal course of business, the Manager issues share-based compensation awards to employees of Brookfield Asset Management ULC. Such awards are accounted for as awards issued to employees of equity method investees under ASC 323 Investments – Equity Method and Joint Ventures. As the awards vest, the Manager recognizes the entire cost of the awards as an expense included in share of income from equity method investments, as no proportionate funding by the other investors occurs and the Manager does not receive any increase in its relative ownership percentage of Brookfield Asset Management ULC. However, the cost associated with the investor’s ownership interest is recognized when the Manager recognizes its share of Brookfield Asset Management ULC’s earnings. Brookfield Asset Management ULC reimburses the Manager for such awards, which the Manager recognizes as income included in share of income from equity method investments in the same period as the associated cost of issuing the awards. As such, this arrangement with Brookfield Asset Management ULC has no net impact on the Manager’s Condensed Consolidated Statement of Comprehensive Income. To the extent that Brookfield Asset Management ULC reimburses the Manager for such awards before they vest, the Manager recognizes the advanced reimbursement in additional paid-in capital.
Refer to Note 5 for further details of the Manager's share based compensation.
Carried Interest Compensation Expense
Carried interest is performance-based compensation associated with realized or unrealized carried interest earned on the performance of investments on a fund-by-fund basis. Employees of the Manager earn carried interest compensation which is subject to both positive and negative adjustments and recoverable from Brookfield Asset Management ULC to the Manager and the Corporation under the terms of both the ASMA and the Relationship Agreement.
Related Parties
In the normal course of operations, the Manager enters into various transactions on market terms with related parties, including amounts in Due from/to affiliates. The Manager and its subsidiaries may also transact with entities that share a common parent. Amounts owed to and by equity method investments are not eliminated on consolidation. See Note 7 for further detail.
Dividends
Dividends are reflected in the Condensed Consolidated Financial Statements when declared.
Earnings per Share
The Manager uses the two class method to calculate basic and diluted net income per share. Undistributed earnings for each period are allocated to participating securities based on the contractual participation rights of the security to share in the current earnings as if all current period earnings had been distributed. Undistributed losses are not allocated to participating securities that do not have a contractual obligation to share in losses.
Diluted net income per share reflects the impact of dilutive instruments, which are generally determined using the treasury stock method. For potentially dilutive instruments that are also participating securities, the treasury stock method or the two-class method, whichever, produces the more diluted result, is used to determine diluted net income per share.
3. INVESTMENTS
The Manager has a variable interest in the Company, an unconsolidated VIE. It has been determined that the Manager is not the primary beneficiary mainly due to its lack of power to unilaterally make decisions about the activities that most significantly impact the VIE’s returns. The Manager accounts for its interest in Brookfield Asset Management ULC using the equity method of accounting as it has significant influence from its 25% equity interest and its ability to appoint two directors on the VIE’s board.
The summarized financial information and results of the Company’s equity method investment in Brookfield Asset Management ULC as at June 30, 2023 and December 31, 2022, and for the three and six months ended June 30, 2023 are outlined in the tables below:
| | | | | | | | | | | |
AS AT JUNE 30, AND DECEMBER 31,
(MILLIONS) | 2023 | | 2022 |
| Cash | $ | 2,918 | | | $ | 3,545 | |
| Investments | 7,364 | | | 6,877 | |
| Assets | 14,060 | | | 14,087 | |
| Liabilities | 2,590 | | | 2,670 | |
| Preferred shares redeemable non-controlling interest | 2,032 | | | 1,811 | |
| Equity | 9,438 | | | 9,606 | |
| | | | | | | | | | | |
FOR THE PERIODS ENDED JUNE 30,
(MILLIONS) | Three Months Ended | | Six Months Ended |
| 2023 | | 2023 |
| Revenues | $ | 985 | | | $ | 2,039 | |
| Expenses | (350) | | | (816) | |
| Net income | 580 | | | 1,096 | |
| | | |
| Net (income) loss attributable to preferred share redeemable non-controlling interest | (90) | | | (71) | |
| Net (income) loss attributable to non-controlling interest | (35) | | | (54) | |
| Net income attributable to the common stockholders | 455 | | | 971 | |
As of June 30, 2023, the carrying value of the equity method investment was equal to the Manager’s interest in the Company’s underlying net assets.
For the three and six months ended June 30, 2023, the Manager’s share of net income from the Company was $114 million and $243 million respectively. The Manager received cash distributions from the Company of $263 million as of June 30, 2023. The Manager had a cumulative deficit of $1 million.
4. INCOME TAXES
The Manager does not currently carry a provision (benefit) for taxes.
As of June 30, 2023 and December 31, 2022, the Manager did not have any material unrecognized tax benefits related to uncertain tax positions and had no material temporary differences.
The Manager files its tax returns as prescribed by the tax laws of the jurisdictions in which it operates. In the normal course of business, the company is subject to examination by Canadian and foreign tax authorities. As of June 30, 2023, no tax returns are subject to examination.
5. SHARE-BASED COMPENSATION
The Manager and the Corporation have granted share-based compensation awards to certain employees and non-employee directors of the Manager, under a number of compensation plans (the “Equity Plans”). The Equity Plans provide for the granting of share options, restricted shares, escrowed shares and deferred share and restricted share units which contain certain service or performance requirements of the Manager or the Corporation.
For the three months ended June 30, 2023 no stock options were issued. For the six months ended June 30, 2023 the Manager granted 7.9 million stock options at a weighted average exercise price of $35.13. The compensation expense was calculated using the Black-Scholes method of valuation, assuming an average 7.5 year term, 28.5% volatility, a weighted average expected dividend yield of 4.6% annually, a risk-free rate of 3.9% and a liquidity discount of 25%, with a fair value of $5.26 per unit. The total fair value of the options granted was $41.3 million.
For the three months ended June 30, 2023 no escrowed shares were issued. For the six months ended June 30, 2023 the Manager granted 4.8 million escrowed shares at a weighted average exercise price of $35.13. The compensation expense was calculated using the Black-Scholes method of valuation, assuming an average 7.5 year term, 28.5% volatility, a weighted average expected dividend yield of 4.6% annually, a risk-free rate of 3.9% and a liquidity discount of 25%, with a fair value of $5.26 per unit. The total fair value of the escrowed shares granted was $25.2 million.
The expenses of the share-based compensation are recognized on the financial statements of the Manager and are summarized in the following table:
| | | | | | | | | | | |
FOR THE PERIODS ENDED JUNE 30,
(MILLIONS) | Three Months Ended | | Six Months Ended |
| 2023 | | 2023 |
| Expense arising from equity classified share-based payment transactions | $ | 9 | | | $ | 18 | |
| Expense arising from liability classified share-based payment transactions | 5 | | | 30 | |
| $ | 14 | | | $ | 48 | |
Management Share Option Plan
The Manager recognizes any awards associated with the existing Equity Plans for its employees irrespective of whether the awards were granted by the Corporation or the Manager. Options issued under the Management Share Option Plan (“MSOP”) of both the Corporation and the Manager vest over a period of up to five years, expire ten years after the grant date and are settled through issuance of Class A shares of the Corporation or the Manager. The exercise price is equal to the market price at the grant date. For the three months ended and six months ended June 30, 2023, the total expense incurred by the Manager with respect to MSOP totaled $3 million and $5 million, respectively.
Escrowed Stock Plan
The Escrowed Stock Plan ("ES") shares generally vest over five years and must be held to the fifth anniversary of the grant date. At a date no more than ten years from the grant date, all outstanding ES shares will be exchanged for Class A shares issued by the Corporation or the Manager based on the market value of the respective Class A shares at the time of the exchange. The number of Class A shares issued on exchange will be less than the Class A shares purchased under the ES Plan resulting in a net reduction in the number of Class A shares issued by the Manager.
For the three months ended and six months ended June 30, 2023, the total expense incurred with respect to the ES Plan totaled $5 million and $10 million, respectively.
Restricted Stock Plan
The Restricted Stock Plan awards executives with Class A shares of the Corporation and the Manager purchased on the open market (“Restricted Shares”). Under the Restricted Stock Plan, Restricted Shares awarded vest over a period of up to five years, except for Restricted Shares awarded in lieu of a cash bonus, which may vest immediately. Vested and unvested Restricted Shares are subject to a hold period of up to five years. Holders of Restricted Shares are entitled to vote Restricted Shares and to receive associated dividends. Employee compensation expense for the Restricted Stock Plan is charged against income over the vesting period.
Compensation expense recognized for the three months ended and six months ended was $1 million and $3 million, respectively.
Deferred Share Unit Plan and Restricted Share Unit Plan
The Deferred Share Unit ("DSU") Plan and Restricted Share Unit ("RSU") Plan provides for the issuance of DSUs and RSUs, respectively. Under these plans, qualifying employees and directors receive varying percentages of their annual incentive bonus or directors’ fees in the form of DSUs and RSUs. The DSUs and RSUs vest over periods of up to five years, and DSUs accumulate additional DSUs at the same rate as dividends on Class A shares of the Corporation and the Manager based on the market value of the Class A shares of the Manager at the time of the dividend. Participants may convert vested DSUs and RSUs into cash upon retirement or cessation of employment.
The value of these DSUs, when converted to cash, will be equivalent to the market value of the Class A shares of the Corporation and the Manager at the time the conversion takes place. The value of the RSUs, when converted into cash, will be equivalent to the difference between the market price of equivalent number of Class A shares of the Corporation or the Manager at the time the conversion takes place and the market price on the date the RSUs are granted.
Employee compensation expense for these plans is charged against income over the vesting period of the DSUs and RSUs. As these awards are liability classified, the amount payable in respect of vested DSUs and RSUs changes as a result of dividends and share price movements. All of the amounts attributable to changes in the amounts payable by the company are recorded as employee compensation expense in the period of the change. For the three months ended and six months ended June 30, 2023, employee compensation expense totaled $5 million and $30 million respectively due to a change in the underlying share price.
6. EARNINGS PER SHARE
Basic earnings per share is computed by dividing net income by the weighted average number of common shares outstanding during the period. The Manager applies the two-class method in calculating earnings per share for each of its two classes of shares and participating securities, based on their pro-rata share of earnings. Class A shares held under the ES Plans in one or more private wholly owned subsidiaries of the Manager are classified as treasury shares and have been excluded from the calculation of earnings per share. The Manager has certain dilutive securities relating to outstanding restricted stock and options held by employees and non-employees and have been reflected accordingly in diluted earnings per share figures.
Basic and diluted net income per share of common stock for the three and six months ended June 30, 2023 was calculated as follows:
| | | | | | | | | | | | | | | | | | | | | | | |
FOR THE PERIODS ENDED JUNE 30,
(MILLIONS) | Three Months Ended | | Six Months Ended |
| 2023 | | 2023 | | 2023 | | 2023 |
| Class A Shares | | Class B Shares | | Class A Shares | | Class B Shares |
| Numerator | | | | | | | |
| Net income | $ | 109 | | | $ | — | | | $ | 234 | | | $ | — | |
| Denominator | | | | | | | |
| Weighted average of common stock outstanding - basic | 392.1 | | | — | | | 393.5 | | | — | |
| Dilutive effect of conversion of options and escrowed shares using treasury stock method | 4.2 | | | — | | | 6.1 | | | — | |
| Weighted average of common stock outstanding - diluted | 396.3 | | | — | | | 399.6 | | | — | |
| Net Income per Share | | | | | | | |
| Earnings per share - basic | $ | 0.28 | | | $ | 0.28 | | | $ | 0.59 | | | $ | 0.59 | |
| Earnings per share - diluted | 0.28 | | | 0.28 | | | 0.59 | | | 0.59 | |
The following weighted average potentially dilutive securities were evaluated under the treasury stock method for potentially dilutive effects and have been excluded in the above computation of diluted net income per share attributable to common shareholders for the period presented due to their anti-dilutive effect:
| | | | | | | | | | | |
FOR THE PERIODS ENDED JUNE 30,
(MILLIONS) | Three Months Ended | | Six Months Ended |
| 2023 | | 2023 |
| Management stock options of the Manager issued and allocated | 10.6 | | | 7.8 | |
| Escrow shares of the Manager issued and allocated | 4.9 | | | 3.7 | |
| Restricted shares of the Manager issued and allocated | — | | | — | |
| Total | 15.5 | | | 11.5 | |
7. RELATED PARTY TRANSACTIONS
In the normal course of business, the Manager enters into transactions with related parties by recovering or bearing the cost of certain employee compensation awards with the Corporation and Brookfield Asset Management ULC and by borrowing on its $500 million credit facility with Brookfield Asset Management ULC to fund short-term capital requirements.
Under the AMSA, the Manager provides the services of its employees and its Chief Executive Officer to Brookfield Asset Management ULC on a cost recovery basis. For the three and six months ended June 30, 2023, under this arrangement the Manager has recognized $36 million and $87 million, respectively in Operating Recoveries. In addition, the Manger recovered $2 million in Unrealized carried interest compensation expense from the asset management business for the six months ended.
As outlined in the Relationship Agreement, the Corporation is responsible for the stock based awards which are subject to revaluation at each balance sheet date and will also bear the cost of the employee entitlement to carried interest on mature funds either directly or indirectly through reimbursement to the Company. For the three and six months ended June 30, 2023, the Manager has recognized $19 million and $100 million in Operating Recoveries under this arrangement, respectively.
Under the TSA, Brookfield Asset Management ULC and the Corporation provide the Manager certain services to support day-to-day corporate activities. For services provided to the Manager, costs are recorded on a gross basis in the Condensed Consolidated Statement of Comprehensive Income. For the three and six months ended June 30, 2023, the Manager has recognized $nil in the Condensed Consolidated Statement of Comprehensive Income under this arrangement.
For three months ended, the Manager received from Brookfield Asset Management ULC prepayments under the AMSA for share-based compensation of $nil, which represent deferred income and have been included in Accounts payable and accrued liabilities For the six months ended the Manager received from Brookfield Asset Management ULC advanced reimbursements for Manager share-based awards issued to employees of Brookfield Asset Management ULC of $88 million, which has been recorded in additional paid-in capital.
The balances due from affiliates related to compensation costs are presented in Due from affiliates on the Condensed Consolidated Balance Sheet and the balances due to affiliates are presented in Due to Affiliates.
Due from affiliates and Due to affiliates consisted of the following:
| | | | | | | | | | | | | | | | | |
AS AT JUNE 30, AND DECEMBER 31,
(MILLIONS) | 2023 | | 2022 | | |
| Due from Affiliates | | | | | |
| Receivables related to share and cash-based compensation | $ | 776 | | | $ | 782 | | | |
| Other transactions with related parties | 34 | | — | | | |
| $ | 810 | | | $ | 782 | | | |
| | | | | |
| Due to Affiliates | | | | | |
| Borrowings on short-term credit facility | $ | 124 | | | $ | — | | | |
| Other transactions with related parties | 44 | | 3 | | | |
| $ | 168 | | | $ | 3 | | | |
In the current period, the Manager recorded its share of a non-cash distribution declared by ULC to the Corporation in the amount of $56 million within the Condensed Consolidated Statement of Changes in Equity.
In addition, the Manager purchased options to acquire Brookfield Asset Management ULC’s shares for $41 million during the three months ended March 31, 2023. No additional options were purchased during the three months ended June 30, 2023. These options track certain options issued under our Management Share Option Plan and are automatically exercised at the same time and the same exercise prices as the tracked Manager options. As of June 30, 2023, the carrying amount of these options is $41 million, included in other assets on the Condensed Consolidated Balance Sheet.
8. COMMITMENTS AND CONTINGENCIES
Litigation
The Manager may from time to time be involved in litigation and claims incidental to the conduct of its business. The Manager’s business is also subject to extensive regulation, which may result in regulatory proceedings against the company.
The Manager accrues a liability for legal proceedings only when those matters present loss contingencies that are both probable and reasonably estimable. In such cases, there may be an exposure to loss in excess of any amounts accrued. Although there can be no assurance of the outcome of such legal actions, based on information known by management, the Manager does not have a potential liability related to any current legal proceeding or claim that would individually or in the aggregate materially affect its results of operations, financial position or cash flows.
9. SUBSEQUENT EVENTS
On August 8, 2023, the Board of the Manager declared a quarterly dividend of $0.32 per share, payable on September 29, 2023 to shareholders of record as at the close of business on August 31, 2023.
On July 5, 2023 Brookfield Reinsurance Ltd. signed an agreement to acquire all of the outstanding shares of common stock of American Equity Investment Life Holding Company ("AEL"). In connection with the transaction, the Manager will issue Class A limited voting shares to the Corporation in exchange for a portion of its interest in the Asset Management Company. As consideration, AEL shareholders will receive a combination of cash and Brookfield Asset Management Ltd. Class A limited voting shares issued to the Corporation with a value of approximately $1 billion increasing the public float by approximately 10% and decreasing the Corporation's ownership interest in the Asset Management Company by 2%. The Manager will not have any ownership interest in AEL following the completion of the transaction.
BROOKFIELD ASSET MANAGEMENT ULC
CONDENSED CONSOLIDATED AND COMBINED FINANCIAL STATEMENTS (UNAUDITED)
June 30, 2023
BROOKFIELD ASSET MANAGEMENT ULC
CONDENSED CONSOLIDATED AND COMBINED BALANCE SHEETS (UNAUDITED)
| | | | | | | | | | | |
AS AT JUNE 30, AND DECEMBER 31,
(MILLIONS) | 2023 | | 2022 |
| Assets | | | |
| Cash and cash equivalents | $ | 2,918 | | | $ | 3,545 | |
| Accounts receivable and other | 510 | | | 429 | |
| Due from affiliates | 2,129 | | | 2,121 | |
| Investments | 7,364 | | | 6,877 | |
| Property, plant and equipment | 65 | | | 68 | |
| Intangible assets | 59 | | | 59 | |
| Goodwill | 265 | | | 249 | |
| Deferred income tax assets | 750 | | | 739 | |
| Total assets | $ | 14,060 | | | $ | 14,087 | |
| | | |
| Liabilities and shareholder’s equity | | | |
| Accounts payable and other | $ | 1,685 | | | $ | 1,842 | |
| Due to affiliates | 890 | | | 811 | |
| Deferred income tax liabilities | 15 | | | 17 |
| Total liabilities | 2,590 | | | 2,670 | |
| | | |
| Commitments and contingencies | | | |
| | | |
| Preferred shares redeemable non-controlling interest | 2,032 | | | 1,811 | |
| | | |
| Equity | | | |
| Common equity (common shares - unlimited authorized, 1,635,327,858 issued and outstanding) | 9,013 | | | 9,271 | |
| Retained earnings | 3 | | | 84 | |
| Accumulated other comprehensive income | 166 | | | 153 | |
| Additional paid-in capital | 65 | | | — | |
| Total common equity | 9,247 | | | 9,508 | |
| Non-controlling interest | 191 | | | 98 | |
| Total equity | 9,438 | | | 9,606 | |
| Total liabilities, redeemable non-controlling interest and common equity | $ | 14,060 | | | $ | 14,087 | |
BROOKFIELD ASSET MANAGEMENT ULC
CONDENSED CONSOLIDATED AND COMBINED STATEMENTS OF OPERATIONS (UNAUDITED)
| | | | | | | | | | | | | | | | | | | | | | | |
FOR THE PERIODS ENDED JUNE 30,
(MILLIONS) | Three Months Ended | | Six Months Ended |
| 2023 | | 2022 | | 2023 | | 2022 |
| Revenues | | | | | | | |
| Base management and advisory fees | $ | 770 | | | $ | 665 | | | $ | 1,561 | | | $ | 1,336 | |
| Investment income | | | | | | | |
| Carried interest allocations | | | | | | | |
| Realized | 1 | | | 10 | | | 32 | | | 57 | |
| Unrealized | 113 | | | 153 | | | 141 | | | 105 | |
| Total investment income | 114 | | | 163 | | | 173 | | | 162 | |
| Interest and dividend revenue | 40 | | | 74 | | | 83 | | | 141 | |
| Other revenues | 61 | | | 22 | | | 222 | | | 40 | |
| Total revenues | 985 | | | 924 | | | 2,039 | | | 1,679 | |
| Expenses | | | | | | | |
| Compensation, operating, and general and administrative expenses | | | | | | | |
| Compensation and benefits | (258) | | | (134) | | | (557) | | | (303) | |
| Other operating expenses | (78) | | | (55) | | | (148) | | | (106) | |
| General, administrative and other | (12) | | | (34) | | | (19) | | | (74) | |
| Total compensation, operating, and general and administrative expenses | (348) | | | (223) | | | (724) | | | (483) | |
| Carried interest allocation compensation | | | | | | | |
| Realized | (14) | | | (10) | | | (14) | | | (20) | |
| Unrealized | 17 | | | (8) | | | (71) | | | (111) | |
| Total carried interest allocation compensation | 3 | | | (18) | | | (85) | | | (131) | |
| Interest expense | (5) | | | (43) | | | (7) | | | (85) | |
| Total expenses | (350) | | | (284) | | | (816) | | | (699) | |
| Other income (expenses), net | 72 | | | 269 | | | 50 | | | 726 | |
| Share of income from equity accounted investments | 29 | | | 87 | | | 72 | | | 155 | |
| Income before taxes | 736 | | | 996 | | | 1,345 | | | 1,861 | |
| Income tax expense | (156) | | | (162) | | | (249) | | | (304) | |
| Net income | 580 | | | 834 | | | 1,096 | | | 1,557 | |
| Net (income) loss attributable to redeemable non-controlling interests in consolidated funds | — | | | (166) | | | — | | | (541) | |
| Net (income) loss attributable to preferred share redeemable non-controlling interest | (90) | | | — | | | (71) | | | — | |
| Net (income) loss attributable to non-controlling interest | (35) | | | — | | | (54) | | | — | |
| Net income attributable to the common stockholders | $ | 455 | | | $ | 668 | | | $ | 971 | | | $ | 1,016 | |
BROOKFIELD ASSET MANAGEMENT ULC
CONDENSED CONSOLIDATED AND COMBINED STATEMENTS OF COMPREHENSIVE INCOME (UNAUDITED)
| | | | | | | | | | | | | | | | | | | | | | | |
FOR THE PERIODS ENDED JUNE 30,
(MILLIONS) | Three Months Ended | | Six Months Ended |
| 2023 | | 2022 | | 2023 | | 2022 |
| Net income | $ | 580 | | | $ | 834 | | | $ | 1,096 | | | $ | 1,557 | |
| Currency translation, net of tax impact | 7 | | | (10) | | | 13 | | | (10) | |
| Comprehensive income | 587 | | | 824 | | | 1,109 | | | 1,547 | |
| Comprehensive loss (income) attributable to redeemable non-controlling interest in consolidated funds | — | | | (166) | | | — | | | (541) | |
| Comprehensive loss (income) attributable to preferred share redeemable non-controlling interest | (90) | | | — | | | (71) | | | — | |
| Comprehensive loss (income) attributable to non-controlling interest | (35) | | | — | | | (54) | | | — | |
| Comprehensive income attributable to common stockholders | $ | 462 | | | $ | 658 | | | $ | 984 | | | $ | 1,006 | |
BROOKFIELD ASSET MANAGEMENT ULC
CONDENSED CONSOLIDATED AND COMBINED STATEMENTS OF CHANGES IN EQUITY (UNAUDITED)
| | | | | | | | | | | | | | | | | | | | | | | | | | | | | | | | | | | | | | | | | |
AS AT
(MILLIONS) | Common equity | | |
Common
shares | | Additional
paid-in
capital | | Retained
earnings | | Accumulated
other
comprehensive
income | | Total
common equity | | Non-controlling
interest | | Total
equity |
| Balance at March 31, 2023 | $ | 9,242 | | | $ | 32 | | | $ | 72 | | | $ | 159 | | | $ | 9,505 | | | $ | 156 | | | $ | 9,661 | |
| Net income | — | | | — | | | 455 | | | — | | | 455 | | | 35 | | | 490 | |
| Currency translation | — | | | — | | | — | | | 7 | | | 7 | | | — | | | 7 | |
| Contributions | — | | | 33 | | | — | | | — | | | 33 | | | — | | | 33 | |
| Distributions | (229) | | | — | | | (524) | | | — | | | (753) | | | — | | | (753) | |
| Transfer of interest | — | | | — | | | — | | | — | | | — | | | — | | | — | |
| Balance at June 30, 2023 | $ | 9,013 | | | $ | 65 | | | $ | 3 | | | $ | 166 | | | $ | 9,247 | | | $ | 191 | | | $ | 9,438 | |
| | | | | | | | | | | | | |
| | | | | | | | | | | | | |
| | | | | | | | | | | | | |
| | | | | | | | | | | | | |
| | | | | | | | | | | | | |
| | | | | | | | | | | | | |
| | | | | | | | | | | | | |
| | | | | | | | | | | | | | | | | | | | | | | | | | | | | | | | | | | | | | | | | |
AS AT
(MILLIONS) | Common equity | | |
Common
shares | | Additional
paid-in
capital | | Retained
earnings | | Accumulated
other
comprehensive
income | | Total
common equity | | Non-controlling
interest | | Total
equity |
| Balance at December 31, 2022 | $ | 9,271 | | | $ | — | | | $ | 84 | | | $ | 153 | | | $ | 9,508 | | | $ | 98 | | | $ | 9,606 | |
| Net income | — | | | — | | | 971 | | | — | | | 971 | | | 54 | | | 1,025 | |
| Currency translation | — | | | — | | | — | | | 13 | | | 13 | | | — | | | 13 | |
| Contributions | — | | | 65 | | | — | | | — | | | 65 | | | 10 | | | 75 | |
| Distributions | (229) | | | — | | | (1,052) | | | — | | | (1,281) | | | — | | | (1,281) | |
| Transfer of interest | (29) | | | — | | | — | | | — | | | (29) | | | 29 | | | — | |
| Balance at June 30, 2023 | $ | 9,013 | | | $ | 65 | | | $ | 3 | | | $ | 166 | | | $ | 9,247 | | | $ | 191 | | | $ | 9,438 | |
BROOKFIELD ASSET MANAGEMENT ULC
CONDENSED CONSOLIDATED AND COMBINED STATEMENTS OF CASH FLOWS (UNAUDITED)
| | | | | | | | | | | | | | | | | | | | | | | |
FOR THE PERIODS ENDED JUNE 30,
(MILLIONS) | Three Months Ended | | Six Months Ended |
| 2023 | | 2022 | | 2023 | | 2022 |
| Operating activities | | | | | | | |
| Net income | $ | 580 | | | $ | 834 | | | $ | 1,096 | | | $ | 1,557 | |
| Other income, net | (66) | | | (269) | | | (44) | | | (726) | |
| Other revenue | (37) | | | — | | | (198) | | | — | |
| Share of (income) loss from investments accounted for under the equity method, net | 17 | | | (17) | | | 14 | | | (51) | |
| Depreciation and amortization | 3 | | | 2 | | | 7 | | | 5 | |
| Deferred income taxes | 22 | | | 109 | | | 79 | | | 189 | |
| Stock based equity awards | 24 | | | (129) | | | 115 | | | 6 | |
| | | | | | | |
| Unrealized carried interest allocation, net | (130) | | | (165) | | | (70) | | | 6 | |
| Net change in working capital balances | 79 | | | 1,870 | | | (473) | | | 1,461 | |
| Other non-cash operating items | 34 | | | 432 | | | (39) | | | (179) | |
| 526 | | | 2,667 | | | 487 | | | 2,268 | |
| Investing activities | | | | | | | |
| Acquisitions | | | | | | | |
| Property, plant and equipment | (3) | | | (2) | | | (4) | | | (19) | |
| Equity accounted investments | (239) | | | (194) | | | (243) | | | (199) | |
| Financial assets and other | (1) | | | (266) | | | (1) | | | (266) | |
| Dispositions | | | | | | | |
| | | | | | | |
| | | | | | | |
| Financial assets and other | 11 | | | 126 | | | 11 | | | 410 | |
| Restricted cash and deposits | — | | | (3) | | | — | | | (3) | |
| (232) | | | (339) | | | (237) | | | (77) | |
| Financing activities | | | | | | | |
| Corporate borrowings | — | | | 959 | | | — | | | 854 | |
| Capital repaid to parent | — | | | (3,050) | | | — | | | (2,695) | |
| Contributions from redeemable non-controlling interests | 1 | | | 166 | | | 1 | | | 166 | |
| Capital repaid to redeemable non-controlling interests | — | | | (266) | | | — | | | (266) | |
| Issuance of related party loans | — | | | 110 | | | 194 | | | 365 | |
| Repayment of related party loans | (39) | | | (1) | | | — | | | (73) | |
| Advances provided to related parties | (29) | | | — | | | (124) | | | — | |
| Preferred equity issuances | 63 | | | — | | | 63 | | | — | |
| Issuance of tracking option | — | | | — | | | 41 | | | — | |
| Distributions to redeemable non-controlling interests | — | | | (4) | | | — | | | (8) | |
| Distributions to parent | (524) | | | (179) | | | (1,052) | | | (386) | |
| (528) | | | (2,265) | | | (877) | | | (2,043) | |
| Cash and cash equivalents | | | | | | | |
| Change in cash and cash equivalents | (234) | | | 63 | | | (627) | | | 148 | |
| Effect of exchange rate changes on cash and cash equivalents | — | | | — | | | — | | | (2) | |
| Balance, beginning of period | 3,152 | | | 2,577 | | | 3,545 | | | 2,494 | |
| Balance, end of period | $ | 2,918 | | | $ | 2,640 | | | $ | 2,918 | | | $ | 2,640 | |
BROOKFIELD ASSET MANAGEMENT ULC
CONDENSED CONSOLIDATED AND COMBINED STATEMENTS OF CASH FLOWS (UNAUDITED)
| | | | | | | | | | | | | | | | | | | | | | | |
| Three Months Ended | | Six Months Ended |
| 2023 | | 2022 | | 2023 | | 2022 |
| Supplemental cash flow disclosures | | | | | | | |
| Net change in working capital balances | | | | | | | |
| Accounts receivable and other | $ | 89 | | | $ | (79) | | | $ | (46) | | | $ | (134) | |
| Accounts payable and other | (242) | | | 136 | | | (269) | | | 153 | |
| Due from affiliates | 355 | | | (203) | | | (8) | | | (732) | |
| Due to affiliates | 106 | | | 2,016 | | | 79 | | | 2,174 | |
| Income taxes paid | 59 | | | 43 | | | 140 | | | 85 | |
| Interest paid | — | | | 55 | | | 2 | | | 115 | |
| Financing Activities | | | | | | | |
| Non-cash distribution | $ | 229 | | | $ | — | | | $ | 229 | | | $ | — | |
BROOKFIELD ASSET MANAGEMENT ULC
NOTES TO THE CONDENSED CONSOLIDATED AND COMBINED FINANCIAL STATEMENTS (UNAUDITED)
1. ORGANIZATION
On May 12, 2022, Brookfield Corporation (formerly known as Brookfield Asset Management Inc.) (the “Corporation”) announced that it would separately list and distribute to its shareholders a 25% interest in its asset management business. The transaction was completed on December 9, 2022 by way of an arrangement agreement (the “Arrangement”), which resulted in the transfer of the Corporation's historical asset management business into the newly incorporated Brookfield Asset Management ULC ("our asset management business"). On completion of the Arrangement, the Corporation transferred a 25% interest in Brookfield Asset Management ULC to Brookfield Asset Management Ltd. (the “Manager”). These Condensed Consolidated and Combined Financial Statements represent the activities, assets and liabilities of the Corporation's historical asset management business using a legal entity approach.
References in these financial statements to “us,” “we,” “our” or “the Company” refer to our asset management business and its direct and indirect subsidiaries and consolidated entities. Brookfield Asset Management ULC's asset management business focuses on renewable power and transition, infrastructure, real estate, private equity, and credit, operating in various markets globally.
The Company was formed on July 4, 2022 as an unlimited liability company under, and governed by, the laws of British Columbia. The registered office of the company is 1055 West Georgia Street, 1500 Royal Centre, P.O. Box 11117, Vancouver, British Columbia V6E 4N7.
We describe in these footnotes the business held by us after the Arrangement as if it were a standalone business for all historical periods described. However, we were not a standalone separate entity with independently conducted operations prior to the completion of the Arrangement.
The Company entered into several agreements and arrangements resulting from the Arrangement, among which include:
•The Asset Management Services Agreement (the "AMSA") under which the Manager provides the services of its employees and its Chief Executive Officer to the Company who in turn pays the Manager for the services of these individuals on a cost recovery basis such that neither party receives financial gain nor suffers financial loss. Most of the Manager's employees/executives spend their time discharging their duties as officers and employees of the Manager and towards responsibilities related to the Company which include investment, corporate and other services. In addition, at the request of the Company, the Manager may provide options and long term incentive awards to its employees, which will be reimbursed under this agreement. See discussion of the accounting for this agreement in the Other Revenues, net accounting policy in Note 2;
•The Transitional Services Agreement (the "TSA") pursuant to which (i) the Company provides the Corporation and the Manager, on a transitional basis, certain services to support day-to-day corporate activities (including services relating to finance, treasury, accounting, legal and regulatory, marketing, communications, human resources, internal audit, information technology), and (ii) the Corporation provides, on a transitional basis, certain services to the Company to facilitate the orderly transfer of the asset management business. See discussion of the accounting for this agreement in the Related Parties accounting policy in Note 2; and
•The Relationship Agreement under which certain employee share-based and performance-based compensation costs are recovered from the Corporation. See discussion of the accounting for this agreement in the Other Revenues, net accounting policy in Note 2.
2. SUMMARY OF SIGNIFICANT ACCOUNTING POLICIES
Basis of Presentation
The accompanying unaudited Condensed Consolidated and Combined Financial Statements of the Company have been prepared in accordance with accounting principles generally accepted in the United States of America (“U.S. GAAP”) for interim financial information. The Condensed Consolidated and Combined Financial Statements, including these notes, are unaudited and exclude some of the disclosures required in annual financial statements. Management believes it has made all necessary adjustments (consisting of only normal recurring items) so that the Condensed Consolidated and Combined Financial Statements are presented fairly and that estimates made in preparing its Condensed Consolidated and Combined Financial Statements are reasonable. The
operating results presented for interim periods are not necessarily indicative of the results that may be expected for any other interim period or for the entire year.
These Condensed Consolidated and Combined Financial Statements should be read in conjunction with the audited consolidated financial statements included in the Managers 20-F for the year ended December 31, 2022. The financial statements for periods prior to and through the date of the Arrangement were prepared on a combined standalone basis and were derived from the Condensed Consolidated and Combined Financial Statements and accounting records of the Corporation. The financial statements for the period from December 9, 2022 through December 31, 2022, and for the year ended December 31, 2022 are consolidated financial statements of the Company and its subsidiaries, each of which is wholly owned, and is based on the financial position and results of operations of the Company as a standalone company.
Use of Estimates
The preparation of the Condensed Consolidated and Combined Financial Statements in accordance with U.S. GAAP requires management to make estimates that affect the amounts reported in the Condensed Consolidated and Combined Financial Statements and accompanying notes. Management believes that estimates utilized in the preparation of the Condensed Consolidated and Combined Financial Statements are reasonable. Such estimates include those used in the valuation of investments and financial instruments, the measurement of deferred tax balances (including valuation allowances), accrued carried interest, incentive distributions and the accounting for share-based and performance-based compensation. Actual results may differ from those estimates and such differences may be material.
Consolidation
The Company consolidates all entities that it controls through a majority voting interest and all variable interest entities (“VIE”) for which it is the primary beneficiary. An enterprise is determined to be the primary beneficiary if it holds a controlling financial interest. A controlling financial interest is defined as (a) the power to direct the activities of a VIE that most significantly impact the entity’s economic performance and (b) the obligation to absorb losses of the entity or the right to receive benefits from the entity that could potentially be significant to the VIE. The Company determines whether it is the primary beneficiary of a VIE at the time it becomes involved with a variable interest entity and reconsiders that conclusion upon certain events. In determining whether the Company is the primary beneficiary, the Company evaluates its control rights as well as economic interests in the entity held either directly or indirectly by the Company. The consolidation analysis can generally be performed qualitatively; however, if it is not readily apparent that the Company is not the primary beneficiary, a quantitative analysis may also be performed. Investments and redemptions (either by the Company, affiliates of the Company or third parties) or amendments to the governing documents of the respective funds could affect an entity’s status as a VIE or the determination of the primary beneficiary. As at June 30, 2023, the Company is not the primary beneficiary of any VIEs.
All intercompany balances and transactions have been eliminated on consolidation.
Redeemable preferred shares non-controlling interest
Upon completion of the Arrangement, the Company issued various special tracking preferred shares of subsidiaries of the Company (“Tracking Shares”) which provides the Corporation with a redemption right, upon a liquidation or redemption event, to receive a preferred amount equal to the fair value of carried interest entitlement from certain tracked assets, net of any compensation related costs. These returns are realized through the payment of cumulative dividends, as and when declared by the board of directors of the relevant Brookfield Asset Management ULC subsidiary. These tracking shares are entitled to vote, together with the common shares owned indirectly by the Company, in respect of those subsidiaries. The tracking shares are presented as preferred share redeemable non-controlling interest within the Condensed Consolidated and Combined Balance Sheet, outside of permanent equity.
The first series of tracking shares issued by Brookfield US Holdings Inc. ("BUSHI"), a subsidiary of the Company, provides the Corporation with economic interest equal to effectively 100% of the carried interest earned in mature funds. This series of tracking shares has a redemption clause whereby the issuer may elect to redeem the tracking shares upon the tenth anniversary of issuance. While this series of tracking shares are not currently redeemable, the Company considers that it is probable that the instrument will become redeemable as the redemption requirement is only through passage of time. As such, the relevant redeemable non-controlling interest recognized outside of permanent equity requires remeasurement at each reporting period. The Company issued 100 shares with a carrying value equal to redemption value of $2.0 billion.
The second series of tracking shares issued by Brookfield Manager Holdings Ltd. ("BMHL") provides the Corporation with the economic interest equal to effectively a 33.3% share of similar distributions on open-ended funds. This series of tracking shares can only be redeemed upon exceptional circumstances that cause a materially adverse impact to the subsidiary. As the instrument
is not currently redeemable and the Company considers such a triggering event to be remote and outside of the control of the entity, the relevant redeemable non-controlling interest recognized outside of permanent equity does not require remeasurement at each reporting period. The Company issued 100 shares with a carrying value and redemption value equal to $nil.
In addition to the Tracking Shares, BUSHI also has class B preferred shares outstanding as at June 30, 2023, all of which are held by the Corporation. The class B preferred shares of BUSHI are redeemable at the option of both the holder and the issuer at $25 per share (the redemption amount) plus unpaid dividends, and are entitled to non-cumulative preferential cash dividends at 6.7% per annum on the redemption amount. These preferred shares are non-voting and rank junior to the BUSHI Tracking Shares and senior to common shares of the entity. Due to the currently exercisable holder redemption option, these shares are presented as a part of preferred share redeemable non-controlling interest within the Company’s Condensed Consolidated and Combined Balance Sheet, outside of permanent equity and measured at their redemption amount plus any dividends declared and unpaid at each reporting date.
The Company recognizes any change of the carrying amount of its preferred shares redeemable non-controlling interest in net income (loss) attributable to preferred share redeemable non-controlling interest in its Condensed Consolidated and Combined Statement of Comprehensive Income.
Non-controlling interest of consolidated subsidiaries
Upon completion of the Arrangement, the Company issued various classes of equity interests of the Company’s subsidiaries to the Corporation which have rights to priority distributions. Net income (loss) and other comprehensive income, if applicable, generated by the respective subsidiaries is allocated to non-controlling interest in consolidated entities based on the substantive contractual terms of the subsidiaries’ governing agreements that specify the allocation of income or loss.
Revenue recognition
Revenue is measured based on the amount the Company expects to be entitled to under the contract with the customer and excludes amounts collected on behalf of third parties. A performance obligation is a promise in a contract to transfer a distinct good or service (or a bundle of goods and services) to the customer and is the unit of account in ASC 606. In determining the transaction price, an entity may include variable consideration only to the extent that it is probable that a significant reversal in the amount of cumulative revenue recognized would not occur when the uncertainty associated with the variable consideration is resolved. A contract’s transaction price is allocated to each distinct performance obligation and recognized as revenue, as, or when, the performance obligation is satisfied. The Company recognizes revenue when it transfers control of a product or service to a customer.
Revenues primarily consist of management and advisory fees, incentive fees (including incentive distributions and performance fees), investment income, interest and dividend revenue and other revenue.
Management and advisory fees — Management and advisory fees are comprised of base management fees and transaction, advisory and other fees and are accounted for as contracts with customers.
The Company earns base management fees from its customers at a fixed percentage of a calculation base which is typically committed capital or invested capital or net asset value. The Company identifies its customers on a fund-by-fund basis in accordance with the terms and circumstances of the individual fund. Generally, the customer is identified as the investor in its managed funds and investment vehicles, but for certain widely held funds or vehicles, the fund or vehicle itself may be identified as the customer. These customer contracts require the Company to provide investment management services over a period of time, which represents a performance obligation that the Company satisfies over time. Management fees are a form of variable consideration because the fees that the Company is entitled to vary based on fluctuations in the basis for the management fee. The amount recorded as revenue is generally determined at the end of the period because these management fees are payable on a regular basis (typically quarterly) and are not subject to claw back once paid.
Transaction, advisory and other fees are principally fees charged to the investors of funds indirectly through the managed funds and portfolio companies. These fees are based on a fixed percentage of enterprise value or equity value of pooled capital raised and are earned which generally coincides with when the capital is called. These fees are not tied to performance or ongoing investment management services, are not subject to claw back and are recorded in the period in which the related transaction closes.
Accrued but unpaid management and advisory fees, net of management fee reductions and management fee offsets, as of the reporting date are included in Accounts receivable and other or Due from affiliates in the Condensed Consolidated and Combined Balance Sheet.
Incentive distributions — Incentive distributions are incentive payments to reward the Company for meeting or exceeding certain performance thresholds of managed entities. They are comprised of incentive distributions and performance fees.
Incentive distributions paid to us by our permanent capital vehicles are determined by contractual arrangements and represent a portion of distributions paid by the permanent capital vehicles above a predetermined hurdle. They are accrued as revenue on the respective affiliates’ distribution record dates only if the predetermined hurdle has been achieved. They are not subject to claw back.
Incentive distributions will not be recognized until (a) it is probable that a significant reversal in the amount of cumulative revenue recognized will not occur, or (b) the uncertainty associated with the variable consideration is subsequently resolved. Accrued but unpaid incentive distributions and performance fees are recorded within Due from affiliates in the Condensed Consolidated and Combined Balance Sheets as of the reporting date.
Performance fees — Performance fees are generated when the Company exceeds predetermined investment returns within Brookfield Business Partners L.P. ("BBU") and on certain liquid strategy portfolios. BBU performance fees are based on the quarterly volume-weighted average increase in BBU unit price over the previous threshold and are accrued on a quarterly basis, whereas performance fees within liquid strategy funds are typically determined on an annual basis. These fees are not subject to claw back.
Investment income (loss) — Investment income (loss) represents the unrealized and realized gains and losses on carried interest and movements in the fair value of the principal investments.
Carried interest is a performance fee arrangement in which the Company receives a percentage of investment returns, generated within a private fund on carry eligible capital, based on a contractual formula. We are eligible to earn carried interest from a fund once returns exceed the fund’s contractually defined performance hurdles at which point, we earn an accelerated percentage of the additional fund profit until we have earned the percentage of total fund profit, net of fees and expenses, to which we are entitled. At the end of each reporting period, the Company calculates the balance of accrued carried interest that would be due to the company for each fund, pursuant to the fund agreements, as if the fair value of the underlying investments were realized as of such date, irrespective of whether such amounts have been realized. As the fair value of underlying investments varies between reporting periods, it is necessary to make adjustments to amounts recorded as accrued carried interest to reflect either (a) positive performance resulting in an increase in the accrued carried interest to the general partner or (b) negative performance that would cause the amount due to the Company to be less than the amount previously recognized as revenue, resulting in a negative adjustment to the accrued carried interest to the general partner. These adjustments are recorded in the Condensed Consolidated and Combined Statements of Operations as unrealized carried interest allocations in Investment income. In each scenario, it is necessary to calculate the accrued carried interest on cumulative results compared to the accrued carried interest recorded to date and make the required positive or negative adjustments. The Company ceases to record negative carried interest once previously accrued carried interest for such funds have been fully reversed. The Company is not obligated to pay guaranteed returns or hurdles, and therefore, cannot have negative carried interest over the life of a fund. Accrued carried interest as of the reporting date is reflected in Investments on the Condensed Consolidated and Combined Balance Sheet.
Carried interest is realized when an underlying investment is profitably disposed of and the fund’s cumulative returns are in excess of the preferred return or, in limited instances, after certain thresholds for return of capital are met. Carried interest is subject to claw back to the extent that the carried interest received to date exceeds the amount due to the Company based on cumulative results. The accrual for potential repayment of previously received carried interest would represent amounts previously paid to the Company that would need to be repaid if these funds accruing carry were to be liquidated based on the fair value of their underlying investments. This amount is estimated to be $nil for all periods presented and as a result no clawback provision has been recognized in these Condensed Consolidated and Combined Financial Statements.
Fair value gains (losses) on principal investments include the unrealized and realized gains and losses on the Company’s principal investments, including its investments in the funds that are not consolidated and receive pro-rata allocations and other principal investments. Income (loss) on principal investments is realized when the Company redeems all or a portion of its investment or when the Company receives cash income, such as dividends or distributions. Unrealized income (loss) on principal investments results from changes in the fair value of the underlying investment as well as the reversal of unrealized gain (loss) at the time an investment is realized.
Interest and dividend revenue — Interest and dividend revenue comprise primarily of interest and dividend income earned on principal investments not accounted for under the equity method held by the Company.
Other revenues, net
Other Revenues, net relates to the AMSA between the Manager and the Company and the Relationship Agreement between the Manager, the Company, and the Corporation.
Under the perpetual AMSA, the Manager provides the services of its employees on a cost recovery basis. Expenses incurred under the AMSA relating to these services is recognized as Other Revenues, net in the Condensed Consolidated and Combined Statement of Comprehensive Income on a gross basis as and when the services are performed by the Manager.
Under the Relationship Agreement, certain employee share-based and performance-based compensation costs are recovered from the Corporation. Income generated under the Relationship Agreement relating to these instruments is recognized as Other Revenues, net in the Condensed Consolidated and Combined Statement of Comprehensive Income on a gross basis as the instruments vest.
Certain liability classified share-based awards covered by the AMSA and Relationship Agreement are required to be revalued at each balance sheet date. As a result, where the revaluation results in an increase in the equity award liability, the Corporation and the Company will reimburse the Manager while conversely, where the revaluation results in a decrease in the equity award liability, the Manager will be responsible for reimbursing the difference to the Corporation or the Company.
Fair value of financial instruments
U.S GAAP establishes a hierarchical disclosure framework which prioritizes and ranks the level of market price observability used in measuring financial instruments at fair value. Market price observability is affected by a number of factors, including the type of financial instrument, the characteristics specific to the financial instrument and the state of the marketplace, including the existence and transparency of transactions between market participants. Financial instruments with readily available quoted prices in active markets generally will have a higher degree of market price observability and a lesser degree of judgment used in measuring fair value.
Financial instruments measured and reported at fair value are classified and disclosed based on the observability of inputs used in the determination of fair values, as follows:
•Level I — Quoted prices are available in active markets for identical financial instruments as of the reporting date. The types of financial instruments in Level I include listed equities and mutual funds with quoted prices. The Company does not adjust the quoted price for these investments, even in situations where the Company holds a large position and a sale could reasonably impact the quoted price.
•Level II — Pricing inputs are other than quoted prices in active markets, which are either directly or indirectly observable as of the reporting date, and fair value is determined through the use of models or other valuation methodologies.
•Level III — Pricing inputs are unobservable for the financial instruments and include situations where there is little, if any, market activity for the financial instrument. The inputs into the determination of fair value require significant management judgment or estimation.
In certain cases, the inputs used to measure fair value may fall into different levels of the fair value hierarchy. In such cases, the determination of which category within the fair value hierarchy is appropriate for any given financial instrument is based on the lowest level of input that is significant to the fair value measurement. The Company’s assessment of the significance of a particular input to the fair value measurement in its entirety requires judgment and considers factors specific to the financial instrument.
Level II Valuation Techniques
Financial instruments classified within Level II of the fair value hierarchy are comprised of certain equity securities.
The valuation techniques used to value financial instruments classified within Level II of the fair value hierarchy are as follows:
•Equity Securities are valued on the basis of prices from an orderly transaction between market participants provided by reputable dealers or pricing services. In determining the value of a particular investment, the Company may use certain information with respect to quotations from dealers, pricing matrices and market transactions in comparable investments and various relationships between investments. The valuation of certain equity securities is based on an observable price for an identical security adjusted for the effect of a restriction that is embodied in the security.
Level III Valuation Techniques
In the absence of observable market prices, the Company values its investments using valuation methodologies applied on a consistent basis. For some investments where little market activity may exist; management’s determination of fair value is then based on the best information available in the circumstances and may incorporate management’s own assumptions and involves a significant degree of judgment, taking into consideration a combination of internal and external factors, including the appropriate risk adjustments for non-performance and liquidity risks.
Real estate investments — The Company uses both the discounted cash flow method or the direct capitalization method to value the real estate investments held in consolidated funds. Valuations may be derived by referencing observable valuation measures for comparable assets and recent market transactions, adjusted for asset specific factors. Where a discounted cash flow method is used, a terminal value is derived by referencing to a stabilized exit EBITDA and a capitalization rate.
Credit investments — The Company uses the discounted cash flow method to value credit investments that are not publicly traded or whose market prices are not readily available. The discounted cash flow method projects the expected cash flows of the debt instrument based on contractual terms and discounts such cash flows back to the valuation date using a market-based yield. The market-based yield is estimated using yields of similar publicly traded debt instruments, subject to a liquidity discount.
Investments
Investments include (i) investments held by funds which the Company controls and consolidates and (ii) the Company’s ownership interests (typically general partner interests) in nonconsolidated funds which are accounted for as equity method investments.
(i) Investments at fair value under Consolidated Funds
Investments held in consolidated funds are measured at fair value as disclosed in Note 3. Upon the sale of an investment, the realized net gain or loss is computed using the weighted average cost on a first in, first out basis. Securities transactions are recorded on the trade date.
(ii) Company’s ownership interests in funds accounted for as equity method investments
Investments in which the Company is deemed to exert significant influence, but not control, are accounted for using the equity method of accounting. The Company has significant influence over certain Brookfield funds in which it invests but does not consolidate. Therefore, its investments in such Brookfield funds, which include both a proportionate and disproportionate allocation of the profits and losses, are accounted for under the equity method.
In cases where the Company’s equity method investments provide for a disproportionate allocation of the profits and losses, the Company’s share of earnings (losses) from equity method investments is determined using a balance sheet approach referred to as the hypothetical liquidation at book value (“HLBV”) method. Under the HLBV method, at the end of each reporting period the Company calculates the accrued carried interest that would be due to the Company pursuant to fund agreements as if the fair value of the underlying investments were realized as of such date, irrespective of whether such amounts have been realized. As the fair value of the underlying investments varies between reporting periods, it is necessary to make adjustments to the amounts recorded as carried interest to reflect either a positive performance resulting in an increase in the carried interest allocated to the general partner or a negative performance that would cause the amount due to the Company to be less than the amount previously recognized, resulting in a negative adjustment to carried interest allocated to the general partner. In each case, such accrued carried interest will be recognized in the Condensed Consolidated and Combined Statements of Operations.
Refer to Note 3 for details in relation to equity accounted investments.
Compensation, benefits and fund operating expenses — Compensation and carried interest compensation
Compensation — Compensation consists of (a) salary and bonus, and benefits paid and payable to employees, and (b) share-based compensation associated with the grants of share-based awards to employees. Compensation cost relating to the issuance of equity-based awards to senior management and employees is accounted for in accordance with ASC 718, Compensation — Stock Compensation. These awards are measured at fair value at the grant date and expensed over the vesting period, taking into consideration expected forfeitures, except in the case of share-based awards that do not require future service, which are expensed immediately. Cash settled share-based awards and awards settled in a variable number of shares are classified as liabilities and are remeasured at the end of each reporting period.
Prior to the completion of the Arrangement, share-based compensation expense was allocated to the Company based on the awards and terms previously granted to its employees under the Corporation's stock-based compensation plans. The value of these
long term incentive plans changed as a result of the spin-off of the asset management business. In order to make award participants whole following the Arrangement, the Corporation and the Manager modified the strike price of the historical awards and issued additional awards such that participants would receive the same economic outcome immediately before and after the spin-off. As part of the execution of the Arrangement, certain employees are now employed by the Company and any unvested amounts cease to be recognized by the non-employing entity. The Company assessed the fair value of the modified instruments immediately before and after the spin-off date to determine if there was any change in value and will account for the impact of the modification and recognizes any relevant incremental fair value generated at the time of the spin-off prospectively.
In addition, as may be agreed with the Company from time to time, the Manager may award options or other long-term incentive awards to employees of the Company who will compensate the Manager for the costs associated with these awards. Compensation costs associated with these instruments are recorded on a gross basis in the Condensed Consolidated and Combined Statements of Operations as the instruments vest.
Refer to Note 8 for further details of the Company's share-based compensation.
Carried Interest Compensation — Unrealized and realized carried interest is performance-based compensation associated with realized or unrealized carried interest based on performance of investments on a fund-by-fund basis. Such compensation expense is subject to both positive and negative adjustments.
Other income (expense)
Other income (expense) in the Condensed Consolidated and Combined Statement of Operations includes net unrealized gains (losses) resulting from changes in the fair value of the company’s investments in common shares in addition to investments in its sponsored funds.
Income taxes
The Company is an unlimited liability company organized under the provincial laws of British Columbia and is subject to Canadian federal and provincial income taxes.
Prior to the Arrangement, the Company's domestic and foreign operating results were included in the income tax returns of the Corporation. The Company accounted for income taxes under the separate return method. Under the approach, the Company determined its deferred tax assets and liabilities and related tax expenses as if it were filing separate tax returns.
The provision for income taxes is determined using the asset and liability approach of accounting for income taxes. Under this approach, deferred taxes represent the future tax consequences expected to occur when the reported amounts of assets and liabilities are recovered or paid. Income taxes as presented attribute deferred income taxes of the Company's standalone Condensed Consolidated and Combined Financial Statements in a manner that is systematic, rational, and consistent with the asset and liability method.
The provision for income taxes represents income taxes paid or payable for the current year plus the change in deferred taxes during the year. Deferred taxes result from differences between the financial and tax basis of the Company's assets and liabilities and are adjusted for changes in tax rates and tax laws when such changes are enacted. Valuation allowances are recorded to reduce deferred tax assets when it is more likely than not that a tax benefit will not be realized.
The Company analyzes its tax filing positions in all jurisdictions where it is required to file income tax returns, as well as for all open tax years in these jurisdictions. Tax benefits associated with actual or expected income tax positions are recognized when the “more likely than not” recognition threshold is met. The tax benefits are measured at the largest amount of benefit that is greater than 50% likely to be realized upon settlement with the related tax authority.
The Company recognizes accrued interest and penalties related to uncertain tax positions within the provision for income taxes in the Condensed Consolidated and Combined Statements of Operations.
Related parties
In the normal course of operations, the Company enters into various transactions on market terms with related parties, including amounts in Due from/to affiliates. The Company and its subsidiaries may also transact with entities that share a common parent. Amounts owed to and by associates and joint ventures are not eliminated on consolidation.
The Company has certain loans and receivables within Due from Affiliates (Note 10) which are long-term in nature. These receivables are initially recognized at fair value and subsequently measured at their amortized cost bases with interest recognized using the interest method.
In addition to the Relationship Agreement and AMSA, the Corporation, the Manager and the Company have entered into the TSA pursuant to which (i) the Company agrees to provide the Corporation and the Manager, on a transitional basis, certain services to support day-to-day corporate activities (including services related to finance, treasury, accounting, legal and regulatory, marketing, communications, human resources, internal audit, information technology) and (ii) the Corporation provides, on a transitional basis, certain services to the Manager and the Company to facilitate the orderly transition of the asset management business (the services, collectively, being "Transitional Services"). The Transitional Services are provided, at cost, for a period of three years from December 9, 2022, unless extended by mutual agreement. The Company also provides to the Corporation, as required from time to time and on a cost recovery basis, services of its investment personnel to assist in acquisitions or other transactions undertaken by the Corporation.
In the normal course of business, the Manager issues its equity-based compensation awards to the Company’s employees. The Company accounts for such transactions in accordance with ASC 505 Equity, and recognizes the entire cost of the awards, as they vest, as compensation expense and a corresponding increase in additional paid-in capital. As the Company reimburses the Manager for the cost of these awards, the reimbursement is recognized as a decrease in additional paid-in capital. As such, this arrangement with the Manager has a net impact on the Company’s condensed consolidated financial statements as if the Company had paid for the employee compensation in cash. To the extent that the Company reimburses the Manager before the associated awards vest, the Company recognizes the prepayment in Due from Affiliates.
See Note 10 for further detail on the related party transactions.
Dividends
Dividends are reflected in the Condensed Consolidated and Combined Financial Statements when declared.
3. INVESTMENTS
| | | | | | | | | | | | |
AS AT JUNE 30, AND DECEMBER 31,
(MILLIONS) | 2023 | | 2022 | |
| Common shares (a) | $ | 74 | | | $ | 75 | | |
| Investments in affiliates (b) | 1,383 | | | 1,309 | | |
| Accrued carried interest - mature funds (c) | 1,145 | | | 1,163 | | |
| Accrued carried interest - new funds (c) | 289 | | | 108 | | |
| Equity method investments (d) | | | | |
| Equity interest in Oaktree | 4,175 | | | 3,940 | | |
| Equity interest in other affiliates | 298 | | | 282 | | |
| $ | 7,364 | | | $ | 6,877 | | |
Where appropriate, the accounting for the Company’s investments incorporates the changes in fair value of those investments.
(a) As at June 30, 2023, common share investments were $74 million. Common shares primarily represents investments of $64 million investment in Brookfield Renewable Energy L.P. (2022 - $64 million). Common share investments are carried at fair value with changes in fair value recorded on the Condensed Consolidated and Combined Statements of Operations in Other income (expenses), net.
(b) As at June 30, 2023, Investments in affiliates are primarily comprised of an interest in BSREP III of $1.3 billion (2022 - $1.2 billion) which is accounted for as an equity investment measured at its net asset value ("NAV") in accordance with ASC 321, Investments - Equity Securities.
(c) Accrued carried interest represents the disproportionate allocation of capital from our private funds to the extent that such interest is provided for in the relevant fund agreements. Accrued carried interest is accounted for using the equity method of accounting based on the Company’s entitlement to the funds’ net assets as if all investments were liquidated at fair value and all liabilities were satisfied, regardless of whether such amounts have been realized.
The change in the Company’s accrued carried interest for mature funds during the three and six months ended June 30, 2023 is as follows:
| | | | | | | | | | | | | | | | | | |
FOR THE PERIODS ENDED JUNE 30,
(MILLIONS) | Three Months Ended | | Six Months Ended | |
| 2023 | 2022 | | 2023 | 2022 | |
| Balance, beginning of period | $ | 1,145 | | $ | 628 | | | $ | 1,163 | | $ | 676 | | |
| Changes in fund fair values | 1 | | 153 | | | 14 | | 105 | | |
| Realized carried interest | (1) | | — | | | (32) | | — | | |
| Balance, end of period | $ | 1,145 | | $ | 781 | | | $ | 1,145 | | $ | 781 | | |
The change in the Company’s accrued carried interest for new funds during the three and six months ended June 30, 2023 is as follows:
| | | | | | | | | | | | |
FOR THE PERIODS ENDED JUNE 30,
(MILLIONS) | Three Months Ended | | Six Months Ended | |
| 2023 | | 2023 | |
| Balance, beginning of period | $ | 174 | | | $ | 108 | | |
| Changes in fund fair values | 115 | | | 181 | | |
| Realized carried interest | — | | | — | | |
| Balance, end of period | $ | 289 | | | $ | 289 | | |
(d) The Company’s equity method investments include a 68% (2022 - 64%) economic interest in Oaktree acquired on September 30, 2019, a 49.9% (2022 – 49.9%) economic interest in LCM Partner Group transferred into the Company on spin-off, a 35% economic interest in Primary Wave acquired on October 3, 2022, and a number of general partner investments in our private funds. The Company has significant influence, but not control, over the operating and financial policies of these equity method investees by virtue of having the ability to appoint members of these investee’s governing bodies. Despite a 68% economic interest, the Company does not control Oaktree due to less than 50% of board representation and other contractual agreements that prevent the Company from having a controlling financial interest.
The Company recognized in Share of income from equity accounted investments in its Condensed Consolidated and Combined Statement of Operations its share of earnings or losses from all of its equity method investments of $29 million and $87 million for the three months ended June 30, 2023 and June 30, 2022 respectively.
The summarized financial information of all of the Company’s equity method investments for the three and six months ended June 30, 2023 is as follows:
| | | | | | | | | | | | | | | |
FOR THE PERIODS ENDED JUNE 30,
(MILLIONS) | Three Months Ended | | | | Six Months Ended | | |
| 2023 | | | | 2023 | | |
| Revenues | $ | 1,066 | | | | | $ | 1,767 | | | |
| Expense | (826) | | | | | (1,655) | | | |
| Net income | 240 | | | | | 112 | | | |
| Net income attributable to non-controlling interest | (11) | | | | | — | | | |
4. VARIABLE INTEREST ENTITIES
The Company holds variable interest in certain VIEs which are not consolidated as it has been determined that the Company is not the primary beneficiary. VIEs that are not consolidated predominately include investment funds sponsored by or managed by the Company. The Company's investment strategies differ by investment fund; however, the fundamental risks have similar characteristics, including loss of invested capital and loss of management and performance income. The Company's maximum exposure to loss as a result of its investments in the unconsolidated investment funds is the carrying value of such investments,
including the Company's capital interest and any unrealized carried interest. For the three months ended June 30, 2023 and 2022 the Company did not provide any amounts to unconsolidated VIEs other than its obligated commitments.
The assets and liabilities recognized in the Company's Condensed Consolidated and Combined Balance Sheet related to its maximum exposure to loss of those VIEs of which the Company is determined not to be the primary beneficiary, the non-consolidated VIEs, are as follows:
| | | | | | | | | | | | | |
(UNAUDITED) AS AT JUNE 30 AND DECEMBER 31
(MILLIONS) | 2023 | | 2022 |
| Investments | $ | 21 | | | $ | 18 | | | |
| Due from affiliates | 48 | | | 22 | | | |
| VIE related assets | 69 | | | 40 | | | |
| Maximum exposure to loss | $ | 69 | | | $ | 40 | | | |
| | | | | |
| | | | | |
| | | | | |
| | | | | |
5. FAIR VALUE MEASUREMENTS OF FINANCIAL INSTRUMENTS
Fair value approximates carrying value for the following financial instruments that are not measured at fair value in the consolidated and combined financial statements: Accounts receivable and other (except as otherwise indicated below), Accounts payable and other (except as otherwise indicated below), Due to affiliates and Due from affiliates, Accrued carried interest, and Redeemable non-controlling interest.
The following tables summarize the fair value hierarchy of financial assets and liabilities of the Company that are measured at fair value as at June 30, 2023 and December 31, 2022:
| | | | | | | | | | | | | | | | | | | | | | | |
AS AT JUNE 30, 2023 (MILLIONS) | Level I | | Level II | | Level III | | Total |
| Assets | | | | | | | |
| Cash and cash equivalents | $ | 2,918 | | | $ | — | | | $ | — | | | $ | 2,918 | |
| Accounts receivable and other | — | | | — | | | 36 | | | 36 | |
| Common shares | — | | | — | | | 74 | | | 74 | |
| Total assets | $ | 2,918 | | | $ | — | | | $ | 110 | | | $ | 3,028 | |
| Liabilities | | | | | | | — | |
| Accounts payable and other | $ | — | | | $ | — | | | $ | 180 | | | $ | 180 | |
| Total liabilities | $ | — | | | $ | — | | | $ | 180 | | | $ | 180 | |
| | | | | | | |
| | | | | | | |
| | | | | | | |
| | | | | | | |
| | | | | | | | | | | | | | | | | | | | | | | |
AS AT DECEMBER 31, 2022 (MILLIONS) | Level I | | Level II | | Level III | | Total |
| Assets | | | | | | | |
| Cash and cash equivalents | $ | 3,545 | | | $ | — | | | $ | — | | | $ | 3,545 | |
| Accounts receivable and other | — | | | — | | | 52 | | | 52 | |
| Common shares | — | | | — | | | 75 | | | 75 | |
| Total assets | $ | 3,545 | | | $ | — | | | $ | 127 | | | $ | 3,672 | |
| Liabilities | | | | | | | — | |
| Accounts payable and other | $ | — | | | $ | — | | | $ | 190 | | | $ | 190 | |
| Total liabilities | $ | — | | | $ | — | | | $ | 190 | | | $ | 190 | |
The fair value measurement of items categorized in Level III of the fair value hierarchy is subject to valuation uncertainty arising from the use of significant unobservable inputs. The significant unobservable inputs used in the fair value measurement of financial assets and liabilities recurringly measured at fair value are discount rates and capitalization rates. Significant increases (decreases) in these inputs in isolation would have resulted in a significantly lower (higher) fair value measurement. The following tables summarize the quantitative inputs and assumptions used for items categorized in Level III of the fair value hierarchy as of June 30, 2023 and December 31, 2022:
| | | | | | | | | | | | | | | | | | | | | | | | | | | | | | | | | | | | | | |
AS AT JUNE 30, 2023 (MILLIONS) | | Fair Value | | Valuation techniques | | Unobservable inputs | | Ranges | | Weighted-average (a) | | Impact to valuation from an increase in input |
| Common shares | | $ | 74 | | | See note (b) | | N/A | | N/A | | N/A | | N/A |
| Accounts receivable and other | | 36 | | | See note (d) | | N/A | | N/A | | N/A | | N/A |
| Accounts payable and other | | 180 | | | See note (c) | | N/A | | N/A | | N/A | | N/A |
| | | | | | | | | | | | |
| | | | | | | | | | | | |
| | | | | | | | | | | | |
| | | | | | | | | | | | |
| | | | | | | | | | | | |
| | | | | | | | | | | | | | | | | | | | | | | | | | | | | | | | | | | | | | |
AS AT DECEMBER 31, 2022 (MILLIONS) | | Fair Value | | Valuation techniques | | Unobservable inputs | | Ranges | | Weighted-average (a) | | Impact to valuation from an increase in input |
| Common shares | | $ | 75 | | | See note (b) | | N/A | | N/A | | N/A | | N/A |
| Accounts receivable and other | | 52 | | | See note (d) | | N/A | | N/A | | N/A | | N/A |
| Accounts payable and other | | 190 | | | See note (c) | | N/A | | N/A | | N/A | | N/A |
(a) Unobservable inputs were weighted based on the fair value of the investments included in the range.
(b) Common shares as at June 30, 2023 relate to the Company’s $64 million (2022- $64 million) investment in Brookfield Renewable Energy L.P. which are being recorded at fair value on the Condensed Consolidated and Combined Balance Sheet.
(c) Accounts payable and other recorded at fair value and categorized in Level III relate to a put option held by other investors of Oaktree and Primary Wave under which the Company may be required to purchase additional shares of these investees using a prescribed valuation methodology in exchange for cash, Class A shares of the Corporation or other forms of consideration at the discretion of the Company. The fair value of these instruments is determined quarterly using a Monte Carlo simulation and various inputs prepared by management.
(d) Accounts receivable and other recorded at fair value and categorized in Level III relate to a call option held by the Company to acquire additional shares of Primary Wave from other investors of the investee using a prescribed valuation methodology in exchange for cash, Class A shares of the Corporation or other forms of consideration at the discretion of the Company. The fair value of this instrument is determined quarterly using a Monte Carlo simulation and various inputs prepared by management.
During the three months ended June 30, 2023, there have been no changes in valuation techniques within Level II and Level III that have had a material impact on the valuation of financial instruments.
The following tables summarize the changes in financial assets and liabilities measured at fair value for which the Company has used Level III inputs to determine fair value and does not include gains or losses that were reported in Level III in prior years or for instruments that were transferred out of Level III prior to the end of the respective reporting period. These tables also exclude financial assets and liabilities measured at fair value on a non-recurring basis. Total realized and unrealized gains and losses recorded for Level III investments are reported in Other income (expense) in the Condensed Consolidated and Combined Statements of Operations.
| | | | | | | | | | | | | | | | | | | | | | | | | |
AS AT AND FOR THE THREE MONTHS ENDED JUNE 30, 2023 (MILLIONS) | Common shares | | Accounts receivable and other | | | | | | | | | | Accounts payable and other |
| Balance as at March 31, 2023 | $ | 74 | | | $ | 38 | | | | | | | | | | | $ | 193 | |
| Net purchases (redemptions) | — | | | — | | | | | | | | | | | — | |
| Gains (losses) included in earnings | — | | | (2) | | | | | | | | | | | (13) | |
| Balance as at June 30, 2023 | $ | 74 | | | $ | 36 | | | | | | | | | | | $ | 180 | |
| | | | | | | | | | | | | | | | | | | | | | | | | |
AS AT AND FOR THE SIX MONTHS ENDED JUNE 30, 2023 (MILLIONS) | Common shares | | Accounts receivable and other | | | | | | | | | | Accounts payable and other |
| Balance as at December 31, 2022 | $ | 75 | | | $ | 52 | | | | | | | | | | | $ | 190 | |
| Net purchases (redemptions) | — | | | — | | | | | | | | | | | — | |
| Gains (losses) included in earnings | (1) | | | (16) | | | | | | | | | | | (10) | |
| Balance as at June 30, 2023 | $ | 74 | | | $ | 36 | | | | | | | | | | | $ | 180 | |
6. REVENUE
The Company focuses on a number of investment strategies, specifically renewable power and transition, infrastructure, private equity, real estate, and credit and other, operating in various markets including the United States, Canada, and the rest of the world.
The following table sets out revenue disaggregated by segment.
| | | | | | | | | | | | | | | | | | | | | | | | | | | | | | | | | | | | | | |
| FOR THE THREE MONTHS ENDED JUNE 30, 2023 | | Renewable power and transition | | Infrastructure | | Private equity | | Real estate | | Credit and other | | Total |
| Management and advisory fees, net | | $ | 120 | | | $ | 211 | | | $ | 75 | | | $ | 191 | | | $ | 80 | | | $ | 677 | |
| Incentive distributions | | 28 | | | 65 | | | — | | | — | | | — | | | 93 | |
| | $ | 148 | | | $ | 276 | | | $ | 75 | | | $ | 191 | | | $ | 80 | | | $ | 770 | |
| | | | | | | | | | | | | | | | | | | | | | | | | | | | | | | | | | | | | | |
| FOR THE THREE MONTHS ENDED JUNE 30, 2022 | | Renewable power and transition | | Infrastructure | | Private equity | | Real estate | | Credit and other | | Total |
| Management and advisory fees, net | | $ | 125 | | | $ | 164 | | | $ | 48 | | | $ | 185 | | | $ | 59 | | | $ | 581 | |
| Incentive distributions | | 23 | | | 61 | | | — | | | — | | | — | | | 84 | |
| | $ | 148 | | | $ | 225 | | | $ | 48 | | | $ | 185 | | | $ | 59 | | | $ | 665 | |
| | | | | | | | | | | | | | | | | | | | | | | | | | | | | | | | | | | | | | |
| FOR THE SIX MONTHS ENDED JUNE 30, 2023 | | Renewable power and transition | | Infrastructure | | Private equity | | Real estate | | Credit and other | | Total |
| Management and advisory fees, net | | $ | 239 | | | $ | 418 | | | $ | 138 | | | $ | 397 | | | $ | 182 | | | $ | 1,374 | |
| Incentive distributions | | 56 | | | 131 | | | — | | | — | | | — | | | 187 | |
| | $ | 295 | | $ | — | | $ | 549 | | $ | — | | $ | 138 | | $ | — | | $ | 397 | | $ | — | | $ | 182 | | $ | — | | $ | 1,561 | |
| | | | | | | | | | | | | | | | | | | | | | | | | | | | | | | | | | | | | | |
| FOR THE SIX MONTHS ENDED JUNE 30, 2022 | | Renewable power and transition | | Infrastructure | | Private equity | | Real estate | | Credit and other | | Total |
| Management and advisory fees, net | | $ | 242 | | | $ | 362 | | | $ | 91 | | | $ | 354 | | | $ | 119 | | | $ | 1,168 | |
| Incentive distributions | | 48 | | | 120 | | | — | | | — | | | — | | | 168 | |
| | $ | 290 | | | $ | 482 | | | $ | 91 | | | $ | 354 | | | $ | 119 | | | $ | 1,336 | |
7. INCOME TAXES
The Company’s Canadian statutory income tax rate has remained consistent at 27% during the three months ended June 30, 2023, and 2022.
As of June 30, 2023 and December 31, 2022, the company did not have any material unrecognized tax benefits related to uncertain tax positions.
The company files its tax returns as prescribed by the tax laws of the jurisdictions in which it operates. In the normal course of business, the company is subject to examination by Canadian and foreign tax authorities. As of June 30, 2023, the company’s Canadian income tax returns for the years 2018 through 2022 are open under the normal four-year statute of limitations and therefore subject to examination. Certain subsidiaries’ tax returns for 2018 through 2021 are currently subject to examination.
8. SHARE-BASED COMPENSATION
The Manager and the Corporation, related parties of the Company, have granted share-based compensation awards to certain employees and non-employee directors of the Company under a number of compensation plans (the “Equity Plans”). The Equity Plans provide for the granting of share options, restricted shares, escrowed shares and deferred share and restricted share units which contain certain service or performance requirements of the Manager or the Corporation.
The expense recognized for share-based compensation is summarized in the following table:
| | | | | | | | | | | | | |
FOR THE PERIODS ENDED JUNE 30,
(MILLIONS) | Three Months Ended | | Six Months Ended |
| 2023 | | | 2023 | |
| Expenses arising from equity-settled share-based payment transactions | $ | 22 | | | | $ | 45 | | |
| Expense (recovery) arising from cash-settled share-based payment transactions | 2 | | | | 70 | | |
| $ | 24 | | | | $ | 115 | | |
The share-based payment plans are described below.
Management Share Option Plan
Options issued under the Management Share Option Plan (“MSOP”) of both the Corporation and the Manager vest over a period of up to five years, expire ten years after the grant date and are settled through issuance of Class A shares of the Corporation or the Manager. The exercise price is equal to the market price at the grant date. For the three and six months ended June 30, 2023, the total expense incurred with respect to MSOP totaled $6 million and $13 million, respectively.
Escrowed Stock Plan
Under the Escrowed Stock Plan ("ES") Plans, executives are granted common shares (the “ES Shares”) in one or more private companies that own Class A shares of the Manager and the Corporation. The ES shares generally vest over five years and must be held to the fifth anniversary of the grant date. At a date no more than ten years from the grant date, all outstanding ES shares will be exchanged for Class A shares issued by the Corporation or the Manager based on the increase in market value between the date of grant and date of exercise of the respective Class A shares at the time of the exchange. An equal number of Class A shares held in the private Escrow companies will be cancelled such that the issuance of shares to employees is non-dilutive. In general, the shares issued on exchange will be less than the Class A shares purchased under the ES Plan resulting in a net reduction in the number of Class A shares issued.
For the three and six months ended June 30, 2023, the total expense incurred with respect to the ES Plan totaled $4 million and $8 million, respectively.
Restricted Stock Plan
The Restricted Stock Plan awards executives with Class A shares of the Corporation and the Manager purchased on the open market (“Restricted Shares”). Under the Restricted Stock Plan, Restricted Shares awarded vest over a period of up to five years, except for Restricted Shares awarded in lieu of a cash bonus, which may vest immediately. Vested and unvested Restricted Shares are subject to a hold period of up to five years. Holders of Restricted Shares are entitled to vote Restricted Shares and to receive associated dividends. Employee compensation expense for the Restricted Stock Plan is charged against income over the vesting period.
Compensation expense for the three and six months ended June 30, 2023 is $12 million and $25 million, respectively.
Deferred Share Unit Plan and Restricted Share Unit Plan
The Deferred Share Unit ("DSU") Plan and Restricted Share Unit ("RSU") Plan provides for the issuance of DSUs and RSUs, respectively. Under these plans, qualifying employees and directors receive varying percentages of their annual incentive bonus or directors’ fees in the form of DSUs and RSUs. The DSUs and RSUs vest over periods of up to five years, and DSUs accumulate additional DSUs at the same rate as dividends on Class A shares of the Corporation and the Manager based on the market value of the Class A shares at the time of the dividend. Participants are not allowed to convert DSUs and RSUs into cash until retirement or cessation of employment.
The value of the DSUs, when converted to cash, will be equivalent to the market value of the Class A shares of the Corporation and the Manager at the time the conversion takes place. The value of the RSUs, when converted into cash, will be equivalent to the difference between the market price of equivalent number of Class A shares of the Corporation or the Manager at the time the conversion takes place and the market price on the date the RSUs are granted. The fair value of the vested DSUs and RSUs as at June 30, 2023 was $234 million.
Employee compensation expense for these plans is charged against net income over the vesting period of the DSUs and RSUs. The new grant of DSUs as part of the make-whole arrangement is considered a modification under ASC 718, Compensation - Stock Compensation. The amount payable in respect of vested DSUs and RSUs changes as a result of dividends and share price
movements. All of the amounts attributable to changes in the amounts payable by the company are recorded as employee compensation expense in the period of the change. For the three months ended and six months ended June 30, 2023, employee compensation recovery totaled $2 million and $70 million, respectively.
9. PREFERRED SHARES REDEEMABLE NON-CONTROLLING INTEREST
In December 2022, at the time of the spin-off, BUSHI and BMHL, subsidiaries of the Company, entered into arrangements with the Corporation whereby BUSHI and BMHL issued preferred shares to the Corporation in exchange for the Corporation's holdings in BUSHI's and BMHL's common shares.
The preferred shares are denoted as a form of preferred shares, which we also refer to as tracking shares and represents a class of ownership senior to common stock and subordinate to debt and are entitled to quarterly dividends when declared by BUSHI and BMHL. The BUSHI preferred shares are redeemable at the option of the issuer after 10 years and the BMHL preferred shares are redeemable when a redemption triggering event has occurred. As the Company does not solely control the redemption event, these preferred shares are accounted for as redeemable non-controlling interest.
In addition to the tracking shares, BUSHI has issued class B preferred shares during the six months ended June 30, 2023 which are redeemable at the option of both the holder and the issuer at $25 per share (the redemption amount) plus unpaid dividends. These preferred shares are non-voting and rank junior to the BUSHI tracking shares and senior to common shares of the entity, and are entitled to non-cumulative cash dividends at 6.7% per annum on their redemption amount. As they are currently redeemable, the Company measures these preferred shares at their redemption amount at each reporting date.
The Company accounts for the changes in the value of the redeemable non-controlling interest in accordance with ASC 480, Distinguishing Liabilities from Equity. The Company elects for the BUSHI tracking shares to recognize changes in the redemption value immediately as they occur and adjust the carrying amount to equal the redemption value at the end of each reporting period. As the BMHL tracking shares are not currently redeemable and management has determined that it is not probable that the instrument will become redeemable no subsequent adjustment in the value of the preferred shares is expected. In addition, since the redemption amount of the BUSHI class B preferred shares do not change, and any dividends declared are expected to be paid on or prior to each reporting date, no adjustment to the carrying value of these preferred shares is expected.
The movement in the carrying value of the preferred shares redeemable non-controlling interest is as follows:
| | | | | | | | | | | |
AS AT AND FOR THE PERIOD ENDED JUNE 30, 2023 (MILLIONS) | Three Months Ended | | Six Months Ended |
| 2023 | | 2023 |
| Opening balance | $ | 1,864 | | | $ | 1,811 | |
| Net issuances (redemptions) | 78 | | | 150 | |
| Changes in redemption value included in net income attributable to preferred share non-controlling interest | 90 | | | 71 | |
| Balance as at June 30, 2023 | $ | 2,032 | | | $ | 2,032 | |
10. RELATED PARTY TRANSACTIONS
In the normal course of business, the Company entered into transactions with related parties and derived the majority of its revenue from the provision of asset management services to the Corporation along with its subsidiaries and operating entities. During the three and six months ended June 30, 2023, the Company recorded $884 million and $1.7 billion of revenues derived from related party transactions on its Consolidated and Combined Statement of Operations (2022 – $828 million and $1.5 billion, respectively).
In the normal course of business, the Company entered into transactions with related parties by providing and borrowing on short-term credit facilities, working capital facilities, as well as unsecured loans. The balances due and from these facilities as well as those amounts due and from equity compensation recharge and recovery arrangements are recorded as Due from affiliates and Due to affiliates on the Condensed Consolidated and Combined Balance Sheets.
Under the AMSA, the Manager provides the services of its employees and its Chief Executive Officer to the Company on a cost recovery basis. For services received, costs are recorded on a gross basis in the Consolidated and Combined Statements of Operations. During the three and six months ended June 30, 2023, under this arrangement, the Company has recognized
$42 million and $95 million in the Consolidated and Combined Statements of Operations which includes the impacts of the fair value movements of the cash-settled equity instruments provided by the Manager to the Company employees.
As outlined in the Relationship Agreement, the Corporation is responsible for certain costs associated with the options and other awards for certain employees, some of which are subject to revaluation at each balance sheet date, and will also bear the cost of the employee entitlement to carried interest on mature funds either directly or indirectly through reimbursement to the Company. Income generated under the Relationships Agreement relating to these instruments is recognized as Other revenue in the Consolidated and Combined Statement of Operations on a gross basis as the instruments vest. During the three and six months ended June 30, 2023, the Manager has recognized a charge of $16 million and a recharge of $165 million, respectively in the Condensed Consolidated and Combined Statement of Comprehensive Income under this arrangement.
In the current period, the Asset Management Company declared a non-cash distribution to the Corporation in the amount of $229 million which has been recorded in the Condensed Consolidated and Combined Statement of Changes in Equity
Due from affiliates and due to affiliates consisted of the following:
| | | | | | | | | | | |
AS AT JUNE 30, 2023 AND DECEMBER 31, 2022 (MILLIONS) | 2023 | | 2022 |
| Due from Affiliates | | | |
| Loans to affiliates | $ | 1,383 | | | $ | 1,317 | |
| Receivables from affiliates related to share and cash-based compensation | 649 | | | 801 | |
| Loans to related parties | 97 | | | 3 | |
| $ | 2,129 | | | $ | 2,121 | |
| | | |
| Due to Affiliates | | | |
| Operating payables due to related parties | $ | 657 | | | $ | 786 | |
| Payables to affiliates related to share and cash-based compensation to carried interest | 38 | | | 25 | |
| Borrowings from related parties | 195 | | | — | |
| $ | 890 | | | $ | 811 | |
Due from affiliates
Due from affiliates of $2.1 billion (2022 - $2.1 billion) consists of $1.4 billion (2022 - $1.3 billion) of loans to affiliates which are comprised of asset management fees receivables, working capital facilities, and other outstanding short-term credit facilities provided to the Corporation and its subsidiaries in the normal course of business. Loans to related parties are unsecured with floating rates of L-375 bps or a fixed interest rate of 0.14%. The prior period non-operating loans to related parties are unsecured with floating rates of L-375bps or fixed interest rates ranging from 2.5% – 6.5%. Maturities on loans to related parties range from 2023 to 2057. The loans were generally issued to finance acquisitions and fund commitments.
During the six months ended June 30, 2023, the Company paid the Manger $88 million as a prepayment for equity based compensation granted to the Company's employees which has been recognized by the Company as a prepayment for compensation expense in Due from affiliates. The Company also made a $15 million prepayment to the Manger under the AMSA for equity based compensation, which has been recognized in Due from Affiliates. The Company also issued to the Manager options to acquire the Company’s shares, which are accounted for as the Company’s equity in Additional Paid-In Capital at their fair value on issuance date of $41 million. These options are options that track to certain Manager stock options issued under its Management Share Option Plan and are automatically exercised at the same time and the same exercise prices as these awards.
Due to affiliates
Due to affiliates of $890 million (2022 - $811 million) consists of amounts payable to related parties for services received in the normal course of business including operating expenses payable and borrowings from the Manager under the line of credit.
11. COMMITMENTS AND CONTINGENCIES
Commitments
On January 31, 2019, a subsidiary of the Company committed $2.8 billion to BSREP III and has funded $2.0 billion of the total commitment as of June 30, 2023 (December 31, 2022 – $1.8 billion).
In the normal course of business, the Company enters into contractual obligations which include commitments to provide guarantees. As at June 30, 2023 the total amount of these guarantees was $700 million.
Contingencies
Litigation
The Company may from time to time be involved in litigation and claims incidental to the conduct of its business. The Company’s businesses are also subject to extensive regulation, which may result in regulatory proceedings against the company.
The Company accrues a liability for legal proceedings only when those matters present loss contingencies that are both probable and reasonably estimable. In such cases, there may be exposure to loss in excess of any amounts accrued. Although there can be no assurance of the outcome of such legal actions, based on information known by management, the Company does not have a potential liability related to any current legal proceeding or claim that would individually or in the aggregate materially affect its results of operations, financial condition or cash flows.