SECURITIES AND EXCHANGE COMMISSION
Washington, DC 20549
FORM 10-Q
QUARTERLY REPORT UNDER SECTION 13 OR 15(d)
OF THE SECURITIES EXCHANGE ACT OF 1934
| | | |
| For the Quarter Ended September 30, 2001 | | Commission file number 1-5805 |
J.P. MORGAN CHASE & CO.
(Exact name of registrant as specified in its charter)
| | | |
| Delaware | | 13-2624428 |
| |
|
(State or other jurisdiction of
incorporation or organization) | | (IRS Employer
Identification No.) |
| | | |
| 270 Park Avenue, New York, New York | | 10017 |
| |
|
| (Address of principal executive offices) | | (Zip Code) |
Registrant’s telephone number, including area code (212) 270-6000
Indicate by check mark whether the registrant (1) has filed all reports required to be filed by Section 13 or 15(d) of the Securities Exchange Act of 1934 during the preceding 12 months (or for such shorter period that the registrant was required to file such reports), and (2) has been subject to such filing requirements for the past 90 days.
Yes No
No
| | | |
| Common Stock, $1 Par Value | | 1,972,993,278 |
|
Number of shares outstanding of common stock on October 31, 2001.
TABLE OF CONTENTS
FORM 10-Q
TABLE OF CONTENTS
| | | | | |
| | | | | Page |
| | | | |
|
| Part I – Financial Information | | |
|
|
|
|
| | | | | |
|
|
|
|
| Item 1 | | Financial Statements – J.P. Morgan Chase & Co.: | | |
|
|
|
|
| | | | | |
|
|
|
|
| | | Consolidated Statement of Income for three and nine months ended September 30, 2001 and September 30, 2000 | | 3 |
|
|
|
|
| | | | | |
|
|
|
|
| | | Consolidated Balance Sheet at September 30, 2001 and December 31, 2000 | | 4 |
|
|
|
|
| | | | | |
|
|
|
|
| | | Consolidated Statement of Changes in Stockholders’ Equity for the nine months ended September 30, 2001 and September 30, 2000 | | 5 |
|
|
|
|
| | | | | |
|
|
|
|
| | | Consolidated Statement of Cash Flows for the nine months ended September 30, 2001 and September 30, 2000 | | 6 |
|
|
|
|
| | | | | |
|
|
|
|
| | | Notes to Consolidated Financial Statements | | 7-14 |
|
|
|
|
| | | | | |
|
|
|
|
| Item 2 | | Management’s Discussion and Analysis of Financial Condition and Results of Operations | | 15-51 |
|
|
|
|
| | | | | |
|
|
|
|
| | | Glossary of Terms | | 52 |
|
|
|
|
| | | | | |
| | | Important Factors That May Affect Future Results | | 53 |
|
|
|
|
| | | | | |
|
|
|
|
| Item 3 | | Quantitative and Qualitative Disclosures about Market Risk | | 54 |
|
|
|
|
| | | | | |
|
|
|
|
| Part II – Other Information | | |
|
|
|
|
| | | | | |
|
|
|
|
| Item 1 | | Legal Proceedings | | 54-55 |
|
|
|
|
| | | | | |
|
|
|
|
| Item 2 | | Sales of Unregistered Common Stock | | 55 |
|
|
|
|
| | | | | |
|
|
|
|
| Item 6 | | Exhibits and Reports on Form 8-K | | 55 |
The Management’s Discussion and Analysis contains statements that are forward-looking within the meaning of the Private Securities Litigation Reform Act of 1995. Such statements are based upon the current beliefs and expectations of J.P. Morgan Chase & Co.’s management and are subject to significant risks and uncertainties. Actual results may differ from those set forth in the forward-looking statements. Factors that could cause J.P. Morgan Chase & Co.’s results to differ materially from those described in the forward-looking statements are enumerated under “Important Factors That May Affect Future Results” in this Form 10-Q and are further described in the 2000 Annual Report on Form 10-K of J.P. Morgan Chase & Co. filed with the Securities and Exchange Commission.
-2-
Part I
Item 1
J.P. MORGAN CHASE & CO.
CONSOLIDATED STATEMENT OF INCOME
(in millions, except per share data)
| | | | | | | | | | | | | | | | | |
| | | Third Quarter | | Nine Months |
| | |
| |
|
| | | 2001 | | 2000 | | 2001 | | 2000 |
|
Revenue | | | | | | | | | | | | | | | | |
|
|
|
|
| Investment Banking Fees | | $ | 811 | | | $ | 1,013 | | | $ | 2,681 | | | $ | 3,311 | |
|
|
|
|
| Trading Revenue | | | 1,301 | | | | 1,455 | | | | 4,563 | | | | 5,156 | |
|
|
|
|
| Fees and Commissions | | | 2,331 | | | | 2,427 | | | | 6,784 | | | | 6,842 | |
|
|
|
|
| Private Equity – Realized Gains | | | 204 | | | | 656 | | | | 570 | | | | 1,678 | |
|
|
|
|
| Private Equity – Unrealized Gains (Losses) | | | (311 | ) | | | (676 | ) | | | (1,379 | ) | | | (565 | ) |
|
|
|
|
| Securities Gains | | | 142 | | | | 90 | | | | 664 | | | | 111 | |
|
|
|
|
| Other Revenue | | | 212 | | | | 415 | | | | 732 | | | | 807 | |
|
| Total Noninterest Revenue | | | 4,690 | | | | 5,380 | | | | 14,615 | | | | 17,340 | |
|
| Interest Income | | | 7,709 | | | | 9,423 | | | | 25,358 | | | | 26,721 | |
|
|
|
|
| Interest Expense | | | 5,050 | | | | 7,080 | | | | 17,500 | | | | 19,670 | |
|
| Net Interest Income | | | 2,659 | | | | 2,343 | | | | 7,858 | | | | 7,051 | |
|
| Revenue before Provision for Loan Losses | | | 7,349 | | | | 7,723 | | | | 22,473 | | | | 24,391 | |
|
|
|
|
| Provision for Loan Losses | | | 745 | | | | 298 | | | | 1,717 | | | | 968 | |
|
| Total Net Revenue | | | 6,604 | | | | 7,425 | | | | 20,756 | | | | 23,423 | |
|
Expense | | | | | | | | | | | | | | | | |
|
|
|
|
| Compensation Expense | | | 2,883 | | | | 3,135 | | | | 9,292 | | | | 9,438 | |
|
|
|
|
| Occupancy Expense | | | 339 | | | | 338 | | | | 1,014 | | | | 943 | |
|
|
|
|
| Technology and Communications | | | 663 | | | | 632 | | | | 1,991 | | | | 1,786 | |
|
|
|
|
| Merger and Restructuring Costs | | | 876 | | | | 79 | | | | 1,682 | | | | 129 | |
|
|
|
|
| Amortization of Intangibles | | | 182 | | | | 157 | | | | 542 | | | | 342 | |
|
|
|
|
| Other Expense | | | 992 | | | | 1,011 | | | | 3,101 | | | | 3,142 | |
|
| Total Noninterest Expense | | | 5,935 | | | | 5,352 | | | | 17,622 | | | | 15,780 | |
|
Income before Income Tax Expense and Effect of Accounting Change | | | 669 | | | | 2,073 | | | | 3,134 | | | | 7,643 | |
|
|
|
|
| Income Tax Expense | | | 220 | | | | 675 | | | | 1,083 | | | | 2,624 | |
|
Income before Effect of Accounting Change | | | 449 | | | | 1,398 | | | | 2,051 | | | | 5,019 | |
|
|
|
|
| Net Effect of Change in Accounting Principle | | | — | | | | — | | | | (25 | ) | | | — | |
|
Net Income | | $ | 449 | | | $ | 1,398 | | | $ | 2,026 | | | $ | 5,019 | |
|
Net Income Applicable to Common Stock | | $ | 436 | | | $ | 1,374 | | | $ | 1,973 | | | $ | 4,944 | |
|
Net Income per Share(a) | | | | | | | | | | | | | | | | |
|
|
|
|
| Basic | | $ | 0.22 | | | $ | 0.73 | | | $ | 1.00 | | | $ | 2.64 | |
|
|
|
|
| Diluted | | $ | 0.22 | | | $ | 0.69 | | | $ | 0.97 | | | $ | 2.53 | |
|
| (a) | | Basic and diluted earnings per share have been reduced by $0.01 in the first nine months of 2001 due to the impact of the adoption of SFAS 133 relating to the accounting for derivative instruments and hedging activities. |
The Notes to Consolidated Financial Statements are an integral part of these Statements.
-3-
Part I
Item 1 (continued)
J.P. MORGAN CHASE & CO.
CONSOLIDATED BALANCE SHEET
(in millions, except share data)
| | | | | | | | | | | | | |
| | | | | | | September 30, | | December 31, |
| | | | | | | 2001 | | 2000 |
|
ASSETS | | | | | | | | |
|
|
|
|
| Cash and Due from Banks | | $ | 22,299 | | | $ | 23,972 | |
|
|
|
|
| Deposits with Banks | | | 9,341 | | | | 8,333 | |
|
|
|
|
| Federal Funds Sold and Securities Purchased under Resale Agreements | | | 78,997 | | | | 69,474 | |
|
|
|
|
| Securities Borrowed | | | 37,499 | | | | 32,371 | |
|
|
|
|
| Trading Assets: Debt and Equity Instruments | | | 165,143 | | | | 139,249 | |
|
|
|
|
| | | | | Derivative Receivables | | | 85,407 | | | | 76,373 | |
|
|
|
|
| Securities: Available-for-Sale | | | 65,973 | | | | 73,106 | |
|
|
|
|
| | | | | Held-to-Maturity (Fair Value: $512 at September 30, 2001 and $593 at December 31, 2000) | | | 495 | | | | 589 | |
|
|
|
|
| Loans (net of the Allowance for Loan Losses of $3,874 at September 30, 2001 and $3,665 at December 31, 2000) | | | 219,411 | | | | 212,385 | |
|
|
|
|
| Goodwill and Other Intangibles | | | 14,683 | | | | 15,833 | |
|
|
|
|
| Private Equity Investments | | | 9,628 | | | | 11,428 | |
|
|
|
|
| Accrued Interest and Accounts Receivable | | | 18,253 | | | | 20,618 | |
|
|
|
|
| Premises and Equipment | | | 7,268 | | | | 7,087 | |
|
|
|
|
| Other Assets | | | 64,903 | | | | 24,530 | |
|
TOTAL ASSETS | | $ | 799,300 | | | $ | 715,348 | |
|
LIABILITIES | | | | | | | | |
|
|
|
|
| Deposits: | | | | | | | | |
|
|
|
|
| | Noninterest-Bearing | | $ | 72,734 | | | $ | 62,713 | |
|
|
|
|
| | Interest-Bearing | | | 208,870 | | | | 216,652 | |
| | | |
| | | |
| |
| | Total Deposits | | | 281,604 | | | | 279,365 | |
|
|
|
|
| Federal Funds Purchased and Securities Sold under Repurchase Agreements | | | 181,775 | | | | 131,738 | |
|
|
|
|
| Commercial Paper | | | 19,299 | | | | 24,851 | |
|
|
|
|
| Other Borrowed Funds | | | 21,941 | | | | 19,840 | |
|
|
|
|
| Trading Liabilities: Debt and Equity Instruments | | | 58,594 | | | | 52,157 | |
|
|
|
|
| | | | | Derivative Payables | | | 70,817 | | | | 76,517 | |
|
|
|
|
| Accounts Payable and Other Liabilities (including the Allowance for Credit Losses of $283 at September 30, 2001 and December 31, 2000) | | | 75,231 | | | | 40,754 | |
|
|
|
|
| Long-Term Debt | | | 42,315 | | | | 43,299 | |
|
|
|
|
| Guaranteed Preferred Beneficial Interests in the Firm’s Junior Subordinated Deferrable Interest Debentures | | | 4,439 | | | | 3,939 | |
|
TOTAL LIABILITIES | | | 756,015 | | | | 672,460 | |
|
PREFERRED STOCK OF SUBSIDIARY | | | 550 | | | | 550 | |
|
STOCKHOLDERS’ EQUITY | | | | | | | | |
|
|
|
|
| Preferred Stock | | | 1,009 | | | | 1,520 | |
|
|
|
|
| Common Stock (Authorized 4,500,000,000 Shares, Issued 1,992,661,185 Shares at September 30, 2001 and 1,940,109,081 Shares at December 31, 2000) | | | 1,993 | | | | 1,940 | |
|
|
|
|
| Capital Surplus | | | 12,244 | | | | 11,598 | |
|
|
|
|
| Retained Earnings | | | 28,021 | | | | 28,096 | |
|
|
|
|
| Accumulated Other Comprehensive Income (Loss) | | | 267 | | | | (241 | ) |
|
|
|
|
| Treasury Stock, at Cost (19,789,475 Shares at September 30, 2001 and 11,618,856 Shares at December 31, 2000) | | | (799 | ) | | | (575 | ) |
|
TOTAL STOCKHOLDERS’ EQUITY | | | 42,735 | | | | 42,338 | |
|
TOTAL LIABILITIES, PREFERRED STOCK OF SUBSIDIARY AND STOCKHOLDERS’ EQUITY | | $ | 799,300 | | | $ | 715,348 | |
|
The Notes to Consolidated Financial Statements are an integral part of these Statements.
-4-
Part I
Item 1 (continued)
J.P. MORGAN CHASE & CO.
CONSOLIDATED STATEMENT OF CHANGES IN STOCKHOLDERS’ EQUITY
(in millions, except per share data)
| | | | | | | | | | |
| Nine Months Ended September 30, | | 2001 | | 2000 |
|
Preferred Stock | | | | | | | | |
|
|
|
|
| Balance at Beginning of Year | | $ | 1,520 | | | $ | 1,622 | |
|
|
|
|
| Redemption of Stock | | | (450 | ) | | | (100 | ) |
|
|
|
|
| Purchase of Treasury Stock | | | (61 | ) | | | — | |
|
| Balance at End of Period | | | 1,009 | | | | 1,522 | |
|
Common Stock | | | | | | | | |
|
|
|
|
| Balance at Beginning of Year | | | 1,940 | | | | 1,625 | |
|
|
|
|
| Issuance of Common Stock for a Three-for-Two Stock Split | | | — | | | | 441 | |
|
|
|
|
| Issuance of Common Stock | | | 51 | | | | — | |
|
|
|
|
| Issuance of Common Stock for Purchase Accounting Acquisitions | | | 2 | | | | — | |
|
| Balance at End of Period | | | 1,993 | | | | 2,066 | |
|
Capital Surplus | | | | | | | | |
|
|
|
|
| Balance at Beginning of Year | | | 11,598 | | | | 12,724 | |
|
|
|
|
| Issuance of Common Stock for a Three-for-Two Stock Split | | | — | | | | (441 | ) |
|
|
|
|
| Issuance of Common Stock for Purchase Accounting Acquisitions | | | 79 | | | | 136 | |
|
|
|
|
| Shares Issued and Commitments to Issue Common Stock for Employee Stock-Based Awards and Related Tax Effects | | | 567 | | | | 8 | |
|
| Balance at End of Period | | | 12,244 | | | | 12,427 | |
|
Retained Earnings | | | | | | | | |
|
|
|
|
| Balance at Beginning of Year | | | 28,096 | | | | 28,455 | |
|
|
|
|
| Net Income | | | 2,026 | | | | 5,019 | |
|
|
|
|
| Cash Dividends Declared: Preferred Stock | | | (53 | ) | | | (75 | ) |
|
|
|
|
| Common Stock ($1.02 and $0.96 per share) | | | (2,048 | ) | | | (1,721 | ) |
|
| Balance at End of Period | | | 28,021 | | | | 31,678 | |
|
Accumulated Other Comprehensive Income (Loss) | | | | | | | | |
|
|
|
|
| Balance at Beginning of Year | | | (241 | ) | | | (1,428 | ) |
|
|
|
|
| Other Comprehensive Income | | | 508 | | | | 433 | |
|
| Balance at End of Period | | | 267 | | | | (995 | ) |
|
Treasury Stock, at Cost | | | | | | | | |
|
|
|
|
| Balance at Beginning of Year | | | (575 | ) | | | (7,942 | ) |
|
|
|
|
| Purchase of Treasury Stock | | | (761 | ) | | | (2,536 | ) |
|
|
|
|
| Reissuance of Treasury Stock | | | 537 | | | | 1,767 | |
|
|
|
|
| Reissuance of Treasury Stock for Purchase Accounting Acquisitions | | | — | | | | 3,415 | |
|
| Balance at End of Period | | | (799 | ) | | | (5,296 | ) |
|
Total Stockholders’ Equity | | $ | 42,735 | | | $ | 41,402 | |
|
Comprehensive Income | | | | | | | | |
| Net Income | | $ | 2,026 | | | $ | 5,019 | |
|
|
|
|
| Other Comprehensive Income | | | 508 | | | | 433 | |
|
| Comprehensive Income | | $ | 2,534 | | | $ | 5,452 | |
|
The Notes to Consolidated Financial Statements are an integral part of these Statements.
-5-
Part I
Item 1 (continued)
J.P. MORGAN CHASE & CO.
CONSOLIDATED STATEMENT OF CASH FLOWS
(in millions)
| | | | | | | | | | | | | |
| Nine Months Ended September 30, | | 2001 | | 2000 |
|
Operating Activities | | | | | | | | |
|
|
|
|
| Net Income | | $ | 2,026 | | | $ | 5,019 | |
|
|
|
|
| Adjustments to Reconcile Net Income to Net Cash Provided by Operating Activities: | | | | | | | | |
|
|
|
|
| | | Provision for Loan Losses | | | 1,717 | | | | 968 | |
|
|
|
|
| | | Merger and Restructuring Costs | | | 1,682 | | | | 129 | |
|
|
|
|
| | | Depreciation and Amortization | | 2,094 | | | | 1,364 | |
|
|
|
|
| | | Private Equity Unrealized Losses and Write-offs | | | 1,379 | | | | 565 | |
|
|
|
|
| | | Net Change in: | | | | | | | | |
|
|
|
|
| | | | Trading-Related Assets | | | (34,928 | ) | | | (27,208 | ) |
|
|
|
|
| | | | Securities Borrowed | | | (5,128 | ) | | | (158 | ) |
|
|
|
|
| | | | Accrued Interest and Accounts Receivable | | | 2,365 | | | | 3,761 | |
|
|
|
|
| | | | Other Assets | | | (40,202 | ) | | | (11,836 | ) |
|
|
|
|
| | | | Trading-Related Liabilities | | | 424 | | | | 5,124 | |
|
|
|
|
| | | | Accounts Payable and Other Liabilities | | | 32,094 | | | | 7,051 | |
|
|
|
|
| | | | Other, Net | | (243) | | | | (1,791 | ) |
|
| Net Cash Used in Operating Activities | | (36,720) | | | | (17,012 | ) |
|
Investing Activities | | | | | | | | |
|
|
|
|
| Net Change in: | | | | | | | | |
|
|
|
|
| | Deposits with Banks | | | (1,008 | ) | | | 21,741 | |
|
|
|
|
| | Federal Funds Sold and Securities Purchased under Resale Agreements | | | (9,523 | ) | | | (3,670 | ) |
|
|
|
|
| | Loans Due to Sales and Securitizations | | | 42,683 | | | | 19,551 | |
|
|
|
|
| | Other Loans, Net | | | (50,202 | ) | | | (35,822 | ) |
|
|
|
|
| | Other, Net | | | 1,861 | | | | (131 | ) |
|
|
|
|
| Held-to-Maturity Securities: Proceeds | | | 95 | | | | 372 | |
|
|
|
|
| | | | | Purchases | | | — | | | | (67 | ) |
|
|
|
|
| Available-for-Sale Securities: Proceeds from Maturities | | | 6,352 | | | | 7,904 | |
|
|
|
|
| | | | | Proceeds from Sales | | | 132,188 | | | | 64,265 | |
|
|
|
|
| | | | | Purchases | | | (132,042 | ) | | | (68,261 | ) |
|
|
|
|
| Cash Used in Acquisitions | | | (1,677 | ) | | | (3,062 | ) |
|
|
|
|
| Proceeds from Divestitures of Nonstrategic Businesses and Assets | | | 141 | | | | — | |
|
| Net Cash (Used in) Provided by Investing Activities | | (11,132 | ) | | | 2,820 | |
|
Financing Activities | | | | | | | | |
|
|
|
|
| Net Change in: | | | | | | | | |
|
|
|
|
| | Domestic Deposits | | | 14,439 | | | | (2,974 | ) |
|
|
|
|
| | Foreign Deposits | | | (12,200 | ) | | | (14,386 | ) |
|
|
|
|
| | Federal Funds Purchased and Securities Sold under Repurchase Agreements | | | 50,037 | | | | 27,814 | |
|
|
|
|
| | Commercial Paper and Other Borrowed Funds | | | (3,451 | ) | | | 1,295 | |
|
|
|
|
| | Other, Net | | | 368 | | | | (1,003 | ) |
|
|
|
|
| Proceeds from the Issuance of Long-Term Debt and Capital Securities | | | 8,961 | | | | 13,384 | |
|
|
|
|
| Repayments of Long-Term Debt | | | (9,813 | ) | | | (8,929 | ) |
|
|
|
|
| Proceeds from the Issuance of Stock and Stock-Related Awards | | | 1,155 | | | | 4,749 | |
|
|
|
|
| Redemption of Preferred Stock | | | (450 | ) | | | (100 | ) |
|
|
|
|
| Treasury Stock Purchased | | | (822 | ) | | | (2,536 | ) |
|
|
|
|
| Cash Dividends Paid | | | (2,020 | ) | | | (1,694 | ) |
|
| Net Cash Provided by Financing Activities | | 46,204 | | | | 15,620 | |
|
| Effect of Exchange Rate Changes on Cash and Due from Banks | | | (25 | ) | | | 164 | |
|
|
|
|
| Net (Decrease) Increase in Cash and Due from Banks | | | (1,673 | ) | | | 1,592 | |
|
|
|
|
| Cash and Due from Banks at December 31, 2000 and 1999 | | | 23,972 | | | | 18,692 | |
|
| Cash and Due from Banks at September 30, 2001 and 2000 | | $ | 22,299 | | | $ | 20,284 | |
|
|
|
|
| Cash Interest Paid | | $ | 17,894 | | | $ | 20,126 | |
|
|
|
|
| Taxes Paid | | $ | 676 | | | $ | 2,377 | |
|
The Notes to Consolidated Financial Statements are an integral part of these Statements.
-6-
Part I
Item 1 (continued)
See Glossary of Terms on page 52 for definition of terms used throughout the Notes to Consolidated Financial Statements.
NOTES TO CONSOLIDATED FINANCIAL STATEMENTS
NOTE 1 – MERGER WITH J.P. MORGAN & CO. INCORPORATED
On December 31, 2000, J.P. Morgan & Co. Incorporated (“J.P. Morgan”) merged with and into The Chase Manhattan Corporation (“Chase”). Upon consummation of the merger, Chase changed its name to J.P. Morgan Chase & Co. (“JPMorgan Chase” or “the Firm”). The merger was accounted for as a pooling of interests, and, accordingly, the information included in these financial statements and consolidated notes reflects the combined results of Chase and J.P. Morgan as if the merger had been in effect for all periods presented. In addition, certain amounts have been reclassified to conform to the current presentation.
NOTE 2 – BASIS OF PRESENTATION
The accounting and financial reporting policies of JPMorgan Chase and its subsidiaries conform to U.S. generally accepted accounting principles (“GAAP”) and prevailing industry practices for interim reporting. Additionally, where applicable, the policies conform to bank regulatory accounting and reporting guidelines. The unaudited consolidated financial statements prepared in conformity with GAAP require management to make estimates and assumptions that affect reported revenues, expenses, assets, liabilities and disclosure of contingent assets and liabilities. Actual results could be different from these estimates. In the opinion of management, all necessary adjustments, consisting only of normal recurring adjustments, have been included for a fair presentation of this interim financial information. These unaudited financial statements should be read in conjunction with the audited financial statements included in JPMorgan Chase’s 2000 Annual Report on Form 10-K (“2000 Annual Report”), with the exception of Note 3 below, “Accounting for Derivative Instruments and Hedging Activities.”
NOTE 3 – ACCOUNTING FOR DERIVATIVE INSTRUMENTS AND HEDGING ACTIVITIES
On January 1, 2001, JPMorgan Chase adopted SFAS 133, which establishes accounting and reporting standards for derivative instruments, including certain derivative instruments embedded in other contracts and used for hedging activities. The adoption of SFAS 133 resulted in an after-tax reduction to net income of $25 million and an after-tax reduction to other comprehensive income (“OCI”) of $36 million. The impact of reclassifying certain SFAS 115 securities from available-for-sale to trading was not material at the adoption date.
The majority of JPMorgan Chase’s derivatives are entered into for trading purposes and were not affected by the adoption of SFAS 133. The Firm also uses derivatives as an end user to hedge market exposures, modify the interest rate characteristics of related balance sheet instruments or meet longer-term investment objectives. Both trading and end-user derivatives are recorded in trading assets and liabilities. For further discussion of the Firm’s use of derivative instruments, see Note 3 of the JPMorgan Chase March 31, 2001 Form 10-Q in addition to Note 25 and page 50 of the JPMorgan Chase 2000 Annual Report.
The following table presents derivative instrument and hedging related activities for the periods indicated.
| | | | | |
| (in millions) | | Nine Months |
| | |
|
| | | 2001 |
| | |
|
Fair Value Ineffective Hedging Net Gains(a) | | $ | 84 | |
|
|
|
|
Cash Flow Ineffective Hedging Net (Losses)(a) | | | (9 | ) |
|
|
|
|
| Cash Flow Hedging Gains on Forecasted Transactions that did not occur | | | 40 | |
|
|
|
|
| Expected Reclassifications from OCI to Earnings | | | (113) | (b) |
|
|
|
|
| Net Investment Hedging Gains (Losses) on Forward Points | | | (19) | (c) |
| (a) | | Includes ineffectiveness and the portion of the hedging instrument excluded from the assessment of hedge effectiveness. |
|
|
|
|
| (b) | | Represents the reclassification of net losses on derivative instruments from OCI to earnings that are expected to occur over the next 12 months. |
|
|
|
|
| (c) | | Represents the forward points on forward foreign exchange (“FX”) contracts used to hedge the investments in foreign subsidiaries in foreign currencies. |
-7-
Part I
Item 1 (continued)
NOTE 4 – MERGER AND RESTRUCTURING COSTS
The following table shows the components of merger and restructuring costs during the third quarter and nine months of 2001.
| | | | | | | | | | |
| | | | | 2001 |
| | | |
|
| | | | Third Quarter | | | | Nine Months |
| | | |
| | | |
|
| (in millions) | | | | |
| |
Merger and Restructuring Costs | | | | | | | | |
|
|
|
|
| Previously Announced Merger Actions | | $ | 500 | | | | $ | 1,179 |
|
|
|
|
| Right-Sizing of Certain Businesses beyond That Planned at Time of Merger | | | 300 | | | | | 300 |
|
|
|
|
| Relocation and Other Business Initiatives | | | 76 | | | | | 203 |
| | | |
| | | | |
|
| | Total Merger and Restructuring Costs | | $ | 876 | | | | $ | 1,682 |
| | | |
| | | | |
|
The following table shows the utilization of the original $1.25 billion merger liability during the third quarter of 2001.
| | | | | |
| (in millions) | | | | |
| |
Merger Liability | | | | |
|
|
|
|
| Liability Balance at June 30, 2001 | | $ | 496 | |
|
|
|
|
| Liability Utilized during Third Quarter of 2001 | | | (160 | ) |
| | | |
| |
| Liability Balance at September 30, 2001 | | $ | 336 | (a) |
| | | |
| |
| (a) | | The remaining balance consists primarily of facilities costs and severance. |
Management originally estimated that the Firm would incur one-time pre-tax costs of $3.2 billion in connection with the merger of J.P. Morgan and Chase. These costs consisted of a $1.25 billion merger charge that was recorded on the December 31, 2000 merger date and $1.95 billion of other costs to be incurred in 2001 and 2002 that were not accruable under existing accounting pronouncements. Management now estimates that $650 million of additional nonaccruable merger costs will be incurred in 2001 and 2002. This results in approximately $1.42 billion of total nonaccruable merger costs yet to be incurred at September 30, 2001. These costs consist primarily of system integration costs, facilities costs and retention payments. Cumulative merger-related employee reductions, including attrition, since the merger announcement are approximately 5,500.
Management estimates that the Firm also will incur one-time pre-tax costs of $400 million in connection with the right-sizing of employee levels of certain businesses (2,000 employee reductions) beyond that planned at the time of the merger. These severance costs consist of a $300 million charge that was recorded on September 30, 2001 related to employees who were notified that their positions had been eliminated and $100 million of costs which are expected to be incurred in the fourth quarter of 2001 and in 2002 and which are not accruable under existing accounting pronouncements.
For a further discussion of JPMorgan Chase’s merger and restructuring costs, refer to Note 7 and page 42 of JPMorgan Chase’s 2000 Annual Report.
-8-
Part I
Item 1 (continued)
NOTE 5 – TRADING ASSETS AND LIABILITIES
For a discussion of the accounting policies relating to trading assets and liabilities, see Note 1 of JPMorgan Chase’s 2000 Annual Report.
The following table presents trading assets and trading liabilities for the dates indicated.
| | | | | | | | | | |
| (in millions) | | September 30, | | December 31, |
| | | 2001 | | 2000 |
| | | |
| |
|
Trading Assets | | | | | | | | |
|
|
|
|
| Debt and Equity Instruments: | | | | | | | | |
|
|
|
|
| | U.S. Government, Federal Agencies and Municipal Securities | | $ | 59,388 | | | $ | 43,251 | |
|
|
|
|
| | Certificates of Deposit, Bankers’ Acceptances and Commercial Paper | | | 11,175 | | | | 7,258 | |
|
|
|
|
| | Debt Securities Issued by Foreign Governments | | | 47,723 | | | | 41,631 | |
|
|
|
|
| | Corporate Securities and Other | | | 46,857 | | | | 47,109 | |
| | | |
| | | |
| |
| Total Trading Assets – Debt and Equity Instruments | | $ | 165,143 | | | $ | 139,249 | |
| | | |
| | | |
| |
| Derivative Receivables: | | | | | | | | |
|
|
|
|
| | Interest Rate Contracts | | $ | 51,816 | | | $ | 41,124 | |
|
|
|
|
| | Foreign Exchange Contracts | | | 13,198 | | | | 15,484 | |
|
|
|
|
| | Debt, Equity, Commodity and Other Contracts | | | 20,393 | | | | 19,765 | |
| | | |
| | | |
| |
| Total Trading Assets – Derivative Receivables | | $ | 85,407 | | | $ | 76,373 | |
| | | |
| | | |
| |
Trading Liabilities | | | | | | | | |
|
|
|
|
| Debt and Equity Instruments: | | | | | | | | |
|
|
|
|
| | Securities Sold, Not Yet Purchased | | $ | 58,132 | | | $ | 51,762 | |
|
|
|
|
| | Structured Notes | | | 462 | | | | 395 | |
| | | |
| | | |
| |
| Total Trading Liabilities – Debt and Equity Instruments | | $ | 58,594 | | | $ | 52,157 | |
| | | |
| | | |
| |
| Derivative Payables: | | | | | | | | |
|
|
|
|
| | Interest Rate Contracts | | $ | 32,692 | | | $ | 27,968 | |
|
|
|
|
| | Foreign Exchange Contracts | | | 12,468 | | | | 17,759 | |
|
|
|
|
| | Debt, Equity, Commodity and Other Contracts | | | 25,657 | | | | 30,790 | |
| | | |
| | | |
| |
| Total Trading Liabilities – Derivative Payables | | $ | 70,817 | | | $ | 76,517 | |
| | | |
| | | |
| |
Debt and equity instruments pledged as collateral that can be sold or repledged by the secured party amounted to $65.8 billion at September 30, 2001 and $53.6 billion at December 31, 2000.
-9-
Part I
Item 1 (continued)
NOTE 6 – SECURITIES
For a discussion of the accounting policies relating to securities, see Note 1 of JPMorgan Chase’s 2000 Annual Report.
The following table presents realized gains and losses from available-for-sale (“AFS”) securities.
| | | | | | | | | | | | | | | | | |
| (in millions) | | Third Quarter | | Nine Months |
| | |
| |
|
| | | 2001 | | 2000 | | 2001 | | 2000 |
| | |
| |
| |
| |
|
| Realized Gains | | $ | 226 | | | $ | 126 | | | $ | 1,053 | | | $ | 377 | |
|
|
|
|
| Realized Losses | | | (84 | ) | | | (36 | ) | | | (389 | ) | | | (266 | ) |
| | | |
| | | |
| | | |
| | | |
| |
| Net Realized Gains | | $ | 142 | | | $ | 90 | | | $ | 664 | | | $ | 111 | |
| | | |
| | | |
| | | |
| | | |
| |
The amortized cost and estimated fair value of securities were as follows for the dates indicated.
| | | | | | | | | | | | | | | | | | | |
| (in millions) | | September 30, 2001 | | December 31, 2000 |
| | |
| |
|
| | | | | Amortized | | Fair | | Amortized | | Fair |
| | | | | Cost | | Value | | Cost | | Value |
| | | | |
| |
| |
| |
|
Available-for-Sale Securities | | | | | | | | | | | | | | | | |
|
|
|
|
| U.S. Government and Federal | | | | | | | | | | | | | | | | |
|
|
|
|
| | Agency/Corporation Obligations: | | | | | | | | | | | | | | | | |
|
|
|
|
| | | Mortgage-Backed Securities | | $ | 29,531 | | | $ | 29,709 | | | $ | 38,107 | | | $ | 37,168 | |
|
|
|
|
| | | Collateralized Mortgage Obligations | | | 3,220 | | | | 3,362 | | | | 5,130 | | | | 5,215 | |
|
|
|
|
| | | U.S. Treasuries | | | 15,174 | | | | 15,490 | | | | 16,250 | | | | 16,294 | |
|
|
|
|
| Obligations of State and Political Subdivisions | | | 1,226 | | | | 1,324 | | | | 896 | | | | 967 | |
|
|
|
|
| Debt Securities Issued by Foreign Governments | | | 13,224 | | | | 13,303 | | | | 10,749 | | | | 10,800 | |
|
|
|
|
Corporate Debt, Equity and Other(a) | | | 2,778 | | | | 2,785 | | | | 2,434 | | | | 2,662 | |
| | | |
| | | |
| | | |
| | | |
| |
| | | Total Available-for-Sale Securities | | $ | 65,153 | | | $ | 65,973 | | | $ | 73,566 | | | $ | 73,106 | |
| | | |
| | | |
| | | |
| | | |
| |
Held-to-Maturity Securities(b) | | $ | 495 | | | $ | 512 | | | $ | 589 | | | $ | 593 | |
| | | |
| | | |
| | | |
| | | |
| |
| (a) | | Includes collateralized mortgage obligations of private issuers, which generally have underlying collateral consisting of obligations of U.S. government and federal agencies and corporations. |
|
|
|
|
| (b) | | Primarily mortgage-backed securities. |
AFS securities pledged as collateral that can be sold or repledged by the secured party amounted to $29.6 billion and $28.7 billion at September 30, 2001 and December 31, 2000, respectively.
NOTE 7 – MORTGAGE SERVICING RIGHTS
The following table summarizes the changes in residential mortgage servicing rights (“MSR”).
| | | | | | | | | | | | | |
| (in millions) | | Nine Months |
| | |
|
| | | 2001 | | | | | | 2000 |
| | |
| | | | | |
|
| Balance at Beginning of Period | | $ | 6,362 | | | | | | | $ | 5,187 | |
|
|
|
|
| Additions | | | 2,752 | | | | | | | | 1,755 | |
|
|
|
|
| Sales | | | (83 | ) | | | | | | | (260 | ) |
|
|
|
|
| Pre-SFAS 133 Hedging Activities | | | — | | | | | | | | (126 | ) |
|
|
|
|
| SFAS 133 Hedge Valuation Adjustments | | | (1,873 | ) | | | | | | | — | |
|
|
|
|
| Amortization | | | (791 | ) | | | | | | | (478 | ) |
|
|
|
|
| Change in Valuation Allowance | | | (636 | ) | | | | | | | — | |
| | | |
| | | | | | | |
| |
| Balance at End of Period | | $ | 5,731 | | | | | | | $ | 6,078 | |
| | | |
| | | | | | | |
| |
| Estimated Fair Value at Period End | | $ | 5,731 | | | | | | | | | |
| | | |
| | | | | | | | | |
| Weighted-Average Prepayment Speed Assumption | | | 16.82 | % | | CPR | | | | |
|
|
|
|
| Weighted-Average Discount Rate | | | 8.56 | % | | | | | | | | |
CPR – Constant prepayment rate.
-10-
Part I
Item 1 (continued)
Interest rate derivatives and AFS securities are used to manage the interest rate risk of the residential mortgage servicing rights. Certain interest rate derivatives qualify as fair value hedges under SFAS 133 which results in recording adjustments to the carrying value of the hedged MSRs. In addition, certain derivatives and AFS securities are used as economic hedges of the MSRs. For the nine months ended September 30, 2001, the SFAS 133 hedge valuation adjustments and the change in the valuation allowance totaled $2,509 million. These losses were substantially offset by derivative gains, including SFAS 133 hedges, and realized gains from sales of AFS securities of $2,317 million.
NOTE 8 – OTHER ASSETS AND ACCOUNTS PAYABLE AND OTHER LIABILITIES
As a result of the events of September 11th, Other Assets and Other Liabilities increased $40 billion and $34 billion, respectively, at September 30, 2001 from December 31, 2000, primarily due to the securities industry's temporary delay in clearing and settling cash and securities. The growth in Other Assets and Other Liabilities is primarily composed of failed to deliver securities and fail to receive securities, respectively.
NOTE 9 – SUBORDINATED DEFERRABLE INTEREST DEBENTURES
At September 30, 2001, 11 wholly owned Delaware statutory business trusts established by JPMorgan Chase had issued an aggregate $4,439 million of capital securities, net of discount. There were no issuances or redemptions of capital securities during the third quarter of 2001. For a discussion of these business trusts, see page 78 of JPMorgan Chase’s 2000 Annual Report and Note 8 of JPMorgan Chase’s March 31, 2001 Form 10-Q.
NOTE 10 – EARNINGS PER SHARE
For a discussion of JPMorgan Chase’s earnings per share (“EPS”), see Note 17 of the 2000 Annual Report. For the calculation of basic and diluted EPS for the third quarter and nine months ended September 30, 2001 and 2000, see Exhibit 11 on page 58.
NOTE 11 – COMPREHENSIVE INCOME
Comprehensive income is composed of net income and other comprehensive income, which includes the after-tax change in unrealized gains and losses on AFS securities, cash flow hedging activities and foreign currency translation adjustments.
| | | | | | | | | | | | | | | | | |
| Nine Months Ended September 30, | | | | | | | | | | | | | | | | |
| (in millions) | | 2001 |
| | |
|
| | | Unrealized | | | | | | | | | | Accumulated |
| | | Gains (Loss) | | | | | | | | | | Other |
| | | on AFS | | Translation | | Cash Flow | | Comprehensive |
| | | Securities | | Adjustments | | Hedges | | Income (Loss) |
| | |
| |
| |
| |
|
| Beginning Balance | | $ | (244 | ) | | $ | 3 | | | $ | — | | | $ | (241 | ) |
|
|
|
|
| Change during Period | | | 722 | | | | (8) | (b) | | | (206) | (d) | | | 508 | |
| | | |
| | | |
| | | |
| | | |
| |
| Ending Balance | | $ | 478 | (a) | | $ | (5) | (c) | | $ | (206 | ) | | $ | 267 | |
| | | |
| | | |
| | | |
| | | |
| |
| | | | | | | | | | | | | | | | | |
| | | 2000 |
| | |
|
| | | Unrealized | | | | | | | | | | Accumulated |
| | | Gains (Loss) | | | | | | | | | | Other |
| | | on AFS | | Translation | | Cash Flow | | Comprehensive |
| | | Securities | | Adjustments | | Hedges | | Income (Loss) |
| | |
| |
| |
| |
|
| Beginning Balance | | $ | (1,427 | ) | | $ | (1 | ) | | | N/A | | | $ | (1,428 | ) |
|
|
|
|
| Change during Period | | | 425 | | | | 8 | | | | N/A | | | | 433 | |
| | | |
| | | |
| | | | | | | |
| |
| Ending Balance | | $ | (1,002) | (a) | | $ | 7 | (c) | | | N/A | | | $ | (995 | ) |
| | | |
| | | |
| | | | | | | |
| |
| (a) | | Primarily represents the after-tax difference between the fair value and amortized cost of the available-for-sale securities portfolio. |
|
|
|
|
| (b) | | Includes $296 million of after-tax losses on foreign currency translation from operations for which the functional currency is other than the U.S. dollar, which are offset by $288 million of after-tax gains on hedges. |
|
|
|
|
| (c) | | Includes after-tax gains and losses on foreign currency translation from operations for which the functional currency is other than the U.S. dollar. |
|
|
|
|
| (d) | | Includes $25 million of after-tax losses reclassified to income and $231 million of after-tax losses representing the net change in derivative fair values and the impact of the adoption of SFAS 133 that were recorded in comprehensive income. The net derivative amounts included in OCI as of September 30, 2001 are expected to be reclassified into earnings through 2011. |
N/A – Not applicable, as SFAS 133 was adopted effective January 1, 2001.-11-
Part I
Item 1 (continued)
NOTE 12 – CAPITAL
For a discussion of the calculation of risk-based capital ratios, see Note 23 of JPMorgan Chase’s 2000 Annual Report.
The following table presents the risk-based capital ratios for JPMorgan Chase and its significant banking subsidiaries. At September 30, 2001, the Firm and each of its depository institutions, including those listed in the table below, were “well-capitalized” as defined by banking regulators.
| | | | | | | | | | | | | | | | | |
| | | | | | | Significant Banking Subsidiaries |
| | | | | | |
|
| September 30, 2001 | | | | | | The Chase | | Morgan | | | | |
| (in millions, except ratios) | | JPMorgan Chase(a) | | Manhattan Bank | | Guaranty Trust Co. | | Chase USA |
| | |
| |
| |
| |
|
| Tier 1 Capital | | $ | 38,570 | | | $ | 22,654 | | | $ | 10,778 | | | $ | 3,742 | |
|
|
|
|
| Total Capital | | | 54,638 | | | | 30,715 | | | | 13,328 | | | | 5,551 | |
|
|
|
|
| Risk-Weighted Assets (b) | | | 471,729 | | | | 291,166 | | | | 120,769 | | | | 44,333 | |
|
|
|
|
| Adjusted Average Assets | | | 728,438 | | | | 408,865 | | | | 157,908 | | | | 48,167 | |
|
|
|
|
| Tier 1 Capital Ratio | | | 8.18 | % | | | 7.78 | % | | | 8.92 | % | | | 8.44 | % |
|
|
|
|
| Total Capital Ratio | | | 11.58 | | | | 10.55 | | | | 11.04 | | | | 12.52 | |
|
|
|
|
| Tier 1 Leverage Ratio | | | 5.29 | | | | 5.54 | | | | 6.83 | | | | 7.77 | |
| (a) | | Assets and capital amounts for JPMorgan Chase’s significant banking subsidiaries reflect those intercompany transactions, whereas the respective amounts for JPMorgan Chase reflect the elimination of intercompany transactions. |
|
|
|
|
| (b) | | Risk-weighted assets include off-balance sheet risk-weighted assets in the amounts of $160,007 million, $94,800 million, $53,311 million and $3,174 million, respectively. |
NOTE 13 – INTEREST INCOME AND INTEREST EXPENSE
The following table details the components of interest income and interest expense as reported on the Consolidated Statement of Income.
| | | | | | | | | | | | | | | | | |
| (in millions) | | | | | | | | | | | | | | | | |
| | | Third Quarter | | Nine Months |
| | |
| |
|
| | | 2001 | | 2000 | | 2001 | | 2000 |
| | |
| |
| |
| |
|
Interest Income | | | | | | | | | | | | | | | | |
|
|
|
|
| Loans | | $ | 3,696 | | | $ | 4,496 | | | $ | 12,254 | | | $ | 12,555 | |
|
|
|
|
| Securities | | | 851 | | | | 1,092 | | | | 2,889 | | | | 3,326 | |
|
|
|
|
| Trading Assets | | | 1,909 | | | | 1,855 | | | | 5,600 | | | | 5,125 | |
|
|
|
|
| Federal Funds Sold and Securities Purchased under Resale Agreements | | | 848 | | | | 1,193 | | | | 3,120 | | | | 3,484 | |
|
|
|
|
| Securities Borrowed | | | 305 | | | | 607 | | | | 1,145 | | | | 1,663 | |
|
|
|
|
| Deposits with Banks | | | 100 | | | | 180 | | | | 350 | | | | 568 | |
| | | |
| | | |
| | | |
| | | |
| |
Total Interest Income | | | 7,709 | | | | 9,423 | | | | 25,358 | | | | 26,721 | |
|
|
|
|
Interest Expense | | | | | | | | | | | | | | | | |
|
|
|
|
| Deposits | | | 1,820 | | | | 2,765 | | | | 6,578 | | | | 7,916 | |
|
|
|
|
| Short-Term and Other Liabilities | | | 2,730 | | | | 3,458 | | | | 9,044 | | | | 9,389 | |
|
|
|
|
| Long-Term Debt | | | 500 | | | | 857 | | | | 1,878 | | | | 2,365 | |
| | | |
| | | |
| | | |
| | | |
| |
Total Interest Expense | | | 5,050 | | | | 7,080 | | | | 17,500 | | | | 19,670 | |
| | | |
| | | |
| | | |
| | | |
| |
Net Interest Income | | | 2,659 | | | | 2,343 | | | | 7,858 | | | | 7,051 | |
|
|
|
|
| Provision for Loan Losses | | | 745 | | | | 298 | | | | 1,717 | | | | 968 | |
| | | |
| | | |
| | | |
| | | |
| |
Net Interest Income after Provision for Loan Losses | | $ | 1,914 | | | $ | 2,045 | | | $ | 6,141 | | | $ | 6,083 | |
| | | |
| | | |
| | | |
| | | |
| |
NOTE 14 – COMMITMENTS AND CONTINGENCIES
For a discussion of legal proceedings, see Part II, Item 1 of this Form 10-Q.
-12-
Part I
Item 1 (continued)
NOTE 15 – FAIR VALUE OF FINANCIAL INSTRUMENTS
For a discussion of JPMorgan Chase’s fair value methodologies, see Note 28 of JPMorgan Chase’s 2000 Annual Report. The following table presents the financial assets and liabilities valued under SFAS 107.
| | | | | | | | | | | | | | | | | | | | | | | | | |
| (in billions) | | September 30, 2001 | | December 31, 2000 |
| | |
| |
|
| | | Carrying | | Estimated | | Appreciation/ | | Carrying | | Estimated | | Appreciation/ |
| | | Value | | Fair Value | | (Depreciation) | | Value | | Fair Value | | (Depreciation) |
|
| Total Financial Assets | | $ | 789.5 | | | $ | 794.5 | | | $ | 5.0 | | | $ | 691.0 | | | $ | 693.1 | | | $ | 2.1 | |
| | | |
| | | |
| | | | | | | |
| | | |
| | | | | |
| Total Financial Liabilities | | $ | 756.0 | | | $ | 758.0 | | | | (2.0 | ) | | $ | 670.3 | | | $ | 670.3 | | | | — | |
| | | |
| | | |
| | | |
| | | |
| | | |
| | | |
| |
| Estimated Fair Value in Excess of Carrying Value | | | | | | | | | | $ | 3.0 | | | | | | | | | | | $ | 2.1 | |
| | | | | | | | | | | |
| | | | | | | | | | | |
| |
NOTE 16 – ACCOUNTING DEVELOPMENTS
For a discussion of JPMorgan Chase’s recent accounting developments, see page 46 of this Form 10-Q.
NOTE 17 – SEGMENT INFORMATION
JPMorgan Chase is organized into five major businesses: Investment Bank, Investment Management & Private Banking, Treasury & Securities Services, JPMorgan Partners and Retail & Middle Market Financial Services. These businesses are segmented based on the products and services provided, or the type of customer serviced, and reflect the manner in which financial information currently is evaluated by the Firm’s management. For a further discussion concerning JPMorgan Chase’s business segments, see Lines of Business Results in the Management’s Discussion and Analysis (“MD&A”) section of this Form 10-Q on pages 18-28.
Shareholder Value Added (“SVA”) is a primary performance measure of the Firm’s businesses. SVA represents operating earnings excluding the amortization of goodwill and certain other intangibles (i.e., cash operating earnings) minus preferred dividends and an explicit charge for capital. The Firm implemented an integrated cost of capital during the first quarter of 2001. A 12% cost of capital has been used for all businesses except JPMorgan Partners. This business is charged a 15% cost of equity capital, which is equivalent to a representative after-tax hurdle rate for private equity investments. The effective cost of equity capital used in the SVA framework for JPMorgan Chase overall is 12%. All prior periods have been restated. See Management Performance Measurements in the MD&A on page 25 and Note 29 of JPMorgan Chase’s 2000 Annual Report for a further discussion of performance measurements and policies for cost allocation.
The table below presents a reconciliation of the combined segment information to the Firm’s reported net income as included in the Consolidated Statement of Income.
| | | | | | | | | | | | | | | | | |
| (in millions) | | Third Quarter | | Nine Months |
| | |
| |
|
| | | 2001 | | 2000 | | 2001 | | 2000 |
| | |
| |
| |
| |
|
Segments’ Cash Operating Earnings | | $ | 1,296 | | | $ | 1,599 | | | $ | 3,961 | | | $ | 5,661 | |
|
|
|
|
| Corporate/Reconciling Items | | | (78 | ) | | | (23 | ) | | | (257 | ) | | | (155 | ) |
| | | |
| | | |
| | | |
| | | |
| |
Consolidated Cash Operating Earnings | | | 1,218 | | | | 1,576 | | | | 3,704 | | | | 5,506 | |
|
|
|
|
| Amortization of Intangibles | | | (182 | ) | | | (157 | ) | | | (542 | ) | | | (342 | ) |
| | | |
| | | |
| | | |
| | | |
| |
Consolidated Operating Earnings | | | 1,036 | | | | 1,419 | | | | 3,162 | | | | 5,164 | |
|
|
|
|
| Restructuring/Merger Expenses & Special Items | | | (587 | ) | | | (21 | ) | | | (1,111 | ) | | | (145 | ) |
|
|
|
|
| Net Effect of Change in Accounting Principle | | | — | | | | — | | | | (25 | ) | | | — | |
| | | |
| | | |
| | | |
| | | |
| |
Consolidated Net Income | | $ | 449 | | | $ | 1,398 | | | $ | 2,026 | | | $ | 5,019 | |
| | | |
| | | |
| | | |
| | | |
| |
-13-
Part I
Item 1 (continued)
The following table provides the Firm’s segment results.
| | | | | | | | | | | | | | | | | | | | | | | | | | | | | |
| | | | | | | Investment | | | | | | | | | | Retail & | | | | | | | | |
| | | | | | | Management | | Treasury & | | | | | | Middle Market | | Corporate/ | | | | |
| | | Investment | | & Private | | Securities | | JPMorgan | | Financial | | Reconciling | | | | |
| (in millions, except ratios) | | Bank | | Banking | | Services | | Partners | | Services | | Items(a) | | Total |
|
Third Quarter 2001 | | | | | | | | | | | | | | | | | | | | | | | | | | | | |
|
|
|
|
| Operating Revenue (b) | | $ | 3,601 | | | $ | 733 | | | $ | 917 | | | $ | (179 | ) | | $ | 2,782 | | | $ | (235 | ) | | $ | 7,619 | |
|
|
|
|
| Intersegment Revenue (b) | | | (56 | ) | | | 17 | | | | 40 | | | | 1 | | | | (6 | ) | | | 4 | | | | — | |
|
|
|
|
| Operating Earnings | | | 681 | | | | 42 | | | | 166 | | | | (160 | ) | | | 398 | | | | (91 | ) | | | 1,036 | |
|
|
|
|
| Cash Operating Earnings (c) | | | 710 | | | | 118 | | | | 184 | | | | (155 | ) | | | 439 | | | | (78 | ) | | | 1,218 | |
|
|
|
|
| Average Managed Assets (d) | | | 514,518 | | | | 33,970 | | | | 18,555 | | | | 10,744 | | | | 167,160 | | | | 10,722 | | | | 755,669 | |
|
|
|
|
| SVA | | | 142 | | | | (65 | ) | | | 94 | | | | (383 | ) | | | 172 | | | | (10 | ) | | | (50 | ) |
|
|
|
|
| Cash Return on Common Equity (e) | | | 15.1 | % | | | 7.7 | % | | | 25.1 | % | | NM | | | 19.8 | % | | NM | | | 11.5 | % |
| |
|
|
|
|
|
| | | | | | | | | | | | | | | | | | | | | | | | | | | | | |
|
|
|
|
Third Quarter 2000 | | | | | | | | | | | | | | | | | | | | | | | | | | | | |
|
|
|
|
| Operating Revenue (b) | | $ | 3,881 | | | $ | 890 | | | $ | 889 | | | $ | (73 | ) | | $ | 2,623 | | | $ | (297 | ) | | $ | 7,913 | |
|
|
|
|
| Intersegment Revenue (b) | | | (56 | ) | | | 33 | | | | 36 | | | | 7 | | | | 5 | | | | (25 | ) | | | — | |
|
|
|
|
| Operating Earnings | | | 829 | | | | 106 | | | | 170 | | | | (123 | ) | | | 472 | | | | (35 | ) | | | 1,419 | |
|
|
|
|
| Cash Operating Earnings (c) | | | 855 | | | | 157 | | | | 186 | | | | (118 | ) | | | 519 | | | | (23 | ) | | | 1,576 | |
|
|
|
|
| Average Managed Assets (d) | | | 471,430 | | | | 33,886 | | | | 16,720 | | | | 13,799 | | | | 149,823 | | | | 17,620 | | | | 703,278 | |
|
|
|
|
| SVA | | | 255 | | | | (7 | ) | | | 100 | | | | (411 | ) | | | 263 | | | | 226 | | | | 426 | |
|
|
|
|
| Cash Return on Common Equity (e) | | | 17.2 | % | | | 11.5 | % | | | 26.3 | % | | NM | | | 24.6 | % | | NM | | | 16.5 | % |
|
|
|
|
|
| | | | | | | | | | | | | | | | | | | | | | | | | | | | | |
|
|
|
|
Nine Months 2001 | | | | | | | | | | | | | | | | | | | | | | | | | | | | |
|
|
|
|
| Operating Revenue (b) | | $ | 11,794 | | | $ | 2,337 | | | $ | 2,733 | | | $ | (1,011 | ) | | $ | 8,038 | | | $ | (634 | ) | | $ | 23,257 | |
|
|
|
|
| Intersegment Revenue (b) | | | (166 | ) | | | 75 | | | | 120 | | | | 12 | | | | (3 | ) | | | (38 | ) | | | — | |
|
|
|
|
| Operating Earnings (f) | | | 2,453 | | | | 124 | | | | 475 | | | | (810 | ) | | | 1,212 | | | | (292 | ) | | | 3,162 | |
|
|
|
|
| Cash Operating Earnings (c)(f) | | | 2,546 | | | | 340 | | | | 530 | | | | (794 | ) | | | 1,339 | | | | (257 | ) | | | 3,704 | |
|
|
|
|
| Average Managed Assets (d) | | | 511,051 | | | | 34,235 | | | | 18,128 | | | | 11,852 | | | | 164,364 | | | | 12,346 | | | | 751,976 | |
|
|
|
|
| SVA | | | 800 | | | | (217 | ) | | | 264 | | | | (1,531 | ) | | | 566 | | | | 44 | | | | (74 | ) |
|
|
|
|
| Cash Return on Common Equity (e) | | | 17.6 | % | | | 7.3 | % | | | 24.1 | % | | NM | | | 20.9 | % | | NM | | | 11.8 | % |
| |
|
|
|
|
|
| | | | | | | | | | | | | | | | | | | | | | | | | | | | | |
|
|
|
|
Nine Months 2000 | | | | | | | | | | | | | | | | | | | | | | | | | | | | |
|
|
|
|
| Operating Revenue (b) | | $ | 12,251 | | | $ | 2,453 | | | $ | 2,650 | | | $ | 925 | | | $ | 7,595 | | | $ | (656 | ) | | $ | 25,218 | |
|
|
|
|
| Intersegment Revenue (b) | | | (266 | ) | | | 116 | | | | 134 | | | | (1 | ) | | | 16 | | | | 1 | | | | — | |
|
|
|
|
| Operating Earnings | | | 2,931 | | | | 357 | | | | 471 | | | | 396 | | | | 1,196 | | | | (187 | ) | | | 5,164 | |
|
|
|
|
| Cash Operating Earnings (c) | | | 2,972 | | | | 429 | | | | 518 | | | | 406 | | | | 1,336 | | | | (155 | ) | | | 5,506 | |
|
|
|
|
| Average Managed Assets (d) | | | 465,682 | | | | 29,104 | | | | 16,351 | | | | 13,439 | | | | 146,473 | | | | 15,738 | | | | 686,787 | |
|
|
|
|
| SVA | | | 1,325 | | | | 104 | | | | 258 | | | | (456 | ) | | | 545 | | | | 532 | | | | 2,308 | |
|
|
|
|
| Cash Return on Common Equity (e) | | | 21.9 | % | | | 15.9 | % | | | 24.2 | % | | | 6.9 | % | | | 20.4 | % | | NM | | | 20.9 | % |
| (a) | | Corporate/Reconciling Items include LabMorgan, Support Units, Corporate and the net effect of management accounting policies. |
|
|
|
|
| (b) | | Operating Revenue includes Intersegment Revenue, which includes intercompany revenue and revenue sharing agreements, net of intersegment expenses. Transactions between business segments are primarily conducted at fair value. |
|
|
|
|
| (c) | | Cash Operating Earnings exclude the impact of restructuring costs, special items, and amortization of goodwill and certain other intangibles. |
|
|
|
|
| (d) | | Excludes the impact of credit card securitizations. |
|
|
|
|
| (e) | | Based on annualized amounts. |
|
|
|
|
| (f) | | Excludes the after-tax impact of SFAS 133 cumulative transition adjustment for the Investment Bank $(19) million, Retail & Middle Market Financial Services $(3) million and Corporate $(3) million. |
NM – Not meaningful.
-14-
Part I
Item 2
MANAGEMENT’S DISCUSSION AND ANALYSIS
OF FINANCIAL CONDITION AND RESULTS OF OPERATIONS
OVERVIEW
Results for all periods give effect to the merger of The Chase Manhattan Corporation and J.P. Morgan & Co. Incorporated on December 31, 2000.
Financial Results:Reported net income, which includes merger and restructuring costs, was $449 million, or $0.22 per share, in the third quarter of 2001. This compares with $378 million, or $0.18 per share, in the second quarter of 2001 and $1,398 million, or $0.69 per share, in the third quarter of 2000. For the first nine months of 2001, reported net income was $2,026 million, or $0.97 per share, compared with $5,019 million, or $2.53 per share, in the same period last year.
| | | | | | | | | | | | | | | | | | | | | | | | | |
| | | Third Quarter | | Nine Months |
| | |
| |
|
| | | | | | | | | | | Over (Under) | | | | | | | | | | Over (Under) |
| (in millions, except per share and ratio data) | | 2001 | | 2000 | | 2000 | | 2001 | | 2000 | | 2000 |
| | |
| |
| |
| |
| |
| |
|
REPORTED BASIS | | | | | | | | | | | | | | | | | | | | | | | | |
|
|
|
|
| Revenue | | $ | 7,349 | | | $ | 7,723 | | | | (5 | )% | | $ | 22,473 | | | $ | 24,391 | | | | (8 | )% |
|
|
|
|
| Net Income | | | 449 | | | | 1,398 | | | | (68 | ) | | | 2,026 | | | | 5,019 | | | | (60 | ) |
|
|
|
|
| Diluted Net Income per Share | | | 0.22 | | | | 0.69 | | | | (68 | ) | | | 0.97 | | | | 2.53 | | | | (62 | ) |
|
|
|
|
| Return on Average Common Equity (“ROCE”) | | | 4.2 | % | | | 14.6 | % | | (1,040)bp | | | 6.4 | % | | | 19.0 | % | | (1,260)bp |
|
|
|
|
| Tier 1 Capital Ratio | | | | | | | | | | | | | | | 8.2 | | | | 8.1 | | | | 10 | |
|
|
|
|
| Total Capital Ratio | | | | | | | | | | | | | | | 11.6 | | | | 11.7 | | | | (10 | ) |
|
|
|
|
| Tier 1 Leverage | | | | | | | | | | | | | | | 5.3 | | | | 5.6 | | | | (30 | ) |
bp – Denotes basis points; 100 bp equals 1%.
In addition to disclosing its results on a reported basis, JPMorgan Chase manages its financial performance on an operating basis. As used by JPMorgan Chase, “operating basis” excludes the impact of credit card securitizations, merger and restructuring costs, special items and the net effect of changes in accounting principles. For a reconciliation between reported results and results on an operating basis, see page 29.
| | | | | | | | | | | | | | | | | | | | | | | | | |
| | | Third Quarter | | Nine Months |
| | |
| |
|
| | | | | | | | | | | Over (Under) | | | | | | | | | | Over (Under) |
| (in millions, except per share and ratio data) | | 2001 | | 2000 | | 2000 | | 2001 | | 2000 | | 2000 |
| | |
| |
| |
| |
| |
| |
|
OPERATING BASIS(a) | | | | | | | | | | | | | | | | | | | | | | | | |
|
|
|
|
| Revenue | | $ | 7,619 | | | $ | 7,913 | | | | (4 | )% | | $ | 23,257 | | | $ | 25,218 | | | | (8 | )% |
|
|
|
|
| Earnings | | | 1,036 | | | | 1,419 | | | | (27 | ) | | | 3,162 | | | | 5,164 | | | | (39 | ) |
|
|
|
|
| Diluted EPS | | | 0.51 | | | | 0.70 | | | | (27 | ) | | | 1.53 | | | | 2.60 | | | | (41 | ) |
|
|
|
|
Cash Operating Earnings(b) | | | 1,218 | | | | 1,576 | | | | (23 | ) | | | 3,704 | | | | 5,506 | | | | (33 | ) |
|
|
|
|
| Diluted Cash EPS | | | 0.60 | | | | 0.78 | | | | (23 | ) | | | 1.80 | | | | 2.78 | | | | (35 | ) |
|
|
|
|
| Cash ROCE | | | 11.5 | % | | | 16.5 | % | | (500)bp | | | 11.8 | % | | | 20.9 | % | | (910)bp |
| (a) | | Operating basis excludes the impact of credit card securitizations, merger and restructuring costs, special items and the net effect of a change in accounting principle. |
|
|
|
|
| (b) | | Cash operating earnings also exclude the impact of the amortization of goodwill and certain other intangibles. For a further discussion, see Glossary of Terms on page 52. |
-15-
Part I
Item 2 (continued)
On an operating basis, JPMorgan Chase’s diluted earnings per share for the third quarter of 2001 were $0.51, compared with $0.33 in the second quarter of 2001 and $0.70 in the third quarter of 2000. Operating earnings were $1,036 million in the 2001 third quarter, compared with $690 million in the second quarter of 2001 and $1,419 million one year ago. For the first nine months of 2001, operating earnings were $3,162 million, or $1.53 per share, as against $5,164 million, or $2.60 per share, in last year’s same period.
Management also tracks the operating performance of JPMorgan Chase excluding the results of JPMorgan Partners (“JPMP”). Management believes that the valuation of JPMP should not be assessed simply by assigning a multiple to gains and losses recorded during a quarterly accounting period. Excluding the results of JPMorgan Partners, operating earnings were $1,196 million in the third quarter of 2001, compared with $1,317 million in the second quarter of 2001 and $1,542 million in the 2000 third quarter. Operating earnings excluding JPMP for the first nine months of 2001 were $3,972 million, compared with $4,768 million in the first nine months of 2000.
| | | | | | | | | | | | | | | | | | | | | | | | | |
| | | Third Quarter | | Nine Months |
| | |
| |
|
| (in millions, except per share data) | | | | | | | | | | Over (Under) | | | | | | | | | | Over (Under) |
| | | 2001 | | 2000 | | 2000 | | 2001 | | 2000 | | 2000 |
| | |
| |
| |
| |
| |
| |
|
OPERATING BASIS
(EXCLUDING JPMORGAN PARTNERS) | | | | | | | | | | | | | | | | | | | | | | | | |
|
|
|
|
| Revenue | | $ | 7,798 | | | $ | 7,986 | | | | (2 | )% | | $ | 24,268 | | | $ | 24,293 | | | | — | % |
|
|
|
|
| Earnings | | | 1,196 | | | | 1,542 | | | | (22 | ) | | | 3,972 | | | | 4,768 | | | | (17 | ) |
|
|
|
|
| Diluted EPS | | | 0.59 | | | | 0.77 | | | | (23 | ) | | | 1.94 | | | | 2.41 | | | | (20 | ) |
|
|
|
|
| Cash Operating Earnings | | | 1,373 | | | | 1,694 | | | | (19 | ) | | | 4,498 | | | | 5,100 | | | | (12 | ) |
|
|
|
|
| Diluted Cash EPS | | | 0.67 | | | | 0.84 | | | | (20 | ) | | | 2.19 | | | | 2.58 | | | | (15 | ) |
Over the past few years, volatile stock markets have produced significant fluctuations in the values of the securities held by JPMorgan Partners, resulting in unrealized and realized valuation adjustments for various periods that have significantly affected, both favorably and unfavorably, the Firm’s operating results. The contribution of JPMP to operating earnings per share was a loss of $0.08 in the third quarter of 2001, compared with a $0.31 loss in the second quarter of 2001 and a loss of $0.07 in the third quarter of 2000. Excluding the results of JPMP, operating earnings per share were $0.59 in the third quarter of 2001. This compares with $0.64 in the second quarter of 2001 and $0.77 in the third quarter of 2000.
The impact of the amortization of intangibles was $0.09 per share in both the third and second quarters of 2001 and $0.08 per share one year ago.
For a reconciliation of diluted EPS from reported net income to cash operating earnings excluding JPMP, see the table below.
| | | | | | | | | | | | | | | | | |
| | | Third Quarter | | Nine Months |
| | |
| |
|
| | | 2001 | | 2000 | | 2001 | | 2000 |
| | |
| |
| |
| |
|
DILUTED EPS | | | | | | | | | | | | | | | | |
|
|
|
|
Reported Net Income | | $ | 0.22 | | | $ | 0.69 | | | $ | 0.97 | | | $ | 2.53 | |
|
|
|
|
| Restructuring/Merger Expenses & Special Items | | | 0.29 | | | | 0.01 | | | | 0.56 | | | | 0.07 | |
| | | |
| | | |
| | | |
| | | |
| |
Operating Earnings | | | 0.51 | | | | 0.70 | | | | 1.53 | | | | 2.60 | |
|
|
|
|
| Less: Impact of JPMorgan Partners | | | (0.08 | ) | | | (0.07 | ) | | | (0.41 | ) | | | 0.19 | |
| | | |
| | | |
| | | |
| | | |
| |
Operating Earnings excluding JPMP | | | 0.59 | | | | 0.77 | | | | 1.94 | | | | 2.41 | |
|
|
|
|
| Add Back: Amortization of Intangibles | | | 0.08 | (a) | | | 0.07 | (a) | | | 0.25 | (a) | | | 0.17 | (a) |
| | | |
| | | |
| | | |
| | | |
| |
Cash Operating Earnings excluding JPMP | | $ | 0.67 | | | $ | 0.84 | | | $ | 2.19 | | | $ | 2.58 | |
| | | |
| | | |
| | | |
| | | |
| |
| (a) | | The amortization of intangibles excludes the impact of JPMP. |
-16-
Part I
Item 2 (continued)
Highlights of Third Quarter 2001 Operating Results:
(All periods in 2000 are on a pro forma basis, which assumes that the purchase of Robert Fleming Holdings Limited (“Flemings”) had occurred at the beginning of that year.)Highlights for the third quarter 2001 are as follows:
| | • | | Cash operating expenses declined by 4% from the second quarter of 2001 and by 7% from the third quarter of 2000. |
| |
| | • | | Trading revenues reflected a strong performance in fixed income and other trading activities, offset by a significant decline in equity trading. |
| |
| | • | | The Investment Bank maintained its position as No. 1 arranger of leveraged and syndicated loans and as No. 2 arranger of U.S. high-grade bonds; and increased its market share in announced mergers and acquisitions (“M&A”) transactions from last quarter. |
| |
| | • | | Retail & Middle Market Financial Services and Treasury & Securities Services posted solid results, with cash operating ROCE of 20% and 25%, respectively. |
| |
| | • | | The Firm’s leading position in risk management was highlighted by Risk magazine’s annual global derivative rankings that placed JPMorgan Chase No. 1 in 10 out of the 14 top rankings in derivative categories. |
Nonperforming assets were $2.65 billion at September 30, 2001, compared with $2.50 billion and $1.94 billion at June 30, 2001 and September 30, 2000, respectively. Net charge-offs on a managed basis (i.e., treating securitized credit card receivables as if continued to be owned by the Firm) were $815 million in the 2001 third quarter, an increase from $798 million in the second quarter of 2001 and $559 million in the third quarter of 2000. Provisions in excess of charge-offs of $200 million were recorded in the third quarter of 2001, of which $140 million related to the commercial portfolio and $60 million related to the consumer portfolio. Management of JPMorgan Chase believes nonperforming assets will continue to increase.
Total assets as of September 30, 2001 were $799 billion, compared with $713 billion as of June 30, 2001 and $707 billion one year ago. The increase partly reflected the effect of clearing and settlement issues following the events of September 11th, which are expected to be temporary. During the third quarter of 2001, the Firm purchased approximately 19 million shares of common stock pursuant to JPMorgan Chase’s stock buy-back program. The cost for these repurchases, net of stock issuance, was approximately $500 million. JPMorgan Chase’s Tier One Capital ratio was 8.2% at September 30, 2001, 8.7% at June 30, 2001 and 8.1% one year ago.
JPMorgan Chase’s third quarter 2001 special items included $876 million (pre-tax) in merger and restructuring costs, including an additional $300 million related to the right-sizing of employee levels beyond that planned at the time of the merger. Special items in the third quarter of 2000 included an $81 million gain from the sale of a business in Panama, a $35 million loss resulting from the economic hedge of the purchase price of Flemings prior to its acquisition and $79 million in restructuring costs.
General Outlook:
Results for the quarter were overshadowed by the tragic events of September 11th. In the days immediately following that tragedy, management’s attention was focused on the needs of the Firm’s clients, employees and community. The current climate continues to be challenging and is expected to remain challenging for at least the remainder of the year. In this environment, management’s strategy is to continue to control the Firm’s risk and level of expenses. Actions include accelerating the right-sizing of market-sensitive businesses; setting profit margin targets for each line of business; focusing on distribution and diversification within the credit-related portfolios; and continuing capital discipline. These efforts are intended to produce significant operating leverage once the markets return to more normal activity levels.
Merger Update:
| • | | Annual savings associated with merger and right-sizing activities currently are projected to be $3.6 billion, compared with an original projection of $2.0 billion at the time of the merger. Savings in 2001 are estimated at $1.8 billion, with approximately 90% of the total savings of $3.6 billion expected to be realized by the end of 2002. The current estimate for total merger costs and for costs of right-sizing employee levels now is $4.3 billion, $1.1 billion higher than originally estimated. |
| |
| • | | The merger of The Chase Manhattan Bank and Morgan Guaranty Trust Company of New York occurred on November 10, 2001. The name of the resulting bank is JPMorgan Chase Bank. |
-17-
Part I
Item 2 (continued)
LINES OF BUSINESS RESULTS
The table below provides summary financial information on a cash operating basis for the five major business segments. All periods below have been restated on a comparable basis to reflect the changes in capital allocation adopted in the first quarter of 2001; restatements may occur in future periods to reflect further alignment of management accounting policies or changes in organizational structures between businesses. For a discussion of each business profile, see pages 28-36 of the JPMorgan Chase 2000 Annual Report.
| | | | | | | | | | | | | | | | | | | | | | | | | | | | | |
| (in millions) | | Third Quarter | | Nine Months |
| | |
| |
|
| | | | | | | Over (Under) | | | | | | Over (Under) |
| | | | | | |
| | | | | |
|
| | | | | | | | | | | | | | | Pro Forma(a) | | | | | | | | | | Pro Forma(a) |
| | | 2001 | | 3Q 2000 | | 2Q 2001 | | 3Q 2000 | | 2001 | | 2000 | | 2000 |
| | |
| |
| |
| |
| |
| |
| |
|
OPERATING REVENUE | | | | | | | | | | | | | | | | | | | | | | | | | | | | |
|
|
|
|
| Investment Bank | | $ | 3,601 | | | | (7 | )% | | | (4 | )% | | | (10 | )% | | $ | 11,794 | | | | (4 | )% | | | (9 | )% |
|
|
|
|
| Investment Management & Private Banking | | | 733 | | | | (18 | ) | | | (8 | ) | | | (23 | ) | | | 2,337 | | | | (5 | ) | | | (20 | ) |
|
|
|
|
| Treasury & Securities Services | | | 917 | | | | 3 | | | | 1 | | | | 3 | | | | 2,733 | | | | 3 | | | | 3 | |
|
|
|
|
| Retail & Middle Market Financial Services | | | 2,782 | | | | 6 | | | | 4 | | | | 6 | | | | 8,038 | | | | 6 | | | | 6 | |
|
|
|
|
Corporate(b) | | | (235 | ) | | NM | | NM | | NM | | | (634 | ) | | NM | | NM |
| | | |
| | | | | | | | | | | | | | | |
| | | | | | | | | |
Operating Revenue Excluding JPMP | | | 7,798 | | | | (2 | ) | | | (3 | ) | | | (4 | ) | | | 24,268 | | | | — | | | | (5 | ) |
|
|
|
|
| JPMorgan Partners | | | (179 | ) | | NM | | | 80 | | | NM | | | (1,011 | ) | | NM | | NM |
| | | |
| | | | | | | | | | | | | | | |
| | | | | | | | | |
Operating Revenue Including JPMP | | $ | 7,619 | | | | (4 | ) | | | 7 | | | | (6 | ) | | $ | 23,257 | | | | (8 | ) | | | (12 | ) |
| | | |
| | | | | | | | | | | | | | | |
| | | | | | | | | |
EARNINGS | | | | | | | | | | | | | | | | | | | | | | | | | | | | |
|
|
|
|
| Investment Bank | | $ | 710 | | | | (17 | )% | | | (10 | )% | | | (19 | )% | | $ | 2,546 | | | | (14 | )% | | | (18 | )% |
|
|
|
|
| Investment Management & Private Banking | | | 118 | | | | (25 | ) | | | (2 | ) | | | (29 | ) | | | 340 | | | | (21 | ) | | | (35 | ) |
|
|
|
|
| Treasury & Securities Services | | | 184 | | | | (1 | ) | | | 9 | | | | (1 | ) | | | 530 | | | | 2 | | | | 2 | |
|
|
|
|
| Retail & Middle Market Financial Services | | | 439 | | | | (15 | ) | | | (3 | ) | | | (15 | ) | | | 1,339 | | | | — | | | | — | |
|
|
|
|
Corporate(b) | | | (78 | ) | | NM | | NM | | NM | | | (257 | ) | | NM | | NM |
| | | |
| | | | | | | | | | | | | | | |
| | | | | | | | | |
Cash Operating Earnings Excluding JPMP | | | 1,373 | | | | (19 | ) | | | (8 | ) | | | (20 | ) | | | 4,498 | | | | (12 | ) | | | (15 | ) |
|
|
|
|
| JPMorgan Partners | | | (155 | ) | | | (31 | ) | | | 75 | | | | (31 | ) | | | (794 | ) | | NM | | NM |
| | | |
| | | | | | | | | | | | | | | |
| | | | | | | | | |
Cash Operating Earnings Including JPMP | | | 1,218 | | | | (23 | ) | | | 40 | | | | (23 | ) | | | 3,704 | | | | (33 | ) | | | (35 | ) |
|
|
|
|
| Less: Amortization of Intangibles | | | 182 | | | | 16 | | | | (1 | ) | | | (3 | ) | | | 542 | | | | 58 | | | | (2 | ) |
| | | |
| | | | | | | | | | | | | | | |
| | | | | | | | | |
Operating Earnings | | | 1,036 | | | | (27 | ) | | | 50 | | | | (26 | ) | | | 3,162 | | | | (39 | ) | | | (39 | ) |
|
|
|
|
| Restructuring/Merger Expenses & Special Items | | | (587 | ) | | NM | | | 88 | | | NM | | | (1,136 | ) | | NM | | NM |
| | | |
| | | | | | | | | | | | | | | |
| | | | | | | | | |
Net Income | | $ | 449 | | | | (68 | ) | | | 19 | | | | (68 | ) | | $ | 2,026 | | | | (60 | ) | | | (60 | ) |
| | | |
| | | | | | | | | | | | | | | |
| | | | | | | | | |
| (a) | | Pro forma results assume that the purchase of Flemings occurred at the beginning of 2000 and primarily affected the Investment Bank, Investment Management & Private Banking and total consolidated results. |
|
|
|
|
| (b) | | Includes LabMorgan, Support Units and the effects remaining at the corporate level after the implementation of management accounting policies. |
NM – Not meaningful.
-18-
Part I
Item 2 (continued)
INVESTMENT BANK
The following table sets forth selected financial data of the Investment Bank.
| | | | | | | | | | | | | | | | | | | | | | | | | | | | | |
| (in millions, except ratios) | | Third Quarter | | Nine Months |
| | |
| |
|
| | | | | | | Over (Under) | | | | | | Over (Under) |
| | | | | | |
| | | | | |
|
| | | | | | | | | | | | | | | Pro Forma(a) | | | | | | | | | | Pro Forma(a) |
| | | 2001 | | 3Q 2000 | | 2Q 2001 | | 3Q 2000 | | 2001 | | 2000 | | 2000 |
| | |
| |
| |
| |
| |
| |
| |
|
| Trading-Related Revenue | | $ | 1,523 | | | | (2 | )% | | | (6 | )% | | | (3 | )% | | $ | 5,276 | | | | (4 | )% | | | (5 | )% |
|
|
|
|
| Investment Banking Fees | | | 807 | | | | (23 | ) | | | (12 | ) | | | (24 | ) | | | 2,667 | | | | (19 | ) | | | (23 | ) |
|
|
|
|
| Net Interest Income | | | 812 | | | | 32 | | | | 11 | | | | 28 | | | | 2,258 | | | | 17 | | | | 11 | |
|
|
|
|
| Fees and Commissions | | | 390 | | | | (2 | ) | | | (2 | ) | | | (12 | ) | | | 1,256 | | | | 14 | | | | (13 | ) |
|
|
|
|
| All Other Revenue | | | 69 | | | | (74 | ) | | | (24 | ) | | | (75 | ) | | | 337 | | | | (21 | ) | | | (37 | ) |
| | | |
| | | | | | | | | | | | | | | |
| | | | | | | | | |
Operating Revenue | | | 3,601 | | | | (7 | ) | | | (4 | ) | | | (10 | ) | | | 11,794 | | | | (4 | ) | | | (9 | ) |
| | | |
| | | | | | | | | | | | | | | |
| | | | | | | | | |
| Compensation Expense | | | 1,355 | | | | (15 | ) | | | (8 | ) | | | (18 | ) | | | 4,562 | | | | (5 | ) | | | (14 | ) |
|
|
|
|
| Noncompensation Expense | | | 825 | | | | (9 | ) | | | (5 | ) | | | (10 | ) | | | 2,578 | | | | 5 | | | | (1 | ) |
| | | |
| | | | | | | | | | | | | | | |
| | | | | | | | | |
Cash Expense | | | 2,180 | | | | (12 | ) | | | (7 | ) | | | (15 | ) | | | 7,140 | | | | (2 | ) | | | (9 | ) |
|
|
|
|
| Amortization of Intangibles | | | 33 | | | | 10 | | | | (11 | ) | | | (15 | ) | | | 105 | | | | 98 | | | | (7 | ) |
| | | |
| | | | | | | | | | | | | | | |
| | | | | | | | | |
Operating Expense | | | 2,213 | | | | (12 | ) | | | (7 | ) | | | (15 | ) | | | 7,245 | | | | (1 | ) | | | (9 | ) |
| | | |
| | | | | | | | | | | | | | | |
| | | | | | | | | |
| Operating Margin | | | 1,388 | | | | 2 | | | | — | | | | 1 | | | | 4,549 | | | | (8 | ) | | | (10 | ) |
|
|
|
|
| Credit Costs | | | 270 | | | NM | | | 60 | | | NM | | | 536 | | | | 366 | | | | 316 | |
| | | |
| | | | | | | | | | | | | | | |
| | | | | | | | | |
| Operating Income before Taxes | | | 1,118 | | | | (17 | ) | | | (8 | ) | | | (18 | ) | | | 4,013 | | | | (16 | ) | | | (18 | ) |
|
|
|
|
| Income Taxes | | | 437 | | | | (17 | ) | | | (6 | ) | | | (17 | ) | | | 1,560 | | | | (17 | ) | | | (18 | ) |
| | | |
| | | | | | | | | | | | | | | |
| | | | | | | | | |
Operating Income | | $ | 681 | | | | (18 | ) | | | (10 | ) | | | (19 | ) | | $ | 2,453 | | | | (16 | ) | | | (18 | ) |
| | | |
| | | | | | | | | | | | | | | |
| | | | | | | | | |
Cash Operating Earnings | | $ | 710 | | | | (17 | ) | | | (10 | ) | | | (19 | ) | | $ | 2,546 | | | | (14 | ) | | | (18 | ) |
| | | |
| | | | | | | | | | | | | | | |
| | | | | | | | | |
| Average Common Equity | | $ | 18,575 | | | | (5 | ) | | | (2 | ) | | | (8 | ) | | $ | 19,191 | | | | 7 | | | | (3 | ) |
|
|
|
|
| Average Assets | | | 514,518 | | | | 9 | | | | 2 | | | | 8 | | | | 511,051 | | | | 10 | | | | 7 | |
|
|
|
|
| Shareholder Value Added | | | 142 | | | | (44 | ) | | | (34 | ) | | | (43 | ) | | | 800 | | | | (40 | ) | | | (38 | ) |
|
|
|
|
| Cash Return on Common Equity | | | 15.1 | % | | (210)bp | | (140)bp | | (180)bp | | | 17.6 | % | | (430)bp | | (320)bp |
|
|
|
|
| Cash Overhead Ratio | | | 61 | | | | (300 | ) | | | (100 | ) | | | (400 | ) | | | 61 | | | | 200 | | | | — | |
|
|
|
|
| Compensation Expense as a % of Operating Revenue | | | 38 | | | | (300 | ) | | | (100 | ) | | | (300 | ) | | | 39 | | | | — | | | | (200 | ) |
| (a) | | Pro forma results assume that the purchase of Flemings occurred at the beginning of 2000. |
NM – Not meaningful.
(All comments related to 2000 give pro forma effect to the purchase of Flemings, which is treated as if it had occurred at the beginning of that year.)
The Investment Bank’s operating revenues were $3.60 billion in the third quarter of 2001, a decline of 4% from the second quarter and a decline of 10% from the third quarter of 2000. Cash operating expenses of $2.18 billion were down by 7% from the second quarter and by 15% from the third quarter of 2000. The decline in expenses was spread across all expense categories and reflected merger synergies and expense management initiatives. By year-end, management expects to have eliminated approximately 6,000 positions in the Investment Bank since the merger announcement date. These initiatives resulted in stable operating margins during 2001 despite difficult market conditions, as the overhead ratio for the quarter was 61%. The Investment Bank is targeting a cash overhead ratio of 60% for the full-year 2001, assuming no further deterioration in market conditions.
-19-
Part I
Item 2 (continued)
Trading revenues (including related net interest income (“NII”)) of $1.52 billion declined by 6% from the second quarter and by 3% from the third quarter of 2000. Overall trading was only marginally lower, as fixed income and other trading activities generated higher revenues, compared with the prior periods, while equity trading was lower as a result of market conditions. In addition, due to heightened market activity in September, the Investment Bank realized a greater demand for its market-making services across a broad range of products, including fixed income products such as debt instruments and interest rate contracts.
Investment banking fees totaled $807 million in the third quarter of 2001, declining 12% from the second quarter and 24% from the third quarter of 2000. High-grade bond underwriting continued to generate strong results, although results were lower than the record level in the second quarter. The continued weak equity market conditions resulted in lower equity underwriting fees. Advisory revenues in the third quarter increased 9% from the second, but decreased 28% from the third quarter of 2000. During the first nine months of 2001, important product leadership positions were maintained in leveraged and syndicated lending (No.1) and U.S. high-grade bonds (No.2). In addition, the Investment Bank increased its market share of global announced M&A transactions to 21% for the first nine months of 2001 from 18% in 2000 (derived from Thomson Financial Securities Data, based on proceeds). Nevertheless, investment banking revenues for the remainder of the year will be largely dependent upon the level of market activity for underwriting and M&A advisory work, which are currently expected to remain at the same weak levels as experienced during the first nine months of this year.
Net interest income rose 11% and 28% from the second quarter of 2001 and last year’s third quarter, respectively. The increases were primarily attributable to the favorable impact of the continuing decline in interest rates in 2001 as spreads on interest-earning assets were slightly wider than in each of the two other prior periods, reflecting the fact that the interest expense related to carrying the interest-earning assets declined faster than the interest income earned.
Fees and commissions of $390 million in the third quarter of 2001 declined by 2% from the second quarter and by 12% from the third quarter of 2000. In each instance, the declines reflected lower equity brokerage commissions.
All other revenue declined significantly from the second quarter of 2001 and the third quarter of last year as a result of unfavorable valuation adjustments, primarily on loans that were syndicated or originated for distribution but still are currently carried on the Consolidated Balance Sheet.
The Investment Bank’s cash operating earnings totaled $710 million in the third quarter, a 10% decline from the second quarter and a 19% reduction from the third quarter of 2000. Earnings declines also were affected negatively by higher credit costs, including $140 million in provisions in excess of charge-offs.
-20-
Part I
Item 2 (continued)
JPMORGAN PARTNERS
The following table sets forth selected financial data of JPMorgan Partners. Due to the significant fluctuations in JPMP’s operating results, prior periods are shown in absolute dollars rather than percent changes from the current period.
| | | | | | | | | | | | | | | | | | | | | | |
| (in millions) | | Three Months Ended | | Nine Months Ended |
| | |
| |
|
| | | | 3Q 2001 | | 3Q 2000 | | 2Q 2001 | | 2001 | | 2000 |
| | | |
| |
| |
| |
| |
|
| Private Equity: | | | | | | | | | | | | | | | | | | | | |
|
|
|
|
| Realized Gains | | $ | 203 | | | $ | 652 | | | $ | (60 | ) | | $ | 555 | | | $ | 1,669 | |
|
|
|
|
| Unrealized Gains (Losses) | | | (306 | ) | | | (672 | ) | | | (766 | ) | | | (1,352 | ) | | | (588 | ) |
| | | |
| | | |
| | | |
| | | |
| | | |
| |
| | Total Private Equity Gains (Losses) | | | (103 | ) | | | (20 | ) | | | (826 | ) | | | (797 | ) | | | 1,081 | |
|
|
|
|
| Net Interest Income | | | (87 | ) | | | (92 | ) | | | (81 | ) | | | (252 | ) | | | (215 | ) |
|
|
|
|
| Fees and Other Revenue | | | 11 | | | | 39 | | | | 15 | | | | 38 | | | | 59 | |
| | | |
| | | |
| | | |
| | | |
| | | |
| |
Operating Revenue | | | (179 | ) | | | (73 | ) | | | (892 | ) | | | (1,011 | ) | | | 925 | |
| | | |
| | | |
| | | |
| | | |
| | | |
| |
| Compensation Expense | | | 33 | | | | 45 | | | | 33 | | | | 108 | | | | 136 | |
|
|
|
|
| Noncompensation Expense | | | 30 | | | | 68 | | | | 35 | | | | 116 | | | | 176 | |
| | | |
| | | |
| | | |
| | | |
| | | |
| |
Cash Expense | | | 63 | | | | 113 | | | | 68 | | | | 224 | | | | 312 | |
|
|
|
|
| Amortization of Intangibles | | | 7 | | | | 7 | | | | 7 | | | | 20 | | | | 14 | |
| | | |
| | | |
| | | |
| | | |
| | | |
| |
Operating Expense | | | 70 | | | | 120 | | | | 75 | | | | 244 | | | | 326 | |
| | | |
| | | |
| | | |
| | | |
| | | |
| |
| Operating Margin | | | (249 | ) | | | (193 | ) | | | (967 | ) | | | (1,255 | ) | | | 599 | |
|
|
|
|
| Credit Costs | | | — | | | | — | | | | — | | | | — | | | | — | |
| | | |
| | | |
| | | |
| | | |
| | | |
| |
| Operating Income before Taxes | | | (249 | ) | | | (193 | ) | | | (967 | ) | | | (1,255 | ) | | | 599 | |
|
|
|
|
| Income Taxes | | | (89 | ) | | | (70 | ) | | | (340 | ) | | | (445 | ) | | | 203 | |
| | | |
| | | |
| | | |
| | | |
| | | |
| |
Operating Earnings | | $ | (160 | ) | | $ | (123 | ) | | $ | (627 | ) | | $ | (810 | ) | | $ | 396 | |
| | | |
| | | |
| | | |
| | | |
| | | |
| |
|
|
|
|
Cash Operating Earnings (Loss) | | $ | (155 | ) | | $ | (118 | ) | | $ | (622 | ) | | $ | (794 | ) | | $ | 406 | |
| | | |
| | | |
| | | |
| | | |
| | | |
| |
| Average Common Equity | | $ | 5,989 | | | $ | 7,639 | | | $ | 6,493 | | | $ | 6,495 | | | $ | 7,541 | |
| Average Assets | | | 10,744 | | | | 13,799 | | | | 11,681 | | | | 11,852 | | | | 13,439 | |
| Shareholder Value Added | | | (383 | ) | | | (411 | ) | | | (867 | ) | | | (1,531 | ) | | | (456 | ) |
JPMorgan Partners had private equity losses of $103 million in the third quarter of 2001, compared with losses of $826 million in the second quarter and losses of $20 million in the third quarter of 2000. The unrealized losses were primarily related to mark-to-market losses taken on public positions during the quarter and included the positive impact of economic hedging actions aimed at reducing the portfolio’s sensitivity to market movements. Realized gains were attributable to investment returns from both direct and third-party fund investments, highlighted by strong returns from JPMP’s energy sector.
-21-
Part I
Item 2 (continued)
JPMORGAN PARTNERS INVESTMENT PORTFOLIO
The following table presents the carrying values and costs of the JPMP investment portfolio for the dates indicated.
| | | | | | | | | | | | | | | | | | | | | | | | | | |
| (in millions) | | September 30, 2001 | | June 30, 2001 | | September 30, 2000 |
| | |
| |
| |
|
| | | | Carrying | | | | | | Carrying | | | | | | Carrying | | | | |
| | | | Value | | Cost | | Value | | Cost | | Value | | Cost |
| | | |
| |
| |
| |
| |
| |
|
Public Securities (169 Companies)(a) (b) | | $ | 1,149 | | | $ | 829 | | | $ | 1,680 | | | $ | 974 | | | $ | 2,486 | | | $ | 999 | |
|
|
|
|
Private Direct Securities (927 Companies)(b) | | | 6,371 | | | | 7,322 | | | | 6,089 | | | | 6,998 | | | | 6,873 | | | | 6,762 | |
|
|
|
|
Private Fund Investments (344 Funds)(b) | | | 2,108 | | | | 2,217 | | | | 2,086 | | | | 2,201 | | | | 2,575 | | | | 2,588 | |
| | | |
| | | |
| | | |
| | | |
| | | |
| | | |
| |
| | Total Investment Portfolio | | $ | 9,628 | | | $ | 10,368 | | | $ | 9,855 | | | $ | 10,173 | | | $ | 11,934 | | | $ | 10,349 | |
| | | |
| | | |
| | | |
| | | |
| | | |
| | | |
| |
| (a) | | Publicly traded positions only. |
|
|
|
|
| (b) | | Represents the number of companies and funds at September 30, 2001. |
The book value of JPMP’s investment portfolio was $2.3 billion lower on September 30, 2001 than on September 30, 2000, reflecting write-downs and write-offs in the portfolio, particularly those taken in the second quarter of 2001 relating to JPMP’s technology, media and telecommunications investments (“TMT”). At September 30, 2001, TMT investments represented approximately 32% of the total carrying value of JPMP’s portfolio, unchanged from June 30, 2001. During the remainder of 2001 and in 2002, JPMP will continue to focus on increasing the industry and geographic diversification of its portfolio. JPMP reviews investments in its portfolio on an ongoing basis.
During the first nine months of 2001, JPMP invested $0.6 billion of its own funds in direct equity. The following table presents information about the 10 largest holdings of public securities in the JPMP investment portfolio at September 30, 2001.
| | | | | | | | | | | | | | | | | | |
| Public Securities Investments at September 30, 2001(a) | | | | | | | | | | | | | | | | |
| (in millions) | | | | | | | | | | Quoted | | | | |
| | | Symbol | | Shares | | Public Value | | Cost |
| | | |
| |
| |
| |
|
| Triton PCS Holdings, Inc. | | TPCS | | | 20.2 | | | $ | 769 | | | $ | 89 | |
|
|
|
|
| Telecorp PCS | | TLCP | | | 11.4 | | | | 126 | | | | 8 | |
|
|
|
|
| Encore Acquisition Company | | EAC | | | 6.4 | | | | 97 | | | | 44 | |
|
|
|
|
| American Tower Corp. | | AMT | | | 5.8 | | | | 81 | | | | 18 | |
|
|
|
|
| Fisher Scientific International | | FSH | | | 3.0 | | | | 74 | | | | 27 | |
|
|
|
|
| Packaging Corp. of America | | PKG | | | 3.9 | | | | 60 | | | | 18 | |
|
|
|
|
| Guitar Center Inc. | | GTRC | | | 4.7 | | | | 56 | | | | 50 | |
|
|
|
|
| 1-800 FLOWERS.com | | FLWS | | | 4.1 | | | | 49 | | | | 15 | |
|
|
|
|
| Crown Media Holdings Inc. | | CRWN | | | 2.7 | | | | 28 | | | | 40 | |
|
|
|
|
| Wesco International, Inc. | | WCC | | | 4.4 | | | | 23 | | | | 47 | |
| | | | | | | | | | | |
| | | |
| |
| | Top 10 Public Securities | | | | | | | | | | $ | 1,363 | | | $ | 356 | |
|
|
|
|
| Other Public Securities (159 Companies) | | | | | | | | | | | 307 | | | | 473 | |
| | | | | | | | | | | |
| | | |
| |
| | Total Public Securities(169 Companies) | | | | | | | | | | $ | 1,670 | | | $ | 829 | |
| | | | | | | | | | | |
| | | |
| |
| (a) | | Policy: Public securities held by JPMorgan Partners are marked-to-market at the quoted public value less liquidity discounts, with the resulting unrealized gains/losses included in the income statement. JPMorgan Partners’ valuation policy for public securities incorporates the use of liquidity discounts and price averaging methodologies in certain circumstances to take into account the fact that JPMorgan Partners cannot immediately realize the quoted public values as a result of the regulatory, corporate and contractual sales restrictions generally imposed on these holdings. Private investments are initially carried at cost, which is viewed as an approximation of fair value. The carrying value of private investments is adjusted to reflect valuation changes resulting from unaffiliated party transactions and for evidence of a decline in value. |
The carrying values of the equity investments recorded on JPMorgan Chase’s financial statements are net of interests of investors other than the Firm. JPMP has sold interests in certain of its fund investments to persons not affiliated with the Firm. In November 2001, JPMP completed its first closing, in the amount of approximately $825 million, on the sale to unaffiliated third parties of interests in a new investment fund that will co-invest with JPMP in its direct investments. As a result, JPMorgan Chase’s proportional ownership share of investments to be made by JPMP in the future is expected to be reduced. However, the Firm continues to believe JPMP’s equity-related investments will create long-term value for JPMorgan Chase. The Firm currently is prepared to commit at least $1.5 billion of its own funds to JPMP in each of the next four years.
-22-
Part I
Item 2 (continued)
INVESTMENT MANAGEMENT & PRIVATE BANKING
The following table reflects selected financial data for Investment Management & Private Banking (“IMPB”).
| | | | | | | | | | | | | | | | | | | | | | | | | | | | | |
| (in millions, except ratios) | | Third Quarter | | Nine Months |
| | |
| |
|
| | | | | | | | | | | Over (Under) | | | | | | Over (Under) |
| | | | | | | | | | |
| | | | | |
|
| | | | | | | | | | | | | | | Pro Forma(a) | | | | | | | | | | Pro Forma(a) |
| | | 2001 | | 3Q 2000 | | 2Q 2001 | | 3Q 2000 | | 2001 | | 2000 | | 2000 |
| | |
| |
| |
| |
| |
| |
| |
|
| Fees and Commissions | | $ | 558 | | | | (9 | )% | | | (6 | )% | | | (15 | )% | | $ | 1,749 | | | | 10 | % | | | (11 | )% |
|
|
|
|
| Net Interest Income | | | 124 | | | | (22 | ) | | | (5 | ) | | | (23 | ) | | | 391 | | | | (19 | ) | | | (21 | ) |
|
|
|
|
| All Other Revenue | | | 51 | | | | (58 | ) | | | (27 | ) | | | (61 | ) | | | 197 | | | | (48 | ) | | | (58 | ) |
| | | |
| | | | | | | | | | | | | | | |
| | | | | | | | | |
Operating Revenue | | | 733 | | | | (18 | ) | | | (8 | ) | | | (23 | ) | | | 2,337 | | | | (5 | ) | | | (20 | ) |
| | | |
| | | | | | | | | | | | | | | |
| | | | | | | | | |
| Compensation Expense | | | 298 | | | | (22 | ) | | | (12 | ) | | | (27 | ) | | | 1,016 | | | | — | | | | (16 | ) |
|
|
|
|
| Noncompensation Expense | | | 276 | | | | (2 | ) | | | (10 | ) | | | (8 | ) | | | 890 | | | | 16 | | | | (2 | ) |
| | | |
| | | | | | | | | | | | | | | |
| | | | | | | | | |
Cash Expense | | | 574 | | | | (14 | ) | | | (11 | ) | | | (19 | ) | | | 1,906 | | | | 6 | | | | (10 | ) |
|
|
|
|
| Amortization of Intangibles | | | 76 | | | | 46 | | | | 7 | | | | 46 | | | | 218 | | | | 195 | | | | 195 | |
| | | |
| | | | | | | | | | | | | | | |
| | | | | | | | | |
Operating Expense | | | 650 | | | | (9 | ) | | | (9 | ) | | | (14 | ) | | | 2,124 | | | | 14 | | | | (3 | ) |
| | | |
| | | | | | | | | | | | | | | |
| | | | | | | | | |
| Operating Margin | | | 83 | | | | (52 | ) | | | 9 | | | | (56 | ) | | | 213 | | | | (64 | ) | | | (71 | ) |
|
|
|
|
| Credit Costs | | | 6 | | | | (14 | ) | | NM | | | (14 | ) | | | 12 | | | | (40 | ) | | | (40 | ) |
| | | |
| | | | | | | | | | | | | | | |
| | | | | | | | | |
| Operating Income before Taxes | | | 77 | | | | (54 | ) | | | 1 | | | | (58 | ) | | | 201 | | | | (65 | ) | | | (72 | ) |
|
|
|
|
| Income Taxes | | | 35 | | | | (42 | ) | | | 35 | | | | (48 | ) | | | 77 | | | | (64 | ) | | | (71 | ) |
| | | |
| | | | | | | | | | | | | | | |
| | | | | | | | | |
Operating Earnings | | $ | 42 | | | | (60 | ) | | | (16 | ) | | | (64 | ) | | $ | 124 | | | | (65 | ) | | | (73 | ) |
| | | |
| | | | | | | | | | | | | | | |
| | | | | | | | | |
|
|
|
|
Cash Operating Earnings | | $ | 118 | | | | (25 | ) | | | (2 | ) | | | (29 | ) | | $ | 340 | | | | (21 | ) | | | (35 | ) |
| | | |
| | | | | | | | | | | | | | | |
| | | | | | | | | |
| Average Common Equity | | $ | 5,952 | | | | 12 | | | | (2 | ) | | | (10 | ) | | $ | 6,110 | | | | 72 | | | | (6 | ) |
|
|
|
|
| Average Assets | | | 33,970 | | | | — | | | | 1 | | | | (8 | ) | | | 34,235 | | | | 18 | | | | (4 | ) |
|
|
|
|
| Shareholder Value Added | | | (65 | ) | | NM | | | (2 | ) | | NM | | | (217 | ) | | | (309 | ) | | | 234 | |
|
|
|
|
| Cash Return on Common Equity | | | 7.7 | % | | (380)bp | | (10)bp | | (220)bp | | | 7.3 | % | | (860)bp | | (340)bp |
|
|
|
|
| Cash Overhead Ratio | | | 78 | | | | 300 | | | | (300 | ) | | | 300 | | | | 82 | | | | 900 | | | | 1,000 | |
|
|
|
|
| Compensation Expense as a % of Operating Revenue | | | 41 | | | | (200 | ) | | | (200 | ) | | | (200 | ) | | | 43 | | | | 100 | | | | 200 | |
| (a) | | Pro forma results assume that the purchase of Flemings occurred at the beginning of 2000. |
|
|
|
|
| | | NM – Not meaningful. |
(All comments related to 2000 give pro forma effect to the purchase of Flemings, which is treated as if it had occurred at the beginning of that year.)
IMPB had operating revenues of $733 million in the third quarter of 2001, an 8% decline from the second quarter of 2001 and a 23% decline from the third quarter of 2000. For the first nine months of 2001, revenues decreased 20% from the same period a year ago. The declines were mainly due to lower brokerage commissions driven by the reduction in clients' self-directed market activities at the Private Bank; lower net interest income due to the adverse effects of declining interest rates on deposit spreads at the Private Bank; and lower investment fees as a result of the lower values of funds under management as a result of the weaker market environment of 2001.
IMPB’s cash operating expenses declined 11% from last quarter and 19% from the third quarter of 2000. Cash operating expenses for the first nine months of 2001 declined 10% from the first nine months of 2000. The decreases were driven by expense management initiatives, in particular lower compensation expense as a result of headcount reductions. Cash operating earnings were $118 million, down 29% from the third quarter of 2000. For the first nine months of 2001, cash operating earnings were $340 million, a 35% decline from 2000.
-23-
Part 1
Item 2 (continued)
The table below reflects the assets under management in IMPB and assets under supervision in Private Banking as of September 30, 2001 and 2000, respectively.
| | | | | | | | | | |
| (in billions) | | | | | | | | |
| | | | September 30, |
| | | |
|
| | | | 2001 | | 2000 |
| | | |
| |
|
ASSETS UNDER MANAGEMENT(a) | | | | | | | | |
|
|
|
|
| Private Banking | | $ | 137 | | | $ | 155 | |
|
|
|
|
| Institutional | | | 390 | | | | 433 | |
|
|
|
|
| Retail | | | 57 | | | | 64 | |
| | | |
| | | |
| |
| | Total | | $ | 584 | | | $ | 652 | |
| | | |
| | | |
| |
| Americas | | $ | 423 | | | $ | 440 | |
|
|
|
|
| Europe and Asia | | | 161 | | | | 212 | |
| | | |
| | | |
| |
| | Total | | $ | 584 | | | $ | 652 | |
| | | |
| | | |
| |
| Fixed Income and Cash | | $ | 314 | | | $ | 279 | |
|
|
|
|
| Equities and Other | | | 270 | | | | 373 | |
| | | |
| | | |
| |
| | Total | | $ | 584 | | | $ | 652 | |
| | | |
| | | |
| |
ASSETS UNDER SUPERVISION(b) | | | | | | | | |
|
|
|
|
| Private Banking | | $ | 302 | | | $ | 351 | |
| | | |
| | | |
| |
| (a) | | Assets under management represent assets actively managed by IMPB on behalf of institutional and Private Banking clients. Excludes assets managed at American Century. |
|
|
|
|
| (b) | | Assets under supervision represent assets under management as well as custody, restricted stock, deposit, brokerage and loan accounts. |
Equity market conditions in 2001 led to a 10% decline in assets under management at September 30, 2001, compared with September 30, 2000. Net cash flows for the 2001 third quarter were positive as a result of a significant increase in clients’ cash and money market assets. This excludes assets managed by other lines of business and assets attributable to the Firm’s 45% interest in American Century Companies, Inc. (“American Century”).
-24-
Part I
Item 2 (continued)
TREASURY & SECURITIES SERVICES
The following table sets forth selected financial data of Treasury & Securities Services (“T&SS”).
| | | | | | | | | | | | | | | | | | | | | |
| (in millions, except ratios) | | | | | | | | | | | | | | | | | | | | |
| | | Third Quarter | | Nine Months |
| | |
| |
|
| | | | | | | Over (Under) | | | | | | Over (Under) |
| | | | | | |
| | | | | |
|
| | | 2001 | | 3Q 2000 | | 2Q 2001 | | 2001 | | 2000 |
| | |
| |
| |
| |
| |
|
| Fees and Commissions | | $ | 511 | | | | 7 | % | | | (2 | )% | | $ | 1,537 | | | | 7 | % |
|
|
|
|
| Net Interest Income | | | 350 | | | | (3 | ) | | | 3 | | | | 1,050 | | | | 1 | |
|
|
|
|
| All Other Revenue | | | 56 | | | | 17 | | | | 14 | | | | 146 | | | | (16 | ) |
| | | |
| | | | | | | | | | | |
| | | | | |
Operating Revenue | | | 917 | | | | 3 | | | | 1 | | | | 2,733 | | | | 3 | |
| | | |
| | | | | | | | | | | |
| | | | | |
| Compensation Expense | | | 287 | | | | 7 | | | | — | | | | 872 | | | | 7 | |
|
|
|
|
| Noncompensation Expense | | | 347 | | | | 5 | | | | (5 | ) | | | 1,044 | | | | 1 | |
| | | |
| | | | | | | | | | | |
| | | | | |
Cash Expense | | | 634 | | | | 6 | | | | (3 | ) | | | 1,916 | | | | 4 | |
|
|
|
|
| Amortization of Intangibles | | | 20 | | | | 11 | | | | (5 | ) | | | 60 | | | | 15 | |
| | | |
| | | | | | | | | | | |
| | | | | |
Operating Expense | | | 654 | | | | 6 | | | | (3 | ) | | | 1,976 | | | | 4 | |
| | | |
| | | | | | | | | | | |
| | | | | |
| Operating Margin | | | 263 | | | | (3 | ) | | | 10 | | | | 757 | | | | 1 | |
|
|
|
|
| Credit Costs | | | 1 | | | | — | | | | — | | | | 3 | | | | (25 | ) |
| | | |
| | | | | | | | | | | |
| | | | | |
| Operating Income before Taxes | | | 262 | | | | (3 | ) | | | 10 | | | | 754 | | | | 1 | |
|
|
|
|
| Income Taxes | | | 96 | | | | (5 | ) | | | 9 | | | | 279 | | | | 1 | |
| | | |
| | | | | | | | | | | |
| | | | | |
Operating Earnings | | $ | 166 | | | | (2 | ) | | | 11 | | | $ | 475 | | | | 1 | |
| | | |
| | | | | | | | | | | |
| | | | | |
Cash Operating Earnings | | $ | 184 | | | | (1 | ) | | | 9 | | | $ | 530 | | | | 2 | |
| | | |
| | | | | | | | | | | |
| | | | | |
| Average Common Equity | | $ | 2,888 | | | | 3 | | | | (4 | ) | | $ | 2,916 | | | | 3 | |
|
|
|
|
| Average Assets | | | 18,555 | | | | 11 | | | | — | | | | 18,128 | | | | 11 | |
|
|
|
|
| Shareholder Value Added | | | 94 | | | | (6 | ) | | | 21 | | | | 264 | | | | 2 | |
|
|
|
|
| Cash Return on Common Equity | | | 25.1 | % | | (120)bp | | 270bp | | | 24.1 | % | | (10)bp |
|
|
|
|
| Cash Overhead Ratio | | | 69 | | | | 200 | | | | (200 | ) | | | 70 | | | | — | |
|
|
|
|
| Compensation Expense as a % of Operating Revenue | | | 31 | | | | 100 | | | | (100 | ) | | | 32 | | | | 100 | |
|
|
|
|
Operating Revenue by Business: | | | | | | | | | | | | | | | | | | | | |
|
|
|
|
| Treasury Services | | $ | 344 | | | | 7 | % | | | 3 | % | | $ | 1,001 | | | | 5 | % |
|
|
|
|
| Investor Services | | | 393 | | | | (3 | ) | | | 1 | | | | 1,184 | | | | (3 | ) |
|
|
|
|
| Institutional Trust Services | | | 174 | | | | 12 | | | | (3 | ) | | | 533 | | | | 15 | |
|
|
|
|
| Other | | | 6 | | | | 20 | | | | 20 | | | | 15 | | | | (6 | ) |
| | | |
| | | | | | | | | | | |
| | | | | |
| Total Treasury & Securities Services | | $ | 917 | | | | 3 | | | | 1 | | | $ | 2,733 | | | | 3 | |
| | | |
| | | | | | | | | | | |
| | | | | |
Treasury & Securities Services’ operating revenues were $917 million in the third quarter of 2001, essentially flat with the second quarter of 2001 and an increase of 3% from the third quarter of 2000. Operating revenues for Treasury Services increased by 3% from the second quarter and by 7% from the prior year, reflecting higher cash management product revenues in the United States and Europe that offset the negative effect of declining short-term interest rates on deposits. Institutional Trust revenues increased 12%, when compared with the third quarter of 2000, driven by stronger volumes in debt markets as well as the impact of acquisitions. Investor Services’ operating revenues were virtually flat, when compared with the second quarter of 2001 but declined 3% from the third quarter of 2000, reflecting lower fees based on asset values, lower foreign exchange revenue and lower spreads on deposits.
Operating expenses declined 3% from the second quarter of 2001 but increased 6% from the third quarter of 2000. The combination of modest revenue growth and improved expense control resulted in a 9% improvement in cash operating earnings from the second quarter. Cash operating earnings declined 1% from the third quarter of 2000. Cash ROCE was 25% in the third quarter of 2001 and 24% year-to-date.
Expense discipline will continue, and management of T&SS continues to work towards its long-term target of a cash overhead ratio of approximately 65%.
-25-
Part I
Item 2 (continued)
RETAIL & MIDDLE MARKET FINANCIAL SERVICES
The following table reflects selected financial data for Retail & Middle Market Financial Services (“RMMFS”).
| | | | | | | | | | | | | | | | | | | | | |
| (in millions, except ratios) | | | | | | | | | | | | | | | | | | | | |
| | | Third Quarter | | Nine Months |
| | |
| |
|
| | | | | | | Over (Under) | | | | | | Over (Under) |
| | | | | | |
| | | | | |
|
| | | 2001 | | 3Q 2000 | | 2Q 2001 | | 2001 | | 2000 |
| | |
| |
| |
| |
| |
|
| Net Interest Income | | $ | 1,777 | | | | 9 | % | | | 4 | % | | $ | 5,124 | | | | 8 | % |
|
|
|
|
| Fees and Commissions | | | 774 | | | | 14 | | | | 1 | | | | 2,239 | | | | 13 | |
|
|
|
|
| Securities Gains | | | 1 | | | NM | | NM | | | 317 | | | | 214 | |
|
|
|
|
| All Other Revenue | | | 230 | | | | (9 | ) | | | 19 | | | | 358 | | | | (53 | ) |
| | | |
| | | | | | | | | | | |
| | | | | |
Operating Revenue | | | 2,782 | | | | 6 | | | | 4 | | | | 8,038 | | | | 6 | |
| | | |
| | | | | | | | | | | |
| | | | | |
| Compensation Expense | | | 626 | | | | 13 | | | | 4 | | | | 1,803 | | | | 7 | |
|
|
|
|
| Noncompensation Expense | | | 756 | | | | 1 | | | | 1 | | | | 2,239 | | | | — | |
| | | |
| | | | | | | | | | | |
| | | | | |
Cash Expense | | | 1,382 | | | | 6 | | | | 2 | | | | 4,042 | | | | 3 | |
|
|
|
|
| Amortization of Intangibles | | | 45 | | | | (10 | ) | | | — | | | | 135 | | | | (9 | ) |
| | | |
| | | | | | | | | | | |
| | | | | |
Operating Expense | | | 1,427 | | | | 6 | | | | 2 | | | | 4,177 | | | | 3 | |
| | | |
| | | | | | | | | | | |
| | | | | |
| Operating Margin | | | 1,355 | | | | 6 | | | | 6 | | | | 3,861 | | | | 10 | |
|
|
|
|
| Credit Costs | | | 712 | | | | 42 | | | | 17 | | | | 1,885 | | | | 21 | |
| | | |
| | | | | | | | | | | |
| | | | | |
| Operating Income before Taxes | | | 643 | | | | (17 | ) | | | (3 | ) | | | 1,976 | | | | 1 | |
|
|
|
|
| Income Taxes | | | 245 | | | | (18 | ) | | | (5 | ) | | | 764 | | | | — | |
| | | |
| | | | | | | | | | | |
| | | | | |
Operating Earnings | | $ | 398 | | | | (16 | ) | | | (2 | ) | | $ | 1,212 | | | | 1 | |
| | | |
| | | | | | | | | | | |
| | | | | |
Cash Operating Earnings | | $ | 439 | | | | (15 | ) | | | (3 | ) | | $ | 1,339 | | | | — | |
| | | |
| | | | | | | | | | | |
| | | | | |
| Average Common Equity | | $ | 8,739 | | | | 5 | | | | 3 | | | $ | 8,493 | | | | (1 | ) |
|
|
|
|
Average Managed Assets(a) | | | 167,160 | | | | 12 | | | | — | | | | 164,364 | | | | 12 | |
|
|
|
|
| Shareholder Value Added | | | 172 | | | | (35 | ) | | | (11 | ) | | | 566 | | | | 4 | |
|
|
|
|
| Cash Return on Common Equity | | | 19.8 | % | | (480)bp | | (130)bp | | | 20.9 | % | | 50bp |
|
|
|
|
| Cash Overhead Ratio | | | 50 | | | | — | | | | (100 | ) | | | 50 | | | | (200 | ) |
|
|
|
|
| Compensation Expense as a % of Operating Revenue | | | 23 | | | | 200 | | | | — | | | | 22 | | | | — | |
| (a) | | Excludes the impact of credit card securitizations. |
NM – Not meaningful.
RMMFS’ operating revenues in the third quarter of 2001 were $2.78 billion, increasing by 6% from the third quarter of 2000 and 4% from the 2001 second quarter. The growth reflected higher production in home and auto financing, growth in managed credit card outstandings, and higher deposit volumes in retail and middle market banking. These increases were partially offset by the impact of lower rates on deposit spreads, mortgage servicing prepayments and an overall market decline in investment volume. In addition, comparisons with the first nine months of 2000 benefited from the $100 million charge for auto lease residual taken in the first quarter of 2000. The risk of future charges for residual values was substantially mitigated in the first quarter of 2001 through the purchase of a residual value insurance policy to cover previously uninsured auto leases in the portfolio.
Cash expenses increased by 6% from the third quarter of last year and 2% from the second quarter of 2001, reflecting the higher production volumes in credit card and mortgage originations. Cash operating earnings of $439 million for the third quarter of 2001 were down 15% from the record third quarter of 2000 as a result of higher net charge-offs, a $60 million provision in excess of charge-offs taken in the third quarter of 2001, and the sale of the consumer banking operations in Hong Kong at the end of 2000. In comparison to the second quarter of 2001, cash operating earnings were down 3%. For the first nine months of 2001, however, cash operating earnings were relatively flat from the first nine months of 2000.
Management is cautious about consumer credit conditions and anticipates consumer credit quality may worsen over the remainder of the year.
-26-
Part I
Item 2 (continued)
The following table sets forth certain key financial performance measures of the businesses within RMMFS.
| | | | | | | | | | | | | | | | | | | | | |
| (in millions) | | Third Quarter | | Nine Months |
| | |
| |
|
| | | | | | | Over (Under) | | | | | | Over (Under) |
| | | | | | |
| | | | | |
|
| | | 2001 | | 3Q 2000 | | 2Q 2001 | | 2001 | | 3Q 2000 |
| | |
| |
| |
| |
| |
|
OPERATING REVENUE | | | | | | | | | | | | | | | | | | | | |
|
|
|
|
| Cardmember Services | | $ | 1,135 | | | | 17 | % | | | 7 | % | | $ | 3,180 | | | | 13 | % |
|
|
|
|
| Regional Banking Group | | | 737 | | | | (7 | ) | | | (3 | ) | | | 2,273 | | | | (3 | ) |
|
|
|
|
| Home Finance | | | 448 | | | | 28 | | | | 14 | | | | 1,186 | | | | 20 | |
|
|
|
|
| Middle Markets | | | 298 | | | | (5 | ) | | | — | | | | 907 | | | | (2 | ) |
|
|
|
|
| Auto Finance | | | 136 | | | | 33 | | | | 2 | | | | 379 | | | | 68 | |
|
|
|
|
| Other | | | 28 | | | NM | | NM | | | 113 | | | NM |
| | | |
| | | | | | | | | | | |
| | | | | |
| Total | | $ | 2,782 | | | | 6 | | | | 4 | | | $ | 8,038 | | | | 6 | |
| | | |
| | | | | | | | | | | |
| | | | | |
CASH OPERATING EARNINGS | | | | | | | | | | | | | | | | | | | | |
|
|
|
|
| Cardmember Services | | $ | 149 | | | | 2 | % | | | 12 | % | | $ | 398 | | | | 9 | % |
|
|
|
|
| Regional Banking Group | | | 120 | | | | (16 | ) | | | (8 | ) | | | 394 | | | | (6 | ) |
|
|
|
|
| Home Finance | | | 114 | | | | 20 | | | | 27 | | | | 288 | | | | 23 | |
|
|
|
|
| Middle Markets | | | 77 | | | | (13 | ) | | | 7 | | | | 234 | | | | (5 | ) |
|
|
|
|
| Auto Finance | | | 31 | | | | 41 | | | | (11 | ) | | | 88 | | | NM |
|
|
|
|
| Other | | | (52 | ) | | NM | | NM | | | (63 | ) | | NM |
| | | |
| | | | | | | | | | | |
| | | | | |
| Total | | $ | 439 | | | | (15 | ) | | | (3 | ) | | $ | 1,339 | | | | — | |
| | | |
| | | | | | | | | | | |
| | | | | |
NM – Not meaningful.
Cardmember Services
Cardmember Services’ operating revenues were up 17% for the third quarter and 13% for the first nine months of 2001, compared with the same periods last year. The level of operating revenues in the third quarter of 2001 represents the seventh consecutive quarterly increase for Cardmember Services. The higher revenues were driven by an increase in new accounts over the last several quarters, higher purchase volume and greater fee-based revenue. The increase in revenues for the third quarter and nine-month period was partly offset by higher credit costs. In addition, expenses rose as a result of higher business volumes. Cash operating earnings were up 2% for the third quarter of 2001 and 9% for the first nine months of 2001, compared with the same periods in 2000. Credit card related outstandings grew more than 14% from one year ago to more than $39 billion.
Regional Banking Group
Regional Banking Group’s operating revenues for the third quarter of 2001 and the first nine months of 2001 declined 7% and 3% from the respective periods of 2000, and cash operating earnings for the third quarter of 2001 and the first nine months of 2001 declined 16% and 6%, when compared with the third quarter and first nine months of 2000, respectively. These results reflected the adverse effects of declining interest rates on deposit spreads and lower investment brokerage volume as a result of weaker market conditions in 2001, partly offset by deposit growth of 4%.
-27-
Part I
Item 2 (continued)
Home Finance
Home Finance’s operating revenues and cash operating earnings rose 28% and 20%, respectively, in the third quarter of 2001 versus the prior year’s quarter and were up 20% and 23%, respectively, for the first nine months of 2001 over the same period last year. The increases in the third quarter of 2001 were due to a 132% growth in origination volume (as a result of lower interest rates during 2001), 21% growth in servicing balances and higher net interest margin. Home Finance’s revenues were reduced in the first nine months of 2001 by $279 million due to impairments on MSRs and other assets, partially offset by gains on AFS securities and derivative instruments used to economically hedge MSRs. This reduction in revenues resulted from accelerated prepayments from borrowers due to the decline in interest rates. Originations (residential, home equity and manufactured housing) for the third quarter of 2001 were $47 billion, and the Home Finance servicing portfolio exceeded $400 billion at September 30, 2001.
Middle Markets
Middle Markets’ operating revenues and cash operating earnings for the third quarter of 2001 declined 5% and 13%, respectively, from the third quarter of 2000. Operating revenues decreased 2% compared with the first nine months of 2000, while cash operating earnings decreased 5% over that same time period. The decrease in cash operating earnings in the third quarter of 2001 reflected the negative impact of narrower spreads on deposits, partially offset by deposit growth of 6%.
Auto Finance
Auto Finance’s operating revenues and cash operating earnings were $379 million and $88 million, respectively, in the first nine months of 2001. These results reflected a 65% increase in originations volume for the first nine months of 2001, the impact of lower interest rates, and the effect of a $100 million charge recognized last year for the estimated decrease in auto lease residual value. In the third quarter of 2001, Auto Finance’s market share increased to 4% from 2% during last year’s same period.
SUPPORT UNITS AND CORPORATE
JPMorgan Chase’s Support Units and Corporate include LabMorgan, Enterprise Technology Services, Corporate Business Services and the net effect of management accounting policies. For the third quarter of 2001, Support Units and Corporate had a cash operating loss of $78 million, compared with a cash operating loss of $23 million in the third quarter of 2000.
-28-
Part I
Item 2 (continued)
RESULTS OF OPERATIONS
The following section provides a discussion of JPMorgan Chase’s results of operations on both a reported and operating basis. The table below provides a reconciliation between the Firm’s reported and operating results.
| | | | | | | | | | | | | | | | | | | | | | | | | | | | | | | | | |
| (in millions, except per share data) | | Third Quarter 2001 | | Third Quarter 2000 |
| | |
| |
|
| | | Reported | | Credit | | Special | | Operating | | Reported | | Credit | | Special | | Operating |
| | | Results | | Card | | Items | | Basis | | Results | | Card | | Items | | Basis |
| | | (a) | | (b) | | (c) | | | | (a) | | (b) | | (c) | | |
| | |
| |
| |
| |
| |
| |
| |
| |
|
Income Statement | | | | | | | | | | | | | | | | | | | | | | | | | | | | | | | | |
|
|
|
|
| Revenue | | $ | 7,349 | | | $ | 270 | | | $ | — | | | $ | 7,619 | | | $ | 7,723 | | | $ | 236 | | | $ | (46 | ) | | $ | 7,913 | |
|
|
|
|
| Cash Expense | | | 4,877 | | | | — | | | | — | | | | 4,877 | | | | 5,116 | | | | — | | | | — | | | | 5,116 | |
|
|
|
|
| Amortization of Intangibles | | | 182 | | | | — | | | | — | | | | 182 | | | | 157 | | | | — | | | | — | | | | 157 | |
| | | |
| | | |
| | | |
| | | |
| | | |
| | | |
| | | |
| | | |
| |
| Operating Margin | | | 2,290 | | | | 270 | | | | — | | | | 2,560 | | | | 2,450 | | | | 236 | | | | (46 | ) | | | 2,640 | |
|
|
|
|
| Credit Costs | | | 745 | | | | 270 | | | | — | | | | 1,015 | | | | 298 | | | | 236 | | | | — | | | | 534 | |
| | | |
| | | |
| | | |
| | | |
| | | |
| | | |
| | | |
| | | |
| |
| Income before Merger and Restructuring Costs | | | 1,545 | | | | — | | | | — | | | | 1,545 | | | | 2,152 | | | | — | | | | (46 | ) | | | 2,106 | |
|
|
|
|
| Merger and Restructuring Costs | | | 876 | | | | — | | | | (876 | ) | | | — | | | | 79 | | | | — | | | | (79 | ) | | | — | |
| | | |
| | | |
| | | |
| | | |
| | | |
| | | |
| | | |
| | | |
| |
| Income before Income Tax Expense | | | 669 | | | | — | | | | 876 | | | | 1,545 | | | | 2,073 | | | | — | | | | 33 | | | | 2,106 | |
|
|
|
|
| Tax Expense | | | 220 | | | | — | | | | 289 | | | | 509 | | | | 675 | | | | — | | | | 12 | | | | 687 | |
| | | |
| | | |
| | | |
| | | |
| | | |
| | | |
| | | |
| | | |
| |
| Net Income | | $ | 449 | | | $ | — | | | $ | 587 | | | $ | 1,036 | | | $ | 1,398 | | | $ | — | | | $ | 21 | | | $ | 1,419 | |
|
|
|
|
| Add Back: Amortization of Intangibles | | | 182 | | | | — | | | | — | | | | 182 | | | | 157 | | | | — | | | | — | | | | 157 | |
| | | |
| | | |
| | | |
| | | |
| | | |
| | | |
| | | |
| | | |
| |
| Cash Earnings | | $ | 631 | | | $ | — | | | $ | 587 | | | $ | 1,218 | | | $ | 1,555 | | | $ | — | | | $ | 21 | | | $ | 1,576 | |
| | | |
| | | |
| | | |
| | | |
| | | |
| | | |
| | | |
| | | |
| |
Net Income per Share | | | | | | | | | | | | | | | | | | | | | | | | | | | | | | | | |
|
|
|
|
| Basic | | $ | 0.22 | | | | | | | | | | | $ | 0.52 | | | $ | 0.73 | | | | | | | | | | | $ | 0.74 | |
|
|
|
|
| Diluted | | | 0.22 | | | | | | | | | | | | 0.51 | | | | 0.69 | | | | | | | | | | | | 0.70 | |
|
|
|
|
Cash Earnings per Share | | | | | | | | | | | | | | | | | | | | | | | | | | | | | | | | |
| Basic | | | | | | | | | | | | | | $ | 0.61 | | | | | | | | | | | | | | | $ | 0.82 | |
|
|
|
|
| Diluted | | | | | | | | | | | | | | | 0.60 | | | | | | | | | | | | | | | | 0.78 | |
| | | | | | | | | | | | | | | | | | | | | | | | | | | | | | | | | |
| | | Nine Months 2001 | | Nine Months 2000 |
| | |
| |
|
Income Statement | | | | | | | | | | | | | | | | | | | | | | | | | | | | | | | | |
|
|
|
|
| Revenue | | $ | 22,473 | | | $ | 784 | | | $ | — | | | $ | 23,257 | | | $ | 24,391 | | | $ | 732 | | | $ | 95 | | | $ | 25,218 | |
|
|
|
|
| Cash Expense | | | 15,398 | | | | — | | | | — | | | | 15,398 | | | | 15,309 | | | | — | | | | — | | | | 15,309 | |
|
|
|
|
| Amortization of Intangibles | | | 542 | | | | — | | | | — | | | | 542 | | | | 342 | | | | — | | | | — | | | | 342 | |
| | | |
| | | |
| | | |
| | | |
| | | |
| | | |
| | | |
| | | |
| |
| Operating Margin | | | 6,533 | | | | 784 | | | | — | | | | 7,317 | | | | 8,740 | | | | 732 | | | | 95 | | | | 9,567 | |
|
|
|
|
| Credit Costs | | | 1,717 | | | | 784 | | | | — | | | | 2,501 | | | | 968 | | | | 732 | | | | — | | | | 1,700 | |
| | | |
| | | |
| | | |
| | | |
| | | |
| | | |
| | | |
| | | |
| |
| Income before Merger and Restructuring Costs | | | 4,816 | | | | — | | | | — | | | | 4,816 | | | | 7,772 | | | | — | | | | 95 | | | | 7,867 | |
|
|
|
|
| Merger and Restructuring Costs | | | 1,682 | | | | — | | | | (1,682 | ) | | | — | | | | 129 | | | | — | | | | (129 | ) | | | — | |
| | | |
| | | |
| | | |
| | | |
| | | |
| | | |
| | | |
| | | |
| |
| Income before Income Tax Expense and Effect of Accounting Change | | | 3,134 | | | | — | | | | 1,682 | | | | 4,816 | | | | 7,643 | | | | — | | | | 224 | | | | 7,867 | |
|
|
|
|
| Tax Expense | | | 1,083 | | | | — | | | | 571 | | | | 1,654 | | | | 2,624 | | | | — | | | | 79 | | | | 2,703 | |
| | | |
| | | |
| | | |
| | | |
| | | |
| | | |
| | | |
| | | |
| |
| Income before Effect of Accounting Change | | | 2,051 | | | | — | | | | 1,111 | | | | 3,162 | | | | 5,019 | | | | — | | | | 145 | | | | 5,164 | |
|
|
|
|
| Net Effect of Change in Accounting Principle | | | (25 | ) | | | — | | | | 25 | | | | — | | | | — | | | | — | | | | — | | | | — | |
| | | |
| | | |
| | | |
| | | |
| | | |
| | | |
| | | |
| | | |
| |
| Net Income | | $ | 2,026 | | | $ | — | | | $ | 1,136 | | | $ | 3,162 | | | $ | 5,019 | | | $ | — | | | $ | 145 | | | $ | 5,164 | |
|
|
|
|
| Add Back: Amortization of Intangibles | | | 542 | | | | — | | | | — | | | | 542 | | | | 342 | | | | — | | | | — | | | | 342 | |
| | | |
| | | |
| | | |
| | | |
| | | |
| | | |
| | | |
| | | |
| |
| Cash Earnings | | $ | 2,568 | | | $ | — | | | $ | 1,136 | | | $ | 3,704 | | | $ | 5,361 | | | $ | — | | | $ | 145 | | | $ | 5,506 | |
| | | |
| | | |
| | | |
| | | |
| | | |
| | | |
| | | |
| | | |
| |
Net Income per Share | | | | | | | | | | | | | | | | | | | | | | | | | | | | | | | | |
|
|
|
|
| Basic | | $ | 1.00 | (d) | | | | | | | | | | $ | 1.58 | | | $ | 2.64 | | | | | | | | | | | $ | 2.72 | |
|
|
|
|
| Diluted | | | 0.97 | (d) | | | | | | | | | | | 1.53 | | | | 2.53 | | | | | | | | | | | | 2.60 | |
|
|
|
|
Cash Earnings per Share | | | | | | | | | | | | | | | | | | | | | | | | | | | | | | | | |
|
|
|
|
| Basic | | | | | | | | | | | | | | $ | 1.85 | | | | | | | | | | | | | | | $ | 2.90 | |
|
|
|
|
| Diluted | | | | | | | | | | | | | | | 1.80 | | | | | | | | | | | | | | | | 2.78 | |
| (a) | | Represents condensed results as reported in JPMorgan Chase’s financial statements. |
|
|
|
|
| (b) | | This column excludes the impact of credit card securitizations. For receivables that have been securitized, amounts that would have been reported as net interest income and as provision for loan losses are instead reported as components of noninterest revenue. |
|
|
|
|
| (c) | | Includes merger and restructuring costs and special items. The 2001 third quarter and nine months include $876 million and $1,682 million (pre-tax), respectively, in merger and restructuring expenses. The 2000 third quarter and nine months included an $81 million gain (pre-tax) from the sale of a business in Panama; a $35 million and $176 million loss (pre-tax), respectively, resulting from the economic hedge of the purchase price of Flemings prior to its acquisition; and $79 million and $129 million (pre-tax), respectively, of restructuring costs associated with previously announced relocation initiatives. |
|
|
|
|
| (d) | | Includes the effect of the accounting change. Excluding the accounting change, basic and diluted net income per share for the first nine months of 2001 were $1.01 and $0.98, respectively. |
-29-
Part I
Item 2 (continued)
REVENUES
| | | | | | | | | | | | | | | | | | | | | | | | | |
| (in millions) | | Third Quarter | | Nine Months |
| | |
| |
|
| | | | | | | | | | | Pro Forma | | | | | | | | | | Pro Forma |
| | | 2001 | | 2000 | | 2000(a) | | 2001 | | 2000 | | 2000(a) |
| | |
| |
| |
| |
| |
| |
|
Operating Revenue: | | | | | | | | | | | | | | | | | | | | | | | | |
|
|
|
|
| Investment Banking Fees | | $ | 811 | | | $ | 1,013 | | | $ | 1,048 | | | $ | 2,681 | | | $ | 3,311 | | | $ | 3,435 | |
|
|
|
|
| Trading-Related Revenue (including Trading NII) | | | 1,614 | | | | 1,632 | | | | 1,640 | | | | 5,375 | | | | 5,728 | | | | 5,814 | |
|
|
|
|
| Fees and Commissions | | | 2,231 | | | | 2,314 | | | | 2,408 | | | | 6,597 | | | | 6,556 | | | | 7,379 | |
|
|
|
|
| Private Equity – Realized Gains | | | 204 | | | | 656 | | | | 656 | | | | 570 | | | | 1,678 | | | | 1,678 | |
|
|
|
|
| Private Equity – Unrealized Gains (Losses) | | | (311 | ) | | | (676 | ) | | | (676 | ) | | | (1,379 | ) | | | (565 | ) | | | (565 | ) |
|
|
|
|
| Securities Gains | | | 142 | | | | 90 | | | | 91 | | | | 664 | | | | 111 | | | | 111 | |
|
|
|
|
| Other Revenue | | | 203 | | | | 365 | | | | 373 | | | | 728 | | | | 890 | | | | 1,018 | |
|
|
|
|
| Net Interest Income (excluding Trading NII) | | | 2,725 | | | | 2,519 | | | | 2,534 | | | | 8,021 | | | | 7,509 | | | | 7,595 | |
| | | |
| | | |
| | | |
| | | |
| | | |
| | | |
| |
Total Operating Revenue | | $ | 7,619 | | | $ | 7,913 | | | $ | 8,074 | | | $ | 23,257 | | | $ | 25,218 | | | $ | 26,465 | |
| | | |
| | | |
| | | |
| | | |
| | | |
| | | |
| |
| (a) | | Pro forma revenue assumes that the purchase of Flemings occurred at the beginning of 2000. |
Investment Banking Fees
Investment banking fees in the third quarter and first nine months of 2001 declined significantly from last year’s respective periods. Weak market conditions in equity underwriting and merger and acquisition advisory services drove the decline in revenues. For a further discussion of JPMorgan Chase’s investment banking fees, see the Investment Bank line of business results on pages 19-20 of this Form 10-Q.
| | | | | | | | | | | | | | | | | |
| (in millions) | | Third Quarter | | Nine Months |
| | |
| |
|
| | | 2001 | | 2000 | | 2001 | | 2000 |
| | |
| |
| |
| |
|
| Advisory | | $ | 329 | | | $ | 362 | | | $ | 977 | | | $ | 1,116 | |
|
|
|
|
| Underwriting and Other Fees | | | 482 | | | | 651 | | | | 1,704 | | | | 2,195 | |
| | | |
| | | |
| | | |
| | | |
| |
Total Investment Banking Fees | | $ | 811 | | | $ | 1,013 | | | $ | 2,681 | | | $ | 3,311 | |
| | | |
| | | |
| | | |
| | | |
| |
Trading-Related Revenue
Trading-related revenue (including associated NII) in the third quarter of 2001 was relatively flat, when compared with the third quarter of 2000 but for the first nine months of 2001 was down 6% from the first nine months of 2000.
| | | | | | | | | | | | | | | | | |
| (in millions) | | Third Quarter | | Nine Months |
| | |
| |
|
| | | 2001 | | 2000 | | 2001 | | 2000 |
| | |
| |
| |
| |
|
Trading-Related Revenue:(a) | | | | | | | | | | | | | | | | |
|
|
|
|
Equities(b) | | $ | 251 | | | $ | 471 | | | $ | 1,206 | | | $ | 1,535 | |
|
|
|
|
Fixed Income and Other(c) | | | 1,363 | | | | 1,161 | | | | 4,169 | | | | 4,193 | |
| | | |
| | | |
| | | |
| | | |
| |
Total Trading-Related Revenue(d) | | $ | 1,614 | | | $ | 1,632 | | | $ | 5,375 | | | $ | 5,728 | |
| | | |
| | | |
| | | |
| | | |
| |
Trading Revenue | | $ | 1,301 | | | $ | 1,455 | | | $ | 4,563 | | | $ | 5,156 | |
|
|
|
|
Net Interest Income Impact(a) | | | 313 | | | �� | 177 | | | | 812 | | | | 572 | |
| | | |
| | | |
| | | |
| | | |
| |
Total Trading-Related Revenue | | $ | 1,614 | | | $ | 1,632 | | | $ | 5,375 | | | $ | 5,728 | |
| | | |
| | | |
| | | |
| | | |
| |
| (a) | | Includes net interest income associated with trading activities, which includes interest recognized on interest-earning and interest-bearing trading-related positions, as well as management allocations reflecting the funding costs or benefits associated with trading positions. These amounts are included in net interest income on the Consolidated Statement of Income. Trading-related net interest income has been restated in the prior periods in order to conform to the current presentation. |
|
|
|
|
| (b) | | Includes results from trading equity securities and equity derivatives. |
|
|
|
|
| (c) | | Includes results from trading instruments such as bonds and commercial paper, various types of interest rate derivatives, as well as foreign exchange and commodities. Also includes trading gains or losses on certain assets received as part of troubled debt restructurings. |
|
|
|
|
| (d) | | Derivative and foreign exchange contracts are marked-to-market, and valuation adjustments are included in trading-related revenue. |
-30-
Part I
Item 2 (continued)
| | • | | Revenues from equities were down 47% and 21% from the third quarter of 2000 and first nine months of last year, respectively, due to the generally downward movement of the equities market, particularly over-the-counter securities. |
| |
| | • | | Fixed income and other in the 2001 third quarter was 17% higher than the third quarter of 2000 but was flat in the first nine months of 2001, compared with the same period last year. The increase was driven by volatility in the interest rate markets, resulting in strong demand for the market-making capabilities of the Investment Bank. |
Fees and Commissions
Fees and commissions for the third quarter of 2001 declined 4%, when compared with the third quarter of 2000. For the first nine months of 2001, fees and commissions were flat, when compared with the same period last year. The table below presents the significant components of fees and commissions.
| | | | | | | | | | | | | | | | | | |
| (in millions) | | Third Quarter | | Nine Months |
| | |
| |
|
| | | | 2001 | | 2000 | | 2001 | | 2000 |
| | | |
| |
| |
| |
|
| Investment Management, Custody and Processing Services | | $ | 918 | | | $ | 963 | | | $ | 2,835 | | | $ | 2,620 | |
|
|
|
|
| Credit Card Revenue – Operating | | | 448 | | | | 358 | | | | 1,259 | | | | 1,025 | |
|
|
|
|
| Brokerage and Investment Services | | | 268 | | | | 313 | | | | 939 | | | | 885 | |
|
|
|
|
| Mortgage Servicing Fees, Net of Amortization and Write-downs | | | 9 | | | | 139 | | | | (149 | ) | | | 420 | |
|
|
|
|
| Other Lending-Related Service Fees | | | 125 | | | | 143 | | | | 377 | | | | 447 | |
|
|
|
|
| Deposit Service Charges | | | 262 | | | | 221 | | | | 746 | | | | 668 | |
|
|
|
|
| Other Fees | | | 201 | | | | 177 | | | | 590 | | | | 491 | |
| | | |
| | | |
| | | |
| | | |
| |
| | Total Fees and Commissions – Operating | | $ | 2,231 | | | $ | 2,314 | | | $ | 6,597 | | | $ | 6,556 | |
| | | |
| | | |
| | | |
| | | |
| |
Investment Management, Custody and Processing Services
Investment management fees were slightly lower than the third quarter of 2000 but significantly higher in the first nine months of 2001 than the same period last year. The decline from the third quarter of 2000 was driven by the lower value of assets under investment management and lower transaction volume; however, net cash flows for the 2001 third quarter were positive, compared with the prior quarter as a result of significant increases in cash and money market assets. The increase for the nine months of 2001 when compared with last year was primarily attributable to the contributions of Flemings, which increased the level of funds under management.
Custody and processing services fees decreased slightly from the third quarter of 2000 but for the first nine months of 2001 were flat, when compared with the first nine months of 2000. The decrease for the quarter was largely due to the lower values of securities under custody and slower investment flows overseas, partly offset by new business related to processing the issuance of debt instruments and servicing their interest payments, coupled with higher cash management fees related to treasury activities.
Credit Card Revenue
The increases of over 20% for both the third quarter and first nine months of 2001 reflected the impact of higher card fees, including higher interchange income as a result of greater customer purchase volume. Also contributing to the increases were higher late fees as a result of the rise in delinquencies.
The following table reconciles JPMorgan Chase’s reported credit card revenue and operating credit card revenue (which excludes the impact of credit card securitizations). The decline in revenue relating to securitized credit cards was due to the maturity of several securitizations.
| | | | | | | | | | | | | | | | | |
| (in millions) | | Third Quarter | | Nine Months |
| | |
| |
|
| | | 2001 | | 2000 | | 2001 | | 2000 |
| | |
| |
| |
| |
|
| Reported Credit Card Revenue | | $ | 548 | | | $ | 471 | | | $ | 1,446 | | | $ | 1,311 | |
|
|
|
|
| Less Impact of Credit Card Securitizations | | | (100 | ) | | | (113 | ) | | | (187 | ) | | | (286 | ) |
| | | |
| | | |
| | | |
| | | |
| |
| Operating Credit Card Revenue | | $ | 448 | | | $ | 358 | | | $ | 1,259 | | | $ | 1,025 | |
| | | |
| | | |
| | | |
| | | |
| |
Brokerage and Investment Services
Brokerage and investment services in the 2001 third quarter decreased $45 million from the prior year’s same quarter but rose $54 million in the first nine months of 2001 from the prior year. The decline in the third quarter of 2001 was partly due to the weaker markets that reduced the volume of institutional and retail brokerage activities. The Flemings acquisition significantly contributed to the increase in revenues for the first nine months of 2001.
-31-
Part I
Item 2 (continued)
Mortgage Servicing Fees
Mortgage servicing fees in the third quarter and first nine months of 2001 decreased $130 million and $569 million, respectively, from the same periods last year as a result of the net impairment of mortgage servicing rights due to the decline in mortgage interest rates. The impairment of the rights was substantially offset by the favorable results of their linked SFAS 133 derivatives and other economic hedges. Economic hedge results are reflected in trading revenue and securities gains. While lower mortgage rates negatively affected mortgage servicing fees, they positively affected loan origination volume; higher loan origination volume increased net interest income, as well as residential mortgage origination and sales activities, which are recognized in other revenue.
Other Lending-Related Service Fees
Other lending-related service fees were $18 million lower than the third quarter of 2000 and $70 million lower than the first nine months of last year. The declines were primarily attributable to the lower volume at, and the repositioning of, the trade finance business.
Deposit Service Charges
Deposit service charges in the 2001 third quarter rose $41 million from the prior year’s quarter and, for the first nine months of 2001, increased $78 million from the prior year. The increases reflected the impact of the lower interest rates as institutional customers at Treasury & Securities Services who customarily would pay for deposit products and services by maintaining a higher level of compensating balances instead reduced their balances and paid for the services through separate fees. Also contributing to the increase were new pricing schedules implemented for the deposit products in the third quarter of 2001.
Other Fees
All other fees rose $24 million in the third quarter of 2001 from the same period last year, partly as a result of the acquisition of Colson Services Corp. (“Colson”), a provider of record keeping, paying agent and other financial services. Other fees for the first nine months of 2001 were $99 million higher than the prior year, reflecting the growth in the volume of annuity sales and the addition of Flemings and Colson.
Private Equity Gains
Private equity gains (losses) were significantly affected by the continuing downturn in the equities market. Realized gains of $204 million and $570 million in the third quarter and first nine months of 2001, respectively, were offset by unrealized losses, which included mark-to-market losses on public securities. Unrealized losses also includes an unrealized gain of approximately $65 million on a NASDAQ-based hedge instrument that was entered into in mid-August. For a further discussion of JPMorgan Chase’s private equity results, see the JPMP line of business results on pages 21-22 of this Form 10-Q.
| | | | | | | | | | | | | | | | | |
| (in millions) | | Third Quarter | | Nine Months |
| | |
| |
|
| | | 2001 | | 2000 | | 2001 | | 2000 |
| | |
| |
| |
| |
|
| Realized Gains | | $ | 204 | | | $ | 656 | | | $ | 570 | | | $ | 1,678 | |
|
|
|
|
| Unrealized Gains (Losses) | | | (311 | ) | | | (676 | ) | | | (1,379 | ) | | | (565 | ) |
| | | |
| | | |
| | | |
| | | |
| |
Private Equity Gains (Losses)(a) | | $ | (107 | ) | | $ | (20 | ) | | $ | (809 | ) | | $ | 1,113 | |
| | | |
| | | |
| | | |
| | | |
| |
(a) Includes Private Equity Gains (Losses) from JPMP and other business units.Securities Gains
Securities gains in the third quarter of 2001 were up 58% from last year’s same quarter and, on a year-to-date basis, were up significantly from last year. These increases were principally the result of positioning the available-for-sale securities of the Firm in anticipation of a continued reduction in interest rates in the United States and Europe. As a consequence of the interest rate declines in the first nine months of 2001, the value of debt securities held this year rose and produced significant gains upon the sale of those securities.
Home Finance utilized debt securities in addition to derivatives to hedge the value of the mortgage servicing rights it carries on the Balance Sheet. In the 2001 first quarter, Home Finance realized $315 million of gains from the sale of debt securities used as economic hedges of the mortgage servicing rights. These gains partially offset the decline in mortgage servicing fees as a result of the impairment. In the 2001 second and third quarters, no material gains were recorded from the sale of securities.
-32-
Part I
Item 2 (continued)
Other Revenue
| | | | | | | | | | | | | | | | | |
| (in millions) | | Third Quarter | | Nine Months |
| | |
| |
|
| | | 2001 | | 2000 | | 2001 | | 2000 |
| | |
| |
| |
| |
|
| Residential Mortgage Origination/Sales Activities | | $ | 151 | | | $ | 50 | | | $ | 396 | | | $ | 135 | |
|
|
|
|
| All Other Revenue | | | 52 | | | | 315 | | | | 332 | | | | 755 | |
| | | |
| | | |
| | | |
| | | |
| |
| Operating Other Revenue | | | 203 | | | | 365 | | | | 728 | | | | 890 | |
|
|
|
|
| Gain on Sale of Panama Operations | | | — | | | | 81 | | | | — | | | | 81 | |
|
|
|
|
| Loss on Economic Hedge of the Flemings Purchase Price | | | — | | | | (35 | ) | | | — | | | | (176 | ) |
|
|
|
|
| Other Revenue – Credit Card Securitizations | | | 9 | | | | 4 | | | | 4 | | | | 12 | |
| | | |
| | | |
| | | |
| | | |
| |
| Reported Other Revenue | | $ | 212 | | | $ | 415 | | | $ | 732 | | | $ | 807 | |
| | | |
| | | |
| | | |
| | | |
| |
Residential mortgage activities (which include originations and sales of loans and selective dispositions of mortgage servicing rights) in the third quarter and first nine months of 2001 rose as a result of the higher volume of mortgage loans originated and sold in 2001. The decline in mortgage interest rates and a strong housing market led to the growth of residential loan originations and refinancings.
All other revenue decreases were attributable to lower equity income from the American Century investment, reflecting the decline in the value of its funds under management; decline in hedge gains on planned overseas revenues; and unfavorable valuation adjustments, primarily on loans that were syndicated or originated for distribution but still are carried on the Consolidated Balance Sheet.
On a reported basis, results for the third quarter and nine months of 2000 also included a gain of $81 million on the sale of the Panama operations offset by losses of $35 million and $176 million, respectively, resulting from the economic hedge for the purchase price of Flemings prior to its acquisition.
Net Interest Income
Operating NIIadjusts reported NII for the impact of credit card securitizations and trading-related NII that is considered part of total trading-related revenue. The following table reconciles reported and operating NII.
| | | | | | | | | | | | | | | | | | | | | | | | | |
| (in millions) | | Third Quarter | | Nine Months |
| | |
| |
|
| Net Interest Income | | 2001 | | 2000 | | Change | | 2001 | | 2000 | | Change |
| | |
| |
| |
| |
| |
| |
|
| Reported NII | | $ | 2,659 | | | $ | 2,343 | | | | 13 | % | | $ | 7,858 | | | $ | 7,051 | | | | 11 | % |
|
|
|
|
| Add Impact of Credit Card Securitizations | | | 379 | | | | 353 | | | | | | | | 975 | | | | 1,030 | | | | | |
|
|
|
|
| Less Trading-Related NII | | | (313 | ) | | | (177 | ) | | | | | | | (812 | ) | | | (572 | ) | | | | |
| | | |
| | | |
| | | | | | | |
| | | |
| | | | | |
| Operating NII | | $ | 2,725 | | | $ | 2,519 | | | | 8 | % | | $ | 8,021 | | | $ | 7,509 | | | | 7 | % |
| | | |
| | | |
| | | | | | | |
| | | |
| | | | | |
Net interest income in the third quarter and nine months of 2001 grew from the same periods last year, both on a reported and operating basis. The primary contributor to the increases was the continuing decline in interest rates in 2001, which led to growth in the level of interest-earning assets (in particular, consumer loans such as residential mortgages, credit card receivables and auto financings). The reduction in interest rates also favorably affected the spreads on interest-earning assets as the cost related to carrying these assets declined faster than the interest income earned on them.
In addition, both 2001 periods included the receipts of several interest refunds on prior years’ taxes aggregating $84 million ($13 million in the third quarter).
-33-
Part I
Item 2 (continued)
NONINTEREST EXPENSE
Total operating noninterest expenses were $5.1 billion in the third quarter of 2001, down 4% from the same period in 2000. On a pro forma basis, operating expenses for the first nine months of 2001 declined 6% from last year. JPMorgan Chase continues to target cash operating expenses for full year 2001 to be lower than pro forma cash operating expenses for full year 2000. The declines in expenses primarily reflected lower compensation expense as a result of headcount reductions, partly offset by investments in technology and communications facilities. The following table presents the components of noninterest expense on an operating and reported basis.
| | | | | | | | | | | | | | | | | | | | | | | | | | |
| (in millions, except ratios) | Third Quarter | Nine Months |
| |
| |
|
| | | | | | | | | | | | Pro Forma | | | | | | | | | | Pro Forma |
| Expense: | | 2001 | | 2000 | | 2000(a) | | 2001 | | 2000 | | 2000(a) |
| | |
| |
| |
| |
| |
| |
|
| Compensation Expense | | $ | 2,883 | | | $ | 3,135 | | | $ | 3,229 | | | $ | 9,292 | | | $ | 9,438 | | | $ | 10,167 | |
|
|
|
|
| Occupancy Expense | | | 339 | | | | 338 | | | | 350 | | | | 1,014 | | | | 943 | | | | 992 | |
|
|
|
|
| Technology and Communications | | | 663 | | | | 632 | | | | 640 | | | | 1,991 | | | | 1,786 | | | | 1,846 | |
|
|
|
|
| Other Expense | | | 992 | | | | 1,011 | | | | 1,047 | | | | 3,101 | | | | 3,142 | | | | 3,322 | |
| | | |
| | | |
| | | |
| | | |
| | | |
| | | |
| |
Cash Operating Noninterest Expense | | | 4,877 | | | | 5,116 | | | | 5,266 | | | | 15,398 | | | | 15,309 | | | | 16,327 | |
|
|
|
|
| Amortization of Intangibles | | | 182 | | | | 157 | | | | 187 | | | | 542 | | | | 342 | | | | 552 | |
| | | |
| | | |
| | | |
| | | |
| | | |
| | | |
| |
| | Operating Noninterest Expense | | | 5,059 | | | | 5,273 | | | | 5,453 | | | | 15,940 | | | | 15,651 | | | | 16,879 | |
|
|
|
|
| Merger and Restructuring Costs | | | 876 | | | | 79 | | | | 79 | | | | 1,682 | | | | 129 | | | | 129 | |
| | | |
| | | |
| | | |
| | | |
| | | |
| | | |
| |
| | Reported Noninterest Expense | | $ | 5,935 | | | $ | 5,352 | | | $ | 5,532 | | | $ | 17,622 | | | $ | 15,780 | | | $ | 17,008 | |
| | | |
| | | |
| | | |
| | | |
| | | |
| | | |
| |
| Operating Overhead Ratio (b) | | | 66 | % | | | 67 | % | | | 68 | % | | | 69 | % | | | 62 | % | | | 64 | % |
|
|
|
|
| Cash Operating Overhead Ratio (b) | | | 64 | | | | 65 | | | | 65 | | | | 66 | | | | 61 | | | | 62 | |
| (a) | | Pro forma expense treats the purchase of Flemings as if it had occurred at the beginning of 2000. |
|
|
|
|
| (b) | | The overhead ratio is defined as noninterest expense as a percentage of total operating revenue (excluding merger and restructuring costs and special items). The cash overhead ratio also excludes the impact of the amortization of intangibles. |
Compensation Expense
Compensation expense declined 8% from the third quarter and 2% from the first nine months of 2000. The decreases were driven by headcount reductions, in particular in areas affected by the merger such as the Investment Bank and Investment Management & Private Banking, as well as by lower incentive costs as a result of the decrease in revenues in these areas. Partially offsetting the decline in the first nine months were the additions of Flemings and the mortgage business of Advanta Corp. and the impact of new hires at Home Finance and Cardmember Services to support the high production volumes.
The Firm had 96,633 and 99,189 full-time equivalent employees at September 30, 2001 and September 30, 2000, respectively. The decline in full-time equivalent employees was attributable to the elimination of positions in the Investment Bank and Investment Management & Private Banking.
Occupancy Expense
Occupancy expense was relatively flat from last year’s third quarter due to the savings derived from relocations of certain functions from the New York metropolitan area to the South and Southwest regions of the United States, partially offset by leasing costs for additional space requirements. The 8% increase in the first nine months of 2001 was primarily attributable to the acquisition of Flemings, coupled with moderate inflationary increases across various occupancy expenses.
Technology and Communications
The increases from both the third quarter and first nine months of 2000 mainly reflected the depreciation of hardware systems and amortization of capitalized software applications. In addition, the increases reflected higher telecommunications expenses, primarily associated with the increase in demand for market data, and higher leasing and maintenance costs for various telecommunications, computer and other office equipment.
-34-
Part 1
Item 2 (continued)
Other Expense
Other expense declined 2% from the third quarter of 2000 and 1% from the first nine months of 2000. The following table presents the components of other expense.
| | | | | | | | | | | | | | | | | | |
| (in millions) | | Third Quarter | | Nine Months |
| | |
| |
|
| | | | 2001 | | 2000 | | 2001 | | 2000 |
| | | |
| |
| |
| |
|
| Professional Services | | $ | 267 | | | $ | 275 | | | $ | 850 | | | $ | 838 | |
|
|
|
|
| Outside Services | | | 181 | | | | 161 | | | | 513 | | | | 477 | |
|
|
|
|
| Marketing | | | 137 | | | | 161 | | | | 422 | | | | 422 | |
|
|
|
|
| Travel and Entertainment | | | 116 | | | | 115 | | | | 375 | | | | 347 | |
|
|
|
|
| All Other | | | 291 | | | | 299 | | | | 941 | | | | 1,058 | |
| | | |
| | | |
| | | |
| | | |
| |
| | Total Other Expense | | $ | 992 | | | $ | 1,011 | | | $ | 3,101 | | | $ | 3,142 | |
| | | |
| | | |
| | | |
| | | |
| |
| | • | | Outside Servicesincreased in both periods of 2001, primarily due to higher outside data processing costs related to the significant increase in origination volume at Home Finance and to greater securities and cash transaction volume at Treasury & Securities Services. |
| | • | | The decline inMarketingexpense from the third quarter of last year reflected streamlining of various marketing programs and fewer retail banking campaign requirements. |
| | • | | The increase inTravel and Entertainmentfor the first nine months of 2001 was largely due to higher travel, meals and hotel expenses (principally during the first half of this year) related to global business generated by the Investment Bank. |
| | • | | The decline inAll Otherexpense of 11% for the nine months of 2001 partly reflected lower recruitment costs and various other costs. |
Amortization of Intangibles
The increases in amortization of intangibles over both periods in 2000 were attributable to the acquisitions of Flemings and The Beacon Group, LLC in August and July of 2000, respectively.
Merger and Restructuring Costs
As indicated in Note 4 on page 8 of this Form 10-Q, management currently estimates that $650 million of nonaccruable merger costs will be incurred in 2001 and 2002. These nonaccruable merger costs will be in addition to the original total merger cost estimate of $3.2 billion. Expense savings have also increased from the $2 billion originally estimated at the time of the merger to $3.2 billion.
Additionally, management currently estimates that the Firm will incur one-time pre-tax costs of $400 million in connection with the right-sizing of employee levels of certain businesses (2,000 employee reductions) beyond that planned at the time of the merger. Expense savings estimated to be realized from these right-sizing costs are $400 million. These severance costs consist of a $300 million charge that was recorded on September 30, 2001 related to employees who were notified that their positions had been eliminated and $100 million of costs which are expected to be incurred in the fourth quarter of 2001 and in 2002 and which are not accruable under existing accounting pronouncements.
Approximately 90% of the expense savings from the above merger and “right-sizing” costs currently are anticipated to be realized by the end of 2002.
CREDIT COSTS
Credit costs on an operating basis are composed of the provision for loan losses related to loans on the Consolidated Balance Sheet and to the credit costs associated with credit card receivables that have been securitized.
| | | | | | | | | | | | | | | | | |
| (in millions) | | Third Quarter | | Nine Months |
| |
|
| |
|
| | | 2001 | | 2000 | | 2001 | | 2000 |
| | |
| |
| |
| |
|
| Provision for Loan Losses | | $ | 745 | | | $ | 298 | | | $ | 1,717 | | | $ | 968 | |
|
|
|
|
| Credit Costs Associated with Credit Card Securitizations | | | 270 | | | | 236 | | | | 784 | | | | 732 | |
| | | |
| | | |
| | | |
| | | |
| |
| Operating Credit Costs | | $ | 1,015 | | | $ | 534 | | | $ | 2,501 | | | $ | 1,700 | |
| | | |
| | | |
| | | |
| | | |
| |
The increases in the provision for loan losses were indicative of the more difficult market environment and the higher volume of consumer loans outstanding. Credit costs also included a $200 million provision in excess of charge-offs in response to the current weaker credit environment for both commercial and consumer loans. See page 41 of this Form 10-Q for a discussion of the allowance for credit losses.
-35-
Part I
Item 2 (continued)
INCOME TAXES
JPMorgan Chase recognized income tax expense of $220 million in the third quarter of 2001, compared with $675 million in the third quarter of 2000. For the first nine months of 2001, JPMorgan Chase recorded income tax expense of $1,083 million, compared with $2,624 million for the first nine months of 2000. The effective tax rates were 33% in the third quarter of 2001 and 35% in the first nine months of 2001, compared with 33% and 34% in the third quarter of 2000 and first nine months of 2000, respectively.
RISK MANAGEMENT
JPMorgan Chase is in the business of managing risk to create shareholder value. The major risks to which the Firm is exposed are credit, market, operational and liquidity risk. For a discussion of these risks and definition of terms associated with managing these risks, please refer to the Glossary of Terms on page 52 of this Form 10-Q and pages 43-59 of JPMorgan Chase’s 2000 Annual Report.
CREDIT RISK MANAGEMENT
The following discussion of credit risk management and derivative and foreign exchange contracts used by JPMorgan Chase focuses primarily on developments since December 31, 2000 and should be read in conjunction with pages 46-53 and Notes 1 and 25 of JPMorgan Chase’s 2000 Annual Report, in addition to Note 3 of this Form 10-Q.
The following table presents the Firm’s credit-related information for the dates indicated.
| | | | | | | | | | | | | | | | | | | | | | | | | |
| | | | | | | | | | | | | | | | | | | Past Due 90 Days |
| | | Credit-Related Assets | | Nonperforming Assets(c) | | & Over and Accruing |
| | |
| |
| |
|
| | | Sept 30, | | Dec 31, | | Sept 30, | | Dec 31, | | Sept 30, | | Dec 31, |
| (in millions) | | 2001 | | 2000 | | 2001 | | 2000 | | 2001 | | 2000 |
| | |
| |
| |
| |
| |
| |
|
| Commercial Loans | | $ | 116,578 | | | $ | 119,460 | | | $ | 2,018 | | | $ | 1,434 | | | $ | 63 | | | $ | 99 | |
|
|
|
|
| Derivative and FX Contracts (a) | | | 85,407 | | | | 76,373 | | | | 46 | | | | 37 | | | | — | | | | — | |
|
|
|
|
| Consumer Loans (b) | | | 125,431 | | | | 114,461 | | | | 459 | | | | 384 | | | | 771 | | | | 788 | |
| | | |
| | | |
| | | |
| | | |
| | | |
| | | |
| |
Total Managed Credit-Related | | $ | 327,416 | | | $ | 310,294 | | | $ | 2,523 | | | $ | 1,855 | | | $ | 834 | | | $ | 887 | |
| | | |
| | | |
| | | | | | | | | | | |
| | | |
| |
| Assets Acquired as Loan Satisfactions | | | | | | | | | | | 123 | | | | 68 | | | | | | | | | |
| | | | | | | | | | | |
| | | |
| | | | | | | | | |
Total Nonperforming Assets | | | | | | | | | | $ | 2,646 | | | $ | 1,923 | | | | | | | | | |
| | | | | | | | | | | |
| | | |
| | | | | | | | | |
| | | | | | | | | | | | | | | | | |
| | | Net Charge-offs | | Annual Average Net Charge-off Rates (d) |
| | |
| |
|
| (in millions, except ratios) | | Third Quarter | | Third Quarter |
| | |
| |
|
| | | 2001 | | 2000 | | 2001 | | 2000 |
| | |
| |
| |
| |
|
| Commercial Loans | | $ | 189 | | | $ | 83 | | | | 0.65 | % | | | 0.27 | % |
|
|
|
|
| Consumer Loans | | | 626 | | | | 476 | | | | 1.96 | | | | 1.72 | |
| | | |
| | | |
| | | | | | | | | |
Total Managed Credit-Related | | $ | 815 | | | $ | 559 | | | | 1.33 | % | | | 0.96 | % |
| | | |
| | | |
| | | | | | | | | |
| | | | | | | | | | | | | | | | | |
| | | Net Charge-offs | | Annual Average Net Charge-off Rates (d) |
| | |
| |
|
| | | Nine Months | | Nine Months |
| | |
| |
|
| | | 2001 | | 2000 | | 2001 | | 2000 |
| | |
| |
| |
| |
|
| Commercial Loans | | $ | 549 | | | $ | 241 | | | | 0.64 | % | | | 0.27 | % |
|
|
|
|
| Consumer Loans | | | 1,752 | | | | 1,482 | | | | 1.90 | | | | 1.84 | |
| | | |
| | | |
| | | | | | | | | |
Total Managed Credit-Related | | $ | 2,301 | | | $ | 1,723 | | | | 1.30 | % | | | 1.02 | % |
| | | |
| | | |
| | | | | | | | | |
| (a) | | Charge-offs for derivative receivables are included in trading revenue. |
|
|
|
|
| (b) | | Includes credit card receivables that have been securitized. |
|
|
|
|
| (c) | | Nonperforming assets have not been reduced for credit protection (single name credit default swaps and collateralized loan obligations) aggregating $114 million related to nonperforming counterparties at September 30, 2001. |
|
|
|
|
| (d) | | Annualized. |
-36-
Part I
Item 2 (continued)
JPMorgan Chase’s managed credit-related assets of $327 billion at September 30, 2001 increased 6%, when compared with year-end 2000. Commercial loans decreased $2.9 billion, or 2%, reflecting the Firm’s ongoing discipline of originating loans for distribution and sale. Derivative and foreign exchange instruments increased by 12% from $76.4 billion at year-end 2000. Consumer managed credit-related assets increased $11.0 billion, or 10%, from December 31, 2000, largely in residential mortgages, auto financing and credit cards.
The portion of the commercial loan portfolio and counterparty credit outstanding considered investment grade was 66% at September 30, 2001, compared with 67% at year-end 2000. Management currently believes that credit conditions in the United States will remain challenging for the remainder of the year, which could have an adverse impact on credit quality over time.
The increase in nonperforming assets was primarily related to domestic commercial and industrial credits. Given the credit conditions noted above, management expects a further increase in nonperforming assets in the fourth quarter of 2001. However, management believes that the Firm’s credit performance this year will continue to be better than the industry average.
Net charge-offs in the managed portfolio were $815 million and $2,301 million in the third quarter and nine months of 2001, respectively, an increase of $256 million and $578 million, respectively, from the same periods one year ago, primarily reflecting increased net charge-offs in the telecommunications portion of the domestic commercial loan portfolio and in the consumer credit card portfolio.
Commercial Portfolio
| | | | | | | | | | | | | | | | | | | | | | | | | | |
| (in millions) | | | | | | | | | | | | | | | | | | Past Due 90 Days & Over |
| | | Credit-Related Assets | | Nonperforming Assets | | and Accruing |
| | | |
| |
| |
|
| | | | Sept 30, | | Dec 31, | | Sept 30, | | Dec 31, | | Sept 30, | | Dec 31, |
| Commercial Loans: | | 2001 | | 2000 | | 2001 | | 2000 | | 2001 | | 2000 |
| | |
| |
| |
| |
| |
| |
|
| Domestic Commercial: | | | | | | | | | | | | | | | | | | | | | | | | |
|
|
|
|
| | Commercial and Industrial | | $ | 64,826 | | | $ | 64,031 | | | $ | 1,335 | | | $ | 727 | | | $ | 7 | | | $ | 95 | |
|
|
|
|
| | Commercial Real Estate | | | 5,061 | | | | 4,834 | | | | 68 | | | | 65 | | | | 12 | | | | 3 | |
|
|
|
|
| | Financial Institutions | | | 7,825 | | | | 7,342 | | | | 35 | | | | 29 | | | | — | | | | — | |
| | | |
| | | |
| | | |
| | | |
| | | |
| | | |
| |
| Total Domestic Commercial Loans | | | 77,712 | | | | 76,207 | | | | 1,438 | | | | 821 | | | | 19 | | | | 98 | |
|
|
|
|
| Foreign Commercial: | | | | | | | | | | | | | | | | | | | | | | | | |
|
|
|
|
| | Commercial and Industrial | | | 35,150 | | | | 37,002 | | | | 530 | | | | 556 | | | | 44 | | | | 1 | |
|
|
|
|
| | Commercial Real Estate | | | 922 | | | | 1,470 | | | | 9 | | | | 9 | | | | — | | | | — | |
|
|
|
|
| | Financial Institutions | | | 2,197 | | | | 3,976 | | | | 9 | | | | 13 | | | | — | | | | — | |
|
|
|
|
| | Foreign Governments | | | 597 | | | | 805 | | | | 32 | | | | 35 | | | | — | | | | — | |
| | | |
| | | |
| | | |
| | | |
| | | |
| | | |
| |
| Total Foreign Commercial Loans | | | 38,866 | | | | 43,253 | | | | 580 | | | | 613 | | | | 44 | | | | 1 | |
| | | |
| | | |
| | | |
| | | |
| | | |
| | | |
| |
Total Commercial Loans | | | 116,578 | | | | 119,460 | | | | 2,018 | | | | 1,434 | | | | 63 | | | | 99 | |
|
|
|
|
Derivative and FX Contracts(a) | | | 85,407 | | | | 76,373 | | | | 46 | | | | 37 | | | | — | | | | — | |
| | | |
| | | |
| | | |
| | | |
| | | |
| | | |
| |
Total Commercial Credit-Related | | $ | 201,985 | | | $ | 195,833 | | | $ | 2,064 | | | $ | 1,471 | | | $ | 63 | | | $ | 99 | |
| | | |
| | | |
| | | |
| | | |
| | | |
| | | |
| |
| | | | | | | | | | | | | | | | | | |
| (in millions, except ratios) | | Net Charge-offs | | Annual Average Net Charge-off Rates(b) |
| | |
| |
|
| | | | Third Quarter | | Third Quarter |
| | | |
| |
|
| Commercial Loans: | | 2001 | | 2000 | | 2001 | | 2000 |
| | |
| |
| |
| |
|
| Domestic Commercial: | | | | | | | | | | | | | | | | |
|
|
|
|
| | Commercial and Industrial | | $ | 132 | | | $ | 81 | | | | 0.73 | % | | | 0.44 | % |
|
|
|
|
| | Commercial Real Estate | | | 2 | | | | (3 | ) | | | 0.32 | | | NM |
|
|
|
|
| | Financial Institutions | | | (8 | ) | | | 2 | | | NM | | | 0.10 | |
| | | |
| | | |
| | | | | | | | | |
| Total Domestic Commercial | | | 126 | | | | 80 | | | | 0.59 | | | | 0.38 | |
|
|
|
|
| Foreign Commercial: | | | | | | | | | | | | | | | | |
|
|
|
|
| | Commercial and Industrial | | | 63 | | | | 4 | | | | 0.84 | | | | 0.04 | |
|
|
|
|
| | Commercial Real Estate | | | — | | | | — | | | | — | | | | — | |
|
|
|
|
| | Financial Institutions | | | — | | | | — | | | | — | | | | — | |
|
|
|
|
| | Foreign Governments | | | — | | | | (1 | ) | | | — | | | NM |
| | | |
| | | |
| | | | | | | | | |
| Total Foreign Commercial | | | 63 | | | | 3 | | | | 0.79 | | | | 0.03 | |
| | | |
| | | |
| | | | | | | | | |
Total Commercial Loans | | $ | 189 | | | $ | 83 | | | | 0.65 | % | | | 0.27 | % |
| | | |
| | | |
| | | | | | | | | |
-37-
Part I
Item 2 (continued)
Commercial Portfolio (continued)
| | | | | | | | | | | | | | | | | | |
| (in millions, except ratios) | | Net Charge-offs | | Annual Average Net Charge-off Rates(b) |
| | |
| |
|
| | | | Nine Months | | Nine Months |
| | | |
| |
|
| Commercial Loans: | | 2001 | | 2000 | | 2001 | | 2000 |
| | |
| |
| |
| |
|
| Domestic Commercial: | | | | | | | | | | | | | | | | |
|
|
|
|
| | Commercial and Industrial | | $ | 404 | | | $ | 181 | | | | 0.75 | % | | | 0.33 | % |
|
|
|
|
| | Commercial Real Estate | | | 1 | | | | (6 | ) | | | 0.05 | | | NM |
|
|
|
|
| | Financial Institutions | | | 24 | | | | 27 | | | | 0.44 | | | | 0.50 | |
| | | |
| | | |
| | | | | | | | | |
| Total Domestic Commercial | | | 429 | | | | 202 | | | | 0.70 | | | | 0.32 | |
|
|
|
|
| Foreign Commercial: | | | | | | | | | | | | | | | | |
|
|
|
|
| | Commercial and Industrial | | | 124 | | | | 43 | | | | 0.54 | | | | 0.18 | |
|
|
|
|
| | Commercial Real Estate | | | — | | | | — | | | | — | | | | — | |
|
|
|
|
| | Financial Institutions | | | (4 | ) | | | (4 | ) | | NM | | NM |
|
|
|
|
| | Foreign Governments | | | — | | | | — | | | | — | | | | — | |
| | | |
| | | |
| | | | | | | | | |
| Total Foreign Commercial | | | 120 | | | | 39 | | | | 0.49 | | | | 0.15 | |
| | | |
| | | |
| | | | | | | | | |
Total Commercial Loans | | $ | 549 | | | $ | 241 | | | | 0.64 | % | | | 0.27 | % |
| | | |
| | | |
| | | | | | | | | |
| (a) | | Charge-offs for derivative receivables are included in trading revenue. |
|
|
|
|
| (b) | | Annualized. |
|
|
|
|
| NM | – | Not meaningful. |
|
|
|
|
| Note | – | Amounts in the brackets represent net recoveries. |
Commercial and Industrial:The domestic commercial and industrial portfolio increased $795 million from 2000 year-end. Domestic commercial and industrial net charge-offs in the 2001 third quarter amounted to $132 million, compared with $81 million in the 2000 third quarter. Nonperforming domestic commercial and industrial loans were $1.3 billion, an increase of $608 million from the 2000 year-end. The foreign commercial and industrial portfolio totaled $35.2 billion at September 30, 2001, a decrease of 5% from the 2000 year-end level. Nonperforming foreign commercial and industrial loans were $530 million, a decrease of $26 million from year-end 2000, primarily as a result of a reduction in nonperforming commercial loans in Asia but partially offset by an increase in nonperforming loans in Latin America. Net charge-offs in the foreign commercial and industrial loan portfolio for the third quarter of 2001 increased to $63 million from $4 million in the same period last year.
Financial Institutions:Loans to financial institutions decreased $1.3 billion during 2001, when compared with year-end, as a result of reductions in the foreign portion of the portfolio. Nonperforming financial institution loans were $44 million at September 30, 2001 and $42 million at December 31, 2000.
Derivative and Foreign Exchange Contracts
The following table provides the remaining maturities of derivative and foreign exchange contracts outstanding at September 30, 2001 and December 31, 2000.
| | | | | | | | | | | | | | | | | | | | | | | | | | | | | | | | | |
| | | At September 30, 2001 | | At December 31, 2000 |
| | |
| |
|
| | | Interest | | Foreign | | Equity, | | | | | | Interest | | Foreign | | Equity, | | | | |
| | | Rate | | Exchange | | Commodity and | | | | | | Rate | | Exchange | | Commodity and | | | | |
| | | Contracts | | Contracts | | Other Contracts | | Total | | Contracts | | Contracts | | Other Contracts | | Total |
| | |
| |
| |
| |
| |
| |
| |
| |
|
| Less Than 1 Year | | | 11 | % | | | 78 | % | | | 40 | % | | | 19 | % | | | 12 | % | | | 89 | % | | | 40 | % | | | 28 | % |
|
|
|
|
| 1 to 5 Years | | | 46 | | | | 18 | | | | 54 | | | | 44 | | | | 45 | | | | 9 | | | | 57 | | | | 41 | |
|
|
|
|
| Over 5 Years | | | 43 | | | | 4 | | | | 6 | | | | 37 | | | | 43 | | | | 2 | | | | 3 | | | | 31 | |
| | | |
| | | |
| | | |
| | | |
| | | |
| | | |
| | | |
| | | |
| |
| Total | | | 100 | % | | | 100 | % | | | 100 | % | | | 100 | % | | | 100 | % | | | 100 | % | | | 100 | % | | | 100 | % |
| | | |
| | | |
| | | |
| | | |
| | | |
| | | |
| | | |
| | | |
| |
-38-
Part I
Item 2 (continued)
Country Exposure
The following table presents JPMorgan Chase’s exposure to selected countries. This disclosure is based on management’s current view of country exposure. The differences between the current presentation and that used at December 31, 2000 and March 31, 2001 are primarily as follows: (1) collateral held is used to reduce exposure on counterparty trades within a country; and (2) disclosure is based on total exposure, which includes local exposure funded locally in addition to cross-border exposure. Management believes the current presentation more accurately reflects JPMorgan Chase’s country exposure. Amounts as of December 31, 2000 have been restated to conform to the current presentation.
Selected Country Exposure
| | | | | | | | | | | | | | | | | | | | | | | | | |
| | | At September 30, 2001 | | At Dec 31, 2000 |
| | |
| |
|
| | | | | | | | | | | | | | | | | | | Total | | Total |
| | | Cross Border | | Local(d) | | Exposure(e) | | Exposure |
| | |
| |
| |
| |
|
| (in billions) | | Lending(a) | | Trading(b) | | Other(c) | | | | | | | | | | | | |
| | |
| |
| |
| | | | | | | | | | | | |
| Brazil | | $ | 1.8 | | | $ | 0.2 | | | $ | 0.4 | | | $ | 1.1 | | | $ | 3.5 | | | $ | 2.4 | |
|
|
|
|
| Mexico | | | 1.0 | | | | 1.0 | | | | 0.2 | | | | 0.4 | | | | 2.6 | | | | 3.3 | |
|
|
|
|
| Argentina | | | 0.3 | | | | 0.5 | | | | 0.1 | | | | — | | | | 0.9 | | | | 1.4 | |
|
|
|
|
| South Africa | | | 0.4 | | | | 0.5 | | | | — | | | | — | | | | 0.9 | | | | 1.3 | |
|
|
|
|
| Indonesia | | | 0.4 | | | | 0.1 | | | | — | | | | 0.1 | | | | 0.6 | | | | 0.9 | |
|
|
|
|
| Turkey | | | 0.2 | | | | — | | | | — | | | | — | | | | 0.2 | | | | 0.7 | |
|
|
|
|
| Russia | | | — | | | | 0.1 | | | | — | | | | — | | | | 0.1 | | | | 0.3 | |
| (a) | | Lending includes loans and accrued interest receivable, interest-bearing deposits with banks, acceptances, other monetary assets, issued letters of credit and undrawn commitments to extend credit. |
|
|
|
|
| (b) | | Trading includes (1) issuer exposure on cross-border debt and equity instruments, held in both trading and investment accounts, adjusted for the impact of issuer hedges, including credit derivatives; and (2) counterparty exposure on derivative and foreign exchange contracts as well as security financing trades (resale agreements and securities borrowed). The amounts associated with derivative and foreign exchange contracts are presented after taking into account the impact of legally enforceable master netting agreements. |
|
|
|
|
| (c) | | Mainly local exposure funded cross border. |
|
|
|
|
| (d) | | Local exposure is defined as exposure to a country denominated in local currency, booked and funded locally. |
|
|
|
|
| (e) | | Total exposure includes exposure to both government and private sector entities in a country. |
The Firm has been closely managing its exposure to Argentina over the prior several quarters and, in particular, in the months leading up to the government’s recent announcement of a restructuring of its bond obligations. Since June 30, 2001, the Firm has reduced its exposure to Argentina by $0.5 billion.
-39-
Part I
Item 2 (continued)
Consumer Portfolio
| | | | | | | | | | | | | | | | | | | | | | | | | |
| | | | | | | | | | | | | | | | | | | Past Due 90 Days & Over |
| | | Credit-Related Assets | | Nonperforming Assets | | and Accruing |
| | |
| |
| |
|
| (in millions) | | Sept 30, | | Dec 31, | | Sept 30, | | Dec 31, | | Sept 30, | | Dec 31, |
| Consumer Loans: | | 2001 | | 2000 | | 2001 | | 2000 | | 2001 | | 2000 |
| | |
| |
| |
| |
| |
| |
|
| 1-4 Family Residential Mortgages | | $ | 55,160 | | | $ | 50,302 | | | $ | 273 | | | $ | 269 | | | $ | — | | | $ | 2 | |
|
|
|
|
| Credit Card – Reported | | | 19,255 | | | | 18,495 | | | | 23 | | | | 26 | | | | 394 | | | | 327 | |
|
|
|
|
| Credit Card Securitizations (a) | | | 18,724 | | | | 17,871 | | | | — | | | | — | | | | 348 | | | | 387 | |
| | | |
| | | |
| | | |
| | | |
| | | |
| | | |
| |
| Credit Card – Managed | | | 37,979 | | | | 36,366 | | | | 23 | | | | 26 | | | | 742 | | | | 714 | |
|
|
|
|
| Auto Financings | | | 24,448 | | | | 19,802 | | | | 110 | | | | 76 | | | | 1 | | | | 1 | |
|
|
|
|
| Other Consumer (b) | | | 7,844 | | | | 7,991 | | | | 53 | | | | 13 | | | | 28 | | | | 71 | |
| | | |
| | | |
| | | |
| | | |
| | | |
| | | |
| |
Total Consumer Loans | | $ | 125,431 | | | $ | 114,461 | | | $ | 459 | | | $ | 384 | | | $ | 771 | | | $ | 788 | |
| | | |
| | | |
| | | |
| | | |
| | | |
| | | |
| |
| | | | | | | | | | | | | | | | | |
| | | Net Charge-offs | | Annual Average Net Charge-off Rates (c) |
| | |
| |
|
| (in millions, except ratios) | | Third Quarter | | Third Quarter |
| | |
| |
|
| Consumer Loans: | | 2001 | | 2000 | | 2001 | | 2000 |
| | |
| |
| |
| |
|
| 1-4 Family Residential Mortgages | | $ | 15 | | | $ | 7 | | | | 0.10 | % | | | 0.06 | % |
|
|
|
|
| Credit Card – Reported | | | 264 | | | | 167 | | | | 5.47 | | | | 5.06 | |
|
|
|
|
| Credit Card Securitizations (a) | | | 270 | | | | 236 | | | | 5.82 | | | | 4.94 | |
| | | |
| | | |
| | | | | | | | | |
| Credit Card – Managed | | | 534 | | | | 403 | | | | 5.64 | | | | 4.99 | |
|
|
|
|
| Auto Financings | | | 32 | | | | 20 | | | | 0.53 | | | | 0.41 | |
|
|
|
|
| Other Consumer (b) | | | 45 | | | | 46 | | | | 2.33 | | | | 1.94 | |
| | | |
| | | |
| | | | | | | | | |
Total Consumer Loans | | $ | 626 | | | $ | 476 | | | | 1.96 | % | | | 1.72 | % |
| | | |
| | | |
| | | | | | | | | |
| | | | | | | | | | | | | | | | | |
| | | Net Charge-offs | | Annual Average Net Charge-off Rates(c) |
| | |
| |
|
| | | Nine Months | | Nine Months |
| (in millions, except ratios) | |
| |
|
| Consumer Loans: | | 2001 | | 2000 | | 2001 | | 2000 |
| | |
| |
| |
| |
|
| 1-4 Family Residential Mortgages | | $ | 32 | | | $ | 26 | | | | 0.08 | % | | | 0.07 | % |
|
|
|
|
| Credit Card – Reported | | | 716 | | | | 521 | | | | 4.88 | | | | 5.28 | |
|
|
|
|
| Credit Card Securitizations (a) | | | 784 | | | | 732 | | | | 6.06 | | | | 5.15 | |
| | | |
| | | |
| | | | | | | | | |
| Credit Card – Managed | | | 1,500 | | | | 1,253 | | | | 5.43 | | | | 5.20 | |
|
|
|
|
| Auto Financings | | | 87 | | | | 63 | | | | 0.52 | | | | 0.44 | |
|
|
|
|
| Other Consumer (b) | | | 133 | | | | 140 | | | | 2.18 | | | | 1.90 | |
| | | |
| | | |
| | | | | | | | | |
Total Consumer Loans | | $ | 1,752 | | | $ | 1,482 | | | | 1.90 | % | | | 1.84 | % |
| | | |
| | | |
| | | | | | | | | |
| (a) | | Represents the portion of JPMorgan Chase’s credit card receivables that have been securitized. |
|
|
|
|
| (b) | | Consists of installment loans (direct and indirect types of consumer finance), student loans, unsecured lines of credit and foreign consumer. |
|
|
|
|
| (c) | | Annualized. |
Residential Mortgage Loans:Residential mortgage loans were $55.2 billion at September 30, 2001, a $4.9 billion increase, or 10%, from year-end. During the first nine months of 2001, the level of nonperforming residential mortgage loans increased 1%. The net charge-off rate of 0.10% for the third quarter of 2001 was four basis points higher than for the third quarter of 2000.
Credit Card Loans:JPMorgan Chase analyzes its credit card portfolio on a “managed basis,” which includes credit card receivables on the balance sheet as well as credit card receivables that have been securitized.
Managed credit card receivables of $38.0 billion as of September 30, 2001 increased 4%, when compared with year-end 2000. During the 2001 third quarter, net charge-offs as a percentage of average credit card receivables increased to 5.64%, compared with 4.99% in the prior-year period. Loans over 90 days past due remained stable at 1.95% of the portfolio at September 30, 2001, compared with 1.96% at December 31, 2000. Management anticipates that the managed credit card net charge-off ratio for full-year 2001 will be higher than the 5.12% for full-year 2000.
-40-
Part I
Item 2 (continued)
Auto Financings:Auto financings outstanding increased 23% at September 30, 2001, when compared with year-end 2000. The net charge-off rate of 0.53% for the 2001 third quarter was 12 basis points higher than the same period a year ago. Total originations were $14.3 billion for the nine months of 2001, compared with $8.7 billion for the same 2000 period.
Other Consumer Loans:The level of other consumer loans of $7.8 billion at September 30, 2001 decreased 2% from year-end 2000. The net charge-off rates related to this portfolio were higher in the third quarter, when compared with the third quarter of 2000 due to losses for certain discontinued businesses.
Allowance for Credit Losses
Loans: JPMorgan Chase’s allowance for loan losses is intended to cover probable credit losses as of September 30, 2001, for which either the asset is not specifically identified or the size of the loss has not been fully determined. Within the allowance, there are both specific and expected loss components and a residual component. The allowance for loan losses was increased by approximately $200 million during the third quarter of 2001, reflecting the challenging credit conditions which resulted in an increase in the specific and expected loss components of the allowance. For a further discussion of the specific loss, expected loss and residual components of the allowance for loan losses, see page 53 of JPMorgan Chase’s 2000 Annual Report.
The provision for loan losses for the third quarter of 2001 increased $447 million, or 150%, when compared with the third quarter of 2000.
Foreign commercial loan net charge-offs increased $81 million during the first nine months of 2001, when compared with the first nine months of 2000, while foreign commercial nonperforming loans decreased $164 million from September 30, 2000 to $580 million at September 30, 2001. However, domestic commercial loan net charge-offs and nonperforming loans increased $227 million and $767 million, respectively, during the same periods.
| | | | | | | | | | | | | | | |
| Allowance Components | | | | | | | | | | | | |
| (in millions) | | At September 30, 2001 | | At December 31, 2000 | | At September 30, 2000 |
| | |
| |
| |
|
| Specific Loss | | $ | 1,095 | | | $ | 602 | | | $ | 614 | |
|
|
|
|
| Expected Loss: | | | | | | | | | | | | |
|
|
|
|
| | Consumer | | | 1,694 | | | | 1,444 | | | | 1,480 | |
|
|
|
|
| | Commercial | | | 673 | | | | 919 | | | | 763 | |
| | | |
| | | |
| | | |
| |
| | | Total Expected Loss | | | 2,367 | | | | 2,363 | | | | 2,243 | |
| | | |
| | | |
| | | |
| |
| Residual Component | | | 412 | | | | 700 | | | | 892 | |
| | | |
| | | |
| | | |
| |
| | | Total | | $ | 3,874 | | | $ | 3,665 | | | $ | 3,749 | |
| | | |
| | | |
| | | |
| |
| To Total Loans | | | 1.74 | % | | | 1.70 | % | | | 1.72 | % |
|
|
|
|
| To Nonperforming Loans | | | 156 | | | | 202 | | | | 207 | |
|
|
|
|
| To Nonperforming Assets | | | 146 | | | | 191 | | | | 193 | |
Lending-Related Commitments: JPMorgan Chase also has an allowance for its lending-related commitments, using a methodology similar to that used for the loan portfolio. This allowance, which is reported in Other Liabilities, was $283 million at September 30, 2001 and December 31, 2000 and was $304 million at September 30, 2000.
-41-
Part I
Item 2 (continued)
MARKET RISK MANAGEMENT
Aggregate VAR Exposure
Value-at-Risk (“VAR”) is a measure of the dollar amount of potential loss from adverse market moves in an everyday market environment. VAR calculations are performed for all material trading and investment portfolios and for market risk-related asset/liability management (“A/L”) activities. Due to procedural differences at the heritage firms, combined VAR is not available for periods prior to the merger date.
Although no single risk statistic can reflect all aspects of market risk, the tables that follow provide an overview of the market risk exposure of JPMorgan Chase at the dates indicated. The following table represents JPMorgan Chase’s average and period-end VARs for its trading portfolios and its A/L activities.
Aggregate Portfolio
| | | | | | | | | | | | | | | | | | |
| | | | Nine Months Ended September 30, 2001 |
| | | |
|
| | | | Average | | Minimum | | Maximum | | At September 30, 2001 |
| (in millions) | | VAR | | VAR | | VAR | |
| | |
| |
| |
| |
| |
| Trading Portfolio | | $ | 65.3 | | | $ | 48.9 | | | $ | 87.5 | | | $ | 62.6 | |
|
|
|
|
| Investment Portfolio and A/L Activities (a) | | | 103.7 | | | | 79.8 | | | | 120.2 | | | | 91.9 | |
|
|
|
|
| Less: Portfolio Diversification | | | (42.5 | ) | | NM | | NM | | | (32.6 | ) |
| | | |
| | | |
| | | |
| | | |
| |
| | Total VAR | | $ | 126.5 | | | $ | 98.2 | | | $ | 163.8 | | | $ | 121.9 | |
| | | |
| | | |
| | | |
| | | |
| |
| (a) | | Substantially all of the risk is interest rate related. |
|
|
|
|
| NM | – | Because the minimum and maximum may occur on different days for different risk components, it is not meaningful to compute a portfolio diversification effect. JPMorgan Chase’s average and period-end VARs are less than the sum of the VARs of its market risk components due to risk offsets resulting from portfolio diversification. |
Market Risk-Related Activities
Value-at-Risk: JPMorgan Chase is exposed to interest rate, foreign exchange, equity and commodity market risks in its trading portfolio. The table below reflects VAR data for the trading portfolio by risk category. See the Aggregate VAR Exposure section above for average and period-end VARs for the total trading portfolio.
Marked-to-Market Trading Portfolio(a)
| | | | | | | | | | | | | | | | | | |
| | | | Nine Months Ended September 30, 2001 |
| | | |
|
| | | | Average | | Minimum | | Maximum | | At September 30, 2001 |
| (in millions) | | VAR | | VAR | | VAR | |
| | |
| |
| |
| |
|
| Interest Rate | | $ | 45.3 | | | $ | 26.1 | | | $ | 82.4 | | | $ | 53.4 | |
|
|
|
|
| Foreign Exchange | | | 7.4 | | | | 3.9 | | | | 16.9 | | | | 6.9 | |
|
|
|
|
| Equities | | | 24.3 | | | | 15.8 | | | | 36.9 | | | | 19.3 | |
|
|
|
|
| Commodities | | | 4.5 | | | | 2.5 | | | | 7.1 | | | | 4.7 | |
|
|
|
|
| Hedge Fund Investments | | | 3.0 | | | | 2.5 | | | | 4.2 | | | | 3.0 | |
|
|
|
|
| Less: Portfolio Diversification | | | (19.2 | ) | | NM | | NM | | | (24.7 | ) |
| | | |
| | | |
| | | |
| | | |
| |
| | Total Trading VAR | | $ | 65.3 | | | $ | 48.9 | | | $ | 87.5 | | | $ | 62.6 | |
| | | |
| | | |
| | | |
| | | |
| |
| (a) | | Although aggregate VAR has been calculated throughout 2001 using a single methodology, VAR by risk category prior to July 2001 was calculated based on the methodologies used by the heritage firms, assuming no correlation between the heritage firms’ exposures. |
|
|
|
|
| NM | – | Because the minimum and maximum may occur on different days for different risk components, it is not meaningful to compute a portfolio diversification effect. JPMorgan Chase’s average and period-end VARs are less than the sum of the VARs of its market risk components due to risk offsets resulting from portfolio diversification. |
-42-
Part I
Item 2 (continued)
Histogram:
The following histogram illustrates JPMorgan Chase’s daily market risk-related revenue, which is defined as the daily change in value of the marked-to-market trading portfolios plus any trading-related net interest income, brokerage commissions, underwriting fees or other revenue.
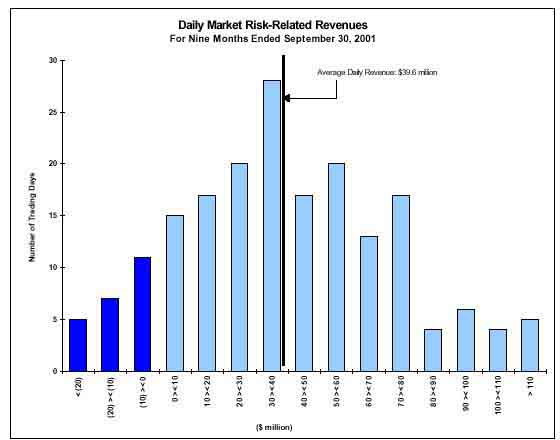
In the first nine months of 2001, JPMorgan Chase posted positive daily market risk-related revenue for 166 out of 189 business days, with 134 days exceeding positive $20 million. Losses were sustained on 23 of the 189 days represented in the histogram. JPMorgan Chase incurred five daily trading losses in excess of $20 million in the first nine months of 2001.
Stress Testing:Whereas VAR captures exposure to unlikely events in normal markets, stress testing discloses market risk under plausible events in abnormal markets.
The following table represents the potential stress test loss (pre-tax) in JPMorgan Chase’s trading portfolio predicted by JPMorgan Chase’s stress test scenarios.
Largest Monthly Stress Test Loss – Pre-Tax
| | | | | | | | | | | | | | | | | |
| | | Nine Months Ended September 30, 2001 | | | | |
| | |
| | | | |
| (in millions) | | Average | | Minimum | | Maximum | | At September 30, 2001 |
| | |
| |
| |
| |
|
| Stress Test Loss – Pre-Tax | | $ | | (351) | | $ | (118 | ) | | $ | (641 | ) | | $ | (411 | ) |
-43-
Part I
Item 2 (continued)
Investment Portfolio and Asset/Liability Activities
JPMorgan Chase is exposed to market risk in its investment portfolio and A/L activities. Market risk measurements for JPMorgan Chase’s investment portfolio and A/L activities reflect all significant market risk-related factors that have an effect on these activities. Non-market factors that are not included in market risk measurements, such as changes in credit quality, also may have an effect on these activities.
Value-at-Risk:See the VAR Aggregate Exposure section on page 42 for JPMorgan Chase’s average and period-end VARs for its investment portfolio and market risk-related A/L activities.
Stress Testing:
Economic value stress testing measures the potential change in the market value of JPMorgan Chase’s investment portfolio and A/L activities. As of September 30, 2001, the largest potential loss under the various economic value stress test scenarios utilized by the Firm on the value of JPMorgan Chase’s investment portfolio and A/L activities would have been equivalent to 1% of JPMorgan Chase’s market capitalization.
The NII stress test measures the potential change in JPMorgan Chase’s interest earnings over a one-year time horizon. At September 30, 2001, JPMorgan Chase’s largest potential NII stress test loss was estimated to be approximately 1.3% of projected net income for the full-year 2001.
Nonstatistical Risk Measures:Exposure to interest rate risk is assessed using a Basis Point Value (“BPV”) method. BPV measures the change in market value of JPMorgan Chase’s investment portfolio and A/L activities to a one basis point increase in interest rates (directional risk) or one basis point widening of interest rate spreads (basis risk). The table that follows shows that JPMorgan Chase had a directional BPV of $(1.5) million (pre-tax) at September 30, 2001. This indicates that the market value of JPMorgan Chase’s A/L positions would have declined by approximately $1.5 million for every one basis point increase in interest rates along the interest rate yield curve. The table also shows that the economic value of JPMorgan Chase’s investment portfolio and A/L activities would have decreased by $11.0 million (pre-tax) for every one basis point widening of interest rate spreads (basis risk).
Market Risk-Related A/L Activities
| | | | | | | | | | | | | | | | | |
| | | Nine Months Ended September 30, 2001 | | | | |
| | |
| | | | |
| (in millions) | | Average | | Minimum | | Maximum | | At September 30, 2001(a) |
| | |
| |
| |
| |
|
| Directional Risk | | $ | (6.3 | ) | | $ | (1.5 | ) | | $ | (8.9 | ) | | $ | (1.5 | ) |
|
|
|
|
| Basis Risk | | | (14.1 | ) | | | (11.0 | ) | | | (18.4 | ) | | | (11.0 | ) |
-44-
Part I
Item 2 (continued)
CAPITAL MANAGEMENT
The following discussion of JPMorgan Chase’s capital management focuses primarily on the developments since December 31, 2000 and should be read in conjunction with pages 44-45 and Note 23 of JPMorgan Chase’s 2000 Annual Report.
Capital
JPMorgan Chase’s capital levels at September 30, 2001 continued to exceed regulatory guidelines. At September 30, 2001, the Tier 1 and Total Capital ratios were 8.2% and 11.6%, respectively. In addition, at September 30, 2001, all of JPMorgan Chase’s subsidiary depository institutions were “well-capitalized” under bank regulatory agencies’ definitions. The Firm’s ratios were negatively affected as a result of market disruptions following the events of September 11th. Management estimates that the Firm experienced balance sheet growth of approximately $86 billion and risk-weighted asset growth of approximately $21 billion in the period between September 11, 2001 and September 30, 2001.
The following table shows JPMorgan Chase’s capital generation and use during the periods indicated.
| | | | | | | | | | | | | | | | | | |
| (in billions) | | Third Quarter | | Nine Months |
| | |
| |
|
| | | | 2001 | | 2000 | | 2001 | | 2000 |
| | | |
| |
| |
| |
|
Sources of Free Cash Flow | | | | | | | | |
| | Cash Operating Earnings Less Dividends | | $ | 0.5 | | | $ | 1.0 | | | $ | 1.6 | | | $ | 3.7 | |
|
|
|
|
| | Plus: Preferred Stock and Equivalents/Special Items | | | (0.6 | ) | | | 0.2 | | | | (1.1 | ) | | | (0.1 | ) |
|
|
|
|
| | Less: Capital for Internal Asset Growth | | | (1.3 | ) | | | — | | | | (2.3 | ) | | | (1.2 | ) |
| | | |
| | | |
| | | |
| | | |
| |
| Total Sources of Free Cash Flow | | $ | (1.4 | ) | | $ | 1.2 | | | $ | (1.8 | ) | | $ | 2.4 | |
| | | |
| | | |
| | | |
| | | |
| |
Uses of Free Cash Flow |
| | Increases (Decreases) in Capital Ratios | | $ | (1.9 | ) | | $ | (1.9 | ) | | $ | (1.4 | ) | | $ | (1.6 | ) |
|
|
|
|
| | Acquisitions | | | — | | | | 6.8 | | | | 0.1 | | | | 6.8 | |
|
|
|
|
| | Repurchases Net of Stock Issuances | | | 0.5 | | | | (3.7 | ) | | | (0.5 | ) | | | (2.8 | ) |
| | | |
| | | |
| | | |
| | | |
| |
| Total Uses of Free Cash Flow | | $ | (1.4 | ) | | $ | 1.2 | | | $ | (1.8 | ) | | $ | 2.4 | |
| | | |
| | | |
| | | |
| | | |
| |
In the first quarter of 2001, JPMorgan Chase raised the quarterly cash dividend on its common stock to $0.34 per share from $0.32 per share. The Firm’s current dividend policy is to pay over time common stock dividends equal to approximately 25% to 35% of operating earnings less preferred stock dividends, although in any given quarter the common stock dividend may be higher or lower than this range. The current quarterly dividend exceeds the target range given this quarter’s lower operating earnings. Future dividend policies will be determined by JPMorgan Chase’s Board of Directors after taking into consideration the Firm’s earnings, financial condition and applicable governmental regulations and policies.
On July 19, 2001, JPMorgan Chase’s Board of Directors authorized the repurchase of up to $6 billion of the Firm’s common stock. As of September 30, 2001, the Firm had repurchased, net of stock issuances, approximately $500 million of the Firm’s common stock.
At September 30, 2001, the total capitalization of JPMorgan Chase (the sum of Tier 1 and Tier 2 Capital) was $54.6 billion, an increase of $1.2 billion from December 31, 2000. This increase reflects retained earnings (net income less common and preferred dividends) generated during the period, aggregate common stock issuances and treasury stock reissuances of $1.2 billion and the issuance of an aggregate $2.5 billion in trust preferred capital securities and subordinated debt. These sources of capital were partially offset by the repurchase of common stock and the redemption of preferred stock and subordinated debt.
LIQUIDITY RISK MANAGEMENT
The following discussion of JPMorgan Chase’s liquidity risk management focuses primarily on the developments since December 31, 2000 and should be read in conjunction with page 59 of JPMorgan Chase’s 2000 Annual Report.
Liquidity
During the first nine months of 2001, JPMorgan Chase issued approximately $8.5 billion of long-term debt and $500 million of trust preferred capital securities. During the same period, $9.8 billion of long-term debt matured or was redeemed, and $0.5 billion of preferred stock was called.
-45-
Part I
Item 2 (continued)
As a result of the events of September 11th, the Consolidated Balance Sheet increased $86 billion to $799 billion at September 30, 2001 from $713 billion at June 30, 2001, primarily due to the securities industry’s temporary delay in clearing and settling cash and securities. The balance sheet growth is primarily composed of federal funds sold/purchased, trading assets and failed to deliver/receive securities (Other Assets/Other Liabilities). Management of JPMorgan Chase expects a reduction in balance sheet levels once the market returns to a more normal environment.
OPERATIONAL RISK MANAGEMENT
For a discussion of JPMorgan Chase’s operational risk management, refer to page 58 of JPMorgan Chase’s 2000 Annual Report.
SUPERVISION AND REGULATION
The following discussion should be read in conjunction with the Supervision and Regulation section on pages 1 through 6 of JPMorgan Chase’s 2000 Form 10-K.
Dividends
JPMorgan Chase’s bank subsidiaries, without the approval of their relevant banking regulators, could pay dividends to their respective bank holding companies in amounts up to the limitations imposed upon such banks by regulatory restrictions. These dividend limitations, in the aggregate, totaled approximately $4.8 billion at September 30, 2001.
ACCOUNTING DEVELOPMENTS
Legal Isolation
In July 2001, the FASB issued a Technical Bulletin that would delay the effective date of SFAS 140 for certain provisions that impact entities subject to possible receivership by the FDIC. For those entities, the Technical Bulletin delays the isolation standards of SFAS 140 until at least December 31, 2001. The Firm currently is reviewing its transactions to determine what modifications will be required to conform with SFAS 140 and the Technical Bulletin.
Business Combinations and Intangible Assets
In June 2001, the FASB issued SFAS 141, which revises the financial accounting and reporting for business combinations, and also issued SFAS 142, which revises the financial accounting and reporting for goodwill and other intangible assets. SFAS 141 requires that all business combinations be accounted for using the purchase method. Accounting for business combinations using the pooling of interests method no longer is allowed. SFAS 141 also requires that intangible assets acquired in a business combination be recognized apart from goodwill if the intangible assets meet one of two criteria — the contractual-legal criterion or the separability criterion. The provisions of SFAS 141 apply to all business combinations initiated after June 30, 2001 as well as business combinations accounted for by the purchase method for which the date of acquisition is July 1, 2001 or later. Certain transition provisions could affect the accounting for business combinations using the purchase method that were completed before July 1, 2001.
SFAS 142 establishes how intangible assets (other than those acquired in a business combination) should be accounted for upon acquisition. It also addresses how goodwill and other intangible assets should be accounted for subsequent to their acquisition. Goodwill and intangible assets that have indefinite useful lives no longer will be amortized but will be tested at least annually for impairment. Intangible assets with finite lives will continue to be amortized over their useful lives. The provisions of SFAS 142 are required to be adopted by the Firm beginning January 1, 2002. Impairment losses that arise due to the initial application of SFAS 142 are required to be reported as a change in accounting principle.
The Firm currently is assessing the impact of SFAS 141 and SFAS 142 on its financial condition and operating performance. The Firm has not yet determined the extent of goodwill impairment, if any, that may be recognized upon the adoption of SFAS 142. Based on current levels of amortization expense, the Firm estimates that the elimination of goodwill amortization expense will reduce total noninterest expense by approximately $580 million during 2002.
-46-
Part I
Item 2 (continued)
J.P. MORGAN CHASE & CO.
FINANCIAL HIGHLIGHTS
(in millions, except per share data and ratios)
| | | | | | | | | | | | | | | | | | | | | | | | | | | | |
| | | | Third Quarter | | | | Nine Months | | |
| | | |
| | Over (Under) | | |
| | Over (Under) |
| REPORTED BASIS | | 2001 | | 2000 | | 2000 | | | 2001 | | 2000 | | 2000 |
| | |
| |
| |
| | |
| |
| |
|
| Revenue | | $ | 7,349 | | | $ | 7,723 | | | | (5 | )% | | | $ | 22,473 | | | $ | 24,391 | | | | (8 | )% |
|
|
|
|
| Noninterest Expense (Excluding Merger and Restructuring Costs) | | | 5,059 | | | | 5,273 | | | | (4 | ) | | | | 15,940 | | | | 15,651 | | | | 2 | |
|
|
|
|
| Merger and Restructuring Costs | | | 876 | | | | 79 | | | NM | | | | 1,682 | | | | 129 | | | NM |
|
|
|
|
| Provision for Loan Losses | | | 745 | | | | 298 | | | | 150 | | | | | 1,717 | | | | 968 | | | | 77 | |
|
|
|
|
| Net Income (a) | | $ | 449 | | | $ | 1,398 | | | | (68 | )% | | | $ | 2,026 | | | $ | 5,019 | | | | (60 | )% |
|
|
|
|
| Net Income per Share: | | | | | | | | | | | | | | | | | | | | | | | | |
|
|
|
|
| | Basic (a) | | $ | 0.22 | | | $ | 0.73 | | | | (70 | )% | | | $ | 1.00 | | | $ | 2.64 | | | | (62 | )% |
|
|
|
|
| | Diluted (a) | | | 0.22 | | | | 0.69 | | | | (68 | ) | | | | 0.97 | | | | 2.53 | | | | (62 | ) |
|
|
|
|
| Cash Dividends Declared | | | 0.34 | | | | 0.32 | | | | 6 | | | | | 1.02 | | | | 0.96 | | | �� | 6 | |
|
|
|
|
| Share Price at Period End | | | | | | | | | | | | | | | | 34.15 | | | | 46.19 | | | | (26 | ) |
|
|
|
|
| Book Value at Period End | | | | | | | | | | | | | | | | 21.15 | | | | 20.98 | | | | 1 | |
|
|
|
|
| Common Shares Outstanding: | | | | | | | | | | | | | | | | | | | | | | | | |
|
|
|
|
| Average Common Shares: | | | | | | | | | | | | | | | | | | | | | | | | | |
|
|
|
|
| | Basic | | | 1,975.3 | | | | 1,893.3 | | | | 4 | % | | | | 1,973.5 | | | | 1,870.7 | | | | 5 | % |
|
|
|
|
| | Diluted | | | 2,020.9 | | | | 1,983.4 | | | | 2 | | | | | 2,028.9 | | | | 1,955.8 | | | | 4 | |
|
|
|
|
| Common Shares at Period End | | | 1,972.9 | | | | 1,901.1 | | | | 4 | | | | | 1,972.9 | | | | 1,901.1 | | | | 4 | |
|
|
|
|
| Performance Ratios: | | | | | | | | | | | | | | | | | | | | | | | | | |
|
|
|
|
| Return on Average Total Assets (b) | | | 0.24 | % | | | 0.81 | % | | | (57 | )bp | | | | 0.37 | % | | | 1.00 | % | | | (63 | )bp | |
|
|
|
|
| Return on Average Common Equity (b) | | | 4.2 | | | | 14.6 | | | | (1,040 | ) | | | | 6.4 | | | | 19.0 | | | | (1,260 | ) |
|
|
|
|
| Capital Ratios: | | | | | | | | | | | | | | | | | | | | | | | | |
|
|
|
|
| Tier 1 Capital Ratio | | | | | | | | | | | | | | | | 8.2 | % | | | 8.1 | % | | | 10 | bp | |
|
|
|
|
| Total Capital Ratio | | | | | | | | | | | | | | | | 11.6 | | | | 11.7 | | | | (10 | ) |
|
|
|
|
| Tier 1 Leverage | | | | | | | | | | | | | | | | 5.3 | | | | 5.6 | | | | (30 | ) |
| |
| | | INCLUDING JPMORGAN PARTNERS (f) |
| | |
|
OPERATING BASIS(c)
Revenue | | $ | 7,619 | | | $ | 7,913 | | | | (4 | )% | | | $ | 23,257 | | | $ | 25,218 | | | | (8 | )% |
|
|
|
|
| Noninterest Expense | | | 5,059 | | | | 5,273 | | | | (4 | ) | | | | 15,940 | | | | 15,651 | | | | 2 | |
|
|
|
|
| Credit Costs | | | 1,015 | | | | 534 | | | | 90 | | | | | 2,501 | | | | 1,700 | | | | 47 | |
|
|
|
|
| Earnings | | | 1,036 | | | | 1,419 | | | | (27 | ) | | | | 3,162 | | | | 5,164 | | | | (39 | ) |
|
|
|
|
| Diluted Earnings per Share | | | 0.51 | | | | 0.70 | | | | (27 | ) | | | | 1.53 | | | | 2.60 | | | | (41 | ) |
|
|
|
|
| Common Dividend Payout Ratio | | | 66 | % | | | 42 | % | | | 2,400 | bp | | | | 66 | % | | | 34 | % | | | 3,200 | bp | |
|
|
|
|
Cash Operating Basis: | | | | | | | | | | | | | | | | | | | | | | | | | |
|
|
|
|
| Cash Earnings | | $ | 1,218 | | | $ | 1,576 | | | | (23 | )% | | | $ | 3,704 | | | $ | 5,506 | | | | (33 | )% |
|
|
|
|
| Cash Diluted Earnings per Share | | | 0.60 | | | | 0.78 | | | | (23 | ) | | | | 1.80 | | | | 2.78 | | | | (35 | ) |
|
|
|
|
| Shareholder Value Added (d) | | | (50 | ) | | | 426 | | | NM | | | | (74 | ) | | | 2,308 | | | NM |
|
|
|
|
| Cash Return on Average Managed Assets (b) | | | 0.64 | % | | | 0.89 | % | | | (25 | )bp | | | | 0.66 | % | | | 1.07 | % | | | (41 | )bp | |
|
|
|
|
| Cash Return on Average Common Equity (b) | | | 11.5 | | | | 16.5 | | | | (500 | ) | | | | 11.8 | | | | 20.9 | | | | (910 | ) |
|
|
|
|
| Cash Overhead Ratio (e) | | | 64 | | | | 65 | | | | (100 | ) | | | | 66 | | | | 61 | | | | 500 | |
| |
| | | | | | | | | | | EXCLUDING JPMORGAN PARTNERS (f) | | | | |
| | |
|
OPERATING BASIS(c)
Revenue | | $ | 7,798 | | | $ | 7,986 | | | | (2 | )% | | | $ | 24,268 | | | $ | 24,293 | | | | — | % |
|
|
|
|
| Noninterest Expense | | | 4,989 | | | | 5,153 | | | | (3 | ) | | | | 15,696 | | | | 15,325 | | | | 2 | |
|
|
|
|
| Credit Costs | | | 1,015 | | | | 534 | | | | 90 | | | | | 2,501 | | | | 1,700 | | | | 47 | |
|
|
|
|
| Earnings | | | 1,196 | | | | 1,542 | | | | (22 | ) | | | | 3,972 | | | | 4,768 | | | | (17 | ) |
|
|
|
|
| Diluted Earnings per Share | | | 0.59 | | | | 0.77 | | | | (23 | ) | | | | 1.94 | | | | 2.41 | | | | (20 | ) |
|
|
|
|
Cash Operating Basis: | | | | | | | | | | | | | | | | | | | | | | | | |
|
|
|
|
| Cash Earnings | | $ | 1,373 | | | $ | 1,694 | | | | (19 | )% | | | $ | 4,498 | | | $ | 5,100 | | | | (12 | )% |
|
|
|
|
| Cash Diluted Earnings per Share | | | 0.67 | | | | 0.84 | | | | (20 | ) | | | | 2.19 | | | | 2.58 | | | | (15 | ) |
| (a) | | Reported basis for the nine months of 2001 includes the cumulative effect of a transition adjustment of $(25) million, net of taxes, and basic and diluted earnings per share have been reduced by $0.01 in the first nine months of 2001 due to the impact of the adoption of SFAS 133 relating to the accounting for derivative instruments and hedging activities. |
|
|
|
|
| (b) | | Based on annualized amounts. |
|
|
|
|
| (c) | | Operating basis excludes the impact of credit card securitizations, merger and restructuring costs, special items and the net effect of a change in accounting principle. See page 29 for a reconciliation of results on a reported and operating basis. |
|
|
|
|
| (d) | | SVA represents cash operating earnings minus preferred dividends and an explicit charge for capital. |
|
|
|
|
| (e) | | The cash overhead ratio is noninterest expense as a percentage of the total of net interest income and noninterest revenue (excluding merger and restructuring costs, the impact of amortization of intangibles, special items and the net effect of a change in accounting principle). |
|
|
|
|
| (f) | | JPMP is JPMorgan Chase’s private equity business. See pages 21-22 for its line of business results. |
|
|
|
|
| bp | – | Denotes basis points; 100 bp equals 1%. |
|
|
|
|
| NM | – | Not meaningful. |
-47-
Part I
Item 2 (continued)
J.P. MORGAN CHASE & CO.
CONSOLIDATED AVERAGE BALANCE SHEET, INTEREST AND RATES
(Taxable-Equivalent Interest and Rates; in millions, except rates)
| | | | | | | | | | | | | | | | | | | | | | | | | | |
| | | | Three Months Ended September 30, 2001 | | Three Months Ended September 30, 2000 |
| | | |
| |
|
| | | | Average | | | | | | Rate | | Average | | | | | | Rate |
| | | | Balance | | Interest | | (Annualized) | | Balance | | Interest | | (Annualized) |
| | | |
| |
| |
| |
| |
| |
|
ASSETS
Deposits with Banks | | $ | 8,583 | | | $ | 100 | | | | 4.64 | % | | $ | 8,258 | | | $ | 180 | | | | 8.68 | % |
|
|
|
|
| Federal Funds Sold and Securities Purchased under Resale Agreements | | | 80,396 | | | | 848 | | | | 4.19 | | | | 79,495 | | | | 1,193 | | | | 5.97 | |
|
|
|
|
| Securities and Trading Assets | | | 200,161 | | | | 2,781 | | | | 5.51 | (a) | | | 179,233 | | | | 2,964 | | | | 6.58 | (a) |
|
|
|
|
| Securities Borrowed | | | 38,122 | | | | 305 | | | | 3.17 | | | | 37,270 | | | | 607 | | | | 6.48 | |
|
|
|
|
| Loans | | | 224,125 | | | | 3,698 | | | | 6.54 | | | | 213,312 | | | | 4,498 | | | | 8.39 | |
| | | |
| | | |
| | | | | | | |
| | | |
| | | | | |
| Total Interest-Earning Assets | | | 551,387 | | | | 7,732 | | | | 5.56 | % | | | 517,568 | | | | 9,442 | | | | 7.26 | % |
|
|
|
|
| Allowance for Loan Losses | | | (3,746 | ) | | | | | | | | | | | (3,680 | ) | | | | | | | | |
|
|
|
|
| Cash and Due from Banks | | | 19,752 | | | | | | | | | | | | 17,327 | | | | | | | | | |
|
|
|
|
| Trading Assets – Derivative Receivables | | | 74,639 | | | | | | | | | | | | 68,644 | | | | | | | | | |
|
|
|
|
| All Other Assets | | | 95,246 | | | | | | | | | | | | 84,426 | | | | | | | | | |
| | | |
| | | | | | | | | | | |
| | | | | | | | | |
| Total Assets | | $ | 737,278 | | | | | | | | | | | $ | 684,285 | | | | | | | | | |
| | | |
| | | | | | | | | | | |
| | | | | | | | | |
LIABILITIES
Interest-Bearing Deposits | | $ | 207,430 | | | $ | 1,820 | | | | 3.48 | % | | $ | 212,918 | | | $ | 2,765 | | | | 5.17 | % |
|
|
|
|
| Federal Funds Purchased and Securities Sold under Repurchase Agreements | | | 170,708 | | | | 1,640 | | | | 3.81 | | | | 134,478 | | | | 2,047 | | | | 6.06 | |
|
|
|
|
| Commercial Paper | | | 21,307 | | | | 190 | | | | 3.53 | | | | 16,851 | | | | 282 | | | | 6.65 | |
|
|
|
|
| Other Borrowings (b) | | | 67,218 | | | | 900 | | | | 5.31 | | | | 61,770 | | | | 1,129 | | | | 7.27 | |
|
|
|
|
| Long-Term Debt | | | 44,788 | | | | 500 | | | | 4.43 | | | | 47,113 | | | | 857 | | | | 7.24 | |
| | | |
| | | |
| | | | | | | |
| | | |
| | | | | |
| Total Interest-Bearing Liabilities | | | 511,451 | | | | 5,050 | | | | 3.92 | | | | 473,130 | | | | 7,080 | | | | 5.95 | |
| | | |
| | | |
| | | | | | | |
| | | |
| | | | | |
| Noninterest-Bearing Deposits | | | 61,526 | | | | | | | | | | | | 52,645 | | | | | | | | | |
|
|
|
|
| Trading Liabilities – Derivative Payables | | | 65,031 | | | | | | | | | | | | 64,092 | | | | | | | | | |
|
|
|
|
| All Other Liabilities | | | 56,200 | | | | | | | | | | | | 55,027 | | | | | | | | | |
| | | |
| | | | | | | | | | | |
| | | | | | | | | |
| Total Liabilities | | | 694,208 | | | | | | | | | | | | 644,894 | | | | | | | | | |
| | | |
| | | | | | | | | | | |
| | | | | | | | | |
PREFERRED STOCK OF SUBSIDIARY | | | 550 | | | | | | | | | | | | 550 | | | | | | | | | |
| | | |
| | | | | | | | | | | |
| | | | | | | | | |
STOCKHOLDERS’ EQUITY
Preferred Stock | | | 1,017 | | | | | | | | | | | | 1,522 | | | | | | | | | |
|
|
|
|
| Common Stockholders’ Equity | | | 41,503 | | | | | | | | | | | | 37,319 | | | | | | | | | |
| | | |
| | | | | | | | | | | |
| | | | | | | | | |
| Total Stockholders’ Equity | | | 42,520 | | | | | | | | | | | | 38,841 | | | | | | | | | |
| | | |
| | | | | | | | | | | |
| | | | | | | | | |
| | Total Liabilities, Preferred Stock of Subsidiary and Stockholders’ Equity | | $ | 737,278 | | | | | | | | | | | $ | 684,285 | | | | | | | | | |
| | | |
| | | | | | | | | | | |
| | | | | | | | | |
TOTAL INVESTABLE FUNDS | | | | | | | | | | | 3.63 | % | | | | | | | | | | | 5.44 | % |
|
|
|
|
INTEREST RATE SPREAD | | | | | | | | | | | 1.64 | % | | | | | | | | | | | 1.31 | % |
|
|
|
|
NET INTEREST INCOME AND NET INTEREST MARGIN | | | | | | $ | 2,682 | | | | 1.93 | % | | | | | | $ | 2,362 | | | | 1.82 | % |
| | | | | | | |
| | | | | | | | | | | |
| | | | | |
NET INTEREST MARGIN ADJUSTED FOR SECURITIZATIONS | | | | | | | | | | | 2.13 | % | | | | | | | | | | | 2.01 | % |
| (a) | | For the three months ended September 30, 2001 and September 30, 2000, the annualized rate for available-for-sale securities based on historical cost was 5.30% and 6.07%, respectively, and the annualized rate for available-for-sale securities based on fair value was 5.31% and 6.26%, respectively. |
|
|
|
|
| (b) | | Includes securities sold but not yet purchased and structured notes and trust preferred notes. |
-48-
Part I
Item 2 (continued)
J.P. MORGAN CHASE & CO.
CONSOLIDATED AVERAGE BALANCE SHEET, INTEREST AND RATES
(Taxable-Equivalent Interest and Rates; in millions, except rates)
| | | | | | | | | | | | | | | | | | | | | | | | | | |
| | | | Nine Months Ended September 30, 2001 | | Nine Months Ended September 30, 2000 |
| | | |
| |
|
| | | | Average | | | | | | Rate | | Average | | | | | | Rate |
| | | | Balance | | Interest | | (Annualized) | | Balance | | Interest | | (Annualized) |
| | | |
| |
| |
| |
| |
| |
|
ASSETS
Deposits with Banks | | $ | 8,549 | | | $ | 350 | | | | 5.48 | % | | $ | 9,133 | | | $ | 568 | | | | 8.31 | % |
|
|
|
|
| Federal Funds Sold and Securities Purchased under Resale Agreements | | | 83,254 | | | | 3,120 | | | | 5.01 | | | | 78,988 | | | | 3,484 | | | | 5.89 | |
|
|
|
|
| Securities and Trading Assets | | | 198,587 | | | | 8,546 | | | | 5.75 | (a) | | | 172,436 | | | | 8,511 | | | | 6.59 | (a) |
|
|
|
|
| Securities Borrowed | | | 37,799 | | | | 1,145 | | | | 4.05 | | | | 36,234 | | | | 1,663 | | | | 6.13 | |
|
|
|
|
| Loans | | | 220,253 | | | | 12,257 | | | | 7.44 | | | | 207,496 | | | | 12,561 | | | | 8.09 | |
| | | |
| | | |
| | | | | | | |
| | | |
| | | | | |
| Total Interest-Earning Assets | | | 548,442 | | | | 25,418 | | | | 6.20 | % | | | 504,287 | | | | 26,787 | | | | 7.10 | % |
|
|
|
|
| Allowance for Loan Losses | | | (3,718 | ) | | | | | | | | | | | (3,694 | ) | | | | | | | | |
|
|
|
|
| Cash and Due from Banks | | | 20,871 | | | | | | | | | | | | 16,666 | | | | | | | | | |
|
|
|
|
| Trading Assets – Derivative Receivables | | | 76,218 | | | | | | | | | | | | 73,010 | | | | | | | | | |
|
|
|
|
| All Other Assets | | | 92,878 | | | | | | | | | | | | 77,531 | | | | | | | | | |
| | | |
| | | | | | | | | | | |
| | | | | | | | | |
| Total Assets | | $ | 734,691 | | | | | | | | | | | $ | 667,800 | | | | | | | | | |
| | | |
| | | | | | | | | | | |
| | | | | | | | | |
LIABILITIES
Interest-Bearing Deposits | | $ | 213,355 | | | $ | 6,578 | | | | 4.12 | % | | $ | 214,164 | | | $ | 7,916 | | | | 4.94 | % |
|
|
|
|
| Federal Funds Purchased and Securities Sold under Repurchase Agreements | | | 163,569 | | | | 5,563 | | | | 4.55 | | | | 128,489 | | | | 5,486 | | | | 5.70 | |
|
|
|
|
| Commercial Paper | | | 19,042 | | | | 649 | | | | 4.56 | | | | 16,636 | | | | 779 | | | | 6.25 | |
|
|
|
|
Other Borrowings(b) | | | 66,941 | | | | 2,832 | | | | 5.66 | | | | 57,292 | | | | 3,124 | | | | 7.28 | |
|
|
|
|
| Long-Term Debt | | | 45,792 | | | | 1,878 | | | | 5.48 | | | | 46,134 | | | | 2,365 | | | | 6.85 | |
| | | |
| | | |
| | | | | | | |
| | | |
| | | | | |
| Total Interest-Bearing Liabilities | | | 508,699 | | | | 17,500 | | | | 4.60 | | | | 462,715 | | | | 19,670 | | | | 5.68 | |
| | | |
| | | |
| | | | | | | |
| | | |
| | | | | |
| Noninterest-Bearing Deposits | | | 58,960 | | | | | | | | | | | | 52,561 | | | | | | | | | |
|
|
|
|
| Trading Liabilities – Derivative Payables | | | 70,549 | | | | | | | | | | | | 67,797 | | | | | | | | | |
|
|
|
|
| All Other Liabilities | | | 53,190 | | | | | | | | | | | | 47,823 | | | | | | | | | |
| | | |
| | | | | | | | | | | |
| | | | | | | | | |
| Total Liabilities | | | 691,398 | | | | | | | | | | | | 630,896 | | | | | | | | | |
| | | |
| | | | | | | | | | | |
| | | | | | | | | |
PREFERRED STOCK OF SUBSIDIARY | | | 550 | | | | | | | | | | | | 550 | | | | | | | | | |
| | | |
| | | | | | | | | | | |
| | | | | | | | | |
STOCKHOLDERS’ EQUITY
Preferred Stock | | | 1,246 | | | | | | | | | | | | 1,588 | | | | | | | | | |
|
|
|
|
| Common Stockholders’ Equity | | | 41,497 | | | | | | | | | | | | 34,766 | | | | | | | | | |
| | | |
| | | | | | | | | | | |
| | | | | | | | | |
| Total Stockholders’ Equity | | | 42,743 | | | | | | | | | | | | 36,354 | | | | | | | | | |
| | | |
| | | | | | | | | | | |
| | | | | | | | | |
| | Total Liabilities, Preferred Stock of Subsidiary and Stockholders’ Equity | | $ | 734,691 | | | | | | | | | | | $ | 667,800 | | | | | | | | | |
| | | |
| | | | | | | | | | | |
| | | | | | | | | |
TOTAL INVESTABLE FUNDS | | | | | | | | | | | 4.27 | % | | | | | | | | | | | 5.21 | % |
|
|
|
|
INTEREST RATE SPREAD | | | | | | | | | | | 1.60 | % | | | | | | | | | | | 1.42 | % |
|
|
|
|
NET INTEREST INCOME AND NET INTEREST MARGIN | | | | | | $ | 7,918 | | | | 1.93 | % | | | | | | $ | 7,117 | | | | 1.89 | % |
| | | | | | | |
| | | | | | | | | | | |
| | | | | |
NET INTEREST MARGIN ADJUSTED FOR SECURITIZATIONS | | | | | | | | | | | 2.10 | % | | | | | | | | | | | 2.08 | % |
| (a) | | For the nine months ended September 30, 2001 and September 30, 2000, the annualized rate for available-for-sale securities based on historical cost was 5.64% and 6.07%, respectively, and the annualized rate for available-for-sale securities based on fair value was 5.67% and 6.35%, respectively. |
|
|
|
|
| (b) | | Includes securities sold but not yet purchased and structured notes and trust preferred notes. |
-49-
Part I
Item 2 (continued)
J.P. MORGAN CHASE & CO.
QUARTERLY CONSOLIDATED STATEMENT OF INCOME
(in millions, except per share data)
| | | | | | | | | | | | | | | | | | | | | | | | | |
| | | 2001 | | 2000 |
| | |
| |
|
| | | Third | | Second | | First | | Fourth | | Third |
| | | Quarter | | Quarter | | Quarter | | Quarter | | Quarter |
| | |
| |
| |
| |
| |
|
|
|
|
|
REVENUE
Investment Banking Fees | | $ | 811 | | | $ | 929 | | | $ | 941 | | | $ | 1,051 | | | $ | 1,013 | |
|
|
|
|
| Trading Revenue | | | 1,301 | | | | 1,261 | | | | 2,001 | | | | 1,142 | | | | 1,455 | |
|
|
|
|
| Fees and Commissions | | | 2,331 | | | | 2,388 | | | | 2,065 | | | | 2,387 | | | | 2,427 | |
|
|
|
|
| Private Equity – Realized Gains (Losses) | | | 204 | | | | (46 | ) | | | 412 | | | | 373 | | | | 656 | |
|
|
|
|
| Private Equity – Unrealized Gains (Losses) | | | (311 | ) | | | (783 | ) | | | (285 | ) | | | (471 | ) | | | (676 | ) |
|
|
|
|
| Securities Gains | | | 142 | | | | 67 | | | | 455 | | | | 118 | | | | 90 | |
|
|
|
|
| Other Revenue | | | 212 | | | | 274 | | | | 246 | | | | 1,482 | | | | 415 | |
| | | |
| | | |
| | | |
| | | |
| | | |
| |
| TOTAL NONINTEREST REVENUE | | | 4,690 | | | | 4,090 | | | | 5,835 | | | | 6,082 | | | | 5,380 | |
| | | |
| | | |
| | | |
| | | |
| | | |
| |
| Interest Income | | | 7,709 | | | | 8,469 | | | | 9,180 | | | | 9,922 | | | | 9,423 | |
|
|
|
|
| Interest Expense | | | 5,050 | | | | 5,688 | | | | 6,762 | | | | 7,461 | | | | 7,080 | |
| | | |
| | | |
| | | |
| | | |
| | | |
| |
| NET INTEREST INCOME | | | 2,659 | | | | 2,781 | | | | 2,418 | | | | 2,461 | | | | 2,343 | |
| | | |
| | | |
| | | |
| | | |
| | | |
| |
| REVENUE BEFORE PROVISION FOR LOAN LOSSES | | | 7,349 | | | | 6,871 | | | | 8,253 | | | | 8,543 | | | | 7,723 | |
|
|
|
|
| Provision for Loan Losses | | | 745 | | | | 525 | | | | 447 | | | | 409 | | | | 298 | |
| | | |
| | | |
| | | |
| | | |
| | | |
| |
| TOTAL NET REVENUE | | | 6,604 | | | | 6,346 | | | | 7,806 | | | | 8,134 | | | | 7,425 | |
| | | |
| | | |
| | | |
| | | |
| | | |
| |
|
|
|
|
EXPENSE
Compensation Expense | | | 2,883 | | | | 3,052 | | | | 3,357 | | | | 3,310 | | | | 3,135 | |
|
|
|
|
| Occupancy Expense | | | 339 | | | | 327 | | | | 348 | | | | 351 | | | | 338 | |
|
|
|
|
| Technology and Communications | | | 663 | | | | 674 | | | | 654 | | | | 668 | | | | 632 | |
|
|
|
|
| Merger and Restructuring Costs | | | 876 | | | | 478 | | | | 328 | | | | 1,302 | | | | 79 | |
|
|
|
|
| Amortization of Intangibles | | | 182 | | | | 183 | | | | 177 | | | | 186 | | | | 157 | |
|
|
|
|
| Other Expense | | | 992 | | | | 1,047 | | | | 1,062 | | | | 1,227 | | | | 1,011 | |
| | | |
| | | |
| | | |
| | | |
| | | |
| |
| TOTAL NONINTEREST EXPENSE | | | 5,935 | | | | 5,761 | | | | 5,926 | | | | 7,044 | | | | 5,352 | |
| | | |
| | | |
| | | |
| | | |
| | | |
| |
INCOME BEFORE INCOME TAX EXPENSE AND EFFECT OF ACCOUNTING CHANGE | | | 669 | | | | 585 | | | | 1,880 | | | | 1,090 | | | | 2,073 | |
|
|
|
|
| Income Tax Expense | | | 220 | | | | 207 | | | | 656 | | | | 382 | | | | 675 | |
| | | |
| | | |
| | | |
| | | |
| | | |
| |
INCOME BEFORE EFFECT OF ACCOUNTING CHANGE | | | 449 | | | | 378 | | | | 1,224 | | | | 708 | | | | 1,398 | |
|
|
|
|
| Net Effect of Change in Accounting Principle | | | — | | | | — | | | | (25 | ) | | | — | | | | — | |
| | | |
| | | |
| | | |
| | | |
| | | |
| |
NET INCOME | | $ | 449 | | | $ | 378 | | | $ | 1,199 | | | $ | 708 | | | $ | 1,398 | |
| | | |
| | | |
| | | |
| | | |
| | | |
| |
NET INCOME APPLICABLE TO COMMON STOCK | | $ | 436 | | | $ | 359 | | | $ | 1,178 | | | $ | 687 | | | $ | 1,374 | |
| | | |
| | | |
| | | |
| | | |
| | | |
| |
NET INCOME PER SHARE(a)
Basic | | $ | 0.22 | | | $ | 0.18 | | | $ | 0.60 | | | $ | 0.36 | | | $ | 0.73 | |
| | | |
| | | |
| | | |
| | | |
| | | |
| |
| Diluted | | $ | 0.22 | | | $ | 0.18 | | | $ | 0.58 | | | $ | 0.34 | | | $ | 0.69 | |
| | | |
| | | |
| | | |
| | | |
| | | |
| |
| (a) | | Basic and diluted earnings per share have been reduced by $0.01 in the first quarter of 2001 due to the impact of the adoption of SFAS 133 relating to the accounting for derivative instruments and hedging activities. |
-50-
Part I
Item 2 (continued)
J.P. MORGAN CHASE & CO.
QUARTERLY CONSOLIDATED BALANCE SHEET
(in millions)
| | | | | | | | | | | | | | | | | | | | | | | | |
| | | | | | Sept 30, | | June 30, | | March 31, | | Dec 31, | | Sept 30, |
| | | | | | 2001 | | 2001 | | 2001 | | 2000 | | 2000 |
| | | | | |
| |
| |
| |
| |
|
|
|
|
|
ASSETS
Cash and Due from Banks | | $ | 22,299 | | | $ | 24,219 | | | $ | 22,371 | | | $ | 23,972 | | | $ | 20,284 | |
|
|
|
|
| Deposits with Banks | | | 9,341 | | | | 11,903 | | | | 7,979 | | | | 8,333 | | | | 8,669 | |
|
|
|
|
| Federal Funds Sold and Securities Purchased under Resale Agreements | | | 78,997 | | | | 61,308 | | | | 71,147 | | | | 69,474 | | | | 69,413 | |
|
|
|
|
| Securities Borrowed | | | 37,499 | | | | 38,296 | | | | 37,264 | | | | 32,371 | | | | 36,424 | |
|
|
|
|
| Trading Assets: Debt and Equity Instruments | | | 165,143 | | | | 139,135 | | | | 138,270 | | | | 139,249 | | | | 140,992 | |
|
|
|
|
| | | | Derivative Receivables | | | 85,407 | | | | 68,910 | | | | 78,907 | | | | 76,373 | | | | 67,028 | |
|
|
|
|
| Securities | | | 66,468 | | | | 68,488 | | | | 69,731 | | | | 73,695 | | | | 71,282 | |
|
|
|
|
| Loans (Net of Allowance for Loan Losses) | | | 219,411 | | | | 216,245 | | | | 213,116 | | | | 212,385 | | | | 214,496 | |
|
|
|
|
| Goodwill and Other Intangibles | | | 14,683 | | | | 16,224 | | | | 15,351 | | | | 15,833 | | | | 15,678 | |
|
|
|
|
| Private Equity Investments | | | 9,628 | | | | 9,855 | | | | 10,877 | | | | 11,428 | | | | 11,502 | |
|
|
|
|
| Accrued Interest and Accounts Receivable | | | 18,253 | | | | 17,080 | | | | 15,352 | | | | 20,618 | | | | 15,491 | |
|
|
|
|
| Premises and Equipment | | | 7,268 | | | | 7,186 | | | | 7,085 | | | | 7,087 | | | | 6,863 | |
|
|
|
|
| Other Assets | | | 64,903 | | | | 33,853 | | | | 26,174 | | | | 24,530 | | | | 29,375 | |
| | | |
| | | |
| | | |
| | | |
| | | |
| |
TOTAL ASSETS | | $ | 799,300 | | | $ | 712,702 | | | $ | 713,624 | | | $ | 715,348 | | | $ | 707,497 | |
| | | |
| | | |
| | | |
| | | |
| | | |
| |
|
|
|
|
LIABILITIES
Deposits: | | | | | | | | | | | | | | | | | | | | |
|
|
|
|
| | Noninterest-Bearing | | $ | 72,734 | | | $ | 64,231 | | | $ | 59,686 | | | $ | 62,713 | | | $ | 54,903 | |
|
|
|
|
| | Interest-Bearing | | | 208,870 | | | | 212,573 | | | | 212,886 | | | | 216,652 | | | | 214,882 | |
| | | |
| | | |
| | | |
| | | |
| | | |
| |
| | Total Deposits | | | 281,604 | | | | 276,804 | | | | 272,572 | | | | 279,365 | | | | 269,785 | |
|
|
|
|
| Federal Funds Purchased and Securities Sold under Repurchase Agreements | | | 181,775 | | | | 155,062 | | | | 145,703 | | | | 131,738 | | | | 145,210 | |
|
|
|
|
| Commercial Paper | | | 19,299 | | | | 19,985 | | | | 16,281 | | | | 24,851 | | | | 19,462 | |
|
|
|
|
| Other Borrowed Funds | | | 21,941 | | | | 18,418 | | | | 28,716 | | | | 19,840 | | | | 20,065 | |
|
|
|
|
| Trading Liabilities: Debt and Equity Instruments | | | 58,594 | | | | 53,571 | | | | 52,501 | | | | 52,157 | | | | 58,972 | |
|
|
|
|
| | | | Derivative Payables | | | 70,817 | | | | 62,373 | | | | 73,312 | | | | 76,517 | | | | 65,253 | |
|
|
|
|
| Accounts Payable and Other Liabilities (including the Allowance for Credit Losses) | | | 75,231 | | | | 38,157 | | | | 33,575 | | | | 40,754 | | | | 37,225 | |
|
|
|
|
| Long-Term Debt | | | 42,315 | | | | 40,917 | | | | 42,609 | | | | 43,299 | | | | 45,634 | |
|
|
|
|
| Guaranteed Preferred Beneficial Interests in the Firm’s Junior Subordinated Deferrable Interest Debentures | | | 4,439 | | | | 4,439 | | | | 4,439 | | | | 3,939 | | | | 3,939 | |
| | | |
| | | |
| | | |
| | | |
| | | |
| |
TOTAL LIABILITIES | | | 756,015 | | | | 669,726 | | | | 669,708 | | | | 672,460 | | | | 665,545 | |
| | | |
| | | |
| | | |
| | | |
| | | |
| |
PREFERRED STOCK OF SUBSIDIARY | | | 550 | | | | 550 | | | | 550 | | | | 550 | | | | 550 | |
|
|
|
|
STOCKHOLDERS’ EQUITY | | | | | | | | | | | | | | | | | | | | |
|
|
|
|
| Preferred Stock | | | 1,009 | | | | 1,025 | | | | 1,362 | | | | 1,520 | | | | 1,522 | |
|
|
|
|
| Common Stock | | | 1,993 | | | | 1,990 | | | | 1,984 | | | | 1,940 | | | | 2,066 | |
|
|
|
|
| Capital Surplus | | | 12,244 | | | | 12,000 | | | | 11,663 | | | | 11,598 | | | | 12,427 | |
|
|
|
|
| Retained Earnings | | | 28,021 | | | | 28,265 | | | | 28,592 | | | | 28,096 | | | | 31,678 | |
|
|
|
|
| Accumulated Other Comprehensive Income (Loss) | | | 267 | | | | (834 | ) | | | (214 | ) | | | (241 | ) | | | (995 | ) |
|
|
|
|
| Treasury Stock, at Cost | | | (799 | ) | | | (20 | ) | | | (21 | ) | | | (575 | ) | | | (5,296 | ) |
| | | |
| | | |
| | | |
| | | |
| | | |
| |
TOTAL STOCKHOLDERS’ EQUITY | | | 42,735 | | | | 42,426 | | | | 43,366 | | | | 42,338 | | | | 41,402 | |
| | | |
| | | |
| | | |
| | | |
| | | |
| |
TOTAL LIABILITIES, PREFERRED STOCK OF SUBSIDIARY AND STOCKHOLDERS’ EQUITY | | $ | 799,300 | | | $ | 712,702 | | | $ | 713,624 | | | $ | 715,348 | | | $ | 707,497 | |
| | | |
| | | |
| | | |
| | | |
| | | |
| |
-51-
Part I
Item 2 (continued)
GLOSSARY OF TERMS
The page numbers included after each definition represent the pages in this Form 10-Q where the term primarily is used.
Basis Point Value (“BPV”):This measurement quantifies the change in the market value of JPMorgan Chase’s assets and liabilities (that are not part of its trading activities) that would result from a one basis point change in interest rates or one basis point widening of interest rate spreads. (Page 44)
Cash Operating Earnings:Operating earnings excluding the impact of the amortization of intangibles. (Pages 13-16, 18-21, 23, 25-28, 45 and 47)
Cash Overhead Ratio: Noninterest expense, excluding amortization of intangibles, as a percentage of the total of net interest income and noninterest revenue (excluding merger and restructuring costs and special items). (Pages 19, 23, 25-26, 34 and 47)
Chase USA:Chase Manhattan Bank USA, National Association. (Page 12)
FASB: Financial Accounting Standards Board. (Page 46)
Managed Credit Card Receivables or Managed Basis:JPMorgan Chase uses this terminology to refer to its credit card receivables on the balance sheet plus credit card receivables that have been securitized. (Pages 14, 17, 26, 36-37, 40 and 47)
Merger:The term refers to the December 31, 2000 merger of The Chase Manhattan Corporation and J.P. Morgan & Co. Incorporated. (Pages 7-8, 13, 15-19, 29, 34-35, 42, 47 and 50)
Operating BasisorOperating Earnings:Reported results excluding the impact of credit card securitizations, merger and restructuring costs, special items and the net effect of a change in accounting principle. (Pages 13-19, 21, 23, 25-31, 33-35, 45 and 47)
Overhead Ratio:Noninterest expense as a percentage of the total of net interest income and noninterest revenue (excluding merger and restructuring costs and special items). (Pages 19 and 34)
SFAS:Statement of Financial Accounting Standards.
SFAS 107:“Disclosures about Fair Value of Financial Instruments.” (Page 13)
SFAS 115:“Accounting for Certain Investments in Debt and Equity Securities.” (Page 7)
SFAS 133:“Accounting for Derivative Instruments and Hedging Activities.” (Pages 7, 10-11, 14, 47 and 50)
SFAS 140:“Accounting for Transfers and Servicing of Financial Assets and Extinguishments of Liabilities – a replacement of FASB Statement No. 125.” (Page 46)
SFAS 141:“Business Combinations.” (Page 46)
SFAS 142:“Goodwill and Other Intangible Assets.” (Page 46)
Shareholder Value Added (“SVA”): Represents cash operating earnings minus preferred dividends and an explicit charge for capital. (Pages 13-14, 19, 21, 23, 25-26 and 47)
Special Items:The first nine months of 2001 included $1,682 million (pre-tax) in merger and restructuring expenses and the cumulative effect of a transition adjustment of $(25) million (after-tax) related to the adoption of SFAS 133. Special items in the first nine months of 2000 include a $176 million (pre-tax) loss resulting from the economic hedge of the purchase price of Flemings prior to its acquisition, $129 million (pre-tax) in merger and restructuring costs and an $81 million (pre-tax) gain from the sale of a business in Panama. (Pages 13-18, 34, 45 and 47)
Stress Testing:Discloses market risk under plausible events in abnormal markets. (Pages 43 and 44)
Value-at-Risk (“VAR”):A measure of the dollar amount of potential loss from adverse market moves in an everyday market environment. (Pages 42, 43 and 44)
-52-
Part I
Item 2 (continued)
IMPORTANT FACTORS THAT MAY AFFECT FUTURE RESULTS
This Form 10-Q contains statements that are forward-looking within the meaning of the Private Securities Litigation Reform Act of 1995. Such statements are based upon the current beliefs and expectations of JPMorgan Chase's management and are subject to significant risks and uncertainties. Actual results may differ from those set forth in the forward-looking statements. These uncertainties include: the risk that the tragic events of September 11, 2001 and their aftermath will have an adverse effect upon markets and businesses in general and exacerbate the following additional risks and uncertainties: the risk of adverse movements or volatility in the debt and equity securities markets or in interest or foreign exchange rates or indices; the risk of adverse impacts from an economic downturn; the risk of a downturn in domestic or foreign securities and trading conditions or markets; the risks involved in deal completion including an adverse development affecting a customer or the inability by a customer to receive a regulatory approval; the risks associated with increased competition; the risks associated with unfavorable political and diplomatic developments in foreign markets or adverse changes in domestic or foreign governmental or regulatory policies; the risk that the merger integration will not be successful or that the revenue synergies and cost savings anticipated from the merger may not be fully realized or may take longer to realize than expected; the risk that the integration process may result in the disruption of ongoing business or in the loss of key employees or may adversely affect relationships with employees, clients or suppliers; the risk that the credit, market, liquidity, and operational risks associated with the various businesses of JPMorgan Chase are not successfully managed; or other factors affecting operational plans. Additional factors that could cause JPMorgan Chase's results to differ materially from those described in the forward-looking statements can be found in the 2000 Annual Report on Form 10-K of J.P. Morgan Chase & Co., filed with the Securities and Exchange Commission and available at the Securities Exchange Commission's internet site (http://www.sec.gov).
Any forward-looking statements made by or on behalf of the Firm in this Form 10-Q speak only as of the date of this Form 10-Q. JPMorgan Chase does not undertake to update forward-looking statements to reflect the impact of circumstances or events that arise after the date the forward-looking statement was made. The reader should, however, consult any further disclosures of a forward-looking nature JPMorgan Chase may make in its Annual Reports on Form 10-K, its Quarterly Reports on Form 10-Q and its Current Reports on Form 8-K.
-53-
Part I
| |
| Item 3 | Quantitative and Qualitative Disclosures about Market Risk |
| |
| | For a discussion of the quantitative and qualitative disclosures about market risk, see the market risk management section of the MD&A on pages 42-44 of this Form 10-Q. |
Part II – OTHER INFORMATION
| | | | In June 1999, Sumitomo Corporation filed a lawsuit against The Chase Manhattan Bank in the United States District Court for the Southern District of New York. The complaint alleges that during the period from 1994 to 1996, the Bank assisted a Sumitomo employee in making copper trades by funding unauthorized loans to the Sumitomo employee. The complaint alleges that the Bank knew the employee did not have authority to enter into the transactions on behalf of Sumitomo. The complaint asserts claims under the Racketeer Influenced and Corrupt Organizations Act (“RICO”) and New York common law and alleges damages of $532 million (subject to trebling under RICO), plus punitive damages. |
| |
| | | | In August 1999, Sumitomo Corporation filed a separate action against J.P. Morgan & Co., Morgan Guaranty Trust Company of New York and a former Morgan employee (collectively, “Morgan”) in the United States District Court for the Southern District of New York. The complaint in this action contains allegations, similar to the allegations in the complaint filed by Sumitomo against Chase, that during the period from 1993 to 1996, Morgan assisted a Sumitomo employee in making copper trades by funding unauthorized loans to the Sumitomo employee. The complaint alleges that Morgan knew the employee did not have authority to enter into the transactions on behalf of Sumitomo. The complaint asserts claims under RICO and New York common law and alleges damages of $735 million (subject to trebling under RICO), plus punitive damages. The separate actions against Chase and Morgan have been consolidated for discovery purposes. |
| |
| | | | Chase Securities Inc. (now known as J.P. Morgan Securities Inc. (“JPMSI”)) has been named as a defendant or third-party defendant in 16 actions that were filed in either the United States District Court for the Northern District of Oklahoma or Oklahoma state court or New York state court beginning in October 1999 arising out of the failure of Commercial Financial Services, Inc. (“CFS”). Plaintiffs in these actions are institutional investors who purchased over $1.6 billion in original face amount of asset-backed securities issued by CFS. The securities were backed by delinquent credit card receivables. In addition to JPMSI, the defendants in various of the actions are the founders and key executives of CFS, as well as its auditors, its outside counsel and the rating agencies that rated the securities. JPMSI is alleged to have been the investment banker to CFS and to have acted as an initial purchaser and as placement agent in connection with the issuance of certain of the securities. Plaintiffs allege that defendants either knew or were reckless in not knowing that the securities were sold to plaintiffs on the basis of misleading misrepresentations and omissions of material facts. The complaints against JPMSI assert claims under the Securities Exchange Act of 1934, the Oklahoma Securities Act, and under common law theories of fraud and negligent misrepresentation. In the actions against JPMSI, damages in the amount of approximately $1.2 billion allegedly suffered as a result of defendants’ misrepresentations and omissions, plus punitive damages, are being claimed. |
| |
| | | | The Securities and Exchange Commission (“SEC”) investigated the question of whether, in connection with the bond paying agency function within JPMorgan Chase’s Institutional Trust Services group, there had been violations of its transfer agency recordkeeping or reporting regulations and whether JPMorgan Chase’s disclosure regarding these issues had been adequate and timely. In September 2001, JPMorgan Chase consented, without admitting or denying the underlying factual allegations or findings, to a $1 million civil penalty and to an SEC order that it cease and desist from further violations of the transfer agency recordkeeping and reporting regulations. The conditions giving rise to the alleged violations have been addressed. |
-54-
Part II — OTHER INFORMATION (continued)
| |
| Item 1 | Legal Proceedings (continued) |
| | | | Beginning in May 2001, JPMorgan Chase and certain of its securities subsidiaries have been named, along with numerous other firms in the securities industry, as defendants in a large number of putative class action lawsuits filed in the United States District Court for the Southern District of New York. These suits purport to challenge alleged improprieties in the allocation of stock in various public offerings, including some offerings for which a JPMorgan Chase entity served as an underwriter. The suits allege violations of securities and antitrust laws arising from alleged material misstatements and omissions in registration statements and prospectuses for the initial public offerings and with respect to aftermarket transactions in the offered securities. The securities claims allege, among other things, misrepresentations concerning commissions paid to JPMorgan Chase and aftermarket transactions by customers who received allocations of shares in the respective initial public offerings. The antitrust claims allege an illegal conspiracy to require customers, in exchange for initial public offering allocations, to pay undisclosed and excessive commissions and to make aftermarket purchases of the initial public offering securities at a price higher than the offering price, as a precondition to receiving allocation. JPMorgan Chase also has received various subpoenas and informal requests from governmental and other agencies seeking information relating to initial public offering allocation practices. JPMorgan Chase is cooperating with these agencies and has responded or is in the process of responding to these requests. |
| |
| | | | In addition to the matters described above, JPMorgan Chase and its subsidiaries have been named from time to time as defendants in various legal actions and proceedings arising in connection with their respective businesses and have been involved from time to time in investigations and proceedings by governmental agencies. In view of the inherent difficulty of predicting the outcome of such matters, JPMorgan Chase cannot state what the eventual outcome of these pending matters will be. JPMorgan Chase is contesting the allegations made in each pending matter and believes, based on current knowledge and after consultation with counsel, that the outcome of such matters will not have a material adverse effect on the consolidated financial condition of JPMorgan Chase but may be material to JPMorgan Chase’s operating results for any particular period, depending on the level of JPMorgan Chase’s income for such period. |
| |
| Item 2 | Sales of Unregistered Common Stock |
| | | | During the third quarter of 2001, shares of common stock of J.P. Morgan Chase & Co. were issued in a transaction exempt from registration under the Securities Act of 1933 pursuant to Section 4(2) thereof as follows: On July 2, 2001, 501 shares of common stock were issued to a retired director who had deferred receipt of such common stock pursuant to the Deferred Compensation Plan for Non-Employee Directors. |
| |
| Item 6 | Exhibits and Reports on Form 8-K |
| | | | | |
| | 11 | | – | Computation of Earnings per Common Share |
|
|
|
|
| | 12(a) | | – | Computation of Ratio of Earnings to Fixed Charges |
|
|
|
|
| | 12(b) | | – | Computation of Ratio of Earnings to Fixed Charges and Preferred Stock Dividend Requirements |
| | | | JPMorgan Chase filed one report on Form 8-K during the quarter ended September 30, 2001 as follows: |
| |
| | | | Form 8-K dated July 18, 2001: JPMorgan Chase announced second quarter 2001 results. |
-55-
SIGNATURE
Pursuant to the requirements of the Securities Exchange Act of 1934, the Registrant has duly caused this report to be signed on its behalf by the undersigned thereunto duly authorized.
| | | | | |
| | | J.P. MORGAN CHASE & CO. |
| | |
|
| | | (Registrant) |
|
|
|
|
| | | | | |
|
|
|
|
| Date November 14, 2001 | | By | | /s/ Joseph L. Sclafani |
| | | | |
|
| | | | | Joseph L. Sclafani |
| | | | | Executive Vice President and Controller
[Principal Accounting Officer] |
-56-
INDEX TO EXHIBITS
SEQUENTIALLY NUMBERED
| | | | | | | |
| EXHIBIT NO. | | EXHIBITS | | PAGE AT WHICH LOCATED |
| |
| |
|
| 11 | | Computation of Earnings per Common Share | | | 58 | |
|
|
|
|
| 12(a) | | Computation of Ratio of Earnings to Fixed Charges | | | 59 | |
|
|
|
|
| 12(b) | | Computation of Ratio of Earnings to Fixed Charges and Preferred Stock Dividend Requirements | | | 60 | |
-57-