Exhibit 99.1

Exhibit 99.1
ISI Energy Conference
May 7-9, 2013
Cross Winds® Energy Park Consumers Smart Energy Program
Gas Combined Cycle Plant

AGA Financial Forum
May 5-7, 2013
Cross Winds® Energy Park Consumers Smart Energy Program
Gas Combined Cycle Plant
This presentation is made as of the date hereof and contains “forward-looking statements” as defined in Rule 3b-6 of the
Securities Exchange Act of 1934, as amended, Rule 175 of the Securities Act of 1933, as amended, and relevant legal decisions.
The forward-looking statements are subject to risks and uncertainties. They should be read in conjunction with “FORWARDLOOKING
INFORMATION” “FACTORS” Energy’s LOOKING STATEMENTS AND INFORMATION and RISK FACTORS sections of CMS Energy s and Consumers Energy’s
Form 10-K for the year ended December 31 and as updated in subsequent 10-Qs. CMS Energy’s and Consumers Energy’s
“FORWARD-LOOKING STATEMENTS AND INFORMATION” and “RISK FACTORS” sections are incorporated herein by
reference and discuss important factors that could cause CMS Energy’s and Consumers Energy’s results to differ materially from
those anticipated in such statements. CMS Energy and Consumers Energy undertake no obligation to update any of the
information presented herein to reflect facts, events or circumstances after the date hereof.
The presentation also includes non-GAAP measures when describing CMS Energy’s results of operations and financial
performance. A reconciliation of each of these measures to the most directly comparable GAAP measure is included in the
appendix and posted on our website at www.cmsenergy.com.
CMS Energy provides financial results on both a reported (Generally Accepted Accounting Principles) and adjusted (non-GAAP)
basis. Management views adjusted earnings as a key measure of the company’s present operating financial performance,
unaffected by discontinued operations, asset sales, impairments, regulatory items from prior years, or other items. Certain of
these items have the potential to impact, favorably or unfavorably, the company's reported earnings in 2013. The company is not
able to estimate the impact of these matters and is not providing reported earnings guidance.
1
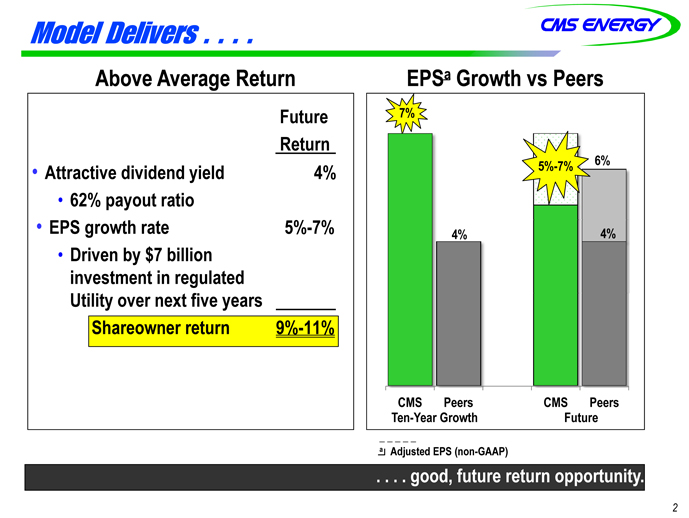
Model Delivers . . . .
Ab A Above Average Return EPSaGrowth vs Peers
Future
Return
7%
• Attractive dividend yield 4%
• 62% payout ratio
5% 5%-7% 6%
• EPS growth rate 5%-7%
• Driven by $7 billion
investment in regulated
U ili fi
4% 4%
Utility over next five years
Shareowner return 9%-11%
Ten-Year Growth Future
CMS Peers CMS Peers
. . . . good, future return opportunity.
2
a Adjusted EPS (non-GAAP)
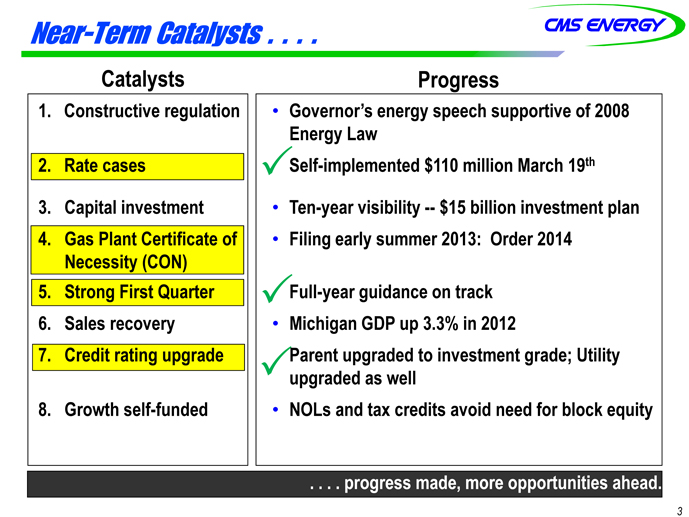
Near-Term Catalysts . . . .
Catalysts Progress
?
1. Constructive regulation • Governor’s energy speech supportive of 2008
Energy Law
2. Rate cases Self-implemented $110 million March 19th
3. Capital investment • Ten-year visibility — $15 billion investment plan
4. Gas Plant Certificate of
Necessity (CON)
• Filing early summer 2013: Order 2014
5 Strong First Quarter ?
Full-year guidance on track
?
5. Full 6. Sales recovery • Michigan GDP up 3.3% in 2012
7. Credit rating upgrade Parent upgraded to investment grade; Utility
upgraded as well
8. Growth self-funded • NOLs and tax credits avoid need for block equity
3
. . . . progress made, more opportunities ahead.
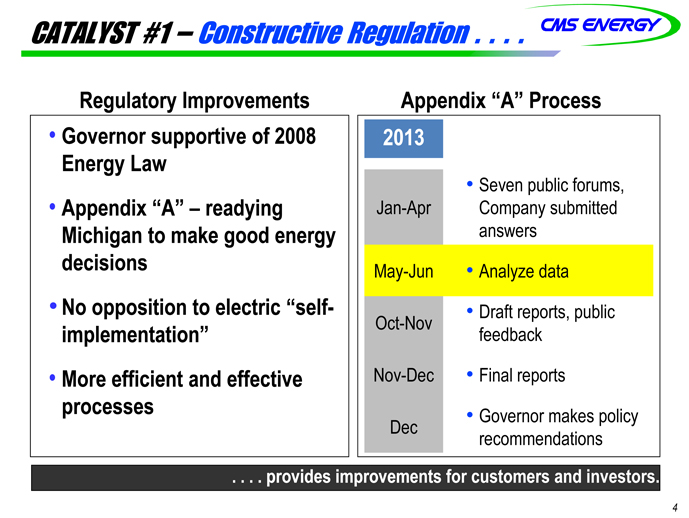
CATALYST #1 – Constructive Regulation . . . .
• Governor supportive of 2008
Regulatory Improvements Appendix “A” Process
pp 2013
Energy Law
• Appendix “A” – readying Jan-Apr
• Seven public forums,
pp y g Company submitted
Michigan to make good energy
decisions
answers
May-Jun • Analyze data
• No opposition to electric “selfimplementation”
Oct-Nov • Draft reports, public
feedback
• More efficient and effective
processes
Nov-Dec • Final reports
Dec • Governor makes policy
recommendations
. . . . provides improvements for customers and investors.
4
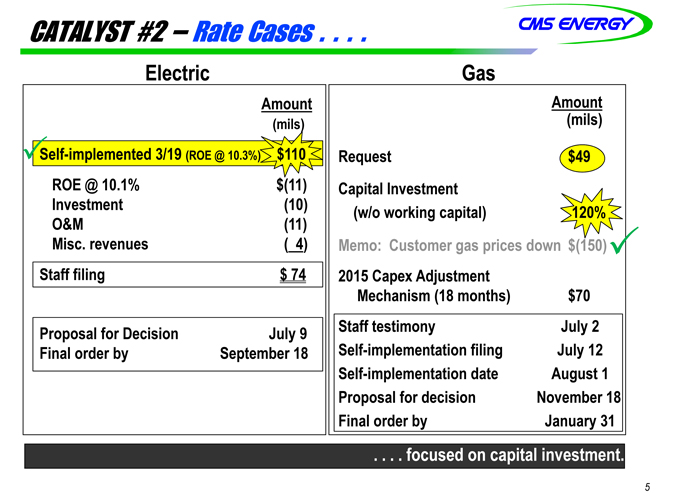
CATALYST #2 – Rate Cases . . . .
Electric Gas
Amount
(mils)
Amount
(mils)
?
Request $49
Capital Investment
(w/o working capital) 120%
Self-implemented 3/19 (ROE @ 10.3%) $110
ROE @ 10.1% $(11)
Investment ( 10)
Memo: Customer gas prices down $(150)
2015 Capex Adjustment
?
)
O&M (11)
Misc. revenues ( 4)
Staff filing $
74 Mechanism (18 months) $70
Staff testimony July 2
Self-implementation filing July 12
g Proposal for Decision July 9
Final order by September 18
Self-implementation date August 1
Proposal for decision November 18
Final order by January 31
5
. . . . focused on capital investment.
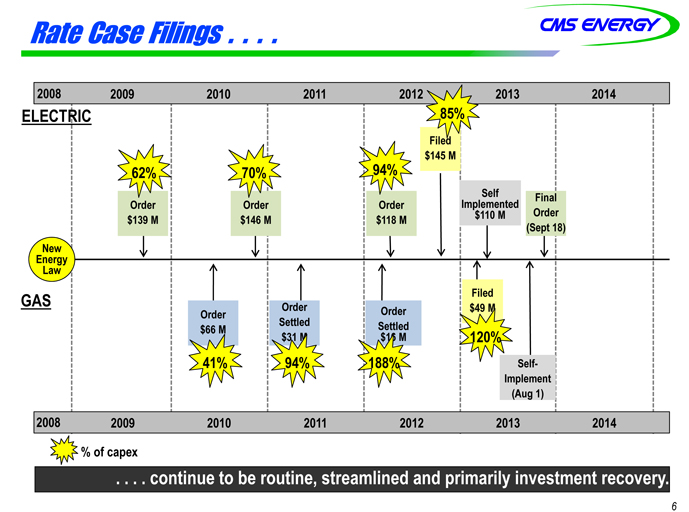
Rate Case Filings . . . .
2008
ELECTRIC
Filed
85%
2009 2010 2011 2012 2013 2014
$145 M
Self
Implemented
$ 110 M
Order
$139 M
Order
$146 M
Order
$118 M
Final
Order
62% 70% 94%
New
Energy
Law
Filed
(Sept 18)
GAS
Order
$66 M
Order
Settled
$31 M
Order
Settled
$16 M
$49 M
41%
94% 188%
Self-
120%
2008
Self
Implement
(Aug 1)
2009 2010 2011 2012 2013 2014
6 |
|
. . . . continue to be routine, streamlined and primarily investment recovery.
% of capex
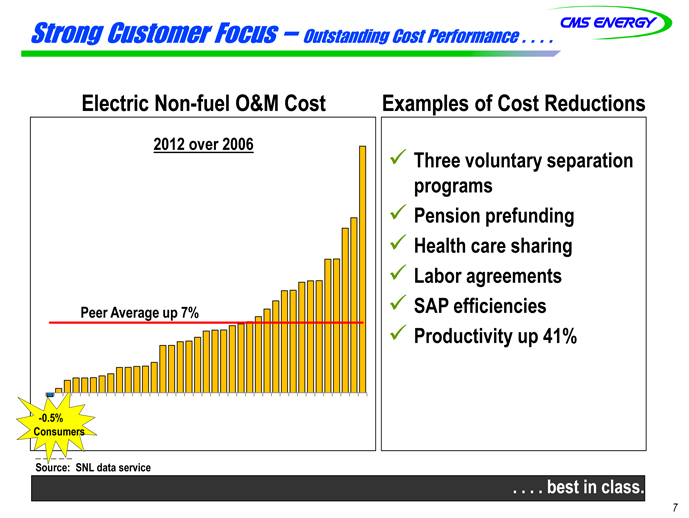
Strong Customer Focus – Outstanding Cost Performance . . . .
Electric Non-fuel O&M Cost Examples of Cost Reductions
2012 over 2006
? Three voluntary separation
programs
? Pension prefunding
? Health care sharing
? Labor agreements
? SAP efficiencies
? Productivity up 41%
Peer Average up 7%
-0.5%
Consumers
7 |
|
. . . . best in class.
Source: SNL data service
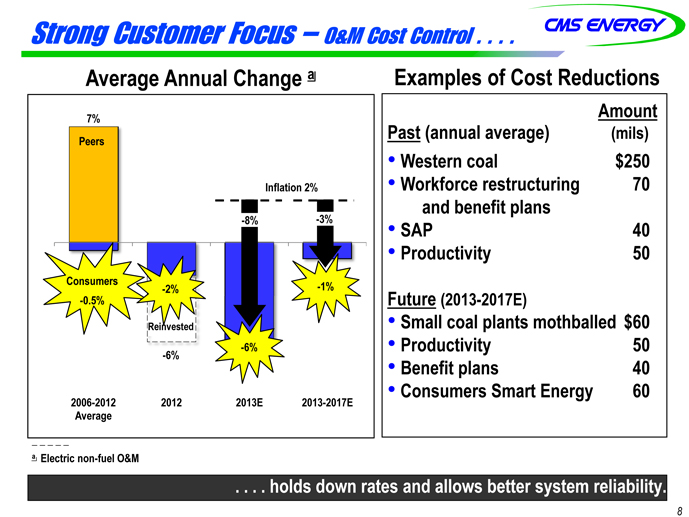
Strong Customer Focus – O&M Cost Control . . . .
A erage Ann al Examples of Cost Reductions
Amount
Past (annual average) (mils) Peers
7%
Average Annual Change a
• Western coal $250
• Workforce restructuring 70
and benefit plans
Inflation 2%
-8% -3%
• SAP 40
• Productivity 50
-2%
F t re(2013 2017E)
Consumers -2% -1%
Future (2013-• Small coal plants mothballed $60
• Productivity 50
• Benefit plans 40
-6%
Reinvested
-0.5%
-6%
• Consumers Smart Energy 60 2006-2012
Average
2012 2013E 2013-2017E
8 |
|
. . . . holds down rates and allows better system reliability.
a Electric non-fuel O&M
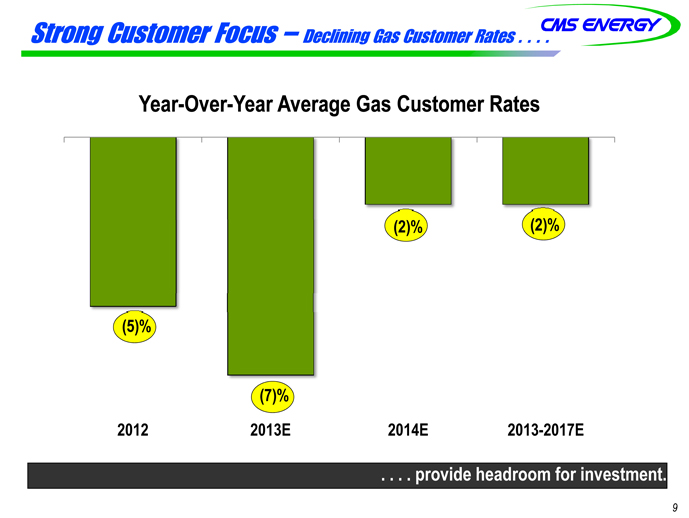
Strong Customer Focus – Declining Gas Customer Rates . . . .
Year-Over-Year Average Gas Customer Rates
(2)% (2)%
(5)%
(7)%
2012 2013E 2014E 2013-2017E
. . . . provide headroom for investment.
9

Strong Customer Focus – Propane to Gas Switching . . . .
70 000 t ti • 70,000 potential customers
• Saves customers ~$2,000 per year
Propane to Gas
Total New Customers
Annual Customer Switching . . .. . Pace Picking Up
8,600 8,600
3,000
5,000
2,738
1,345
2012 2013E Future 2013E-
2017E
10
. . . . a better energy value.
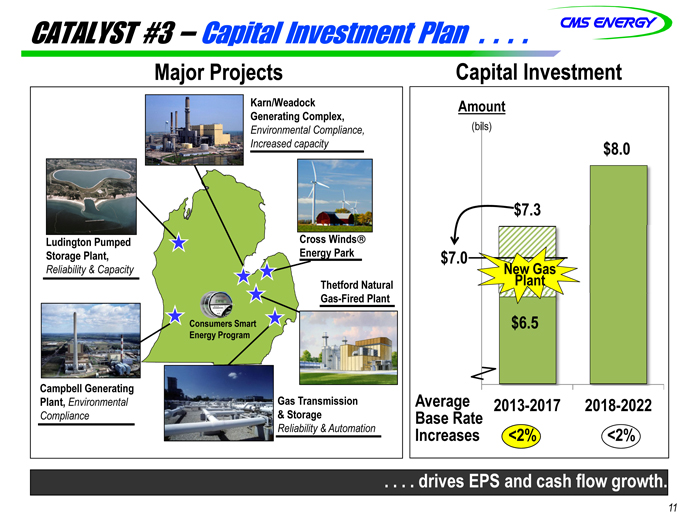
CATALYST #3 – Capital Investment Plan . . . .
Major Projects Capital Investment
8 |
| 0 |
Amount
(bils)
Karn/Weadock
Generating Complex,
Environmental Compliance,
Increased capacity
$8.0
$7.3
$7.0 New Gas
Plant
Ludington Pumped
Storage Plant,
Reliability & Capacity
Cross Winds®
Energy Park
Thetford Natural
$6.5
Gas-Fired Plant
Consumers Smart
Energy Program
Average 2013-2017 2018-2022
Base Rate
Increases <2% <2%
Gas Transmission
& Storage
Reliability & Automation
Campbell Generating
Plant, Environmental
Compliance
11
. . . . drives EPS and cash flow growth.
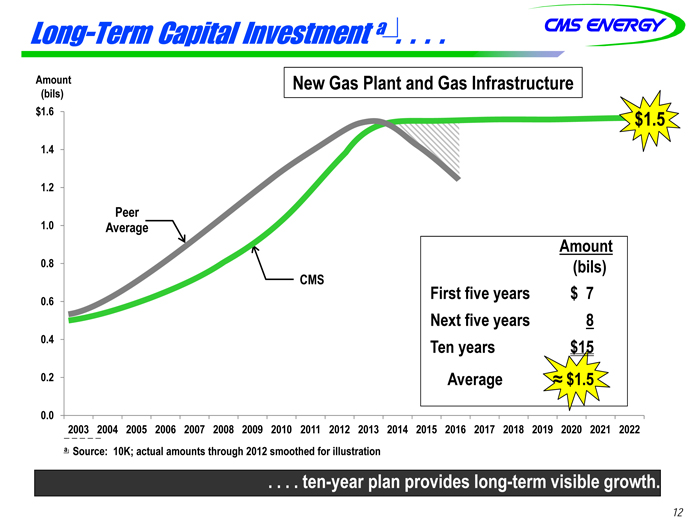
Long-Term Capital Investment a . . . .
1 |
| 4 |
1.6
Amount
(bils)
$ $1.5
New Gas Plant and Gas Infrastructure
1 |
| 0 |
1.2
1.4
Peer
0.8
1.0
CMS
Average
Amount
(bils)
First five years $ 7
0.4
0.6 Next five years 8
Ten years $15
0.0
0.2
2003 2004 2005 2006 2007 2008 2009 2010 2011 2012 2013 2014 2015 2016 2017 2018 2019 2020 2021 2022
Average ? $1.5
. . . . ten-year plan provides long-term visible growth.
a Source: 10K; actual amounts through 2012 smoothed for illustration
12
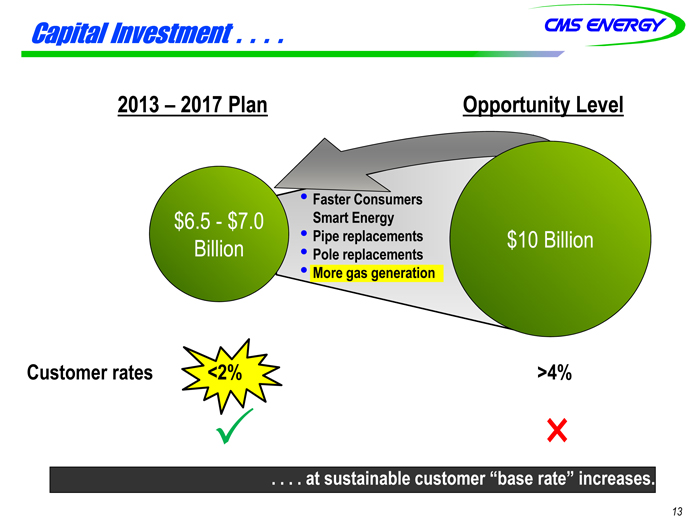
Capital Investment . . . .
2013 – 2017 Plan Opportunity Level
$6 5 $7 0
• Faster Consumers
6.5—7.0 Smart Energy
Billion $10 Billion
• Pipe replacements
• Pole replacements
• More gas generation
Customer rates <2% >4%
?
×
. . . . at sustainable customer “base rate” increases.
13

Gas Pipeline Integrity Inspection . . . .
2012 Checklist
? 270 HCA miles
? 920 non-HCA miles
? 90% in-line inspections
? 100% compliant, zero safety
incidents
2013 and Beyond Plan
• Six year reassessment program
• Over 1,000 miles
• $75 million next six years
• In-line inspections
14
. . . . focused on safe and reliable gas transmission.
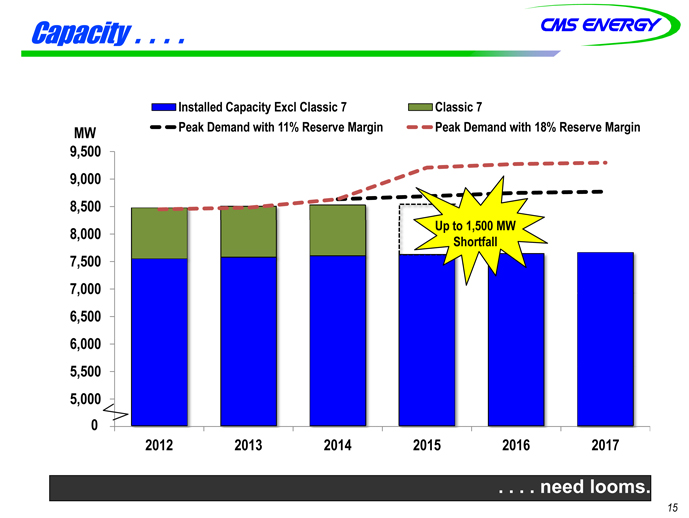
Capacity . .. . .
9 500
Installed Capacity Excl Classic 7 Classic 7
Peak Demand with 11% Reserve Margin MW Peak Demand with 18% Reserve Margin
8,500
9,000
9,500
7,000
7,500
8,000 Up to 1,500 MW
Shortfall
5 |
| 500 |
6,000
6,500
4,500
5,000
5,500
2012 2013 2014 2015 2016 2017
0
. . . . need looms.
15
CATALYST #4 – Gas Plant CON
• Generating plant investments exceeding $500 million
• Demonstrate need through an Integrated Resource Plan
• File early summer 2013
• Decision within 270 days
2012 2013 2014 2015 2016 2017
Air Permit
Submitted Approval
Certificate of
Necessity
Project
Award Major
Full Notice
Commercial
Submit Approval
Investment
(mils) — $6 $112 $346 $237 $49
to Proceed
Operation
Contracts
16
Cumulative
Spending 6 118 464 701 750
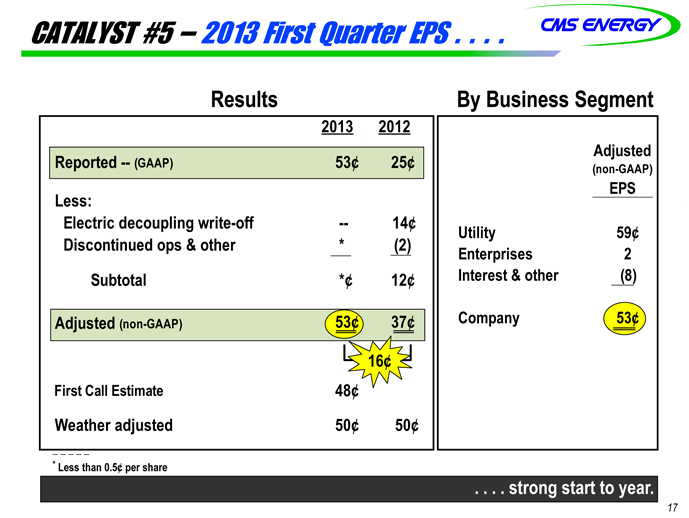
CATALYST #5 – 2013 First Quarter EPS . . . .
Adj t d
Results By Business Segment
2013 2012
Adjusted
(non-GAAP)
EPS
Reported — (GAAP) 53¢ 25¢
Less:
Electric decoupling write off 14¢
Utility 59¢
Enterprises 2
Interest & other (8)
write—- Discontinued ops & other * (2)
Subtotal *¢ 12¢
Adjusted (non-GAAP) 53¢ 37¢ Company 53¢
16¢
First Call Estimate 48¢
Weather adjusted 50¢ 50¢
17
. . . . strong start to year.
* |
| Less than 0.5¢ per share |
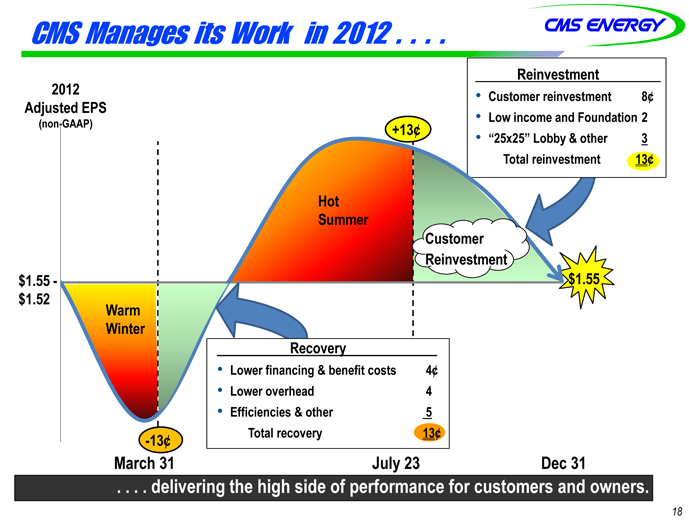
CMS Manages its Work in 2012 . . . .
Reinvestment
2012
Adjusted EPS
(non-GAAP) +13¢
• Customer reinvestment 8¢
• Low income and Foundation 2
• “25x25” Lobby & other 3
Hot
Hot
Summer
Total reinvestment 13¢
$1.55
Summer Customer
Reinvestment
$1.55 -
$1 52
Warm
Winter
1.52
Recovery
• Lower financing & benefit costs 4¢
-13¢
• Lower overhead 4
• Efficiencies & other 5
Total recovery 13¢
18
. . . . delivering the high side of performance for customers and owners.
March 31 July 23 Dec 31
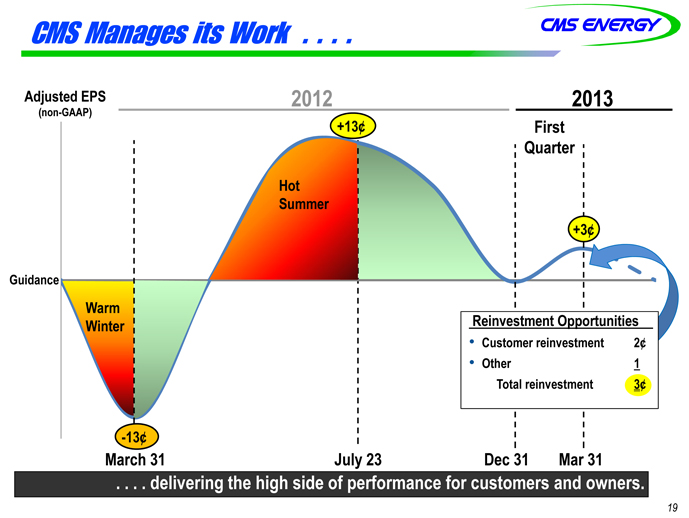
CMS Manages its Work . . . .
Adjusted EPS
(non-GAAP)
+13¢
2012 2013
First
Quarter
Hot
Summer
Guidance
+3¢
Warm
Winter Reinvestment Opportunities
• Customer reinvestment 2¢
• Other 1
-13¢
Total reinvestment 3¢
19
. . . . delivering the high side of performance for customers and owners.
March 31 July 23 Dec 31 Mar 31
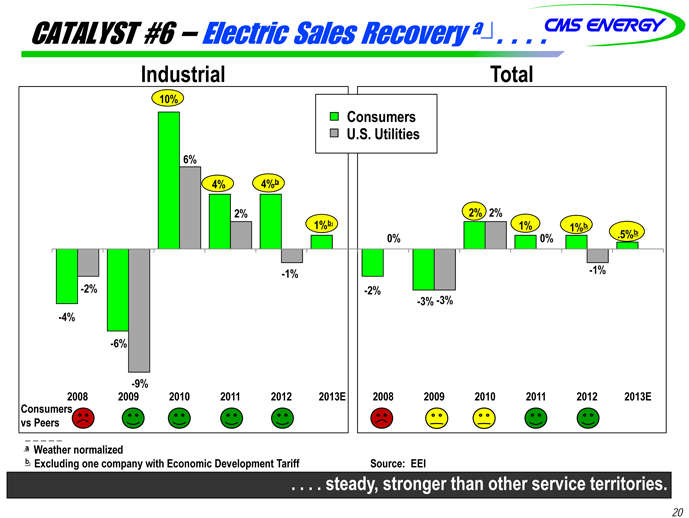
CATALYST #6 – Electric Sales Recovery a . . . .
Industrial Total
10%
U.S. Utilities
Consumers
4% 4%b
1%b
2%
1%
6%
2% 2%
-2%
1%b
.5%b
-2%
-1%
0%
3%
0%
-1%
-4%
-6%
-3% -
Consumers
vs Peers
-9%
2008 2009 2010 2011 2012 2013E 2008 2009 2010 2011 2012 2013E
20
. . . . steady, stronger than other service territories.
a Weather normalized
b Excluding one company with Economic Development Tariff Source: EEI
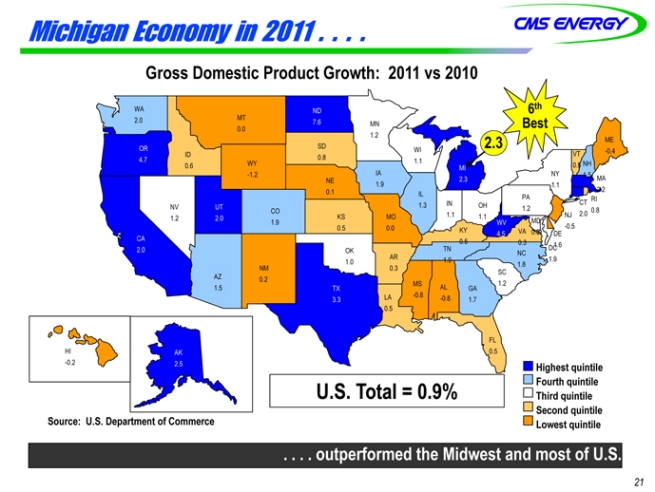
Michigan Economy in 2011 . . . .
Gross Domestic Product Growth: 2011 vs 2010
2 |
| 3 |
WA
2.0 MT
0.0
ND
7.6 MN
1.2 ME
6th
Best
2.3 OR
4.7
NV
ID
0.6 WY
-1.2
UT
CO
SD
0.8
NE
0.1
IA
1.9
WI
1.1
IL
1.3
MI
2.3
IN OH
PA
1 2
NY
1.1
CT RI
0 8
NH
1.5
VT
0.5
MA
2.2
-0.4
CA
2.0
1.2
2.0
AZ
NM
0 2
1.9
KS
0.5
OK
1.0
MO
0.0
AR
0.3
TN
1.9
1.1 1.1
KY
0.5
VA
0.3
WV
4.5
1.2
MD
0.9 DE
1.6
NJ
-0.5
2.0 0.8
DC
1.9
SC
NC
1.8
1.5
0.2
TX
3.3 LA
0.5
MS
-0.8
AL
-0.8
FL
GA
1.7
1.2
Highest quintile
Fourth quintile
Third quintile
Second quintile
S U S D t t f C
HI
-0.2
AK
2.5
0.5
U.S. Total = 0.9%
Source: U.S. Department of Commerce Lowest quintile
. . . . outperformed the Midwest and most of U.S.
21

Michigan Economy in 2012 . . . .
Estimated Gross Domestic Product Growth: 2012 vs 2011
WA
3.1 MT
ND
6.8 MN
6th
Best
3.3 OR
4.8
1.9
ID
2.2 WY
1.2
SD
2.3
NE
2.0
2.6
IA
3.0
WI
2.6
IL
MI
3.3
PA
NY
2.5
NH
2.8
MA
3.2
ME
VT 1.7
2.2
CA
3.1
NV
2.6
UT
3.1
CO
3.0
KS
2.2
OK
2.5
MO
1.9
AR
2.7
TN
3.0
IN
2.6
OH
2.5
KY
2.2
VA
2.0
WV
4.7
2.6
MD
2.4 DE
2.8
NJ
1.6
CT
3.1
RI
2.3
DC
3.1
NC
3 |
| 0 |
AZ
2.8
NM
2.0
TX
3.9
2.1
LA
2.2
MS
1.4
AL
1.4
GA
2.9
SC
2.6
3.0
Highest quintile
Fourth quintile
Third quintile
Second quintile
HI
1.7
AK
3.4
FL
2.2
U.S. Total ( est) = 2.2%
. . . . continued strong performance.
Source: U.S. Department of Commerce
Lowest quintile ) %
22
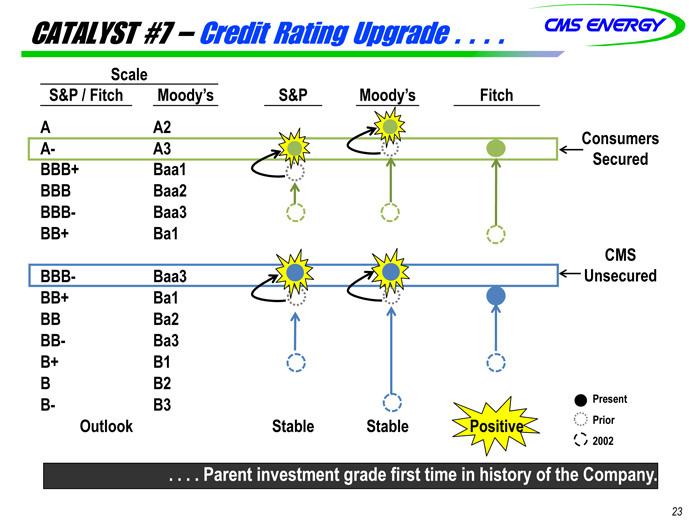
CATALYST #7 – Credit Rating Upgrade . . . .
Scale
S&P / Fitch Moody’s S&P Moody’s Fitch
AA- AA32 CoSnescuumreedrs
BBB+ Baa1
BBB Baa2
BBB- Baa3
BB+ Ba1
CMS
BBB- Baa3 Unsecured
BB+ Ba1
BB Ba2
BB- Ba3
B+ B1
B B2
B- B3
Outlook Stable Stable Positive
Present
Prior
2002
23
. . . . Parent investment grade first time in history of the Company.
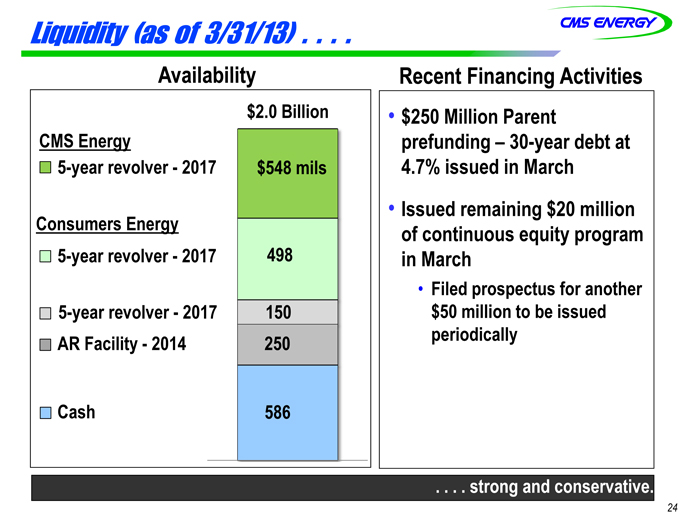
Liquidity (as of 3/31/13) . . . .
$2.0 Billion
CMS Energy
Availability Recent Financing Activities
• $250 Million Parent
prefunding – 30-year debt at
5-year revolver—2017
C E
$548 mils
30 4.7% issued in March
• Issued remaining $20 million
Consumers Energy
5-year revolver—2017 498
g
of continuous equity program
in March
• Filed prospectus for another
AR Facility—2014
5-year revolver—2017 150
250
$50 million to be issued
periodically
Cash 586
24
. . . . strong and conservative.
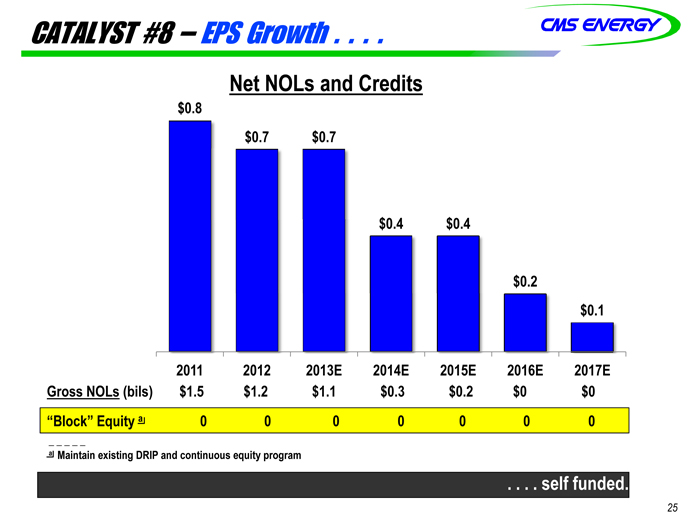
CATALYST #8 – EPS Growth . . . .
$0.8
$0.7 $0.7
Net NOLs and Credits
$0.4 $0.4
$0.2
$0.1
2011 2012 2013E 2014E 2015E 2016E 2017E
Gross NOLs (bils) $1.5 $1.2 $1.1 $0.3 $0.2 $0 $0
“Block” Equity a 0 0 0 0 0 0 0
25
. . . . self funded.
a Maintain existing DRIP and continuous equity program
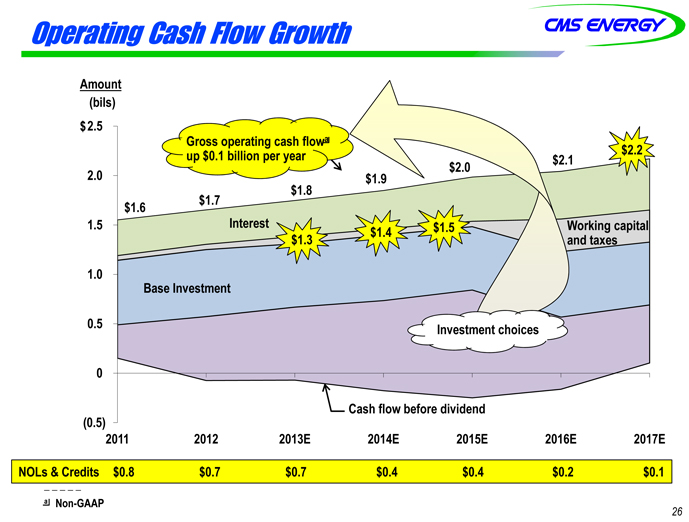
Operating Cash Flow Growth
2.5
Amount
(bils)
$
Gross operating cash flowa $2 2
1 |
| 5 |
2.0
$2.1
Interest W ki it l
$1.6
$1.9
$2.0
2.2
$1.7
$1.8
p g
up $0.1 billion per year
$
1.0
1.5 Working capital
and taxes
Base Investment
$1.3 $1.4 1.5
0 0
0.5 Investment choices
(0.5)
0.0
2011 2012 2013E 2014E 2015E 2016E 2017E
Cash flow before dividend
26
a Non-GAAP
NOLs & Credits $0.8 $0.7 $0.7 $0.4 $0.4 $0.2 $0.1
EPS a and Dividend Growth . . . .
1.02
14%
Dividend in Place
6%
EPS
84¢
96¢
27%
$ 1.45
$1.55
7%
5%
50¢
32% 66¢
b 39%
$1 08
$1.21
$1.26
$1.36
5 |
|
20¢
80% 36¢
$0.90
$0.96
1.08
$0.84
0
2006 2007 2008 2009 2010 2011 2012 2013
Payout 0% 25% 30% 40% 49% 58% 62% 62%
$0.81
a Adjusted EPS (non-GAAP) excluding MTM in 2004-2006
2003 2004 2005 2006 2007 2008 2009 2010 2011 2012 2013E Future
27
. . . . provides for strong TSR.
y
b $1.25 excluding discontinued Exeter operations and accounting changes related to
convertible debt and restricted stock
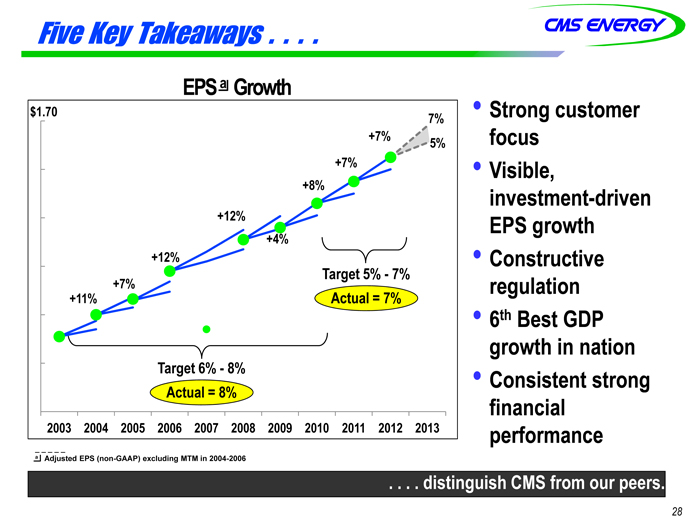
Five Key Takeaways . . . .
• Strong customer
focus
EPS a Growth
+7%
$1.70 7%
5% • Visible,
investment-driven
+12% EPS growth
+8%
+7%
%
• Constructive
regulation +11%
+7%
+12%
+4%
Target 5%—7%
Actual = 7%
g
• 6th Best GDP
growth in nation
Target 6%—8%
• Consistent strong
financial
performance
Actual = 8%
2003 2004 2005 2006 2007 2008 2009 2010 2011 2012 2013
28
p
. . . . distinguish CMS from our peers.
a Adjusted EPS (non-GAAP) excluding MTM in 2004-2006

APPENDIX
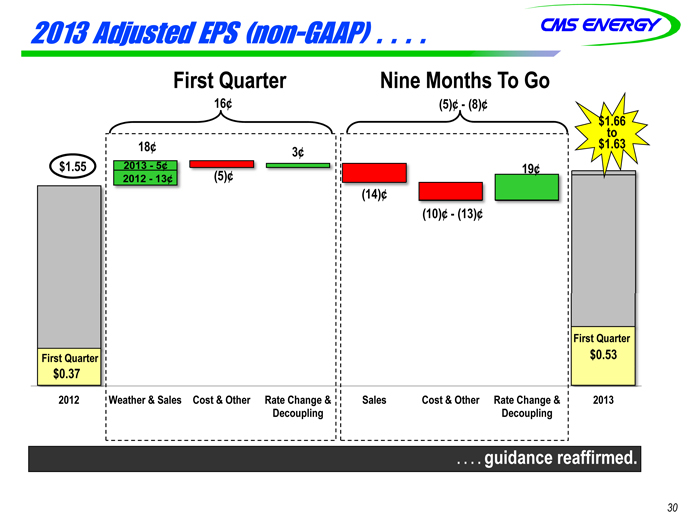
2013 Adjusted EPS (non-GAAP) . . . .
Fi t Q t Ni M th T G
First Quarter Nine Months To Go
16¢ (5)¢—(8)¢
$1.66
to
(5)¢ |
|
(14)¢ |
|
( 10)¢—( 13)¢
18¢
3¢ |
|
$1.55 19¢
$1.63
2013—5¢
2012—13¢
)¢ )¢
First Quarter $0.53
First Quarter
$0.37
2012 Weather & Sales Cost & Other Rate Change &
Decoupling
Sales Cost & Other Rate Change &
Decoupling
2013
30
. . . . guidance reaffirmed.
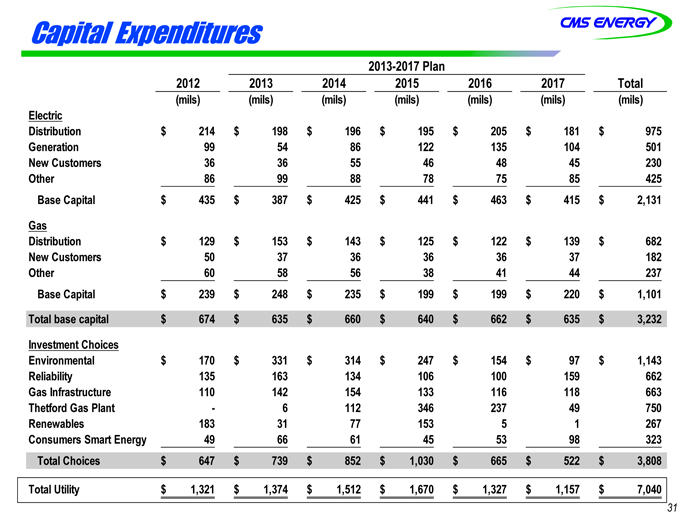
2013-2017 Plan
Capital Expenditures
2012 2013 2014 2015 2016 2017 Total
(mils) (mils) (mils) (mils) (mils) (mils) (mils)
Electric
Distribution $ 2 14 $ 198 $ 196 $ 195 $ 205 $ 181 $ 9 75
Generation 99 54 86 122 135 104 501
New Customers 36 36 55 46 48 45 230
Other 86 99 88 78 75 85 425
Base Capital $ 435 $ 387 $ 425 $ 441 $ 463 $ 415 $ 2,131
Gas
Distribution $ 1 29 $ 153 $ 143 $ 125 $ 122 $ 139 $ 6 82
New Customers 50 37 36 36 36 37 182
Other 60 58 56 38 41 44 237
Base Capital $ 2 39 $ 2 48 $ 2 35 $ 1 99 $ 1 99 $ 2 20 $ 1,101
Total base capital $ 6 74 $ 635 $ 660 $ 640 $ 662 $ 635 $ 3,232
Investment Choices
Environmental $ 1 70 $ 3 31 $ 3 14 $ 247 $ 1 54 $ 97 $ 1,143
Reliability 135 163 134 106 100 159 662
Gas Infrastructure 110 142 154 133 116 118 663
Thetford Gas Plant—6 112 346 237 49 750
Renewables 183 31 77 153 5 1 267
Consumers Smart Energy 49 66 61 45 53 98 323
Total Choices $ 6 47 $ 739 $ 852 $ 1,030 $ 665 $ 522 $ 3,808
Total Utility $ 1,321 $ 1,374 $ 1,512 $ 1,670 $ 1,327 $ 1,157 $ 7,040
31
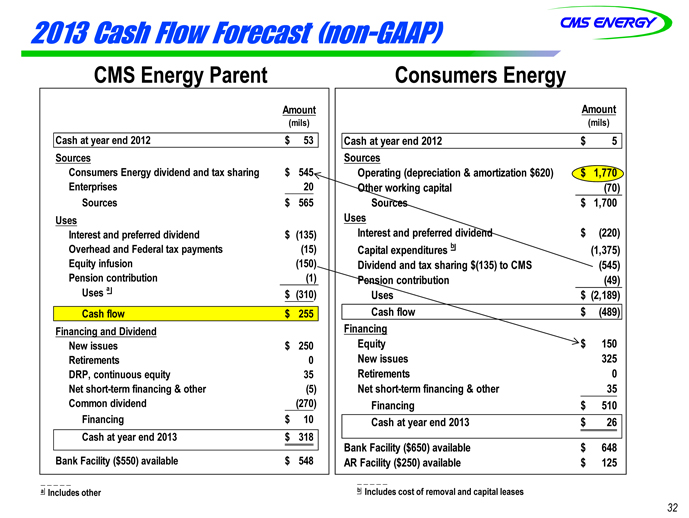
2013 Cash Flow Forecast (non-GAAP)
CMS Energy Parent Consumers Energy
Cash at year end 2012 $ 5 3
Amount
(mils)
Cash at year end 2012 $ 5
Amount
(mils)
Sources
Consumers Energy dividend and tax sharing $ 545
Enterprises 20
Sources $ 565
Uses
y
Sources
Operating (depreciation & amortization $620) $ 1,770
Other working capital (70)
Sources $ 1,700
Uses
Interest and preferred dividend $ (135)
Overhead and Federal tax payments (15)
Equity infusion (150)
Pension contribution (1)
Uses a $ (310)
Interest and preferred dividend $ (220)
Capital expenditures b (1,375)
Dividend and tax sharing $(135) to CMS (545)
Pension contribution (49)
Uses $ (2 189)
Cash flow $ 255
Financing and Dividend
New issues $ 250
Retirements 0
2,189)
Cash flow $ (489)
Financing
Equity $ 150
New issues 325
DRP, continuous equity 35
Net short-term financing & other (5)
Common dividend (270)
Financing $ 10
Cash at year end 2013 $ 318
Retirements 0
Net short-term financing & other 35
Financing $ 510
Cash at year end 2013 $ 26
32
Bank Facility ($550) available $ 548
a Includes other
b Includes cost of removal and capital leases
Bank Facility ($650) available $ 648
AR Facility ($250) available $ 125

GAAP Reconciliation
CMS ENERGY CORPORATION
Earnings Per Share By Year GAAP Reconciliation
(Unaudited)
| 2003 | 2004 | 2005 | 2006 | 2007 | 2008 | 2009 | 2010 | 2011 | 2012 | |||||||||||||||||||||||||||||||
Reported earnings (loss) per share - GAAP | ($ | 0.30 | ) | $ | 0.64 | ($ | 0.44 | ) | ($ | 0.41 | ) | ($ | 1.02 | ) | $ | 1.20 | $ | 0.91 | $ | 1.28 | $ | 1.58 | $ | 1.42 | ||||||||||||||||
After-tax items: | ||||||||||||||||||||||||||||||||||||||||
Electric and gas utility | 0.21 | (0.39 | ) | — | — | (0.07 | ) | 0.05 | 0.33 | 0.03 | 0.00 | 0.17 | ||||||||||||||||||||||||||||
Enterprises | 0.74 | 0.62 | 0.04 | (0.02 | ) | 1.25 | (0.02 | ) | 0.09 | (0.03 | ) | (0.11 | ) | (0.01 | ) | |||||||||||||||||||||||||
Corporate interest and other | 0.16 | (0.03 | ) | 0.04 | 0.27 | (0.32 | ) | (0.02 | ) | 0.01 | * | (0.01 | ) | *w | ||||||||||||||||||||||||||
Discontinued operations (income) loss | (0.16 | ) | 0.02 | (0.07 | ) | (0.03 | ) | 0.40 | ( | *) | (0.08 | ) | 0.08 | (0.01 | ) | (0.03 | ) | |||||||||||||||||||||||
Asset impairment charges, net | — | — | 1.82 | 0.76 | 0.60 | — | — | — | — | — | ||||||||||||||||||||||||||||||
Cumulative accounting changes | 0.16 | 0.01 | — | — | — | — | — | — | — | — | ||||||||||||||||||||||||||||||
Adjusted earnings per share, including MTM - non-GAAP | $ | 0.81 | $ | 0.87 | $ | 1.39 | $ | 0.57 | $ | 0.84 | $ | 1.21 | (a) | $ | 1.26 | $ | 1.36 | $ | 1.45 | $ | 1.55 | |||||||||||||||||||
Mark-to-market impacts | 0.03 | (0.43 | ) | 0.51 | ||||||||||||||||||||||||||||||||||||
Adjusted earnings per share, excluding MTM - non-GAAP | NA | $ | 0.90 | $ | 0.96 | $ | 1.08 | NA | NA | NA | NA | NA | NA | |||||||||||||||||||||||||||
| * | Less than $500 thousand or $0.01 per share. |
| (a) | $1.25 excluding discontinued Exeter operations and accounting changes related to convertible debt and restricted stock. |
2003-12 EPS
CMS Energy
Reconciliation of Gross Operating Cash Flow to GAAP Operating Activities
(unaudited)
(mils)
| 2011 | 2012 | 2013 | 2014 | 2015 | 2016 | 2017 | ||||||||||||||||||||||
Consumers Operating Income + Depreciation & Amortization | $ | 1,527 | $ | 1,635 | $ | 1,735 | $ | 1,821 | $ | 1,948 | $ | 2,011 | $ | 2,113 | ||||||||||||||
Enterprises Project Cash Flows | 24 | 17 | 20 | 29 | 37 | 44 | 56 | |||||||||||||||||||||
Gross Operating Cash Flow | $ | 1,551 | $ | 1,652 | $ | 1,755 | $ | 1,850 | $ | 1,985 | $ | 2,055 | $ | 2,169 | ||||||||||||||
Other operating activities including taxes, interest payments and working capital | (382 | ) | (411 | ) | (405 | ) | (400 | ) | (435 | ) | (805 | ) | (819 | ) | ||||||||||||||
Net cash provided by operating activities | $ | 1,169 | $ | 1,241 | $ | 1,350 | $ | 1,450 | $ | 1,550 | $ | 1,250 | $ | 1,350 | ||||||||||||||
2011-17 OCF
CMS ENERGY CORPORATION
Earnings By Quarter and Year GAAP Reconciliation
(Unaudited)
(In Millions, Except Per Share Amounts) | 2012 | |||||||||||||||||||
| 1Q | 2Q | 3Q | 4Q | YTD Dec | ||||||||||||||||
Reported net income - GAAP | $ | 67 | $ | 100 | $ | 148 | $ | 67 | $ | 382 | ||||||||||
After-tax items: | ||||||||||||||||||||
Electric and gas utility | 36 | 7 | * | ( | *) | 43 | ||||||||||||||
Enterprises | 1 | 1 | (3 | ) | ( | *) | (1 | ) | ||||||||||||
Corporate interest and other | — | — | — | * | * | |||||||||||||||
Discontinued operations income | (7 | ) | * | * | * | (7 | ) | |||||||||||||
Adjusted income - non-GAAP | $ | 97 | $ | 108 | $ | 145 | $ | 67 | $ | 417 | ||||||||||
Average shares outstanding, basic | 255.6 | 261.2 | 262.9 | 263.0 | 260.7 | |||||||||||||||
Average shares outstanding, diluted | 266.8 | 268.2 | 269.0 | 269.5 | 268.6 | |||||||||||||||
Reported earnings per share - GAAP | $ | 0.25 | $ | 0.37 | $ | 0.55 | $ | 0.25 | $ | 1.42 | ||||||||||
After-tax items: | ||||||||||||||||||||
Electric and gas utility | 0.14 | 0.03 | * | ( | *) | 0.17 | ||||||||||||||
Enterprises | 0.01 | * | (0.01 | ) | ( | *) | (0.01 | ) | ||||||||||||
Corporate interest and other | — | — | — | * | * | |||||||||||||||
Discontinued operations income | (0.03 | ) | * | * | * | (0.03 | ) | |||||||||||||
Adjusted earnings per share - non-GAAP | $ | 0.37 | $ | 0.40 | $ | 0.54 | $ | 0.25 | $ | 1.55 | ||||||||||
(In Millions, Except Per Share Amounts) | 2013 | |||||||||||||||||||
| 1Q | ||||||||||||||||||||
Reported net income - GAAP | $ | 144 | ||||||||||||||||||
After-tax items: | ||||||||||||||||||||
Electric and gas utility | — | |||||||||||||||||||
Enterprises | * | |||||||||||||||||||
Corporate interest and other | — | |||||||||||||||||||
Discontinued operations loss | * | |||||||||||||||||||
Adjusted income - non-GAAP | $ | 144 | ||||||||||||||||||
Average shares outstanding, basic | 263.6 | |||||||||||||||||||
Average shares outstanding, diluted | 270.9 | |||||||||||||||||||
Reported earnings per share - GAAP | $ | 0.53 | ||||||||||||||||||
After-tax items: | ||||||||||||||||||||
Electric and gas utility | — | |||||||||||||||||||
Enterprises | * | |||||||||||||||||||
Corporate interest and other | — | |||||||||||||||||||
Discontinued operations loss | * | |||||||||||||||||||
Adjusted earnings per share - non-GAAP | $ | 0.53 | ||||||||||||||||||
Note: Year-to-date (YTD) EPS may not equal sum of quarters due to share count differences.
| * | Less than $500 thousand or $0.01 per share. |
2013 A-1
CMS Energy Corporation
Earnings Segment Results GAAP Reconciliation
(Unaudited)
| Three Months Ended | ||||||||
March 31 | 2013 | 2012 | ||||||
Electric Utility | ||||||||
Reported | $ | 0.24 | $ | 0.08 | ||||
Electric Decoupling Court Order | — | 0.14 | ||||||
Adjusted | $ | 0.24 | $ | 0.22 | ||||
Gas Utility | ||||||||
Reported | $ | 0.35 | $ | 0.21 | ||||
Restructuring Costs | — | — | ||||||
Adjusted | $ | 0.35 | $ | 0.21 | ||||
Enterprises | ||||||||
Reported | $ | 0.02 | $ | 0.01 | ||||
Restructuring Costs | * | 0.01 | ||||||
Adjusted | $ | 0.02 | $ | 0.02 | ||||
Corporate Interest and Other | ||||||||
Reported | $ | (0.08 | ) | $ | (0.08 | ) | ||
Restructuring Costs | — | — | ||||||
Adjusted | $ | (0.08 | ) | $ | (0.08 | ) | ||
Discontinued Operations | ||||||||
Reported | (*) | $ | 0.03 | |||||
Discontinued Operations Income | * | (0.03 | ) | |||||
Adjusted | $ | — | $ | — | ||||
Totals | ||||||||
Reported | $ | 0.53 | $ | 0.25 | ||||
Discontinued Operations Income | * | (0.03 | ) | |||||
Electric Decoupling Court Order | — | 0.14 | ||||||
Restructuring Costs | * | 0.01 | ||||||
Adjusted | $ | 0.53 | $ | 0.37 | ||||
Average Common Shares Outstanding - Diluted (in millions) | 270.9 | 266.8 | ||||||
* |
| Less than $0.01 per share. |
2013 A-2
Consumers Energy
2013 Forecasted Cash Flow GAAP Reconciliation (in millions) (unaudited)
| Reclassifications From Sources and Uses to Statement of Cash Flows | ||||||||||||||||||||||||||||||||||||||
Presentation Sources and Uses | Tax | Interest | Other Working | Capital | Securitization | Preferred | Common | Consolidated Statements of Cash Flows | ||||||||||||||||||||||||||||||
Description | non-GAAP Amount | Sharing Operating | Payments as Operating | Capital as Investing | Lease Pymts as Financing | Debt Pymts as Financing | Dividends as Financing | Dividends as Financing | GAAP Amount | Description | ||||||||||||||||||||||||||||
Cash at year end 2012 | $ | 5 | $ | — | $ | — | $ | — | $ | — | $ | — | $ | — | $ | — | $ | 5 | Cash at year end 2012 | |||||||||||||||||||
Sources | ||||||||||||||||||||||||||||||||||||||
Operating (dep & amort $620) | $ | 1,770 | ||||||||||||||||||||||||||||||||||||
Other working capital | (70 | ) | ||||||||||||||||||||||||||||||||||||
Sources | $ | 1,700 | $ | (135 | ) | $ | (218 | ) | $ | (108 | ) | $ | 28 | $ | 41 | $ | — | $ | — | $ | 1,308 | Net cash provided by operating activities | ||||||||||||||||
Uses | ||||||||||||||||||||||||||||||||||||||
Interest and preferred dividend | $ | (220 | ) | |||||||||||||||||||||||||||||||||||
Capital expendituresa | (1,375 | ) | ||||||||||||||||||||||||||||||||||||
Dividends and tax sharing $(135) to CMS | (545 | ) | ||||||||||||||||||||||||||||||||||||
Pension Contribution | (49 | ) | ||||||||||||||||||||||||||||||||||||
Uses | $ | (2,189 | ) | $ | 135 | $ | 218 | $ | 108 | $ | — | $ | — | $ | 2 | $ | 410 | $ | (1,316 | ) | Net cash provided by investing activities | |||||||||||||||||
Cash flow | $ | (489 | ) | $ | — | $ | — | $ | — | $ | 28 | $ | 41 | $ | 2 | $ | 410 | $ | (8 | ) | Cash flow from operating and investing activities | |||||||||||||||||
Financing | ||||||||||||||||||||||||||||||||||||||
Equity | $ | 150 | ||||||||||||||||||||||||||||||||||||
New Issues | 325 | |||||||||||||||||||||||||||||||||||||
Retirements | — | |||||||||||||||||||||||||||||||||||||
Net short-term financing & other | 35 | |||||||||||||||||||||||||||||||||||||
Financing | $ | 510 | $ | — | $ | — | $ | — | $ | (28 | ) | $ | (41 | ) | $ | (2 | ) | $ | (410 | ) | $ | 29 | Net cash provided by financing activities | |||||||||||||||
Net change in cash | $ | 21 | $ | — | $ | — | $ | — | $ | — | $ | — | $ | — | $ | — | $ | 21 | Net change in cash | |||||||||||||||||||
Cash at year end 2013 | $ | 26 | $ | — | $ | — | $ | — | $ | — | $ | — | $ | — | $ | — | $ | 26 | Cash at year end 2013 | |||||||||||||||||||
a Includes cost of removal and capital leases
2013 B-1
CMS Energy Parent
2013 Forecasted Cash Flow GAAP Reconciliation (in millions) (unaudited)
| Reclassifications From Sources and Uses to Statement of Cash Flows | ||||||||||||||||||||||||||
Presentation Sources and Uses | Interest | Overheads & | Other | Cash From | Consolidated Statements of Cash Flows | |||||||||||||||||||||
Description | non-GAAP Amount | Payments as Operating | Tax Payments as Operating | Uses (a) as Operating | Consolidated Companies | GAAP Amount | Description | |||||||||||||||||||
Cash at year end 2012 | $ | 53 | $ | — | $ | — | $ | — | $ | 35 | $ | 88 | Cash at year end 2012 | |||||||||||||
Sources | ||||||||||||||||||||||||||
Consumers Energy dividends/tax sharing | $ | 545 | ||||||||||||||||||||||||
Enterprises | 20 | |||||||||||||||||||||||||
Sources | $ | 565 | $ | (135 | ) | $ | (15 | ) | $ | (9 | ) | $ | 23 | $ | 429 | Net cash provided by operating activities | ||||||||||
Uses | ||||||||||||||||||||||||||
Interest and preferred dividends | $ | (135 | ) | |||||||||||||||||||||||
Overhead and Federal tax payments | (15 | ) | ||||||||||||||||||||||||
Equity infusions | (150 | ) | ||||||||||||||||||||||||
Pension Contribution | (1 | ) | ||||||||||||||||||||||||
Uses (a) | $ | (310 | ) | $ | 135 | $ | 15 | $ | 9 | $ | (86 | ) | $ | (237 | ) | Net cash provided by investing activities | ||||||||||
Cash flow | $ | 255 | $ | — | $ | — | $ | — | $ | (63 | ) | $ | 192 | Cash flow from operating and investing activities | ||||||||||||
Financing and dividends | ||||||||||||||||||||||||||
New Issues | $ | 250 | ||||||||||||||||||||||||
Retirements | — | |||||||||||||||||||||||||
DRP, continuous equity | 35 | |||||||||||||||||||||||||
Net short-term financing & other | (5 | ) | ||||||||||||||||||||||||
Common dividend | (270 | ) | ||||||||||||||||||||||||
Financing | $ | 10 | $ | — | $ | — | $ | — | $ | 72 | $ | 82 | Net cash provided by financing activities | |||||||||||||
Net change in cash | $ | 265 | $ | — | $ | — | $ | — | $ | 9 | $ | 274 | Net change in cash | |||||||||||||
Cash at year end 2013 | $ | 318 | $ | — | $ | — | $ | — | $ | 44 | $ | 362 | Cash at year end 2013 | |||||||||||||
| (a) | Includes other |
2013 B-2
Consolidated CMS Energy
2013 Forecasted Consolidation of Consumers Energy and CMS Energy Parent Statements of Cash Flow (in millions) (unaudited)
Statements of Cash Flows | Eliminations/Reclassifications to Arrive at the Consolidated Statement of Cash Flows | Consolidated Statements of Cash Flows | ||||||||||||||||||||||||
| Consumers Common Dividend as Financing | Consumers Preferred Dividend as Operating | Equity Infusions to Consumers | ||||||||||||||||||||||||
| Consumers Amount | CMS Parent Amount | |||||||||||||||||||||||||
Description | Amount | Description | ||||||||||||||||||||||||
Cash at year end 2012 | $ | 5 | $ | 88 | $ | — | $ | — | $ | — | $ | 93 | Cash at year end 2012 | |||||||||||||
Net cash provided by operating activities | $ | 1,308 | $ | 429 | $ | (410 | ) | $ | (2 | ) | $ | — | $ | 1,325 | Net cash provided by operating activities | |||||||||||
Net cash provided by investing activities | (1,316 | ) | (237 | ) | — | — | 150 | (1,403 | ) | Net cash provided by investing activities | ||||||||||||||||
Cash flow from operating and investing activities | $ | (8 | ) | $ | 192 | $ | (410 | ) | $ | (2 | ) | $ | 150 | $ | (78 | ) | Cash flow from operating and investing activities | |||||||||
Net cash provided by financing activities | $ | 29 | $ | 82 | $ | 410 | $ | 2 | $ | (150 | ) | $ | 373 | Net cash provided by financing activities | ||||||||||||
Net change in cash | $ | 21 | $ | 274 | $ | — | $ | — | $ | — | $ | 295 | Net change in cash | |||||||||||||
Cash at year end 2013 | $ | 26 | $ | 362 | $ | — | $ | — | $ | — | $ | 388 | Cash at year end 2013 | |||||||||||||
2013 B-3