Exhibit 99.1
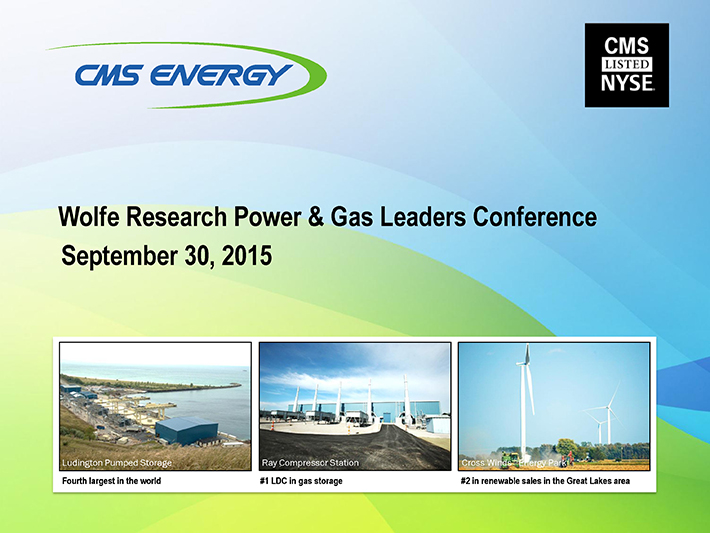
Wolfe Research Power & Gas Leaders Conference September 30, 2015
Ludington Pumped Storage Ray Compressor Station Cross Winds ?Energy Park
Fourth largest in the world #1 LDC in gas storage #2 in renewable sales in the Great Lakes area
This presentation is made as of the date hereof and contains “forward-looking statements” as defined in Rule 3b-6 of the
Securities Exchange Act of 1934, Rule 175 of the Securities Act of 1933, and relevant legal decisions. The forward-looking statements are subject to risks and uncertainties. All forward-looking statements should be considered in the context of the risk and other factors detailed from time to time in CMS Energy’s and Consumers Energy’s Securities and Exchange Commission filings. Forward-looking statements should be read in conjunction with “FORWARD-LOOKING STATEMENTS AND
INFORMATION” and “RISK FACTORS” sections of CMS Energy’s and Consumers Energy’s Form 10-K for the year ended
December 31, 2014 and as updated in subsequent 10-Qs. CMS Energy’s and Consumers Energy’s “FORWARD-LOOKING
STATEMENTS AND INFORMATION” and “RISK FACTORS” sections are incorporated herein by reference and discuss important factors that could cause CMS Energy’s and Consumers Energy’s results to differ materially from those anticipated in such statements. CMS Energy and Consumers Energy undertake no obligation to update any of the information presented herein to reflect facts, events or circumstances after the date hereof.
The presentation also includes non-GAAP measures when describing CMS Energy’s results of operations and financial performance. A reconciliation of each of these measures to the most directly comparable GAAP measure is included in the appendix and posted on our website at www.cmsenergy.com.
CMS Energy provides historical financial results on both a reported (Generally Accepted Accounting Principles) and adjusted (non-GAAP) basis and provides forward-looking guidance on an adjusted basis. Management views adjusted earnings as a key measure of the company’s present operating financial performance, unaffected by discontinued operations, asset sales, impairments, regulatory items from prior years, or other items. These items have the potential to impact, favorably or unfavorably, the company’s reported earnings in future periods.
Investors and others should note that CMS Energy routinely posts important information on its website and considers the Investor Relations section, www.cmsenergy.com/investor-relations, a channel of distribution.

Why Invest in CMS Energy?
Our Growth Engine Supported By
(2015-2024 Capex)
SIDES — More growth
(Investment, Sales, Cost, & DIG)
• |
| PARTNERS — Facilitate growth |
$15.5 Billion (Customers, Regulators, & Policy Makers)
• |
| PASSION to improve for customers AND owners |
(Value, Reliability, & Environment)
More “upside” $5 bil NOT yet in Plan! • SELF-FUNDED!
. . . . next 10 years even brighter than last 10 year record!

Simple, Perhaps Unique CMS Growth Model . . . .
5-Year Upside Plan Opportunity Capital investment (drives long-term growth) 5%—7% 6%—8%
—O&M cost reductions -2 pts
Short-term
—Sales growth — 1/2 ROA return
—No “block” equity dilution -1
and/or
—Surcharges and other -1 1/2 Long-term INVESTMENT SELF-FUNDED -5 pts Replace PPAs Rate increase at or below inflation <2 % <2%
. . . . drives sustainable growth with upside opportunities.

Investment “Catch-up” . . . .
Capex
(bils) One of first with a ten year plan
$1.8
> $1.5 per year
“Catch-up” a
Capex as a Percent of Market Cap
2005—2014 2015—2024
CMS 10% 16% Peers 15
0
2003 2004 2005 2006 2007 2008 2009 2010 2011 2012 2013 2014 2015 2016 2017 2018 2019 2020 2021 2022 2023 2024
a Based on December 31, 2014 information percent of market cap Source: 10K; actual amounts through 2014 smoothed for illustration
. . . . creating an opportunity for the next ten years.

Capex Up 45% . . . .
2005-2014 2015-2024 Opportunity $10.7 bil $15.5 bil $20 + bil
Opportunity
+45% +30%
Gas Infrastructure
Electric Gas 27% Maintenance Infrastructure Electric Maintenance 37% ctric Environ. Reliability Smart New Energy
Generation Infra New Generation Smart Percent of Energy Electric Reliability
Mkt Cap Environmental
– CMS 10% 16% 21%
– Peers 15
. . . . with more opportunity and no “big bets” over ten years!

O&M Cost Reductions . . . .
2006 2014 2018
Down 7% Down 10% or 2%/yr
$1.1 bil $1.0 bil $0.9 bil
Inflation Inflation
?2% ?2%
• |
| Coal to Gas Switching (Zeeland) Coal to Gas Switching (Jackson) |
• |
| Smarter benefit plans “Pole Top” Hardening |
• |
| Productivity/Attrition Productivity/Smart Energy |
. . . . provide more “headroom” for more capital investment.

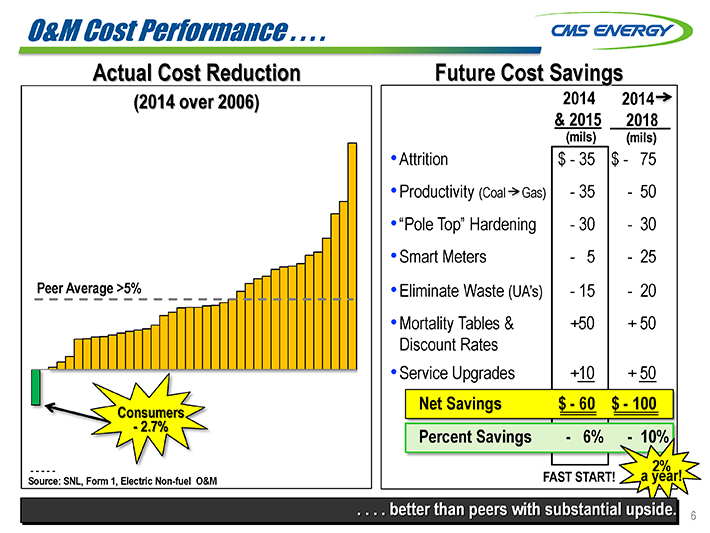
O&M Cost Performance . . . .
Actual Cost Reduction Future Cost Savings
(2014 over 2006) 2014 2014
& 2015 2018
(mils) (mils)
• |
| Attrition $—35 $— 75 |
• |
| Productivity (Coal Gas) —35 — 50 |
• |
| “Pole Top” Hardening —30 — 30 |
• |
| Smart Meters — 5 — 25 |
Peer Average >5% •Eliminate Waste (UA’s) —15 — 20
• |
| Mortality Tables & +50 + 50 Discount Rates |
• |
| Service Upgrades +10 + 50 |
Net Savings $—60 $—100
Consumers—2.7%
Percent Savings — 6% — 10%
— ——2%
Source: SNL, Form 1, Electric Non-fuel O&M FAST START! a year!
. . . . better than peers with substantial upside.

Sales Growth . . . .
Our Service Territorya Outperforms Annual Electric Sales c
Industrial Total
6%
Conservative
2%
1%
1/2%
2010-2014 2015—2019 Post-Recession Future
a Grand Rapids c Weather normalized vs. prior year b Annualized numbers thru July
Grand Rapids Michigan U.S.
Building Permitsb +23% +11% +12%
GDP 15 11 8
2010 2013
Population 3 0 2
2011 2014
Unemployment 3.3 5.3 5.3
(7/15)
A Grand Rapids
B Annualized numbers thru July
. . . . planned conservatively.
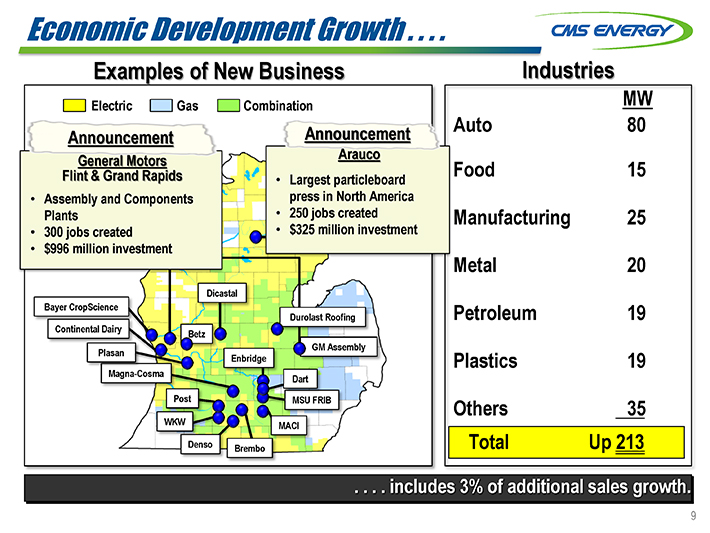
Economic Development Growth . . . .
Examples of New Business Industries
Electric Gas Combination MW
Announcement Announcement
Flint & Grand Rapids • Largest particleboard
• |
| Assembly and Components press in North America Plants 250 jobs created |
• |
| 300 jobs created $325 million investment |
• |
| $996 million investment |
Dicastal Bayer CropScience
Durolast Roofing Continental Dairy Betz GM Assembly Plasan Enbridge Magna-Cosma Dart Post MSU FRIB
WKW MACI
Denso Brembo Total Up 213
. . . . includes 3% of additional sales growth.
General Motors
Arauco
Auto 80
Food 15
Manufacturing 25
Metal 20
Petroleum 19
Plastics 19
Others 35

No “Block Equity” Dilution . . . .
Typical utility Model w/o NOLs CMS Model w/ NOLs
6% 6%
< 6%
< 5% -1%
0
Rate Base Dilution EPS Growth Rate Base Dilution EPS Growth Growth Growth
. . . . under CMS growth model.

PPAs (2,000 MW) Create Unique Opportunity for . . . .
PPA vs Owned Capacity Opportunity 2,000 MW
30%
Amount
(mils)
PPAs $(650) New Gas Build 650 Annual Customer Impact zero 10%
5%
Peers CMS Today CMS Future
. . . . more capacity investment, without increasing bills.
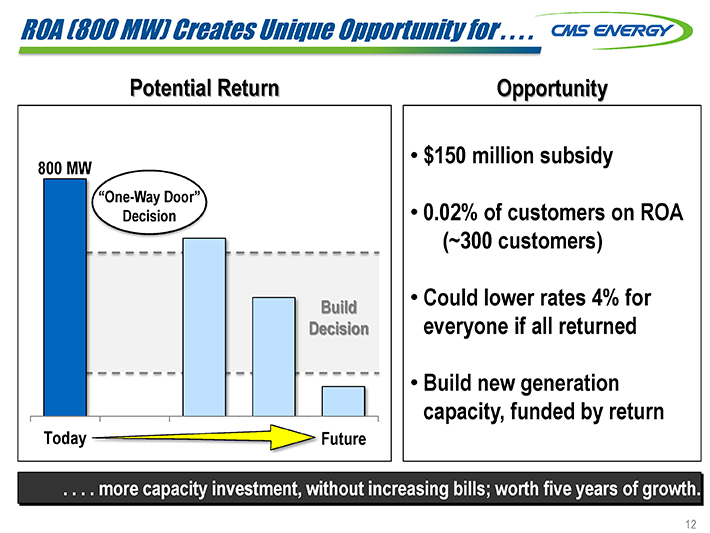
ROA (800 MW) Creates Unique Opportunity for . . . .
Potential Return Opportunity
• |
| $150 million subsidy |
800 MW
“One-Way Door”
Decision • 0.02% of customers on ROA (~300 customers)
Build • Could lower rates 4% for Decision everyone if all returned
• |
| Build new generation capacity, funded by return |
Today Future
. . . . more capacity investment, without increasing bills; worth five years of growth.

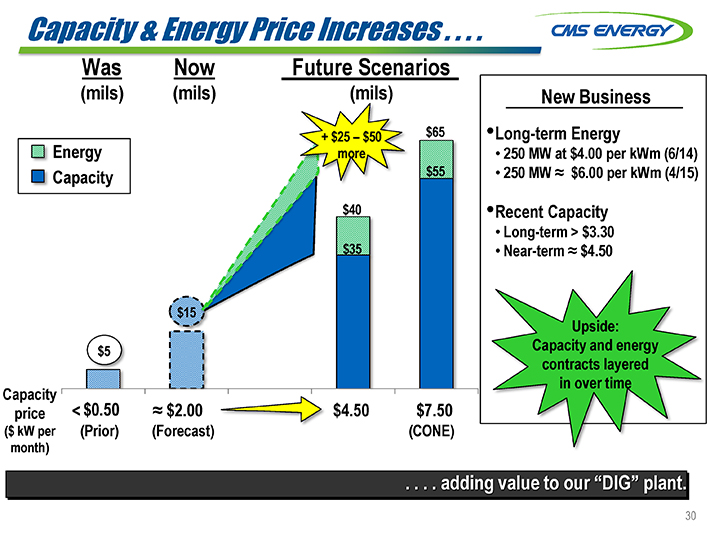
Capacity & Energy Price Increases . . . .
Was Now Future Scenarios
(mils) (mils) (mils) New Business
+ $25 – $50 $65 •Long-term Energy
Energy more • 250 MW at $4.00 per kWm (6/14) Capacity $55 • 250 MW ? $6.00 per kWm (4/15)
$40 •Recent Capacity
• |
| Long-term > $3.30 |
$35 • Near-term ? $4.50
$15 Upside:
$5 Capacity and energy contracts layered in over time Capacity
< $0.50 ? $2.00 $4.50 $7.50
price
($ kW per (Prior) (Forecast) (CONE) month)
. . . . adding value to our “DIG” plant.

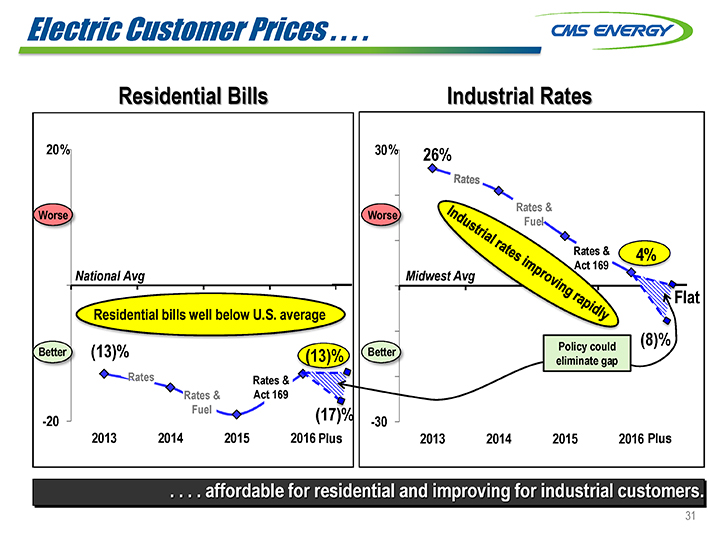
Electric Customer Prices . . . .
Residential Bills Industrial Rates
20% 30% 26%
Worse Worse
4%
National Avg Mid
Flat
Residential bills well below U.S. average
Policy could (8)% Better (13)% (13)% Better eliminate gap Rates Rates & Rates & Act 169
-20 Fuel (17)% -30
2013 2014 2015 2016 Plus 2013 2014 2015 2016 Plus
. . . . affordable for residential and improving for industrial customers.
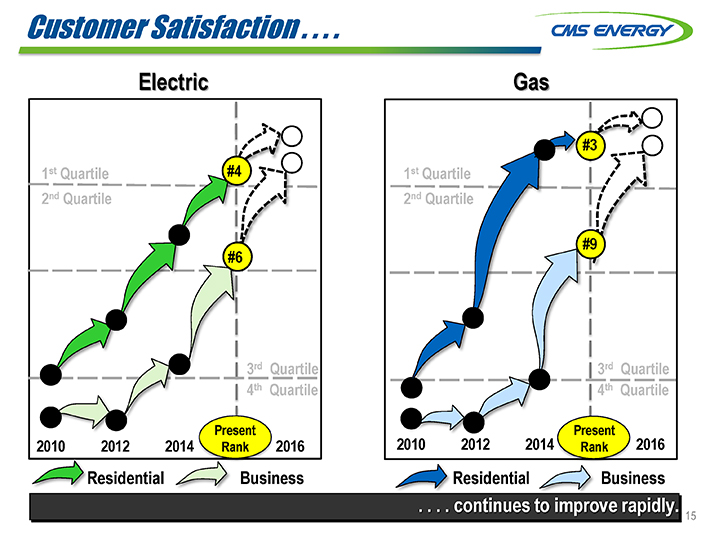
Customer Satisfaction . . . .
Electric Gas
#3 1st Quartile #4 1st Quartile 2nd Quartile 2nd Quartile
#9 #6
3rd Quartile 3rd Quartile 4th Quartile 4th Quartile
Present 2010 2012 2014 Present 2016 2010 2012 2014 Rank 2016 Rank
Residential Business Residential Business
. . . . continues to improve rapidly.

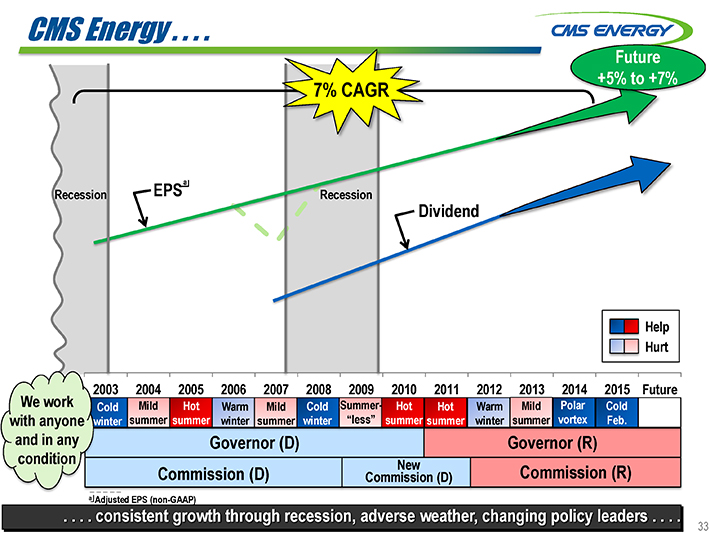
CMS Energy .. . . .
Future +5% to +7%
7% CAGR
a
Recession EPS Recession
Dividend
Help Hurt
003 2004 2005 2006 2007 2008 2009 2010 2011 2012 2013 2014 2015 Future
We work Cold Mild Hot Warm Mild Cold Summer- Hot Hot Warm Mild Polar Cold with anyone winter summer summer winter summer winter “less” summer summer winter summer vortex Feb.
and in any Governor (D) Governor (R)
condition New
Commission (D) Commission (D) Commission (R)
a Adjusted EPS (non-GAAP)
. . . . consistent growth through recession, adverse weather, changing policy leaders . . . .
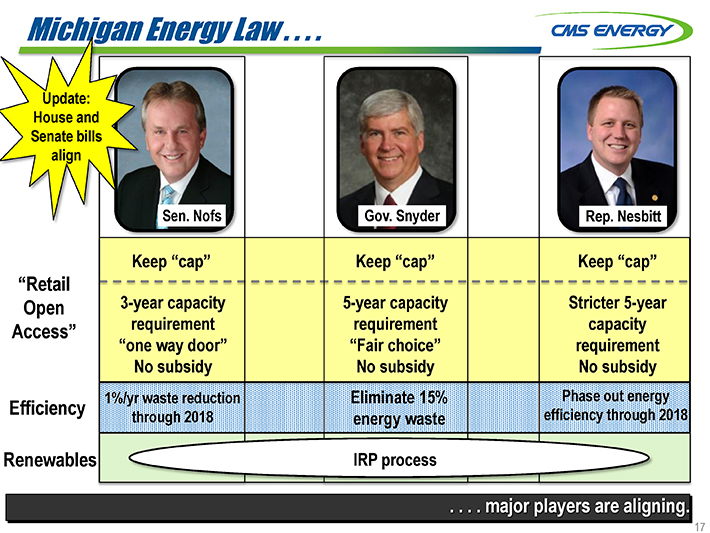
Michigan Energy Law . . . .
Update: House and Senate bills align
“Retail
Open
Access”
Efficiency
Renewables IRP process
. . . . major players are aligning.
Keep “cap”
3-year capacity requirement
“one way door”
No subsidy
1%yr waste reduction through 2018
Keep “cap”
5-year capacity
Requirement
“Fair choice”
No subsidy
Eliminate 15%
Energy waste
Keep “cap”
Stricter 5-year
Capacity requirement
No subsidy
Phase out energy efficiency through 2018

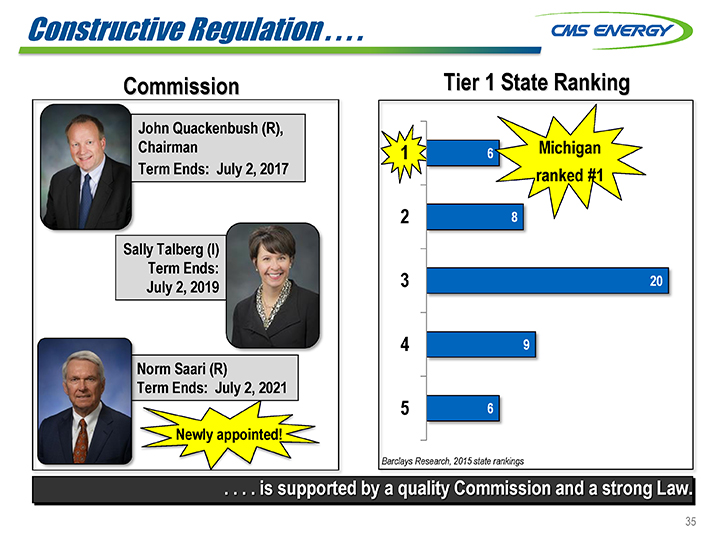
Constructive Regulation . . . .
Commission Tier 1 State Ranking
John Quackenbush (R), Chairman Term Ends: July 2, 2017
Sally Talberg (I) Term Ends: July 2, 2019
Norm Saari (R)
Term Ends: July 2, 2021
Newly appointed!
. . . . is supported by a quality Commission and a strong Law.
1 |
| 6 |
2 |
| 8 |
3 |
| 20 |
4 |
| 9 |
5 |
| 6 |
Michigan ranked #1
Barclays Research, 2015 state rankings

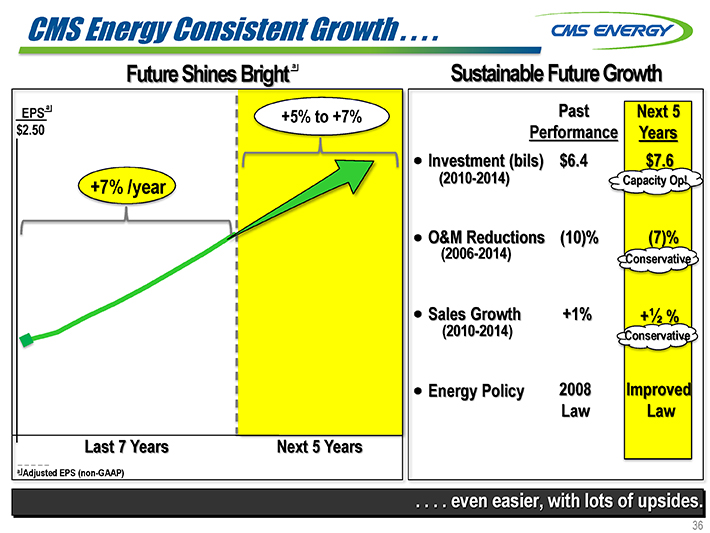
CMS Energy Consistent Growth . . . .
Future Shines Bright a Sustainable Future Growth
EPS a Past Next 5 +5% to +7% $2.50 Performance Years Investment (bils) $6.4 $7.6
+7% /year (2010-2014) Capacity Op!
O&M Reduction (10)% (7)%
(2006-2014) Conservative
Sales Growth +1% + 1/2 %
(2010-2014) Conservative
Energy Policy 2008 Improved Law Law Last 7 Years Next 5 Years
a Adjusted EPS (non-GAAP)
. . . . even easier, with lots of upsides.

Appendix

Clean Power Plan . . . .
Lbs CO2
(per MWh) (Preliminary — Emission Rate)
2500
Consumers Energy 2005 Baseline
Retire 950 MW coal State of Michigan Target
Projected outlook with 20% renewables —investment not yet in Plan
0
2014 2015 2016 2017 2018 2019 2020 2021 2022 2023 2024 2025 2026 2027 2028 2029 2030
. . . . positioned well for compliance.

Capacity Diversity . . . .
Oil Nuclear
6% 8%
Coal reduced Renewables by over 40%!
9% Coal 34% Pumped 2014 Storage 11%
Nuclear Gas Nuclear Oil 6% 32% 8% 8% Oil Renewables 9%
3% Purchases
Coal 1% 24% Pumped Coal Storage 41% Renewables
11% 2005 11% 2017
Pumped
Gas Storage Gas
31% 12% 35%
. . . . evolving to cleaner generation while becoming more cost competitive.

Rate Base Growth . . . .
10 Years of Growth Investment
Rate Ba 2015 Amount —2024
(bils) (bils)
$ +6% /year
Gas Infrastructure $ 5.8
& Maintenance
Electric Reliability 2.3 Smart Energy 0.4 Environmental 0.9
New Generation 1.1
Depreciation
Electric Maintenance 5.0
0 Plan Investment $15.5
. . . . drives EPS growth.
2014 2015 2016 2017 2018 2019 2020 2021 2022 2023 2024
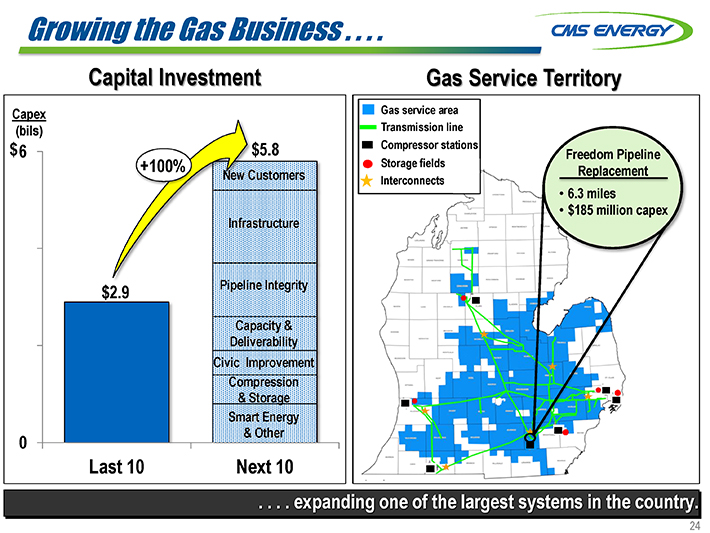
Growing the Gas Business . . . .
Capital Investment Gas Service Territory
Capex Gas service area (bils) Transmission line
$ 6 $5.8 Compressor stations
Freedom Pipeline
+100% Storage fields
Customers Replacement
Interconnects
• |
| 6.3 miles |
• |
| $185 million capex structure |
$2.9 ne Integrity Capacity & Deliverability Civic Improvement Compression
& Storage Smart Energy
& Other
0
Last 10 Next 10
. . . . expanding one of the largest systems in the country.

Rate Cases .. . . .
Gas (mils) Electric Track Record
$21 $85 Date Step Amount
(mils)
May 2013 Settlement $ 89 $64 2014 Stay ? —June 2015 Self-implement
Dec. 2015 Order expected
2 1/2 |
| years |
Investment Cost of Capital, Filed 7/17 since last order! Upgrades, & Other
. . . . fair and timely.
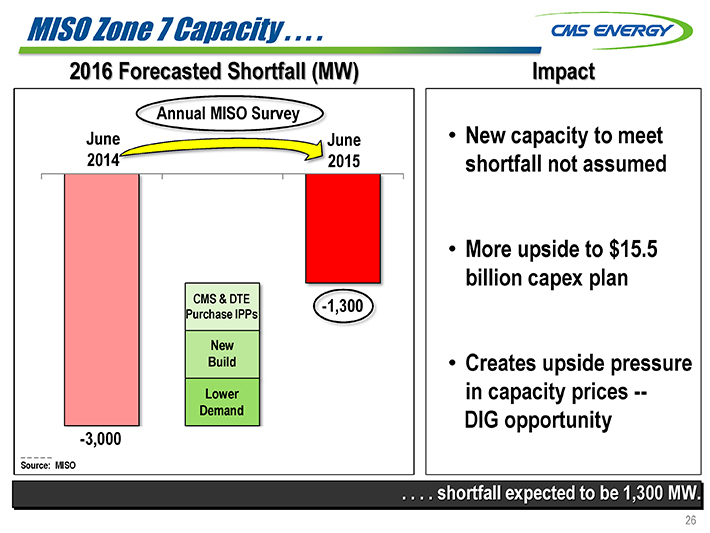
MISO Zone 7 Capacity . . . .
2016 Forecasted Shortfall (MW) Impact
June June • New capacity to meet 2014 2015 shortfall not assumed
• |
| More upside to $15.5 billion capex plan |
CMS & DTE Purchase IPPs
New
Build • Creates upside pressure Lower in capacity prices — Demand DIG opportunity
-3,000
Source: MISO
. . . . shortfall expected to be 1,300 MW.
Annual MISO Survey
-1,300
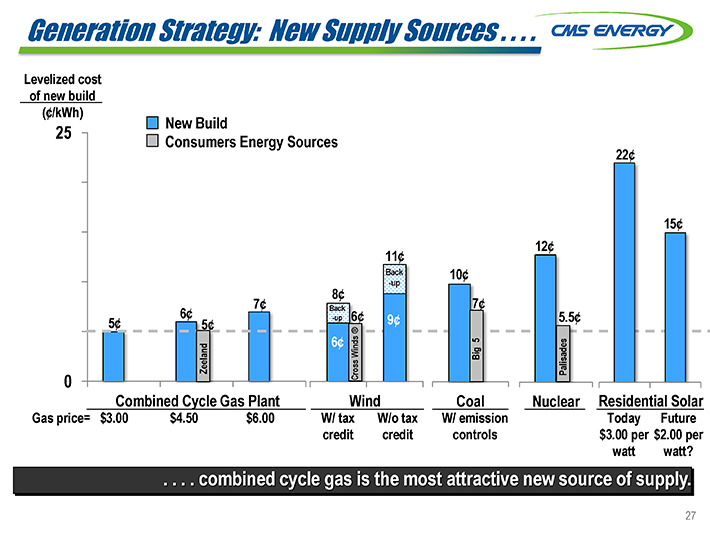
Generation Strategy: New Supply Sources . . . .
Levelized cost of new build (¢/kWh)
New Build
25
Consumers Energy Sources
22¢
15¢ 12¢ 11¢
Back 10¢ 8¢ -up
7¢ |
| 6¢ Back 7¢ |
6¢ |
| -up 6¢ 9¢ 5.5¢ |
5¢ |
| 5¢ ? |
6¢ |
| 5 |
Winds
Zeeland Cross Big Palisades
0
Combined Cycle Gas Plant Wind Coal Nuclear Residential Solar
Gas price= $3.00 $4.50 $6.00 W/ tax W/o tax W/ emission Today Future credit credit controls $3.00 per $2.00 per watt watt?
. . . . combined cycle gas is the most attractive new source of supply.

Operating Cash Flow Growth . . . .
Amount Up $0.6 a Billion
(bils) Gross operating cash flow $ 2.6 up $0.1 billion per year $2.5
2.1 $1.8 $1.9 1.6 $1.55
1.1
0.6 Investment
0.1
(0.4) Cash flow before dividend
(0.9) a Non-GAAP
2014 2015 2016 2017 2018 2019 2020
NOLs & Credits $0.7 $0.7 $0.7 $0.5 $0.3 $0.2 $0.1
. . . . up $0.6 billion or 30% over five years!
$2.1 $2.2 $2.3 $2.6
Interest, Working capital and taxes

GAAP Reconciliation
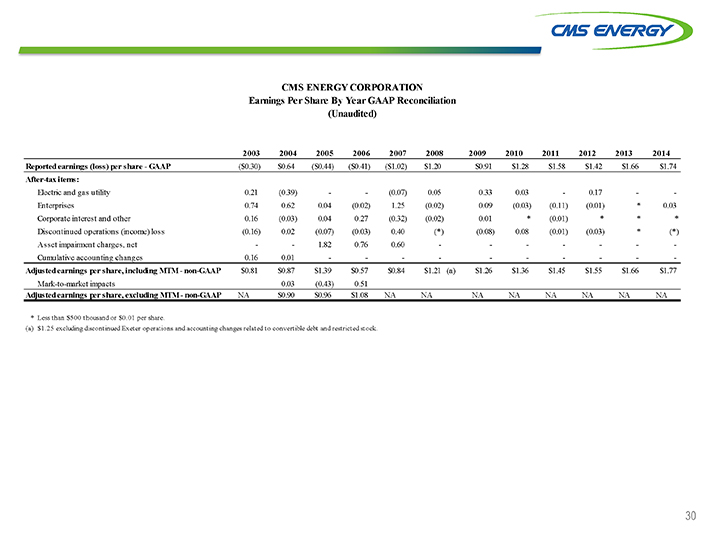
CMS ENERGY CORPORATION
Earnings Per Share By Year GAAP Reconciliation (Unaudited)
2003 2004 2005 2006 2007 2008 2009 2010 2011 2012 2013 2014
Reported earnings (loss) per share—GAAP($0.30) $0.64($0.44)($0.41)($1.02) $1.20 $0.91 $1.28 $1.58 $1.42 $1.66 $1.74
After-tax items:
Electric and gas utility 0.21(0.39) —(0.07) 0.05 0.33 0.03—0.17 —
Enterprises 0.74 0.62 0.04(0.02) 1.25(0.02) 0.09(0.03)(0.11)(0.01)* 0.03
Corporate interest and other 0.16(0.03) 0.04 0.27(0.32)(0.02) 0.01*(0.01)***
Discontinued operations (income) loss(0.16) 0.02(0.07)(0.03) 0.40(*)(0.08) 0.08(0.01)(0.03)*(*)
Asset impairment charges, net — 1.82 0.76 0.60 — — — -
Cumulative accounting changes 0.16 0.01 — — — — —
Adjusted earnings per share, including MTM—non-GAAP $0.81 $0.87 $1.39 $0.57 $0.84 $1.21(a) $1.26 $1.36 $1.45 $1.55 $1.66 $1.77
Mark-to-market impacts 0.03(0.43) 0.51
Adjusted earnings per share, excluding MTM—non-GAAP NA $0.90 $0.96 $1.08 NA NA NA NA NA NA NA NA
* |
| Less than $500 thousand or $0.01 per share. |
(a) $1.25 excluding discontinued Exeter operations and accounting changes related to convertible debt and restricted stock.

CMS Energy
Reconciliation of Gross Operating Cash Flow to GAAP Operating Activities
(unaudited)
(mils)
2014 2015 2016 2017 2018 2019 2020
Consumers Operating Income + Depreciation & Amortization $ 1,813 $ 1,920 $ 2,027 $ 2,145 $ 2,266 $ 2,401 $ 2,515
Enterprises Project Cash Flows 20 20 40 58 62 67 71
Gross Operating Cash Flow $ 1,833 $ 1,940 $ 2,067 $ 2,203 $ 2,328 $ 2,468 $ 2,586
Other operating activities including taxes, interest payments and
working capital(386)(390)(567)(603)(628)(668)(686)
Net cash provided by operating activities $ 1,447 $ 1,550 $ 1,500 $ 1,600 $ 1,700 $ 1,800 $ 1,900
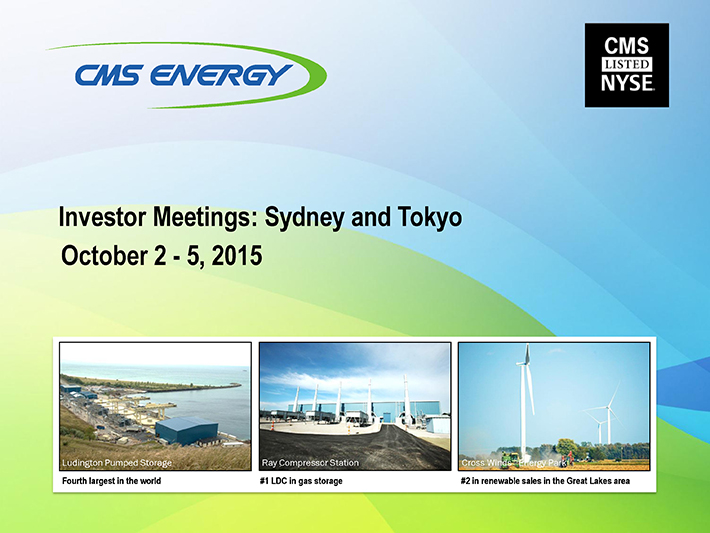
Investor Meetings: Sydney and Tokyo October 2—5, 2015 Ludington Pumped Storage Ray Compressor Station Cross Winds ®Energy Park Fourth largest in the world #1 LDC in gas storage #2 in renewable sales in the Great Lakes area

This presentation is made as of the date hereof and contains “forward-looking statements” as defined in Rule 3b-6 of the Securities Exchange Act of 1934, Rule 175 of the Securities Act of 1933, and relevant legal decisions. The forward-looking statements are subject to risks and uncertainties. All forward-looking statements should be considered in the context of the risk and other factors detailed from time to time in CMS Energy’s and Consumers Energy’s Securities and Exchange Commission filings. Forward-looking statements should be read in conjunction with “FORWARD-LOOKING STATEMENTS AND INFORMATION” and “RISK FACTORS” sections of CMS Energy’s and Consumers Energy’s Form 10-K for the year ended December 31, 2014 and as updated in subsequent 10-Qs. CMS Energy’s and Consumers Energy’s “FORWARD-LOOKING STATEMENTS AND INFORMATION” and “RISK FACTORS” sections are incorporated herein by reference and discuss important factors that could cause CMS Energy’s and Consumers Energy’s results to differ materially from those anticipated in such statements. CMS Energy and Consumers Energy undertake no obligation to update any of the information presented herein to reflect facts, events or circumstances after the date hereof. The presentation also includes non-GAAP measures when describing CMS Energy’s results of operations and financial performance. A reconciliation of each of these measures to the most directly comparable GAAP measure is included in the appendix and posted on our website at www.cmsenergy.com. CMS Energy provides historical financial results on both a reported (Generally Accepted Accounting Principles) and adjusted (non-GAAP) basis and provides forward-looking guidance on an adjusted basis. Management views adjusted earnings as a key measure of the company’s present operating financial performance, unaffected by discontinued operations, asset sales, impairments, regulatory items from prior years, or other items. These items have the potential to impact, favorably or unfavorably, the company’s reported earnings in future periods. Investors and others should note that CMS Energy routinely posts important information on its website and considers the Investor Relations section, www.cmsenergy.com/investor-relations, a channel of distribution.

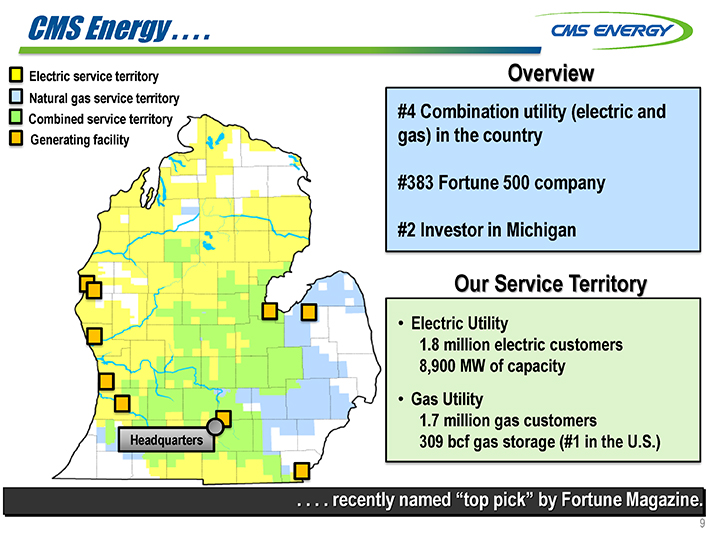
Electric service territory Overview Natural gas service territory Combined service territory #4 Combination utility (electric and Generating facility gas) in the country #383 Fortune 500 company #2 Investor in Michigan Our Service Territory • Electric Utility 1.8 million electric customers 8,900 MW of capacity • Gas Utility 1.7 million gas customers Headquarters 309 bcf gas storage (#1 in the U.S.) . . . . recently named “top pick” by Fortune Magazine. 2
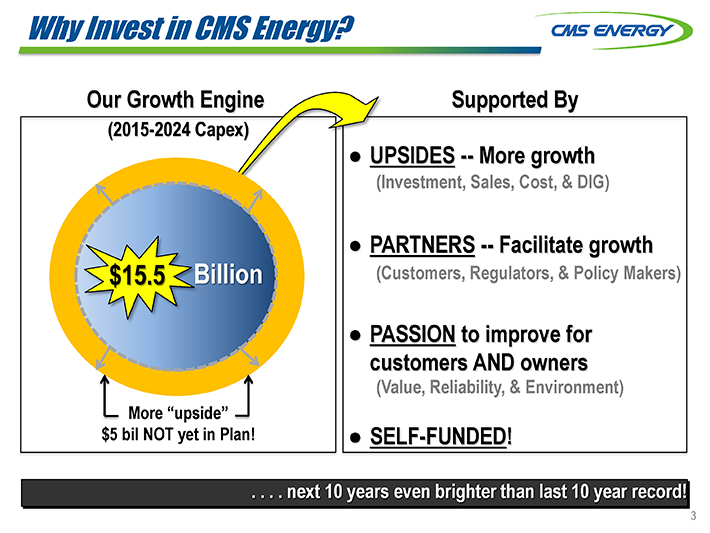
Why Invest in CMS Energy? Our Growth Engine Supported By (2015-2024 Capex) SIDES — More growth (Investment, Sales, Cost, & DIG) • PARTNERS — Facilitate growth $15.5 Billion (Customers, Regulators, & Policy Makers) • PASSION to improve for customers AND owners (Value, Reliability, & Environment) More “upside” $5 bil NOT yet in Plan! • SELF-FUNDED! . . . . next 10 years even brighter than last 10 year record! 3

Simple, Perhaps Unique CMS Growth Model . . 5-Year Upside Plan Opportunity Capital investment (drives long-term growth) 5%—7% 6%—8%—O&M cost reductions -2 pts Short-term—Sales growth— 1/2 ROA return—No “block” equity dilution -1 and/or—Surcharges and other -1 1/2 Long-term INVESTMENT SELF-FUNDED -5 pts Replace PPAs Rate increase at or below inflation <2 % <2% . . . . drives sustainable growth with upside opportunities.

Capex Up 45% . . . . 2005-2014 2015-2024 Opportunity $10.7 bil $15.5 bil $20 + bil Opportunity +45% +30% Gas Infrastructure Electric Gas 27% Maintenance Infrastructure Electric Maintenance 37% ctric Environ. Reliability Smart New Energy Generation Infra New Generation Smart Percent of Energy Electric Reliability Mkt Cap Environmental – CMS 10% 16% 21% – Peers 15 . . . . with more opportunity and no “big bets” over ten years! 5
O&M Cost Performance . . . . Actual Cost Reduction Future Cost Savings (2014 over 2006) 2014 2014 & 2015 2018 (mils) (mils) •Attrition $—35 $—75 •Productivity (Coal Gas)—35—50 •“Pole Top” Hardening—30—30 •Smart Meters—5—25 Peer Average >5% •Eliminate Waste (UA’s)—15—20 •Mortality Tables & +50 + 50 Discount Rates •Service Upgrades +10 + 50 Net Savings $—60 $—100 Consumers—2.7% Percent Savings—6%—10% — ——2% Source: SNL, Form 1, Electric Non-fuel O&M FAST START! a year! . . . . better than peers with substantial upside.

CMS Energy CMS Energy . . . . Future +5% to +7% 7% CAGR a Recession EPS Recession Dividend Help Hurt 003 2004 2005 2006 2007 2008 2009 2010 2011 2012 2013 2014 2015 Future We work Cold Mild Hot Warm Mild Cold Summer- Hot Hot Warm Mild Polar Cold with anyone winter summer summer winter summer winter “less” summer summer winter summer vortex Feb. and in any Governor (D) Governor (R) condition New Commission (D) Commission (D) Commission (R) a Adjusted EPS (non-GAAP) . . . . consistent growth through recession, adverse weather, changing policy leaders . . . .

Investor Meetings: Sydney and Tokyo October 2—5, 2015 Ludington Pumped Storage Ray Compressor Station Cross Winds ®Energy Park Fourth largest in the world #1 LDC in gas storage #2 in renewable sales in the Great Lakes area
CMS Energy .. . . . Electric service territory Overview Natural gas service territory Combined service territory #4 Combination utility (electric and Generating facility gas) in the country #383 Fortune 500 company #2 Investor in Michigan Our Service Territory • Electric Utility 1.8 million electric customers 8,900 MW of capacity • Gas Utility 1.7 million gas customers Headquarters 309 bcf gas storage (#1 in the U.S.) . . . . recently named “top pick” by Fortune Magazine. 9

Why Invest in CMS Energy? Our Growth Engine Supported By (2015-2024 Capex) SIDES — More growth (Investment, Sales, Cost, & DIG) • PARTNERS — Facilitate growth $15.5 Billion (Customers, Regulators, & Policy Makers) • PASSION to improve for customers AND owners (Value, Reliability, & Environment) More “upside” $5 bil NOT yet in Plan! • SELF-FUNDED! . . . . next 10 years even brighter than last 10 year record! 10
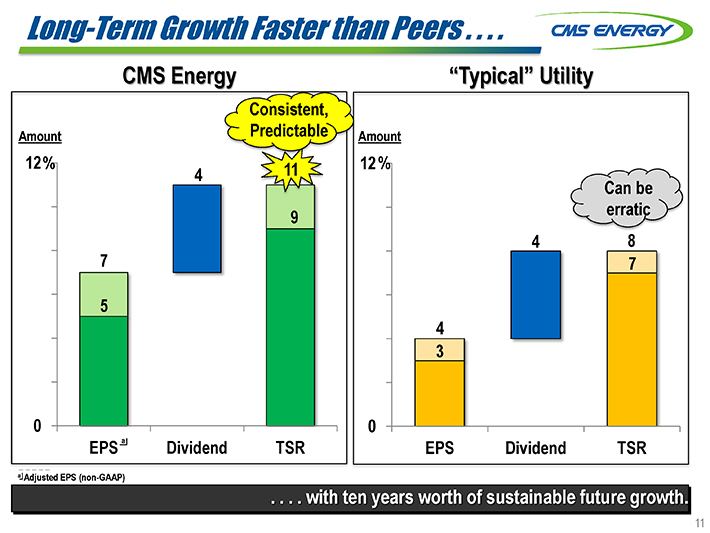
Long-Term Growth Faster than Peers . . . . CMS Energy “Typical” Utility Consistent, Amount Predictable 12% 11 4 Can be 9 erratic 7 5 0 a EPS Dividend TSR a Adjusted EPS (non-GAAP) . . . . with ten years worth of sustainable future growth.

Total Shareowner Return . . . . 500 % 400 300 200 S&P 500 Utilities +185% S&P 500 +122% 100 0 -100 2003 2004 2005 2006 2007 2008 2009 2010 2011 2012 2013 2014 September 23, 2015 — ——Source: Bloomberg . . . . CMS outperforms peers. 12
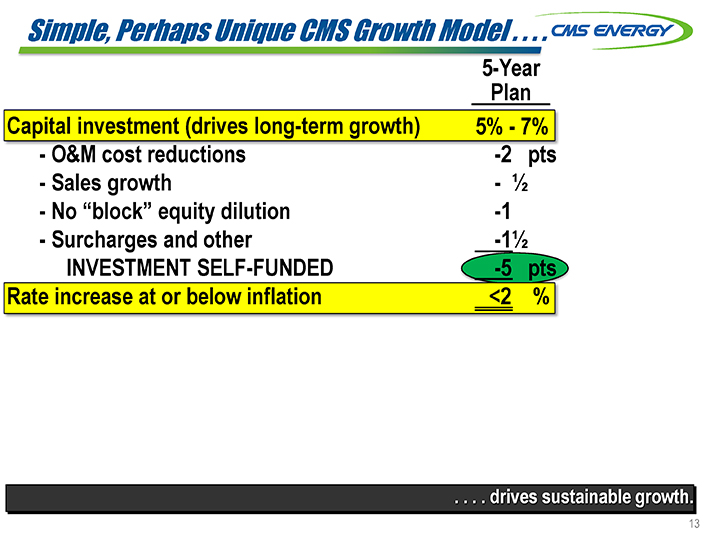
Simple, Perhaps Unique CMS Growth Model . Capital investment (drives long-term growth) - O&M cost reductions - Sales growth - No “block” equity dilution - Surcharges and other INVESTMENT SELF-FUNDED Rate increase at or below inflation -2 pts - ½ -1 -1½ -5 pts <2 % Plan 5% - 7% . . . . drives sustainable growth 13
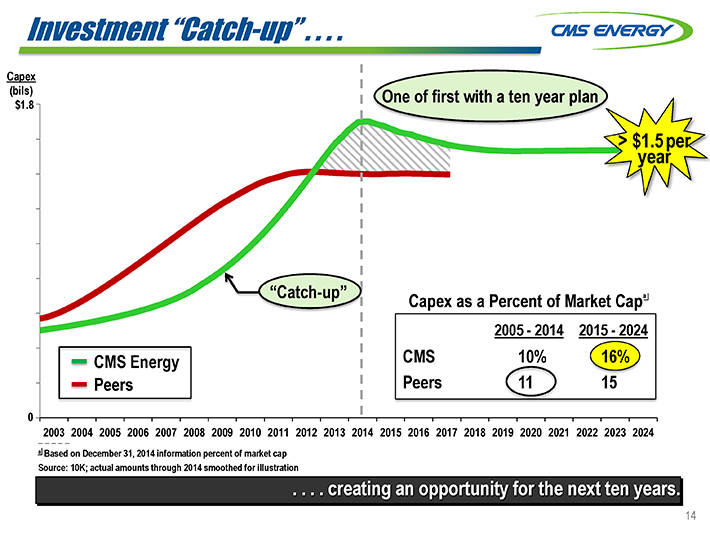
Investment “Catch-up” . . . . Capex (bils) One of first with a ten year plan $1.8 > $1.5 per year “Catch-up” a Capex as a Percent of Market Cap 2005—2014 2015—2024 CMS 10% 16% Peers 15 0 2003 2004 2005 2006 2007 2008 2009 2010 2011 2012 2013 2014 2015 2016 2017 2018 2019 2020 2021 2022 2023 2024 a Based on December 31, 2014 information percent of market cap Source: 10K; actual amounts through 2014 smoothed for illustration . . . . creating an opportunity for the next ten years. 14
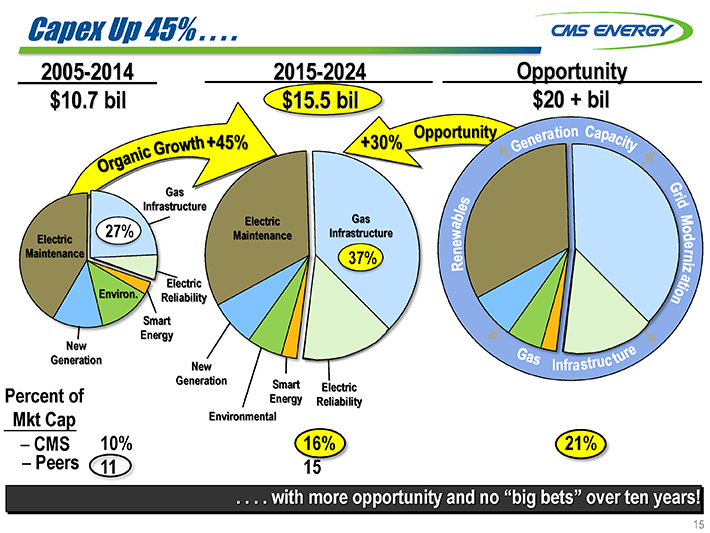
Capex Up 45% . . . . 2005-2014 2015-2024 Opportunity $10.7 bil $15.5 bil $20 + bil Opportunity +45% +30% Gas Infrastructure Electric Gas 27% Maintenance Infrastructure Electric Maintenance 37% ctric Environ. Reliability Smart New Energy Generation Infra New Generation Smart Percent of Energy Electric Reliability Mkt Cap Environmental – CMS 10% 16% 21% – Peers 15 . . . . with more opportunity and no “big bets” over ten years!
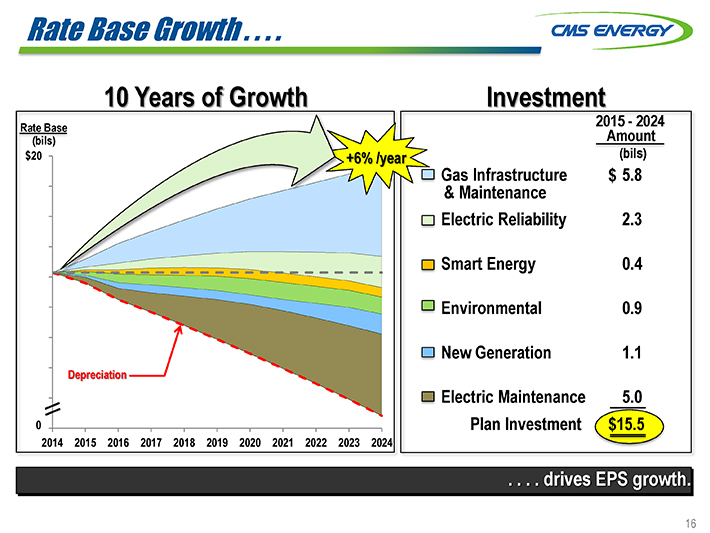
Rate Base Growth . . . . 10 Years of Growth Investment Rate Ba 2015 Amount—2024 (bils) (bils) $ +6% /year Gas Infrastructure $ 5.8 & Maintenance Electric Reliability 2.3 Smart Energy 0.4 Environmental 0.9 New Generation 1.1 Depreciation Electric Maintenance 5.0 0 Plan Investment $15.5 . . . . drives EPS growth. 16
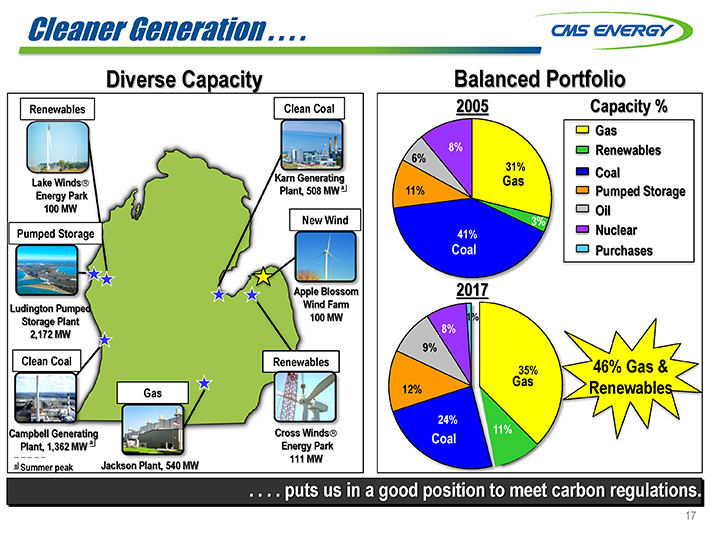
Cleaner Generation . . . . Diverse Capacity Balanced Portfolio Renewables Clean Coal 2005 Capacity % 8% 6% 31% Lake Winds Gas Energy Par lant, 508 MW a 11% 100 MW New Wind 3% Pumped Storage 41% Coal Apple Blossom 2017 Ludington Pumped Wind Farm Storage Plant 100 MW 1% 8% 2,172 MW 9% Clean Coal Renewables 46% Gas & 35% Gas Gas 12% Renewables 24% Campbell Generating Cross Winds? 11% a Coal Plant, 1,362 MW Energy Park 111 MW a Summer peak Jackson Plant, 540 MW . . . . puts us in a good position to meet carbon regulations. 17
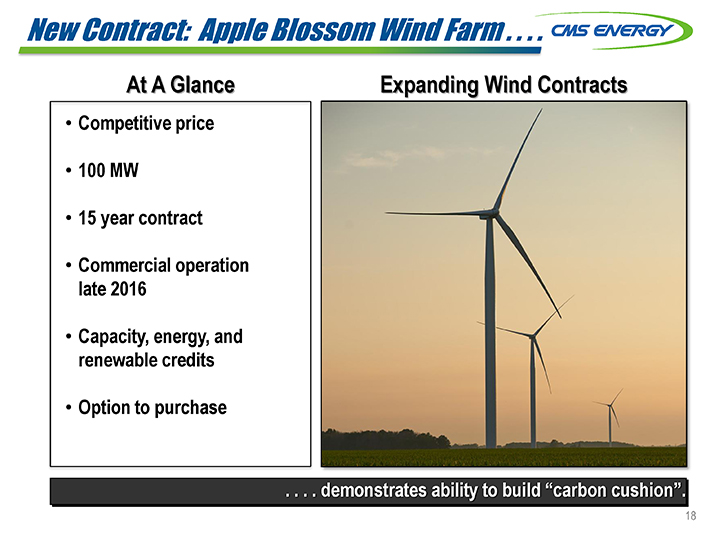
New Contract: Apple Blossom Wind Farm . . . . At A Glance Expanding Wind Contracts . . . . demonstrates ability to build “carbon cushion”. 18
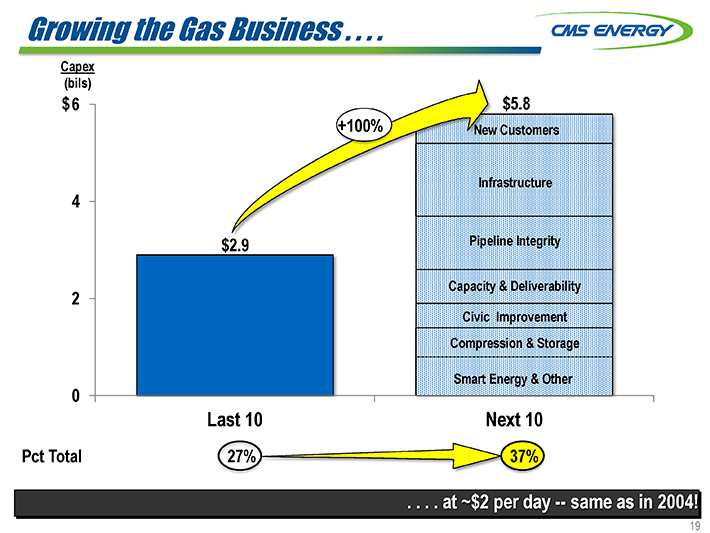
Growing the Gas Business . . . . Capex (bils) $ 6 $5.8 +100% Customers frastructure 4 $2.9 line Integrity Capacity & Deliverability 2 Civic Improvement Compression & Storage Smart Energy & Other 0 Last 10 Next 10 Pct Total 37% . . .. . at ~$2 per day — same as in 2004!

O&M Cost Performance . . . . Actual Cost Reduction Future Cost Savings (2014 over 2006) 2014 2014 & 2015 2018 (mils) (mils) •Attrition $—35 $—75 •Productivity (Coal Gas)—35—50 •“Pole Top” Hardening—30—30 •Smart Meters—5—25 Peer Average >5% •Eliminate Waste (UA’s)—15—20 •Mortality Tables & +50 + 50 Discount Rates •Service Upgrades +10 + 50 Net Savings $—60 $—100 Consumers—2.7% Percent Savings—6%—10% — ——2% Source: SNL, Form 1, Electric Non-fuel O&M FAST START! a year! . . . . better than peers with substantial upside.
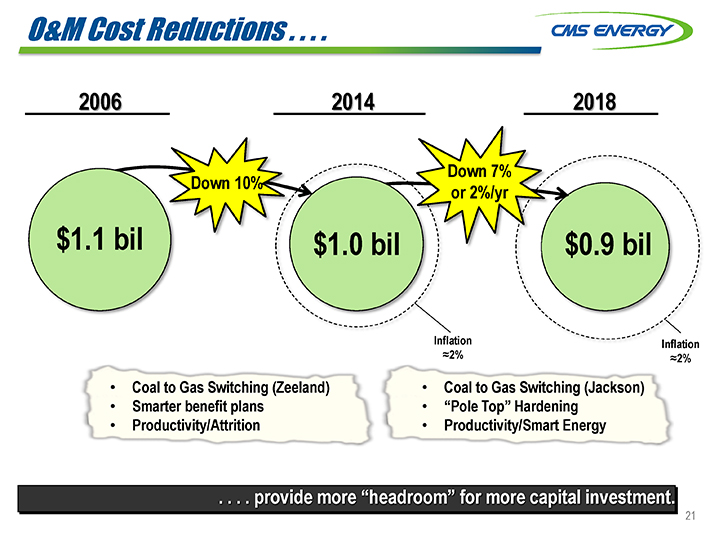
O&M Cost Reductions . . . . 2006 2014 2018 Down 7% Down 10% or 2%/yr $1.1 bil $1.0 bil $0.9 bil Inflation Inflation ?2% ?2% • Coal to Gas Switching (Zeeland) • Coal to Gas Switching (Jackson) • Smarter benefit plans • “Pole Top” Hardening • Productivity/Attrition • Productivity/Smart Energy . . . . provide more “headroom” for more capital investment. 21
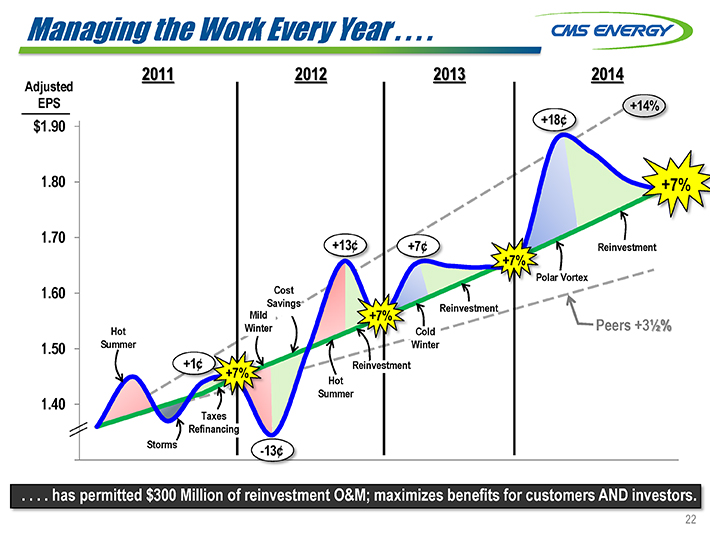
Managing the Work Every Year . . . . 2011 2012 2013 2014 Adjusted EPS +14% $1.90 +18¢ 1.80 +7% 1.70 +13¢ +7¢ Reinvestment +7% olar Vortex 1.60 Cost Savings Reinvestment Mild +7% Hot Winter Cold Peers +3 1/2% 1.50 Summer Winter +1¢ Reinvestment +7% Hot Summer 1.40 Taxes Refinancing Storms -13¢ . . . . has permitted $300 Million of reinvestment O&M; maximizes benefits for customers AND investors. 22
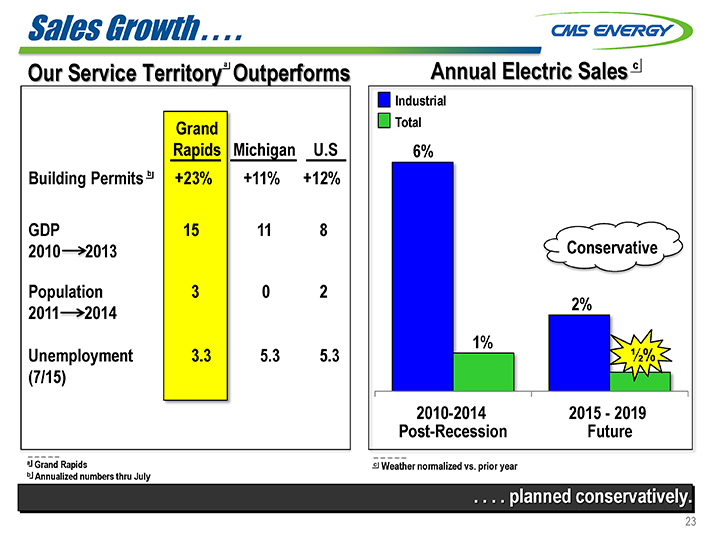
Sales Growth . . . . Our Service Territorya Outperforms Annual Electric Sales c Industrial Total 6% Conservative 2% 1% 1/2% 2010-2014 2015—2019 Post-Recession Future a Grand Rapids c Weather normalized vs. prior year b Annualized numbers thru July . . . . planned conservatively.

Economic Development Growth . . . . Examples of New Business Industries Electric Gas Combination MW Announcement Announcement Flint & Grand Rapids • Largest particleboard • Assembly and Components press in North America Plants • 250 jobs created • 300 jobs created • $325 million investment • $996 million investment Dicastal Bayer CropScience Durolast Roofing Continental Dairy Betz GM Assembly Plasan Enbridge Magna-Cosma Dart Post MSU FRIB WKW MACI Denso Brembo Total Up 213 . . . . includes 3% of additional sales growth. 24
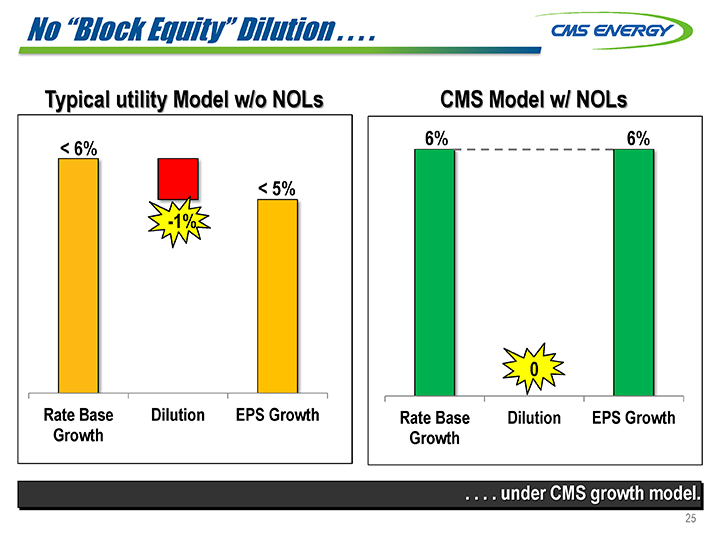
No “Block Equity” Dilution . . . . Typical utility Model w/o NOLs CMS Model w/ NOLs 6% 6% < 6% < 5% -1% 0 Rate Base Dilution EPS Growth Rate Base Dilution EPS Growth Growth Growth . . . . under CMS growth model. 25
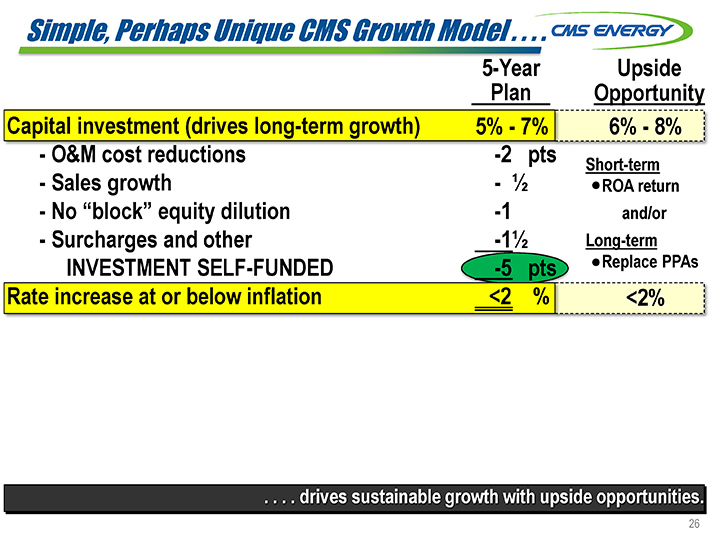
Simple, Perhaps Unique CMS Growth Model . . . . 5-Year Upside Plan Opportunity Capital investment (drives long-term growth) 5%—7% 6%—8%—O&M cost reductions -2 pts Short-term—Sales growth— 1/2 ROA return—No “block” equity dilution -1 and/or—Surcharges and other -1 1/2 Long-term INVESTMENT SELF-FUNDED -5 pts Replace PPAs Rate increase at or below inflation <2 % <2% . . . . drives sustainable growth with upside opportunities.
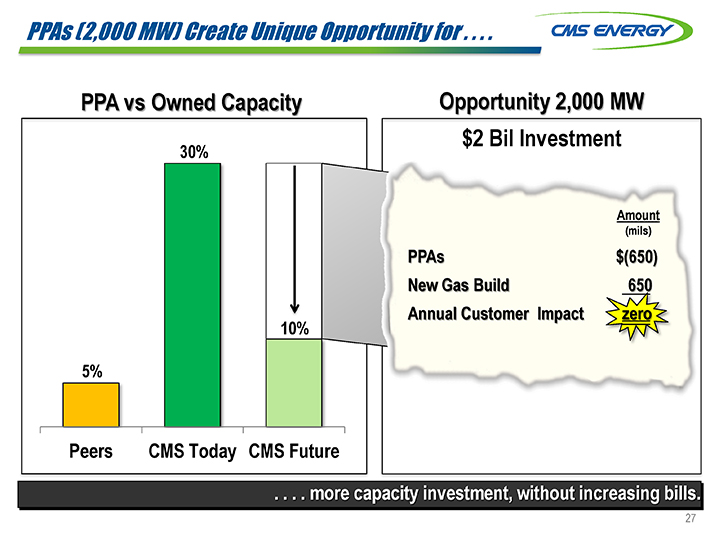
PPAs (2,000 MW) Create Unique Opportunity for . . . . PPA vs Owned Capacity Opportunity 2,000 MW 30% Amount (mils) PPAs $(650) New Gas Build 650 Annual Customer Impact zero 10% 5% Peers CMS Today CMS Future . . . . more capacity investment, without increasing bills. 27

ROA (800 MW) Creates Unique Opportunity for . . . . Potential Return Opportunity • $150 million subsidy 800 MW “One-Way Door” Decision • 0.02% of customers on ROA (~300 customers) Build • Could lower rates 4% for Decision everyone if all returned • Build new generation capacity, funded by return Today Future . . . . more capacity investment, without increasing bills; worth five years of growth. 28

MISO Zone 7 Capacity . . . . 2016 Forecasted Shortfall (MW) Impact June June • New capacity to meet 2014 2015 shortfall not assumed • More upside to $15.5 billion capex plan CMS & DTE Purchase IPPs New Build • Creates upside pressure Lower in capacity prices — Demand DIG opportunity -3,000 Source: MISO . . . . shortfall expected to be 1,300 MW. 29
Capacity & Energy Price Increases . . . . Was Now Future Scenarios (mils) (mils) (mils) New Business + $25 – $50 $65 •Long-term Energy Energy more • 250 MW at $4.00 per kWm (6/14) Capacity $55 • 250 MW ? $6.00 per kWm (4/15) $40 •Recent Capacity • Long-term > $3.30 $35 • Near-term ? $4.50 $15 Upside: $5 Capacity and energy contracts layered in over time Capacity < $0.50 ? $2.00 $4.50 $7.50 price ($ kW per (Prior) (Forecast) (CONE) month) . . . . adding value to our “DIG” plant. 30
Electric Customer Prices . . . . Residential Bills Industrial Rates 20% 30% 26% Worse Worse 4% National Avg Mid Flat Residential bills well below U.S. average Policy could (8)% Better (13)% (13)% Better eliminate gap Rates Rates & Rates & Act 169 -20 Fuel (17)% -30 2013 2014 2015 2016 Plus 2013 2014 2015 2016 Plus . . . . affordable for residential and improving for industrial customers.

Customer Satisfaction . . . . Electric Gas #3 1st Quartile #4 1st Quartile 2nd Quartile 2nd Quartile #9 #6 3rd Quartile 3rd Quartile 4th Quartile 4th Quartile Present 2010 2012 2014 Present 2016 2010 2012 2014 Rank 2016 Rank Residential Business Residential Business . . . . continues to improve rapidly. 32
CMS Energy .. . . . Future +5% to +7% 7% CAGR a Recession EPS Recession Dividend Help Hurt 003 2004 2005 2006 2007 2008 2009 2010 2011 2012 2013 2014 2015 Future We work Cold Mild Hot Warm Mild Cold Summer- Hot Hot Warm Mild Polar Cold with anyone winter summer summer winter summer winter “less” summer summer winter summer vortex Feb. and in any Governor (D) Governor (R) condition New Commission (D) Commission (D) Commission (R) a Adjusted EPS (non-GAAP) . . . . consistent growth through recession, adverse weather, changing policy leaders . . . . 33

Michigan Energy Law . . . . Update: House and Senate bills align “Retail Open Access” Efficiency Renewables IRP process . . . . major players are aligning. 34
Constructive Regulation . . . . Commission Tier 1 State Ranking John Quackenbush (R), Chairman Term Ends: July 2, 2017 Sally Talberg (I) Term Ends: July 2, 2019 Norm Saari (R) Term Ends: July 2, 2021 Newly appointed! . . . . is supported by a quality Commission and a strong Law. 35
CMS Energy Consistent Growth . . . . Future Shines Bright a Sustainable Future Growth EPS a Past Next 5 +5% to +7% $2.50 Performance Years Investment (bils) $6.4 $7.6 +7% /year (2010-2014) Capacity Op! O&M Reduction (10)% (7)% (2006-2014) Conservative Sales Growth +1% + 1/2 % (2010-2014) Conservative Energy Policy 2008 Improved Law Law Last 7 Years Next 5 Years a Adjusted EPS (non-GAAP) .. . . . even easier, with lots of upsides. 36

Appendix
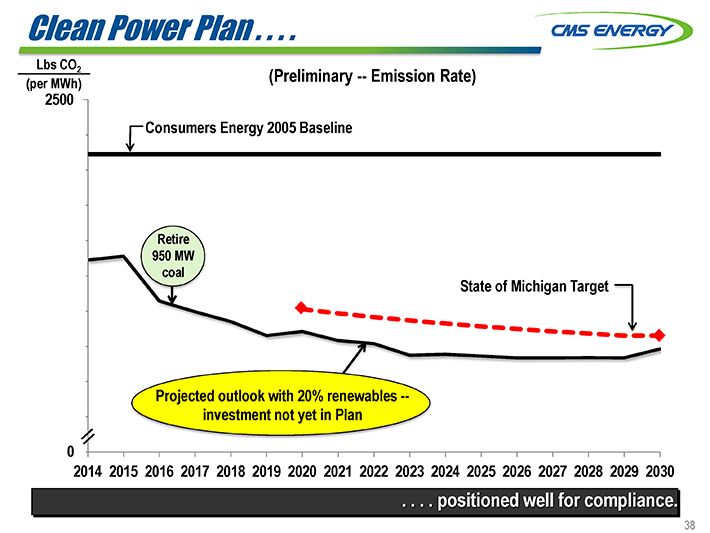
Clean Power Plan . . . . Lbs CO2 (per MWh) (Preliminary — Emission Rate) 2500 Consumers Energy 2005 Baseline Retire 950 MW coal State of Michigan Target Projected outlook with 20% renewables —investment not yet in Plan 0 2014 2015 2016 2017 2018 2019 2020 2021 2022 2023 2024 2025 2026 2027 2028 2029 2030 . . . . positioned well for compliance.
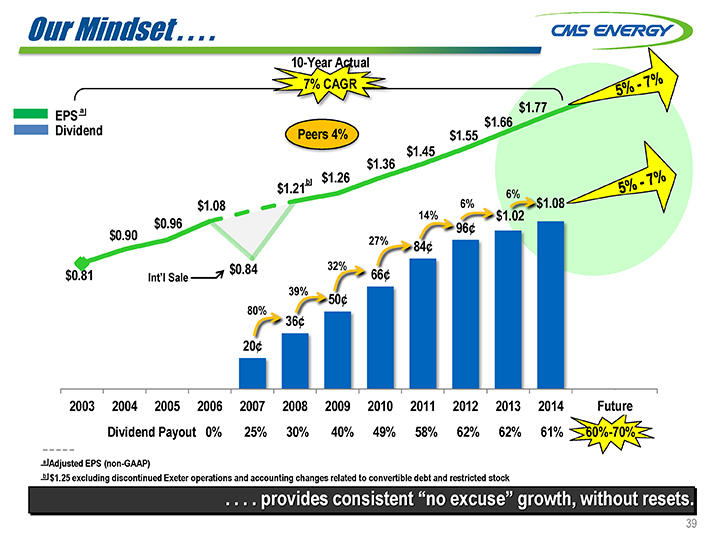
Our Mindset . . . . 10-Year Actual 7% CAGR a $1.77 EPS $1.66 Dividend Peers 4% $1.55 $1.36 $1.45 b $1.26 $1.21 6% $1.08 6% $1.08 14% $1.02 $0.96 96¢ $0.90 84¢ $0.81 $0.84 66¢ Int’l Sale 50¢ 36¢ 20¢ 2003 2004 2005 2006 2007 2008 2009 2010 2011 2012 2013 2014 Future Dividend Payout 0% 25% 30% 40% 49% 58% 62% 62% 61% 60%-70% a Adjusted EPS (non-GAAP) b $1.25 excluding discontinued Exeter operations and accounting changes related to convertible debt and restricted stock . . . . provides consistent “no excuse” growth, without resets. 39

O&M “Reinvestment” Helps CUSTOMERS . . . . Adjusted EPS 2015 O&M 2016 (non-GAAP) Reinvestment Savings (mils) (mils) DIG outage $ (8) $10 2014 Forestry (5) 5 17¢ Donations & other (5) 5 Total $(18) $20 13¢ Weather 12¢ Natural Offsets (4) 2015 Flex Items Cost & Other 5 • O&M choices Total 13¢ • Alt. financing • Plant outage • Contributions Guidance January March 31 Jun tember 30 December . . . . AND provides sustainable, premium growth for INVESTORS.
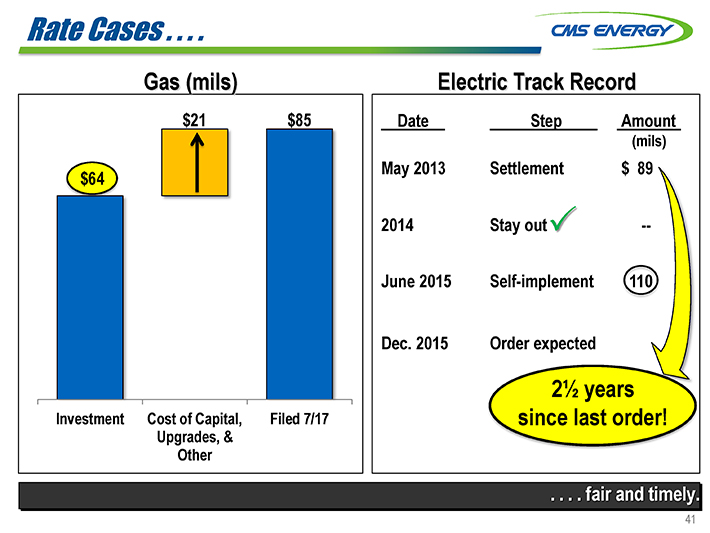
Rate Cases .. . . . Gas (mils) Electric Track Record $21 $85 Date Step Amount (mils) May 2013 Settlement $ 89 $64 2014 Stayü —June 2015 Self-implement Dec. 2015 Order expected 2 1/2 years Investment Cost of Capital, Filed 7/17 since last order! Upgrades, & Other . . . . fair and timely. 41
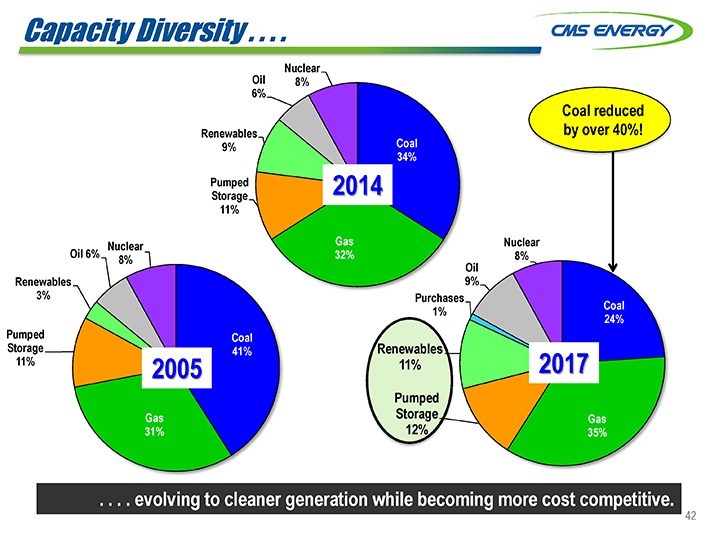
Capacity Diversity . . . . Oil Nuclear 6% 8% Coal reduced Renewables by over 40%! 9% Coal 34% Pumped 2014 Storage 11% Nuclear Gas Nuclear Oil 6% 32% 8% 8% Oil Renewables 9% 3% Purchases Coal 1% 24% Pumped Coal Storage 41% Renewables 11% 2005 11% 2017 Pumped Gas Storage Gas 31% 12% 35% . . . . evolving to cleaner generation while becoming more cost competitive. 42
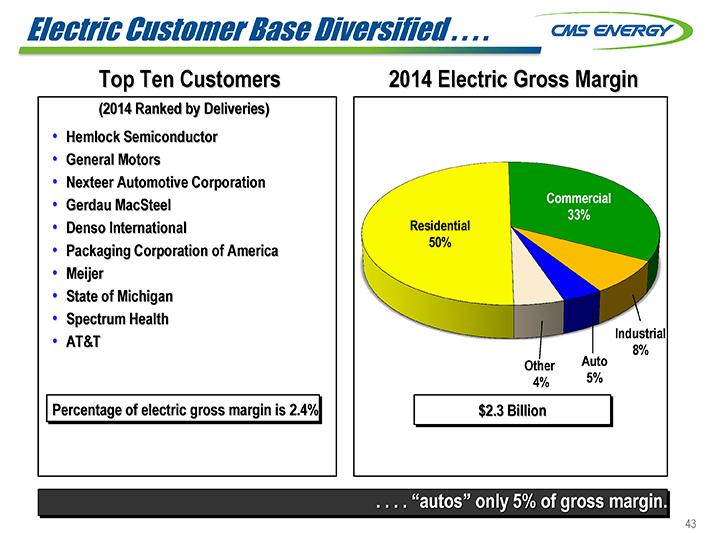
Electric Customer Base Diversified . . . . Top Ten Customers 2014 Electric Gross Margin (2014 Ranked by Deliveries) • Hemlock Semiconductor • General Motors • Nexteer Automotive Corporation • Gerdau MacSteel Commercial 33% • Denso International Residential 50% • Packaging Corporation of America • Meijer • State of Michigan • Spectrum Health Industrial • AT&T 8% Other Auto 4% 5% Percentage of electric gross margin is 2.4% . . . . “autos” only 5% of gross margin. 43
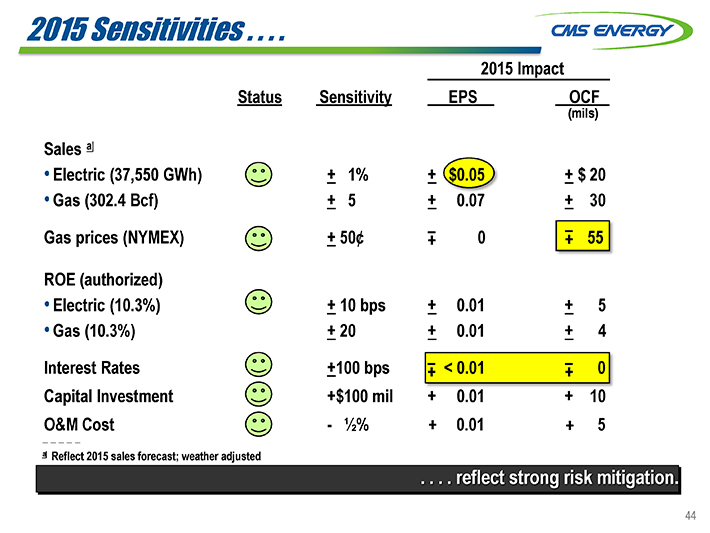
2015 Sensitivities a Reflect 2015 sales forecast; weather adjusted 2015 Impact Status Sensitivity EPS OCF Sales a Electric (37,550 GWh) Gas (302.4 Bcf) + 1% + 5 + $0.05 + 0.07 + $ 20 + 30 Gas prices (NYMEX) + 50¢ 0 55 ROE (authorized) Electric (10.3%) Gas (10.3%) + 10 bps + 20 + 0.01 + 0.01 + 5 + 4 Interest Rates Capital Investment O&M Cost +100 bps +$100 mil - ½% < 0.01 + 0.01 0.01 0 + 10 5 44
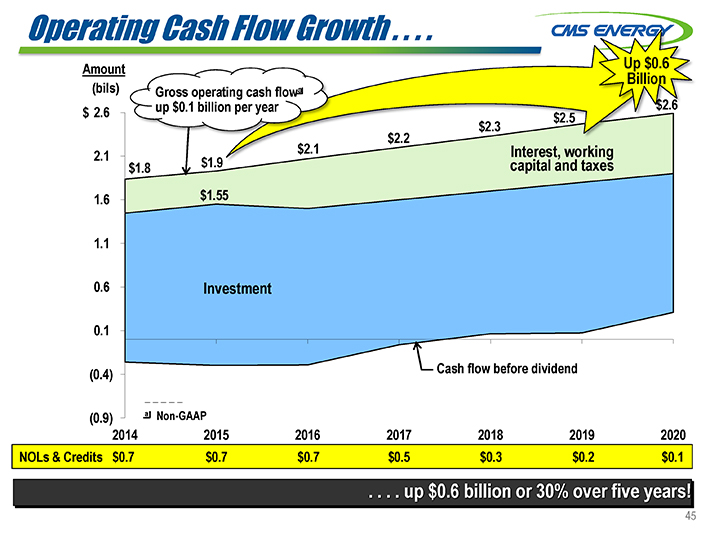
Operating Cash Flow Growth . . . . Amount Up $0.6 a Billion (bils) Gross operating cash flow $ 2.6 up $0.1 billion per year $2.5 2.1 $1.8 $1.9 1.6 $1.55 1.1 0.6 Investment 0.1 (0.4) Cash flow before dividend (0.9) a Non-GAAP 2014 2015 2016 2017 2018 2019 2020 NOLs & Credits $0.7 $0.7 $0.7 $0.5 $0.3 $0.2 $0.1 . . . . up $0.6 billion or 30% over five years!

Generation Strategy: New Supply Sources . . . . Levelized cost of new build (¢/kWh) New Build 25 Consumers Energy Sources 22¢ 15¢ 12¢ 11¢ Back 10¢ 8¢ -up 7¢ 6¢ Back 7¢ 6¢ -up 6¢ 9¢ 5.5¢ 5¢ 5¢ ® 6¢ 5 Winds Zeeland Cross Big Palisades 0 Combined Cycle Gas Plant Wind Coal Nuclear Residential Solar Gas price= $3.00 $4.50 $6.00 W/ tax W/o tax W/ emission Today Future credit credit controls $3.00 per $2.00 per watt watt? . . . . combined cycle gas is the most attractive new source of supply. 46
GAAP Reconciliation

CMS ENERGY CORPORATION Earnings Per Share By Year GAAP Reconciliation (Unaudited) 2003 2004 2005 2006 2007 2008 2009 2010 2011 2012 2013 2014 Reported earnings (loss) per share—GAAP ($0.30) $0.64 ($0.44) ($0.41) ($1.02) $1.20 $0.91 $1.28 $1.58 $1.42 $1.66 $1.74 After-tax items: Electric and gas utility 0.21 (0.39) — (0.07) 0.05 0.33 0.03—0.17 —Enterprises 0.74 0.62 0.04 (0.02) 1.25 (0.02) 0.09 (0.03) (0.11) (0.01) * 0.03 Corporate interest and other 0.16 (0.03) 0.04 0.27 (0.32) (0.02) 0.01 * (0.01) * * * Discontinued operations (income) loss (0.16) 0.02 (0.07) (0.03) 0.40 (*) (0.08) 0.08 (0.01) (0.03) * (*) Asset impairment charges, net — 1.82 0.76 0.60 — — — -Cumulative accounting changes 0.16 0.01 — — — — — Adjusted earnings per share, including MTM—non-GAAP $0.81 $0.87 $1.39 $0.57 $0.84 $1.21 (a) $1.26 $1.36 $1.45 $1.55 $1.66 $1.77 Mark-to-market impacts 0.03 (0.43) 0.51 Adjusted earnings per share, excluding MTM—non-GAAP NA $0.90 $0.96 $1.08 NA NA NA NA NA NA NA NA * Less than $500 thousand or $0.01 per share. (a) $1.25 excluding discontinued Exeter operations and accounting changes related to convertible debt and restricted stock.
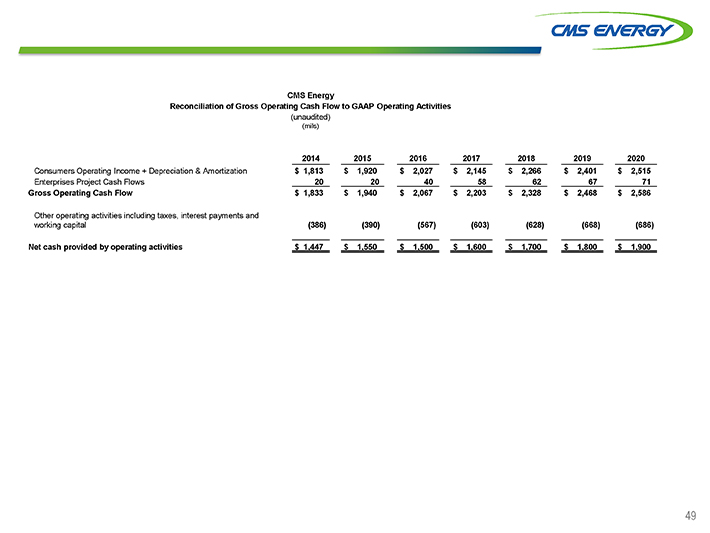
CMS Energy Reconciliation of Gross Operating Cash Flow to GAAP Operating Activities (unaudited) (mils) 2014 2015 2016 2017 2018 2019 2020 Consumers Operating Income + Depreciation & Amortization $ 1,813 $ 1,920 $ 2,027 $ 2,145 $ 2,266 $ 2,401 $ 2,515 Enterprises Project Cash Flows 20 20 40 58 62 67 71 Gross Operating Cash Flow $ 1,833 $ 1,940 $ 2,067 $ 2,203 $ 2,328 $ 2,468 $ 2,586 Other operating activities including taxes, interest payments and working capital (386) (390) (567) (603) (628) (668) (686) Net cash provided by operating activities $ 1,447 $ 1,550 $ 1,500 $ 1,600 $ 1,700 $ 1,800 $ 1,900
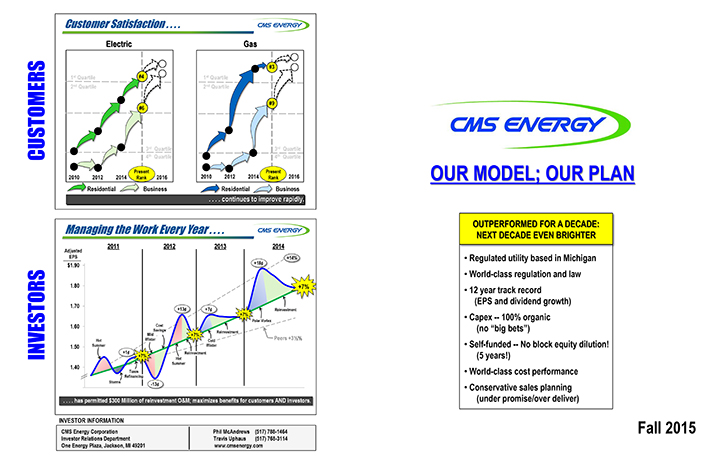
Customer Satisfaction . . . . Electric Gas #3 1st Quartile #4 1st Quartile 2nd Quartile 2nd Quartile #9 #6 3rd Quartile 3rd Quartile CUSTOMERS 4th Quartile 4th Quartile Present 2010 2012 2014 Present 2016 2010 2012 2014 Rank 2016 Rank OUR MODEL; OUR PLAN Residential Business Residential Business . . . . continues to improve rapidly. Managing the Work Every Year . . . . OUTPERFORMED FOR A DECADE: NEXT DECADE EVEN BRIGHTER 2011 2012 2013 2014 Adjusted EPS +14% • Regulated utility based in Michigan +18¢ $1.90 • World-class regulation and law $1.80 +7% year track record • 12 (EPS and dividend growth) $1.70 +13¢ +7¢ Reinvestment +7% • Capex — 100% organic Polar Vortex $1.60 Cost (no “big bets”) Savings Reinvestment Mild Hot Winter Cold Peers +3 1/2% $1.50 Summer Winter • Self-funded — No block equity dilution! +1¢ Reinvestment +7% (5 years!) INVESTORS Hot Summer $1.40 Taxes World-class • cost performance Refinancing Storms • Conservative sales planning . . . . has permitte Million of reinvestment O&M ximizes benefits for customers AND investors. (under promise/over deliver) IN TOR INFORMATION Fall 2015 y Corporation Phil McAndrews (517) 788-1464 ions Department Travis Uphaus (517) 768-3114 www.cmsenergy.com
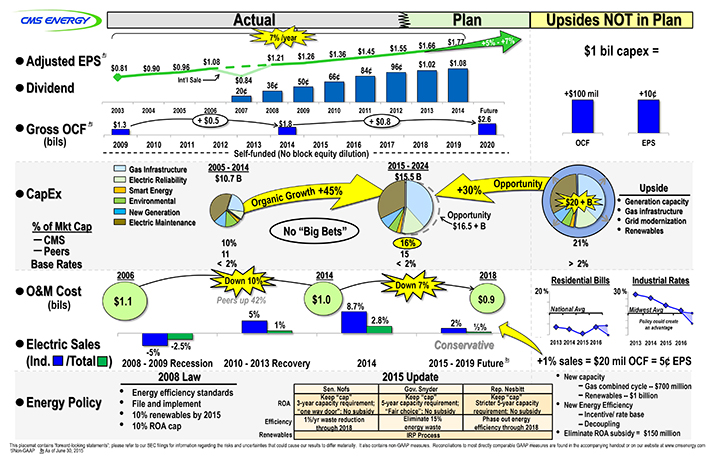
Actual Plan Upsides NOT in Plan 7% /year $1.55 $ a $1.36 $1.45 $1 bil capex = $1.21 $1.26 Adjusted EPS $1.08 96¢ $1.02 $1.08 $0.81 $0.90 $0.96 84¢ Int’l Sale $0.84 66¢ 50¢ Dividend 36¢ 20¢ +$100 mil +10¢ 2003 2004 2005 2006 2007 2008 2009 2010 2011 2012 2013 2014 Future + $0.5 $2.6 Gross OCF a $1.3 $1.8 + $0.8 (bils) 2009 2010 2011 2012 2013 2014 2015 2016 2017 2018 2019 2020 OCF EPS Self-funded (No block equity dilution) Gas Infrastructure 2005—2014 2015—2024 Electric Reliability $10.7 B $15.5 B Opportunity Upside CapEx Smart Energy +45% +30% Environmental $20 + B • Ge city New Generation Opportunity • Gas infrastructure Electric Maintenance • Grid modernization % of Mkt Cap $16.5 + B • No “Big Bets” Renewables 10% 16% 21% Peers 11 15 < 2% > 2% 2006 2014 2018 Down 10% Residential Bills Industrial Rates Down 7% O&M Cost $0.9 20 % 30 % (bils) $1.1 Peers up 42% $1.0 8.7% National Avg Midwest Avg 5% 1% 2.8% 2% Policy could create 1/2% an advantage Electric Sales -2.5% Conservative 2013 2014 2015 2016 2013 2014 2015 2016 -5% (Ind. /Total ) 2008—2009 Recession 2010—2013 Recovery 2014 2015—2019 Future b +1% sales = $20 mil OCF = 5? EPS 2008 Law 2015 Update • New capacity Sen. Nofs Gov. Snyder Rep. Nesbitt • Gas combined cycle — $700 million • Energy standards • Renewables — $1 billion Keep “cap” Keep “cap” Keep “cap” Energy Policy • File and implement ROA 3-year capacity requirement; 5-year capacity requirement; Stricter 5-year capacity • New Energy Efficiency • 10% renewables by 2015 “one way door”; No subsidy “Fair choice”; No subsidy requirement; No subsidy • Incentive/ rate base Efficiency 1%/yr waste reduction Eliminate 15% Phase out energy • 10% ROA cap energy waste efficiency through 2018 • Decoupling through 2018 Renewables IRP Process • Eliminate ROA subsidy = $150 million This placemat contains “forward-looking statements”; please refer to our SEC filings for information regarding the risks and uncertainties that could cause our results to differ materially. It also contains non-GAAP measures. Reconciliations to most directly comparable GAAP measures are found in the accompanying handout or on our website at www.cmsenergy.com a Non-GAAP b As of June 30, 2015